Mercator Revisited conference proceedings
118
Mercator Revisited Cartography in the Age of Discovery Soetkin Vervust, Bart Ooghe, Philippe De Maeyer (eds.) Soetkin Vervust, Bart Ooghe, Philippe De Maeyer (eds.) Mercator Revisited - Conference Proceedings International conference - Sint-Niklaas, Belgium 25-28 April 2012 International conference - Sint-Niklaas, Belgium Conference Proceedings
-
Upload
sunderland -
Category
Documents
-
view
0 -
download
0
Transcript of Mercator Revisited conference proceedings

Mercator RevisitedCartography in the Age of Discovery
Soetkin Vervust, Bart Ooghe, Philippe De Maeyer (eds.)
Soetkin Vervust, Bart Ooghe, Philippe D
e Maeyer (eds.)
Mercator Revisited - Conference Proceedings
Internationa
l conference - Sint-Nikla
as, Belg
ium
25-28 April 2012International conference - Sint-Niklaas, Belgium
Conference Proceedings
Proceedings of the International Conference Mercator Revisited
Sint-Niklaas - Belgium

Cover Design: Wim Van Roy
Book Design: Soetkin Vervust
Print: University press, Zelzate, www.universitypress.be
ISBN: 978-94-6197036-7
No responsibility is assumed by the Publisher, the Editors and Authors for any in-
jury and/or damage to persons or property as a matter of products liability, negli-
gence or otherwise, or from any use or operation of any methods, products, in-
structions or ideas contained in the material herein. The Publisher and the Editors
do not necessarily endorse the ideas held, or views expressed by the Authors of
the material contained in this publication. Authors are responsible for their input.
All rights reserved. No parts of this book may be reproduced or transmitted in any
form or by any means, electronic, mechanical, photocopying, recording, or other-
wise, without the prior written permission of the publisher.

Preface
This book comprises the proceedings of the International Conference
“Mercator Revisited – Cartography in the Age of Discovery”, held in Sint-
Niklaas, Belgium on April 25-28, 2012.
The conference focuses on the place of cartography in general and of Mer-
cator in specific in the 16th century. The Age of Discovery presented map-
makers with an unprecedented opportunity and a scientific obligation to
collect, record and categorize the world ‘as it was’. The greatest mapmak-
ers of the era were scientists, craftsmen and humanists combined, influ-
enced by international politics, science and philosophy. Their maps not on-
ly reflect the factual discoveries of the time but also the environments
within which the maps were produced. In celebration of the 500th anniver-
sary of the birth of Gerard Mercator, the conference aims at giving a fresh
impetus to the study of his work and of the cartography of his time.
This book is organized into three parts, containing three full papers, 17 ab-
stracts and four abstracts of the full papers that are selected for publication
in The Cartographic Journal, based on an extensive peer-review by mem-
bers of the Program Committee.
We would like to thank the many people who helped to make this confer-
ence a success. We owe special thanks to Helga Vermeulen, Nathalie Van
Nuffel and Karen De Coene for their great help in organizing the confer-
ence, to Wim Van Roy for his excellent design skills and to Steven De
Vriese for his technological expertise. Further, we would like to thank our
partners and sponsors for their financial or material support. These include
the Heritage Cell Waasland, Ghent University, the Faculty of Sciences, the
City Museum of Sint-Niklaas, the Flemish Government, the International
Cartographic association (ICA), the Research Foundation Flanders (FWO)
and the Koninklijke Oudheidkundige Kring van het Land van Waas
(KOKW). Finally, we would like to thank the members of the Program
Committee for carefully reviewing the contributions and all those who
submitted their work and participated in “Mercator Revisited – Cartogra-
phy in the Age of Discovery”.
Ghent, Belgium
April 2012
Soetkin Vervust, Bart Ooghe and Philippe De Maeyer


Program Committee
Wouter Bracke, Royal Library of Belgium (Belgium)
Frank Canters, Free University of Brussels (Belgium)
Karen De Coene, Ghent University (Belgium)
Philippe De Maeyer, Ghent University (Belgium)
Joost Depuydt, FelixArchief / City Archives Antwerp (Belgium)
Elri Liebenberg, University of South Africa (South Africa)
Evangelos Livieratos, Aristotle University of Thessaloniki (Greece)
Bart Ooghe, Heritage Cell Waasland (Belgium)
Hélène Richard, Bibliothèque nationale de France (France)
Peter van der Krogt, Universiteit Utrecht (The Netherlands)
Soetkin Vervust, Ghent University (Belgium)
Local Organizing Committee
Karen De Coene, Philippe De Maeyer, Nathalie Van Nuffel, Helga Ver-
meulen, Soetkin Vervust
Ghent University (Belgium)
Bart Ooghe, Heritage Cell Waasland (Belgium)


Table of contents
Preface ........................................................................................................ 3
Table of contents ........................................................................................ 7
Full papers
Cornelis Van Wytfliet: The Age of Discovery and Colonization
revisited ..................................................................................................... 13 Stanislas De Peuter
A surveying symbol connects G. Mercator and J. van Deventer ......... 53 Eric Leenders, Jan De Graeve
Map as metaphor ..................................................................................... 69 Inge Panneels
Abstracts
Cartographic typography: Gerard Mercator’s contribution .............. 85 Maria Graciela Borozuki
The world map by Gerard Mercator (1569) in the shape of an atlas
revisited ..................................................................................................... 87 Sjoerd de Meer
Mercator’s magnetic work, recalculated ............................................... 88 Hugo Decleir
Secret Maps of Early Modern Spain ...................................................... 90 Benjamin Ehlers

Mapping American History in The Tempest......................................... 92 David Evans
A tenacious Atlantic legend. From the so-called "Flemish Islands" to
the imaginary island "Flanders" ............................................................ 93 John Everaert
Squaring the circle: how Mercator did it in 1569 ................................. 94 Joaquim Alves Gaspar
The Far East in the Mercator's World map in 1569 ............................. 95 Koji Hasegawa
The sale of atlases by the Antwerp Plantin Press .................................. 96 Dirk Imhof
Cartesius: one graphical geoportal combines four types of institutions
for Belgium and Africa ............................................................................ 98 Rink Kruk, B. Pigeon, W. Bracke, M. Carnier, L. Verachten, B. Verschueren,
D. Baudet, D. Van Hassel, M. Fernandez, P. Verheyen, G. Gryseels, K. Velle,
P. Lefèvre, I. Vanden Berghe
The pre-history of the Mercator projection ........................................ 100 Henrique Leitao, Joaquin Alves Gaspar and J. Filipe Queiró
The influence of Gerard Mercator on the work of Michiel Coignet
(1549-1623) ............................................................................................. 101 Ad Meskens
A GIS analysis of the 1633 planning of Venetian guardposts on Crete
(Greece) ................................................................................................... 102 Steven Soetens, C. Geerdink, E. Barbetsea and R. Verhagen
Gerhard Mercator and Wolfgang Lazius - A comparative analysis . 104 Petra Svatek
The ‘Digital Thematic Deconstruction’ of 16th-century urban maps106 Bram Vannieuwenhuyze
Reframing Mercator’s Orbis Imago, the double cordiform world map
of 1538 ..................................................................................................... 108 Ruth Watson

Modern edition of texts and maps of the Cadastral Land Survey of
Swedish Pomerania 1692-1709 on the internet with help of WebGIS
and Content Management Systems ...................................................... 110 Reinhard Zölitz
Abstracts of full papers appearing in The Cartographic Journal
Between the Cross and Crescent: Countries Bordering the Ottoman
Empire in the Eyes of Dutch ................................................................. 113 Mirela Altic
A ‘Devious Course’: Projecting Toleration on Mercator’s ‘Map of the
World’, 1569 ........................................................................................... 115 Jerry Brotton
Geographical names on Mercator's maps of Croatia ......................... 116 Josip Faričić, Damir Magaš and Lena Mirošević
Digital Representation of Historical Globes: Methods to Make 3D and
Semi-3D Models of 16th Century Mercator Globes ........................... 117 Cornelis Stal, Alain De Wulf, Karen De Coene, Philippe De Maeyer, Timothy
Nuttens, Thérèse Ongena


Full Papers


13
Cornelis Van Wytfliet: The Age of Discovery and Colonization revisited
Stanislas De Peuter Independent scholar, Belgium
“Von einem, der daheim blieb, die (Neue) Welt zu entdecken”1
1 The man and his book
The first goal of this paper is to present the man, his book and the maps.
Little is known about this Flemish cartographer of the 16th century. It has
been widely reported that Cornelis van Wytfliet (hereafter called Wytfliet)
was an advocate to become Geography Secretary of the Council of Brabant
during the mid-16th century. As the subtitle suggests he never visited the
New World. His work Descriptionis Ptolemaicae augmentum sive
Occidentis notitia brevis commentario, published in Leuven in 1597 as a
supplement to Ptolemy’s Geographia, was the first atlas devoted exclusive-
ly to the New World. This book includes 19 maps: one world map and 18
regional maps, all of which were specially engraved for this edition. Many
of Wytfliet's maps are the first or among the earliest of specific regions of
North and South America. In line with contemporary tradition, the accom-
panying text describes the geography, natural history and ethnography of
the entire continent. Based on decades of expeditions, the atlas provides
historical snatches of so many well-known voyages by world famous ex-
plorers, as well as of the second level of discoverers such as Diego Veláz-
1 Paraphrase used by Günther Wesel as title for his book on Sebastian Münster (Wesel (2004): “one who stayed home to discover the New World.”)

14
quez de Cuéllar, Pedro de Valdivia, Gaspar Corte-Real, Ponce de Léon or
Pedro Arias Dávila. This brings us to the second and more ambitious ob-
jective of this review as the atlas provides an ideal opportunity to review
prime cartographic information by surfing on the early European voyages
leading to discovery and early colonization both North and South. Let’s
follow our guide Cornelis Wytfliet and revisit with him some of the places
and events which shaped our world.
(Toponyms named on the maps of the Atlas are mentioned in italics in this
commentary.)
2 Wytfliet & Metellus or Metellus & Wytfliet?
There is some controversy about the authenticity of the Wytfliet maps as
his maps and those of Metellus are very similar, on many points identical.
In 1588 Acosta, a Spanish missionary and cartographer, published De
Natura Nova Orbis (Salamanca). The maps in this work were attributed to
Johannes Matalius Metellus (Jean Matal, maybe born in Leuven in 1520).
In the America sive Novis Orbis version of 1600, Metellus is explicitly
named as the cartographer of these maps. As Metellus also died in 1597,
the work was finished by Conrad Loew, pseudonym for Matthias Quad.
Both Wytfliet and Metellus worked in Leuven. The discussion may lead to
the conclusion, that not Wytfliet, but Metellus was the original cartogra-
pher of the America maps. So, was Metellus indeed the cartographer of
the Wytfliet maps? We do not know. Both atlases contain 19 maps, of
which 18 are more or less identical. Concerning the 19th map: where
Wytfliet shows Yucatan, which was in later editions replaced by four small
views of Asian countries, Metellus chose for a smaller version of Ortelius’
map of the Pacific. The maps by Metellus are much rarer (and maybe fin-
er?) than those of Wytfliet. The size of the Metellus maps is somewhat
smaller (18 x 23 cm) than the size used by Wytfliet (23 x 29 cm).
3 Content, sources and editions
The title Descriptionis Ptolemaicae augmentum (“Descriptionis”) sug-
gests that Wytfliet marketed his study as a supplement to Ptolemy's Cos-
mography, however, based on new knowledge. Still, many maps (in par-
ticular those of North America) are expressions of (mythical) fantasy and
don’t pass the reality test which will be later illustrated in this article. Log-
ically, since around 1600 European knowledge of Central and South
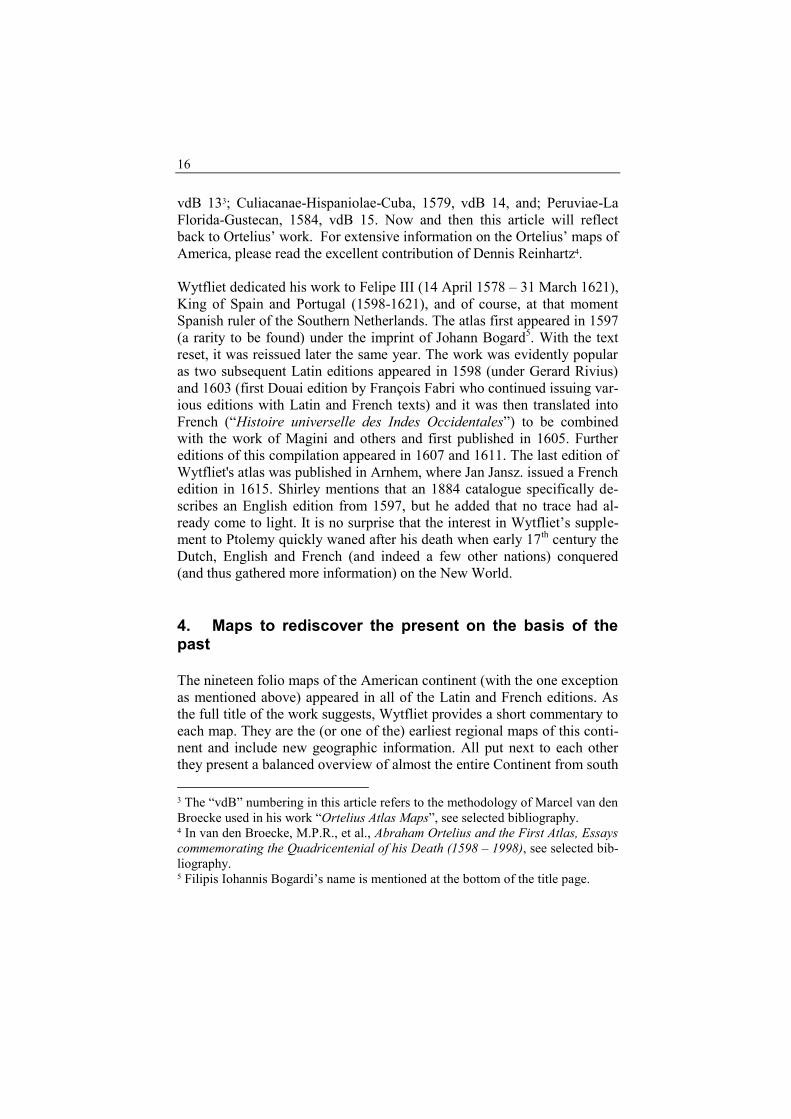
15
America was much more accurate than of North America. Where the earli-
est expeditions were made to discover the entire continent, commercial
reasons made the stakeholders chose for explorations of Central and South
America; the exploration of the North, therefore, lagged behind more than
50 years. The first part of the Descriptionis contains an historical survey
starting from the discovery of America by Columbus up to 1540 (and thus
including the explorations by, inter alia, Caboto, Pizarro, Verrazano, Car-
tier and others). Wytfliet goes on to describe geography and natural history
of the different regions from Tierra del Fuego up to Alaska and Canada.
The editions from 1605 onwards contain a second part on the East Indies.
In addition to the large double-page maps there are also four small maps
on one double-page sheet in Magini's supplement showing smaller maps of
the East Indies, Japan, China and the Philippines, replacing, as mentioned,
the Yucatan map, thus keeping the total number of maps to 19. The text by
Giovanni Antonio Magini (1555 – 1617) and others deal with the discov-
ery of Cape of Good Hope, India, Indonesia, and Japan, followed by a ge-
ographical description of these countries. An additional third part, which
first appeared in the 1607 edition, includes descriptive material based on
letters from Jesuit missionaries and a discussion about the conversion of
natives of the East Indies and Far East!
Wytfliet drew upon a variety of sources2, including Gerhard Mercator's
large world map of 1569, Peter Plancius' world map of 1592, regional
maps by Ortelius and of de Jode as well as several manuscript maps and
travel accounts by so many conquerors to which he had access. The truth is
that his atlas covers an entire continent and this, more than 100 years after
Spain’s first touchdown in the West Indies and also decades after many
subsequent discoveries, so that the sources to and the quality of the maps
are very diverse. Wytfliet consulted a wide range of European authors, in-
cluding Cieza de León (Crónica de Perú, 1553), Hakluyt (Principall Navi-
gations, 1589), de Bry (America, 1590), Acosta (Historia natural y moral
de las India, 1590) and probably also Ramusio’s Navigationi, Vol III
(1556) and Laudonnière’s Histoire notable de la Floride (1586). Some of
his sources will be specifically mentioned at the discussion of the maps.
Looking at Wytfliet, one cannot but stop at Ortelius. Apart from his gen-
eral (world & continental) maps, the Antwerp scholar had already pub-
lished the following regional maps on the Americas: Hispania nova, 1579,
2 Skelton provides an interesting analysis of the sources.
16
vdB 133; Culiacanae-Hispaniolae-Cuba, 1579, vdB 14, and; Peruviae-La
Florida-Gustecan, 1584, vdB 15. Now and then this article will reflect
back to Ortelius’ work. For extensive information on the Ortelius’ maps of
America, please read the excellent contribution of Dennis Reinhartz4.
Wytfliet dedicated his work to Felipe III (14 April 1578 – 31 March 1621),
King of Spain and Portugal (1598-1621), and of course, at that moment
Spanish ruler of the Southern Netherlands. The atlas first appeared in 1597
(a rarity to be found) under the imprint of Johann Bogard5. With the text
reset, it was reissued later the same year. The work was evidently popular
as two subsequent Latin editions appeared in 1598 (under Gerard Rivius)
and 1603 (first Douai edition by François Fabri who continued issuing var-
ious editions with Latin and French texts) and it was then translated into
French (“Histoire universelle des Indes Occidentales”) to be combined
with the work of Magini and others and first published in 1605. Further
editions of this compilation appeared in 1607 and 1611. The last edition of
Wytfliet's atlas was published in Arnhem, where Jan Jansz. issued a French
edition in 1615. Shirley mentions that an 1884 catalogue specifically de-
scribes an English edition from 1597, but he added that no trace had al-
ready come to light. It is no surprise that the interest in Wytfliet’s supple-
ment to Ptolemy quickly waned after his death when early 17th century the
Dutch, English and French (and indeed a few other nations) conquered
(and thus gathered more information) on the New World.
4. Maps to rediscover the present on the basis of the past
The nineteen folio maps of the American continent (with the one exception
as mentioned above) appeared in all of the Latin and French editions. As
the full title of the work suggests, Wytfliet provides a short commentary to
each map. They are the (or one of the) earliest regional maps of this conti-
nent and include new geographic information. All put next to each other
they present a balanced overview of almost the entire Continent from south
3 The “vdB” numbering in this article refers to the methodology of Marcel van den Broecke used in his work “Ortelius Atlas Maps”, see selected bibliography. 4 In van den Broecke, M.P.R., et al., Abraham Ortelius and the First Atlas, Essays commemorating the Quadricentenial of his Death (1598 – 1998), see selected bib-liography. 5 Filipis Iohannis Bogardi’s name is mentioned at the bottom of the title page.
17
to north: the most important region missing is the one between Plata and
Tierra del Fuego. For obvious reasons, a long stretch of the coast of North
Canada is also missing6. It goes without saying that many place names in
the Descriptiones are the result of misallocation, misinterpretation or even
pure fantasy. But this makes this historical investigation the more fascinat-
ing. Let’s serve through the “conquista” and other colonization programs!
Please note that founding dates and credits are often disputable. In the or-
der of the 1597 edition, the atlas contains the following maps:
4.1 Utriusque hemispherii delineatio
The first map of the atlas is a double-hemisphere world map, which is
based (in reduced format) on Rumold Mercator's influential map of 1587.
Atlas, a Titan in Greek mythology, bears the two hemispheres. The shape
of the American continent is similar to de Bry’s 1596 version, published in
Grand Voyages7. The presentation of the world8 through a double-
hemisphere was not novel: it was used before inter alia by Tramezino
(1554), Ruscelli (1561), Jost Amman (1564), Benito Arias (Montano)
(1572), Simon Girault (1592), Jode (1593), Jodocus Hondius (1592 and
1595), Plancius (1590, 1594 and 1596).
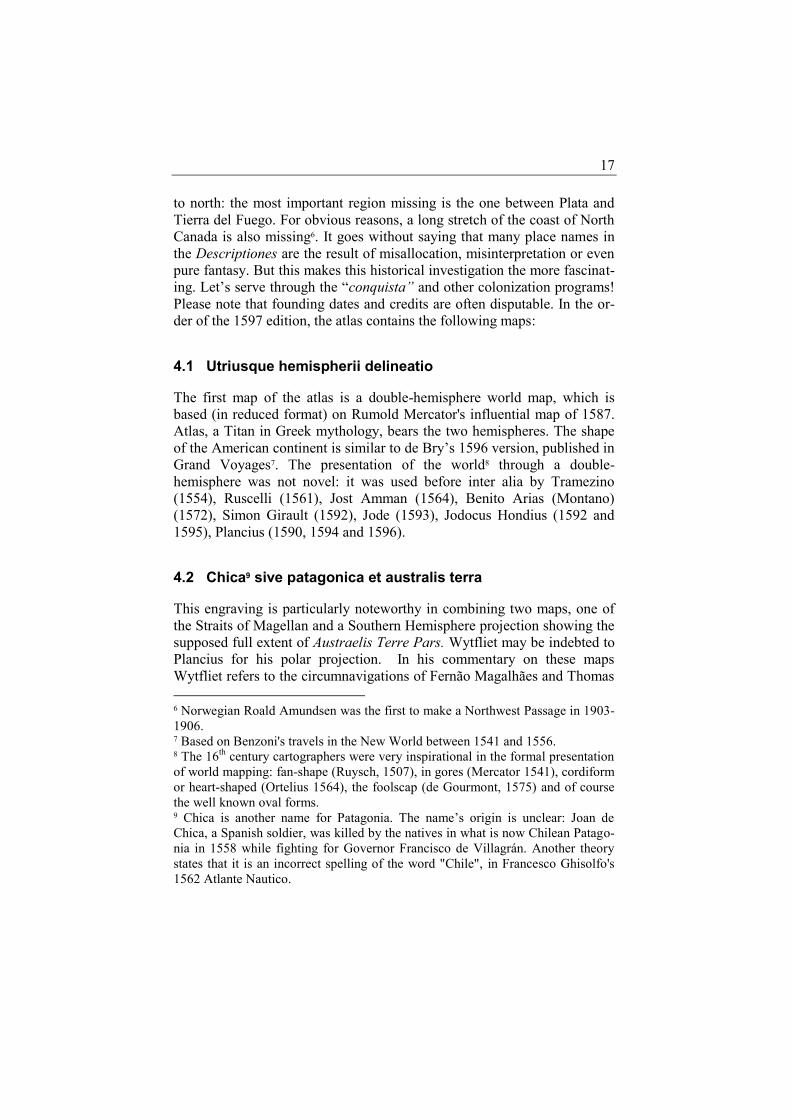
4.2 Chica9 sive patagonica et australis terra
This engraving is particularly noteworthy in combining two maps, one of
the Straits of Magellan and a Southern Hemisphere projection showing the
supposed full extent of Austraelis Terre Pars. Wytfliet may be indebted to
Plancius for his polar projection. In his commentary on these maps
Wytfliet refers to the circumnavigations of Fernão Magalhães and Thomas
6 Norwegian Roald Amundsen was the first to make a Northwest Passage in 1903-1906. 7 Based on Benzoni's travels in the New World between 1541 and 1556. 8 The 16th century cartographers were very inspirational in the formal presentation of world mapping: fan-shape (Ruysch, 1507), in gores (Mercator 1541), cordiform or heart-shaped (Ortelius 1564), the foolscap (de Gourmont, 1575) and of course the well known oval forms. 9 Chica is another name for Patagonia. The name’s origin is unclear: Joan de Chica, a Spanish soldier, was killed by the natives in what is now Chilean Patago-nia in 1558 while fighting for Governor Francisco de Villagrán. Another theory states that it is an incorrect spelling of the word "Chile", in Francesco Ghisolfo's 1562 Atlante Nautico.

18
Cavendish. Magalhães’ fleet (see illustration of his flagship Victoria) ar-
rived on 31 March 1520 at a natural harbour which he called B. de S. Jul-
ian where his fleet overwintered10. At the end of August 1520 Magalhães
chose to sail again; unfortunately, too early, so that he had to bunker again
at the mouth of R. de S. Crus. The sailors also met the native people who
were described by Antonio Pigafetta11 as giants, and called them Patagoni-
ans, meaning "Big Feet. The map illustration is of Magalhães' ship, the
Victoria. Remarkable is the mention of Philipopolis12, the Spanish settle-
ment founded in March 1584 by Pedro Sarmiento de Gamboa and part of
Spain's measures to prevent a repeat of Drake's 1578 entry into the Pacific
via the Strait. It started with around 300 settlers, but conditions were harsh
and local vegetation was sparse. This attempt to colonize the shores of the
Strait ended tragically when the settlers starved or froze to death. When the
next English navigator, Thomas Cavendish13 landed at the site in 1587, he
found only ruins of the settlement. He renamed the place Port Famine
which got subsequently translated into Spanish as Puerto Hambre or Puer-
to del Hambre, and these names are still in use. Puerto Hambre (60 km
south of Punta Arenas14) lies halfway between the South Pole and Chile's
northern border with Peru. Since Chile claims its Antarctic territories ex-
tending all the way to the pole, this point is also considered to be the geo-
graphical centre of Chile!
The lower part of the map is shown on a polar projection, with Terra
Australis a very large landmass made up of four peninsulas that reach to-
wards Nova Guinea and Africa. This early engraving supports the late 16 th
century theory that such continent existed in the Southern Hemisphere.
This hypothetical continent appeared on some maps for approximately two
hundred years until it was finally proven false by the voyage of James
Cook in 1769. The circular inset of Terra Australis was copied from
Plancius’ planisphere map of 1592. The following passage is to be found
in the Descriptiones: "The Australis Terra is the most southern of all
lands; it is separated from New Guinea by a narrow strait; its shores are
10 … and where an unsuccessful mutiny by two of his captains broke out. In June 1578 Francis Drake also overwintered at this place. 11 … and one of the 18 survivors out of the approximately 240 adventurers. 12 The city of Rey Don Felipe, Philipopolis is not indicated on the Mercator-Hondius map of the Magellan Straits. 13 Later, Cavendish captured or sank 9 Spanish ships and looted fresh supplies along the Chilean coast. 14 where a replica of the Victoria can be visited.
19
hitherto but little known, since, after one voyage and another, that route
has been deserted, and seldom is the country visited unless when sailors
are driven there by storms. The Australis Terra begins at two or three de-
grees from the equator, and is maintained by some to be of so great an ex-
tent that if it were thoroughly explored it would be regarded as a fifth part
of the world." This quote is so vague and suppositious that it would scarce-
ly be worth mentioning, were it not for the singular mention of the narrow
strait separating Australis Terra from New Guinea (now known as the
Torres Strait15); for at this time Torres had not yet sailed through the straits,
nor was the fact of his venture known to the world until the end of the 18th
century, when Dalrymple discovered his report amongst the archives of
Manila, and did justice to his memory. In 1981 the Solomon Islands issued
a mini-sheet of four stamps which included an extract of this chart by
Wytfliet showing that the separation of New Guinea and Australia was al-
ready known more than ten years before the voyages of Janszoon, Quirós,
and de Torres. A number of authors, such as Schilder, McIntyre Major and
Collingridge also discuss this map at length and point to the possibility that
Australia had already been “discovered” in the 16th century...
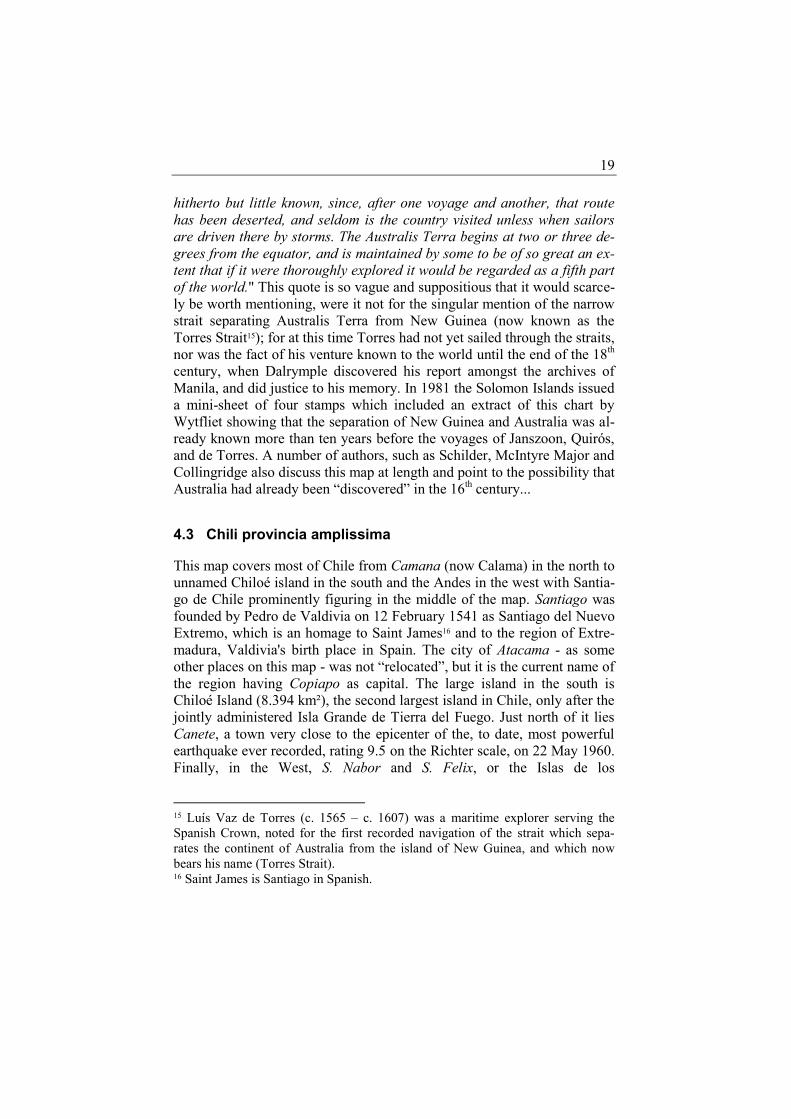
4.3 Chili provincia amplissima
This map covers most of Chile from Camana (now Calama) in the north to
unnamed Chiloé island in the south and the Andes in the west with Santia-
go de Chile prominently figuring in the middle of the map. Santiago was
founded by Pedro de Valdivia on 12 February 1541 as Santiago del Nuevo
Extremo, which is an homage to Saint James16 and to the region of Extre-
madura, Valdivia's birth place in Spain. The city of Atacama - as some
other places on this map - was not “relocated”, but it is the current name of
the region having Copiapo as capital. The large island in the south is
Chiloé Island (8.394 km²), the second largest island in Chile, only after the
jointly administered Isla Grande de Tierra del Fuego. Just north of it lies
Canete, a town very close to the epicenter of the, to date, most powerful
earthquake ever recorded, rating 9.5 on the Richter scale, on 22 May 1960.
Finally, in the West, S. Nabor and S. Felix, or the Islas de los
15 Luís Vaz de Torres (c. 1565 – c. 1607) was a maritime explorer serving the Spanish Crown, noted for the first recorded navigation of the strait which sepa-rates the continent of Australia from the island of New Guinea, and which now bears his name (Torres Strait). 16 Saint James is Santiago in Spanish.
20
Desventurados, which Juan Fernández (c. 1536 – c. 1604) discovered in
1574.
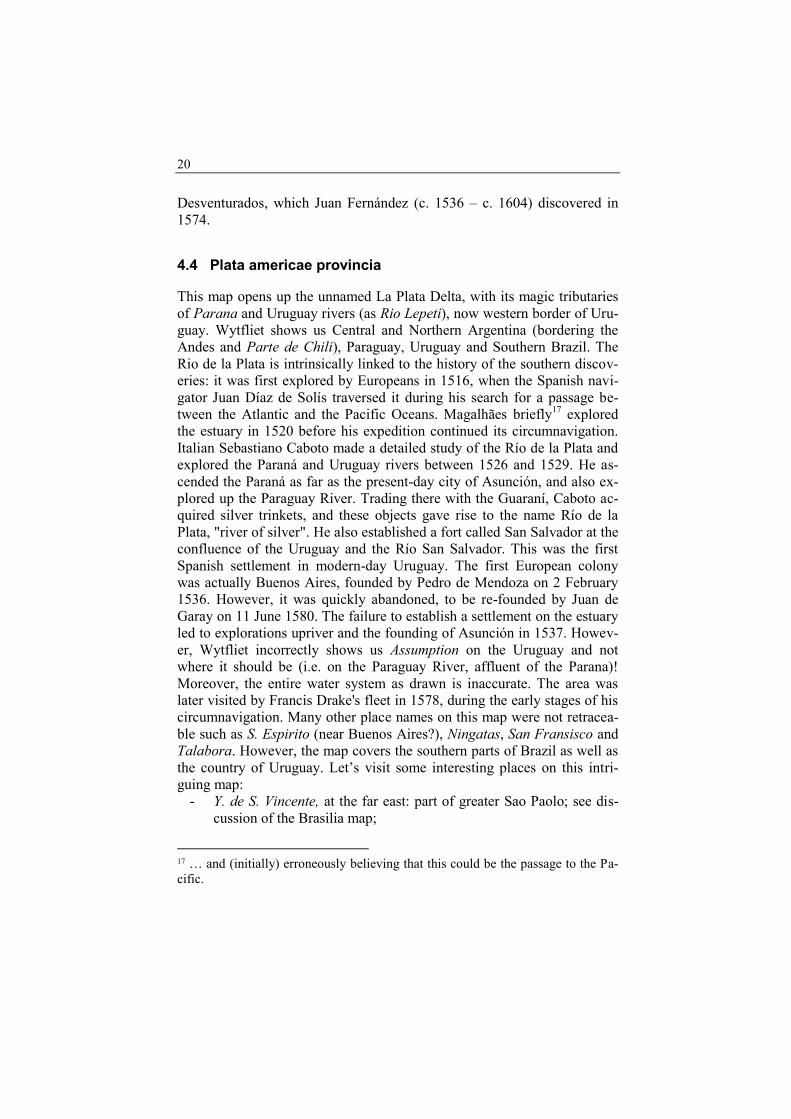
4.4 Plata americae provincia
This map opens up the unnamed La Plata Delta, with its magic tributaries
of Parana and Uruguay rivers (as Rio Lepeti), now western border of Uru-
guay. Wytfliet shows us Central and Northern Argentina (bordering the
Andes and Parte de Chili), Paraguay, Uruguay and Southern Brazil. The
Rio de la Plata is intrinsically linked to the history of the southern discov-
eries: it was first explored by Europeans in 1516, when the Spanish navi-
gator Juan Díaz de Solís traversed it during his search for a passage be-
tween the Atlantic and the Pacific Oceans. Magalhães briefly17
explored
the estuary in 1520 before his expedition continued its circumnavigation.
Italian Sebastiano Caboto made a detailed study of the Río de la Plata and
explored the Paraná and Uruguay rivers between 1526 and 1529. He as-
cended the Paraná as far as the present-day city of Asunción, and also ex-
plored up the Paraguay River. Trading there with the Guaraní, Caboto ac-
quired silver trinkets, and these objects gave rise to the name Río de la
Plata, "river of silver". He also established a fort called San Salvador at the
confluence of the Uruguay and the Río San Salvador. This was the first
Spanish settlement in modern-day Uruguay. The first European colony
was actually Buenos Aires, founded by Pedro de Mendoza on 2 February
1536. However, it was quickly abandoned, to be re-founded by Juan de
Garay on 11 June 1580. The failure to establish a settlement on the estuary
led to explorations upriver and the founding of Asunción in 1537. Howev-
er, Wytfliet incorrectly shows us Assumption on the Uruguay and not
where it should be (i.e. on the Paraguay River, affluent of the Parana)!
Moreover, the entire water system as drawn is inaccurate. The area was
later visited by Francis Drake's fleet in 1578, during the early stages of his
circumnavigation. Many other place names on this map were not retracea-
ble such as S. Espirito (near Buenos Aires?), Ningatas, San Fransisco and
Talabora. However, the map covers the southern parts of Brazil as well as
the country of Uruguay. Let’s visit some interesting places on this intri-
guing map:
- Y. de S. Vincente, at the far east: part of greater Sao Paolo; see dis-
cussion of the Brasilia map;
17 … and (initially) erroneously believing that this could be the passage to the Pa-cific.

21
- the large Y. de S. Catharina, now also the name of a state in the Fed-
eral Republic of Brazil, having its capital Florianopolis on the is-
land;
- C. de Santa Maria is not the famous Punta del Este but lies some 60
km north-eastwards on the Atlantic in a town called La Paloma,
Uruguay.
- inland, Cordaba (Córdoba), the second-largest city in Argentina af-
ter the federal capital Buenos Aires, with about 1.3 million inhabit-
ants according to the 2001 census. The city was founded on July 6,
1573 by Jerónimo Luis de Cabrera, who named it after Córdoba,
Spain. It was one of the first Spanish colonial capitals of the region
that is now Argentina.
- Santa Ana, on the Parana River, now a forgotten place close to Re-
conquista.
- The town of Mepenes probably refers to an indigenous tribe living in
the current province of Corrientes, situated in the North-East of Ar-
gentina, so between the two rivers and is therefore somewhat mis-
placed.
- S. Miguel is the current town of San Miguel de Tucuman, also the
most important city of Northern Argentina. It was founded in 1565
by Diego de Villarroel during an expedition originating in Peru.
4.5 Peruani regni descriptio
This map also includes Bolivia, Ecuador18 and western Brazil. The region
was of particular interest since it was one of Spain's primary production
areas of gold and silver. Both the Maragnon (Maranon) and the
Paucarmayo (Ucayali) dominate the Peruvian Amazon water system,
which Wytfliet certainly must have known from Ortelius map19 (vdB 15).
Picora Provincia is now called Picota province. The map concentrates on
Inca land, as conquered by Francisco Pizarro (with de Soto) in 1531-1533
(cfr. decisive battle at Chamarra20, 1532) and shows many Inca and Span-
ish settlements. Peru = Pizarro land!
18 Equador claimed for a long time a large part of northern Peru (+/- 200.000 km³): this dispute was settled by the Protocol of Rio de Janeiro in 1942; after some more cross-border shootings the Protocol was confirmed in 1995. 19 Ortelius covered a larger area, also including the Isolas de Galapagos, which were discovered by Tomas de Bertanga in 1535. 20 After the battle of Cajamarca, Inca King Atahualpa was executed and his 10 year old wife became the mistress of Pizarro.

22
Inca sites:
- Cuzco: capital of the Inca Empire until conquered by Pizarro in
1533.
- Quito: Quito's origins date back to the first millennium, when the
“Quitu” tribe occupied this area. It was conquered by the Inca in
1462.
- Pachama21 (temple): Pacha Kamaq or “Earth-Maker” was consid-
ered the creator god by the people who lived in this part of Peru be-
fore the Inca conquest.
- Nasca: southern coastal town, name now applied to the Nazca cul-
ture that flourished in the area between 100 BC22 and 800 AD. They
were “responsible” for the so-called Nazca Lines.
- How about Machu Pichu? Not shown, as it was unknown by
Wytfliet and his contempories. The town was abandoned by the Inca
rulers in 1572. Although known locally, there is no record of the
Spanish having visited this remote city. It was unknown to the out-
side world until being brought to international attention in 1911 by
the American historian Hiram Bingham.
Spanish settlements:
- Guaiaquil: town at the Ecuadorian coast, founded because the Span-
ish were not satisfied with Quito; now the largest city in the country.
- Trujiilo: founded by Diego de Almagro23 on 6 December 1534, now
third largest city in Peru.
- Lima as “vel Reg. civitatis”: Pizarro founded the city in 1533 as his
new capital. In 1541 he was murdered in his palace there (in a failed
“coup d'etat” by Diego de Almagro II, son of Diego de Almagro)
and later buried in Lima Cathedral.
- Potosi: at the south end of the Titicaca lacus, founded in 1546 as the
silver mining town24 now in Bolivia.
21 Van Linschoten described the God Pachacama as “Schepper des Hemels ende der aerden” (Itinerario, page 223). 22 For the BBC viewers: “BC” means “Before Christ“ and “AD” means “anno domini” i.e. after birth of Christ. 23 He got in conflict with Pizarro, was subsequently allowed by the Spanish Crown to conquer Chile, but was afterwards executed by Pizarro in 1538. 24 The Spanish expression valer un potosí means “to be worth a fortune”.

23
Fig. 1: Peru
4.6 Brasilia
Wytfliet considered Brazil as an integrated part of South America, contrary
to certain other maps25.. This map shows most of Brazil with the mighty
Amazon River and its enormous delta. Top left lies Chirmos (Manaus) at
the confluence with the Rio Negro. The map focuses on the western coast-
line and its colonial settlements: Pernambuco (Recife?), Olinda and C. de
S. Augustino, which formed the centre of the short-lived Dutch colony26
25 Please check the Mercator-Hondius map of America Meridionalis (1606) show-ing a quasi separation of Brasilia from the rest of the continent through a water system running from the Amazon River in the north over a mythical lake to the Plata system in the south. This interpretation was not unique, and quite popular in Dutch cartography. 26 1624/1630 to 1661: at the Treaty of The Hague in that year the Dutch sold New Holland (as their part of Brasil was called) to the Portuguese.
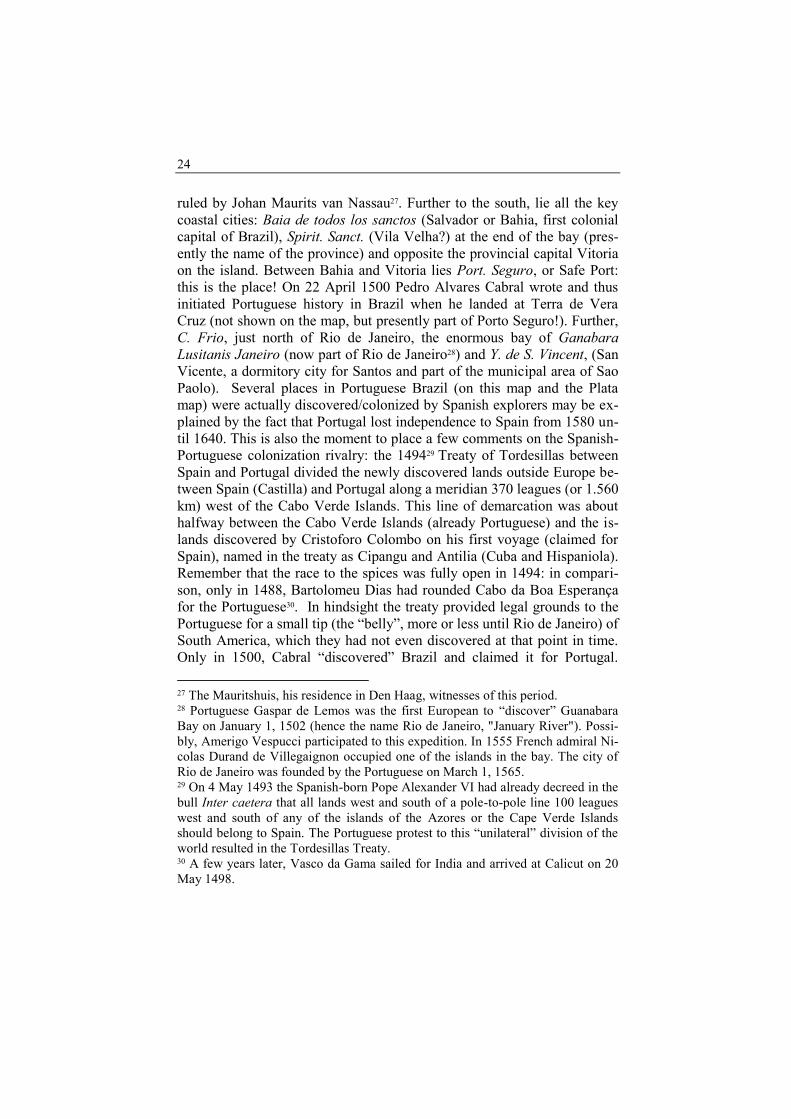
24
ruled by Johan Maurits van Nassau27. Further to the south, lie all the key
coastal cities: Baia de todos los sanctos (Salvador or Bahia, first colonial
capital of Brazil), Spirit. Sanct. (Vila Velha?) at the end of the bay (pres-
ently the name of the province) and opposite the provincial capital Vitoria
on the island. Between Bahia and Vitoria lies Port. Seguro, or Safe Port:
this is the place! On 22 April 1500 Pedro Alvares Cabral wrote and thus
initiated Portuguese history in Brazil when he landed at Terra de Vera
Cruz (not shown on the map, but presently part of Porto Seguro!). Further,
C. Frio, just north of Rio de Janeiro, the enormous bay of Ganabara
Lusitanis Janeiro (now part of Rio de Janeiro28) and Y. de S. Vincent, (San
Vicente, a dormitory city for Santos and part of the municipal area of Sao
Paolo). Several places in Portuguese Brazil (on this map and the Plata
map) were actually discovered/colonized by Spanish explorers may be ex-
plained by the fact that Portugal lost independence to Spain from 1580 un-
til 1640. This is also the moment to place a few comments on the Spanish-
Portuguese colonization rivalry: the 149429 Treaty of Tordesillas between
Spain and Portugal divided the newly discovered lands outside Europe be-
tween Spain (Castilla) and Portugal along a meridian 370 leagues (or 1.560
km) west of the Cabo Verde Islands. This line of demarcation was about
halfway between the Cabo Verde Islands (already Portuguese) and the is-
lands discovered by Cristoforo Colombo on his first voyage (claimed for
Spain), named in the treaty as Cipangu and Antilia (Cuba and Hispaniola).
Remember that the race to the spices was fully open in 1494: in compari-
son, only in 1488, Bartolomeu Dias had rounded Cabo da Boa Esperança
for the Portuguese30. In hindsight the treaty provided legal grounds to the
Portuguese for a small tip (the “belly”, more or less until Rio de Janeiro) of
South America, which they had not even discovered at that point in time.
Only in 1500, Cabral “discovered” Brazil and claimed it for Portugal.
27 The Mauritshuis, his residence in Den Haag, witnesses of this period. 28 Portuguese Gaspar de Lemos was the first European to “discover” Guanabara Bay on January 1, 1502 (hence the name Rio de Janeiro, "January River"). Possi-bly, Amerigo Vespucci participated to this expedition. In 1555 French admiral Ni-colas Durand de Villegaignon occupied one of the islands in the bay. The city of Rio de Janeiro was founded by the Portuguese on March 1, 1565. 29 On 4 May 1493 the Spanish-born Pope Alexander VI had already decreed in the bull Inter caetera that all lands west and south of a pole-to-pole line 100 leagues west and south of any of the islands of the Azores or the Cape Verde Islands should belong to Spain. The Portuguese protest to this “unilateral” division of the world resulted in the Tordesillas Treaty. 30 A few years later, Vasco da Gama sailed for India and arrived at Calicut on 20 May 1498.
25
“Tordesillas” was primarily agreed upon to protect, both the New World
for the Spanish and the Eastern (read African and Atlantic island) spice
route to the Portuguese; but was it also intended to provide the Portuguese
with a legal claim for a (to be discovered) landmass in the south-west? Or,
did they already know? However, the forthcoming Portuguese entitlement
and colonization gradually went much further West than their piece allo-
cated by the Pope at Tordesillas. Finally, the 1750 Treaty of Madrid grant-
ed Portugal control (of even more) territory which it occupied in South
America.
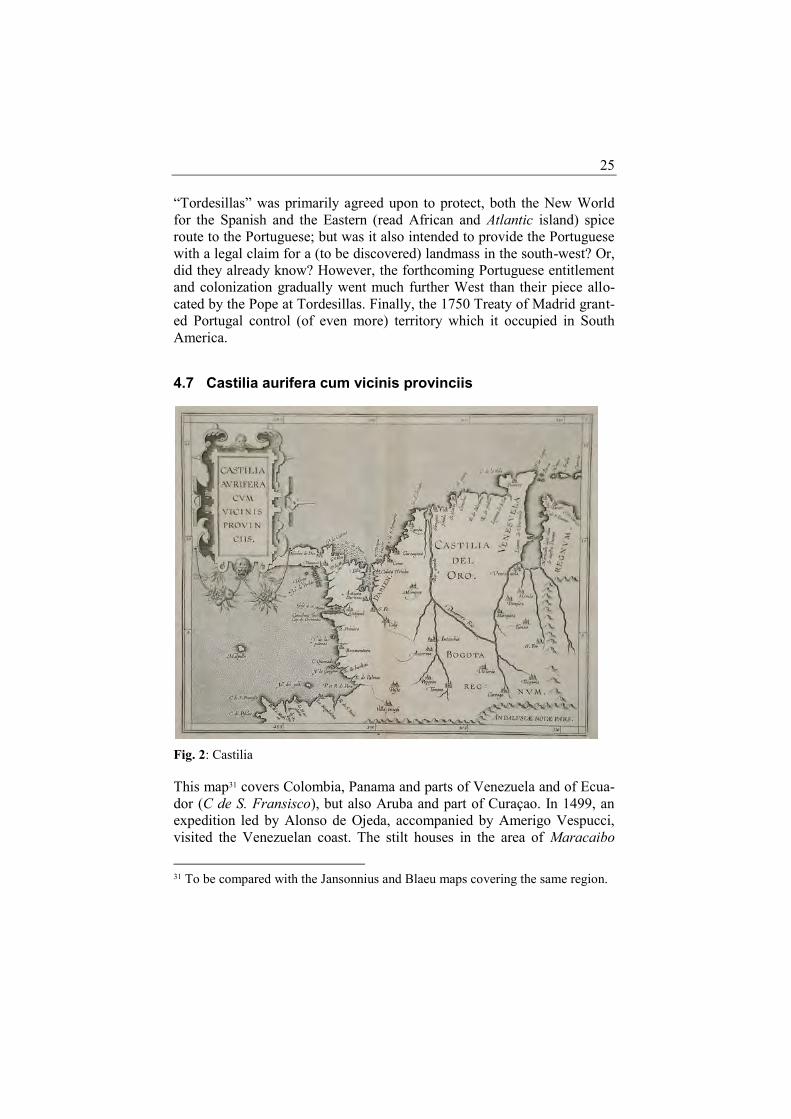
4.7 Castilia aurifera cum vicinis provinciis
Fig. 2: Castilia
This map31 covers Colombia, Panama and parts of Venezuela and of Ecua-
dor (C de S. Fransisco), but also Aruba and part of Curaçao. In 1499, an
expedition led by Alonso de Ojeda, accompanied by Amerigo Vespucci,
visited the Venezuelan coast. The stilt houses in the area of Maracaibo
31 To be compared with the Jansonnius and Blaeu maps covering the same region.

26
lago reminded the latter of Venice, so he named the region "Veneziola",
which in contemporary Tuscan (Vespucci's native tongue) meant "little
Venice". The name acquired its current spelling as a result of Spanish in-
fluence, where the suffix -uela is used as a diminutive term. Nonetheless, a
different reason for the name comes up in the account of Martín Fernández
de Enciso, a member of Ojeda’s crew. In his work Summa de Geografía,
he states that they found an indigenous population who called themselves
the "Veneciuela," which suggests that the name "Venezuela" may have
evolved from the native word.
Several important Spanish colonial settlements are named and located, in-
cluding Panama City (founded on 15 August 1519 by Pedro Arias de Ávi-
la), Cartagena (founded on 1 June 1533 by Pedro de Heredia and key port
for the Spanish Treasure Fleet for South America; “aurifera”: what’s in a
name?; see Boazio’s view, 1586), Buenaventura (founded on 14 June 1540
by Juan Ladrillero), Cartago (founded on 9 August 1540 by Jorge
Robledo) and Merida (founded on 9 October 1588 by Juan Rodriguez Sua-
rez). The map is dominated by Colombia’s principal river the Rio Grande
(now Rio Magdalena). This map also shows the spot of the first European
crossing of the Isthmus of Panama to the Pacific Ocean made by Vasco
Núñez de Balboa’s expedition in 1513. Already in 1510 Balboa had
founded Santa María la Antigua del Darién (Antiqua Dariensis, situated in
present-day Colombia), the starting point of his journey. This town was
later abandoned (in favour of Panama32 as local capital) and already in
1524 burned by the indigenous people. In 1513, Balboa (c. 1475 - 15 Janu-
ary 1519), well informed, crossed the continental landmass at one of its
smallest width. So coming from the north he borrowed the name of the sea
from the natives and called it Mar del Sur (Pacific Ocean33). Hence, the At-
lantic Ocean was called the Mar del Norte34. After traveling more than
110 km, Balboa named the bay where they ended up San Miguel, because
they arrived on 29 September (1513), the feast day of the archangel Mi-
chael. The bay of San Miguel is clearly visibly on the map. Just north in
32 Panama City was founded on 15 August 1519 by Spanish conquistador Pedro Arias Dávila. It was the starting point of expeditions that conquered the Inca Em-pire in Peru. 33 Magellan called the ocean Pacífico since he encountered calm seas after having passed through the rough Strait called after him during his world circumnavigation of 1521. 34 One finds these two names on many contemporary maps.

27
the same area lies Darién Gap, a large swath of undeveloped swampland
and forest separating Panama from Colombia35.
4.8 Residuum continentis cum adiacentibus insulis
”Residuum continentis”, what’s in a name? One of the principal sources of
this map (as well as others on the Caribbean area) is de Bry’s map36
“Occidentalis Americae partis”, which covers the entire area of the four
expeditions by Colombo. On his map next to the Isle of Trinidad, de Bry
commented: “on the third voyage Colombus was carried to this island,
which he named after the pearls, of which he yielded a fifth part to the
king.” Indeed, on his third voyage Colombo landed on the south coast of
the island on 31 July 1498. From 4 August through 12 August he explored
the Gulf of Paria which separates Trinidad from Venezuela. He explored
the mainland of South America, including Cumana and the Orinoco River.
On his fourth voyage Colombo sighted the Cayman Islands, naming them
"Las Tortugas" after the numerous sea turtles there. As most of the islands
were already explored in Wytfliet’s days, he nicely maps and names them.
Across Trinidad lies the vast, but unnamed Orinoco Delta. Discernable on
the continent are also Cumana and Barbaruta37. Please notice, moreover,
“Andalusia Nova” (including the source of the Rio Negro) (bottom). Final-
ly, this map also shows Puerto Rico with S. Geoan (San Juan, its present
capital). Ponce de Léon, who had joined Colombo on his second voyage
(1493) eventually, became the first Spanish Governor of Puerto Rico from
where he set out in 1513 to touch the Floridian coast for the first time. Af-
ter the Spanish-American War, Spain and the United States signed the
35 It measures just over 160 km long and about 50 km wide. Road building of the so-called Pan-American Highway through this area is expensive as the environ-mental toll is also steep. Political consensus in favor of the construction of this part of the road has not yet emerged, and consequently there is no road connection through the Darién Gap connecting North to South America. It is, therefore, the missing link (between Yaviza and Turbo) of the Pan-American Highway (from Prudhoe Bay to Ushuaia). 36 Published in the fourth part of his Grands Voyages. This map was actually made to illustrate Girolamo Benzoni’s travel account since he had participated to nu-merous expeditions in the Spanish New World from 1541 to 1555. 37 Near this town Simón Bolívar successfully fought the decisive Battle of Cara-bobo in his war against the Spanish Royalist forces on 24 June 1821, which led to the independence of Venezuela.

28
Treaty of Paris of 1898, by which Spain ceded Puerto Rico38 (with the
Philippines, and Guam) to the United States for the sum of $20 million39.
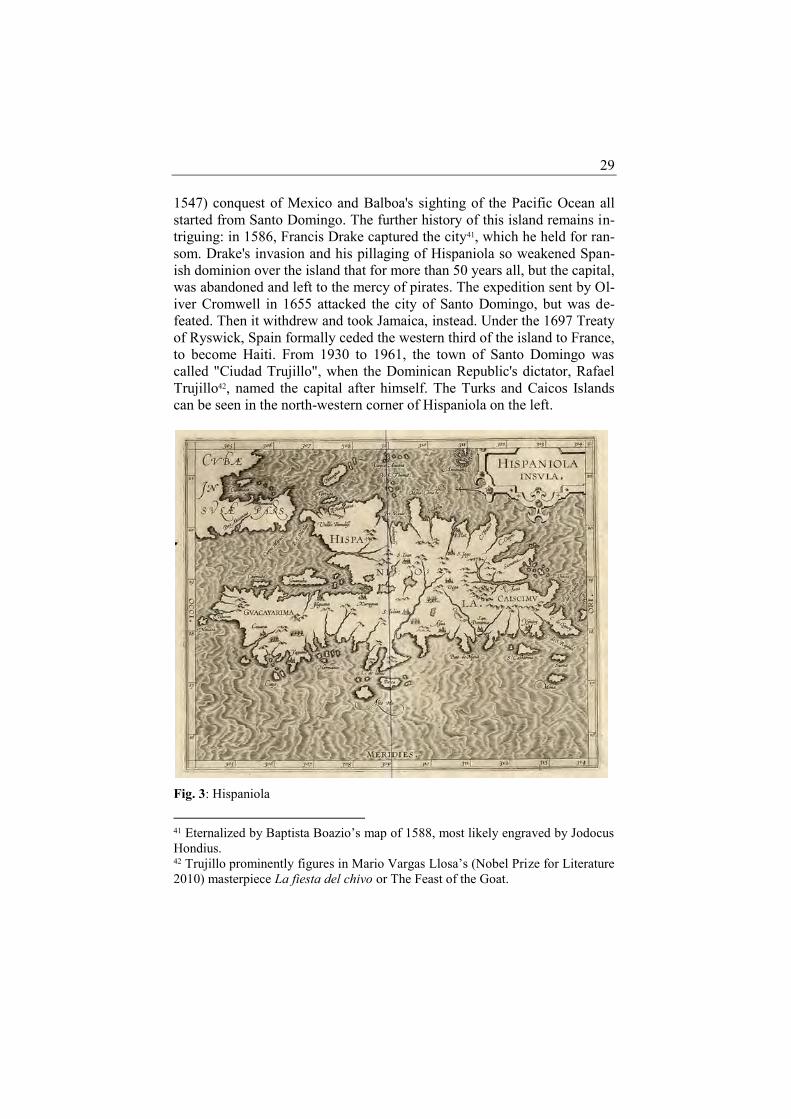
4.9 Hispaniola insula
Hispaniola was widely known in cartographic circles long before Wytfliet:
already in 1528 Bordone mapped the island, showing the Isabella settle-
ment, followed by Ramusio (1534), Gastaldi (1548), Ruscelli (1561) and
others. The island of Hispaniola (Haiti/Dominican Republic) will eternally
be linked to Colombo: on Christmas day 25 December 1492, the Santa
Maria ran aground off the present-day site of Cap Haitien, but the ship was
lost. In the same area Colombo established the very first Spanish settle-
ment which he adequately called to Jesus birth, La Natividad, i.e. P.
Nativitat on the map at the north coast of present day Haiti. On his return
the subsequent year, following the disbandment of the settlement La
Navidad, Colombo founded a second town, Isabella, further east in present
day Dominican Republic. Wytfliet also widely commented on the Colom-
bo’s travels to Hispaniola.
San. Domingo was founded by Bartolomeo Colombo40, Cristoforo’s
younger brother and became from 1496 onwards the oldest “continuously”
inhabited European settlement in the Americas. It also became the first
seat of Spanish colonial rule in the New World. In 1509, Diego Colombo
(son of Cristoforo) was named Governor of the Indies, the post his father
had held. He established his home (El Alcázar de Colón), which still
stands, in Santo Domingo. Also, the expeditions that led to Cortes' (1485 –
38 The current constitutional status of Puerto Rico is, to say the least, bizarre as a sort of an unincorporated territory of the USA: benefitting, though, of a reciprocal free movement of persons, the islanders may not vote in U.S. presidential elec-tions Puerto Rico is now an "unincorporated territory" of the United States which according to the U.S. Supreme Court's Insular Cases is "a territory appurtenant and belonging to the United States, but not a part of the United States”. Puerto Ri-cans were collectively made U.S. citizens in 1917 as a result of the Jones-Shafroth Act. 39 Under the same Treaty, Spain also relinquished all claims of sovereignty over Cuba. 40 In the 1470s Bartholomeo (c. 1461 - 1515) was a mapmaker in Lisbon. When word spread in 1493 that his brother had succeeded, he returned to Spain, where he missed Christopher, who had already left on the second voyage. Funded by the crown, Bartholomeo traveled to Hispaniola in 1494 to meet his brother. He re-mained on the island until 1500.
29
1547) conquest of Mexico and Balboa's sighting of the Pacific Ocean all
started from Santo Domingo. The further history of this island remains in-
triguing: in 1586, Francis Drake captured the city41, which he held for ran-
som. Drake's invasion and his pillaging of Hispaniola so weakened Span-
ish dominion over the island that for more than 50 years all, but the capital,
was abandoned and left to the mercy of pirates. The expedition sent by Ol-
iver Cromwell in 1655 attacked the city of Santo Domingo, but was de-
feated. Then it withdrew and took Jamaica, instead. Under the 1697 Treaty
of Ryswick, Spain formally ceded the western third of the island to France,
to become Haiti. From 1930 to 1961, the town of Santo Domingo was
called "Ciudad Trujillo", when the Dominican Republic's dictator, Rafael
Trujillo42, named the capital after himself. The Turks and Caicos Islands
can be seen in the north-western corner of Hispaniola on the left.
Fig. 3: Hispaniola
41 Eternalized by Baptista Boazio’s map of 1588, most likely engraved by Jodocus Hondius. 42 Trujillo prominently figures in Mario Vargas Llosa’s (Nobel Prize for Literature 2010) masterpiece La fiesta del chivo or The Feast of the Goat.

30
4.10 Cuba insula et iamaica
The name Cuba comes from the Taíno43 language. The exact meaning of
the name is unclear but it may be translated either as “where fertile land is
abundant” (cubao), or “great place” (coabana). On his first voyage Co-
lombo also explored the northeast coast of Cuba where he landed on 28
October 1492. At his second voyage he arrived there on 30 April 1494 and
named the island Juana. Then he explored the Southern coast, which he be-
lieved to be a peninsula rather than an island, and several nearby islands,
including the large Y. de Pinas, later known as La Evangelista and now
called Isla de la Juventud. Diego Velázquez de Cuéllar founded Baracoa,
the first settlement on the island (far east) in 1512. Havana was probably
only founded around 1519, to become the capital of this Spanish colony in
1607. Its name is derived from the Indian leader Habaguanex. On the
south east coast one recognizes S. Iacobus (Santiago de Cuba) founded in
1514 and from 1522 until 1589 capital of the Spanish colony of Cuba. Fur-
ther to the east one recognizes a wide unnamed bay which is presently
known as Guantanamo. Further, Colombo reached Jamaica during his se-
cond voyage on 5 May 149444. The first Spanish settlement here was
Sevilla (central north), which was already abandoned around 1524 because
it was deemed unhealthy. Some crumbling walls still remain at Oristan
(now called Bluefields), where the Spaniards founded a short-lived settle-
ment in 1509. Rather early, already in 1655, the English took this colony
from the Spanish.
4.11 Iucatana region et fondura
On his fourth voyage in 1502 Colombo explored for several months the
coasts of Honduras, Nicaragua, and Costa Rica, before arriving in Almi-
rante Bay, Panama. In 1517 Francisco Hernández de Córdoba led the ex-
pedition in Iucatan. Unfortunately, this map carries no information on the
great Maya sites in Yucatan. But, what strikes at first glance are the two
enormous (but unnamed) inland lakes: they probably are the Lago de
Izabel in Guatemala (north) and the even larger Lago Nicaragua in Nicara-
gua (south). The river running from this last lake to the Caribbean Sea,
however, does not exist as a long mountain range cuts it off that sea. As
43 Taino were Native Americans mainly living on the Greater Antilles (Cuba, Ja-maica, Hispaniola and Puerto Rico) and the Bahamas. 44 On his fourth voyage Columbus and his men remained stranded on Jamaica for a year.

31
the countries of Nicaragua and Honduras are fertile volcano lands, this
middle section on the map is further embellished with three volcanoes.
Fig. 4: Iucatan
On the other hand, the cities of Nicaragua (not Managua?45), Guatemala,
Léon, Granata (both in Nicaragua) and Panama are clearly depicted. So is
Cap. Gracias a Dios, the majestic cape forming the northern international
border of Nicaragua and Honduras, as determined by King Alfonso XIII of
Spain in 1906 and confirmed by the International Court of Justice in 1960
as the frontline between the two countries. The Spanish name "Cape Thank
God" is said to have been bestowed by Colombo on his last voyage in
45 On the basis of its location on the map, it is possible that Nicaragua refers to San Salvador. Also, on September 15, 1821, Spanish authorities signed the Acta de Independencia (Deed of Independence) which released all of the Captaincy of Guatemala (comprising current territories of Guatemala, El Salvador, Honduras, Nicaragua and Costa Rica and the Mexican state of Chiapas) from Spanish rule and declared its Independence. So until 1821 there was no clear separation in these territories.

32
1502 when the weather calmed suddenly as he turned the cape during a se-
vere storm. The moment also gave the name to Honduras, which means
“depths” in Spanish, since the complete phrase is said to have been “Gra-
cias a Dios hemos salido de esas honduras”, or “Thank God we have come
out from those depths”. This map was later replaced by four smaller maps
of India, China, Japan and the Philippines by Magini.
4.12 Hispania nova
This map shows the section of New Spain from the Gulf of California to
the Gulf of Mexico including Mexico City and several missions in Texas.
Hispania nova = Cortés land or in full Hernán Cortés de Monroy y Pizarro.
In July 1519 his troops took Vera Cruz and, in November later that year,
Tenochtitlan or Mexico. Wytfliet’s scarce view of the inland area can only
be considered as a regression in comparison to Ortelius’ equivalent but far
more detailed map (1579, vdB 13) and to de Bry’s copy of 1595. Ortelius
pictured the smallest Indian villages, named several tribes and indicated
the Spanish camps. In his description Ortelius also referred to Cortés as a
source and mentioned that Pope Paul III established the seat of an arch-
bishop in Mexico City in 1547. Vera Cruz became the key port for the
Spanish treasure fleet (sailing in convoy), installed from 1566 onwards as
a response to attacks by French privateers. Further, credit to this map and
the one of Iucatana has to be given to Ruscelli, whose map of 1561 (par-
tially based on Gastaldi’s map of 1548) covers Mexico, including Baja
California as a peninsula. With the Spanish colonization of the Americas,
viceroys were instituted in Hispania nova and in Peru. The viceroys had
oversight over the other provinces, with most of the North America, Cen-
tral America, the Caribbean and Venezuela (!) supervised by the viceroy in
Mexico City and the rest of South American by the viceroy in Lima. This
situation continued until the 18th
century, when the new Bourbon Dynasty
established two additional viceroyalties for New Granada in 1717 (capital,
Bogotá) and the Río de la Plata in 1776 (capital, Buenos Aires). The Span-
ish rulers also extensively organized the judiciary system in the new
World46.
46 A Hearing (or court proceedings) settled for the first time in Santo Domingo in 1511, during the government of Diego Columbus, but soon after it was suppressed (being restored in 1526). Under Carlos I and Felipe II, between 1526 and 1583, the system of Hearings were thoroughly organized with Hearings in Mexico (New Spain) in 1527; Panama in 1538; Guatemala and Lima in 1543; Guadalajara (New Galicia) and Santa Fe de Bogota (New Granada) in 1548; Pools (High Peru) in

33
4.13 Granata nova et California (Philip Burden, in The Mapping of America, 106, 1 state)
This map, the first one in the atlas of North America, is a cornerstone in
the early cartography of the American West, not to be forgotten that a few
decades later Baja California would be depicted as an island47. This is the
second printed map of the region of California48 and the northwest - the
first one was by de Jode (1592) on which this one is based. It is, therefore,
of seminal importance to Californian cartography49. Wytfliet’s map covers
the area from the tip of the peninsula to Los Farallones in the north, with
the Gulf of California shown in its entirety, and the Colorado River ex-
tending to the interior. Burden notes that "The outline of the map is fairly
accurate and is derived largely from Petrus Plancius' large world map of
1592. The main coastal irregularity is the westward slant of the California
coastline. Bearing in mind that it would be shown as part of an island in
twenty five years, this is quite forgivable...” Wytfliet’s presentation of Cal-
ifornia is absolutely not novel; think of the Ortelius maps of America and
Tartaria, both first published in 1570. Wytfliet’s map is also an example of
some cartographic errors long perpetuated by the European mapmakers
starting with the course of the Rio Grande (or Rio Bravo) del Norte south-
west to the Gulf of California rather than southeast to the Gulf of Mexico50.
The river is shown flowing from a large mythical lake in the New Mexico
region surrounded by the legendary Septem civitatum Patria (Seven cities
of Cibola) - a misconception that arose from several wishful thinking
sources. The origin of the myth was an outgrowth of the Muslim conquest
of Portugal in the early eighth century. Allegedly, in 714 seven Catholic
bishops and their faithful followers had fled across the Atlantic to a land
1559; Exempt (Ecuador) and Conception (Chile) in 1563 (the last one between 1565 - 1575); and Manila (Philippine) in 1583. In 1605 the Hearing of Santiago (Chile) was created and the one of Buenos Aires (River of the Silver) in 1661 (un-til 1671). Finally, in the late 18th century followed the establishment of the Hear-ings of Buenos Aires (1783) of Caracas (1786) and the one of Cuzco (1787). 47 Noteworthy is Mercator’s world map of 1569 showing California also as a pen-insula. 48 Was the first mapping of California (depicted there as a peninsula) made on the world map by Sebastiano Caboto, 1544? 49 For detailed information of the early explorations and mapping of California: see Dora Beale Polk in the selected bibliography. 50 It was not before Giovanni Battista Nicolosi’s “Dell’ Hercole e Studio Geografico” of 1660 that the Rio Grande (called R. Escondido) was given its cor-rect course.
34
known as Antilia, the name of which, incidentally, was the source of the
name Antilles, which was initially applied to the West Indian islands of the
Caribbean. The Antillean islands failed to produce large quantities of gold
and silver. The fabulous seven El Dorado cities were first reported on by
Álvar Núñez Cabeza de Vaca who, after being shipwrecked off Florida in
1528, had wandered through what later became Texas and Northern Mexi-
co. Returned to Spain, he instituted the Seven Cities of Gold theory. Later,
Friar Marcos de Niza led an expedition into the Zuni Indian region of New
Mexico in 1539. His exaggerated description of the Zuni Pueblos seriously
promoted the legend of the Seven Cities of Cibola. It was an electrifying
statement to Spanish explorers who were scouring the New World for the
“fantastic” wealth of the Native Americans. But when a large and expen-
sive Spanish expedition returned to the area in 1541, they found only a
modest adobe pueblo that wasn’t anything resembling what the priest de-
scribed. The expedition turned out to be a ruinous misadventure for those
involved - including famed conquistador Francisco Vazquez de Coronado
(1510 – 1554)51. Finally, in 1582 Antonio de Espejo52 traveled to the Pueb-
lo Indian country of the upper Rio Grande where he received reports from
local Indians about a large lake surrounded by a land of great wealth. De
Espejo's mythical lake quickly found its way too onto early maps of the
West. Yet, the map is intriguingly interesting on California: the Gulf of
California is here labeled both Mar Vermeio and Californie Sinus. Francis-
co de Ulloa (d. 1540), an early Spanish explorer who explored in 1539 the
west coast of present-day Mexico under the commission of Cortés, named
the gulf “vermeio” due to the resemblance of the colour of the water with
the Red Sea. The reports of Ulloa’s expeditions along Baja California are
credited with being influential in the perpetuation of the 17 th
century car-
tographic misconception of the existence of the Island of California53. Fur-
ther, one notices on this map the following:
- an unnamed river flowing straight north on the top of the Gulf is
most likely the Colorado river.
51 Later, in 1540, he mounted his own expedition starting in Mexico and passing Indian Territory of i.a. Apache and Cheyenne land, as far as Kansas. 52 Wytfliet may have read de Espejo’s work, which was translated in English in 1587. 53 The first known mention of this legend was in a 1510 novel by Garcia Ordonez de Montalvo who described the island in this passage: “Know, that on the right hand of the Indies there is an island called California very close to the side of the Terrestrial Paradise; and it is peopled by black women, without any man among them, for they live in the manner of Amazons.”

35
- on the west coast, the Y. de los Cedros: drawn far too much to the
north. In 1539, a Spanish expedition led by Francisco de Ulloa land-
ed on the island, which was the furthest he went up north coast-side.
- top north Los Farallones: mark the plural! The only similar topo-
graphic name still in use is the one for the Farallon islands, just out-
side San Francisco Bay. Surprisingly, Wytfliet draws a short but
large bay area: could this be the Bay?
To illustrate the deep controversy around the island- status of California: it
lasted until 1747 when Ferdinand VII of Spain finally issued a formal de-
cree that California was a part of the mainland.
Fig. 5: California
4.14 Limes Occidentis Quivira et Anian (Burden 107, 2 states)
This map is much more about present-day Oregon and California than it is
about Alaska (notice the Circulus Arcticus). Cornelius de Jode produced a
very similar and superior map “Quivrae Regnu” in 1593 which clearly
served as inspiration to Wytfliet.

36
Fig. 6: West-Anian
The coastline above Cape Mendocino (correctly shown at about 40˚ N lati-
tude) may have been explored by Portuguese João Rodrigues Cabrilho in
1542–1543 (for Spain), but many other place-names and topographical
features are mostly imaginary. Nevertheless, this map and previous ver-
sions such as de Jode’s anticipate the westward bulge of present-day Alas-
ka. Apart from the east-west distortion of the coastline, this map does dis-
play several of the coastal place-names, such as R. de los Estrechos
(Columbia River54?) and C. Blanco in Oregon and C. Mendocino, Sierra
Nevada, C. de S. Francisco (correctly shown at 38˚ N latitude), and, to the
south, C. Blanco, in California more or less correctly. Quivira (another
mythical name) - an area explored by Coronado - appears too far to the
west. The exact site of Quivira is unknown but historians speculate it was
in present-day Kansas55. Curiously the map also shows a number of Indian
54 Another reference indicates Stikine River (British Columbia). 55 Archaeological evidence has suggested that Quivira was located near the Great Bend of the Arkansas River in central Kansas. The remains of several Indian set-

37
settlements such as: Tuchano, Cicuic, Tignex (most likely in New Mexi-
co). The strait of Anian (Latin: Anian Fretum) first appeared in Gastaldi's
(and others) woodcut map of the world, ca. 1561. Gastaldi found the name
Ania or Anian in the Travels of Marco Polo, whose Italian edition was (re-
) published by Giovanni Battista Ramusio in 1559. The original Ania of
Marco Polo was probably Annam or Tonkin (Vietnam), but Gastaldi must
have misplaced the site, giving the name to a supposed strait between Asia
and America, somewhere north of Japan, and to the nearby “Ania re-
gion”56. The name stucks: Zaltieri, Ortelius and Mercator used it, so mak-
ing its fortune for more than a century. The proportions on this map are
somewhat strange. Finally, the northern coastal delineation of the Conti-
nent in a (correct) straight east-west line is quite intriguing. Or was it just
copying Mercator’s conception of how the poles were shaped? Clearly,
Wytfliet perpetuates the much-hoped-for prospect of a northwest passage
and the separation of the continents by the Strait of Anian; only to be dis-
covered a few centuries later.
4.15 Conibas regio cum vicinis gentibus (Burden 100, 3 states)
This map attempts to provide a view of Central Canada as the first of its
kind. The lack of detail is evidence of how little was really known in Eu-
rope about the interior of North America at the end of the 16th century. One
of the possible comparisons to be made is the world map by Mercator of
1569 who depicted a large body of water inland in the extreme north –
Hudson Bay57? The dominating “lake of Conibas”, drained north into a
gulf, already appeared on André Thevet’s map of 1575. It has been sug-
gested that Wytfliet’s view possibly was a record of a voyage unknown to
us that visited Hudson Bay, but it could even be remnants of Verrazano’s
sea theory and thus that the French were locally informed of this large wa-
ter mass up north. It was only a dozen years after Wytfliet’s publication,
that Henry Hudson will sail under English Flag through Hudson Strait,
discover Hudson Bay, be the victim of a mutiny in 1611 and tragically
vanish into history. But even so, the Great Lakes58 are missing on this map!
tlements have been found near Lyons along Cow Creek and the Little Arkansas River. Ortelius (America, 1570) pictures Quivira both as a region and a city. 56 See Gastaldi’s map “Terza parte dell’ Asia” 1561. 57 Mercator showed a similar “inland water mass” on his North Pole map of 1595. 58 Shown at Mercator’s world map of 1569

38
Or are they the lakes near “Faga”. Maybe not, as the Ottawa River (at the
border of Quebec and Ontario) pouring into the Saint Lawrence at
Hochelaga59 (Montreal) crosses many lakes. The name Saguenai60 (small
river in the east) refers to a present region and river in Quebec. The river
pouring into the St. Lawrence from the southeast may be sourced by Lake
Champlain. At the top of the map one sees the open north-west passage,
not known in 1600.
Fig. 7: Conibas
As said, this map covers a very large continental land mass, including both
Hochelaga in the east and, surprisingly, also the Septem civitates in the far
south-west (located in Nova Granatae Pars) (see discussion California
map). Cornelius de Jode produced “Americae Pars Borealis” in 1593,
which also covered most of the northern continent. Both cartographers
drew a number of cities in the Central Canadian region such as Ciogigua,
59 See Ramusio’s great town view. 60 The name Saguenay is possibly derived from the Innu word "Saki-nip" which means "where water flows out”.

39
Canoagua, Zubilaga and Zabaira, all on the Obilo River, and unfortunate-
ly not identified in the context of this article. Finally, Wytfliet mysterious-
ly mentions Higuater61, upstream on the St. Lawrence River.
4.16 Florida et Apalche (Burden 104, 1 state)
Fig. 8: Florida
Gastaldi's Nueva Hispania Tabula Nova map, reissued by Ruscelli, was the
first regional map of the southwest, Gulf Coast and Florida regions of
North America. Thereafter, Wyfliet's map is also one of the earliest to fo-
cus on the southeast and to name Florida. Along with Johannus Metellus'
map of 1598, it is one of only 3 printed maps of the Southern United States
published in the 16th century. The map is based upon Abraham Ortelius
(vdB 15) drawn by Gerónimo de Chaves62 and published in 1584. Another
61 Could this be an indirect reference to the much later explored Great Lakes? 62 Geronimo Chavez was the son of Alonso de Chavez, a topographical engineer who worked in Mexico and who was also engaged as a pilot and cosmographer to

40
source may be de Bry’s detailed map based on Jacques le Moyne’s notes
(156463). What strikes in comparison with the other maps is the lack of any
meaningful information on the explorations with Wytfliet. On April 2,
1513, Ponce de Léon, the first Spanish Governor of Puerto Rico, sighted
land which was believed to be yet another island. He named it “La Flori-
da” in recognition of the verdant landscape and because it was the Easter
season, which the Spaniards called “Pascua Florida” (Festival of Flowers).
The following day they came ashore. The precise location of their landing
on the Florida coast has been disputed for many years. Some historians be-
lieve it occurred at St. Augustine, but others prefer a more southern land-
ing at a small harbor now called Ponce de León Inlet; and some argue that
Ponce came ashore even further south near the present location of Mel-
bourne Beach. Unfortunately, none of the places is identified on this map.
The inland details are derived from the reports of Hernando de Soto's ex-
plorations of 1539-1542 (passing i.a. Cofaquj, Cosle, Tali), continued by
Moscoso (via Quigata) as far as Texas (Naguater may be situated some-
where in northwestern Louisiana) and down the Mississippi river. De Soto
started his search for the El Dorado in B. de S. Spirito (now Bradenton, just
south of and now art of greater Tampa). Other sources are Álvar Núñez
Cabeza de Vaca, whose expedition stranded near Galveston (to travel back
over land to Mexico City). Wytfliet covers a larger territory than his Ant-
werp predecessor, covering some of the Appalachian Mountains to the
north and C. de Arenas - or the area of the Outer Banks of Carolina -,
Mexico to the east, and Cuba and the Bahamas to the south. The majority
of the cartography is derived from de Soto's explorations 1539-1542 and,
as such, it is one of the few maps of the sixteenth century to record infor-
mation on the interior. The Mississippi is labeled as the R. de S. Santo. On
the Floridian peninsula it is the first printed map to show Cap. de Canav-
eral, C. de Florida (on Key Biscayne), and the area of the Everglades, la-
beled Aquatio – what’s in a name? Finally, the map also shows most of the
Bahamas. It is here that Colombo’s first landfall in the New World took
Charles I/V of Spain. Geronimo drew this manuscript map, probably after 1560. He succeeded Sebastiano Caboto as "Piloto Mayor de la Casa de la Contratacion" the repository of Spain's secret maps of their explorations and conquests. 63 Grands Voyages, art II; The French unsuccessfully tried to get a foothold in Florida with two expeditions in 1563 and 1564. Jacques le Moyne de Morgues (c. 1533–1588) participated at Ribaults’ ill-fated expedition of 1564, but he left us with fabulous drawings of native human beings and plants.

41
place, probably64 on the tiny Isle of San Salvador (also known as Watling's
Island) in the southeastern Bahamas, unfortunately not pictured by
Wytfliet. Can the clutch of Roques be anything else than the Key Islands?
Note at the bottom the northern tip of Iucatinae Pars as well as Y. de Are-
nas and the Y. de Alacranes (Scorpion Reef), both still called the same. Fi-
nally and unfortunately, the map does not show the early French and Span-
ish settlements of Fort Caroline (1562) and St. Augustine (1565).
4.17 Norumbega et Virginia (Burden 103, 3 states)
This map is depicted after the first English attempts to explore and settle in
this region. It is the most accurate antecedent to Johan de Laet’s 1630 No-
va Anglia, Novum Belgium et Virginia and the second to use the name
Virginia, after de Bry-White of 1590. Norumbega: region, very large town
or river? Arthur James Weise65 argues in 1891 that the river of Norumbega
was the Hudson66, and that the town was on Manhattan Island. The name
may indeed be connected with Verrazzano’s voyage67 of 1524 in French
service. He was the first European to briefly explore later “New York”
harbour68. The “Hudson River” is the only one which in his letters
Verrazzano speaks of entering. However, Professor E. N. Horsford be-
lieves that the river of Norumbega is the Charles River, where the Norwe-
gian Vikings founded a settlement at its junction with Stony Brook. The
64 However, in October 1986 the National Geographic Society, announcing com-pletion of a five-year study, claimed that Samana Cay (also known as Atwood Cay) was the site of Columbo’s first landfall in the New World. Samana Cay is the largest now uninhabited island in the Bahamas. 65 In his work “Troy's One Hundred Years, 1789-1889”. 66 Henry Hudson, on this voyage sailing for the VOC, is traditionally credited with the discovery of Long Island in 1609 and said to have been the first to land on Co-ney Island (or Staten Island) on 3 September of the same year. Since 2009 (400th anniversary) a Dutch made replica of Hudson’s Halve Maene serves a travelling museum on the Hudson River. 67 This first voyage to North America since the Vikings covered the Atlantic coast from Cape Fear (North Carolina) to Narragansett Bay at the Rhode Island Sound, roughly the area shown on this map. 68 Almost simultaneously, Portuguese Estêvão Gomes (who a few years earlier de-serted Magalhães’ expedition his ship was ordered to explore the Straits) explored for the Spanish crown the coastline from Nova Scotia to Florida (1524-1525) and thus provided Diogo Ribeiro with data to outline the East coast of North America on his world map of 1529.

42
Native Americans would have remembered its name for two centuries
longer and imparted that name to the whites, Norumbega being the Indian
attempt at pronouncing “Norvega”, the Latin form of Norway. The name
found its way to many 16th century maps. On his map of the American
continent (1570) Ortelius called the entire area south of St. Lawrence Riv-
er Norumbega. Clearly inaccurate is the positioning of Chesipooc Sinus
(Chesapeake) at 43 degrees, the latitude of what is now Maine. Then,
Wytfliet compensates and depicts the coastline north of Chesapeake in an
almost east-west line, rather than to the north-east. Also Y. de Breton
(Cape Breton Island), now part of the Nova Scotia is located too far south.
It is therefore also unlikely that R. Primero can be First River, in the state
of New Jersey. To the south, the Outer Banks (North Carolina) are better
presented with Hatarask (Hatteras), Roanoac, site of the failed attempts to
settle a colony in 158569 and in 1587 and at the very south Buelta de Are-
nas, thus linking up with the Florida map. This part of the map is fully in-
spired by Gastaldi’s map of 1548 and to John White’s sketches, mapped by
de Bry.
4.18 Nova Francia et Canada (Burden 102, 2 states)
The area covered on this map (with most names in French) was essential to
the French attempts to build their colony. It shows, inter alia, the mouth of
the St Laurence, Newfoundland and Labrador. After Florida, it was the
first area to be explored by a European power, first prudently by the Corte-
Real family for Portugal and firmly by the English under the Caboto fami-
ly, and later by the French more in particular under Verrazano in 1524 and
Jacques Cartier in 1534. Obviously, this part of the Continent had been
mapped frequently in the 16th century (see selected list below). Wytfliet’s
map naming Canada in its title is the first to concentrate, on a more realis-
tic basis, on the St. Lawrence River and its gulf. The general outline of the
map is derived from Gerard Mercator and summarizes sixteenth-century
knowledge of the region. The region north of the St. Lawrence and east of
69 Grenville led a first expedition in 1585, but he came back to England and a se-cond voyage under John White was organized in 1587 only to a deserted colony. After having rebuilt the place, White also returned to England, leaving his grand-daughter and first English born on American soil, Virginia Dare, behind. When White returned overseas in 1590 the colony as was in ruins again, with only one clue carved “croatoan”, the name of a nearby Indian tribe.. The colony was never rebuilt.

43
the Saguenai70 River is labeled Canada, and Nova Francia is centered on
the town of Hochelaga (present-day Montreal). The Ramusio view of this
town (1556) is the first map to detail any North American settlement, iden-
tifying the site of present-day Montreal and one which records the meeting
of the explorer Jacques Cartier with the local Iroquois Indians at the stock-
aded village of Hochelaga. Ramusio's "Navigationi Et Viaggi ...", in which
this map was published, was one of the 16th century's major references to
early discoveries and the world beyond European shores. The other French
metropolis Quebec was officially founded by French explorer Samuel de
Champlain on July 3, 1608. Cartier had already built a fort at the site in
1535 which was abandoned in 1542. Quebec is shown as the town of Can-
ada. The name Canada originated around 1535 from the Iroquoian word
kanata meaning "village", "settlement", or land. Finally, at the mouth of
the River, lies Anticosti Island or Y. de Assumptione, where Jacques Car-
tier sailed in 1534. He provided its first written description and named it
Isle de l'Assomption, because he discovered it on the Day of the Assump-
tion of Mary. But this name had fallen into disuse: about 1586, the histori-
an André Thevet wrote that "the savages named [it] Naticousti", while
Samuel de Champlain later spelled it Antiscoti (1612), Antiscoty (1613),
Enticosty (1625), and Antycosty (1632). Just south of the Island appears
the name of “Etroit de S. Pierre”. In the southeast lies Terra de Bacallaos,
often used to name Newfoundland Island. The name was first used on a
map in 1508 and the Portuguese navigator João Vaz Corte-Real is credited
for the discovery of Terra do Bacalhau71. Bacalao also means codfish and it
is suggested that Basque fisherman have fished on cod at the Grand Banks
of Newfoundland in the 15 th
century already, so this could also explain the
origins of the name. Cartier’s map was probably the first to detach New-
foundland from the mainland, but the island is shown as an archipelago as
late as 1597. Across the island one recognizes the toponym C.S.Pietro on
the mainland: could this be a reference to the island of Saint Pierre72? This
map was, thereafter, superseded by more accurate presentations, such as
the ones by Johannes de Laet (1630) and Jean Boisseau (1643).
70 Saguenai is here probably incorrectly located as it purports to present what is now the long Ottawa River (sourced by many lakes). A better geographical presentation of the Sanguenai River is shown on the Conibas map. 71 This claim originates from Gaspar Frutuoso in his book Saudades de terra around 1570-80. João Vaz Corte-Real’s expeditions go back to the 1470ies: as re-ward he was granted São Jorge Island in the Azores in 1472. 72 Saint Pierre and Miquelon islands, located just before Newfoundland Island, are still controlled by the French Republic.

44
Fig. 9: Nova Francia and Canada
4.19 Estotilandia et Laboratoris Terra (Burden 101, 3 states)
Let’s start history to where it should by giving credit to certain Portuguese
explorers. In an attempt to discover land East of the Tordesillas line, King
Manoel of Portugal (1495–1521) ordered from 1498 on several expeditions
to the Northern Atlantic to find the passage to India: during the next four
years, Pedro de Barcelos, João Fernandes Lavrador73, João Vaz Corte-Real
and his sons Gaspar and Miguel, and João Martins (all prominent residents
of Terceira Island, part of the Azores archipelago) took part in the search
for new land up north. The contribution of each of them is not yet fully es-
tablished. Gaspar Corte-Real sighted “Ponta d’Asia” (Greenland), in the
73 He was the first modern explorer on the coasts of the Northeast of Northern America, including the Labrador Peninsula, (which he may have sighted in 1500) which bears his name.

45
likely vicinity of Cape Farewell in 1500, although Harrisse74 believes that
he reached the eastern shores of Newfoundland. Anyway, in 1501 Gaspar
Corte-Real made another voyage, and is believed to have arrived on Lab-
rador: he identifies some aborigines whom brought back to Portugal as
“Nasquapee Indians who still inhabit Labrador”75. This story may explain
why the northern part of this map (i.e. Labrador) is called “Terra
Cortereale”. Almost simultaneously, the English were also active in the
same area under Italian captains Giovanni and Sebastiano Caboto (1496-
1508) with the first European one making landfall (after the Vikings)
somewhere along the Canadian coastline/islands, on June 24, 1497.
Fig. 10: Davis Strait
74 Harrisse, H., The discovery of North America: a critical, documentary, and his-toric investigation, with an essay on the cartography of the new world . . . , Lon-don, 1892, 59–76. 75 Biggar, H.P., The voyages of the Cabots and of the Corte-Reals to North Ameri-ca and Greenland, 1497–1503, Paris, 1903, 96–97, 100.

46
This map is the first one to focus on the late 16th century expeditions of the
English explorers Martin Frobisher and John Davis, both having made
three voyages attempting to discover the northwestern passage. Wytfliet
learned of the recent voyages by Frobisher and Davis from Hakluyt’s
“Principall Navigations” (1589). The map covers the coast of Labrador,
Greenland, Iceland, and the mythical island of Frislant, surprisingly shown
with many named towns. Pre-existing published maps, two by James
Beare76 (1578), a captain of one of Frobisher's ships and one by Michael
Lok (1582), were so crude that cartographers had little idea where Fro-
bisher (voyages 1576-1578) had been. He is credited with the exploration
of what he thought was the passage. However, this was nothing else than
“Frobisher Bay” (at Baffin Island) (see below). He also landed on Resolu-
tion Island: could this be Elisabeth promontorum? A few years later, John
Davis' three voyages (1585-87) to more or less the same area first appeared
on maps in the 1590s. He left us Davis Strait, the “royal” passage between
Greenland and Baffin Island. He too missed the Hudson Strait, indicated
on the map as a furious over fall (for good reason). The maps by Mercator
(1595) and Wytfliet (1597) are representative of Davis' contribution.
Wytfliet wrote that the Northern parts of America were first discovered by
"Frislandish" fishermen, which were further purportedly explored by the
Zeno brothers around 1390. He also mentioned: "but the honour of its se-
cond discovery fell to the Pole Johannes Scolvus77, who in the year 1476 -
eighty-six years after its first discovery - sailed beyond Norway, Green-
land, Frisland, penetrated the Northern Strait, under the very Arctic Cir-
cle, and arrived at the country of Labrador and Estotiland". Admittedly,
Wytfliet was not the first or last cartographer to do so78. This view was not
supported by contemporary evidence; even the existence of Scolvus has
been disputed. Frislant (mark some Italian place names on the map) first
appeared in a map by Nicolo Zeno in 1558 and was accepted by Gerhard
Mercator for his world map of 1569 (and later his 1595 map of the North
Pole). The island will persist on numerous maps until as late as the 18th
century. Frobisher's reference to Frislant caused a great deal of cartograph-
76 In George Best, A true discourse of the late voyages of discoveries for the find-ing of a passage to Cathaya. 77 Also called John of Kolno (1435-1484) who was a semi-legendary Polish sailor and navigator serving the court of Denmark. It has even been suggested that João Vaz Corte-Real took part in this expedition. 78 Scolvus was also referred to by François de Belleforest 1570 and later by Claude Barthélemy Morisot 1643, George Horn 1671, Coronelli 1691 and Charle-voix 1744.

47
ic confusion, for when he reported seeing a "high and rugged land," he as-
sumed it was Frislant though it was actually Greenland79. When he arrived
at Baffin Island, he thought he was at Greenland; hence, “his” discovery of
"Frobisher's Strait" (Forbisseri Angvstiæ) was positioned for many years at
the bottom of Greenland. Incorrectly, however, since Davis' “L. Lumleÿs
Inlet” is actually the same place, but more accurately located and correctly
identified it as a bay.
5 Final remarks and conclusions
This article is the product of a historical search of many toponyms. Still,
many names were simply not found after hours of research. It was an abso-
lute adventure to follow the early discoverers on their routes, men who
risked their lives for their own benefit and glory (see short list below). His-
tory books brought our attention to the survivors, but many more were lost
in myth and legend. After a century of explorations, Wyfliet could piece-
meal deliver some of the protagonists to us. This atlas smells and spurs the
mystery about Wytfliet himself: who was he, what were his sources and
why did he make this (single) cartographic product? Maybe these ques-
tions will remain covered by the mystery of history. But, what should we
retrieve from his atlas? Some conclusions:
1. Still, understanding the controversy about the originality of the
maps and the introduction of certain fantasy, the Wytfliet atlas has
not been given its right place in cartography. As the first/second
atlas on this entire continent it opens a new world to the 16th/17th
century audience and in hindsight to us. It is nothing less than a
valuable summary of the early cartography of this vast continent
and opens up an entirely new view on the early discoveries of the
New World.
2. Although the discovery of Central/South America took place al-
most simultaneously with the one of North America, their respec-
tive development was radically different: due to a lack of natural
resources, easily to plunder and so much sought after (gold and
silver), the expeditions to the north virtually came to a standstill
for about 70 years. The rest of the continent was explored and
conquered, which results in fairly accurate maps of Latin America,
drawn over several decades. And then, towards the last quarter of
79 An even less plausible theory is that Frislant is nothing else but the Faroe Is-lands.
48
the century, the north became fashionable again: English explorers
in search for a northwestern passage delivered fresh information.
Of course, Wytfliet built upon all this knowledge.
3. It appears from this article that the early expeditions to North
America have to be nuanced with many question marks (who,
when, what). This had an immediate effect on the maps of this part
of the continent. Some maps are, indeed, rather based on fantasy
(such as the picturing of the northwestern passage, the Seven Cit-
ies, Quivirae, Frislant) than on scientific research.
4. Most intriguing conclusion of this study is the position of an anno
1500 still small empire. Some early key explorations in the North
Atlantic were made by … the Portuguese. But they did not capital-
ize on their early efforts: why, economies of scale? And so, later
on, history never really gave them credit for their efforts. Concern-
ing the colonization of South America and although “Tordesillas”
gave the Portuguese the right to discover/colonize a part of this
unknown continent, this atlas reminds us of the fact that the basic
effort to discover the inland was Spanish. This fact cannot (only)
be explained by the fact that Portugal's independence was inter-
rupted between 1580 and 1640 by ... the Spanish.
5. Finally, 16th century mapmaking of the New World was not at all
an exclusive matter of the powers that be (first Portugal & Spain80,
then France & England). Quite to the contrary! It needs further
analysis why mapmakers of adjacent and (hardly to be called)
west-faring nations regions such as Italy (i.a.the Lafreri school,
Ramusio and Ruscelli), Germany (Waldseemïller, Münster) and
Flanders (too many) could, by all means, claim fame in their own
right.
Appendix A Selection of 15th – 16th century explorers (with sponsoring nation) and their key exploits with date to be traced back on Wytfliet’s maps (names, dates and locations are always relative and open to discussion):
- João Vaz Corte-Real, Portugal, 1470’s: Newfoundland?
- Cristoforo Colombo, Spain, 1492-1502: Caribbean islands & north coast of
South America
80 Why is there no Spanish Theatrum Orbis Terrarum, anno 1570?

49
- Bartolomeo Colombo (brother of), Spain, 1496: founded Santo Domingo,
first Spanish oversees capital
- Giovanni Caboto, England, 1497-98: Newfoundland
- Alonso de Ojeda, Spain, 1499: Venezuela (accompanied by Juan de la Cosa
and Amerigo Vespucci)
- João Fernandes Lavrador, Portugal, 1500 (and others): may have sighted
Labrador
- Pedro Cabral, Portugal, 1500: Porto Seguro, first Portuguese landfall on
Brazil
- Gaspar de Lemos, Portugal, 1502: Bay of Rio de Janeiro
- Gaspar Corte-Real, (son of João Vaz) Portugal, 1501: explorer of Green-
land
- Diego Velázquez de Cuéllar, Spain, 1512: founded Baracoa, the first set-
tlement on Cuba
- Vasco Núñez de Balboa, Spain, 1513: Isthmus of Panama to the Pacific
Ocean
- Ponce de Léon, as Governor of Puerto Rico, Spain, 1513: first landfall on
Florida
- Juan Diaz de Solis, Spain, 1516: Plata estuary
- Francisco Hernández de Córdoba, Spain, 1517: expedition in Yucatán
- Hernan Cortés, Spain, 1519: his conquest of Mexico (City) started in Vera
Cruz
- Pedro Arias de Ávila, Spain, 1519: founded Panama City on 15 August
- Fernão de Magalhães, Spain, 1520: Plata estuary and “his own” Strait
- Giovanni da Verrazzano, France, 1524: North Carolina to Rhode Island
- Estêvão Gomes, Spain, 1525-1526, from Nova Scotia to Florida
- Sebastiano Caboo, England, 1526-1529: Parana and Uruguay Rivers
- Francisco Pizarro, Spain, 1527-35: Peru+
- Álvar Núñez Cabeza de Vaca, Spain, 1528+, explorer through Florida Tex-
as and Northern Mexico
- Pedro de Heredia, Spain, 1533: Cartagena
- Diego de Almagro, Spain, 1533-1534: Peru
- Jacques Cartier, France, 1534+: Saint Lawrence River
- Pedro de Mendoza, Spain, 1536: founded Buenos Aires
- Francisco de Ulloa, Spain, 1539: Baja California
- Hernando de Soto, Spain, 1539-1542: Texas+
- Marcos de Niza, Spain, 1539: expedition into the Zuni Indian region of
New Mexico
- Francisco Vázquez de Coronado, Spain, 1540-1542: conquistador of Arizo-
na and New Mexico to Kansas
- João Rodrigues Cabrilho, Spain, 1542-43: further expeditions of the north-
western American coast
- Jerónimo Luis de Cabrera Zúñiga y Toledo, Spain, 1573: founded Cordoba
(Mexico)
- Juan Fernández, Spain, 1574: Islas Desventuradas and Archipiélago Juan
Fernández (which includes Robinson Crusoe island) (Chile)
50
- Martin Frobisher, England, 1576-78: Atlantic Canada
- Antonio de Espejo, Spain 1582-83: New Mexico - Arizona
- Pedro Sarmiento de Gamboa, Spain, 1584: founded Philipopolis
- John Davis, England , 1585-87: Atlantic Canada
It strikes that many of the early explorers sailed under the flag of another
nation (this is before exploration and colonization took place) and that so
few of them died a natural death!
Appendix B Selection of 16th century folio maps of (parts of) America (excluding world maps and settlements):
- Martyr: Indies, 1511
- Waldseemüller: Terre Nove, 1513
- Ribero & Ramusio: Terre Firma & the west Indies, 1533
- Münster: Novae Insulae, XVII – Nova Tabula, 1540
- Rotz, North America and West Indies, 1542
- Tramenzanius: Western Hemisphere, 1554
- Le Testu: east coast of North America, Florida & the Greater Antilles, 1556
- Zaltieri: North America, 1556
- Forlani: South America, 1556
- Ramusio: Western Hemisphere, 1556; La Nuova Francia, 1556; Brasil,
1558
- Rosaccio: La Nouva Francia - Terra de Labrorador, 1556
- Homem, Diego: The North Atlantic, 1558; Brazil & Patagonia, 1558
- Gastaldi: La nuova Francia, 1556 (Gunti)
- Ruscelli: Tierra Nueva, 1561, Nueva Hispaniola (1561), South America
(1561); Brasil, 1561
- Guttiérez: Americae Sive Qvartae Orbis Partis Nova Et Exactissima Des-
criptio, 1562
- Bertelli: Al Molto Mag (separately published), 1565
- Zaltieri: Il Disegno del discoperto della noua Franza, 1566
- Mercator, Gerhard: Nova et aucta Orbis Terrae descriptio Ad Usum
Navigantium emendaté accommodata, 1569
- Camocio: “America” (separately published), 1569
- Ortelius: Septentrionalium Regionum Descrip., 1570; Tartariae sive Magni
Chami Regni, 1570; Americae sive novi orbis, nova descriptio., 1570;
Hispaniae novae sivae magnae, recens et vera description, 1579;
Culiacanae, Americae Regionis, description - Hispaniolae, Cubae,
aliamarque Insularum circumiacientium, deleniatio, 1579; Peruviae
auriferae regionis typus - La Florida - Guastecan, 1584; Maris Pacifici,
1590
51
- de Nicolai: Nouveau Monde, 1573
- Thevet: Le nouveau Monde, 1575
- de Jode: “Peru & Chili” (separately published), 1576; Americae Pars Bore-
alis, 1593; Quivirae Regnu, 1593
- Best & Beare: “Passage to Cathaya”, 1578
- d’Anania: America, 1582
- Boazio: the Famouse West Indian Voyadge, 1588
- Mazz:a Americae, 1589
- White: Virginia Pars, 1585; Americae pars. Nunc Virginia dicta, 1590
- Le Moyne de Morgues: Floridae Americae Provinciae Recens & exactis-
simma description, 1591
- de Bry: Floridae Americae Provinciae, 1591; Americae Pars Magis Cogni-
ta, 1592; Occidentalis Americae partis; Occidentalis Americae partis, 1594;
America sive novus Orbis …, 1596
- Claesz: Nova Franciaa alio nomine dicta Terra nova, 1594
- Mercator, Michaël: America sive India Nova, 1595
- Mercator, Gerard: Septentrionalium, 1595
- Rughesi: Amercia, 1597
- Metellus atlas, 1598
- Hondius: “America” (separately published), 1598
- de Solis: Americae sive Novi orbis – Nova description, 1598
References
Beale Polk, D. (1991) The island of California: a history of the myth, Spokane:
The Arthus H. Clark Company.
Burden, C. (1996) The Mapping of North America: a list of printed maps 1511-
1670, Hertfordshire: Rickmansworth.
Diwald, H. (1980) Der Kampf um die Weltmeere, München: Droemer-Knaur.
Nordenskiold, A.E. (1973), Facsimile-Atlas to the Early History of Cartography
with Reproductions of the Most Important Maps Printed in the XV and XVI
Centuries, New York: Dover Publications, Inc.
Moreland, C. and Bannister, D. (2004) Antique Maps, London: Phaidon Press Ltd.
Nebenzahl, K. (1990) Atlas of Columbus and the Great Discoveries, Chicago:
Rand McNally.
Portinaro, P. and Knirsch, F. (1990) The Cartography of North America (1500 –
1800), New York: BookSales.
Pritchard, M., and Taliaferro, H. (2002) Mapping Colonial America: Degrees of
Latitude, New York: The Colonial Williamsburg Foundation.
Shirley, R. (1984) The mapping of the world (1472-1700), s.l.: Holland Press Pub-
lisher.
Skelton, R.A. (1964) Bibliograpical Note to Cornelius à Wytfliet, Descriptionis
Augentum Polemaicae, facsimile reprint of the first edition, s.l.

52
Schwartz, S.I. and Ehrenberg, R.E. (2001) The Mapping of America, Edison:
Wellfleet Press.
Van den Broecke, M.P.R. (2011) Ortelius Atlas Maps: an illustrated guide, ‘t Goy
– Houten: HES Publishers.
Van den Broecke, M.P.R. et al. (1998) Abraham Ortelius and the First Atlas, Es-
says commemorating the Quadricentenial of his Death (1598 – 1998), ‘t Goy
– Houten: HES Publishers.
Van der Krogt, P. (1997-2003) Koeman’s Atlantes Neerlandici, Volumes 1 and
3,’t Goy-Houten: HES Publishers.
Van Ermen, E. (1990) The United States in old Maps and Prints, Tielt: Lannoo.
Weise, A.J. (1989) Troy's One Hundred Years, 1789-1889, Troy.
Wesel, G. (2004) 'Von einem, der daheim blieb, die Welt zu entdecken - Die Cos-
mographia des Sebastien Münstir oder Wie men sich vor 500 Jahern die Welt
vorstellte, Frankfurt: Campus Verlag.
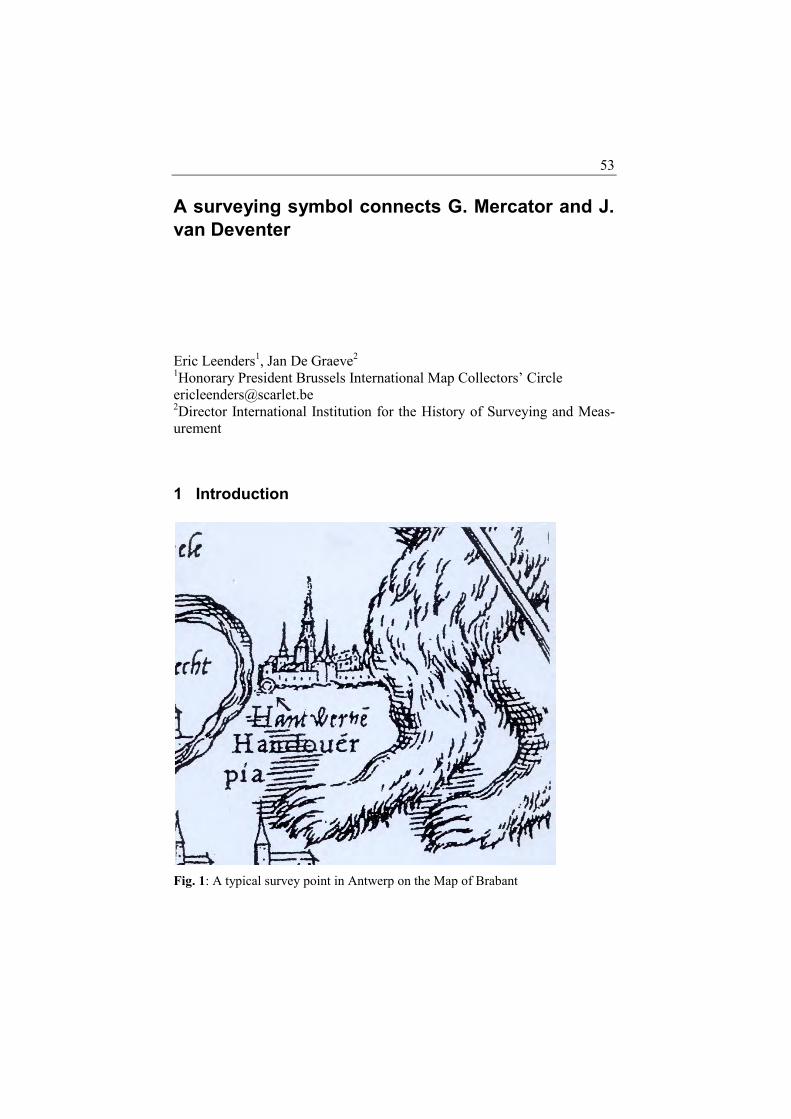
53
A surveying symbol connects G. Mercator and J. van Deventer
Eric Leenders1, Jan De Graeve2 1Honorary President Brussels International Map Collectors’ Circle
[email protected] 2Director International Institution for the History of Surveying and Meas-
urement
1 Introduction
Fig. 1: A typical survey point in Antwerp on the Map of Brabant

54
It was an observation on the map of Flanders ‘faciebat Mercator’ 1540, of
which there is only one specimen, that triggered a study of the surveying
technique used by Jacob van Deventer. Between 1532 and 1547 he sur-
veyed the northern region of the Seventeen Provinces.
For indeed the Flanders map discloses the same surveying symbol as the
five regional maps by van Deventer. The results of angular measurements
and comparison with the angles on all regional maps, confirms the hy-
pothesis of the topographical origin of the Flanders map, made by
G.Mercator and surveyed by J.van Deventer.
As we know Jacques Surhon was asked to make maps of the southern part
of the Seventeen Provinces. He used the same surveying symbol and dis-
plays analogue topographical results to the ones obtained by Van Devent-
er.
2 The surveying symbol
Fig. 2: Van Deventer declares on the Gelderland map the use of a survey symbol

55
On the regional map Gelderland (1543), his fourth map (Flanders in-
cluded), Van Deventer discloses his way of working. He writes “but in
those cases where they do not have the sign O, same are not so good and
accurate as the other ones, because it was not everywhere possible to
freely and with consent make a survey”. On this map he refers to the ongo-
ing war between Charles V and the Duke of Gueldres. Although only
noted on the fourth map, it was not a one map shot. Indeed this double ring
(ring point) survey symbol is present since 1536 on all his regional maps
as well as on the map of Flanders.
His maps are the result of a triangulation carried out from as many towers
as would be necessary, for his eyes were his only vision instrument. In or-
der to conclude to a system one should find the survey symbol on all maps
in a similar proportion and with comparative results. The localities were
counted on all six maps, so were the survey symbols. The following table
shows not only the number of survey symbols or survey points but also the
percentage of localities (towers) needed to survey the region.
Table 1: Presence of the survey symbol in relation to the number of localities
Localities Survey points %
Brabant 1536 1239 57 4,60
Holland 1537 612 56 9.15
Vlaanderen 1540 1014 44 4.33
Gelderland 1543 639 61 9.54
Friesland 1545 767 35 4.56
Zeeland 1547 391 35 8.95
3 Flanders map
Although the map carries the title ‘faciebat Mercator’, the origin has al-
ways been a point of discussion. Without substantial proof some attributed
the topographical content to Van Deventer. A study by Leenders in 2005
indicated the presence of a similar surveying symbol on the Flanders and
the five regional maps by Van Deventer. The most important source on
Mercator is the ‘Vita Mercatoris’ by Walter Ghym (1530-1611). This work
confrims that Mercator was asked to draft a map in a hurry, but says noth-

56
ing on how it was done. It also tells us that he surveyed only one region
namely Lotharingen. As a result he became sick and developed distaste for
this kind of work. It was the systematic use of a similar survey symbol
from Van Deventer on the Flanders map that led to the conclusion that this
map was triangulated by Van Deventer but engraved by Mercator. To sub-
stantiate this hypothesis a comparative study of the angular measurements
on all six maps using only the survey symbols was carried out. Such study
would also prove that Van Deventer used a topographical system which
eventually might be copied later on by others.
Fig. 3: Survey points on the Map of Flanders, with the Zenoi addition
4 Van Deventer maps
Little is known about the man, not even his date of birth. His inscription in
1520 at the University of Louvain makes us suppose that he had knowl-
edge of G. Frisius’ work on triangulation. Who influenced the other, we
don’t know. Frisius was probably the theorist and Van Deventer the practi-
cal one. Over a period of eleven years he published his regional maps in a

57
regular tempo: almost one every two years. Flanders fits in these series.
For the evaluation of these maps, the facsimiles ‘regional maps of the
Netherlands’ by prof. Koeman were used.
Fig. 4: Survey points on the regional map of Holland by Van Deventer.
This study is limited to the angular values between localities because they
were measured and are controllable. Only one distance was measured,
most probably in walking hours and therefore less precise.
His instruments were a compass and or a geometrical quadrant or a full
circle. Due to the lack of special glasses the distance between survey tow-
ers was judged by the naked eye and rarely surpasses 20km. This is indeed
an acceptable Fig.ure, as tested from the Atomium in Brussels (h: 103m).
One can easily see the Cathedral tower in Mechelen at a distance of 25km.
but not the cool towers at Doel at 42 km. Measurements were carried out
with a graduated circle of 29cm diameter (one degree measures 1.5mm). In
order to avoid overlapping angles, the measurements were carried out on a
similar size copy of each separate facsimile sheet.

58
Fig. 5: Angular measurements on a modern Michelin map 1:200,000.
In a first phase 60 angles from the regional maps were compared with
similar angles measured on a modern map 1:200,000. The regional maps
have a scale between 1:170,000 and 1:190,000. The method to compare
anglemeasurements between a tourist map and Deventer’s maps may at
first sight be unscientific. For indeed a survey point on Deventer’s maps
measures two mm, a town on a modern map measures between 1 and 4cm.
The measurepoint on modern maps was arbitrarely placed at the center of
the towns. The results demonstrate that with this method we can have a
reasonable insight in the cartographic capacities of Deventer. I dare con-
clude that the method is usefull in cases where one can not compare with
scientifical established angle-measurements. The same will apply with
Surhon.
On each Van Deventer map 60 angles using the survey symbol were
measured and compared. The second colomn expresses the mean angular
deviation as opposed to the angles measured on a modern map.

59
Table 2: Mean angular deviation as compared to a modern map 1:200,000.
N° measure-
ments
Mean angu-
lar deviation
Min. Max.
Brabant 60 4.58° 0° 21°
Holland 60 3.26° 0° 11°
Vlaanderen 60 2.54° 0° 11°
Gelderland 60 5.70° 0° 17°
Friesland 60 4.71° 0° 23°
Zeeland 60 3.46° 0° 19°
The overall angular deviation from the six maps amounts to 4.07. These
Fig.ures however indicate a remarkable result. The method has at first
sight a flaw, namely the comparison with a modern map (scale 1:200,000),
not knowing what measure point to chose in the cities. The center seemed
a good bet. Subsequently there was the idea to compare the angles with the
highly precise ones measured by Kraeyenhoff 1802-1811, partially from
the same high (church) towers.
5 Van Deventer versus Kraeyenhoff
Kraeyenhoff triangulated an area similar to the one Van Deventer did. Due
to the use of optical instruments he was able to measure distances from 20
to 40km. Therefore the independant facsimile sheets were reassembled in
full maps which made long distance angle measurements possible. Of the
268 survey points on the six Van Deventer maps, 57 were the same used
by Kraeyenhoff. These measure points offered 120 angles to compare.

60
Fig. 6: Comparative angular measurements on the triangulation map by Kraeyen-
hoff, using only the survey symbols corresponding with Van Deventer
Table 3: Medium Angular deviation Van Deventer versus Kraeyenhoff:
1. 268 survey points on Van Deventers’ maps
2. 57 localities which appear as well on Van Deventer as on Kraeyenhoff
3. Of these 120 angles were compared; 67 showed a difference of only 0° to
2° suggesting that both used the same spot for their measurements.
4. Medium angle deviation of each map. The overall angle deviation from
the six regional maps amount to 2.3°
1 2 3 4 Min. Max.
Brabant 57 8 18 4.72° 0° 11°
Holland 56 18 45 2.84° 0° 7°
Vlaanderen 44 9 15 1.26° 0° 3°
Gelderland 61 10 25 1.48° 0° 4°
Friesland 35 4 6 1.33° 0° 12°
Zeeland 15 8 12 2.08° 0° 6°
It is clear that Brabant was the school where Van Deventer learned the
hard way. Afterwards his results became better, with the slight exception

61
of Zeeland, most probably due to the large water surfaces. It is true that we
don’t know for sure that Van Deventer and Kraeyenhoff measured from
the same location (tower?). It is to be noted that on the 120 comparable
angles 67 showed a difference of 0° to 2°. These results were only possible
if they both used the same location.
6 Jacobo Surhon
Fig. 7: Hannoniae by Jacobo Surhon, with the survey points
As a result of the topographic work of the northern part of the Seventeen
Provinces by Van Deventer, Charles V commissioned Jacques Surhon in

62
1548 to survey the southern part. He drew a map of Hannoniae in 1548, of
Lutzenburgen in 1551 and of Atebratum (Artois) in 1554 using the same
survey symbol. He was a goldsmith from Mons. In 1551, the Emperor
Charles V nominates him as “ingéniaire des cartes des pays de par-deça”.
In 1551 Surhon drew a map of the territory of the abbey of St.Hubert lo-
cated in Luxemburg. Jacobo and his son Johanne may have worked to-
gether. Jacobo used Van Deventer’s survey symbol. Johanne did not use
the symbol on the maps he produced later alone, as for example
Vermandois and Picardiae. Since Johanne did not use the double ring (sur-
vey symbol) on his own maps, one must conclude that the map of Artois
signed Johanne is in fact a map surveyed by his father Jacobo. A study,
similar to that carried out on the Van Deventer maps was also carried out
on the three maps by Jacobo Surhon.
Table 4: Presence of the survey symbol in relation to the number of localities
Localities Survey points % of total
Hannoniae 1547 870 34 3.90
Lutzenbergen 1551 592 46 7.77
Artois 1554 920 37 4.02
Compared with Van Deventer’s number of measurepoint localities or sur-
vey points (table 1) which he needed to establish his maps, it is clear that
Surhon used a comparable amount of localities (towers) to measure the
southern regions. In Lutzenbergen he most probably needed more survey
points due to the hilly landscape. The distances between the survey points
on the maps by Surhon are similar as those on the maps by Van Deventer,
namely between 4 and 18 km. The distances also suggest that he did not
use any telescopic instrument.
In order to indicate the places from where he carried out the angular meas-
urements, he used the same survey symbol. As for the Van Deventer’s
study, the angles of the three maps were compared with similar angles on a
map 1:175000. Just as Kraeyenhoff offered us more precise comparable
angles for the Van Deventer’ study, Cassini de Thury did the same for the
study of Hannoniae. This region was compared with the angular measure-
ments made by Cassini de Thury during the 18th century wars by Louis
XV.
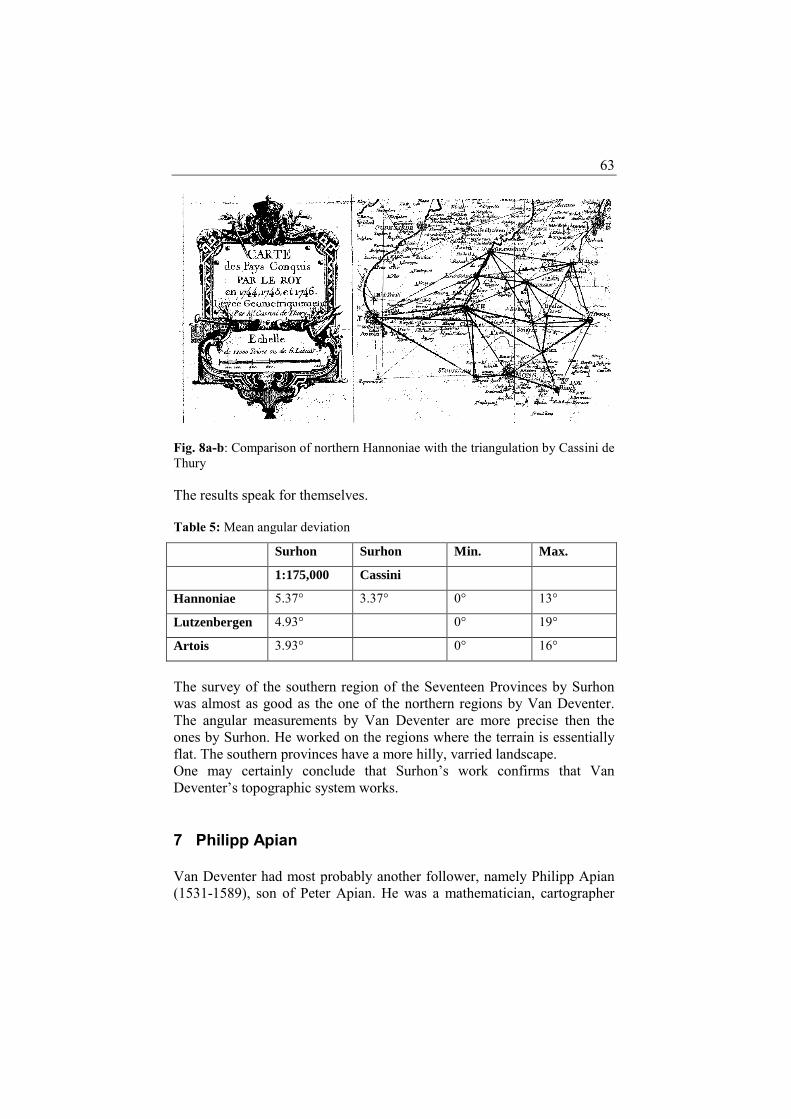
63
Fig. 8a-b: Comparison of northern Hannoniae with the triangulation by Cassini de
Thury
The results speak for themselves.
Table 5: Mean angular deviation
Surhon Surhon Min. Max.
1:175,000 Cassini
Hannoniae 5.37° 3.37° 0° 13°
Lutzenbergen 4.93° 0° 19°
Artois 3.93° 0° 16°
The survey of the southern region of the Seventeen Provinces by Surhon
was almost as good as the one of the northern regions by Van Deventer.
The angular measurements by Van Deventer are more precise then the
ones by Surhon. He worked on the regions where the terrain is essentially
flat. The southern provinces have a more hilly, varried landscape.
One may certainly conclude that Surhon’s work confirms that Van
Deventer’s topographic system works.
7 Philipp Apian
Van Deventer had most probably another follower, namely Philipp Apian
(1531-1589), son of Peter Apian. He was a mathematician, cartographer

64
and doctor of medecine. In 1554 he was commissioned to survey Bavaria.
He started barely three years after Surhon finished his last map. Philipp be-
ing the son of Peter Apian must have been acquainted with the work of
G.Frisius which appeared in Peter Apian’s ‘Cosmographiae’. As Van
Deventer he must have learned the principles of triangulation with limited
instruments as the geometrical quadrant or full circle and compass. In 1554
he was commissioned by the duke to survey Bavaria. He produced from
1554 to 1561 a handmade wall map 5 x 5m at a scale of 1:45000. He pub-
lished in 1561 a reduced map in 24 sheets, 160 x 170 cm at 1:144000. This
map became the prototype of many copies until the twentieth century, and
formed the base for the Bavarian map used by Ortelius, Mercator and oth-
ers. This map has been thoroughly studied by many scholars.
Fig. 9: The Bayerischen Landtafeln by Philipp Apian.
His excellent topographic work is supposedly based on astronomical, ge-
ometrical measurements and triangulation. It was shown that the accuracy
was best at the area around Ingolstadt (where he lived) and became less
accurate towards the periphery; which is a well known effect of triangula-
tion. The survey of the mountainous area is less accurate.

65
By studying the 24 map sheets it became clear that this wall map contains
also a double ring symbol, spread over all the maps. Out of thousand
known localities there are some 125 with a double ring. These 12.5% is in
accordance with the number of survey cities used by Van Deventer and
Surhon. This sign disappears in several later copies.
Some will argue that the double ring was symbol for a large city as in the
past some scholars thought about Van Deventer. It is true that there is a
legenda on the map sheet 23 which calls a double ring a symbol for Stadt.
It is also noted that this legenda is not present on the overall picture of the
wall map. I think as part of the hypothesis that this legenda was created by
one of the several copyists, unaware of the through meaning of the symbol.
Fig. 10: The survey symbol on Apian’s map.
A short angular measurement test (only 10 angles) showed an angle devia-
tion of 3.7°. This finding favors the validity of the hypothesis that P. Apian
used the Van Deventer method. This needs confirming by means of an ex-
tensive study.
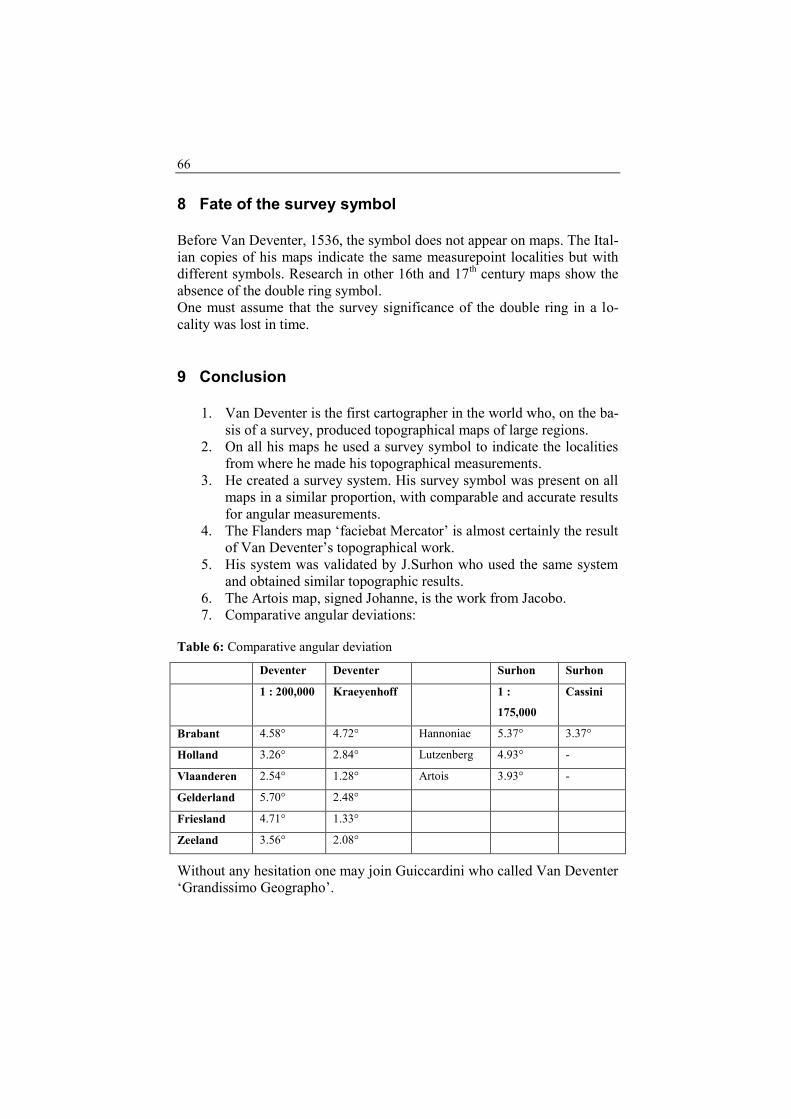
66
8 Fate of the survey symbol
Before Van Deventer, 1536, the symbol does not appear on maps. The Ital-
ian copies of his maps indicate the same measurepoint localities but with
different symbols. Research in other 16th and 17th century maps show the
absence of the double ring symbol.
One must assume that the survey significance of the double ring in a lo-
cality was lost in time.
9 Conclusion
1. Van Deventer is the first cartographer in the world who, on the ba-
sis of a survey, produced topographical maps of large regions.
2. On all his maps he used a survey symbol to indicate the localities
from where he made his topographical measurements.
3. He created a survey system. His survey symbol was present on all
maps in a similar proportion, with comparable and accurate results
for angular measurements.
4. The Flanders map ‘faciebat Mercator’ is almost certainly the result
of Van Deventer’s topographical work.
5. His system was validated by J.Surhon who used the same system
and obtained similar topographic results.
6. The Artois map, signed Johanne, is the work from Jacobo.
7. Comparative angular deviations:
Table 6: Comparative angular deviation
Deventer Deventer Surhon Surhon
1 : 200,000 Kraeyenhoff 1 :
175,000
Cassini
Brabant 4.58° 4.72° Hannoniae 5.37° 3.37°
Holland 3.26° 2.84° Lutzenberg 4.93° -
Vlaanderen 2.54° 1.28° Artois 3.93° -
Gelderland 5.70° 2.48°
Friesland 4.71° 1.33°
Zeeland 3.56° 2.08°
Without any hesitation one may join Guiccardini who called Van Deventer
‘Grandissimo Geographo’.
67
References
Cassini de Thury (1775) “Carte des Pays Conquis par le Roi en 1774, 1745 et
1746. Levée Geometriquement”, In: Relation d’un voyage en Allemagne, Pa-
ris.
Duvosquel, J.-M. (2006) “Une œuvre inédite de Jacques de Surhon : la carte de la
terre abbatiale de Saint Hubert (1551)”, In: Bracke, W. (ed.) Margaritae car-
tographicae. Studia Lisette Danckaert 75um diem natalem agenti oblata,
Brussel, pp. 29-41. (Archief- en bibliotheekwezen in België / Archives et bi-
bliothèques de Belgique extranummer - numéro spécial 80)
Ghym, W. (s.d.) Vita celeberrini clarissimique viri Gerardi Mercatoris Rupel-
mondani.
Frisius, G. (1533) Libellus de locorum describendorum ratione, Antwerpen.
Frisius, G. (1537) Een boecxken seer nut ende profijtelijck allen geographiens lee-
rende, Antwerpen.
Karov, R.W. (1996) Mapmakers of the 16th century and their maps, s.l.
Koeman, C. (1964) Gewestkaarten van de Nederlanden door J. van Deventer
1536-1545, Alphen aan den Rijn.
Kraeyenhoff, C.R.T. (1827) Précis historique des opérations géodésiques et as-
tronomiques en Hollande, Den Haag.
Leenders, E. (2006) “De kaart van Vlaanderen van G.Mercator en J. van Deven-
ter”, Caert Thresoor, 25/4, pp. 108-115.
Leenders, E. (2008) “The Map of Flanders by G.Mercator and J. van Deventer”,
BIMCC.Newsletter, 8, p. 18.
Schilder, G. (1986) Monumenta Cartographica Neerlandica, deel 1, Alphen aan
den Rijn.
Wolff, H. (1988) Cartographia Bavariae. Bayern im Bild der Karte, Weißenhorn.
Wolff, H. (1989) Philipp Apian und die cartographie der Renaissance, Weißen-
horn.


69
Map as metaphor
Inge Panneels Institute for International Research on Glass (IIRG), Faculty of Arts, De-
sign and Media, University of Sunderland, National Glass Centre, Liberty
Way, Sunderland SR6 0 GL, United Kingdom.
1 Introduction
Maps have acted as a universal metaphor and have been used throughout
cultures and times to visually organise information; a process that has tra-
ditionally been interpreted by artists, who were often employed as early
cartographers. Artists have also, by extension, used map iconography to
express their own ideas about the world. According to the Victoria and Al-
bert Museum’s Mapping the Imagination exhibition guide (2008) ‘maps
offer us a means of describing and understanding the intangible’. A map is
of course never truly an objective instrument but rather one shaped by its
time; artists have explored its potential to be subversive and create works
using maps as metaphors rather than measurements of high fidelity. The
integration of maps and mapping techniques is a manifestation of post-
modern art, where the appropriation of past styles and conventions is an
expression of its questioning nature. In mapping the cultural terrain, case
studies of the work of several international artists will set the context and
describe how they have assimilated maps into their works of art and ques-
tioned maps as instruments of truth-telling. The case studies, including the
author’s Liverpool Map, will demonstrate the use of both traditional hand-
drawn maps and contemporary digital mapping techniques to gather and
order complex data to create artworks with a sense of place. This is the no-
tion of the map as metaphor.
The cultural heritage of Mercator will be examined through Map-i; a
proposed personal re-evaluation of his legacy by the author. This art pro-
ject will be informed by an-artist-in-residency scheme at the Mercator Mu-

70
seum in Sint-Niklaas, which holds a collection of physical objects made or
related to the cartographer. Mercator considered his life’s most significant
work to be the publication of Atlas sive Cosmographiae Meditationes de
Fabrica Mundi et Fabricati Figura, a synthesis of the history of heaven
and earth, an issue of particular relevance to the museum’s collection of
terrestrial and celestial globes. Mercator was a polymath whose scholarly
skills and craftsmanship were embodied in his work as a cartographer and
maker of globes. The importance of his making skills and his willingness
to engage with contemporary cutting edge technology and science will be
examined in the Map-i project, as will the relationship of the two-
dimensional map and the three-dimensional globe. The proposal is that the
choice of glass will be an apt metaphor as a window on the world. The re-
consideration of the Mercator globes from the 16th century and their ex-
panded mechanistic worldview, critical in the Age of Discovery and in-
formed by world exploration and early astronomical observations, will
contrast the 21st century digital quantum worldview.
2 Mapping the cultural terrain
If a map is an ‘interpretation of reality’ in scaled down version with ‘a
measurement of high fidelity’1 then the definition of maps as formulated
by Harley and Woodward in 1987 that ‘maps are graphic representations
that facilitate a spatial understanding of things, concepts, conditions, pro-
cesses, or events in the human world”2 is a broad and generous assertion.
Cartographers may disagree with this wider definition but for the purposes
of this argument, I refer to mapping in its widest possible meaning.
Historically artists were employed by cartographers to embellish maps but
increasingly mapmakers became regarded as painters3 between the 15
th and
18th centuries and thus art and cartography became intrinsically linked. The
1 Fairbairn, David, Dr, University of Newcastle, in discussion with Inge Panneels (February 10, 2011) 2 Definition formulated at the beginning of the first volume of their “History of Cartography”: Barber, Peter, “The Map Book” ( London: Weidenfeld & Nicolson, 2005), p6 3 Barber Peter – Harper, Tom, “Magnificent Maps: power, propaganda and art” (London: The British Library, 2010) p 16

71
Fra Mauro4 map has exquisite detail painted in both the main part of the
map as well as the Garden of Eden, controversially placed outside the out-
line of the world5. Maps are of course objects of their time, shaped and
coloured by political, social and cultural conditions as so ably demonstrat-
ed by the Magnificent Maps exhibition at The British Library in 2010, with
a strapline that read; power, propaganda and art. 6
Many contemporary artists have harnessed the power of maps as a means
for sharing their viewpoint and making political, social or cultural com-
mentary. The map format is used as a vocabulary with an expectation to be
able to extract information from it, as the visual literacy required to read
maps is commonplace; “Humans evolved with amazing navigational abili-
ties in our brains from an evolutionary perspective”7. Artists have used
their artistic license to appropriate the visual language of maps and subvert
them into their own work. Cartographic rules give artists assumptions to
play with and imagery to exploit. Since the 1960’s there has been a marked
increase in artists working with maps, perhaps not surprising within the
context of postmodern art where the appropriation of historical themes and
styles is commonplace; ‘in post-modern times8, with all truths suspect’
9,
4 Frau Mauro Map dates from around 1448 (2.39x2.29m), a copy of which is in the Biblioteca Marciana in Venice, Italy. Barber Peter – Harper, Tom, “Magnificent Maps: power, propaganda and art” (London: The British Library, 2010) p52 5 Up until that time, heaven had been depicted as an integral part of mappa mundi, not outside of it and in doing so the author was challenging the dominant religious world view. Barber Peter – Harper, Tom, “Magnificent Maps: power, propaganda and art” (London: The British Library, 2010) p 52 6 Mercator was aware of the power of maps; he had been commissioned by mer-chants from Ghent to produce a map to placate the Emperor Charles V to counter-act the inflammatory map produced by Pieter Van der Beke in 1538, which had caused a minor revolution. 7 Eric Schmidt, Google’s chief executive who argues that the correlation between the map on the phone and the internal map in your head is a natural way to navi-gate all kinds of information. Source: Markoff, John, “The Cellphone, navigating our lives” The New York Times (February 16, 2009)(http://www.nytimes.com/2009/02/17/science/17map.html?pagewanted=2&_r=1) 8 Postmodernism is a philosophical movement in reaction to modernism; whereas modernism was mostly concerned with principles such as authority, unity and cer-tainty, postmodernism is often associated with difference, plurality and skepti-cism.

72
artists have also been able to play with the perceived neutrality of maps as
instruments of science.
If This Then That (The First Four: San Diego at the Centre of the World)
by the artists Helen and Newton Harrison depicts the world map in beauti-
ful sepia tones, not dissimilar to renaissance hand drawn maps, with the
explicit political message of climate change as early as 197410
.
The artist Mona Hatoum explores the recognizable iconography of map-
ping; Map (1999) is made up of clear glass marbles laid out in a world map
pattern on the floor in a traditional north facing Mercator projection. The
piece was shown at the South London Gallery in 2010 and the exhibition
booklet said: "Precariously balanced, fragile yet potentially dangerous,
Hatoum's work powerfully suggests the contingency that defines the geo-
political landscape"11
; the marbles were being moved by casual footfall
and randomly re-arranged, a commentary perhaps on the arbitrary re-
drawing of a political boundaries across a map, irrespective of social or
cultural associations? Hatoum used maps in other works including Conti-
nental Drift (2000)12
where the cut out of glass world map on the northern
Mercator projection, rests on a bed of metal filings underneath which a
magnetic arm rotates thus making the filings endlessly crash against the
coastlines, an experience which she described as both mesmerizing and
sinister.
Maps as depositaries of wholly imagined places are commonplace and are
often used as a literary device13
to access the imagined landscapes of a
novel. Turner Prize winner (2003) Grayson Perry’s Map of Nowhere
9 Harmon, Katharine, The Map as Art: contemporary artists explore cartography (New York: Princetown Architectural Press, 2009) p8 10 Kastner, Jeffrey – Wallis, Brian, Land and Environmental Art (London: Phaidon, 1998), p143 11 blogpost by Rodcorp, July 20th , 2006 about an exhibition of Mona Hatoum’s work at the South London Gallery in 2006 (http://rodcorp.typepad.com/rodcorp/2006/07/mona_hatoums_ma.html) 12 blogpost by Octavo, May 30th, 2011 about an exhibition of Mona Hatoum’s work at Tate Britain in 2010 (http://octavoblog.wordpress.com/tag/mona-hatoum/) 13 The map drawn on the inside cover pages of Tolkien’s imaginary hobbit world is crucial to unfolding of the story across the imagined landscape. Tolkien, J.R.R (1892-1973) wrote the fantasy trilogy Lord of the Rings in the 1920’s and which became bestsellers and turned into box office success with its eponymous films in the early 2000’s.

73
(2008) is a contemporary mappa mundi, a black and white etching of his
social inner landscape, which he states was based on the Ebstorf World
Map14
; both were exhibited at the Magnificent Maps exhibition where Per-
ry was one of only a handful of contemporary artists to be showcased
alongside the collection of historical maps. Perry states: “Most of my art
stems from seeing an artifact in a book or museum and then making my
own version of it. I make things that recognizably belong in traditional cat-
egories; pots, costumes, tapestries and maps”15
. Perry recently had a major
solo show at the British Museum; The Tomb of an Unknown Craftsman16
where he selected objects from the collection and curated an exhibition of
these objects, made by unknown craftsmen and woman, and placed these
alongside his own idiosyncratic work.
Other artists simply use physical maps as artefacts in their work; maps
have been cut, torn, pasted, layered, glued. Claire Brewster reincarnates
old maps and atlases by cutting them into exquisite delicate flowers, birds,
butterflies. Georgia Russell’s Britain March 2003 (Britain on Iraq)(2003)
cut a lace like outline of the UK out of the coloured map of the Arabian
peninsula. The jeweler Hannah Lamb engraves British coastlines on
matching rings, their site-specific nature have proved popular with newly-
weds. Samantha Clark Spill (2002) is an installation of 2000 glass droplets,
each with a tiny section of a map are mounted crawling on a wall.
Others use mapping as a technique to gather data. The artists Langlands
and Bell state that their work ‘focuses on the structures we inhabit and the
networks that permeate and link them, while reflecting at a wider global
level on the many ways space is encoded as social, political or economic
territory”17
. Plans, blueprints and maps feature frequently in their work; in
Air Routes of the World (diptych) (2001)18
, the air routes of the world are
plotted against an implied world map.
14 Ebstorf Map, circa 1300 no longer exists but a photographic reproduction was exhibited at Magnificent Maps, British Library, 2010. 15 Barber Peter – Harper, Tom, Magnificent Maps: power, propaganda and art (London: The British Library, 2010) p81 16 Grayson Perry: Tomb of an Unknown Craftsman, The British Museum, October 6th, 2011 – February 19th, 2012 17 Langlands and Bell website; introduction (http://www.langlandsandbell.com/index.html) 18 Langlands, Ben and Bell, Nikki, Routes of World (night) (2001), V&A Museum collection, London (http://collections.vam.ac.uk/item/O81301/print-air-routes-of-the-world/)
74
The artist Ingrid Calame literally traces marks left on roads and painstak-
ingly maps them onto large paper sheets thus converting them into ‘con-
stellations of residue’19
.
Richard Long traces his solitary walks through the British countryside on
Ordnance Survey maps a temporal activity that could be made permanent
by plotting it on a physical map20
; Long attempts to ‘draw’ simple geomet-
ric shapes by walking their outline in the landscape, a three dimensional
activity transferred to a two dimensional map.
The digital researcher Chris Speed developed Drawing with Satellites with
artist Ether Polak, using GPS technology to ‘draw’ in the landscape, an ac-
tivity which was only made visible on the screen later and ‘retains some of
the magic that all astronomical instruments possess - a dimension of rec-
onciling the scale of the spaces that are outside of earths atmosphere with a
personal sense of place21
’.
Artists have been using mapping to create images for decades and under-
stood ‘that scientific measurement was not the be all and end all22
. Map-
ping has historically been based on geographical data, which gave us in-
formation about places, whereas in the digital age the gluttony of
information itself has to be mapped, which has lead to an entire new
branch of mapping; infographics23
or infostethics,24
as was humorously
19 Harmon, Katharine, The Map as Art: contemporary artists explore cartography (New York: Princetown Architectural Press, 2009) p106 20 Kastner, Jeffrey – Wallis, Brian, Land and Environmental Art (London: Phaidon, 1998), p35 21 Speed, Chris, Edinburgh College of Art, School of Architecture and Landscape; Drawing with Satelites, February 2011 (http://fields.eca.ac.uk/fields/wp-content/uploads/2011/03/DrawingWithSatellites.pdf) 22 Barber, Peter, The Map Book ( London: Weidenfeld & Nicolson, 2005), p7 23 McCandless; data journalist and author of Information is Beautiful (London; Collins, 2009) (http://www.ted.com/speakers/david_mccandless.html) (http://www.ted.com/talks/lang/en/david_mccandless_the_beauty_of_data_visualization.html) 24 Information Aesthetics; where form follows data (http://infosthetics.com/)

75
demonstrated by David McCandless25
at TEDGlobal2010. “Mapping is of
course not just about cartography, it is also about imagery” said Blaise
Aguera y Arcas when he showcased augmented-reality maps at TED
201026
; maps have become interactive, enable time travel and encourage
and allow user participation and co-authorship; post modernism has be-
come mainstream. “The map underlies man’s ability to perceive,” said
Richard Saul Wurman, a graphic designer who was a pioneer in the use of
maps as a generalized way to search for information of all kinds before the
emergence of the online world27
. The desktop computer revolutionized the
way we organised information in files and folders, the World Wide Web
brought new ways of visualising the data stream and with the mobile
phone “a new metaphor is emerging for how we organise, find and use in-
formation. New in one sense, that is. It is also as ancient as humanity itself.
That metaphor is the map28
”
3 Mapping a sense of place
“The nature of the discipline of cartography ( ) covers a vast range of hu-
man activity and enquiry, including measurement science, data processing,
information technology, image analysis, graphic production, socio-
economic and environmental applications, institutional policy, aesthetics,
history, and culture ( )”29
. This range of human activity and enquiry is
what has attracted many artists to use mapping as a tool. It can be argued
that the process of making site-specific artwork is a form of mapping. It is
25 McCandless, David, The Beauty of data visualization, TEDGlobal 2010, filmed July 2010, posted August 2010 (http://www.ted.com/talks/david_mccandless_the_beauty_of_data_visualization.html) 26 Aguera y Arcas, Blaise TED talks; Blaise Aguera y Arcas demos augmented-reality maps, TED 2010, filmed and posted February 2010 (http://www.ted.com/talks/lang/en/blaise_aguera.html) 27 Markoff, John, “The Cellphone, navigating our lives” The New York Times (February 16, 2009) (http://www.nytimes.com/2009/02/17/science/17map.html?pagewanted=2&_r=1) 28 Markoff, John, “The Cellphone, navigating our lives” The New York Times (February 16, 2009) (http://www.nytimes.com/2009/02/17/science/17map.html?pagewanted=2&_r=1) 29 Fairbairn, David, Dr, University of Newcastle, definition of geomatics on Dr Fairbairn homepage at the University of Newcastle website (http://www.ceg.ncl.ac.uk/profiles2/dave.fairbairn)
76
as such no coincidence that many artists in the Land and Environmental
art movement, a category to which the works of Richard Long and the
Harrisons belong30
, use maps or mapping to embody or record a sense of
place. Working with specific locations where the context has to be mapped
to the site in an appropriate and relevant manner. Site-specific art works
that are generally considered successful in the long term, are those that are
rooted in its locale; “it draws attention to the environment around us. The
street becomes an artwork, and the public becomes complicit”31
. A sense
of public ownership is fostered through public engagement as demonstrat-
ed in Field of the British Isles (1993) by the sculptor Anthony Gormley32
where he asked the British public to mould a lump of clay into an amor-
phous figure, its only conformity two gaping holes for eyes. The Field pro-
ject was repeated in different locations across the world, each involving
local communities and materials, thus ensuring each project was embedded
with a sense of belonging.
This sense of place is also embedded in the Liverpool Map (2010), a sculp-
ture by Inge Panneels and Jeffrey Sarmiento, commissioned by the Muse-
um of Liverpool to commemorate Liverpool; City of Culture 2008. The re-
sulting glass sculpture is a cultural snapshot of the city anno 2008. It is
both a literal map, where visitors can pinpoint their locale, and a cultural
terrain of the City, the content of which was contributed by the public. The
contribution took the form of online polls, conducted by the Liverpool
Daily Post33
, where the public could vote on the status of cultural icons
and personalities. Written statements, both typed and handwritten, with
personal testaments about the city were collected by the newspaper and
museum respectively. All of this was data was collated by the artists and
embedded in the seventeen layers of glass that make up the sculpture, a
medium which was chosen for its ability to view information in layers in
three dimensions. The web-like structure of the city map, cut from opaque
30 Kastner, Jeffrey – Wallis, Brian, Land and Environmental Art (London: Phaidon, 1998) 31 Carson, Andrea; What makes public art good? The Huffington Post, 25 July 2011 (http://www.huffingtonpost.ca/andrea-carson/public-art_b_907529.html) 32 Gormley, Anthony (http://www.antonygormley.com/sculpture/chronology-item-view/id/2217) 33 The Liverpool Daily Post was the press partner in the project and was crucial in the public engagement aspect of the project by keeping the project tin the public’s mind over its three year timeframe, prior to the public opening of the Museum on the 19th July 2011.
77
white glass, provided the internal but highly visible structure of the map,
with the Mersey River placed centrally to account for its historical and ge-
ographical importance to the city, the region and its global connections.
The official and emotive boundaries of the city, as voted on the public, and
outlined by the project sponsor34
were cut from transparent blue, yellow
and red glasses. The spaces in between the streetscape, were intersected
with printed archive images of the chosen icons and personalities. The fi-
nal installation of the work, in The People’s Republic gallery of the new
Museum of Liverpool, overlooks the Mersey River and the Liver building,
both of which are referenced in the work35
. The direct literal connections
of the work to its site and the fact that viewers can find their way home on
the map, or recognize personal references in it, is what makes the Liver-
pool Map a sculpture which maps a sense of place36
for the people of Liv-
erpool..
The Liverpool Map was also a pivotal piece of work that directed me fur-
ther towards the field of mapping in art and the map as metaphor specifi-
cally37
. New work based on microscope and satellite images, which are
mapping our micro and macro cosmos, is exploring the interconnectedness
of things. On the final page of The Map Book38
, Peter Barber displays a
satellite image with the question; is this really a Map? It alludes to the fact
that the traditional boundaries of cartography are being eroded and that
mapping is becoming a much broader, interdisciplinary activity. Mapping
has allowed us to record for prosperity information about resources, to plot
military intelligence but primarily it has been a tool to help us to navigate
our world. The quest for understanding a sense of place, of belonging, is
34 The project was funded by Phil and Alexis Redmon, the Museum of Liverpool and the making of it supported by the University of Sunderland. 35 See Museum of Liverpool website; gallery highlights (http://www.liverpoolmuseums.org.uk/mol/visit/galleries/peoples/liverpool-map.aspx) 36 A book Liverpool in Layers; mapping a sense of place will be published about the Liverpool Map later in 2012 (Liverpool; Capsica, 2012) and will allow con-tributors to trace and dissects their contributions in detail. 37 There is a direct if tenuous link between Liverpool and Mercator; a bronze stat-ue of Mercator was commissioned by the philanthropist and publisher Henry Yates Thompson (1838-1929) and sculpted by the French sculptor Léon-Joseph Chavalliaud (c1858-1921) and graces one of the corners of the octagonal Palm House in Sefton Park, the latter is of course embedded in the Liverpool Map as a significant location. 38 Barber, Peter, The Map Book ( London: Weidenfeld & Nicolson, 2005) p354
78
fundamental to our human nature and this universal search forms the es-
sence of my work.
4 The cultural heritage of Mercator
As a native Belgian, my abiding memory of the Flemish school system of
the 1980’s, apart from unsuccessful crochet attempts, were the bright pull
down maps which charted the geography of Europe and brought the histor-
ical changes of the Low Countries alive with its vivid colours. History les-
sons not only charted Flanders’ turbulent past and changing allegiances but
also illuminated some of its illustrious compatriots39
. Belgium is of course
a relatively young nation (1830) but as Flanders was an intellectual strong-
hold40
, during the Middle Ages, many world-renowned names originated
from the Low Countries before it separated into current Belgium and the
Netherlands. The names of Jan van Eyck (c1395-1441), Hieronymus
Bosch (c1450-1516), Pieter Brueghel the Elder (c1525-1569) and Pieter
Paul Rubens (1577-1640) might be familiar; artists who had the patronage
of the prosperous mercantile class, the clergy and royalty. The rich palette
of Flemish painting and the wonderful tales of discovery as expressed in
the vivid school maps have become intrinsically linked; Rubens became
not just ‘a painter from Antwerp’, but a significant European artist who in-
fluenced a whole new school of painting and Mercator was not simply a
local mapmaker but justifiable one of the most important cartographers of
the Modern Era. Mercator was a polymath41
with all the skills required to
become an excellent cartographer and globemaker42
, taking full advantage
39 It is a running joke amongst my British friends and a frequently asked pubquiz question; can you name 10 famous Belgians? 40 The relative safety and tolerance of the Low Countries, where the emerging hu-manist philosophy was gaining ground, attracted many European scholars. The University of Leuven -founded in 1425- included esteemed scholars such as the theologian and humanist Desiderius Erasmus (1466-1536), the anatomist and phy-sician Andreas Vesalius (1514-1564) and the cartographer Gerardus Mercator (1512-1594) 41 He received a humanist education with a thorough grounding in Latin, grammar, rhetoric, logic and geography; the latter was taught as a means to study etymolo-gy, as most place names had been recorded by classical scholars ; an education as outlined in Erasmus’ treatise de ratione studii; Crane, Nicolas, “Mercator; the man who mapped the planet”(London: Phoenix, 2002) p36 42 When his mentor and tutor Gemma Frisius (1508-1555) was offered a formal Imperial Charter by the reigning Spanish emperor Charles V (1500-1558) in 1535

79
of the emerging new printing techniques 43
and the discoveries made by the
explorers44
for Mercator was a scholar who combined ancient learning
with the most current research45
. The Age of Discovery can retrospectively
be seen as a bridge between the dogmatic doctrine of the Middle Ages and
the cultural renaissance of the Modern Era. The advent of printing, of dis-
tributing ideas and concepts quickly, heralded an era of unprecedented
transfer of knowledge, probably not seen again until the 20th century and
the invention of the worldwide web. Mercator happened to be the right
man in the right place at the right time.
The choice of the work of Mercator as a source of inspiration was made
because of its historical reference, its cultural connections and its enduring
international significance. The Mercator Museum collection in Sint-
Niklaas, Belgium will form the prime source of inspiration for a new body
of work being developed. An artist-in-residency scheme in early 2012 will
allow access to the collection46
for investigation. Objects of particular in-
terest currently, are the Earth globe from 1541 and its corresponding celes-
tial counterpart as globes have featured previously in my own works;
Creationseries was a collection of globes based on creation mythologies
from around the world, which chronicle the coming into being of heaven
and earth, and is now in the Dexia collection in Brussels. An unconscious
to make a globe which reflected the new world view and would be like no other seen, Mercator was called in to assist. The globe was duly completed with great success and Mercator’s reputation as a cartographer was cemented. Mercator con-tinued his collaboration in 1537 with Frisius on a celestial partner to the terrestrial globe. 43 Founded by Christoffel Plantin (1520-89) in Antwerp, spawned by the invention of the printing press by Johannes Gutenberg (1398-1468) 44 Tales of discovery brought back from intrepid explorers such as the Italian Marco Polo (1254- 1324) and the Portugese Ferdinand Magellan (1480-1521) and Vasco Da Gama (1469-1524) were expanding the worldview beyond the confines of Europe and changing the ancient geography as espoused by Ptolemy’s (cAD 90- cAD168) Geographia and Almagest, whose work had only recently re-emerged with a 15th century Latin translation. 45 As taught by Mercator’s mentor Gemma Frisius (1508-1555), a brilliant mathe-matician and astronomer who fearlessly compared the dogmatic teaching of an-cient knowledge with current research Taylor, Andrew, “The world of Gerard Mercator; the mapmaker who revolution-ized geography” (London: Harper Collins, 2004) p60 46 The Museum is also currently developing a project called ‘Mercator 2012’ with the purpose of digitalizing the Mercator archive.

80
but fitting connection was found years later with the globe painted on the
closed shutters of the triptych Garden of Earthly Delights by Bosch47
.
Globes and maps were highly valued and prized collectables by the estab-
lishment, which like their counterparts in painting, reflected the aspiration-
al values of their collectors.
Mercator considered his life’s most significant work to be the publication
of Atlas sive Cosmographiae Meditationes de Fabrica Mundi et Fabricati
Figura, a synthesis of the history of heaven and earth48
. The compilation of
his life’s work in a bound book of maps, coined the term atlas as we know
it today but Mercator’s major and long lasting achievement was the devel-
opment of the eponymous projection and was first seen in his celebrated
World Map of 1569. Perhaps the most compelling evidence of the endur-
ance of Mercator’s work, was the re-publication of Atlas in CD format in
200049
and the use of a variant of his projection by the major online street
mapping services50
for their map images, for despite its obvious scale vari-
ation at small scales, the projection is well-suited as an interactive world
map that can be zoomed seamlessly to large-scale (local) maps and vice-
versa with relatively little distortion. The advent of digital mapping which
recently includes 3D mapping and user interaction has grown exponential-
ly in the last decade; maps are becoming integral to our lives and the ap-
plications we use on a daily basis. Mercator’s legacy lives on 500 years
later.
My childhood fascination with colourful maps remains, even though most
school maps probably dated from the early 20th century
51, and many a car-
tographer has had a bemused reaction when I was extolling the aesthetic
47 Dated from between 1490 and 1510, this masterpiece was acquired by Philip II of Spain (1527-1589) and bequeathed from the Royal Collection to the Museo del Prado in Madrid where it is still on public display. 48 Mercator had made it his life’s work to investigate ‘the mysteries of nature”48 , a potentially dangerous pursuit, and although Mercator himself saw no clash in ‘the contemplation of Nature’48 as to study Creation was a way to understand its na-ture, the contemporary authorities may have considered it heretic. 49 Monmonier, Mark, Rhumb Lines and Map Wars (Chicago: The University of Chicago Press, 2004) p45 50 such as Bing Maps, Google Maps, MapQuest, Yahoo Maps, and others; source (http://en.wikipedia.org/wiki/Mercator_projection) 51 Little did I understand the controversy that the Mercator projection of these childhood maps would cause in 1974 when Arno Peters proposed an alternative to Mercator.

81
virtues of their work rather than scientific ones. At heart, I remain an aes-
thete and not a scientist. The Map-i project proposes that the choice of
glass will be an apt metaphor as a window on the world and its resulting
work will be exhibited in Sint-Niklaas in 201352
. The re-consideration of
the Mercator globes from the 16th century and their expanded mechanistic
worldview, critical in the Age of Discovery and informed by world explo-
ration and early astronomical observations, will attempt to contrast the 21st
century digital quantum worldview. Physicists and scientists are busy
modeling this new view of the world in relation to the expanded cosmos
and are at a similar point now to where Mercator was 500 years ago when
he tried to assimilate all the disparate tales of discovery and fragments of
information into a coherent body of work with his Atlas. But perhaps a
word of caution from Einstein from 1951: “All the fifty years of conscious
brooding have brought me no closer to answer the question, 'What are light
quanta?' Of course today every rascal thinks he knows the answer, but he
is deluding himself”.
5 Conclusion
The American artist James Turrell has made light his medium of choice; in
his seminal work Mapping Spaces (1987) he states; “The work I do does
not have to do with science or demonstrations of scientific principles. My
work has to do with perception-how we see and how we perceive. Though
I use the information and need the help of people in the sciences to calcu-
late positions of celestial events and to solve problems of refraction caused
by changes in atmospheric pressure and temperature, for example, my
work does not push the boundaries of science. I think artists have a lot
more to do with investigating the limits of perception than science does at
this time. The basic difference though, is one of intent. I am more interest-
ed in posing questions than answering them”.
As Turrell states, the main objective is the intent to question; the answers
may not be forthcoming but I hope it will be a delightful exploration where
the journey is as important as the destination, and its many stations will be
mapped along the way.
52 At time of going to press, an informal offer of exhibition at SteM, the regional cultural museum and adjacent to the Mercator Museum in Sintniklaas, was offered for 2013 but concrete details were to be confirmed.

82
References
Aguera y Arcas, B. (2010) TED talks; Blaise Aguera y Arcas demos augmented-
reality maps, TED2010, filmed and posted February 2010.
(http://www.ted.com/talks/lang/en/blaise_aguera.html)
Barber, P. (2005) The Map Book, London: Weidenfeld & Nicolson.
Barber, P., Harper, T. (2010) Magnificent Maps: power, propaganda and art ,
London: The British Library.
Carson, A. (2011) “What makes public art good?” The Huffington Post, 25 July
2011.
(http://www.huffingtonpost.ca/andrea-carson/public-art_b_907529.html)
Clark, S. (2002)
(http://www.samanthaclark.net/artworks/2002/29/Spill)
Crane, N. (2002) Mercator; the man who mapped the planet, London: Phoenix.
Gormley, A.
(http://www.antonygormley.com/sculpture/chronology-item-view/id/2217)
Harmon, K. (2009) The Map as Art: contemporary artists explore cartography,
New York: Princetown Architectural Press.
Kastner, J., Wallis, B. (1998) Land and Environmental Art, London: Phaidon.
Langlands, B., Bell, N.
(http://www.langlandsandbell.com/www.html)
Markoff, J. (2009) “The Cellphone, navigating our lives” The New York Times,
February 16, 2009
(http://www.nytimes.com/2009/02/17/science/17map.html?pagewanted=2&_r=1)
McCandless, D. (2009) Information is beautiful, London: Collins.
McCandless, D. (2010) The Beauty of data visualization, TEDGlobal 2010, filmed
July 2010, posted August 2010
(http://www.ted.com/talks/david_mccandless_the_beauty_of_data_visualization.ht
ml)
Monmonier, M. (2004) Rhumb Lines and Map Wars, Chicago: The University of
Chicago Press.
Parker, M. (2009) Map Addict, London: Collins.
Pearman, H. (2011) “Plot on the landscape; why so many artists and makers are
fascinated by maps?” Crafts: the magazine for contemporary craft Nr233,
Nov-Dec 2011, p40-43.
Speed, C. (2011) Drawing with Satellites; an ESALA GPS drawing project
(http://fields.eca.ac.uk/fields/wp-
content/uploads/2011/03/DrawingWithSatellites.pdf)
Taylor, A. (2004) The world of Gerard Mercator; the mapmaker who revolution-
ized geography, London: Harper Collins.
The U.S. Department of the Army (2009) The U.S Army Guide to map reading
and land navigation, New York: Skyhorse Publishing.
Turrell, J. (1987) Mapping Spaces: a topological survey of the work of James
Turrell, New York: Peter Blum Edition.
Whitfield, P. (1995) The Mapping of the Heavens, London: The British Library.

Abstracts


85
Cartographic typography: Gerard Mercator’s contribution
Maria Graciela Borozuki National Geographic Institute, Cabildo 381, Ciudad de Buenos Aires, Ar-
gentina
Abstract. Rupelmonde in 1512. The Early Sixteenth Century was the most
favorable time in which a man with the talent, vision and interest of Gerard
Mercator might have been born. That was a time of discoveries and navi-
gation. Maps users claimed for greater accuracy.
He understood this situation and improved it. It has been assumed that the
cartography can be divided into two different phases: a decorative phase,
in which geographical information was portrayed without accuracy and a
second phase, scientific, in which accuracy took a very important place.
But in that time navigators needed cartographic information.
He recognized the iconographic caracter of maps, and the sources and de-
velopment of such cartographic elements as color, symbols design but es-
sentially lettering. On Gemma's Globe Mercator had used the italic scripts,
called the sweet roman hand for its lightness and easy reading, which had
been developed in Florence. This style of lettering that he adopted, italic,
was appropriate to his purpose: Gerard Mercator wanted his maps to be
used and every element of their design that made it easier to do so was im-
portant.
Gerard Mercator understood mapping as a form of geographic information,
so he considered lettering as an essential element. His contribution was in-
tegrated in a book that he wrote when he was twenty eight years old: the
Handwritting Manual Litterarurn Latinarum, quas Italicas, cursoriasque
vocant, scribendarum Ratio, Lovanium 1540, in which he examines the let-
ters elements as slope, pen angle, letter proportion, lenght of ascenders and
spacing. He treated each item separately and interrelating every part a sin-

86
gle system. It's known that the whole style of the script is affected if one of
the topics is changed or neglected.
Some cartographers have claimed that the names on maps complicate the
representation. They argued that the view of the Earth from above is unen-
cumbered by names. On the other hand maps are made to show where the
things are and to do this, it is very important to be able to tell what is what
is being seen. What have we learned from Gerard Mercator about typogra-
phy on maps? This work is a trip revisiting his teachings and applications
that allow us to rethink mapping as an integration of art and information.
87
The world map by Gerard Mercator (1569) in the shape of an atlas revisited
Sjoerd de Meer Maritime Museum Rotterdam, Leuvehaven 1, 3011 EA Rotterdam, The
Netherlands
Abstract. Mercator’s fame is for a part derived from the world map Nova
et aucta Orbis Terrae descriptio ad usum navigantium emendate accomo-
data he published in august 1569 in Duisburg. It is the world map in
which Mercator proposed a new projection which became known as the
Mercator projection which is used until today.
Hundreds of Mercator’s world maps were printed in the sixteenth century.
Nowadays only three copies of his map still exist, one in Paris, the other
one in Basel and the third in Rotterdam. A fourth copy in Wroclaw (the
former Breslau) was destroyed at the end of the Second World War. Two
sheets of the world map can be found in the 'Atlas of Europe' nowadays in
the British library.
The Rotterdam copy is unusual. It is not a wall map, but bound in the
shape of an atlas. Also it is coloured presumably in the atelier of Mercator
himself. A facsimile in black and white of the Rotterdam copy was pub-
lished in 1961 in cooperation with Imago Mundi. In 2011 a new facsimile
in full colour was published.
This paper focuses on the world map by Mercator in the shape of an atlas
as an ‘object’. It explores the questions why this Mercator world map was
acquired by the Maritime Museum Rotterdam, what research into this
world map (its pedigree and characteristics) has taken place and how this
world map is used and preserved in the context of a museum collection.

88
Mercator’s magnetic work, recalculated
Hugo Decleir Department of Geography, Free University of Brussels, Belgium
Abstract. Mercator’s interest in the earth’s magnetic field can be followed
over a time interval of more than 30 years and appears from the study of
two important letters written by Mercator (one letter to the bishop of Arras,
the other as an instruction manual destined for Charles V) and from the in-
formation contained in the legends and the geography of his maps, pub-
lished during that period. A number of historians of science have drawn
the attention to this specific aspect of Mercator’s contribution to science,
however no comprehensive study, including a critical review and accurate
check of his calculations has been made up to now. The present paper will
focus on this last aspect.
We will show how Mercator, after having proved that the magnetic pole is
situated not in the heavens but at the surface of the earth, introduced a
mathematical model (great circle field lines converging at the magnetic
pole) to describe the observed magnetic field. This model allowed him to
explain the observed variation of the declination in function of latitude and
longitude and to criticise the shipmasters who did not take this variation
into account in their dead reckoning navigation. The model was among
other things employed by Mercator to estimate the declination in Danzig
based on the shipmaster’s miscalculations. Mercator’s major concern how-
ever was to find the geographic coordinates of the north magnetic pole.
This search consisted in solving the spherical triangle formed by the inter-
section of the magnetic field lines passing through two distinct places with
known magnetic declination and the great circle distance between those
two places. Alternatively he used the knowledge of the declination at one
place with known geographic coordinates and the location of the zero iso-
gon (line of zero declination), as reported by the ship’s captains. Employ-
ing Mercator’s original data, or reliable estimates, we recalculated all his
cases and found, contrary to Mercator’s own calculations in 1546, 1552

89
and partly in 1569, a very consistent picture of the emplacement of the
magnetic north pole. However, we do not know as yet how Mercator
solved the spherical triangle, numerically or graphically.
Mercator’s ultimate aim was - just as with his masterwork ‘Ad usum navi-
gantium’ - to solve a mariner’s problem, in this case finding the longitude
at sea by measuring the declination, and knowledge of the latitude and the
coordinates of the magnetic north pole. Solving the spherical triangle nu-
merically for this purpose appears straightforward. However, Mercator de-
scribed in his ‘Declaratio’ only a semi-graphical method to be used with
the double globe instrument made for Charles V. Furthermore, by allowing
the zero isogon and the prime meridian to coincide, Mercator tried to give
the prime meridian a geophysical meaning instead of a political choice. In
short, Mercator’s geophysical insight and repeated efforts to ameliorate the
calculation of the magnetic pole, by using each time new data, reveals a
picture of an experimental scientist at work, a worthy precursor of the gi-
ants of the Scientific Revolution of the following century.

90
Secret Maps of Early Modern Spain
Benjamin Ehlers Department of History, LeConte Hall, University of Georgia, Athens, GA
30602, USA
Abstract. Amid the many recent studies on atlases, cosmographies, and
published city-views, a few scholars have focused rather on secret maps, or
maps not intended for public consumption. In Mapping for Money, Kees
Zandvliet argued that the Spanish and the Portuguese strove to maintain
the secrecy of their cartographical collections, in keeping with their view
of maps as instruments of empire: only by guarding knowledge of currents
and coastlines could they maintain their monopolies and trade routes. The
Dutch, by the same token, commissioned navigational and hydrographic
maps for internal purposes, in the administration of their Eastern and
Western trading companies. The collections of the Archivo del Reino de
Valencia, in eastern Spain, house a series of secret maps of another kind.
The records of the Real Audiencia, an appellate court, include several
maps created specifically as exhibits in disputes over territorial boundaries,
farmland, water use, and the maintenance of irrigation canals. In form and
composition, these maps bear out Ricardo Padrón’s point that linear, medi-
eval maps persisted in the early modern period alongside the mathematical
projections of Gerard Mercator. Whereas Padrón argues that Spanish maps
of the New World correlated to physical descriptions in chronicles, the
maps in the Real Audiencia reflect the biases and objectives of the towns
involved in litigation. In depicting rural spaces, waterways, and populated
areas, the cartographers commissioned to create these maps promoted not
an imperial or commercial agenda, but rather the local interests of their cli-
ents. Just as lawyers testified against the baptized Muslims of Valencia as
a drain upon the region’s resources, for example, so the mapmakers used
color, altered perspective, and notations to characterize the Moriscos as a
looming menace in visual terms.

91
In the early modern period, royal mapping projects such as public cosmog-
raphies and the collection of data for administrative purposes co-existed in
tension with local perspectives. Richard Kagan has traced the means by
which chorographers used both modern projection techniques and commu-
nal symbols in order to celebrate the virtues, historical events, and archi-
tecture of their cities. The secret maps of the Archivo del Reino de Valen-
cia – unpublished in any format to the best of my knowledge – defy our
expectations, revealing an alternative world of cartography in the service
of local, polemical concerns.
92
Mapping American History in The Tempest
David Evans Dalhousie University, Halifax, Canada
Abstract. Cartography is as much an imaginative activity as a scientific
one, and maps inevitably shape our moral and symbolic sense of the world
as much as they express our geographic understanding of it. A case in
point is the challenge presented by the discovery of America, to which
cartographers responded in two opposed ways, presenting the New World
as an extension of Asia, or as a truly new world physically separated from
the old one. Martin Waldseemuller’s seminal world map of 1507 depicted
America as a distinct continent, but there would be no empirical support
for this decision until Cook’s voyages more than two centuries later, and
throughout the 16th maps of each kind were printed. It can be argued that
the cartographical depiction of a distinct America reinforced a conviction
about the moral status of the new world as a place with no history, where
life can begin afresh from new origins – a notion which would eventually
become a key component of the complex of doctrine’s that go under the
rubric of “American Exceptionalism.”
My argument is that this cartographical controversy is one of the things
behind Shakespeare’s The Tempest. The play deals with the question both
of physical isolation and the possibility of beginning history over again –
of both physical and historical discontinuity. But while Shakespeare rec-
ognizes the temptation to exceptionalism, it is ultimately the dangers of the
isolation of the self on a physical and historical island (I-land), and the
willful amnesia that makes it possible. The images of cartography that en-
able us to understand the earth, that is, become deeply problematic when
they are unconsciously converted into metaphors that give meaning to our
world.

93
A tenacious Atlantic legend. From the so-called "Flemish Islands" to the imaginary island "Flanders"
John Everaert Department of Colonial and Maritime History, Ghent University, Belgium
Abstract. The maritime oral fantasy had created a series of legendary is-
lands in the northern Atlantic Ocean, borrowed by the late medieval travel
accounts and primitive charts. Surprisingly enough, Mercator put on his
world map (1569) an imaginary island “Vlaenderen” (Flanders). Up to the
17th century this aberration will persist on some maritime maps.
Where did the father of the modern cartography get his inspiration for this
strange anomaly? Most probably, already in Antwerp as well as during his
exile in Duisburg, he took cognizance of the so-called “Flemish islands”,
as the Azores were initially named. But this nomenclature was also par-
tially fake for being forced on the first terrestrial globe (1492) attributed to
Martin Behaim. As a matter of fact, because of his family link with the
first Flemish colonial entrepreneurs, the latter had exaggerated the impor-
tance of the Flemish settlements in the archipelago.
94
Squaring the circle: how Mercator did it in 1569
Joaquim Alves Gaspar CIUHCT, University of Lisbon, Campo Grande, Edificio C4, 1749-016
Lisboa, Portugal
Abstract. A cartometric analysis of the Mercator world map of 1569 is
presented and discussed, aiming to assess its navigational accuracy and
contribute to a better knowledge of its geometry, sources and construction.
Modern digital tools are used, identical to the ones I have recently applied
to the study of the Cantino planisphere, which include georeferencing and
the assessment of scales, geographic coordinates and directions. To my
knowledge this is the first time such type of quantitative analysis of Mer-
cator’s map is presented.
Three independent components of the positional accuracy of the map are
considered, all affecting its quality as a navigational chart: the accuracy of
the graticule, which is measured by the agreement between the position of
the meridians and parallels with the theoretical grid of the cylindrical con-
formal projection ; the absolute positional accuracy of the places, that is,
the accuracy of their latitudes and longitudes as measured on the map and
compared with the corresponding exact values; and the relative positional
accuracy of the places, whose most important component is the accuracy
of the rhumb-line directions connecting them.
Relevant historical insights can be obtained from the results of the analysis
concerning the construction method used to draw the graticule, and the
origin and accuracy of the geographic information. It is a well-known fact
that the Mercator projection was mostly ignored by the pilots at the time it
as presented and that its full adoption by marine navigation had to wait
some two hundred years until magnetic directions were abandoned and ef-
fective methods for finding longitude were invented. Whether the initial
resistance of the pilots had anything to do with the lack of navigational ac-
curacy of the map is a possibility that will be investigated.

95
The Far East in the Mercator's World map in 1569
Koji Hasegawa Institute of Geography, Graduate School of Humanities, Kobe University,
1-1, Rokkodai-cho, Nada-ku, Kobe 657-8501, Japan
Abstract. From the western point of view, the Far East, Japan has long
been a mythical place since Marco Polo’s Description of the World written
in c.1299. The first mention of Japan in maps can be confirmed in the
world map of Fra Mauro in c.1459 as the Ixola de cimpagu inserted in the
Far East as only a small island with rocky hill, but the situation is totally
different from the description of Marco Polo. A faithful reflection of it ap-
peared in the terrestrial globe of Martin Behaim in 1492. Off the east coast
of China, the oblong island Zipangu extends north to south. In
B.Bordone’s book Isolario published in 1528, the island of Ciampagu ap-
peared as an oblong island extending east to west including hills, trees and
palaces. Until this stage of maps Japan remains the imaginary island.
The real information and figure of Japan was brought to the West by
Portuguse traders and Jesuit monks. The most eminent modern catographer
G. Mercator depicts Japan in his famous world map published in 1569.
The great oval island includes several actual place names, supplemented
by Ryukyu in the south-west and the imaginary Miyako islands in the
north-west. This so-called Mercator type of Japan has been considered to
be derived from J.Gastaldi’s map.
In this paper comparing the description of Marco Polo with the expressions
in European and Japanes maps, the presenter would like to make clear how
the mythcal island of Japan, the wonder of the Far East, appears in the
Mercator’s world map and investigate the source of this figure, as well as
trying to elucidate the enigmatic Streto de Anian between the Far East and
North America.

96
The sale of atlases by the Antwerp Plantin Press
Dirk Imhof
Plantin-Moretus Museum, Jan Moorkensstraat 58, 2600 Berchem, Belgium
Abstract. In books or articles on atlases from the 16th and 17th centuries,
we often read about how expensive these books were. The only people
who could afford them must have been rich merchants, nobles or court
members. Consequently, such atlases as those made by Gerard Mercator,
Gerard de Jode or Abraham Ortelius must have been consulted by a very
small group of readers. However, a systematic account of these sales has
not yet been made. In my talk I will document the sale of Mercator and
Ortelius atlases in detail in order to provide a better understanding of their
distribution.
The archives of the Plantin Press offer a rare opportunity to document the-
se sales more accurately. In particular, the Plantin Press was actively in-
volved in the distribution of Ortelius’s atlas, the Theatrum Orbis Terrarum,
since the first edition appeared in 1570. After the printing of the maps,
Plantin and his successor Jan Moretus I bought a large number of atlases
back from Ortelius for further distribution. The number of atlases bought
by the Plantin bookshop varied from ca. 20 % to the complete run of all
the copies of an edition. Aside from the limited number of preserved cop-
ies themselves, the account books recording these sales are now the only
source for documenting the spread and the reading public of these books.
Moreover, knowing more about the general distribution of these books can
also better inform us about the relative impact of the varying texts that
were printed on the verso of each map in Ortelius’s atlases. These accom-
panying texts provided information on the region depicted and were print-
ed either in Latin or in one of several vernacular languages. However, it
appears that the vernacular versions of these texts were not just a simple
translation of the Latin, but completely different, lacking, for example, the
Latin references to Antiquity or quotations from classical authors. Presum-
ably, the atlases with Latin texts would have been bought primarily by
97
learned scholars, while the atlases with texts in the vernacular languages
were intended for a public of merchants or other interested readers who
were less familiar with Latin or classical texts in general. An analysis of
the distribution of these works will help determine whether this was, in-
deed, the case.
Although Plantin is known for selling many of Mercator’s large wall maps,
only a small number of his atlases were sold via the Plantin Press. Never-
theless, when these records are considered in conjunction with the more
extensively documented sales of Ortelius’s atlas, the result will be a better
understanding of them and their place in the broader context of the distri-
bution of comparable cartographic materials at this time.

98
Cartesius: one graphical geoportal combines four types of institutions for Belgium and Africa
Rink Kruk1, B. Pigeon2, W. Bracke2, M. Carnier3, L. Verachten3, B. Verschueren3, D. Baudet4, D. Van Hassel4, M. Fernandez4, P. Verheyen1, G. Gryseels4, K. Velle3, P. Lefèvre2, I. Vanden Berghe1
1 National Geographic Institute Belgium, Abdij Ter Kameren 13, 1000
Brussels, Belgium
[email protected] 2 Royal Library of Belgium, Keizerslaan 4, 1000 Brussels, Belgium
3 State Archives Belgium, Ruisbroekstraat 2, 1000 Brussels, Belgium
4 Royal Museum for Central Africa, Leuvensesteenweg 13, 3080 Tervuren,
Belgium
Abstract. The Cartesius project aims to virtually combine the collections
of old maps and aerial photographs of four Belgian federal institutions, by
making them digitally accessible through the internet for the general public
and the scientific community. The project opens up the largest collections
of maps and aerial photographs on Belgium and Central Africa to the
world. The pioneering institutions are the Royal Library, the State Ar-
chives, the Royal Museum for Central Africa and the National Geographic
Institute of Belgium. As a matter of fact, the project forms the Cartesius
centre of excellence for the federal cartographic patrimony, a place where
the institutions share their specific skills, knowledge and experiences.
The project focuses in first instance on the development of a common
geoportal that enables the end-user to search, find and look at the available
maps, cityscapes, aerial photographs, etc. of the four institutions (virtually
any geolocalizable object), irrespective of the ownership of the objects.
Most importantly, the portal allows end-users to delimit an area of interest
on a base map of Belgium or Africa as a search criterion, besides tradition-
al search criteria.

99
Secondly, the development of the portal acts as a lever for the development
of a common metadata model, the scanning and description of the physical
objects, and includes often adaptation of existing metadata –for example
adding geographic coordinates for a polygon or point and scale. Our aim is
to comply with internationally recognized metadata models for geo-
objects: i.e. ISO19125 and INSPIRE. It also pushes the institutions to
make their (meta)data accessible through open standard services that can
be connected to the central Cartesius website.
The strengths of the project are that:
- Old maps and aerial photographs are becoming easily accessible to
and recoverable for the general public, while they were not before;
- Physical objects can remain untouched and reproduction of maps,
aerial photographs, etc. can be carried out quicker and easier by the
use of e.g. (photo) plotters;
- Four different types of institutions are working together, apart from
combining collections virtually, they share knowledge, skills and
experiences in reality;
- Software, web services, IT architecture developed in the project is
developed once and can be used by the four institutions and others;
- The IT-architecture is scalable, i.e. other institutes can step into the
Cartesius project too, using open standards and internationally rec-
ognized metadata standards.
100
The pre-history of the Mercator projection
Henrique Leitao1, Joaquin Alves Gaspar1 and J. Filipe Queiró2 1 CIUHCT, University of Lisbon, Campo Grande, Edificio C4, 1749-016
Lisboa, Portugal
[email protected] 2 Department of Mathematics, University of Coimbra
Abstract. The conformal cylindrical projection, first presented by Gerard
Mercator in 1569, is justly considered a major landmark in the history of
cartography and marine navigation. In this paper, it is shown how its de-
velopment was the culmination of a long intellectual debate, started by the
Portuguese mathematician Pedro Nunes in 1537, around the concept of
rhumb-line and the way to represent it on globes and charts. Besides Nunes
these discussions involved some of the finest scientific minds of Early
Modern Europe, including Gemma Frisius, John Dee and Edward Wright.
101
The influence of Gerard Mercator on the work of Michiel Coignet (1549-1623)
Ad Meskens Artesis Hogeschool Antwerpen, Keizerstraat 15, 2000 Antwerpen, Belgi-
um
Abstract. The Antwerp mathematician Michiel Coignet (1549-1623) is
best remembered as one of the fathers of the sector. He wrote the only 16th
century Antwerp manual on navigation. In this book he calculates the
length of a loxodrome and uses Mercator’s theory of the magnetic pole as
a solution for the problem of the determination of longitude. He is known
to have corresponded with Mercator about the prime meridian.
In the beginning of the seventeenth century he edited Ortelius’ Epitome to
which he added maps in a Mercatorprojection. In his manuscripts on the
sector he shows that he is able to calculate the grid for such maps.

102
A GIS analysis of the 1633 planning of Venetian guardposts on Crete (Greece)
Steven Soetens, C. Geerdink, E. Barbetsea and R. Verhagen Institute of Geo- and Bioarchaeology, VU University Amsterdam, De
Boelelaan 1085, 1081 HV Amsterdam, The Netherlands
Abstract. In 1633, Nicolo Gualdo de Priorati prepared a plan to improve
the existing guardpost system on Venetian Crete against Ottoman piracy
attacks.
In the written documentation, he included a schematic representation of the
island of Crete on which actual lines of sight between the guardposts are
drawn. In terms of historical cartography this document is remarkable. It
allows for the tracing of Venetian remains in today’s landscape, and much
more.
The text has been elaborately studied by historian Maria Arakadaki (1997)1
and the scanned drawing is now under GIS investigation by students of the
Institute of Geo- and Bioarchaeology of the VU University Amsterdam.
We are verifying the precise location of the guardposts, on the detection of
highest elevation points in a digital elevation model and we analyse the
visibility of those points, in relation to each other and the Venetian/Cretan
toponymy. Not all of the guardposts have survived but GIS allows us to es-
tablish their location for eventual archaeological field investigation. Their
relation to the main settlements of Candia (now Iraklion) and other Vene-
tian cities can also be spatially investigated on the effectiveness of this
plan as a military tool against the pirates. After all, only 36 years later in
1669, the island is part of the Ottoman Empire.
The results so far include amongst others:
1 Arakadaki, M. (1997) “Diagramma tou Diktyou Aktofrourwn ths Krhths apo thn
ekthesh tou Nicolo Gualdo de Priorati (1633)”, Kritologika Grammata 13, 49-80
103
- a list of the original guardposts with precise coordinates, and present
day toponymy,
- a minimum estimated elevation for the towers of bonfires necessary
for the planned intervisibility based on viewshed analysis
- an evaluation of the effectiveness of the guardpost system
- a GIS map of 17th century Venetian Crete
This research originates in the study of Minoan (Bronze Age) mountain
sanctuaries, which happen to coincide with many of these Venetian guard
posts. In-the- field investigation may then clarify the chronology of the
remaining ashlayers that have repeatedly been related to the Bronze Age
sites, because they were discovered in the context of Bronze Age archae-
ology. This means that we will also be able to better define the character of
those Bronze Age sites, since the discovered ashlayers have probably been
related too easily to those sanctuaries, which are mainly involved in rituals
about fertility and livestock.
It is hoped that in the future a field study of selected sites will be possible
to disclose a number of “lost” Venetian guard posts as well as clarify the
nature and chronology of the ashlayers. If the ashlayers are a pure Vene-
tian phenomenon, the ritual actions at the Minoan sites may well need re-
consideration.

104
Gerhard Mercator and Wolfgang Lazius - A comparative analysis
Petra Svatek Department of History, University of Vienna, Dr. Karl Lueger Ring 1, A-
1010 Vienna, Austria
Abstract. In 1570 Gerhard Mercator suggested in a letter to Abraham
Ortelius: “I could wish that you add the most recent works of Lazius, who
described the area subject to the King of Hungary, which Johannes Maior
of Vienna sells, and certain other works” (Taylor 2004, p. 216). Mercator
recommended the work of Wolfgang Lazius, and years later finally the
maps of Lazius became an important source of his own maps. Wolfgang
Lazius (1514-1565) was the most important Austrian cartographer during
the 16th century. He was professor of medicine at the University of Vienna
and the personal doctor and historiographer of Emperor Ferdinand I. His
main research topics were the history of the Habsburgs and the ancient
time. In addition of this historical studies he produced 24 maps showing
Central and South-eastern Europe. His book “Typi chorographici
provinciarum Austriae” (1561, 11 maps), the first atlas of the Austrian
provinces, may be justly called the cartographic magnum opus of Lazius.
Furthermore Wolfgang Lazius was one of the pioneers in producing the-
matic maps.
At first the lecture will introduce the following maps of Lazius, which be-
came an important source for Mercator: “Regni Hungariae descriptio”
(map of Hungary and today’s western part of Romania, 1552/56), some
maps of the “Typi” (e. g. “Carinthiae ducatus cum palatinatū Goricia“,
“Regni Francorum orientalis sive Austriae ad Danubium“, “Rhetiae
alpestris in qua Tirolis com: descriptio”, 1561) and “Austriae
Chorographia” (map of Lower and Upper Austria, 1563).
Second the lecture will focus on the comparison of the Mercator-maps
based on Lazius and the original Lazius-maps. Which differences can we

105
find in the depiction of rivers, lakes, mountains and villages? The hypothe-
sis is that Mercator did not copy everything of the Lazius-maps. Instead
Mercator generalized their content. So we can find less legends, mountains
and names of places, but also less mistakes. In comparison with his profes-
sional colleagues Lazius made a lot of mistakes regarding the fundamental
principles of mathematics and astronomy. There are many distortions in
his maps. Most of the distortions we can find in the “Typi“-maps because
of their oval shape. Especially near the borders Lazius integrated a lot of
rivers and towns, which are situated in reality outside the map. The etch-
ings of Mercator’s maps are also better than of the maps of Lazius. Be-
cause of the shortage of skilled engravers, Lazius had to etch his maps
himself.

106
The ‘Digital Thematic Deconstruction’ of 16th-century urban maps
Bram Vannieuwenhuyze Department of Medieval History, Katholieke Universiteit Leuven, Blijde
Inkomststraat 21 bus 3307, 3000 Leuven, Belgium
Abstract. The analysis of medieval urban space, medieval town develop-
ment and even urban origins is not possible without studying the oldest ur-
ban maps. Although historians and archaeologists usually agree with this
statement, they rather seldom proceed to an in depth analysis of carto-
graphic documents. Indeed, in many historical studies old maps are mostly
used as ‘nice pictures’ which illustrate or even embellish the texts. This is
not only due to the fact historians mainly focus on the text itself (both as
records and as means of communication), but also because they are lacking
(or don’t have access to) appropriate analytic tools and techniques to study
old maps properly.
For my PhD on the town development and spatial morphology of the me-
dieval city of Brussels, I developed a new method to analyse 16th-century
urban maps, which I called the ‘Digital Thematic Deconstruction’. It starts
from the assumption that historic maps are very complex and multi-layered
compilations of cartographic elements, which have to be analysed sepa-
rately from other kinds of records (texts, iconography, material artefacts,
etc.). Briefly worded, the ‘Digital Thematic Deconstruction’ implies a sys-
tematic dismantling of a rasterized file (a qualitative scan of the historic
map), followed by a thematic transformation into a multi-layered psd-file
The method not only allows to isolate every single cartographic detail, but
also to gain insight in the complex composition and accuracy of the map as
a whole. Mutatis mutandis, it allows to study topographic features and pat-
terns of the mapped town and its surroundings more properly. Of course, at
a final stage the results of the ‘Digital Thematic Deconstruction’ must be
compared to other data, such as other maps, texts and images.

107
In this paper, I first want to explain the basic assumptions and methodolog-
ical principles of the ‘Digital Thematic Deconstruction’ more profoundly.
Afterwards, I will show some concrete applications, realized on a series of
16th-century urban maps of the Southern Low Countries: the topographic
maps of Jacob of Deventer (Brussels, Halle, Vilvoorde, Kortrijk,
Oudenaarde, Dendermonde, Gistel) and bird eye views of 16th-century cit-
ies, made by various cartographers (Bruges, Ypres, Brussels). Of course, I
will especially pay attention to new findings thanks to the ‘Digital Themat-
ic Deconstruction’ and indicate some possibilities for further research. In
fact, the method seems very useful to study, for instance, segregation pat-
terns, building density, building history and spatial perception.

108
Reframing Mercator’s Orbis Imago, the double cordiform world map of 1538
Ruth Watson Elam School of Fine Arts, University of Auckland, Auckland, New Zea-
land
Abstract. Existing scholarship around Mercator’s double cordiform
(heart-shaped) world map of 1538 could be described as circumspect. This
is due to a combination of factors: relatively little contemporary infor-
mation about it, and that the map – with its overt dedication to an unortho-
dox thinker – sits uneasily with the notion of Mercator as a key progenitor
of Modern cartography. Older scholarly accounts of Mercator’s work are
clear in their description of the map’s mathematical provenance, as well as
lauding the map as a first (to use the term America on the North American
continent), but some more recent accounts have described the projection as
‘peculiar’ and ‘not a success’, or ‘a mapmaker’s map’ and these kinds of
responses to the cordiform maps as a group is widespread.1 Overall, atti-
tudes about the map projection used, its dedication, as well as limited in-
1 “Peculiar” and “not a success” come from the popular biography by Andrew
Taylor’s The World of Mercator: the Mapmaker who Revolutionised Geography,
(London: HarperCollinsPublishers, 2004) p.89-90, and “a mapmakers’ map” are
from Nicholas Crane’s Mercator: the Man who Mapped the Planet (London:
Weidenfeld and Nicolson, 2002), p. 96, also describing Oronce Fine’s 1531 map
from which the projection is derived as making viewers scratch their heads (p.96).
Even some eminent nineteenth-century commentators found the projection prob-
lematic; one example is Steinhauser, in an article on the projection’s inventor, Jo-
hannes Stabius, calling it “bizarre”. Anton Steinhauser, "Stabius Redivivus, Eine
Reliquie Aus Dem 16. Jahrhundert," Zeitschrift für Wissenschaftliche Geographie
T.5 (1885), p.289.

109
terpretations of the use of the heart-shape, have impeded study of Orbis
Imago.
My recent study focussing on misapplications of nineteenth century nam-
ing and classification issues concerning the wider group of cordiform maps
has, however, clarified the early history of these extraordinary maps, pav-
ing the way for new interpretations of the use of the heart-shape in six-
teenth century cartography.2 This reshaping of the maps’ development can
now be used to reconsider specific examples and, based on these changed
parameters, I wish to make some new propositions about Mercator’s Orbis
Imago. This altered framework casts new frameworks for Orbis Imago’s
dedication to Johannes Drosius, its decoration (or relative lack thereof),
and the prominence of the large southern continent, and why it may have
been useful to omit the map from the Vita Mercatoris.
The paper briefly outlines the early history of the cordiform maps once
longstanding misapprehensions have been removed and adds this clarified
overview to an account of the heart in the first half of the sixteenth century
– before Vesalius, and significantly before the Jesuit uptake of the heart
symbol. I will employ newer forms of image theory – including from film
studies – to reconsider the function of images in the sixteenth century, re-
conceiving Orbis Imago as a cosmographic object with its new geography
serving older, pre-Modern purposes. The cumulative impact of these new
directions for the study of Orbis Imago will, in turn, impact upon the over-
all appreciation of Mercator’s relationship to religion, humanism and cos-
mography. With centuries of ‘scientism’ applied retrospectively to the car-
tographers of the sixteenth century, this paper aims to bring the early
aspirations of Gerhard Mercator into a more nuanced, and ultimately more
balanced, perspective.
2 Watson, Ruth “Cordiform Maps since the Sixteenth Century: the Legacy of Nine-
teenth-Century Classificatory Systems”, Imago Mundi (2008), 60:2, 182-194.

110
Modern edition of texts and maps of the Cadastral Land Survey of Swedish Pomerania 1692-1709 on the internet with help of WebGIS and Content Management Systems
Reinhard Zölitz Department of Cartography and GIS, Institute of Geography and Geology,
Greifswald University, D-17487 Greifswald, Germany
Abstract. The Land Survey of Swedish Pomerania 1692-1709 AD is con-
sidered the first cadastre in Germany, covering 8700 km2 with approx.
1,600 hand-drawn coloured maps and 65,000 text pages. It offers valuable
information on rural economy and landscape 300 years ago. To publish the
maps and texts on the internet, different efforts have been made, mainly
with projects funded by EU and DFG. Recently, in the framework of a
multidisciplinary research project of historians and geographers, funded by
DFG, a digital scientific edition of a considerable part of the material is
developed. Recent IT-standards are used to provide the material with full
information on the internet for the public. Constituent parts of the edition
are: digital high quality facsimiles of the maps; geo-referenced maps; vec-
torised maps with data base entries about land use etc. extracted from the
scanned maps and translated texts; digital transcription of the texts written
in Swedish language from 1700 AD; digital translation of the texts into
modern German language with scientific annotations. Innovative is, above
all, the linkage of texts and maps in a WebGIS. The paper presentation
provides information about the various tasks and results in our project,
primarily in the fields of georeferencing and vectorisation of the maps, set
up of a WebGIS linking maps with texts, and perspectives of further scien-
tific work with and on the maps upgraded by these means. The website is:
http://www.svea-pommern.de/

Abstracts of full papers appearing in The Cartographic Journal


113
Between the Cross and Crescent: Countries Bordering the Ottoman Empire in the Eyes of Dutch
Mirela Altic Institute of Social Sciences, Marulicev trg 19, 10 000 Zagreb, Croatia
Abstract. With the expansion of the Ottoman Empire in the early 16th
century, the countries of Southeastern Europe became the great European
battlefield. The countries bordering the Ottoman Empire were reorganizing
their territories into the Military Frontier, thus becoming a shield for the
rest of Europe.
Due to the military strategic importance Southeastern Europe gained with
the invasion of the Turks, the countries that otherwise were not attracting
greater attention of the European cartographic public suddenly found
themselves the focus of interest of West European cartography. From the
mid-16th century, the maps of countries such as Croatia, Slavonia or Dal-
matia, which had previously been represented only in the cartographies of
directly concerned countries (the Republic of Venice, the Habsburg Mon-
archy, Hungary), became an indispensable part of the majority of Dutch at-
lases.
Maps of the countries which were at war with the Turks were developed in
a very specific way. Because of the continuing warfare, there were no pre-
conditions for extensive field surveys, and a handful of surveys conducted
for the purposes of war operations were mostly kept as military secrets.
How did Dutch cartographers, who built their reputation on field survey
based maps, cope with depictions of countries for which they had no origi-
nal recent data? What templates did Dutch cartographers and publishers
use to create maps of the area during the 16th and 17th centuries, and how
successful were they (the problems of new borders and the extent of the
Turkish conquest, military fortresses, locations of decisive battles, network
of new settlements, etc.)?

114
The paper presents the results of original research based on the compara-
tive analysis of maps from the atlases of Abraham Ortelius, Gerhard and
Cornelius de Jode, Gerhard Mercator, Jodocus and Henricus Hondius, and
Jan Janssonius. We discover the templates Dutch cartographers and pub-
lishers used for their cartographic depictions of the above countries and
descriptions appearing on the back of these maps. In this matter we give
special attention to the role played by Gerhard Mercator and his succes-
sors. In addition, we evaluate the significance of Dutch cartography in
spreading the knowledge about geography and history of Southeastern Eu-
rope, and, generally, its impact on the perception of the countries border-
ing the Ottoman Empire.

115
A ‘Devious Course’: Projecting Toleration on Mercator’s ‘Map of the World’, 1569
Jerry Brotton School of English & Drama, Queen Mary, University of London, London
E1 4NS, United Kingdom
Abstract. This paper aims to generate new ways of understanding the gen-
esis of Gerard Mercator’s famous projection incorporated within his world
map, published in Duisburg in 1569 and entitled Nova et aucta orbis terrae
descriptio ad usum navigantium emendate accommodate, or ‘A new and
enlarged description of the earth with corrections for use in navigation’.
Every student of geography is taught that this map represents a defining
moment in the history of projecting the earth’s spherical dimensions onto a
plane surface. Mercator’s map offered the first consistent method of pro-
jecting loxodromes as straight lines which, at least in theory, enabled navi-
gators to accurately plot a straight line across the globe that took into ac-
count the curvature of the earth’s surface. The study of Mercator’s
projection has struggled to understand what enabled its author to create
such an innovative mathematical resolution to this cartographic problem,
but in what follows I want to suggest that we might look at the theological
and philosophical contexts of Mercator’s career to provide a solution.
116
Geographical names on Mercator's maps of Croatia
Josip Faričić, Damir Magaš and Lena Mirošević Department of Geography, University of Zadar, F. Tudjmana 24 i, 23 000
Zadar, Croatia
[email protected], [email protected], [email protected]
Abstract. Mercator depicted Croatia on several general maps. In accor-
dance with the level of geographical knowledge, map scales and technical
possibilities of the time, Mercator provided a relatively detailed depiction
of basic geographical features on these maps. His interest in mapping
Croatia was probably motivated by the fact that the Venetian Republic, the
Habsburg Monarchy and the Ottoman Empire had fought over this area in
the sixteenth century, contributing to the fragmentation of the medieval
Croatian State, while at the same time facilitating economic, religious, lin-
guistic, artistic and scientific communication between Central, South East
and Mediterranean Europe.
Mercator paid special attention to toponyms that enabled geographical ob-
jects to be identified and the decoding of cartographic contents. Research
into Mercator's maps has shown that geographical names, among other
things, clearly indicate the sources of spatial data that he used. Addition-
ally, geographical names on Mercator's maps are significant indicators of
the linguistic and cultural contacts that were particularly prominent in bor-
der areas, for example along the eastern Adriatic coast, or the courses of
the Danube, Sava and Drava.

117
Digital Representation of Historical Globes: Methods to Make 3D and Semi-3D Models of 16th Century Mercator Globes
Cornelis Stal, Alain De Wulf, Karen De Coene, Philippe De Maeyer, Ti-mothy Nuttens, Thérèse Ongena Department of Geography, Ghent University, Krijgslaan 281, S8 (WE 12),
9000 Gent, Belgium
Abstract. In this paper, the construction of digital representations of a ter-
restrial and celestial globe is discussed. Virtual digital (3D) models play an
important role in the recent research and publication on cultural heritage.
The globes, discussed in this paper, were made by Gerardus Mercator
(1512 – 1594) in respectively the years 1541 and 1551. Four techniques for
the digital representation are discussed and analysed, all using high resolu-
tion photographs of the globes. These photographs are taken under studio
conditions in order to get equal lighting of the globes and avoid unwanted
light spots. These lighting conditions are important, since the globes have a
highly reflective varnish covering. Processing these photographs using
Structure from Motion, georeferencing of separate scenes and the combi-
nation of the photographs with terrestrial laser scanning data result in true
3D representations of the globes. Besides, 3D-models of virtual globes
were generated using Dynamic Imaging, which is an extensively used
technique for visualizations over the internet. The four techniques and the
consequent results are compared on geometric and radiometric quality,
usefulness for distribution and visualization during an exhibition in honour
of the 500th birthday of Gerardus Mercator.