PROCEEDINGS - African Conference on Precision Agriculture
320
December 8-10 2020 1 st African Conference on Precision Agriculture www.PAafrica.org PROCEEDINGS PRECISION AGRICULTURE in ACTION for AFRICA
-
Upload
khangminh22 -
Category
Documents
-
view
3 -
download
0
Transcript of PROCEEDINGS - African Conference on Precision Agriculture

December8-10 2020
1st
African Conference on Precision Agriculture
www.PAafrica.org
PROCEEDINGS
PRECISION AGRICULTURE in ACTION for AFRICA

1st African Conference on Precision Agriculture | 8-10 December | 2020
i
1st African Conference on Precision Agriculture | 8-10 December | 2020
ii
PROCEEDINGS OF THE
1st African Conference on Precision Agriculture (AfCPA)
8-10 December, 2020
PUBLISHED BY:
African Plant Nutrition Institute Benguérir, Morocco
www.apni.net
CONFERENCE WEBSITE: www.paafrica.org
This publication contains the full paper submissions from the AfCPA. These papers, along with
all other accepted abstract submissions are available at the conference website.

1st African Conference on Precision Agriculture | 8-10 December | 2020
iii
1st African Conference on Precision Agriculture (AfCPA)
Organized by:
SCIENTIFIC COMMITTEE: Steve Phillips APNI, Morocco - Chair
Abdelaziz Belal, NARSS, Egypt Martin Bosompem, UCC, Ghana
Jeremy Cordingley, Cropnuts, Kenya Nicodeme Fassinou, UAC, Benin Sam Gameda, CIMMYT, Ethiopia
Aboubacar Karim, Investiv, Côte d’Ivoire Jess Lowenberg-DeBoer, Harper Adams, UK
Helene Marrou, UM6P, Morocco
Sponsored by:

1st African Conference on Precision Agriculture | 8-10 December | 2020
iv
TABLE OF CONTENTS
ADOPTION OF PRECISION AGRICULTURE
#7507 VALIDATION OF CLIMATE SMART AGRICULTURAL TECHNOLOGIES FOR IMPROVED CROP YIELDS IN SEMI-ARID LANDS OF KENYA
A.O. Esilaba, D. Nyongesa, M. Okoti, A. Micheni, A. Kathuku-Gitonga, D. Mutisya, E. Njiru., D.R. Macharia, R. Kisilu, J. Kavoi, C. Bett, J. Wambua, M. Njunie, P. Finyange, B.M. Muli, E. Muthiani, C. Nekesa, A. Mzingirwa, E. Thuranira, B. Rono, P. Gicheru, N. Mangale, J. Mutegi, and. L. Wasilwa ....................................................... 2
#7523 VARIABILITY IN MONTHLY RAINFALL AND TEMPERATURE HAS AN INFLUENCE ON DAILY MILK PRODUCTION IN SAHIWAL COWS IN KENYA
MacDonald Gichuru Githinji, Evans Deyie Ilatsia, Thomas Kainga Muasya, and Bockline Omedo Bebe ............. 8
#7616 DEVELOPMENT OF LODGING DIRECTION DETERMINATION SYSTEM USING IMAGE PROCESSING
Y. Arai, E. Morimoto, K. Nonami, and T. Ito .................................................................................................... 16
#7666 DETERMINANTS OF THE ADOPTION OF AN INTELLIGENT MONITORING SYSTEM AND EFFECTS ON FARMS PERFORMANCE IN TUNISIA
J. Ben Nasr, H. Chiboub, and M. Msaddak ....................................................................................................... 22
#7773 THE STATUS OF PRECISION AGRICULTURE AND ITS ADOPTION IN MOROCCO Rachid Bouabid, Hakim Boulal, and Steve Phillips ........................................................................................... 27
#7893 THE ROLES OF KEY PUBLIC SERVICES ON THE ADOPTION OF CLIMATE-SMART AGRICULTURAL TECHNOLOGIES IN COFFEE-BASED FARMING SYSTEM OF ETHIOPIA
Samuel Diro and Agajie Tesfaye ...................................................................................................................... 33
APPLICATIONS FOR UAVS
#7465 CASHEW TREES DETECTION AND YIELD ANALYSIS USING UAV-BASED MAP Thierry Roger Bayala, Issouf Ouattara, Sadouanouan Malo, and Arto Visala ................................................... 42
#7657 AUTONOMOUS HEXACOPTER SPRAYING DRONES FOR PLANTS PROTECTION Abbes Kailil, Hassan Benaouda, and Abdelhakim Mohsine ............................................................................... 49
CLIMATE SMART AGRICULTURE
#7883 CLIMATE SMART AGRICULTURE: CHALLENGES AND OPPORTUNITIES TO PROMOTE THE SYSTEM IN ETHIOPIA
Getachew Agegnehu and Tilahun Amede .......................................................................................................... 54

1st African Conference on Precision Agriculture | 8-10 December | 2020
v
#7927 CHANGES IN CLIMATIC FACTORS LEAD TO THE CHANGE IN CULTURAL WEDGING OF RICE IN THE IVORIAN PRE-FOREST ZONE
Y.C. Brou, D.A. Kouassi, K.P-M. Kouakou, and E-O. Tienebo .......................................................................... 61
DECISION SUPPORT SYSTEMS
#7549 CROPSAT – OPPORTUNITIES FOR APPLICATIONS IN PRECISION AGRICULTURE IN AFRICA
O. Alshihabi, I. Nouiri, M. Mechri, H. Angar, K. Piikki, J. Martinsson, and M. Söderström ............................... 67
#7889 APPLICATION OF INFORMATION & COMMUNICATION TECHNOLOGIES (ICTS) INTO PRECISION FARMING ECOSYSTEM IN ETHIOPIAN DIGITAL AGRICULTURE DEVELOPMENT PERSPECTIVE PLAN
Tadesse Anberbir ............................................................................................................................................. 72
ECONOMICS OF PRECISION AGRICULTURE
#7517 TOMATO YIELD AND ECONOMIC PERFORMANCE UNDER ORGANIC AND MINERAL FERTILIZER APPLICATIONS IN COASTAL TOGO
Jean M. Sogbedji and Mouhamadou Lare ......................................................................................................... 78
MAPPING AND GEOSTATISTICS
#7598 SOME ESSENTIAL NUTRIENTS, ACTIVE LIMESTONE AND PH STATUS OF NORTH AND CENTER TUNISIAN SOILS
A. Hachana, I. Hemissi, I. Achour, A. Souissi, and B. Sifi.................................................................................. 85
#7659 SOIL ORGANIC CARBONE MAPPING IN NORTH OF TUNISIA: COMPARISON BETWEEN DIFFERENT INTERPOLATION METHODS
M. Barbouchi, H. Bahri, A. Souissi, H. Cheikh Mhammed, and M. Annabi ........................................................ 88
#7834 COMPARISON OF SOIL TESTING AND SCANNING METHODS FOR IN-FIELD SPATIAL VARIABILITY ASSESSMENT OF SOIL FERTILITY: IMPLICATIONS FOR PRECISION AGRICULTURE
Rachid Bouabid, Ibtissam El Hadad, Samir Benmansour .................................................................................. 94
#7880 SPATIAL SOIL LOSS RISK ASSESSMENT FOR PROPER INTERVENTION: A CASE OF NERI WATERSHED OMO-GIBE BASIN SOUTHWESTERN ETHIOPIA
Abebe Hegano, Awdenegest Moges, and Nigatu Wonderade ........................................................................... 100
1st African Conference on Precision Agriculture | 8-10 December | 2020
vi
#7891 GEO-STATISTICAL PREDICTION OF SPATIAL DISTRIBUTION OF SALT-AFFECTED SOILS OF MEKI-ZEWAY FARM AREAS IN ETHIOPIA: BASELINE INFORMATION FOR PRACTICAL IMPLEMENTATION OF PRECISION AGRICULTURE SYSTEM
Melese Minaleshoa and Girma Kassa............................................................................................................. 106
#8019 CARTOGRAPHIE INTERACTIVE DES EXPLOITATIONS DE NOIX DE CAJOU DES PRODUCTEURS DE LA COOPÉRATIVE COPRODIGO DE GOHITAFLA
S. Kone, N. Coulibaly, D.J.M.J. Djina, K. Berté, et A. C. Kambou ................................................................... 111
POLICY SUPPORT INNOVATIONS
#7464 JUST A MOMENT; THE NEED FOR STREAMLINING PRECISION AGRICULTURE DATA IN AFRICA
Tegbaru B. Gobezie and Asim Biswas ............................................................................................................ 118
PRECISION AGRICULTURE FOR FIELD AND PLANTATION CROPS
#7410 MAXIMISATION DE L’EFFICIENCE D’UTILISATION DE L’AZOTE PAR LA TOMATE (SOLANUM LYCOPERSICUM L.) SUR LES FERRASOLS AU SUD DU TOGO
Mouhamadou Lare et Jean Mianikpo Sogbedji ............................................................................................... 123
#7505 MAPPING OF SOIL NUTRIENT VARIABILITY IN SOME PLANTATION CROPS IN ABEOKUTA, OGUN STATE NIGERIA
E.C. Basil, B.A. Senjobi, R.T. Basil, and A.O. Tobore...................................................................................... 132
#7540 EVALUATION OF ON-FARM OIL PALM YIELD PARAMETERS IN NIGER DELTA REGION OF NIGERIA
D.K. Madukwe, F. Ekhator, P. Osayande, V.O. Aduramigba-Modupe, O. Solomon, M.N. Okoye, and C.E. Ikuenobe ........................................................................................................................................................ 136
#7545 DEVELOPMENT OF CANOPY MAPPING SYSTEM OF ASIAN PEARS (PYRUS PYRIFOLIA NAKA) USING TERRESTRIAL LASER SCANNING
Jaehwan Lee, Eiji Morimoto, Kazuyoshi Nonami, Ichizen Matumura, So Sato, and Mana Ikebe ...................... 141
#7566 EFFECT OF INTERCROPPING SORGHUM WITH COWPEA AND NITROGEN APPLICATION ON GROWTH AND YIELD OF SORGHUM (Sorghum bicolor (L.) MOENCH)
Peter E. Moi, Onesmus M. Kitonyo, George N. Chemining’wa, and Josiah M. Kinama ................................... 146
#7604 GRAIN YIELD OF TWO PRE-RELEASE RICE VARIETIES INCREASED MARGINALLY WITH HIGHER PLANT DENSITY AND NITROGEN RATE
Wilfred Kioko, Onesmus Kitonyo, George Chemining’wa, Setegn Gebeyehu, and Rosemary Murori ................ 151
#7667 MAPPING OF MICRONUTRIENTS STATUS IN SOILS UNDER MULTIVARIETAL CITRUS SINENSIS PRODUCTION FOR PRECISION AGRICULTURE
Bernard N. Okafor, Vincent Aduramigba-Modupe, and Olubunmi Denton ...................................................... 155
1st African Conference on Precision Agriculture | 8-10 December | 2020
vii
#7933 CARACTERISATION ARCHITECTURALE POUR LA PREDICTION DU POTENTIEL DE PRODUCTION DES TETES DE CLONES DE COFFEA CAENOPHORA PIERRE EX A. FROEHNER
Kouassi Kouadio Henri, Yao N’guessan Abraham, Kouassi Roland Herve, Angama Djedoux, and Maxime et Legnate.......................................................................................................................................................... 159
PRECISION AGRICULTURE FOR SMALL HOLDERS
#7414 DIGITAL PLATFORMS FOR BOOSTING FARMER KNOWLEDGE: TWO CASE STUDIES IN KENYA AND UGANDA
T. Harigaya, J. Zhu, M. Mwanje, E. Bakirdjian, and J. Abuli .......................................................................... 166
#7422 MAPPING AFRICAN SOILS AT 30M RESOLUTION – ISDASOIL: LEVERAGING SPATIAL AGRONOMY IN FARM-LEVEL ADVISORY FOR SMALLHOLDERS
M. Miller, J. Collinson, K. Shepherd, A. Dobermann, and J. Crouch ............................................................... 170
#7442 AFFORDABILITY OF MECHANISATION SERVICES FOR SMALLHOLDERS IN ZAMBIA BY AGRODEALER DEVELOPMENT
S. Peets and S. Woods .................................................................................................................................... 174
#7515 SPATIAL VARIABILITY AND MAPPING OF SELECTED SOIL QUALITY INDICATORS FOR PRECISION FARMING AT A SMALLHOLDING LEVEL IN MINNA, NIGERIA
B.A. Lawal, M.K.A Adeboye, and P.A. Tsado .................................................................................................. 179
#7646 POTENTIAL PRECISION AGRICULTURE PRACTICES FOR HIGH QUALITY AND EFFICIENT FRUITS AND VEGETABLES PRODUCTION IN WEST AFRICA: A MINI REVIEW
Nicodeme V. Fassinou Hotegni, Leocade Azonhoumon, and Enoch G. Achigan-Dako ..................................... 184
PRECISION NUTRIENT MANAGEMENT
#7462 MAPPING SPATIAL VARIABILITY OF SOIL NUTRIENT DEFICIENCIES IN SMALLHOLDER VILLAGES – A PREREQUISITE FOR IMPROVED CROP PRODUCTION IN AFRICA
Mats Söderström, Kristin Piikki, Job Kihara, John Mutua, and Johanna Wetterlind ........................................ 191
#7506 GESTION STRATEGIQUE DES NUTRIMENTS POUR L’AMELIORATION DU RENDEMENT ET DE LA PROFITABILITE ECONOMIQUE DU GOMBO (Abelmoschus esculentus L.) SUR LES SOLS FERRALITIQUES AU SUD TOGO
Kossi Kotchadjo and Jean. M. Sogbedji .......................................................................................................... 196
#7513 PRECISION NUTRIENT MANAGEMENT FOR CASSAVA PRODUCTION Kodjovi S. Ezui, Meklit Tariku Meklit, Adeyemi Olojede, Mutiu Busari, Peter Deusdedit Mlay, Florence Olowokere, Joy Adiele, Rebecca Enesi, Ademola Adebiyi, Christine Kreye, Stefan Hauser, Frederick Baijukya, Thompson Ogunsanmi, Theresa Ampadu-Boakye, Shamie Zingore, Bernard Vanlauwe, and Pieter Pypers...... 206

1st African Conference on Precision Agriculture | 8-10 December | 2020
viii
#7579 SOIL FERTILITY MAPPING OF DRY SAVANNAH ZONE OF TOGO Ganyo Komla, Ablede Komlan, Koudjega Kossi, Ani Sékou, Afawoubo Koffi, Anoumou Dosseh, Mensah Achité, Assih-Faram Essodésibè, Tchalla-Kpondi M’klwa, Bonfoh Bédibètè, Kpemoua Kossi, and Lombo Yao ........... 211
#7581 NUTRIENT MANAGEMENT TAILORED TO SMALLHOLDER AGRICULTURE ENHANCES PRODUCTIVITY AND SUSTAINABILITY
Pauline Chivenge, Kazuki Saito, Michelle Anne Bunquin, Sheetal Sharma, and Achim Dobermann ................. 216
#7599 IMPACT OF SENSOR-BASED PRECISION NITROGEN MANAGEMENT ON WHEAT YIELD AND NITROGEN USE EFFICIENCY
Abdou A. Soaud, A. El-Metwally, M. Ali, and Radwa K. Sayed........................................................................ 222
#7708 ENHANCING THE USE OF APPROPRIATE FERTILIZERS FOR IMPROVING RICE AND MAIZE PRODUCTION IN TANZANIA
C.J. Senkoro, K.A. Mtua, C. Komba, S.A. Kazyoba, J.D. Mbogoni, and M.M. Msolla ...................................... 230
#7785 COMPARATIVE FERTILIZATION EFFECTS ON MAIZE PRODUCTIVITY UNDER CONSERVATION AND CONVENTIONAL TILLAGE ON SANDY SOILS IN A SMALLHOLDER CROPPING SYSTEM IN ZIMBABWE
Nyasha Kafesu, Regis Chikowo, and Shamie Zingore...................................................................................... 236
#7835 SPATIAL VARIABILITY OF SOIL AND PLANT NUTRIENT STATUS IN RELATION TO THE OCCURRENCE OF BITTER PIT IN APPLE ORCHARDS IN THE SAIS PLATEAU, MOROCCO
R. Bouabid, H. Labazi, and H. Bahri .............................................................................................................. 241
PRECISION WATER MANAGEMENT
#7475 CROP WATER REQUIREMENTS, BIOMASS AND GRAIN YIELDS ESTIMATION FOR SULLA (HEDYSARUM CORONARIUM L.) USING CROP WAT IN SEMI-ARID REGION OF TUNISIA
R. Hajri, M. Rezghui, M. Mechri, and M. Ben Younes ..................................................................................... 248
#7595 A PRECISION IRRIGATION APP FOR SMART WATER MANAGEMENT BY FARMERS: “IRRISMART”
A. Abouabdillah and R. Bouabid .................................................................................................................... 253
#7645 MONITORING IRRIGATION WATER USE AT LARGE SCALE IRRIGATED AREAS USING REMOTE SENSING IN WATER SCARCE ENVIRONMENT
M.H. Kharrou, V. Simonneaux, M. Le Page, S. Er-Raki, G. Boulet, J. Ezzahar, S. Khabba, and A. Chehbouni . 256
#7451 ESTIMATING SOIL ORGANIC MATTER FROM CELL PHONE IMAGES A. Biswas, H. Vasava, Y. Fu, P. Taneja, S. Lin, and P. Daggupati ................................................................... 261
1st African Conference on Precision Agriculture | 8-10 December | 2020
ix
ROBOTICS, AUTOMATION, AND SMALL FARM MECHANIZATION
#7493 WILLINGNESS TO PAY FOR DRONE TECHNOLOGY IN THE APPLICATION OF PESTICIDE FOR THE CONTROL OF FALL ARMYWORM
S. Omega, F. Annor-Frimpong, S. Akaba, W. Ghartey, J. Ocran, and I. Asante ............................................... 266
#7606 A REVIEW ON SENSOR BASED ROBOTIC AGRICULTURE: IMPROVING TRADITIONAL PRACTICES
S.C. Karad, Prabhat Kumar, and G.U. Shinde ................................................................................................ 270
#7641 LOCALLY ADAPTED MACHINERY SOLUTIONS FOR SUSTAINABLE INTENSIFICATION OF CROP-LIVESTOCK SYSTEMS IN TUNISIA
Udo Rudiger, Zied Idoudi, Aymen Frija, Mourad Rekik, Monia El Ayed, Hatem Cheikh, and Anis Zaim .......... 282
#7648 LIDAR-BASED SOYBEAN CROP SEGMENTATION FOR AUTONOMOUS NAVIGATION V.A.H. Higuti, A.E.B. Velasquez, M.V. Gasparino, D.V. Magalhães, R.V. Aroca, D.M.B.P. Milori, and M. Becker ...................................................................................................................................................................... 289
SATELLITE IMAGERY
#7629 MONITORING CORN (ZEA MAYS) YIELD USING SENTINEL-2 SATELLITE IMAGES FOR PRECISION AGRICULTURE APPLICATIONS
A. Kayad, M. Sozzi, S. Gatto, L. Sartori, F. Pirotti, and F. Marinello .............................................................. 295
#7681 PREDICTING IN-SEASON SORGHUM YIELD POTENTIAL USING REMOTE SENSING APPROACH: A CASE STUDY OF KANO IN SUDAN SAVANNAH AGRO- ECOLOGICAL ZONE, NIGERIA
A. Tukur, H.A. Ajeigbe, F.M. Akinseye, I.B. Mohammed, and M.M. Badamasi ................................................ 298
SOFTWARE AND MOBILE APPLICATIONS
#7368 SOCIO-DEMOGRAPHIC FACTORS CONTRIBUTING TO ADOPTION OF E-COMMERCE BY AGRIBUSINESS SMES IN THE UPPER EAST REGION OF GHANA
S. Omega and S. Akaba .................................................................................................................................. 304

1st African Conference on Precision Agriculture | 8-10 December | 2020
1
ADOPTION OF PRECISION AGRICULTURE
1st African Conference on Precision Agriculture | 8-10 December | 2020
2
#7507 VALIDATION OF CLIMATE SMART AGRICULTURAL TECHNOLOGIES FOR IMPROVED CROP YIELDS IN SEMI-ARID LANDS OF KENYA
A.O. Esilaba*, D. Nyongesa, M. Okoti, A. Micheni, A. Kathuku-Gitonga, D. Mutisya, E. Njiru., D.R. Macharia, R. Kisilu, J. Kavoi, C. Bett, J. Wambua, M. Njunie, P. Finyange, B.M. Muli, E. Muthiani, C. Nekesa, A. Mzingirwa, E. Thuranira, B. Rono, P. Gicheru, N. Mangale, J. Mutegi,
and. L. Wasilwa Kenya Agricultural and Livestock Research Organization, P.O. Box 57811 – 00200, Nairobi,
Kenya, [email protected]
ABSTRACT
Kenya’s Vision 2030 economic strategy identifies agriculture as one of the key sectors to drive the Country’s economy. However, the agricultural sector faces various challenges. For instance, the sector is predominantly rain-fed and 80% of the land area is arid and semi-arid (ASALs). Due to challenges associated with rain-fed agriculture, the ASALs have the lowest development indicators and the highest poverty incidence levels. The Kenya Cereals Enhancement Programme – Climate Resilient Agricultural Livelihoods (KCEP-CRAL) tested and validated several agricultural technologies with potential to improve crop production in Kenya. This was achieved through establishment of ‘Mother and Baby’ Climate Smart Agriculture (CSA) trials for soil and crop management in eight Counties in Eastern and Coastal regions. These Counties included, Embu, Tharaka-Nithi, Kitui, Machakos, Makueni, Kilifi, Kwale and Taita-Taveta. The trials were established on station and on-farm during the October-November-December (OND) season of 2016 (for Eastern region and Taita-Taveta) and May 2018 (March-April-May (MAM) season for Kwale and Kilifi Counties. The tested CSA technologies were those of Conservation Agriculture (CA), Integrated Soil Fertility Management (ISFM), fertilizer source/efficacy, nitrogen, phosphorus, potassium, sulphur and zinc-based fertilizers. The test crops included cereals (maize, sorghum and millet) and pulses (beans, green grams, cowpeas and pigeon peas). In addition, the project conducted validation trials on push-pull technologies (PPT) for control of Fall Army Worms (FAW). The crops were tested for their performance, adaptability and acceptability in these environments. Results from soil characterization and field trials showed that organic carbon, nitrogen, phosphorus, sulphur and zinc were the most limiting nutrients in most of the counties. The soil amendments supplying the above listed limited nutrients were either organic, inorganic or/and organic inorganic combination sources coupled with appropriate crop varieties and soil and water management practices. The cereal and legume crop yields increased by at least 50-100 percent depending on the agro-ecological zone, crop type and ISFM technologies. It was concluded that farm-specific characterizations were important towards determining levels of farm/catchment specific application of both macro- and/or micro-nutrients for improved land and crop productivity. The study recommended adoption of sustainable farm specific management strategies to improve soil water, fertilizers and labour use efficiencies in the Kenyan ASALs. Keywords: arid and semi-arid lands; macro and micronutrients; climate resilient agriculture; inputs use efficiency
1st African Conference on Precision Agriculture | 8-10 December | 2020
3
INTRODUCTION
Agricultural sector is not only the driver of Kenyan economy but also the means of livelihood for over 80% of the rural Kenyans population. Indeed, the Kenya’s Vision 2030 economic strategy identifies agriculture as one of the key sectors to drive the Country’s economy. However, the agricultural sector faces a myriad of challenges related to aridity which characterizes over 80% of the total land area. These are compounded by rain-fed agriculture in Kenya which over the years has failed to adequately support crops to produce high yields. Smallholder farmers who account for about 80% of the country’s population use inorganic fertilizers in combination with organic resources. Cereal and legume crop yield gaps are large in the smallholder farming systems but there is a potential of closing them through adoption of improved crop varieties and sustainable cropping systems. Continuous use of unbalanced inorganic fertilizers without addition of organics has led to increase in soil acidity, nutrient mining and decline in soil organic matter. In addition, rainfall variability resulting from climate change has negatively affected agricultural productivity. As one of the climate smart agriculture (CSA) remedies, Integrated Soil Fertility Management (ISFM) which also embraces adherence to conservation agriculture practices offer the best options for improving soil fertility and consequently the crop yields within and beyond the Kenyan ASALs. Based on the above background, a study was conducted in 8 Counties in Upper Eastern, Lower Eastern and Coastal regions to validate the benefits of embracing CSA principles and practices on soil and crop productivity in the selected sites and counties.
MATERIALS AND METHODS
For almost five years (2016 to 2020), the Kenya Cereals Enhancement Programme – Climate Resilient Agricultural Livelihoods (KCEP-CRAL) validated CSA technologies with potential to improve soil and crop production in the ASALs of Kenya. This was achieved through establishment and monitoring of on-station and on-farm trials following a “Mother and Baby approach in the Upper Eastern (Embu and Tharaka-Nithi Counties); Lower Eastern (Kitui, Machakos and Makueni Counties), and the Coastal regions (Taita-Taveta, Kilifi and Kwale Counties). A soil testing SMART (Soil analysis, Mapping, Recommendation and Transfer to farmers) approach was used as part of the novel procedures before and during seasonal establishment of the field trials. The first trials in the list of trials were the CA practices. These set of trials were made up of 24 treatments of residue management, tillage practices and crop varieties laid out in split-split plot randomized complete plot design. The second set of trials were based on ISFM treatments that included, a control, inorganic fertilizer at the recommended rates, farmyard manure (FYM) at the recommended rate and organic and inorganic fertilizer applied at half the recommended rates. The third set of trials were based on the fertilizer sources as defined in the 4R nutrient stewardship framework. This trial focused on the effect of the various fertilizer materials on crop productivity and had up to seven treatments composed of five inorganic fertilizers, farmyard manure and no input (control). The effect of potassium (K) based fertilizer on crop performance was the fourth trial in the list and tested the efficacy of 0, 40, 80, 120, 160 and 200 kg K2O ha-1. The K application treatments (including the 0 kg K2O ha-1) were provided with the recommended rates of N and P. The study had the effect of sulphur (S) based fertilizer as the fifth trial. The trials focused on the efficacy of 0, 10, 20, 30 and 40 kg S ha-1. The five S application rates (including the 0 kg S ha-1) were provided with the recommended rates of N and P. The sixth trial was of the effect of zinc (Zn) on crop yields. The trial had Zn applied at (0, 5, 10, 15 and 20
1st African Conference on Precision Agriculture | 8-10 December | 2020
4
kg Zn ha-1). The five Zn application rates (including the 0 kg Zn ha-1) were provided with the recommended rates of N and P. The sixth treatment in the trial structure was absolute control (no inputs). The crops included in the trials were cereals (maize, sorghum and millet) and associated pulses (beans, green grams, cowpeas and pigeon peas) and push-pull technologies (PPT) to control Fall Army Worm (FAW). The crops were tested for their performance, adaptability and acceptability in these environments. Participatory Learning and Action Research (PLAR) was used during technology development, dissemination and capacity building of farmers, extension providers and other partners. Data Collected and Analysis The types of datasets that were collected included: crop performance during the growth period (phonological development) and crop yields (biomass and grains). Data sets were subjected to the analysis of variance (ANOVA) procedure (SAS, 2002). Differences between treatments means was separated using LSD at 5% level of significance.
RESULTS AND DISCUSSIONS Effect of Conservation Agriculture (CA) on Crop Yields
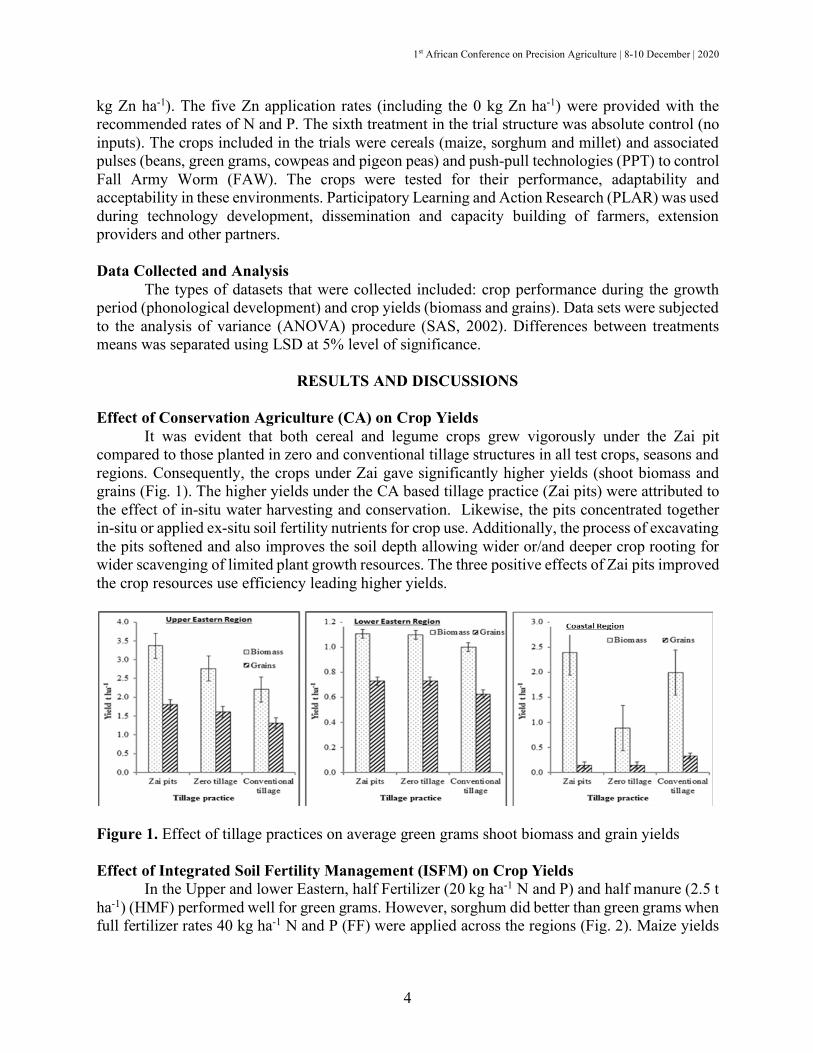
It was evident that both cereal and legume crops grew vigorously under the Zai pit compared to those planted in zero and conventional tillage structures in all test crops, seasons and regions. Consequently, the crops under Zai gave significantly higher yields (shoot biomass and grains (Fig. 1). The higher yields under the CA based tillage practice (Zai pits) were attributed to the effect of in-situ water harvesting and conservation. Likewise, the pits concentrated together in-situ or applied ex-situ soil fertility nutrients for crop use. Additionally, the process of excavating the pits softened and also improves the soil depth allowing wider or/and deeper crop rooting for wider scavenging of limited plant growth resources. The three positive effects of Zai pits improved the crop resources use efficiency leading higher yields.
Figure 1. Effect of tillage practices on average green grams shoot biomass and grain yields Effect of Integrated Soil Fertility Management (ISFM) on Crop Yields
In the Upper and lower Eastern, half Fertilizer (20 kg ha-1 N and P) and half manure (2.5 t ha-1) (HMF) performed well for green grams. However, sorghum did better than green grams when full fertilizer rates 40 kg ha-1 N and P (FF) were applied across the regions (Fig. 2). Maize yields
1st African Conference on Precision Agriculture | 8-10 December | 2020
5
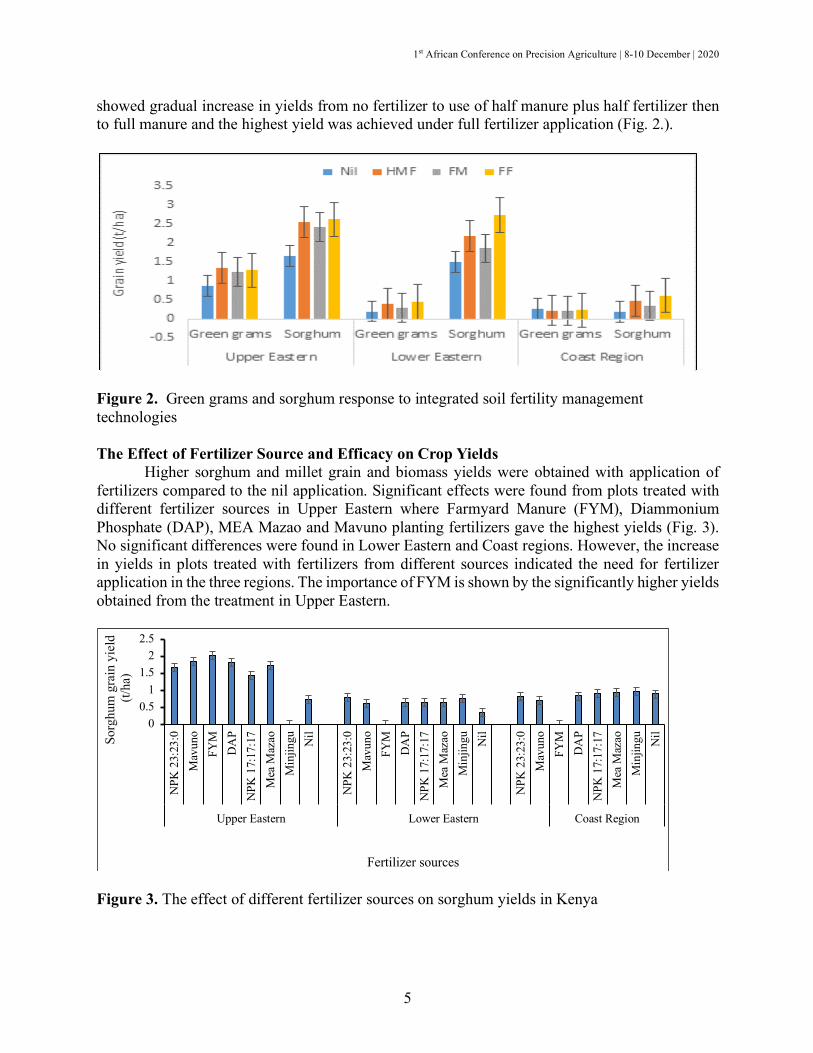
showed gradual increase in yields from no fertilizer to use of half manure plus half fertilizer then to full manure and the highest yield was achieved under full fertilizer application (Fig. 2.).
Figure 2. Green grams and sorghum response to integrated soil fertility management technologies The Effect of Fertilizer Source and Efficacy on Crop Yields
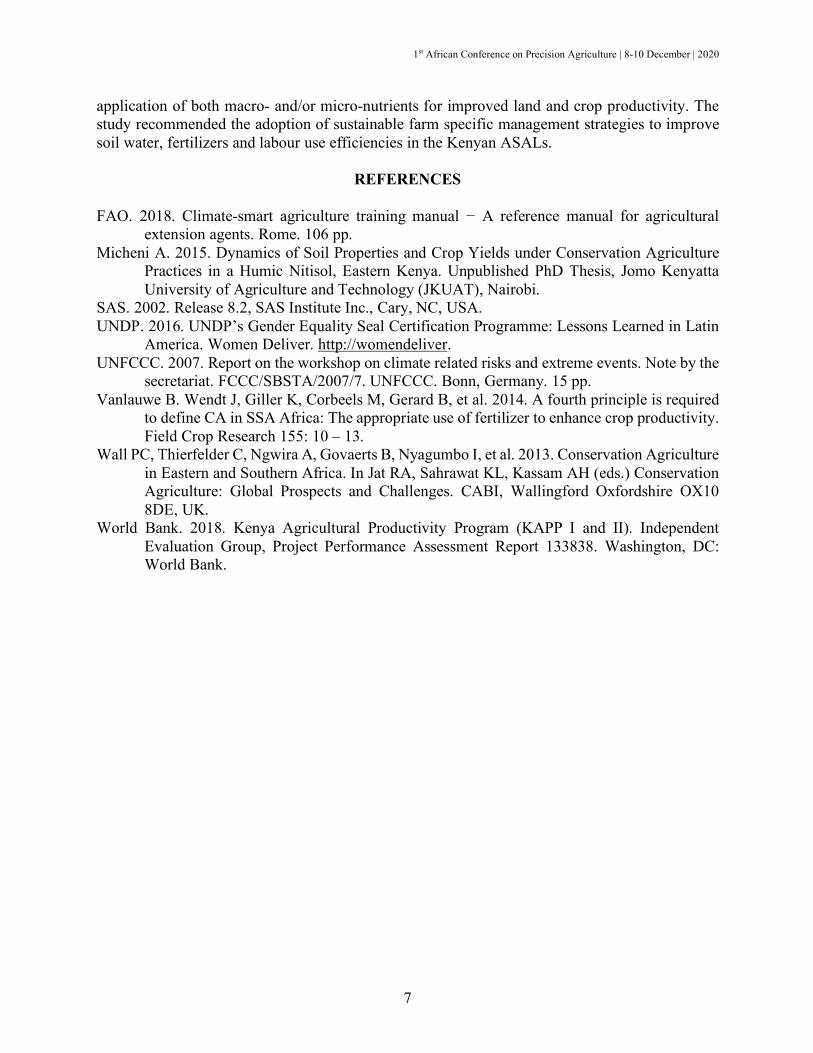
Higher sorghum and millet grain and biomass yields were obtained with application of fertilizers compared to the nil application. Significant effects were found from plots treated with different fertilizer sources in Upper Eastern where Farmyard Manure (FYM), Diammonium Phosphate (DAP), MEA Mazao and Mavuno planting fertilizers gave the highest yields (Fig. 3). No significant differences were found in Lower Eastern and Coast regions. However, the increase in yields in plots treated with fertilizers from different sources indicated the need for fertilizer application in the three regions. The importance of FYM is shown by the significantly higher yields obtained from the treatment in Upper Eastern.
Figure 3. The effect of different fertilizer sources on sorghum yields in Kenya
00.5
11.5
22.5
NPK
23:
23:0
Mav
uno
FY
M D
AP
NPK
17:
17:1
7 M
ea M
azao
Min
jingu Nil
NPK
23:
23:0
Mav
uno
FY
M D
AP
NPK
17:
17:1
7 M
ea M
azao
Min
jingu Nil
NPK
23:
23:0
Mav
uno
FY
M D
AP
NPK
17:
17:1
7 M
ea M
azao
Min
jingu Nil
Upper Eastern Lower Eastern Coast Region
Sorg
hum
gra
in y
ield
(t/ha
)
Fertilizer sources

1st African Conference on Precision Agriculture | 8-10 December | 2020
6
The Effect of Potassium Fertilizers on Crop Yields Application of potassium at 80 kg ha-1 had the highest millet yield but was not significantly
different (P<0.05) from 40 kg ha-1 and no application of K (Fig. 4). Under sorghum, the highest yield response was recorded at 40 kg K ha-1 across the regions which was significantly different (P<0.05) from the other higher K fertilizer rates (Fig. 4). On average, the yields of millet, sorghum, maize and cowpeas highest at 40 kg K ha-1 (Fig. 4).
Figure 4. Average yields of millet and sorghum across Eastern and Coastal regions The Effect of Sulphur and Zinc Fertilizers on Crop Production
A general trend showed that there was gradual sorghum, millet, maize and cowpea grain yield increases up to 20 kg S ha-1 followed by a decrease in yield on further addition of S. There was no significant response of cowpea and maize on sulphur application at the coast region. Similarly, there was no significant response of green grams, sorghum and maize to zinc fertilizers. Crop yields increased up to 5 kg Zn ha-1. There is need for long-term trial management to confirm micronutrient responses. Push-Pull Technologies (PPT)
In addition, the project conducted testing and validation on push-pull technologies (PPT) for control of Fall Army Worm (FAW). Brachiaria spp and Pannicum maximum grasses for wet and dry areas (respectively) attracted (pulled) fall armyworm from maize and sorghum while Clitoria and Lablab dolichos had the highest (40%) repelling (pushing) effect on the pest from the crops.
CONCLUSIONS
Soil characterization and field trials showed that organic carbon, nitrogen, phosphorus, sulphur and zinc were the most limiting nutrients in almost all the counties. The soil amendments supplying the above listed nutrients were either organic, inorganic or/and organic inorganic combination sources coupled with appropriate crop varieties and soil and water management practices. The cereal and legume crop yields increased by at least 50-100 percent depending on the agro ecological zone, crop type and relevant ISFM technologies. It was concluded that farm-specific characterizations were important in determining levels of farm/catchment specific
0
0.5
1
1.5
Nil NP0K NP40K NP80K NP120K NP160K NP200K
Yiel
d (t
/ha)
Potassium rates (kg/ha)
Millet Sorghum
1st African Conference on Precision Agriculture | 8-10 December | 2020
7
application of both macro- and/or micro-nutrients for improved land and crop productivity. The study recommended the adoption of sustainable farm specific management strategies to improve soil water, fertilizers and labour use efficiencies in the Kenyan ASALs.
REFERENCES
FAO. 2018. Climate-smart agriculture training manual − A reference manual for agricultural extension agents. Rome. 106 pp.
Micheni A. 2015. Dynamics of Soil Properties and Crop Yields under Conservation Agriculture Practices in a Humic Nitisol, Eastern Kenya. Unpublished PhD Thesis, Jomo Kenyatta University of Agriculture and Technology (JKUAT), Nairobi.
SAS. 2002. Release 8.2, SAS Institute Inc., Cary, NC, USA. UNDP. 2016. UNDP’s Gender Equality Seal Certification Programme: Lessons Learned in Latin
America. Women Deliver. http://womendeliver. UNFCCC. 2007. Report on the workshop on climate related risks and extreme events. Note by the
secretariat. FCCC/SBSTA/2007/7. UNFCCC. Bonn, Germany. 15 pp. Vanlauwe B. Wendt J, Giller K, Corbeels M, Gerard B, et al. 2014. A fourth principle is required
to define CA in SSA Africa: The appropriate use of fertilizer to enhance crop productivity. Field Crop Research 155: 10 – 13.
Wall PC, Thierfelder C, Ngwira A, Govaerts B, Nyagumbo I, et al. 2013. Conservation Agriculture in Eastern and Southern Africa. In Jat RA, Sahrawat KL, Kassam AH (eds.) Conservation Agriculture: Global Prospects and Challenges. CABI, Wallingford Oxfordshire OX10 8DE, UK.
World Bank. 2018. Kenya Agricultural Productivity Program (KAPP I and II). Independent Evaluation Group, Project Performance Assessment Report 133838. Washington, DC: World Bank.

1st African Conference on Precision Agriculture | 8-10 December | 2020
8
#7523 VARIABILITY IN MONTHLY RAINFALL AND TEMPERATURE HAS AN INFLUENCE ON DAILY MILK PRODUCTION IN SAHIWAL COWS IN KENYA
MacDonald Gichuru Githinji1, 2*, Evans Deyie Ilatsia1, Thomas Kainga Muasya2,
Bockline Omedo Bebe2
1Kenya Agriculture and Livestock Research Organization, Naivasha, Kenya; 2Department of Animal Sciences, Egerton University, Egerton, Kenya, [email protected]
ABSTRACT
Climate change leads to alteration of environmental conditions directly or indirectly through anthropogenic activities. The consequences include fluctuations in the mean as well as variability of recognizable environmental variables with the changes persisting for longer than normal periods. Climate change poses numerous serious threats to livestock production through increased temperature, changes and shifts in rainfall distribution and increased frequency of extreme weather events. Grazing systems that are dependent on the natural cycle of climatic conditions are expected to be more seriously impacted by climate change. The consequences of climate change include increased heat stress, reduced water and feed quality and availability, increased cases of diseases and pests and or emergence of new ones. As livestock farmers in the tropics continue to bear the brunt of climate change, there is need to understand how the variability of identifiable environmental variables influence livestock performance. The objective of this study was to determine the influence of rainfall and temperature of milk yield in Sahiwal cattle in Kenya. Monthly milk yield records of Sahiwal cows and meteorological data for monthly minimum and maximum temperature and rainfall for a period of 32 years were extracted from records at the national Sahiwal stud, Naivasha, Kenya. The relationship between the variables was studied by multiple regression analysis. Minimum and maximum temperature and monthly rainfall significantly (P<0.05) affected monthly milk yield. The proportion of total variation accounted for by climatic variables was small (0.5%) but significant. Each individual weather variable accounted for a small proportion of total variation. Minimum and maximum temperature had a negative effect on monthly milk yield. For every 1oC increase temperature, in monthly milk yield decreased by -1.58 kg and -1.17 kg, respectively. A 1 mm increase in monthly rainfall of monthly caused monthly milk yield to increase by 0.07 kg. Mitigating strategies are required to alleviate the negative effects of temperature on monthly milk yield. Sound grazing management and feed conservation could harness the advantage of the positive effect of rainfall on milk yield. Keywords: climate change; heat stress, mitigation, rainfall variability
INTRODUCTION
Climate change is attributed directly or indirectly to anthropogenic activities which alter the makeup of the earth’s atmosphere (UNFCC, 2008). Whether due to natural variability or human activity, climate change leads to changes in the mean and or variability of the identifiable properties of climate persisting for longer than normal periods of time (IPCC, 2007). Climate change poses a serious threat to livestock production through increased temperature, changes and shifts in rainfall distribution and increased frequency of extreme weather events (Rojas-Downing
1st African Conference on Precision Agriculture | 8-10 December | 2020
9
et al. 2017). The consequences of climate change include increased heat stress, reduced water (Chapman et al. 2012) and feed quality and availability (Nardone et al. 2010), increased cases of diseases (Thorton et al. 2009.) and pests and or emergence of new ones Karl et al. 2009). The greatest adverse effects of climate change will be felt by crop and livestock farmers in developing countries who are dependent on natural systems (UNDP 2014).
Grazing systems that depend on the natural cycle of climatic conditions are expected to be more seriously impacted by climate change (Aydinalp and Cresser 2008). Among grazing systems across the world those found in low altitude arid and semi-arid areas will be affected most severely as higher temperatures and reduced rainfall reduce feed yields and increased land degradation (Hoffman and Vogel 2008). On the other hand, non-grazing systems are expected to be less affected by climate change because housing and other structures allow for greater control of production conditions FAO 2009; Thorton and Gerber 2010). Heat stress is one of the components of climate change with the most significant direct impact on livestock production.
Recent studies have reported on the temporal and spatial variability of rainfall and temperature in different countries and ecosystems across the world (Nouaceur et al. 2017; Rustum et al. 2017). Most these studies have reported either increase or decrease in intensity of rainfall, increased incidences of drought and rising ambient temperatures (Nouaceur et al 2017; Pedersen et al. 2010; Kumar et al. 2017). Heat stress decreases feed intake, feed conversion efficiency leading to reduced milk production, growth, reproduction and increased incidences of diseases and mortality (Thorton 2010; Lacetera 2019; Santos et al. 2019). Poor feed conversion efficiency leads to increased methane gas emissions (Wagnorn and Hegarty 2011), further fueling global warming. The objective of this study was to determine the influence of rainfall and temperature of milk yield in Sahiwal cattle in Kenya.
MATERIALS AND METHODS
Data of this study were collected at the National Sahiwal Stud, Naivasha, Kenya from 1985
to 2012. The study is located at 0o 43'1.8408'' S, 36o 25' 51.6936''E on the floor of the Great Rift Valley at about 600 m above sea level. The climate of this location is semi-arid with an annual average rainfall of 600 mm. The rainfall pattern of the area is bimodal, with two distinct peaks occurring in May and the other one in November. However, the rainfall distribution varies from year to year. The average minimum and maximum temperatures are 8oC and 30oC, respectively. The breed reared at the Stud is the Sahiwal cattle. The breed was brought into the country from India and Pakistan in the first half of the 20th century. Since then it has been systematically bred for milk and growth. The Stud is run as a closed nucleus, in which performance and pedigree recording and genetic evaluation is carried out. The improved germplasm is distributed to commercial herds mainly breeding bulls and sometimes semen and surplus heifers (Ilatsia et al. 2011). The design of the breeding programme is described in details by Muhuyi et al (1999). The cows at the stud are mainly raised on natural pastures dominated by star grass (cynodon dactylon) with mineral salts being provided. The pasture land is dotted by acacia trees with the main genus being the acacia xanthophloea. The cows are milk twice a day by hand. Average milk yield has been reported to be 4.5±1.5kg per day per cow. Climatic was collected routinely by neighbouring flower farm and included ambient temperatures and rainfall. The climatic variable recorded were minimum and maximum temperatures and monthly rainfall. Milk yields for each cow were recorded at milking and added to daily and weekly totals. From the weekly totals monthly totals
1st African Conference on Precision Agriculture | 8-10 December | 2020
10
were summed up. The monthly milk yield yields were then related to minimum and maximum temperature and rainfall for the same period.
RESULTS
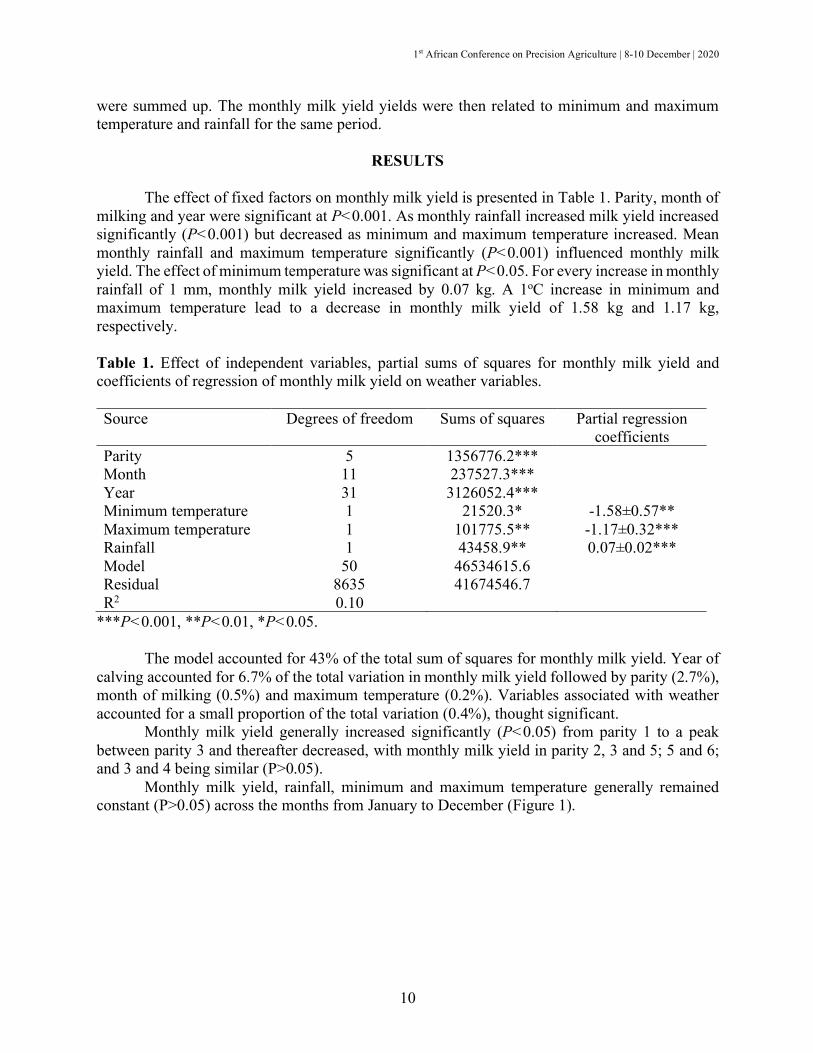
The effect of fixed factors on monthly milk yield is presented in Table 1. Parity, month of
milking and year were significant at P<0.001. As monthly rainfall increased milk yield increased significantly (P<0.001) but decreased as minimum and maximum temperature increased. Mean monthly rainfall and maximum temperature significantly (P<0.001) influenced monthly milk yield. The effect of minimum temperature was significant at P<0.05. For every increase in monthly rainfall of 1 mm, monthly milk yield increased by 0.07 kg. A 1oC increase in minimum and maximum temperature lead to a decrease in monthly milk yield of 1.58 kg and 1.17 kg, respectively. Table 1. Effect of independent variables, partial sums of squares for monthly milk yield and coefficients of regression of monthly milk yield on weather variables. Source Degrees of freedom Sums of squares Partial regression
coefficients Parity 5 1356776.2*** Month 11 237527.3*** Year 31 3126052.4*** Minimum temperature 1 21520.3* -1.58±0.57** Maximum temperature 1 101775.5** -1.17±0.32*** Rainfall 1 43458.9** 0.07±0.02*** Model 50 46534615.6 Residual 8635 41674546.7 R2 0.10
***P<0.001, **P<0.01, *P<0.05.
The model accounted for 43% of the total sum of squares for monthly milk yield. Year of calving accounted for 6.7% of the total variation in monthly milk yield followed by parity (2.7%), month of milking (0.5%) and maximum temperature (0.2%). Variables associated with weather accounted for a small proportion of the total variation (0.4%), thought significant.
Monthly milk yield generally increased significantly (P<0.05) from parity 1 to a peak between parity 3 and thereafter decreased, with monthly milk yield in parity 2, 3 and 5; 5 and 6; and 3 and 4 being similar (P>0.05).
Monthly milk yield, rainfall, minimum and maximum temperature generally remained constant (P>0.05) across the months from January to December (Figure 1).

Figure 1. Trends of mean monthly rainfall (RF), minimum (AMINT) and maximum (AMAXT) temperature and milk yield for Sahiwal cattle in Kenya.
The correlations between monthly milk yield and rainfall, average minimum temperature,
average temperature and maximum temperature are shown in Table 2. The correlations between monthly milk yield and monthly rainfall was positive and low and significantly different from 0 (P<0.0001). Monthly milk yield was negatively correlated with average minimum (P>0.05), average (P<0.05) and maximum temperature (P<0.05). This implies that months receiving high amounts of rain were generally cooler. Table 2. Correlations between mean monthly milk yield, rainfall, minimum and maximum temperature at the National Sahiwal Stud, Naivasha, Kenya.
Variable Monthly milk yield
Monthly rainfall
Mean minimum temperature
Mean maximum temperature
Monthly milk yield - 0.042*** -0.017ns -0.046***
Monthly rainfall - 0.123*** -0.047*** Mean minimum temperature - -0.112***
Mean maximum temperature -
***P<0.001, **P<0.01, *P<0.05.
Mean monthly rainfall was positively and significantly correlated (P<0.001) with mean monthly minimum and negatively and significantly correlated with mean monthly maximum temperature (P<0.001). The hottest months were also the coldest as indicated by the negative and significant correlation (P<0.001) maximum and minimum temperatures. This means that the study area has a wide diurnal temperature range.
1st African Conference on Precision Agriculture | 8-10 December | 2020
12
DISCUSSION
Monthly milk yield was positively associated with rainfall as shown by the positive
correlation and regression coefficient. Many studies have reported a significant effect of rainfall on milk yield (Msechu et al. 1995). The effect of climate change is complex. However, studies have reported either upward or downward trend in monthly or seasonal rainfall (Rustum et al. 2017; Msechu et al. 1995). For the NSS at Naivasha Kenya, monthly rainfall increased leading to a concomitant increase in milk yield. The regression coefficient of monthly milk yield on rainfall [0.07±0.02kg/mm] reflects the effect of rainfall on pasture growth feed availability, palatability and nutritive value. The time lag from onset of rains to the maximal response in pasture value was also displayed in the current study. However, shorter periods may have been more sensitive in measuring this time lag.
The partial regression coefficients of milk yield on temperature indicate the importance of ambient temperature on the welfare of animals. The loss of 1.58±0.57 and 1.17±0.32 kg milk yield for every 1oC increase in minimum and maximum temperature is related to the negative effect of high ambient temperatures on animal behavior and physiological responses of animals. As ambient temperatures increase metabolic heat production increases (Rhoads et al. 2013) as animals respond by altering their behavior and physiological processes. The changes include changes in feeding and water seeking behavior, increase in respiration rate, heart rate and rectal temperature (Brown-Brandl et al. 2005). The consequence of the behavioral and physiological changes is often reduced milk yield and growth (Nardone et al. 2010; Berman 2005). The widest monthly temperature range of the study site of about 17.9oC occurred in January, February, March, and September to December, which were also associated with significantly lower milk production. As a consequence of climate change, a number of studies have reported significant increase in mean and minimum average temperature (Asfaw et al.; 2018; Javari 2017). This may explain the greater influence of mean minimum temperature on milk yield found in the current study.
The results of the current study call for identification of mitigating strategies for pasture-based beef and milk production systems. Some of the strategies suggested include modifications in the management systems, breeding strategies, policy changes and a change in farmer perception and adaptive capacity to climate change (Rojas-Downing et al. 2017; IFAD 2010; USDA 2013). Specifically the mitigation strategies will involve improvement of feeding strategies in terms of modifying diet composition, feeding time and frequency (Renaudeau et al. 2012), incorporation of agroforestry to modify micro-climates in grazing lands (Thorton and Herrero 2010). However even when farmers employ heat stress mitigation strategies, losses of more than 50% of production per cow have been reported for dairy cattle (Lakew 2017). In most production systems, animals are rarely exposed to a single environmental stressor. It is likely that the cows at the NSS were exposed to more stressors than were captured in the current study. Other stressors may be include wind speed, poor nutrition, diseases, pests and humidity. Seijan et al (2013) reported that production and reproduction was further compromised by poor nutrition, long distances to feeding areas water sources. Although the Sahiwal cattle are reared within a demarcated area at the NSS, it is likely that animals walk longer seeking feed and spend more time under shade during hot months, further affecting production.

1st African Conference on Precision Agriculture | 8-10 December | 2020
13
CONCLUSIONS
Climatic variables, minimum and maximum temperature and monthly rainfall significantly (P<0.05) affected monthly milk yield but for a small proportion of total variation (0.5%) through significant. A 1oC increase in minimum and maximum temperature led to a 1.58 kg and 1.17 kg decrease in monthly milk yield, respectively. A 1 mm increase in monthly rainfall of monthly caused monthly milk yield to increase by 0.07kg. Mitigating strategies are required to alleviate the negative effects of temperature on monthly milk yield. Sound grazing management and feed conservation could harness the advantage of the positive effect of rainfall on milk yield.
REFERENCES
Asfaw A, Simane B, Hassen A, Bantider A. 2018. Variability and time series trend analysis of
rainfall and temperature in northcentral Ethiopia: A case study in Woleka sub-basin. Weather and Climate Extremes 19: 29-41.
Aydinalp C, Cresser MS. 2008. The effects of global climate change on agriculture. American-Eurasian J. Agric. Environ. Sci. 3: 672-676.
Berman AJ. 2005. Estimates of heat stress relief needs for Holstein dairy cows. Journal of Animal Science 83: 1377–1384. https://europepmc.org/article/med/15890815
Brown-Brandl TM, Eigenberg RA, Nienaber JA, Hahn GL. 2005. Dynamic response indicators of heat Stress in shaded and non-shaded feedlot cattle, Part 1: analyses of indicators. Biosystems Engineering 90: 451 - 462.
Chapman SC, Chakraborty S, Dreccer MF, Howden SM. 2012. Plant adaptation to climate change: opportunities and priorities in breeding. Crop Pasture Sci. 63: 251–268. https://bioone.org/journals
FAO. 2009. State of food and agriculture - livestock in the balance. Rome. http://www.fao.org Hoffman MT, Vogel C. 2008. Climate change impacts on African rangelands. Rangelands 30: 12-
17. https://bioone.org/ IFAD. 2010. Livestock and climate change.
http://www.ifad.org/lrkm/events/cops/papers/climate.pdf Ilatsia ED, Roessler R, Kahi AK, Piepho H-P, Valle Zárate A. 2011. Production objectives and
breeding goals of Sahiwal cattle keepers in Kenya. Implications for a breeding programme. Tropical Animal Health and Production (Online first article; doi: 10.1007/s11250-011-9928-8s). https://pdfs.semanticscholar.org/
IPCC. 2007. Climate Change 2007: impacts, adaptation and vulnerability. Contribution of Working Group II to the Fourth Assessment Report of the IPCC, ML Parry, OF Canziani, JP Palutikof, PJ van der Linden, CE Hanson, eds. Cambridge, UK, Cambridge University Press. 976 pp. http://www.eea.europa.eu
Javari M. 2017. Assessment of temperature and elevation controls on spatial variability of rainfall in Iran. Atmos. 8(3): 45, doi:10.3390/atmos8030045. https://www.mdpi.com/2073-4433/8/3/45
Karl TR, Melillo JM, Peterson TC. 2009. Global Climate Change Impacts in the United States. U.S. Global Change Research Programme. Cambridge Univ. Press. http://www.iooc.us.
Kumar N, Panchal CC, Chandrawanshi SK, Thanki JD. 2017. Analysis of rainfall by using Mann-Kendall trend, Sen’s slope and variability at five districts of south Gujarat, India. Mausam 68(2): 205-222. www.indiaenvironmentportal.org.in
1st African Conference on Precision Agriculture | 8-10 December | 2020
14
Lacetera N. 2019. Impact of climate change on animal health and welfare. doi: 10.1093/af/vfy030. https://academic.oup.com/af/article/9/1/26/5168813
Lakew H. 2017. Economic impact of climate change on milk production: a case study of selected areas in the Free State. MSc thesis, University of the Free State, Bloemfontein, South Africa.
Muhuyi WB, Lokwaleput I, Ole Sinkeet SN. 1999. Conservation and utilization of the sahiwal cattle in kenya. AGRI 26: 35-44. https://pdfs.semanticscholar.org
Msechu JKK, Mgheni IM, Syrstad O. 1995. Influence of various climatic factors on milk production in cattle in Tanzania Tropical Animal Health and Production 27: 121-126.
Nardone A, Ronchi B, Lacetera N, Ranieri MS, Bernabucci U, 2010. Effects of climate change on animal production and sustainability of livestock systems. Livestock Sci. 130: 57–69.
Nouaceur Z, Murărescu O, Murătoreanu G. 2017. Rainfall variability and trend analysis of multiannual rainfall in Romanian plain. Annals of Valahia University of Targoviste. Geogr. Series 17(2): 124-144 doi: 10.1515/avutgs-2017-0012. https://content.sciendo.com/
Pedersen L, Jensen NE, Christensen LE, Madsen H. 2010. Quantification of the spatial variability of rainfall based on a dense network of rain gauges. Atmos. Res. 95: 441–454. https://orbit.dtu.dk/
Renaudeau D, Collin A, Yahav S, De Basilio V, Gourdine JL, Collier RJ. 2012. Adaptation to hot climate and strategies to alleviate heat stress in livestock production. Animal 6(05): 707–728.
Rhoads RP, Baumgradt H, Saugee-Bedore J. 2013. Metabolic priorities during heat stress with emphasis on skeletal muscle. J. Ani. Sci. 91(6), doi:10.2527/jas.2012-6120.
Rojas-Downing MM, Nejadhashemi AP, Harrigan T, Woznicki SA. 2017. Climate change and livestock: impacts, adaptation, and mitigation. Climate Risk Manage. 16: 145–163.
Rustum R, Adeloye AJ, Mwale F. 2017. Spatial and temporal Trend Analysis of Long-term rainfall records in data-poor catchments with missing data, a case study of Lower Shire floodplain in Malawi for the Period 1953-2010. Hydro. Earth Sys. Sci. Discuss. https://doi.org/10.5194/hess-2017-601
Santos R, Cachapa A, Carvalho GP, Silva CB, Hernández L, Preira LS, Minas M, Vala H. 2019. Mortality and Morbidity of Beef Calves in Free-Range Farms in Alentejo, Portugal—A Preliminary Study. Veter. Med. Inter. Vol. 2019, Article ID 3616284, 8 p. https://doi.org/10.1155/2019/3616284.
Sejian V, Maurya VP, Kumar K, Naqvi SMK. 2013. Effect of multiple stresses (thermal, nutritional, and walking stress) on growth, physiological response, blood biochemical and endocrine responses in Malpura ewes under semi-arid tropical environment. Trop. Ani. Health and Prod. 45: 107–116. doi:10.1007/s11250-012-0180-7
Thornton PK. 2010. Livestock production: recent trends, future prospects. Philosophical Transactions of the Royal Society B 365: 2853-2867. https://royalsocietypublishing.org/doi/10.1098/rstb.2010.0134
Thornton PK, Van de Steeg J, Notenbaert A, Herrrero M. 2009. The impacts of climate change on livestock and livestock systems in developing countries: A review of what we know and what we need to know. Agric. Sys. 101: 113–127. http://www.fao.org/tempref/AG/Reserved
Thornton PK, Gerber PJ. 2010. Climate change and the growth of the livestock sector in developing countries. Mitig. Adapt. Strat. Global Change 15: 169–184.
1st African Conference on Precision Agriculture | 8-10 December | 2020
15
Thornton PK, Herrero M. 2010. The Inter-linkages between rapid growth in livestock production, climate change, and the impacts on water resources, land use, and deforestation. World Bank Policy Research Working Paper, WPS 5178. World Bank, Washington, DC. http://citeseerx.ist.psu.edu/
UNDP. 2014. Sustaining Human Progress: Reducing Vulnerabilities and Building Resilience; Human Development Report 2014. United Nations Development Programme (UNDP), New York, USA. http://www. hdr.undp.org/
UNFCC. 2008. Challenges and opportunities for mitigation in the agricultural sector. http://unfccc.int/resource/docs/2008/tp/08.pdf
USDA. 2013. Climate Change and Agriculture in the United States: Effects and Adaptation. USDA technical bulletin, Washington, DC. http://www.usda.gov/oce/climate_change/effects_2012/CC%20and%20Agriculture%20Report%20%2802-04-2013%29b.pdf.
Waghorn GC, Hegarty RS. 2011. Lowering ruminant methane emissions through improved feed conversion efficiency. Ani. Feed Sci. Tech. 166-167: 291-301.
1st African Conference on Precision Agriculture | 8-10 December | 2020
16
#7616 DEVELOPMENT OF LODGING DIRECTION DETERMINATION SYSTEM USING IMAGE PROCESSING
Arai Y, Morimoto E, Nonami K, Ito T
Tottori University, Tottori Prefecture, Japan [email protected], +81-0857-31-5343
ABSTRACT
In this study, image processing system was developed for application on rice plants to determine lodging condition, which was contributing factor to declining harvester efficiency by using combine harvester. Therefore, we developed a system for determination of the lodging direction by algorithm based on convolutional neural network (CNN). As for deep learning framework, Pytorch1.1.0 were used to train and test the judging direction. GoogLeNet was used as a pre-trained CNN model.
Lodging direction was defined as 3 classes in images (i.e. frontward, backward and the others). Charge Coupled Device Camera (CCD camera) was installed in head feeding type combine and image was captured in front of a divider (2-10 m). CCD camera’s height and depression angle were set to 2.5 m and 39 degrees. Image size was 640 x 480 pixels, and the sampling rate was 30 Hz.
After acquisition of images, Region of Interest (ROI) were set to 250 x 250 pixels in images. These images were cropped in ROI. The images that are contained the lodging rice in more than half of ROI were selected manually. A total of 17,899 sample images were collected for training and validation. 4,997 images were used as training data and 12,902 images were used as validation data. As data augmentation, the training data was rotated 90°, 180° and 270°. Then, training and validation data were labeled manually. 19,988 images were used for training data set and 12,902 images were for validation, respectively.
The recall was applied for evaluation of the validation. As a result, the recall of frontward, backward, and others were 89.0%, 97.9%, and 81.5%, respectively. Main reason of the error was the situation where one image contains various lodging directions. However, total accuracy was 90.6%, so the result indicated that the developed system could be acceptable for determination lodging direction on combine harvester.
INTRODUCTION
According to the Japanese Census of Agriculture and Forestry in 2015, the number of
growers with farmland area of 20 ha or more increased by 38.1 % to 3850 and it means that young workers will manage a lot of farmland (Static Agriculture Census, 2015).
To solve these problems, the Ministry of Agriculture, Forestry and Fishery of Japan has launched a plan to promote the development of robots for agricultural use. This also aims at increasing agricultural productivity and improving self-sufficiency in Japan. Currently, many different types of agricultural robots are under development in Japan, such as a robot wheel-type tractor (Kise et al., 2002, Yang et al., 2012), a robot crawler-type tractor (Takai et al., 2010), a robot rice transplant machine (Nagasaka et al., 2004) and a robot combine harvester (Iida et al., 2011). In all the research mentioned above, a real-time kinematic GPS receiver and an IMU/GPS

1st African Conference on Precision Agriculture | 8-10 December | 2020
17
compass are required. In addition, to ensure the safety and precision while combine harvesters operating autonomously, it is also important for combines to capable of identifying the surrounding environment quickly and accurately. For example, there is a research to distinguish what are harvested areas from what is unharvest areas using image processing (Yang et al., 2020). Especially, it is important to estimate lodging in harvesting. The lodging area takes more time and effort to harvest than the non-lodging area. The operator needs to adjust the cutting speed for lodging degree and direction. Therefore, the automation of process for adjusting the cutting speed is an important function for not only the development the of robotic combine harvester but also the reduction of agricultural workload, as well as proper positioning, which is independent of the operator’s skill and experience.
From the above, lodging condition was focused on as data that can be get at harvesting by combine. Lodging is caused by excess of growth because of excess of fertilizer and causes to be deteriorated grain’s quality, to generate disease and insect pest and to worsen with by efficiency at harvesting (Ibaraki, 1967; Saito, 1991). Acquisition and accumulation of lodging condition is result of cultivation management of the year and it can be used not only for sharing information but also for reference for fertilization after the next year.
Many research studies on prediction of lodging have been studied (Fukuda et al., 1988; Sato, 2002; Hama et al., 2016; Tanaka et al., 2016). As a method for determination of the lodging level, Morimoto et al. (2020) judged the level by support vector machine by using image processing with the CCD camera mounted on the combine. However, there is few reports on method to visualize lodging direction during harvest.
The objectives of this research were 1) to collect sample image during harvest using combine harvester, 2) to develop rice lodging direction detection algorithm.
MATERIALS AND METHODS
Method of Sample Image Acquisition and Definition of Region of Interest
In this research, the tablet (FZ-M1, Panasonic) and the head feeding type combine harvester (HJ6123GZCAPLW, Iseki) were used and CCD camera on tablet’s back collected images in front of a divider. Also, camera’s height and depression angle were set to 2.5 m and 39 degrees in 2018 (Figure 1). Image size was 786,432 pixels and the sampling rate was 30 Hz. 171,877 images were collected.
Figure 2 shows data preparation. After acquisition of images, ROI (Region of Interest) were set to 250 x 250 in images (Figure 3) and cropped in ROI.
Then, the images that are contained the rice in more than half of ROI were selected. Finally, images visually determined to be lodging were selected as training and validating images. 4,997 images were selected as training images and 12,902 images were selected as validating images, respectively.
Figure 1. Position of CCD camera installation

1st African Conference on Precision Agriculture | 8-10 December | 2020
18
Development of Lodging Direction Algorithm Figure 4 shows steps of the proposed algorithm. Firstly, as data augmentation, rotating the
training images 90°, 180° and 270°. Lodging direction was defined as 3 classes (Figure 5) in an image (frontward, backward and the others), and labeled manually for training and validating images. As a result, 19,987 images were made as training set and 12,902 images were made as validation set, respectively. Pytorch0.3 were used to train and test the judging lodging direction. GoogLeNet was used as a deep learning model. Trained with the training set, and then validating the model on the validation set, respectively.
Figure 2. Steps of the data preparation
Figure 4. Steps of the proposed algorithm
Figure 3. Region of interest

1st African Conference on Precision Agriculture | 8-10 December | 2020
19
Model Training and Testing
Lodging direction was judged based on the liner Support Vector Machine leaned in advance. reproducibility defined as follows was calculated with each lodging direction.
Equation 1.
RESULTS AND DISCUSSION
Processing Result by Real-time Lodging Analysis System
Real-time lodging direction analysis system was applied, and the reproducibility was calculated. As the result, reproducibility of “frontward” was 97.9%, of “backward” was 81.5%, and of “others” was 89.0%, respectively (Table 1), and showed that the system was usable as a lodging analysis tool. Table 1. Reproducibility of each lodging direction
Prediction Backward Frontward Others Total Reproducibility
Act
ual c
lass
Backward 4,156 19 72 4,247 97.9% Frontward 310 5,673 385 6,368 89.1% Others 281 143 1,863 2,287 81.5% Total 4,747 5,835 2,320 12,902 90.6%
Figure 5. Definition of lodging direction

1st African Conference on Precision Agriculture | 8-10 December | 2020
20
When there was a different direction of lodging in one image, it is considered to have been the cause of erroneous determination. Figure 6 is an image of “others”, but it was misjudged as “frontward”. Especially, it is considered that the high reproducibility of backward was a good tendency, because the head feeding type combine harvester may break when harvesting in “backward”. In addition, the number of the misjudgment of "backward" was more "others" than "Frontward". It is considered that the judgment on the borderline between “backward” and “others” was ambiguous, so we are trying to get more training data and to improve reproducibility.
REFERENCES Fukuda K, Kamada Y, Dakeishi S, 1988. Lodging diagnosis of rice plants by “Fieldtron”, Rep.
Tohoku Br., Crop Sci. Soc. Japan 31: 47-49. Hama A, Hayazaki Y, Mochizuki A, Tsuruoka Y, Tanaka K, Kondoh A, 2016. Rice growth
monitoring using small UAV and SfM-MVS technique, J. Japan Soc. Hydrol. And Water Resour, 29(1): 44-54.
Ibaraki T. 1967. A case study on disease injury that frequently occur in lodging rice (in Japanese), Annual report of the Society of Plant Protection of North Japan, 1967(18): 53.
Iida M, Yamada Y. 2006. Rice harvesting operation using an autonomous combine with a GPS and a FOG, Proceedings of the Conference of Automation Technology for Off-road Equipment, ASAE, 125-131.
Matsui. Control of crawler tractor using GPS as navigation sensor, Master Thesis, 2007. Morimoto E, Inagaki N, Ueta D, Takahashi K, Nonami K. 2020. Estimate of Rice Lodging Based
on Image Processing (Part 2) -Effect Verification of Convolutional Neural Network and Learning to Rank- Journal of JSAM, 82(2): 156-161.
Nagasaka Y, Umeda N, Kanetani Y, Taniwaki K, Sasaki Y, 2004. Autonomous guidance for rice transplanting using global positioning and gyroscopes, Computers and Electronics in Agriculture 43: 223-234.
Kise M, Noguchi N, Ishii K, Terao H. 2002. Field mobile robot navigated by RTK-GPS and FOG (Part3), Journal of JSAM. 64(2): 102-110.
Saito Y. 1991. Fertilization and lodging (in Japanese), The Hokuriku Crop Science 26: 125-131. Sato T. 2002. Studies on techniques for lodging prevention of rice variety “Koshihikari” based on
growth diagnosis, The Hokuriku Crop Science 37: 4-9. Static Agriculture Census. 2015. Ministry of Agriculture and Forestry and Fisheries.
http://www.maff.go.jp/j/tokei/sihyo/data/08.html#1. Accessed Aug. 17, 2017. Takai R, Barawid O. Jr., Ishii K, Noguchi N. 2010. Development of Crawler-Type Robot Tractor
based on GPS and IMU, Preprint of the IFAC International Conference on AGRICONTROL 2010 (CD-R), A3-5.
Tanaka K, Kondoh A. 2016. Mapping of rice growth using low altitude remote sensing by multicopter, Journal of The Remote Sensing Society of Japan 36(4): 373-387.
Yang L, Noguchi N, Ishii K. 2012. Development of a Real Time Multi-lens-based Omni-directional Stereo Vision, Automation Technology for Off-Road Equipment 35-40.
Figure 6. Image of “others”

1st African Conference on Precision Agriculture | 8-10 December | 2020
21
Yang L, Iida M, Suguri M, Masuda R. 2020. Regional segmentation of Field Image Based on Convolutional Neural Network for Rice Combine Harvester, J. of JSAM. 82(1): 47-56.
1st African Conference on Precision Agriculture | 8-10 December | 2020
22
#7666 DETERMINANTS OF THE ADOPTION OF AN INTELLIGENT MONITORING SYSTEM AND EFFECTS ON FARMS PERFORMANCE IN TUNISIA
J. Ben Nasr, H. Chiboub and M. Msaddak
National Agronomic Institute, Tunis, Tunisia [email protected] +216 96570453
ABSTRACT
Technology has become essential to the farm organization not only for its effectiveness, but also for its strategic development within its competitive environment. The aim of this study is to assess the extent to which farmers complied with the aspects of precision agriculture for transforming agricultural extension in developing countries using the latest available technologies and research methods.
Considering the observation of the rise of Computerized Management Software Packages and intelligent monitoring in a path of modernization of agricultural techniques, we questioned the main factors influencing the decision to adopt software management, farmers’ perception of these management tools and their impact on farm performance. Referring to a theoretical framework focused on innovation and technologies adoption in agriculture, we built the hypothesis of our research: Changes in farming practices, such as the installation of management software, are the result of a process of innovation. This process begins with a technical proposal, which is gradually adopted by farmers based on several factors. On the basis of a sample of 50 agricultural specialized in crop production, with an area of 40 ha or more and spread over the two areas: Grand Tunis and Zaghouan governorates, an econometric analysis (Logit model) has been carried to test this hypothesis and to identify the decisions of adoption factors of the technology management; in our case the software AgriManager produced by the company Ezzayra.
Initially, through a bivariate analysis, it was possible to remove the variables most influencing the choice of operators to adopt computerized management software. Secondly, to overcome the constraint of the model degree of freedom, an analysis in main components identified the main components containing the most significant explanatory variables. These were introduced into the estimated Logit model, which allows several correlations to be drawn between the selected variables and farmers' decision to adopt this innovative technique. These are the variables relating to the characteristics of the holding (total area, crop types, etc. ), of the operator (their age, level of education and their formation) and their relational networks. Finally, an analysis of farmers' perceptions of such software has made it possible to identify the expected effects of its adoption in terms of productivity gains, stock management, improving the profitability and efficiency of the exploitation of scarce resources. The partial cost method and the comparison of the situation before and after software are used to confirm the positive effect of intelligent monitoring methods on the economic performance of the farms using this management method.

1st African Conference on Precision Agriculture | 8-10 December | 2020
23
INTRODUCTION
Technology has become essential to the farm organization not only for its effectiveness, but also for its strategic development within its competitive environment (Bucci et al, 2019; Akullo et al., 2018; Kalirajan and Shand, 2001).
Our research purpose is to contribute to a better understanding of the adoption of new technologies by farms. This study determines technology adoption factors and their consequences for the implementation of management software within large farms to various types of speculation, particularly arboriculture, market gardening and field crops. In this paper, we answer the following two research questions: What are the main factors that influence farmers decision about adopting a new technology for managing agricultural businesses? What changes have been observed in farms that have chosen to use this practice? On the basis of a sample of 50 farmers belonging to the governorates of Manouba, Ben Arous and Zaghouan chosen as study areas, statistical and econometric analyses were carried out in order to identify the determinants of decisions to adopt a new management technology by farms.
MATERIALS AND METHODS
Modelling the Decision to Adopt New Management Technology: Logit model
Logit models are built on the assumption of cumulative logistic distributions allowing an adequate treatment of outliers due to their set ends unlike Probit models (Hurlin, 2003).
We consider a sample of N farms indexed i = 1, .., N. For each farm, we observe whether a certain event has occurred, and we denote yi the coded variable associated with the event.
pi = Prob (y
i = 1| X
i) = F (α )
where the function F (.) denotes the distribution function. The choice of the distribution function F (.) is a priori unconstrained for i of the interval [1, N] we have the following form: 1 if the event has occurred: farm i adopts agricultural management software Y
i = 0 if the event did not happen for farm i
The decision of adoption a new technology by an operator depends on several factors which
are social, economic, related to the environment, climatic, related to the external market, and / or related to the internal characteristics of the operation. The operator's behavior following the choice of technology adoption is correlated with several explanatory variables Xi which will be taken from the principal component analysis.
The variables collected from the database collected are: age, education level, agricultural training, exploitation area, olive groves, type of culture: market gardening and arboriculture or field crops, irrigation, difficulties in recruiting labor, exportation, information about management software and sources of this information.
The number of explanatory variables is equal to 17 and the number of observations is 50. The degree of freedom is dof = 50-17 + 1= 32. This low degree of freedom does not permit a good estimate of the logit model. Hence, we carry out a principal component analysis to reduce the number of variables without affecting the quality of the information.
1st African Conference on Precision Agriculture | 8-10 December | 2020
24
Data Data for farmers are generally unavailable or not up to date. In addition, there is a lack of
information about the management systems adopted by the farms and the conditions affecting the decision to change agricultural technics. The field study is essential to succeed in filling this gap and producing the needed data for our research. The conduct of surveys covering technical, social and economic aspects among operators allows the creation of a database necessary for the analysis of their situation, their characteristics, their responses and attitudes towards the adoption of new management technologies. The sample is made up of 50 farmers, spread over 2 zones, Grand Tunis (Ben Arous and Mannouba) and Zaghouan. The minimum area is 40ha. The cultures adopted are widely varied: arboriculture, market gardening and field crops. Among the 50 farms visited, only 22 use software as a means of management, which corresponds to 44% of the sample studied.
RESULTS AND DISCUSSION
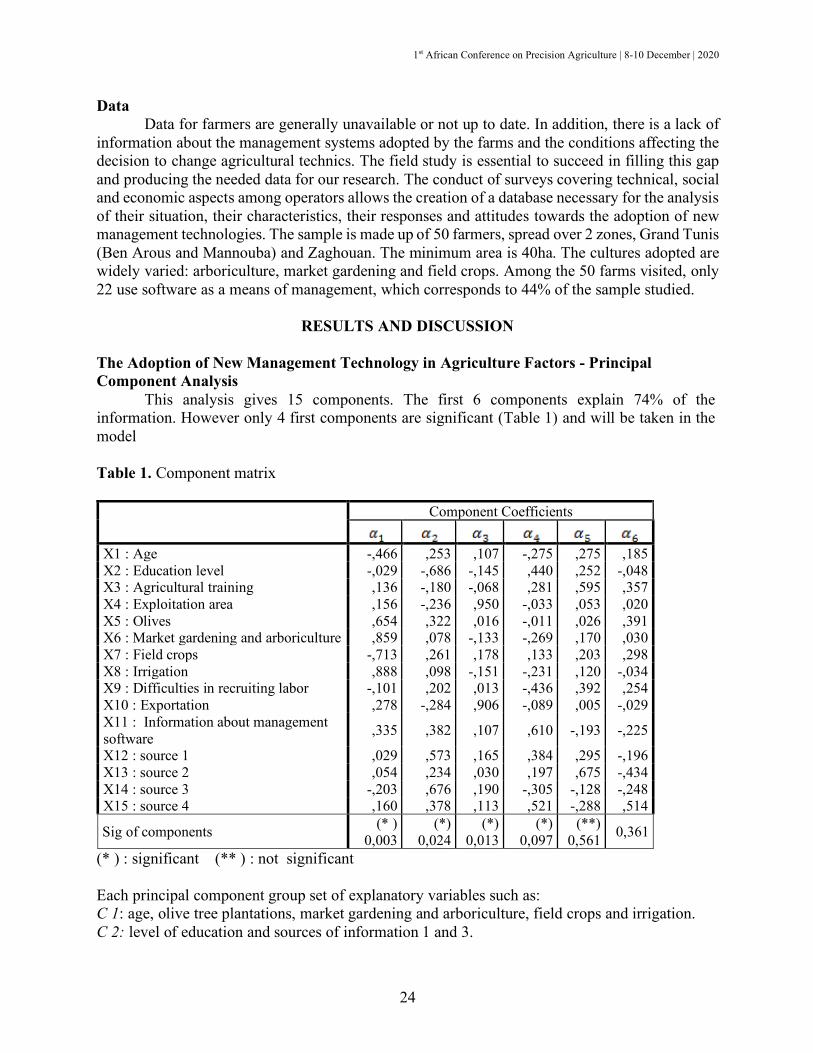
The Adoption of New Management Technology in Agriculture Factors - Principal Component Analysis
This analysis gives 15 components. The first 6 components explain 74% of the information. However only 4 first components are significant (Table 1) and will be taken in the model
Table 1. Component matrix Component Coefficients
X1 : Age -,466 ,253 ,107 -,275 ,275 ,185 X2 : Education level -,029 -,686 -,145 ,440 ,252 -,048 X3 : Agricultural training ,136 -,180 -,068 ,281 ,595 ,357 X4 : Exploitation area ,156 -,236 ,950 -,033 ,053 ,020 X5 : Olives ,654 ,322 ,016 -,011 ,026 ,391 X6 : Market gardening and arboriculture ,859 ,078 -,133 -,269 ,170 ,030 X7 : Field crops -,713 ,261 ,178 ,133 ,203 ,298 X8 : Irrigation ,888 ,098 -,151 -,231 ,120 -,034 X9 : Difficulties in recruiting labor -,101 ,202 ,013 -,436 ,392 ,254 X10 : Exportation ,278 -,284 ,906 -,089 ,005 -,029 X11 : Information about management software ,335 ,382 ,107 ,610 -,193 -,225
X12 : source 1 ,029 ,573 ,165 ,384 ,295 -,196 X13 : source 2 ,054 ,234 ,030 ,197 ,675 -,434 X14 : source 3 -,203 ,676 ,190 -,305 -,128 -,248 X15 : source 4 ,160 ,378 ,113 ,521 -,288 ,514
Sig of components (* ) 0,003
(*) 0,024
(*) 0,013
(*) 0,097
(**) 0,561 0,361
(* ) : significant (** ) : not significant Each principal component group set of explanatory variables such as: C 1: age, olive tree plantations, market gardening and arboriculture, field crops and irrigation. C 2: level of education and sources of information 1 and 3.

1st African Conference on Precision Agriculture | 8-10 December | 2020
25
C 3: the total area of exploitation and export. C 4: difficulties in recruiting labour, information on management software and source of information. Logistic Regression: Logit Model
The overall significance test gives a result <5% which reveals the high significance of the model. The maximum likelihood test gives a result equal to 24.6 which complies with the acceptance standards of the model. Table 2. Model estimation result Explanatory variable Constant
Coefficient 6.663 -4.092 19.343 1.403 2.041 The results of the regression test show that:
• - increases with: The young age, the increase in the areas planted with olive trees, market gardening and arboriculture, the reduction in the area of the farm and irrigation.
• Given the positive correlation proved in the model, this induces an increase in Y which tends towards 1 signifying a choice for the adoption of management software.
• - decreases with: The increase in the level of education, The non-use of media and collective interest groups as sources of information. This leads Y to tend towards 1, which support the choice of adopting management technology.
• - increase in line with Y: The increase in the total area of the farm concerned and exportation.
• - also increases: Have ease of recruiting labor, Be informed about management software, and the influence of neighbouring farmers.
Effect of Adoption on Performance
Overhead costs were not recorded in the operating account, which leads to erroneous results in the calculation of gross operating income, in cost control and in generating the need for financial resources. The figure shows the share of each type of expense in the total cost recognized.
Structural Cost Operating cost Non-operating
cost
Figure 1. The part of each type of load in the total cost

1st African Conference on Precision Agriculture | 8-10 December | 2020
26
It emerges that by changing the management mode, the farm has managed to reduce the share of its expenses allocated to the consumption of raw materials, the purchase of inputs, transport, and energy costs as well as personnel costs. This mainly comes down considering structural loads.
The personnel costs for the year 2015 were only 2168 TND. Correcting the above costs is essential to be able to compare between the two studied and to take inflation into account. Each cost will be divided by the GDP deflator for the corresponding year. The GDP deflators for the years 2015 and 2018 have the respective values 3.4 and 5.6.
• Results show that operating expenses as well as some production expenses clearly decreased from 2015 to 2018. The main findings are as follows:
• The increase of workers costs with 33% due to the inclusion of labor compensation for permanent and occasional workers.
• The decrease in the costs of delegated work with 9%. The value of this charge is around 5,000 TND (actual cost). This reveals the decrease in subcontracting due to the lack of workforce resources for carrying out daily or exceptional work such as repairing equipment. There is therefore a better allocation of this resource as well as an optimization of the execution of work orders.
• The other consumption charges decrease with 16% due to the savings in mechanical traction energy and electrical energy used for carrying out certain production work.
REFERENCES
Akullo D, Maat H, Wals AEJ. 2018. An institutional diagnostics of agricultural innovation; public-
private partnerships and smallholder production in Uganda, NJAS - Wageningen J. Life Sciences 84: 6-12, ISSN 1573-5214, https://doi.org/10.1016/j.njas.2017.10.006.
Bucci G, Bentivoglio D, Finco A. 2019. Factors affecting ICT adoption in Agriculture: a case study in Italy. Quality - Access to Success 20 : 122-129.
Hurlin C. 2003. Econométrie des Variables Qualitatives. Polycopié de Cours Maîtrise d’Econométrie, Université d’Orléans
Kalirajan K. Shand R. 2001, Technology and farm performance: paths of productive efficiencies over time. Agricultural Economics, 24: 297-306. https://doi.org/10.1111/j.1574-0862.2001.tb00031.x
1st African Conference on Precision Agriculture | 8-10 December | 2020
27
#7773 THE STATUS OF PRECISION AGRICULTURE AND ITS ADOPTION IN MOROCCO
Rachid Bouabid1, Hakim Boulal2 and Steve Phillips2
1National School of Agriculture of Meknes; 2African Plant Nutrition Institute, [email protected]
ABSTRACT In Morocco, agriculture represents a major economic sector and has known important
changes in the last two decades. Nevertheless, despite the many efforts to improve the agricultural environment and boost productivity, precision agriculture (PA) practices are still in their embryonic stage. Factors affecting PA onset and adoption are multiple, among which (i) the dominance of smallholder farming and the structure of the farms, (ii) the level of farmer’s education, perception and ability to use new technologies, (iii) the affordability of relevant information and specific equipment required, (iv) the lack of training and extension regarding PA, (v) the limited number of PA service providers and their high service cost, (vi) government restrictions on the use of drones for PA purposes, (vii) limited support in previous government strategies for hard PA technologies. PA in Morocco did not reach yet to the level of “adoption”, but still at the level of “presence”. Most farmers are not well informed about PA and its benefits. Few tentatives of soft PA have been initiated in the past but did not attain satisfactory momentum. Soil testing, as a basic classical example for soil fertility assessment and nutrient management, was promoted and subsidised for a long time, but is remain limitedly adopted by farmers on a large scale. Precision irrigation, a vertical approach in precision farming, is an exception that has known particular expansion in Morocco as a result of the efforts by the government for promoting drip irrigation with regard to water scarcity, yet meriting innovative and adapted technologies, especially for small farmers. Sensing-based assessment of soil properties and crop monitoring (drone carried sensors, soil scanners) were recently introduced, but are still in a trial process and their cost is very discouraging, even for large commercial farms. Free online platforms providing vegetation indices are just being discovered and explored by few curious farmers and used to experiment making adjusted nutrient rates (even without adapted equipment). The implementation of digital technologies by the sugar industry for affiliated farmers for sowing, input use, yield monitoring and traceability is a recent success story that merits to be extrapolated to other industrial crops. The present paper raises questions about the factors that delayed the presence and adoption of PA in Morocco and provides insights of its future development. Keywords: precision agriculture, adoption, developing countries, Morocco
INTRODUCTION PA, as an integrated crop management system that uses various tools and technologies for
assessing and monitoring soil and crop spatial variability and for implementing site-specific applications, is considered nowadays in many developed countries a common practice rather than an innovation. On the contrary, in most developing countries, agriculture is still struggling with
1st African Conference on Precision Agriculture | 8-10 December | 2020
28
the basics of farming, and is constrained by many factors, such as land tenure and farm structure, low inputs use, limited farmer’s knowledge, weak extension service and undeveloped markets.
Agriculture, like other industries, is evolving towards a knowledge-based direction. Its development and competitiveness will be highly driven by new technologies. In most developing countries, increasing productivity on small-scale farms is of priority concern and is critical for food security. However, the delay in the introduction, promotion and adoption of new technologies will enlarge the time gap and leave these countries way behind. PA has known a good emergence and a rapid spreading in the USA since late 80s, and has also known in recent years a good take-off in several other countries in Europe, Latin America, China and Australia (Tey and Briandal; 2012; Silva et al, 2015; Kendal et al. 2017, Lowenberg-DeBoer and Erickson, 2019). However, in Morocco, as in similar developing countries, PA is still poorly known, if not unknown at all, among farmers and even among a large community of professionals and decision makers. PA in Morocco
Morocco is a country of which the economy is tightly related to agriculture. Although small holder farms are dominant (about 65%), medium and large size farms play an important role in driving the changes in farming systems and in adopting new technologies. Past government agricultural strategies focused on various segments such as crop diversification, improved input use, adoption of machinery, water management (large infrastructures and in-farm systems), access to financing, etc. Conversion to drip irrigation was among the main targets, especially with regard to water scarcity. Although the ‘Green Morocco Plan’ included multiple actions to boost Moroccan agriculture, the promotion of new technologies, such as PA, was timid. The new ‘Green Generation Strategy 2020-2030’ explicitly addressed such a dimension and is intended to give particular attention in the future to PA and other digital technologies.
To some extent, small farmers have been practicing insentiently various forms of soft PA techniques for a long time. Varying seed and fertilizer rates on slope lands, adjusting manure applications to poor field areas, adapting irrigation water to soil texture, etc. are examples of such use. However, these practices are not to the level of technology and advancement to catch-up with the rapid development expected for a modern agriculture.
Soil testing can help implement appropriate site-specific fertilizer applications if soil sampling takes into consideration within-field zoning and among-field differences. Soil testing has been subsidized (50%) and promoted since early 90s. However, its adoption by farmers remained very limited, until recent years. Despite the overlooking of infield spatial variability required for PA, soil testing remains a good tool for optimizing fertilizer use and increasing productivity.
PA is applied to some extent in high-value crops such as orchards and vignards. Farms with several fields are managing fertilizers and irrigation according soil heterogeneity, varieties, age, expected yield, etc. Within field variability is sometimes taken into consideration and site-specific applications are implemented with available means. Examples include field patches with high pH and high lime causing micronutrient deficiencies, for which site-specific soil application or foliar sprays are used. Segmenting fields for drip irrigation allows variable rate (VR) irrigation (and fertigation) according to crop requirement at various growth stages. This is often automated as the cost of irrigation packages are becoming affordable with government incentives. A smartphone application (IrriSmartOne) was developed recently by a team from the National School of Agriculture to help farmers better manage irrigation water and engage widely in the practice of precision irrigation.

1st African Conference on Precision Agriculture | 8-10 December | 2020
29
At a large-scale mapping, soil fertility assessment was recently implemented over 7 million ha of arable land by a joint public-private partnership. This project enabled developing a country-wide reference soil fertility database, generating spatial variability maps of selected soil parameters, and developing an online DSS platform (fertimap.ma) to help farmers and extensionists make sound fertilizer recommendations for specific crops. Although this project is considered a valuable tool, the coarse resolution of the data does not reflect in-field spatial variability which is the foundation for PA.
In Morocco, PA application in its technological concept is still at an embryonic stage. It is not yet to the level of “adoption”, but still to the level of “presence”. Most farmers are not well informed about it and about its benefits. Few tentatives of soft PA have been initiated in the past but did not reach satisfactory momentum.
The main manufacturer of white sugar in Morocco (Cosumar) engaged in a farmer aggregation process to provide technical and financial support and guaranty the absorption of production. Since 2019, they digitally registered about 80000 farmers to undergo real time monitoring of agricultural practices (sowing, input use, irrigation, etc.), crop growth and yield, as well as the planning of harvest and flow to sugar factories. Soil testing is performed for all farmers and adapted fertilizer recommendations are provided. PA in this example is considering variability among clusters of farmers rather variability within-field.
Sensing based proximal tools using different technologies (contact resistivity, infrared reflectance, passive gamma-ray spectroscopy, etc.) were recently introduced by a couple PA service providers and are in the phase of trials and demonstration in few large commercial farms. These sensors (if well calibrated using soil testing data) have the advantage of providing rapid, direct or indirect, assessment of some soil properties and delivering spatial variability maps for quick PA use. However, their adoption has been delayed by several factors, mainly, their high cost, the required knowledge for information handling, and the unavailability of variable-rate-equipment to implement site-specific nutrient management. Al-Moutmir program of the OCP group recently introduced the SoilOptix tool and is conducting multiple trials in small farm to demonstrate the use of such technology for fertilizer management.
Remote sensing information from satellites or drone-carried sensors, are getting popular among farmers. Free online platforms providing vegetation indices (VI) are being explored by few curious farmers to experiment crop monitoring and make adjusted nutrient rates. The example of the ‘Onesoil’ platform offers reasonable spatial (10m) and temporal (5 days) resolutions NDVIs and generates map files that can be used for VR applications. However, to our knowledge, only two farms in Morocco have GPS guided tractors and VR equipment, and therefore, the use of such platforms remains limited to an overall crop monitoring. Drone flying is subject to very strict licensing in Morocco and therefore remains of limited use.
Although yield mapping using yield monitors have been increasingly used in several developing countries (South Africa, Turkey and Mexico), this practice is still absent in Morocco from both machinery and farmers perspectives. Factors Affecting PA Onset and Adoption in Morocco
The attitude of farmers towards any new technology is strongly driven by the benefits that this technology can provide, mainly increasing profitability with reasonable investments (financial, technical, time & efforts). The net return of any PA technique should offset the costs of dedicated/necessary equipment and software, information and data processing, knowledge upgrade, trained personnel, related services, etc. The question often postulated: ‘Is it worth the

1st African Conference on Precision Agriculture | 8-10 December | 2020
30
hassle’. The logic in this process will differ among farmers, depending on various factors especially linked to their socio-economic and cultural context.
A rapid and unstructured survey with a short list of farmers and professionals revealed that the main factors behind the limited onset and adoption of PA, in its technological concept, are the following:
• Lack of awareness and information: at the level of the farmers, professionals and extensionists
• Perception: PA has been perceived as a practice that requires highly advanced knowhow, hard technologies and heavy investments
• Farm structure: small size and fragmentation of farms (fields) are not in favour of in-field variability-based PA
• Level of education: PA requires a minimum level of training and ability to use computers, process and manage data, understand and manipulate RS information, use smart-apps, etc
• Cost of equipment: packages required for PA (data, equipment, software, etc) are still expensive even for commercial farms. Soft tools are still not available on the market with reasonable prices
• Cost of PA services: only a few service providers are present and their services are expensive and not economically justified
• Constraints on the use of flying objects (drones): the use of drones is subject to severe restriction for use by farmers and service providers
• Lack of trained personnel: limited number of PA specialists • Limited government support: PA has not received much attention in previous Ag-strategies
The Future of PA in Morocco Various soft PATs have been used by small farmers in many developing countries and
showed good promise even in traditional cropping systems (Cook et al., 2003, Mondal et Basu, 2009; Lowenberg-DeBoer and Erickson, 2019). The costs and benefits of using PATs are very complex (Thompson et al. 2018) and would require time to be demonstrated.
PA in Morocco can be promoted and implemented at various scales (spatial, temporal, equipment, etc.) by targeting key agricultural practices, low-cost tools, adapted decision support systems (DSS), extension, data availability, incentives (subsidies) for equipment acquisition, etc.
Future development of PA and its adoption in Morocco needs to take into consideration the local context, mainly farm size and fragmentation, level of education, limited financial means to invest in equipment and other related tools. Farms of less than 20 ha represent about 65% of arable land (20-100 ha: 25% and >100 ha: 10% only). In some regions with a high agricultural potential, PATs would be much easily perceived, implemented and more likely adopted.
PA actions need to be adapted to the various categories of farm holders (Table 1). The spontaneous initiatives need to be capitalized and used to bring new followers. Simple tools (leaf colour charts, handheld sensors, etc.) adopted in countries such as India and South Africa can be tested to help grasp the concept of in-field variability and the practice of site-specific interventions.

1st African Conference on Precision Agriculture | 8-10 December | 2020
31
Table 1. Adapted PA technologies to different farmer categories Small farms (soft PA)
• Simple soil and crop tests, free available remote sensing information, in situ observations field mapping-, low-cost tools and low cost adapted equipment for GNSS and VR applications;
• Easy-to-use smartphone apps and DSS; • Farmer clustering (aggregation, cooperatives, etc.); • Incentives (subsidies) for equipment and related software
Medium and large commercial farms (soft and hard PA)
• Soil fertility mapping (intensive soil testing, proximal soil scanners, etc)
• Remote sensing (free or via service provider) • Yield monitoring system, • GNSS and VRA equipment, • Advanced smartphone apps and DSS
Field demonstrations and pilot projects (by the extension services or business companies)
can play a major accompanying role to show the usefulness and the added-value of PA, train leading farmers as early adopters, and expose other potential followers. To train specialists in PA and related information technologies, academic institutions need to update and tailor their curricula to offer adapted PA programs. Continuing education programs need to be developed for professionals willing to invest in PA tools and services. Relevant information on PATs should be made available to farmers and professionals through appropriate and operative channels (extension programs, social media, agri-fairs, media, etc). The international agricultural Fair of Meknes, visited annually by thousands of farmers and professionals, can serve as a platform for promoting PATs with the effective presence of the industry operating in this segment.
Despite the actual constraints, the future developments of PA technologies and equipment and their affordability, the availability of open-source relevant information, the competitivity among service providers, and the fostering of digital technologies are all factors in favour of better prospects for PA in Morocco. Internet development and the wide use of smartphones by farmers and extension agents would greatly help raising the awareness towards PA. The degree of future adoption will depend on several factors:
• Government support (including subsidies) and promotion of PA (concrete actions of the ‘Green Generation’ strategy)
• Change of perceptions for PA • Availability and/or design of adapted strategies • Market availability and affordability of technologies and services • Increased presence of specialized service providers • Farmer’s organisation • Training, extension and advisory for PA use • Creation of business opportunities for PA technologies and services. • Supporting research and development to develop adapted PATs and assess their feasibility
and benefits.
1st African Conference on Precision Agriculture | 8-10 December | 2020
32
The curve of PA adoption can be timely compressed to reduce the gap of PA development and engage in a rapid adoption with context-fitted solutions.
REFERENCES
Cook SE, O’Brien R, Corner RJ, et al. 2003. Is precision agriculture relevant to developing countries. Proceedings of the 4th European conference on precision agriculture, vol. 115–119. The Netherlands: Wageningen Academic Publishers.
Kendall H, Naughton P, Clark B, Taylor J, Li Z, Zhao C, Yang G, et al. 2017. Precision agriculture in China: Exploring awareness, understanding, attitudes and perceptions of agricultural experts and end-users in China. Adv. Anim. Biosci. 8(2): 703–707.
Lowenberg-DeBoer J, Erickson B. 2019. Setting the Record Straight on Precision Agriculture Adoption. Agronomy Journal 111(4): 1552-1569.
Mondal P, Basu, M. 2009. Adoption of precision agriculture technologies in India and in some developing countries: Scope, present status and strategies. Progress in Natural Science 19: 659–666.
Silva Antolini L, Scare RF, Dias A. 2015. Adoption of precision agriculture technologies by farmers: A systematic literature review and proposition of an integrated conceptual framework. International Food and Agribusiness Management Association Conference. St. Paul, MN, 14–17 June 2015 https://www.ifama.org/resources/files/2015-Conference/1259_paper_Antonlini _precision.pdf (Accessed November 2020).
Tey YS, Brindal M. 2012. Factors influencing the adoption of precision agricultural technologies: A review for policy implications. Prec. Agric. 13: 713–730.
Thompson N, Bir C, Widmar D, Mintert J. 2018. Farmer perceptions of precision agriculture benefits. J. Agric. Appl. Econ. 51: 142–163. doi:10.1017/aae.2018.27
1st African Conference on Precision Agriculture | 8-10 December | 2020
33
#7893 THE ROLES OF KEY PUBLIC SERVICES ON THE ADOPTION OF CLIMATE-SMART AGRICULTURAL TECHNOLOGIES IN COFFEE-BASED FARMING
SYSTEM OF ETHIOPIA
Samuel Diro and Agajie Tesfaye Ethiopian Institute of Agricultural Research; Holeta, Ethiopia
[email protected] /+251920533748
ABSTRACT
This study explored the adoption status of Climate Smart Agricultural (CSA) practices and factors that influenced their adoption including the key public services (education, extension, and communication devices). The study used quantitative primary data collected from smallholder farmers from major coffee-growing regions of the country: Oromia and SNNP. A multivariate probit (MVP) model was used to study factors that influenced the adoption of climate-smart agricultural technologies namely manure application, minimum tillage, intercropping, use of improved forage, and physical soil and water management practices. The effect of the education level of the household head, farmers' extension access, and the role of communication technologies in technology adoption was also observed. The study result showed that 35% of the farmers applied manure on their farm plots. Application of minimum tillage was also experienced by 36% of the farmers. Intercropping, improved forages and, physical soil and water management structures were adopted by 45, 19, and 47% of the farmers, respectively. The findings of the study also revealed the positive and significant effect of education, extension (access to extension services and participation on field days), and ownership of communication devices specifically radio on the adoption of climate-smart agricultural practices. However, more than half of the farming community has not yet adopted improved technologies and practices of these factors. Policymakers and public authorities must pay due attention to problems affecting effective extension service provision. The positive effect of radio ownership on technology adoption also suggests the need for launching more rural FM radio channels to farmers which focus on the provision of agricultural information and knowledge. Keywords: climate-smart, extension, forage, intercropping, manure, and multivariate
INTRODUCTION
Adoption starts from knowing the existence of any improved technologies or practices.
Thus, awareness is the main factor that affects the adoption of agricultural technologies. Next to awareness, farmers analyze to try or wait for the use of technologies which is highly affected by the education level of the household. However, the role of education, extension, and communication devices such as radio is neglected in different adoption studies. This study stresses to show the effects of these variables on the adoption of different climate-smart agricultural practices. The purpose of the study was to investigate the role of education, extension, and communication on the adoption of climate-smart agricultural technologies in the coffee-based farming system of Ethiopia. Moreover, the study was anticipated to explore demographic, socio-economic, and institutional factors affecting the adoption of climate-smart agricultural
1st African Conference on Precision Agriculture | 8-10 December | 2020
34
technologies, study climate-smart agricultural technologies' adoption status and analyze the interrelationship between the adoptions of different climate-smart agricultural technologies.
MATERIALS AND METHODS
Study Area and the Data
The study used quantitative primary data collected from smallholder farmers from major coffee-growing regions of the country: Oromia and SNNP. Gedeo, Sidama, Kafa, and Sheka zones from the SNNP region and Ilubabor, Jimma, West Wollega, and Kellem Wollega zones from the Oromia region were coffee-producing zones selected for the study. Sampling and Data Collection A multistage sampling technique was employed to select the population for the study which involved both purposive and random sampling techniques. A total of 953 sample households were selected for the study (584 from SNNP and 369 from Oromia Regions). Data was collected from the sampled households through a structured questionnaire administered. Data Analysis
Descriptive statistics were used to describe the collected and cleaned data. A multivariate probit (MVP) model was also used to factors that influenced the adoption of climate-smart agricultural technologies (Minimum Tillage, Manure Application, and Physical Soil and Water Management Practices). Farmers adopt a mix of technologies to enhance declining soil fertility and mitigate climate change. This implies that the adoption decision is inherently multivariate, and attempting univariate modeling would exclude useful economic information about interdependent and simultaneous adoption decisions (Dorfman, 1996). Ignoring these interdependencies can lead to inconsistent policy recommendations (Marenya and Barrett, 2007). Thus, the use of a multivariate probit model is vital.
RESULTS AND DISCUSSION
Farm Household Characteristic
The descriptive result of the study showed of the total sample, 61% of farmers fall under SNNP and the rest 39% was from the Oromia region. About 90% of farmers were male-headed households. Farmers' mean age was 42.6 years with a minimum of 21 and a maximum of 90 years. The average family size of the respondents was 6.3 families. The minimum education level of the household head was 0 and the maximum was 12 years with a mean of 4.8 years. The mean distance from homestead to farm plots was 2.6 km with a maximum of 11 km. About 54 and 37% of farmers have access to radio and credit, respectively. More than 85% of farmers have also access to the extension of soil and water management which is really better despite the quality of the services. However, only 24% of farmers have participated in field days. About 25% of farmers also participated in off-farm income-generating activities. The mean total land in the study area was 1.8 hectares. Study area farmers also have on average 4.2 tropical livestock units (TLU). Coffee is the main cash crop in the study area. The study result showed 60% of farmers have adopted improved coffee varieties.

1st African Conference on Precision Agriculture | 8-10 December | 2020
35
Adoption Patterns of Climate-smart Agricultural Practices The study result showed that 34 and 37% of farmers in the SNNP and Oromia regions use
manure on their farmland, respectively. The use of minimum tillage was higher at SNNP than in the Oromia region with an overall mean of 36%. About 20 and 61% of farmers in the Oromia and SNNP regions used intercropping, respectively (mean = 45%). Only 9% of farmers in Oromia and 25% in SNNP regions used improved forage. The result also exhibited that 49% of respondents in the Oromia region use physical soil conservation structures which are higher as compared to the SNNP region (44%). On average, 47% of respondents used soil and water conservation structures on their land along the study regions (Figure 1).
Figure 1. Adoption status of climate-smart agricultural technologies Econometric Result
The pairwise coefficients of intercropping and manure application, use of improved forage and manure application, physical soil and water conservation and manure application, physical soil and water conservation and minimum tillage, use of improved forage and intercropping, physical soil and water conservation and intercropping and physical soil and water conservation and the use of improved forage are revealed to be positively and significantly correlated indicating complementarity among the paired practices. However, the pairwise coefficient of minimum tillage and manure application was negative and significant which implies the substitutability of the improved paired practices. Factors Affecting Manure Application
A positive and significant relation was seen between household head age and the application of manure. The result is consistent with Ketema and Bauer, (2011). Family size negatively and significantly affects the use of manure. The result is contrary to Tao et al., (2014) who found a positive relationship between family size and manure application. Distance from homestead to farm plots also affects the use of manure negatively and significantly due to the bulky nature of manure which hampers the transportation of manure to the further plots. The result is in line with Mesfin et al., (2016). Access to natural resource management extension affects the application of manure positively and significantly. The result is in line with Makokha et al., (2001) and Abebe and Debebe, (2019). Likewise, participation in field days affects the application of
Manure Minimum tillage Intercropping Improved forage PSWconservation
Oromia 37 24 20 9 49SNNP 34 44 61 25 44Overall 35 36 45 19 47
010203040506070
Perc
enta
ge o
f far
mer
s (%
)
Oromia SNNP Overall

1st African Conference on Precision Agriculture | 8-10 December | 2020
36
manure positively and significantly. TLU or livestock ownership affects the use of manure positively and significantly. The result corroborates with Mesfin et al., (2016). The result also showed a positive and significant relationship between manure application and participation in off-farm income generation activities. The result contrasts with Makokha et al., (2001) where a negative relationship between manure application and participation in off-farm income-generating activities was found. Factors Affecting the Use of Minimum Tillage
The age of the household head affects the adoption of minimum tillage negatively. The finding is in line with Ketema and Bauer (2012) and Prakash et al., (2018) and contrasts with Grabowski et al., (2014). The relationship between minimum tillage adoption and mean distance to farm plots was also positive which corroborates with the finding of Zulu-Mbata et al., (2016). The education of the household head affects the adoption of minimum tillage positively and significantly. The result agrees with Ketema and Bauer (2012), Grabowski et al., (2014), and Prakash et al., (2018). Radio ownership of the household head affects the adoption of minimum tillage positively and significantly as information from radio enhances the adoption of improved technologies. Besides, farmers who have access to natural resource management extension services are more likely to use minimum tillage. The result is in line with Ketema and Bauer, (2012), Marenya et al., (2017), and Prakash et al., (2018). Participation in field days also affects the adoption of minimum tillage positively and significantly. These three communications and extension services enhance the information exchange on improved agricultural technologies. Land size affects the adoption of minimum tillage positively and significantly. Grabowski et al., (2014), Ngoma et al., (2014), Zulu-Mbata et al., (2016), and Prakash et al., (2018) also found the same result. Marenya et al., (2017) also found a positive relationship between minimum tillage use and land size in Ethiopia which contrasts with the finding of the study in Kenya and Tanzania. Factors Affecting the Use of Intercropping
The age of the household heads and participation in off-farm income-generating activities affect the adoption of intercropping positively and significantly. Female-headed households also use intercropping than male-headed households. The negative relationship between credit access and adoption of intercropping. Both education and participation in field days affect the adoption of intercropping positively and significantly which witnessed the positive role of education and extension on the adoption of agricultural technologies. The positive relationship between the use of intercropping and access to extension service agree with Ketema and Bauer, (2012). Land size and adoption of improved coffee varieties also affect the adoption of intercropping negatively and significantly due to the subsistence nature of intercropping, which is also in line with Ketema and Bauer, (2012). An increase in family size also enhances farmers to use of intercropping. The result also corroborates with Ketema and Bauer, (2012) and contrast with Ekepu and Tirivanhu, (2016). The negative relation between TLU and adoption of intercropping showed that those farmers who use intercropping have a small land size and they do not have space to rear livestock. Factors Affecting the Adoption of Improved Forage
Female-headed households have less likely to adopt improved forage than male-headed counterparts. Female household heads are resource-poor especially land. Thus, they opt to plant other crops than forage to feed their family member. The education level of the household head affects the adoption of improved forage positively and significantly which is also agreeing with

1st African Conference on Precision Agriculture | 8-10 December | 2020
37
Lapar and Ehui, (2003). Extension on natural resource management is directly related to the adoption of improved forage which is in line with Beshir, (2014) and Abebe et al., (2018). Both education and extension services affect the adoption of agricultural technologies positively through enhancing the search, evaluation, decision, and utilization of new information. Mean distance from farm plots has a negative and significant effect on the adoption of improved forage. Forage is a new technology for farmers and farmers plant the grasses in and around the homestead. The result is consistent with Abebe et al., (2018). TLU also affects the adoption of improved forage positively. The result also supports the finding of Beshir (2014). Coffee improved variety adoption affects the adoption of improved forage positively and significantly. Factors Affecting the Adoption of Physical Conservation Structures
Source of information and knowledge such as ownership of radio and access to extension services affect the adoption of physical soil and water conservation structures positively and significantly. The positive relationship between the adoption of soil and water conservation structures and extension service was also found by Birhanu and Meseret, (2013); Damtew et al., (2015); Asfaw and Neka, (2017); Issahaku and Abdulai, (2019) and Wordofa et al., (2020). Better exposure to education increases farmers’ better understanding of the benefits and constraints. However, the result contrasts with Belachew et al., (2020). Construction of physical soil and water conservation structures is capital, time, and labor-intensive. Both coffee variety adoption and TLU which help the farmer to generate more income have positively and significantly affected the adoption of physical soil and water conservation structures. The result is consistent with Nigussie et al., (2015); Issahaku and Abdulai, (2019), and Belachew et al., (2020).

1st African Conference on Precision Agriculture | 8-10 December | 2020
38
Table 1. Factors affecting adoption of climate-smart agricultural practices
Variables Manure Application
(MA)
Minimum Tillage (MT)
Intercropping
(IC)
Improved Forage
(IF)
Physical soil and water
Management (PM)
Region [SNNP] -0.045 (0.094)
0.726*** (0.095)
0.950*** (0.100)
0.944*** (0.124)
-0.400*** (0.097)
Sex [Female] 0.042 (0.154)
0.052 (0.155)
0.378** (0.160)
-0.529** (0.223)
-0.118 (0.153)
Household head age in completed years
0.007*
(0.004) -0.009** (0.004)
0.007* (0.004)
0.002 (0.005)
0.003 (0.004)
Household head education in completed years
0.016 (0.013)
0.037*** (0.013)
0.049*** (0.014)
0.060*** (0.016)
0.007 (0.014)
Family size in number -0.039**
(0.019) -0.015 (0.019)
0.069*** (0.021)
0.013 (0.022)
-0.000 (0.020)
Mean distance from farm plots in km
-0.006* (0.027)
0.137*** (0.026)
-0.015 (0.028)
-0.051* (0.031)
-0.028 (0.027)
Access to natural resource management extension [Yes]
0.491***
(0.135) 0.478*** (0.141)
-0.055 (0.144)
0.325* (0.168)
1.034*** (0.128)
Participation on field days [Yes]
0.372***
(0.105) 0.226** (0.103)
0.211* (0.113)
0.192 (0.123)
0.178 (0.115)
Radio ownership [Yes] 0.100 (0.091)
0.216** (0.090)
0.096 (0.096)
0.007 (0.109)
0.211** (0.094)
Tropical Livestock Units (TLU) in numbers
0.011* (0.012)
-0.019 (0.012)
-0.067*** (0.013)
0.059*** (0.013)
0.038*** (0.013)
Total land in hectares -0.039 (0.030)
0.099*** (0.029)
-0.091*** (0.034)
-0.051 (0.034)
-0.027 (0.031)
Improved coffee adoption [Yes]
-0.154*
(0.090) 0.025
(0.089) -0.183* (0.095)
0.032** (0.109)
0.334*** (0.092)
Household credit access [Yes]
-0.231**
(0.089) 0.067
(0.090) -0.207** (0.097)
0.032 (0.107)
0.001 (0.093)
Off-farm income-generating activities [Yes]
0.401***
(0.102) -0.151 (0.104)
0.528*** (0.112)
-0.024 (0.121)
0.048 (0.108)
Constant -0.801***
(0.307) -1.067*** (0.310)
-1.868*** (0.332)
-4.156*** (0.437)
-0.332 (0.311)
Number of draws = 5; Number of observations = 918; Wald chi2(70) = 668.57; Prob > chi2 = 0.000 Estimated covariance of the correlation matrix rhoMTMA = -0.158(0.053) *** rhoICMA = 0.227(0.054) *** rhoIFMA = 0.141(0.060) ** rhoPMMA = 0.220(0.054) *** rhoICMT= -0.019(0.056)
rhoIFMT = 0.009(0.059) rhoPMMT = 0.118(0.055) ** rhoIFIC = 0.077(0.061) rhoPMIC = 0.202(0.057) *** rhoPMIF = 0.265(0.061) ***
Note: Numbers in the parenthesis is standard error *** (P < 0.01); ** (P < 0.05); * (P < 0.10).

1st African Conference on Precision Agriculture | 8-10 December | 2020
39
CONCLUSIONS AND POLICY INTERVENTION
The study found a positive and significant effect of education, extension (extension services and participation on field days), and communication (ownership of radio) on the adoption of climate-smart agricultural practices. Thus, policymakers and public authorities must pay due attention to problems affecting effective farmers-extension linkage. Extension service is beyond expert assistance in the improvement of production and marketing. It also enables a flow of information and the transfer of knowledge and scientific findings. The agricultural extension workers have an effective and important role in helping farmers solve agricultural problems. Thus, extension workers must have a wide knowledge of various agricultural disciplines and they should have the ability to deal with farmers. The farmers' training center system which is partially functioning currently should also be strengthened to its full capacity. The positive effect of radio ownership on technology adoption also suggests launching FM channels to farmers which initially focuses on the provision of agricultural information and knowledge.
REFERENCES
Abebe A, Hagos A, Alebachew H, Faji M. 2018. Determinants of adoption of improved forages
in selected districts of Benishangul-Gumuz; Western Ethiopia. Tropical Grasslands-Forrajes Tropicales 6(2):104–110.
Abebe G, Debebe S. 2019. Factors affecting use of organic fertilizer among smallholder farmers in Sekela district of Amhara region, Northwestern Ethiopia. Cogent Food and Agriculture 5: 1, 1669398.
Asfaw D, Neka M. 2017. Factors affecting adoption of soil and water conservation practices: The case of Wereillu Woreda (District), South Wollo Zone, Amhara Region, Ethiopia. International Soil and Water Conservation Research 5(4): 273-297.
Belachew A, Mekuria W, Nachimuthu K. 2020. Factors influencing adoption of soil and water conservation practices in the northwest Ethiopian highlands. International Soil and Water Conservation Research 8: 80-89.
Beshir H. 2014. Factors affecting the adoption and intensity of use of improved forages in North East Highlands of Ethiopia. American Journal of Experimental Agriculture 4(1): 12-27.
Birhanu A, Meseret D. 2013. Structural Soil and Water Conservation Practices in Farta District, North Western Ethiopia: An Investigation on Factors Influencing Continued Use. Science, Technology and Arts Research Journal 2(4): 114-121.
Damtew AA, Maru HA, Mesfin DA. 2015. Determinants of adopting techniques of soil and water conservation in Goromti Watershed, Western Ethiopia. Journal of Soil Science and Environmental Management 6(6): 168-177.
Dorfman JH. 1996. Modelling multiple adoption decisions in a joint framework. American Journal of Agricultural Economics 78: 547-557.
Ekepu D, Tirivanhu P. 2016. Assessing socio–economic factors influencing adoption of Legume-based multiple cropping systems among smallholder Sorghum farmers in Soroti, Uganda. South African Journal of Agricultural Extension 44(2): 195 –215.
Grabowski PP, Kerr JM, Haggblade S, Kabwe S. 2014. Determinants of Adoption of Minimum Tillage by Cotton Farmers in Eastern Zambia. Indaba Agricultural Policy Research Institute (IAPRI); Working Paper 87, Lusaka, Zambia.

1st African Conference on Precision Agriculture | 8-10 December | 2020
40
Issahaku G, Abdulai A. 2019. Adoption of climate-smart practices and its impact on farm performance and risk exposure among smallholder farmers in Ghana. Agricultural and Resource Economics 64(2): 396-420.
Ketema M, Bauer S. 2011. Determinants of Manure and Fertilizer Applications in Eastern Highlands of Ethiopia. Quarterly Journal of International Agriculture 50(3): 237-252.
Ketema M, Bauer S. 2012. Factors Affecting Intercropping and Conservation Tillage Practices in Eastern Ethiopia. Agris on-line Papers in Economics and Informatics 4(1): 21-29.
Lapar M, Ehui S. 2003. Adoption of dual-purpose forages: some policy implications. Tropical Grasslands 37: 284 –291.
Makokha S, Kimani S, Mwangi W, Verkuijl H, Musembi F. 2001. Determinants of Fertilizer and Manure Use in Maize Production in Kiambu District, Kenya. Mexico, D.F. International Maize and Wheat Improvement Center (CIMMYT) and Kenya Agricultural Research Institute (KARI).
Marenya PP, Barrett CB. 2007. Household-level determinants of adoption of improved natural resources management practices among smallholder farmers in Western Kenya. Food Policy 32: 515–536.
Marenya, PP., K., Menale, J., Moti, Rahut, DB., Erenstein, O. 2017. Predicting minimum tillage adoption among smallholder farmers using micro-level and policy variables. Agricultural and Food Economics; 5(12): 1-22.
Mesfin M, Ahmed M, Abady S. 2016. Determinants of multiple groundnut technology adoption in Eastern Ethiopia. Review of agricultural and applied economics 19 (2): 51-60.
Ngoma H, Mulenga BP, Jayne TS. 2014. What explains minimal use of minimum tillage in Zambia: Evidence from District representative data. IAPRI working paper # 82. Lusaka, Zambia: Indaba Agricultural Research Institute.
Nigussie M, Sisay M, Yesuf J, Ketema H. 2015. Physical soil and water conservation structures: adoption and challenges to smallholder farmers in southern Ethiopia. International Journal of Current Research 7(8): 19233-19245.
Prakash JA, Bahadur DR, Maharjan S, Erenstein O. 2018. Factors affecting the adoption of multiple climate-smart agricultural practices in the Indo-Gangetic Plains of India. Natural Resources Forum 42: 141-158.
Tao H, Morris T, Bravo-Ureta B, Meinert R. 2014. Factors Affecting Manure Applications as Directed by Nutrient Management Plans at Four Connecticut Dairy Farms. Agronomy Journal: Agronomy, Soils & Environmental Quality 106(4): 1420-1426.
Wordofa MG, Okoyo EN, Erkalo E. 2020. Factors influencing adoption of improved structural soil and water conservation measures in Eastern Ethiopia. Environmental System Research 9(13): 1-11.
Zulu-Mbata O, Chapoto A, Hichaambwa M. 2016. Determinants of Conservation Agriculture Adoption among Zambian Smallholder Farmers Indaba Agricultural Policy Research Institute Working Paper 114 Lusaka, Zambia. PP: 25.

1st African Conference on Precision Agriculture | 8-10 December | 2020
41
APPLICATIONS FOR UAVS
1st African Conference on Precision Agriculture | 8-10 December | 2020
42
#7465 CASHEW TREES DETECTION AND YIELD ANALYSIS USING UAV-BASED MAP
Thierry Roger Bayala1*, Issouf Ouattara2*, Sadouanouan Malo1 and Arto Visala2
1LAMDI (Laboratoire d’Algèbre, de Mathematiques Discretes et Informatiques), Université Nazi Boni, Bobo Dioulasso, Burkina Faso, [email protected] 2Autonomous Systems research group, Department of Electrical Engineering and Automation, School of Electrical
Engineering, Aalto University, Espoo, Finland, [email protected]
ABSTRACT
In this study we developed a novel method to detect cashew trees in an orthophoto map derived from images collected by an unmanned aerial vehicle (UAV). We also suggest a way in which these detections can be used to analyze the yield of the cashew farm. The proposed method uses images analysis to find the tops of trees, to merge different tops located on the same tree, and to segment individual tree. The segmented trees are used in a deep learning framework to know the exact location of cashew trees. The preliminary cashew detection from UAV-based map is promising.
This study can be interesting for developing countries where UAV system are nowadays gaining popularity in agriculture. Given that our method does not require any additional sensor other than the RGB camera onboard the UAV, this low-cost solution is suitable for small and medium cashew farmers. The developed method can also be extended to other types of trees, other than the cashew.
INTRODUCTION
Native to brazil, cashew was brought to Africa due to its qualities of adaptation to difficult
soil and climatic conditions. It has therefore been used in several regions of Africa as a species of reforestation since the 1970s. In the 1990s, its world production declined due to the decline in production in India. This situation has led the government of Burkina Faso to emphasize the production of cashew. Engaging more than 45.000 households with 35.000 tones/year, cashew is nowadays one of the most exported horticulture crops in the country (Issa et al. 2017).
One of the big challenges faced by farmers and institutions is to predict the yield with accuracy. The early estimation of the yield is crucial for field management in term of fertilizer and pesticide application in agriculture in general (Geipel et al. 2014), and cashew farming, in particular. An accurate yield estimate is also important for governmental institutions to accurately measure the impact of cashew production and take adequate political decisions. Several approaches have been introduced for yield prediction of species such as corn, wheat, soybean, etc. These approaches include ground-based field surveys, remote sensing-based methods, or environmental factors techniques (Vuong et al. 2018; Bresilla et al. 2018; Geipel et al. 2014; Wang et al. 2014; Mu et al. 2014; Yang et al. 2019; Maimaitijiang et al. 2020). In Burkina Faso, the yield estimation process is carried out manually and therefore not precise enough.
In this work we show a new approach to identify cashew trees using deep learning model. We also propose a model for estimating the yield.

1st African Conference on Precision Agriculture | 8-10 December | 2020
43
MATERIALS AND METHODS
Data Collection and Pre-processing In this study, images have been collected using the DJI Phantom 4 pro v2 drone and the
DJI Inspire 1 drone. Both vehicles have a flight time of approximatively 30 minutes. The image size from the camera is 5472x3648 for the Phantom 4 pro v2 drone, and 4000x3000 for the Inspire 1.
Figure 1. Study area (11°07'35.5"N and 2° 05'52.5"W), image generated using google earth online.
The images have been collected in Léo which is a rural town located in the province of
Sissili in Burkina Faso. The study area is marked in Fig. 1. The total mapped area is 11.53 hectares. The images have been collected at the same flight altitude of 36 meters. A total of 1221 images have been collected using four different flight missions.
The collected images are combined in a structure from motion and photogrammetry scheme using the Agisoft Metashape Professional v1.5.5 software (Agisoft 2019). From this process, an orthophoto, a digital surface model (DSM), and digital terrain model (DTM) are produced. The DSM is produced from the point cloud generated from the collected images. It represents the earth surface and everything on it. The DTM is generated by first classifying the point cloud into ground points and non-ground points. Only the ground points are used to generate the DTM which represents the bare-earth surface. All data in this study are generated using the reference frame WGS 84/ UTM zone 30N (EPSG:32630).
Individual Tree Identification
The individual tree identification (ITD) method in this study follows the steps used in the study by (Issouf et al. 2020). Here, we present the most important aspects of the method. For more detail refer to (Issouf et al. 2020; Mohan et al. 2017; Baena et al. 2017). We also present some of the differences adopted in this study.

1st African Conference on Precision Agriculture | 8-10 December | 2020
44
Using a canopy high model (CHM) computed as the difference between the DSM and the DTM, a local maximum filter is used with fixed window size to find the points which are on the upper surface of each trees. The result of this process is a set of points representing the top part of the trees in the map.
In the study in (Issouf et al. 2020), the trees which were detected are coniferous trees which have conic shape and the maximum filter in this case generally results in a single point representing the top of the tree. In this study, the trees of concern are deciduous trees which have partially a locally flat top surface. Therefore, a maximum filter algorithm will detect several points on the top of the trees. These points, on the same tree, need to be grouped together in order to be effectively used in a subsequent watershed segmentation algorithm to segment out the individual trees. To group several points on the same tree, we use a simple but effective heuristic detailed in the Algorithm 1.
These points representing the tops of the individual trees are used as markers in a marker-
controlled watershed segmentation algorithm to segment out individual trees in the map (Myer and Beucher 1990; Meyer 2012). The segmented trees are used in the subsequent detection step to separate the cashew trees from non-cashew trees. Cashew Tree Detection
To separate the cashew trees from the non-cashew trees in the orthophoto map covering an area of more than 11 hectares, a deep learning detection algorithm is used with the results of the watershed segmentation algorithm. A pure classification algorithm could also be used to simply
1st African Conference on Precision Agriculture | 8-10 December | 2020
45
classify the segmented trees from the orthophoto map. This might however introduce errors because the segmentation results might have several trees segmented as one tree.
The Faster R-CNN with Inception v2 deep neural network architecture is used as done in (Issouf et al. 2020). As explained in this study, using the detection algorithm on the segmented tree images has an advantage over a pure classification. If the segmented tree image contains both the cashew and other tree species the detection algorithm can correctly identify the cashew tree while the classification algorithm might not. Using the individual segmented tree images for detection has an advantage because, there is no need to apply a classification or detection all over the entire orthophoto map. This helps to avoid going through parts of the orthophoto map that obviously do not contain any tree.
The deep learning detection algorithm is implemented, trained, and tested using the python programming language and the TensorFlow object detection API (Huang et al. 2016). A pre-trained model is used to speed up the training and to avoid the problem of overfitting given the limited number of annotated images (Yamashita et al. 2018). Yield Estimation
For each detected cashew tree, the height and the true area (geographic area) can be respectively estimated from the CHM and the detection process. Using the height and the surface area, we suggest the use of a K-Nearest Neighbors (KNN) algorithm to estimate the yield of a given cashew tree. This is, however, only possible if there is enough ground truth data which can serve as training data. These ground truth data can be collected with farmers from current and historical yield. In this study, these data are not available to validate the KNN algorithm, and therefore the result of the yield estimation is not presented. In addition to the surface area value and the heigh of the cashew tree, other parameters such as the location, the type of soil, the year of production, etc could also be used in the KNN algorithm in order to account for local environmental effect and the time effect in the yield estimation.
RESULTS
In the previous Section, the material and method have been presented. The aerial vehicle
platforms used for the data collection have been also presented. The method consists of individual tree identification step which uses a maximum filter analysis and a watershed segmentation algorithm, and a deep learning detection algorithm.
The result of fusing the detected points using the Algorithm 1 is presented. Using the maximum filter analysis several points are detected at the upper surface of each tree. In order to segment the tree as a single tree using the watershed segmentation algorithm, these points are merged so that for each tree only one point is used to represent its top. A sample of the result of the fusion is shown in Fig. 2. Using the merged points as markers in the marker-controlled watershed segmentation, the trees are segmented, and the result is shown in Fig 3. It can be seen that in many cases, individual trees are segmented. However, in some other cases, group of trees are segmented as one tree. This happens because the trees are too closed to each other and have comparative height.
The segmented trees are cropped with a margin from the map and the resulting images are used as input to the deep learning algorithm. Parts of these images (from an area of the overall map) have been used for training the neural network. After the training, the images from another part of the map are used to test the neural network. Fig. 4 shows the detection result. In this figure,

1st African Conference on Precision Agriculture | 8-10 December | 2020
46
the yellow patches represent the original segmented trees from the individual tree identification step. The reddish patches represent the result of the detection of the cashew trees. The deep learning model can effectively detect the cashew trees among other types of trees. Even when the cashew tree belongs to a segmented patch which contains another species of tree, the detection algorithm can still find the cashew tree. This is an advantage over a simple classification technique on the segmented patch.
The detection model is also tested with another dataset which has been collected five months earlier (in May 2020) on a portion of the same site. The result is shown in Fig. 5. It can be seen from this result that the model is able to effectively detect the cashew trees. This result is important because it shows the proposed method is effective on dataset taken at different time and in different conditions.
CONCLUSIONS AND FUTURE WORK
In this study, a method for detecting cashew trees and estimating the yield have been presented. The process for detecting the cashew trees includes an individual tree identification and a deep learning detection step. The proposed method can effectively detect the cashew trees among other trees. The area of the detected trees can be computed because the orthophoto is georeferenced. This area along with the heigh can be used in a KNN algorithm for yield estimation for each tree.
In the future work, the accuracy of our proposed detection method can be better accessed by using ground truth data. Yield data can also be collected to not only train the KNN algorithm (hyperparameter selection) but also evaluate its performance.
Fig 2: local maximum detection and merging result. The points in the blue rectangles best illustrate the merging result.
Fig 4: The detection result
Fig 3: The marker-controlled watershed segmentation result
Fig 5: The detection result of cashew trees. Yellow patches represent non-cashew trees, the reddish patches are the detected cashew trees.

1st African Conference on Precision Agriculture | 8-10 December | 2020
47
ACKNOWLEDGEMENTS
Through the contribution of authors Issouf Ouattara and Arto Visala, this work is indirectly supported by the Strategic Research Council at the Academy of Finland Through Integrated Disruptive Technologies of 3D Digitalization, Robotics, Geospatial Information and Image Processing/Computing - Point Cloud Ecosystem” (project decision numbers 293389 and 314312).
FasoDrone (www.fasodrone.com) is also acknowledge for contributing in the data collection and putting computing resources for this study.
REFERENCES
Agisoft R. LLC. 2019. St. Petersburg, Agisoft metashape user manual, professional edition, ver.
1.5 [On-line]. https://www.agisoft.com/pdf/metashape-pro_1_5_en.pdf. Baena S, Moat J, Whaley O, Boyd DS. 2017. Identifying species from the air: UAVs and the very
high-resolution challenge for plant conservation, PLOSONE 12(11): 1–21, DOI:10.1371/journal.pone.0188714.
Bresilla K, Perulli GD, Boini A, Morandi B, Grappadelli LC, Manfrini L. 2018. Using Deep Learning - Convolutional Naural Networks (Cnns) For Real-Time Fruit Detection in Trees, 14th International Conference on Precision Agriculture.
Geipel J, Link J, Claupein W. 2014. Combined spectral and spatial modeling of corn yield based on aerial images and crop surface models acquired with an unmanned aircraft system. Remote Sens. 6: 10335–10355.
Huang J, Rathod V, Sun C, Zhu M, Korat-tikara A, Fathi A, Fischer I, Wojna Z, Song Y, Guadarrama S, Murphy K 2016. Speed/accuracy trade-offs for modern convolutional object detectors, CoRR, http://arxiv.org/abs/1611.10012.
Issa W, et al. 2017. Diseases of Cashew Nut Plants (Anacardium Occidentale L.) in Burkina Faso, Advances in Plants and Agriculture Research 6 (February) 7.
Issouf O, Heikki H, Arto V. 2020. Drone based mapping and identification of young spruce stand for semiautonomous cleaning, preprint accepted for IFAC World Congress.
Maimaitijiang M, Sagan V, Sidike P, Hartling, S, Esposito F, Fritsch F. 2020. Soybean yield prediction from UAV using multimodal data fusion and deep learning. Remote Sensing of Environment 237: 1. doi:10.1016/j.rse.2019.111599
Meyer F, Beucher S. 1990. Morphological segmentation, Journal of Visual Communication and Image Representation 1(1): 21–46. https://doi.org/10.1016/1047-3203(90)90014-M.
Meyer F. 2012. The watershed concept and its use in segmentation: A brief history, CoRR, http://arxiv.org/abs/1202.0216.
Mohan M, Silva CA, Klauberg C, Jat P, Catts G, Cardil A, Hudak AT, Dia M. 2017. Individual tree detection from unmanned aerial vehicle (UAV) derived canopy height model in an open canopy mixed conifer forest, Forests, vol. 8, no. 9, 2017, ISSN: 1999-4907. [Online]. https://www.mdpi.com/1999-4907/8/9/340.
Mu H, Zhou L, Dang X, Yuan B. 2019. Winter Wheat Yield Estimation from Multitemporal Remote Sensing Images based on Convolutional Neural Networks, 10th International Workshop on the Analysis of Multitemporal Remote Sensing Images (MultiTemp), Shanghai, China, pp. 1-4, DOI: 10.1109/Multi-Temp.2019.8866918.
Ngo VM, Le-Khac N-A, Kechadi M-T. 2018. An Efficient Data Warehouse for Crop Yield Prediction, 14th International Conference on Precision Agriculture.
1st African Conference on Precision Agriculture | 8-10 December | 2020
48
Wang L, Tian Y, Yao X, Zhu Y, Cao W. 2014. Predicting grain yield and protein content in wheat by fusing multi-sensor and multi-temporal remote-sensing images. Field Crop Res. 164: 178–188.
Yamashita R, Nishio M, Do R, Togashi K. 2018. Convolutional neural networks: An overview and application in radiology, Insights into Imaging 9: 611 –629.
Yang S, Hu L, Wu H, Fan W, Ren H. 2019. Estimation Model of Winter Wheat Yield Based on UAV Hyperspectral Data, IGARSS 2019 - 2019 IEEE International Geoscience and Remote Sensing Symposium, Yokohama, Japan, pp. 7212-7215, DOI: 10.1109/IGARSS.2019.8898839.

1st African Conference on Precision Agriculture | 8-10 December | 2020
49
#7657 AUTONOMOUS HEXACOPTER SPRAYING DRONES FOR PLANTS PROTECTION
Abbes Kailil1, Hassan Benaouda2, Abdelhakim Mohsine3,
1 Eng. Doctor in aerospace engineering, Moroccan Industry Services & Engineering SARL, Morocco. 2 Eng. Doctor in Agriculture, National Institute of Agriculture Research (INRA),
Morocco. 3 Engineer in agriculture, National Office of Agriculture Extension (ONCA), Morocco. [email protected], [email protected], [email protected]
ABSTRACT
Farming technologies have considerably evolved over the last decades considering new agricultural problems and constraints. This paper discusses a Moroccan project based on autonomous spraying drones developed during the last three years in collaboration between Moroccan Industry Services & Engineering company, the INRA institute and the ONCA office. The main purposes of this project is to assist Moroccan farmers improve their performance and enhance their efficiency using chemicals to withstand different diseases, increase crop yields (crops and orchards) and monitor their growth. Also, using our drones helped farmers during the last two years protect themselves and the environment from chemicals and reduce the use of water. Many operations and tests have been carried out in cooperation with the two departments (INRA and ONCA) to highlight the efficiency of our system and to develop new processes together considering this new technology. This paper gives an overview of different experiences conducted, the main results obtained and the technical descriptions of our hexacopter.
INTRODUCTION
Precision agriculture and digital tools are becoming the pillar parameters for an agriculture
that withstand to all constraints and climate changes. The use of agricultural inputs including fertilizers, plant protection chemicals and water, is increasing considerably and it is becoming important to optimize their use in order to protect humans and environment. Currently the chemical treatments are done through sprayers dragged by tractors or on small vehicles or by plane in case of large areas. These conventional methods can be very time-consuming and energy-non-efficient, polluting and non-water-efficient. They can also cause damage especially at advanced stages of cultivation. The spraying drone greatly reduces time and cost of treatment, water consumption based on low volume technology ensuring a stable and high yield, crops need balanced, consistent fertilization and continuous maintenance. It also allows immediate access to the parcels for the treatment of large crops after the rains fall and after irrigation, especially for clay soils with difficult access. The use of spraying drones could be the ideal solution for hard-to-reach crops (rice, sugar cane, corn, rapeseed, sunflower). This paper deals with technical characteristics of our hexacopter (Moroccan Agriculture Spraying Drone MASD-M6) from design to flight tests and highlights the most important operational phases during the last two years.

1st African Conference on Precision Agriculture | 8-10 December | 2020
50
Design and Manufacturing First Phase: the main purpose was to design and manufacture hexacopter drone achieving all performance parameters mainly the stability and thrust subsystem. Three prototypes were realized before reaching the final version.
During these stages we focused on structure mechanical strength and configuration and the flight stability. We used a Linear Quadratic Regulator controller to establish an efficient control law which satisfies a given specification and maintains sufficient stability and accuracy even under the strong effects of intrinsic parameters uncertainties.
In the next step we will adapt the fractional controller to enhance the stability performances and reduce the energy consumption.
In order to reduce the weight and increase the capacity of the drone in term of chemical payload, we decided to choose the carbon fiber material for the 90% of the structure and all other parts are made from Aerospace Aluminum. Second Phase: After flight and crash tests, we started working on the spraying system and nozzles configurations. Two main categories were adopted: pressure and electrostatic nozzles.
• Pressure nozzles for crops

1st African Conference on Precision Agriculture | 8-10 December | 2020
51
• Electrostatic nozzles for orchard Two pumps are mounted in order to ensure the pressure and flow rates during the spraying
operations. The main performances of MASD-M6 drone are:
• Payload capacity: 25 liters • Spraying area/hour: 8-10 ha
Spraying Operation and Chemical Treatments
Since the final version of the hexcopter drone was tested and approved we started spraying operations in collaboration with our clients.
The spraying program was supported by our two main partners INRA and ONCA. In this way, during 2019 year we have treated:
• more than 3,000 hectares of rice, • more than 1000 hectares of sunflower • more than 1000 hectares of olive trees • more than 500 hectares of citrus • more than 200 hectares of sugar canes • more than 200 hectares of corn • more than 200 demonstrations and tests.
As such, in order to raise awareness among all stakeholders about the benefits and added values of these drones, we organized several awareness and scientific field days in partnership with all our partners. We cite as an example:
• In partnership with INRA a National Scientific Conference: Smart Agriculture. • In partnership with the province of SIDI KACEM: Field day with official use of
drones for wheat treatment with the presence of major agricultural departments (ONCA, DRA, ORMVA, Associations, etc.).
During these operation two main objectives were defined: • the efficiency of the treatments • the droplets distribution and density

1st African Conference on Precision Agriculture | 8-10 December | 2020
52
CONCLUSIONS
MASD-M6 drone is an autonomous hexacopter spraying drone for agriculture chemical treatments. This project aims to develop R&D and scientific research rather than helping Moroccan farmers to enhance their efficiencies and improve spraying methods while protecting environment and humans from chemicals.
In this project, an aerial spraying system with a capacity of 25-liter tank was designed and manufactured. Field experiments were carried out in order to apply pesticide in agriculture. The results are excellent and meets the farming constraints and chemical spraying optimal objectives.
However, in order to improve the main performance parameters of the drone many research programs were developed to continue increasing the stability against the wind effect and spraying efficiencies in different conditions.
REFERENCES Gundlach J. 2012. Designing Unmanned Aircraft Systems: A Comprehensive Approach, Aurora
Flight Sciences Manassas, Virginia. Kailil A, Mrani M. 2004. Low Earth-orbit satellite attitude stabilization with fractional regulators,
International Journal of Scientific Sciences. Krishna KR. 2018. Agricultural drones a peaceful pursuit, Tylor & Francis, Apple Academic press
Inc. Quan Q. 2017. Introduction to multicopter design and control, Springer, Singapore.

1st African Conference on Precision Agriculture | 8-10 December | 2020
53
CLIMATE SMART AGRICULTURE

1st African Conference on Precision Agriculture | 8-10 December | 2020
54
#7883 CLIMATE SMART AGRICULTURE: CHALLENGES AND OPPORTUNITIES TO PROMOTE THE SYSTEM IN ETHIOPIA
Getachew Agegnehu and Tilahun Amede
International Crops Research Institute for the Semi-Arid Tropics (ICRISAT), Addis Ababa, Ethiopia, [email protected]
ABSTRACT
Agriculture is vital to the Ethiopian economy and its development has significant implications for food security and poverty reduction. Yet, the substantial reliance of the sector on rain-fed systems has made it vulnerable to variability in rainfall, temperature, and climate change. Climate-smart agriculture (CSA) is a viable alternative, which combines climate change and food security through the integration of adaptation and mitigation measures. Two strategies are important in the process of climate-friendly agricultural management: agricultural practices can mitigate climate changes by reducing greenhouse gas (GHG) emissions, adapting agriculture to the noticeable changes through the development of soil and water management, sustainable crop production, and livestock management. Adaptation to climate change is a major challenge for Ethiopia. A significant portion of the population is still dependent on highly climate-sensitive agriculture. Long drought spells during the small rainy season, increased temperatures, and torrential rains during summer have caused serious distress to agriculture-dependent communities in many locations. Climate change adaptation interventions needs to be implemented if achieving food security and promoting sustainable agriculture to end poverty is to be realized. The drought-prone areas in the country are likely to experience more intense and irregular rainfall, affecting yields of late maturing crops, and posing challenges to vulnerable pastoral and agro-pastoral populations. If CSA is to be applicable for farmers, cross-disciplinary research and development supported by policy and socio-economic contexts are essential to transform smallholder agriculture. Keywords: Adaptation, climate change, climate smart agriculture, mitigation, sustainable agriculture
INTRODUCTION
Agriculture is still the key sector to meeting the basic needs and livelihoods of most people, but meeting the food demand for a growing population has been a formidable challenge for the sector. The sector is dominated by smallholder subsistence agriculture, largely rain-fed dependent and most vulnerable to climate change, and responsible for the supply of 95% of agricultural produce (EPCC 2015), with limited contribution of irrigated agriculture. It is characterized by low input-output production systems due to low adoption of improved technologies, inadequate capacity of the agricultural extension service, low adaptive capacity of smallholder farmers to climate change and limited financial resources for investment in climate change adaptation and mitigation measures to sustainably increase productivity and income, enhance resilience and reduce the adverse effects of climate change. If the business as usual approach is continued, climate change may decrease GDP by 8-10% by 2050 but if adaptation actions are applied these losses

1st African Conference on Precision Agriculture | 8-10 December | 2020
55
could be reduced by half (CIAT:BFS/USAID 2017). The development and dissemination of improved agricultural technologies are the major driving factors for increasing the productivity and commercialization of smallholder farming in the country.
Increasing agricultural productivity in a sustainable way to meet the growing demand of the growing population, while at the same time to adapt to and reduce the GHG emissions are the three interlinked challenges that the agriculture sector need to overcome. To address these challenges, agricultural production and food systems should undergo a complete transformation from subsistence farming to a more productive and commercial agriculture through adoption of CSA. CSA is a strategy to address the challenges of climate change and food security by sustainably increasing productivity, strengthening resilience to adapt to and reduce GHG emissions and thereby enhancing the achievement of national food security and development goals (FAO 2010). Policy imperatives for CSA include the need to increase crop yields, feed a growing population, mobilize investments to farmers and reduce GHG emissions. CSA differs from the conventional approaches as it emphasizes the capacity to implement flexible, context-specific solutions, backed by innovative policy and financing instruments. CSA represents a combination of practices that have been used in environmental ecology, conservation, climate change, and agriculture (Lipper et al. 2018). However, the relationship between agriculture and climate change is not well understood. The dual relationship between climate change and agriculture has been apparent through scientific assessments of the Intergovernmental Panel on Climate Change (IPCC) and policy reviews of development agencies (Parry et al. 2007). Agricultural systems contribute to and are influenced by climate change, with the majority of impacts being felt by developing countries. Thus, CSA is accepted globally as a feasible approach to transform and protect the agriculture sector to sustainably increase productivity, enhance resilience and reduce GHG emissions.
RESULTS AND DISCUSSION
Climate Change
Climate change affects all sections of a society, but the degree of vulnerability of each group within a community varies based on resource possession or wealth status, gender, age and location. In Ethiopia, total annual GHG emission has been estimated to be 144 Mt CO2eq (including emissions from land-use change and forestry), approximately 0.3% of global emissions, while per capita emissions are low, amounting to 2 tons of CO2eq annually (World Bank 2016). The agricultural sector in the country is a major contributor to national emissions, approximately 60% of total emissions. Since Ethiopia has the largest livestock population in Africa (FAO 2016), most of the agricultural GHG emissions emanate from livestock-related activities (CH4 and N2O emissions from enteric fermentation and manure, respectively), which account for almost 92% of agricultural emissions. Thus, the livestock sub-sector is the major emitter of methane (CH4) while the crop sub-sector mainly releases nitrous oxide (N2O) due to application of N fertilizer (IPCC 2007). As indicated in Fig. 1, most emissions from the forest sector are associated with deforestation due to agricultural land expansion (FAO 2016), implying that land-use change also contributes to emissions of CO2 and N2O. Thus, mitigation measure is very relevant on the reduction of CH4 and N2O, which are the major gases emitted from the agriculture sector.
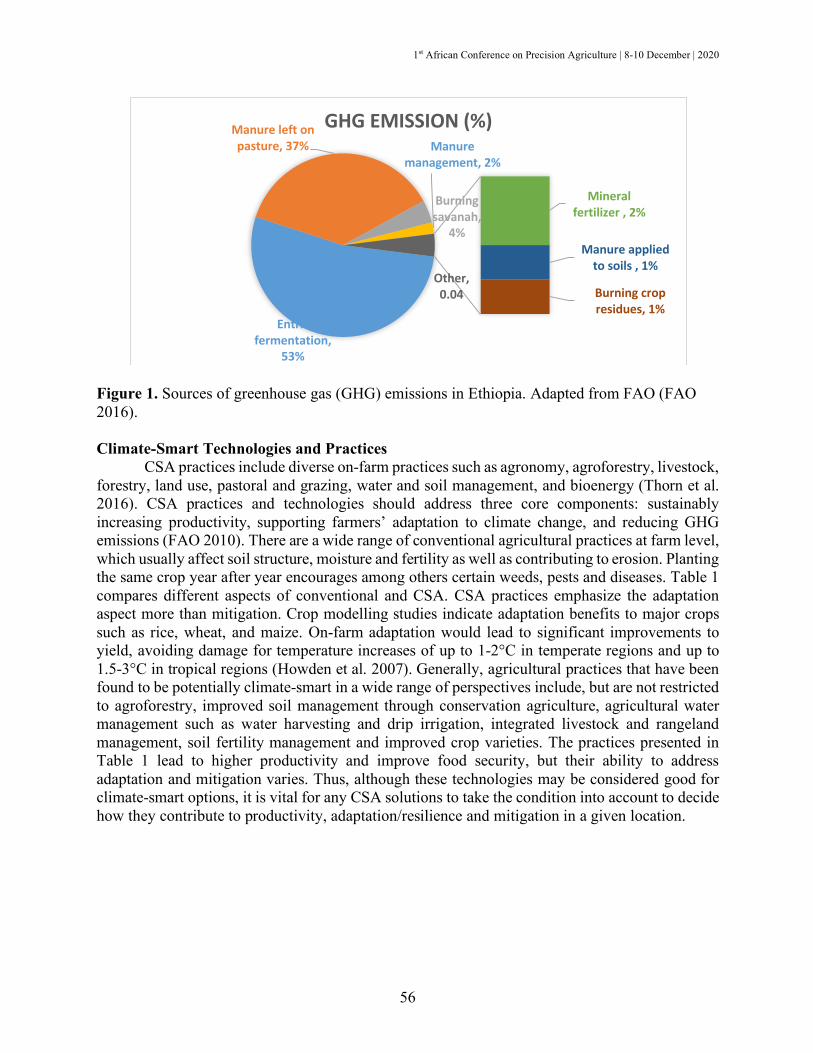
1st African Conference on Precision Agriculture | 8-10 December | 2020
56
Figure 1. Sources of greenhouse gas (GHG) emissions in Ethiopia. Adapted from FAO (FAO 2016). Climate-Smart Technologies and Practices
CSA practices include diverse on-farm practices such as agronomy, agroforestry, livestock, forestry, land use, pastoral and grazing, water and soil management, and bioenergy (Thorn et al. 2016). CSA practices and technologies should address three core components: sustainably increasing productivity, supporting farmers’ adaptation to climate change, and reducing GHG emissions (FAO 2010). There are a wide range of conventional agricultural practices at farm level, which usually affect soil structure, moisture and fertility as well as contributing to erosion. Planting the same crop year after year encourages among others certain weeds, pests and diseases. Table 1 compares different aspects of conventional and CSA. CSA practices emphasize the adaptation aspect more than mitigation. Crop modelling studies indicate adaptation benefits to major crops such as rice, wheat, and maize. On-farm adaptation would lead to significant improvements to yield, avoiding damage for temperature increases of up to 1-2°C in temperate regions and up to 1.5-3°C in tropical regions (Howden et al. 2007). Generally, agricultural practices that have been found to be potentially climate-smart in a wide range of perspectives include, but are not restricted to agroforestry, improved soil management through conservation agriculture, agricultural water management such as water harvesting and drip irrigation, integrated livestock and rangeland management, soil fertility management and improved crop varieties. The practices presented in Table 1 lead to higher productivity and improve food security, but their ability to address adaptation and mitigation varies. Thus, although these technologies may be considered good for climate-smart options, it is vital for any CSA solutions to take the condition into account to decide how they contribute to productivity, adaptation/resilience and mitigation in a given location.
Entric fermentation,
53%
Manure left on pasture, 37%
Burning savanah,
4%
Manure management, 2%
Mineral fertilizer , 2%
Manure applied to soils , 1%
Burning crop residues, 1%
Other, 0.04
GHG EMISSION (%)

1st African Conference on Precision Agriculture | 8-10 December | 2020
57
Table 1. Comparison of conventional and climate smart agriculture. Aspects Conventional agriculture Climate-smart agriculture Technologies Conversion of energy sources from
human to animal and fossil fuel dependent machinery.
Use of energy efficient technologies for agricultural power (such as for irrigation water pumping or tillage). Reduces amount of energy use in land preparation.
Agricultural inputs
Increased use of fertilizer, pesticides and herbicides (also highly dependent on fossil fuels), and inefficiently applied
Enhanced efficiency of fertilizer. Optimum supply of soil nutrients over time and space matching to the requirements of crops with the right product, rate, time and place.
Land areas Expansion of agricultural land area through deforestation and conversion from grasslands to cropland.
Intensification on existing land areas as main source of production increase rather than expansion to new areas. Promote carbon sequestration including sustainable land use management.
Natural resources
Depletion of natural resources (e.g. land, water, genetic resources), which are used in the production systems.
Restoration, conservation and sustainable use of natural resources in agricultural production systems. Promote carbon sequestration including sustainable land use management.
Production and marketing
Increased specialization in agricultural production and marketing systems.
More diversification in production, input and output marketing systems.
Summary of key climate-smart agricultural practices Crop management
Livestock management
Soil and water management
Conservation agriculture
Agroforestry Food energy systems
• Intercropping with legumes
• Crop rotations • New crop
varieties • Improved
storage and processing techniques
• Greater crop diversity
• Improved feeding strategies
• Rotational grazing
• Fodder crops • Grassland
restoration and conservation
• Manure treatment
• Improved livestock health
• Animal husbandry improvements
• Contour planting
• Terraces and bunds
• Planting pits
• Water storage
• Dams, ponds, ridges
• Improved irrigation system (e.g. drip)
• Minimum tillage
• Crop residue retention as permanent soil cover.
• Crop rotation or association (intercropping)
• Balanced application of mineral and organic fertilizers
• Boundary trees and hedgerows
• Nitrogen-fixing trees on farms
• Multipurpose trees
• Improved fallow with fertilizer shrubs
• Woodlots • Fruit
orchards
• Biogas • Production
of energy plants
• Improved energy saving stoves
Conservation Agriculture
Conservation agriculture (CA) was introduced by the FAO (FAO 2008) as a concept for resource-efficient agricultural crop production based on integrated management of soil, water, and biological resources combined with external inputs. CA is an approach to farming which can
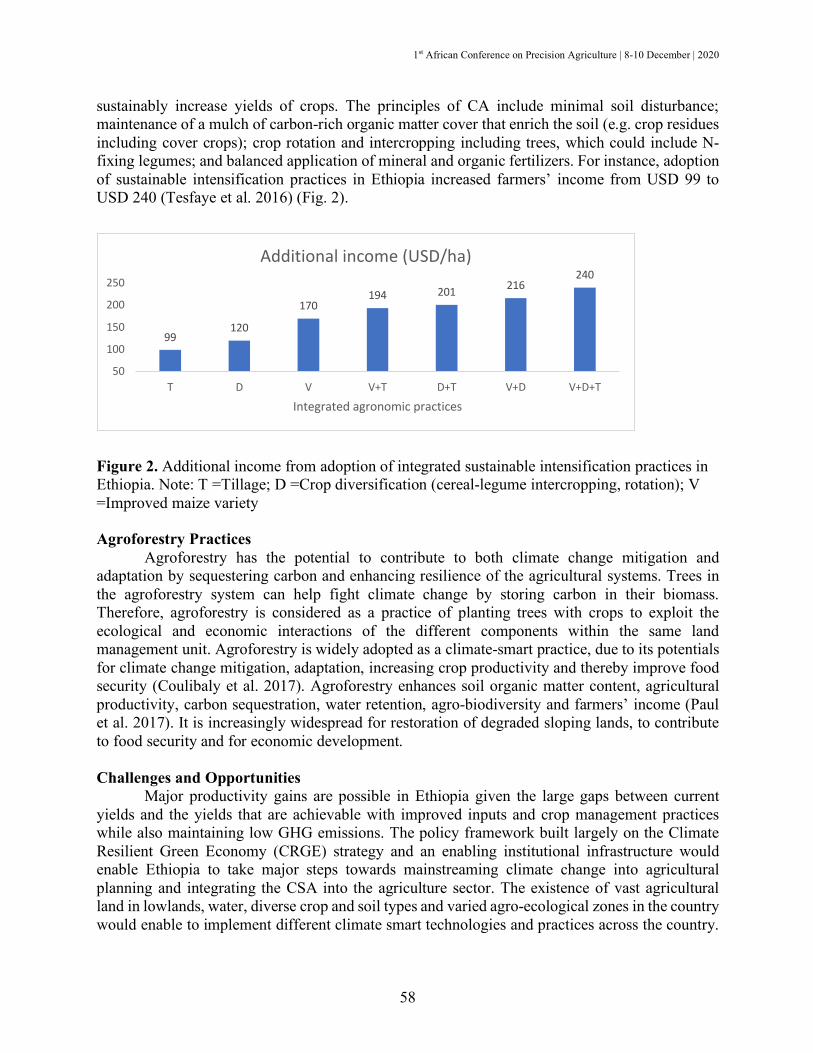
1st African Conference on Precision Agriculture | 8-10 December | 2020
58
sustainably increase yields of crops. The principles of CA include minimal soil disturbance; maintenance of a mulch of carbon-rich organic matter cover that enrich the soil (e.g. crop residues including cover crops); crop rotation and intercropping including trees, which could include N-fixing legumes; and balanced application of mineral and organic fertilizers. For instance, adoption of sustainable intensification practices in Ethiopia increased farmers’ income from USD 99 to USD 240 (Tesfaye et al. 2016) (Fig. 2).
Figure 2. Additional income from adoption of integrated sustainable intensification practices in Ethiopia. Note: T =Tillage; D =Crop diversification (cereal-legume intercropping, rotation); V =Improved maize variety Agroforestry Practices
Agroforestry has the potential to contribute to both climate change mitigation and adaptation by sequestering carbon and enhancing resilience of the agricultural systems. Trees in the agroforestry system can help fight climate change by storing carbon in their biomass. Therefore, agroforestry is considered as a practice of planting trees with crops to exploit the ecological and economic interactions of the different components within the same land management unit. Agroforestry is widely adopted as a climate-smart practice, due to its potentials for climate change mitigation, adaptation, increasing crop productivity and thereby improve food security (Coulibaly et al. 2017). Agroforestry enhances soil organic matter content, agricultural productivity, carbon sequestration, water retention, agro-biodiversity and farmers’ income (Paul et al. 2017). It is increasingly widespread for restoration of degraded sloping lands, to contribute to food security and for economic development.
Challenges and Opportunities
Major productivity gains are possible in Ethiopia given the large gaps between current yields and the yields that are achievable with improved inputs and crop management practices while also maintaining low GHG emissions. The policy framework built largely on the Climate Resilient Green Economy (CRGE) strategy and an enabling institutional infrastructure would enable Ethiopia to take major steps towards mainstreaming climate change into agricultural planning and integrating the CSA into the agriculture sector. The existence of vast agricultural land in lowlands, water, diverse crop and soil types and varied agro-ecological zones in the country would enable to implement different climate smart technologies and practices across the country.
99120
170194 201 216
240
50
100
150
200
250
T D V V+T D+T V+D V+D+T
Integrated agronomic practices
Additional income (USD/ha)

1st African Conference on Precision Agriculture | 8-10 December | 2020
59
The presence of trained and skilled human power in the agriculture sector at different levels is also another opportunity to successfully implement CSA.
The major challenges include shortage of relevant CSA technologies and practices; Weak coordination among stakeholders working on CSA; lack of regulatory framework for implementation of policies and strategies for CSA; low adoption of CSA practices due to poor dissemination and awareness creation mechanisms; and Shortage of finance and facilities. Poor accessibility, inadequate technology multiplication and supply, unaffordability of the CSA technologies and practices are also main challenges for implementation and dissemination of CSA practices.
CONCLUSIONS
The gaps in technology adoption and yield are yet very high in Ethiopia despite concerted
efforts to increase production and productivity through the use of improved agricultural technologies and practices. There are a number of interplaying challenges from technology to farmers’ capacity to use climate smart practices to boost production and productivity in the changing climate. Most importantly, there is inadequate use of agricultural technologies and improved practices in crops, livestock, and NRM. Minimum requirements need to be set for packaging CSA practices based on farming systems, agroecology, choices of agricultural enterprises and access to the market. Agro-ecological based and local-specific research and development approach has been followed for years for demonstration and scaling up of agricultural technologies. Without adoption of CSA technologies and innovations, farming communities in Ethiopia will not be able to deal with the effects of climate change and variabilities. The issue of CSA practices has to receive due attention in an effort to ensure sustainability of the rural livelihood system and food security goal of the country in the face of climate change. Thus, current and emerging policies need to include options to facilitate and accelerate uptake and scaling up strategies of CSA, and to be informed by research to achieve this.
REFERENCES
CIAT:BFS/USAID. 2017. Climate-Smart Agriculture in Ethiopia. CSA Country Profiles for
Africa Series. International Center for Tropical Agriculture (CIAT); Bureau for Food Security, United States Agency for International Development (BFS/USAID), Washington, D.C. 26 p.
Coulibaly JY, Chiputwa B, Nakelse T, Kundhlande G. 2017. Adoption of agroforestry and the impact on household food security among farmers in Malawi. Agricultural Systems.155:52-69.
EPCC. 2015. First assessment report, working group II agriculture and food security. Addis Ababa, Ethiopia.
FAO. 2008. Investing in Sustainable Agricultural Intensification: The Role of Conservation Agriculture Rome.
FAO. 2010. Climate-smart’agriculture: Policies, practices and financing for food security, adaptation and mitigation. Rome.
FAO. 2016. Ethiopia Climate-Smart Agriculture Scoping Study. Rome: Food and Agriculture Organization of the United Nations (FAO). Rome. Available at: www.fao.org/3/a-i5518e.pdf.

1st African Conference on Precision Agriculture | 8-10 December | 2020
60
Howden SM, Soussana J-F, Tubiello FN, Chhetri N, Dunlop M, Meinke H. 2007. Adapting agriculture to climate change. Proceedings of the national academy of sciences.104:19691-19696.
IPCC. 2007. Agriculture. In Climate change 2007: Mitigation. Working Group III Contribution to the Fourth Assessment Report of the Intergovernmental Panel on Climate Change (IPCC). In: Cambridge University Press.
Lipper L, McCarthy N, Zilberman D, Asfaw S, Branca G. 2018. Climate Smart Agriculture. Natural Resource Management and Policy.52:2018.
Parry ML, Canziani OF, Palutikof JP, Van Der Linden PJ, Hanson CE. 2007. IPCC, 2007: climate change 2007: impacts, adaptation and vulnerability. Contribution of working group II to the fourth assessment report of the intergovernmental panel on climate change. Cambridge Uni-versity Press, Cambridge, UK.
Paul C, Weber M, Knoke T. 2017. Agroforestry versus farm mosaic systems–Comparing land-use efficiency, economic returns and risks under climate change effects. Science of the Total Environment.587:22-35.
Tesfaye K, Cairns J, Kassie M, Misiko M, Stirling C, Abate T, Prasanna B, Mekuria M, Hailu H, Bahadur Rahut D. Potential for taking climate smart agricultural practices to scale: Examples from Sub-Saharan Africa. Proceedings of the Symposium on Climate Change Adaptation in Africa; 2016.
Thorn JP, Friedman R, Benz D, Willis KJ, Petrokofsky G. 2016. What evidence exists for the effectiveness of on-farm conservation land management strategies for preserving ecosystem services in developing countries? A systematic map. Environmental Evidence.5:13.
World Bank. 2016. World Development Indicators: Ethiopia. World Bank, Washington D.C.

1st African Conference on Precision Agriculture | 8-10 December | 2020
61
#7927 CHANGES IN CLIMATIC FACTORS LEAD TO THE CHANGE IN CULTURAL
WEDGING OF RICE IN THE IVORIAN PRE-FOREST ZONE
Y.C. Brou, D.A. Kouassi, K.P-M. Kouakou, and E-O. Tienebo Research and Innovation Unit in Agronomic Sciences and Rural Engineering,
Félix HOUPHOUËT-BOIGNY National Polytechnic Institute,Yamoussoukro, Côte d'Ivoire. [email protected]
ABSTRACT
Climate change in the pre-forest zone of Cote d'Ivoire has led to a mismatch between cropping periods and new seasons, challenging the sowing periods usually recommended for rainfed rice cultivation in this area. Our study aims to determine the optimal sowing period for two rainfed rice varieties cultivated in this pre-forest zone of the country. The agro-climatic analysis carried out over the period 1980-2017 allowed to determine the optimal dates for sowing rice, which ensures, with the maximum probability, the crop's water satisfaction over its entire cycle. This analysis showed that for an annual probability of success over 80%, the optimal sowing period ranges from March 22 to April 26 for the 120-day average cycle rainfed rice variety and, from March 27 to May 11, for the 100-day short cycle rainfed rice variety. These periods allow a good water supply for the crop's first cycle, but it is not possible to implement a second cycle with the same water supply levels in this area.
INTRODUCTION
Rice (Oryza sativa) is a staple food for the whole Ivorian population. The overall use of rice in Cote d'Ivoire in 2011, compared with 1960, was tenfold increased to 1.43 million tons, with about 50% of domestic demand not covered by the national production (Bahan et al. 2012; JICA and JAICAF 2013). Consequently, Cote d'Ivoire relies on massive importations to satisfy the local demand for rice.
In response to this issue, the country is engaged in an ambitious National Rice Sector Development Program in order to achieve food self-sufficiency (ONDR, 2012). Emphasis has been focused on rainfed rice which occupies 86% of the cultivated areas and contributes to 80% of the national paddy production (Zingore et al. 2014). However, rice productivity is still low and strongly constrained by the adverse effects of climate changes in the study region where the bimodal four-season rainfall regime is gradually being replaced by a monomodal two-season rainfall regime (Diomandé et al. 2017).Therefore, an update of the cropping calendar is needed for the development of rainfed rice cultivation in this area. This study aims to address this problem by determining the optimal sowing period for rainfed rice grown in the pre-forest zone of Cote d'Ivoire.
MATERIALS AND METHODS

1st African Conference on Precision Agriculture | 8-10 December | 2020
62
The department of Yamoussoukro (latitude 6.85 North; longitude 5.29 West; altitude 214 m) is the study area.
Two categories of data were used in this study: climatic and agronomic data. Daily climate data over 38 years (1980 to 2017) were supplied by the SODEXAM weather Station in Yamoussoukro (latitude North 6.90; longitude East -5.37). The ETP (Potential Evapotranspiration) values for the area were calculated using the Penman-Monteith formula (Allen et al. 1998).
Agronomic data consist first in soil water capacity (RU), and rhizosphere water holding capacity (RUR) estimated at 70 mm.
In this study, one medium-cycle of 120 days (IDSA 85) and one short-cycle of 100 days (Nerica 1) varieties were used. For these two rice varieties, there are four major growing phases, and each one is characterized by a crop coefficient Kc that determines the phase water requirements (Allen 2000).
The agro-climatic analysis approach was used in this study to determine the favorable sowing period and the optimal sowing period for rice. The optimal sowing period ensures, with the maximum probability, that both water requirements for the emergence and those for crop's development and growth (Lhomme and Monteny 1981), particularly the heading-flowering and maturation phases, are achieved.
The good water supply conditions for the heading-flowering and maturation phases were determined from the rainfed rice water requirements index I defined by Frère (1987), whose values should be greater than or equal to 95. Indeed, Frère (1987) developed a method for estimating the index I of satisfaction of crop water needs in countries where water is a limiting factor in rainfed agriculture. Index I expresses the degree to which the plant's cumulative water requirements have been achieved at a given phase or for the entire growing cycle.
The water balance is based on a relatively simple principle. At the beginning of the rainy season, the index I was assigned the value 100 on the assumption that at sowing time, the water content in the soil is higher than the water requirements of the plants. I value decreases as soon as water stress occurs. In the event of a water deficit (Di), the I index is reduced by the percentage of this deficit in relation to the total water requirements for the season (TMR).
If (Ei/Di) < 0 then I_i=I_(i-1)-(E_i/D_i ×100)/TMR, with TMR = Kci ×ETP (1) If 0 ≤ Ei/Di ≤ 100 then Ii = Ii-1.
Kci: crop coefficient of the plant at a phenological stage and a given decade or pentad i (Dancette 1983); ETPi: potential evapotranspiration of the decade or pentad I; and Ei: excess water in the soil of the decade or pentad i.
In the event of excess water in the soil of more than 100 mm, considered as excess water harmful to the plant, the index will be reduced by three units.
If (Ei /Di) > 100, then Ii = Ii-1 - 3 (2)
Depending on the frequency level, we have cases of excellent (I=100%), good (95≤ I ≤ 99), moderate (80 ≤ I ≤ 94), mediocre (60 ≤ I ≤ 79) and poor (50 ≤ I ≤ 59) water supply (Sarr 2007; Sarr et al. 2012).
The analysis of the evolution, as a function of sowing dates, of the likelihood of dry sequences occurring for more than ten days during the 30 days following sowing, as well as the evolution of the likelihood of good water supply conditions in the heading-flowering and

1st African Conference on Precision Agriculture | 8-10 December | 2020
63
maturation phases enabled to determine the optimal period for the sowing of rainfed rice in the study area.
The optimal sowing period was determined graphically from the intersection of three curves: (i) the evolution curve, as a function of sowing dates, of the likelihood of dry sequences exceeding ten days occurring, 30 days after sowing of rainfed rice, (ii) the evolution curve, as a function of sowing dates, of the likelihood of good water supply conditions (I ≥ 95) of the heading-flowering phase, and (iii) the evolution curve, as a function of sowing dates, of the likelihood of good water supply conditions occurring (I ≥ 95) in the maturation phase
RESULTS AND DISCUSSION
Optimal Sowing Period for Average Cycle Rainfed Rice of 120 Days
From the intersection of the three curves (Figure 1), the optimum period for sowing rainfed rice of 120 days ranges from March 22 to April 26 with a probability of success greater than 80%. Sowing between March 22 and April 26 will provide a good water supply for a 120-day variety of rainfed rice in more than 80% of the years.
Fig 3 Graphical determination of the optimal sowing period for average cycle rainfed rice by the intersection of the three curves I: index I of satisfaction of crop water needs at a given phase or for the entire growing cycle; ss: dry sequences
Figure 1. Graphical determination of the optimal sowing period for average cycle rainfed rice by the intersection of the three curves. I: index I of satisfaction of crop water needs at a given phase or for the entire growing cycle; ss: dry sequences. Optimal Sowing Period for Short-Cycle Rainfed Rice of 100 Days
For rainfed rice of 100 days, according of the intersection of the three curves (Figure 2), the optimum period for sowing ranges from March 27 to May 11. Sowing made in this period will provide a good supply of water for a 100-day variety of rainfed rice with more than 80% of success.
0
10
20
30
40
5060
70
80
90
100
1-Ja
n
21-J
an
10-F
eb
2-M
ar
22-M
ar
11-A
pr
1-M
ay
21-M
ay
10-J
un
30-J
un
20-J
ul
9-A
ug
29-A
ug
18-S
ep
8-O
ct
28-O
ct
17-N
ov
7-D
ec
27-D
ec
Prob
abili
ties
(%)
Flowering with I ≥ 95Maturity with I ≥95Probabilities ss >10Pr=80
Optimal sowing period (Pr > 80 %) Dates of sowing
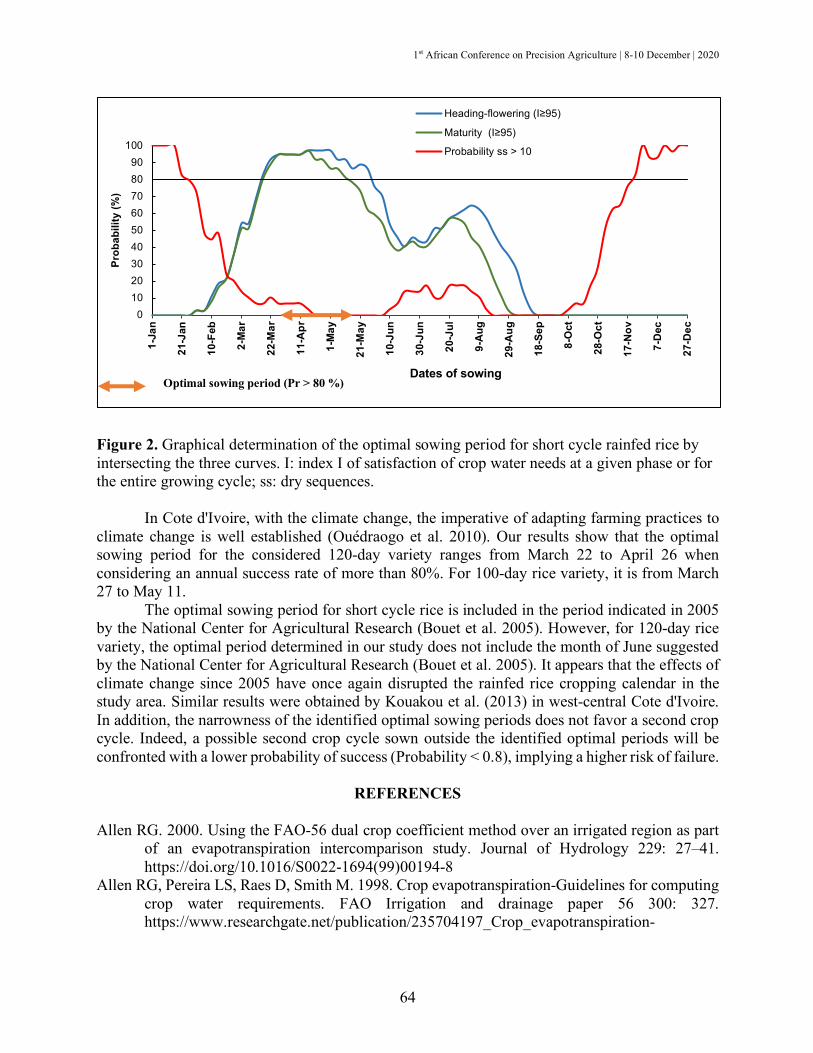
1st African Conference on Precision Agriculture | 8-10 December | 2020
64
Figure 2. Graphical determination of the optimal sowing period for short cycle rainfed rice by intersecting the three curves. I: index I of satisfaction of crop water needs at a given phase or for the entire growing cycle; ss: dry sequences.
In Cote d'Ivoire, with the climate change, the imperative of adapting farming practices to
climate change is well established (Ouédraogo et al. 2010). Our results show that the optimal sowing period for the considered 120-day variety ranges from March 22 to April 26 when considering an annual success rate of more than 80%. For 100-day rice variety, it is from March 27 to May 11.
The optimal sowing period for short cycle rice is included in the period indicated in 2005 by the National Center for Agricultural Research (Bouet et al. 2005). However, for 120-day rice variety, the optimal period determined in our study does not include the month of June suggested by the National Center for Agricultural Research (Bouet et al. 2005). It appears that the effects of climate change since 2005 have once again disrupted the rainfed rice cropping calendar in the study area. Similar results were obtained by Kouakou et al. (2013) in west-central Cote d'Ivoire. In addition, the narrowness of the identified optimal sowing periods does not favor a second crop cycle. Indeed, a possible second crop cycle sown outside the identified optimal periods will be confronted with a lower probability of success (Probability < 0.8), implying a higher risk of failure.
REFERENCES
Allen RG. 2000. Using the FAO-56 dual crop coefficient method over an irrigated region as part
of an evapotranspiration intercomparison study. Journal of Hydrology 229: 27–41. https://doi.org/10.1016/S0022-1694(99)00194-8
Allen RG, Pereira LS, Raes D, Smith M. 1998. Crop evapotranspiration-Guidelines for computing crop water requirements. FAO Irrigation and drainage paper 56 300: 327. https://www.researchgate.net/publication/235704197_Crop_evapotranspiration-
0102030405060708090
1001-
Jan
21-J
an
10-F
eb
2-M
ar
22-M
ar
11-A
pr
1-M
ay
21-M
ay
10-J
un
30-J
un
20-J
ul
9-A
ug
29-A
ug
18-S
ep
8-O
ct
28-O
ct
17-N
ov
7-D
ec
27-D
ec
Prob
abili
ty (%
)
Dates of sowing
Heading-flowering (I≥95)
Maturity (I≥95)
Probability ss > 10
Optimal sowing period (Pr > 80 %)

1st African Conference on Precision Agriculture | 8-10 December | 2020
65
Guidelines_for_computing_crop_water_requirements-FAO_Irrigation_and_drainage_paper_56
Bagnouls F, Gaussen H. 1957. Les climats biologiques et leur classification. Annales de Géographie 66: 193–220. https://www.jstor.org/stable/23443505
Bahan F, Kéli J, Yao-Kouamé A, et al. 2012. Caractérisation des associations culturales à base de riz (Oryza sp): cas du Centre-Ouest forestier de la Côte d’Ivoire. Journal of Applied Biosciences 56: 4118–4132. http://m.elewa.org/JABS/2012/56/8.pdf
Dancette C. 1983. Estimation des besoins en eau des principales cultures pluviales en zone soudano-sahélienne. L’agronomie tropicale 38: 281–294. https://www.africabib.org/rec.php?RID=186059507
Diomandé M, Dongo K, Koné B, et al. 2017. Vulnérabilité de l’agriculture pluviale au changement de régime pluviométrique et adaptation des communautés rurales du «V-Baoulé» en Côte d’Ivoire. African Journal of Science and Technology 8: 8–16. https://www.sifee.org/static/uploaded/Files/ressources/actes-des-colloques/niamey/simultanee-2/2_DIOMANDE_comm.pdf
Frère M. 1987. Suivi agrométeorologique des cultures et prévision des rendements. FAO, Rome, Italie, p 170
JICA, JAICAF. 2013. Etude de Collecte d’informations dans le secteur agricole en Côte d’Ivoire. Japan International Cooperation Agency, Japon, p 236. http://open_jicareport.jica.go.jp/pdf/12121513.pdf
Kouakou KE, Kouakou A, Kouassi FW, et al. 2013. Détermination des périodes optimales de semis du riz pluvial au Centre-ouest de la Côte d’Ivoire. International Journal of Innovation and Applied Studies 3: 719–726. http://www.ijias.issr-journals.org/abstract.php?article=IJIAS-13-109-03
Lhomme JP, Monteny B. 1981. Une méthode d’analyse agroclimatique pour le calage des cycles culturaux en zone intertropicale. L’Agronomie Tropicale 36: 334–338. https://www.africabib.org/rec.php?RID=192196219
ONDR. 2012. Stratégie Nationale Révisée de Développement de la filière Riz en côte d’ivoire (SNDR) 2012 - 2020. ONDR, Côte d’Ivoire, p 40. https://riceforafrica.net/downloads/NRDS/Cote_dIvoire_fr.pdf
Ouédraogo M, Dembélé Y, Somé L. 2010. Perceptions et stratégies d’adaptation aux changements des précipitations: cas des paysans du Burkina Faso. Science et changements planétaires/Sécheresse 21: 87–96. https://pdfs.semanticscholar.org/b6e3/d12884032821677dcc4f3d1ab1cedce68a78.pdf
Sarr B. 2007. Manuel d’utilisation destiné aux ingénieurs en agrométéorologie. Centre Régional AGRHYMET, Niamey, Niger
Sarr B, Atta S, Kafando L. 2012. Revue des indices climatiques utilisés dans les systèmes d’assurances agricoles indicielles en Afrique. Science et changements planétaires/Sécheresse 23: 255–260. http://www.hubrural.org/IMG/pdf/sarr_et_al_2012_revue_des_indices_climatiques_utilises_dans_les_assurances_agricoles.pdf
Zingore S, Wairegi L, N’Diaye MK. 2014. Guide pour la gestion des systèmes de culture de riz. Consortium Africain pour la Santé des Sols, Nairobi Le Consortium Africain pour la Santé des Sols (ASHC) 60. http://africasoilhealth.cabi.org/wpcms/wp-content/uploads/2016/06/French-Rice-Guide-A4-BW-lowres.pdf

1st African Conference on Precision Agriculture | 8-10 December | 2020
66
DECISION SUPPORT SYSTEMS
1st African Conference on Precision Agriculture | 8-10 December | 2020
67
#7549 CROPSAT – OPPORTUNITIES FOR APPLICATIONS IN PRECISION AGRICULTURE IN AFRICA
O. Alshihabi1, I. Nouiri2, M. Mechri3, H. Angar3, K. Piikki1, J. Martinsson4, and M. Söderström1
1Swedish University of Agricultural Sciences (SLU), Skara, Sweden; 2National Agronomic Institute of Tunisia (INAT), Tunis, Tunisia; 3National Institute of Field Crops (INGC), Bou
Salem, Tunisia; 4Dataväxt AB, Grästorp, Sweden, [email protected]
ABSTRACT
The present paper aims at describing the CropSAT system, a Sentinel-2-based interactive decision support system (DSS) that provides vegetation index (VI) maps free-of-charge all across the globe for different applications in precision agriculture. We summarize research results from the ongoing developmental process and pointing to opportunities for development and application in precision agriculture in Africa. The DSS was initially developed in a research project at the Swedish University of Agricultural Sciences (SLU), and has since its launch in 2015 been continuously developed in a private-public-partnership between SLU, private companies and the Swedish Board of Agriculture. One of the main applications of CropSAT is providing spatial variation maps of several VIs to be used in variable rate application (VRA) of any input in agriculture (fertilizers, pesticides or growth regulators). These maps could be either downloaded in different formats compatible with a wide range of spreaders/sprayers available in the machinery market or printed out to be used manually or with the help of smart phones localization apps, for example to support discussion in advisory situations. Such a DSS is an appropriate platform for developing other application using the satellite images like nitrogen uptake estimation, protein content/yield prediction and water stress assessment. Ongoing research is now running to develop and integrate models in CropSAT for new applications and the tool is subject of research and development projects in other countries worldwide. An initial study was carried out to test the DSS in Tunisia in collaboration between SLU, the National Agronomic Institute of Tunisia (INAT) and the National Institute of Field Crops (INGC) to assess the feasibility for application under arid and semi-arid climate where different crops varieties are used. Further development in Tunisia will focus on integrating crops water status indices in order to use the tool for irrigation water management. Now CropSAT has continuously updated global coverage with new satellite images (about every three days in North Africa), and is provided in multiple languages including English, Arabic and French. Keywords: CropSAT, decision support system, Sentinel-2, precision agriculture, nitrogen fertilization
INTRODUCTION
Increasing crop yield and improved quality is a main target of nitrogen (N) application. Well-
adjusted N rates means improving nitrogen use efficiency and in turn better profit and minimized risk of negative environmental impact associated with non-optimal nutrient application, such as nitrate leaching (Delin et al., 2014) and emissions of gaseous nitrous oxide (Balafoutis et al., 2017). The web-based decision support tool CropSAT (Dataväxt AB, Grästorp, Sweden) allows the

1st African Conference on Precision Agriculture | 8-10 December | 2020
68
optimization of the application of fertilizers and pesticides using variable rate application (VRA) technology at the within-field scale (Söderström et al., 2017, Alshihabi et al., 2020). The system has global coverage and is free of charge. CropSAT It is a decision support system that was initially based on DMC low-cost data with 22m spatial resolution, with 30-m Landsat 8 as backup. From 2015 and 2017, the first of two Sentinel-2 satellites became available, with higher spatial resolution (10 m) and some additional spectral bands within the red edge region of the crop canopy reflectance spectra with 20-m resolution (Figure 1), dedicated to vegetation studies. The vegetation index (VI) used, after initial performance tests, was the modified soil adjusted vegetation index (MSAVI2; Eq.1; Qi et al. 1994). Other indices were considered but rejected because they reached saturation too early in the season (e.g. the normalized difference vegetation index NDVI; Rouse et al. 1973). Common broadband vegetation indices (e.g. NDVI, MSAVI2) are based on the reflectance differences in the NIR and RED regions (ρRED and ρNIR).
𝑀𝑆𝐴𝑉𝐼2 =12*(2 × 𝜌./0 + 1)4[(2 × 𝜌./0 + 1)6 − 8 × (𝜌./0 − 𝜌09:)]<(1)
Figure 1. Spectral bands of the satellites used in CropSAT in part of the visible to near-infrared (NIR) region.
MATERIALS AND METHODS
The global version of the CropSAT system follows a simple interactive workflow:
1. First, an area of interest (often a crop field) is delineated by digitizing the area boundaries manually on the screen.
2. Then, a list of Sentinel-2 images available for that field is previewed and an appropriate image not affected by the clouds or their shadows is selected.
3. Rates of N fertilizer (or any other product) for five intervals of a VI map calculated from the chosen image are specified.
4. A derived VRA map can be modified by interactive tools (e.g. by drawing on the map or by specifying a new mean rate).
5. The VRA map can then be exported in various file formats (for different brands of spreaders or sprayers) or downloaded as a map for manual use.
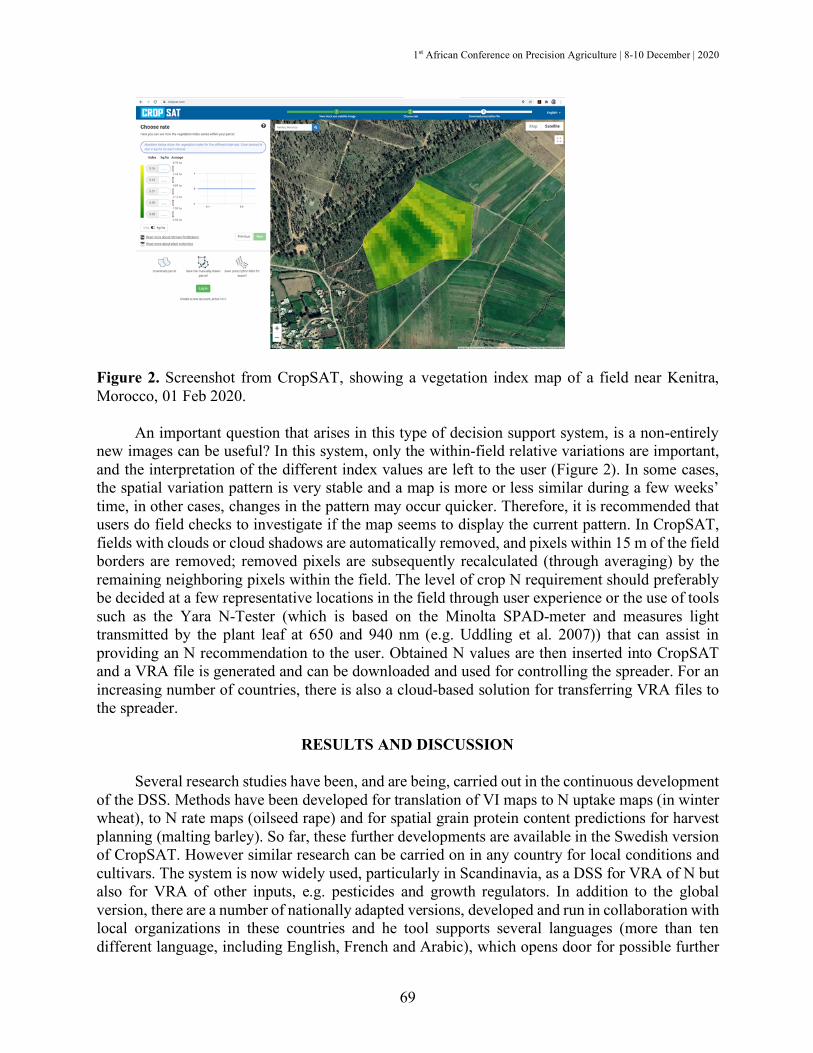
1st African Conference on Precision Agriculture | 8-10 December | 2020
69
Figure 2. Screenshot from CropSAT, showing a vegetation index map of a field near Kenitra, Morocco, 01 Feb 2020.
An important question that arises in this type of decision support system, is a non-entirely new images can be useful? In this system, only the within-field relative variations are important, and the interpretation of the different index values are left to the user (Figure 2). In some cases, the spatial variation pattern is very stable and a map is more or less similar during a few weeks’ time, in other cases, changes in the pattern may occur quicker. Therefore, it is recommended that users do field checks to investigate if the map seems to display the current pattern. In CropSAT, fields with clouds or cloud shadows are automatically removed, and pixels within 15 m of the field borders are removed; removed pixels are subsequently recalculated (through averaging) by the remaining neighboring pixels within the field. The level of crop N requirement should preferably be decided at a few representative locations in the field through user experience or the use of tools such as the Yara N-Tester (which is based on the Minolta SPAD-meter and measures light transmitted by the plant leaf at 650 and 940 nm (e.g. Uddling et al. 2007)) that can assist in providing an N recommendation to the user. Obtained N values are then inserted into CropSAT and a VRA file is generated and can be downloaded and used for controlling the spreader. For an increasing number of countries, there is also a cloud-based solution for transferring VRA files to the spreader.
RESULTS AND DISCUSSION
Several research studies have been, and are being, carried out in the continuous development
of the DSS. Methods have been developed for translation of VI maps to N uptake maps (in winter wheat), to N rate maps (oilseed rape) and for spatial grain protein content predictions for harvest planning (malting barley). So far, these further developments are available in the Swedish version of CropSAT. However similar research can be carried on in any country for local conditions and cultivars. The system is now widely used, particularly in Scandinavia, as a DSS for VRA of N but also for VRA of other inputs, e.g. pesticides and growth regulators. In addition to the global version, there are a number of nationally adapted versions, developed and run in collaboration with local organizations in these countries and he tool supports several languages (more than ten different language, including English, French and Arabic), which opens door for possible further

1st African Conference on Precision Agriculture | 8-10 December | 2020
70
developments and dissemination in Africa and the Middle East region. Sustainable uses of natural resources in agriculture in arid and semi–arid areas require integrated management of soil and water. Water scarcity and climate change adaptation/mitigation demand scientifically based DSSs for site-specific fertilizer application and water management in the agricultural sector. In future versions of CropSAT, also VIs related to the water status (such as NDWI; McFeeters, 1996) of the crop could be presented as decision support for variable-rate irrigation and VRA of nitrogen, so that farmers and authorities can manage their natural resources in a sustainable, profitable and practical way. The feasibility of the DSS for use under arid and semi-arid climate will be investigated in a collaboration between SLU and the National Agronomic Institute of Tunisia (INAT) and the National Institute of Field Crops (INGC), two institutions concerned by developing the field crops in the north of Tunisia. The first test on the ground under the Tunisian conditions showed a well functionality of the system under sub-humid to arid climate conditions. The full adaptation of the system to different climate conditions is planned in Tunisia as a starting point for a wider dissemination in arid and semi-arid areas.
ACKNOWLEDGEMENTS
CropSAT was developed in a project financed by the Swedish Foundation for Agricultural
Research (SLF; project no. H1233115). Subsequent funding of development/running has been provided by VGR/SLU (contract: RUN 2018-00141) together with Dataväxt AB (Grästorp, Sweden) and the Swedish Board of Agriculture (Jönköping, Sweden).
REFERENCES
Alshihabi O, Piikki K, Söderström M. 2020. CropSAT – A Decision Support System for Practical
Use of Satellite Images in Precision Agriculture. In: El Moussati A., Kpalma K., Ghaouth Belkasmi M., Saber M., Guégan S. (eds) Advances in Smart Technologies Applications and C ase Studies. SmartIC T 2019. Lecture Notes in Electrical Engineering, vol 684. Springer, C ham. Available at: https://doi.org/10.1007/978-3-030-53187-4_45 Verified September 09, 2020.
Balafoutis A, Beck B, Fountas S, Vangeyte J, Wal TVD, Soto I, et al. 2017. Precision agriculture technologies positively contributing to GHG emissions mitigation, farm produc-tivity and economics. Sustainability 9(8): 1339.
Delin S, Stenberg M. 2014. Effect of nitrogen fertilization on nitrate leaching in relation to grain yield response on loamy sand in Sweden. European Journal of Agronomy 52: 291–296.
McFeeters SK. 1996. The use of normalized difference water index (NDWI) in the delineation of open water features. International Journal of Remote Sensing 17: 1425–1432.
Qi J, Chehbouni A, Huete AR, Kerr YH. 1994. Modified Soil Adjusted Vegetation Index (MSAVI). Remote Sensing of Environment 48: 119-126.
Rouse JW Jr, Hass RH, Schell JA, Deering DW. 1973. Monitoring vegetation systems in the Great Plains with ERTS. In Proceedings Earth Resources Technology Satellite (ERTS) Symposium, 3rd., Greenbelt, MD, 10–14 Dec 1973 (Vol. I, pp. 309–317). Washington, DC: NASA SP-351, NASA.
Söderström M, Piikki K, Stenberg M, Stadig H, Martinsson J. 2017. Producing nitrogen (N) uptake maps in winter wheat by combining proximal crop measurements with Sentinel-2 and

1st African Conference on Precision Agriculture | 8-10 December | 2020
71
DMC satellite images in a decision support system for farmers. SOIL & PLANT SCIENCE, https://doi.org/10.1080/09064710.2017.1324044.
Uddling J, Gelang-Alfredsson J, Piikki K, Pleijel H. 2007. Evaluating the relationship between leaf chlorophyll concentration and SPAD-502 chlorophyll meter readings. Photosynthesis Research 91: 37–46.

1st African Conference on Precision Agriculture | 8-10 December | 2020
72
#7889 APPLICATION OF INFORMATION & COMMUNICATION TECHNOLOGIES (ICTS) INTO PRECISION FARMING ECOSYSTEM IN ETHIOPIAN DIGITAL
AGRICULTURE DEVELOPMENT PERSPECTIVE PLAN
Tadesse Anberbir Ethiopian Institute of Agricultural Research (EIAR), Addis Ababa, Ethiopia,
[email protected] /[email protected]
ABSTRACT
Information and Communication Technologies (ICTs) in agriculture is an emerging field focusing on the enhancement of agriculture and digital technologies for precision farming are now replacing the traditional farming system. The Ethiopian government recognized the importance ICTs for the country’s development and ICT in Agriculture is also expected to be a key catalyst for the transformation of Agriculture so as to contribute for the economic prosperity in the country. The endorsed and currently enforced ICT policy and the recent Digital Ethiopia strategy 2025 are the demonstration of its commitment to the development of ICTs in Agriculture and an enabler of socioeconomic transformation. Ethiopian Institute of Agricultural Research (EIAR) is a federal government organ, with a network of 20 research centers and more than 55 sub centers representing various agro-ecological settings. In EIAR, integrating ICTs into agriculture research, aiming at generation of context specific evidences to measure values of digital technologies in precision farming, compared to the analogue method, is considered as a major catalyst for modernizing the research system. However, there exist major challenges of building ICT infrastructure for sharing and exchanging agricultural knowledge generated from research at national and regional levels and there is a huge gap between the agricultural researchers, extension officers and farmers related to sharing, exchanging and disseminating agricultural knowledge and technologies. This paper presents the result of a survey on the use of ICTs in agricultural research, challenges, lessons and future needs in EIAR and discusses progresses on the application of precision farming technologies mainly on the use of unmanned aerial vehicles (UAVs for soil moisture nutrient and disease detection at crop critical growth stages, aiming at spot based and immediate response. The findings of the survey revealed that the use of ICT for agricultural research is still at its initial stage and lack of ICT policy and awareness about ICT for agriculture (e-Agriculture) by researchers and administrative staff is the main challenge. The poor ICT infrastructure, lack of centralized agricultural research information system, access and dissemination of the resources currently available in EIAR are also critical challenges which limits the full integration of Digital Agriculture practices. However, the recent initiatives on use of UAVs for precision agriculture and digitization of the Wheat rust diseases monitoring and early warning processes are believed to help breaking the old thinking and revolutionize the traditional way of data collection, analysis and interpretation. The possible integration of soil-crop-disease diagnoses tools, the remote sensing; including the current 13.75m resolution ETRSS-1 satellite imageries is a good initiative and so far, the preliminary results showed that precision agriculture practices are very critical for modernizing the research activities in EIAR and transforming smallholders to smart farmers through large scale demonstration farming approach.
Keywords: ICT, digital agriculture, precision farming, UAVs, wheat rust surveillance

1st African Conference on Precision Agriculture | 8-10 December | 2020
73
INTRODUCTION
Information and Communication Technologies (ICTs) in agriculture is an emerging field focusing on the enhancement of agriculture and the advancement in ICT can be utilized for providing accurate, timely, relevant information and services to the farmers, extension agents and researchers. ICTs are used to digitalize agricultural processes and precision farming are now replacing the traditional farming system.
Agriculture is an important sector with the majority of the rural population in developing countries depend on it. In Ethiopia, agriculture influence the overall economic performance and poverty reduction and it accounts for nearly 40% of GDP and over 70% of employment. Accordingly, the Ethiopian government gives special attention to the sector and like in other sectors the government recognized the importance of ICT for modernizing the agricultural practices and developments. ICT in Agriculture is expected to be a key catalyst for the transformation of Agriculture so as to contribute for the economic prosperity in the country. The endorsed and currently enforced ICT policy and the recent Digital Ethiopia strategy 2025 are the demonstration of its commitment to the development of ICTs in Agriculture and an enabler of socioeconomic transformation. Projects such as 8028 IVRS/SMS toll-free hotline for farmers, Market Information System (MIS), Wheat Rust Surveillance Information System, Livestock tracking system and e-extension services which are implemented by the Ministry of Agriculture (MoA), Ethiopian Institute of Agriculture (EIAR), Agricultural Transformation Agency (ATA) and other partners shows some of the efforts that the government commitment to the sector on using ICT for agriculture so as to digitizing the agricultural processes across the value chain. However, the sector faces major challenges in enhancing production and to sustain and improve the livelihood of small holder farmers and despite these and other initiatives, there exist major challenges of building ICT infrastructure for sharing and exchanging agricultural knowledge generated from research at national and regional levels and there is a huge gap between the agricultural researchers, extension officers and farmers related to sharing, exchanging and disseminating agricultural knowledge and technologies. In general, the digitization of agriculture in Ethiopia is still far behind most other countries [1] and Precision Agriculture (PA) practices are very limited and most of the small holder farmers still use traditional farming system.
Therefore, ICT technologies play an important role in addressing these challenges and uplifting the livelihoods of the rural people. This paper reports the result of a survey on the use of ICTs in agricultural research in EIAR, which was conducted using an online questionnaire and interviews, and discusses current digital agriculture initiatives and progresses on the application of precision farming technologies mainly on the application of unmanned aerial vehicles (UAVs) and Wheat Rust Early Warning & Advisory System.
Application of ICTs in EIAR
The Ethiopian Agricultural Research System (EARS) consists of Ethiopian Institute of Agricultural Research (EIAR), seven Regional Agricultural Research Institutes (RARIs), which are administered by the regional state governments, and Higher Learning Institutions (HLIs). EIAR is a federal research institutes which coordinates research within the EARS, by taking a leading role in influencing agricultural policy development and conducts research at its federal research centers. EIAR is one of the oldest and largest agricultural research systems in Africa that comprises of 20 research centers and many sub centers located across various ecological zones in

1st African Conference on Precision Agriculture | 8-10 December | 2020
74
the nation. This section presents the results on a survey conducted to assess the current status on the use of ICTs for agricultural research in EIAR HQs and across 17 research centers.
METHODOLOGY
The survey was collected from researchers in HQs and 17 agricultural research centers through online questioners via http://www.qualtrics.com/ and interviews by personally visiting the research centers. Among the 17 research centers, 12 research centers & HQs participated in the survey and in total 43 researchers responded the questioners.
The following were some of the major questions presented via online: 1. What are the benefits of using ICT in Agriculture? 2. What data types do you use or generate? Where do you store your data? 3. Estimate the amount of research data you currently maintain (both 4. active and inactive data stored for long term) 5. What are the main challenges you encounter within your work on Data
Management and open research data? (more than one answer possible) 6. In your opinion, what do you consider to be the most significant obstacles
preventing greater use of ICTs in Agricultural research in EIAR?
Survey Analysis From responses received as to the most significant obstacles preventing greater use of ICTs
in Agricultural research, an overwhelming amount of respondents, (84%), indicated that their research center is not equipped the necessary ICT infrastructure and systems for delivering digital agriculture services while 16% of respondents indicated they have the necessary equipment/ICT infrastructure system and manpower for delivering ICT services. And most of the researchers responded that the main challenges they encountered in the research systems are the difficulty of accessing data and lack of data management system (see Figure 1).
Figure 1. Responses for question no. 6 “What are the main challenges you encounter within your work on data Management and open research data? (More than one answer possible)”
DISCUSSION The application/integration of ICTs in agricultural research in EIAR has shown significant
progress over the last years and mainly internet connectivity were improved and EIAR Agri-Net which connects 17 agricultural research centers were fully implemented. And recently, some digital agriculture practices has been started. However, there exist major challenges of building ICT infrastructure for sharing and exchanging agricultural knowledge generated from research and

1st African Conference on Precision Agriculture | 8-10 December | 2020
75
there is a huge gap between the agricultural researchers, extension officers and farmers related to sharing, exchanging and disseminating agricultural knowledge and technologies. The research systems face various challenges and mainly the poor ICT infrastructure, lack of centralized agricultural research information system, access and dissemination of the resources currently available in EIAR are critical challenges which limits the full integration of Digital Agriculture practices. Therefore, the ICT infrastructure in all research centers should be upgraded, integrated application platforms needs to be implemented, awareness should be created and e-Agriculture policy and strategy should be crafted at institutional level. Precision Agriculture Practices in EIAR
Digital Agriculture (DA) practice is a gateway to Precision Agriculture (PA) and the much-dreamed transformation of Ethiopian Agriculture research systems. PA is an approach to farm management that uses information technology (IT) to ensure that crops and soil receive exactly what they need for optimum health and productivity [2]. In EIAR, DA practices is not new except that efforts are scattered here and there. For instance, agro-climate advisory services dissemination using a tool/platform called Ethiopian Digital Agro Climate Advisory Platform (EDACaP) has already been under piloting, while the Wheat Rust Surveillance and Early Warning platform and the Breeding Management System (BMS) in major crops, making an attractive example of the already incubated digital technologies in the agricultural research system. Accordingly, EIAR has already started to see important signs of progress, as well as notable areas for further improvement. The following systems and platforms are implemented in EIAR and greatly supports the initiatives towards ICT-based precision agriculture services.
Wheat Rust Surveillance Information System (WRSIS)
Wheat rust diseases pose one of the greatest threats to global food security, including subsistence farmers in Ethiopia. The Wheat Rust Early Warning and Advisory System or Wheat Rust Surveillance Information System (WRSIS) integrates a web portal and mobile app and it aims to collect real time data from field, report incidences in advance and provide integrated wheat rust disease related information for wheat rust disease protection community via SMS and Interactive Voice Response System (IVRS) and decision makers at the MoA. The framework represents one of the first advanced crop disease Early Warning Systems (EWSs) implemented in a developing country and EIAR manages the system at national level (www.WRSIS.gov.et).
Remote Sensing Applications-Drones for Precision Agriculture
EIAR recently acquired two Parrot Bluegrass drones donated by Technical Centre for Agricultural and Rural Cooperation (CTA) which are designed for end-to-end agricultural solutions. Currently the drones are used mainly for crops monitoring, wheat rust disease identification, water stress and nutrient deficiency applications at crop critical growth stages, aiming at spot based and immediate response for early warning and advisory services for researchers, farmers and extension agents.
CONCLUSIONS AND RECOMMENDATIONS
The findings of the survey revealed that the poor ICT infrastructure, lack of centralized agricultural research information system, access and dissemination of the resources currently available in EIAR are critical challenges which limits the full integration of DA practices.

1st African Conference on Precision Agriculture | 8-10 December | 2020
76
However, the recent initiatives on use of Drones or Unmanned Aerial Vehicles (UAVs) for PA and digitization of the Wheat rust diseases monitoring and early warning processes are believed to help breaking the old thinking and revolutionize the traditional way of data collection, analysis and interpretation. The possible integration of soil-crop-disease diagnoses tools and the remote sensing are a good initiative and so far, the preliminary results showed that precision agriculture practices are very critical for modernizing the research activities in EIAR.
As a frontrunner in the agriculture sector, EIAR must take maximum advantage of the opportunities presented by technological explosion (capturing the late comer advantage) and from the new national digital strategy. DA should be considered as a major catalyst for modernizing the research system and technologies including Artificial Intelligence (AI), Machine learning (ML), Robotics, Internet-of-Things (IoT), Sensors and satellite-based communications needs to be integrated in the existing systems/platforms and so that early warning and advisory services can be provided to farmers and development agents via expert systems and different channels.
REFERENCES
Allen Sader C, et al. 2019. An early warning system to predict and mitigate wheat rust diseases in
Ethiopia. Environ. Res. Lett. 14 115004. EIAR. 2020 www.eiar.gov.et/ict Ethioagroclimate. 2020. https://ethioagroclimate.net/ Manish M, Abhishek S, et al. 2012. Uses of ICT in Agriculture, International Journal of Advanced
Computer Research Vol. 21 (3) March-2012. Spyros F, et al. 2003. ICT in Precision Agriculture – diffusion of technology: An overview of
Precision Agriculture. DOI: 10.13140/2.1.1586.5606 Technical Centre for Agricultural and Rural Cooperation (CTA), Digitalization of
African Agriculture Report, https://www.cta.int/en/digitalisation 2018–2019

1st African Conference on Precision Agriculture | 8-10 December | 2020
77
ECONOMICS OF PRECISION AGRICULTURE

1st African Conference on Precision Agriculture | 8-10 December | 2020
78
#7517 TOMATO YIELD AND ECONOMIC PERFORMANCE UNDER ORGANIC AND MINERAL FERTILIZER APPLICATIONS IN COASTAL TOGO
Jean M. Sogbedji and Mouhamadou Lare
Ecole Supérieure d’Agronomie, Université de Lomé. 01 BP 1515 Lomé 01 Togo, [email protected]
ABSTRACT
Research efforts towards enhancing vegetables production are still needed in Togo. We assessed tomato (Solanum lycopersicum) yield and associated economic returns under three soil fertility management strategies in a 3-yr period study. Three tomato varieties were used including: MONGAL-F1 (V1), SUMO-F1 (V2) and COBRA 26-F1 (V3). The fertilization regimes were: no fertilizer application as the control (F1), application of 200 kg of N15P15K15 + 100 kg of urea (46% N) corresponding to N76P30K30 ha-1 (F2) and application of farm yard manure (FYM) at the rate of 6 Mg ha-1 (F3). The 3-yr period was segmented into two different cropping periods with three tomato crops for each period. The first period runs from October to January and the second runs from the subsequent period of February to May. Tomato fresh fruit yields were collected and were used to determine the net cash return through a partial budget analysis under each variety – fertilization regime combination. Across tomato varieties, three-crop mean yields were 93 to131% and 109 to 144% higher for fertilization regimes F2 and F3, respectively, as compared to yield under the control (F1), and mean yields with F3 were 7.5% on average superior to those for F2. Irrespective of fertilization regime, the MONGAL-F1 mean yields were 6 to 24 and 16 to 31% superior to yields under SUMO-F1 and COBRA 26-F1, respectively, and SUMO-F1 based yields were 6 to 10% higher than those for COBRA 26-F1. Higher economic returns (typically ranging from 9500 to 27000 USD ha-1) were recorded when fertilizers were applied, and lower returns (typically in the range of -131 to 4700 USD ha-1) were obtained with no fertilization, with the highest economic return under the V1F3 combination during the February to May cropping period. Tomato cropping without external mineral and/or organic nutrient input may not be advised for the study area.
Keywords: tomato variety, cropping period, ferralsols, fertilization regime, yield and net cash return
INTRODUCTION
Vegetables production continuously gains importance because of the high nutritional value of its products. These non-traditional crops could revitalize rural economies and contribute to food and nutrition security towards achieving the United Nations Sustainable Development Goals (SDGs). Historically, research and extension in Africa has concentrated on staples (cereals) because of food security. However, to achieve food, nutrition and financial security, vegetables production should be promoted in sub-Saharan Africa (SSA) because of their importance. A recent study conducted in several West African countries by IFDC using the IFAD grant No 1174 (IFDC, 2014) established that vegetable cropping highly contributes to provision of revenues to address key needs including food security, children education, inputs provision for annual crops, and

1st African Conference on Precision Agriculture | 8-10 December | 2020
79
several other social needs for smallholder farmers. Moreover, the value of vegetables (over 3000$ per hectare per year) in Benin, Burkina Faso, Ghana, Niger and Togo is 6 to 10 times that of cereals (150-250$ per hectare per year).
Tomato is one of the most produced vegetables in the world, ranking second after potato (Kalbani et al., 2016). As it is a relatively short duration crop and gives a high yield, it is economically attractive and the area under cultivation is increasing daily (Naika et al., 2005). Moreover, tomatoes contribute to a healthy, well balanced diet and having rich in minerals, vitamins, essential amino acids, sugars and dietary fibers (Kalbani et al., 2016). Although tomato may be produced throughout the year in coastal western Africa, it tends to be abundantly available only part of the year, which leads to very low demands with associated non-economic sale prices along with important postharvest losses.
Some constraints to vegetable production are water deficiency/quality, poor soils, labor, inadequate information on production and processing, low yielding varieties that are susceptible to insect pests and diseases, cost of inputs, and poor infrastructure for processing, storage and transport that contribute to high postharvest losses. In coastal Togo, tomato yields are between 5 and 6 Mg ha-1 (ITRA, 2011), which is drastically below the world average yield of 34 Mg ha-1 as reported by Debela et al. 2016. To secure and sustain the social and economic potential role of tomato cropping in the region, research is needed towards improving its yields and net cash returns.
The objective of this work was to assess the response of three tomato varieties to three fertilization schemes and the effect of cropping timing on both the productivity and economic profitability of the crop on costal West African ferralsols. The aim was to identify management practices that enhance and secure tomato cropping contribution to social welfare in this agro ecosystem.
MATERIAL AND METHODS
Experimental Site
The study was conducted at the University of Lomé Agricultural Research Station in Lomé, Togo (6°22’N, 1°13’E; altitude = 50 m). The soil type was a rhodic ferralsol locally called “Terres de Barre” that originated from a continental deposit, and covers part of the arable lands in Togo, Bénin, Ghana, and Nigeria in coastal Western Africa. Annual rainfall typically ranges from 800 to 1100 mm and allows for two cropping seasons: a first season from April to July, the main season with a 25-yr average rainfall of 470 mm, and a second season from September to December with a 25-yr average rainfall of 200 mm. At the onset of this experiment, the site has been under continuous mineral (NPK) fertilized maize cropping. Soil and Crop Management
A 3-yr period (2016-2019) split-plot experiment was settled with three replicates. Three tomato varieties were the main plot effects and three fertilizer schemes were at the subplot level. The site was manually plowed and 9 main plots (4 m x 3 m) were laid out in a randomized complete block design. The three tomato varieties were: (i) MONGAL-F1, V1, (ii) SUMO-F1, V2 and (iii) COBRA 26-F1, V3. Three fertilizer treatments were applied: (i) no fertilizer application as the control (F1), (ii) application of 200 kg of N15P15K15 + 100 kg of urea (46% N) corresponding to N76P30K30 ha-1 (F2) and (iii) application of FYM at the rate of 6 Mg ha-1 (F3). Fertilizer treatment F2 is a recommendation by the national agricultural extension services in Togo, and F3 is a recommended FYM-based organic amendment by IFDC (2014).

1st African Conference on Precision Agriculture | 8-10 December | 2020
80
Six tomato crops were performed during the three years of experimentation in two periods typically embedded in the two cropping seasons. The first period runs from October to January and the second from the subsequent period of February to May, with three crops for each period. During each crop period, tomato was transplanted after three weeks of nursing at a density of 37,000 plants ha-1 and weeded as needed. Fertilizer N15P15K15 and FYM rates were applied two weeks after transplanting (just after the first weeding) while urea was applied four weeks after transplanting as recommended by the national agricultural research and extension services in the region. In each cropping period of each of the three years, all fertilizers were manually point-placed at approximately 8 cm depth. Plants were chemically treated against diseases and insects and received additional water (apart from rainfall) as needed that was brought through hand watering.
Data Collection and Analysis
Tomato fresh fruit yield was determined under each treatment by harvesting all the plants from each plant bed. The GENSTAT statistical software package was used to run the analysis of variance (ANOVA) on the yield data sets and the Duncan test at 5% was used to discriminate among mean tomato yields. Mean tomato fruit yield data were used to establish a partial financial budget which represents the net profitability of the production under each variety – fertilization combination.
Economic Analysis
The profitability of tomato fresh fruit production in each cropping period was estimated through a partial budget (output value minus inputs cost value) analysis. Output consisted of the amount of cash corresponding to the mean fresh fruit yield under each tomato variety – fertilization scheme combination, which was determined to be sold at 600 CFA (US$1.2) kg-1 and at 800 F CFA (US$1.6) kg-1, the average sale price for the first and the second crop periods, respectively. The inputs consisted of the production costs under each combination, including those for soil preparation, seed, crop nursing and transplanting and related tasks, fertilizer purchase and application, crop weeding and crop harvesting and associated tasks. Labor costs were determined to be 2 000 F CFA (US$4.0) per person-day based on labor records from the experiment, and fertilizer costs were based on ongoing prices which were 220 F CFA kg-1 (US$0.44) for both N15P15K15 and urea. Farmyard manure cost was determined to be 20 000 F CFA Mg-1 (US$40.0).
RESULTS AND DISCUSSION
Tomato Fresh Fruit Yield Tomato mean yields were typically between 8 and 30 Mg ha-1 (Table 1) with the lowest
yield under the control fertilizer treatment. This reasonably agrees with mean yield range of 10 to 30 Mg ha-1 reported by Tesfay et al. 2018 and Rajya et al. 2015 using a control and various combinations of organic and inorganic fertilization schemes. The three varieties were clearly responsive, although differently, to fertilization schemes. Irrespective of tomato variety, three-crop mean yields were consistently highest under fertilization regime F3 and lowest for F1 in both cropping periods. During the first cropping period and for V1, mean yields increased by 95 and 119% under F2 and F3, respectively, as compared to yield under F1, and yield for F3 was 12% superior to that under F2. For V2, F2 and F3 resulted in mean yield increase by 115 and 139% under F2 and F3, respectively, as compared to yield under F1, with F3-based yield being 11%

1st African Conference on Precision Agriculture | 8-10 December | 2020
81
higher than that of F2. Mean yields for V3 increased by 93 and 109% under F2 and F3, respectively, as compared to yield under F1, and yield for F3 was 9% superior to that under F2. In the second cropping period and for V1, mean yields increased by 131 and 144% under F2 and F3, respectively, as compared to yield under F1, and yield for F3 was 5% superior to that under F2. For V2, F2 and F3 resulted in similar mean yield but 122% higher than yield for F1. Mean yields for V3 increased by 103 and 120% under F2 and F3, respectively, as compared to yield under F1, and yield for F3-based fertilization was 8% superior to that under F2. The results of this study demonstrate that enhancement of soil fertility is needed for tomato production in the area of study if high yields are to be achieved, which agrees with research results published by Gorobani et al. 2017 in the area. Organic (FYM) fertilizing regime proved superiority over mineral (NPK)-based fertilization by 7.5% on average. This trend in our yield data sets does not corroborate results by Kochakinezhad et al. 2012 who found that the difference between the two classes of fertilizers (organic and chemical) was not very high (yield under chemical fertilizer was 2.2% higher than that for organic fertilizer), and concluded that organic fertilizers are competitive and may be a suitable replacement for chemical fertilizer. In our area of study, Gorobani et al. 2017 found no-significant difference between tomato yield under FYM fertilizing regime and that under inorganic (NPK) based fertilization. The superiority of organic fertilization over the inorganic fertilization in our study may be explained by the continuous use (six consecutive crops) of organic fertilizer that might lead to more nutrient released for the crop use. Table 1. Tomato yield (Mg ha-1) and net cash profit (USD ha-1).
Treatment Cropping period October to January February to May __________________________________ ____________________________________________ Crop 1 Crop 2 Crop 3 Mean
yield Net cash profit
Crop 1 Crop 2 Crop 3 Mean Net cash profit
V1F1 10.64c¶ 11.94b 10.81c 11.13c 1386 7.74b 13.03c 11.91b 10.90c 4768 V1F2 17.94b 23.10a 23.98b 21.67b 12464 21.97a 24.80b 28.88a 25.21b 25069 V1F3 22.79a 24.25a 26.02a 24.35a 15304 22.09a 27.49a 30.07a 26.55a 26944 Mean 17.12 19.76 20.27 19.05 17.27 21.77 23.62 20.88
V2F1 10.65c 9.71c 8.83b 9.73c -131 8.24c 11.17b 8.57b 9.33b 2502 V2F2 21.23b 19.74b 21.83a 20.93b 11659 15.29a 22.67a 24.06a 20.67a 18525 V2F3 23.58a 23.63a 22.57a 23.26a 14121 13.86b 23.23a 24.83a 20.64a 18428 Mean 18.49 17.70 17.75 17.98 12.46 19.02 19.15 16.88
V3F1 9.73b 11,15c 8,48b 9.79c -58 6.96c 11.03b 9.36b 9.12c 2208 V3F2 16.06a 17.66b 22.94a 18.89b 9464 13.47b 20.49a 21.68a 18.55b 15481 V3F3 16.63a 22.58a 22.28a 20.50a 11149 14.23a 22.55a 23.35a 20.04a 17573 Mean 14.14 17.13 17.90 16.39 11.55 18.02 18.13 15.90
¶ Means within the same column followed by the same letter are not significantly different at P = 0.05.
Regardless of fertilization treatment, overall 3-crop mean tomato yields were 19.05, 17.98 and 16.39 Mg ha-1 for the V1, V2 and V3, respectively, in the first cropping period, and 20.88, 16.88 and 15. 90 Mg ha-1 for V1, V2 and V3, respectively, in the second cropping period (Table 1). Overall mean yield with V1 increased by 6 and 16% as compared to yields for V2 and V3,
1st African Conference on Precision Agriculture | 8-10 December | 2020
82
respectively, while the V2-based yield was 10% superior to that under V3, during the first cropping period. In the second cropping period, mean yield for V1 was 24 and 31 % higher as compared to yields with V2 and V3, respectively, and the V2-based yield was 6% over the yield under V3. These results indicate that within the cropping period, yield potential was consistently highest and lowest for V1 and V3, respectively, and fluctuates between cropping period. The three varieties responded positively to fertilization scheme with a higher response to organic fertilizer and a better performance for V1, indicating that the variety-fertilization regime interaction was measurable. Such variety effects on tomato yield as well as positive crop-fertilization regime interactions were reported by Kochakinezhad et al. 2012 and Ilupeju et al. 2015.
Partial Budget Analysis Results of the balance of outputs (cash values of tomato fresh fruit mean yield) and
corresponding inputs (total costs associated with production) for the three crops within each cropping period are presented in Table 1. On a per hectare basis, except the V2F1 and V3F1 combinations during the first cropping period, the balance was positive in all other cases, indicating that there was profit or net gain. The data sets reveal that higher net returns (typically ranging from 9500 to 27000 USD ha-1) were recorded when fertilizers were applied, and lower returns (typically in the range of -131 to 4700 USD ha-1) were obtained with no fertilization. For the three varieties and within each of the two cropping periods, net returns were consistently higher (15304 to 26944 USD ha-1) with the F3 fertilization regime as compared to returns (9464 to 25069 USD ha-1) when the F2 fertilization regime was used. Net returns were consistently higher for the second cropping period (February to May) with values typically ranging from 2200 to 26944 USD ha-1 in comparison to those (-131 to 15304 USD ha-1) for the first cropping period (October to January) primarily because of the higher tomato sale price in the second cropping period. Overall the highest net return (26944 USD ha-1) was recorded for the V1 (MONGAL-F1 variety) combined with the F3 (FYM-based) fertilization regime.
CONCLUSIONS
Enhancement of soil fertility is needed for tomato production in the area of study if high yields are to be achieved. The three varieties responded positively to fertilization scheme with a higher response to organic fertilizer and a better yield-based performance for the MONGAL-F1 variety regardless of cropping timing. The economic profitability of tomato cropping was in general evident and strongly affected by fertilization scheme, crop variety and cropping timing. Tomato production using organic (FYM) based fertilization regime and MONGAL-F1 variety preferably during the February to May cropping period appears to be the best management practices that improve the crop yield and maximize the economic returns in the study zone.
REFERENCES
Debela KB, Belew D, and Nego J. 2016. Evaluation of Tomato (Lycopersicon Esculentum Mill.)
Varieties for Growth and Seed Quality under Jimma Condition, South Western Ethiopia. International Journal of Crop Science and Technology 2(2): 69-77
Gorobani A, Sogbedji JM, Mazinagou M. 2017. Amélioration de la productivité et de la rentabilité économique de la tomate (Solanum lycopersicum L.) sur les sols ferrallitiques au sud Togo. J. Rech. Sci. Univ. Lomé (Togo) 19(2-Spécial): 131-138.
1st African Conference on Precision Agriculture | 8-10 December | 2020
83
IFDC. 2014. Mainstreaming pro-poor fertilizer access and innovative practices in West Africa. IFAD Technical Assistance Grant No. 1174 report. Muscle Shoals, Alabama, U.S.A.
Ilupeju EAO, Akanbi WB, Olaniyi JO, Lawal BA, Ojo MA, Akintokun PO. 2015. Impact of organic and inorganic fertilizers on growth, fruit yield, nutritional and lycopene contents of three varieties of tomato (Lycopersicon esculentum (L.) Mill) in Ogbomoso, Nigeria. Afr. J. Biotechnol. 14(31): 2424-2433
ITRA. 2011. Rapport national sur l'état des ressources phytogénétiques pour l'alimentation et l'agriculture. MAEH, ITRA, Togo
Kalbani FOSA, Salem MA, Cheruth AJ, Kurup SS, Senthilkumar A. 2016. Effect of some organic fertilizers on growth, yield and quality of tomato (Solanum lycopersicum). International Letters of Natural Sciences 53:1-9
Kochakinezhad H, Peyvast Gh, Kashi AK, Olfati JA, Asadii A. 2012. A comparison of organic and chemical fertilizers for tomato production. Journal of Organic Systems 7(2): 14-25
Naika S, van Lidt de Jeude J, de Goffau M, Hilmi M, van Dam B. 2005. Cultivation of tomato production, processing and marketing. Agromisa Foundation and CTA, Wageningen, pp 1–92.
Rajya Laximi P, Saravanan S, Kakshman Naik M. 2015. Effect of organic manures and inorganic fertilizers on plant growth, yield, fruit quality and shelf life of tomato (Solanum lycopersicum). International Journal of Agricultural Science and Research 5(2): 7-12
Tesfay T, Gebremariam M, Gebretsadik K, Hagazi M, Girmay S. 2018. Tomato Yield and Economic Performance Under Vermicompost and Mineral Fertilizer Applications. The Open Agriculture Journal 12: 262-269.

1st African Conference on Precision Agriculture | 8-10 December | 2020
84
MAPPING AND GEOSTATISTICS

1st African Conference on Precision Agriculture | 8-10 December | 2020
85
#7598 SOME ESSENTIAL NUTRIENTS, ACTIVE LIMESTONE AND PH STATUS OF NORTH AND CENTER TUNISIAN SOILS
A. Hachana1,2,*, I. Hemissi1, I. Achour1, A. Souissi1,2, and B. Sifi1
1Agronomic Sciences and Techniques Laboratory, National Institute of Agricultural Research of Tunisia (INRAT), Carthage University, 2049, Ariana, Tunisia. 2Crop Production
Department, National Institute of Agriculture of Tunisia, Carthage University, 1082, Tunis, Tunisia, [email protected]
ABSTRACT
Tunisia is a North African country characterized by a Mediterranean climate in the north and Saharan climate in the south part of the country, which resulted in a high geo-morphological diversity of its soils. Indeed, the soils in Tunisia are characterized by high variability of their fertility status that is affected mainly by abiotic and biotic constraints such as salinity, drought, erosion and low soil organic carbon (Mhiri, 2018). Thereby, soil fertility is largely linked to geographical location, making recommendation of chemical fertilization for small holder difficult. This study aims to generate maps at national level characterizing current nutritional status of the soil in order to facilitate the recommendation of integrated soil fertility management and land use planning according to the specificity of the soils and agro-climatic conditions.
MATERIALS AND METHODS
Seventy (70) soil samples collected from different agro-ecological zones was analyzed in
the laboratory to determine assimilable phosphorus (P), exchangeable potassium (K), active limestone content (CaCO3), and pH. In each site, samples were taken from the 0-20 cm ground layer from four points (North, South, East, West, and Center) forming a square with a diagonal of 10 m. Samples were then homogenized, air-dried and sieved (2 mm).
The content of P was determined according to Olsen method (Gautheyrou and Gautheyrou, 1966), the content of K using the flame photometric method, active limestone according to Drouineau-Galet method (Gautheyrou and Gautheyrou, 1966) and the pH using 1:5 w/v soil suspensions in the water at 25°C.
To determine the spatial variability of the different parameters (phosphorus, potassium, pH, and active limestone), a geo-statistical analysis was performed. Semi-variograms have been constructed and four different soil maps have been generated by the Ordinary Kriging interpolation method using SPATIAL ANALYST extension of the software “ArcGIS Pro”. The method adopted is commonly used as interpolation methods, where the spatial prediction of the unmeasured point X0 is given by predicting the value Z*(X0), which equals the line sum of the observed value Z(Xi). The formula is described as following (Pham et al., 2019):
𝑍∗(𝑋@) =A𝜆C
D
CEF
Z(𝑋C)
With λi = weighting coefficient from the measured position to X0 n = the number of positions within the neighborhood searching.

1st African Conference on Precision Agriculture | 8-10 December | 2020
86
The method used allowed to generate a graphical representation of the spatial variability of the studied parameters from 70 soil sampling points in Tunisia.
RESULTS AND DISCUSSION
Data Description from Soil Samples Collected Results showed that assimilable soil P content was a major limiting nutrient with values
varying from 31.1 to 208.3 ppm and mean value equal to 96.9 ppm. Soil P dispersion was high with a coefficient of variation (CV) of 40.6%. In addition, results showed that exchangeable soil K status was high (mean value of 166.3 ppm) with a high variability (CV of 35.1%) and values were ranged between 76.9 and 334 ppm. Moreover, pH evaluation showed that soils were alkaline (7.6-8.4). Mean value was of 8.03 and CV was low (1.5%). Soils were mostly calcareous (8.1-24 % CaCO3) with a mean of 14.2%. Values were mainly high in the North-East of the country. Only 25 % of the soils had their active limestone content less than 8% showing a high CV (24.2%).
Semivariogram Analysis Results
Based on the semivariogram analysis and according to the ratio of nugget to threshold, which determines the spatial dependence, results showed that phosphorus, potassium and lime and pH have a strong spatial dependence, whereas, pH has a weak spatial dependence.
Spatial Distribution of Soil P, K, Active Ca, and pH
Figures 1, 2, 3 and 4 showed interpolated maps of P and K nutrients availability, active limestone and pH, respectively. Results showed that P availability was increasing from North West to Central West and decreasing from North East to Central East. Potassium availability was very high in North East of Tunisia, very low in the Center East, and good in the remaining areas. Soil active Ca was very high in the North East of Tunisia and high in the remaining regions. Soil pH was high alkaline expertly for Nord West which was moderate
Figure 1. Interpolation map of assimilable P availability in Tunisian soils.
Figure 2. Interpolation map of exchangeable K availability in Tunisian soils.

1st African Conference on Precision Agriculture | 8-10 December | 2020
87
CONCLUSIONS
Based on this research study it is confirmed that the interpolation approach using the
ordinary kriging method gives expressive and explicative maps of the spatial distribution of soils nutrients variability as found by other studies in other countries (Wani t al., 2012; Pham et al., 2019; Seminova et al., 2020). The maps generated can be used as decision making tools for integrated soil fertility management to optimize returns on chemical fertilizers inputs while preserving ecosystems and improving crop productivity and yields.
REFERENCES
Gautheyrou J, Gautheyrou M. 1966. Soil analysis. Methods used by the Antilles Soils Bureau Laboratory, 5A ed. Soil Office of Antille.
Mhiri A. 2018. Tunisian agriculture at a crossroads, Boudjebel, M. (Ed.), Simpact, Tunisia. Pham TG, Kappas M, Huynh CV, Nguyen LHK. 2019. Application of Ordinary Kriging and
Regression Kriging Method for Soil Properties Mapping in Hilly Region of Central Vietnam. ISPRS Int. J. Geo-Inf. 8(3), 147: 1-17.
Smirnova EV Giniyatullin KG, Sahabiev IA,Okunev RV. 2020. Comparison of interpolated soil nutrients maps obtained with application of various approaches of ordinary kriging. IOP Conf. Ser. Earth Environ. Sci. 548.
Wani MA, Wani JA, Bhat MA, Kirmani NA, Wani ZM, Bhat SN. 2013. Mapping of Soil Micronutrients in Kashmir Agricultural Landscape Using Ordinary Kriging and Indicator Approach. J. Indian Soc. Remote Sens. 41: 319–329.
Figure 3. Interpolation map of active limestone content in Tunisian soils.
Figure 4. Interpolation map of pH in Tunisian soils.
1st African Conference on Precision Agriculture | 8-10 December | 2020
88
#7659 SOIL ORGANIC CARBONE MAPPING IN NORTH OF TUNISIA: COMPARISON BETWEEN DIFFERENT INTERPOLATION METHODS
M. Barbouchi1, H. Bahri, A. Souissi, H.2,3 Cheikh Mhammed2 and M. Annabi2
1Laboratoire des Sciences et Techniques Agronomiques, INRGREF-Université de Carthage, Rue Hédi Karray, 1004, Al Manzah 1, Tunis, Tunisie. 94. 2Laboratoire des Sciences et Techniques Agronomiques, INRAT-Université de Carthage, Rue Hédi Karray, 1004, Al Manzah 1, Tunis,
Tunisie. 3Institut National Agronomique de Tunis, Université de Carthage, Avenue Charles Nicolle, Tunis 1082, Tunisia, [email protected]; [email protected];
[email protected]; [email protected]; [email protected]
ABSTRACT
Soil organic carbon (SOC) stock is an important carbon pool in terrestrial ecosystems. It plays an important role in agricultural productivity and is often used as a key indicator of soil quality whether for soil fertility or climate regulation. SOC stocks are difficult to estimate due to the large spatial variability. In this way, many different techniques have been conducted for predicting and mapping SOC content. However, although numerous techniques are in use, there is still debate on which is most appropriate for regional soil mapping. In this context, this paper discussed the application of geostatistical method to mapping SOC in North of Tunisia. 1097 samples of SOC were collected over the Northeast region from different sources. The selection of data was based on the rigor and credibility of the sources. The available data covered the period between 2000 and 2014. The sampling was carried out in the top soil (0-30 cm). Data were analyzed using geostatistical methods: simple kriging, ordinary kriging, universal kriging and inverse distance weighting (IDW) with the power 1, 2 and 4. These methods were compared using different performance criteria: normalized root mean square (RMSE), average standard error (ASE) and coefficient of determination (R²). The best model for describing spatially variation of soil organic carbon was the ordinary kriging with the lowest error criteria and the highest coefficient of determination (R²=0.6). The spatial structure of soil organic carbon is well described by the stable model. The nugget effect indicated that soil organic carbon was highly dependent on the study area (nugget/sill ratio=20%).
INTRODUCTION
Soil organic carbon is the main component of soil organic matter. As an indicator of soil
health, SOC is important for its contributions to food production, it improves the structural stability of the soil by promoting the formation of aggregates which, in combination with porosity, provide sufficient aeration and water infiltration for plant growth (FAO, 2017). Soil organic carbon (SOC) is one of the soil properties that is not only key to sustainable soil fertility and productivity, but has become increasingly important as a major terrestrial carbon reservoir in the face of climate change (Wiesmeier et al. 2012). As COS is a spatially variable property, COS maps are of great interest for agricultural management as well as for environmental research related to terrestrial sequestration of atmospheric carbon (Liu et al. 2014). In fact, on a global scale, the soil C stock includes about 1500 Pg (1 Pg=1015 g) of soil organic carbon (SOC) (FAO, 2017). Small changes in the COS stock can influence atmospheric CO2 concentrations and, in turn, have an impact on

1st African Conference on Precision Agriculture | 8-10 December | 2020
89
global climate (Lal, 2003). It is therefore very important to estimate this stock in order to explore areas of high and low COS stock potential for effective land-use management decisions. SOC distribution is affected by many factors, including climate, hydrology, soil type, land use, and others (McBratney et al, 2003, Cumble et al, 2013, Luo et al 2017), and its spatial variation is often wide and complex. SOC stocks are difficult to estimate due to the large spatial variability in a given soil (Cerri, 2007).
Therefore, quantitative evaluation of SOC levels is meaningful to facilitate regional planning and to provide decision makers with a reference tool. hence, SOC maps are of strong interest for agricultural management as well as in environmental research related to terrestrial carbon (Liu et al 2014). One of the most important challenges of digital soil mapping is the development of methods that allow the characterization of large areas with high resolution. Surface soils, which form the largest reservoir of the organic carbon, may be able to sequester atmospheric carbon and thus mitigate climate change. In that way, many different techniques have been conducted for predicting and mapping SOC content, such as the machine learning model (Ottoy and al, 2018; Wu and al., 2020), multiple linear regression (Ottoy and al, 2018), the random forest model (Nabiollah et al., 2019) and the geostatistical methods (Kumar et al,2012; Gol et al., 2017; Chabala et al,2017; Phachamphon, 2010). Although numerous techniques are in use, there is still debate on which is most appropriate for regional soil mapping. In this context, this paper discussed the application of the different geostatistical methods for the SOC mapping.
MATERIALS AND METHODS
Study Area The study was conducted in the North of Tunisia. This region is characterized by three
types of bioclimatic stage (humid, sub-humid and semi-arid). Northern regions where forests and fertile agricultural land. This region is divided into two regions; the very rainy regions where the rainfall is above 600mm. and the rainy regions where the average annual rainfall amounts between 400 and 600mm. Soil Organic Carbon Data Base
A total of 1097points were gathered over the north region eleven governorate between 2000 and 2014, mainly by the Soil direction bulletins, analysis laboratories, research work (thesis, masters, etc.), scientific articles and annals of research institutes. The selection of data was based on the rigor and credibility of the sources. The data adequately reflect the distribution of the soil in this region. Soil samples were collected within soil profiles in the 0–30cm. SOC Spatial Modeling
The spatial variability of SOC was studied using different geostatistical methods: ordinary kriging, simple kriging, universal kriging and IDW. It used to estimate a soil organic Carbone value at a region for which a variogram is known, using data in the neighborhood of the estimation location. The predicted SOC at an unsampled location using measured values. In fact, it used to describe how a soil organic carbon varies over the land surface. It demonstrates mathematically the means in which the variance of SOC varied as the distance and direction separating any two points. The process of modeling semivariogram function fits a semivariogram curve to SOC empirical data. An automated adjustment procedure was followed during the adjustment of the SOC semivariogram using the stable model for each geostatistical method. And we applied the power 1,2 and 4 for the IDW method.

1st African Conference on Precision Agriculture | 8-10 December | 2020
90
To validate the spatial prediction of SOC, we used the leave-one-out cross validation. The indices used during this validation were determination coefficient (R²), root mean square error (RMSE), average standard error (ASE), and standardized RMSE (RMSSE). Thus, for each of the sampled locations, there was a measured value SOC (x0) and a predicted value (SOC(xi)), The R², ASE and RMSE described by (Piccini et al., 2013).
RESULTS AND DISCUSSION
Variography and Interpolated Surfaces of SOC
Table 1 shows the variographic parameters. It was observed that the spatial autocorrelation was high for simple kriging and ordinary kriging with a nugget to sill ratio of 0.22 and 0.2 respectively and medium for universal kriging. The distance at which the sill is reached is 24 km for OK, 1km for SK and 6.2Km for UK it marks the limit of spatial dependence. This expresses that the places near to each another have a similar SOC while those more distant tend to have a more different soil on average this is explained by other intrinsic factors which can influence the SOC in particular, the type of soil, the land Use, agricultural practices etc.…This shows that semi variogram parameters obtained from fitting of experimental semi variogram values were reasonable to describe the spatial variation of SOC. Coupling the predicted and measured SOC in a cross validation indicated a positive relationship (R²=0.6 for OK, 0.4 for both SK and UK). The three types of kriging showed very similar results but the ordinary kriging showed the best results R² higher and ASE and RMSE lower this is in accordance with the literature the OK is one of the geostatistical models that use a set of statistical tools to predict the value of a given soil property (in this case SOC) at a location that was not sampled (Johnston et al., 2001). OK is said to be an exact interpolator in the sense that interpolated values or their local average coincide with the values at the sampled locations (Chabala, 2017). Table 1. Variogram characteristics and indices used for leave-out-one cross validation of kriging model for soil organic carbon prediction.
Nugget Range Sill NSR* R² RMSE ASE OK 0.11 240 0.51 0.22 0.6 1.92 0.69 SK 0.08 10.5 0.4 0.2 0.49 1.93 3.02 UK 1.57 62 3.5 0.44 0.4 1.98 3.37
*NSR: Nugget to Sill ratio
For the IDW model results showed higher RMSE and lower R² compared to kriging this is can be explained by the better performance of geostatistical approach compared to deterministic one for mapping soil proprieties because the soil properties such as SOC do not depend on the distance only.
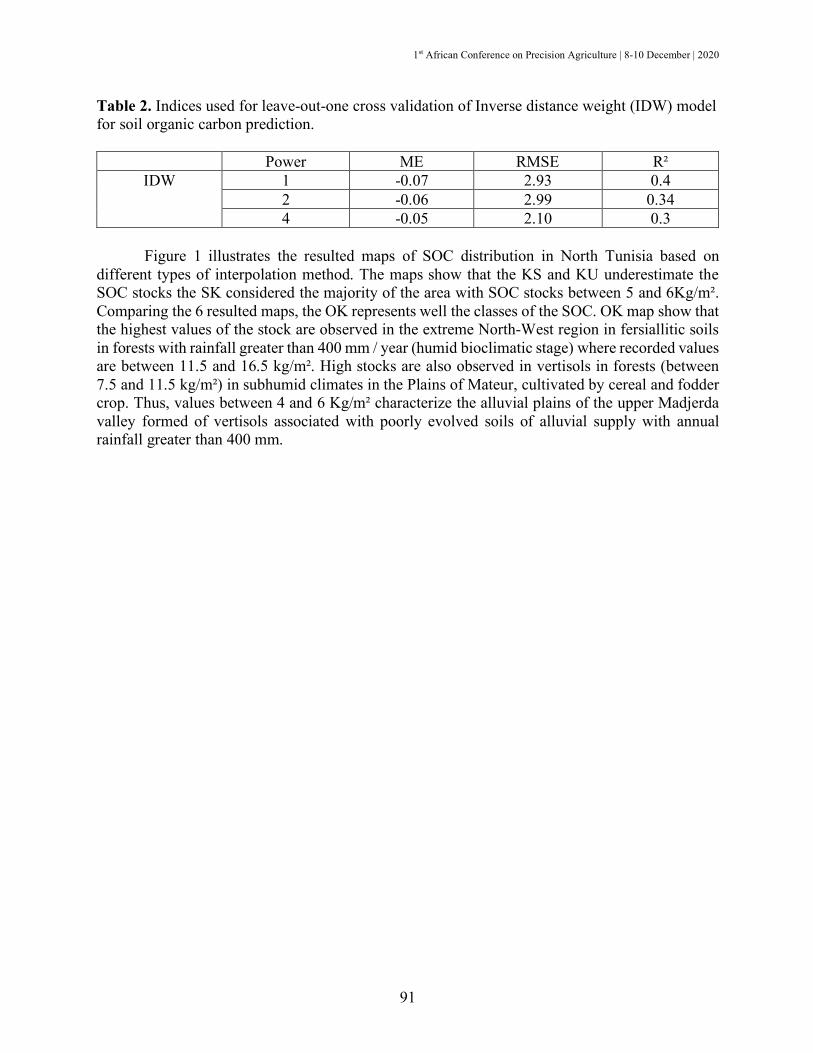
1st African Conference on Precision Agriculture | 8-10 December | 2020
91
Table 2. Indices used for leave-out-one cross validation of Inverse distance weight (IDW) model for soil organic carbon prediction.
Power ME RMSE R² IDW 1 -0.07 2.93 0.4
2 -0.06 2.99 0.34 4 -0.05 2.10 0.3
Figure 1 illustrates the resulted maps of SOC distribution in North Tunisia based on
different types of interpolation method. The maps show that the KS and KU underestimate the SOC stocks the SK considered the majority of the area with SOC stocks between 5 and 6Kg/m². Comparing the 6 resulted maps, the OK represents well the classes of the SOC. OK map show that the highest values of the stock are observed in the extreme North-West region in fersiallitic soils in forests with rainfall greater than 400 mm / year (humid bioclimatic stage) where recorded values are between 11.5 and 16.5 kg/m². High stocks are also observed in vertisols in forests (between 7.5 and 11.5 kg/m²) in subhumid climates in the Plains of Mateur, cultivated by cereal and fodder crop. Thus, values between 4 and 6 Kg/m² characterize the alluvial plains of the upper Madjerda valley formed of vertisols associated with poorly evolved soils of alluvial supply with annual rainfall greater than 400 mm.

1st African Conference on Precision Agriculture | 8-10 December | 2020
92
Figure 1. Maps of soil organic carbon (SOC) spatial distribution, generated based on kriging and IDW model in North Tunisian site.
REFERENCES
Cerri CEP, Easter M, Paustian K, Killian K, Coleman K, Bernoux M, ... Cerri CC. 2007. Predicted soil organic carbon stocks and changes in the Brazilian Amazon between 2000 and 2030. Agriculture, ecosystems & environment 122(1): 58-72.
Chabala LM, Mulolwa A, Lung O. 2017. Application of ordinary kriging in mapping soil organic carbon in Zambia. Pedosphere 27(2): 338-343.
FAO. 2017. Carbone organique du sol, une richesse invisible. Rome. Göl C, Bulut S, Bolat F. 2017. Comparison of different interpolation methods for spatial
distribution of soil organic carbon and some soil properties in the Black Sea backward region of Turkey. Journal of African Earth Sciences 134: 85-91.
Johnston K, Ver Hoef JM, Krivoruchko K, Lucas N. 2001. Using ArcGIS Geostatistical Analyst. ESRI Press, Redlands.
Kumar S, Lal R, Liu D. 2012. A geographically weighted regression kriging approach for mapping soil organic carbon stock. Geoderma 189: 627-634.
Liu E, Teclemariam SG, Yan C, Yu J, Gu R, Liu S, … Liu Q. 2014. Long-term effects of no-tillage management practice on soil organic carbon and its fractions in the northern China. Geoderma 213: 379-384.

1st African Conference on Precision Agriculture | 8-10 December | 2020
93
Lal R. 2003. Soil erosion and the global carbon budget. Environment International 29(4): 437-450. Luo Z, Feng W, Luo Y, Baldock J, Wang E. 2017. Soil organic carbon dynamics jointly controlled
by climate, carbon inputs, soil properties and soil carbon fractions. Global Change Biology, 23(10): 4430-4439.
McBratney AB, Santos MM, Minasny B. 2003. On digital soil mapping. Geoderma, 117(1-2): 3-52.
Nabiollahi K, Eskandari S, Taghizadeh-Mehrjardi R, Kerry R, Triantafilis J. 2019. Assessing soil organic carbon stocks under land-use change scenarios using random forest models. Carbon Management 10(1): 63-77.
Ottoy S, Angileri V, Gibert C, Paracchini ML, Pointereau P, Terres JM, ... Dicks LV. 2018. Impacts of selected Ecological Focus Area options in European farmed landscapes on climate regulation and pollination services: a systematic map protocol. Environmental Evidence 7(1): 10.
Phachomphon K, Dlamini P, Chaplot V. 2010. Estimating carbon stocks at a regional level using soil information and easily accessible auxiliary variables. Geoderma 155(3-4): 372-380.
Wiesmeier M, Spörlein P, Geuß U, Hangen E, Haug S, Reischl A. Kögel-Knabner I. 2012. Soil organic carbon stocks in southeast Germany (Bavaria) as affected by land use, soil type and sampling depth. Global Change Biology 18(7): 2233-2245.
Wu Q, Wang Z, Hu X, Zheng T, Yang Z, He F, ... Wang J. 2020. Uncovering the eutectics design by machine learning in the Al–Co–Cr–Fe–Ni high entropy system. Acta Materialia 182: 278-286.
1st African Conference on Precision Agriculture | 8-10 December | 2020
94
#7834 COMPARISON OF SOIL TESTING AND SCANNING METHODS FOR IN-FIELD SPATIAL VARIABILITY ASSESSMENT OF SOIL FERTILITY:
IMPLICATIONS FOR PRECISION AGRICULTURE
Rachid Bouabid1*, Ibtissam El Hadad1, Samir Benmansour2 1National School of Agriculture of Meknes, Morocco; 2Les Domaines Agricoles, Morocco,
ABSTRACT
Understanding spatial variability of soil fertility is a key to variable rate nutrient applications for precision fertilization. The objective of this study was to assess field spatial variability of soil fertility using two approaches, a gridded soil testing and a proximal sensing technique. Measurements were performed on a 12-ha field planned for corn. For the first approach, soil samples were taken from 161 geopositioned grid points and were analyzed for pH, electrical conductivity (ECs), organic matter, phosphorus and potassium, while the second approach relied on a soil scanner (Veris U3) that uses sensors for measuring apparent electrical conductivity (ECa), pH and organic matter. Three interpolation methods (IDW, Spline and Kriging) were used for comparative mapping of spatial variability of the selected soil parameters. The findings show that, in the case of the gridded soil testing, the three interpolation methods generated similar results based on map patterns and quadratic mean errors (QME), with universal kriging giving the least error. The ECa obtained from Veris scanner data was relatively similar to soil ECs obtained from gridded soil testing, with a significant correlation (R2=0,67). High salinity levels were depicted by both methods. However, the maps obtained for organic matter and pH were different, with no significant correlation. This can be attributed to the fact that the pH and infrared readings might be biased by factors such as soil moisture and soil roughness. Although both approaches showed high contents of phosphorus and potassium in the soil, the trends depicted by their respective maps were different. These differences have important implications for the management of soil salinity, organic matter (and its contribution to soil N balance by mineralization), as well as for phosphorus and potassium that would require a drawdown strategy.
Keywords: precision fertilization, spatial variability, spatial interpolation, Veris U3, electrical conductivity, precision agriculture
INTRODUCTION
The heterogeneity of soil properties represents an important source of variability that can affect crop productivity (Mulla, 1993; Cambardella 1994; Mallarino et al. 2004). It is related to various inherent soil factors as well as to agricultural practices (Zwaenepoel and Le Bars, 1997). Conventional methods of soil testing can reflect soil fertility but overcome its in-field variability. In the context of precision farming, soil heterogeneity assessment and mapping require well distributed measurements and appropriate methods of interpolation. High density grid-sampling is considered most accurate for map representation but can be costly and time-constraining (Mallarino et al. 2004). Various sensing tools have been used for direct (ie. electrical conductivity) or indirect (ie. organic matter) measurement of some soil properties (Shibusawa, 2006). Their
1st African Conference on Precision Agriculture | 8-10 December | 2020
95
reliability depends on the type of sensor and the specific conditions of their use. Translating point-data to spatial variability maps is accomplished by spatial interpolation methods, such as IDW, Spline and Kriging. The latter informs better about spatial autocorrelation and spatial dependence (Tabor et al. 1985; Cambardella et al. 1994). The objectives of this study were (i) to assess soil spatial variability as a basis for precision fertilization using two methods, gridded laboratory soil testing and a sensing technique using a soil scanner with multiple sensors, and (ii) to compare three spatial interpolation methods for the case of the grid soil testing.
MATERIALS AND METHODS
The research was conducted on a 12-ha irrigated corn filed located in a farm adopting precision agriculture near the city of Fes, Morocco. The soil is a Vertic Calcixeroll. For the soil testing method, 161 regularly spaced composite soil samples were collected (0.2-m depth) on a regular grid in mid-February 2020 before sowing and analyzed for electrical conductivity (ECs) (1:5 soil extract), pH, organic matter (OM), available phosphorus (P) and potassium (K). In the case of the sensing method, a Veris U3 scanner (Veris Technologies®) contracted by the farm was passed throughout the field (with 15-m spacing) to collect data for apparent electrical conductivity (ECa), pH and OM. Few samples were collected by the service provider for extrapolations for phosphorus and potassium based on own developed models.
In the case of the lab soil testing, spatial interpolation was performed using Inverse Distance Weight (IDW), Spline and Kriging using ArcGIS Geostatistical Analyst. Best optimization parameters and models were used each method and cross validations were based on QME and map patterns. In the case of kriging, the degree of spatial dependence was evaluated using the nugget/sill ratio (Cambardella et al.,1994). In the case of the scanner method, spatial interpolation was done by the kriging for ECa, pH and OM. Phosphorus and potassium maps were derived by the Veris service provider and were made available to this study for comparisons. Mean values of scanner data situated within a 10 meters radius relative to the same positions of the grid sampling points were used for the purpose of correlations among the two methods.
RESULTS AND DISCUSSION
Spatial Variability Using the Gridded Soil Testing Data The soil parameters measured presented different degrees of variability, with pH and OM
showing low CVs (2,6% and 13,2% respectively) and ECs, phosphorus and potassium showing high CVs (61.7%, 59,7 % and 39.2, respectively). Values ranged from 0,1 to 1,14 ds/m for ECs, from 7,7 to 8,3 for pH, from 2,04 to 4,35% for OM, from 21,3 to 512 ppm (P2O5) for phosphorus, and from 226 to 982 ppm (K2O) for potassium. High skewness of ECs, pH P and K were noticed indicating that these properties have particular high local distribution.
The spatial variability maps obtained with the 3 interpolation methods showed similar trends and patterns for all the measured parameters. For the purpose of this short article, only maps with kriging method are presented (Figure 1). Kriging (Universal) showed the smallest MQE. Overall, the maps revelled the existence of a general NE-SW gradient for all measured parameters.
The ECs map revealed a high salinity area in the SW part of the field (0,5 to 1,14 ds/m), exceeding corn salt tolerance. The low range (92m) and nugget/sill ratio (0.09) of ECs obtained from the kriging semi-variogram indicates a strong spatial dependence (<0,25) inferring that

1st African Conference on Precision Agriculture | 8-10 December | 2020
96
variability is affected more by structural extrinsic factors (topography and drainage) than by farming practices (Tabor et al. 1985; Cambardella et al., 1994; Goovaerts, P., 1998).
Soil pH variations across the field (map not shown) were relatively small (0.6 pH unit). The alkaline conditions are attributed to the presence of active CaCO3 (2,5 to 7,3%) that tends to buffet soil pH around 8.2. The high alkaline conditions, in the eastern part of the field, can affect soil conditions, mainly micronutrient availability, with risks of iron chlorosis.
In general, the soil OM map did not show great variability, with the 2.5-3.5% class being the dominant. OM accumulation in the western part of the field can be related to residue management. Although the overall amplitude differences are not too high across the field, short-terms management of residues and organic amendments are needed to level up OM contents. Kriging variogram gave a range of 594m and nugget/sill ratio of 0,69 indicating a weak spatial dependence compared to ECs. Similar results were reported by other studies (Miao and Mulla, 2006).
Figure 1. Spatial variability maps of ECs, organic matter, phosphorus and potassium based on grid laboratory soil testing data
The maps of soil available phosphorus were also quite similar among the three interpolators, with kriging yielding a smoother map. The P level was in general very high (>50 ppm) indicating that the phosphorus fertilization practice leads to a build-up of this nutrient and needs to be drawdown to a reasonable level. The kriging semi-variogram gave a range of 594 meters and a nugget/sill ratio of 0,13 that indicate large autocorrelation distances and high spatial dependence, inferring a stronger influence of management practices (Cambardella et al., 1994).
The exchangeable K maps revealed also a general E-W decreasing trend with high levels (>300 ppm K2O) on more than two thirds of the field. These high K levels are most probably related to the mineralogy of the soil clays which are illite rich (Bouabid et al., 1996). In fact, K fertilizers were not applied on this field for several years. Kriging semivariogram gave a range of 393m, while the nugget/sill ratio was very low (1,6), suggesting a high spatial dependence which corroborates that variation of K are more related to inherent soil conditions than to fertilizer practice. Spatial Variability Maps Using Veris U3 Scanner
The ECa map obtained by the Veris U3 using universal kriging (Figure 2) shows a very patchy pattern, but still displays a NE-SW gradient similar to that depicted in the map obtained by the grid laboratory soil testing. The map revels also that the SW part of the field has a high ECa. Correlation among ECa and ECs was highly significant (R2 of 0.67). Compared to the 1:1 curve, it

1st African Conference on Precision Agriculture | 8-10 December | 2020
97
appears that for low salt levels (<0.020 ds/m), the scanner seems to underestimate measurements, and for higher salt levels (>0.020 ds/m), it tends to overestimate EC measurements.
The OM map shows contents within close range compared to the laboratory grid soil testing map, but with different trends. The <2.5% class being the dominant, and the class >3.5% being negligeable. Some agreement for the intermediate class (2,5-3,5%) were observed in the middle part of the field. No significant correlation was obtained with MO obtained with soil the grid laboratory testing method. This lack of correlation can be attributed to various factors, such as the state of organic residues decomposition, soil moisture, aggregate heterogeneity and soil surface roughness (Shonk et al., 1991; Sudduth and Hummel, 1993; Christy, 2008; Bricklemyer and Brown, 2009; Morgan et al., 2009;).
Figure 2. Spatial variability maps of ECa, organic matter, phosphorus and potassium based on Veris U3 scanner data
The maps of phosphorus and potassium provided by the Veris service provider (using own
models) and made available to this study by the farm showed also different class extents and trends compared to those obtained by the gridded soil test method. In the case of P, both methods show that the class ‘>80 ppm’ was the dominant, but the extents these classes were different. While the gradient of P was relatively E-W in the case of the scanner method, it was rather NE-SW in the case of the laboratory grid soil testing method (Figure 1 & 2). In the case of potassium, both methods revelled high soil K contents, but the trends were also different, especially for classes higher than 300 ppm. Recommendations in both cases would be toward no, or minimum, P and K applications in a small part of the field only. The observed differences for both P and K could be attributed to the models used by the service provider for extrapolations for these two elements across the field, which rely on a small number of tested soil samples (4 samples for 13 ha). A greater number of P and K testing could provide a better portrayal of the spatial variability of P and K using the various Veris U3 sensed parameters.
CONCLUSIONS
Spatial interpolation using IDW, Spline and Kriging generated similar map trend with close MQEs. Kriging gave smoother limits among the classes adopted. Soil ECs showed small variations and low spatial dependence compared to the other parameters. Apparent ECa map obtained using the Veris scanner showed similarity with laboratory grid soil test ECs, with a significant correlation. However, differences among the two methods were shown for organic matter, pH, phosphorus and potassium. Differences for OM can be attributed to artefacts in sensing by the scanner due to factors such as soil moisture and surface roughness, while those

1st African Conference on Precision Agriculture | 8-10 December | 2020
98
observed for P and K can be attributed to the small number of soil-tested samples used for extrapolations. The spatial variability revealed on this field has important implications for site-specific management of salinity, organic matter and nutrients.
ACKNOWLEDGEMENTS
The authors acknowledge the Company ‘Les Domaines Agricoles’ for allowing this research to be conducted on one of their fields, as well as for making the Veris U3 data available for analysis and comparisons.
REFERENCES
Bouabid R, Badraoui M, Bloom PR, Daniane M. 1996. The nature of smectites and associated interstratified minerals in soils of the Gharb plain of Morocco. European Journal of Soil Science 47(2): 165–174.
Brikelmeyer RS, Brown DJ. 2010. On-the-go VisNIR: Potential and limitations for mapping soil clay and organic carbon. Computers and Electronics in Agriculture 70: 209–216.
Cambardella CA, Moorman TB, Novak JM, Parkin TB, Karlen DL, Turco RF, Konopka AE. 1994. Field-scale variability of soil properties in central Iowa soils. Soil Science Society America Journal 58(5): 1501–1511.
Christy CD. 2008. Real-time measurement of soil attributes using on-the-go near infrared reflectance spectroscopy. Comput. Electron. Agric. 61 (1): 10–19.
Goovaerts P. 1998. Geostatistical tools for characterizing the spatial variability of microbiological and physico-chemical soil properties. Biology and Fertility of Soils 27(4): 315–334.
Mallarino AP, Wittry DJ. 2004. Efficacy of grid and zone soil sampling approaches for site-specific assessment of phosphorus, potassium, pH, and organic matter. Precis. Agric. 5: 131–144.
Miao Y, Mulla DJ, Robert PC. 2006. Spatial Variability of Soil Properties, Corn Quality and Yield in Two Illinois, USA Fields: Implications for Precision Corn Management. Precision Agriculture 7(1): 5–20. doi:10.1007/s11119-005-6786-2
Morgan CLS, Waiser TH, Brown DJ, Hallmark CT. 2009. Simulated in situ characterization of soil organic and inorganic carbon with visible near-infrared diffuse reflectance spectroscopy. Geoderma 151: (3–4), 249–256.
Mulla DJ. 1993. Mapping and managing spatial patterns in soil fertility and crop yield. In P. C. Robert, W. E. Larson, & R. Rust (Eds.), Soil Specific Crop Management (pp. 15-26). Amer. Soc. Agronomy.
Shibusawa S. 2006. Soil Sensors for Precision Farming. In Handbook of Precision Agriculture, Principles and Applications; Srinivasan, A., Ed.; The Haworth Press: New York, NY, USA, pp. 57–90.
Sudduth KA, Hummel JW. 1993. Soil organic matter, CEC, and moisture sensing with a portable NIR spectrophotometer. Trans. ASAE 36, 1571–1582.
Shonk JL, Gaultney LD, Schulze DG, Vanscoyoc GE. 1991. Spectroscopic sensing of soil organic matter content. Trans. ASAE 34 (5) : 1978–1984.
Tabor JA, Warrick AW, Myers DE, Pennington DA. 1985. Spatial variability of nitrate irrigated cotton: II. Soil nitrate and correlated variables. Agron. J. 49: 390-394.

1st African Conference on Precision Agriculture | 8-10 December | 2020
99
Zwaenepoel P, Le Bars JM. 1997. L’agriculture de précision. Ingénieries Eau-Agriculture-Territoires, 12 : 67-79. IRSTEA ; CEMAGREF, 1997, ffhal-00461080.

1st African Conference on Precision Agriculture | 8-10 December | 2020
100
#7880 SPATIAL SOIL LOSS RISK ASSESSMENT FOR PROPER INTERVENTION: A CASE OF NERI WATERSHED OMO-GIBE BASIN SOUTHWESTERN ETHIOPIA
Abebe Hegano1*, Awdenegest Moges2, and Nigatu Wonderade2
1Southern Agricultural Research Institute (SARI), PO Box 06, Hawassa, Ethiopia 2Hawassa University, Institute of Technology, PO Box 05, Hawassa, Ethiopia,
ABSTRACT
Soil erosion is one of the biggest global environmental problems resulting in both on-site and offsite effects. It contributes negatively to agricultural production, quality of source water for drinking, ecosystem health in land and aquatic environments, and aesthetic value of landscapes. This study was conducted in Neri watershed, part of Omo Gibe basin with area of 465.46 km2. RUSLE model supported by a GIS framework is used to assess the average annual soil loss, and create a soil erosion hazard map. To this end, data for the model parameters were derived from, a Digital Elevation Model (30*30 m), thirty years (1988-2017) rainfall data at 4 rain gauge stations, soil erodibility data from field samples, Landsat-8 satellite image for cover management and support practices. As result, the estimated average annual soil loss in Neri watershed varied from 0 at flat lands to 465.16 t ha-1 yr-1at worst condition, with an estimated mean annual soil loss of 9.955 t ha-1 yr-1 and total amount of soil loss is 463365.46 t yr-1 About 54.88% (25536.8 ha) of the watershed was categorized below moderate classes. The remaining 45.12% (21009.2 ha) of land area was classified under high to very high classes about several times the maximum tolerable soil loss. Based on the soil loss hazard map, six sub-watersheds out of eleven Neri sub- watersheds need prior intervention in terms of integrated cover-management and mechanical conservation measures. Furthermore, RUSLE results can be refined by analyzing along with sub-watersheds level real time monitoring for conservation practices. Keywords: soil erosion, RUSLE, GIS, Neri watershed, Ethiopia
INTRODUCTION
Soil erosion is the one among major threats to the sustainability of environment and
productive capacity of agriculture (Yang et al., 2003; Feng et al., 2010), which makes plant root depth shallow, removes plant nutrients and losses water (Mahmud et al., 2005). This possibility can be attributed to the fact that the impact of soil erosion is more damaging on bare land and cultivated land than any other types of land use/land cover. A 17% productivity reduction in the global scale since the end of world war second (Angima et al., 2003). It results in serious food insecurity in many developing countries as it depletes productive soils (Blanco and Lal, 2008). The severe situation in Ethiopia is quantified by loss of 1 billion USD per year (Sonneveld, 2002) and is still affecting 50% of the agricultural area. It is the prime contributor to temporary or permanent decline of the productivity of land (Oldeman et al., 1991). Its effects are also recognized to be severe threats to the national economy of Ethiopia (Tamene, 2005).
Soil loss by surface runoff is a severe ecological problem occupying 56% (1,100 million hectares) of the world-wide area as accelerated by human-induced soil degradation as (Bai et al.,

1st African Conference on Precision Agriculture | 8-10 December | 2020
101
2008). In the same manner, about 43% (537,000 km2) of the total highland areas of Ethiopia are highly affected by soil erosion (Hurni, 1990).
Quantitative understanding of soil loss has got attention of scientific community in different parts of Ethiopia. For instance, in the Ethiopian highlands only, an annual soil loss reaches 200-300 tons ha-1yr-1 (FAO, 1984; Hurni, 1993) and soil loss due to erosion in Ethiopia amounts to 1493 million tons per annum, of which about 42t ha-1 yr-1 was estimated from cultivated fields of Ethiopia (Hurni, 2008).
The study area, Neri watershed, lower part of Omo Gibe basin in South Omo zone, obviously shares the above-mentioned hazards and threats of soil erosion. Despite all these all these could not go beyond quantified risks of soil loss and its spatial distribution for prioritized intervention, there was no area specific information investigated particular to this watershed.
Consequently, this study is aimed to assess the average annual soil loss, and create a soil erosion hazard map within this watershed is needed for decision makers in policy and strategy formulation and, for natural resource managers by providing a necessary tool to design the right intervention strategy for the specific climate, soil type, and topography and land use situation.
MATERIALS AND METHODS
Soil erosion modeling study was conducted, Neri watershed is situated in the lower part of
the Omo Ghibe basin southwestern, Ethiopia. Geographically, it lies between 5.630 and 5.930
North, and 36.310 and 36.670 East. The study area is about 465.46 km2. RUSLE empirical model Renard et al. (1997) supported by a GIS framework is used to
assess the average annual soil loss, and create a soil erosion hazard map. To this end, data for the model parameters were derived from, NMA thirty years (1988-2017) rainfall data at 4 rain gauge stations, soil erodibility data from field samples, Landsat-8 satellite image (OLI) assessed online USGS on 1st January 2017, for cover management and support practices. The RUSLE (Renard et al., 1997) model can be expressed as Equation (1);
…… ………………………………………………Equation 1
Where, A, stands for computed soil loss per unit area per year (t ha-1 yr-1), R for rainfall
erosivity factor (MJ mm ha-1 h-1yr-1), K for soil erodibility factor (t ha MJ-1 mm-1) , LS for slope length and steepness factor (dimensionless), C for cover - management factor (dimensionless) and P for support practice factor (dimensionless) R factor was determined using regression (Equation 1) calibrated by (Kaltenrieder, 2007).
………………………………………………………Equation 2
Where, R is rainfall erosivity factor, P is mean annual rainfall in (mm) Soil erodibility (K-factor) has been calculated after textural (analysis particle size
distribution) by means of the following formulae which were developed from global data of measured K values, obtained from 225 soil classes (Renard et al. 1997).

1st African Conference on Precision Agriculture | 8-10 December | 2020
102
……………………………Equation 3 With R2 = 0.983 Where, Dg is the geometric mean particle size, for each particle size class (clay, silt, sand), di is the maximum diameter (mm), di-1 is the minimum diameter and fi is the corresponding mass fraction.
LS-factor was computed from ASTER DEM by ArcGIS 10.3.1 in raster calculator using
the map algebra expression in (Equation 4) suggested by Mitasova and Mitas (1999)
…………………………………………………………………………………..Equation 4 C-factor estimation was done by two maps generated (LULC and NDVI suggested by
Durigon et al.(2014) and regression equation (Equation 5) obtained for this particular study watershed from C-factor tabular values of references and NDVI map was employed.
C= -1.211*(NDVI) + 0.615 ………………………………………………Equation 5 P-factor was obtained from both slope and LULC classes (Wischmeier and Smith, 1978)
because no soil conservation practices. So, conservation practices vary based on LULC and slope.
RESULTS AND DISCUSSION Revised Universal Soil Loss Equation Model Individual Factors Outputs
Rainfall erosivity values as result of Inverse distance weighted (IDW) interpolation, range from 713.1 to 754.43 MJmmh-1ha-1yr-1 with mean of 731.87. As the result of kriging interpolation of calculated spatial K-values based on equation (11) and (12). K-factor values in the study watershed differed from (0.0306 – 0.044) Mg h MJ-1 mm-1. Estimated annual average soil erodibility factor was 0.0385Mg hMJ-1mm-1. As result of linear regression equation, C-factor output was found to its maximum value of 0.6141, minimum 0.01056 and average 0.385 and the P factor values of study area ranges between 0.11 and 1 with mean of 0.591.
Soil Loss Estimation Results
The RUSLE model output pixel level analysis result of Neri watershed ranges from in the mean (0-465.16 ton ha-1yr-1) the maximum amount estimated at the mid-eastern parts of the watershed. The very high pixel values (more than 25 tons ha-1yr-1) were detected in a distributed manner throughout the watershed. However, the particular maximum pixel value found at much of the steeper slope banks with high LS factor value where poor surface cover condition. The average annual soil loss rate is 9.955 tons ha-1yr-1 from the entire watershed area (46546 hectare). The total amount of soil loss is 463365.46 tons yr-1.
The mean annual soil loss rate from this watershed is higher than the previous research report compared with the case of Gibe-III Dam Catchment which is 7.47 t /ha/ y by Gera work and Awdenegest (2014). Conversely, the mean annual soil loss results of current study is lower than the annual average soil loss under Ethiopian condition which is 12 tons per hectare per year and

1st African Conference on Precision Agriculture | 8-10 December | 2020
103
about 42tha-1yr-1 from cultivated highland (Hurni, 1993) could be due to agricultural fields lie less slopes.,
According to WBISPP (2001), the average annual soil erosion rates were classified into the five priority classes, namely, ‘Very Less (0-03.125), Less (3.125-6.25), High (12.5-25) and Very high (>25) t ha-1 yr-1 to develop soil erosion severity maps.
Table 1. Area and amount of annual soil loss for each severity class (WBISPP, 2001).
Soil loss (t ha-1 year-1)
Equivalent top soil removal (mm)
Soil loss risk class
Area (ha)
Area (%)
(0 - 3.125) (<0.2.5) Very Less 25023.13 53.76% (3.125 - 6.25) 0.2.5 – 0.5 Less 6316.29 13.57% (6.25 - 12.5) 0.5 - 1 Moderate 10896.42 23.41% (12.5 - 25) 1 - 2 High 3025.49 6.5%
(> 25) >2 Very High 1284.67 2.76% 46546 100%
As result, about more than 6.25 tons ha-1yr -1, was (19,241ha.), which comprises 32.67%
of the total study area which zone of a great danger of soil erosion and the remaining 67.33%, (31339.42) hectare is lesser, which is recognized as not.
Prioritization of Intervention areas
According to (Gebreyesus and Kirubel, 2009; FAO and UNEP., 1984), soil loss tolerance (SLT) denotes the maximum allowable soil loss rate that will sustain an economic and a high level of productivity. (WBISPP, 2001) classification of soil loss classes which is for Southern Ethiopia was used, which is more than tolerable loss rate category (>6.125 t ha-1 year-1 As result, 7 sub watersheds out of eleven and or 9 kebeles out of 19 were beyond this soil loss tolerance rate.
Figure 2. Soil loss severity classes by sub watershed.

1st African Conference on Precision Agriculture | 8-10 December | 2020
104
CONCLUSIONS
The application of RUSLE model with the aid of GIS and remote sensing was applied over the Neri watershed to generate soil loss hazard map. Moreover, the study was an attempt to estimate average annual soil loss at this watershed and to identify risky areas priority intervention. The soil loss map produced by overlaying of grid maps of the six factors showed that the soil loss rate of the watershed ranged from (0 – 465.16 t ha-1yr-1) with a mean annual soil loss rate of 9.95 t ha-1yr-1 and overall total annual amount of 463,365.46t/yr. So that, it is perceptible that this watershed is under risk of soil erosion.
As a further matter, for the prioritization of intervention, the soil loss map of baseline period was used to extract the soil loss per nineteen (19) kebeles administrative units and eleven (11) sub-watersheds (SWs). But sub-watersheds having greater than SLT were chosen. Based on the analysis, sub-watersheds greater than SLT in their order of area weighted average soil loss were identified for priority intervention. Based on the findings of this study, to ensure sustainable resource use, management practice by strong policy measures, erosion minimization in agricultural and non-agricultural land use classes are of paramount importance
REFERENCES
Angima SD, Stott DE, O‟Neill MK, Ong CK, Weesies GA. 2003. Soil erosion prediction using RUSLE for central Kenyan highland conditions. Agriculture, ecosystems and environment 97(13): 295- 308.
Bai Z, Dent DL, Olson L, Shaepman ME. 2008. Proxy global assessment of land degradation. Soil Use and Management 24, 223-234.
Blanco CH, Lal R. 2008. Principles of soil conservation and management. Springer Science and Business Media B.V, Berlin P 240.
De Jong, SM, Paracchini ML, Bertolo F, Folving S, Megier J, de Roo APJ. 1999. Regional assessment of soil erosion using the distributed model SEMMED and remotely sensed data. Catena 37, 291–308.
Durigon VL, Carvalho DF, Antuness MAH, Oliveira PTS, Fernandess MM. 2014. NDVI time series for monitoring RUSLE cover management factor in a tropical watershed. International Journal of Remote Sensing 35, p.441-453.
Feng X, Wang Y, Chen L, Fu B, Bai G. 2010. Modelling soil erosion and its response to land-use change in hilly catchments of the Chinese Loess Plateau. Geomorphology 118: 239–248.
Food and Agricultural Organization (FAO) and UNEP. 1984. Provisional Methodology for Assessment and Mapping of desertification.
Gebreyesus B, Kirubel M. 2009. Estimating Soil Loss Using Universal Soil Loss Equation (USLE) for Soil Conservation planning at Medego Watershed, Northern Ethiopia. Journal of American Science 5(1), pp 58-69. Marsland Press.
Gerawork B, Awdenegest M. 2014. Spatial Erosion Hazard Assessment for Proper Intervention in the case of Gibe-III Dam Catchment, Southwest Ethiopia. MSc Thesis, Haramaya University.
Hurni H, Herweg K, Portner B, Liniger H. 2008. Soil Erosion and Conservation in Global Agriculture. In Land Use and Soil Resources. Springer, Dordrecht pp. 41-71.
Hurni, H. 1990. Degradation and conservation of soil resources in the Ethiopian highlands. Mountain Research and Development 8: 123-130.
1st African Conference on Precision Agriculture | 8-10 December | 2020
105
Hurni H. 1993. Land degradation, fine, and land resource scenarios in Ethiopia. In: Pimenta (edition.),
Kaltenrieder J. 2007. Adaptation and Validation of the Universal Soil Loss Equation (USLE) for the Ethiopian Eritrean Highlands. MSc Thesis, University of Berne, Centre for Development and Environment Geographisches Institute.
Lal R, Elliot W. 1994: Erodibility and erosivity, In Lal, R. (ed.), Soil Erosion research Methods, St. Lucie Press, Delray Beach, Florida, pp 181-207.
Mahmud Y, Alemu M, Menale K, Pender J. 2005. Cost of Land degradation in Ethiopia: A Critical Review of Past Studies. Environmental Economics Policy Forum in Ethiopia, and International Food Policy Research Institute, Addis Ababa, Ethiopia.
Mitasova H, Mitas Z. 1999. Modeling soil detachment with RUSLE 3D using GIS. IL, USA: University of Illinois at Urbana –Champaign.
Oldeman LR. 1994. The global extent of land degradation. In: Greenland DJ, Szabolcs I (eds) Land resilience and sustainable land use. CAB International, Wallingford UK, pp 99–118.
Renard KG, Foster GR, Weesies GA, McCool DK, Yoder DC. 1997. Predicting soil erosion by water: A guide to conservation planning with the Revised Universal Soil Loss equation, Agriculture Handbook No. 703, U.S. Department of Agriculture, Washington, D.C., USA.
Smith JL, Halvorson JJ, Papendick RI. 1993. Using Multiple-Variable Indicator Kriging for Evaluating Soil Quality. Soil Science Society of America Journal 57: 743-749.
Sonneveld BGJS. 2002. Land under Pressure: The Impact of Water Erosion on Food Production in Ethiopia. Shaker Publishing, Maastricht, the Netherlands.
Tamene L. 2005. Reservoir siltation in the dry lands of Northern Ethiopia: causes, Source areas, management option. PhD. Thesis, University of Bonn, Germany
Wischmeier WH, Smith DD. 1978. Predicting Rainfall Erosion Losses: A Guide For Conservation Planning-USDA Agricultural Hand book No 537, Washington, DC.
Woldeamlak B, Teferi E. 2009. Assessment of soil erosion hazard and prioritization for treatment at the watershed level: Case study in the Chemoga watershed, Blue Nile basin, Ethiopia. Land. Degrad. Dev. 20: 609–622.
Woody Biomass Inventory and Strategic Planning Project (WBISPP). 2001. Southern Nations. Yang D, Kanae S, Oki T, Koike T, Musiake K. 2003. Global potential soil erosion with reference
to land use and climate changes. Hydrology Process 17: 2913–2928.
1st African Conference on Precision Agriculture | 8-10 December | 2020
106
#7891 GEO-STATISTICAL PREDICTION OF SPATIAL DISTRIBUTION OF SALT-AFFECTED SOILS OF MEKI-ZEWAY FARM AREAS IN ETHIOPIA: BASELINE
INFORMATION FOR PRACTICAL IMPLEMENTATION OF PRECISION AGRICULTURE SYSTEM
Melese Minaleshoa and Girma Kassa
Ethiopian Institute of Agricultural Research (EIAR), Debre Zeite Agricultural Research Center, [email protected]
ABSTRACT
Salinity and sodicity induced soil degradation are major soil property related environmental constraint with severe negative impacts on productivity and sustainability of both rainfed and irrigated agriculture in arid and semi-arid lowlands of Ethiopia. The spatial prediction, data bases creation and preparation of actionable digital soil salinization/sodiciation pattern maps has a special importance to enable site-specific management system leading to the establishment and execution of Digital Agriculture (DA) in general and Precision Agriculture in particular. Spatially high-resolved digital input layers are the fundamental requirements of space time conscious variable rate application devices in the Internet of Things (IOT)realm to address the with-in-farm-plot soil property variation. This study was conducted at Meki-Zeway farm areas during 2018-2019 with objective to investigate extent and spatial distribution of salt-affected soils and prepare the associated digital database and digital maps. A grid sampling scheme was designed and auger samples were collected at three depths (0-30, 30-60 and 60-90cm). Based on Geo-referenced soil attribute data related to salinity/sodicity was collected from the field and respective laboratory values generated. The spatial prediction and mapping of the unsampled surface from laboratory point values was carried out in opensource GIS environment following geo-statistical interpolation techniques. Statistical surfaces of the salinity/sodicity indicator preliminary layers including EC, ESP and pHe and the final salinity/sodicity distribution predicted raster was generated. The results revealed a widespread occurrence of salt-affected soils of the investigated farm areas being remarkably varied spatially in terms of extent and types of the problems both in vertical and horizontal modes. Larger proportion of the area contained pHe values greater than 7.8 with extreme value of 10.3 and overall range values of ECe and ESP between 0.20-15.30dS/m and 3-58, respectively for the upper 0-30cm soil depth. With increasing soil depth sodicity and alkalinity increased consistently whereas salinity followed the reverse depth-wise distribution. Extent of soils alkalinity and sodicity was more pronounced South-ward (Zeway farm area) than Meki farm area (North-ward). Chloride and bicarbonate salts of calcium and sodium predominate in the salt composition of the saline soils while carbonate and bicarbonate salt of sodium appeared dominant salts in sodic soils contributing to common alkaline reaction of sodic and saline sodic soils of the area. Diverse manifestations of spatial heterogeneity in terms of types and severity among different salt-affected soil classes is highly evident from present study and therefore site-specific, more precise pixel-by-pixel reclametive and ameliorative measures must be taken to account such scenarios- with precision agriculture. The study recommended a similar pathway of preparing the remaining other soil properties to be prepared and included to provide a more complete and unified soil fertility improvement guide and digitally actionable input to AI and IOT tools for effective

1st African Conference on Precision Agriculture | 8-10 December | 2020
107
deployment of precision agriculture and underlines the need for further research on investigation of salinity-sodicity casual factors and development of effective management options.
INTRODUCTION
Widespread occurrence of salt-affected soil in Ethiopia has been well documented (Hawando, 1995; Aredehey et al., 2018; Kidane et al., 2006; Fantaw A (2007).). In recent years salinity and sodicity-induced soil degradation is becoming a major environmental constraint with severe negative impacts on productivity and sustainability of irrigated agriculture in arid, semi-arid and lowlands of the country. Meki-Zeway located in the Central Rift valley zone of the Great Rift Valley system of Ethiopia where soils of the area are naturally salt-affected and prone to secondary salinization. According to Meron (2007) buildup and expansion of salinization and sodiciation in particular is becoming potential threat to sustainability of irrigated farms of the area. Soil salinity and sodicity are spatially variable and temporally highly dynamic. Soil heterogeneity particularly imposed by mosaic distribution of salinity and sodicity is an important management challenge. Such heterogeneity predetermines differences in rehabilitation and management practices. In this regard the spatial prediction, data bases creation and preparation of actionable digital soil salinization/sodiciation pattern maps has a special importance to enable site-specific management system leading to the establishment and execution of Digital Agriculture (DA) in general and precision agriculture in particular. In past only limited studies has been conducted in the area which generally focused on soil taxonomic classification and related aspect where detailed information on extent and spatial distribution of salt-affected soils in the area is lacking. This study, therefore, was executed with objective to investigate extent and spatial distribution of salt-affected soils and prepare the associated digital database and digital maps.
MATERIALS AND METHODS
The study site lies between 7˚ 57' 6.15'' N to 8˚ 9' 4.43'' N Latitude and 38˚ 42' 36.2'' E to 38˚51' 1.17'' E Longitude found at 160 km south of Addis Ababa, and at an average altitude of 1628m above sea level. Slope gradients are generally very low, and predominantly lying in the range between 1 and 2%. The area received average annual rainfall of 775 mm and has a mean annual temperature ranging from 12.33 to 26.18°C laying within warm semi-arid lowland agro-climatic zone classification of Ethiopian (MOARD, 2005). The dominant soil type of the study site is Haplic Andosols, Typic Haploxerands (Zewdie 2004) and it is of sandy loam texture. The agro-climatic conditions allow farmers to grow onion (Allium cepa), tomato (Solanum lycopersicum) and maize (Zea mays). A grid sampling scheme was designed and auger samples were collected at three soil depths (0-30, 30-60 and 60-90cm). Following standard analytical method, collected soil samples were analyzed for particle size distribution, pH, EC, CEC, exchangeable bases, water soluble cations and anions. ESP was computed as the percentage of exchangeable Na to the CEC of the soil. The soils were classified into different salt-affected soils according to the standard guidelines. The spatial prediction and mapping of the unsampled surface from laboratory point values was carried out in opensource GIS environment following geo-statistical interpolation techniques. Statistical surfaces of the salinity/sodicity indicator preliminary layers including EC, ESP and pHe and the final salinity/sodicity distribution predicted raster was generated. Data generated was subjected to descriptive statistics. Regression analysis was also used to examine the relationships between selected soil properties.

1st African Conference on Precision Agriculture | 8-10 December | 2020
108
RESULTS AND DISCUSSION
Particle size analysis indicates that the soils of Meki-Zeway irrigated farm areas was sandy loam to loamy textured soils. The proportion of clay particle varied between 14 to 25% while silt and sand varied from 13 to 42 and 31 to 70%, respectively. Result revealed that the sand content in the soils of studied area was very high and silt/clay ratios were greater than 0.76 indicating that the soils are relatively young with high degree of weathering potential (Meron, 2007). Soil pH values of saturation paste extract (pHe) for all soil samples analyzed varied between range values of 6.9 to 9.3, 7.2 to 9.7 and 7.9 to 10.3, respectively for the upper (0-30cm), middle (30-60cm) and lower (60-90cm) soil layers and could be rated to lie between neutral to very strongly alkaline in reaction(Table 1). From range values, existence of remarkable spatial variation is evident on both vertical and horizontal planes. Magnitude of alkalinity and extent of spatial coverage increased in the direction from North (Meki) to South-ward (Zeway). Close to 3,897ha (40.1%) of farm area exhibit soil with pHe value that could be rated as moderately alkaline in reaction whereas about 398ha (4.1%) of studied area had pHe value greater than 9.0 and regarded as strongly alkaline in reaction.
Distribution of salinity and extent of severity showed spatially heterogeneous pattern throughout studied area mostly dominated along irrigated farm areas adjacent to Lake Zeway. The overall range values of ECe, varied from 0.20 to 15.30, 0.19 to 12.98 and 0.21 to 7.56dS/m with mean value of 3.08, 2.30 and 1.93dS/m, respectively at a soil depth of 0-30, 30-60 and 60-90cm (Table 1). Depth-wise distribution of soil ECe didn’t showed consistent trend of either increasing or decreasing. Nearly 82% (7,969ha) out of the total farmland studied, contained ECe values less than 4dS/m and generally categorized as free of excess salt having no adverse effect on growth and productivity of most crops. Close to 17% (1,652ha) had ECe values between 4 and 8dS/m for the upper 0-30cm soil layer which could be rated as moderately saline soil class whereas only about 84ha (1%) were regarded as highly saline soil class (ECe between 8 and15 dS/m).
Sodic soils; contains soluble carbonate (CO32-) and bicarbonate (HCO3-) ions of Na+. The concentrations of Na+ were greater than the accompanying levels of chloride (Cl-) and sulfate (SO42-) that is CNa: (CCl- + CSO42-) ratio greater than 1. Alternatively, the ratio (2CCO32- + CHCO3-) : (CCl- + 2CSO42-) was more than 1 in soil solution phase, expressed as meq/lt which agrees with Chhabra (2005) observation as cited by Qadir et.al., (2007). The main cause of alkaline reaction of soils is the hydrolysis of either exchangeable cations or of salts such as Na2CO3 (FAO (1988). Result implies that NaHCO3 and Na2CO3 were the dominant salts in sodic soils and could be presumed to be the major soluble salts predominantly contributing to common alkaline reaction of sodic and saline sodic soils of the area. The range values of ESP as a measure of soil sodicity varied between 3 and 58 with mean value of 13 for the upper 0-30cm soil layer (Table 1). The ESP consistently increased with increasing soil depth indicating lower soil layer had more sodic property. Assessment of soils of irrigated lands in Meki Zeway by Mengistu (2001) as cited by Kidane et.al. 2006 revealed that the soils of the area are sodic in the subsurface horizons. Spatial distribution of soil with sodic nature followed the same trend to that of soils with alkaline property.

1st African Conference on Precision Agriculture | 8-10 December | 2020
109
Figure 3. Spatial distribution of predicted salt-affected soil classes for Meki-Zeway. Table 1. Mean and range values of soil pH, EC and ESP for Meki-Zeway irrigated farm areas.
Range and mean
pHe ECe (dS/m) ESP
0-30 cm
30-60 cm
60-90 cm
0-30 cm
30-60 cm
60-90 cm
0-30 cm
30-60 cm
60-90 cm
Min 6.9 7.2 7.9 0.20 0.19 0.21 3 5 7 Max 9.0 9.7 10.3 15.30 12.98 7.56 58 65 76 Mean 7.9 8.3 8.7 3.08 2.30 1.93 12 22 34
CONCLUSIONS
Some limited part of farms under investigation had shown to contain excess accumulation of free salt in which 15% out of the total area could be classified as saline affected soil. The soils lack appreciable quantities of neutral soluble salts but contain measurable to appreciable quantities of alts capable of alkaline hydrolysis, Substantial area of irrigated farms exhibit alkaline soil property that range from moderate to strongly alkaline reaction and tend to increase with increasing soil depth. The study also revealed that majority of farm areas contained soils with sodic character that increased with increasing soil depth and could be regarded as a major soil productivity constraint. Diverse manifestations of spatial heterogeneity in terms of types and severity among different salt-affected soil classes is highly evident from present study and therefore site-specific, more precise pixel-by-pixel reclaiming and ameliorative measures must be taken to account such scenarios- with precision agriculture. The study recommended a similar pathway of preparing the remaining other soil properties to be prepared and included to provide a more complete and unified soil fertility improvement guide and digitally actionable input to AI and IOT tools for effective deployment of precision agriculture. The study also underlines the need for further research on
1st African Conference on Precision Agriculture | 8-10 December | 2020
110
investigation of casual factors responsible for buildup of soils with saline and sodic property and development of effective management option.
REFERENCES
Aredehey G, Libsekal H, Brhane M, Welde K, Giday A, Moral MT. 2018. Top-soil salinity mapping using geostatistical approach in the agricultural landscape of Timuga irrigation scheme , South Tigray , Ethiopia. Cogent Food & Agriculture 4(1): 1–13. https://doi.org/10.1080/23311932.2018.1514959
FAO. 1988. Salt Affected Soils and Their Management. Soil Resources, Management and Conservation Service FAO Land and Water Development Division. FAO Soils Bulletin 39, Rome, Italy.
FAO. 2018. Precision agriculture systems on saline and alkaline soils. Soil salinity management manual. pp 59-61. ISBN 978-92-5-130141-8
Fentaw A. 2007. An overview of Salt Affected Soils and their Management in Ethiopia, a Paper Presented in the Third International Workshop on Water Management (Water Man) Project. Third International Workshop on Water Management (Water Man) Project. Haramaya, Ethiopia.: Haramaya University.
Hawando T. 1995. The survey of the soil and water resources of Ethiopia. UNU/Tokyo. Kidane G, Abebe F, Heluf G, Fentaw A, Wondimagegne C. 2006. Assessment of salt affected soils
in Ethiopia and recommendations on management options for their sustainable utilization. A Task Force Report Submitted to the Office of the Deputy Prime Minister and Minister of Agriculture and Rural Development. Addis Ababa, Ethiopia.
Meron N. 2007. Characterization of salt affected soils in the central Rift Valley and assessing salt tolerance of different plants: A case study at the southwestern shore of Lake Ziway. Addis Abeba University.
MOARD. 2005. Aajor Agro-ecological Zones of Ethiopia. Addis Ababa. Qadir M, Oster JD, Schubert S, Noble AD, Sahrawat KL. 2007. Phytoremediation of Sodic and
Saline-Sodic Soils. Advances in Agronomy 96(07): 197–247. https://doi.org/10.1016/S0065-2113(07)96006-X

1st African Conference on Precision Agriculture | 8-10 December | 2020
111
#8019 CARTOGRAPHIE INTERACTIVE DES EXPLOITATIONS DE NOIX DE CAJOU DES PRODUCTEURS DE LA COOPÉRATIVE COPRODIGO DE GOHITAFLA
S. Kone, N. Coulibaly, D.J.M.J. Djina, K. Berté, et A. C. Kambou Institut National Polytechnique Félix Houphouët Boigny, Département Gestion Commerce et
Economie Appliquée, Yamoussoukro, Côte d’Ivoire [email protected] 00 225 08 48 93 85
RESUME L’agriculture a connu de profondes mutations : la spécialisation, la réduction de la main
d’œuvre agricole, la mécanisation croissante, etc. Ces dernières années, l'intégration des technologies de l'information et de la communication dans la gestion des exploitations agricoles a donné naissance à l'agriculture de précision. Ces innovations technologiques permettent de piloter et d’optimiser les principales fonctions (productions, transports, commercialisation, transformation, consommation, etc.) qui structurent les exploitations agricoles. L'agriculture de précision, lancée aux USA dans les années 80, s'implante aujourd'hui dans les principaux pays agricoles africains, via la géolocalisation et la cartographie des exploitations agricoles. Les organisations professionnelles agricoles, sont confrontées à une montée croissante des problématiques d’allocation efficiente des ressources et d’organisation du travail en lien avec les variabilités spatiales et temporelles des exploitations agricoles. L’organisation spatiale des parcellaires agricoles est généralement caractérisée de manière dynamique par des indicateurs géographiques, sociologiques, agronomiques et économiques. Notre papier vise à concevoir une cartographie interactive des exploitations de noix de cajou, afin d’optimiser la gestion des ressources au profit des membres de la coopérative COPRODIGO de Gohitafla en Côte d’Ivoire. Nous avons utilisé des récepteurs GPS pour collecter les données géographiques sur le terrain et réaliser le mapping des parcelles des producteurs. Nous avons utilisé une méthodologie des systèmes d’informations géographiques qui comprend des traitements et l’analyse des données géographiques avec la version PI (3.14) du logiciel QGIS. Les résultats nous ont permis d’obtenir un code source en langage web (disponible hors ligne pour les zones à faible couverture réseau) que nous avons édité pour obtenir une carte web interactive multicritères des exploitations de noix de cajou. La carte interactive est interprétable par un navigateur web et comporte des champs de filtres sélectifs permettant de caractériser les exploitations de noix de cajou en fonction de plusieurs indicateurs (date de création, superficie, production, rendement, distance au siège, etc.). La carte interactive permet à la coopérative de localiser ses exploitations dans le territoire, de mieux gérer ses informations, d’être efficace dans la prise des décisions stratégiques et opérationnelles, d’optimiser le groupage et la collecte des productions de noix de cajou afin de leur commercialisation.
INTRODUCTION
L’agriculture ivoirienne emploie plus de 60% de la population active et représente au moins
34% du PIB (Kone et al., 2019). Le dynamisme agricole de la Côte d’Ivoire continue de surprendre les marchés de matières premières, notamment la filière de production et de transformation des noix de cajou (anacarde). La Côte d’Ivoire occupe la place de premier producteur mondial de noix
1st African Conference on Precision Agriculture | 8-10 December | 2020
112
de cajou. De 8500 tonnes en 1989, la production ivoirienne d’anacarde a dépassé 70 000 tonnes en 1999, puis a bondi à plus de 800 000 tonnes en 2020. Dans un premier temps, le boom de l’anacarde s’est produit principalement en zone de savane. La noix de cajou s’est également produite vers le sud dès les années 2000, dans les zones cacaoyères de contact forêt-savane telles que celles de Tanda, mais également dans les anciennes boucles du cacao vers M’Bahiakro à l’Est et Bouaflé à l’Ouest, et plus récemment, vers 2010, au cœur des régions cacaoyères comme à Bayota, au nord de Gagnoa (Ruf et al., 2019). La commercialisation des noix de cajou rapporte plus de 480 millions d’euros aux producteurs. En effet, la noix de cajou fournit des revenus importants aux paysans et contribue au développement local à travers la création d’emplois directs et indirects (Kouassi et al., 2020).
La Côte d’Ivoire, a fait le choix de baser son développement agricole sur les organisations professionnelles agricoles, notamment les coopératives agricoles de production, de collecte, de commercialisation et de transformation. L’utilisation partagée par les agriculteurs de tous les moyens pour faciliter ou développer leur activité économique permet d’améliorer leur activité économique, d’améliorer ou d’accroître leurs performances économiques (Barraud-Didier et al., 2012). La création des coopératives agricoles permet la réalisation de plusieurs avantages, au profit des producteurs, d'une organisation à grande échelle dans l'agriculture tout en évitant ses coûts de transaction (Tortia et al., 2013). Les coopératives agricoles, jouent un rôle important dans le développement de l’agriculture et plus précisément la filière anacarde en Côte d’Ivoire.
Par ailleurs, les coopératives agricoles font face à de nombreuses difficultés et défis, notamment celui de l'intégration des technologies de l'information et de la communication dans la gestion stratégique et opérationnelle des exploitations agricoles. L’agriculture de précision offre de réelles possibilités aux coopératives en termes de caractérisation dynamiques et multicritères des exploitations agricoles à travers les systèmes d’information géographique. Les coopératives, font de plus en plus face aux difficultés de mapping et de la typologie des producteurs et de leurs exploitations pour optimiser les services aux membres de la coopérative. Les coopératives doivent optimiser la chaîne d'approvisionnement agroalimentaire qui comporte quatre principaux domaines fonctionnels à savoir : (1) la production, (2) la récolte, (3) le stockage, (4) la distribution et le transport des produits agricoles (Ahumada et al., 2009 ; Graf Plessen, 2019). Le domaine fonctionnel de la distribution et du transport des produits agricole nécessite de la part des dirigeants des coopératives une bonne connaissance de la localisation géographique des exploitations agricoles afin de planifier de manière optimale l’affectation des camions pour la collecte et le transport des produits agricoles dans les zones de production et de les livrer dans les zones de commercialisation, de transformation et ou de consommation à moindre coût.
Dans la littérature, la structure et l’organisation spatiale des parcellaires agricoles peuvent être décrits sur la base d’un indicateur qualitatif simple. Ce type de descripteur se retrouve principalement dans des études de cas sur de petits territoires et généralement concomitantes avec des enquêtes directes en exploitation (Marie et al., 2009 ; Pauchard et al., 2016 ; Thomas Puech et al., 2020). Les outils des systèmes d'information géographique (SIG) peuvent aider à élargir la compréhension des disparités des résultats de santé au sein d'une communauté (Geraghty et al., 2010).
L’objectif général de notre papier est de s’appuyer sur une démarche des systèmes d’information géographique pour réaliser une cartographie interactive qui permet la géolocalisation multicritère des exploitations de noix de cajou dans la coopérative COPRODIGO de Gohitafla en Côte d’Ivoire. Les données actualisées (surface, fidélité, production, rendement,

1st African Conference on Precision Agriculture | 8-10 December | 2020
113
âge du vergers, suivi agronomique, état du verger et des équipements, etc.) permettent le suivi optimal des coopératives en matière de politique managériale, administratif et opérationnel.
L’hypothèse qui sous-tend cette étude est que la caractérisation spatiale et temporelles des exploitations agricoles facilite la gestion stratégique et opérationnelle des coopératives puis accroît leurs revenus et celui des producteurs de noix de cajou en Côte d’Ivoire. L’intérêt de cette étude est de contribuer à intégrer les innovations technologiques de l’agriculture de précision à savoir les technologies de l'information et de la communication pour renforcer la compétitivité des organisations professionnelles agricoles, afin de jouer un rôle moteur dans le développement des filières agricoles en Afrique.
MATÉRIELS ET MÉTHODES
Les données ont été collectées, par visite de terrains en 2020, dans les 10 sections de la
coopérative COPRODIGO de Gohitafla, auprès de 249 producteurs qui avaient 394 parcelles. Ces parcelles représentent une superficie totale de 1335,53 ha, et une moyenne de 3,39 ha par exploitation agricole. Nous avons obtenu la distance entre chaque parcelle et le siège de la coopérative. Les calculs de surfaces et de distances ont été réalisés automatiquement grâce à QGIS. Nous avons obtenu les données grâce aux enquêtes que nous avons effectué sur le terrain. La méthodologie utilisée, a été inspiré des travaux de plusieurs auteurs (Auda, 2018 ; Bahoken et al., 2016 ; Delsart, 2020 ; Quesseveur, 2001 ; Thevenin, 2002 ; Fao et al., 2020 ; Shaw et al., 2017 ; Boelaert et al., 2002 ; AZZI, 2016 ; King et al., 1989 ; Ocaña et al., 2002 ; Ramos, 2003 ; Vidal et al., 1998 ; Habert, 2000). Des récepteurs (GPS) ont été utilisés pour les délimitations et la collecte des waypoints des exploitations et des magasins de stockage. Chacune des exploitations a été physiquement délimitée et géoréférencée. Les informations collectées ont été ensuite extraites en utilisant le logiciel d’extraction de Garmin : Garmin Basecamp. Nous avons procédé par utilisation des outils de vecteurs de QGIS pour convertir les tracés en polygones. Après l’ajout des données vecteurs des parcelles et celles des magasins de stockage des sections, nous avons ajouté les informations sur le réseau routier et les multi-polygones de couche d’arrière-plan que nous avons obtenue grâce au SIG collaboratifs OpenStreet map. Nous avons extrait ces données sous forme de fichier d’extension osm grâce au logiciel libre JOSM. Grâce au plugin qgis2web nous avons réalisé une exportation de notre projet en fichier HTML, CSS et javascript (avec les Framework libre OpenLayer et Leaflet). Les codes sources du projet ont ensuite été édités pour réaliser notre cartographie interactive.
RÉSULTATS ET DISCUSSIONS
Les résultats de l’analyse des informations géographiques, ont permis de concevoir une carte
interactive des 394 exploitations agricoles de noix de cajou de la coopérative de Gohitafla (Figure 1). Ces 394 exploitations agricoles appartiennent à 249 producteurs répartis dans 10 sections de la coopérative agricole. Cette carte peut être utilisée au sein de la coopérative même sans avoir accès à une connexion internet, elle est aussi disponible via une connexion internet pour une consultation à distance. Elle permet aux dirigeants de la coopérative et aux décideurs politiques de connaitre la géolocalisation des exploitations agricoles et de s’assurer de l’existence des membres d’une coopérative agricole. Ces informations participent à la visibilité interne et externe de la coopérative et contribuent à sa crédibilité vis-à-vis des partenaires techniques, commerciaux et financiers. L’interface graphique de la carte interactive comprend 7 champs qui comportent des informations
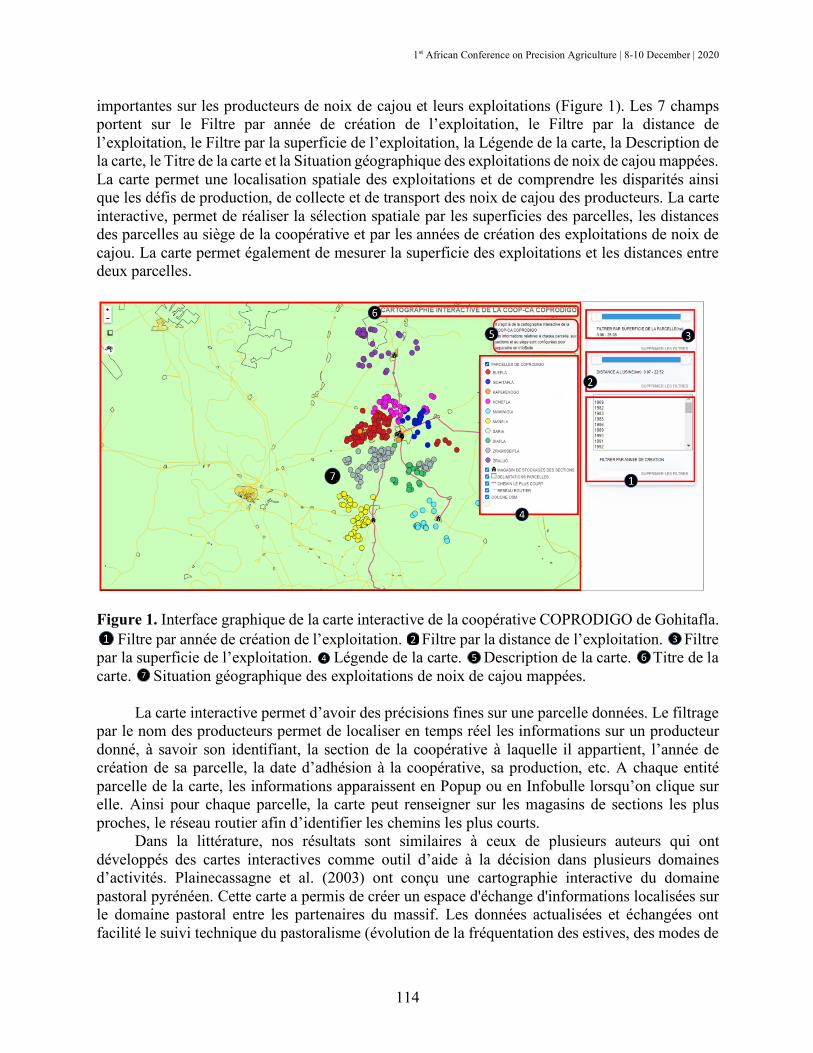
1st African Conference on Precision Agriculture | 8-10 December | 2020
114
importantes sur les producteurs de noix de cajou et leurs exploitations (Figure 1). Les 7 champs portent sur le Filtre par année de création de l’exploitation, le Filtre par la distance de l’exploitation, le Filtre par la superficie de l’exploitation, la Légende de la carte, la Description de la carte, le Titre de la carte et la Situation géographique des exploitations de noix de cajou mappées. La carte permet une localisation spatiale des exploitations et de comprendre les disparités ainsi que les défis de production, de collecte et de transport des noix de cajou des producteurs. La carte interactive, permet de réaliser la sélection spatiale par les superficies des parcelles, les distances des parcelles au siège de la coopérative et par les années de création des exploitations de noix de cajou. La carte permet également de mesurer la superficie des exploitations et les distances entre deux parcelles.
Figure 1. Interface graphique de la carte interactive de la coopérative COPRODIGO de Gohitafla.
Filtre par année de création de l’exploitation. Filtre par la distance de l’exploitation. Filtre par la superficie de l’exploitation. Légende de la carte. Description de la carte. Titre de la carte. Situation géographique des exploitations de noix de cajou mappées.
La carte interactive permet d’avoir des précisions fines sur une parcelle données. Le filtrage
par le nom des producteurs permet de localiser en temps réel les informations sur un producteur donné, à savoir son identifiant, la section de la coopérative à laquelle il appartient, l’année de création de sa parcelle, la date d’adhésion à la coopérative, sa production, etc. A chaque entité parcelle de la carte, les informations apparaissent en Popup ou en Infobulle lorsqu’on clique sur elle. Ainsi pour chaque parcelle, la carte peut renseigner sur les magasins de sections les plus proches, le réseau routier afin d’identifier les chemins les plus courts.
Dans la littérature, nos résultats sont similaires à ceux de plusieurs auteurs qui ont développés des cartes interactives comme outil d’aide à la décision dans plusieurs domaines d’activités. Plainecassagne et al. (2003) ont conçu une cartographie interactive du domaine pastoral pyrénéen. Cette carte a permis de créer un espace d'échange d'informations localisées sur le domaine pastoral entre les partenaires du massif. Les données actualisées et échangées ont facilité le suivi technique du pastoralisme (évolution de la fréquentation des estives, des modes de
1 2 3
4 5 67

1st African Conference on Precision Agriculture | 8-10 December | 2020
115
gardiennage, de l'état des équipements, etc.), qui ont aidé à défendre des orientations en matière de politique pastorale. Thomas Puech et al (2020) ont développé une méthode pour caractériser l’organisation spatiale des parcellaires d’exploitations agricoles. Leurs travaux ont permis de produire un indicateur qualitatif simple sur l’organisation structurelle des parcellaires d’exploitations agricoles en croisant les outils de la statistique multivariée et de la géomatique. Geraghty et al (2010) se sont appuyés sur les systèmes d'information géographique (SIG) pour évaluer les disparités de résultats chez les patients atteint du Diabète de type 2. Cette approche a permis une meilleure prise en charge des patients suivant une cartographie de la pathologie.
REMERCIEMENTS
Cette communication a été réalisée grâce au Projet de Promotion et de Compétitivité de la
Chaine de valeur de l’Anacarde (PPCA) financé par la Banque Mondiale et piloté par le Conseil Coton Anacarde (CCA) en Côte d’Ivoire. Les auteurs remercient Dr Coulibaly Adama Coordonnateur du Projet PPCA et Mme GUI LOU IRIE Epse TA Présidente du Conseil d’Administration de la coopérative COPRODIGO de Gohitafla pour leur disponibilité à faciliter la collecte des données et leurs analyses.
RÉFÉRENCES
Ahumada O, Villalobos JR. 2009. Application of planning models in the agri-food supply chain:
A review. European Journal of Operational Research. 196: 1-20. Auda Y. 2018. Systèmes d'information géographique avec les logiciels libres grass et qgis. AZZI L. 2016. Modélisation d’un réseau d’aep et contribution a sa gestion à l’aide d’un système
d’information géographique. Étude de la rive gauche de la ville de sidi aiche. Université Mohamed Khider-Biskra.
Bahoken F, et al. 2016. Les réseaux de transport à grande vitesse en france: Construction et apports d'un système d'information géo-historique.
Barraud-Didier V, Henninger M-C, Anzalone G. 2012. The weakening of the member-cooperative relationship in france. Études rurales. 190: 119-130.
Boelaert A, Van Der S. 2002. Editorial: Geographical information systems (gis), gimmick or tool for health district management? Tropical Medicine & International Health. 3: 163-165.
Delsart, B. 2020. Segmentation manuelle de nuage de points au sein d'un système d'information géographique web 3d.
Fao R, et al. 2020. Le systeme d'information geographique de la fao. XF2006294997. Geraghty EM, et al. 2010. Using geographic information systems (gis) to assess outcome
disparities in patients with type 2 diabetes and hyperlipidemia. The Journal of the American Board of Family Medicine. 23: 88-96.
Graf Plessen M. 2019. Coupling of crop assignment and vehicle routing for harvest planning in agriculture. Artificial Intelligence in Agriculture. 2: 99-109.
Habert, EJL. IRD 2000. Qu’est-ce qu’un système d’information géographique. Laboratoire de cartographie appliquée.
King D, Daroussin J, Arrouays D. 1989. Analyse cartographique et systeme d'information geographique en pedologie.
1st African Conference on Precision Agriculture | 8-10 December | 2020
116
Kone S, Coulibaly N, Djina, DJMJ. 2019. Evaluation of short and long run impacts of cotton price on rural poverty of lialibé and kossou producers in cote d’ivoire. International Journal of Agricultural Economics. 4: 225-232.
Kouassi KM, Kouakou, LS. 2020. Dynamiques socio-economiques de l’adoption de la culture de l’anacarde en milieu rural ivoirien : Cas de la sous-préfecture de languibonou. International Journal of Progressive Sciences and Technologies. 21: 12.
Marie M, Bensaïd, A, Delahaye D. 2009. Le rôle de la distance dans l’organisation des pratiques et des paysages agricoles : L’exemple du fonctionnement des exploitations laitières dans l’arc atlantique. CyberGeo: European Journal of Geography.
Ocaña R, Mundó J, Lusitano J. 2002. Les gis comme outils de travail pour la planification et gestion des transports urbains. 153.
Pauchard L, Madeline P, Marie M. 2016. L’échange parcellaire : Une nouvelle étape dans l’aménagement foncier de l’ouest français. 240: 7-24.
Plainecassagne L, Roucolle M. 2003. Une cartographie interactive du domaine pastoral pyrénéen : Le volet pastoral du sig pyrénées. Revue géographique des Pyrénées et du Sud-Ouest. Sud-Ouest Européen. 95-99.
Quesseveur E. 2001. Traitement spatial du bruit des transports terrestres. Ramos, F. École doctorale" Information, Communication, Simulation, Modélisation 2003.
Modélisation et validation d’un système d’information géographique 3d opérationnel. Ruf F, Kone S, Bebo B. 2019. Le boom de l’anacarde en côte d’ivoire : Transition écologique et
sociale des systèmes à base de coton et de cacao. Cahiers Agricultures. 28: 21. Shaw N, McGuire S. 2017. Understanding the use of geographical information systems (gis) in
health informatics research: A review. J Innov Health Inform. 24: 940. Thevenin T. 2002. Quand l'information géographique se met au service des transports publics
urbains: Une approche spatio-temporelle appliquée à l'agglomération bisontine. Besançon. Puech T., et al. 2020. Une méthode pour caractériser l’organisation spatiale des parcellaires
d’exploitations agricoles Cybergeo : European Journal of Geography [En ligne], Cartographie, Imagerie, SIG, document 938, mis en ligne le 23 mars 2020, consulté le 19 novembre 2020. URL : http://journals.openedition.org/cybergeo/34181 ; DOI : https://doi.org/10.4000/cybergeo.34181
Tortia EC, Valentinov VL, Iliopoulos C. 2013. Agricultural cooperatives. Journal of Entrepreneurial and Organizational Diversity. 2: 23-36.
Vidal E, et al. 1998. Teledetection et systemes d'information geographique en irrigation et drainage; guide methodologique et applications.

1st African Conference on Precision Agriculture | 8-10 December | 2020
117
POLICY SUPPORT INNOVATIONS
1st African Conference on Precision Agriculture | 8-10 December | 2020
118
#7464 JUST A MOMENT; THE NEED FOR STREAMLINING PRECISION AGRICULTURE DATA IN AFRICA
Tegbaru B. Gobezie and Asim Biswas*
School of Environmental Sciences, University of Guelph, 50 Stone Road East, N1G 2W1, Guelph, ON, Canada
* [email protected], +1 519 824 4120 Extn. 54249
ABSTRACT
Precision agriculture (PA) data sources in the era of digital agriculture are diverse in terms of the range of technology options and the types of data they generate. These include proximal sensors, unmanned aerial vehicle (UAV), satellites, farm machinery mounted sensors and robotics to generate static data or real time information (e.g., yield monitoring). Government institutions, scientists and private sectors take the lion’s share in generating PA data at innovation, validation and dissemination phases. At scale-up and wider application phases, farmers also generate tremendous amount of data that might have privacy and ownership concerns. There are no one-size-fits-all approach in terms of PA technology applications, but there remains a question on better way of integrating PA data continent-wide in Africa. The data privacy and ownership concerns have to be addressed while maintaining the integration of PA data at continental scale. The objective of this paper is to review the existing opportunities and challenges of data harmonization in PA in Africa and discuss the existing technological advancements in PA data science and their applications in the other parts of the world. Finally, we proposed a new PA data sharing and rewarding model – ‘PrecisionLink’ to rationalize data network system through establishing strong institutions and self-sustaining business model for all of Africa. The model uses AI and blockchain technology to track and stamp PA data using unique dataset_IDs or PrecisionPrint (like a fingerprint), valuing credit amounts using ‘pVouchers’ (eVouchers) and distribute credits between PA data owner or ‘PrecisionProprietor’, data client or ‘PrecisionClient’ and funders or ‘PrecisionPatron’. The system we propose lays the foundation for win-win PA data sharing and self-sustaining business models for smallholder farmers and technology solutions, while ensuring strong partnership between farmers’ cooperatives, private sectors, scientists, government and financial institutions, and countries at high-level. Establishing and networking strong PA data-nodes in all of African countries is timely to ensure the future of PA big data application in Africa. Keywords: precision agriculture, data, AI, blockchain, ‘PrecisionLink’, ‘pVoucher’, ‘PrecisionPrint’, ‘PrecisionProprietor’, ‘PrecisionPatron’, ‘PrecisionClient’
INTRODUCTION
The sources of precision agriculture (PA) data include machine-generated, process-
mediated or human-sourced data that are known to be highly heterogeneous (Wolfert et al., 2017). Most of the PA applications in Africa are related to improving water use efficiency and input costs reduction such as water-efficient and climate smart deciduous and fruit farming in South Africa, Mozambique, Tanzania and Zimbabwe (Ncube et al., 2018). In PA something that perfectly works for a given farm might not work for adjacent farm. This implicitly indicate that PA applications

1st African Conference on Precision Agriculture | 8-10 December | 2020
119
for the very fragmented pieces of lands of African smallholder farmers that are mainly characterised by high variabilities between and within farms require more tailored PA solutions. The diversity of PA data in terms of volume and variety can be considered as important driver of bigdata in the era of digital agriculture if there are high success rate of PA technology adoption. In such scenario, shortage of data might not be the question in the future, but sustainable way of integrating PA data from different sources continent-wide in Africa is one of the key issues. Various research results have shown that different data captured from variety of sources can be harmonized using data-fusion techniques for application of PA (Bendre et al., 2015; Ji et al., 2019, 2017; Xu et al., 2019). Data-fusion and other state-of-the-art methods address the technical layer that are very critical in the data value chain. However, the governance layer of such a big and very diverse data that might have privacy and ownership concerns is the elephant in the room. Data is merchantable good but key issues related to data marketing in PA are ownership, privacy and lack of sustainable business model (Pierce et al., 2019). Therefore, the objective of this paper is to review the existing opportunities and major challenges of PA data harmonization in Africa in relation to existing technological advancements in PA data science and their applications in the other parts of the world. For future application of PA data synchronisation, we proposed a new data sharing and rewarding model – ‘PrecisionLink’ to network several PA data-hubs for establishing self-sustaining business model that connects different actors in the PA data landscape for all member countries in Africa.
CHALLENGES AND OPPORTUNITIES
Looking at data as marketable good and as the new oil in the 21st century, PA data passes
through different stages before reaching the final data marketing stage. Mostly data capture is the initial stage in the entire process of data value chain and the intermediary stages respectively include data storage, data transfer, data transformation and data analytics (Wolfert et al., 2017). Data governance issues, which are one of the major challenges of data sharing, become more complicated at the later stage due to privacy and ownership concerns that are in turn associated with lack of viable business model that motivates data holders to share their data. The other challenges in PA are related to the technical realm, especially decisions made at the data capture stage. Sanches et al. (2018) reported that number of samples usually collected to spatially represent soil attributes are denser for PA than ordinary field observation methods, however, sometimes outputs are reported similar for both approaches, e.g., application of apparent electrical conductivity (ECa) to formulate lime recommendation rate. This has a direct implication on the volume of data required for certain PA solutions and the ultimate adoption rate of the technologies.
The opportunities for PA to advance in Africa are enormous since some reports have shown that use of Internet of things (IOT) technologies using sensors-based computer visioning assisted PA have been tested for on-site fertilizer recommendations (OLIVEIRA-JR et al., 2020). Some of the initiatives like Agricultural Commercialization Cluster (ACC) in Ethiopia lay the foundation for PA applications on cluster of farms which otherwise could have been fragmented and remain challenging for smallholder farmers. In addition, there are several enablers that promote the PA use, which include: (1) the example of using drones and AI to estimate what yield (2) cloud computing and freely available high resolution imageries from google earth engine (3) handheld proximal sensors and breakthrough on automated farm inputs management system, (4) immerging high-resolution information on biophysical and agronomic advisories (e.g., the iSDA-Soil) and (5)
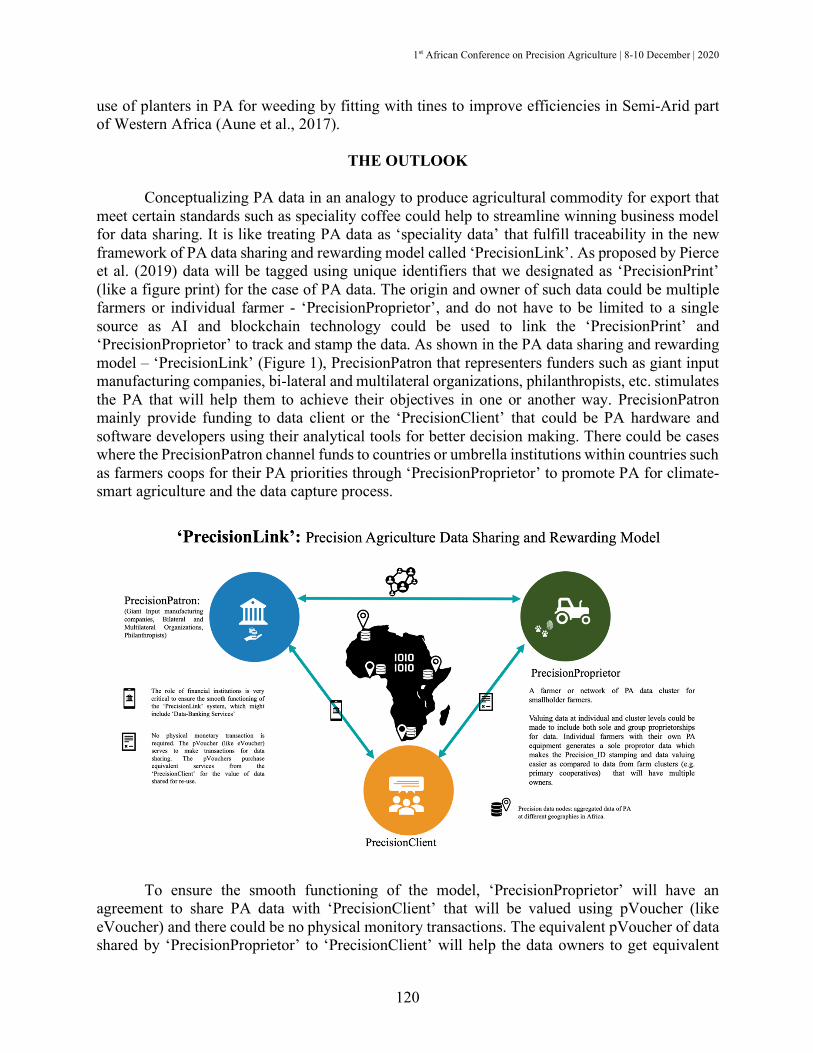
1st African Conference on Precision Agriculture | 8-10 December | 2020
120
use of planters in PA for weeding by fitting with tines to improve efficiencies in Semi-Arid part of Western Africa (Aune et al., 2017).
THE OUTLOOK
Conceptualizing PA data in an analogy to produce agricultural commodity for export that
meet certain standards such as speciality coffee could help to streamline winning business model for data sharing. It is like treating PA data as ‘speciality data’ that fulfill traceability in the new framework of PA data sharing and rewarding model called ‘PrecisionLink’. As proposed by Pierce et al. (2019) data will be tagged using unique identifiers that we designated as ‘PrecisionPrint’ (like a figure print) for the case of PA data. The origin and owner of such data could be multiple farmers or individual farmer - ‘PrecisionProprietor’, and do not have to be limited to a single source as AI and blockchain technology could be used to link the ‘PrecisionPrint’ and ‘PrecisionProprietor’ to track and stamp the data. As shown in the PA data sharing and rewarding model – ‘PrecisionLink’ (Figure 1), PrecisionPatron that representers funders such as giant input manufacturing companies, bi-lateral and multilateral organizations, philanthropists, etc. stimulates the PA that will help them to achieve their objectives in one or another way. PrecisionPatron mainly provide funding to data client or the ‘PrecisionClient’ that could be PA hardware and software developers using their analytical tools for better decision making. There could be cases where the PrecisionPatron channel funds to countries or umbrella institutions within countries such as farmers coops for their PA priorities through ‘PrecisionProprietor’ to promote PA for climate-smart agriculture and the data capture process.
To ensure the smooth functioning of the model, ‘PrecisionProprietor’ will have an agreement to share PA data with ‘PrecisionClient’ that will be valued using pVoucher (like eVoucher) and there could be no physical monitory transactions. The equivalent pVoucher of data shared by ‘PrecisionProprietor’ to ‘PrecisionClient’ will help the data owners to get equivalent
1st African Conference on Precision Agriculture | 8-10 December | 2020
121
services by the ‘PrecisionClient’. In return to the funding channelled to ‘PrecisionClient’ by ‘PrecisionPatron’ the total values of the ‘pVouchers’ could be used to claim for fulfilment of agreement made with the ‘PrecisionPatron’.
REFERENCES
Aune JB, Coulibaly A, Giller KE. 2017. Precision farming for increased land and labour productivity in semi-arid West Africa. A review. Agron. Sustain. Dev. 37: 16. https://doi.org/10.1007/s13593-017-0424-z
Bendre MR, Thool RC, Thool VR. 2015. Big data in precision agriculture: Weather forecasting for future farming, In: 1st International Conference on Next Generation Computing Technologies (NGCT). pp. 744–750. https://doi.org/10.1109/NGCT.2015.7375220
Ji W, Adamchuk V, Chen S, Biswas A, Leclerc M, Viscarra Rossel R. 2017. The use of proximal soil sensor data fusion and digital soil mapping for precision agriculture, In: Pedometrics 2017, Abstract Book Pedometrics 2017. Wageningen, Netherlands, p. 298 p.
Ji W, Adamchuk VI, Chen S, Mat Su AS, Ismail A, Gan Q, Shi Z, Biswas A. 2019. Simultaneous measurement of multiple soil properties through proximal sensor data fusion: A case study. Geoderma 341: 111–128. https://doi.org/10.1016/j.geoderma.2019.01.006
Ncube B, Mupangwa W, French A. 2018. Precision Agriculture and Food Security in Africa, In: Mensah P, Katerere D, Hachigonta S, Roodt A. (Eds.), Systems Analysis Approach for Complex Global Challenges. Springer International Publishing, Cham, pp. 159–178. https://doi.org/10.1007/978-3-319-71486-8_9
Oliveira-Jr A, Resende C, Gonçalves J, Soares F, Moreira W. 2020. IoT Sensing Platform for e-Agriculture in Africa, in: 2020 IST-Africa Conference (IST-Africa). Presented at the 2020 IST-Africa Conference (IST-Africa), pp. 1–8.
Pierce HH, Dev A, Statham E, Bierer BE, 2019. Credit data generators for data reuse. Nature 570: 30–32. https://doi.org/10.1038/d41586-019-01715-4
Sanches GM, Magalhães PSG, Remacre AZ, Franco HCJ. 2018. Potential of apparent soil electrical conductivity to describe the soil pH and improve lime application in a clayey soil. Soil and Tillage Research 175: 217–225. https://doi.org/10.1016/j.still.2017.09.010
Wolfert S, Ge L, Verdouw C, Bogaardt M-J. 2017. Big Data in Smart Farming – A review. Agricultural Systems 153: 69–80. https://doi.org/10.1016/j.agsy.2017.01.023
Xu D, Chen S, Viscarra Rossel RA, Biswas A, Li S, Zhou Y, Shi Z. 2019. X-ray fluorescence and visible near infrared sensor fusion for predicting soil chromium content. Geoderma 352: 61–69. https://doi.org/10.1016/j.geoderma.2019.05.036

1st African Conference on Precision Agriculture | 8-10 December | 2020
122
PRECISION AGRICULTURE FOR FIELD AND PLANTATION CROPS
1st African Conference on Precision Agriculture | 8-10 December | 2020
123
#7410 MAXIMISATION DE L’EFFICIENCE D’UTILISATION DE L’AZOTE PAR LA TOMATE (SOLANUM LYCOPERSICUM L.) SUR LES FERRASOLS AU SUD DU
TOGO
Mouhamadou Lare et Jean Mianikpo Sogbedji Ecole Supérieure d’Agronomie, Université de Lomé. 01 BP 1515 Lomé 01 Togo,
RESUME
Maximiser l’efficience d’utilisation de l’Azote (N) en culture de tomate est une condition pour optimiser la production de la culture. Il a été mené sur trois ans, six cultures de tomate réparties sur deux périodes (Septembre à janvier 2017-2019 et de Février à Mai 2018-2020) sur un sol ferralitique à la Station d’Expérimentations Agronomiques de Lomé suivant un dispositif expérimental en blocs aléatoires complets à trois répétitions. Onze formules de fertilisations couplées à la variété Mongal ont fait l’objet de l’étude. Deux formes d’urées (UO : Urée Ordinaire et USG : Urée Super Granulée) ont été utilisées aux doses identiques de N (0 ; 30 ; 60 ; 90 ; 120 ; 150 kg ha-1) comme fumure d’appoint respectivement le T+, T1, T2, T3, T4, T5 pour UO et T+, T1’, T2’, T3’, T4’, T5’ pour USG. 200 kg ha-1 de NPK 15-1515 ont été appliqués comme fumure de fond pour tous les traitements de fertilisation. La réponse du rendement en fruits frais de tomate à la dose d’urée ordinaire (UO) et d’urée super granulée (USG) a été modélisée. Les modèles quadratiques obtenus ont servi à déterminer les doses économiques optimales d’application de N. En première période, la dose économique optimale d’application a été de 131 et 118 kg de N ha-1 respectivement pour l’UO et l’USG. En deuxième période, la dose économique optimale a été de 122 et 123 kg de N ha-1 respectivement pour l’UO et l’USG. Toutes ces doses ont permis de dégager des profits économiques variant typiquement entre 10 et 18 millions de F CFA ha-1, avec une plus grande profitabilité pour l’USG à la deuxième période de production. Mots clés : tomate, dose économique optimale d’application, rendement économique optimal, urée ordinaire, urée super granulée
ABSTRACT
Maximizing the efficiency of using Nitrogen (N) in tomato cultivation is a condition for optimizing crop production. It was carried out over three years, six tomato crops spread over two periods (September to January 2017-2019 and from February to May 2018-2020) on ferralitic soil at the Lomé Agronomic Experimentation Station following an experimental device in complete random blocks with three repetitions. Eleven fertilization formulas coupled with the Mongal variety were the subject of the study. Two forms of urea (UO: Ordinary Urea and USG: Super Granulated Urea) were used at identical doses of N (0; 30; 60; 90; 120; 150 kg ha-1) as supplemental manure respectively the T + , T1, T2, T3, T4, T5 for UO and T +, T1 ', T2', T3 ', T4', T5 'for USG. 200 kg ha-1 of NPK 15-1515 was applied as a basic fertilizer for all fertilization treatments. The response of fresh tomato fruit yield to the dose of ordinary urea (UO) and super granulated urea (USG) was modeled. The quadratic models obtained were used to determine the optimal economic application rates of N. In the first period, the optimum economic application

1st African Conference on Precision Agriculture | 8-10 December | 2020
124
rate was 131 and 118 kg of N ha-1 respectively for UO and USG. . In the second period, the optimal economic dose was 122 and 123 kg of N ha-1 respectively for UO and USG. All these doses made it possible to generate economic profits typically varying between 10 and 18 million CFA F ha-1, with greater profitability for the USG in the second production period.
Keywords tomato, optimal economic application rate, optimal economic yield, ordinary urea, super granulated urea
INTRODUCTION
L’agriculture est la principale source de revenus et d’emplois pour 70% de la population mondiale pauvre vivant en milieu rural (Banque Mondiale, 2014). Secteur clé des économies Africaines, elle reste le principal moyen de subsistance pour un continent qui devrait voir sa population passer de 700 millions de 2007 à 1,2 milliard en 2030 (FAO, 2003). Au Togo, Le secteur agricole fait vivre les 2/3 de la population active, contribue en moyenne à hauteur de 38% au PIB et participe pour 20% aux recettes d’exportations (MAEP, 2007). Avec une population qui devrait avoisiner 9,76 millions d’habitants en 2031 dont 4,79 millions d’hommes et 4,97 millions de femmes (INSEED, 2015), la recherche de l’équilibre alimentaire s’impose. Pourtant dans le domaine de maraichage et surtout dans la production de tomate (S. lycopersicum L.), les systèmes de production existant au Togo notamment la culture sur sol en plein champ ou en jardins familiaux ont toujours aboutit aux rendements relativement faibles qui n’excèdent pas 5 Mg ha-1 malgré l’utilisation de la fumure (ITRA, 2011; FAOSTAT, 2018). Ces faibles rendements sont dus, aux contraintes récurrentes dans les différentes régions économiques et qui sont entre autre les attaques parasitaires et des ravageurs, les maladies, l’appauvrissement des sols, la divagation des animaux, le manque de main d’œuvre, l’approvisionnement en eau, les problèmes foncier et financier (Kanda et al., 2014). Pour Adden et al., 2016, la perte de fertilité des sols est la principale contrainte de la baisse des rendements. Etant donné que le sol est épuisable, il apparait nécessaire d’envisager des modes de gestion qui permettent une exploitation rationnelle et durable des terres (Mandi, 2000). Or l’azote étant le moteur de la croissance végétale (Mustapha, 2012) et par conséquent indispensable à la production de la tomate. Cependant, en raison de divers phénomènes de perte (lixiviation, volatilisation, adsorption sur les colloïdes du sol, immobilisation microbienne et minéralisation), la quantité d’azote du sol disponible pour la plante peut changer drastiquement sur une courte période, rendant difficile la formulation de recommandations spécifiques à chaque agroécosystème (Detchinli and Sogbedji, 2015). Il est important d’optimiser la fertilisation de l’azote qui consiste à trouver un bon équilibre entre besoins de la plante, reliquats du sol et apports exogènes. L’enjeu est de taille tant pour la rentabilité de l’exploitation que pour le bilan environnemental à l’échelle de la parcelle. Pour évoluer vers une agriculture de précision, il est nécessaire de concevoir de nouveaux systèmes de culture répondant au mieux à la multiplicité des objectifs, économiques, environnementaux et sociaux. La modélisation est devenue l’outil incontournable qui permet de connaître, comprendre, inventer et partager ces nouvelles manières de produire. C’est dans cette optique que la présente étude intitulée «Maximisation de l’efficience d’utilisation de l’azote par la tomate sur les ferrasols du Sud du Togo» est initiée. L’objectif général de l’étude est d’optimiser la production en fruits de tomate. Plus précisément, il s’agit : (i) de déterminer l’effet de la forme et de la dose d’application de l’azote sur le rendement en fruits de la tomate ; (ii) d’étudier la réponse du rendement en fruits de la tomate à la forme et à la dose
1st African Conference on Precision Agriculture | 8-10 December | 2020
125
d’application de l’azote ; (iii) d’évaluer la rentabilité économique de l’utilisation de l’azote sous culture de tomate.
MATERIEL ET METHODES
Site expérimental Les travaux ont été réalisés dans la région maritime au sud du Togo à la Station
d’Expérimentations Agronomiques de Lomé (SEAL) sise dans l’enceinte de l’Université de Lomé (UL). Lomé est une ville de l’extrême Sud-Ouest du Togo dont elle est la capitale. Elle est localisée sur 6°10 latitude nord et 1°10 longitude Est (Detchinli et Sogbedji, 2015). Le climat est celui du sud-Togo, de type subéquatorial à deux saisons sèches et deux saisons pluvieuses. Les précipitations annuelles varient de 800 à 1200 mm et la température moyenne annuelle est entre 24 et 30°C. La température moyenne annuelle est de 27 °C (Worou, 2000). Le sol est de type ferralitique communément appelé « terre de barre », qui s’est développé à partir des dépositions continentales (Saragoni et al., 1992). Sa teneur en potassium (K) est inférieure à 2 cmol.kg-1 ; il a un contenu en phosphore total variant de 250 à 300 mg.kg-1, une capacité d’échange cationique de 3 à 4 méq.kg-1, le N total est de 0,05 - 0,1% avec un rapport C/N de 7 – 11, un pH de 5,2 à 6,8 (Detchinli et Sogbedji, 2015). Conduite de l’essai
L’essai a été mené sur trois ans, six cultures de tomate réparties sur deux périodes (Septembre à janvier 2017-2019 et de Février à Mai 2018-2020) sur un sol ferralitique à la Station d’Expérimentations Agronomiques de Lomé suivant un dispositif expérimental en blocs aléatoires complets à trois répétitions. Le schéma cultural 50 cm x 60 cm a été adopté, soit une densité de peuplement de 33 333 plants ha-1. Six doses identiques ont été appliquées de part et d’autre de l’USG et de l’UO à raison de (0, 30, 60, 90, 120, 150 kg ha-1 respectivement T+, T1, T2, T3, T4, T5 pour UO et T+, T1’, T2’, T3’, T4’, T5’ pour USG) comme fumure de relais et 200 kg ha-1 de NPK : 15 15 15 comme fumure de fond. Collecte et analyse des données
Le rendement en fruits frais de tomate sous chaque traitement et la profitabilité ont été déterminé à partir des lignes centrales de chaque parcelle élémentaire de tomate dont les fruits ont été récoltés et pesés. Le rendement potentiel a été calculé par extrapolation à partir du poids des fruits issus des plants récoltés et sur la base de la densité de peuplement de 33 333 plants ha-1. Les données obtenues ont été traitées à l’aide du tableur Excel pour déterminer les modèles (ou fonctions) de la réponse du rendement en fruits frais de tomate aux différents traitements de fertilisation appliqués. L’analyse statistique a été réalisée à l’aide du logiciel GenSTAT Version 12.1, et le test de Duncan a été utilisé pour discriminer les rendements au seuil de 5%. La dose économique optimale de l’azote est définie comme la dose d’azote pour laquelle la valeur marchande du rendement marginal correspond au coût marginal de la fumure azotée. Pour les modèles quadratiques, elle est calculée en égalant les premières dérivées des fonctions obtenues aux ratios entre les coûts unitaires des fertilisants et les prix unitaires du produit (NAS, 1961 ; Nelson et al., 1985 ; Sogbedji, 1999 ; Agbangba et al., 2016 ; Detchinli et al., 2017). La tomate a été vendu à 600 F CFA kg-1 et 800 F CFA kg-1 respectivement pour la première période et la seconde. Le prix d’achat de l’azote a été fixé à 695,65 F CFA kg-1 pour l’urée ordinaire (soit 16 000 F CFA le sac de 50 kg d’urée ordinaire à 46 % N) et à 717,39 F CFA kg-1 pour l’urée super
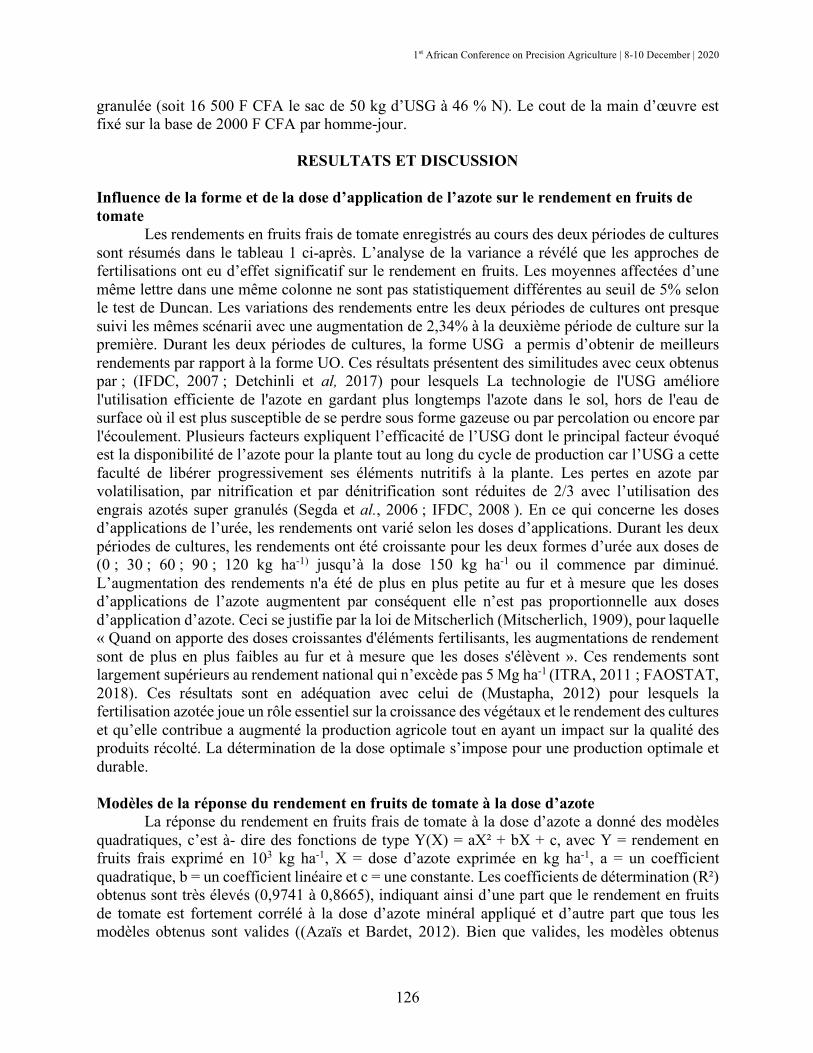
1st African Conference on Precision Agriculture | 8-10 December | 2020
126
granulée (soit 16 500 F CFA le sac de 50 kg d’USG à 46 % N). Le cout de la main d’œuvre est fixé sur la base de 2000 F CFA par homme-jour.
RESULTATS ET DISCUSSION
Influence de la forme et de la dose d’application de l’azote sur le rendement en fruits de tomate
Les rendements en fruits frais de tomate enregistrés au cours des deux périodes de cultures sont résumés dans le tableau 1 ci-après. L’analyse de la variance a révélé que les approches de fertilisations ont eu d’effet significatif sur le rendement en fruits. Les moyennes affectées d’une même lettre dans une même colonne ne sont pas statistiquement différentes au seuil de 5% selon le test de Duncan. Les variations des rendements entre les deux périodes de cultures ont presque suivi les mêmes scénarii avec une augmentation de 2,34% à la deuxième période de culture sur la première. Durant les deux périodes de cultures, la forme USG a permis d’obtenir de meilleurs rendements par rapport à la forme UO. Ces résultats présentent des similitudes avec ceux obtenus par ; (IFDC, 2007 ; Detchinli et al, 2017) pour lesquels La technologie de l'USG améliore l'utilisation efficiente de l'azote en gardant plus longtemps l'azote dans le sol, hors de l'eau de surface où il est plus susceptible de se perdre sous forme gazeuse ou par percolation ou encore par l'écoulement. Plusieurs facteurs expliquent l’efficacité de l’USG dont le principal facteur évoqué est la disponibilité de l’azote pour la plante tout au long du cycle de production car l’USG a cette faculté de libérer progressivement ses éléments nutritifs à la plante. Les pertes en azote par volatilisation, par nitrification et par dénitrification sont réduites de 2/3 avec l’utilisation des engrais azotés super granulés (Segda et al., 2006 ; IFDC, 2008 ). En ce qui concerne les doses d’applications de l’urée, les rendements ont varié selon les doses d’applications. Durant les deux périodes de cultures, les rendements ont été croissante pour les deux formes d’urée aux doses de (0 ; 30 ; 60 ; 90 ; 120 kg ha-1) jusqu’à la dose 150 kg ha-1 ou il commence par diminué. L’augmentation des rendements n'a été de plus en plus petite au fur et à mesure que les doses d’applications de l’azote augmentent par conséquent elle n’est pas proportionnelle aux doses d’application d’azote. Ceci se justifie par la loi de Mitscherlich (Mitscherlich, 1909), pour laquelle « Quand on apporte des doses croissantes d'éléments fertilisants, les augmentations de rendement sont de plus en plus faibles au fur et à mesure que les doses s'élèvent ». Ces rendements sont largement supérieurs au rendement national qui n’excède pas 5 Mg ha-1 (ITRA, 2011 ; FAOSTAT, 2018). Ces résultats sont en adéquation avec celui de (Mustapha, 2012) pour lesquels la fertilisation azotée joue un rôle essentiel sur la croissance des végétaux et le rendement des cultures et qu’elle contribue a augmenté la production agricole tout en ayant un impact sur la qualité des produits récolté. La détermination de la dose optimale s’impose pour une production optimale et durable.
Modèles de la réponse du rendement en fruits de tomate à la dose d’azote
La réponse du rendement en fruits frais de tomate à la dose d’azote a donné des modèles quadratiques, c’est à- dire des fonctions de type Y(X) = aX² + bX + c, avec Y = rendement en fruits frais exprimé en 103 kg ha-1, X = dose d’azote exprimée en kg ha-1, a = un coefficient quadratique, b = un coefficient linéaire et c = une constante. Les coefficients de détermination (R²) obtenus sont très élevés (0,9741 à 0,8665), indiquant ainsi d’une part que le rendement en fruits de tomate est fortement corrélé à la dose d’azote minéral appliqué et d’autre part que tous les modèles obtenus sont valides ((Azaïs et Bardet, 2012). Bien que valides, les modèles obtenus

1st African Conference on Precision Agriculture | 8-10 December | 2020
127
portent les insuffisances ou limites soulignées par (Agbangba et al., 2016) à savoir notamment la difficulté d’interprétation agronomique des paramètres (coefficients quadratiques, coefficients linéaires et constantes). Par exemple, les constantes c des différents modèles ne correspondent pas exactement aux rendements enregistrés sous le témoin positif (correspondant à x = 0).
Tableau 1. Rendement en fruits de tomate en Mg ha-1.
Traitements Période 1 Période 2
UO USG UO USG T+= N0 18,50 g 18,50 g 18,67 f 18,67 f T1= N30 22,26 f 22,88 f 21,58 e 23,91 d T2= N60 24,12 e 24,40 e 24,69 d 26,03 c T3= N90 25,68 d 26,84 bc 26,66 c 27,72 b T4= N120 27,61 b 31,00 a 28,23 b 31,62 a T5= N150 25,98 cd 26,34 cd 26,29 c 27,77 b Moyenne 22,32 23,15 22,50 23,87
PPDS Période 1 : 1,0512 ; PPDS Période 2 : 1,0512 ; Période 1 : Septembre à Janvier ; Période 2 : Février à Mai ; 200 kg ha-1 de NPK : 15 15 15 a été associé à tous les traitements ; tous les traitements ayant reçu le NPK ont également reçu une dose de 0 ; 30 ; 60 ; 90 ; 120 ; 150 de USG : Urée Super Granulée ou UO : Urée Ordinaire.
Figure 1 : Modèle quadratique du rendement en fruits de tomate en fonction de la dose d’azote minéral appliqué à la 1ere période sous forme UO
Figure 3 : Modèle quadratique du rendement en fruits de tomate en fonction de la dose d’azote minéral appliqué à la 1ere période sous forme USG
Figure 4: Modèle quadratique du rendement en fruits de tomate en fonction de la dose d’azote minéral appliqué à la 2e période sous forme USG
Figure 2 : Modèle quadratique du rendement en fruits de tomate en fonction de la dose d’azote minéral appliqué à la 2e période sous forme UO
y = -0,0006x2 + 0,1477x + 18,254R² = 0,9731
0
10
20
30
0 5 0 1 0 0 1 5 0 2 0 0Rend
emen
t en (
Mg ha
-1)
Dose de N (kg ha-1 )
y = -0,0005x2 + 0,1318x + 18,508R² = 0,9741
0
10
20
30
0 5 0 1 0 0 1 5 0 2 0 0
Rend
emen
t en (
Mg ha
-1)
Dose de N (kg ha-1)
y = -0,0007x2 + 0,173x + 18,884R² = 0,888
010203040
0 5 0 1 0 0 1 5 0 2 0 0Rend
emen
t en (
Mg ha
-1)
Dose de N (kg ha-1 )
y = -0,0007x2 + 0,166x + 18,217R² = 0,8665
010203040
0 5 0 1 0 0 1 5 0 2 0 0Rend
emen
t en (
Mg ha
-1)
Dose de N (kg ha-1 )
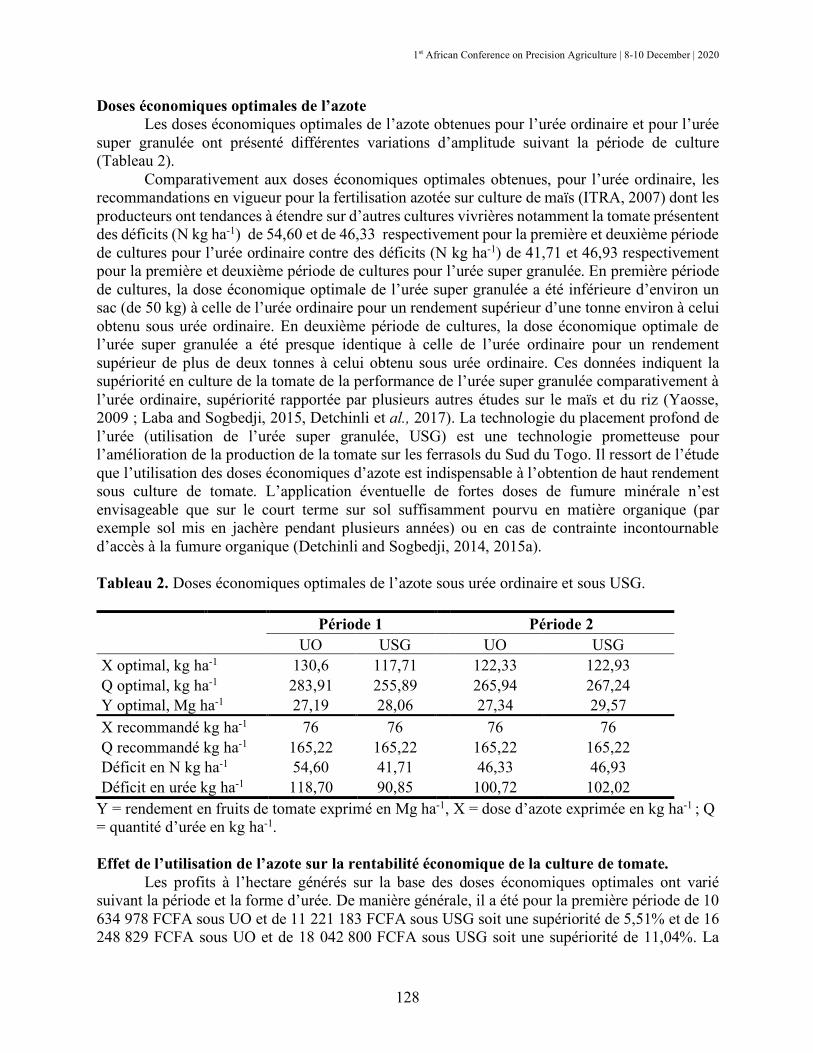
1st African Conference on Precision Agriculture | 8-10 December | 2020
128
Doses économiques optimales de l’azote Les doses économiques optimales de l’azote obtenues pour l’urée ordinaire et pour l’urée
super granulée ont présenté différentes variations d’amplitude suivant la période de culture (Tableau 2).
Comparativement aux doses économiques optimales obtenues, pour l’urée ordinaire, les recommandations en vigueur pour la fertilisation azotée sur culture de maïs (ITRA, 2007) dont les producteurs ont tendances à étendre sur d’autres cultures vivrières notamment la tomate présentent des déficits (N kg ha-1) de 54,60 et de 46,33 respectivement pour la première et deuxième période de cultures pour l’urée ordinaire contre des déficits (N kg ha-1) de 41,71 et 46,93 respectivement pour la première et deuxième période de cultures pour l’urée super granulée. En première période de cultures, la dose économique optimale de l’urée super granulée a été inférieure d’environ un sac (de 50 kg) à celle de l’urée ordinaire pour un rendement supérieur d’une tonne environ à celui obtenu sous urée ordinaire. En deuxième période de cultures, la dose économique optimale de l’urée super granulée a été presque identique à celle de l’urée ordinaire pour un rendement supérieur de plus de deux tonnes à celui obtenu sous urée ordinaire. Ces données indiquent la supériorité en culture de la tomate de la performance de l’urée super granulée comparativement à l’urée ordinaire, supériorité rapportée par plusieurs autres études sur le maïs et du riz (Yaosse, 2009 ; Laba and Sogbedji, 2015, Detchinli et al., 2017). La technologie du placement profond de l’urée (utilisation de l’urée super granulée, USG) est une technologie prometteuse pour l’amélioration de la production de la tomate sur les ferrasols du Sud du Togo. Il ressort de l’étude que l’utilisation des doses économiques d’azote est indispensable à l’obtention de haut rendement sous culture de tomate. L’application éventuelle de fortes doses de fumure minérale n’est envisageable que sur le court terme sur sol suffisamment pourvu en matière organique (par exemple sol mis en jachère pendant plusieurs années) ou en cas de contrainte incontournable d’accès à la fumure organique (Detchinli and Sogbedji, 2014, 2015a). Tableau 2. Doses économiques optimales de l’azote sous urée ordinaire et sous USG. Période 1 Période 2 UO USG UO USG X optimal, kg ha-1 130,6 117,71 122,33 122,93 Q optimal, kg ha-1 283,91 255,89 265,94 267,24 Y optimal, Mg ha-1 27,19 28,06 27,34 29,57 X recommandé kg ha-1 76 76 76 76 Q recommandé kg ha-1 165,22 165,22 165,22 165,22 Déficit en N kg ha-1 54,60 41,71 46,33 46,93 Déficit en urée kg ha-1 118,70 90,85 100,72 102,02
Y = rendement en fruits de tomate exprimé en Mg ha-1, X = dose d’azote exprimée en kg ha-1 ; Q = quantité d’urée en kg ha-1. Effet de l’utilisation de l’azote sur la rentabilité économique de la culture de tomate.
Les profits à l’hectare générés sur la base des doses économiques optimales ont varié suivant la période et la forme d’urée. De manière générale, il a été pour la première période de 10 634 978 FCFA sous UO et de 11 221 183 FCFA sous USG soit une supériorité de 5,51% et de 16 248 829 FCFA sous UO et de 18 042 800 FCFA sous USG soit une supériorité de 11,04%. La

1st African Conference on Precision Agriculture | 8-10 December | 2020
129
culture de tomate est une spéculation rentable économiquement. Ces résultats sont en adéquation avec les résultats de Hanson, (2001) pour lesquels la culture de la tomate est une activité génératrice de revenus. Les profits enregistrés au cours de la seconde période sont supérieurs à ceux de la première période malgré que les tendances en termes de rendement soient similaires. En cette période les prix de vente de la tomate sont très attractifs.
CONCLUSION
La culture de la tomate est une activité génératrice de revenu. La détermination des doses
économiques optimales d’azote devient alors une nécessité. A l’issue de cet essai conduit à la Station d’Expérimentations Agronomiques de Lomé ; il ressort que les doses économiques optimales d’azote sont supérieures à la recommandation en vigueur. A la première période de cultures, la dose économique optimale a été de 293,91 et 255,89 respectivement pour l’urée ordinaire (soit 131 kg de N ha-1) et pour l’urée super granulé (soit 118 kg de N ha-1). A la deuxième période de cultures, la dose économique optimale a été de 265,94 et 267,24 respectivement pour l’urée ordinaire (soit 122 kg de N ha-1) et pour l’urée super granulé (soit 123 kg de N ha-1). Les formules de fertilisation pour la première période sont N131 P30 K30 pour l’urée ordinaire et N118 P30 K30 pour l’urée super granulée. Pour la deuxième période, elles sont N122 P30 K30 pour l’urée ordinaire et N123 P30 K30 pour l’urée super granulée. Toutes ces doses économiques obtenues durant les deux périodes de cultures sont économiquement rentables avec une plus grande profitabilité au cours de la deuxième période de culture. L’utilisation de l’urée sous la forme USG est plus avantageuse en termes de rendements et de rentabilité économique que la forme UO.
REFERENCES
Adden AK, Mawussi G, Sogbedji JM, Sanda K, Kokou K. 2016. Cropping Systems Effects on Sustainable Maize Crop (Zea mays L.). Production on Depleted Tropical Soil. Int. J. Pure App. Biosci. 4 (3): 206-215.
Agbangba CE, Sossa EL, Dagbenonbakin GD, Tovihoudji P, Kindomihou V. 2016. Modélisation de la réponse de l’ananas Cayenne lisse a l’azote, au phosphore et au potassium sur sols ferralitiques au bénin. rev. cames 4(2): 424-7235
Azaïs JM, Bardet JM. 2012. Le modèle linéaire par l’exemple: Régression, analyse de la variance et plans d’expérience illustrés par R et SAS. 2ème Edition DUNOD.
Banque mondiale. 2014. Agriculture et développement rural : Data. Disponible sur https://donnees.banquemondiale.org/theme/agriculture-et-developpement-rural, consulté le 02 juin 2020).
Detchinli K S, Sogbedji JM. 2014. Assessment of the profitability and the effects of three maize-based cropping systems on soil health in Western Africa. American Journal of Agriculture and Forestry 2(6): 321-329.
Detchinli KS, Sogbedji JM. 2015. Assessment of the profitability and the effects of three maize-based cropping systems on soil health in Western Africa. Ecole Supérieure d’Agronomie, Université de Lomé, Togo. Publié dans American Journal of Agriculture and Forestry. 2 (6): 321-329.
Detchinli KS, Sogbedji JM. 2015a. Yield performance and economic return of maize as affected by nutrient management strategies on ferralsols in coastal western Africa. European Scientific Journal 11: 1857–7881.

1st African Conference on Precision Agriculture | 8-10 December | 2020
130
Detchinli KS, Sogbedji JM, Atchoglo R, Bona K. 2017. Modélisation des doses économiques optimales de l’azote en culture du maïs (zea mays l.) sur les sols ferralitiques au Togo. rev. cames 5(01): 2424-7235.
FAOSTAT. 2018. Production/rendement et surface cultivable de la tomate fraiche. Disponible sur http://www.fao.org/faostat/fr/#data/QC/visualize. Consulté le 05 juin 2020
Godard C. 2005. Modélisation de la réponse du rendement des grandes cultures et intégration dans un modèle économique d’offre agricole à l’échelle européenne. Application à l’évaluation des impacts du changement climatique. Thèse de doctorat. Institut National Agronomique Paris-Grignon, Ecole Doctorale ABIES, UMR Economie Publique, INRA - INA P-G.
Hanson P, Chen JT, Kuo CG, Morris R, Open RT. 2001. Suggestions sur les pratiques culturales de la tomate. Learning center, pp 1 - 9.
IFDC. 2003b. Adapting Nutrient Management Technologies Project (ANMAT). A project supported by International Fund for Agricultural Development (IFAD), Rome. Octobre 2003. 5p.
IFDC Report. 2007. Actualités des travaux et des progrès de l’IFDC- Un Centre International pour la Fertilité des Sols et le Développement Agricole. Vol 32, N° 2, 8p.
IFDC. 2008. An International Center for Soil Fertility and Agricultural Development. www.ifdc.org. Consulté le 07/06/2008.
INSEE. 2016. Rentabilité économique. https://comptabilite.ooreka.fr// (consulté le 05 juin 2020). ITRA. 2007. Situation de référence sur les principales céréales cultivées au Togo : maïs, riz,
sorgho, mil. Lomé : Institut Togolais de Recherche Agronomique, pp. 9-38. Consulté le 03 juin 2020.
Kanda M, Akpavi S, Wala K, Boundjou GD, Akpagana K. 2014. Diversité des espèces cultures et contraintes à la production en agriculture maraichère au Togo. Int. J. Biol. Chem. Sci. 8(1): 115-127, February, issn 1997-342X (Online).
Laba BS, Sogbedji JM. 2015. Identification of land degradation and climate change resilient soil and crop management strategies for maize production on West African ferralsols. International Invention Journal of Agriculture and Soil Science 3(2): 13-20.
MAEP. 2007. Deuxième rapport sur l’état des lieux des ressources phytogénétiques pour l’alimentation et l’agriculture au Togo. Disponible sur http://www.fao.org/docrep/013/i1500e/Togo.
Mitscherlich EA. 1909. Das gesetz des minimums und das gesetz des abnehmenden bodenertrages. 38: 537-552.
Mustapha A. 2012. Etude de la nutrition uréique et ammoniacale chez le colza (Brassica napus L.) et développement de nouveaux inhibiteurs d’uréases et de la nitrification. Thèse de doctorat. Sciences du Vivant [q-bio]. Université de Caen Basse Normandie.
National Academy of Sciences – National Research Council. 1961. Statistical methods of research in economic aspects of fertilizer response and use. Committee on economic of fertilizer use of the agricultural board, NAS-NRC pub. 918, NAS-NRS,Washington, DC.
Nelson LA, Voss RD, Pesek JT. 1985. Agronomic and statistical evaluation of fertilizer response. P. 53-90. In O.P. Angelstad (Ed.) Fertilizer technology and use, 3rd ed. ASA, Madison.
RECA (Réseau National des Chambres d'Agriculture du Niger). 2016. La tomate au Niger. Saragoni H, Poss R, Marquett J, Latrille E. 1992. Fertilisation et succession des cultures vivrières
au sud du Togo: synthèse d'une expérimentation de longue durée sur terres de barre. Agronomie Tropicale 46 : 107-120.
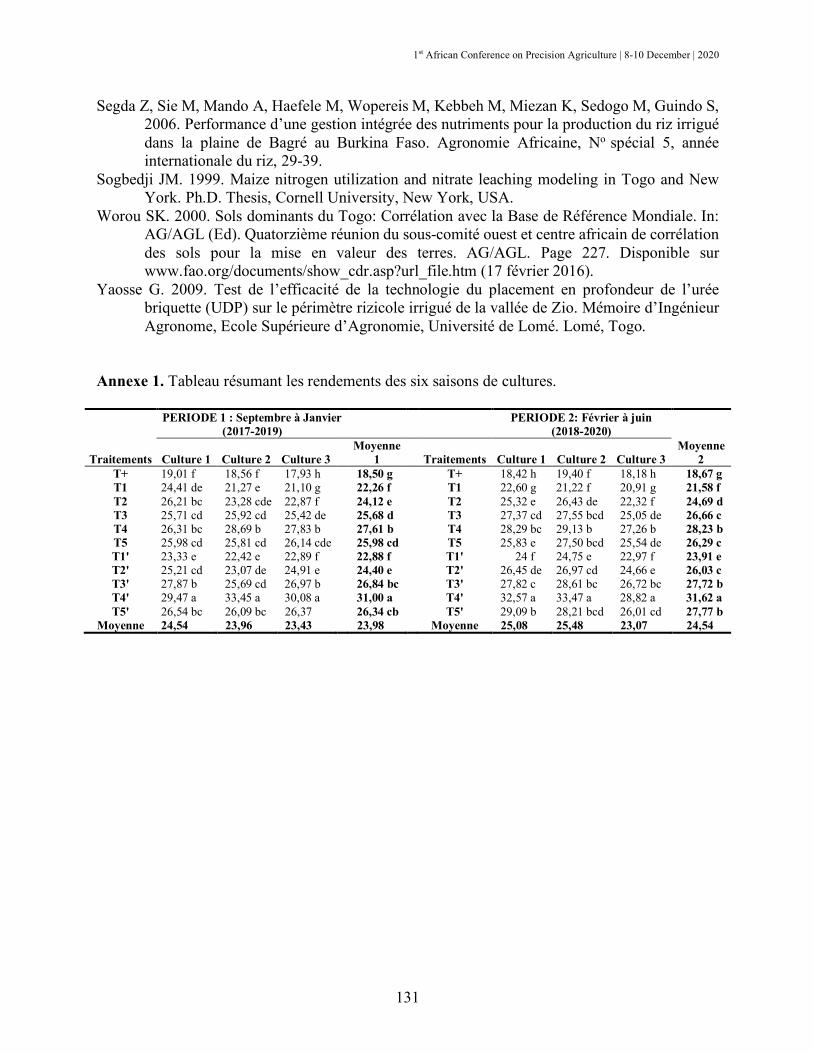
1st African Conference on Precision Agriculture | 8-10 December | 2020
131
Segda Z, Sie M, Mando A, Haefele M, Wopereis M, Kebbeh M, Miezan K, Sedogo M, Guindo S, 2006. Performance d’une gestion intégrée des nutriments pour la production du riz irrigué dans la plaine de Bagré au Burkina Faso. Agronomie Africaine, No spécial 5, année internationale du riz, 29-39.
Sogbedji JM. 1999. Maize nitrogen utilization and nitrate leaching modeling in Togo and New York. Ph.D. Thesis, Cornell University, New York, USA.
Worou SK. 2000. Sols dominants du Togo: Corrélation avec la Base de Référence Mondiale. In: AG/AGL (Ed). Quatorzième réunion du sous-comité ouest et centre africain de corrélation des sols pour la mise en valeur des terres. AG/AGL. Page 227. Disponible sur www.fao.org/documents/show_cdr.asp?url_file.htm (17 février 2016).
Yaosse G. 2009. Test de l’efficacité de la technologie du placement en profondeur de l’urée briquette (UDP) sur le périmètre rizicole irrigué de la vallée de Zio. Mémoire d’Ingénieur Agronome, Ecole Supérieure d’Agronomie, Université de Lomé. Lomé, Togo.
Annexe 1. Tableau résumant les rendements des six saisons de cultures.
PERIODE 1 : Septembre à Janvier
(2017-2019) PERIODE 2: Février à juin
(2018-2020)
Traitements Culture 1 Culture 2 Culture 3 Moyenne
1 Traitements Culture 1 Culture 2 Culture 3 Moyenne
2 T+ 19,01 f 18,56 f 17,93 h 18,50 g T+ 18,42 h 19,40 f 18,18 h 18,67 g T1 24,41 de 21,27 e 21,10 g 22,26 f T1 22,60 g 21,22 f 20,91 g 21,58 f T2 26,21 bc 23,28 cde 22,87 f 24,12 e T2 25,32 e 26,43 de 22,32 f 24,69 d T3 25,71 cd 25,92 cd 25,42 de 25,68 d T3 27,37 cd 27,55 bcd 25,05 de 26,66 c T4 26,31 bc 28,69 b 27,83 b 27,61 b T4 28,29 bc 29,13 b 27,26 b 28,23 b T5 25,98 cd 25,81 cd 26,14 cde 25,98 cd T5 25,83 e 27,50 bcd 25,54 de 26,29 c T1' 23,33 e 22,42 e 22,89 f 22,88 f T1' 24 f 24,75 e 22,97 f 23,91 e T2' 25,21 cd 23,07 de 24,91 e 24,40 e T2' 26,45 de 26,97 cd 24,66 e 26,03 c T3' 27,87 b 25,69 cd 26,97 b 26,84 bc T3' 27,82 c 28,61 bc 26,72 bc 27,72 b T4' 29,47 a 33,45 a 30,08 a 31,00 a T4' 32,57 a 33,47 a 28,82 a 31,62 a T5' 26,54 bc 26,09 bc 26,37 26,34 cb T5' 29,09 b 28,21 bcd 26,01 cd 27,77 b
Moyenne 24,54 23,96 23,43 23,98 Moyenne 25,08 25,48 23,07 24,54

1st African Conference on Precision Agriculture | 8-10 December | 2020
132
#7505 MAPPING OF SOIL NUTRIENT VARIABILITY IN SOME PLANTATION CROPS IN ABEOKUTA, OGUN STATE NIGERIA
E.C. Basil, B.A. Senjobi, R.T. Basil, A.O. Tobore
Department of Soil Science and Land Management, Federal University of Agriculture, Abeokuta, Ogun State, Nigeria, [email protected] +2348068904445
ABSTRACT
The activities of man in the soil and the undulating topography have great effects on soil nutrient variability. For near accurate application of nutrients in precision agriculture in order to reduce wastage of resources, the research was conducted to acquaint the research farm of the institute with the nutrient variability at specific location. A detailed soil survey was carried out at the Teaching and Research Farms of Federal University of Agriculture, Abeokuta. Following observed soil variations, surface (0-15cm) and sub-surface (15-30 cm) soil samples were taken viz: Arboretum, Cashew, Oil palm. A Fallow land was also sampled. The samples were subjected to physical and chemical analyses for some nutrients determination. The results were digitally mapped using ARC GIS software package. The result showed variability in organic carbon in oil palm plantation, variability in the bulk density, available phosphorus and organic carbon in the fallow. Cashew plantation recorded a variation in the bulk density while the arboretum had variations in the available phosphorus. In order to minimize fertilizer wastage, concern should be given to these areas of variability.
INTRODUCTION
A great deal of inference can be drawn from the morphology of the soil as they were seen on the field and make interpretation and prediction about its qualities. However, for accurate interpretation and prediction, especially for modern agriculture and non-agricultural uses of soils, quantitative data on composition of the soils are needed for characterization (Buol, 1997). Soil is a vital resource for producing the food and fiber needed to support an increasing world population (Pappendick and Parr, 1992), therefore, characterizing and evaluation of the soil for suitability purpose for desired crops cannot be over emphasized. The objectives of this study are to characterize the soil and map the variability shown in the nutrients in the various plantations.
MATERIALS AND METHODS
The study was conducted at the Teaching and Research Farms of the Directorate of University Farms (DUFARMS), Federal University of Agriculture, Abeokuta (FUNAAB). The area is located between latitude 70 12’ N and 70 23’, Longitude 3o 20’ E and 30 23’ and on Elevation 108 m. The vegetation is basically derived savanna, which has been modified by various agricultural practices over time. The climate of Abeokuta falls between the humid and sub-humid tropics with mean annual rainfall of about 1113 mm, two peaks distribution pattern and five dry months in the year. Three different crop plantations and a fallow were considered for this study namely: Arboretum, Cashew, Oil palm and Fallow. At each of the chosen land use type, an area of 4 ha was demarcated for the study. Surface (0-15 cm) and sub-surface (15-30 cm) soil samples

1st African Conference on Precision Agriculture | 8-10 December | 2020
133
were collected with the aid of soil auger at the intersections of traverses using Rigid Grid method at 100 m interval. A representative profile pit (2 x 1 x 2 m) was dug at each of the predominate land types or slope segments and soil types/mapping units encountered at each of the chosen land use types. The profile pits were described morphologically after FAO (2006) guidelines. They were sampled and placed in labeled bags and then processed in the laboratory after air-drying. Soil colour was determined using Munsell colour chart. The air-dried soil samples were, grinded and sieved with a 2 mm mesh sieve and sub-samples were further sieved with 0.5 mm sieve for the organic carbon and nitrogen determination. The Organic Carbon was determined using Walkley and Black method. Soil pH in water (1:1) was determined with the use of a glass electrode pH meter (Mclean,1965). Exchangeable cations were extracted with 1M NH4OAC (pH7.0), sodium and potassium were determined using flame photometer and exchangeable Mg and calcium by Atomic Absorption Spectrometer (Spark,1965). Available P was extracted using Bray-1 extractant followed by Molybdenum blue colorimetric. Exchangeable acidity was determined by the KCl extraction method (Mclean, 1965). Total nitrogen was determined by the Macro-kjeldahl digestion method of Jackson (1962). The bulk density was determined by core method. Particle size distribution analysis was determined by the Bouyoucos hydrometer (1951) method using calgon as dispersing agent. The data were subjected to analysis of variance (ANOVA) to assess the effect of different land use types on the soil quality indices. Mean value were separated by Duncan’s Multiple Range Test (DMRT) at p<0.05.
RESULTS AND DISCUSSION
Generally, the soil textural fractions of sand, clay and silt varied significantly with the different plantation. The particle size distribution showed that the pedons have very high sand contents (>800 g/kg) and this decreased with depth across the land uses. The clay contents also ranged from 120 g/kg in the arboretum to 450 g/kg in the oil palm across the profiles. The soils were so compacted and as a result, samples could only be taken from the Ap designated horizon. The high percentage of sand in all the land uses is a good indication of the observable high infiltration rate (Fagbemi and Udoh 1992; Senjobi 2007). The poor water holding capacity of the soils which is as a result of coarse texture of the studied soil, enhanced erodibility of the soil which may have been exposed through cultivation and livestock grazing. Bulk density >1.65g/cm3 may impede roots and inhibits development and water movement (Aminu et al., 2013). The increase in soil bulk density can be probably attributed to the loss of organic matters through tillage practices. This is in conformity with Click (2005) and Bahramie et al., (2010). Ogunkunle et al., (2014) also supported that soils with bulk density values ≥ 1.30 as recorded in almost all the land uses are indicative of compaction prone soils which will hinder root elongation, reduce aeration and impede water infiltration and movement within the root zone. The total nitrogen content in all the soils of land use types was moderate (0.11-0.22%) compared to the TSQI used (0.1 - 0.5 %). This is due to the accumulation of litter falls. This could be as a result of an imbalance in the accumulation of litter-falls and the rate of decomposition by micro-organisms. This means that the rate of mineralization is on a reduction trend compared to the rate of accumulation. Though there was nutrient variability as shown in Figure 1, the maps designated with different colour did show with the legend the areas that had the nutrients very low, low, moderate or high. Maps with a colour showed no variation while maps with multiple colours showed variation.

1st African Conference on Precision Agriculture | 8-10 December | 2020
134
CONCLUSIONS
It could be inferred from the study that different crop plantation has different soil characteristics and there were variations in the soil nutrient distribution with space with respect to the physical, chemical and biological parameters under different plantations. In the oil palm plantation, most of the nutrients were leached down the profile or probably held up in the clay content which was highly improved and compacted. The nutrients maps could be used to offer solutions to nutrient deficiencies and accurate application of nutrients to avoid wastage of resources.
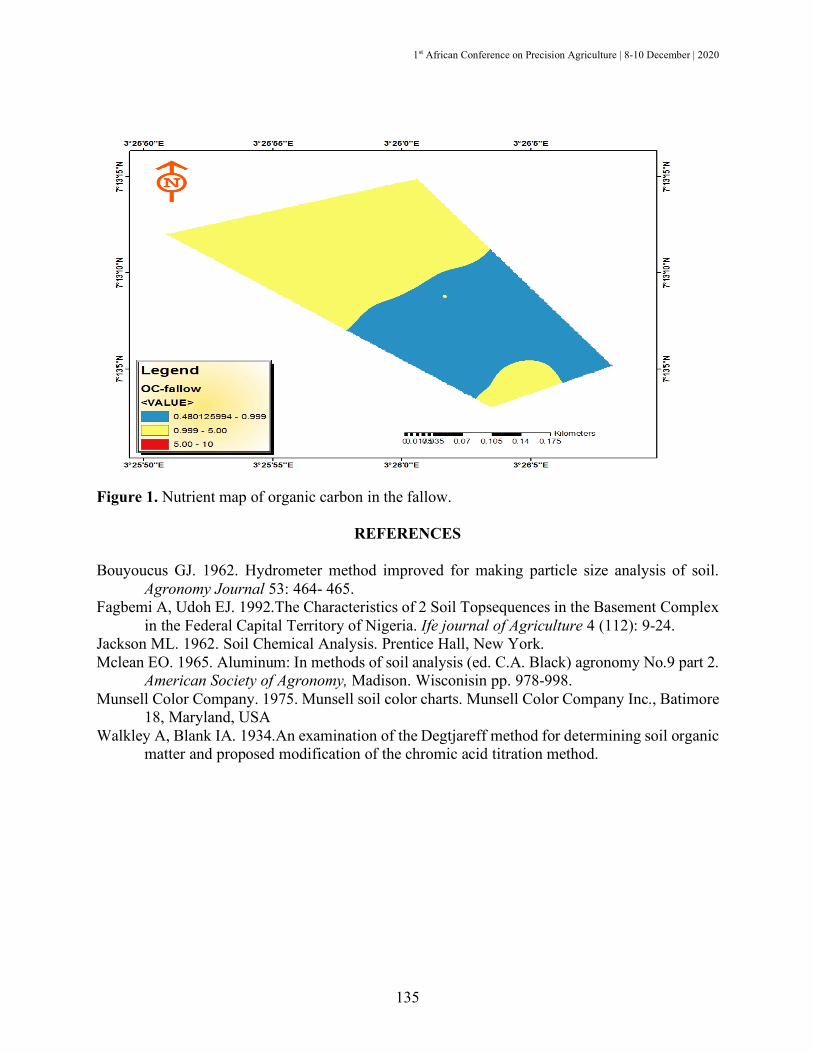
1st African Conference on Precision Agriculture | 8-10 December | 2020
135
Figure 1. Nutrient map of organic carbon in the fallow.
REFERENCES
Bouyoucus GJ. 1962. Hydrometer method improved for making particle size analysis of soil. Agronomy Journal 53: 464- 465.
Fagbemi A, Udoh EJ. 1992.The Characteristics of 2 Soil Topsequences in the Basement Complex in the Federal Capital Territory of Nigeria. Ife journal of Agriculture 4 (112): 9-24.
Jackson ML. 1962. Soil Chemical Analysis. Prentice Hall, New York. Mclean EO. 1965. Aluminum: In methods of soil analysis (ed. C.A. Black) agronomy No.9 part 2.
American Society of Agronomy, Madison. Wisconisin pp. 978-998. Munsell Color Company. 1975. Munsell soil color charts. Munsell Color Company Inc., Batimore
18, Maryland, USA Walkley A, Blank IA. 1934.An examination of the Degtjareff method for determining soil organic
matter and proposed modification of the chromic acid titration method.
1st African Conference on Precision Agriculture | 8-10 December | 2020
136
#7540 EVALUATION OF ON-FARM OIL PALM YIELD PARAMETERS IN NIGER DELTA REGION OF NIGERIA
D.K. Madukwe3, *F. Ekhator1, P. Osayande1, V.O. Aduramigba-Modupe2, O. Solomon1, M.N.
Okoye1 and C.E. Ikuenobe1 1Nigerian Institute for Oil Palm Research (NIFOR) P.M.B 1030, Benin City, Edo State. 2Institute
of Agricultural Research and Training, Obafemi Awolowo University, Ibadan, Oyo state 3OCP Fertilizer, Nigeria, [email protected]
ABSTRACT
The potential yield of oil palm in smallholder farmers’ field has been low due to poor nutrient management. Yield of over 40 tons of fresh fruit bunch hectare-1 is realizable with NIFOR tenera material if the plant environment is properly harnessed for the crop beneficiary; however, actual yield of NIFOR tenera material is between 22-25 tons ha-1. A yield survey study was conducted in small and medium scale farmers’ fields in Niger delta states of Nigeria where oil palm is predominantly grown to determine the actual yield of oil palm for precise nutritional management. In each of the states three local governments and five communities’ local governments were sampled. Three samples were collected from each community. Data collected were fresh fruit bunch (FFB) weight, palm frond petiole cross section and leaf area. Data collected were subjected to analysis of variance and means separated using Ducan Multiple Range Test (DMRT). The results showed that bunch weight palm-1 at harvest, bunch weight palm-1 year-1, bunch weight tons hectare-1, leaf area and petiole cross section were significantly different in all the local government and state. Bunch weight palm-1 at harvest, bunch weight palm-1 year-1, bunch weight tons hectare-1, and petiole cross section were significantly highest in Emohua local government area with values of 8.99 kg palm-1, 65.7 kg palm-1 year-1, and 9.55 tons hectare-1year-
1 respectively. Cross river state had the highest bunch weight palm-1 at harvest, bunch weight palm-
1 year-1, bunch weight tons hectare-1, leaf area and petiole cross section of 8.926 kg palm-1, 8.03 tons hectare-1 year-1, 56.2 kg palm-1 year-1, 5.68 m2, and 19.9 cm2 respectively. There was positive correlation between bunch weight, leaf area and petioles cross section in all the local government area. Tenera fruit form had the highest percentage of 93.33 in Emohua and the lowest percentage of 6.67 in Oruk Anam. Nigrescens was the predominant fruit type and 100% was recorded in Itu, Oruk-Anam and Ahoada. This result suggests that oil palm yield in the area is far lower than the average yield of well-nourished and managed NIFOR tenera material in Nigeria Keywords: Evaluation, oil palm, yield parameters, tenera, NIFOR
INTRODUCTION
Oil palm is a unique tropical crop cultivated mainly for its mesocarp and kernel oil
(Woittiez et al., 2017). Crude palm oil is the preferred oil for the diet of Sub-Saharan African people (Corley and Tinker, 2015). A growing demand for palm oil for food and soap industries is due to an increase in population in Africa, which is estimated as 770 million. The use of palm oil for biodiesel has added greatly to the continent’s demand for the commodity (Bakoume et al., 2017). There is a growing global demand for palm oil because of its universal applicability and
1st African Conference on Precision Agriculture | 8-10 December | 2020
137
increasing population (Murphy, 2014). Oil palm is a uniquely productive tropical crop with a potential fresh fruit bunch (FFB) and palm oil yield capacity well over 40 tons FFB ha-1yr-1 and 10 tons of palm oil ha-1yr-1 (Murphy, 2014). Actual yields are between 18 to 30 tons FFB ha-1yr-1 and 3-6 tons of palm oil ha-1yr-1 and for NIFOR tenera hybrid it is 22 to 25 tons in Nigeria (Donough et al., 2010; Okomu, 2018; Okwagwu et al 2005). It is a significant crop in Nigeria, occupying over 2.53 million hectares and production stands at 1million ton yr-1 (Bassey, 2016). Nigeria’s current palm oil production falls far short of the national local consumption and industrial uses (Proshare, 2019). The national production deficit estimated at nearly 2 million metric tonnes is met by importation into the country (Asemota, 2013; Bassey, 2016, Proshare, 2019). This deficit could be due to the fact that of the 2.53 million hectares purportedly cultivated to oil palm in Nigeria, 2.1millions hectares are in the wild and poorly managed (Bassey, 2016). There is every need for planned and co-ordinated best management practices that will impact on oil palm farmers’ yield and income and eventually very balanced communities (Corley and Tinker, 2015). In order to bridge the palm oil deficit gap and considering the population of Nigeria which currently stands at about 200 million and consumption of palm oil which is estimated at about 3 million metric tons; the need to increase the farm size and adopt best management practices which promote proper palm nutritional enhancement becomes very pertinent for the development of oil palm industries in Nigeria and also satisfying the palm oil need of the Nigerian populace.
The stem, fronds and leaf are proper agronomic parameters that determine plant vigour (Rankie and Fairhurst, 1999; Fairhurst and Hardter, 2005). If these parameters are not properly developed due to nutrient imbalance, fresh fruit bunch yield will be affected. Therefore, assessment of oil palm agronomic parameters that will help in soil specific and regional fertilizer formulations for the oil palm becomes very necessary if the aim of meeting the palm oil need of Nigeria is to be achieved.
This study evaluated oil palm fresh fruit bunch yield, leaf area and petiole cross section in Niger Delta Region of Nigeria.
MATERIALS AND METHODS
A yield survey study was conducted in small and medium scale farmers’ fields in Niger
delta states of Nigeria where oil palm is predominantly grown to determine the actual yield of oil palm for precise nutritional management. Three states were marked out for agronomic data collection, in each of the three states three local governments and five communities’ local governments were also marked for agronomic data collection. Three samples (fresh fruit bunch weight, leaf area, and petiole cross section) were collected from each community. The area sampled were three local governments of Cross River state (Biase, Akamkpa and Akpabuyo), Akwa Ibom state (Abak, Itu and Oruk Anam) and River state (Ahoada, Emouha and Tai). The samples were collected in three selected farmers’ field in each community on June 28, 2020. The samples collected were properly labeled and place in samples bags for further processing. Agronomic data was recorded in a field book and later calculated.
RESULTS AND DISCUSSION
The results of this study showed that bunch weight palm-1 at harvest, bunch weight palm-1
year-1, bunch weight tons hectare-1, leaf area and petiole cross section were significantly different in all the local government and state. Bunch weight palm-1 at harvest, bunch weight palm-1 year-1,

1st African Conference on Precision Agriculture | 8-10 December | 2020
138
bunch weight tons hectare-1, and petiole cross section were significantly highest in Emohua local government area with values of 8.99 kg palm-1, 65.7 kg palm-1 year-1, and 9.55 tons hectare-1year-
1 respectively (Table 1). Conversely, bunch weight palm-1 at harvest, bunch weight palm-1 year-1, bunch weight tons hectare-1 were lowest in Akamkpa local government area with values of 2.07 kg palm-1 30.5 kg palm-1 year-1 4.18 tons hectare-1year-1 respectively; but leaf area and petiole cross section were lowest in Tai local government area with values of 3.45 m2 and 11.74 cm2 respectively (Table 1). In addition, Cross river state had the highest bunch weight palm-1 at harvest, bunch weight palm-1 year-1, bunch weight tons hectare-1, leaf area and petiole cross section of 8.926 kg palm-1, 8.03 tons hectare-1 year-1, 56.2 kg palm-1 year-1, 5.68 m2, and 19.9 cm2 respectively. However, bunch weight palm-1 at harvest, bunch weight palm-1 year-1, bunch weight tons hectare-
1 and leaf area was lowest in Akwa Ibom state with values of 3.371 kg palm-1, 5.61 kg palm-1 year-
1 39.2 tons hectare-1 year-1 and 5.38 m2 respectively (Table 1). Nigrescens was the predominant fruit type in all the local government and 100% was recorded in Itu, Oruk-Anam and Ahoada while virescens was recorded in Biase local government, Akpabuyo local government, Akamkpa local government, Emohua local government and Tai local government with values of 15.38 %, 6.67 %, 13.35% and 14.29% respectively (Table 1). There was positive correlation between bunch weight, leaf area and petioles cross section in all the local government area. Tenera fruit form had the highest percentage of 93.33 in Emohua local government (Table 2). Fresh fruit bunch weight kg palm-1 year-1 and fresh fruit bunch weight ton ha-1 were lower than the fresh fruit bunch yield of NIFOR hybrid tenera probably because most of the palms were left without adequate care and fertilization. During the period of sampling, most of the farms were overgrown with weeds, hardly pruned, inaccessible and no records of fertilizer application. If oil palm is left unkempt and unfertilized, large amount of nutrient are removed which must be replaced either by recycling of palm waste or by addition of inorganic mineral fertilizers; to avoid yield reduction or else assimilates will be partitioned to vegetative growth during stress instead of reproductive growth (Hartely 1988; Woittiez et al., 2017). Harvesting frequency of once month-1 may also be attributed to the low bunch yield observed in all locations. Yield increase over 20 % in palm had been recorded by reducing harvesting frequency from 30 to 7 days (Donough et al., 2013). Leaf area was lower than the standard recommended for field palm in all the locations probably because of the fact that the palms in the area were not properly managed or fertilized. The correlation observed in leaf area, petiole cross section with oil palm fresh fruit bunch yield in all the local government sampled indicated that any response in vegetative growth due to the partitioning of assimilates will probably increase fresh fruit bunch yield in these areas. The observed low rate of adoption of NIFOR elite tenera hybrid materials in almost the local government except Emohua indicated lack of awareness on the benefits of using NIFOR tenera hybrid materials. Virescens has previously been found to occur at very low frequency in Africa usually 50 in 10, 000 bunches in grove in Nigeria (Hartley, 1988).This result concluded that bunch yield, leaf area and petiole cross section were lower than the standard recommended for oil palm. This study recommends oil palm best management practices and development of appropriate regional specialty fertilizer for the oil palm.

1st African Conference on Precision Agriculture | 8-10 December | 2020
139
Table 1. Oil palm fresh bunch yield, leaf area petiole cross section, percentage fruit types and forms local government.
Local government (state-1)
Bunch weight
(kg) palm-1
at harvest
Bunch weight
(kg) palm-1 year-1
Bunch weight
(tons)ha-
1 year-1
Leaf area (m2)
Petiole cross
section (cm2)
Tenera (%)
Dura (%)
Nigrescens (%)
Virescens (%)
Biase (cross river)
6.77b 53.8a 7.92ab 4.27bc 15.72b 38.50 61.50 84.62 15.38
Akpabuyo (cross river)
8.74a 60.9ab 8.43a 6.98a 23.22a 53.33 46.67 93.33 6.67
Akamkpa (cross river)
2.07b 30.5c 4.18c 5.31ab 19.65ab 33.33 66.67 86.67 13.33
Abak (Akwa Ibom)
5.31b 43.1c 6.10b 5.23ab 17.13b 60.00 40.00 100.00 0
Itu (Akwa Ibom)
5.69b 47.3bc 6.67a 5.48ab 20.05ab 26.67 73.33 100.00 0
Oruk Anam Akwa Ibom
6.57b 54.8ab 7.76ab 5.86ab 21.41ab 6.67 93.33 100.00 0
Ahoada (Rivers)
3.94b 39.0c 5.81bc 6.43b 21.13ab 58.33 41.67 100.00 0
Emohua (Rivers)
8.99a 65.7a 9.55a 6.68ab 25.71a 93.33 6.67 86.67 13.33
Tai (Rivers) 4.65 40.1c 5.16b 3.45c 11.74c 85.71 14.29 85.71 14.29 S:E 1.551 6.92 0.995 0.598 2.489
Table 2. Relationship between bunch weight, petiole cross section and leaf area across local government in the three states.
Bunch weight tons
ha-1 Petiole Cross Section (cm2)
Leaf area (m2)
Bunch weight at harvest (kg)
Bunch weight (kg) palm-1
year-1 Bunch Weight
tonsha-1 Pearson
Correlation 1
N 135 Petiole Cross Section (cm2)
Pearson Correlation 0.627** 1
N 135 135 Leaf area (m2) Pearson
Correlation 0.599** 0.864** 1
N 135 135 135 Bunch weight at harvest (kg)
Pearson Correlation 0.819** 0.503** 0.472** 1
N 135 135 135 135 Bunch weight
(kg) palm-1 year-1
Pearson Correlation 0.928** 0.646** 0.612** 0.841** 1
N 135 135 135 135 135 **Correlation is significant at 0.01 level
1st African Conference on Precision Agriculture | 8-10 December | 2020
140
REFERENCES
Asemota O. 2013. Open forum on agricultural biotechnology (OFAB) in Africa, Nigeria chapter: Modifying the quality of palm oil through biotechnology. 24pp
Bakoume C, Ndiaye O, Okoye MN. 2017. Oil palm development in Africa. The planter 93 (1098): 632-641.
Bassey OI. 2016. Overview of oil palm production in Nigeria, comparative, social and environmental impacts: the case of Ekong Amaku Community in Cross River State, Nigeria. Institute of Social Science, Erasmus University of Rotterdam. 10pp.
Corley RHV, Tinker PB. 2015. The Oil palm. Fifth edition. Black well Science Ltd 9600 Garington Road, Oxford OX4 2DQ,UK. 562 PP
Donough C, Witt C, Fairhurst T. 2010. Yield intensification in oil palm using BMP as a management tool. In: Proceedings of the International Oil Palm Conference, 1–3 June 2010, Yogyakarta, Indonesian Oil Palm Research Institute.
Donough CR, Cock J, Oberthür T,, Indrasuara K, Gatot AR, Dolong T. 2013. Estimating oil content of commercially harvested oil palm fresh fruit bunches—A step towards increasing palm oil yields. Poster Presented at the PIPOC 2013 International Palm Oil Congress and Exhibition, 19–21 November2013, Kuala Lumpur.
Fairhurst TH, Hardter R. 2005. Oil palm. Management for large and sustainable yields. First edition. Oxford graphic printer Pte Ltd. 382 pp
Hartley CWS. 1988. The oil palm (Elaeis guineensis Jacq.). Third edition. Longmans Publisher, London, UK. 112-113.
Murphy DJ. 2014.The future of oil palm as a major global crop: opportunities and challenges. Journal of oil palm research 26 (1): 1-24.
Okomu. 2018. Okomu daily harvest yield data report from harvested fields. Okwuagwu CO, Ataga CD, Okolo EC, Ikuenobe CE, Ugbah MM. 2005. The production of NIFOR
elite tenera hybrid planting material. The NIFOR EWS. A technical report. 21 pp Proshare. 2019. The Nigerian Oil Palm Sector Report. Proshare Ecosystem. Woitiez LS, van Wijk MT, Slingerland M, van Noordwijk M, Giller KE. 2017. Yield gaps in oil
palm: A quantitative review of contributing factors. Europ. J. Agronomy 8: 57–77.

1st African Conference on Precision Agriculture | 8-10 December | 2020
141
#7545 DEVELOPMENT OF CANOPY MAPPING SYSTEM OF ASIAN PEARS (PYRUS PYRIFOLIA NAKA) USING TERRESTRIAL LASER SCANNING
Jaehwan Lee1*, Eiji Morimoto1, Kazuyoshi Nonami1, Ichizen Matumura1, So Sato2, Mana Ikebe2
1United Graduate School of Agricultural Sciences, Tottori University, Japan. 2Faculty of Agriculture, Tottori University, Japan, [email protected]
ABSTRACT
Bud thinning and Pruning in Asian pears (Pyrus pyrifolia Naka) is necessary to ensure the quality and number of fruits but is time-consuming and heavily dependent on work experience and time availability. The objectives of this research were 1) establishing a method for measuring point cloud data of pear trees, 2) to validate the number of fruits prediction based on point cloud data analysis. Point cloud data of pruning of the orchard were measured by using a Terrestrial Laser Scanner (TLS; Topcon GLS-2000). The number of measured point cloud points is 18,682,993. Then, to measure the length of the branches, tree data were extracted from the point cloud data, and the predicted number of fruits was verified based on 8 pears/m of each branch. For example, a tree branch with an area of 24 m² (number of points 31,975) has a total length of 22.9 m, multiplied by 8 to calculate the estimated number of fruits from 3D scanning data. The predicted number of fruits was 183 and the actual number of fruits was 164. That means it has 19 fewer fruits than the theoretical number of fruits. So, the measured number of fruits/m² was an average of 6.8, and the Predicted number of fruits/m² was average at 7.6. The absolute error of the two results was 0.8/m². Keywords: orchard management, Asian pears, point cloud data, remote sensing, fruit yield prediction, bud thinning, pruning
INTRODUCTION
According to the Japanese Census of Agriculture and Forestry in 2015, 74% (i.e. 24,511
people) of farmers in Tottori Prefecture are over 60 years old (Static Agriculture Census, 2015). Recent cultivation trends have decreased the area of Japanese pears due to the aging of producers, lack of labor, and aging of pear trees. This may be due to reduced production, lower prices, reduced employment due to aging, and reduced agricultural land. Japanese pear is more difficult to cultivate than other fruit trees, and intensive farming is necessary (Yamada, 1983). But cultivation techniques take decades to acquire with tacit knowledge, and most of the work relies on the sensory experience of workers (Suenaga, 2009). As a result, orchard data is becoming important for both skilled and unskilled individuals. For example, research on visualization of agricultural records using telemetry and sensors is being conducted on rice crops. Morimoto et al. (2017) developed a smart rice transplanter to measure topsoil depth and soil fertility values. Pruning and buds thinning are the ones that have a large impact on the yield and quality of pear crops. Because, the yields of pear were closely correlated between pear trees biomass parameters such as canopy area and the total length of LAI (Yoshida et al., 2006). So, a study on the characterization of various pruning methods of apple trees for the preparation of pruning manual for beginners was also conducted (Asada, 2006). Bud thinning is the process of identifying of buds which are thought to be an

1st African Conference on Precision Agriculture | 8-10 December | 2020
142
abnormality (twin flowers, etc.) or poor growth, and removing them from the tree. Japanese pears are produced on the basis of 12,000 pears per 10a, and it is said that it is best to have 8 pears per 1m of the branch. The problem, however, is the time-consuming work of walking through the orchard and checking the unusual buds by the workers. The know-how of horticulture of fruit is the accumulation of experience gained from decades of work experience, and the hurdles of technological succession to new farmers. However, the research to prove the correlation such as the quality according to the work has been carried out, but the research on the recording and utilization of the work contents of the expert has not proceeded. Therefore, in this research, Tree data measurement with 3D scanner data was developed. The objectives of this research were to establish methods for collecting orchard point cloud data and analyze tree data.
MATERIALS AND METHODS
Terrestrial Laser Scanner (TLS) uses a tripod-mounted, Light Detection and Ranging
(LiDAR) to create a high-resolution 3D point cloud of objects. LiDAR technology is one option to collect data about the canopy geometry of plants in tree crops and it is a method that can measure large areas such as forests and orchards in a short time (Karp et al., 2017; Liang et al., 2016). In this study, the point cloud data of the orchard was measured using a 3D scanner (Topcon's GLS - 2000) In March 2018. There is a total of four measuring points, and the number of measured point cloud points is 18,682,993 (Fig. 1). The point cloud data is used to record the pruning of the orchard. In this study, was used the point cloud data to measure the length of branches.
Figure 4. Point cloud data of orchard.
Using a tripod, a common measurement method for Asian pear orchard measurements, the data measurement time per measurement point is about 30 minutes. So, to simplify the installation of the TLS, a new type of fixing device Ground-station was made (Fig. 2). The Ground-station was pinned 30 mm below the ground of the measurement point. The Ground-station is divided into a fixed iron plate at the bottom and an upper part, which is the instrument fixture. The upper part can be moved, and the installation height of the 3D TLS is 100 mm from the ground. In March 2018, the instrumentation was started using a Ground-station and the scanning time was 10

1st African Conference on Precision Agriculture | 8-10 December | 2020
143
minutes. Instrument points were all measured before scanning by Topcon's LN - 100. Since the measurement time was fasted by 1/3 than the tripod fix method. As a result, high-density point cloud data could be obtained in a shorter time.
Figure 2. 3D scanner mount method.
RESULTS AND DISCUSSION
The survey methods were obtained from the orchard in August 2018 with the number of fruits for each tree. Also, the point cloud data was obtained in March 2018 after pruning to measure the length of tree branches using the point cloud data. Sample tree data were extracted to verify point cloud data measured in the orchard. It is assumed that 8 fruits are produced per 1m, which is the standard cultivation method of Japanese pears. After measuring the length of tree branches using point cloud data, the optimum number of fruits was calculated and compared with the total number of actual productions. Estimates of the number of fruits analyzed the absolute error between the length of each tree branch and actual the number of fruits. The result was as follows. For example, the total length of tree A branch was 22.9m and the total length was multiplied by 8 to calculate the predicted number of fruits (Fig. 3). As a result, Tree A produced 164 pears in 2018. And, estimates of the pear number of fruits based on the length of the branches were 183 and the area occupied by trees is 24 m². So, the measured number of fruits/m² was average 6.8, and the Predicted number of fruits/m² was average 7.6. The absolute error of the two results was 0.8/m² (Table 1).
(a) Tripod-mounted (b) Ground-station-mounted

1st African Conference on Precision Agriculture | 8-10 December | 2020
144
Figure 3. Length measuring of the branch of sample tree by point cloud data. Table 1. Result of predicted number of fruits. Tree A Tree B Tree C Tree D Area (m²) 24.0 21.0 21.0 15.0 Branch length (m) 22.9 26.9 21.9 21.0 Predicted fruits 183.1 215.3 174.9 157.7 Measured fruits 164.0 218.0 192.0 124.0 Absolute error 19.1 2.7 17.1 33.7 Predicted fruits/m² 7.6 10.3 8.3 10.5 Measured fruits/m² 6.8 10.4 9.1 8.3
*Absolute error: (Predicted fruits - Measured yield)
As a result, the comparison between the number of fruits prediction data and the actual number of fruits was in the range of an average of 20.65. And, the number of fruits per unit area could be estimated through analysis of point cloud data. And, the average of the measured and predicted number of fruits was 8.7 number of fruits /m² and 9.4 number of fruits /m².
A-1
A-2 A-3 A-4
A-5 A-6 A-7
A-8

1st African Conference on Precision Agriculture | 8-10 December | 2020
145
CONCLUSIONS
In this paper, the CMS of Asian pears for estimating the number of fruits during Bud thinning and Pruning operations using point cloud data was proposed. The results of this study can be used to determine the number of fruits during thinning operations conducted from December to April in Asian pear horticulture. We collected 18,682,993 points cloud data containing Asian pear tree shapes using TLS. The experimental results showed a similar number of fruits/m² when compared to different each tree data, but it was confirmed that the measured number of fruits/m² was less than the predicted number of fruits/m². Thus, the predicted number of fruits/m² may not be sufficient for practical application. In actual Pruning, however, the worker does not know the total length of branches that need to be removed, and the total length of branches remaining. The number of fruits by the length of the branch can, thus, only be determined on the basis of worker experience with canopy map. If this information can be mapped, it may be possible to adjust the number of flower buds to the theoretical number at the time for flower thinning in the next season. In the future, the producer can probably make next year’s schedule for pruning and buds thinning by using accumulated data over the years. Therefore, we will conduct research to confirm the relationship between the canopy area and the number of pears to be harvested. From the above results, the proposed CMS proposed a method to efficiently measure parameters necessary for the management and monitoring of orchards.
REFERENCES Asada T. 2006. A study of differentially located apple tree spurs. Bulletin of the Faculty of
Agriculture and Life Science-Hirosaki University (Japan). Karp FHS, et al. 2017. Accuracy assessment of a mobile terrestrial laser scanner for tree
crops. Advances in Animal Biosciences 8(2): 178-182. Liang X, et al. 2016. Terrestrial laser scanning in forest inventories. ISPRS Journal of
Photogrammetry and Remote Sensing 115: 63-77. Morimoto E, Hayashi K. 2017. Design of smart agriculture Japan model. Advances in Animal
Biosciences 8(2): 713-717. Static Agriculture Census, Ministry of Agriculture and Forestry and Fisheries. 2015. Suenaga S. 2009. Agriculture, forestry and fisheries and knowledge management. Agricultural
management research 46(4): 8-16. Yamada. 1983. Technological Change and Farm Development of Pear Production: A Case Study
of Pear Farming in Chiba Prefecture 32: 81-91. Yoshida A, et al. 2006. Effects of various training systems on canopy development, yield and fruit
quality in young filler trees of Japanese pear [Pyrus pyrifolia] Gold Nijisseiki. Horticultural Research (Japan).
1st African Conference on Precision Agriculture | 8-10 December | 2020
146
#7566 EFFECT OF INTERCROPPING SORGHUM WITH COWPEA AND NITROGEN APPLICATION ON GROWTH AND YIELD OF SORGHUM (Sorghum bicolor (L.)
MOENCH)
Peter E. Moi, Onesmus M. Kitonyo, George N. Chemining’wa and Josiah M. Kinama University of Nairobi, Nairobi, Kenya, [email protected]
ABSTRACT
Despite the development of improved varieties, the yield of sorghum has remained significantly low in dryland environments due to low soil fertility and inappropriate cropping practices. However, implementation of precision agriculture (PA) within the context of companion cropping with legumes and fine-tuning the supply of fertilizer nitrogen (N) has the potential to increase sorghum yield in these environments. The objective of this study was to determine the effect of intercropping and fertilizer N rate on growth and yield of selected varieties of sorghum. Results showed that intercropping significantly reduced crop growth rate (CGR) of sorghum by 54% compared with sole crop system. Addition of N increased sorghum CGR by 30% but no differences were detected between 40 and 80 kg N ha-1. Under sole crop system, Gadam out-yielded Serena by 1.3 t ha-1 in Igoji but there were no differences in yield between the two varieties in Katumani which was drier than the former. However, intercropping significantly reduced the grain yield of both sorghum varieties by about 50% irrespective of the cowpea variety. Addition of N increased grain yield by at least 26% in both sites but yield differences between 40 and 80 kg N ha-1 were marginal under both sole crop and intercrop systems. Cropping system × N interaction effects on grain yield were significant in Igoji only, where N increased sorghum grain yield under sole crop system but higher N rates only marginally increased yield under intercrop. Although intercropping reduced sorghum yield, present results show that there is potential to exploit cropping system × N interactions to increase yields, more so in wet environments than in areas with low rainfall. Lack of significant differences in grain yield between the application of 40 and 80 kg N ha-1 suggests that sorghum yield could be maximized at lower N rates. However, further studies are needed to establish the economically optimal N rate in sorghum production.
Keywords: cropping system, crop growth rate, drylands, interactions
INTRODUCTION
The increased demand to enhance food production to feed a rapidly growing population
has progressively worsened primary resources such as soil, water and atmosphere (Mariangela et al., 2012). Precision agriculture has been investigated in previous studies and is considered a win–win solution both for improving crop yields and environmental quality of agriculture (Mariangela et al., 2012). Sorghum (Sorghum bicolor (L.) Moench) is an essential cereal as a food security crop and a raw material for making malt thus, increasing its productivity could end severe food insecurity and increase incomes of smallholder farmers in the dryland environments due to its unique traits of tolerating moisture stress and high yielding ability in a wide range of soils (Mwadalu and Mwangi, 2013). However, despite the development of improved varieties, the yield of sorghum has remained significantly low in dryland environments due to low soil fertility and

1st African Conference on Precision Agriculture | 8-10 December | 2020
147
inappropriate cropping practices (Kilambya and Witwer, 2013). Therefore, implementation of precision agriculture approaches in sorghum production within the context of companion cropping with legumes and variable rate of nitrogen fertilizer application could improve sorghum yields, fertilizer use efficiency and profitability as well as reduce negative environmental consequences (Mariangela et al., 2012).
Cereal-legume intercropping is a sustainable agricultural practice where more than two crops are grown simultaneously on the same land (Sibhatu & Belete, 2015). In comparison with sole crop systems, intercropping improves crop diversification, increases crop yields and stability, especially under low-input conditions, improves soil fertility and conservation, as well as weed control (Oseni, 2010; Layek et al., 2018). Nitrogen (N) is among the most deficient nutrients in many agricultural soils for cereal production on a global basis but is essential in crop growth (Yagoub and Abdelsalam, 2010). The N fertilizer application rates in sorghum production often vary across environments and cropping systems. An earlier study reported that maximum grain yield of sorghum in cereal-legume intercrop system was attained with addition of 41 kg N ha-1 in dry environment (Sibhatu & Belete, 2015). However, Shamme & Raghavaiah (2016) reported that under sole crop system, the highest sorghum grain yield was recorded with the application of 92 kg N ha-1 while the lowest grain yield was recorded with no nitrogen application. Additionally, higher crop yields have been attained by increasing N addition across environments (Dobermann, 2007). While N is limiting in most agriculture soils, it’s a very mobile element in the soil and susceptibility to loses through leaching, denitrification, volatilization and runoff thus, farmers have resorted to excessive application of N fertilizers in the agricultural systems to compensate for these losses (Shamme and Raghavaiah, 2016). This excessive use of N fertilizers often causes environmental pollution, weed problems, sorghum susceptibility to diseases, lodging, delayed maturity thus, precision farming techniques such as appropriate fertilizer placement method at the correct rate and right time when the plant needs the nutrients and variable-rate N fertilizers are required to increase productivity, efficient use of inputs and reduce negative environmental impact (Dobermann, 2007; Mariangela et al., 2012). However, little information exists on the appropriate N rate for sorghum production in a sorghum-legume intercrop system in dry and medium potential environments. Thus, the objective of this study was to determine the effect of intercropping and fertilizer N rate on growth and yield of selected varieties of sorghum.
MATERIALS AND METHODS
Two field experiments were simultaneously conducted under rain-fed conditions at the
Kenya Agricultural and Livestock Research Organization (KALRO) stations in Katumani and Igoji during 2018/2019 short rains. Experiments were laid out in randomized complete block design with split plot arrangement replicated three times. Treatments comprised two cropping systems (intercrop vs. sole crop) with two varieties of sorghum (Gadam and Serena) and two cowpea varieties (M66 and K80), and three rates of fertilizer nitrogen (0, 40 and 80 kg N ha−1). Fertilizer N was supplied from urea (46% N) and side banded on both sorghum and cowpea in fractions of a third at sowing and two-thirds top dressed at tillering stage of sorghum growth. All treatment plots received 60 P kg ha−1 of basal fertilizer in the form of triple super phosphate that was banded on the planting rows of both crops.
Sorghum was sampled for shoot biomass at flowering and physiological maturity and crop growth rate (CGR) (g m-2 day-1), computed between the two stages. Yield components were collected from a net area of 16 m2, and included panicle length, grain yield and weight. Data were

1st African Conference on Precision Agriculture | 8-10 December | 2020
148
subjected to the analysis of variance using GenStat 14th Edition. Treatment means were compared and separated using least significant difference (LSD) test at 5%cprobability level.
RESULTS AND DISCUSSION
Crop growth rate (CGR) did not significantly differ between Gadam and Serena in both
sites but cropping system significantly affected this trait in Igoji (P = 0.002) and Katumani (P = 0.016) (Table 1). In both sites, intercropping significantly reduced sorghum growth rate by 2.4 g m-2 day-1, irrespective of the cowpea variety. Addition of N significantly increased sorghum growth rate only in Igoji (P = 0.002) where application of 80 kg N ha-1 increased overall CGR by 1.6 g m-2 day-1 (30%) compared with control plots but without significant differences between 40 and 80 kg N ha-1. Cropping system × N rate effect CGR was significant in Igoji (P <.001) and Katumani (P = 0.042). Under sole cropping system, sorghum CGR increased with additional N but marginal effects were observed under the intercrop system.
Sorghum grain yield was significantly affected by the cropping system (P <.001) in both sites, N rate in Igoji (P <0.01) and Katumani (P = 0.013) while cropping system × N rate interactions only occurred in Igoji (P <0.01) (Table 1). Under sole crop system, Gadam out-yielded Serena by 1.3 t ha-1 in Igoji but there were no differences in yield between the two varieties in Katumani. However, intercropping significantly reduced the grain yield of both sorghum varieties by about 50%, irrespective of the cowpea variety. Addition of fertilizer increased grain yield by at least 26% in both sites but yield differences between 40 and 80 kg N ha-1 were marginal under both sole crop and intercrop systems. Cropping system × N rate effect on sorghum grain yield in Igoji revealed that while sorghum grain yield increased with the addition of N under sole crop system, higher N rates only marginally increased yield under intercropping system. Intercropping sorghum with either cowpea variety significantly reduced 1000 seed weight. However, the addition of N and its interaction with cropping system did not affect 1000-seed weight in both sites.
The reduction in the grain yield and CGR of intercropped sorghum could be attributed to interspecies competition for resources like soil nutrients, sunlight and water in the intercrop system which affected growth of vegetative and reproductive parts (stems, leaves and panicles) resulting into low biomass production and grain yield (Oseni, 2010; Makoi et al., 2010; Legwaila et al., 2012; Karanja et al., 2014; Sibhatu and Belete, 2015). However, the increase in CGR and grain yield with addition of N could be attributed to the important role of N in increasing growth and development of plant reproductive parts and photosynthetic capacity suggesting that proper rate and time of N application are critical for meeting crop nutrient needs and increases CGR and grain yield (Shamme & Raghavaiah, 2016; Yang et al. (2018). The interaction of cropping system × nitrogen treatments were significant where the highest CGR and mean grain yield was recorded under sole but only marginal increase in intercrop system was observed. This could have been attributed to non-proportional sharing of soil N sources resulting from competition between sorghum and cowpea and limited fixation of N by the cowpea in an intercrop system resulting to low grain yield in an intercrop system as opposed to sole cropping system (Jensen et al., 2020). Therefore, the study findings suggest that Gadam variety was superior to Serena in terms of growth and yield and sole cropping system with addition of N was effective in achieving maximum CGR and grain yield. However, present results also show that there is potential to exploit cropping system × N interactions to increase yields, more so in wet environments than in areas with low rainfall despite grain yield reduction in an intercrop system.

1st African Conference on Precision Agriculture | 8-10 December | 2020
149
CONCLUSIONS
The overall findings suggest that sole cropping system and split application of N fertilizer was effective in increasing sorghum crop growth rate and yield compared with intercropping system and no fertilizer application. Additionally, although intercropping reduced CGR and sorghum grain yield by about 50%, present results show that there is potential to exploit cropping system × N interactions to increase yield, more so in wet environments than in areas with low rainfall. Lack of significant differences in grain yield between the application of 40 and 80 kg N ha-1 suggests that sorghum yield could be maximized at lower N rates, and further studies are needed to establish the economically optimal N rate.
Table 2. Crop growth rate (CGR) and grain yield of two sorghum varieties (Gadam and Serena) grown under sole and intercrop system with two varieties of cowpea (K80 and M66), and at three N rates at KALRO research stations in Igoji and Katumani during 2018/2019 short rain season. Treatments Igoji Katumani
CGR (g m-2 day-1)
Grain yield
(t ha-1)
Seed weight
(g)
CGR (g m-2 day-1)
Grain yield
(t ha-1)
Seed weight (g)
Cropping system (CS) Sole Gadam 5.32ab 3.15a 31.1a 5.86ab 3.09a 33.6a Gadam + K80 5.19ab 1.48bc 30.7a 3.74bc 0.89c 29.1b Gadam + M66 6.17a 1.27bc 30.9a 7.69a 1.43b 32.9a Sole Serena 4.35b 1.82b 27.4b 4.31bc 2.76a 30.1b Serena + K80 4.88ab 1.06bc 26.1b 3.44bc 1.10bc 26.3c Serena + M66 1.97c 0.95c 31.0a 1.94c 1.27bc 30.7b P-value 0.002 <.001 0.002 0.011 <.001 <.001 N rate 0 kg N ha-1 3.67b 1.46b 30.06a 3.60a 1.43b 30.33a 40 kg N ha-1 5.00a 1.57b 29.50a 5.11a 1.96a 30.72a 80 kg N ha-1 5.27a 1.84a 29.06a 4.77a 1.88a 30.28a P-value 0.002 0.015 0.341 0.157 0.013 0.803 P-value CS × N rate
<.001 <.001 0.236 0.042 0.061 0.761
Means within a column followed by the same letters are statistically similar; CS × N is interaction between cropping system (CS) and N rate, ns is not significant.
REFERENCES
Dobermann A. 2007. Nutrient use efficiency – measurement and management. In: Krauss, A., Isherwood, K., Heffer, P. (Eds.), Fertilizer Best Management Practices General Principles, Strategy for Their Adoption and Voluntary Initiatives vs Regulations. International Fertilizer Industry Association, Paris, France, 1–28.
Gomez AA, Gomez KA. 1984. Statistical procedures for agricultural research: second Edition. A Wiley-Interscience Publication, 6, 690.
Karanja SM, Kibe AM, Karogo PN, Mwangi M. 2014. Effects of Intercrop Population Density
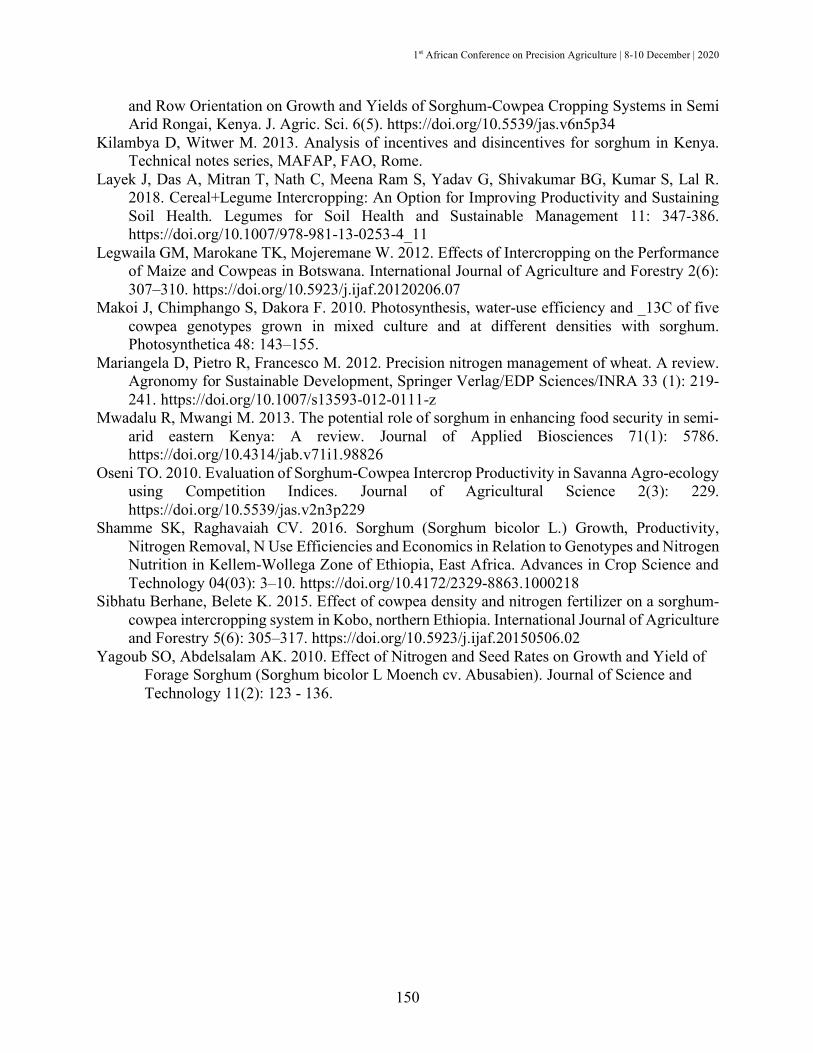
1st African Conference on Precision Agriculture | 8-10 December | 2020
150
and Row Orientation on Growth and Yields of Sorghum-Cowpea Cropping Systems in Semi Arid Rongai, Kenya. J. Agric. Sci. 6(5). https://doi.org/10.5539/jas.v6n5p34
Kilambya D, Witwer M. 2013. Analysis of incentives and disincentives for sorghum in Kenya. Technical notes series, MAFAP, FAO, Rome.
Layek J, Das A, Mitran T, Nath C, Meena Ram S, Yadav G, Shivakumar BG, Kumar S, Lal R. 2018. Cereal+Legume Intercropping: An Option for Improving Productivity and Sustaining Soil Health. Legumes for Soil Health and Sustainable Management 11: 347-386. https://doi.org/10.1007/978-981-13-0253-4_11
Legwaila GM, Marokane TK, Mojeremane W. 2012. Effects of Intercropping on the Performance of Maize and Cowpeas in Botswana. International Journal of Agriculture and Forestry 2(6): 307–310. https://doi.org/10.5923/j.ijaf.20120206.07
Makoi J, Chimphango S, Dakora F. 2010. Photosynthesis, water-use efficiency and _13C of five cowpea genotypes grown in mixed culture and at different densities with sorghum. Photosynthetica 48: 143–155.
Mariangela D, Pietro R, Francesco M. 2012. Precision nitrogen management of wheat. A review. Agronomy for Sustainable Development, Springer Verlag/EDP Sciences/INRA 33 (1): 219-241. https://doi.org/10.1007/s13593-012-0111-z
Mwadalu R, Mwangi M. 2013. The potential role of sorghum in enhancing food security in semi-arid eastern Kenya: A review. Journal of Applied Biosciences 71(1): 5786. https://doi.org/10.4314/jab.v71i1.98826
Oseni TO. 2010. Evaluation of Sorghum-Cowpea Intercrop Productivity in Savanna Agro-ecology using Competition Indices. Journal of Agricultural Science 2(3): 229. https://doi.org/10.5539/jas.v2n3p229
Shamme SK, Raghavaiah CV. 2016. Sorghum (Sorghum bicolor L.) Growth, Productivity, Nitrogen Removal, N Use Efficiencies and Economics in Relation to Genotypes and Nitrogen Nutrition in Kellem-Wollega Zone of Ethiopia, East Africa. Advances in Crop Science and Technology 04(03): 3–10. https://doi.org/10.4172/2329-8863.1000218
Sibhatu Berhane, Belete K. 2015. Effect of cowpea density and nitrogen fertilizer on a sorghum-cowpea intercropping system in Kobo, northern Ethiopia. International Journal of Agriculture and Forestry 5(6): 305–317. https://doi.org/10.5923/j.ijaf.20150506.02
Yagoub SO, Abdelsalam AK. 2010. Effect of Nitrogen and Seed Rates on Growth and Yield of Forage Sorghum (Sorghum bicolor L Moench cv. Abusabien). Journal of Science and Technology 11(2): 123 - 136.

1st African Conference on Precision Agriculture | 8-10 December | 2020
151
#7604 GRAIN YIELD OF TWO PRE-RELEASE RICE VARIETIES INCREASED MARGINALLY WITH HIGHER PLANT DENSITY AND NITROGEN RATE
Wilfred Kioko1*, Onesmus Kitonyo1, George Chemining’wa1, Setegn Gebeyehu2 and Rosemary
Murori2
1Department of Plant Science and Crop Protection, University of Nairobi; 2International Rice Research Institute, [email protected] +254720436843
ABSTRACT
The application of precision agriculture (PA) through the optimization of plant population and management of fertilizer nitrogen (N) can increase yield. Current rice (Oryza sativa) plant population and N management guidelines in Kenya were developed from research conducted about three decades. These management guidelines might still be robust and could be applied to recently released as well as close-to-release varieties. However, the yield potential of new and pipeline varieties might not be maximized under existing sowing density and N rate. A study was conducted to investigate the effect plant population and N rate on two pre-release rice varieties, namely 08FAN10 and CSR36. Field experiments were carried out in Ahero and Mwea rice research stations. Treatments were laid out in a randomized complete block design with split-split plot arrangement where three N rates (0, 75 and 125 kg N/ha) formed the main plots, varieties were assigned to the sub-plots while three plant densities (1, 2 and 3 plants per hill, PPH) were allocated to the sub-sub plots. Nitrogen was applied in the form of urea in two equal splits at 21 and 45 day after transplanting (DAT). Data were collected on crop growth, yield and N traits, and subjected to analysis of variance using GenStat 14th edition. Treatment means were compared and separated the least significant difference at 5% probability level. Variety 08FAN10 out-yielded CSR36 by 47% in Mwea only while the addition of fertilizer nitrogen significantly improved grain yield compared with control but there were no marked yield differences between 75 and 125 kg N/ha. The effects of plant density were marginal with only a 20% increase in grain yield under 3PPH compared with 1PPH in Mwea only but without differences between 2 and 3PPH. Number of productive tillers numbers were significantly affected by N rate and variety but there were no differences between the three plant densities. In addition, grain yield was a function of the number of reproductive tillers (R2 = 0.49) in Ahero only. Both two-way and three-way treatment interactions were not significant for grain yield in both sites.
INTRODUCTION
Since being introduced to Kenya in 1907, rice has become the third most important cereal crop after maize and wheat (IRRI, 2018). Kenya’s annual rice production is estimated at 112,800 metric tons against a consumption demand of 538,000 metric tons (IRRI, 2018). These deficits demonstrate the need to increase rice production in the Country. Current farmers’ yields are estimated on 4.25 t/ha against a yield potential of 7 t/ha (Atera et al., 2018). This large yield gap stems from lack of improved varieties, poor agronomic practices and water shortages as well as high cost of inputs and machinery (Atera et al., 2018)). Current rice agronomic practices were developed about three decades ago despite significant advances in rice breeding both locally and globally. Whilst these practices might be robust with modern varieties, the yield potential of these

1st African Conference on Precision Agriculture | 8-10 December | 2020
152
new and pre-release genotypes might not be maximized. Plant density and N rate are important precision agriculture tools in rice production (Dong et al., 2012). Counce and Wels (1990) reported that at an adequate plant population density with a high level of N, rice crops have shown to produce more tillers, hence a high number of panicles which results to greater grain yield. The objective of this study was to evaluate the effect of fertilizer N rate and plant density on the yield of two pre-release rice varieties in Kenya.
MATERIALS AND METHODS
Field experiments were carried out in Ahero and Mwea irrigation schemes in Kenya. Treatments comprised two pre-release varieties (08 FAN 10 and CSR 36), three plant population densities and three nitrogen rates (0, 75, and 125 kg N/ha). The treatments were laid out in a randomized complete block design with split split plot arrangement and replicated three times in Mwea and four times in Ahero. Seedlings were transplanted after 21 days at a spacing of 20 cm by 20 cm. Fertilizer N was sourced from urea (46% N) and applied in two equal portions at 21 and 45 days after transplanting. One, two and three seedling number per hill were planted to create different plant population densities, designated as 1PPH, 2PPH and 3PPH. Data was collected on crop phenology, crop growth traits and yield components, and subjected to analysis of variance using GenStat 14th edition software at 5% significance level.
RESULTS AND DISCUSSION
Variety 08 FAN 10 out-yielded CSR 36 by 30% in both sites. Addition of fertilizer N significantly increased grain yield of rice in both sites compared with control (Table 1). In Ahero the effect of nitrogen rates on the grain yield was highly significant at p˂0.05. Nitrogen is the most essential macro nutrient for plant growth; hence the increase in its application, leads to increment in yields (Dong et al., 2012). There was significant effect of nitrogen rates to the number of productive tillers in both sites at p˂0.05. Tillering is essential in determining the overall grain yield in rice (Ling, 2000). This can be attributed to the important role nitrogen plays in cell division in plants (Rajput et al., 1988).
Varietal effect on grain yield and the number of productive tillers was significant at p˂0.05 in the both sites. Higher yields were recorded in Ahero as compared to Mwea. This could be due to the fact the temperature conditions for Ahero are relatively higher than Mwea. Ying et al., (1998) reported that rice production is correlated to air temperature and amount of nitrogen applied, where rice grown in hotter places tend to have a faster crop growth rate than the ones grown in cooler ones.
The effect of plant per hill on grain yield was highly significant in Mwea at p˂0.05 but not significant in Ahero. Likewise, the effect of plants per hill on productive tillers number was not significant at p˂0.05 in the two sites. There was a marginal increase in grain yield in the two sites due to the effect of plant per hill although not significant. Nitrogen rate and variety interaction had a significant effect on grain yield at p˂0.05 in Mwea and a highly significant effect in Ahero. Nitrogen and variety interaction was not significant on productive tiller number in the two sites. This can be attributed to the fact that the natural endowments of crop cultivars to optimally utilize available nutrients and subsequently partition its photosynthates for dry matter accumulation do vary (Mani et al., 2018).

1st African Conference on Precision Agriculture | 8-10 December | 2020
153
Nitrogen rate and plant per hill interaction effect was not significant on grain yield and productive tiller number at p˂0.05 as shown in table below. Variety, plant per hill interaction was only significant on the productive tillers in Ahero and not significant on grain yield and productive tillers in Mwea. Nitrogen rate, variety and plants per hill interactions at p˂0.05 were not significant in the two sites as shown in Table 1. The analysis of variance did not show any significant effect on grain yield and productive tillers numbers.
CONCLUSIONS
Results of the present study imply that, irrespective of rice variety, higher N rates increase grain yield but an economically optimal rate requires further investigation. The possibility of modern pre-release varieties to withstand higher seedling densities without compromising on grain yield offers the opportunity to reduce weed competition in rice fields. Further fine tuning of plant population and N rate in modern varieties through the application of PA technologies will contribute to the reduction of rice yield gaps. Table 1. Grain yield and number of productive tillers per m2 of two pre-release rice varieties grown under three N rates and three plant densities in Mwea and Ahero.
Treatment Mwea Ahero Yield (t/ha) Tillers/m2 Yield (t/ha) Tillers/m2
Variety 08 FAN 10 3.92a 11a 7.08a 12a CSR 36 2.12b 11a 6.42b 11b P value ˂0.001 0.015 0.017 0.016 N rate 0 kg N/ha 2.15b 10b 5.82b 11b 75 kg N/ha 3.37a 11a 7.28a 11b 125 kg N/ha 3.54a 11a 7.15a 12a P value 0.015 0.015 ˂0.001 0.019 Plants per hill (PPH) 1 PPH 2.65b 11a 6.69a 12a 2 PPH 3.08a 11a 6.74a 11b 3 PPH 3.33a 11a 6.81a 11b P-value 0.017 0.381 0.942 0.393 Interactions N rate × variety 0.030 0.637 <0.001 0.091 N rate × plants per hill 0.255 0.653 0.859 0.534 Variety × plants per hill 0.794 0.491 0.865 0.031 N rate × variety × plants per hill 0.878 0.680 0.665 0.325
Means followed by the same letter are not significantly different

1st African Conference on Precision Agriculture | 8-10 December | 2020
154
REFERENCES
Artacho P, Bonomeli C, Meza F. 2009. Nitrogen application in irrigated rice grown in Mediterranean conditions. Effects on grain yield, dry matter production, nitrogen uptake and nitrogen use efficiency. J. Plant Nutr. 32: 1574-1593.
Counce PA, Wells BR. 1990. Rice plant population density effect on early-season nitrogen requirement. J. Prod. Agric. 3(3).
Evan AA, Onyancha FN, Majiwa EBO. 2018. Production and marketing of rice in Kenya: Challenges and opportunities. J. Dev. Agric, Econ. 10(3): 64-70.
Fageria NK, Moreira A, Coelha AM. 2011. Yield and yield components of upland rice as influenced by nitrogen sources. J. Plant Nutr. 34(3): 361-370.
Hezhong D, Li W, Egrinya Eneji A, Zhang D. 2012. Nitrogen rate and Plant density effects on yield and late-season leaf senescence of cotton raised on a saline field. Field Crops Res. 126: 137-144.
IRRI. 2018. Intensifying agricultural productivity through research and development. Jifeng Y, Shaobing P, Qingrui H, Hong Y, Chongdang Y, Visperas RM, Cassman, KG. 1998.
Comparison of high-yield rice in tropical and subtropical environments. Field Crops Res. 55: 71-84.
Ling QH. 2000. Crop population quality. Shanghai Scientific and Technical Publishers, Shanghai, China. pp. 32-36.
Mani H, Muhammad A, Mahmoud BA, Jari S, Usman A. 2018. Response of rice varieties to nitrogen fertilization under irrigation at Talata Mafara, Sudan Savanna. JFNA 1(1): 17-20.
Rajput, MMK, Ansari AH, Mehdi S, Hussain AM. 1988. Effect of N and P fertilizers alone and in combanition with organic matter on the growth and yield of Toria Sarhad. J. Agric. Res. 4: 3-6.

1st African Conference on Precision Agriculture | 8-10 December | 2020
155
#7667 MAPPING OF MICRONUTRIENTS STATUS IN SOILS UNDER MULTIVARIETAL CITRUS SINENSIS PRODUCTION FOR PRECISION
AGRICULTURE
1*Bernard N. Okafor, 2Vincent Aduramigba-Modupe and 2Olubunmi Denton 1National Horticultural Research Institute (NIHORT), Idi-Ishin, Ibadan, Nigeria, 2Institute of Agricultural Research &Training, Obafemi Awolowo University, Moor Plantation, Ibadan,
Nigeria, [email protected]
ABSTRACT
Citrus production in Nigeria is below the world average; and this is caused by poor soil management among other things. The situation is further acerbated by blanket fertiliser application and low application of precision in soil fertility management. A study was carried out on a 34-year-old multi varietal citrus orchard under sweet orange (Citrus sinensis) to determine the current soil fertility status and variability of micronutrients. Soil samples were collected at a sampling depth of 0-15cm to determine soil micronutrient level. The sampling were done at 7x7m interval using a hand-held GPS while spatial analysis was done using ArcGIS software. The results showed that mean value of Mn, Fe, Cu and Zn were as follows: Mn 330.08±88.84; Fe 115.7±30.74; Cu 3.14±0.72 and Zn 8.81±3.65 mg/kg, with a kurtosis of 0.44, -0.53, -0.098 and 0.94 and skewness of 0.28, 0.43, -0.31 and -0.06 for Mn, Fe, Cu and Zn respectively. Due to the micronutrient variability of the orchard soils, it is important to use precision agriculture for management in order to improve yield and soil quality.
Keywords: mapping, micronutrients, citrus, variability, soil fertility
INTRODUCTION
Attainment of sufficiency in citrus production in Nigeria remains a challenge. This is due to limiting factors such as low availability of quality rootstock material, climate change, low agricultural input, lack of precision / poor use of fertiliser, high post-harvest losses and low value addition. Of importance in increasing citrus yield in Nigeria is the need for intensive soil fertility management as most farms in Nigeria are low in fertility due to low application/ precision in use of fertiliser and blanket fertiliser application. Nigeria currently has a fertiliser index rate of 5.5kg/ha of arable land (Worldbank, 2020). This has grossly affected soil and plant nutrient needs leading to micronutrient deficiency and crop failure in many cases. Consequently, there is need for improved micronutrient fertility in Nigerian agriculture. Micronutrients are essential in crop growth and are usually required in little quantity. Raja (2009) observed that the role of micronutrient in crop production include improved crop quality, increase in yield, improved disease resistance and prevention of physiological disorder. Beyond the supply of micronutrients, soil organic matter needs to be given serious attention as there is a strong correlation between organic matter and most crop properties (Ogunkunle and Awotoye, 2011).
Precision in agricultural practice has improved its productivity significantly (Yousefi and Radzari (2014). Continuous cultivation and low application of fertiliser has led to soil fertility decline (Ogunjimi et al., 2017). Due to the inherent variability of soil properties as a result of land

1st African Conference on Precision Agriculture | 8-10 December | 2020
156
use (Borusiewicz, 2016) and climatic change (Pareek, 2017), it is important to use precise management to ensure soil conservation and improve its quality. Precision agriculture has been a viable tool for soil variability management (Zude-Sasse et al., 2016) as it helps to reduce low and poor utilization of farm input due to variation in factor of agricultural production. Shaato et al., (2005) observed that studies on micronutrient in Nigerian soil are limited. Therefore, this study was carried out to map micronutrient status of a citrus orchard in order to enhance precision in its fertility management.
MATERIALS AND METHODS
Soil samples were collected from multi-varietal citrus collection block at National
Horticultural Research Institute (NIHORT), Ibadan. It consists of 12 sweet orange varieties planted at a spacing of 7m x 7m. The varieties include Bende, Meran, Umudike, Agege, Pineapple and Parson Brown among others. Soil samples were taken from 0 - 15 cm depth using a soil auger. The samples were analyzed for micronutrients using standard laboratory procedures. Data were subjected to descriptive statistics while spatial analysis was carried out using GIS software package.
RESULTS AND DISCUSSION
Table 1 shows the descriptive statistics of the micronutrient concentration of the study area.
Micronutrients play a vital role in citrus productivity. As shown in Table 1, the mean values of Mn, Fe and Zn are adequate for citrus production while mean concentration of Cu was indicative of low nutrient concentration for citrus production as recommended by (Chen et al., 2007). Improved fertility management of soil micronutrient is important because of its effect on crop quality and productivity (Patil et al., 2018). Coefficient of variation (CV) is an indicator of the level of variability of soil properties. Wilding and Dress (1983), characterized CV values as follows; 0-15 (low variability), 15-35 (moderate variability) and >35 (high variability). From the foregoing, (Mn, Fe and Cu) were moderately variable while Cu was highly variable. Consequently, Cu fertility management should be more precise and site specific. Application of fertiliser without recourse to site specific needs of the soil/crop leads to wastage of resource and poor crop yield (schellberg et al., 2008). Precision agriculture helps to restrict resource use to particular area, improve yield and farm efficiency; thereby reducing wastage (Chan, 2006). Mapping aids visibility and presentation of soil properties to enhance farm and soil management. The micronutrient maps of the citrus orchard are presented in Figures 1-2
Table 1. Descriptive statistics of the orchard. Micronutrient Mean CV Kurtosis Skewness Mn 330.08±88.84 29.91 0.44 0.28 Fe 115.7±30.74 26.56 -0.53 0.43 Cu 3.14±0.72 22.85 -0.01 -0.31 Zn 8.81±3.65 36.83 0.94 -0.06
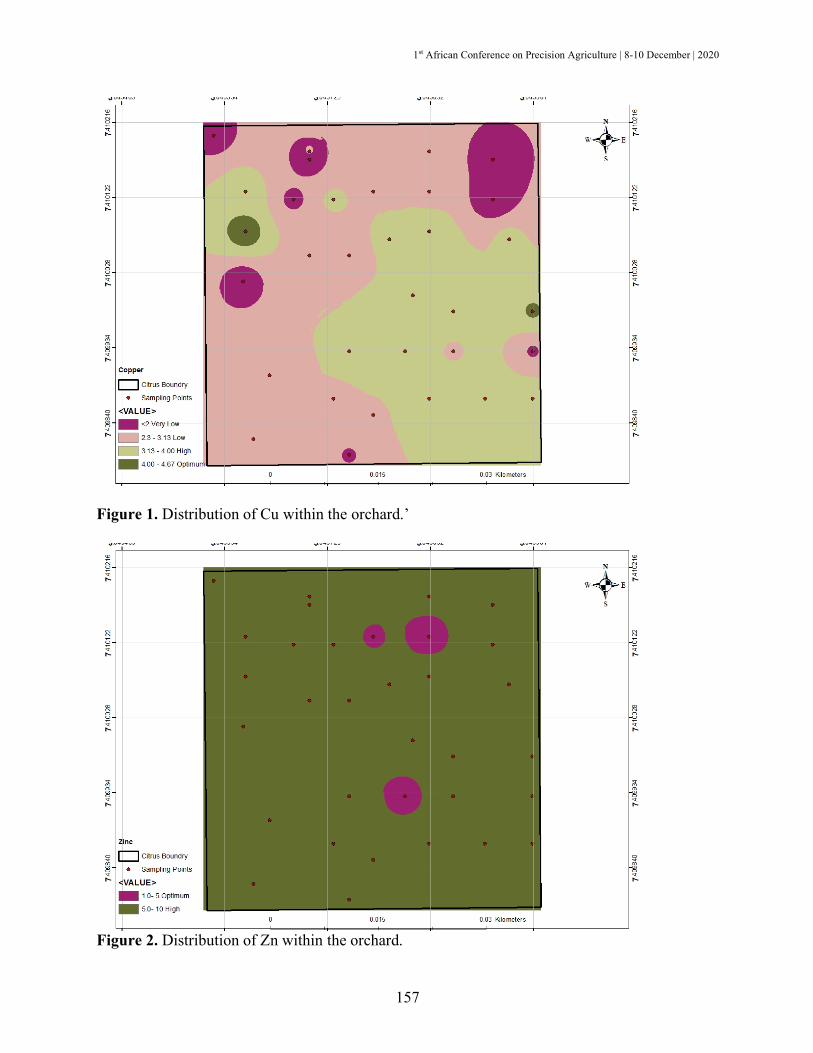
1st African Conference on Precision Agriculture | 8-10 December | 2020
157
Figure 1. Distribution of Cu within the orchard.’
Figure 2. Distribution of Zn within the orchard.

1st African Conference on Precision Agriculture | 8-10 December | 2020
158
Mean value of Cu (3.14 mg/kg) across the orchard indicated low nutrient status but the map (Fig 1) showed particular areas of deficiency. Precision and site-specific management are required to improve Cu concentration of the orchard, enhance yield, improve soil quality and reduce wastage of fertiliser. Blanket fertiliser application should be avoided.
REFERENCES
Borusiewicz A, Kapela K, Drożyner P, and Marczuk T. 2016. Application of Precision Agriculture
Technology in Podlaskie Voivodeship. Agricultural Engineering 20: 5-11. Chan CW. 2006. Application of precision agriculture technologies in the tropical greenhouse
environment. Acta Horti. 710: 479-484D. OI:10.17660/ActaHortic. 2006.710.59 DOI: 10.17660/ActaHortic.2006.710.59.
Chen F, Lu JW, Liu D. 2007. Investigation of soil fertility in citrus orchards of Southern China. Better Crops 91 3: 24 -27.
Ogunkunle CO, Awotoye O. 2011. Soil Fertility Status under Different Tree Cropping System in a Southwestern Zone of Nigeria. Notulae Scientia Biologicae 3(2): 123-128 DOI: 10.15835/nsb.3.2.6050
Pareek N. 2017. Climate change impact on soils: adaptation and mitigation. MOJ Eco Environ Sci ;2(3):136-139. DOI: 10.15406/mojes.2017.02.00026
Patil KD, More SS, Wahane MR, Puranik UY, Khobragade NH. 2018. Micronutrient importance in high tech horticulture. Journal of Pharamcognosy and photochemistry 7(3): 628-635.
Raja MD. 2009. Importance of micronutrient in the changing horticultural scenario in India. Journal of Horticultural science 4(1): 1-27.
Schellberg J, Hill MJ, Gerhards R, Rothmund M, Braun M. 2008. Precision agriculture on grassland: Applications, perspectives and constraints. European Journal of Agronomy 29(2-3): 59-71
Shaato R, Ajayi SO, Ojanuga AG. 2005. Total and extractable copper, iron, manganese and zinc in major agricultural soils in the Lower Benue Valley, Central Nigeria and the concept of extractant efficiency. Nigerian Journal of Chemical Research 59 – 68.
Wilding LP, Dress LR. 1983. Spatial variability and pedology. In: Wilding LP, Smeek NE and Hall GF. Eds. Pedogenesis and soil taxonomy. Pudoc wageningen.
Yousefi1 MR, Razdari AM. 2016. Application of GIS and GPS in Precision Agriculture (A Review). International journal of Advanced Biological and Biomedical Research 4(2): 473-476.
Zude-Sasse M, Fountas S, Gemtos TA, Abu-Khalaf N. 2016. Applications of precision agriculture in horticultural crops. Eur. J. Hortic. Sci. 81(2): 78–90 DOI: 10.17660/eJHS.2016/81.2.2
1st African Conference on Precision Agriculture | 8-10 December | 2020
159
#7933 CARACTERISATION ARCHITECTURALE POUR LA PREDICTION DU POTENTIEL DE PRODUCTION DES TETES DE CLONES DE COFFEA
CAENOPHORA PIERRE EX A. FROEHNER. 1Kouassi Kouadio Henri, 1Yao N’guessan Abraham, 3Kouassi Roland Herve, 1Angama Djedoux
Maxime et 2Legnate 1Université Jean Lorougnon guédé (Daloa, Côte d’Ivoire), 2Centre national de recherche
agronomique (CNRA, Divo, Côte d’Ivoire), 3Ecole normale de l’Enseignement Supérieur (ENS, Abidjan, Côte d’Ivoire), [email protected]
RESUME
Le café demeure jusqu’à ce jour une culture très importante dans le monde et particulièrement en Côte d’Ivoire. Cette culture est avec les changements climatiques confrontée à de nombreux facteurs qui limitent sa production. Parmi ces facteurs les plus problématiques sont : la baisse de la fertilité des sols, les insectes et les performances agronomiques de l’espèce et/ou de la variété cultivée. C’est dans un tel contexte qu’une étude des paramètres de croissance a été réalisée chez 35 variétés de caféier de l’espèce Coffea canephora, dont 11 clones et 24 descendances hybrides. L’objectif est de prédire le potentiel de production des variétés étudiées en vu d’opérer une sélection plus rigoureuse des variétés à cultiver. Cette étude était basée sur la modélisation de l’architecture des variétés étudiées à partir du logiciel Grenlab qui est parmi les plus récents conçu à cet effet. Les résultats ont montré que toutes les variétés ont des probabilités de développement du tronc et des branches supérieures à 0,82, et celles des ramifications supérieures à 0,70. Les rapports de rythme sont inférieurs à 1 (W < 1) pour 14 d’entre elles. Pour 17 autres variétés de caféier de petite taille, ces rapports sont supérieurs ou égaux à 1. Ce dernier groupe est plus facile d’accès aux producteurs au cours de la récolte. Par ailleurs, la production serait négativement influencée par l’élongation compétitive des branches. Les variétés les plus compétitives sont celles les branches plagiotropes sont de forme retombante ; cela grâce à leur meilleure adaptation.
Mot clés: architecture, paramètre de croissance, prédiction, production, Coffea canephora, Côte d’Ivoire
INTRODUCTION
Le café est le produit le plus commercialisé après le pétrole (ICO, 2015). La culture du café
représente un enjeu économique majeur pour les 70 pays producteurs de toute la zone intertropicale humide (ICO, 2015). Deux espèces de caféiers sont cultivées à l'échelle industrielle (Coffea arabica L, et Coffea canephora Pierre (Robusta). L'arabica est cultivé en altitude (1600 à 2100 m), à de basses températures. C'est le café le plus apprécié par les consommateurs à cause de son arôme et son goût agréable. Il représente 70% de l’offre mondiale du café (Montagnon et al., 1992). Cependant, cette espèce est sensible aux maladies. C canephora, l’autre espèce, est renommée pour sa robustesse agronomique, d’où son nom commun de Robusta. Il est cultivé principalement dans les zones tropicales humides de basse altitude et représente 30% de la production mondiale de café. En Côte d’Ivoire, la culture du café robusta concerne près de 500 000 planteurs et leurs
1st African Conference on Precision Agriculture | 8-10 December | 2020
160
familles, et participe à la création de nombreux emplois dans les secteurs secondaires et tertiaires de l’économie. Quelque soit le mode de culture de l’arbre (graines ou bouturage), le rendement augmente dans les 3 à 4 années suivant la plantation, puis se stabilise et commence généralement à diminuer avec de l’âge de l’arbre. La baisse de fertilité des sols sous caféières, le faible rendement et le vieillissement des vergers, etc. constituent les principales contraintes de la production du café en Côte d’Ivoire. Face à celles-ci, un programme de sélection de variétés améliorées a été initié depuis 1960 pour l'amélioration de l'espèce C. canephora. Les principaux critères retenus sont la vigueur et l'architecture (Leroy, 1993), la productivité (Montagnon & al., 2012), la résistance aux aléas climatiques, la synchronisation de la maturité des fruits, etc. La modélisation de la caféiculture est de plus en plus utilisée par les agronomes pour prédire les récoltes en fonction des conditions environnementales, du point de vue quantitatif et d'optimiser les itinéraires culturaux (De reffye, 2009). Divers modèles agronomiques et écophysiologiques ont été développés : le modèle LIGNUM (Gawain, 2009) et récemment, le modèle GreenLab (Qi et al, 2010). Ce dernier modèle cumulant architecture et croissance végétative, apparaissant comme le plus avancé de tous a été utilisé dans le cadre du présent travail dont l’objectif est de modéliser des architectures de caféiers afin d’identifier celles qui prédisent le mieux le rendement chez de nouvelles variétés en cours de sélection. Spécifiquement, les activités consistaient à établir une corrélation entre les paramètres de l’architecture des variétés et leur potentiel réel de production et à identifier les paramètres architecturaux prédisant le mieux le potentiel de production.
MATERIEL ET METHODES
Zonze de l’étude
Les travaux présentés dans ce mémoire ont été réalisés sur une parcelle expérimentale de la station CNRA de Divo (Fig. 1). Cette station est située entre (5°46’04.07N, 5° 13’22.09W), à 17 km de la ville de Divo (route de Guitry) et à 200 km du nord-ouest d’Abidjan. Elle est dans une zone de climat tropical humide à quatre saisons. Deux saisons des pluies dont une grande (Avril-Juillet) et une petite (Octobre-Novembre), puis deux saisons sèches dont une grande (Décembre-Mars) et une petite (Aout-Septembre). Elle a une pluviométrie moyenne de 1223 mm/an. Les températures oscillent entre 21 °C et 35 °C en moyenne par an. L’hygrométrie est relativement élevée avec un taux d’humidité qui dépasse parfois 80 %. Les sols sont ferralitiques (Kassin et al., 2018). Cette région contribue significativement à la production de café et de cacao en Côte d’Ivoire.
Métode
L’étude partait sur 35 variétés de C.canephora en cours de sélection, dont 11 clones et 24 descendances hybrides. Les plants analysés sont tous âgés de 3 ans, depuis la date de leur dernier recépage en décembre 2017. L’expérience a été mise en place en utilisant des pancartes pour marquer les arbres sélectionnés, d’une balance de précision électronique (SARTORIUS) pour peser les récoltes, de sachets en plastique pour la récolte des cerises mûres. Toutes les mesures ont été réalisées sur une parcelle portant le numéro A18-2003. Le nombre total d’arbres analysés est de 347, à raison de 7 à 10 arbres choisis au hasard par variété, suivant leur taux de survie dans l’essai. L’analyse des cimes a été réalisée pour chaque arbre individuel, et sa production en cerises fraiches récoltées et pesées au laboratoire. Toutes les données collectées ont constitué en une base de données pour les analyses. L’analyse des cimes a consisté au comptage du nombre de phytomères sur chaque axe, de l’apex à la base (tige principale (A1), rameaux plagiotropes sur
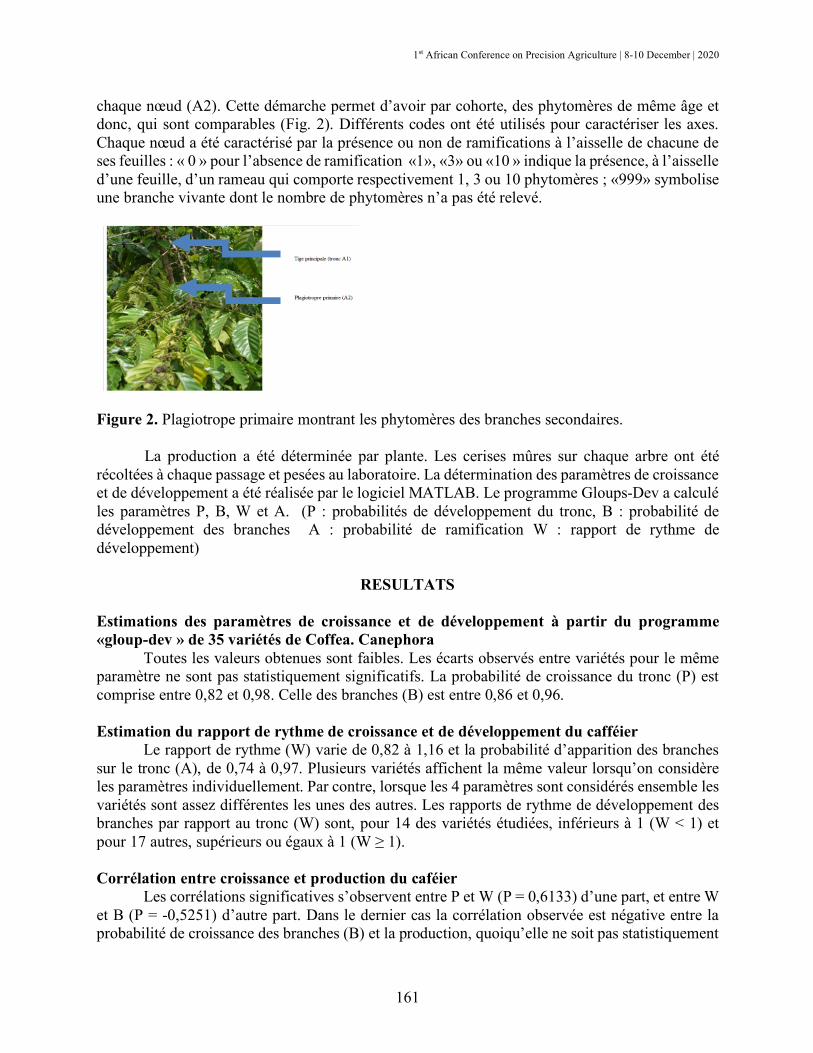
1st African Conference on Precision Agriculture | 8-10 December | 2020
161
chaque nœud (A2). Cette démarche permet d’avoir par cohorte, des phytomères de même âge et donc, qui sont comparables (Fig. 2). Différents codes ont été utilisés pour caractériser les axes. Chaque nœud a été caractérisé par la présence ou non de ramifications à l’aisselle de chacune de ses feuilles : « 0 » pour l’absence de ramification «1», «3» ou «10 » indique la présence, à l’aisselle d’une feuille, d’un rameau qui comporte respectivement 1, 3 ou 10 phytomères ; «999» symbolise une branche vivante dont le nombre de phytomères n’a pas été relevé.
Figure 2. Plagiotrope primaire montrant les phytomères des branches secondaires.
La production a été déterminée par plante. Les cerises mûres sur chaque arbre ont été récoltées à chaque passage et pesées au laboratoire. La détermination des paramètres de croissance et de développement a été réalisée par le logiciel MATLAB. Le programme Gloups-Dev a calculé les paramètres P, B, W et A. (P : probabilités de développement du tronc, B : probabilité de développement des branches A : probabilité de ramification W : rapport de rythme de développement)
RESULTATS
Estimations des paramètres de croissance et de développement à partir du programme «gloup-dev » de 35 variétés de Coffea. Canephora
Toutes les valeurs obtenues sont faibles. Les écarts observés entre variétés pour le même paramètre ne sont pas statistiquement significatifs. La probabilité de croissance du tronc (P) est comprise entre 0,82 et 0,98. Celle des branches (B) est entre 0,86 et 0,96.
Estimation du rapport de rythme de croissance et de développement du cafféier
Le rapport de rythme (W) varie de 0,82 à 1,16 et la probabilité d’apparition des branches sur le tronc (A), de 0,74 à 0,97. Plusieurs variétés affichent la même valeur lorsqu’on considère les paramètres individuellement. Par contre, lorsque les 4 paramètres sont considérés ensemble les variétés sont assez différentes les unes des autres. Les rapports de rythme de développement des branches par rapport au tronc (W) sont, pour 14 des variétés étudiées, inférieurs à 1 (W < 1) et pour 17 autres, supérieurs ou égaux à 1 (W ≥ 1).
Corrélation entre croissance et production du caféier
Les corrélations significatives s’observent entre P et W (P = 0,6133) d’une part, et entre W et B (P = -0,5251) d’autre part. Dans le dernier cas la corrélation observée est négative entre la probabilité de croissance des branches (B) et la production, quoiqu’elle ne soit pas statistiquement
1st African Conference on Precision Agriculture | 8-10 December | 2020
162
significative. Aucune différence n’a été observée entre les paramètres de croissance et de production suivant les générations de sélection. Par contre, une légère augmentation de productivité des premières aux dernières générations de sélection, a été observée autant pour les hybrides que pour les clones.
DISCUSSION
Les paramètres de développement des axes des 35 variétés de caféiers ont montré des
probabilités de développement du tronc (P) et des branches (B) élevées, supérieures à 80 %. Ces données indiquent le faible taux d’échec dans l’émission des phytomères. Comme l’a montré Mathieu (2006). Celui-ci a mentionné que chez les arbres tropicaux à développement continu, la plupart des cycles de développement aboutissent à l’émission de phytomères à partir de tous les méristèmes. Les caféiers, comme beaucoup d’autres espèces tropicales, sont caractérisés par un développement continu. La ramification, tout comme le nombre de phytomères des branches, sont des critères de sélection importants. Les caféiers avec des branches qui font moins de pause sont les idéotypes les plus recherchés par la sélection. Les rapports de rythme de développement des branches par rapport au tronc (W) inférieurs à 1 (W < 1) pour 14 des variétés étudiées, et supérieurs ou égaux à 1 (W ≥ 1) pour 17 autres, montre que le tronc des 14 premières variétés ont une croissance plus rapide que les branches et sont des caféier de grande taille. Les 17 variétés pour lesquelles W est supérieur ou égal à 1 représentent des caféiers de petite taille qui offre aux producteurs l’avantage d’accès facile aux branches pendant la récolte du café. Les valeurs de l’intensité de ramification (A) obtenues dans cette étude sont toutes supérieures à 0,7. Ces valeurs sont très élevées par rapport aux valeurs trouvées par Ouattara (2013) sur la même espèce (A< 0,5). Ces écarts pourraient s’expliquer par la différence d’âge des caféiers, et les conditions climatiques dans lesquelles les travaux se sont déroulés. Les valeurs observées sur de jeunes individus seraient, selon Andrianasolo, (2012) influencées par « l’effet de base », les conditions de l’environnement, les effets maternels. Les caféiers étudiés ici étant plus âgés, les valeurs obtenues seraient donc, caractéristiques de chacune des variétés étudiées. La valeur maximale (0,97) est obtenue avec le clone 588, l’un des plus ramifiés qui soient actuellement connus. La valeur la plus faible (0,74) est obtenue avec l’hybride 900 de seconde génération. Les valeurs les plus élevées sont celles relevées sur des caféiers dont les méristèmes axillaires sont toujours fonctionnels pour générer une ramification (Hallé, 1978). L’idéal de la sélection architecturale du caféier serait de rechercher les variétés ou les arbres qui ramifient le plus. La présente étude a montré deux corrélations très significatives, entre P et W d’une part (positive) et entre B et W d’autre part (négative). L’estimation de telles corrélations entre paramètres de croissance à partir des résultats de Ouattara (2013), Okoma (2019) confirme la forte liaison entre P et W mais également, entre P et B. Par ailleurs, aucun paramètre architectural ne montre de liaison significative avec la production (Y). La valeur la plus élevée s’observe avec P, le paramètre de croissance du tronc. En effet, quoique ce soient uniquement les branches qui portent les fruits chez cette espèce, leur mise en place a lieu à chaque nœud de la tige principale, celui-ci dépendant du fonctionnement du méristème apical. Le contraire du comportement du 528 s’observe avec la variété 126, connue pour la rigidité de son bois et de ses plagiotropes. Grande victime de cette forte compétition avec ses proches voisins, cette variété affiche l’une des productions les plus faibles de la parcelle d’essai.

1st African Conference on Precision Agriculture | 8-10 December | 2020
163
CONCLUSION
Les écarts observés entre variétés pour chacun des paramètres estimés sont très faibles et non significatifs statistiquement. L’étude a permit d’identifier 17 variétés de petite taille, avec des plagiotropes plus longues. Cette architecture présente des branches plus faciles d’accès pendant la récolte du café. Les paramètres de croissance et de production ne sont pas corrélés mais les valeurs obtenues montrent que la probabilité d’élongation du tronc est plus fortement liée à la production. Cependant, la compétions générée par l’élongation des branches au cours de la croissance influence négativement la production des caféiers. Dans cette compétition, les variétés qui ont des plagiotropes de forme retombante présentent les meilleures adaptations et ont une production plus élevée. Par ailleurs il est possible par GreenLab à partir des paramètres de croissance caractéristiques de l’espèce C. canephora de faire des simulations de densités de plantation les mieux adaptées aux nouvelles variétés sélectionnées de caféiers. Une telle stratégie permettrait, non seulement un gain considérable de temps en matière de mise au point de techniques culturales du caféier, mais également une économie substantielle de moyens.
REFERENCES
Andrianasolo DN. 2012. Génétique des populations et modèles d’architecture et de production végétale. Application à la préservation des ressources génétiques des Mascarocoffea. Thèse de Doctorat, Département de Biologie des Organismes, Université de Montpellier II (Montpellier, France), 208 p.
De Reffye P. 2009. Modélisation en biologie végétale. Production végétale et architecture des plantes. Académie d'Agriculture de France - 2009. Séance du 28 janvier,
Gawain J. 2009. Modélisation d’image agronomique application à la reconnaissance d’adventices par un pulvérisateur localisé 54: 102-180.
Hallé F, Oldeman RAA, Tomlinson PB. 1978. Eds. Tropical trees and forests :an architectural analysis. Berlin : Springer-Verlag, 441pp.
ICO 2015. International Coffee Organization. Trade Statistics, http://www.ico.org/trade_ statistics. asp. consulté le 23/02/2016.
IRD 2010. A new history of coffee. Scientific bulletin no 347; April 2010. Kassin KE, Kouame B, Coulibaly K, Tahi GM, N’guessan WP, Aka AR, Assi ME, Guiraud BH,
Kone B, Yao GF. 2018. Prospects for sustainable cocoa farming from the rainfall balance in the last thirty years at Lôh-Djiboua and Gôh post-pioneer regions, Côte d’Ivoire. Journal of Soil Science and Environmental Management 9(11): 188-198.
Leroy T. 1993. Diversité, paramètres génétiques et amélioration par sélection récurrente réciproque du caféier Coffeacanephora Pierre, Thèse de doctorat, Ecole Nationale agronomie de Renne, 147 p.
Montagnon C, Cubry P, Leroy T. 2012. Amélioration génétique du caféier Coffeacanephora Pierre connaissances acquises, stratégies et perspectives. Cahier Agriculture, 21(2): 143-153.
Montagnon C, Leroy T, and Yapo A. 1992. Diversité génotypique et phénotypique de quelques groupes de caféiers (Coffeacanephora) en collection, Conséquences leur utilisation en sélection, Café, Cacao, Thé, 36(3): 187–198.
Okoma P. 2019. Modélisation et identification de QTL de l’architecture et de la production de biomasse chez six espèces de caféiers Africain, Thèse de doctorat, Université Jean Lorougnon Guede de Daloa (Cote D’Ivoire).

1st African Conference on Precision Agriculture | 8-10 December | 2020
164
Ouattara Y. 2013. Étude des paramètres de croissance, d’architecture et de l’ajustement de la biomasse chez cinq espèces de caféiers (coffeasp). Mémoire pour l’obtention du diplôme de master en sciences agronomiques, spécialité : protection des végétaux et de l’environnement, 67 p.
Qi R, Ma Y, Hu B, De Reffye P, Cournède PH. 2010. Optimization of source-sinkdynamics in plant growth for ideotypebreeding a case study on maize. Computers and Electronics in Agriculture 71: 96-105.

1st African Conference on Precision Agriculture | 8-10 December | 2020
165
PRECISION AGRICULTURE FOR SMALLHOLDERS

1st African Conference on Precision Agriculture | 8-10 December | 2020
166
#7414 DIGITAL PLATFORMS FOR BOOSTING FARMER KNOWLEDGE: TWO CASE STUDIES IN KENYA AND UGANDA
T. Harigaya, J. Zhu, M. Mwanje, E. Bakirdjian, and J. Abuli
Precision Agriculture for Development, Nairobi, Kenya [email protected]
ABSTRACT
The aim of this paper is to share rich insights on issues, and to identify knowledge gaps present on farms in two contexts in East Africa. This paper describes the experience of Precision Agriculture for Development (PAD), an international NGO, in developing and implementing digital advisory platforms for smallholder farmers in Kenya and Uganda. In Kenya, PAD has developed and deployed MoA-INFO, a large-scale SMS platform, on behalf of the Ministry of Agriculture, Livestock, and Fisheries. MoA-INFO provides free agronomic recommendations to more than 460,000 Kenyan smallholder farmers. The two-way SMS platform allows for the collection of data from farmers which, in turn, informs the customization of agronomic advice provided to farmers. In Uganda, PAD has developed an IVR (Interactive Voice Response) service to provide free agronomic advice to coffee farmers in Western Uganda. The service consists of a combination of push calls (pre-recorded audio messages) sent to farmers and an automated call center which allows farmers to record questions and receive answers from an agronomist for free and in their local language.
INTRODUCTION
Approximately 80% of African farms, equivalent to 33 million farms, are two hectares or less in size. Many smallholder farmers do not have access to the resources and information they need to improve productivity and yields on their farms. Lack of knowledge of Good Agronomic Practices (GAPs) means that many farmers fail to realize their full yield potential. Moreover, extension workers, who are responsible for disseminating GAPs to farmers, are spread too thin to be effective. For example, as of March of 2019, there was one extension worker for every 1,800 coffee farmers in Uganda. This paper describes the experience of Precision Agriculture for Development (PAD), an international NGO, in developing and implementing two digital advisory platforms for smallholder farmers in Kenya and Uganda.
Precision Agriculture for Development (PAD) works with partners to develop, pilot, test, and scale mobile phone-based solutions that deliver appropriate information to smallholder farmers, with the goal of increasing agricultural productivity, farmer incomes, and environmental sustainability. Three core principles inform our approach: 1) the application of insights from behavioral economics and user-centered design to create appropriate and actionable agricultural messages, 2) an iterative and interactive process of innovating, testing, and refining through A/B trials and rigorous impact evaluations, and 3) operating at scale. In our model, scaling, innovating, and learning work together.
In 2018, PAD worked with the Kenyan Ministry of Agriculture, Livestock, and Fisheries (MoALF) to launch an advisory service (MoA-INFO) to provide farmers with free SMS advisory messages, delivered in English and Swahili, throughout the growing seasons. This service was
1st African Conference on Precision Agriculture | 8-10 December | 2020
167
initially launched to address the Fall Armyworm crisis sweeping the African continent, but has since been expanded to incorporate content across 10 value chains on GAPs from pre-planting to post-harvest. In addition, the service provides decision support tools to assist farmers to make informed decisions about which maize and bean seeds to plant, which fertilisers to apply, and whether pesticides are appropriate based on the scale of pest infestation. This service has reached more than 460,000 farmers. To implement this service, PAD partnered with Safaricom to register users from among its existing subscriber base, and with the Kenya Agriculture and Livestock Research Organization (KALRO) and the Centre for Agriculture and Biosciences International (CABI) to develop agronomic content.
As part of the Uganda Coffee Agronomy Training Program (UCAT - https://www.ucat.coffee), PAD has built a coffee GAPs advisory service and automated call center for a sub-sample of robusta coffee farmers in Uganda. Selected farmers receive weekly advisory training on GAPs and have access to an automated question & answer IVR (Interactive Voice Response) platform. Farmers are able to: (1) listen to advisory messages again and access past messages (2) record a question for a local agronomist (3) listen to the answer to their question given by the agronomist and (4) listen to past questions and answers they have asked. The platform is available to selected coffee farmers free of charge in four languages and can be accessed through any basic feature phone.
MATERIALS AND METHODS To assess the needs of farmers and characterize their interests and priorities, we first present
an overview of farmer interactions on the MoA-INFO and UCAT digital platforms. In both settings, we have conducted multiple rounds of surveys with users to collect feedback on content, which in turn is used to develop more relevant agronomic advice.
PAD uses A/B testing to iterate the design of the MoA-INFO service. By assessing relative engagement against changes in framing, timing or type of required response PAD is able to implement rapid updates to improve user experience and engagement. PAD also conducts phone surveys with farmers to assess their knowledge and practices to better understand what information is most important to them, and to assess how they are internalizing the MoA-INFO recommendations. PAD also pilots other channels for sharing information with farmers. In April-June 2020, PAD offered an information service for banana farmers via IVR and in November-December 2020, PAD is operating a service for tomato farmers on Telegram, a messaging app.
In Uganda, PAD designed several experiments in an effort to improve farmer engagement with the platform. To increase the pick-up rate of weekly advisory calls, we used an A/B test to identify whether it was more efficient to send farmers a reminder twenty-four hours or one hour before receiving the call. We used a similar methodology to determine whether farmers were more likely to listen to the full advisory call if the recording's voice matched the gender of the farmer. Finally, we tested whether providing farmers with non-financial incentives (airtime credit) increased their propensity to record a question for our agronomists.
We also present results from different types of experiments (RCT, A/B trials)

1st African Conference on Precision Agriculture | 8-10 December | 2020
168
RESULTS & DISCUSSION
Kenya In one A/B test administered on the MoA-INFO platform, we assessed two messages
inviting users to conduct a self-survey of their field for Fall Armyworm. We randomized a regular message1, which advertises the tool keyword (“CHECK” or “ANGALIA”), and a message which instead takes the users directly into the monitoring tool, bypassing the first question. Of the two different message phrasings, the second, “make it easy”2, formulation stimulated two percent more recipients to initiate the tool. Moreover, of farmers who initiated the tool in response to either message, those responding to the “make it easy” message were more likely to complete the test. Overall farmers responding to the “make it easy” message demonstrated a 6% higher completion rate when compared to farmers who initiated the tool after having received the “regular message”.
We also investigated the timing of these invitations (7 AM, 12 PM, 3 PM and 6 PM). Messages sent at 6 PM returned the highest number of users who accessed the monitoring tool, but not by a great deal (1 to 2% improvement over other times). The midday message, while eliciting the lowest commencement rate, resulted in the highest completion rate across the four times. Intuitively, midday is a time when it is most likely that farmers will be in their fields; a requirement for undertaking and completing the assessment tool. The midday message resulted in significantly better information generation than the 7 AM message. Comparisons in the completion rate between the 3 PM and 6 PM rates were not statistically significant, but both were below the completion rates associated with the midday call.
Based on the results of the A/B test, the service was re-designed to send the advisory tool at midday using the “make it easy” phrasing. In conjunction with improved farmer targeting, the monitoring tool was pushed to farmers 77,568 times in the 2019 Kenyan short rains season (October-January). A sample of 50,779 farmers received messages (some received it more than once); 16,234 invitations were accepted for the survey (21% of invitations; 32% as a share of farmers) and 5,213 surveys were completed (10.3% of farmers, but 32% of those who initiated the tool). Of the 5,213 farmers who completed the test, 1,934 were encouraged not to use pesticides because it would not be cost effective for them while the rest were encouraged to use pesticides to address the infestation. The phrasing of the “make-it-easy” message has also been adapted for use in other messages sent to farmers inviting them to receive content.
Table 1 below shows results from a pilot MoA-INFO polling survey, which highlight how questions on user knowledge, adoption, and reasons for non-adoption of priority recommendations, can be combined to identify recommendations that might be most susceptible to an information intervention. In this case, we highlighted misconceptions around maize thinning and planting fertilizer-use to be particularly fertile areas for shifting behavior with information. The survey was administered to 214 randomly selected MoA-INFO maize farmers.
1 Regular message:
Hi. Now is a great time to scout your maize for Fall Armyworm! Send CHECK to 40130 for help scouting your maize.
2 ‘Make it easy’ message: Are you ready to assess the extent of Fall Armyworm (FAW) damage on your farm and receive advice? You will need to go to your shamba [farm]. A. Yes, B. No

1st African Conference on Precision Agriculture | 8-10 December | 2020
169
Table 1. Summary of survey responses of MoA-INFO users (N= 214) Knowledge Adoption Reasons for Non-Adoption Reasons for Sub-
optimal Adoption Recommendations % Farmers
Aware of Best
Practices
N % Adoption
# Non- adopters
Financial constraints
(N)
Time constraints
(N)
Information constraints
(N)
Unavail-ability
(N)
Other reasons
(N)
Financial constraints
(N)
Limited availability
(N)
Early Planting 68.5 212 58.5 88 34.2% (14)
36.6% (15)
2.4% (1)
2.4% (1)
24.4% (10)
Manure/Compost Use
76.2 214 48.1 111 3.6% (4)
9% (10)
10.8% (12)
72.1% (80)
4.5% (5)
Manure/Compost Quantity
103 28.2 74
Planting Fertilizer Use
214 79.0 45 37.8% (17)
2.2% (1)
48.9% (22)
0% (0)
11.1% (5)
Planting Fertilizer Quantity
57.9 169 57.4 72 91.3% (63)
1.5% (1)
Maize Thinning 73.0 125 30.4 87 0% (0)
3.5% (3)
62.1% (54)
- 34.5% (30)
Weeding 74.3 214 90.2 21 0% (0)
33.3% (7)
23.8% (5)
- 42.7% (9)
Top-dressing Fertilizer Use
214 68.2 68 61.3% (38)
1.6% (1)
22.6% (14)
0% (0)
14.5% (9)
Top-dressing Fertilizer Application
72.0 146 57.5 62 45% (27)
20% (12)
18.3% (11)
- 16.7% (11)
95.5% (42)
2.3% (1)
Uganda
In Uganda 4,407 coffee farmers are registered on our platform. Since the beginning of the programme in October 2019, 1,311 questions have been recorded by farmers and answered by our agronomist team. The pick-up rate of advisory IVR messages varies between 70% and 75%, and 76% of users listen to at least 90% of the message content. In terms of user satisfaction, approximately 80% of surveyed farmers (N=40) reported discussing the content of our messages with their family and friends, which helps to diffuse our advisory content beyond the population of registered farmers.
We have designed several A/B tests to improve farmer engagement on the UCAT service. For example, we assessed the effect of sending a dramatised version of our weekly message relative to the regular, non-dramatised, framing (dramatised messages emphasize the risk of not applying the recommendations in the message, while non-dramatised messages put the emphasis on the benefits). We found that the pick-up rate was 3 percentage points lower among recipients of dramatised messages.
We have also assessed whether sending a reminder to farmers increases the likelihood of their picking up our calls. Running the experiment for 8 weeks, we found that receiving a reminder increases the pick-up rate by 9%. The impact was mainly driven by reminders received 24 hours in advance, as opposed to reminders received one hour in advance.

1st African Conference on Precision Agriculture | 8-10 December | 2020
170
#7422 MAPPING AFRICAN SOILS AT 30M RESOLUTION – ISDASOIL: LEVERAGING SPATIAL AGRONOMY IN FARM-LEVEL ADVISORY FOR
SMALLHOLDERS
M. Miller, J. Collinson, K. Shepherd, A. Dobermann and J. Crouch Innovative Solutions for Decision Agriculture (iSDA), www.isda-africa.com
with T. Hengl, EnvirometriX and S. Haefele, Rothamsted Research [email protected]
ABSTRACT
Field level soil data has been the foundation of agronomic advisory, but traditional methods involving on-farm sampling are too expensive for a large proportion of African smallholders. Building on the work of the African Soil Information Service (AfSIS), Innovative Solutions for Decision Agriculture (iSDA) and partners have created an agronomic soil database which covers the entire African continent at a spatial resolution of 30 m. At this resolution each soil property prediction map results in over 24 billion pixels.
“iSDAsoil” combines remote sensing data and other geospatial information with point samples subjected to spectral analysis and traditional wet chemistry reference analysis – and is freely available via a user-friendly web interface, with full data available under an open license (CC-BY 4.0) and developer API at: https://www.isda-africa.com/isdasoil/
Our digital maps cover 17 agronomically important soil properties at two depths and include soil texture, soil pH, macronutrients (soil organic carbon, nitrogen, phosphorous, and potassium, magnesium), micronutrients, CEC, electrical conductivity etc. Each property includes estimates of uncertainty and from these raw properties a fertility capability classification (FCC) has been calculated for each 30m point, enabling users to identify yield limiting constraints in soil properties on a per-field basis.
iSDAsoil is designed to encourage sharing and we hope that the owners of other soil and agronomic data, in industry and academia, will share their datasets to help create ever more accurate maps. The mapping infrastructure has been designed to allow fast updates for regular addition of new data. We view these agronomy data stacks as the starting point, rather than an end-product per se. Our aim is to catalyse opportunities to develop and deliver products and services supporting low-cost agronomic advisory for millions of smallholders across Africa – as well as bring greater efficiency to agribusinesses supporting smallholder value chains.
Together with its partners across Africa and elsewhere, iSDA is building site-specific fertilizer recommendation services, yield prediction and risk-return tools based on iSDAsoil. These are currently being validated through a network of on-farm trials in Ghana. iSDA is also designing end-to-end solutions for commercial aggregators and off-takers in Kenya, Ghana and Rwanda, each based on a different blend of technologies including iSDAsoil. This paper will provide an overview of these and other applications including consortium data-sharing opportunities and plans for a central referencing and calibration service.

1st African Conference on Precision Agriculture | 8-10 December | 2020
171
INTRODUCTION
Soil has long been appreciated as an important factor in determining crop yields. However, until recently soil information for Africa has only been available at relatively coarse resolutions (Jones et al., 2013). In high income countries, farmers frequently pay for lab-based soil testing to understand their constraints in soil fertility down to the field level and even finer levels of detail. But smallholders in Africa have access to neither the testing infrastructure, nor the finances to routinely adopt this approach. As a result, it is impossible for most farmers in Africa to consider the current soil nutrient status of their fields when making management decisions, such as the type and quantity of fertiliser to apply. More recently, continental scale soil sampling initiatives, such as the AfSIS project (funded by the Bill and Melinda Gates Foundation) have allowed for the creation of a pan-African database of soil information (Leenaars et al., 2014). Coupled with high resolution satellite information, predictive soil mapping (PSM) has now become possible; this uses machine learning algorithms to predict soil properties on a consistent spatial scale (Malone at al., 2017). Hengl et al. (2015, 2017) and Vagen et al. (2016) pioneered this approach for Africa, initially at a resolution of 250m. These maps proved useful for strategy formulation and policy-making, but the resolution is too coarse for interface with farm-level advisory.
iSDAsoil, at 30m resolution, bridges the gap to farm-level information. It is available through Open and FAIR data access principles in order to empower researchers, businesses, governments and others to make data-informed decisions for improving the productivity of African agriculture, ranging from the field to the country level.
The data platform is designed to encourage sharing and we hope that the owners of other soil and agronomic data, in industry and academia, will share their datasets to help create ever more accurate maps. With this in mind, the mapping infrastructure was designed to allow fast updates for regular addition of new data. As well as being able to explore the data visually at the iSDAsoil website, the data can be queried via a free API, and downloaded in bulk via Zenodo.
We hope to create a virtuous cycle, whereby contributors of point data will benefit from increasingly accurate maps as more data is added. While additional soil sampling will always be required, it is hoped that users of iSDAsoil will be able to focus on incorporating the data into their applications and products.
MATERIALS AND METHODS
iSDAsoil is a collection of spatial predictions of soil nutrients and properties, based on the predictive soil mapping (PSM) techniques described in Hengl and Macmillan. The first step in this process was to standardise all the input soil data as follows:
• Ensuring all measured units were in the same format • Harmonizing properties measured using different techniques • Removing any erroneous datapoints
An extensive selection of covariates was then used to predict soil properties across Africa. We apply a multiscale ensemble machine learning approach that combines input covariates at two different geospatial resolutions:
• Coarse scale: 250m (includes climatic and vegetation variables based on MODIS satellite products and similar)

1st African Conference on Precision Agriculture | 8-10 December | 2020
172
• Fine scale: 30m (includes digital terrain model (DTM) derivatives, as well as Sentinel-2 satellite and Landsat-7/8 cloud-free composite images)
We then applied five regression modelling algorithms: • Random forest as implemented in the Ranger package • Gradient boosting as implemented in the XGBoost package • Cubist regression models as implemented in the Cubist package • Neural network algorithms as implemented in the deepnet package • GLM with Lasso or Elasticnet Regularization as implemented in the glmnet package
All programming was implemented using R software for statistical computing and open-source packages and applications for spatial analysis. For each property, we ran model fine tuning, feature selection (to reduce the number of covariates) and ensemble machine learning, using the SuperLearner algorithm as implemented in the mlr package. Predictions at the coarse (250m) and fine (30m) resolutions were generated independently, then merged using ensembling. We first predict values at three depths: 0, 20cm and 50cm, then aggregate values to standard depth intervals (0–20cm and 20–50cm). In principle, all steps, except the soil data import and feature selection, are fully automated. Computing was implemented in a high-performance system with tasks fully parallelized using the R snowfall package. As training points, we have used a compilation of legacy soil profiles and point data from various datasets. The total number of training points used depends on the soil property, but is generally higher than 100,000. Please see our website for further details at: https://www.isda-africa.com/isdasoil/technical-information/
RESULTS AND DISCUSSION
iSDA's unique focus is combining new low-cost technologies, rigorous on-farm science and viable last mile delivery business models. We are initially focusing on advisory for maize, rice, potato and coffee but will expand to cover all major crops of importance to smallholders in Africa. iSDA is currently carrying out a series of on-farm trials to verify the use of iSDAsoil as a “virtual soil test” for fertiliser recommendations. This purely digital solution offers the possibility of a radically lower cost alternative to physical soil tests, while providing a substantial improvement on currently available national (blanket) fertilizer recommendations by virtue of providing recommendations tailored to individual farms. This could potentially allow a route to low-cost yet customised agronomic advisory for millions of smallholders who could not afford a service based on a traditional soil test. If this provides a reliable foundation, we will then augment this with historical agronomic and economic data in combination to generate probabilistic, risk-based return-on-investment advisory.
Agronomic advisory for paddy rice, particularly fertilizer recommendation, is extremely challenging as flooding substantially alters soil chemistry and traditional soil tests tend to give inconsistent results in diagnosing nutrient deficiencies. iSDA is therefore investigating whether iSDAsoil can help determine optimum stratification of nutrient omission trials in order to provide fertilizer recommendations at the community level. This would then be implemented as a public-private-partnership with government extension services and commercial aggregators.
The maps in iSDAsoil include prediction uncertainty for all data points. These can be useful in identifying areas where soil property predictions are of lower accuracy, and thus care should be

1st African Conference on Precision Agriculture | 8-10 December | 2020
173
taken in terms of associated conclusions. These areas should also be primary targets for additional soil sampling campaigns. We are also better able to understand what covariates are important for predicting specific soil properties.
Soil infrared spectroscopy is the most promising technology that has emerged over the past 20 years for measuring soil health at low cost. However, this potential is constrained by the lack of regional spectral calibration libraries, and the limited capacity and large inter-lab variability of conventional soil testing labs in Africa needed to develop the calibrations. To overcome this, iSDA has joined an initiative to provide a centralised soil reference laboratory service, and a centralised high quality service for developing spectral calibrations. The initiative has been housed under the Global Soil Partnership (GSP) and implemented through the Global Soil Laboratory Network, hosted by FAO, as well as linked to the GSP’s Global Soil Information System (GLOSIS).
There are many other possible uses for iSDAsoil, such as in the fight against climate change. Carbon budgeting has recently become an important topic as governments and companies attempt to offset their carbon emissions. An important aspect of carbon budgets is being able to estimate the amount of carbon stored in the soil. iSDAsoil provides estimates of both organic and total carbon.
REFERENCES Jones A. (ed.), et al. 2013. Soil atlas of Africa. Luxembourg: Union Européenne, 176 p. (Joint
Research Centre Soil Atlas Series). ISBN 978-92-79-26715-4. Leenaars J. 2014. Africa Soil Profiles Database, version 1.2: a compilation of georeferenced and
standardised legacy soil profile data for Sub-Saharan Africa (with dataset). Technical report (ISRIC — World Soil Information, 2014).
Hengl T, et al. 2015. Mapping Soil Properties of Africa at 250 m Resolution: Random Forests Significantly Improve Current Predictions. PLoS ONE 10(6): e0125814. doi:10.1371/journal.pone.0125814.
Hengl T, et al. 2017. Soil nutrient maps of sub-Saharan Africa: assessment of soil nutrient content at 250 m spatial resolution using machine learning. Nutr. Cycl. Agroecosystems 109: 77–102.
Malone BP, Minasny B, McBratney AB, et al. 2017. Using R for digital soil mapping, Springer. Vagen T-G et al. 2016. Mapping of soil properties and land degradation risk in Africa using
MODIS reflectance. Geoderma 263: 216–225.

1st African Conference on Precision Agriculture | 8-10 December | 2020
174
#7442 AFFORDABILITY OF MECHANISATION SERVICES FOR SMALLHOLDERS IN ZAMBIA BY AGRODEALER DEVELOPMENT
S. Peets, and S. Woods
Harper Adams University, Newport, Shropshire, TF10 8NB, United Kingdom, [email protected]
ABSTRACT The objective of this work was to assess the affordability of mechanisation systems along
with conservation agriculture for smallholders in Zambia by agrodealer development. Two smallholder communities (60 km east of Lusaka, and 150 km southwest of Lusaka) with a conservation farming extension service and a suitable agrodealer available were the focus of the trial. Each agrodealer received a mechanisation package to operate and offer the service to local smallholder farms. The performance of agrodealers was monitored by a variety of methods and showed agrodealers as mechanisation contractors can be profitable given sufficient business pump-priming and training. Conservation farming practices undertaken by trained agrodealers were also shown to improve yields and the resilience of smallholder farms in difficult growing season.
INTRODUCTION
In Zambia, there are 1.46 million small and medium-scale farmers (Sitko et al. 2015) of which only 17.9% (261,590) are medium-scale farmers farming 5–100 ha. 81.1% (1,196,720) are either subsistence farmers farming 2 ha or less by hand and typically with a family of five to six members, or slightly larger farms farming 2–5 ha. Smallholders have a restricted purchasing power and cannot afford to invest in agricultural machinery.
The challenges hampering agricultural mechanization in sub-Saharan Africa (SSA) are affordability, availability, lack of farmer skills and constraints within the private sector (Sims et al., 2016). Low capacity and lack of support for mechanisation contractors (agrodealers) to succeed is therefore holding back the development.
There are activities to stimulate private investment in agriculture (Musika) and promote conservation farming practices (Conservation Farming Unit) in Zambia. Thierfelder et al. (2015) found that in 80% of cases studied, regardless of soil type or conservation system employed, conservation management increased maize yield. They also suggested that the continuing improvements seen over time under conservation management were due both to recovery in soil health and the skills of the producers themselves
There is a business opportunity for mechanisation service providers to be in the vanguard of conservation agriculture for African countries (Sims et al. 2014, Adu-Baffour et al 2019). This is a key strategy needed to improve farm resilience and improve crop yields and incomes for smallholder farmers in Sub-Saharan Africa (SSA) (Rockström et al., 2009).
The objective of this work was to assess the affordability of mechanisation systems along with conservation agriculture for smallholders in Zambia by agrodealer development.

1st African Conference on Precision Agriculture | 8-10 December | 2020
175
MATERIALS AND METHODS
Two smallholder communities (60 km east of Lusaka, and 150 km southwest of Lusaka) with a conservation farming extension service and a suitable agrodealer available were the focus of the trial in Zambia (Peets et al 2019). Two agrodealers, one on each site, received mechanisation packages to operate and offer the service to local smallholder community. The mechanisation package consisted of: 82HP 2WD tractor, 3 tine ripper, off-set disc harrow, 3 row planter, 3 tonne trailer, 12m boom sprayer, and a maize sheller (Table 1). Resale values and years owned were estimated based on local knowledge of resale values and applying a straight-line depreciation model. The performance of agrodealers was monitored by telemetry data (standard reports such as daily engine hours, and advanced GPS tracking analysis to detect boundaries of worked areas), agrodealer sales invoices, agrodealer accounting data, and site visits during the period of June 2018 to August 2019. Table 1. Mechanisation package items and cost (USD). Item Purchase Price ($) Resale ($) Years owned Tractor 33538 16000 6 Ripper 2250 500 10 Disc Harrow 4200 2500 10 Boom Sprayer 2800 500 5 Planter 4650 1000 10 Sheller 7000 2000 5 Trailer 4000 2000 10 Total 58438 24500 –
The data obtained was modelled in Microsoft Excel using standard costing methodology
(Landers, 2000). Multiple spreadsheets were produced which costed the individual machines on a per hectare basis using theoretical work rates. The model accumulated hectares worked as more jobs were undertaken with the aim of spreading the fixed costs of ownership over the total hectares. This allowed judgements and model adjustments to be made which reflected the actual workrates achieved by the machinery according to the telemetry data. Maize yields were assessed in adjacent fields for a range of customers where mechanisation was done on one field and standard local practice applied to the other.
RESULTS AND DISCUSSION The results of mechanisation contractor (agrodealer) performance analysis demonstrate the
following: fieldwork was conducted on 142 days out of available 393 calendar days; tractor worked 980 engine hours during this period; a total of 219 jobs were done; invoiced area was 364 ha (258 ha of conservation farming); average worked area was 2.3 ha; seasonal work rate was 3.8 ha/day (0.5 ha/hr); revenue generated 43 USD/ha (18.63 USD/hr).
The actual quantity of work achieved fell short of the projected values for a variety of reasons ranging from the timing of machine delivery missing a large part of the season (Table 2.) to delayed advertisement of tractor service. This is highlighted by the planter, sprayer and shelling

1st African Conference on Precision Agriculture | 8-10 December | 2020
176
machines in particular. However, once working, the operators produced better workrates than projected. Table 2. Actual and projected work in a season (year).
Type of work Quantity of work Time to complete (hr) Work rate ha/hr Actual Projected Actual Projected Actual Projected
Ripping (ha) 258 300 512 595 0.50 0.50 Discing (ha) 35 70 63 50 0.56 1.40 Planting (ha) 25 100 46 124 0.54 0.81 Spraying (ha) 46 100 24 46 1.92 2.16 Shelling (bags) 11036 33000 221 165 50 200 Trailer (hrs) 65 200 65 200 – – Total 364 ha 570 ha 931 1180 – –
Table 3 shows the projected financial statement for the Agrodealer business which could
have made a gross profit of over $15,000 with the enterprise breaking even in just under 4 years. This is based on favourable and timely working conditions with minimal breakdowns but in no way unrealistic rates of work. Table 3. Projected Agrodealer mechanisation services financial statement (USD). Task Cost($/hr) Cost ($/ha) Retail ($/ha) Gross profit ($) Ripping 19.47 38.64 50.00 3407.86 Spraying 30.35 14.05 46.15 3210.37 Discing 34.41 24.58 46.15 1510.17 Planting 21.05 25.99 46.15 2016.44 Shelling 17.49 0.09 0.19 3460.47 Trailer 19.74 30.00 2051.20 Total ($/yr) 24,151.18 39,807.69 15,331.51 Opex ($/yr) 13,397.16 Breakeven (yr) 3.81 Capex ($/yr) 10,754.03
The actual financial statement shown in Table 4 shows a loss of just over $1,500. Two
tasks were profitable, and it is envisaged that given a better season and a longer work window with full machine availability that planting and shelling operations will also contribute to the enterprise profitability. Indeed, spraying which only became available part way through the season still turned a profit.
The farm trial results demonstrated that maize crop established by ox ploughing wilted mostly and performed poorly (mean yield 0.3 t/ha), crop established by tractor ripping demonstrated more vigorous root development and better yield (mean yield 5.5 t/ha) (number of farms in comparison trial 21). The rainfall in the period of November 2018 to April 2019 was 277 mm as measured at five locations in the trial area.

1st African Conference on Precision Agriculture | 8-10 December | 2020
177
Table 4. Actual Agro dealer mechanisation services financial statement (USD). Task Cost ($/hr) Cost ($/ha) Retail ($/ha) Gross profit ($) Ripping 22.51 44.66 50.00 1378.31 Spraying 48.42 25.22 46.15 963.01 Discing 33.20 59.29 46.15 -459.59 Planting 35.61 65.94 46.15 -494.61 Shelling 18.37 0.37 0.15 -2356.90 Trailer 29.92 26.70 -209.15 Total ($/yr) 22,404.58 21,225.65 -1,503.93 Opex ($/yr) 11,650.55 Breakeven (yr) -38.86 Capex ($/yr) 10,754.03
CONCLUSIONS
Contracting business (agrodealer) can be profitable, however, in early stages needs support
such as set up with financial aid, time to build customer base, and training. The actual financial statement for the mechanisation contractor business showed a loss of just over $1,500. Ripping and spraying were profitable. The projected financial statement for the agrodealer mechanisation contractor business shows a potential to make a gross profit of over $15,000 with the enterprise breaking even in just under 4 years. This is based on favourable and timely working conditions with minimal breakdowns but in no way unrealistic rates of work.
Conservation farming practices undertaken by trained agrodealers were also shown to improve yields and the resilience of smallholder farms: a yield improvement of mechanised ripping for maize establishment versus ox driven techniques of 5.2 t/ha (mean yield 5.5 t/ha and 0.3 t/ha respectively) during difficult season was shown.
Further work is required to improve the efficiency of tractor field work by better planning, scheduling and training.
ACKNOWLEDGMENTS
This work has been funded by Innovate UK (grant No 103713), AGCO Ltd, Daniel Tembo General Dealers, and ChoAgro.
REFERENCES Adu-Baffour F, Daum T, Birner R. 2019. Can small farms benefit from big companies’ initiatives
to promote mechanization in Africa? A case study from Zambia. Food Policy 84: 133–145 (https://doi.org/10.1016/j.foodpol.2019.03.007)
Landers A. 2000. Farm machinery: Selection, Investment and Management. 79-94. Farming Press, Tonbridge. UK.
Peets S, Misiewicz PA, Woods S, Ngwene B, Burbidge J, Barlow G.R. 2019. Mechanization of smallholders in Sub-Saharan Africa by agrodealer development. Written for presentation at the 2019 ASABE Annual International Meeting, Sponsored by ASABE Detroit, Michigan July 7-10, 2019 (https://doi.org/10.13031/aim.201901285).
1st African Conference on Precision Agriculture | 8-10 December | 2020
178
Rockström J, Kaumbutho P, Mwalley J, Nzabi AW, Temesgen M, Mawenya L, Barron J, Mutua, J, Damgaard-Larsen S. 2009. Conservation farming strategies in East and Southern Africa: Yields and rain water productivity from on-farm action research. Soil and Tillage Research 103 (1): 23–32 (https://doi.org/10.1016/j.still.2008.09.013).
Sims B, Breen J, Luchen S. 2014. Mechanization of smallholder Conservation Agriculture in Zambia: lessons learnt and future directions. Landwards e-Xtra, 69 (4): 1–12.
Sims BG, Kienzle J, Hilmi M. 2016. Agricultural mechanization: A key input for sub-Saharan African smallholders. Integrated Crop Management Vol 23. FAO.
Sitko NJ, Chamberlin J, Mulenga B. 2015. Unpacking the Growth of Medium-scale Farms Zambia: What are the Implications for the Future of Smallholder Agriculture? IAPRI, Lusaka.
Thierfelder C, Rusinamhodzi L, Ngwira AR, Mupangwa W, Nyagumbo I, Kassie GT, Cairns JE. 2015. Conservation agriculture in Southern Africa: Advances in knowledge. Renewable Agriculture and Food Systems 30(4): 328–48.

1st African Conference on Precision Agriculture | 8-10 December | 2020
179
#7515 SPATIAL VARIABILITY AND MAPPING OF SELECTED SOIL QUALITY INDICATORS FOR PRECISION FARMING AT A SMALLHOLDING LEVEL IN
MINNA, NIGERIA
*B.A. Lawal, M.K.A Adeboye, and P.A. Tsado Department of Soil Science and Land Management, Federal University of Technology, PMB 65,
Minna, Nigeria, [email protected], Mobile: +2348036207353
ABSTRACT
Smallholding farmers in Nigeria still practice blanket application of fertilizers, without considering spatial variations in soil properties across their fields. Understanding of spatial variability in soil properties is essential for precision farming, especially in this era of resource scarcity and high cost of fertilizers. This study was carried out to assess and map the spatial variability in selected soil quality indicators in a smallholder farm in Minna, North-central Nigeria, for site-specific management. Four-hectare field was selected for the study. The field was divided into subplots of 25 m x 25 m and serially numbered from 1 to 64. Each subplot was geo-referenced and soil samples were collected from 0-15 cm depth in 10 randomly selected subplots and sent to the laboratory for analysis. Field and laboratory data were analyzed using descriptive statistics. The data were then transferred into GIS software, SURFER 11, for interpolation and production of spatial maps of the selected soil quality indicators. Results indicated that the texture of the soils was sandy loam, pH was neutral; soil organic carbon and total nitrogen were low while phosphorus and potassium were medium. Spatial variability was low in sand, clay, bulk density and pH with their coefficient of variation (CV) ≤ 10 %. The CV for silt (28 %) and nitrogen (25 %) were moderate, while soil organic carbon (40 %), phosphorus (38 %) and potassium (36 %) were high. Correlation analysis indicated a non-significant (> 0.05) relationship between the micro-relief and spatial distribution of the soil properties within the farm. Based on the results, management practices related to soil organic carbon, nitrogen, phosphorus and potassium will require dividing the farm into relatively smaller homogenous units. This would help the farmers significantly in managing the spatial variability through application of the right quantity of fertilizers appropriate for each unit.
Keywords: Site-specific management, spatial variability, geospatial mapping
INTRODUCTION
Spatial variability in soil properties is a major global challenge and contributes to differences observed in growth, yields and quality of field crops (Jabro et al., 2010). Hence, knowledge of the spatial variability of soil properties is a prerequisite for site-specific management as it permits appropriate application of field inputs, e.g. fertilizer, irrigation water, herbicides etc. according to the spatial requirements of soil and crop.
Knowledge of spatial variability of soil properties in smallholder (peasant) fields for the purpose of site-specific management practices has been a major concern, particularly in Nigeria. Recent studies in a north-central state in Nigeria had revealed that farmers in this category are yet to understand that such phenomenon exists in soils (Abdulrasak et al., 2019). This could have accounted for differences usually observed in the growth and yield of their field crops. The way
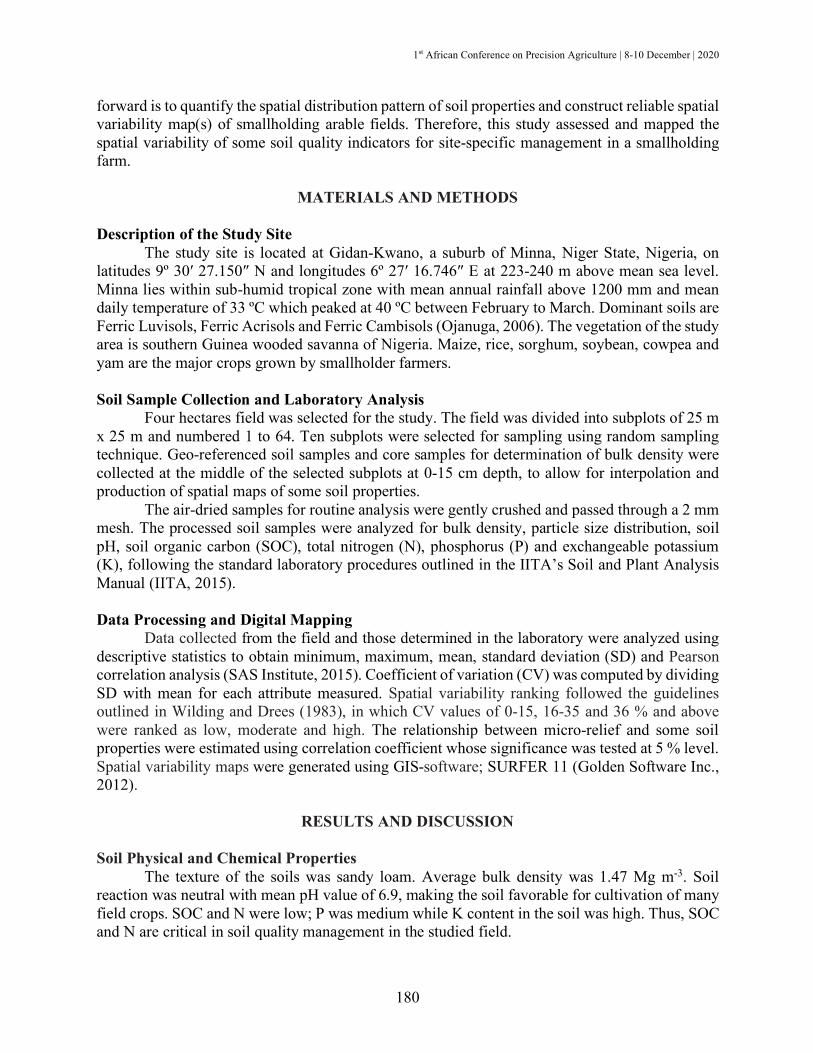
1st African Conference on Precision Agriculture | 8-10 December | 2020
180
forward is to quantify the spatial distribution pattern of soil properties and construct reliable spatial variability map(s) of smallholding arable fields. Therefore, this study assessed and mapped the spatial variability of some soil quality indicators for site-specific management in a smallholding farm.
MATERIALS AND METHODS
Description of the Study Site
The study site is located at Gidan-Kwano, a suburb of Minna, Niger State, Nigeria, on latitudes 9º 30′ 27.150″ N and longitudes 6º 27′ 16.746″ E at 223-240 m above mean sea level. Minna lies within sub-humid tropical zone with mean annual rainfall above 1200 mm and mean daily temperature of 33 ºC which peaked at 40 ºC between February to March. Dominant soils are Ferric Luvisols, Ferric Acrisols and Ferric Cambisols (Ojanuga, 2006). The vegetation of the study area is southern Guinea wooded savanna of Nigeria. Maize, rice, sorghum, soybean, cowpea and yam are the major crops grown by smallholder farmers. Soil Sample Collection and Laboratory Analysis
Four hectares field was selected for the study. The field was divided into subplots of 25 m x 25 m and numbered 1 to 64. Ten subplots were selected for sampling using random sampling technique. Geo-referenced soil samples and core samples for determination of bulk density were collected at the middle of the selected subplots at 0-15 cm depth, to allow for interpolation and production of spatial maps of some soil properties.
The air-dried samples for routine analysis were gently crushed and passed through a 2 mm mesh. The processed soil samples were analyzed for bulk density, particle size distribution, soil pH, soil organic carbon (SOC), total nitrogen (N), phosphorus (P) and exchangeable potassium (K), following the standard laboratory procedures outlined in the IITA’s Soil and Plant Analysis Manual (IITA, 2015). Data Processing and Digital Mapping
Data collected from the field and those determined in the laboratory were analyzed using descriptive statistics to obtain minimum, maximum, mean, standard deviation (SD) and Pearson correlation analysis (SAS Institute, 2015). Coefficient of variation (CV) was computed by dividing SD with mean for each attribute measured. Spatial variability ranking followed the guidelines outlined in Wilding and Drees (1983), in which CV values of 0-15, 16-35 and 36 % and above were ranked as low, moderate and high. The relationship between micro-relief and some soil properties were estimated using correlation coefficient whose significance was tested at 5 % level. Spatial variability maps were generated using GIS-software; SURFER 11 (Golden Software Inc., 2012).
RESULTS AND DISCUSSION Soil Physical and Chemical Properties
The texture of the soils was sandy loam. Average bulk density was 1.47 Mg m-3. Soil reaction was neutral with mean pH value of 6.9, making the soil favorable for cultivation of many field crops. SOC and N were low; P was medium while K content in the soil was high. Thus, SOC and N are critical in soil quality management in the studied field.
1st African Conference on Precision Agriculture | 8-10 December | 2020
181
Spatial Variability of Soil and Land Attributes
The results summarizing the descriptive statistics of the soil and land attributes measured are presented in Table 1 and spatial variability maps of some soil quality attributes represented in Figures 1a-d. The micro-relief of the farm had low coefficient of variation (CV), implying low spatial variability in land configuration. Except silt with moderate CV, other soil physical properties measured had CV values < 15 %, also indicating low spatial variability. Seasonal tillage activities could have been responsible for such homogenization in those soil properties.
Table 1: Spatial variability of land and soil properties of a farmer’s field in Minna, Nigeria Parameter Min. Max. Mean SD CV
(%) Spatial variability Ranking
Topography 223 240 228.90 5.80 3 Low Sand (g kg-1) 662 772 719 38.89 5 Low Silt (g kg-1) 60 140 102 28.60 28 Moderate Clay (g kg-1) 158 198 179 18.53 10 Low Bulk density (Mg m-1) 1.19 1.67 1.47 0.13 9 Low Ph 6.5 7.4 6.9 0.28 4 Low Organic carbon (g kg-1) 2.16 7.30 4.94 1.98 40 High Total nitrogen (g kg-1) 0.06 0.12 0.08 0.02 25 Moderate Phosphorus 5 18 10.90 4.12 38 High Potassium 0.30 1.08 0.64 0.23 36 High
Figure 1. Spatial distribution of (a) soil organic carbon, (b) total nitrogen, (c) available phosphorus and (d) potassium in the surface soils of the studied site.

1st African Conference on Precision Agriculture | 8-10 December | 2020
182
Spatial variability in chemical properties varied from low in pH, moderate in N, high in SOC, P and K. This variation could be attributed to differences in land use types (tuber and cereal crops) requiring different soil fertility management practices. Maniyunda et al. (2013) reported high spatial variability in SOC, N, P, K and S in some savanna soils which they attributed to differences in land use types, management and cultural practices and the socio-economic status of farmers. Thus, the implication of the current findings is that while issues related to soil reaction may be handled uniformly, management of SOC, N, P and K have to conform to their spatial variations in the soil. In this regard, it is appropriate to partition the field into relatively homogenous units for effective management. Relationship Between Micro-Relief and Soil Properties
The Pearson correlation between the micro-relief of the farm showed non-significant (P>0.05) correlations with sand (r = 0.403), silt (r = -0.514), clay (r = -0.082), bulk density (r = 0.419), pH (r = 0.310), SOC (r = -0.449), P (r = 0.009), N (r = -0.052) and K (r = 0.435). This suggests that other pedogenic factors overshadowed the effect of topography on spatial distribution of soil properties within the confine of the farm.
CONCLUSIONS
On the basis of the soil texture, bulk density and soil pH, management practices related to soil compaction and soil reaction (pH) could be handled uniformly. Uniform/blanket soil fertility management should be discouraged due to high spatial variability, particularly for the amendment of SOC, N, P and K. Smallholder farmers in this part of Nigeria are encouraged to partition their farms into relatively homogenous management units to permit proportionate application of these nutrients. This may eliminate the possibility of some parts of their farms receiving insufficient of these nutrients, while other parts received in excess.
REFERENCES
Abdurasak YL, Lawal BA, Raji BA, Yakubu, M, Panti A.A. 2019. An Assessment of Farmers Awareness and Perception on use of Soil Information in Niger State. In: Chinma, C.E. et al. Food Insecurity in Africa: Agricultural Diversification as a Panacea. Proceedings of the International Conference of Agriculture and Agricultural Technology, 23rd - 26th April, 2019 held at the Federal University of Technology, Minna, School of Agriculture and Agricultural Technology. pp453-459.
Golden Software Inc. 2012. SURFER 11 for Windows. Surface mapping system package. (www.goldensoftware.com)
IITA. 2015. Selected Methods for Soil and Plant Analysis. Manual Series N0.3, IITA Ibadan, Nigeria. 126pp.
Jabro JD, Stevens WB, Evans RG, Iversen WM. 2010. Spatial variability and correlation of selected soil properties in the AP horizon of a CRP grassland. Applied Engineering in Agriculture, 26 (3): 419–428.
Maniyunda LM, Raji BA, Gwari MG. 2013. Variability of Some Soil Physicochemical Properties on Lithosequence in Funtua, North - Western Nigeria. International Journal of Science and Research (IJSR) 2(9): 174-180.

1st African Conference on Precision Agriculture | 8-10 December | 2020
183
Ojanuga AG. 2006. Agroecological Zones of Nigeria Manual. FAO/NSPFS, Federal Ministry of Agriculture and Rural Development, Abuja, Nigeria, 124pp.
SAS Institute. 2015. SAS systems for information delivery for Windows. Statistical analysis software. SAS Institute, Cary, NC, USA.
Wilding LP, Drees LR. 1983. Spatial variability and pedology. I. Concepts and interactions. In L.P. Wilding, N. Smeck and G.F. Hall (eds.). Pedogenesis and Soil Taxonomy. Wageningen, Netherlands, 83-116.
1st African Conference on Precision Agriculture | 8-10 December | 2020
184
#7646 POTENTIAL PRECISION AGRICULTURE PRACTICES FOR HIGH QUALITY AND EFFICIENT FRUITS AND VEGETABLES PRODUCTION IN WEST AFRICA:
A MINI REVIEW
Nicodeme V. Fassinou Hotegni1, Leocade Azonhoumon, Enoch G. Achigan-Dako Laboratory of Genetics, Horticulture and Seed Science (GBioS), Faculty of Agronomic Sciences,
Abomey-Calavi University, 03 BP 2819 Cotonou, Benin [email protected]
ABSTRACT
During the last decades, efforts have been made to increase the yield and the quality of major fruits and vegetables but still, farmers mainly those in West African countries are struggling to close the yield gap. Precision agriculture has been reported in most developed countries as a set of tools integrating information and technologies for efficient crop production. Over the decades, scholars have been skeptical about the development and implementation of precision agriculture in West Africa mainly because of the type of agriculture, which is smallholder driven. The present paper aims at grabbing existing precision agriculture technologies in the West Africa to adapt and scale them up in the fruit and vegetable sector. A systematic literature review approach used. Out of the 353 papers pre-selected, 71 scientific papers were finally considered. It came out that there is a lack of research on precision agriculture related to fruits and vegetable crops. The existing technologies have been widely documented for field and cash crops; some technologies were region-specific. Technologies such as seed priming and seed treatment (13% of selected papers) and conservation agriculture (12% of selected papers) are more specific to the semi-arid West Africa whereas site-specific fertilizer management (25% of selected papers) is mostly present in humid West Africa. However, low-cost mechanization (6% of selected papers), fertilizer micro-dosing (21% of selected papers) and precision water management (23% of selected papers) are used throughout the West African region. A multi-steps model is proposed for a wide adoption of these technologies for high quality and efficient fruits and vegetables production in West Africa. New research initiatives need to be undertaken to identify other low-cost technologies such as hand-held sensors which could be used as a decision support tools by smallholders’ farmers. Keywords: Precision horticulture, fruits and vegetables, fertilizer micro-dosing, precision water management, site-specific fertilizer management, West Africa
INTRODUCTION
Fruits and vegetables are the main products highly demanded in West African horticulture (Bouët & Odjo, 2019). The trade of vegetables in West Africa was worth 27.3 US$ million between 2001 and 2005 and rose to 133.7 US$ million between 2011 and 2013 (Badiane et al., 2018). Vegetables grown in West Africa are diverse across countries and are generally categorized based on the harvested parts. Thus, three categories of vegetables are found: leafy vegetables, fruit vegetables, and root vegetables. Most important leafy vegetables in West Africa include Corchorus olitorusL., Solanum macrocarpumL., Sesamum radiatumS., Amaranthus hybridusL., Lactuca sativaL., Brassica oleraceaL.), fruit vegetables include Solanum Lycopersicum L.,

1st African Conference on Precision Agriculture | 8-10 December | 2020
185
Capsicum annumL., Solanum aethiopicumL., Phaseolus vulgarisL., Cucumis sativusL.and root vegetables include Daucus carotaL., Allium cepaL., Allium ampeloprasumL. (Chagomoka et al., 2015; Houngla et al., 2019; James et al., 2010). Important exporters of vegetables within West Africa are Niger (71.2%), Ghana (15.2%), and Burkina Faso (11.8%) (Badiane et al., 2018). The West Africa fruits sector is made of commodities such as banana, pineapples, mango, coconut, etc. Fruits and vegetables are not just profitable but they are key components of balanced diets and thus essential to the food security of population in the region. Fruits and vegetables are good sources of dietary fibre which consumption is associated with a lower incidence of cardiovascular diseases and obesity; they are also good sources of vitamins and minerals as well as phytochemicals that serve as antioxidants, phytoestrogens, and anti-inflammatory agents (Alissa & Ferns, 2017; Catarino et al., 2019; Slavin & Lloyd, 2012). Despite efforts of many scientists to improve quality including the yield of horticultural products, farmers still face some problems such as the (i) decline of soil fertility over the years, (ii) high susceptibility of crops to pests and diseases, (iii) low yield along with a low harvest index of many horticultural crops in West Africa, (iv) not efficient irrigation facilities, (v) poor inputs management technologies increasing labour and consequently production cost, and (vi) poor storage facilities (Adebooye et al., 2018; James et al., 2010). These problems constitute a bottleneck to the development of a sustainable horticultural sector in West Africa mainly in the current context characterized by the high interest of young entrepreneurs to agribusiness and mainly to vegetables production. To tackle these problems and incite more people to invest in horticultural sector in West Africa, there is an urgent need to rethink the whole horticultural value chains, mainly the fruits and vegetables farming systems. Sustainable agriculture intensification could be an option to revisit the fruit and vegetable production since it promotes efficient use of inputs (fertilizer, pesticides, water, etc.) (Aune et al., 2017) which will help fruits and vegetables farmers to reduce the huge yield gap. Such agricultural intensification calls for precision agriculture which promotes the timely and efficient execution of farming operations using the optimal rate of input and ensuring its application at the right location in the field (Aune et al., 2017). Indeed, the main objective of precision agriculture is to use information and science-based decision tools to make the best management decisions, achieve the highest possible yield, and reduce the agricultural impact on the environment thereby making it more productive, profitable, and sustainable (Kent Shannon et al., 2018). During the last decade, many scientists engaged some research fitting into the context of precision agriculture for fruits and vegetables production in West Africa and institutions such as the African Plant Nutrition Institute (APNI) based in Benguérir, Morocco has recently started promoting precision agriculture in Africa including, West Africa. Based on the need to develop fruits and vegetables sector in West Africa and tackle the different constraints encountered by stakeholders engaged in this sector, there is a need to capitalise existing technologies, classify them based on the readability to be used. Therefore, the present review aims at grabbing precision agriculture technologies for fruits and vegetables production in West Africa context and proposing a model to scale up these technologies in order to boost fruits and vegetables production. The mini-review is divided into three main sections: (i) definition of precision agriculture in African context, (ii) precision agriculture technologies for fruits and vegetables production in West Africa, and a (iii) way forward for the promotion of precision agriculture in horticultural sector in West Africa.

1st African Conference on Precision Agriculture | 8-10 December | 2020
186
MATERIALS AND METHODS
A systematic literature approach was used. Google scholar and Scopus were used to find scientific papers related to precision agriculture practices in West Africa. The following key words were used in various combinations: ‘Precision agriculture’, ‘precision horticulture’, ‘vegetables’, ‘fruits’, ‘horticultural crops’, ‘West Africa’, ‘micro-dosing’, ‘drip irrigation’, ‘deficit irrigation’, ‘conservation agriculture’, ‘site-specific management’,‘farming mechanization’, ‘seed priming’ and ‘seed treatment’. A total of 353 papers were found. Considering criteria such as the study location (which should be within West Africa), the period when the research was conducted (from 1990 -when precision agriculture emerged- to . 2020, and the adaptability of the technology to fruit and vegetable production in West Africa, a total of 71 scientific papers were retained and used in this review.
RESULTS AND DISCUSSION
What is Precision Agriculture and How Can It be Defined in West African Agriculture Context?
The International Society for Precision Agriculture (ISPA) define Precision Agriculture (PA) as: "a management strategy that gathers, processes and analyzes temporal, spatial and individual data and combines it with other information to support management decisions according to estimated variability for improved resource use efficiency, productivity, quality, profitability and sustainability of agricultural production"(http://www.ispag.org). Although complete, this official definition may not always fit in African and mainly West African context where the use of technology in agriculture is still lagging and the management approach is not information-intensive like in developed countries. (Mondal & Basu, 2009) reported that soft precision agriculture technologies are present in West Africa. Technologies such as mineral fertilizer micro-dosing, mechanized sowing, fertilizer application, and weeding, bamboo drip irrigation system based on the principles of precision farming have been used for long and were proven useful for agriculture in West Africa (Agossou et al., 2019; Dubos et al., 2019). So, an adapted definition fitting into the context of West African agriculture is proposed: "Precision Agriculture is a tool or set of tools which allow farmers to reduce uncertainties by making the right management decisions through the use of the right variety, the right inputs, the right crop management, the right fertilizers, the right application time and dose, the right pest management strategies, to obtain the right product for the right market and at the right time". Based on such definition, many technologies are available and can be classified as precision agriculture practices. Seed Priming and Treatment
Seed priming is low-cost technology and physiological method to improve pre germinative ability of seeds before sowing. Few scientific papers (13% of selected scientific papers) dealing with seed priming in West Africa were found. (Waqas et al., 2019) reported many seed priming treatments ranging from conventional methods (hydro-priming, osmo-priming, nutrient priming, chemical priming, bio-priming, and priming with plant growth regulators) to advanced methods (nano-priming and priming with physical agents). Priming increased yield by up to 67% in Sudan and 40% in Mali (Aune et al., 2012; Coulibaly et al., 2019). (Harris, 2006) demonstrated that priming reduces time to germination and improved crop establishment, plant vigour, advances flowering and increases yield in regions with very limited rainfall making it a good tool in dry

1st African Conference on Precision Agriculture | 8-10 December | 2020
187
areas in West Africa. A deep description and explanation of this technique can be found in the chapter of (Waqas et al., 2019) entitled “Advances in the Concept and Methods of Seed Priming’’. It is important to stress that in seed priming technique, there is a safe limit for soaking time to ensure the seed do not germinate before sowing. In fact, germination prior to sowing could result in a big failure in dryland because very harsh conditions for the new seedling to thrive. Studies have revealed that for many tropical crops the ‘safe limits’ for soaking seed is around 8h (overnight) (Harris, 2006). Primed seed should be surface dry prior to sowing and sown only when soil is moist enough to allow seed to absorb additional water from the soil and offers conducive soil condition for proper plant establishment (Harris, 2006). A study in Mali revealed that seed priming did not improve yield in area with relatively high rainfall, probably because of high soil moisture (Coulibaly et al., 2019). The same author reported the use of priming technique in area with erratic rainfall. So, in fruit and vegetable production this technique can be used. Conservation Agriculture
Few scientific papers (12% of selected papers) dealing with conservation agriculture (CA) were found). The No-till (NT) or minimum tillage system of CA is in line with the principles of PA for it guarantees an efficient use of labour force at sowing. In addition, CA implementation leads to the improvement of soil quality, creating good soil conditions for the success of PA practices. In fact, mulching and crops diversification (legumes, cereals, etc.) have lots of different benefits such as improved total soil nitrogen and soil organic carbon and other biophysical and nutritional qualities (Naab et al., 2017). CA is then a good practice to be considered in sustainable agriculture (Naab et al., 2017; Tittonell & Giller, 2013). Some challenges evolve from CA implementation such as the dearth of crop residue for mulching due to limited yield and the competition for multiple uses and economic value of the crop residue (Giller et al., 2009). Site-Specific Fertilizer Management, Microdosing, Precision Irrigation and Water Management
Regarding soil fertility, several plant growth simulation models have been developed and proved efficient. In Benin, DSSAT (Decision Support System for Agrotechnology Transfert) has been used to make fertilizer recommendation in different maize production system (Igue et al., 2018; Saïdou et al., 2018). In both studies, DSSAT has been used as decision-support tool which integrated soil and agro-ecological conditions to propose the suitable fertilizer rates. Furthermore, the fertilizer recommendations based on EPIC model (Erosion Productivity Impact Calculator) has been used and authors found that Field Specific Nutrient Management (FSNM) gave higher yield than common local practices in cotton field in Benin (Gandonou & Dillon, 2017; Jones et al., 2003; Williams et al., 1989). However, due to the cost of the technology adoption in Benin (mainly of soil analysis), FSNM is less cost effective than the conventional approach of sole fertilizer rate for every soil unit. In this context, the efforts made by CORAF to avail D4Ag West African database for region-specific seed and fertilizer recommendation needs to be acknowledged and can be viewed at the following website: https://www.coraf.org/2020/09/24/feserwam-a-new-digital-for-agriculture-d4ag-tool-launched/. Fertilizer microdosing has also been listed as proven technologies. The combination of micro-dosing and seed priming greatly increased the crop yield (Aune et al., 2012; Aune et al., 2007). This clearly shows that combining micro-dosing with seed priming result in an additional benefit in semi-arid West Africa. These two practices have high potentiel if used in fruit and vegetables production in West Africa but still studies need to be conducted to validate their effectiveness.

1st African Conference on Precision Agriculture | 8-10 December | 2020
188
Regarding water management, apart from drip irrigation techniques, an automated irrigation system based on sensors has been developed. One of this type of technology is the chameleon sensor which is place under the soil surface and possesses a solar-powered chameleon reader showing three different colour patterns: blue meaning excess of water, green meaning adequate moisture and red meaning lack of water (Ncube et al., 2018). If the sensing device is connected with the irrigation system, the red colour pattern triggers the watering of the field and stops it as well when soil is humid enough (blue pattern). The use of this kind of technology could significantly reduce need labour force, save water for other uses and spare times for farmer to go for others business or farming practices. Based on information gathered, a model for PA in fruit and vegetable production in West Africa should be based on the crop (fruit and vegetables) physiology, farmer constraints, cost effectiveness, and accessibility of the technologies. These PA technologies should also be designed taking into account the most preferred quality attributes of the products and farmers should be trained to use them.
REFERENCES Adebooye O, Akponikpe P, Oyedele D, Peak D, Aluko E. 2018. Synergizing fertilizer micro-
dosing and indigenous vegetable production to enhance food and economic security of West African farmers. Global Affairs Canada, Ottawa, ON, Canada.
Agossou H, Bogardi J, Tischbein B. 2019. Soil-water management performance and layout optimization of an innovative bamboo-drip system in West-Africa.
Alissa EM, Ferns GA. 2017. Dietary fruits and vegetables and cardiovascular diseases risk. Critical reviews in food science and nutrition, 57(9): 1950-1962.
Aune J, Traoré C, Mamadou S. 2012. Low-cost technologies for improved productivity of dryland farming in Mali. Outlook on Agriculture 41(2): 103-108.
Aune JB, Coulibaly A, Giller KE. 2017. Precision farming for increased land and labour productivity in semi-arid West Africa. A review. Agronomy for sustainable development, 37(3): 16.
Aune JB, Doumbia M, Berthe A. 2007. Microfertilizing sorghum and pearl millet in Mali: Agronomic, economic and social feasibility. Outlook on Agriculture, 36(3): 199-203.
Badiane O, Odjo SP, Collins J. 2018. Africa agriculture trade monitor 2018: CTA. Bouët A, Odjo SP. 2019. Africa agriculture trade monitor 2019: Intl Food Policy Res Inst. Catarino L, Romeiras MM, Bancessi Q, Duarte D, Faria D, Monteiro F, Moldão, M. 2019. Edible
Leafy Vegetables from West Africa (Guinea-Bissau): Consumption, Trade and Food Potential. Foods 8(10): 493.
Chagomoka T, Drescher A, Glaser R, Marschner B, Schlesinger J, Nyandoro G. 2015. Vegetable production, consumption and its contribution to diets along the urban–rural continuum in Northern Ghana. African Journal of Food, Agriculture, Nutrition and Development, 15(4): 10352-10367.
Coulibaly A, Woumou K, Aune JB. 2019. Sustainable intensification of sorghum and pearl millet prodction by seed priming, seed treatment and fertilizer microdosing under different rainfall regimes in Mali. Agronomy 9(10) : 664.
Dubos B, Baron V, Bonneau X, Dassou O, Flori A, Impens R, . . . Pardon L. 2019. Precision agriculture in oil palm plantations: diagnostic tools for sustainable N and K nutrient supply.
1st African Conference on Precision Agriculture | 8-10 December | 2020
189
Gandonou J-M, Dillon C. 2017. Field Specific Nutrient Management Profitability and Production Risk Analysis: The Case of Cotton Production in Benin. International Journal of Business and Social Science 8(5).
Giller KE, Witter E, Corbeels M, Tittonell P. 2009. Conservation agriculture and smallholder farming in Africa: the heretics’ view. Field Crops Research 114(1): 23-34.
Harris D. 2006. Development and testing of “On-Farm” seed priming. Advances in Agronomy 90: 129-178.
Houngla EJH, Hinson CDT, Gbankoto A, Anani BLC 2019. Characteristics of urban market gardening in Porto-Novo, Republic of Benin, West Africa. International Journal of Agricultural Science 4.
Igue A, Balogoun I, Oga A, Saidou A, Ezui G. 2018. Recommendations of Fertilizer Formulas for the Maize Production in Northern Benin. Adv Crop Sci Tech, 6(359): 2.
James B, Atcha-Ahowé C, Godonou I, Baimey H, Goergen H, Sikirou R, Toko M. 2010. Integrated pest management in vegetable production: A guide for extension workers in West Africa: IITA.
Jones JW, Hoogenboom G, Porter CH, Boote KJ, Batchelor WD, Hunt L, . . . Ritchie JT 2003. The DSSAT cropping system model. European journal of agronomy 18(3-4): 235-265.
Kent Shannon D, Clay DE, Sudduth KA. 2018. An introduction to precision agriculture. Precision agriculture basics, 1-12.
Mondal P, Basu M. 2009. Adoption of precision agriculture technologies in India and in some developing countries: Scope, present status and strategies. Progress in Natural Science, 19(6): 659-666.
Naab JB, Mahama GY, Yahaya I, Prasad P. 2017. Conservation agriculture improves soil quality, crop yield, and incomes of smallholder farmers in North Western Ghana. Frontiers in plant science 8: 996.
Ncube B, Mupangwa W, French A. 2018. Precision agriculture and food security in Africa. In Systems Analysis Approach for Complex Global Challenges (pp. 159-178): Springer.
Saïdou A, Balogoun I, Ahoton E, Igué A, Youl S, Ezui G, Mando A. 2018. Fertilizer recommendations for maize production in the South Sudan and Sudano-Guinean zones of Benin. In Improving the Profitability, Sustainability and Efficiency of Nutrients Through Site Specific Fertilizer Recommendations in West Africa Agro-Ecosystems (pp. 215-234): Springer.
Slavin JL, Lloyd B. 2012. Health benefits of fruits and vegetables. Advances in nutrition 3(4): 506-516.
Tittonell P, Giller KE. 2013. When yield gaps are poverty traps: The paradigm of ecological intensification in African smallholder agriculture. Field Crops Research 143: 76-90.
Waqas M, Korres NE, Khan MD, Nizami A-S, Deeba F, Ali I, Hussain H. 2019. Advances in the concept and methods of seed priming. In Priming and Pretreatment of Seeds and Seedlings (pp. 11-41): Springer.
Williams J, Jones C, Kiniry J, Spanel DA. 1989. The EPIC crop growth model. Transactions of the ASAE, 32(2): 497-0511.

1st African Conference on Precision Agriculture | 8-10 December | 2020
190
PRECISION NUTRIENT MANAGEMENT

1st African Conference on Precision Agriculture | 8-10 December | 2020
191
#7462 MAPPING SPATIAL VARIABILITY OF SOIL NUTRIENT DEFICIENCIES IN SMALLHOLDER VILLAGES – A PREREQUISITE FOR IMPROVED CROP
PRODUCTION IN AFRICA
Mats Söderström1,3, Kristin Piikki1,2, Job Kihara2, John Mutua2, Johanna Wetterlind1 1Swedish University of Agricultural Sciences (SLU), Skara, Sweden
2 Alliance of Bioversity International and International Center for Tropical Agriculture (CIAT), Nairobi, Kenya, [email protected]; +4651167000
ABSTRACT
Various approaches to derive decision support for site-specific soil fertility management were assessed in a smallholder farming system, a village in western Kenya. The results indicate that at least a small number of soil analyses from the village is important. A collaborative approach among farmers within an area or village can facilitate detailed and cost-effective soil properties mapping, where parts of samples are analyzed in the laboratory, and most samples are scanned by a combination of sensors. Maps from continental geodatabases were less useful.
INTRODUCTION
Precision agriculture in the context of smallholder farming, the dominating type of
agricultural production in many parts of Africa, can be regarded as adapting the management to match the specific needs of individual plots. Management of soil fertility through balanced crop nutrition that takes account of site-specific deficiencies in macronutrients and micronutrients is needed to close the yield gap to remedy hidden hunger (Kihara et al., 2016, 2020). A fundamental prerequisite is the availability of basic information on soil properties at a detailed enough level. Such detailed soil information is often missing, but there are different ways in which it can be acquired. Traditional soil mapping by collecting and analyzing soil samples may be regarded as too expensive for small-scale farmers. However, recently, global or continental digital soil property maps of high spatial resolution have become available, including maps of predicted concentrations of many nutrients of interest (Hengl et al., 2017). Such data sources provide great opportunity to enable spatially extensive recommendations with improved and sustainable nutrient management advice (Rurinda et al., 2020). On another spatial scale, an alternative is to use proximal soil sensors that rapidly can measure many soil samples (Viscarra Rossel et al., 2011). So far, however, such sensors normally do not directly measure the soil property of interest, but require some mathematical/statistical models in order to determine that soil property. As with data from general geodatabases, the accuracy of generated results can be difficult or impossible to judge for the local farmer or advisor.
In this case study we have assessed various approaches to derive decision support for site-specific soil fertility management in a smallholder farming system. Our study area is a village in western Kenya. The aim was to compare and discuss different methods to generate practically useful soil information for farms in this village: i) a regional soil dataset covering the watershed within which the village is located, ii) a continental publicly available digital soil database produced by machine learning methods, iii) soil maps derived by interpolation of local soil sample data, iv) the continental map downscaled by local soil samples, and v) information derived by three
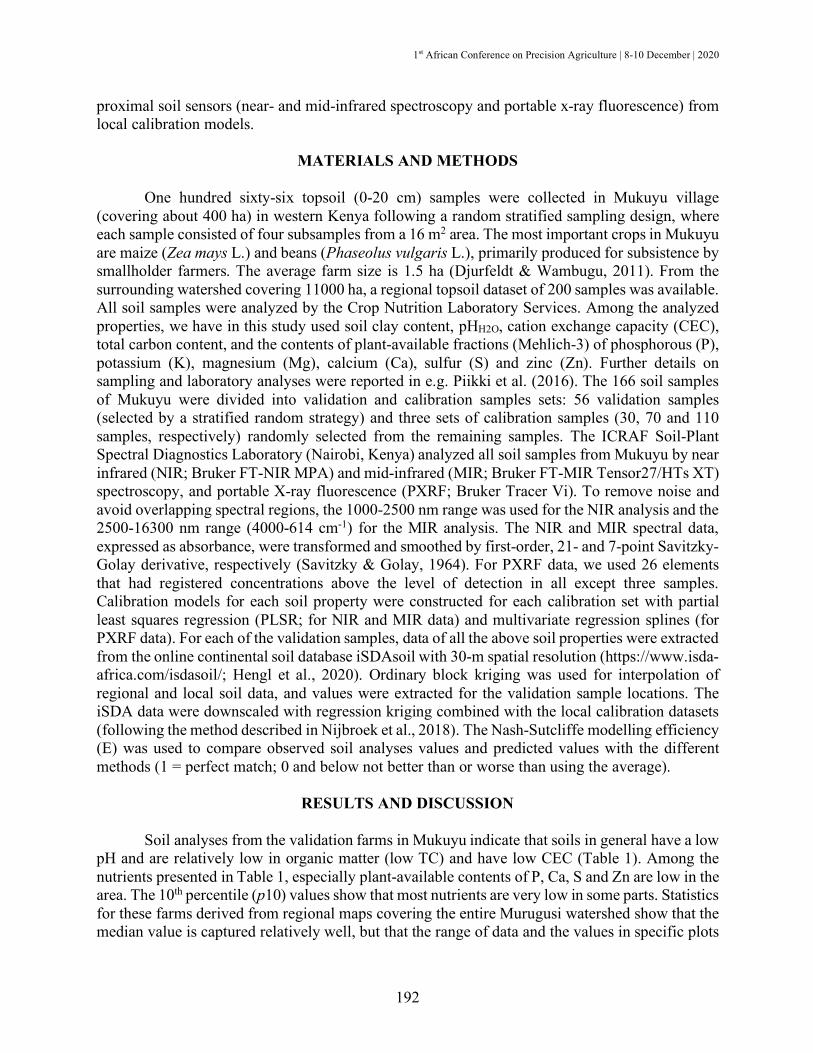
1st African Conference on Precision Agriculture | 8-10 December | 2020
192
proximal soil sensors (near- and mid-infrared spectroscopy and portable x-ray fluorescence) from local calibration models.
MATERIALS AND METHODS
One hundred sixty-six topsoil (0-20 cm) samples were collected in Mukuyu village
(covering about 400 ha) in western Kenya following a random stratified sampling design, where each sample consisted of four subsamples from a 16 m2 area. The most important crops in Mukuyu are maize (Zea mays L.) and beans (Phaseolus vulgaris L.), primarily produced for subsistence by smallholder farmers. The average farm size is 1.5 ha (Djurfeldt & Wambugu, 2011). From the surrounding watershed covering 11000 ha, a regional topsoil dataset of 200 samples was available. All soil samples were analyzed by the Crop Nutrition Laboratory Services. Among the analyzed properties, we have in this study used soil clay content, pHH2O, cation exchange capacity (CEC), total carbon content, and the contents of plant-available fractions (Mehlich-3) of phosphorous (P), potassium (K), magnesium (Mg), calcium (Ca), sulfur (S) and zinc (Zn). Further details on sampling and laboratory analyses were reported in e.g. Piikki et al. (2016). The 166 soil samples of Mukuyu were divided into validation and calibration samples sets: 56 validation samples (selected by a stratified random strategy) and three sets of calibration samples (30, 70 and 110 samples, respectively) randomly selected from the remaining samples. The ICRAF Soil-Plant Spectral Diagnostics Laboratory (Nairobi, Kenya) analyzed all soil samples from Mukuyu by near infrared (NIR; Bruker FT-NIR MPA) and mid-infrared (MIR; Bruker FT-MIR Tensor27/HTs XT) spectroscopy, and portable X-ray fluorescence (PXRF; Bruker Tracer Vi). To remove noise and avoid overlapping spectral regions, the 1000-2500 nm range was used for the NIR analysis and the 2500-16300 nm range (4000-614 cm-1) for the MIR analysis. The NIR and MIR spectral data, expressed as absorbance, were transformed and smoothed by first-order, 21- and 7-point Savitzky-Golay derivative, respectively (Savitzky & Golay, 1964). For PXRF data, we used 26 elements that had registered concentrations above the level of detection in all except three samples. Calibration models for each soil property were constructed for each calibration set with partial least squares regression (PLSR; for NIR and MIR data) and multivariate regression splines (for PXRF data). For each of the validation samples, data of all the above soil properties were extracted from the online continental soil database iSDAsoil with 30-m spatial resolution (https://www.isda-africa.com/isdasoil/; Hengl et al., 2020). Ordinary block kriging was used for interpolation of regional and local soil data, and values were extracted for the validation sample locations. The iSDA data were downscaled with regression kriging combined with the local calibration datasets (following the method described in Nijbroek et al., 2018). The Nash-Sutcliffe modelling efficiency (E) was used to compare observed soil analyses values and predicted values with the different methods (1 = perfect match; 0 and below not better than or worse than using the average).
RESULTS AND DISCUSSION
Soil analyses from the validation farms in Mukuyu indicate that soils in general have a low
pH and are relatively low in organic matter (low TC) and have low CEC (Table 1). Among the nutrients presented in Table 1, especially plant-available contents of P, Ca, S and Zn are low in the area. The 10th percentile (p10) values show that most nutrients are very low in some parts. Statistics for these farms derived from regional maps covering the entire Murugusi watershed show that the median value is captured relatively well, but that the range of data and the values in specific plots

1st African Conference on Precision Agriculture | 8-10 December | 2020
193
are difficult to assess. The iSDA database performs even worse in terms of capturing the spread of data, but the median is fairly accurate for some properties (clay content, pH, CEC and plant-available contents of P, K and Ca are within about 20% of the observed median).
The modelling efficiencies for the tested methods can be examined in Table 2. Using already available map products (regional map and continental database, respectively) was clearly not successful. To have at least 30 local soil analyses was a major improvement. Just by interpolating these soil data gave models that were better than using the village average. Downscaling of the continental database by the local soil samples did improve the performance of that dataset, but it was not better than just interpolating the soil data. Models based on the spectral methods were in most cases the best approach. Even a limited number of local soil analyses was sufficient to construct calibration models for NIR, MIR and PXRF sensors useful for rapid and functioning assessment of clay content, TC content, pH, CEC, Ca and Mg. If only 30 calibration samples were available, especially the MIR models performed well. However, for P and Zn, (and to some extent for K and S) none of the tested methods were useful, not even when as many as 110 local observations were used for model calibration. Note, however, that we did not assess the performance of sensors calibrated on the national level, but earlier studies have shown that such models can be improved by spiking with local data (e.g. Wetterlind & Stenberg, 2010; Nocita et al., 2015). Another option not tested is to combine different sensors in the modelling. In previous research in an area in central Kenya, it was possible to generate well performing local models for all of these soil nutrients except for P when multiple sensors were combined (Piikki et al., 2016).
Digital soil mapping, where digital soil properties maps are created by empirical modelling using spatial covariates, has become increasingly used at all spatial scales. This is of course particularly interesting in areas where soil sampling and chemical analysis are sparse, since it may provide easily accessible information at a seemingly high detail. As has been shown here and in earlier research care must be taken before such data is applied for decision support at the farm or field level (Nijbroek et al., 2019; Söderström et al., 2017). The best approach to use such products is to combine the data with some local data to both assess the performance, and if needed use the local data for downscaling. Systems for this purpose are now available, e.g. GSDM online (https://gsdm.online; Nzuki, 2019).
To conclude, in order to produce detailed information of soil conditions for smallholder farms for more accurate management decision, this study conducted in western Kenya suggests that at least a small number of soil analyses from the village is important. A collaborative approach among farmers within an area or village can facilitate detailed and cost-effective soil properties mapping, where parts of samples are analyzed in the laboratory, and most samples are scanned by a combination of sensors.
ACKNOWLEDGEMENTS
Funding; VGR/SLU (contract: RUN 2018-00141), Formas/SIDA (contract: 220-1975-
2013), Formas (contract: 220-2014-00646), BMZ (contract: 81206681), and GIZ (contract: 81193729). Thanks to the farmers in Mukuyu and the surrounding watershed for good collaboration. The soil samples were collected by J. Mukulama, S. Munialo, J. Mutua, S. Nyawade, R. Rogito, and G. Kavochi.

1st African Conference on Precision Agriculture | 8-10 December | 2020
194
Table 1. Summary statistics (10th, 50th and 90th percentiles) of soil analyses from samples collected at 56 smallholder farms in Mukuyu village in western Kenya. Similar statistics are shown for the regional soil maps of the Murugusi watershed, as well as for the iSDA continental soil database.
Table 2. Modelling efficiency (E) for predictions of soil properties of 56 smallholder farms in Mukuyu village using various methods. Cells are coloured according to performance: darkest is the best (>0.70) – to uncoloured (<0.10) indicating a model similar to the village average or worse.
p10 Median p90 p10 Median p90 p10 Median p90Clay (%) 22 36 42 30 32 33 38 40 42TC (%) 0.93 1.31 1.82 1.18 1.42 1.78 2.01 2.22 2.45pH 5.0 5.4 6.0 5.2 5.7 6.2 5.7 5.7 5.8CEC (cmolc kg-1) 5.7 8.5 13.3 7.8 10.6 15.2 9.0 10.0 11.0P (ppm) 5.5 13.9 26.3 11.6 15.4 18.2 10.0 11.0 12.2K (ppm) 55 130 218 87 125 220 122 134 148Ca (ppm) 342 787 1310 652 991 1800 812 945 1097Mg (ppm) 73 117 267 108 163 239 134 164 181S (ppm) 4.5 10.8 15.5 5.6 7.0 10.9 4.5 5.0 5.0Zn (ppm) 1.0 2.0 4.6 0.9 1.7 2.8 3.3 3.7 3.7
Village samples (n=56) Regional map Continental database
Clay TC pH CEC P K Ca Mg S Zn(%) (%) (cmolc kg-1) (ppm) (ppm) (ppm) (ppm) (ppm) (ppm)
Regional map 0.11 -0.31 -0.15 -0.08 -0.04 0.18 -0.64 0.05 -0.73 -0.23Continental map -0.85 -5.54 -0.16 0.01 -0.19 -0.03 -0.07 0.15 -2.45 -0.32
30 soil analysesInterpolation 0.29 0.36 0.09 0.26 -0.21 -0.03 0.33 0.46 0.35 -0.06Downscaling 0.24 0.15 0.05 0.26 -0.25 -0.02 0.20 0.46 0.20 -0.11NIR 0.42 0.08 0.31 0.41 -0.07 0.20 0.43 0.42 0.11 0.03MIR 0.79 0.76 0.52 0.50 -0.21 0.11 0.46 0.67 0.00 0.03PXRF 0.80 0.14 -0.52 0.58 -0.06 -0.94 0.37 0.62 -0.09 0.14
70 soil analysesInterpolation 0.12 0.30 0.05 0.22 -0.34 0.12 0.17 0.23 0.28 -0.58Downscaling 0.09 0.14 0.00 0.15 -0.33 0.12 -0.26 0.24 0.21 -0.71NIR 0.63 0.61 0.48 0.70 -0.07 0.30 0.71 0.66 0.18 -0.02MIR 0.83 0.85 0.79 0.83 -0.23 0.12 0.94 0.83 0.08 -0.23PXRF 0.77 0.48 0.40 0.78 -0.17 -0.25 0.74 0.71 -0.29 0.04
110 soil analysesInterpolation 0.29 0.28 0.03 0.27 -0.05 0.14 0.20 0.41 0.27 -0.44Downscaling 0.21 0.21 0.04 0.26 -0.05 0.14 0.12 0.42 0.25 -0.49NIR 0.62 0.41 0.71 0.78 -0.01 0.43 0.79 0.74 0.17 -0.48MIR 0.84 0.86 0.67 0.81 -0.11 -2.95 0.80 0.88 0.35 -11.20PXRF 0.84 0.56 0.44 0.62 -0.63 0.14 0.65 0.83 0.09 0.13

1st African Conference on Precision Agriculture | 8-10 December | 2020
195
REFERENCES
Djurfeldt AA, Wambugu SK. 2011. In-kind transfers of maize, commercialization and household consumption in Kenya. J East Afr Studies 5: 447–464.
Hengl T, Leenaars JGB, Shepherd KD, et al. 2017. Soil nutrient maps of Sub-Saharan Africa: assessment of soil nutrient content at 250 m spatial resolution using machine learning. Nutr Cycl Agroecosys.109: 77-102.
Hengl T, Miller M, Križan J, Kilibarda M. 2020. iSDAsoil (Version v0.13) [Data set]. Zenodo. https://zenodo.org/search?page=1&size=50&q=iSDAsoil
Kihara J, Nziguheba G, Zingore S, et al. 2016. Understanding variability in crop response to fertilizer and amendments in sub-Saharan Africa. Agr Ecosyst Environ. 229: 1–12.
Kihara J, Bolo P, Kinyua M, et al. 2020. Micronutrient deficiencies in African soils and the human nutritional nexus: opportunities with staple crops. Environ Geochem Hlth. 42: 3015–3033.
Nijbroek R, Piikki K, Söderström M, et al. 2018. Soil Organic Carbon Baselines for Land Degradation Neutrality: Map Accuracy and Cost Tradeoffs with Respect to Complexity in Otjozondjupa, Namibia. Sustainability 10: 1610.
Nocita M, Stevens A, van Wesemael B, et al. 2015. Chapter Four - Soil Spectroscopy: An Alternative to Wet Chemistry for Soil Monitoring. Adv Agron. 132: 139–59.
Rurinda J, Zingore S, Jibrinc JM, et al. 2020. Science-based decision support for formulating crop fertilizer recommendations in sub-Saharan Africa. Agr Syst. 180: 102790.
Nzuki R. 2019. Simplifying soil data management in sub-Saharan Africa. Blog of the Alliance of Bioversity International and International Center for Tropical Agriculture (CIAT). https://blog.ciat.cgiar.org/simplyfying-soil-data-management-in-sub-saharan-africa/
Piikki K, Söderström M, Eriksson J , et al. 2016. Performance Evaluation of Proximal Sensors for Soil Assessment in Smallholder Farms in Embu County, Kenya. Sensors 16: 1950.
Piikki K, Söderström M, Sommer R, et al. 2019. A boundary plane approach to map hotspots for achievable soil carbon sequestration and soil fertility improvement. Sustainability 11: 4038.
Piikki K, Söderström M, Stadig H, Martinsson J. 2019. Automated mixed-scale data fusion for mapping of within-field variation in a national decision support system - the example of pH correction. In: Stafford, J.V. (Ed.) Precision Agriculture '19. Wageningen Academic Publishers, Wageningen, the Netherlands, pp 993–1000.
Savitzky A, Golay M. 1964. Smoothing and differentiation of data by simplified least squares procedures. Anal Chem 36: 1627–1639.
Viscarra Rossel RA, Adamchuch VI, Sudduth KA, et al. 2011. Chapter Five - Proximal Soil Sensing: An Effective Approach for Soil Measurements in Space and Time. Adv Agron. 113: 243–291.
Wetterlind J, Stenberg B. 2010. Near-infrared spectroscopy for within-field soil characterization: small local calibrations compared with national libraries spiked with local samples. Eur J Soil Sci. 61: 823–843.
Söderström M, Piikki K, Cordingley J. 2017. Improved usefulness of continental soil databases for agricultural management through local adaptation. South African Journal of Plant and Soil 34: 35–45. DOI: 10.1080/02571862.2016.1166400
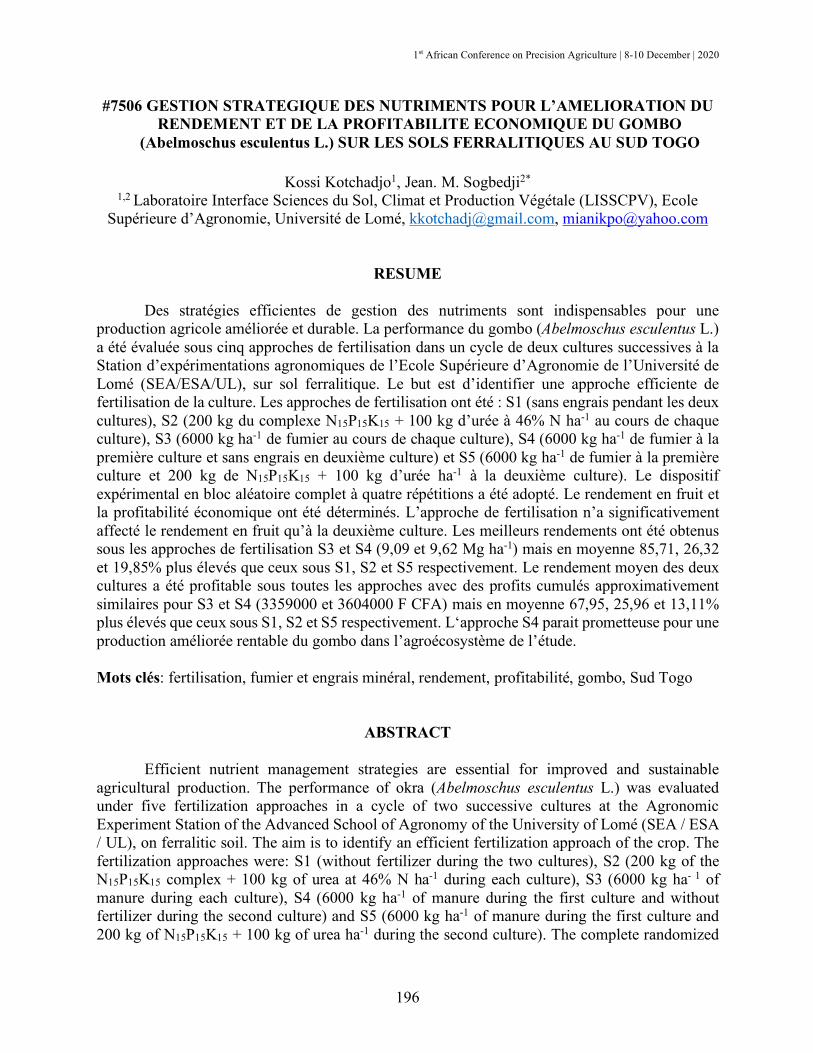
1st African Conference on Precision Agriculture | 8-10 December | 2020
196
#7506 GESTION STRATEGIQUE DES NUTRIMENTS POUR L’AMELIORATION DU RENDEMENT ET DE LA PROFITABILITE ECONOMIQUE DU GOMBO
(Abelmoschus esculentus L.) SUR LES SOLS FERRALITIQUES AU SUD TOGO
Kossi Kotchadjo1, Jean. M. Sogbedji2* 1,2 Laboratoire Interface Sciences du Sol, Climat et Production Végétale (LISSCPV), Ecole
Supérieure d’Agronomie, Université de Lomé, [email protected], [email protected]
RESUME
Des stratégies efficientes de gestion des nutriments sont indispensables pour une production agricole améliorée et durable. La performance du gombo (Abelmoschus esculentus L.) a été évaluée sous cinq approches de fertilisation dans un cycle de deux cultures successives à la Station d’expérimentations agronomiques de l’Ecole Supérieure d’Agronomie de l’Université de Lomé (SEA/ESA/UL), sur sol ferralitique. Le but est d’identifier une approche efficiente de fertilisation de la culture. Les approches de fertilisation ont été : S1 (sans engrais pendant les deux cultures), S2 (200 kg du complexe N15P15K15 + 100 kg d’urée à 46% N ha-1 au cours de chaque culture), S3 (6000 kg ha-1 de fumier au cours de chaque culture), S4 (6000 kg ha-1 de fumier à la première culture et sans engrais en deuxième culture) et S5 (6000 kg ha-1 de fumier à la première culture et 200 kg de N15P15K15 + 100 kg d’urée ha-1 à la deuxième culture). Le dispositif expérimental en bloc aléatoire complet à quatre répétitions a été adopté. Le rendement en fruit et la profitabilité économique ont été déterminés. L’approche de fertilisation n’a significativement affecté le rendement en fruit qu’à la deuxième culture. Les meilleurs rendements ont été obtenus sous les approches de fertilisation S3 et S4 (9,09 et 9,62 Mg ha-1) mais en moyenne 85,71, 26,32 et 19,85% plus élevés que ceux sous S1, S2 et S5 respectivement. Le rendement moyen des deux cultures a été profitable sous toutes les approches avec des profits cumulés approximativement similaires pour S3 et S4 (3359000 et 3604000 F CFA) mais en moyenne 67,95, 25,96 et 13,11% plus élevés que ceux sous S1, S2 et S5 respectivement. L‘approche S4 parait prometteuse pour une production améliorée rentable du gombo dans l’agroécosystème de l’étude. Mots clés: fertilisation, fumier et engrais minéral, rendement, profitabilité, gombo, Sud Togo
ABSTRACT
Efficient nutrient management strategies are essential for improved and sustainable agricultural production. The performance of okra (Abelmoschus esculentus L.) was evaluated under five fertilization approaches in a cycle of two successive cultures at the Agronomic Experiment Station of the Advanced School of Agronomy of the University of Lomé (SEA / ESA / UL), on ferralitic soil. The aim is to identify an efficient fertilization approach of the crop. The fertilization approaches were: S1 (without fertilizer during the two cultures), S2 (200 kg of the N15P15K15 complex + 100 kg of urea at 46% N ha-1 during each culture), S3 (6000 kg ha- 1 of manure during each culture), S4 (6000 kg ha-1 of manure during the first culture and without fertilizer during the second culture) and S5 (6000 kg ha-1 of manure during the first culture and 200 kg of N15P15K15 + 100 kg of urea ha-1 during the second culture). The complete randomized

1st African Conference on Precision Agriculture | 8-10 December | 2020
197
block design with four replications was adopted. Fruit yield and economic profitability were determined. The fertilization approach only significantly affected fruit yield during the second culture. The best yields were obtained under the S3 and S4 fertilization approaches (9.09 and 9.62 Mg ha-1) but on average 85.71, 26.32 and 19.85% higher than those under S1, S2 and S5 respectively. The average yield of the two cultures was profitable under all approaches with cumulative profits roughly similar for S3 and S4 (3,359,000 and 3,604,000 F CFA) but on average 67.95, 25.96 and 13.11% higher than those under S1, S2 and S5 respectively. The S4 approach seems promising for sustaining enhanced okra crop productivity and profitability in the agro-ecosystem of the study. Keywords: fertilization, manure and mineral fertilizer, yield, profitability, okra, South Togo
INTRODUCTION
Durant les trois dernières décennies, l’Afrique Subsaharienne a connu une croissance de sa population de 3,1% contre 2,1% de sa production alimentaire (Henao et al., 2006). Cette situation se matérialise par une pression sévère sur les ressources en terre, une disparition des pratiques traditionnelles d’utilisation des terres et la prévalence des approches d’utilisation continue des terres. Pourtant selon Liniger et al., (2011), la production alimentaire devrait augmenter de 70% d’ici l’horizon de 2050 pour répondre au besoin calorique nécessaire à la population. Dans ces conditions, seule l’intensification agricole est reconnue comme la principale opportunité pour faire face à ce besoin alimentaire sans cesse croissant (Kihara et al., 2012). Cette intensification doit impérativement se baser sur une gestion efficiente et raisonnée des nutriments. Aussi dans les conditions socioéconomiques de l'Afrique, il est prôné que la fertilisation des sols soit focalisée sur la technologie de la matière organique où l'on recommande l'usage maximal des nutriments d'origine organique et la minimisation de l'usage d'engrais chimiques qui sont d'ailleurs très coûteux (Smalling et al., 1992 cité par Adden, 2008) en vue d'améliorer la santé du sol. Par ailleurs, étant donné que les besoins des plants en éléments nutritifs varient d’une culture à une autre et que l’efficience interne des fertilisants suit également la même dynamique, il devient urgent de développer des technologies de fertilisation appropriées à chaque spéculation. C’est dans cette même logique que Sogbedji (2001) insiste sur la compréhension de la dynamique des nutriments dans le système sol - plante - atmosphère afin de prévenir la dégradation des sols en ressources de base et soutenir donc une production agricole efficiente avec une gestion propre des nutriments. La présente étude s’intéresse donc particulièrement à la production du gombo vue son importance dans la lutte contre la faim et la pauvreté. En effet, le gombo joue un rôle remarquable et original du fait de la valorisation de toutes ses parties tant sur le plan alimentaire que médicinal, sur le plan artisanal qu’industriel (Marius et al., 1997). Cependant la production du gombo rencontre malheureusement toute une panoplie de contraintes influençant négativement sa productivité. Parmi ces contraintes, la pauvreté des sols occupe une place majeure. Conscient de cette situation, des efforts concrets de recherche ont été effectués par bon nombre de chercheurs dans la plupart des pays de la sous – région pour accroître la production de ladite culture ; tandis qu’au Togo aucune stratégie de fertilisation appropriée n’est disponible par rapport à la culture du gombo jusqu’à ce jour. D’où la pertinence de cette étude qui consiste à étudier d’une part, l’effet continu du fumier et des engrais minéraux, d’autre part l’effet alterné des deux fertilisants et enfin l’effet résiduel du fumier sur la productivité et la profitabilité du gombo ainsi que sur la santé du sol.

1st African Conference on Precision Agriculture | 8-10 December | 2020
198
L’objectif principal attaché à cette étude est d’améliorer durablement la production du gombo au Togo méridional à travers des stratégies de gestion des nutriments techniquement, socialement, économiquement justifiées et respectueuse de l’environnement. Spécifiquement l’étude vise à : (i) tester différentes approches de fertilisation sur la productivité du gombo, (ii) évaluer la rentabilité économique des différentes approches et (iii) identifier une approche efficiente de la fertilisation de la culture.
MATERIEL ET METHODE
Site Expérimental L’essai a été réalisé à la Station d’Expérimentation Agronomique de Lomé (SEAL) de
l’Ecoles Supérieure d’Agronomie de l’Université de Lomé (06°17’N, 001°21’E) dans la région maritime. La pluviométrie annuelle fluctue entre 800 à 1100 mm tandis que la température moyenne annuelle est de 27 °C. Cette station est caractérisée par un sol ferralitique communément appelé « terre de barre ». Ce dernier est bien drainé et possède un faible taux de matière organique (< 10 g.kg-1). Sa teneur en potassium (K) est inférieure à 2 cmol kg-1 ; il a un contenu en phosphore total (P total) variant de 250 à 300 mg kg-1, une capacité d’échange cationique de 3 à 4 méq.kg-1, un pH de 5,2 à 6,8 (Raunet, 1973 ; Tossah, 2000). Son contenu sableux est approximativement de 800 g kg-1 dans l’horizon 0 – 20 cm et décroît à moins de 600 g.kg-1 à partir de 50 à 120 cm de profondeur (Lamouroux, 1969). Signalons que le site a été sous culture continue du maïs (zea mays L.) durant deux ans avant l’installation de cette expérimentation. Dispositif expérimental et approches de fertilisation adoptées
Différentes approches de fertilisation ont été adoptées dans un cycle de deux cultures successives (tableau 1). Ces dernières ont été entre autre: S1 (sans engrais pendant les deux cultures), S2 (200 kg du complexe N15P15K15 + 100 kg d’urée à 46% N ha-1 au cours de chaque culture), S3 (6000 kg ha-1 de fumier au cours de chaque culture), S4 (6000 kg ha-1 de fumier à la première culture et sans engrais en deuxième culture) et S5 (6000 kg ha-1 de fumier à la première culture et 200 kg de N15P15K15 + 100 kg d’urée ha-1 à la deuxième culture). Les différentes approches de fertilisation sont clairement explicitées dans le tableau 1 ci-dessous. Le dispositif expérimental adopté a été celui en blocs aléatoires complets à 4 répétitions. La superficie de la parcelle expérimentale a été de 265m2 soit 25m x 10,6m. L’unité expérimentale a consisté en une planche de 9,6 m2 soit 4,8m de long sur 2m de large. Au total 20 planches ont constitué la parcelle expérimentale. Les planches ont été espacées de 0,5 m tandis que l’espacement entre les différents blocs a été 1m. Gestion du sol et de la culture
L’étude a été portée sur une variété locale de gombo (Abelmoschus esculentus L. Moench). Le semis a été effectué le 19 septembre 2015 et le 15 Janvier 2016 respectivement pour la 1ère et la 2ème culture et est précédé d’un labour ainsi que la confection des planches. L’application du fumier de ferme (crottes de petits ruminants) et de la fumure minérale NPK : 15-15-15 a été intervenue au 25è jour après semis (JAS) durant les deux cultures ; alors que l’Urée a été appliquée dès le début de la floraison (soit 43 JAS) des plants de gombo. Rappelons que la densité de semis a été de 3grains/poquet suivi d’un démariage à un plant/poquet au stade 3 feuilles et que le schéma cultural 60cm X 40cm a été adopté. Les travaux d’entretien ont consisté aux opérations suivantes:

1st African Conference on Precision Agriculture | 8-10 December | 2020
199
ü Un arrosage régulier jusqu’à la fin de la récolte; ü Un sarclobinage; ü La protection phytosanitaire a été effectuée ici pour lutter en particulier contre les maladies
fongiques et les insectes vecteurs de maladies virales. La première récolte a été faite le 51è et le 48è (JAS) respectivement pour la 1ère et la 2ème
culture tandis que la dernière a eu lieu le 97è et le 110è JAS respectivement pour la 1ère et 2ème culture. La récolte a été faite tous les deux ou trois jours de telle sorte que le fruit ne soit pas ligneux avant d’être récolté. Méthode de collecte et d’analyse des données
Le rendement en fruit a été évalué sur les trois lignes centrales sur cinq de chaque unité expérimentale en cumulant les productions de chaque traitement en fin de récolte. L’analyse des données a été effectuée par le logiciel GenStat édition 4 suivant la méthode ANOVA au seuil de 5%. Les différentes moyennes ont été discriminées par le test de DUNCAN au seuil de 5%. Tableau 1. Approches de fertilisation dans un cycle de deux cultures successives. Approche de fertilisation
Culture 1 Culture 2
S1 Sans engrais Sans engrais S2 200 kg N15P15K15 + 100 kg urée
ha-1 200 kg N15P15K15 + 100 kg urée ha-1
S3 Fumier, 6 Mg ha-1 Fumier, 6 Mg ha-1 S4 Fumier, 6 Mg ha-1 Sans engrais S5 Fumier, 6 Mg ha-1 200 kg N15P15K15 + 100 kg urée ha-1
Analyse économique
La profitabilité de chaque approche de fertilisation a été estimée à travers une analyse de bilan partiel qui est la différence entre le gain brut (output) et la charge totale ou input (coût des intrants + coût des travaux manuels). Le gain brut a été constitué par le montant d’argent correspondant au rendement moyen en fruit de chaque traitement, qui a été supposé être vendu à 300 F CFA kg-1. Les intrants ont été constitués par les coûts associés à chaque traitement incluant ceux liés à l’achat des semences, des fertilisants et des pesticides. Tandis que les travaux manuels ont consisté à la préparation du sol, au semis, au sarclage, à la récolte et travaux connexes. Le coût de la main d’œuvre a été estimé à 2000 F CFA par personne-jour ; le montant de 11000 F CFA par sac de 50 kg d’engrais NPK : 15-15-15 et d’urée à 46% d’azote (prix subventionné par le gouvernement) a été utilisé et le prix de la tonne de fumier de ferme a été estimé à 20 000 F CFA. L’estimation de la main d’œuvre par approche de fertilisation et par culture est présentée dans les Tableaux 2 et 3.
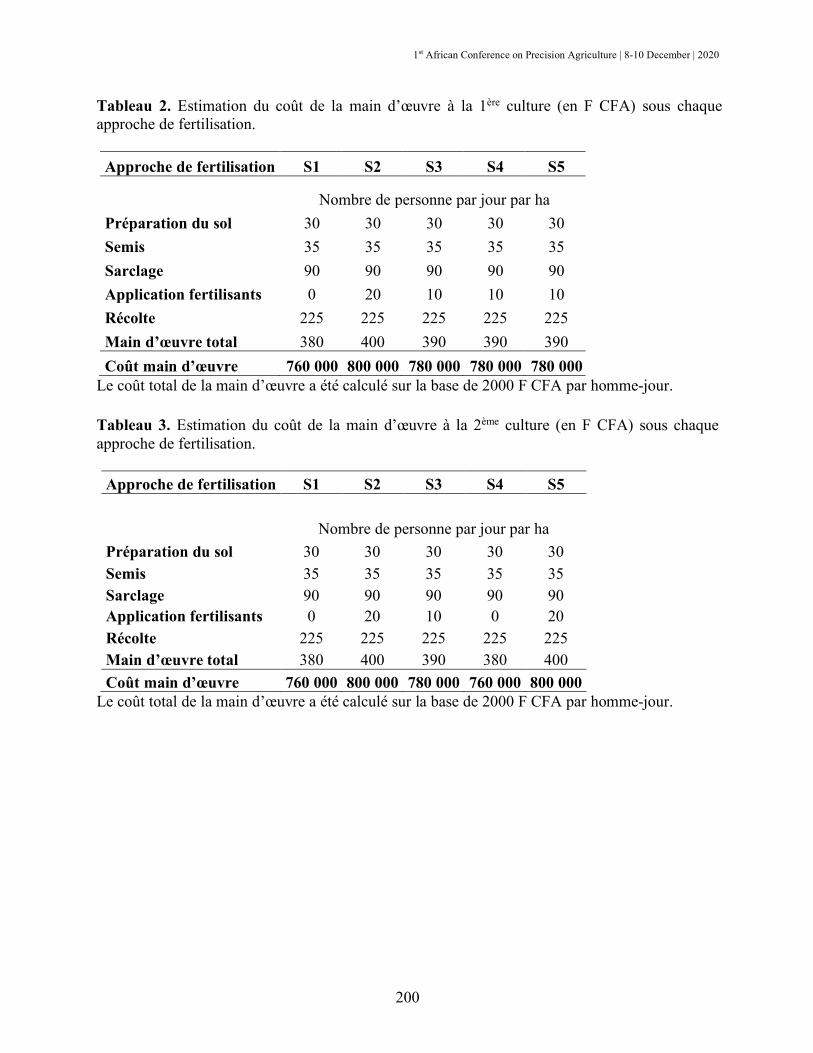
1st African Conference on Precision Agriculture | 8-10 December | 2020
200
Tableau 2. Estimation du coût de la main d’œuvre à la 1ère culture (en F CFA) sous chaque approche de fertilisation.
Approche de fertilisation S1 S2 S3 S4 S5 Nombre de personne par jour par ha Préparation du sol 30 30 30 30 30 Semis 35 35 35 35 35 Sarclage 90 90 90 90 90 Application fertilisants 0 20 10 10 10 Récolte 225 225 225 225 225 Main d’œuvre total 380 400 390 390 390 Coût main d’œuvre 760 000 800 000 780 000 780 000 780 000
Le coût total de la main d’œuvre a été calculé sur la base de 2000 F CFA par homme-jour. Tableau 3. Estimation du coût de la main d’œuvre à la 2ème culture (en F CFA) sous chaque approche de fertilisation.
Approche de fertilisation S1 S2 S3 S4 S5 Nombre de personne par jour par ha Préparation du sol 30 30 30 30 30 Semis 35 35 35 35 35 Sarclage 90 90 90 90 90 Application fertilisants 0 20 10 0 20 Récolte 225 225 225 225 225 Main d’œuvre total 380 400 390 380 400 Coût main d’œuvre 760 000 800 000 780 000 760 000 800 000
Le coût total de la main d’œuvre a été calculé sur la base de 2000 F CFA par homme-jour.

1st African Conference on Precision Agriculture | 8-10 December | 2020
201
RESULTATS ET DISCUSSION
Rendement en fruit du gombo Tableau 4. Effet des différentes approches de fertilisation sur le rendement en fruit du gombo (en Mg/ha).
Approches S1 S2 S3 S4 S5 Culture 1 8,53±0,84 a 9,17±0,20 a 9,7±0,33 a 9,52±0,15 a 9,93±0,56 a Culture 2 5,04±2,75 c 7,41±0,38 b 9,09±1,29 ab 9,62±1,83 a 7,81±0,01 ab Moyenne 6,79±1,79 8,29±0,29 9,39±0,81 9,57±0,99 8,87±0,29
CV Culture 1 = 9,8 % ; CV Culture 2 = 15,2 %. Les valeurs d’une même ligne affectées d’un même indice de lettre sont statistiquement identiques au seuil de 5%. S1 (sans engrais pendant les deux saisons), S2 (200 kg du complexe N15P15K15 + 100 kg d’urée à 46% N ha-1 au cours des deux saisons), S3 (6000 kg ha-1 de fumier pendant les deux saisons), S4 (6000 kg ha-1 de fumier à la première saison et sans engrais en deuxième saison) et S5 (6000 kg ha-1 de fumier à la première saison et 200 kg de N15P15K15 + 100 kg d’urée ha-1 à la deuxième saison).
L’Analyse de la variance au seuil de 5% du rendement en fruit du gombo n’a révélé aucune différence significative pour les différentes approches de fertilisation à la 1ère culture ; par contre elle s’est révélée significative à la 2è culture (tableau 4). La discrimination des moyennes des différentes approches à la 2è culture par le test de DUNCAN au seuil de 5% nous a permis d’avoir trois classes (a, b et c) et une classe intermédiaire ab.
Ainsi les rendements obtenus aux niveaux des approches S4, S3, S5 et S2 ont été respectivement supérieurs de 90,87, 80,36, 54,96 et 47,02% comparés à S1, les rendements sous S4, S3 et S5 ont été supérieurs à S2 de 29,82, 22,67 et 5,40% respectivement, les rendements sous S4 et S3 ont été de 23,18 et 16,39% respectivement plus élevés que S5 tandis que le rendement sous S4 a été de 5,83% supérieur à S3.
Les rendements moyens des deux cultures sous S4, S3, S5 et S2 ont été plus élevés de 40,94, 38,29, 30,63 et 22,09% respectivement par rapport à S1, les rendements moyens sous S4, S3 et S5 ont été de 15,44, 13,27 et 7,00% supérieurs comparés à S2 respectivement, les rendements moyens sous S4 et S3 ont été caractérisés par une supériorité de 7,89 et 5,86% comparativement à S5 respectivement pendant que le rendement moyen sous S4 a été de 1,92% plus élevé que celui obtenu sous S3.
L’absence d’effet des différentes approches de fertilisation sur le rendement en fruit du gombo à la 1ère culture serait inhérente à la bonne fertilité initiale du sol due aux effets résiduels des engrais minéraux (NPK, TSP, KCl et l’Urée USG) utilisés successivement pendants 2 ans sous culture continue du maïs (précédent cultural) avant l’installation de notre culture du gombo. En effet le maïs restitue assez de résidus de récolte riche en potassium et en azote (soit 1.2% et 0.7% respectivement) ; de plus les engrais phosphatés à l’instar du TSP utilisé ont tendance à libérer progressivement leur phosphore. « D’une manière générale, même s’ils sont apportés sous une forme soluble, les engrais phosphatés et potassiques ne sont jamais utilisés en totalité par les cultures. Celles-ci ne prélèvent en moyenne que 0 à 30 % des apports. Le reste est fixé dans le sol sous des formes plus ou moins disponibles. » (Asdrubal, 2006).

1st African Conference on Precision Agriculture | 8-10 December | 2020
202
La supériorité des rendements obtenus aux niveaux des approches S3 et S4 pendant la deuxième culture soit en moyenne 85,71, 26,32 et 19,85% plus élevés que les rendements sous S1, S2 et S5 respectivement, serait due d’une part au fait que le fumier de ferme utilisé a amélioré les propriétés physico-chimiques et biologiques du sol ; d’autre part à ses effets résiduels étant donné qu’il libère graduellement ses nutriments (en particulier l’azote). Ces résultats sont en conformité avec ceux obtenus par bon nombre d’auteurs notamment (Abd-Allah et al., 2001; Aly, 2002; Bayoumi, 2005; Ehaliotis et al., 2005 cité par Omidire et al., 2015) montrant donc que l’utilisation de fertilisants organiques accroît considérablement le rendement comparé aux engrais chimiques. Les résultats de cette étude viennent confirmer également les efforts de recherches de (Allah et al., 2013 ; Awodun, 2007) indiquant que le fumier de ferme améliore le rendement en fruit du gombo.
Cependant la faiblesse du rendement au niveau de l’approche S2 au cours de cette seconde culture peut être liée d’une part à une lixiviation des engrais apportés ; d’autre part à l’intoxication du sol. En effet l’utilisation continue de la fumure minérale sans combinaison ni rotation avec la matière organique est préjudiciable pour les microorganismes telluriques et par conséquent pour la santé et la productivité des sols.
Par ailleurs en apportant la fumure minérale tout juste après un apport de la matière organique (fumier), on peut espérer un effet positif sur le rendement en fruit du gombo ; pourtant nous faisons face à une situation contraire au niveau de l’approche S5 où on assiste à une chute numérique de rendement comparé aux approches S4 et S3 ; ceci peut être justifié par la loi des rendements moins que proportionnel. D’où la nécessité de tenir compte de l’arrière effet de la matière organique dans la formulation de nos différents engrais chimiques. Ce résultat est en adéquation avec celui obtenu par Maltas et al., (2012) signalant que « L’azote apporté par le fumier représente 16 % du N total apporté l’année de l’apport, 8 % un an plus tard et 5 % deux ans après. Donc la non prise en compte de ces valeurs fertilisantes dans le calcul de la fertilisation azotée accroît les stocks d’azote minéral du sol à la récolte et donc, les risques de lixiviation ».
Toutefois l’analyse de la production moyenne des deux cultures nous indique que les différentes stratégies de fertilisation (apport de fumure organique et/ou minérale) ont favorablement affecté le rendement en fruit du gombo ; ce qui se démarque par leurs supériorités caractéristiques par rapport au témoin continu sans apport (S1). Analyse économique
Les profits réalisés durant les deux cultures sous les différentes approches de fertilisation sont consignés dans le tableau 5. Les outputs des différentes stratégies ont suivi la dynamique des rendements étant donné que le kilogramme du fruit du gombo a été supposé vendu à un prix unique de 300 F CFA. L’analyse du tableau 6 nous montre que les profits engendrés par les 5 approches à la première culture ont été d’une manière générale identiques. Par contre ces derniers ont beaucoup fluctué à la deuxième culture ; c’est ainsi que les profits sous S4, S3, S5 et S2 ont été de 267,84, 209,55, 141,33 et 117,93% respectivement supérieurs à S1, les profits sous S4, S3 et S5 ont été de 68,78, 42,04 et 10,73% plus élevés respectivement comparé à S2, les profits sous S4 et S3 ont été de 52,42 et 28,27% respectivement supérieurs par rapport à S5 alors que le profit sous S4 a été de 18,83% supérieur comparativement à S3.
On note également une forte dépression de profit aux niveaux des approches S1, S5 et S2 ; et une dépression moyenne au niveau de l’approche S3 à la deuxième culture comparée à la première, soit respectivement 67,12, 32,72, 32,08 et 10,33% tandis qu’un gain de 9,90% a été enregistrée au niveau de la stratégie S4.

1st African Conference on Precision Agriculture | 8-10 December | 2020
203
Toutefois, en considérant le profit cumulé des deux cultures, on voit que toutes les approches de fertilisation ont été profitables. Cependant le meilleur profit se retrouve toujours au niveau de l’approche S4 suivi respectivement des stratégies S3, S5, S2 et S1. D’une manière plus claire, les profits cumulés sous les stratégies S4, S3, S5 et S2 ont été de 73,85, 62,04, 48,48 et 33,33% respectivement plus élevés comparés à S1, les profits cumulés sous S4, S3 et S5 ont été de 30,39, 21,53 et 11,36% supérieurs par rapport à celui sous S2 respectivement, les profits cumulés sous S4 et S3 ont été de 17,09 et 9,13% supérieurs respectivement en comparaison avec celui sous S5 alors que le profit cumulé réalisé sous S4 a été de 7,29% plus élevé comparativement à celui sous S3.
En définitive, on voit que les meilleurs profits ont été répertoriés aux niveaux des stratégies de fertilisation S4 et S3 indiquant donc que la technologie de la matière organique seule est plus économiquement rentable pour la culture du gombo dans les conditions de notre étude. Tableau 5. Bilan partiel pour chacune des cinq approches de fertilisation.
APPROCHES S1 S2 S3 S4 S5 ____F CFA ha-1____ PREMIERE CULTURE Output Total +2 559 000 2 751 000 2 910 000 2 856 000 2 979 000 Input Total -999 000 1 105 000 1 139 000 1 139 000 1 139 000 Main d'œuvre (760 000) (800 000) (780 000) (780 000) (780 000) Semence (23 000) (23 000) (23 000) (23 000) (23 000) Fertilisants (0) (66 000) (120 000) (120 000) (120 000) Pesticides (216 000) (216 000) (216 000) (216 000) (216 000) Bénéfice +1 560 000 1 646 000 1 771 000 1 717 000 1 840 000 DEUXIEME CULTURE Output Total +1 512 000 2 223 000 2 727 000 2 886 000 2 343 000 Input Total -999 000 1 105 000 1 139 000 999 000 1 105 000 Main d'œuvre (760 000) (800 000) (780 000) (760 000) (800 000) Semence (23 000) (23 000) (23 000) (23 000) (23 000) Fertilisants (0) (66 000) (120 000) (0) (66 000) Pesticides (216 000) (216 000) (216 000) (216 000) (216 000) Bénéfice +513 000 1 118 000 1 588 000 1 887 000 1 238 000 BENEFICE CUMULE DES DEUX CULTURES +2 073 000 2 764 000 3 359 000 3 604 000 3 078 000
CONCLUSION
Des résultats de cette étude, il ressort que la technologie de la matière organique seule
semble être l’approche à encourager sous la culture du gombo vu son impact en terme de rendement et de profitabilité aux niveaux des stratégies S4 et S3. Toutefois notons que la stratégie S4 (c’est-à-dire le fumier et son arrière effet) semble être plus prometteuse pour une production améliorée et rentable du gombo dans l’agroécosystème de l’étude.

1st African Conference on Precision Agriculture | 8-10 December | 2020
204
RÉFÉRENCES
Abd-Allah AM, Safia MA, Abou-Hadid AF. 2001. Response of Some Tomato Hybrids to the
Organic Fertilizer under Newly Reclaimed Soil Conditions. Egypt Journal Horticulture 28 (3): 341-353.
Adden K A. 2008. Effets de trois systèmes culturaux sur la durabilité de la production de maïs (Zea mays L.) sur sol ferralitique au Togo Méridional. Diplôme de DEA Sciences des Agroressources et Génie de l'Environnement. Université de Lomé – 87p.
Allah B G, Hafiz M S, Shazia J, Tooba M, Muhammad IA, Muhammad A. 2013. Effects of Animal manure on the growth and development of Okra (Abelmoschus esculentus L.). ARPN Journal of Agricultural and Biological Science. ©2006-2013 Asian Research Publishing Network (ARPN). www.arpnjournals.com
Asdrubal M. 2006 Fertilisation et amendements, dossier d’autoformation. ENESAD, Domaine technologique et professionnel, Educagri, 2006.
Awodun MA. 2007. Effect of Goat Manure and Urea Fertilizer on Soil, Growth and Yield of Okra (Abelmoschus esculentus (L.) Moench). International Journal of Agricultural Research 2: 632-636
Henao S, Baanante C. 2006. Agricultural production and soil nutrient mining in Africa: Implication for resource conservation and policy development. IFDC, Muscle shoals, AL 35662, USA, 75 p.
Kihara J, Fatondji D, Jones JW, Hoogenboom G, Tabo R,Bationo A. 2012. Improving Soil Fertility Recommendations in Africa using the Decision Support System for Agrotechnology Transfer (DSSAT).VIII, 187.
Lamouroux M. 1969. Carte pédologique du Togo au 1/1000000. Office de la Recherche Scientifique et Technique Outre-Mer, Centre ORSTOM de Lomé, Togo.
Liniger HP, Mekdaschi SR, Hauert C, Gurtner M. 2011. La pratique de la gestion durable des terres. Directives et bonnes pratiques en Afrique subsaharienne. TerrAfrica, Panorama mondial des approches et technologies de conservation (WOCAT) et Organisation des Nations Unies pour l’alimentation et l’agriculture (FAO). Rome, Italie, 243 pp.
Maltas A, Oberholzer H, Charles R, Bovet V, Sinaj S. 2012. Effet à long terme des engrais organiques sur le rendement et la fertilisation azotée des cultures. Station de recherche Agroscope Changins-Wädenswil ACW, 1260 Nyon ; Station de recherche Reckenholz-Tänikon ART, 8046 Zurich - in Recherche Agronomique Suisse 3 (3): 156–163.
Marius C, Gerard V, Antoine G. 1997. Le gombo, Abelmosehuseseulentus (L.) Moench, une source possible de phospholipides. Agronomie et Biotechnologies, Oléagineux, corps gras, lipides, Vol. 4: 389-392.
Omidire NS, Shange R, Khan V, Bean R, Bean J. 2015. Assessing the Impacts of Inorganic and Organic Fertilizer on Crop Performance Under a Microirrigation-Plastic Mulch Regime, Professional Agricultural Workers Journal: Vol. 3(1); 6. Available at: http://tuspubs.tuskegee.edu/pawj/vol3/iss1/6
Raunet M. 1973. Contribution à l’étude pédologique des terres de barre du Dahomey et du Togo. Agronomie Tropicale 28: 1049-1069.
Sogbedji JM. 2001. Sustaining maize yields in smallholders cropping systems on West Africa ferralsols. Research Project Paper. Rockefeller Foundation / IFS. 11p.

1st African Conference on Precision Agriculture | 8-10 December | 2020
205
Tossah BK. 2000. Influence of soil properties and organic inputs on phosphorus cycling in herbaceous legume-based cropping systems in the West African derived savanna. Ph.D. Thesis No. 428, K.U. Leuven, Belgium.
1st African Conference on Precision Agriculture | 8-10 December | 2020
206
#7513 PRECISION NUTRIENT MANAGEMENT FOR CASSAVA PRODUCTION
Kodjovi S. Ezuia, Meklit Tariku Meklitb, Adeyemi Olojedec, Mutiu Busarid, Peter Deusdedit Mlaye, Florence Olowokered, Joy Adielec,f, Rebecca Enesig,h, Ademola Adebiyih, Christine
Kreyeh, Stefan Hauserh, Frederick Baijukyai, Thompson Ogunsanmih, Theresa Ampadu-Boakyeb, Shamie Zingorea, Bernard Vanlauweb, Pieter Pypersb
a African Plant Nutrition Institute (APNI), Nairobi, Kenya; b International Institute of Tropical Agriculture (IITA), Nairobi, Kenya; c National Root Crops Research Institute, Umudike, Nigeria;
d Federal University of Agriculture Abeokuta (FUNAAB), Nigeria; e Tanzania Agricultural Research Institute (TARI), Mwanza, Tanzania; f Wageningen University and Research Centre (WUR), Wageningen, The Netherlands; g Swiss Federal Institute of Technology, ETH-Zurich,
Switzerland; h International Institute of Tropical Agriculture (IITA), Ibadan, Nigeria; iInternational Institute of Tropical Agriculture (IITA), Dar-es-Salaam, Tanzania, [email protected]
ABSTRACT
Matching nutrient supplies with plant nutrient requirements is key to sustaining crop
production while preserving the environment. However, in cassava production systems in sub-Saharan Africa, fertilizer recommendations are either inexistent or provided as blanket rates. We studied the effects on cassava yield and profitability of site-specific fertilizer rates against farmer’s practices within the framework of the African Cassava Agronomy Initiative (ACAI) project in Nigeria and Tanzania.
A fertilizer recommendation framework combining crop modelling, geospatial analysis, machine learning techniques and price optimization was designed to estimate site-specifc fertilizer rates. This framework uses data on temporal and spatial variabilities of soil and weather, fertilizer and cassava root prices, and farmer’s budget to generate fertilizer recommendations optimized to maximum return for investment. The resulting decision support tool for agronomy advice delivery was used to estimate site-specific fertilizer rates per planting and harvest dates for more than 800 farms in Nigeria and Tanzania in 2018 and 2019. The fertilizer recommendations considered the types of fertilizer available in the regional market, and accompanied with advices on split dressings and timing of fertilizer applications following 4R nutrient stewardship.
Results revealed that large variation in yield response was associated with variation in locations. Recommended fertilizer nutrient rates ranged from 0-120 kg N, 0-23 kg P and 0-115 kg K ha-1 in Nigeria against 0-129 kg N, 0-30 kg P and 0-46 kg K ha-1 in Tanzania for a maximum fertilizer budget of 200 USD ha-1. Application of recommended fertilizer rates generated yield increases in 91% of cases, and 9% negative responses compared with the control without fertilizer. Average yield increase was about 7 t ha-1 in Nigeria and 5 t ha-1 in Tanzania. Revenue generated through these site-specific recommendations were profitable for 72% of the farmers.
Applying site-specific fertilizer rates was beneficial for most farmers. However, the recommendations were highly susceptible to market price fluctuations of cassava roots. Developing affordable fertilizer blends for cassava and linking farmers to markets with more consistent prices may sustain positive returns on investments for cassava producers.
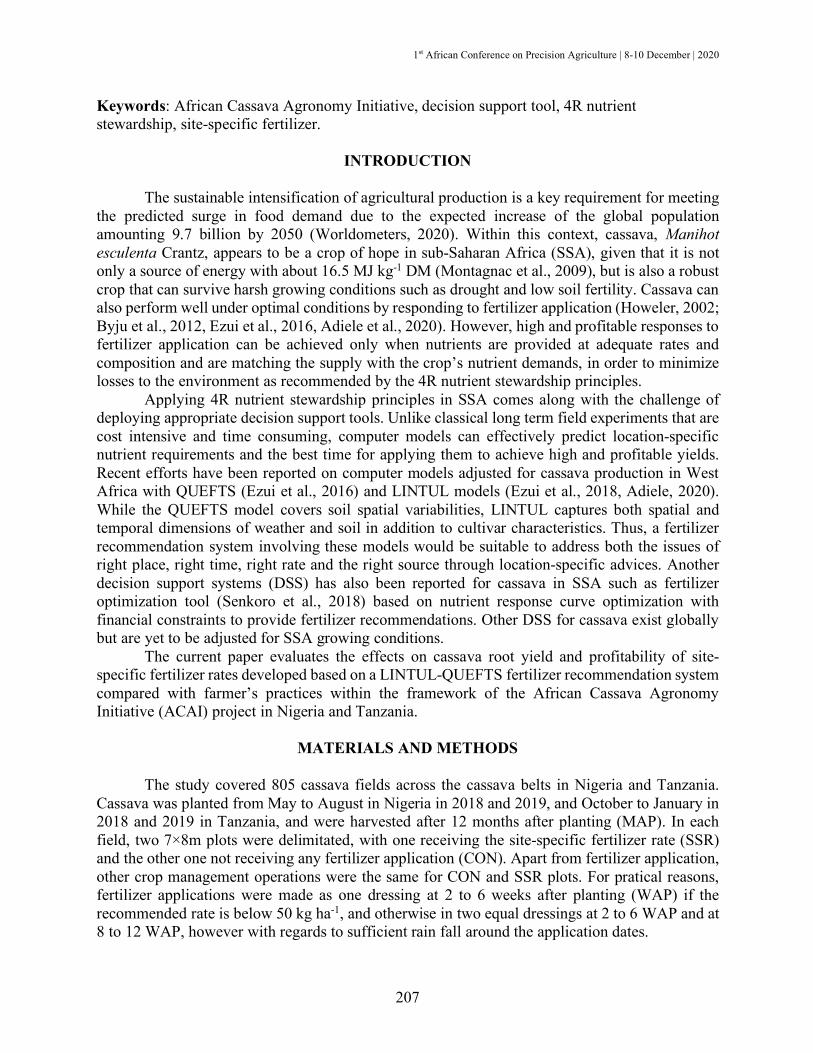
1st African Conference on Precision Agriculture | 8-10 December | 2020
207
Keywords: African Cassava Agronomy Initiative, decision support tool, 4R nutrient stewardship, site-specific fertilizer.
INTRODUCTION
The sustainable intensification of agricultural production is a key requirement for meeting the predicted surge in food demand due to the expected increase of the global population amounting 9.7 billion by 2050 (Worldometers, 2020). Within this context, cassava, Manihot esculenta Crantz, appears to be a crop of hope in sub-Saharan Africa (SSA), given that it is not only a source of energy with about 16.5 MJ kg-1 DM (Montagnac et al., 2009), but is also a robust crop that can survive harsh growing conditions such as drought and low soil fertility. Cassava can also perform well under optimal conditions by responding to fertilizer application (Howeler, 2002; Byju et al., 2012, Ezui et al., 2016, Adiele et al., 2020). However, high and profitable responses to fertilizer application can be achieved only when nutrients are provided at adequate rates and composition and are matching the supply with the crop’s nutrient demands, in order to minimize losses to the environment as recommended by the 4R nutrient stewardship principles.
Applying 4R nutrient stewardship principles in SSA comes along with the challenge of deploying appropriate decision support tools. Unlike classical long term field experiments that are cost intensive and time consuming, computer models can effectively predict location-specific nutrient requirements and the best time for applying them to achieve high and profitable yields. Recent efforts have been reported on computer models adjusted for cassava production in West Africa with QUEFTS (Ezui et al., 2016) and LINTUL models (Ezui et al., 2018, Adiele, 2020). While the QUEFTS model covers soil spatial variabilities, LINTUL captures both spatial and temporal dimensions of weather and soil in addition to cultivar characteristics. Thus, a fertilizer recommendation system involving these models would be suitable to address both the issues of right place, right time, right rate and the right source through location-specific advices. Another decision support systems (DSS) has also been reported for cassava in SSA such as fertilizer optimization tool (Senkoro et al., 2018) based on nutrient response curve optimization with financial constraints to provide fertilizer recommendations. Other DSS for cassava exist globally but are yet to be adjusted for SSA growing conditions.
The current paper evaluates the effects on cassava root yield and profitability of site-specific fertilizer rates developed based on a LINTUL-QUEFTS fertilizer recommendation system compared with farmer’s practices within the framework of the African Cassava Agronomy Initiative (ACAI) project in Nigeria and Tanzania.
MATERIALS AND METHODS
The study covered 805 cassava fields across the cassava belts in Nigeria and Tanzania. Cassava was planted from May to August in Nigeria in 2018 and 2019, and October to January in 2018 and 2019 in Tanzania, and were harvested after 12 months after planting (MAP). In each field, two 7×8m plots were delimitated, with one receiving the site-specific fertilizer rate (SSR) and the other one not receiving any fertilizer application (CON). Apart from fertilizer application, other crop management operations were the same for CON and SSR plots. For pratical reasons, fertilizer applications were made as one dressing at 2 to 6 weeks after planting (WAP) if the recommended rate is below 50 kg ha-1, and otherwise in two equal dressings at 2 to 6 WAP and at 8 to 12 WAP, however with regards to sufficient rain fall around the application dates.

1st African Conference on Precision Agriculture | 8-10 December | 2020
208
The fertilizer rate was obtained using a decision support tool in the form of an app named ‘AKILIMO’ meaning ‘Smart Agriculture’ inferred from the fusion of two Swahili words ‘akili’ and ‘kilimo’ (www.akilimo.org). AKILIMO calculates fertilizer recommendations based on a modular modelling framework involving Light Interception and Utilization (LINTUL) and Quantitative Evaluation of the Fertility of Tropical Soils (QUEFTS), and machine learning techniques. This framework was improved from season to seasons based on field data. The input were daily weather data from NASA POWER (1° resolution) for solar radiation, temperature (minimum and maximum) and wind speed, from CHRIPS (0.05° resolution) for rainfall data, and from ISRIC (250m resolution) for soil grid data. Farmers provided information on their desired planting and harvest dates and estimate of current yield achieved in their farm by selecting one out of five pictures of cassava root stocks corresponding to different yield classes. The calculated SSR was also tailored to farmers investment capacity and market prices of fertilizers and produce (fresh storage roots) using an optimization procedure to generate fertilizer rates optimized to maximum return for investment.
The profitability of investments in fertilizers was evaluated using benefit-cost ratio (BCR), estimated as the ratio of the difference in gross revenues between SSR and CON plots over the cost of fertilizers used in the SSR. Gross revenue was obtained by multiplying storage root yield by its unit price. The price range per Megagram (Mg) of storage roots was 13.9-97.2 USD in Nigeria and 20.9-159.1 USD in Tanzania. For simplicity of this analysis, we calculated BCR using average values of 55.6 USD and 90.0 USD Mg-1 in Nigeria and Tanzania, respectively.
RESULTS AND DISCUSSION Performance of the Recommendations
The results show wide yield ranges across country and season indicating a large variability across locations and time (Fig.1A). This highlights the varying response of cassava to soil fertility management decisions. Thus, time and location-specific recommendations are indispensable. Recommended fertilizer nutrient rates ranged from 0-120 kg N, 0-23 kg P and 0-115 kg K ha-1 in Nigeria against 0-129 kg N, 0-30 kg P and 0-46 kg K ha-1 in Tanzania. Predictions improved from season 1 to 2. In about 88 and 96% of the fields in seasons 1 and 2 in Nigeria, respectively, and 88 and 92% in Tanzania (Fig. 1A), cassava root yields were higher in the SSR plots (i.e. are above the 1:1 line), indicating better performance of the recommended fertilizer rates (SSR) compared with the control plots without fertilizer (CON). This means that AKILIMO provided good advice to farmers in 91% of the cases by recommending the application of the site-specific fertilizer rate and predicting a root yield increase. However, this advice was not correct for about 9% of the fields. In these cases, the DST provided sub-optimal estimates of the attainable yield and or the initial soil supply of nutrients. The latter was obtained from soil grid data corrected with farmers estimates of their current yields during the preceeding cropping season. Picking wrong yield classes led to imcomparable values of initial soil supply of nutrients. Sub-optimal results were as well caused by the scale of predictions with differences in micro-climate conditions between farms, because weather and soil conditions were obtained at a much larger scale, thus not being able to consider small scale differences. Profitability of the Recommendations
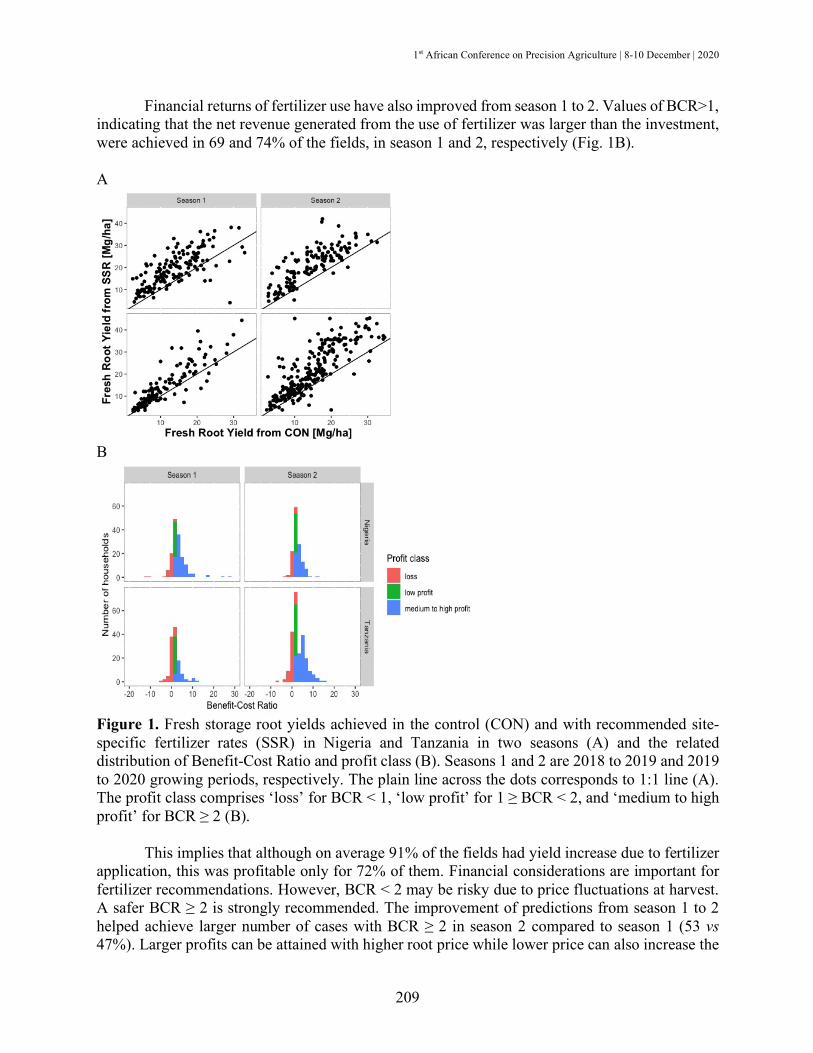
1st African Conference on Precision Agriculture | 8-10 December | 2020
209
Financial returns of fertilizer use have also improved from season 1 to 2. Values of BCR>1, indicating that the net revenue generated from the use of fertilizer was larger than the investment, were achieved in 69 and 74% of the fields, in season 1 and 2, respectively (Fig. 1B). A
B
Figure 1. Fresh storage root yields achieved in the control (CON) and with recommended site-specific fertilizer rates (SSR) in Nigeria and Tanzania in two seasons (A) and the related distribution of Benefit-Cost Ratio and profit class (B). Seasons 1 and 2 are 2018 to 2019 and 2019 to 2020 growing periods, respectively. The plain line across the dots corresponds to 1:1 line (A). The profit class comprises ‘loss’ for BCR < 1, ‘low profit’ for 1 ≥ BCR < 2, and ‘medium to high profit’ for BCR ≥ 2 (B).
This implies that although on average 91% of the fields had yield increase due to fertilizer application, this was profitable only for 72% of them. Financial considerations are important for fertilizer recommendations. However, BCR < 2 may be risky due to price fluctuations at harvest. A safer BCR ≥ 2 is strongly recommended. The improvement of predictions from season 1 to 2 helped achieve larger number of cases with BCR ≥ 2 in season 2 compared to season 1 (53 vs 47%). Larger profits can be attained with higher root price while lower price can also increase the

1st African Conference on Precision Agriculture | 8-10 December | 2020
210
profit gap. Thus, ensuring reliable and stable root prices at harvest is of a paramount importance for producers to sustainably intensify cassava production through the use of fertilizer. This can be implemented through diverse strategies such as: i) scheduled planting and harvesting at periods with favourable root prices, ii) policies enabling a reduction in root price fluctuations or iii) linking producers with processing companies offering pre-negotiated convenable prices. The negative BCR are associated with underestimation of the current and attainable yields.
CONCLUSIONS
Increased root yields and profits can be achieved through the use of site-specific fertilizer recommendations. While efforts should be intensified to better capture the diversity of cassava farming systems for enhanced production, mechanisms should also be in place to guarantee relatively stable produce prices to ensure that profits are achieved from the use of decision support tools.
REFERENCES Adiele 2020. Growing out of hunger: Towards an improved understanding of the water and
nutrient limited yield of cassava. PhD thesis, Wageningen University, The Netherlands, 138p.
Adiele JG, Schut AGT, van den Beuken RPM, Ezui KS, Pypers P, Ano AO, Egesi CE, Giller KE. 2020. Towards closing cassava yield gap in West Africa: Agronomic efficiency and storage root yield responses to NPK fertilizers. Field Crops Res. Published online https://doi.org/10.1016/j.fcr.2020.107820.
Ezui KS, Franke A, Mando A, Ahiabor B, Tetteh FM, Sogbedji J, Janssen B, Giller KE. 2016. Fertiliser requirements for balanced nutrition of cassava across eight locations in West Africa. Field Crops Res. 185: 69-78.
Ezui K, Leffelaar P, Franke AC, Mando A, Giller KE. 2018. Simulating drought impact and mitigation in cassava using the LINTUL model. Field Crops Res. 219: 256-272.
Howeler RH. 2002. Cassava mineral nutrition and fertilization. In: Hillocks RJ, Thresh JM, Bellotti AC (eds) Cassava: biology, production and utilization. CABI, Wallingford
Montagnac JA, Davis CR, Tanumihardjo SA. 2009. Nutritional value of cassava for use as a staple food and recent advances for improvement. Compr. Rev. Food Sci F. 8: 181-194.
Senkoro CJ, Tetteh FM, Kibunja CN, Ndungu-Magiroi KW, Quansah GW, Marandu AE, Ley GJ, Mwangi TJ, Wortmann CS. 2018. Cassava Yield and Economic Response to Fertiliser in Tanzania, Kenya and Ghana. Agron. J. doi: 10.2134/agronj2018.01.0019
Worldometers. 2020. Current world population. https://www.worldometers.info/world-population/

1st African Conference on Precision Agriculture | 8-10 December | 2020
211
#7579 SOIL FERTILITY MAPPING OF DRY SAVANNAH ZONE OF TOGO
Ganyo Komla*1, Ablede Komlan1, Koudjega Kossi1, Ani Sékou1, Afawoubo Koffi1, Anoumou Dosseh1, Mensah Achité1, Assih-Faram Essodésibè1, Tchalla-Kpondi M’klwa1, Bonfoh
Bédibètè1, Kpemoua Kossi1, Lombo Yao1 Institut Togolais de Recherche Agronomique, BP : 1163, Lomé-Togo, [email protected],
00228 90 87 51 38
ABSTRACT
Increasing agricultural productivity, and therefore the production, requires a good knowledge of the soil fertility status and a sustainable nutrients management. The objective of this study is to map the spatial distribution of selected soil fertility parameters in the dry savannah agro-ecological zone that covers the regions of Savanes and Kara in Togo. Soil pH, available phosphorus (P), exchangeable potassium (K) and organic matter were determined in soil samples collected at 1000 m grid intervals (1/100 000). Based on the soil samples analysis data, GIS maps were designed using Arc GIS v10.5 software. The results showed that the soils in the area were slightly acidic (5.5 <pH <6.5) while 62.5% of soils had low organic carbon levels (<2%). In the regions, the available phosphorus was low (<15 mg P/kg) in 94.3% of the agricultural soils. Exchangeable potassium was also low (<131 mg K/kg) in 97.5% of agricultural soils in this area. Results from soil samples tests showed a deficiency in the macro-nutrients (P and K) and a low organic matter content of the soils of the dry Savannah. Based on the soil fertility status determined, the crop needs and the environment conditions there is a need of reviewing the currents fertilizer application rates recommended.
Keywords: Soil fertility maps, Dry Savannah, Togo
INTRODUCTION
Togo is mainly an agricultural country where agriculture employs about 70% of the active population. Although the agriculture, dependent on rainfall, it constitutes the main sector that drives the economy and the social development of the country. It is generally practiced by small farmers with low productivity due to various biophysical and low-level farming management constraints. Inadequate or poor rainfall distribution, and low levels agricultural soils in nitrogen (N) and phosphorus (P) greatly affect crop productivity (Bationo et al., 2003). Crop yields are generally limited as result of nutrients mining and soil fertility depleting due to inadequate or no fertilizer application, (Prabhavati et al., 2015). Soils are not only thirsty but also hungry (Wani, 2008). Increasing agricultural productivity, and therefore production, requires a good knowledge of soil fertility status and land degradation indices at the national level. Unfortunately, Togo does not yet have maps on soil fertility status and the lack of a national soil information system limits land use planning for sustainable agricultural development.
With regard of the above-described situation of lack of soil fertility status, Togo have undertaken a study in 2017 with the objective of mapping the fertility of agriculture soils. This

1st African Conference on Precision Agriculture | 8-10 December | 2020
212
paper presents the results of the regions of Savanes and Kara located in the dry savannah agroecological zone of Togo.
MATERIALS AND METHODS
The Zone of Study
The agro-ecological zone of dry savannah in Togo comprising the regions of Savanes and Kara is located within 9 and 11° North and 0 and 1° East. The climate is of the Sudanian type characterized by two seasons, a rainy one from May to October and a dry one from November to April. The annual rainfall ranges from 600 to 1200 mm. Vegetation consists of vast grassy savannas.
Soil Sampling, Analysis and Mapping
Composite soil samples were collected on grid points of 1000 m interval (1/100,000) at 20 cm depth. A total of 10,849 samples were collected: 4,283 the region of Savanes and 6,566 in the region of Kara. Soil samples were air-dried and sieved using a 2 mm mesh sieve. pH and electrical conductivity were determined by Jackson, (1959) method , available phosphorus (P), exchangeable potassium (K) and organic matter (OM) were determined by the methods described by Olsen and Sommers (1982), Helmke and Sparks (1996) et Nelson and Sommers (1996) respectively. Fertility maps were designed using ArcGIS 10th ed software and the inverse distance method for extrapolation. Table 1. Soil fertility parameters classification
Nutrients Fertility ratings Very low Low Medium High Very high
Phosphorus (mg/kg) < 8 8 - 15 15 - 23 23 - 30 > 30 Potassium (mg/kg) < 90 90 - 131 131 - 170 170 – 200 > 200 Organic matter (%) < 0,7 0,7 - 2 2 - 3,5 3,5 – 4,5 > 4,5 Soil reaction pH (H20) < 5,5
Acidic 5,5 – 6,5 Slightly acidic
6,5 – 7,5 Neutral
7,5 – 8,5 Slightly Alkaline
> 8,5 Alkaline
RESULTS AND DISCUSSION
Soil pH
Dry savannah soils are slightly acidic (85% of the soils, Figure 1) with an average pH value of 6.1 ± 0.5 (mean ± standard deviation). This can be explained by the fact that most of the soils in the area are formed on acid parent materials (granite, gneiss, quartzite, etc.) (Lamouroux, 1969).
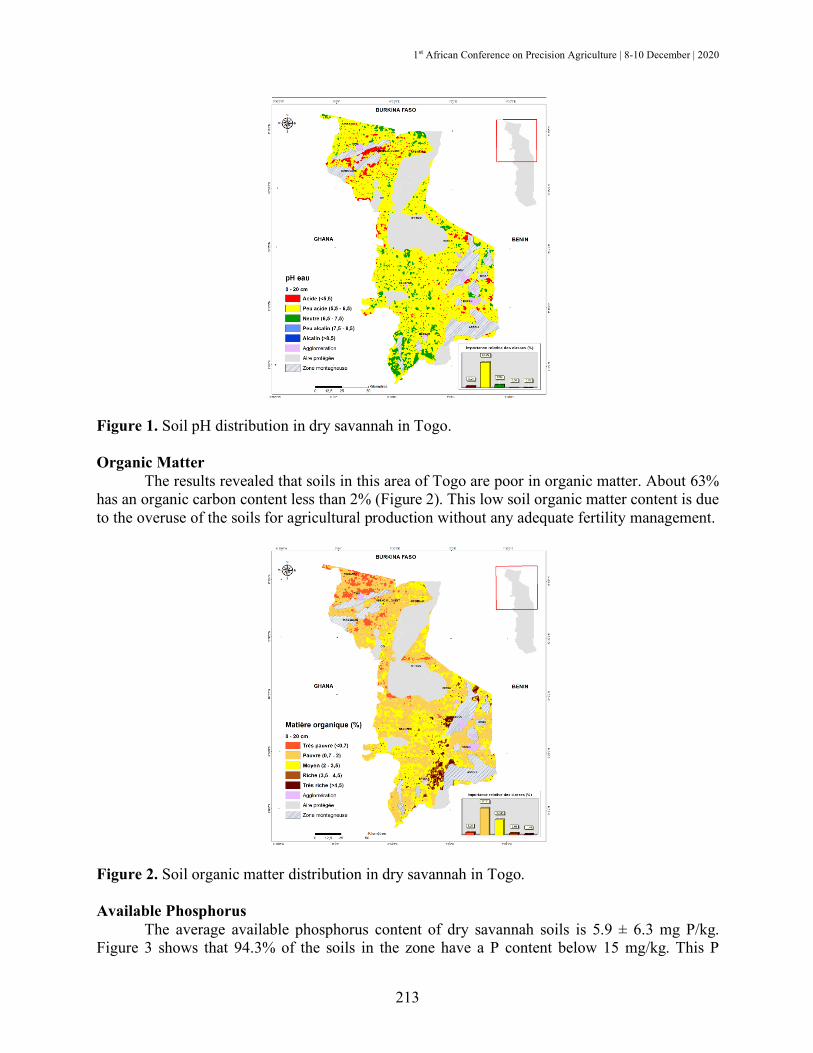
1st African Conference on Precision Agriculture | 8-10 December | 2020
213
Figure 1. Soil pH distribution in dry savannah in Togo. Organic Matter
The results revealed that soils in this area of Togo are poor in organic matter. About 63% has an organic carbon content less than 2% (Figure 2). This low soil organic matter content is due to the overuse of the soils for agricultural production without any adequate fertility management.
Figure 2. Soil organic matter distribution in dry savannah in Togo. Available Phosphorus
The average available phosphorus content of dry savannah soils is 5.9 ± 6.3 mg P/kg. Figure 3 shows that 94.3% of the soils in the zone have a P content below 15 mg/kg. This P
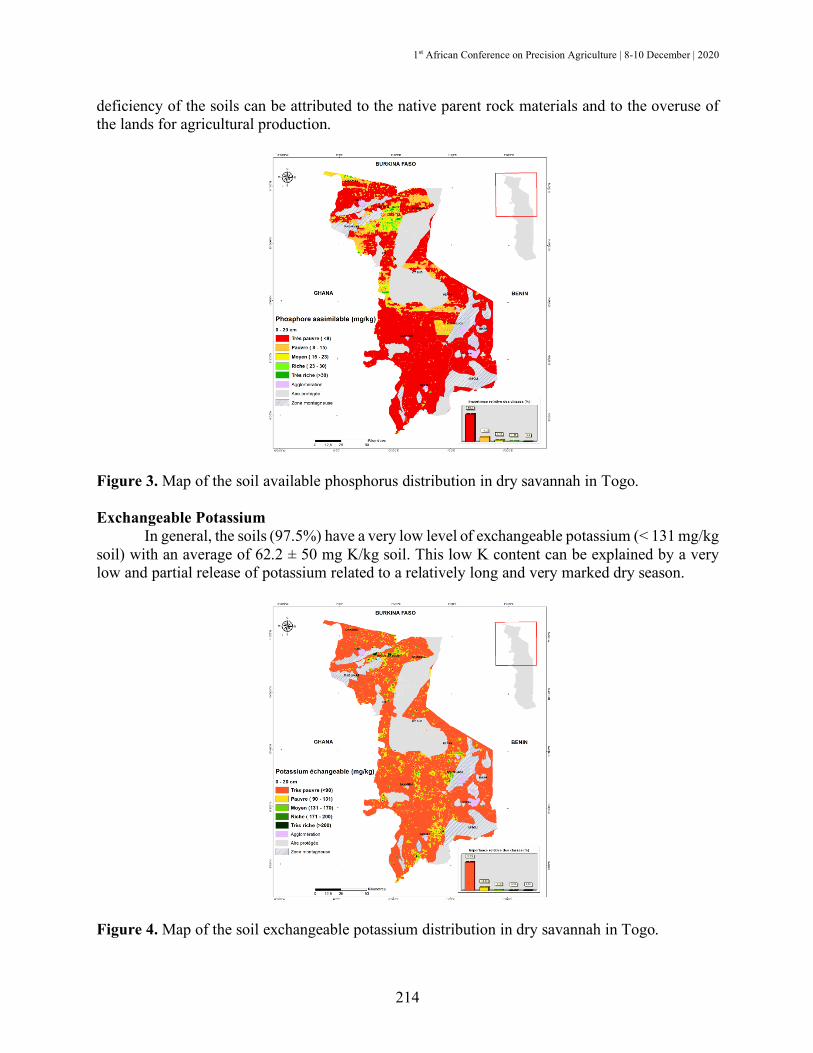
1st African Conference on Precision Agriculture | 8-10 December | 2020
214
deficiency of the soils can be attributed to the native parent rock materials and to the overuse of the lands for agricultural production.
Figure 3. Map of the soil available phosphorus distribution in dry savannah in Togo. Exchangeable Potassium
In general, the soils (97.5%) have a very low level of exchangeable potassium (< 131 mg/kg soil) with an average of 62.2 ± 50 mg K/kg soil. This low K content can be explained by a very low and partial release of potassium related to a relatively long and very marked dry season.
Figure 4. Map of the soil exchangeable potassium distribution in dry savannah in Togo.

1st African Conference on Precision Agriculture | 8-10 December | 2020
215
CONCLUSIONS
The results of this study revealed a deficiency in the macro nutrients analyzed (P and K) in the dry savannah soils of Togo and a low organic matter content. With to this overall low level of fertility of the agricultural soils in the studied areas, there is a need to review the current recommendations of fertilizer rates to be applied on crops. The new fertilization formula should take into consideration the soil fertility status, crop needs and the environment conditions.
ACKNOWLEDGEMENTS
We thank the Foundation OCP and FAO for providing funds and facilities without which this study would not have been possible.
REFERENCES
Bationo A, Mokwunye U, Vlek PLG, Koala S, Shapiro BI. 2003. Soil fertility management for sustainable land use in the West African Sudano-Sahelian Zone, In: Gichuri MP, Bationo A, Bekunda MA, Goma HC, Mafongoya PL, Mugendi DN, Murwuira HK, Nandwa SM, Nyathi P, Swift M. (Eds.), Soil Fertility Management in Africa: A Regional Perspective. African Academy of Sciences; Centro Internacional de Agricultura Tropical (CIAT); Tropical Soil Biology and Fertility (TSBF), Nairobi, Kenya, pp. 253–292.
Helmke PA, Sparks DL. 1996. Lithium, sodium, potassium, rubidium and cesium, in: Sparks, D.L. (Ed.), Methods of Soil Analysis, Part 3, Chemical Methods. American Society of Agronomy and Soil Science Society of America., Madison, WI, pp. 551–574.
Jackson ML. 1959. Soil Chemical Analysis. J. Agric. Food Chem. 7: 138. https://doi.org/10.1021/jf60096a605
Lamouroux M. 1969. Notice Explicative - Carte Pédologique du Togo au 1/1.000.000, Office de. ed, OSTROM. Paris, France.
Nelson DW, Sommers LE. 1996. Total carbon, organic carbon and organic matter, in: Sparks, D.L. (Ed.), Methods of Soil Analysis, Part 3. Chemical Methods. American Society of Agronomy and Soil Science Society of America., Madison, WI, pp. 961–1010.
Olsen SR, Sommers LE. 1982. Phosphorus, in: Page, A.L. et al. (Ed.), Methods of Soil Analysis, Part 2. American Society of Agronomy and Soil Science Society of America., Madison, WI, pp. 403–430.
Prabhavati K, Dasog GS, Patil PL, Sahrawat KL, Wani SP. 2015. Soil fertility mapping using gis in three agro-climatic zones of belgaum district, karnataka. J. Indian Soc. Soil Sci. 63: 173–180. https://doi.org/10.5958/0974-0228.2015.00022.5
Wani SP. 2008. Taking Soil Science to Farmers’ Doorsteps through Community Watershed Management. J. Indian Soc. Soil Sci. 56, 367–377.

1st African Conference on Precision Agriculture | 8-10 December | 2020
216
#7581 NUTRIENT MANAGEMENT TAILORED TO SMALLHOLDER AGRICULTURE ENHANCES PRODUCTIVITY AND SUSTAINABILITY
Pauline Chivenge1, Kazuki Saito2, Michelle Anne Bunquin1, Sheetal Sharma3, Achim
Dobermann4
1International Rice Research Institute (IRRI), DAPO Box 7777, Metro Manila 1301, Philippines; 2Africa Rice Center (AfricaRice), 01 B.P. 2551, Bouaké 01, Côte d'Ivoire; 3IRRI, NASC
Complex, Pusa, New Delhi-110012, India; 4International Fertilizer Association (IFA), 49 avenue d’Iena, 75116 Paris, France
ABSTRACT
Plant nutrition plays a central role in the global challenge to produce sufficient and nutritious food, lessen rural poverty, and reduce the environmental footprint of crop production. Efficient fertilizer use requires tailored solutions that are scientifically sound, practical and scalable especially for smallholder farmers, such as the crop-led site-specific nutrient management (SSNM) approach developed in the 1990s for cereal production systems in Asia to address variability among farms. Originating from a simple model to calculate crop nutrient requirements, this unique approach has evolved over 25 years, covering a growing number of crops and countries in Asia and Africa with development of digital tools and dissemination approaches. We performed a meta-analysis using 61 published papers across 11 countries to compare SSNM with the farmer fertilizer practice (FFP), for rice, wheat and maize. Overall, relative to the FFP, grain yield was 0.7 Mg ha-1 (12%) greater with SSNM, and this was achieved using about 20 kg N ha-1 less nitrogen (N) fertilizer; associated with greater agronomic N use efficiency under SSNM than the FFP (17 vs 12 kg grain kg-1 N applied). This was likely because SSNM had more splits of N fertilizer than FFP, which was applied in better congruence with key periods of crop growth and N demand, thereby reducing N pollution to the environment and sustaining soil health. Moreover, the benefits with SSNM were achieved through balanced nutrition, with application of the same amount of phosphorus (P) but higher potassium (K) rates than FFP. In countries where grain yield with the FFP was high, a substantial reduction in N application rate with SSNM resulted in greater improvement of N use efficiency and reduced N loss and this was especially the case for China across the three crops. In contrast, larger yield gains were observed for farmers who typically attain low yields than farmers that already have high yields. Such cases were mainly observed in Africa and South Asia. We know no other agronomic intervention that has increased crop yield, profitability, and N use efficiency across three cereal crops and geographies. This approach represents a win-win situation from which millions of smallholder farmers could benefit.
INTRODUCTION
Nutrient management is an important component for sustainable crop production to meet
the challenges of rising food demand driven by population growth, while protecting the environment. Production of cereal crops increased significantly in the developing world since the 1960’s, largely due to increased use of fertilizer and agrochemicals, coupled with adoption of improved, high yielding varieties, and increased access to irrigation (Pingali, 2012). However, the orientation of producing more food has been associated with overuse of fertilizers, although

1st African Conference on Precision Agriculture | 8-10 December | 2020
217
fertilizer use has been widely variable across regions and crops (FAO, 2006; Lu and Tian, 2017). More than 50% of the global nitrogen (N) is used in Asia while less than 5% is used in Africa (Heffer et al., 2017). While low fertilizer us in Africa has been associated with low crop productivity, in Asia fertilizers have been overused, with losses to the environment; both cases affect sustainability of cropping systems. Scientifically sound, tailored nutrient management solutions that are scalable are needed especially in smallholder farming systems.
The site specific nutrient management (SSNM) approach, developed in the 1990’s to calculate field specific requirements for fertilizer N, P and K for cereal crops (Dobermann et al., 2004) can potentially contribute to the attainment of sustainable cropping systems. This approach was initially conceptualized for rice cropping systems in Asia, based on principles from the Quantitative Evaluation of the Fertility of Tropical Soils (QUEFTS) model (Janssen et al., 1990) to estimate fertilizer nutrient requirements as the difference between the total amount of nutrient required by the crop to achieve a specific target yield and the indigenous supply of the nutrient (Witt and Dobermann, 2004). SSNM was shown to improve crop yields, nutrient use efficiency and profit versus the farmer fertilizer practice (FFP), which is often based on blanket recommendations (Dobermann et al., 2002; Pampolino et al., 2007; Peng et al., 2010; Wang et al., 2001), sometimes while reducing fertilizer application (Peng et al., 2010). The timing of fertilizer application is adjusted to meet peak crop demand to enhance nutrient use efficiency.
This unique approach has evolved over 25 years, covering a growing number of crops (Khurana et al., 2008; Witt et al., 2006) and extended to other geographies in Asia and Africa (Saito et al., 2015). The advancements in information and communication technology, the SSNM approach have led to the development of digital tools (Buresh et al., 2019; Pampolino et al., 2012; Saito et al., 2015) for wider dissemination of SSNM recommendations to smallholder farmers. In this study we conducted a meta-analysis using 61 published papers to provide a comprehensive and systematic evaluation of the performance of SSNM in terms of grain yield, N use efficiency and profit compared to the FFP for three cereal crops; maize, rice and wheat.
MATERIALS AND METHODS
We conducted a meta-analysis using data collected from 61 published studies conducted
in 11 countries in Asia and Africa. A literature search was conducted on major search engines using search terms: site-specific nutrient management (SSNM), SSNM rice, SSNM maize, SSNM wheat, SSNM cereals, SSNM vs farmers’ fertilizer practice (FFP). We focused on rice, wheat and maize, which account for an estimated 43% of the world's food calorie supply and consume about half of the world’s NPK fertilizers annually. To be included in this meta-analysis, studies should have reported grain yield under SSNM and FFP, and other agronomic management practices were similar between SSNM and FFP. Of the reviewed studies, 65, 21, and 14% were on rice, wheat and maize, respectively; all conducted in Asia, except three papers on rice in Africa.
Means for grain yield, agronomic N use efficiency (AEN) under SSNM and FFP were retrieved from each study. Site characteristics including location, study duration, soil properties, climatic conditions were recorded. Management practices were also recorded. We calculated partial factor productivity of N (PFP N), another index for N use efficiency, based on grain yield and total N fertilizer applied, using the following equation:
PFP N = GYN (kg ha-1)/ N rate (kg N ha-1)

1st African Conference on Precision Agriculture | 8-10 December | 2020
218
Where GYN is the grain yield in a treatment with N application and GY0 is the grain yield in a treatment without N application.
We also calculated economic performance of SSNM compared to FFP: total fertilizer cost (TFC), gross return, and gross return above fertilizer cost (GRF) using the following equations:
TFC (US$ ha-1) = (pN × Nrate) + (pP × Prate) + (pK × Krate)
Gross return (US$ ha-1) = FGP × GY
GRF (US$ ha-1) = Gross return – TFC
Where pN, pP, pK = prices of N, P and K fertilizers, respectively (US $ kg-1); Nrate, Prate, Krate = amount of N, P and K applied (kg ha-1); FGP = farmgate price of paddy rice, maize or wheat (US$ kg-1); GY = grain yield of paddy rice, maize and wheat (kg ha-1)
We estimated fertilizer prices from the 10-year average across countries listed in the
database (indexmundi, 2020) and reported as per unit of nutrient; US$ 0.642 kg-1 N, US$ 2.151 kg-1 P, and US$ 0.633 kg-1 K. We used grain prices of US$ 0.25 kg-1 paddy rice, US$ 0.15 kg-1 maize and US$ 0.20 kg-1 wheat based on the trend of the market prices over the last 25 years.
Grain yield, N fertilizer rates, number of N splits, AEN, PFPN and economic parameters were analyzed using MetaWin 2.1 software (Rosenburg et al., 2000).
RESULTS AND DISCUSSION
Overall, relative to the FFP, SSNM increased grain yield, gross return on fertilizer,
agronomic efficiency of N (i.e., additional grain yield per kg of fertilizer N applied), by 12, 15, and 46% respectively (Fig. 1). While mean grain yield increases were 0.7 Mg ha-1 (12%) across the three crops, greater increases were for wheat (20%), followed by maize (15%), with lowest for rice (9%). Gross return was 12% greater, while gross return above fertilizer cost was 15% higher under SSNM than FFP. This resulted in an average profit of USD 140 ha-1 greater under SSNM than FFP. Importantly, grain yield and N use efficiencies were greater with SSNM, but with 20 kg N ha-1 (11%) lower N fertilizer rates than FFP. This was because of more N splits under SSNM (3.1) compared to 2.6 times under FFP, and N fertilizer was applied in better congruence with key periods of crop growth and N demand (Cassman et al., 2002), thereby reducing N pollution to the environment and sustaining soil health. This resulted in greater N use efficiency with SSNM than FFP where AEN was 17 kg grain kg-1 N applied for SSNM compared to 12 kg grain kg-1 N applied for FFP. Similarly, PFP N was 54 and 43 kg grain kg-1 N applied for SSNM and FFP, respectively. Moreover, the benefits with SSNM compared to FFP were achieved through balanced nutrition, with application of the same amount of P but higher K rates than FFP. Larger yield gains were observed for farmers who typically attain low yields than farmers that already have high yields. Such cases were mainly observed in Africa and South Asia (data not shown). In contrast, where grain yield in FFP was high, a substantial reduction in N application rate in SSNM resulted in greater improvement of N use efficiency and reduced N loss. This was especially the case for China.

1st African Conference on Precision Agriculture | 8-10 December | 2020
219
Figure 1. a) Grain yield, total fertilizer cost (TFC), gross return and gross return above fertilizer cost (GRF), and b) N use efficiency (agronomic N use efficiency; AEN, partial factor of productivity; PFP N) responses to site-specific nutrient management (SSNM) compared to the farmer fertilizer practice (FFP) for rice, wheat and maize. Responses are expressed as mean response percentage with 95% confidence intervals represented by error bars. Numbers of effect size comparisons are given as # of data points.
-20 -10 0 10 20 30
% difference in yield and profit between SSNM and FFP
# data points
Gra
in
TFG
ross
retu
rnG
RF
3985984255
2955071174
3985984255
2955071174
all cropsmaizewheatrice
all cropsmaizewheatrice
all cropsmaizewheatrice
all cropsmaizewheatrice
-40 -20 0 20 40 60 80
% difference in N-management and N-use efficiency between SSNM and FFP
# data points
No.
N sp
lits
N ra
teA
ENPF
P
3665679231
128173081
3665679231
1842534125
all cropsmaizewheatrice
all cropsmaizewheatrice
all cropsmaizewheatrice
all cropsmaizewheatrice
a)
b)

1st African Conference on Precision Agriculture | 8-10 December | 2020
220
We know no other agronomic intervention that has achieved increase in crop yield, profitability, and N use efficiency across three cereal crops and geographies. SSNM represents a win-win situation from which millions of smallholder farmers could benefit and is an essential component of agronomic solutions for improving crop production. Several digital decision support tools and platforms were recently developed in collaboration with national agricultural extension agencies and other partners to scale out SSNM adoption. Examples include Nutrient Expert (Pampolino et al., 2012; Xu et al., 2017), Rice Crop Manager (Buresh et al., 2019; Sharma et al., 2019), and RiceAdvice (Saito et al., 2015). Evaluation of these tools with smallholder farmers has shown improved yields, profitability and N use efficiency under irrigated and rainfed conditions that are comparable to our meta-analysis, indicating a very robust performance in widely varying environments. Reaching millions of farmers can be achieved through integration of policy incentives, financial and input supply services, and improved knowledge exchange among extension, public and private partners.
REFERENCES
Buresh RJ, Castillo RL, Torre JCD, Laureles EV, Samson MI, Sinohin PJ, Guerra M. 2019. Site-
specific nutrient management for rice in the Philippines: Calculation of field-specific fertilizer requirements by Rice Crop Manager. Field Crops Research 239: 56-70.
Cassman KG, Dobermann A, Walters DT. 2002. Agroecosystems, nitrogen-use efficiency, and nitrogen management. AMBIO 31: 132-140.
Dobermann A, Witt C, Dawe D. 2004. "Increasing productivity of intensive rice systems through site-specific nutrient management. Science Publishers, Inc., Enfield, NH, USA and Int. Rice Res. Inst., Los Baños, Philippines," Science Publishers.
Dobermann A, Witt C, Dawe D, Abdulrachman S, Gines H, Nagarajan R, Satawathananont S, Son T, Tan P, Wang G. 2002. Site-specific nutrient management for intensive rice cropping systems in Asia. Field Crops Research 74: 37-66.
FAO. 2006. Fertilizer use by crop. FAO Fertilizer and Plant Nutrition Bulletin 17, Rome, 109 pp. Heffer P, Gruère A, Roberts T. 2017. Assessment of fertilizer use by crop at the global level 2014-
2014/15. International Fertilizer Association and International Plant Nutrition Institute, Paris.
Janssen BH, Guiking F, Van der Eijk D, Smaling E, Wolf J, Van Reuler H. 1990. A system for quantitative evaluation of the fertility of tropical soils (QUEFTS). Geoderma 46: 299-318.
Khurana HS, Phillips SB, Alley MM, Dobermann A, Sidhu AS, Peng S. 2008. Agronomic and economic evaluation of site-specific nutrient management for irrigated wheat in northwest India. Nutrient Cycling in Agroecosystems 82: 15-31.
Lu CC, Tian H. 2017. Global nitrogen and phosphorus fertilizer use for agriculture production in the past half century: shifted hot spots and nutrient imbalance. Earth System Science Data 9: 181.
Pampolino MF, Manguiat IJ, Ramanathan S, Gines H, Tan P, Chi T, Rajendran R, Buresh R. 2007. Environmental impact and economic benefits of site-specific nutrient management (SSNM) in irrigated rice systems. Agricultural Systems 93: 1-24.
Pampolino MF, Witt C, Pasuquin JM, Johnston A, Fisher MJ. 2012. Development approach and evaluation of the Nutrient Expert software for nutrient management in cereal crops. Computers and electronics in agriculture 88:103-110.
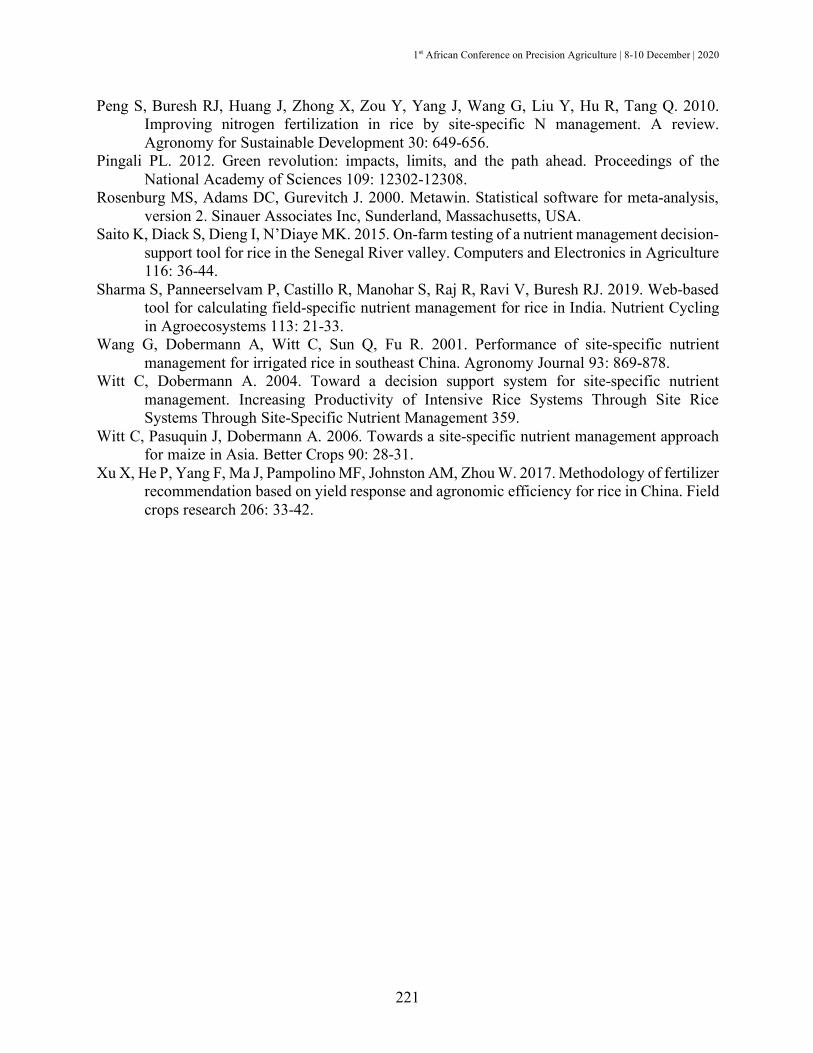
1st African Conference on Precision Agriculture | 8-10 December | 2020
221
Peng S, Buresh RJ, Huang J, Zhong X, Zou Y, Yang J, Wang G, Liu Y, Hu R, Tang Q. 2010. Improving nitrogen fertilization in rice by site-specific N management. A review. Agronomy for Sustainable Development 30: 649-656.
Pingali PL. 2012. Green revolution: impacts, limits, and the path ahead. Proceedings of the National Academy of Sciences 109: 12302-12308.
Rosenburg MS, Adams DC, Gurevitch J. 2000. Metawin. Statistical software for meta-analysis, version 2. Sinauer Associates Inc, Sunderland, Massachusetts, USA.
Saito K, Diack S, Dieng I, N’Diaye MK. 2015. On-farm testing of a nutrient management decision-support tool for rice in the Senegal River valley. Computers and Electronics in Agriculture 116: 36-44.
Sharma S, Panneerselvam P, Castillo R, Manohar S, Raj R, Ravi V, Buresh RJ. 2019. Web-based tool for calculating field-specific nutrient management for rice in India. Nutrient Cycling in Agroecosystems 113: 21-33.
Wang G, Dobermann A, Witt C, Sun Q, Fu R. 2001. Performance of site-specific nutrient management for irrigated rice in southeast China. Agronomy Journal 93: 869-878.
Witt C, Dobermann A. 2004. Toward a decision support system for site-specific nutrient management. Increasing Productivity of Intensive Rice Systems Through Site Rice Systems Through Site-Specific Nutrient Management 359.
Witt C, Pasuquin J, Dobermann A. 2006. Towards a site-specific nutrient management approach for maize in Asia. Better Crops 90: 28-31.
Xu X, He P, Yang F, Ma J, Pampolino MF, Johnston AM, Zhou W. 2017. Methodology of fertilizer recommendation based on yield response and agronomic efficiency for rice in China. Field crops research 206: 33-42.

1st African Conference on Precision Agriculture | 8-10 December | 2020
222
#7599 IMPACT OF SENSOR-BASED PRECISION NITROGEN MANAGEMENT ON WHEAT YIELD AND NITROGEN USE EFFICIENCY
Abdou A. Soaud1. El-Metwally A. El-Metwally2, Ali M. Ali3 and Radwa K. Sayed1
1Department of Soil Science, Faculty of Agriculture, Cairo University, Egypt. 2Department of Agronomy, Faculty of Agriculture, Cairo University, Egypt. 3Department of Soil Fertility and
Microbiology, Desert Research Center, Egypt, [email protected]
ABSTRACT
Optical sensors are promising new technology for precision nitrogen management in crops.
Fertilizer N management for wheat (Cultivar: Giza 171) using optical sensor (GreenSeeker®) was evaluated at the Experimental Farm of Faculty of Agriculture, Cairo University, Giza Governorate, Egypt. The experiment was laid out in randomized block design with three replications during two successive winter seasons (2017/2018 and 2018/2019) to quantify the relationship between N uptake at jointing growth stage with GreenSeeker measurements and to formulate a strategy to optimize N fertilizer use efficiency. An increasing rate of N fertilizer was applied in the experiment conducted in the first season to create variability in GreenSeeker readings (Normalized Difference Vegetation Index, NDVI) determined at jointing growth stage of wheat. The data revealed that relationship between total N uptake and sufficiency index (SI, SI=VDVI of the measured treatment/NDVI of the reference treatment)) of NDVI measured by GreenSeeker at Feekes 6 growth stage of wheat fitted to power function (y= 291.47x-1.686). The suggested exponential model based on the GreenSeeker could explain about 78% of the variation in N uptake. Accordingly, a strategy to refine N application dose applied at jointing growth stage of wheat was suggested as guided by the sensor in the second season. The suggested strategy was applying 0, 10, 61, 77, 85 or 109 kg N ha-1 corresponding to sufficiency index of NDVI values of 0.80, 0.74, 0.72, 071 and 0.68, respectively. When appropriate prescriptive N fertilizer was applied (100 kg N ha-1in two splits, 40 and 60 kg N ha-1) followed by corrective dose (161 kg N ha-1) as guided by the GreenSeeker, the achieved N recovery efficiency was 74.1% compared with 51.5% in the general recommendation. The grain yield of this treatment has no statistically significant effect compared with general recommendation treatment. This study indicated that N fertilizer could be managed more efficiently in wheat using GreenSeeker sensor compared with the current general recommendation. Keywords: nitrogen use efficiency, GreenSeeker, sufficiency index, NDVI, wheat
MATERIALS AND METHODS
The Experimental Site In two successive winter seasons (2017/2018 and 2018/2019), field experiments were
carried out on wheat ( Triticum aestivum L.) variety Giza 171 at the Experimental Farm of the Faculty of Agriculture, Cairo University, Giza Governorate , Egypt. Initial soil samples were taken from the experimental site and analyzed using the procedures outlined by Page et al. (1982) for physical and chemical characteristics as recorded in Table 1.

1st African Conference on Precision Agriculture | 8-10 December | 2020
223
Table 1. Some physical and chemical properties of the topsoil (0-30 cm) of the experimental site.
Texture pH* EC**
dS m-1 Organic matter
% Available N
mg kg-1 Available P
mg kg-1 Available K
mg kg-1 Clay Loam 7.91 4.53 2.30 100.90 18.50 354.00
* pH in saturated soil paste. ** Electrical conductivity in saturated soil paste extract. Experimental Design and Treatments
The soil has been ploughed and levelled prior to sowing. In both seasons, in mid-November, wheat (Triticum aestivum L.) of the variety Giza 171 grains was mechanically sown in rows 15 cm apart and divided into 15 m2 parcels. N fertilizer levels of 0, 40, 80, 120, 160, 200, 240, 280 and 320 kg N ha-1 were added in three equal split doses in the first season as ammonium sulphate. This range was used to determine plots with great variability in the wheat uptake and yield of N. The second season was developed to validate the effectiveness of the GreenSeeker Sensor for the application of N fine-tuning fertilizer. The treatment consisted of setting various prescriptive N application scenarios at the early growth stage, followed by a corrective dose at the joint growth stage, as directed by GreenSeeker. The experiments were performed with three replications in a randomized complete block design. Following the general recommendation, phosphorus (as a single superphosphate) was applied for sowing. Potassium fertilizer was avoided because sufficient quantities of available K (354 mg kg-1) were present in the soil. Plant Sampling and Analysis
At the joint growth stage, over ground plant samples from an area of 1 m2 were collected from each plot straight after the GreenSeeker readings were obtained. The wheat production was manually collected from a net area of 6 m2 at maturity from the centre of each plot. Grain and straw samples are collected from each plot were left to dry to constant weight and soil in the hot air oven at 70°C. Samples were digested in a mixture of H2SO4-H2O2, and total N was determined using the micro-Kjeldahl method (Kalra, 1997).
Calculations and Statistical Analysis
Using Microsoft excel program (a component in Microsoft Office 2016), regression models were mounted. Variance analysis (ANOVA) has been used to evaluate the effect of N treatments on the data collected. As described by Gomez and Gomez (1984), Duncan's multiple range test (DMRT) at probability value < 0.05 was used to examine the difference between means. As described by Cassman et al. (1998), the recovery efficiency of N (REN) was computed as:
𝑅𝐸.(%) =𝑇𝑜𝑡𝑎𝑙𝑁𝑢𝑝𝑡𝑎𝑘𝑒𝑖𝑛𝑓𝑒𝑟𝑡𝑖𝑙𝑖𝑧𝑒𝑑𝑝𝑙𝑜𝑡 − 𝑇𝑜𝑡𝑎𝑙𝑁𝑢𝑝𝑡𝑎𝑘𝑒𝑖𝑛𝑧𝑒𝑟𝑜𝑁𝑝𝑙𝑜𝑡
𝑄𝑢𝑎𝑛𝑡𝑖𝑡𝑦𝑜𝑓𝑎𝑝𝑝𝑙𝑖𝑒𝑑𝑁𝑓𝑒𝑟𝑡𝑖𝑙𝑖𝑧𝑒𝑟
RESULTS AND DISCUSSION
Effect of N Fertilizer Application Rate on Grain Yield of Wheat
In contrast to the increasing N fertilizer rate, grain yields of wheat collected from the first season study were plotted (Fig.1). The relationship exhibited a second-degree response function, as is shown in the curve. Function derivation analysis show that the highest grain yield of 8881 kg
1st African Conference on Precision Agriculture | 8-10 December | 2020
224
ha-1 can be achieved by applying an N fertilizer rate of 215.8 kg N ha-1. Approximately 155 kg N ha-1 was calculated as the N fertilizer rate required for economic grain yield (8437 kg ha-1, 95 percent of maximum yield). The widely adopted general N fertilizer recommendation for wheat in the area is 180-240 kg N ha-1. In addition, N fertilizer levels are usually applied by farmers even higher than the general recommendation, which means that unnecessary amounts of N fertilizer are applied. In addition to the susceptibility to loss of excess N fertilizer from the soil-plant system, it could also lead to soil health deterioration (Bijay-Singh, 2018). These results suggest that there is a need to establish site-specific management strategies in the season that have the ability to adjust the rate of application of N fertilizer according to the actual need for the crop.
Figure 1. Response of wheat to increasing rate of N fertilizer fitted to quadratic function. Prediction of N Uptake at Jointing Growth Stage using GreenSeeker
Rapid acquisition of N uptake information where plants can respond to N inputs prior to harvesting is essential for the development of a successful N fertilizer management plan for precision. Variation in N uptake at the joint growth stage of wheat was created by the increasing rate of N fertilizer applicable in the first season experiment. This variability has been reflected in grain yield increases. This data was derived from the relationship among grain yield and N wheat uptake:
Estimated maximum uptake = 373 kg N ha-1 Estimated maximum yield = 7981 kg grain ha-1 95% of the maximum grain yield = 7582 kg grain ha-1 Optimum N uptake = 275 kg N ha-1
y = -0.1064x2 + 45.922x + 3926.2R² = 0.94
0
2000
4000
6000
8000
10000
0 50 100 150 200 250 300 350
Grai
n yi
eld
(kg
ha-1
)
N fertilizer rate (kg ha-1)

1st African Conference on Precision Agriculture | 8-10 December | 2020
225
Figure 2. Relationship between grain yield and N uptake in wheat.
For the development of strategies to optimize N fertilization and reduce the environmental dangers associated with the application of high amounts of N fertilizer, monitoring of N uptake during the season is crucial. Inaccurate N uptake prediction may result in N fertilizer over- or under-applications as compared to the actual demands (Yao et al., 2012). Many other studies have also shown that in-season spectral measurements of leaf can estimate the N status and grain production of many crops (Varvel, 1997; Raun et al., 2001; Ali et al., 2014). In fact, portable hand - held sensors such as GreenSeeker have opened a new approach to quickly make precise choices in the season.
Sufficiency Index Approach for Managing N Fertilizer using GreenSeeker
By many varietal groups, seasons or regions, leaves greenness may vary. Consequently, one GreenSeeker fixed threshold value may not work effectively. The strategy to the sufficiency index (calculated as the ratio of NDVI reading of the evaluated plot and that of a reference N-rich plot) allows dynamic values instead of a fixed threshold value to be used for precision N management. According the variability of soil properties and seasons, this strategy has the potential to be self-calibrating.
y = -0.0634x2 + 47.367x - 865.69R² = 0.8969
0
1500
3000
4500
6000
7500
9000
0 50 100 150 200 250 300
Gra
in yi
eld
(kg
ha-1
)
Total N uptake (kg ha-1)

1st African Conference on Precision Agriculture | 8-10 December | 2020
226
Figure 3. Relationship between total N uptake and sufficiency index of NDVI measured by GreenSeeker at Feekes 6 growth stage of wheat fitted to power function.
In keeping with these findings, it was recommended a strategy to modify N application dose be added in the second season at jointing stage of wheat, as steered by the GreenSeeker. From this algorithm N fertilizer dose (kg N ha-1) was calculated as:
The proposed algorithm N fertilizer dose (kg N ha-1) = 𝟐𝟕𝟓d𝟐𝟗𝟏.𝟒𝟕×𝑺𝑰𝑵𝑫𝑽𝑰
𝟏.𝟔𝟖𝟔
𝟎.𝟔𝟓
In this study, the GreenSeeker values at jointing wheat growth stage matched Feekes 6
growth stage (approximately 50 days after sowing) and this is considered to be the suitable stage for obtaining information and making decisions on in-season N fertilizer management. For example, Raun et al. (2001) found that the relationship between both the readings of optical sensors and wheat grain yield was the highest among Feekes 4 and 6 stages. Zhang et al. (2019) also noted that leaf dry matter in wheat is more varied than other stages during Feekes stages 4 to 7, and that agricultural information can be obtained accurately.
y = 291.47x1.686
R² = 0.77520
50
100
150
200
250
300
350
0.4 0.5 0.6 0.7 0.8 0.9 1 1.1
Tota
l N u
ptak
e (k
g ha
-1)
Sufficiency index of NDVI
y = 291.47x1.686
R² = 0.77520
50
100
150
200
250
300
350
0.4 0.5 0.6 0.7 0.8 0.9 1 1.1
Tota
l N u
ptak
e (k
g ha
-1)
Sufficiency index of NDVI
y = -0.0634x2 + 47.367x - 865.69R² = 0.8969
0
1500
3000
4500
6000
7500
9000
0 50 100 150 200 250 300
Gra
in y
ield
(k
g ha
-1)
Total N uptake (kg ha-1)

1st African Conference on Precision Agriculture | 8-10 December | 2020
227
Validation of GreenSeeker in Managing N Fertilizer The experiment performed during the second season has been used to assess the
GreenSeeker sensor performance as proposed in this study. Various doses and timings of N fertilizer were added prior to applying the corrective dose as steered by the GreenSeeker to make growth variance in biomass and N uptake in wheat.
The data mentioned in table (2) show that the grain yield was obtained in Treatment # 3 (applying 40 and 60 kg N ha-1 at 0 and 30 DAS, respectively, followed by a corrective dose of 60.9 kg N ha-1 as guided by the GreenSeeker for a total of 160.9 kg N ha-1) is approximately equal to the yield was obtained in the general recommendation, but with 79 kg N ha-1 less. Other treatments demonstrated the GreenSeeker's effectiveness in increasing or decreasing the N fertilizer levels at jointing growth stage, depending on the plant's need. The N management based on GreenSeeker successfully overcame the variability in wheat growth caused by various prescriptive N management and with less N fertilizer quantities had been used.
REN data indicate that GreenSeeker-guided N treatments have resulted in greater efficiency of use compared with the general recommendation. For example, when suitable prescriptive N fertilizer (Treatment # 3) was applied, accompanied by a corrective dose as guided by the GreenSeeker, a 22.6 percent increase in REN compared to the general recommendation. Therefore, by using GreenSeeker in guidance N management could efficiently control N fertilizer to achieve higher yield along with less N fertilizer being applied. Table 2. Wheat grain yields, total N uptake, and N use efficiencies as influenced by different N fertilizer treatments as guided by GreenSeeker sensor. Treatment N fertilizer NDVI
Feekes 6 Corrective
dose kg N ha-1
Total amount of N fertilizer kg N ha-1
Grain yield
kg ha-1
Total N uptake kg ha-1
REN+ % At
sowing 30 days
age
T1 (zero-N) 0 0 - 0 0 3118 d 109.6 c - T2 (gen. rec.) 80 80 0.75 80 (fixed) 240 8023 a 233.4 a 51.5 c T3 40 60 0.74 60.9 160.9 7989 a 228.9 a 74.1 a T4 100 0 0.72 77.3 177.3 7373 b 238.7 a 72.8 a T5 0 100 0.71 85.3 185.3 7742 a 243.2 a 72.1 a T6 0 0 0.68 109.1 109.1 6114 c 183.5 b 67.7 b T7 100 100 0.80 10.1 210.1 7871 a 224.6 a 54.7 c + REN = Recovery efficiency of nitrogen fertilizer. Means followed by the same letter within the same column are not significantly different at the 0.05 level of probability by Duncan’s multiple range test (DMRT).
CONCLUSIONS
The GreenSeeker sensor is proved to be an effective tool to predict N uptake in wheat from data measured at jointing growth stage. This hand-held GreenSeeker sensor can be used reliably for the management of N fertilizer in wheat. Accordingly, the application of corrective doses of 0, 80, 60.9, 77.3, 85.3, 109.1 or 10.1 kg N ha-1 corresponding to the sensor values of GreenSeeker has suggested a strategy. Compared to the general recommendation, the suggested strategy used

1st African Conference on Precision Agriculture | 8-10 December | 2020
228
effectively in the management of N fertilizer led to an increasing in N recovery efficiency level of 22.6 percent with statistically similar yield.
REFERENCES
Adhikari C, Bronson KF, Panuallah GM, Regmi AP, Saha PK, Dobermann A, Olk DC, Hobbs PR,
Pasuquin E. 1999. On-farm soil N supply and N nutrition in the rice–wheat system of Nepal and Bangladesh. Field Crops Res. 64(3): 273-286.
Ali AM, Ibrahim S, Fawy H. 2017. Soil-Based Technique for Managing Nitrogen Fertilization in Wheat in some Desert Soils at West Nile Delta, Egypt. Alexandria Science Exchange Journal 38(Oct.-Dec.): 699-706.
Ali AM, Ibrahim SM, Singh B. 2019. Wheat grain yield and nitrogen uptake prediction using atLeaf and GreenSeeker portable optical sensors at jointing growth stage. Information Processing in Agriculture (in-press), https://doi.org/10.1016/j.inpa.2019.09.008
Ali AM, Thind HS, Sharma S. 2014. Prediction of dry direct-seeded rice yields using chlorophyll meter, leaf color chart and GreenSeeker optical sensor in northwestern India. Field Crops Res. 161: 11-15.
Ali AM, Thind HS, Sharma S, Singh Y. 2015. Site-specific nitrogen management in dry direct-seeded rice using chlorophyll meter and leaf colour chart. Pedosphere 25(1): 72-81.
Cassman KG, Peng S, Olk DC, Ladha JK, Reichardt W, Dobermann A, Singh U. 1998. Opportunities for increased nitrogen-use efficiency from improved resource management in irrigated rice systems. Field Crops Res. 56(1-2): 7-39.
Dobermann A, Witt C, Abdulrachman S, Gines HC, Nagarajan R, Son TT, Tan PS, Wang GH, Chien NV, Thoa VTK, Phung CV. 2003. Estimating indigenous nutrient supplies for site-specific nutrient management in irrigated rice. Agron. J. 95(4): 924-935.
Fageria NK, Baligar VC. 2005. Enhancing nitrogen use efficiency in crop plants. Advances in Agronomy 88: 97-185.
FAO. 2015. Egypt: Wheat sector review. FAO Investment Centre. Country Highlights, eng no. 21. Francis DD, Piekielek WP. 2019. Assessing crop nitrogen needs with chlorophyll meters. SSMG-
12. Site-specific management guidelines. Available at http://www.ipni.net/ssmg (accessed April 2019).
Gomez KA, Gomez AA. 1984. Statistical procedures for agricultural research. John Wiley & Sons. Heffer P, Gruère A, Roberts T. 2017. Assessment of fertilizer use by crop at the global level. Paris:
International Fertilizer Industry Association. Hussain F, Bronson KF, Peng S. 2000. Use of chlorophyll meter sufficiency indices for nitrogen
management of irrigated rice in Asia. Agron. J. 92(5): 875-879. Hussain F, Bronson KF, Peng S. 2000. Use of chlorophyll meter sufficiency indices for nitrogen
management of irrigated rice in Asia. Agron. J. 92(5): 875-879. Kalra Y. Ed. 1997. Handbook of reference methods for plant analysis. Boca Raton (FL): CRC
Press. Khosla R, Alley MM. 1999. Soil-specific nitrogen management on mid-Atlantic coastal plain
soils. Better Crops 83(3): 6-7. Noulas C, Herrera JM, Tziouvalekas M, Qin R. 2018. Agronomic assessment of nitrogen use
efficiency in spring wheat and interrelations with leaf greenness under field conditions. Communications in Soil Sci Plant Analy. 49(7): 763-781.
1st African Conference on Precision Agriculture | 8-10 December | 2020
229
Page AL. 1982. Methods of soil analysis: chemical and microbiological properties. Am. Soc. of Agronomy.
Peng S, Garcia FV, Laza RC, Sanico AL, Visperas RM, Cassman KG. 1996. Increased N-use efficiency using a chlorophyll meter on high-yielding irrigated rice. Field Crops Res. 47(2-3): 243-252.
Raun WR, Johnson GV. 1999. Improving nitrogen use efficiency for cereal production. Agron. J. 91(3): 357-363.
Raun WR, Solie JB, Johnson GV, Stone ML, Lukina EV, Thomason WE, Schepers JS. 2001. In-season prediction of potential grain yield in winter wheat using canopy reflectance. Agron. J. 93(1): 131-138.
Schepers JS, Francis DD, Vigil M, Below FE. 1992. Comparison of corn leaf nitrogen concentration and chlorophyll meter readings. Communications in Soil Sci. Plant Analy. 23(17-20): 2173-2187.
Schlemmer MR, Francis DD, Shanahan JF, Schepers JS. 2005. Remotely measuring chlorophyll content in corn leaves with differing nitrogen levels and relative water content. Agron. J. 97(1): 106-112.
Singh B, Ali AM. 2020. Using Hand-Held Chlorophyll Meters and Canopy Reflectance Sensors for Fertilizer Nitrogen Management in Cereals in Small Farms in Developing Countries. Sensors 20(4), p.1127.
Singh B, Singh Y. 2003. Environmental implications of nutrient use and crop management in rice-based ecosystems. In International Rice Research Conf. Beijing, China, 16-19 September 2002. International Rice Research Institute.
Singh B. 2018. Are nitrogen fertilizers deleterious to soil health? Agron. J. 8(4): 48. Singh B, Gupta RK, Singh Y, Gupta SK, Singh J, Bains JS, Vashishta M. 2006. Need-based
nitrogen management using leaf color chart in wet direct-seeded rice in northwestern India. J. of New Seeds 8(1): 35-47.
Singh B, Sharma RK, Kaur J, Jat ML, Martin KL, Singh Y, Singh V, Chandna P, Choudhary OP, Gupta RK, Thind HS, Singh J, Uppal HS, Khurana HS, Kumar A, Uppal RK, Vashistha M, Raun WR, Gupta R. 2011. Assessment of the nitrogen management strategy using an optical sensor for irrigated wheat. Agronomy for Sustainable Development 31(3): 589-603.
Singh B, Singh Y, Ladha JK, Bronson KF, Balasubramanian V, Singh J, Khind CS. 2002. Chlorophyll meter–and leaf color chart–based nitrogen management for rice and wheat in Northwestern India. Agron. J. 94(4): 821-829.
Singh V, Singh B, Singh Y, Thind HS, Buttar GS, Kaur S, Singh M, Kaur S, Bhowmik A. 2017. Site-specific fertilizer nitrogen management for timely sown irrigated wheat (Triticum aestivum L. and Triticum turgidum L. spp. durum) genotypes. Nutrient Cycling in Agro Ecosystems 109(1): 1-16.
Varvel GE, Schepers JS, Francis DD. 1997. Ability for in-season correction of nitrogen deficiency in corn using chlorophyll meters. Soil Sci. Soc. Am. J. 61(4): 233-1239.
Yao Y, Miao Y, Huang S, Gao L, Ma X, Zhao G, Jiang R, Chen X, Zhang F, Yu K, Gnyp ML. 2012. Active canopy sensor-based precision N management strategy for rice. Agronomy for Sustainable Development 32(4): 925-933.
Zhang J, Liu X, Liang Y, Cao Q, Tian Y, Zhu Y, Cao W, Liu X. 2019. Using a portable active sensor to monitor growth parameters and predict grain yield of winter wheat. Sensors 19(5), p.1108.

1st African Conference on Precision Agriculture | 8-10 December | 2020
230
#7708 ENHANCING THE USE OF APPROPRIATE FERTILIZERS FOR IMPROVING RICE AND MAIZE PRODUCTION IN TANZANIA
C.J. Senkoro1, K. A. Mtua1, C. Komba1, S. A. Kazyoba1, J. D. Mbogoni1 and M.M. Msolla2 1Tanzania Agricultural Research Institute, TARI Mlingano, P. O. Box 5088, Tanga, Tanzania
2OCP Tanzania Limited, P. O. Box 10049, Dar es Salaam, Tanzania [email protected]; [email protected] +255 754 649188
ABSTRACT
In years 2017 to 2019, site specific fertilizer trials were conducted in Tanzania to enhance the precision in using appropriate fertilizer in rice and maize production. Two new fertilizers namely: NPS (19- 38-0+7S) and NPSZn (12- 45-0+5S+1Zn) were tested in comparison with DAP, the commonly used fertilizer by farmers. Control treatment was also added to assess crop yields under farmers practices. The trial design was randomized complete block designed. Treatments were replicated 4 to 16 times in each village depending on soil variations and willingness of farmers to set trial. The amount applied for NPS and NPSZn fertilizers were based on the recommended rates of P for rice and maize in the studied Agricultural Zones. Nitrogen fertilizer was applied in 2 splits as urea in all treatment except control. The amount of urea applied was adjusted to take into consideration the N contained in each fertilizer. Results indicates that there is a significant variation (P<0.05) of soil fertility status and crop yields among agro-ecological zones. All study sites are characterized by low levels of N and OC for maize and rice production. Most of the study areas have medium to low levels of P, K, Zn, Mg, Ca, and S. In Southern highlands zones, application of NPSZn and NPS gave significantly higher rice grain yields up to 8.39 t ha-1 as compared to DAP fertilizer (6.84 t ha-1). For the other 7 zones, fertilizers tested (DAP, NPSZn, NPS) had comparable effectiveness in improving rice and maize grain yields. The tested fertilizers increased up to 3 times more grain yields than control practices. Economically, NPSZn and NPS fertilizers gave more profit in maize and rice production than DAP and farmer’s practices. It is recommended that, fertilizers NP+S and NP+SZn be adopted by farmers in the study areas instead of DAP. Further research is needed to determine appropriate S, K, Zn, Mg, and Ca nutrients rates which can be used to formulate balanced fertilizer recommendations for improving maize and rice production in Tanzania.
INTRODUCTION
Maize and rice are important staple food in Tanzania. Maize ranks the first staple food followed by rice. These crops are also used to generate income when there is surplus. Most soils under maize and rice production in the country are characterized by low soil fertility. Nitrogen (N) and phosphorus (P) are the major limiting nutrients. For this reason, nutrient management efforts have been concentrating on these two nutrients. The available fertilizer recommendations for most crops by Samki & Harrop (1984), Mowo et al. (1993) and Marandu et al. (2016) do not cover micronutrients because of insufficient information on micronutrient status of the soils as well as response of crops to micronutrients. However, some studies have indicated deficiencies of micronutrients particularly Zn, Cu and S in some parts of Tanzania (Amur and Semu 2006; Massawe and Amur, 2012; Kamasho and Singh 2012; Mhoro et al., 2015; Senkoro et al., 2017)).
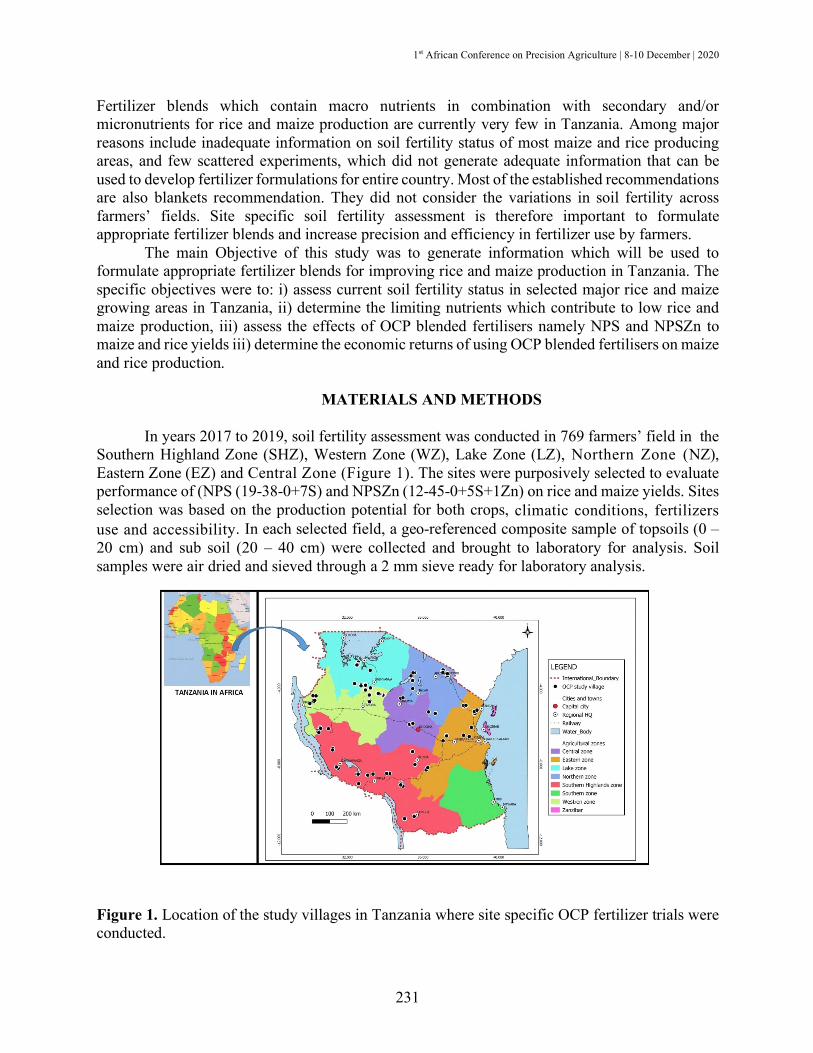
1st African Conference on Precision Agriculture | 8-10 December | 2020
231
Fertilizer blends which contain macro nutrients in combination with secondary and/or micronutrients for rice and maize production are currently very few in Tanzania. Among major reasons include inadequate information on soil fertility status of most maize and rice producing areas, and few scattered experiments, which did not generate adequate information that can be used to develop fertilizer formulations for entire country. Most of the established recommendations are also blankets recommendation. They did not consider the variations in soil fertility across farmers’ fields. Site specific soil fertility assessment is therefore important to formulate appropriate fertilizer blends and increase precision and efficiency in fertilizer use by farmers.
The main Objective of this study was to generate information which will be used to formulate appropriate fertilizer blends for improving rice and maize production in Tanzania. The specific objectives were to: i) assess current soil fertility status in selected major rice and maize growing areas in Tanzania, ii) determine the limiting nutrients which contribute to low rice and maize production, iii) assess the effects of OCP blended fertilisers namely NPS and NPSZn to maize and rice yields iii) determine the economic returns of using OCP blended fertilisers on maize and rice production.
MATERIALS AND METHODS
In years 2017 to 2019, soil fertility assessment was conducted in 769 farmers’ field in the
Southern Highland Zone (SHZ), Western Zone (WZ), Lake Zone (LZ), Northern Zone (NZ), Eastern Zone (EZ) and Central Zone (Figure 1). The sites were purposively selected to evaluate performance of (NPS (19-38-0+7S) and NPSZn (12-45-0+5S+1Zn) on rice and maize yields. Sites selection was based on the production potential for both crops, climatic conditions, fertilizers use and accessibility. In each selected field, a geo-referenced composite sample of topsoils (0 – 20 cm) and sub soil (20 – 40 cm) were collected and brought to laboratory for analysis. Soil samples were air dried and sieved through a 2 mm sieve ready for laboratory analysis.
Figure 1. Location of the study villages in Tanzania where site specific OCP fertilizer trials were conducted.

1st African Conference on Precision Agriculture | 8-10 December | 2020
232
Nutrient availability was determined using mid-infrared (MIR) spectral analysis following validation using data from wet chemistry analysis which were 10% of the total samples (Shepherd and Walsh, 2007; Terhoeven-Urselmans et al. 2010; and Towett et al. 2015). Soil pH was determined with a 1:2.5 soil: water slurry. The Mehlich 3 extraction was used for available P, exchangeable bases and available micronutrients (Mehlich 1984).
Soils at the study areas are characterized by low levels of N and OC for maize and rice production. Most of the study areas have medium to low levels of P, K, Zn, Mg, Ca, and S ((Landon 1991; Horneck et al. 2011; Howeler 2002).
The experimental design was randomized complete block designed with 4 treatments replicated 4 to 16 times in one village depending on soil variations. Treatments tested were: (1) absolute control (2) NP at recommended rates for maize and rice, (3) NPS (19-38-0+7S) and (4) NPSZn (12-45-0+5S+1Zn). The amount applied for NPS and NPSZn fertilizers were based on recommended rate of P for rice and maize (Senkoro et. al., 2017). Nitrogen fertilizer was applied in 2 splits as urea in all treatments except control. The amount of urea applied was adjusted to take into consideration the N contained in each fertilizer. The amount of fertilizer nutrient rates applied are as indicated in Table 1. Maize and rice grain yield data were subjected to Analysis of Variance using Statistix statistical programme and where significant difference existed, means were separated using Duncan’s New Multiple Range Test. The profitability of maize and rice production in the study areas from each of the four fertilizer types was estimated through a partial budget analysis, and Value-Cost Ratio (VCR). Table 1. Nutrients from NPSZn and NPS fertilizers applied to rice and maize in the studied zones. Agricultural Zone Rice Maize
N* P* S Zn N P S Zn Nutrients applied (kg ha-1) from NPSZn (12-45-0+5S+1Zn) Eastern Zone 150 20 5.0 1 65 40 10 2 Northern Zone 100 20 5.0 1 74 20 5 1 Southern Highland Zones 116 40 10.0 2 60 20 5 1 Western Zone 66 23 8.1 1.2 43 25 6.3 1.3 Lake Zone 80 31 7.8 1.6 53 30 7.5 1.5 Nutrients applied (kg ha-1) from NPS (19-38-0+7S) Eastern Zone 150 20 7 0 65 40 14 0 Northern Zone 100 20 7 0 74 20 7 0 Southern Highland Zones 116 40 14 0 60 20 7 0 Western Zone 66 23 8.1 0 43 25 8.8 0 Lake Zone 80 31 10.9 0 53 30 10.5 0
*Fertilizer recommendations for the Zones
RESULTS AND DISCUSSION
The results indicate that most smallholder famers (52 – 95%) in Central, Western, Eastern, Northern and Lake Zones do not use fertilizers in maize and rice production; 70% of farmers in Southern Highland Zone use fertilizers. There is a significant variation (P<0.05) of soil fertility

1st African Conference on Precision Agriculture | 8-10 December | 2020
233
status and crop yields among agro-ecological zones indicating that site specific fertilizer recommendation is important to increase fertilizer use efficiency and crop yield. All study sites are characterized by low levels of N and OC for maize and rice production. Most of the study areas have medium to low levels of P, K, Zn, Mg, Ca, and S. In Southern highlands zones, application of NPSZn and NPS gave significantly higher rice grain yields up to 8.39 t ha-1 as compared to DAP fertilizer (6.84 t ha-1). For the other 7 zones, fertilizers tested (DAP, NPSZn, NPS) had comparable effectiveness in improving rice and maize grain yields (Table 2). The tested fertilizers increased up to 3 times more grain yields than control practices (Table 2).
Economically, NPSZn and NPS fertilizers gave more profit in maize and rice production than DAP and farmer’s practices. Rice yield from NPSZn fertilizer in Nzega district in the lake Zone had the highest net benefit of TZS. 7,370,597 equivalents to US $ 3,258.40. Table 2. Rice response to tested fertilizers in the studied Agricultural Zones in Tanzania. Crop and Zone
Grain yield per fertilizer type (t ha-1)
Level of significance
CV (%)
Control NPS NPSZ
n DAP
Rice Lake Zone 2.26b 5.35a 5.29a 5.72a *** 32.0 Western Zone 4.54b 8.81a 9.76a 8.29a *** 32.1 Southern Highland Zone 1 3.55c 7.82a 8.39a 6.35b *** 25.0 Southern Highland Zone 2 5.37d 6.32c 7.56a 6.84b *** 14.0 Northern Zone 5.1 5.1 6.4 5.9 ns 31.8 Eastern Zone 3.6 4.5 4.8 4.8 ns 18.3 Maize
Lake Zone 1.83 4.24 4.27 3.62 ns 55.0 Western zone 3.42 5.21 5.83 5.99 ns 78.0 Southern highlands1 3.36b 6.55a 6.69a 6.46a *** 39.0 Southern highlands2 1.60 3.61 3.95 3.26 ns 42.0 Northern Zone 2.057b 3.173b 3.745b 3.7b ** 21.6 Eastern Zone 1.15 1.73 1.99 1.91 ns 26.7
Numbers within the same row bearing the same letter are not significantly different using Duncan New Multiple Range Test (DNMRT)
CONCLUSIONS AND RECOMMENDATIONS
There is significant variation of soil fertility status among sites in areas under rice and maize production in Tanzania emphasizing that more assessment is needed to establish site specific nutrient recommendations. Due to nutrient mining, application of N and P alone will not lead to sustainable production. It is recommended that, fertilizers NP+S and NP+SZn be adopted by farmers in the study areas instead of DAP. Further research is needed to determine appropriate S, K, Zn, Mg, and Ca nutrients rates which can be used to formulate balanced fertilizer recommendations for improving maize and rice production in Tanzania.

1st African Conference on Precision Agriculture | 8-10 December | 2020
234
ACKNOWLEDGEMENTS
TARI Mlingano is grateful to OCP Africa for providing funds to conduct this study. The
author acknowledges the Ministry of Agriculture and the District Councils for enabling the field research. Many thanks to researchers, OCP Africa staff, farmers and extension officers who participated to this study.
REFERENCES
Black CA. 1982. Methods of Soil Analysis. Part 2. Chemical and Microbiological Properties, Agronomy Monograph 9.2, 1982 Published by: American Society of Agronomy, Soil Science Society of America
Blaesing D. 2006. in http://www.agvita.com.au/pdf/expresssoil/Soil_P_tests.pdf Dewis J, Freitas F. 1970. Physical Methods of Soil and Water Analyses. FAO Soil Bull. No.10,
pp. 39-51. Grobler L, Bloem AA, Claassens AS. 1999. A critical soil sulphur level for maize (Zea mays L.)
grown in a glasshouse, South African Journal of Plant and Soil 16(4): 204-206, DOI: 10.1080/02571862.1999.10635012
Horneck DA, Sullivan DM, Owen J, Hart JM. 2011. Soil test interpretation guide https://catalog.extension.oregonstate.edu/ec1478, accessed on 20th December 2017
Landon JR. 1991. Booker tropical soil manual. Longman Group UK Ltd., Harlow. 474 pp Marandu AET, Mbogoni JDJ and Ley GJ. 2014 (Eds.). Revised Fertilizer Recommendations for
Maize and Rice in the Eastern, Southern Highlands and Lake Zones of Tanzania. Ministry of Agriculture, Food Security and Cooperatives, Department of Research and Development, Dar-es-Salaam, Tanzania. 40 pp.
Mehlich A. 1984. Mehlich 3 Soil Test Extractant: A Modification of Mehlich 2 Extractant. Comm. Soil Sci. Plant Anal. 15 (12): 1409–1416. DOI 10.1080/00103628409367568
Mowo JG, Floor J, Kaihura FBS, Magogo JP. 1993. Review of Fertilizer Recommendations in Tanzania. Part 2: Revised Fertilizer Recommendations for Tanzania. National Soil Service, ARI Mlingano, Ministry of Agriculture, Tanga, Tanzania.
Ruffo M, Olson R, D averede I. 2016. Maize Yield Response to Zinc Sources and Effectiveness of Diagnostic Indicators. Communications in Soil Science and Plant Analysis 47: 137-141.
Sawyer JE, Mallarino AP, Killorn R. 1999. Differentiating and Understanding the Mehlich 3, Bray and Olsen soil P tests. In General guide for crop nutrient recommendation in Iowa. Publ. Pm-1688 (Rev.). Iowa State Univ. Ext., Ames.
Senkoro CJ, Ley GJ, Marandu AE, Wortmann C, Mzimbiri M, Msaky J, Umbwe R and Lyimo SD. 2017. Optimizing fertilizer use within the context of integrated soil fertility management in Tanzania. In Fertilizer Use Optimization in sub-Saharan Africa. Wortmann CS and Sones K (Ed). Published by CABI, UK pp 176-192
Senkoro CJ, Kalumuna M, M t u a K , Wickama J. 2017. Site Selection and Characterization –Report 1. OCP Africa and ARI Mlingano, Tanga. 30 pp
Sillampaa N. 1982. Micronutrients and nutrients status of soils. A global study, FAO soil bulletin, FAO. Rome, pp. 17 – 96.

1st African Conference on Precision Agriculture | 8-10 December | 2020
235
Wendt JW. 1995. Evaluation of the Mehlich 3 soil extractant for upland Malawi soils. Communications in Soil Science and Plant Analysis 26(5-6).
1st African Conference on Precision Agriculture | 8-10 December | 2020
236
#7785 COMPARATIVE FERTILIZATION EFFECTS ON MAIZE PRODUCTIVITY UNDER CONSERVATION AND CONVENTIONAL TILLAGE ON SANDY SOILS
IN A SMALLHOLDER CROPPING SYSTEM IN ZIMBABWE
Nyasha Kafesua, Regis Chikowoa and Shamie Zingoreb aUniversity of Zimbabwe, Harare, Zimbabwe
bInternational Plant Nutrition Institute, Nairobi, Kenya, [email protected]
ABSTRACT
Low crop yields, food insecurity and abject rural poverty continue to be rampant in much
of Southern Africa. Components of conservation agriculture (CA) are being widely promoted in southern Africa as one of the strategies to increase food security and mitigate rural poverty, despite there being scarce empirical evidence on their efficacy on degraded soils. This research aimed to assess the effects of tillage systems on maize grain yields under rain-fed conditions across a soil organic matter gradient using on-farm trials set-up in Eastern Zimbabwe. The effects of three tillage systems were compared, that is a) conventional tillage (CT), b) basins-based CA (B-CA), and c) furrow-based CA (F-CA) on sandy soils with soil organic carbon (SOC) ranging from 0.18-0.89% and clay content from 60 -150 g kg-1. Fields were tagged using a Geography Positioning System (GPS) and mapped to improve nutrient targeting across seasons. An on-farm study was established with thirty farms, each with two fields previously selected as either rich or poor by host farmers as a nutrient omission trial using nitrogen (N), phosphorus (P), potassium (K), cattle manure (M) and their combinations. Host farmers’ local soil fertility rating of poor and rich fields was validated by lab-based results which showed that poor fields had SOC <0.4%, were more acidic, had lower amounts of exchangeable bases (Mg, Ca, K), available P and total N. Whilst no significant tillage effects were observed in the first year, nutrient management significantly increased maize yields across the three years (P<0.001). Maize grain yields increased from 0.3 Mg ha-1 for unfertilized control to 4.1 Mg ha-1 for the NPKSM treatment. Maize grain yields were significantly higher under B-CA compared to both F-CA and CT in the second year (P <0.01), responding to improved targeting of fertilizers using basins. Maize grain yields were consistently larger for SOC rich fields. Response to N increased with increase in soil fertility, suggesting higher N use efficiency for soils with higher SOC. An amalgamated approach to nutrient management using both organic and inorganic nutrient sources is vital to ensure maize productivity on poor soils in agro-ecologies receiving unreliable rainfall. Keywords: conservation agriculture, soil organic carbon (SOC), nutrient targeting, tillage practice
INTRODUCTION
Hunger and poverty that continues to ravish sub-Saharan Africa (SSA) is mainly a result of poor maize grain yields by farmers averaging less than 1 Mg ha-1. Agricultural crop production is primarily rain-fed, characterised by mid-season droughts and flash floods. There is need to rethink strategies to improve productivity (Tittonell & Giller, 2013), as approaches to curb food insecurity in the region have largely failed to capture the individual needs of farmers and therefore gains continue to be abortive. Blanket fertiliser recommendations on heterogenous soils are often

1st African Conference on Precision Agriculture | 8-10 December | 2020
237
promoted without consideration of farm specific needs. Farmers constantly use little to no fertiliser use, with resource constrained farmers failing to invest in organic fertilisers (Mtambanengwe & Mapfumo, 2005). Strategies to preserve moisture and maximise the little additional fertilisers continue to be relevant in soils with low soil organic carbon (SOC), areas experiencing rainfall variability and farmers who are resource constrained. Solutions that are often presented to work in the present environment have often worked elsewhere but with little empirical evidence on how they will perform in the local context. Governmental effort in Zimbabwe is concentrated on promoting CA but there is lack of knowledge on how the technology will perform in varied farming systems with little fertiliser use and dominated by maize monocropping. There is increased need to generate data on how the technology will perform in comparison to balanced CT systems. The study therefore aimed to: i) assess the influence of inherent soil fertility on the performance of CA and CT technologies under similar production environments in the smallholder farming systems, and ii) determine the interaction of soil fertility and tillage system on maize yield response to application of macronutrients. In this context, CA is used but is deficient in meeting all the necessary CA pillars. In its strictest sense they are tillage systems compared as a result.
MATERIALS AND METHODS
The study was established in Zimbabwe, Murewa district (17°49′S, 31°34′E; 1400 masl) spanning over three seasons till 2016. Murewa recorded daily cumulative rainfall of 1087 mm and a minimum cumulative daily rainfall of 587mm with varied distribution from November to March across the seasons. Characteristic sandy-lixisols with poor SOC content are dominant. Murewa has a strong crop-livestock interaction where livestock graze on crop residues and manure is used to fertilise fields. For this study, to help understand how CA best fits in the local farmer context, crop residues were retained in the field after each harvest and were partially grazed by livestock.
Farmers were tasked to identify the most fertile (rich) field and the least (poor) field in an exploratory survey involving 70 farms. Farmer’s soil fertility rating was amongst other factors a function of preceding nutrient management and response to fertilizer amendments, historical crop productivity and indicator weed species. Composite soil samples consisting of five subsamples were collected along the field’s diagonal line from the plough layer (0–20 cm depth) and bulked. The soil samples were air dried and prepared, pH and soil texture determined (Gee & Bauder, 1986) and tested for SOC (Okalebo, et al., 2002), total N determined, as well as available P (Anderson & Ingram, 1993) and extractable bases. Soils had clay content that ranged between 60 – 150 g kg-1 and SOC ranged between 0.18 – 0.89% C. Fields were later were grouped into three soil fertility classes (Field Types 1–3) as defined by Kurwakumire et al. (2014). The majority (48%) had SOC of less than 0.4% C – type 1. Experiments were set on these rich and poor fields as split-plot designs with tillage as the main plot (B-CA, F-CA and CT), 6 nutrient omission treatments as sub-plots in 6 x 5m plots and farmers used as replicates. Nutrient omission treatments were as follows: i) Control (no nutrients added), ii) PKS (single super phosphate, (18 P2O5 + 9% S) + muriate of potash (60% K). iii) NK (ammonium nitrate (34.5% N) + muriate of potash. iv) NPS (ammonium nitrate + single super phosphate). v) NPKS (ammonium nitrate + muriate of potash + single super phosphate). vi) NPKSM (ammonium nitrate + muriate of potash + single super phosphate, +cattle manure −M). Fertilizer treatments were designed to reflect amendments that are normally accessible and used by farmers which are usually constrained in availability as sole S fertilizers. Nitrogen was applied as a rainfall response strategy (targeting 0-140 kg N ha−1), at 110 kg N ha−1 in years 1 and 2, and 90 kg N ha−1 in year 3. Other fertilizer rates were at 30 kg

1st African Conference on Precision Agriculture | 8-10 December | 2020
238
P ha−1, 30 kg K ha−1, and 5 Mg ha−1 manure. Manure used in the study contained an average of 1.1% N, 0.15% P, 0.18% Ca, 0.09% Mg, 0.7% K, 20 mg kg−1 Cu, 285 mg kg−1 Mn, 810 mg kg−1 Fe and 115 mg kg−1 Zn, which translate to annual nutrient investments of 55 kg N, 7.5 kg P, 35 kg K, 4.5 kg Mg, 9 kg Ca, 0.1 kg Cu, 1.425 kg Mn, 4.05 kg Fe and 0.575 kg Zn ha−1. Rain gauges were used to monitor rainfall in all study sites, and planting was done to achieve a plant population of 44400. Harvesting of maize plants was done at physiological maturity from central net plots of 3.6 m2 (2 rows × 2 m long). Yields were computed and reported at 12.5% moisture content, in line with moisture level at which maize grain is reported and marketed in the region. Nutrient limitations/responses were determined by calculating the difference in the attainable yield and the nutrient-limited yield.
All the data violated the ANOVA assumptions, hence were transformed before ANOVA analysis. Soils were grouped into three classes based on SOC content according to Kurwakumire et al. (2014). Data was clustered into three field Types based on SOC content. Data was subjected to ANOVA analysis using a generalized linear model to test tillage effects (main plot factor), fertilization (sub-plot factor), and their interactions on grain yields across the three years. [Field Type 1, SOC < 0.4; Type 2, 0.4% < SOC < 0.6%; and Type 3, SOC > 0.6%]. Separation of means was done using the Fischer’s protected least significance test (LSD) at 5% significance level. All statistical analyses were done using GENSTAT version 14 statistical package.
RESULTS
The season (year), field type and fertilization showed significant maize yield effects (P<0.005). Maize productivity constantly increased as we moved from type 1 (SOC< 0.4%) to type 3 (SOC > 0.6%) fields across all seasons and treatments. Full NPKS + manure treatment showed consistently larger grain yields across all field types, whilst the control (0.27–0.38 Mg ha−1) and PKS (0.36–0.48 Mg ha−1) treatments were consistently lower for all field types. Whilst no tillage effects were observed in the first year, significant tillage effects were only observed from the second season (P = 0.005). The B-CA outperformed both F-CA and CT (by up to 1 Mg ha-1), even in poor soils (with SOC < 0.4%), which could be as a result of increased soil water availability and precise fertilizer application. Grain yield differences (deviation from the NPKS treatments) showed largest negative differences under B-CA and the largest positive differences (0.8 Mg ha-1) for NPKSM treatment under B-CA as well, suggesting additional benefits of using manure. Nutrient omission experiments showed a constant grain yield penalty following N omission across all sites. Nutrient N and P response was highest in soils with > 0.6% SOC at 37 kg grain kg−1 N and 63 kg grain kg−1 P applied.
DISCUSSION
In year 2, B-CA showed significantly higher yields than both F-CA and CT. Improved nutrient targeting, cumulative fertilizer effects and increased efficiency of rainwater are highlighted as the major reasons surrounding successes in CA systems, especially in seasons with limited seasonal rainfall. Thierfelder and Wall (2012)’ s studies have proved the benefits of CA over CT after at least one cropping season, while Kihara et al. (2011), sited gains after 3 cropping seasons. Concerns have been raised over the increased costs on labor with CA, but Twomlow et al. (2008a, 2008b) established that CA gave returns that are twice those of CT. Whilst residue retention helps improve soil quality (Govaerts, et al., 2009), and retain P in soils, it is proving to
1st African Conference on Precision Agriculture | 8-10 December | 2020
239
be extremely difficult to retain all crop residues as livestock are left to graze openly (Zingore, et al., 2011). Using both organic and inorganic fertlizers resulted in increased crop productivity which was synonymous with results from Mtambanengwe et al., (2006) and Kurwakumire et al., (2014). Mtambanengwe and Mapfumo, (2005); Zingore et al., (2008) attributed these increases partly to pH amelioration, increased water infiltration, reduced run-off and increased SOC and improved micronutrient uptake. Strategic fertilizer targeting was identified as one of the strategies for viable fertilizer use (Giller, et al., 2006).
Inherent soil fertility affects maize response to applied fertilizers (Vanlauwe et al., 2006) and integrating N2- fixing is suggested as the most viable option in many cases (Chikowo et al., 2004; Rusinamhodzi et al., 2012). Farmers’ ability to rate fields as poor and rich could be exploited to allow them to focus limited nutrient amendments on fields that give better returns to nutrient amendment. These results were in line with results by Zingore et al. (2007) where home fields that had higher SOC content, available P and exchangeable bases, had higher yields than the outfields with poor SOC content. Rehabilitating depleted soils therefore proves to be necessary to get meaningful returns to input investments.
CONCLUSIONS The study investigated the effect of tillage practices on productivity as affected by nutrient management on predominantly poor fertility soils. The positive effect of B-CA was observed from the second year, and was probably a function of both season type and accumulation of nutrients. Basins-based CA concentrates nutrients as nutrient application is physically localized near plant roots hence superior yields observed. The highest yields were achieved with the application of NPKSM irrespective of tillage system. As expected on soils with such low SOC, N was the most limiting nutrient for maize crop productivity. Prioritization is therefore essential due to poor residual effects of N fertilizer, particularly on sandy soils. Co-application of N and P was the ideal fertilizer investment strategy in Year 1. This fertilization strategy is beneficial irrespective of tillage system, when acutely poor soils that are non-responsive to fertilizers are avoided. This highlights the challenges to sustainable crop production intensification faced by smallholder farmers in SSA. Maize grain yields were consistently larger for SOC rich fields. Response to N increased with increase in soil fertility, suggesting higher N use efficiency for soils with higher SOC. Combining both organic and inorganic nutrient sources therefore proves to be a viable approach to nutrient management to ensure maize productivity on poor soils, which were the most widespread soils in agro-ecologies receiving unreliable rainfall.
REFERENCES Anderson JM, Ingram JS. 1993. Tropical Soil Biology and Fertility: A Handbook of Methods.
Wallington, Oxfordshire: CAB International. Chikowo R, Mapfumo P, Nyamugafata P, Giller KE. 2004. Maize productivity and mineral N
dynamics following different soil fertility management practices on a depleted sandy soil in Zimbabwe. Agric. Ecosyst. Environ. 100: 119-131.
Gee GW, Bauder JW. 1986. Particle size analysis. In: A. Klute, ed. Methods of soil analysis. Madison, WI: Am. Soc.Agron. pp.383-411.
Giller KE, Rowe EC, de Ridder N. van Keulen H. 2006. Resource use dynamics and interactions in the tropics: scaling up in space and time. Agric. Syst. 88: 8-27.

1st African Conference on Precision Agriculture | 8-10 December | 2020
240
Govaerts B et al. 2009. Conservation agriculture and soil carbon sequestration: between myth and farmer reality. Crit. Rev. Plant Sci. 28: 97-122.
Kihara J, et al. 2011. Conservation tillage, local organic resources and nitrogen fertilizer combinations affect maize productivity: soil structure and nutrient balances in semi-arid Kenya. Nutr. Cycl. Agroecosyst. 90: 213-225.
Kurwakumire N, et al. 2014. Maize productivity and nutrient and water use efficiencies across soil fertility gradients on smallholder farms in Zimbabwe. Field Crops Res. 164: 136-147.
Mtambanengwe F, Mapfumo P. 2005. Organic matter management as an underlying cause for soil fertility gradients on smallholder farms in Zimbabwe. Nutri. Cycl. Agroecosyst. 73: 227-243.
Mtambanengwe F, Mapfumo P, Vanlauwe B. 2006. Comparative short-term effects of different quality of organic resources on maize productivity under different environments in Zimbabwe. Nutr. Cycl. Agrocosyst. 76: 271-284.
Nikoli T, Matsi T. 2011. Influence of liquid cattle manure on micronutrients content and uptake by corn and their availability in a calcareous soil. Agron. J. 103: 113-118.
Okalebo JR, Gathua KW, Woomer PL. 2002. Laboratory Methods of Plant and Soil Analysis: A Working Manual. Nirobi, Kenya: TSBF-UNESCO.
Rusinamhodzi L, Corbeels M, Nyamangara J, Giller KE. 2012. Maize–grain legume intercropping is an attractive option for ecological intensification that reduces climatic risk for smallholder farmers in central Mozambique. Field Crops Res. 136: 12-22.
Thierfelder C, Wall PC. 2009. Effects of conservation agriculture techniques on infiltration and soil water content in Zambia and Zimbabwe. Soil Tillage Res. 105: 217-227.
Thierfelder C, Wall PC. 2012. Effects of conservation agriculture on soil quality and productivity in contrasting agro-ecological environments in Zimbabwe. Soil Use Manage. 28: 209-220.
Tittonell P, Giller KE. 2013. When yield gaps are poverty traps: the paradigm of ecological intensification in African smallholder agriculture. Field Crops Res. 143: 76-90.
Twomlow SJ, Urolov JC, Jenrich M, Oldrieve B. 2008b. Lessons from the field–Zimbabwe’s conservation agriculture task force. J. SAT. Agric. Res. 6:1-11.
Twomlow S, et al. 2008a. Building adaptive capacity to cope with increasing vulnerability due to climatic change in Africa - a new approach. Phys. Chem. Earth. 3: 780-787.
Vanlauwe B, et al. 2010. Integrated soil fertility management operational definition and consequences for implementation and dissemination. Outlook Agric. 39: 17-24.
Vanlauwe B, Tittonell P, Mukalama J. 2006. Within-farm soil fertility gradients affect response of maize to fertilizer application in western Kenya. Nutr. Cycl. Agroecosyst. 76: 171-182.
Zingore S, Delve RJ, Nyamangara J, Giller KE. 2008. Multiple benefits of manure: the key to maintenance of soil fertility and restorationof depleted sandy soils on African smallholder farms. Nutr. Cycl. Agroecosyst. 80: 267-282.
Zingore S, Murwira HK, Delve RJ, Giller KE. 2007. Soil type, management history and current resource allocation: three dimensions regulating variability in crop prouctivity on African smallholder farms. Field Crops Res. 101: 296-305.
Zingore S, et al. 2011. Managing soil fertility diversity to enhance resource use efficiencies in smallholder farming systems: a case from Murewa district, Zimbabwe. Nutr. Cycl. Agroecosyst. 90: 87-103.
1st African Conference on Precision Agriculture | 8-10 December | 2020
241
#7835 SPATIAL VARIABILITY OF SOIL AND PLANT NUTRIENT STATUS IN RELATION TO THE OCCURRENCE OF BITTER PIT IN APPLE ORCHARDS IN
THE SAIS PLATEAU, MOROCCO
R. Bouabid*, H. Labazi and H. Bahri National School of Agriculture of Meknes, Morocco, [email protected]
ABSTRACT
Bitter-pit is a nutritional disorder that affects apple fruit quality and post-harvest cold storage aptitude. In many Moroccan orchards, this disorder causes substantial yield loss on the field and upon cold storage. It is attributed to several factors, mainly the Ca-K-Mg nutrition equilibrium. Soil, leaf and fruit analyses can help assess the nutritional status and vulnerability to such a disorder. However, conventional methods relying on few samples cannot inform about the spatial variability of soil and tree conditions across the field, especially in large farms. The present study aims at assessing the spatial variability of soil, leaf and fruit K-Ca-Mg in an apple orchard using a high-density grid sampling in order to get a better understanding of the incidence of bitter bit and propose site-specific nutrient management. The study was conducted on a 30-ha field and targeted the Golden Smoothee variety. Composite samples of soil and leaf were taken at 130 regularly spaced points (50 m). Soil analyses concerned mineral N, exchangeable K, Mg and Ca. Leaf analyses included N, K, Mg and Ca. Spatial variability maps were elaborated for each nutrient and for the (K+Mg/Ca) ratio using spatial interpolation to identify the most vulnerable areas to bitter-pit. The results revealed important spatial variability for all nutrients, with K buildup on a major part of the field, thus causing a high (K+Mg)/Ca ratio incriminated for bitter-pit incidence. Leaf K content was normal to high with a N-S gradient, while leaf Ca was low on a large part of the field despite the high levels of exchangeable Ca in the soil. Leaf (K+Mg)/Ca ratio showed also similar trends to that of soil with values greater than 1.2 considered as a threshold for bitter pit development. Based on cut-off levels of 1.25 and 1.5, the map shows that about 35% of the field is of moderate risk and about 25% is of high risk to bitter-pit incidence. The spatial variability maps can serve as a decision support for site-specific management of fertilizers application to the soil, mainly K and N, as well as foliar applications of Ca in order to balance tree nutrition, avoid bitter pit occurrence and ensure better fruit quality, and profitability.
Keywords: bitter-pit, apples, Golden Smoothee, soil test, foliar analysis, potassium, calcium magnesium, spatial variability
INTRODUCTION
Bitter pit is a nutritional disorder, related directly or indirectly to calcium nutrition, and affects apple fruits. It manifests as brown spots on the apple skin with a bitter taste of the underneath tissue. It can develop at fruit maturity, but develops even more after periods of cold storage (Rui-Luiz, 1985; Lotze, 2005), therefore, affecting fruit quality and market value. Its occurence is attributed to various factors that impacts calcium (Ca) levels in the fruits (Ferguson et Watkins 1989). Moreover, potassium (K) and magnesium (Mg) are particularly involved in the Ca-K-Mg equilibrium, as both are considered antagonists to Ca (Faust and Shear, 1968; Ferguson

1st African Conference on Precision Agriculture | 8-10 December | 2020
242
and Watkins, 1989). Fruits with bitter pit expression are of low Ca contents. However, a high (K+Mg)/Ca ratio of leaf or fruit have been reported as a better indicator of bitter pit occurrence compared to Ca alone (Boon, 1980). The incidence can exceed 30% when leaf (K+Mg)/Ca ration is greater than 1.15 (Boon, 1980). Soils with high exchangeable K concentrations may lead to bitter pit even when soil exchangeable Ca is adequate or high. Excess nitrogen (N) absorption in the fruit can cause an increase in fruit size, and therefore a consequent Ca flesh dilution (Rui Luiz, 1985; Saure, 2005). Some varieties have been reported to be more susceptible than others (Ferguson and Watkins, 1989; Cheng and Sazo, 2018). Bitter-pit has been observed on many apple orchards in the Sais and Mid Atlas mountain regions of Morocco (Faraj, 2006), with fruit loss exceeding 50% of the yield after cold storage. Soil testing and foliar analysis are often used to assess soil fertility and tree nutrition. However, few composite samples are insufficient to reveal orchard nutrient spatial variability and depict the vulnerable areas to bitter-pit. The objective of this study was to assess the spatial variability of K, Ca and Mg in the soil and leaf in an apple orchard in the Sais plateau in NW Morocco in order to gain a better understanding of the occurrence of bitter-pit and propose site-specific nutrient management as a precision farming practice.
MATERIALS AND METHODS
The study was conducted on an apple orchard farm near the city of Meknes, in northwestern
Morocco. The farm experienced repeated important losses of fruit quality due to bitter pit, mainly after cold storage periods. A 30-ha apple orchard (12 years old) with a density of 1250 tree/ha, was selected. It houses 3 varieties (Lyse Golden, Golden Smoothee and Ozark Gold), but the study focused on the Golden Smoothee only. The fertilizer program varies from one year to another and consists of 100-120 kg/ha N, 80-100 kg/ha P2O5 and 180-240 kg/ha of K2O, in addition to K, Ca and boron (B) foliar sprays.
Composite samples (consisting of 9 subsamples) were collected at 130 geopositioned grid points (50x50m) for soil (3 weeks before bud) and leaf (80 days after full flowering). At each point, soil samples were taken at 2 depths (0-30cm and 30-60cm) and leaf samples were taken from 4 nonboring trees and comprised 160 leaves. Soil samples were prepared and analyzed for mineral N, available P and exchangeable K, Ca and Mg. Leaves were analyzed for N, P, K, Ca and Mg contents. Analysis were done according to Estephan et al. (2013).
Spatial variability maps of individual nutrients and (K+Mg)/Ca ratios in the soil and the leaves were derived by surface interpolation using Inverse Distance Weight (IDW) method under geostatistical analyst of ArcGIS software. In the case of soil data, only the maps of the surface layer will be presented.
RESULTS AND DISCUSSION
The orchard field shows a moderate NW-SE gradient in terms of soil depth (60 to 80 cm),
soil texture (clayey to clay loam), organic matter content (1.8 to 2.7%), active lime (15.6% to 10.0) and pH (8.3 to 7.9).
Soil Exchangeable K, Ca and Mg
Exchangeable potassium showed an important spatial variability, with values ranging from 122 to 780 ppm in the surface layer and 100 to 452 ppm in the sub-surface layer, with means of 452 and 237 ppm respectively. Surface and subsurface K were significantly correlated (R2=0.58).

1st African Conference on Precision Agriculture | 8-10 December | 2020
243
The map for the surface layer (Figure 1) shows that more than 2/3 of the orchard has high K content, considered rich to excessive for apples orchards, and may cause antagonistic effect on calcium nutrition for apple trees. For exchangeable Ca, values ranged from 6372 and 12084 ppm in the surface layer (cv= 10%) and from 6482 to 10094 ppm in the subsurface (cv = 9.2%). These values are typical of calcareous soils containing important levels of active CaCO3. A small, but significant, correlation exists between surface and subsurface Ca (R2= 0,32). The surface layer Ca map (Figure 1) shows a clear N-S gradient, but variations are due mainly to inherent soil conditions than to management practices. Despite high Ca levels, Ca deficiencies can be observed as a result of K and Mg antagonisms and/or imbalance. Excess Ca absorption by plants does not occur and is believed to be physiologically controlled compared to other nutrients such as N and K.
Soil exchangeable Mg showed values ranging from 508 and 2156 ppm with a mean of 1588 (cv= %) in the surface and from 628 et 2608 ppm with a mean of 1800 ppm (CV= %) in the subsurface. Magnesium content in the subsurface were higher than those at the surface compared to calcium. Surface and sub-surface Mg were highly correlated (R2=0.84). The surface layer Mg map (Figure 1) shows less variability compared to K and Ca. The high Mg levels add up to potassium and therefore impact Ca absorption by the apple trees, making them more vulnerable to bitter pit development.
The soil (K+Mg)/Ca ratio (eq/eq) varied from 0.1 to 0.5 with an average of 0.31 (CV=25.8%). The corresponding map (Figure 1) shows a net N-S gradient that reveals an important imbalance of Ca-K-Mg across the field. It is suggested that a cut-off value of 0.3 be considered for this ratio as a threshold for Bitter pit incidence.
Figure 1. Spatial variability maps of exchangeable K, Ca, Mg and (K+Mg)/Ca ration in the surface (0-30cm) layer of the apple orchard field studied.
Leaf K, Ca and Mg
Leaf K contents varied from 1.45% to 3.17%, with an average of 2.3% (CV=17%). These levels are considered satisfactory to moderate high. The leaf-K map (Figure 2) shows a net N-S gradient, with about a third of the trees being over-fertilized with K. A leaf K content greater than 1.5% can be favourable to Bitter pit if leaf Ca content are lower than 1.6% (Van Der Boon, 1980). A highly significant correlation (R2=0.62) was observed among soil-K and leaf-K contents.
Leaf Ca contents ranged from 0.89% to 1.45%, with an average of 1.16% (CV=11.2%). In general, these values are considered relatively low for apple trees (the optimum being about 1.5 to
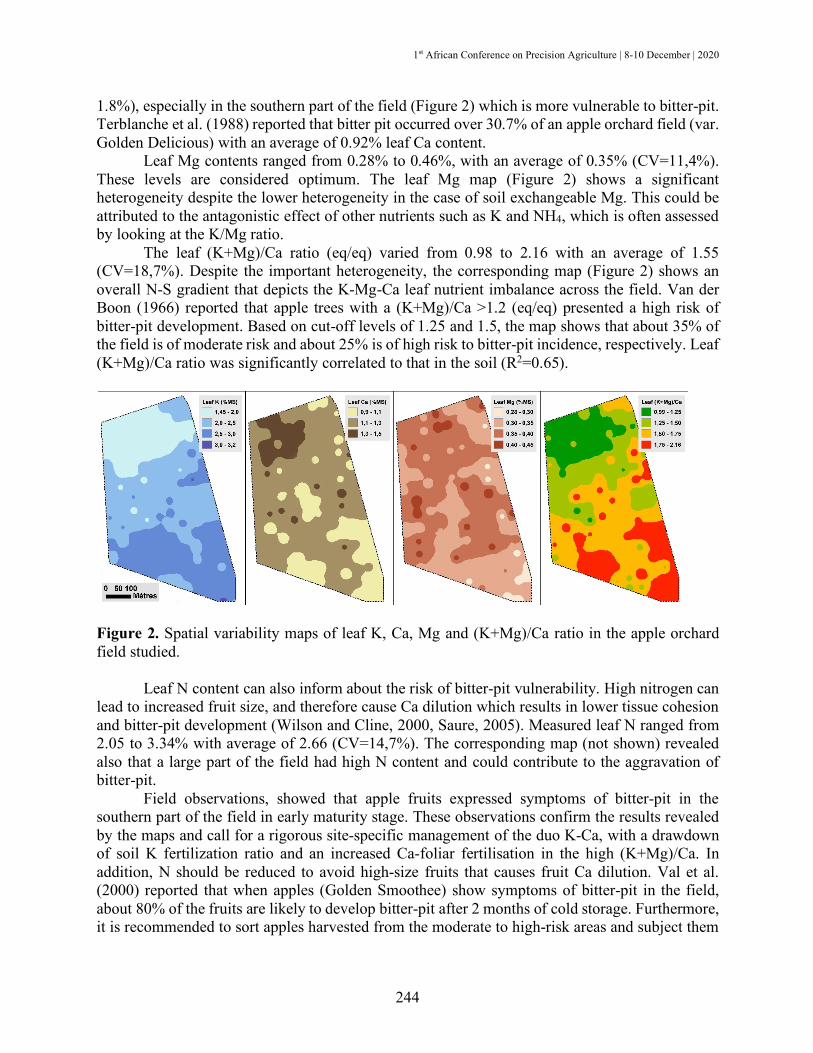
1st African Conference on Precision Agriculture | 8-10 December | 2020
244
1.8%), especially in the southern part of the field (Figure 2) which is more vulnerable to bitter-pit. Terblanche et al. (1988) reported that bitter pit occurred over 30.7% of an apple orchard field (var. Golden Delicious) with an average of 0.92% leaf Ca content.
Leaf Mg contents ranged from 0.28% to 0.46%, with an average of 0.35% (CV=11,4%). These levels are considered optimum. The leaf Mg map (Figure 2) shows a significant heterogeneity despite the lower heterogeneity in the case of soil exchangeable Mg. This could be attributed to the antagonistic effect of other nutrients such as K and NH4, which is often assessed by looking at the K/Mg ratio.
The leaf (K+Mg)/Ca ratio (eq/eq) varied from 0.98 to 2.16 with an average of 1.55 (CV=18,7%). Despite the important heterogeneity, the corresponding map (Figure 2) shows an overall N-S gradient that depicts the K-Mg-Ca leaf nutrient imbalance across the field. Van der Boon (1966) reported that apple trees with a (K+Mg)/Ca >1.2 (eq/eq) presented a high risk of bitter-pit development. Based on cut-off levels of 1.25 and 1.5, the map shows that about 35% of the field is of moderate risk and about 25% is of high risk to bitter-pit incidence, respectively. Leaf (K+Mg)/Ca ratio was significantly correlated to that in the soil (R2=0.65).
Figure 2. Spatial variability maps of leaf K, Ca, Mg and (K+Mg)/Ca ratio in the apple orchard field studied.
Leaf N content can also inform about the risk of bitter-pit vulnerability. High nitrogen can lead to increased fruit size, and therefore cause Ca dilution which results in lower tissue cohesion and bitter-pit development (Wilson and Cline, 2000, Saure, 2005). Measured leaf N ranged from 2.05 to 3.34% with average of 2.66 (CV=14,7%). The corresponding map (not shown) revealed also that a large part of the field had high N content and could contribute to the aggravation of bitter-pit.
Field observations, showed that apple fruits expressed symptoms of bitter-pit in the southern part of the field in early maturity stage. These observations confirm the results revealed by the maps and call for a rigorous site-specific management of the duo K-Ca, with a drawdown of soil K fertilization ratio and an increased Ca-foliar fertilisation in the high (K+Mg)/Ca. In addition, N should be reduced to avoid high-size fruits that causes fruit Ca dilution. Val et al. (2000) reported that when apples (Golden Smoothee) show symptoms of bitter-pit in the field, about 80% of the fruits are likely to develop bitter-pit after 2 months of cold storage. Furthermore, it is recommended to sort apples harvested from the moderate to high-risk areas and subject them

1st African Conference on Precision Agriculture | 8-10 December | 2020
245
to soaking in a 1% CaCl2 or Ca(NO3)2 solution (for about 2 minutes) prior to cold storage (Boon, 1968).
CONCLUSIONS
The K, Ca and Mg nutrient levels in the soil and in the leaves of apple orchard were
assessed to determine its vulnerability to bitter-pit. Spatial variability was approached using a 130 grid sampling points over a 30-ha field. Maps of K, Ca as well as that of the (K+Mg)/Ca ratio showed that the apple field presented a high risk of bitter-pit development that explains the substantial yield loss observed after apples undergo a period of cold storage exceeding four weeks. About 60% of the field is at risk, with 35% of moderate risk and 25% of high risk. These findings help explaining the high incidence of bitter-bit. The spatial variability maps allowed and identifying the most contributing areas would orient site-specific nutrient management including both soil and foliar fertilization. Appropriate cost-benefit soil and foliar testing tools can be used for soil fertility and three nutrient status assessment as a precision agriculture practice to avoid post-harvest loss of yield due to bitter-pit.
REFERENCES
Cheng L, Sazo MM. 2018. Why Is ‘Honeycrisp’ so Susceptible to Bitter Pit? Fruit Quarterly 26(1):
19-23. De Freitas ST, do Amarante CVT, Mitcham EJ. 2015. Mechanisms regulating apple cultivar
susceptibility to bitter pit. Scientia Horticulturae 186: 54–60. Estephan G, Sommer R, Ryan J. 2013. Methods of Soil, Plant, and Water Analysis: A manual for
the West Asia and North Africa Region: Third Edition. Beirut, Lebanon: International Center for Agricultural Research in the Dry Areas (ICARDA).
Faraj A. 2006. Vulnérabilité du pommier au bitter pit et essais d’apport du calcium en pré et post-récolte. Mémoire de 3éme cycle, Ecole Nationale d’Agriculture de Meknès, Maroc.
Faust M. Shear CB. 1968. Corking disorders of apples: A physiological and biochemical review. Bot. Rev. 34: 441–469.
Ferguson IB, Watkins CB. 1989. Bitter pit in apple fruit. Hort. Rev. 11:2 89–355. Lotze E. 2005. Pre-harvest determination of bitter pit potential in apples. Dissertation presented
for the Degree of Doctor of Philosophy (Agric). University of Stellenbosch. December 2005.
Rui-Luiz V. 1985. Preharvest fruit analysis as a predictor of d'Anjou pear and Yellow Newtown apple physiological disorders, storage quality and ripening behavior. Thèse d’obtention de doctorat dans la philosophie d’horticulture. Oregon State University. 363 p.
Saure MC. 2005. Calcium translocation to fleshy fruit: its mechanism and endogenous control. Sci. Hortic. 105: 65–89.
Terblanche JH, Gurgen KH, Hesebeck I. 1988. An integrated approach to orchard nutrition and bitter pit control. In: Mineral nutrition of fruit trees, D. Atkinson, J.E. Jackson, R.O. Sharples et W.M. Waller Eds. Studies in the Agricultural and Food Sciences, Butterworths, London-Boston, 11-16.
Val J, Gil A, Aznar Y, Monge E, Blanco A. 2000. Nutritional Study of an Apple Orchard as endemically affected by bitter-pit. Estación Experimental de Aula Dei (CSIC). Zaragoza, Spain.

1st African Conference on Precision Agriculture | 8-10 December | 2020
246
Van Der Boon J. 1980. Prediction and control of bitter pit in apples. I. Prediction based on mineral leaf composition, cropping levels and summer temperatures. Journal of Horticultural Science 55 (3): 307-312.
Van Der Boon J, Das A, Van Schreven AC. 1968. Control of bitter pit and breakdown by calcium in the apples Cox's Orange Pippin and Jonathan. Agricultural Research Report, 711, Centre for Agricultural Publishing and Documentation, Wageningen.

1st African Conference on Precision Agriculture | 8-10 December | 2020
247
PRECISION WATER MANAGEMENT
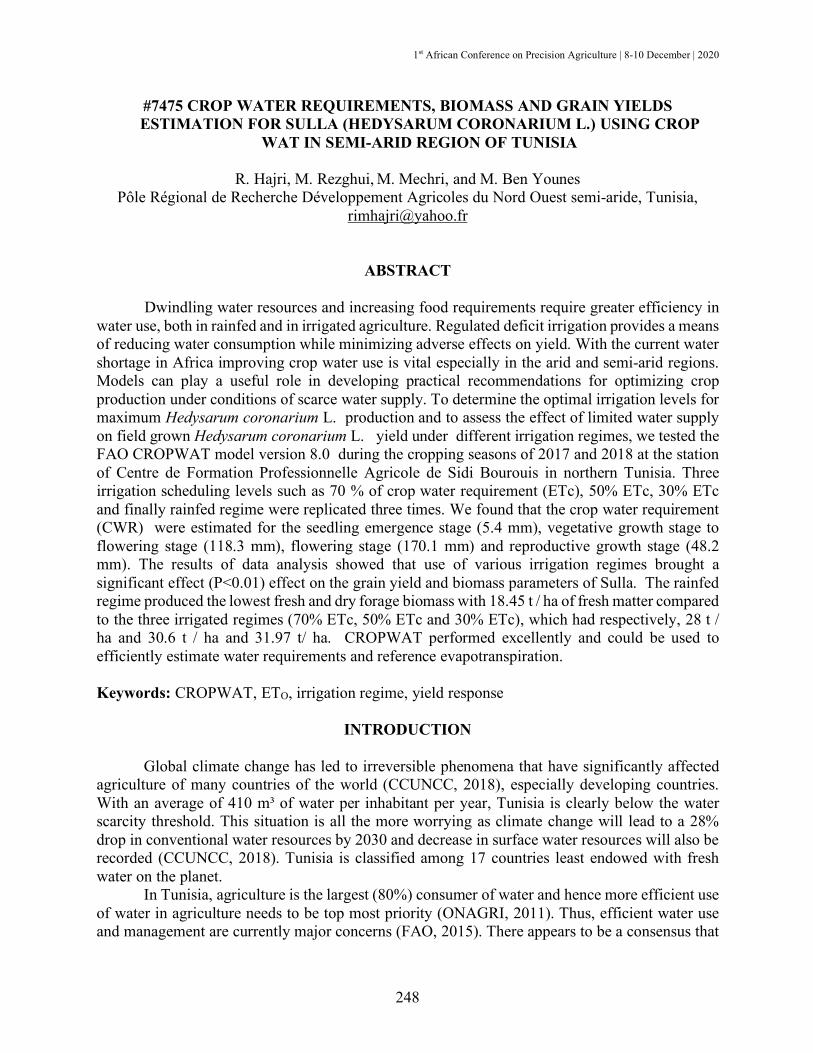
1st African Conference on Precision Agriculture | 8-10 December | 2020
248
#7475 CROP WATER REQUIREMENTS, BIOMASS AND GRAIN YIELDS ESTIMATION FOR SULLA (HEDYSARUM CORONARIUM L.) USING CROP
WAT IN SEMI-ARID REGION OF TUNISIA
R. Hajri, M. Rezghui, M. Mechri, and M. Ben Younes Pôle Régional de Recherche Développement Agricoles du Nord Ouest semi-aride, Tunisia,
ABSTRACT
Dwindling water resources and increasing food requirements require greater efficiency in water use, both in rainfed and in irrigated agriculture. Regulated deficit irrigation provides a means of reducing water consumption while minimizing adverse effects on yield. With the current water shortage in Africa improving crop water use is vital especially in the arid and semi-arid regions. Models can play a useful role in developing practical recommendations for optimizing crop production under conditions of scarce water supply. To determine the optimal irrigation levels for maximum Hedysarum coronarium L. production and to assess the effect of limited water supply on field grown Hedysarum coronarium L. yield under different irrigation regimes, we tested the FAO CROPWAT model version 8.0 during the cropping seasons of 2017 and 2018 at the station of Centre de Formation Professionnelle Agricole de Sidi Bourouis in northern Tunisia. Three irrigation scheduling levels such as 70 % of crop water requirement (ETc), 50% ETc, 30% ETc and finally rainfed regime were replicated three times. We found that the crop water requirement (CWR) were estimated for the seedling emergence stage (5.4 mm), vegetative growth stage to flowering stage (118.3 mm), flowering stage (170.1 mm) and reproductive growth stage (48.2 mm). The results of data analysis showed that use of various irrigation regimes brought a significant effect (P<0.01) effect on the grain yield and biomass parameters of Sulla. The rainfed regime produced the lowest fresh and dry forage biomass with 18.45 t / ha of fresh matter compared to the three irrigated regimes (70% ETc, 50% ETc and 30% ETc), which had respectively, 28 t / ha and 30.6 t / ha and 31.97 t/ ha. CROPWAT performed excellently and could be used to efficiently estimate water requirements and reference evapotranspiration.
Keywords: CROPWAT, ETO, irrigation regime, yield response
INTRODUCTION
Global climate change has led to irreversible phenomena that have significantly affected agriculture of many countries of the world (CCUNCC, 2018), especially developing countries. With an average of 410 m³ of water per inhabitant per year, Tunisia is clearly below the water scarcity threshold. This situation is all the more worrying as climate change will lead to a 28% drop in conventional water resources by 2030 and decrease in surface water resources will also be recorded (CCUNCC, 2018). Tunisia is classified among 17 countries least endowed with fresh water on the planet.
In Tunisia, agriculture is the largest (80%) consumer of water and hence more efficient use of water in agriculture needs to be top most priority (ONAGRI, 2011). Thus, efficient water use and management are currently major concerns (FAO, 2015). There appears to be a consensus that

1st African Conference on Precision Agriculture | 8-10 December | 2020
249
irrigated agriculture, in general, is up against a future with less water. This consequently, calls for increased efficiency in the utilization of scarce water resources. A better understanding of the intricate interactions between climate, water and crop growth needs to be a priority area in Tunisia.
Crop simulation models such as DSSAT, CROPWAT 8 and FASSET can play a useful role in developing practical recommendations for optimizing crop production under conditions of scarce water supply (De Wit et al., 2019; Halimi et al., 2019). Crop water requirement simulation models compute effective rainfall, reference evapotranspiration (ETo), crop evapotranspiration (ETc), net irrigation water requirement (NIWR), gross irrigation water requirement (GIWR), irrigation scheduling and crop growth. Several methods are used for ETo calculation such as mass transferbased methods, radiation-based methods and temperature-based methods, etc. (Adarsh et al., 2018). The Penman–Monteith method (Allen et al., 1998) is proved as one of the most reliable and comprehensive methods for estimation of evapotranspiration and crop water requirements, and it is widely used. CROPWAT 8 model developed by FAO is used for the calculation of crop water requirements and irrigation requirements based on soil, climate and crop data. In addition, the program allows the development of irrigation schedules for different management conditions and the calculation of scheme water supply for varying crop patterns (FAO, 2020).
Forage Fabaceae, such as Sulla (Hedysarum coronarium L.) play a fundamental floristic and agronomic role. The specie is commonly used to enhance the productivity and sustainability of cereal-based systems because of its excellent adaptability to marginal and drought-prone environments (Amato et al., 2016). Annicchiarico et al. (2008) highlighted the particular value of genetic resources of Sulla for severely drought-prone environments, whose extent in the Mediterranean Basin is expected to rise as a consequence of climate change and foreseeable reduction of water available for irrigation (CCUNCC, 2018). Forage of Sulla is a versatile crop which can be used for silage production, grazing and hay making. It has a high biomass yield and is one of the more productive legume crops with high protein content in rainfed environments. It is a perennial species that require less energy to plant and fertilize, reduce the risk of soil erosion, and increase soil carbon (Schwartz et al., 2013). Moreover, it has several nonagricultural uses; for example, it can be planted to protect soil (Amato et al., 2016) and revegetate disturbed land or used for honey production and landscape architecture (Annicchiarico et al. 2008).
There is a lack of information with respect to Sulla on crop water requirements in general and in Tunisia. Hence, in this study an attempt has been made to compute the crop water requirements of Sulla in semi arid regions at the station of Centre de Formation Professionnelle Agricole de Sidi Bourouis in northern Tunisia using FAO CROPWAT model version 8.0. Also, FAO CROPWAT 8.0 was used to determine of optimal irrigation levels for higher Sulla (Hedysarum coronarium L.) forage production under four irrigation regimes (Three irrigation regimes of 70 % of crop water requirement (ETc), 50% Etc–, 30% ETc and rainfed treatments).
MATERIALS AND METHODS
Experimental Location, Design, Treatments and Cultural Practices
Trials were conducted during the cropping seasons of 2017 and 2018 at the station of Centre de Formation Professionnelle Agricole of Sidi Bourouis in northern Tunisia. The research station is located about seven kilometers north of Siliana. It is in the east of the State between north latitudes 36.10 ′ and east longitudes 9.07, at an elevation of 406 m above sea level. The climate of the area is semi-arid Mediterranean climate, with a dry period that can reach 5 months. The rainfall in the order of 350 to 400 mm per year. Soils at the station are coarse textured sandy clay loam

1st African Conference on Precision Agriculture | 8-10 December | 2020
250
type. The design of the experiment was randomized plot with three replicates. The subplot size was 3 ×6 m. The main plots comprised three irrigation four irrigation regimes (Three irrigation regimes of 70 % of crop water requirement (ETc), 50% Etc, 30% ETc and rainfed treatment). The subplots were cultivated with Hedysarum coronarium cv. Bikra 21. The seeds were sown on 28 October 2017.
Soil, Crop and Meteorological Data
The Data of soil physical parameters, such as soil texture, depth, infiltration rate, the available soil moisture, and bulk density, are required to estimate the total available water in the area of root zone and the irrigation plan. The parameters derived from this search are presented in Table 1.
Table 1. Soil parameters. Parameter Value Total plant available moisture (mm/m) 120 Maximum rain infiltration rate (mm/day) 36 Maximum rooting depth (cm) 80 Initial soil moisture depletion (as % TAM) 90 Initial available soil moisture (mm/m) 12
Crop coefficient (Kc) curves of variation of the seasonal/annual for the studied crops
were taken according to Allen et al, (1998). Maximum and minimum temperature (oC), humidity (%), wind speed (m/S) and sunshine (hours) were collected from the Meteoblue website (Meteoblue, 2018). Daily rainfall (mm) was collected from Sidi Bourouis station.
RESULTS AND DISCUSSION
Reference Evapotranspiration, Water Requirement The estimate of the Reference Evapotranspiration (ET0) for the study area is presented in
Figure 1. The results show that the highest average daily evapotranspiration ET0 values are attained in May (5.13 mm/day) and in April (4.76 mm / day), it is a critical phase with regard of Sulla. If we multiply these values by the number of days of each month, you can have the amount of water that has been evapotranspired, respectively during the month of May (156.03 mm) and April (142.8 mm). Consequently and in the absence of rains during this period must be applied to net irrigation dose during March of 1560 m 3 /ha and during the month of April 1428 m3/ha.
The total water requirements of Sulla (CWR) are equal to 343 mm. We found that the crop water requirement were estimated for the seedling emergence stage (5.4 mm), vegetative growth stage to flowering stage (118.3 mm), flowering stage (170.1 mm) and reproductive growth stage (48.2 mm) (Fig. 2).
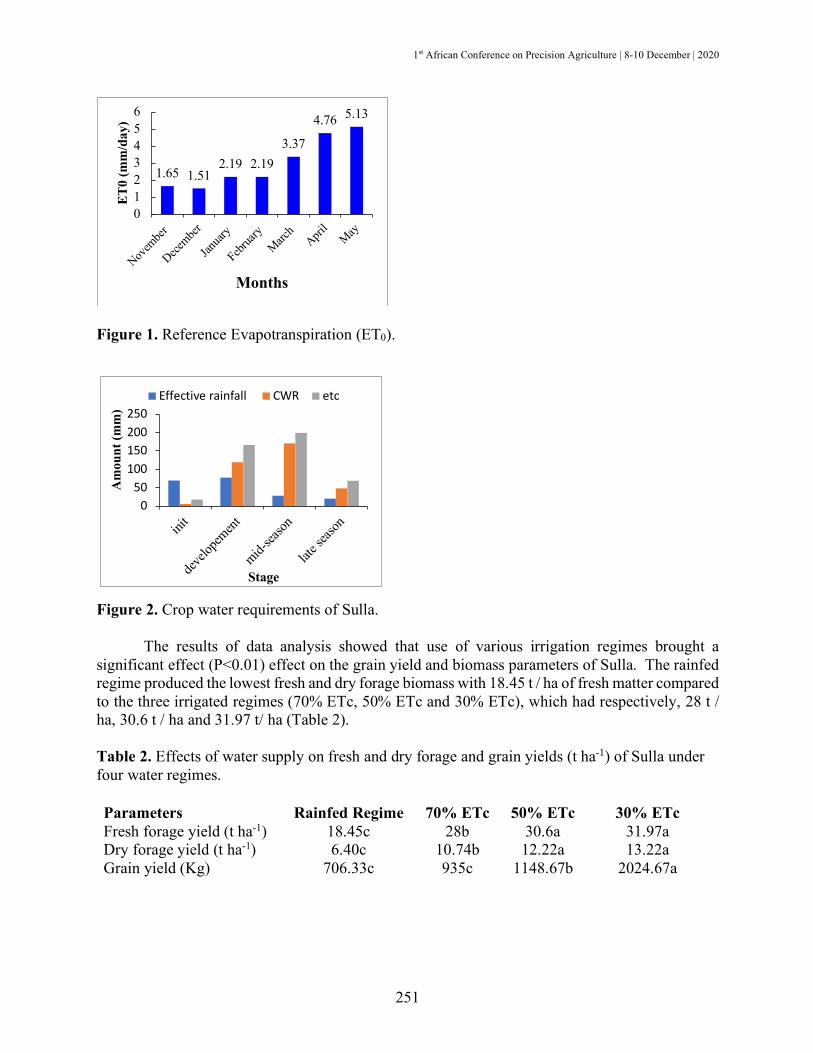
1st African Conference on Precision Agriculture | 8-10 December | 2020
251
Figure 1. Reference Evapotranspiration (ET0).
Figure 2. Crop water requirements of Sulla. The results of data analysis showed that use of various irrigation regimes brought a
significant effect (P<0.01) effect on the grain yield and biomass parameters of Sulla. The rainfed regime produced the lowest fresh and dry forage biomass with 18.45 t / ha of fresh matter compared to the three irrigated regimes (70% ETc, 50% ETc and 30% ETc), which had respectively, 28 t / ha, 30.6 t / ha and 31.97 t/ ha (Table 2).
Table 2. Effects of water supply on fresh and dry forage and grain yields (t ha-1) of Sulla under four water regimes.
1.65 1.512.19 2.19
3.37
4.76 5.13
0123456
Novem
ber
Decembe
r
Januar
y
Februar
yMarc
hApri
lMay
ET0
(mm
/day
)
Months
Parameters Rainfed Regime 70% ETc 50% ETc 30% ETc Fresh forage yield (t ha-1) 18.45c 28b 30.6a 31.97a Dry forage yield (t ha-1) 6.40c 10.74b 12.22a 13.22a Grain yield (Kg) 706.33c 935c 1148.67b 2024.67a
050
100150200250
init
deve
lopem
ent
mid-sea
son
late s
eason
Am
ount
(mm
)
Stage
Effective rainfall CWR etc

1st African Conference on Precision Agriculture | 8-10 December | 2020
252
CONCLUSIONS The Sustainable Water Management helps ensure a more stable production. Improving
irrigation efficiency is very important for farmers to have a more correct use of water and for this reason, before thinking of irrigation as a water source, they must establish whether irrigation is really necessary or not in their specific environmental conditions. For this purpose, a preliminary analysis is very useful. CROPWAT performed excellently and could be used to efficiently estimate water requirements and reference evapotranspiration.
REFERENCES
Adarsh S, Sulaiman Sanah KK, Murshida PN. 2018. Scale dependent prediction of reference
evapotranspiration based on Multi-Variate Empirical mode decomposition. Ain Shams Eng J. 9: 1839–48.
Allen R, Pereira L, Raes D, Smith M. Crop evapotranspiration guidelines for computing crop water requirements. 1998. FAO irrigation and drainage paper 56. FAO, Rome.
Amato G, Giambalvo D, Frenda AS, et al. 2016. Sulla (Hedysarum coronarium L.) as Potential Feedstock for Biofuel and Protein. Bioenerg. Res. 9: 711–719.
Annicchiarico P, Ruisi P, Di Miceli G, Pecetti L. 2014. Morpho-physiological and adaptive variation of Italian germplasm of Sulla (Hedysarum coronarium L.), Crop and Pasture Science 65: 206-213.
CCNUCC. 2018. Koronivia Joint Work on Agriculture: Analysis of Submissions. Environment and Natural Resources Management Series, Working Paper 71, Rome. 52 pages.
de Wit A, Boogaard H, Fumagalli D, Janssen S, Knapen R, van Kraalingen D, Supit I, van der Wijngaart R, van Diepen K. 2019. 25 years of the WOFOST cropping systems model. Agric Syst. 168: 154-167.
FAO. 2020. CROPWAT software. http:// www. Fao. org/land-water/databases-and-software/Cropwat/en/.
FAO. 2015. État des ressources en sols du monde Résumé technique 92: 13-14. Halimi A, Ashebir HT. 2019. Application of CROPWAT model for estimation of irrigation
scheduling of Tomato in changing climate of Eastern Europe: the case study of Godollo, Hungary. Int J Agric Environ Sci. 6:1–11.
ONAGRI. 2011. Enquête sur les périmètres irrigués 2010-2011. Observatoire National de l’Agriculture. Ministère de l’Agriculture et des Ressources Hydrauliques, Tunis.
Schwartz C, Amasino R. 2013. Nitrogen recycling and flowering time in perennial bioenergy crops. Front Plant Sci 4. 76:1–7.
1st African Conference on Precision Agriculture | 8-10 December | 2020
253
#7595 A PRECISION IRRIGATION APP FOR SMART WATER MANAGEMENT BY FARMERS: “IRRISMART”
A. Abouabdillah*, and R Bouabid
National School of Agriculture of Meknès, [email protected]
ABSTRACT
In a context of climate change and water scarcity which is globally recognized, Morocco is one of the countries that are facing already insufficient water supply for irrigation in order to sustain productivity and food security. Therefore, there is a strong need for adapting agricultural practices and developing new technologies for efficient and smart irrigation management to make best use of available water and maximize productivity per unit of consumed water. Recent studies have shown that water use by farmers in drip irrigation systems exceed in many cases the recommended crop requirements. This is due mainly to the limited knowledge of farmers for the irrigation parameters in relation to crop requirements, climatic demand and soils conditions. This work aimed to develop a Smartphone application that integrates all components of the soil-water-crop-atmosphere continuum to provide precision irrigation to farmers, managers and other potential users in order to help them better manage irrigation water and improve profitability per unit water used. The application allows the farmer to enter specific climate information or use information provided from nearby weather stations or satellite data. The application uses suitable crop coefficients (Kc) adjusted to the climatic context and gives the user the possibility of fine-tuning them according to crop cycle in order to obtain appropriate ETc values. Daily water needs are calculated using soil conditions, crop planting and drip irrigation system characteristics. The user receives then a daily water irrigation scheduling program for the chosen crop (amount and frequencies). A wide list of crops is available. The application keeps track of past water requirement and can provide a forecast of the needs for upcoming days.
Keywords: precision irrigation, drip irrigation, smartphone app
INTRODUCTION
In arid regions, water is a major constraint for crop production, given the dramatic increase in demand for this resource on one hand and the consequences of climate change on the other hand. Irrigation has known a considerable development in Morocco in recent years. However, the question of rational use of irrigation water is still of concern, even in drip irrigation systems.
It’s well known that there is a limited knowledge on irrigation parameter determination (ie: frequency, timing, quantity). In fact, studies carried out on irrigation within Fes-Meknes region (Abouabdillah et al., 2019; Assouli et al., 2019) have shown that the applied irrigation water by the farmers, under the drip system, in many cases exceed the recommended crops water requirements. Another study conducted in the Ain Taoujdate region (Benouniche et al., 2014) showed that 100% of onion producers in the region over irrigate their crops and apply quantities of water that far exceed the crop water needs recommended by FAO (Allen et al. al., 1998).
Rational water management is an essential component of agricultural development. It necessarily involves the adoption and improvement of localized irrigation techniques (in particular

1st African Conference on Precision Agriculture | 8-10 December | 2020
254
the drip irrigation system) and the development of new methods of irrigation management. In order to be effective, irrigation must be conducted in an adequate and smart manner. There are three main aspects related to smart irrigation management. First of all, knowledge on crop water requirements, secondly, irrigation frequency (number of irrigations) and then the irrigation duration. However, it should be clearly state that having this information available for farmer in time is even more crucial for better decision making.
This work aimed to develop a Smartphone application that integrates all components of the soil-water-crop-atmosphere continuum to provide farmers, managers and other potential users with precision irrigation parameters, such as daily irrigation calendar, in order to well manage irrigation and as consequence save water, and improve profitability.
MATERIALS AND METHODS
IrriSmart app was developed based on proven scientific algorithm combined with IT
technology. The four components of the continuum were considered. The climate is considered to estimate the reference evapotranspiration “ET0” by either of the two suggested methods: the first one is based on Penman Monteith formula using the climatic parameters measured by meteorological stations available in the area of Fes-Meknes, (three stations). While the second method based on satellite data using climatic parameters generated from an open source satellite server. The generated climatic parameters cover the whole country with 1698 different locations assigned mainly to the administrative districts as well as all significant different altitudes within the same district. As a result, daily climatic demand is attributed to each registered field from nearby location data based on its geographic coordinates.
Regarding the crops, a large list of vegetable crops practiced in the country was included in the app. Once the crop is chosen, a crop coefficient “Kc” model is assigned using data from FAO 66 or using new crop coefficients (for other crops) that have been developed in the area (Abouabdillah et al., 2019; Bergui et al., 2020; El Jaouhari el al., 2018). Furthermore, the assignment of the Kc depends on the phenological stage of the crop determined by the date of sowing which is identified by the app user. The modification of the crop coefficient as well as the duration of the phenological stage is available on a professional version of the application, for more knowledgeable users.
The third component of the continuum consists on the soil role as a water reservoir for the plant as little attention is being paid to irrigation scheduling based on soil monitoring. The availability of water depends on soil water holding capacity; It is crucial to consider the available water content as well as the water holding capacity within the soil to be readily for the plant. As consequence, two options were considered in the app. The first one considers the soil proprieties indicating the percentage of clay, and sand, and then using the Saxston formula (saxstan et al., 2006) to estimate the soil water availability. While the second option, is based on the selection of a soil texture from a proposed list of various soil texture classes, where an average of soil water available is attributed (Keller et kameli, 1974)
The fourth component defining the irrigation duration is the system characteristics such as the dripper flow, and the line and dripper spacings, in order to determine the flow rate. Other parameters are estimated using a combination of other inputs such as the percentage of humidified soil, the efficiency and the uniformity of the system.
All these inputs are thereby organized in 5 steps, field identification, climatic simulation, crop choice and sowing date, irrigation system characteristics and finally soil characteristics.
1st African Conference on Precision Agriculture | 8-10 December | 2020
255
RESULTS
The irrigation program, which is of most importance to the app user, is generated on daily basis based on the approach and algorithms used. All the data are saved on a cloud server, and then sent directly to the user. Output data are summarized in five items: (i) daily crop water requirement “ETc”; (ii) water quantity to be applied for each irrigation; (iii) irrigations frequency; (iv) duration of one irrigation; and (iv) the total duration of irrigation per day. In simple terms, scheduling irrigation parameters are generated on daily basis and can be found by the user on a specific section assigned to each saved farm field providing the actual irrigation parameter and also the previously recorded ones. It should be also point it out, that in case of non-access to internet network, the app user can request to get the outputs via SMS. Up to this point, the IrriSmart app is under validation by users, and the results obtained raised great interest among farmers and other water management decision makers.
The new developed irrigation app IrriSmart, will contribute to a precision irrigation and a smart management of irrigation water leading to a significant water saving, mainly in the context of climate change and water scarcity that Morocco is facing.
REFERENCES
Abouabdillah A, Bouabid R, Bourioug M, Mrahli D, El Jaouhari N. 2019. Réponse de l’oignon
(Allium Cepa) à l’irrigation déficitaire continue avec différentes fréquences dans la région du Saïs. Communication orale. Conférence: Exploitation des eaux souterraines et défis de la durabilité de l’agriculture irriguée Mercredi 10 juillet 2019 au Qualipole Alimentation de Meknès.
Allen RG, Pereira LS, Raes D, Smith M, et al. 1998. Crop evapotranspiration-Guidelines for computing crop water requirements-FAO Irrigation and drainage paper 56. FAO, Rome, 300(9), D05109.
Assouli O, El Bilali H, Abouabdillah A, Harbouze R, El Jaouhari N, Chaoui M, Bouabid R. 2019. Transition from surface to drip irrigation in morocco: analysis through the multi-level perspective. AGROFOR 3(3) https://doi.org/10.7251/AGRENG1803142A
Benouniche M, Kuper M, Hammani A, Boesveld H. 2014. Making the user visible: Analysing irrigation practices and farmers’ logic to explain actual drip irrigation performance. Irrigation Science 32(6): 405-420. https://doi.org/10.1007/s00271-014-0438-0
El Bergui O, Abouabdillah A, Bouabid R, El Jaouhari N, Brouziyne Y, Bourioug M. 2020. Agro-physiological response of potato to “sustainable” deficit irrigation in the plain of Saïs, Morocco; Published online: 03 August 2020; E3S Web of Conferences 183, 03001, 3S Web Conf. Vol. 183, DOI: https://doi.org/10.1051/e3sconf/202018303001
El Jaouhari N, Abouabdillah A, Bouabid R, Bourioug M, Aleya L, Chaoui M. 2018. Assessment of sustainable deficit irrigation in a Moroccan apple orchard as a climate change adaptation strategy. Science of the Total Environment 642: 574–581.
Keller J, Karmeli D. 1974. Trickle irrigation design parameters. ASAE Transactions 17(4): 678-684.
Saxton KE, Rawls WJ. 2006. Soil Water Characteristics estimates by texture and organic matter for hydrologic solutions. Soil Sci. Soc. Am. J. 70: 1569-1578.

1st African Conference on Precision Agriculture | 8-10 December | 2020
256
#7645 MONITORING IRRIGATION WATER USE AT LARGE SCALE IRRIGATED AREAS USING REMOTE SENSING IN WATER SCARCE ENVIRONMENT
M.H. Kharrou1, V. Simonneaux2, M. Le Page2, S. Er-Raki4,6, G. Boulet2, J. Ezzahar5,6, S.
Khabba3,6, A. Chehbouni1,2,6 1 International Water Research Institute, Mohammed VI Polytechnic University, Benguerir,
Morocco. 2 CESBIO – Centre des Etudes Spatiales de la BIOsphère, Toulouse, France. 3 LMME, Department of Physics, Faculty of Sciences Semlalia, Marrakesh, Morocco. 4 LP2M2E,
Department of Physics, Faculty of Sciences and Technology, Marrakesh, Morocco. 5 Ecole Nationale des Sciences Appliquées, Cadi Ayyad University, Safi, Morocco. 6 Center for Remote
Sensing Application, Mohammed VI Polytechnic University, Benguerir, Morocco [email protected]
ABSTRACT
Increasing pressure on available water resources in semi-arid region will affect the availability of water for irrigated agriculture. In this context, adoption of innovative and cost-effective tools for water management and analysis of water use patterns in irrigated areas is required for an efficient and sustainable use of water resources. This study aims to evaluate a remote sensing-based approach which allows estimation of the temporal and spatial distribution of crop evapotranspiration and irrigation water requirements over large irrigated areas. The method consists of an adaptation of the daily step FAO-56 Soil Water Balance model combined with time series of basal crop coefficient (Kcb) and the fractional vegetation cover (fc) derived from high resolution satellite NDVI imagery (Normalized Difference Vegetation Index). The model was first calibrated and validated at plot scale using evapotranspiration measured by eddy-covariance systems over wheat fields and olive orchards which represents the main crops grown in the study area of Haouz plain located around Marrakesh city. Then, the model was used to compare remotely sensed estimates of irrigation water requirements and observations of irrigation water use at plot scale over an irrigation district in Haouz plain along three agricultural seasons. At plot scale, the results showed that the model provides good estimates of evapotranspiration for wheat and olive trees, given specific calibration of crop and soil related parameters that control transpiration and evaporation processes. At the irrigation district scale, the comparison of spatialized irrigation water requirements and irrigation water use showed great discrepancies indicating a temporal and spatial varying demand and supply of irrigation water over the seasons. In addition to the model and the observed data uncertainties, the variability observed could be influenced by different biophysical factors and the farmer’s behaviour and management practices. Also, some differences between observations and estimates were spatially correlated at some extent with the distribution of wells in the area, which shows a potential use of the method for monitoring groundwater withdrawals. These results suggested that the water supplied within the studied irrigation district needs to be improved for a better performance of irrigation. The findings demonstrate the potential interests for irrigation managers of using remote sensing-based models to assess irrigation water requirements and monitor irrigation water use for efficient and sustainable use of water resources.

1st African Conference on Precision Agriculture | 8-10 December | 2020
257
INTRODUCTION Irrigated agriculture is the main water consumer worldwide, accounting for about 70% of
all available fresh water (FAO, 2016). However, increasing pressure on available water resources, particularly in semi-arid region, due to population growth, climate change and competition from other economic sectors will affect the availability of water for irrigated agriculture in the future. In this context, assessing irrigation performance and improving irrigation water management using innovative and cost-effective tools is necessary for an efficient and sustainable use of water resources.
One key information useful for irrigation managers to evaluate irrigation performance is the temporal and spatial distribution of crop water use or evapotranspiration (ET) over large irrigated areas. Recently, research has demonstrated the potential for remote sensing to monitor crop development and to assess the spatial and temporal variability in crop water use (Tasumi and Allen, 2007; Zhang et al., 2016).
In this study, we evaluated the reliability of an approach based on a soil water balance model assisted by remote sensing data for assessing crop irrigation requirement and monitoring spatialized irrigation water use. This approach was used to compare remotely sensed estimates of crop irrigation requirements and in situ observations of irrigation water use in the Haouz irrigated plain (Morocco). Our goal is to demonstrate the operational application of a remote sensing-based water balance model to monitor irrigation water use at field level over large irrigated areas.
MATERIALS AND METHODS The irrigation district evaluated in this study, during three agricultural seasons (2002-03,
2005-06 and 2008-09), is located in the Haouz plain around Marrakesh city (Morocco) which is a part of the Tensift watershed characterized by a semi-arid climate (Figure 1).
The crop irrigation water requirements over the irrigated area were obtained by a remote sensing-based Soil Water Balance model which consists in coupling the FAO-56 dual crop coefficient model with time series of high resolution NDVI imagery (Normalized Difference Vegetation Index) providing estimates of the actual basal crop coefficient (Kcb) and the fractional vegetation cover (fc). The FAO-56 model was modified by adding a deep soil layer below the root compartment to account for deep water storage and capillary rise (Zhang and Wegehenkel, 2006). A series of Landsat TM (in 2002-03, 2008-09) and Formosat (in 2005-06) images of the studied area were acquired and used to provide a NDVI time series and a land cover map (Simonneaux et al., 2008; Duchemin et al., 2008). The latter shows a predominance of annual crops (mainly cereals), and trees (mainly olive trees) over the irrigated areas (Figure 1).
Calibration and validation of the model were performed at plot scale using evapotranspiration (ET) measured by eddy-covariance systems over wheat fields and olive orchards during experiments conducted in the studied area (Er-Raki et al., 2007, 2010). Then, the model was used to compare spatialized estimates of irrigation water requirements with observations of irrigation water use at plot scale over the R3 irrigation district in Haouz plain along the three agricultural seasons.

1st African Conference on Precision Agriculture | 8-10 December | 2020
258
Figure 1. Location of the studied area and land cover map (2008-09). Land cover: trees in green, cereals in orange and bare soil in brown. Bold line: plot boundaries in R3 irrigation district.
RESULTS AND DISCUSSION
The calibration was performed for the parameters controlling the processes of transpiration
(Kcb mid-season, root zone depth max, diffusion coefficient between deep and root zone layers and maximum soil depth) and evaporation (diffusion coefficient between root zone and evaporation layers, Readily evaporable water, soil surface layer depth). The Kcb and fc profiles were estimated from satellite data using linear Kcb-NDVI and fc-NDVI relationships and the other parameters (soil moistures at field capacity and wilting point, fraction of soil surface wetted by irrigation, initial soil moisture) were obtained from ground observations.
The parameters values obtained allowed a good adjustment between the ET estimated by the model and the measured ET. The validation of the model was performed using the same set of calibrated parameters over other wheat and olive fields. The results showed a good performance of the model in estimating actual ET with average Nash-sutcliff efficiency (NSE) and Root Mean Square Error (RMSE) respective values of 0.67, 0.56 mm/day for wheat and 0.64, 0.52 mm/day for olive tree. The dynamic of actual ET estimated by the model followed reasonably well the time course of observed actual ET (Figure 2).
At the irrigation district scale, the model was used to estimate the spatial and temporal distribution of ET and irrigation water requirement. The cumulated seasonal ET values were 470 mm, 420 and 400 mm on average respectively for the 2002-03, 2005-06 and 2008-09 seasons with a great heterogeneity inside the R3 district. The same was true for irrigation requirement with average values of 163, 156 and 103 mm respectively for the 2002-03, 2005-06 and 2008-09 seasons. This seasonal variability could be explained by the differences in climatic conditions characterized by high climatic demand (reference evapotranspiration, ETo) and low rainfall in 2002-03 compared with the other seasons.
Tensift watershed

1st African Conference on Precision Agriculture | 8-10 December | 2020
259
Figure 2. Time course of observed and simulated actual ET over a validation wheat field in 2002-03 season (left), and map of difference between simulated and observed irrigation at plot scale for 2002-03 season over R3 irrigation district (right).
The differences between irrigation water needs and irrigation water supplied at farm level
showed great spatial variations in each season and across seasons (Figure 2). This suggest that large proportion of farms were either over-irrigating or under-irrigating regardless the seasonal water availability. The spatial distribution of farms whose irrigation water needs exceeded observed supply were located to some extent close to the wells suggesting groundwater extractions to meet crop water needs (Figure 2). In addition to the model and the observed data uncertainties, the variability observed could be attributed to different biophysical factors, irrigation supply conditions which depends on water availability, the farmer’s behaviour (inadequate irrigation scheduling, financial considerations, …) and management practices (cultivar, sowing date, fertilizers, weed control…etc) as previously reported (Duchemin et al., 2008; Kharrou et al. 2013). These results revealed that this approach could provide an interesting framework for irrigation managers to monitor irrigation water use for efficient and sustainable use of agricultural water.
REFERENCES
Duchemin B, Hagolle O, Mougenot B, Simonneaux V, Benhadj I, Hadria R, Ezzahar J, Hoedges
J, Khabba S, Kharrou MH, Boulet G, Dedieu G, Er-Raki S, Escadafal R, Olioso A, Chehbouni A. 2008. Agrometerological study of semi-arid areas: an experiment for analysing the potential of FORMOSAT-2 time series of images in the Marrakech plain. Int. J. Remote Sens. 29 : 5291-5299.
Er-Raki S, Chehbouni G, Guemouria N, Duchemin B, Ezzahar J, Hadria R. 2007. Combining FAO-56 model and ground-based remote sensing to estimate water consumptions of wheat crops in a semi-arid region. Agric. Water Manage. 87: 41–54.
Er-Raki S, Chehbouni G, Boulet G, Williams D. 2010. Using the dual approach of FAO-56 for partitioning ET into soil and plant components for olive orchards in a semi-arid region. Agr. Water Manage. 97: 1769–1778.
FAO. 2016. AQUASTAT website. Food and Agriculture Organization of the United Nations (FAO). http://www.fao.org/aquastat/en/.
0
1
2
3
4
5
6
7
8ac
tual
ET
(mm
)
ET_obs ET_sim
1st African Conference on Precision Agriculture | 8-10 December | 2020
260
Kharrou MH, Le Page M, Chehbouni A, Simonneaux V, Er-Raki S, Jarlan L, Ouzine L, Khabba S, Chehbouni G. 2013. Assessment of equity and adequacy of water delivery in irrigation systems using remote sensing-based indicators in semi-arid region, Morocco. Water Resour. Manage. 27: 4697-4714.
Simonneaux V, Duchemin B, Helson D, Er-Raki S, Olioso A, Chehbouni A. 2008. The use of high-resolution image time series for crop classification and evapotranspiration estimate over an irrigated area in central Morocco. Int. J. Remote Sens. 29(1): 95-116.
Tasumi M, Allen RG. 2007. Satellite-based ET mapping to assess variation in ET with timing of crop development. Agric. Water Manag. 88: 54–62.
Zhang K, Kimball JS, Running SW. 2016. A review of remote sensing based actual evapotranspiration estimation. Wiley Interdiscip. Rev. Water 3834–53.
Zhang Y, Wegehenkel M. 2006. Integration of MODIS data into a simple model for the spatial distributed simulation of soil water content and evapotranspiration. Remote Sens. Environ. 104 : 393–408.

1st African Conference on Precision Agriculture | 8-10 December | 2020
261
#7451 ESTIMATING SOIL ORGANIC MATTER FROM CELL PHONE IMAGES
A. Biswas1, H. Vasava1, Y. Fu2, P. Taneja3, S. Lin1, and P. Daggupati3 1School of Environmental Sciences, University of Guelph, 50 Stone Road East, Guelph,
Ontario, N1G 2W1, Canada. 2National Engineering Research Center for Information Technology and Agriculture, Beijing, China. 3School of Engineering, University of Guelph,
50 Stone Road East, Guelph, Ontario, N1G 2W1, Canada, [email protected]
ABSTRACT
Soil organic matter (SOM) is considered as the backbone of soil health and soil quality. Thus, its’ estimation is critical to support the development of management decision including precision agriculture. To overcome challenges of laborious, rather expensive, and time-consuming laboratory measurements, recent advances in image acquisition systems provided a new dimension of image-based SOM prediction. However, challenges remain in using soil images taken directly in the field due to variable soil surface conditions including vegetation cover, illumination, and soil moisture. Soil moisture can significantly influence soil color and thus confounds the relationship between SOM and soil color. This study quantifies the effects of soil moisture on the relationship between SOM and color parameters derived from cell phone images and establishes suitable SOM prediction models under varying conditions of soil moisture contents (SMCs). To simulate the continuous variation of soil moisture in the field, air-dried ground soil samples were saturated and allowed to dry naturally. Images were captured with a cellular phone over time representing various SMCs (set of images). Final set of images were captured on oven-dried samples. Images were preprocessed using illumination normalization to avoid illumination inconsistencies and segmentation technique to remove non-soil parts of the images including black cracks, leaf residues and specular reflection before modelling. Five color space models including RGB, HIS, CIELa*b*, CIELc*h* and CIELu*v* were used to quantify soil color parameters. Univariate linear regression models were developed between SOM and color parameters and an optimal set of color parameters that are capable of resisting variation in SMC was determined. It was observed that SMC exerted a considerable influence on SOM prediction accuracy when its value reached >10%. The threshold of 10% SMC was considered as the critical SMC. Consequently, stepwise multiple linear regression (SMLR) models were developed for soil samples with SMC below and above the critical SMC. For the soil samples at below the critical SMC, the color parameter R based model produced satisfactory prediction accuracy for SOM with R2cv, RMSEcv, and RPDcv values of 0.936, 4.44% and 3.926, respectively. For the soil samples at above the critical SMC, the SOM predictive model including SMC as a predictor variable showed better accuracy (R2cv=0.819, RMSEcv=7.747%, RPDcv =2.328) than that without including SMC (R2cv=0.741, RMSEcv=9.382%, RPDcv =1.922). This study showed potential of cellular phone to be used as a proximal soil sensor fast, accurate and non-destructive estimation of SOM both in the laboratory and field conditions. Keywords: Proximal soil sensor; Soil moisture content; Cell phone images; Color space models; Stepwise linear regression

1st African Conference on Precision Agriculture | 8-10 December | 2020
262
INTRODUCTION
Soil organic matter (SOM), the organic matter component of soil, is considered as the backbone of soil health and regulates various physical, chemical, and biological processes and properties. However, like other properties, SOM is highly spatially variable within a field which contributes to the development of variable SOM pool in soil. Therefore, the information on spatial variability of SOM can help decide site-specific management of agricultural resources including application of nitrogen fertilizer and achieve the tradeoff between crop production increase and environment pollution reduction [1], the critical component of precision agriculture.
Traditional procedures for estimating SOM are laborious, costly and require time intensive spatially dense soil sampling (10 m or less) and laboratory analysis [2]. This often restricts the detailed characterization of its spatial variability in field. Furthermore, larger field sizes make detailed characterization unaffordable for many growers. Recently, with the development of technology, various soil sensors have been used to characterize SOM. For example, soil spectroscopy has shown potential to characterize SOM both in-situ and in laboratory conditions [3-11]. Although vis-NIR-MIR spectroscopy has shown great potential in predicting SOM, the related complex processing techniques and expensive equipment restrict their widespread usage in practical agricultural production scenarios. In addition, SOM prediction accuracy is limited using vis-NIR-MIR spectroscopy when uncontrolled soil conditions, like variable soil moisture and surface roughness are confronted [12-14].
Recently, with technological progression and the advancement of image acquisition systems, image-based soil characterization techniques have garnered significant attention from the researchers in soil science. Unlike soil diffuse reflectance spectroscopy, image acquisition devices like digital cameras or even cameras in cellular phone are easily accessible. In the existing image-based SOM or soil organic carbon (SOC) prediction studies [8, 15-17], soil color was used as a proxy to link SOM or SOC with images. Soils with darker color are generally associated with higher OM contents and are regarded fertile and suitable for plant growth [18]. The existence (prevalence) of strong relationship amid soil’s color and its organic matter was also confirmed by researchers [19, 20] who came up with a cell-phone application named SOCIT (only pertinent to mineral soils in Scotland) which utilizes this connection. The app provides an approximation of topsoil organic matter content using a photograph of the soil of interest and user’s positional information to access location-specific factors [21]. A recent study also reported the development of an algorithm to quantify soil organic matter and soil texture from image parameters using geostatistical and regression-based methods [22]. However, due to the limited scope of the study in terms of soil moisture conditions, the authors pointed out that their algorithm needs further testing.
The existing image-based SOM or SOC prediction studies [8, 10, 15, 17, 22] directly used soil color parameters to develop prediction models without considering the contribution of other factors like soil moisture, surface residue, surface roughness and light [23]. These factors are known to influence spectral response in the visible range of the electromagnetic spectrum (400 to 700 nm). Among these factors, soil moisture is the most important one that restricts practical in-situ measurement of SOM. Usually, dry soils are lighter in color than wet soils [24, 25]. As soil moisture content (SMC) increases, soil micro and macro pores are gradually filled with water and alter the physical structure of soil. Consequently, the relative refractivity at the soil particle surface also changes causing the change in soil color [12]. The soil moisture, thus, makes the relationship between SOM and soil color complicated and becomes a key determinant factor for the practical

1st African Conference on Precision Agriculture | 8-10 December | 2020
263
use of image-based SOM prediction. SMC was implicitly involved in the models developed in the above-mentioned studies since the SMCs of soil samples were variable in these studies, but it’s influence on SOM prediction was not considered and hence, the given study was planned in which SMC was explicitly considered for SOM prediction.
Following up on the missing links, the research questions addressed in this study were to (1) evaluate the ability of cell phone images to predict SOM using color parameters; (2) quantify the effect of soil moisture on the accuracy of SOM prediction models based on color parameters; and (3) determine the critical moisture content at which it begins to influence SOM prediction accuracy based on color parameters and establish suitable SOM prediction models accordingly.
MATERIALS AND METHODS
Twenty-five soil samples with a wide variation in SOM (3.3-62.7%) were selected for this
study, for whom SOM was measured using loss on ignition (LOI) method (Schulte and Hopkins, 1996). Digital images (2322 ×4128 pixels) were captured with a cellular phone 10-megapixel camera set to a holder 32 cm above the sample and the images were saved as Joint Photographic Experts Group (JPEG) standard compression. A total of six sets of images were collected corresponding to six different levels of SMC (“group 1”, “group 2”, “group 3”, “group 4”, “group 5” and “group 6” with increasing SMC). The images of oven-dried soil samples formed the components/constituents/parts of “group 1”, images of air-dried soil samples of “group 2”, three sets of images collected during the natural drying process of “group 3”, “group 4” and “group 5” and those of saturated soil samples of “group 6”. There were 146 images in all, with 25 images for each group except 24 images for “group 2”and “group 6”, and 23 images for “group 1”. Before the images were analyzed, preprocessing was carried out with four components: 1) region of interest (ROIs) selection, 2) illumination normalization, 3) image segmentation and 4) color space conversions.
RESULTS AND DISCUSSION
The scatter plot between SOM and color parameter R for all the groups is shown in Fig.
1. It can be witnessed that there exists a negative correlation between the color parameter R and SOM for the first three groups. However, for the latter three groups, the scatter plot demonstrates that an increase in SOM content occurred, without a considerable decrease in the R values. Similar trends were observed in the scatter plots between SOM and other color parameters G and B. The change in the behavior observed (the pattern of distribution of scatter plots) supported that the negative correlation between SOM and color parameters cannot be held with increasing variation in SMC, and that SMC influences color parameter-based SOM prediction in a different manner below and above a specific level and hence, it was crucial to identify that level of SMC after which it exerted significant influence.
Since the decrease in SOM prediction accuracy was not obvious for the first three groups, the SMC frequency distribution for soil samples belonging to these groups was analyzed and the results showed that 95% soil samples had a SMC of less than 10%. Similar patterns were also observed in other studies; for instance, Nocita et al. (2013) grouped together soil samples with a gravimetric SMC >=15% and developed a single SOC model with good prediction accuracy using a PLSR of soil diffuse reflectance in the vis-NIR region. Rienzi et al. (2014) demonstrated that predicting SOC over a range of 10% soil moisture variability did not substantially change
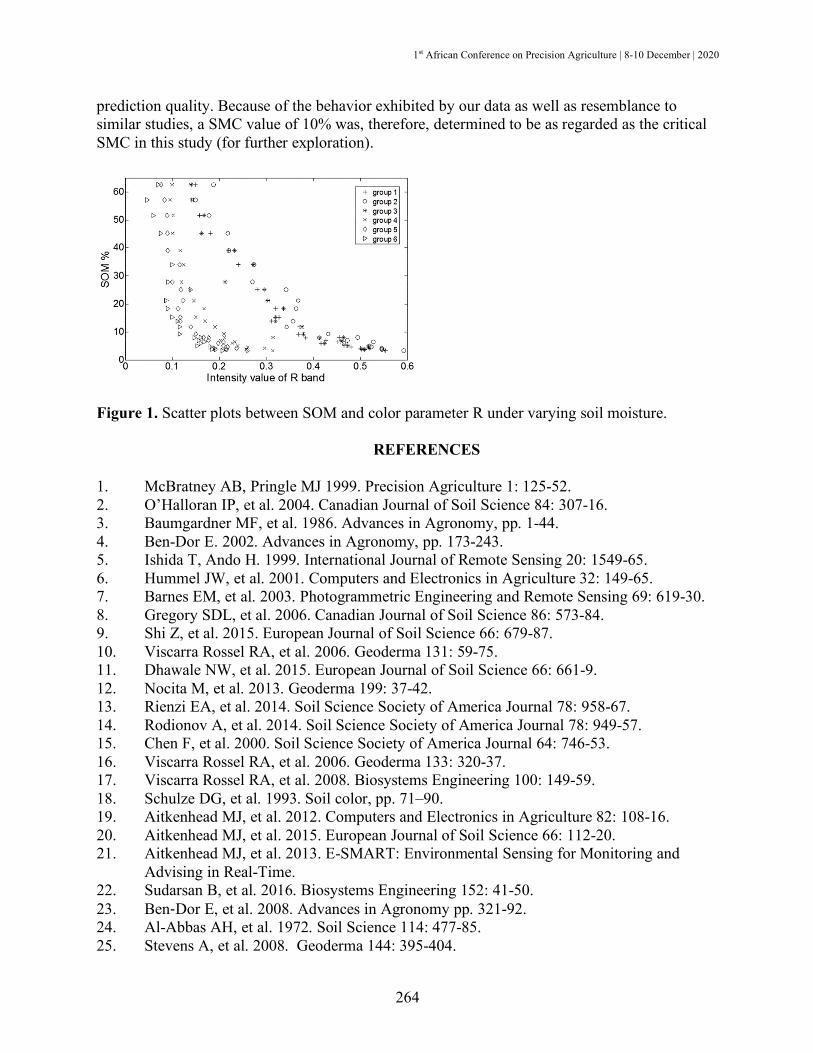
1st African Conference on Precision Agriculture | 8-10 December | 2020
264
prediction quality. Because of the behavior exhibited by our data as well as resemblance to similar studies, a SMC value of 10% was, therefore, determined to be as regarded as the critical SMC in this study (for further exploration).
Figure 1. Scatter plots between SOM and color parameter R under varying soil moisture.
REFERENCES
1. McBratney AB, Pringle MJ 1999. Precision Agriculture 1: 125-52. 2. O’Halloran IP, et al. 2004. Canadian Journal of Soil Science 84: 307-16. 3. Baumgardner MF, et al. 1986. Advances in Agronomy, pp. 1-44. 4. Ben-Dor E. 2002. Advances in Agronomy, pp. 173-243. 5. Ishida T, Ando H. 1999. International Journal of Remote Sensing 20: 1549-65. 6. Hummel JW, et al. 2001. Computers and Electronics in Agriculture 32: 149-65. 7. Barnes EM, et al. 2003. Photogrammetric Engineering and Remote Sensing 69: 619-30. 8. Gregory SDL, et al. 2006. Canadian Journal of Soil Science 86: 573-84. 9. Shi Z, et al. 2015. European Journal of Soil Science 66: 679-87. 10. Viscarra Rossel RA, et al. 2006. Geoderma 131: 59-75. 11. Dhawale NW, et al. 2015. European Journal of Soil Science 66: 661-9. 12. Nocita M, et al. 2013. Geoderma 199: 37-42. 13. Rienzi EA, et al. 2014. Soil Science Society of America Journal 78: 958-67. 14. Rodionov A, et al. 2014. Soil Science Society of America Journal 78: 949-57. 15. Chen F, et al. 2000. Soil Science Society of America Journal 64: 746-53. 16. Viscarra Rossel RA, et al. 2006. Geoderma 133: 320-37. 17. Viscarra Rossel RA, et al. 2008. Biosystems Engineering 100: 149-59. 18. Schulze DG, et al. 1993. Soil color, pp. 71–90. 19. Aitkenhead MJ, et al. 2012. Computers and Electronics in Agriculture 82: 108-16. 20. Aitkenhead MJ, et al. 2015. European Journal of Soil Science 66: 112-20. 21. Aitkenhead MJ, et al. 2013. E-SMART: Environmental Sensing for Monitoring and
Advising in Real-Time. 22. Sudarsan B, et al. 2016. Biosystems Engineering 152: 41-50. 23. Ben-Dor E, et al. 2008. Advances in Agronomy pp. 321-92. 24. Al-Abbas AH, et al. 1972. Soil Science 114: 477-85. 25. Stevens A, et al. 2008. Geoderma 144: 395-404.

1st African Conference on Precision Agriculture | 8-10 December | 2020
265
ROBOTICS, AUTOMATION, AND SMALL FARM MECHANIZATION
1st African Conference on Precision Agriculture | 8-10 December | 2020
266
#7493 WILLINGNESS TO PAY FOR DRONE TECHNOLOGY IN THE APPLICATION OF PESTICIDE FOR THE CONTROL OF FALL ARMYWORM
S. Omega, F. Annor-Frimpong, S. Akaba, W. Ghartey, J. Ocran, and I. Asante
University of Cape Coast, Cape Coast, Ghana [email protected]; Phone: +233545022814
ABSTRACT
In Ghana, maize is one of the major staple food crops. Since 2016, it has been plagued by fall armyworm, leaving production capacity below the national average. The introduction of drone technology is to assist farmers to reduce havoc caused by fall armyworm. The majority of research done in the area of drone technology has focused on the technical and mechanical aspects. This gap gives rise to this study, as the study seeks to ascertain the willingness to pay for drone technology in the application of pesticides for fall armyworm control. The study adopted a quantitative research approach and cross-sectional survey design to ascertain the interplay of variables, using a sample of 152 maize farmers in the Northern and North East Region of Ghana. The research used a questionnaire as the data collection tool with binary logistic regression for analysis. The majority of respondents were willing to pay for drone technology but did not have the resource to purchase. Their decision was influence by their source of income, access to credit and input. The study recommends that the cost of drone technology be reduced to make it affordable for all categories of farmers.
INTRODUCTION
The government has done little in the fight against fall armyworm (FAW) since its discovery in 2017 in Ghana (Nunda, 2018). This limitation is due to the absence of empirical data to guide the government in its policy formulation for effective control of FAW. Africa was estimated to have lost 70% of its total maize, sorghum, rice and sugarcane yield in 2016 mainly due to the activities of FAW (Prasanna et al., 2018). Day et al. (2017) estimated that the impact of FAW in Ghana was 22% of yield in Ghana, translating to millions of dollars in losses. However, the estimates were based solely on socio-economic studies that focused on the perceptions of farmers. Despite the large-scale use of drones in agriculture in other parts of the globe, literature on Africa's agricultural use of drones for pesticide application is less to be desired. In Ghana, for instance, there have been few reports of areas of drone technology application in the control of fall armyworm, therefore this research was conducted to ascertain farmers’ willingness to pay for drone technology for the control of FAW.
MATERIALS AND METHODS
A cross-sectional survey design was used for the study to ascertain the status of the variables of the study and their inter-relationships. The study was conducted in the Northern Region (Tolon and Mion) and the North East (West Mamprusi) Region of Ghana. A multistage sampling technique was used to select communities in the Tolon (2) and Mion (3) district of the Northern Region and two (2) communities from West Mamprusi in the North-East Region with
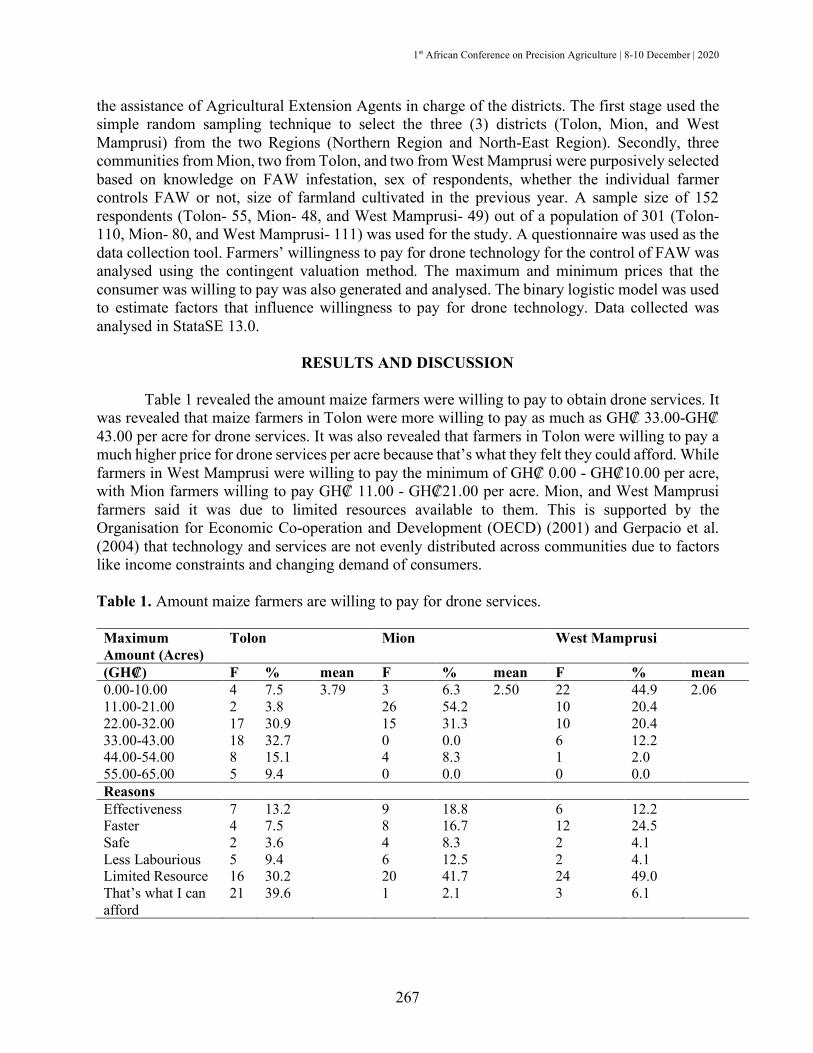
1st African Conference on Precision Agriculture | 8-10 December | 2020
267
the assistance of Agricultural Extension Agents in charge of the districts. The first stage used the simple random sampling technique to select the three (3) districts (Tolon, Mion, and West Mamprusi) from the two Regions (Northern Region and North-East Region). Secondly, three communities from Mion, two from Tolon, and two from West Mamprusi were purposively selected based on knowledge on FAW infestation, sex of respondents, whether the individual farmer controls FAW or not, size of farmland cultivated in the previous year. A sample size of 152 respondents (Tolon- 55, Mion- 48, and West Mamprusi- 49) out of a population of 301 (Tolon-110, Mion- 80, and West Mamprusi- 111) was used for the study. A questionnaire was used as the data collection tool. Farmers’ willingness to pay for drone technology for the control of FAW was analysed using the contingent valuation method. The maximum and minimum prices that the consumer was willing to pay was also generated and analysed. The binary logistic model was used to estimate factors that influence willingness to pay for drone technology. Data collected was analysed in StataSE 13.0.
RESULTS AND DISCUSSION Table 1 revealed the amount maize farmers were willing to pay to obtain drone services. It
was revealed that maize farmers in Tolon were more willing to pay as much as GH₡ 33.00-GH₡ 43.00 per acre for drone services. It was also revealed that farmers in Tolon were willing to pay a much higher price for drone services per acre because that’s what they felt they could afford. While farmers in West Mamprusi were willing to pay the minimum of GH₡ 0.00 - GH₡10.00 per acre, with Mion farmers willing to pay GH₡ 11.00 - GH₡21.00 per acre. Mion, and West Mamprusi farmers said it was due to limited resources available to them. This is supported by the Organisation for Economic Co-operation and Development (OECD) (2001) and Gerpacio et al. (2004) that technology and services are not evenly distributed across communities due to factors like income constraints and changing demand of consumers.
Table 1. Amount maize farmers are willing to pay for drone services. Maximum Amount (Acres)
Tolon Mion West Mamprusi
(GH₡) F % mean F % mean F % mean 0.00-10.00 4 7.5 3.79 3 6.3 2.50 22 44.9 2.06 11.00-21.00 2 3.8 26 54.2 10 20.4 22.00-32.00 17 30.9 15 31.3 10 20.4 33.00-43.00 18 32.7 0 0.0 6 12.2 44.00-54.00 8 15.1 4 8.3 1 2.0 55.00-65.00 5 9.4 0 0.0 0 0.0 Reasons Effectiveness 7 13.2 9 18.8 6 12.2 Faster 4 7.5 8 16.7 12 24.5 Safe 2 3.6 4 8.3 2 4.1 Less Labourious 5 9.4 6 12.5 2 4.1 Limited Resource 16 30.2 20 41.7 24 49.0 That’s what I can afford
21 39.6 1 2.1 3 6.1

1st African Conference on Precision Agriculture | 8-10 December | 2020
268
Again, from Table 2, income source was found to be statistically significant in influencing willingness to pay but the relationship was negative. This implies that as the income of farmers increases, they stand a -17.461 chance of not being willing to pay for drone service and this directionality denies the stated hypothesis. This is consistent with Alimi et al. (2016) who found out that income was a very vital factor that influence farmers’ willingness to pay for a service. Furthermore, access to credit was positively related to willingness to pay. Showing that if farmers have access to credit, they will stand an 18.942 chance of being willing to pay for drone services. Also, the relationship between willingness to pay and access to credit were statistically significant. This agrees with Mersha (2018) that access to credit was a significant determinant of willingness to pay. Lastly, from Table 2, access to input was inversely related to willingness to pay. As farmers gain access to input, there is -3.049 chance of them not being willing to pay for drone service, this was significant. This is consistent with Chai et al. (2020) that consumer willingness to pay is not influenced by access to obtain input.
Table 2. Binary logistic regression for willingness to pay for drone services.
Source: Field Data, 2019, n= 152, *** significant at 1%, ** at 5%. * at 10%.
Variables Coef. Robust Std. Err.
Z P>ǀZǀ
Gender .308 1.635 .19 .851 Marital Status .980 1.652 .59 .553 Access to Credit 18.942 2.099 9.03 .000*** Access to Input -3.049 1.560 -1.95 .051* Access to Information .060 1.868 .03 .974 Status .956 .813 1.18 .240 Primary Occupation 1.659 1.446 1.15 .251 Farm size .907 1.252 .72 .469 Income source -17.461 1.059 -16.49 .000*** Contact with Extension Agents .540 1.594 .34 .735 Household size 1.446 1.039 1.39 .164 Landholding -1.170 .920 -1.27 .203 Age .220 1.240 .18 .859 Farming Experience .021 .017 1.20 .231 Education -.803 1.436 -.56 .576 Constant -23.873 6.962 -3.43 .001*** Cut1 51.774 17.422 Number of observations
150
Wald Chi2(17) 1083.47 Prob> Chi2 .0000 Pseudo R2 .3295 Log Pseudo Likelihood -20.942

1st African Conference on Precision Agriculture | 8-10 December | 2020
269
REFERENCES
Alimi BA, Oyeyinka AT, Olohungbebe LO. 2016. Socio-economic characteristics and willingness of consumers to pay for the safety of fura de nunu in Ilorin, Nigeria. Quality Assurance and Safety of Crops & Foods 8(1): 81-86.
Chai L, Han Z, Liang Y, Su Y, Huang G. 2020. Understanding the blue water footprint of households in China from a perspective of consumption expenditure. Journal of Cleaner Production 262 (121321): 121-321.
Day R, Abrahams P, Bateman M, Beale T, Clottey V, Cock M, Gomez J. 2017. Fall armyworm: impacts and implications for Africa. Outlooks on Pest Management 28(5): 196-201.
Gerpacio R, Labios J, Labios R, Diangkinay E. 2004. Maize in the Philippines: Production systems, constraints and research priorities. Texcoco, Mexico: International Maize and Wheat Improvement Centre (CIMMYT).
Mersha D. 2018. Farmers’ perception and willingness to pay for weather index based insurance in central rift valley of Ethiopia: The case of Adamitulu Jidokombolcha and Bora Districts. (Doctoral thesis, Haramaya University).
Nunda W. 2018. Fall armyworm: impacts and implications for Africa (Evidence Note Update). Oxfordshire, England: CABI.
OECD. 2001. Oslo manual. Guidelines for collecting and interpreting innoviation data (3rd Ed.) Paris, Fance: OECD and European Commission.
Prasanna BM, Huesing JE, Eddy R, Peschke VM. (Eds). 2018. Fall Armyworm in Africa: A Guide for Integrated Pest Management, First Edition. Mexico, CDMX: CIMMYT.
1st African Conference on Precision Agriculture | 8-10 December | 2020
270
#7606 A REVIEW ON SENSOR BASED ROBOTIC AGRICULTURE: IMPROVING TRADITIONAL AGRICULTURE PRACTICES
S.C. Karad, Prabhat Kumar and G.U Shinde
National Agriculture Higher Education Project, ICAR, New Delhi Centre of Excellence for Digital Farming Solutions Enhancing
Productivity by Robots, Drones, and AGVs (DFSRDA) Vasantrao Naik Marathwada Krishi Vidyapeeth, (431402) Parbhani
[email protected], +919370728496
ABSTRACT
Agribot is advanced mechatronic applicant machinery that serves precision agricultural practices and works independently with logical programs duly coded with several set of operational task in the field. This is automated device that expedites accuracy and speed of every task of field operations associated with the farming. The most important characteristics of sensors in Agribot applications are such that it must be Robust, Smart, Low-cost , with strong signal interpretation. The issues of Sensor Fusion, Robust algorithms and overall quick response to activate the mechanism are important quality parameters. The operational task like properties and contains sensing, paste detection and paste management, plant properties sensing and climate monitoring issues are very important while designing a hardware and software deigning in Agribot. The weed detection in which cameras, machine vision and image processing like methods and tools are developed and need to be very précises and specific as traditional practices are challenging with an expected output such as operation cost and time must be saving with high quality agricultural production capacity and economic for Indian farming system. So sensors are the core components of Agribot where in the cost of the device can be minimised so that there will be a digital farming practices by smart farm machinery. The present paper introduces a overall review about sensors used in weeding, insect and disease detection, spraying and harvesting like operations. Keywords: Precision Agriculture, Digital Farming, Field Operation, Autonomous vehicles & Sensors, DOF, Machine Vision
INTRODUCTION
Agriculture is the most dominant sector which affects the GDP of every nation in the world
map. To soothe hunger and bridge demand and supply gap surely there is a need for precision agriculture. Hi Tech agriculture technology outstandingly transformed almost every field operations procedure both in crop and livestock systems in today's time. Use of these technologies with sensor development is a need of an hour. Due to revolution in agriculture robotics technology, minimum investment required in terms of time and efforts related with operation and production cost. Operations involved in agriculture enhanced because of, evolution in software development, machine vision and multivariate data processing. Additionally, there is improvement in equipment and machinery associated with field operations optimized real time scenarios faced by farmers. In today’s time there is a dearth of human labours extensively required in field operations.
1st African Conference on Precision Agriculture | 8-10 December | 2020
271
Management of weed in intra row and harvesting is very tedious when it is done with traditional farm equipment and machines. As a consequence, labour arability crop field operations accelerated with the help of robots [Marinoudi et. al. (2019)]. Some of complexities associated with operation and performance of advanced robotics used in the field operation. These complexities should be addressed to transform the applicability of robotics in agriculture. While building a perfect robotic solution for complex operations for the field, cost operation analysis, advantages and disadvantages should be given priority [Pedersen et.al. (2006)]. Other factors are also anxiously needed to execute any prominent task to suffice the need of requirement which includes adaption capacity, smartness, networking and capability of communication, less length and weight [Blackmore et. al. (2008)]. Smaller self-dependent autonomous machines are preferred to perform soil erosion and associated problems rather use of big farm machineries [Fountas et. al. (2010)]. Divide any big operation into small steps of operation before fully atomizing any task related with field operations. To cope up complex conditions involved in the field, there is a need to optimize all small operations [Fountas et. al. (2020)]. There are some frequently observed troubles commonly faced by robots while performing field operations which include assessment of terrain [Reina et.al. (2017), Fernandes & Garcia et.al. (2018)], plan and path [Bochtis et.al. (2009),Bochtis et.al. (2015),Yang & Noguchi et.al. (2012)] human observation - detection problem [Yang & Noguchi (2012)], and light-footed robots [Yang et al. (2004)]. Troubles in tasks related field operations are mainly associated with Inputs of utility and crop specific specifications related with their physiology, anatomy and architecture and pest - disease detection. To implement full autonomous application to any field operations, difficulties are always part and parcel. While implementing any robotic solution common difficulties are frequently with actuation, intelligence, navigation and vision of robotic systems. Some multifaceted robotics responsibilities and tasks associated with field operations which agribots won’t perform well includes harvesting, seeding, management of weeds, interaction, purning, navigation and assessment of systems [Aravind, et al. (2017)]. Some arable land farming operation set has been examined [R Shamshiri (2018)]. Proper attitude review has been a very integral part of commercially available agribots [Fountas et al. 2020]. Examination is essential for agribots, for study of farm environment and to see exact technique of operation [Tsolaki et al. (2019)]. Most advanced agribots have seen for weed management agribot in the field which is autonomously operated for weed related operation [Slaughter et al., (2008)]. Similarly, straw berry related study and operation has been done by these agribots [Defterli (2016)]. However, holistic study of agribots architecture and operation is essential, because there are different types of field operations related to various types of crops and controlled environment. Primary challenges of agribots are associated with weather adaptable structures which are evolved to fulfil various needs of crops and their respective field operations. Weather agribots structures are accurate to cope up the challenges concerned with autonomy of actuation. This paper will try to give review about the traditional agriculture practice improvements based on sensors used in agribots.
MATERIALS AND METHODS
Correlational survey has been done for sensors used for weeding, insect and disease
detection, spraying and for harvesting applications has been studied. For this review paper several research articles were downloaded from renowned peer reviewed journals and then papers as per the sensor’s application category divided into four applications. While reading papers focus has been given to sensors and types of crops these strategies used for each application. Afterwards, in
1st African Conference on Precision Agriculture | 8-10 December | 2020
272
the (Table 1) weed detection types are presented such as chemical and mechanical. Additionally, crop disease and insect detection are categorized in the column number three of (Table 2). (Table 3) mentions about spraying mechanism two modes such as present and absent. At the end in (Table 4) is depicting harvesting application rate of picking fruit in column number three, categorized into two modes such as present or absent with their speed. These studies conducted while writing this research paper will be a torchbearer to shade light to see how sensors revolutionized every traditional practice in conjunction with field operation. The role of sensors in various applications is discussed as follows. Weeding
Amongst all field operation related tasks, wedding tasks are quite repetitive and time consuming in nature. More than 40% hard work required by farmers is to collect weed manually [Labrada et. al. (2006)]. There are certain crops that are quite disturbing to farmers and labours and so it took lots of money to do that manually. This kind of field operation will have some of the very bad effect over the health of farmers because of manual herbicide sprayed over crops. As a result yield will be less because of spraying without knowing the difference between the crops and weed. There is a huge loss up to 61.5% in the yield of wheat and maize and 33.7% actual yield loss because of heavy use of pest [orke et. al.(2006)]. So to avoid such huge losses weeding robots is the solution [Utstumo et. al (2018)]. These weed robots are usually classified into two types: chemical and mechanical. These robots 100% efficiently and effectively can detect the weed in the crop field row and can spray the exact amount of herbicide required [Utstumo et. al (2018)]. Weeding robots can [Asterix. (2020)]. spot the weed very precisely in the range of 98% [Van Evert et. al (2006)]. Some of the commercial robots can spot and destroy the weed very precisely with the accuracy of 85%. Commercial chemical weeding robots [EcoRobotix (2020)] are less in performance compared with mechanical types [Klose et. al. (2008)].
Cameras which are internet enabled are widely used. Listed cameras such as RGB and IR are widely used. Sensors like optical and acoustic distance sensors, laser, gyroscope and IMU mentioned in the literature. Sensors integrated with robotics systems can increase the performance of weed detection in both chemical and mechanical types. Herbicide with weed refers to weed extraction by chemical method which is famous than mechanical type because of less work done required by it. But spraying more will have some bad toxic impact over the health of individuals involved in these operations. So, precision spraying is the best solution for spraying chemicals in an accurate amount and in precise quantity over the weed. This is attained by integrating sensors with robots with machine vision applications which are highly capable to detect weeds. In the end even though there are good solutions available in the market, still there is a lot to do to increase efficiency. That includes correct navigation guidance and simulation systems with the help of deep learning, so as to make the exact decision at the correct time.
There is only one point which comes in between greater accuracy of robotic systems. Accurate identification of most accurate weed from field is a challenge for such system. Sensors and cameras integrated with robotics systems like vision cameras and sensors measuring distance could be a very great help for precision detection and spraying on weeds. There is huge scope for advancement of weed detects in their early stage like sprouting using soil EC sensors.
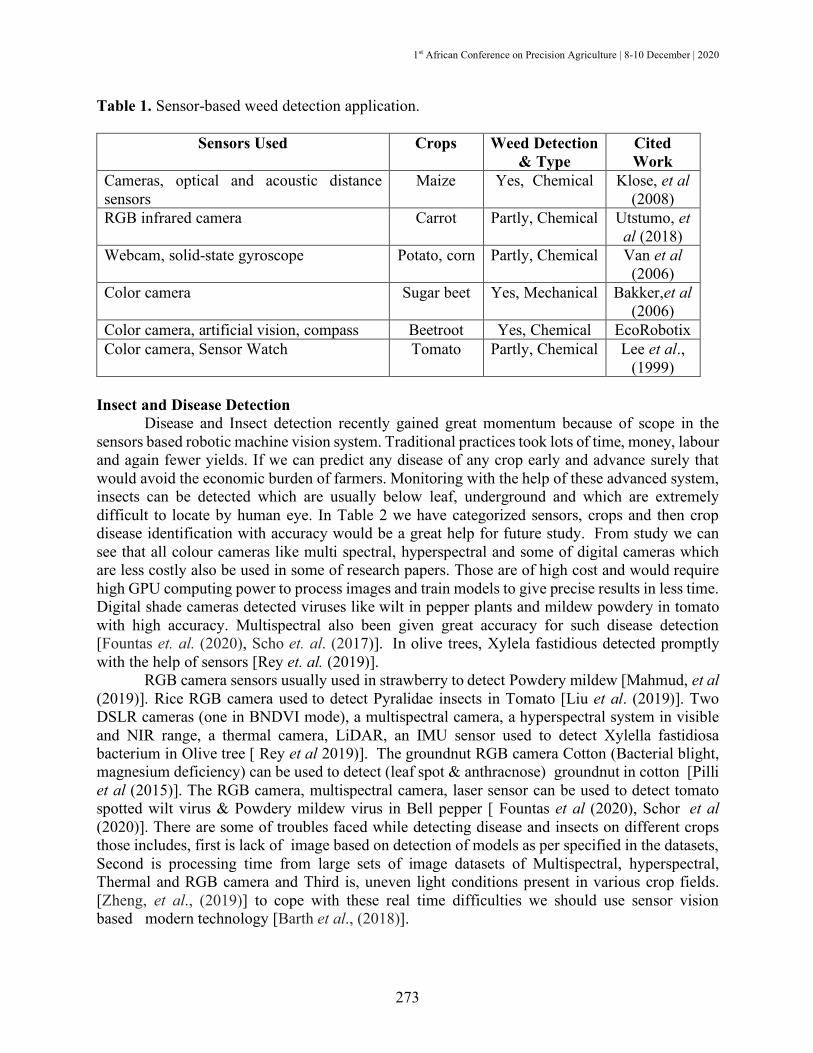
1st African Conference on Precision Agriculture | 8-10 December | 2020
273
Table 1. Sensor-based weed detection application.
Sensors Used Crops Weed Detection & Type
Cited Work
Cameras, optical and acoustic distance sensors
Maize Yes, Chemical Klose, et al (2008)
RGB infrared camera Carrot Partly, Chemical Utstumo, et al (2018)
Webcam, solid-state gyroscope Potato, corn Partly, Chemical Van et al (2006)
Color camera Sugar beet Yes, Mechanical Bakker,et al (2006)
Color camera, artificial vision, compass Beetroot Yes, Chemical EcoRobotix Color camera, Sensor Watch Tomato Partly, Chemical Lee et al.,
(1999) Insect and Disease Detection
Disease and Insect detection recently gained great momentum because of scope in the sensors based robotic machine vision system. Traditional practices took lots of time, money, labour and again fewer yields. If we can predict any disease of any crop early and advance surely that would avoid the economic burden of farmers. Monitoring with the help of these advanced system, insects can be detected which are usually below leaf, underground and which are extremely difficult to locate by human eye. In Table 2 we have categorized sensors, crops and then crop disease identification with accuracy would be a great help for future study. From study we can see that all colour cameras like multi spectral, hyperspectral and some of digital cameras which are less costly also be used in some of research papers. Those are of high cost and would require high GPU computing power to process images and train models to give precise results in less time. Digital shade cameras detected viruses like wilt in pepper plants and mildew powdery in tomato with high accuracy. Multispectral also been given great accuracy for such disease detection [Fountas et. al. (2020), Scho et. al. (2017)]. In olive trees, Xylela fastidious detected promptly with the help of sensors [Rey et. al. (2019)].
RGB camera sensors usually used in strawberry to detect Powdery mildew [Mahmud, et al (2019)]. Rice RGB camera used to detect Pyralidae insects in Tomato [Liu et al. (2019)]. Two DSLR cameras (one in BNDVI mode), a multispectral camera, a hyperspectral system in visible and NIR range, a thermal camera, LiDAR, an IMU sensor used to detect Xylella fastidiosa bacterium in Olive tree [ Rey et al 2019)]. The groundnut RGB camera Cotton (Bacterial blight, magnesium deficiency) can be used to detect (leaf spot & anthracnose) groundnut in cotton [Pilli et al (2015)]. The RGB camera, multispectral camera, laser sensor can be used to detect tomato spotted wilt virus & Powdery mildew virus in Bell pepper [ Fountas et al (2020), Schor et al (2020)]. There are some of troubles faced while detecting disease and insects on different crops those includes, first is lack of image based on detection of models as per specified in the datasets, Second is processing time from large sets of image datasets of Multispectral, hyperspectral, Thermal and RGB camera and Third is, uneven light conditions present in various crop fields. [Zheng, et al., (2019)] to cope with these real time difficulties we should use sensor vision based modern technology [Barth et al., (2018)].

1st African Conference on Precision Agriculture | 8-10 December | 2020
274
Table 2. Sensor based disease and insect detection application.
Sensor Used Crop Crop Disease Cited Work RGB camera, multispectral
camera, laser sensor Bell
pepper tomato spotted wilt virus
& Powdery mildew [ Fountas et al (2020), Schor et al (2020)]
groundnut RGB camera Cotton (Bacterial blight, magnesium
deficiency),
Cotton (leaf spot & anthracnose) groundnut
Pilli et al (2015)
Two DSLR cameras (one in BNDVI mode), a multispectral camera, a hyperspectral system
in visible and NIR range, a thermal camera, LiDAR, an
IMU sensor( * )
Olive tree Xylella fastidiosa bacterium
[ Rey et al 2019)
rice RGB camera Tomato Pyralidae insect Liu et al. (2019)
RGB camera Strawberry Powdery mildew Mahmud, et al (2019)
One of the difficulties is uneven light conditions and that can be reduced using some of the novel imaging modalities about light to detect some of the insects and diseases on crops [Mahmud, et al. (2019)]. There other difficulties too apart from lightning conditions which are some of insect morphology related with imaging constraints such as shadow etc. For detection of bugs under the plant on the crop beneath the soil requires some of the advance mechanism to detect that precisely and that is the challenge.
Spraying
Even though we manage to control the toxic effect of active substances like herbicide and liquid fertilizer which we use for spraying application over pests and insects in the field. There is a risk associated with the health of farmers even if we use some advanced robotic for applications. Precautionary measures should be taken. Spraying agri drones and agribots can avoid such risks. Traditional spraying accuracy has been replaced by sensor integrated machine vision intelligence nowadays. Using these practices with the help of drones and agriculture robots, we can attain precise spraying over rightly spotted part of crops in the field operations. So as a result of homogenous spraying, we will get proportionate yield in less time. Research papers have been reviewed for sensor applications in spraying applications which are shown in Table 3. Some of the processes were corrected which are used in the greenhouse in association with robots [Sammons et al. (2005)], robots which are working in very alignment of crop rows [Singh, et al (2005)]. Sensors which detect the correct spot used with robots always increase the accuracy of precision spraying [Oberti et al. (2013), Underwood, et al (2015)]. Nozzles are used with spraying devices associated with Agri drones [Sammons et al. (2005, Sogaard, & Lund (2007)], also that nozzles could be used with the end effector with manipulator other types of agribots to attain variety DOF applications ranging from 3 DOF [Slaughter et al. (2008)], [Underwood, et al. (2015)] to 9 DOF [Oberti et al. (2013)].

1st African Conference on Precision Agriculture | 8-10 December | 2020
275
Table 3. Sensor-based spraying application.
Sensors Used Crop Presence or absent of real time Detection
Cited Work
Thermal IR camera Hyperspectral camera, stereo
vision, monocular color camera
Vegetable crops Present Underwood, et al (2015)
Robot controller Cantaloupe Absent Mahmud et al (2019)
infra-red sensors , Bump sensors, induction sensors
Cucumber Absent ammons et al. (2005)
Ultrasonic sensor, color TV camera
Grapevine Absent Ogawa,et al (2003)
RGB camera, R-G-NIR multispectral camera
Grapevine Present [Oberti et al (2013),]
Also, in some of the applications, spraying time and machine effectiveness plays an
important role.These suggestions should be taken in positive mode to optimize existing systems [Mahmud et al (2019)]. Other parameters should also be taken considerations to optimize existing mechanism such as machine error [Sánchez-Hermosilla et al. (2010), Singh et al. (2008)], parameter of performance metrics [Oberti et al (2013)], actual [Sammons et al. (2005, Sánchez-Hermosilla et al. (2010) Ogawa, et al. (2013)] and real time detection and spraying capabilities [Underwood, et al (2015)]. Harvesting
Harvesting is one of the most repetitive field operations out of all the other applications mentioned in this paper. Some of the research universities and companies are taking efforts to automate these repetitive applications. Based on literature review found, two types of robotics harvesting applications which are Bulk type and second is selective type. Selective type application is a need of the hour which is point of attraction to everyone because of its fastest and precise operational results. Performance of these selective kinds of harvesting robots can be measured based on the objects effective picking speed and picking charge [Hayashi, et al. (2014)].These applications of harvesting with the help of sensor machine vision based robotics should be done in precise given type without affecting crops and plant. Cash crops like strawberries suffer lots of manufacturing and labour cost in some stage of harvesting [Qingchun et al., (2012), Feng et al., (2012)]. So, to overcome that, strawberries harvesting robots is a solution [Hayashi et al. (2014) Hayashi et al. (2014), Xiong et al. (2019]. Strawberries selection speed of harvester robots is 7.5 to 8.6 seconds per strawberries and claimed speed is about 8 second per this fruit in line of crop [ Xiong et al (2019)], 5 second per fruit strawberries picking speed mentioned in [Arima, et al., (2004)]. Only speed is immature, what matters is accuracy of picking fruit. Traditional harvesting practices over acers of acres of land cost more to growers, so to avoid cost and exertion of robotics harvesting is a solution. Performance metrics of harvesting robots is also an important point to be considered for harvesting [Shiigi, et al., (2008)].
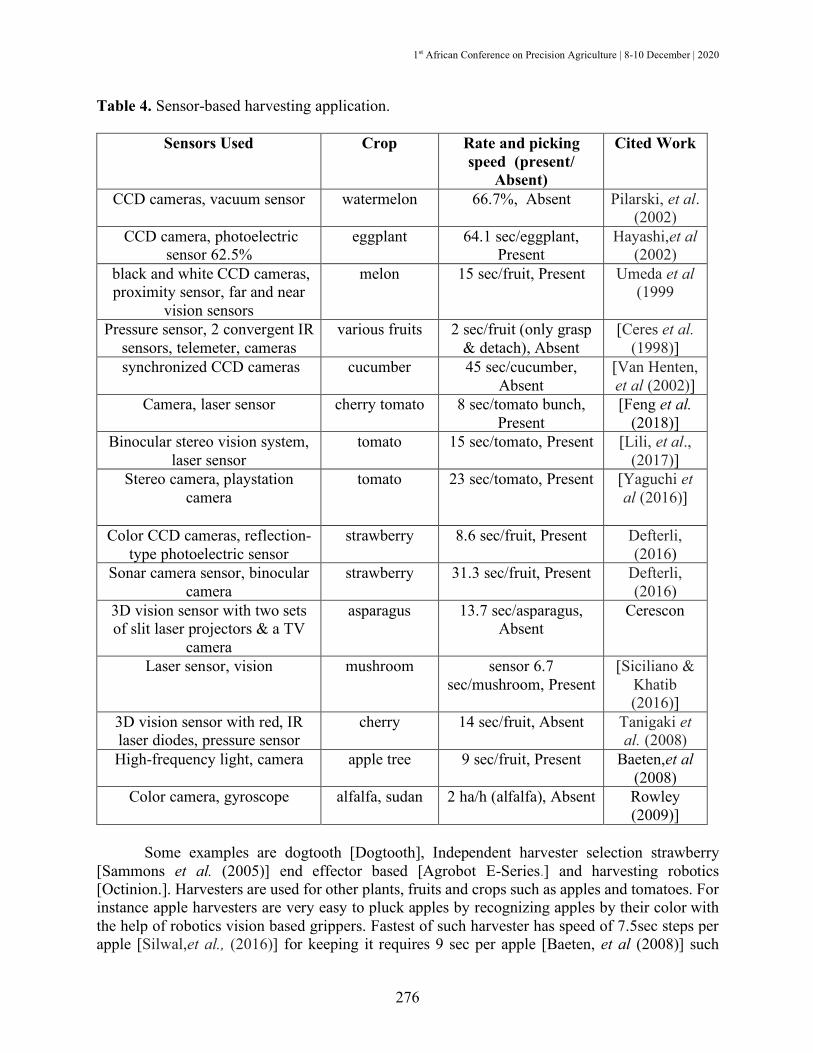
1st African Conference on Precision Agriculture | 8-10 December | 2020
276
Table 4. Sensor-based harvesting application.
Sensors Used Crop Rate and picking speed (present/
Absent)
Cited Work
CCD cameras, vacuum sensor watermelon 66.7%, Absent Pilarski, et al. (2002)
CCD camera, photoelectric sensor 62.5%
eggplant 64.1 sec/eggplant, Present
Hayashi,et al (2002)
black and white CCD cameras, proximity sensor, far and near
vision sensors
melon 15 sec/fruit, Present Umeda et al (1999
Pressure sensor, 2 convergent IR sensors, telemeter, cameras
various fruits 2 sec/fruit (only grasp & detach), Absent
[Ceres et al. (1998)]
synchronized CCD cameras cucumber 45 sec/cucumber, Absent
[Van Henten, et al (2002)]
Camera, laser sensor cherry tomato 8 sec/tomato bunch, Present
[Feng et al. (2018)]
Binocular stereo vision system, laser sensor
tomato 15 sec/tomato, Present [Lili, et al., (2017)]
Stereo camera, playstation camera
tomato 23 sec/tomato, Present [Yaguchi et al (2016)]
Color CCD cameras, reflection-type photoelectric sensor
strawberry 8.6 sec/fruit, Present Defterli, (2016)
Sonar camera sensor, binocular camera
strawberry 31.3 sec/fruit, Present Defterli, (2016)
3D vision sensor with two sets of slit laser projectors & a TV
camera
asparagus 13.7 sec/asparagus, Absent
Cerescon
Laser sensor, vision
mushroom sensor 6.7 sec/mushroom, Present
[Siciliano & Khatib (2016)]
3D vision sensor with red, IR laser diodes, pressure sensor
cherry 14 sec/fruit, Absent Tanigaki et al. (2008)
High-frequency light, camera apple tree 9 sec/fruit, Present Baeten,et al (2008)
Color camera, gyroscope alfalfa, sudan 2 ha/h (alfalfa), Absent Rowley (2009)]
Some examples are dogtooth [Dogtooth], Independent harvester selection strawberry
[Sammons et al. (2005)] end effector based [Agrobot E-Series.] and harvesting robotics [Octinion.]. Harvesters are used for other plants, fruits and crops such as apples and tomatoes. For instance apple harvesters are very easy to pluck apples by recognizing apples by their color with the help of robotics vision based grippers. Fastest of such harvester has speed of 7.5sec steps per apple [Silwal,et al., (2016)] for keeping it requires 9 sec per apple [Baeten, et al (2008)] such
1st African Conference on Precision Agriculture | 8-10 December | 2020
277
machine has 90% around accuracy in dense orchids [FR Robotics] and apple [Bulanon & Kataoka et. al. (2010)]. Vegetable crops such as tomato and potato, tomato harvester is used for plucking it for a quickest speed of around 24 seconds [Yaguchi et al. (2016)], with 87% of picking price [Lili et al. (2017)]. Without moving a tomato bunch 8seconds per tomato speed also achieved by tomato harvester [Feng et al (2018)]. Commercial tomato harvesters are also good such as [Metomotion.] and Root-AI [Root-AI.]. For citrus family fruit like oranges, citrus harvester is also used with the speed of 3 seconds per orange [Energid]. For cherry orchid the speed is like 14 seconds per cherry orchards [Tanigaki, et al. (2008)]. For manually plucking fruit requires some more time [Ceres et al. (1998)]. Cucumber harvester claimed speed of around 45 seconds per it with 80% accuracy [Van Henten, et al (2002)]. For eggplant harvester it took 64 seconds per it with accuracy of 62% [Hayashi, et al (2002)]. Size and weight of object has affect over accuracy and precision of plucking them. Harvester of commercial plucking of pumpkin and cabbage [Edan, et al. (2002)] is also used and robotic system is also designed. For melon and watermelon, melon robotic harvester has around 86 % accuracy [Umeda et al (1999)], with 67% of selection rate [Pilarski, et al. (2002)]. Harvester machine, designed for Sorghum showed 2 hector acer fastest speed of harvesting it [Rowley et. al. (2009)]. Mushroom harvester shown 70% accuracy [Siciliano, & Khatib (2016)] damages were avoided and cost loss was made up with the help of these robotics applications.
In summary, Harvester robots are of two types one which is mounted on tractor used for apple [Baeten, et al. (2008)] and other type is strawberries manual harvester [Xiong et al., (2019)] and remaining type is independent one. Two types of picking structures such as suction vacuum type and other is gripping gripper type. Gripper type is with a casual joints and links used to pluck item by the force enabled mechanism of end effector with manipulator [Abundant Robotics]. Whereas suction vacuum type can able to pull and twist and then pluck the item. The gripper’s arms is one of the advance structure helpful for plucking fruit in harvesting application [Agrobot E-Series], peduncle type arms [Hayashi et al. (2014)] and fruit is plucked off with gripper or vacuum suction [Yaguchi et al. (2016), Zapotezny & Lehnert (2019), Agrobot E-Series.]. For localization of fruit is very important in machine vision using sensors such as RGB cameras, time of flight sensors, infrared sensors [Xiong et al. (2019), Agrobot E-Series.] or laser sensors [Feng, et al. (2018)] and other robots uses [Cerescon] Proximity sensors instead of cameras. Manipulators were commonly used in harvesting applications which has degree of freedom movements ranging from 2 DOF to 7 DOF.
CONCLUSIONS Sensors and cameras integrated with robotics systems like vision cameras would be very
great help for precision detection and spraying on weeds. There is huge scope for advancement of weed detects in their early stage like sprouting using soil EC sensors. There other difficulties too apart from lightning imaging constraints such as shadow etc. some of the advance mechanism to detect bugs under the plant on the crop beneath the soil requires that precisely and that is the challenge. Some of the applications, spraying time and machine effectiveness play an important role and that suggestions should be taken in positive mode to optimize existing systems. Other parameters should also be taken into like machine error parameter of performance metrics actual and real time detection and spraying capabilities. Manipulators were commonly used in harvesting applications which works in degree of freedom between 2 DOF to 7 DOF. From this paper we can say that sensors useful in agribots applications on Weed Detection, Spraying, Disease and Insect

1st African Conference on Precision Agriculture | 8-10 December | 2020
278
Detection and harvesting. Out of these four applications harvesting application has much more ahead in sensor development associated with vision-based agriculture robots. Whereas less sensors used in the rest of applications. Specifically, for weed detection application we found there is huge scope for full autonomous sensor-based weed detection and for its effective efficiency. However, weed control done by mechanical type than chemical one. Even though for insect and disease detection application has good result accuracy but the work done on limited crop is very less. Image processing should be immediately linked with processing strategies, communication way, vision structures and the extent of the photographs. A key task related to the robotic imaginative and prescient structures is to offer uniform lighting situations via synthetic illumination methods. In future we need to increase decision support system of these applications and there is need of new algorithm development in relation with sensor based robotic system.
REFERENCES
Abundant Robotics. Available online: https://www.abundantrobotics.com/ (accessed on 6 May 2020).
Agrobot E-Series. Available online: http://agrobot.com/ (accessed on 6 May 2020). Arima S, Kondo N, Monta M. 2004. Strawberry harvesting robot on table-top culture. In 2004
ASAE Annual Meeting (p. 1). American Society of Agricultural and Biological Engineers. Asterix. Available online: https://www.adigo.no/portfolio/asterix/?lang=en (accessed on 6 May
2020). Baeten J, Donné K, Boedrij S, Beckers W, Claesen E. 2008. Autonomous fruit picking machine:
A robotic apple harvester. In Field and service robotics: 531-539. Springer, Berlin, Heidelberg.
Bakker T, van Asselt K, Bontsema J, Müller J, van Straten G. 2006. An autonomous weeding robot for organic farming. In Field and Service Robotics: 579-590. Springer, Berlin, Heidelberg.
Barth R, IJsselmuiden J, Hemming J, Van Henten EJ. 2018. Data synthesis methods for semantic segmentation in agriculture: A Capsicum annuum dataset. Computers and electronics in agriculture, 144: 284-296.
Bulanon DM, Kataoka T. 2010. Fruit detection system and an end effector for robotic harvesting of Fuji apples. Agricultural Engineering International: CIGR Journal, 12(1).
Ceres R, Pons JL, Jimenez AR, Martin JM, Calderon L. 1998. Design and implementation of an aided fruit-harvesting robot (Agribot). Industrial Robot: An International Journal.
Cerescon. Available online: https://www.cerescon.com/EN/sparter Defterli SG. 2016. Review of robotic technology for strawberry production. Applied Engineering
in Agriculture 32(3): 301-318. Dogtooth. Available online: https://dogtooth.tech/ (accessed on 6 May 2020). EcoRobotix. Available online: https://www.ecorobotix.com/en/ (accessed on 6 May 2020). Feng Q, Wang, Zheng, W, Qiu Q, Jiang K. 2012. New strawberry harvesting robot for elevated-
trough culture. International Journal of Agricultural and Biological Engineering 5(2): 1-8.
Feng Q, Zou W, Fan P, Zhang C, Wang X. 2018. Design and test of robotic harvesting system for cherry tomato. International Journal of Agricultural and Biological Engineering 11(1): 96-100.
FF Robotics. Available online: https://www.ffrobotics.com/ (accessed on 6 May 2020).
1st African Conference on Precision Agriculture | 8-10 December | 2020
279
Fountas S, Mylonas N, Malounas I, Rodias E, Hellmann Santos C, Pekkeriet E. 2020. Agricultural Robotics for Field Operations. Sensors 20(9): 2672.
Fountas S, Mylonas N, Malounas I, Rodias E, Hellmann Santos C, Pekkeriet E. 2020. Agricultural Robotics for Field Operations. Sensors 20(9): 2672.
Hayashi S, Ganno K, Ishii Y, Tanaka I. 2002. Robotic harvesting system for eggplants. Japan Agricultural Research Quarterly: JARQ, 36(3): 163-168.
Hayashi S, Shigematsu K, Yamamoto S, Kobayashi K, Kohno Y, Kamata J, Kurita M. 2010. Evaluation of a strawberry-harvesting robot in a field test. Biosystems engineering 105(2): 160-171.
Hayashi S, Yamamoto S, Tsubota S, Ochiai Y, Kobayashi K, Kamata J, Peter R. 2014. Automation technologies for strawberry harvesting and packing operations in japan 1. Journal of Berry Research 4(1): 19-27.
Ibex. Available online: http://www.ibexautomation.co.uk/ (accessed on 6 May 2020). Klose R, Thiel M, Ruckelshausen A, Marquering J. 2008. Weedy–a sensor fusion based
autonomous field robot for selective weed control. In 66th International Conference Agricultural Engineering/AgEng, Stuttgart-Hohenheim, VDI-Verlag, Conference Proceedings: 167-172.
Klose R, Thiel M, Ruckelshausen A, Marquering J. 2008. Weedy–a sensor fusion based autonomous field robot for selective weed control. In 66th International Conference Agricultural Engineering/AgEng, Stuttgart-Hohenheim, VDI-Verlag, Conference Proceedings: 167-172.
Labrada R. 2006. Recommendations for improved weed management. Lee WS, Slaughter DC, Giles DK. 1999. Robotic weed control system for tomatoes. Precision
Agriculture 1(1): 95-113. Lili W, Bo Z, Jinwei F, Xiaoan H, Shu W, Yashuo L, Chongfeng W. 2017. Development of a
tomato harvesting robot used in greenhouse. International Journal of Agricultural and Biological Engineering 10(4): 140-149.
Liu B, Hu Z, Zhao Y, Bai Y, Wang Y. 2019. Recognition of Pyralidae Insects Using Intelligent Monitoring Autonomous Robot Vehicle in Natural Farm Scene. arXiv preprint arXiv: 1903.10827.
Mahmud MSA, Abidin MSZ, Mohamed Z, Abd Rahman MKI, Iida M. 2019. Multi-objective path planner for an agricultural mobile robot in a virtual greenhouse environment. Computers and Electronics in Agriculture 157: 488-499.
Mahmud MS, Zaman QU, Esau TJ, Price GW, Prithiviraj B. 2019. Development of an artificial cloud lighting condition system using machine vision for strawberry powdery mildew disease detection. Computers and Electronics in Agriculture 158: 219-225.
Metomotion. Available online: https://metomotion.com (accessed on 6 May 2020). Oberti R, Marchi M, Tirelli P, Calcante A, Iriti M, Hočevar M, Ulbrich H. 2013. Selective spraying
of grapevine’s diseases by a modular agricultural robot. Journal of agricultural engineering.
Octinion. Available online: http://octinion.com/products/agricultural-robotics/rubion (accessed on 6 May 2020.
Oerke EC. 2006. Crop losses to pests. The Journal of Agricultural Science, 144: 31. Ogawa Y, Kondo N, Monta M, Shibusawa S. 2003. Spraying robot for grape production. In Field
and Service Robotics: 539-548. Springer, Berlin, Heidelberg. OUVA. Available online: https://www.polariks.com/text?rq=ouva (accessed on 6 May 2020).
1st African Conference on Precision Agriculture | 8-10 December | 2020
280
Pilarski T, Happold M, Pangels H, Ollis M, Fitzpatrick K, Stentz A. 2002. The demeter system for automated harvesting. Autonomous Robots 13(1): 9-20.
Pilli SK, Nallathambi B, George SJ, Diwanji V. 2015. (February). eAGROBOT—A robot for early crop disease detection using image processing. In 2015 2nd International Conference on Electronics and Communication Systems (ICECS): 1684-1689. IEEE.
Qingchun F, Wengang Z, Quan Q, Kai J, Rui G. 2012. (May). Study on strawberry robotic harvesting system. In 2012 IEEE International Conference on Computer Science and Automation Engineering (CSAE) 1:320-324). IEEE.
Rey B, Aleixos N, Cubero S, Blasco J. 2019. XF-ROVIM. A field robot to detect olive trees infected by Xylella fastidiosa using proximal sensing. Remote Sensing 11(3): 221.
Roshanianfard AR, Noguchi N. 2018. Kinematics analysis and simulation of a 5DOF articulated robotic arm applied to heavy products harvesting. Journal of Agricultural Sciences 24(1): 90-104.
Rowley JH. 2009. Developing flexible automation for mushroom harvesting (Agaricus bisporus). University of Warwick.
Sammons PJ, Furukawa T, Bulgin A. 2005. (December). Autonomous pesticide spraying robot for use in a greenhouse. In Australian Conference on Robotics and Automation 1(9).
Sánchez-Hermosilla J, Rodríguez F, Guzman JL, Berenguel M, Gonzalez R. 2010. A mechatronic description of an autonomous mobile robot for agricultural tasks in greenhouses. INTECH Open Access Publisher.
Schor N, Berman S, Dombrovsky A, Elad Y, Ignat T, Becha A. 2017. Development of a robotic detection system for greenhouse pepper plant diseases. Precision agriculture 18(3): 394-409.
Shiigi T, Kurita M, Kondo N, Ninomiya K, Rajendra P, Kamata J, Kohno Y. 2008. Strawberry harvesting robot for fruits grown on table top culture. In 2008 Providence, Rhode Island, American Society of Agricultural and Biological Engineers.
Siciliano B, Khatib O. (Eds.). 2016. Springer handbook of robotics. Springer. Silwal A, Davidson J, Karkee M, Mo C, Zhang Q, Lewis K. 2016. Effort towards robotic apple
harvesting in Washington State. In 2016 ASABE Annual International Meeting American Society of Agricultural and Biological Engineers.
Singh S, Burks TF, Lee WS. 2005. Autonomous robotic vehicle development for greenhouse spraying. Transactions of the ASAE, 48(6): 2355-2361.
Slaughter DC, Giles DK, Downey D. 2008. Autonomous robotic weed control systems: A review. Computers and electronics in agriculture, 61(1): 63-78.
Søgaard HT, Lun I. (2007. Application accuracy of a machine vision-controlled robotic micro-dosing system. Biosystems Engineering 96(3): 315-322.
Tanigaki K, Fujiura T, Akase A, Imagawa J. 2008. Cherry-harvesting robot. Computers and electronics in agriculture 63(1): 65-72.
Umeda M, Kubota S, Iida M. 1999. Development of “STORK”, a watermelon-harvesting robot. Artificial Life and Robotics 3(3): 143-147.
Underwood JP, Calleija M, Taylor Z, Hung C, Nieto J, Fitch R, Sukkarieh S. 2015. (May). Real-time target detection and steerable spray for vegetable crops. In Proceedings of the International Conference on Robotics and Automation: Robotics in Agriculture Workshop, Seattle, WA, USA: 26-30.
Utstumo T, Urdal F, Brevik A, Dørum J, Netland J, Overskeid Ø, Gravdahl T. 2018. Robotic in-row weed control in vegetables. Computers and electronics in agriculture 154: 36-45.
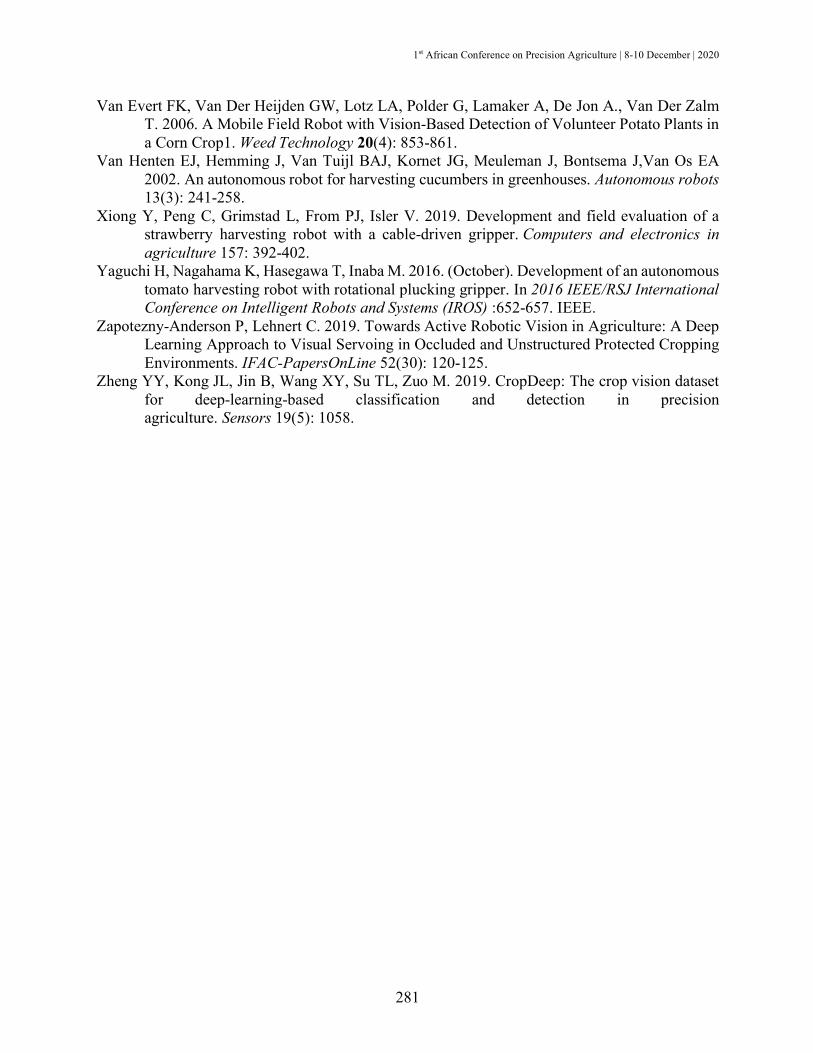
1st African Conference on Precision Agriculture | 8-10 December | 2020
281
Van Evert FK, Van Der Heijden GW, Lotz LA, Polder G, Lamaker A, De Jon A., Van Der Zalm T. 2006. A Mobile Field Robot with Vision-Based Detection of Volunteer Potato Plants in a Corn Crop1. Weed Technology 20(4): 853-861.
Van Henten EJ, Hemming J, Van Tuijl BAJ, Kornet JG, Meuleman J, Bontsema J,Van Os EA 2002. An autonomous robot for harvesting cucumbers in greenhouses. Autonomous robots 13(3): 241-258.
Xiong Y, Peng C, Grimstad L, From PJ, Isler V. 2019. Development and field evaluation of a strawberry harvesting robot with a cable-driven gripper. Computers and electronics in agriculture 157: 392-402.
Yaguchi H, Nagahama K, Hasegawa T, Inaba M. 2016. (October). Development of an autonomous tomato harvesting robot with rotational plucking gripper. In 2016 IEEE/RSJ International Conference on Intelligent Robots and Systems (IROS) :652-657. IEEE.
Zapotezny-Anderson P, Lehnert C. 2019. Towards Active Robotic Vision in Agriculture: A Deep Learning Approach to Visual Servoing in Occluded and Unstructured Protected Cropping Environments. IFAC-PapersOnLine 52(30): 120-125.
Zheng YY, Kong JL, Jin B, Wang XY, Su TL, Zuo M. 2019. CropDeep: The crop vision dataset for deep-learning-based classification and detection in precision agriculture. Sensors 19(5): 1058.

1st African Conference on Precision Agriculture | 8-10 December | 2020
282
#7641 LOCALLY ADAPTED MACHINERY SOLUTIONS FOR SUSTAINABLE INTENSIFICATION OF CROP-LIVESTOCK SYSTEMS IN TUNISIA
Udo Rudiger1*, Zied Idoudi1, Aymen Frija1, Mourad Rekik1, Monia El Ayed, Hatem Cheikh,
and Anis Zaim 1Resilient Agricultural Livelihood Systems Program (RALSP), International Center for Agricultural Research in the Dry Areas (ICARDA), Tunis, Tunisia, [email protected]
ABSTRACT
Small crop-livestock systems in Low- and Middle-Income Countries (LMIC) such as North African ones are characterized by low mechanization levels, thus undermining their productivity and sustainability. Machinery being promoted in local markets are made and imported mostly from industrial Countries where farm systems are larger in terms of size. Prices of these machines are unaffordable for small to medium sized land-holding farmers who remain incapable of upgrading and modernizing their farming operations. Through its work on crop livestock integration under conservation agriculture (CLCA) and the CRP livestock (feed and forage flagship), ICRADA and its national partners in Tunisia have been working on developing small machineries well adapted to small farming systems, and contributing to crops rotations through inclusion of forage crops, enhance the quality of animal feed, and allow to reduce the impact of livestock grazing on soil covers. These machines include “small mobile seed cleaning and treatment unit” and “small mobile feed-grinder machine”, etc. and were all locally manufactured at low cost. Adapted business models have been developed to further deploy these machines to small and medium farmers’ cooperatives and other potential machinery service delivery enterprises, thus contributing to diversify and enhance their respective incomes.
INTRODUCTION
The conventional national seed system in Tunisia is not providing enough quality forage seeds. Forage seed production like barley, faba beans, vetch or alfalfa is mainly undertaken by large seed producing cooperatives through subcontracting with individual farmers. One private seed enterprise COTUGRAIN and the national Office of Livestock & Pasture OEP are equally engaged in forage seed production.
Due to insufficient forage seed supply, but also to save costs, many small-scale, mixed farmers prefer using their own farm seed. The quality of these farm seeds is generally low as they are normally cleaned manually, so the final product still contains some unproductive seeds (broken seeds or small sized seeds). In addition, these seeds are sometimes attacked by pests and diseases as they are not treated. The results of using these poor-quality farm seeds are low forage yields and quality and low income.
To tackle this constraint the CRP livestock (feed and forage flagship) in collaboration with the IFAD funded CLCA-II Project, promoted the use of innovative locally produced seed cleaning and treatment units to develop business for lead farmers and farmer cooperatives around forage seed production. After discussing with national partners (INRAT, OEP, INGC), the business idea was found more suitable for small or medium SMSA (Mutual Association of Agricultural Services/Societé Mutuelle des Services Agricoles) as the machine would benefit more farmers.
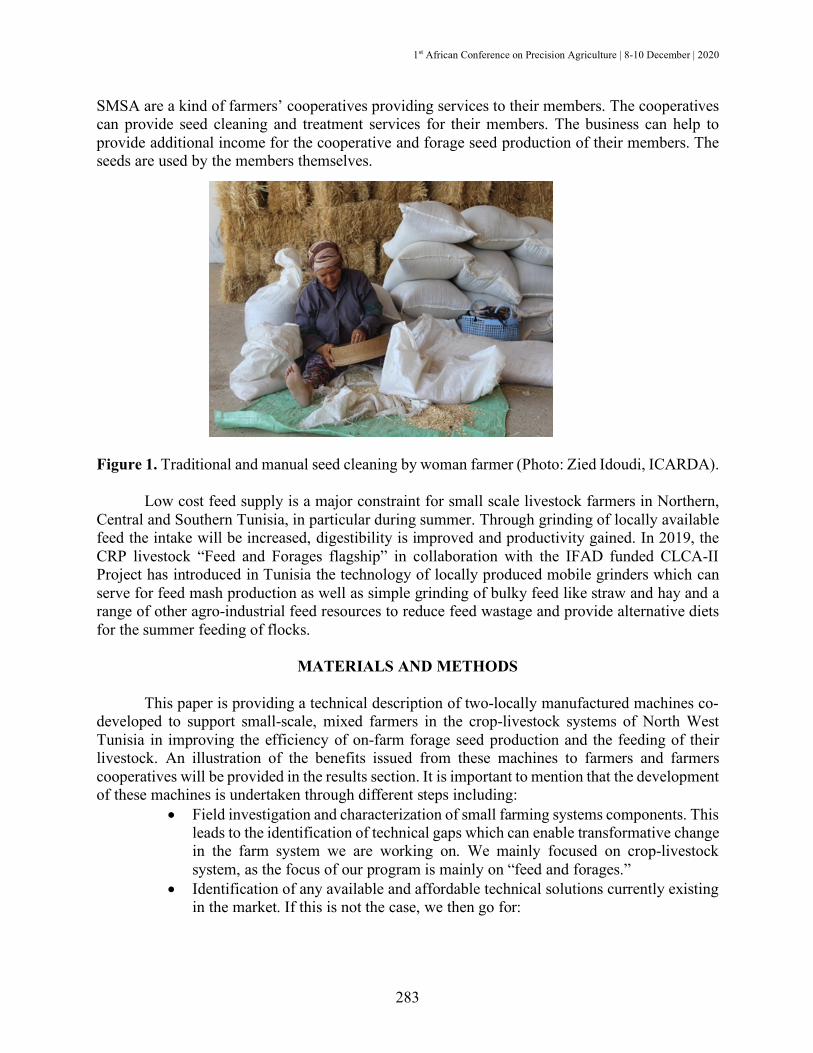
1st African Conference on Precision Agriculture | 8-10 December | 2020
283
SMSA are a kind of farmers’ cooperatives providing services to their members. The cooperatives can provide seed cleaning and treatment services for their members. The business can help to provide additional income for the cooperative and forage seed production of their members. The seeds are used by the members themselves.
Figure 1. Traditional and manual seed cleaning by woman farmer (Photo: Zied Idoudi, ICARDA).
Low cost feed supply is a major constraint for small scale livestock farmers in Northern,
Central and Southern Tunisia, in particular during summer. Through grinding of locally available feed the intake will be increased, digestibility is improved and productivity gained. In 2019, the CRP livestock “Feed and Forages flagship” in collaboration with the IFAD funded CLCA-II Project has introduced in Tunisia the technology of locally produced mobile grinders which can serve for feed mash production as well as simple grinding of bulky feed like straw and hay and a range of other agro-industrial feed resources to reduce feed wastage and provide alternative diets for the summer feeding of flocks.
MATERIALS AND METHODS
This paper is providing a technical description of two-locally manufactured machines co-
developed to support small-scale, mixed farmers in the crop-livestock systems of North West Tunisia in improving the efficiency of on-farm forage seed production and the feeding of their livestock. An illustration of the benefits issued from these machines to farmers and farmers cooperatives will be provided in the results section. It is important to mention that the development of these machines is undertaken through different steps including:
• Field investigation and characterization of small farming systems components. This leads to the identification of technical gaps which can enable transformative change in the farm system we are working on. We mainly focused on crop-livestock system, as the focus of our program is mainly on “feed and forages.”
• Identification of any available and affordable technical solutions currently existing in the market. If this is not the case, we then go for:
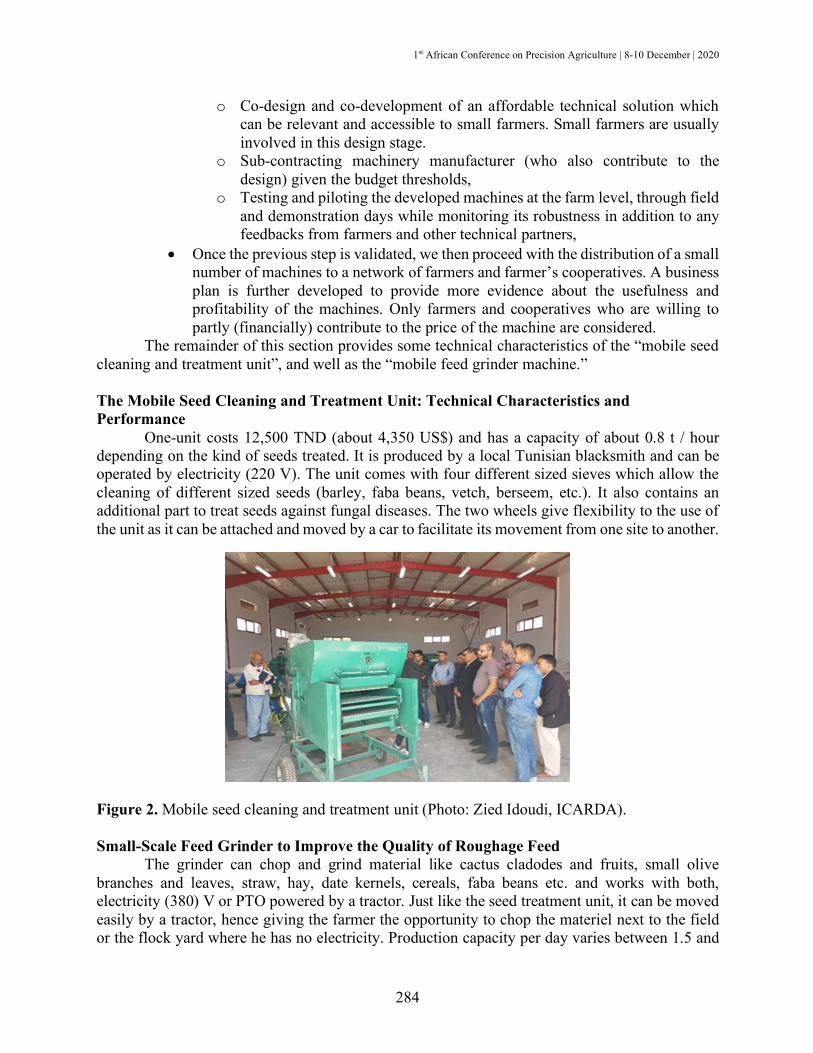
1st African Conference on Precision Agriculture | 8-10 December | 2020
284
o Co-design and co-development of an affordable technical solution which can be relevant and accessible to small farmers. Small farmers are usually involved in this design stage.
o Sub-contracting machinery manufacturer (who also contribute to the design) given the budget thresholds,
o Testing and piloting the developed machines at the farm level, through field and demonstration days while monitoring its robustness in addition to any feedbacks from farmers and other technical partners,
• Once the previous step is validated, we then proceed with the distribution of a small number of machines to a network of farmers and farmer’s cooperatives. A business plan is further developed to provide more evidence about the usefulness and profitability of the machines. Only farmers and cooperatives who are willing to partly (financially) contribute to the price of the machine are considered.
The remainder of this section provides some technical characteristics of the “mobile seed cleaning and treatment unit”, and well as the “mobile feed grinder machine.”
The Mobile Seed Cleaning and Treatment Unit: Technical Characteristics and Performance
One-unit costs 12,500 TND (about 4,350 US$) and has a capacity of about 0.8 t / hour depending on the kind of seeds treated. It is produced by a local Tunisian blacksmith and can be operated by electricity (220 V). The unit comes with four different sized sieves which allow the cleaning of different sized seeds (barley, faba beans, vetch, berseem, etc.). It also contains an additional part to treat seeds against fungal diseases. The two wheels give flexibility to the use of the unit as it can be attached and moved by a car to facilitate its movement from one site to another.
Figure 2. Mobile seed cleaning and treatment unit (Photo: Zied Idoudi, ICARDA). Small-Scale Feed Grinder to Improve the Quality of Roughage Feed
The grinder can chop and grind material like cactus cladodes and fruits, small olive branches and leaves, straw, hay, date kernels, cereals, faba beans etc. and works with both, electricity (380) V or PTO powered by a tractor. Just like the seed treatment unit, it can be moved easily by a tractor, hence giving the farmer the opportunity to chop the materiel next to the field or the flock yard where he has no electricity. Production capacity per day varies between 1.5 and
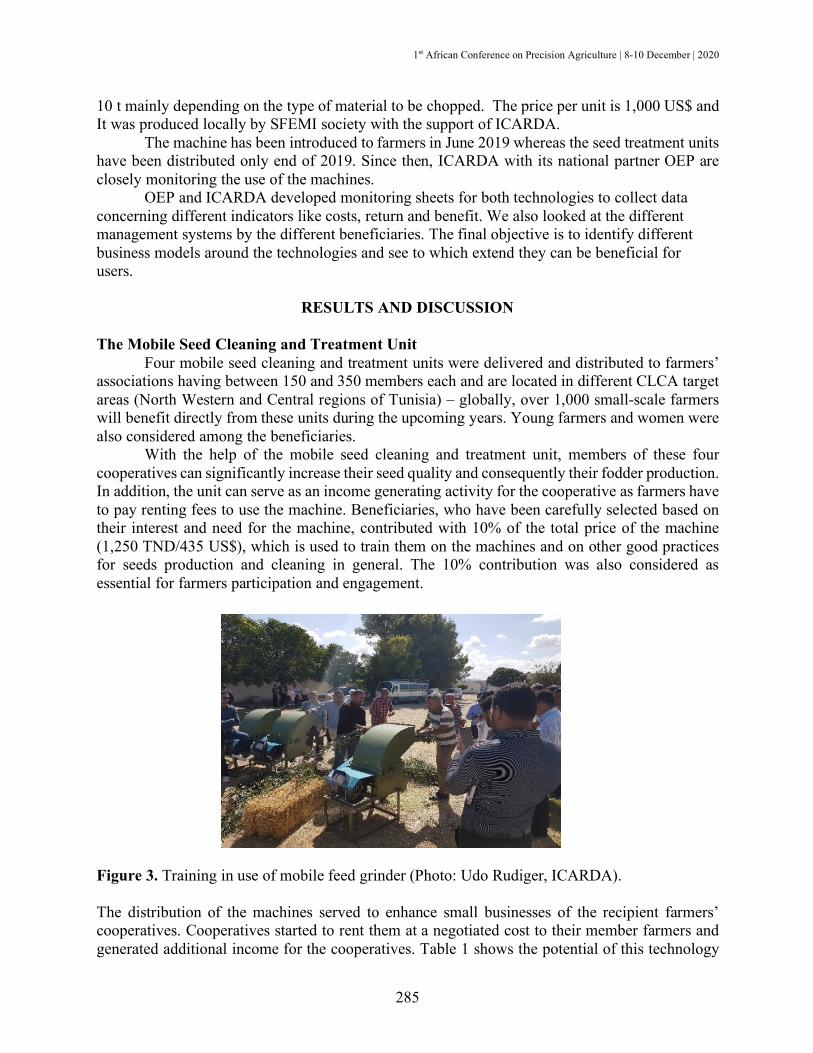
1st African Conference on Precision Agriculture | 8-10 December | 2020
285
10 t mainly depending on the type of material to be chopped. The price per unit is 1,000 US$ and It was produced locally by SFEMI society with the support of ICARDA.
The machine has been introduced to farmers in June 2019 whereas the seed treatment units have been distributed only end of 2019. Since then, ICARDA with its national partner OEP are closely monitoring the use of the machines.
OEP and ICARDA developed monitoring sheets for both technologies to collect data concerning different indicators like costs, return and benefit. We also looked at the different management systems by the different beneficiaries. The final objective is to identify different business models around the technologies and see to which extend they can be beneficial for users.
RESULTS AND DISCUSSION The Mobile Seed Cleaning and Treatment Unit
Four mobile seed cleaning and treatment units were delivered and distributed to farmers’ associations having between 150 and 350 members each and are located in different CLCA target areas (North Western and Central regions of Tunisia) – globally, over 1,000 small-scale farmers will benefit directly from these units during the upcoming years. Young farmers and women were also considered among the beneficiaries.
With the help of the mobile seed cleaning and treatment unit, members of these four cooperatives can significantly increase their seed quality and consequently their fodder production. In addition, the unit can serve as an income generating activity for the cooperative as farmers have to pay renting fees to use the machine. Beneficiaries, who have been carefully selected based on their interest and need for the machine, contributed with 10% of the total price of the machine (1,250 TND/435 US$), which is used to train them on the machines and on other good practices for seeds production and cleaning in general. The 10% contribution was also considered as essential for farmers participation and engagement.
Figure 3. Training in use of mobile feed grinder (Photo: Udo Rudiger, ICARDA). The distribution of the machines served to enhance small businesses of the recipient farmers’ cooperatives. Cooperatives started to rent them at a negotiated cost to their member farmers and generated additional income for the cooperatives. Table 1 shows the potential of this technology

1st African Conference on Precision Agriculture | 8-10 December | 2020
286
and the engagement of all four cooperatives in using the units. The treated seeds were to a large extent forage cereal like barley; legume forage seeds like vetch and faba beans were also recorded.
During this short period of use, a total of 66 tons of seeds were cleaned only and 173.6 t cleaned and treated. A total of 138 farmers benefited from the four units. The total benefit for these four cooperatives with about 2,000 TND (682 US$) is not significant as the intention of some cooperatives during this first experience was rather to attract members using this service than making a profit. This explains the different service prices varying between 10 TND and 35 TND for cleaning 1 t of seeds and 50 – 80 TND for treating seeds. Service prices will be adjusted once the demand and market are created. Table 1. Use of seed cleaning and treatment unit by four farmer cooperatives (SMSA) in November and December 2019
SMSA Qtt Seeds
Cleaned (t)
Qtt Seeds Treate
d (t)
Cleaning Price (TND/t)
Treatment Price
(TND/t)
Return
Total Benefi
t (TND)
Number of Users (Farmer
s)
Number of
Potential SMSA Users
El Amen 24.2 0 35 N/A 847 315 12 320 El Felah 4.7 42.6 10 80 3,455 -13 20 200 Ettaouen 14.6 131.1 20 70 9,469 1467 95 350 Melyen 22.5 0 20 50 450 225 11 150 Total 66 173.6 N/R N/R 14,221 1,994 138 1,020
All four cooperatives employed one person on a temporary basis to make the unit
functioning. Some cooperatives assigned the unit to be stationed at the cooperatives’ base; others allowed the farmers to take it and use it at the farmers’ site. In all cases, it was the cooperatives’ employee who was responsible for manipulating the unit. The SMSA Ettaouen which used the machine for almost 150 t of seeds is already considering the purchase of a second machine as the demand is high and the processing period limited. A hybrid system will be adopted whereby one unit will be placed permanently at the cooperatives site and the other will be allowed to move from farmer to farmer.
Mobile Feed-Grinder Machine
Besides the seed cleaning and treatment units, ICARDA donated twenty mobile grinders to 12 young entrepreneurs and eight farmers associations in Northern, Central and Southern Tunisia. The beneficiaries contributed with 10% (300 TND / 110 $) and used the machine to develop their feed and / or compost business.
More than 3,000 beneficiaries including young farmers and women are now benefiting from this equipment. Recipient farmers’ associations were carefully selected based on their interest and need for the use of the machine to develop their feed and / or compost business. These grinders can lead to reducing costs and thus increasing income. It is an ideal tool for smallholder farmers to improve their incomes which represents an opportunity for improved livelihoods in traditional small-scale farming. The use of these tools reduces the labor time spent on feed-farming operations especially for women farmers.
1st African Conference on Precision Agriculture | 8-10 December | 2020
287
Each cooperative developed its own management strategy for the use of the grinding machine. For example, the cooperative SMSA “Ettaouen” in Siliana, North-West Tunisia, with 350 members, uses three different management models:
1. If the farmer is a member without a tractor he can ask the cooperative to come and chop his feed at his farm using the cooperative’s tractor and driver. In such a case he pays 30 TND / hour (approx. 10 US$). This includes tractor rent, tractor drivers wage, and petrol.
2. If the farmer is a member with a tractor he can use the grinder with it at his farm but he has to pay 25 TND / day ( 8.3 US$) for the cooperative’s grinder technician (operating the grinder with his tractor) and 15 TND / day (5 US$) for the cooperative as renting fees for the grinder which is used for maintenance of the machine. Petrol charges are at farmer’s cost.
3. The farmer can also use the cooperatives tractor and grind his materiel at the cooperatives warehouse, bringing along his feed to chop. In such a case he pays 3 TND (1 US$) per 100 kg of feed irrespective of its nature (barley, hay, straw, etc.). The SMSA “Ettaouen” has so far provided service to 40 members of their cooperative and
employed one person on a part time basis, depending on the demand. The objective of the cooperative is rather to provide services to their members and attract new farmers to join, than making benefit with the machine. So far, the model (a) has been mostly requested.
The farmer organization SMSA “Serj-Weslet” in Ouslatia, Central-West, Tunisia has only 46 members but focuses also on service provision to non-members in order to generate revenue for the cooperative. They are operating this small side business for six months and estimate their monthly net benefice at 150 TND (50 US$).
CONCLUSIONS
The efforts undertaken by ICARDA and its national partners in identifying the demand,
co-designing, and co-developing locally adapted machinery solutions appropriate for small farming systems is proving to be highly effective and beneficial. Similar self-sustained and institutionalized innovation processes are unfortunately rare in Tunisia. Most of the technologies available to farmers are rather imported or developed without strong concertation with the different stakeholders and mainly the end users.
ACKNOWLEDGEMENTS
This work was partly supported by the CGIAR Research Program on Livestock, and the CLCA project, Phase II (Use of conservation agriculture in crop-livestock systems in the dry lands for enhanced water use efficiency, soil fertility and productivity in NENA and LAC countries) which is funded by the International Fund for Agricultural Development (IFAD).
REFERENCES
Idoudi Z. https://hdl.handle.net/20.500.11766/11102 ReliefWeb. 2020. ICARDA develops mobile seed treatment unit prototype with Tunisian partners. Sulc RM. 1998. Factors effecting forage stand establishment.

1st African Conference on Precision Agriculture | 8-10 December | 2020
288
Zhou K. 2018. Feed Processing Technology-Effects of grinding particle size on feed quality; VIV online.

1st African Conference on Precision Agriculture | 8-10 December | 2020
289
#7648 LIDAR-BASED SOYBEAN CROP SEGMENTATION FOR AUTONOMOUS NAVIGATION
V.A.H. Higuti, A.E.B. Velasquez, M.V. Gasparino, D.V. Magalhães, R.V. Aroca, D.M.B.P.
Milori, M. Becker University of São Paulo, São Paulo, Brazil
[email protected] +55 16 3373 8646
ABSTRACT
This study describes how a 2D LiDAR (Light Detection and Ranging) can be combined with ground mobile robot’s odometry to generate a 3D point cloud to represent the surroundings, e.g. a soybean crop. Additionally, it also shows how the robot interprets the point cloud to allow autonomous row following without the most common positioning source: GNSS (Global Navigation Satellite System). Experiments were carried out with a 4WSD (four-wheel steering and drive) robot in a soybean research crop to verify the behavior of the proposed system.
INTRODUCTION
The technological advances in the last few decades have greatly changed agriculture.
Modern farms have adopted sophisticated technologies, such as sensors, aerial images, and GNSS (Global Navigation Satellite System) to become safer, more profitable, efficient, and sustainable. These technologies not only increase the crop productivity, but also reduce the wide use of water, fertilizers, and pesticides. Due to this, they reduce costs and negative environmental impacts, such as the contamination of water sources. In special, the use of mobile robots has allowed more reliable monitoring and management of natural resources (NIFA, n.d.).
However, the application of robotics in agriculture is still challenging and researchers are seeking smarter autonomous vehicles that can safely operate in semi-structured or unstructured dynamic environments, where humans, animals, and agricultural machinery may be present. The most common sensor types used are cameras, LiDAR (Light Detection and Ranging), GNSS, inertial sensors, and encoders. Real Time Kinematics GNSS has allowed the autonomous operation of many machinery due to its highly accurate positional information when a clean view of satellites is possible. Nevertheless, such systems cannot handle dynamic obstacles, and their performance may degrade due to uncontrollable sources that affect the satellites signals. To guarantee safety in scenarios where GNSS may fail, cameras and/or LiDAR can be used (Reina et al., 2016).
Although vision systems are commonly used in mobile robot navigation, they suffer from high variation of lighting conditions in outdoor environments and the large amount of data from camera is still a severe compromise between robustness and available processing power in mobile robots. Other sensors (e.g. LiDAR, ultrasound, and infrared) are used to measure absolute distances. Among them, LiDAR have greatly benefited from cost reductions while maintaining a fast, high range, and millimeter-level measurement (Bechar & Vigneault, 2016). Some works, including others in our laboratory, use a 2D LiDAR parallel to ground. This assumes that rows are taller than the sensor and that horizontal reading planes provide similar information. However, soybean grows in branches and main stem may not always be visible. This confers a bushy shape that may be misleading if sensed only in a single horizontal plane. Moreover, the sensor would

1st African Conference on Precision Agriculture | 8-10 December | 2020
290
need to be positioned too close to ground to read plants at earlier stages, which is either dangerous for device safety or it requires additional structural solutions.
In this paper, we describe the deployment of a perception system based on two 2D LiDAR sensors for the navigation of an agricultural robot in soybean crops. The proposed system takes advantage of the robot’s movement, which is tracked by odometry, to create a 3D point cloud by concatenating consecutive 2D LiDAR readings. This setup can be referred as a push-broom (Baldwin and Newman, 2012) and it has the cost advantage when compared to an off-the-shelf 3D LiDAR and dismisses additional hardware to obtain more degrees of freedom to the sensor, e.g. rotation/translation around one axis to have multiple reading planes over time.
MATERIALS AND METHODS
This study follows a similar process as presented by Gasparino et al., 2020: a laser
reconstruction, data filtering, and determination of navigable space. In the first step, we change from an active method to create the multilayered point cloud (custom hardware to rotate the sensor) to a passive one (push broom). In data filtering, the Gaussian multiplication step is replaced by a threshold. Finally, the determination of navigable space changes from Under Canopy LiDAR-based Perception Subsystem (Higuti et al., 2018) to a histogram.
The locomotion system is composed of four modules linked by a passive suspension. Each one has a motor for traction and another for steering. All motors are electric, and they are controlled by ESCON 50/5 (traction) or EPOS 24/5 (steering). An industrial computer Advantech ARK-3510 running Ubuntu 16.04 with Robotic Operating System (ROS) Kinetic performs all computational tasks. Further information may be found in Higuti et al., 2017.
Two types of sensor provide the information to perform the environment recognition. First, UTM30-LX Hokuyo is a 2D LiDAR that returns 1081 distance readings over a 270º range with 40 Hz update rate. One LiDAR was placed on each frontal locomotion module, hence one to the left and another to the right, in a way that wheels and the sensor are aligned on the same longitudinal line and at a height of around 0.65 m from ground (see red circles in Fig. 1a). They point downwards such that sensors’ field of view forms an angle of 60º with ground plane. Second, MILE encoders provide the traction motors’ rotational speed and steering motors’ position.
The proposed system starts with the generation of a 3D point cloud from sensor data. A single 2D laser scan provides distance measurements only on the sensor’s reading plane (see orange features in Fig. 1b). Therefore, when the robot moves, the scans are assembled considering the robot movement, creating a local 3D crop reconstruction. In this study, the targeted forward speed is small (maximum of 0.3 m/s) and the terrain is regular, without bumps and/or weed infestation. Furthermore, Mirã 2 passive suspension keeps all wheels with contact to ground. These reasons allow us to conclude that slippage and dynamic interaction between wheels and soil have negligible interference to estimate the instantaneous robot’s position with an odometry based on robot kinematics (Jazar, 2014; Rajamani, 2006; Khristamto et al., 2015).
The odometry estimates the center of mass position, a point that represents the robot, which was determined using the method presented in Velasquez, 2015 and Jazzar, 2014. The position of center of mass is given on a cartesian reference frame (XY coordinates) whose origin is set as the position where the robot starts moving autonomously, usually the begin of the lane. Angular and linear velocities are integrated over time to estimate the current position of center of mass. The velocities are calculated using Ackermann geometry (Jazar, 2014), a set of kinematic equations that relates the wheels direction and speed into robot’s linear and angular velocities. The steering

1st African Conference on Precision Agriculture | 8-10 December | 2020
291
(a)
(b)
Figure 1. (a) Mirã 2 in the soybean crop; (b) The axes show some reference frames: base_link is placed on the robot’s center of mass; right_lidar and left_lidar represent how LiDAR sensors are placed with respect to center of mass – note that the reading plane is given by red and green axes, therefore an angled plane towards ground; and grid’s red and green axes represent the ground plane. The last LiDAR scan from the left sensor is shown by orange points, the red set is the resulting point cloud for right side, the grids are the white rectangles with gray/black elements, and the navigable space is bounded by the green/blue or purple/brown boxes.
motor encoders inform the wheel direction and those from traction motors provide the wheel speed.
After center of mass position is known, a static spatial transformation from center of mass to each LiDAR sensor allows us to know where each laser scan happened and two point clouds (one from right and another for the left LiDAR sensor) are obtained by concatenating the scans (see the red point cloud in Fig. 1b). Each point cloud keeps 100 scans before throwing the old ones and it is downsampled using a voxel, i.e. a box, of 0.02 m size in all axes. This leaves enough detail while reducing subsequent processing time. These operations use Point Cloud Library.
Subsequently, the 3D point cloud is converted to a 2D occupancy grid, a discrete representation of navigable space on the plane parallel to ground. In this study, the grids have 100 rows, 90 columns and 0.02 m resolution. Their center point (between rows 49-50 and cols 44-45 with initial index 0) projects from the reading origin of LiDAR sensors down to the ground. This effectively removes the point cloud z-dimension as each grid cell contains the number of points from the point cloud that are within the cell XY-boundaries.
After grid is obtained, a mask enhances the cells that are in the column direction as they are mostly linked to the crop rows (most populated region in the point cloud). After this operation, the grid is normalized to have values between 0 and 100, with 100 given to the most populated cell. Subsequently, two thresholds are applied to the grid and those cells under 40% are set to 0 and those above 60% are set to 100, respectively white and black cells on the grid rectangle in Fig. 1b. The gray cells are in-between values. Finally, a histogram on row axis highlights two densest rows, one to the right and another to the left of sensor. These rows reflect the boundaries of the navigable space (represented by the long-colored boxes in Fig. 1b). Going back from grid units to XY coordinates, the distance to lateral rows (𝑑p for right and 𝑑q for left) become known. For a control system designed to follow row, a cross track error can be calculated for each LiDAR as

1st African Conference on Precision Agriculture | 8-10 December | 2020
292
𝑐𝑡𝑒 = 0.5(𝑑p − 𝑑q) and such value shows the error from the desired position, i.e. middle of row. In this study, the sum of lateral distances (lane width) will be used to assess the system performance because it can be compared to a nominal value and variations along run and between runs on the same rows show how stable is the determination of navigable space.
RESULTS AND DISCUSSION
Field experiments were conducted at the National Reference Laboratory in Precision
Agriculture (Lanapre) located in São Carlos, SP. Two plots with four soybean (Intacta RR2 Pro) rows each were planted. Distance between rows is 0.45 m within plot, total length is 32 m and plant spacing is about 12 plants/m. Tests happened 55 days after seeding.
A first set of tests evaluated a system like the one shown by Gasparino et al., 2020. Due to platform difference, it already differed in the laser reconstruction, which was done as explained in the previous section. It still used a multiplication of the grid by a sum of two Gaussian functions to highlight the most probable row position. Although that had effect for their study with corn, this failed to keep a constant boost to only the densest part of the row: different regions were enhanced in consecutive scans because of multiple branches. This led to navigable space changing more than a few centimeters between consecutive estimates. Such instability prejudiced control actions as the robot constantly thought it had a different navigable space than before. Additionally, the algorithm transformed from grid to a laser scan parallel to ground. This would enable the usage of the Under Canopy LiDAR-based Perception Subsystem (Higuti et al., 2018), which was assessed for corn, sorghum and dry soybean. But that method was designed for crops with well-defined stems, even if sometimes occluded. This is not the case for early-mid soybean because of the high number of branches, and a similar behavior as from the Gaussian use happened: unstable definition of a lateral distance. With such system, the robot could barely move few meters without hitting.
After changes described in this study, the robot completed 22 of 28 runs (78% success rate). The six failures occurred due to mechanical restrictions or an oscillatory behavior caused by the control system. The following reported values reflect an average value for a run, if not specified. Left LiDAR calculations gave lane width in the range of 0.323-0.406 m and standard deviation between 0.063-0.156 m. Analogously, right LiDAR had lane width in the range 0.363-0.423 m and standard deviation of 0.041-0.157 m. As these runs occurred on the same soybean rows, these variations show that perceived navigable space is still not continuous enough, which may have led the control to believe the robot had more/less room to operate than it truly had and made oscillating commands. Indeed, with respect to each run’s average value for successful runs, left LiDAR had only 37-61% and right LiDAR had 42-62% of the instantaneous lane width within 0.05 m error (a comparable range expected from RTK GNSS). However, this increases to 75-83% (left) and 77-92% (right) for a 0.1 m error. Coupled with the 78% success rate to traverse the 32 m plot, this 0.1 m error seems reasonable to allow autonomous navigation. Hence, we concluded that the proposed perception system is a promising tool to detect the position of soybean crop rows.
ACKNOWLEDGEMENTS
Supported by Embrapa Instrumentation, University of São Paulo, Brazilian National Council
for Scientific and Technological Development (CNPq), Coordination for the Improvement of Higher Education Personnel (CAPES) and São Paulo Research Foundation (FAPESP) with grants
1st African Conference on Precision Agriculture | 8-10 December | 2020
293
#2018/10894-2 and #2013/07276-1. The opinions, hypotheses, conclusions or recommendations expressed herein do not necessarily reflect those of FAPESP.
REFERENCES
Baldwin I, Newman P. 2012. Road vehicle localization with 2D push-broom LIDAR and 3D
priors," 2012 IEEE International Conference on Robotics and Automation 2611-2617. Bechar A, Vigneault C. 2016. Agricultural robots for field operations: Concepts and components.
Biosystems Engineering 149: 94–111. Gasparino M, Higuti V, Velasquez A, Becker M. 2020. Improved localization in a corn crop row
using a rotated laser rangefinder for three-dimensional data acquisition. Journal of the Brazilian Society of Mechanical Sciences and Engineering 45: 592.
Higuti V, Velasquez A, Gasparino M, Oliveira G, Carrasco C, Risardi J, Magalhães D, Becker M, Milori D. 2017. Robotic Platform with Passive Suspension to Be Applied on Soybean Crops: Initial Results. Proceedings of the 24th ABCM International Congress of Mechanical Engineering.
Higuti V, Velasquez A, Magalhaes D, Becker M, Chowdhary G. 2019. Under canopy light detection and ranging-based autonomous navigation. Field Robotics J. 36: 547–567.
Jazzar R, 2014. Vehicle Dynamics – Theory and Application. Springer. 2nd edition. 579-580. Khristamto M, Praptijanto A, Kaleg S, 2015. Measuring geometric and kinematic properties to
design steering axis to angle turn of the electric golf car. Energy Procedia 68: 463–470. National Institute of Food and Agriculture (NIFA), n.d. Agriculture Technology. Available on
https://nifa.usda.gov/topic/agriculture-technology Rajamani R. 2006. Vehicle dynamics and control. Springer. Reina G, Milella A, Rouveure R, Nielsen M, Worst R, Blas MR. 2016. Ambient awareness for
agricultural robotic vehicles. Biosystems Engineering 146: 114-132. Velasquez A. 2015. ℏELVIS III – Desenvolvimento e caracterização da plataforma robótica.
Master dissertation, University of São Paulo.

1st African Conference on Precision Agriculture | 8-10 December | 2020
294
SATELLITE IMAGERY
1st African Conference on Precision Agriculture | 8-10 December | 2020
295
#7629 MONITORING CORN (ZEA MAYS) YIELD USING SENTINEL-2 SATELLITE IMAGES FOR PRECISION AGRICULTURE APPLICATIONS
A. Kayad1,2, M. Sozzi1, S. Gatto3, L. Sartori1, F. Pirotti1 and F. Marinello1
1Department TESAF, University of Padova, Italy 2Agricultural Engineering Research Institute, Agricultural Researh Center, Giza, Egypt
3 Porto Felloni srl, Lagosanto (FE), Italy [email protected] 0039 3475828230
ABSTRACT
Currently, there is a growing demand to apply precision agriculture (PA) management practices at agricultural fields expecting more efficient and more profitable management. One of PA principal components for site-specific management is crop yield monitoring which varies temporally between seasons and spatially within-field. In this study, we investigated the possibility of monitoring within-field variability of corn grain yield through satellite images in a 22-ha field located in Ferarra, North Italy. Archived yield data for 2016, 2017 and 2018 seasons were correlated with different vegetation indices derived from Sentinel-2 satellite images at different crop growth stages. Yield data were filtered to remove field boundaries and other outliers to maintain yield map accuracy. A total of 34 cloud-free satellite images (6 images for 2016, 14 for 2017 and 14 for 2018 season) were analysed and vegetation indices such as Green Normalized Difference Vegetation Index (GNDVI) were calculated. Vegetation indices of each season were compared with the actual corn yield map for the same season and model accuracy metrics were calculated for each index and image date. Results of this work are as follows: Firstly, GNDVI was the most accurate vegetation index to monitor within-field variability of corn yield with an R2 value of 0.48 and showed the same trend for all studied seasons. Secondly, crop age of 120 days after sowing (R4-R6) showed the best results for corn yield prediction which is during summer in Italy (July to August) with less cloud probability. This study provides a tool for monitoring within-field variability that could be applied for archived satellite images to provide farmers with their historical yield spatial variability.
INTRODUCTION
Yield monitoring for within-field variability is a fundamental component for precision
agriculture (PA) system. Crop yield varies spatially within the same field and temporally between seasons due to several reasons such as soil physiochemical variability, management practices and environmental impact. Crop yield maps are used for the delineation of management zones and support farmers for their management decisions.
Traditional yield measurement practices are laborious, destructive and time consuming. Moreover, it is not suitable for in season measurements especially from large fields. Currently, remote sensing from satellite images provides continues observations with high spatial resolutions and temporal frequency. For instance, Sentinel-2 satellite images from the European Space Agency provides images every 5 days with a spatial resolution of 10m with 12 different spectral bands. Satellite images are used to derive vegetation indices, which could describe crop vigor and subsequently predict crop yield through empirical models. Corn yield prediction through

1st African Conference on Precision Agriculture | 8-10 December | 2020
296
vegetation indices such as normalized deference vegetation index (NDVI), enhanced vegetation index (EVI) and green NDVI (GNDVI) was investigated in several studies while most of them were at the country and county scale or used just limited field observations. Furthermore, the current availability of yield monitors mounted on combine harvesters provides an accurate and detailed yield data from agricultural fields. Yield monitors could provide thousands of yield observations from each field according to the field size, harvester width and the yield monitoring sensor specifications. Both Sentinel-2 and yield monitors provided huge amount of data from previous seasons, which could be fused using machine-learning techniques to provide more robust yield prediction models. Therefore, the main objective for this study was to predict corn yield variability within field scale using Sentinel-2 images through vegetation indices.
MATERIALS AND METHODS
This study conducted in a 22-ha field located in North Italy and cultivated by corn in 2016,
2017 and 2018 growing seasons. The sowing date was by the beginning of April and harvesting after 160 days in average. Archived yield data was collected at harvesting time from the three studied seasons using a calibrated grain yield monitor mounted on a combine harvester. The harvester working width was 6m and the yield monitor could record yield observations every one second, which is equivalent to 1.5m long in average. A total of 20,000 ground yield data were collected from the study field every season. This data was filtered by removing outliers over ±3 standard deviation from each season. Then yield data was interpolated to 10m pixels to match with Sentinel-2 spatial resolution.
Sentinel-2 satellite images level 2A were acquired from the Copernicus Open Access Hub. A total of 34 cloud free images covering the study period where 6, 14 and 14 images acquired from the 2016, 2017 and 2018 seasons, respectively. All sentinel-2 images bands were resampled to 10m and several vegetation indices were calculated such as NDVI and GNDVI. Vegetation indices were correlated with corresponding yield at different crop growing stages corresponding to each image date. Equations 1 and 2 describes the calculation of NDVI and GNDVI from Sentinel-2 images as an example.
Equation 1. NDVI = (B8-B4)/(B8+B4) Equation 2. GNDVI = (B8-B3)/(B8+B3)
Where B8 is the NIR band, B4 is the red band and B3 is the green band of Sentinel-2 satellite images.
RESULTS AND DISCUSSION
Results showed that GNDVI was the most accurate vegetation index to predict corn grain
yield with an R2 value of 0.48 while the most suitable period to predict corn grain yield was between R4-R6 growing stages. In general, all studied vegetation indices showed the same trend across studied seasons where the R2 values were < 0.3 until crop age of 90 days after sowing (DAS) and increased to reach the beak around 120 DAS then decreased significantly before harvesting time. This trend repeated for the three studied seasons and this result in agreement with previous studies (Peralta et al., 2016 and Schwalbert et al., 2018). Figure 1 shows an example from the 2018 season ground yield data and the best correlated GNDVI map from Sentinel-2 acquired on 7
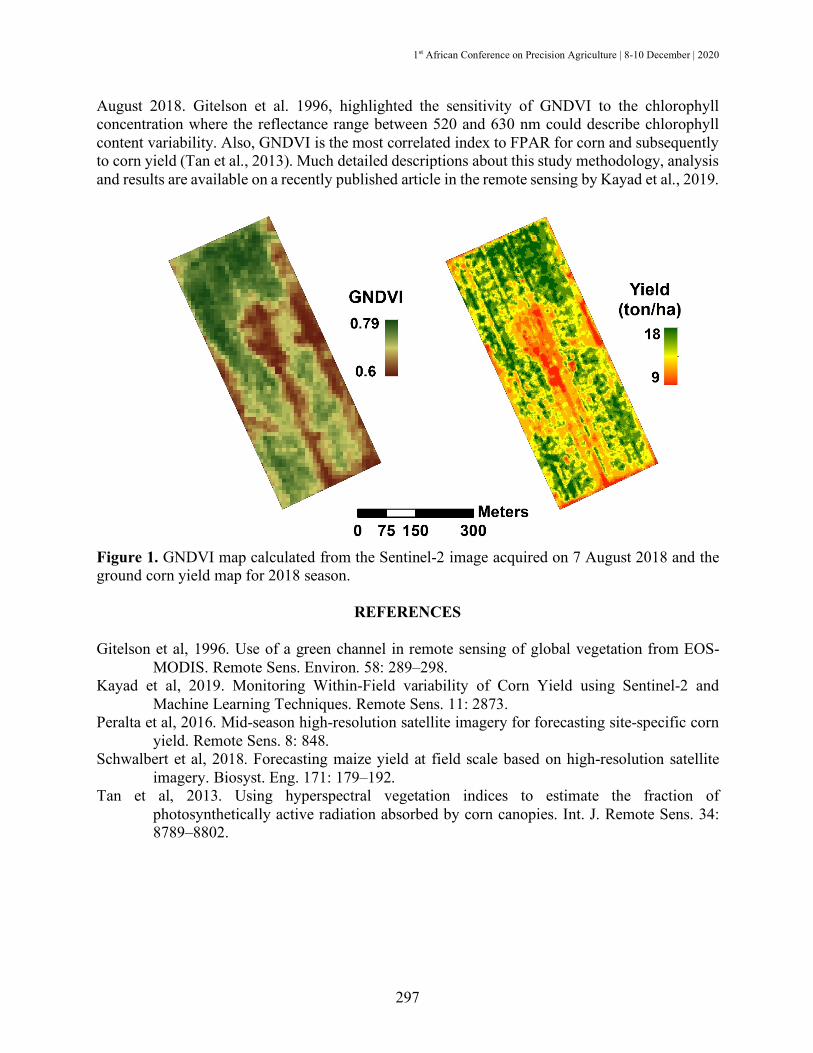
1st African Conference on Precision Agriculture | 8-10 December | 2020
297
August 2018. Gitelson et al. 1996, highlighted the sensitivity of GNDVI to the chlorophyll concentration where the reflectance range between 520 and 630 nm could describe chlorophyll content variability. Also, GNDVI is the most correlated index to FPAR for corn and subsequently to corn yield (Tan et al., 2013). Much detailed descriptions about this study methodology, analysis and results are available on a recently published article in the remote sensing by Kayad et al., 2019.
Figure 1. GNDVI map calculated from the Sentinel-2 image acquired on 7 August 2018 and the ground corn yield map for 2018 season.
REFERENCES
Gitelson et al, 1996. Use of a green channel in remote sensing of global vegetation from EOS-
MODIS. Remote Sens. Environ. 58: 289–298. Kayad et al, 2019. Monitoring Within-Field variability of Corn Yield using Sentinel-2 and
Machine Learning Techniques. Remote Sens. 11: 2873. Peralta et al, 2016. Mid-season high-resolution satellite imagery for forecasting site-specific corn
yield. Remote Sens. 8: 848. Schwalbert et al, 2018. Forecasting maize yield at field scale based on high-resolution satellite
imagery. Biosyst. Eng. 171: 179–192. Tan et al, 2013. Using hyperspectral vegetation indices to estimate the fraction of
photosynthetically active radiation absorbed by corn canopies. Int. J. Remote Sens. 34: 8789–8802.

1st African Conference on Precision Agriculture | 8-10 December | 2020
298
#7681 PREDICTING IN-SEASON SORGHUM YIELD POTENTIAL USING REMOTE
SENSING APPROACH: A CASE STUDY OF KANO IN SUDAN SAVANNAH AGRO- ECOLOGICAL ZONE, NIGERIA
*A. Tukur1, 2, H. A. Ajeigbe1, F. M. Akinseye1, 3, I. B. Mohammed2, M.M. Badamasi4, 5
1International Crops Research Institute for the Semi-Arid Tropics (ICRISAT), Kano, Nigeria 2Department of Agronomy, Bayero University Kano, Nigeria; 3Department of Meteorology and Climate Science, Federal University of Technology, PMB 704, Akure, Ondo State; 4 Centre for
Dryland Agriculture, Bayero University Kano, Nigeria; 5Department of Environmental Management, Bayero University Kano, PMB 3011 Kano, Nigeria; [email protected]
ABSTRACT
Estimating crop yield prior to harvest using remote sensing techniques has proven to be successful. However, accuracy of estimation still varies across crops and landscapes. This study was conducted to examine the applicability of Sentinel-2B for estimating sorghum yield during the 2018 rainy season in three locations (Bebeji, Dawakin Kudu and Rano) within the Sudan Savannah agro-ecological zone of Nigeria. SAMSORG 45 (an early maturing improved sorghum variety) was established in five (5) randomly selected farmer plots in each of the three LGAs. The relationship among different vegetation indices, Normalized Difference Vegetation Index (NDVI), Green Normalized Difference Vegetation Index (GNDVI), Ratio Vegetation Index (RVI) and grain yield were determined using linear regression analysis. Models at different growth stages were then compared using root mean square error (RMSE), coefficient of variations (CV) and coefficient of determination (R2) respectively. The results from the statistical analysis showed that NDVI was superior to GNDVI and RVI for grain yield estimation, indicating low RMSE, high R2
and low CV values at early vegetative (40 days after sowing, DAS), reproductive stage, and entire crop-life cycle. The estimate at 40DAS, reproductive stage, and entire crop-life cycle showed RMSE of 0.04, 0.03, 0.02, R2 (0.75, 0.77 0.93), CV (13.7%, 27.3%, 39.2%) respectively. In addition, RVI had the best fit for stalk yield estimates, having RMSE (0.06, 0.04, 0.01), R2 (0.5, 0.83, 0.98) and CV (15.7%, 19.9% 38.5%) at 70DAS, reproductive stage, and entire crop-life cycle respectively. This study therefore concludes that sorghum yield could be accurately predicted in-season with NDVI and RVI for grain and stalk yields using Sentinel-2B. Keywords: Sorghum, Normalized Difference Vegetation Index (NDVI), green Normalized Difference Vegetation Index (GNDVI), Ratio Vegetation Index (RVI), in-season yield estimate, Sudan Savanna
INTRODUCTION
Sorghum [Sorghum bicolor (L.) Moench] is the most important cereal in the Guinea (800–
1100 mm rainfall) to Sudan savanna (600–800 mm) zones of West Africa (Akinseye et al. 2020) and in the drier Sahel (300-600mm) environments. Its productivity has an important influence on food security, contributing directly to household food availability and as well as influencing incomes due to its industrial demand (Ajeigbe et al. 2017). The recent advances in sensors

1st African Conference on Precision Agriculture | 8-10 December | 2020
299
technology and availability of free high-resolution (spatial and temporal) multispectral satellite images afford an opportunity to predict crop yields as well as mapping the spatial distribution in near real-time (Chivasa et al. 2017). In particular, crop yield estimation may play a fundamental role in supporting policy formulation and decision-making in agriculture (e.g. management of food shortage) especially in the Savanna region of West Africa that is characterized by high climate variability and food price volatility. Among the possible approaches that may be adopted for yield estimation at large spatial scales include the integration of crop simulation model (Akinseye et al. 2020) and satellite data that seems to be one of the most appropriate quantitative analysis methodologies (Moriondo et al. 2007). Yield estimation plays an important role in stabilizing prices and can have a direct influence in marketing and logistical issues and determination of pricing policies of food (Lobell et al. 2003).
In Nigeria, crop surveys, seed purchase records, land area under cultivation, field visits from extension officers, visual assessment of the crop, etc., are mostly used in estimating yield. These methods are either costly, time consuming, not accurately representing the overall production picture or prone to large errors due to incomplete ground observations, leading to poor crop yield estimation and often not available in good time for early warning purposes. As such, there is the need to develop faster models for early crop yield estimation that can contribute to minimizing yield gap (Printer et al. 2003). Satellite data has a wide range of applications in the field of agriculture, which include yield estimation (Claverie et al. 2012). In this study, we examine the suitability and applicability of Sentinel-2B for estimating sorghum yield using vegetation indices such as Normalized Difference Vegetation Index (NDVI), Green Normalized Difference Vegetation Index (GNDVI) and Ratio Vegetation Index (RVI).
MATERIALS AND METHODS
The study was carried out during the 2018 cropping season in three selected sites within the
Sudan Savanna ecological zone of Nigeria: Bebeji (11.537°N 8.31°E), Dawakin Kudu (11.797°N 8.706°E) and Rano (11.485°N 8.514°E) Local Government Areas of Kano State.. The long-term daily rainfall (1981–2016) for all sites was obtained to establish comparison with the cropping year (2018). The record showed that 2018 total rainfall from May- October (852mm at Bebeji, 757 mm at Dawakin-kudu and 748 mm at Bunkure) was higher in Bebeji and a little below for Dawakin- kudu and Bunkure compared to seasonal (1980 -2015) average of 784 mm for Kano as the reference site. The analysis of monthly rainfall of both stations indicate a distinct mono-modal pattern with the peak amount in August and varied between May and October. Over 50% of the total rainfall was received in the month of July and August, while both minimum and maximum temperatures decrease uniformly throughout the growing season. Furthermore, the Sentinel-2B, level-1C time series images for the year 2018 were sourced and downloaded from Copernicus Open Access Hub (COAH) using the link (https://scihub.copernicus.eu/dhus/#/home). The images used were captured between 25 May and 11 November, 2018 at 10-day interval. The variety of Sorghum used was SAMSORG 45, which is an improved early maturing variety that reaches 50% flowering in 67 days after sowing (DAS) and has a yield potential of 2.4 to 2.8 tons ha-1. Sen2Cor version 2.4 processor was used to generate Level 2A (Bottom-of-atmosphere), while Sentinel application platform SNAP version 5.0 was used to obtain NDVI, GNDVI and RVI values derived for the sorghum plants. The vegetation indices tested were calculated using the formulae presented in Table 1.

1st African Conference on Precision Agriculture | 8-10 December | 2020
300
Table 1. Vegetation Indices (VIs), their mathematical formulae, the scale of development and parameters estimated (Cammarano et al. 2011).
Index Formula Scale Parameter NDVI (Normalized Difference Vegetation Index)
(NIR-Red)/(NIR+Red) Canopy Biomass; Vegetation Fraction
GNDVI (Green Normalized Difference Vegetation Index)
(NIR-Green)/(NIR+Green) Canopy Chlorophyll; Vegetation Fraction
RVI (Ratio Vegetation Index) NIR/Red Leaf Biomass
In-season estimated yield (INSEY) was determined using the equation described by Teal et al. (2006):
INSEY= VI / CGDD
where VI is the vegetation index and CGDD is the cumulative growing degree days from the beginning of the season to the day of sensing. Growing degree days (GDD) were calculated using the equation:
GDD = (Tmax + Tmin) / 2) - Tb
where Tmax - maximum daily temperature, Tmin - minimum daily temperature and Tb -base temperature.
In addition, regression analysis was used in determining the relationship between VIs as independent variables and final grain yield as a dependent variable. Finally, coefficient of determination (R2), adjusted R2, root mean square error (RMSE) and the variability of the vegetation index measurements expressed as coefficient of variation (CV) in percentage (%) were used as the criteria in selecting the best fit model.
RESULTS AND DISCUSSION
Table 2 shows the multiple regression analysis for the entire crop cycle using INSEY values generated for both grain and stalk yield. The estimates of VIs (NDVI, GNDVI and RVI) for grain and stalk yield varied due to the parameters the VIs measures on the crop. Among the three VIs for grain yield, NDVI indicates the lowest RMSE of 0.019, highest R2 value of 0.93 and strong R value of 0.96, and CV estimate was 39.2% respectively. Meanwhile for stalk yield, the INSEY estimated revealed that RVI had the lowest RMSE (0.011), highest R2 value of 0.98 and CV value of 38.5%. The analysis for the entire crop cycle showed that NDVI had the best model fit for grain yield with 93% coefficient of determination, while RVI was found to have the best model fit for stalk yield, estimated 98% accuracy.

1st African Conference on Precision Agriculture | 8-10 December | 2020
301
Table 2. Multiple regression models for estimating sorghum grain and stalk yields for the entire crop’s life cycle.
Yield VI CV RMSE R2 Multiple R
Grain Yield NDVI 39.23 0.019 0.93 0.96
GNDVI 51.59 0.024 0.89 0.94 RVI 38.49 0.026 0.87 0.93
Stalk Yield NDVI 39.23 0.025 0.92 0.96
GNDVI 51.59 0.034 0.84 0.92 RVI 38.49 0.011 0.98 0.99
VI= Vegetation Index, CV= coefficient of variation (%), RMSE= Root Mean Square Error and R2= Coefficient of determination The results agreed with similar findings reported by Morel et al. (2014) that found NDVI has most appropriate estimative measure to crop productivity during entire growing season for wheat crop.
However, Table 3 reveals the estimates of sorghum grain yield at different stages, and the results showed vegetative stage as most suitable model fit for grain yield estimates compared to reproductive and grain filling and physiological maturity stages. NDVI had the lowest RMSE and CV value of 0.03 and 27.3%, highest R2 of 0.77 and multiple R value of 0.88 respectively. The vegetative stage suggests as the critical growing point differentiation (GPD) of any crop indicating as best fit with 77% yield prediction accuracy. At this stage, the plant is entering into a phase of rapid nutrients and water uptake, and has little tolerance to stress. This can significantly affect the grain yield. This result agreed with findings by Shambel et al. (2017) who reported that grain yield prediction in sorghum using spectral measurements should be carried out at a stage of critical nutrient demand.
Table 3. Multiple regression models for estimating sorghum grain yield at different stages of the crop’s development.
STAGE VI CV RMSE R2 Multiple R
Vegetative NDVI 27.26 0.03 0.77 0.88
GNDVI 33.36 0.04 0.76 0.87 RVI 27.66 0.04 0.63 0.80
Reproductive NDVI 16.89 0.04 0.74 0.86
GNDVI 23.57 0.05 0.50 0.70 RVI 19.91 0.04 0.74 0.86
Grain Filling and Physiological
Maturity
NDVI 23.36 0.06 0.40 0.63 GNDVI 24.12 0.06 0.35 0.59
RVI 33.30 0.06 0.26 0.51 VI= Vegetation Index, CV= coefficient of variation (%), RMSE= Root Mean Square Error and R2= Coefficient of determination
CONCLUSIONS
This study concludes that sorghum yield could be accurately predicted in-season with NDVI and RVI for grain and stalk yields using Sentinel-2B.

1st African Conference on Precision Agriculture | 8-10 December | 2020
302
REFERENCES
Ajeigbe HA, Akinseye FM, Angarawai II, Umma SA, Inuwa AH, Adinoyi A, Abdulazeez T. 2017.
Enhancing Farmer’s Access to Technology and Market for Increased Sorghum Productivity in the Selected Staple Crop Processing Zones. Proceedings of the 51st Annual Conference of the Agricultural Society of Nigeria, Abuja, Nigeria. 1068-1072.
Akinseye FM, Ajeigbe HA, Kamara AY, Adefisan EA, Whitbread AM. 2020. Understanding the response of sorghum cultivars to nitrogen applications in the semi-arid Nigeria using the agricultural production systems simulator. Journal of Plant Nutrition 43(6): 834-850
Cammaran D, Fitzgerald G, Basso B, O’Leary G, Chen D, Grace P, et al. 2011. Use of the canopy chlorophyll content index (CCCI) for remote estimation of wheat nitrogen content in rainfed environments. Agronomy Journal 103: 1597–1603.
Chivasa W, Onisimo M, Chandrashekhar B. 2017. Application of remote sensing in estimating maize grain yield in heterogeneous African agricultural landscapes: a review, International Journal of Remote Sensing 38(23): 6816-6845.
Claverie M, Demarez V, Duchemin B, Hagolle O, Ducrot D, Marais-Sicre C, Dedieu G. 2012. Maize and Sunflower Biomass Estimation in Southwest France using High Spatial and Temporal Resolution Remote Sensing Data. Remote Sensing of Environment 124: 844–857.
Lobell DB, Asner GP, Ortiz Monasterio JI, Benning TL. 2003. Remote Sensing of Regional Crop Production in the Yaqui Valley, Mexico: Estimates and Uncertainties. Agricultural Ecosystem and Environment 94: 205–220.
Morel J, Todorof P, Bégué A, Bury A, Martiné JF, Petit M. 2014. Toward a Satellite-based System of Sugarcane Yield Estimation and Forecasting in Smallholder Farming Conditions: A Case Study on Reunion Island. Remote Sensing 6: 6620-6635.
Moriondo M, Maselli F, Bindi M. 2007. A simple model of regional wheat yield based on NDVI data. Europ. J. Agronomy 26: 266–274.
Printer PJ Jr, Ritchie JC, Hatfield JL, Hart GF. 2003. The Agricultural Research Service’s Remote Sensing Program: An Example of Interagency Collaboration, Photogramm. Engineering Remote Sensing 69 (6): 615-618.
Rouse JW, Haas JAS, Deering DW. 1974. Monitoring vegetation systems in the Great Plains with ERTS. Third ERTS-1 Symbosium. Washington, DC: 301-317.
Shambel MM, Kefyalew G, Roger KT, Kyle W, Hailin Z, Daryl BA, Starr LH, Brenda ST, Olga W, Byungkyun C, William RR. 2017. In-season Estimation of Grain Sorghum Yield Potential using a Hand-held Optical Sensor. Archives of Agronomy and Soil Science 53 (6): 617 – 628.
Teal RK, Tubana BS, Girma K, Freeman KW, Arnall DB, Walsh O, Raun WR. 2006. In-season Prediction of Corn Grain Yield Potential using Normalized Difference Vegetation Index. Agronomy Journal 98: 1488–1494.

1st African Conference on Precision Agriculture | 8-10 December | 2020
303
SOFTWARE AND MOBILE APPLICATIONS

1st African Conference on Precision Agriculture | 8-10 December | 2020
304
#7368 SOCIO-DEMOGRAPHIC FACTORS CONTRIBUTING TO ADOPTION OF E-COMMERCE BY AGRIBUSINESS SMES IN THE UPPER EAST REGION OF
GHANA
S. Omega and S. Akaba University of Cape Coast, Cape Coast, Ghana [email protected]; Phone: +233505401918
ABSTRACT
The study’s objective focused on examining some socio-demographic indicators influencing Agribusiness small and medium scale enterprises electronic commerce adoption and the preferred Agribusiness small and medium scale enterprises electronic commerce applications in the Upper East region of Ghana. A cross-sectional survey design was adopted for the study to determine the status of the variables and their interplay. The research used a purposive sampling technique for the study. Out of the 120 questionnaires administered for the study, only 100 (83.3%) respondents filled it. Data were analysed using both descriptive and inferential statistics. Results of the objectives showed that educational level, the scale of the enterprise, age, years in business and type of Agribusiness small and medium scale enterprise were significant to influencing the adoption decision of Agribusiness small and medium scale enterprises in the study area. The results also revealed that Agribusiness small and medium scale enterprises in the Upper East region use electronic commerce applications mostly for customer relation management and inter-organisation system.
INTRODUCTION
For businesses, E-commerce has become a playground as it offers a tremendous
opportunity for growth and development of businesses (Ya-ping, 2012). Description of E-commerce includes the process of purchasing and selling goods over the Internet (Chong, 2008). Rainer and Cegielski (2011) defined it as “the process of buying, selling, transferring or exchanging of products, services and information via computer network including the internet”. E-commerce is redefining the relationship between suppliers and customers as market-sensitive commodities are being released to need-based customers at the right time and ensuring efficient allocation of the resource by suppliers. Javalgi and Ramsey (2001) hold that E-commerce has caused a paradigm shift in the concept of market competition by making smaller businesses compete with more prominent and large market holders for market shares for quality and accessibility. Early researchers classified E-commerce into business and consumer interaction flow, while current researchers have acknowledged the increasing role of government as a market player.
On the other hand, Agribusiness SMEs around the globe have served as a reliable option for international economies development. In Ghana, the commonly used criterion for defining Agribusiness SME is the employees’ number in the enterprise, which follows the Ghana statistical service (Ghana Statistical Service, 2007) framework of small-scale enterprises being enterprise with less than ten (10) employees with above ten (10) employees as a medium and large-sized enterprise. Bank Negara Malaysia (2005) reported that for SMEs to stay relevant continuously,

1st African Conference on Precision Agriculture | 8-10 December | 2020
305
they have to enhance their capacity and efficiency to produce a high-quality product at a competitive price, bearing in mind the role of E-commerce. Although Ghana is still trying to meet up with the swift progression of E-commerce, so far there has been little progress made. However, this paper was limited solely to the socio-demographic characteristics which influence the E-commerce adoption of Agribusiness SMEs and usage of E-commerce applications Upper East region of Ghana. This study is essential as it aims to analysis various ways Agribusiness SMEs can stand out in the Agribusiness industry through E-commerce usage.
MATERIALS AND METHODS
The study adopted a cross-sectional survey design. The survey design was to help
generalise the study to a larger population from a sample to make room for inferences about the population characteristics of the study. The population for the study was made of Agribusiness SME owners in the Upper East Region of Ghana. Using Slovin’s formula (1960), the sample size for the study was 120 respondents. However, only 100 (83.33% response rate) respondents participated in the study. A purposive sampling technique was employed to select the various Agribusiness SMEs in the study area. The qualification for being part of this study was as follows: (a) the respondent must own a business that qualified to be an Agribusiness SME. (b) The location of the Agribusiness SME must be in the Upper East Region of Ghana. Primary data was collected through the use of questionnaires. Face validity and content validity of the research instrument was ensured through a pilot study before the data collection to help correct ambiguous questions, and an expert in the field also checked it. The data collected was analysed using SPSS version 21.0.
RESULTS AND DISCUSSION Adoption of E-commerce Among Agribusiness SMEs
Table 1 reveals that as the age of respondents increases, their chance of adopting E-commerce for their operation falls by -3.656, and this was revealed to be significant (.058) to influencing adoption of E-commerce. The analysed result showed that age plays a significant role in the adoption of E-commerce by Agribusiness SMEs. The finding disagrees with Wu and Wang (2005) who reported that age is not a decisive factor (not significant) in the starting and the adoption of technologies. Instead attributed the decision to adopt E-commerce to enough training and preparation. The educational level of the respondents was significant (.017) to influencing adoption of E-commerce with the likelihood of the respondent adopting E-commerce falling by -2.793 as educational level increases. Educational level showed a significant relationship indicating that the level of educational attainment by an individual plays a vital role to influence adoption. It implies that Agribusiness owners with less or no formal education are less attracted to E-commerce. The findings agree with Quaye (2011) and Wadhwa et al. (2009) that ‘the business owners with higher educational level are more likely to take the risk of adopting new technologies, hence greater chances of succeeding’. As the years in business increases, the chance of Agribusiness SME owner adopting E-commerce increases by 5.056 and this was significant. Years in business and the source of funding for the business also showed a statistically significant relationship with E-commerce adoption. Thus, the age of business does determine if an Agribusiness SME is going to adopt an E-commerce application or not. Interestingly, most of the businesses in the study area were less than 4 years implying that SME development and operation were on the rise in the study area. The finding of this research was consistent with Autio (2005)

1st African Conference on Precision Agriculture | 8-10 December | 2020
306
that ‘the longer a business stays in operation, it gives the business an advantage to the acquisition of research over time, and hence the tendency to adopt new technologies like E-commerce application’. Again, it was revealed from Table 1 that the type of Agribusiness SME tends to increase the likelihood of the business adopting E-commerce by 3.120, and this was significance (.054) to influencing adoption of E-commerce. Lastly, the scale of the enterprise decreases the chance of Agribusiness SME adopting E-commerce by -4.885. It was a significant influence on the adoption of E-commerce. The scale of the enterprise was revealed to be statistically significant showing that the smaller the size of an Agribusiness SME, the higher the tendency to the adoption of an E-commerce, this agrees with Stokes and Wilson (2010) that small Agribusiness SMEs are regarded as being innovative and willing to try new approaches to production. Agribusiness SMEs which are small in size, are more determined to increase market share. Hence the high likelihood to adopt an E-commerce technology to increase its market position.
Table 1. Binary Logistic Regression of socio-demographic characteristics on adoption of E-commerce. Socio-demographic characteristics ß Std. Error Sig. Constant 12.663 6.204 .041 *** Age -3.656 1.930 .058** Gender -2.103 1.429 .141 Marital Status 1.062 1.415 .453 Educational Level -2.793 1.166 .017*** Years in Business 5.056 2.586 .051** Business Location -.735 1.632 .203 Type of Agribusiness SME 3.120 1.618 .054** Source of Funding 1.298 1.687 .442 Scale of Enterprise -4.885 2.270 .031*** Annual Revenue .136 1.332 .919
Model Summary Test Value Sig. Omnibus Test of model coefficients 19.492 .021 Hosmer & Lemeshow Test 1.092 .998 Cox & Snell R square .284 Nagelkerke R square .626 -2 log Likelihood 27.055 Note: ***represent significant level at 5%, ** represent significant level at 10% Preferred E-commerce Applications Used by Agribusiness SMEs
The results of Table 2, using the mean score showed that E-commerce application used for Customer relation management (CRM) was the most used (1.7733), with Payment System being the least used E-commerce application (1.4650). This assertion is supported by Turban et al. (2002) and Ainin and Noorismawati (2003) that most Agribusiness SMEs prefer E-commerce application for customer relation management. This is because the business wants to stay in touch with their customers, which create trust, and assure the costumers of quality. It is also a way of helping the business in forecasting. On the other head, fewer respondents used E-commerce applications as a means of payment system. Agribusiness SME owners preferred physical cash payment to
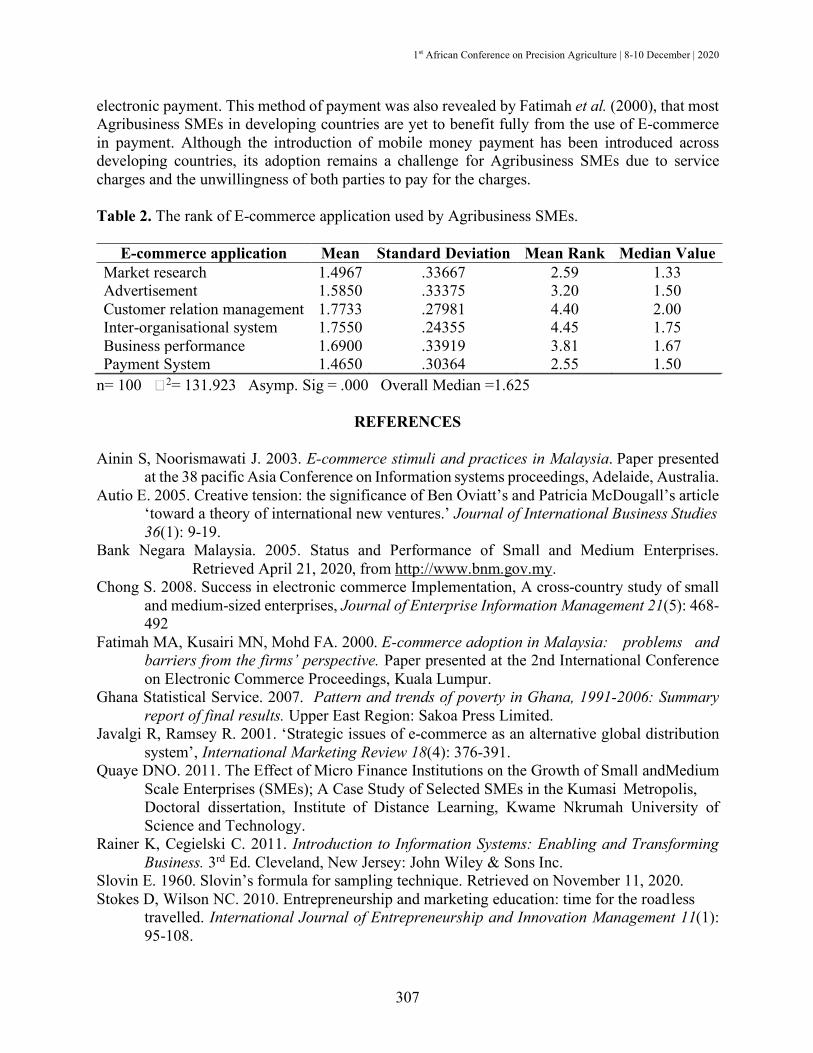
1st African Conference on Precision Agriculture | 8-10 December | 2020
307
electronic payment. This method of payment was also revealed by Fatimah et al. (2000), that most Agribusiness SMEs in developing countries are yet to benefit fully from the use of E-commerce in payment. Although the introduction of mobile money payment has been introduced across developing countries, its adoption remains a challenge for Agribusiness SMEs due to service charges and the unwillingness of both parties to pay for the charges. Table 2. The rank of E-commerce application used by Agribusiness SMEs.
E-commerce application Mean Standard Deviation Mean Rank Median Value Market research 1.4967 .33667 2.59 1.33 Advertisement 1.5850 .33375 3.20 1.50 Customer relation management 1.7733 .27981 4.40 2.00 Inter-organisational system 1.7550 .24355 4.45 1.75 Business performance 1.6900 .33919 3.81 1.67 Payment System 1.4650 .30364 2.55 1.50
n= 100 �2= 131.923 Asymp. Sig = .000 Overall Median =1.625
REFERENCES Ainin S, Noorismawati J. 2003. E-commerce stimuli and practices in Malaysia. Paper presented
at the 38 pacific Asia Conference on Information systems proceedings, Adelaide, Australia. Autio E. 2005. Creative tension: the significance of Ben Oviatt’s and Patricia McDougall’s article
‘toward a theory of international new ventures.’ Journal of International Business Studies 36(1): 9-19.
Bank Negara Malaysia. 2005. Status and Performance of Small and Medium Enterprises. Retrieved April 21, 2020, from http://www.bnm.gov.my.
Chong S. 2008. Success in electronic commerce Implementation, A cross-country study of small and medium-sized enterprises, Journal of Enterprise Information Management 21(5): 468-492
Fatimah MA, Kusairi MN, Mohd FA. 2000. E-commerce adoption in Malaysia: problems and barriers from the firms’ perspective. Paper presented at the 2nd International Conference on Electronic Commerce Proceedings, Kuala Lumpur.
Ghana Statistical Service. 2007. Pattern and trends of poverty in Ghana, 1991-2006: Summary report of final results. Upper East Region: Sakoa Press Limited.
Javalgi R, Ramsey R. 2001. ‘Strategic issues of e-commerce as an alternative global distribution system’, International Marketing Review 18(4): 376-391.
Quaye DNO. 2011. The Effect of Micro Finance Institutions on the Growth of Small andMedium Scale Enterprises (SMEs); A Case Study of Selected SMEs in the Kumasi Metropolis, Doctoral dissertation, Institute of Distance Learning, Kwame Nkrumah University of Science and Technology.
Rainer K, Cegielski C. 2011. Introduction to Information Systems: Enabling and Transforming Business. 3rd Ed. Cleveland, New Jersey: John Wiley & Sons Inc.
Slovin E. 1960. Slovin’s formula for sampling technique. Retrieved on November 11, 2020. Stokes D, Wilson NC. 2010. Entrepreneurship and marketing education: time for the road less
travelled. International Journal of Entrepreneurship and Innovation Management 11(1): 95-108.

1st African Conference on Precision Agriculture | 8-10 December | 2020
308
Turban E, King D, Lee J, Viehland D. 2002. Electronic commerce: A managerial perspective, Dallas, Texas: Prentice Hall.
Wadhwa V, Aggarwal R, Holly K, Salkever A. 2009. Making of a successful entrepreneur: anatomy of an entrepreneur part II. Kauffman Foundation Small Research Projects Research Paper 1(2): 8-15.
Wu JH, Wang C. 2005. What drives mobile commerce? An empirical evaluation of the revised technology acceptance model. Information & management 42(5): 719-729.
Ya-ping H. 2012. E-Marketing Development in Virtual Market-Space: A Strategic Perspective. Asian Journal of Business Management 4(4): 359–366.


Published By:
www.apni.net