Conference Proceedings 2017
152
-
Upload
khangminh22 -
Category
Documents
-
view
3 -
download
0
Transcript of Conference Proceedings 2017
1
Remsons International Conference
On
Innovative Business Practices for
Achieving Excellence in Globalised Competitive Environment
Organised on
18 February, 2017
Vol. 3, February 2017 ISBN 978-93-5196-952-5

2
INAUGURAL SPEECH
Mr Krishna Kejriwal (MD, Remsons Industries)
I am deeply pleased as well as privileged & honoured to be present here this
morning for the inaugural session of the 4th Remsons International Research
Conference on Innovative Business Practices for Achieving Excellence in
Globalised Competitive Environment.
Friends, I stand before you today as a representative of our company
Remsons Industries Ltd, a company which since 1968 has been in the
forefront of manufacturing components for the automobile industry. This is
where I started my career almost 4 and a half decades earlier and hence my
knowledge is mostly restricted to the automobile sector. Unfortunately I
have not had the benefit of expanding my vision & knowledge in an excellent
institute as represented by The Durgadevi Saraf Institute of Management
Studies and hence have remained what I would term as a “Nuts & Bolts”
man.
To understand the challenges faced by companies in today’s environment it
is imperative to visualize the scenario that prevailed in the early years after
independence. It was only in 1985 that the Indian government started to
allow foreign technology and joint ventures to enter the Indian automotive
sector. Till 1985 you could count the number of automobile industries
operating in our country on your fingers and annual production of
automobiles in 1985 stood at1.5 millionof 2 wheelers (mostly scooters),
70,000 cars and 90,000 commercial vehicles. All these vehicles were made
by Indian manufactures without the aid of any foreign technology or any
3
foreign components. What did this result in? Excessively long waiting
periods to buy a vehicle thus allowing for an absolute seller’s market,
resulting in a high cost product with very low quality and zero customer
satisfaction. Last year the quantum of automobiles production in India
stood at approximately 19 million 2 wheelers, 3.5 million of passenger
vehicles and close to 1 million of commercial vehicles. Today there are about
20 companies manufacturing passenger cars in India of which only 2 are
Indian owned. These 2 Indian companies have a market share of less than
12%. In the 2 wheelers there are close to 13 manufacturers with 5 Indian
companies who contribute to over 70% market share. 3 of these India
companies who account for major market share had entered into joint
venture agreements with leading Japanese manufacturers, were able to
absorb whatever technology was provided and were financially strong
enough to buy out their Japanese partners. All the 3 Japanese partners
have since entered the Indian market on their own and have started to make
inroads in the market share of the Indian companies. What has this meant
for the Indian customer? A seller’s market has been converted into a buyer’s
market and one can buy almost any vehicle off the shelf after they have
made a complete comparison on features, reliability and cost. The customer
now has to be satisfied if favourable mouth to mouth publicity is to be
generated and a repeat sale has to be ensured. In turn what has this meant
to companies like us for whom the customer is the automobile
manufacturer?
The Government of India started the process of liberalization in the year
1971. In the initial years a fair amount of protection was offered in terms of
specifying minimum local content and imposition of high import duties on
finished products. Gradually, before the turn of the century, all this
disappeared. Accustomed as we were to dominant positions in a protected
market we had to suddenly contend with foreign rivals wielding a daunting
array of advantages: advanced technology, superior products, substantial
financial resources, highly developed manufacturing techniques, powerful
brands and seasoned marketing and management skills. With the market
size expanding exponentially, competition also expanded in equal measures.
Competing foreign rivals with deep financial chests initiated a never before
4
seen squeeze on margins. What are the major challenges faced by our
industry today.
Technology- In today’s liberalized economy, no one wants to outsource
technology without ownership. You either have to accede to a minority stake
or develop your own technology.
Manufacturing- You have to emulate the best of the manufacturing
techniques. No longer is the famous Indian Juggad of any relevance. Your
manufacturing & management capability must be proven to ensure zero
defects on products supplied by you.
Customer Expectations- The customer today requires you to be a full
resource supplier in terms of design, support and product testing. The
customer also demands that you have in place fully qualified and trained
personnel in all activities of your organization.
Support System- Your company must be equipped with an ERP system and
will need to have capability to access and interact with all data electronically
such as in design scheduling, quality etc.
Financial- Commit huge resources to all of the above and still present a
healthy balance sheet to satisfy that you are not a risk supplier.
Pricing- Ensure that you cost competitive in relation to any local supplier or
with any supplier from around the globe. The automobile giants have access
to most major markets in the world.
Customer Loyalty- Today this word has become a misnomer.You are only as
good as your last supply and/or maybe your last rating report. One slip and
you may be shoveled out. Definitely no resting on past laurels.
These are only some of the challenges. I could use a full session if I will start
to enumerate all them.
How then do we survive? One option is to focus on upgrading existing
capabilities and resources to match multinational standards often by
limiting ourselves to niche markets. One of the niche areas is to develop low
volume markets where because of our developed expertise in manufacturing
low volumes we can find ourselves to be cost effective. Also to focus on
international markets similar to that of the home base using competencies
developed in house. What is however a given for survival is that
management, quality and manufacturing systems must necessary be in line
with global standards. There has to be a concerted effort in creating a
5
culture within the company ensuring that there is a constant effort in
improvement of every single process within the company. This is not limited
to technology and manufacturing only but covers every single aspect such
as human resources, marketing, finance, purchase etc. A famous quote by
Eiji Toyoda, former President of Toyota Motor Corporation is very relevant
and I quote “If you put your mind to it, water can be wrung from a dry
towel”. In other words, no matter how perfect the process is, it can still get
better. It can still improve. We have to constantly innovate. As Jay Abraham
said “Innovation basically involves making obsolete that which you did
before.” Besides innovation we have to allocate sufficient resources to
research and development for creation of new technology maybe starting
with reverse engineering with which we have long functioned and then
extending the same to development of some newer cost effective technology.
One of the major problems faced by a large many companies in the field of
automobile components is the concept of forward sourcing adopted by these
large global companies. To avoid high costs in testing critical products
developed by a new company, they would prefer to outsource the same from
an existing supplier either by imports if volumes are small or by facilitating
that supplier to set up manufacturing facilities in India. To counter this we
have to look for customers abroad with such products where such type of
testing is not essential and whom we have to entice with attractive prices. In
this we have to ensure that the customer still enjoys all the benefits offered
by the current supplier including just in time deliveries. We have to critically
examine the cost of each raw material and sub assembly process and
ascertain the better option, make or outsource. We have not only to look
within the country but around the globe for each material and sub assembly
always keeping in mind the pressure of quality and consistency. Even small
and seemingly inconsequential slip ups can cause huge financial losses by
way of product recall.
I will now like to dwell on Management research. It is indeed a tragedy that
our country with its rich history has become totally dependent on western
techniques of management. Devdutt Patnaik in his now famous books has
culled some very relevant management pearls from our ancient scriptures,
the Ramayana and Mahabharata. Who has not heard of the famous Parta
6
system adopted by the very successful Birla family? Research in itself has
been defined in several ways.
A broad definition of research is given by Godwin Colibao: "In the broadest
sense of the word, the definition of research includes any gathering of data,
information, and facts for the advancement of knowledge."
Another definition of research is given by John W. Creswell, who states that
"research is a process of steps used to collect and analyze information to
increase our understanding of a topic or issue". It consists of three steps:
pose a question, collect data to answer the question, and present an answer
to the question.”
The Merriam-Webster Online Dictionary defines research in more detail as
"a studious inquiry or examination; especially investigation or
experimentation aimed at the discovery and interpretation of facts, revision
of accepted theories or laws in the light of new facts, or practical application
of such new or revised theories or laws".
In a lighter vein, the famous novelist Raymond Chandler also describes his
research as “I do a great deal of research – particularly in the apartments of
tall blondes”.
In more advanced countries we are all aware that there is fair amount of
collaboration between the academia and industry in the field of research. A
lot of this is related with the development of new products and technologies.
This process is yet to really gain any strong foothold in India. Research per
se is the quest to create new knowledge. Research for a company means
creating specific new knowledge which that company can use to further its
business. For a company it represents a medium to long term investment
which will help it to generate more revenue and profits. Till before
liberalization and/or globalization the need for research was not felt for
most companies as they were able to run their businesses with knowledge
that existed in the public domain. But that is changing now.
However if management research is not focused on the applied side which
can be used by the company to grow its business further, then we will not
see much collaboration between academia and industry on research.
University and industry will have to focus on the benefits to each party that
will result from collaborations by streamlining negotiations to ensure timely
7
conduct of the research and the development of the research findings. On
the university side, there is often a lack of human and financial resources
and capabilities to produce research results that can be converted to
economic returns through patents or other means like consulting. On the
industry side, low technological capability and low interest in technological
innovation limit the demand for the external knowledge that universities
could provide.
We also have to factor in the issues of confidentiality. For any applied
research required by industry to solve a certain problem a lot of data has to
be provided to the researcher. There is always a fear that some of the data
could be misused. Also if the industry is financing or even part financing the
research it would like to be the sole user of the findings for some period of
time. Hence comes the dimension of Intellectual Property Rights. With the
current state of IP Rights in India this can create hurdles. We shall have to
overcome the factor of trust deficit.
It is a fact that other than large industries, very few industries would be able
to afford the expense of hiring several research personnel to solve their
problems. How then can collaboration benefit both industry and the
university? In this context it may be useful to differentiate between short
term and long term collaborations. Short term collaborations could consist
of on demand problem solving with predefined results that may be
articulated through contract research, consulting and or licensing. Long
term collaborations could be associated with joint projects that involve
partnerships between private funded university institutes and/or chairs and
industry which allows the industry to contract for a core set of services.
Industry in India often looks for “consultants” in the academic community –
basically experts who can help and guide them in solving problems. In this
it is often assumed that academia is already working on such types of
problems. This, very often is not the case. Industry and academia will have
to spend considerable time together to identify common issues which can
then be addressed by joint research. One of the main hurdles today is the
lack of well-defined and organized structures and mechanisms to have
researchers spend time together. This, I feel can serve as a starting point
and bring about fruitful joint research between academia and industry.
8
WELCOME ADDRESS BY CHIEF CONVENOR
Dr Sharad Kumar, Dean DSIMS
Honorable Chief Guest Shri Krishna Kejriwal ji,Chairman and Managing
Director, Remsons Industries Ltd.; President RajesthaniSammelan
Educational Society- and Chairman, DSIMSShriAshokji Saraf, Trust
Members and Distinguished Guests, Dr. N. M.Kondap, Director General,
Dr. Babu,Director, DSIMS. Shri Anil Agrawal, Director Finance, Remsons
Industries Ltd. Researchers from academia and industry andMydear
colleagues and students.
It is my pleasure to have you all here to participate in our4th
RemsonsInternational Conference on Innovative Business Practices for
Achieving Excellence in Globalized Competitive Environment
Three key words emerge from the theme are:
1. Innovation
2. Globalization
3. Competition
These are the challenges as well as the opportunities for ensuring success
of any business and corporate. The corporates and business units are
required to innovate product and services and to strive for innovative
problem solutions to deal with harsh competitive environment which
operates in a globalized environment.
This conference is being organized under the aegis of Remsons Centre for
Management Research.The Remsons Centre for Management Research is
focusing on developing contemporary and usable research in various areas
of Management.This Centre has been set up with the help of the generous
donation from Remsons Group of Companies. It is set up by Late
ShriVishvaPrakashjiHarlalka in the memory of his mother Smt.
RadhadeviHarlalka.
.RESEARCH ACTIVITIES OF REMSONS CENTRE FOR MANAGEMENT
RESEARCH
DSIMS encourages its faculty and students for undertaking practical
research to address issues faced by corporates and industry. It also
encourages the faculty to undertake research Leading to Ph.D. Degree,
publish and present research papers and case studies in national and
international level conferences organized by reputed bodies/ institutions.
The faculty members are also deputed for the Faculty Development
Programs (FDPs) and Management Development Programmes (MDPs) to
enhance their knowledge and teaching effectiveness.
9
BACKGROUND OF OUR EARLIER CONFERENCES
Our 1st conference was held in 2014 on the theme of Rise of Asia –
Opportunities and Challenges which was inaugurated by Dr. Lie Yufa,
Consul General of People’s Republic of China, It emerged that the Asia was
going to play a dominant role in worlds economic development. In his
inaugural address Dr. Yufa had observed that China and India is going to
dominate the entire world through their accelerated economic activities
focusing on manufacturing and services sectors respectively. He however,
had shown his concern that the Asian work force are still not in a position
to bargain what they really deserve.
The 2ndconference was held in 2015 on Outsourcing Strategy – A New
Paradigm, which was inaugurated by Mr. Prashant Saran, Member,SEBI.
Through various presentations it was evident that the outsourcing is going
to be the integral part of business strategy. Special coverage was given to
the off-shore outsourcing in a well-connected globalized business
environment.
The 3rd conference was inaugurated by the Chancellor VIT University Dr.
Vishvanathan, on the broad based theme of Emerging Management
Practices to discuss the management practices to be followed for the
survival and growth of the corporates.
The present conference received an overwhelming response by receiving a
large number of good research papers including from our own faculty and
students. We have short listed 20 papers to be presented in the conference.
We have evaluated these papers with the help of experts and with 50 %
weightage and 50% weightage will be given for the presentation and
handling the questions.
We hope it will be a very successful event which will provide good insights
to the participants of this conference. The papers selected for the
conference will be published under ISBN.
I once again thank Shri Krishna Kejriwal ji for sparing his valuable time to
inaugurate the conference. He has always been a source of inspiration for
DSIMS for its endeavors to undertake valuable research under the
Remsons Centre for management Research.
10
EDITORIAL
Amidst worldwide protectionism and inwardly looking strategies by the
advanced economies, currently the most crucial ingredient for a sustained
economic growth in India is to foster Innovation. There is a growing
awareness among policymakers that innovation is the main driver of
economic progress as well as potential factor in meeting global challenges.
The physical world is highly dynamic with a continuous rotation and
revolution in its own path.We also needs to embrace this dynamism with
serious effort for continual innovation in science, technology and business
practices. As Ganesh Natarajan rightly said that Indian IT sector has to re
model their business with more innovation in terms of newer product and
platform development, not through mere wage arbitration which used to be
the model of the past.
So the need of the hour is Innovation, which can be done in product or in
processes. Innovative business practices make a nation more efficient, cost
competitive, highly rewarding and self-reliant.
The International Conference at Durgadevi Saraf Institute of Management
Studies(DSIMS) on 18 February,2017, aptly coveys the perfect synergy
between innovation and excellence in business practices across sectors to
eventually lead Indian economy to gain competitive advantage in the face of
retreated Globalisation.
The papers presented in this International Conference on the theme-
Innovative Business Practices for Achieving Excellence in Globalised
Competitive Environment are compiled as a part of the post Conference
Proceeding.
Professor ArchanaKhemka and Dr NishikantJha in their article Uncontrolled
Innovation- Private Gains at Public Loss, emphasise the importance of
regulation for uncontrolled innovations.
Prof Anthony Colaco’sworking paper on Open Innovation highlights the
importance of collaboration- internal as well as external collaboration of
resources for the maximum gain of all the stakeholders.
In his article HR Consulting: Present & Future in Competitive World, Professor
Caral D’ Cunha draw a trajectory of recruitment practices and future
prospects of HR Outsourcing industry.
The research article on A Study of Association between the Demographic
Factors and Patients’ Visit to Pharmacy authored by Dr Chandrasekhar
Kaushik, is a cross sectional survey to study a systemic association
between the patients’ visit to Pharmacy and the demographic factors of the
patients.
11
To increase the retail participation in the derivatives market, Prof Chirag
Shah worked on the research article A Study of Back testing of Direction
Neutral Option Strategy on Nifty Options and bagged the best paper award as
decided by a jury of blind reviewers and session chairs.
Professor DiptiAmburle’s article Design Thinking- The Strongest Weapon of
Business Strategists, brings forth the emerging concept of Design Thinking
as a constructive approach to identify the needs of the consumers.
Phoenix Udaan of FunsukhWangdu by Research Scholar Mr Gitesh Chavan,
is a case article based on cinematic analogy. The article is a sincere
endeavour by the author to collate the three vertices, like- technology,
innovation & global business environment to create the foundation for a
successful & sustainable business.
Dr Harsh Pathak’s article Corruption and its Compliance on International
Business dealt with corruptive business practices and increasing demand
for new governance standards.
Professor Jai Kotecha, Sagar Mehta and LashaChugh’s article A Study of
Brexit & its impact on EU, analysed the long term consequence of this recent
geopolitical issue on Trade & Businesses.
Mr Neel Jani in his article Trends and Scope of Commercial Lending in India,
worked on Commercial Lending via ECB & FCCB route.
Prof Pallavi Srivastava’s field of innovation is not actually the business but
classroom. In her article Teaching of Organisational Behaviour with
Dramatics, she studied the effectiveness of interactive drama as a
pedagogical way to teach the subject of Organisational Behaviour.
Leveraging Mobile CRM- on Time Food Availability, is another innovative e-
commerce business model presented by Mr Siddharth Jain and Dr Preeti
Sharma.
Dr RavindraDey in his article Impact of Inovative Business Practices on
Employee Engagement and Employee Satisfaction, proved that irrespective of
gender, there is a positive correlation between innovative business practices
and employee engagement and satisfaction.
In the article Linking Social Sustainability to Urban Poverty, Prof Ritu Sinha
focused on the required systemic changes to address the issues of social
equity and corporate intervention.
Dr Shailja Badra and Prof Vivek Sharma in their paper The Future Lies in
Innovative Governance, highlighted the importance of E- Governance and its
impact on business efficiency.

12
A unique endeavour on the part of the Institute to host a Conference on
Innovative Business Practices as one of the most critical strategic
requirement for Indian growth trajectories in times of global uncertainty.
The rich and diverse research articles presented in the Proceeding will
definitely steer young Indians to Dream Innovative Accomplishments (INDIA)
and spearhead the tools of innovation to gear our nation to the league of
advanced economies of the west and lead the global economy to a cohesive
world.
Dr Sumana Chaudhuri
Editor
13
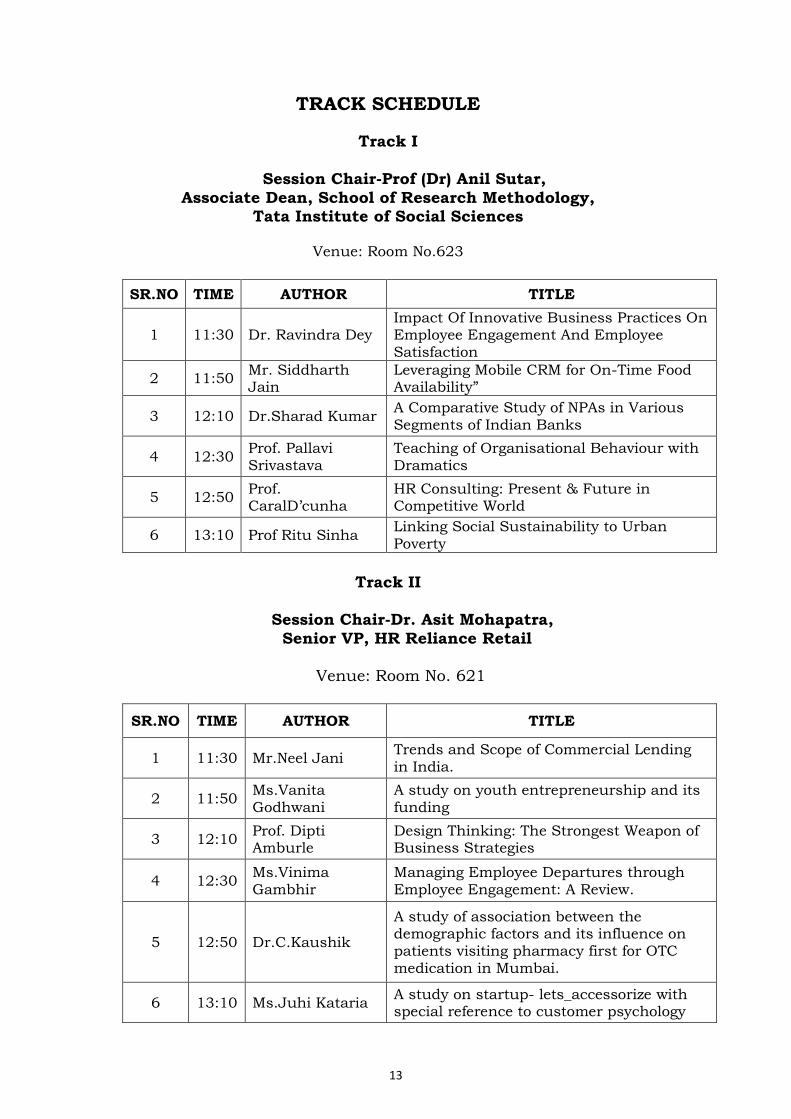
TRACK SCHEDULE
Track I
Session Chair-Prof (Dr) Anil Sutar,
Associate Dean, School of Research Methodology, Tata Institute of Social Sciences
Venue: Room No.623
SR.NO TIME AUTHOR TITLE
1 11:30 Dr. Ravindra Dey Impact Of Innovative Business Practices On Employee Engagement And Employee Satisfaction
2 11:50 Mr. Siddharth Jain
Leveraging Mobile CRM for On-Time Food Availability”
3 12:10 Dr.Sharad Kumar A Comparative Study of NPAs in Various Segments of Indian Banks
4 12:30 Prof. Pallavi Srivastava
Teaching of Organisational Behaviour with Dramatics
5 12:50 Prof. CaralD’cunha
HR Consulting: Present & Future in Competitive World
6 13:10 Prof Ritu Sinha Linking Social Sustainability to Urban Poverty
Track II
Session Chair-Dr. Asit Mohapatra,
Senior VP, HR Reliance Retail
Venue: Room No. 621
SR.NO TIME AUTHOR TITLE
1 11:30 Mr.Neel Jani Trends and Scope of Commercial Lending
in India.
2 11:50 Ms.Vanita Godhwani
A study on youth entrepreneurship and its funding
3 12:10 Prof. Dipti Amburle
Design Thinking: The Strongest Weapon of Business Strategies
4 12:30 Ms.Vinima Gambhir
Managing Employee Departures through Employee Engagement: A Review.
5 12:50 Dr.C.Kaushik
A study of association between the demographic factors and its influence on patients visiting pharmacy first for OTC medication in Mumbai.
6 13:10 Ms.Juhi Kataria A study on startup- lets_accessorize with special reference to customer psychology
14
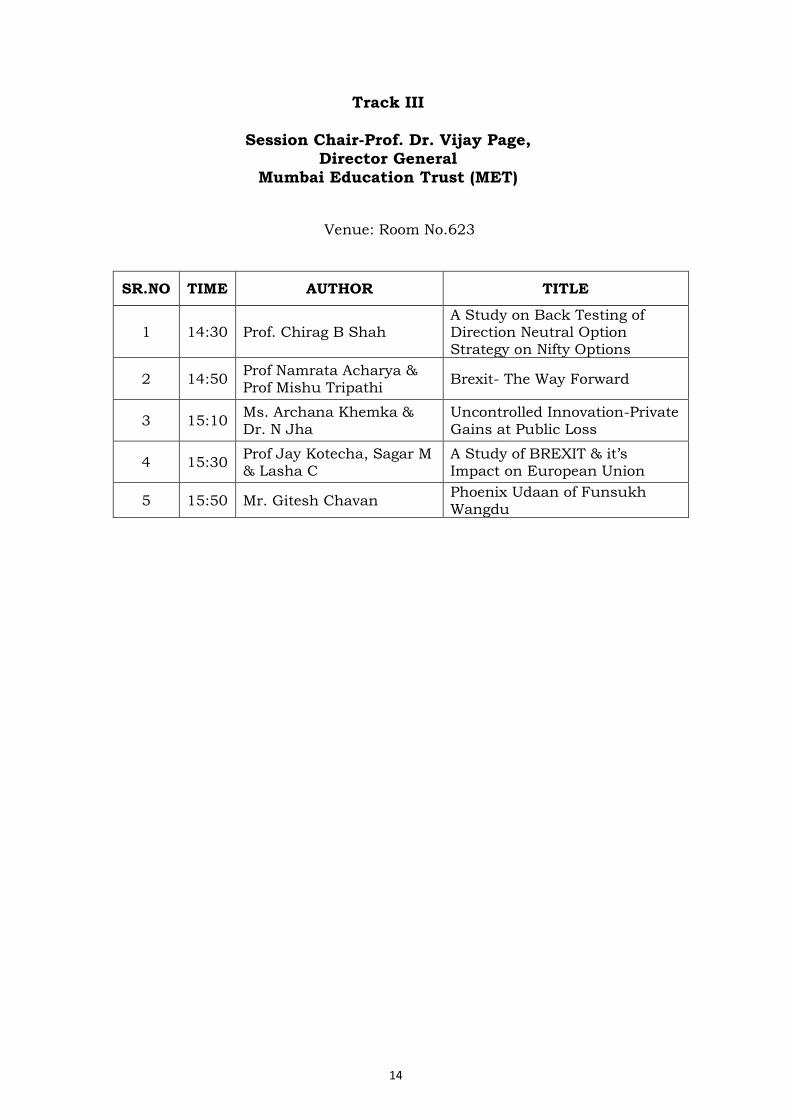
Track III
Session Chair-Prof. Dr. Vijay Page, Director General
Mumbai Education Trust (MET)
Venue: Room No.623
SR.NO TIME AUTHOR TITLE
1 14:30 Prof. Chirag B Shah A Study on Back Testing of Direction Neutral Option Strategy on Nifty Options
2 14:50 Prof Namrata Acharya & Prof Mishu Tripathi
Brexit- The Way Forward
3 15:10 Ms. Archana Khemka & Dr. N Jha
Uncontrolled Innovation-Private Gains at Public Loss
4 15:30 Prof Jay Kotecha, Sagar M & Lasha C
A Study of BREXIT & it’s Impact on European Union
5 15:50 Mr. Gitesh Chavan Phoenix Udaan of Funsukh Wangdu
15
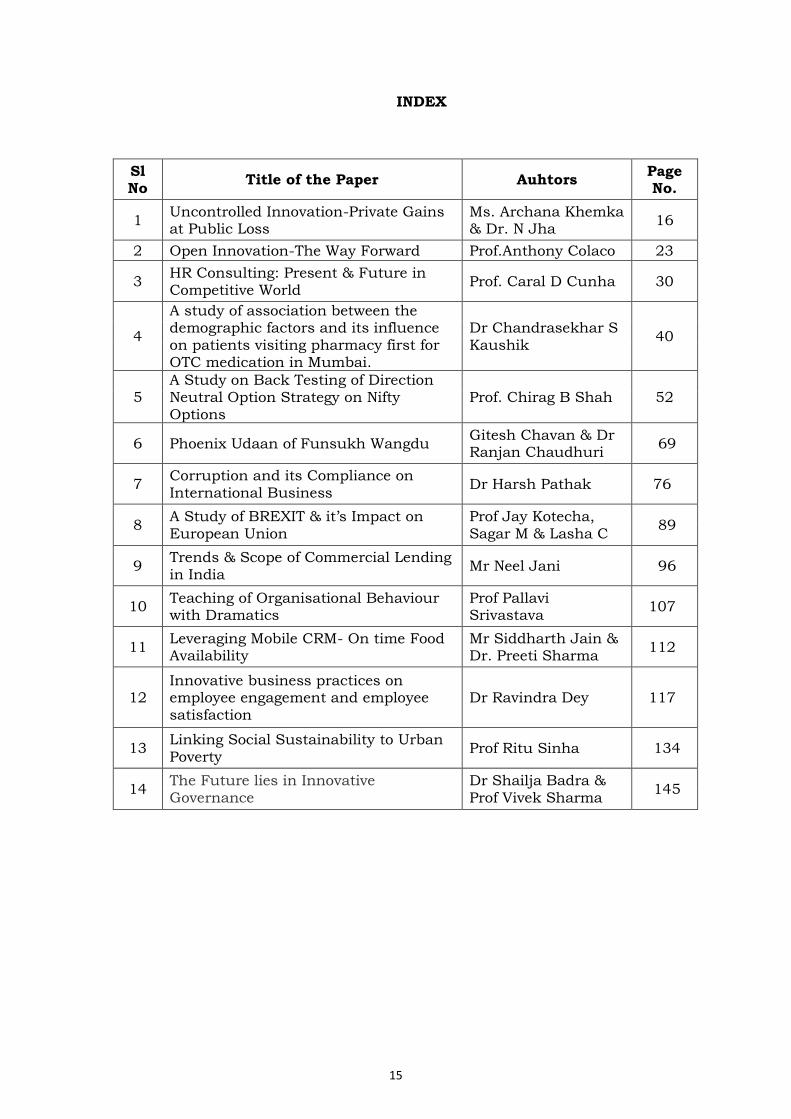
INDEX
Sl No
Title of the Paper Auhtors Page No.
1 Uncontrolled Innovation-Private Gains at Public Loss
Ms. Archana Khemka & Dr. N Jha
16
2 Open Innovation-The Way Forward Prof.Anthony Colaco 23
3 HR Consulting: Present & Future in Competitive World
Prof. Caral D Cunha 30
4
A study of association between the demographic factors and its influence on patients visiting pharmacy first for OTC medication in Mumbai.
Dr Chandrasekhar S Kaushik
40
5 A Study on Back Testing of Direction Neutral Option Strategy on Nifty Options
Prof. Chirag B Shah 52
6 Phoenix Udaan of Funsukh Wangdu Gitesh Chavan & Dr Ranjan Chaudhuri
69
7 Corruption and its Compliance on International Business
Dr Harsh Pathak 76
8 A Study of BREXIT & it’s Impact on European Union
Prof Jay Kotecha, Sagar M & Lasha C
89
9 Trends & Scope of Commercial Lending in India
Mr Neel Jani 96
10 Teaching of Organisational Behaviour with Dramatics
Prof Pallavi Srivastava
107
11 Leveraging Mobile CRM- On time Food Availability
Mr Siddharth Jain & Dr. Preeti Sharma
112
12 Innovative business practices on employee engagement and employee satisfaction
Dr Ravindra Dey 117
13 Linking Social Sustainability to Urban
Poverty Prof Ritu Sinha 134
14 The Future lies in Innovative Governance
Dr Shailja Badra & Prof Vivek Sharma
145
16
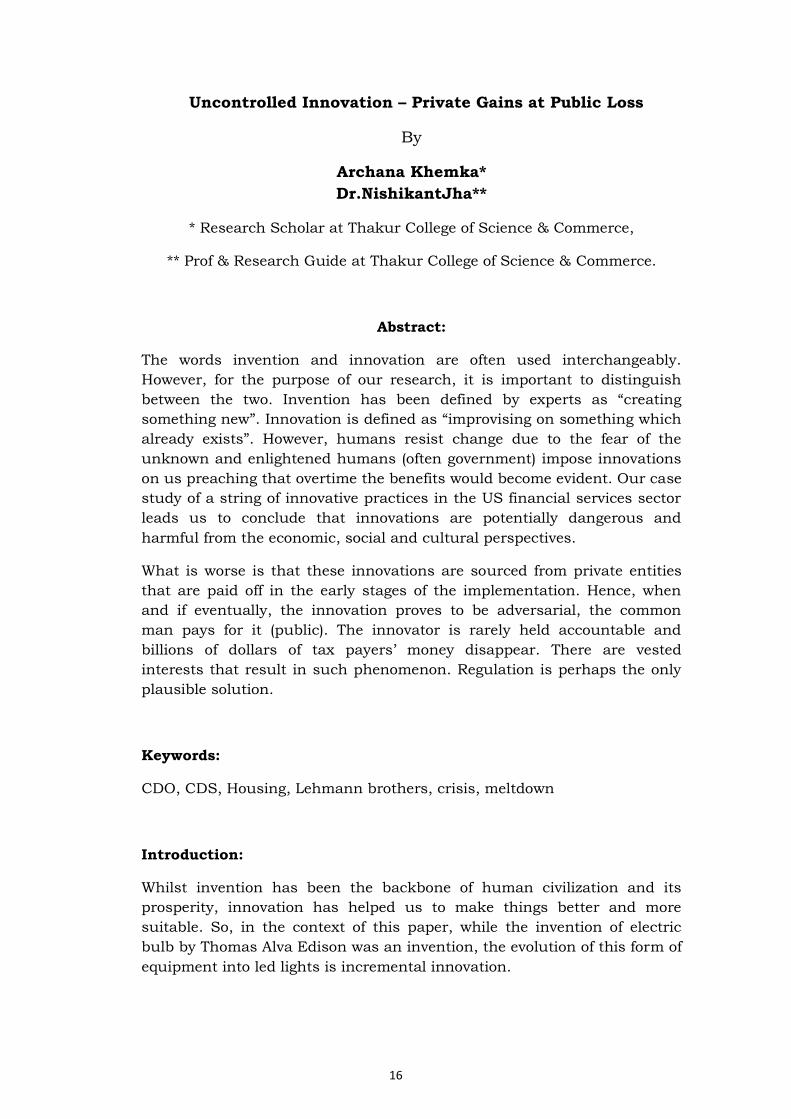
Uncontrolled Innovation – Private Gains at Public Loss
By
Archana Khemka*
Dr.NishikantJha**
* Research Scholar at Thakur College of Science & Commerce,
** Prof & Research Guide at Thakur College of Science & Commerce.
Abstract:
The words invention and innovation are often used interchangeably.
However, for the purpose of our research, it is important to distinguish
between the two. Invention has been defined by experts as “creating
something new”. Innovation is defined as “improvising on something which
already exists”. However, humans resist change due to the fear of the
unknown and enlightened humans (often government) impose innovations
on us preaching that overtime the benefits would become evident. Our case
study of a string of innovative practices in the US financial services sector
leads us to conclude that innovations are potentially dangerous and
harmful from the economic, social and cultural perspectives.
What is worse is that these innovations are sourced from private entities
that are paid off in the early stages of the implementation. Hence, when
and if eventually, the innovation proves to be adversarial, the common
man pays for it (public). The innovator is rarely held accountable and
billions of dollars of tax payers’ money disappear. There are vested
interests that result in such phenomenon. Regulation is perhaps the only
plausible solution.
Keywords:
CDO, CDS, Housing, Lehmann brothers, crisis, meltdown
Introduction:
Whilst invention has been the backbone of human civilization and its
prosperity, innovation has helped us to make things better and more
suitable. So, in the context of this paper, while the invention of electric
bulb by Thomas Alva Edison was an invention, the evolution of this form of
equipment into led lights is incremental innovation.
17
One could argue that innovation has helped create more efficient,
convenient, economic products and practices. However, it would be naïve
to let the adverse implication of such innovations go unnoticed. In this
paper, we would like to highlight certain innovations, which prima facie
were means of prosperity, however, their adverse impact on the socio
cultural, economic and political environment either make them obsolete or
a necessary evil.
We reckon that innovations pushed down the throat of mankind without
considering the holistic impact on the arms of sociology, economy, politics
and culture have backfired. A few examples being robotics, Collateralized
Debt Obligations (CDO), nuclear bombs (weapons of mass destruction),
fractional reserve banking, etc.We also conduct a case study on how CDOs
which presented a very lucrative investment opportunity for long term
funds ended up not only creating huge losses for these funds, but also
culminating into a global economic crisis in 2008.
We conclude this paper by highlighting current on-going innovations,
which we believe have not considered the holistic impact. We go on to
make certain recommendations as to how regulators could probably mirror
the pharmaceutical industry and let only incrementally positive
innovations be imposed on mankind.
Research methodology
We conduct a case study on CDO s and Credit Default Swaps (CDS) and
showcase their impact on the global economic environment as an example
of an innovation which led to business excellence initially, but eventually
proved to be a disaster.
Data collection
Primary data: We interviewed several investment bankers, commercial
bankers and fund managers who were directly or indirectly involved during
the CDO crisis.
Secondary data: economic data points from finance.yahoo.com, reuters,
Bloomberg, and US government websites.
The definition of “innovation” and basic human instinct
Innovation is defined as to improve on something. Mankind has used
innovation to improve the environment around itself so that it can survive.
However, by basic human instinct, humans are resistant to change. The
resistance comes from the fear of the unknown. Hence, most innovations
are literally imposed on mankind by few enlightened ones arguing that one
will realise in future that it is for the best.
What has been worse in the modern world is that the innovations have
come from private sources and since the R&D in innovation costs a lot,
18
even before mankind has been able to assess the true impact of the
innovation, the innovator has had to be paid off for his efforts. Hence, later
when some of these innovations actually end up creating massive negative
impact on economics, society and culture, it is the public’s loss and the
innovator is not accountable (after effects).
However, we argue that Darwin’s theory of survival of the fittest suggests
that the instincts that have survived with mankind are there for good
reason. Hence, when we resist change and it is imposed upon us, the
imposers need to be absolutely sure that the change will be for the better.
Case study
CDO/ CDS – an innovated disastrous avatar of mortgage bonds.
In order to comprehend the role of innovation in the CDO/CDS disaster,
we first identify the various parties (sections of society/ professions)
involved.
Modern era banks (commercial + investment), Insurance companies,
Housing finance companies, Rating agencies, Institutional Investors,
Academicians and Government.
The evolution of role of banks – deregulation leading to an unstable avatar
The innovative practice for sake of competitiveness – engaging in derivatives
Banks (historically only goldsmiths) were initially allowed to borrow from
public and lend the borrowed money or make investments to make a
spread. Hence, a bank would practice fractional reserve banking under the
guidance of the central regulatory body (central banks). In the US, the
Glass- Steagall act of 1956 prohibited commercial banks from making
engaging in any risk aggressive investment banking practices. This was
done to ensure that the public deposit money was not gambled with
making risky bets. However, in 1998, when Alan Greenspan was chairman
of Federal Reserve, Citibank merged with Travellers insurance creating
CitiGroup. Although this merger was clearly a violation of the Glass-
Steagall Act, the regulators did not prevent it. Instead, they exempted the
merger for a year and in 1999, passed the Gramm-Leach-Bliley Act which
overturned Glass-Steagalland legalized the CitiGroup merger. This act
eventually came to be known as the CitiGroup Relief act.
The GLB act was a ground breaking regulation as it now allowed
commercial banks to engage in risky investment banking activities which
had thus far been the strong hold of small private partnership called
investment banks. The big difference being that the private investment
banks bet the partners own money, whereas the commercial banks were
taking such bets with the baking of public money.
19
On the other hand, investment banks which were originally private
partnership between technically equipped individuals with experience in
financial markets were allowed to go public and borrow public money
(equity and debt). This led to a multi factor growth in the size of the
investment banks and hence the size of the bets that they could make. As
an example Morgan Stanley in 19xx was a private partnership with a total
strength of 110 employees including 7 partners who were the only stock
holders. It had only 1 office in the world (US). Post going public Morgan
Stanley had achieved a size of 50,000 personnel and the original 7
partners were now a minority stake in the firm’s equity. It has offices
across the globe.
The traditional home financing model
In the traditional model of lending to retail customers for housing
purposes, step 1 needs to be the assessment of the customers paying
power. This was done by assessing the source and stability of his income,
existing liabilities, future expected liabilities, past savings, current net
worth, past credit record etc. The bank, based on fractional banking
reserve, would extend the loan to a customer which would cover 70-80% of
the cost of the house and in turn would keep some money aside to cover
the risk of this lending as per capital adequacy norms. This loan would
remain on the books of the bank till the customer fully repaid the loan. In
case of default, the bank would confiscate the mortgaged house, auction it
and bear the loss (if any ) on its equity. Since, the banks equity was
involved, the credit worthiness of the customer was checked thoroughly
and it was also insured they the customer also had some (20-30%) equity
in the house.
The “innovative” home financing model
Under the innovative model, with the help of de regulation, the banks were
able to sell the housing loans on their books to investment banks and
immediately recognise profit on the transaction. Since the loan was no
longer on the books, the bank did not have to meet the Capital adequacy
norms. Further, since the banks were no longer collecting the mortgage
payments, the incentive to check the credit worthiness of the customer was
almost zeroed. For e.g. earlier a person with gross income of a $1000 p.a.
would not be able to secure a loan of more than $3000. But now, since the
banks were not worried about repayment, the same person was approved
for a loan as high as $15,000. Moreover, another innovative practices
adopted by the bank was teaser rate loans. under the teaser rate loans, the
customer was required to pay only subsidized mortgage payment for the
initial few years of the mortgage, and at a later reset date the mortgage
payment would balloon up to a much larger size. So for e.g. if in the
traditional model a customer was supposed to pay a mortgage payment of
$10 per month through the life of the mortgage, now under the traditional
model he was required to pay only $5 for initial few years, and $20 per
20
month for the remaining years. Hence, when under the new “innovative”
model the subsidy period expired, the American public at large started to
default at mortgage payments, and default rates skyrocketed to
unprecedented rates.
The role of other players and their innovative practices in the scam
Insurance companies – The innovative practice for sake of
competitiveness – insuring derivatives
AIG, the public insurer in US, was the largest insurance company. The
investment banks soon realised that as the teaser rates on the home loans
expired, defaults would rise to such an extent that most of these AAA rated
CDOs would become worthless. Thus to hedge their balance sheet
exposure to the CDO s held on their books, the investment banks started
purchasing CDS from insurers like AIG. Now, traditionally an insurer also
has to meet capital adequacy norms while providing insurance. However
since derivatives were not regulated, the insurers were allowed to sold
these products without meeting capital adequacy norms. The CEO of AIG
at a press conference in March 2007 famously said “we cannot envisage a
situation where we lose a single $ on any of these exposures”. AIG lost
$800 billion in the housing collapse, and had to be bailed out by the
federal government with tax payers’ money.
Housing finance companies – The innovative practice for sake of
competitiveness – making predatory loans
Housing finance companies like Freddie Mac and Fannie Mae (who were
bailed by US taxpayers in 2008) were the home loan providers to the larger
public. As the securitisation food chain ensured that the lender no longer
had to be the beneficiary for the repayment of the loan, the housing
finance companies started making predatory loans. This implies that the
lenders were completely aware of the fact that the borrower was incapable
of repaying the loan under normal circumstances. These loans were
extended to the low income American who had the great American dream,
but could not afford a house due to prevailing prices. However, when the
lenders stopped checking income documents or assessing repay ability, the
low income American could suddenly realise his dream. These loans were
junk rated per se. However, in mathematical models since the probability
of default of each of this loan was as high as 50%, but they were
considered as mutually exclusive event (hence ignoring systematic risk),
8000 such loans out in a CDO, would get the CDO a very low probability of
failure (50%^8000) = less than 1%. Hence, the rating agencies would rate
these CDOs as AAA that is as safe as government securities.
21
Rating agencies –The innovative practice for sake of competitiveness
– default on each loan in a given economy is a mutually exclusive
event
Fitch, Moody’s and S&P were the principal rating agencies who escaped
unscathed from this turmoil. These rating agencies have an inherent
conflict of interest. They are paid by the issuer of the instrument to rate
and evaluate its credit risk. Hence, if an issuer (say Goldman Sachs) could
not get a AAA rating for his CDO, he would simply take his business to
another rating agency. Thus, being prudent in rating these securities
would come at the cost of revenues and profits of rating agencies. Also,
these ratings that formed the base for investment of pension and
retirement trusts and funds came at a disclaimer that they were merely
opinions and should not be relied upon whilst making investment
decisions.
Investors – The innovative practice for sake of competitiveness –
investing in deregulated but AAA rated instruments the corpus
meant for government securities
Pension funds, asset management companies, sovereign funds etc lost a
huge amount of their wealth invested in CDOs which were meant to be
invested in AAA rated risk free assets like government securities. The
investors got greedy when they invested the money in CDOs as the CDOs
showed potentially higher returns vs government securities with similar
credit ratings. These investors too were aware of the credit rating agencies
disclaimer and yet they bet a substantial amount of their corpus in such
CDOs about which they knew very little other than the credit rating.
Government and Academicians - The innovative practice for sake of
competitiveness – deregulating derivatives
Academicians play a pivotal role in shaping public policy in US. The de
regulation of the financial sector which allowed “innovative practices” was
led by academicians from renowneduniversities like Harvard, Chicago and
Oxford. The Great Depression had led to US government to tighten
regulations around banks. Yet, the Reagan administration started a 30
year long process of financial deregulation and these banks were once
again allowed to engage in investment banking activities. The
academicians also catalysed this deregulation by encouraging the
Government to deregulate for the sake of economic growth and stability to
the markets. Their financial innovations did not cost them anything and
actually helped them make millions of dollars in consultancy fees from
investment banks. The taxpayer paid the bill when it came to losses from
these innovations.
22
Conclusion of the CDO case study
Whilst a handful of investment bankers, academicians, government
officials, credit rating agencies and portfolio managers benefitted from the
innovative practice of deregulating derivative products and allowing
commercial banks to bet public money on risky instruments, millions of
American taxpayers paid the bill when the system collapsed. Each of the
aforementioned benefactors made their wealth whilst they were
architecting the crisis and they were never held accountable. Hence, if
innovations aren’t controlled in a phased manner and continue to be
imposed on mankind against their will, the innovators will continue to
make their money regardless of the impact of their innovations. It is a
perfect crime to create private gains at public loss.
Recommendations
All innovations with systematic implications must be implemented in a
pilot phase to study the economic, social and cultural impact over a
reasonable period of time.
Innovators must be compensated in a phased manner in alignment with
the success of the pilot phase.
If the eventual outcome is adversarial, the innovator has to payback the
rewards received for the innovation.
The regulator should also be held accountable for the lack of its monitoring
ability in such cases and public money should not be used to compensate
for losses.
Limitations of the study
Whilst we have studied a case where many entities used innovative
practices to enable a systemic disaster, one should not discourage
innovation in any form or shape. There are many innovations that have
helped mankind to improve their lives. We are merely suggesting a
regulatory framework so that the implications can be studied from a
broader perspective and then the innovation can be judged on its merits.
References
https://en.wikipedia.org/wiki/Subprime_mortgage_crisis
https://books.google.co.in/books?id=OMlfCgAAQBAJ&pg=PA124&dq=hom
e+loan+crisis&hl=en&sa=X&ved=0ahUKEwj13dnm-
ObRAhUMp5QKHZ9hBdwQ6AEIMjAA#v=onepage&q=home%20loan%20cri
sis&f=false
https://books.google.co.in/books?id=Ur1wuFamG5cC&printsec=frontcove
r&dq=home+loan+crisis&hl=en&sa=X&ved=0ahUKEwj13dnm-
ObRAhUMp5QKHZ9hBdwQ6AEIODAB#v=onepage&q=home%20loan%20cr
isis&f=false
23
Open Innovation – The Way Forward
By
Anthony Colaco
Assistant Professor at Durgadevi Saraf Institute of Management Studies
Abstract
Open innovation is “the use of purposive inflows and outflows of knowledge
to accelerate internal innovation, and expand the markets for external use of
innovation, respectively.” Open innovation can be understood as the
antithesis of the traditional vertical integration approach where internal
R&D activities lead to internally developed products that are then
distributed by the firm. As the definition by Chesbrough suggests, there are
two facets to open innovation. One is the “outside in” aspect, where external
ideas and technologies are brought into the firm’s own innovation
process. Thus with the introduction of open innovation, company
boundaries become ‘permeable’, enabling the matching and integration of
resources between the company and external collaborators. In the ‘closed’
innovation model, companies innovate relying on internal resources alone.
For business, open innovation is a more profitable way to innovate, because it can reduce costs, accelerate time to market, increase differentiation in the market, and create new revenue streams for the company. So there’s a lot of opportunity for business to profit from open innovation. Keywords: Open Innovation, Technology, Resource Integration
Introduction Innovation not only has been considered as a critical source of competitive
advantage in an increasingly changing environment, but also, innovation
capability is one of the most important determinants of organizational
performance. Thus in the past, organizations used to conduct most of their
innovative activities in-house as this was viewed as a strategic asset, and in
some industries even as a market entry barrier. On this sense, the main
studies about innovation have been addressed from two different
approaches. The first one, or the traditional approach (closed innovation),
points out that organizational sustainable growth relies on internal
investments in R&D and the control and protection of the results derived
from these investments. However, a number of factors that characterize the
current market dynamics have deteriorated the perspective before described.
Among these factors it is important to mention the following: the labor
mobility, the abundant venture capital, the availability of knowledge, the
reduction of product life cycles, and the rising cost of technology
development.These factors coupled with the increasing complexity of
24
products and technologies, the rising costs of innovation, shorter
development lead times, organizations today are forced to open up their
innovation activities and to enter not only into different forms of
cooperation, but into new forms as well.
Literature Review Chesbrough argues that the innovation approach applied by organizations
has shifted from a closed system to an open system. In contrast to the
closed innovation approach, the open innovation approach focuses on the
acquisition of external knowledge, blurring organizational boundaries.
Ståhle goes so far as to make a distinction between open systems and
complex, self-organizing systems that are the bases for innovation
ecosystems.
The open innovation paradigm on the other hand strongly believes that
organizational boundaries are permeable rather than closed, and the locus
of innovation is moved from a location internal to the organization to a
relational system comprising the organization and its external partners
(Bogers& West, 2012; Chesbrough, 2006a, 2006b; Vanhaverbeke et al.,
2008). The model of open innovation recognizes that not all good ideas come
from inside the company and not all good ideas created within the company
can be successfully marketed internally.Therefore, an increasing number of
organizations have actively started involving customers, suppliers and other
stakeholders in their innovation processes.
Open Innovation in organizations can thus occur through three processes:
(i) outside-in or inbound process, which involves the inflow and acquisition
of knowledge from external sources; (ii) inside-out or outbound process,
which involves the outflow and commercialization of knowledge; and (iii)
coupled process, which combines the inbound and outbound processes to
result in a continuous co-creation of knowledge (Enkel et al., 2009;
Gassmann&Enkel, 2006). In an inside-out process an organization may
generate profits by transferring internal ideas to the outside environment. In
an outside-in process, organizations expand their own knowledge base
through the inflow of external knowledge provided by suppliers, customers
or other market actors. Finally, in a coupled process, organizations combine
outside-in and inside-out processes. Given the different locus of the
innovation process, each process requires different characteristics.
Gassmann and Enkel [28] conclude that organizations using an inside-out
process are very interested in branding and setting standards, whereas
organizations employing an outside-in process focus on early supplier
integration and customer co-development. Organizations using a coupled
process take a relational view of the organization.
25
Open Innovation business models enable organizations to integrate and
commercialize complementary resources and capabilities to capture value
and maximize profits from innovation (e.g., Chesbrough&Crowther, 2006;
Laursen& Salter, 2006).
Further the open innovation model has been adjusted to the current market
conditions since its adoption provides suitable benefits, such as faster time-
to-market, less cost of innovation, better adaptation of products and services
to customer needs, commercial utilization of knowledge or technologies that
are not aligned with the actual business model of the company, and shared
risk in products and services development.
In the last decade, open innovation model has attracted interest both, in
academia and industry contexts because of its adjustment to the innovation
management trend. In this sense, this paradigm has been defined in the
scientific literature by Chesbrough (2003) as “The purposive inflows and
outflows of knowledge to accelerate internal innovation, and expand the
markets for external use of innovation, respectively. Open Innovation is a
paradigm that assumes that firms can and should use external ideas as well
an internal ideas, and internal and external paths to market, as they look to
advance their technology”.This definition suggests that organizations should
put even greater emphasis on collaboration and networking. Instead of using
the ‘closed’ innovation model of keeping all innovation activities in house,
firms are being urged to open up controlled passages in their otherwise
protective organizational walls. This standpoint is often illustrated by an
innovation funnel, drilled with holes where knowledge can trickle in and out.
In other words, Open Innovation highlights the importance of using a wide
range of knowledge sources for a company’s innovation and invention
process (including customers, competitors, academics, companies in
unrelated sectors), as cooperating with external actors is essential to
increase the innovation capability. In the same way, it assumes that internal
ideas can be taken to the market through external channels, outside a firm’s
current business in order to generate additional value.
In contrast to earlier concepts discussed in the academic literature, the open
innovation paradigm regards internal and external knowledge as being of
equivalent quality. The focal point is the business model, that is, its
relevance to innovation is now considered as well. R&D evaluation is
reconsidered, which means that R&D projects that do not fit in with the
business model may be commercialized elsewhere, referring to the latter
having outbound flows of knowledge firms can benefit through the
application of external revenue models.
In contrast, inbound flows of knowledge refer to an outside-in process
intended to acquire knowledge from external sources. Additionally, it is
acknowledged that knowledge is widely distributed, which requires firms to
become good networkers in order to gain access to this pool of knowledge.
26
The bilateral flow of knowledge has also contributed to a stronger role of IP
management, opening up further means of revenues. Intermediaries also
benefit from this new situation as they help to bring together the different
actors and thus enabling transactions.
Chesbrough argues that the changing business environment has required
organizations toturn from a closed innovation approach to an open one. This
observation has paved the way foropen innovation debates. Dahlander and
Gann, however, conclude that a binaryclassification of open innovation
systems and closed ones fails to go into sufficient depth. Instead,the authors
argue that the two systems should be viewed as a continuum, making
possiblevarying degrees of innovation systems and thus of openness.
The open innovation model has been widely adopted in a variety of
industries. In spite of the fact that initial, evidence was only found in high-
tech industries (e.g., computers, information technology and
pharmaceuticals), open innovation concepts were already being used in a
wide range of industries. Similarly, it was found that SMEs in the
Netherlands employ a lot of open innovation practices and their adoption
has had an incremental behavior since its appearance.For instance, Mowery
(2009) shows that many elements of open innovation were visible in the US
industrial revolution in the late 19th and early 20th centuries.
The notion of open innovation has also been therefore criticized as simply
being ‘old wine in new bottles’ (Trott& Hartmann, 2009) that fails to “bring
anything new to the table” (Remneland-Wikhamn&Wikhamn, 2013, p. 179).
Trott and Hartmann (2009) argue that the open innovation research
community “has given insufficient credit to previous researchers who
described, analyzed and argued in favor of most of the principles on which
Open Innovation was founded, long before the term for this new model was
actually coined”.
Scholars have recognized the need to gather a consolidated understanding of
the field, and have started to review and synthesize the literature. However,
patterns within existing literature can be hard to uncover when a research
field is complex, in its early stages of inquiry, and rapidly evolving (DiStefano
et al., 2010). The relative immaturity of open innovation as a research
domain, the multitude of definitions and conceptualizations, and the steep
increase in publications in the field add to the task.
Regarding to the economic benefits generated by incorporating open
innovation practices, significant evidence has been found. For example,
Procter and Gamble announced that they were able to increase their product
success rate by 50% and the efficiency of their R&D by 60% as a result of
introducing the concept of open innovation in the organization.
Overall, the integration of open innovation practices in companies as well as
its economic benefits is evident. As can be expected, leaving behind the
closed model to move forward the open model requires significant changes in
27
the way innovation processes are managed in the companies.
McLaughlinstresses that open innovation can only happen if there is
sufficient openness and participation from all actors involved. Yet this is
easier said than done. Indeed, organizations have reported serious
difficulties when trying to implement open innovation activities.
Two tendencies in particular – the “not-invented-here” and “not-sold-here”
attitudes – seem to have a serious impact on the successful implementation
of open innovation activities. In this connection, West et al.call for research
efforts to better understand the meaning of incentives and organizations of
R&D workers.
Buganzaet al. [18] demonstrate the influence of industry-level variables,
such as R&D intensity, strengths of the appropriability regime, turbulence
and uncertainty, on the adoption and institutionalization of open
innovation. This indicates that organizations need to revise their current
business models and organizational structures so as to cope with the new
requirements presented by open innovation.
To address this challenge and to link the open innovation framework to the
related literature, Lichtenthaler [8] proposes an expanded definition of open
innovation, which says that the term comprises systematically performing
knowledge exploration, retention, and exploitation inside and outside an
organization’s boundaries throughout the innovation process” (p. 77). The
intention of this definition is to more firmly anchor the concept of open
innovation to related field of studies, such as knowledge management,
organizational learning and firm boundaries. Felleret al. argue that in order
to fully understand organizations’ open innovation activities, it is imperative
to include the economic structures, institutions and regulatory
environments as well.
Some researchers of open innovation model recognize that customer
involvement is a relevant alternative to improve internal innovation process.
According to Van de Vrande et al companies can obtain benefits from the
customer’s ideas and innovations of its clients either by doing proactive
market research, through the provision of tools to experiment with and/or
develop products similar to the ones that are currently offered; or by means
of the development and assessment of products based on customers’
designs.
Another possibility to search and integrate external knowledge in any
company’s innovation processes is by means of external networking. It
includes formal collaborative projects (e.g. R&D alliances) and more general
and informal networking activities. External networking allows companies to
quickly fill up specific knowledge needs without having to spend large
amounts of time and money to develop this knowledge on their own.Simard
and West stress the role of network ties in conjunction with open
28
innovation, and call for studies that would shed light on informal ties in the
context of open innovation. They also correctly observe that the mere
existence of ties does not automatically trigger the transfer of knowledge;
instead a certain level of trust must exist among the partners involved.
Additionally, Simard and West make reference to network portfolios which
consist of complementary ties, as firms are likely to be involved in a number
of different networks that need to be managed in order to meet the
anticipated expectations. It is important to have a coherent strategy at hand
that allows firms to integrate their collaborative activities.
Way Forward Moreover, companies can acquire intellectual property from other
organizations through licensing patents, copyrights or trademarks in
order to accelerate and consolidate their internal research engines.
Equally, projects that are not aligned with the actual business model
and core competencies of the company can be licensed to others,
providing bilateral benefits. The company that receives the license may
use it and prove its value, and the company that licenses may obtain
additional funds and observe and learn from their experience.
Companies can also invest in start-ups or other organizations (e.g.
spin-off) to keep an eye on potential opportunities for innovation.
It was found that companies actively collaborate with other
organizations (universities, competitors, companies in unrelated
sectors, suppliers, etc.) in order to satisfy a specific technological or
knowledge need and/or to improve and expand the products and
services portfolio. These organizations either have solutions that can
improve the company’s innovations or that can exploit solutions the
company has developed. These collaborations provide a number of
benefits (e.g. faster products or services development and cost
reduction), which allow companies to effectively react to market
requirements, obtaining greater productivity, competitiveness and
leadership. Universities are a source of knowledge that impacts the
companies R&D processes. This can be achieved through various
channels, for instance: consulting, research partnerships, research
services, academic entrepreneurship, human resource transfer (from
industry to university and vice versa), commercialization of intellectual
property, scientific publications and informal interaction.
References G. G. Dess and J. C. Picken, “Changing roles: Leadership in the 21st century,” Organizational Dynamics, vol. 28, no. 3. pp. 18–34, Jan. 2000 B. Lawson and D. Samson, “Developing innovation capability in
29
organisations: A dynamic capabilities approach,” Int. J. Innov. Manag., vol. 5, no. 3, pp. 377-400, Sep. 2001. H. Chesbrough and A. K. Crowther, “Beyond high tech: Early adopters of open innovation in other industries,” R&D Manag., vol. 36, no. 3, pp. 229–236, June 2006 H. Chesbrough, “Managing open innovation,” Res. Technol. Manag., vol. 47, no. 1, pp. 23–26, Feb. 2004. V. van de Vrande, J. P. J. de Jong, W. Vanhaverbeke, and M. de Rochemont, “Open innovation in SMEs: Trends, motives and management challenges,” Technovation, vol. 29, no. 6–7, pp. 423– 437, Jun. 2009.
C. Simard and J. West. “Knowledge Networks and the Locus of Innovation,” in Open Innovation: Researching a new paradigm. H. Chesbrough, W. Vanhaverbeke and J. West, Eds. Open innovation: Researching a new paradigm, Oxford: Oxford University Press, 2006, pp. 220-24 P. Ståhle. “The dynamics of self-renewal: A systems-thinking to understanding organizationalchallenges in dynamic environments,” in Organisational Capital: Modelling, measuring and contextualizing. A. Bonfour. Ed. London: Routledge, 2008. U. Lichtenthaler. “Open Innovation: Past Research, Current Debates, and Future Directions.”Academy of Management Perspectives, February, pp. 75-93, 2011. O. Gassmann and E. Enkel. “Towards a Theory of Open Innovation: Three Core ProcessArchetypes,“ presented at the R&D Management Conference (RADMA). Lisbon, Portugal,July 6-9, 2004.
30
HR Consulting: Present & Future in Competitive World
By
Caral D’Cunha
Assistant Professor at NL Dalmia Institute of Management Studies and
Research
Abstract
HR outsourcing as an organizational strategy has increased substantially
over the last decade. In a significant shift, companies are outsourcing for
competitive advantage, seeking benefits ranging from access to expertise
better information management. Large Indian companies are diversifying
into new sectors and prefer candidates with relevant experience. However,
since their HR function find it difficult at times to source candidates from
the large and geographically dispersed talent pool, companies are
increasingly looking at external help. This change in approach and mindset
has made sourcing a relatively complex activity, resulting in companies
increasingly partnering with recruitment consultants with a global footprint
or access to global databases to source the right candidates. The objective of
this research paper is to study current trends & future prospects of the HR
outsourcing industry in Indian context.
Keywords:
Permanent recruitment, temporary staffing, trends
The HR Solutions Industry: An Introduction
While there is no uniform definition for the HR solutions industry, we may
define it as the rewards derived from any decision on buying services for any
part of the human capital value chain. The HR solutions industry can be
broadly divided into two main functions — permanent recruitment of
executives and professionals, and temporary recruitment, specializing in
professional and general staffing.
HR solutions are being increasingly viewed as a distinct industry with the
role of HR consultants evolving with changing market dynamics.
Large Indian companies are diversifying into new sectors and prefer
candidates with relevant experience.
However, since their HR function find it difficult at times to source
candidates from the large and geographically dispersed talent pool,
companies are increasingly looking at external help. This change in
approach and mindset has made sourcing a relatively complex activity,
resulting in companies increasingly partnering with recruitment consultants
31
with a global footprint or access to global databases to source the right
candidates.
The service industry is a people-driven one and is clocking double-digit
growth. The service industry has a large manpower requirement, which
facilitates the need for a large HR function to fulfil its growing needs. Since
recruitment is not a recurring activity and is a function of economy and a
company‘s growth plans, companies prefer to partner with consultants to
source the right candidates as and when required, and have their HR
function focus on the core and strategic activities of selection, planning and
retention.
Temporary staffing is a growing human resource trend and the phenomenon
is finally catching up in India. While industry experts estimate employee
leasing to be a US$140 billion business worldwide, the domestic staffing
industry has yet to witness large figures. The scenario is however set to
change as companies are increasingly partnering with consultants, and
experts expect that in the near future, 2.5%-3%of the workforce in the
country will be hired on a temporary basis.
Objectives of the study:
To study the recent trends in HR consulting industry in India.
To understand the future of the HR consulting industry in India.
Literature review:
Graubner, M., & Richter, A. (2003)HR and benefits consulting is growing
rapidly as employers struggle to bridge the gap between their HR needs and
talent pool. So says a recent report by Kennedy Information in Fitzwilliam,
N.H., publisher of Consultants News, entitled The Global Human Resources
Consulting Marketplace: Key Data, Forecasts & Trends.
"For many years HR consultants sat in the shadow of more glamorous
strategists and IT mavens," according to Tim Bourgeois, Kennedy's vice
president of research and advisory services. "But the drum-tight labor
market and new attitudes toward human resources have brought HR
consulting to the fore.
"As a result, we see new respect for this consulting discipline, as well as new
HR techniques and practices and intense acquisition activity among HR
consulting firms."
The report found that HR consulting growth has been driven by changes in
(and the complexity of) client needs, the widening gap between HR needs
and work force capabilities, and the ability of HR management consulting
firms to fill this gap.
32
Vosburgh, R. M. (2007)Concentration in the consulting industry is not a
transitory phenomenon of the current economic crisis but, in fact, a sign of
a long-term shift in power away from consultants toward their clients.
Inevitably, over the next 3 to 5 years these developments will have a
significant effect on the internal organization of consulting firms, especially
their human resource management policies and practices. On the supply
side, competition in the consulting industry has been growing as many
companies have entered the market. On the demand side, clients are
becoming increasingly choosy, and under the current market conditions,
they can be. Consulting firms need to take a more conscious look at their
organizational and HRM policies and practices and employ these tools more
proactively.
Permanent recruitment
The permanent recruitment market is estimated to be in the range of INR28–
INR31 billion1. This segment can be divided into executive search# and
recruitment#. “Search,” being a niche category, is focused on hiring of CXO-
level positions in an organization, while recruitment is for mid- and junior-
level positions.
Permanent recruitment is a four-step process of sourcing — screening,
selection and on-boarding of candidates — with sourcing being one the most
critical steps, since it involves short listing and attracting the right
candidates from the pool.
Sourcing of the right candidates takes place through campus recruitment
programs, employment agencies, internal referrals and job portals. However,
employment agencies and referrals account for more than 65%2 of the
candidate sourcing process. Sourcing of candidates through employment
agencies is now gaining traction and currently has a 30%2 share.
Executive search In the early 90s, “executive search” was less prevalent, and small placement
agencies dotted the landscape. It was all about database recruiting. The
transformation was noticed after the economy opened up with
multinationals setting up shop in the country. Business for the Indian
search industry largely emanated from global MNCs and accounted for 85–
90%3 of their revenues. The space was dominated by HR consultants such
as ABC consultants and Mafoi.
The end of the 90s and the early 2000s saw the entry of some global search
companies such as Amrop, EgonZehnder, Korn Ferry, Transearch and
Heidrick& Struggles into India. At that time, these MNCs followed the policy
of their international CXOs heading their India operations.Themid 2000s
saw the emergencies of new industries and the need for local talent led
33
multinationals to demand a more scientific approach to top-rung hiring.
Large search companiesbegan importing their knowledge base, global best
practices and proprietary tools to their Indian subsidiaries.
Recruitment India’s recruitment industry has grown with the rising prominence of
industries such as IT, telecom, retail, pharma, ITES and hospitality. These
industries have shown significant growth on the back of strong demand
from the rising Indian consumer class and the dominance of Indian
companies in the outsourcing space.
The recruitment industry has evolved on the back of the increase in the
demand for workforce on the talent acquisition and the client fronts. On the
talent acquisition front, the change has been significant, from a mere
match-making function and career counseling to competency-based
assessment hiring. On the client side, it has moved from a requirement-
based fulfilment system to turnkey project-based hiring to hiring for value
added services (VAS).
The recruitment market for the junior level is dominated by a large number
of small companies and job portals from which companies generally source
profiles. Being a volume- driven segment, the focus is more on the
turnaround time than quality. Hence, having a large data base is of prime
importance. Given the volume nature of this industry sub-segment, fees for
consultants may be lower (in the range of 7-10%2 of the annual cost-to-
company salary) per recruitment.
Temporary recruitment
The temporary recruitment market is estimated to be INR172 billion.
Temporary recruitment takes place when a temporary work agency finds
and retains workers, while other companies in need of short-term workers
enter a contract with the agency to send temporary workers on assignment.
Temporary employees are generally used in industries that are cyclical in
nature and require frequent adjustment of staffing levels.
The temporary recruitment market can be broadly classified on the basis of
the skill set of temporary workers.
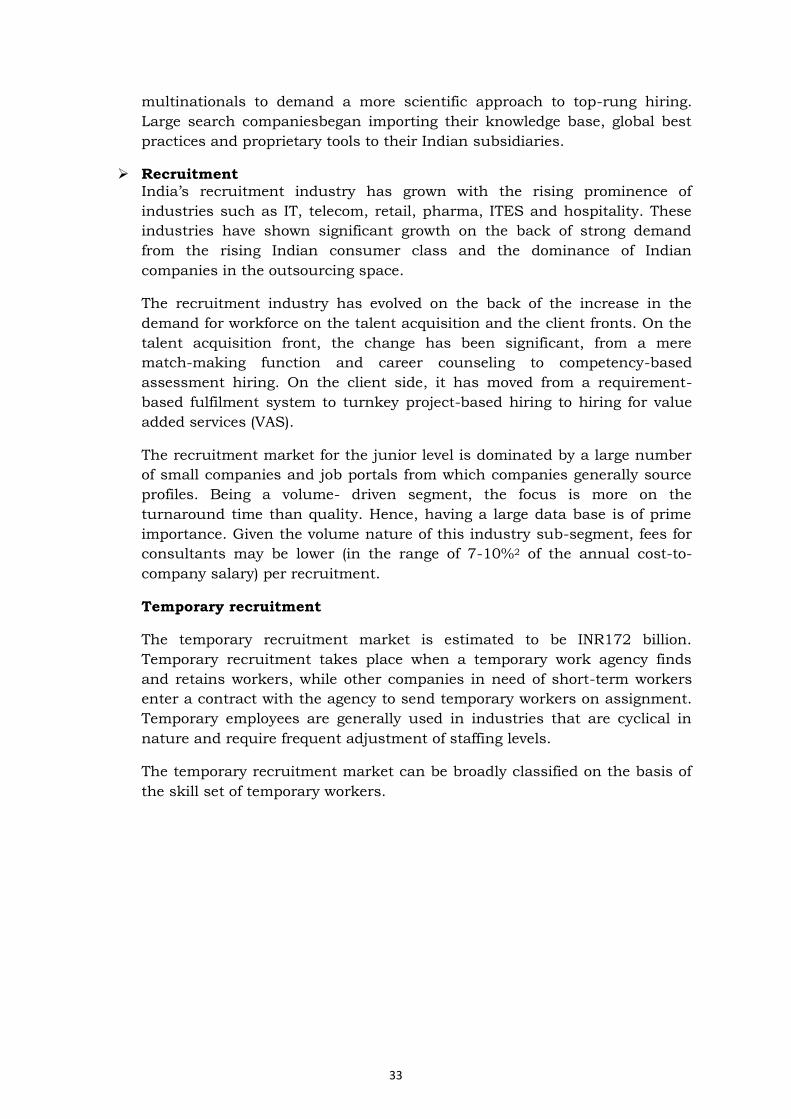
34
Professional staffing:
A staffing company provides temporary skilled professionals on their
payrolls tolarge companies that typically operate in the IT and engineering
sectors. These Professional are technically proficient workers such as web
developers, planners, etc.
General Staffing - White collar:
A staffing company provides temporary skilled labor on their payrolls to
large companies operating in the ITeS, retail and telecom sectors. These may
be people with basic training for generic training, e.g., front -ending a retail
store, BPO employees, etc.General staff salaries typically range between
~INR 10,000 and 13, 0002 pm.
Staffing - blue collar:
A company provides a large number of employees to factories or plants.
These typically include workers. Blue collar staff are paid the minimum
wages applicable in the state where the company operates around ~ INR
5,000 to 8,000 pm.
Other segments of the HR industry
Recruitment process outsourcing (RPO)
The provider acts as a company’s internal recruitment function for all or
part of its recruitment activities, e.g., sourcing of the right candidates,
screening candidates through tests and/or interviews, selection of
candidates based on screening results, and on-boarding and training.
While the global scenario in RPO is evolving rapidly, offshoring in India has
been relatively slow to take off. There are very few homebred companies that
prominent in this space (Elixir Web Solutions, MaFoi Consultants and
Professional
staffing
General Staffing
- White collar
Staffing - blue collar
35
People Strong). Several other RPOs are extensions of recruitment agencies
that offer their services to prevent RPO from having a cannibalizing effect on
their recruitment business. RPO contracts generally extend for six months
to a year, unlike recruitment, which is based on successful referral, and it is
an annuity. However, most recruitment companies do not have the
wherewithal to support the large-scale nature of such contracts and global
clientele.
Most of the recent newsmakers in the Indian RPO space are global players
that are setting up or expanding their Indian delivery base. Some of these
include Alexander Mann Solutions, which has tied up with ABC
Consultants, and Kelly Services, which is launching its RPO services in the
country.
Large international players have entered the Indian market as they are of
the view that small and medium-sized companies will increase their
outsourcing of non-core activities. Moreover, with the market becoming
increasingly more competitive, large players are also expected to begin
outsourcing to reduce costs and increase their efficiency.
Payroll processing and compliance
Payroll outsourcing largely involves analysis of organizational data,
computation of gross salaries, TDS, allowances, reimbursements of
expenses and filing of TDS.
Organizations have the option to establish their payroll systems, but it is
time-consuming and requires expertise. Increasing workloads, strategic roles
gaining in importance, low costs and the enhanced quality of outsourcing is
driving organizations to outsource their processes. According to a survey
conducted by the Society for Human Resource Management, 49%1 of
organizations are outsourcing their payroll processes due to their increasing
headcount.
This space is dominated by large established players such as Hewitt and
Mafoi and small players find it difficult to enter the space, since not all of
them provide end-to-end solutions and last-mile compliance, which is an
extremely important factor. Furthermore, organizations are not comfortable
sharing sensitive information with less established and known players.
Contracts in payroll outsourcing are generally offered for fixed fees in the
range of INR100–INR150per employee. Some of the key success factors in
any payroll agreement include technology, security, last mile compliance,
business continuity and web-enabled query-handling capabilities.
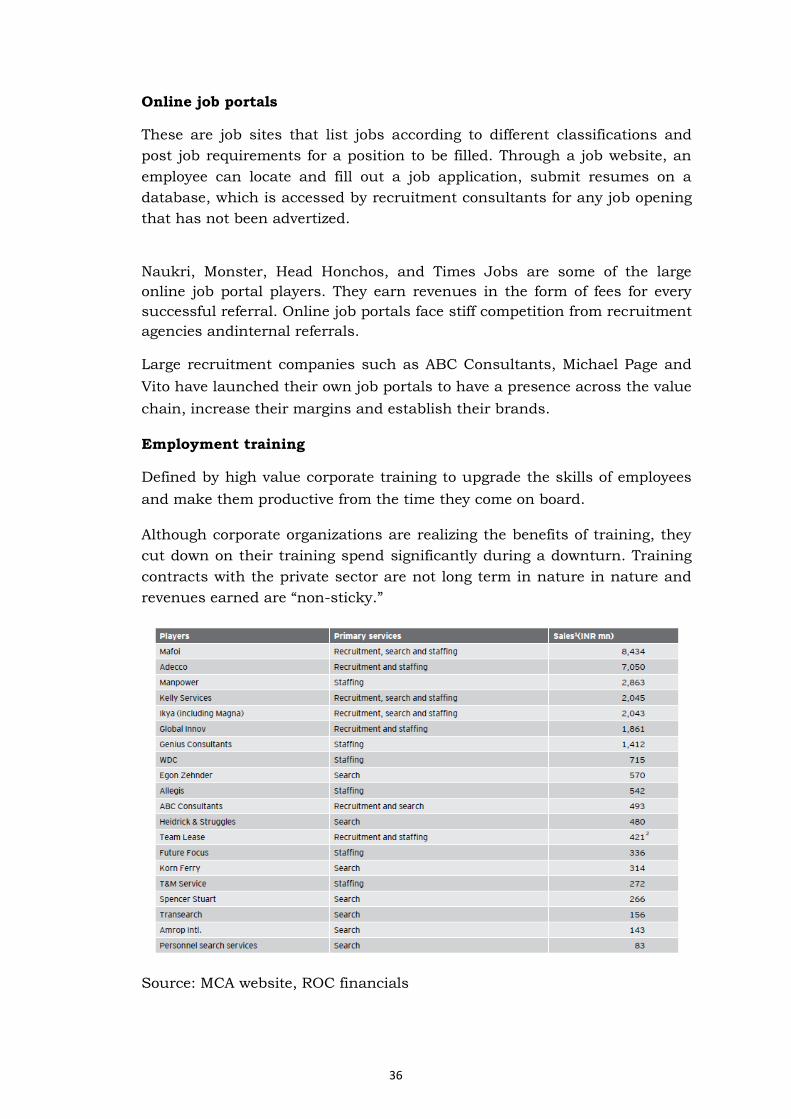
36
Online job portals
These are job sites that list jobs according to different classifications and
post job requirements for a position to be filled. Through a job website, an
employee can locate and fill out a job application, submit resumes on a
database, which is accessed by recruitment consultants for any job opening
that has not been advertized.
Naukri, Monster, Head Honchos, and Times Jobs are some of the large
online job portal players. They earn revenues in the form of fees for every
successful referral. Online job portals face stiff competition from recruitment
agencies andinternal referrals.
Large recruitment companies such as ABC Consultants, Michael Page and
Vito have launched their own job portals to have a presence across the value
chain, increase their margins and establish their brands.
Employment training
Defined by high value corporate training to upgrade the skills of employees
and make them productive from the time they come on board.
Although corporate organizations are realizing the benefits of training, they
cut down on their training spend significantly during a downturn. Training
contracts with the private sector are not long term in nature in nature and
revenues earned are “non-sticky.”
Source: MCA website, ROC financials
37
Emerging trends
Emerging trends in Executive search:
1) Large executive search firms providing CXOs on hire for a short term
a) Large executive firms have started providing CXOs for short tenures of one to three years to stressed investee companies, to enable them to turn around their operations, or to companies looking for subject matter experts to guide them through their roll-out plans to enter new sectors.
b) Huge demand for CXOs on hire by private equity investors for their investee companies
c) Demand from large corporate organizations planning to enter new sectors and conducting pilot testing to fulfill the need for CXOs on hire
Emerging trends in Recruitment:
1) Recruitment firms providing RPO as an offering
a) RPO can have a cannibalizing effect on traditional forms of recruitment; hence, to avoid any loss of business, most recruitment providers have themselves begun providing RPO as a service offering.
b) RPO as a service is an annuity and the term of contracts vary from six months to a year, providing a definitive revenue source to recruitment-focused companies, wherein revenue is only earned on successful referrals.
2) Recruitment firms with their own online portals
a) Recruitment Consultants have their own online portal, called “Head Honchos,” on which they post jobs for senior- level positions only.
b) Mid-level recruiters have ready access to a database of relevant profiles and therefore have a quick turnaround time.
c) Recruitment agencies can have higher margins because they do not need to share their revenues with online portals to source profiles.
d) They help recruitment firms build credible brand.
3) Large executive search firms entering mid-level recruitment
a) The mid-level recruitment segment, which provides an opportunity of INR16.5–INR18 billion1, is characterized by average margins (lower than in executive search), but higher volumes.
Emerging Trends in temporary recruitment:
1) Recruitment companies providing RPO as an offering
38
a) Manpower, which was focused more on recruitment and general staffing, has acquired WDC, which is a large player in professional staffing.
b) Professional staffing companies have high margins.
c) IT companies are pioneers in engaging temporary employees, and therefore, companies do not need to educate them about the benefits derived from availing of these services.
d) IT companies are gradually increasing the share of temporary staff in their total workforce.
2) Staffing companies entering managed services
a) Staffing companies are moving up the value chain and have entered
managed services to earn increased margins.
3) Large international players entering blue collar staffing
4) Staffing companies entering into vocational training
a) Training is the starting point for developing a temporary work-force. A company with training facilities has an edge in terms of an employment-ready and local temporary workforce.
5) 6) Permanent reruitment focused firms entering temporary recruitment
a) Recruitment-focused companies are entering the temporary recruitment segment to build a healthy top line. A large balance sheet makes them attractive from the perspective of investors and banks and helps them to obtain funds required for their future growth.
b) A large player in recruitment and search planning is also planning to enter the temporary recruitment segment.
The road ahead
The HR solutions industry is highly competitive and is poised for enormous
growth in the next 10 years as companies increase their investment in their
HR infrastructure.
Changing market dynamics and global competitive pressures has resulted in
business becoming more complex. This has made companies realize the
importance of getting the right candidates to undertake complex tasks and
outsourcing non-core activities. Companies that were earlier reluctant to
engage external vendors now consider HR consultants their partners in
achieving their organizational growth strategy.
Search
The search market, which evolved in the late 2000s, is expected to continue
growing on the back of the expansion and entry plans of large domestic and
international companies into new sectors and geographies.
39
Recruitment
Recruitment is expected to evolve from a fragmented ecosystem to players
adopting ways to work closely with clients’ requirements, where “resume
pushers” (who do not add significant value to their clients) will eventually get
marginalized. Recruitment companies are likely to move away from sourcing
relevant candidates to accessing the right ones by using psychometric and
other robust tests to shortlist them.
Temporary staffing
Temporary staffing, one of the leading HR trends today, is expected to
increase its penetration significantly, given the current uncertain economic
conditions. Companies and captive units are likely to increasingly depend on
agencies to lease them with the required manpower in time, to meet sudden
demand from clients.
Other segments
Organizations are fast realizing the benefits of outsourcing non-core activities
and focusing on enhanced value-added activities. Outsourcing non-core
activities enables HR professionals to move away from routine administration
to a more strategic role. As a result, the number of companies outsourcing
HR activities is expected to continue to rise and the scope of outsourced HR
activities to expand.
The HR solutions industry is seems poised for interesting times; with 11
deals in the last three years, the overall sector is expected to keep innovating
and evolving toward exponential growth.
Bibliography:
Graubner, M., & Richter, A. (2003). Managing tomorrow's consulting
firm.Consulting to Management, 14(3), 43-50.
Switser, J. ((Nov 1997)). Trends in human resources outsourcing. Management Accounting, 22-27.
Vosburgh, R. M. (2007). The evolution of HR: Developing HR as an internal
consulting organization. HR.Human Resource Planning, 30(3), 11-16,18-23.
Young, E. &. (2012). Human Resource Solution Industry. KolKatta: Executive Recruiter Associates.
Employee Benefit News, 13(5), 7.10(1)
www.mca.gov.in/
40
A Study of Association between the Demographic Factors and
Patients’
Visit to Pharmacy
By
Dr. Chandrashekhar Suresh Kaushik
Associate Professor at Durgadevi Saraf Institute of Management
Studies
Abstract
Medicines which do not require doctor’s prescription for sale are called as
over the counter or OTC medicines. In developing country like India, most of
the patients visit pharmacies first, when they suffer from various common
indications. These patients are given OTC medicines by the pharmacists. The
purpose of this study is to find out whether a systematic association exists
between the visit of patient to pharmacy first for medication on various
indications with the demographic factors, like, age of patient and education
of patient in Mumbai. The study is a cross- sectional survey of patients
visiting pharmacy stores before visiting doctor to get OTC medicines in
Mumbai city.
Keywords:
Age, Education, OTC medicines, Patients, Pharmacy, Indication.
INTRODUCTION:
Medicines which do not require doctor’s prescription for sale are called as
over the counter or OTC medicines. In developing country like India, most of
the patients visit pharmacies when they suffer from various common
indications. These patients are given OTC medicines by the pharmacists.
In today’s world, every day, lakhs of people visit community pharmacies for
their health care needs (Adepu & Nagavi, 2006).In patient- centered health
care, the first challenge is to identify and meet the changing needs of
patients. There should be a universal code of conduct for pharmacist working
in pharmacy to safeguard patient’s health. Pharmacists practicing in
community pharmacy are shifting their aim from drug product to serving
patient. This change in shift has brought in the changing role that
pharmacist have to adopt. Now pharmacists have to adopt a more patient
focused approach. The change in priority has been an evolving process, not
an event. (Knowlton, 1990, p. 28).
41
The most commonly understood definition is “Pharmaceutical care is the
responsible provision of drug therapy for the purpose of achieving definite
outcomes that improve a patient’s quality of life” (Hepler & Strand, 1990).
Increase in consumption of medicines is because of increase in the life span
of individuals, newer and newer infectious diseases are emerging, younger
generation people are suffering from chronic diseases, which can be related
to lifestyle diseases, and to treat this we need lifestyle medicines. In many
parts of the world, patients (consumers) can now buy medicines in
supermarkets (malls), in drug stores or at markets. In some parts of the
world, where there is prevalence of e-prescription (electronic prescription)
there is e-dispensing i.e. medicines can be obtained by mail order and / or
Internet.
According to Philip Kotler, “Retailing includes all the activities involved in
selling goods or services to the final customers for personal, non-business
use” (Pradhan, 2010, p. 4)
Retailing activity related to medicines is done in stores called ‘Pharmacy’. The
word pharmacy has different synonyms in India, like ‘Medical store’,
‘Chemists and Druggist’, ‘Drugstore’, ‘Chemists’ to name a few.
LITERATURE REVIEW:
For review on consumer’s views, Literature review was done by Eades,
Ferguson, & O’Carroll (2011). This study was done from 2001 to 2010. The
major findings in the study by (Eades, Ferguson, & O’Carroll, 2011) were
consumer’s perception of pharmacists was of a drug expert rather than
experts on health and illness. Visit to the pharmacy by consumers was
majorly for dispensing prescriptions and purchasing over the counter (OTC)
medicines.
A research done by (Upasani, Shah, Ingle, & Patil, 2011) dealt with status of
retail as well as their social status and role of community pharmacists in
Amalner Tehsil in Khandesh Region of Maharashtra, India, threw the same
light which earlier researchers had studied. Upasani et.al., mentions,
pharmacists have opportunity to communicate with patients. Pharmacists
are proving themselves as health care professionals through their services in
developing countries.
A study conducted by Eadeset. al (2011) where they have mentioned, visit to
the pharmacy by consumers was majorly for prescriptions and purchasing
over the counter (OTC) medicines and consumer’s perception of pharmacists
was of a drug expert rather than experts on health and illness.
A study conducted by Caamano et.al (2005) assessed the opinion of
pharmacists on medicines dispensed by them without requiring a doctor’s
prescription. The study was conducted in Spain, where a cross-sectional
42
study was undertaken to study 166 community pharmacists. In the study,
pharmacists were asked for their opinion on their responsibility regarding the
dispensed drugs and pharmacists’ perception of their work performed. The
results were almost 66% pharmacists dispensed antibiotics (used for
infections) without prescription, the percentage increased drastically to 83%
when it came to non-steroidal anti-inflammatory drugs (NSAID used for pain)
as compared to 46% for angiotensin converting enzyme inhibitor drugs (used
for hypertension). The results further mentions, pharmacists which had more
workload, did not insist on demand for medical prescriptions. “In contrast,
pharmacists who stressed the importance of their duty in rationalizing the
consumption of drugs more frequently demanded medical prescriptions”
(Caamano, Tome-Otero, Takkouche, & Gestal-Otero, 2005).
Wazaify et.al (2005) study was to investigate the public’s perceptions and
opinion about OTC medicines. The researchers divided the questionnaire into
parts which addressed, “Attitudes towards community pharmacy and
patient’s contacts with pharmacies” with “attitudes towards the use of OTC
medicines” and “views on OTC medicines” (Wazaify, Sheilds, Hughes, &
McElnay, 2005). The data was collected from 1000 respondents using a
structured interview technique from Northern Ireland. Pilot was done in
small sample, with general public (n=20).The results did show, almost, 70%
patients reported they visit always or often the same pharmacy, and the
reason being to obtain a prescription medicine, over 60% patients reported
they are comfortable in seeking advice from pharmacists for minor ailments
rather than visiting a doctor.
Further, theresults pointed out recommendation of the pharmacist were a
major influence in the choice of OTC medicines. According to the
researchers, in recent years, there is a positive trend among patients in self-
medications with non-prescription drugs, these non-prescription drugs are
often called over the counter (OTC) drugs. The common OTC drugs in
Wazaify et.al (2005) study were Cough remedies, Painkillers,
Indigestion/heart burn, Hay fever products, Vitamins and/ or minerals,
Laxatives, Anti-diarrheal. Hugheset. al (2001) found there is an advantage of
self-medication when it comes to healthcare systems, as it leads to good use
of clinical skills of pharmacists, patient’s easier access to medication. But,
increasing availability of OTC drugs may motivate patients to think that there
is a drug for every disease/disorder. Moreover, Hughes C. (2003) states, the
use of such over the counter products may delay or act as hindrance to the
diagnosis of serious illness.
Bissell et.al. (2000) and Hughes L. (2002) reported the reflection of the
public’s growing confidence in self-care. This was substantiated by Wazaify
et.al (2005) study mentioning a rise in number of people buying OTC
medicines regularly. Mr. Terry Spears in his article named, Community
Pharmacists Play Key Role in Improving Medication Safety, mentions, “ as
43
trusted community health advisors, pharmacists can promote the safe use of
medications and improve clinical outcomes” (Spears, 2010).
(Neoh C. F., Hassali, Shafie, & Ahmed, 2011)in their research related to
nature and adequacy of information on dispensed medications delivered to
patients in community pharmacies have highlighted patients should receive
information related to their medications from healthcare professionals such
as a community pharmacist, general medical practitioner or their assistants.
Yet the information provided by these healthcare professionals may be
inconsistent, incomplete and insufficient for patients to understand. Without
adequate and appropriate information conveyed to the patients, medication
errors are likely to occur. The researcher further states, “There is a globally
growing trend for consumers to self-medicate with non-prescription
medications for common ailments and pharmacists are the most accessible
healthcare professionals who are equipped with specialized knowledge in
relation to the safe and rational use of medications.
METHODOLOGY:
Purpose:To find out whether a systematic association exists between the
visit of patient to pharmacy for medication on various indications with the
age of patient and education of patient in Mumbai.
The research done was Exploratory and Descriptive in nature. Qualitative
approach: In-depth interviews were conducted with 10 patients across
Mumbai. This was done to know what does individuals perceive and expect
from a pharmacy where they purchase medicines. Quantitative approach:
The tool used for this survey was a questionnaire for patients. Before
conducting field survey, pilot study was undertaken; data was collected from
20 respondents from Mumbai.
Patient’s Questionnaire: Self-developed questionnaire. There were few
questions taken from Community Pharmacy Patient Questionnaire (CPPQ),
which was formerly referred to as Patient Satisfaction Questionnaire, with
few questions related to the research were taken from patient’s questionnaire
developed by Dr. Carmin Jane Gade(Carmin, 2003).
Sampling Design are Patients (Individuals) living in Mumbai. Sampling
method was Random purposive sampling for both Pharmacists and Patients.
Note: Purpose defined: Randomly selected individuals from households where
the researcher had gone for filling patient’s questionnaire. The Sample size
taken was 300 Patients (Individuals) living in Mumbai city.
Statistical test: Chi Square test
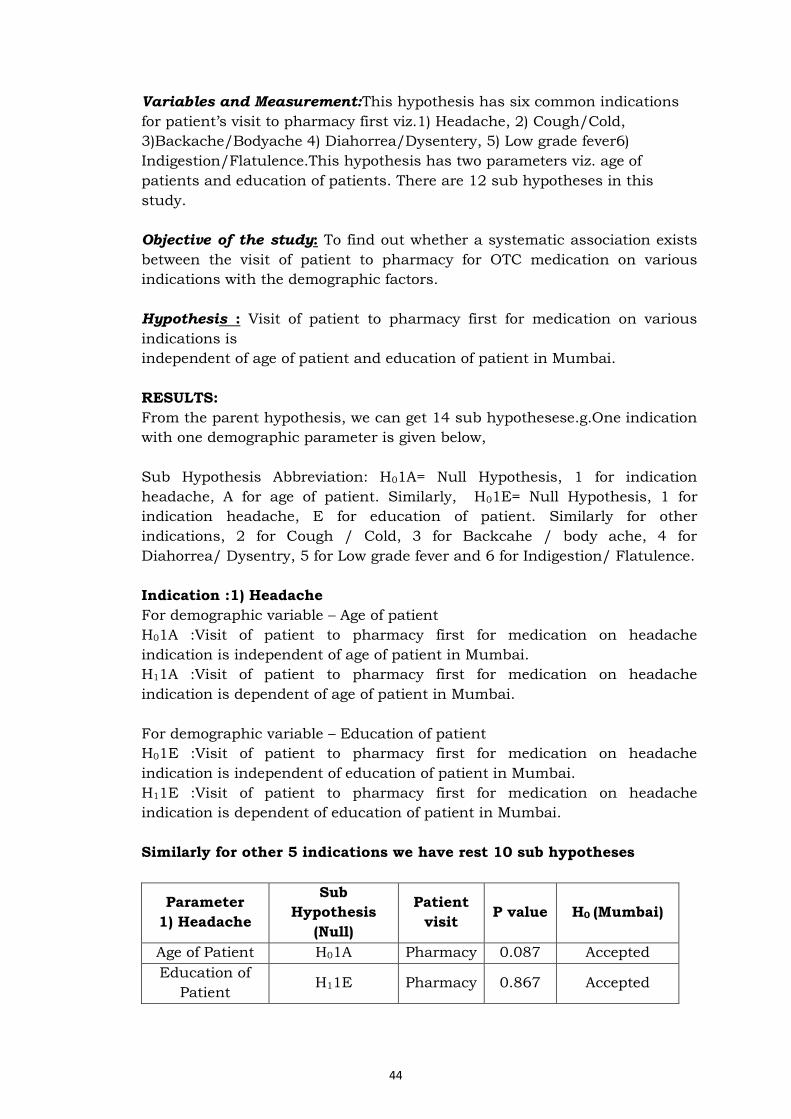
44
Variables and Measurement:This hypothesis has six common indications
for patient’s visit to pharmacy first viz.1) Headache, 2) Cough/Cold,
3)Backache/Bodyache 4) Diahorrea/Dysentery, 5) Low grade fever6)
Indigestion/Flatulence.This hypothesis has two parameters viz. age of
patients and education of patients. There are 12 sub hypotheses in this
study.
Objective of the study: To find out whether a systematic association exists
between the visit of patient to pharmacy for OTC medication on various
indications with the demographic factors.
Hypothesis : Visit of patient to pharmacy first for medication on various
indications is
independent of age of patient and education of patient in Mumbai.
RESULTS:
From the parent hypothesis, we can get 14 sub hypothesese.g.One indication
with one demographic parameter is given below,
Sub Hypothesis Abbreviation: H01A= Null Hypothesis, 1 for indication
headache, A for age of patient. Similarly, H01E= Null Hypothesis, 1 for
indication headache, E for education of patient. Similarly for other
indications, 2 for Cough / Cold, 3 for Backcahe / body ache, 4 for
Diahorrea/ Dysentry, 5 for Low grade fever and 6 for Indigestion/ Flatulence.
Indication :1) Headache
For demographic variable – Age of patient
H01A :Visit of patient to pharmacy first for medication on headache
indication is independent of age of patient in Mumbai.
H11A :Visit of patient to pharmacy first for medication on headache
indication is dependent of age of patient in Mumbai.
For demographic variable – Education of patient
H01E :Visit of patient to pharmacy first for medication on headache
indication is independent of education of patient in Mumbai.
H11E :Visit of patient to pharmacy first for medication on headache
indication is dependent of education of patient in Mumbai.
Similarly for other 5 indications we have rest 10 sub hypotheses
Parameter
1) Headache
Sub
Hypothesis
(Null)
Patient
visit P value H0 (Mumbai)
Age of Patient H01A Pharmacy 0.087 Accepted
Education of
Patient H11E Pharmacy 0.867 Accepted
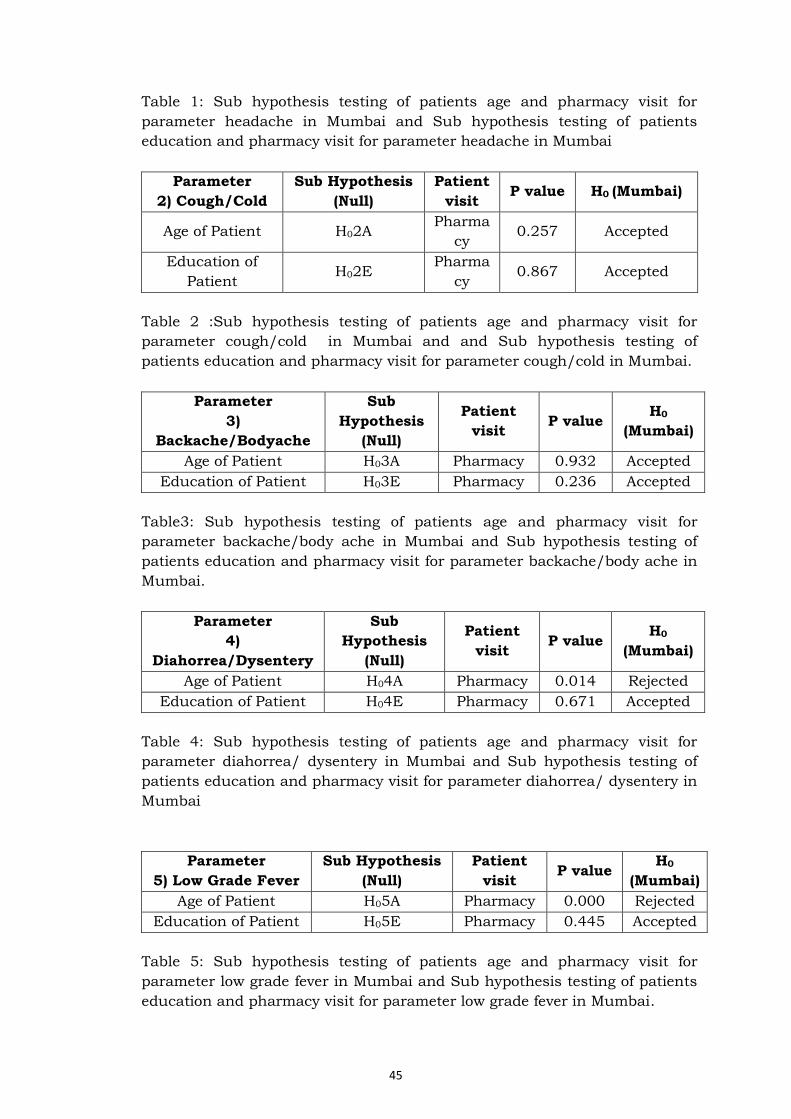
45
Table 1: Sub hypothesis testing of patients age and pharmacy visit for
parameter headache in Mumbai and Sub hypothesis testing of patients
education and pharmacy visit for parameter headache in Mumbai
Parameter
2) Cough/Cold
Sub Hypothesis
(Null)
Patient
visit P value H0 (Mumbai)
Age of Patient H02A Pharma
cy 0.257 Accepted
Education of
Patient H02E
Pharma
cy 0.867 Accepted
Table 2 :Sub hypothesis testing of patients age and pharmacy visit for
parameter cough/cold in Mumbai and and Sub hypothesis testing of
patients education and pharmacy visit for parameter cough/cold in Mumbai.
Parameter
3)
Backache/Bodyache
Sub
Hypothesis
(Null)
Patient
visit P value
H0
(Mumbai)
Age of Patient H03A Pharmacy 0.932 Accepted
Education of Patient H03E Pharmacy 0.236 Accepted
Table3: Sub hypothesis testing of patients age and pharmacy visit for
parameter backache/body ache in Mumbai and Sub hypothesis testing of
patients education and pharmacy visit for parameter backache/body ache in
Mumbai.
Parameter
4)
Diahorrea/Dysentery
Sub
Hypothesis
(Null)
Patient
visit P value
H0
(Mumbai)
Age of Patient H04A Pharmacy 0.014 Rejected
Education of Patient H04E Pharmacy 0.671 Accepted
Table 4: Sub hypothesis testing of patients age and pharmacy visit for
parameter diahorrea/ dysentery in Mumbai and Sub hypothesis testing of
patients education and pharmacy visit for parameter diahorrea/ dysentery in
Mumbai
Parameter
5) Low Grade Fever
Sub Hypothesis
(Null)
Patient
visit P value
H0
(Mumbai)
Age of Patient H05A Pharmacy 0.000 Rejected
Education of Patient H05E Pharmacy 0.445 Accepted
Table 5: Sub hypothesis testing of patients age and pharmacy visit for
parameter low grade fever in Mumbai and Sub hypothesis testing of patients
education and pharmacy visit for parameter low grade fever in Mumbai.
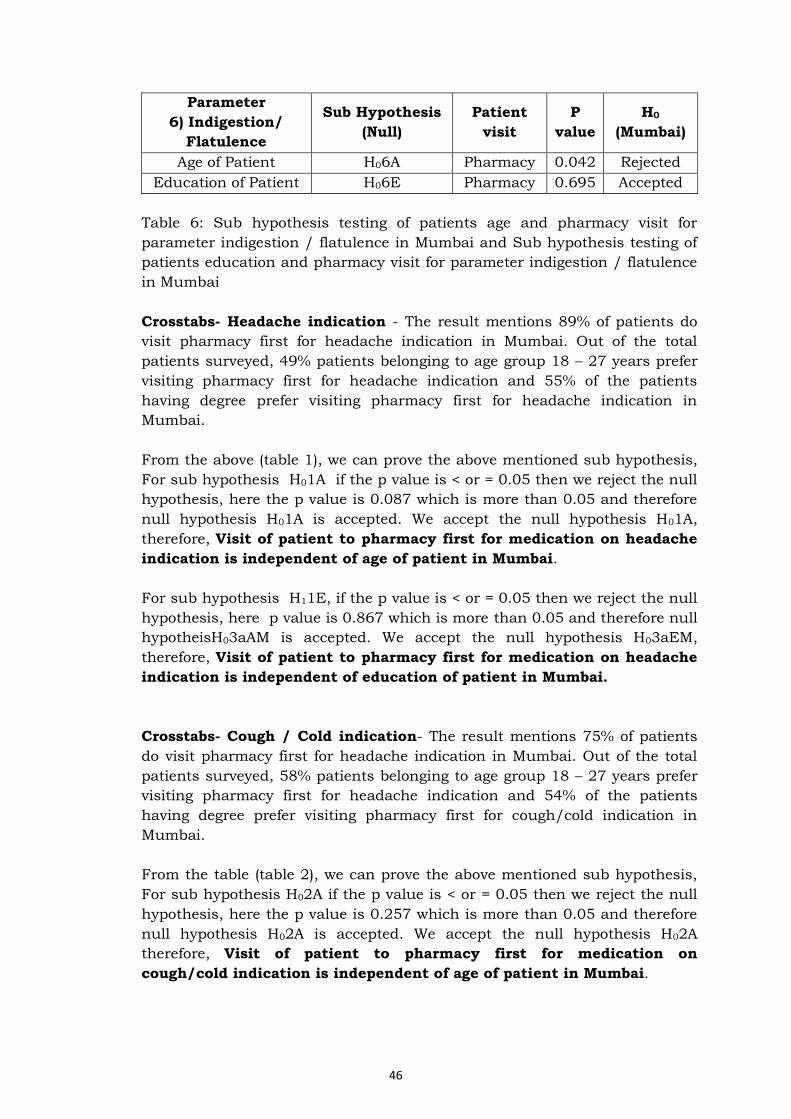
46
Parameter
6) Indigestion/
Flatulence
Sub Hypothesis
(Null)
Patient
visit
P
value
H0
(Mumbai)
Age of Patient H06A Pharmacy 0.042 Rejected
Education of Patient H06E Pharmacy 0.695 Accepted
Table 6: Sub hypothesis testing of patients age and pharmacy visit for
parameter indigestion / flatulence in Mumbai and Sub hypothesis testing of
patients education and pharmacy visit for parameter indigestion / flatulence
in Mumbai
Crosstabs- Headache indication - The result mentions 89% of patients do
visit pharmacy first for headache indication in Mumbai. Out of the total
patients surveyed, 49% patients belonging to age group 18 – 27 years prefer
visiting pharmacy first for headache indication and 55% of the patients
having degree prefer visiting pharmacy first for headache indication in
Mumbai.
From the above (table 1), we can prove the above mentioned sub hypothesis,
For sub hypothesis H01A if the p value is < or = 0.05 then we reject the null
hypothesis, here the p value is 0.087 which is more than 0.05 and therefore
null hypothesis H01A is accepted. We accept the null hypothesis H01A,
therefore, Visit of patient to pharmacy first for medication on headache
indication is independent of age of patient in Mumbai.
For sub hypothesis H11E, if the p value is < or = 0.05 then we reject the null
hypothesis, here p value is 0.867 which is more than 0.05 and therefore null
hypotheisH03aAM is accepted. We accept the null hypothesis H03aEM,
therefore, Visit of patient to pharmacy first for medication on headache
indication is independent of education of patient in Mumbai.
Crosstabs- Cough / Cold indication- The result mentions 75% of patients
do visit pharmacy first for headache indication in Mumbai. Out of the total
patients surveyed, 58% patients belonging to age group 18 – 27 years prefer
visiting pharmacy first for headache indication and 54% of the patients
having degree prefer visiting pharmacy first for cough/cold indication in
Mumbai.
From the table (table 2), we can prove the above mentioned sub hypothesis,
For sub hypothesis H02A if the p value is < or = 0.05 then we reject the null
hypothesis, here the p value is 0.257 which is more than 0.05 and therefore
null hypothesis H02A is accepted. We accept the null hypothesis H02A
therefore, Visit of patient to pharmacy first for medication on
cough/cold indication is independent of age of patient in Mumbai.
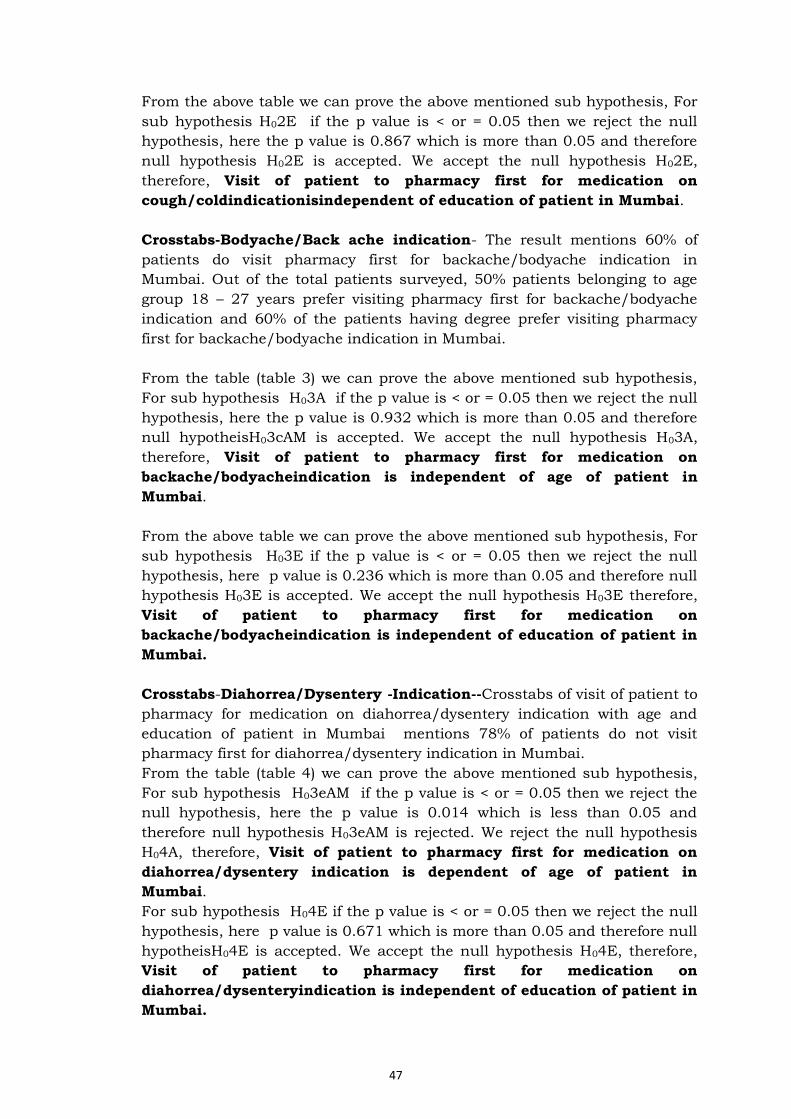
47
From the above table we can prove the above mentioned sub hypothesis, For
sub hypothesis H02E if the p value is < or = 0.05 then we reject the null
hypothesis, here the p value is 0.867 which is more than 0.05 and therefore
null hypothesis H02E is accepted. We accept the null hypothesis H02E,
therefore, Visit of patient to pharmacy first for medication on
cough/coldindicationisindependent of education of patient in Mumbai.
Crosstabs-Bodyache/Back ache indication- The result mentions 60% of
patients do visit pharmacy first for backache/bodyache indication in
Mumbai. Out of the total patients surveyed, 50% patients belonging to age
group 18 – 27 years prefer visiting pharmacy first for backache/bodyache
indication and 60% of the patients having degree prefer visiting pharmacy
first for backache/bodyache indication in Mumbai.
From the table (table 3) we can prove the above mentioned sub hypothesis,
For sub hypothesis H03A if the p value is < or = 0.05 then we reject the null
hypothesis, here the p value is 0.932 which is more than 0.05 and therefore
null hypotheisH03cAM is accepted. We accept the null hypothesis H03A,
therefore, Visit of patient to pharmacy first for medication on
backache/bodyacheindication is independent of age of patient in
Mumbai.
From the above table we can prove the above mentioned sub hypothesis, For
sub hypothesis H03E if the p value is < or = 0.05 then we reject the null
hypothesis, here p value is 0.236 which is more than 0.05 and therefore null
hypothesis H03E is accepted. We accept the null hypothesis H03E therefore,
Visit of patient to pharmacy first for medication on
backache/bodyacheindication is independent of education of patient in
Mumbai.
Crosstabs-Diahorrea/Dysentery -Indication--Crosstabs of visit of patient to
pharmacy for medication on diahorrea/dysentery indication with age and
education of patient in Mumbai mentions 78% of patients do not visit
pharmacy first for diahorrea/dysentery indication in Mumbai.
From the table (table 4) we can prove the above mentioned sub hypothesis,
For sub hypothesis H03eAM if the p value is < or = 0.05 then we reject the
null hypothesis, here the p value is 0.014 which is less than 0.05 and
therefore null hypothesis H03eAM is rejected. We reject the null hypothesis
H04A, therefore, Visit of patient to pharmacy first for medication on
diahorrea/dysentery indication is dependent of age of patient in
Mumbai.
For sub hypothesis H04E if the p value is < or = 0.05 then we reject the null
hypothesis, here p value is 0.671 which is more than 0.05 and therefore null
hypotheisH04E is accepted. We accept the null hypothesis H04E, therefore,
Visit of patient to pharmacy first for medication on
diahorrea/dysenteryindication is independent of education of patient in
Mumbai.
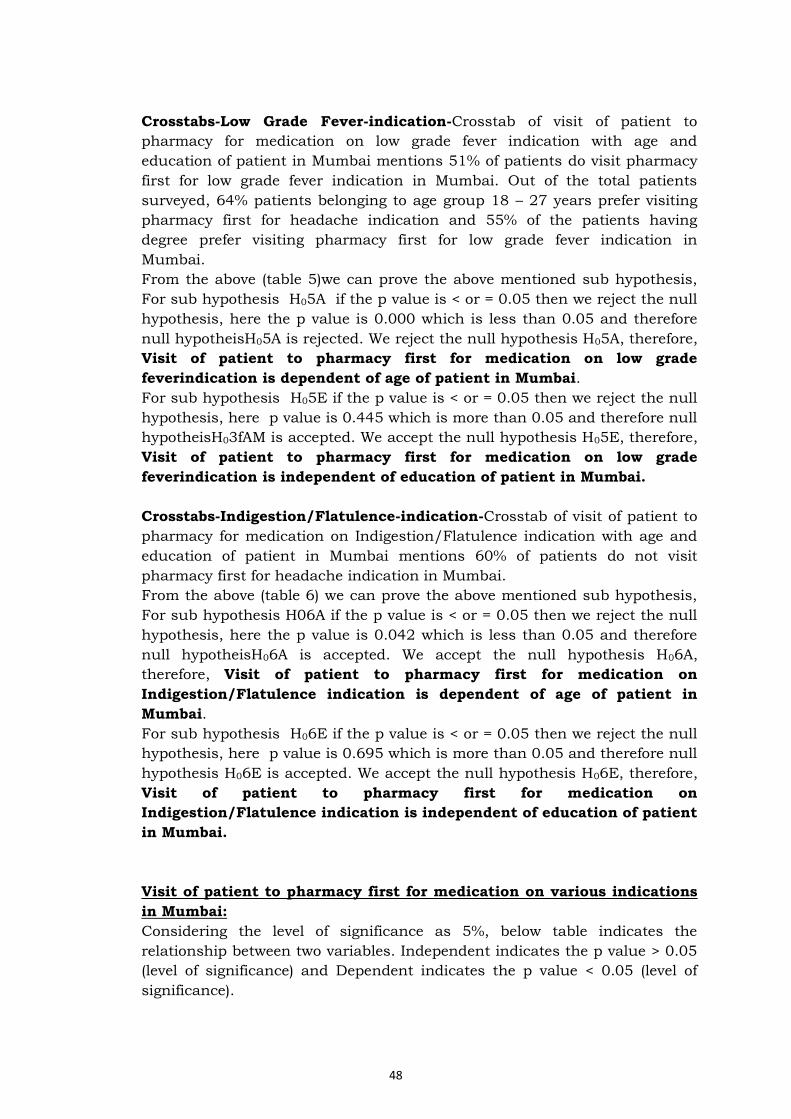
48
Crosstabs-Low Grade Fever-indication-Crosstab of visit of patient to
pharmacy for medication on low grade fever indication with age and
education of patient in Mumbai mentions 51% of patients do visit pharmacy
first for low grade fever indication in Mumbai. Out of the total patients
surveyed, 64% patients belonging to age group 18 – 27 years prefer visiting
pharmacy first for headache indication and 55% of the patients having
degree prefer visiting pharmacy first for low grade fever indication in
Mumbai.
From the above (table 5)we can prove the above mentioned sub hypothesis,
For sub hypothesis H05A if the p value is < or = 0.05 then we reject the null
hypothesis, here the p value is 0.000 which is less than 0.05 and therefore
null hypotheisH05A is rejected. We reject the null hypothesis H05A, therefore,
Visit of patient to pharmacy first for medication on low grade
feverindication is dependent of age of patient in Mumbai.
For sub hypothesis H05E if the p value is < or = 0.05 then we reject the null
hypothesis, here p value is 0.445 which is more than 0.05 and therefore null
hypotheisH03fAM is accepted. We accept the null hypothesis H05E, therefore,
Visit of patient to pharmacy first for medication on low grade
feverindication is independent of education of patient in Mumbai.
Crosstabs-Indigestion/Flatulence-indication-Crosstab of visit of patient to
pharmacy for medication on Indigestion/Flatulence indication with age and
education of patient in Mumbai mentions 60% of patients do not visit
pharmacy first for headache indication in Mumbai.
From the above (table 6) we can prove the above mentioned sub hypothesis,
For sub hypothesis H06A if the p value is < or = 0.05 then we reject the null
hypothesis, here the p value is 0.042 which is less than 0.05 and therefore
null hypotheisH06A is accepted. We accept the null hypothesis H06A,
therefore, Visit of patient to pharmacy first for medication on
Indigestion/Flatulence indication is dependent of age of patient in
Mumbai.
For sub hypothesis H06E if the p value is < or = 0.05 then we reject the null
hypothesis, here p value is 0.695 which is more than 0.05 and therefore null
hypothesis H06E is accepted. We accept the null hypothesis H06E, therefore,
Visit of patient to pharmacy first for medication on
Indigestion/Flatulence indication is independent of education of patient
in Mumbai.
Visit of patient to pharmacy first for medication on various indications
in Mumbai:
Considering the level of significance as 5%, below table indicates the
relationship between two variables. Independent indicates the p value > 0.05
(level of significance) and Dependent indicates the p value < 0.05 (level of
significance).
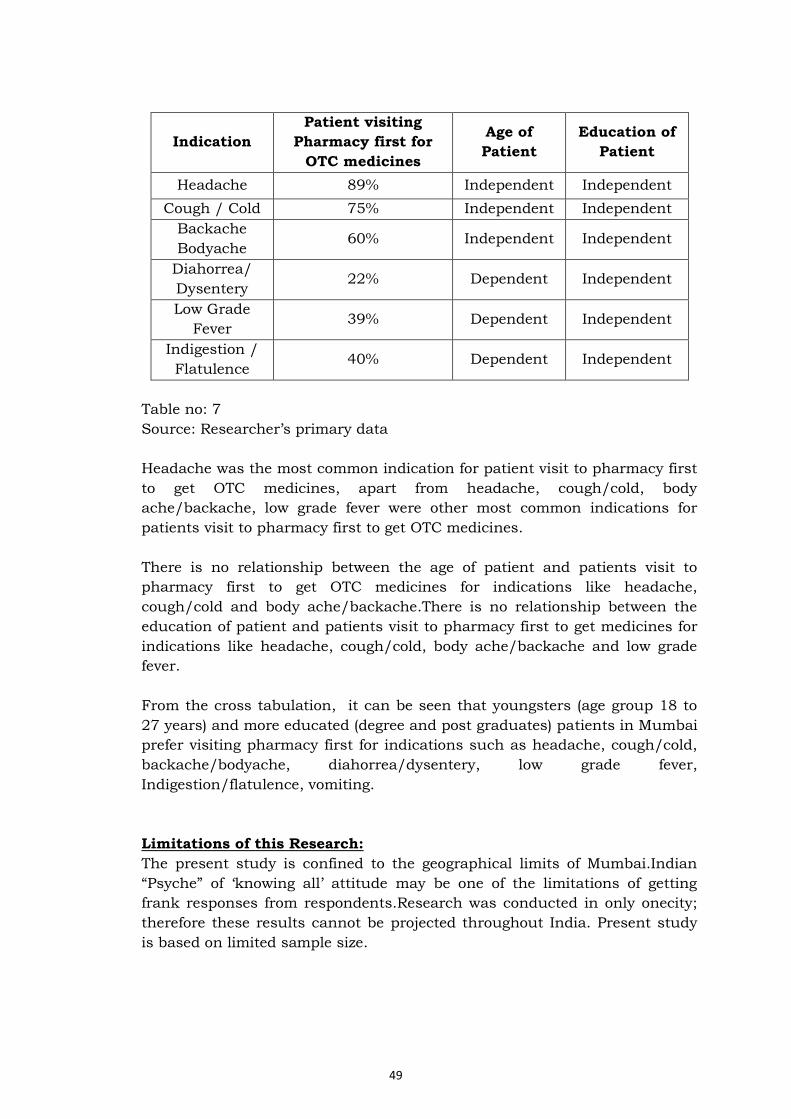
49
Indication
Patient visiting
Pharmacy first for
OTC medicines
Age of
Patient
Education of
Patient
Headache 89% Independent Independent
Cough / Cold 75% Independent Independent
Backache
Bodyache 60% Independent Independent
Diahorrea/
Dysentery 22% Dependent Independent
Low Grade
Fever 39% Dependent Independent
Indigestion /
Flatulence 40% Dependent Independent
Table no: 7
Source: Researcher’s primary data
Headache was the most common indication for patient visit to pharmacy first
to get OTC medicines, apart from headache, cough/cold, body
ache/backache, low grade fever were other most common indications for
patients visit to pharmacy first to get OTC medicines.
There is no relationship between the age of patient and patients visit to
pharmacy first to get OTC medicines for indications like headache,
cough/cold and body ache/backache.There is no relationship between the
education of patient and patients visit to pharmacy first to get medicines for
indications like headache, cough/cold, body ache/backache and low grade
fever.
From the cross tabulation, it can be seen that youngsters (age group 18 to
27 years) and more educated (degree and post graduates) patients in Mumbai
prefer visiting pharmacy first for indications such as headache, cough/cold,
backache/bodyache, diahorrea/dysentery, low grade fever,
Indigestion/flatulence, vomiting.
Limitations of this Research:
The present study is confined to the geographical limits of Mumbai.Indian
“Psyche” of ‘knowing all’ attitude may be one of the limitations of getting
frank responses from respondents.Research was conducted in only onecity;
therefore these results cannot be projected throughout India. Present study
is based on limited sample size.
50
CONCLUSION:
Findings reveal that,people from all age groups in Mumbai prefer to visit
pharmacy first for indications such as headache, cough/cold and
backache/body ache, whereas, they do not visit pharmacy first for
indications like diahorrea/dysentery, low grade fever, Indigestion/flatulence.
Findings reveal, in Mumbai educated patients prefer visiting pharmacy first
for indications such as headache, cough/cold, backache/bodyache,
diahorrea/dysentery, low grade fever, Indigestion/flatulence. This indicates
educated people visit pharmacy first for all minor indications mentioned in
this research.
REFERENCES:
Adepu, R., & Nagavi, B. (2006). General practitioners' perception about the extended roles of community pharmacists in the state of Karnataka: A study. Indian J. Pharm. Sci. , 36-40. Bissell,P., Ward,P.R., Noyce, P.R. (2000). Mapping the contours of risk:
consumer perceptions of non-prescription medicines.J SocAdm Pharm, 136-
142.
Carmin Jane Gade MA, An exploration of Pharmacist-Patient communicative
relationship. 2003. The Ohio State University.
Caamano, F., Tome-Otero, M., Takkouche, B., & Gestal-Otero, J. J. (2005). Influence of pharmacists opinions on their dispensing medicines without requirement of a doctor's prescription. Gac Sanit , 9-14. Eades, C. E., Ferguson, J. S., & O’Carroll. (2011). Public health in community pharmacy:A systematic review of pharmacist and consumer views. BMC Public Health , 11:582. Hepler, C. D., & Strand, L. M. (1990). Opportunities and responsibilities in pharmaceutical care. American Journal of Hospital Pharmacy , 533.
Hughes, L., Whittlesea, C., Luscombe,D. (2002). Patient’s knowledge and
perceptions of the side-effects of OTC medication.J Clin Pharm Ther, 243-248.
Knowlton, C. H. (1990). The Practice of Community Pharmacy. In A. R. Gennaro, Remington's Pharmaceutical Sciences (p. 28). Philadelphia: Mack Publishing Company.
Neoh, F., Hassali, M., Shafie, A., & Awaisu, A. (2011). Nature and adequacy of information on dispensed medications delivered to patients in community pharmacies : a pilot study from Penang, Malaysia. Journal of Pharmaceutical Health Services Research . Pradhan, S. (2010). Retailing Management. New Delhi: Mc Graw Hill.

51
Spears, T. (2010, November 23). Community Pharmacists Play Key Role in Improving Medication Safety. Retrieved June 12, 2012, from Pharmacy Times: http://www.pharmacytimes.com/publications/issue/2010/November2010/CommunityPharmacistsMedSafety Upasani, S., Shah, V., Ingle, P., & Patil, P. (2011). The Assessment of Current Status of Retail Pharmacists of Amalner Tehsil in Khandesh Region of Maharashtra. IJPI's Journal of Hospital and Clinical Pharmacy , 37-38.
Wazaify, M., Sheilds, E., Hughes, C. M., & McElnay, J. C. (2005). Societal
perspectives on over-the-counter (OTC) medicines. Family Practice , 170-176
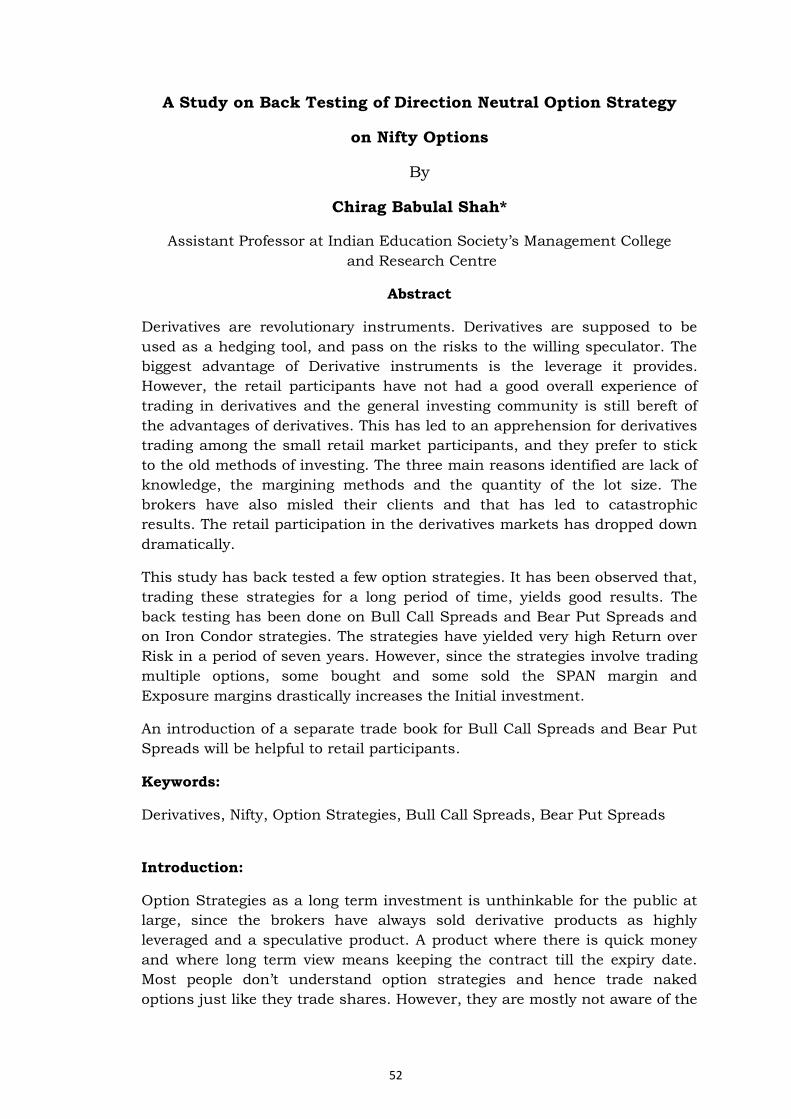
52
A Study on Back Testing of Direction Neutral Option Strategy
on Nifty Options
By
Chirag Babulal Shah*
Assistant Professor at Indian Education Society’s Management College
and Research Centre
Abstract
Derivatives are revolutionary instruments. Derivatives are supposed to be
used as a hedging tool, and pass on the risks to the willing speculator. The
biggest advantage of Derivative instruments is the leverage it provides.
However, the retail participants have not had a good overall experience of
trading in derivatives and the general investing community is still bereft of
the advantages of derivatives. This has led to an apprehension for derivatives
trading among the small retail market participants, and they prefer to stick
to the old methods of investing. The three main reasons identified are lack of
knowledge, the margining methods and the quantity of the lot size. The
brokers have also misled their clients and that has led to catastrophic
results. The retail participation in the derivatives markets has dropped down
dramatically.
This study has back tested a few option strategies. It has been observed that,
trading these strategies for a long period of time, yields good results. The
back testing has been done on Bull Call Spreads and Bear Put Spreads and
on Iron Condor strategies. The strategies have yielded very high Return over
Risk in a period of seven years. However, since the strategies involve trading
multiple options, some bought and some sold the SPAN margin and
Exposure margins drastically increases the Initial investment.
An introduction of a separate trade book for Bull Call Spreads and Bear Put
Spreads will be helpful to retail participants.
Keywords:
Derivatives, Nifty, Option Strategies, Bull Call Spreads, Bear Put Spreads
Introduction:
Option Strategies as a long term investment is unthinkable for the public at
large, since the brokers have always sold derivative products as highly
leveraged and a speculative product. A product where there is quick money
and where long term view means keeping the contract till the expiry date.
Most people don’t understand option strategies and hence trade naked
options just like they trade shares. However, they are mostly not aware of the

53
factors affecting the option price, i.e. Time to expiry, Implied Volatility and
lastly the direction of the market movement.
Eventually, when a trader is right in his view, he exits at small profits, but
when he is wrong, he waits till the option expires at zero, hoping that his
trade will turn profitable. Thus even if the trader’s success ratio in taking a
view is favorable, he ends up making more losses than the profits.
SEBI has recently shown concern for the retail investors, and noted that they
are allured in trading derivatives because of the inbuilt leverage. Hence in a
recent move, SEBI has asked the exchanges to increase the lot size, which
attracts higher margin and hence keeps retail investors away from
speculative practices. The diagnosis, that retail participants are losing money
in derivatives is right, however the remedy of keeping them at bay is not
welcomed. Less retail participation, will lead to immature markets and the
market will be a playground for strong hands and algorithms, which may
lead to manipulation of the prices.
The study tries to prescribe a remedy to help retail investors by back testing
the results of a few option strategies as a long term investment method.
Traditionally, all asset classes have a linear payoff, in terms that an investor
can only buy the asset and wait for the prices to go up. If the price goes
down, there is a loss, and if the price goes up eventually, there is a profit.
However, options are instruments which will allow you to have different views
on the market and hence different payoffs. This is possible because there are
four types of trades that one can do with options.
1. Buy Call
2. Sell Call
3. Buy Put
4. Sell Put
Since the buyer has to pay an upfront premium to buy the right to exercise,
but not the obligation to honor the contract, the maximum loss is limited to
the premium paid. Hence when one buys the option, he pays upfront the
maximum possible loss. So there is no need of taking any initial margin.
However, when one sells an option, there is always a chance of unlimited
loss, and hence the exchange, through its SPAN calculator, tries to assess
the maximum loss in one day and collects it as SPAN margin. In any
uncertain event, there can be an extreme loss; hence the exchange charges
an extra extreme loss margin.
Prima facie the margin calculation system seems logical and fair. However,
when there is a combination of options, the payoff structure changes and
hence the margins should change. The SPAN calculator takes 16 risk arrays
for the entire portfolio of options in consideration, and the maximum loss
case scenario is the initial margin. For a strategy like a Bull call spread, in
54
which one call is bought and a call with a higher strike price is sold, the
maximum loss is the premium difference which is always positive. This
means that the maximum loss in the strategy is the premium paid. However,
since there is an option which is sold, the exchange would charge a short
option minimum charge.
Thus the total margin exceeds much higher than the maximum possible loss.
For the retail investor this is additional burden of investment.
The study will back test the result of a few strategies for 7 years, where the
margin is much higher than the maximum possible loss and calculate the
ROI. These strategies can be a useful tool for the retail investor, only if the
excess margin is avoided.
Within the current framework, it doesn’t seem possible that the regulator or
the exchange will waive off the short option minimum charge. An alternative
would be to introduce a separate trade book for Bull call spreads and Bear
put spreads. Here only the spread would be traded and hence there is no
question of a short option minimum charge.
Spread trading would be easy for retail investors as it will be lesser
complicated than trading naked options. The Spread trade book can run
parallel with the normal option trade book. Any discrepancy in pricing will
lead to a risk free arbitrage and hence equilibrium.
Separate spread trade books are currently present in one month and two
month futures, two month and three month futures, and, One month and
three month futures.
Literature Review
According to the Black and Scholes (1973) option pricingmodel, the option
price is determined only by five input factors. Bollen and Whaley (2004) find
evidence suggestingthat net buying pressure affects options’ implied
volatility, which suggests that optionprices are affected by demand and
supply. According to their research, there are more index putstraded than
index calls. However, the opposite is observed for individual stock
options.Their findings suggest that the index put buying pressure drives the
change in volatility ofindex options, while the stock call buying pressure
drives the change in volatility of stockoptions. Intuitively, the demand for
calls and puts would be different in rising and fallingmarkets. When the
market becomes more volatile, the increasing volatility results in higher
pricesfor both calls and puts.
Debashish and Mitra(2008) examined the lead and lag relationship between
the cash markets and derivatives markets and concluded that derivatives
markets led the cash markets. However other studies like Pradhan and Bhatt
(2009), Johansen (1988), Basdas (2009) have observed that in many
55
countries spot markets lead the derivatives markets. This ambiguity of which
market leads the other, has made it very difficult for retail traders to take
view and trade on prices.
Trennepohl and Dukes (1981) is among the earliest empirical research to test
option writing and buying return.
Merton,Scholes and Gladstein (1978) concluded that certain option strategies
like fully covered writing strategyhave been successful in changing the
patterns of returns and are not reproducible by any simple strategy of
combining stocks with fixed income securities.Covered strategy is a
combination of the stock with its respective option. The strategy can give
good returns in the long run compared to the traditional approach of long
term investing in stocks.
Green and Figlewski (1999) examine the forecast of stock volatility and
return of option writing. They find that at-the-money stock index calls have a
high probability of producing large losses, with larger losses for longer time
to maturity. Writing options with a delta hedge reduces the writer’s risk
exposure compared to naked writing, but risk is still considerable.The
practice of option writing has increased steadily in recent years, and
somepractitioners apply relatively complicated hedging techniques to manage
writing risks(Collins; 2007).
Research done by Bondarenko (2003), Jones (2006), and Coval and
Shumway (2001), examine the returns of strategies that involve puts and
calls. They report that strategies involving put options offer good returns and
that put options are more expensive than calls of comparable distance from
the money. Yet, little research has been done to explore the returns from
combinations, straddles, and collars.
Maheshwari(2013) concludes that market participants majorly retail
participants may not be experiencing efficient markets, due to lack of
education, liquidity and transaction charges. This is true in the current
scenario as retail traders and investors view options as a highly leveraged
instrument apt for speculating. However speculation does not always work
and these investors shy away from derivatives markets once they burn their
hands with leveraged losses.
Research Methodology:
The study will use secondary data on Nifty index stock options and check the
results of Bull Call Spread and Bear Put spread options strategy from the
period of Jan, 2008 to Dec, 2014. Secondary data of futures and options
prices are available on the website of www.nseindia.com
At the start of every Derivative series month, a 200 point Nifty bull call
spread strategy will be initiated and it will be squared off at the expiry price.
A 200 point Nifty bear put spread strategy will also be initiated separately at

56
the same time. The futures price on the opening of the current month will be
considered as the spot price.To determine the At the money (ATM) strike
price, the opening future price is taken as the reference point. The future
price is rounded off to the nearest 100th and that point is considered as the
ATM.
In a Bull Call Spread or a Bear Put spread option strategy, the maximum
profit and maximum loss is capped. There are no extreme loss case
scenarios. The Breakeven point is the net premium added/subtracted, to the
buying option strike price. Thus the strategy is easy to understand and
implement. The strategy needs to be held till expiry. If squared off earlier
during the life of the option, the profit or loss will be lesser than the
maximum possible.
In the study, the total cumulative premium outflow will be considered as the
investment and the net cumulative profit at the end of the 7 years will be
considered as the final profit.
Here we assume 3 cases:
1. An options trader is always bullish on the market every month as he
thinks the market will always go up in the long run. No matter what the
sentiments are, the trader will follow the strategy mechanically.
2. An options trader is always bearish on the market as he thinks the prices
are always higher than the value. No matter what the sentiments are, the
trader will follow the strategy mechanically.
3. An options trader does not have any directional view, but is sure the
market will move away from the start point. No matter what the
sentiments are, the trader will follow the strategy mechanically.
Hence we analyze bull call spread, bear put spread and iron condor strategy
respectively for 7 years.
The returns are then compared to
Considering the maximum cumulative loss at any point during 7 years
as investment.
The total margin required for the strategy as per exchange and SEBI
norms.
Objective of the study:
The main objective of this research study is to create a win-win situation for
the retail investors and the exchange. The study will focus on the need for a
separate trade book for option spreads The study will give retail investors a
chance to profit from options trading using basic strategies which they can
understand, rather than using complex models. The study will do a research
on actual market prices and prove that such a methodology is
possible.Options’ trading is perceived as complex and is considered as a tool
57
for only professionals. This study will focus on simplicity of trading option
strategies.
Significance of the study:
The study will highlight on the faulty margin calculation system used by
exchanges. Recently, SEBI has increased the lot size of derivative contracts to
keep retail participants away from the derivatives markets as they have been
making losses. The study will prove that retail participants can use option
strategies as a long term investment tool and make good return on
investment, if the margin calculation system is reviewed. Even, if the existing
system is not changed, at least if a separate trade book for Bull call spreads
and Bear put spreads is allowed, the small investor can benefit from it.
Assumptions and limitations of the research
Bull call spread is an option strategy created on the same underlying asset
by buying one call and selling a call of a higher strike price. The premium of
the bought call is always higher than the sold call, or else there will be a risk
free arbitrage.
Bear Put spread is an option strategy created on the same underlying asset
by buying one put and selling a put of a lower strike price. The premium of
the bought put is always higher than the sold put, or else there will be a risk
free arbitrage.
The Regulator, SEBI, and the exchanges are not aware that the Bull call
spread strategy and Bear put strategy has limited loss and limited profit, and
in any case, there cannot be more loss or profit.Even though there are
mandatory exams to be given by every trader, conducted by the regulator and
the exchanges, which explicitly mentions the payoff of both strategies, the
exchange feels the need to cover the extreme loss case scenario and take
excess margin amounts and penalize the trader if those margins are not paid.
The period from Jan, 2008 to Dec, 2014 has been a period when the
Indian stock markets have seen all the practically extreme scenarios.
The results are based on the past and hence not a guarantee for the
future. However, one can safely assume the markets will more or less
behave in the same way in the long run.
The transaction costs including the brokerage and taxes are not
included in the calculation as it may differ from broker to broker.
Back Testing Data and Analysis
Nifty options are considered in the study as they are most widely traded and
the most liquid. Bull call spreads and Bear put spreads of 200 points on the
Nifty are considered. Everyexpiry month is tabulated based on its first day.
58
The open is the open price on the last Friday of the previous calendar month
which also is the starting of the new series. Since the strategy has to initiate
at the ATM, the strike which is closest to the open price is considered open
strike. The close is the settlement price on the date of expiry. The spreads are
calculated by subtracting the received premium by selling option, from the
paid premium by buying option. The difference between the close price and
the open strike is the intrinsic value that will remain on the last day. Since
this strategy caps the profit at 200 points, any movement above 200 points
will yield the maximum profit.
The Analysis for Bull Call Spread is shown in table 1.
The Analysis for Bear Put Spread is shown in table 2.
The Analysis for Iron Condor Spread is shown in table 3.
Analysis and Findings
Looking at the data, one can observe that the market has behaved in quite
random manner. In some months there had been extreme movements and in
some there was no movement at all. The direction of the market has been up
in 46 months and down in 38 months from its starting point of the expiry
period. In these 84 months, markets have behaved in all risk scenarios and
hence it can be called an optimum sample for capital markets.
If one had initiated Bull Call spreads (200 pts) every month for 7 years (See
Table 1)
Profit at end of 7 years = Rs. 1150.70
Max cumulative loss at any point = Rs. 474.25
Max Cumulative profit at any point = Rs. 1213.66
Max Cash Investment = Rs. 546.60
Margin as per existing rules = Rs. 450.00 (per share)
(Can be paid in collateral)
Max Investment including margin = Rs. 996.60
If one had initiated Bear Put spreads (200 pts) every month for 7 years (See
Table 2)
Profit at end of 7 years = Rs. 224.55
Max cumulative loss at any point = Rs. 72.80
Max cumulative profit at any point = Rs. 762.80
59
Max Cash Investment = Rs. 167.80
Margin as per existing rules = Rs. 450.00 (per share)
(Can be paid in collateral)
Max Investment including margin = Rs. 567.80
If one had initiated both Bull Call and Bear Put spreads (200 pts) together
making an Iron Condor Spread every month for 7 years (See table 3)
Profit at end of 7 years = Rs.1375.26
Max Cumulative loss at any point = Rs. 0.00
Max Cumulative profit at any point = Rs. 1375.26
Max Cash Investment = Rs. 128.70
Margin as per existing rules = Rs. 890.00 (per share)
(Can be paid in collateral)
Max Investment including margin = Rs. 1018.70
Conclusion:
The study is done with a mechanical approach and still the yield is quite
high. If human aspects such as intellectual analysis, news flows, exits at the
right time before expiry, etc. are used, the net profit can be considerably
increased.
For a person who thinks the market will go up in the long run, and hence is
always bullish on the market, using the bull call spread consistently, ends
up with a decent ROI.
For a person who wants to be bearish on the market all the time, using Bear
put spreads consistently gives fair ROI.
For a person who believes that the direction of the market is hard to predict,
but is sure that the market will move away from its start point, can do both,
Bull call spread and Bear put spread, thus creating an Iron condor strategy.
This strategy has shown fantastic results.
All strategies discussed have good ROIs if compared to the actual premium
investment. But if one considers the entire margin that is required for the
strategy, the ROIs fall down drastically.
Hence, if there is a separate trade book for option spreads, there will be no
need for the high margin investments, and one can take advantage of the
option strategies.
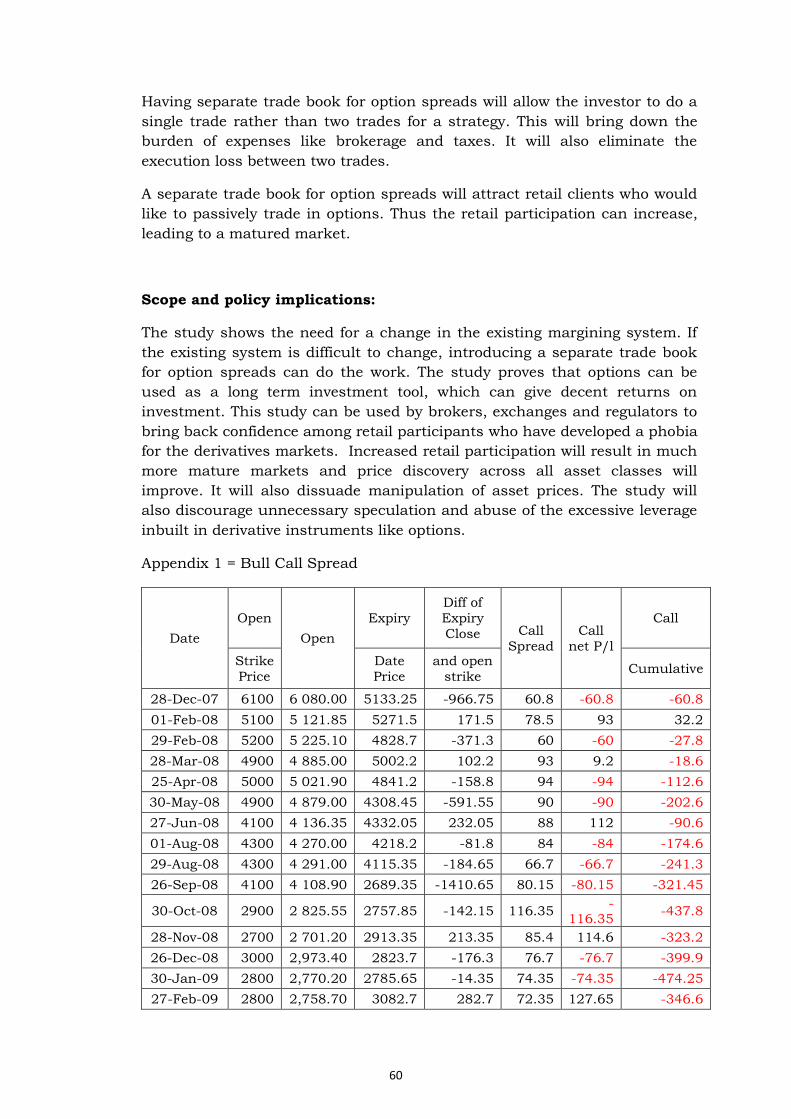
60
Having separate trade book for option spreads will allow the investor to do a
single trade rather than two trades for a strategy. This will bring down the
burden of expenses like brokerage and taxes. It will also eliminate the
execution loss between two trades.
A separate trade book for option spreads will attract retail clients who would
like to passively trade in options. Thus the retail participation can increase,
leading to a matured market.
Scope and policy implications:
The study shows the need for a change in the existing margining system. If
the existing system is difficult to change, introducing a separate trade book
for option spreads can do the work. The study proves that options can be
used as a long term investment tool, which can give decent returns on
investment. This study can be used by brokers, exchanges and regulators to
bring back confidence among retail participants who have developed a phobia
for the derivatives markets. Increased retail participation will result in much
more mature markets and price discovery across all asset classes will
improve. It will also dissuade manipulation of asset prices. The study will
also discourage unnecessary speculation and abuse of the excessive leverage
inbuilt in derivative instruments like options.
Appendix 1 = Bull Call Spread
Date
Open
Open
Expiry
Diff of
Expiry
Close Call
Spread
Call
net P/l
Call
Strike
Price
Date
Price
and open
strike Cumulative
28-Dec-07 6100 6 080.00 5133.25 -966.75 60.8 -60.8 -60.8
01-Feb-08 5100 5 121.85 5271.5 171.5 78.5 93 32.2
29-Feb-08 5200 5 225.10 4828.7 -371.3 60 -60 -27.8
28-Mar-08 4900 4 885.00 5002.2 102.2 93 9.2 -18.6
25-Apr-08 5000 5 021.90 4841.2 -158.8 94 -94 -112.6
30-May-08 4900 4 879.00 4308.45 -591.55 90 -90 -202.6
27-Jun-08 4100 4 136.35 4332.05 232.05 88 112 -90.6
01-Aug-08 4300 4 270.00 4218.2 -81.8 84 -84 -174.6
29-Aug-08 4300 4 291.00 4115.35 -184.65 66.7 -66.7 -241.3
26-Sep-08 4100 4 108.90 2689.35 -1410.65 80.15 -80.15 -321.45
30-Oct-08 2900 2 825.55 2757.85 -142.15 116.35 -
116.35 -437.8
28-Nov-08 2700 2 701.20 2913.35 213.35 85.4 114.6 -323.2
26-Dec-08 3000 2,973.40 2823.7 -176.3 76.7 -76.7 -399.9
30-Jan-09 2800 2,770.20 2785.65 -14.35 74.35 -74.35 -474.25
27-Feb-09 2800 2,758.70 3082.7 282.7 72.35 127.65 -346.6
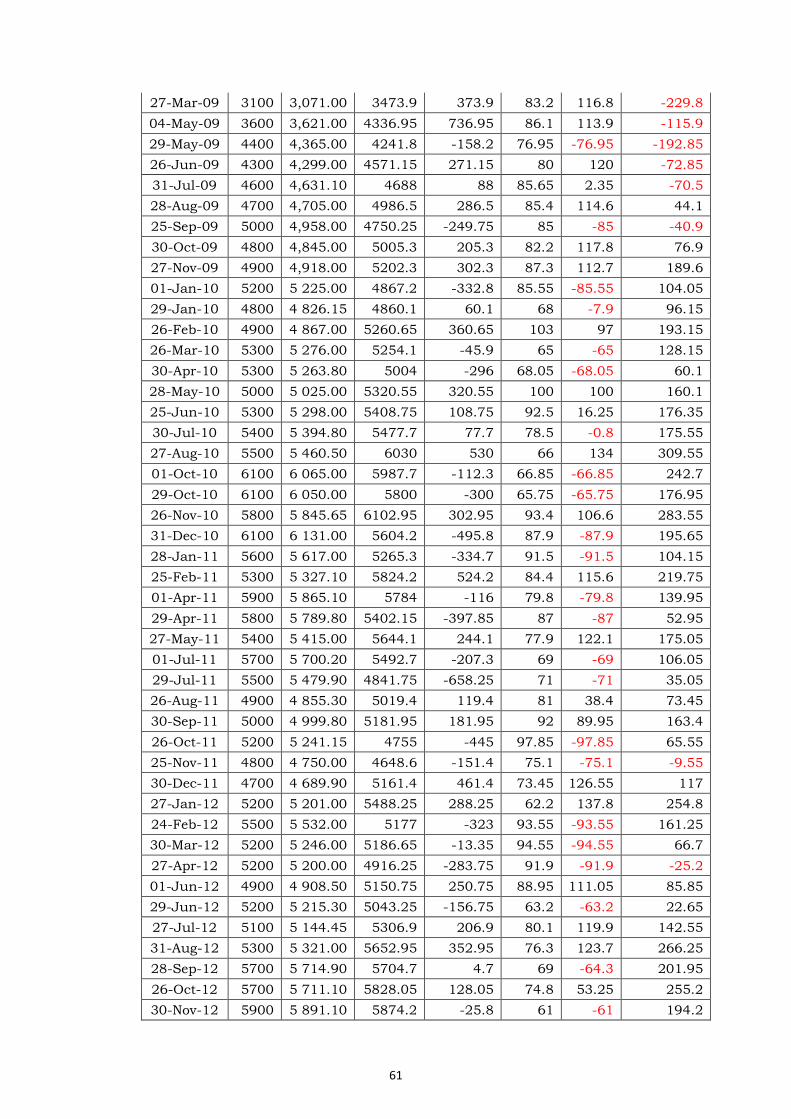
61
27-Mar-09 3100 3,071.00 3473.9 373.9 83.2 116.8 -229.8
04-May-09 3600 3,621.00 4336.95 736.95 86.1 113.9 -115.9
29-May-09 4400 4,365.00 4241.8 -158.2 76.95 -76.95 -192.85
26-Jun-09 4300 4,299.00 4571.15 271.15 80 120 -72.85
31-Jul-09 4600 4,631.10 4688 88 85.65 2.35 -70.5
28-Aug-09 4700 4,705.00 4986.5 286.5 85.4 114.6 44.1
25-Sep-09 5000 4,958.00 4750.25 -249.75 85 -85 -40.9
30-Oct-09 4800 4,845.00 5005.3 205.3 82.2 117.8 76.9
27-Nov-09 4900 4,918.00 5202.3 302.3 87.3 112.7 189.6
01-Jan-10 5200 5 225.00 4867.2 -332.8 85.55 -85.55 104.05
29-Jan-10 4800 4 826.15 4860.1 60.1 68 -7.9 96.15
26-Feb-10 4900 4 867.00 5260.65 360.65 103 97 193.15
26-Mar-10 5300 5 276.00 5254.1 -45.9 65 -65 128.15
30-Apr-10 5300 5 263.80 5004 -296 68.05 -68.05 60.1
28-May-10 5000 5 025.00 5320.55 320.55 100 100 160.1
25-Jun-10 5300 5 298.00 5408.75 108.75 92.5 16.25 176.35
30-Jul-10 5400 5 394.80 5477.7 77.7 78.5 -0.8 175.55
27-Aug-10 5500 5 460.50 6030 530 66 134 309.55
01-Oct-10 6100 6 065.00 5987.7 -112.3 66.85 -66.85 242.7
29-Oct-10 6100 6 050.00 5800 -300 65.75 -65.75 176.95
26-Nov-10 5800 5 845.65 6102.95 302.95 93.4 106.6 283.55
31-Dec-10 6100 6 131.00 5604.2 -495.8 87.9 -87.9 195.65
28-Jan-11 5600 5 617.00 5265.3 -334.7 91.5 -91.5 104.15
25-Feb-11 5300 5 327.10 5824.2 524.2 84.4 115.6 219.75
01-Apr-11 5900 5 865.10 5784 -116 79.8 -79.8 139.95
29-Apr-11 5800 5 789.80 5402.15 -397.85 87 -87 52.95
27-May-11 5400 5 415.00 5644.1 244.1 77.9 122.1 175.05
01-Jul-11 5700 5 700.20 5492.7 -207.3 69 -69 106.05
29-Jul-11 5500 5 479.90 4841.75 -658.25 71 -71 35.05
26-Aug-11 4900 4 855.30 5019.4 119.4 81 38.4 73.45
30-Sep-11 5000 4 999.80 5181.95 181.95 92 89.95 163.4
26-Oct-11 5200 5 241.15 4755 -445 97.85 -97.85 65.55
25-Nov-11 4800 4 750.00 4648.6 -151.4 75.1 -75.1 -9.55
30-Dec-11 4700 4 689.90 5161.4 461.4 73.45 126.55 117
27-Jan-12 5200 5 201.00 5488.25 288.25 62.2 137.8 254.8
24-Feb-12 5500 5 532.00 5177 -323 93.55 -93.55 161.25
30-Mar-12 5200 5 246.00 5186.65 -13.35 94.55 -94.55 66.7
27-Apr-12 5200 5 200.00 4916.25 -283.75 91.9 -91.9 -25.2
01-Jun-12 4900 4 908.50 5150.75 250.75 88.95 111.05 85.85
29-Jun-12 5200 5 215.30 5043.25 -156.75 63.2 -63.2 22.65
27-Jul-12 5100 5 144.45 5306.9 206.9 80.1 119.9 142.55
31-Aug-12 5300 5 321.00 5652.95 352.95 76.3 123.7 266.25
28-Sep-12 5700 5 714.90 5704.7 4.7 69 -64.3 201.95
26-Oct-12 5700 5 711.10 5828.05 128.05 74.8 53.25 255.2
30-Nov-12 5900 5 891.10 5874.2 -25.8 61 -61 194.2

62
28-Dec-12 5900 5 932.50 6037.25 137.25 79.65 57.6 251.8
01-Feb-13 6100 6 068.95 5692.45 -407.55 55.65 -55.65 196.15
01-Mar-13 5700 5 718.95 5676.5 -23.5 68.05 -68.05 128.1
05-Apr-13 5700 5 716.35 5910.05 210.05 70.29 129.71 257.81
26-Apr-13 5900 5 919.00 6124.2 224.2 72.85 127.15 384.96
31-May-13 6100 6 119.00 5683.9 -416.1 72.3 -72.3 312.66
28-Jun-13 5800 5 761.15 5907.35 107.35 62 45.35 358.01
26-Jul-13 6000 5 955.00 5416.75 -583.25 69 -69 289.01
30-Aug-13 5400 5 400.00 5883.85 483.85 85 115 404.01
27-Sep-13 6000 5 951.25 6294.9 294.9 80.75 119.25 523.26
01-Nov-13 6300 6 315.05 6087.05 -212.95 77.9 -77.9 445.36
29-Nov-13 6200 6 162.00 6279.35 79.35 72.8 6.55 451.91
27-Dec-13 6300 6 340.00 6069.2 -230.8 67 -67 384.91
31-Jan-14 6100 6 115.00 6238.85 138.85 73.75 65.1 450.01
28-Feb-14 6300 6 265.40 6646.2 346.2 60.1 139.9 589.91
28-Mar-14 6700 6 708.60 6837.05 137.05 74.35 62.7 652.61
25-Apr-14 6900 6 900.00 7238.9 338.9 92.2 107.8 760.41
30-May-14 7300 7 275.50 7497.95 197.95 66.85 131.1 891.51
27-Jun-14 7600 7 550.00 7723.75 123.75 69.25 54.5 946.01
01-Aug-14 7700 7 686.05 7952.75 252.75 70.2 129.8 1075.81
01-Sep-14 8000 8 021.20 7902.25 -97.75 72.4 -72.4 1003.41
26-Sep-14 8000 7 956.00 8166.6 166.6 67.65 98.95 1102.36
31-Oct-14 8200 8 234.95 8493 293 88.7 111.3 1213.66
28-Nov-14 8600 8 576.10 8182.75 -417.25 62.95 -62.95 1150.71
Appendix 2 = Bear Put Spread
Date
Open
Strike
Price
Open
Expiry
Date
Price
Diff of
Expiry
Close
and open
strike
Put
Sprea
d
Put net
P/l
Put
Cumulative
28-Dec-07 6100.00 6 080.00 5133.25 (966.75) 67.90 132.10 132.10
1-Feb-08 5100.00 5 121.85 5271.50 171.50 101.15 (101.15) 30.95
29-Feb-08 5200.00 5 225.10 4828.70 (371.30) 83.90 116.10 147.05
28-Mar-08 4900.00 4 885.00 5002.20 102.20 76.05 (76.05) 71.00
25-Apr-08 5000.00 5 021.90 4841.20 (158.80) 82.00 76.80 147.80
30-May-08 4900.00 4 879.00 4308.45 (591.55) 60.10 139.90 287.70
27-Jun-08 4100.00 4 136.35 4332.05 232.05 55.00 (55.00) 232.70
1-Aug-08 4300.00 4 270.00 4218.20 (81.80) 67.00 14.80 247.50
29-Aug-08 4300.00 4 291.00 4115.35 (184.65) 71.00 113.65 361.15
26-Sep-08 4100.00 4 108.90 2689.35 (1410.6
5) 70.30 129.70 490.85
30-Oct-08 2900.00 2 825.55 2757.85 (142.15) 75.05 67.10 557.95
28-Nov-08 2700.00 2 701.20 2913.35 213.35 80.00 (80.00) 477.95
26-Dec-08 3000.00 2,973.40 2823.70 (176.30) 55.20 121.10 599.05
30-Jan-09 2800.00 2,770.20 2785.65 (14.35) 74.60 (60.25) 538.80
27-Feb-09 2800.00 2,758.70 3082.70 282.70 79.90 (79.90) 458.90

63
27-Mar-09 3100.00 3,071.00 3473.90 373.90 74.00 (74.00) 384.90
04-May-09 3600.00 3,621.00 4336.95 736.95 90.00 (90.00) 294.90
29-May-09 4400.00 4,365.00 4241.80 (158.20) 89.00 69.20 364.10
26-Jun-09 4300.00 4,299.00 4571.15 271.15 90.00 (90.00) 274.10
31-Jul-09 4600.00 4,631.10 4688.00 88.00 89.00 (89.00) 185.10
28-Aug-09 4700.00 4,705.00 4986.50 286.50 77.45 (77.45) 107.65
25-Sep-09 5000.00 4,958.00 4750.25 (249.75) 78.00 122.00 229.65
30-Oct-09 4800.00 4,845.00 5005.30 205.30 61.25 (61.25) 168.40
27-Nov-09 4900.00 4,918.00 5202.30 302.30 72.00 (72.00) 96.40
01-Jan-10 5200.00 5 225.00 4867.20 (332.80) 64.70 135.30 231.70
29-Jan-10 4800.00 4 826.15 4860.10 60.10 100.00 (100.00) 131.70
26-Feb-10 4900.00 4 867.00 5260.65 360.65 75.00 (75.00) 56.70
26-Mar-10 5300.00 5 276.00 5254.10 (45.90) 67.05 (21.15) 35.55
30-Apr-10 5300.00 5 263.80 5004.00 (296.00) 66.10 133.90 169.45
28-May-10 5000.00 5 025.00 5320.55 320.55 58.60 (58.60) 110.85
25-Jun-10 5300.00 5 298.00 5408.75 108.75 56.95 (56.95) 53.90
30-Jul-10 5400.00 5 394.80 5477.70 77.70 60.20 (60.20) (6.30)
27-Aug-10 5500.00 5 460.50 6030.00 530.00 66.50 (66.50) (72.80)
01-Oct-10 6100.00 6 065.00 5987.70 (112.30) 95.00 17.30 (55.50)
29-Oct-10 6100.00 6 050.00 5800.00 (300.00) 73.00 127.00 71.50
26-Nov-10 5800.00 5 845.65 6102.95 302.95 58.30 (58.30) 13.20
31-Dec-10 6100.00 6 131.00 5604.20 (495.80) 55.60 144.40 157.60
28-Jan-11 5600.00 5 617.00 5265.30 (334.70) 76.45 123.55 281.15
25-Feb-11 5300.00 5 327.10 5824.20 524.20 85.00 (85.00) 196.15
01-Apr-11 5900.00 5 865.10 5784.00 (116.00) 74.00 42.00 238.15
29-Apr-11 5800.00 5 789.80 5402.15 (397.85) 73.75 126.25 364.40
27-May-11 5400.00 5 415.00 5644.10 244.10 67.35 (67.35) 297.05
01-Jul-11 5700.00 5 700.20 5492.70 (207.30) 70.00 130.00 427.05
29-Jul-11 5500.00 5 479.90 4841.75 (658.25) 67.00 133.00 560.05
26-Aug-11 4900.00 4 855.30 5019.40 119.40 80.50 (80.50) 479.55
30-Sep-11 5000.00 4 999.80 5181.95 181.95 63.45 (63.45) 416.10
26-Oct-11 5200.00 5 241.15 4755.00 (445.00) 55.00 145.00 561.10
25-Nov-11 4800.00 4 750.00 4648.60 (151.40) 80.85 70.55 631.65
30-Dec-11 4700.00 4 689.90 5161.40 461.40 69.90 (69.90) 561.75
27-Jan-12 5200.00 5 201.00 5488.25 288.25 61.90 (61.90) 499.85
24-Feb-12 5500.00 5 532.00 5177.00 (323.00) 61.60 138.40 638.25
30-Mar-12 5200.00 5 246.00 5186.65 (13.35) 57.40 (44.05) 594.20
27-Apr-12 5200.00 5 200.00 4916.25 (283.75) 61.65 138.35 732.55
01-Jun-12 4900.00 4 908.50 5150.75 250.75 64.50 (64.50) 668.05
29-Jun-12 5200.00 5 215.30 5043.25 (156.75) 62.00 94.75 762.80
27-Jul-12 5100.00 5 144.45 5306.90 206.90 59.00 (59.00) 703.80
31-Aug-12 5300.00 5 321.00 5652.95 352.95 56.25 (56.25) 647.55
28-Sep-12 5700.00 5 714.90 5704.70 4.70 61.30 (61.30) 586.25
26-Oct-12 5700.00 5 711.10 5828.05 128.05 58.80 (58.80) 527.45
30-Nov-12 5900.00 5 891.10 5874.20 (25.80) 63.00 (37.20) 490.25
28-Dec-12 5900.00 5 932.50 6037.25 137.25 55.70 (55.70) 434.55
01-Feb-13 6100.00 6 068.95 5692.45 (407.55) 67.30 132.70 567.25
01-Mar-13 5700.00 5 718.95 5676.50 (23.50) 64.80 (41.30) 525.95
05-Apr-13 5700.00 5 716.35 5910.05 210.05 54.80 (54.80) 471.15
26-Apr-13 5900.00 5 919.00 6124.20 224.20 55.15 (55.15) 416.00
31-May-13 6100.00 6 119.00 5683.90 (416.10) 57.00 143.00 559.00
28-Jun-13 5800.00 5 761.15 5907.35 107.35 65.60 (65.60) 493.40
26-Jul-13 6000.00 5 955.00 5416.75 (583.25) 78.25 121.75 615.15
30-Aug-13 5400.00 5 400.00 5883.85 483.85 64.50 (64.50) 550.65
27-Sep-13 6000.00 5 951.25 6294.90 294.90 76.45 (76.45) 474.20
01-Nov-13 6300.00 6 315.05 6087.05 (212.95) 64.90 135.10 609.30
29-Nov-13 6200.00 6 162.00 6279.35 79.35 84.20 (84.20) 525.10
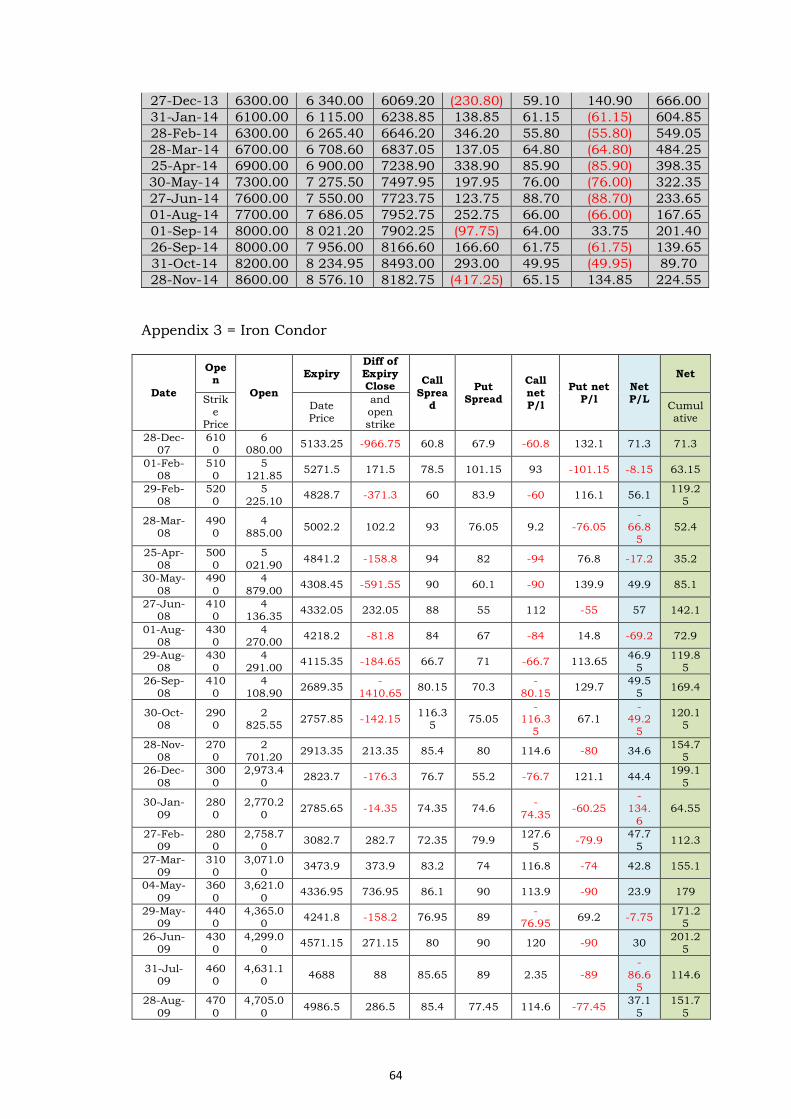
64
27-Dec-13 6300.00 6 340.00 6069.20 (230.80) 59.10 140.90 666.00
31-Jan-14 6100.00 6 115.00 6238.85 138.85 61.15 (61.15) 604.85
28-Feb-14 6300.00 6 265.40 6646.20 346.20 55.80 (55.80) 549.05
28-Mar-14 6700.00 6 708.60 6837.05 137.05 64.80 (64.80) 484.25
25-Apr-14 6900.00 6 900.00 7238.90 338.90 85.90 (85.90) 398.35
30-May-14 7300.00 7 275.50 7497.95 197.95 76.00 (76.00) 322.35
27-Jun-14 7600.00 7 550.00 7723.75 123.75 88.70 (88.70) 233.65
01-Aug-14 7700.00 7 686.05 7952.75 252.75 66.00 (66.00) 167.65
01-Sep-14 8000.00 8 021.20 7902.25 (97.75) 64.00 33.75 201.40
26-Sep-14 8000.00 7 956.00 8166.60 166.60 61.75 (61.75) 139.65
31-Oct-14 8200.00 8 234.95 8493.00 293.00 49.95 (49.95) 89.70
28-Nov-14 8600.00 8 576.10 8182.75 (417.25) 65.15 134.85 224.55
Appendix 3 = Iron Condor
Date
Open
Open
Expiry Diff of Expiry Close
Call
Spread
Put Spread
Call
net P/l
Put net P/l
Net P/L
Net
Strike
Price
Date Price
and open strike
Cumulative
28-Dec-07
6100
6 080.00
5133.25 -966.75 60.8 67.9 -60.8 132.1 71.3 71.3
01-Feb-08
5100
5 121.85
5271.5 171.5 78.5 101.15 93 -101.15 -8.15 63.15
29-Feb-08
5200
5 225.10
4828.7 -371.3 60 83.9 -60 116.1 56.1 119.2
5
28-Mar-08
4900
4 885.00
5002.2 102.2 93 76.05 9.2 -76.05 -
66.85
52.4
25-Apr-08
5000
5 021.90
4841.2 -158.8 94 82 -94 76.8 -17.2 35.2
30-May-
08
490
0
4
879.00 4308.45 -591.55 90 60.1 -90 139.9 49.9 85.1
27-Jun-08
4100
4 136.35
4332.05 232.05 88 55 112 -55 57 142.1
01-Aug-08
4300
4 270.00
4218.2 -81.8 84 67 -84 14.8 -69.2 72.9
29-Aug-08
4300
4 291.00
4115.35 -184.65 66.7 71 -66.7 113.65 46.9
5 119.8
5
26-Sep-08
4100
4 108.90
2689.35 -
1410.65 80.15 70.3
-80.15
129.7 49.5
5 169.4
30-Oct-08
2900
2 825.55
2757.85 -142.15 116.3
5 75.05
-116.3
5 67.1
-49.2
5
120.15
28-Nov-08
2700
2 701.20
2913.35 213.35 85.4 80 114.6 -80 34.6 154.7
5
26-Dec-
08
300
0
2,973.4
0 2823.7 -176.3 76.7 55.2 -76.7 121.1 44.4
199.1
5
30-Jan-
09
280
0
2,770.2
0 2785.65 -14.35 74.35 74.6
-
74.35 -60.25
-134.
6
64.55
27-Feb-09
2800
2,758.70
3082.7 282.7 72.35 79.9 127.6
5 -79.9
47.75
112.3
27-Mar-09
3100
3,071.00
3473.9 373.9 83.2 74 116.8 -74 42.8 155.1
04-May-
09
360
0
3,621.0
0 4336.95 736.95 86.1 90 113.9 -90 23.9 179
29-May-09
4400
4,365.00
4241.8 -158.2 76.95 89 -
76.95 69.2 -7.75
171.25
26-Jun-09
4300
4,299.00
4571.15 271.15 80 90 120 -90 30 201.2
5
31-Jul-09
4600
4,631.10
4688 88 85.65 89 2.35 -89
-
86.65
114.6
28-Aug-
09
470
0
4,705.0
0 4986.5 286.5 85.4 77.45 114.6 -77.45
37.1
5
151.7
5
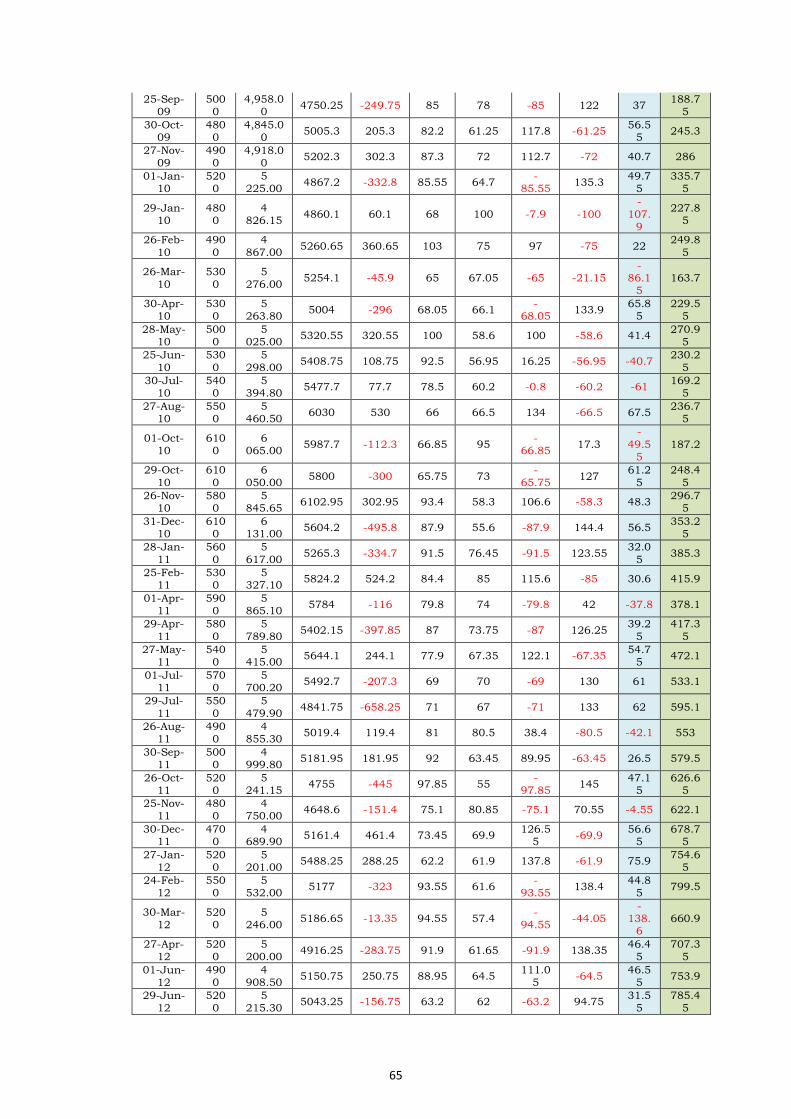
65
25-Sep-09
5000
4,958.00
4750.25 -249.75 85 78 -85 122 37 188.7
5
30-Oct-09
4800
4,845.00
5005.3 205.3 82.2 61.25 117.8 -61.25 56.5
5 245.3
27-Nov-09
4900
4,918.00
5202.3 302.3 87.3 72 112.7 -72 40.7 286
01-Jan-10
5200
5 225.00
4867.2 -332.8 85.55 64.7 -
85.55 135.3
49.75
335.75
29-Jan-10
4800
4 826.15
4860.1 60.1 68 100 -7.9 -100 -
107.9
227.85
26-Feb-
10
490
0
4
867.00 5260.65 360.65 103 75 97 -75 22
249.8
5
26-Mar-
10
530
0
5
276.00 5254.1 -45.9 65 67.05 -65 -21.15
-86.1
5
163.7
30-Apr-10
5300
5 263.80
5004 -296 68.05 66.1 -
68.05 133.9
65.85
229.55
28-May-10
5000
5 025.00
5320.55 320.55 100 58.6 100 -58.6 41.4 270.9
5
25-Jun-
10
530
0
5
298.00 5408.75 108.75 92.5 56.95 16.25 -56.95 -40.7
230.2
5
30-Jul-10
5400
5 394.80
5477.7 77.7 78.5 60.2 -0.8 -60.2 -61 169.2
5
27-Aug-10
5500
5 460.50
6030 530 66 66.5 134 -66.5 67.5 236.7
5
01-Oct-10
6100
6 065.00
5987.7 -112.3 66.85 95 -
66.85 17.3
-
49.55
187.2
29-Oct-
10
610
0
6
050.00 5800 -300 65.75 73
-
65.75 127
61.2
5
248.4
5
26-Nov-10
5800
5 845.65
6102.95 302.95 93.4 58.3 106.6 -58.3 48.3 296.7
5
31-Dec-10
6100
6 131.00
5604.2 -495.8 87.9 55.6 -87.9 144.4 56.5 353.2
5
28-Jan-
11
560
0
5
617.00 5265.3 -334.7 91.5 76.45 -91.5 123.55
32.0
5 385.3
25-Feb-11
5300
5 327.10
5824.2 524.2 84.4 85 115.6 -85 30.6 415.9
01-Apr-11
5900
5 865.10
5784 -116 79.8 74 -79.8 42 -37.8 378.1
29-Apr-
11
580
0
5
789.80 5402.15 -397.85 87 73.75 -87 126.25
39.2
5
417.3
5
27-May-11
5400
5 415.00
5644.1 244.1 77.9 67.35 122.1 -67.35 54.7
5 472.1
01-Jul-11
5700
5 700.20
5492.7 -207.3 69 70 -69 130 61 533.1
29-Jul-
11
550
0
5
479.90 4841.75 -658.25 71 67 -71 133 62 595.1
26-Aug-11
4900
4 855.30
5019.4 119.4 81 80.5 38.4 -80.5 -42.1 553
30-Sep-11
5000
4 999.80
5181.95 181.95 92 63.45 89.95 -63.45 26.5 579.5
26-Oct-11
5200
5 241.15
4755 -445 97.85 55 -
97.85 145
47.15
626.65
25-Nov-11
4800
4 750.00
4648.6 -151.4 75.1 80.85 -75.1 70.55 -4.55 622.1
30-Dec-11
4700
4 689.90
5161.4 461.4 73.45 69.9 126.5
5 -69.9
56.65
678.75
27-Jan-12
5200
5 201.00
5488.25 288.25 62.2 61.9 137.8 -61.9 75.9 754.6
5
24-Feb-12
5500
5 532.00
5177 -323 93.55 61.6 -
93.55 138.4
44.85
799.5
30-Mar-12
5200
5 246.00
5186.65 -13.35 94.55 57.4 -
94.55 -44.05
-138.
6 660.9
27-Apr-12
5200
5 200.00
4916.25 -283.75 91.9 61.65 -91.9 138.35 46.4
5 707.3
5
01-Jun-12
4900
4 908.50
5150.75 250.75 88.95 64.5 111.0
5 -64.5
46.55
753.9
29-Jun-12
5200
5 215.30
5043.25 -156.75 63.2 62 -63.2 94.75 31.5
5 785.4
5
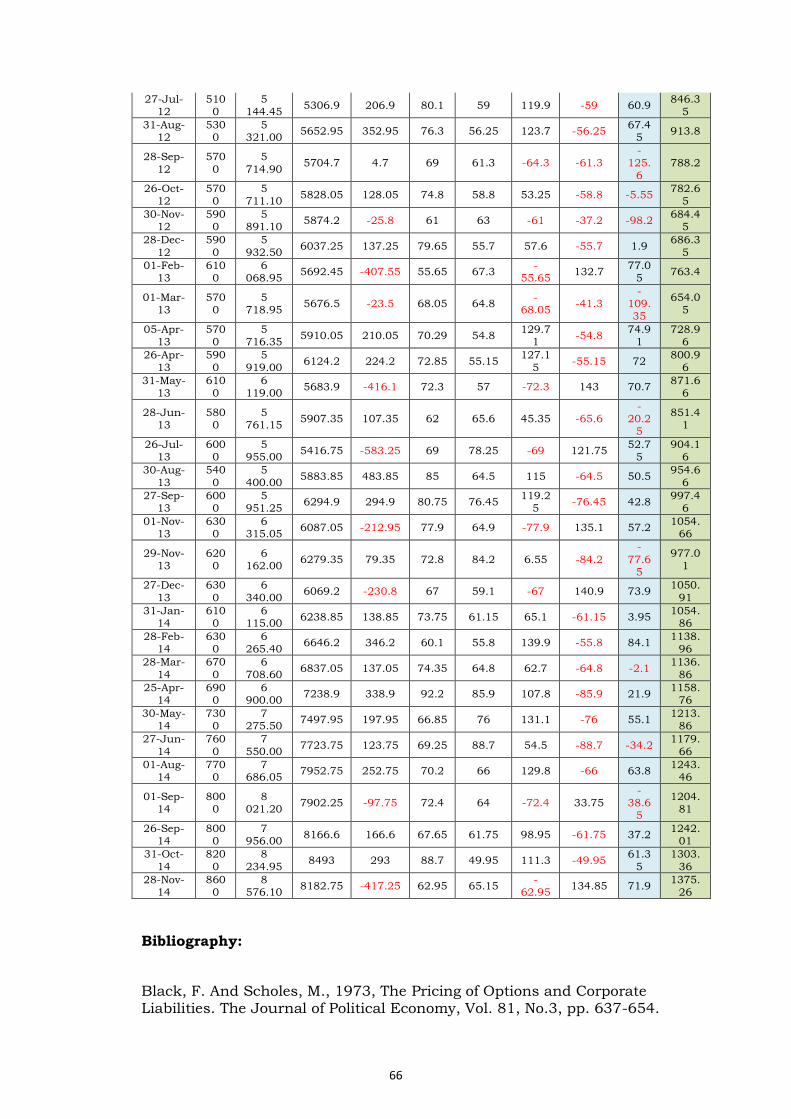
66
27-Jul-12
5100
5 144.45
5306.9 206.9 80.1 59 119.9 -59 60.9 846.3
5
31-Aug-12
5300
5 321.00
5652.95 352.95 76.3 56.25 123.7 -56.25 67.4
5 913.8
28-Sep-
12
570
0
5
714.90 5704.7 4.7 69 61.3 -64.3 -61.3
-125.
6
788.2
26-Oct-12
5700
5 711.10
5828.05 128.05 74.8 58.8 53.25 -58.8 -5.55 782.6
5
30-Nov-12
5900
5 891.10
5874.2 -25.8 61 63 -61 -37.2 -98.2 684.4
5
28-Dec-
12
590
0
5
932.50 6037.25 137.25 79.65 55.7 57.6 -55.7 1.9
686.3
5
01-Feb-13
6100
6 068.95
5692.45 -407.55 55.65 67.3 -
55.65 132.7
77.05
763.4
01-Mar-13
5700
5 718.95
5676.5 -23.5 68.05 64.8 -
68.05 -41.3
-109.35
654.05
05-Apr-13
5700
5 716.35
5910.05 210.05 70.29 54.8 129.7
1 -54.8
74.91
728.96
26-Apr-
13
590
0
5
919.00 6124.2 224.2 72.85 55.15
127.1
5 -55.15 72
800.9
6
31-May-13
6100
6 119.00
5683.9 -416.1 72.3 57 -72.3 143 70.7 871.6
6
28-Jun-13
5800
5 761.15
5907.35 107.35 62 65.6 45.35 -65.6 -
20.25
851.41
26-Jul-13
6000
5 955.00
5416.75 -583.25 69 78.25 -69 121.75 52.7
5 904.1
6
30-Aug-
13
540
0
5
400.00 5883.85 483.85 85 64.5 115 -64.5 50.5
954.6
6
27-Sep-13
6000
5 951.25
6294.9 294.9 80.75 76.45 119.2
5 -76.45 42.8
997.46
01-Nov-13
6300
6 315.05
6087.05 -212.95 77.9 64.9 -77.9 135.1 57.2 1054.
66
29-Nov-13
6200
6 162.00
6279.35 79.35 72.8 84.2 6.55 -84.2
-
77.65
977.01
27-Dec-
13
630
0
6
340.00 6069.2 -230.8 67 59.1 -67 140.9 73.9
1050.
91
31-Jan-14
6100
6 115.00
6238.85 138.85 73.75 61.15 65.1 -61.15 3.95 1054.
86
28-Feb-14
6300
6 265.40
6646.2 346.2 60.1 55.8 139.9 -55.8 84.1 1138.
96
28-Mar-
14
670
0
6
708.60 6837.05 137.05 74.35 64.8 62.7 -64.8 -2.1
1136.
86
25-Apr-14
6900
6 900.00
7238.9 338.9 92.2 85.9 107.8 -85.9 21.9 1158.
76
30-May-14
7300
7 275.50
7497.95 197.95 66.85 76 131.1 -76 55.1 1213.
86
27-Jun-
14
760
0
7
550.00 7723.75 123.75 69.25 88.7 54.5 -88.7 -34.2
1179.
66
01-Aug-14
7700
7 686.05
7952.75 252.75 70.2 66 129.8 -66 63.8 1243.
46
01-Sep-14
8000
8 021.20
7902.25 -97.75 72.4 64 -72.4 33.75 -
38.65
1204.81
26-Sep-14
8000
7 956.00
8166.6 166.6 67.65 61.75 98.95 -61.75 37.2 1242.
01
31-Oct-
14
820
0
8
234.95 8493 293 88.7 49.95 111.3 -49.95
61.3
5
1303.
36
28-Nov-14
8600
8 576.10
8182.75 -417.25 62.95 65.15 -
62.95 134.85 71.9
1375.26
Bibliography:
Black, F. And Scholes, M., 1973, The Pricing of Options and Corporate Liabilities. The Journal of Political Economy, Vol. 81, No.3, pp. 637-654.
67
Bollen, N. P. B. And Whaley, R. E., 2004, Does Net Buying Pressure Affect the Shape of Implied Volatility Functions? The Journal of Finance, Vol. 59, No. 2, pp. 711- 753. Bondarenko, O., 2003, Why are Put Options So Expensive?, Working Paper. Chidambaran, N. and Figlewski, S., 1995, Streamlining Monte Carlo Simulation with the Quasi-analytic Method: Analysis of a Path-Dependent Option Strategy, The Journal of Derivatives, 10, pp. 29-51. Collins, D., 2007, Khan Noorpuri: Perfect Option Writing, Futures, September, 36, 11, pp. 86.
Coval, J. and Shumway, T., 2001, Expected Option Returns. The Journal of Finance, Vol. LVI, No. 3, pp. 983-1009. Debasish, S. and Mishra, B. (2008), “Econometric Analysis of Lead-Lag relationship between NSE Nifty and its Derivative Contracts”, Indian Management Studies Journal, Vol.12 Figlewski, S., Chidambaran, N. K., and Kaplan, S, 1993, Evaluating the performance of the Protective Put Strategy, Financial Analyst Journal, 49, pp.46-56. Green, C. and Figlewski, S., 1999, Market Risk and Model Risk for a Financial Institution Hill, J., Balasubramanian, V., Gregory, K., and Tierens, I., 2006, Find Alpha via Covered Hull, J., Options, Futures and Other Derivatives, 7th ed, Pearson Prentice Hall. Merton, R. C., Scholes, M. and Gladstein, M., 1978, The Returns and Risk of Alternative Call Option Portfolio Investment Strategies. The Journal of Business, Vol. 51, No. 2, pp. 183-242. Maheshwari (2013) .Risk management through Options trading in Indian Market.
Merton, R. C., Scholes, M. and Gladstein, M., 1982, The Returns and Risks of Alternative Put-Option Portfolio Investment Strategies.The Journal of Business, Vol. 55, No. 1, pp. 1-55. Radoll, R.W., 2001, Hedging Covered Calls: A Way to Profit While Minimizing Risk. Futures, November, pp. 54-57. Tannous, G. and Lee-Sing, C., 2008, Expected Time Value Decay of Options: Implications for Put-Rolling Strategies. The Financial Review ,43, pp. 191-218. Trennepohl, G. and Dukes, W., 1981, An Empirical Test of Option Writing and Buying Strategies Utilizing In-the –money and Out-of-the-money Contracts. Journal of Business Finance & Accounting, 8, 2, pp. 185-202.

68
Whaley, R., 2002, Return and Risk of CBOE Buy Write Monthly Index. The Journal of Derivatives, winter, pp. 35-42. Mo Zhou, 2010, The Time Value of Options and Writing Strategies.
List of Reference Websites
www.proquest.com
www.investopedia.com
www.wikipedia.org/wiki/optionstrategies
www.theoptionsguide.com
www.nseindia.com
Falcon Software for charts.
69
Phoenix Udaan of Funsukh Wangdu
By
Gitesh Chavan* Dr. Ranjan Chaudhuri**
* Doctoral Scholar of National Institute of Industrial Engineering (NITIE)
**Associate Professor (Marketing) of National Institute of Industrial
Engineering (NITIE)
Abstract
Armstrong Automation , India’s leading Automation System Integrators was
located in Gurgaon. It provided detailed engineering services to its customers
located in Mumbai, Delhi, Pune, Chennai etc.
Mr. Premsukh Wangdu founded the company in 1985. Its engineering
services catered to varied industry verticals like Metals & Mining (M&M),
Food & Beverage (F&B), Oil & Gas (O&G) and other sectors. In 2007,
Funsukh Wangdu took charge of the business as the new CEO of the
Armstrong Automation.
The financials of Armstrong Automation in 2010 showed a net income of INR
35 Cr; which was the highest earning in its history. However 2011 and 2013
period seemed to be a rough patch for Armstrong Automation. This was
because of the heavy import of Chinese goods in India.
In 2014, a new Government was formed at the centre. Seeing the
encroachment on the Indian manufacturing sector, the government
formulated policy decisions against heavy imports from China, Taiwan etc by
imposing Anti Dumping Duties. On the other hand government also declared
“Make in India” as a domestic manufacturing renaissance policy in order to
enhance domestic manufacturing and increase FDI an Indian Manufacturing
and Automation sector.
The government norms had opened the flood gates for FDI in India.
How can Mr. Funsukh Wangdu write a success story for Armstrong
Automation after the rough patch of 2013? Should he join hands with an
International players to gain a winning edge is his dilemma.
Keywords: B2B Marketing, Solution Selling, Strategic Marketing, Industrial Buying Behaviour, Pricing.
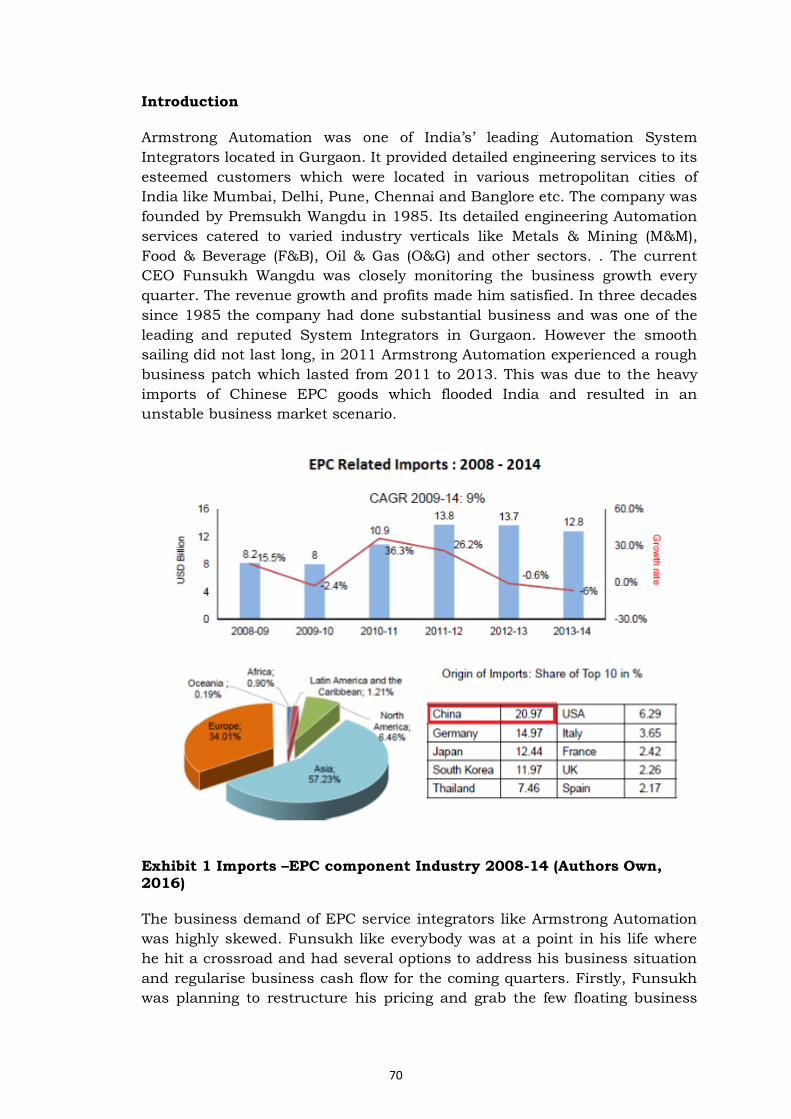
70
Introduction
Armstrong Automation was one of India’s’ leading Automation System
Integrators located in Gurgaon. It provided detailed engineering services to its
esteemed customers which were located in various metropolitan cities of
India like Mumbai, Delhi, Pune, Chennai and Banglore etc. The company was
founded by Premsukh Wangdu in 1985. Its detailed engineering Automation
services catered to varied industry verticals like Metals & Mining (M&M),
Food & Beverage (F&B), Oil & Gas (O&G) and other sectors. . The current
CEO Funsukh Wangdu was closely monitoring the business growth every
quarter. The revenue growth and profits made him satisfied. In three decades
since 1985 the company had done substantial business and was one of the
leading and reputed System Integrators in Gurgaon. However the smooth
sailing did not last long, in 2011 Armstrong Automation experienced a rough
business patch which lasted from 2011 to 2013. This was due to the heavy
imports of Chinese EPC goods which flooded India and resulted in an
unstable business market scenario.
Exhibit 1 Imports –EPC component Industry 2008-14 (Authors Own, 2016)
The business demand of EPC service integrators like Armstrong Automation
was highly skewed. Funsukh like everybody was at a point in his life where
he hit a crossroad and had several options to address his business situation
and regularise business cash flow for the coming quarters. Firstly, Funsukh
was planning to restructure his pricing and grab the few floating business
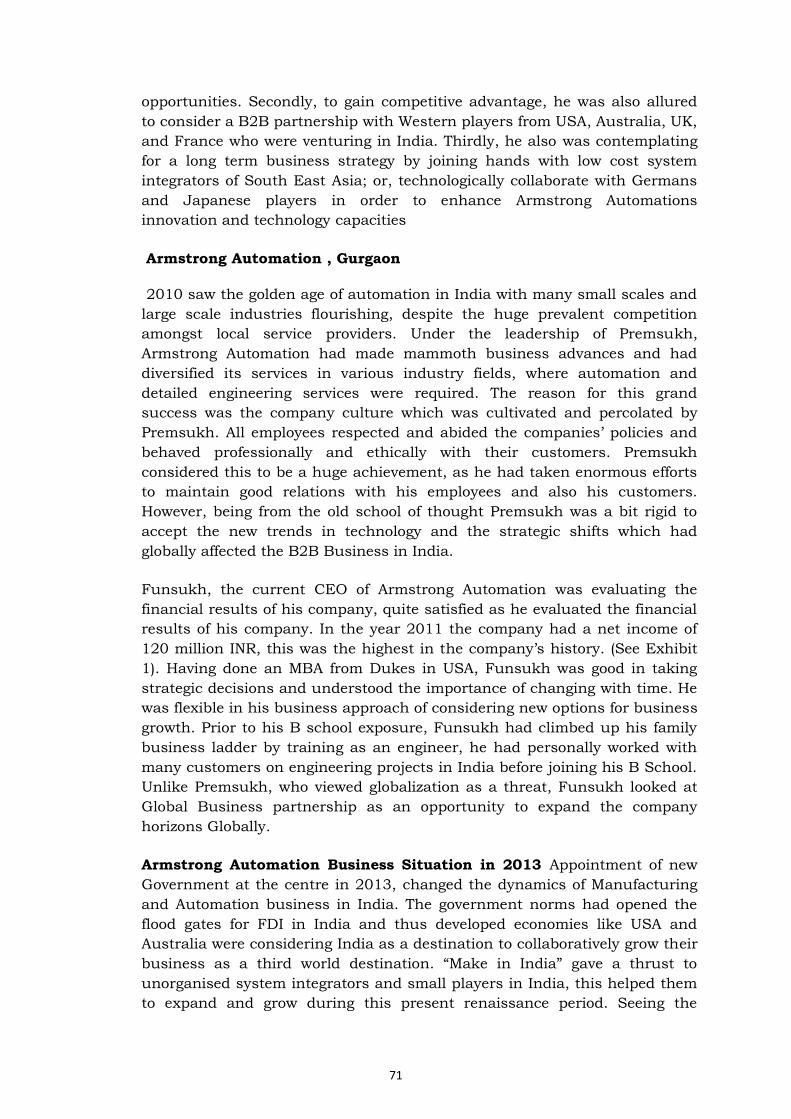
71
opportunities. Secondly, to gain competitive advantage, he was also allured
to consider a B2B partnership with Western players from USA, Australia, UK,
and France who were venturing in India. Thirdly, he also was contemplating
for a long term business strategy by joining hands with low cost system
integrators of South East Asia; or, technologically collaborate with Germans
and Japanese players in order to enhance Armstrong Automations
innovation and technology capacities
Armstrong Automation , Gurgaon
2010 saw the golden age of automation in India with many small scales and
large scale industries flourishing, despite the huge prevalent competition
amongst local service providers. Under the leadership of Premsukh,
Armstrong Automation had made mammoth business advances and had
diversified its services in various industry fields, where automation and
detailed engineering services were required. The reason for this grand
success was the company culture which was cultivated and percolated by
Premsukh. All employees respected and abided the companies’ policies and
behaved professionally and ethically with their customers. Premsukh
considered this to be a huge achievement, as he had taken enormous efforts
to maintain good relations with his employees and also his customers.
However, being from the old school of thought Premsukh was a bit rigid to
accept the new trends in technology and the strategic shifts which had
globally affected the B2B Business in India.
Funsukh, the current CEO of Armstrong Automation was evaluating the
financial results of his company, quite satisfied as he evaluated the financial
results of his company. In the year 2011 the company had a net income of
120 million INR, this was the highest in the company’s history. (See Exhibit
1). Having done an MBA from Dukes in USA, Funsukh was good in taking
strategic decisions and understood the importance of changing with time. He
was flexible in his business approach of considering new options for business
growth. Prior to his B school exposure, Funsukh had climbed up his family
business ladder by training as an engineer, he had personally worked with
many customers on engineering projects in India before joining his B School.
Unlike Premsukh, who viewed globalization as a threat, Funsukh looked at
Global Business partnership as an opportunity to expand the company
horizons Globally.
Armstrong Automation Business Situation in 2013 Appointment of new
Government at the centre in 2013, changed the dynamics of Manufacturing
and Automation business in India. The government norms had opened the
flood gates for FDI in India and thus developed economies like USA and
Australia were considering India as a destination to collaboratively grow their
business as a third world destination. “Make in India” gave a thrust to
unorganised system integrators and small players in India, this helped them
to expand and grow during this present renaissance period. Seeing the
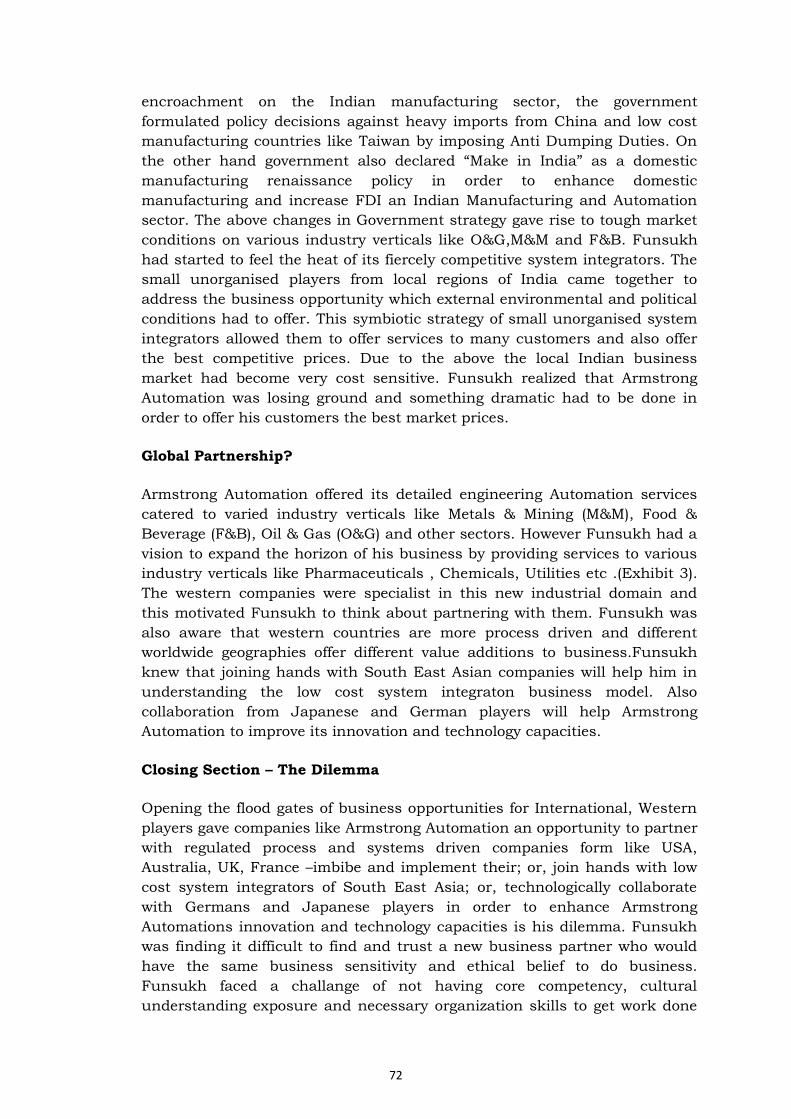
72
encroachment on the Indian manufacturing sector, the government
formulated policy decisions against heavy imports from China and low cost
manufacturing countries like Taiwan by imposing Anti Dumping Duties. On
the other hand government also declared “Make in India” as a domestic
manufacturing renaissance policy in order to enhance domestic
manufacturing and increase FDI an Indian Manufacturing and Automation
sector. The above changes in Government strategy gave rise to tough market
conditions on various industry verticals like O&G,M&M and F&B. Funsukh
had started to feel the heat of its fiercely competitive system integrators. The
small unorganised players from local regions of India came together to
address the business opportunity which external environmental and political
conditions had to offer. This symbiotic strategy of small unorganised system
integrators allowed them to offer services to many customers and also offer
the best competitive prices. Due to the above the local Indian business
market had become very cost sensitive. Funsukh realized that Armstrong
Automation was losing ground and something dramatic had to be done in
order to offer his customers the best market prices.
Global Partnership?
Armstrong Automation offered its detailed engineering Automation services
catered to varied industry verticals like Metals & Mining (M&M), Food &
Beverage (F&B), Oil & Gas (O&G) and other sectors. However Funsukh had a
vision to expand the horizon of his business by providing services to various
industry verticals like Pharmaceuticals , Chemicals, Utilities etc .(Exhibit 3).
The western companies were specialist in this new industrial domain and
this motivated Funsukh to think about partnering with them. Funsukh was
also aware that western countries are more process driven and different
worldwide geographies offer different value additions to business.Funsukh
knew that joining hands with South East Asian companies will help him in
understanding the low cost system integraton business model. Also
collaboration from Japanese and German players will help Armstrong
Automation to improve its innovation and technology capacities.
Closing Section – The Dilemma
Opening the flood gates of business opportunities for International, Western
players gave companies like Armstrong Automation an opportunity to partner
with regulated process and systems driven companies form like USA,
Australia, UK, France –imbibe and implement their; or, join hands with low
cost system integrators of South East Asia; or, technologically collaborate
with Germans and Japanese players in order to enhance Armstrong
Automations innovation and technology capacities is his dilemma. Funsukh
was finding it difficult to find and trust a new business partner who would
have the same business sensitivity and ethical belief to do business.
Funsukh faced a challange of not having core competency, cultural
understanding exposure and necessary organization skills to get work done
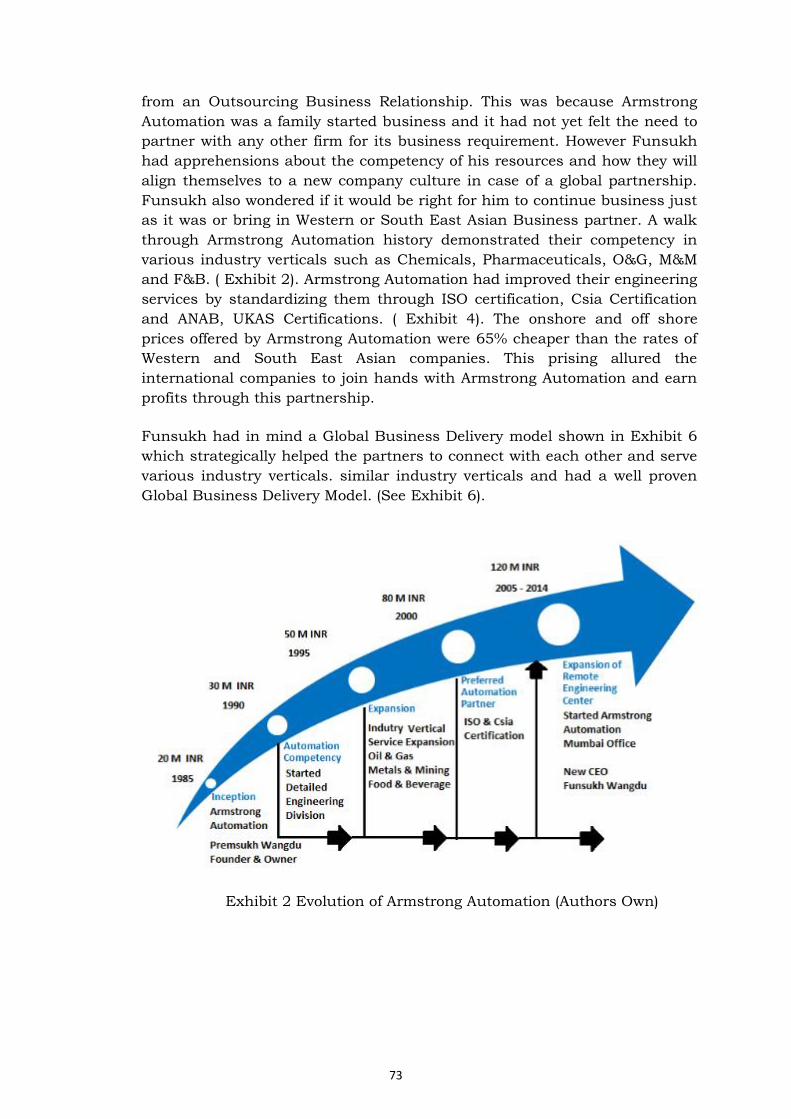
73
from an Outsourcing Business Relationship. This was because Armstrong
Automation was a family started business and it had not yet felt the need to
partner with any other firm for its business requirement. However Funsukh
had apprehensions about the competency of his resources and how they will
align themselves to a new company culture in case of a global partnership.
Funsukh also wondered if it would be right for him to continue business just
as it was or bring in Western or South East Asian Business partner. A walk
through Armstrong Automation history demonstrated their competency in
various industry verticals such as Chemicals, Pharmaceuticals, O&G, M&M
and F&B. ( Exhibit 2). Armstrong Automation had improved their engineering
services by standardizing them through ISO certification, Csia Certification
and ANAB, UKAS Certifications. ( Exhibit 4). The onshore and off shore
prices offered by Armstrong Automation were 65% cheaper than the rates of
Western and South East Asian companies. This prising allured the
international companies to join hands with Armstrong Automation and earn
profits through this partnership.
Funsukh had in mind a Global Business Delivery model shown in Exhibit 6
which strategically helped the partners to connect with each other and serve
various industry verticals. similar industry verticals and had a well proven
Global Business Delivery Model. (See Exhibit 6).
Exhibit 2 Evolution of Armstrong Automation (Authors Own)
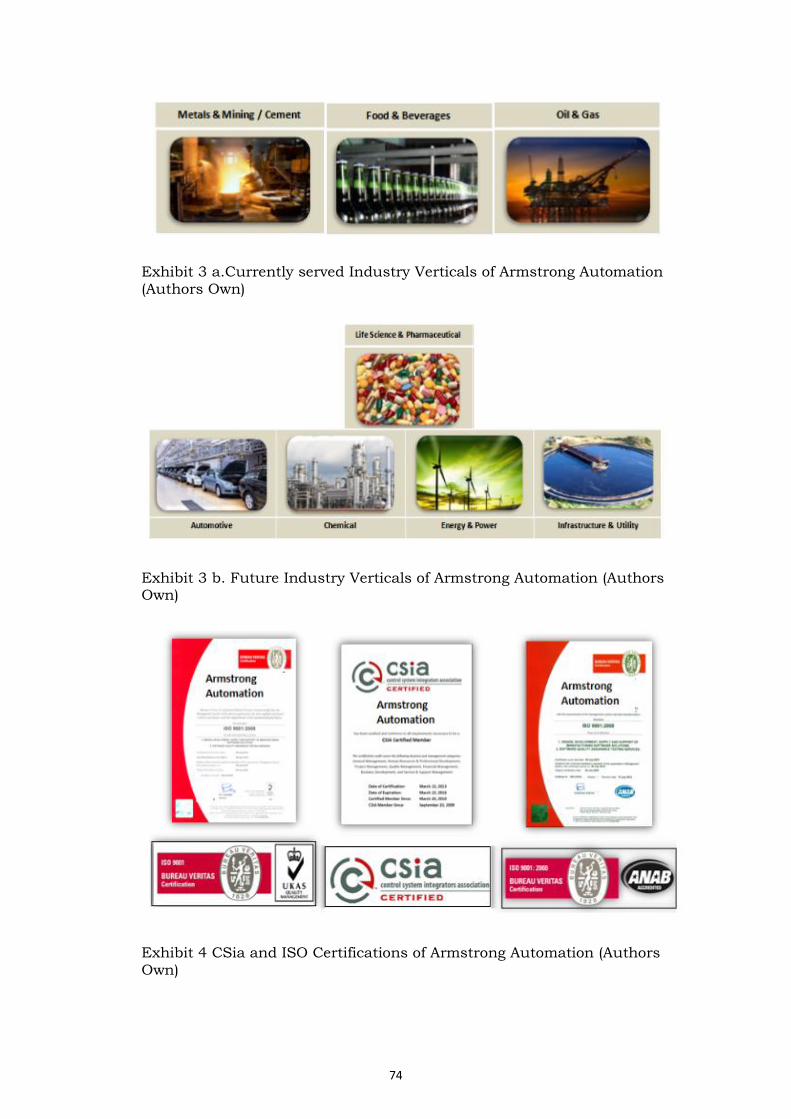
74
Exhibit 3 a.Currently served Industry Verticals of Armstrong Automation (Authors Own)
Exhibit 3 b. Future Industry Verticals of Armstrong Automation (Authors Own)
Exhibit 4 CSia and ISO Certifications of Armstrong Automation (Authors Own)
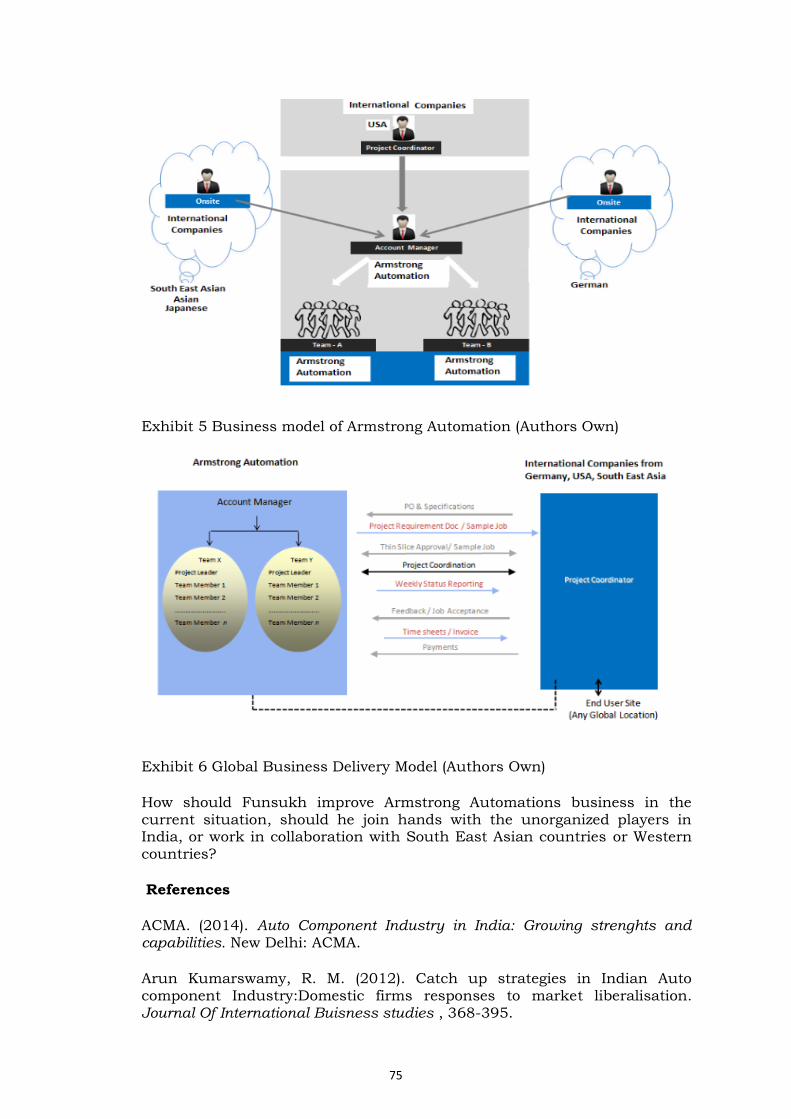
75
Exhibit 5 Business model of Armstrong Automation (Authors Own)
Exhibit 6 Global Business Delivery Model (Authors Own)
How should Funsukh improve Armstrong Automations business in the current situation, should he join hands with the unorganized players in India, or work in collaboration with South East Asian countries or Western countries?
References
ACMA. (2014). Auto Component Industry in India: Growing strenghts and capabilities. New Delhi: ACMA.
Arun Kumarswamy, R. M. (2012). Catch up strategies in Indian Auto component Industry:Domestic firms responses to market liberalisation. Journal Of International Buisness studies , 368-395.
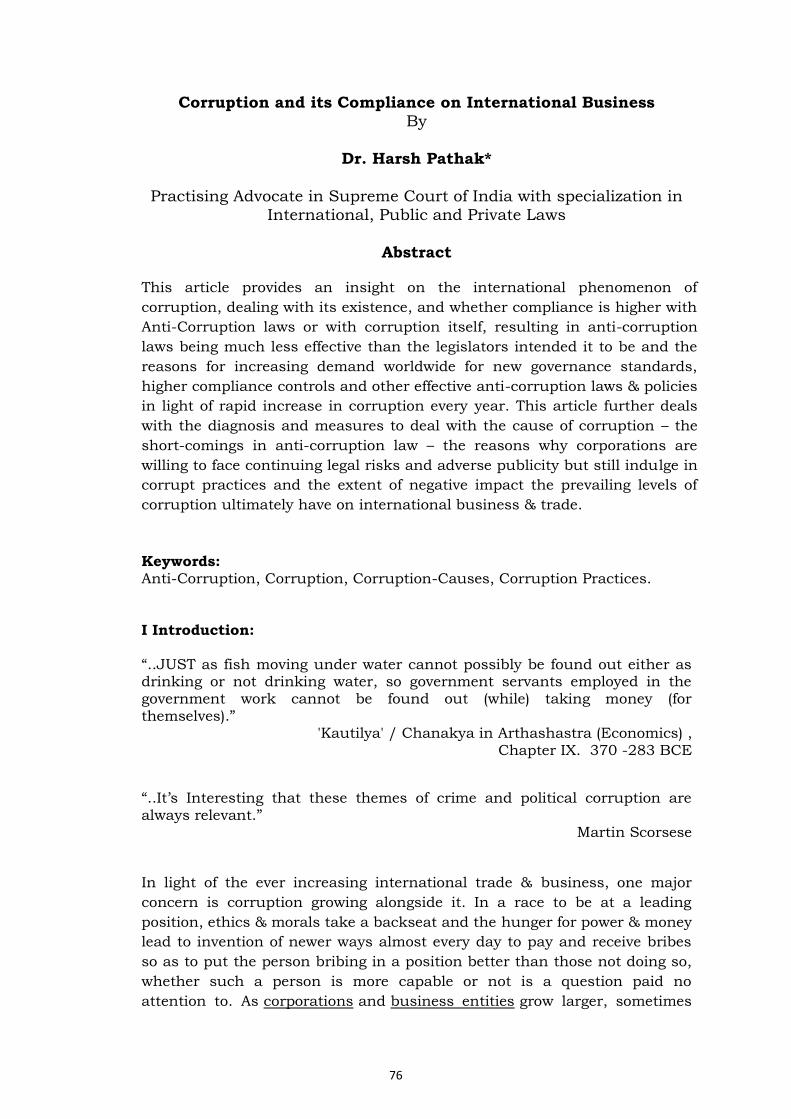
76
Corruption and its Compliance on International Business By
Dr. Harsh Pathak*
Practising Advocate in Supreme Court of India with specialization in International, Public and Private Laws
Abstract
This article provides an insight on the international phenomenon of
corruption, dealing with its existence, and whether compliance is higher with
Anti-Corruption laws or with corruption itself, resulting in anti-corruption
laws being much less effective than the legislators intended it to be and the
reasons for increasing demand worldwide for new governance standards,
higher compliance controls and other effective anti-corruption laws & policies
in light of rapid increase in corruption every year. This article further deals
with the diagnosis and measures to deal with the cause of corruption – the
short-comings in anti-corruption law – the reasons why corporations are
willing to face continuing legal risks and adverse publicity but still indulge in
corrupt practices and the extent of negative impact the prevailing levels of
corruption ultimately have on international business & trade.
Keywords: Anti-Corruption, Corruption, Corruption-Causes, Corruption Practices.
I Introduction: “..JUST as fish moving under water cannot possibly be found out either as drinking or not drinking water, so government servants employed in the government work cannot be found out (while) taking money (for themselves).”
'Kautilya' / Chanakya in Arthashastra (Economics) , Chapter IX. 370 -283 BCE
“..It’s Interesting that these themes of crime and political corruption are always relevant.”
Martin Scorsese
In light of the ever increasing international trade & business, one major
concern is corruption growing alongside it. In a race to be at a leading
position, ethics & morals take a backseat and the hunger for power & money
lead to invention of newer ways almost every day to pay and receive bribes
so as to put the person bribing in a position better than those not doing so,
whether such a person is more capable or not is a question paid no
attention to. As corporations and business entities grow larger, sometimes
77
with a monetary turnover many times that of small countries, the threat of
corruption in the business world, within the organization, in dealings with
other organisations and in dealings with the government is a looming and
growing threat. So is it that capability has little relevance as a qualifying
factor in today’s time and the race is only monetarily driven, the winner
predetermined, on basis of the highest payer? It would certainly seem so.
II. Definition & meaning of corruption: Corruption has been defined as1:
Per Oxford Dictionary:
“Dishonest or fraudulent conduct by those in power, typically involving
bribery.
Per Black’s Law Dictionary (2nd Edition):
Illegality; a vicious and fraudulent intention to evade the prohibitions of the
law. The act of an official or fiduciary person who unlawfully and wrongfully
uses his station or character to procure some benefit for himself or for
another person, contrary to duty and the rights of others.
As per Dictionary.com:
The word corrupt (Middle English, from Latin corruptus, past participle
of corrumpere, to abuse or destroy: com-, intensive pref. and rumpere, to
break) when used as an adjective literally means "perverted, made inferior,
affected, tainted, decayed".2
Earlier corruption was believed to be prevalent only in public offices, giving
corruption the meaning of use of public office for private gain3 but such a
narrow meaning does not hold in today’s time where corruption is prevalent
in public offices, private offices and commercial spheres of business and one
does not need any analysis or study in support of such contentions. One of
the most popular of the definitions of corruption, namely, ‘Corruption is the
abuse of power by a public official for private gain’ is too limited to be able to
include the levels and spheres corruption and corrupt persons have invaded.
Therefore, corruption maybe political, personal/private or commercial.
The basic difference is in the office, power and position, which are abused,
and aim of abuses. Political corruption may include bribery, use of
governmental offices for private enrichment and substitution by
particularistic for universalistic norms of public decision-making4. Personal
corruption may include violations of fiduciary duty, untruthfulness with
friends for personal gains. Commercial corruption may include suppliers
1 Retrieved on 27.06.2015 2 As defined in Maria Dakolias and Kim Thachuk, The Problem of Eradicating Corruption from the Judiciary: Attacking
Corruption in the Judiciary: A Critical Process in Judicial Reform, 18 Wis. Int'l L.J. 353, 355 (2000). 3 Id. at 356 4 "Glossary". U4 Anti-Corruption Resource Centre. Retrieved on 27.06.2015.
78
bribing agents to sell their products over other suppliers’ products,
organisations bribing media agencies for better publicity, et al. Corruption is
a crime of calculation, where the benefit received by the briber overweighs
the amount paid as bribe, which is the most seducing factor for everyone
ready to indulge is paying bribe. On the other hand, the receiver of bribe has
nothing to lose and all to gain from the bribe so received as if it is not this
person upon whom the benefit is vested by him then it would be so vested
upon someone else, who may not have paid bribe for it, leading to corruption.
Another aspect of corruption is the scale of corruption. Corruption can occur
on many different scales. There is petty corruption that occurs as small
favours between a small number of people within established social
frameworks and governing norms, usually occurring in developing nations
where public servants are significantly underpaid. Then there is the
corruption that affects the government on a large scale, i.e., grand corruption
or political corruption, occurring at the highest levels of government in a way
that requires significant subversion of the political, legal and economic
systems. Such corruption is commonly found in countries with authoritarian
or dictatorial governments and in those without adequate policing of
corruption by anti-corruption agencies. Then there is corruption that is so
prevalent that it is part of the everyday structure of society, i.e., systemic
corruption)5, which is primarily due to the weaknesses of an organization or
process. It can be contrasted with individual officials or agents who act
corruptly within the system. Factors which encourage systemic corruption
include conflicting incentives, discretionary powers; monopolistic powers;
lack of transparency; low pay; and a culture of impunity.6 Specific acts of
corruption include "bribery, extortion, and embezzlement" in a system where
"corruption becomes the rule rather than the exception.” 7 Scholars
distinguish between centralized and decentralized systemic corruption,
depending on which level of state or government corruption takes place; in
countries such as the Post-Soviet states both types occur.8
The difference between bribery and corruption is almost always ignored,
corruption being broader in scope than bribery. Bribery, as an act of
corruption, always deals with obtaining of illegal payments with abuse of
public or commercial office. 9 The payment need not always involve the
exchange of money (could be other gifts or advantages, such as membership
of an exclusive club or promises of scholarships for children, special favours
or influence).10 As an act, despite the form it takes, corruption is always a
5 Lorena Alcazar, Raul Andrade (2001). Diagnosis corruption. pp. 135–136.
6 Znoj, Heinzpeter (2009). "Deep Corruption in Indonesia: Discourses, Practices, Histories". In Monique Nuijten,
Gerhard Anders. Corruption and the secret of law: a legal anthropological perspective. Ashgate. pp. 53–54. 7 Legvold, Robert (2009). "Corruption, the Criminalized State, and Post-Soviet Transitions". In Robert I.
Rotberg. Corruption, global security, and world orde. Brookings Institution. p. 197 8 See John T. Noonan, Bribe (1987) for discussion of bribery.
9 Enery Quinones, What is Corruption, OECD Observer, (April 1, 2000), Pg. 23
10 Id.
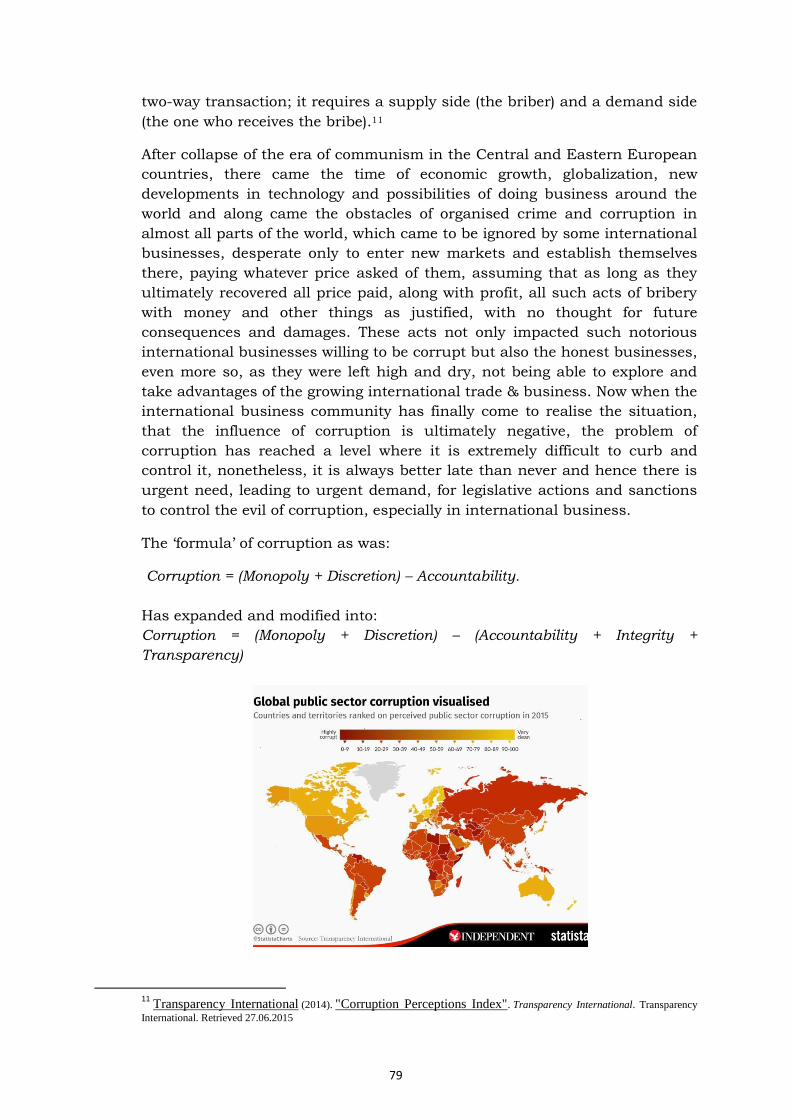
79
two-way transaction; it requires a supply side (the briber) and a demand side
(the one who receives the bribe).11
After collapse of the era of communism in the Central and Eastern European
countries, there came the time of economic growth, globalization, new
developments in technology and possibilities of doing business around the
world and along came the obstacles of organised crime and corruption in
almost all parts of the world, which came to be ignored by some international
businesses, desperate only to enter new markets and establish themselves
there, paying whatever price asked of them, assuming that as long as they
ultimately recovered all price paid, along with profit, all such acts of bribery
with money and other things as justified, with no thought for future
consequences and damages. These acts not only impacted such notorious
international businesses willing to be corrupt but also the honest businesses,
even more so, as they were left high and dry, not being able to explore and
take advantages of the growing international trade & business. Now when the
international business community has finally come to realise the situation,
that the influence of corruption is ultimately negative, the problem of
corruption has reached a level where it is extremely difficult to curb and
control it, nonetheless, it is always better late than never and hence there is
urgent need, leading to urgent demand, for legislative actions and sanctions
to control the evil of corruption, especially in international business.
The ‘formula’ of corruption as was:
Corruption = (Monopoly + Discretion) – Accountability.
Has expanded and modified into:
Corruption = (Monopoly + Discretion) – (Accountability + Integrity +
Transparency)
11
Transparency International (2014). "Corruption Perceptions Index". Transparency International. Transparency
International. Retrieved 27.06.2015
80
Fig.1 Corruption & world map- Corruption perception index 2015
Since 1995, Transparency International (TI) publishes the Corruption
Perceptions Index (CPI) annually ranking countries "by their perceived levels
of corruption, as determined by expert assessments and opinion surveys.12
The CPI generally defines corruption as "the misuse of public power for
private benefit.13 The CPI currently ranks 175 countries "on a scale from 100
(very clean) to 0 (highly corrupt)." 14 The 2015 corruption perceptions
index measures the perceived levels of public sector corruption in 175
countries and territories around the world. Upon perusal of this index, it is
clear that no part of the world is devoid of the evil of corruption. So this
implores us to re-think as to how effective any anti-corruption legislation can
be and how aggressive the penalty will have to be to force corrupt people and
organisations to think before indulging in such practices as clearly, expecting
ethical, moral values and integrity to be doing the job has failed, hence, the
urgent need for penal legislation.
III. Causes of corruption:
Causes of corruption, in the author’s opinion, are so many that may not be
easily divided into limited groups. Low income, overburdening tax system,
weak law, no strict action taken against corruption due to corrupted people's
popularity, no transparency in dealing, low morals and integrity of people,
lust for power and money, and it can go on and on.... Specifically the author
will herein discuss two categories - socio-political and economic as being the
most affecting.
i. Socio-political causes of corruption are following: (a) weak governance of a
country; (b) dysfunctional government’s budgets; (c) delays in the release of
budget funds, especially when this involves pay; (d) closed political systems
dominated by narrow vested interests; (e) use of public office for private gain
by senior officials and political leaders; (f) divergence between the formal and
the informal rules governing behaviour in the public sector; (g) weak
accountability, (h) eroded ethical values, (i) inoperative financial management
systems resulting in no formal mechanism to hold public officials
accountable for results; (j) low and declining civil service salaries and
promotion unconnected to performance and a public service long dominated
by patron-client relationships, in which the sharing of bribes and favours has
become entrenched; (k) civil services receive inadequate supplies and
equipment; (l) lacking adequate legislative controls; (m) unenforced rules of
conduct and conflict of interest with ineffectual watchdog institutions such
as ombudsmen, auditors, and the media or their absence in toto; (n)
12 CPI 2010: Long methodological brief, p. 2 13 Transparency International (2015). "Corruption Perceptions Index 2015: In detail ".Transparency International.
Transparency International. 14 James P. Wesberry Jr., International Financial Institutions Face the Corruption Eruption, 18 J. INTL. L. BUS, 498, 509 (1998).
81
international sources of corruption associated with major projects or
equipment purchases.15
ii. Economic causes of corruption are closely connected with political ones. They
are following: (1) existence of trade restrictions leads to payments to
governmental officials in order to get import licenses which are in limited
quantity; (2) existence of a big number of government subsidies regulate
industrial policy, governmental officials strongly involved in price controls; (3)
existence of multiple exchange rate practice and foreign exchange allocation
schemes leads to attempts to gain the most advantageous rates by bribing
governmental officials; (4) low wages in civil services leads to extortion bribes
by civil servants to improve their financial situation; (5) natural resources
endowments leads to bribes of governmental official to get the best prices in
avoidance of government regulations.16
Iv. Consequences of corruption:
Corruption has very strong effect at political, social and economic life of a
country where it takes place. The existence of corruption in this case puts
some costs and some benefits of political, judicial, and bureaucratic actions
to different members of the society.17 In the field of International business
transactions the corruption has an impact at both sides: countries where
corruption takes place suffer from social, political and economic losses and
foreign companies, which are doing or trying to do business in those
countries, suffer from commercial losses.
In these countries there exist problems of undermined democracy by
effecting rights of ordinary people and small entrepreneurs, harm to the
environment, retarded development, eroding moral values of people,
disregard for the rule of law, increase in organised crime and money
laundering, lowers investment and retarded economic growth to significant
extent, loss of tax revenue, lower quality of infrastructure and public
services, distortion in the allocation of resources, weakening trade with other
countries; lowers growth.18
Commercial loses for the companies are that entrepreneurs suffer higher
risks and increased costs of doing business, international bribery results in
lost exports for those who play by the rules and seek to win contracts
through fair competition, the ability of businesses to operate in a
transparent, honest and predictable environment is lost, corruption hurts
suppliers of exporters and impedes international trade.19
V. Measures Taken By International Organizations:
15 Paolo Mauro, Why Worry About Corruption? 4-6 (1997). 16 See Henry R. Luce, The Role of The World Bank in Controlling Corruption, 29 Law & Pol'y Int'l Bus. 93, 95-97 (1997) for 6
situations where bribery plays role of the distributor of costs and benefits. 17 See Vito Tanzi, Roads to Nowhere:How Corruption in Public Investment Hunts Growth (1998). 18 DONALD J. JOHNSTON, Honesty is the Best Policy, OECD Observer (April 1, 2000), Pg. 3. 19
European Union, Resolution on the communication from the Commission to the Council and the European Parliament on a
Union policy against corruption, (May 21, 1997), COS/1997/2116, also available at http://wwwdb.europarl.eu.int/
82
On May 21, 1997, the European Commission adopted a Communication to
the Council and to the European Parliament on a Union Policy against
Corruption.20 The Communication provides member states with a consistent
and coherent policy on corruption in international trade and commerce well
as in other pertinent area. But the Communication does not have legal effect
of corruption. The Convention criminalizes bribery of E.U. officials as well
public officials of E.U. member states, but does not concern transnational
bribery with foreign officials of countries that are not members of the
European Union.21 The Convention on the Fight against Corruption involving
Officials of the European Community or Officials of Member States of the
European Union22, adopted on May 26 1997, criminalized active and passive
corruption of officials even where financial damage to the Union was not at
issue. The Joint Action of 22 December 1998 adopted by the Council on the
Basis of article K.3 of the Treaty on European Union, on corruption in the
private sector, constituted another important instrument.”23
Other international organisations have also been actively fighting against
growing corruption. The United Nations (U.N.) has drafted three very
important documents to deal with issues of corruption: United Nations
Declaration against Corruption and Bribery in International Commercial
Transactions24, International Code of Conduct for Public Officials25, and Code
of Conduct for Law enforcement Officials 26 . The Draft United Nations
Convention against Transnational Organized Crime, in its article 4 ter 27
envisages the criminalization of corruption when an organized criminal group
is involved. The Convention includes following acts: corrupt activities
involving an international civil servant, a foreign public official, a judge or
other official of an international court. The draft convention is aimed at
corrupt activities towards international officials. Additional international
measures were proposed for further combating corruption the 10th U.N.
Congress 28 included “develop, ratify and incorporate international
instruments to encourage strengthen anti-corruption programs at the
national level” and “Consider the development of a comprehensive United
Nations convention against corruption”.29
20 Convention on the Fight Against Corruption Involving Officials of the European Communities or Officials of Member States of
the European Union, May 26 (1997), O.J.C. 195, 26.5.1997 21
Id. 22 See, European Union, Joint Action of 22 December 1998 Adopted by the Council on the Basis of Article K.3 of the Treaty on
European Union, on Corruption in the Private Sector, 1998 O.J. (L358), also available at http://www.consilium.eu.int/ejn/vol_b/5_actions_communes/corruption/13909en.html 23 United Nations Declaration against Corruption and Bribery in International Commercial Transactions, U.N. GAOR, 51st Sess.,
U.N. Doc. A/RES/51/191 (Dec. 16, 1996) 24 United Nations International Code of Conduct for Public Officials, U.N. Doc A/RES/51/59 (Dec.12, 1996) 25 Code of Conduct for Law enforcement Officials General Assembly Resolution, U.N.Doc A/34/196 of (Dec. 17 1979) 26 Draft United Nations Convention against Transnational Organized Crime, U.N. Doc. A/AC.254/4/REV.6 27 10th United Nations Congress on the Prevention of Crime and The Treatment of Offenders, Vienna, 10-17 April 2000,
International cooperation in combating transnational rime: new challenges in the twenty-first century. Background paper for the
workshop on combating corruption prepared by the United Nations Interregional Crime and Justice Research Institute. U.N. DOC
A/conf.187/9,available at http://www.uncjin.org/Documents/10thcongress/10thcongress.html. 28 Id. 29 John Brademas and Fritz Heimann, Tackling International Corruption; No Longer Taboo, Foreign Affairs, October, 1998, Pg. 17
83
In 1996, president of the World Bank, James Wolfensohn, made combating
bribery a top priority. In 1997, with help of Transparency International, the
bank adopted a comprehensive program, including strong controls to prevent
bribery on World Bank-financed projects and assistance to governments to
promote reforms.30 It was decided that bank will fight corruption by following
means: (a) preventing fraud and corruption in World Bank-financed projects;
(b) assisting countries fight corruption, if and when they request it; (c)
seriously considering corruption in the World Bank's internal planning, in
the design of its projects and in its analysis and policy dialogue with
countries which lead to agreeing upon strategies; (d) supporting international
efforts against corruption.31
Transparency International is a non-governmental organization established in
1993 in Berlin. It has former governmental officials and business people as
its members. The main aim of this organization is to increase governments’
accountability and curbing both international and national corruption.32 The
most important actions by the Transparency International are information
gathering and raising public awareness. For this purpose, it publishes a
Corruption Perceptions Index33 that scores countries on ten-point scale, a
score of ten indicating a highly clean country and zero indicating a highly
corrupt country.34 TI also publishes a Bribery Index of Leading Exporting
Nations35 to uncover the sources of bribery by scoring countries on a ten-
point scale with a score of ten indicating negligible bribery and zero
indicating very high levels of bribery.36
The International Monetary Fund has been emphasizing the need for
transparency and other steps to curb corruption.37 On August 4, 1997, the
IMF Executive Board released guidelines, which instructed IMF staff to
consider corruption and accountability issues in its relations with borrowing
countries. The IMF guidelines are worded in the language of economists,
which makes them difficult to understand for laypersons. The Guidelines do,
however, officially recognize the problem of corruption for the first time. More
importantly, they call the attention of IMF staff to the threat that corruption
poses to international lending for development. The IMF guidelines
specifically seek to provoke greater attention to involvement in governance
issues by advocating policies and development of institutions and
administrative systems with aim to eliminate opportunity for corruption and
fraud. It also expresses great concern that corruption issues be addressed
only based on economic considerations within its mandate prohibiting IMF
30 James P. Wesberry Jr., International Financial Institutions Face the Corruption Eruption, 18 J. INTL. L. BUS, 498, 509 (1998).
at 501-502. 31 Transparency International, Welcome! at http://www.transperency.de/welcome.html (visited 27.06.2015) 32 See Transparency International Corruption Perception Index/Bribe Payers Index at
http://www.transparency.de/documents/cpi/index.html 33 See Id. 34 See Id. 35 See Id. 36 John Brademas and Fritz Heimann, Tackling International Corruption; No Longer Taboo, Foreign Affairs, October, 1998 37 James P. Wesberry Jr., International Financial Institutions Face the Corruption Eruption, 18 J. INTL. L. BUS, 498, 509 (1998).
84
adopt the role of an investigative agency or guardian of financial integrity in
member countries.38
The International Chamber of Commerce in Paris plays an important role in
encouraging the international business community to become active in
fighting corruption. The Chamber's focus is on improving corporate self-
regulation programs. The biggest Chamber’s achievement is the "Rules of
Conduct to Combat Extortion and Bribery".39 On 26 March 1996, the ICC's
Executive Board updated the Rules40 and expanded them to cover a broader
range of corrupt practices. The Rules deal with such issues as payments to
sales agents and other intermediaries, business entertainment and gifts, and
political contributions. They cover not only bribery of public officials but
bribery within the private sector as well. The basic approach of the Rules is
the need for action by international organizations, governments and by
enterprises, nationally and internationally, to meet the challenging goal of
greater transparency in international trade. The rues have also been revised
in 1999. Thus, extortion and bribery in judicial proceedings, in tax matters,
in environmental and other regulatory cases or in legislative proceedings are
now covered by the Rules.
World Trade Organization has also recently mobilized its efforts against
corruption. So far the only one legal action was taken by the WTO: the 1996
WTO Ministerial Declaration41 which included a provision establishing the
Transparency in Government Procurement working Group to study
transparency in government procurement practices. In 1999 the Group has
issued its first report.42 Within the WTO the most feasible possibility is to
revise the Agreement on Government Procurement, focusing on
anticorruption aspects. This agreement entered in force on January 1, 1996,
but only a few courtiers, mostly in industrial world, have adopted its
provisions.
The Foreign Corrupt Practices Act, 1977 (United States of America), prohibits
American companies from making corrupt payments to foreign officials for
the purpose of obtaining or keeping business. The Congress enacted the
FCPA to bring a halt to the bribery of foreign officials and to restore public
confidence in the integrity of the American business system. FCPA was
amended in 1988 and in 1998.43
38 International Chamber of Commerce, Rules of Conduct to Combat Extortion and Bribery (revised) at
http://www.iccwbo.org/home/statements_rules/rules/1999/briberydoc99.asp, (Visited 27.06.2015) 39
International Chamber of Commerce, Rules of Conduct to Combat Extortion and Bribery at
http://www.iccwbo.org/home/statements_rules/rules/1996/1996/briberydoc.asp, (Visited 27.06.2015). 40 See WTO Singapore Ministerial Declaration (Dec. 13 1996) at
http://www.wto.org/english/thewto_e/minist_e/min96_e/wtodec.htm (last updated 18/10/2000) 41 See WTO Report (1999) to the General Council (Oct.12, 1999) at http://www.wto.org/english/tratop_e/grpoc_e/tran99_e.htm. 42 See WTO Text of the Agreement on Government Procurement at
http://www.wto.org/english/tratop_e/gproc_e/agrmnt_e.htm 43 See Barbara Crutchfield George & Kathleen A. Lacey, A Coalition of Industrialized Nations, Dveloping Nations, Multilateral
Development Banks , and Non-Governmental Organizations:A Pivotal Complement to Current Anti-Corruption Initiatives, 33
Cornell Int’l L.J. 547 (2000) for discussion of the amendments. See also Stuart H. Deming, Foreign Corrupt Practices, 33 Int'l Law. 507 (Summer, 1999).
85
VI. International laws compliances:
Trans-national organisations are eager to spur growth by taking advantage of
economic growth, especially that of the developing economies such as South-
East Asia. Well-educated and lower-cost workforce and its promising market
may have little choice but to take a vigorous approach to Anti Corruption
Law compliance.
Vii. What next at legislative level:
Urgent need for accountability of Judiciary, legislative and executive
branches, as always was intended by the fore-fathers of nations wherein the
government system is divided into
the legislative, executive and judiciary branches in an attempt to provide
independent services that are less prone to corruption due to their
independence. Therefore, need for establishing an effective mechanism for
dealing with complaints made with regard to corruption with penalty that
acts as a deterrent and not merely a paper tiger. Anti-corruption legislation
needs to cover not only monetary bribes but also gifts, valuables, extended
hospitality and other benefits derived by acts of corruption. Anti-corruption
legislation needs to cover bribe as “speedy money” regularly paid for routine
governmental action.
Steps towards Compliance:
Transnational /National organisation(s) should create a culture of integrity and compliance by:
1) Due diligence;
2) Business Plan;
3) Anti Corruption compliance policy;
4) Internal monitoring mechanism;
5) Regular compliance training;
6) Whistleblower policy;
7) Conduct due-diligence on prospective business/partner.
8) Ensure that a comprehensive business plan is put in place at the start, to ensure that unanticipated regulatory hurdles do not result in incentive to engage in illegal activities.
9) Lay out a comprehensive anti corruption compliance policy with respect to all dealings with public servants, including guidelines for giving gifts and offering hospitality.
86
10) Set up an effective internal monitoring mechanism to check illegal acts by employees, and also ensure that incentives do not exist to engage in such illegal acts.
11) Conduct regular compliance training for employees of all levels, to sensitize them to anti-corruption laws and their consequences.
12) Establish and publicize a whistleblower policy to encourage reporting of illegal activities. Viii. Conclusion
The paradigm is “...Corruption exists in the world, but world is not a corrupt
society.” Clearly most people in the world are living in ignorance and are not
realising the urgency and cry for immediate action to control and curb
corruption, failure of which will be nothing less than a catastrophe. In order
for the anti-corruption legislation to work effectively, it is imperative that
people be made aware of the long-term consequences of such acts. When
even in a place like Europe, where people are generally found to be more
honest, with higher integrity and morals as compared to say South-east
Asian countries, the problem of corruption persists, one can easily imagine
the affect that corruption has on the people of these South-east Asian
countries, and if imagination is not enough, there is enough data in support,
easily available, which should be a lesson learnt by developed nations to
control the evil as early and as effectively as possible, so as to avoid an
uncontrollable situation. Corruption mostly affects developing countries in
political, social and economic aspects but at the same time it has a very
strong influence on foreign businesses as well.
The nature of the causes of corruption is already understood to a great extent
and the degree of effectiveness of the various measures initiated by the
political leaders to combat corruption is lagging behind. Even though Anti-
corruption is gaining more relevance as, simultaneous with increasing
enforcement of anti-corruption laws, nations have started to focus on
individual and corporate liability in cases of violation of anti-corruption laws,
the problem of corruption still persists enough to have adverse affects on the
general public all over the world.
Positively speaking, in the context of the far-reaching developments
internationally to curb corruption, it appears unlikely that the more corrupt
nations can act very differently and buck this trend, in the current context
wherein all these nations have entered into mutual obligations with several
countries to extend cooperation in respect of investigations and legal
proceedings and maybe it is only a matter of time but it a question that too
will have an answer in time. The public reporting of corruption cases is on
the rise and it seems the best time to put anti-corruption legislations and
mechanisms in place to control and eliminate the evil of corruption. In the
recent past, a number of sensational cases have grabbed media headlines,
including those involving the politicians, bureaucrats and top management of
87
the corporations, either been arrested or are under investigation on charges
of bribery. Practically, prosecutions against companies and officials are on
the rise. The continuing legal risks and adverse publicity for the corporations
involved should be used as an advantage to encourage anti-corruption
attitude.
Corruption is an ancient concept but always contemporary. Corruption is a
manifestation of administrative malpractices for purported economic gains
due to lack of political will and reforms. When a concept like corruption is
put in to practice, it’s bad for the socio-economic health of the nation and
warrants a determined politico-administrative intent to eliminate such
practices from the system, not merely to regulate. As nations and regional
groupings seek to implement stricter laws with respect to bribery and corrupt
practices, the legal risks faced by trans-national corporations are becoming
more complex. Scope and operation of anti-corruption laws is not restricted
to territorial boundaries. Anti-corruption compliance is a hot-button issue in
developing countries where trans-national corporations are increasing
presence.
As Chanakya said…..
Chanakya, is considered as the pioneer of the field of economics and political
science in India. Authored the ancient Indian political treatise called
Arthshastra (Economics), credited for establishment of the Maurya Empire,
the first empire in archaeologically recorded history to rule most of the Indian
subcontinent. Chanakya is often called the "Indian Machiavelli", although his
works predate Niccolo Machiavelli’s by about 1,800 years. Without a
corruption-free system, the Mauryan empire – which was the largest in
Indian history and the largest (in relative terms) the world has ever seen,
could never have arisen. ...“You can't build a MEGA EMPIRE if your
ministers, officials, police, and army is corrupt. TOTAL integrity is the
minimum requirement and high quality governance.
References
1. Barbara Crutchfield George & Kathleen A. Lacey, 2000, A Coalition of
Industrial Nations, Developing Nations, Multilateral Development Banks,
and Non-Governmental Organization: A Pivotal Complement to Current
Anti-Corruption Initiatives, 33 Cornell Int’l L.J. 547 (2000)
2. Enery Quinones, 2000, What is Corruption, OECD Observer
3. Heidenheimer, Arnold J. and Michael Johnston, 2002, Political
Corruption: Concepts and Contexts
4. Henry R. Luce, 1997, The Role of The World Bank in Controlling
Corruption,
5. James P. Wesberry Jr.,1998, International Financial Institutions Face the
Corruption Eruptions, 18 J. INTL. L. BUS, 498, 509
6. John Brademas and Fitz Heimann, 1998, Trackling International
Corruption; No Longer Taboo, Foreign Affairs,
88
7. John T. Noonam, 1987, Bribe
8. Legyold, Robert, 2009, “Corruption, the Criminalized State, and Post-
Soviet Transitions”.
9. Lorena Alcazar, Raul Andrade, 2001, Diagnosis corruption.
10. Maria Dakolias and Kim Thachuk, 2000, The Problem of Eradicating
Corruption from the Judiciary: Attacking Corruption in the Judiciary: A
Critical Process in Judicial Reform, 18 Wis. Int’l L.J. 353, 355.
11. Monique Nuijten Gerhard Anders, 2009, Corruption and the secret of law:
a legal Anthropological perspective. Ashgate
12. Paolo Mauro, 1997, Why Worry About Corruption?
13. Robert I. Rotberg, 2009, Corruption, global security, and world order.
14. Rose-Ackerman, Susan, 1999, Corruption and Government: Causes,
Consequences and Reform.
15. Stuart H. Deming, 1999, Foreign Corrupt Practices, 33Int’l Law.507
16. World Bank, 1997, Helping Countries Combat Corruption: The Role of the
World Bank.
17. Znoj, Heinzpeter, 2009, “Deep Corruption in Indonesia: Discourses,
Practices, Histories.”
89
A Study of BREXIT & it’s Impact on European Union
By
Jai Kotecha* Sagar Mehta** Lasha Chugh***
* CA & Faculty at Thakur Institute of Management Studies and Research
** Student of Thakur Institute of Management Studies and Research
*** Student of Thakur Institute of Management Studies and Research
Abstract
The study is about how the European Union is formed. The study shows that
how EU policies aim to ensure the free movement of people, goods, services,
and capital within the internal market, enact legislation in justice and home
affairs, and maintain common policies on trade. Corporate operating in the
transport equipment, food & beverages, textiles, electrical equipment’s and
chemical sector are most exposed due to trade linkages.
The study is about how the British exit impacts the European Union; this is
analyzed with the help of secondary data. It shows how BREXIT impact on
Trade, Agriculture, Employment along with its worldwide long term economic
impact.
Keywords:
BREXIT, European Union, House of Common
Introduction:
The European Union (EU) got its origin from European Coal and Steel
Community (ECSC) and European Economic Community (EEC). It was
formed after the world war II in 1951-1958 by the inner six countries namely
Belgium, France, Italy, Luxembourg, Netherlands and West Germany. EU
comprises of 28 state members that are primarily in Europe and is a unique
economic and political union. EU has developed an internal single market
through a standardised system of laws that apply in all member states, for
the free movement of people, goods, services and capital within market. EU
policies aim to enact legislation in justice and home affairs and maintain
common policies on trade.
European Union operates mainly according to the rules of law, where
everything it does is founded on treaties, voluntarily and democratically
90
agreed by is member countries. Institution of European Union- the European
Council, the Council of European Union, the European Parliament, the
European Commission, the court of Justice of European Union, the
European Central Bank, and the European Court of Auditors are the seven
principle decision-making bodies. Generally laws made by EU institutions are
mainly classified into two groups: those which come into force without the
necessity for national implementation which are known as regulations and
those which specifically require national implementation measures which are
known as directives.
The main objective of the European Economic Community is the development
of common market between its member states, subsequently becoming a
single market and a customs union between its member states. The single
market involves free movement of goods, capital, people and services within
the EU and as per the customs union there is an application of common
external tariff on all goods entering the market. The non-EU members can
participate in single market but cannot participate in the customs union.
Research methodology:
The study is quantitative in nature. We will be relying exclusively on
secondary sources of data. The methodology is used for analyzing the impact
of BREXIT on United Kingdom and the other members of European Union.
This report primarily focuses on finding out the working of European Union
as well as the overall impact on the decision of brexit.
Scope of the study:
The following are some of the objectives that we hope to accomplish during
the course of study.
To study the formation of European Union.
To study about the BREXIT.
To understand the impact of British exit on Trade, Agriculture,
Defence and the economy as a whole.
Significance of study/Literature review:
The research is to study the impact of BREXIT on United Kingdom as well as
the European Union as a whole. It tries to identify how the British exit
impacts on the free movement of people, goods, services and capital within
the member countries of European Union. Since there is no road map for the
exit of UK from European Union the study is completely dependent on the
existing information from House of Commons UK.
Limitation of study:
The major problem being faced is there is no policy framed by the UK
government setting out its BREXIT plan.
Hence the study is limited to the report by House of Commons UK.
91
Time constraint will limit the extent & depth of the study.
BREXIT:
A process of United Kingdom (UK) to withdraw from the European Union (EU)
is commonly known as BREXIT. It is the result of June 2016 referendum in
which 51.9% voted to leave the EU. The separation process of UK from EU is
complex, causing political and economical changes for the UK and other
countries. On 2nd October 2016, British Prime Minister Theresa May
announced she would trigger Article 50 by the end of March 2017 which
would make the UK to leave EU by the end of March 2019. With the exit of
United Kingdom from European Union, it also opens the door for other
countries to leave European Union. This is one of the major fears of many
people around the world. In the meantime, UK remains a full member of
European Union.
The exit of United Kingdom will lead to negotiations about new relation with
European Union. The first step for the UK government is to inform the
European Union about the intention of withdrawal, and it is unlikely to
happen before the end of 2016. When such notification is sent by UK to EU it
will trigger the negotiation for withdrawal agreement. Until that negotiation is
done, the UK remains bound by EU law. Negotiating the withdrawal
agreement seems to be very challenging, in lights with substantial trade ties
between the UK and EU.
Impact of British Exit on Trade:
The EU Member States do not pay any tariffs on goods moving between them
and a common tariff is applied on the goods entering from Non-EU nations.
Through Common Commercial Policy (CCP) external trade relationships are
coordinated at EU level, since the EU members cannot operate their
independent trade policies. The EU Trade Commissioner plays an important
role as he acts as a negotiator in multilateral and bilateral trade talks with
European Parliament and the ministers of the member states called as the
EU Council making certain decisions regarding the negotiations and final
result. The principle of free trade in services between EU Member States is
also mentioned in the EU Treaties.
Though services make a very important contribution to the overall EU
economy, but the trade in services within the single market is much less as
compared to goods. EU is UK’s most important trading partner till now. In
2015 it accounted for 44% (£222 billion) of the UK goods and services exports
and 53% (£291 billion) of the UK imports. The UK’s imports are more from
EU as compared to exports. The UK’s new relations with the EU will range in
options from membership of the European Economic Area (EEA) to trading
under World Trade Organization (WTO) rules. If UK chooses EEA as their
option then it will be closest to EU membership and would largely maintain
access to the EU single market and would accept the free movement of
92
people and contribution to the EU’s budget. The UK will not have any direct
influence over EU rules if it chooses to be a member of EEA. If UK chooses to
be a member of WTO instead of EEA then it would bring a biggest change in
the current situations of EU as there would be no need to accept the free
movement of people or make EU budget contributions and trade between UK
and EU will be subject to tariffs and other barriers to trade. Other barriers to
trade are also called as non-tariff barriers to trade.
Impact of British Exit on Agriculture:
40% of the EU’s budget is related to agriculture and rural development
through the Common Agriculture policy (CAP). CAP provides an EU
framework of regulation for direct payments to farmers, market support
measures and rural development programs to support the wider rural
economy. BREXIT in all scenarios mean a departure from the Common
agriculture policy (CAP). The loss of the CAP and the future EU/UK trading
relationships raises lot of uncertainties for farmers in terms of income,
tariffs, commodity and consumer prices and environmental management
requirements in the future. EU farm subsidies just make up to 50-60% of
income. Previous government has said that CAP reforms have indicated that
UK government and developed administrations would not be able to match
the current levels of subsidy. Farming organizations are anxious about the
common market and migrant labor and how imports will be regulated.
Environmental groups are concerned about the overall level of funding agri-
environment schemes outside CAP and till when UK agriculture policy will be
supporting environmental goals. UK agriculture policy, UK farming and
landowning bodies are starting to set out their wish list for the future. They
are asking government to act quickly to reduce uncertainty and take the
opportunity to devise simpler approaches to farming regulation which
support competitiveness.
IMPACT OF BRITISH EXIT ON DEFENCE:
The UK is one of the strongest among all EU member states in terms of
Defence and arm forces. It has the ability to deploy an operational
headquarter and they are capable of taking command of a mission. Unless
the UK formally leaves the EU it will remain a part of Common Security and
Defence Policy (CSDP) planning structures and the EU military operations to
which UK has committed forces. Although the impact of BREXIT on UK
military will be minimal, in the long run UK's ability to influence or shape the
CSDP agenda will be significantly cut shorted. Since the UK is one of the
most largest and advanced military power in the EU in terms of manpower,
assets, capabilities and defence spending, EU has a disadvantage with fewer
manpower, assets, capabilities etc with the withdrawal of UK from EU. The
EU defence directives agreed in 2011 are retained in the withdrawal
agreement but the applicability of their provisions to the UK will not change.
The UK will have an impact on its procurement approach if UK chooses not
93
to follow the directives. UK has been one of the main driving forces behind
the development of CSDP.
Impact of British Exit on the European Economy:
The exit of United Kingdom (UK) from the European Union (EU) will not only
have an impact on trade, employment and agriculture but also on Foreign
Direct Investment (FDI), politics, GDP and migration laws. The effect on FDI
is uncertain as it mainly depends on the trade arrangements reached with
the EU and other countries. Access to the single market is an important
determinant of FDI. The UK may be able to establish a regulatory regime
more favorable to overseas investors which could offset the effect of its
departure from the EU. The UK will contribute to the EU’s budget till it is the
member state of EU. In 2015, the UK’s contribution was an estimated £8.5
billion which is around 1% of total public expenditure and equivalent to 0.5%
of GDP. Future contributions will depend on the arrangements for which UK
agrees. If UK chooses to be the member of EEA then it will likely to pay into
the EU budget.
The way in which BREXIT will have an impact on political scenario is that
there will be a potential loss of international political weight as UK leaves
European Union. The UK is one of the union’s most liberal countries and has
acted as a mediator in the Franco-German relationship. The departure of UK
can bring about the internal shifts in the EU’s relations. It will become more
difficult to pass the legislations if France and Germany don’t agree. It has
been noticed that there is also a nationalist push in the EU countries,
whereas Spain has noticed a regionalist push for independence. All these
happenings will give rise to the political uncertainty in the near future.
Impact of this will be more evident in non-euro zones as compared to euro
zones.
BREXIT will also have an impact on migration laws and this will directly
affect the business and economy, as it will reduce the overall number of
people moving to work in the UK. The UK’s exit is likely to reduce the
remittances of EU migrants to their home countries. In long term less
migration to the UK could benefit the EU. Currently UK is unable to impose
the limits on immigration from within the EU as there is a free movement of
labor and it stands as one of the fundamentals of EU. If UK refuses to sign
up for the free movement of people then it can impose its own control with
the EU/EEA immigrations as it currently does not follow it. If government
imposes a more restrictive immigration system for EU/EEA nationals then
the option would be to simply extend current rules of non-EU/EEA nationals
to all non-UK nationals.
Challenges of BREXIT:
The prices of British exports will increase as UK takes an exit from
EU.
94
The exit of UK will also result in the loss of economic activities and
production.
In extreme scenario UK would lose all the trade privilege arising from
EU membership.
There will be a reduction in cross border trade activities.
BREXIT may cause political damage and weaken Europe geopolitically.
BREXIT will cause migration of people from Europe.
Europe will also face a challenge of lower economic growth.
UK would lose their preferential access to the EU single market.
The free trade deal which EU negotiated with 53 countries, will no
longer apply to the UK.
Latest News:
Germany’s Finance Minister has said, the EU should offer Britain a
“reasonable” BREXIT deal because financial services offered by the
City of London benefit Europe as a whole.
The High Court has blocked a fresh legal challenge over BREXIT which
would have made the Article 50 fight "look like a walk in the park".
Judges refused to let the challenge go further at a short hearing at
London's Royal Courts of Justice.
The government has published an official policy document setting out
its BREXIT plans. The White Paper lays out the government's 12
"principles" including migration control and "taking control of our own
laws". The White Paper's publication comes after pressure from MPs
across the House of Commons. It sets out the themes of the
government's goals for its negotiations with the EU, as announced by
Prime Minister Theresa May.
Conclusion:
There will be a lot of challenges faced by UK to exit the European Union as it
will affect them economically and politically. Other members of the EU are
also affected by the decision of BREXIT as EU was formed basically to
develop an internal single market between the members of European Union.
With the decision of Britain to leave EU it impacts on Trade, Agriculture,
Defence and the economy as a whole. The UK’s new relations with the EU will
range in options from membership of the European Economic Area (EEA) to
trading under World Trade Organization (WTO) rules.
BREXIT will result into departure from the Common agriculture policy (CAP).
The loss of the CAP and the future EU/UK trading relationships will amount
into lot of uncertainties for farmers in terms of income, tariffs, commodity
and consumer prices and environmental management requirements in the
future
95
UK being one of the strongest country among all the other EU members in
terms of defence, the impact of BREXIT on UK military will be very minimal
and short term as to the other countries of EU. Also BREXIT will impact on
migration laws which will directly affect the business and the economy.
References:
BREXIT: Impact Across Policy Areas (House of Commons Library-BRIEFING
PAPER-Number 07213, 26 August 2016)
https://europa.eu/european-union/about-eu/eu-in-brief_en
http://www.bbc.com/news/uk-politics-32810887
http://www.independent.co.uk/news/world/europe/brexit-latest-german-
finance-minister-eu-should-not-punish-britain-wolfgang-schaeuble-
tagesspiegel-a7562936.html
https://en.wikipedia.org/wiki/Brexit
https://en.wikipedia.org/wiki/European_Union
https://en.wikipedia.org/wiki/History_of_the_European_Union
https://en.wikipedia.org/wiki/Member_state_of_the_European_Union
96
Trends and Scope of Commercial Lending in India
By
Neel Jani
Post Graduate student (PTMFM) at DSIMS
Abstract
Using the data from Reserve Bank of India between 2014 to 2016, the paper
investigates the correlation between administrative support & policy easing
and the reasons for enterprises in India to avail funds via the ECB and FCCB
route. We would look at the various numerical data points from the
Handbook of Indian Economy 2015-16 and study the lending patterns of the
financial sector and its contributions and performance over the said period.
For this paper, the Median and Mean were calculated for all data which was
referred to. The analysis of the paper suggest that the prime focus areas for
the financial sector in the coming years, the improvements in their current
business practices, the scope and the viability of the projects for which they
lend and the improvements for the financial sector from a operational model
perspective.
Keywords:
Commercial Lending, ECB, FCCB
Introduction
Ravi Kishore in his book Strategic Financial Planning (Taxmann, 2nd Edition)
defines strategic planning as a systematic analytical approach which reviews
the business as a whole in relation to its environment with the object of the
following:
I. Developing an integrated, coordinated and consistent view of the route the
company wishes to follow
II. Facilitating the adaptation of the organization to environmental change.
He goes on to say that within Strategic Financial Management; strategic
planning is long-range in scope and has its focus on the organization as a
whole. The concept is based on an objective and comprehensive assessment
of the present situation of the organization and the setting up of targets to be
achieved in the context of an intelligent and knowledge anticipation of
changes in the environment.
The strategic financial planning involves financial planning, financial
forecasting, provision of finance and formulation of finance policies which
should lead the firm’s survival and success. The strategic financial planning
show enable the firm to judiciously allocate funds, capitalization of relative
strengths, mitigation of weaknesses, early identification of shifts in
97
environment, counter possible actions of competitor, reduction in financing
costs, effective use of funds deployed, timely estimation of funds
requirement, identification of business and financial risks etc.
To add to this, Ravi Kishore also elaborates that financial sector reforms aim
at promoting a diversified, efficient and competitive financial sector with
ultimate objective of improving the allocative efficiency of available resources,
increasing the return on investments and promoting the an accelerated
growth of real sectors of economy.
Richard A Brealey, Stewart C Myers, Franklin Allen, Pitabas Mohanty in their
book Principles of Corporate Finance (Tata McGraw Hill, 10th Edition) give an
answer to a very pertinent question – Do Firms Rely Too Much on Internal
Funds? According to Brealey et al., internal funds (retained earnings plus
depreciation) cover most of the cash needed for investment. It seems that
internal financing is more convenient than external financing by stock and
debt issues.
Sonia Singh and Hiranmay Saha in their research paper Centralization of
Microfinance (published: The IUP Journal of Entrepreneurship Development,
Vol. VIII, No. 2, 2011) stated that according to Consultative Group to Assist
the Poor (CGAP) (2006), microfinance means the supply of loans, savings,
and other basic services to the poor people.
It is based on the principle of helping people so that they are able to help
themselves. In the development of entire region the increased income earned
by micro-entrepreneurs is the most important precondition. Thus
microfinance enables poor but economically active people to increase their
income, and thus helps in generating some additional savings which may be
used for further development.
Sumit K. Majumdar and Kunal Sen in their research paper Debt in the
Indian Corporate Sector: Its effects on firm strategy and performance
(Published: Decision, Vol. 3, No.3, December, 2010) stated that the
relationship between a firm’s capital structure and its strategic behaviour
has been a question that has dominated much of the literature on corporate
governance and corporate finance.
The role of different types of debt has been completely downplayed. This is a
particular omission in the emerging economy context, given that most firms
in such economies tend to be highly leveraged. Also, there are several
varieties of debt to be raised in emerging economies.
The theoretical literature suggests that, similar to its application in the case
of equity ownership, some types of debt holders such as banks may be able
to exert a stronger monitoring role on managers of firms than other types of
debt holders such as arm’s-length lenders.
98
Literature Review
Ashish Kumar Rastogi, P.K. Jain, Surendra S. Yadav in their research paper
‘Debt Financing in India in Public, Private and Foreign Companies’ studied
the debt financing decisions and practices of the public sector, private sector
and foreign controlled companies in India. It also found out the impact of the
liberalized environment, in terms of the significant changes, if any, in the
phase-2 (1998-2003) of the liberalized business scenario vis-à-vis phase-1
(1992-1997).
The study also indicated that the profile of debt financing has significantly
changed during the period covered by the study. Ownership control was
observed to be a significant factor in influencing the debt financing decisions
in terms of its composition and maturity structure. Long- term debt was
found more prevalent among public sector firms vis-à-vis private sector
business group firms. Interestingly, foreign controlled firms made the least
use of long-term debt among the three types of ownership groups.
The paper also suggested that sound financial management practices expect
corporate firms to have unused debt capacity for future needs in order to
preserve operating flexibility, particularly in circumstances when fund
requirements are sudden and unpredictable. The paper suggests that private
sector business group firms have been able to reduce the proportion of debt,
particularly current liabilities and provisions; however, they have failed to
reduce, to a large extent, the share of borrowed funds. This may have vital
implications on their debt financing decisions in times to come. Hence, it
becomes imperative to study the objectives with which Indian firms – private,
public or otherwise raise funds via the credit route since the operational
model of businesses in India evolved with the macro-economic environment.
Sumit K. Majumdar, Kunal Sen in their research paper ‘Debt in the Indian
Corporate Sector: Its Effects on Firm Strategy and Performance’ examined
the effects of debt structure on firms’ strategic behaviour and performance
for the Indian economy, which is one of the largest and most important
economies of the world today.
Majumdar and Sen also stated that India has a large number of firms in the
industrial sector, with a variety of ownership structures, for example state
versus private ownership, foreign versus domestic ownership and firms
which are members of business groups and those which are independent.
Debt financing is particularly important in India. Unlike in the West, where
debt ratios are more than half of nominal equity capital values are considered
high, in India very high debt to equity ratios are the norm.
They found that there is arm’s-length debt such as debentures and fixed
deposits are most likely to have a positive impact on firm diversification and
advertising expenditures. Borrowing from term-lending institutions was most
likely to have a dampening effect of diversification and spending on
99
advertising. Finally, reliance on fixed deposits was most likely to have a
positive impact on firm profitability.
Their results suggested that firms which were the most aggressive and
dynamic such as those who have diversified their investments or engaged in
higher intensity of advertising are more likely to see funds from private
arm’s-length creditors, even though these types of funds tend to be more
expensive than loans from banks and term-lending institutions. They also
found reliance on unsecured arm’s-length debt such as fixed deposits make
these firms more profitable.
On the other hand, more conservative firms which have chosen not to
diversify as much or engage in high levels of advertising expenditures have
relied on bank and term-lending institution debt. The fact that these
institutions tend to be mostly state-owned in India suggest that these
institutions have chosen not to be risk-taking with their lending, in spite of
the informational and monitoring advantages they hold over arm’s-length
creditors.
Overall, their results suggested that the pervasive presence of state owned
financial institutions in the Indian financial sector has inhibited risk taking
by Indian firms and has not had a positive impact on their performance, in
spite of the informational and monitoring advantages that commercial banks
and term-lending institutions possess. This leads to study the risks
associated with the lending businesses of banks; the philosophy by which
investments were made into businesses by the financial sector firms in India
and the scope & performance of banks in their lending businesses with the
given risks.
Sonia Singh and Hiranmay Saha in their research paper ‘Centralization of
Microfinance’ found out that microfinance is one of the most effective
techniques for poverty alleviation in developing and underdeveloped
countries. According to them, if microfinance is managed, organized and
planned well, then it should be supported by non-governmental
organizations and socially-oriented investors with low default rates,
encouraging greater commercial involvement because of attractive returns.
Through microfinance it will be easy to include this section of society into the
economic mainstream to achieve balanced growth, which is critical for social
development and economic prosperity.
Singh and Saha also state that the key context of the paper is how poor
people can easily avail the micro-financial services under one umbrella in the
fastest way. While discussing the factors and the theoretical position
associated with innovation in microfinance, this paper also brought out the
missing link between the lender and borrower in the Indian context. As per
the authors, filling of this gap is a precondition for poverty reduction on
account of the influence of new paradigm of institutional viability under
commercial microfinance. This led us to study the performance of the
100
mainstream financial sector into investing in the rural areas of India which is
mainly based on agriculture and associated activities. Also, another factor
linked to the agriculture is the micro, small and medium-sized enterprise
(MSME) industries which is fast spreading as a sustainable alternative model
for banks to invest in.
The book ‘Strategic Financial Management’ authored by Ravi M. Kishore
discusses in detail the various financial planning strategies adopted by
companies for raising funds. It provides comprehensive details of the various
inorganic and organic methods of growth for businesses and the role
financial institutions in providing the required capital. This book helps us to
understand the various reasons and modes of fund-raising done by
businesses.
The book ‘Principles of Corporate Finance’ co-authored by Richard A Brealey,
Stewart C Myers, Franklin Allen and Pitabas Mohanty describe the theory
and practice of corporate finance. The book spells out why the management
needs to bother with theory while focusing on the practical aspects. The book
provides a theory of taking an inclusive decision which takes into
consideration the changing factors in the economy and its impact on the
businesses. This book helps us to understand the changes brought in by RBI
while letting businesses raise funds via ECB and FCCB route.
The Reserve Bank of India issued a circular on the External Commercial
Borrowings (ECB) Policy – Revised Framework (A.P. DIR Series – Circular No.
32) provided a more detailed note on the changes in the fund-raising method
along with the industry guidelines and specific orientations. With the help of
this circular, we try to understand the trends and reasons of the ECB and
FCCB funds raised by Indian business.
Objectives
To understand the various reasons and modes of raising funds via debt by
businesses.
The changes incorporated by RBI in raising funds via ECB (External
Commercial Borrowing) and FCCB (Foreign Currency Convertible Bond) route
by businesses.
The borrowing trends in ECBs and FCCBs from May 2014 onwards.
The current and comparative trend of investments made by the domestic
financial sector into various other sectors for gaining a view on Indian
economy.
101
The risks associated with lending from a lender’s perspective.
Methodology
For this research paper, the data collection was done via two ways:
1. RBI External Commercial Borrowings Monthly Data – May 2014 to July
2016.
2. RBI – Handbook of Statistics on Indian Economy 2015-16.
For the first point of RBI External Commercial Borrowings Monthly Data –
May 2014 to July 2016; please note the following:
There is no specific methodology applicable. Hence, we have done the
following:
A consolidated table of the monthly numbers of ECB/FCCB from the RBI
website from May 2014 to July 2016. (Source Link:
https://rbi.org.in/Scripts/ECBView.aspx)
A sum of the amounts sourced through automatic and approval route.
A pivot table with the unique reasons for the requirement of funds.
A corresponding pie diagram using the Pivot functionality within Microsoft
Excel.
For the data from the RBI – Handbook of Statistics on Indian Economy 2015-
16; below are the tables which were analyzed for this paper:
Table 64: Consolidated Balance Sheet of Scheduled Commercial Banks
(Excluding Regional Rural Banks).
Table 39: Sector-wise Cost Overrun of Delayed Central Sector projects (End-
March).
Table 61: Scheduled Commercial Banks' Direct Finance to Farmers according
to size of land holdings (outstanding) - Short-term and long-term loans.
Table 60: Scheduled Commercial Banks' Direct Finance to Farmers according
to size of land holdings (disbursements) - Short-term and long-term loans.
Table 65: Gross and Net NPAs of scheduled commercial banks - Bank group-
wise.
Table 178: Industry-wise Deployment of Bank Credit.
Table 177: Deployment of Bank Credit by Major Sectors.
Table 63: Scheduled Commercial Banks’ advances to Agriculture –
Outstanding.
Table 62: Scheduled Commercial Banks’ advances to Small-Scale Industries
and Allied Services – Outstanding.
Table 181: Commercial Bank Survey.
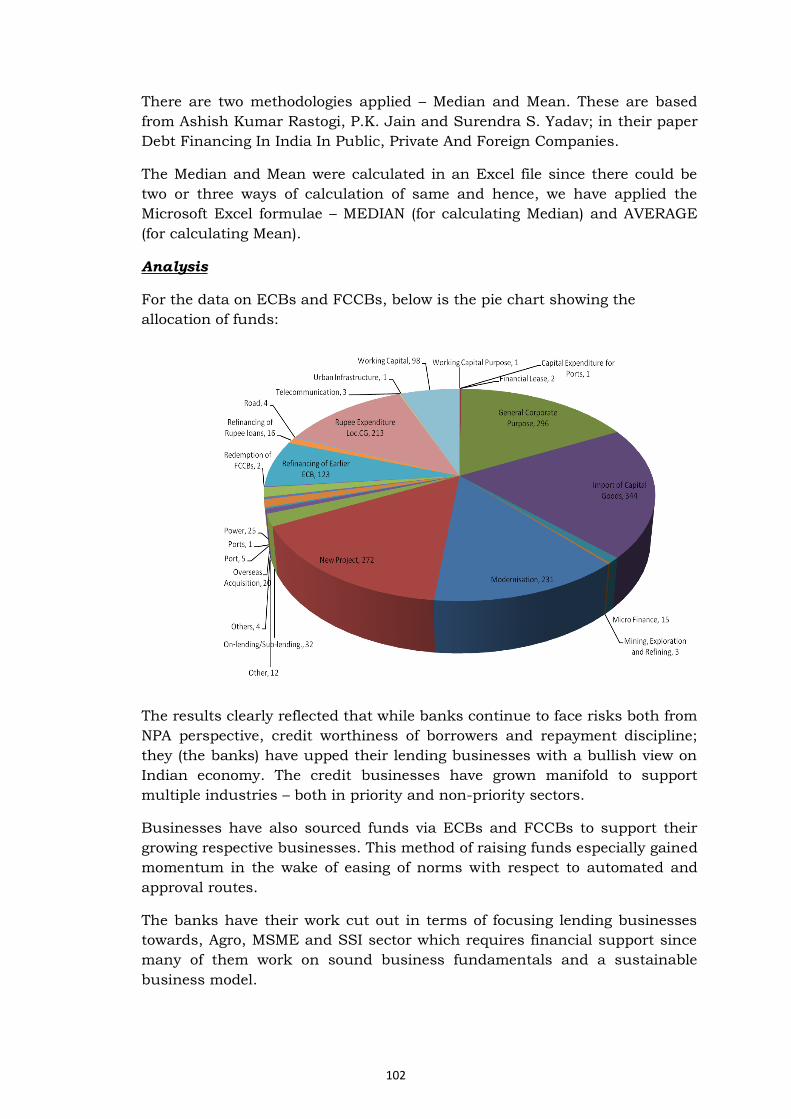
102
There are two methodologies applied – Median and Mean. These are based
from Ashish Kumar Rastogi, P.K. Jain and Surendra S. Yadav; in their paper
Debt Financing In India In Public, Private And Foreign Companies.
The Median and Mean were calculated in an Excel file since there could be
two or three ways of calculation of same and hence, we have applied the
Microsoft Excel formulae – MEDIAN (for calculating Median) and AVERAGE
(for calculating Mean).
Analysis
For the data on ECBs and FCCBs, below is the pie chart showing the
allocation of funds:
The results clearly reflected that while banks continue to face risks both from
NPA perspective, credit worthiness of borrowers and repayment discipline;
they (the banks) have upped their lending businesses with a bullish view on
Indian economy. The credit businesses have grown manifold to support
multiple industries – both in priority and non-priority sectors.
Businesses have also sourced funds via ECBs and FCCBs to support their
growing respective businesses. This method of raising funds especially gained
momentum in the wake of easing of norms with respect to automated and
approval routes.
The banks have their work cut out in terms of focusing lending businesses
towards, Agro, MSME and SSI sector which requires financial support since
many of them work on sound business fundamentals and a sustainable
business model.
103
It needs to be seen how the banking sector accommodates the growing
expectations of businesses and government while RBI works on easing of
rules/procedures to aim at an increased financial inclusion and supporting
the growth of industries at a micro/rural level.
To conclude, in a global economy which is facing a slowdown, India has
emerged as a favourable destination for investors to come and invest in.
While the mainstream focus remains on that, the Indian financial sector
faces challenges in terms of reformative practices, technology and inclusion.
The government of the day introduced radical financial reforms from
November 8 onwards, the results of which should soon be visible, the focus
for the banks should be on expanding reach, connecting people & businesses
to the mainstream & regulated banking and providing funds for expansion of
worthy businesses in India.
Recommendations
Although the numbers suggest that since the sourcing of funds via ECBs and
FCCBs has been increasing over time, it may or may not mean that
businesses are growing. While the numbers suggest the possible reasons of
sourcing funds for new business projects, modernization of existing projects
and importing of capital goods indicating a growing and expanding
manufacturing base; banks need to delve deeper into companies, before
lending more, who take this route for general corporate purposes, working
capital and rupee expenditure LOC which suggest that the short-term
financing of companies is not optimum. At the same time, it also reflects
inaccurate expense and credit management.
From the RBI Handbook of Statistics on Indian Economy 2015-16, following
would be the recommendations;
Before lending hook, line and sinker into upcoming infrastructure projects,
there has always been a trend of cost overruns in core infrastructural sector,
due to many issues, mainly operational and legal reasons.
o A keen eye needs to be maintained for mapping future growth of the
company and the projects which they have initiated on this aspect.
The numbers for outstanding amounts in farm credit deployment are
worrisome with its own reasons such as – natural limitations and limited
progress made in the last few decades.
o Although the credit deployment is being supported by the RBI and the
government, the banks need to up their lending business into the farm and
farm-related business sectors.
104
To tackle the NPA problem plaguing the Indian banking sector, RBI wrote off
bad debts worth more than Rs. 1 lakh crore. Currently, there are even talks
of setting up of a bad bank. However, these cannot solve the larger issue
which is detailed due diligence and credit worthiness checks of borrowers
which should be the prime focus of banks.
o In this regard, Indian banks could emulate other international banks such as
JP Morgan Chase or alike. Banks should also be prompt in taking strict
action towards delinquent accounts.
The industry-wise deployment of credit shows that commercial banks are
deploying credit in areas which are on the focus of the government since the
last three years, viz., infrastructure, oil, metals, power, etc. With the
economy in its revival phase as suggested by many, this sector would surely
be on the watch-out list of banks, investors, administrators, et al.
o To add to these, the renewable energy is fast gaining momentum in India
with a recent study suggesting that India is the fourth largest producer of
renewable energy in the world. This sector should be on the top priority of
banks and financial institutions from a lending perspective.
The sectoral deployment of credit reflects the export sector needing reforms
in its process of revival. The current numbers are not really encouraging,
however, any investment made currently could not provide the expected
returns without the impetus from the RBI and/or the government.
o The manufacturing businesses are expected to grow more in the next few
years by way of various projects and that would be a factor to consider from
a lending perspective in the coming times which would ultimately benefit the
export sector.
Credit societies and scores of middlemen had their roles reduced with the
rapid expansion mainstream and regulated banking reaching the rural and
interior regions of India. The challenge for banks would be to compete
against the likes of microfinance institutions such as Bandhan Microfinance
which enjoy a premium position and stronghold in these markets.
o To compete against these institutions, banks need to develop a separate
model altogether on the lines of a microfinance institution to first set up their
businesses and then reaching the market with a wide array of offerings.
Conclusion
Brealey et al in their book Principles of Corporate Finance talk in depth of
decision making under risk and uncertainty. The risks could be broadly
105
classified into business risk and financial risk. A company’s business risk is
determined by how it finances its investments. Financial risk is primarily
influenced by the level of financial gearing, interest cover, operating leverage
and cash flow adequacy. According to Brealey et al., uncertainty arises from
a lack of previous experience and knowledge. Uncertainty could be attached
to following factors:
Level of capital outlay required
Level of selling prices
Level of sales volume
Level of revenue
Level of operating costs
Taxation rules
Based on these two broad parameters; we can say that businesses in India
and elsewhere inherently have to face these while aiming to grow, both
organically and inorganically.
One of the approaches would be through the ECB/FCCB route depending on
respective company’s reasons, domestic options available, costs associated
with raising funds, etc.
Consequentially, we saw that the performance of the commercial banks on
various parameters via two simple methods – median and mean. These
parameters have been set on the various numbers tabulated by the Reserve
Bank of India in their annual publication, the Handbook of Statistics on
Indian Economy 2015-16.
While the numbers say a particular story – that of the growth of the economy
on all major fronts, there would be a few factors which might require a deep-
delving for making a real change.
Also, we could do another research to provide a more in-depth analysis into
the change of the governments and their policies and the impact which it
renders on the industries and eventually on the economies.
To conclude, we can sum India’s growth story with the following –
While we have a long way to go, our story has just begun where some of the
world’s most formidable businesses are taking a serious note of. Investors are
making a beeline for investments and with GST almost on track for July
rollout, India is set to project itself as a country to invest in, make in and
serve in.
While the focus remains on making India at top-notch investment
destination, the financial sector needs to also focus on the MSME, SSI,
Agriculture and related industries’ sectors which is aptly supported by a
robust financial structure, a focused RBI and a huge market of supportive
106
banks which are usually correct in their business practices, the economy
just doesn’t seem to be a bubble but a force to reckon with.
References
Books:
Strategic Financial Management by Ravi M. Kishore; Taxmann, 2nd Edition
Principles of Corporate Finance by Richard A Brealey, Stewart C Myers,
Franklin Allen, Pitabas Mohanty; Tata McGraw Hill, 10th Edition
Journals
Sonia Singh, Hiranmay Saha, Centralization of Microfinance, The IUP Journal
of Entrepreneurship Development, Vol. VIII, No. 2, 2011
Ashish Kumar Rastogi, P.K. Jain, Surendra S. Yadav, Debt Financing in India
in Public, Private and Foreign Companies, The Journal of Business
Perspective, Vol. 10 l, No. 3l July-Sept 2006
Rajlakshmi Mallik, Being Credit Rationed: Delay and Transaction Cost,
International Game Theory Review, Vol. 17, No. 2 (2015)
Jayan Jose Thomas, Explaining the ‘jobless’ growth in Indian manufacturing,
Journal of the Asia Pacific Economy, 2013; Vol. 18, No. 4, 673–692
Stephanie Caputo, Ammar Askari, Barry Wides, Commercial Lending in
Indian Country: Potential Opportunities in a Growing Market, Office of the
Comptroller of the Currency, February 2016
Richard H. Gamble, Passage to India, National Association of Credit
Management, 2003
Dr. G. Parimalarani, Performance of Commercial Banks in Priority Sector
Lending, Asia Pacific Journal of Research in Business Management, Volume
2, Issue 7 (July, 2011)
Raju, M.T., Bhutani, U. and Sahay, Anubhuti, Corporate Debt Market in
India: Key Issues and Policy Recommendations, Securities and Exchange
Board of India, Working Paper No. 9
Other Sources:
o RBI External Commercial Borrowings Monthly Data – May 2014 to July 2016
– Source: https://rbi.org.in/Scripts/ECBView.aspx
o RBI – Handbook of Statistics on Indian Economy 2015-16 – Source: https://www.rbi.org.in/SCRIPTs/AnnualPublications.aspx?head=Handbook%20of%20Statistics%20on%20Indian%20Economy
107
Teaching of Organizational Behavior with Dramatics
By
Pallavi Srivastava*
Assistant Professor at St. John Institute of Management and Research
Abstract
The purpose of this study was to determine the effectiveness of interactive
drama as a pedagogical way to teach the subject of Organizational Behaviour.
The management educators can benefit from the myriad usage of this
technique to teach the subject “Organizational Behavior” which is a very
important subject for all the would be managers and MBA graduates. The
paper presents a result of an experimental study where the students were
taught the subject using a different pedagogy for the mid semester exams
and the technique of interactive drama after it before the students appeared
for the end semester exams. The students of the class were divided into
random groups and were given the relevant topics to be developed into role-
plays. The results show that the students when taught by using the
interactive drama method had better understanding of the concepts and even
remembered them for a long time. A lot of students even showed an
inclination towards learning more concepts of human psychology.
Key Words:
Teaching Pedagogy, Role-play, Dramatics, Interactive drama
Introduction The purpose of this study was to determine the effectiveness of interactive
drama as a pedagogical way to teach the subject of Organizational Behaviour.
The management educators can benefit from the myriad usage of this
technique to teach the subject “Organizational Behaviour” which is a very
important subject for all the would be managers and MBA graduates. The
paper presents a result of an experimental study where the students were
taught the subject using a different pedagogy for the mid semester exams
and the technique of interactive drama after it before the students appeared
for the end semester exams. The students of the class were divided into
random groups and were given the relevant topics to be developed into role-
plays. The results show that the students when taught by using the
interactive drama method had better understanding of the concepts and even
remembered them for a long time. A lot of students even showed an
inclination towards learning more concepts of human psychology. Interactive
drama gives the students the liberty to discuss the scene they just witnessed,
replaying the scene after the suggestions given by the audience.
108
Literature Review: It started with a methodical literature review on the use of drama to teach
the management subjects. Recent efforts to improve higher education have
focused on the learning process (Kolb & Kolb, 2005). Boggs, Mickel and
Holtom(2007) say that unlike traditional drama,interactive drama is a tool
that promotes participation from the audience and fosters experiential
learning. It has been used in higher education classrooms in a variety of
disciplines and organizational training workshops in numerous fields such as
business, law, health care, education, and social work. Kolb and Kolb (2005)
described traditional arts education as an experiential learning process of
demonstration that emphasizes showing and integrating theory and practice;
in contrast, traditional management education is described as a text-driven
approach that emphasizes telling and theory. Unlike a traditional
management classroom where most of the time is spent conveying
information, much of the time in an arts classroom is spent on student
expression of ideas and skills (Kolb & Kolb, 2005).
Need for the Study The subject Organizational Behaviour relies heavily on human psychology to
derive it's content and curriculum. It is one of the most important subjects
taught to the management students. The beauty of teaching management is
that it is highly dynamic and there is no problem that has a single correct
answer. No single day in a manager's life is alike. From a long time the
management educators have been using the role play technique to teach the
management subjects. The technique of interactive drama can be used as a
substitute to the role play. It helps the students by making them involved in
the happenings of the class room by being an active participant instead of
just a passive listener. The paper tries to find out the effectiveness of this
pedagogy in teaching the subject of Organizational Behaviour.
Objectives of the study
1. To study the effectiveness of the pedagogy of “Interactive Drama” to teach the subject Organizational Behaviour. 2. To understand the need of using an interactive technique of teaching for teaching a theoretical subject. Research Methodology
Project Design: It is the specification of procedures and methods for
acquiring the information needed. The methodology used for the purpose of
study is basically data collection. The data was collected from both primary
and secondary.
Data Collection Method
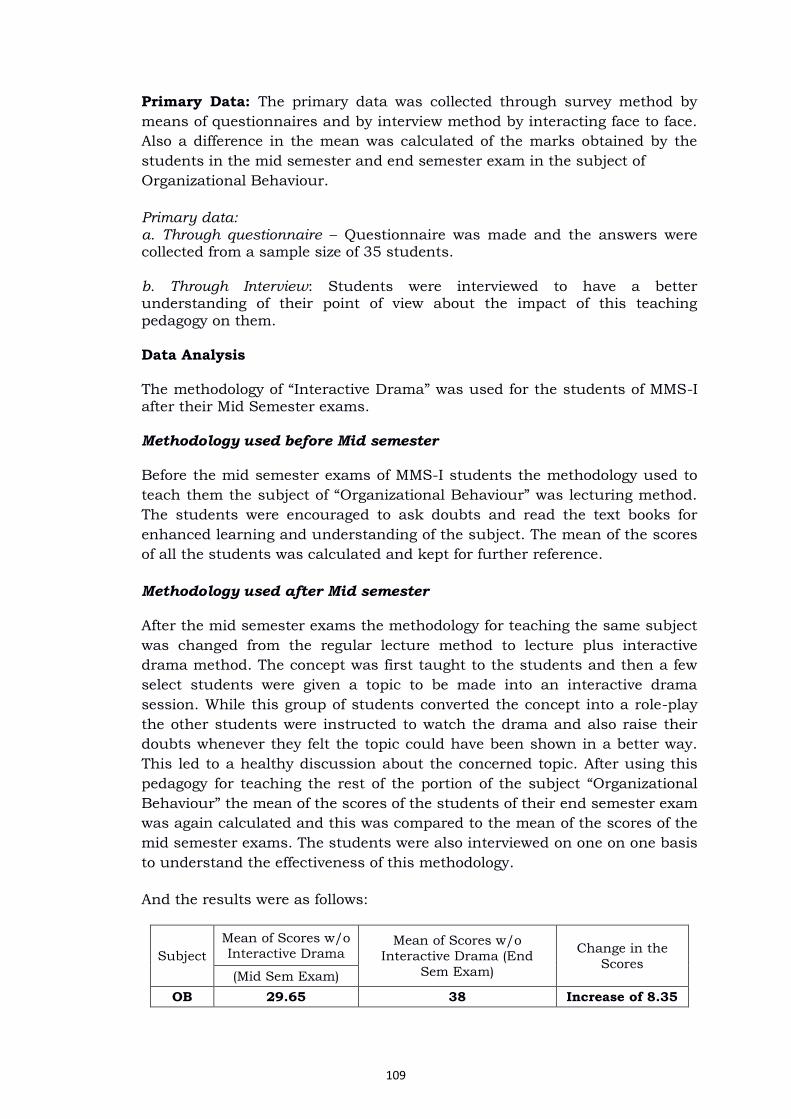
109
Primary Data: The primary data was collected through survey method by
means of questionnaires and by interview method by interacting face to face.
Also a difference in the mean was calculated of the marks obtained by the
students in the mid semester and end semester exam in the subject of
Organizational Behaviour.
Primary data: a. Through questionnaire – Questionnaire was made and the answers were collected from a sample size of 35 students. b. Through Interview: Students were interviewed to have a better understanding of their point of view about the impact of this teaching
pedagogy on them. Data Analysis The methodology of “Interactive Drama” was used for the students of MMS-I after their Mid Semester exams. Methodology used before Mid semester
Before the mid semester exams of MMS-I students the methodology used to
teach them the subject of “Organizational Behaviour” was lecturing method.
The students were encouraged to ask doubts and read the text books for
enhanced learning and understanding of the subject. The mean of the scores
of all the students was calculated and kept for further reference.
Methodology used after Mid semester
After the mid semester exams the methodology for teaching the same subject
was changed from the regular lecture method to lecture plus interactive
drama method. The concept was first taught to the students and then a few
select students were given a topic to be made into an interactive drama
session. While this group of students converted the concept into a role-play
the other students were instructed to watch the drama and also raise their
doubts whenever they felt the topic could have been shown in a better way.
This led to a healthy discussion about the concerned topic. After using this
pedagogy for teaching the rest of the portion of the subject “Organizational
Behaviour” the mean of the scores of the students of their end semester exam
was again calculated and this was compared to the mean of the scores of the
mid semester exams. The students were also interviewed on one on one basis
to understand the effectiveness of this methodology.
And the results were as follows:
Subject
Mean of Scores w/o Interactive Drama
Mean of Scores w/o
Interactive Drama (End
Sem Exam)
Change in the
Scores (Mid Sem Exam)
OB 29.65 38 Increase of 8.35
110
Apart from this a questionnaire was administered to the same batch to understand their attitude towards the subject “Organizational Behaviour” and it's teaching by the dramatics pedagogy. The responses to the different questions were: Q.1 Have you participated in any of the role plays before? Please specify. 70% of the students responded in affirmative. Q. 2 What did you feel about enacting the OB theories in the class? 95% students claimed that it was lots of learning with fun.
Q. 3 Did the entire exercise help you in understanding the subject better? 96% students answered in affirmative. Q.4 Rate the entire teaching methodology of OB through the medium of dramatics on a scale of 5. 1-- Poor 2-- Average 3-- Good 4-- Very Good 5- - Excellent 82% of students said it was excellent, 10% said very good, 4% said good and 2% remarked it as an average pedagogy. Findings:
1. The mean of the scores after using dramatics as a way of teaching increased.
2. The increase in the mean that is 8.35 is quite remarkable. 3. A huge percentage of students have admitted to liking this method of
pedagogy in the questionnaire. 4. In the one on one interview the students accepted that this
methodology helped in enhancing their learning and understanding of the subject.
5. A lot of students showed an inclination towards the subject of psychology and OB after these sessions.
Conclusion: The subject Organizational Behaviour relies heavily on other streams of arts for its content. This subject becomes very important for any management graduate as the understanding of self becomes the basis of a good management. It gives students a better understanding of themselves and also the nuances of the behavioural psychology. From the time immemorial the management educators have been searching and using various methodologies to teach this subject. This paper concludes that teaching of this subject through the way of dramatics (interactive drama) can be one of the great means of imparting the knowledge and facilitate the student's learning. The mean of the scores for the students show the effectiveness of

111
this way of teaching. It can also help the students to develop a positive attitude towards this subject. References: Bhattacharjee, S. (2014). Effectiveness of Role-Playing as a Pedagogical Approach in Construction Education,50 ASC Annual International Conference Proceedings Boggs,J. , Mickel, A., Holtom, B. Experiential learning through Interactive drama: an alternative to student role plays, Journal of management education, Vol. 31 No. 6, December 2007, 832-858 Kolb, A., & Kolb, D. A. (2005). Learning styles and learning spaces: Enhancing experiential learning in higher education. Academy of Management Learning and Education, 4,193-212. Kolb, A. Y., & Kolb, D. A. (2006). Learning styles and learning spaces: A review of interdisciplinary application of experiential learning in higher education. In R. Sims and S. Sims(Eds.), Learning styles and learning: A key to meeting the accountability demands in edu-cation. Hauppauge, NY: Nova. Huffaker, J. S., & West, E. (2005). Enhancing learning in the business classroom: An adventure with improve theater techniques. Journal of Management Education, 29, 852-869
112
Leveraging Mobile CRM - On Time Food Availability
By
Siddharth Jain* Dr. Preeti Sharma**
Post Graduate student of Institute of Management Technology(IMT),
Hyderabad
** Assistant Professor (IT & Analytics), Chairperson, IT Infrastructure,
Institute of Management Technology (IMT), Hyderabad
Abstract
This paper presents an e-commerce business model based on a mobile
Food Truck Application built to provide mobile food availability over
smart devices by leveraging state of the art technology. This application
focuses on mobile Customer Relationship Management (mobile CRM)
by providing real-time information and delivery of desired food items
from a food truck. In addition, the customer can know real-time
location of the preferred food truck to plan their order. Also customer
gets notification from their favorite food truck about the daily deals and
schedule for the day. It is intended to build on Location Based Services
and Context Based Services wherein the location of the food truck in
particular vicinity and the context of instant food delivery will be of
prime importance.
Keywords:
Mobile Customer Relationship Management, mobile CRM, Food Truck,
Business model, Location Based Services, Context Based Service Introduction The capacity observed by companies in the fact that a mobile phone is
a personal object, has enabled mobile technology to enter the
business world primarily as a marketing tool (Agrebi and Jallais,
2015; Riivari,2005; San-Martín, 2016). Moreover, collaboration
technology, in the form of mobile customer relationship management
applications (mobile CRM applications), has emerged and gained
increased interest in corporate enterprises (Trainor, 2016) which
can be further extend to new start-ups for relatively less
developed concepts such as mobile food trucks.
Mobile CRM is designed to be accessed and operated via a mobile
device, such as a smartphone or tablet, and enables professionals to
not only access customer and prospect information but also update
various activities anytime, anywhere in real time (Trainor, 2016).
Earlier, mobile technology, as an emerging tool in sales force
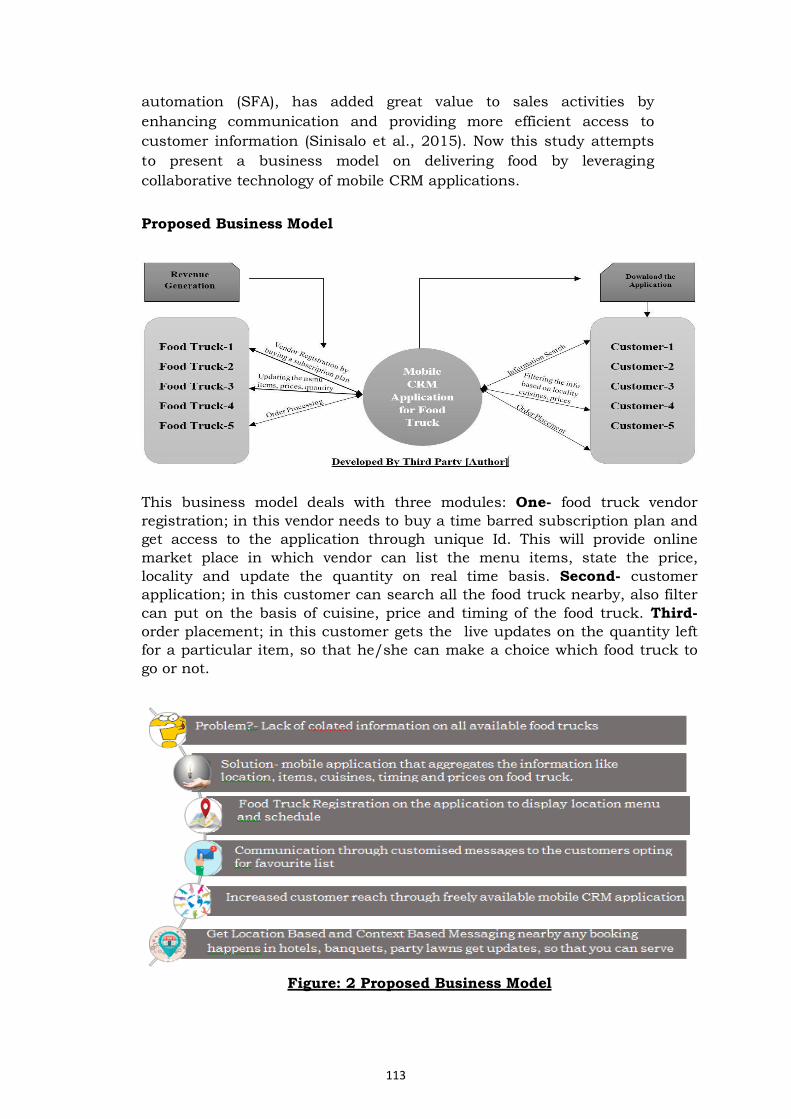
113
automation (SFA), has added great value to sales activities by
enhancing communication and providing more efficient access to
customer information (Sinisalo et al., 2015). Now this study attempts
to present a business model on delivering food by leveraging
collaborative technology of mobile CRM applications.
Proposed Business Model
This business model deals with three modules: One- food truck vendor
registration; in this vendor needs to buy a time barred subscription plan and
get access to the application through unique Id. This will provide online
market place in which vendor can list the menu items, state the price,
locality and update the quantity on real time basis. Second- customer
application; in this customer can search all the food truck nearby, also filter
can put on the basis of cuisine, price and timing of the food truck. Third-
order placement; in this customer gets the live updates on the quantity left
for a particular item, so that he/she can make a choice which food truck to
go or not.
Figure: 2 Proposed Business Model
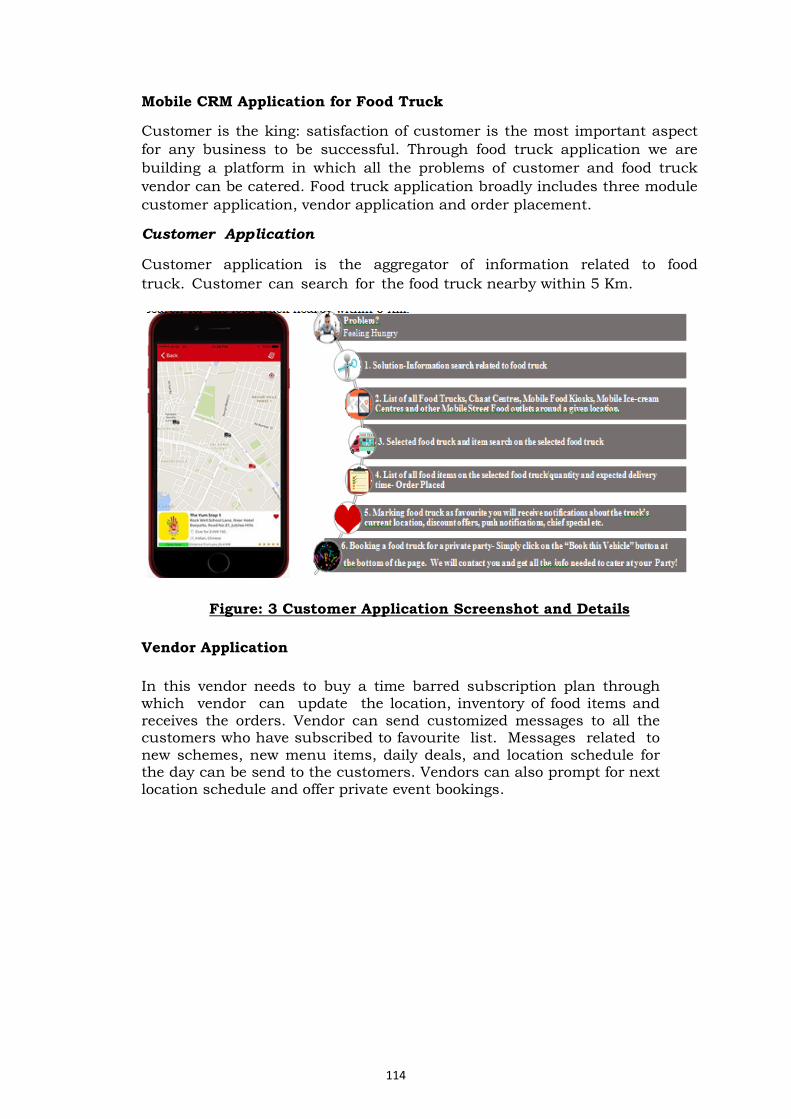
114
Mobile CRM Application for Food Truck Customer is the king: satisfaction of customer is the most important aspect
for any business to be successful. Through food truck application we are
building a platform in which all the problems of customer and food truck
vendor can be catered. Food truck application broadly includes three module
customer application, vendor application and order placement. Customer Application
Customer application is the aggregator of information related to food
truck. Customer can search for the food truck nearby within 5 Km.
Figure: 3 Customer Application Screenshot and Details
Vendor Application
In this vendor needs to buy a time barred subscription plan through which vendor can update the location, inventory of food items and receives the orders. Vendor can send customized messages to all the customers who have subscribed to favourite list. Messages related to
new schemes, new menu items, daily deals, and location schedule for the day can be send to the customers. Vendors can also prompt for next location schedule and offer private event bookings.
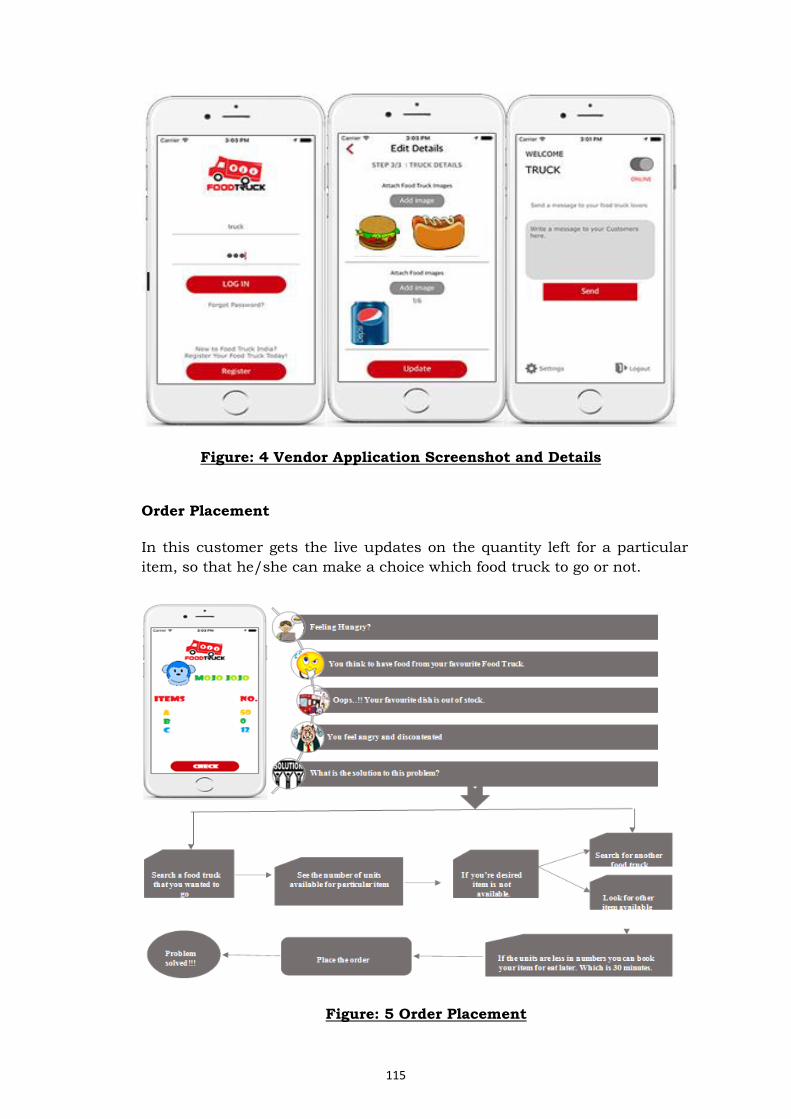
115
Figure: 4 Vendor Application Screenshot and Details
Order Placement
In this customer gets the live updates on the quantity left for a particular
item, so that he/she can make a choice which food truck to go or not.
Figure: 5 Order Placement
116
Conclusion- Through mobile CRM, the application attempts to bridge the information
gap between customer and food truck vendor. The food truck application is
providing a market place through which all food truck/mobile food stall
comes in the same platform to sell their food items. It is also helping the
customer who wants to eat from the food truck which is located in the local
vicinity. Through this application we are by passing the feeling of
discontentment of not getting your favourite food item by showing the real
time updates on the items available on the food truck. This application
provides anytime, anywhere access to food services. The idea presented
here is in the preliminary stage of developing the blue print of mobile
CRM application which is expected to be in place next year. Besides this list
of interested food truck vendor is being prepared so that application, once
ready, can be tested for different functionality.
References Agrebi, S., & Jallais, J. (2015). Explain the intention to use smartphones for mobile
shopping. Journal of Retailing and Consumer Services, 22, 16-23.
González, J., Preiss, D., & San Martín, E. (2016). Evaluando el Discurso Docente:
Desarrollo de un Modelo de Rasch a partir de Evidencia Audiovisual de
Profesores Chilenos de Primer Ciclo de Educación Básica en el Área de Lenguaje.
Revista Iberoamericana de Evaluación Educativa, 1(2).
Riivari, J. (2005). Mobile banking: A powerful new marketing and CRM tool for
f inancial services companies all over Europe. Journal of Financial Services
Marketing, 10(1), 11-20.
Sinisalo, J., Karjaluoto, H., & Saraniemi, S. (2015). Barriers to the use of mobile sales
force automation systems: a salesperson’s perspective. Journal of Systems and
Information Technology, 17(2), 121-140.3
Steidel, C. C., Strom, A. L., Pettini, M., Rudie, G. C., Reddy, N. A., &
Trainor, R. F. (2016). Reconciling the stellar and nebular spectra of high-redshift
galaxiesBased on data obtained at the WM Keck Observatory, which is operated as a
scientific partnership among the California Institute of Technology, the University of
California, and NASA, and was made possible by the generous financial support of
the WM Keck Foundation. The Astrophysical Journal, 826(2), 159.
117
INNOVATIVE BUSINESS PRACTICES ON EMPLOYEE ENGAGEMENT AND EMPLOYEE SATISFACTION
By
RAVINDRA DEY
Professor and Head of Organizational Behaviour, Xavier Institute of Management and Research, Mumbai
Abstract
In the recent years organisations have been facing a challenge- the requirement to innovate continuously. This requirement puts pressure on organisations to look for new ways for being creativity and innovation in the organisation. Thus, what motivates and enables innovation in organisations have become an important question that every organisation is seeking to answer to survive in today’s competitive business world. Today’s organisations need to have innovative business practices for survival and growth.
This study was carried out to understand the relationship between innovative business practices and employee engagement and employee satisfaction.The research shows that there is a positive correlation between innovative business practices and employee engagement and employee satisfaction. The study also reveals that statistically there is no significant difference in the perception of male and female employees where it comes to Innovative Business Practices or employee engagement and employee satisfaction.
Keywords:
Innovation, Innovative Business Practices, Employee Engagement, Employee Satisfaction, Workplace
1. Introduction
The term innovation has been used to refer to two related concepts. Some researchers use the term to refer to the process of bringing new products, equipment, programmes or systems into use (Damanpour, 1991) while others have used it to refer to the object of the innovation process, that is, the new product, equipment, programme or system (Rogers,1983). Use of the term innovation has also differed in respect of whether 'objective newness' is considered an important criterion of innovation. While some researchers consider objective newness to be an important criterion, others consider an innovation to be a product, programme or system which is new to the adopting organization (e.g. Damanpour, 1991), arguing that whether an idea is objectively new matters little so far as human behaviour is concerned (Rogers, 1983). Innovation can be viewed as either a process or an outcome. In terms of business, innovation is the generation of fresh ideas, the ongoing development of products, services and processes and their commercial application.
118
Engagement is about passion and commitment-the willingness to invest oneself and expand one’s discretionary effort to help the employer succeed, which is beyond just simple satisfaction with the employment arrangement or basic loyalty to the employer (Blessing White, 2008; Erickson, 2005; Macey and Schnieder ,2008). Therefore, the full engagement equation is obtained by aligning maximum job satisfaction and maximum job contribution. Stephen Young, the executive director of Towers Perrin, also distinguishes between job satisfaction and engagement contending that only engagement (not satisfaction) is the strongest predictor of organizational performance (Human Resources, 2007). Satisfaction refers to the level of fulfillment of one’s needs, wants and desire. Satisfaction depends basically upon what an individual wants from the
world, and what he gets. (Morse, 1997). Employee satisfaction is a measure of how happy workers are with their job and working environment. It is sure that there may be many factors affecting the organizational effectiveness and one of them is the employee satisfaction. Effective organizations should have a culture that encourages the employee satisfaction. (Bhatti & Qureshi, 2007). Sundaray (2011) noted that engaged employees are enthusiastic about their work and will often be fully immersed in their job resulting in creativity and innovation. Unsworth (2003) used inductive methods to investigate factors affecting engagement in the innovation process. Engaged employees would be satisfied and loyal to the organization.
1.1 Problem Statement:
In the recent years organisations have been facing a challenge- the requirement to innovate continuously. This requirement puts pressure on organisations to look for new ways for being creativity and innovation in the organisation. Thus, what motivates and enables innovation in organisations have become an important question that every organisation is seeking to answer to survive in today’s competitive business world.
1.2 Objective of the Study:
This study aims at understanding the relationship between innovative business practices on employee engagement and employee satisfaction. The objectives of the study are as follows:
To find out the relationship between innovative business practices and employee engagement.
To find out the relationship between innovative business practices and employee satisfaction.
To find out the relationship between employee engagement and employee satisfaction.
To understand the difference in perception between genders on innovative business practices.
To understand the difference in perception between genders on employee engagement.
To understand the difference in perception between genders on employee satisfaction.
119
1.3 Purpose of the Study:
Today’s organisations need to have innovative business practices for survival and growth. It also possible helps in employee engagement and employee satisfaction. The purpose of this study is to understand how innovative business practices lead to employee engagement and employee satisfaction.
2. Literature review
2.1 Innovative Business Practices
An obvious question that is raised often is – why innovate? Though many organisations in the past have been able to survive even with very limited amounts of innovation, emerging trends like globalisation and outsourcing which push to improve efficiency and effectiveness have driven the innovation process. Organisations need more than good products to survive; they require innovative processes and management that can drive down costs and improve productivity. Workforce retention and need to engage them profitably in achieving organizational goals have also contributed towards the push for innovations.Innovation is important as it is one of the primary ways to differentiate an organisation from its competitors.
2.2 Employee Engagement
Many researchers have tried to identify factors leading to employee engagement and developed models to draw implications for managers. Their diagnosis aims to determine the drivers that will increase employee engagement level. According to Penna research report (2007) meaning at work has the potential to be valuable way of bringing employers and employees closer together to the benefit of both where employees experience a sense of community, the space to be themselves and the opportunity to make a contribution, they find meaning. Employees want to work in the organizations in which they find meaning at work. Penna (2007) researchers have also come up with a new model they called “Hierarchy of engagement” which resembles Maslow’s need hierarchy model. In the bottom line there are basic needs of pay and benefits. Once an employee satisfied these needs, then the employee looks to development opportunities, the possibility for promotion and then leadership style will be introduced to the mix in the model. Finally, when all the above cited lower level aspirations have been satisfied the employee looks to an alignment of value-meaning, which is displayed by a true sense of connection, a common purpose and a shared sense of meaning at work. The BlessingWhite (2006) study has found that almost two third’s (60%) of the surveyed employees want more opportunities to grow forward to remain satisfied in their jobs. Strong manager-employee relationship is a crucial ingredient in the employee engagement and retention formula.
Most drivers that are found to lead to employee engagement are non-financial in their nature. Therefore, any organization who has committed leadership can achieve the desired level of engagement with less cost of doing it. This does not mean that managers should ignore the financial aspect of their employees. In fact, performance should be linked with reward. Nevertheless, this is simply to repeat the old saying of Human Relations Movement which goes “as social being, human resource is not motivated by money alone.” As
120
Buckingham and Coffman (2005) said, pay and benefits are equally important to every employee, good or bad. A company’s pay should at least be comparable to the market average. However, bringing pay and benefits package up to market levels, which is a sensible first step, will not take a company very far- they are like tickets to the ballpark, they can get the company into the game, but can’t help it win.
2.3 Employee Satisfaction
Employees are more loyal and productive when they are satisfied (Hunter &Tietyen, 1997), and these satisfied employees affect the customer satisfaction and organizational productivity, Potterfield, (1999). There is no
limit for the employees to reach the full satisfaction and it may vary from employee to employee. Sometimes they need to change their behaviours in order to execute their duties more effectively to gain greater job satisfaction(Miller, 2006). Having good relationships with the colleagues, high salary, good working conditions, training and education opportunities, career developments or any other benefits may be related with the increasing of employee satisfaction. Employee satisfaction is the terminology used to describe whether employees are happy, contended and fulfilling their desires and needs at work. Cranny, Smith & Stone (1992) defined Employee Satisfaction as the combination of affective reactions to the differential perceptions of what he/she wants to receive compared with he/she actually receives. According to Moyes, Shao & Newsome (2008) the employee satisfaction may be described as how pleased an employee is with his or her position of employment. ‘Job satisfaction is all the feelings that a given individual has about his/her job and its various aspects. Employee satisfaction is a comprehensive term that comprises job satisfaction of employees and their satisfaction overall with companies‟
policies, company environment etc’ as defined by (Spector, 1997).
Companies have to make sure that employee satisfaction is high among the workers, which is a precondition for increasing productivity, responsiveness, and quality and customer service. Human Relations perspective posits that satisfied workers are productive workers (e.g., Likert, 1961; McGregor, 1960). Thus, organizational productivity and efficiency is achieved through employee satisfaction and attention to employees‟ physical as well as socio
emotional needs. Human relations researchers further argue that employee satisfaction sentiments are best achieved through maintaining a positive social organizational environment, such as by providing autonomy, participation, and mutual trust (Likert, 1961). Employees‟ job satisfaction sentiments are important because they can determine collaborative effort. Consistent with this reasoning, Likert (1961) has argued that collaborative effort directed towards the organization‟s goals is necessary for achievement of organizational objectives, with unhappy employees failing to participate (effectively) in such efforts.
2.4 Link between Innovation and Employee Engagement:
Organizational culture and organizational commitment plays a very crucial role. The link between these two factors is that an organization’s culture
121
affects the organizational commitment and performance. Organizational commitment is developed through organizational culture which is enforced through organizational practices. This simply means that organizational commitment is the outcome of organizational culture (Martins and Martins, 2003). It is the imperative of every organization to understand its own dynamic culture so that managers can capitalize on the insights generated by the cultural perspective to wield greater control over their organizations. The culture of an organization has an important impact on its performance (Naicker, 2008).
A study conducted by Drenth, Thierry and Wolff (1998) found that there is a positive relationship between a high level of organizational commitment and the two dimensions of organizational culture which are support-oriented culture and innovation-oriented culture. This means that support and innovation culture dimensions helps to develop a stronger or higher level of organizational commitment.
2.5 Link between Innovation and Employee Satisfaction:
The concept of “employees’ job satisfaction” was first put forth by Hoppock (1935) as satisfaction displayed by employees both physically and mentally with regard to the working environment. Employee satisfaction is also called job satisfaction. (Wang Song-Hong, 2005). According to Smith, Kendall and Hulin (1969), job satisfaction is the result of a worker explaining the distinctive nature of his/her job based on a particular dimension, and whether a specific work situation affects job satisfaction involves many other factors, such as the comparison of good/bad jobs, comparison with colleagues, how competent an individual is, and the previous work experiences possessed by a worker. Schneider and Zornitsky (1994) defined “employee’s job satisfaction” as an employee’s attitude or feelings toward his/her job, compared to the definition presented by Gerald and Robert (1995) that employee’s job satisfaction is the general attitude an employee holds toward his/her duties. Locke (1973) considers “employee’s job satisfaction” the pleasant/positive emotional response of a person evaluating his/her duties or work experiences. Smith et al. (1969) proposed the five dimensions of job satisfaction, namely the job itself, job promotions, salary, supervisors and co-workers.
3. Hypothesis
The hypothesis for the study is as follows: Ho1: There is no correlation between Innovative Business Practices and Employee Engagement. Ho2: There is no correlation between Innovative Business Practices and Employee Satisfaction. Ho3: There is no correlation between Employee Engagement and Employee Satisfaction.
122
Ho4: There is no difference in the perception among male and female respondents for Innovative Business Practices. Ho5: There is no difference in the perception among male and female respondents for Employee Engagement. Ho6: There is no difference in the perception among male and female respondents for Employee Satisfaction.
4. Research Methodology
The objective of the study was to identify how innovative business practices
impacts employee engagement and employee satisfaction. Hence for this
purpose, a quantitative study seemed more apt as against a qualitative
study. This study solely relies on primary data collected from employees
working in different organisations across different industries. The primary
data has been collected through a structured questionnaire. It was an
objective questionnaire with no room for subjective answers.
4.1. Primary Data
The primary data was collected administering the questionnaire to 76
employees working in different organizations.
4.2. Secondary Data
The secondary data was gathered by reviewing various research papers and
articles published by different authors on the same subject.
4.3. Research Instruments
Two instruments were used for the purpose of this research, as follows;
Innovative Business Practices (To measure the level of innovative business
practices followed in the organization)
Employee Engagement (To measure the level of employee engagement and
employee satisfaction in the organization)
Innovative Business Practices
The first 16 statements of the questionnaire were related to Innovative
Business practices. The elements constituted were as follows:
i. Effective leadership and supervision (LS) ii. Opportunities for learning & advancement (LA) iii. Promotion of workplace flexibility (WF) iv. Culture of inclusion (CI) v. Meaningful work (MW) vi. Cultivation of teams and social supports (TS) vii. Competitive compensation and benefits (CB) viii. Promotion of health and wellness (HW)
123
Employee Engagement and Employee Satisfaction
The next 17 statements of the questionnaire were related to Employee
Engagement. The elements constituted were as follows:
i. Alignment of efforts with strategy (S)
ii. Empowerment (E)
iii. Teamwork and Collaboration (TC)
iv. Development Plans (DP)
v. Support and recognition (SR)
The next 3 statements of the questionnaire were related to Employee
Satisfaction and Loyalty (ES).
Each statement had to be responded on a 5 point Likert scale with 1 as
Strongly Disagree, 2 as Disagree, 3 as Neutral, 4 as Agree and 5 as Strongly
Agree.
4.4. Reliability & Validity of the Study
Cronbach’s Alpha Reliability Index was used to evaluate internal consistency
of each construct. A minimum of 0.5 is considered as satisfactory level
during the early stage of any research and a score of over 0.7 is considered to
be a good level. The reliability for the sample collected for the Innovative
Business practices was found to be 0.840 and the reliability for the sample
collected for Employee Engagement and Employee Satisfaction was found to
be 0.916. This indicates that there is a high level of consistency for both the
scales. Refer to Table 1a and 1b.
4.5. Logical Analysis
Effective and efficient data analysis is the result of effective data
preparation. Data preparation involved transferring the questionnaire into an
electronic format, which permitted and enabled data processing. Microsoft
Excel was used to compile the data. This data were further used using
Statistical Program for Social Sciences (SPSS) software for further analysis
and interpretation.
5. Results and Discussion
5.1 Correlation of scales To understand the impact and the nature of relationship between the innovative business practices and employee engagement and employee satisfaction, Karl Pearson’s coefficient of correlation was calculated. (Refer Table 2d). Table 2a indicates very high correlations between innovative business practices and employee engagement. The result indicates that innovative
124
business practices has a positive impact on employee engagement. Table 2a indicates a high positive correlation at 0.01 significant level therefore we reject the first null hypothesis that there is no correlation between innovative business practices and employee engagement.
Table 2b indicates very high correlations between innovative business practices and employee satisfaction. The result indicates that innovative business practices has a positive impact on employee satisfaction. Table 2b indicates a high positive correlation at 0.01 significant level therefore we reject the second null hypothesis that there is no correlation between innovative business practices and employee satisfaction.
Table 2c indicates very high correlations between employee engagement and
employee satisfaction. The result indicates that employee engagement has a positive impact on employee satisfaction. Table 2c indicates a high positive correlation at 0.01 significant level therefore we reject the third null hypothesis that there is no correlation between employee engagement and employee satisfaction.
5.2 Regression analysis Regression results for innovative business practices and employee engagement is shown in Table 3a. We see that the correlation between innovative business practices and employee engagement is .697 exactly what we see in Table 2a. This indicates a strong association between the two variables. We carried out further regression analysis that will allow us to predict values of employee engagement (variable y) values of innovative business practices (variable x). The prediction equation is Y = a + bx. Thus our prediction equation would be Y’ = 1.082 + .726X where Y is the dependent variable and x is the independent variable. So if innovative business practices score is 4 then the prediction for employee engagement would be 3.99. Regression results for innovative business practices and employee satisfaction is shown in Table 3b. We see that the correlation between innovative business practices and employee satisfaction is .786 exactly what we see in Table 2b. This indicates a strong association between the two variables. We carried out further regression analysis that will allow us to predict values of employee satisfaction (variable y) values of innovative business practices (variable x). The prediction equation is Y = a + bx. Thus our prediction equation would be Y’ = -1.366 + 1.389X where Y is the dependent variable and x is the independent variable. So if innovative business practices score is 4 then the prediction for employee satisfaction would be 4.2. Regression results for employee engagement and employee satisfaction is shown in Table 3c. We see that the correlation between employee engagement and employee satisfaction is .786 exactly what we see in Table 2b. This indicates a strong association between the two variables. We carried out further regression analysis that will allow us to predict values of employee satisfaction (variable y) values of employee engagement (variable x). The prediction equation is Y = a + bx. Thus our prediction equation would be Y’ = -1.421 + 1.377X where Y is the dependent variable and x is the
125
independent variable. So if employee engagement score is 4 then the prediction for employee satisfaction would be 4.09.
5.3 Ranking of sub-scales and t-test for Innovative Business Practices
among Gender
One of the objectives of this study is to understand the difference in perception of various sub-scales of innovative business practices and employee engagement and employee satisfaction between genders and the overall score. In this sample of 76 respondents, there are 40 males and 36 females. This is done by taking the mean score of each parameter of the two variables and then ranking them accordingly.
For innovative business practices, it is interesting to see that, there are difference in the ranking of sub-scales of innovative business practices. Opportunities for learning and advancement is seen as the top priority for men, whereas female sees this as the sixth priority out of 8 sub-scales. There are differences in terms of perception among male and female respondents in terms of priorities for innovative business practices. (See Table 4a). To find out whether the difference are significant or not a t-test was carried out. The t-test between genders for Innovative business practices yields a probability of .63, and since this probability is greater than 0.5, we conclude that the variances are not statistically significantly different from one another and that t-test statistics should be based on equal variances. Further results indicates t-value of -.771, with 74 degrees of freedom and a probability of .44. As this is greater than .05, we conclude that males and females had similar mean innovative business practices scores. (Refer Table 5). Therefore we accept the fourth null hypothesis that there is no difference in the perception among male and female respondents for Innovative Business Practices.
5.4 Ranking of sub-scales and t-test for Employee Engagement among
Gender
Yet again for employee engagement, it is interesting to see that, there are difference in the ranking of sub-scales of employee engagement among male and female respondents. Teamwork and Collaboration which is seen as the top priority for female respondent is the fourth ranking for male respondent. (See Table 4b). However the differences in mean among gender is not too wide, therefore a t-test would give us the significant difference status among gender. The t-test between genders for employee engagement yields a probability of .88, and since this probability is greater than 0.5, we conclude that the variances are not statistically significantly different from one another and that t-test statistics should be based on equal variances. Further results indicates t-value of -.913, with 74 degrees of freedom and a probability of .36. As this is greater than .05, we conclude that males and females had similar mean employee engagement scores. (Refer Table 5). Therefore we accept the fifth null hypothesis that there is no difference in the perception among male and female respondents for Employee Engagement.
126
5.5 Ranking of sub-scales and t-test for Employee Satisfaction among
Gender
The t-test between genders for employee satisfaction yields a probability of .027, and since this probability is less than 0.5, we conclude that the variances are statistically significantly different from one another and that t-test statistics should not be based on equal variances. Further results indicates t-value of -.624, with 59.7 degrees of freedom and a probability of .54. As this is greater than .05, we conclude that males and females had similar mean employee satisfaction scores. (Refer Table 5). Therefore we accept the sixth null hypothesis that there is no difference in the perception
among male and female respondents for Employee Satisfaction. 6. Limitation and Future Scope of Study
The various limitations to this study are:
1. A lack of time and resources limited our sample group to 76
respondents only. With increased time and resources a greater sample size
could have been drawn.
2. The sample was collected only from Mumbai and its suburbs. Sample
from other places across the nation would have given more variety and
insights to the whole study.
7. Recommendations & Conclusion
The survey conducted depicts that there is a very strong relationship between innovative business practices and employee engagement. In today’s time for survival and growth innovation and creativity is very important in organizations. The study proves that innovative business practices leads to employee engagement. The study also depicts a very strong relationship between innovative business practices and employee satisfaction thereby proving the point that innovation business practices also increases employee satisfaction.
The study also states that there is no significant difference between the perception of male and female when it comes to Innovative business practices, employee engagement nor employee satisfaction. Organization needs to give more focus on innovative business practices as organizations today’s faces lot of challenges and change and the same can be managed by innovative practices.
Engaged employees are more satisfied and thereby increasing the changes of more productivity and output and positive results. Engaged employees will be less likely to leave their jobs and less likely to remain absent. All these will result to long term sustainable results and success.
127
References:
Academy of Management Executive, Vol.13, No. 2, pp. 38-48.
Amabile, T. M., Conti, R., Coon, H., Lazenby, J. & Herron, M., 1996. Assessing the Work Environment for Creativity. Academy of Management Journal, 39(5), pp. 1154–1184.
Arnett, K. P., & Obert, T. L. (1995). What Employees Really Want? Datamation, Vol.
41, No. 5, pp. 84.
Bateman, T.S., & Organ D. W. (1983). Job Satisfaction and the good soldier,
Paper
presented at the meeting of the Academy of Management, New York.
Bhatti, K., & Qureshi, T. (2007). Impact of employee participation on job satisfaction, employee commitment and employee productivity. International Review of Business Research Papers, 3(2), 54 – 68.
Blessing White. (2008). The Employee Engagement Equation in India. Presented by BlessingWhite and HR Anexi.
Blessing White. (2006). Employee Engagement Report 2006 BlessingWhite, Inc. Princeton, New Jersey.
Coffman C. (2000). Is Your Company Bleeding Talent? How to become a true “employer of choice”. The Gallup Management Journal, 2000. The Gallup Organization, Princeton, NJ
Cranny, C.J., Smith, P.C., & Stone, E.F. (1992). Job satisfaction: How people feel about their jobs and how it affects their performance. New York: Lexington.
Damanpour, F., (1991), Organizational Innovation: A meta-analysis of effects of determinants and moderators, Academy of management journal, Vol.34/ No.3
Dernovsek D. (2008). Creating highly engaged and committed employee starts at the top and ends at the bottom line Credit Union Magazine, May 2008. Credit Union National Association, Inc.
Development Dimensions International. (2005). (Predicting Employee Engagement MRKSRR12-1005 Development Dimensions International, Inc., MMV.
Dessler, G. (1999). How to Earn Your Employees Commitment. Academy of
Management Executive , Vol.13, No.2, pp.58-66.
Erickson, T.J. (2005). Testimony submitted before the US Senate Committee on Health, Education, Labour and Pensions, May 26
Evan, W. M. 1966. Organizational lag. Human Organizations, 25: 51-53
Fernandez. C.P. (2007). Employee engagement. Journal of Public Health Management and Practice.
128
Gerald Carlino & Robert DeFina (1995). The differential effects of monetary policy shocks on regional economic activity, Working Papers, 95-15, Federal Reserve Bank of Philadelphia.
Gichohi, P. M., 2014. The Role of Employee Engagement in Revitalizing Creativity and Innovation at the Workplace: A Survey of Selected Libraries in Meru County - Kenya. Library Philosophy and Practice, 1, pp. 1-33.
Hoppock, R. (1935), Job satisfaction, New York: Harper and Brothers
Human Resources. (2007). Research: Employee engagement ROI-rules of engagement
Hunter, W., & Tietyen, D. (1997). Business to business marketing: Creating a community of customers. Lincolnwood-Illinois, McGraw-Hill Professional.
Katz, D. & Kahn, R., 1978. The Social Psychology of Organizations. New York: John Wiley and Sons
Knight, K. E. 1967. A Descriptive Model of the Intra-Firm Innovation Process. The Journal of Business, 40(4): 478-496.
Likert, R. L. (1961). The human organization. New York: McGraw-Hill.
Locke, E. A. (1973), Satisfactory and Dissatisfactory among White Collar and Blue Collar Employees, Administrative Science quarterly, 22, 57-75
Macey W.H and Schneider B. (2008). The Meaning of Employee Engagement. Industrial and Organizational Psychology, 1 (2008), 3-30.
McGregor, D. (1960). The human side of enterprise. New York: McGraw-Hill
Miller, J. L. (2006). Coach Yourself to Succeed @ Work: How to Achieve Optimal Performance and Job Satisfaction.CA, Dorrance Publishing Co.
Moyes, G. D., & Shao, L. P., Newsome, M. (2008). Comparative analysis of employee job satisfaction in the accounting profession. Journal of Business & Economics Research, 6(2), 65-81
Nancy C. Morse , (1977)-Satisfactions in the white-collar job, Ayer publishing.
Organ, D. W., & Konovsky, M. (1989), Cognitive vs. Affective Determinants of
Organizational Citizenship Behaviour. Journal of Applied Psychology, Vol.74, pp.157-164.
Organ, D. W., & Lingl, A. (1995). Personality, Satisfaction and Organizational Citizenship Behaviour. The Journal of Social Psychology, Vol.135, No.3, pp.339-350.
Penna (2007). Meaning at Work Research Report
Perrin T. (2003). Working Today: Understanding What Drives Employee Engagement The 2003 Towers Perrin Talent Report U.S Report.
Pfeffer, J., & Veiga J.F. (1999). Putting People First for Organizational Success
129
Puffer, S. (1987). Pro Social Behaviour, noncompliant behaviour, and work performance among commission sales people. Journal of Applied Psychology, Vol. 72, pp.615-621
Robinson D., Perryman S., and Hayday S. (2004). The Drivers of Employee
Engagement Report 408, Institute for Employment Studies, UK
Schlesinger, Leonard A. and Jeffery Zornitsky (1994), Job satisfaction, service capability, and customer satisfaction: An examination of linkages and management implications, Human Resource Planning, 14(2), 141-149
Schnake, M. E., & Dumler, M. P. (2003). Levels of Measurement and Analysis Issues in Organizational Citizenship Behaviour Research. Journal of Occupational and Organizational Psychology, Vol.76, pp.283-301.
Smith, P. C., Kendall, L., & Hulin, C.L. (1969). The measurement of satisfaction work and retirement, Chicago: Rand McNally
Smith, C.A., Organ, D.W., & Near, J.P. (1983). Organizational Citizenship Behaviour: Its Nature and Antecedents. Journal of Applied Psychology, Vol.68, No.4, pp.653-663
Spector, P.E. (1997). Job Satisfaction: Application, Assessment, Causes, and Consequences. Thousand Oaks, CA: Sage.
Wang, Song-Hong (2005). A study of the correlation of employees’ job satisfaction and customer satisfaction: An empirical analysis of seven Taiwanese hospitals. MA, Graduate Institute of Business Administration, National Taipei University, Taiwan.
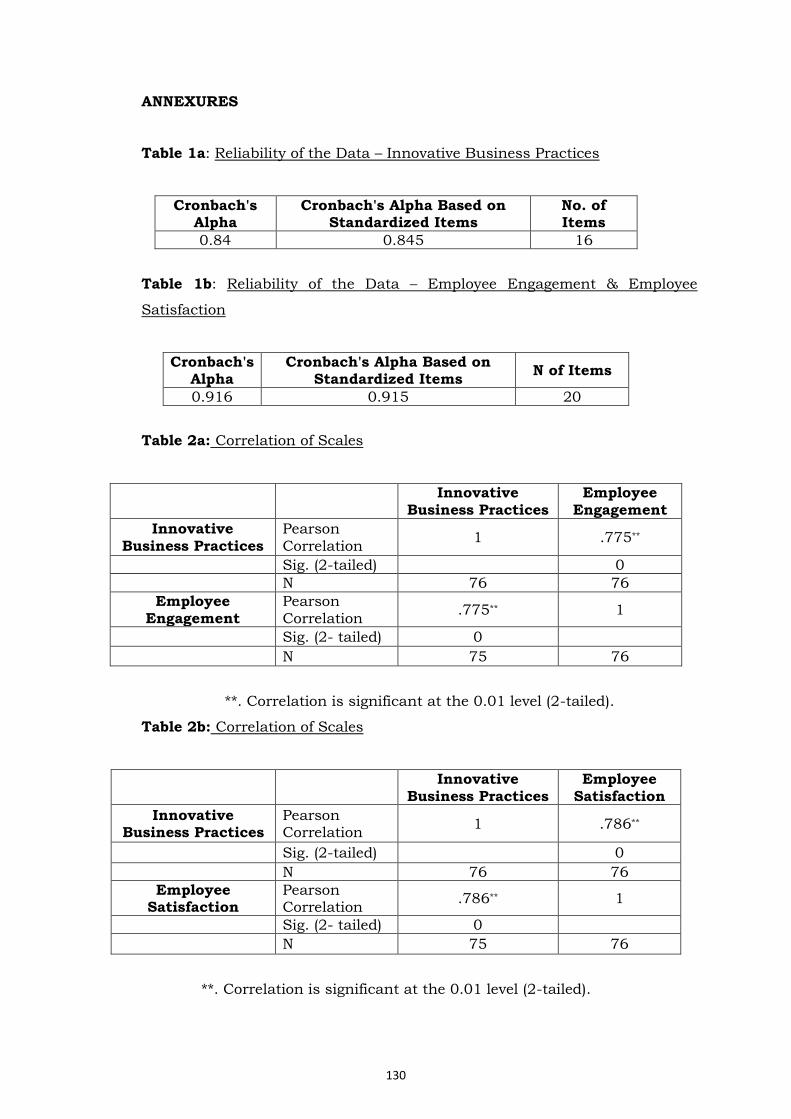
130
ANNEXURES
Table 1a: Reliability of the Data – Innovative Business Practices
Cronbach's Alpha
Cronbach's Alpha Based on Standardized Items
No. of Items
0.84 0.845 16
Table 1b: Reliability of the Data – Employee Engagement & Employee
Satisfaction
Cronbach's Alpha
Cronbach's Alpha Based on Standardized Items
N of Items
0.916 0.915 20
Table 2a: Correlation of Scales
Innovative
Business Practices Employee
Engagement
Innovative
Business Practices
Pearson Correlation
1 .775**
Sig. (2-tailed) 0
N 76 76
Employee Engagement
Pearson Correlation
.775** 1
Sig. (2- tailed) 0
N 75 76
**. Correlation is significant at the 0.01 level (2-tailed).
Table 2b: Correlation of Scales
Innovative
Business Practices Employee
Satisfaction
Innovative Business Practices
Pearson Correlation
1 .786**
Sig. (2-tailed) 0
N 76 76
Employee Satisfaction
Pearson Correlation
.786** 1
Sig. (2- tailed) 0
N 75 76
**. Correlation is significant at the 0.01 level (2-tailed).
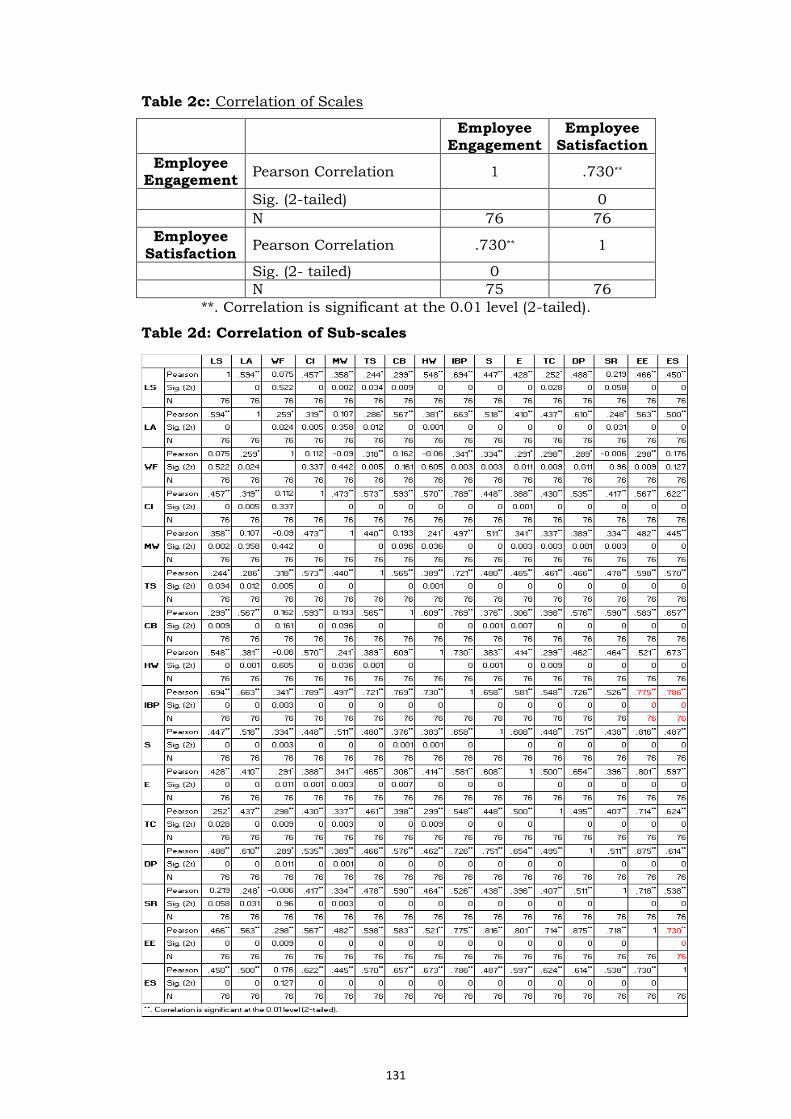
131
Table 2c: Correlation of Scales
Employee
Engagement Employee
Satisfaction
Employee Engagement
Pearson Correlation 1 .730**
Sig. (2-tailed) 0
N 76 76
Employee Satisfaction
Pearson Correlation .730** 1
Sig. (2- tailed) 0
N 75 76
**. Correlation is significant at the 0.01 level (2-tailed).
Table 2d: Correlation of Sub-scales
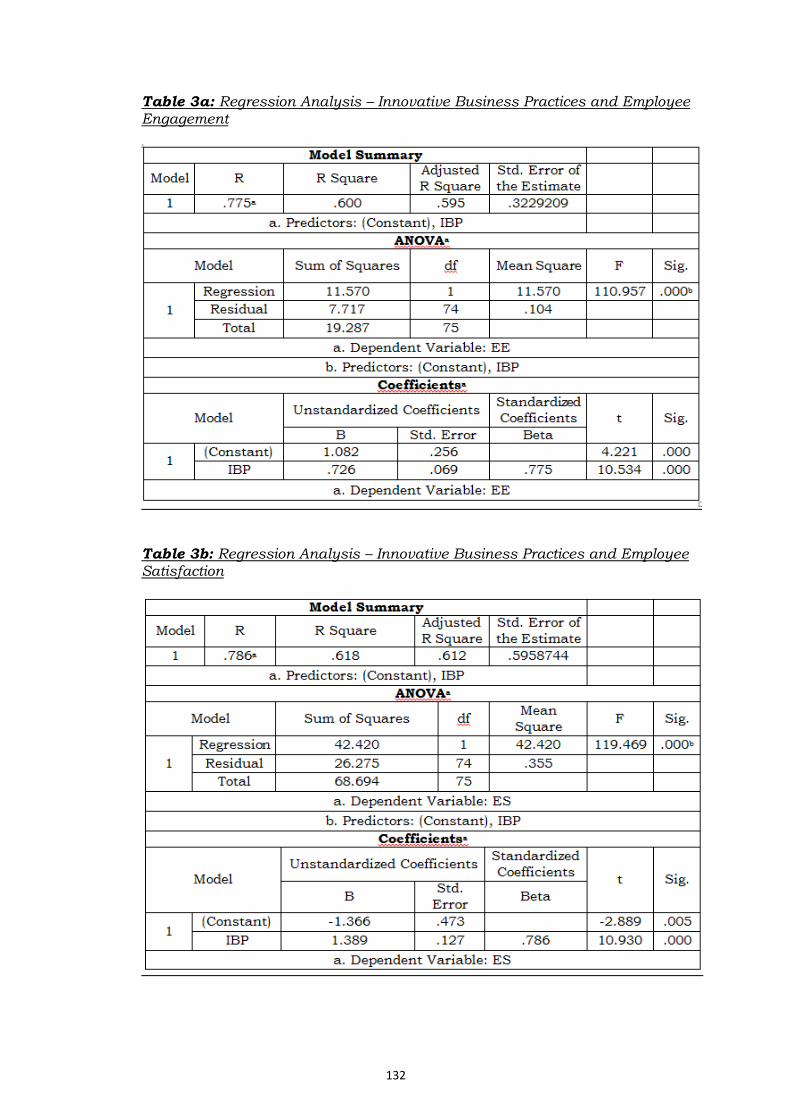
132
Table 3a: Regression Analysis – Innovative Business Practices and Employee Engagement
Table 3b: Regression Analysis – Innovative Business Practices and Employee Satisfaction
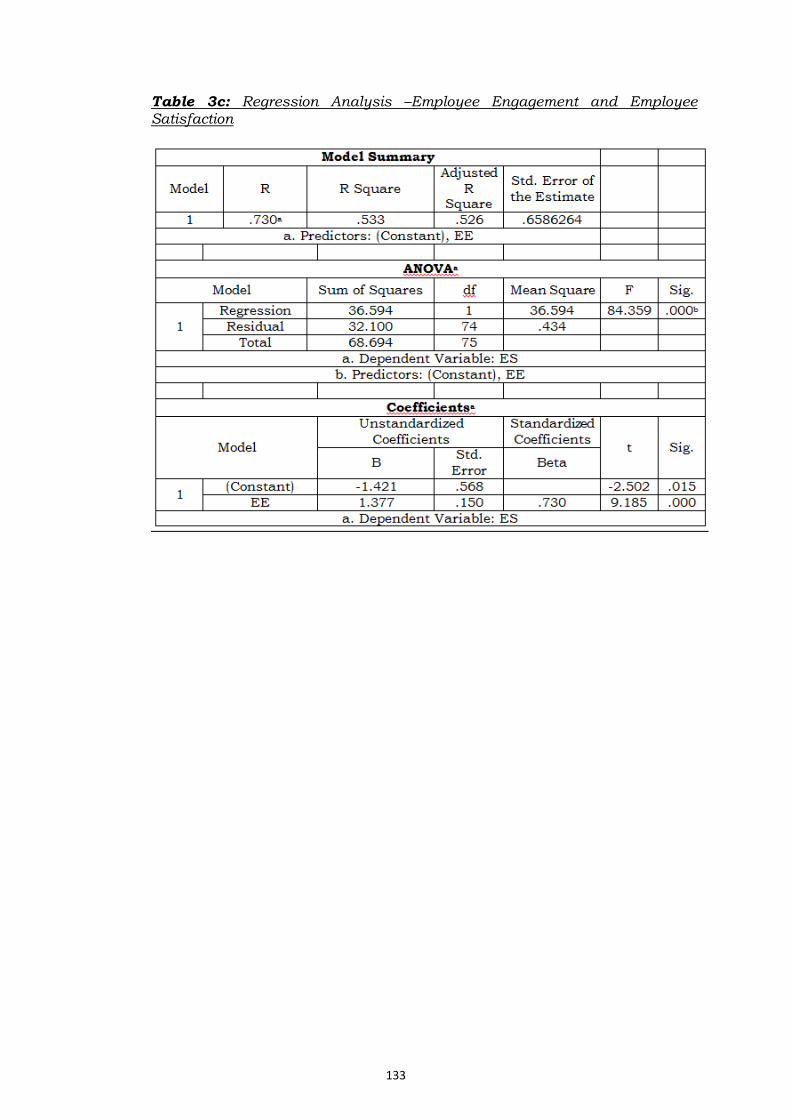
133
Table 3c: Regression Analysis –Employee Engagement and Employee Satisfaction
134
Linking Social Sustainability to Urban Poverty
By
Ritu Sinha
Assistant Professor, IES Management College and Research Centre,
Mumbai
Abstract Urban development comes with its own opportunities and challenges. The
rapid pace of urbanization has dire implications for urban poor for their sustainability in urban areas. This transition has produced an urban crisis resulting in urban poverty and urban slums, which is marked by the lack of adequate infrastructure and growth management. The issues pertaining to urban poverty are migration, labor, the role of gender, access to basic services and the appalling condition of India’s slums. This poses distinct challenges for housing, water, sanitation, health, education, social security, livelihoods and the special needs of vulnerable groups such as women, children and the aging. Hence, the issues of urban poverty needed to be addressed distinctly from those addressed in the typical analysis of poverty. The present study is aimed at understanding the problems faced by the poor and focuses on the systemic changes that are needed to address them. It also attempts to link the concept of social sustainability in addressing the issues of urban poverty by creating the physical, cultural and social places that support the community. It aims at bringing together a number of different ideas about social equity, social needs and corporate intervention in bringing social integration to create an inclusive society. Keywords: Urban Poor, Social Sustainability, Housing, Poor Infrastructure Study Background
Urban development comes with its own opportunities and challenges. It
brings benefits for urban poor by offering them a pool of unskilled jobs
and average income. This led to rural urban migration relying on the
livelihood opportunities in urban areas. But this caused income
inequalities in urban areas and is one of the reasons for the rise in
poverty in urban areas. As per the statistics released by government,
urban poverty in India is over 25 percent. Around 81 million people live in
urban areas on incomes that are below the poverty line. Although rural
poverty remains higher than urban poverty at the national level yet the
gap is closing.
135
The rapid pace of urbanization is having dire implications for these urban
poor for their sustainability in urban areas. These people are forced by
circumstance to live in the cities in most dangerous and health-
threatening environments known as urban slums. The census defines a
slum as residential areas where dwellings are unfit for human habitation
as they are dilapidated, cramped, poorly ventilated, and unclean. Nearly
one in every six urban Indian residents lives in a slum which is
significantly lower than the slum growth that had been projected for
India. Around 1.37 crore households or 17.4% of urban Indian
households lived in a slum in the year 2011 as suggested by data
released by the registrar general and census commissioner's office. The
2001 data had set India's slum population at 15% of the total population.
Slums are visual manifestations of urban poverty. According to the 2002
National Sample Survey (NSS), an estimated 8.23 million households in
urban areas of the country were living in slums. The rapidly increasing
slums have been observed in the four mega cities of Mumbai, Delhi,
Kolkata, and Chennai due to expanding employment opportunities.
However, even the tier I and tier II cities are undergoing rapid social and
economic transformation as they are also getting attention from big
businesses. Another common perception regarding the slum dwellers is
that they are poor. But a survey of nine slums in Howrah in the state of
West Bengal revealed that almost two thirds of the population living in
the slums was above the poverty line (Sengupta 1999).
Urban Poor
There is huge heterogeneity in the living standards of urban poor within a
city. There are many studies that suggest that large differences exist
among the urban poor in modes of livelihood and access to resources
(Moser, Gatehouseand Garcia 1996). Urban poverty even today accounts
for one quarter of total poverty in India, and this trend is expected to rise
in the future. It refers to those urban poor that live with many
deprivations like limited access to employment opportunities, inadequate
and insecure housing and services, violent and unhealthy environments
and limited access to adequate health and education opportunities. It is
multidimensional construct that is rooted in a complexity of resource and
136
capacity constraints, inadequate Government policies at both the central
and local level, and a lack of planning for urban growth and management.
Most of the time, urban poor are defined on the basis of a monthly
income cutoff, which is currently Rs 4,824 for a family. But now the
government is planning to estimate in terms of parameters like housing,
economic, social and occupational.
Urban poverty has its issues that needed attention distinctly from those
addressed in the typical analysis of poverty (Baker and Schuler 2004).
Predominantly, there are three distinctive characteristics along which
urban poverty and vulnerability that make it different from the rural
poverty. These characteristic are commoditization, environmental hazard,
and social fragmentation (Moser, Gatehouse,and Garcia 1996). Urban
households need to pay in cash for all their necessities and do not have
the support of production, in particular food. Commuting costs to work in
urban areas is on higher side as compare to rural areas. All these aspects
of urban life are referred to as commoditization. Environmental hazards
are also on higher side for these urban dwellers. Inadequate access to
water and sanitation, poor quality housing, and overcrowding poses
health risks for the urban poor in particular. Social fragmentation relates
to the lack of social security in urban areas as compared to rural areas.
Urban dwellers are exposed to higher levels of violence, alcohol, and drug
abuse, and greater risk of motor vehicle accidents.
Characteristic of Urban Poverty
Urban poor consists of heterogeneous groups with varied characteristics.
Some remain poor as they do not have access to employment, do not have
secure shelter and some others fall below the poverty line if their shelter
is demolished due to an eviction drive in a city. Urban poor have to pay
more for accommodation, food, transport and other services than the
rural poor. They faces multiple vulnerabilities like lack of regular income
and employment, productive assets, access to social safety nets; lack of
access to services such as education, health care, water supply and
sanitation; dignity and respect. Understanding intra urban differences
137
across various cities is also very important in light of urbanization of
poverty in developing countries (Ravallion et. al. 2007) and the growth of
slum population fuelled by migration. In India, between 1983 and 2004-
05, there has been decline in poverty (head count ratio), the total number
of rural poor has declined by 12.31 percent whereas urban poor has
increased by 13.89 percent. Also, it has been found that the mega cities
are getting attention and developmental focus whereas other cities are
been ignored owing to their size.
Issues afflicting Urban Poor
The urban poverty in India is more than 25 percent where around 81
million people live in urban areas on incomes that are below the poverty
line. India has also come up with its report on the nature and dynamics
of urban poverty in the year 2009 that is aimed to identify the problems
faced by the poor and focuses on the systemic changes that are needed to
address them. These issues pertain to migration, labour, the role of
gender, access to basic services and the appalling condition of India’s
slums. This poses distinct challenges for housing, water, sanitation,
health, education, social security, livelihoods and the special needs of
vulnerable groups such as women, children and the aging. An increasing
pace of urbanization and the absence of affordable housing have resulted
in proliferation of slums in urban India which is increasing and becoming
denser. According to a 2001 census, India’s cities have a slum population
of 42.6 million (23.7 percent of the urban population). The majority (11.2
million) of them belong to Maharashtra region and that too in Mumbai,
Dharavi and Mankurd slum. These slums are illegal urban settlements on
public land where slum dwellers reside in sub-human conditions, with
little or no access to civic amenities like clean water, sanitation and
health care facilities.
Slum dwellers face a constant threat of eviction, removal, confiscation of
goods and have virtually no social security cover. Some 54 percent of
urban slums do not have toilets; public facilities are unusable due to a
lack of maintenance. The conditions often lead to various types of anti-
social activities, create environmental problems and, more often are
havens for criminals. The problem of slums has attained alarming
138
proportions and had started threatening the sustainability of urban life.
The problems and issues that are peculiar to slum dwellers are limited
access to income and employment, Inadequate and insecure living
conditions, poor infrastructure and services, vulnerability to risks such as
natural disasters, environmental hazards and health risks with focus on
people living in slums, Inequality closely linked to problems of exclusion,
improving quality of life, struggle for recognition and helping to reduce
insecurity
General Framework of Action
Addressing urban poverty is not only the onus of central and local
governments, but also a responsibility of society, organizations, business,
and local communities themselves. It requires support from higher levels
of government, provision of public services, assistance for small-scale
enterprises with the help of private public partnership and corporate
social responsibility of the firms. Corporate can look for the inclusive
business models whereby companies can consider long-term values that
can be created for society and shareholders. The Impact Assessments
commissioned by DFID India in 1997 (IAS, 1999; PIAS, 1997) suggested
that poor urban people consider employment, assets and savings, and
income as the key determinants of their well-being. This in turn is linked
with security and predictability of income, as well as to the security of
assets. So, there is need of poverty alleviation programs that aimed at
increasing the facilities for education, training and increasing earning
avenues for urban poor. In addition to the government role, PPP model
can also play an important and significant role in this aspect. Corporate
houses should adopt rural areas and urban poverty areas to empower the
people at these places. It requires a huge outlay of funds and budgetary
provision for development of basic infrastructure.
Social Sustainability
Social sustainability refers to the life-enhancing condition within
communities, and a process within communities that can achieve access
to key services like health, education, transport, housing and recreation.
It combines the design of the physical realm with design of the social
139
world i.e. infrastructure to support social and cultural life, social
amenities, systems for citizen engagement and space for people and
places to evolve’ (Woodcraft et al, 2011 p. 16). Sachs (1999) defined ‘social
sustainability’ in terms of number of constituent elements including
social homogeneity, equitable incomes and access to goods, services and
employment. He also emphasized on the importance of ‘cultural
sustainability’ which requires balancing externally imposed change with
continuity and development. Godschalk (2004) defined social
sustainability in terms of urban planning tripartite consisting of
‘resource’, ‘development’ and ‘property’ conflicts. Chiu (2002, 2003)
explored social sustainability in the context of housing in Hong Kong. She
identified three components of social sustainability based on
conceptualisations of social limits, ecological limits and equality.
Today no business can survive without assessing the impact of it is
activities on the society in general. People are reluctant to turn a blind
eye to socially insensitive acts of the businesses. Companies are shifting
their focus from shareholder value (i.e. maximizing profit) to stakeholder
value and are striving to balance among people, planet and profit. The
societal expectations pressure on companies is making them to act
responsible with regards to their external as well as internal
environments (Du, Bhattacharya & Sen., 2010; Issaksson & Jørgensen,
2010; Waller & Conaway, 2011). Within this context, the objective of this
paper is to reflect on various interventions that needed to be undertaken
to mitigate the complex problem of urban poverty through various
approaches of social sustainability.
Findings
Urban poverty is a complex process and is multi-dimensional
phenomenon which makes it difficult to define and analyze it. Urban
poverty presents a different set of issues which are different from general
poverty analysis. There are distinctive groups of the urban poor like
pavement dwellers, people and others are nearly invisible. There are
either homeless or somewhere to be found between homelessness and a
stable residence in a slum. The construction sector is mostly
140
characterized by mobile poor, unskilled construction workers who have to
search for the work continuously. These workers work on a short term
basis, daily or weekly. Before moving to another site, or any other job
location, there is never enough time or even the possibility to get settled.
They don’t have rationed food and remain malnourished. These workers
live in tent like structures and lack any access to infrastructure. Many
seasonal migrants spent their seasons in big cities under horrendous
conditions.
Urban poor always remain in a fear of destitution and homelessness and
hence there is a need to get involved the urban poor in the process of
urban development. There should be measures to protect them from risks
like ill-health, eviction, loss of employment along with need safety nets.
The other important aspect is the security associating with income,
tenure, access to consumption and investment savings and loans,
educational opportunities which are an investment for the future, and
strong social networks to support families in times of crisis. For women, it
also includes the protection against violence and discrimination. All these
measures can help the urban poor to improve their quality of life.
Urban poor can be empowered by imparting skill training programs that
offer them a better employment prospects in the future. Even the
government has recognized the need of public-private partnership and
corporate social responsibility to achieve the objective of providing
affordable home to the urban poor. The government has earmarked Rs
35,000 crores to provide affordable housing and for slum development in
the 12th Plan. Hence its analysis requires additional tools and techniques
for the analysis of urban poverty and how corporates can contribute
towards the empowerment of urban poor. For this, a city poverty profile is
needed so that it can help policy makers, community members,
academics, corporate and government to offer them social sustainability.
Corporates Interventions
Many Indian companies have been taking proactive initiatives to become
a part of socially responsible companies. These corporates are running
their programs in areas like education, community health, and
sustainable livelihood development and building human capabilities,
141
community engagement, women empowerment and protecting
environment. Even the employees of these companies volunteer
themselves for making a meaningful difference in the lives of urban poor.
Some firms are involved in providing clean drinking water, repair existing
water resources and manage the new pipelines to transport water to help
the community. Large scale cleanliness drives are being organized by
these firms in the slum areas to address the deteriorating sanitation
conditions. Some of the companies are working towards the concept of
recycling that not only offers benefits beyond the environmental benefits
but also added business opportunity.
Most of the time, these urban poor are victim of poor health and lack of
hygiene awareness and quality education, early marriages of girls,
unemployment and lack of women empowerment. Companies can engage
themselves in community interaction and work towards these issues that
are plaguing the community. They can involve Self Help Groups (SHGs)
for getting in touch with this community. Some of the notable works can
be observed from the live examples of the corporates undertaking the
activities for empowering the economically marginalized social group
especially urban poor. Axis Bank Foundation runs Balwadi which are
learning places for children living in large slum clusters. It also conducts
Skill Development Programs in motor driving, welding, mobile repairing,
tailoring etc. for the youth. Hindalco Industries awards scholarships for
the poor students. Infosys Science Foundation supports causes in
healthcare and culture.
KC Mahindra Education Trust supports education of over 75,000 under
privileged girls. It provides vocational training and livelihood training to
the youth from socially and economically disadvantage community.
HUDCO has extended the support to the local bodies for construction of
night shelter facilities in Bhubaneswar, Vadodara and West Bengal. It
has extended support for construction of community pay and use toilets
at Delhi, Tamil Nadu and Bengal. Apart from this, it has also taken up
Skill Development Training Programs at various urban locations. Aptech
Ltd. in association with leading NGOs sponsored computers and the
education to the underprivileged children at the schools of urban slums.
142
They also undertook the task of conducted training and awareness-camps
for such students. Education is a top corporate priority for Cisco and
pursues a philosophy of strong “triple bottom line” which is described as
profits, people and presence. The company promotes a culture of
charitable giving and connects employees to non profit organizations
serving the communities.
Policy Implications
The dynamics of urban inequalities are leading to urban poverty. The
qualitative aspect of urban poverty makes it different from its rural
counterpart, and therefore may require very different policy interventions.
It requires critical attention of the policymakers; otherwise this
phenomenon would results in inequality and insecurity that might strain
the city life. Social sustainability can ensure the sustenance of the diverse
social relations that exist in healthy communities. Creating the physical,
cultural and social places that support wellbeing and a sense of
community will help the urban poor to move away from poverty traps. It
aims at bringing together a number of different ideas about social equity,
social needs and to promote sustainable development, and draw upon
social capital, social cohesion and wellbeing in urban areas as a means of
explicating these ideas.
There is a need for the strategy development for providing quality of life
and creating competitive cities. It also calls for a better appreciation for
the complexities of these social dimensions which are fundamental to the
success of the sustainable development movement. These strategies
might relate to City Development Strategies (CDS) where we can identify
key urban issues through quantitative measures of urban poverty, and
qualitative measures of community priorities. It can also be valuable
inputs to the Local Economic Development (LED) where local government,
the private sector, the not- for-profit sectors and the local community got
an opportunity to work together to improve the local economy so as to
ensure inclusive growth. It can set the road map for the requirements for
the changes in policies, investments and activities that can be formulated
for empowering urban poor. The policy makers should look for the
143
development of social, political and legal structures which are inclusive
and provide opportunities for all people.
Bibliography
Agarwal, S., A Satyavarda, S. Kaushik, and R. Kumar. 2007.
Urbanization, Urban Poverty and Health of the Urban Poor: Status,
Challenges and the Way Forward. Demography India 36(1): 121-134.
Anand, R., Tulin, V., & Kumar, N. (2014). India: Defining and explaining
inclusive growth and poverty reduction.
Anjaria, J. (2006) Street hawkers and public space in Mumbai, Economic
and Political Weekly, 41
Arabindoo, P. (2011). Rhetoric of the ‘slum’ Rethinking urban poverty.
City, 15(6), 636-646.
Baker J.,(2008), Urban Poverty: A Global View, The International Bank for
Reconstruction and Development/The World Bank
Beinhocker, E. D., Farrell, D., & Zainulbhai, A. S. (2007). Tracking the
growth of India's middle class. McKinsey Quarterly, 3, 50.
Blowfield, M.,& Frynas, J.G. (2005). Setting New Agendas: Critical
Perspectives on Corporate Social Responsibility in the Developing World.
International Affairs, 81(3), 499-513.
Boyko, C. T., Cooper, R., Davey, C. L., & Wootton, A. B. (2006).
Addressing sustainability early in the urban design process. Management
of Environmental Quality: An International Journal, 17(6), 689-706.
Chandrasekhar, S. and A. Mukhopadhyay., 2008. Multidimensions of
Urban Poverty: Evidence from India, 2007-08. Indira Gandhi Institute of
Development Research Working Paper. Mumbai: Indira Gandhi Institute
of Development Research
Chen, S. & Ravallion, M. (2008) The developing world is poorer than we
thought, but no less successful in the fight against poverty, World Bank
Policy Research Working Paper No. 4703, available at: http://ssm.com/
abstract¼1259575
Chaudhuri, S., & Gupta, N. (2009). Levels of living and poverty patterns:
a district-wise analysis for India. Economic and Political Weekly, 94-110.
Dhingra, C., Gandhi, S., Chaurey, A., & Agarwal, P. K. (2008). Access to
clean energy services for the urban and peri-urban poor: a case-study of
Delhi, India. Energy for Sustainable Development, 12(4), 49-55.
144
Gangopadhyay Shubhashis,Ghosh Namrata, Sharma Purti and Kumari
Niloo (2011), report on “Generating Poverty Estimates Using New Poverty
Lines”, submitted to Planning Commission
Grieco, M. (2015). Social sustainability and urban mobility: shifting to a
socially responsible pro-poor perspective. Social Responsibility Journal,
11(1), 82-97.
H. Taubenböck, N. J. ( 2013). The physical face of slums: a structural
comparison of slums in Mumbai, India, based on remotely sensed data.
Journal of Housing and the Built Environment
Mahadevia D., Urban Poverty In India and Post-MDG Framework, Oxfam
India working papers series, April 2013, OIWPS – XVII
Ministry of Housing and Urban Poverty Alleviation (MOHUPA) and UNDP.
2009. Poverty in India. New Delhi: MOHUPA and UNDP.
Montgomery, M.R. and Hewett, P.C. 2005. Urban Poverty and Health in
Developing Countries
Nicolas J.F. Ragodoo, (2009) "CSR as a tool to fight against poverty: the
case of Mauritius", Social Responsibility Journal, Vol. 5 Iss: 1, pp.19 – 33
Mutisya, E., & Yarime, M. (2014). Moving towards urban sustainability in
Kenya: a framework for integration of environmental, economic, social
and governance dimensions. Sustainability science, 9(2), 205-215.
Panagariya, A., & Mukim, M. (2014). A comprehensive analysis of poverty
in India. Asian Development Review.
Planning Commission. (2014). Report of the expert group on estimation of
proportion and number of poor (No. id: 5627). pp. 2140–2146.
Singh, R., Bakshi, M., & Mishra, P. (2015). Corporate Social
Responsibility: Linking Bottom of the Pyramid to Market Development?.
Journal of Business Ethics, 131(2), 361-373.
Urban Health Resource Centre (UHRC). 2008. Key Indicators for Urban
Poor in INDIA from NFHS-3 and NFHS-2, Wall Chart. New Delhi: UHRC.
Wu, F. (2004), Urban poverty and marginalization under market
transition: the case of Chinese cities. International Journal of Urban and
Regional Research, 28: 401–423.
145
THE FUTURE LIES IN INNOVATIVE GOVERNANCE
By
Dr.Shailja Badra* Vivek Sharma**
* Assistant Professor at Durgadevi Saraf Institute of Management Studies
** Assistant Professor at Sheila Raheja Business School, Bandra
Abstract
The last two years have seen a major thrust of Central and State
Governments on e-governance. Traditional administrative practices have
superannuated. As the country takes a pivotal role in world stage, the
contrast between India and Bharat is visible. The scourge of poverty and
population made governance challenging for able administrators too.
Independent India adopted best practices in Governance from different
countries of the world. It helped to serve vast cultural and geographical
diversity of Indian people for almost seven decades. The globalization and
liberalization of Indian economy in 1991 saw a new thrust in governance.
Technology is the single big contributor to transforming India. The
country has been quick to adopt new learning in governance and pave
way for a new generation. The Central government has tried to create a
social, economic and technological infrastructure that shall pave way for
better governance and less paper work in the foreseeable future.. E-
governance goes beyond mindset issues. This paper attempts to
understand e-governance and its impact on efficiency and cutting costs.
KEYWORDS:
E-Governance, optimal utilization of resources
I. Introduction
The spectrum of e-governance initiatives across various states in the
country is the reflection of the political to embrace change.The examples
are many and varied. The Chief Minister of Maharashtra takes the
technology route to govern. It makes his administration more responsive
and efficient. The government of Madhya Pradesh uses a geometrics
application, i-GeoApproach to monitor construction and maintenance of
100000 kilometers of road.The island city of Mumbai uses its Facebook
146
page where citizens report traffic congestion. Haryana uses a
management information system to track child birth. Bihar Police has a
web portal to see the status of complaints.
The national e-governance plan initially had 14 of 27 projects like e-
passport and national citizen database. Various state governments
provide services such as telemedicine, high-quality and cost-effective
video and data connectivity. Governancerequires addressing issues of
public-private partnership, water supply, waste disposal, power
distribution, telecommunications network and industrial development.
Logistic hubs, special economic zones for IT and ITES, amusement parks,
sports complex are integral to holistic governance.E-governance requires
process simplification and the greater co-ordination among multiple
departments. It is common knowledge that projects with longer gestation
period and uncertain demand are not easy to get financers. Ease of
governance eliminates fly–by-night operators.
In modern times, it is easier to know about title of land, environmental
issues, infrastructure available socio-political back check and
development and planning regulations.Poorland record maintenance led
to sale of land to multiple buyers resulting in mental anguish and
financial loss to the affected people. It hampered the development of the
area, forced industries to reconsider alternative locations. However, a lot
needs to be done on computerization and regular update of land title data
to make it transparent and efficient.
Road, rail and air connectivity has a bearing on development of any
region. E-governance bring technology savvy international citizens closer
to fruitful business lines. The Government of Gujarat converted vast
areas of barren land useful for cultivation by monitoring the flow of water
to parched regions. New Delhi has a Smart city embedded in the heart of
the Capital. Karnataka and Andhra Pradesh have shown the rest of India
that giant stridescan be made in governance if there is the right
leadership .Organizations and industries are lining up in these states in
areas of defence production, logistics, IT and many more. Developed
nations make a beeline to have their pie, after getting fully convinced on
good governance and strong public policy is well in place.
147
India witnessed a change in Central government in May 2014. Many
states elected governments which promised e-governance and sensible
utilization of scarce resources.
A flagship scheme on financial inclusion called “Jan Dhan Yojana”
became a talking point in governing India the modern way. It added
21million account holders throughout the country. Fertilizer subsidy,
educational scholarship, social service initiatives are linked to the
scheme. It reduced pilferage and embezzlement of funds. It also ensured
that the beneficiaries get maximum advantage with optimal utilization of
resources. However, during 50 days of demonetization, there have been
reports suggesting misuse of many of these accounts. But stricter laws
would mean that the government tracks those who misused the accounts
of the less priveledged.
E-governance takes centre stage in areas where development issues
tackled poorly in the past. E-governance augurs well for underdeveloped
regions, societies that remained outside the benefits of development, the
less privileged and also special interest groups.
Oil companies believe in e-auction, housing development boards use
technology to become transparent. The bidders, based anywhere in the
world, come together as technology cuts across geographical boundaries.
The applications of e-governance permeate many sectors & change the
history and geography of the region.
Global financial, commercial and entertainment hubs are the
transforming element in governance. Special economic zones with single
window clearances, expressways and information highways are part of big
development agenda followed by each government.
E-district pilot projects have been implemented in Karnataka, Andhra
Pradesh, UP to improve efficiency through complete automated system.
Online pension distribution and scholarships, procurement and
distribution are facilitated by use of technology in governance.
Banks and financial institutions have taken a cue to implement e-
governance. ICICI dedicated a digital village recently to the cause. RBI
and NABARD extensively use technology to govern better. Multinational
148
and private banks have focused on better implementation of user friendly
technologies.
II. Literature Review
It is well established that big decisions of foreign collaborations,
partnering growth and investments are based on technology of the
country, wisdom, experiences and human resources. E-governance takes
centre stage in such a situation, ripe with brilliant possibilities.
In the view of World Bank, e-governance is the use of information
technology to transform relations with citizens, business and other arms
of government. The use of these technologies results in better delivery of
government services to citizens.
The National e-Governance Plan (NeGP) comprised of 27 Mission Mode
Projects(MMPs) and 10 components came into force on May 18, 2006. It
aimed at the providing access to services, focusing on service delivery
while ensuring efficiency, transparency and reliability at affordable cost.
The strategy included common support infrastructure, decentralized
implementation, public-private partnership and ownership of Central
ministries. Bharat Nirman, Rural Employment Guarantee Schemes used
e-governance techniques since inception of these initiatives.
The Bhoomi venture in Karnataka, a G2B module, aims at computerized
land record, which in turn makes the middleman irrelevant.
The Ministry of Civil Aviation followed a G2B module in the selection of
financial advisors in its Mumbai and New Delhi privatization project. The
Ministry of Railways follows G2G module for postings to make e-
governance work. Its G2B module helps bidders to check their status
online.
The Ministry of Finance adopted G2G e-governance model to make
transfers/ posting more transparent in Department of Income Tax. Many
departments have followed suit. (The Times of India, December 27, 2014)
The state of Uttar Pradesh uses 17500 Common Service Centres to
provide services like birth /death certificates, domicile, caste, income
among many utilities. Digitization of ration cards, e-villages, e-suvidha for
149
G2C and G2B usher in better efficiency. Global IT giants like HP help 13
rural incubation centres to encourage entrepreneurship and generate
employability among rural youth in UP (The Times of India Advertorial,
March 4, 2015)
III. Problem Statement
The focus on Governance is priority for welfare of the people. Technology
is the lever which provides efficiency and speed in mass outreach
initiatives. It helps to set the following objectives.
IV. Objectives
4.1 To study e-governance as a catalyst in providing socio economic
development of people.
4.2 To evaluate the impact of recent initiatives on governance.
V. Hypothesis
5.1 E-governance is one of the potent contributing factor for the development
of India.
VI. Methodology
Tools: Qualitative as well as quantitative method of data collection was
used. Analysis was done by Questionnaire method and the opinion of 8
experts was also used to conclude the paper.
Sample size: 155 Respondents
Sampling Method: Simple Random sampling
Sampling Place: Mumbai
VII. Findings
7.1 The respondents feel that India is ready for e-governance. The areas
where e-governance is most helpful are utility services, municipal
documents, general administration, land and revenue matters and
pension/medical services to senior citizens and the poor.
150
7.2 E-governance makes life simpler for the ordinary Indian. Greater
transparency in administration helps to build trust and stronger bond
between people and government.
7.3 Increased efficiency was highest rated among the factors in e-governance.
Respondents kept cost cutting, time saving and curb on corruption as the
other reasons for implementing e-governance.
7.4 The four key areas of e- governance were agricultural and land revenue
records, public-private partnership (PPP), transport /communication and
public utility services.
7.5 Technology is a big enabler in governance. It helps to serve people better
through greater access to information. Respondents felt that simplified
dissemination of important information is critical to governance. Thus,
the hypothesis e-governance is one of the potent contributing factor for
the development of India holds true.
7.6 The respondents felt that Gujarat is ahead of all other states in e-
governance. Maharashtra followed by Karnataka were rated higher than
other states which have accepted e-governance as the way forward.
VIII. Conclusions
The view of experts on e-governance too is that it provides better services.
Empowering people is a bye product of providing greater access to
information at the click of a button. It helps people participation in
government and opens new avenues for citizen dialogue. In turn, it
strengthens the social fabric.A strong view emerged that e-governance
impacts quality of life, Simplicity of operation helps in enhancing
efficiency. The expanded reach in governance helps in more responsive
and clinical execution of policies.
Governance is challenging in the vast diversity of cultures, languages and
ethnicity of India. The results indicate that greater co-ordination and
integration of policy initiatives, happens in e-governance. There is
roleclarity and evolution of one’s responsibility. Fixing the problem in
such situations becomes relatively easier.Greater citizen access to public
information, create efficiency in the long run. The multiplier effect on
efficiency makes the initial cost of installing system, procedures and
process insignificant. Developed countries and ASEAN nations have long
practiced this model and reaped sizable benefits. Another expert view was
151
that managing voluminous data in governance becomes mandatory as all
elements of the population need to be covered. The role of the
administrator expands. The pursuit of excellence in governance takes an
exponential upswing with accountability in the fore of every action.
IX. Suggestions
Governments and organization should walk the talk with commitment
toward simplified systems and procedures, transparency and efficiency. It
is a constant dialogue with people beneficiaries which cements
partnerships. In a large Indian population with a myriad of procedures
and laws, e-governance infrastructure and architecture has to be on solid
foundation. Funding should precede proper planning. Course correction,
if required, requires seamless processes and without administrative
delays. The different PESTEL environments should not be treated as
mutually exclusive; rather they could enhance performance by
complementing each other.
X. References
[1] Kotler, Philip (2013), Marketing Management, Pearson Publication, 13
Edition, Page 68-69
[2] Saxena, Rajan, Marketing Management, Tata McGraw-Hill, 4th
Edition, Page 59-68
[3] Fernando, A.C, Business Ethics, Pearson Education,Page144-146
[4] Baines, Paul, Sinha Piyush, Marketing Asian Edition, Oxford
University Press, 2013, Page 38-45
[5] National e-Governance Plan 2006, Report of Department of
Electronics and Information Technology.
[6] Malhotra, N& Dash, S (2011), Marketing Research, Pearson
Publication, 6th Edition, Page 27-28