Proceedings Asphalt Rubber 2009 Conference - Abacus.hr
504
Proceedings Asphalt Rubber 2009 Conference
-
Upload
khangminh22 -
Category
Documents
-
view
2 -
download
0
Transcript of Proceedings Asphalt Rubber 2009 Conference - Abacus.hr
Proceedings Asphalt Rubber 2009
Conference

This publication includes all the communications accepted for publication at the Asphalt Rubber 2009 Conference that took place in Nanjing, China, 2nd to 4th of November, 2009.
Nanjing, China, November 2009

Proceedings of theAsphalt Rubber 2009
Conference
Nanjing, China, November 2009
Edited by
Dr. Jorge B. SousaDr. Rongji Cao
Printed by: Beijing Kun Tai Shi Ji Printing Co., Ltd.
Cover Drawings: Fernanda Barros
Proceedings of the Asphalt Rubber 2009 Conference
Copyright © 2009 by Jorge B. Sousa and Rongji Cao
ISBN: 978-988-18681-1-4
All rights reserved. No part of this publication, whether whole or partial, may be reproduced or transmitted in any form or by any means, electronic or mechanical, including photocopying, recording or by any information storage or retrieval system, without prior permission in writing from the editors.

All reasonable efforts were taken to print the exact document sent by email from the authors. However, in some cases, minor changes had to be made to accommodate the proper format.
Organization Committee Local CommitteeDr. Jorge B. Sousa Director Prof. You QingzhongDr. Rongji Cao Deputy Director Dr. Qian GuochaoGeorge Way Prof. Chen XianghuiDr. Wu Chunying Prof. Chen XiaotongDoug Carlson Dr. Fu Guanhua
Executive Secretary Members Prof. Jin Ling
Catia Dantas Dr. Zhao MinProf. Pan WeiyuProf. Xia WeiProf. Wu ZanpingWang JunhuaXu ShenghuaZhu Xiaogan
Secretary General Prof. Jin LingVice-Secretary General Wang Junhua
Yang GuixinDr. Rongji Cao
Technical Committee
Prof. Guo Zhongyin ChinaProf. Alex Visser South AfricaDr. Jorge B. Sousa Portugal USADr. Shakir Shatnawi USAProf. Jorge Prozzi USAProf. Hussein Bahia USAProf. Jorge Pais PortugalProf. Marcio Muniz BrazilProf. Kamil Kaloush USAProf. Jun Yang ChinaProf. Juan Gallego SpainProf. Andrew Collop England

Prof. Hervé di Benedetto FranceDr. Ines Antunes ItalyDr. Lurdes Antunes PortugalProf. Yu Jia ChinaProf. Wangjiaqiang ChinaDr. Zhao Min ChinaProf. Xianming Kong ChinaDr. Cuihong Wang ChinaProf. Peiwen Hao ChinaProf. Tianqing Ling ChinaProf. Yiqiu Tan ChinaProf. Jinchuan Zhou ChinaProf. Junan Shen China
Hosted by
Rubber Pavements Association (RPA)Jiangsu Provincial Communications Department
Co-hosted by
Jiangsu Communication Holdings Company
Organized by
Jiangsu Highway and Transportation SocietyJiangsu Transportation Research Institute
Supported by
Jiangsu Provincial Transportation Engineering Construction BureauJiangsu Highway BureauNanjing Communication BureauUnited States Environmental Protection AgencyRecycled Tire Engineering and Research FoundationArizona State University

Synopsis
These Proceedings from the AR2009 Conference in Nanjing, China, summarized 50 years of research and experience in the use, performance, and properties of Asphalt-Rubber binders and provided much needed vital current and historical information on the product for engineers worldwide. This information has allowed engineers to successfully take advantage of this cost effective, durable and environmentally beneficial material. These proceedings from AR2009 will build on the earlier AR2000, AR2003 and AR2006 volumes through the latest research and experiences of routine and beginning users throughout the world.

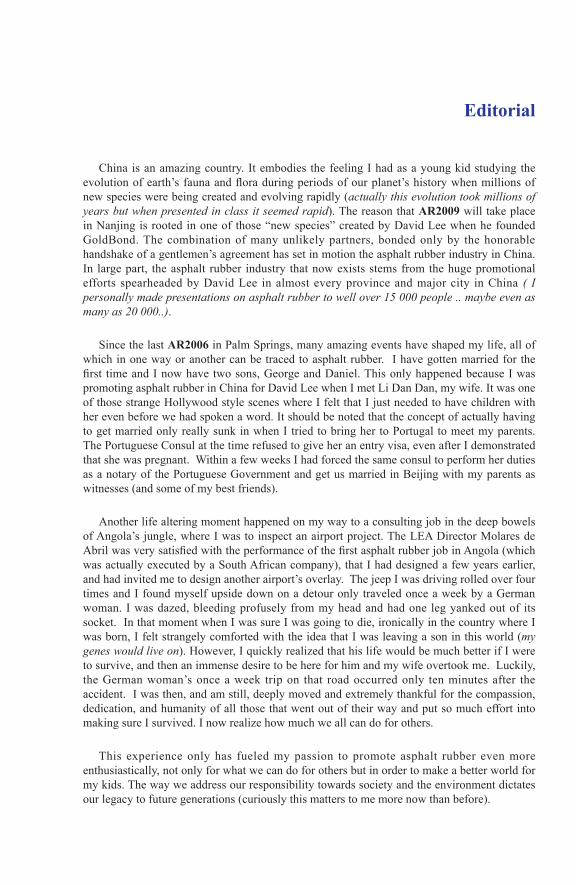
Editorial
China is an amazing country. It embodies the feeling I had as a young kid studying the evolution of earth’s fauna and flora during periods of our planet’s history when millions of new species were being created and evolving rapidly (actually this evolution took millions of years but when presented in class it seemed rapid). The reason that AR2009 will take place in Nanjing is rooted in one of those “new species” created by David Lee when he founded GoldBond. The combination of many unlikely partners, bonded only by the honorable handshake of a gentlemen’s agreement has set in motion the asphalt rubber industry in China. In large part, the asphalt rubber industry that now exists stems from the huge promotional efforts spearheaded by David Lee in almost every province and major city in China ( I personally made presentations on asphalt rubber to well over 15 000 people .. maybe even as many as 20 000..).
Since the last AR2006 in Palm Springs, many amazing events have shaped my life, all of which in one way or another can be traced to asphalt rubber. I have gotten married for the first time and I now have two sons, George and Daniel. This only happened because I was promoting asphalt rubber in China for David Lee when I met Li Dan Dan, my wife. It was one of those strange Hollywood style scenes where I felt that I just needed to have children with her even before we had spoken a word. It should be noted that the concept of actually having to get married only really sunk in when I tried to bring her to Portugal to meet my parents. The Portuguese Consul at the time refused to give her an entry visa, even after I demonstrated that she was pregnant. Within a few weeks I had forced the same consul to perform her duties as a notary of the Portuguese Government and get us married in Beijing with my parents as witnesses (and some of my best friends).
Another life altering moment happened on my way to a consulting job in the deep bowels of Angola’s jungle, where I was to inspect an airport project. The LEA Director Molares de Abril was very satisfied with the performance of the first asphalt rubber job in Angola (which was actually executed by a South African company), that I had designed a few years earlier, and had invited me to design another airport’s overlay. The jeep I was driving rolled over four times and I found myself upside down on a detour only traveled once a week by a German woman. I was dazed, bleeding profusely from my head and had one leg yanked out of its socket. In that moment when I was sure I was going to die, ironically in the country where I was born, I felt strangely comforted with the idea that I was leaving a son in this world (my genes would live on). However, I quickly realized that his life would be much better if I were to survive, and then an immense desire to be here for him and my wife overtook me. Luckily, the German woman’s once a week trip on that road occurred only ten minutes after the accident. I was then, and am still, deeply moved and extremely thankful for the compassion, dedication, and humanity of all those that went out of their way and put so much effort into making sure I survived. I now realize how much we all can do for others.
This experience only has fueled my passion to promote asphalt rubber even more enthusiastically, not only for what we can do for others but in order to make a better world for my kids. The way we address our responsibility towards society and the environment dictates our legacy to future generations (curiously this matters to me more now than before).

After it having been so amply, clearly and unequivocally demonstrated by Texas DOT Dale Rand that asphalt rubber overlays save lives, I have found myself having serious discussions with key members of highway network agencies. The simple fact that AR overlays saves lives and cost less is still not enough to sway them into full use on their networks. Powerful lobbying forces set in motion by those that stand to lose from superbly performing roads are still in the way of cleaner environments, more cost-effective pavement structures, and safer roads. Governments/People must step in and decide if they would rather have one more student in college for each mile of safer asphalt rubber road or bury the money mixed in more asphalt, more aggregate, more fuel consumption, more CO2 emissions and more pollution. The choice from any parent’s view point worldwide is obvious.
However, it is truly inspiring and motivating, when we are made aware of the phenomenal political savvy, intelligence, patience and dedication that the Brazilian DER-RJ has employed to win over some powerful lobbies and put into their standard specifications asphalt rubber products, without one single ton of asphalt rubber ever having been produced in Brazil. Actually I need to let you know a secret. The one truly responsible for all these efforts is Raphael Pinto. His father, as all good fathers do, involves his son in things that are dear to him, and at many meals had me explain to his son the advantages of AR. One day Raphael, who is a brilliant kid, saw an accident caused by the notorious lack of friction in Rio’s (and Brazil’s) roads after the first rains, and told the father that the accident was his fault because he was not using AR in the road networks under his care.
Also since AR2006, events have happened in the USA that will shape generations to come. Starting with the decision by the Supreme Court that CO2 is a pollutant, to the worldwide global recession we face, and lastly the election of the first mutt (in his own words) to the Presidency of the United States. Obama campaigned on a platform of hope and he made the world believe that we all can hope for something better. We can hope for better governments, we can have hope for better lives, and above all we can hope that we are smart enough to leave a better world for our children. I am absolutely sure that each one of you that is reading this Editorial has the power to directly or indirectly influence the application of AR in some road network, someplace in the world. I just hope that, for the sake of our children, you will use that power.
It has taken six years, since AR2003 in Brasilia, (an only a few years after Rafael spoke to his father) for AR specifications to be on the books in Rio de Janeiro. It has taken about eight years since AR2000 in Vilamoura, Portugal for standard specifications to start to be more widely accepted in Portugal, thanks to environmental forces (credit must be given to Camara Pestana for understanding the benefits and using AR specifications early on in his AEA road network). However, there are now in Portugal, as in other countries, some pundits clinging to the coat tails of AR performance to market their asphalt products that have only meager sprinklings of tire-recycled rubber.
It has to resonate positively that Jiangsu Province already has AR specifications even before AR2009 has happened in Nanjing. This can only be attributed to the vision, leadership and deep scientific knowledge of Dr. Qian Guochao, Deputy Director of the Jiangsu Provincial Communications Department, who has graciously provided the FORWARD for these Proceedings. Clearly the in-depth research conducted on asphalt rubber by the Jiangsu

Transportation Research Institute over the last few years made his task easier.
I am greatly honored that Dr. Rongji Cao agreed to be the Co-Chairman of this AR2009 conference and that we received the full support of the Jiangsu Transportation Research Institute , the Jiangsu Provincial Communications Department and the Ministry of Transport.
We, (my Co-Chairman and I) express our gratitude to Cátia Dantas for her efforts as the Conference Secretary who, even while pregnant with her first son Pedro, persistently managed to insure the timeliness of the review process. Since papers in the AR2009 are all peer reviewed, we plan to send a selected number of them for further consideration and publication in the International Journal of Road Materials and Pavement Design (IJRMPD). This creates the potential opportunity for some of AR2009’s high caliber papers to be included in future editions of IJRMPD. The IJRMPD has a blind peer review process for accepting papers, and has substantial international distribution. This could facilitate the dissemination of papers that would otherwise be confined to these proceedings and have somewhat limited distribution. Therefore, it should be understood that papers that are being presented at this conference may later be accepted for the peer review and modification process of the IJRMPD prior to their printing. For those papers accepted later for publication by the IJRMPD, their inclusion here in these Asphalt-Rubber 2009 Proceedings should be considered as pre-publication drafts.
I greatly appreciate the friendship and counseling I got from George Way and Dr. Shakir Shatnawi throughout the AR series of conferences as I cherish their opinions and insights. Sometimes I think I created these AR conferences just to have an excuse to interact with them.
The Rubber Pavement Association (RPA) must be recognized as a unique lighthouse in the sea of lobbying interests in the paving community. It is a group of dedicated experts that genuinely tries to promote asphalt rubber worldwide because they believe in its quality and in the benefits to society which stem from its usage. I have been very proud to serve on RPA’s Board of Directors as I respect and endorse the goals of the Association (however, taking an example from Raphael Pinto’s intervention, we could be more effective if RPA started a campaign of education for the young children of key people responsible for highway networks…).
The efforts of the Technical Committee should be known by all, authors and readers alike. The quality of the papers clearly stems from the authors but in many cases the reviewers offered excellent advice and suggestions which improved them. I personally feel highly honored that our reviewers chose to serve in that role for the AR2009 Proceedings.
I express my deepest appreciation to the authors that have provided us with so many excellent papers, some with a great deal of original work. Clearly, without these dedicated individuals, neither these Proceedings nor this conference would have been possible.
Jorge B. Sousa, Ph.D.Chairman


Foreword
In China, traffic volume and the transportation highway system of roads and bridges is currently in the period of rapid growth. Likewise, to support this rapid growth the transportation highway industry relies on a myriad of resources which include a large amount of land, coastlines, mines, building materials and other natural and manmade resources. In order to achieve a sustainable development of the rapidly growing transportation system, China must employ means and methods to resolve the problem of wisely using limited resources and meet environment constraints. Therefore, the Ministry of Transport made a series of major strategic decisions, such as building a resource-saving and environment-friendly, innovation-oriented transport industry, transiting transportation services from the traditional to the modern style, and developing the modern transportation industry.
Recycling of waste tires into asphalt-rubber is an innovative, environmentally friendly and resource saving means to effectively build modern highway pavements which provide ideal pavement performance. The widespread application of the asphalt-rubber reduces the number of waste tires, provides for energy conservation, environmental protection, and mitigates environmental pollution problem. As early as the 1980’s, developed countries in Europe and America had begun a large number of applications of asphalt- rubber. China, in recent years through a series of scientific research, has made considerable progress in asphalt rubber technology by means of appropriate industrialization methods and large-scale application.
At present, the total opening length of the Jiangsu province’s expressway have exceeded 3,700 kilometers with a density ranking first in the nation. In the past nearly 10 years, Jiangsu Province has solved the early damages of asphalt pavement and made fundamental progress in the road construction quality. Most newly-built pavements can be maintained with no rehabilitation in the first 10 years.
Jiangsu Provincial Communications Department attaches great importance to the applications of new technologies and materials in pavement. After years of researching, application and review, Jiangsu Department of Transportation forms a complete and innovative asphalt-rubber technology system including the selection of raw materials, production and construction technology. Asphalt-rubber has been successfully applied in Nanjing-Changzhou, Nanjing-Hangzhou Expressway and Highway S340 Provincial Highway and other projects. Therefore, domestic and international experts have noted these asphalt-rubber projects for their good quality.
AR2009 Conference will gather together the asphalt-rubber industry experts, academics, engineers and construction managers from many countries, and will discuss on the topics of all aspects of asphalt-rubber production, engineering application and production facilities etc. We hope that AR2009 will help to promote the pavement application of the asphalt-rubber technology and further contribute to energy-saving emission reduction and resource recycling in the world.
Nanjing is a famous cultural city with a long history, and is a charming and vibrant modern

city as well. I sincerely wish every participant a happy stay in Nanjing’s golden autumn and the AR2009 Conference a complete and great success!
Dr. Qian Guochao,Deputy Director Jiangsu Provincial Communications Department

Index
Chapter 1 Performance Evaluation and Design
Asphalt-Rubber 40 Years of Use in ArizonaA. Zareh, G. B. Way…………………………………………………………………25
Treatment Performance Capacity – A Tool to Predict the Effectiveness of Maintenance StrategiesJ. B. Sousa, G. Way, J. Pais ……………………………………………………… 47
Optimum Timing for Pavement Treatment ApplicationJ. B. Sousa, G. Way…………………………………………………………………73
Evaluation of New Generation of Gap Graded Asphalt Rubber MixturesR. Cao……………………………………………………………………………… 97
Research on Mix Design Method and Application of Asphalt Rubber Open-graded Friction CourseBai Q., Qian Z., Cao R. ……………………………………………………………109
Performance of California Rubberized Hot Mix Asphalt High Binder Open Graded MixesG. Way, K. Kaloush, G. Hicks , M. Stroup-Gardner, S. Shatnawi……………………119
Implementation of Asphalt-Rubber Mixes into the Mechanistic Empirical Pavement Design GuideM. C. Rodezno, K. E. Kaloush. …………………………………………………137
A Fracture Energy Approach to Model the Thermal Cracking Performance of Asphalt Rubber MixturesA. Zborowski, K. E. Kaloush. ……………………………………………………153

4 Years of Performance of A Test Track Using Crumb Rubber Asphalt And Other ModifiersG. Martínez, B. Caicedo, L. Celis, D. Gonzáles……………………………………171
Ref lec t ion Cracking and Permanent Deformat ion of Over lays wi th Recycled Tire Rubber and Polymer Modifiers Under HVS Loading P. Ullidtz, D. Jones, R. Wu, J. Harvey……………………………………189
Research on the low-temperature Cracking Resistance of Semi-flexible Pavement with Waste Rubber PowderS. Hu, Y. Yang, Q. Ding, C. Huang, S. Huang……………………………………209
Chapter 2 Mix Properties
Lab Simulation of Reflective Cracking By LoadYu B., Cao B., Yang J. …………………………………………………………… 223
Characterization of HMA Mixtures ontaining High Reclaimed Asphalt Pavement Content With Crumb Rubber AdditivesL. N. Mohammad, S. B. Cooper, Jr. ……………………………………………… 233
Evaluation of Alternative Laboratory Aging Methods of Asphalt Rubber Friction CoursesJ. X. Reed, K. P. Biligiri, K.E. Kaloush ……………………………………………255
Evaluating Permanent Deformation in Asphalt Rubber MixturesL. Fontes, G.Triches, J. Pais, P. Pereira …………………………………………269
Improvement of Moisture Damage of CRM-modified Asphalt Concretes in KoreaM. Ryu, J. C. Kim, H. H. Kim, Y. S. Doh, K. W. Kim …………………………… 285
The Production and Placement of Asphalt Rubber Hot Mix Using Warm Mix Asphalt TechnologyJ. V. Kirk, J. Reed, J. Reed…………………………………………………………291

Research on The Gradation of AR Mixtures Based On GTMLi Z., Song X., Zhou W., Tan Y.…………………………………………………… 303
Laboratory Assessment of Workability, Performance and Durability of Rubberised Asphalt MixturesI. Widyatmoko, R. Elliott, J. Grenfell, G. Airey, A. Collop, S. Waite …………317
Study of the Rutting in Asphalt Mixtures by Addition of RubberF.R.Lizcano, H.Rondón, A.S.Figueroa ……………………………………………… 329
Effect of Cryogenic and Ambient Crushed Rubber on the Mechanical Properties of Hot Mix AsphaltsS. Neto, M. Farias, J. C. Pais ……………………………………………………… 341
Influence of Digestion Time on the Mechanical Properties of Gap-graded Hot Mixes Produced with Asphalt Rubber BindersS. Neto, M. Farias, J. C. Pais ……………………………………………………… 355
Laboratory Performance of Asphalt Rubber MixturesL. Fontes, G.Trichês, J. Pais, P. Pereira, M. Minhoto……………………………369
Laboratory Evaluation of Asphalt Rubber Gap Graded Mixture in SwedenK. E. Kaloush, T. Nordgren, K. P. Biligiri, W. A. Zeiada, M. C. Rodezno, M. I. Souliman, J. Reed ………………………………………………………………… 387
Asphalt Rubber Mixtures Susceptibility to Moisture DamageK. E. Kaloush, A. Nadkarni, W. Zeiada, P. Burch, C. Dimitroplos……………………401
Testing Asphalt-rubber According to European Standards and its use in the Czech RepublicJ. Kudrna, O. Dašek……………………………………………………………… 415

Chapter 3 Binder Properties
Comparison of the Properties of Laboratory and Field-Prepared CRM BindersJ. Shen, S. Amirkhanian ……………………………………………………………437
Study on Hot Storage Stability of Reclaimed Rubber Modified AsphaltLi J., Zhu Y., Wang H. ,Wang S., Zhang Y., Zhang Y.………………………………449
Asphalt Rubber With Temporarily Decreased ViscosityS. Biro, A. Geiger,J. Kay ………………………………………………………… 461
Evaluation of Current Modified Asphalt Binders Using the Multiple Stress Creep Recovery TestC. Thodesen, S. Biro,J. Kay ……………………………………………………… 475
Fuel Resistance of Crumb Rubber Modified Asphalt BindersG. Polacco, F. Merusi, S. Filippi, D. Biondi, F.Giuliani ………………………… 493
Characteristics of Rubberised Bitumen BlendsI. Widyatmoko, R. Elliott, J. Grenfell, G. Airey, A. Collop, S. Waite …………………… 505
Mechanical properties of HMA mixes using crumb-rubber modified binders F. Pilati, A.Faxina, A. Furlan, G. Fabbri, A. Gigante……………………… 519
Fatigue-Related Properties of Crumb Rubber Modified Asphalt BindersF. Giuliani, F. Merusi, A. Montepara ………………………………………………541
Influence of the Bitumen Properties on the Functional and Rheological Behaviour of Asphalt Rubber BindersJ. Peralta, H. Silva, A. Machado, J. Pais……………………………………………555
Rheological Changes in Bitumen Caused by Aging and by the Interaction with RubberJ. Peralta, H. Silva, A. Machado, J. Pais……………………………………………579

Study on the Reduction of the Viscosity of Asphalt RubberCao P., Wang S., Li J. ……………………………………………………………603
Mechanism Research of Crumb Rubber Modified AsphaltZhang X., Xu C., Zhang Y. ……………………………………………………… 609
Chapter 4 Case Studies
The application of Semi-flexible Pavement with Asphalt -Rubber on Heavy Traffic RoadT. Ling , Wu D., Wei X., Z. Zhao, Chu H., Li C. …………………………………619
Asphalt Rubber - a New Concept for Asphalt Pavements in Sweden.T. Nordgren, L. Preinfalk ………………………………………………………… 633
The Use of Asphalt Rubber in a Motorway Section Pavement Rehabilitation in PortugalE. Fung, D. Baptista …………………………………………………………… 647
Crumb Rubber From Scrap Tyres For Use in Asphalt Pavements in the UKR. Hewson ………………………………………………………………………659
Chapter 5 Function, Environemental and other Aspects
Noise Characteristics and Field Performance of Five Different Wearing Courses in ArizonaD. Carlson, G. Way, A. Zareh, K. Kaloush, K. Biligiri ……………………………693
Asphalt-Rubber Open Graded Friction Course Reduces Noise-The Quiet Pavement ProgramA. Zareh, D. Carlson, G. Way……………………………………………………711
Development of Innovative Pavement Types to Reduce Traffic NoiseJ. Haberl …………………………………………………………………………725

Field Investigation of Tire/Pavement Noise and Durability for Asphalt Pavements with and without Asphalt Rubber Q. Lu, E. Kohler, A. Öngel, J. Harvey ……………………………………………737
Environmental, Energy Consumption and CO2 Aspects of Recycled Waste Tires Used in Asphalt-RubberJ. Sousa, G. Way, D. Carlson ……………………………………………………755
Promoting Asphalt Rubber Application through EducationD. Cheng, G. Hicks, A. Johnson, S. Shatnawi …………………………………… 767
Analysis of Environmental Sustainability in The Rehabilitation of Existing Pavements Using Asphalt Rubber Hot MixesI. Antunes, A. Murachelli …………………………………………………………777
Chapter 6 Evaluation and Design of Chip Seals
Asphalt Rubber Chip Seal Construction EvaluationJ. Rizzutto …………………………………………………………………………795
The Development of a Design Procedure and Usage Criteria for Hot Applied Chip Seal ApplicationsJ. Smith ……………………………………………………………………………813
Chapter 7 Terminal Blend Binders
Properties of HMA Mixtures Produced with Polymer-Modified and Tire Rubber-Modified Asphalt BindersP. Sebaaly, H. Sebaaly, E. Hajj…………………………………………………831
Pavement Monitoring Results After Seven Years of Using Crumb Rubber Modified Asphalt in BrazilR. Barros …………………………………………………………………………847
Studies on Adhesive Performance of Waste Crumb Rubber Modified Asphalt MixturesWu S., Han J ………………………………………………………………………865
Rheological and Engineering Properties of Rubberized Asphalt Concrete Mixtures Containing Warm Mix Asphalt AdditiveF. Xiao, S. N. Amirkhanian, C. Akisetty, W. Zhao…………………………………873
Stability Assesment Through Solubility and Rheological Measurements of Gtr-modified BitumenA. Pérez-Lepe, A. Páez …………………………………………………………885
Comparison Between Various Bituminous Binders Modified With Crumb Tyre RubberD. Lo Presti, N. Memon, G. Airey, J. Grenfell …………………………………903
Laboratory Performance Evaluation Of Gtr-modified Sma Mixtures With Fractionated RapW. Vavrik, S. Carpenter, S. Gillen, F. Garrott ……………………………………929
Steady Shear Properties of Crumb Rubber Modified BitumenB. Saha, S. Maheswari, P. Senthivel, N. Choudury and J. Krishnan………………941
Chapter 8 Invited papers on related aspects
Experimental Study on Strength Developing Law of Epoxy Asphalt Mixture during its Curing ReactionHuang W., Chen L., Qian Z ……………………………………………………… 955
Asphalt Rubber: policy disclosure in ItalyF. Canestrari, E. Pasquini, F. A. Santagata, I. Antunes …………………………… 967
De-icing Characteristics of Rubber Concrete PavementsF.Milani, H.B.Takallou.……………………………………………………………989


Performance Evaluation and Design 23
Chapter 1
Performance Evaluation and Design


Performance Evaluation and Design 25
Asphalt-Rubber 40 Years of Use in Arizona
Ali Zareh — George B. Way
Arizona Department of Transportation Recycle Tire Engineering and Research Foundation [email protected]@cox.net
ABSTRACT: Since 1969 the state of Arizona in the United States has used a unique asphalt binder called asphalt-rubber which contains a large percentage of crumb rubber from ground waste tires as an asphalt binder. This unique paving asphalt material consisting of approximately 20 percent ground waste tires and 80 percent paving grade asphalt is used to primarily reduce all types of cracking, including reflective cracking, thermal cracking, fatigue cracking and it is used as a crack and joint sealant. In addition since 1994 asphalt-rubber binder has been defined by an ASTM standard specification. Asphalt-rubber can be applied as a chip seal coat or in a hot mix. The asphalt-rubber chip seals and hot mixes have been used on state, city and county highways in Arizona to increase the pavement service life in a cost effective manner. This paper reports on the long term history and performance of asphalt-rubber with regard to reducing all forms of cracking, providing a surface with virtually no rutting, good skid resistance, little maintenance, smooth ride and less noise. Approximately 50 percent of the pavements in Arizona have an asphalt-rubber surface. In general, objective pavement performance measurements taken over a 40 year period all indicate that asphalt-rubber is a very good durable surface wearing course material that can be successfully applied in both cold and hot climates and used on both asphalt and concrete pavements. In addition approximately 50 million tires have been successfully recycled.
KEYWORDS: asphalt-rubber, crumb rubber, reflective cracking, benefits, performance
26 Asphalt-Rubber 2009
1. Foreword
This paper is a continuation and updating of the AR2006 paper (Zareh, 2006) that documented the history and use of asphalt-rubber (AR) in Arizona. The paper is similar to the previous paper but adds new material indicative of the continued use of AR. The paper is a summary paper and other Conference papers go into more detail in several areas touched upon in this paper. AR continues to be used in Arizona as a routine asphalt binder which is codified in various agency standards including the Arizona Department of Transportation 2008 Standard Specification (ADOT, 2008) and the Maricopa Association of Government standard specification (MAG, 2008).
2. What is Asphalt-rubber?
Asphalt-rubber (AR) is a mixture of hot asphalt and crumb rubber derived from waste or scrap tires. It is used extensively in the highway paving industry, particularly in the states of Arizona, California and Texas. It is a material that can be used to seal cracks and joints, be applied as a chip seal coat and added to hot mineral aggregate to make a unique asphalt paving material. The American Society of Testing and Materials (ASTM) defines AR as “a blend of asphalt cement, reclaimed tire rubber and certain additives, in which the rubber component is at least 15% by weight of the total blend and has reacted in the hot asphalt cement sufficiently to cause swelling of the rubber particles,” (ASTM, 2008). This definition was developed in the late 1990’s along with an ASTM specification for AR, D 6114 (ASTM, 1997).
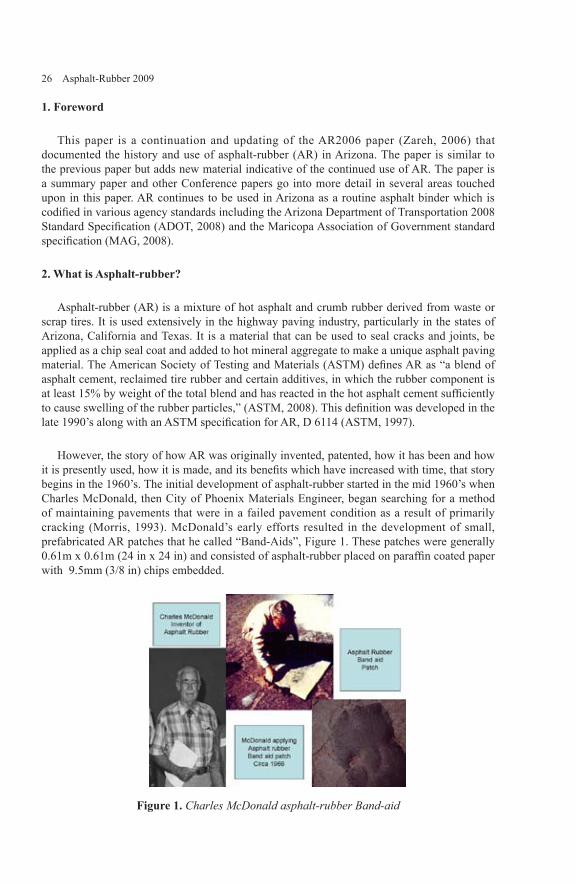
However, the story of how AR was originally invented, patented, how it has been and how it is presently used, how it is made, and its benefits which have increased with time, that story begins in the 1960’s. The initial development of asphalt-rubber started in the mid 1960’s when Charles McDonald, then City of Phoenix Materials Engineer, began searching for a method of maintaining pavements that were in a failed pavement condition as a result of primarily cracking (Morris, 1993). McDonald’s early efforts resulted in the development of small, prefabricated AR patches that he called “Band-Aids”, Figure 1. These patches were generally 0.61m x 0.61m (24 in x 24 in) and consisted of asphalt-rubber placed on paraffin coated paper with 9.5mm (3/8 in) chips embedded.
Figure 1. Charles McDonald asphalt-rubber Band-aid

Performance Evaluation and Design 27
3. Asphalt Rubber as a Slurry Material
Recognizing that fatigue cracking generally occurred in larger areas rather than small patches the concept was extended to full pavement sections by spreading the AR with slurry seal equipment, Figure 2, followed by aggregate application with standard chip spreaders (McDonald, 1981). This process had two distinct construction problems. First, in order to achieve the desired reaction of the asphalt and crumb rubber in the limited time available in the slurry equipment, it was necessary to employ asphalt temperatures of 232℃ (450°F) and higher. Second, the thickness of the membrane varied directly with the irregularity of the pavement surface. This resulted in excessive materials in areas such as wheel ruts and insufficient membrane thickness in between.
Figure 2. Asphalt-rubber applied as a slurry seal
4. Asphalt-Rubber as a Chip Seal Application
In 1971, technology had developed to the point that standard asphalt distributor trucks with appropriate continuous mixing capability were employed to apply a uniform thickness of binder to the pavement Figure 3. Although problems with distribution and segregation of materials were encountered on the early projects, these were recognized as primarily equipment limitations. Within the next few years equipment was developed with pumping, metering and agitation capabilities needed to handle the highly viscous AR materials.
Following the development of suitable equipment to spray apply AR Charles McDonald and his colleagues in the development of this material were granted a patent in 1975. This patented process is described as the McDonald Process or Wet Process for making AR. It should be noted that AR patents ended in 1992. As noted earlier the Arizona Department of Transportation (ADOT) monitored the development of AR and placed a band aid type maintenance application of AR in 1964. In 1968, experience from trial and error and the burning of a couple of distributor boot trucks lead to improvements in mixing to a satisfactory degree that AR could be safely and consistently placed with a distributor truck by using a diluent (kerosene). From 1968 - 1972, ADOT placed AR on six projects that were slated for

28 Asphalt-Rubber 2009
reconstruction. The cracking on these projects was generally typical of a failed pavement needing at least a six inch overlay or complete reconstruction, Figure 4.
Figure 3. Asphalt-rubber chip seal
Figure 4. Asphalt-rubber chip seal applied to badly cracked pavement, circa 1972
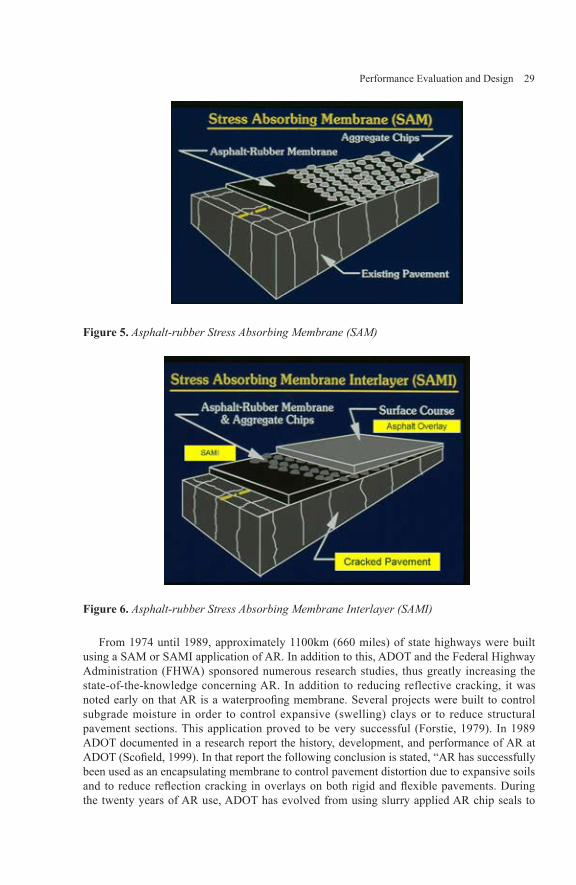
For these seal coat type application projects a boot truck distributor was used to apply the AR. In these early applications the ground tire rubber was introduced into the top of the boot truck and mixed by rocking the truck forward and backward. Even with this rather primitive early technology it was possible to construct the first full scale ADOT field experiment in 1972 using AR as a seal coat or Stress Absorbing Membrane (SAM), as well as an interlayer under a hot mix asphalt (HMA) surfacing. The interlayer application is typically referred to as a Stress Absorbing Membrane Interlayer (SAMI), Figure 5 and 6. Both the SAM and SAMI applications showed great promise in reducing reflective cracking (Way, 1979).
Performance Evaluation and Design 29
Figure 5. Asphalt-rubber Stress Absorbing Membrane (SAM)
Figure 6. Asphalt-rubber Stress Absorbing Membrane Interlayer (SAMI)
From 1974 until 1989, approximately 1100km (660 miles) of state highways were built using a SAM or SAMI application of AR. In addition to this, ADOT and the Federal Highway Administration (FHWA) sponsored numerous research studies, thus greatly increasing the state-of-the-knowledge concerning AR. In addition to reducing reflective cracking, it was noted early on that AR is a waterproofing membrane. Several projects were built to control subgrade moisture in order to control expansive (swelling) clays or to reduce structural pavement sections. This application proved to be very successful (Forstie, 1979). In 1989 ADOT documented in a research report the history, development, and performance of AR at ADOT (Scofield, 1999). In that report the following conclusion is stated, “AR has successfully been used as an encapsulating membrane to control pavement distortion due to expansive soils and to reduce reflection cracking in overlays on both rigid and flexible pavements. During the twenty years of AR use, ADOT has evolved from using slurry applied AR chip seals to
30 Asphalt-Rubber 2009
utilizing reacted AR as a binder in open and gap graded asphalt concrete.” He noted that AR could be used as a binder for HMA. Concurrent with this conclusion, it became evident that AR as a binder could provide a HMA suitable for addressing cracked pavements.
5. Asphalt-rubber in Hot Mix Applications
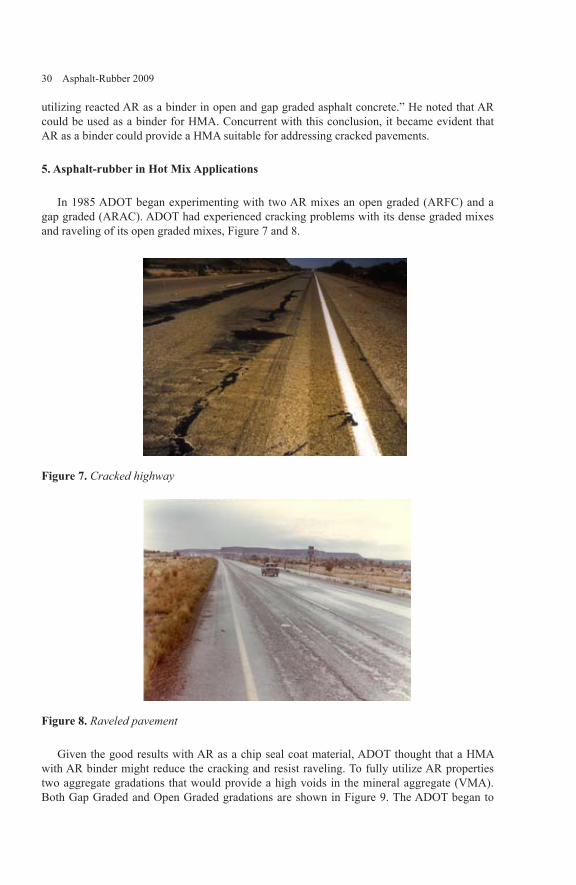
In 1985 ADOT began experimenting with two AR mixes an open graded (ARFC) and a gap graded (ARAC). ADOT had experienced cracking problems with its dense graded mixes and raveling of its open graded mixes, Figure 7 and 8.
Figure 7. Cracked highway
Figure 8. Raveled pavement
Given the good results with AR as a chip seal coat material, ADOT thought that a HMA with AR binder might reduce the cracking and resist raveling. To fully utilize AR properties two aggregate gradations that would provide a high voids in the mineral aggregate (VMA). Both Gap Graded and Open Graded gradations are shown in Figure 9. The ADOT began to
Performance Evaluation and Design 31
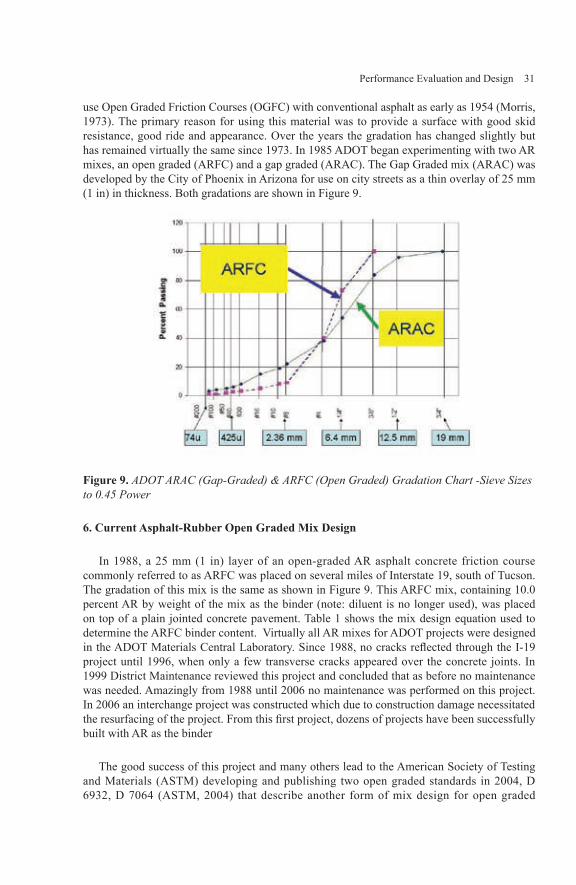
use Open Graded Friction Courses (OGFC) with conventional asphalt as early as 1954 (Morris, 1973). The primary reason for using this material was to provide a surface with good skid resistance, good ride and appearance. Over the years the gradation has changed slightly but has remained virtually the same since 1973. In 1985 ADOT began experimenting with two AR mixes, an open graded (ARFC) and a gap graded (ARAC). The Gap Graded mix (ARAC) was developed by the City of Phoenix in Arizona for use on city streets as a thin overlay of 25 mm (1 in) in thickness. Both gradations are shown in Figure 9.
Figure 9. ADOT ARAC (Gap-Graded) & ARFC (Open Graded) Gradation Chart -Sieve Sizes to 0.45 Power
6. Current Asphalt-Rubber Open Graded Mix Design
In 1988, a 25 mm (1 in) layer of an open-graded AR asphalt concrete friction course commonly referred to as ARFC was placed on several miles of Interstate 19, south of Tucson. The gradation of this mix is the same as shown in Figure 9. This ARFC mix, containing 10.0 percent AR by weight of the mix as the binder (note: diluent is no longer used), was placed on top of a plain jointed concrete pavement. Table 1 shows the mix design equation used to determine the ARFC binder content. Virtually all AR mixes for ADOT projects were designed in the ADOT Materials Central Laboratory. Since 1988, no cracks reflected through the I-19 project until 1996, when only a few transverse cracks appeared over the concrete joints. In 1999 District Maintenance reviewed this project and concluded that as before no maintenance was needed. Amazingly from 1988 until 2006 no maintenance was performed on this project. In 2006 an interchange project was constructed which due to construction damage necessitated the resurfacing of the project. From this first project, dozens of projects have been successfully built with AR as the binder
The good success of this project and many others lead to the American Society of Testing and Materials (ASTM) developing and publishing two open graded standards in 2004, D 6932, D 7064 (ASTM, 2004) that describe another form of mix design for open graded

32 Asphalt-Rubber 2009
mixes including those using asphalt-rubber and guidelines for the construction of such open graded mixes. ADOT AR open graded mixes substantially conform to the ASTM open graded standards.
Table 1. Asphalt-rubber open graded binder content
The AR contains 20 percent ground tire crumb rubber by weight of the asphalt content and is commonly referred to as the Arizona AR binder. These projects were built with the expressed purpose of controlling reflective cracks with a very thin layer of very elastic material. To date, all projects have performed as expected. As a further extension of this work, a structural overlay called a gap graded ARAC was designed and built in 1990 on Interstate 40 near Flagstaff, using AR as the asphalt concrete binder (Way, 1991 and Way 2000). This project also contained numerous Strategic Highway Research Program (SHRP) test sections as well as ADOT test sections. The purpose of the project was to overlay a severely cracked and failed concrete pavement. With the completion test section experiment in 2001 the AR sections built as the top portion (overlay top 50 mm (2 in) ARAC, with a 12.5 mm (0.50 in) ARFC) have the least percentage of reflective cracks. Indeed the percent cracking of the AR section is less than one third of the 100 mm (4 in) conventional HMA dense graded overlay and less than one half the 200 mm (8 in) conventional HMA dense graded overlay.
7. Asphalt-rubber Open Graded Construction
Construction of an AR pavement involves first mixing and then fully reacting the crumb rubber as required by specification. Typically 20 percent ground tire rubber that meets the gradation shown in Table 2 is added to a hot base asphalt heated to a temperature of about 190℃ (375°F) and mixed for at least one hour. After reaction the AR mixture is kept at a temperature of about 175℃ (350°F) until it is introduced into the mixing plant. Samples of the rubber, base asphalt, and AR mixture are taken and tested accordingly. The ARFC which typically has one percent lime added to the mix is placed with a conventional laydown machine and immediately rolled with a steel wheel roller. In the past on rare occasions a small amount of sand, 1 kg/m2 (two pounds per square yard) was specified in case it was needed as a release agent. Presently lime water is used on rare occasions (high temperatures) in place of sand to reduce pickup from tires. Generally one bag of lime is added to a water truck and sprayed on the pavement.
binder content % = ((.38) (w)+8.6))
C620.2
W = % WATER ABSORPTION of Aggregate (Note value cannot be greater than 2.5%)C = COMBINED Oven Dry SPECIFIC GRAVITY of Aggregate(Note value must be between 2.35
and 2.85)
Example
((.38(1.10) + 8.6))
65.2620.2 = 8.92
Performance Evaluation and Design 33
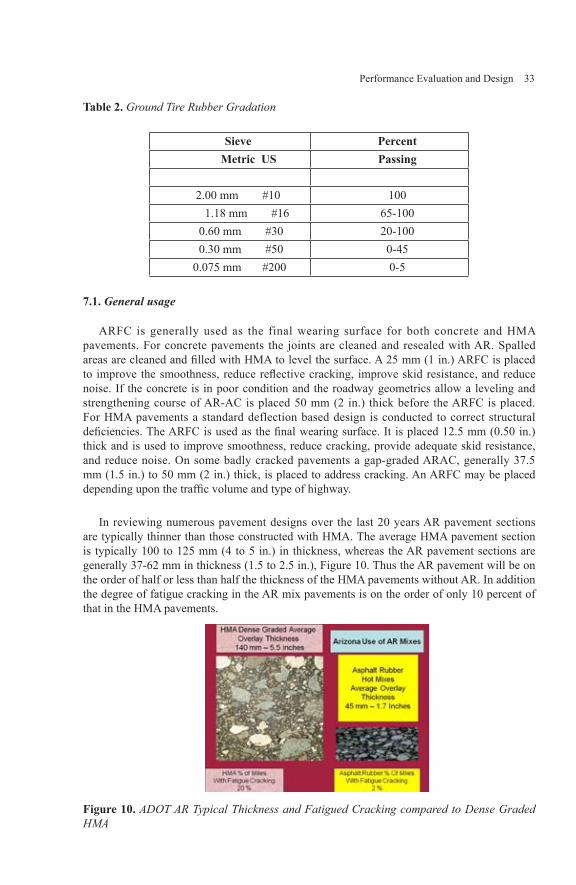
Table 2. Ground Tire Rubber Gradation
Sieve Percent Metric US Passing
2.00 mm #10 100 1.18 mm #16 65-100 0.60 mm #30 20-100 0.30 mm #50 0-45 0.075 mm #200 0-5
7.1. General usage
ARFC is generally used as the final wearing surface for both concrete and HMA pavements. For concrete pavements the joints are cleaned and resealed with AR. Spalled areas are cleaned and filled with HMA to level the surface. A 25 mm (1 in.) ARFC is placed to improve the smoothness, reduce reflective cracking, improve skid resistance, and reduce noise. If the concrete is in poor condition and the roadway geometrics allow a leveling and strengthening course of AR-AC is placed 50 mm (2 in.) thick before the ARFC is placed. For HMA pavements a standard deflection based design is conducted to correct structural deficiencies. The ARFC is used as the final wearing surface. It is placed 12.5 mm (0.50 in.) thick and is used to improve smoothness, reduce cracking, provide adequate skid resistance, and reduce noise. On some badly cracked pavements a gap-graded ARAC, generally 37.5 mm (1.5 in.) to 50 mm (2 in.) thick, is placed to address cracking. An ARFC may be placed depending upon the traffic volume and type of highway.
In reviewing numerous pavement designs over the last 20 years AR pavement sections are typically thinner than those constructed with HMA. The average HMA pavement section is typically 100 to 125 mm (4 to 5 in.) in thickness, whereas the AR pavement sections are generally 37-62 mm in thickness (1.5 to 2.5 in.), Figure 10. Thus the AR pavement will be on the order of half or less than half the thickness of the HMA pavements without AR. In addition the degree of fatigue cracking in the AR mix pavements is on the order of only 10 percent of that in the HMA pavements.
Figure 10. ADOT AR Typical Thickness and Fatigued Cracking compared to Dense Graded HMA
34 Asphalt-Rubber 2009
7.2. Cost
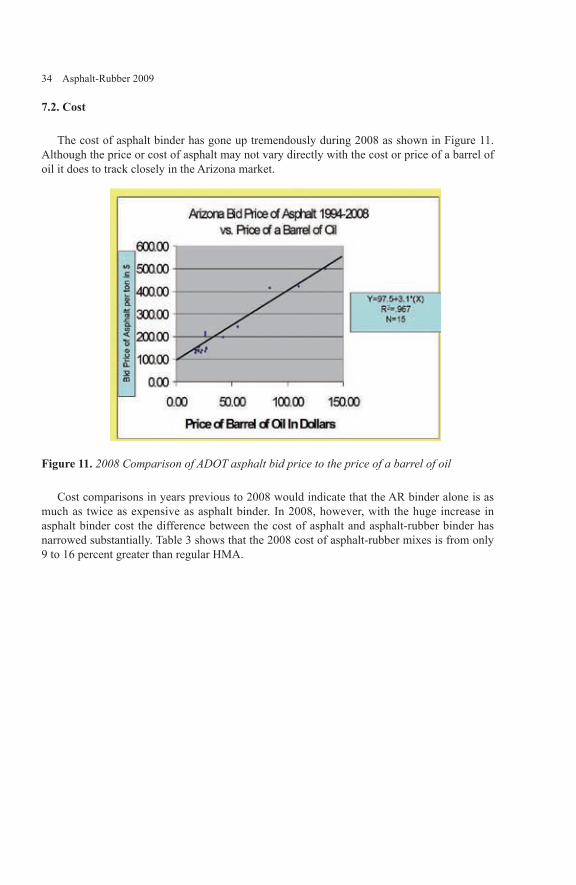
The cost of asphalt binder has gone up tremendously during 2008 as shown in Figure 11. Although the price or cost of asphalt may not vary directly with the cost or price of a barrel of oil it does to track closely in the Arizona market.
Figure 11. 2008 Comparison of ADOT asphalt bid price to the price of a barrel of oil
Cost comparisons in years previous to 2008 would indicate that the AR binder alone is as much as twice as expensive as asphalt binder. In 2008, however, with the huge increase in asphalt binder cost the difference between the cost of asphalt and asphalt-rubber binder has narrowed substantially. Table 3 shows that the 2008 cost of asphalt-rubber mixes is from only 9 to 16 percent greater than regular HMA.

Performance Evaluation and Design 35
Table 3. Asphalt-Rubber Mix Bid Prices 2008
Total Mix Costs in Dollars, June 2008Mix Bid Price per
TonCost perSquare Yd/Inch
Cost perSquareMeter/25 mm
HMADense
$79 $4.30 $4.66
ARACGap
$94 (+16%) $5.00 (+16%) $5.42 (+16%)
ACFCOpen
$75 $3.43 $3.72
ARFCOpen
$82 (+9%) $3.75 (+9%) $4.05 (+9%)
Given this change in the cost structure it is easy to observe that asphalt-rubber mixes are presently very attractive in cost when particularly examined in light of actual usage. On the I-19 project, only a 25 mm (1 in.) ARFC was placed at a cost of about $2.45 per square meter. The comparable repair strategy is to grind the concrete, which costs about $5.00 dollars per square meter, thus the AR mix was actually less expensive to construct. The ARFC continues to provide a smooth riding, virtually crack free, good skid resistant, quiet and virtually maintenance free surface for a period as long as seventeen years. Similarly, the ARAC, ARFC project on the I-40 Flagstaff cost about ten dollars per square meter including the cost of the cracking and seating. The adjacent reconstruction project was built at a cost of about $25 per square meter for the paving alone. When all other costs including detours are included the cost for reconstruction is about $45 per square meter. In addition, the 16 km (10 mile) AR overlay project was built in four months, whereas the adjacent 8 km (5 mile) reconstruction project took two years to build. Also, the reconstruction project was overlaid with AR after ten years of service due to excessive cracking and rough ride. The AR overlay project built in 1990 as of today, ten years after construction, still has virtually no cracking. It should be noted that the Flagstaff projects are located at about 2134 m (7000 feet) elevation. Typical rainfall is about 625 mm (25 in.) per year with an average annual snowfall of about 2250 mm (90 inches) per year. The coldest temperature recorded since construction on this project has been – 32℃ (-25°F). The use of AR on this I-40 project alone conservatively saved at least $18 million dollars and about four years of construction traffic disruption. Attached pictures of I-40 before overlay (Illustration 1) and pictures taken in November 1997 (Illustration 2), clearly show the long term benefit of the use of AR on this project. In 1998 additional comparative photos were taken from a higher vantage point, and also clearly show the reduction in reflective cracking due to AR (Illustration 3).

36 Asphalt-Rubber 2009
Illustration 1. Interstate 40 concrete pavement before overlay with asphalt-rubber mixes
Illustration 2. Interstate 40 concrete pavement seven years after overlay with asphalt-rubber mixes

Performance Evaluation and Design 37
Illustration 3. Interstate 40 concrete pavement nine years after overlay with 100 mm (4 in.) of HMA and cracked (left side) and 50 mm (2 in.) of asphalt-rubber gap graded mix after nine years and virtually no cracks (right side)
38 Asphalt-Rubber 2009
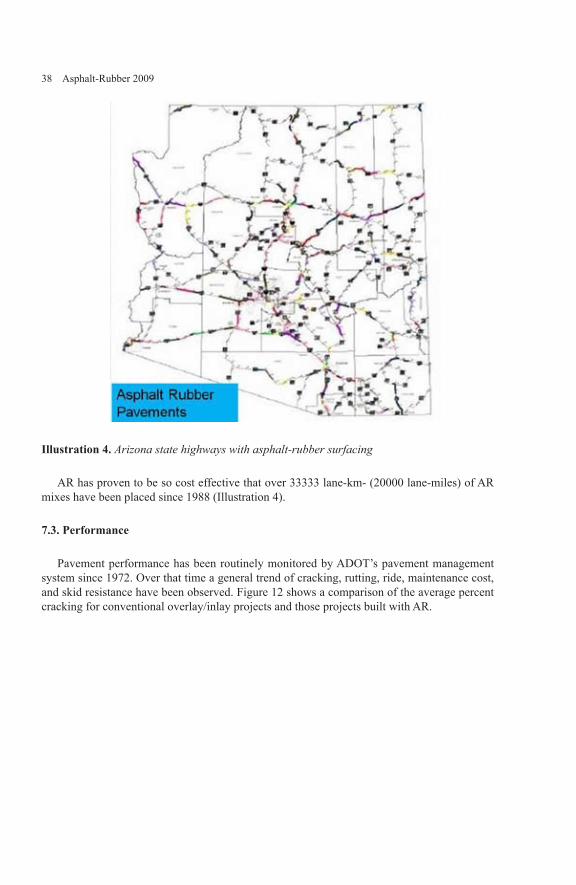
Illustration 4. Arizona state highways with asphalt-rubber surfacing
AR has proven to be so cost effective that over 33333 lane-km- (20000 lane-miles) of AR mixes have been placed since 1988 (Illustration 4).
7.3. Performance
Pavement performance has been routinely monitored by ADOT’s pavement management system since 1972. Over that time a general trend of cracking, rutting, ride, maintenance cost, and skid resistance have been observed. Figure 12 shows a comparison of the average percent cracking for conventional overlay/inlay projects and those projects built with AR.

Performance Evaluation and Design 39
Figure 12. Percent cracking versus years of service for HMA and asphalt-rubber pavements
AR has reduced the amount of reflective cracking as expected and designed for. A value of ten percent cracking is considered as fatigue cracking, therefore virtually no fatigue cracking has been seen in the AR rubber projects.
Figure 13 shows the average rutting performance, which has been surprisingly better than expected. This could be due to less cracking as well as the use of a very stable stone structure in the ARFC. Rut depths below 6 mm (0.25 in.) are considered low and not of any major concern. Even projects placed on very heavy truck traffic interstate highways, have shown very little rutting. The reduction of “rut depth” on the conventional mixes after the 12th year is due to the fact that the average is measured based only on the surviving pavements. Many pavements at that time are overlaid only the very good pavements remain. This obviously causes the data to be skewed. Figure 14 shows the average smoothness over time. AR has performed a little better than expected, again perhaps due to less cracking and attendant maintenance. Smoothness values below 1415 mm/km (93 in per mile) are considered satisfactory and not in need of any correction. ARFC is typically used as the final pavement surface and has produced some of the smoothness riding surfaces as measured as part of ADOT’s smoothness specification.

40 Asphalt-Rubber 2009
Figure 13. Rut depth in mm versus years of service for HMA and asphalt-rubber pavements
Figure 14. Pavement smoothness in mm/km versus years of service for HMA and asphalt-rubber pavements
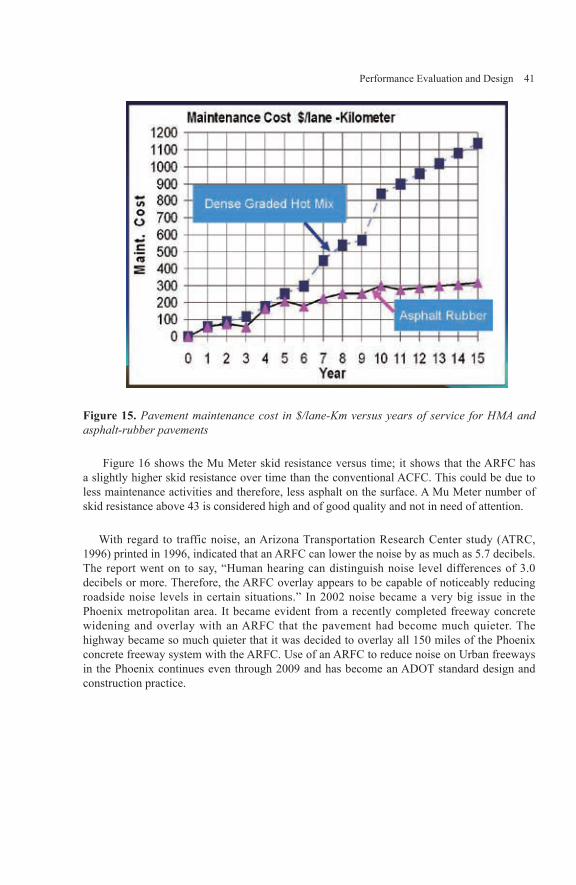
Figure 15 shows the average maintenance cost versus time; again, AR has performed better as expected due to less cracking and less rutting. A value of $400 per lane kilometer ($666 dollars of maintenance cost per lane mile) per year is considered high and worthy of attention. Projects with AR typically need much less maintenance and rarely exceed the $400 threshold even after ten years of service.
Performance Evaluation and Design 41
Figure 15. Pavement maintenance cost in $/lane-Km versus years of service for HMA and asphalt-rubber pavements
Figure 16 shows the Mu Meter skid resistance versus time; it shows that the ARFC has a slightly higher skid resistance over time than the conventional ACFC. This could be due to less maintenance activities and therefore, less asphalt on the surface. A Mu Meter number of skid resistance above 43 is considered high and of good quality and not in need of attention.
With regard to traffic noise, an Arizona Transportation Research Center study (ATRC, 1996) printed in 1996, indicated that an ARFC can lower the noise by as much as 5.7 decibels. The report went on to say, “Human hearing can distinguish noise level differences of 3.0 decibels or more. Therefore, the ARFC overlay appears to be capable of noticeably reducing roadside noise levels in certain situations.” In 2002 noise became a very big issue in the Phoenix metropolitan area. It became evident from a recently completed freeway concrete widening and overlay with an ARFC that the pavement had become much quieter. The highway became so much quieter that it was decided to overlay all 150 miles of the Phoenix concrete freeway system with the ARFC. Use of an ARFC to reduce noise on Urban freeways in the Phoenix continues even through 2009 and has become an ADOT standard design and construction practice.

42 Asphalt-Rubber 2009
Figure 16. Pavement Mu Meter test values for skid resistance versus years of service for HMA and asphalt-rubber pavements
In general, objective pavement performance measurements taken over time all indicate that AR is a very good durable surface wearing course material. Over twenty years of excellent service and cost effectiveness has been documented to date with little sign of change in the near future.
8. Recycling of AR mix
AR hot mixes over the years have been recycled in several states with various levels of performance. ADOT has used AR since the late 1960’s but had not recycled any of the mixes until 2006. In 2006 the ADOT constructed a pavement rehabilitation project in the Tucson area on Interstate 19 (Zareh, 2005) which included the recycling of an ARFC and a hot in-place recycle. The existing ARFC was constructed in 1988 and consisted of a 25 mm layer (1 in.) placed on top a concrete pavement. The ARFC had served satisfactorily for 18 years, however recent construction in the vicinity of the ARFC had caused some deterioration and the re-stripping of the highway had left the ride somewhat unsatisfactory. It was decided to mill off most of the ARFC and replace it and to use the millings in another open graded mix to be placed on an adjoining frontage road. The recycle mix consists of approximately 75 percent virgin open graded aggregate and 25 percent ARFC millings. To this recycle blended aggregate mix was added 6.5 percent Performance Graded binder, PG 76-22 TR+, which contains a minimum of 8 percent ground tire rubber and a minimum of 2 percent styrene-

Performance Evaluation and Design 43
butadiene-styrene (SBS) polymer. In addition to this hot plant mixed recycle AR open graded mix an in-place hot recycle mix was also constructed on Interstate 19. The in-place hot recycle consisted of heating the in-place ARFC and scarifying it and then adding a polymerized high float emulsified asphalt at a rate of about 0.6 liters/square meter (0.15 gallons per square yard). Both AR recycling test sections were reviewed in 2007. The frontage road hot plant recycled AR open graded mix is performing satisfactorily with some small amount of cracking. The hot in-place ARFC on I-19 is still in place, however all the concrete joints have reflected and some joint/crack deterioration is occurring and is somewhat rough riding, Figure 17. This test I-19 project showed that an AR-ACFC can be recycled and that the hot plant recycling is preferable. The test sections will be monitored and reported on in future years.
Figure 17. Recycled ARFC pavement
9. Summary and conclusion
In general, ADOT is using AR as a binder in HMA mixes to reduce reflection cracking, improve durability of surface courses, and in urban areas to reduce noise. By using asphalt-rubber as a binder the film thickness is increased to a value of 19 - 36 micrometer compared to the typical dense-graded HMA film thickness of about 9 micrometer.
The grade of asphalt binder used as a base to make AR is a PG58-22 (AC-10), in contrast to typically stiffer grade of PG 64-16 (AC-20) used in the mountains. In the desert the AR base asphalt grade is PG 64-16 (AC-20) compared to PG 70-10 (AC-40) typically used for dense grade mixes. The 20 percent ground tire crumb rubber particles change the AR temperature susceptibility such, that at high temperatures, the AR is much more viscous than the neat asphalt. However, at cold temperatures, the AR acts like an AC-10 asphalt. SHRP asphalt binder tests indicate that AR can be graded from a PG 70-22 to a PG 82-28, which is indicative of a low temperature susceptible asphalt binder.

44 Asphalt-Rubber 2009
Typically, the AR mixes are 12.5 mm (0.50 in) to 25 mm (1 in) in thickness when open-graded and 25 mm (1 in) to 50 mm (2 in) thick when gap-graded. For Arizona’s climate and materials, AR provides an excellent durable wearing course. AR has proven to be so cost effective that over 33333 lane-km- (20000 lane-miles) of AR mixes have been placed since 1988 (Illustration 4). As an extra benefit, the ground tire crumb rubber from over fifty million tires has been recycled into these in service projects.
The story of AR began on or about the year 1965 with the simple goal of developing a maintenance patching material to hold old crack pavements long enough to allow for the future overlaying or reconstruction of the pavement. In the intervening over 40 years its use has grown an expanded into a myriad of areas and now is a routine paving material in Arizona, California and Texas. Additional useful AR reference material can be found at the Rubber Pavements Association website (RPA, 2006) as well as in the proceedings of three International Asphalt Rubber Conferences (Sousa, 2000, Sousa, 2003, Sousa 2006). Useful products from adding crumb rubber to pavements will continue to be developed because pavements that last longer and need less maintenance will always be in demand.
10. Bibliography
ADOT, Arizona Department of Transportation Standard Specifications for Road and Bridge Construction, 2008.
ASTM International Annual Book of Standards, D 8 Definition, Volume 04.03, 2008.
ASTM International Annual Book of Standards, D 6114-97, Standard Specification for Materials for Asphalt-Rubber Binder, Volume 04-03, 2008.
ASTM International Annual Book of Standards, D 6932-04, Standard Guide for Materials and Construction of Open-Graded Friction Course Plant Mixtures, Volume 04-03, 2008.
ASTM International Annual Book of Standards, D 7064-04, Standard Practice for Open-Graded Friction Course (OGFC) Mix Design, Volume 04-03, 2008.
ATRC, Asphalt Rubber Friction Course Reduces Traffic Noise, ADOT Research Notes, August 1996.
Forstie, D., Walsh, H, and Way, G.B., “Membrane Technique for Control of Expansive Clays”, Transportation Research Record Number 705, 1979. pp. 49-53.
Maricopa Association of Government (MAG) Uniform Standard Specifications for Public WorksConstruction, 1998 including 2007 revisions. www.mag.maricopa.gov
McDonald, C.H., “Recollections of Early Asphalt-Rubber History”, National Seminar on Asphalt-Rubber, October 1981.
Performance Evaluation and Design 45
Morris, G.R. and Scott, N.R., “Arizona’s Experience with Asphalt Concrete Friction Courses”,59th Annual Meeting AASHTO, Los Angeles, California, November 1973.
Morris, G. R., “True Cost Effectiveness of Asphalt-RubberPaving Systems”, Use of Waste Materials in Hot-Mix Asphalt. ASTM STP1193, H. Fred Waller, Ed., American Society for Testing and Materials, Philadelphia, 1993.
RPA, Rubber Pavements Association, Website, www.rubberpavements.org, Tempe, Arizona, 2006.
Scofield, L. A., “The History, Development, and Performance of Asphalt Rubber at ADOT”,Report Number AZ-SP-8902, ADOT, December 1989.
Sousa, J., Proceedings AR2000 International Conference on Asphalt Rubber, Villamora, Portugal, IBSN: 972-95240-9-2, 2000.
Sousa, J., Proceedings AR2003 International Conference on Asphalt Rubber, Brazilia, Brazil,IBSN: 85-903997-1-0, 2003.
Sousa, J., Proceedings AR2006 International Conference on Asphalt Rubber, Palm Springs, California, IBSN: 962-405-091-0, 2006.
Way, G. B., “Prevention of Reflective Cracking Minnetonka-East”, Report Number 1979GWI,Arizona Department of Transportation, August 1979.
Way, G. B., “Flagstaff I-40 Overlay Project”, 4R Conference & Road Show, Cincinnati, OhioDecember 1991.
Way, G. B., “Flagstaff I-40 Asphalt Rubber Overlay Project Nine Years of Success”, TRB 78th
Annual Meeting, Washington D.C., January, 2000.
Way, G. B., “Asphalt Rubber-Research and Development, 35 Years of Progress andControversy”, ETRA Annual Meeting, Brussels, Belgium, March, 2000.
Zareh, A. and G. B. Way, “35 Years of Asphalt-Rubber Use in Arizona”, AR2006 Proceedings,Palm Springs, California, October 25th, 2006.
Zareh, A., “ADOT MATERIALS DESIGN REPORT, NOGALES - TUCSON HWY (I-19)19 PM 59 H659501C, I 019-A-511, Final Report”, ADOT, Phoenix, Arizona, November 23, 2005.


Performance Evaluation and Design 47
Treatment Performance Capacity – A Tool to Predict the Effectiveness of Maintenance Strategies
Jorge B. Sousa — George Way — Jorge Pais
Consulpav Consulpav University of Minho, Portugal
[email protected]@[email protected]
ABSTRACT. The California Department of Transportation (Caltrans) employs a variety of pavement preservation treatments to maintain and preserve their network of paved highways. In this work a model was developed to relate asphalt treatment life in terms of Treatment Performance Capacity (TPC), pavement condition, traffic level and location temperatures for all asphalt based treatments. This model is able to provide estimates of the performance of 23 treatments, in three climatic zones, three pavement conditions levels and three traffic magnitudes. Using the TPC values for each treatment and the price of each treatment, the cost effectiveness for all treatments was developed. The results indicate that there are huge differences in values between treatments currently used in California and that there appears to exist a great opportunity for Caltrans to optimize (i.e. minimize) its annual budget by applying only treatments with highest cost-effectiveness at the correct time.

48 Asphalt-Rubber 2009
1. Introduction
The California Department of Transportation (Caltrans) employs a variety of pavement preservation (preventive maintenance or corrective maintenance) treatments to maintain and preserve their network of paved highways as shown in Figure 1 (Caltrans, 2003). The primary purpose of the proactive pavement preservation program is to delay the need for costly pavement rehabilitation or reconstruction.
Figure 1. Pavement Condition vs. Life and Type of Work Required
The purpose of this paper is to estimate, in a rational manner, the pavement treatment life. In addition, this approach can help establish the cost effectiveness of pavement preservation treatments and information on treatment lives.
This paper is based on the reports produced by Sousa and Way (Sousa, 2007) and Sousa (Sousa, 2009) and it was based on subjective data developed by the California Pavement Preservation Task Group (PPTG) and data and numerous studies conducted in Arizona (Kaloush, 2002), (Way, 1976), (Way, 1979), (Way ,1980), and (Zborowski and Kaloush,2006).
Table 1 shows the treatments that were considered for this study. All the treatments involve the use of asphalt based materials and may be applied very thin like a fog or rejuvenating seal or as thick as a one inch HMA surfacing.
Furthermore, new tables representing the expected life of treatments in each of the major climate zones in California are included in this report. It was recognized that heavy traffic affects treatment lives more than light traffic. The proposed tables reflect the traffic index (TI) as used by Caltrans but they can be easily converted to the standard AASHTO 18-kip equivalent single axle loads (ESAL’s) by the Equation 1 (AASHTO, 1993).

Performance Evaluation and Design 49
Table 1. Maintenance Pavement Treatments Used by Caltrans (Flexible Pavements)
Maintenance TreatmentHot Mix Asphalt (HMA)
Maintenance TreatmentAsphalt Concrete (AC)
1 HMA Crack Sealing 14 Conventional HMA, 1 inch2 HMA Crack Filling 15 Open Graded OGAC, 1 inch3 Fog Seals 16 PBA HMA, 1 inch4 Rejuvenator Seals5 Scrub Seals Rubberized AC (RAC)6 Slurry Seals 17 RAC-G Gap Graded, 1 inch7 REAS Slurry Seal 18 RAC-O Open Graded, 1 inch8 Micro-Surfacing 19 RAC-O(HB) High Binder, 1 inch
9 Polymer Modified Emulsion (PME) Chip Seal
10 Polymer Modified Asphalt (PMA) Chip Seal Bonded Wearing Course (BWC)
11 Asphalt Rubber (AR) Chips Seal 20 BWC- Open, ¾ inch
12 Asphalt Rubber Cape Seals AR (slurry) ½ inch 21 BWC- Gap, ¾ inch
13 Asphalt Rubber Cape Seals AR (micro) ¾ inch 22 BWC- RAC- ¾ inch
23 BWC- RAC-O, ¾ inch
[1]
The estimated life information compiled in this document is based on the collective experience of the California Pavement Preservation Task Group (PPTG) to which the experience and best engineering judgment of a few experts in the industry were added. The extensive empirical tables prepared by the PPTG relating treatment duration to TI, percent cracking and location are presented in reports by Sousa and Way (Sousa, 2007) and Sousa (Sousa, 2009).
The data used in this study still needs to be verified in California using actual performance data from the existing Caltrans performance data bases or pavement management systems. Of course, the life of the treatment is highly dependent on the timing of the treatment, the traffic it experiences, and the climate it is placed in and these factors are addressed in the models as well as possible given the limited data and information.
The time of placement of the treatments can influence the performance of the treatment. In other words, treatments placed on good pavements will last longer than treatments placed on bad pavements. Many times, a treatment is scheduled to be placed on a good pavement, but

50 Asphalt-Rubber 2009
by the time it is actually placed, the condition of the pavement has deteriorated and this will affect the expected life of the treatment. The models developed in this study are limited by this observation of actual practice.
To the degree practical, the models in this report address the lives of the treatment as a function of the level of traffic and climate (coastal, valley, mountains, and desert) in which the treatment is placed.2. Study approach-estimating treatment lives
2. 1. Estimate of treatment lives
The initial tables were first developed by the PPTG strategy selection committee, although the original tables provided ranges of average life. As part of this study, the PPTG original tables were converted into the average and standard deviation of life for each treatment. Some corrections were also made so that the treatment lives were adjusted for different climatic regions. The asphalt PG grading regions shown in Figure 2 were used to identify treatment lives by climatic regions. It was decided that the treatment lives developed by the PPTG most appropriately fit into the Coastal and Valley areas (PG 64-10 and PG 64-16). Following this approach, tables were developed for the Mountainous (PG 64-28) and the Desert regions (PG 70-10). The Mountainous and Desert values represent the estimates of the treatment lives based on the experience of the authors, and like the Coastal and Valley regions represent a surrogate group of values based on engineering experience and judgment. This was done in lieu of real California performance data. In the future, it is hoped that the Caltrans pavement management system will provide more definitive measures of treatment life for the various climate regions.
The tables previously developed (Sousa and Way, 2007) take into consideration that the maintenance treatments are strongly affected by climate, traffic and pavement condition. It was considered important to try to evaluate treatment lives as a direct function of the treatment itself and these key factors.
Figure 2. Climate Regions Proposed For California- Coastal, Valley, Mountain and Desert

Performance Evaluation and Design 51
2.2. Effect of climate in life of treatments
As previously stated the first step was to identify significant climatic zones that affect the performance of the maintenance treatments. It was considered that the expected life of a treatment and life extension is influenced by the weather and to facilitate integration with other areas, it was decided to develop four tables of expected performance; one for each PG region in California as shown in Figure 2.
2.3. Effect of traffic in life of treatments
It was recognized that traffic is also a key aspect that affects the life of maintenance strategies. However, the number of cars is not a key factor. The recognized factor that affects any treatment is indeed the effect of heavy traffic which is defined by the American Association of State Highway and Transportation Officials (AASHTO) as 18-kip equivalent single axle loads (ESAL’s). Caltrans uses the Traffic Index which can be easily converted into ESAL’s. Also, most structural analysis and reflective modeling programs require some input to calculate stress caused by actual loads derived from ESAL’s.
Likewise, the traffic volume and truck volume is incorporated to the degree it can be identified in three major traffic categories. Namely, Interstate which generally has a high truck percentage, non interstate divided routes ( includes sections with four or more lanes that might not be divided) which has a lower percentage of trucks and non-interstate, non divided routes (essentially two lane highways) that have a lower traffic volume and lower truck percentage level of traffic. The traffic loading per year was divided into three categories as follows:
Low TI < 6 [Less than 33,000 ESAL’s] Intermediate 6 < TI < 12 [Between 33,000 and 1.1 million ESAL’s]Heavy TI >12 [Greater than 1.1 million ESAL’s]
2.4. Effect of existing pavement condition
It was recognized that for treatment life and life extension to be meaningful, one must know the actual pavement condition at the time of the application of the treatment. Currently there is no easy way to derive information on treatment performance from the existing PMS data in California. Also, Pavement Condition Index (PCI) similar to the ASTM D6433 standard (ASTM, 2007) used by many cities and counties in California by itself may not be descriptive enough to be of significant help in this area.
Since pavement preservation is a non-structural treatment, this means these treatments should only be used on pavements with low deflection values and low levels of distress. If high deflections (beyond a certain limit) are present, rehabilitation of the pavement will be needed. There is also a maximum cracking threshold before a certain treatment is applied. For pavement preservation, it is suggested that a maximum value of 5% cracking and a minimum PCI of 70 be used as the limits for applying pavement preservation treatments.
•••

52 Asphalt-Rubber 2009
If the pavement is in poor condition, it can have structural problems. Therefore, pavement preservation should not be used as an option in these situations. In the tables, “poor condition” is identified along with the associated maintenance treatment option. This is done in order to develop treatment lives that will demonstrate that preventive maintenance treatments are not cost effective in the late cycle of pavement life. When determining extended life benefits, it may be found that placing some pavement preservation treatments on pavements in poor condition is not cost effective.
In summary, the primary concern for preservation treatments is surface cracking or raveling when the pavement is in good to medium condition and structural cracking when the pavement is in poor condition. It could be either reflective or structural cracking in the medium condition. It should be noted that this study focuses mainly on maintenance treatments to seal out moisture from cracks and as such raveling or bleeding are not directly addressed in this approach.
Pavement preservation should preserve the structural integrity of the pavement so that it can perform for a longer time where structural integrity implies load carrying capacity of the pavement. For example, crack sealing may provide the benefits of minimizing water intrusion into the base and subgrade and prevent fines from accumulating in the crack.
However, when taking a more in depth look at what affects a treatment life, it was considered that cracking extent by itself may be the most significant aspect. The percent of cracking is an indication of the capacity of the existing pavement to be relatively impervious to water and the affect moisture has on the underlying layers. Also, the extent of cracking is an indication of the possible relative movement between the tips of the crack that have a strong effect on the life of the treatment. Although the treatments considered in this report are not considered to add structural capacity to the pavement, they may to some degree reduce the amount of water that penetrates into the pavement, which can contribute to extending the pavement life.
Treatment life is defined as the number of years a given treatment will serve its function (before another treatment is required). Treatment life is a function of the existing pavement condition and other factors such as traffic, climate, quality of materials and construction. Following are tentative definitions for the various categories of pavement condition.
Good – Minor distress (< 5 % cracking). Expected life of 8-10 years or more;Fair – minor to moderate distress (5-20% cracking). Expected life of 4-6 years;Poor condition (>20 % cracking). Moderate to severe distress and with structural problems. Expected life of 1-3 years.
2.5. Intrinsic maintenance material properties
Clearly if a good Pavement Management System (PMS) were available, it would be populated with adequate data so that the intrinsic properties of each treatment would not be needed because a rigorous multiple variable regression over all the data would give directly the life of each treatment. However, these data do not exist yet for most treatments and
•••

Performance Evaluation and Design 53
therefore it is necessary to use a mathematical modelling approach to bridge this gap. As such, the need to use some “models” in some cases to model or at least to relate and compare estimated lives from similar treatments arises.
It was felt that there was a need to present in a simple format a summary of the data of the key aspects that contribute to what is intrinsically valuable in a treatment. Generically, it can be considered that many aspects will or may contribute to the quality and durability of a flexible pavement treatment such as the following;
Quantity of binder, Aging characteristics of the binder used in treatmentsElastic characteristics of binder,Strain energy at break of the binder,Types of additives (none, polymer, rubber, others), Mix stiffness (if applicable)
2.6. Effect of amount of binder on treatment life
A preliminary summary research allowed the determination of the effective binder content available for each of the treatment as presented in Table 2. Some of the numbers were obtained from the MTAG reports while others were based on the authors’ experience and submitted for review to the Pavement Preservation Task Group (PPTG). In this table, the average values of the amounts of binder were used in the treatments; while for emulsions the residual binder content was used. It was also considered the use of tack coats add to the binder content available to each treatment. Clearly one important aspect is also thickness of the treatment as it provides some indication of the degree of protection the treatment provides to the underlying layer and to itself.
Table 2. Maintenance Treatment Thickness and Asphalt Content (Gallons per Square Yard) or Percent Asphalt in the Mix
Maintenance Treatment
Thickness of Seal Layer,
inch
Overall thickness
including chips and mix, inch
Asphalt/OilGal./sq. yd.On surface
OverallAsphalt/OilGal./sq. yd.On surface
including tack
Mix Percent
Asphalt by weight of aggregate
HMA Crack sealing 0.10 0.10 0.59 0.59
HMA Crack filling 0.03 0.03 0.27 0.27
Fog seals 0.01 0.01 0.07 0.07
Rejuvenator seals 0.01 0.01 0.07 0.07
Scrub seals 0.19 0.19 0.30 0.30
Slurry seals 0.19 0.19 0.30 0.30
REAS slurry seal 0.19 0.19 0.30 0.30
••••••

54 Asphalt-Rubber 2009
Maintenance Treatment
Thickness of Seal Layer,
inch
Overall thickness
including chips and mix, inch
Asphalt/OilGal./sq. yd.On surface
OverallAsphalt/OilGal./sq. yd.On surface
including tack
Mix Percent
Asphalt by weight of aggregate
Micro-Surfacing 0.01 0.19 0.30 0.37
PME chip seals 0.03 0.37 0.27 0.27
PMA chip seals 0.03 0.37 0.27 0.27
AR chip seals 0.10 0.37 0.59 0.59
Cape seals AR (slurry) ½ inch
0.10 0.56 0.55 0.85
Cape seals AR (micro) ¾ inch
0.10 0.85 0.55 0.97
Conventional HMA, 1 inch
0.01 1.18 0.05 0.78 5.00
OGAC, 1 inch 0.01 1.18 0.05 0.81 6.00
PBA HMA, 1 inch 0.01 1.18 0.05 0.78 5.00
RAC-G, 1 inch 0.01 1.18 0.05 0.86 5.50
RAC-O, 1 inch 0.01 1.18 0.05 0.84 6.20
RAC-O (HB), 1 inch
0.01 1.18 0.05 1.12 8.50
BWC-Open, ¾ inch 0.02 0.75 0.11 0.60 6.20
BWC-Gap, ¾ inch 0.02 0.75 0.11 0.62 5.50
BWC-RAC-G, ¾ inch
0.02 0.75 0.11 0.62 5.50
BWC-RAC-O, ¾ inch
0.02 0.75 0.11 0.60 6.20
2.7. Type of binder
Several types of binder are available for use in the various treatments. The quality of binder has been defined many different ways, such as resistance to aging, elastic recovery, stiffness and other. Clearly aging resistance is an important aspect, but specifications today are such that all binders show similar values by aging in the Rolling Thin Film Oven (RTFO) and Pressure Aging Vessel (PAV). One key aspect contributing to the longevity of a surface treatment, beyond binder quantity, is its capability to withstand strain before failure (breaking or cracking). Limited data are available for many binders regarding the strain level associated with the break point (cracking) and as such the conclusions and numbers included in this section should be revised as more data are collected. However, Kaloush et al (2002), Kaloush et al (2003) and Zborowski and Kaloush (2006) have reported data comparing the strain at failure for asphalt rubber (AR) binder to conventional binders. Also, relating this information to the fact that AR is known to withstand 5 times the strain (Green, 1977) before failure, and the results of four point flexural fatigue tests where usually the ratio between fatigue life at the same strain level is 1 to 10 between conventional and AR binder mixes and 1 to 3 for polymer

Performance Evaluation and Design 55
modified mixes in this study (Sousa et al, 2000; Sousa et al, 2003 and Sousa et al, 2006), the following strain at failure ratios were adopted as shown in Table 3 (again subject to further analysis).
Table 3. Strain at Failure Ratio
Binder type Estimated Strain at Failure Ratio of mixes (or binder)
Conventional 1Polymer/Other Modified Binder 1.5
Asphalt Rubber 5
2.8. Treatment performance capacity
To bring into a single parameter several of the key aspects related to the performance of a treatment in a previous report (Sousa and Way, 2007), the authors developed a conceptual measure of treatment effectiveness called the Treatment Performance Capacity (TPC) and it is defined as follows:
[2]
where: TPC = Treatment Performance Capacity; BC = Binder Content per unit area (L/m2); SFR = Strain at failure ratio; T = Thickness of treatment (mm).
Obviously a fog seal with a regular emulsion will have a much smaller number in terms of TPC than a chip seal simply because it has less binder. Also an asphalt rubber treatment will show a better capacity number (even if with the same binder content) because has a higher strain at failure ratio than regular binder.
The concept that this index is trying to capture is simple: more binder is better; better binder (more strain before failure) is also better; and thicker treatment is better in all cases in generic terms. Based upon these assumptions, Table 4 was developed. Clearly having a binder that ages less is better, but this factor may be compounded or confounded (possible bleeding or flushing and low skid resistance value) with more binder which also promotes less aging.
A treatment with a high performance capacity, when placed under heavy traffic over a badly cracked pavement will have its performance capacity consumed, “drained”, faster compared to when it is placed over a low traffic non-cracked pavement. Obviously a treatment with a low performance capacity will have its performance capacity consumed even faster under the same scenarios. The TPC is inherent to each treatment. How long it takes to “consume” that capacity depends on the cracking condition, traffic and climate where the treatment is applied.
TSFRBCTPC ××=

56 Asphalt-Rubber 2009
Table 4. Treatment Performance Capacity for several treatments used in California (mm l/m2)
Maintenance Treatment Treatment Performance Capacity
HMA Crack sealing 6.25HMA Crack filling 0.81Fog seals 0.08Rejuvenator seals 0.08Scrub seals 6.41Slurry seals 7.05REAS slurry seal 12.83Micro-Surfacing 8.08PME chip seals 14.25PMA chip seals 11.88AR chip seals 128.25Cape seals AR (slurry) ½ inch 274.31Cape seals AR (micro) ¾ inch 473.00Conventional HMA, 1 inch 107.11OGAC, 1 inch 110.54PBA HMA, 1 inch 107.11RAC-G, 1 inch 585.34RAC-O, 1 inch 569.88RAC-O (HB), 1 inch 767.38BWC-Open, ¾ inch 62.65BWC-Gap, ¾ inch 64.14BWC-RAC-G, ¾ inch 267.24BWC-RAC-O, ¾ inch 261.04
3. Modeling the effect of TPC on treatment life
3.1. General effect of TPC on treatment life
From the analysis of the data presented in Figures 3, 4 and 5 for Coastal and Valley, Mountain and Desert regions respectively, it can be observed that the effect of TPC appears to drive the life of a pavement preservation treatment. For a given set of conditions, treatments with higher TPC appear to outperform in general those with lower TPC.
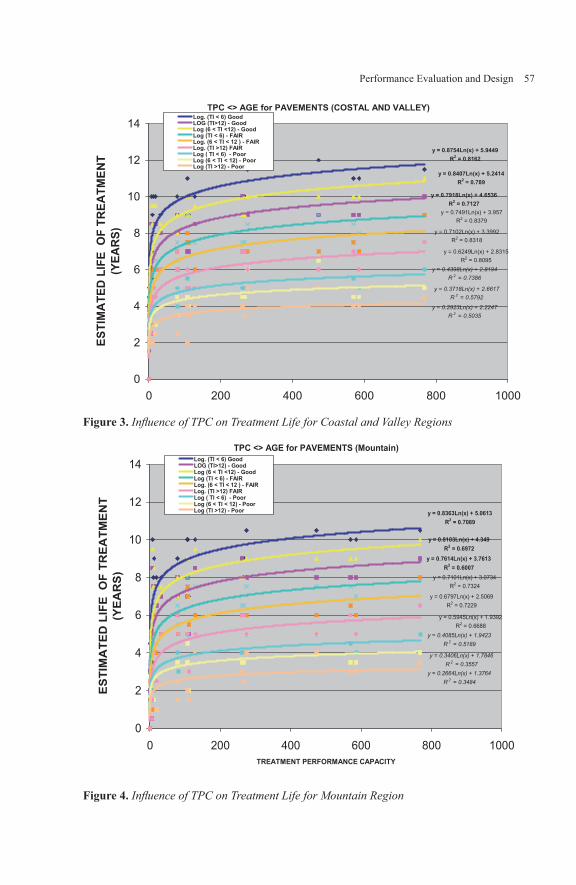
Performance Evaluation and Design 57
TPC <> AGE for PAVEMENTS (COSTAL AND VALLEY)
y = 0.8754Ln(x) + 5.9449R2 = 0.8162
y = 0.7918Ln(x) + 4.6536R2 = 0.7127
y = 0.8407Ln(x) + 5.2414R2 = 0.789
y = 0.7491Ln(x) + 3.957R2 = 0.8379
y = 0.7102Ln(x) + 3.3992R2 = 0.8318
y = 0.6249Ln(x) + 2.8315R2 = 0.8095
y = 0.4398Ln(x) + 2.8194R 2 = 0.7386
y = 0.3718Ln(x) + 2.6617R 2 = 0.5792
y = 0.2923Ln(x) + 2.2247R 2 = 0.5035
0
2
4
6
8
10
12
14
0 200 400 600 800 1000TREATMENT PERFORMANCE CAPACITY
ESTI
MA
TED
LIFE
OF
TREA
TMEN
T(Y
EAR
S)Log. (TI < 6) GoodLOG (TI>12) - GoodLog (6 < TI <12) - GoodLog (TI < 6) - FAIRLog. (6 < TI < 12 ) - FAIRLog. (TI >12) FAIRLog ( TI < 6) - PoorLog (6 < TI < 12) - PoorLog (TI >12) - Poor
Figure 3. Influence of TPC on Treatment Life for Coastal and Valley Regions
TPC <> AGE for PAVEMENTS (Mountain)
y = 0.8363Ln(x) + 5.0613R2 = 0.7089
y = 0.7614Ln(x) + 3.7613R2 = 0.6007
y = 0.8103Ln(x) + 4.349R2 = 0.6972
y = 0.7101Ln(x) + 3.0734R2 = 0.7324
y = 0.6797Ln(x) + 2.5069R2 = 0.7229
y = 0.5945Ln(x) + 1.9392R2 = 0.6688
y = 0.4085Ln(x) + 1.9423R 2 = 0.5189
y = 0.3406Ln(x) + 1.7846R 2 = 0.3557
y = 0.2664Ln(x) + 1.3764R 2 = 0.3484
0
2
4
6
8
10
12
14
0 200 400 600 800 1000TREATMENT PERFORMANCE CAPACITY
ES
TIM
ATE
DLI
FEO
FTR
EA
TME
NT
(YE
AR
S)
Log. (TI < 6) GoodLOG (TI>12) - GoodLog (6 < TI <12) - GoodLog (TI < 6) - FAIRLog. (6 < TI < 12 ) - FAIRLog. (TI >12) FAIRLog ( TI < 6) - PoorLog (6 < TI < 12) - PoorLog (TI >12) - Poor
Figure 4. Influence of TPC on Treatment Life for Mountain Region

58 Asphalt-Rubber 2009
TPC <> AGE for PAVEMENTS (DESERT)
y = 0.7901Ln(x) + 5.5512R2 = 0.7299
y = 0.7028Ln(x) + 4.2513R2 = 0.6194
y = 0.7517Ln(x) + 4.8391R2 = 0.7053
y = 0.6638Ln(x) + 3.5633R2 = 0.719
y = 0.6211Ln(x) + 2.9969R2 = 0.7497
y = 0.5482Ln(x) + 2.3639R2 = 0.6843
y = 0.3901Ln(x) + 2.1898R 2 = 0.4563
y = 0.3145Ln(x) + 2.0874R 2 = 0.2855
y = 0.2369Ln(x) + 1.7178R 2 = 0.2254
0
2
4
6
8
10
12
14
0 200 400 600 800 1000TREATMENT PERFORMANCE CAPACITY
ESTI
MA
TED
LIFE
OF
TREA
TMEN
T(Y
EAR
S)
Log. (TI < 6) GoodLOG (TI>12) - GoodLog (6 < TI <12) - GoodLog (TI < 6) - FAIRLog. (6 < TI < 12 ) - FAIRLog. (TI >12) FAIRLog ( TI < 6) - PoorLog (6 < TI < 12) - PoorLog (TI >12) - Poor
Figure 5. Influence of TPC on Treatment Life for Desert Region
3.2. Effect of temperature
Treatment life is also strongly affected by environment. After several trials, it was determined that the temperature that best explained the observed effect was the difference between the weighted mean monthly air temperature (Shell, 1985) and the minimum air temperature. Table 5 shows the various average temperature statistics for the California climate zone. For model calibration, the average of the temperatures and temperature differences (RCT) of Valley and Coastal regions shown in Table 5 were grouped together as the Costal – Valley (CV) statistics since they are so similar.
It is noteworthy to mention that in a totally unrelated project the difference in temperatures was shown to have a strong influence in the reflective cracking life of overlays (Sousa et al, 2001). Thus it makes sense that as this temperature difference widens it indicates more overall tension (stress and strain) in the surface layers which leads to increase in the likelihood of reflective cracking.

Performance Evaluation and Design 59
Table 5. Average Temperatures for the regions in California
A B C D B-D C-D
RegionM a x i m u m Air Temp.℃
Maximum 7 DayAverageAir Temp.℃
Mean Annual AirTemp. ℃(ShellDesign)
MinimumAir Temp.℃
M a x . 7 DayAve.-Min. Air ℃
RCT(Mean-Min)℃
Valley 38.8 35.3 16.2 -10.0 45.3 26.2
Coastal 38.1 32.7 17.3 -5.7 38.4 23.0
CV 38.5 34.0 16.8 -7.9 41.9 24.6Mountain 36.1 33.0 11.2 -30.7 63.7 41.9
Desert 46.9 44.7 24.8 -9.1 53.8 33.9
3.3. Model determination and parameters
The statistical analysis used to develop the model to fit the treatment life results was performed using the nonlinear estimation option of the SPSS software. This option allows the user to define a specified regression equation which is fitted to the existing data. The use of a suitable estimation method, in the case the Levenberg-Marquardt estimation method produced a precise estimation of the model parameters. The model developed was based on the fact that the Treatment Life (LIFE) of a given pavement condition can be correlated with the TPC by a logarithmic equation:
[3]
where: LIFE = Treatment Life; TPC = Treatment Performance Capacity; k1 and k2 = Coefficients.
The inclusion of the other independent variables (Reflective Cracking Temperature (RCT), Percent Cracking (PC), and TI), is applied in the k1 and k2 coefficients of the logarithmic equation.
Thus, the difficult job of this task is selection of the equations that best define the influence of Reflective Cracking Temperature (RCT), Percent Cracking and Traffic Index in the logarithmic equation. Among the known equations, a parabolic regression seems to be best at producing a fit of the existing data, resulting in the model expressed in Equations 4 and 5,
[4]
[5]
( ) 21 log kTPCkLIFE +×=
( )∏=
×+×+=3
1
23211
iiiiii XaXaak
( )∏=
×+×+=3
1
23212 bbb
iiiiii XXk

60 Asphalt-Rubber 2009
where: aij and bij = coefficients given in Table 6; Xi = Variables defined in Table 7.
Table 6. Statistical coefficients for the life model (Equations 2 and 3) [R2=0.844]
i ai1 ai2 ai1 bi2 bi3 bi3
1 -1.029E+02 3.826E+00 -5.381E-02 -1.269E+02 -8.601E-01 3.199E-02
2 3.223E-02 -1.646E-03 3.354E-05 -8.063E-01 6.716E-02 -2.350E-03
3 -1.708E+00 9.926E-03 1.342E-03 7.147E-02 -3.076E-03 7.195E-05
Table 7. Variables defining the pavement conditions in Equations 4 and 5
i XI Minimum Maximum
1 RCT - Temperature defined by:Air Mean Monthly – Minimum Air (℃) 20 45
2 PC – Percent Cracking 0 183 TI – Traffic Index 3 15
All variables show statistical significance and the correlation of the model is 0.84 as demonstrated in Figure 6.
0
2
4
6
8
10
12
14
0 2 4 6 8 10 12 14EXPERTS ESTIMATED TREATMENT LIFE (years)
STA
TIST
ICM
OD
ELPR
EDIC
TED
TREA
TMEN
TLI
FE(y
ears
) ) R2 = 0.84
Figure 6. Best fit between expert estimated treatment life and corresponding estimations from statistical model

Performance Evaluation and Design 61
Based on this new model, the expected analytically derived treatment lives of the four California regions are shown in Table 8 through Table 11. It can be observed that the values predicted for Coastal and Valley are slightly different but vary more from Mountain and Desert regions due to temperature effects.
Table 8. Model estimated treatment lives for Coastal Region (years) as a function of traffic and % cracking
Treatment Lives for Coastal Region (PG 64-10)Traffic Index (TI)
5 8.5 13Pavement Condition Cracking 0 5 15 0 5 15 0 5 15
Maintenance TreatmentHMA Crack sealing 7.9 5.4 3.3 7.0 4.8 2.9 6.1 4.2 2.6HMA Crack filling 5.9 3.8 2.4 5.1 3.3 2.1 4.4 2.9 1.8Fog seals 3.5 2.0 1.3 2.9 1.6 1.0 2.4 1.4 0.9Rejuvenator seals 3.5 2.0 1.3 2.9 1.6 1.0 2.4 1.4 0.9Scrub seals 7.9 5.4 3.3 7.0 4.8 3.0 6.1 4.2 2.6Slurry seals 8.3 5.7 3.5 7.4 5.1 3.1 6.4 4.4 2.7REAS slurry seal 9.5 6.6 4.1 8.5 5.9 3.7 7.4 5.2 3.2Micro-Surfacing 8.1 5.6 3.4 7.2 5.0 3.1 6.3 4.3 2.7PME chip seals 8.9 6.2 3.8 8.0 5.5 3.4 6.9 4.8 3.0PMA chip seals 8.5 5.9 3.6 7.6 5.2 3.2 6.6 4.6 2.8AR chip seals 10.8 7.7 4.7 9.8 6.9 4.3 8.6 6.1 3.7Cape seals AR (slurry) ½ inch 11.6 8.2 5.1 10.5 7.5 4.6 9.2 6.6 4.0
Cape seals AR (micro) ¾ inch 12.1 8.7 5.3 11.0 7.9 4.8 9.6 6.9 4.2
Conventional HMA, 1 inch 10.7 7.5 4.6 9.6 6.8 4.2 8.4 6.0 3.7
OGAC, 1 inch 10.7 7.5 4.6 9.6 6.8 4.2 8.4 6.0 3.7PBA HMA, 1 inch 10.7 7.5 4.6 9.6 6.8 4.2 8.4 6.0 3.7RAC-G, 1 inch 12.3 8.8 5.4 11.2 8.0 4.9 9.8 7.0 4.3RAC-O, 1 inch 12.3 8.8 5.4 11.2 8.0 4.9 9.8 7.0 4.3RAC-O (HB), 1 inch 12.6 9.0 5.5 11.4 8.2 5.0 10.0 7.2 4.4BWC-Open, ¾ inch 10.4 7.3 4.5 9.3 6.6 4.0 8.1 5.8 3.5BWC-Gap, ¾ inch 10.4 7.3 4.5 9.4 6.6 4.1 8.2 5.8 3.5BWC-RAC-G, ¾ inch 11.6 8.2 5.0 10.5 7.5 4.6 9.2 6.5 4.0BWC-RAC-O, ¾ inch 11.6 8.2 5.0 10.4 7.4 4.6 9.1 6.5 4.0

62 Asphalt-Rubber 2009
Table 9. Model estimated treatment lives for Valley Region (years) as a function of traffic and % cracking
Treatment Lives for Valley Region (PG 64-16)
Traffic Index (TI)
5 8.5 13
Pavement Condition Cracking 0 5 15 0 5 15 0 5 15
Maintenance TreatmentHMA Crack sealing 7.6 5.2 3.2 6.7 4.6 2.8 5.9 4.0 2.5HMA Crack filling 5.8 3.8 2.3 5.0 3.3 2.0 4.3 2.8 1.7Fog seals 3.6 2.1 1.3 3.0 1.7 1.1 2.5 1.4 0.9Rejuvenator seals 3.6 2.1 1.3 3.0 1.7 1.1 2.5 1.4 0.9Scrub seals 7.6 5.2 3.2 6.8 4.6 2.8 5.9 4.0 2.5Slurry seals 8.0 5.5 3.4 7.1 4.9 3.0 6.2 4.3 2.6REAS slurry seal 9.1 6.3 3.9 8.1 5.7 3.5 7.1 4.9 3.0Micro-Surfacing 7.8 5.4 3.3 7.0 4.8 2.9 6.1 4.2 2.6PME chip seals 8.5 5.9 3.6 7.6 5.3 3.3 6.6 4.6 2.8PMA chip seals 8.2 5.6 3.5 7.3 5.0 3.1 6.3 4.4 2.7AR chip seals 10.3 7.3 4.5 9.3 6.6 4.0 8.1 5.7 3.5Cape seals AR (slurry) ½ inch 11.0 7.8 4.8 9.9 7.1 4.3 8.7 6.2 3.8
Cape seals AR (micro) ¾ inch 11.5 8.2 5.0 10.4 7.4 4.6 9.1 6.5 4.0
Conventional HMA, 1 inch 10.2 7.2 4.4 9.2 6.5 4.0 8.0 5.6 3.5
OGAC, 1 inch 10.2 7.2 4.4 9.2 6.5 4.0 8.0 5.7 3.5PBA HMA, 1 inch 10.2 7.2 4.4 9.2 6.5 4.0 8.0 5.6 3.5RAC-G, 1 inch 11.7 8.3 5.1 10.6 7.6 4.6 9.3 6.6 4.1RAC-O, 1 inch 11.7 8.3 5.1 10.6 7.5 4.6 9.3 6.6 4.0RAC-O (HB), 1 inch 11.9 8.5 5.1 10.8 7.7 4.7 9.5 6.8 4.2BWC-Open, ¾ inch 9.9 6.9 4.3 8.9 6.3 3.8 7.8 5.5 3.4BWC-Gap, ¾ inch 9.9 7.0 4.3 8.9 6.3 3.8 7.8 5.5 3.4BWC-RAC-G, ¾ inch 11.0 7.8 4.8 9.9 7.1 4.3 8.7 6.2 3.8BWC-RAC-O, ¾ inch 11.0 7.8 4.8 9.9 7.0 4.3 8.7 6.2 3.8

Performance Evaluation and Design 63
Table 10. Model estimated treatment lives for Mountain Region (years) as a function of traffic and % cracking
Treatment Lives for Mountain Region (PG 64-28)Traffic Index (TI)
5 8.5 13Pavement Condition Cracking 0 5 15 0 5 15 0 5 15
Maintenance TreatmentHMA Crack sealing 6.5 4.5 2.7 5.8 4.0 2.4 5.0 3.5 2.1HMA Crack filling 4.8 3.1 1.9 4.2 2.7 1.7 3.6 2.4 1.5Fog seals 2.8 1.6 1.0 2.3 1.3 0.8 1.9 1.1 0.7Rejuvenator seals 2.8 1.6 1.0 2.3 1.3 0.8 1.9 1.1 0.7Scrub seals 6.6 4.5 2.8 5.8 4.0 2.5 5.1 3.5 2.1Slurry seals 6.9 4.7 2.9 6.1 4.2 2.6 5.3 3.7 2.3REAS slurry seal 7.9 5.5 3.4 7.1 5.0 3.1 6.2 4.3 2.7Micro-Surfacing 6.7 4.6 2.8 6.0 4.1 2.5 5.2 3.6 2.2PME chip seals 7.4 5.1 3.2 6.6 4.6 2.8 5.8 4.0 2.5PMA chip seals 7.1 4.9 3.0 6.3 4.4 2.7 5.5 3.8 2.3AR chip seals 9.1 6.4 3.9 8.2 5.8 3.6 7.2 5.1 3.1Cape seals AR (slurry) ½ inch 9.7 6.9 4.2 8.8 6.3 3.8 7.7 5.5 3.4
Cape seals AR (micro) ¾ inch 10.2 7.3 4.5 9.2 6.6 4.1 8.1 5.8 3.5
Conventional HMA, 1 inch 8.9 6.3 3.9 8.1 5.7 3.5 7.0 5.0 3.1
OGAC, 1 inch 9.0 6.3 3.9 8.1 5.7 3.5 7.1 5.0 3.1PBA HMA, 1 inch 8.9 6.3 3.9 8.1 5.7 3.5 7.0 5.0 3.1RAC-G, 1 inch 10.4 7.4 4.5 9.4 6.7 4.1 8.2 5.9 3.6RAC-O, 1 inch 10.3 7.4 4.5 9.4 6.7 4.1 8.2 5.9 3.6RAC-O (HB), 1 inch 10.6 7.6 4.6 9.6 6.9 4.2 8.4 6.1 3.7BWC-Open, ¾ inch 8.7 6.1 3.7 7.8 5.5 3.4 6.8 4.8 3.0BWC-Gap, ¾ inch 8.7 6.1 3.8 7.8 5.5 3.4 6.8 4.8 3.0BWC-RAC-G, ¾ inch 9.7 6.9 4.2 8.8 6.3 3.8 7.7 5.5 3.4BWC-RAC-O, ¾ inch 9.7 6.9 4.2 8.8 6.3 3.8 7.7 5.5 3.4

64 Asphalt-Rubber 2009
Table 11. Model estimated treatment lives for Desert Region (years) as a function of traffic and % cracking
Treatment Lives for Desert Region (PG 70-10)Traffic Index (TI)
5 8.5 13Pavement Condition Cracking 0 5 15 0 5 15 0 5 15
Maintenance TreatmentHMA Crack sealing 7.0 4.8 2.9 6.2 4.2 2.6 5.4 3.7 2.3HMA Crack filling 5.4 3.5 2.2 4.7 3.1 1.9 4.1 2.6 1.6Fog seals 3.5 2.1 1.3 2.9 1.7 1.1 2.5 1.4 0.9Rejuvenator seals 3.5 2.1 1.3 2.9 1.7 1.1 2.5 1.4 0.9Scrub seals 7.0 4.8 3.0 6.3 4.3 2.6 5.4 3.7 2.3Slurry seals 7.4 5.0 3.1 6.6 4.5 2.8 5.7 3.9 2.4REAS slurry seal 8.3 5.8 3.6 7.5 5.2 3.2 6.5 4.5 2.8Micro-Surfacing 7.2 4.9 3.0 6.4 4.4 2.7 5.6 3.8 2.4PME chip seals 7.9 5.4 3.3 7.0 4.9 3.0 6.1 4.2 2.6PMA chip seals 7.5 5.2 3.2 6.7 4.6 2.8 5.8 4.0 2.5AR chip seals 9.4 6.6 4.1 8.5 6.0 3.7 7.4 5.2 3.2Cape seals AR (slurry) ½ inch 10.0 7.1 4.4 9.1 6.4 3.9 7.9 5.6 3.4
Cape seals AR (micro) ¾ inch 10.5 7.4 4.6 9.5 6.7 4.1 8.3 5.9 3.6
Conventional HMA, 1 inch 9.3 6.5 4.0 8.4 5.9 3.6 7.3 5.1 3.2OGAC, 1 inch 9.3 6.5 4.0 8.4 5.9 3.6 7.3 5.2 3.2PBA HMA, 1 inch 9.3 6.5 4.0 8.4 5.9 3.6 7.3 5.1 3.2RAC-G, 1 inch 10.6 7.6 4.6 9.6 6.9 4.2 8.4 6.0 3.7RAC-O, 1 inch 10.6 7.6 4.6 9.6 6.9 4.2 8.4 6.0 3.7RAC-O (HB), 1 inch 10.9 7.7 4.7 9.8 7.0 4.3 8.6 6.2 3.8BWC-Open, ¾ inch 9.0 6.3 3.9 8.1 5.7 3.5 7.1 5.0 3.1BWC-Gap, ¾ inch 9.1 6.3 3.9 8.1 5.7 3.5 7.1 5.0 3.1BWC-RAC-G, ¾ inch 10.0 7.1 4.3 9.0 6.4 3.9 7.9 5.6 3.4BWC-RAC-O, ¾ inch 10.0 7.1 4.3 9.0 6.4 3.9 7.9 5.6 3.4
Cost effectiveness is defined in this report as a measure of the cost of the treatment in relation to its performance. Given that each treatment has a TPC; it is possible to couple this with the cost of the treatments and determine the cost effectiveness of each treatment. Table 12 presents typical costs of the various treatments (per square yard) provided by PPTG as a function of the size of the job.

Performance Evaluation and Design 65
Table 12. Average price per square yard for treatments in California
August 11, 2007Maintenance Treatment
Average PriceUSD/sq. yd.
Quantity UsedSmall
Average PriceUSD/sq. yd.
Quantity UsedMedium
Average PriceUSD/sq. yd.
Quantity UsedLarge
HMA Crack sealing (10%-15% cracked) 0.83 0.53 0.38
HMA Crack filling (10%-15% cracked) 0.78 0.48 0.33
Fog seals 0.30 0.23 0.15
Rejuvenator seals 0.50 0.35 0.20
Scrub seals 2.15 2.15 2.15
Slurry seals 2.25 2.10 1.80
REAS slurry seal 2.80 2.20 2.00
Micro-Surfacing 2.65 2.50 2.40
PME chip seals 3.25 2.50 1.90
PMA chip seals 3.25 2.50 2.00
AR chip seals 4.63 4.38 4.15
Cape seals AR (slurry) ½ inch 6.50 6.25 6.00
Cape seals AR (micro) ¾ inch 6.90 6.75 6.50
Conventional HMA, 1 inch 12.00 10.00 8.00
OGAC, 1 inch 12.00 10.00 8.00
PBA HMA, 1 inch 14.00 12.00 10.00
RAC-G, 1 inch 14.00 12.00 10.00
RAC-O, 1 inch 14.00 12.00 11.00
RAC-O (HB), 1 inch 15.00 13.00 10.00
BWC-Open, ¾ inch 14.00 12.00 10.00
BWC-Gap, ¾ inch 14.00 12.00 10.00
BWC-RAC-G, ¾ inch 14.00 12.00 10.00
BWC-RAC-O, ¾ inch 14.00 12.00 10.00
It has already been determined that there is a very good correlation (at times higher then 80%) between the TPC and expected treatment lives. Based on the above information, the cost effectiveness (TPC/$) of each treatment was determined by dividing the treatment’s TPC by its cost. In Figure 7, these values, for all treatments, can be compared. It can also be observed that there is a very wide range in the cost effectiveness of treatments. Some are as low as 0.25 while some are close to 70.

66 Asphalt-Rubber 2009
These values could be used as a criterion to help CALTRANS select its maintenance strategies. What this data is basically suggesting is that treatments with low TPC/$ should only be used in very special situations. Otherwise, other treatments can be used that are more cost effective. The data also indicates that generally the most cost effective treatments follow this concept: more binder is better; better binder is also better; and thicker treatment is better - in all cases in generic terms. Asphalt rubber products generally have the best TPC/$ because they fit the general concept and associated underlying qualities to resist cracking and water intrusion.
0.00
10.00
20.00
30.00
40.00
50.00
60.00
70.00
80.00
HMA Crack se
aling
HMA Crack filli
ng
Fogse
als
Rejuve
nator
seals
Scrub se
als
Slurry
Seals
REAS slurry
seal
Micro-S
urfac
ing
PME chip
seals
PMA chip
seals
ARch
ipse
als
Cape se
alsAR
(slurr
y)1/2
inch
Cape Sea
lsAR
(micr
o)3/4
inch
Conve
ntion
alHMA, 1
inch
OGAC, 1inc
h
PBA HMA, 1inc
h
RAC-G, 1
inch
RAC-O,
1 inch
RAC-O(H
B), 1inc
h
BWC-Ope
n,3/4
inch
BWC-Gap
, 3/4
inch
BWC-RAC-G
, 3/4
inch
BWC-RAC-O
, 3/4
inch
TPC
/$
SmallMediumLarge
Figure 7. Cost effectiveness, measured in TPC/$, for California treatments function of job size
Depending on what the current maintenance strategies of CALTRANS are, it appears that by maximizing treatments with asphalt rubber, the potential for long term savings or increase pavement performance is very high.
Data are needed to determine what pavements the current monetary allocations are of money for each type of treatment, what percentage of area is covered with each kind of treatment each year and the total annual maintenance budget of CALTRANS so that a more informed determination, quantifying the costs effectiveness of alternative maintenance strategies, can be made.
4. Discussion
4. 1. Strain at failure ratio (SFR)
One of the components that have helped the TPC to capture rather well the treatment
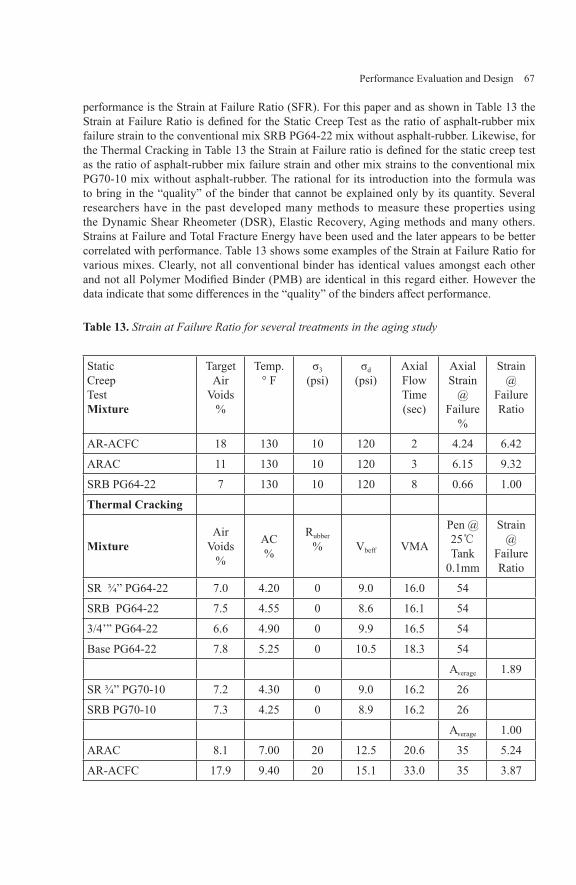
Performance Evaluation and Design 67
performance is the Strain at Failure Ratio (SFR). For this paper and as shown in Table 13 the Strain at Failure Ratio is defined for the Static Creep Test as the ratio of asphalt-rubber mix failure strain to the conventional mix SRB PG64-22 mix without asphalt-rubber. Likewise, for the Thermal Cracking in Table 13 the Strain at Failure ratio is defined for the static creep test as the ratio of asphalt-rubber mix failure strain and other mix strains to the conventional mix PG70-10 mix without asphalt-rubber. The rational for its introduction into the formula was to bring in the “quality” of the binder that cannot be explained only by its quantity. Several researchers have in the past developed many methods to measure these properties using the Dynamic Shear Rheometer (DSR), Elastic Recovery, Aging methods and many others. Strains at Failure and Total Fracture Energy have been used and the later appears to be better correlated with performance. Table 13 shows some examples of the Strain at Failure Ratio for various mixes. Clearly, not all conventional binder has identical values amongst each other and not all Polymer Modified Binder (PMB) are identical in this regard either. However the data indicate that some differences in the “quality” of the binders affect performance.
Table 13. Strain at Failure Ratio for several treatments in the aging study
StaticCreepTestMixture
TargetAir
Voids%
Temp.° F
σ3
(psi)σd
(psi)AxialFlowTime(sec)
AxialStrain
@Failure
%
Strain@
FailureRatio
AR-ACFC 18 130 10 120 2 4.24 6.42
ARAC 11 130 10 120 3 6.15 9.32
SRB PG64-22 7 130 10 120 8 0.66 1.00
Thermal Cracking
MixtureAir
Voids%
AC%
Rubber
% Vbeff VMA
Pen @25℃Tank
0.1mm
Strain@
FailureRatio
SR ¾” PG64-22 7.0 4.20 0 9.0 16.0 54
SRB PG64-22 7.5 4.55 0 8.6 16.1 54
3/4’” PG64-22 6.6 4.90 0 9.9 16.5 54
Base PG64-22 7.8 5.25 0 10.5 18.3 54
Average 1.89
SR ¾” PG70-10 7.2 4.30 0 9.0 16.2 26
SRB PG70-10 7.3 4.25 0 8.9 16.2 26
Average 1.00
ARAC 8.1 7.00 20 12.5 20.6 35 5.24
AR-ACFC 17.9 9.40 20 15.1 33.0 35 3.87
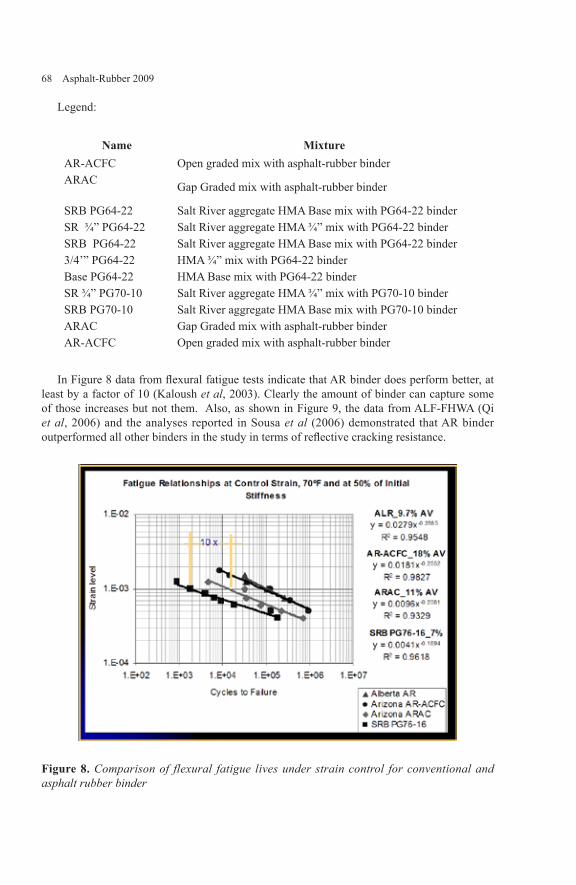
68 Asphalt-Rubber 2009
Legend:
Name MixtureAR-ACFC Open graded mix with asphalt-rubber binderARAC Gap Graded mix with asphalt-rubber binder
SRB PG64-22 Salt River aggregate HMA Base mix with PG64-22 binderSR ¾” PG64-22 Salt River aggregate HMA ¾” mix with PG64-22 binderSRB PG64-22 Salt River aggregate HMA Base mix with PG64-22 binder3/4’” PG64-22 HMA ¾” mix with PG64-22 binderBase PG64-22 HMA Base mix with PG64-22 binderSR ¾” PG70-10 Salt River aggregate HMA ¾” mix with PG70-10 binderSRB PG70-10 Salt River aggregate HMA Base mix with PG70-10 binderARAC Gap Graded mix with asphalt-rubber binderAR-ACFC Open graded mix with asphalt-rubber binder
In Figure 8 data from flexural fatigue tests indicate that AR binder does perform better, at least by a factor of 10 (Kaloush et al, 2003). Clearly the amount of binder can capture some of those increases but not them. Also, as shown in Figure 9, the data from ALF-FHWA (Qi et al, 2006) and the analyses reported in Sousa et al (2006) demonstrated that AR binder outperformed all other binders in the study in terms of reflective cracking resistance.
Figure 8. Comparison of flexural fatigue lives under strain control for conventional and asphalt rubber binder

Performance Evaluation and Design 69
TPF-5(019) Accelerated Loading Facility Status ReportJan.2005
0
10
20
30
40
50
60
70
80
90
100
25000 50000 75000 100000 125000 150000 175000 200000 225000 250000 275000 300000
Number of Load Passes
Cum
ulat
ive
Cra
ckLe
ngth
(m)
Control L2 SBS LG L4 CR-AZ L1
Figure 9. ALF-FHWA data relating number of passes and cracking level for three pavements with the same thickness (10 cm control- conventional, 10cm SBSLGL4- PMB binder and CR-AZL1- with 5 cm of asphalt rubber binder over 5 cm of conventional).
Figure 10 shows the strain at failure ratio of 5 for AR binder against 1.5 for PMB and 1 for conventional in order to help address the “extra quality” question.
Figure 10. Influence of TPC on Treatment Life for Coastal and Valley Regions for Pavements in POOR condition.
It can be observed in Table 14 (see columns A, B and C) that with the assumption that the Strain at Failure Ratio is 1.5 the correlation R2 is higher than if it is assumed to be 2 or even 5.
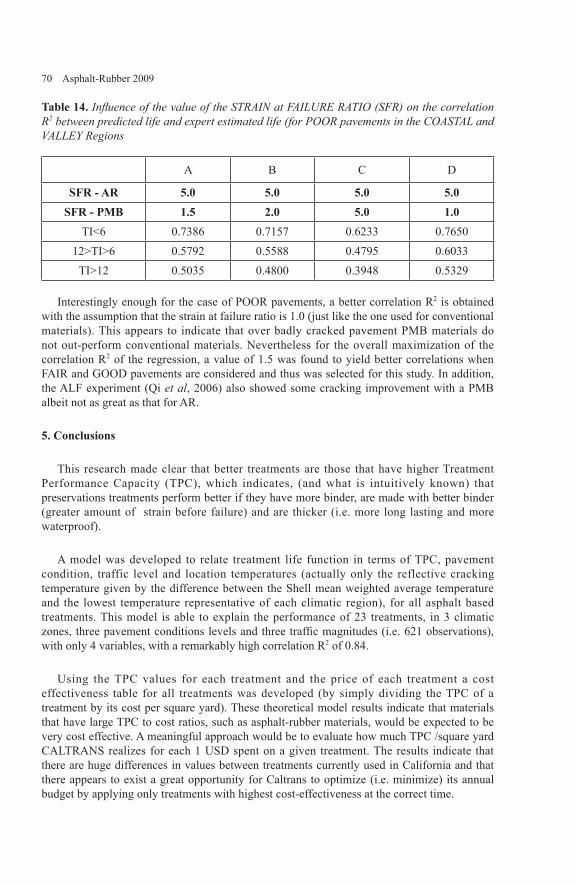
70 Asphalt-Rubber 2009
Table 14. Influence of the value of the STRAIN at FAILURE RATIO (SFR) on the correlation R2 between predicted life and expert estimated life (for POOR pavements in the COASTAL and VALLEY Regions
A B C D
SFR - AR 5.0 5.0 5.0 5.0SFR - PMB 1.5 2.0 5.0 1.0
TI<6 0.7386 0.7157 0.6233 0.765012>TI>6 0.5792 0.5588 0.4795 0.6033
TI>12 0.5035 0.4800 0.3948 0.5329
Interestingly enough for the case of POOR pavements, a better correlation R2 is obtained with the assumption that the strain at failure ratio is 1.0 (just like the one used for conventional materials). This appears to indicate that over badly cracked pavement PMB materials do not out-perform conventional materials. Nevertheless for the overall maximization of the correlation R2 of the regression, a value of 1.5 was found to yield better correlations when FAIR and GOOD pavements are considered and thus was selected for this study. In addition, the ALF experiment (Qi et al, 2006) also showed some cracking improvement with a PMB albeit not as great as that for AR.
5. Conclusions
This research made clear that better treatments are those that have higher Treatment Performance Capacity (TPC), which indicates, (and what is intuitively known) that preservations treatments perform better if they have more binder, are made with better binder (greater amount of strain before failure) and are thicker (i.e. more long lasting and more waterproof).
A model was developed to relate treatment life function in terms of TPC, pavement condition, traffic level and location temperatures (actually only the reflective cracking temperature given by the difference between the Shell mean weighted average temperature and the lowest temperature representative of each climatic region), for all asphalt based treatments. This model is able to explain the performance of 23 treatments, in 3 climatic zones, three pavement conditions levels and three traffic magnitudes (i.e. 621 observations), with only 4 variables, with a remarkably high correlation R2 of 0.84.
Using the TPC values for each treatment and the price of each treatment a cost effectiveness table for all treatments was developed (by simply dividing the TPC of a treatment by its cost per square yard). These theoretical model results indicate that materials that have large TPC to cost ratios, such as asphalt-rubber materials, would be expected to be very cost effective. A meaningful approach would be to evaluate how much TPC /square yard CALTRANS realizes for each 1 USD spent on a given treatment. The results indicate that there are huge differences in values between treatments currently used in California and that there appears to exist a great opportunity for Caltrans to optimize (i.e. minimize) its annual budget by applying only treatments with highest cost-effectiveness at the correct time.

Performance Evaluation and Design 71
Acknowledgment
In addition, would like to thank Dr. Kamil Kaloush of Arizona State University who assisted in reviewing the project and assembling data.
Disclaimer
The contents of this report and theoretical models reflect only the views of the authors. The authors do not endorse specific proprietary products or manufacturers. Trade or manufacturers’ names appear herein solely because they are considered essential to the object of this report.
References
AASHTO, AASHTO Design of Pavement Structures. AASHTO, 1993.
ASTM 6433, “Standard Practice for Roads and Parking Lots Pavement Condition Index Surveys,” ASTM 2007 Annual Book of ASTM Standards, Volume 04.03, 2007.
Caltrans, “Maintenance Technical Advisory Guide (TAG),” Caltrans, Office of Pavement Preservation, Division of Maintenance, October, 2003.
Green, E. L. and William J. Tolonen, “The Chemical and Physical Properties of Asphalt-Rubber Mixtures,” Arizona Department of Transportation, ADOT-RS-14(162), July, 1977.
Kaloush, K., Witczak, M., Way, G., Zborowski, A., Abojaradeh, M., and Sotil, A., “Performance Evaluation of Arizona Asphalt Rubber Mixtures Using Advanced Dynamic Material Characterization Tests”, Final Report Submitted to FNF Construction and the Arizona Department of Transportation, July 2002.
Kaloush, K., Zborowski, A., Sotil, A., Abojaradeh, M., and Way G. “Material Characteristicsof Asphalt Rubber Mixtures”. Proceedings Asphalt Rubber 2003 Conference, ISBN 85-903997-1-0, p129-145, Brasilia, Brazil, December 2003.
Qi, Xicheng, Aroon Shenoy, Ghazi Al-Khateeb, Terry Arnold, Nelson Gibson, Jack Youcheffand Tom Harman, “Laboratory Characterization and Full-scale Accelerated Performance Testing of Crumb Rubber Asphalts And Other Modified Asphalt Systems,” Proceedings of the Asphalt Rubber 2006 Conference, Pages 39-65, Palm Springs, California, October 25-27, 2006, ISBN 962-405-091-0.
Shell, “1985 Addendum to 1978 Shell Pavement Design Manual,” Shell InternationalPetroleum Company, Limited, London, 1985.
Sousa, Jorge, Jorge C. Pais and Rachid Saim, “The Effect of Mode of Loading on theComparison Between Asphalt Rubber and Traditional Hot Mixes Laboratory Performance,” Proceedings of the Asphalt Rubber 2000 Conference, Pages 259-272, Vilamoura, Portugal, November 14-17, 2000, ISBN 972-95240-9-2.

72 Asphalt-Rubber 2009
Sousa, Jorge, Jorge C. Pais, Rachid Saim, George Way, and Richard N. Stubstad, “Development of a Mechanistic Overlay Design Method Based on Reflective Cracking Concepts,” Rubber Pavements Association, Tempe, Arizona, July, 2001.
Sousa, J. B., PAIS, Jorge C., SAIM, Rachid, George B. Way & STUBSTAD, Richard N, “Development of a Mechanistic-Empirical Based Overlay Design Method for Reflective Cracking”, Transportation Research Board, 2002, p. 209-217
Sousa, Jorge, Jorge C. Pais and George B. Way, “A Mechanistic-Empirical Based OverlayDesign Method for Reflective Cracking,” Proceedings of the Asphalt Rubber 2003 Conference, Pages 85-110, Brasilia, Brazil, December 1-4, 2003, ISBN 85-903997-1-0.
Sousa, Jorge, George B. Way, Shakir Shatnawi and Catia Dantas, “Asphalt Rubber in New Pavement Design and Construction,” Proceedings of the Asphalt Rubber 2006 Conference, Pages 67-98, Palm Springs, California, October 25-27, 2006, ISBN 962-405-091-0.
Sousa, Jorge, George B. Way, “Considerations for Estimating Pavement Treatment Livesand Pavement Life Extension on Flexible Pavement”, Report for California Department of Transportation and California Pavement Preservation Center, August 22, 2007
Sousa, Jorge, George B. Way, “CONSIDERATIONS FOR ESTIMATING PAVEMENTTREATMENT LIVES AND PAVEMENT LIFE EXTENTION ON FLEXIBLE PAVEMENTS Volume 1,” Report for California Department of Transportation and California Pavement Preservation Center, Feb. 2009.
Sousa, Jorge, George B. Way, “MODELS FOR ESTIMATING TREATMENT LIVES,PAVEMENT LIFE EXTENTION AND THE COST EFFECTINESS OF TREATMENTS ON FLEXIBLE PAVEMENTS Volume 2,” Report for California Department of Transportation and California Pavement Preservation Center, Feb. 2009.
Way, George, “Prevention of Refection Cracking in Arizona Minnetonka-East (A Case S tudy) , ” Ar izona DOT, Repor t Number 11 HPR-1-13(224) , May, 1976 .
Way, George, “Prevention of Refection Cracking Minnetonka-East,” Arizona DOT, Report Number 1979, GWI, August, 1979.
Way, George, “Prevention of Reflective Cracking in Arizona,” TRB, National Academy ofSciences, TRB, National Academy of Sciences, Transportation Research Record 756, pp. 29-32, 1980.
Zborowski, Aleksander and Kamil E. Kaloush “Predictive Equations to Evaluate ThermalFracture of Asphalt Rubber Mixtures”, Pages 177-192, Proceedings of the Asphalt Rubber 2006 Conference, ISBN 962-405-091-0.
Performance Evaluation and Design 73
Optimum Timing for Pavement Treatment Application
Jorge B. Sousa — George Way
Consulpav Consulpav
[email protected]@cox.net
ABSTRACT: One difficult aspect associated with pavement maintenance strategies is the assessment of the proper timing to intervene in a continuously deteriorating pavement and pavement network. This paper addresses the research efforts undertaken to determine the optimal time for maintenance treatment application and provide an assessment of cost effectiveness of each type of treatment in terms of its own duration and its contribution to pavement life extension. Although there are many studies on structural pavement rehabilitation greater than one inch in thickness, comprehensive research on thin maintenance treatments is more difficult to obtain. In addition, little if any objective maintenance performance data and associated materials properties and aging were very hard to obtain in California. Structural and reflective cracking analyses indicate that the optimum time to apply a treatment is when the pavement cracking levels are in the range of 1% to 2%. There are significant structural benefits (structural pavement life extension) when a pavement has a waterproofing treatment applied by the time it reaches 4 to 5% cracking. Preventive maintenance treatments, if applied at the correct time, with long lasting 100% waterproofing capabilities, can provide structural life extensions for the underlying pavement of up to almost 3 years.
KEYWORDS: Preventative Maintenance Treatments, Optimal Timing, Treatment Performance Capacity, Asphalt Pavements

74 Asphalt-Rubber 2009
1. Introduction
The California Department of Transportation (Caltrans) employs a variety of pavement preservation (preventive maintenance or corrective maintenance) treatments to maintain and preserve their network of paved highways as shown in Figure 1 (Maintenance, 2003). The primary purpose of the proactive pavement preservation program is to delay the need for costly pavement rehabilitation or reconstruction.
Preventative Maintenance *
Corrective Maintenance
Rehabilitation
Emergency Reconstruction
Figure 1. Pavement Condition vs. Life and Type of Work Required
The history of the use of these various maintenance treatments reaches back as far as 1949 (Hveem 1949) if not earlier. Hveem discussed the purpose of the seal coat, although his discussion can be applied to many different types of maintenance surface treatments. He noted the term “seal coat” was to seal the road surface; that is, to prevent surface water from penetrating the pavement or base. However, all highway engineers will recognize that a surface treatment of asphalt and screenings may be applied to a road to accomplish one or more of several distinct purposes. Distinct purposes enumerated for seal coats are as follows (Hveem 1949):
1. Seal the road to the entrance of moisture2. Develop a non-skid surface on the existing road3. Apply fresh coatings of aggregate which will enliven and provide an all weathered
surface to improve wear resistance4. Reinforce and build an adequate pavement surface5. Provide new stripping between lanes.6. Improve luminosity.

Performance Evaluation and Design 75
Hveem identified sealing out moisture as the primary reason for a seal coat application. Later he noted (Hveem 1950) that the structural integrity and endurance of most engineering works are jeopardized by the action of water. He went on to state that in its simplest form then, one of the major problems confronting the civil engineer is the necessity for guarding against or combating the deleterious effects arising from the action of water upon the materials of construction. Thus maintenance surface treatments need to be able to some degree to seal out water, Figure 2.
Figure 2. Effect of too much water in the roadway
Historically, thin pavement preservation surfacing less than one inch in thickness are considered to improve one or more of the distinct purposes enumerated by Hveem, but the degree of structural reinforcement of these thin treatments has been difficult to estimate. The purpose of this paper is to present an approach to estimate, in a rational manner, the pavement life extension added by different types of treatment. Life extension is defined as the time the treatment delays the need for rehabilitation. Treatment life does not necessarily equal life extension; it is often less depending when the treatment is placed as shown in Figure 3.
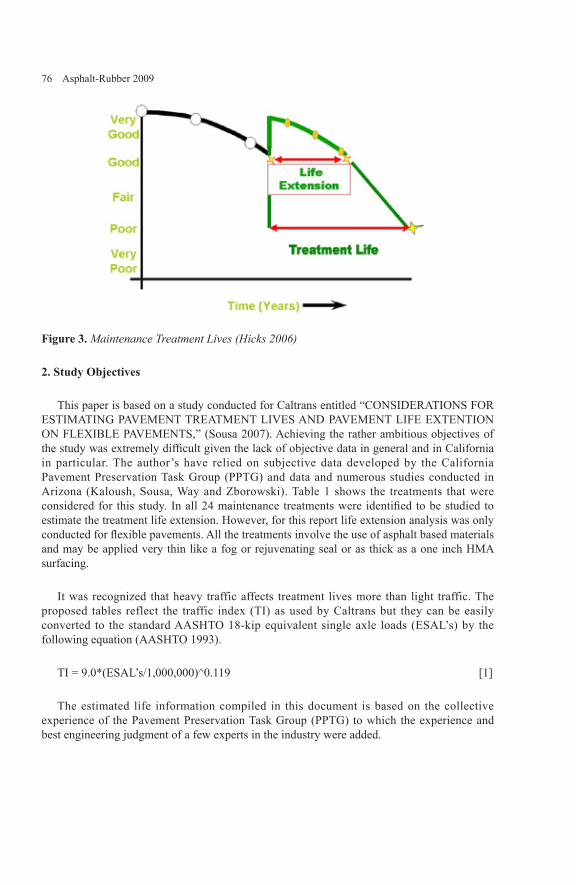
76 Asphalt-Rubber 2009
Figure 3. Maintenance Treatment Lives (Hicks 2006)
2. Study Objectives
This paper is based on a study conducted for Caltrans entitled “CONSIDERATIONS FOR ESTIMATING PAVEMENT TREATMENT LIVES AND PAVEMENT LIFE EXTENTION ON FLEXIBLE PAVEMENTS,” (Sousa 2007). Achieving the rather ambitious objectives of the study was extremely difficult given the lack of objective data in general and in California in particular. The author’s have relied on subjective data developed by the California Pavement Preservation Task Group (PPTG) and data and numerous studies conducted in Arizona (Kaloush, Sousa, Way and Zborowski). Table 1 shows the treatments that were considered for this study. In all 24 maintenance treatments were identified to be studied to estimate the treatment life extension. However, for this report life extension analysis was only conducted for flexible pavements. All the treatments involve the use of asphalt based materials and may be applied very thin like a fog or rejuvenating seal or as thick as a one inch HMA surfacing.
It was recognized that heavy traffic affects treatment lives more than light traffic. The proposed tables reflect the traffic index (TI) as used by Caltrans but they can be easily converted to the standard AASHTO 18-kip equivalent single axle loads (ESAL’s) by the following equation (AASHTO 1993).
TI = 9.0*(ESAL’s/1,000,000)^0.119 [1]
The estimated life information compiled in this document is based on the collective experience of the Pavement Preservation Task Group (PPTG) to which the experience and best engineering judgment of a few experts in the industry were added.

Performance Evaluation and Design 77
Table 1. Maintenance Pavement Treatments Used by Caltrans Flexible Pavements
Maintenance Treatment Maintenance Treatment
Hot Mix Asphalt (HMA) Asphalt Concrete (AC)1 HMA Crack Sealing 14 Conventional HMA, 1 inch
2 HMA Crack Filling 15 Open Graded OGAC, 1 inch
3 Fog Seals 16 PBA HMA, 1 inch
4 Rejuvenator Seals5 Scrub Seals Rubberized AC (RAC)
6 Slurry Seals 17 RAC-G Gap Graded, 1 inch
7 REAS Slurry Seal 18 RAC-O Open Graded, 1 inch
8 Micro-Surfacing 19 RAC-O(HB) High Binder, 1 inch
9 Polymer Modified Emulsion (PME) Chip Seal
10 Polymer Modified Asphalt (PMA) Chip Seal Bonded Wearing Course (BWC)
11 Asphalt Rubber (AR) Chips Seal 20 BWC- Open, ¾ inch
12 Asphalt Rubber Cape Seals AR (slurry) ½ inch 21 BWC- Gap, ¾ inch
13 Asphalt Rubber Cape Seals AR (micro) 3/4 inch 22 BWC- RAC- ¾ inch
23 BWC- RAC-O, ¾ inch
As previously stated, the data used in this study still needs to be verified in California using actual performance data from the existing Caltrans performance data bases or pavement management systems. Nevertheless, an attempt is made in this report to verify the models as best as the limited data outside of California allows. Of course, the life of the treatment is highly dependent on the timing of the treatment, the traffic it experiences, and the climate it is placed in and these factors are addressed in the models as best as possible given the limited data and information. The time of placement of the treatments can influence the performance that is treatments placed on good pavements will last longer than treatments placed on bad pavements. Many times, a treatment is scheduled to be placed on a good pavement, but by the time it is actually placed, the condition of the pavement has deteriorated and this will affect the expected live of the treatment. The models developed in this study are limited by this observation of actual practice. To the degree practical, the models in this report address the lives of the treatment as a function of the level of traffic and climate (coastal, valley, mountains, and desert) in which the treatment is placed.

78 Asphalt-Rubber 2009
3. Effects of Waterproofing on Treatment Life
Water within pavement layers is a principal cause of pavement deterioration (Cedergren 1994). Specific problems associated with water include: stripping of asphalt pavement; joint displacement in concrete pavements; reduction in pavement strength due to positive pore water pressures in the base course layers; shrinking and swelling of subgrade materials due to water content changes; and frost heave and thaw weakening due to upward (capillary) flow beneath pavements. Water related problems are thus responsible for decreased pavement life, increased costs for maintenance, and increased pavement roughness, and occur throughout all regions and climates of the US. A recent National Cooperative Highway Research Program study estimated that excess water reduces the life expectancy of pavement systems by more than half (Christopher and McGuffey,1997).
One of the major contributors to deterioration and premature failure of flexible pavements is the presence of excessive moisture within the pavement structure. Water from many sources enters a pavement structure. The largest source of free water in pavement is from surface infiltration (Cedergren, 1974).
Excessive moisture that remains under the paved surface can substantially decrease the service life of a pavement structure. Early full-scale pavement tests in the United States, including the Maryland Road Test (HRB, 1952), the WASHO Road Test (HRB, 1955), and the AASHO Road Test (HRB, 1962), indicated that rates of pavement damage attributable to traffic were significantly higher when the pavement structure was saturated. Cedergren (1974) predicted a 50% reduction in pavement service life if a pavement base was saturated as little as 10% of the time.
A treatment can also be evaluated based on its water proofing capabilities. Waterproofing is an important characteristic of a treatment from a view point of preserving the investment in the pavement structure. Some treatments afford minimal waterproofing and would also be ranked as a relatively short life. Not all treatments are equal in their structural and functional roles.
A fog seal serves the purpose of holding the existing aggregate in place and thus delaying raveling for a short time. It is not considered to be a waterproofing layer in the same sense as a seal coat; however their contribution for evaluating extended structural pavement life can be understood through its water proofing capability.
Likewise, crack seals, seal coats, microsurfacings, chip seals and any other treatment that is not placed with a screed (laydown) does not improve the ride. The ride smoothness is the most important functional attribute that a pavement can have and is by far the one that drivers consider of most importance. Notwithstanding these treatments lack of improving the ride smoothness can significantly contribute to the waterproofing of a pavement. Likewise safety is very important that is why any treatment that reduces skid resistance should not be used since as engineers first priority is always safety.
All these things are important in judging which treatment to use and when to use it. In addition, it doesn’t rain that often in the desert areas so deflections remain very flat over time

Performance Evaluation and Design 79
and aging becomes more of the predominate damage factor. So in low aging areas like high rainfall, coastal areas waterproofing is important, in desert areas aging is important, and in mountainous areas, snow and ice (water in another form) is important. However, given the constraints in this project, there was a need to concentrate on waterproofing capabilities of the treatments. Based on the engineering judgment of the authors, Table 2 was developed showing how effective a treatment is at waterproofing a pavement as a function of the pavement condition.
Table 2. Percent Waterproofing for Various Treatments
Maintenance Treatment Waterproofing Waterproofing Waterproofing
Pavement Pavement Pavement
Condition Condition Condition
HMA Crack sealing 70 30 15
HMA Crack filling 30 15 5
Fog seals 10 5 0
Rejuvenator seals 10 5 0
Scrub seals 50 25 15
Slurry seals 50 25 15
REAS slurry seal 50 25 15
Micro-Surfacing 40 20 15
PME chip seals 40 20 10
PMA chip seals 40 20 10
AR chip seals 80 70 60
Cape seals AR (slurry) ½ inch 90 80 70
Cape seals AR (micro) ¾ inch 100 100 80
Conventional HMA, 1 inch 60 40 25
OGAC, 1 inch 60 40 20
PBA HMA, 1 inch 60 40 25
RAC-G, 1 inch 60 45 35
RAC-O, 1 inch 60 50 40
RAC-O (HB), 1 inch 70 65 55
BWC-Open, ¾ inch 50 40 20
BWC-Gap, ¾ inch 50 40 20
BWC-RAC-G, ¾ inch 50 40 30
BWC-RAC-O, ¾ inch 50 40 30
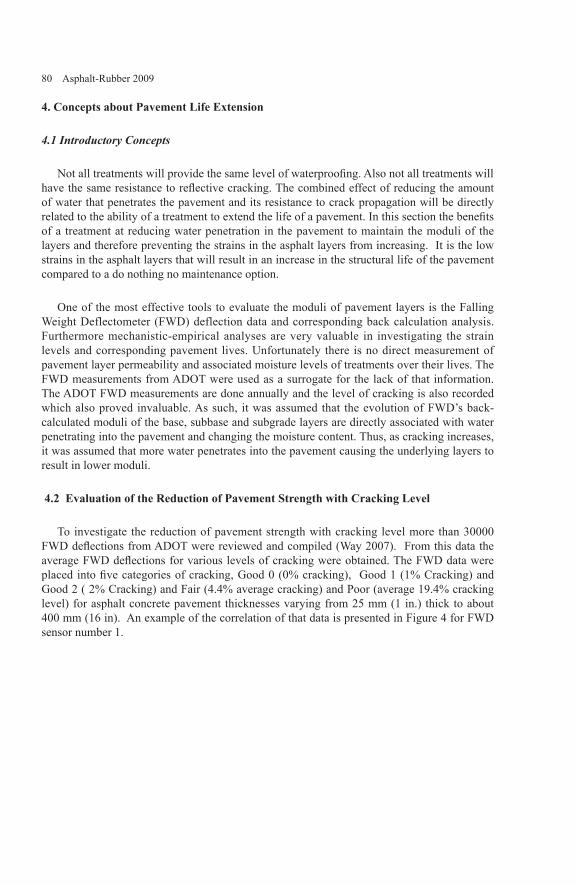
80 Asphalt-Rubber 2009
4. Concepts about Pavement Life Extension
4.1 Introductory Concepts
Not all treatments will provide the same level of waterproofing. Also not all treatments will have the same resistance to reflective cracking. The combined effect of reducing the amount of water that penetrates the pavement and its resistance to crack propagation will be directly related to the ability of a treatment to extend the life of a pavement. In this section the benefits of a treatment at reducing water penetration in the pavement to maintain the moduli of the layers and therefore preventing the strains in the asphalt layers from increasing. It is the low strains in the asphalt layers that will result in an increase in the structural life of the pavement compared to a do nothing no maintenance option.
One of the most effective tools to evaluate the moduli of pavement layers is the Falling Weight Deflectometer (FWD) deflection data and corresponding back calculation analysis. Furthermore mechanistic-empirical analyses are very valuable in investigating the strain levels and corresponding pavement lives. Unfortunately there is no direct measurement of pavement layer permeability and associated moisture levels of treatments over their lives. The FWD measurements from ADOT were used as a surrogate for the lack of that information. The ADOT FWD measurements are done annually and the level of cracking is also recorded which also proved invaluable. As such, it was assumed that the evolution of FWD’s back-calculated moduli of the base, subbase and subgrade layers are directly associated with water penetrating into the pavement and changing the moisture content. Thus, as cracking increases, it was assumed that more water penetrates into the pavement causing the underlying layers to result in lower moduli.
4.2 Evaluation of the Reduction of Pavement Strength with Cracking Level
To investigate the reduction of pavement strength with cracking level more than 30000 FWD deflections from ADOT were reviewed and compiled (Way 2007). From this data the average FWD deflections for various levels of cracking were obtained. The FWD data were placed into five categories of cracking, Good 0 (0% cracking), Good 1 (1% Cracking) and Good 2 ( 2% Cracking) and Fair (4.4% average cracking) and Poor (average 19.4% cracking level) for asphalt concrete pavement thicknesses varying from 25 mm (1 in.) thick to about 400 mm (16 in). An example of the correlation of that data is presented in Figure 4 for FWD sensor number 1.
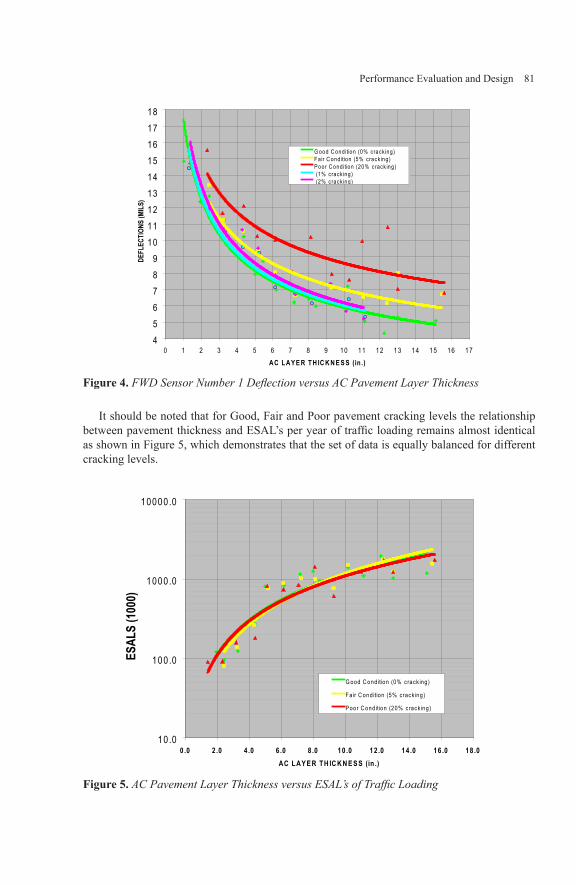
Performance Evaluation and Design 81
456789
101112131415161718
0 1 2 3 4 5 6 7 8 9 10 11 12 13 14 15 16 17AC LAYE R TH IC K N E S S (in .)
DEFL
ECTI
ONS
(MIL
S)G ood C ond ition (0% crack ing)Fa ir C ond ition (5% crack ing)P oor C ond ition (20% crack ing) (1% crack ing) (2% crack ing)
Figure 4. FWD Sensor Number 1 Deflection versus AC Pavement Layer Thickness
It should be noted that for Good, Fair and Poor pavement cracking levels the relationship between pavement thickness and ESAL’s per year of traffic loading remains almost identical as shown in Figure 5, which demonstrates that the set of data is equally balanced for different cracking levels.
10.0
100.0
1000.0
10000.0
0 .0 2 .0 4 .0 6 .0 8 .0 10 .0 12 .0 14 .0 16 .0 18 .0AC LAYE R TH IC K N E S S (in .)
ESAL
S (1
000)
G ood C ond ition (0% crack ing)
Fa ir C ond ition (5% crack ing)
P oor C ond ition (20% crack ing)
Figure 5. AC Pavement Layer Thickness versus ESAL’s of Traffic Loading
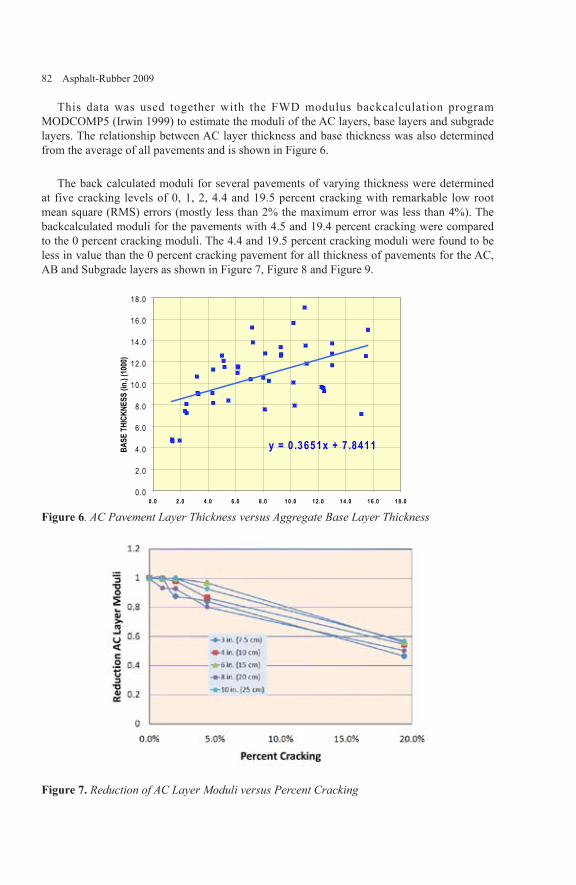
82 Asphalt-Rubber 2009
This data was used together with the FWD modulus backcalculation program MODCOMP5 (Irwin 1999) to estimate the moduli of the AC layers, base layers and subgrade layers. The relationship between AC layer thickness and base thickness was also determined from the average of all pavements and is shown in Figure 6.
The back calculated moduli for several pavements of varying thickness were determined at five cracking levels of 0, 1, 2, 4.4 and 19.5 percent cracking with remarkable low root mean square (RMS) errors (mostly less than 2% the maximum error was less than 4%). The backcalculated moduli for the pavements with 4.5 and 19.4 percent cracking were compared to the 0 percent cracking moduli. The 4.4 and 19.5 percent cracking moduli were found to be less in value than the 0 percent cracking pavement for all thickness of pavements for the AC, AB and Subgrade layers as shown in Figure 7, Figure 8 and Figure 9.
y = 0 .3651x + 7 .8411
0.0
2 .0
4 .0
6 .0
8 .0
10.0
12.0
14.0
16.0
18.0
0 .0 2 .0 4 .0 6 .0 8 .0 10 .0 12 .0 14 .0 16 .0 18 .0
AC LAY E R TH IC K N E S S (in .)
BASE
THI
CKNE
SS (i
n.) (
1000
)
Figure 6. AC Pavement Layer Thickness versus Aggregate Base Layer Thickness
Figure 7. Reduction of AC Layer Moduli versus Percent Cracking

Performance Evaluation and Design 83
Figure 8. Reduction of Subgrade Layer Moduli versus Percent Cracking
Figure 9. Reduction of Base Layer Moduli versus Percent Cracking
For the purpose of this investigation, it was assumed that the reduction in subgrade moduli and base moduli present in the 1, 2, 4.4 and 19.5 percent cracked pavements was basically caused by moisture/water. Clearly, this is a bold assumption because one other aspect can be responsible for the decrease in subgrade and base moduli (namely the higher strains representing the POOR and FAIR pavement) because the AC layer modulus has decreased due to the presence of cracking.
However, given the strong effect that water can have in the pavements, this was considered a valid assumption at this time. Also the reduction of moduli is not very significant in well

84 Asphalt-Rubber 2009
compacted materials if the strain levels are low enough.
Using elastic layer theory (the BISAR program was used to compute stresses and strains) and taking advantage of the well established SHELL equations to relate strains in the bottom of asphalt layer and top of subgrade layer to pavement life, the lives for several pavements with 75, 100, 150, 200, 250 mm (3, 4, 6, 8 and 10 in.) thickness and at the 5 levels of cracking were computed and shown in Table 3.
Table 3. Determination of Remaining Life Function of Cracking Level (0, 1, 2, 4.4 and 19.5%)

Performance Evaluation and Design 85
To develop Table 3 the following equations used were:
1. Maximum admissible tensile strain on the base of traditional asphalt concrete layers (Shell 1985):
2.036.0.)08.1856.0( −− ×+= NEV mbε ……………………………………………[2]
where:ε – tensile strainVb – volumetric bitumen percentage Em – bituminous mixture deformation modulus N – 86 KN standard axle number
2. Foundation soil top maximum compressive strain (Shell 1985):
25.0−×= NKsε ………………………………………………………………………[3]
where:ε – compressive strainKs – parameter depending on survival probability adopted in the criteria for pavement
design (0.028 - 50% survival probability; 0.021 - 85% survival probability; 0.018 - 95% survival probability)
N – 86 KN standard axle number
The following is a detailed description of the development of Table 3 and its meaning. It was assumed based on ADOT experience that a GOOD pavement with 0% cracking has an average life of 12 years. Caltrans often places treatments on pavement with up to 25% cracking or more indicating the life of their treatments on such a badly cracked pavement will be much less than 12 years.
The Remaining Life (Do Nothing) column in Table 3 is computed assuming that a pavement in good condition will last 12 years. Based on this assumption, the annual traffic is computed (assuming no annual growth). Using that annual traffic computed from above the number of years that remain for each condition (1%, 2%, 4.4% and 19.5% cracking) is determined.
The number of years determined from the Do Nothing scenarios is the benchmark for the rest of the analysis. As such the extra fatigue life determined from the Bisar and Shell analysis for the 100% and 50% levels of water proofing are computed to determine how many years the pavement will last after the treatment is done (assuming that the waterproofing will last at least as long as needed). The numbers in the tables were computed for each pavement thickness. The somewhat similarity of duration for each case is due to the fact that it is assumed that the pavement thickness is such that it can take the traffic and fail in 12 years. The steps taken in the analysis are summarized below.
The approach to investigate the increased structural pavement life was as such:
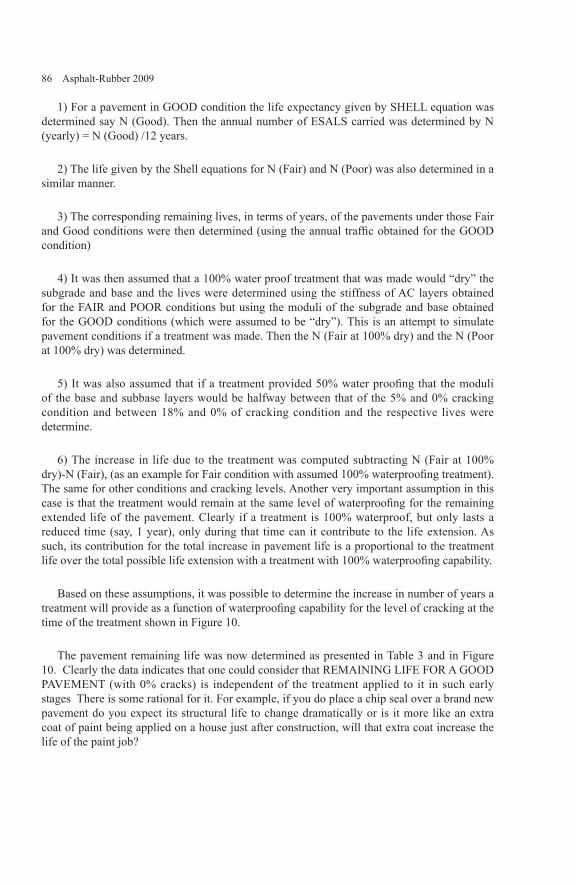
86 Asphalt-Rubber 2009
1) For a pavement in GOOD condition the life expectancy given by SHELL equation was determined say N (Good). Then the annual number of ESALS carried was determined by N (yearly) = N (Good) /12 years.
2) The life given by the Shell equations for N (Fair) and N (Poor) was also determined in a similar manner.
3) The corresponding remaining lives, in terms of years, of the pavements under those Fair and Good conditions were then determined (using the annual traffic obtained for the GOOD condition)
4) It was then assumed that a 100% water proof treatment that was made would “dry” the subgrade and base and the lives were determined using the stiffness of AC layers obtained for the FAIR and POOR conditions but using the moduli of the subgrade and base obtained for the GOOD conditions (which were assumed to be “dry”). This is an attempt to simulate pavement conditions if a treatment was made. Then the N (Fair at 100% dry) and the N (Poor at 100% dry) was determined.
5) It was also assumed that if a treatment provided 50% water proofing that the moduli of the base and subbase layers would be halfway between that of the 5% and 0% cracking condition and between 18% and 0% of cracking condition and the respective lives were determine.
6) The increase in life due to the treatment was computed subtracting N (Fair at 100% dry)-N (Fair), (as an example for Fair condition with assumed 100% waterproofing treatment). The same for other conditions and cracking levels. Another very important assumption in this case is that the treatment would remain at the same level of waterproofing for the remaining extended life of the pavement. Clearly if a treatment is 100% waterproof, but only lasts a reduced time (say, 1 year), only during that time can it contribute to the life extension. As such, its contribution for the total increase in pavement life is a proportional to the treatment life over the total possible life extension with a treatment with 100% waterproofing capability.
Based on these assumptions, it was possible to determine the increase in number of years a treatment will provide as a function of waterproofing capability for the level of cracking at the time of the treatment shown in Figure 10.
The pavement remaining life was now determined as presented in Table 3 and in Figure 10. Clearly the data indicates that one could consider that REMAINING LIFE FOR A GOOD PAVEMENT (with 0% cracks) is independent of the treatment applied to it in such early stages There is some rational for it. For example, if you do place a chip seal over a brand new pavement do you expect its structural life to change dramatically or is it more like an extra coat of paint being applied on a house just after construction, will that extra coat increase the life of the paint job?

Performance Evaluation and Design 87
y = 12.843e-0.0791x
R2 = 0.9336
y = 12.555e-0.1066x
R2 = 0.969y = 12e-0.1373x
R2 = 0.9657
0
1
2
3
4
5
6
7
8
9
10
11
12
13
0 2 4 6 8 10 12 14 16 18 20 22
Percent (%) Cracking at time of treatment
Rem
aini
ngLi
fe (y
ears
)
No treatment
100% waterproofing treatment
50% waterproofing treatment
Figure 10. Pavement Remaining Structural Life vs. Cracking Level (based on data at 1, 2, 4.5 and 18% cracking)
From this data the Pavement Life Extension for preservation treatments with 50% and 100% waterproofing capability can be derived and shown in Figure 11.
0
0.5
1
1.5
2
2.5
3
0 5 10 15 20 25
Percent Cracking at Time of Treatment Placement (%)
Pave
men
tStr
uctu
ralL
ifeEx
tens
ion
(yea
rs)
Treatment Waterproofing Capability - 50%
Treatment Waterproofing Capability - 100%
Figure 11. Structural Life Extension vs. Percent Cracking at Time of Treatment (based on data at 1, 2, 4.5 and 18.5%)
Figure 11 implies that there is no reason for applying much in the way of preservation treatments in the very early stages of a pavement life (before cracks develop) but rather there is really an optimum time for pavement preservation which is between the time the pavement is 4 to 8 % cracked, depending on whether it is a 50% waterproof treatment or a

88 Asphalt-Rubber 2009
100% waterproofing treatment. It is also clear the great benefit of the level of waterproofing a treatment can bring to a pavement.
However, if the shape of each curve in Figure 12 is studied, it can be observed that a big drop in remaining life is reached when the pavement exhibits 2 to 5% cracking. This is probably due to the fact that at this stage the pavement structure weakens from the water “damaging” the base and subgrade.
0
1
2
3
4
5
6
7
8
9
10
11
12
13
0 2 4 6 8 10 12 14 16 18 20 22
Percent (%) Cracking at time of treatment
Rem
aini
ngLi
fe(y
ears
)
No treatment100% waterproofing treatment50% waterproofing treatment
Figure 12. Pavement Remaining Structural Life vs. Cracking Level (based on data at 1, 2, 4.5% and 18% cracking) (no best fit)
Looking at the FWD deflections in Figure 13 of the seventh geophone, DF7, which is indicative of subgrade support (or lack of support), reveals some of the damage process as a function of cracking level.
0.8
0.9
1.0
1.1
1.2
1.3
1.4
1.5
0 1 2 3 4 5 6 7 8 9 10 11 12
AC LAYER THICKNESS (in.)
DEF
LEC
TIO
NS
(MIL
S)
Good Condition (0% cracking)Fair Condition (5% cracking)Poor Condition (20% cracking)(1% cracking)(2% cracking)
Figure 13. FWD Geophone Number 7 (DF7) Deflection Related to the AC Layer Thickness and Level of Percent Cracking

Performance Evaluation and Design 89
It can clearly be observed in Figure 13 that most of the loss of subgrade strength (higher DF7 deflection) occurs when the cracking increases from 1 or 2% to about 4.5%. After that the rate of loss of strength with cracking level is not as severe. This is probably due to the cracking level magnitude allowing water penetration to some degree to reach the base and subgrade and thus reduce the moduli. As such this is the crucial point where pavement preservation strategies must intervene by sealing the pavement to prevent water intrusion. Conversely, Figure 14 (based on actual values from the study not the best fit computation) demonstrates the huge benefits of making sure that the pavement is sealed before cracking levels reach 3 to 5%.
This analysis also indicates that the pavement should be sealed as cracking develops. Structural cracks will indeed occur as a pavement ages. Pavement preservation treatments, in order to extend structural pavement life must act to prevent water from penetrating the pavement as soon as 1 to 2% cracking is reached. Pavement preservation may be delayed but should not be delayed beyond 3 to 5 % cracking because by then weaker foundations have accelerated the loss of the pavement flexural fatigue life due to increased deformability (deflection) of the structure of the pavement.
0.0
0.5
1.0
1.5
2.0
2.5
3.0
3.5
4.0
4.5
5.0
0 2 4 6 8 10 12 14 16 18 20
% Cracking at time of 100% waterproof treatment
Stru
ctur
alLi
feIn
crea
se(y
ears
)
Th = 3 in.Th = 4 in.Th = 6 in.Th = 8 in.Th = 10 in.
Figure 14. Structural Life Increase as a Function of cracking Level for Several Pavement Thicknesses (using 100% waterproof treatments)
It was interesting to note that the structural life increase for all pavement thickness is very similar as a function of percent cracking at time of treatment for all asphalt concrete layer thickness except for the 75 mm (3 in.) section. To investigate the reason for this “abnormality”, the back calculated AC layer moduli are examined as a function of pavement thickness as shown in Figure 15. It is noticeable that the back calculated moduli for the 75 mm (3 in.) thick pavement is much higher then for all other pavements. This is probably due to the fact that in a thin AC layer ages to a greater degree then the thicker pavements. As such, it is speculated that due to aging of the relatively thin asphalt concrete layer some capability of recuperating structural life is lost. It is well recognized that a hot mix with a stiffer asphalt binder in general has a lower fatigue life at the same strain level then a softer binder.

90 Asphalt-Rubber 2009
0
1000
2000
3000
4000
5000
6000
7000
8000
9000
0 2.5 5 7.5 10 12.5
AC Thickness (in.)
AC
Bac
kC
alcu
late
dM
odul
i(M
Pa)
Figure 15. Effect of Thickness on the Back Calculated Moduli of the AC Layer
After taking special care to minimize all back calculation errors the FWD values for the 200 mm and 250 mm (8 and 10 in.) thick pavements was redone and the layer moduli relationship at various cracking levels investigated. The results are shown in Figure 16 and Figure 17. It is in Figure 16 clear the as cracking increases the layer moduli of the AB base and subgrade foundation decrease. A sharper decrease can be observed between 2 and 5% cracking levels. It should be noted that even thicker pavements exhibit aging with time. As can be observed in Figure 17, before the AC layer moduli is severely decreased by more extensive cracking it increases due to aging, until the cracking levels reach 2 percent. This further validates the findings that preventive maintenance activities should take place before cracking levels reach 1 or 2 percent levels to maximize structural pavement life extension.
0
50
100
150
200
250
300
0 4 8 12 16 20% C rack ing
Laye
rMod
uli(
Mpa
)
B ase Layer - 10 inFoundation -10 in .B ase Layer - 8 in .Foundation - 8 in .
Figure 16. Variation of AB Base and Subgrade moduli of 200 and 250 mm (8 and 10 in.) AC thick pavements with percent cracking levels

Performance Evaluation and Design 91
0
500
1000
1500
2000
2500
3000
3500
0 4 8 12 16 20
% Cracking
Laye
rMod
uli (
MPa
)Asphalt Concrete Layer - 10 inAsphalt Concrete Layer - 8 in
Figure 17. Variation of AC Layer Moduli with Cracking Level for 200 and 250 mm (8 and 10 in.) AC Thick Pavements
5. Optimum Time for Treatments
The determination of the optimum time for overlay is essential when it is necessary to optimize budgets in order to ensure acceptable levels of road serviceability. In the papers by the authors (Sousa, 2009) it was determined that treatments with high Treatment Performance Capacity (TPC), such as those using asphalt-rubber binder, will outperform treatments with low TPC in every pavement condition and region. Treatments with low TPC will not last as long and will age faster and thus be more prone to cracking and consequently allow more water to penetrate into the pavement structure (if it is already cracked).
As a pavement is subjected to traffic and aging factors it will go through several stages of degradation. During a first phase the pavement structure is intact and the pavement surface layers will age (become harder and more brittle) while consuming fatigue life. As the fatigue life reaches the end of its capability the pavement sections with lower compaction levels and lower amounts of asphalt will first exhibit cracking which will allow water to penetrate into the pavement. As the water penetrates into the asphalt structure, aggregate base and subgrade it will reduce their moduli and will cause a “softer” foundation to induce higher strains in the asphalt layers leading to accelerated fatigue damage.
When a thin maintenance surface treatment is placed on the pavement it has some degree of waterproofing capability which keeps the base and subgrade in a more stable condition thus promoting a more sound foundation and leading to an increase in pavement life. However the treatment itself is subject to aging. As it ages and is subjected to traffic loads it will also crack and allow water to penetrate again into the base and subgrade.
If a treatment that has a low TPC is applied while the pavement has no cracks it is likely that it will age before it can perform its function. It is possible that such a treatment with a low

92 Asphalt-Rubber 2009
TPC may last 3 years and that treatment is placed when a pavement as 0 or 1 percent cracked. By the time the pavement develops 4 or 5 percent cracking (when water does start to seriously affect subgrade moduli) the treatment is already consumed and of little or no value (too brittle and prone to cracking to actually be effective.) In this sense this was a treatment of low long term value.
However if a high TPC treatment is placed instead it may be able to function well at the outset of the cracking thus provide some water penetration mitigation and extend the pavement life. In this case some of the capabilities of the treatment were consumed but because it was a longer lasting it still had performance capacities enough left to perform most of its function.
The treatment may be placed after the pavement reaches 10 or 12% cracking. By that time structural damage has reached such an extent that even if a 100% water proof treatment is placed with high TPC there is little opportunity to recover from all the loss.
Data appear to indicate that the maximum beneficial effects of a high TPC treatment are obtained when the treatment is placed as soon as it reaches a cracking level of 1 or 2%. At the most such treatment should be placed before the pavement reaches 4 to 5 % so that the highest benefits in terms of pavement life extension can be derived. In this case a structural life extension can reach 3 years.
Low TPC treatments should be placed very close to the time the pavement reaches 3 or 4% cracking to ensure that they are at their peak of performance when they are most needed.
There is no great benefit in delaying application of treatments past 4% cracking. From that point on for each percent cracking level reached structural life extension is always less even for very high TPC treatments.
It was not possible from the available data to determine how much time it takes for a pavement at the 1 or 2% level to deteriorate to the 4 or 5% level (function of region, pavement and traffic). This clearly would help Caltrans in the definition of trigger values to plan interventions for the years ahead. This aspect has been noted in the recommendations for further research.
Preventive maintenance strategies based on the concepts collected in this report should follow an approach similar to this:
(A) Determine when a pavement reaches 1 to 2 percent cracking and apply the treatment. It is noteworthy to consider that if a treatment trigger value is set at a higher value, (say 5 percent) it is very likely that by the time treatments are actually performed the pavement has already further deteriorate to 7 or 8percent cracking level. Also at 7 to 8 percent cracking the pavement structural layer experience accelerated rate of damage affecting the AC layer due to the much higher strain/deformation level existing when the pavement is at 4 to 5 percent cracking level).
(B) Apply the treatment with the most cost effective TPC/$ depending on what type of road it is. These theoretical model results indicate that materials that have large TPC to cost ratios, such as asphalt-rubber materials, would be expected to be very cost effective.

Performance Evaluation and Design 93
(C) If delayed maintenance is require all efforts should be made so that maintenance takes place before cracking levels reach 4 percent (i.e. pavements should be sealed from water penetration BEFORE they reach 4 to 5 percent cracking levels)
6. Conclusions
Structural and reflective cracking analyses indicate that the optimum time to apply a treatment is when the pavement cracking level is in the range of 1 to 2 percent. There are significant structural benefits (structural pavement life extension) when a pavement has a waterproofing treatment applied by the time it reaches 4 to 5 percent cracking. Preventive maintenance treatments, if applied at the correct time, with long lasting 100 percent waterproofing capabilities, can provide a structural life extension of about 3 years.
7. Acknowledgment
The authors would like to thank Dr. Kamil Kaloush of Arizona State University who assisted in reviewing the project and assembling data.
8. Disclaimer
The contents of this report and theoretical models reflect only the views of the authors. The authors do not endorse specific proprietary products or manufacturers. Trade or manufacturers’ names appear herein solely because they are considered essential to the object of this report.
9. References
AASHTO, AASHTO Design of Pavement Structures. AASHTO, 1993.
ASTM 6433, “Standard Practice for Roads and Parking Lots Pavement Condition Index Surveys,” ASTM 2007 Annual Book of ASTM Standards, Volume 04.03, 2007.
Cedergren, H.R., Arman, J.A., and O’Brien, K.H. (1973). Development of Guidelines for the Design of Subsurface drainage Systems for Highway Pavement Structural Sections.FHWA-RD-73-14. Federal Highway Administration, Washington, DC.
Cedergren, H.R. (1974). Drainage of Highway and Airfield Pavements. John Wiley & Sons, Inc., New York.
Cedergren, H.R. (1994). “America’s Pavements: World’s Longest Bathtubs,” CivilEngineering, American Society of Civil Engineering, September, pp. 56-58.
Christopher, B.R. and V.C. McGuffey (1997). NCHRP Synthesis of Highway Practice239: Pavement Subsurface Drainage Systems. TRB, National Research Council,Washington,
94 Asphalt-Rubber 2009
FWD, “Falling Weight Deflectometer Deflections,” Arizona DOT FWD Data Base, 2002
Green, E. L. and William J. Tolonen, “The Chemical and Physical Properties of Asphalt-Rubber Mixtures,” Arizona Department of Transportation, ADOT-RS-14(162), July, 1977.
Hicks, R. G. and Rob Marsh, “Pavement Preservation Sub-Group on Strategy Selection & Evaluation,” Power Point Presentation, April 25, 2006.
Hveem, F. N., Lovering, W.R., and G.B. Sherman, “The Design of Seal Coats and Surface Treatments,” State of California Department of Public Works Division or Highways, Materials and Research Department, 1950.
Hveem, F.N. (1950)). “WATER IN HIGHWAY SUBGRADES AND FOUNDATIONS,” State of California Department of Public Works Division or Highways, Materials and Research Department, Prepared for National Research Council
American Geophysical Union, South Pacific Meeting, Sections of Hydrology and Meteorology, University of California, Davis, California, February 3 and 4, 1950.
Kaloush, K., Witczak, M., Way, G., Zborowski, A., Abojaradeh, M., and Sotil, A., “Performance Evaluation of Arizona Asphalt Rubber Mixtures Using Advanced Dynamic Material Characterization Tests”, Final Report Submitted to FNF Construction and the Arizona Department of Transportation, July 2002.
Kaloush, K., Zborowski, A., Sotil, A., Abojaradeh, M., and Way G. “Material Characteristics of Asphalt Rubber Mixtures”. Proceedings Asphalt Rubber 2003 Conference, ISBN 85-903997-1-0, p129-145, Brasilia, Brazil, December 2003.
Maintenance, “Maintenance Technical Advisory Guide (TAG),” Caltrans, Office of Pavement Preservation, Division of Maintenance, October, 2003.
Irwin, L. H., “MODCOMP5,” Cornell University Local Roads Program, October, 1999.
Peters, Rowan and David Stephens, “Properties of Asphalts in Seal Coat Emulsions Field Test Status Report,” Arizona DOT, Presented at Annual Asphalt Emulsion Manufacturers Association Meeting, San Francisco, California, March 1979.
PMS, “Arizona Pavement Management System Cracking Data,” Arizona DOT, 2004.
Qi, Xicheng, Aroon Shenoy, Ghazi Al-Khateeb, Terry Arnold, Nelson Gibson, Jack Youcheff and Tom Harman, “Laboratory Characterization and Full-scale Accelerated Performance Testing of Crumb Rubber Asphalts And Other Modified Asphalt Systems,” Proceedings of the Asphalt Rubber 2006 Conference, Pages 39-65, Palm Springs, California, October 25-27, 2006, ISBN 962-405-091-0.

Performance Evaluation and Design 95
Schnormeier, Russell, “Fifteen-Year Pavement Condition History of Asphalt Rubber Membranes,” City of Phoenix, Arizona, 1985.
Shell, “1985 Addendum to 1978 Shell Pavement Design Manual,” Shell International Petroleum Company, Limited, London, 1985.
Sousa, Jorge, Jorge C. Pais and Rachid Saim, “The Effect of Mode of Loading on the Comparison Between Asphalt Rubber and Traditional Hot Mixes Laboratory Performance,” Proceedings of the Asphalt Rubber 2000 Conference, Pages 259-272, Vilamoura, Portugal, November 14-17, 2000, ISBN 972-95240-9-2.
Sousa, Jorge, Jorge C. Pais, Rachid Saim, George Way, and Richard N. Stubstad,
“Development of a Mechanistic Overlay Design Method Based on Reflective Cracking Concepts,” Rubber Pavements Association, Tempe, Arizona, July, 2001.
Sousa, Jorge, Jorge C. Pais, George B. Way, Rachid Saim and Richard N. Stubstad, “A Mechanistic-Empirical Overlay design Method for Reflective Cracking,” Transportation Research Record 1809, TRB National Research Council, Washington D.C., 2002, pp. 209-217.
Sousa, Jorge, Jorge C. Pais and George B. Way, “A Mechanistic-Empirical Based Overlay Design Method for Reflective Cracking,” Proceedings of the Asphalt Rubber 2003 Conference, Pages 85-110, Brasilia, Brazil, December 1-4, 2003, ISBN 85-903997-1-0.
Sousa, Jorge, George B. Way, Shakir Shatnawi and Catia Dantas, “Asphalt Rubber in New Pavement Design and Construction,” Proceedings of the Asphalt Rubber 2006 Conference, Pages 67-98, Palm Springs, California, October 25-27, 2006, ISBN 962-405-091-0.
Sousa, Jorge, George B. Way, “Considerations for Estimating Pavement Treatment Lives and Pavement Life Extension on Flexible Pavement”, Report for California Department of Transportation and California Pavement Preservation Center, August 22, 2007.
Sousa, Jorge, George B. Way, “CONSIDERATIONS FOR ESTIMATING PAVEMENT TREATMENT LIVES AND PAVEMENT LIFE EXTENTION ON FLEXIBLE PAVEMENTS
Volume 1,” Report for California Department of Transportation and California Pavement Preservation Center, Feb. 2009.
Sousa, Jorge, George B. Way, “MODELS FOR ESTIMATING TREATMENT LIVES, PAVEMENT LIFE EXTENTION AND THE COST EFFECTINESS OF TREATMENTS ON FLEXIBLE PAVEMENTS Volume 2,” Report for California Department of Transportation and California Pavement Preservation Center, Feb. 2009.
Way, George, “Prevention of Refection Cracking in Arizona Minnetonka-East (A Case
96 Asphalt-Rubber 2009
Study),” Arizona DOT, Report Number 11 HPR-1-13(224), May, 1976.
Way, George, “Prevention of Refection Cracking Minnetonka-East,” Arizona DOT, Report Number 1979GWI, August, 1979.
Way, George, “Prevention of Reflective Cracking in Arizona,” TRB, National Academy of Sciences, TRB, National Academy of Sciences, Transportation Research Record 756, pp. 29-32, 1980.
Way, George, “Environmental Factor Determination from In-Place Temperature and Moisture Measurements Under Arizona Pavements,” Arizona DOT, Report Number FHWA/AZ 80/157, September, 1980.
Zborowski, Aleksander and Kamil E. Kaloush “Predictive Equations to Evaluate Thermal Fracture of Asphalt Rubber Mixtures”, Pages 177-192, Proceedings of the Asphalt Rubber 2006 Conference, ISBN 962-405-091-0.

Performance Evaluation and Design 97
Evaluation of New Generation of Gap Graded Asphalt Rubber Mixtures
Rongji Cao
Jiangsu Transportation Research Institute2200 Chengxin Rd., Nanjing, 211112, [email protected]
ABSTRACT: Based on the research and application of asphalt rubber in past few years, a new type of asphalt rubber gap graded mix, named AR-AC13S, was developed and used in many projects. In this paper, AR-AC13S was compared with SMA-13 and AC-13C by a series of tests in laboratory, including wheel track tests, dynamic modulus, beam bending test, TSRST tests etc. Finally, conclusion was drawn: (1) AR-AC13S had similar resistance to rutting deformation as SMA-13 at high temperature;(2)In dynamic modulus test, gap gradation mixes were more sensitive to confinement level than dense gradation mixes, and AR-AC13S was more sensitive than SMA-13; (3) AR-AC13S had better performance in thermal cracking than conventional mixtures; (4)From the results of Marshall residual stability and TSR, AR-AC13 mix had the similar water susceptibility as SMA-13 and AC-13. (5) the fatigue life of AR-AC13S was 17%, 87% higher than SMA-13, AC-13C respectively (6) AR-AR13S has excellent resistance to thermal cracking and fatigue, while it still keeps good performance in resistance to rutting and moisture sensitive.
KEYWORDS: Crumb Rubber, Asphalt Rubber, Gap-graded, Mixture, Performance

98 Asphalt-Rubber 2009
1. Introductions
As the fast development of highway transportation, there are more and more used tires every year, and it become an environmental problem. Crumb rubber can be used to produce asphalt rubber for asphalt pavement. It can not only improve pavement performance, but also save energy and protect environment.
According to the ASTM definition, asphalt rubber is “a blend of asphalt cement, reclaimed tire rubber, and certain additives in which the rubber component is at least 15 percent by weight of the total blend and has reacted in the hot asphalt cement sufficiently to cause swelling of the rubber particles”. Asphalt rubber physical properties are significantly different than those of conventional asphalts. The rubber stiffens the binder and increases elasticity over these pavement operating temperature ranges, which decreases pavement temperature susceptibility and improves resistance to permanent deformation and fatigue cracking.
Asphalt rubber is used as a binder in various types of pavement including surface treatments and hot mixes. But using of asphalt rubber in hot mixes is limited to gap and open gradations. Use of asphalt rubber in dense-graded mixtures is not recommended because there is insufficient void space to accommodate enough binder to significantly improve performance of the pavement (Caltrans, 2003).
In the early period, Arizona AR-AC mixes and Texas SMAR mixes were tested and evaluated in some asphalt rubber trial projects in China [2]. Based on the research and engineering practice at last 5 years, new generation of gap graded asphalt rubber mixes, AR-AC13S, were developed.
To design AR-AC13S, existing Marshall tests method is still used with some modifications, including allowance for lower stability, requirements for voids in mineral aggregate (VMA) and significantly higher binder content(7~9%). The target air voids at optimum asphalt content are 5~6%(Zhao, 2007). Void in coarse aggregate of mix (VCA) is used to measure the stone on stone contact.
Table 1. AR-AC13S Mixture Characteristics
Parameter Design Criteria Test MethodMarshall Compaction, blows/side 75 AASHTO T-245Stability, kN >6 AASHTO T-245Air Void, % 5~6 AASHTO T269VFA, % 70~85 /VMA, % >20.0 /VCAmix <VCAdrc AASHTO T-19TSR,% >80 JTJ052 T0729[4]
Dynamic stability, passes/mm >3000 JTJ052 T0719[4]
Failure Strain, με >2500 JTJ052 T0728[4]

Performance Evaluation and Design 99
Table 2. AR-AC13S Aggregate Gradation Criteria
Sieve Size,mm 19 13.2 9.5 4.75 2.36 0.075Design Limits,% Passing 100 90-100 50-70 18-30 10-22 0-5
Comparing with Arizona AR-AC and Texas SMAR, new generation of gap graded asphalt rubber mixture, AR-AC13S, has more coarse gradation, less filler content, higher WMA. AR-AC13S mixes provide a durable, flexible pavement surface with increased resistance to reflective cracking, rutting and oxidation, good surface friction characteristics due to the texture provided by the gapped aggregate gradation. These types of mix are typically most effective as rehabilitative overlays of distressed flexible or rigid pavements. It has been used successfully in more than 10 pavement projects since 2006.
2. Test Materials
There mixtures were designed with Marshal Method in the lab. The aggregate was Nanjing basalt. Same SBS polymer modified binder, PG76-22, was used in AC-13C mixture and SMA-13. The asphalt rubber of AR-AC-13S was produced in wet process, with the PG64-22 base asphalt and 20 mesh crumb rubber. The ratio of asphalt to crumb rubber was 81.5:18.5. In order to improve the resistance to moisture, 2% of cement by weight was added to AR-AC13S mixture. The design results were shown in Table 3 and Table 4.
Table 3. Mixtures Properties
Mixture TypeBinder content
(%)
Densityg/cm3
VV(%)
VMA(%)
VFA(%)
Stability(%)
FN(0.1mm)
AR-AC13S 7.9 2.358 5.45 21.84 75.03 7.55 34.5
SMA-13 5.8 2.469 4.19 16.79 75.04 10.67 25.7
AC-13C 4.9 2.447 5.23 16.89 69.05 13.26 25.6
Table 4. Mixtures Gradations
Mixture Type
Percentage Passing, %
16 13.2 9.5 4.75 2.36 1.18 0.6 0.3 0.15 0.075
AR-AC13S 100 95.6 65.8 27.9 18.1 12.3 7.9 4.4 3.1 2.3
SMA-13 100 92.9 57.6 27.1 23.2 19.6 16.4 14.4 13 10.4
AC-13C 100 92.7 73.3 45.9 35.2 23.1 16.8 11 8.5 6.4

100 Asphalt-Rubber 2009
3. High Temperature Performance
3.1. Wheel Track Tests
Wheel track tests (T0719, JTJ052-2000)) , with tire pressure of 0.7 MPa, were done for three mixtures at 60℃. Dynamic Stability, the slop of creep curve between 45th and 60th minute, was used to evaluate the mixtures’ resistance to rutting deformation.
Table 5. Wheel track tests Results
Mixture Type
binder content(%)
Dynamic Stability, passes/mmRequirement
1 2 3 Aver.
AR-AC13 7.9 4846 4846 4846 4846
>3000SMA-13 5.8 7000 5727 5250 5992
AC-13C 4.9 3938 3706 3500 3715
From Table 5, all of the 3 mixtures met the requirement of 3000 passes/mm. The resistance performance of rutting was sorted from high to low: SMA-13 > AR-AC13S > AC-13C. Aggregate skeleton plays great contribution to mixture’s high temperature performance, so does the asphalt property. Dynamic stability of AC-13C was the lowest among them because its traditional dense gradation gave low internal friction strength under deformation. While SMA-13 and AR-AC13S mixtures were gap-graded, with more coarse aggregate and better stone skeleton, they had better high temperature performance than AC-13C. Dynamic stability of AR-AC13S mixture was lower than that of SMA-13. But considering the asphalt content of AR-AC13S is 1.36 times of SMA-13, its high temperature performance was obviously excellent.
3.2. Dynamic Modulus Test
For linear viscoelastic materials, the stress-strain relationship under a continuous sinusoidal loading is defined by a complex modulus E*, which has a real and imaginary part that defines the elastic and viscous behavior of the linear viscoelastic material. The absolute value of the complex modulus ︱E*︱, is defined as the dynamic modulus. Mathematically, the dynamic modulus is defined as the maximum (peak) dynamic stress divided by the recoverable axial strain.
The dynamic modulus response of an asphalt mixture is known to be dependent on temperature, rate of loading, aging level, confinement level and mixture characteristics; such as binder stiffness, aggregate gradation, binder content, and air voids. To account for the effect of temperature and rate of loading, a master curve is constructed which is built using as a reference any arbitrary temperature value. Using dynamic modulus master curve, analysis and comparisons between several mixtures and conditions can be made.
Dynamic modulus tests were performed in Simple Performance Tester (SPT) with three

Performance Evaluation and Design 101
confinement levels, 0kPa, 100kPa and 200kPa. The test specimens were cored from laboratory compacted gyratory plugs, 100 mm in diameter and 150 mm high. For each specimen, a full factorial of test frequencies (25, 20 , 10 , 5 , 1 , 0.5, and 0.1Hz) and temperatures of 4, 15, 25, 40, and 55 ℃ were used. Each specimen was tested in an increasing order of temperature, and for each temperature level, specimens were tested in a decreasing order of frequency. This temperature- frequency sequence was carried out to cause the minimum damage to the specimen before the next test.
Dynamic modulus master curves of three types of mixture were constructed at different confinement level, as shown in Figure1~ Figure 3.
1
10
100
1000
10000
1E-06 0.0001 0.01 1 100 10000
Dyna
mic Mo
dulu
s E*
,KPs
i
ARAC-13S_0KPa
SMA-13_0Kpa
Sup-13_0kpa
Reduced Time,S
Figure 1. Dynamic Modulus Master Curve( 25℃, Unconfined )
1
10
100
1000
10000
1E-06 0.0001 0.01 1 100 10000
Dyna
mic Mo
dulu
s E*
,KPs
i
Reduced Time,S
ARAC-
13S_100KPa
SMA-13_100Kpa
Figure 2. Dynamic Modulus Master Curve( 25℃, Confined, 100Kpa)

102 Asphalt-Rubber 2009
1
10
100
1000
10000
1E-06 0.0001 0.01 1 100 10000
Dyna
mic Mo
dulu
s E*
,KPs
i
Reduced Time,S
ARAC-13S_200KPa
SMA-13_200Kpa
Sup-13_200Kpa
Figure 3. Dynamic Modulus Master Curve( 25℃, Confined, 200Kpa)
A big difference in E* response was found when specimens were tested between unconfined conditions and confined conditions, in low frequency area (high temperature). E* values Increase with confinement levels, especially in the master curves of AR-AC13S mixture AR-AC13S mixture had lower stiffness compared to conventional mixtures at unconfined conditions. But when confined E* tests results were compared, it was found that the AR-AC13S mixes had better response.
For gap graded mixes, such as AR-AC13S and SMA-13, coarse aggregate skeleton gave strong support to mixes under load and made an important rule on high temperature performance. But their performance highly depended on test confinement levels. In dynamic modulus test, gap gradation mixes were more sensitive to confinement level than continues gradation mixes, and AR-AC13S was more sensitive than SMA-13 because of higher binder content.
The confined dynamic modulus E* test is a better field performance indicator than the unconfined test (Kamil, 2002). So it could be concluded that AR-AC13S mixture has better high temperature performance than SMA-13 and AC-13C.
3.3. E*/sinφ
Dynamic modulus term, (E*/sinφ), determined from the triaxial dynamic modulus test was selected as the one of SPT candidates for evaluating an HMA mixture’s permanent deformation in NCHRP report 465 (Witczak, 2002). The results of E*/sinφat 55℃ for 3 mixes got from dynamic modulus test were shown in figure 4~figure 6.
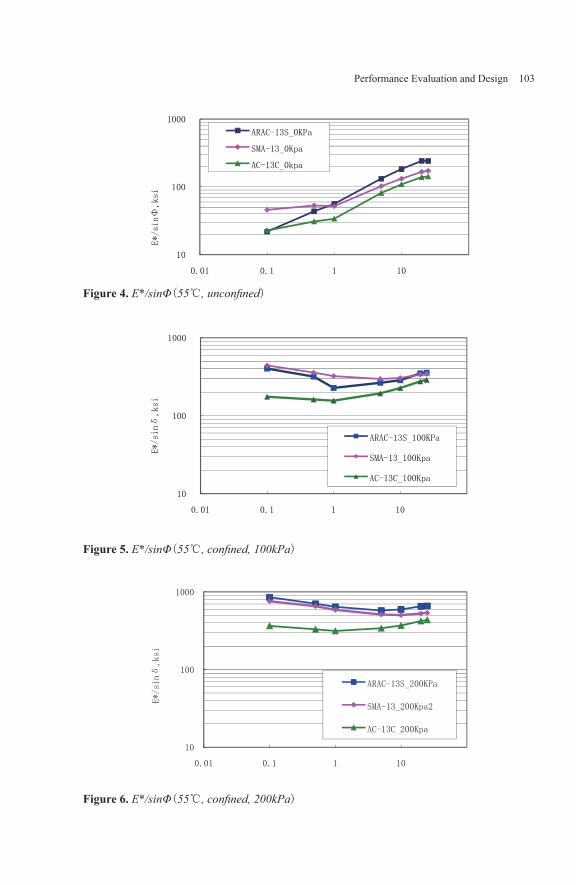
Performance Evaluation and Design 103
10
100
1000
0.01 0.1 1 10
E*/sinΦ
,ksi
Frequence,Hz(55℃)
ARAC-13S_0KPa
SMA-13_0Kpa
AC-13C_0kpa
Figure 4. E*/sinΦ(55℃, unconfined)
10
100
1000
0.01 0.1 1 10
E*/sinδ
,ksi
Frequence,Hz(55℃)
ARAC-13S_100KPa
SMA-13_100Kpa
AC-13C_100Kpa
Figure 5. E*/sinΦ(55℃, confined, 100kPa)
10
100
1000
0.01 0.1 1 10
E*/sinδ
,ksi
Frequence,Hz(55℃)
ARAC-13S_200KPa
SMA-13_200Kpa2
AC-13C_200Kpa
Figure 6. E*/sinΦ(55℃, confined, 200kPa)

104 Asphalt-Rubber 2009
The E*/sinφof AR-AC13S was low at low frequency (<1Hz) condition when it was tested without confinement as shown in figure 4. But it changed quickly with the increasing of confinement level, and overtook SMA-13 when 200 kPa confinement was applied as shown in figure 5. At all test condition, the E*/sinφof AC-13C was the lowest. If E*/sinφwas used as evaluation parameter of rutting resistance, the performance of three mixes could be ranked as following: SMA-13 ≈ AR-AC13S > AC-13C.
When considering the test results of dynamic stability, dynamic modulus and E*/sinΦ, conclusion could be drawn that AR-AC13S had similar resistance to rutting deformation as SMA-13, which was better than AC-13C.
4. Low Temperature performance
4.1. Beam Bending Test
Beam Bending Tests T0728 (JTJ052, 2000) were done at -10℃ to the three mixtures. The specimens were compacted by steel wheel in the lab and were cut to size of 300mmX45mmX30mm.
Failure strain was used to describe materials’ performance at low temperature. The higher the Failure strain, the better the crack resistance. The test results were shown in Table 6.
Table 6. Beam Bending Tests Results (-10℃)
Mixture TypeMax. Load(N)
Displacement(mm)
Stress(MPa)
Failure Strain
(με)
Requirement(με)
AR-AC13S 0.50 0.92 9.17 4823>2000SMA-13 1.26 0.62 10.69 3270
AC-13C 1.05 0.55 8.61 2912
Failure strain was used in the test to evaluated low temperature performance. All the failure stains of three mixtures were higher than 2000με. Usually, the higher the asphalt content, the higher the failure strain. The asphalt content of SMA-13 was 18% higher than that of AC-13, and its failure strain was 12% higher than that of AC-13. As for AR-AC13S, the asphalt content 61% higher than that of AC-13, and failure strain was 66% higher.
4.2. Thermal Stress Restrained Specimen Test (TSRST)
Thermal cracking is a distress mode of asphalt pavements. Low temperatures or fast cooling rates create tensile stresses in the restrained surface layer. Thermal cracking occurs when the tensile stress generated is greater than the tensile strength of the surface mix. Thermal Stress Restrained Specimen Test (TSRST) was done in this paper to determine the fracture property of asphalt mixes.
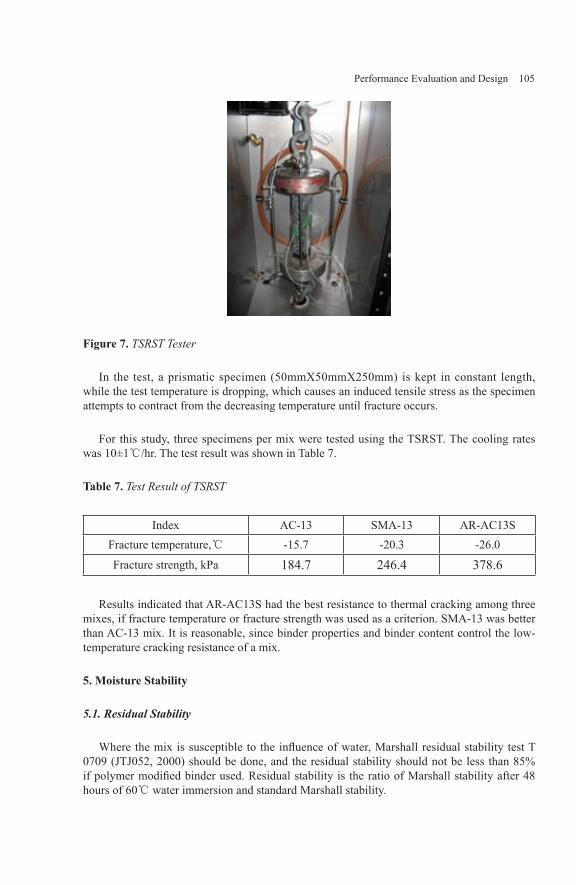
Performance Evaluation and Design 105
Figure 7. TSRST Tester
In the test, a prismatic specimen (50mmX50mmX250mm) is kept in constant length, while the test temperature is dropping, which causes an induced tensile stress as the specimen attempts to contract from the decreasing temperature until fracture occurs.
For this study, three specimens per mix were tested using the TSRST. The cooling rates was 10±1℃/hr. The test result was shown in Table 7.
Table 7. Test Result of TSRST
Index AC-13 SMA-13 AR-AC13SFracture temperature,℃ -15.7 -20.3 -26.0
Fracture strength, kPa 184.7 246.4 378.6
Results indicated that AR-AC13S had the best resistance to thermal cracking among three mixes, if fracture temperature or fracture strength was used as a criterion. SMA-13 was better than AC-13 mix. It is reasonable, since binder properties and binder content control the low-temperature cracking resistance of a mix.
5. Moisture Stability
5.1. Residual Stability
Where the mix is susceptible to the influence of water, Marshall residual stability test T 0709 (JTJ052, 2000) should be done, and the residual stability should not be less than 85% if polymer modified binder used. Residual stability is the ratio of Marshall stability after 48 hours of 60℃ water immersion and standard Marshall stability.

106 Asphalt-Rubber 2009
Marshall residual stability test is a traditional test for moisture sensitive, simple and easy. But the air void of the test specimen is usually around 4%, less than air void of pavement at early period, which is around 7%. Practice on projects indicates that this test doesn’t accord with the actual in place condition and that residual Marshall stability is not reliable (Zhao, 2001).
The test result for 3 mixes was shown in Table 8. All of them preformed well in the test, since polymer or crumb rubber was used in the binder.
Table 8. Test Result of Residual Stability
Mixture Type Air void(%)
Stability(kN) Residual Stability(%)
Requirement(%)None condition
AR-AC13S 5.4 8.63 7.97 92.4≥85SMA-13S 4.1 10.03 9.26 92.3
AC-13C 5.2 13.15 11.82 89.9
5.2. Indirect Tension Test
Indirect tension test with and without freeze-thaw cycle T 0729(JTJ052, 2000)was used to evaluate the water susceptibility of asphalt mixes. The tensile strength ratio (TSR) is the ratio of the indirect tensile strength of a Marshall specimen with and without the freeze-thaw cycle. Usually a minimum TSR of 70% is recommended for normal binder and 80% for polymer modified binder.
In the test, the specimen was compacted with 50 blows per side instead of 75 blows per side. The wet sample was exposed to freeze-thaw cycle. This test was thought to be better to evaluate the water susceptibility than Marshall residual stability test.
The test result for 3 mixes was shown in Table 9. In indirect tension test, the specimen fractures under load without constrained force, which is thought to be unreasonable for gap gradation mix, such as AR-AC13S and SMA-13. AC-13C was dense graded and got highest indirect tension strength and TSR value. Generally the TSR values of three were on same level.
Table 9. Indirect Tension Test Result
Mixture Type Air void(%)
Strength(MPa) TSR(%)
Requirement(%)control condition
AR-AC13S 6.0 1.0027 0.8152 81.3
≥80SMA-13S 5.3 1.0239 0.8288 80.9
AC-13C 6.3 1.0644 0.9017 84.7
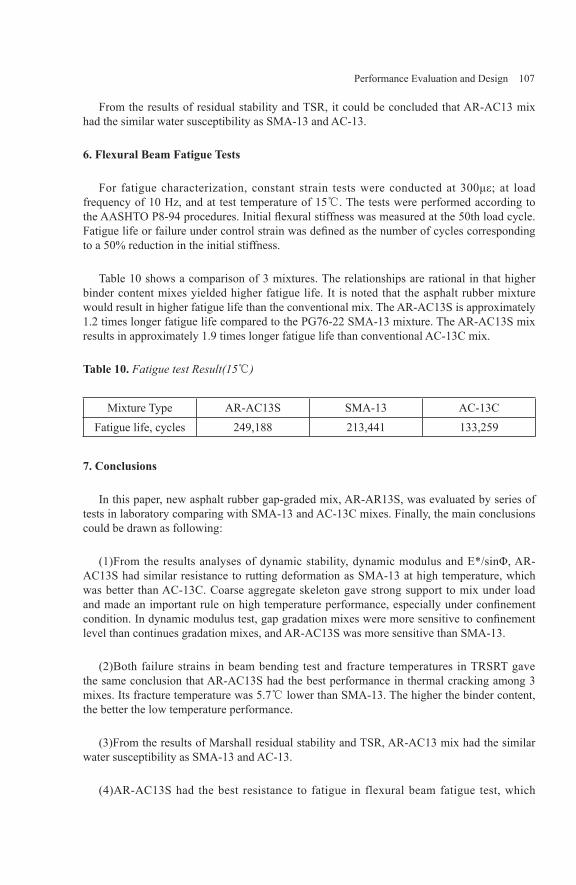
Performance Evaluation and Design 107
From the results of residual stability and TSR, it could be concluded that AR-AC13 mix had the similar water susceptibility as SMA-13 and AC-13.
6. Flexural Beam Fatigue Tests
For fatigue characterization, constant strain tests were conducted at 300με; at load frequency of 10 Hz, and at test temperature of 15℃. The tests were performed according to the AASHTO P8-94 procedures. Initial flexural stiffness was measured at the 50th load cycle. Fatigue life or failure under control strain was defined as the number of cycles corresponding to a 50% reduction in the initial stiffness.
Table 10 shows a comparison of 3 mixtures. The relationships are rational in that higher binder content mixes yielded higher fatigue life. It is noted that the asphalt rubber mixture would result in higher fatigue life than the conventional mix. The AR-AC13S is approximately 1.2 times longer fatigue life compared to the PG76-22 SMA-13 mixture. The AR-AC13S mix results in approximately 1.9 times longer fatigue life than conventional AC-13C mix.
Table 10. Fatigue test Result(15℃)
Mixture Type AR-AC13S SMA-13 AC-13CFatigue life, cycles 249,188 213,441 133,259
7. Conclusions
In this paper, new asphalt rubber gap-graded mix, AR-AR13S, was evaluated by series of tests in laboratory comparing with SMA-13 and AC-13C mixes. Finally, the main conclusions could be drawn as following:
(1)From the results analyses of dynamic stability, dynamic modulus and E*/sinΦ, AR-AC13S had similar resistance to rutting deformation as SMA-13 at high temperature, which was better than AC-13C. Coarse aggregate skeleton gave strong support to mix under load and made an important rule on high temperature performance, especially under confinement condition. In dynamic modulus test, gap gradation mixes were more sensitive to confinement level than continues gradation mixes, and AR-AC13S was more sensitive than SMA-13.
(2)Both failure strains in beam bending test and fracture temperatures in TRSRT gave the same conclusion that AR-AC13S had the best performance in thermal cracking among 3 mixes. Its fracture temperature was 5.7℃ lower than SMA-13. The higher the binder content, the better the low temperature performance.
(3)From the results of Marshall residual stability and TSR, AR-AC13 mix had the similar water susceptibility as SMA-13 and AC-13.
(4)AR-AC13S had the best resistance to fatigue in flexural beam fatigue test, which

108 Asphalt-Rubber 2009
fatigue life was 17%, 87% higher than SMA-13, AC-13C respectively. Its excellent fatigue performance benefitted from high binder content and property of asphalt rubber.
(5)From above analysis, AR-AR13S has excellent resistance to thermal cracking and fatigue, while it still keep good performance in resistance to rutting and moisture sensitive.
8. Bibliography
Caltrans, Asphalt Rubber Usage Guide, State of California Department of Transportation, Sacramento, California, 2003.
Caltrans, Use Of Scrap Tire Rubber, State of California Department of Transportation, Sacramento, California, 2005.
Kaloush, K. E., Zborowski, A., and Sotil, A. Performance Evaluation of Arizona Asphalt Rubber Mixtures in Albert,. Arizona State University, Tempe, AZ, 2003.
Kaloush, K. E. Witczak, M.W..Way, George.B. 《Performance Evaluation of Arizona Asphalt Rubber Mixtures Using Advanced Dynamic Material Characterization Tests》, Final report, Department of Civil and Engineering, Arizona State University, 2002.
Minister of Communication of China, Test Specification of Asphalt and AsphaltMixtures (JTJ052, 2000), China Communications Press, 2000.
Witczak, M.W.. Kaloush, K. 《NCHRP report 465 Simple Performance Test forSuperpave Mix Design》, Transportation Research Record, Washington, D.C, 2002.
Zhao, Min.. Cao, Rongji, 《Research on Using Asphalt Rubber in ExpresswayPavement》, Final report, Jiangsu Department of Expressway Construction, 2007.
Zhao, Yongli, “Tests of Moisture Susceptibility for Asphalt Paving Mixtures”, Journal of Southeast University, 2001.

Performance Evaluation and Design 109
Research on Mix Design Method and Application of Asphalt Rubber Open-graded Friction Course
Bai Qi-feng* Qian Zhen-dong* Cao Rong-ji**
*Southeast University Nanjing 210096, China;[email protected]@seu.edu.cn
**Jiangsu Transportation Research InstituteNanjing 211112, [email protected]
Abstract:Recent years, asphalt rubber open-graded friction course ( AR-OGFC ) has attracted more and more attentions in China. In this paper, based on laboratory analysis and application experiences, mix design method of AR-OGFC using Marshall Test and mix gradation was recommended. On this basis, key technologies of AR-OGFC overlay structural design were studied,such as the treatment of underlying pavement, selection of track coat, etc. Finally, performances of AR-OGFC overlay of two trial sections were summarized and analyzed.
Key words: asphalt rubber, open-graded friction course, mix design method, application research

110 Asphalt-Rubber 2009
0 Introductions
Recent years, people have paid more attention to AR-OGFC which can lower traffic noise, and has higher skid resistance and higher crack resistance ability. In China, open-graded mix has not been widely used, and researches or practices about AR-OGFC are even more seldom. Gradation and mix design method about AR-OGFC have not been reported in China. In this paper, mix design method and main points of structure design of AR-OGFC overlay were studied and performances of its foremost two trail projects in China were introduced.
1 Mix Design Method of AR-OGFC
1.1 Mix Design Method Review
1.1.1 Gradation
According to the review of AR-OGFC gradations of several states in American, the main deference of AR-OGFC gradations is about the amount of fine aggregate [1] [2] [3]. In Texas, Florida and Arizona, very little fine aggregate is used in OGFC, the percentage passing limit of 2.36mm is below 10%. However, in California, more fine aggregate is used, the requirement of percentage passing of 2.36mm is 7% to 18%. 0.075mm is also a key sieve for OGFC13. In California, Texas and Arizona the percentage passing 0.075mm is permitted close to zero, but in Florida, require at least 2% of filler material (passing 0.075mm) be used.
1.1.2 Mix Design Criteria
In Arizona, AR-OGFC is designed using a statically compaction apparatus which loads at a rate of 5mm per minute until a load of 1.5kg per square mm is reached. Equetion1 is used to determine the AR-OGFC binder content.
Binder content% = (0.38×W + 8.6)×2.6/C (1)W——%Water Absorption of Aggregate;C——Combined Oven Dry Specific Gravity of Aggregate.
When AR-OGFC is to be used in concrete pavement overlay, binder content should be increased by 1 percent to achieve better crack resistance performance. In Arizona, asphalt rubber open graded mix should be tested for draindown in accordance with AASHTO T305 of ASTM 6390. The draindown should not exceed 0.3%.
In California, asphalt rubber content is designed by air void and draindown, where air void is required no less than 18%, and draindown is required less 0.3%.
In Texas, Asphalt rubber permeable fiction course (PFC) in Texas is designed using Texas gyratory compactor with Ndes=50, and design parameters include draindown, laboratory-mold density, CRM content and Cantabro loss.
In China, OGFC were not used as widely as in American and Japanese, and in these

Performance Evaluation and Design 111
applications, OGFC usually used high viscosity asphalt or SBS modified asphalt. OGFC were designed by Marshall Tests. OGFC by asphalt rubber were seldom used in China, and research about its mix design method was also scarcely. According to the aforementioned reviews, the OGFC mix design method in China was deferent from methods of other countries. Then, it is necessary to study proper mix design method suitable for our country’s AR-OGFC.
1.2 Mix Design Method of Jiangsu
1.2.1 Gradation
It can be concluded from literature review that although gradation requirements have significant differences, the principles of gradation design are consistent. They get open graded mixture by reducing the amount of fine aggregate, and then the main difference is the mix of coarse aggregate. As open graded mixture has big air void, no mater how to mix the coarse aggregate, it gets good interlock state. Therefore, the grade range of coarse aggregate can be relaxed appropriately. It was found from engineering applications that drainage performance of OGFC usually declines due to the decrease of air void. To avoid this situation, it was considered that we should minimize the amount of fine aggregate. The gradation requirements of AR-OGFC were recommended in table1.
Percentage (%) Passing Following Sieves(mm)
16 13.2 9.5 4.75 2.36 0.075
Up Limit 100 100 80 15 10 2
Lower Limit 100 85 45 3 0 0
Tab.1 Mix design grading limits for mineral aggregate of AR-OGFC in Jiangsu province
1.2.2 Specimen Molding Method
Mix specimen molding method is the basis of OGFC mix design. Specimen molding laboratory should simulate construction and traffic conditions. In Arizona AR-OGFC is designed using a statically compaction apparatus, however in Jiangsu OGFC was usually designed by 50 time Marshall blows. To find the AR-OGFC specimen forming method suitable for Jiangsu Province, deferent methods were compared by laboratory tests. In these tests, basalt aggregate from Luhe Jiangsu Province was used, and asphalt content is 8.4%, test results were listed in table2 and table3.
Beat NumberPercentage (%) Passing Following Sieves(mm)
13.2 9.5 4.75 2.36 1.18 0.6 0.3 0.15 0.075Original gradation 96.0 72.2 16.1 8.0 6.1 3.9 2.5 1.5 0.9
50 beats 96.1 73.2 16.5 9.0 6.5 4.2 3.1 2.1 0.9 75 beats 96.2 78.9 20.5 10.2 7.3 4.3 3.2 2.1 1
Tab.2 Influence of Marshall beat number on mixture gradation

112 Asphalt-Rubber 2009
Static Compaction 50 beats 75 beats
Density(g/cm3)
Air Void(%)
Density(g/cm3)
Air Void(%)
Density(g/cm3)
Air Void(%)
1.907 24.3 2.049 18.7 2.201 12.3
Tab.3 Density and air voids of specimens by deferent forming methods
It can be seen from table2 that because OGFC has comparatively more coarse aggregate, it gradation may deviate from original gradation when be beat excessively. Due to gradation deviation, air void of specimen by 75 beats is only half of specimen by static compaction, however specimen by 50 beats have similar air void with specimen by static compaction.
In “Technical Specifications for Construction of Highway Asphalt Pavements” (JTG F40-2004) Promulgated by China’s Ministry of Transportation and Communications, OGFC was designed by Marshall Test of 50 beats, and same beat number was adopted in several OGFC trail sections in Jiangsu Province. It was found that Marshall Test of 50 beats is suitable for the construction and traffic conditions. Therefore, based on the feasibility of specimen forming, technical characteristics of AR-OGFC and experiences of Jiangsu Province, it was recommended that AR-OGFC be designed by Marshall Test of 50 beats.
1.2.3 Design of Asphalt Content
As for the design of asphalt content, empirical formula of Arizona shown in formula1 has reference value. At the same time, in OGFC mix design method of deferent countries, draindown test and stripping test usually are used to determine proper asphalt content. In Japan, asphalt content range of OGFC is designed by the inflexion points of draindown-asphalt content curves and stripping-asphalt content curves.
In this paper, asphalt contents designed by laboratory test and formula1 were compared. Table4 lists the estimated asphalt content by formula1, where the AR-OGFC mix adopted gradation listed in table2.
Combined Water Absorption of Composite Aggregate
(%)
Combined Specific Gravity of Aggregate
(g/cm3)
Estimated Asphalt Content by Aggregate
(%)
1.389 2.854 9.2
Tab.4 Estimated asphalt content of AR-OGFC
Draindown test and stripping test results of AR-OGFC are shown in figure1 and figure2. It can be seen from the draindown-asphalt curve that the up limit of asphalt content is 9.4%. At the same way, the low limit of asphalt content is 8.9% from strip-asphalt content curve. Therefore, the proper asphalt content should be between 8.9%~9.4%, and the estimated asphalt

Performance Evaluation and Design 113
content by formula1 approaches its middle value. It can be concluded that the empirical formula of Arizona has the similar result with that of experimental method. Therefore, the empirical formula can be used as easy way for asphalt content determination.
0.10
0.15
0.20
0.25
0.30
0.35
0.40
0.45
7.5 8.0 8.5 9.0 9.5 10.0 10.5
Asphalt content (%)
Dra
indo
wn(
%)
Fig1. Asphalt content VS draindown
4.0
6.0
8.0
10.0
12.0
14.0
16.0
18.0
7.5 8.0 8.5 9.0 9.5 10.0 10.5
Asphalt content (%)
Strip
ping
(%)
Fig2. Asphalt content VS stripping
1.3 examples of AR-OGFC mix design
1.3.1 AR-OGFC mix design of NINGGAO expressway
Mix design result of AR-OGFC is listed in table5 and table6. The design air void is 22%, and optimal asphalt content is 8.9%.

114 Asphalt-Rubber 2009
ProjectPercentage (%) Passing Following Sieves(mm)
16 13.2 9.5 4.75 2.36 1.18 0.6 0.3 0.15 0.075NINGGAO Expressway 100 91.2 52.5 4.2 1.5 0.7 0.7 0.7 0.7 0.7
Tab.5 Aggregate gradation design result of AR-OGFC13
Asphalt Content(%)
Stability(kN)
Flow Value(0.1mm)
VV(%)
VMA(%)
VFA(%)
8.9 3.78 36 22.4 36.2 38.1
Tab.6 Marshall test result of AR-OGFC13
1.3.2 AR-OGFC Mix Design of NANJING Belt Expressway
AR-OGFC mix design result of Nanjing Belt expressway is listed in table7 and table8. The design air void is23.9%, and optimal asphalt content is 8.0%.
ProjectPercentage (%) Passing Following Sieves(mm)
16 13.2 9.5 4.75 2.36 1.18 0.6 0.3 0.15 0.075NANJING Belt
Way 100 92.3 58.9 0.9 0.4 0.4 0.4 0.4 0.4 0.4
Tab.7 Aggregate gradation design result of AR-OGFC13
Asphalt Content(%)
Stability(kN)
Flow Value(0.1mm)
VV(%)
VMA(%)
VFA(%)
8.0 2.77 30.4 23.9 36.4 34.1
Tab.8 Marshall test result of AR-OGFC13
2 Key Technologies for AR-OGFC Overlay Design
In Jiangsu Province, AR-OGFC is mainly used as overlay on concrete pavement or asphalt pavement, whose thickness is usually 2.5~3.0cm. Expect for overlay structure and mix design, the treatments of old pavements and selection of tack coat materials are also key factors influencing overlay performances.
2.1 Treatment of Original Pavement
As for OGFC overlay, original pavements should be have sufficient carrying capacity, smoothness and waterproof ability.

Performance Evaluation and Design 115
Therefore, treatment of old pavements is very important. OGFC overlay is permeable, therefore if defects of old pavement were not properly treated, these defects may deteriorate gradually, followed by overlay failure, figure3.
Fig3. Overlay failure due to improper treatment of old pavement
In following conditions, pavements should be milled and paved before overlaying.
①Pavement has been experienced too much repair. Repairing areas exceed 15% of that of lane.
②Pavement distress has developed severely, where net-shaped cracks, water damage, rutting were continuously.
③Reflective cracking space is below 15 meters, and was accompanied by pumping.
Local distress should be repaired by usual methods. Local distress of lower course should be repaired similarly after upper course being milled, and the repair area should includes at least one lane in transverse and exceed 1 meter of the distress area in longitude.
In some projects, accurate milling was adopted to improve the smoothness of surface course. It was found that this method may disturb the pavement and accelerate the deterioration of distress, therefore milling method of surface should be avoided at any possible.
2.2 Design of Tack Coat
Tack coat is very important for OGFC overlay. Asphalt rubber stress absorbing interlayer (SAMI) and modified emulsified asphalt are usually used as tack coat. In application of SAMI, the quantity of asphalt rubber is 1.5~2.5 kilogram per square meter. The advantages of SAMI are its high waterproofing ability and perfect anti-cracking performances. However, in construction, the asphalt may exceed allowable quantity in overlapping areas which may

116 Asphalt-Rubber 2009
cause bleeding problems, figure4. At the same time, the asphalt in SAMI may uplift then reduce the air void of OGFC overlay, which may cause the permeability of overlay decline even lose. According to engineering experiences, tack coat using modified emulsified asphalt may avoid these disadvantages aforementioned. Therefore, modified emulsified asphalt is recommended to be used as tack coat of AR-OGFC overlay. At the same time, to ensure the bonding and waterproofing effect, more emulsified asphalt should be used than usual pavement tack coat. The quality of emulsified asphalt used for AR-OGFC overlay tack coat is recommended to be 0.3 ~ 0.5kg/m2 appropriately (converted into asphalt deposit).
Fig4. Bleeding in overlapping area of SAMI
3 Application effects of AR-OGFC overlay
3.1 Ninggao Expressway AR-OGFC Trail Project
Trail project of AR-OGFC on Ninggao Expressway is 1km long, and opened to traffic in October of 2006, the pavement structure of which is shown in figure5.
2.5cm AR-OGFC13Asphalt Rubber SAMI
Original pavement
Fig5. AR-OGFC overlay structure of trail project on Ninggao expressway
3.1.1 Performance on Noise Reduction
One year after opening to traffic, traffic noise of trail section and control section were tested. Results are listed in table9. Compared to dense grading asphalt mix of original pavement, AR-OGFC overlay can reduce traffic noise by 4.9Dbs, shows very good noise elimination performance.
Section Test Results(Db)Original Pavement (AC16) 78.0
AR-OGFC Overlay 73.1
Tab.9 Noise test results of AR-OGFC overlay trail road and control road

Performance Evaluation and Design 117
3.1.2 Permeability Performance
After construction, permeable coefficient of the trail pavement is over 1000ml per minute. Two years after opening to traffic, trail pavement permeability performance is shown in figure6. AR-OGFC overlay shows good permeability performance.
Fig6. Pavement permeability performance after raining of Ninggao expressway AR-OGFC overlay (two years after open to traffic)
3.1.3 Other Performances
There are about 40 reflective cracks with space from 20 to 30 meters on original pavement. Two years after opening to traffic, there was no crack appeared, even the thickness of overlay is only 2.5cm. At the same time, other distresses such as net-shaped cracks, bleeding etc were not found on this trail pavement.
3.2 Nanjing Belt Expressway AR-OGFC Trail Project
The structure of Nanjing Belt Expressway AR-OGFC trail project is shown in figure7. Deferent from Ninggao Expressway AR-OGFC trail road, modified emulsified asphalt tack coat was used in this project. The trail road opened to traffic in September of 2008.
2.5cm AR-OGFC13SBS modified emulsified asphalt tack coat
Original pavement
Fig7. AR-OGFC overlay structure of trail project on nanjing belt expressway
3.2.1 Performance on Noise Reduction
Traffic noise of trail section and control section were tested. Results are listed in table10. Compared to dense grading asphalt mix of original pavement, AR-OGFC overlay can reduce traffic noise by 3.1Dbs.

118 Asphalt-Rubber 2009
Section Test Results(Db)
Original Pavement (AC13) 85.1
AR-OGFC Overlay 82.0
Tab10. Noise test results of AR-OGFC overlay trail road and control road
3.2.2 Permeability Performance
After construction, permeable coefficient of the trail pavement is over 1000ml per minute.
4 Conclusions
In this paper, mix design method of AR-OGFC were recommended and validated. The key technologies of AR-OGFC overlay design were studied. Finally, the performances of AR-OGFC overlay were observed and summarized.
(1) Gradation scope of AR-OGFC was recommended in this paper. In AR-OGFC mix design, the proper method of specimen molding is Marshall Compaction tests by 50 beats.
(2) It was found that the empirical formula of Arizona has the similar result with that of experimental method by drain down test and stripping test. The empirical formula was recommended as an easy way for asphalt content determination.
(3) Performance observation shows that AR-OGFC overlay has good permeability and noise reduction capability.
References
[1] Arizona Department of Transportation. 2000. “Standard Specifications for Road and Bridge Construction.”
[2] State of California Department of Transportation, January 2003. “Asphalt Rubber Usage Guide”.
[3]Texas Department of Transportation. 2004. “Standard Specifications for Construction and Maintenance of Highways, Streets, and Bridges”.
[4]Jiangsu Provincial Communication Department, Jiangsu Transportation Research Institute. Jiangsu Provincial Transport Scientific Research Projects: “Study on the Application of Asphalt Rubber on Expressway Pavements”.
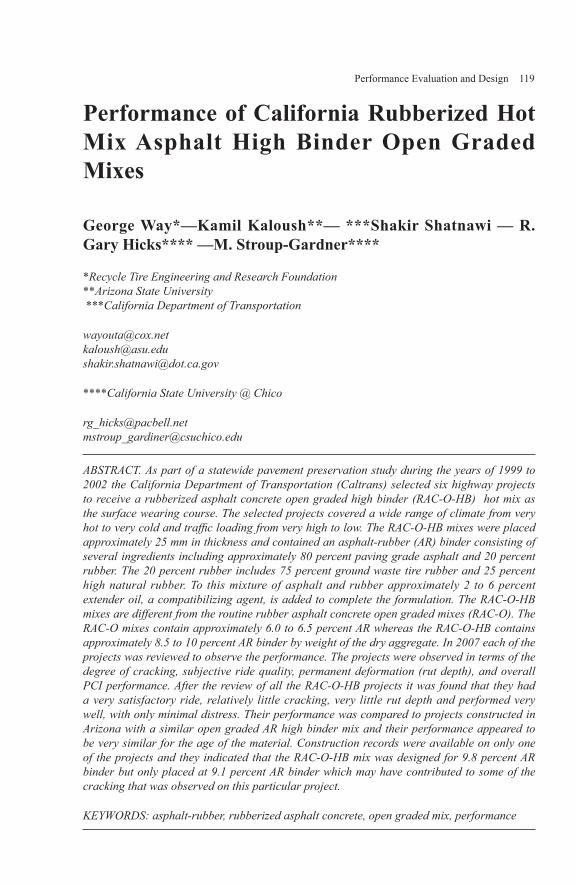
Performance Evaluation and Design 119
Performance of California Rubberized Hot Mix Asphalt High Binder Open Graded Mixes
George Way*—Kamil Kaloush**— ***Shakir Shatnawi — R. Gary Hicks**** —M. Stroup-Gardner****
*Recycle Tire Engineering and Research Foundation **Arizona State University ***California Department of Transportation
[email protected]@[email protected]
****California State University @ Chico
[email protected][email protected]
ABSTRACT. As part of a statewide pavement preservation study during the years of 1999 to 2002 the California Department of Transportation (Caltrans) selected six highway projects to receive a rubberized asphalt concrete open graded high binder (RAC-O-HB) hot mix as the surface wearing course. The selected projects covered a wide range of climate from very hot to very cold and traffic loading from very high to low. The RAC-O-HB mixes were placed approximately 25 mm in thickness and contained an asphalt-rubber (AR) binder consisting of several ingredients including approximately 80 percent paving grade asphalt and 20 percent rubber. The 20 percent rubber includes 75 percent ground waste tire rubber and 25 percent high natural rubber. To this mixture of asphalt and rubber approximately 2 to 6 percent extender oil, a compatibilizing agent, is added to complete the formulation. The RAC-O-HB mixes are different from the routine rubber asphalt concrete open graded mixes (RAC-O). The RAC-O mixes contain approximately 6.0 to 6.5 percent AR whereas the RAC-O-HB contains approximately 8.5 to 10 percent AR binder by weight of the dry aggregate. In 2007 each of the projects was reviewed to observe the performance. The projects were observed in terms of the degree of cracking, subjective ride quality, permanent deformation (rut depth), and overall PCI performance. After the review of all the RAC-O-HB projects it was found that they had a very satisfactory ride, relatively little cracking, very little rut depth and performed very well, with only minimal distress. Their performance was compared to projects constructed in Arizona with a similar open graded AR high binder mix and their performance appeared to be very similar for the age of the material. Construction records were available on only one of the projects and they indicated that the RAC-O-HB mix was designed for 9.8 percent AR binder but only placed at 9.1 percent AR binder which may have contributed to some of the cracking that was observed on this particular project.
KEYWORDS: asphalt-rubber, rubberized asphalt concrete, open graded mix, performance

120 Asphalt-Rubber 2009
1. Introduction
Asphalt rubber is a blend of asphalt cement, reclaimed and ground tire rubber, and additives such as extender oils. Various types of asphalt rubber mixes including gap graded and open graded friction courses are used in the state of California. These thinner types of pavement preservation and rehabilitative mixes are used for noise reduction and improved resistance to reflective cracking over distressed flexible and rigid pavements (Carlson, 2003; Caltrans, 2003).
Open graded mixes, unlike the gap graded mixes, are not considered a structural component of the pavement. Open graded mixes are routinely designed to provide a freely draining driving surface that rapidly removes water away from the tire-pavement interface. They are also used to restore or improve surface friction in dry conditions, accentuate visibility of pavement markings, and minimize reflective cracking from older, distressed pavement surfaces. Open graded surface courses are placed in thin lifts of 25 to 30 mm (1- to 1.2 inches); rubberized asphalt binder can be used instead of paving grade asphalt with this gradation. The rubberized binder further improves the flexibility and durability as a result of the higher viscosity, hence higher binder contents associated with rubberized binder mixes. In California, the increase in binder content in the open graded mixes is 20% more than for open graded mixes constructed with unmodified asphalts (Caltrans, 2003).
Caltrans is currently evaluating potential additional benefits of using a higher binder content, similar to those used by the Arizona Department of Transportation (ADOT) ,with RAC-O mixes (Carlson, 2003). The 5 to 7 year performance of Caltrans high binder mixes, designated RAC-O-HB for rubberized asphalt concrete open graded mixes with a high binder content, are the focus of the case studies summarized in this paper.
2. Objectives and Scope
The objective of this paper is to summarize individual RAC-O-HB project durability and noise reduction performance for seven projects on five California roadways as reported by George Way on behalf of the California Pavement Preservation (CP2) Center to the California Department of Transportation (Way, 2007). Projects varied by the type of existing surface which include dense graded hot mix asphalt and Portland cement concrete (HMA and PCC), traffic level (300,000 to 3,000,000 annual ESALs), and environmental conditions (desert to mountainous), Figure 1.
Figure 1. Location and general climatic conditions for RAC-O-HB projects
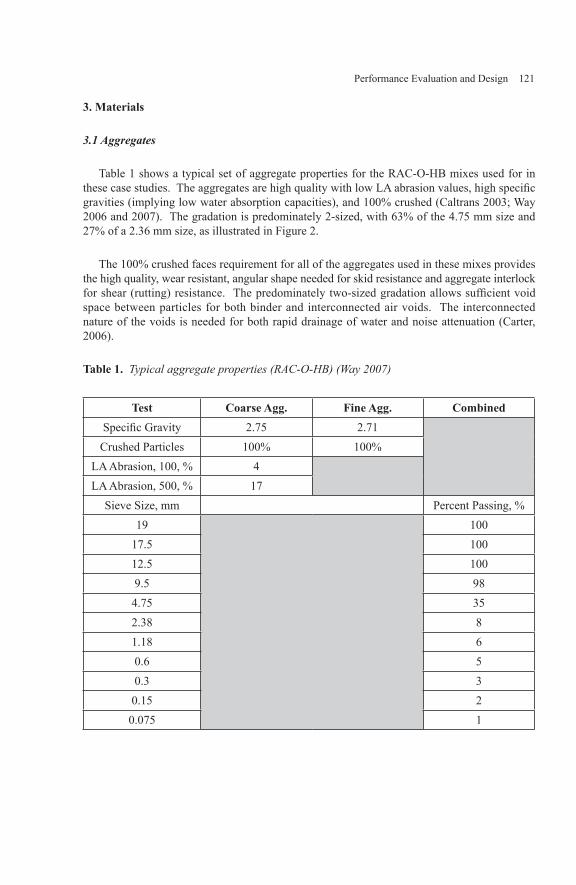
Performance Evaluation and Design 121
3. Materials
3.1 Aggregates
Table 1 shows a typical set of aggregate properties for the RAC-O-HB mixes used for in these case studies. The aggregates are high quality with low LA abrasion values, high specific gravities (implying low water absorption capacities), and 100% crushed (Caltrans 2003; Way 2006 and 2007). The gradation is predominately 2-sized, with 63% of the 4.75 mm size and 27% of a 2.36 mm size, as illustrated in Figure 2.
The 100% crushed faces requirement for all of the aggregates used in these mixes provides the high quality, wear resistant, angular shape needed for skid resistance and aggregate interlock for shear (rutting) resistance. The predominately two-sized gradation allows sufficient void space between particles for both binder and interconnected air voids. The interconnected nature of the voids is needed for both rapid drainage of water and noise attenuation (Carter, 2006).
Table 1. Typical aggregate properties (RAC-O-HB) (Way 2007)
Test Coarse Agg. Fine Agg. CombinedSpecific Gravity 2.75 2.71Crushed Particles 100% 100%
LA Abrasion, 100, % 4LA Abrasion, 500, % 17
Sieve Size, mm Percent Passing, %19 100
17.5 10012.5 1009.5 984.75 352.38 81.18 60.6 50.3 30.15 20.075 1

122 Asphalt-Rubber 2009
Figure 2. Typical aggregate gradation for RAC-O-HB (after Way 2007)
3.2 Rubberized Asphalt Binder
Rubberized asphalt binder as specified by Caltrans (2003) is comprised of 80% conventional paving grade AR-4000 and 20% (+/- 2%) of a 25:75 blend of high natural rubber (isoprene; truck tires) and scrap tire rubber (synthetic rubber; passenger tire rubber). The truck tire rubber is finely ground to a particle size between 1.18 and 0.30 mm (No. 16 and No. 50). The passenger tire rubber has a slightly coarser gradation which is typically between 2.00 and 0.60 mm (No 10 and No. 30). Extender oils are used as additive to improve the blending and interactions between the rubber particles and the base asphalt. Table 2 shows the properties evaluated for rubberized asphalt (Type II) and the specification limits for each.
This modified asphalt produces a binder that retains a high resistance to permanent deformation (rutting) at warm temperature while the base asphalt properties provide the ductility needed for resistance to thermal and reflective cracking. This combination of desirable materials properties is responsible for the improved crack resistant, durable, long wearing surface course.
Table 2. Asphalt rubber binder requirements Type II (Caltrans 2003)
Test Specification Limits at 45 minutesViscosity, cP Haake at 190C 1,500 to 4,000
Resilience at 5C (% Rebound) 18 minimumRing and Ball Softening Point, ℃ 52 to 74 (15 to 165F)
Cone Penetration at 25℃ 25 to 70

Performance Evaluation and Design 123
3.3 RAC-O-HB Mix Design
The basis for the Caltrans RAC-O-HB mix design is the California Test 368 Standard Method for Determining Optimum Bitumen Content for Open Graded Asphalt Concrete (Caltrans 2007-1). This test method compacts in a static manner asphalt-coated aggregate mix to form a plug of HMA, and then uses a draindown test to select the highest binder content with a draindown of no more than 4 grams. The approximate binder ratio (ABR) is used to estimate the binder content used for preparing samples. The ABR is calculated as the centrifuge kerosene equivalent (Kc) times 1.5 plus 4.0. The Kc value, which was 1.4 for these projects, is determined according to the California Test 303 Standard test for Centrifuge Kerosene Equivalent and Approximate Bitumen Ratio (Caltrans 2007-2). Figure 1 shows how the optimum binder content is determined for open graded mixes using a conventional paving grade binder. The optimum rubberized binder content for open graded mixes was then defined as the optimum content times 1.2 (i.e., a 20% increase for rubberized binders, recently in 2009 this was increased to 1.4). Based on other state’s experiences and recommendations from industry, Caltrans selected the optimum binder for the high binder content RAC-O-HB mixes as 1.65 times the optimum binder content for open graded mixes using conventional AR4000 paving grade binder. Industry also recommended that this value be set at a minimum of 8.5%. It is important to note that California describes the optimum binder content as a percent of the dry weight of aggregate rather than the total weight of mix.
Figure 3. Selecting optimum binder content for open graded mix (Kc is 1.4)
4. Project Performance
4.1 Project Descriptions
The SAC 50/99 project was constructed in 1999 in District 3 from posted miles (PM) 21.6 to 24.6, in Sacramento, California. This project was designed to reconstruct the Route 99 median and add a high occupancy vehicle (HOV) lane in both the north and south bound directions as well as convert the number 1 lanes in both directions on Route 50 to HOV lanes. The pre-treatment existing pavement condition was a cracked and seated old PCC pavement. While some repair work was completed to repair concrete spalling, longitudinal and transverse

124 Asphalt-Rubber 2009
cracking, and slab replacement prior to placing the RAC-O-HB; the high traffic volumes and need for construction speed limited the actual amount of repairs that could be completed prior to resurfacing. This resulted in the RAC-O-HB being placed over the old, unrepaired PCC pavement in some locations.
The FRE I-5 project was constructed in 2000 in District 6 on I-5 PM 0.0 to 38.0, which is 70 miles north of Bakersfield, California. This is a valley farming area 170 m elevation (500 ft) with summer highs around 38℃ (100℉), with winter lows down to 0℃ (32℉), annual rainfall 145 mm (5.7 inches), two-way annual average daily traffic (AADT) of 33,500 with 8,899 trucks in the mix. This traffic level was used to estimate the annual equivalent 18,000 lb single axle loads (ESALs) of 2,748,000. The pre-treatment surface was a cracked and seated PCC pavement.
The MONO 395 project was constructed 2000 in District 9 on Route 395 from PM 76.0 to 84.5 near Bridgeport, California. This is a mountainous area 2100 m elevation (6,250 ft) with summer highs of 27℃ (80℉) and winter lows of around -12℃ (10℉) and an annual rainfall around 228 mm (9 inches). The two-way traffic has an AADT of about 6,400 with a low number of trucks (1,062) in the mix. The estimated annual ESALs are 297,000. The 25 mm (1-in) RAC-O-HB treatment was placed on existing distressed HMA pavement. Predominate distresses in the existing pavements were thermal cracking with some alligator cracking in the wheel paths.
The two sections of the SBD 40 project were constructed in District 8 in 2002: 1) I-40 from PM 3.0 to15.0 near Barstow, California, and 2) I-40 PM 73.4 to 89 about 80 km (50 miles) east of Ludlow. Both sections can be described by the same environmental and traffic conditions. The area is considered a desert area at an elevation of 630 m (1,900 ft), with summer highs well over 38℃ (100℉) and winter lows around 0℃ (32℉) with an annual rainfall around 110 mm (4.3 inches). The AADT two-way is 14, 900 with 6,333 trucks, which results in estimated annual ESALs of 1,892,000. The 25mm (1-in) RAC-O-HB treatment was placed over old HMA with minor distress levels.
4.2 Surface Condition
Table 3 summarizes the projects evaluated as garnered from construction records; treatment beginning and ending Post Mile (PM), length in miles (LM), the year of RAC-O-HB construction (YR Blt), construction percent binder content (% Bind), and pre-overlay condition of existing pavement prior to treatment, and surface condition at the time of the follow up survey (Way 2006 and 2007).
4.3 SAC 50/99
The project work was started on April 1, 1998. The production and the paving of the RAC-O-HB mix were completed during a night time paving operation between July 19, 1999 and August 3, 1999. Due to various difficulties, only the southbound lane PCC pavement was complete; repairs on the northbound lane was less thoroughly repaired. The minimum air temperature of 18 ℃ (65℉) was difficult to meet; paving temperatures were closer to 13℃ (55℉) during most of the paving. The binder content was also lower than the preferred

Performance Evaluation and Design 125
target of 8.5% as shown in Table 3. The construction records indicate intermittent difficulties with pick-up on the mat by rubber tires and difficulty in hand-working the mix. Construction records indicate the following observations were made:
The binder content was consistently too low due to a field engineering change in the mix design. There was some debate on whether the final mix represented a RAC-O-HB as a result of the low binder content.
Longitudinal joints were not aligned with the striping, leaving a construction joint in a wheel path.
The contractor was instructed to pave the full width of the lane each night. It was felt that a better paving job would have been accomplished by paving each lane in its entity, with one full lane being completed each night.
Pick-up would have been less of a problem if sanding the new surface had been required.
The overall performance, even with all of the less-than-optimum paving conditions, produced a surface treatment that is providing good to fair performance. In areas where the reflective cracks in the surface mix are starting to ravel, the areas of distresses are limited and the mix is well bonded with the original PCC surface, as shown in Figure 4.
•
•
•
•
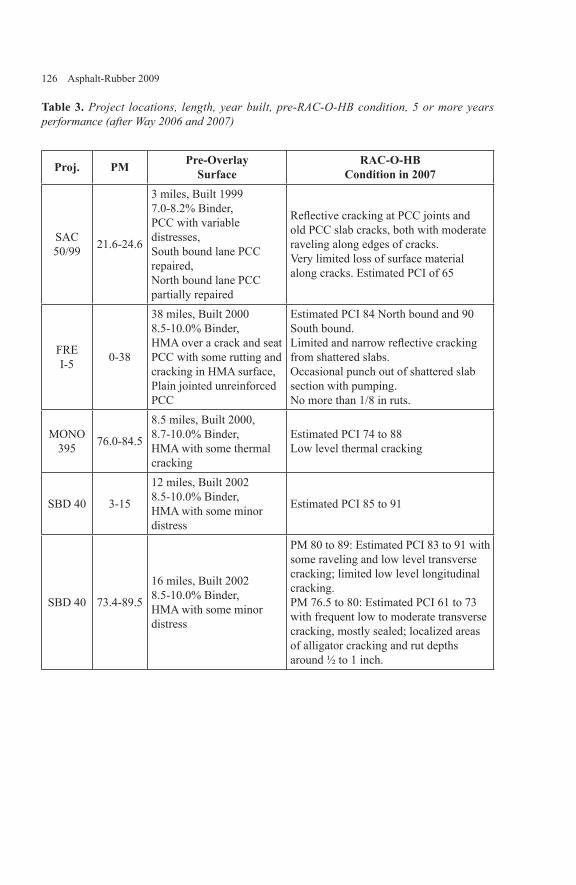
126 Asphalt-Rubber 2009
Table 3. Project locations, length, year built, pre-RAC-O-HB condition, 5 or more years performance (after Way 2006 and 2007)
Proj. PM Pre-OverlaySurface
RAC-O-HB Condition in 2007
SAC 50/99 21.6-24.6
3 miles, Built 19997.0-8.2% Binder,PCC with variable distresses,South bound lane PCC repaired,North bound lane PCC partially repaired
Reflective cracking at PCC joints and old PCC slab cracks, both with moderate raveling along edges of cracks.Very limited loss of surface material along cracks. Estimated PCI of 65
FRE I-5 0-38
38 miles, Built 20008.5-10.0% Binder,HMA over a crack and seat PCC with some rutting and cracking in HMA surface,Plain jointed unreinforced PCC
Estimated PCI 84 North bound and 90 South bound.Limited and narrow reflective cracking from shattered slabs.Occasional punch out of shattered slab section with pumping.No more than 1/8 in ruts.
MONO395 76.0-84.5
8.5 miles, Built 2000,8.7-10.0% Binder,HMA with some thermal cracking
Estimated PCI 74 to 88Low level thermal cracking
SBD 40 3-15
12 miles, Built 20028.5-10.0% Binder,HMA with some minor distress
Estimated PCI 85 to 91
SBD 40 73.4-89.5
16 miles, Built 20028.5-10.0% Binder,HMA with some minor distress
PM 80 to 89: Estimated PCI 83 to 91 with some raveling and low level transverse cracking; limited low level longitudinal cracking.PM 76.5 to 80: Estimated PCI 61 to 73 with frequent low to moderate transverse cracking, mostly sealed; localized areas of alligator cracking and rut depths around ½ to 1 inch.
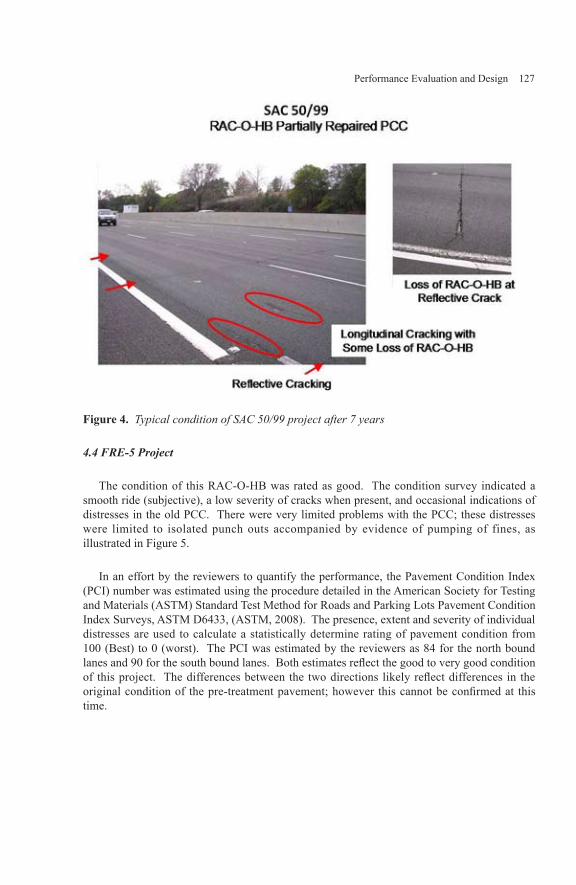
Performance Evaluation and Design 127
Figure 4. Typical condition of SAC 50/99 project after 7 years
4.4 FRE-5 Project
The condition of this RAC-O-HB was rated as good. The condition survey indicated a smooth ride (subjective), a low severity of cracks when present, and occasional indications of distresses in the old PCC. There were very limited problems with the PCC; these distresses were limited to isolated punch outs accompanied by evidence of pumping of fines, as illustrated in Figure 5.
In an effort by the reviewers to quantify the performance, the Pavement Condition Index (PCI) number was estimated using the procedure detailed in the American Society for Testing and Materials (ASTM) Standard Test Method for Roads and Parking Lots Pavement Condition Index Surveys, ASTM D6433, (ASTM, 2008). The presence, extent and severity of individual distresses are used to calculate a statistically determine rating of pavement condition from 100 (Best) to 0 (worst). The PCI was estimated by the reviewers as 84 for the north bound lanes and 90 for the south bound lanes. Both estimates reflect the good to very good condition of this project. The differences between the two directions likely reflect differences in the original condition of the pre-treatment pavement; however this cannot be confirmed at this time.

128 Asphalt-Rubber 2009
Figure 5. Typical condition of FRE-5 after 7 years
4.5 MONO 395 Project
Transverse cracking consistently observed at spacing of between 8 m and 16 m (25 and 50 feet). This type of cracking distress is environmentally related and is due to either long term thermal cycling or large single drops in temperature. It is likely that the cracking in the RAC-O-HB is a reflection of cracking patterns in the old HMA surface. Some of the transverse cracks had been sealed to limit water intrusion into the underlying layers, as illustrated in Figure 6.
Alligator cracking, a traffic load-related distress, is only seen in limited areas of the project. These limited areas also exhibited some loss of material (raveling). Rutting, combination of traffic during periods of warm weather, was usually less than 3 mm (1/8 in); in some cases rutting was as much as 10 mm (3/8 inch).
The reviewers noted that the ride was good, with some occasional noticeable bumps at the transverse cracks. The PCI for this project was estimated between 74 and 88. In general, this RAC-O-HB is in good shape for a 7 year old surface treatment.

Performance Evaluation and Design 129
Figure 6. Typical condition of Mono 395 after 7 years
4.6 SBD-40 Project PM 3 to 15
Only limited pre-treatment information was available for these projects (Table 4). After 5 years of heavy traffic, the RAC-O-HB was in very good condition. There were only a few fine longitudinal cracks in the wheel paths, limited alligator cracking of a low severity, and little to no rutting. There was some evidence of pumping of fines in the areas of alligator cracking, as illustrated in Figure 7.
The PCI estimates of 85 to 91 support the conclusion that these sections are in very good
Figure 7. Typical condition of SBD-40 PM 3-15 after 5 years

130 Asphalt-Rubber 2009
4.7 SBD 40 PM 73.4 – 89.5
A bridge reconstruction repair job between PM 78.5 and 80 divide this one project into two sections, each with different current pavement conditions. From PM 73.4 to about PM 80, the RAC-O-HB is in good condition with only a few longitudinal cracks in the wheel paths, limited alligator cracking, and some wear and weather related raveling, Figure 8. The estimated PCI were between 83 and 90.
The section of the project from PM 80 to 89.5 showed sealed transverse cracks from low to moderate severity for more than half of the section. In one area, there was a limited section of severe alligator cracking with 12 to 25 mm (½ to 1 in) ruts, as illustrated in Figure 8. The estimated PCI for this side of the bridge were much lower: 61 to 73.
The significant difference between the pavement condition on either side of the bridge suggests that there may be different geological or original construction differences (e.g., cut versus fill). These results highlight the need to assess the load carrying capability and structural condition of the existing roadway prior to selecting a surface treatment.
Figure 8. Typical condition of SBD-40 PM 73.4-89 after 5 years
5. Noise Reduction
A 1999 report by Sacramento County and Bollard & Brennen, Inc. (Bollard, 1999) documents several California asphalt rubber open graded mix studies between 1991 and 1993. This research was conducted using the pass-by Federal Highway Administration Highway
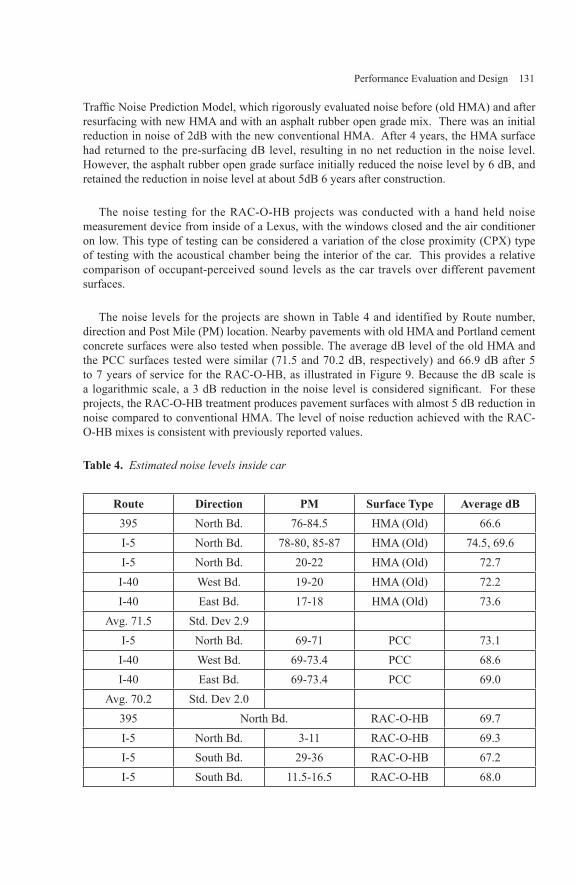
Performance Evaluation and Design 131
Traffic Noise Prediction Model, which rigorously evaluated noise before (old HMA) and after resurfacing with new HMA and with an asphalt rubber open grade mix. There was an initial reduction in noise of 2dB with the new conventional HMA. After 4 years, the HMA surface had returned to the pre-surfacing dB level, resulting in no net reduction in the noise level. However, the asphalt rubber open grade surface initially reduced the noise level by 6 dB, and retained the reduction in noise level at about 5dB 6 years after construction.
The noise testing for the RAC-O-HB projects was conducted with a hand held noise measurement device from inside of a Lexus, with the windows closed and the air conditioner on low. This type of testing can be considered a variation of the close proximity (CPX) type of testing with the acoustical chamber being the interior of the car. This provides a relative comparison of occupant-perceived sound levels as the car travels over different pavement surfaces.
The noise levels for the projects are shown in Table 4 and identified by Route number, direction and Post Mile (PM) location. Nearby pavements with old HMA and Portland cement concrete surfaces were also tested when possible. The average dB level of the old HMA and the PCC surfaces tested were similar (71.5 and 70.2 dB, respectively) and 66.9 dB after 5 to 7 years of service for the RAC-O-HB, as illustrated in Figure 9. Because the dB scale is a logarithmic scale, a 3 dB reduction in the noise level is considered significant. For these projects, the RAC-O-HB treatment produces pavement surfaces with almost 5 dB reduction in noise compared to conventional HMA. The level of noise reduction achieved with the RAC-O-HB mixes is consistent with previously reported values.
Table 4. Estimated noise levels inside car
Route Direction PM Surface Type Average dB395 North Bd. 76-84.5 HMA (Old) 66.6I-5 North Bd. 78-80, 85-87 HMA (Old) 74.5, 69.6I-5 North Bd. 20-22 HMA (Old) 72.7I-40 West Bd. 19-20 HMA (Old) 72.2I-40 East Bd. 17-18 HMA (Old) 73.6
Avg. 71.5 Std. Dev 2.9I-5 North Bd. 69-71 PCC 73.1I-40 West Bd. 69-73.4 PCC 68.6I-40 East Bd. 69-73.4 PCC 69.0
Avg. 70.2 Std. Dev 2.0395 North Bd. RAC-O-HB 69.7I-5 North Bd. 3-11 RAC-O-HB 69.3I-5 South Bd. 29-36 RAC-O-HB 67.2I-5 South Bd. 11.5-16.5 RAC-O-HB 68.0
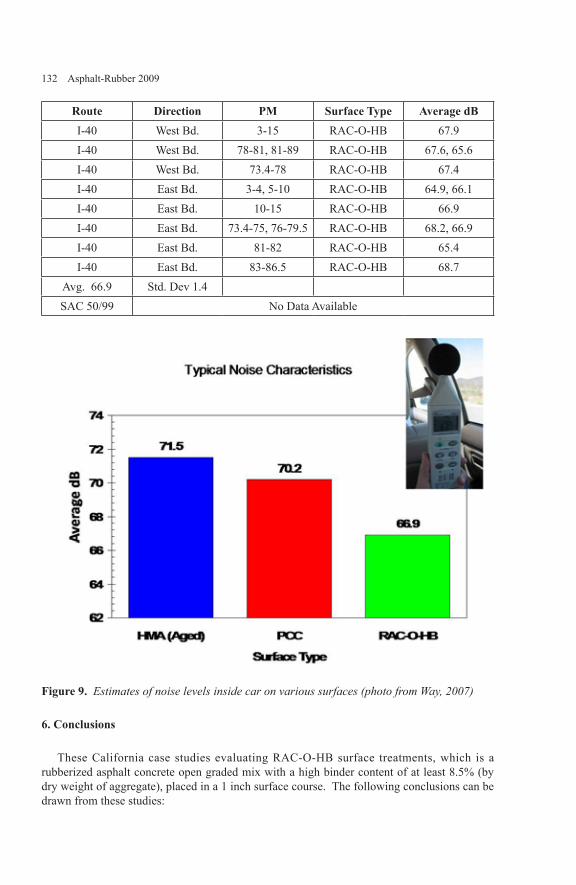
132 Asphalt-Rubber 2009
Route Direction PM Surface Type Average dBI-40 West Bd. 3-15 RAC-O-HB 67.9I-40 West Bd. 78-81, 81-89 RAC-O-HB 67.6, 65.6I-40 West Bd. 73.4-78 RAC-O-HB 67.4I-40 East Bd. 3-4, 5-10 RAC-O-HB 64.9, 66.1I-40 East Bd. 10-15 RAC-O-HB 66.9I-40 East Bd. 73.4-75, 76-79.5 RAC-O-HB 68.2, 66.9I-40 East Bd. 81-82 RAC-O-HB 65.4I-40 East Bd. 83-86.5 RAC-O-HB 68.7
Avg. 66.9 Std. Dev 1.4SAC 50/99 No Data Available
Figure 9. Estimates of noise levels inside car on various surfaces (photo from Way, 2007)
6. Conclusions
These California case studies evaluating RAC-O-HB surface treatments, which is a rubberized asphalt concrete open graded mix with a high binder content of at least 8.5% (by dry weight of aggregate), placed in a 1 inch surface course. The following conclusions can be drawn from these studies:

Performance Evaluation and Design 133
The high binder content and rubberized modification of the binder bonds very well with a wide range of existing pavement surfaces such as older distressed HMA, distressed PCC, and PCC that has been cracked and seated.
The reflective cracking, while expected with such a thin surface treatment, is typically of a low severity, which is a function of the fine and narrow width of any visible cracks.
RAC-O-HB surfaces, when placed using the minimum recommended binder content, can be expected to perform well, even at high traffic levels (3 million annual ESALs), for at least 7 years without needing any other pavement preservation activities.
When the rubberized binder content is below the recommended 8.5%, the surface treatment is less wear- and crack-resistant.
7. Best Practices
The following key points need to be considered for future evaluations and for achieving maximum service life:
Preparation of existing PCC pavements such as slab repair or replacement, crack sealing, and spall repairs will influence the life of the treatment. For example, weak areas in a crack and seat PCC project can result in punch outs. While the RAC-O-HB will still be firmly bound to the PCC, the punch out will still have to be repaired.
Treatment joints need to be aligned with new lane lines to prevent placing joints in wheel paths. This high wear in a potentially low density or thermally segregated area can result in accelerated loss of the treatment surface.
Assurances that the minimum recommended binder content of 8.5% (dry weight of aggregate) is achievable are needed at the mix design phase. Adjusting the gradation to provide more room for higher binder content at the design stage is more desirable than a lowering of the binder content based on visual inspection during construction. This is especially important if it is a night time job when visual inspections are difficult. Since night time paving is usually on high traffic volume roadways, attention to the mix design prior to paving is critical.
Mix designs and optimum binder content should be verified using project materials immediately prior to placement.
Material properties for all components (e.g., crumb rubber materials, rubberized asphalt, aggregates) should be submitted to a central data collection point so that construction material histories can be evaluated during future pavement condition surveys of experimental materials. Rubber tired vehicles should be limited on still-warm RAC-O-HB surfaces to avoid pick-up and damage to the new surface.
•
•
•
•
•
•
•
•
•
134 Asphalt-Rubber 2009
Tight controls are needed on temperatures: air temperature, pavement temperature, and mix delivery temperature.
Include the existing pavement (pre-treatment) distress survey information in the construction records for future comparisons.
8. Acknowledgment
The authors thank Dr. Luiz Guiherme R. Mello for helping with the noise measurements, data recording and data organization. Dr. Mello was an Arizona State University graduate research assistant from Brazil studying for his Ph.D. in Civil Engineering when conducting this study. He subsequently received his doctorate and is presently with the National Department of Transportation, Brasilia, Brazil.
9. References
ASTM D6433-07 Standard Practice for Roads and Parking Lots Pavement ConditionIndex Surveys, ASTM 2008 Annual Book of ASTM Standards, Section Four, Construction.
Bollard & Brennan, Inc. Report on the Status of Rubberized Asphalt Traffic Noise Reduction in Sacramento County. Sacramento County Public Works Agency-
Transportation Division. November, 1999.
Caltrans. Asphalt Rubber Usage Guide. Caltrans Report. January 2003. www.rubberpavements.org, Library, ARI, Caltrans Asphalt-Rubber Usage Guide.
Caltrans. http://www.dot.ca.gov/hq/esc/ctms/CT_368_1-00.pdf accessed September 2007.
Caltrans. http://www.dot.ca.gov/hq/esc/ctms/CT_303.pdf Accessed September 2007.
Carlson, Douglas D., Han Zhu and Can Xiao. Analysis of Traffic Noise Before andAfter Paving with Asphalt-Rubber. Proceedings AR2003 International Conference on Asphalt Rubber, Brazilia, Brazil, IBSN: 85-903997-1-0, Dec., 2003.
Carter, Alan, and Stroup-Gardiner, M. Influence of Texture on Tire/Pavement Noise.Proceedings, International Society for Asphalt Pavements, Quebec City, Quebec. August 2006.
Evaluation of a RAC-O-HB Project 03-405614 SAC 50, 99 – 0.8/2.8 (Draft). CaliforniaDepartment of Transportation Sacramento and California Pavement Preservation Center California State University Chico. www.cp2info.org/center, . March 15, 2007
Sacramento County Department of Environmental Review and Assessment and Bollard & Brennan, Inc. Consultants in Acoustics and Noise Control Engineering. Report on the Status of Rubberized Asphalt Traffic Noise Reduction in Sacramento County. November 1999.
•
•

Performance Evaluation and Design 135
Shatnawi, Shakir, and Long, Bing. Asphalt Rubber Usage Guide Appendix A: Performance of Asphalt Rubber as Thin Overlays. Caltrans Report. January 2003.
Way, George B. and Kamil Kaloush. Evaluation of RAC-O-HB Project Contract No.09-302804 Mono 395- PM 76-84.5. Report for California Department of Transportation, Sacramento, California. Chico State University report number CP2C-2007-104, www.cp2info.org/center, July 7, 2007.
Way, George B. and Kamil Kaloush. Evaluation of RAC-O-HB Project SBD 40-PM 3-15.Report for California Department of Transportation, Sacramento, California. Chico State University report number CP2C-2007-102, www. www.cp2info.org/center, June 15, 2007.
Way, George B. and Kamil Kaloush. Evaluation of RAC-O-HB Project FRE I-5 PM 0-38.Report for California Department of Transportation, Sacramento, California. Chico State University report number CP2C-2007-103, www.cp2info.org/center, July 7, 2007.
Way, George B. and Kamil Kaloush. Evaluation of RAC-O-HB Project SBD 40-PM73.4-89.5. Report for California Department of Transportation, Sacramento, California. Chico State University report number CP2C-2007-102, www.cp2info.org/center June 30, 2007.


Performance Evaluation and Design 137
Implementation of Asphalt-Rubber Mixes into the Mechanistic Empirical Pavement Design Guide
Maria C. Rodezno* – Kamil E. Kaloush*
* Department of Civil, Environmental and Sustainable Engineering, Arizona State University, Tempe, AZ 85287-5306, [email protected]@asu.edu
ABSTRACT: The Mechanistic-Empirical Pavement Design Guide (MEPDG) developed by the National Cooperative Highway Research Program (NCHRP) utilizes material properties to predict distresses in pavement structures. This new MEPDG is the process of replacing the traditional pavement design based on the AASHTO 1993 Design Guide. As it is well known, the Arizona Department of Transportation (ADOT) uses Asphalt- Rubber (AR) mixes state-wide. The Arizona mixes include both gap and open gradation designs. However, the national calibration process that was undertaken for the MEPDG did not include asphalt-rubber mixes. Because of their unique characteristics, this paper addresses steps and efforts undertaken in a recent study to implement these AR mixes into the MEPDG. There were several issues and limitations identified pertaining to the implementation of AR mixes in the MEPDG. Short and long term recommendations were provided.
KEYWORDS: Mechanistic Empirical Pavement Design Guide, Dynamic (Complex) Modulus, Asphalt-Rubber, Permanent Deformation, Fatigue.

138 Asphalt-Rubber 2009
1. Introduction
The Mechanistic- Empirical Pavement Design Guide (MEPDG) developed by the National Cooperative Highway Research Program (NCHRP) utilizes material properties to predict distresses in pavement structures. The MEPDG is expected to replace the traditional design of pavements based on the AASHTO 1993 Design Guide that is mostly used by the various DOT’s in the United State and around the world.
The utilization of asphalt-rubber mixtures has regained popularity in the past few years. Several states in the U.S. and countries around the world have used, or are in the process of using, asphalt-rubber mixtures in new pavement designs or in their pavement rehabilitation programs (Mohammad et al, 2002; Natu and Tayebali, 1999). Several researchers have reported on the unique material responses of these modified mixtures (Way, 1999; Kaloush et al, 2002).
As it is well known, the Arizona Department of Transportation (ADOT) uses Asphalt-Rubber mixes on a regular basis, and these mixes have shown good performance in the field. These mixes included Asphalt-Rubber Asphalt Concrete (ARAC) or GAP graded mixes and Asphalt-Rubber Friction Courses (ARFC), and Open Graded mixes. However, the national calibration process that was undertaken for the MEPDG did not include any Asphalt-Rubber (AR) mixes.
This paper addresses what needs to be done in order to implement AR mixes into the MEPDG. The focus of this evaluation was on permanent deformation and fatigue cracking. A database with engineering properties of AR mixtures and binders from ADOT projects were assembled from laboratory tests conducted at Arizona State University.
2. Objective
The objective of this paper was to identify issues that need to be considered for the implementation of asphalt-rubber mixtures into the MEPDG. The focus was on their short term implementation, and to provide recommendations for their full implementation in future designs.
3. MEPDG Material Input and Implementation for Asphalt-Rubber Mixtures
It would be helpful to provide a brief overview of the required input data for MEPDG implementation. In the MEPDG, there are basically 3 input steps for the asphalt concrete layer: mixture, asphalt cement (binder or bitumen), and a general asphalt category. The information required in each of these fields will vary according to the level of analysis to be used, as described in the following section.
3.1. Level 1
3.1.1. Mix Information
At Level 1, laboratory test data are required to develop the dynamic modulus master curve
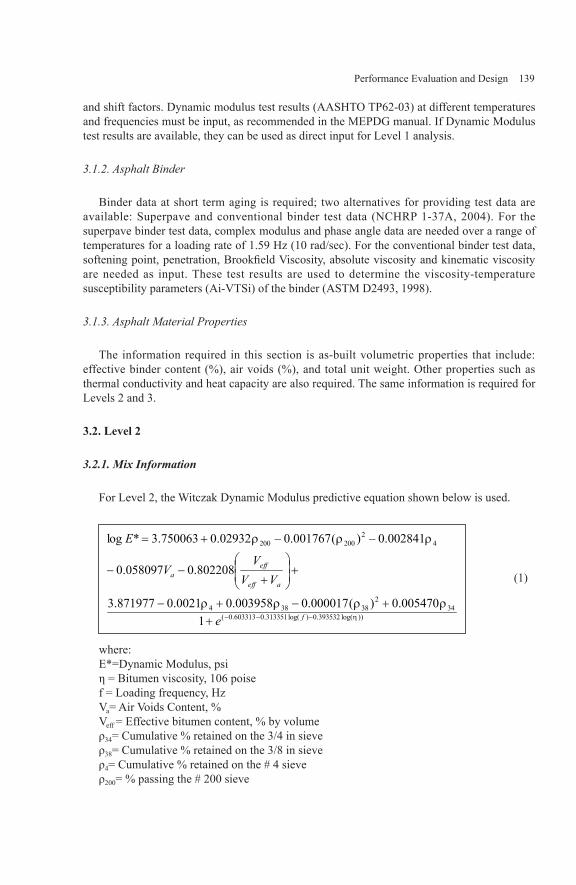
Performance Evaluation and Design 139
and shift factors. Dynamic modulus test results (AASHTO TP62-03) at different temperatures and frequencies must be input, as recommended in the MEPDG manual. If Dynamic Modulus test results are available, they can be used as direct input for Level 1 analysis.
3.1.2. Asphalt Binder
Binder data at short term aging is required; two alternatives for providing test data are available: Superpave and conventional binder test data (NCHRP 1-37A, 2004). For the superpave binder test data, complex modulus and phase angle data are needed over a range of temperatures for a loading rate of 1.59 Hz (10 rad/sec). For the conventional binder test data, softening point, penetration, Brookfield Viscosity, absolute viscosity and kinematic viscosity are needed as input. These test results are used to determine the viscosity-temperature susceptibility parameters (Ai-VTSi) of the binder (ASTM D2493, 1998).
3.1.3. Asphalt Material Properties
The information required in this section is as-built volumetric properties that include: effective binder content (%), air voids (%), and total unit weight. Other properties such as thermal conductivity and heat capacity are also required. The same information is required for Levels 2 and 3.
3.2. Level 2
3.2.1. Mix Information
For Level 2, the Witczak Dynamic Modulus predictive equation shown below is used.
))log(393532.0)log(313351.0603313.0(34
238384
42
200200
1005470.0)(000017.0003958.00021.0871977.3
802208.0058097.0
002841.0)(001767.002932.0750063.3*log
η
ρρρρ
ρρρ
−−−++−+−
+
+−−
−−+=
f
aeff
effa
e
VVV
V
E
(1)
where:E*=Dynamic Modulus, psiη = Bitumen viscosity, 106 poisef = Loading frequency, HzVa= Air Voids Content, %Veff = Effective bitumen content, % by volumeρ34= Cumulative % retained on the 3/4 in sieveρ38= Cumulative % retained on the 3/8 in sieveρ4= Cumulative % retained on the # 4 sieveρ200= % passing the # 200 sieve

140 Asphalt-Rubber 2009
3.2.2. Binder Information
The same binder test data needed as in the Level 1 analysis.
3.3. Level 3
3.3.1. Mix Information
For Level 3 analysis, Witczak’s Dynamic Modulus predictive equation is also used to estimate the dynamic modulus. The aggregate gradation is the only mix information required.
3.3.2. Binder Information
The binder information for Level 3 does not require laboratory test data. The binder viscosity information as a function of time is estimated from typical temperature- viscosity relationships after the Rolling Thin Film Oven (RTFO) test results are established for different asphalt grades derived from various grading systems.
4. Asphalt-Rubber Binder Characteristics
Typical asphalt-rubber binder test results obtained at ASU for the Ai-VTSi parameters are shown in Table 1. The table shows average Ai and VTSi test data for two different binders that are commonly used in Arizona. This includes PG 58-22 and PG 64-16 with and without crumb rubber modification. This table also includes test results for the three different aging levels: original, RTFO and PAV.
It is observed that the crumb rubber modification of the binder increases the performance grade of the virgin binder especially at the high temperature end. Figure1 shows a comparison of a stiff conventional binder (PG 76-16) versus two binder grades with and without crumb rubber at RTFO conditions. From this Figure it can be seen that the AR binders have the better viscosity-temperature susceptibility indicated by higher viscosities at high temperature, and lower (or unchanged) viscosities at lower temperatures.
Table 1. Typical Ai and VTSi Parameters for Binders with and without Asphalt-Rubber, and at Different Aging Conditions.
Binder Type Aging Ai VTSi
PG58-22Original 11.164 -3.764RTFO 11.076 -3.722PAV 11.3195 -3.795
PG58-22 AROriginal 8.3595 -2.726RTFO 8.0475 -2.598PAV 7.8955 -2.534
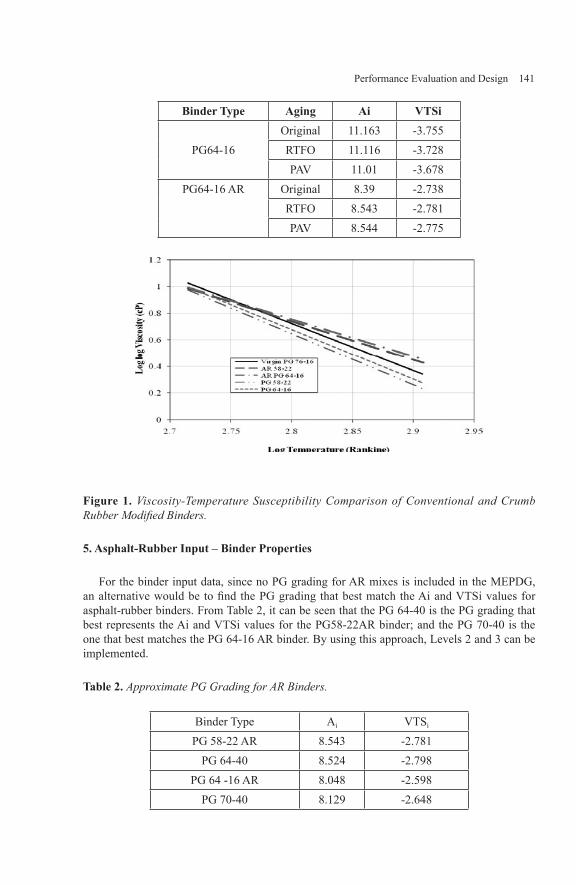
Performance Evaluation and Design 141
Binder Type Aging Ai VTSi
PG64-16Original 11.163 -3.755RTFO 11.116 -3.728PAV 11.01 -3.678
PG64-16 AR Original 8.39 -2.738RTFO 8.543 -2.781PAV 8.544 -2.775
Figure 1. Viscosity-Temperature Susceptibility Comparison of Conventional and Crumb Rubber Modified Binders.
5. Asphalt-Rubber Input – Binder Properties
For the binder input data, since no PG grading for AR mixes is included in the MEPDG, an alternative would be to find the PG grading that best match the Ai and VTSi values for asphalt-rubber binders. From Table 2, it can be seen that the PG 64-40 is the PG grading that best represents the Ai and VTSi values for the PG58-22AR binder; and the PG 70-40 is the one that best matches the PG 64-16 AR binder. By using this approach, Levels 2 and 3 can be implemented.
Table 2. Approximate PG Grading for AR Binders.
Binder Type Ai VTSi
PG 58-22 AR 8.543 -2.781PG 64-40 8.524 -2.798
PG 64 -16 AR 8.048 -2.598PG 70-40 8.129 -2.648

142 Asphalt-Rubber 2009
6. Typical Asphalt-Rubber Mixtures Characteristics
Typical ARAC mixes tested at ASU had an asphalt content range between 6.8 and 8.9%, with air voids between 8 and 11%. For the ARFC mixes, the asphalt content range is between 8.8-9.5%, with an air voids level of about 18%. Table 3 shows typical aggregate gradations for these mixtures. They correspond to ADOT Standard ARAC 413 Specifications. Note that two years ago, ADOT has revised the ARAC 413 specification to a new ARAC 415 specification, which includes a final density requirement.
7. Dynamic Modulus Test Results
The dynamic modulus testing program follows AASHTO TP 62-03; however, at ASU, the testing program includes unconfined and confined stress state conditions. The confined testing is necessary because of the gap and open gradations used for the AR mixes. These types of gradations are very sensitive to the state of stress applied in the laboratory.
A comparison of the average dynamic modulus master curves for ARAC and ARFC mixes under unconfined and confined conditions (138 kPa) is presented in Figures 2 and 3. From these figures it is observed that at different temperatures and frequencies, the dynamic modulus values for the AR mixes are always higher for confined conditions. This is particularly true at high temperatures, were the values can be as much as 2 and 3 times higher, especially for the ARFC mix, under confined testing conditions. The authors believe that this is very important to consider when such values are used as input in the MEPDG. Previous studies have shown that the use of confined dynamic modulus test data gives better predictions of rutting values in the MEPDG (Rodezno et al, 2005).
Table 3. Typical Aggregate Gradations for Asphalt-Rubber Mixes
Binder gradation ARAC 413 ARAC 415 ARFC 414 2 100 100 -
Gradation 1 1/2 - - 100(% passing) 1 1/4 100 100 -
1 100 100 100 3/4 100 100 100 1/2 82 81 100 3/8 67 65 100 1/4 49 43 67 No. 4 36 32 36 No. 8 20 17 7 No. 10 18 15 7 No. 16 13 11 5 No. 30 8 7 3

Performance Evaluation and Design 143
Binder gradation ARAC 413 ARAC 415 ARFC 414 No. 40 6 6 2 No. 50 5 5 2 No. 100 3 3 1 No. 200 1.3 2.8 1.2
100
1,000
10,000
100,000
-8 -7 -6 -5 -4 -3 -2 -1 0 1 2 3 4 5 6 7 8
Log Reduced Time (sec)
E*
(MPa
)
ARAC Unconfined ARAC Confined 138 kPa
54.4 °C0.1 Hz
Figure 2. Dynamic Modulus Master Curves for ARAC Mixtures at Unconfined and Confined Conditions (138 kPa).
100
1,000
10,000
100,000
-8 -7 -6 -5 -4 -3 -2 -1 0 1 2 3 4 5 6 7 8
Log Reduced Time (sec)
E*
(kPa
)
ARFC Unconfined ARFC Confined 138 kPa
54.4 °C0.1 Hz
Figure 3. Dynamic Modulus Master Curves for ARFC Mixtures at Unconfined and Confined

144 Asphalt-Rubber 2009
Conditions (138 kPa).
8. Asphalt-Rubber Input - Mixtures Properties
After reviewing the information that is required as input data for the MEPDG, the following recommendations are given for the Asphalt-Rubber Mixes:
8.1 Level 1
If confined laboratory test results for the Dynamic Modulus are available, they can be input directly into the MEPDG. A minimum of 138 kPa confining pressure is desirable; higher confining levels will have minimal impact on increased moduli values (Kaloush et al, 2003).
8.2 Level 2 and Level 3
Currently, the data used in the development of the Witczak Dynamic Modulus predictive equation is not calibrated for asphalt-rubber mixes. Furthermore, the Witczak Dynamic Modulus predictive equation has been developed and calibrated only for unconfined tests. The next section presents an effort that was undertaken to develop a modified version of Witczak’s E* Dynamic Modulus predictive equation for AR mixes using confined test data.
9. Modified Witczak E* Predictive Equation for Asphalt-Rubber Mixtures
A non linear optimization of the regression parameters was performed to obtain new coefficients for the current version of the Witczak Dynamic Modulus predictive equation used in the MEPDG. The focus was on using the confined dynamic modulus test data. The confinement level used was 138 kPa. Nineteen asphalt-rubber mixtures: 12 ARAC and 7 ARFC mixes were used, for a total of 1260 data points.
Table 4 shows the new regression parameters for the modified predictive equation along with the statistical goodness of fit (R2). The results of the calibration are shown in Figure 4. The figure shows the observed versus predicted plot using this equation; the prediction for confined dynamic modulus shows good measures of model accuracy (R2 = 0.90 and Se/Sy=0.32,
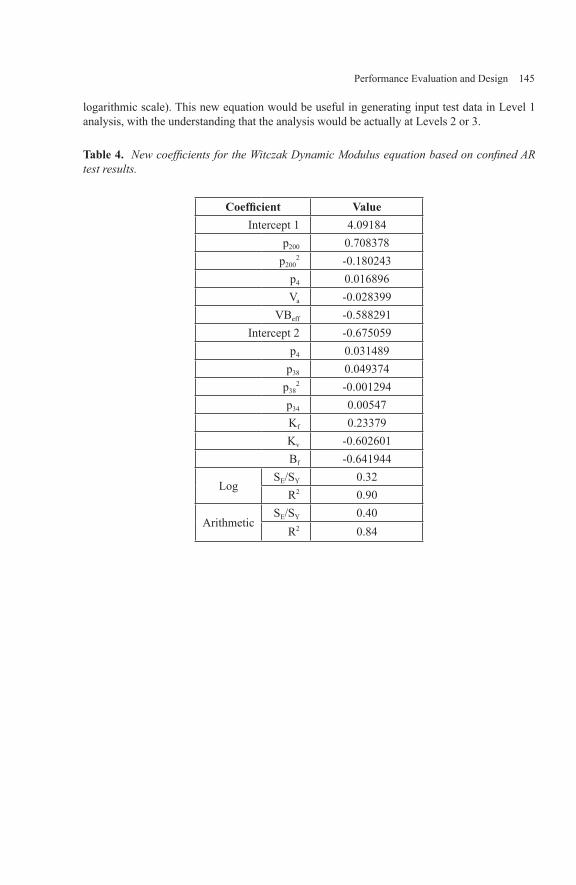
Performance Evaluation and Design 145
logarithmic scale). This new equation would be useful in generating input test data in Level 1 analysis, with the understanding that the analysis would be actually at Levels 2 or 3.
Table 4. New coefficients for the Witczak Dynamic Modulus equation based on confined AR test results.
Coefficient ValueIntercept 1 4.09184
p200 0.708378p200
2 -0.180243p4 0.016896Va -0.028399
VBeff -0.588291Intercept 2 -0.675059
p4 0.031489p38 0.049374
p382 -0.001294
p34 0.00547Kf 0.23379Kv -0.602601Bf -0.641944
Log SE/SY 0.32
R2 0.90
ArithmeticSE/SY 0.40
R2 0.84

146 Asphalt-Rubber 2009
1.0E+04
1.0E+05
1.0E+06
1.0E+07
1.0E+08
80+E0.170+E0.160+E0.150+E0.140+E0.1
Pred
icte
dE*
(psi
)
MeasuredE* (psi)
Data Point=1260,se/sy=0.399 (arithm), 0.32(log)R2=0.84 (arithm) 0.90(log)
Figure 4. Dynamic Modulus measured versus predicted (Confined AR mixes)
10. MEPDG Design Analysis and Pavement Response Models
10.1 Permanent Deformation
The constitutive relationship used in the MEPDG to predict rutting for asphalt mixtures is based on a field calibrated statistical analysis model developed from unconfined laboratory repeated load permanent deformation tests. The final rutting equation implemented is as shown in Equation 2:
332211
rr aar
r
p NTa βββε
ε= (2)
where:εp = Accumulated plastic strain at N repetitions of load εr = Resilient strain of the asphalt material as a function of mix properties, temperature and time rate of loading N = Number of load repetitionsT = Temperature ai = Non-linear regression coefficientsβr’s= Field Calibration Factors
To compare the how AR mixtures fit into the above relationship, several unconfined repeated load test results available from the ADOT projects were evaluated. The calibration factors for the AC rutting prediction model were calculated for both the ARAC and ARFC mixes. Most of the repeated load tests conducted correspond to a single stress level (103 kPa) and one temperature (~38℃). Because of this, only βr1 and βr3 parameters needed to be estimated. Using these new coefficients, the εp/εr vs. number of cycles relationship was evaluated for each mix and compared with the relationship from the same parameters, but

Performance Evaluation and Design 147
using the original MEPDG AC Rutting calibration model.
Figure 5 shows that the rate of accumulation of εp/εr for both the ARAC and ARFC mixes are higher when compared with the one from the MEPDG. This is again attributed to the lack of confinement that these type of mixes need for proper evaluation. Unfortunately, the current database contains limited confined repeated load test data that were insufficient to develop new model coefficients. Efforts are continuing at ASU to build a database for future development of such relationships. The recommendation by the authors is to tentatively continue the use of the MEPDG default coefficients for the rutting model.
1
10
100
1000
10 100 1000 10000 100000Number of Cycles
ε p/ ε r
ARAC ARFC MEPDG
.
Figure 5. εp/εr Relationship—using ARAC, ARFC and MEPDG Calibration Factors.
10.2 Fatigue Cracking
The fatigue model used in the MEPDG is shown in Equation 3:
32
32
)()(1111
kkt
kk
tf Ek
EkN −−=
= ε
ε (3)
where:Nf = number of repetitions to fatigue crackingεt = tensile strain at the critical location E = stiffness of the materialk1, k2, k3 = laboratory calibration parameters
The asphalt-rubber testing program for fatigue included a full factorial for each mixture. Control strain tests were used at three temperatures (4.4, 21.1, 37.8 ℃) using six or more levels of strain for each test temperature. The tests were performed according to the AASHTO TP8, and SHRP M-009 procedures. Table 7 shows the range of regression coefficients k1, k2, k3 that were obtained for the AR mixes compared to those in the MEPDG.
Table 5. Range of the regression coefficients k1, k2, k3 -for ARAC and ARFC mixes.
Regression Coefficients k1, k2, k3
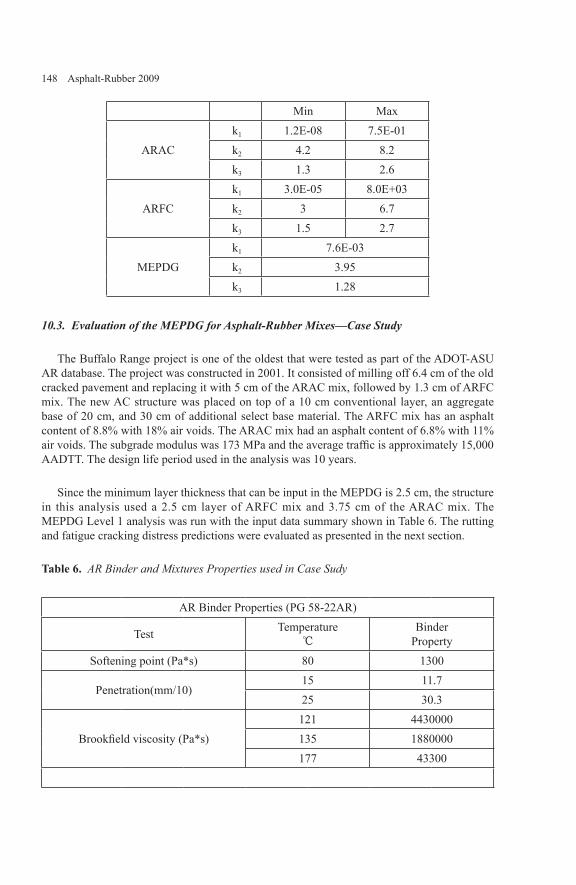
148 Asphalt-Rubber 2009
Min Max
ARAC k1 1.2E-08 7.5E-01 k2 4.2 8.2 k3 1.3 2.6
ARFC k1 3.0E-05 8.0E+03 k2 3 6.7 k3 1.5 2.7
MEPDG k1 7.6E-03 k2 3.95 k3 1.28
10.3. Evaluation of the MEPDG for Asphalt-Rubber Mixes—Case Study
The Buffalo Range project is one of the oldest that were tested as part of the ADOT-ASU AR database. The project was constructed in 2001. It consisted of milling off 6.4 cm of the old cracked pavement and replacing it with 5 cm of the ARAC mix, followed by 1.3 cm of ARFC mix. The new AC structure was placed on top of a 10 cm conventional layer, an aggregate base of 20 cm, and 30 cm of additional select base material. The ARFC mix has an asphalt content of 8.8% with 18% air voids. The ARAC mix had an asphalt content of 6.8% with 11% air voids. The subgrade modulus was 173 MPa and the average traffic is approximately 15,000 AADTT. The design life period used in the analysis was 10 years.
Since the minimum layer thickness that can be input in the MEPDG is 2.5 cm, the structure in this analysis used a 2.5 cm layer of ARFC mix and 3.75 cm of the ARAC mix. The MEPDG Level 1 analysis was run with the input data summary shown in Table 6. The rutting and fatigue cracking distress predictions were evaluated as presented in the next section.
Table 6. AR Binder and Mixtures Properties used in Case Sudy
AR Binder Properties (PG 58-22AR)
Test Temperature ℃
Binder Property
Softening point (Pa*s) 80 1300
Penetration(mm/10)15 11.725 30.3
Brookfield viscosity (Pa*s)121 4430000135 1880000177 43300

Performance Evaluation and Design 149
AR Mixtures Properties (E*)
Temperature ℃
ARFC Mixture E* (MPa)Frequencies ( Hz)
25 10 5 1 0.5 0.1-10 15307 13887 12620 9717 8710 68554.4 12540 11133 9738 6618 5646 382621.1 9020 8084 6598 3991 3342 249837.8 6181 6031 5397 3477 2974 242654.4 5916 5474 4238 2839 2446 2024
Temperature ℃
ARAC Mixture E* (MPa)Frequencies ( Hz)
25 10 5 1 0.5 0.1-10 14632 14100 13251 10818 9856 77394.4 11096 10331 9197 7062 6210 463421.1 7852 6897 6013 4350 3766 280637.8 6452 5938 5320 3856 3331 271354.4 4364 4058 3557 2837 2605 2374
10.3.1 Results and Analysis
Table 7 shows the rutting prediction for the Buffalo Range pavement structure using the default MEPDG Rutting Coefficients and the E* confined test results. This table shows the rutting prediction for each layer as well as the subtotal and total for the pavement structure. From these results it can be observed that the AC rutting is 7.62 mm with a rutting of 15.75 mm for the total structure after 10 years. These results are high compared to the field observation, since the rutting recorded for this project after 7 years of service was about 2.5 mm.
Table 7. MEPDG Rutting Prediction-Buffalo Range Project using confined E* values and modified rutting coefficients.
Buffalo Range Project -Confined E*- Default MEPDG Rutting Coefficients
Year
Rutting (mm)
ARFC (mm)
ARAC (mm)
Conventional (mm)
Subtotal AC (mm)
Subtotal Base-
Subgrade (mm)
Total Rutting (mm)
1 0 1.02 1.02 2.29 6.10 8.382 0 1.52 1.52 3.05 6.60 9.65

150 Asphalt-Rubber 2009
3 0 2.03 2.03 3.81 7.11 10.924 0 2.29 2.29 4.57 7.37 11.945 0 2.54 2.54 5.33 7.62 12.956 0 3.05 3.05 5.84 7.87 13.727 0 3.05 3.30 6.35 7.87 14.228 0 3.30 3.30 6.86 7.87 14.739 0 3.56 3.56 7.11 8.13 15.2410 0 3.81 3.81 7.62 8.13 15.75
Table 8 shows the fatigue results for two conditions: using the default MEPDG fatigue coefficients and using the specific ARAC layer coefficients. Based on the field distress survey, the fatigue observed after 7 years was approximately 7%. The use of the specific ARAC coefficients assists in achieving a better prediction of actual cracking and more realistic fatigue cracking percentages.
Table 8. MEPDG total cracking prediction at surface (%) for different case scenarios.
Total Cracking at Surface (%)
Year Default Coefficients ARAC Coefficients
1 0.47 0.442 3.31 3.033 11.21 9.734 17.07 13.145 20.71 13.826 24.00 13.887 27.42 13.958 30.83 14.019 34.14 14.08
10 37.30 14.14
11. Concluding Remarks
The binder test results showed improved viscosity-temperature susceptibility when compared to the virgin binder. The crumb rubber modification generally bumps up the effective Performance Grade for the binder by at least one level, both at the high and low temperature ranges. For the AR binder MEPDG input data, the recommendation is to find the PG that best matches the AR Ai and VTSi values.

Performance Evaluation and Design 151
The use of confined Dynamic Modulus test results was found to be important in this study; this is largely due to the gradation of the AR mixes (gap and open), which are sensitive to the stress state used in the laboratory. These AR mixtures are subjected to confinement in their in-situ or field state of stress. This is specifically important at higher temperatures (37.8 and 54.4℃), where the rubber mixture moduli values are two or even three times larger when compared with unconfined modulus values.
A modified Witczak Dynamic Modulus predictive equation was developed in this study to predict confined moduli values for AR mixes. The predictive equation can be simply used to generate dynamic modulus input data for Level 1 analysis. Even though one would be performing a Level 1 analysis, it is understood that the analysis level is actually 2 or 3.
Since the minimum AC layer thickness in the MEPDG is, and most ARFC mixes are, only 1.3-2.5 cm thick, the recommendation is to either use 2.5 cm thick layer for the ARFC and subtract the difference from the ARAC layer, or completely ignore the ARFC layer. The justification would be that this layer is not normally considered a structural layer.
The use of confined moduli helped in reasonable predictions of rutting and fatigue. For fatigue cracking, the use of the specific ARAC coefficients also helped in predicting fatigue cracking more accurately. The recommendation is to run the MEPDG with the calibrated fatigue coefficients that are specific to the AC layer where fatigue cracking will develop.
Bibliography
ASTM D2493. Viscosity Temperature Chart for Asphalts. In Annual Book of ASTM Standards, pp230-234, Vol. 4.03, 1998.
Guide for Mechanistic-Empirical Design of New and Rehabilitated Pavement Structures. Final Report. NCHRP 1-37A, National Research Council, Washington, D. C., March 2004.
Kaloush, K.E., et al., Performance Evaluation of Arizona Asphalt Rubber Mixtures using Advanced Dynamic Material Characterization Tests, Final Report Submitted to Arizona Department of Transportation, Department of Civil and Environmental Engineering, Arizona State University, Tempe, Arizona, 2002.
Kaloush, K.E., Zborowski, A., Sotil, A., Way, G. “Materials Characteristics of Asphalt Rubber Mixtures”. Proceedings of the Asphalt Rubber 2003 International Conference, pp 139-145, Brasilia, Brazil, 2003.
Mohammad, Louay N.; Graves, Philip S., Huang, Baoshan; Abadie, Chris, Louisiana Experience With Crumb Rubber-Modified Hot-Mix Asphalt Pavement Transportation Research Record, p 1-13, n 1789, 2002.
Natu, G., and Tayebali, A. A., Mixture Design and Accelerated Laboratory Performance Evaluation of Unmodified and Crumb Rubber Modified Mixtures, Journal of the Association of Asphalt Paving Technologists, Vol. 68, pp. 192-221, 1999.

152 Asphalt-Rubber 2009
Rodezno, M., Kaloush K., Way, G.; Distress Assessment of Conventional Hot Mix Asphalt and Asphalt Rubber Overlays on Portland Cement Concrete Pavements using the Mechanistic-Empirical Design of New and Rehabilitated Pavement Structures, Journal of the Transportation Research Board, No. 1929, pp 20-27, Washington, D.C., 2005.
Way, George B., Flagstaff I-40 Asphalt Rubber Overlay Project – Ten Years of Success, Transportation Research Record, N 1723, 1999, p 45-52.

Performance Evaluation and Design 153
A Fracture Energy Approach to Model the Thermal Cracking Performance of Asphalt Rubber Mixtures
Aleksander Zborowski* — Kamil E. Kaloush**
* Skanska S.A.Road and Bridge DivisionPL-80-298 Gdańsk, [email protected]
** Arizona State UniversityDepartment of Civil, Environmental, and Sustainable EngineeringPO Box 875306, Tempe, AZ [email protected]
ABSTRACT. During the Asphalt Rubber 2006 conference in Palms Springs - California, the authors reported on the development of predictive equations to evaluate thermal fracture of Asphalt Rubber mixtures. The paper concluded by recommending a fracture energy modeling approach to truly capture the thermal cracking performance of asphalt rubber mixtures in the field. This paper is a follow up effort on the AR2006 study and recommendation. A major accomplishment of this new study is the development of a new Crack Depth Fracture Model that is based on utilizing fracture energy.
The paper discusses how the existing Thermal Cracking Model (TCMODEL) TCMODEL, which is an integral part of the Mechanistic Empirical Pavement Design Guide (MEPDG), falls short in properly predicting the observed thermal cracking resistance of Asphalt Rubber mixtures in the field. Necessary revisions and refinements of the existing IDT test protocol were made, and an IDT test results database was created and used in the development of a new Crack Depth Fracture Model that was based on utilizing fracture energy. The new fracture energy model is presented and validated with laboratory test results and field observations. Recommendations on changes to the existing TCMODEL in the MEPDG are made.
KEYWORDS: Thermal Cracking, IDT Test, MEPDG, Asphalt Rubber Mixtures, Crack Depth Fracture Model.

154 Asphalt-Rubber 2009
1. Introduction and Objectives
1.1. Problem Statement
Thermal cracking is a serious type of pavement distress and its prevention is a critical issue for many transportation agencies in the United States and Canada (Christensen and Bonaquist, 2004).
Thermal cracks allow for the ingress of water, which may result in a depression / settlement at the crack because of the pumping of support materials. During the winter months, deicing chemicals can enter the cracks and cause localized thawing of the base and a further deterioration at the crack. Water entering the crack may also freeze, resulting in the formation of an ice lens, which can produce upward lifting at the crack edge. All of these effects result in poor ride quality and reduction in pavement service life (Vinson et al, 1989).
The indirect tensile (IDT) creep and strength tests were developed during the Strategic Highway Research Program (SHRP) to characterize the resistance of Hot Mix Asphalt concrete (HMA) to low-temperature cracking (Christensen and Bonaquist, 2004; Vinson et al, 1989). These methods have been standardized in AASHTO T322, Standard Method of Test for Determining the Creep Compliance and Strength of Hot-Mix Asphalt (HMA) Using the Indirect Tensile Test Device. Currently, the IDT creep and strength tests are considered the most promising for predicting the low-temperature performance of asphalt concrete mixtures (Christensen and Bonaquist, 2004). The IDT tests were also proposed for use as the Simple Performance Test (SPT) for low temperature cracking, and are used as the material characterization tests for thermal fracture in the Mechanistic-Empirical Pavement Design Guide (MEPDG) developed during the National Cooperative Highway Research Program (NCHRP) Project 1-37A.
However, thermal fracture characterization studies conducted at Arizona State University (ASU) and the University of Maryland, as well as, the NCHRP Report 530 (Christensen and Bonaquist, 2004) concluded that the IDT procedures need certain refinements and revisions. In addition, the author’s experience from testing several asphalt rubber mixtures have shown that the existing Thermal Cracking Model (TCMODEL) falls short in properly characterizing the exceptional thermal cracking resistance of the asphalt rubber mixtures in the field.
1.2. Background on the Superpave Thermal Cracking Model (TCMODEL)
The model proposed by Hiltunen and Roque consisted of three primary components. First module is a pavement response model to calculate the stress due to cooling. Next, a mechanics-based model to determine the progression of a vertical crack at one crack site having average material properties. The final component is a probabilistic model that determines the global amount of thermal cracking visible on the pavement surface. Figure 1 presents the Superpave TCMODEL process to determine the amount of thermal cracking (Vinson et al, 1989). The work in this research focused on the Crack Depth Fracture Model.

Performance Evaluation and Design 155
PavementResponse Model
Stress due to Cooling
Crack DepthFracture Model
Crack Propagation
Probability-BasedModel
Amount of Thermal Cracks PerUnit Length of Pavement
Figure 1. SHRP A-005 Thermal Cracking Model (Vinson et al, 1989)
1.3. Crack Depth Fracture Model
The Paris law for crack propagation is used to predict the change in depth of a local crack subjected to a given cooling cycle (Vinson et al, 1989):
where:
( )nC A K∆ = ∆
∆C = change in the crack depth due to a cooling cycle∆K = change in the stress intensity factor due to a cooling cycleA, n = fracture parameters
The change in crack depth (ΔC) is computed and accumulated on a daily basis to determine the total crack depth as a function of time. The crack depth is related to the total amount of cracking by way of a crack depth distribution function. The idea is that material
156 Asphalt-Rubber 2009
variability along the length of the pavement section will result in different crack depths, even for the same exposure conditions. The crack depth distribution governs how much cracking is observed in a particular section having a specific crack depth computed on the basis of average material properties. Schapery’s theory of crack propagation in nonlinear viscoelastic materials indicated that the fracture parameters A and n are theoretically related to (Vinson et al, 1989):
The slope of the linear portion of the log compliance-log time relationship determined from creep tests;
The maximum strength or failure limit of the material (determined from the failure test immediately following the creep test; and
The fracture energy density of the material determined experimentally by monitoring the energy release through crack propagation.
Experimental results during SHRP A-005 program indicated that fairly reasonable estimates of A and n can be obtained from the m-value and the failure limit of the material. Experiments by Molenaar led to the following relationship (Vinson et al, 1989):
mlog A 4.389 2.52*log(E* *n)= − σ
where:Ε = mixture stiffness, psiσm = mixture strength, psi
Experiments conducted by Lytton et al. led to the following relationship:
1n 0.8* 1m
= +
Both the m-value and tensile strength for use in these relationships are determined from the laboratory IDT tensile creep and strength test.
The change in stress intensity, ΔK, involves an additional model. Essentially, the stress intensity model predicts the stress at the tip of the local crack using the far-field stress condition as determined by the pavement response model. The finite element program, CRACKTIP, has been employed by Hiltunen and Roque to model the single vertical crack. CRACKTIP was developed at the Texas Transportation Institute.
1.4. Problems with the Current Thermal Cracking Model
The existing TCMODEL that is currently an integral part of the MEPDG has generally proved to adequately predict low temperature cracking of asphalt concrete mixtures utilizing
•
•
•

Performance Evaluation and Design 157
conventional binders that have distinct (or extreme) characteristics. However, the results of some of the ASU asphalt rubber mixtures characterization projects showed that the existing model does not properly characterize the thermal fracture properties of the modified asphalt concrete mixtures.
The existing TCMODEL utilizes only two material properties from the indirect tensile creep and strength tests, namely the slope of the creep compliance (m), and the tensile strength at -10℃ (St). The generally accepted interpretation of the HMA tensile strength results is that the higher the tensile strength, the higher the thermal fracture resistance of the material. The problem at hand is that the asphalt rubber mixtures consequently indicate lower tensile strength when compared to the conventional mixes; yet these same asphalt rubber mixtures proved to be superior to conventional mixtures in their resistance to thermal cracking as indicated by their field performance in Arizona. Despite the field-proven higher thermal fracture resistance of the asphalt rubber gap graded mixture over the conventional mix, the comparison of the thermal cracking length predicted by the MEPDG program shows higher thermal cracking of the asphalt rubber mixture (more than twice the crack length after the first three years compared to the conventional mixture).
Way et al. (Way et al, 2003, 2006) reported the comparison of field performance of Arizona Conventional Hot Mix Asphalt and Asphalt Rubber Mixtures. Over the last fourteen years, ADOT paved several projects with three typical asphalt mixtures, namely: a dense graded conventional mix, a gap graded asphalt rubber mix (ARAC) and open graded asphalt rubber friction course mix (AR-ACFC). The study included data representing about 500 routinely built projects. The results showed that the conventional dense graded mixes reach ten percent cracking threshold in about ten years. For the same service time, the asphalt rubber mixes reached only about five percent level of cracking.
An example of this field performance is represented by the asphalt rubber mixtures used during the rehabilitation project on Interstate Highway I-40 (Buffalo Range Project). The project was located at the elevation of 1,700 m in the dry, freeze zone with the air temperature range: -29 to 38℃. The average measured traffic was 2.2 million ESAL per year. The project consisted of milling 2.5 inches of existing highly cracked conventional HMA and overlaying it with 2 inches of Asphalt Rubber Gap Graded mixture (AR PG58-22) and 0.5 inch of Asphalt Rubber Open Graded Friction Course (AR PG58-22). After 8 years of service, the measured rut depth was less than 5mm and the amount of cracking was less than 4% (despite of the high risk of reflective cracking occurrence). Despite the very good field performance of these mixtures, the results of the laboratory tests showed that comparable conventional asphalt concrete mixtures had considerably higher tensile strength. At the same time, the asphalt rubber mixtures had almost two times higher total fracture energy than the conventional mixtures. These observations and trends were confirmed by test results from other projects and indicated that the total fracture energy is potentially a much better indicator of the thermal fracture resistance than the tensile strength as shown in Figure 2. This parameter, with some protocol modifications, can be measured during the same IDT tensile strength test.
Another limitation of the existing TCMODEL is the assumption that the pavement structure has only one AC layer. If the pavement consists of two or more AC layers the user has to decide which material properties should be input into the model.

158 Asphalt-Rubber 2009
This is a serious problem in case when materials used in a pavement differ significantly. Several recent rehabilitation projects in Arizona utilized a three-layer overlay system with the conventional dense graded HMA at the bottom, the gap graded asphalt rubber mixture in a middle, and the open graded asphalt rubber mix on a top. The material properties of these three mixtures including thermal fracture parameters are substantially different and assuming the properties of one material for other two layers can generate a big error in the crack growth estimation.
Total Fracture Energy @ -10oCConventional vs Rubber Asphalt Mixture
0
1,000
2,000
3,000
4,000
5,000
6,000
7,000
8,000
9,000
10,000
0.00 0.05 0.10 0.15 0.20 0.25 0.30
Vertical Deformation [in]
Load
[lbf]
Conventional HMAGap Graded Rubber Asphalt
Γ fract = 263 lb*inch
Γ fract = 588 lb*inch
St = 454 psi
St = 494 psi
Figure 2. Total Fracture Energy Comparison for a Conventional and Asphalt Rubber Mixture
1.5. Research Objectives
The main objective of this research was to develop a new thermal cracking model for asphalt concrete mixtures to be used in the next generation of the AASHTO Design Guide. The new model, which is based on the existing Superpave TCMODEL, utilizes the total fracture energy and creep compliance “D1” parameter in combination with the tensile strength maximum limit of the material and the slope of the creep compliance - “m” parameter to calculate the crack propagation (modified Crack Depth Fracture Model). This new model allows for proper thermal fracture evaluation of asphalt concrete mixtures, modified binder mixtures and specifically asphalt rubber mixtures that are gaining popularity in usage nationwide.
In order to fulfill the above objectives, the scope of work also included necessary revisions and refinements of the existing IDT test protocol, as well as development of an IDT database
Performance Evaluation and Design 159
to be used for the new thermal cracking model. Ultimately, the results of this research serve as a characterization study of the thermal fracture properties of the asphalt rubber mixtures.
1.6. Scope of Work
The scope of this research study included a comprehensive literature study and analysis on the thermal cracking behavior of HMA mixes, as well as methodologies, testing, and modeling techniques used for this type of pavement distress.
The research plan was basically divided into four main tasks:
Revision and Modification of the Indirect Tension Test (IDT) Protocol.Development of the Thermal Cracking Characterization Database which will include:
a) Conventional Asphalt Concrete Mixtures b) Asphalt Rubber Mixtures3) Development of a modified Crack Depth Fracture Model for Thermal Cracking
Model.
2. Experimental Plan
2.1. Test Specimen Preparation and Conditioning
All test specimens were prepared according to the Test Protocol UMD 9808, “Method for Preparation of Triaxial Specimens” (Majidzadeh et al, 1976). The air voids and other volumetric properties (i.e., asphalt content and gradation) of the test specimens were matched with the in-place properties measured after placement and compaction of the HMA mixtures for each individual test section. Only specimens that air voids matched the target air void with tolerance of ± 0.5% were selected for further testing.
The mixing and compaction temperatures were determined using binder consistency test results and viscosity-temperature relationships for both binders. All mixtures were short-term oven-aged for 4 hours at 135℃, according to the AASHTO PP2 Test Method, “Standard Practice for Short and Long Term Aging of Hot Mix Asphalt,” before compaction.
The specimens were compacted with a Servopac gyratory compactor into a 150-mm diameter gyratory mold to approximately 160-mm in height. The test specimen’s “ideal” geometry was based on the specimen size and the aggregate effects study that was completed by the Superpave models team (Abdulshafi and Majidzadeh, 1985). Approximately 5-mm was sawed from each end of the compacted specimen, and 3 test specimens approximately 38-mm thick were cut from each compacted specimen.
2.2. Research Testing Plan
The research testing plan included the complete thermal fracture characterization of the 27 mixtures from 7 different projects. Sixteen of them are conventional mixtures and 11 are
1)2)

160 Asphalt-Rubber 2009
asphalt rubber mixtures. Assuming that in average 9 specimens from every mixture is needed to complete the IDT tests the total of 243 specimens were tested in this research study.
The testing program was divided into two phases. Phase I included testing of 11 conventional mixtures designated by Arizona Department of Transportation (ADOT Project 4) and served as an initial ASU thermal fracture characterization database to validate the rationality of the modifications incorporated into the original IDT protocol. The Phase I mixtures used five different aggregate sources and gradations, and four different binder types used throughout Arizona (PG 58-28, PG 64-22, PG 70-10, and PG 76-16). Results from this part of the program were compared to the data used to calibrate the original TCMODEL (SHRP A-005 study). Phase II of the program included testing of another 5 conventional and 11 asphalt rubber mixtures from subsequent projects.
3. Modifications to the Original IDT Protocol
In general, the Indirect Tensile Creep and Strength tests were conducted based on the procedure developed by Roque et al and described in the draft indirect tensile tests protocol AASHTO TP9-02. A few important changes to the original protocol were implemented at ASU.
3.1. Gage Length of the LVDTs
The first change consisted of increasing the original LVDT’s gage length of 1.5-in into a 3.0-in center-to-center spacing. This modification was applied based on the recommendations from the NCHRP Project 1-28A. In general, it was concluded that a recommended gage length of 3”, mounted on a 6” diameter specimen, regardless of the mix type being evaluated; will yield total variance values that are as close to the most likely minimum values possible. In addition, the 3” gage length should have the potential for possessing the minimum amount of possible problems associated with the on-sample measurement system (Vinson et al, 1989).
3.2. Low Temperature
The second change, being actually a limitation when compared to the original protocol, consisted of using a low temperature different from the recommended -20 ℃. The actual low temperature used in this study was –15 ℃. This change was necessary due to the fact that the environmental chamber used during the IDT test was unable to reach and maintain at the stable level temperature of -20 ℃. Based on the results from 0, -10, and -15℃ temperatures, creep compliance data were extrapolated to -20 ℃.
3.3. The Original and Modified Method of Determining the Tensile Strength of HMA
3.3.1. The Original SHRP A-005 Method
The tensile strength test was conducted and analyzed using two methods. One specimen per mixture was tested using the original SHRP A-005 procedure. The results of this method were used in the ASU - SHRP A-005 IDT results comparison, as well as in building the

Performance Evaluation and Design 161
MEPDG database of the ASU mixtures thermal fracture properties. The original Roque et al method involves using both vertical and horizontal LVDTs and requires finishing the test immediately after reaching the maximum load in order to preserve the vertical LVDTs. Finishing the test at this point eliminates the possibility of measuring the total fracture energy that is calculated as an area under the deformation - load curve. The vertical LVDTs are used solely to identify which face of the specimen failed first during the strength test. Further analysis of the conducted tests indicated that the difference of the tensile strength between both faces do not exceed 10%.
3.3.2. Modified IDT Tensile Strength Method
A modified method of measuring the tensile strength that allows also for determining the energy until failure and total fracture energy was applied using three replicates per mixture. The vertical LVDTs were eliminated and tensile strength was calculated as an average value from both specimen faces. The total fracture energy is calculated as the area under the load-vertical deformation curve and it was previously reported in asphalt rubber characterization projects conducted at ASU as a promising parameter to characterize the fracture resistance of the HMA mixtures (Way et al, 2006 and Carpenter, 1983).
4. Development of a Modified Crack Depth Fracture Model for Superpave Thermal Cracking Model
4.1. Modeling Approach for the Modified Crack Depth Fracture Model
From experimental data, Paris and Erdogan (Zhiming et al, 2002) found that the crack growth rate, ΔC, during the propagation phase could be described by the following equation:
( )nC A K∆ = ∆
where:∆C = change in the crack depth due to a cooling cycle∆K = change in the stress intensity factor due to a cooling cycleA, n = fracture parameters
The initial Superpave study on modeling the thermal cracking in hot mix asphalt utilized the Schapery’s theory of crack propagation in nonlinear viscoelastic materials. Schapery theoretically justified the use of Paris’s law for the description of the crack growth process in viscoelastic materials (Zhiming et al, 2002). He presented a relationship between the crack growth velocities due to mode I loading (opening mode due to normal stresses) and fundamental properties of the material in which the crack propagate according to:
Γ
−= ∫
∆tn
m
m
dttwDI
A0
/1
12
21
2 )(2
)1(6
νσπ
where:n = 2[1 + (1/m)] for stress-controlled tests, and n = 2/m for strain-controlled testsσm = the tensile strength of the material, GPa
162 Asphalt-Rubber 2009
I1 = value of the integral of the dimensionless stress-strain curve of the material. Its value range between 1 and 2ν = Poisson’s ratio of the materialD1 = the compliance coefficient D1, in the power-law creep compliancem = slope of the log compliance versus log time graphΓ = fracture energy, defined as work (applied force times resulting displacement) done on a material to increase the fractured surface with a unit area, MN-mw(t) = the normalized waveform of the applied load with time. Its values range between 0 and 1.Δt = period of the loading to complete one cycle of loading, sec
In subsequent efforts, SHRP researchers concluded (Vinson et al, 1989) that: “Determination of the fracture energy density requires additional complex testing, which could not be incorporated into a mixture specification scenario. However, experimental results indicate that fairly reasonable estimates of A and n can be obtained from the m-value and the failure limit of the material.” Since then, the fracture energy parameter has been excluded from thermal cracking modeling. Efforts and data analysis explored in this study implied the necessity of re-incorporating the total fracture energy into a thermal cracking model. This is especially true for modified mixtures, such as asphalt rubber. The new model proposed in this study is based on the existing Superpave TCMODEL utilizes the fracture energy in combination with the tensile strength maximum limit of the material, “D1” creep compliance parameter and the slope of the creep compliance - “m” parameter.
4.2. Mixtures Used in Development of a Modified Crack Depth Fracture Model
Twenty three mixtures including both conventional HMA and Asphalt Rubber mixtures have been carefully selected from all IDT test data available at ASU. The SHRP A-005 IDT database, which served for the original calibration of the MEPDG and subsequently for development of the level 3 predictive equations, could not be used since it did not contain the “Total Fracture Energy” results. From the thirty mixtures that were tested at ASU seven mixtures have been excluded because they were either tested using different IDT setup and test protocol (I-40 Asphalt Rubber Pilot Project, and Alberta I Asphalt Rubber Project), or they were disqualified due to the test results quality problems (i.e. Salt River ¾” PG70-10).
The 23 mixtures qualified for further analysis in development of a modified crack depth fracture model included: 4 open graded asphalt rubber mixtures (AR-ACFC), 6 gap graded asphalt rubber mixtures (ARAC), and 13 conventional mixtures (HMA). Three ARAC mixtures from Alberta II project were a result of a mini study for the influence of air voids variation upon the predicted thermal cracking.
Table 1 presents a summary of mixtures and their volumetric properties. For every type of material (AR-ACFC, ARAC, HMA) mixtures are grouped in order of increasing relative stiffness of the mixture, based on their binder grade, binder content, air voids content, VMA, and VFA. The same order of mixtures has been used in subsequent analysis and plots.
4.3. Significance of the Fracture Energy Parameters
At the early stage of this research work it was observed and concluded that the total fracture energy is potentially a much better indicator of the thermal fracture resistance of bituminous mixtures than the tensile strength alone. The total fracture energy can by itself
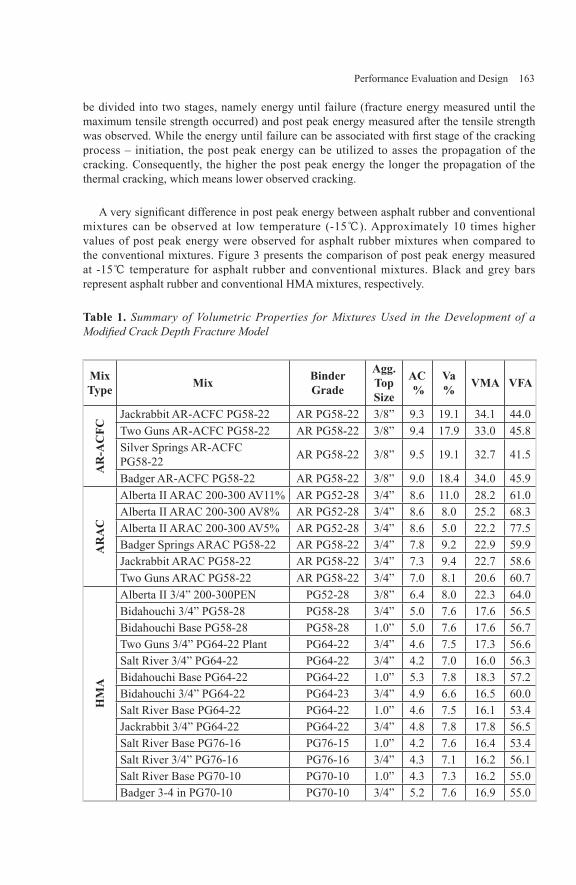
Performance Evaluation and Design 163
be divided into two stages, namely energy until failure (fracture energy measured until the maximum tensile strength occurred) and post peak energy measured after the tensile strength was observed. While the energy until failure can be associated with first stage of the cracking process – initiation, the post peak energy can be utilized to asses the propagation of the cracking. Consequently, the higher the post peak energy the longer the propagation of the thermal cracking, which means lower observed cracking.
A very significant difference in post peak energy between asphalt rubber and conventional mixtures can be observed at low temperature (-15℃). Approximately 10 times higher values of post peak energy were observed for asphalt rubber mixtures when compared to the conventional mixtures. Figure 3 presents the comparison of post peak energy measured at -15℃ temperature for asphalt rubber and conventional mixtures. Black and grey bars represent asphalt rubber and conventional HMA mixtures, respectively.
Table 1. Summary of Volumetric Properties for Mixtures Used in the Development of a Modified Crack Depth Fracture Model
Mix Type Mix Binder
Grade
Agg. Top Size
AC %
Va % VMA VFA
AR
-AC
FC
Jackrabbit AR-ACFC PG58-22 AR PG58-22 3/8” 9.3 19.1 34.1 44.0Two Guns AR-ACFC PG58-22 AR PG58-22 3/8” 9.4 17.9 33.0 45.8Silver Springs AR-ACFC PG58-22 AR PG58-22 3/8” 9.5 19.1 32.7 41.5
Badger AR-ACFC PG58-22 AR PG58-22 3/8” 9.0 18.4 34.0 45.9
AR
AC
Alberta II ARAC 200-300 AV11% AR PG52-28 3/4” 8.6 11.0 28.2 61.0Alberta II ARAC 200-300 AV8% AR PG52-28 3/4” 8.6 8.0 25.2 68.3Alberta II ARAC 200-300 AV5% AR PG52-28 3/4” 8.6 5.0 22.2 77.5Badger Springs ARAC PG58-22 AR PG58-22 3/4” 7.8 9.2 22.9 59.9Jackrabbit ARAC PG58-22 AR PG58-22 3/4” 7.3 9.4 22.7 58.6Two Guns ARAC PG58-22 AR PG58-22 3/4” 7.0 8.1 20.6 60.7
HM
A
Alberta II 3/4” 200-300PEN PG52-28 3/8” 6.4 8.0 22.3 64.0Bidahouchi 3/4” PG58-28 PG58-28 3/4” 5.0 7.6 17.6 56.5Bidahouchi Base PG58-28 PG58-28 1.0” 5.0 7.6 17.6 56.7Two Guns 3/4” PG64-22 Plant PG64-22 3/4” 4.6 7.5 17.3 56.6Salt River 3/4” PG64-22 PG64-22 3/4” 4.2 7.0 16.0 56.3Bidahouchi Base PG64-22 PG64-22 1.0” 5.3 7.8 18.3 57.2Bidahouchi 3/4” PG64-22 PG64-23 3/4” 4.9 6.6 16.5 60.0Salt River Base PG64-22 PG64-22 1.0” 4.6 7.5 16.1 53.4Jackrabbit 3/4” PG64-22 PG64-22 3/4” 4.8 7.8 17.8 56.5Salt River Base PG76-16 PG76-15 1.0” 4.2 7.6 16.4 53.4Salt River 3/4” PG76-16 PG76-16 3/4” 4.3 7.1 16.2 56.1Salt River Base PG70-10 PG70-10 1.0” 4.3 7.3 16.2 55.0Badger 3-4 in PG70-10 PG70-10 3/4” 5.2 7.6 16.9 55.0

164 Asphalt-Rubber 2009
Comparison of Post-Peak Fracture Energy at -15oC
237 26
8 287
139
357
279
272
277
221
297
136
36
16 23 14 22 28
14 16
34
16 17
51
0
50
100
150
200
250
300
350
400
Jack
rabbit AR-A
CFCPG58-2
2
Two Guns AR-ACFC
PG58-22
Silver
Springs AR-A
CFCPG58
-22
BadgerAR-A
CFCPG58
-22
Alberta II A
RAC200
-300 PEN
AV11%
Alberta II A
RAC200
-300 PEN
AV8%
Alberta II A
RAC200
-300 PEN
AV5%
BadgerSprin
gs ARACPG58-2
2
Jack
rabbit ARAC
PG58-22
Two Guns ARACPG58-2
2
Alberta II 3
/4"200
-300PEN
Bidahouch
i 3/4" PG58
-28
Bidahouch
i Bas
e PG58-28
Bidahouch
i 3/4" PG64
-22
SaltRive
r 3/4" PG64-2
2
Bidahouch
i Bas
e PG64-22
Jack
rabbit 3/4
" PG64-22
SaltRive
r Base PG64-2
2
Two Guns 3/4" PG64-2
2 Plant
SaltRive
r Base PG76-1
6
SaltRive
r 3/4" PG76-1
6
SaltRive
r Base PG70-1
0
BadgerSprin
gs 3/4" PG70-1
0
Ener
gy, l
bs*in
Figure 3. Differences in Post-Peak Fracture Energy Results at -15℃ for Asphalt Rubber and Conventional HMA Mixtures (Black=Asphalt Rubber, Grey = Conventional).
4.4. Development of a Modified Schapery’s “A” Parameter
A new equation for calculating the Paris law “A” parameter has been developed based on Schapery’s general “A” parameter equation for viscoelastic materials. The original model allows also for analysis of material’s fatigue fracture due to the cyclic loading. In the case of thermal cracking analysis using IDT methodology, cyclic loading does not occur, and because of this, the second term of the Schapery’s general equation for viscoelastic materials has been assumed equal to one. The only modification to the original model was limited to assuming a constant value of 0.12 (average value for tested mixtures) for Poisson’s ratio.
Both creep compliance parameters, namely slope (m) and intercept (D1) are constants for a given mixture and do not change with temperature. This is because they have been calculated as parameters describing the master creep compliance curve, which by itself has been constructed using creep compliance results for three different temperatures. Tensile Strength and Total Fracture Energy, used in calculating the “A” parameter, are interpolated from the three laboratory measured values for temperature at which the maximum stress occurred. Due to this fact, “A” is no longer a constant material property, but is temperature-dependent and changes with every new cooling cycle. This new feature of the Crack Depth Fracture model is considered a big improvement over the old model.
A second order polynomial function is used to interpolate and extrapolate the tensile

Performance Evaluation and Design 165
strength and total fracture energy values. The extrapolation outside the range of temperatures used in laboratory testing is limited to 5℃ (41oF). The maximum or minimum extrapolated value respectively is assumed for any temperature outside the +/-5℃ range.
The I1 parameter defined as a value of the integral of the dimensionless stress-strain curve of the material is proportional to the total fracture energy defined as the area under the load – deformation curve, and is calculated as the ratio of the given total fracture energy to the maximum value of total fracture energy (assumed to be 1,000 psi) plus 1. The value of I1 parameter is in range between 1 and 2.
Table 2 presents a summary of units and value ranges for variables used in the calculation of the “A” parameter.
The new “A” parameter is calculated according to the following equation:
m
m
DI
A/1
12
21
2 2)12.01(
6
Γ
−=
σπ
where,σm = tensile strength at maximum stress temperature, GPam = slope of the creep compliance curveΓ = total fracture energy at maximum stress temperature, MN-m I1 = value of the integral of the dimensionless stress-strain curve of the material. Its value range between 1 and 2
Table 2. Summary of Variables Used in the New “A” Parameter
Variable Units Min Value Max Valuem - 0.2251 0.6017D1 1/GPa 1.96E-04 3.83E-02
σm GPa 7.24E-04 4.36E-03
Γ MN * m 9.75E-06 1.10E-04I1 - 1.086 1.977
4.5. Comparison of the Existing “A” and Modified Schapery’s “A” Parameter
It was observed from a comparison of “A” parameters calculated for conventional mixtures using the old and new “A” model that values of “A” calculated utilizing the old model are higher (means more cracking) for softer mixtures when compared to the new “A” model. This observation is generally irrational. Results of “A” parameters calculated using the new model show expected trend indicating lower “A” value for softer, more crack-resistant mixtures, and reasonable gradual increase of “A” value with increasing relative stiffness of the mixtures.

166 Asphalt-Rubber 2009
4.6. Validation of a New Crack Depth Fracture Model
Since limited numerical field distress evaluation data for thermal cracking was available for mixtures used in development of the modified crack depth fracture model, the validation and preliminary calibration of a new model was conducted based on rationality of predicted cracking and expected amount of cracking for given climate and given type of mixture.
Twenty three mixtures, both conventional and asphalt rubber were used in combination with four climatic regions (very cold – Fargo, ND, cold – Grand Canyon, AZ and Flagstaff, AZ, and hot Scottsdale, AZ) to conduct preliminary calibration and check the rationality of the new thermal cracking model. The preliminary calibration factor of 4.0E-14 has been developed and used for the new model validation study. The analysis of conventional HMA mixtures (Figure 4 and Figure 5) show improved, more rational results of predicted thermal cracking when new model is used. The predicted cracking gradually increases, as expected, with increasing relative stiffness of the mixture and increasing severity of the climate. Thermal cracking results using the old model generally indicated some unjustified cases of over- and/or under prediction. The results also show lower cracking predictions for asphalt rubber mixtures with the new model used. In comparison, these mixtures had unreasonable high predicted cracking for very cold region, and were irrational for the warmer climate when the old model was utilized.
Alberta II 3
/4"200
-300PEN
Bidahouch
i 3/4" PG58
-28
Bidahouch
i Bas
e PG58-28
Bidahouch
i 3/4" PG64
-22
SaltRive
r 3/4" PG64-2
2
Bidahouch
i Bas
e PG64-22
Jack
rabbit 3/4
" PG64-22
SaltRive
r Base PG64-2
2
Two Guns 3/4" PG64-2
2 Plant
SaltRive
r Base PG76-1
6
SaltRive
r 3/4" PG76-1
6
SaltRive
r Base PG70-1
0
BadgerSprin
gs 3/4" PG70-1
0
0.0
500.0
1,000.0
1,500.0
2,000.0 ThermalC
racking,ft/mile
Comparison of HMA Thermal Cracking Amount for Different ClimatesOld "A" Parameter - 7 years
Fargo, NDGrand Canyon, AZFlagstaff, AZScottsdale, AZ
Very Cold
Hot
Type of Climate
Relative Stifness of the Mixture
Stiff Mix
Soft Mix
Figure 4. Predicted Thermal Cracking for Conventional Mixtures Using Old Model

Performance Evaluation and Design 167
Alberta
II 3/4"
200-3
00PEN
Bidaho
uchi
3/4" PG58
-28
Bidaho
uchi
Base PG58
-28
Bidaho
uchi
3/4" PG64
-22
SaltRiver
3/4" PG64
-22
Bidahouc
hiBas
e PG64-22
Jack
rabbit 3
/4"PG64
-22
SaltRive
r Base PG64
-22
Two Gun
s 3/4" PG64
-22Plan
t
SaltRive
r BasePG76
-16
SaltRive
r 3/4" PG76
-16
SaltRive
r BasePG70
-10
Badge
r Spring
s 3/4" PG70
-10
0.0
500.0
1,000.0
1,500.0
2,000.0 ThermalC
racking,ft/mile
Comparison of HMA Thermal Cracking Amount for Different ClimatesNew "A" Parameter - 7 years
Fargo, NDGrand Canyon, AZFlagstaff, AZScottsdale, AZ
Relative Stifness of the Mixture
Stiff Mix
Soft Mix
Very Cold
Hot
Type of Climate
Figure 5. Predicted Thermal Cracking for Conventional Mixtures Using New Model
The only exception from the general trend (using the new model) of improved resistance to thermal cracking for the asphalt rubber mixtures was observed for the Badger Springs AR-ACFC project. This mixture showed much higher predicted thermal cracking when the new model was used. In fact, the Badger Springs project failed after less than one season due to raveling of the surface layer. This project was located on Interstate highway I-17 approximately 80 miles north of Phoenix. Further analysis and field investigation indicated material quality issues associated with binder stripping and high content of fines, which would justify poorer thermal cracking performance of the material. Based on the above results, it was concluded that the new thermal cracking model is able to better distinguish between good and bad mixtures when compared to the old model.
At the same time stiffer mixtures (not suitable for cold regions) such as the Salt River ¾”PG76-16 had higher cracking (as expected) predicted using the new model.
5. Conclusions and Recommendations
5.1. Conclusions
A major accomplishment of this research was the development of a new method for evaluation of the thermal cracking potential in HMA, with focus on mixtures with modified binders including asphalt rubber mixtures. Necessary revisions and refinements of the existing IDT test protocol were made, and an IDT test results database was created and used in the development of a modified Crack Depth Fracture Model. The new model was developed based on the Schapery’s general “A” equation for viscoelastic materials utilizing the total fracture energy and intercept of the creep compliance master curve (D1) in addition to tensile strength
168 Asphalt-Rubber 2009
of the material and slope of the creep compliance master curve (m) to calculate the Paris law “A” parameter. This new model allows for proper thermal fracture evaluation of asphalt concrete mixtures, modified binder mixtures and specifically asphalt rubber mixtures that are gaining popularity in usage nationwide.
The validation and preliminary calibration of the new model were conducted based on rationality of predicted cracking and expected amount of cracking for given climate and given type of mixture. Twenty three mixtures, both conventional and asphalt rubber were used in combination with four climatic regions (very cold – Fargo, ND, cold – Grand Canyon, AZ and Flagstaff, AZ, and hot Scottsdale, AZ) to conduct preliminary calibration and check the rationality of the new thermal cracking model.
It was concluded that the new Thermal Cracking Model utilizing the modified Crack Depth Fracture Model generates more rational and reasonable predictions of thermal cracking for both conventional and asphalt rubber mixtures when compared to the old model. It has been also concluded that the new TCMODEL that utilizes total fracture energy in addition to other material properties has higher capabilities to detect poor mixtures than the old Thermal Cracking model.
5.2. Recommendations
The following were identified as specific issues or areas of possible improvement that are recommended for further consideration and research:
The IDT testing temperatures currently fix at -20, -10, and 0℃, should be dependent on binder PG grade to minimize errors in extrapolating tensile strength and total fracture energy values beyond the testing temperatures. This would also improve predictions done based on the creep compliance master curve parameters.
One of the limitations in the existing TCMODEL is the assumption that the pavement structure has only one AC layer. If the pavement consists of two or more AC layers the user has to decide which material properties should be input into the model. This is a serious problem in cases when materials used in a pavement differ significantly. A multilayer system for Thermal Cracking analysis should be developed.
The existing Thermal Cracking characterization database should be further expanded and field results of the pavement performance for corresponding mixtures should be collected to allow for proper calibration of the new Thermal Cracking model.
The IDT test setup, specifically environmental chamber should be improved allowing for conducting the IDT testing in broader range of temperatures.
References
Abdulshafi, A., and Majidzadeh, K., (1985) “J-Integral and Cyclic Plasticity Approach to Fatigue and Fracture of Asphaltic Mixtures”, Transportation Research Record No.1034, 1985.
•
•
•
•

Performance Evaluation and Design 169
Carpenter, S.H., (1983) “Thermal Cracking in Asphalt Pavements: an Examination of Modelsand Input Parameters”, USA CRREL, 1983.
Christensen, D.W., Bonaquist, R.F., (2004) “Evaluation of Indirect Tensile Test (IDT) Procedures for Low-Temperature Performance of Hot Mix Asphalt”, NCHRP Report 530, 2004.
Majidzadeh, K., Buranrom, C., Karakomzian, M., (1976) “Application of Fracture Mechanicsfor Improved Design of Bituminous Concrete”, FHWA U.S. Department of Transportation Report No. 76-91, 1976.
Vinson, T.S., and V.C. Janoo., R.C.G. Haas, (1989) “Low Temperature and Thermal FatigueCracking”, SHRP Summary Report No. A-003A, 1989.
Way, G., Sousa, J. and Kaloush, K., (2003) “Hot Mix Asphalt Design Prediction and Field Performance, An Arizona Study”. 6th International RILEM Symposium on Performance Testing and Evaluation of Bituminous Materials, PTEBM’03, ISBN 2-912143-35-7, p.543-549, Zurich, Switzerland, April 2003.
Way, G., Sousa, J. and Kaloush, K., (2006) “Asphalt Rubber Pavements in Arizona, 17 Yearsof Success.” Third Gulf Conference on Roads (TGCR06), Muscat, Oman, , March 6-8, 2006.
Zhiming Si., Little, D.N., and Lytton, P.E., (2002) “Characterization of Microdamage and Healing of Asphalt Concrete Mixtures”, Journal of Materials in Civil Engineering, December 2002.


Performance Evaluation and Design 171
4 Years of Performance of A Test Track Using Crumb Rubber Asphalt And Other Modifiers
Gilberto Martínez Arguelles*, Libardo Celis Yaruro ***, Bernardo Caicedo Hormaza** , David Gonzáles Herrera***
*Program of Civil Engineering, Universidad Piloto de Colombia - Instituto de Desarrollo Urbano de Bogota, Colombia, South America. [email protected]
** Department of Civil and Environmental Engineering. Universidad de los Andes. [email protected]
***Instituto de Desarrollo Urbano de Bogotá. Bogotá D.C, Colombia, South [email protected]@cable.net.co
ABSTRACT. This paper presents the performance of 4 full-scale test section constructed with the aim of applying asphalt rubber technology in Colombia. This study reports the results of the performance of a test track constructed with one section using Crumb Rubber Modifier-CRM. The CRM was incorporated to the asphalt hot mix introducing the CRM as a bitumen modifier (wet process). Additionally the 4 full-scale test section were constructed with the same pavement structure; one with conventional asphalt binder Barrancabermeja (Barranca) 80-100(80-100 penetration grade), two sections with modified asphalt binder, Styrene Butadiene Rubber-SBR, and Styrene Butadiene Styrene-SBS and one with asphalt rubber binder. The 4 mixtures were designed using a continuous grain size distribution. The track was submitted to loads produced by public transport vehicles, light and heavy vehicle. The paper reports the test track performance over 4 years, with measures of; deflections (FWD), Ground Penetration Radar(GPR) and distress survey. An analytical comparison is presented considering the structural capacity of each section of the test track, by using backcalculation analysis.
KEYWORDS: test section, asphalt rubber,wet process, hot mix, polymer modified binder, fatigue, cracking density, performance.
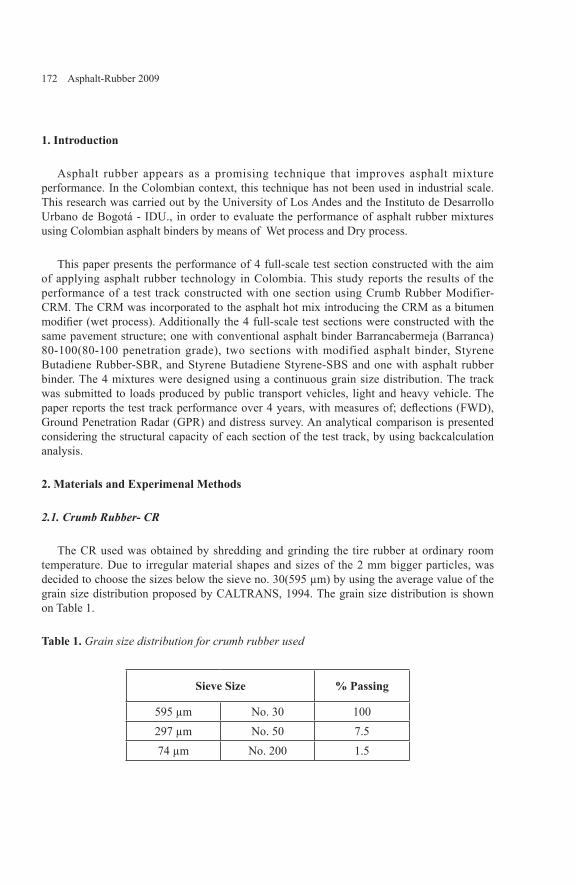
172 Asphalt-Rubber 2009
1. Introduction
Asphalt rubber appears as a promising technique that improves asphalt mixture performance. In the Colombian context, this technique has not been used in industrial scale. This research was carried out by the University of Los Andes and the Instituto de Desarrollo Urbano de Bogotá - IDU., in order to evaluate the performance of asphalt rubber mixtures using Colombian asphalt binders by means of Wet process and Dry process.
This paper presents the performance of 4 full-scale test section constructed with the aim of applying asphalt rubber technology in Colombia. This study reports the results of the performance of a test track constructed with one section using Crumb Rubber Modifier-CRM. The CRM was incorporated to the asphalt hot mix introducing the CRM as a bitumen modifier (wet process). Additionally the 4 full-scale test sections were constructed with the same pavement structure; one with conventional asphalt binder Barrancabermeja (Barranca) 80-100(80-100 penetration grade), two sections with modified asphalt binder, Styrene Butadiene Rubber-SBR, and Styrene Butadiene Styrene-SBS and one with asphalt rubber binder. The 4 mixtures were designed using a continuous grain size distribution. The track was submitted to loads produced by public transport vehicles, light and heavy vehicle. The paper reports the test track performance over 4 years, with measures of; deflections (FWD), Ground Penetration Radar (GPR) and distress survey. An analytical comparison is presented considering the structural capacity of each section of the test track, by using backcalculation analysis.
2. Materials and Experimenal Methods
2.1. Crumb Rubber- CR
The CR used was obtained by shredding and grinding the tire rubber at ordinary room temperature. Due to irregular material shapes and sizes of the 2 mm bigger particles, was decided to choose the sizes below the sieve no. 30(595 µm) by using the average value of the grain size distribution proposed by CALTRANS, 1994. The grain size distribution is shown on Table 1.
Table 1. Grain size distribution for crumb rubber used
Sieve Size % Passing
595 µm No. 30 100297 µm No. 50 7.574 µm No. 200 1.5
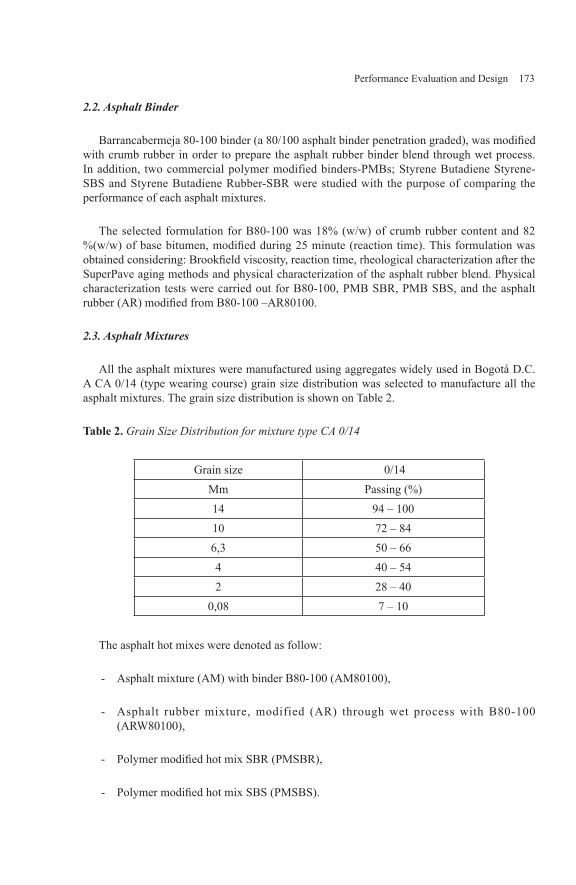
Performance Evaluation and Design 173
2.2. Asphalt Binder
Barrancabermeja 80-100 binder (a 80/100 asphalt binder penetration graded), was modified with crumb rubber in order to prepare the asphalt rubber binder blend through wet process. In addition, two commercial polymer modified binders-PMBs; Styrene Butadiene Styrene-SBS and Styrene Butadiene Rubber-SBR were studied with the purpose of comparing the performance of each asphalt mixtures.
The selected formulation for B80-100 was 18% (w/w) of crumb rubber content and 82 %(w/w) of base bitumen, modified during 25 minute (reaction time). This formulation was obtained considering: Brookfield viscosity, reaction time, rheological characterization after the SuperPave aging methods and physical characterization of the asphalt rubber blend. Physical characterization tests were carried out for B80-100, PMB SBR, PMB SBS, and the asphalt rubber (AR) modified from B80-100 –AR80100.
2.3. Asphalt Mixtures
All the asphalt mixtures were manufactured using aggregates widely used in Bogotá D.C. A CA 0/14 (type wearing course) grain size distribution was selected to manufacture all the asphalt mixtures. The grain size distribution is shown on Table 2.
Table 2. Grain Size Distribution for mixture type CA 0/14
Grain size 0/14Mm Passing (%)14 94 – 10010 72 – 846,3 50 – 664 40 – 542 28 – 40
0,08 7 – 10
The asphalt hot mixes were denoted as follow:
Asphalt mixture (AM) with binder B80-100 (AM80100),
Asphalt rubber mixture, modified (AR) through wet process with B80-100 (ARW80100),
Polymer modified hot mix SBR (PMSBR),
Polymer modified hot mix SBS (PMSBS).
-
-
-
-

174 Asphalt-Rubber 2009
Table 3 presents the asphalt mixture designs for each test section.
Table 3. Asphalt Hot Mixtures Design Results
Asphalt mixture
Bulk specific gravity Voids (%) Asphalt
content (%)
AM80100 2,13 6,5 6,89ARW80100 2,13 6,5 6,78ARD80100 2,09 6,0 6,78
PMSBS 2,16 6,4 6,35PMSBR 2,14 6,5 6,72
3.1. Production of Asphalt Rubber in a Pilot Plant
The asphalt rubber modification procedure in real scale (pilot plant) had three important conditions to fulfill. The first one was the difficulty to maintain a controlled temperature at 155℃. The second one was the asphalt volume by batch, which was established at 0,21 m3, and the last one was the velocity and type of agitation to be applied.
According to these requirements a cylindrical mixing container and mixer equipment were chosen with the following characteristics (Figure 1):
Mixer type turbine that allows and ensures axial flow.
Maximum temperature: 200℃.
5 HP Engine, with 220V coil.
Mixing velocity: 1800 rpm.
Stainless steel AISI 304.
An asphalt mixture with 18% crumb rubber content was chosen according to the mixture design. The asphalt blend was modified in the Pilot Plant at 163℃, with 25 min mixing time. Under these conditions, Brookfield viscosity values ranging from 2000 to 2500 cP were obtained.
The physical properties of the asphalt binder selected are shown on Table 4.
•
•
•
•
•

Performance Evaluation and Design 175
Figure 1. Mixer and Pilot plant
Table 4. Physical properties of the asphalt rubber selected
Characteristic ValueCrumb Rubber content (%) 18
Mixing time (min) 25Brookfield Viscosity (cP) 2000-2500
T failure unmodified on DSR(℃) G*/sin δ ≥ 1 kPa, AASTHO TP5 74-76
T failure RTFO residue on DSR(℃)G*/sin δ ≥ 2,2 kPa AASTHO TP5 – ASTM D2872; 65-70
T failure PAV on DSR (℃) G* sin δ ≤ 5MPa AASTHO TP5 – ASTM PS 36 16 - 16,5
3. Test Track Characteristics
The roadway for this study is located in Bogotá, Colombia (Figure 2). The track was selected according to the following criteria: same amount of heavy vehicles along the test track (canalised traffic) and uniform subgrade characteristics.
The selected site was a 270 m. long track, having a flexible pavement in very bad conditions (Figure 2). Four pits were made in order to study the subgrade and granular material characteristics. The test track was divided in four sections of 54 m, and 7 m. wide as
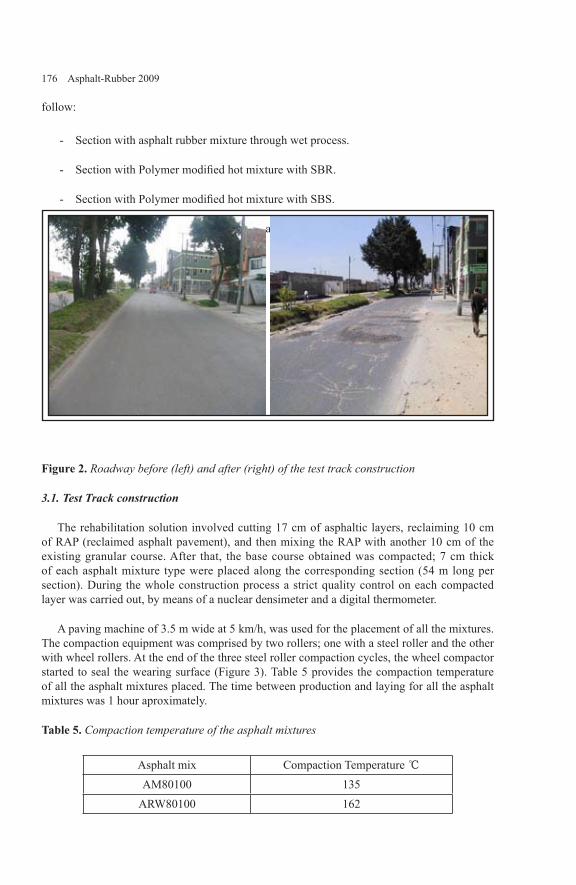
176 Asphalt-Rubber 2009
follow:
Section with asphalt rubber mixture through wet process.
Section with Polymer modified hot mixture with SBR.
Section with Polymer modified hot mixture with SBS.
Section with conventional asphalt (Barrancabermeja 80/100) mixture.
Figure 2. Roadway before (left) and after (right) of the test track construction
3.1. Test Track construction
The rehabilitation solution involved cutting 17 cm of asphaltic layers, reclaiming 10 cm of RAP (reclaimed asphalt pavement), and then mixing the RAP with another 10 cm of the existing granular course. After that, the base course obtained was compacted; 7 cm thick of each asphalt mixture type were placed along the corresponding section (54 m long per section). During the whole construction process a strict quality control on each compacted layer was carried out, by means of a nuclear densimeter and a digital thermometer.
A paving machine of 3.5 m wide at 5 km/h, was used for the placement of all the mixtures. The compaction equipment was comprised by two rollers; one with a steel roller and the other with wheel rollers. At the end of the three steel roller compaction cycles, the wheel compactor started to seal the wearing surface (Figure 3). Table 5 provides the compaction temperature of all the asphalt mixtures placed. The time between production and laying for all the asphalt mixtures was 1 hour aproximately.
Table 5. Compaction temperature of the asphalt mixtures
Asphalt mix Compaction Temperature ℃AM80100 135
ARW80100 162
-
-
-
-

Performance Evaluation and Design 177
PMSBS 154PMSBR 155
Figure 3. Placement procedure of asphalt mixes
4. Test track Performance using crumb rubber asphalt and other modifiers.
The performance of the test track was studied on a first stage during one year. Along this year differents measurements were carried out in order to establish the development and evolution of the possible distresses in each section. Another of the desired purposes of the test track construction was to verify the results obtained from extended studies accomplished in laboratory about rhelogical behavior of the asphalt rubber binders, and the mechanical performance of asphalt rubber mixtures (IDU , 2002, IDU, 2005).
The following parameters were studied every three months during the first year:
Traffic measurements, 12 hours per day.
Measurements of International Roughness Index (IRI).
Distress Evaluation using World Bank methodology.
Cores were taken from Asphalt mixtures to make rheological test.
Measurements of longitudinal profiles and cross sectional profiles
Static deflection.
Currently, the test track has achieved 4 years on service. The purpose of this paper is to present the results of the condition assessment of the full scale test section, after 4 years, thereby the study involved:
-
-
-
-
-
-

178 Asphalt-Rubber 2009
Surface condition (visual assessment)Structural Characterization based on Falling Weight Deflectometer (FWD), and Ground penetration Radar (GPR).
According to the traffic measurements, the test track had had 4 x 10⁶ ESAL’s (Equivalent Single-Axle Load) of 80 kN during the analysis period (4 years). As a result of this traffic conditions, the sections have shown a variety of distress, such as; alligator crackings, block crackings and potholes. Figure 4, exhibits the evolution of the cracking density on each section after 4 year of performance. The AM80100 section has showed the bigger cracking density with respect to the other sections. As can be expected the AM80100 showed the worst behavior, presenting a high degration rate. ARW80100 and PMSBS presented an excellent performance showing a cracking density smaller than 10%. In contrast to ARW80100 and PMSBS, the PMSBR section showed a fair performance exhibiting a cracking density close to 20%.
0%
5%
10%
15%
20%
25%
30%
35%
Cra
ckin
gde
nsity
(%)
AM80100 PMSBS ARW80100 PMSBR
Month 3 Month 6 Month 12 Month 48
Figure 4. Cracking density in each section, after 4 year
4.1. Superficial Distress Assessment
The distress assessment was carried out according to the U.S Army Corps of Engineers methodology-Paver 2, which is defined in the Pavement Management Guide of the Instituto de Desarrollo Urbano de Bogotá (IDU, 1999).
The methodology establishes two indexes:OPI: Overall Pavement Index.MDR: Modified Distress Rating.
••
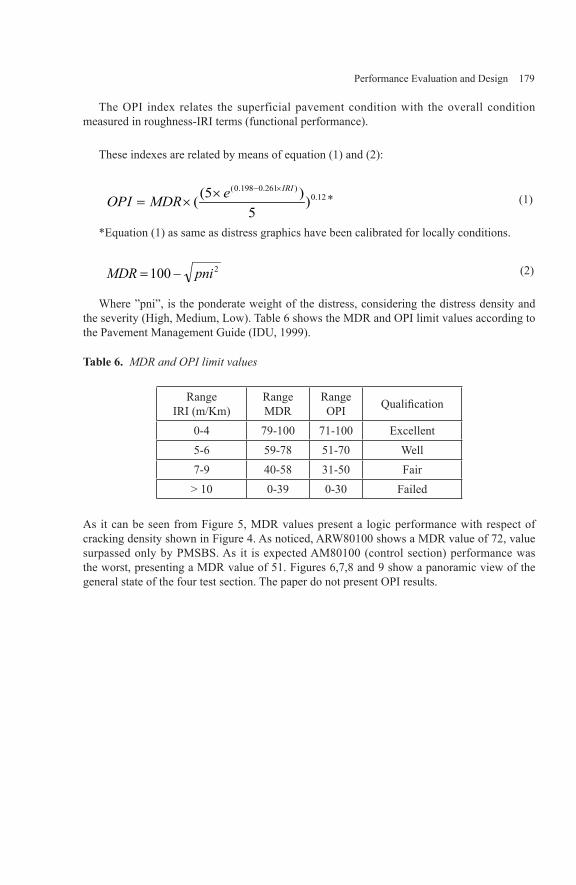
Performance Evaluation and Design 179
The OPI index relates the superficial pavement condition with the overall condition measured in roughness-IRI terms (functional performance).
These indexes are related by means of equation (1) and (2):
12.0)261.0198.0(
)5
)5((IRIeMDROPI
×−××= * (1)
*Equation (1) as same as distress graphics have been calibrated for locally conditions.
2100 pniMDR −= (2)
Where ”pni”, is the ponderate weight of the distress, considering the distress density and the severity (High, Medium, Low). Table 6 shows the MDR and OPI limit values according to the Pavement Management Guide (IDU, 1999).
Table 6. MDR and OPI limit values
RangeIRI (m/Km)
RangeMDR
RangeOPI Qualification
0-4 79-100 71-100 Excellent5-6 59-78 51-70 Well7-9 40-58 31-50 Fair> 10 0-39 0-30 Failed
As it can be seen from Figure 5, MDR values present a logic performance with respect of cracking density shown in Figure 4. As noticed, ARW80100 shows a MDR value of 72, value surpassed only by PMSBS. As it is expected AM80100 (control section) performance was the worst, presenting a MDR value of 51. Figures 6,7,8 and 9 show a panoramic view of the general state of the four test section. The paper do not present OPI results.

180 Asphalt-Rubber 2009
5 1
8 9
7 2
6 0
0
1 0
2 0
3 0
4 0
5 0
6 0
7 0
8 0
9 0MD
R
A M80100 PMSBS A RW 80100 PMSBR
S ECTIONS
Figure 5. Surface condition Index
Analizing the performance of the four test sections, is remarkable the good behavior of ARW80100, presenting a performance on the same level of Commercial Polymer Modified binders, obtaining a well qualification according to Table 6.
Figure 6. Surface condition for AM80100
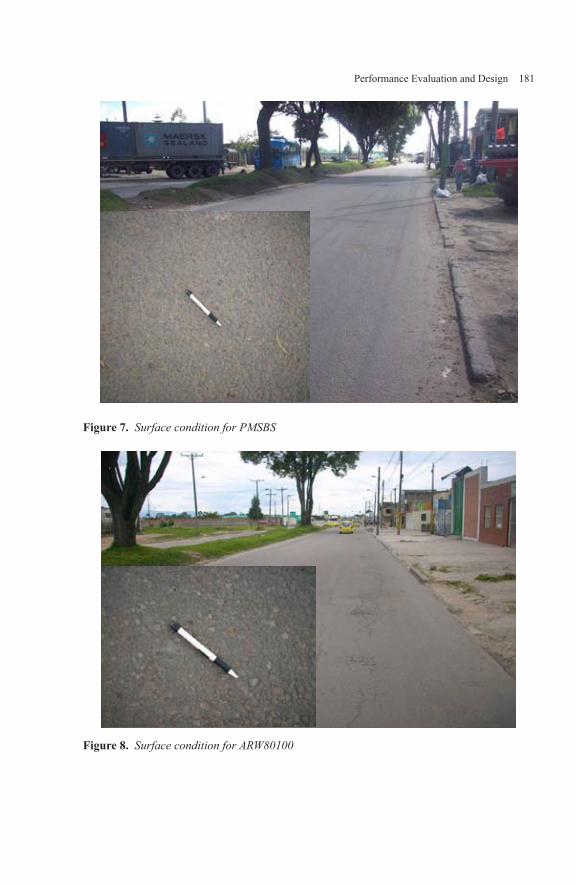
Performance Evaluation and Design 181
Figure 7. Surface condition for PMSBS
Figure 8. Surface condition for ARW80100

182 Asphalt-Rubber 2009
Figure 9. Surface condition for PMSBR
5. Structural assessment of the test track
A structural assessment was carried out along each test section by using a Falling Weight Deflectometer (FWD) measuring each 10 m per section, by applying 40 kN load normalized at 20 ℃. In addition, a Ground Penetration Radar was used to stablish the real thickness of the pavement structure. Analizing both FWD and GPR results a backcalculation analisys was conduct by means of the Rohde’s method (Rohde, 1994).
Figure 10. GPR and FWD used on the survey
The Rohde method uses the Structural Index of the Pavement (SIP), which represents the amount of deflection that has occurred within the pavement structure:
HpDDSIP 5.10 −= (3)
where,SIP = structural index of pavement.D0 = peak deflection measured under a standard 9,000-lb FWD load.D1.5 Hp = surface deflection measured at offset of 1.5 times of Hp under a standard 9,000-lb FWD load.Hp = total pavement thickness.

Performance Evaluation and Design 183
The structural number of the pavement can be calculated with the whole thickness of the pavement and the SIP value. The function used in the analysis is as follows:
321
kP
k HSIPkSN ××= (4)
where,SN = pavement structural number(in).SIP = structural index of pavement (microns).Hp = total pavement thickness (mm).
k1, k2, k3 = regression coefficients (table 7),
Table 7. Coefficients for SN formula
Surface Type k1 k2 K3 Surface Seals 0.1165 -0.3248 0.8241
Asphalt Concrete 0.4728 -0.4810 0.7581
The results of the GPR survey are shown on Figure 11. As was mentioned above (numeral 3.1), each section was comprised of 0.07 m wearing course, a granular base compound of 0.10 m thick of existing granular base and Reclaimed Asphalt Pavement (RAP) and a variable layer of existing granular material ranging 0.2 and .6 m according to boreholes undertaken before the construction of the test track.
0,00
0,10
0,20
0,30
0,40
0,50
0,60
0,70
0,80
0,90
1,000 20 40 60 80 100 120 140 160 180 200 220 240 260
Position (m)
App
roxi
mat
e Th
ickn
ess
(m)
LAYER 1 (m)LAYER 2 (m)LAYER 3 (m)
AM8010FAILED SECTION,NO STUDIED PMSBRPMSBS ARW8010
Figure 11. Asphalt pavement GPR profile
The peak deflection measured below a FWD loading plate is a combination of the deflection in the subgrade and the elastic compression of the pavement structure (Zhang, 2003). Figure 12 shows the peak deflection measured underneath a FWD loading plate normalized at 20 ℃. The figure exhibits the structural capacity of each section of the test track. Analizing PMSBR section is observed a big variability (Standard Deviation = 438) along the stretch with respect of the other sections, undertaking deflection ranging from 700

184 Asphalt-Rubber 2009
(mm/1000) to 1600 (mm/1000), undergoing in general the biggest deflection (mean = 1277). On the other hand, ARW80100 present on average the second bigger deflection, denoting uniform values along the stretch (Table 8). Whereas, PMSBS and AM80100 had a similar performance, with the exception of the last AM80100 measure that was outside of the general trend.
0
500
1000
1500
2000
2500
3000
1 2 3 4 5 6Measures (54 m )
Nor
mal
ized
Def
lect
ions
FWD
40kN
(mm
/100
0)
AM80100 SECTION 1 ARD 80100 SECTION 2PMSBS SECTION 3 ARW80100 SECTION 4PMSBR SECTION 5
Figure 12. FWD center of plate deflections for each section
Table 8. Deflection values
SECTIONDeflection
Mean * (mm/1000) SD
AM80100 1031 448PMSBS 833 153
ARW80100 1243 30PMSBR 1277 438
* Deflection undertaken each 10 meters, along section 54 m long *SD - Standard deviation
The Structural Number was calculated considering FWD and GPR results, by using equation (3) and (4) (Rohde, 1994). Figure 13 shows the SNs backcalculated for each section. As can be noticed in the Figure, PMSBS present the higher SN, followed by ARW80100; the lowest value as should be expected was to AM80100 (control mix). PMSBS, ARW80100 and PMSBR are asphalt hot mix modified, by means of a polymer modification or an asphalt rubber modification. With a modification process, can be improved the temperature susceptibility by increasing binder stiffness at high service temperatures and reducing stiffness at low service temperatures (Airey, 2004). The asphalt hot mixes modified on the test sections (PMSBS, ARW80100 and PMSBR) are stiffer mixes, because of the asphalt modified contribution (Martínez et al, 2006) together with the granular skeleton. Therefore,

Performance Evaluation and Design 185
is expected that modified sections present the higher SN. Is important to mention, concerning GPR profiles showed on Figure 11, that AM80100 had the lower existing granular layer, that is, below the layer comprised by RAP and the existing granular base.
0,0
0,5
1,0
1,5
2,0
2,5
3,0
3,5
A M 80100 P M S B S A RW 80100 P M S B R
SN R
OHDE
Figure 13. FWD center of plate deflections for each section
At this point, is possible to relate cracking density, FWD and GPR results for understanding the test sections performance. As was analized on Figure 4, the PMSBS and ARW80100 exhibited the lowest cracking percentage. However, ARW80100 deflections were higher to that of PMSBS or even AM80100. This is an evidence of the superior performance of asphalt rubber mixes and their resistance to fatigue cracking, confirming that AR can tolerate significantly higher deflections (Kirk, 2006).
Concerning fatigue cracking, SuperPave specification system requires the fatigue parameter to reflect energy dissipated per load cycle, which can be calculated as G*sin δ (Anderson and Kennedy, 2003). The parameter indicates a relationship whereby a reduction in G*sin δ at 10 rad/s corresponds to improved fatigue resistance. Since the cracking percentage is a direct signal of fatigue distress, the SuperPave fatigue parameter of each binder was related in order to stablish a relationship between the cracking density per section and the asphalt binder applied. The G*sin δ results were obtained from samples aged in laboratory by using Rolling Thin Film Oven (RTFO) and then aged on Pressure Aging Vessel (PAV). According to SuperPave protocol this procedure can simulate aging conditions of asphalt hot mixes on service ranging from 3 to 5 years. Figure 14, compares the SuperPave fatigue parameter at 28℃ of each asphalt binder after RTFO+PAV procedure. ARW80100, exhibit the best fatigue performance, furthermore a huge reduction (60%) is observed with regard to control asphalt binder (AM80100), this fact confirms the remarkable improvement obtained with the asphalt rubber incorporation on unmodified asphalt binder. Results of the rheological characterization for each asphalt binder can be consulted in Martinez et al, 2006. As can be observed (Figure 14) SuperPave fatigue parameter has predicted superior fatigue performance for the ARW80100, fact confirmed with the AR section.

186 Asphalt-Rubber 2009
0
5
10
15
20
25
30
35
1500 2000 2500 3000 3500 4000 4500 5000 5500
G* Se n (d e lta) k Pa at 28 ºC
% C
rack
ing
A RW 80100 PMSBS PMSBR B80100
Figure 14. Surface condition for AM80100 and PMSBS sections
Regarding polymer modified mixes, differences in performance based on binder properties, and performance based on mixes mechanical properties, may be related to the physico-chemical interaction between the Polymer modified binders, specifically the polymer phase, and the mineral aggregates within the different asphalt mixes (Airey, 2003).
6. Conclusions
The results presented in this paper illustrate the excellent performance of the first test section with real condition (traffic, weather) where Asphalt Rubber is applied in Colombia, by using the “wet process”, project undertaken in 2004. One of the main objectives when a test section is projected is observing the evolution of the distress and the several fail mechanism developed on a test section. In the case of the AR section, since 2005, we are expecting to observe the distress evolution. However, it did not happen; the cause has been the excellent performance of this section.
The following conclusions can be drawn from this research project:
Based on cracking density and MDR index, PMSBS and ARW80100 sections showed the best fatigue cracking resistance, while AM80100 (Control mix) exhibited as expected the worst performance.
A structural evaluation was carried out on the test section, by using a FWD and GPR profiles, The peak deflection measured below the FWD loading plate showed the ARW80100 section as one with bigger deflections, nevertheless, cracking density demonstrated the high cracking resistance of AR layers, confirming that AR can tolerate significantly higher deflections. Backcalculation analysis was conducted by
1.
2.

Performance Evaluation and Design 187
using the Rohde’s method, thereby Structural Number – SN was possible of obtaining. SN along the whole section exhibited similar values among modified mixes (PMSBS, PMSBS, ARW80100), meanwhile distress indexes confirms the superior cracking resistance of AR with regard to PMSBS and PMSBR, in spite of the higher delflection of AR section.
Finally, a comparison between Cracking Density and SuperPave Fatigue parameter was done, confirming the ability of G* sin δ on asphalt rubber of predicting fatigue performance, quatififying a huge reduction (60%) in this parameter with regard to the Contraol mix(AM80100)
7. Bibliography
Airey G., “Fundamental binder and practical mixture evaluation of polymer modified bituminous materials”. The International Journal of Pavement Engineering, Vol 5(3), p 137-151, September 2004.
Anderson, D.A., Kennedy, T.W., “Development of SHRP binder specification”, Journal of the Association of Asphalt Paving Technologist 62, 481-507, 2003.
California Department of Transportation Appendix D, Typical Specifications, California Special Provision. Gap-Graded Asphalt Rubber (12-13-94). http:/www.rubberpavements.org/library/fp25_index. Asp.
Instituto de Desarrollo Urbano de Bogotá, TNM Limited. Plan Maestro de Sostenibilidad Vial IDU – TNM contrato 834 de 1999.
Instituto de Desarrollo Urbano de Bogotá, Universidad de Los Andes. Estudio de las mejoras mecánicas de mezclas asfálticas con desechos de llantas (Study for mechanical improvement on asphalt mixtures with waste tires), Bogota D.C., 2002.
Instituto de Desarrollo Urbano de Bogotá D.C., Universidad de Los Andes. Segunda fase delestudio de las mejoras mecánicas de mezclas asfálticas con desechos de llantas – Pista de Prueba contrato 306-2003 (Second stage of the study for mechanical improvement on asphalt mixtures with waste tires - test track), Bogota D.C., 2005.
Martínez, G., Caicedo, B., Gonzáles, D., Celis, L., “Rheological Behaviour of Asphalt with Crumbed Rubber and other Modifiers”. Proceedings of the Asphalt Rubber 2006 Conference. Palm Springs 2006.
Rohde, G.T. Determining Pavement Structural Number from FWD Testing. Transportation Research Record, No.1448, Washington, DC, 1994.
Kirk, V.J., “Multi-layer Pavement Strategies Utilizing Asphalt Rubber Binder”. Proceedings of the Asphalt Rubber 2006 Conference. Palm Springs 2006.
3.

Zhang, Z,. Claros, G., Lance, M. Damnjanovic, I., “Evaluation Of The Pavement Structural Condition At Network Level Using Falling Weight Deflectometer (Fwd) Data”. 82nd Annual Meeting Of The Transportation Research Board And Publication In The Transportation Research Record Series.
Ludomir, U., Maher, M., Balasundaram, A., Uzarowski, L., “Practical Application of GPR toSupplement Data from FWD for Quick Pavement Performance Prediction. 2005 Annual Conference of the Transportation Association of Canada Calgary, Alberta.

Performance Evaluation and Design 189
Reflect ion Cracking and Permanent Deformation of Overlays with Recycled Tire Rubber and Polymer Modifiers Under HVS Loading
P. Ullidtz* - D. Jones** - R. Wu** - J. Harvey** - R. Hogan***
* Dynatest InternationalNaverland 32DK 2600, [email protected]
** University of California, DavisEngineering Unit 3Davis, CA 95616USA
[email protected]@[email protected]
***California Department of Transportation1120 N StreetSacramento, CA 94273USA
ABSTRACT. The paper describes a study of the reflection cracking and rutting performance of rubber modified asphalt mixes used in overlays for rehabilitating cracked asphalt concrete pavement in California. Twelve Heavy Vehicle Simulator (HVS) experiments were carried out. All were simulated using the computer program CalME to enable “virtual” experiments to be conducted under exactly uniform conditions, and to enable extrapolation to other loading and climatic conditions. Temperatures, applied loads, resilient and permanent deformations measured and any surface cracking recorded during the HVS experiments, were imported into the CalME database. Experiments were simulated, hour by hour, using the incremental-recursive procedure. Care was taken to ensure that the calculated resilient deflections matched the measured deflections reasonably well during the full experiment. The results shown in this paper are single examples of each mix type. However, the incremental-recursive method used in CalME and associated laboratory testing provide a means for evaluating the full life of the overlay with respect to reflective cracking, which better captures the crack resistance
190 Asphalt-Rubber 2009
performance of rubber asphalt overlays than does the traditional approach using 50% loss of stiffness as failure and Miner’s Law.
keywords: Heavy Vehicle Simulator, Accelerated pavement testing, Incremental-recursive analysis, Overlay, Reflection cracking, Rutting
1. Introduction
The main objective of this investigation was to compare the performance of three maintenance overlays using modified binders (MB, with 15% recycled tire rubber and modified binders blended at the refinery) mixes against two control maintenance overlay mixes (Dense Graded Asphalt Concrete, DGAC (sometimes called AR4000) and Rubberized Asphalt Concrete, Gap graded, RAC-G, 18-22% recycled tire rubber), essentially asking the question “Will gap-graded modified binder (MB-G) mixes provide performance equal to gap-graded rubberized asphalt concrete (RAC-G) mixes in half-thickness applications?” (UCPRC 2003). MB binders are asphalt binders modified with polymers and recycled tire rubber and blended at the refinery meeting a Caltrans performance related specification.
The project was divided into two phases. In the first phase six test sections were trafficked with the HVS to induce fatigue cracking on the asphalt concrete layer. The original pavement consisted of 77 to 88 mm of DGAC on a design thickness of 410 mm of aggregate base (AB) on a clay subgrade. The AB consisted of 100% recycled building waste material with a high percentage of crushed concrete. Reactive cement was found in the AB. In the second phase, selected overlay mixes were placed both on the trafficked and on the untrafficked sections, to evaluate:
Reflection cracking (expected failure mode) under HVS trafficking at moderate temperatures (≈15- 20 ˚C), andRutting performance under HVS loading at high temperature (45-50 ˚C at 50 mm depth).
A laboratory study, primarily investigating the shear and fatigue properties of the mixes, was undertaken in parallel with the HVS study.
Both the reflection cracking experiment and the rutting experiment had one of each of the following overlays:
Half-thickness MAC15TR gap-graded overlay with minimum 15 percent recycled tire rubber.Full-thickness MB4 gap-gradedHalf-thickness MB4 gap-graded overlayFull-thickness (90 mm) DGAC overlay (split into two subsections in some of the analysis)Half-thickness rubberized asphalt concrete gap-graded (RAC-G) overlayHalf-thickness (45 mm) MB4 gap-graded overlay with minimum 15 percent recycled tire rubber (referred to as “MB15” in this paper)
-
-
-
---
--

Performance Evaluation and Design 191
Test 1 Test 2 Test 3
Test 4 Test 5 Test 6
Phas
e1
M A C 15-G M B 4-G M B 4-G
A R 4000-D R A C -G M B 15-G
Phas
e2
R u t test
R u t test R u t testR u t test
R u t testR u t test
Test 1 Test 2 Test 3
Test 4 Test 5 Test 6
Phas
e1
M A C 15-G M B 4-G M B 4-G
A R 4000-D R A C -G M B 15-G
Phas
e2
R u t test
R u t test R u t testR u t test
R u t testR u t test
Figure 1. Test section layout
The test section layouts for phase 1 and 2 are shown in Figure 1 (Jones et al., 2008)
The test sections were instrumented with Multi Depth Deflectometers (MDDs) and thermocouples. At regular intervals during the HVS tests the resilient deflections were recorded at several depths using the MDDs and at the pavement surface using a Road Surface Deflectometer (RSD, similar to a Benkelman beam). The permanent deformations were also recorded by the MDDs and the pavement profile was measured using a laser profilometer. Any distress at the surface of the pavement was recorded. During HVS testing the temperature was controlled using a climate chamber. Falling Weight Deflectometer (FWD) tests were carried out before and after the HVS tests. Details on the HVS and the instrumentation can be found in Harvey et al., 1998 and on the overall study in Jones et al, 2007a.
2. Laboratory tests
A number of laboratory tests were carried out on the materials. For the purpose of this paper, the most important are the tests to characterize the fatigue and permanent deformation parameters of the asphalt materials. The stiffness reduction of the asphalt may be described by a Weibull distribution:
( )( ) ( ) ( )NSRorNSR
lnlnlnln)exp(
×+=−×−=
βαα β
[1]
Equation 1. Weibull distribution
where:SR is the stiffness reduction of the asphalt = E/Ei,E is the modulus at N load applications,Ei is the initial modulus (first 100 load applications),N is the number of load applications, andα and β are functions of resilient strain, modulus and/or temperature.
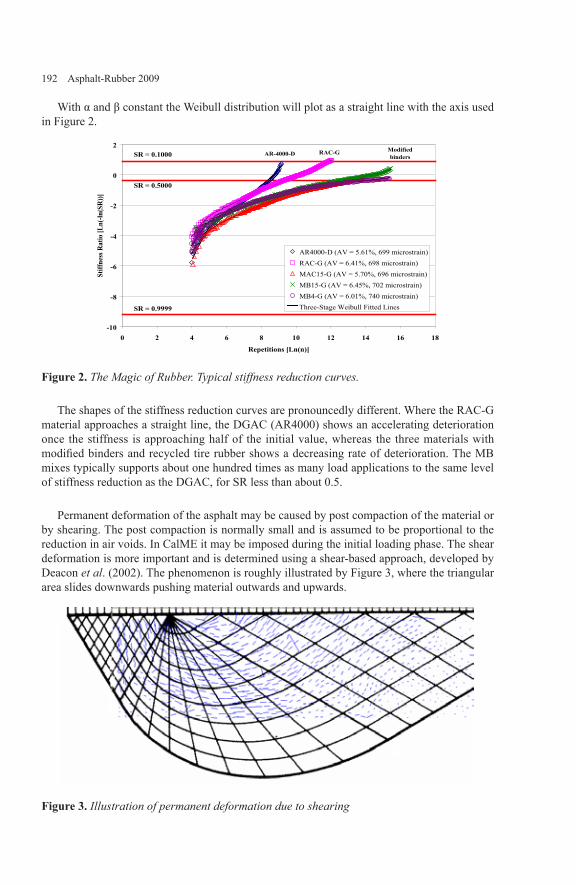
192 Asphalt-Rubber 2009
With α and β constant the Weibull distribution will plot as a straight line with the axis used in Figure 2.
-10
-8
-6
-4
-2
0
2
0 2 4 6 8 10 12 14 16 18
Repetitions [Ln(n)]
Stiff
ness
Rat
io [L
n(-ln
(SR
))]
AR4000-D (AV = 5.61%, 699 microstrain)RAC-G (AV = 6.41%, 698 microstrain)MAC15-G (AV = 5.70%, 696 microstrain)MB15-G (AV = 6.45%, 702 microstrain)MB4-G (AV = 6.01%, 740 microstrain)Three-Stage Weibull Fitted Lines
SR = 0.1000
SR = 0.5000
SR = 0.9999
AR-4000-D RAC-G Modified binders
Figure 2. The Magic of Rubber. Typical stiffness reduction curves.
The shapes of the stiffness reduction curves are pronouncedly different. Where the RAC-G material approaches a straight line, the DGAC (AR4000) shows an accelerating deterioration once the stiffness is approaching half of the initial value, whereas the three materials with modified binders and recycled tire rubber shows a decreasing rate of deterioration. The MB mixes typically supports about one hundred times as many load applications to the same level of stiffness reduction as the DGAC, for SR less than about 0.5.
Permanent deformation of the asphalt may be caused by post compaction of the material or by shearing. The post compaction is normally small and is assumed to be proportional to the reduction in air voids. In CalME it may be imposed during the initial loading phase. The shear deformation is more important and is determined using a shear-based approach, developed by Deacon et al. (2002). The phenomenon is roughly illustrated by Figure 3, where the triangular area slides downwards pushing material outwards and upwards.
Figure 3. Illustration of permanent deformation due to shearing

Performance Evaluation and Design 193
The permanent, or inelastic, shear strain, γi, will depend on the shear stress, τ, the elastic shear strain, γe, and the number of load repetitions, N. The relationship is determined from Repeated Simple Shear Tests at Constant Height (RSST-CH) in the laboratory. The best fitting relationship for the materials used was found to be a gamma function:
( ) ( ) e
ref
i NNA γττβ
γγαγ ×
××
+×
−−×+= expln1lnexp1exp [2]
Equation 2. Inelastic shear strain as a function of shear stress and elastic shear strain
where:α, β, γ, and τref are constants derived from the RSST-CH.
3. Heavy Vehicle Simulator (HVS) tests
Since 1995 the California Department of Transportation (Caltrans) has owned and operated two HVS equipments in cooperation with the University of California Pavement Research Center (UCPRC). The HVS may be considered to be a “large scale” laboratory equipment, capable of applying loads up to 100 kN to full scale pavement structures under controlled conditions of wheel position, speed, climate, etc.
Figure 4. Heavy Vehicle Simulator (HVS)
The overlay rutting sections were trafficked with the HVS on sections next to the demarcated fatigue sections on each overlay, and over a part of the underlying pavement that had not been trafficked during Phase 1. During this period a total of about 80,000 60 kN channelized, unidirectional load repetitions with a dual tire (720 kPa pressure) were applied across the sections, equating to approximately 455,000 ESALs. A temperature chamber was used to maintain the pavement temperature at 50℃±4℃ at 50 mm depth. An average maximum rut of 12.5 mm was set as the failure criterion. Findings and observations based on the data collected during the Phase 2 HVS rutting study are given by Steven, et al. (2007).
The number of repetitions required to reach the failure criterion of 12.5 mm average maximum rut depth varied between 726 repetitions for the MAC15-G mix and 8,266 repetitions for the AR4000-D mix (DGAC). Results are shown Figure 5.

194 Asphalt-Rubber 2009
60 kN, 50°C
MB15-G
RAC-G
AR4000
-D
45mm M
B4-G
90mm M
B4-G
MAC15-G
0
2
4
6
8
10
12
14
16
0 2 4 6 8 10
Load Repetitions (Thousand)
Ave
rage
Max
imum
Rut
Dep
th (m
m)
580RF581RF582RF583RF584RF585RF
Figure 5. Rutting as a function of number of load applications
Analysis of surface profiles and test pit observations during a forensic investigation (Jones, et al, 2007b) indicate that most of the permanent deformation occurred in the underlying DGAC surfacing layer (Figure 6). The deformation along each section was reasonably uniform, with the exception of the 90-mm MB4-G, where more severe rutting and heaving occurred at one end of the test section compared to the other. All of the sections showed some heaving at the sides of the trafficked area, with heights varying between 5 mm and 16 mm.
Figure 6. Rutting in the underlying DGAC on the 45-mm MB4-G Section
HVS trafficking of the overlay reflective cracking sections applied approximately 12.5 million load repetitions at loads varying between 60 kN and 100 kN (385 ESALs), depending on the stage in the test plan, and were applied across the sections. A temperature chamber

Performance Evaluation and Design 195
was used to maintain the pavement temperature on each section at 20℃±4℃ for the first one million repetitions, then at 15℃±4℃ for the remainder of the test. A dual tire (720 kPa pressure) in a bidirectional loading pattern with lateral wander was used for all experiments. A crack density of 2.5 m/m2 was set as the failure criteria. FWD measurements were taken before and after each HVS tests. No fatigue cracking was recorded on the MB4-G, MB15-G and the MAC15-G sections. A small area of cracking attributed to shear failure of underlying layers was observed at one end of the 45 mm MB4-G section.
Studies of the asphalt layers, including fractured cores, showed that cracking in the DGAC and RAC-G overlays had mostly reflected from the underlying DGAC layer (Figure 7). There was no observed cracking on the surface of the MB sections (except as mentioned above). There was some variation in layer thicknesses over the length of the experiment. DCP measurements and scanning electron microscope studies indicated that the stiffness of the recycled aggregate base varied somewhat between sections due to some re-cementation of the recycled construction waste that occurred after construction. The strongest part of the base was typically between 100 mm and 250 mm below the asphalt concrete (Jones et al, 2007b).
Figure 7. Fatigue section forensic (cracks are highlighted with marker pen)
4. Simulation of HVS tests using CalME
The HVS tests were simulated using an incremental-recursive program known as CalME (Ullidtz et al., 2005). Data from each HVS test were imported into a CalME database. The data comprised information on loads (time of application and load level), temperatures at different levels, RSD results, MDD resilient and permanent deformations and pavement profiles.
The backcalculated layer moduli from the last FWD test before commencement of the HVS loading were used as the initial layer moduli (for asphalt layers at the reference temperature of 20 ℃). Layer moduli were backcalculated using CalBack. For asphalt layers the master curve was obtained from frequency sweep tests on beams in the laboratory, with the exception of the original DGAC layer where the master curve was based on FWD backcalculated moduli. For

196 Asphalt-Rubber 2009
the subgrade the change in stiffness with changing stiffness of the pavement layers and with changing load level was obtained from FWD backcalculated values. These parameters were used with the response model (LEAP, Symplectic Engineering Corporation, 2004) to calculate stresses, strains and deflections in the pavement structure. The strain in the overlay over an existing cracked asphalt layer was calculated using the reflection cracking model developed by Wu (2005).
To predict the pavement performance, in terms of cracking and permanent deformation, a number of models were used. Parameters for prediction of asphalt fatigue damage were obtained from controlled strain fatigue tests on beams. Repeated Simple Shear Tests at Constant Height (RSST-CH) were used to determine the parameters for predicting permanent deformation in the asphalt layers. A crushing model was developed for the self-cementing base layer, consisting of recycled building waste material with a high content of crushed concrete. Cracking at the pavement surface was calculated from the reflection damage to the surface layer, using a model developed based on previous simulations of HVS tests and the WesTrack experiment, with coefficients modified based on the results of the present experiment. For the details of these and other models used in CalME see Ullidtz, et al. 2008a and 2008b.
An incremental-recursive process was used to simulate the performance of the test sections. The time increment used was one hour. For the first hour of the simulation the program would read the temperatures from the database and calculate the moduli, for a constant wheel speed of 9.6 km/h, the approximate speed of the HVS wheel. The number of loads during the first hour, as well as the load level and the tire pressure, were also read from the database. The modulus of the subgrade would be adjusted to the stiffness of the pavement layers and to the load level. If the test had wheel wander, five different positions of the wheel would be considered. For the first wheel position the stresses and strains at the center line of the test section were calculated and used to determine the decrease in moduli and the increase in permanent deformation of each of the pavement layers. The output from these calculations were used, recursively, as input to the calculation for the next wheel position. Because of the changes to moduli, response, damage, and permanent deformation the “time hardening” procedure was used (Deacon et al. 2002).
The first step in the simulation is to make sure that the calculated pavement response is reasonably close to the actual pavement response during the test. The calculated pavement response is used to predict the pavement performance (damage and permanent deformation). Therefore, if the calculated response is not reasonably correct it would be futile to try to use it for calibration of the performance models. For the HVS tests used for this paper, response measurements were available in the form of resilient MDD deflections and/or RSD deflections.
Once the resilient deflections are predicted reasonably well during the simulations, it is possible to calibrate the performance models so that the permanent deformation of each layer, the decrease in layer moduli and the observed surface cracking, are reasonably well predicted.
The deflections normally increase considerably during an HVS test, as a result of damage to the bound layers (asphalt and self-cementing AB in this case). This means that the stresses and strains in the pavement layers, which are used in calculation of the pavement performance,

Performance Evaluation and Design 197
also change during the test. To ensure that the pavement response calculated by CalME was reasonably correct for the duration of the test, the surface deflections and the deflections at the depths of the MDD modules were calculated by CalME and compared to the RSD and MDD measurements.
Figure 8. Measured (RSD) and calculated (Calc) surface deflection versus load applications
Figure 8 shows a comparison of surface deflection under a 60 kN wheel load, for the test section with a 45 mm MB15 overlay. Even though the test section is only 6 m long the measured surface deflections vary considerably over the area of the test section, sometimes by as much as a factor of 2. The coefficient of variation on the RSD measurements varies from less than 10% to more than 20%. It may be noticed that the deflection increases by more than 50% within the first one million load applications. The drop in deflection after one million load applications is due to the temperature being reduced from 20 ℃ to 15 ℃. The deflections calculated by CalME are seen to be in reasonably good agreement with the average of the RSD deflections.
Measured and calculated surface deflections, MB15
-0.5
-0.4
-0.3
-0.2
-0.1
0
0 500000 1000000 1500000 2000000 2500000
Number of load applications
Def
lect
ion,
mm
RSDMonte Carlo
Figure 9. Monte Carlo simulation of the MB15 section
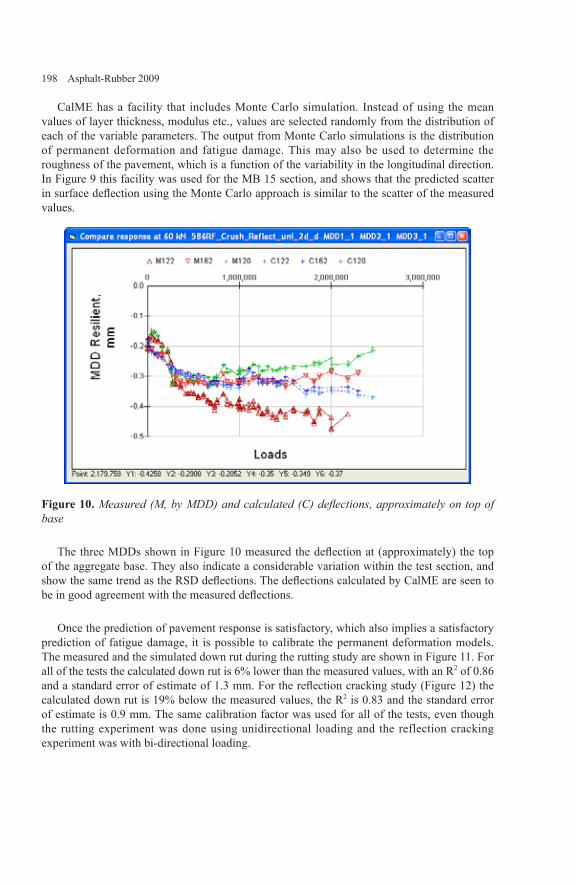
198 Asphalt-Rubber 2009
CalME has a facility that includes Monte Carlo simulation. Instead of using the mean values of layer thickness, modulus etc., values are selected randomly from the distribution of each of the variable parameters. The output from Monte Carlo simulations is the distribution of permanent deformation and fatigue damage. This may also be used to determine the roughness of the pavement, which is a function of the variability in the longitudinal direction. In Figure 9 this facility was used for the MB 15 section, and shows that the predicted scatter in surface deflection using the Monte Carlo approach is similar to the scatter of the measured values.
Figure 10. Measured (M, by MDD) and calculated (C) deflections, approximately on top of base
The three MDDs shown in Figure 10 measured the deflection at (approximately) the top of the aggregate base. They also indicate a considerable variation within the test section, and show the same trend as the RSD deflections. The deflections calculated by CalME are seen to be in good agreement with the measured deflections.
Once the prediction of pavement response is satisfactory, which also implies a satisfactory prediction of fatigue damage, it is possible to calibrate the permanent deformation models. The measured and the simulated down rut during the rutting study are shown in Figure 11. For all of the tests the calculated down rut is 6% lower than the measured values, with an R2 of 0.86 and a standard error of estimate of 1.3 mm. For the reflection cracking study (Figure 12) the calculated down rut is 19% below the measured values, the R2 is 0.83 and the standard error of estimate is 0.9 mm. The same calibration factor was used for all of the tests, even though the rutting experiment was done using unidirectional loading and the reflection cracking experiment was with bi-directional loading.

Performance Evaluation and Design 199
R utting s tudy, un i-d irectional, 45-50 C a t 50 m m
0
2
4
6
8
10
12
14
16
18
0 2 4 6 8 10 12 14 16 18M easured dow n ru t, m m
Calcu
lated
dow
n ru
t, m
m
M B 15 45 m mR A C -G 45 m mD G A C 90 m mM B 4 45 m mM B 4 90 m mM A C 15 45 m m =
Figure 11. Measured and calculated down rut during rutting study
R eflection crack ing s tudy, b i-d irectional, 20 C
0
2
4
6
8
10
12
14
16
18
0 2 4 6 8 10 12 14 16 18M easured dow n ru t, m m
Calcu
lated
dow
n ru
t, m
m
M B 15 45 m mR A C -G 45 m mD G A C a 90 m mD G A C b 90 m mM B 4 45 m mM B 4 90 m mM A C 15 45 m m =
Figure 12. Measured and calculated down rut during reflection cracking study
Based on previous HVS experiments on new pavements and on simulation of the WesTrack experiment the following equations were found to be capable of estimating the severity, or density, of surface cracking, in m/m2, reasonably well:
2
2501
1−
+
=
mmhAC
iω [3]
Equation 3. Model for estimating damage at crack initiation

200 Asphalt-Rubber 2009
where ωi is the damage at crack initiation, and hAC is the combined thickness of the asphalt layers.
8
2
1
/10−
+
=
o
mmCr
ωω [4]
Equation 4. Model for estimating crack density (severity)
where Cr is the crack density (severity in m/m2), ω is the damage to the surface layer, and ωo is a constant.
ωo was determined based on the assumption that crack initiation corresponds to a severity of 0.5 m/m2.
Figure 13 shows the crack severity, in m/m2 of the wheel track, as a function of the fatigue damage determined from the strain at the bottom of the original asphalt layer. This damage is used to reduce the average modulus of both the original asphalt layer and of the overlay. In Figure 13 the original pavement sections, before overlay, are designated by their test numbers. The overlaid sections are given by the type and thickness of the overlay. The heavy curves indicated by a thickness value are the crack severities calculated using Equation [3] and Equation [4]. The approximate thickness of the asphalt layer before overlay was 80 mm, and the thicknesses of the combined asphalt layers after overlay were either about 125 mm or 170 mm.
0
1
2
3
4
5
6
7
8
9
10
0 0.1 0 .2 0 .3 0 .4 0 .5 0 .6 0 .7 0 .8Fatigue dam age
Crac
king,
m/m
2
0
1
2
3
4
5
6
7
8
9
10
Calcu
lated
crac
king,
m/m
2
567R F568R F569R Fa569R Fb571R F572R F573R FM B 15 45 m mR A C -G 45 m mD G A C a 90 m mD G A C b 90 m mM B 4 45 m mM B 4 90 m mM A C 15 45 m m80 m m125 m m170 m m
Figure 13. Surface cracking as a function of fatigue damage
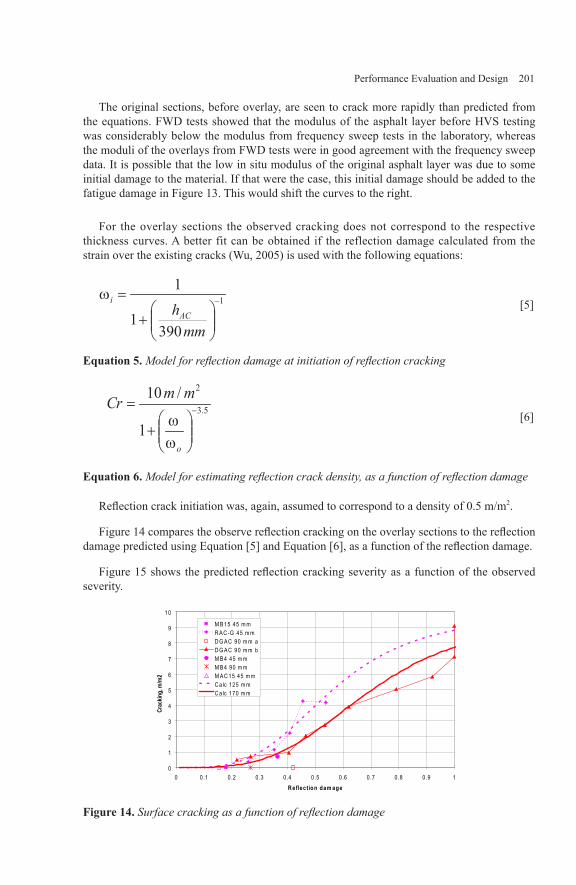
Performance Evaluation and Design 201
The original sections, before overlay, are seen to crack more rapidly than predicted from the equations. FWD tests showed that the modulus of the asphalt layer before HVS testing was considerably below the modulus from frequency sweep tests in the laboratory, whereas the moduli of the overlays from FWD tests were in good agreement with the frequency sweep data. It is possible that the low in situ modulus of the original asphalt layer was due to some initial damage to the material. If that were the case, this initial damage should be added to the fatigue damage in Figure 13. This would shift the curves to the right.
For the overlay sections the observed cracking does not correspond to the respective thickness curves. A better fit can be obtained if the reflection damage calculated from the strain over the existing cracks (Wu, 2005) is used with the following equations:
1
3901
1−
+
=
mmhAC
iω [5]
Equation 5. Model for reflection damage at initiation of reflection cracking
5.3
2
1
/10−
+
=
o
mmCr
ωω [6]
Equation 6. Model for estimating reflection crack density, as a function of reflection damage
Reflection crack initiation was, again, assumed to correspond to a density of 0.5 m/m2.
Figure 14 compares the observe reflection cracking on the overlay sections to the reflection damage predicted using Equation [5] and Equation [6], as a function of the reflection damage.
Figure 15 shows the predicted reflection cracking severity as a function of the observed severity.
0
1
2
3
4
5
6
7
8
9
10
0 0.1 0 .2 0 .3 0 .4 0 .5 0 .6 0 .7 0 .8 0 .9 1R eflection dam age
Crac
king,
m/m
2
M B 15 45 m mR A C -G 45 m mD G A C 90 m m aD G A C 90 m m bM B 4 45 m mM B 4 90 m mM A C 15 45 m mC alc 125 m mC alc 170 m m
Figure 14. Surface cracking as a function of reflection damage

202 Asphalt-Rubber 2009
P red icted re flection crack ing versus observed crack ing
y = 1 .0173xR 2 = 0 .9486
0
2
4
6
8
0 1 2 3 4 5 6 7 8O bserved cracking , m /m 2
Calcu
lated
crac
king,
m/m
2
Figure 15. Predicted reflection cracking severity as a function of observed severity
Although the original pavement (phase 1) was built to provide a uniform support for the rutting and the reflection cracking studies, the FWD tests and the forensic investigation showed that there were large variations over the length of the pavement section. The conditions of underlying structure, wheel loads and climate should be identical when ranking the different overlays. Because it was found that the permanent deformations and reflection cracking were predicted reasonably well with CalME it was possible to carry out a number of “virtual” HVS tests with identical conditions.
-20
-18
-16
-14
-12
-10
-8
-6
-4
-2
0
0 20000 40000 60000 80000 100000 120000 140000 160000 180000 200000N um ber o f load app liactions
Perm
anen
t def
orm
atio
n, m
m
M B 4 45M B 4 90M B 15 45R A C -G 45M A C 15 45A R 4000 90
Figure 16. Result of rutting simulation with identical underlying structure, loads and temperatures.
Several of the reflection cracking sections did not get any cracking during the “real” experiments, even though the traffic loading corresponded to up to about 100 MESAL (million ESAL) and lasted from 150 to 230 days. The “virtual” experiments were, therefore, done with about 500 MESAL.
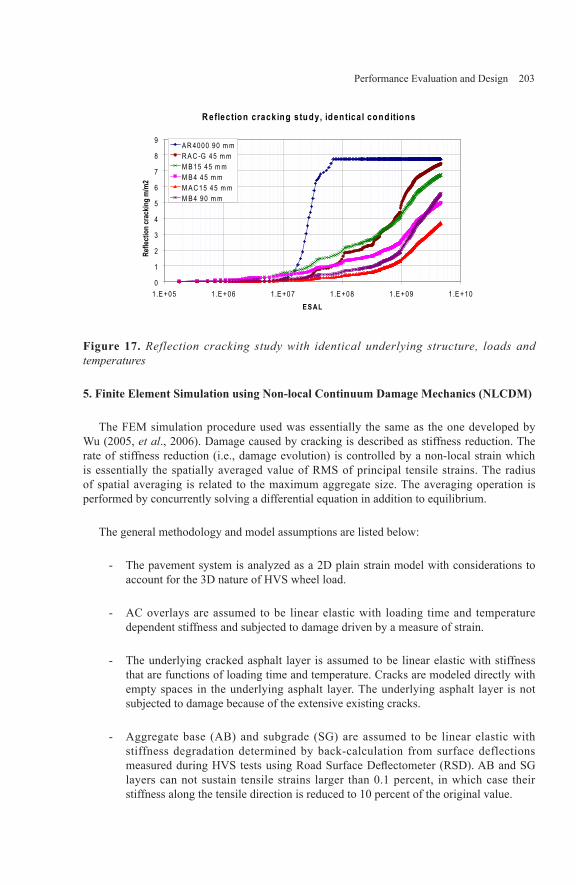
Performance Evaluation and Design 203
R eflection crack ing s tudy, iden tica l cond itions
0
1
2
3
4
5
6
7
8
9
1.E +05 1.E +06 1.E +07 1.E +08 1.E +09 1.E +10E S AL
Refle
ctio
n cr
ackin
g m
/m2
A R 4000 90 m mR A C -G 45 m mM B 15 45 m mM B 4 45 m mM A C 15 45 m mM B 4 90 m m
Figure 17. Reflection cracking study with identical underlying structure, loads and temperatures
5. Finite Element Simulation using Non-local Continuum Damage Mechanics (NLCDM)
The FEM simulation procedure used was essentially the same as the one developed by Wu (2005, et al., 2006). Damage caused by cracking is described as stiffness reduction. The rate of stiffness reduction (i.e., damage evolution) is controlled by a non-local strain which is essentially the spatially averaged value of RMS of principal tensile strains. The radius of spatial averaging is related to the maximum aggregate size. The averaging operation is performed by concurrently solving a differential equation in addition to equilibrium.
The general methodology and model assumptions are listed below:
The pavement system is analyzed as a 2D plain strain model with considerations to account for the 3D nature of HVS wheel load.
AC overlays are assumed to be linear elastic with loading time and temperature dependent stiffness and subjected to damage driven by a measure of strain.
The underlying cracked asphalt layer is assumed to be linear elastic with stiffness that are functions of loading time and temperature. Cracks are modeled directly with empty spaces in the underlying asphalt layer. The underlying asphalt layer is not subjected to damage because of the extensive existing cracks.
Aggregate base (AB) and subgrade (SG) are assumed to be linear elastic with stiffness degradation determined by back-calculation from surface deflections measured during HVS tests using Road Surface Deflectometer (RSD). AB and SG layers can not sustain tensile strains larger than 0.1 percent, in which case their stiffness along the tensile direction is reduced to 10 percent of the original value.
-
-
-
-
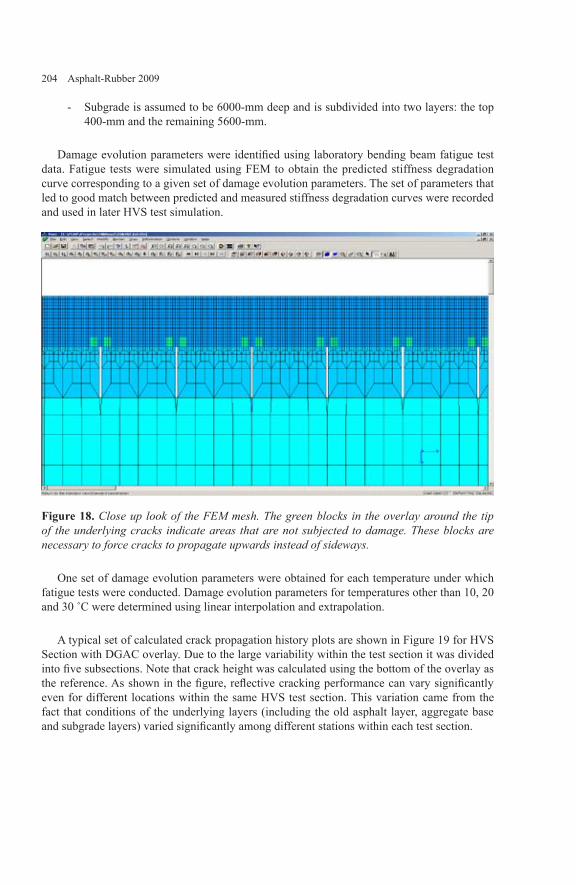
204 Asphalt-Rubber 2009
Subgrade is assumed to be 6000-mm deep and is subdivided into two layers: the top 400-mm and the remaining 5600-mm.
Damage evolution parameters were identified using laboratory bending beam fatigue test data. Fatigue tests were simulated using FEM to obtain the predicted stiffness degradation curve corresponding to a given set of damage evolution parameters. The set of parameters that led to good match between predicted and measured stiffness degradation curves were recorded and used in later HVS test simulation.
Figure 18. Close up look of the FEM mesh. The green blocks in the overlay around the tip of the underlying cracks indicate areas that are not subjected to damage. These blocks are necessary to force cracks to propagate upwards instead of sideways.
One set of damage evolution parameters were obtained for each temperature under which fatigue tests were conducted. Damage evolution parameters for temperatures other than 10, 20 and 30 ˚C were determined using linear interpolation and extrapolation.
A typical set of calculated crack propagation history plots are shown in Figure 19 for HVS Section with DGAC overlay. Due to the large variability within the test section it was divided into five subsections. Note that crack height was calculated using the bottom of the overlay as the reference. As shown in the figure, reflective cracking performance can vary significantly even for different locations within the same HVS test section. This variation came from the fact that conditions of the underlying layers (including the old asphalt layer, aggregate base and subgrade layers) varied significantly among different stations within each test section.
-

Performance Evaluation and Design 205
0
5
10
15
20
25
30
35
40
45
50
0 0.5 1 1.5 2 2.5 3 3.5 4 4.5 5
Number of Load Repetitions (Million)
Cra
ck H
eigh
t (m
m)
Station 4Station 6Station 8Station 10Station 12
Overlay Thickness 49-mm
Section 589RF
Figure 19. Evolution of height of crack tip with number of load repetitions for sub-sections of HVS section DGAC.
The simulations were divided into two stages: (1). Calibrate the simulation procedure using in-situ conditions of different overlays as model inputs and match model predictions with observed reflective cracking performance; (2). Predict reflective cracking performance of different asphalt overlays placed on various given underlying structures. The first stage simulations serve as validation of the FEM procedure. The results obtained in the second stage simulations provide objective ranking of different asphalt overlays with respect to reflective cracking performance without the influence of underlying conditions.
The effects of overlay thickness on reflective cracking life are shown in Figure 20. As shown in the figure, increasing overlay thickness from 45 mm to 90 mm increases reflective cracking lives by 30 to 70 percent for all the mixes except AR4000 (DGAC), whose reflective cracking lives are essentially the same for both overlay thicknesses.
Effect of Overlay Thickness
4.76
4.04
3.19
2.02
0.37
6.846.49
5.39
2.71
0.37
0.00
1.00
2.00
3.00
4.00
5.00
6.00
7.00
8.00
MAC15 MB4 MB15 RACG AR4000
Mix Type
Ref
lect
ive
Cra
ckin
gLi
fe(M
illio
n)
Overlay Thickness = 45 mmOverlay Thickness = 90 mm
Figure 20. Effects of AC overlay thickness on reflective cracking life for different AC mixes.

206 Asphalt-Rubber 2009
The effects of aggregate base (AB) stiffness are shown in Figure 21. As shown in the figure, increasing AB stiffness (from 150 to 300 MPa) increases reflective cracking lives significantly for all the asphalt mixes. The improvements in reflective cracking lives ranges from 80 percent for AR4000 mix (DGAC) to 230 percent for MAC15 mix.
Effect of Aggregate Base Stiffness
3.69
2.591.99
1.51
0.26
7.91 7.93
6.60
3.22
0.48
0.00
1.00
2.00
3.00
4.00
5.00
6.00
7.00
8.00
9.00
MAC15 MB4 MB15 RACG AR4000
Mix Type
Ref
lect
ive
Cra
ckin
g Li
fe(M
illio
n)
Aggregate Base Stiffness = 150 MPaAggregate Base Stiffness = 300 MPa
Figure 21. Effects of aggregate base stiffness on reflective cracking life for different AC mixes.
According to the results shown in Figure 20 and Figure 21, increasing asphalt overlay thickness from 45 to 90 mm is not as effective in improving reflective cracking performance as increasing AB stiffness from 150 to 300 MPa.
6. Conclusions
The main conclusion from this study is that the mixes with modified binders (binders including 15% recycled tire rubber and modified binders blended at the refinery) were more efficient than conventional mixes in preventing cracking from an old asphalt pavement from reflecting through the overlay. For the test conditions, the mixes with modified binders could sustain in the order of ten to one hundred more load applications, to the same level of reflection cracking, than the conventional mix. The MB mixes were also superior to the gap-graded rubberized asphalt concrete (RAC-G) commonly used in California. For identical conditions the permanent deformation was found to be a little higher on the sections with a 45 mm thick overlay than on the sections with a 90 mm thick overlay.
Other conclusions were:
The stiffness reduction of asphalt pavement layers can be predicted quite well from stiffness reduction parameters determined in the laboratory using bending beam fatigue tests with controlled strain,
The permanent deformation of asphalt layers can be predicted quite well from
-
-

Performance Evaluation and Design 207
resistance to shear deformation determined in the laboratory using the Repeated Simple Shear Tests at Constant Height,
Due to the variability within and between test sections, the HVS tests should be carefully simulated using mechanistic principles, in order to compare different tests and to extrapolate to conditions different from the test conditions.
Before the models can be applied to the design of rehabilitation overlays, however, a number of issues need to be addressed such as the influence of aging, seasonal variations, wheel speeds and rest periods, and variability of loads and climate, but the calibration using the HVS data reported in this paper is believed to provide a solid foundation for the ongoing calibration effort.
Acknowledgements
This paper describes research activities requested and sponsored by the California Department of Transportation (Caltrans), Division of Research and Innovation. Caltrans sponsorship is gratefully acknowledged. The contents of this paper reflect the views of the authors and do not reflect the official views or policies of the State of California or the Federal Highway Administration. The authors would also like to thank Jeremy Lea and Lorina Popescu of the UCPRC and CSIR for their work in preparing the HVS database for the calibrations.
Bibliography
Deacon, J.A, Harvey, J.T., Guada, I., Popescu, L. & Monismith, C.L. “Analytically Based Approach to Rutting Prediction,” Transportation Research Record 1806, Washington D.C., 2002.
Harvey, J. T., L. du Plessis, F. Long, S. Shatnawi, C. Scheffy, B-W. Tsai, I. Guada, D. Hung,N. Coetzee, M. Reimer, and C. L. Monismith. “Initial CAL/APT Program: Site Information, Test Pavement Construction, Pavement Materials Characterizations, Initial CAL/APT Test Results, and Performance Estimates.” Report for the California Department of Transportation. Report No. RTA-65W485-3. Pavement Research Center, CAL/APT Program, Institute of Transportation Studies, University of California Berkeley, June 1996.
Jones, D., Harvey, J., and Monismith, C. 2007a. “Reflective cracking study: Summary report.” Davis & Berkeley, CA: University of California Pavement Research Center. (UCPRC-SR-2007-01).
Jones, D., Steven, B. and Harvey, J. 2007b. Reflective cracking study: HVS test sectionforensic investigation.” Davis & Berkeley, CA: University of California Pavement Research Center. (UCPRC-RR-2007-05).
Jones, D., Harvey, J., Bressette, T. “Overview of an Accelerated Pavement Testing Study to Assess the Performance of Modified Binders in Asphalt Concrete Overlays.” 3rd International Conference on Accelerated Pavement Testing, Madrid 2008.
-

208 Asphalt-Rubber 2009
Steven, B., Jones, D., and Harvey, J. 2007. “Reflective cracking study: First-level report onthe HVS rutting experiment.” Davis & Berkeley, CA: University of California Pavement Research Center (UCPRC-RR-2007-06).
Symplectic Engineering Corporation, Leap2.0 a layer elastic analysis program, Release 2.0, March 2004. Berkeley, California.
Ullidtz, P., Harvey, J. T., Tsai, B.-W. and Monismith, C. L. “Calibration of Incremental-Recursive Flexible Damage Models in CalME Using HVS Experiments.” Report prepared for the California Department of Transportation (Caltrans) Division of Research and Innovation by the University of California Pavement Research Center, Davis and Berkeley. UCPRC-RR-2005-06.
Ullidtz, P., Harvey, J., Tsai, B-W., Steven, B. and Monismith, C.L. “Calibration of Mechanistic Empirical Models for Cracking and Rutting of New Pavements Using Heavy Vehicle Simulator Tests,” The 3rd International Conference on Accelerated Pavement Testing, Madrid, 2008a.
Ullidtz, P., Harvey, J., Tsai, B-W. and Monismith, C.L. “Simulation of the WesTrack Experiment Using CalME,” The 3rd International Conference on Accelerated Pavement Testing, Madrid, 2008.
University of California Pavement Research Center (UCPRC). 2003. “Comparison of MB, RAC-G and DGAC Mixes Under HVS and Laboratory Testing.” Davis and Berkeley, CA. (Project Workplan).
Wu, R-Z. “Finite Element Analyses of Refective Cracking in Asphalt Concrete Overlays.” Doctoral dissertation. Department of Civil and Environmental Engineering, University of California, Berkeley, 2005.
Wu, R., Harvey, J. & Monismith, C. 2006. “Towards a Mechanics Model for Reflective Cracking in Asphalt Concrete Overlays,” Journal of Asphalt Paving Technologists, 491-534.
Performance Evaluation and Design 209
Research on the low-temperature Cracking Resistance of Semi-flexible Pavement with Waste Rubber Powder
Yan Yang * —Qingjun Ding ** —Chong Huang ** —Shaolong Huang **
* Key Laboratory of Silicate Materials Science and Engineering of Ministry of Education, Wuhan University of Technology, China
[email protected]@[email protected]@126.com
* * Construction Project of Wuying Highway ,Hubei province ,China [email protected]
ABSTRACT. Semi-flexible pavement(SFP) is a kind of composite pavement that utilizes the porous pavement structure of the open-graded asphalt pavement which is subsequently grouted with an appropriate cementitious grouts.The main purpose of this study is to concentrate on five injection ways of rubber powder which is added to the semi-flexible pavement to enhance the low-temperature anti-cracking resistance. In this study five kinds of SFP were prepared which were composed of two kinds of rubber-modified cement mortars and three kinds of open graded tire rubber-modified asphalt binder pavement. The blending and splitting tests were carried out to measure the low-temperature cracking resistance of SFP. Results showed that the low-temperature cracking resistance of SFP could be greatly improved by waste rubber powder, with the ways of injection differed, the effect varied. KEYWORDS: Semi-flexible pavement (SFP), Open graded tire rubber-modified asphalt binder pavement (OGTRMABP), Rubber modified cement groups, Low-temperature anti-cracking resistance
210 Asphalt-Rubber 2009
1. Introduction
By the end of 2008, the expressway of China had exceeded 60,000km in distance. Most of it was newly constructed with flexible pavement material after the year 2000. However, due to the increasing of traffic volume and traffic load, rutting occurred in a large amount of expressways during the first and second summer after the expressways were open to traffic. A kind of new way was developed to solve rutting problem and increase the loading capacity of asphalt pavement by using semi-flexible pavement material. Traditionally, road pavements are generally categorized into two broad classification or type, namely flexible pavement, such as asphalt pavement and rigid pavement, such as Portland cement concrete pavement.
Semi-flexible pavement is a highly functional composite material, not only does it have excellent road performance, high temperature stability, water resistance to abrasion, but also has a strong oil corrosion ability, comfort, coloring and other many advantages [1]. Studies done by Setyawan [2] and Mayer [3] showed that semi-flexible pavement had high capacity, long durability, chemical and freeze/throw resistance. In recent years, there has been an increasing amount of interest in developing in this type of pavement in Europe and USA [4 - 6].
However, whether it is rigid concrete pavement or flexible asphalt pavement, there is a serious problem- cracking, and this also happens in semi-flexible pavement. The low-temperature anti-cracking problems of Semi-flexible pavement were not earlier than its anti-rutting-cracks occur. To solve the problem, a new method that improving the anti-cracking performance of Semi-flexible pavement by using rubber powder to modify the asphalt pavement or cement groups is introduced in this paper. Rubber powder has good toughness, impermeability, anti-fatigue, thermal insulation, sound insulation and other features [7-8 ]. In recent years, rubber powder was used by many researchers all over the world. Not only could it be used to produce rubber-asphalt and tire rubber-modified asphalt binder pavement or rubber-asphalt pavement [9], but also can it enhance the seismic and impact resistance performance of cement concrete cement mortar when added.
In this paper, rubber powder was added into cement mortar to prepare the crumb rubber modified mortar (CRMM) ,it was also added into the common asphalt or the aggregate to prepare two kinds of open graded tire rubber-modified asphalt binder pavement(OGTRMABP) .Pour the OGTRMABP with different kinds of CRMM to prepare 5 kinds of SFP. Then the effects of rubber powder on the anti-cracking performance of porous asphalt mixture were evaluated through bending beam test.
2 Experimental and test methods
2.1 Materials
The cement used in the test was OPC 42.5 according with Chinese national standard,which is from Huaxin Cement Co., Ltd, Hubei, China.
The sand used in the test consisted of clean, sound, durable, particles of processed silica sand that meet the requirements for wear and soundness specified for coarse aggregate. The sand should contain no clay, silt, or other objectionable matter. Table 1 represents the
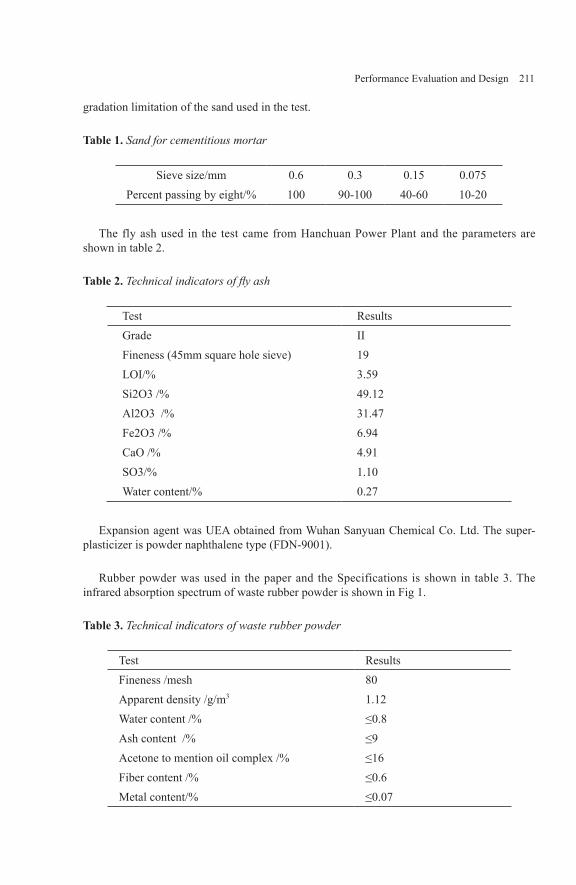
Performance Evaluation and Design 211
gradation limitation of the sand used in the test.
Table 1. Sand for cementitious mortar
Sieve size/mm 0.6 0.3 0.15 0.075Percent passing by eight/% 100 90-100 40-60 10-20
The fly ash used in the test came from Hanchuan Power Plant and the parameters are shown in table 2.
Table 2. Technical indicators of fly ash
Test ResultsGrade IIFineness (45mm square hole sieve) 19LOI/% 3.59Si2O3 /% 49.12Al2O3 /% 31.47Fe2O3 /% 6.94CaO /% 4.91SO3/% 1.10Water content/% 0.27
Expansion agent was UEA obtained from Wuhan Sanyuan Chemical Co. Ltd. The super-plasticizer is powder naphthalene type (FDN-9001).
Rubber powder was used in the paper and the Specifications is shown in table 3. The infrared absorption spectrum of waste rubber powder is shown in Fig 1.
Table 3. Technical indicators of waste rubber powder
Test ResultsFineness /mesh 80Apparent density /g/m3 1.12Water content /% ≤0.8Ash content /% ≤9Acetone to mention oil complex /% ≤16Fiber content /% ≤0.6Metal content/% ≤0.07

212 Asphalt-Rubber 2009
4000 3500 3000 2500 2000 1500 1000 50060
80
100
713.5
87
3.6
1112
.7
1452
.1 16
31.5
2919
.7
3430
.7
Inten
sity(a
.u.)
wavenumber/cm-1
Figure 1. Infrared absorption spectrum of waste rubber powder
The common asphalt binder was used in this research, the performance of asphalt binder is shown in Table 4.The aggregate is diabase which comes from Hong’an city in Hubei province of China.
Table 4. Properties of common asphalt binder
Test Results
Penetration( 25℃、100g、5s)/0.1mm 74.3Softening Point /℃ 48.5Ductility (15℃、5cm/min)/cm 127.3Locomotion viscosity(135℃) /(Pa·s) 0.60Elastic recovery ratio/% 58.7
2.2 Methods and procedure
2.2.1 Workability of the mortar
The workability of the mortar was evaluated by both its flow-ability and bleeding rate in this study. The flow-ability was tested through funnel test. The volume of the funnel used in the test was 1.725 L. The bleeding rate was performed as the specification of “Masonry Cement” (GB/T 3183-1997). [10]
2.2.2 Mechanical performance of the mortar
The compressive strength and tensile strength of the mortar were tested after3, 7days and

Performance Evaluation and Design 213
28 days of curing according to “Method of testing cements—Determination of the strength” (GB/T17671-1999). [11] In this article,the concept of brittleness index [12] was index to evaluate the brittle paste of the mortars, which was defined as (Tensile strength) / (Flexural strength). The higher the brittleness index is, the greater the brittle paste of the mortar is, the worse the anti-resistance is. As the experiment is carried out at room temperature, and the temperature sensitivity of the slurry is worse than that of asphalt, therefore, brittle paste index can reflect the temperature of the brittle paste and cracking capacity under normal temperature
2.2.3 Bending tests of the semi-flexible material
Three-point bending beam test was taken to evaluate the resistance to low temperature cracking of the mixtures according to “Bending Test for Asphalt Mixtures” (T0715-2000) [13].
3 Mix design
3.1 Crumb Rubber Modified Mortar Preparation
The non-rubber-modified cement mortar were mixed as follows: Cement: Fly Ash: Expansive Agent: sand: Water: Super-plasticizer = 1:0.5:0.12:0.49:0.62:0.005,using the weight rate .In order to modify the mortar, rubber powder was added to the groups to replace the same ratio of the sand, with the content was 0%, 5%, 10%, 15%, 20%,25%,30% by the volume of sand. The results of the cement groups were shown in table 5.
Table 5. Test results of rubber- cements mortars
Rubbercontent/%
Fluidity(s)
Tensile strength(MPa)
Flexural strength(MPa) Brittleness index
3d 7d 28d 3d 7d 28d 3d 7d 28d0 11.47 11.0 30.9 45.9 2.39 4.75 7.09 4.59 6.51 6.475 12.08 6.4 25.9 38.4 1.58 2.21 4.16 4.05 11.72 9.2310 12.19 5.9 18.9 34.4 1.29 1.78 2.78 4.57 10.62 12.3715 12.84 5.3 14.9 23.3 1.24 1.64 2.72 4.27 9.09 8.5720 13.02 4.9 14.7 22.7 1.13 1.56 2.52 4.34 9.42 9.0130 13.16 4.4 14.2 22.4 1.06 1.42 2.46 4.15 10.00 9.11
Test results showed that fluidity of slurry have been changed very little, but the compressive and flexural strength decreased significantly. When the content is more than 15%, the two strengths decreased marginally. For the brittle index, a 15% discount rubber powder made the cement mortar have the lowest brittle during the three ages. Therefore, 15% rubber of modified cement mortar has the best toughness and anti-cracking resistance. In this paper, two kinds of cement mortars were used to prepare semi-flexible pavement, one is rubber modified cement mortar with the rubber powder content is 15%, the other one is cement mortar without any rubber powder.

214 Asphalt-Rubber 2009
3.2 Open graded tire rubber-modified asphalt binder pavement Preparation
In order to prepare open graded tire rubber-modified asphalt binder pavement, the tire rubber-modified asphalt binder (TRMAB) must be made first. Adding the waste rubber powder into the common asphalt at 180℃, shearing in high-speed, stiffing to prepare rubber modified asphalt. Rubber powder content is 18% by weight of the common asphalt. The performance of tire rubber-modified asphalt binder (TRMAB) is shown in Table 6.
Table 6. Properties of tire rubber-modified asphalt binder(TRMAB)
Test ResultsPenetration (25℃、100g、5s)/0.1mm 35.5Softening Point /℃ 57.0Ductility (5℃、5cm/min)/cm 27.5Locomotion viscosity(135℃) /(Pa·s) 1.32Elastic recovery ratio/% 87.6
The open-graded asphalt mixture with void content of 30% and connected void content of 27% was used in the study. It was composed of basalt, limestone filler and tire rubber-modified asphalt binder or common asphalt. The asphalt content of the mixture was 2.8%.~3.1% .The mix gradation is shown in table 7.
Table 7. Mix gradation of open-graded (tire rubber-modified asphalt binder)
Sieve size/mm 16 13.2 9.5 4.75 2.36 1.18 0.6 0.3 0.15 0.075Passing /% 100 79.7 15.7 7.9 7.5 6.0 5.2 4.4 3.6 3.0
Three kinds of open-graded asphalt specimens were mixed and compacted to prepare semi-flexible pavement material. The first one is using prepared tire rubber-modified asphalt binder (TRMAB) and the content is 3.1%. The second one is using common asphalt with 2% rubber the weight of aggregate being poured into the hot aggregate. When the rubber powder was added, the same weight of conventional mineral filler was reduced. In this pavement, the content of the asphalt is 3.5%. The third one is using common asphalt, not adding any rubber powder. All of the pavements were cylindrical sample with the dimension of 300mm×300mm×50mm for the bent test.
3.3. Rubber modified semi-flexible pavement design
All of the asphalt pavement is 300 mm in length, 300 mm in width and 50 mm in thickness .Pour 2 kinds of mortars to three kinds of asphalt pavement and get 5 kinds of rubber modify semi-flexible pavement. The five kinds of pavement list as follows: TRMAB + modified cement groups--15%rubber, TRMAB + cement groups--0%rubber, Common-asphalt+ modified cement groups--15%rubber Common-asphalt+2% rubber as aggregate+ modified

Performance Evaluation and Design 215
cement groups--15%rubber, Common-asphalt+2% rubber as aggregate+ cement groups--0%rubber.The sixth kind was prepare to be contrasted by others ,which was produce by common-asphalt + cement groups--0%rubbe.
During the preparation, the bottom and the side were sealed when the mortar was filling to the specimens. The mortar penetrated and filled the void all by its flow ability. No vibration should be taken during the whole test. When the filling was finish, the mortar on the surface of specimens was scraped to make the texture of the open-graded asphalt mixture revealed. The weight of specimens before test and after hardening of mortar was measured to calculate volume properties of semi-flexible pavement specimens.
4. Bending beam test and results
Three-point bending beam test was taken to evaluate the resistance to low temperature cracking of the mixtures. The test was performed using Material Testing System (MTS810) on the cabinet beam which was 250mm in length, 30mm in width and 35mm in height, at -10℃, -0℃, 10℃. The specimen for bending beam test was cut from the semi-flexible pavement, which had been kept in the steam for 28 days. The strain value and bending strength were measured from the test. The bending strength and bending modulus were calculated to evaluate the resistance to low temperature cracking of the mixtures. The tests results are shown in table 8.
Table 8. Results of bent tests of semi-flexible pavement
Mixturetype
Temperature/℃
Flexuraltensile
strength/MPa
Flexuraltensile
Stain/με
Flexuraltensile
modulus/MPa
A-10 8.36 813 10282.9 0 6.59 1143 5765.5 10 4.29 1342 3196.7
B-10 8.19 733 11173.3 0 6.43 1086 5920.8 10 4.23 1324 3194.9
C-10 8.24 770 10701.3 0 6.38 1067 5979.4 10 3.76 1333 2820.7
D-10 8.31 737 11275.4 0 6.18 1018 6070.7 10 3.47 1259 2756.2
E-10 8.45 741 11403.5 0 6.54 1044 6264.4 10 4.79 1154 4150.8
F-10 8.61 712 12092.7 0 6.74 959 7028.2 10 5.05 1021 4946.1
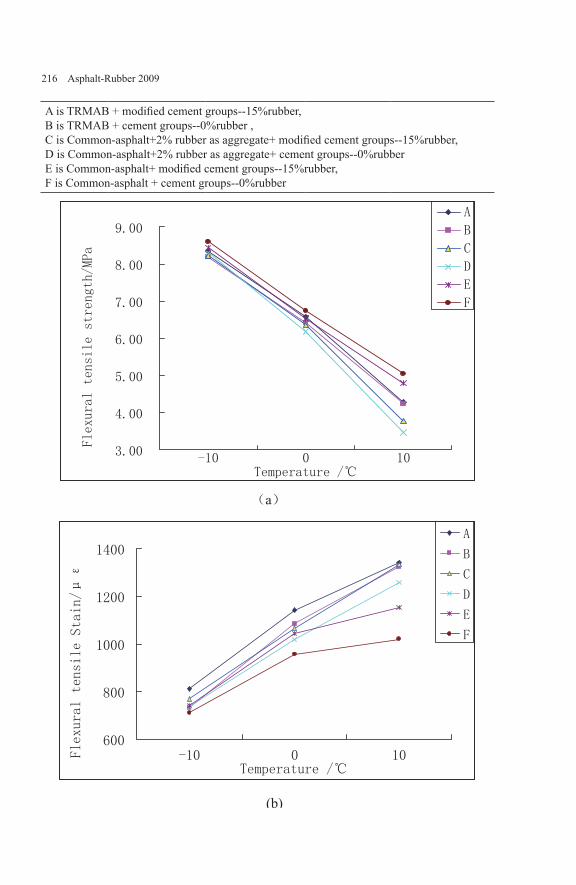
216 Asphalt-Rubber 2009
A is TRMAB + modified cement groups--15%rubber,B is TRMAB + cement groups--0%rubber ,C is Common-asphalt+2% rubber as aggregate+ modified cement groups--15%rubber,D is Common-asphalt+2% rubber as aggregate+ cement groups--0%rubberE is Common-asphalt+ modified cement groups--15%rubber,F is Common-asphalt + cement groups--0%rubber
3.00
4.00
5.00
6.00
7.00
8.00
9.00
-10 0 10Temperature /℃
Flexural tensile strength/MPa
A
B
C
D
E
F
(a)
600
800
1000
1200
1400
-10 0 10Temperature /℃
Flexural tensile Stain/μ
ε
A
B
C
D
E
F
(b)

Performance Evaluation and Design 217
2000
4000
6000
8000
10000
12000
14000
-10 0 10
Temperature /℃
Flexural tensile modulus/MPa
A
B
C
D
E
F
(c)
Figure 2. Temperature influence on the low-temperature anti-cracking resistance of rubber modified semi-flexible pavement. (a) Flexural tensile strength (b) Flexural tensile stain (c) Flexural tensile modulus
Compare pavement A and B, pavement C and D, pavement E and F, we can easily find that the effect of rubber modified cement groups is better than that of non-rubber modified cement groups, whether they were poured in open graded tire rubber-modified asphalt binder pavement or open graded common asphalt pavement .The flexural tensile strength of A and B is nearly the same, but flexural tensile stain of A is larger than B. The similar situation occurred in pavement C and D, it also happened between pavement E and F.
For pavement B, D and F, we can see, when adding non-doped rubber modified mortar, the role of ordinary asphalt mixture is worse than that of tire rubber-modified asphalt binder pavement, between of which, the effect of the rubber modified the asphalt is slightly better than using rubber to modify the aggregate.
For pavement A, C and E, we can see, when adding rubber modified mortar, the role of ordinary asphalt mixture is slightly worse than that of tire rubber-modified asphalt binder pavement (OGTRMABP) ,between of which, the effect of the rubber modified the asphalt is slightly better than using rubber to modify the aggregate.
For Figure 2, we can get that all the flexural tensile strength and modulus of semi-flexible pavement decrease when the temperature increases, but the flexural tensile stain increases at the same time. We also find that the tensile strength of pavement A, B and C have the larger stain. Pavement D, E and F have the lower strain. Pavement F has the largest modulus but it
218 Asphalt-Rubber 2009
also has the lowest stain. This illustrates that the temperature sensitivity of rubber modified cement mortar is worse than that of non-modified cement mortar or the tire rubber-modified asphalt binder, the rubber modified the asphalt is better than rubber modified the aggregate.
From the whole, we can get that when the rubber powder was added, the stain of the flexible pavement increased and the tensile deceased, whether it was added into the asphalt, the aggregate or the mortar. With the temperature differed, the influence varied. The rubber which was added to the asphalt had the best anti-resistance ability, added to the aggregate was the second and added to the mortar was the last. The reason is that the asphalt is much more sensitive to the temperature than the cement mortar. In the low temperature anti-resistance of semi-flexible pavement, the contribution of the asphalt is more than the cement mortar. The pavement block fractured from the area where the stress was the most vulnerable. The rubber can modified the asphalt and the cement groups, it made a strong adhesive ability exist among the asphalt, mortar, aggregate possible.
5. Conclusion
This study investigated the effect of rubber powder with different pouring ways on the Low-temperature cracking resistance of open graded asphalt pavement asphalt mixture. Based on several laboratory tests and analysis, main conclusions are summarized as below:
The rubber powder can greatly affect the tensile strength and flexural strength of cement mortar. With the content increased, the strength decreased greatly, which can be found easily in table 4.
The rubber powder can improve the anti-cracking performance of cement mortar. The best rubber content is 15% by the volume of sand, in this percent, the brittleness index is very low and it has the minimum changes with the age changes.
During three kinds of rubber single injection, adding rubber powder to the asphalt has the best anti-cracking resistance, adding to the aggregate be the second and the cement groups be the last. The OGTRMABP can make the semi-flexible pavement have better anti-cracking resistance than that of open-graded common asphalt mixture. Between the two kinds of OGTRMABP, the effect of rubber modified the asphalt is slightly better than that of the aggregate.
Complex-doped of rubber powder is better than single-doped, and open-graded tire rubber-modified asphalt binder mixture combined with the rubber modified cement has the best anti-cracking resistance.
Acknowledgements
The authors would like to appreciate the financial support of “Hi-tech Research and Development Program of China”, Ministry of Science and Technology, China. (Project number: 2006AA11Z117)
1)
2)
3)
4)

Performance Evaluation and Design 219
References
[1] Ai-Qadi IL, Gouru H, Weyers R E. Asphalt portland cement concrete composite: laboratory evaluation [ J ].ASCE, 1994, 120 (1) : 94-108.
[2] Setyawan, A., Development of Semi-Flexible Heavy-Duty Pavements. PhD thesis. University of Leeds. Leeds. 2003.
[3] Mayer, J. and Thau, M. “Jointless pavements for heavy-duty airport application: the semi-flexible approach.” Proceedings of the 27th International Air Transportation Conference. Chicago, Illinois, USA, 2001, pp.87-100.
[4] EAPA. Airfield use of asphalt. May 2003.
[5] Robert J. et al. Selecting a Rut Resistant Hot Mix Asphalt For Boston-Logan International Airport. Proceedings of Airfield Pavements Specialty conference ,2003 pp. 390-408.
[6] Densit a/s. Densiphalt Handbook. Aalborg, 2000.
[7] Segre N , Joekes I. Use of tire rubber particles as addition to cement paste [ J ] . Cement and Concrete Research , September 2000 , 30 (9),pp.1421-1425(5).
[8] Waite,B.,The Advances in rubberized Asphalt[J].March2,2001.
[9] Renshal,R.H;Hoffmann,P.;Potqierer,C.J. “Bitumen rubber asphalt in South Africa and experience in China. ” 26th Annual Southern African Transport Conference: The Challenges of Implementing Policy. Pretoria, South Africa, 2007, pp.239-246.
[10] GB/T 3183-1997, Masonry Cement. State Bureau of Quality and Technical Supervision, China. 1997. (in Chinese)
[11] GB/T 17671-1999, Method of testing cements—Determination of the strength. State Bureau of Quality and Technical Supervision, China. 1999. (in Chinese)
[12] Peng,Z.B., Liu,Z.B., The Shrinkage Mechanism and Treatment Principle of Concrete, Concrete,2003,(3):30-31,55. (in Chinese)
[13] JTJ 052-2000, Standard test methods bitumen and bituminous mixtures for highway engineering. Ministry of Communication, China. 2000. (in Chinese)


Chapter 2
Mix Properties

Mix Properties 223
Lab Simulation of Reflective Cracking By Load
Yu Bin— Cao Baigang—Yang Jun
School of Transportation, Southeast University, Nanjing, Jiangsu, [email protected] [email protected]@seu.edu.cn
ABSTRACT. On reference to many lab simulations of reflective cracking, the simulation of reflective cracking by load was carried out in lab with the Hamburg wheel tracking test which was more reasonable than other fatigue tests because the load applied was similar to the actual situation. Four types of stress absorbing interlayer, including SBS modified asphalt sand interlayer、asphalt-rubber sand interlayer、fiberglass-polyester paving mat interlayer and SAMI(Stress absorbing membrane interlayer )were tested. Also tested was the specimen without any interlays to serve as a control. The paper introduced the material properties and gradations of five different specimens and the fatigue test employed cyclic round moving load on different stress absorbing interlayer specimens (including the specimens without interlayer) to asses their abilities to retard the development of reflective cracking by load. Finally, the paper built corresponding finite element models to analyze the test results.
KEYWORDS: road engineering、 reflective cracking by load、Hamburg wheel tracking test、stress absorbing interlayer、finite element model

224 Asphalt-Rubber 2009
1. Background
Semi-rigid base, for its high strength to support the traffic load and sound stability, is widely adopted in the expressway of China. However, the semi-rigid base material tends to generate cracking due to the influence of temperature and moisture which will then be reflected to the surface layer at the effect of temperature change and vehicle load. There are two types of reflective cracking: reflective cracking by load and reflective cracking by temperature, both of which are detrimental to the pavement service.
Many researches have been done on the reflective cracking and lots of measures have been raised to cope with the reflective cracking ranging from material property to pavement structure which include: (1) improving the performance of surface material, (2) ameliorating the performance of base material, (3) increasing the thickness of surface layer, (4) adding a stress absorbing interlayer.
Road researchers have done a lot simulate the reflective cracking in lab. As to the reflective cracking by load, (Majidzadeh1985) evaluated the ability of the asphalt mixture to retard reflective cracking and the effects of geotextile and SAMI to retard the development of the reflective cracking by three point bending test; according to the Paris law, Limoges civil engineering laboratory(1996) calculated the fatigue life of specimens with notch at the middle by three point bending test; (Liao et al., 2005) simulated the reflective cracking caused by bending and shearing with compound beam consisted of concrete lab and asphalt overlay by the material test system. As to the reflective cracking by temperature, (B.J.Dempsey, 2002) substituted thermal load with tension displacement to simulate the effect of cyclic temperature change; (Franken, 1992) and (Hass et al, 1989) used the similar method to simulate the reflective cracking by temperature. Autun laboratory (Zhou et al, 1997) devised a tester combining thermal contraction and load bending to simulate the compound reflective cracking. Although many have been done about the reflective cracking by load, the study mainly focused on the tension and shearing damage of specimens with the load fixed at a certain point which was not approximate to the actual condition on the pavement. Thus Hamburg wheel tracking test was employed to apply cyclic round moving load which was similar to the practical situation on compound specimens with precutting cracking in the base to assess the effects of different reflective cracking retard measures.
2. Design of stress absorbing interlayer specimens
Five types of specimens were designed and tested, including specimens without stressing absorbing interlayer、SBS modified asphalt sand interlayer、asphalt-rubber sand interlayer、fiberglass-polyester paving mat interlayer、SAMI. The test recorded the fatigue lives of specimens by which to assess effects of different reflective cracking retard measures. Figure1 illustrates the size of the specimen which included surface layer、stress absorbing interlayer and base from up to down .

Mix Properties 225
specimen with asphalt sand (cm) specimen without asphalt sand (cm)
Figure1. Figuration of specimens
Table1 shows the gradation of the surface layer .The binder is the 70# base asphalt and the property is listed in table 2. The optimal asphalt aggregate ratio is 5.1%.
Table 1. Gradation of the surface layer
mesh(mm)pass rate of the mesh /%
13.2 9.5 4.75 2.36 1.18 0.6 0.3 0.15 0.075composite gradation 96.3 80.9 57.9 40.4 33.9 23.6 12.4 8.2 5.4
Table 2. Properties of asphalts
test item test condition
70# base
asphalt
asphalt-rubber
SBS modified asphalt
penetration degree/0.1mm 25 ℃ 65.5 58.9 58.5softening point/ ℃ TR&B 53.1 62.5 65.7
ductility/cm 15 ℃ 93.5 12.1 100.5elasticity recovery/% 25 ℃ 8 64 91.3
viscosity/Pa·s 60 ℃ 206.4 2365.7 2017.1
filmy heating operational test(163℃,5h)
Mass loss/% -0.133 0.119 0.055Softening point TR&B 55.8 73.6 65.9
ductility/cm 5 ℃ 4.3 2.2 24.1viscosity/Pa·s 60 ℃ 262.8 2182.9 2462.8
dynamic shear rheometer
G*/sinδ/KPa 64 ℃ 2.7 14.7 5.3G*sinδ/KPa 28 ℃ 0.87 0.6 0.53
bending beam rheometer
Stiffness/MPa -12 ℃, aged
119 98.1 75.5m 0.41 0.42 0.41

226 Asphalt-Rubber 2009
Table 3 is the gradation of asphalt sand with a designed void ration of 1.5% and the optimal asphalt aggregate ration is 8.5% decided by gyratory compaction test of Super pave.
Table 3. Gradation of the asphalt sand
mesh(mm)pass rate of the mesh /%
9.5 4.75 2.36 1.18 0.6 0.3 0.15 0.075compositegradation 100.0 93.3 74.2 52.5 34.0 21.3 14.0 7.8
The properties of SBS modified asphalt and asphalt-rubber are listed in table 2 and the asphalt-rubber is home-made by mixing 20 mesh of rubber powder with 70# base asphalt and the quality ratio of rubber powder and base asphalt is 18:82. Table 4 lists the technical index of the rubber powder.
Table4. Mesh and technical requirement of the rubber powder
mesh of the rubber powder
Mesh(mm) pass rate/% technical requirements
2.36 100 test item technical index
1.18 65~100 viscosity(177℃)/Pa·s 1.5~4.0
0.6 20~100 Penetration degree (25℃,100g,5s)/0.1mm ≥25
0.3 0~45 Softening point/℃ ≥540.075 0~5 elastic recovery(25℃)/% ≥60
The property of fiber glass-polyester paving mat is listed in table 5. As to the SAMI, the gravel content is (16±2) kg/m2 and the asphalt-rubber content is 2.0 kg/m2.Table 6 is the gradation of SAMI.
Of all the specimens, the base is just concrete slab and brushed with emulsified asphalt of 0.4~0.5kg/m2 before paving the stress absorbing interlayer or asphalt surface.
Table5. Property of the fiberglass-polyester paving mat
Density(g/m2) 134asphalt absorbing capacity(L/m2) 1.14melting point/℃ >230longitudinal tensile strength(N/cm) 59longitudinal tensile elongation/% 1.61transverse tensile strength(N/cm) 51transverse tensile elongation /% 1.51
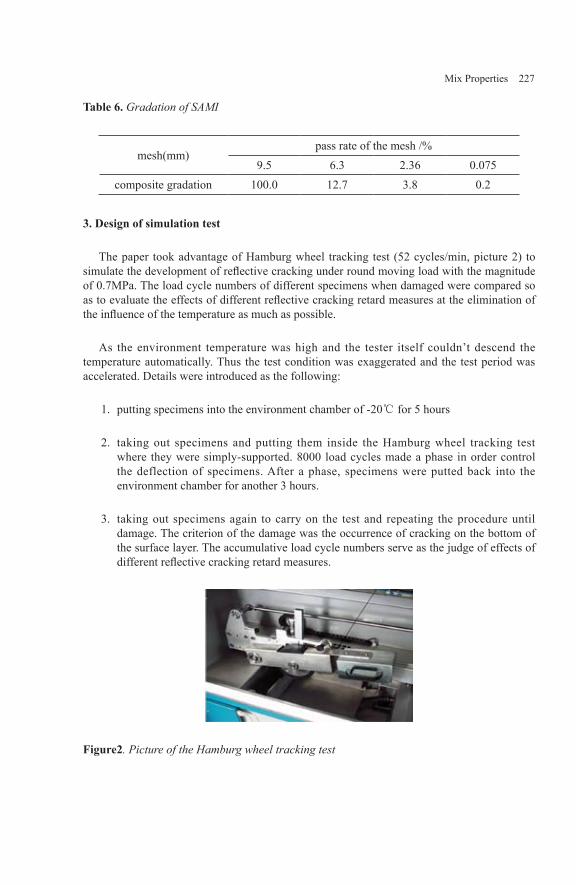
Mix Properties 227
Table 6. Gradation of SAMI
mesh(mm)pass rate of the mesh /%
9.5 6.3 2.36 0.075composite gradation 100.0 12.7 3.8 0.2
3. Design of simulation test
The paper took advantage of Hamburg wheel tracking test (52 cycles/min, picture 2) to simulate the development of reflective cracking under round moving load with the magnitude of 0.7MPa. The load cycle numbers of different specimens when damaged were compared so as to evaluate the effects of different reflective cracking retard measures at the elimination of the influence of the temperature as much as possible.
As the environment temperature was high and the tester itself couldn’t descend the temperature automatically. Thus the test condition was exaggerated and the test period was accelerated. Details were introduced as the following:
putting specimens into the environment chamber of -20℃ for 5 hours
taking out specimens and putting them inside the Hamburg wheel tracking test where they were simply-supported. 8000 load cycles made a phase in order control the deflection of specimens. After a phase, specimens were putted back into the environment chamber for another 3 hours.
taking out specimens again to carry on the test and repeating the procedure until damage. The criterion of the damage was the occurrence of cracking on the bottom of the surface layer. The accumulative load cycle numbers serve as the judge of effects of different reflective cracking retard measures.
Figure2. Picture of the Hamburg wheel tracking test
1.
2.
3.

228 Asphalt-Rubber 2009
4. Analysis of test results
During the test, the damage of some specimens started with the debond between the base and the stress absorbing interlayer which also occurred in pavement. It’s necessary to pay attention to the bonding condition between layers. Table 7 lists test results:
Table 7. Results of the test
plans valid results (cycle) average (cycle)
without reflective cracking retard measures
1260013440
14280
SBS modified asphalt sand19360
1936021566
asphalt-rubber sand22822
2199321164
fiberglass-polyester paving mat19932
231892596023676
SAMI 23348
2606828788
The results show that SAMI retards the reflective cracking most effectively and fiberglass-polyester paving mat is next. SBS asphalt sand and asphalt-rubber sand demonstrate the approximate ability to retard the reflective cracking while the specimens without any reflective cracking retard measures prove to be poor. The results also suggest that suitable reflective cracking retard measures can prolong the fatigue life of the specimen greatly.
SAMI behaves best not only for its ability to mitigate the stress around the crack tip but also to change the path of the crack development. Fiberglass-polyester paving mat assumes the capacity of high tension and low elongation while the finite element calculation reveals that the tension stress and strain of Hamburg wheel tracking test was predominate so it was not strange for the sound performance of the fiberglass-polyester paving mat. Asphalt sand layer is of fine gradation and low stiffness which can alleviate the stress concentration around the crack tip and cause the redistribution of the stress which should behaves good. However, they are not as prominent as the other 2 measures under the test condition of the paper due to the decreased ability of bearing tension stress and strain at low temperature. Picture 3 is the damage complexion of different measures.

Mix Properties 229
Picture3. Damage complexion of different specimens
5. Finite element simulation of the test and comparison of the load conditions between Hamburg wheel tracking test and the real pavement
Finite element models of specimens with and without the stress absorbing interlayer were constructed in accordance with the Hamburg wheel tracking test, the size of which were identical to figure 1 .Boundary conditions of the models were simplified to be continuous between two layers and fixed at two ends as the modulus of the stress absorbing interlayer set to be 600MPa (Dai, 2007). The load was moving from one end to the other with the magnitude of 0.7MPa. Models with the stress absorbing interlayer were differentiated into two types. One was the asphalt sand model employing solid element for the interlayer was of 2cm thickness. The other was the model for SAMI and the fiberglass-polyester paving mat .Since the interlayer was thin and carried little resistance to bending, membrane element was invited to simulate the interlayer. Details of the above mentioned models please referred to table 8. The model of real pavement was also constructed to compare with models of test specimens to find the difference. Parameters of the model of real pavement were listed in table 9 and the size of the real pavement model is of 6m×4m with the boundary condition to be continuous between layers and fixed at the bottom and no displacement in the horizontal direction. All the above mentioned models were set with a cut through crack inside the base with singularity elements around the crack tip. Calculation results are listed in table 10 and some conclusions are achieved:
SBS modified asphalt sand asphalt-rubber sand
Fiberglass-polyester paving mat SAMI

230 Asphalt-Rubber 2009
the force conditions of specimens consisted of relatively bigger tension stress and strain and smaller shearing stress and strain whether there was stress absorbing interlayer or not.
the force conditions of specimens with the stress absorbing interlayer were ameliorated phenomenally compared with those without the stress absorbing interlayer. Tension stress decreased from 0.28MPA to 0.09MPA、0.075MPa and tension strain decreased from 169 ×10-6 to 116×10-6、75×10-6.
tension stress and strain occupied a major part and shearing stress and strain shared a minor part in the force condition of the real pavement model while the force condition of Hamburg wheel tracking test followed the same rule, just with the tension stress and strain to be more predominant.
the Hamburg wheel tracking test exaggerated the force condition in comparison with the real pavement: the maximum tension strain was 169×10-6 in the model without interlayer and 116×10-6 and 75×10-6 in the model with the interlayer while the maximum tension strain was 44×10-6 in the real pavement structure.
Table 8. Parameters of the models of the specimens
layer modulus (MPa) poisson ratiosurface 1500 0.25
stress absorbing interlayer 600 0.25base 30000 0.18
Table 9. Parameters of the model of real pavement
layer modulus (MPa) poisson ratio Height(m)
surface 1500 0.25 0.18base 4000 0.25 0.4
sub base 2000 0.25 0.2sub grade 80 0.35 3.5
Table 10. Results of finite element simulations
modelsmaximum
tensile stress(MPa)
maximum tensile strain
(×10-6)
maximum shear
stress(MPa)
maximum shear strain
(×10-6)with interlayer 0.075 116 minimal minimal
without interlayer 0.28 169 0.011 12real pavement 0.075 44 0.0094 16
1.
2.
3.
4.

Mix Properties 231
6. Conclusions and recommendations
The paper carried out simulation test of reflective cracking with Hamburg wheel tracking test and designed four stress absorbing interlayer specimens including SBS modified asphalt sand、asphalt-rubber sand、 fiberglass-polyester paving mat、SAMI. The specimen without reflective cracking retard measures was also designed to serve as the control. The conclusions and recommendations are as the following:
utility of Hamburg wheel tracking test to simulate the reflective cracking by load was reasonable at the aspect of the load bearing compared with other fatigue tests and the results turned out to be sound.
as to the effects of reflective cracking retard measures, SAMI was the best as fiberglass-polyester paving mat ranked next; SBS modified asphalt sand and asphalt-rubber sand were at the same level and are relatively poor.
suitable reflective cracking retard measures could prolong the fatigue life of specimens greatly compared with those without any measures.
debond between base and stress absorbing interlayer occurred during the test which was also existed in pavement, so bonding conditions should be strengthened during the pavement construction.
tension stress and strain occupied a major part and shearing stress and strain shared a minor part in the fatigue test which was approximate to the load conditions of the real pavement. So the test results were reliable but the test could be improved on temperature control.
Reference book
Dai peng, Study on the stress absorbing interlayer of asphalt sand in semi-rigid base asphalt pavement[D], Nanjing: Southeast university, 2007
Development and performance of interlayer stress absorbing composite(ISAC) in AC overlays,TRB paper #02-3111, submitted for Publication and Presentation at the 81# Annual TRB Meeting, January 2002
K.Majidzadeh,Improved Methods to Eliminate Reflective Cracking, FHWA/RD-86/075, Federal HighwayAdministration,Washington,D.C,1985
L.Francken, A.Vanelstraete. Interface Systems to Prevent Reflective Cracking: Modeling andExperimental Testing Methods. Proceedings of the 7th ISAP, Vol.1, 1992, pp.45~60
Liao wei dong, Chen shuan fa, Liu gang. research on asphalt overlay reflective cracking underfatigue load[J], Journal of wuhan university of technology 2005,27
1.
2.
3.
4.
5.

232 Asphalt-Rubber 2009
P.E.Joseph and R.Hass, Evaluating Alternative Solutions to Reflective Cracking Through Asphalt Overlays, Transportation Research Board, Transportation Research Record 1215,1989
Reflective Cracking in Pavements Design and Performance of Overlay Systems. Proc of 3rdInt. R IL EM Conferce. 1996. 12. London, ISBN 0419 22260X
Zhou fu jie, Sun li jun, Assessments of lab simulation of reflective cracking[J], Municipal engineering of china, No1,1997
Mix Properties 233
Characterization of HMA Mixtures ontaining High Reclaimed Asphalt Pavement Content With Crumb Rubber Additives
Louay N. Mohammad* — Samuel B. Cooper, Jr.**
*Dept. of Civil Engineering & Louisiana Transportation Research CenterLouisiana State UniversityBaton Rouge, LA 70808U.S.A.
** Louisiana Transportation Research CenterBaton Rouge, LA. [email protected]
ABSTRACT: This paper presents the findings of laboratory characterization of HMA mixtures containing high reclaimed asphalt pavement (RAP) content with crumb rubber (CR) additives. Six mixtures were examined in this study. Three were conventional mixtures containing an unmodified asphalt cement binder and styrene-butadiene-styrene polymer modified asphalt cement, Performance Grade (PG) 64-22, PG 70-22, and PG 76-22 respectively. The fourth mixture contains no RAP, 30 mesh CR additives blended (wet process) with a PG 64-22 binder. The fifth mixture contains 15 percent RAP and PG 76-22 asphalt cement binder. The final mixture contains 40 percent RAP, 30 mesh CR additives blended (dry process) with a PG 64-22 asphalt cement binder. Laboratory mixture characterization includes the asphalt mixture performance tests (dynamic modulus, E*, and flow number, FN), semi-circular bend test, dissipated creep strain energy test, and the modified Lottman test. Mixtures containing high RAP content and CR additives exhibited similar performance as conventional mixture with PG 76-22 binder.
Key Words: Crumb Rubber, HMA, Asphalt Mixture Performance Tests, Materials Characterization
RÉSUMÉ:
MOTS-CLÉS: un maximum de six mots significatifs, en français et en anglais, doivent être isolés sous forme de mots-clés

234 Asphalt-Rubber 2009
1. Introduction
As the price of petroleum and material costs escalate transportation agencies must continually seed methods to decrease material costs and maximize benefits while providing for the sustainability of our environment. One of the issues concerning environmental sustainability is determining how to make production, distribution, and consumption of goods and services last longer and have less impact on our ecological systems consisting of all plants, animals and micro-organisms in an area functioning together with all of the non-living physical factors of the environment. One such method of sustainability in the hot mix asphalt (HMA) industry is using recycled materials such as reclaimed asphalt pavement (RAP) and Crumb Rubber (CR) from waste tires to replace a percentage of virgin materials used in the manufacturing process such as aggregates and asphalt cement binder which has a direct impact on cost and the environment.
Asphalt pavements are the most recycled product in the United States of America. The Federal Highway Administration (FHWA) and the United States Environmental Protection Agency (U.S. EPA) reported that approximately 80 percent of removed asphalt pavements are reused as part of new roads, roadbeds, shoulders, and embankments (NAPA, 2008). In the 1970s, States and paving contractors began making extensive use of RAP in HMA pavements. The use of RAP resulted in cost savings and an environmentally positive method of recycling.
One of the distinct shortcomings is the lack of provisions for the use of RAP in the mix design process i.e. Superpave. Studies have shown that the effect of aged binder from RAP on the performance properties of the virgin binder depends upon the level of RAP used in the HMA mixture. As RAP percentage is increased (greater than 20 percent) in the HMA the aged binder from RAP blends with the virgin asphalt binder in sufficient quantity to significantly affect the asphalt binder performance. The blending of old, hardened asphalt binders from RAP with a virgin asphalt binder will typically result in an asphalt binder that is harder than the virgin asphalt binder properties used. To counteract asphalt binder hardening, a softer virgin asphalt, recycling agents or rejuvenators are also used to soften the hardened RAP asphalt binders (McDaniel et al., 2001).
The use of crumb-rubber modifier (CRM) in hot-mix asphalt mixtures can be traced back to the 1840s when natural rubber was introduced into bitumen to enhance its engineering performance. Since the 1960s, researchers and engineers have used shredded automobile tires in HMA mixtures. The processes of applying crumb-rubber in asphalt mixtures can be divided into two broad categories: a dry process and a wet process. In the dry process, crumb rubber is added to the aggregate before the asphalt binder is charged into the mixture. In the wet process, asphalt cement is pre-blended with the rubber at high temperature (177 – 210 ℃) and specific blending conditions (Heitzman, 1992).
This study explored the use of the absorption properties of crumb rubber to carry asphalt cement binder components (light-ends) that are typically lost during oxidation of HMA pavements as a dry feed component in the making of hot mix asphalt mixtures. Laboratory and mixture characterization evaluation and analysis were performed to determine the effects of CR additives and RAP on the HMA mixture’s performance.
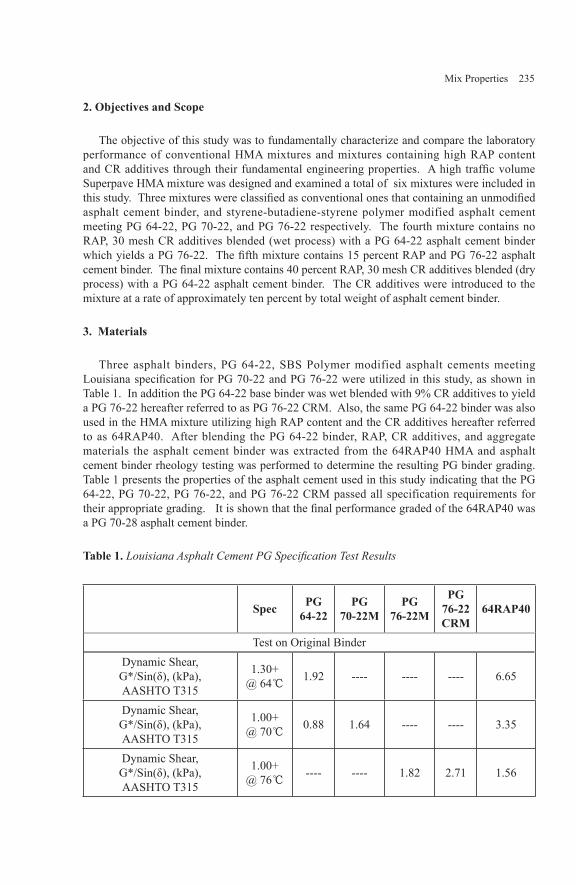
Mix Properties 235
2. Objectives and Scope
The objective of this study was to fundamentally characterize and compare the laboratory performance of conventional HMA mixtures and mixtures containing high RAP content and CR additives through their fundamental engineering properties. A high traffic volume Superpave HMA mixture was designed and examined a total of six mixtures were included in this study. Three mixtures were classified as conventional ones that containing an unmodified asphalt cement binder, and styrene-butadiene-styrene polymer modified asphalt cement meeting PG 64-22, PG 70-22, and PG 76-22 respectively. The fourth mixture contains no RAP, 30 mesh CR additives blended (wet process) with a PG 64-22 asphalt cement binder which yields a PG 76-22. The fifth mixture contains 15 percent RAP and PG 76-22 asphalt cement binder. The final mixture contains 40 percent RAP, 30 mesh CR additives blended (dry process) with a PG 64-22 asphalt cement binder. The CR additives were introduced to the mixture at a rate of approximately ten percent by total weight of asphalt cement binder.
3. Materials
Three asphalt binders, PG 64-22, SBS Polymer modified asphalt cements meeting Louisiana specification for PG 70-22 and PG 76-22 were utilized in this study, as shown in Table 1. In addition the PG 64-22 base binder was wet blended with 9% CR additives to yield a PG 76-22 hereafter referred to as PG 76-22 CRM. Also, the same PG 64-22 binder was also used in the HMA mixture utilizing high RAP content and the CR additives hereafter referred to as 64RAP40. After blending the PG 64-22 binder, RAP, CR additives, and aggregate materials the asphalt cement binder was extracted from the 64RAP40 HMA and asphalt cement binder rheology testing was performed to determine the resulting PG binder grading. Table 1 presents the properties of the asphalt cement used in this study indicating that the PG 64-22, PG 70-22, PG 76-22, and PG 76-22 CRM passed all specification requirements for their appropriate grading. It is shown that the final performance graded of the 64RAP40 was a PG 70-28 asphalt cement binder.
Table 1. Louisiana Asphalt Cement PG Specification Test Results
Spec PG64-22
PG70-22M
PG76-22M
PG76-22CRM
64RAP40
Test on Original BinderDynamic Shear,G*/Sin(δ), (kPa),AASHTO T315
1.30+@ 64℃ 1.92 ---- ---- ---- 6.65
Dynamic Shear,G*/Sin(δ), (kPa),AASHTO T315
1.00+@ 70℃ 0.88 1.64 ---- ---- 3.35
Dynamic Shear,G*/Sin(δ), (kPa),AASHTO T315
1.00+@ 76℃ ---- ---- 1.82 2.71 1.56

236 Asphalt-Rubber 2009
Spec PG64-22
PG70-22M
PG76-22M
PG76-22CRM
64RAP40
Force Ductility Ratio (F2/F1, 4℃, 5 cm/min, F2 @ 30 cm elongation, AASHTO T300
N/A N/A 0.49 N/A N/A
Force Ductility, (4℃, 5 cm/min, 30 cm elongation, kg),
AASHTO T300N/A 0.31 N/A N/A N/A
Rotational Viscosity @ 135℃ (Pa·s),AASHTO T316
3.0+ 0.5 0.9 1.7 3.1 1.3
Tests on RTFODynamic Shear,G*/Sin(δ), (kPa),AASHTO T315
2.20+@ 64℃ 3.25 ---- ---- ---- 5.56
Dynamic Shear,G*/Sin(δ), (kPa),AASHTO T315
2.20+@ 70℃ 1.61 3.14 ---- 4.72 3.07
Dynamic Shear,G*/Sin(δ), (kPa),AASHTO T315
2.20+@ 76℃ ---- 1.65 2.48 5.97 1.68
Elastic Recovery, 25℃,10 cm elongation, %
AASHTO T301N/A 65 70 75 N/A
Tests on (RTFO+ PAV)Dynamic Shear, @ 25℃,
G*Sin(δ), (kPa), AASHTO T315
5000- 2774 4615 2297 2166 1463
BB Creep Stiffness@ -12℃, (MPa), AASHTO T313
300- 234 196 152 104 53
Bending Beamm-value@ -12℃, AASHTO T313
0.300+ 0.312 0.317 0.327 0.320 0.421
BB Creep Stiffness@ -18℃, (MPa), AASHTO T313
300- ---- ---- ---- ---- 151
Bending Beamm-value@ -18℃, AASHTO T313
0.300+ ---- ---- ---- ---- 0.342
Actual PG Grading PG64-22
PG70-22M
PG76-22M
PG76-22
PG70-28

Mix Properties 237
For the mixtures considered in this study, reclaimed asphalt pavement (RAP), siliceous limestone aggregates (#67 Limestone, #78 Limestone, and #11 Limestone), and coarse sand typically used in Louisiana were included in this study. In addition, limestone aggregates were tested to determine their aggregate consensus properties. The consensus properties test items included coarse aggregate angularity (CAA), fine aggregate angularity (FAA), flat and elongated particles (F&E), and sand equivalency (SE).
There were two distinct CR additive components incorporated into the HMA mixtures as a dry feed. The first CR component was comprised of 70 percent 30 mesh CR that had been pre-swelled, 10 percent long-chain wax, and 20 percent asphaltenes. The second component contained 70 percent 30 mesh pre-swelled CR, 10 percent long-chain wax, and 20 percent de-metalized oil. The two components were blended at a 50/50 ratio before being introduced into the HMA mixture at a rate of 10 percent by total weight of binder. Table 2 shows the sieve analysis and chemical composition of the 30 mesh crumb rubber utilized in this study.
Table 2. Tire Crumb Rubber Certificate of Analysis
Sieve Size Sieve Analysis (% passing) Chemical Analysis, %
30 mesh* 100.0 Acetone Extract 12.0940 mesh 87.0 RHC 49.0350 mesh 45.7 Carbon Black 31.8560 mesh 31.5 Ash 7.02180 mesh 16.2 Moisture Content 0.65
Pan 0.0
Reference: PolyVulc, Lot 236-A, 6-06-08*Trace retained on 30 Mesh
4. Hot Mix Asphalt Mixture Design
A Superpave l9-mm nominal maximum aggregate size (NMAS) Level 2 HMA mixture meeting Lousiana Department of Transportationa and Development specification (Ninitial = 8-, Ndesign = 100-, Nfinal = 160-gyrations), was designed according to AASHTO TP28, “Standard Practice for Designing Superpave HMA”. Specifically, the optimum asphalt cement content was determined based on volumetric (VTM = 2.5 - 4.5 percent, VMA ≥ 12%, VFA = 68% -78%) and densification (%Gmm at Ninitial ≤ 89, %Gmm at Nfinal ≤ 98) requirements. Siliceous limestone aggregates and coarse natural sand that are commonly used in Louisiana were included in this study. Three HMA mixtures were classified as conventional containing an unmodified asphalt cement binder (64CO) and two mixtures containing styrene-butadiene-styrene polymer 70CO and 76CO respectively. The fourth mixture contained no RAP, 30 mesh CR additives blended (wet process) with a PG 64-22 asphalt cement binder, 76CRM. The fifth mixture contains 15 percent RAP and PG 76-22 asphalt cement binder, 76RAP15. The final mixture contains 40 percent RAP, 30 mesh CR additives blended

238 Asphalt-Rubber 2009
(dry process) with a PG 64-22 asphalt cement binder, 64RAP40. For this study, mixture designations and their descriptions are as follows:
64CO: HMA Mixture/PG 64-22, Conventional70CO: HMA Mixture/PG 70-22M, Conventional76CO: HMA Mixture/PG 76-22M, Conventional76CRM: HMA Mixture/PG 76-22, Crumb Rubber Modified (Wet Blend) PG 64-2276RAP15: HMA Mixture/PG 76-22M + 15% RAP (No CR Additive)64RAP40: HMA Mixture/PG 64-22 +40% RAP + CR Additives
The job mix formula for all mixtures considered in this study is summarized in Table 3. The design optimum asphalt cement binder content for the mixtures indicated is similar. It is noted that the aggregate structure for all the mixtures considered are similar (i.e., the aggregate proportions for the blend selected were adjusted to allow for the addition of RAP).
5. Mixture Characterization Tests
Laboratory mixture characterization through fundamental material property tests included the asphalt mixture performance tests (dynamic modulus, E*, and flow number, FN), semi-circular bend (SCB) test, dissipated creep strain energy (DCSE) test, and the modified Lottman test.
Asphalt mixture specimens were prepared using the Superpave gyratory compactor (SGC) from laboratory produced materials according to the specific requirements of each individual test as shown in Table 4. Specimens fabricated through various methods at the target air voids (7 ± .5%) were used to conduct laboratory mixture performance tests as outlined in Table 4.
Table 5 presents the test factorial performed for each mixture evaluated and the number of specimens tested. A brief description of each test is provided.
Table 3. Job Mix Formula
Mixture Designation 64CO 70CO 76CO 76CRM 76RAP15 64RAP40Mix Type 19.0 mm (3/4 in.) Superpave
AggregateBlend
#67 LS 37% 37% 37% 37% 38.5% 34%#78 LS 25% 25% 25% 25% 24. 5% 19.6%#11 LS 29% 29% 29% 29% 14% ----
CS 9% 9% 9% 9% 8% 6%RAP N/A N/A N/A N/A 15% 40%CR N/A N/A N/A N/A N/A 0.4%
Binder type PG64-22
PG70-22M
PG76-22M
PG76-22CRM
PG76-22M
PG64-22
••••••

Mix Properties 239
Mixture Designation 64CO 70CO 76CO 76CRM 76RAP15 64RAP40% Gmm at NIni 87.0 87.0 87.0 86.9 87.7 87.6
% Gmm at NMax 97.6 97.6 97.6 97.5 97.3 98.0Binder content, % 4. 0 4. 0 4. 0 4. 0 4. 1 4.0Design air void, % 3.7 3.7 3.7 4.2 3.9 3.4
VMA, % 13 13 13 12 13 12VFA, % 68 68 68 66 71 72
Metric (U. S.) Sieve Composite Gradation Blend37. 5 mm (1½ in.) 100 100 100 100 100 10025.0 mm (1 in.) 100 100 100 100 100 100
19.0 mm (3/4 in.) 98 98 98 98 95 9512. 5 mm (1/2 in.) 77 77 77 77 77 799. 5 mm (3/8 in.) 61 61 61 61 60 614. 75 mm (No. 4) 41 41 41 41 37 372. 36 mm (No. 8) 29 29 29 29 28 271. 18 mm (No. 16) 21 21 21 21 21 190. 600 mm (No. 30) 15 15 15 15 16 150. 300 mm (No. 50) 8 8 8 8 9 90.150 mm (No. 100) 6 6 6 6 6 60. 075 mm (No. 200) 4.6 4.6 4. 6 4. 6 4. 6 4.5
Note: N/A: Not Applicable, LS: Limestone, CR: Crumb Rubber, CS: Coarse Sand, Reclaimed Asphalt Pavement: RAP
Table 4. Mixture Performance Tests
Performance Characteristics Test Specimen Details Test
Temp Test Protocol
Durability Modified Lottman* N150x95-mm ---- AASHTOT 283
Permanent Deformation
Complex Modulus N150x100-mm 54 ℃ AASHTOTP7
Flow Number N150x100-mm 54 ℃ AASHTOTP7
Fatigue Cracking
DCSE N150x50-mm 10 ℃ (Roqueet al.,2002)
Semi Circular Bend N150x57-mm 25 ℃ (Mohammadet al., 2005)
*One freeze/thaw cycle only.

240 Asphalt-Rubber 2009
Table 5. Test Factorial
MIX TYPE Mixture Variables Modified
Lottman DCSE E* Fn Jc
19 mm NMAS
SP Level 2
% RAP CR Additives Uncond. Cond. Aged Aged64CO 0 ---- 3 3 3 3 3 970CO 0 ---- 3 3 3 3 3 976CO 0 ---- 3 3 3 3 3 9
76CRM 0 9% 3 3 3 3 3 976RAP15 15 ---- 3 3 3 3 3 964RAP40 40 10% 3 3 3 3 3 9
TOTAL 18 18 18 18 18 54
Note: SP = Superpave, DCSE= dissipated creep strain energy, E*= dynamic modulus, Fn= flow number, Jc= critical strain energy release rate
5.1. Modified Lottman Test
The Modified Lottman test evaluates the effect of saturation and accelerated water conditioning on compacted HMA samples utilizing freeze-thaw cycles. This method quantifies HMA mixtures sensitivity to moisture damage which is necessary to assure durability and long lasting hot mix asphalt. Numerical values of retained indirect-tensile properties are obtained by comparing conditioned samples, samples subjected to vacuum saturation and freeze-thaw cycles, to unconditioned samples. “Unconditioned” samples are samples that are not saturated nor subjected to freeze-thaw cycles. For each mix used in the study, six – 150 x 95-mm diameter samples were compacted with a Superpave gyratory compactor (SGC) to an air void content of 7 ± 0.5 percent. After compaction and air void determination, the six SGC samples were subdivided into two groups of three samples so that the average air void contents of the two subsets are approximately equivalent. The “unconditioned” sample subset was stored at room temperature for 24 ± 3 hours. Afterwards the “unconditioned” specimens were wrapped or placed in a heavy duty, leak proof plastic bag and then placed in a 25 ± 0.5 ℃ (77 ± 1°F) water bath for 2 hours ± 10 minutes. The “unconditioned” specimens were then tested to determine the indirect tensile strength for each sample. The “conditioned” samples were placed in a freezer at 0 °F for 16 to 18 hours. After the freezing cycle, the conditioned samples were placed in a 140 °F water bath for 24 hours. Upon completion of the freeze/thaw cycle the indirect tensile strength for the conditioned samples was determined. The average indirect tensile strength was determined for both conditioned and unconditioned samples by summing the test values and then determining the average value. The tensile strength ratio (TSR) is defined as the ratio of the conditioned to the unconditioned indirect tensile strength (AASHTO T-283, 2003).
5.2. Dissipated Creep Strain Energy Test
The DCSE threshold represents the energy that the mixture can tolerate before it fractures.
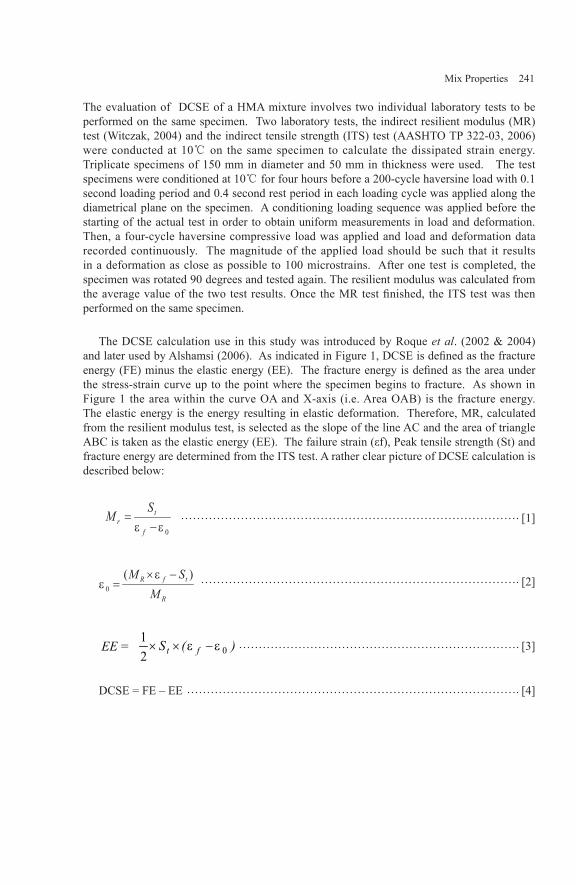
Mix Properties 241
The evaluation of DCSE of a HMA mixture involves two individual laboratory tests to be performed on the same specimen. Two laboratory tests, the indirect resilient modulus (MR) test (Witczak, 2004) and the indirect tensile strength (ITS) test (AASHTO TP 322-03, 2006) were conducted at 10℃ on the same specimen to calculate the dissipated strain energy. Triplicate specimens of 150 mm in diameter and 50 mm in thickness were used. The test specimens were conditioned at 10℃ for four hours before a 200-cycle haversine load with 0.1 second loading period and 0.4 second rest period in each loading cycle was applied along the diametrical plane on the specimen. A conditioning loading sequence was applied before the starting of the actual test in order to obtain uniform measurements in load and deformation. Then, a four-cycle haversine compressive load was applied and load and deformation data recorded continuously. The magnitude of the applied load should be such that it results in a deformation as close as possible to 100 microstrains. After one test is completed, the specimen was rotated 90 degrees and tested again. The resilient modulus was calculated from the average value of the two test results. Once the MR test finished, the ITS test was then performed on the same specimen.
The DCSE calculation use in this study was introduced by Roque et al. (2002 & 2004) and later used by Alshamsi (2006). As indicated in Figure 1, DCSE is defined as the fracture energy (FE) minus the elastic energy (EE). The fracture energy is defined as the area under the stress-strain curve up to the point where the specimen begins to fracture. As shown in Figure 1 the area within the curve OA and X-axis (i.e. Area OAB) is the fracture energy. The elastic energy is the energy resulting in elastic deformation. Therefore, MR, calculated from the resilient modulus test, is selected as the slope of the line AC and the area of triangle ABC is taken as the elastic energy (EE). The failure strain (εf), Peak tensile strength (St) and fracture energy are determined from the ITS test. A rather clear picture of DCSE calculation is described below:
0εε −=
f
tr
SM [1]
R
tfR
MSM )(
0
−×=
εε [2]
EE = )(S ft 021
εε −×× [3]
DCSE = FE – EE [4]
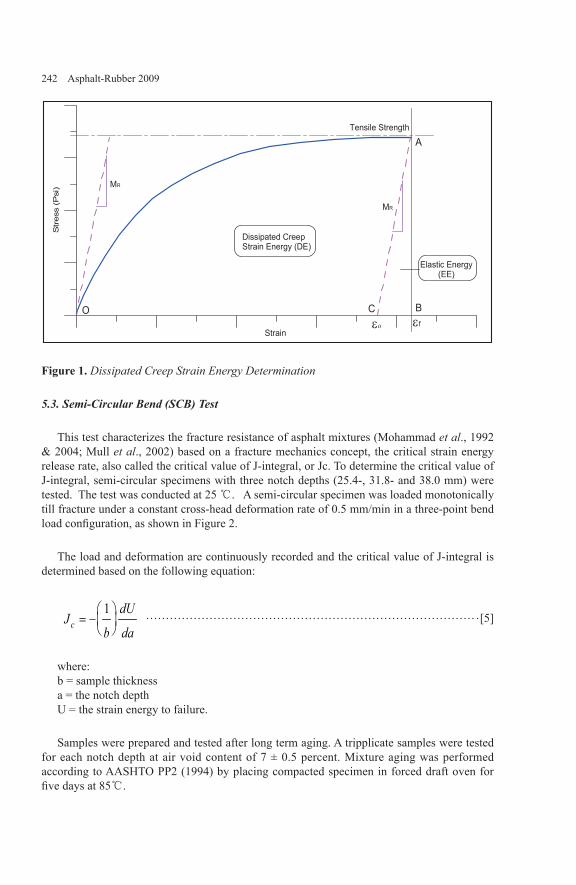
242 Asphalt-Rubber 2009
Strain
Str
ess
(Psi
)
A
BCO
Tensile Strength
Dissipated CreepStrain Energy (DE)
Elastic Energy(EE)
εο εf
MR
MR
Figure 1. Dissipated Creep Strain Energy Determination
5.3. Semi-Circular Bend (SCB) Test
This test characterizes the fracture resistance of asphalt mixtures (Mohammad et al., 1992 & 2004; Mull et al., 2002) based on a fracture mechanics concept, the critical strain energy release rate, also called the critical value of J-integral, or Jc. To determine the critical value of J-integral, semi-circular specimens with three notch depths (25.4-, 31.8- and 38.0 mm) were tested. The test was conducted at 25 ℃. A semi-circular specimen was loaded monotonically till fracture under a constant cross-head deformation rate of 0.5 mm/min in a three-point bend load configuration, as shown in Figure 2.
The load and deformation are continuously recorded and the critical value of J-integral is determined based on the following equation:
Jb
dU
dac = −
1 [5]
where:b = sample thicknessa = the notch depthU = the strain energy to failure.
Samples were prepared and tested after long term aging. A tripplicate samples were tested for each notch depth at air void content of 7 ± 0.5 percent. Mixture aging was performed according to AASHTO PP2 (1994) by placing compacted specimen in forced draft oven for five days at 85℃.
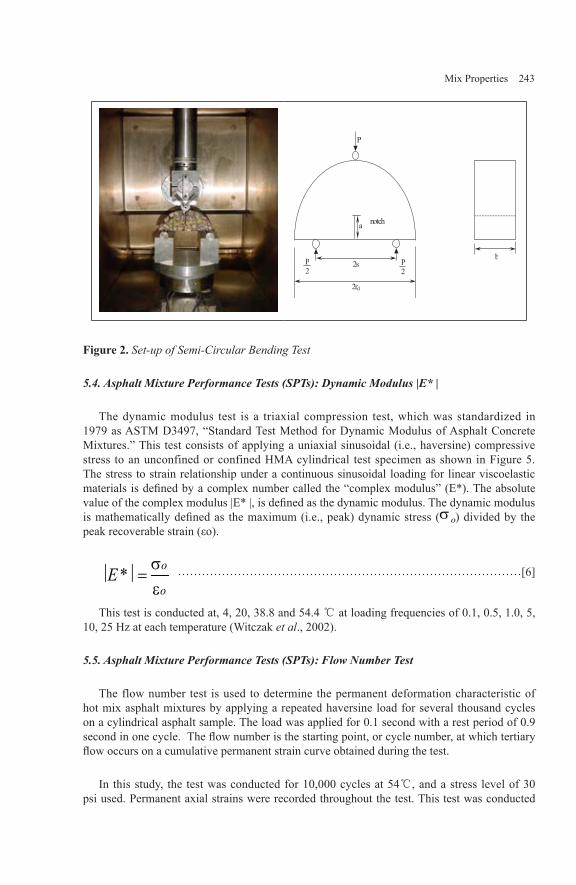
Mix Properties 243
a
2s
2rd
P
notch
P2
P2
b
Figure 2. Set-up of Semi-Circular Bending Test
5.4. Asphalt Mixture Performance Tests (SPTs): Dynamic Modulus |E* |
The dynamic modulus test is a triaxial compression test, which was standardized in 1979 as ASTM D3497, “Standard Test Method for Dynamic Modulus of Asphalt Concrete Mixtures.” This test consists of applying a uniaxial sinusoidal (i.e., haversine) compressive stress to an unconfined or confined HMA cylindrical test specimen as shown in Figure 5. The stress to strain relationship under a continuous sinusoidal loading for linear viscoelastic materials is defined by a complex number called the “complex modulus” (E*). The absolute value of the complex modulus |E* |, is defined as the dynamic modulus. The dynamic modulus is mathematically defined as the maximum (i.e., peak) dynamic stress ( o) divided by the peak recoverable strain (εo).
o
o*Eεσ
= [6]
This test is conducted at, 4, 20, 38.8 and 54.4 ℃ at loading frequencies of 0.1, 0.5, 1.0, 5, 10, 25 Hz at each temperature (Witczak et al., 2002).
5.5. Asphalt Mixture Performance Tests (SPTs): Flow Number Test
The flow number test is used to determine the permanent deformation characteristic of hot mix asphalt mixtures by applying a repeated haversine load for several thousand cycles on a cylindrical asphalt sample. The load was applied for 0.1 second with a rest period of 0.9 second in one cycle. The flow number is the starting point, or cycle number, at which tertiary flow occurs on a cumulative permanent strain curve obtained during the test.
In this study, the test was conducted for 10,000 cycles at 54℃, and a stress level of 30 psi used. Permanent axial strains were recorded throughout the test. This test was conducted

244 Asphalt-Rubber 2009
on specimens 100mm in diameter and 150mm tall for mixtures with nominal maximum size aggregates less than or equal to 37.5mm (1.5 in). The flow number was defined as the number of repetitions corresponding to the minimum rate of change in permanent strain under repeated loading conditions. It is determined by differentiation of the permanent strain versus the number of load cycles curve.
5.6. Load Wheel Tracking (LWT) Test
One of the major distresses in asphalt pavements is its inability to resist permanent deformation due to traffic loading. To determine the rutting characteristics of the HMA mixtures considered in this study a loaded wheel tracking test was conducted in accordance with AASHTO T 324-04 “Standard Method of Test for Hamburg Wheel-Track Testing of Compacted Hot-Mix Asphalt (HMA)”. In this test specimens are subjected to a steel wheel weighing 703 N (158 pounds) which is repeatedly rolling across its surface at 56 passes per minute while being submerged in 50 ℃ hot water. The test completion time is predicated upon test specimens being subjected to a maximum of 20,000 cycles or attainment of 20 mm deformation, whichever is reached first. Upon completion of the test the average rut depth for the samples tested were recorded.
6. Discussion of Results
Several laboratory tests were conducted and evaluated to measure the performance characteristics of the HMA mixtures considered in this study. The pavement performance characteristics were analyzed for the HMA mixtures durability as measured by the modified Lottman test. The HMA mixtures performance in terms of resistance to fatigue cracking was evaluated from results obtained from the semi-circular bend (SCB), dissipated creep strain energy (DCSE) and dynamic modulus (i.e. fatigue factor, E*(Sinδ)) tests. Furthermore, dynamic modulus (i.e. rutting factor, E*/Sinδ) and flow number was used to determine the mixtures resistance to permanent deformation.
6.1. Modified Lottman Test Results
Figure 3 presents the Modified Lottman test results for the six mixtures evaluated in this study. It is noted that no liquid anti-strip or hydrated lime, which facilitates adhesion of the asphalt cement binder to the aggregates, were used in this study. Based on previous experience with these mixes, the 64CO HMA mixture utilizing an unmodified asphalt cement binder (PG 64-22) failed the Modified Lottman test. As indicated, four of the six HMA mixtures (70CO, 76CO, 76RAP15, and 64RAP40) evaluated met Louisiana’s specified minimum required tensile strength ratio of 80 percent. It is also shown in Figure 3 that the 76CRM mixture failed the minimum required tensile strength ratio. The binder used in the 76CRM HMA mixture is unmodified asphalt cement (PG 64-22) that has been wet blended with CR additives to yield PG 76-22 asphalt cement. The CR modified asphalt had a total of 9 percent crumb rubber additive, 8 percent 30 mesh crumb rubber and 1 percent Gilsonite. It is suspected that the percentage of Gilsonite, which is used to increase resistance to water susceptibility (stripping), was insufficient to increase the retained tensile strength to an acceptable level.

Mix Properties 245
6.2. Dissipated Creep Strain Energy (DCSE) Test Results
Mull et al. (2002) has indicated dissipated creep strain energy (DCSE) is a good indicator of the cracking mechanism of asphalt pavements. The calculated DCSE threshold values represent the energy that the mixture can tolerate before it fractures. Roque et al. (2004) reported a DCSE value of 0.75 KJ/m3 as the limiting criterion for acceptable fracture resistance. HMA mixtures having DCSE value greater than 0.75 KJ/m3 are not as susceptible to cracking. Mixtures that exhibit lower DCSE values are more susceptible to cracking than HMA mixtures having higher values when mixtures are exposed to similar environmental and loading conditions. Figure 4 represents the calculated DCSE mean values for the HMA mixtures analyzed in this study. The coefficient of variation (CV) of the samples tested ranged from 6 to 18 percent. It is shown that the 76CO mixture has the highest DCSE values of all mixtures tested and is therefore less prone to crack. In addition, five out of the six mixtures meet the 0.75 KJ/m3 criterion for resistance to cracking. The 64RAP40 had less than the limiting criterion necessary for fracture resistance.
0102030405060708090
100
64C0 70C0 76C0 76CRM 76RAP15 64RAP40
%T
SR
Mix Type
%TSR = 80
Figure 3. Modified Lottman Retained Tensile Strength
0
0.5
1
1.5
2
2.5
3
3.5
4
4.5
64CO 70CO 76CO 76CRM 76RAP15 64RAP40
DC
SE, K
J/m
3(A
GE
D)
Mix Type
0.75 KJ/m3
Figure 4. Dissipated Creep Strain Energy Test Results

246 Asphalt-Rubber 2009
6.3. Semi-Circular Bend (SCB) Test Results
Figure 5 presents the calculated critical fracture resistance (Jc) values for the six HMA mixture types evaluated. In terms of fracture resistance, the higher the Jc value the greater the fracture resistance the HMA mixtures possess. In a previous study, Mohammad et al. (2004) indicates that any mixture achieving a Jc value greater than 0.65 KJ/m2 is expected to exhibit good fracture resistance. It is shown that the 76RAP15 HMA mixture had the highest Jc value and therefore has the greatest fracture resistance of all mixtures evaluated in this study. Figure 5 indicates that with the exception of the 64CO HMA mixture all other mixtures passed this criterion. The coefficient of variation (CV) of the samples tested ranged from 10 to 25 percent.
Jc(K
J/m
2 )
0
0.2
0.4
0.6
0.8
1
1.2
64C
Jc(K
J/m
2 )
CO 70CO
0.65
76CO 76C
Mix Typ
KJ/m2
CRM 76RAP1
pe5 64RAP40
Figure 5. Semi-Circular Bend Test Results
6.4. Dynamic Modulus (E*) Test Results
The purpose of the dynamic modulus test is to evaluate the visco-elastic response characteristics of HMA mixtures over a given range of temperatures and frequencies. Figure 6 present the dynamic modulus isotherms at the various temperatures and frequencies for all mixtures considered in this study. The values indicated are the average E* results for three laboratory specimens evaluated per HMA mixture type. The CV of the samples tested ranged from 1 to 18 percent. As shown in Figure 6, the E* values increase as the frequency increases. Furthermore the E* values decrease with increased temperatures. Figure 6 indicates that at low temperatures (4.4 ℃) the isotherms are in an inclined straight line direction. This indicates that the HMA mixture behavior is in the visco-elastic region and is predominately affected by the asphalt cement binders. The E* isotherms became concave at the intermediate and high temperature levels, 25 ℃, 37.8 ℃, and 54 ℃ respectively. This change in the isotherm shape represents the non-linear behavior in HMA mixtures during compression. This non-linear behavior reveals the mechanical response which is caused by the aggregate skeleton of the HMA mixture overwhelming the viscous influence of the asphalt cement binder materials within the HMA materials at these high temperatures. In addition Figure 6 shows that at any given temperature for any given HMA mixture that the E* values decrease with decreased frequency.
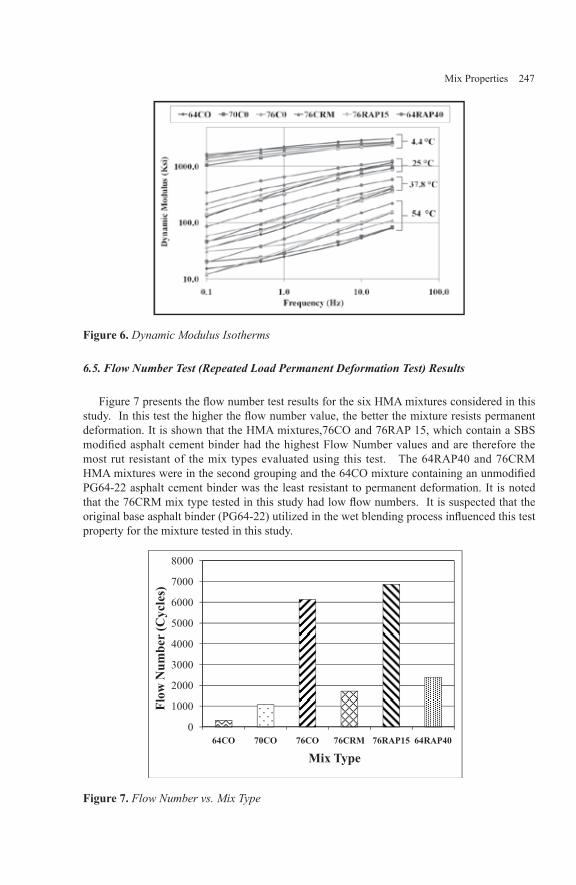
Mix Properties 247
Figure 6. Dynamic Modulus Isotherms
6.5. Flow Number Test (Repeated Load Permanent Deformation Test) Results
Figure 7 presents the fl ow number test results for the six HMA mixtures considered in this study. In this test the higher the fl ow number value, the better the mixture resists permanent deformation. It is shown that the HMA mixtures,76CO and 76RAP 15, which contain a SBS modifi ed asphalt cement binder had the highest Flow Number values and are therefore the most rut resistant of the mix types evaluated using this test. The 64RAP40 and 76CRM HMA mixtures were in the second grouping and the 64CO mixture containing an unmodifi ed PG64-22 asphalt cement binder was the least resistant to permanent deformation. It is noted that the 76CRM mix type tested in this study had low fl ow numbers. It is suspected that the original base asphalt binder (PG64-22) utilized in the wet blending process infl uenced this test property for the mixture tested in this study.
0
1000
2000
3000
4000
5000
6000
7000
8000
64CO 70CO 76CO 76CRM 76RAP15 64RAP40
Flow
Num
ber
(Cyc
les)
Mix Type
Figure 7. Flow Number vs. Mix Type

248 Asphalt-Rubber 2009
6.6 Evaluation of Rutting and Fatigue Factors from E* Tests
A HMA mixture’s propensity to resist permanent deformation (rutting) and fatigue cracking can be characterized by using the dynamic modulus test results from various temperatures and frequencies. The rutting factor is defined as E*/Sinδ, where δ is the phase angle, at a particular temperature and frequency. A loading frequency of 5Hz and test temperature of 54.4 ℃ was used for computation of the rutting factor, E*/Sinδ in this study (Witczak et al., 2002). For mixtures to be rut resistant and exhibit higher stiffness necessitates a higher E* value and a lower phase angle. The higher the rutting factor value the greater resistance to permanent deformation.
Figure 8 shows the rutting factor values for all mix types evaluated in this study. It clearly indicates that the 64RAP40 mixture has the greatest resistance to rutting. This can be attributed to the high RAP content (40%) used in this mixture type. It is noted that there is a grouping of similar results for the 76CO, 76CRM, and 76RAP15 HMA mixture types. As indicated in Figure 8 the 64CO mixture has the least resistance to rutting as would be expected because of the less stiff asphalt cement binder utilized in this HMA mixture.
0.0
50.0
100.0
150.0
200.0
250.0
64C0 70C0 76C0 76CRM 76RAP15 64RAP40
E*/
Sinδ
Mix Type
Figure 8. Rutting factor, E*/Sinδ @ 5Hz, 54.4 ℃
To determine a mixtures resistance to fatigue cracking, a parameter termed fatigue factor is calculated from dynamic modulus test results at a given frequency and test temperature. The test temperature of 25 ℃ and a loading frequency of 5 Hz were selected for this study (Witczak et al., 2002). By definition the fatigue factor is calculated as E*(Sinδ), where δ is the phase angle, at the selected temperature and frequency. For a mixture to resist fatigue cracking its corresponding E* value should be lower as well as the phase angle at the in-service temperature of 25 ℃. The lower the fatigue factor value, the better the mixture’s resistance to fatigue cracking.

Mix Properties 249
Figure 9 indicates the fatigue factor values for all mix types evaluated in this study. There are three distinct groups as shown in Figure 9. The first grouping is the 70CO HMA mixture that indicates this mixture as being the best in terms of fatigue cracking resistance for the six mixtures evaluated in this study. The second grouping that indicates similar results is the 76CO, 76CRM, and 76RAP15 HMA mixtures. The last groups, which exhibit the highest fatigue factor values and therefore are the least resistant to fatigue cracking, are the 64CO and 64RAP40 mixtures. This can be attributed to the base asphalt binder cement (PG 64-22) being more viscous and less stiff at the elevated temperature of 25 ℃ in mixture 64CO and the stiff binder in mixtures with RAP.
0.0
50.0
100.0
150.0
200.0
250.0
300.0
350.0
400.0
64C0 70C0 76C0 76CRM 76RAP15 64RAP40
E*Si
nδ
Mix Type
Figure 9. Fatigue factor, E*(Sinδ) @ 5Hz, 25.0 ℃
6.7. Loaded Wheel Tracking Test Results
Figure 10 indicates the average rut depth of the six mixtures evaluated in this study. The specimens rut depth is continuously measured and recorded for 20,000 passes unless the specimen attains more than 20.0 mm of rutting in which the testing is terminated. The average rut depth reported in Figure 10 is the mean rut depth after 20,000 passes of the LWT. Mixtures with an average rut depth less than 6.0 mm after 20,000 passes are considered acceptable. As shown in Figure 10 the 64CO and 64RAP40 HMA mixtures that utilize PG 64-22 asphalt cement failed the acceptable rutting criterion. However, it is noted that the 64RAP40 mixture was borderline failing with a measured rut depth of 6.1 mm. All other mixtures tested passed the maximum rut depth requirement (6.0 mm).

250 Asphalt-Rubber 2009
0
2
4
6
8
10
12
64CO 70CO 76CO 76CRM 76RAP15 64RAP40
Rut
Dep
th(m
m)
Mix Type
Rut Depth = 6 mm
Figure 10. LWT Rutting Results
6.8. Comparison of Statistical Ranking of HMA Mixtures
Laboratory test data were statistically analyzed and grouped using the analysis of variance (ANOVA) procedure provided in the Statistical Analysis System (SAS) program. A multiple comparison procedure with a risk level of 5 percent was performed on the means. The groupings will represent the mean for the test results reported by mixture type. The results of the statistical grouping were reported with the letters A, B, C, D, and so forth. The letter A was assigned to the highest mean followed by the other letters in appropriate order. A double (or more) letter designation, such as A/B, will indicate the difference in the means is not clear-cut, and that the result could fall in either group.
Tables 6 summarizes the statistical ranking of several of the laboratory performance test results for the HMA mixture types considered in this study. The evaluation of the HMA mixtures laboratory performance in this study included durability, permanent deformation, and fatigue resistance. However, the statistical analysis is based only on two mixture performance criteria namely: 1) fatigue resistance and 2) permanent deformation. In addition the results reported in this analysis are the DCSE, fatigue factor, rutting factor, and flow number tests because the SCB and Modified Lottman tests numbers were limited and did not lend themselves to statistical analysis for this study.
It is indicated in Table 6 that HMA mixtures containing unmodified asphalts (64CO and 64RAP40) ranked lowest in regard to resistance to fatigue cracking. Generally, HMA mixtures containing SBS modified asphalt cements (70CO and 76CO), crumb rubber modified (76CRM), and 15 percent RAP (76RAP15), ranked the best in fatigue resistance. In terms of permanent deformation (i.e. rutting), mixtures 76RAP15, 64RAP40, and the 76CO SBS

Mix Properties 251
modified HMA mixture performed the best in resistance to permanent deformation as shown in Table 6. The HMA mixture (64CO) containing the unmodified asphalt cement performed worst and is the most susceptible to permanent deformation for the mixtures evaluated in this study. It is also noted that in general the 76CO HMA mixture ranked highest in all tests evaluated.
The tests evaluated and presented were selected to capture the laboratory performance of the HMA mixtures studied. However the test results were not consistent and did not clearly rank the mixtures. The LWT and FN tests which are used for assessing a mixture’s resistance to permanent deformation were not clear cut. This may be due to the fact that the LWT samples are tested in confinement whereas the FN test is tested in an unconfined mode. In addition the Modified Lottman and SCB tests were inconsistent. A mixtures adhesion and cohesive behavior is important in both of these tests. In one test, Modified Lottman, the 64RAP40 shows good properties. However the JC test the mean values are low for this mixture type. If the Modified Lottman indicated good adhesive and cohesion properties then the JC values should have been higher than the reported value.
Table 6. Statistical Ranking of Mixtures Fatigue and Rutting Characteristics
Fatigue Performance Characteristic
Permanent Deformation Performance Characteristic
Property Fatigue Factor (E*Sinδ) DCSE Rutting Factor
(E*/Sinδ) Flow Number
Aging Criterion Un-aged Aged Un-aged Un-aged
Mixture Type Mean Rank Mean Rank Mean Rank Mean Rank
64CO 340.5 B 1.21 C 79.6 C 324.0 C
70CO 262.9 A 2.52 B 96.7 C 1068.3 C76CO 296.5 A/B 4.20 A 141.0 B 6132.0 A
76CRM 316.8 B 2.29 B 126.5 B 1325.3 C76RAP15 300.4 A/B 2.30 B 133.7 B 6867.0 A64RAP40 330.2 B 0.57 C 197.4 A 2397.0 B
7. Summaries and Conclusions
This study characterized the laboratory performance of conventional HMA mixtures and those containing high RAP content and waste tire crumb rubber/additives through their fundamental engineering properties. A comparative laboratory evaluation of six 19-mm nominal maximum aggregate size (NMAS) Level 2 Superpave HMA mixtures meeting LADOTD specification were considered in this study. Three mixtures used in the study are classified as conventional mixtures that contain an unmodified asphalt cement binder and mixtures containing styrene-butadiene-styrene polymer modified asphalt cement meeting

252 Asphalt-Rubber 2009
Louisiana specifications for PG 64-22, PG 76-22M, and PG 76-22M respectively. The fourth mixture contained 30 mesh crumb rubber (CR) and additives blended (wet process) with a PG 64-22 asphalt cement binder which yielded a PG 76-22 and no RAP. The fifth mixture contained 15 percent RAP and PG 76-22M asphalt cement binder. The final mixture contained 40 percent RAP, 30 mesh crumb rubber and additives blended (dry process) with a PG 64-22 asphalt cement binder. Physical and rheological tests were conducted to evaluate the fundamental engineering properties and laboratory performance of asphalt binders and hot mix asphalt mixtures (HMA) considered in this study. Based on the objectives of this study, the following conclusions are drawn:
The addition of the crumb rubber additives softened the blended AC for the 64RAP40 HMA mixture as determined by rheology testing of the asphalt cement extracted from the mixture. The blended AC for the 64RAP40 HMA mixture that contained PG 64-22, high RAP content (40 percent), and crumb rubber additives graded as a PG 70-28 asphalt cement.
It is clearly shown that the addition of the crumb rubber additives with RAP had a positive influence on the asphalt cement binder rheology. This can be attributed to the use of the absorptive properties of crumb rubber carrying rejuvenating products back into the HMA mixture.
The HMA mixtures considered in this study were subjected to the modified Lottman test which quantifies the HMA mixtures sensitivity to moisture damage. The mixtures containing utilizing unmodified PG 64-22 failed this test whereas the mixes containing polymer modified asphalt cements (70CO, 76CO) passed as expected. The 64RAP40 mixture that contained unmodified PG 64-22 asphalt cement binder passed the modified Lottman test. This may indicate that the CR additives had a positive influence on the asphalt cement binder’s ability to increase adhesion to the aggregate structure.
Fracture resistance as measured by the dynamic creep strain energy test and confirmed by the semi-circular bend test indicates that the 64RAP40 HMA mixture ranked last in its ability to resist fracture while the 76CO mixture had the highest fracture resistance.
The HMA mixtures resistance to permanent deformation (i.e. rutting) as determined by the rutting factor, E*/Sinδ, as measured from the dynamic modulus test indicate that the 64RAP40 HMA mixture has the greatest propensity to resist rutting.
In regard to fatigue resistance as determined from the fatigue factor, E*(Sinδ), the 64RAP40 and 64CO HMA mixtures have the least resistance to fatigue cracking. Both mixtures utilized unmodified PG 64-22 and therefore these results may be attributed to the asphalt cement binder properties of the PG64-22 and the high RAP content utilized in the 64RAP40 HMA mixture.
8. Acknowledgement
This research was sponsored by the Louisiana Transportation Research Center (LTRC) and the Department of Transportation and Development. The authors would like to express their
•
•
•
•
•
•

Mix Properties 253
thanks to all of those who have provided valuable helps in this study. In addition the authors would like to thank Mr. John Osborn of
Elastomeric Concentrates, LLC who supplied the crumb rubber additives utilized in this study.
9. References
AASHTO, American Association of State Highways and Transportation Officials, “Standard Method of Test for Resistance of Compacted Asphalt Mixtures to Moisture-Induced Damage”, AASHTO T 283-03, Washington D.C., 2003.
AASHTO, American Association of State Highways and Transportation Officials.” Practicefor Short and Long Term Aging of Hot Mix Asphalt”. AASHTO Designation PP2, Washington D.C., 1994.
AASHTO, American Association of State Highways and Transportation Officials,“Standard Method of Test for Determining the Creep Compliance and Strength of Hot-Mix Asphalt (HMA) Using the Indirect Tensile Test Device”, AASHTO Designation: TP 322-03, Washington D.C., 2006.
Alshamsi, K.S., “Development of Mix Design Methodology for Asphalt Mixtures withAnalytically Formulated Aggregate Structures”, Ph.D. Dissertation, Louisiana State University and Agricultural and Mechanical College, Baton Rouge, Louisiana, May, 2006.
ASTM D3497, “Standard Test Method for Dynamic Modulus of Asphalt Mixtures.” ASTM International, West Conshohocken, PA, 1979.
Heitzman, M., “State of the Practice – Design and Construction of Asphalt Paving Materials with Crumb Rubber Modifier,” Research Report No. FHWA-SA-92-022, Federal Highway Administration, Washington, D.C., May, 1992.
McDaniel, R., Anderson, R.M., “Recommended Use of Reclaimed Asphalt Pavement in the Superpave Mix Design Method: Technician’s Manual”, NCHRP Report 452, 2001.
Mohammad, L.N., and Paul, H.R., “Evaluation of a New Indirect Tension Test Apparatus,” Transportation Research Record No. 1353, pp.62-68, 1992.
Mohammad, L.N., Daly, W.H., Negulescu, I.I., Wu, Z., Daranga, C., “Investigation of theUse of Recycled Polymer-Modified Asphalt in Asphaltic Concrete Pavements”, Louisiana Transportation Research Center, Report No. FHWA/LA04/391, June 2004.
Mohammad, L.N., Wu, Z., Aglan, M., “Characterization of Fracture and Fatigue Resistance onRecycled Polymer-Modified Asphalt Pavements”, The 5th RILEM conference on Pavement Cracking, France, 2004.
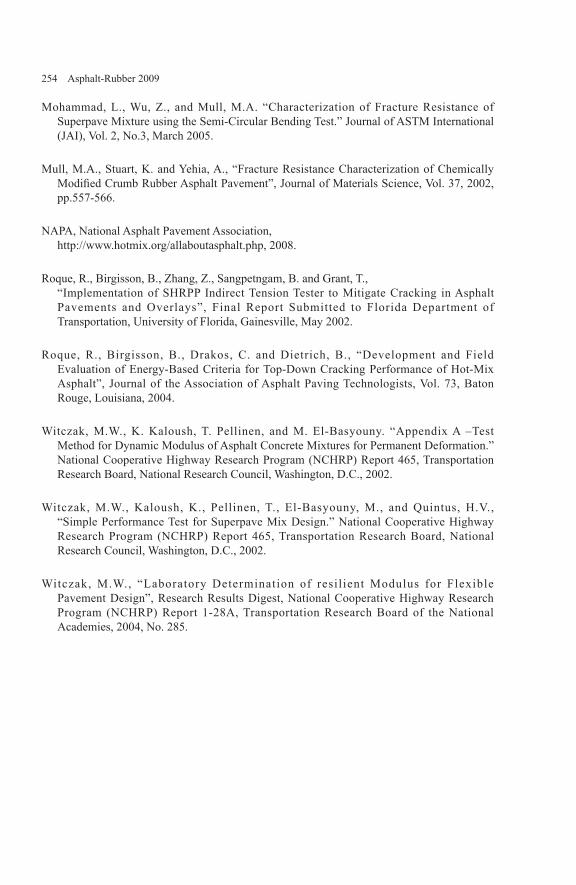
254 Asphalt-Rubber 2009
Mohammad, L., Wu, Z., and Mull, M.A. “Characterization of Fracture Resistance of Superpave Mixture using the Semi-Circular Bending Test.” Journal of ASTM International (JAI), Vol. 2, No.3, March 2005.
Mull, M.A., Stuart, K. and Yehia, A., “Fracture Resistance Characterization of Chemically Modified Crumb Rubber Asphalt Pavement”, Journal of Materials Science, Vol. 37, 2002, pp.557-566.
NAPA, National Asphalt Pavement Association, http://www.hotmix.org/allaboutasphalt.php, 2008.
Roque, R., Birgisson, B., Zhang, Z., Sangpetngam, B. and Grant, T., “Implementation of SHRPP Indirect Tension Tester to Mitigate Cracking in Asphalt Pavements and Overlays”, Final Report Submitted to Florida Department of Transportation, University of Florida, Gainesville, May 2002.
Roque, R., Birgisson, B., Drakos, C. and Dietrich, B., “Development and FieldEvaluation of Energy-Based Criteria for Top-Down Cracking Performance of Hot-Mix Asphalt”, Journal of the Association of Asphalt Paving Technologists, Vol. 73, Baton Rouge, Louisiana, 2004.
Witczak, M.W., K. Kaloush, T. Pellinen, and M. El-Basyouny. “Appendix A –TestMethod for Dynamic Modulus of Asphalt Concrete Mixtures for Permanent Deformation.” National Cooperative Highway Research Program (NCHRP) Report 465, Transportation Research Board, National Research Council, Washington, D.C., 2002.
Witczak, M.W., Kaloush, K., Pellinen, T., El-Basyouny, M., and Quintus, H.V., “Simple Performance Test for Superpave Mix Design.” National Cooperative Highway Research Program (NCHRP) Report 465, Transportation Research Board, National Research Council, Washington, D.C., 2002.
Witczak, M.W., “Laboratory Determination of resilient Modulus for FlexiblePavement Design”, Research Results Digest, National Cooperative Highway Research Program (NCHRP) Report 1-28A, Transportation Research Board of the National Academies, 2004, No. 285.

Mix Properties 255
Evaluation of Alternative Laboratory Aging Methods of Asphalt Rubber Friction Courses
Jordan X. Reed* – Krishna P. Biligiri* – Kamil E. Kaloush*
* Department of Civil, Environmental and Sustainable Engineering, Arizona State University, Tempe, AZ 85287-5306, [email protected] [email protected]@asu.edu
ABSTRACT: Long term aging, or the oxidation and subsequent stiffening of hot mix asphalt (HMA) mixtures, is a contributing cause of the pavement’s performance loss. Laboratory testing protocols simulating field aging characteristics, such as SHRP-A-417, have been developed to test asphalt mixtures in order to evaluate their aging resistance in the field. However, the SHRP-A-417 protocol requires some specialized equipment to age open graded mixtures. This study focused on evaluating alternative aging methods for Asphalt Rubber Friction Course (ARFC) mixtures. Compacted laboratory specimens (cores) as well as loose mixtures (pan) were aged under similar temperatures and time durations. Aging effects were assessed using the E* dynamic modulus test and the modular aging ratio developed in this study. Specimen geometry, air voids, and compaction parameters were also examined before and after the aging process to evaluate the effectiveness of the aging procedures. The core aging procedure proved to be a better alternative to the pan aging method; pan aging was ineffective in simulating aging characteristics.
KEYWORDS: Asphalt Rubber Friction Course, Aging, SHRP-A-417, Core versus Pan, E* Dynamic Modulus, Modular Aging Ratio

256 Asphalt-Rubber 2009
1. Introduction
The effects of aging on an asphalt pavement are critical to its long term performance. Oxidation and the associated stiffening can lead to cracking, which can lead to functional and structural failure of the pavement system. The accelerated long-term aging of hot mix asphalt (HMA) mixtures in a laboratory setting provides an indication of the mix’s performance in the field towards the end of its life span. Currently, the most commonly used method to age mixtures in the laboratory is the SHRP-A-417 protocol (SHRP-A-417). However, there are some limitations of this procedure cited in the literature, particularly its effectiveness of accurately simulating field conditions. The protocol calls for the use of high temperatures and the accessibility of oxygen in order to accelerate oxidation to a state corresponding to seven to ten years in the field. However, a difference in sample air voids will directly affect the rate of oxidation. In addition, deformation of samples during the oven testing may be a concern, particularly with asphalt rubber mixtures that have higher air voids and binder contents.
Therefore, a simple, accurate, and rapid method to age samples to be representative of properties of later service life would allow for a better understanding of a pavement’s lifetime performance and allow State Departments of Transportation and local agencies to better assess overall lifecycle properties of a pavement, including cost.
This paper attempts to evaluate the effects of aging simulated by SHRP-A-417 on laboratory prepared asphalt rubber friction course (ARFC) pavement materials. Evaluation of mixture materials properties of laboratory aged samples was performed using the Dynamic Modulus (E*) laboratory test, which is one of the most important material properties for asphalt mixture pavement design. It was recommended as a Simple Performance Test (SPT) to complement the mixture design process under the National Cooperative Highway Research Program (NCHRP) Project 9-19 (Witczak et al, 2002). The E* is also an important input property into the Mechanistic Empirical Pavement Design Guide (MEPDG). This paper investigates if the initial stiffness (E* dynamic modulus) can distinguish between the different asphalt mixes in terms of their laboratory aging characteristics. In addition, the relationships between unaged and aged mixtures were established through the development of modular aging ratios.
2. Objectives and Scope of Work
The main objective of this study was to investigate the laboratory aging characteristics of Asphalt Rubber Friction Course (ARFC) mixtures by using the E* Dynamic Modulus test, while simultaneously attempting to identify the applicability of the current laboratory aging methodology to ARFC mixtures. Additionally, the relationships between unaged and aged mixtures were established through the development of modular aging ratios.
The aging characteristics of pavements have a significant impact on their effective service life. Therefore, in evaluating pavements, a simple and effective aging method has significant value in approximating the ability of a pavement to resist aging. SHRP-417-A provides a relatively simple method for dense and gap graded mixtures, but recommends that open graded mixes be aged at a lower temperature in a pressurized oxygen chamber to prevent specimen degradation. Such an apparatus is specialized and it was not available for this study. Thus, an alternative method that can age an open graded mixture like ARFC without the

Mix Properties 257
need of specialized equipment was needed. Two methods were used in this study. The first method was to age the ARFC mixtures according to the SHRP-417 protocol that is utilized for aging conventional dense graded mixtures. This method was used in conformation to the protocol except that a confining mesh was used to prevent damage to the specimens. The second method was to age the mix in a loose state and then use this aged mix to prepare test specimens. The purpose of this method was to age the mix as homogeneously as possible. In addition to using these two methods, an additional aging period was included to better understand the aging effects of the two methods.
3. Background to Aging of Asphalt Mixtures
The majority of research into the aging of HMA has been focused on the aging of asphalt binders. Chipps et al (2001) has observed that asphalt rubber binders seem to be more resistant to aging than conventional mixtures due to a lower rate of oxidation during the long-term aging phase (Chipps et al, 2001). It was also shown that rubberized binders have more significant differences in aging effects than conventional mixes at different temperatures. The same research also suggested that aging samples at a single temperature may not accurately represent the aging characteristics of a given asphalt binder. Further investigations are needed to assess the binder performance over a wider range of environmental conditions such as temperature.
Jung (2006) tested a number of aged binder properties from neat binder specimens and binder extracted from aged mixes (Jung, 2006). Binder oxidation was found to be similar in neat binder and binder extracted from mixtures. It was also found that oxidative aging decreases the capacity for HMA to self-heal and significantly reduces the strain-controlled fatigue life of an HMA pavement. Furthermore, while healing potential increases with higher binder content, at longer aging periods an increase in binder content does not significantly improve healing potential. This seems to suggest that there is a value at which a binder has fully oxidized and is not contributing to healing. Walubita (2006) tested similar mixes and found that oxidative aging reduces an HMA mixture’s fracture resistance in addition to its capacity to heal (Walubita, 2006).
Raghavendra et al (2006) verified laboratory procedures to simulate the field-hardening of asphalt binders and mixes that were developed and adopted by American Association of State Highway and Transportation Officials (AASHTO) as Provisional Protocol PP2-99 (Raghavendra et al, 2006). This research study under the National Cooperative Highway Research Program (NCHRP) 9-23, was initiated to verify these protocols, identify their limitations, and make recommendations to enhance their predictive capabilities. Binders and field cores were obtained from Long Term Pavement Performance (LTPP) and other sites across the United States. Plant-mix, laboratory-aged cores, and field-aged cores were characterized using E* dynamic modulus testing. Verification of the existing protocol was carried out using the data collected from testing. Warmer climates resulted in higher aging compared to cooler climates. Laboratory cores were found to have more uniform aging profiles than field cores. It was concluded that the existing protocol is insufficient to accurately predict the field aging of asphalt mixes. In addition, for pavements with air voids lower than 8% laboratory aging exposes the samples to harsher oxidation than they would experience in the field. Note that the findings were based on tests conducted on conventional asphalt mixes containing conventional, non-modified binders.

258 Asphalt-Rubber 2009
In another research study, it found that crumb rubber inclusions in an asphalt rubber binder also appear to absorb some of the maltenes of the binder (Lee, 2007). Lee observed this phenomenon by testing the percentile content of large molecular solids within an asphalt rubber binder. Furthermore, during the aging process he found an evidence to suggest that the maltenes would be released from the rubber particles during aging. However, the testing of binders from HMA mixtures aged in a loose state found control and asphalt rubber mixtures did not show a significant difference between the two. The reasons attributed to this type of behavior are that the binder film thickness was too thin and aging temperature was too low to facilitate a reaction.
3.1 Standard Laboratory Aging Protocol for Asphalt Mix
Currently, laboratory aging of asphalt mixtures is carried out under the SHRP-A-417 test protocol (SHRP-A-417). In this method, samples are placed in a forced draft oven at a constant temperature of 85 ℃ for a period of five days (120 hours). The protocol is intended to simulate the oxidative aging effects of about 7 to 10 years. This protocol has a provision that open graded mixtures should be aged in a low pressure oxygen chamber at 60 ℃ in order to mitigate sample degradation during aging.
3.2 E* Dynamic Modulus Test
AASHTO TP 62-03 test protocol is followed for E* dynamic modulus testing (AASHTO TP-62-03). The protocol calls for testing three replicates for a mixture. For each specimen, E* tests are conducted at -10, 4.4, 21.1, 37.8 and 54.4 ℃ and 25, 10, 5, 1, 0.5 and 0.1 Hz loading frequencies. A 60 second rest period is used between each frequency to allow some specimen recovery before applying the new loading at a lower frequency. The E* tests are done using a controlled sinusoidal stress that produced strains smaller than 150 micro-strain. This ensured, to the best possible degree, that the response of the material is linear across the temperatures used. Generally, the dynamic stress levels are 69 to 690 kPa for colder temperatures (-10 to 21.1 ℃) and 14 to 69 kPa for higher temperatures (37.8 to 54.4 ℃). All E* tests are conducted in a temperature-controlled chamber capable of holding temperatures from –16 to 60 ℃. Typical test specimens are shown in Figure 1.
Figure 1. Typical E* Dynamic Modulus Test Sample

Mix Properties 259
4. Experimental Program
The experimental program included an ARFC mix with two aging durations (5 and 14 day) for each of the two aging procedures in addition to control samples not subjected to aging (unaged condition). Samples were prepared using field mixtures from one of the Arizona Department of Transportation (ADOT) projects to evaluate laboratory aging performance characteristics. Typical ADOT ARFC mixes comprise of 20% rubber content by weight of the asphalt binder. The standard SHRP-A-417 aging protocol was followed but the study incorporated one additional level of aging. Therefore, the samples were aged for a period of 5 days conforming to the protocol as well as 14 days that was additionally used. Also, a confining mesh was used to prevent damage to the specimens, which is not a provision in the protocol. In another method, the mix was aged in a loose state and the aged mix was used to prepare test specimens. The purpose of this method was to age the mix as homogeneously as possible.
The first procedure that was followed to subject samples to laboratory aging is described as follows. Laboratory samples that were subjected to the aging according to the current protocol are referred to as ‘core aged’ specimens. The sample cores for the mixtures were prepared after compaction using a gyratory compactor. Cores were then taken from the gyratory plugs and prepared into 150-mm high, 100-mm diameter cylindrical specimens. As a modification to the protocol, ARFC samples were wrapped in wire mesh secured by steel bands in order to control sample degradation during aging. As excess pressure would deform the samples, care was taken to only tighten the bands just enough to secure the mesh cage. Mesh was also placed underneath the samples to minimize loss of material from the bottom of the samples. Figure 2 shows a typical ARFC sample wrapped in a mesh cage to be subjected to aging. This mesh was removed prior to testing.
Figure 2. ARFC Sample Confined in Mesh Cage
The second methodology adopted to age ARFC mixes is described next. This methodology details the samples that were aged in a loose state in a pan. The authors term this procedure
260 Asphalt-Rubber 2009
‘pan aging’. Pan aging was performed for the two aging durations: 5 and 14 days which were similar to the first procedure. Pan aging consisted of placing ARFC mix in large trays in a loose state with a depth of approximately 50-100 mm. The mix was then heated in a forced-draft oven at 85 ℃ for the aging duration. In order to uniformly age the specimens and avoid hardening in place, the samples were broken up and stirred throughout the aging process on a day-to-day basis. Location of the aging trays inside the oven was also varied daily to minimize the effects of temperature variation inside the oven. After aging, specimens were compacted in a gyratory compactor and prepared into samples of 150-mm height and 100-mm diameter.
Air voids were obtained on all samples subjected to two aging procedures described above and unaged specimens with a CoreLok device. Three sample replicates were prepared for different aging conditions. Note that only 2 replicates of ARFC 14 day core and 14 day pan aged samples were available for testing because one sample from each set disintegrated during the aging process.
E* dynamic modulus tests were conducted on both unaged and aged samples per the standard protocol at five temperatures: -10, 4.4, 21.1, 37.8, and 54.4 ℃ and six loading frequencies: 25, 10, 5, 1, 0.5, and 0.1 Hz. Table 1 provides summary of the experimental program. Analysis of Variance (ANOVA) was performed on the sample air voids for each group. A confidence interval of 95% was assumed and ANOVA was performed assuming unequal variance. The statistical results indicate that there is no significant difference of average sample air voids between ARFC specimens at different aging conditions as shown in Table 1.
Table 1. Experimental Program for Laboratory Aging of Conventional Dense Graded and Asphalt Rubber Friction Course Mixtures
Aging Condition Avg. Air Voids (%)
Variance of Air Voids (%)
Asphalt Content (%)
Number of Samples
ARFC Control (Unaged) 17.72 3.33E-03 9.4 3
ARFC 5-Day Core 19.77 11.91 9.4 3
ARFC 14-Day Core 18.28 0.59 9.4 2
ARFC 5-Day Pan 18.76 1.46E-05 9.4 3
ARFC 14-Day Pan 18.77 0.31 9.4 2
P-Value 0.71
F-statistic 0.54
F-critical 3.84
5. Results and Analysis
5.1 Compaction and Preparation
Comparison of gyratory compaction data indicated that there is a significant increase in
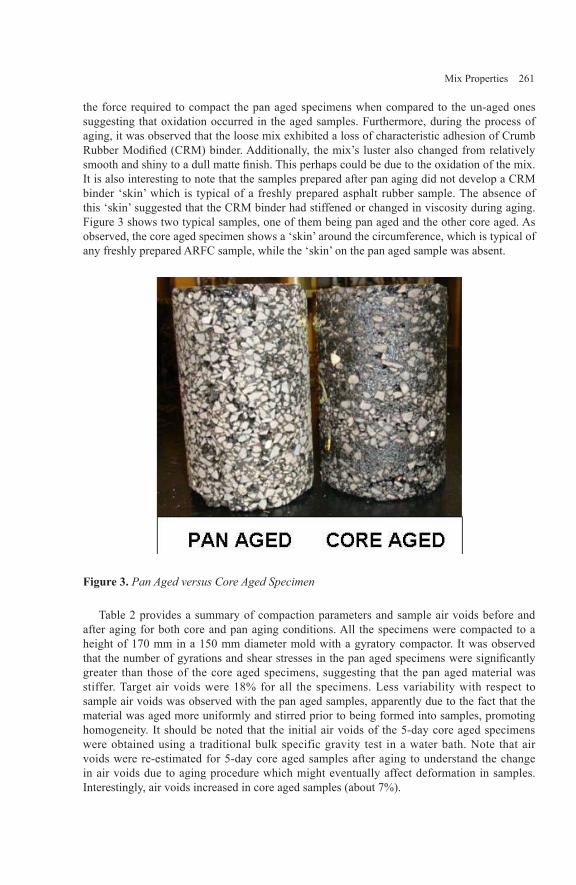
Mix Properties 261
the force required to compact the pan aged specimens when compared to the un-aged ones suggesting that oxidation occurred in the aged samples. Furthermore, during the process of aging, it was observed that the loose mix exhibited a loss of characteristic adhesion of Crumb Rubber Modified (CRM) binder. Additionally, the mix’s luster also changed from relatively smooth and shiny to a dull matte finish. This perhaps could be due to the oxidation of the mix. It is also interesting to note that the samples prepared after pan aging did not develop a CRM binder ‘skin’ which is typical of a freshly prepared asphalt rubber sample. The absence of this ‘skin’ suggested that the CRM binder had stiffened or changed in viscosity during aging. Figure 3 shows two typical samples, one of them being pan aged and the other core aged. As observed, the core aged specimen shows a ‘skin’ around the circumference, which is typical of any freshly prepared ARFC sample, while the ‘skin’ on the pan aged sample was absent.
Figure 3. Pan Aged versus Core Aged Specimen
Table 2 provides a summary of compaction parameters and sample air voids before and after aging for both core and pan aging conditions. All the specimens were compacted to a height of 170 mm in a 150 mm diameter mold with a gyratory compactor. It was observed that the number of gyrations and shear stresses in the pan aged specimens were significantly greater than those of the core aged specimens, suggesting that the pan aged material was stiffer. Target air voids were 18% for all the specimens. Less variability with respect to sample air voids was observed with the pan aged samples, apparently due to the fact that the material was aged more uniformly and stirred prior to being formed into samples, promoting homogeneity. It should be noted that the initial air voids of the 5-day core aged specimens were obtained using a traditional bulk specific gravity test in a water bath. Note that air voids were re-estimated for 5-day core aged samples after aging to understand the change in air voids due to aging procedure which might eventually affect deformation in samples. Interestingly, air voids increased in core aged samples (about 7%).

262 Asphalt-Rubber 2009
Table 2. Summary of Compaction and Sample Air Voids for Core and Pan Aged Conditions
Aging Condition 5-Day Core 14-Day Core 5-Day Pan 14-Day Pan
Number of Samples 3 2 3 2Avg. Number of Gyrations 67 85 88
Avg. Shear Stress, kPa 543 545 618 630Avg. Initial Air Voids, % 19.77 18.83 18.76 18.70
Table 3 provides changes in lateral dimensions of 5-day core aged samples before and after aging. It can be seen that the first sample experienced significant changes in height and width whereas the other two samples experienced minor dimensional changes. During physical observation of the specimens, sample number 1 showed some slumping inside of its mesh cage. This was possibly due to its high initial air voids as seen in the table. Additionally, the other two samples showed similar increase in air voids despite a lack of deformation during aging. This can be attributed to the loss of lighter oils from the rubber particles in the asphalt. Generally, crumb rubber inclusions absorb and store the oils in the asphalt and transform the hard rubber into a relatively soft and fluffy material. Therefore, during the aging process, the asphalt binder film thickness decreases, indicating the evaporation of the lighter oils from the rubber inclusions, which increases sample air voids as shown in Figure 4. Similarly, the loss of lighter oils during aging also explains the absence of the ‘skin’ on the samples made out of pan aged mix, because the CRM binder revert to a hardened state. This eventually leads to a sample that looks dry on the outside (Figure 3).
Binder in anUnaged State
Binder in anAged State
Figure 4. Increase of Air Voids Due to Aging and Decrease of Film Thickness
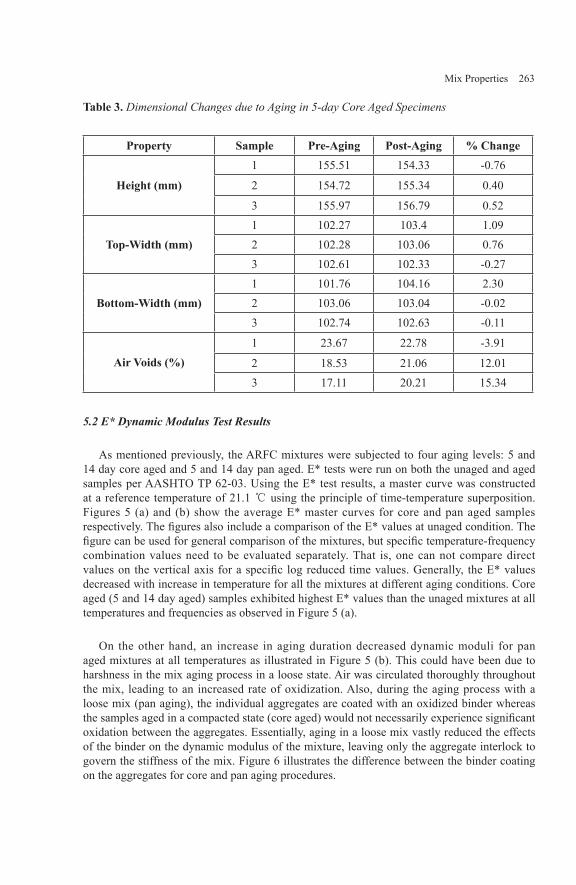
Mix Properties 263
Table 3. Dimensional Changes due to Aging in 5-day Core Aged Specimens
Property Sample Pre-Aging Post-Aging % Change
Height (mm)
1 155.51 154.33 -0.76
2 154.72 155.34 0.40
3 155.97 156.79 0.52
Top-Width (mm)1 102.27 103.4 1.092 102.28 103.06 0.763 102.61 102.33 -0.27
Bottom-Width (mm)1 101.76 104.16 2.302 103.06 103.04 -0.023 102.74 102.63 -0.11
Air Voids (%)1 23.67 22.78 -3.91
2 18.53 21.06 12.013 17.11 20.21 15.34
5.2 E* Dynamic Modulus Test Results
As mentioned previously, the ARFC mixtures were subjected to four aging levels: 5 and 14 day core aged and 5 and 14 day pan aged. E* tests were run on both the unaged and aged samples per AASHTO TP 62-03. Using the E* test results, a master curve was constructed at a reference temperature of 21.1 ℃ using the principle of time-temperature superposition. Figures 5 (a) and (b) show the average E* master curves for core and pan aged samples respectively. The figures also include a comparison of the E* values at unaged condition. The figure can be used for general comparison of the mixtures, but specific temperature-frequency combination values need to be evaluated separately. That is, one can not compare direct values on the vertical axis for a specific log reduced time values. Generally, the E* values decreased with increase in temperature for all the mixtures at different aging conditions. Core aged (5 and 14 day aged) samples exhibited highest E* values than the unaged mixtures at all temperatures and frequencies as observed in Figure 5 (a).
On the other hand, an increase in aging duration decreased dynamic moduli for pan aged mixtures at all temperatures as illustrated in Figure 5 (b). This could have been due to harshness in the mix aging process in a loose state. Air was circulated thoroughly throughout the mix, leading to an increased rate of oxidization. Also, during the aging process with a loose mix (pan aging), the individual aggregates are coated with an oxidized binder whereas the samples aged in a compacted state (core aged) would not necessarily experience significant oxidation between the aggregates. Essentially, aging in a loose mix vastly reduced the effects of the binder on the dynamic modulus of the mixture, leaving only the aggregate interlock to govern the stiffness of the mix. Figure 6 illustrates the difference between the binder coating on the aggregates for core and pan aging procedures.
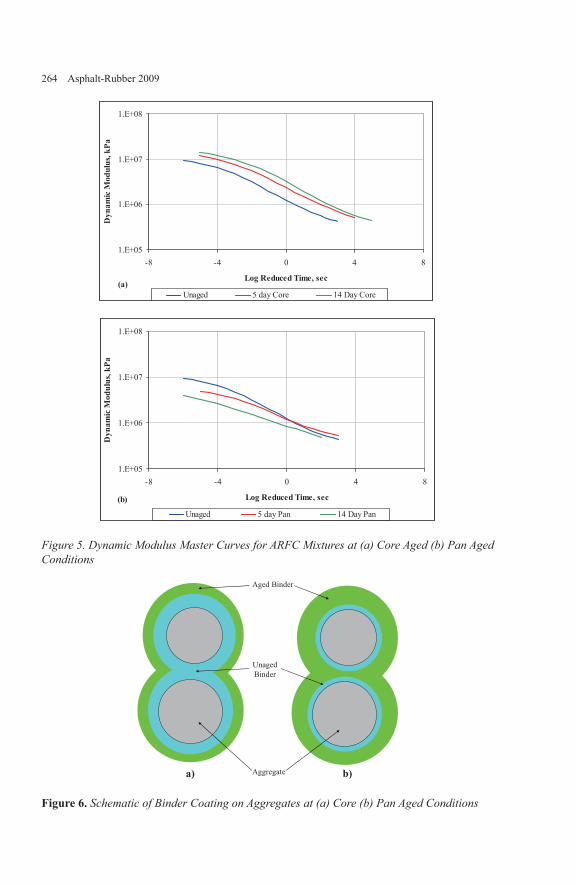
264 Asphalt-Rubber 2009
1.E+05
1.E+06
1.E+07
1.E+08
-8 -4 0 4 8
Log Reduced Time, sec
Dyn
amic
Mod
ulus
,kPa
Unaged 5 day Core 14 Day Core(a)
1.E+05
1.E+06
1.E+07
1.E+08
-8 -4 0 4 8
Log Reduced Time, sec
Dyn
amic
Mod
ulus
, kPa
Unaged 5 day Pan 14 Day Pan
(b)
Figure 5. Dynamic Modulus Master Curves for ARFC Mixtures at (a) Core Aged (b) Pan Aged Conditions
Aggregate
Aged Binder
UnagedBinder
)b)a
Figure 6. Schematic of Binder Coating on Aggregates at (a) Core (b) Pan Aged Conditions

Mix Properties 265
5.3 Modular Aging Ratios
As mentioned previously, one of the objectives of this research study was to establish relationships between unaged and aged mixtures through the development of modular aging ratios. Modular aging ratio aids in understanding the effects of aging on the mixtures’ stiffness (here E* dynamic moduli) with respect to stiffness of a control (unaged) mix. Modular aging ratio (MAR) is given by the following equation:
CONTROL
AGED
EE
MAR*
*= (1)
Where:MAR = Modular Aging RatioE*AGED = E* Dynamic Modulus for the aged mixtureE*CONTROL = E* Dynamic Modulus for the unaged mixture
MAR for core aged samples at both 5 and 14 day aging conditions were calculated for each E* test temperature and frequency. Figure 7 presents the relationship between temperature and MAR for each aging condition for ARFC mixture. As observed from the figure, MAR increased with increase in temperature. A higher MAR would indicate an increase in aging effects, especially at higher temperatures. One would desire to have a higher modulus value at high temperatures to avoid rutting, and at the same time, a lower modulus value at low temperatures to counter cracking potential. Along with an increase in E* values at all temperatures for different aging durations, a greater increase in MAR also was observed at higher temperatures relative to lower temperatures. This is indicative of mixture’s significant resistance to rutting. An increase in MAR (about 30-50%) at low temperatures indicates the stiffening of the mixture due to aging. Nevertheless, with limited data and analyses undertaken in this study, one may expect a considerable significant decrease in thermal cracking resistance of ARFC mixtures with aging. Note that the sensitivity of the change in MAR is ongoing.
1.0
1.2
1.4
1.6
1.8
2.0
2.2
2.4
2.6
-10.0 0.0 10.0 20.0 30.0 40.0
Temperature, °C
Mod
ular
Agi
ngR
atio
5-Day Core 14-Day Core
Figure 7. Modular Aging Ratio for ARFC, Core Aged

266 Asphalt-Rubber 2009
6. Conclusions
The main objective of this study was to investigate the laboratory aging characteristics of Asphalt Rubber Friction Course (ARFC) mixtures by using the E* Dynamic Modulus test, while simultaneously attempting to identify the applicability of the current laboratory aging methodology to ARFC mixtures. Additionally, the relationships between unaged and aged mixtures were established through the development of modular aging ratios.
The experimental program in this study included preparation of an ARFC mix and subject them to two aging durations (5 and 14 day) for each of the two aging procedures in addition to control samples not subjected to aging (unaged condition). Samples were prepared using field mixtures to evaluate laboratory aging performance characteristics. Currently, laboratory aging of asphalt mixtures is carried out under the SHRP-A-417 test protocol (SHRP-A-417). In this study, the standard SHRP-A-417 aging protocol was followed but an additional level of aging was introduced. Therefore, the samples were aged for a period of 5 days conforming to the protocol as well as 14 days that was additionally used. Also, a confining mesh was used to prevent damage to the specimens, which is not a provision in the protocol. In another method, the mix was aged in a loose state and the aged mix was used to prepare test specimens. The purpose of this method was to age the mix as homogeneously as possible.
Comparison of gyratory compaction data indicated that there is a significant increase in the force required to compact the pan aged specimens when compared to the un-aged ones suggesting that oxidation occurred in the aged samples. Additionally, it was observed that the number of gyrations and shear stresses in the pan aged specimens were significantly greater than those of the core aged specimens, suggesting that the pan aged material was stiffer.
. E* dynamic modulus tests were run on both the unaged and aged samples per AASHTO TP 62-03. E* master curves were constructed for all the mixtures. Generally, the E* values decreased with increase in temperature for all the mixtures at different aging conditions. Core aged (5 and 14 day aged) samples exhibited highest E* values than the unaged mixtures at all temperatures and frequencies. On the other hand, an increase in aging duration decreased dynamic moduli for pan aged mixtures at all temperatures. This could have been due to harshness in the mix aging process in a loose state.
Relationships between unaged and aged mixtures were established through the development of modular aging ratios (MAR). MAR increased with increase in temperature for all mixtures. A higher MAR would indicate an increase in aging effects, especially at higher temperatures. Along with an increase in E* values at all temperatures for different aging durations, a greater increase in MAR also was observed at higher temperatures relative to lower temperatures. This is indicative of mixture’s significant resistance to rutting. An increase in MAR (about 30-50%) at low temperatures indicates the stiffening of the mixture due to aging.
The pan aging loose mix appears to have not been a reasonable method to simulate field aging due to the aging of the binder film surrounding each individual aggregate. This resulted in limited cohesion between aggregates, resulting in the aggregate interlock governing the dynamic modulus of the mixture. It is the opinion of the authors that this aging method does not accurately model long term aging in the field. The SHRP-A-417 procedure with some
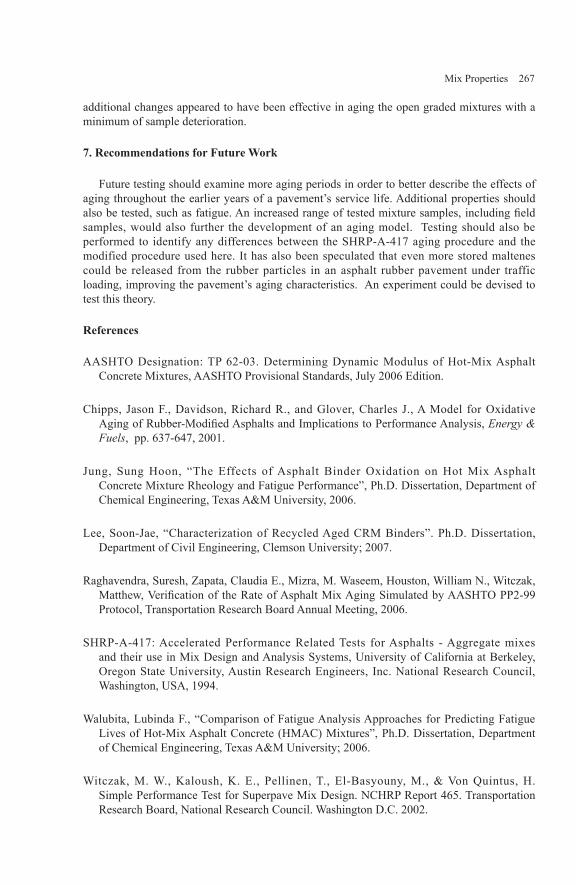
Mix Properties 267
additional changes appeared to have been effective in aging the open graded mixtures with a minimum of sample deterioration.
7. Recommendations for Future Work
Future testing should examine more aging periods in order to better describe the effects of aging throughout the earlier years of a pavement’s service life. Additional properties should also be tested, such as fatigue. An increased range of tested mixture samples, including field samples, would also further the development of an aging model. Testing should also be performed to identify any differences between the SHRP-A-417 aging procedure and the modified procedure used here. It has also been speculated that even more stored maltenes could be released from the rubber particles in an asphalt rubber pavement under traffic loading, improving the pavement’s aging characteristics. An experiment could be devised to test this theory.
References
AASHTO Designation: TP 62-03. Determining Dynamic Modulus of Hot-Mix Asphalt Concrete Mixtures, AASHTO Provisional Standards, July 2006 Edition.
Chipps, Jason F., Davidson, Richard R., and Glover, Charles J., A Model for Oxidative Aging of Rubber-Modified Asphalts and Implications to Performance Analysis, Energy & Fuels, pp. 637-647, 2001.
Jung, Sung Hoon, “The Effects of Asphalt Binder Oxidation on Hot Mix Asphalt Concrete Mixture Rheology and Fatigue Performance”, Ph.D. Dissertation, Department of Chemical Engineering, Texas A&M University, 2006.
Lee, Soon-Jae, “Characterization of Recycled Aged CRM Binders”. Ph.D. Dissertation, Department of Civil Engineering, Clemson University; 2007.
Raghavendra, Suresh, Zapata, Claudia E., Mizra, M. Waseem, Houston, William N., Witczak, Matthew, Verification of the Rate of Asphalt Mix Aging Simulated by AASHTO PP2-99 Protocol, Transportation Research Board Annual Meeting, 2006.
SHRP-A-417: Accelerated Performance Related Tests for Asphalts - Aggregate mixesand their use in Mix Design and Analysis Systems, University of California at Berkeley, Oregon State University, Austin Research Engineers, Inc. National Research Council, Washington, USA, 1994.
Walubita, Lubinda F., “Comparison of Fatigue Analysis Approaches for Predicting FatigueLives of Hot-Mix Asphalt Concrete (HMAC) Mixtures”, Ph.D. Dissertation, Department of Chemical Engineering, Texas A&M University; 2006.
Witczak, M. W., Kaloush, K. E., Pellinen, T., El-Basyouny, M., & Von Quintus, H.Simple Performance Test for Superpave Mix Design. NCHRP Report 465. Transportation Research Board, National Research Council. Washington D.C. 2002.


Mix Properties 269
Evaluating Permanent Deformation in Asphalt Rubber Mixtures
Liseane P.T.L. Fontes* — Glicério Trichês*— Jorge C. Pais** — Paulo A.A. Pereira**
* University Federal of Santa CatarinaDepartment of Civil EngineeringFlorianópolis, SC, [email protected] [email protected]
** University of MinhoDepartment of Civil Engineering, Campus of Azurém4800-058 Guimarães, [email protected]@civil.uminho.pt
ABSTRACT. Permanent deformation or rutting, one of the most important distresses in flexible pavements, has long been a problem in asphalt mixtures. Throughout the years, researchers have used different test methods to estimate the performance of asphalt mixtures in relation to rutting. One of the alternatives to reduce permanent deformation in asphalt pavement layers is through the use of mixtures produced with asphalt rubber. This work aims at comparing the performance of a conventional dense graded mixture and that of asphalt rubber mixtures (dense and gap graded) in what respects to rutting. The asphalt rubber mixtures were produced by the wet process (continuous blend at laboratory and tire rubber-modified asphalt binder at an industrial plant). To study their performance, two laboratory tests, the Repeated Simple Shear Test at Constant Height (RSST-CH) and the Accelerated Pavement Testing Simulator test (wheel tracking) were carried out. The results from this study showed that asphalt rubber mixtures can be an alternative to minimize permanent deformation in asphalt pavement layers and that the resilience of asphalt rubber binders can be an indicator of that performance.
KEYWORDS: Permanent Deformation, Asphalt Rubber, RSST-CH, Wheel Tracking.
270 Asphalt-Rubber 2009
1. Introduction
Waste tires constitute a serious environmental problem that many countries have to face as they accumulate rapidly and they are not easily disposed of. The use of crumb rubber from waste tires in asphalt, what has given origin to the term asphalt rubber, has been an alternative to minimize their ecological impact and, simultaneously, to improve the mechanical properties of the asphalt mixtures.
Processing scrap tires into crumb rubber can be accomplished through two main types of technology: (i) ambient grinding; (ii) cryogenic grinding. In the ambient ground-rubber processing, scrap tire rubber is ground or processed at or above ordinary room temperature. Cryogenic processing uses liquid nitrogen to freeze tire chips or rubber particles prior to size reduction (-120℃). A very fine ground crumb rubber modifier is typically used in crumb rubber asphalt (Baker et al., 2003).
There are two processes through which crumb rubber can be added into asphalt: a) through the dry process and b) through the wet process. In the dry process, the crumb rubber is mixed together with the aggregates prior to the addition of the asphalt. In this process, the crumb rubber is used as an aggregate.
The wet process includes any method by which crumb rubber is blended with conventional asphalt before incorporating the binder into the asphalt paving materials. Asphalt rubber binders result from the chemical reaction of a mix of liquid asphalt binder with 15 to 22% crumb rubber obtained from used tires and added to liquid asphalt. It reacts at high temperatures prior to being mixed with the aggregate. Potential benefits of asphalt rubber binders obtained through the wet process include: a) improvement of the fatigue life of a pavement; b) enhanced resistance to permanent deformation; c) reduction of crack propagation when compared to other binders (Caltrans, 2003).
This work intends to evaluate the performance of gap and dense graded mixtures, containing asphalt rubber binders, prepared through the wet processes (continuous blend and tire rubber-modified asphalt binder) and crumb rubber obtained from the cryogenic and ambient processes in relation to permanent deformation. The behaviour of asphalt rubber mixtures was compared to the performance of that of a conventional mixture. The tests were carried out through two rutting tests, such as the RSST-CH (Repeated Simple Shear Test at Constant Height) and the Accelerated Pavement Testing Simulator (wheel tracking).
2. Permanent deformation in asphalt pavements
The permanent deformation (rutting) of asphalt pavements has a major impact on the performance of a pavement. Rutting reduces not only the useful service life of pavements, but it may also affect basic vehicle handling manoeuvres, what can be hazardous to highway users. Rutting develops gradually as the number of load applications increases. Rutting appears as longitudinal depressions in the wheel paths and small upheavals to the sides. It is caused by a combination of densification and shear deformation. These depressions or ruts are important for at least two reasons: i) if the surface is impervious, the ruts trap water causing hydroplaning what is extremely dangerous, particularly for passenger cars; ii) as the ruts

Mix Properties 271
progress in depth, steering becomes increasingly more difficult, posing some added safety concerns (Sousa et al., 1991).
Zaniewski et al. (2003) asserted that densification is the further compaction of asphalt mixture pavements by traffic after construction. When compaction is poor, the channelized traffic provides a repeated kneading action in the wheel track areas and completes the consolidation. A substantial amount of rutting can occur if thick layers of asphalt are consolidated by traffic.
The lateral plastic flow of the asphalt mixtures due to wheel tracks results in rutting. The use of excessive asphalt cement in the mix causes the loss of internal friction between the aggregate particles, what provokes that traffic loads are supported by the asphalt cement rather than by the aggregate structure. Plastic flow can also occur due to a lack of angularity of the aggregates and to an insufficient surface texture that is needed for inter-particle friction. Plastic flow can be minimized by using large size aggregates, angular and rough textured coarse and fine aggregate and stiffer binders, as well as by providing suitable compaction during construction (Roberts et al., 1996).
Additionally, for the assessment of the rut depth it is also necessary to recognize the evolution of the void content in a pavement asphalt layer. When the air-void content drops below 2-3%, the binder acts as a lubricant between the aggregates and reduces point-to-point contact pressures. Permanent deformation of asphalt aggregate mixes is strongly controlled by the plastic component due to the aggregate skeleton. This causes permanent deformation changes either in volume or in shear, what mostly occurs in hotter days or because of heavy loads (Sousa et al., 1994).
Asphalt cements behave like viscous liquids and flow under hot conditions or under sustained loads. Viscous liquids, such as hot asphalts, are sometimes called plastic because, once they start flowing, they do not return to their original position. This is why, in hot weather, some asphalt pavements flow under repeated wheel loads and wheel path ruts appear. However, rutting in asphalt pavements during hot weather is also influenced by the properties of the aggregates and it is probably more correct to say that the asphalt mixture is behaving like a plastic mixture (FHWA, 1994).
According to Bennert et al. (2004), the addition of crumb rubber to asphalt mixtures and the proper design and field implementation of the asphalt rubber mixtures generally expand the working range of the conventional mixtures providing:
Reduction of rutting at high temperatures;
Reduction of fatigue cracking at intermediate temperatures;
Reduction of thermal cracking;
Minimization of the potential for age hardening.
-
-
-
-

272 Asphalt-Rubber 2009
At high temperatures, the asphalt binder tends to flow easier due to the natural decrease of viscosity associated with higher temperatures. This condition creates a “softer” asphalt mixture, which is prone to rutting. The addition of crumb rubber to the asphalt mixture provides extra viscosity, what contributes to the stiffening of the HMA at higher temperatures (Takallou et al., 1997).
Asphalt rubber mixtures generally have a greater fatigue life due to the higher binder contents and higher rutting resistance caused by their higher binder viscosity. They are also generally more permeable than conventional mixes, what reduces the splash and spray during periods of rain (Hicks, 2002).
In the last years some laboratorial tests, like the Wheel Tracking, the Uniaxial Cyclic Compression, the Triaxial test and the Repeated Shear at Constant Height have been used to study permanent deformation in asphalt mixtures (Brown et al., 2001).
3. Mixtures characterization
3.1. Materials characterized in laboratory
Two types of rubber, obtained through the ambient and the cryogenic processes, were used to produce the asphalt rubber binders for this work. In the ambient process the rubber from the tires are size reduced at an ambient temperature. In the cryogenic process liquid nitrogen is used to freeze (in general below 120℃) tire chips or rubber particles prior to size reduction.
Besides the size, the main difference between ambient and cryogenic rubber is the morphology of the particles. Rubber particles from the ambient process generally have a porous or fluffy appearance, whereas when produced by the cryogenic process, the surface of the particles is glasslike (Baker et al., 2003).
The gradation analysis was carried out in accordance with the requirements of the ASTM C 136, amended by the Greenbook (2000) recommendations. The rubber gradations followed the Arizona Department of Transportation (ADOT) requirements type B (ADOT A-R Specifications, Section 1009, 2005), as presented in Table 1.
Table 1. ADOT A-R specifications and rubber gradations
Sieves(mm)
ADOT A-R(% passing)
Ambient(% passing)
Cryogenic(% passing)
2,00 100 – 100 100 1001,18 65 – 100 99 990,60 20 – 100 96 900,30 0 – 45 44 200,075 0 – 5 4 3

Mix Properties 273
Four asphalt rubbers were produced using ambient and cryogenic rubbers. 50/70 and 35/50 pen asphalts were used to produce the asphalt rubber binders. The asphalt rubber produced by the continuous process in laboratory had the following formulation: (i) mixing temperature: 180℃; (ii) digestion time: 90 minutes; (iii) rubber content: 21%. The tire rubber-modified asphalt binders were produced at an industrial plant, considering two different formulations: (i) rubber content: 20%; (ii) rubber content: 15%. Table 2 presents the designations and the summary of each asphalt rubber.
Table 2. Asphalt rubber features
Designation Base asphalt Rubber type Rubber content (%) ProcessARCB1 35/50 pen cryogenic 21 tire rubber-modifiedARCB2 35/50 pen ambient 21 tire rubber-modifiedARTB1 50/70 pen ambient 20 tire rubber-modifiedARTB2 50/70 pen ambient 15 tire rubber-modified
The asphalt rubber binders were characterized by the following tests: (i) penetration; (ii) softening point (ring and ball test); (iii) resilience; (iv) apparent viscosity. The hardening properties were also evaluated using the Rolling Thin-Film Oven Test (RTFOT). As a conventional asphalt 50/70 pen (ACO) was used to produce the conventional mixture, this binder was tested as well. The results of the asphalt characterization tests can be observed in Figure 1. Table 3 presents the results of RTFOT.
01020304050607080
ARCB1 ARCB2 ARTB1 ARTB2 ACOPene
trat
ion
(0,0
1m
m);
Softe
ning
poin
t(ºC
);R
esili
ence
(%)
050010001500200025003000350040004500
App
aren
t visc
osity
(cP )
Penetration Softening point Resilience Apparent viscosity
Figure 1. Characterization tests of the asphalts
Table 3. Results of RTFOT (ASTM D2872)
RTFOT 163℃, 85 minutes ARTB1 ARTB2 ARCB1 ARCB2 ACOChange of mass (%) 0,3 0,3 0,9 0,2 0,3
Softening point elevation (℃) 1,0 2,9 17,2 11,2 4,3Penetration 25℃, 100g, 5s (0,1 mm) 28,8 25,3 15,5 19,5 22,3
Apparent viscosity* (cP), 175℃ 5350 1962 3025 8813 95,8Retained penetration (%) 72,0 60,2 92,2 99,0 43,3
* Brookfield viscometer, spindle number 27, 20 rpm.

274 Asphalt-Rubber 2009
The asphalt rubber binders produced by the continuous blend (ARCB1 and ARCB2) with 35/50 pen asphalt presented a higher softening point temperature than the tire rubber-modified asphalt binders (ARTB1 and ARTB2). The amount of crumb rubber did not influence these results. The same conclusion was drawn in relation to resilience. As expected, the conventional asphalt (ACO) presented a lower softening point and resilience, what indicates that this type of asphalt could produce mixtures with great thermal susceptibility at high temperatures and lesser elastic properties. The ARTB2 presented lower apparent viscosity, followed by ARCB1 and ARTB1. The ARCB2 showed the highest viscosity.
3.2. Mixtures and specimens
Asphalt rubber mixtures were produced using dense and gap gradations whereas the conventional mix was produced with a dense graded, as presented in Table 4. The binder content of the mixtures was evaluated according to the Marshall method. Figure 2 presents the gradation curves of the studied mixtures.
Table 4. Binder and void content of the asphalt mixtures
Name Asphalt Gradation Binder content (%) Void content (%)MGTB1 ARTB1 gap 8,5 6,0MDTB2 ARTB2 dense 7,0 5,0MGCB1 ARCB1 gap 8,0 6,0MDCB2 ARCB2 dense 7,0 5,0MDCO 50/70 pen dense 5,5 4,0
0102030405060708090
100
0,01 0,1 1 10 100Sieves size (mm)
%pa
ssin
g
ConventionalCaltrans (ARHM-GG)
Dense graded
Figure 2. Aggregate gradation of studied mixtures
The dense asphalt rubber mixtures follow the aggregate gradation defined by the Asphalt Institute (mix type IV) in The Asphalt Handbook MS – 4, whereas the gap graded asphalt rubber mixtures follow that defined by the California Department of Transportation (Caltrans)
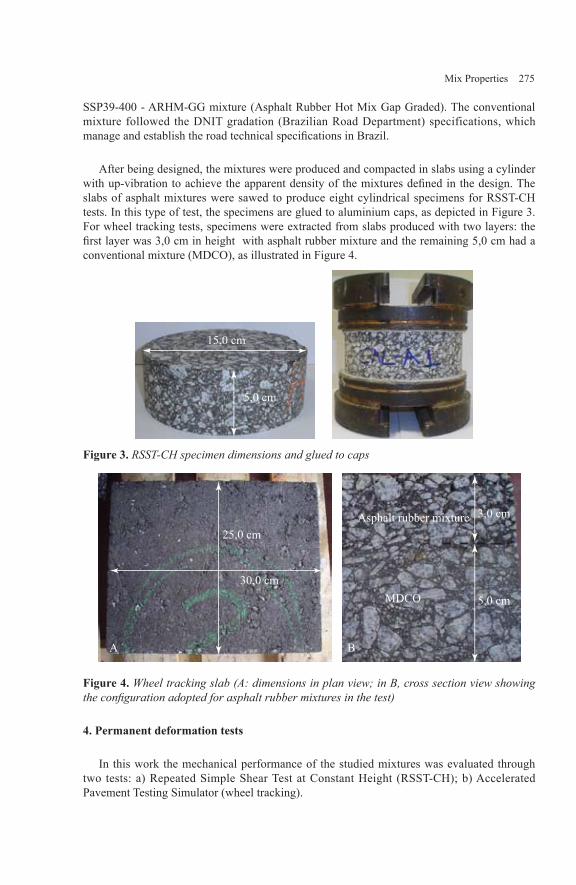
Mix Properties 275
SSP39-400 - ARHM-GG mixture (Asphalt Rubber Hot Mix Gap Graded). The conventional mixture followed the DNIT gradation (Brazilian Road Department) specifications, which manage and establish the road technical specifications in Brazil.
After being designed, the mixtures were produced and compacted in slabs using a cylinder with up-vibration to achieve the apparent density of the mixtures defined in the design. The slabs of asphalt mixtures were sawed to produce eight cylindrical specimens for RSST-CH tests. In this type of test, the specimens are glued to aluminium caps, as depicted in Figure 3. For wheel tracking tests, specimens were extracted from slabs produced with two layers: the first layer was 3,0 cm in height with asphalt rubber mixture and the remaining 5,0 cm had a conventional mixture (MDCO), as illustrated in Figure 4.
Figure 3. RSST-CH specimen dimensions and glued to caps
Figure 4. Wheel tracking slab (A: dimensions in plan view; in B, cross section view showing the configuration adopted for asphalt rubber mixtures in the test)
4. Permanent deformation tests
In this work the mechanical performance of the studied mixtures was evaluated through two tests: a) Repeated Simple Shear Test at Constant Height (RSST-CH); b) Accelerated Pavement Testing Simulator (wheel tracking).
15,0 cm
15,0 cm
5,0 cm
25,0 cm
30,0 cm
Asphalt rubber mixture 3,0 cm
MDCO 5,0 cm
A B

276 Asphalt-Rubber 2009
4.1. Repeated simple shear test at constant height (RSST-CH)
Shear deformations in pavements that have been appropriately compacted, caused primarily by large shear stresses in the upper portions of the asphalt-aggregate layer(s), are frequent (Sousa et al., 1991). Repetitive loading in the shear is required in order to accurately measure the influence of the mixture composition on permanent deformation resistance in laboratory. As the rate at which permanent deformation accumulates increases rapidly at higher temperatures, laboratory testing must be conducted at temperatures that simulate the highest levels expected in the paving mixture in service (Sousa et al., 1994).
The RSST-CH test applies a repeated haversine shear stress of 1218 N to test cylindrical specimens. The applied load has a duration of 0,1 seconds, with an unload time of 0,6 seconds. The test follows the AASHTO TP7-01 Test Procedure C. The results of the RSCH-CH test are expressed in terms of number of passes of the equivalent standard axle load of 80 kN (ESAL 80 kN) as a function of the number of applied load cycles in the RSST-CH. The RSST-CH equipment is presented in Figure 5 (left side).
Figure 5. RSST-CH and Wheel tracking equipments
4.2. Accelerated pavement testing simulator (wheel tracking)
Wheel tracking is used to assess the permanent deformation resistance of asphalt mixtures under conditions which simulate the effect of traffic. A loaded wheel tracks a specimen under specified conditions of load, speed and temperature, while the development of the rut profile is monitored and continuously measured during the test.
The equipment used in this work is presented in Figure 5 (right side) and consists of a wheel that moves forward and backward (frequency of 1 Hz) and of a device that monitors the rate at which a rut develops on the surface of the test specimen. The deformation is measured in established intervals of time, until 120 minutes.
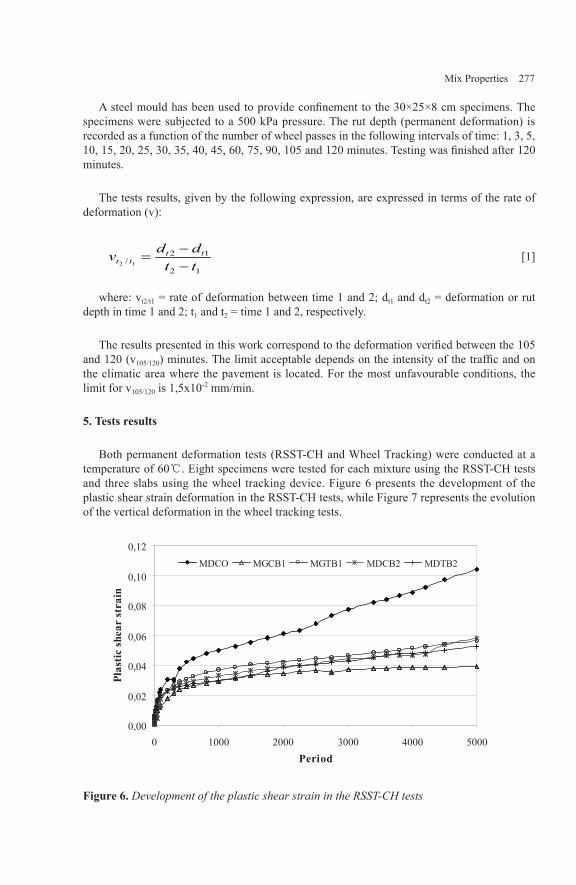
Mix Properties 277
A steel mould has been used to provide confinement to the 30×25×8 cm specimens. The specimens were subjected to a 500 kPa pressure. The rut depth (permanent deformation) is recorded as a function of the number of wheel passes in the following intervals of time: 1, 3, 5, 10, 15, 20, 25, 30, 35, 40, 45, 60, 75, 90, 105 and 120 minutes. Testing was finished after 120 minutes.
The tests results, given by the following expression, are expressed in terms of the rate of deformation (v):
12
12/ 12 tt
ddv tttt −
−= [1]
where: vt2/t1 = rate of deformation between time 1 and 2; dt1 and dt2 = deformation or rut depth in time 1 and 2; t1 and t2 = time 1 and 2, respectively.
The results presented in this work correspond to the deformation verified between the 105 and 120 (v105/120) minutes. The limit acceptable depends on the intensity of the traffic and on the climatic area where the pavement is located. For the most unfavourable conditions, the limit for v105/120 is 1,5x10⁻² mm/min.
5. Tests results
Both permanent deformation tests (RSST-CH and Wheel Tracking) were conducted at a temperature of 60℃. Eight specimens were tested for each mixture using the RSST-CH tests and three slabs using the wheel tracking device. Figure 6 presents the development of the plastic shear strain deformation in the RSST-CH tests, while Figure 7 represents the evolution of the vertical deformation in the wheel tracking tests.
0,00
0,02
0,04
0,06
0,08
0,10
0,12
0 1000 2000 3000 4000 5000Period
Plas
ticsh
ear
stra
in
MDCO MGCB1 MGTB1 MDCB2 MDTB2
Figure 6. Development of the plastic shear strain in the RSST-CH tests

278 Asphalt-Rubber 2009
0
1
2
3
4
5
6
7
8
9
0 20 40 60 80 100 120
Def
orm
atio
n(m
m)
Time (minutes)
MDCO MDTB2 MGCB1 MGTB1 MDCB2
Figure 7. Evaluation of the deformation in the wheel tracking test
In both tests, the results showed that the conventional mixture (MDCO) presents the highest deformation and, therefore, the lowest resistance to permanent deformation, whereas asphalt rubber mixtures show more permanent deformation resistance. Most of the permanent deformation occurs at the first loading cycles during which the permanent deformation develops exponentially. After the first phase of tests, the permanent deformation increases gradually, as it can be observed in Figures 6 and 7.
The RSST-CH results, expressed in terms of number of cycles of the equivalent standard axle (ESAL 80 kN), are presented in Figure 8. The wheel tracking test results, expressed in terms of rate of deformation (v105/120) of the slabs, are presented in Figure 9.
1E+03
1E+04
1E+05
1E+06
1E+07
MDCO MGTB1 MDCB2 MDTB2 MGCB1
ESA
L(8
0kN
)
Figure 8. RSST-CH test results

Mix Properties 279
0,00E+00
5,00E-03
1,00E-02
1,50E-02
2,00E-02
2,50E-02
3,00E-02
3,50E-02
4,00E-02
4,50E-02
MDCB2 MGCB1 MDTB2 MGTB1 MDCO
Ave
rage
v105
/120
(mm
/min
)
Figure 9. Wheel tracking test results
The results obtained from the RSST-CH allow to draw the following conclusions: i) an asphalt rubber binder improves the resistance to permanent deformation in comparison to the conventional one; ii) the MGCB1 (gap graded with continuous blend binder) presented the better performance; iii) the best tire rubber-modified asphalt binder mixture (MDTB2) is the one with the dense aggregate gradation curve; iv) the conventional mixture MDCO exhibited poor rutting performance; v) the mixtures prepared with continuous blend asphalt rubber performed very well independently of the type of rubber (MGCB1 and MDCB2); vi) the gap graded gradation provides rutting resistance, in spite of the fact that the MGCB1 had higher binder and void content.
The results of the wheel tracking tests confirmed that the conventional mixture MDCO presented a lower resistance to permanent deformation. The asphalt rubber binder improved significantly the resistance to rutting. , Except for the MGTB1 (tire rubber-modified asphalt binder and gap graded gradation) asphalt rubber mixtures exhibit identical performance. Mixtures with continuous blend binders (MGCB1 and MDCB2) presented the highest resistance.
The comparison between both tests is illustrated in Figure 10, from which it can be concluded that a linear trend, in log-log scale, exists between both tests. Mixtures with low resistance to permanent deformation in the RSST-CH test exhibit high deformation in the wheel tracking test. Mixtures with low deformation in the wheel tracking test exhibit high permanent deformation resistance in the RSST-CH test. The trend line presented in this case perfectly follows four of the five mixtures tested.
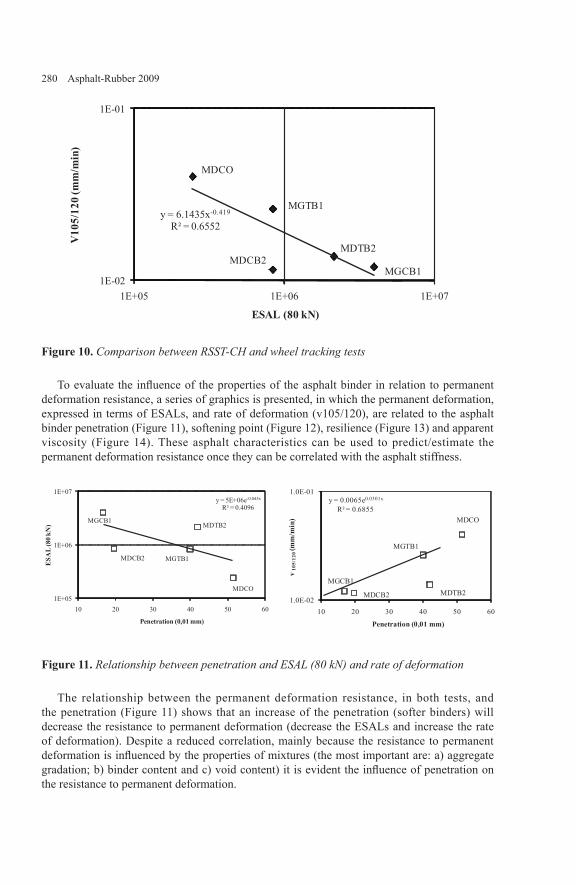
280 Asphalt-Rubber 2009
MDCO
MGTB1
MDCB2MDTB2
MGCB1
y = 6.1435x-0.419
R² = 0.6552
1E-02
1E-01
1E+05 1E+06 1E+07
V10
5/12
0(m
m/m
in)
ESAL (80 kN)
Figure 10. Comparison between RSST-CH and wheel tracking tests
To evaluate the influence of the properties of the asphalt binder in relation to permanent deformation resistance, a series of graphics is presented, in which the permanent deformation, expressed in terms of ESALs, and rate of deformation (v105/120), are related to the asphalt binder penetration (Figure 11), softening point (Figure 12), resilience (Figure 13) and apparent viscosity (Figure 14). These asphalt characteristics can be used to predict/estimate the permanent deformation resistance once they can be correlated with the asphalt stiffness.
MGCB1MDTB2
MGTB1MDCB2
MDCO
y = 5E+06e-0.045x
R² = 0.4096
1E+05
1E+06
1E+07
10 20 30 40 50 60
ESA
L(8
0kN
)
Penetration (0,01 mm)
MGCB1MDTB2
MGTB1
MDCB2
MDCO
y = 0.0065e0.0301x
R² = 0.6855
1.0E-02
1.0E-01
10 20 30 40 50 60
v10
5/12
0(m
m/m
in)
Penetration (0,01 mm)
Figure 11. Relationship between penetration and ESAL (80 kN) and rate of deformation
The relationship between the permanent deformation resistance, in both tests, and the penetration (Figure 11) shows that an increase of the penetration (softer binders) will decrease the resistance to permanent deformation (decrease the ESALs and increase the rate of deformation). Despite a reduced correlation, mainly because the resistance to permanent deformation is influenced by the properties of mixtures (the most important are: a) aggregate gradation; b) binder content and c) void content) it is evident the influence of penetration on the resistance to permanent deformation.

Mix Properties 281
MDCOMGTB1 MDCB2
MDTB2
MGCB1
y = 4909.7e0.0823x
R² = 0.4324
1E+05
1E+06
1E+07
50 55 60 65 70 75
ESA
L(8
0kN
)
Softening point (ºC)
MDCO
MGTB1
MDCB2MDTB2
MGCB1
y = 0.6265e-0.054x
R² = 0.6941
1.0E-02
1.0E-01
50 55 60 65 70 75
v10
5/12
0(m
m/m
in)
Softening point (ºC)
Figure 12. Relationship between the softening point and ESAL (80 kN) and the rate of deformation
The analysis of Figure 12 allows concluding that the softening point can be an indicator of the permanent deformation behaviour. It is noticeable that asphalts with a high softening point make mixtures with better resistance to permanent deformation, expressed in terms of low rate of deformation and high resistance to plastic deformation in the RSST-CH test. In general, a high softening point conducts to an enhanced resistance to permanent deformation.
MDCO 1
MGTB1
MGCB1
MDCB2
MDTB2
y = 312575e0.0383x
R² = 0.5676
1E+05
1E+06
1E+07
0 10 20 30 40 50 60
ESA
L(8
0kN
)
Resilience (%)
MDCO
MGTB1
MGCB1MDCB2
MDTB2
y = 0.0407e-0.025x
R² = 0.8905
1.0E-02
1.0E-01
0 10 20 30 40 50 60
v10
5/12
0(m
m/m
in)
Resilience (%)
Figure 13. Relationship between resilience and ESAL (80 kN) and rate of deformation
The relationship between the resilience and the permanent deformation expressed in terms of ESALs and the rate of deformation allows concluding that the increase of the resilience enhances the resistance to permanent deformation.
MDCO
MDCB2
MGCB1
MGTB1
MDTB2
1E+05
1E+06
1E+07
0 1000 2000 3000 4000 5000
ESA
L(8
0kN
)
Apparent viscosity (cP)
MDCO
MGTB1
MGCB1MDTB2 MDCB2
y = 0.0333e-3E-04x
R² = 0.5748
1.0E-02
1.0E-01
0 1000 2000 3000 4000 5000
v10
5/12
0(m
m/m
in)
Apparent viscosity (cP)
Figure 14. Relationship between apparent viscosity and ESAL (80 kN) and rate of deformation

282 Asphalt-Rubber 2009
The analysis of the results presented in Figure 14 indicates that the apparent viscosity of the binder cannot be used as an indicator of resistance to permanent deformation.
The best correlation between the asphalt characteristics and the resistance to permanent deformation was obtained by the penetration and the resilience in the wheel tracking test. An adequate correlation was also obtained between the resistance to permanent deformation in the RSST-CH test and resilience, allowing to define the resilience as the best indicator for the resistance to permanent deformation of the asphalt mixtures.
6. Conclusions
The incorporation of crumb rubber recycled from waste tires to conventional asphalt, known as asphalt rubber binder, produces asphalt rubber mixtures which have proven to be a great alternative to minimize permanent deformation in asphalt pavement layers.
In this work, the performance in relation to permanent deformation of four asphalt rubber mixtures and that of a conventional mixture were evaluated. The mixtures were tested by using: i) The repeated Simple Shear Test at Constant Height (RSST-CH); ii) the Accelerated Pavement Testing Simulator (wheel tracking). The tests were conducted at a temperature of 60℃ to simulate the worst climate conditions to which the mixtures are subjected when applied in pavement rehabilitation in the South of Brazil.
The RSST-CH results showed that asphalt rubber mixtures improved their resistance to permanent deformation in relation to that of a conventional mixture, independently from the type of asphalt rubber or gradation adopted. The conventional mixture presented a poor rutting performance.
The results of the wheel tracking tests confirmed that the conventional mixture presented low resistance to permanent deformation, what made it inadequate to be applied in pavement layers. It was observed that the asphalt with the highest softening point resulted in a mixture with better resistance to permanent deformation.
The permanent deformation of asphalt rubber mixtures can be associated with the characteristics of the asphalt rubber binder (penetration, resilience and apparent viscosity). The results of this study allow concluding that: i) the higher the resilience of the asphalt, the better rutting resistance; ii) mixtures produced with a lower penetration asphalt showed more resistance; iii) the high apparent viscosity obtained by asphalt rubbers through the incorporation of rubber into the conventional asphalt contributed to improve their resistance to permanent deformation.
A good correlation was obtained between the resilience and the permanent deformation resistance in both tests allowing the use of the resilience to predict the resistance of asphalt mixtures to permanent deformation.
Mix Properties 283
Acknowledgements
The authors would like to thank the companies that supplied the materials used in this study: Greca Asfaltos, Cepsa Portuguesa – Petróleos, Bezerras Ltda. The first author was supported by the Programme Alban, the European Union Programme of High Level Scholarships for Latin America, scholarship nº E04D040507BR from 2004 to 2006. Currently, the first author is supported by CNPQ (Conselho Nacional de Desenvolvimento Científico e Tecnológico).
7. Bibliography
Baker, T.E., Allen, T.M., Jenkins, D.V., Mooney, T., Pierce, L.M., Christie, R.A.; Weston,J.T. “Evaluation of the use of scrap tires in transportation related applications in the State of Washington”, Washington State Department of Transportation, Washington, D.C., 2003.
Brown, E.R.; Kandhal, P.S.; Zhang, J., “Performance testing for hot mix asphalt (executive summary)”, National Center of Asphalt Technology, Report nº 2001-05A, NCAT Auburn University, Alabama, 2001.
Dirección General de Carreteras, “Pliego de prescripciones técnicas generales para obras decarreteras y puentes”, Ano vigente 2004, nº 543 – mezclas bituminosas discontinuas en caliente para capas de rodadura. Madrid, Espana, 2004.
FHWA, “Background of Superpave asphalt mixture design and analysis”, Federal Highway Administration, FHWA-SA-95-003. Lexington, KY, 1994.
Greenbook, “Standard specifications for public works construction”, 2000 Edition, Anaheim, 2000.
NLT-173, “Resistência a la deformación plástica de las mezclas bituminosas mediante la pistade ensayo de laboratório”. Centro de Estudios de Carreteras. España, 1984.
Roberts F.L.; Kandhal, P.S.; Brown, E.R.; Lee, D.; Kennedy, T.W., “Hot mix asphalt materials, mixture design and construction”, NAPA Education Foundation, Lanham, MD, 1996.
Sousa, J. B., Craus, J., Monismith, C.L., “Summary report on permanent deformation in asphalt concrete,” Strategic Highway Research Program, Report nº SHRP-A/IR- 91-104, Washington, D.C., 1991.
Sousa, J.B., Solaimanian, M., Weissman, S.L., “Development and use of the repeated shear test (constant heigh): an optional Superpave mix design tool”, Strategic Highway Research Program, Report nº SHRP-A-698, Washington, DC, 1994.

284 Asphalt-Rubber 2009
Takallou, H.B., Bahia, H.U., Perdomo, D., Schwartz, R., “Use of Superpave technology andconstruction of rubberized asphalt mixtures”, Transportation Research Record 1583, TRB, National Research Council, Washington D.C., 1997, p. 71-81.
Zaniewski, J.P., Sri Harsha, N., “Asphalt technology program evaluation of binder gradeson rutting performance”, Department of Civil and Environmental Engineering, Morgantown, West Virginia, 2003.

Mix Properties 285
Improvement of Moisture Damage of CRM-modified Asphalt Concretes in Korea
Minyong Ryu1, Jin. C. Kim1, Hyun. H. Kim1, Young S. Doh2 and Kwang W. Kim3+
1 Graduate student, Department of Regional Infrastructures, Kangwon National University, Chun Cheon, 200-701, Korea
2 Research Professor, Institute for Advanced Construction Material, Kangwon National University, Chun Cheon, 200-701, Korea [email protected]
3 Professor, Department of Regional Infrastructures, Kangwon National University, Chun Cheon, 200-701, Korea+corresponding author, [email protected]
ABSTRACT. This study was initiated to suggest possible solution for preventing moisture damage of the CRM-modified asphalt pavement mixtures. Among many candidates, the hydrated lime (HL) was selected as the best additive for improving aggregate-bitumen adhesion from previous studies. Asphalt concrete specimens were prepared using various contents of the additive for estimating tensile strength retaining ratio by additive dosage under severe moisture condition. A cycle of freezing at -18oC and thawing at 25oC in 24 hours, and submerging at 60oC water for another 24 hours were applied for each specimen. The indirect tensile strength (ITS) before and after freezing and thawing cycle was measured and the retained tensile strength ratio (TSR) was calculated from the ITS test results. The TSR ratio improving levels were different for additive contents and a significant strength improvement was observed from 0.8% - 1.0% of HL contents.
KEYWORDS: CRM-modified asphalt pavement mixtures, hydrated lime, indirect tensile strength, tensile strength retaining ratio, freezing and thawing cycle

286 Asphalt-Rubber 2009
1. Introduction
The waste tire rubber is widely used as recycling material in various areas in the world. In Korea, several plants produce the crumb rubber modifier (CRM) and a significant amount of fine particle has been used as an asphalt modifier in paving industry. However, because of poor adsorption of granite-base aggregates, which are relatively abundant in Korea, and careless quality control, a significant portion of the CRM-modified asphalt pavements were disintegrated in earlier age after suffering a freezing winter.
Visual observations found that there were significant stripping in the mixture and raveling on surface probably due to water intrusion after freezing and thawing (F/T) (Amirkhanian et al, 1993, Doh et al., 2007b). Therefore, a study was initiated to investigate the cause of damage and to suggest possible treatment method(s) for preventing early age damage of the CRM-modified asphalt pavement mixtures in the nation. Several treating agents were used for improving the stripping resistance and therefore enhancing tensile property of the CRM-modified asphalt concrete mixtures (Doh et al., 2007a, Putman et al., 2006). From those studies, it was observed that the hydrated lime (HL) would be the best choice as an anti-stripping additive for normal asphalt concrete. However, few studies dealing with CRM-included asphalt mixtures were conducted in depth in Korea which shows a humid-hot summer and freezing winter.
Therefore, this study dealt with the hydrated lime as the anti-stripping additive to improve aggregate-bitumen adhesion under moistened condition of CRM mixes. Various contents of the additive were used for preparing asphalt concrete specimens for estimating tensile strength loss due to moisture intrusion. A cycle of F/T was applied before measuring indirect tensile strength (ITS) for estimation of moisture susceptibility of each mixture. The objective of this study is to find out how the additive is effective on improving moisture resistance of CRM-modified asphalt concretes.
2. Materials and Methods
A source of an asphalt binder, AP5 (PG 64-22), which is most widely used in South Korea was used in this study. A size (-30mesh) of crumb rubber modifier (CRM), produced by the mechanical shredding in ambient temperature, was prepared for this study as shown in Figure 1. A 10% of CRM content was used throughout the test. A source (Granite) of coarse and fine aggregates was used for dense-graded surface course, as shown in Figure 2. Limestone powder was used as mineral filler. As an anti-stripping additive, the hydrated lime (HL) powder was used. Table 1 shows physical properties of aggregate and filler materials together with the specification limits given by the Ministry of Homeland and Maritime Affaires, Korea.
Table 1. Physical properties of materials
Classification Specific gravity Absorption (%) Abrasion (%)Specification > 2.45 < 3.0% < 35%
13mm aggregate 2.60 0.91 24.67Fine aggregate 2.61 0.79 -
Filler 2.75 - -Hydrated lime 2.24 - -
Mix Properties 287
Figure 1. Crumb rubber modidier (CRM) powder
0
10
20
30
40
50
60
70
80
90
100
10 100 1000 10000 100000 1000000 10000000 100000000
Sieve size
Passing
rate(%)
#200 #100 #50 #30 #8 #4 13mm 19mm
Figure 2. Gradation of aggregate.
For wet process, the rubber-modified binder (RMB) was made by adding the CRM slowly into the binder while mixing with a stirrer at 180℃ for 30 minutes (reaction time). For dry process, the CRM was directly added into asphalt mixture while the heated binder and aggregates are blended in a mixer.
The optimum binder content (OBC) was determined for each CRM-modified asphalt mixture by Marshall method by using 75 blows per side of specimen. The additive contents were 0, 0.4, 0.6, 0.8 and 1.0% by weight of total mixture. Since the additive (HL) is considered as filler the mineral filler was replaced with it, when it was used. Marshall specimens with diameter of 100mm were prepared for indirect tensile strength (ITS) test before and after F/T treatment. A cycle of freezing at -18℃ and thawing at 25℃ in 24 hours, and submerging at 60℃ water for another 24 hours were applied by the guideline of AASHTO T 283-89 for each specimen. The retained tensile strength ratio (TSR) was calculated from the test results before and after conditioning by the equation below.
100(%) xITSITSTSR
D
W= ---------------------------------------------------------------------- [1]
in which, ITSW is ITS after F/T treatment, ITSD is ITS before F/T treatment.

288 Asphalt-Rubber 2009
3. Results and Discussion
The mix design results of 10% CRM-modified asphalt mixture are shown in Table 2. The OBCs of dry and wet processes were similar to each other and air void ratios were a little bit lower side of specification range.
Table 2. Results of Marshall mix design
Classification OBC1
(%)Air void
(%) VFA2 (%) Marshall stability (kgf)
Flow (0.1mm)
Specification - 3-5 70-85 >750 20-40CRM dry 10% 5.9 3.28 77.74 1,556 34CRM wet 10% 6.0 3.31 80.51 1,659 331. Optimum binder content, 2. Voids filled with asphalt
Table 3 and 4 show tensile strength value and TSR of each mixture before and after F/T treatment by modification method. The tensile strength ratio (TSR) improved as the HL content increase, without significant difference between dry and wet processes.
The TSR of Granite mixture without additive (HL) was approximately 50 % on the average, which is considered as very poor level in general. It was improved up to over 70% by just adding 0.4% of HL in both modification processes. When 0.8 % of additive was used, the mixtures were safely over the 75% of TSR, which is a specification limit for moisture susceptibility test of asphalt mixtures in Korea.
Figure 3 shows the improvement of TSR visually by HL content. It is seen that the wet process is a little better than dry process in TSR level even though the difference is not significant, except the case of HL = 0 %. The improvement was almost maximized at the HL content of 0.8 %, showing no more increase at HL = 1 %. Therefore, the HL content of over 1 % was not necessary for evaluation. The actual weight of material is 10kg for 1% of HL for one ton (1,000kg) of asphalt mixture. Therefore, if the 0.8 % of HL content is used, the moisture susceptibility of mixture will be improved significantly by adding only 8 kg of HL per ton of CRM mixture.
Table 3. Tensile strength and TSR for dry-processed CRM mixtures
Mixture HL content(%) ITS (kgf/) ① ITS after F/T (kgf/) ② TSR (%)
[②/①×100]
CRM dry10%
0 10.50 6.50 61.90.4 10.44 7.41 70.90.6 8.74 6.32 72.40.8 8.93 6.71 75.21.0 9.95 8.20 82.4
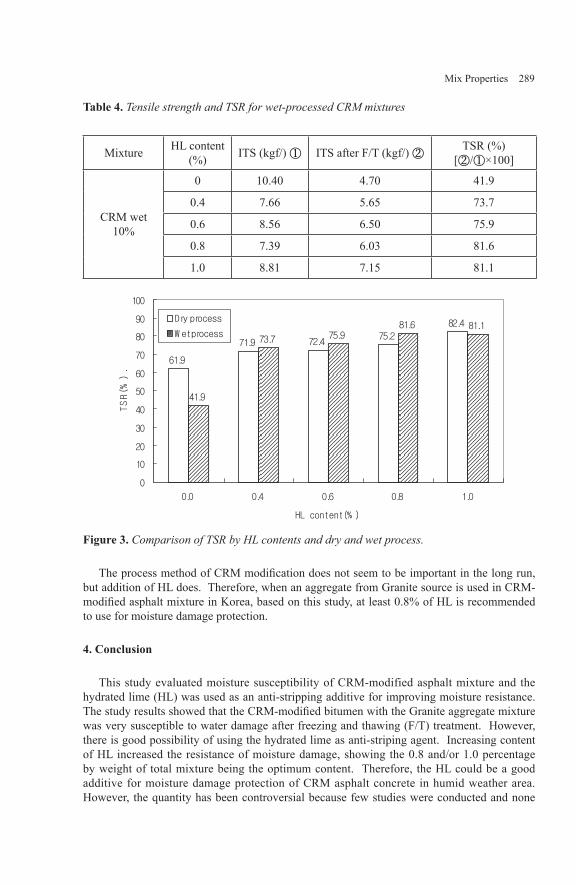
Mix Properties 289
Table 4. Tensile strength and TSR for wet-processed CRM mixtures
Mixture HL content(%) ITS (kgf/) ① ITS after F/T (kgf/) ② TSR (%)
[②/①×100]
CRM wet10%
0 10.40 4.70 41.9
0.4 7.66 5.65 73.7
0.6 8.56 6.50 75.9
0.8 7.39 6.03 81.6
1.0 8.81 7.15 81.1
61.9
71.9 72.475.2
82.4
41.9
73.7 75.981.6 81.1
0
10
20
30
40
50
60
70
80
90
100
0.0 0.4 0.6 0.8 1.0
HL content (% )
TSR(%
) .
Dry process
W et process
Figure 3. Comparison of TSR by HL contents and dry and wet process.
The process method of CRM modification does not seem to be important in the long run, but addition of HL does. Therefore, when an aggregate from Granite source is used in CRM-modified asphalt mixture in Korea, based on this study, at least 0.8% of HL is recommended to use for moisture damage protection.
4. Conclusion
This study evaluated moisture susceptibility of CRM-modified asphalt mixture and the hydrated lime (HL) was used as an anti-stripping additive for improving moisture resistance. The study results showed that the CRM-modified bitumen with the Granite aggregate mixture was very susceptible to water damage after freezing and thawing (F/T) treatment. However, there is good possibility of using the hydrated lime as anti-striping agent. Increasing content of HL increased the resistance of moisture damage, showing the 0.8 and/or 1.0 percentage by weight of total mixture being the optimum content. Therefore, the HL could be a good additive for moisture damage protection of CRM asphalt concrete in humid weather area. However, the quantity has been controversial because few studies were conducted and none
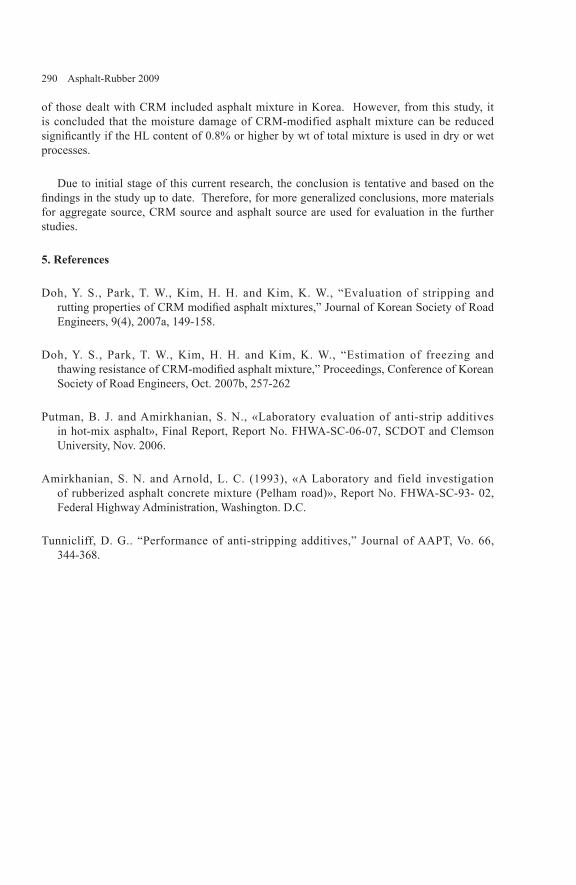
290 Asphalt-Rubber 2009
of those dealt with CRM included asphalt mixture in Korea. However, from this study, it is concluded that the moisture damage of CRM-modified asphalt mixture can be reduced significantly if the HL content of 0.8% or higher by wt of total mixture is used in dry or wet processes.
Due to initial stage of this current research, the conclusion is tentative and based on the findings in the study up to date. Therefore, for more generalized conclusions, more materials for aggregate source, CRM source and asphalt source are used for evaluation in the further studies.
5. References
Doh, Y. S., Park, T. W., Kim, H. H. and Kim, K. W., “Evaluation of stripping and rutting properties of CRM modified asphalt mixtures,” Journal of Korean Society of Road Engineers, 9(4), 2007a, 149-158.
Doh, Y. S., Park, T. W., Kim, H. H. and Kim, K. W., “Estimation of freezing andthawing resistance of CRM-modified asphalt mixture,” Proceedings, Conference of Korean Society of Road Engineers, Oct. 2007b, 257-262
Putman, B. J. and Amirkhanian, S. N., «Laboratory evaluation of anti-strip additivesin hot-mix asphalt», Final Report, Report No. FHWA-SC-06-07, SCDOT and Clemson University, Nov. 2006.
Amirkhanian, S. N. and Arnold, L. C. (1993), «A Laboratory and field investigationof rubberized asphalt concrete mixture (Pelham road)», Report No. FHWA-SC-93- 02, Federal Highway Administration, Washington. D.C.
Tunnicliff, D. G.. “Performance of anti-stripping additives,” Journal of AAPT, Vo. 66, 344-368.

Mix Properties 291
The Production and Placement of Asphalt Rubber Hot Mix Using Warm Mix Asphalt Technology
Jack Van Kirk* - Jordan Reed** - Jeff Reed***
*VSS Asphalt Technologies.3785 Channel DriveWest Sacramento, California 95691, [email protected]
**Arizona State University850 S. McAllister Dr.Tempe, Arizona 85281, [email protected]
***Valley Slurry Seal Co.3785 Channel DriveWest Sacramento, California 95691, [email protected]
Abstract: Asphalt rubber hot mix has been used for many years and has proven to be very cost-effective. However, asphalt rubber hot mix requires a higher mix temperature during placement in order to obtain adequate compaction, which results in higher energy requirements during production. Sometimes there is also more visible smoke evident during placement. Emission testing at the plant and the street has shown that there is no significant difference in the emissions when compared to conventional hot mix. By utilizing warm mix asphalt technology the temperature requirements of the asphalt rubber hot mix can be reduced significantly. The result is a lower production temperature, reduced smoke during production and placement, and ultimately a lower production cost. The purpose of this paper is to document the production and placement of asphalt rubber hot mix with the use of two types of warm mix asphalt technology. The paper documents the production, the placement and the resulting in-place mix properties after compaction.
Key Words: asphalt rubber, asphalt rubber hot mix, warm mix asphalt, and hot mix asphalt production, placement, and compaction.

292 Asphalt-Rubber 2009
1. Introduction
Warm mix asphalt (WMA) is a generic term for a variety of technologies that allow for the production and placement of hot mix asphalt (HMA) pavement at lower temperatures. A reduction in temperature of up to 55 ℃ has been documented on numerous projects (Prowell, et al, 2007). These dramatic reductions in temperature have the obvious benefits of cutting fuel consumption and decreasing emissions, which decreases the production of greenhouse gases. However, in addition there other potential engineering benefits that include; better compaction of the hot mix, the ability to haul the hot mix for longer distances, and the ability to pave at lower temperatures. By cutting emissions, this results in improved conditions for workers and enhances the relationships with neighboring communities. Research has documented the reduction in the production of emissions in a number of countries (D ‘Angelo, et al., 2007).
The National Asphalt Pavement Association (NAPA) first brought WMA technology to the United States from Europe in 2002 (D ‘Angelo, et al., 2007) and this resulted in intense interest among hot mix asphalt producers, contractors, researchers, and government agencies. Since that time, new technologies have been developed in the United States. The benefits of WMA are also well documented. However, most all the experience with WMA has been with conventional HMA. This paper documents the production, the placement and the resulting in-place mix properties after compaction of asphalt rubber hot mix (ARHM) using two WMA technologies.
Asphalt rubber binder has been used in paving applications for over 40 years (Van Kirk, 1992) (Van Kirk, 1999) (Van Kirk, 2003) (Van Kirk, 2006). The use of ARHM is well documented. Asphalt rubber gap graded mixes (ARHM-GG) were first introduced in the late 1980’s (Van Kirk, 1999). In the years since its introduction it has been shown that when designed and placed properly ARHM-GG has proven to provide superior field performance and at reduced cost. The advantages of using asphalt rubber pavement strategies have been validated by many research efforts (Marvin, 2004) (Van Kirk, 1992). The cost effectiveness of asphalt rubber strategies has been validated in a Life Cycle Cost Analysis research effort (Hicks, et al., 1999). Because of its unique properties asphalt rubber provides a cost effective approach to the maintenance and rehabilitation of distressed pavements.
2. Background
As mentioned above most all the experience with WMA has been with conventional HMA. The production, placement and compaction temperature for conventional HMA is limited by the climatic conditions, which includes ambient temperature at the construction site and the haul distance from the hot mix plant to the construction site. These parameters are even more significant for ARHM mixes because they are more temperature sensitive during placement and compaction. There have also been complaints by construction workers of increased sensitivity to the use of these mixes. It has been determined that these complaints are directly related to the higher temperatures required for ARHM mixes. It can de surmised that lower allowable production temperatures for ARHM would have a significant impact on the sensitivity of construction workers during use of these mixes. The use of WMA technology appeared to provide a significant advantage especially for ARHM mixes. It was therefore given that ARHM contractors would want to incorporate the use of the new technology during
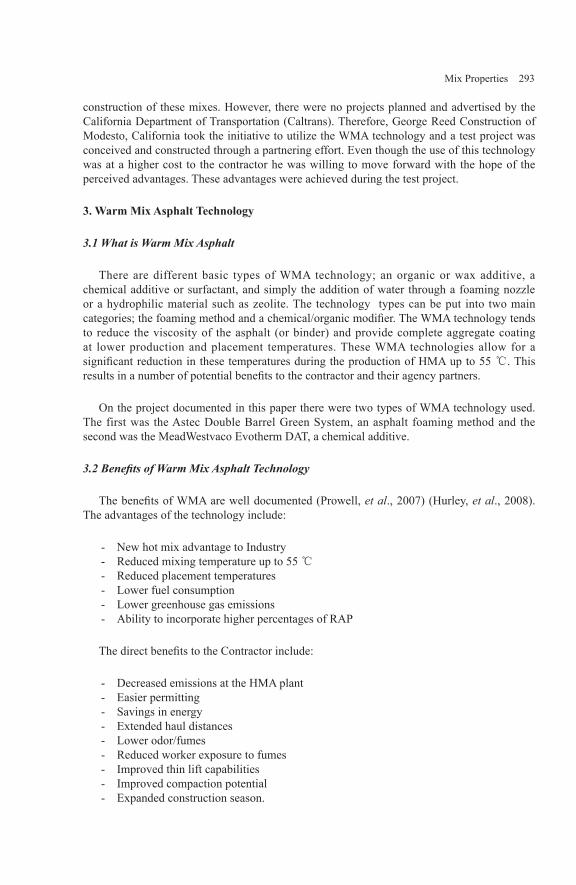
Mix Properties 293
construction of these mixes. However, there were no projects planned and advertised by the California Department of Transportation (Caltrans). Therefore, George Reed Construction of Modesto, California took the initiative to utilize the WMA technology and a test project was conceived and constructed through a partnering effort. Even though the use of this technology was at a higher cost to the contractor he was willing to move forward with the hope of the perceived advantages. These advantages were achieved during the test project.
3. Warm Mix Asphalt Technology
3.1 What is Warm Mix Asphalt
There are different basic types of WMA technology; an organic or wax additive, a chemical additive or surfactant, and simply the addition of water through a foaming nozzle or a hydrophilic material such as zeolite. The technology types can be put into two main categories; the foaming method and a chemical/organic modifier. The WMA technology tends to reduce the viscosity of the asphalt (or binder) and provide complete aggregate coating at lower production and placement temperatures. These WMA technologies allow for a significant reduction in these temperatures during the production of HMA up to 55 ℃. This results in a number of potential benefits to the contractor and their agency partners.
On the project documented in this paper there were two types of WMA technology used. The first was the Astec Double Barrel Green System, an asphalt foaming method and the second was the MeadWestvaco Evotherm DAT, a chemical additive.
3.2 Benefits of Warm Mix Asphalt Technology
The benefits of WMA are well documented (Prowell, et al., 2007) (Hurley, et al., 2008). The advantages of the technology include:
New hot mix advantage to IndustryReduced mixing temperature up to 55 ℃Reduced placement temperaturesLower fuel consumptionLower greenhouse gas emissionsAbility to incorporate higher percentages of RAP
The direct benefits to the Contractor include:
Decreased emissions at the HMA plantEasier permittingSavings in energyExtended haul distancesLower odor/fumesReduced worker exposure to fumesImproved thin lift capabilitiesImproved compaction potentialExpanded construction season.
------
---------

294 Asphalt-Rubber 2009
Agencies and contractors are realizing these benefits on every new project that is constructed. This is currently the most looked at technology by agencies today. This is because of the significant advantages that WMA exhibits. Because of the huge potential benefits with WMA, Caltrans decided that it needed to look at this technology on some of their own projects. In 2006 Caltrans placed its first test section using WMA. Since that time they have constructed a number of projects using WMA technologies in open and dense graded hot mix asphalt. They are currently developing a WMA specification for use on future test projects that will give the contractor the option to use the technology of his choice (from a Caltrans approved list).
3.3 Astec Double Barrel Green Warm Mix Asphalt Technology
The Astec Double Barrel Green System utilizes a multi-nozzle device to foam the asphalt. The “Multi-Nozzle Device”, mixes a small amount of water with the asphalt cement to create a foam made up of microscopic bubbles. This device includes a manifold with a system of valves, mixing chambers, and nozzles, as illustrated in Figure 1. The nozzles inject water into the chamber and the volume of the binder expands. This results in a reduction in the binder viscosity coating the aggregate and thereby allows the mix to be produced and placed at lower temperatures.
The Double Barrel Green System package was added to the George Reed Inc. Astec Double Barrel Counterflow continuous mix drum plant, Figure 1. The asphalt rubber binder was added through the multi-nozzle device and into the hot plant. The result was a WMA RHMA Type G mix that was produced at significantly lower temperatures.
Figure 1. Astec Double Barrel Green System, “Multi-Nozzle Device” and Astec Double Barrel Counterflow continuous mix drum plant with the Double Barrel Green System
3.5 Evotherm Warm Mix Asphalt Technology
The MeadWestvaco Evotherm Dispersed Asphalt Technology (DAT) is a concentrated solution of chemical additives that is injected into the binder at the hot plant. The Evotherm DAT is a chemistry package designed to enhance coating, adhesion, and workability of hot mix at lower temperatures. The Evotherm DAT was delivered in a tote, Figure 2, and was added to the water used in the Astec Double Barrel Green System. The asphalt rubber binder

Mix Properties 295
was then added through the multi-nozzle device and into the hot plant. The result was a WMA RHMA Type G mix that was produced at significantly lower temperatures.
Figure 2. MeadWestvaco Evotherm tote.
4. Asphalt Rubber Warm Mix Asphalt Test Project
4.1 Asphalt Rubber Hot Mix Project
The ARHM project was a California Department of Transportation (Caltrans) project located in Fresno and Merced counties near the town of Santa Nella, California. It was located on Interstate 5, kiloposts Fre 105.9/106.4, and Mer 0.0/52.5 in Caltrans District 10, Contract No. 10-0N1504. The pavement overlay design strategy was to place a 60mm ARHM Type G mix overlay over the existing conventional hot mix. This mix consists of a gap-graded aggregate which utilizes an asphalt rubber binder. The ARHM-GG mix was placed during the summer of 2008. The contractor worked with Caltrans to develop a contract change order (CCO) to allow the use of the material on the project. The WMA RHMA mix was placed on the southbound shoulders as a demonstration of the WMA technology with the RHMA-GG mix. Caltrans was eager to learn if the new technology would provide the same benefits with RHMA as it has already proven with conventional hot mix.
The contractor for the test project was George Reed Construction, Modesto CA. The mix was produced in their portable hot mix plant located in Santa Nella, California. The hot plant was an Astec Double Barrel Counterflow continuous mix plant. The asphalt rubber binder was produced by International Surfacing Systems (ISS), Modesto, CA. The blending equipment was produced by Reed International, VSS Macropaver Division, Hickman, CA.
4.2 Asphalt Rubber Hot Mix Design
There were two different ARHM Type G mixes produced and placed on the project. The aggregate used in the first mix was supplied from Triangle Rock, Los Banos pit and this source was used on the majority of the project. The second aggregate source was supplied by George Reed from their Snelling Pit. Both mix designs were conducted by the contractor and verified by the agency. The mix design properties for both mixes are shown in Table 1. The

296 Asphalt-Rubber 2009
conventional mix design was used with the warm mix additives. There were no changes made to the mix design as a result of the use of the WMA technology. Both mixes used a 19 mm maximum aggregate size. The aggregate grading is shown in Table 2. Both mixes used the same aggregate grading, however the binder contents were quite different. The asphalt rubber binder content was 7.7 % and 7.0 % (by dry mass of aggregate) for the Triangle Rock and Snelling mixes respectively. The binder content chosen for the RHMA-GG mixes was based on air void contents of 5.8 % and 3.9 % for the Triangle Rock and Snelling mixes respectively. The 5.8 % void content is high for this type of mix. These Type ARHM G mixes are difficult to compact in the field and by choosing high air void contents in the mix design it creates difficulty in the field. These are laboratory mix designs and may not reflect what is actually being placed in the field.
Table 1. RHMA-G Mix Properties
Binder(%) Stability VMA Agg.
% CrushAgg. LART100/500 rev
Triangle Rock 7.7 23 20 100 4/21Snelling 7.0 34 18 98 4/23
Table 2. RHMA-G Aggregate Gradings (percent passing)
25mm 19mm 12.5mm 9.5mm 4.75mm 2.36mm 1.18mm 75μm
100 99 85 67 34 22 10 3
4.3 Asphalt Rubber Hot Mix Placement
mix on the Interstate at the project site a test section was placed on the haul road next to the hot mix plant. This test was placed to determine how low the temperature could be successfully reduced using the WMA technology with the ARHM-GG mix. The Astec Double Barrel Green System was used to make the mix placed on the haul road. The ARHM-GG mix was placed at different temperatures ranging from 163 ℃ down to 135 ℃. The mix could be easily compacted and since this test section was successful the contractor was confident that the ARHM Type G mix could be placed at the project site. Figures 3 and 4 show the placement of the WMA ARHM-GG on the haul road at the plant. The mix on the haul road carried truck traffic for over a month with no signs of any distress.

Mix Properties 297
Figure 3. Existing haul road at hot plant and placement of test section.
Figure 4. Completed haul road at the hot plant and haul road one month later after truck traffic.
The RHMA-GG was placed on the majority of the project without any WMA technology. It was placed on the traveled way and on the shoulders. The normal production, placement and compaction temperatures were 163 ℃, 154 ℃, and 145 ℃ respectively. The test section information for each of the WMA RHMA-GG types and sections is summarized in Table 3.
Table 3. WMA RHMA-G test sections summary information.
DATE WMA MIX TYPE TONNES PROD.
TEMP ℃PLACE. TEMP ℃
COMPACT. TEMP ℃
START/END LOC KP
9/18 ASTEC 360 145 135-140 125-135 24.1/23.09/18 ASTEC 186 135 125-130 120-130 23.0/22.210/2 EVOTHERM 264 135 120-125 115-125 12.1/11.3
The Astec Double Barrel Green System allowed the ARHM-GG mix production, placement and compaction temperatures to be reduced by as much as 28 ℃, 29℃, and 25 ℃ respectively, Figures 5 - 7. This material was mixed, placed and compacted with only relatively few problems. It began to become difficult to compact at about 125 ℃.
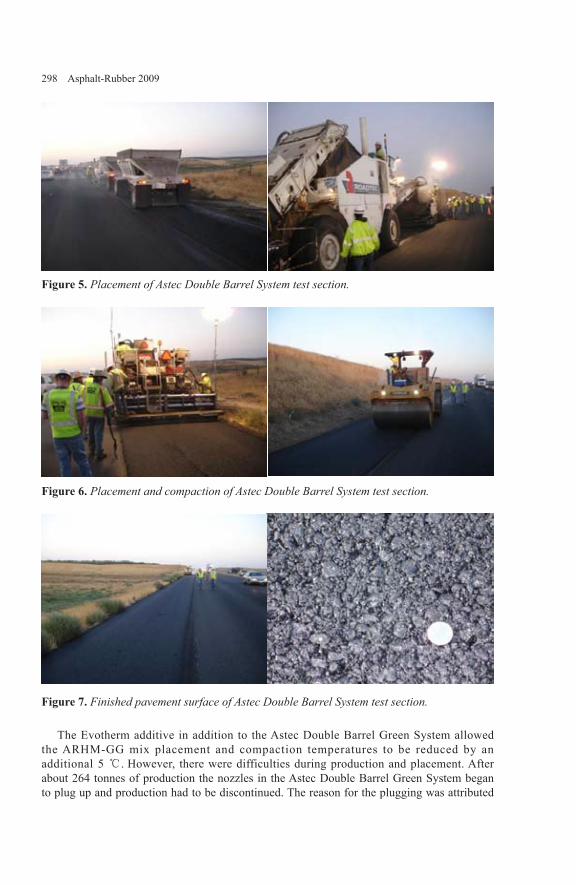
298 Asphalt-Rubber 2009
Figure 5. Placement of Astec Double Barrel System test section.
Figure 6. Placement and compaction of Astec Double Barrel System test section.
Figure 7. Finished pavement surface of Astec Double Barrel System test section.
The Evotherm additive in addition to the Astec Double Barrel Green System allowed the ARHM-GG mix placement and compaction temperatures to be reduced by an additional 5 ℃. However, there were difficulties during production and placement. After about 264 tonnes of production the nozzles in the Astec Double Barrel Green System began to plug up and production had to be discontinued. The reason for the plugging was attributed
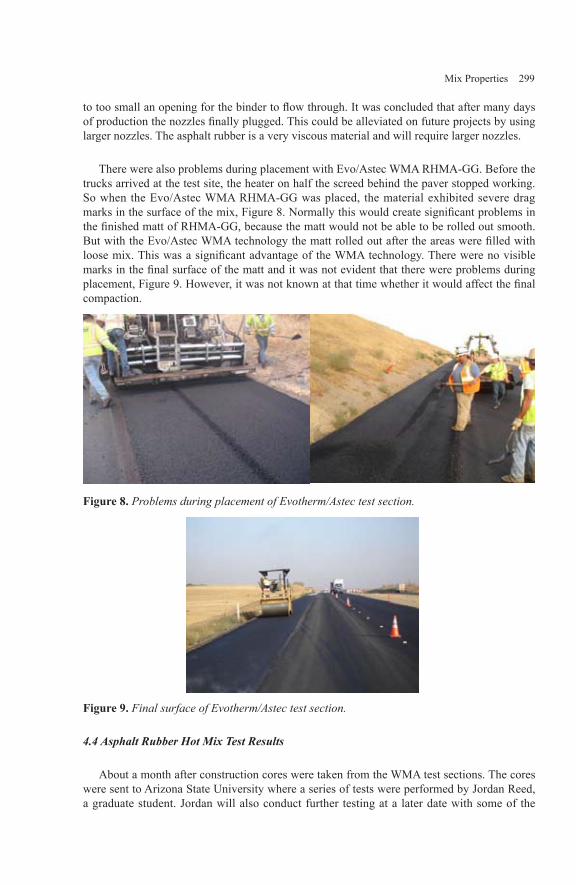
Mix Properties 299
to too small an opening for the binder to flow through. It was concluded that after many days of production the nozzles finally plugged. This could be alleviated on future projects by using larger nozzles. The asphalt rubber is a very viscous material and will require larger nozzles.
There were also problems during placement with Evo/Astec WMA RHMA-GG. Before the trucks arrived at the test site, the heater on half the screed behind the paver stopped working. So when the Evo/Astec WMA RHMA-GG was placed, the material exhibited severe drag marks in the surface of the mix, Figure 8. Normally this would create significant problems in the finished matt of RHMA-GG, because the matt would not be able to be rolled out smooth. But with the Evo/Astec WMA technology the matt rolled out after the areas were filled with loose mix. This was a significant advantage of the WMA technology. There were no visible marks in the final surface of the matt and it was not evident that there were problems during placement, Figure 9. However, it was not known at that time whether it would affect the final compaction.
Figure 8. Problems during placement of Evotherm/Astec test section.
Figure 9. Final surface of Evotherm/Astec test section.
4.4 Asphalt Rubber Hot Mix Test Results
About a month after construction cores were taken from the WMA test sections. The cores were sent to Arizona State University where a series of tests were performed by Jordan Reed, a graduate student. Jordan will also conduct further testing at a later date with some of the
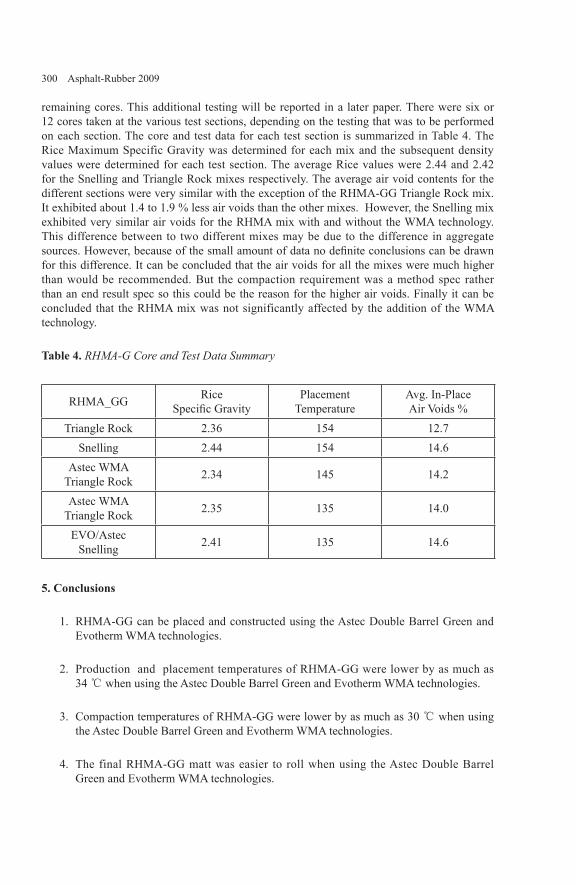
300 Asphalt-Rubber 2009
remaining cores. This additional testing will be reported in a later paper. There were six or 12 cores taken at the various test sections, depending on the testing that was to be performed on each section. The core and test data for each test section is summarized in Table 4. The Rice Maximum Specific Gravity was determined for each mix and the subsequent density values were determined for each test section. The average Rice values were 2.44 and 2.42 for the Snelling and Triangle Rock mixes respectively. The average air void contents for the different sections were very similar with the exception of the RHMA-GG Triangle Rock mix. It exhibited about 1.4 to 1.9 % less air voids than the other mixes. However, the Snelling mix exhibited very similar air voids for the RHMA mix with and without the WMA technology. This difference between to two different mixes may be due to the difference in aggregate sources. However, because of the small amount of data no definite conclusions can be drawn for this difference. It can be concluded that the air voids for all the mixes were much higher than would be recommended. But the compaction requirement was a method spec rather than an end result spec so this could be the reason for the higher air voids. Finally it can be concluded that the RHMA mix was not significantly affected by the addition of the WMA technology.
Table 4. RHMA-G Core and Test Data Summary
RHMA_GG RiceSpecific Gravity
Placement Temperature
Avg. In-PlaceAir Voids %
Triangle Rock 2.36 154 12.7Snelling 2.44 154 14.6
Astec WMATriangle Rock 2.34 145 14.2
Astec WMATriangle Rock 2.35 135 14.0
EVO/AstecSnelling 2.41 135 14.6
5. Conclusions
RHMA-GG can be placed and constructed using the Astec Double Barrel Green and Evotherm WMA technologies.
Production and placement temperatures of RHMA-GG were lower by as much as 34 ℃ when using the Astec Double Barrel Green and Evotherm WMA technologies.
Compaction temperatures of RHMA-GG were lower by as much as 30 ℃ when using the Astec Double Barrel Green and Evotherm WMA technologies.
The final RHMA-GG matt was easier to roll when using the Astec Double Barrel Green and Evotherm WMA technologies.
1.
2.
3.
4.

Mix Properties 301
A significant reduction in visible emissions was noticed during the production and placement of RHMA-GG when using the Astec Double Barrel Green and Evotherm WMA technologies.
When using the same compactive effort similar air void contents can be achieved at significantly lower temperatures during placement and compaction of RHMA-GG when the Astec Double Barrel Green and Evotherm WMA technologies.
6. Recommendations
Agencies need to design and construct full scale RHMA projects using WMA technology to gain further experience.
Agencies should utilize different WMA technologies to determine their effectiveness with RHMA.
During construction of future projects RHMA should be placed at different temperatures to determine appropriate temperatures that RHMA can be successfully placed and compacted.
Air emissions should be tested on future RHMA projects using WMA technology to determine the positive effects of lower temperatures during production and placement.
8. References
D ‘Angelo, J., et.al., “Warm-Mix Asphalt: European Practices”, International Technology Scanning Program, Federal Highway Administration, December 2007.
Hicks, R. G., Lundy, James R., Epps, Jon A., “Life Cycle Costs For Asphalt-Rubber Paving Material.” Rubber Pavements Association, Tempe, Arizona, April 1999.
Hurley, Graham C., Prowell, Brian D., “Field Performance of Warm-Mix Asphalt”, CD-ROM, 87th Annual Meeting of the Transportation Research Board, Washington, DC, January 2008.
Marvin, Steven R., “Pavement Investigation of Enterprise Street and Randolph Avenue within the City of Costa Mesa, California”, August 2004.
Prowell, Brian D., Hurley, Graham C., “Warm-Mix Asphalt: Best Practices”, National Asphalt Pavement Association, Lanham, MD, Quality Improvement Series 125, December 2007.
Van Kirk, Jack L., Holleran, Glynn, “Reduced Thickness Asphalt Rubber Concrete Leads to Cost Effective Pavement Rehabilitation.” 1st International Conference World of Pavements, Sydney, Australia, February 20-24, 2000.
5.
6.
1.
2.
3.
4.

302 Asphalt-Rubber 2009
Va n K i r k , J a c k L . , “ R e v i e w o f t h e U s e o f C r u m b R u b b e r i n P a v e m e n t Maintenance and Rehabilitation Strategies,” Basic Resources Inc., Presented at a Meeting of the Rubber Division, American Chemical Society, Orlando, Florida, September 1999.
Van Kirk, Jack, “Maintenance and Rehabilitation Strategies using Asphalt Rubber Chip Seals,” Asphalt Rubber 2003 Conference, Brasilia, Brazil, December 2-4, 2003.
Van Kirk, Jack, “Multi-Layer Maintenance and Rehabilitation Strategies Utilizing Asphalt Rubber Binder”, Asphalt Rubber 2006 Conference, Palm Springs, California, October 25-27, 2006.
Mix Properties 303
Research on The Gradation of AR Mixtures Based On GTM
Li Zhengzhong* — Song Xiaoyan *—Zhou Weifeng*— Tan Yiqiu**
* Tianjin Municipal Engineering Research Institute 39# Pingshan road, Hexi district, Tianjin, China (Tianjin 300074, China)[email protected]@[email protected]
** Harbin Institute Of Technology 92# Xida street, Nangang district, Harbin, China (Harbin 150090, China)[email protected]
ABSTRACT. In order to research the gradations and the pavement performance of the rubber-asphalt mixtures, it is the first time to use GTM --Gyratory Testing Machine--gyratory compaction moulding method for the mixing ratio design of the rubber-asphalt mixtures in China. Based on this method, research on the continuous-gradation and three kinds of gap-gradation mixtures with different through rate of 4.75mm were carried out systematically. Without considering the volume parameters, the optimum asphalt content were identified only according to the physical and mechanical parameters, including GSI --gyratory stability index and GSF--gyratory safety factor. On this basis, research the linear expansion of the rubber-asphalt mixtures with different gradations and molding modes, and it is proofed that the continuous-gradation rubber-asphalt mixtures can be used based on the GTM design method. Through comprehensive evaluation on the pavement performance, it is effectively proofed that the GTM design method is more appropriate to the continuous-gradation rubber-asphalt mixtures, and designed by which, the pavement performance is much better than that of the gap-gradation mixtures.
KEYWORDS: rubber-asphalt mixture; GTM; linear expansion; pavement performance

304 Asphalt-Rubber 2009
1. Preface
The moulding mode and the design indicators are the basis of the asphalt mixtures’ design, which directly determine the optimum asphalt content, the optimized gradation as well as the on-site compaction-control standards, and ultimately determine the performance of the asphalt mixtures. But the premise that the asphalt mixtures have excellent pavement performance is that the moulding mode and the design indicators are scientific and reasonable, that is to say , the moulding method indoor can simulate the field-compaction conditions farthest, and the design indicators can reflect the stress-strain state accurately under the actual traffic loads. Nowadays, Marshall Design method with hitting molding mold is the most widely used. However, the existing research results show that there are large gaps between the Marshall Design indicators and the pavement performance. In Addition, engineering practice can also prove that Marshall Design method has some certain limitation, which has been difficult to meet the features of modern heavy traffic loads.
Based on the discussion above, the GTM--Gyratory Testing Machine--integrates the characteristics such as compacting, rubbing and shearing, etc. It can simulate the actual stress-strain situation in field-compaction, and can also compact the asphalt mixtures to the ideal dense situation in accordance with the real pavement temperature and traffic loads. Therefore, researching the gradation and the pavement performance of the rubber-asphalt mixtures systematically based on GTM design method will have important practical significance.
2. Principle of the GTM design method
The GTM gyratory compaction instrument design the asphalt mixtures by using the principle of the stress-strain characteristics through a scientific analysis method. During the specimen moulding process, the vertical pressure is determined according to the real pressure that the tire imposes on the pavement. Meanwhile, the compaction power is not changeless in the whole forming process, and taking the limit equilibrium state as the terminal conditions, which can just reflects the physical and mechanical properties of different asphalt mixtures[9].
The design target of the GTM gyratory compaction method is to prevent the final excessive plastic deformation. In the process of specimen molding, the stress-strain data can be automatically collected, and GTM can illustrate the changes of the anti-shearing strength, among which the strain of the sample is characterized by the size of the machinery angle, and the anti-shearing strength is derived from the wheel pressure by conversion and inference. And the final plastic deformation of the compacted sample is characterized by the GSI--gyratory stability index , which is the ratio between the machinery angle at the end of the experiment and the minimum machinery angle in the process of compaction, and it is used to characterize the samples’ plastic deformation degree when bearing shearing strength. Therefore, the GTM design method uses the parameter GSI to identify the optimum asphalt content, which effectively connects the optimum asphalt content with the mechanical properties. In addition, GTM can also provide the anti-shearing strength when the sample was compacted to the limit equilibrium state. We can get the GSF--gyratory safety factor easily by calculation, which is the ratio between the anti-shearing stress when the sample is compacted to the limit equilibrium state and that the mixture is required to bear under the traffic loads. It can characterize the samples’ anti-shearing degree under the traffic loads.

Mix Properties 305
3. Physical and mechanical properties of raw materials
The rubber-asphalt used in the experiment is provided by the Tianjin Haitai Technology Development Limited Corporation, which includes 20% rubber powder particles from recycled waste tires. Mainly referring to the “Technical specification of waste tire rubber powder modified asphalt pavement in Tianjin”, the performance testing is conducted. Based on the analysis and study of existing research results, regards kinematic viscosity (175℃), penetration, softening point and elastic recovery (25℃) as key controlling indicators. The specific experimental results are shown in Table 1.
Table 1. Performance testing data on the rubber asphalt
Test items Units Results MethodsKinematic viscosity(175 ℃) Pa.s 1.863 T 0625Penetration(25 ℃,100g,5s) 0.1mm 57.0 T 0604
Softening point (ring and ball method) ℃ 59.0 T 0606Elastic recovery(25 ℃) % 75 T 0662Ductility(5 ℃,5cm/min) cm 15 T 0605
Segregation(48h,the difference of softening points) ℃ 4.3 T 0661
Residues after TFOT
Mass losing % -0.27 T 0609Penetration ratio % 81.0 T 0604
Ductility(5 ℃,5cm/min) cm 7 T 0605
In order to improve the water stability of the rubber-asphalt mixtures, the experiment uses the basalt aggregate for larger than 4.75mm, the limestone aggregate for smaller than 4.75mm and the limestone powder for the mineral powder. The major physical and mechanical properties of coarse-aggregate are shown in Table 2.
Table 2. Performance testing data on the coarse-aggregate
Test items Units Results MethodsCrushing index % 13.4 T 0316Abrasion loss % 14.2 T 0317
Water absorption % 1.2 T 0304Adhesion to bitumen level 5 T 0616
Content of flat long and thin particle % 9.1 T 0312
4. Design scheme for selecting gradations
The experiments mainly research the gap-gradation, and make a detailed comparison with the continuous- gradation. Based on the GTM design method, the optimized gradation of the rubber-asphalt mixtures is comprehensively identified mainly in order to the mechanical

306 Asphalt-Rubber 2009
indicators and pavement performance, not the volume index. And the application effect of the continuous-gradation will be evaluated at the same time.
In order to reduce the restraint that the mould imposed on the mixtures, the fine-asphalt mixture is used for the research. Although 2.36mm is the sieve pore to discriminate the coarse aggregate and the fine aggregate, in the coarse aggregate with gap-gradation, the real role of the skeleton is the part of the aggregate larger than 4.75mm, and the 4.75mm passing rate is the key indicator to select the coarse gap-gradation[6].Therefore, combined with the existing researches on the rubber-asphalt mixtures[2],[4] ,[5], [8], the 0.075mm passing rate of the gap-gradation is fixed at 5%, and the 4.75mm passing rate at 25%, 30% and 35% respectively. Meanwhile, in order to provide space for the part of the rubber powder particles in the rubber-asphalt to fill in, the 4.75mm passing rate would be reduced and the voids among the coarse aggregate would be increased appropriately in the design process of the continuous-gradation. The specific gradations selected are shown in Figure 1.
1613.29.54.752.361.180.60.30.150.075 0
10
20
30
40
50
60
70
80
90
100
The
pass
ing
rate
ofea
chsi
eve
pore
/%
The dimension of sieve pore / mm
Gradation 1Gradation 2Gradation 3Gradation 4
Figure 1. Trend of the selected gradations
5. Mix design
The GTM design method identifies the optimum asphalt content just by the physical and mechanical parameters such as the stability index GSI and the safety factor GSF, without considering the voidage, the saturation, and other volume parameters, which can effectively circumvent the non-uniformity in the volume parameters’ calculation of the rubber-asphalt mixtures[8]. The existing researches data[3] illustrate that when GSI ≤ 1.10, or GSF ≥ 1.30, the pavement would not have a rutting or the rutting depth is so small that can be negligible.
In view of the high viscosity of the rubber-asphalt, the experimental conditions of the moulding mode are as follows: aggregate heating temperature 200 ℃ ~ 205 ℃, rubber-asphalt heating temperature 180 ℃ ~ 185 ℃, mixing temperature 190 ℃ ~ 195 ℃, molding temperature 170 ℃ ~ 175 ℃, at the same time the GTM vertical pressure is set at 0.8MPa, the initial mechanical angle 1.4 °, and adopt the limit equilibrium state control mode.

Mix Properties 307
According to the conditions mentioned above, 4 different groups of asphalt-aggregate ratios are studied out respectively for the selected gradations and the samples are formed basing on the GTM. Figure 2 illustrates the changing regularity of the bulk volume relative density of the samples and the GTM mechanical parameters with the asphalt-aggregate ratios.
0.95
1.00
1.05
1.10
1.15
5.0 5.3 5.6 5.9 6.2 6.5
GSI
--gy
rato
ryst
abili
tyin
dex
Asphalt-aggregate ratio / %
Gradation 1Gradation 2
1.05
1.10
1.15
1.20
1.25
1.30
1.35
1.40
5.0 5.3 5.6 5.9 6.2 6.5
GSF
--gy
rato
rysa
fety
fact
or
Asphalt-aggregate ratio / %
Gradation 1Gradation 2Gradation 3Gradation 4
2.45
2.46
2.48
2.49
2.51
2.52
2.54
5.0 5.3 5.6 5.9 6.2 6.5
The
bulk
volu
me
rela
tive
dens
ity
Asphalt-aggregate ratio / %
Gradation 1Gradation 2Gradation 3Gradation 4
Figure 2. Changing regularity of the mechanical parameters and density of the GTM samples with the asphalt-aggregate ratios
308 Asphalt-Rubber 2009
From Figure 2, we can see that the stability index GSI which characterizes the plastic deformation of the asphalt mixtures increases with the asphalt-aggregate ratio, while the safety factor GSF which characterizes the anti-shearing strength of the asphalt mixtures increases with the asphalt-aggregate ratios first and then decreases after the peak. By the terms of Gradation 1, when the asphalt-aggregate ratio is more than 5.6%, GSI increases significantly. The rapid increase trend illustrates that the asphalt content has been excessive at this time, and the plastic deformation of the specimen is too large. In addition, when the asphalt-aggregate ratio is equivalent to 5.6 %, GSF comes to the crest value; and when the asphalt-aggregate ratio is more than 5.6%, GSF drops with the increase of asphalt-aggregate ratio, which indicates that the anti-shearing strength of the specimen is maximum at this time and begins to reduce. Considering the mechanical parameters comprehensively and referring to the changing trend of the bulk volume relative density of the samples, the optimum asphalt content of Gradation 1 is identified as 5.6%. By the same token, the optimum asphalt contents of Gradation 2, Gradation 3 and Gradation 4 are 5.7%, 5.8%, 5.4% respectively.
From Figure 2, we can also see that for the Gradation 4, the stability index GSI is smaller and the safety factor GSF is larger than those of other gradations based on the each optimum asphalt content, which indicate that, by means of GTM molding method, the continuous-gradation mixtures have the minimum plastic deformation and the maximum anti-shearing strength.
6. Study on linear expansion
In order to research the influence that the swelling action and the flexibility of rubber powder particles in the rubber- asphalt impose on the samples based on the GTM moulding mode, especially for the continuous-gradation, whether the swelling effect mentioned above would have great influence to interfere in the original gradations and undermine the overall structure, thus, after the samples are rotationally moulded, their heights are measured at different time, which can be used to calculate and analyze the linear expansion of the samples, and to indirectly determine the influence on the different gradations from the macro level. On this basis, using Marshall’s double-sided 75-hit method to mold the samples in accordance with each gradation for comparison, and their linear expansion ratios are measured by the same way, in order to understand the influence of the moulding mode imposing on such a expansion phenomenon.
The linear expansion situation of the samples with different gradations and moulding modes over time are shown in Figure 3, and the linear expansion ratios of which are shown in Table 3, in which the linear expansion ratio is between the value of height variation and the initial height.

Mix Properties 309
10.140
10.150
10.160
10.170
10.180
10.190
0 5 10 15 20 25 30 35
The
heig
htof
GTM
sam
ples
/cm
Test time / min
Gradation 1Gradation 2
6.320
6.340
6.360
6.380
6.400
6.420
6.440
0 10 20 30 40 50
The
heig
htof
Mar
shel
lsm
aple
s/cm
Test time / min
Grad…
Figure 3. Linear expansion situation with different gradations and moulding modes over time
Figure 3 and Table 3 illustrate:
(1) For different moulding modes, there is a certain amount of linear expansion for all the samples of the rubber-asphalt mixtures; for the same kind of moulding mode, the linear expansion rate of the gap-gradation samples is smaller than that of the continuous-gradation samples, and within the test range, the more coarse the gradation is, the smaller the linear expansion rate is;
(2) Moulding mode have significant influence on the linear expansion situation for the rubber-asphalt mixtures; for different moulding modes, the linear expansion rate with the same gradation is different from each other; by comparison with Marshall moulding mode, the linear expansion rate with GTM moulding mode is smaller; and that of the continuous-gradation is even less than that of Gradation 1 and Gradation 2 with Marshall moulding mode.

310 Asphalt-Rubber 2009
Table 3. Linear expansion ratios with different gradations and moulding modes
GradationLinear expansion ratio(%)
GTM moulding mode Marshall moulding mode1 P4.75=35% 0.24 0.472 P4.75=30% 0.21 0.433 P4.75=25% 0.18 0.334 Continuous 0.40 0.97
The experimental data instruct that, no matter what the moulding mode is, compared with the continuous- gradation, the gap-gradation mixtures has more space for the unreacted rubber powder particles in the rubber- asphalt to fill in. So the powder particles interfere with the existing structure less and the linear expansion ratios are smaller. Meanwhile, compared with the traditional Marshall moulding mode, by the means of GTM gyratory compaction molding method, the powder particles would distribute more uniformly with the rubber-asphalt’ moving, and would be easier to fill the space of the coarse aggregate fully, with more stable position as well. During the shearing and rubbing actions for more than 40 minutes, the deformation of the powder particles becomes more stable, and the deformation recovery slower as well. Thus, the rubber powder particles have smaller influence on its original gradation, and the linear expansion ratios are smaller.
As can be seen from the experimental data as also, by means of GTM moulding mode, the linear expansion ratios of the specimens with the continuous-gradation are quiet small[8]. And in such cases, there will be no changes of the voidage, the voids in mineral aggregate, the saturation and other volume indicators of the rubber-asphalt mixtures. So the unreacted rubber powder particles in the rubber- asphalt would has little influence on the original structure. Consequently, based on the GTM design method, the continuous-gradation can be completely adopted for the rubber-asphalt mixtures.
7. Analysis and discussion on pavement performance
7.1. High-temperature performance
Platy samples are formed in accordance with the optimium asphalt content determined by the GTM design method, and rutting tests are conducted to analyze the rutting resistance performance in high temperature of different-gradation rubber-asphalt mixtures. The Rolling Frequency is fixed 50 times[9] rolling back and forth, which is determined by the GTM gyratory compaction power and the on-site compaction condition. The results of rutting tests are shown in table 4, in which the relative deformation is the ratio between the final deformation depth at the end of the rutting test and the initial height of the sample.

Mix Properties 311
Table 4. Results of rutting tests for the rubber-asphalt mixtures with different gradations
Items Gradation 1P4.75=35%
Gradation 2P4.75=30%
Gradation 3P4.75=25%
Gradation 4Continuous
Dynamic stability(times/mm)
3626 3218 2642 4039
Relative deformation(%)
2.8 3.1 3.8 2.4
As can be seen from the experimental data in Table 4, by means of the GTM design method, the high-temperature performance of the continuous-gradation is much better not only in terms of the dynamic stability but also the relative deformation index. Furthermore, the dynamic stability and the relative deformation are consistent in the evaluation on the high-temperature performance of the rubber-asphalt mixtures. For the gap-gradation, the high-temperature performance is optimal when the 4.75mm passing rate is 35%. Referring to the documents[2],[7], the dynamic stability is not reasonable to evaluate on the high-temperature performance of the rubber-asphalt mixtures, while the relative deformation index is more scientific. In view of the importance of the high-temperature performance for the asphalt mixtures, it is proposed to use double controlling indexes----the dynamic stability and the relative deformation, while the latter is the main target. The related document[1] deems that the relative deformation index for the rubber-asphalt mixtures should be controlled within 3% under heavy traffic.
Generally speaking, the rutting resistance performance of the dense continuous-gradation mixtures is worse than that of the coarse gap-gradation aggregate, but by means of the GTM design method, the rutting resistance performance of the dense continuous-gradation is much better than that of the coarse gap-gradation. This is mainly because that the coarse gap-gradation aggregate mixtures have more coarse aggregates. Compared with the 5cm-thick testing mould, the compaction effect is relatively poorer with the same compaction power. In addition, the 0.075mm passing rate of the gap-gradation is only 5%. Thus, the daub content is so little that the skeleton gaps among the coarse aggregate can not be fully filled in, which would be more easily compacted secondly.
The interpretations above can be proved by the experimental data in Table 5. Under the rolling number determined by the experiments, the density of the gap-gradation platy samples is only 97% of that of the GTM gyratory molding samples or so, while the comparative data of the continuous-gradations is 99.6%, which illustrates that the continuous-gradation mixtures are more easily compacted under the same compaction power. Additionally, for the gap-gradation rubber-asphalt mixtures, the density of the plate samples becomes larger as the 4.75mm passing rate increases within the test range, which indicates that the more coarse the gradation is and the more easily the skeleton gaps among the coarse aggregate are filled in, the smaller the porosity is, as explains the regularity that the high-temperature performance varies with the passing rate of 4.75mm.
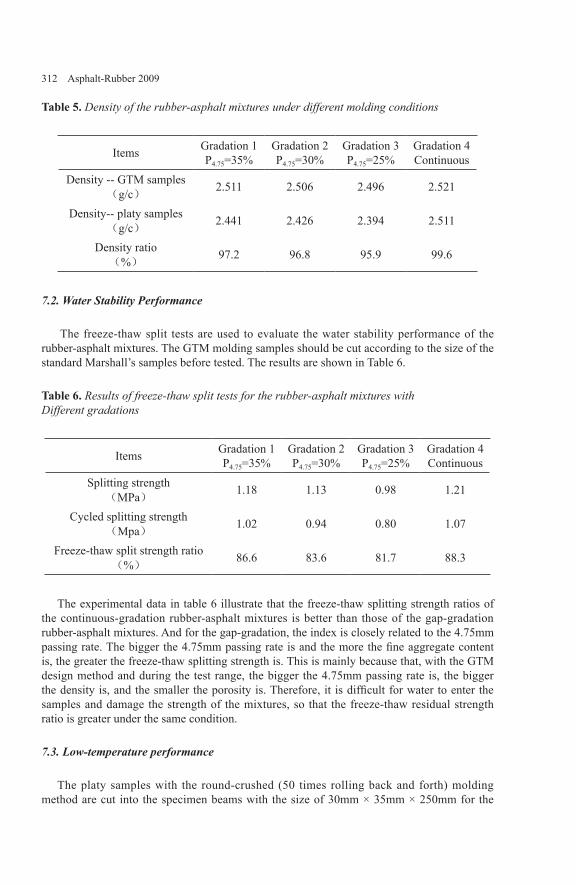
312 Asphalt-Rubber 2009
Table 5. Density of the rubber-asphalt mixtures under different molding conditions
Items Gradation 1P4.75=35%
Gradation 2P4.75=30%
Gradation 3P4.75=25%
Gradation 4Continuous
Density -- GTM samples(g/c) 2.511 2.506 2.496 2.521
Density-- platy samples (g/c) 2.441 2.426 2.394 2.511
Density ratio(%)
97.2 96.8 95.9 99.6
7.2. Water Stability Performance
The freeze-thaw split tests are used to evaluate the water stability performance of the rubber-asphalt mixtures. The GTM molding samples should be cut according to the size of the standard Marshall’s samples before tested. The results are shown in Table 6.
Table 6. Results of freeze-thaw split tests for the rubber-asphalt mixtures with Different gradations
Items Gradation 1P4.75=35%
Gradation 2P4.75=30%
Gradation 3P4.75=25%
Gradation 4Continuous
Splitting strength(MPa) 1.18 1.13 0.98 1.21
Cycled splitting strength(Mpa) 1.02 0.94 0.80 1.07
Freeze-thaw split strength ratio(%)
86.6 83.6 81.7 88.3
The experimental data in table 6 illustrate that the freeze-thaw splitting strength ratios of the continuous-gradation rubber-asphalt mixtures is better than those of the gap-gradation rubber-asphalt mixtures. And for the gap-gradation, the index is closely related to the 4.75mm passing rate. The bigger the 4.75mm passing rate is and the more the fine aggregate content is, the greater the freeze-thaw splitting strength is. This is mainly because that, with the GTM design method and during the test range, the bigger the 4.75mm passing rate is, the bigger the density is, and the smaller the porosity is. Therefore, it is difficult for water to enter the samples and damage the strength of the mixtures, so that the freeze-thaw residual strength ratio is greater under the same condition.
7.3. Low-temperature performance
The platy samples with the round-crushed (50 times rolling back and forth) molding method are cut into the specimen beams with the size of 30mm × 35mm × 250mm for the
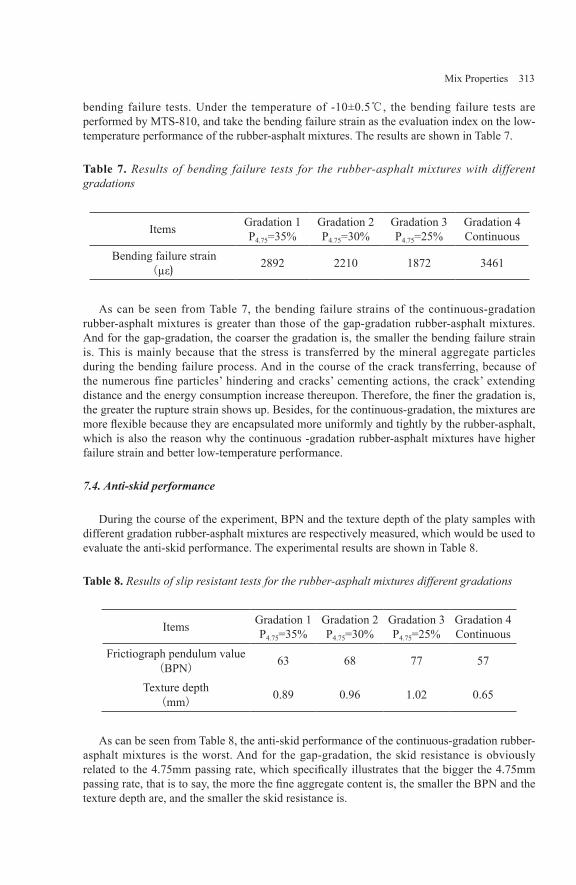
Mix Properties 313
bending failure tests. Under the temperature of -10±0.5℃, the bending failure tests are performed by MTS-810, and take the bending failure strain as the evaluation index on the low-temperature performance of the rubber-asphalt mixtures. The results are shown in Table 7.
Table 7. Results of bending failure tests for the rubber-asphalt mixtures with different gradations
Items Gradation 1P4.75=35%
Gradation 2P4.75=30%
Gradation 3P4.75=25%
Gradation 4Continuous
Bending failure strain(µε) 2892 2210 1872 3461
As can be seen from Table 7, the bending failure strains of the continuous-gradation rubber-asphalt mixtures is greater than those of the gap-gradation rubber-asphalt mixtures. And for the gap-gradation, the coarser the gradation is, the smaller the bending failure strain is. This is mainly because that the stress is transferred by the mineral aggregate particles during the bending failure process. And in the course of the crack transferring, because of the numerous fine particles’ hindering and cracks’ cementing actions, the crack’ extending distance and the energy consumption increase thereupon. Therefore, the finer the gradation is, the greater the rupture strain shows up. Besides, for the continuous-gradation, the mixtures are more flexible because they are encapsulated more uniformly and tightly by the rubber-asphalt, which is also the reason why the continuous -gradation rubber-asphalt mixtures have higher failure strain and better low-temperature performance.
7.4. Anti-skid performance
During the course of the experiment, BPN and the texture depth of the platy samples with different gradation rubber-asphalt mixtures are respectively measured, which would be used to evaluate the anti-skid performance. The experimental results are shown in Table 8.
Table 8. Results of slip resistant tests for the rubber-asphalt mixtures different gradations
Items Gradation 1P4.75=35%
Gradation 2P4.75=30%
Gradation 3P4.75=25%
Gradation 4Continuous
Frictiograph pendulum value(BPN)
63 68 77 57
Texture depth(mm)
0.89 0.96 1.02 0.65
As can be seen from Table 8, the anti-skid performance of the continuous-gradation rubber-asphalt mixtures is the worst. And for the gap-gradation, the skid resistance is obviously related to the 4.75mm passing rate, which specifically illustrates that the bigger the 4.75mm passing rate, that is to say, the more the fine aggregate content is, the smaller the BPN and the texture depth are, and the smaller the skid resistance is.

314 Asphalt-Rubber 2009
7.5. Impermeability
During the course of the experiments, the water permeability coefficient of the platy specimens with different-gradation is measured separately, and the experimental results illustrate that the rubber-asphalt mixtures of each gradation is generally impermeable.
8. Conclusions
Based on the GTM design method, researches on the rubber-asphalt mixtures in the forms of continuous -gradation and gap-gradation are carried out respectively, by analysis and comparison with their linear expansibility and pavement performance, several conclusions could be drawn as follows:
(1) Based on the GTM design method, the rubber-asphalt mixtures can adopt the continuous-gradation, and the rubber powder particles in rubber-asphalt will not affect the original grading structure.
(2) Based on the GTM design method, the continuous-gradation rubber-asphalt mixtures have excellent pavement performance, and which are better than those of the rubber-asphalt mixtures with coarse gap-gradation from the whole aspect.
(3) Comprehensively considering the pavement performance and the ease for construction, it is proposed that the continuous-gradation should be adopted in the engineering practice, while the coarse aggregate content should be increased moderately in order to enhance the anti-skid performance. If using the coarse gap-gradation aggregate, the 4.75mm passing rate suggested should be controlled at about 35% or so.
(4) The GTM design method is more suitable for the design of the continuous-gradation rubber-asphalt mixtures.
9. Bibliography
[1] Beijing Highway Administration Bureau, Research Institute of Highway Ministry of Communications, Guidelines for Design and Construction of Asphalt Rubber and Mixtures in Beijing, Beijing, China, 2006.
[2] Cao Lintao, Li Lihan, Sun Daquan, “Research of evaluation indexes for asphalt mixtures wheel tracking test”. Journal of Wuhan University of Technology , Wuhan, China, 2007 , 29(11).
[3] Guo Xiaohua, Research on the design methods and key indicators of the asphalt mixtures, Tianjin, China, 2008.
[4] Heibei Headquarters For Bao-Cang Expressway Construction, Tongji University, Research on the crack resistance performance of the asphalt mixtures, Shanghai, China, 2008.

Mix Properties 315
[5] Jiangsu Headquarters For Expressways Construction, Jiangsu Transportation Research Institute, Application and research on the rubber-asphalt used on the Lian-Yan-Tong expressway, Nanjing, China, 2007.
[6] Tianjin Municipal Engineering Research Institute, Research on the pavement performance of the urban expressway , Tianjin, China, 2005.
[7] Wang Xudong, He Zhaoyi, “The comparative research of asphalt mixtures dynamic stability and relative deformation”, Journal of Chongqing Jiaotong University , Chongqing, China, 2000, 19(3) .
[8] Wang Xudong, Research on the wasted rubber powder used in highway engineering, Beijing, China, 2004.
[9] Zhou Weifeng, Study of design methodology for asphalt mixtures based on GTM, Xian, China, 2006.


Mix Properties 317
Laboratory Assessment of Workability, Performance and Durability of Rubberised Asphalt Mixtures
I. Widyatmoko* — R. Elliott* — J. Grenfell** — G. Airey** — A. Collop** — S. Waite***
*Scott Wilson Limited12 Regan Way, Chetwyn Business Park, Nottingham, NG9 6RZ, [email protected]@scottwilson.com
**Nottingham Transportation Engineering CentreSchool of Civil Engineering, University Park, Nottingham, NG7 2RD, [email protected]@[email protected]
***Waste & Resources Action ProgrammeThe Old Academy, 21 Horse Fair, Banbury, Oxon, OX16 0AH, [email protected]
ABSTRACT. This paper presents some findings from the recently completed research project on “Rubberised Asphalt Testing to UK Standards”, funded by WRAP (Waste & Resources Action Programme). The use of rubberised bitumen in two families of asphalt mixture historically used in the UK, specifically Porous Asphalt (PA) surface course and Stone Mastic Asphalt (SMA) binder course, has been studied. In summary, the comprehensive laboratory study described in this report has shown the overall performance of rubberised asphalt (RA) mixtures to be at least similar to that of premium asphalt binder course (e.g. SMA) and significantly better than that of a conventional porous asphalt surface course, due to improved tensile strength, superior resistance to deformation, low temperature cracking and aggregate loss (fretting). Good quality RA mixtures can therefore be regarded as strong contenders for heavy duty long life surface course applications.
KEYWORDS: workability, performance, durability, rubberised asphalt.

318 Asphalt-Rubber 2009
1. Introduction
This paper presents some findings from the recently completed research project on “Rubberised Asphalt Testing to UK Standards”, funded by WRAP (Waste & Resources Action Programme). One of the aims from this study was to provide information to potential users of rubberised binder on the properties that can be expected from various sources/types of crumb rubber available in the UK, when blended with typical UK bitumens. A companion paper describes the assessment of the rubberised binders (WIDY 2009); this paper describes the assessment of the resulting rubberised asphalt (RA) mixtures.
2. Materials for Testing
The constituent materials used in the study comprised 2 bitumen sources (each with 2 bitumen grades), 3 aggregate types and 3 rubber types and sources; these were used in 2 RA mixture designs and 2 control asphalt mixtures. Two families of asphalt mixture historically used in the UK, specifically Porous Asphalt (PA) and Stone Mastic Asphalt (SMA), were selected for use as the control surface course and binder course mixtures, respectively, whereas the RA mixtures adopted the composition (grading and binder content) normally used for open and gap graded rubberised asphalts, respectively, as presented in Figure 1.
Note: ARSC-GS/GR = Asphalt Rubber Surface Course containing Gritstone or Granite respectively. ARBC-GR/LS = Asphalt Rubber Binder Course containing Granite or Limestone respectively.
Figure 1. Asphalt Mixture Gradation
It should be noted, however, that the rubberised asphalt gradings exclude the grading of filler additives (around 2%). The target binder contents adopted for the control PA and SMA were 4.5% and 5.8% by weight of the total mixture, respectively, and those for the RA mixtures ranged from 8.7% to 9.0%.

Mix Properties 319
The four control asphalt mixtures are referenced by Asphalt type-Aggregate type-Binder penetration, for example; PA-GS-125pen indicates porous asphalt (PA) with Gritstone aggregate (GS) and a binder with a 125 penetration (i.e. 100/150); and SMA-GR-50pen indicates a Stone Mastic Asphalt (SMA) with Granite aggregate (GR) and a binder with a penetration of 50 (i.e. 40/60). The twelve RA mixtures are referenced by applicable pavement layer-Aggregate type-Blend type. For example ARSC-GR-1 indicates an Asphalt Rubber (AR) in the surface course layer (ARSC) containing Granite aggregate (GR), all mixed according to Blend type 1. ARBC-LS-2 indicates an Asphalt Rubber (AR) in the binder course layer (ARBC) containing Limestone aggregate (LS), all mixed according to Blend type 2. The three rubberised bitumen blends selected from the binder assessment (WIDY 2009) were used, specifically:
81.5% VE 40/60 + 18.5% ambient car tyre rubber (Blend 1)81.5% VE 40/60 + 18.5% cryogenic car tyre rubber (Blend 2)84% ME 40/60 + 16% ambient car tyre rubber (Blend 3)
The respective references for the four control and twelve rubberised asphalt mixtures are presented in Table 1.
Table 1. Sample References
SURFACE COURSE
Aggregate
Control Bitumen
Rubberised BitumenBlend 1
Rubberised BitumenBlend 2
Rubberised BitumenBlend 3
- VE 40/60 + 18.5% ambient car
VE 40/60 + 18.5% cryogenic car
ME 40/60 + 16% ambient car
Gritstone PA-GS-125pen ARSC-GS-1 ARSC-GS-2 ARSC-GS-3
Granite PA-GR-125pen* ARSC-GR-1 ARSC-GR-2* ARSC-GR-3*
BINDER COURSE
Limestone SMA-LS-50pen ARBC- LS-1 ARBC- LS-2 ARBC- LS-3
Granite SMA-GR-50pen* ARBC- GR-1* ARBC- GR-2 ARBC- GR-3*
Note: *following the workability (screening) tests, these mixtures were not selected for further mechanical assessment.
This study involved a two step process, the first being a screening assessment (workability assessment) of twelve RA mixtures and four control mixtures and the second being mechanical assessment of the eight best performing blends from the screening assessment and two control mixtures, i.e. PA and SMA.
•••

320 Asphalt-Rubber 2009
3. Workability
A screening assessment on twelve number RA mixtures (six surface course and six binder course materials) and four sets of control asphalt mixtures was carried out on mixtures prepared in the laboratory using bespoke workability test protocols, developed by Scott Wilson. These workability tests were targeted at assessing any change in mixture characteristics and performance due to variations in sample manufacturing and holding time.
The “viscosity” of loose coated RA mixtures was assessed over a period of 10 minutes of mixing and represented as mixture resistance to the mixing torque applied (measured and recorded during high temperature mixing) per unit weight. A suitably instrumented asphalt mixer (pictured below) was used throughout the testing. The workability test data and the results are summarised in Figure 2.
Figure 2. Workability Test Results
Lower resistance to mixing torque per unit weight is considered to be an indication of better workability. With the exception of the PA mixture which was tested at 140℃, all other mixtures were tested at 165℃. From the graph above, it can be seen that all gritstone and granite ARSC mixtures require a lower mixing torque compared to their respective control (PA) mixtures. This suggests that the mixtures have improved workability compared with their respective control mixtures. Although rubberised bitumen is more viscous than the control bitumen, in the respective mixtures it has been found, in this case, to have improved workability, probably because of the higher mixing temperature (in case of surface course samples) and higher binder content (typically 3-4% higher). Figure 2 also shows that in the case of gritstone mixtures, workability gradually increases from Blend 1 through to Blend 3 whereas the workability of the granite mixtures remains roughly the same.

Mix Properties 321
4. The Effect of Holding Time
Loose coated asphalts were retained at the respective mixing temperature in the asphalt mixer for ‘holding time’ lasting up to 120 minutes. Sub-samples were taken at intervals and compacted to produce cylindrical asphalt samples. Subsequently, an assessment of the effect of holding time on the compacted asphalt mixture stiffness at 20℃ was carried out, using the Indirect Tensile Stiffness Modulus (ITSM) test procedure in the Nottingham Asphalt Tester (NAT), to BS EN 12697-26 Annex C. In addition, assessment of the effect of holding time on mixture tensile strength at 25℃ was carried out using the Indirect Tensile Test at a loading rate of 50mm/minute, to BS EN 12697-23. Some of the results are presented in Figures 3 and 4.
StiffnessVsMixing/Holding Time(Gritstone)
0
500
1000
1500
2000
2500
3000
3500
4000
4500
5000
0 20 40 60 80 100 120 140Mixing/Holding Time (min)
Stiff
ness
at 2
0o C
(MPa
)
PA-GS-125pen ARSC-GS-1
ARSC-GS-2 ARSC-GS-3
StiffnessVsMixing/HoldingTime(Limestone)
0
1000
2000
3000
4000
5000
6000
7000
0 20 40 60 80 100 120 140
Mixing/Holding Time (min)
Stiff
ness
at 2
0o C
(MPa
)
SMA-LS-50pen ARBC- LS-1
ARBC- LS-2 ARBC- LS-3
Figure 3. Stiffness Assessment – Examples of results at 20℃
Tensile Strength Vs Mixing/Holding Time (Gritstone)
0
200
400
600
800
1000
1200
1400
0 20 40 60 80 100 120 140
Mixing/Holding Time (min)
Tens
ileSt
reng
that
25o C
(kPa
)
PA-GS-125pen ARSC-GS-1ARSC-GS-2 ARSC-GS-3
Tensile Strength Vs Mixing/Holding Time (Granite)
0
200
400
600
800
1000
1200
1400
0 20 40 60 80 100 120 140
Mixing/Holding Time (min)
Tens
ileSt
reng
that
25o C
(kPa
)
PA-GR-125pen ARSC-GR-1ARSC-GR-2 ARSC-GR-3
Tensile Strength Vs Mixing/Holding Time(Limestone)
0
500
1000
1500
2000
2500
0 20 40 60 80 100 120 140
Mixing/Holding Time (min)
Tens
ileSt
reng
that
25o C
(kPa
)
SMA-LS-50pen ARBC- LS-1ARBC- LS-2 ARBC- LS-3
Tensile Strength Vs Mixing/Holding Time (Granite)
0
500
1000
1500
2000
2500
0 20 40 60 80 100 120 140Mixing/Holding Time (min)
Tens
ileSt
reng
that
25o C
(kPa
)
SMA-GR-50pen ARBC-GR-1ARBC-GR-2 ARBC-GR-3
Figure 4. Tensile Strength Assessment – Results at 25℃

322 Asphalt-Rubber 2009
Surface course mixtures generally showed an increase in mixture stiffness with increase in mixing/holding time. The control mixtures showed significantly lower values of stiffness in comparison with the rubberised asphalt mixtures. This indicates improved load spreading ability of the RA mixtures compared with that of the PA control samples. Binder course mixtures also showed a small increase in mixture stiffness with increase in mixing/holding time. Apart from ARBC-LS-1, mixture stiffness values were generally similar for all the SMA mixtures. Overall, extended holding time (up to 120 minutes) does not lead to a reduction in stiffness. It should be noted that all RA mixtures exceeded the recommended minimum stiffness value of 1700 MPa.
Apart from samples manufactured using granite aggregate, surface course and binder course mixtures did not show a significant change in tensile strength with increase in mixing (holding) time. The surface course control mixtures showed significantly lower values of tensile strength; those of the RA mixtures were 2 – 3 times higher. The tensile strength of gritstone Blends 2 and 3 initially decreases then either stabilises or increases. Blend 1 shows the most consistent results of the gritstone blends. Regarding the binder course, limestone Blend 2 had tensile strength values similar to the control mixtures’ tensile strength values, with those of Blend 3 being slightly lower and those of Blend 1 more significantly so. The low tensile strength values of limestone Blend 1 are consistent with its low values of stiffness. Research by De Beer et al (1999) on tyre/pavement contact stresses reported horizontal stresses due to the tyres of B-747 aircraft between 260 and 500 kPa. The above laboratory test results from rubberised asphalt exceeded 600 kPa, indicating sufficiently good quality material. Overall, the results suggest that prolonged hot storage (up to 120 minutes) such as that experienced in a delivery lorry during transportation of asphalt materials from the mixing plant to site does not have a detrimental effect on the mixture’s performance. Following the workability assessment, the ten mixtures identified in Table 1 were taken forward to the mechanical assessment stage.
5. Mechanical Assessment
A suite of mechanical assessment tests was carried out on the selected ‘best’ RA mixtures (four surface course and four binder course materials) and two sets of control asphalt mixtures (a control binder course and a control surface course material). The results are presented hereafter.
5.1 Mixture Volumetrics
An assessment of mixture volumetrics was carried out in accordance with BS EN 12697 Parts 5, 6 and 8 and BS EN 13108-20, prior to carrying out the mechanical tests. This provided, to some extent, an early indication of any potential problems associated with workability. The bulk density of surface course mixtures was determined by dimensions and that of binder course mixtures by the sealed method. A summary of the mixture volumetrics of the selected cores removed from the slabs is presented in Table 2.

Mix Properties 323
Table 2. Summary of Mixture Volumetrics
Mixture TypeBulk Density (Mg/) Maximum
Density (Mg/)
Air Voids (%) At Refusal*
By Dimension Sealed By
Dimension Sealed Density (Mg/)
Voids (%)
PA-GS-125pen 2.073 2.530 18.1 2.426 4.1ARSC-GS-1 2.223 2.414 7.9 2.363 2.1ARSC-GS-2 2.187 2.408 9.2 2.374 1.4ARSC-GS-3 2.093 2.450 14.6 2.354 3.9ARSC-GR-1 2.145 2.315 7.3 2.221 4.1
SMA-LS-50pen 2.362 2.450 3.6 2.418 1.3ARBC- LS-1 2.246 2.359 4.8 2.312 1.9ARBC- LS-2 2.256 2.359 4.4 2.317 1.8ARBC- LS-3 2.225 2.359 5.7 2.322 1.6ARBC- GR-2 2.252 2.330 3.3 2.304 1.1
Note: * ARSC and ARBC samples were heated to 177℃, PA samples were heated to 140℃ and SMA samples were heated to 165℃, prior to compaction to refusal.
Refusal density testing is normally adopted to assess the risk of secondary compaction of dense asphalt mixtures. In this test, samples of field compacted asphalt are subjected to further compaction to refusal, in the laboratory, by means of a vibrating hammer. For dense asphalt mixtures, air voids at refusal above 0.5% is typically the minimum specified value. Very low air voids at refusal (e.g. less than 0.5%) are generally considered to be an indication of mixture susceptibility to secondary compaction, leading to low resistance to rutting. In this case, all dense asphalt samples (SMA and ARBC) showed refusal air void contents greater than 1%, which was satisfactory. For porous and open graded mixtures (e.g. PA and ARSC), where mixture strength mostly relies on stone-to-stone contact, the voids at refusal would be expected to be higher. It is possible that aggregate degradation during refusal density testing may have taken place in the ARSC-GS-1 and ARSC-GS-2 mixtures, leading to air voids at refusal of around 1 to 2%.
5.2 Deformation Resistance
The Wheel Tracking Test (WTT) was carried out to BS 598-110, under the standard test conditions of a wheel load of magnitude 520 N, which moves backwards and forwards in simple harmonic motion at 42 passes per minute (21 cycles per minute). In this test, wheel tracking is continued until 45 minutes has elapsed, or a 15mm rut has developed, and the permanent deformation is recorded at 5 minute intervals. The test arrangement and results are presented in Figure 7.

324 Asphalt-Rubber 2009
Wheel Tracking Test (Surface Course)
0.0
0.5
1.0
1.5
2.0
2.5
3.0
3.5
4.0
PA-GS-125pen ARSC-GS-1 ARSC-GS-2 ARSC-GS-3 ARSC-GR-1
Asphalt TypeR
utD
epth
(mm
)/R
utR
ate
(mm
/hr)
WTT Rut Depth (mm)
WTT Rut Rate (mm/hr)
Wheel Tracking Test (Binder Course)
0.0
1.0
2.0
3.0
4.0
5.0
6.0
SMA-LS-50pen ARBC- LS-1 ARBC- LS-2 ARBC- LS-3 ARBC- GR-2
Asphalt Type
Rut
Dep
th(m
m)/
Rut
Rat
e(m
m/h
r)
WTT Rut Depth (mm)
WTT Rut Rate (mm/hr)
Test Setup
Figure 7. Wheel track testing at 60℃
Figure 7 shows that the surface course RA samples have a lower rut depth and rut rate compared to the control samples i.e. PA-GS-125pen; this indicates that the RA samples have better resistance to deformation. For the binder course, only ARBC-GR-2 had better resistance to deformation compared to that of the control sample SMA-LS-50pen. It should be noted, however, that all materials met the UK requirements for surfacing and binder course materials for application on heavily stressed areas, i.e. having a rut depth and rut rate at 60℃ testing of less than 7mm and 5mm/h, respectively.
5.3 Crack Resistance
Asphalt mixtures with very high stiffness may exhibit poorer resistance to crack propagation and/or thermal cracking. The thermal crack resistance was assessed by semi circular bending tests at a loading rate of 5mm/minute (0.085 mm/s) at 0℃, in accordance with prEN 12697-44. Four samples of each of the mixtures were tested; the results are summarised in Figure 8.

Mix Properties 325
SCB Test Arrangement (top) andSamples after Testing (bottom)
Surface Course
0
20
40
60
80
100
120
140
PA-GS-125pen ARSC-GS-1 ARSC-GS-2 ARSC-GS-3 ARSC-GR-1
Asphalt Type
Aver
age
fract
ure
toug
hnes
s(N
/mm
3/2 )
0.0%
0.2%
0.4%
0.6%
0.8%
1.0%
1.2%
1.4%
1.6%
1.8%
Aver
age
stra
inat
max
imum
forc
e
Average fracture toughness Kfc (N/mm3/2)Average Strain at maximum force εmax
Binder Course
0
20
40
60
80
100
120
140
160
SMA-LS-50pen ARBC- LS-1 ARBC- LS-2 ARBC- LS-3 ARBC- GR-2
Asphalt Type
Aver
age
fract
ure
toug
hnes
s(N
/mm
3/2 )
0.0%
0.2%
0.4%
0.6%
0.8%
1.0%
1.2%
1.4%
Aver
age
stra
inat
max
imum
forc
e
Average fracture toughness Kfc (N/mm3/2)Average Strain at maximum force εmax
Figure 8. Crack Resistance at 0℃
Except for ARSC-GR-1, the surface course RA samples had a higher average fracture toughness and average strain at failure than the PA-GS-125pen control sample. This implies that the ARSC samples have better flexibility and better resistance to low temperature cracking. Results for ARBC samples, however, show that the RA samples have lower average fracture toughness and strain at failure when compared to the control sample SMA-LS-50pen.
5.4 Fatigue Resistance
Fatigue resistance was assessed in the NAT by using a controlled load Indirect Tensile Fatigue Test (ITFT) in accordance with the BBA HAPAS Document SG3/08/256 Annex A.13. A minimum value of 10,000 cycles to failure at a microstrain of 200 was adopted as a ‘pass/fail’ criterion for this study. Table 3 shows that PA-GS-125pen, ARSC-GS-3 and ARBC-LS-2 do not meet this requirement. The longest fatigue lives at this level of microstrain are given by ARSC-GR-1 and ARBC-LS-1, for surface and binder courses respectively.

326 Asphalt-Rubber 2009
Table 3. Indirect Tensile Fatigue Test at 20℃
Test Setup Mix Type Cycles to Failure (Nf)at 200 microstrain
PA-GS-125pen 3,263ARSC-GS-1 14,311ARSC-GS-2 27,714ARSC-GS-3 2,689ARSC-GR-1 33,677
SMA-LS-50pen 21,531ARBC- LS-1 32,885ARBC- LS-2 6,884ARBC- LS-3 11,368ARBC- GR-2 25,270
5.5 Durability
The durability or resistance to particle loss was assessed by the loss of mass of compacted mixture subjected to 300 revolutions in the Los Angeles (LA) machine, in accordance with EN 12697-17. This process is commonly referred to as Cantabro testing. It enables an estimation of the resistance to abrasion of laboratory compacted specimens to be made. A threshold value of a maximum particle loss of 26% was specified for this study. The Cantabro test resulted in particle loss averaging between 4% and 9% for all RA mixtures, whilst the control samples showed significantly higher percentages of particle loss compared to the RA mixtures (i.e. averaging between 15% and 19%). This implies that the RA mixtures would be expected to have better durability (resistance to particle loss or abrasion) than the control mixtures. All samples, however, showed material loss lower than that specified for this study, indicating good resistance to particle loss of the tested samples.
The resistance to moisture damage (of surface course samples only) was also assessed, using retained stiffness as the criterion, in addition to the durability assessment presented above. For the purposes of this research, a threshold value of 80% retained stiffness after a soaking regime was adopted as the criterion. The mean retained stiffnesses for the RA samples were found to be all above 1 and consistently greater than those of the control sample PA-GS-125pen. This indicates that the surface course RA blends would not be deemed to be susceptible to water related durability problems in service.
6. Concluding Remarks
The use of rubberised bitumen in porous and dense gap graded asphalt mixtures has been evaluated, together with two traditional UK materials, Porous Asphalt (PA) and Stone Mastic Asphalt (SMA). A two step process has been adopted; the first being a screening assessment (workability assessment) of twelve rubberised asphalt (RA) mixtures and four control

Mix Properties 327
mixtures and the second being mechanical assessment of the eight best performing blends from the screening assessment and two control mixtures, i.e. PA and SMA. The workability assessment concluded RA materials were at least as workable as the control mixtures and retained their mechanical properties over a two hour holding period. The comprehensive laboratory study described in this report has shown the overall performance of RA mixtures to be at least similar to that of premium asphalt binder course (e.g. SMA) and significantly better than that of a conventional porous asphalt surface course, as a consequence of improved tensile strength, superior resistance to deformation, low temperature cracking and aggregate loss (fretting). Good quality RA mixtures can therefore be regarded as strong contenders for heavy duty long life surface course applications.
7. Acknowledgement
The authors would like to compliment and thank Ronald Kibuuka and the laboratory teams in Scott Wilson and NTEC for the efficiency and effectiveness in producing the test data in this paper. The work was won from WRAP by Scott Wilson in partnership with NTEC, by competitive tender. WRAP helps individuals, businesses and local authorities to reduce waste and recycle more, making better use of resources and helping to tackle climate change; more information on WRAP’s work can be found on www.wrap.org.uk. Contributions from Aggregate Industries, Tarmac, Nynas, UK Bitumen, Moncton Rubber Technology, Tyregenics, Allcock and Sons, and Singleton Birch, in providing the materials and the streams of advice from the Technical Advisor to WRAP, Mr Ian Walsh, are greatly appreciated.
8. Bibliography
De Beer M, Fisher C and Jooste, F (1999). “Determination of PneumaticTyre/Pavement Interface Contact Stresses under Moving Loads and some Effects on Pavements with Thin Asphalt Surfacing Layers”. Transportation Research Board Meeting, National Academy of Science, Washington.
Widyatmoko, I., Elliott, R., Grenfell, J., Airey, G., Collop, A., and Waite, S. (2009),“Characteristics of Rubberised Bitumen Blends”, Asphalt Rubber 2009, Nanjing, China, November 2-4, 2009. (In submission)


Mix Properties 329
Study of the Rutting in Asphalt Mixtures by Addition of Rubber
Fredy Reyes Lizcano* - Hugo Rondón** - Ana Sofía Figueroa***
*Pontificia Universidad JaverianaResearch group “CECATA”, Javeriana University. Bogotá, [email protected]
**Universidad Católica de ColombiaResearch group “Pavimentos y materiales de ingeniería”, Catolica University. Bogotá, [email protected].
***Universidad de La SalleResearch group “INDETEC”, De la Salle, University. Bogotá, Colombia. [email protected]
ABSTRACT. The purpose of this research was to determine the rutting effect of asphalt mixture by adding wasted tires as a substitution of granular material. The study started with a description of granular material, asphalt and plastic wasted properties, followed by the result of the optimum asphalt binder content obtained in the Marshall test. It concludes with the Marshall tests performance and rutting adding wasted tires as a substitute of granular material. Wasted rubber was introduced in three different geometrical shapes: powder pieces of rubber of 1.5 centimetres long and a combination of powder and pieces. The results obtained showed that there is a reduction on permanent deformation of 13% by using powder of rubber and 23% by using pieces of rubber.
KEYWORDS: Marshall test, rutting, used tires, asphalt mixture.

330 Asphalt-Rubber 2009
1.Introduction
Rutting is a structural failure that characterizes flexible pavements that correspond to a permanent deformation in the structure produced mainly by excessive traffi c, high loads per axle, wrong construction processes and high temperatures of service.
Figure 1. Rutting phenomenon. Calle 80, Bogotá – Colombia.
Deformations that take place in a pavement structure are composed by elastic and plastic deformations. The fi rst component is restored after the applied load is retired, while the second is accumulated and produce permanent deformation (Figure 2).
Figure 2. Behaviour of viscoelastic materials.

Mix Properties 331
Rubber is composed specially by steel fibers and polymers as natural rubber (NR), polyisoprene rubber (IR), butadiene-styrene-rubber (SBR) or polibutadiene rubber (BR). These polymers have characteristic thermal, mechanical and chemical properties. When polymers are submitted to excessive loads, effects of the climate and chemistry agents do not present significant changes in its mechanical properties, making this an alternative as replacement of granular material in the construction of pavement structures. Many companies have patented industrialized products composed by polymers in order to improve mechanical properties of asphalt mixtures; however because of its high costs these products are not commonly used in developing countries. At present several investigation centers study how to replace granular materials by plastic waste based on the principles of the industrialized polymers, some of these include the works by Oda and Fernandes, Reyes and Reyes, Sobhan and M. Mashnad, among others.
Otherwise, it is important to stand out that these plastic waste products have long periods of degradation (100–1000 years), also generate environmental contamination in river basin and disposal waste fields.
The principal purpose of this investigation is focused on the effect of adding in a 0/10 dense asphalt mixture with 60/70 asphalt, waste tire rubber in the shape of powder or fibres or both in the rutting phenomenon besides reduction of environment contamination by using these materials in roads construction.
2. Methodology
Figure 3 describes the methodology used in the development of this project that later will describe in detail.
Figure 3. Investigation methodology.
2.1. Obtaining gradation and asphalt
Gradation used in the investigation is 0/10 (Figure 4), the same used in the construction of pavements in Bogotá city according to the technical road regulations. The asphalt used is produced by the Barrancabermeja refinery.

332 Asphalt-Rubber 2009
0
20
40
60
80
100
0.1110100
%PA
SSIN
G
GRAIN DIAMETER (mm)
GRADATION CURVE
Figure 4. 0/10 gradation curve.
2.2 Granular Material Description
The granular material was described by the laboratory tests with the results that are shown in the Table 1.
Table 1. Test description of granular material.
TEST PROCEDURE VALUEAbsorption of coarse aggregate ASTM C 127 3.34%
Specific gravity ASTM C 127 2.39Absorption of fine aggregate ASTM C128 1.77%
Specific gravity ASTM C 128 2.50Resistance of degradation in Los Angeles
machine ASTM C 535 25.6%
2.3. Asphalt Description
The asphalt produced by Barrancabermeja refinery has the characteristics shown in Table 2.

Mix Properties 333
Table 2. Asphalt’s test description
TEST PROCEDURE VALUEPenetration ASTM D 5-97 (67-70) x10-1mmDuctility ASTM D 113-99 125 cmViscosity ASTM D 2170-95 1500 (SSU)
Softening point ASTM D 36-95 45℃Flash point ASTM D 3143-98 215℃
2.4. Plastic Waste Description
Rubber material discarded by consumers in Bogotá was used in this investigation, which are composed by elastomers with 0.87 kg/c of density. Waste material was used in three different shapes: first as ground material that passes the 40-mesh sieve. Second in pieces of 1 mm thickness per 15 mm long, finally, a combination of 50 % of the first and 50 % of the second shapes. Material shapes are shown in Figures 5 and 6.
Figure 5. Powder of rubber. Figure 6. Pieces of rubber.
3. Analysis of the results
Fifteen Marshall samples were constructed in order to determine the optimum asphalt binder content. With optimum content (6.5 %) Marshall samples were constructed with 50 and 75 blow energy compaction level and rutting samples that had waste addition between 0.15 and 0.75 % (Figures 7 to 11) were obtained.

334 Asphalt-Rubber 2009
2000
2200
2400
2600
2800
3000
3200
3400
3600
3800
4000
57.06.054.03.051.00
STA
BIL
ITY
(Lb)
WASTED RUBBER CONTENT (%)POWDER & PIECES 50-BLOW
POWDER 50-BLOW
PIECES 50-BLOW
POWDER & PIECES 75-BLOW
POWDER 75-BLOW
PIECES 75-BLOW
X
Figure 7. Stability as function of waste percentage.
-20%
-15%
-10%
-5%
0%
5%
10%
15%
20%
57.06.054.03.051.0INC
REA
SE (%
)
WASTE RUBBER ADDITION (%)
rebburfoseceiPrebburforedwoP 50% Powder & 50% Pieces
Figure 8. Increase of stability as function of waste addition for 50-blows of compaction level.
For 0.15, 0.3 and 0.6 % of waste addition, an increase in stability is presented for all samples compacted with 50 blows and all waste shapes as shown in Figure 8. The increase reached its maximum value (17 %) for 0.15 %. There is a maximum decrease (16 %) for 0.45 and 0.75 % for the asphalt mixture with pieces of rubber.
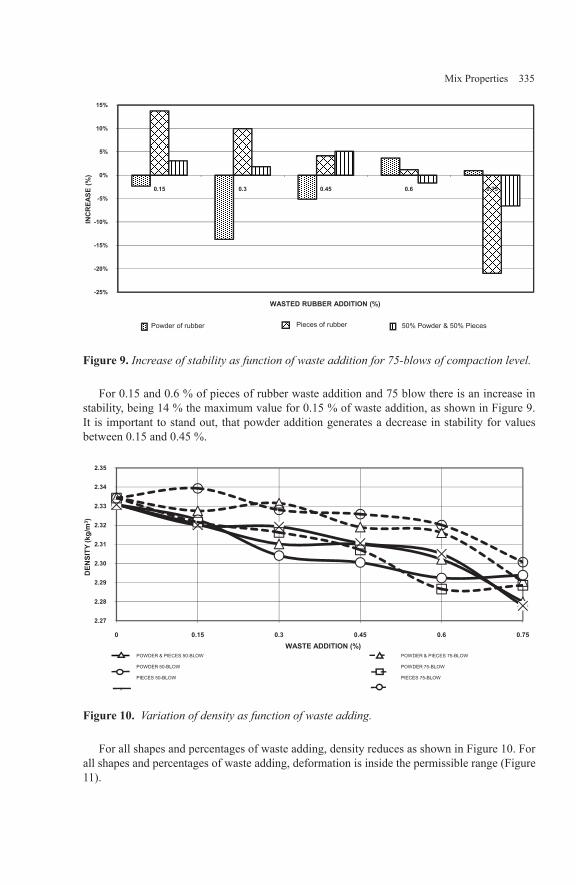
Mix Properties 335
-25%
-20%
-15%
-10%
-5%
0%
5%
10%
15%
57.06.054.03.051.0
INC
REA
SE(%
)
WASTED RUBBER ADDITION (%)
Powder of rubber Pieces of rubber 50% Powder & 50% Pieces
Figure 9. Increase of stability as function of waste addition for 75-blows of compaction level.
For 0.15 and 0.6 % of pieces of rubber waste addition and 75 blow there is an increase in stability, being 14 % the maximum value for 0.15 % of waste addition, as shown in Figure 9. It is important to stand out, that powder addition generates a decrease in stability for values between 0.15 and 0.45 %.
2.27
2.28
2.29
2.30
2.31
2.32
2.33
2.34
2.35
57.06.054.03.051.00
DEN
SITY
(kg/
m3 )
WASTE ADDITION (%)POWDER & PIECES 50-BLOW
POWDER 50-BLOW
PIECES 50-BLOW
POWDER & PIECES 75-BLOW
POWDER 75-BLOW
PIECES 75-BLOW
x
Figure 10. Variation of density as function of waste adding.
For all shapes and percentages of waste adding, density reduces as shown in Figure 10. For all shapes and percentages of waste adding, deformation is inside the permissible range (Figure 11).

336 Asphalt-Rubber 2009
8
10
12
14
16
18
20
0 0.15 0.3 0.45 0.6 0.75
FLO
W(1
/10"
)
WASTE ADDITION (%)POWDER & PIECES 50-BLOW
POWDER 50-BLOW
PIECES 50-BLOW
POWDER & PIECES 75-BLOW
POWDER 75-BLOW
PIECES 75-BLOW
x
Figure 11. Flow variation versus waste adding.
The results obtained of the rutting test are resumed on Figures 12 (powder of rubber), 13 (pieces of rubber) and 14 (combination of powder and pieces).
0
2
4
6
8
10
12
14
0 500 1000 1500 2000 2500 3000 3500 4000 4500 5000
Number of Cycles
Permanent Deformation [mm]
0%
0.45% Powder
0.30% Powder
0.75% Powderx0.15% Powder
0.60% Powder x
Figure 12. Increase of rutting versus number of cycles for powder of rubber adding.

Mix Properties 337
0
2
4
6
8
10
12
14
16
18
20
0 500 1000 1500 2000 2500 3000 3500 4000 4500 5000
Number of Cycles
Permanent Deformation [mm]
0%
0.45% Pieces
0.30% Pieces
0.75% Piecesx0.15% Pieces
0.60% Pieces x
Figure 13. Increase of rutting versus number of cycles for pieces of rubber adding.
0
2
4
6
8
10
12
14
16
0 500 1000 1500 2000 2500 3000 3500 4000 4500 5000
Number of Cycles
Permanent Deformation [mm]
0%
0.45% Powder & Pieces
0.30% Powder & Pieces
0.75% Powder & Pieces
0.15% Powder & Pieces
0.60% Powder & Pieces xx
Figure 14. Increase of rutting versus number of cycles for combination of powder and pieces of rubber.
For 0.45 % of waste adding and powder and pieces of rubber, rutting at 2500 cycles decreases up to 23 % as shown in Figure 15. For 0.6 % of waste adding and powder of rubber there is a reduction of 13 %.

338 Asphalt-Rubber 2009
-50%
-40%
-30%
-20%
-10%
0%
10%
20%
30%
0.15 0.3 0.45 0.6 0.75
INC
REA
SE(%
)
WASTE ADDITION (%)Powder of Pieces of rubber 50% Powder & 50% Pieces
Figure 15. Effect of waste adding on rutting test.
4. Conclusions
Laboratory tests showed that rutting can be reduced for dense asphalt mixtures by adding rubber waste in both, powder and pieces of rubber, reaching up to 23 % of decrease. Also results show that stability increased for 50 blows per face, in 0.15, 0.3 and 0.6 % for both shapes. For 75 blows of level compaction, the increase was 0.15, 0.3 and 0.45 % with pieces of rubber. It is important to stand out that there is a decrease in stability of 0.15, 0.3 and 0.45 % with powder of rubber addition.
Finally, it was determined that combination of 50 % powder and 50 % pieces of rubber, were not favourable for rutting test, because there is an increase of up to 33 %.
The authors would like to thank the following persons and institutions:The Nueva Granada University, especially its ING-2004-003 project. Our students for their collaboration on performing the tests.The 1543 project of Javeriana University The Salle´s University modifier asphalt research team.
5. Bibliography
Oda S., Fernandes J., Evaluación de las propiedades asfalto-caucho para utilización enpavimentación asfáltica, IV Congreso de Ingeniería de Transporte, Departamento de Ingeniería Civil Universidad Estatal de Maringá, Valencia, España, 2000.
Reyes F., Diseño racional de pavimentos, Ed. CEJA, Bogotá, 2003.

Mix Properties 339
Reyes O., Reyes F., “Use of plastic for porous asphalt mixture design”, Road Materials and Pavement Design International Journal, Volume X, 2004, pp 3-13.
Reyes O., Reyes F., Efecto del desperdicio plástico en las propiedades dinámicas de una mezcla asfáltica, Departamento de Ingeniería Civil Universidad de los Andes, Bogotá, 1998.
Reyes F., Figueroa A.S. “Uso de desechos plásticos en mezclas asfálticas”, libro de investigación, Editorial Pontificia Universidad Javeriana, agosto de 2008, Bogotá, Colombia.
Sobhan K., Mashnad M., “Fatigue behavior of a pavement foundation with recycle aggregateand waste HPDE strips”, Journal of Geotechnical and Geoenvironmemtal Engineering, ASCE, Volume 129, Number 7, USA, 2003, pp 630-638.
State of California Department of Transportation, Asphalt rubber usage guide, Office of flexible pavement materials, Division of engineering services, materials engineering and testing services – MS 5, USA, 2003.
Thenoux G., González A., Jamet A., Análisis de casos de ahuellamiento en mezclas asfálticaschilenas, 6° Congreso Internacional Provial, Termas de Chillán, Chile, Noviembre 2002.
Troncoso J., Ospina L., Efecto de las llantas usadas en las propiedades de una mezcla asfáltica, Departamento de Ingeniería Civil Universidad Militar Nueva Granada, Bogotá, 2004.
Universidad de Los Andes, Instituto de Desarrollo Urbano, Reglamento técnico vial para la ejecución de obras en el sector vial de Bogotá, D.C., Ed. Legis, Bogotá, 2002.
Unión Temporal Fichtner – Cydep, Segundo informe del plan maestro para el manejo integral de residuos sólidos en Santafe de Bogotá, D.C, Plan de manejo ambiental para los residuos sólidos de Bogotá, Departamento Administrativo del Medio Ambiente, Bogotá, Colombia, 2000.

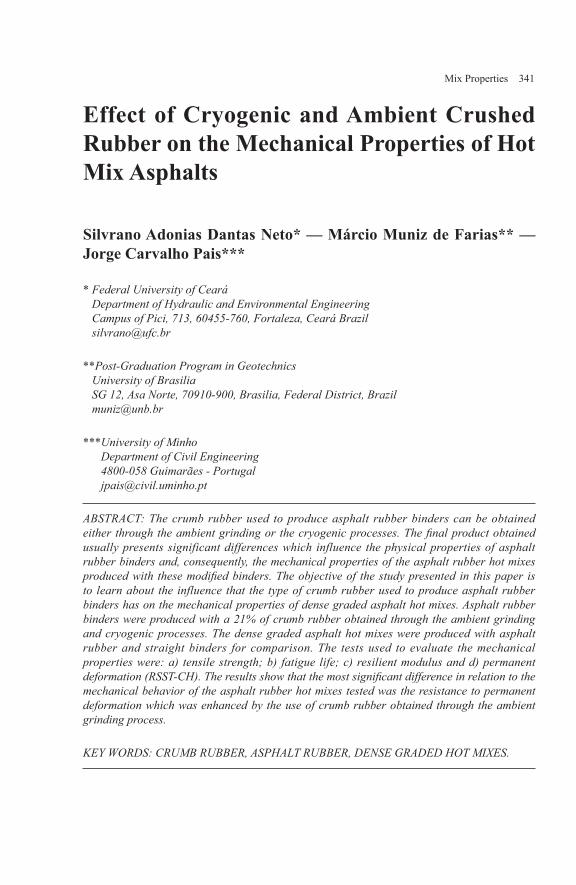
Mix Properties 341
Effect of Cryogenic and Ambient Crushed Rubber on the Mechanical Properties of Hot Mix Asphalts
Silvrano Adonias Dantas Neto* — Márcio Muniz de Farias** — Jorge Carvalho Pais***
* Federal University of Ceará Department of Hydraulic and Environmental Engineering Campus of Pici, 713, 60455-760, Fortaleza, Ceará Brazil [email protected]
**Post-Graduation Program in Geotechnics University of Brasilia SG 12, Asa Norte, 70910-900, Brasilia, Federal District, Brazil [email protected]
***University of Minho Department of Civil Engineering 4800-058 Guimarães - Portugal [email protected]
ABSTRACT: The crumb rubber used to produce asphalt rubber binders can be obtained either through the ambient grinding or the cryogenic processes. The final product obtained usually presents significant differences which influence the physical properties of asphalt rubber binders and, consequently, the mechanical properties of the asphalt rubber hot mixes produced with these modified binders. The objective of the study presented in this paper is to learn about the influence that the type of crumb rubber used to produce asphalt rubber binders has on the mechanical properties of dense graded asphalt hot mixes. Asphalt rubber binders were produced with a 21% of crumb rubber obtained through the ambient grinding and cryogenic processes. The dense graded asphalt hot mixes were produced with asphalt rubber and straight binders for comparison. The tests used to evaluate the mechanical properties were: a) tensile strength; b) fatigue life; c) resilient modulus and d) permanent deformation (RSST-CH). The results show that the most significant difference in relation to the mechanical behavior of the asphalt rubber hot mixes tested was the resistance to permanent deformation which was enhanced by the use of crumb rubber obtained through the ambient grinding process.
KEY WORDS: CRUMB RUBBER, ASPHALT RUBBER, DENSE GRADED HOT MIXES.

342 Asphalt-Rubber 2009
1. Introduction
The experience obtained with the use of asphalt rubber hot mixes in several countries showed the excellent structural and functional behavior of this type of material. In general, improvements can be observed in: a) the fatigue life of wearing courses; b) the reduction of maintenance costs; c) the increase of skid resistance; d) the decrease of reflective cracking in overlays and e) the reduction of noise levels. In addition to the improvement of the mechanical behavior of asphalt hot mixes there is also an environmental benefit. Asphalt-rubber incorporates to the conventional binders approximately 20%, by weight, of crumb rubber recycled from ground tires.
Crumb rubber recycled from ground tires is composed of different constituents capable of conferring better mechanical properties to the conventional binder (Holleran et al., 2000). This material can be obtained from ambient grinding process or cryogenic process. The final product obtained generally presents significant differences which influence the physical properties of asphalt rubber binders, and consequently, the mechanical behavior of asphalt hot mixes produced with these modified binders.
The objective of this paper is to study the influence of the type of crumb rubber used in the manufacturing process of asphalt rubber binders on the mechanical properties of asphalt hot mixes. Asphalt rubber binders were produced by incorporating 21% in weight of crumb rubber obtained from ambient grinding and cryogenic processes. The modified binders were used to produce dense graded asphalt hot mixes that were submitted to indirect tensile strength, fatigue life and permanent deformation tests.
2. Crumb rubber used in the manufacturing process of asphalt rubber binders
The primary component of crumb rubber obtained from ground tires used to produce asphalt-rubber binders is natural rubber. Natural rubber is obtained from the extraction of latex found in a plant called Hevea Brasiliensis. The first records on the use of natural rubber were reported by Spanish sailors in the beginning of the 16th century, when they observed Indians playing with latex balls (Costa et al., 2003).
The novelty was introduced in Europe, but the application of natural rubber was very restrict, since it was soft at high temperatures and very rigid at low temperatures (Costa et al., 2003). In 1826, after many efforts, Faraday established the chemical structure of natural rubber as being a polymer (C5H8)n.
The instability problem of natural rubber with the variation of temperature was accidentally solved in 1840, when Charles Goodyear (USA) and Thomas Hancock (England) established the heating time and temperature that led to the stabilization of natural rubber with the addition of sulfur (Costa et al., 2003). This process, known as vulcanization, also made natural rubber chemically more resistant. The process of vulcanization of natural rubber allowed the implantation of the first vulcanized rubber plants between 1820 and 1830.
In the 1860’s, Greville started the studies to produce synthetic rubber, one of constituents of crumb rubber used to obtain asphalt-rubber binders. However, synthetic rubber was only produced in 1857, when Euller obtained the isoprene in laboratory.
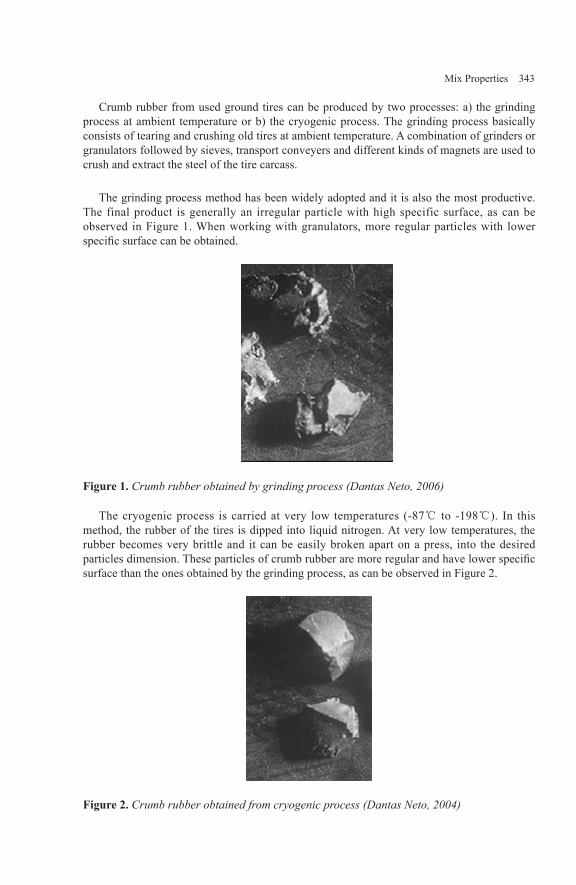
Mix Properties 343
Crumb rubber from used ground tires can be produced by two processes: a) the grinding process at ambient temperature or b) the cryogenic process. The grinding process basically consists of tearing and crushing old tires at ambient temperature. A combination of grinders or granulators followed by sieves, transport conveyers and different kinds of magnets are used to crush and extract the steel of the tire carcass.
The grinding process method has been widely adopted and it is also the most productive. The final product is generally an irregular particle with high specific surface, as can be observed in Figure 1. When working with granulators, more regular particles with lower specific surface can be obtained.
Figure 1. Crumb rubber obtained by grinding process (Dantas Neto, 2006)
The cryogenic process is carried at very low temperatures (-87℃ to -198℃). In this method, the rubber of the tires is dipped into liquid nitrogen. At very low temperatures, the rubber becomes very brittle and it can be easily broken apart on a press, into the desired particles dimension. These particles of crumb rubber are more regular and have lower specific surface than the ones obtained by the grinding process, as can be observed in Figure 2.
Figure 2. Crumb rubber obtained from cryogenic process (Dantas Neto, 2004)

344 Asphalt-Rubber 2009
Dantas Neto (2004) studied the physical properties of asphalt rubber binders produced with crumb rubber by the grinding process and by the cryogenic process. According to the results obtained by this author, the use of crumb rubber obtained from the cryogenic process led to a decrease of rotational viscosity and softening point of asphalt rubber binders in comparison with the modified binders made with crumb rubber obtained at ambient grinding.
These differences can be attributed to the smaller specific surface in the crumb rubber obtained from cryogenic process which,, in relation to that of the crumb rubber obtained at ambient grinding, decreases the interaction between the straight binder and the crumb rubber particles. This explains the differences in behavior between the physical properties described.
3. Materials
3.1. Crumb rubber and straight binder
In this work crumb rubber obtained through the ambient grinding process and through the cryogenic process was used. For the crumb rubber obtained by the ambient grinding process approximately 20% of the tires were from trucks and the remaining 80% were from passenger vehicles of different types and origins. No information was given by the manufacturer about the composition of the crumb rubber obtained by the cryogenic process.
Table 1 depicts the grain size distribution of the crumb rubber and the grading envelope specified by the Arizona Department of Transportation (ADOT). Figure 3 illustrates the comparison between the grain size distribution of the crumb rubber obtained through the grinding process and through the cryogenic process. It can be observed the similarity between the two curves presented in Figure 3, which indicates that the only difference that could influence the physical properties of the asphalt rubber binders produced is the type of crumb rubber. Table 2 presents the results of physical properties characterization tests of the conventional binder AC 50/70 used.
Table 1. Grain size distribution of the crumb rubber used and grading envelope specified by the Arizona Department of Transportation (ADOT)
Sieve size %PassingInch mm ADOT Ambient CryogenicNº 4 4.75 100 100 100 100Nº 8 2.36 100 100 99.9 100Nº 10 2 100 100 96.8 97.3Nº 16 1.18 65 100 47.7 49.7Nº 30 0.6 20 100 18.7 24.6Nº 50 0.3 0 45 7.5 7.5Nº 200 0.075 0 5 0 0

Mix Properties 345
Figure 3. Grain size distribution curves of crumb rubber obtained from the ambient grinding and from the cryogenic processes
Table 2. Characterization of straight binder AC 50/70
Physical properties AC 50/70Penetration, ASTM D 5-95 (1/10 mm) 52.0Softening point, ASTM D36-97 (℃) 50.6Brookfield viscosity at 175℃, ASTM D 4402-87 (cP) 87.5Resilience, ASTM D5329 (%) 14.0
3.2. Aggregates
The following mineral aggregates were used to produce the asphalt hot mixes studied in this research:
Grade 1 crushed granitic stone: particle size 11 - 16 mm;Grade 0 crushed granitic stone: particle size 4 - 11 mm;Fine crushed granitic aggregate: particle size < 4 mm.
Granitic filler, available in the Laboratory of Pavements of the University of Minho (Portugal), was also used. The aggregate mixture presented a gap graded curve specified by the Brazilian standard DNER-ES 313/97 as grade envelope C.
Table 3 shows the aggregate mixture composition to comply with the specified grain size distribution. Some results of the aggregate characterization tests are also shown. Table 4 presents the grain size distribution of the aggregates used in the asphalt hot mixes and the theoretical values for the designed mixture. Figure 2 presents the grain size distribution curves of the specified grade envelope and of the theoretical mixture designed for the asphalt hot mixes according to the aggregate mixture composition described in Table 2.
•••

346 Asphalt-Rubber 2009
Table 3. Characterization of aggregates used in the asphalt hot mixes
Physical properties Crushed stone 1
Crushed stone 0
Fine aggregate Filler
Aggregate percentage (%) 10.5 30.5 54.5 4.5Apparent specific gravity (kN/m3) 26.4 25.8 25.2 25.2Specific gravity of grains (kN/m3) 26.9 26.8 27.1 27.1
Water absorption (%) 0.77 1.39 - -
Table 4. Grain size distribution of the aggregates and of the dense graded mixes
Sieve size % Passing
Inch mm DNER-ES 313/97 Crushed stone 1
Crushed stone 0
Fine aggregate Filler Mix
¾” 19.1 100 100 100 100 100 100 100½” 12.5 85 100 89.55 100 100 100 98.2
3/8” 9.5 75 100 41.02 97.45 100 100 89.4Nº 4 4.8 50 85 3.45 24.57 99.81 100 65.9Nº 10 2.0 30 75 1.09 4.18 76.36 100 47.3Nº 40 0.425 15 40 0.83 2.04 35.04 99.17 24.1Nº 80 0.18 8 30 0.70 1.59 16.56 93.96 13.6Nº 200 0.075 5 10 0.53 1.13 6.18 75.03 6.9
0
20
40
60
80
100
120
0,01 0,1 1 10 100
Diameter (mm)
%Pa
ssin
g
DNER-ES 313/97Mix
Figure 4. Grain size distribution curves for dense graded mixes

Mix Properties 347
4. Asphalt hot mixes: design and production
4.1. Modified binders used in the asphalt-rubber hot mixes.
The following modified binders were used in the production of the studied gap graded asphalt hot mixes:
Asphalt rubber 1 (AR-1): straight binder AC 50/70 + 21% of crumb rubber obtained from the ambient grinding process, at a digestion time of 60 minutes and at a digestion temperature of 190 ℃;Asphalt rubber 2 (AR-2): straight binder AC 50/70 + 21% of crumb rubber obtained from the cryogenic process, at a digestion time of 60 minutes and at a digestion temperature of 190 ℃.
Hot mixes were also prepared with the straight binder AC 50/70 in order to be compared with the mechanical properties of mixes with modified binders. Table 5 presents the physical properties of the modified binders used in the asphalt rubber hot mixes.
Table 5. Characterization of binders AR-1, AR-2 e AC 50/70
Physical properties AR-1 AR-2 AC 50/70Penetration, ASTM D5 (1/10 mm) 32.4 17.3 52.0
Resilience, ASTM D5329 (%) 59.0 60.0 14.0Softening point, ASTM D36 (℃) 82.5 76.0 50.6
Brookfield Viscosity at 210℃, ASTM D 4402 (cP) 8400 3640 -
4.2. Design and production of conventional and asphalt rubber hot mixes
The Marshall procedure was used to define the binder content of the studied asphalt hot mixes. Table 6 presents the values of temperatures of the binders, the aggregates and compaction of the asphalt hot mixes made with AC 50/70, AR-1 and AR-2 binders. These temperature values were chosen taking in consideration the workability of the asphalt-rubber binders and the experience of local producers in the application of this type of material.
Table 6. Temperatures used in the production of studied asphalt hot mixes
Temperatures AC 50/70 AR1/AR2Binder heating (℃) 160 170Aggregates heating (℃) 177 190Compaction of the mix (℃) 160 164
Table 7 presents all volumetric parameters for studied asphalt hot mixes defined in the mix design. All the manufacturing conditions of the asphalt hot mixes studied are also presented.
•
•
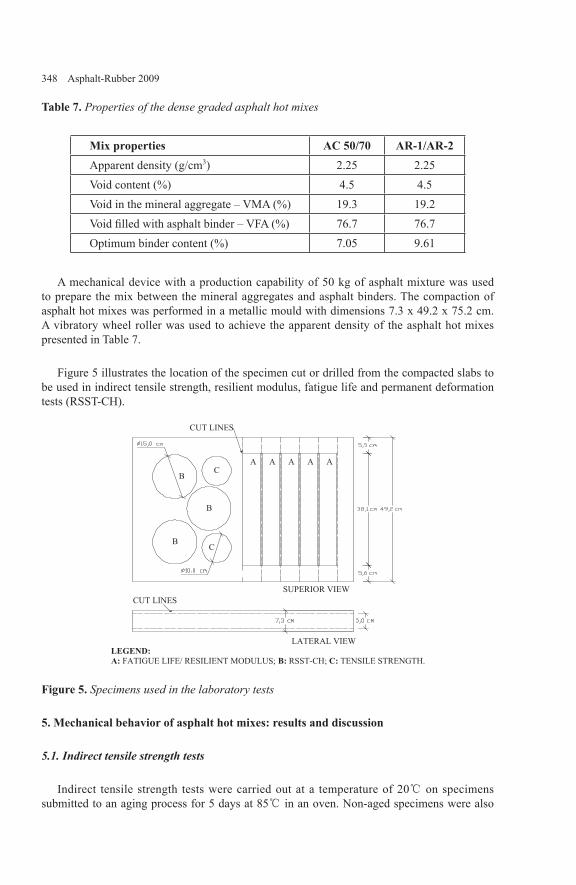
348 Asphalt-Rubber 2009
Table 7. Properties of the dense graded asphalt hot mixes
Mix properties AC 50/70 AR-1/AR-2Apparent density (g/cm3) 2.25 2.25Void content (%) 4.5 4.5Void in the mineral aggregate – VMA (%) 19.3 19.2Void filled with asphalt binder – VFA (%) 76.7 76.7Optimum binder content (%) 7.05 9.61
A mechanical device with a production capability of 50 kg of asphalt mixture was used to prepare the mix between the mineral aggregates and asphalt binders. The compaction of asphalt hot mixes was performed in a metallic mould with dimensions 7.3 x 49.2 x 75.2 cm. A vibratory wheel roller was used to achieve the apparent density of the asphalt hot mixes presented in Table 7.
Figure 5 illustrates the location of the specimen cut or drilled from the compacted slabs to be used in indirect tensile strength, resilient modulus, fatigue life and permanent deformation tests (RSST-CH).
A A A A A
B
B
B
C
C
CUT LINES
SUPERIOR VIEW
LATERAL VIEW
CUT LINES
LEGEND:A: FATIGUE LIFE/ RESILIENT MODULUS; B: RSST-CH; C: TENSILE STRENGTH.
Figure 5. Specimens used in the laboratory tests
5. Mechanical behavior of asphalt hot mixes: results and discussion
5.1. Indirect tensile strength tests
Indirect tensile strength tests were carried out at a temperature of 20℃ on specimens submitted to an aging process for 5 days at 85℃ in an oven. Non-aged specimens were also

Mix Properties 349
tested for comparison. This laboratory aging process is standardised by the AASHTO PP2/94 and simulates the long-term aging that occurs in asphalt hot mixes in field. The tests were carried out in accordance with the recommendations of DNER-ME 138/94 standard.
Figure 6 shows the results obtained in the indirect tensile tests for the dense graded asphalt hot mixes made with AC 50/70, AR-1 and AR-2 binders. The presented results correspond to the average values obtained from two tested specimens. These results were submitted to an analysis of variance (ANOVA) using the Statistica 6.0 software considering 95% as confidence level (α = 5%) and the results are presented in Table 8.
The analysis of variance allows defining if the differences observed between results are really due to the use of different materials or if they occur as a result of the variability of the experimental procedures. Two specimens belong to the same homogeneous group if the difference in the average values of some property obtained from a number of tests can be attributed only to the variability of the experimental procedure, with (100-α)% level of confidence,.
The results in Table 8 show that the aging process affects the indirect tensile strength (ITS) of the mixtures produced with the unmodified binder CAP 50/70, since the non-aged and aged samples are classified in different groups by the statistical analysis. The aged samples present a higher ITS. This difference cannot be attributed to testing error with 95% of confidence, despite the limited number of specimens.
The analysis of variance when comparing non-aged samples, prepared with unmodified CAP 50/70 and with modified asphalt rubber (AR-1 and AR-2), produced three different homogenous groups, thus proving that the modified asphalt rubber produced mixtures with high tensile strength. Moreover, the average strength of samples using ambient ground rubber was higher than that for the binder modified with cryogenic rubber. It is assumed that ambient ground rubber, due to its higher specific surface, provides better interaction with the asphalt binder used in this research.
The effect of aging on the ITS the rubber modified mixture was not confirmed for the samples using cryogenic ground rubber. The statistical analysis grouped the non-aged AR-2 samples and the aged AR-2 samples in the same group (Group 2), which have average ITS values similar to that obtained with the aged unmodified rubber. However, the aging process affected the ITS of the mixtures prepared with binders modified with ambient ground rubber (AR-1), which were classified in a single homogeneous group (Group 4). These samples presented the highest average indirect tensile strength.
In general the results showed that the aging process in the conditions that samples were subject in laboratory produced mixtures with higher indirect tensile. In the case of unmodified asphalt binders this may be due to the increase in viscosity with the lost of light oil fractions. For the samples using modified asphalt rubber, mainly with AR-1, besides the volatization of light fractions, the ambient ground rubber seems to produce better interaction with the binder and better adhesivity with the solid aggregates.

350 Asphalt-Rubber 2009
1,131,31
1,100,94
1,16 1,08
0,0
0,4
0,8
1,2
1,6
AC 50/70 AR-1 (AMB) AR-2 (CRYO)
Type of Crumb Rubber
σt(M
pa)
Aged Non-aged
Figure 6. Indirect tensile strength of the dense graded asphalt hot mixes
Table 8. Homogeneous groups defined from ANOVA on the results of indirect tensile strength tests
AgedYes/No Binder
Indirect Tensile Strength, σt (MPa) Homogeneous groups
Specimen 1 Specimen 2 Max Min Std. Dev.
Ave-rage 1 2 3 4
No AC 50/70 0,98 0,91 0,98 0,91 0,05 0,94 **
No AR-2 1,09 1,06 1,09 1,06 0,02 1,08 **
Yes AR-2 1,08 1,12 1,12 1,08 0,03 1,10 ** **
Yes AC 70/70 1,13 1,12 1,13 1,12 0,01 1,12 ** **
No AR-1 1,19 1,14 1,19 1,14 0,04 1,16 **
Yes AR-1 1,30 1,13 1,30 1,13 0,12 1,30 **
5.2. Resilient modulus, phase angle and fatigue life tests
The resilient modulus and fatigue life tests were carried out under controlled strain conditions according to the AASHTO TP8/96 standard in beam specimens of bituminous concrete with the following dimensions: 381 ± 6.35 mm long, 50.8 ± 6.35 mm high and 63.5 ± 6.35 mm wide. Table 9 presents the conditions imposed during the resilient modulus and fatigue life tests. The specimens obtained from asphalt hot mixes made with AC 50/70, AR-1 and AR-2 binders were submitted to the long-term aging process previously described and standardised by AASTHO PP2/94.
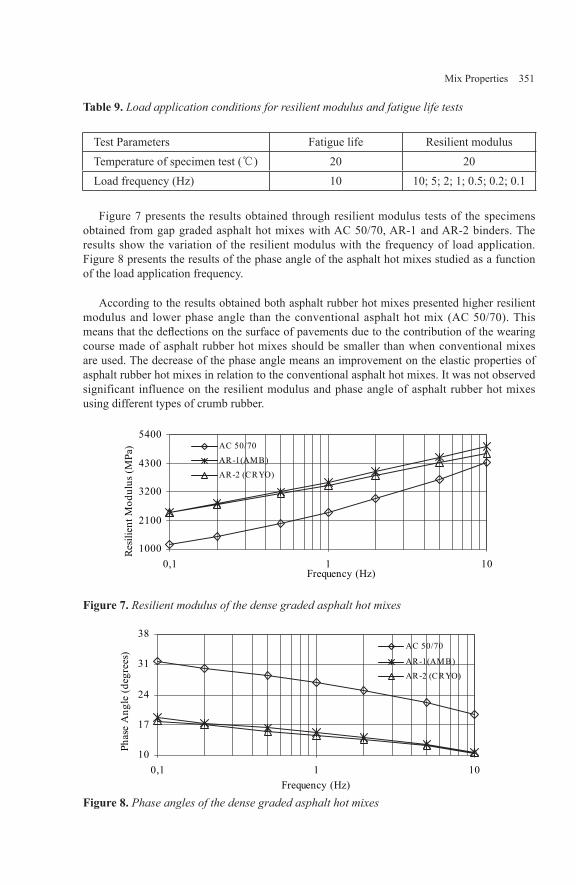
Mix Properties 351
Table 9. Load application conditions for resilient modulus and fatigue life tests
Test Parameters Fatigue life Resilient modulusTemperature of specimen test (℃) 20 20Load frequency (Hz) 10 10; 5; 2; 1; 0.5; 0.2; 0.1
Figure 7 presents the results obtained through resilient modulus tests of the specimens obtained from gap graded asphalt hot mixes with AC 50/70, AR-1 and AR-2 binders. The results show the variation of the resilient modulus with the frequency of load application. Figure 8 presents the results of the phase angle of the asphalt hot mixes studied as a function of the load application frequency.
According to the results obtained both asphalt rubber hot mixes presented higher resilient modulus and lower phase angle than the conventional asphalt hot mix (AC 50/70). This means that the deflections on the surface of pavements due to the contribution of the wearing course made of asphalt rubber hot mixes should be smaller than when conventional mixes are used. The decrease of the phase angle means an improvement on the elastic properties of asphalt rubber hot mixes in relation to the conventional asphalt hot mixes. It was not observed significant influence on the resilient modulus and phase angle of asphalt rubber hot mixes using different types of crumb rubber.
1000
2100
3200
4300
5400
0111,0Frequency (Hz)
Resil
ient
Mod
ulus
(MPa
) AC 50/70
AR-1(AMB)
AR-2 (CRYO)
Figure 7. Resilient modulus of the dense graded asphalt hot mixes
10
17
24
31
38
0111,0Frequency (Hz)
Phas
eA
ngle
(deg
rees
) AC 50/70
AR-1(AMB)
AR-2 (CRYO)
Figure 8. Phase angles of the dense graded asphalt hot mixes

352 Asphalt-Rubber 2009
Figure 9 presents the results of fatigue life tests of asphalt hot mixes made with the AC 50/70, AR-1 and AR-2 binders. It can be observed an increase of fatigue life of asphalt rubber hot mixes in relation to the conventional asphalt hot mixes. The fatigue life presented by the asphalt rubber hot mixes was similar. These results are in accordance with those previously presented for resilient modulus and phase angles of these mixtures.
The specific surface of the crumb rubber obtained from the cryogenic process is smaller than that of the crumb rubber obtained from the ambient grinding process. However, a possible decrease of reactions between the straight binder and the crumb rubber obtained from the cryogenic process did not affect the mechanical behavior of asphalt rubber hot mixes produced with this material, as can be observed from the results of resilient modulus, phase angle and fatigue life tests.
1,0E+04
1,0E+05
1,0E+06
1,0E+07
1,0E+08
1,0E+09
0001001Tensile strain (µm/m)
N(L
oad
Cicl
es) AC 50/70
AR-1 (AMB)AR-2 (CRYO)
Figure 9. Fatigue life of dense graded asphalt hot mixes
5.3. Permanent deformation of the asphalt hot mixes studied
Sousa et al. (1994) consider that rutting in flexible pavements occurs initially due to a densification of the bituminous layers in the first load cycles and, later, through the plastic shear strains produced in the bituminous layers. These plastic shear strains cause a displacement of the material of the bituminous layer without volumetric variation forming upheaval zones adjacent to the wheel paths.
Based on several works, the Strategic Highway Research Program (SHRP) established a procedure to evaluate rutting in pavements through the evaluation of the evolution of the plastic shear strains that occurs in asphalt hot mixes. The main assumption of this procedure it is that rutting is the result of a phenomenon of plastic shear flow under constant volume of the mixture, caused by the shear stress produced below the edge of the truck tires (Sousa et al., 1994).
In this work the resistance to permanent deformation was evaluated by the repeated simple shear test at constant height (RSST-CH). This test consists of applying a repeated shear stress to a cylindrical specimen with 15 cm diameter and 5 cm thick, while the produced plastic shear strains are measured under controlled temperature.

Mix Properties 353
Table 10 presents the conditions imposed to the specimen during the RSST-CH tests which were carried out. A temperature of 50℃ is typically used for pavements in Portugal, while a higher temperature of 60℃ was adopted to simulate more severe climate conditions as those observed in Brazil.
Figure 10 shows the results of the RSST-CH tests for the asphalt hot mixes made with the AC 50/70, AR-1 and AR-2 binders. The results are expressed in terms of number of cycles of the equivalent standard axle (ESALmrd) for the mixture to reach the maximum plastic shear strain or a limit rut depth of 12,7 mm.
Table 10. Test conditions for RSST-CH
Test Parameters ValuesTemperature of the specimens (℃) 50 and 60 ± 0.5Shear stress acting on the specimens (kPa) 69 ± 5Loading time (s) 0.1Unloading time (s) 0.6
The results show that the asphalt rubber hot mixes produced with crumb rubber obtained from cryogenic process did not present a significant gain in resistance against permanent deformation, as observed with the asphalt rubber hot mixes produced with crumb rubber obtained from the ambient grinding process in relation to the conventional asphalt hot mixes. However, it can be observed that the asphalt rubber hot mixes produced with crumb rubber obtained from the cryogenic process present a higher resistance to permanent deformation than that of the conventional asphalt hot mix, for both temperature tests.
0,0E+00
1,0E+06
2,0E+06
3,0E+06
4,0E+06
AC 50/70 AR-1 (AMB) AR-2 (CRYO)
Type of crumb rubber
ESA
L mrd
0
20
40
60
80
100 Softeningpoint(ºC)
60ºC 50ºC Softening point
Figure 10. Results of RSST-CH tests for dense graded asphalt hot mixes
5. Conclusions
The results presented in this paper show that the incorporation of crumb rubber obtained

354 Asphalt-Rubber 2009
from both processes, cryogenic and ambient grinding, into straight binders improves the mechanical behavior of asphalt hot mixes.
The aging process to which the mixtures were subjected in laboratory produced samples with higher indirect tensile strength. This effect was more pronounced in the mixtures using asphalt binders modified with ambient ground rubber. However, this conclusion cannot be generalized due to the limited number of replicates tested for each mixture condition.
No significant differences were observed in the resilient modulus, the phase angle and the fatigue life when using crumb rubber obtained from the cryogenic process rather than crumb rubber obtained from the ambient grinding process .
The use of crumb rubber obtained from the cryogenic process decreases the resistance to permanent deformation as estimated by the RSST-CH procedure of asphalt rubber hot mixes in relation to the mixtures produced with the crumb rubber obtained from the ambient grinding process.
6. Acknowledgements
This work was part of the doctoral research program at Pos-graduate Program in Geotechnics of the University of Brasilia, with the support of the Department of Civil Engineering of the University of Minho, in Portugal. It was supported with grants from the Brazilian agencies CAPES and CNPQ. The authors are also thankful to the companies that supplied the materials used in this work: Cepsa (supplier of the binders), Biosafe (supplier of the granulated rubber) and Bezerras LTDA (supplier of the mineral aggregates).
7. References
Costa, H.M., Visconte, Y.L., Nunes, R.C.R. & Furtado, C.R.G. Historical Aspects of Vulcanization. (In Portuguese). Polímeros: Ciência e Tecnologia, vol. 13, nº 2, p. 125-129, São Carlos, SP, Brazil, 2003.
Dantas Neto, S.A., “Evaluation of the properties of binders and mixes modified with crumb rubber from used tires”. (In Portuguese). PhD Thesis, University of Brasilia, Department of Civil and Environmental Engineering, Brazil, 2004.
Holleran G., Reed J.R., “Emulsification of asphalt rubber blends”, Asphalt Rubber 2000 – Proceedings, Portugal, 2000, p. 383-409.
Sousa J.B., Solamanian, M. & Weissman, L., “Development and use of the Repeated ShearTest (Constant Height): an optional Superpave mix design tool”, Strategic Highway Research Program, National Research Council, Washington, 78p, 1994.
Takallou H.B., Takallou M.B., “Effects of mixing time and temperature on the visco-elastic properties of asphalt rubber binder”, Asphalt Rubber 2003 – Proceedings, Brazil, 2003, p. 589-602.
Mix Properties 355
Influence of Digestion Time on the Mechanical Properties of Gap-graded Hot Mixes Produced with Asphalt Rubber Binders
Silvrano Adonias Dantas Neto* — Márcio Muniz de Farias** — Jorge Carvalho Pais***
* Federal University of Ceara Department of Hydraulic and Environmental Engineering Campus of Pici, 713, 60455-760, Fortaleza, Ceara, Brazil [email protected]
** Post-Graduation Program in Geotechnics University of Brasilia SG 12, Asa Norte, 70910-900, Brasilia, Federal District, Brazil [email protected]
***University of Minho Department of Civil Engineering 4800-058 Guimarães - Portugal [email protected]
ABSTRACT: Asphalt rubber binders are produced by mixing crumb rubber obtained from ground used tires with a straight run binder at high temperatures during a period of time named as digestion time. This is one of many variables that influence the physical properties of asphalt rubber produced by wet process. Thus, the objective of this paper is to evaluate how many mechanical properties of gap-graded hot mixes produced with asphalt rubber binder are influenced by the digestion time used to produce this modified binder. The asphalt rubber binders were produced by incorporating 21% in weight of crumb rubber into a straight run binder at 210℃. The digestion times used were 60 and 300 minutes. These asphalt rubber binders were used to produce gap-graded hot mixes which were submitted to tensile strength, fatigue life, resilient modulus and permanent deformation tests. The results show that the increase of digestion time used to produce asphalt rubber binders led to a decrease of tensile strength, resilient modulus and permanent deformation. However, there was a significantly increase of fatigue life of asphalt hot mixes studied.
KEY WORDS: asphalt-rubber, digestion time, gap-graded hot mixes.

356 Asphalt-Rubber 2009
1. Introduction
Damages in flexible pavements are generally associated to excessive cracking and rutting in their bituminous wearing courses. The combination of heavy traffic loads and high temperatures is responsible for the premature failure of flexible pavements. This could be mitigated by improving the characteristics of the bituminous material employed in the wearing courses.
The improving of bituminous materials characteristics is generally obtained through the incorporation of different types of modifiers to the straight run binder used to produce the asphalt hot mixes employed in the wearing courses. The modifiers used most often are polymers (SBS, EVA, etc) and crumb rubber obtained from used ground tires. The advantages of crumb rubber from used tires is that it is made by many components (SBR, natural rubber, synthetic rubber, carbon black, etc) that can improve the characteristics of a straight run binder in terms of flexibility and temperature susceptibility.
The product obtained from the mixture of a straight run binder and crumb rubber from ground used tires is named asphalt rubber. This mixture is achieved at high temperatures and during a certain period of time named digestion time. Dantas Neto (2004) showed that the digestion time used to produce asphalt rubber binder by the wet process is one of the many variables that influence the physical properties of asphalt rubber binders. Thus, the objective of this paper is to analyze the effect of digestion time in the mechanical properties of gap-graded asphalt hot mixes produced with these modified binders in the production of asphalt rubber binders.
Three different asphalt hot mixes were studied: a conventional gap-graded asphalt hot mix made with a straight run binder (AC 50/70) and two gap-graded asphalt hot mixes using asphalt rubber binders produced by the wet process with a digestion time of 60 and 300 minutes. The asphalt rubber binders were produced by incorporating 21% in weight of crumb rubber, produced by grinding at ambient temperature, into a straight run binder (AC 50/70) at 210 ℃. The asphalt hot mixes studied were submitted to indirect tensile strength tests, fatigue life and resistance to permanent deformation.
2. Background
According to ASTM D6114/97, asphalt-rubber binders are obtained from a combination of straight asphalt, crumb rubber recycled from used ground tires and other additives when necessary. These additives are normally extender oils used to improve the workability of asphalt rubber or the compatibility between the straight run binder and the used crumb rubber.
The use of binders modified with rubber started in the 1940’s. However, only in the 1960’s the process of manufacturing of asphalt rubber binders known as wet process or McDonald process was developed and patented by engineer Charles McDonald. Three different processes are used to produce asphalt rubber binders: i) wet process; ii) dry process and iii) the terminal blending (Takallou and Takallou, 2003).
In the wet process, the straight run binder is initially pre-heated to approximately 190℃

Mix Properties 357
in a tank under hermetic conditions and then transported to a blending tank, where crumb rubber is added. The digestion process, which includes the incorporation of rubber in the conventional binder, continues for a period of 1 to 4 hours, at a temperature of 190℃. The process is facilitated by a mechanical agitation produced by a horizontal shaft (Visser, 2000).
In the dry process, particles of crumb rubber are added to preheated mineral aggregates before the addition of the straight bituminous binder (Visser, 2000). In this case, the aggregates are heated to temperatures of approximately 200℃, when crumb rubber is added and mixed for about 15 seconds until obtaining a homogeneous mixture. Straight run binder is then added in a conventional mixing plant.
The time of contact between the rubber and the binder in the dry process is relatively short and not enough to produce all the necessary reactions between the two materials. Therefore, modified mixes rather than modified binders are produced, since there is little digestion of the rubber by the conventional binder.
In the terminal blending process the digestion of crumb rubber into straight run binder occurs at high temperatures. This process has been used in Texas since 1989 and its main characteristic is the use of lower crumb rubber contents than in the wet process (Takallou and Takallou, 2003).
The physical properties of asphalt rubber binders are influenced by the content of crumb rubber, type of crumb rubber, the grain size distribution of crumb rubber, the type of straight run binder, the temperature of digestion, and particularly the digestion time (Anderson et al., 2000; Leite et al., 2000; Dantas Neto, 2004).
Dantas Neto (2004) demonstrated that the digestion time influences significantly the rotational viscosity, the softening point and the resilience of asphalt rubber binders. According to this author, during the manufacturing process of asphalt rubber for a digestion time until 60 minutes, it was observed that there is absorption of light fractions of straight run binder by the crumb rubber particles, what increases the rotational viscosity, the softening point and the resilience of asphalt rubber binders. For digestion times beyond 120 minutes some degradation of the crumb rubber particles occurs, as it may be observed by the decrease of the rotational viscosity and resilience of asphalt rubber binders. The magnitude of these effects depends on the crumb rubber characteristics and on the temperature of digestion employed.
Dantas Neto (2004) also showed that the combination of high temperature and digestion time produce an almost complete degradation of the crumb rubber particles present in asphalt rubber binders. This is more evident for temperatures of digestion around 210℃ and digestion times higher than 300 minutes. Thus, it is expected that these changes in the binder properties also have some effects in the mechanical behavior of asphalt rubber hot mixes.
3. Materials
3.1. Crumb rubber and straight run binder
The crumb rubber used in this work was recycled from ground tires through the ambient
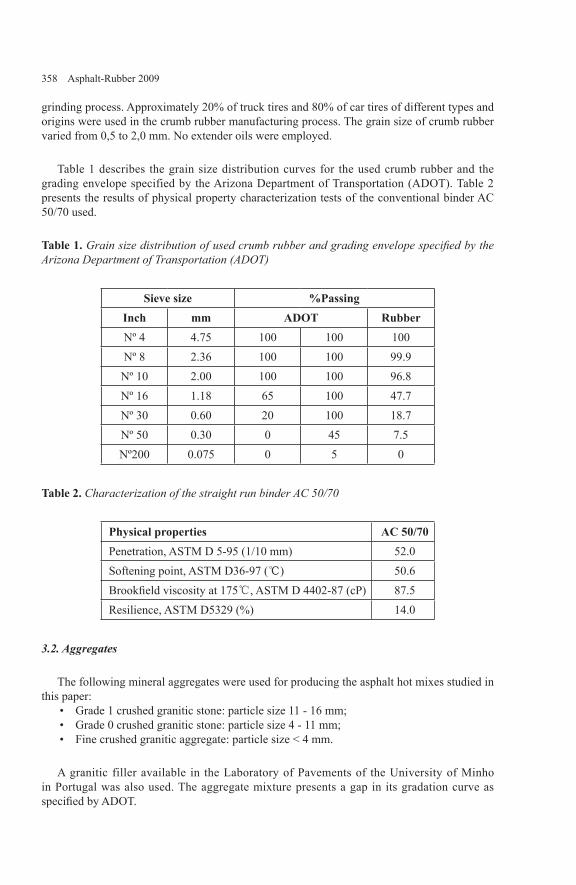
358 Asphalt-Rubber 2009
grinding process. Approximately 20% of truck tires and 80% of car tires of different types and origins were used in the crumb rubber manufacturing process. The grain size of crumb rubber varied from 0,5 to 2,0 mm. No extender oils were employed.
Table 1 describes the grain size distribution curves for the used crumb rubber and the grading envelope specified by the Arizona Department of Transportation (ADOT). Table 2 presents the results of physical property characterization tests of the conventional binder AC 50/70 used.
Table 1. Grain size distribution of used crumb rubber and grading envelope specified by the Arizona Department of Transportation (ADOT)
Sieve size %PassingInch mm ADOT RubberNº 4 4.75 100 100 100Nº 8 2.36 100 100 99.9Nº 10 2.00 100 100 96.8Nº 16 1.18 65 100 47.7Nº 30 0.60 20 100 18.7Nº 50 0.30 0 45 7.5Nº200 0.075 0 5 0
Table 2. Characterization of the straight run binder AC 50/70
Physical properties AC 50/70Penetration, ASTM D 5-95 (1/10 mm) 52.0Softening point, ASTM D36-97 (℃) 50.6Brookfield viscosity at 175℃, ASTM D 4402-87 (cP) 87.5Resilience, ASTM D5329 (%) 14.0
3.2. Aggregates
The following mineral aggregates were used for producing the asphalt hot mixes studied in this paper:
Grade 1 crushed granitic stone: particle size 11 - 16 mm;Grade 0 crushed granitic stone: particle size 4 - 11 mm;Fine crushed granitic aggregate: particle size < 4 mm.
A granitic filler available in the Laboratory of Pavements of the University of Minho in Portugal was also used. The aggregate mixture presents a gap in its gradation curve as specified by ADOT.
•••

Mix Properties 359
Table 3 shows the aggregate mixture composition which complies with the specified grain size distribution. Some results of aggregate characterization tests are also shown. Table 4 presents the grain size distribution of the aggregates used in the asphalt hot mixes and the theoretical values for the designed mixture.
Table 3. Characterization of aggregates used in the asphalt hot mixes
Physical properties Crushed stone 1
Crushed stone 0
Fine aggregate Filler
Aggregate percentage (%) 31.7 41.7 25.7 1.0Apparent specific gravity (kN/m3) 26.4 25.8 25.2 25.2Specific gravity of grains (kN/m3) 26.9 26.8 27. 27.1
Water absorption (%) 0.77 1.39 - -
Table 4. Grain size distribution of the aggregates and of the gap-graded mixes
Sieve size % Passing
Inch mm ADOT Crushed stone 1
Crushed stone 0
Fine aggregate Filler Mix
¾” 19.1 100 100 100 100 100 100 100.0½” 12.5 90 100 89.55 100 100 100 95.9
3/8” 9.5 79 89 41.02 97.45 100 100 77.9Nº 4 4.8 34 42 3.45 24.57 99.81 100 37.2Nº 10 2.0 15 23 1.09 4.18 76.36 100 22.1Nº 40 0.425 4 14 0.83 2.04 35.04 99.17 10.6Nº 80 0.18 - - 0.70 1.59 16.56 93.96 - Nº 200 0.075 1 5 0.53 1.13 6.18 75.03 2.8
Figure 1 presents the grain size distribution curves of the specified grade envelope and of the theoretical mixture designed for the asphalt hot mixes according to the aggregate mixture composition described in Table 3.
0
20
40
60
80
100
120
0,01 0,1 1 10 100
Diameter (mm)
%Pa
ssing
ADOT
Mix
Figure 1. Grain size distribution curves for gap-graded mixes
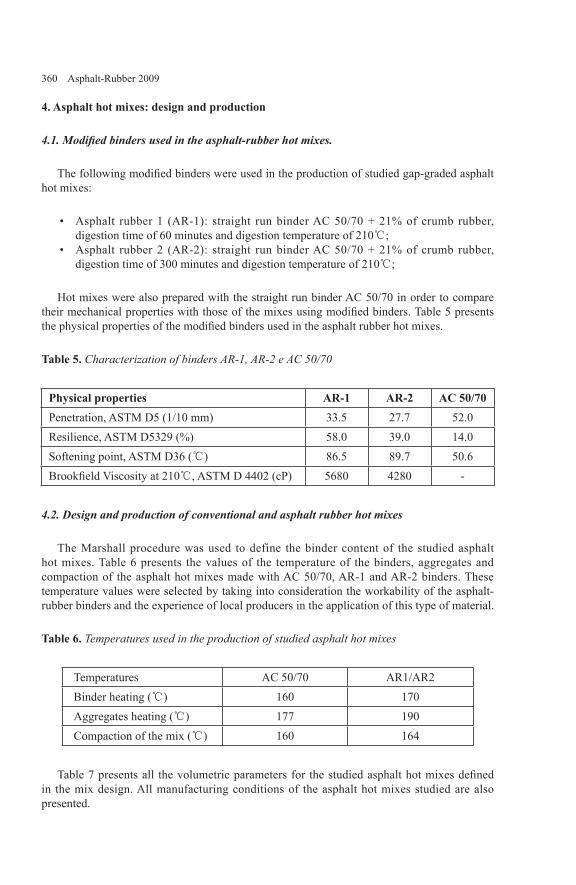
360 Asphalt-Rubber 2009
4. Asphalt hot mixes: design and production
4.1. Modified binders used in the asphalt-rubber hot mixes.
The following modified binders were used in the production of studied gap-graded asphalt hot mixes:
Asphalt rubber 1 (AR-1): straight run binder AC 50/70 + 21% of crumb rubber, digestion time of 60 minutes and digestion temperature of 210℃;Asphalt rubber 2 (AR-2): straight run binder AC 50/70 + 21% of crumb rubber, digestion time of 300 minutes and digestion temperature of 210℃;
Hot mixes were also prepared with the straight run binder AC 50/70 in order to compare their mechanical properties with those of the mixes using modified binders. Table 5 presents the physical properties of the modified binders used in the asphalt rubber hot mixes.
Table 5. Characterization of binders AR-1, AR-2 e AC 50/70
Physical properties AR-1 AR-2 AC 50/70Penetration, ASTM D5 (1/10 mm) 33.5 27.7 52.0Resilience, ASTM D5329 (%) 58.0 39.0 14.0Softening point, ASTM D36 (℃) 86.5 89.7 50.6Brookfield Viscosity at 210℃, ASTM D 4402 (cP) 5680 4280 -
4.2. Design and production of conventional and asphalt rubber hot mixes
The Marshall procedure was used to define the binder content of the studied asphalt hot mixes. Table 6 presents the values of the temperature of the binders, aggregates and compaction of the asphalt hot mixes made with AC 50/70, AR-1 and AR-2 binders. These temperature values were selected by taking into consideration the workability of the asphalt-rubber binders and the experience of local producers in the application of this type of material.
Table 6. Temperatures used in the production of studied asphalt hot mixes
Temperatures AC 50/70 AR1/AR2Binder heating (℃) 160 170Aggregates heating (℃) 177 190Compaction of the mix (℃) 160 164
Table 7 presents all the volumetric parameters for the studied asphalt hot mixes defined in the mix design. All manufacturing conditions of the asphalt hot mixes studied are also presented.
•
•

Mix Properties 361
Table 7. Properties of the gap-graded asphalt hot mixes
Mix properties AC 50/70 AR-1/AR-2Apparent density (g/cm3) 2.25 2.26Void content (%) 4.5 4.5Void in the mineral aggregate – VMA (%) 19.3 17.1Void filled with asphalt binder – VFA (%) 76.7 74.0Optimum binder content (%) 7.05 9.0
After the mix design, several specimens of asphalt hot mixes with AC 50/70, AR-1 and AR-2 binders were prepared. A mechanical device with a production capability of 50 kg of asphalt mixture was used to thoroughly mix the mineral aggregates and the asphalt binders. Compaction of the asphalt hot mix was performed in a metallic mould with the following dimensions: 7.3 x 49.2 x 75.2 cm. A vibratory wheel roller was used to achieve the apparent density of the asphalt hot mixes presented in Table 7.
5. Mechanical behavior of asphalt hot mixes: results and discussion
5.1. Indirect tensile strength tests
Indirect tensile strength tests were carried out at a temperature of 20℃ in specimens submitted to an aging process at 85℃ for 5 days in an oven. Non-aged specimens were also tested for comparison. This laboratory aging process is standardised by AASHTO PP2/94 and simulates the long-term aging that occurs in asphalt hot mixes in field. The tests were carried out in accordance with the recommendations of DNER-ME 138/94 standard.
Figure 2 shows the results obtained in the indirect tensile tests for the gap-graded asphalt hot mixes made with AC 50/70, AR-1 and AR-2 binders. The presented labels correspond to the average of values obtained from two tested specimens. These results were submitted to an analysis of variance (ANOVA) using the Statistica 6.0 software, considering 95% as confidence level (α = 5%). The results are presented in Table 8.
An analysis of variance allows defining if there exist differences in the results obtained due to the use of different materials or if they occur due to the variability of the experimental procedures. In this case, if two variables that present different values for indirect tensile strength average are in the same homogeneous group, this difference will be then due to the variability of experimental procedures.
The results presented in Figure 2 and Table 8 show that the aging did not influence the tensile strength of asphalt hot mixes produced with AR-2 (300 minutes), what indicates that the increase in the digestion time improves the resistance of the asphalt rubber hot mixes produced to aging. This can be explained by two factors: i) the hardening produced in the asphalt rubber binder during the manufacturing process of asphalt rubber binder at high temperatures and for a long period of time (300 minutes); ii) the presence of carbon black in

362 Asphalt-Rubber 2009
the crumb rubber composition. The hardening process occurs by the volatilization of light fractions of the asphalt matrix, as explained in Dantas Neto (2004). Carbon black is an anti-oxidant that decreases the effect of aging over the asphalt binders.
When comparing the asphalt rubber hot mixes tested, it can be observed that the use of a digestion time of 300 minutes produced an increase of the indirect tensile strength in relation to that presented by the asphalt hot mix, the asphalt rubber of which was manufactured using a digestion time of 60 minutes. Again this can be attributed to the hardening of the asphalt matrix produced.
1,071,19
1,01
0,7
1,2
1,0
0,0
0,4
0,7
1,1
1,4
0 (CAP 50/70) 60 (AB-3) 300 (AB-4)Digestion time (min)
σt(M
Pa)
Aged Non-aged
Figure 2. Indirect tensile strength of the gap-graded asphalt hot mixes
Table 8. Homogeneous groups defined from ANOVA on the results of indirect tensile strength tests
AgeS/N Binder σt AVERAGE
(MPa)Homogeneous groups
1 2 3 4 5 6 7 8 9 10 11N AC 50/70 0,73 **S AR-2 1,01 ** ** **N AR-2 1,02 ** ** **S AC 50/70 1,07 ** ** **S AR-1 1,19 ** ** **N AR-1 1,21 ** ** **
5.2. Resilient modulus, phase angle and fatigue life tests
The resilient modulus and fatigue life tests were carried out under controlled strain conditions according to AASHTO TP8/96 standard in beam specimens of bituminous concrete with the following dimensions: 381 ± 6,35 mm in length, 50,8 ± 6,35 mm high and 63,5 ± 6,35 mm wide. Table 9 presents the conditions imposed during the resilient modulus and
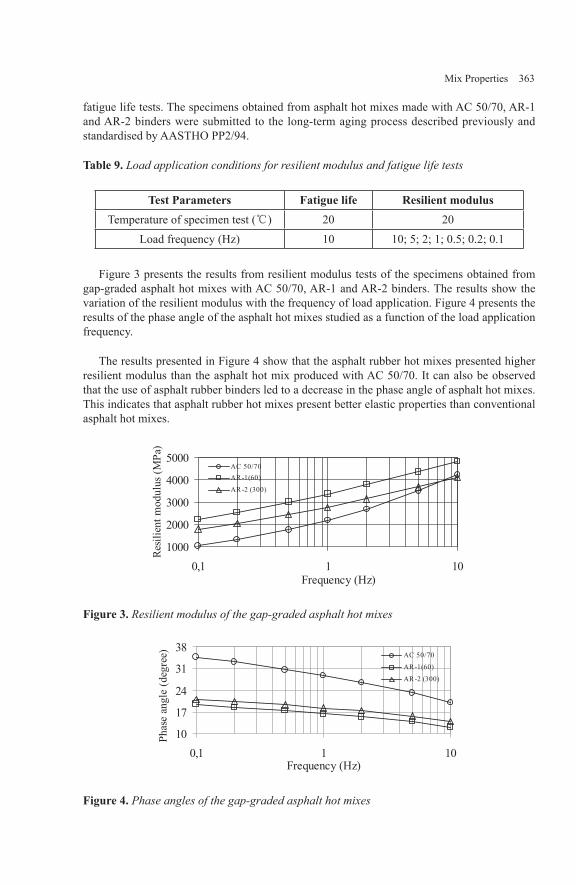
Mix Properties 363
fatigue life tests. The specimens obtained from asphalt hot mixes made with AC 50/70, AR-1 and AR-2 binders were submitted to the long-term aging process described previously and standardised by AASTHO PP2/94.
Table 9. Load application conditions for resilient modulus and fatigue life tests
Test Parameters Fatigue life Resilient modulusTemperature of specimen test (℃) 20 20
Load frequency (Hz) 10 10; 5; 2; 1; 0.5; 0.2; 0.1
Figure 3 presents the results from resilient modulus tests of the specimens obtained from gap-graded asphalt hot mixes with AC 50/70, AR-1 and AR-2 binders. The results show the variation of the resilient modulus with the frequency of load application. Figure 4 presents the results of the phase angle of the asphalt hot mixes studied as a function of the load application frequency.
The results presented in Figure 4 show that the asphalt rubber hot mixes presented higher resilient modulus than the asphalt hot mix produced with AC 50/70. It can also be observed that the use of asphalt rubber binders led to a decrease in the phase angle of asphalt hot mixes. This indicates that asphalt rubber hot mixes present better elastic properties than conventional asphalt hot mixes.
1000
2000
3000
4000
5000
0111,0Frequency (Hz)
Resil
ient
mod
ulus
(MPa
)
AC 50/70AR-1(60)
AR-2 (300)
Figure 3. Resilient modulus of the gap-graded asphalt hot mixes
10
17
24
31
38
0,1 1 10Frequency (Hz)
Phas
ean
gle
(deg
ree) AC 50/70
AR-1(60)
AR-2 (300)
Figure 4. Phase angles of the gap-graded asphalt hot mixes
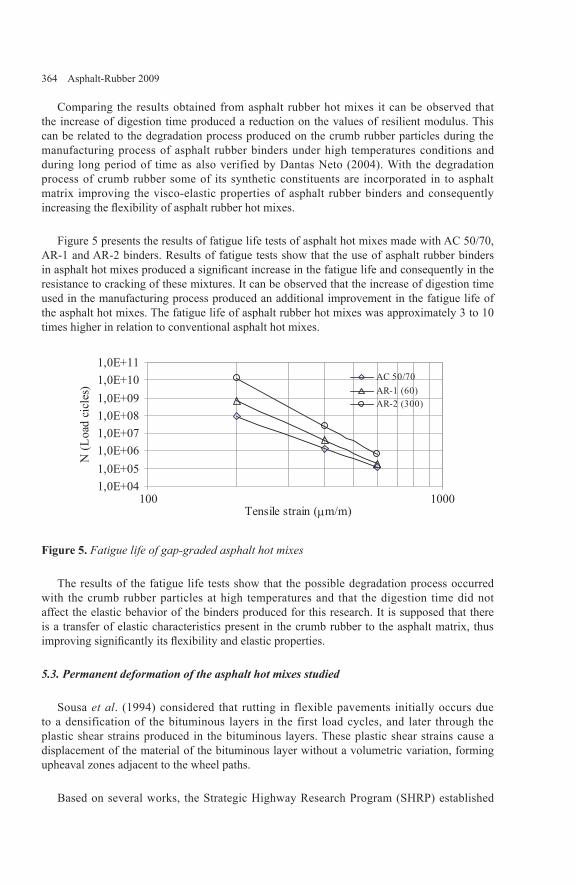
364 Asphalt-Rubber 2009
Comparing the results obtained from asphalt rubber hot mixes it can be observed that the increase of digestion time produced a reduction on the values of resilient modulus. This can be related to the degradation process produced on the crumb rubber particles during the manufacturing process of asphalt rubber binders under high temperatures conditions and during long period of time as also verified by Dantas Neto (2004). With the degradation process of crumb rubber some of its synthetic constituents are incorporated in to asphalt matrix improving the visco-elastic properties of asphalt rubber binders and consequently increasing the flexibility of asphalt rubber hot mixes.
Figure 5 presents the results of fatigue life tests of asphalt hot mixes made with AC 50/70, AR-1 and AR-2 binders. Results of fatigue tests show that the use of asphalt rubber binders in asphalt hot mixes produced a significant increase in the fatigue life and consequently in the resistance to cracking of these mixtures. It can be observed that the increase of digestion time used in the manufacturing process produced an additional improvement in the fatigue life of the asphalt hot mixes. The fatigue life of asphalt rubber hot mixes was approximately 3 to 10 times higher in relation to conventional asphalt hot mixes.
1,0E+041,0E+051,0E+061,0E+071,0E+081,0E+091,0E+101,0E+11
0001001Tensile strain (µm/m)
N(L
oad
cicl
es)
AC 50/70AR-1 (60)AR-2 (300)
Figure 5. Fatigue life of gap-graded asphalt hot mixes
The results of the fatigue life tests show that the possible degradation process occurred with the crumb rubber particles at high temperatures and that the digestion time did not affect the elastic behavior of the binders produced for this research. It is supposed that there is a transfer of elastic characteristics present in the crumb rubber to the asphalt matrix, thus improving significantly its flexibility and elastic properties.
5.3. Permanent deformation of the asphalt hot mixes studied
Sousa et al. (1994) considered that rutting in flexible pavements initially occurs due to a densification of the bituminous layers in the first load cycles, and later through the plastic shear strains produced in the bituminous layers. These plastic shear strains cause a displacement of the material of the bituminous layer without a volumetric variation, forming upheaval zones adjacent to the wheel paths.
Based on several works, the Strategic Highway Research Program (SHRP) established

Mix Properties 365
a procedure to evaluate rutting in pavements through the evaluation of the evolution of the plastic shear strains that occurs in asphalt hot mixes. The main assumption of this procedure is that rutting is the result of a phenomenon of plastic shear flow under a constant volume of mixture, caused by the shear stress produced below the edge of the truck tires (Sousa et al., 1994).
In this work the resistance to permanent deformation was evaluated by the repeated simple shear test at a constant height (RSST-CH). This test consists of applying to a cylindrical specimen with 15 cm diameter and 5 cm thick a repeated shear stress, while the produced plastic shear strains are measured under controlled temperature.
Table 10 presents the conditions imposed to the specimen during the RSST-CH tests performed. The temperature of 50℃ is typically used for pavements in Portugal, while a higher temperature of 60 ℃ was adopted to simulate more severe climate conditions, as those observed in Brazil.
Table 10. Test conditions for RSST-CH
Test Parameters ValuesTemperature of the specimens (℃) 50 and 60 ± 0,5Shear stress actuating on the specimens (kPa) 69 ± 5Loading time (s) 0.1Unloading time (s) 0.6
Figure 6 shows the results of the RSST-CH tests for the asphalt hot mixes made with the AC 50/70, AR-1 and AR-2 binders. The results are expressed in terms of number of cycles of the equivalent standard axle (ESALmrd) for the mixture to reach the maximum plastic shear strain or a limit rut depth of 12.7 mm.
The results show that the asphalt rubber hot mixes presented, for both temperatures, were more resistant to permanent deformation than conventional asphalt hot mixes. It can be observed that the increase of digestion time produced a light reduction of the resistance to permanent deformation. Probably this is a consequence of the decrease of the phase angle of the asphalt rubber hot mixes produced with AR-2 in relation to that produced with AR-1, once that the decrease of the phase angle indicates an increase of the viscous component responsible for the mechanical behavior of the asphalt hot mix.

366 Asphalt-Rubber 2009
0,0E+00
1,0E+06
2,0E+06
3,0E+06
4,0E+06
AC 50/70 60 300Digestion time (min)
ESA
Lmrd
0
30
60
90
120Softening
poi nt(ºC)
60ºC 50ºC Softening point
Figure 6. Results of RSST-CH tests for gap-graded asphalt hot mixes
5. Conclusions
The results presented in this paper show that the incorporation of crumb rubber into a straight run binder enhanced significantly the mechanical behavior of the asphalt hot mixes. The principal advantages were the increase of indirect tensile strength, fatigue life, flexibility, and resistance to the development of permanent deformations.
The influence of the digestion time on the mechanical behavior of gap-graded asphalt rubber hot mixes was significant. It can be verified that, except for rutting, the use of high temperature and digestion times, within the limits tested herein, improve the mechanical behavior of the asphalt rubber hot mixes produced. The increase in the digestion time can contribute to the production of improved asphalt rubber hot mixes.
6. Acknowledgements
This work was part of the doctoral research program of the Pos-graduate Program in Geotechnics of the University of Brasilia, with support of the Department of Civil Engineering of the University of Minho, in Portugal. It was supported with grants from the Brazilian agencies CAPES and CNPQ. The authors are thankful to the companies that supplied the materials used in this work: Cepsa (supplier of the binders), Biosafe (supplier of the granulated rubber) and Bezerras LTDA (supplier of the mineral aggregates).
References
Anderson J., Pampulim V., Saim R. Sousa J.B., “Asphalt rubber laboratory properties related to type and process technology of crumb rubber”, Asphalt Rubber 2000 – Proceedings, Portugal, 2000.

Mix Properties 367
Dantas Neto, S.A., “Evaluation of the properties of binders and mixes modified with crumb rubber from used tires”. (In Portuguese). PhD Thesis, University of Brasilia, Department of Civil and Environmental Engineering, Brazil, 2004.
Leite, L.M.F., Constatino, R.S. & Vivoni, A., “Rheological studies of asphalt with ground tire rubber”, Asphalt Rubber 2000 - Proceedings, Vilamoura, Portugal, p.421-434, 2000.
Sousa J.B., Solamanian, M. & Weissman, L., “Development and use of the Repeated Shear Test (Constant Height): an optional Superpave mix design tool”, Strategic Highway Research Program, National Research Council, Washington, 78p, 1994.
Takallou H.B., Takallou M.B., “Effects of mixing time and temperature on the visco-elastic properties of asphalt rubber binder”, Asphalt Rubber 2003 – Proceedings, Brazil, 2003, p. 589-602.
Visser A.T., Verhaeghe B., “Bitumen rubber: Lessons learned in South Africa”, Asphalt Rubber 2000 – Proceedings, Portugal, 2000, p. 33-52.


Mix Properties 369
Laboratory Performance of Asphalt Rubber Mixtures
Liseane P.T.L. Fontes* — Glicério Trichês* — Jorge C. Pais** — Paulo A.A. Pereira** — Manuel J.C. Minhoto***
* University Federal of Santa Catarina Department of Civil Engineering Florianópolis, SC, Brazil [email protected] [email protected]
** University of Minho Department of Civil Engineering, Campus of Azurém 4800-058 Guimarães, Portugal [email protected] [email protected]
* Polytechnic Institute of Bragança School of Management and Technology Campus de Santa Apolónia, Apartado 134, 5301-857 Bragança, Portugal [email protected]
ABSTRACT. Asphalt rubber mixtures are one of the most promising techniques to extend the service life of asphalt pavement overlays. Asphalt rubber binder is composed of crumb rubber from reclaimed tires and conventional asphalt. The asphalt rubber binder can be obtained through wet process in two different systems: tire rubber-modified asphalt binder (produced at industrial plants) and continuous blending (produced in asphalt plants). This study presents a laboratory evaluation of asphalt rubber mixtures produced with different asphalt rubber binders, using gap and dense gradations. The mechanical behaviour of the mixtures studied was established through several laboratory tests (stiffness, fatigue and permanent deformation). Moreover, the morphologies of the crumb rubber and of the asphalt rubber binder were analysed through scanning micrographs. The rheology of the asphalt rubber binder was characterised in order to predict the mechanical behaviour of asphalt rubber mixtures.
KEYWORDS: Asphalt Rubber, Fatigue, Permanent Deformation
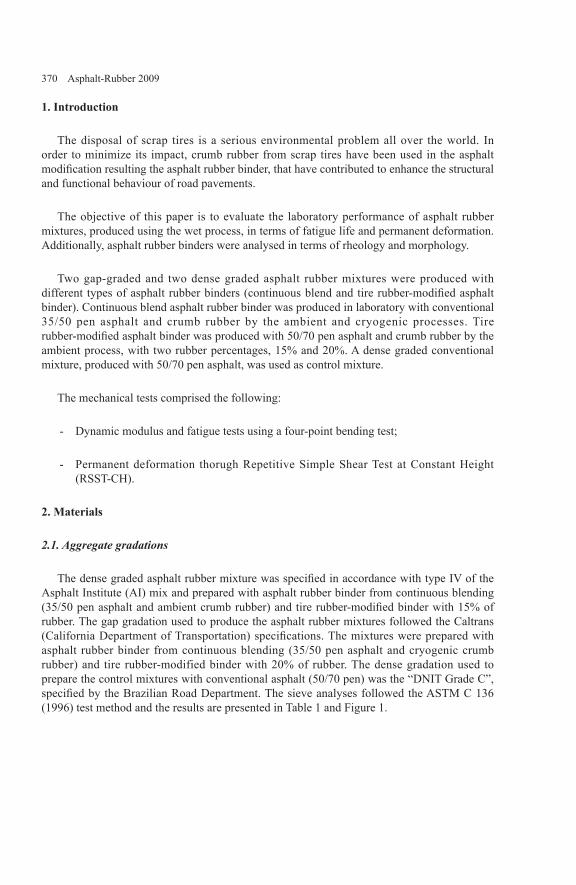
370 Asphalt-Rubber 2009
1. Introduction
The disposal of scrap tires is a serious environmental problem all over the world. In order to minimize its impact, crumb rubber from scrap tires have been used in the asphalt modification resulting the asphalt rubber binder, that have contributed to enhance the structural and functional behaviour of road pavements.
The objective of this paper is to evaluate the laboratory performance of asphalt rubber mixtures, produced using the wet process, in terms of fatigue life and permanent deformation. Additionally, asphalt rubber binders were analysed in terms of rheology and morphology.
Two gap-graded and two dense graded asphalt rubber mixtures were produced with different types of asphalt rubber binders (continuous blend and tire rubber-modified asphalt binder). Continuous blend asphalt rubber binder was produced in laboratory with conventional 35/50 pen asphalt and crumb rubber by the ambient and cryogenic processes. Tire rubber-modified asphalt binder was produced with 50/70 pen asphalt and crumb rubber by the ambient process, with two rubber percentages, 15% and 20%. A dense graded conventional mixture, produced with 50/70 pen asphalt, was used as control mixture.
The mechanical tests comprised the following:
Dynamic modulus and fatigue tests using a four-point bending test;
Permanent deformation thorugh Repetitive Simple Shear Test at Constant Height (RSST-CH).
2. Materials
2.1. Aggregate gradations
The dense graded asphalt rubber mixture was specified in accordance with type IV of the Asphalt Institute (AI) mix and prepared with asphalt rubber binder from continuous blending (35/50 pen asphalt and ambient crumb rubber) and tire rubber-modified binder with 15% of rubber. The gap gradation used to produce the asphalt rubber mixtures followed the Caltrans (California Department of Transportation) specifications. The mixtures were prepared with asphalt rubber binder from continuous blending (35/50 pen asphalt and cryogenic crumb rubber) and tire rubber-modified binder with 20% of rubber. The dense gradation used to prepare the control mixtures with conventional asphalt (50/70 pen) was the “DNIT Grade C”, specified by the Brazilian Road Department. The sieve analyses followed the ASTM C 136 (1996) test method and the results are presented in Table 1 and Figure 1.
-
-
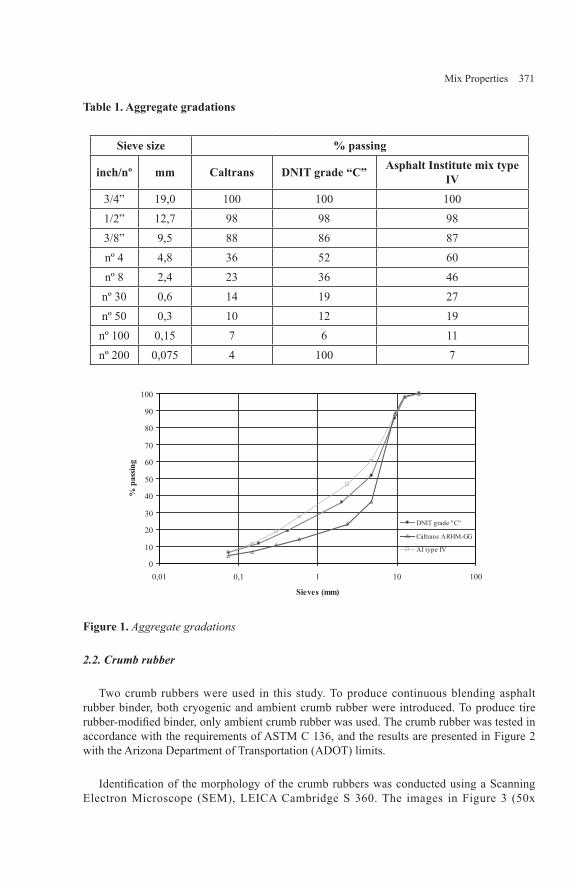
Mix Properties 371
Table 1. Aggregate gradations
Sieve size % passing
inch/nº mm Caltrans DNIT grade “C” Asphalt Institute mix type IV
3/4” 19,0 100 100 1001/2” 12,7 98 98 983/8” 9,5 88 86 87nº 4 4,8 36 52 60nº 8 2,4 23 36 46nº 30 0,6 14 19 27nº 50 0,3 10 12 19nº 100 0,15 7 6 11nº 200 0,075 4 100 7
0
10
20
30
40
50
60
70
80
90
100
0,01 0,1 1 10 100
Sieves (mm)
%pa
ssin
g
DNIT grade "C"
Caltrans ARHM-GG
AI type IV
Figure 1. Aggregate gradations
2.2. Crumb rubber
Two crumb rubbers were used in this study. To produce continuous blending asphalt rubber binder, both cryogenic and ambient crumb rubber were introduced. To produce tire rubber-modified binder, only ambient crumb rubber was used. The crumb rubber was tested in accordance with the requirements of ASTM C 136, and the results are presented in Figure 2 with the Arizona Department of Transportation (ADOT) limits.
Identification of the morphology of the crumb rubbers was conducted using a Scanning Electron Microscope (SEM), LEICA Cambridge S 360. The images in Figure 3 (50x
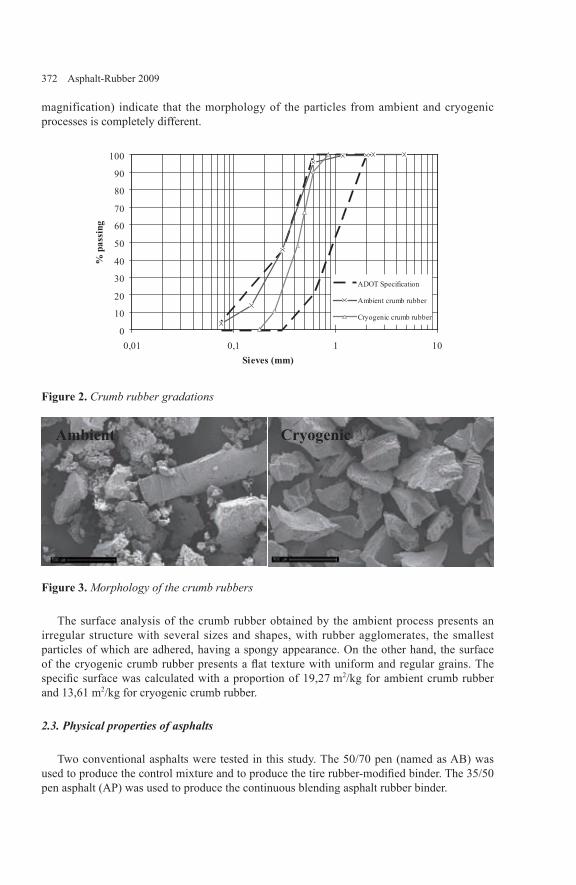
372 Asphalt-Rubber 2009
magnification) indicate that the morphology of the particles from ambient and cryogenic processes is completely different.
0
10
20
30
40
50
60
70
80
90
100
0,01 0,1 1 10Sieves (mm)
%pa
ssin
g
ADOT Specification
Ambient crumb rubber
Cryogenic crumb rubber
Figure 2. Crumb rubber gradations
Figure 3. Morphology of the crumb rubbers
The surface analysis of the crumb rubber obtained by the ambient process presents an irregular structure with several sizes and shapes, with rubber agglomerates, the smallest particles of which are adhered, having a spongy appearance. On the other hand, the surface of the cryogenic crumb rubber presents a flat texture with uniform and regular grains. The specific surface was calculated with a proportion of 19,27 m2/kg for ambient crumb rubber and 13,61 m2/kg for cryogenic crumb rubber.
2.3. Physical properties of asphalts
Two conventional asphalts were tested in this study. The 50/70 pen (named as AB) was used to produce the control mixture and to produce the tire rubber-modified binder. The 35/50 pen asphalt (AP) was used to produce the continuous blending asphalt rubber binder.
CryogenicAmbient

Mix Properties 373
The tire rubber-modified binders were produced at an industrial plant, herein named as TB1 (20% of crumb rubber) and TB2 (15% of crumb rubber). The continuous blending asphalt rubber binders CB1 (with cryogenic rubber) and CB2 (with ambient rubber) were produced as follows: 21% of cryogenic crumb rubber; 90 minutes of digestion time; 180℃ of digestion temperature.
The physical properties of the asphalts were evaluated in laboratory in terms of: softening point; penetration; resilience, apparent viscosity (Brookfield viscometer). The hardening of the asphalts due to oxidation was also tested through the Rolling Thin-Film Oven Test (RTFOT). The asphalt rubber binders tested followed the specifications of the ASTM D 6114 (1997), type II. The test results are presented in Table 2.
Table 2. Asphalt properties
Test Standard AB AP TB1 TB2 CB1 CB2Penetration 25℃, 100g, 5s (0,1 mm) ASTM D5 51,5 33,0 40 42 16,8 19,7Softening point, ring and ball (℃) ASTM D36 51,5 52,7 68,0 67,7 73,4 69,9
Apparent viscosity* (cP), 175 ℃ ASTM D2196 127 175 2179 1644 2246 4058
Resilience (%) ASTM D5329 0 9 28 33 49 52
RTFOT 163℃, 85 minutes
ASTM D2872
Change of mass (%) 0,3 0,2 0,3 0,3 0,9 0,2Softening point (℃) 4,3 0,5 1,0 2,9 11,2 17,1Penetration 25℃, 100g, 5s (0,1 mm) 22,3 27,7 28,8 25,3 15,5 19,5Retained penetration (%) 43,3 84,0 72,0 60,2 92,2 99,0Apparent viscosity* (cP), 175 ℃ 5350 1962 3925 8813Resilience (%) 39 36 56 52
* Brookfield viscometer, spindle 27, 20 rpm.
The test results showed that the modified asphalts were significantly more viscous than the conventional ones. The asphalt rubber binders TB1 and TB2 seemed to be similar, except for the fact that TB1 presented higher viscosity (more rubber content) and that TB2 had more elasticity. The differences between CB1 and CB2 were more evident. CB1 had lower viscosity and a higher softening point. The low viscosity of the continuous blending in relation to tire rubber-modified binder can be explained by the fact that it was produced with more rigid asphalt than TB. Asphalt rubber binders CB (1 and 2) presented a high softening point than TB (1 and 2), what may indicate that mixtures produced with CB would be highly resistant to permanent deformation. In general, asphalt rubber binders are not very sensitive to hardening.
2.4. Compatibility of asphalt rubber binder systems
The compatibility of asphalt/polymer systems, such as asphalt rubber binder, may be
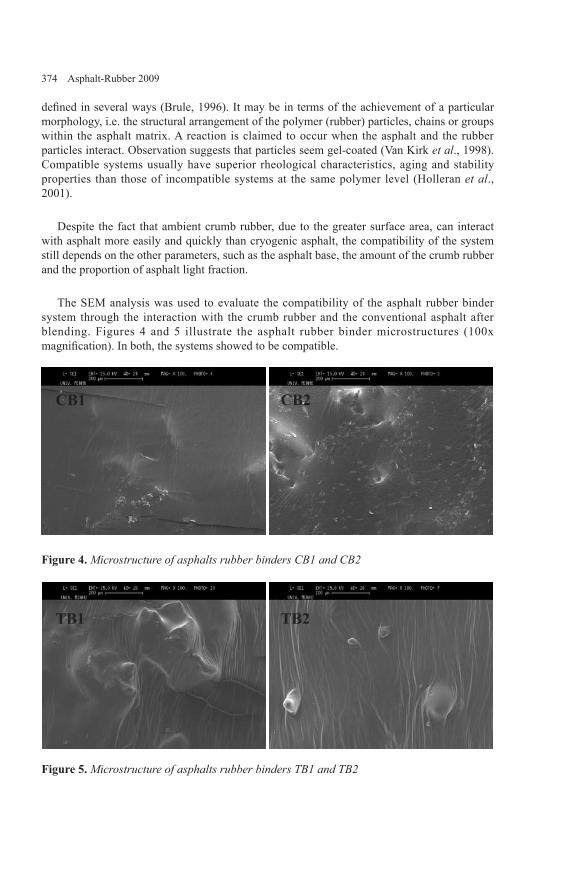
374 Asphalt-Rubber 2009
defined in several ways (Brule, 1996). It may be in terms of the achievement of a particular morphology, i.e. the structural arrangement of the polymer (rubber) particles, chains or groups within the asphalt matrix. A reaction is claimed to occur when the asphalt and the rubber particles interact. Observation suggests that particles seem gel-coated (Van Kirk et al., 1998). Compatible systems usually have superior rheological characteristics, aging and stability properties than those of incompatible systems at the same polymer level (Holleran et al., 2001).
Despite the fact that ambient crumb rubber, due to the greater surface area, can interact with asphalt more easily and quickly than cryogenic asphalt, the compatibility of the system still depends on the other parameters, such as the asphalt base, the amount of the crumb rubber and the proportion of asphalt light fraction.
The SEM analysis was used to evaluate the compatibility of the asphalt rubber binder system through the interaction with the crumb rubber and the conventional asphalt after blending. Figures 4 and 5 illustrate the asphalt rubber binder microstructures (100x magnification). In both, the systems showed to be compatible.
Figure 4. Microstructure of asphalts rubber binders CB1 and CB2
Figure 5. Microstructure of asphalts rubber binders TB1 and TB2
CB2CB1
TB2TB1

Mix Properties 375
The configuration used in this study to produce continuous blending asphalt rubber binder resulted in a good interaction and, apparently, 35/50 pen asphalt reacted better with cryogenic than with ambient rubber (Figure 4). The tire rubber-modified binder system allows blending or combining asphalt and crumb rubber together to produce a long lasting product. Thus asphalt rubber binder produced through this system resulted in a compatible system and in a perfect interaction between asphalt (50/70 pen) and ambient and cryogenic rubbers (Figure 5).
2.5. Rheology of asphalts rubber binder
Asphalt is a viscoelastic material, meaning that it simultaneously shows the behaviour of an elastic material and that of a viscous material. The relationship between these two properties is used to measure the capability of the binder to resist permanent deformation and fatigue cracking., A binder needs to be stiff and elastic to resist permanent deformation; to resist fatigue cracking, the binder needs to be flexible and elastic (FHWA, 1994).
The rheology tests with rheometers are used to characterize the viscous and elastic behaviour of the asphalt. It is accomplished by measuring the viscous and elastic properties of a thin asphalt sample, between an oscillating and a fixed plate. As the force (shear stress) is applied to the asphalt by the spindle, the rheometer measures the response (shear strain) of the asphalt to the force. If the material was perfectly elastic, the response would coincide immediately with the applied force, and the time lag between the two would be zero. A perfectly viscous material would have a larger time lag between load and response.
The relationship between the applied stress and the resulting strain quantifies both types of behaviour, and provides the necessary information to calculate two important asphalt binder properties: the complex shear modulus (G*) and the phase angle (δ). The complex shear modulus, G*, represents the total deformation resistance when loaded or sheared and it is defined as the ratio of maximum shear stress (τmax) to maximum shear strain (εmax), expressed as follows:
max
max*ετ
=G [1]
The phase angle, δ, represents the relative distribution between the elastic response and the viscous response to loading. It indicates the delayed strain response, or lag, of the binder to the applied shear stress, during steady state conditions (Roberts et al., 1996). For a perfectly elastic material, δ is zero, and the whole deformation is temporary, whereas for a viscous material, δ approaches 90º, and the deformation is permanent.
The Superpave specifications define the rutting factor, G*/sin δ, that represents the maximum temperature that a binder can reach without permanent deformation. The fatigue cracking factor is G*.sin δ.
In this study, the rheological characterization of asphalt rubber binders was performed to estimate the mechanical behaviour of the material. The rheological data were collected using a parallel plate rheometer (Rheological StressTech HR) (sample with a diameter of 40 mm and

376 Asphalt-Rubber 2009
a thickness of 0,8 mm) which was capable of measuring the complex shear modulus and the phase angle for different stresses and strain rates (Figure 6). In relation to the asphalt rubber binder obtained by the continuous blending (CB) and through the tire rubber-modified binder processes (TB), the tests were conducted at 20℃ (intermediate service temperature) and 60℃ (high service temperature) with frequencies between 1 to 10 Hz. Figures 7 and 8 present the G*/sinδ, at 60℃ and G*.sinδ , at 20℃. The phase angle is presented in Figure 9.
Figure 6. Rheometer and parallel plates
1E+03
1E+04
1E+05
1 10Frequency (Hz)
G*/
senδ
TB2 TB1
CB1 CB2
Figure 7. G*/sinδ at 60ºC

Mix Properties 377
1E+04
1E+05
1E+06
1 10Frequency (Hz)
G*.
senδ
TB2 TB1
CB1 CB2
Figure 8. G*.sinδ at 20ºC
0
10
20
30
40
50
60
70
80
90
1 10Frequency (Hz)
δ (º
)
TB2 (20ºC) TB1 (20ºC) CB1 (20ºC) CB2 (20ºC)
TB2 (60ºC) TB1 (60ºC) CB1 (60ºC) CB2 (60ºC)
Figure 9. Asphalts rubber binder phase angles
The results of the rheology tests are an indicator of the properties of the asphalt rubber binder and can be used to predict the mixture performance. The results obtained allow concluding that, at high temperatures, the asphalt rubber binder CB1 and CB2 should acquire higher resistance to permanent deformation than TB1 and TB2, due to higher values of G* and lower values of δ. Furthermore, for intermediate temperatures, CB1 and CBs also present the properties of a soft elastic material (lesser G*.sinδ and lower δ), that probability would improve the fatigue properties.
The complex modulus of asphalt, at many levels of temperature and load time-rate, can be determined by a master curve constructed at a reference temperature (20℃). Master curves are constructed using the principle of time-temperature superposition.

378 Asphalt-Rubber 2009
To construct the master curves of asphalt rubber binder, obtained by graphic translation of the isotherms aligning frequencies of same value, the rheology tests were conducted under five temperatures (20℃, 30℃, 40℃, 50℃ and 60℃) with applied frequencies between 0,0001 to 100 Hz. The master curves, at a reference temperature of 20℃, are presented in Figure 10. The results show that CB1 and CB2 are more elastic than TB1 and TB2, what can be verified by the slope of the curves (a horizontal curve represents a purely elastic behaviour). TB1 would be more susceptible to temperature variations.
1E+03
1E+04
1E+05
1E+06
0,0001 0,001 0,01 0,1 1 10 100Frequency (Hz)
G*
(Pa)
TB2
CB1
CB2
TB1
Figure 10. Master curves of the asphalt rubber binders
2.6. Mixtures
Gap and dense graded asphalt rubber mixtures were produced using continuous and tire rubber-modified binder. A conventional dense graded mixture was produced with conventional asphalt 50/70 pen, as the control mixture. These mixtures were produced as follows:
MCB1 – gap graded asphalt rubber mixture; Caltrans ARHM-GG gradation; 8,0% of asphalt content (continuous blending asphalt rubber binder, produced in laboratory, asphalt base 35/50 pen, 21% of cryogenic rubber content, 180℃ digestion temperature; reaction time of 90 minutes), and 6,0% of void content;
MCB2 – dense graded asphalt rubber mixture; AI mix type IV gradation; 7,0% of asphalt content (continuous blending asphalt rubber binder, produced in laboratory, asphalt base 35/50 pen, 21% of ambient rubber content, 180℃ digestion temperature; reaction time of 90 minutes) and 5,0% of void content;
MTB1 – gap graded asphalt rubber mixture, Caltrans ARHM-GG gradation; 8,5% of asphalt content (tire rubber-modified binder, produced at industrial plant, asphalt base 50/70 pen, 20% of ambient rubber content) and 6,0% of void content;
-
-
-

Mix Properties 379
MTB2 – dense graded asphalt rubber mixture, AI mix type IV gradation; 7,0% of asphalt content (tire rubber-modified binder, asphalt base 50/70 pen, produced at industrial plant, 15% of ambient rubber content) and 5,0% of void content;
MCO – dense graded conventional mixture, DNIT Grade “C” gradation; 5,0% of asphalt content (50/70 pen) and 4,0% of void content.
Table 3 presents a summary of the studied mixtures, in which the aggregate gradation, binder content, binder type and void content can be observed.
Table 3. Asphalt mixtures properties
Mixture Aggregate gradation
Binder content(%) Binder type Void content
(%)
MCB1 Caltrans, gap 8,0 Continuous blending, 35/50, 21% rubber 6,0
MCB2 AI, dense 7,0 Continuous blending, 35/50, 21% rubber 5,0
MTB1 Caltrans, gap 8,5 tire rubber modified binder, 50/70, 20% rubber 6,0
MTB2 AI, dense 7,0 tire rubber modified binder, 50/70, 15% rubber 5,0
MCO DNIT, dense 5,0 50/70 4,0
The mixtures were compacted with a steel roller in a mould (75x49x8 cm3). The compacted slabs were sawed and cored with the appropriate dimension for each type of test.
3. Mechanical tests
3.1. Dynamic modulus and fatigue life
Four point bending tests were conducted to evaluate the dynamic modulus and fatigue life. Beam specimens of 38 cm long by 5 cm thick by 6,3 cm wide were used in frequency sweep test to measure the dynamic modulus and the phase angle when subjected to seven loading frequencies (10; 5; 2; 1; 0,5; 0,2; 0,1 Hz), at 20℃.
Fatigue tests were conducted according to the AASHTO TP8/94, at 20℃ and at 10 Hz. Fatigue failure was assumed to occur when the dynamic modulus was reduced to 50 percent of the initial value. The tests were conducted at three strain levels of approximately 200, 400 and 800 microstrains, with three repetitions for each level. The test results considered bottom-up cracking to determine an empirical fatigue relationship of the simple power formula (Monismith et al., 1971) shown as:
[2]
-
-

380 Asphalt-Rubber 2009
where: N = number of repetitions until failure; ε = tensile strain applied (10-6); a and b = experimentally determined coefficients.
The dynamic modulus of the mixtures for all the frequencies applied is shown in Figure 11 and the phase angle of the mixtures is depicted in Figure 12.
The results in Figure 11 show that the MCB2 has a higher dynamic modulus than the other mixtures, and at 10 Hz, this value is similar to MCO. It is noticed that the tire rubber-modified binder mixtures (MTB1 and MTB2) presented lower dynamic modulus than the continuous blend mixtures.
In Figure 12, the results of the phase angle, an indicator of viscoelastic properties of the mixtures, indicate that MCO is more viscous than asphalt rubber mixtures (continuous blend and tire rubber-modified binder), what represents an improvement in the elastic response and, therefore, a better fatigue performance of the asphalt rubber mixtures.
Table 4 shows the experimental parameters of fatigue laws of the mixtures, according to Equation 2, with the strain expressed in terms of microstrains. Figure 13 presents the results of the fatigue curves.
0
1000
2000
3000
4000
5000
6000
7000
0,1 1 10Frequency (Hz)
Dyn
amic
Mod
ulus
(MPa
)
MCO MTB1MCB1 MTB2MCB2
Figure 11. Dynamic modulus of the mixtures
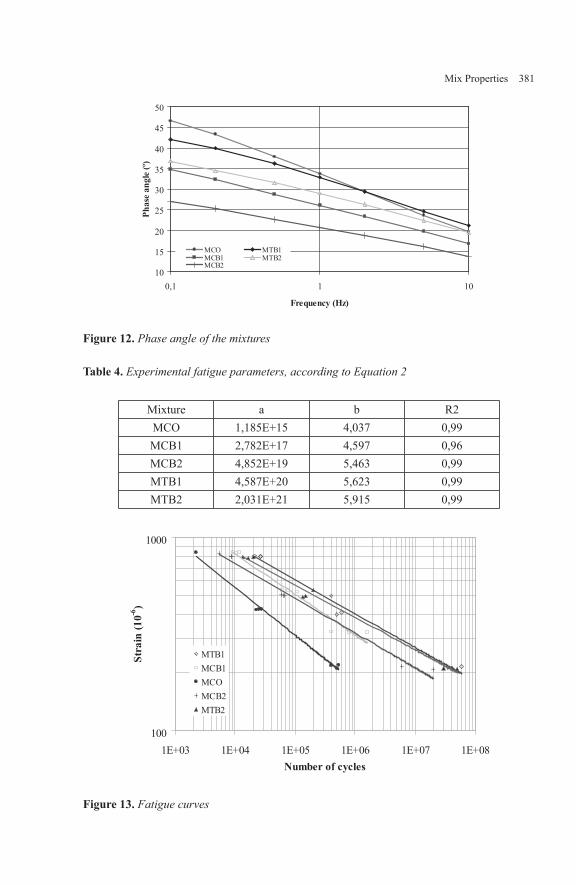
Mix Properties 381
10
15
20
25
30
35
40
45
50
0,1 1 10
Frequency (Hz)
Phas
ean
gle
(º)
MCO MTB1MCB1 MTB2MCB2
Figure 12. Phase angle of the mixtures
Table 4. Experimental fatigue parameters, according to Equation 2
Mixture a b R2MCO 1,185E+15 4,037 0,99MCB1 2,782E+17 4,597 0,96MCB2 4,852E+19 5,463 0,99MTB1 4,587E+20 5,623 0,99MTB2 2,031E+21 5,915 0,99
100
1000
1E+03 1E+04 1E+05 1E+06 1E+07 1E+08Number of cycles
Stra
in(1
0-6)
MTB1MCB1MCOMCB2MTB2
Figure 13. Fatigue curves
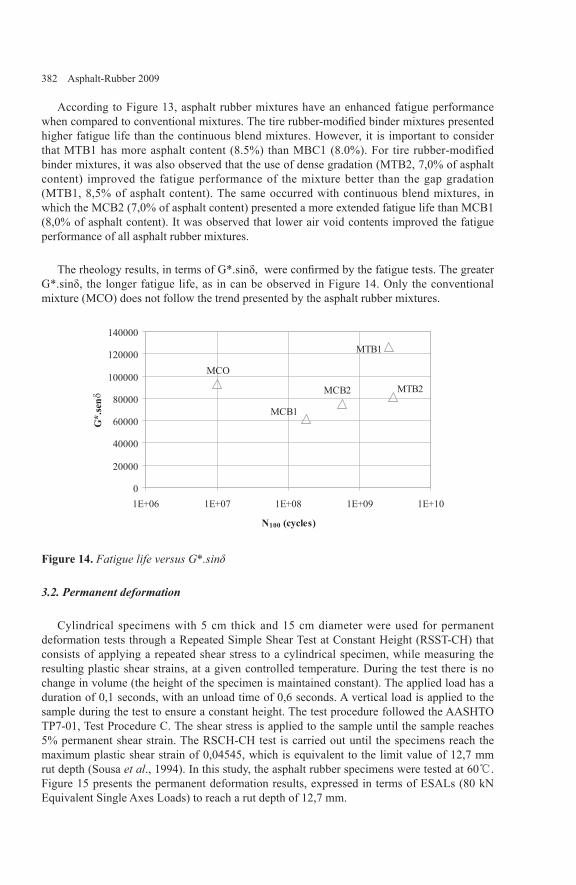
382 Asphalt-Rubber 2009
According to Figure 13, asphalt rubber mixtures have an enhanced fatigue performance when compared to conventional mixtures. The tire rubber-modified binder mixtures presented higher fatigue life than the continuous blend mixtures. However, it is important to consider that MTB1 has more asphalt content (8.5%) than MBC1 (8.0%). For tire rubber-modified binder mixtures, it was also observed that the use of dense gradation (MTB2, 7,0% of asphalt content) improved the fatigue performance of the mixture better than the gap gradation (MTB1, 8,5% of asphalt content). The same occurred with continuous blend mixtures, in which the MCB2 (7,0% of asphalt content) presented a more extended fatigue life than MCB1 (8,0% of asphalt content). It was observed that lower air void contents improved the fatigue performance of all asphalt rubber mixtures.
The rheology results, in terms of G*.sinδ, were confirmed by the fatigue tests. The greater G*.sinδ, the longer fatigue life, as in can be observed in Figure 14. Only the conventional mixture (MCO) does not follow the trend presented by the asphalt rubber mixtures.
MCB2
MCB1
MTB2
MTB1
MCO
0
20000
40000
60000
80000
100000
120000
140000
1E+06 1E+07 1E+08 1E+09 1E+10
N100 (cycles)
G*.
senδ
Figure 14. Fatigue life versus G*.sinδ
3.2. Permanent deformation
Cylindrical specimens with 5 cm thick and 15 cm diameter were used for permanent deformation tests through a Repeated Simple Shear Test at Constant Height (RSST-CH) that consists of applying a repeated shear stress to a cylindrical specimen, while measuring the resulting plastic shear strains, at a given controlled temperature. During the test there is no change in volume (the height of the specimen is maintained constant). The applied load has a duration of 0,1 seconds, with an unload time of 0,6 seconds. A vertical load is applied to the sample during the test to ensure a constant height. The test procedure followed the AASHTO TP7-01, Test Procedure C. The shear stress is applied to the sample until the sample reaches 5% permanent shear strain. The RSCH-CH test is carried out until the specimens reach the maximum plastic shear strain of 0,04545, which is equivalent to the limit value of 12,7 mm rut depth (Sousa et al., 1994). In this study, the asphalt rubber specimens were tested at 60℃. Figure 15 presents the permanent deformation results, expressed in terms of ESALs (80 kN Equivalent Single Axes Loads) to reach a rut depth of 12,7 mm.
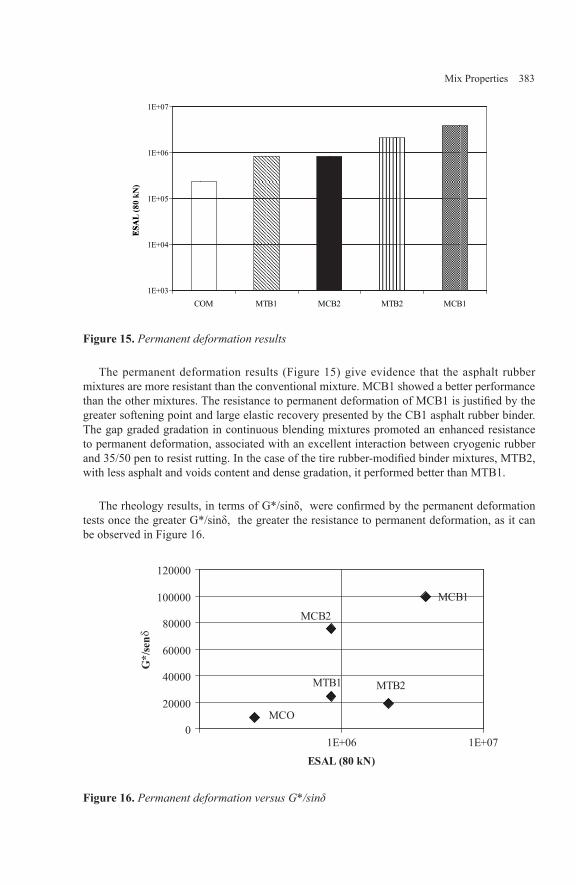
Mix Properties 383
ESA
L(8
0kN
)
1E+03
1E+04
1E+05
1E+06
1E+07
CO
ESA
L(8
0kN
)
OM MTTB1 MCB2 MTBB2 MCBB1
Figure 15. Permanent deformation results
The permanent deformation results (Figure 15) give evidence that the asphalt rubber mixtures are more resistant than the conventional mixture. MCB1 showed a better performance than the other mixtures. The resistance to permanent deformation of MCB1 is justified by the greater softening point and large elastic recovery presented by the CB1 asphalt rubber binder. The gap graded gradation in continuous blending mixtures promoted an enhanced resistance to permanent deformation, associated with an excellent interaction between cryogenic rubber and 35/50 pen to resist rutting. In the case of the tire rubber-modified binder mixtures, MTB2, with less asphalt and voids content and dense gradation, it performed better than MTB1.
The rheology results, in terms of G*/sinδ, were confirmed by the permanent deformation tests once the greater G*/sinδ, the greater the resistance to permanent deformation, as it can be observed in Figure 16.
MCB1
MTB2
MCB2
MTB1
MCO0
20000
40000
60000
80000
100000
120000
1E+06 1E+07ESAL (80 kN)
G*/
senδ
Figure 16. Permanent deformation versus G*/sinδ

384 Asphalt-Rubber 2009
4. Conclusions
The primary aim of this work was to evaluate the mechanical properties of asphalt rubber mixtures when compared to conventional ones. The mechanical tests included dynamic modulus, fatigue cracking and permanent deformation.
From the SEM analysis it can be observed that cryogenic and ambient crumb rubbers have different morphologies. While cryogenic has an angular smooth and cracked appearance surface, ambient has a porous surface. The SEM morphology of asphalts rubber binder systems also showed that all binders result in compatible systems. These analyses are significant and helpful to make a decision when evaluating the digestion time requested to produce asphalt rubber binders.
Asphalt rubber binders were characterised rheologically to estimate the mechanical behaviour of the material, following the SUPERPAVE parameters G*.sinδ and G*/sinδ, which are good indicators of fatigue performance and resistance to permanent deformation. However, the mixture variables such as asphalt and void content and type of gradation also need to be considered in the prediction.
The continuous blend mixtures presented higher dynamic modulus than tire rubber-modified binder. The MCB2 presented a higher dynamic modulus and, at 10 Hz, the value was similar to that of conventional mixtures. The results of the phase angle indicated that the conventional mixture is more viscous than asphalt rubber mixtures independently of the process used, what represents an improvement in its elastic response and, consequently, a better fatigue performance.
Fatigue tests showed that asphalt rubber mixtures exhibit significantly more fatigue performance then conventional mixtures. Tire rubber-modified binder mixtures presented a higher fatigue life than continuous blend mixtures.
The results of permanent deformation tests demonstrated that asphalt rubber mixtures were more resistant to the development of plastic shear strains than the conventional mixture. Although similar, the MCB1 presented a better performance, followed by the MTB2. This behaviour was also predicted through rheology tests.
The most important conclusion drawn from this study states that asphalt rubber mixtures present better mechanical properties and a superior performance than conventional mixtures, what allows asphalt pavement layers have a more extended life cycle.
Acknowledgements
The authors would like to thank the companies that supplied the materials used in this study: Greca Asfaltos, Cepsa Portuguesa, Bezerras Ltda. The first author was supported by the Programme Alban, the European Union Programme of High Level Scholarships for Latin America, scholarship nº E04D040507BR between 2004 and 2006. Current, the first author is supported by CNPQ (Conselho Nacional de Desenvolvimento Científico e Tecnológico).

Mix Properties 385
5. References
Brule B.,“Polymer modified asphalt cements used in the road construction industry, basicprinciples”, Transportation Research Record no. 1535, Transportation Research Board, Washington D.C., 1996.
FHWA, “Background of Superpave asphalt mixture design and analysis”, Federal Highway Administration, FHWA-SA-95-003. Lexington, KY, USA, 1994.
Holleran, Y; Van Kirk, G.; Reed, J.R., “Polymer modification of bitumen for life extension”, International Road Federation Conference, Paris, France, 2001.
Roberts, F.L., Kandhal, P.S., Brown, E. Ray, Lee, D., Kennedy, T.W., “Hot mix asphalt materials, mixture design and construction”, NAPA Research and Education Foundation, Lanham, MD, 1996.
Sousa, J .B., Solaimanian, M., Weissman, S.L., “Development and use of therepeated shear test (constant heigh): an optional Superpave mix design tool”, Strategic Highway Research Program, SHRP-A-698, Washington, DC, 1994.


Mix Properties 387
Laboratory Evaluation of Asphalt Rubber Gap Graded Mixture in Sweden
Kamil E. Kaloush* – Thorsten Nordgren** – Krishna P. Biligiri* – Waleed A. Zeiada* – Maria C. Rodezno* – Mena I. Souliman* – Jordan Reed*
* Department of Civil, Environmental and Sustainable Engineering, Arizona State University, Tempe, AZ 85287-5306, [email protected] [email protected]@[email protected]@[email protected]
** Swedish Road Administration, Goteborg, [email protected]
ABSTRACT: In this study, a laboratory experimental program was conducted to obtain material properties and performance characteristics for a “Reference Gap” and “Asphalt Rubber (AR) Gap” graded mixtures that were used on the Swedish Malmo E-06 Highway. The advanced material characterization tests included: Dynamic (Complex) Modulus for stiffness evaluation, repeated load for permanent deformation characterization, beam fatigue for crack evaluation, and C* Integral test to evaluate crack propagation. The data was used to compare the performance of the AR Gap Graded mixture to the Reference Gap. The results showed that the AR gap graded mix would provide better resistance to low temperature cracking and permanent deformation. The expected fatigue life for the AR gap graded mixture was higher than the reference mix for the existing highway conditions. Furthermore, the crack propagation tests showed that the AR gap graded mixture has higher resistance to crack propagation.
KEYWORDS: Asphalt rubber (AR) Gap Graded, Dynamic (Complex) Modulus, Flow Number, Fatigue, C* Integral Crack Propagation.

388 Asphalt-Rubber 2009
1. Introduction
The Swedish Road Administration (SRA) has been interested in the Arizona application of asphalt rubber surface courses for some time. After some study visits to Phoenix, the SRA decided to construct test sections in the late summer of 2007. The SRA constructed two asphalt rubber demonstration projects, the first near Jonkoping in the central part of the country, and the next near Malmo in the south. The two projects utilized hot in-place recycling process that has become more popular in Sweden. This process involves heating the existing asphalt pavement, milling the top layer, remixing the material, and immediately placing the material back to the road surface. At the same time, a new 30 mm thick, gap graded friction course lift of asphalt rubber hot mix was placed over the top of the remixed leveling course.
In this study, a reference gap graded asphalt mix along with an asphalt rubber gap graded mixture were sampled during construction from the SRA pavement test sections placed on the Swedish Highway Malmo E-06. Figure 1 shows map of Swedish Malmo Highway E-06 where the two mixtures were placed.
The asphalt rubber mixture contained approximately 20 percent ground tire rubber (crumb rubber). The mixtures were sent to Arizona State University (ASU) laboratories for testing and evaluation (Kaloush et al, 2008).
2. Objectives and Scope of Work
The objective of this study was to conduct a laboratory experimental program to obtain material properties and performance characteristics for the “Reference Gap” and “Asphalt Rubber (AR) Gap” graded mixtures that were used on the Swedish Malmo E-06 Highway.
At ASU, the mixtures were re-heated and compacted to cylindrical and beam specimen geometry. A Servopac gyratory compactor was used to compact the cylindrical specimens into 150 mm diameter and 170 mm in height gyratory plugs. One 100 mm diameter sample was cored from each gyratory plug. The sample ends were sawn to arrive at typical test specimens of 100 mm in diameter and 150 mm in height. Beam specimens were prepared according to the Strategic Highway Research Program (SHRP) and the American Association of State Highway and Transportation Officials (AASHTO): SHRP M-009 and AASHTO TP8-94 (SHRP M-009; AASHTO T321-03). Air voids, thickness and bulk specific gravities were measured for each test specimen and the samples were stored in plastic bags in preparation for the testing program.
The advanced material characterization tests included: E* Dynamic (Complex) Modulus for stiffness evaluation; repeated load for permanent deformation characterization; beam fatigue cracking evaluation; and C* Integral test to evaluate crack propagation.

Mix Properties 389
Figure 1. Location of Malmo Highway E-06, Sweden.
3. Mixture Characteristics
The Swedish Road Administration provided information that the field compaction / air voids for both mixtures were 2.0%. The original mix designs were done using the Marshall Mix design method. The in-situ mixture properties of the Swedish Highway E-06 project are reported in Table 1. Table 2 shows the reported average aggregate gradations for the each mixture. The base bitumen used was Pen 70/100.
Table 1. Gap Graded Mixture Characteristics, Swedish Malmo Highway E-06
Mix Bitumen Content (%) Air Voids (%) Gmb Gmm
Reference Gap Graded 6.0 2 2.406 2.453AR - Gap Graded 6.7 2 2.348 2.396
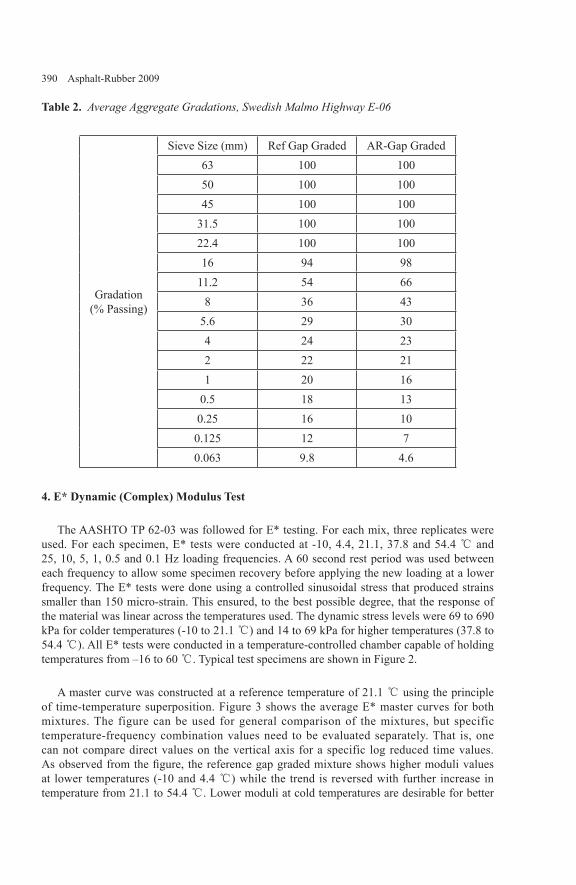
390 Asphalt-Rubber 2009
Table 2. Average Aggregate Gradations, Swedish Malmo Highway E-06
Gradation(% Passing)
Sieve Size (mm) Ref Gap Graded AR-Gap Graded63 100 10050 100 10045 100 100
31.5 100 10022.4 100 10016 94 98
11.2 54 668 36 43
5.6 29 304 24 232 22 211 20 16
0.5 18 130.25 16 100.125 12 70.063 9.8 4.6
4. E* Dynamic (Complex) Modulus Test
The AASHTO TP 62-03 was followed for E* testing. For each mix, three replicates were used. For each specimen, E* tests were conducted at -10, 4.4, 21.1, 37.8 and 54.4 ℃ and 25, 10, 5, 1, 0.5 and 0.1 Hz loading frequencies. A 60 second rest period was used between each frequency to allow some specimen recovery before applying the new loading at a lower frequency. The E* tests were done using a controlled sinusoidal stress that produced strains smaller than 150 micro-strain. This ensured, to the best possible degree, that the response of the material was linear across the temperatures used. The dynamic stress levels were 69 to 690 kPa for colder temperatures (-10 to 21.1 ℃) and 14 to 69 kPa for higher temperatures (37.8 to 54.4 ℃). All E* tests were conducted in a temperature-controlled chamber capable of holding temperatures from –16 to 60 ℃. Typical test specimens are shown in Figure 2.
A master curve was constructed at a reference temperature of 21.1 ℃ using the principle of time-temperature superposition. Figure 3 shows the average E* master curves for both mixtures. The figure can be used for general comparison of the mixtures, but specific temperature-frequency combination values need to be evaluated separately. That is, one can not compare direct values on the vertical axis for a specific log reduced time values. As observed from the figure, the reference gap graded mixture shows higher moduli values at lower temperatures (-10 and 4.4 ℃) while the trend is reversed with further increase in temperature from 21.1 to 54.4 ℃. Lower moduli at cold temperatures are desirable for better
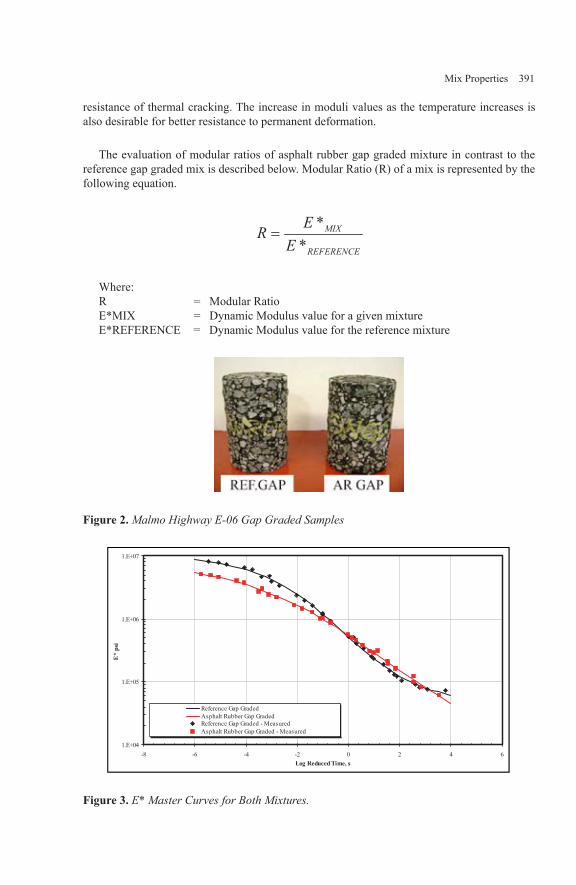
Mix Properties 391
resistance of thermal cracking. The increase in moduli values as the temperature increases is also desirable for better resistance to permanent deformation.
The evaluation of modular ratios of asphalt rubber gap graded mixture in contrast to the reference gap graded mix is described below. Modular Ratio (R) of a mix is represented by the following equation.
REFERENCE
MIX
EER
**
=
Where:R = Modular RatioE*MIX = Dynamic Modulus value for a given mixtureE*REFERENCE = Dynamic Modulus value for the reference mixture
Figure 2. Malmo Highway E-06 Gap Graded Samples
1.E+04
1.E+05
1.E+06
1.E+07
-8 -6 -4 -2 0 2 4 6Log Reduced Time, s
E*
psi
Reference Gap GradedAsphalt Rubber Gap GradedReference Gap Graded - MeasuredAsphalt Rubber Gap Graded - Measured
Figure 3. E* Master Curves for Both Mixtures.
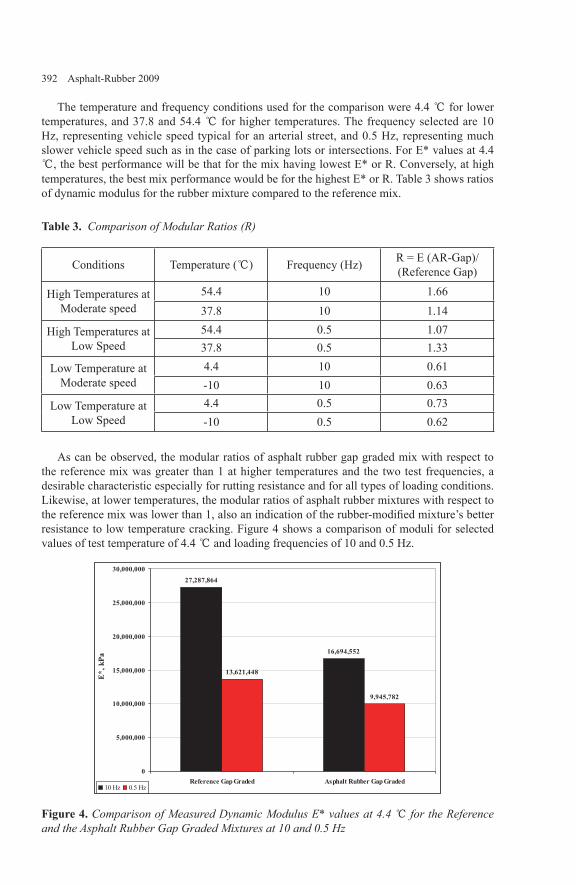
392 Asphalt-Rubber 2009
The temperature and frequency conditions used for the comparison were 4.4 ℃ for lower temperatures, and 37.8 and 54.4 ℃ for higher temperatures. The frequency selected are 10 Hz, representing vehicle speed typical for an arterial street, and 0.5 Hz, representing much slower vehicle speed such as in the case of parking lots or intersections. For E* values at 4.4 ℃, the best performance will be that for the mix having lowest E* or R. Conversely, at high temperatures, the best mix performance would be for the highest E* or R. Table 3 shows ratios of dynamic modulus for the rubber mixture compared to the reference mix.
Table 3. Comparison of Modular Ratios (R)
Conditions Temperature (℃) Frequency (Hz) R = E (AR-Gap)/(Reference Gap)
High Temperatures at Moderate speed
54.4 10 1.6637.8 10 1.14
High Temperatures at Low Speed
54.4 0.5 1.0737.8 0.5 1.33
Low Temperature at Moderate speed
4.4 10 0.61-10 10 0.63
Low Temperature at Low Speed
4.4 0.5 0.73-10 0.5 0.62
As can be observed, the modular ratios of asphalt rubber gap graded mix with respect to the reference mix was greater than 1 at higher temperatures and the two test frequencies, a desirable characteristic especially for rutting resistance and for all types of loading conditions. Likewise, at lower temperatures, the modular ratios of asphalt rubber mixtures with respect to the reference mix was lower than 1, also an indication of the rubber-modified mixture’s better resistance to low temperature cracking. Figure 4 shows a comparison of moduli for selected values of test temperature of 4.4 ℃ and loading frequencies of 10 and 0.5 Hz.
27,287,864
16,694,552
13,621,448
9,945,782
0
5,000,000
10,000,000
15,000,000
20,000,000
25,000,000
30,000,000
dedarGpaGrebbuRtlahpsAdedarGpaGecnerefeR
E*,
kPa
10 Hz 0.5 Hz
Figure 4. Comparison of Measured Dynamic Modulus E* values at 4.4 ℃ for the Reference and the Asphalt Rubber Gap Graded Mixtures at 10 and 0.5 Hz

Mix Properties 393
5. Repeated Load Permanent Deformation Test
The repeated load or Flow Number (FN) test is a dynamic creep test used to determine the permanent deformation characteristics of paving materials. It has been thoroughly documented in the NCHRP Report 465 study (NCHRP 465, 2002). In this test, a repeated dynamic load is applied for several thousand repetitions, and the cumulative permanent deformation, including the beginning of the tertiary stage (defined as FN) as a function of the number of loading cycles over the test period is recorded. Tests are carried out on cylindrical specimens, 100 mm in diameter and 150 mm in height. A haversine pulse load of 0.1 sec and 0.9 sec dwell (rest time) is applied.
The samples that were used for E* Dynamic Modulus test evaluation were used to run repeated load permanent deformation tests as there was limited amount of mixture available for testing. Repeated load tests were conducted using three replicate test specimens for both reference gap graded and asphalt rubber gap graded mixtures. Figure 5 shows a photograph of an actual specimen set-up for unconfined test.
Figure 5. Vertical and Radial LVDTs Set Up for an Unconfined Flow Number Test
The results for the repeated load unconfined tests for the Reference-Gap and asphalt rubber- Gap graded mixtures are presented in Table 4. The table contains final average values used for the analysis and comparison of the two mixtures. Also, the table includes the flow number, percent of axial strain at failure (Flow), and the permanent deformation parameters (a–intercept and b-slope). The results show that AR-Gap graded mixtures had higher flow number values with an average FN of 4,959 cycles than the Reference-Gap graded mixtures whose average FN was 911 cycles. This ratio of 5.5 suggests that the AR-Gap graded mixture will be less susceptible to permanent deformation.

394 Asphalt-Rubber 2009
Table 4. Master Summary of Repeated Load Test Results, Swedish Malmo E-06 Mixtures
Mix σ3 (kPa) σd (kPa)
Axial Flow Number (Cycles)
Axial Strain
(%)
Intercept a (1/MPa) Slope b
Reference Gap
graded
0 1034 1,396 1.61 0.0184 0.61440 1034 906 1.89 0.0257 0.63010 1034 431 2.31 0.0325 0.7000
Average 911 1.94 0.0255 0.6482
AR Gap graded
0 1034 2,566 1.13 0.0098 0.60440 1034 4,836 1.09 0.0042 0.65490 1034 7,476 1.54 0.0029 0.7014
Average 4,959 1.26 0.0056 0.6536
6. Fatigue Cracking Test
The most common model form used to predict the number of load repetitions to fatigue cracking is a function of the tensile strain and mix stiffness (modulus) as follows (SHRP-A-404).
32 kk
t1f E
11KN
ε
= 32 kkt1 )E()(K −−ε=
Where: Nf = number of repetitions to fatigue cracking εt = tensile strain at the critical location E = stiffness of the material K1, K2, K3 = laboratory calibration parameters
Flexural fatigue tests were conducted according to the AASHTO T321and SHRP M-009 (AASHTO T321-03; SHRP M-009). The flexural fatigue test has been used by various researchers to evaluate the fatigue performance of pavements (Witczak et al, 2001; Harvey and Monismith, 1993; Tayebali et al, 1995). Figure 6 shows the flexural fatigue apparatus. The device is typically placed inside an environmental chamber to control the temperature during the test. The beams are saw-cut from compacted specimes to the required dimensions of 63.5 mm wide, 50.8 mm high, and 381 mm long.

Mix Properties 395
Figure 6. Flexural Fatigue Apparatus
As mentioned earlier, the air voids of the beams were 2.0% for both mixtures. Constant strain tests were performed at a range 175-425 µ strain, with a loading frequency of 10 Hz and test temperature of 21.1 ℃.
Initial flexural stiffness was measured at the 50th load cycle. Fatigue life or failure under control strain was defined as the number of cycles corresponding to a 50% reduction in the initial stiffness. The loading was also extended to reach a final stiffness of 30%. The control and acquisition software load and deformation data were reported at predefined cycles spaced at logarithmic intervals. Table 5 shows summary of regression coefficients for the fatigue relationships at 50% of initial stiffness. The relationships obtained were excellent in terms of models accuracy as indicated by the coefficient of determination (R2).
Table 5. Summary of Regression Coefficients for the Fatigue Relationships at 50% of Initial Stiffness, Swedish Mixtures, 21.1 ℃
Mix Type k1 k2 R2
Reference Gap Graded Mixture 0.0061 -0.2322 0.9948
AR Gap Graded Mixture 0.0024 -0.1389 0.9949
* Nf = k1 * (1/εt) k2
Fatigue relationships (flexural strain versus the number of loading cycles) for each mixture are shown in Figures 7 and 8. The figures show a very interesting trend and relationship between both mixtures. At high strain values, the fatigue life is higher for the Reference mix when compared to the AR mix. However, at lower strains, the AR mixture has higher fatigue life. Since the pavement sections are part of a highway, the expected fatigue life for the AR gap graded mixture is higher than the reference mix as the strain level conditions are anticipated to be lower (~80 km/h vehicle speed). If the same two mixtures are used on roads with lower design speeds (such as parking lots and intersections), it is anticipated that the reference mixture will provide higher fatigue life than the AR gap graded mixture.

396 Asphalt-Rubber 2009
Comparison of the Swedish Reference Gap and AR Gap Mixtures at ControlStrain and 21 oC and at 50% of Initial Stiffness
Swedish AR Gapy = 0.0024x-0.1389
R2 = 0.9949
Swedish Reference Gapy = 0.0061x-0.2322
R2 = 0.9948
1.E-04
1.E-03
1.E-02
1.E+02 1.E+03 1.E+04 1.E+05 1.E+06 1.E+07
Cycles to Failure
Stra
inL
evel
Figure 7. Comparison of Fatigue Relationships at 50% of Initial Stiffness
Comparison of the Swedish Reference Gap and AR Gap Mixtures at ControlStrain and 21 oC and at 30% of Initial Stiffness
Swedish AR Gapy = 0.0033x-0.1551
R2 = 0.9507
Swedish Reference Gapy = 0.0145x-0.2861
R2 = 1
1.E-04
1.E-03
1.E-02
1.E+02 1.E+03 1.E+04 1.E+05 1.E+06 1.E+07
Cycles to Failure
Stra
inL
evel
Figure 8. Comparison of Fatigue Relationships at 30% of Initial Stiffness
7. Crack Propagation C* Integral Test
The concept of fracture mechanics was introduced to asphalt concrete by Majidzadeh (Majidzadeh, 1976). Abdulshafi O. applied the energy (C*-Line Integral) approach to predicting the pavement fatigue life using the crack initiation, crack propagation, and failure (Abdulshafi, O. 1983). Abdulshafi, A. and Kaloush used notched disk specimens to apply

Mix Properties 397
J-integral concept to the fracture and fatigue of asphalt pavements (Abdulshafi and Kaloush, 1988). The relation between the J-integral and the C* parameters is a method for measuring it experimentally. J is an energy rate and C* is an energy rate or power integral. An energy rate interpretation of J has been discussed by Rice; and Begley and Landes (Rice, 1968; Begley and Landes). J can be interpreted as the energy difference between the two identically loaded bodies having incrementally differing crack lengths.
Where,U = Potential Energya = Crack Length
C* can be calculated in a similar manner using a power rate interpretation. Using this approach C* is the power difference between two identically loaded buddies having incrementally differing crack lengths.
C* can be calculated in a similar manner using a power rate interpretation. Using this approach C* is the power difference between two identically loaded buddies having incrementally differing crack lengths. Where U* is the power or energy rate defined for a load p and displacement u by:
The test samples were prepared according to the Test Protocol UMD 9808, “Method for Preparation of Triaxial Specimens” (TP UMD 9808, 1998). The specimens were reheated and compacted with a Servopac gyratory compactor into a 150-mm diameter gyratory mold to approximately 160-mm in height. Approximately 5-mm was sawed from each end of the compacted specimen, and 3 test specimens approximately 38-mm thick were cut from each compacted specimen.
A right-angle wedge was cut into the specimens to accommodate the loading device. An IPC Universal Testing Machine (UTM 25) electro- pneumatic system was used to load the specimens. The machine is equipped to apply 25 kN maximum vertical load. The test setup is shown in Figure 9. All tests were conducted at temperature of 21℃.
The experimental testing involves collecting the data as load and crack length versus time for a constant displacement rate. The displacement rates used were 0.38, 0.51, 0.64, 0.76, and 0.89 mm/min for both the reference and asphalt rubber gap graded mixtures. This information is used to determine load as a function of displacement rate for various crack lengths, and crack growth rate versus crack length. The power of energy rate input, U*, is measured as

398 Asphalt-Rubber 2009
the area under the load displacement rate curve. The energy rate, U*, is then plotted versus crack length for different displacement rates and the slopes of these curves constitute the C*-integral. The C*-integral is plotted as a function of the displacement rate. Finally, the crack growth rate is plotted as a function of C* integral.
Figure 9. Typical C* Test Setup
Figure 10 shows relationships between crack growth rates and C* values for the two mixtures. It is observed that the asphalt rubber gap graded mix has about 4 times higher slope value when compared to the reference gap graded mixture. This is an indication that the asphalt rubber gap graded mix has higher resistance to crack propagation. It is also indicative that more energy is required for the asphalt rubber mix to develop full depth cracks compared to the reference mix.
y = 0.4643x + 0.0628R2 = 0.7261
y = 1.8567x - 0.2541R2 = 0.653
0.00
0.01
0.02
0.03
0.04
0.05
0.06
0.07
0.00 2.00 4.00 6.00 8.00 10.00 12.00
Crack Growth Rate, a* (mm/min)
C*,
(N*m
m/m
m2 *m
in)
Conventional GAP Rubber GAP
Figure 15. Crack Growth Rate versus C* Values For Reference and Rubber Gap Mixes

Mix Properties 399
9. Conclusions
The material characterization tests results in this study showed that the AR-Gap provided improved mixture’s performance over the Reference-Gap graded mixture in several unique ways. The dynamic modulus tests indicated that the asphalt rubber gap graded mix would provide better resistance to low temperature cracking (softer modulus at lower temperatures) and to permanent deformation (stiffer modulus at higher temperatures). The flow number test showed that the AR-Gap graded mixture is five times better in resisting permanent deformation. In fatigue, at lower stain values, the fatigue life was higher for the asphalt rubber gap graded mixture; while at higher strain values the fatigue life was higher for the reference gap graded mixture. Since the pavement sections are part of a highway, the expected fatigue life for the AR gap graded mixture is good. The C* Integral tests revealed that the asphalt rubber gap graded mix had about 4 times higher resistance to crack propagation.
Bibliography
AASHTO Designation: T321-03. Determining the Fatigue Life of Compacted Hot-Mix Asphalt(HMA) Subjected to Repeated Flexural Bending.
Abdulshafi, A. and K.E. Kaloush. “Modifiers for Asphalt Concrete.” ESL-TR-88-29, Air ForceEngineering and Services Center, Tyndall Air Force Base, Florida, 1988.
Abdulshafi, O., “Rational Material Characterization of Asphaltic Concrete Pavements,” Ph.D.Dissertation, the Ohio State University, Columbus, OH, 1983.
Begley, J. W. and Landes, J. D., Fracture Toughness, Processing of the 1971 National Symposiumon Fracture Mechanics. Part II, ASTM STP 514, American Society for Testing Materials pp. 1-20., 1972.
Biligiri, K. P. (2008) Asphalt Mixtures’ Properties Indicative of Tire / Pavement Noise, Ph.D.Dissertation, Department of Civil and Environmental Engineering, Arizona State University, December 2008.
Harvey, J., and Monismith, C.L., Effect of Laboratory Asphalt Concrete specimen PreparationVariables on Fatigue and Permanent Deformation Test Results Using Strategic Highway Research Program A-003A Proposed Testing Equipment. Record 1417, Transportation Research Board, Washington, D.C., 1993.
Kamil E. Kaloush, Krishna P. Biligiri, Waleed A. Zeiada, Maria C. Rodezno and Mena I. Souliman, “Laboratory Pavement Performance Evaluation of Swedish Gap Graded Asphalt Concrete Mixtures – Malmo E-06 Highway”, Final Report Submitted to Swedish Road Administration, Vägverket, 405 33 Göteborg, Kruthusgatan 17, Sweden, September 2008.
Majidzadeh, K., “Application of Fracture Mechanics for Improved Design of Bituminous Concrete,” Volumes 1 and 2, Report FHWA-RD-76-91, Federal Highway Administration, Washington, D.C., 1976.

400 Asphalt-Rubber 2009
Method for Preparation of Triaxial Specimens (Test Protocol UMD 9808), “Superpave ModelsTeam Inter-Laboratory Testing Manual” University of Maryland, College Park, MD, 1998.
Rice. J. R., Journal of Applied Mechanics, American Society of Mechanical Engineers, Volume 35, pp. 379-386., 1968.
SHRP-A-404. Fatigue Response of Asphalt-Aggregate Mixes. Asphalt Research Program, InstituteOf Transportation Studies, University Of California, Berkeley, Strategic Highway Research Program, National Research Council, Washington, D.C., 1994.
SHRP Designation: M-009. Standard Method of Test for Determining the Fatigue Life of Compacted Bituminous Mixtures Subjected to Repeated Flexural Bending.
Tayebali, A. A., Deacon, J. A., and Monismith, C. L., Development and Evaluation of SurrogateFatigue Models for SHRP, A-003A Abridged Mix Design Procedure, Journal of the Association of Asphalt Paving Technologists Vol. 64, 1995, pp. 340-366.
Witczak, M.W., Mamlouk, M., and Abojaradeh, M. Flexural Fatigue Tests, NCHRP 9-19, SubtaskF6 Evaluation Tests, Task F Advanced Mixture Characterization. Interim Report, Arizona State University, Tempe, Arizona, July 2001.
Witczak, M. W., Kaloush, K. E., Pellinen, T., El-Basyouny, M., & Von Quintus, H. Simple Performance Test for Superpave Mix Design. NCHRP Report 465. Transportation Research Board, National Research Council. Washington D.C. 2002.
Mix Properties 401
Asphalt Rubber Mixtures Susceptibility to Moisture Damage
Kamil E. Kaloush* — Atish Nadkarni * — Waleed Zeiada * — Krishna P. Biligiri * — Paul Burch ** — Christ Dimitroplos **
* Arizona State UniversityDepartment of Civil and Environmental EngineeringPO Box 875306, Tempe, AZ 85287-5306, [email protected]@[email protected]@asu.edu
** Arizona Department of Transportation, Arizona, [email protected]@azdot.gov
ABSTRACT. The Arizona Department of Transportation (ADOT) has used Asphalt Rubber (AR) in hot mix asphalt since 1988. The primary purpose for using AR is to reduce reflective cracking in Hot Mix Asphalt (HMA) rehabilitation overlays. Currently, there are no standards or laboratory test data in Arizona to support the knowledge area on the susceptibility of asphalt rubber mixtures to moisture damage. The AASHTO T 283 is widely accepted as a test to predict moisture damage in asphalt concrete pavements.
This study was an investigation to identify whether the AASHTO T 283 Modified Lottman moisture susceptibility test can be successfully applied to assess moisture damage of the AR mixtures used in Arizona. The research scope of work included conducting laboratory testing program on AR and conventional HMA mixes using AASHTO T 283 to determine the indirect tensile strength and Tensile Strength Ration (TSR). The test results are discussed along with recommendations on modified test procedures and acceptance limits for Asphalt Rubber Gap and Open graded mixtures.
KEYWORDS: Asphalt Rubber, Hot Mix Asphalt, Moisture Susceptibility, Modified Lottman Test, Tensile Strength Ratio.
402 Asphalt-Rubber 2009
1. Introduction
The Arizona Department of Transportation (ADOT) has used Asphalt Rubber (AR) as a modified binder since the early 1970’s (Scofield, 1989). The primary purpose for using AR is to reduce reflective cracking in Hot Mix Asphalt (HMA) rehabilitation overlays (Sousa et al, 2001; Way, 1979). In addition, AR has been used to reduce maintenance, provide a smooth riding surface, and good skid resistance. AR mixes have also been recognized as means of reducing the tire/ pavement interface noise (Zhu et al, 1999).
The AR as tested in this study and used in Arizona is a mixture of approximately 20 percent ground tire rubber (crumb rubber) made from the recycling of used or defective tires. The ground tire rubber is added to hot paving grade asphalt at a high temperature and mixed with a high shear mixer. After the interaction the hot AR product has acquired unique elastomeric properties. The hot AR is then pumped into a conventional hot plant and mixed with aggregate and placed like a conventional HMA, except for a few significant differences.
These significant differences relate to the gradation of the mineral aggregate and the percent binder. The AR hot mix is generally either a gap graded, Asphalt Rubber Asphalt Concrete (ARAC) or open graded, Asphalt Rubber Friction Course (ARFC) mix. The ARAC mix contains about 7.0 percent AR binder and is placed generally as the final structural course 1.5 to 2 inches in thickness. The ARFC mix contains generally 9 percent binder and is placed as the final wearing course from 0.5 to 1.0 inch thick.
The American Association of State Highway and Transportation Officials (AASHTO) T 283 (Modified Lottman Test) is considered to be the most widely used to evaluate the stripping potential of asphalt mixtures. Tensile strength ratios (TSR) are used to measure the stripping potential of various asphalt mixtures. Kandhal, Parker and Gharaybeh evaluated several asphalt mixtures and reported that the minimum TSR should be 0.7 or 70% (Kandhal, 1992; Parker, 1989).
Lu and Harvey, 2005, developed a fatigue based procedure to evaluate moisture effects on mix performance, where binder content and air voids were the designated variables. They found that irrespective of the percentages of these two variables, repeated load test procedures are more sensitive, and therefore reliable, in predicting moisture damage in asphalt mixes. Solaimanian, et al used Simple Performance Tests (SPT) developed by NCHRP projects 9-19 and 9-29, along with the Environmental Conditioning System (ECS), to test moisture damage sensitivity of hot mix asphalt mixes (Solaimanian et al, 2006). The ASTM D4867 and the Hamburg wheel tracking device were also included as part of their testing program. Unconditioned and conditioned ECS specimens were evaluated using the dynamic modulus, flow number and flow time tests (Witczak et al, 2006). The results indicated that the dynamic modulus test was the most suited amongst the three SPT tests to provide possible improvement as a moisture sensitivity test candidate.
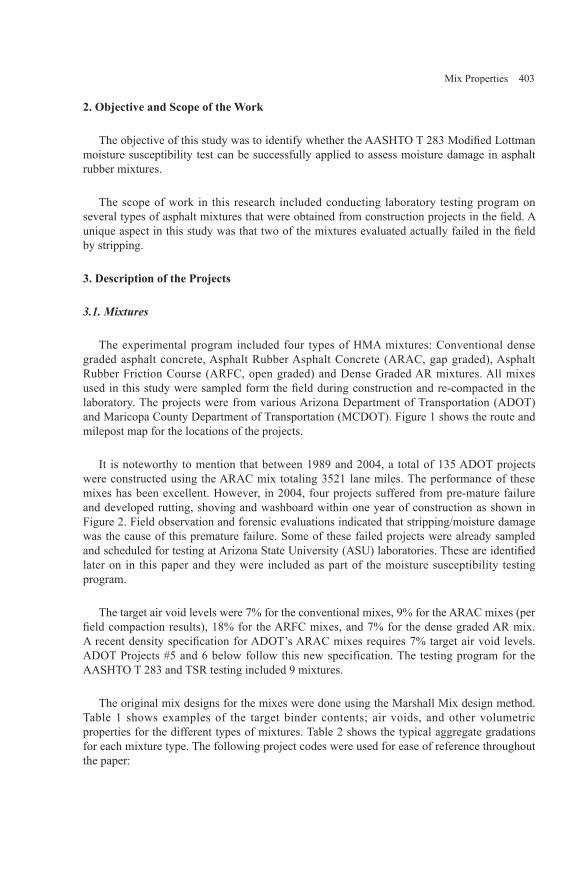
Mix Properties 403
2. Objective and Scope of the Work
The objective of this study was to identify whether the AASHTO T 283 Modified Lottman moisture susceptibility test can be successfully applied to assess moisture damage in asphalt rubber mixtures.
The scope of work in this research included conducting laboratory testing program on several types of asphalt mixtures that were obtained from construction projects in the field. A unique aspect in this study was that two of the mixtures evaluated actually failed in the field by stripping.
3. Description of the Projects
3.1. Mixtures
The experimental program included four types of HMA mixtures: Conventional dense graded asphalt concrete, Asphalt Rubber Asphalt Concrete (ARAC, gap graded), Asphalt Rubber Friction Course (ARFC, open graded) and Dense Graded AR mixtures. All mixes used in this study were sampled form the field during construction and re-compacted in the laboratory. The projects were from various Arizona Department of Transportation (ADOT) and Maricopa County Department of Transportation (MCDOT). Figure 1 shows the route and milepost map for the locations of the projects.
It is noteworthy to mention that between 1989 and 2004, a total of 135 ADOT projects were constructed using the ARAC mix totaling 3521 lane miles. The performance of these mixes has been excellent. However, in 2004, four projects suffered from pre-mature failure and developed rutting, shoving and washboard within one year of construction as shown in Figure 2. Field observation and forensic evaluations indicated that stripping/moisture damage was the cause of this premature failure. Some of these failed projects were already sampled and scheduled for testing at Arizona State University (ASU) laboratories. These are identified later on in this paper and they were included as part of the moisture susceptibility testing program.
The target air void levels were 7% for the conventional mixes, 9% for the ARAC mixes (per field compaction results), 18% for the ARFC mixes, and 7% for the dense graded AR mix. A recent density specification for ADOT’s ARAC mixes requires 7% target air void levels. ADOT Projects #5 and 6 below follow this new specification. The testing program for the AASHTO T 283 and TSR testing included 9 mixtures.
The original mix designs for the mixes were done using the Marshall Mix design method. Table 1 shows examples of the target binder contents; air voids, and other volumetric properties for the different types of mixtures. Table 2 shows the typical aggregate gradations for each mixture type. The following project codes were used for ease of reference throughout the paper:
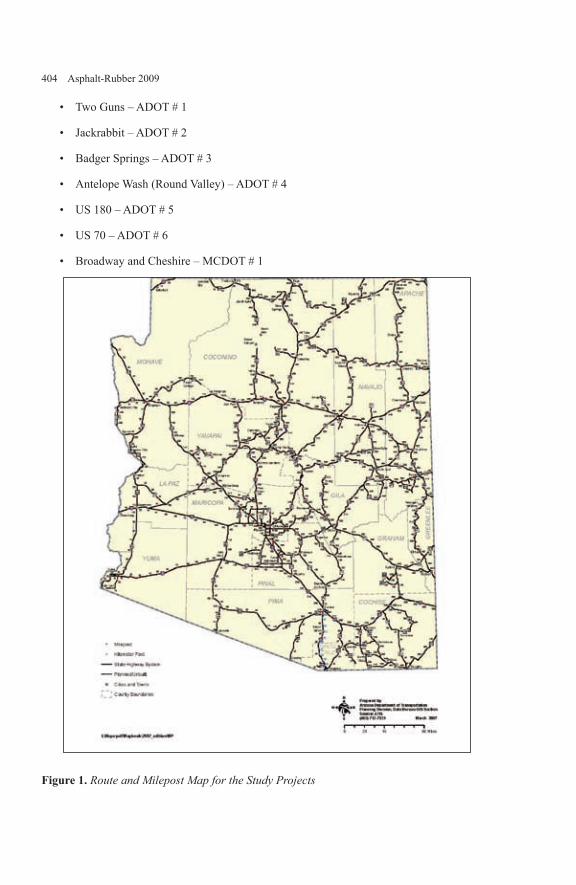
404 Asphalt-Rubber 2009
Two Guns – ADOT # 1
Jackrabbit – ADOT # 2
Badger Springs – ADOT # 3
Antelope Wash (Round Valley) – ADOT # 4
US 180 – ADOT # 5
US 70 – ADOT # 6
Broadway and Cheshire – MCDOT # 1
Figure 1. Route and Milepost Map for the Study Projects
•
•
•
•
•
•
•

Mix Properties 405
Figure 2. An Example of Failed Project (I-40 West Bound ADOT #3, June 2005)
3.2. Specimens Preparation
The laboratory specimens were compacted with a “Servopac Gyratory Compactor” into approximately a 6-inch (150 mm) diameter gyratory mold. One 4-inch (100 mm) diameter sample was cored from each gyratory plug. The sample ends were sawn to arrive at typical test specimens of 4-inch (100 mm) in diameter and 6-inch (150 mm) in height. These are typical sample dimensions used for the simple performance testing. The 6-inch cylinders were sawed in half to arrive at 4-inch diameter and 3-inch thick specimens. Air voids, thickness and bulk specific gravities were measured for each test specimen and the samples were stored in plastic bags in preparation for the testing program.
Table 1. Mixture Properties of the Test Sections
Project Mix TypeBinder Mix Design Data
Binder Type Design AC (%)
Target Va (%)
ADOT # 1ARAC Gap Graded PG 58-22 AR 7.0 9
AR-ACFC Open Graded PG 58-22 AR 9.4 18Conventional PG 64-22 4.6 7
ADOT # 2ARAC Gap Graded PG 58-22 AR 7.3 9
AR-ACFC Open Graded PG 58-22 AR 9.3 18Conventional PG 64-22 4.8 7
ADOT # 3ARAC Gap Graded PG 58-22 AR 7.8 9
AR-ACFC Open Graded PG 58-22 AR 9.0 18Conventional PG 64-22 5.2 7
ADOT # 4 AR-ACFC Open Graded PG 58-22 AR 9.2 18ADOT # 5 ARAC Gap Graded PG 58-22 AR 8.4 7ADOT # 6 ARAC Gap Graded PG 58-22 AR 9.4 7

406 Asphalt-Rubber 2009
Table 2. Typical Mix Gradation of Conventional, ARAC and AR-ACFC Mixtures
Binder Gradation ARAC AR-ACFC Conventional
Gradation (% Passing)
1 ½ 100.0 100.0 100.01 100.0 100.0 100.0¾ 100.0 100.0 100.0½ 82.3 100.0 80.7
3/8 76.0 100.0 68.0¼ 49.3 66.3 52.3
No. 4 36.7 35.3 42.7No. 8 20.0 5.7 27.0No. 10 17.7 5.0 25.0No. 16 11.7 3.7 18.7No. 30 7.0 2.0 13.0No. 40 5.0 1.3 10.7No. 50 4.0 1.3 8.0No. 100 2.3 0.7 4.7No. 200 1.4 0.9 3.4
4. Testing
4.1. AASHTO T 283
As per the standard test procedure AASHTO T 283, the bulk specific gravity and the air voids of the specimen were determined (Lottman, 1971). Because of the type of gradation for the ARAC (gap graded) and the ARFC (open graded) mixtures, the CoreLok device was used since these mixes contains a higher percentage of air voids. The use of the Surface Saturated Dry (SSD) test method per AASHTO T 166 is not possible for these mixtures.
Furthermore, the test procedure requires bare specimens to be placed in water bath at 60℃ for 24 hrs (during the thaw cycle). For the gap and open graded asphalt rubber mixtures, there was a concern that the samples may deform because of their mix types (gap and open graded). To ensure that any damage established in the specimen was only due to moisture damage and not because of sample deforming, all specimens were wrapped by thin steel wire gauze to prevent any such possibility (Figure 3). An IPC UTM 100 testing machine was used for tensile strength testing and the maximum load was recorded. The tensile strength of dry or wet specimens was obtained by averaging the tensile strengths of three replicates.
Tensile strength ratios (TSR) were determined. TSR is defined as the ratio of the original strength that is retained after subjecting the samples to freeze-thaw cycle. It is the ratio of the average tensile strength of conditioned samples to that of the dry ones.

Mix Properties 407
4.2. Modifications to AASHTO T 283 Test Protocol
The Modified Lottman Test (AASHTO T 283) was slightly modified in this study as described below (Lottman, 1971).
The specimens were divided into dry and wet subsets as per the protocol. The dry subset was stored at room temperature and then tested. The practice of wrapping the specimens in a leak proof, heavy duty plastic bag and placing in a 25 ℃ (77 °F) water bath for a minimum of 2 hours was eliminated.
The specimens of the wet subset were wrapped tightly with thin steel wire mesh. The tightening was done so as to apply enough pressure to keep the samples from deforming. This was particularly necessary for ARAC and ARFC mixes because without this confinement, the mixes tended to deform.
The protocol of compacting specimens to 7% air voids was not followed. One of the goals of the study was to compact laboratory specimens to an air void level that corresponded with the field densities and compaction.
Figure 3. Sample Wrapped with Thin Steel Wire Mesh
5. Test Results and Analysis
5.1. AASHTO T 283 Test Results for Conventional Mixes
Table 3 below shows the test results for the conventional mixes. It is observed that the average dry tensile strength values ranged from 152 to 366 psi. The average wet tensile strengths ranged from 107 to 232 psi. The dry as well as wet strengths of ADOT # 3 were the lowest and those of ADOT # 2 were the highest. Overall, the tensile strengths after moisture conditioning (wet specimens) were lower than tensile strength before moisture conditioning (dry specimens).
a)
b)
c)
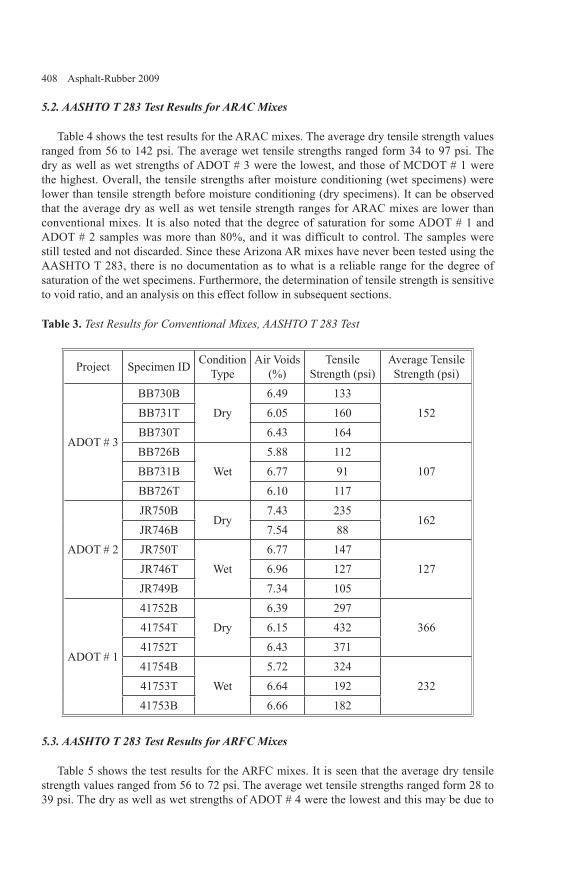
408 Asphalt-Rubber 2009
5.2. AASHTO T 283 Test Results for ARAC Mixes
Table 4 shows the test results for the ARAC mixes. The average dry tensile strength values ranged from 56 to 142 psi. The average wet tensile strengths ranged form 34 to 97 psi. The dry as well as wet strengths of ADOT # 3 were the lowest, and those of MCDOT # 1 were the highest. Overall, the tensile strengths after moisture conditioning (wet specimens) were lower than tensile strength before moisture conditioning (dry specimens). It can be observed that the average dry as well as wet tensile strength ranges for ARAC mixes are lower than conventional mixes. It is also noted that the degree of saturation for some ADOT # 1 and ADOT # 2 samples was more than 80%, and it was difficult to control. The samples were still tested and not discarded. Since these Arizona AR mixes have never been tested using the AASHTO T 283, there is no documentation as to what is a reliable range for the degree of saturation of the wet specimens. Furthermore, the determination of tensile strength is sensitive to void ratio, and an analysis on this effect follow in subsequent sections.
Table 3. Test Results for Conventional Mixes, AASHTO T 283 Test
Project Specimen ID Condition Type
Air Voids (%)
Tensile Strength (psi)
Average Tensile Strength (psi)
ADOT # 3
BB730BDry
6.49 133152BB731T 6.05 160
BB730T 6.43 164BB726B
Wet5.88 112
107BB731B 6.77 91BB726T 6.10 117
ADOT # 2
JR750BDry
7.43 235162
JR746B 7.54 88JR750T
Wet6.77 147
127JR746T 6.96 127JR749B 7.34 105
ADOT # 1
41752BDry
6.39 29736641754T 6.15 432
41752T 6.43 37141754B
Wet5.72 324
23241753T 6.64 19241753B 6.66 182
5.3. AASHTO T 283 Test Results for ARFC Mixes
Table 5 shows the test results for the ARFC mixes. It is seen that the average dry tensile strength values ranged from 56 to 72 psi. The average wet tensile strengths ranged form 28 to 39 psi. The dry as well as wet strengths of ADOT # 4 were the lowest and this may be due to

Mix Properties 409
the higher average air voids for theses samples. For ADOT # 1, the dry and the wet strengths values were the highest. Overall, as in the case of conventional and ARAC mixes, the tensile strengths after moisture conditioning (wet specimens) were lower than the tensile strength before moisture conditioning (dry specimens). Moreover, it can also be seen that the average dry as well as wet tensile strength ranges for the ARFC mixes are lower than conventional mixes. The degrees of saturation of most specimens were less than 55%. As mentioned before, AR mixes, and specifically the ARFC mix, have not been documented for AASHTO T 283 testing and hence, the samples were not discarded. Methods for determining accurate degree of saturation for open graded mixes have not been established, and quite frankly will be very difficult to do. The open graded nature of the mix will always tend to show that the degree of saturation is on the lower side due to quick escape of moisture after the conditioning and during the measurement process.
Table 4. Test Results for ARAC Mixes, AASHTO T 283 Test
Project Specimen ID
Condition Type
Air Voids (%)
Tensile Strength (psi)
Average Tensile Strength (psi)
ADOT # 3
BB350BDry
10.74 5156BB351T 9.59 51
BB349T 9.02 67BB351B
Wet8.68 37
34BB349B 10.34 35BB350T 10.18 28
ADOT # 2
JR342BDry
7.21 144121JR343T 7.68 136
JR340T 14.33 84JR342T
Wet9.05 59
57JR343B 7.31 78JR340B 12.98 36
ADOT # 1
41315BDry
8.90 235941339T 7.44 34
41344B 7.04 12041315T
Wet9.28 15
3841339B 6.78 2541344T 7.30 75
MCDOT # 1
BR305TDry
9.30 109142BR306B 6.18 162
BR306T 7.77 154BR3T1B
Wet7.24 96
96BR3T1T 8.26 104BR305B 7.77 87

410 Asphalt-Rubber 2009
Project Specimen ID
Condition Type
Air Voids (%)
Tensile Strength (psi)
Average Tensile Strength (psi)
ADOT # 6
7P507TDry
7.02 1091147P508B 7.11 122
7P508T 7.09 1107P507B
Wet7.02 104
1007P509T 7.11 907P509B 7.09 106
ADOT # 5
18501 T
Dry
7.19 151
16318502 T 7.03 16418503 T 7.09 16018504 B 6.91 17718501 B
Wet
7.08 146
14918502 B 7.28 15518503 B 7.04 15218504 T 7.03 141
Table 5. Test Results for ARFC Mixes, AASHTO T 283 Test
Project Specimen ID Condition Type
Air Voids (%)
Tensile Strength (psi)
Average Tensile Strength (psi)
ADOT # 4
AW4T1B
Dry
22.22 41
56AW431T 19.24 57
AW437B 18.39 70
AW4T1T
Wet
21.43 23
28AW431B 18.55 28
AW437T 18.82 33
ADOT # 1
41455B
Dry
17.99 63
7241456B 16.96 72
41457B 16.00 82
41455T
Wet
17.48 34
3941456T 17.42 42
41457T 16.00 40
5.4. Effect of Air Voids Variations on Tensile Strength
As mentioned earlier, the protocol of compacting specimens to 7% air voids was not followed in this study. One objective was to compact laboratory specimens to an air void level

Mix Properties 411
that corresponded with the fi eld densities, so a comparison to the fi led performance can be made. Figures 4 through 6 show the effect of the laboratory samples air void variations on the dry and wet tensile strength. As anticipated, the tensile strength decreases with an increase of specimen air voids. It is also noted that the test AASHTO T 283 procedure specifi es grouping specimens so that the average air voids of the dry and wet groups are approximately the same. Since this process was followed in this study for the ARAC and ARFC mix groups, it appears that the trends in Figure 6 are credible, and the variation of the air voids within each mix group did not have an infl uence on the rationality of the trends.
Figure 4. Dry Tensile Strength Versus Specimens Air Voids.
Figure 5. Wet Tensile Strength Versus Specimens Air Voids.
Figure 5. Tensile Strength Trends Versus Specimens Air Voids.

412 Asphalt-Rubber 2009
5.5. Tensile Strength Ratio (TSR)
Table 6 shows the TSR values for all the mixes analyzed. The TSR values for conventional mixes ranged from a high of 78% for ADOT # 2 to a low of 63% for ADOT # 1. The average TSR was 71%.
The TSR values for ARAC mixes ranged from a high of 91% for ADOT # 5 to a low of 47% for ADOT # 2. The low TSR results for two of the ARAC mixes agrees with field performance records. Both of the ADOT # 3 and ADOT # 2 projects failed in the field by stripping (see Table 7). ADOT Project numbers 5 and 6 have the highest TSR values. These two projects were designed according to the new ARAC specifications with a density requirement (7% air voids). This new specification definitely enhances the performance of the ARAC mixes against moisture damage. ADOT project number 1 has a TSR value of 65% and it performed well in the field with in situ air voids at 9%.
Overall, the TSR values for the ARFC mixes were lower (~50%) than those for conventional and ARAC mixes. However, none of the ARFC mixes (thousands of miles paved in Arizona) show any signs of stripping. One possible explanation of the low TSR values could be the fact that the air voids for these mixes are high, and because of this, the flow of moisture in the specimen during vacuum saturation is too high. Subsequent wrapping of the specimen with a saran wrap does not allow the water to come out of the specimen, whereas in the field, the flow of moisture is followed by quick drainage due to open gradation of the ARFC mixes. In addition, preserving the geometry of the test specimens during the conditioning process is difficult, despite that the samples were wrapped with steel wire mesh to minimize disturbance due to handling. Therefore, it is hypothesized that some damage may be attributed to inadequate sample confinement and handling during the conditioning process. These TSR values for the open graded mixtures should be looked at from a consistency point of view and not as threshold pass/fail values.
Table 6. Tensile Strength Ratio (TSR) for each Mix Type
ProjectsTSR (%) for each mix
CONV ARAC ARFC
ADOT # 3 69.95 59.56 -
ADOT # 2 78.41 47.21 -
ADOT # 1 63.41 64.71 53.58
MCDOT # 1 - 67.53 -
ADOT # 4 - - 49.97
ADOT # 5 - 91.03 -
ADOT # 6 - 87.93 -

Mix Properties 413
Table 7. TSR Values for ARAC Passed and ARAC Failed Projects
Field Performance Project Average TSR
Passed
ADOT # 1 64.7
MCDOT # 1 67.5
ADOT # 5 91.0
ADOT # 6 87.9
FailedADOT # 3 59.6
ADOT # 2 47.2
Based on the analysis of TSR values obtained for mixtures in this study, Table 8 shows the TSR values that can be used as threshold criteria (pass criteria) according to the mixture type. Due to the limited number of tests and projects, this should be looked at as tentative judgment criteria. In addition, it is noted that this criteria is based on the use of steel wire mesh as a confining media for the ARAC and ARFC mixes during the conditioning process.
Table 8. Threshold TSR Criteria for All Mixes
Type of Mix Pass Criteria
CONV ≥ 70 %
ARAC (Old Spec.)* ≥ 65 %
ARAC (New Spec.)** ≥ 70 %
ARFC ≥ 50 %
*Old Spec. – ADOT ARAC 413 mix** New Spec. – ADOT ARAC 415 mix
6. Conclusions
At present, there is no standard procedure or laboratory test data in Arizona to support the knowledge area on the susceptibility of asphalt rubber mixtures to moisture damage. The objective of this study was to identify whether the evaluation of the American Association of State Highway and Transportation Officials (AASHTO) T 283 Modified Lottman moisture susceptibility test can be successfully applied to assess moisture damage.
The results in this study supported that the test procedure could be utilized for moisture damage assessment. However, a modification on how the gap and open graded mixtures should be handled during the conditioning process was recommended. A steel wire mesh should be wrapped around the specimens during the condition process. The mesh will provide the necessary confinement to minimize any damage that may be introduced to the specimens during the handling process. This will also insure that the damage introduced in the laboratory specimens is mainly due to moisture conditioning.

414 Asphalt-Rubber 2009
Based on the test results, the TSR values obtained for the ARAC mixtures supported the observed field performance in the field. ARAC mixtures conforming to 7% air void density specification should have no problem meeting the 70% minimum TSR criteria. Again, this is provided that the samples are confined during the conditioning process.
Because of the high air voids content of the ARFC mixes, and their greater sensitivity to damage during their handling process, a TSR value of 50 % was found to be adequate at this time.
Bibliography
Kandhal, P. S. (1992) Moisture susceptibility of HMA mixes: Identification of Problem and Recommended Solutions, NCAT Report No. 92-1, National Centre for Asphalt Technology, Auburn University, Auburn.
Lottman, R. P. (1971) The Moisture Mechanism that Causes Asphalt Stripping in Asphalt Pavement Mixtures, Final Report Research Project R-47, University of Idaho, Moscow, Idaho.
Lu, Q., Harvey, J. T. (2005) Influence of Air-void and Binder contents on Moisture Sensitivity of Hot mix asphalt in Flexural Beam Fatigue test, University of California Pavement Research Center, Davis, California, USA.
Nadkarni, A. A. (2008) Moisture Susceptibility of Asphalt Rubber Mixtures, M.S. Thesis, Department of Civil and Environmental Engineering, Arizona State University, Tempe, AZ, 85287, USA.
Parker, F. (1989) Field Study of Stripping Potential of Asphalt Concrete Mixtures, Report ST 2019-6, Alabama Highway Department.
Scofield, L.A. (1989) History, Development, and Performance of Asphalt Rubber at ADOT,Report Number AZ-SP-8902.
Solaimanian, M., Fedor, D., Bonaquist, R., Soltani, A., Tandon, V. (2006) Simple Performance Test for Moisture Damage prediction in asphalt concrete, Journal of the Association of Asphalt Paving Technologists, Vol. 75, pp. 345-380.
Sousa, J.B., Pais, J.C., Saim, R., Way, G.B., Stubstad, R,N. (2001) Development of aMechanistic Overlay Design Method Based on Reflective Cracking Concepts, Rubber Pavements Association/ADOT.
Witczak, M. W., Kaloush, K. E., Pellinen, T., El-Basyouny, M., & Von Quintus, H. (2002) Simple Performance Test for Superpave Mix Design, NCHRP Report 465. Transportation Research Board. National Research Council. Washington D.C.
Zhu, H., Carlson, D.D. (1999) A Spray Based Crumb Rubber Technology In Highway NoiseReduction Application, Rubber Pavement Association.
Mix Properties 415
Testing Asphalt-rubber According to European Standards and its use in the Czech Republic
Jan Kudrna* — Ondřej Dašek*
* Brno University of Technology Faculty of Civil EngineeringVeveri 95, CZ-602 00 BrnoCzech [email protected]@fce.vutbr.cz
ABSTRACT. Various Asphalt-Rubber technologies have failed in Czech Republic during past decades. Currently the wet process A-R technology is being tested and yields more encouraging results under climate conditions of Central Europe. Recently laboratory tests performed according to European standards have proven the benefits of Asphalt-rubber binders and mixtures and their compliance with European production and control systems. The experience gained during the construction of test sections and the first years of A-R service promises noise reduction and increased road safety.
KEYWORDS: asphalt-rubber, European standards, laboratory tests, performance tests, test sections

416 Asphalt-Rubber 2009
1. Introduction
In the Czech Republic the technologies using rubber from scrap tyres have been tried at several occasions since 1950. Initially, the Asphalt-Rubber (A-R) was used in surface dressing. In late 80’s rubber modified bitumen in Asphalt Concrete and Mastic Asphalt was used. The dry technology of A-R production was introduced in the years 1998 – 2002. Nevertheless, all technologies were abandoned due to their low durability on some sections.
In 2006 a new research resulted in introduction of the wet-process A-R technology with rubber content of 15 % to 25 % in bitumen. The A-R mixtures were tested in laboratory according to European standards to describe the behaviour of the product under the Central European climate conditions. Some test sections were constructed and evaluated.
In the Czech Republic the summer temperatures of asphalt surface reach 60 ℃ and maximum air temperature is sometimes higher than 35 ℃ for the whole week. In winter there are usually several long periods with temperatures fluctuating around 0 ℃, salt is regularly used to prevent ice formation and for short periods the air temperatures can be lower than –25 ℃. Low temperature and ageing of paving grade bitumen cause lots of cracks in wearing courses. Typically, the modified bitumen and Stone Mastic Asphalt are used here to weather these conditions.
This article summarizes results of A-R tests and experience from test sections under such climate conditions.
2. Asphalt-rubber binder
Different types and gradings of crumb rubber, two grades of paving bitumens and different A-R binder compositions were tested.
2.1 Crumb rubber
Crumb rubbers produced by cracker mill and granulator processing were used. The recommended grading Type A and B from 1009 ASRM were respected and several particle size distributions in recommended limits were tested and used. It has been found that composition of 75 % of rubber granulate of grading 0/1 mm and of 25 % of the calendered rubber 1/2 mm offer good results for A-R production, and suits to crumb rubber producers. Calender creates rubber particles with high volume and surface area. (Thodesen et al., 2007)
The used type and grading of crumb rubber are presented in Table 1. The sieving of calendered particles is not sufficiently reliable, thus moving of penetration cup bottom with low pressure on 1 mm test sieve is to be used. Grading of mentioned rubber mixture is shown in column 7 of Table 1.
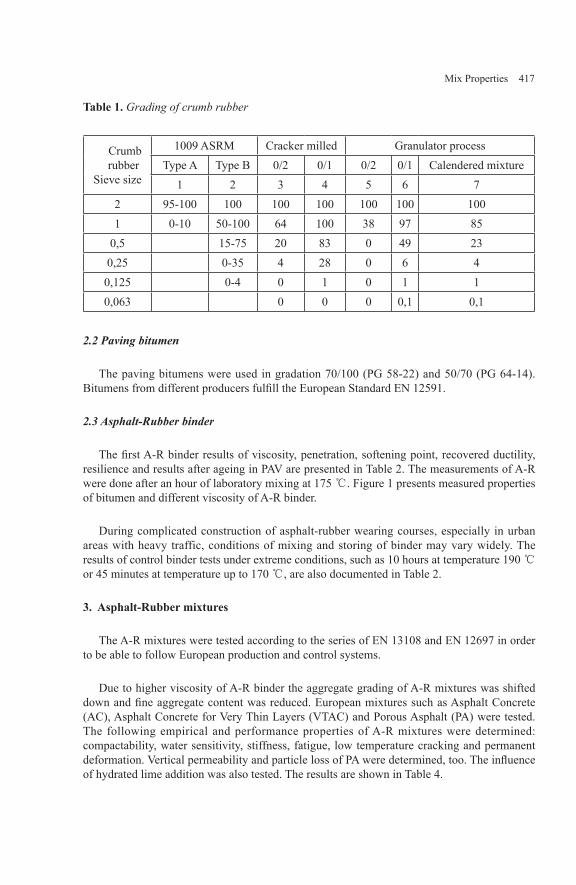
Mix Properties 417
Table 1. Grading of crumb rubber
Crumb rubberSieve size
1009 ASRM Cracker milled Granulator processType A Type B 0/2 0/1 0/2 0/1 Calendered mixture
1 2 3 4 5 6 72 95-100 100 100 100 100 100 1001 0-10 50-100 64 100 38 97 85
0,5 15-75 20 83 0 49 230,25 0-35 4 28 0 6 40,125 0-4 0 1 0 1 10,063 0 0 0 0,1 0,1
2.2 Paving bitumen
The paving bitumens were used in gradation 70/100 (PG 58-22) and 50/70 (PG 64-14). Bitumens from different producers fulfill the European Standard EN 12591.
2.3 Asphalt-Rubber binder
The first A-R binder results of viscosity, penetration, softening point, recovered ductility, resilience and results after ageing in PAV are presented in Table 2. The measurements of A-R were done after an hour of laboratory mixing at 175 ℃. Figure 1 presents measured properties of bitumen and different viscosity of A-R binder.
During complicated construction of asphalt-rubber wearing courses, especially in urban areas with heavy traffic, conditions of mixing and storing of binder may vary widely. The results of control binder tests under extreme conditions, such as 10 hours at temperature 190 ℃ or 45 minutes at temperature up to 170 ℃, are also documented in Table 2.
3. Asphalt-Rubber mixtures
The A-R mixtures were tested according to the series of EN 13108 and EN 12697 in order to be able to follow European production and control systems.
Due to higher viscosity of A-R binder the aggregate grading of A-R mixtures was shifted down and fine aggregate content was reduced. European mixtures such as Asphalt Concrete (AC), Asphalt Concrete for Very Thin Layers (VTAC) and Porous Asphalt (PA) were tested. The following empirical and performance properties of A-R mixtures were determined: compactability, water sensitivity, stiffness, fatigue, low temperature cracking and permanent deformation. Vertical permeability and particle loss of PA were determined, too. The influence of hydrated lime addition was also tested. The results are shown in Table 4.
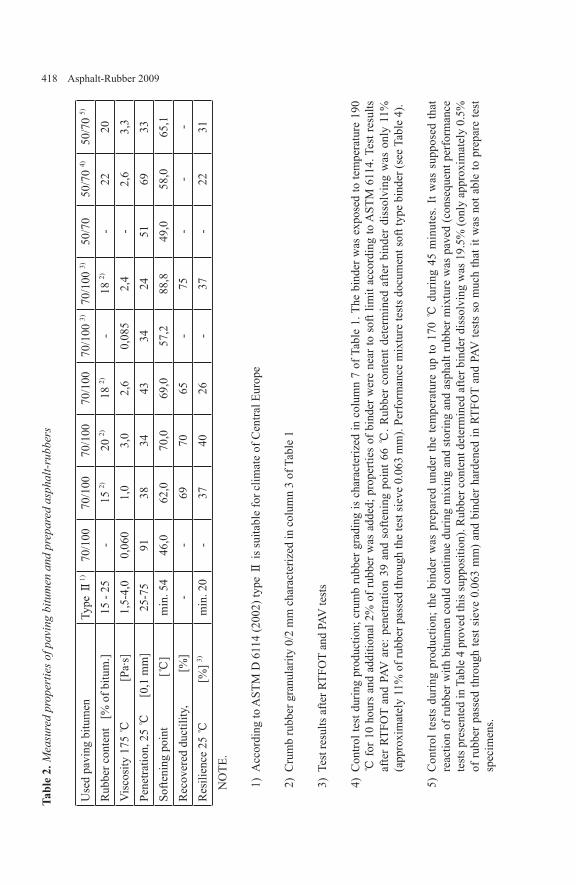
418 Asphalt-Rubber 2009
Tabl
e 2.
Mea
sure
d pr
oper
ties o
f pav
ing
bitu
men
and
pre
pare
d as
phal
t-rub
bers
Use
d pa
ving
bitu
men
Ty
pe Ⅱ
1)
70/1
00
70/1
00
70/1
00
70/1
00
70/1
00 3)
70
/100
3)
50/7
0 50
/70
4)
50/7
0 5)
Rub
ber c
onte
nt
[% o
f bitu
m.]
15 -
25
-15
2)
20 2)
18
2)
-18
2)
-22
20
V
isco
sity
175
℃
[P
a·s]
1,
5-4,
0 0,
060
1,0
3,0
2,6
0,08
5 2,
4 -
2,6
3,3
Pene
tratio
n, 2
5 ℃
[
0,1
mm
] 25
-75
91
38
34
43
34
24
51
69
33
Softe
ning
poi
nt
[℃
]m
in. 5
4 46
,0
62,0
70
,0
69,0
57
,2
88,8
49
,0
58,0
65
,1
Rec
over
ed d
uctil
ity,
[%
] -
-69
70
65
-
75
--
-R
esili
ence
25
℃
[%
] 3)
min
. 20
-37
40
26
-
37
-22
31
NO
TE.
Acc
ordi
ng to
AST
M D
611
4 (2
002)
type
Ⅱ is
suita
ble
for c
limat
e of
Cen
tral E
urop
e
Cru
mb
rubb
er g
ranu
larit
y 0/
2 m
m c
hara
cter
ized
in c
olum
n 3
of T
able
1
Test
resu
lts a
fter R
TFO
T an
d PA
V te
sts
Con
trol t
est d
urin
g pr
oduc
tion;
cru
mb
rubb
er g
radi
ng is
cha
ract
eriz
ed in
col
umn
7 of
Tab
le 1
. The
bin
der w
as e
xpos
ed to
tem
pera
ture
190
℃
for 1
0 ho
urs
and
addi
tiona
l 2%
of r
ubbe
r was
add
ed; p
rope
rties
of b
inde
r wer
e ne
ar to
sof
t lim
it ac
cord
ing
to A
STM
611
4. T
est r
esul
ts
afte
r RT
FOT
and
PAV
are
: pen
etra
tion
39 a
nd s
ofte
ning
poi
nt 6
6 ℃
. Rub
ber
cont
ent d
eter
min
ed a
fter
bind
er d
isso
lvin
g w
as o
nly
11%
(a
ppro
xim
atel
y 11
% o
f rub
ber p
asse
d th
roug
h th
e te
st si
eve
0.06
3 m
m).
Perf
orm
ance
mix
ture
test
s doc
umen
t sof
t typ
e bi
nder
(see
Tab
le 4
).
Con
trol t
ests
dur
ing
prod
uctio
n; th
e bi
nder
was
pre
pare
d un
der
the
tem
pera
ture
up
to 1
70 ℃
dur
ing
45 m
inut
es. I
t was
sup
pose
d th
at
reac
tion
of ru
bber
with
bitu
men
cou
ld c
ontin
ue d
urin
g m
ixin
g an
d st
orin
g an
d as
phal
t rub
ber m
ixtu
re w
as p
aved
(con
sequ
ent p
erfo
rman
ce
test
s pre
sent
ed in
Tab
le 4
pro
ved
this
supp
ositi
on).
Rub
ber c
onte
nt d
eter
min
ed a
fter b
inde
r dis
solv
ing
was
19.
5% (o
nly
appr
oxim
atel
y 0.
5%
of ru
bber
pas
sed
thro
ugh
test
sie
ve 0
.063
mm
) and
bin
der h
arde
ned
in R
TFO
T an
d PA
V te
sts
so m
uch
that
it w
as n
ot a
ble
to p
repa
re te
st
spec
imen
s.
1) 2) 3) 4) 5)

Mix Properties 419
Figure 1. Temperature dependence characteristics of tested binders
3.1 Aggregate and aggregate grading
For the laboratory tests the greywacke aggregate of gradation exceeding 4 mm and granite washed sieved aggregate 0/4 mm were used. Test sections were constructed with using Upper Paleozoic slate aggregate and granite aggregate 0/4 mm. Limestone filler was added. In some laboratory tests and on test sections the hydrated lime (Ca(OH)2) replaced a part of filler.
The aggregate gradations of all tested mixtures are presented in Table 3. First four mixtures were chosen for comparison, especially of performance test results, and remaining mixtures were used on test sections.
4. Asphalt-rubber mixture test results
Empirical and performance test results of laboratory prepared mixtures and mixtures that were taken during construction of test sections are presented in Table 4 and commented in following paragraphs.

420 Asphalt-Rubber 2009
Table 3. Grading of used aggregate of tested asphalt-rubber mixtures
Mixture typeSieve size
AC 11; 70/100
AC 11; AR
VTAC 8; AR
PA 8; AR
VTAC 11 PA 8
Test 1 Test 2Column 1 2 3 4 5 6
16 100 100 100 100 100 10011 96 95 100 100 96 1008 72 72 95 94 60 994 43 39 32 14 28 302 30 27 22 8 16 151 20 18 15 6 9 9
0,5 12 10 10 4 6 70,25 7 6 7 3 4 60,125 5 4 5 2 4 50,063 3,6 2,8 4,2 1,6 3,2 4,0
4.1. Mixture design
In the Czech Republic mixture design uses Marshall compaction test and bitumen content is determined from testing of three to five series of test specimens with consequently increased binder content. This method is not useable, because the dependence of measured A-R specimen characteristics on increasing binder content is very flat. The problem was solved in three steps.
In the first step the binder content was derived from the foreign experience (Hicks, 2002, Ficha Técnica – Recipav, 2004, Hicks et al.,2005, Fontes et al, 2008). In the second step the lower bitumen content was tested to identify its influence on performance test results. Finally, in the third step characteristic mixtures taken from construction site were tested.
4.2 Water sensitivity
Relatively poor water sensitivity test results according to EN 12697-12 of A-R test specimens (see Table 4) require further study of durability, which had been the weak point of older dry-method A-R technologies. Existing standards suppose that the good results of water sensitivity test ensure expected durability of wearing courses. Durability is not influenced only by water effect; freezing and thawing cycles, ageing of binder and heavy traffic are also important factors. Nevertheless, the water sensitivity tests according to EN 12697-12 using the hydrated lime as the adhesive agent was determined.

Mix Properties 421

422 Asphalt-Rubber 2009
Used lime content was 20 % of bitumen weight and amount of lime replaced the same amount of limestone fi ller. The porous A-R was tested to study the infl uence of binder ageing on indirect tensile strength. The ageing was reached by storing of uncompacted 40 mm thick layer of mixture in ventilated oven under the temperature 80 ℃ for 2 and 7 days. The infl uence of freezing and thawing of test specimens was not yet tested, as EN does not respect these climate infl uences on the durability.
Figure 2. The results of indirect tensile strengths of Porous Rubber-Asphalt (PA 8) with different binder content, hydrated lime addition and ageing
Water sensitivity was expressed by ratio of indirect tensile strength (ITS) at temperature 25 ℃ of specimens vacuum saturated and stored in water at temperature 40 ℃ for 3 days (ITSw) to ITS stored on the air (ITSd). These results of ITS and ratios (ITSR) of porous A-R are shown in Figure 2. The A-R content 8,5 % in mixture offer higher both ITS than binder content 9,5 %. The addition of hydrated lime increased both ITS, but despite the expectations, the ITSR was lower.
The ageing of A-R mixtures had different effect on ITS. ITS of mixture without lime was increasing linearly in time. ITS of mixture with lime increased rapidly during the fi rst 2 days of ageing and stayed constant afterwards. This means that lime positively infl uenced ageing of A-R binder. During ageing of mixtures the ITSR changes were very small in both series of mixtures and no infl uence of hydrated lime on ITSR was visible.
As lime increased strengths, it is possible to assume greater resistance to traffi c effects. Therefore, better A-R durability can be expected, despite no change in water sensitivity as ITSR expressed. On the other hand the addition of liquid adhesive agents precludes the effect of water conditioning on the ITSw results.
4.3 Resistance to permanent deformation
The laboratory mixed A-R mixtures were compacted according to EN 12697-35 by roller running on vertical sliding steel plates (as specified in EN 12697-33) into small desk specimens and tested in small wheel tracking tester (according to EN 12697-22) under temperature of air 50 ℃. The results of rutting documented in Table 4 fulfilled the
Mix Properties 423
requirements for heavy and slow traffic. During the tests only the mixture sticking on rubbered test wheel has to be solved. The resistance to permanent deformation is influenced by increased binder elasticity. Porous A-R initial type testing with fine grained structure of Upper Paleozoic slate aggregate instead of sand grained structure of Greywacke (column 4 of Table 3) rendered very unsatisfactory results. This mixture was used on road with low traffic. For very heavy traffic the type of mixture presented in column 6 of Table 3 (Test 2) was used.
Both Test 2 mixtures compacted in impact compactor (EN 12697-30) were tested in triaxial loading according to EN 12697-25. The test conditions are as follows: temperature 50 ℃, confining pressure 150 kPa, block-pulse axial cyclic deviator 450 kPa (peak axial pressure pulse 600 kPa), pulse and rest durations ratio 1s/1s.
Test results were in range 0,25 to 0,90 µm/m/n in case of 10 000 loading cycles, Test 2.2 mixture results were better (up to 0,50 µm/m/n). Turning point of cumulative axial strain in case Test 2.2 mixture was not reached up to 50 000 loading cycles. Test 2.1 mixture sometimes between 15 000 to 25 000 cycles after occurred turn point was quickly pressed and destroyed.
The results of the mixtures Test 2 with different A-R produced during the test section mentioned in 2.3 shown the negative influence of long term high temperature on quality of A-R and opposite usual behaviour of A-R prepared under lower temperature.
4.4 Stiffness
Test specimens were cut from the desks prepared as mentioned in 4.3. Stiffness was determined on trapezoid test specimens in two point bending device according to EN 12697-26. The stiffness moduli under temperature 15 ℃ and frequency 10 Hz are presented in Table 4 and dependence of stiffness on temperature is presented in Figure 3.
Relatively high binder and voids content influenced A-R mixture stiffness moduli, the moduli of all A-R mixtures are lower than moduli of AC 11 with bitumen 70/100. The lowest moduli showed PA 8, as air voids and bitumen film on aggregate were the highest. The mixture Test 2.1 with lime addition has the second lowest moduli curve of dependence on temperature. Test 2.2 mixture has higher moduli than mixture Test 2.1; it proves the higher resistance to permanent deformation as is mentioned in 4.3. Small difference between RAC 11 and VTAC 8 is caused by difference of air voids. The results of mixture Test 1.1 and Test 1.2 document the hydrated lime influence on stiffness in the whole temperature range as was also documented by increase of ITS discussed in section 4.2 and relatively high moduli are caused by high content of rubber in the A-R.

424 Asphalt-Rubber 2009
4
28
6
7
5
3
1
0
1000
2000
3000
4000
5000
6000
7000
8000
9000
10000
11000
-10 -5 0 5 10 15 20 25 30 35 40Temperature [°C]
stiff
ness
mod
ulus
E*(a
t10
Hz)
[MPa
]
1 AC 11
2 RAC 11; AR
3 VTAC 8; AR
4 PA 8; AR
5 Test 1.1
6 Test 1.2
7 Test 2.1
8 Test 2.2
Figure 3. The dependence of stiffness on temperature at 10 Hz
4.5 Fatigue
The same device and test specimens as in stiffness moduli tests were used; tests were performed according to EN 12697-24 at temperature 10 ℃ and frequency 25 Hz. Fatigue properties ε6 (the strain corresponding with 106 loading cycles) and B (function B = -1/b, where b is the fatigue line slope) are characteristics for performance design method in the Czech Republic. The results of fatigue tests are presented in Table 4 and in Figure 4.
Higher binder content and rheological changes of binder substantially increased resistance to fatigue of laboratory prepared mixtures (see column 1 to 4 in Table 4). Fatigue characteristics according to EN 13108-1 of A-R mixtures are in category ε6,190 instead of ε6,115 of AC 11. However, the Test 1 mixtures have lower bitumen content with high rubber granulate content as presented in column 5 of Table 1 and fatigue properties were lower than AC 11; addition of lime hydrate improved the fatigue properties. The fatigue results of Test 2 mixtures in comparison with PA 8 document influence of lower A-R content in mixtures and different production conditions; A-R of Test 2.2 offer lower fatigue properties and A-R of Test 2.1 increased the resistance to fatigue. (The same information in Fátima et al., 2008).
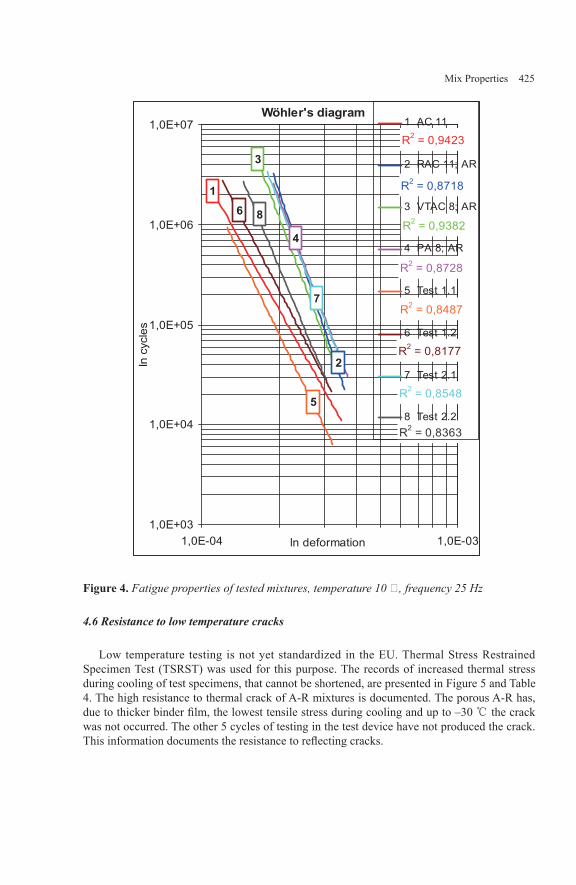
Mix Properties 425
Wöhler's diagram
6
5
7
8
4
3
2
1
R2 = 0,9423
R2 = 0,8718
R2 = 0,9382
R2 = 0,8728
R2 = 0,8487
R2 = 0,8177
R2 = 0,8548
R2 = 0,8363
1,0E+03
1,0E+04
1,0E+05
1,0E+06
1,0E+07
30-E0,140-E0,1 ln deformation
lncy
cles
1 AC 11
2 RAC 11; AR
3 VTAC 8; AR
4 PA 8; AR
5 Test 1.1
6 Test 1.2
7 Test 2.1
8 Test 2.2
Figure 4. Fatigue properties of tested mixtures, temperature 10 ℃, frequency 25 Hz
4.6 Resistance to low temperature cracks
Low temperature testing is not yet standardized in the EU. Thermal Stress Restrained Specimen Test (TSRST) was used for this purpose. The records of increased thermal stress during cooling of test specimens, that cannot be shortened, are presented in Figure 5 and Table 4. The high resistance to thermal crack of A-R mixtures is documented. The porous A-R has, due to thicker binder film, the lowest tensile stress during cooling and up to –30 ℃ the crack was not occurred. The other 5 cycles of testing in the test device have not produced the crack. This information documents the resistance to reflecting cracks.
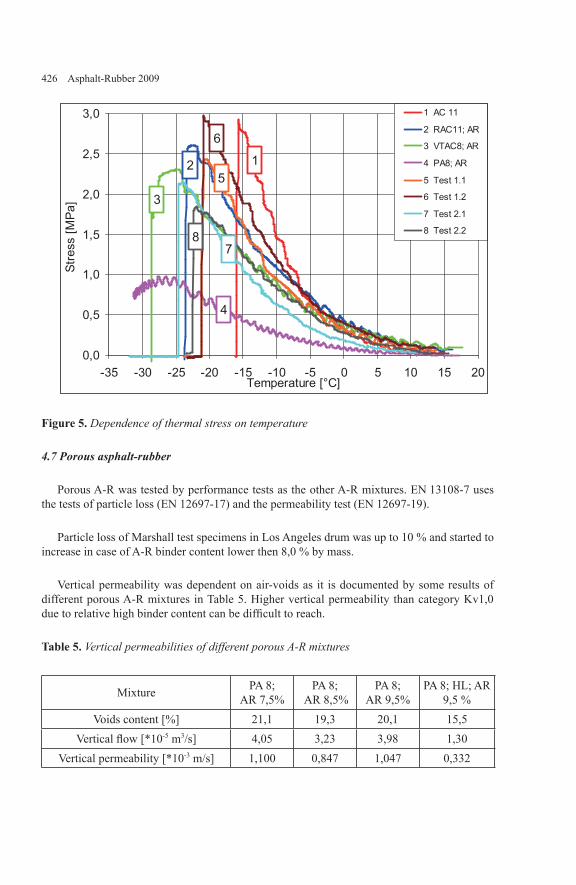
426 Asphalt-Rubber 2009
2
8
3
7
15
6
4
0,0
0,5
1,0
1,5
2,0
2,5
3,0
-35 -30 -25 -20 -15 -10 -5 0 5 10 15 20Temperature [°C]
Stre
ss [M
Pa]
1 AC 11
2 RAC11; AR
3 VTAC8; AR
4 PA8; AR
5 Test 1.1
6 Test 1.2
7 Test 2.1
8 Test 2.2
Figure 5. Dependence of thermal stress on temperature
4.7 Porous asphalt-rubber
Porous A-R was tested by performance tests as the other A-R mixtures. EN 13108-7 uses the tests of particle loss (EN 12697-17) and the permeability test (EN 12697-19).
Particle loss of Marshall test specimens in Los Angeles drum was up to 10 % and started to increase in case of A-R binder content lower then 8,0 % by mass.
Vertical permeability was dependent on air-voids as it is documented by some results of different porous A-R mixtures in Table 5. Higher vertical permeability than category Kv1,0 due to relative high binder content can be difficult to reach.
Table 5. Vertical permeabilities of different porous A-R mixtures
Mixture PA 8; AR 7,5%
PA 8; AR 8,5%
PA 8; AR 9,5%
PA 8; HL; AR 9,5 %
Voids content [%] 21,1 19,3 20,1 15,5Vertical flow [*10-5 m3/s] 4,05 3,23 3,98 1,30
Vertical permeability [*10-3 m/s] 1,100 0,847 1,047 0,332

Mix Properties 427
4.8 Discussion of test results
Performance test results of fatigue, low temperature cracking and particle loss help to find the limits for recommended A-R mixture design. These limits were incorporated into Technical recommendations No 148 of the Ministry of Transport of the Czech Republic. Initial type testing is based on used materials (bitumen, crumb rubber, additives, lime hydrate, aggregate and aggregate grading), composition and viscosity of A-R binder, minimum binder content and empirical tests – voids content, water sensitivity and resistance to permanent deformation in case of heavy traffic. Porous A-R is characterized by particle loss.
The Recommendations also enable the performance design of mixture and its use in Czech performance pavement design. If stiffness and fatigue characteristics of A-R concrete are used in pavement design for heavy traffic, then the thickness of asphalt courses can be reduced nearly by half in comparison to conventional hot mixture (but improved subgrade shall to be used).
In complicated construction without fluent distribution of A-R the maximum temperature and time of A-R binder exposition to high temperature out of allowed limits according to ASTM D 6114 – 97 influence viscosity of A-R binder. If additional crumb rubber is added to reach recommended viscosity, than A-R mixture decrease stiffness, resistance to permanent deformation and increase the resistance to fatigue and low temperature cracking.
5. Test sections
In September 2007 the blender for A-R binder production was imported to the Czech Republic. The blender is one batch type made by Phoenix Environment Ltd. The blender was connected with mixing plant AMMANN 160 and the several tests of the devices were done. After several small tests two bigger test sections were performed.
5.1 Description of test sections
On the first section the very thin asphalt concrete (VTAC) was laid in thickness 20 mm to 40 mm after milling cracked wearing course. VTAC is characterized in column 5 of Table 3 and in columns 5 and 6 of Table 4 (Test 1.1 and Test 1.2). The section is located on secondary road, it is 1,8 km long with several sharp curves and half of the section is in longitudinal slope over 10 %.
The influence of different crumb rubber was tested. The crumb rubber 0/2 mm characterized in column 5 of Table 1 requires rubber content more than 26 % of bitumen mass to be fulfilled viscosity requirements of 1009 ASRM. The rubber particles are visible on the pavement surface after a year of traffic (see Figure 6).

428 Asphalt-Rubber 2009
Figure 6. The rubber particles on the pavement surface trafficking for a period of a year (scale in millimetres)
The second test section is Michelska Street in Prague, two-lane road in both directions with longitudinal slope up to 5 %, with traffic lights on crossing, intensive bus traffic with stops and with annual average of more than 50 000 vehicles per 24 hours.
Pavement consists of lean Portland cement concrete and 180 mm of bitumen mixture courses. Wearing and binder courses were milled and replaced by Asphalt Concrete binder course, aggregate up to 22 mm, thickness 70 mm, the polymer modified bitumen (SBS) and by wearing course of porous A-R defined in column 6 of Table 3 and in columns 7 and 8 of Table 4 (Test 2.1 and Test 2.2) in thickness 30 mm. Tack coat was polymer modified bitumen emulsion of total bitumen thickness 0,2 mm, respectively 0,4 mm.
Due to great traffic importance of the street the construction of two-lane of about 10 000 m2 was divided into 8 sections. Due to rain one section had to be divided, i.e. there were 9 sections. Under these circumstances the production and storing of A-R binder induced different conditions of A-R binder production mentioned in section 2.3.
Content of 70 % of aggregate fraction 4/8 mm creates surface the photo of which is in Figure 7.

Mix Properties 429
Figure 7. Surface of Porous Rubber-Asphalt in Prague after its paving (scale in millimetres)
5.2 Skid resistance
Skid resistance was measured after the finishing of wearing courses. The measured friction coefficient under wetted conditions and 25 % slip of smooth tyre at the velocity 60 km/h was in range of friction coefficient of 20 m sections 0,45 to 0,6. That is a very good result, as surface of new asphalt is usually slippery and mixtures with thicker bitumen film as Stone mastic asphalt are usually chipped during compaction.
The friction coefficient increases during traffic loading. The first section after a year of service rendered the results of friction coefficient under the same conditions in range 0,55 to 0,67 and after the second winter the coefficient again grew up to range 0,59 to 0,72 (excellent classification). In Prague section the friction coefficient after the first winter was in the range 0,48 to 0,60 (very good classification).
5.3 Surface drainability
The problem connected with loss of drainability of porous A-R is expected. Several cross profile sections were established so that the drainability according to EN 12697-40 could be measured. Initial drainability expressed as relative hydraulic conductivity depended on air voids and ranged in 0,005⋅s-1 to 0,030⋅s-1 (average value 0,013⋅s-1). Drainability after five

430 Asphalt-Rubber 2009
months of traffic ranged in 0,002⋅s-1 to 0,019⋅s-1 (average value 0,007⋅s-1). Decrease of drainability in the vehicle paths in case of longitudinal or cross slope greater than 4 % was low.
5.4 Noise reduction
The Prague test section is situated in very noisy part of town, the street cross two main motorways. The noise measurements according to ISO 11819-1 were done before reconstruction and after finishing the first two lanes of the street pavement. The measured value of LAeq before reconstruction was 71 dBA and after reconstruction was 69 dBA, i.e decrease of noise due to porous A-R was measured 2 dBA.
Noise measurements surrounding the tyre according to ISO/CD 11819-2 are documented in Table 6, the values of equivalent continuous A-weighed sound level (LAeq) and noise level at frequency spectrum 1250 Hz (LA) are presented. The results of wearing courses Test 1 and Test 2 are compared with Asphalt Concrete (AC 8) adjacent on Test section 1 and Stone Mastic Asphalt (SMA 11) that was laid on opposite two street lanes in Prague. In the last column the measured values of A-R wearing course with dry process RUBIT® (Plus Ride) are presented, the section is adjacent to Prague test section 2, it was performed in the year 1998 and ravelling of surface is occurred. The noise level dependences of these surfaces on frequency spectrum are presented in Figure 8. The results document the noise reduction of PA 8 expressed in LAeq 3 dB(A) and noise reduction in frequency spectrum 1250 Hz 5 dB(A) in comparison with SMA 11 without chippings that are usually used on heavy trafficked streets and on motorway.
Table 6. The results of noise measurements according to ISO/CD 11819-2 of test sections and adjacent comparative surfaces
Measured velocity,
km/h
Type of wearing coursePA 8
Test 2VTAC 11
Test 1AC 8
Test section 1SMA 11
Test section 2RUBIT®
1998 Equivalent continuous A-weighed sound level, LAeq , dB(A)
40 83 84 85 86 8950 87 - - 90 -60 90 91 92 93 9580 - 96 97 - 100
Noise level at frequency spectrum 1250 Hz, dB(A)60 82 85 85 87 90

Mix Properties 431
65
70
75
80
85
90
95
315
400
500
630
800
1000
1250
1600
2000
2500
3150
4000
Frequency spectrum [Hz]
Noi
seLe
vel[
dB(A
)]
SMA 11 Testsection 2
PA 8 Test 2
ACO 8 50/70Test section1VTAC 11Test 1
Rubit® 1998
Figure 8. The evaluation of noise level by the form of third-octave characteristics of different wearing courses
6. Conclusions
As part of the launch the wet asphalt-rubber technology in the Central European climate conditions, several laboratory empirical and performance tests according to the European standards and field tests focused on characteristics and benefits of new A-R mixtures were performed.
The performance test results have shown that the main advantage of A-R mixtures based on binder rheological changes and higher binder content are (i) high resistance to fatigue and (ii) high resistance to low temperature cracking. The advantage has oriented the use of A-R mixtures in thin and porous wearing courses to reduce hydroplaning, slash, spray and traffic noise. The performance design method has also indicated that the whole asphalt thickness of heavy loaded pavements can be substantially decreased, when A-R mixture is used in the base course.
Higher binder and void content of open graded and porous A-R mixtures decreases stiffness and resistance to permanent deformation, but it did not influence adversely their performance characteristics on heavy trafficked pavements. Both of these desirable properties can be increased by hydrated lime addition and lime positively influences the ageing of A-R binder. Two year testing of skid resistance, noise reduction and drainability changes of wearing courses on test sections have proven expected properties.
Performance testing together with particle loss and permeability of Porous Asphalt helps to prepare Technical Recommendations based on empirical and fundamental approach of specifying of A-R mixtures. It is also shown that the testing of A-R mixtures can be performed
432 Asphalt-Rubber 2009
according to European standards, which provide the benefit of Europe-wide quality and control systems. At the same time, these standards need to be complemented with small adjustments that are important for the A-R production, laying and compacting. These were specified in the Technical Recommendations.
Acknowledgement
Authors would like to acknowledge the financial support of research project 2A-3TP1/099 and project No. 1M0579, within activities of the CIDEAS research centre.
Bibliography
Ficha Técnica – Recipav, Asphalt mixtures BMB – 1,2,3/04, 2004.
ASTM D 6114 – 97, Standard Specification for Asphalt-Rubber Binder, 1997.
EN 12697 Bituminous mixtures – Test methods for hot mix asphalt:Part 1: Soluble binder content.Part 2: Particle size distribution.Part 4: Bitumen recovery: Fractionating column.Part 5: Determination of the maximum density.Part 8: Determination of void characteristics of bituminous specimens.Part 11: Determination of the affinity between aggregate and bitumen.Part 12: Determination of the water sensitivity of bituminous specimens.Part 17: Particle loss of porous asphalt specimen.Part 19: Permeability of specimen.Part 22: Wheel tracking.Part 23: Determination of the indirect tensile strength of bituminous specimens.Part 24: Resistance to fatigue.Part 25: Cyclic compression test.Part 26: Stiffness.Part 28: Preparation of samples for determining binder content, water content and grading.Part 29: Determination of the dimensions of a bituminous specimen.Part 30: Specimen preparation by impact compactor.Part 33: Specimen prepared by roller compactor.Part 34: Marshall test.Part 35: Laboratory mixing.Part 40: In-situ drainability.
EN 13108 Bituminous mixtures – Material specifications:
Part 1: Asphalt Concrete.Part 2: Asphalt Concrete for very thin layers.Part 7: Porous Asphalt.
---------------
------
---

Mix Properties 433
Fontes L. P., Trichês G. Pereira P. A. A., Pais J. C., Comparison Between Asphalt Rubber andConventional Mixtures in Overlay Design, 4th Eurasphalt & Eurobitume Congress, 2008.
Hicks R. G., Asphalt Rubber Design and Construction Guidelines, 2002.
Hicks R. G., Lundy J. R., Leahy R. B., Hanson D., Epps J., Crumb Rubber Modifier (CRM) inAsphalt Pavement, Summary of Practices in Arizona, California and Florida, 2005.
ISO 11819-1 Acoustics – Method for measuring the influence of road surface on traffic noise – Part 1: The statistical pass-by method.
ISO/CD 11819-2: Acoustics – Method for measuring the influence of road surfaces on trafficnoise – Part 2: The close proximity method.
Kaloush K. E., Witczak M. W., Way G. G., Performance Evaluation of Arizona Asphalt Rubber Mixtures Using Advanced Dynamic Material Characterization Tests, Final Report, 2002.
Kudrna J., Laboratory tests and on field experiences in Czech Republic, RE-Book, RecycledTyre Materials in Roads and Civil Engineering, ETRA, 2007.
Lee S. J., Amirkhanian, S. N., Shatanawi, K., Effects of Reaction Time on Physical and Chemical Properties of Rubber-modified Binders, International Rubber Conference, 2006.
Putman B. J., Amirkhanian S. N., Crumb Rubber Modification of Binders: Interaction and Particle Effects, Asphalt-Rubber 2006 Conference, 2006.
Section 1009 ASRM, Standard Specification, Arizona Department of Transportation, 2005.
Standard Specification for Road and Bridge Construction, Arizona, 1996.
Technical Recommendation of Ministry of Transport No 148 Asphalt-Rubber pavement courses, Brno University of Technology, 2008
Thodesen C., Shatanawi K., Amirkhanian S., Effect of crumb rubber characteristics on crumb rubber modified (CRM) binder viscosity, 2007.


Chapter 3
Binder Properties

Binder Properties 437
Comparison of the Properties of Laboratory and Field-Prepared CRM Binders
Junan Shen*, Ph.D. Serji Amirkhanian**, Ph.D.
*1006A Carruth BuildingGeorgia Southern University Statesboro, GA, 30460-8047 USA Tel. (912) 478-0084E-mail:[email protected]
** 110 Lowry HallClemson UniversityClemson, SC, 29634, USA Tel. (864) 656-3316E-mail: [email protected]
ABSTRACT. Crumb Rubber Modified binders (CRM binders) have been used for pavement mixtures because of their better performance properties over base asphalt binders. The performance properties of CRM binders are influenced by various factors including the types of both the base binders and the CRM, and the mixing conditions used for producing the CRM binders. In this study, the properties of CRM binders produced in two different conditions, namely in the laboratory and in the field, were compared. These properties included viscosity and the performance properties specified by SHRP binder specifications. Two lab produced binders and two field produced binders were tested and compared, respectively. The CRM binders were tested in three states: no aging, Rolling Thin Film Oven (RTFO) aging resides, RTFO+Pressurized Aging Vessel (PAV) aging resides as well. The results of this study indicated that: 1) there is no big significant difference between the viscosities of the CRM binders produced in the two different conditions; 2) the high temperature grades of CRM binders produced in laboratory were one PG grade higher than those produced in the field; 3) the difference of low temperature grades for between the binders produced in laboratory and in field was less than one PG grade.
KEYWORDS: DSR, viscosity, CRM binder, performance grade

438 Asphalt-Rubber 2009
1. Introduction
Crum Rubber modifier (CRM) manufactured from scrap tires has been growing in popularity as an additive to modify asphalt binder for hot mix asphalt (HMA) (Eps, 1994, Amirkhanian and Marry, 2004). The use of CRM in paving binder has many advantages. The Crumb Rubber Modified binder (CRM binder) provides the benefits a normal polymer modified binder has such as high rutting assistance to traffic loads (Lougheed, 1996, Huang et al., 2002, Ruth and Roque, 1995). In addition, the use of CRM in the modification reduces stock piles of tremendous scrap tires. The life cycle cost is not higher than expected in most cases as the enhanced performance properties of CRM binders can prolong the life of pavement service. Researches on using CRM binder in asphalt mixtures are necessary.
The CRM is in practice added in the HMA in two ways: either in a wet process or in a dry process. The wet process entails adding the crumb rubber directly to the asphalt binder while hot, before the binder is mixed with aggregate. The dry process adds the CRM onto the heated aggregate before the binder is added. The wet process has been used successfully in many states in the USA. This is because the interaction of CRM with the binder may be occurred completely if mixing condition is properly set before CRM binder being mixed with aggregates. However, the effectiveness of CRM on the improvement of the properties of CRM binders is dependent on many factors including the variables of both the binders and CRM, and mixing conditions.
The improvement of the performance-based properties of CRM binders have been revealed and attributed to the interaction between the CRM and binder as well (Stroup- Gardiner et al., 1993, Bahia and Davies, 1994, Abdelrahman, et al., 1999, Airey et al., 2002). The CRM particles swell as they absorb the oil fraction of the asphalt binders. The residual binders become stiffer and the gaps between the CRM particles become smaller because of their swelling. Consequently, the CRM binders are much more viscous than base binders. Factors influencing the interaction are all important to the properties of CRM binders, such as the binder grade, chemical composition, type of CRM, size of CRM, surface area of CRM, percentage of CRM, mixing temperature, mixing time, type of mixer as well. It has been reported that the laboratory designed CRM binders can not be reproduced in the field with regarding to the properties. In practice, CRM binder is produced using a small mixer in the laboratory and using a mixing unit in the field. The volume of CRM binder prepared in laboratory for testing is usually in a much smaller scale than that used for paving in the field. Certainly, the mixing conditions applied to the CRM binders produced in the laboratory and field are quite different even these mixing condition can be easily set up the same for both the laboratory and field. The differences of mixing conditions occurred in the CRM binders will definitely the main reason causing the difficult in reproducing the CRM binders in the field.
However, there is no much research available on the comparison. In practice, it is very important to know the difference of the properties of the CRM bindproduced in the two conditions for quality control and quality administration. So far, the CRM binders are still evaluated by DSR and BBR processes, which were actually designed for neat binders in Superpave binder specifications (Tory et al., 1996, Hanson and Duncan, 1995, Rebala). It was noted that there have been observed some technique problems in using these testing processes to evaluate the properties of CRM binders (McGennis, 1995). Efforts have been made to modify the testing processes to accommodate CRM binders (Kim et al., 2001). A common
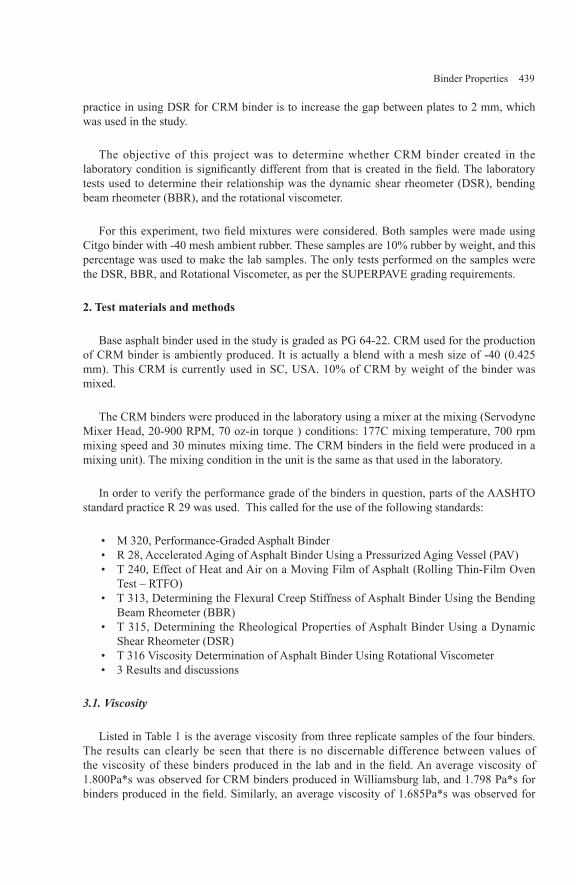
Binder Properties 439
practice in using DSR for CRM binder is to increase the gap between plates to 2 mm, which was used in the study.
The objective of this project was to determine whether CRM binder created in the laboratory condition is significantly different from that is created in the field. The laboratory tests used to determine their relationship was the dynamic shear rheometer (DSR), bending beam rheometer (BBR), and the rotational viscometer.
For this experiment, two field mixtures were considered. Both samples were made using Citgo binder with -40 mesh ambient rubber. These samples are 10% rubber by weight, and this percentage was used to make the lab samples. The only tests performed on the samples were the DSR, BBR, and Rotational Viscometer, as per the SUPERPAVE grading requirements.
2. Test materials and methods
Base asphalt binder used in the study is graded as PG 64-22. CRM used for the production of CRM binder is ambiently produced. It is actually a blend with a mesh size of -40 (0.425 mm). This CRM is currently used in SC, USA. 10% of CRM by weight of the binder was mixed.
The CRM binders were produced in the laboratory using a mixer at the mixing (Servodyne Mixer Head, 20-900 RPM, 70 oz-in torque ) conditions: 177C mixing temperature, 700 rpm mixing speed and 30 minutes mixing time. The CRM binders in the field were produced in a mixing unit). The mixing condition in the unit is the same as that used in the laboratory.
In order to verify the performance grade of the binders in question, parts of the AASHTO standard practice R 29 was used. This called for the use of the following standards:
M 320, Performance-Graded Asphalt BinderR 28, Accelerated Aging of Asphalt Binder Using a Pressurized Aging Vessel (PAV)T 240, Effect of Heat and Air on a Moving Film of Asphalt (Rolling Thin-Film Oven Test – RTFO)T 313, Determining the Flexural Creep Stiffness of Asphalt Binder Using the Bending Beam Rheometer (BBR)T 315, Determining the Rheological Properties of Asphalt Binder Using a Dynamic Shear Rheometer (DSR)T 316 Viscosity Determination of Asphalt Binder Using Rotational Viscometer3 Results and discussions
3.1. Viscosity
Listed in Table 1 is the average viscosity from three replicate samples of the four binders. The results can clearly be seen that there is no discernable difference between values of the viscosity of these binders produced in the lab and in the field. An average viscosity of 1.800Pa*s was observed for CRM binders produced in Williamsburg lab, and 1.798 Pa*s for binders produced in the field. Similarly, an average viscosity of 1.685Pa*s was observed for
•••
•
•
••

440 Asphalt-Rubber 2009
CRM binders produced in Richland field was, and 1.798 Pa*s in the laboratory. The percent difference between the Williamsburg samples is 0.11% and 6.49% between the Richland samples.
Table 1. Average Viscosity of un-aged Binder
Source Average Viscosity (Pa*s)Williamsburg Field 1.800Williamsburg Lab 1.798
Richland Field 1.685Richland Lab 1.798
3.2. DSR results
Binders no aging:
Figures 1 a) to c) show the results obtained from DSR tests on binders at no-aging state. A higher phase angle was found for binders made in the field than in the lab for both Williamsburg and Richland cases, Figure 1 a). The average increases of the phase angles for these tested temperatures between were 5.3 and 4.2 degree for Williamsburg and Richland case, respectively. These increases took up about 7.1 and 6.8%, compared with those binders produced in the lab. A higher difference between the phase angles was observed for lower test temperature. It can be concluded that the CRM binders created in the field have a higher phase angle, a worse elasticity property, than laboratory-produced CRM binders.
Similarly, a smaller complex modulus, G*, was found for binders made in the field than in the laboratory for both Williamsburg and Richland cases, Figure 1, b). The average decrease of the G* for these tested temperatures is 0.7 and 1.8kPa for Williamsburg and Richland cases, respectively. These decreases took up about 24 and 49% for Williamsburg and Richland cases; respectively, compared with those from the binders produced in the lab. A much bigger decrease of the G* was observed for lower test temperature. In a word, the CRM binders created in the field have a smaller value of G*, a worse deformation resistance property, than laboratory-produced CRM binders.
The relationships between the rutting resistance parameter, G*/sin(delta), and the test temperature, Figure 1, c), are similar to those between G* and the test temperature. The failure high temperatures can be obtained from the Figure 1, c), with the parameter G*/sin(delta) being 1.0kPa as specified by SHRP binder specifications. Both of Williamsburg and Richland binders produced in the lab were graded as 82C, and 76C for field produced binders.
The fact that the phase angle, G* and rutting resistance parameter for the samples produced in the lab differed from those from the samples produced in the field suggested a more complete interaction of CRM with the binders happen in the samples produced in the lab. The mixing energy from the mixer in the lab may be larger that the mixer in the mixing unit in the
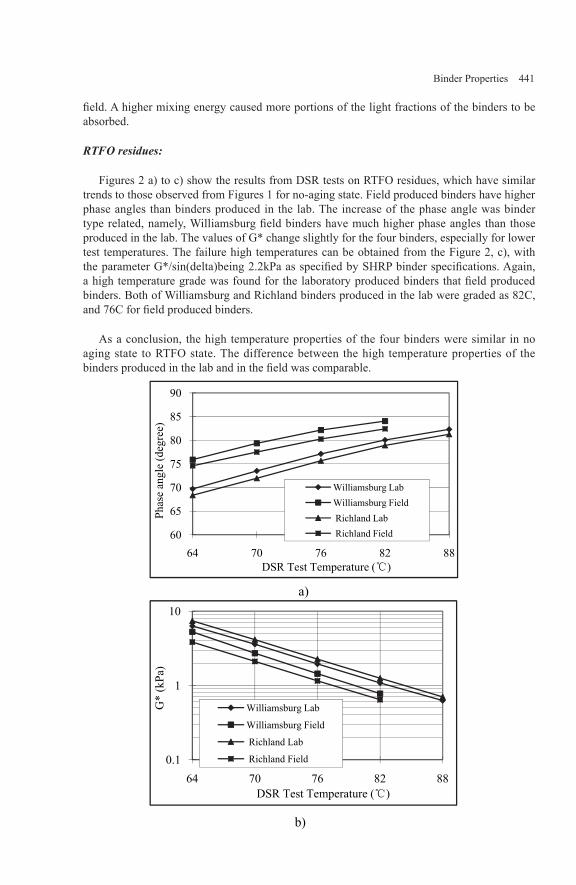
Binder Properties 441
field. A higher mixing energy caused more portions of the light fractions of the binders to be absorbed.
RTFO residues:
Figures 2 a) to c) show the results from DSR tests on RTFO residues, which have similar trends to those observed from Figures 1 for no-aging state. Field produced binders have higher phase angles than binders produced in the lab. The increase of the phase angle was binder type related, namely, Williamsburg field binders have much higher phase angles than those produced in the lab. The values of G* change slightly for the four binders, especially for lower test temperatures. The failure high temperatures can be obtained from the Figure 2, c), with the parameter G*/sin(delta)being 2.2kPa as specified by SHRP binder specifications. Again, a high temperature grade was found for the laboratory produced binders that field produced binders. Both of Williamsburg and Richland binders produced in the lab were graded as 82C, and 76C for field produced binders.
As a conclusion, the high temperature properties of the four binders were similar in no aging state to RTFO state. The difference between the high temperature properties of the binders produced in the lab and in the field was comparable.
a)
60
65
70
75
80
85
90
64 70 76 82 88
Phas
ean
gle
(deg
ree)
DSR Test Temperature (℃)
Williamsburg LabWilliamsburg FieldRichland LabRichland Field
b)
0.1
1
10
64 70 76 82 88
G*
(kPa
)
DSR Test Temperature (℃)
Williamsburg Lab
Williamsburg Field
Richland Lab
Richland Field

442 Asphalt-Rubber 2009
Figures 1. a) to c). Results obtained from DSR tests on no-aging states; a) Phase angle; b) Complex modulus and c) Rutting resistant parameter
c)
0.1
1
10
64 70 76 82 88
G*/
sin(
delta
)(kP
a)
DSR Test Temperature (℃)
Williamsburg Lab
Williamsburg Field
Richland Lab
Richland Field
a)
50
55
60
65
70
75
80
64 70 76 82 88
Phas
ean
gle
(deg
ree)
DSR Test Temperaure (℃)
Williamsburg Lab
Williamsburg Field
Richland Lab
Richland Field
b)
1
10
100
64 70 76 82 88
G*
(kPa
)
DSR Test Temperature (℃)
Williamsburg Lab
Williamsburg Field
Richland Lab
Richland Field

Binder Properties 443
Figures 2. a) to c). DSR results on RTFO residues: a) Phase angle; b) Complex modulus and c) Rutting resistant parameter
RTFO + PAV residues:
Figures 3 a) to c) show the results of DSR test on RTFO + PAV residues. A smaller phase angle was found for binders made in the laboratory than in the field for both cases, Figures 5, a). The average decreases of the phase angles for these tested temperatures depend on the binders with Williamsburg case being 0.15 degree and Richland case being 2.2 degree. There decreases took up 1 and 4%, respectively. A higher decrease between the phase angles was observed for higher test temperature. In a word, the CRM binders created in the field have a higher phase angle, a worse elasticity property, than laboratory-produced CRM binders. This finding under intermediate temperature was similar to that under high temperature. But the difference of phase angle change was much smaller under intermediate temperature than under high temperature.
Similarly, the change of complex modulus, G*, of the binders made in the field and in the laboratory is more dependent on the cases and test temperatures, Figure 3, b). Compared with those of filed produced in the field, the G* of the binders made in the laboratory decreased 31.0 and 376 kPa for Williamsburg Richland case, respectively. These decreases took up about 1 and 7%; respectively.
The failure intermediate temperatures can be obtained from the Figure 3 c), with the G*sin(delta) being 5000kPa as specified by SHRP binder specifications. For Williamsburg case, the failure temperatures were 20℃ for both lab and field produced binders. For Richland case, the lab produced binder has 18.9℃ and field produced has 20℃. The difference in the intermediate failure temperature was small.
The failure temperatures from the DSR tests were summarized in Table 2. These results were obtained from SHRP binder specifications.
c)
1
10
100
64 70 76 82 88
G*/
sin(
delta
)(kP
a)
DSR Test Temperature (℃)
Williamsburg Lab
Williamsburg Field
Richland Lab
Richland Field
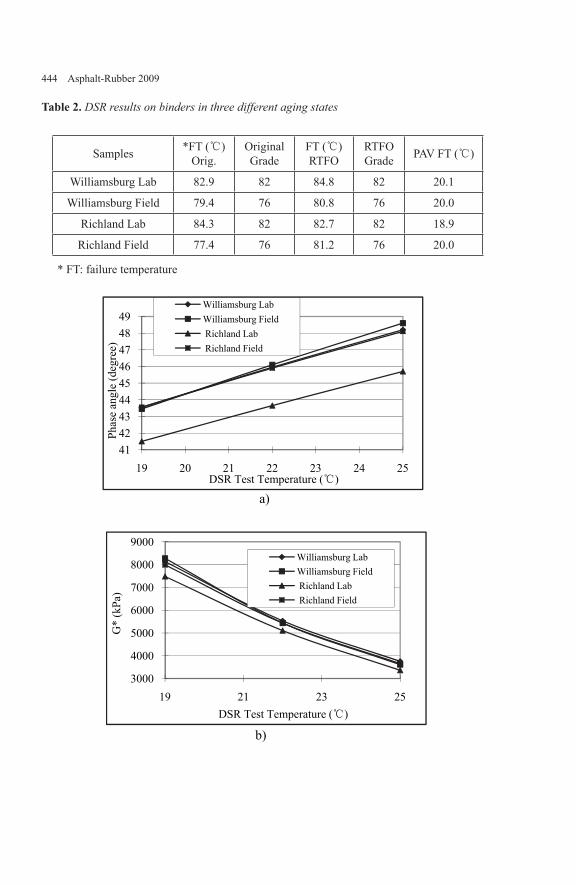
444 Asphalt-Rubber 2009
Table 2. DSR results on binders in three different aging states
Samples *FT (℃) Orig.
Original Grade
FT (℃) RTFO
RTFO Grade PAV FT (℃)
Williamsburg Lab 82.9 82 84.8 82 20.1
Williamsburg Field 79.4 76 80.8 76 20.0
Richland Lab 84.3 82 82.7 82 18.9
Richland Field 77.4 76 81.2 76 20.0
* FT: failure temperature
a)
414243444546474849
19 20 21 22 23 24 25
Phas
ean
gle
(deg
ree)
DSR Test Temperature (℃)
Williamsburg LabWilliamsburg FieldRichland LabRichland Field
b)
3000
4000
5000
6000
7000
8000
9000
19 21 23 25
G*
(kPa
)
DSR Test Temperature (℃)
Williamsburg LabWilliamsburg FieldRichland LabRichland Field
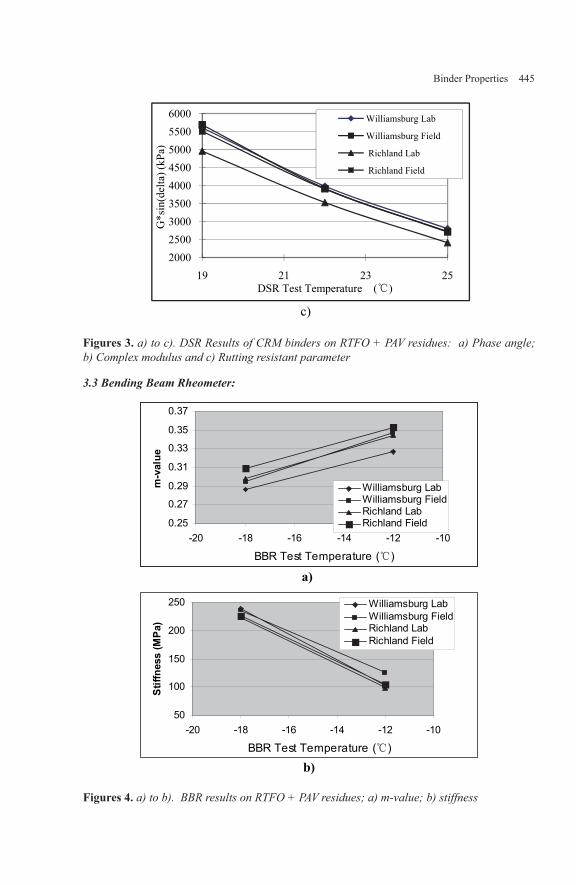
Binder Properties 445
c)
200025003000350040004500500055006000
19 21 23 25
G*s
in(d
elta
)(kP
a)
DSR Test Temperature (℃)
Williamsburg Lab
Williamsburg Field
Richland Lab
Richland Field
Figures 3. a) to c). DSR Results of CRM binders on RTFO + PAV residues: a) Phase angle; b) Complex modulus and c) Rutting resistant parameter
3.3 Bending Beam Rheometer:
b)
50
100
150
200
250
-20 -18 -16 -14 -12 -10
BBR Test Temperature (℃)
Stif
fnes
s(M
Pa)
Williamsburg LabWilliamsburg FieldRichland LabRichland Field
a)
0.25
0.27
0.29
0.31
0.33
0.35
0.37
-20 -18 -16 -14 -12 -10
BBR Test Temperature (℃)
m-v
alue
Williamsburg LabWilliamsburg FieldRichland LabRichland Field
Figures 4. a) to b). BBR results on RTFO + PAV residues; a) m-value; b) stiffness
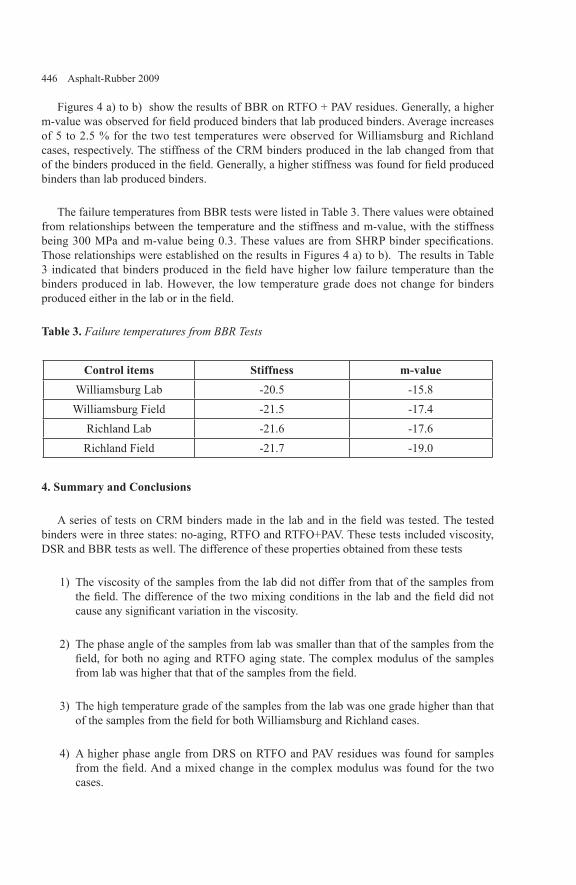
446 Asphalt-Rubber 2009
Figures 4 a) to b) show the results of BBR on RTFO + PAV residues. Generally, a higher m-value was observed for field produced binders that lab produced binders. Average increases of 5 to 2.5 % for the two test temperatures were observed for Williamsburg and Richland cases, respectively. The stiffness of the CRM binders produced in the lab changed from that of the binders produced in the field. Generally, a higher stiffness was found for field produced binders than lab produced binders.
The failure temperatures from BBR tests were listed in Table 3. There values were obtained from relationships between the temperature and the stiffness and m-value, with the stiffness being 300 MPa and m-value being 0.3. These values are from SHRP binder specifications. Those relationships were established on the results in Figures 4 a) to b). The results in Table 3 indicated that binders produced in the field have higher low failure temperature than the binders produced in lab. However, the low temperature grade does not change for binders produced either in the lab or in the field.
Table 3. Failure temperatures from BBR Tests
Control items Stiffness m-valueWilliamsburg Lab -20.5 -15.8
Williamsburg Field -21.5 -17.4Richland Lab -21.6 -17.6
Richland Field -21.7 -19.0
4. Summary and Conclusions
A series of tests on CRM binders made in the lab and in the field was tested. The tested binders were in three states: no-aging, RTFO and RTFO+PAV. These tests included viscosity, DSR and BBR tests as well. The difference of these properties obtained from these tests
The viscosity of the samples from the lab did not differ from that of the samples from the field. The difference of the two mixing conditions in the lab and the field did not cause any significant variation in the viscosity.
The phase angle of the samples from lab was smaller than that of the samples from the field, for both no aging and RTFO aging state. The complex modulus of the samples from lab was higher that that of the samples from the field.
The high temperature grade of the samples from the lab was one grade higher than that of the samples from the field for both Williamsburg and Richland cases.
A higher phase angle from DRS on RTFO and PAV residues was found for samples from the field. And a mixed change in the complex modulus was found for the two cases.
1)
2)
3)
4)

Binder Properties 447
The m-value was larger for field produced samples that lab produced samples, and very small difference in the stiffness was observed between the samples produced in the two conditions.
Filed produced samples have about 1.5℃ lower failure temperature than the lab produced samples. This difference on low failure temperature did not affect the low temperature performance grade.
5. References
Abdelrahman, Magdy A. and Carpenter, Samuel H. (1999), “Mechanism of interaction of asphalt cement with crumb rubber modifier”, Transportation Research Board, 1661, pp.106-113.
Airey, G.., Singleton, T. M. and Collop, A. (2002), “Properties of polymer modified bitumen after Rubber-Bitumen interaction”. Journal of materials in civil engineering, ASCE, Vol.14, No.4, 2002, pp.344-354.
Bahia, H. and Davies R. (1994), “Effect of Crumb Rubber Modifiers (CRM) on Performance-related properties of asphalt binders”. Journal of Asphalt Association of Paving Technologists, Vol.63, pp.414-438.
Epps, J. (1994), “Use of Recycled Rubber Tires in Highway- A synthesis of Highway Practice”, NCHRP synthesis 198.
Hanson, Douglas and Duncan, Gregory (1995), “Characterization of crumb rubber-modified binder using Strategic Highway Research Program technology”, Transportation Research Record, 1488, pp.21-31.
Huang, Baoshan, Mohammad, Louay N., Graves, Philip S., Abadie, Chris (2002),“Louisiana experience with crumb rubber-modified hot-mix asphalt pavement”, Transportation Research Record, n 1789, 02-2620, pp.1-13.
Kim, Sohee, Loh, Ssu-wei, Zhai, Huachun and Bahia, Hussain U. (2001), “Advanced Characterization of crumb rubber-modified asphalts, using protocolsdeveloped for complex binders”, Transportation Research Record, 1716, pp.15-24.
Lougheed, T.J. and Papagiannakis, A.T. (1996), “Viscosity characteristics of rubber-modified asphalts”, Journal of materials in Civil Engineering, Vol.8 (3), pp.153-156.
McGennis, Robert B. (1995), “Evaluation of Physical Properties of Fine Crumb Rubber-Modified Asphalt Binders”, Transportation Research Record, 1488, pp.63-71.
5)
6)

448 Asphalt-Rubber 2009
Noureldin, Ahmed Samy and Wood, Leonard E. (1989), “Variations in Molecular Size Distribution of Virgin and Recycled Asphalt Binders Associated With Aging”, TRB 1228, pp191-197.
Rebala, Sekhar R. and Estakhri, Cindy K. (1995), “Laboratory Evaluation of CrumbRubber Modified Mixtures Designed Using TxDOT Mixture Design Method”, Transportation Research Record, No.1515, pp.1-10.
Ruth, Byron E., Roque, Reynaldo (1995), “Crumb rubber modifier (CRM) in asphalt pavements”, Proceedings of the Transportation Congress, v 1, pp. 768-785.
Serji Amirkhanian and Mary Corley (2004), “Utilization of Rubberized Asphalt in the United States—An Overview”, Proceedings of 04 International Symposium
Advanced Technologies in Asphalt Pavements, South Korea, pp.3-13
Stroup-Gardiner, Mary, Newcomb, David E., and Tanquist, Bruce. (1993), “Asphalt-Rubber Interactions”. Transportation Research Board 1417, pp.99-108.
Tory, Kenneth, Sebaaly, Peter E., Epps, Jon A. (1996), “Evaluation systems for crumb rubber modified binders and mixtures”, Transportation Research Record, 1530, pp.3-10.

Binder Properties 449
Study on Hot Storage Stability of Reclaimed Rubber Modified Asphalt
Jinliang Li*— Yaqin Zhu**—Hongbing Wang **—Shifeng Wang *—Yong Zhang *—Yinxi Zhang *
* Research Institute of Polymer Materials, Shanghai Jiao Tong University Dongchuan Road 800, Shanghai Jiao Tong University .Shanghai 200240 [email protected]@[email protected]@sjtu.edu.cn
** Jiangsu Baoli Asphalt Co. Ltd.Industrial Park .Yunting Town Jiangyin, Jiangsu 211400 China [email protected]
ABSTRACT :The use of crumb rubber as a binder modifier could contribute to solving waste tire disposal problem and to improving the qualities of road pavements, such as the reduction of viscosity-temperature susceptibility, rutting and cracking etc. However, the key point to industrialization of asphalt rubber in plant scale is the hot storage stability, which includes two main aspects, the differences between upper and lower layers after being stored for a period of time, and the attenuation of properties along with time. The effects of processing and recipe factors on the hot storage stability were investigated in this study. Reclaimed crumb rubber was chosen as the modifier for base asphalt Baoli70#. It was found that the stability of the asphalt rubber was highly dependent on properties of crumb rubber, and the chemical compositions of the binder. In this paper, 30 wt % reclaimed rubber modified asphalt with proper hot storage stability was obtained under common polymer modified asphalt conditions. The small amount of SBS (styrene-butadiene-styrene tri-block copolymer) vulcanized by sulfur obviously improved the hot storage stability of reclaimed rubber modified asphalt (RRMA), especially under common processing conditions (185℃, shearing for 45 min).
KEYWORDS: Asphalt Rubber, Hot Storage Stability, Reclaimed Rubber, SBS

450 Asphalt-Rubber 2009
1. Introduction
With great increase in traffic volumes and vehicle loads, there exists an inevitable need to improve the properties of conventional asphalt roads, especially the resistance to rutting (permanent deformation of pavement in the form of ruts or corrugations) and thermal cracking (fracture of pavement due to the lack of flexibility, at a low temperature)(Huang, 2002; Liang, 1996). Thus, the use of waste rubber as a modifier to improve the mechanical properties of asphalt has been investigated for many years (Ruth, 1995; Shen, 2005)
The conventional asphalt rubber (crumb rubber content ≥ 15 %) is mostly produced in a wet process (Adhikari, 2000; Lu, 1997), in which the crumb rubber is added into the asphalt mixture at high temperatures (around 170-190 ℃) processing for a period of about 45 minutes and then stored until the binder is mixed with mineral aggregates. Although asphalt rubber could provide improved mechanical properties, the great increase in the viscosity brought by the high load of crumb rubber (around 20 wt %) and the poor hot storage stability are still obstacles in its plant application. During the hot storage, further continuous rubber digestion favors a decrease in the viscosity and softening point, which leads to the deterioration of properties at high temperatures. Furthermore, the precipitation of these insoluble rubber particles could spoil the asphalt rubber (Tortum, 2005). The storage stability of asphalt rubber has been identified as an important criterion for production and performance of modified asphalt for road use (Bahia HU, 1998; Navarro, 2004). Typical designs of storage tanks used in this field indicate that most asphalt rubber be stored with continuous agitation to obtain uniform temperature and homogeneity in the materials (Bahia, 1998). Therefore the improvement of the hot storage stability would produce a substantial cost reduction for the whole asphalt industry and bring enormous economical benefits.
Usually the crumb rubber content of asphalt rubber is lower than 20%wt. Because the higher content of crumb rubber would significantly increase the viscosity of asphalt rubber, which might have to be processed at a high temperature and also present a challenge to environmental protection. However the reclaimed rubber could be used to obtain reclaimed rubber modified asphalt (RRMA), with higher rubber content, lower processing viscosity and better compatibility. So the RRMA (no sharp deterioration in properties and relatively homogeneous modified asphalt system after being stored for a period of time) with good hot storage stability was investigated in this paper. In this paper, the processing conditions, such as the shearing time and temperature, and the recipe factors including the content of reclaimed rubber were investigated.
2. Experimental
2.1. Materials
Base asphalt (60-70 penetration grade) was provided by Baoli Asphalt Co Ltd (China). The basic parameters were listed in Table 1. The reclaimed crumb rubber with 40 meshes (about 0.425 mm in diameter) had been devulcanized at a high temperature and a high pressure to obtain the plastic state. In this way, the compatibility of crumb rubber and asphalt phase could be improved due to the partially degradation of rigid three dimension net works.

Binder Properties 451
Table1.Properties of base asphalt (BL-70#)
Items Units Properties Test standardPenetration 0.1mm 70 T0604-2000
*SFT ℃ 47-48 T0606-2000Viscosity Pa.s 0.350 T0625-2000
Relative density g/cm3 1.020 T0603-1993*SFT: softening temperature
SBS rubber (F503) was purchased from Maoming Petrol Co Ltd (China). It was SBS with linear-like chains, containing 30 % wt styrene, and the average molecular weight was 120,000. Different contents of SBS combination with sulfur was investigated, such as 1.0 %, 1.5 %, 2.0 % (percentage dependent on the whole mixture).
2.2. Sample preparation
A lab-scale shearing device (purchased from Weiyu Shanghai Co Ltd) was used with a stirring motor and a four-blade impeller. The rotational speed is 4500 rpm. In order to make the rubber particles swollen and be well dispersed in the asphalt phase, the massive reclaimed crumb rubber particles were submerged in the asphalt and then stored in the oven for about 30 minutes before it would be sheared. Then, the mixture was sheared for selected time at selected temperature. After that, a conventional test would be taken to evaluate the properties of RRMA. Figure 1 shows the flow chart of experimental design procedures in this study.
15%CRM
1.0%SBS+S
20%CRM 25%CRM 30%CRM
2.0%SBS+S1.5%SBS+S
45 mins 60 mins 150℃30 mins 180℃ 200℃ 230℃
BAOLI 70# APHALTCRUMB RUBBER
Figure 1. Flow chart of experimental design procedures
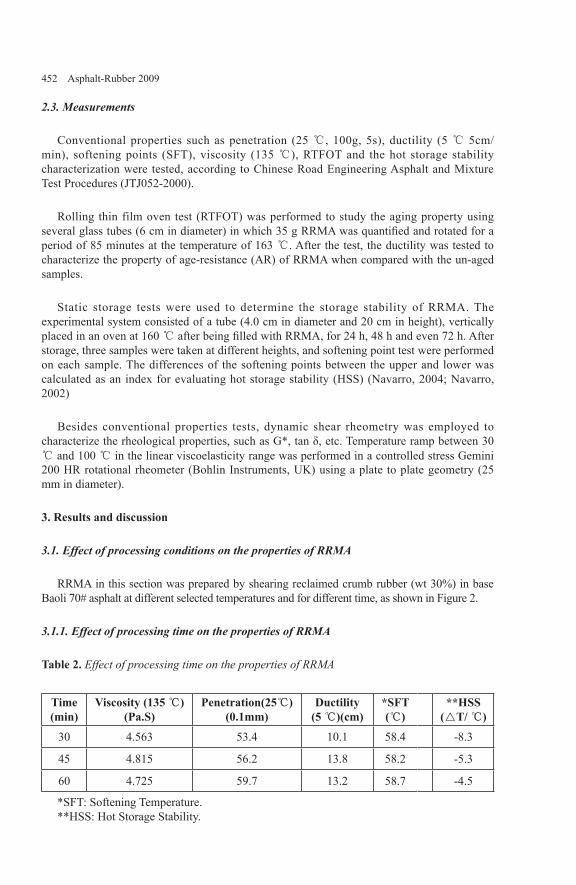
452 Asphalt-Rubber 2009
2.3. Measurements
Conventional properties such as penetration (25 ℃, 100g, 5s), ductility (5 ℃ 5cm/min), softening points (SFT), viscosity (135 ℃), RTFOT and the hot storage stability characterization were tested, according to Chinese Road Engineering Asphalt and Mixture Test Procedures (JTJ052-2000).
Rolling thin film oven test (RTFOT) was performed to study the aging property using several glass tubes (6 cm in diameter) in which 35 g RRMA was quantified and rotated for a period of 85 minutes at the temperature of 163 ℃. After the test, the ductility was tested to characterize the property of age-resistance (AR) of RRMA when compared with the un-aged samples.
Static storage tests were used to determine the storage stability of RRMA. The experimental system consisted of a tube (4.0 cm in diameter and 20 cm in height), vertically placed in an oven at 160 ℃ after being filled with RRMA, for 24 h, 48 h and even 72 h. After storage, three samples were taken at different heights, and softening point test were performed on each sample. The differences of the softening points between the upper and lower was calculated as an index for evaluating hot storage stability (HSS) (Navarro, 2004; Navarro, 2002)
Besides conventional properties tests, dynamic shear rheometry was employed to characterize the rheological properties, such as G*, tan δ, etc. Temperature ramp between 30 ℃ and 100 ℃ in the linear viscoelasticity range was performed in a controlled stress Gemini 200 HR rotational rheometer (Bohlin Instruments, UK) using a plate to plate geometry (25 mm in diameter).
3. Results and discussion
3.1. Effect of processing conditions on the properties of RRMA
RRMA in this section was prepared by shearing reclaimed crumb rubber (wt 30%) in base Baoli 70# asphalt at different selected temperatures and for different time, as shown in Figure 2.
3.1.1. Effect of processing time on the properties of RRMA
Table 2. Effect of processing time on the properties of RRMA
Time(min)
Viscosity (135 ℃) (Pa.S)
Penetration(25℃) (0.1mm)
Ductility(5 ℃)(cm)
*SFT(℃)
**HSS(△T/ ℃)
30 4.563 53.4 10.1 58.4 -8.3
45 4.815 56.2 13.8 58.2 -5.3
60 4.725 59.7 13.2 58.7 -4.5
*SFT: Softening Temperature.**HSS: Hot Storage Stability.

Binder Properties 453
Results of processing time on the properties of RRMA were listed in the Table 2. It can be seen that, with an increase of shearing time, the viscosity changed a little. The penetration and the ductility increased with shearing time, while SFT kept at around 58 ℃. All these changes in properties could be attributed to that the modified binder system became more and more homogeneous along with time. The longer processing time, the more homogeneous the modified system would be. In other words, the equivalence between the swelling degree and the degradation of rubber particles in asphalt phase might take prominent effects on the comprehensive properties, especially the hot stability (Abdelrahman, 1996). When shearing time exceeded 60 minutes, the difference of SFT between the upper and lower in static storage test could be reduced to the range of 5 ℃. It has already been reported (Sundaquan, 2004) that during the process of asphalt rubber, there is a coexistence of devulcanization and swelling. When the former takes the predominant effect, the viscosity would decrease due to the net effect.
Through comprehensive analysis, it was recommended that 45 minutes shearing time would be selected as a favorable line in production. In this way, elasticity of reclaimed crumb rubber could be remained as well as partly devulcanization under the processing conditions, at which point hot storage stability could be highly improved.
3.1.2. Effect of processing temperature on the properties of RRMA
Table 3. Effect of processing temperature on the properties of RRMA
Temperature (℃) Penetration(25 ℃) (0.1mm) *SFT(℃) **HSS(△T / ℃)
150 46.2 68.2 -7.3180 56.5 59.0 -4.7200 63.4 50.5 -3.5230 72.2 51.4 -1.4
*SFT: Softening Temperature.**HSS: Hot Storage Stability.
According to the experimental flow chart, four temperatures, as described above, were chosen to investigate the influence of the shearing temperatures on comprehensive properties of RRMA, on the base of 30 wt % reclaimed crumb rubber shearing for 45 minutes. Test results were listed above in Table 3.
It can be concluded from Table 3 that with increase of processing temperature, there was a great increase in the penetration, which might be due to that the added crumb rubber particles had softened and the macro-rubber chain has been depolymerized into small sections under the high cure conditions. As has been reported by some authors (Batchelor, 1972, Junan, 2009), the micron-sized rubber particles might change from solid state into oil liquid phase and lose the inherent elasticity of the rubber phase. Meanwhile, it was found that when the processing temperature exceeded the 200 ℃, the rubber particles were immediately dissolved in the asphalt mixture. This phenomenon, however, was difficult to observe at common processing temperature, from which it can be seen that the devulcanization and degradation

454 Asphalt-Rubber 2009
played an important role in improving the compatibility between the two phases. (Lee, 2006). High cure temperature could result in breaking crosslink bond and destroying the net work partially, while still remaining the elastic core and basic properties.
From the viewpoint of processing conditions, balance between swelling and devulcanization should be focused as the central issue of influence on RRMA properties, regardless of time and temperature. It is imperative that the material be prepared at high cure, or near high cure level to negate storage settling and installation problems (J. F. Chipps, 2001).
3.2. Effect of recipe factors on the properties of RRMA
In this part, recipe factors were studied, including the content of reclaimed crumb rubber and SBS combined with sulfur.
3.2.1. Effect of reclaimed crumb rubber (RCR) content on the properties of RRMA
Table 4. Effect of RCR contents on the properties of RRMA
RCR content(wt %)
Viscosity(135 ℃)(Pa.S)
Penetration(25 ℃)
(0.1mm)
Ductility(5 ℃)(cm)
*SFT (℃)
**HSS(△T / ℃)
15 2.352 57.7 17.5 55.6 -8.0
20 2.775 53.3 16.3 57.5 -7.325 4.925 43.2 15.7 63.3 -5.330 5.322 38.4 13.8 68.8 -8.330a >10 25.5 8.0 70.2 -13
*SFT: Softening Temperature.
**HSS: Hot Storage Stability.
30a: wt 30% conventional crumb rubber in contrast with above 30% wt reclaimed crumb rubber.
According to the above investigation of processing condition, mild cure condition was chosen and modified asphalt was sheared for 45 minutes at 180 ℃. Mixture with 15 %, 20 %, 25 % and 30 % of reclaimed crumb rubber by mass was considered to study changes of conventional properties with reclaimed crumb rubber content. It is obvious that rubber from the waste tire is very cheap, which means that under conditions of improving or even maintaining mechanical properties of the original binder, the more waste tire used, the more beneficial the product would be.
In this modified system, the addition of reclaimed crumb rubber constrained the flow of asphalt fluid and increased the viscosity, while enhancing the cohesion and flexibility. Table 4 shows the conventional properties. A general trend was found that penetration and ductility
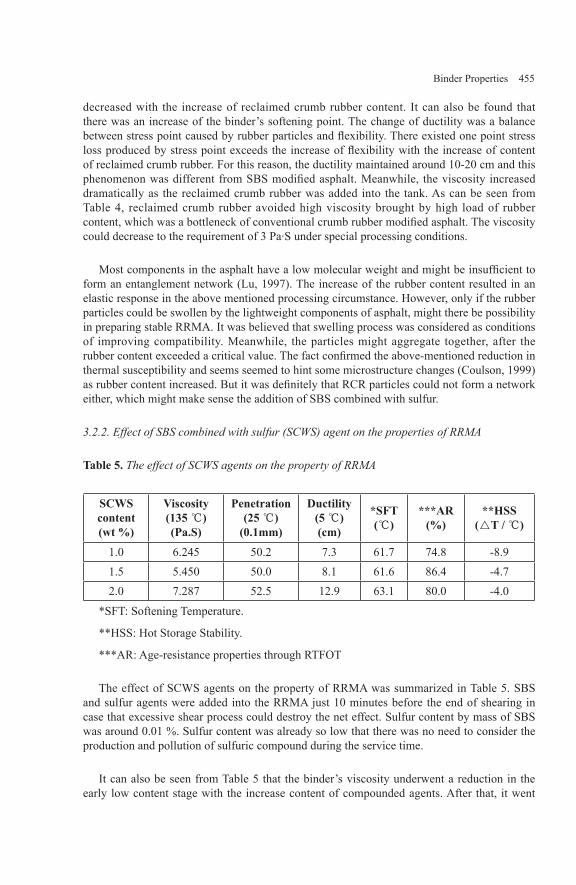
Binder Properties 455
decreased with the increase of reclaimed crumb rubber content. It can also be found that there was an increase of the binder’s softening point. The change of ductility was a balance between stress point caused by rubber particles and flexibility. There existed one point stress loss produced by stress point exceeds the increase of flexibility with the increase of content of reclaimed crumb rubber. For this reason, the ductility maintained around 10-20 cm and this phenomenon was different from SBS modified asphalt. Meanwhile, the viscosity increased dramatically as the reclaimed crumb rubber was added into the tank. As can be seen from Table 4, reclaimed crumb rubber avoided high viscosity brought by high load of rubber content, which was a bottleneck of conventional crumb rubber modified asphalt. The viscosity could decrease to the requirement of 3 Pa·S under special processing conditions.
Most components in the asphalt have a low molecular weight and might be insufficient to form an entanglement network (Lu, 1997). The increase of the rubber content resulted in an elastic response in the above mentioned processing circumstance. However, only if the rubber particles could be swollen by the lightweight components of asphalt, might there be possibility in preparing stable RRMA. It was believed that swelling process was considered as conditions of improving compatibility. Meanwhile, the particles might aggregate together, after the rubber content exceeded a critical value. The fact confirmed the above-mentioned reduction in thermal susceptibility and seems seemed to hint some microstructure changes (Coulson, 1999) as rubber content increased. But it was definitely that RCR particles could not form a network either, which might make sense the addition of SBS combined with sulfur.
3.2.2. Effect of SBS combined with sulfur (SCWS) agent on the properties of RRMA
Table 5. The effect of SCWS agents on the property of RRMA
SCWScontent(wt %)
Viscosity(135 ℃)(Pa.S)
Penetration(25 ℃)
(0.1mm)
Ductility(5 ℃)(cm)
*SFT(℃)
***AR(%)
**HSS(△T / ℃)
1.0 6.245 50.2 7.3 61.7 74.8 -8.91.5 5.450 50.0 8.1 61.6 86.4 -4.72.0 7.287 52.5 12.9 63.1 80.0 -4.0
*SFT: Softening Temperature.
**HSS: Hot Storage Stability.
***AR: Age-resistance properties through RTFOT
The effect of SCWS agents on the property of RRMA was summarized in Table 5. SBS and sulfur agents were added into the RRMA just 10 minutes before the end of shearing in case that excessive shear process could destroy the net effect. Sulfur content by mass of SBS was around 0.01 %. Sulfur content was already so low that there was no need to consider the production and pollution of sulfuric compound during the service time.
It can also be seen from Table 5 that the binder’s viscosity underwent a reduction in the early low content stage with the increase content of compounded agents. After that, it went

456 Asphalt-Rubber 2009
up to a high viscosity. This might possibly be caused by the effect of crosslink between the rubber particles in terms of SBS effect. Our following work would further discover this optimal content, which may bring better storage stability and suitable viscosity. It can also be found that the penetration did not change a lot, although there were some differences in SBS compounds contents. The addition of the crosslink agents increased the ductility greatly because the agent was useful in forming the networks structures in the modified system. However, if the ratio between SBS and sulfur agents went high enough, the materials might become congealed definitely due to the over-network effects (Dogic, 2000). With great excitement, the addition of these agents could increase the hot storage stability of RRMA, which was characterized in the study by differences between SFT as HSS (hot storage stability). Therefore the combination of crosslink agents and SBS rubber can be used to produce a stable entangled system, by which the particles could be hold from agglomeration.
A small amount of SBS could yield more homogeneous RRMA, which has better hot storage stability than the unmodified asphalt. Although the costs of SBS rubber are much higher than reclaimed crumb rubber, it is quite worth adding some amount of SBS to the modified asphalt system, giving consideration to the whole mechanical properties, especially to the hot storage stability(Chandra, 2009).
3.3 Preparation of hot storage stable RRMA
Considering all the factors investigated in this paper, homogeneous and hot storage stable and high load rubber content (30 wt %) RRMA binder was prepared. The results of conventional tests were listed in Table 6. The static storage test was used to characterize the hot storage stability of this kind of RRMA. After being stored for 48 hours, the hot storage stability index was calculated as -2.4 ℃, as described in the Table 6 below, satisfying construction requirement in China of polymer modified asphalt binder. Rheological properties of the three samples (upper mid and low samples) from the storage tanks were tested, from which it could be found that the differences among the three parts were minor and neglectable.
Table 6. Conventional test results of hot storage stable RRMA
Item Unit Results Requirements Methods
Penetration(25 ℃) 0.1 mm 54.4 >25 T0604-2000
*SFT ℃ 63.5 >54 T0606-2000Viscosity(135 ℃) Pa.S 2.050 1.5-4 T0625-2000
*HSS ℃ -2.4 ︱△T︱<5 ℃ /*SFT: Softening Temperature.
**HSS: Hot Storage Stability.

Binder Properties 457
30 40 50 60 70 80 900.5
1.0
1.5
2.0
2.5
3.5
4.0
4.5
5.0
5.5
E
E
E
E
E
G*(
pasc
al)
Tanδ
Temperature(℃)
Upper G*Upper tanδMid G*Mid tanδLow G*Low tanδ
Figure 3. Rheological properties of hot storage stable RRMA
4. Conclusion
From the previous discussion, these conclusions could be summarized as follows:
Crumb rubber used in this study has been devucalized- a process in which the rubber particles were subjected to treatment by heat, pressure or some other extreme conditions to regenerate the rubber compound to its plastic state partly (Zanzotto, 1996). Meanwhile, the crosslinking structure has been destroyed to some extent. Consequently, the hot storage stability of RRMA was improved due to the good compatibility between crumb rubber and asphalt phase, which, furthermore, made the addition of reclaimed crumb rubber to a large content and the reduction in costs possible.
It was strongly recommended that reclaimed rubber would be used while producing asphalt rubber binders. As discovered from above investigation, high content of reclaimed crumb rubber did not bring higher processing viscosity at 135 ℃, due to the favorable compatibility. Meanwhile, considering the network effect of vulcanized SBS, a relative mild method was adopted (shearing at 180 ℃ for 45mins).
It was necessary to import a small amount of block rubber combined with crosslink agents, such as SBS with sulfur, to improve the comprehensive properties, especially the hot storage stability. Meanwhile the elasticity and ductility could also be improved a lot; however the binder might become cured and stiff if too much sulfur was added.
This kind of asphalt rubber could not only improve the service behavior but can also solve the “black pollution” brought by the waste tire rubber, which has become great concern of the world (Adhikari, 2000). With the rapid development of Chinese economy,
I.
II.
III.
IV.

458 Asphalt-Rubber 2009
there would be great burden in the traffic transport systems as well as great demands in road asphalt (Rebala, 1995), all of which indicate that the asphalt rubber would have glorious future in China.
5. Acknowledgement
The work is part of a research project sponsored by National Key Technology R&D Program (2008ABC46B08) in Ministry of Science in People’s Republic of China. The authors gratefully acknowledge its financial support.
Reference:
Abdelrahman Magdy A, Carpenter Samuel H. Mechanism of interaction of asphalt cement with crumb rubber modifier. TRR 1999;1661:106–113.
Adhikari B, De D, Maiti S. Reclamation and recycling of waste rubber. Prog Polym Sci;Vol.25,No.7,2000,P909–48.
Bahia HU, Zhai H. A new method for the storage stability test ofmodified asphalt. Prep Am Chem Soc, Div Fuel Chem ,Vol,43,1998,P1041–5.
Batchelor GK, Green JT. J Fluid Mech 1972;56:375.
Chandra K. Akisetty, Soon-Jae Lee *, Serji N. Amirkhanian High temperature properties ofrubberized binders containing warm asphalt additives Construction and Building Materials ;Vol.23,2009.P565–573
Coulson JM, Richardson JF. In: Backhurst JR, Harker JH, editors. Chemical engineering, 4thed. Particle technology and separation processes, vol. 2. Great Britain: Butterworth-Heinemann; 1999.
Dogic Z, Philipse AP, Fraden S, Dhont JKG. Concentrationdependant sedimentation of colloidal rods. J Chem Phys;Vol.113,No.18,2000,P8368–80
Huang B, Mohammad LN, Graves PS, Abadie C. Louisiana experience with crumb rubber-modified hot-mix asphalt pavement.Transport Res Rec: J Transport Res Board 2002; 1789:1–13.
Jason Fleming Chipps.The Industrial Manufacture of Tire Rubber-Modified Asphalts withEnhanced Rheological Performance and Improved Longevity. [D].Texas:Texas A&M University ,2001
Junan S, Amirkhanian SJ, Feipeng X, Boming T.Influence of surface area and size of crumbrubber on high temperature properties of crumb rubber modified binders. Construction and Building Materials 23(2009) p304-310

Binder Properties 459
Lee SJ, Amirkhanian SN, Thodesen C, Shatanawi K. Effect of compaction temperature on rubberized asphalt mixes, In: Proceedings, asphalt rubber 2006, Palm Springs, CA, November 2006.
Liang RY, Lee S. Short-term and long-term aging behavior of rubber modified asphalt pavingmixtures. Transport Res Rec: J Transport Res Board 1996;1530:11–7.
Lu X, Isacsson U. Rheological characterization of styrene-butadienestyrene copolymer modified bitumens. Constr Build Mater 1997;11(1):23–32.
Navarro F.J., Partal P, Martı´nez-Boza F., Gallegos C. Thermo-rheological behaviour and storage stability of ground tirerubber-modified bitumens, Fuel 83 (2004) 2041–2049
Navarro FJ, Partal P, Martı´nez-Boza F, Valencia C, Gallegos C. Rheological characteristics ofground tire rubber-modified bitumens. Chem Eng J 2002;89:53–61.
Rebala SR, Estakhri CK. Laboratory evaluation of crumb rubber modified mixtures designedusing TxDOT mixture design method. Transport Res Rec 1995;1515:1–10.
Rubber Manufacturer’s Association, Scrap Tire Markets in the United States, 2005 Edition, November, 2006.
Ruth BE, Roque R. Crumb rubber modifier (CRM) in asphalt pavements. In: Proceedings ofthe transportation congress; 1995. p.768–85.
Shen J, Amirkhanian S, Lee S-J. Effects of rejuvenating agents on recycled aged rubber modified binders. Int J Pavement Eng 2005;6(4):273–9.
Soteriou MC, Mosley JH. On the impact of collisions on particle dispersion in a shear layer.52nd Annual Meeting of the American Physical Society’s Division of Fluid Dynamics; 1999. p. 160.
SUN Da-quan , XU Xiao-liang, LV Wei-min,” Key technical parameters analysis for production technology of asphalt rubber”, Journal Of Changsha Communications University,Vol.24,No.3,2004,P.33-37.
Tortum A, Celik C, Aydin AC. Determination of the optimum conditions for tire rubber in asphalt concrete. Build Environ 2005;40(11):1492–504.
Zanzotto L, Kennepohl GJ. Development of rubber and asphalt binders by depolymerizationand devulcanization of scrap tires in asphalt. Transport Res Rec 1996;1530:51–8.


Binder Properties 461
A s p h a l t R u b b e r Wi t h Te m p o r a r i l y Decreased Viscosity
Szabolcs Biro* — Andras Geiger** — John Kay*
*Ecopath Industries14821 N. 73rd St., Scottsdale AZ, 85260, USA [email protected]@stratcoglobal.com
**MOL – Hungarian Oil and Gas PLC2443, Szazhalombatta, P.O. Box 1, [email protected]
ABSTRACT. Application methods of used vegetable oil were investigated in asphalt rubber to temporarily decrease viscosity. It was found that linear unsaturated hydrocarbons effect the dispersion of rubber in asphalt and are at the same time sensitive for oxygenation reactions. By using the appropriate raw materials a 36-38% viscosity reduction was achieved with 0.1% vegetable oil. An Arrhenius model based rheological equation was developed to improve the ability to estimate the viscosity decreasing effect achieved by applying various vegetable oil concentrations. By comparing the viscosity decrease with different polymer modified asphalts, it was found the transport processes between the vegetable oil and the crumb rubber further reduces the viscosity of the crumb rubber containing binders.
KEYWORDS: asphalt rubber, viscosity, Arrhenius equation, warm asphalt additive, vegetable oil

462 Asphalt-Rubber 2009
1. Introduction
Asphalt rubber (AR) has already proven itself an excellent material for various paving and building industrial applications (Zareh, et al., 2006). However, AR also has disadvantages (Biro, et al., 2007 and Memon, 1999) such as a significant tendency for phase separation and higher viscosity which requires elevated temperatures for pumping and mixing. To prevent phase separation AR typically needs to be used within 4 hours of preparation (Shatnawi, 2003) and viscosity will still be a major issue. Heating the binder is essential to decrease viscosity although this results in a significant cost increment. The generally accepted method to decrease viscosity is to mix the rubber with an aromatic based (>50%) solvent (Potgieter, 2003) which promotes the swelling process (Abdelrahman, 2006) or add low molecular weight hydrocarbons into the modified binder to achieve the softening effect. Because aromatic solvents are very toxic and release a significant amount of vapour this option is not desirable. The presence of low molecular weight hydrocarbons, especially aromatics, greatly lowers the flash point and requires strict measures to protect against fires during storage, transportation and maintenance (Pasquier, 2000).
Warm asphalt additives offer technical solutions for this problem however, there are a few concerns regarding their application. Essentially the following methods can work to support the previously discussed theories (D’Angelo, et al., 2008):
– Blending crystallized water containing inert (mostly synthetic zeolite based) additives (or water injecting technologies during asphalt mixing) where the evaporating water generates foam and reduces the viscosity of the binder (Zettler, 2006). Obviously, neither the water nor the zeolite has a modifying effect on the asphalt structure. The above method can create issues in regards to stripping, since asphalt dissolves water (forming secondary chemical bonds between the polar water and any polar asphalt component) because of its polarity (Chilingarian, et al., 1994).
Blending paraffinic wax into the asphalt shifts the high PG grading values in a favourable way, but at the same time will change the structure of the asphalt, resulting in a lower elasticity and worse cold properties (Speight, 2001). Paraffin will not react with any asphalt components, but its presence will result in property changes. Wax producers can normally only guarantee large molar mass distributions approx. C35-C110), which makes the final property estimation even more difficult.
Asphalt-water emulsions provide a good solution to improve workability temperatures, but these acid or base type emulsifiers are not really called warm asphalt additives. It should also be noted that asphalt-water emulsions are very hard to produce from inhomogeneous binders (such as a 15-20% rubber content AR).
During the research study a novel method was investigated which offers decreased viscosity, but only for a limited amount of time (several hours). A commercially available vegetable oil, containing free fatty acids (FFA) at high concentration and having different levels of unsaturation, was added in different ways and at various concentrations. The rheological properties for asphalt rubber and other polymer modified asphalts were studied to better understand the softening and hardening effects.
-
-

Binder Properties 463
2. Materials, preparation and testing methods
The neat asphalt (Table 1.) was of a commercially available Russian crude origin, PG 58-22, because the compatibility of the crumb rubber (mostly from a stability point of view) is better if a high aromatic content virgin binder is used during manufacturing (Liang, 1999).
Table 1. Properties of neat asphalt
Neat asphalt PG 58-22Saturates*, % 5Aromatics*, % 54Resins*, % 22Asphaltenes*, % 19G*/sin δ, kPa 1.9Viscosity at 135℃, mPas 570Viscosity at 180℃, mPas 90After RTFOT, change of mass, % +0.028After RTFOT, G*/sin δ, kPa 5.6After PAV, creep stiffness at -12 ℃, MPa 160After PAV, m-value at -12 0.34After PAV, G*·sin δ, kPa 3953Flash point (Cleveland method, open cup), ℃ >250
* IATROSCAN group analysis.
An analysis of ambient crumb rubber was performed in accordance with ASTM D 297. The crumb rubber gradation met the Arizona DOT requirements, while the chemical analysis showed common values for the chemical composition of the vulcanized rubber (Table 2.), which fulfilled Florida state requirements. Most states in the United States and many other countries have not developed standards for the chemical composition of the rubber. However, rubber chemical composition has an impact on the performance of the modified binder (Fazekas, 2005). Typically only gradation is specified.
Table 2. Properties of crumb rubber
Crumb rubber CRSpecific gravity, wt% 1.041Moisture content, wt% 0.5Ash content wt% 3.6Carbon black content, wt% 32.7Extract content (acetone and chloroform), wt% 7.3Sulfur content*, wt% 1.5

464 Asphalt-Rubber 2009
*determined by Inductive Connected Plasma - Atom Emission Spectroscopy (ICP-AES) method, which was found to be more accurate than regular analytical methods (Mikolczi et. al, 2008).
The used vegetable oil had a low concentration of monoacid triacylglycerol, but had high iodine/bromide, saponification and acid numbers. The applied concentration varied between 0-2 percent by weight of total binder.
Asphalt rubber was produced by blending the components at 177℃ for one hour. The 20 wt% crumb rubber was introduced into hot asphalt, in one dosage, after different types of treatments:
The spraying method consisted of pouring hot (110±30℃) vegetable oil into the crumb rubber; the mixture was stirred for 30 seconds then introduced to the asphalt.
Surface activation method was carried out by blending the hot vegetable oil (130 C±30℃) with the crumb rubber for 30 minutes.
Direct blending method was carried out by pouring the hot vegetable oil into the AR.
Since it is recommended to use the AR within several hours of preparation (Shatnawi, 2003) the study of the hardening effects was the primary focus. To obtain realistic results for the hardening effect, before testing, asphalt mixing conditions had to be simulated (high temperature, thin layer, presence of fresh oxygen). The final product was poured into aluminium moulds (6g each), and put into an oven for 1-5 hours, where hot air ventilation was continuously provided. Samples were taken out after each hour and all flow testing was accomplished immediately by using rheometers or viscometers. Whereas the RTFO (ASTM D2872) is the recommended method for the simulation of asphalt mixing conditions, in case of heavily modified asphalts, (such as a 20% wt. AR) this test can cause difficulties because of the very high viscosity of the binder. RTFO was developed for neat asphalts (Hveem, et al., 1963), and the high viscosity usually causes uneven aging (Bell, 1989), that is why a modified Thin Film Oven Test was carried out. However, it should be noted that many asphalts exhibit volatile loss in the TFOT and RTFO in excess of what is typically lost during the lower temperature long-term field age testing (Petersen, 1989).
An Anton Paar Physica MC301 dynamic shear rheometer was employed for the rheological testing (ASTM D7175), within the linear viscoelasticity region, by using a 25mm plate and plate geometry. At higher temperatures (135-180℃), where asphalt rubber binders act mostly as Newtonian fluids (Toth, 2000), viscosities were measured by Brookfield viscometer (ASTM D 4402-02). For the measured data the Arrhenius equation (Eq.1.) was used to characterize the viscosity temperature susceptibility (Boza, 2001).
[1]
where, η is dynamic viscosity (mPas), T is temperature (K), c1 and c2 are constants.
-
-

Binder Properties 465
The Arrhenius equation was used for modelling thermo-rheologically simple materials (Barnes, 2000), whose chemical structure was stable at the testing temperatures (135-180℃). Polymer modified asphalts, such as asphalt rubber, are sensitive at temperatures exceeding 180-190℃ (because of more intensive depolymerisation/devulcanization (Abdelrahman, 2006), therefore 180℃ was the highest testing temperature used.
3. Results
At the preliminary stage several types of vegetable oils/ animal fats were tested, and their viscosity decreasing effects were studied (Biro, et al., 2008). Based on viscosity decreasing and later the increasing hardening effect, several differences were observed (Figure 1.), depending mostly on their degree of unsaturation and acidity. These findings showed that the appropriate raw materials with the correct combination of properties need to be chosen; otherwise the effect will not be favourable. The whole process was temperature sensitive as well.
Shear rate, sec-10.001 0.01 0.1 1 10 100
Com
plex
visc
osity
at60
o C,P
as
1e+3
1e+4
1e+5controlvegetable oil 1vegetable oil 2
Figure 1. Viscosity decreasing effects of different vegetable oils at 0.1wt% concentration.
In this next study the effect of a high FFA content from used restaurant grease at different concentrations is presented.
3.1. Application method of vegetable oil
Not only did the properties of the vegetable oil affect the viscosity, but the application method also resulted in a viscosity decreasing effect (Figure 2). In the instance of the direct blending method, a 36-38% viscosity decreasing effect was achieved (135-180 ℃), compared to the control AR. The spraying method resulted in lowering the viscosity (50-54%), while the rubber activation method resulted in an even better viscosity decreasing effect (60-62%).
The main difference between the softening effect of direct blending and the activation methods were investigated comparing the transport processes between the vegetable oil and the rubber. During the activation method, in certain circumstances the rubber is immersed into

466 Asphalt-Rubber 2009
vegetable oil, linear aliphatic chains penetrate into the rubber because of their compatibility with the linear polymeric skeleton of the rubber (Gawel, et al., 2006). Additionally, the vegetable oil has a predisposition to polymerize under the action of oxygen (Pasquier, 2000), and it can be grafted to the surface of the rubber. The transport process is not a one way process. Fatty acids are components of the rubber polymer curing system and move from the rubber to the asphalt and vice-versa. Fatty acids are mainly concentrated in the naphthene-aromatic fraction of the asphalt.
Shear rate, sec-10.001 0.01 0.1 1 10 100
Com
plex
visc
osity
at60
o C,P
as
1e+3
1e+4
1e+5controlvegetable oil 1vegetable oil 2
Figure 2. Viscosity decreasing effects of different treating methods at 0.1wt% oil concentration.
The surface activation showed the best viscosity decreasing effect, this application method would be more complicated on a commercial scale than direct blending (not considering spraying, which would require extra equipment). Therefore, the focus for practical purposes was only the direct blending method as a solution, which was further studied.
3.1. Viscosity decreasing effect
It was apparent that by increasing oil concentration lower AR viscosities were achieved. There is a method used to estimate the softening effect, at specified temperatures, for which this estimate is valid and critical for appropriate binder and mix design.
3.1.1. Viscosity decreasing effect on asphalt rubber
Increasing the vegetable oil concentration improved the viscosity lowering effect (Figure 3.) by simple dilution. Very likely, the presence of the oil was more important than the transport effects between the oil and the rubber. An increased oil concentration resulted in a very low viscosity, which would be very unfavourable with blending results during paving. Therefore, finding the optimal oil concentration is critical.
An Arrhenius model correlated with the test data very well (R2=0.97-0.99). Therefore,
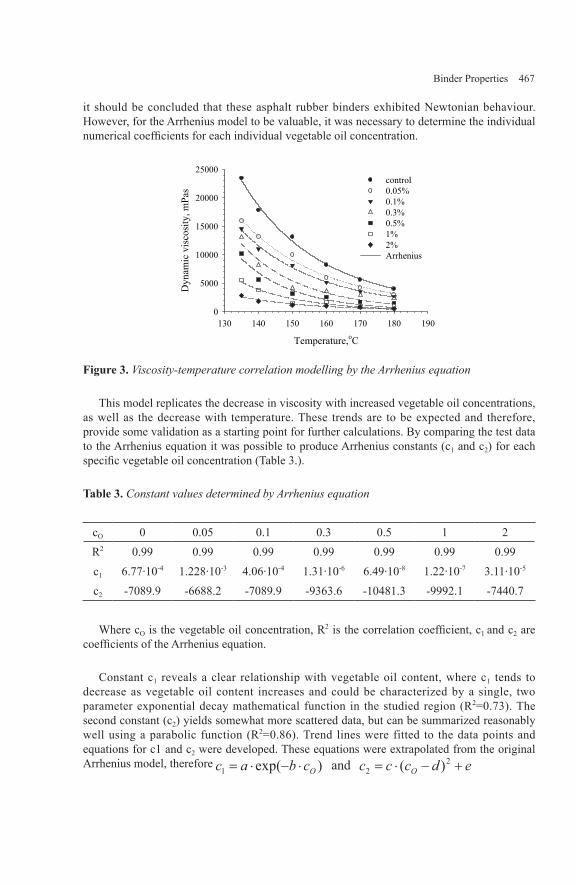
Binder Properties 467
it should be concluded that these asphalt rubber binders exhibited Newtonian behaviour. However, for the Arrhenius model to be valuable, it was necessary to determine the individual numerical coefficients for each individual vegetable oil concentration.
Temperature,oC
130 140 150 160 170 180 190
Dyn
amic
visc
osity
, mPa
s
0
5000
10000
15000
20000
25000control0.05%0.1%0.3%0.5%1%2%Arrhenius
Figure 3. Viscosity-temperature correlation modelling by the Arrhenius equation
This model replicates the decrease in viscosity with increased vegetable oil concentrations, as well as the decrease with temperature. These trends are to be expected and therefore, provide some validation as a starting point for further calculations. By comparing the test data to the Arrhenius equation it was possible to produce Arrhenius constants (c1 and c2) for each specific vegetable oil concentration (Table 3.).
Table 3. Constant values determined by Arrhenius equation
cO 0 0.05 0.1 0.3 0.5 1 2R2 0.99 0.99 0.99 0.99 0.99 0.99 0.99c1 6.77·10-4 1.228·10-3 4.06·10-4 1.31·10-6 6.49·10-8 1.22·10-7 3.11·10-5
c2 -7089.9 -6688.2 -7089.9 -9363.6 -10481.3 -9992.1 -7440.7
Where cO is the vegetable oil concentration, R2 is the correlation coefficient, c1 and c2 are coefficients of the Arrhenius equation.
Constant c1 reveals a clear relationship with vegetable oil content, where c1 tends to decrease as vegetable oil content increases and could be characterized by a single, two parameter exponential decay mathematical function in the studied region (R2=0.73). The second constant (c2) yields somewhat more scattered data, but can be summarized reasonably well using a parabolic function (R2=0.86). Trend lines were fitted to the data points and equations for c1 and c2 were developed. These equations were extrapolated from the original Arrhenius model, therefore

468 Asphalt-Rubber 2009
Vegetable oil concentration, wt%0.0 0.5 1.0 1.5 2.0
C1
0.0000
0.0002
0.0004
0.0006
0.0008
0.0010
0.0012
0.0014f(cO)= a*exp(-b*cO)
Vegetable oil concentration, wt%0.0 0.5 1.0 1.5 2.0
C2
-11000
-10000
-9000
-8000
-7000
-6000
f(cO) = c*(cO-d)2+e
Figure 4. Viscosity-temperature correlation modelling by the Arrhenius equation
Substituting these equations back to the original Arrhenius equation yields the extended form of the Arrhenius model (Eq.2.), exact values of the constants used in Eq.2. are given in Table 4. By using this relationship, the viscosity of the asphalt rubber can be estimated as a function of vegetable oil concentration and temperature.
[2]
Where η is the viscosity (mPas), cO is the vegetable oil concentration (wt %), TV is the temperature (K), a, b, c, d, and e are constants (values are given in Table 4.)
A poor correlation was obtained by using the original value (R2=0.34). However, the constant values were optimized by using the “generalized reduced gradient nonlinear optimization”, (R2=0.98, Table 4.). Equation [2] allows viscosity calculations for a given vegetable oil concentration (0-2wt %) and temperature (135-180℃). This could have practical importance mostly at a binder design level.
Table 4. Constant values determined by Arrhenius equation
Coefficients of Eq.2 a b c d eOriginal parameters 0.0009 5.1111 3260.6405 1.0283 -10373.0555R2 (original parameters): 0.34Optimized parameters 0.0004 6.3450 -273.8976 -3.0535 -4655.7347R2(optimized parameters): 0.98
By using all three variables (viscosity, oil concentration and temperature) it is possible to illustrate the results in a three dimensional plot (Figure 5.), which shows the general trend of the softening effect of vegetable oil in AR.
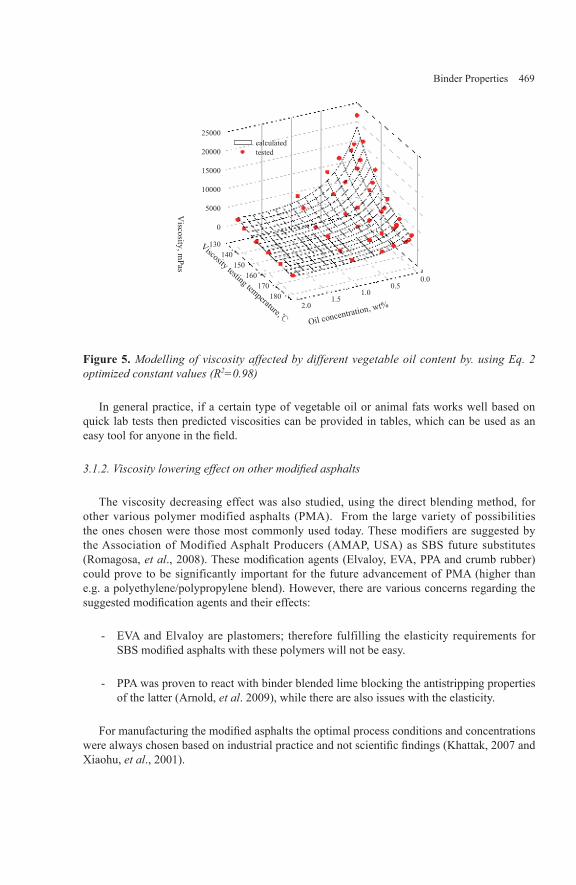
Binder Properties 469
0
5000
10000
15000
20000
25000
0.00.5
1.01.5
2.0
130140
150160
170180
Viscosity,m
Pas
Oil concentration, wt%
Viscosity testing temperature,℃
calculatedtested
Figure 5. Modelling of viscosity affected by different vegetable oil content by. using Eq. 2 optimized constant values (R2=0.98)
In general practice, if a certain type of vegetable oil or animal fats works well based on quick lab tests then predicted viscosities can be provided in tables, which can be used as an easy tool for anyone in the field.
3.1.2. Viscosity lowering effect on other modified asphalts
The viscosity decreasing effect was also studied, using the direct blending method, for other various polymer modified asphalts (PMA). From the large variety of possibilities the ones chosen were those most commonly used today. These modifiers are suggested by the Association of Modified Asphalt Producers (AMAP, USA) as SBS future substitutes (Romagosa, et al., 2008). These modification agents (Elvaloy, EVA, PPA and crumb rubber) could prove to be significantly important for the future advancement of PMA (higher than e.g. a polyethylene/polypropylene blend). However, there are various concerns regarding the suggested modification agents and their effects:
EVA and Elvaloy are plastomers; therefore fulfilling the elasticity requirements for SBS modified asphalts with these polymers will not be easy.
PPA was proven to react with binder blended lime blocking the antistripping properties of the latter (Arnold, et al. 2009), while there are also issues with the elasticity.
For manufacturing the modified asphalts the optimal process conditions and concentrations were always chosen based on industrial practice and not scientific findings (Khattak, 2007 and Xiaohu, et al., 2001).
-
-
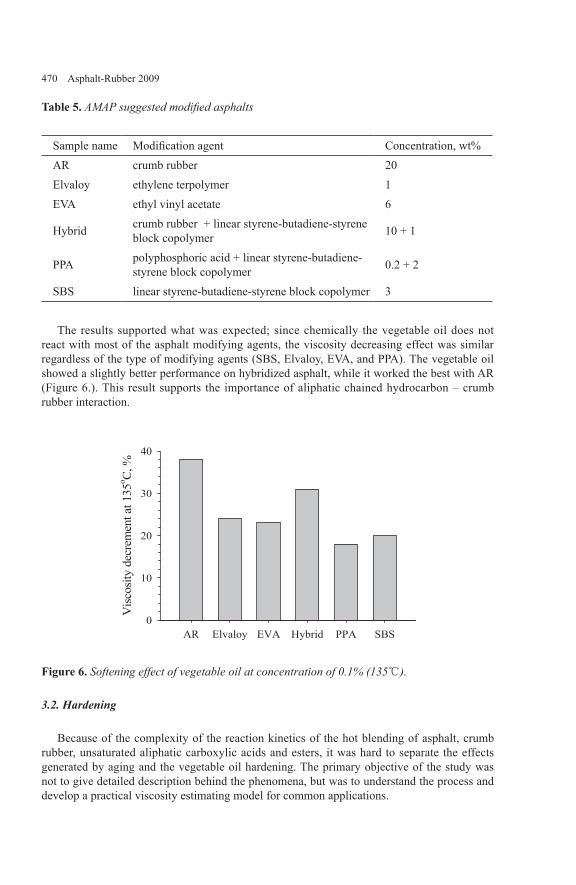
470 Asphalt-Rubber 2009
Table 5. AMAP suggested modified asphalts
Sample name Modification agent Concentration, wt%AR crumb rubber 20Elvaloy ethylene terpolymer 1EVA ethyl vinyl acetate 6
Hybrid crumb rubber + linear styrene-butadiene-styrene block copolymer 10 + 1
PPA polyphosphoric acid + linear styrene-butadiene-styrene block copolymer 0.2 + 2
SBS linear styrene-butadiene-styrene block copolymer 3
The results supported what was expected; since chemically the vegetable oil does not react with most of the asphalt modifying agents, the viscosity decreasing effect was similar regardless of the type of modifying agents (SBS, Elvaloy, EVA, and PPA). The vegetable oil showed a slightly better performance on hybridized asphalt, while it worked the best with AR (Figure 6.). This result supports the importance of aliphatic chained hydrocarbon – crumb rubber interaction.
AR Elvaloy EVA Hybrid PPA SBS
Vis
cosi
tyde
crem
enta
t135
o C,%
0
10
20
30
40
Figure 6. Softening effect of vegetable oil at concentration of 0.1% (135℃).
3.2. Hardening
Because of the complexity of the reaction kinetics of the hot blending of asphalt, crumb rubber, unsaturated aliphatic carboxylic acids and esters, it was hard to separate the effects generated by aging and the vegetable oil hardening. The primary objective of the study was not to give detailed description behind the phenomena, but was to understand the process and develop a practical viscosity estimating model for common applications.

Binder Properties 471
It was found that the viscosity decreasing and later hardening effect is manifest in:
Viscosity decreasing effect caused by the presence of lower molecular weight, short carbon chains of vegetable oil (C8-C22 of each ester chains) and larger chemical compounds and associates in the asphalt.
Viscosity increasing effect of aging (mostly from oxygenation, volatility and time) (structure rearranging during aging), polymerisation caused by light (indicates free grafted reactions) also have an affect on the asphalt (Traxler, 1961).
Condensated polymerization of asphalt caused by heat (Traxler, 1963).
Viscosity increasing effect caused by steric hardening of asphalt (Petersen, 1984).
Viscosity increasing effect of oxygenation of the unsaturated parts of the hydrocarbon chain (Shahidi 2005).
Viscosity increasing effect of potential polymerization of the vegetable oil (Shahidi 2005).
Vegetable oils principle mechanisms of hardening, in certain circumstances, are caused by polymerization and oxygen incorporation which resulted in hardening and thickening (commonly referred to as drying). The presence of various metals salts catalyses this process. Metal salts e.g. are commonly used during rubber vulcanization as initiators however; the polymer matrix of the crumb rubber must be stripped to release them.
During the study of hardening (viscosity increase), difficulties were experienced to provide accurate viscosity data without additional aging of the binder - when the binder is heated, oxidation plays a major role in hardening. Therefore, a dynamic shear rheometer was necessarily applied to run these tests at lower temperature (60℃).
Frequency sweeps were carried out to study changing parameters as a function of traffic. Within one hour after blending the binder experienced a significant viscosity drop. The viscosity values increased and were more sensitive at high speed frequencies. However, the viscosity almost returned to its original value within 5 hours (Figure 7.).
Frequency, rad/sec0.01 0.1 1 10 100 1000
Com
plex
visc
osity
at60
o C,P
as
0
1000
2000
3000
4000
5000
6000control1 hour later2 hours later3 hours later4 hours later5 hours later
Frequency, rad/sec0.01 0.1 1 10 100 1000
G*/
sinδ
at 6
0o C,P
a
0
10000
20000
30000
40000
50000
60000
70000reference1 hour later2 hours later3 hours later4 hours later5 hours later
Figure 7. Hardening effect for AR binders (frequency vs. viscosity and G*/sinδ).
-
-
-
-
-
-

472 Asphalt-Rubber 2009
Viscosity curves were constructed to obtain data regarding the variation of shear sensitivity (Figure 8.). The application of different binder shear rates showed increased sensitivity at low shear stresses. It should be noted that the reproducibility of the process was not investigated and therefore the validity of this trend has not been verified.
Shear rate, sec-1
0.001 0.01 0.1 1 10 100 1000
Com
plex
visc
osity
,Pas
0
2000
4000
6000
8000
10000
12000originalafter 1 hourafter 2 hoursafter 3 hoursafter 4 hoursafter 5 hours
Figure 8. Hardening effect on viscosity curves (60℃) at 0.1% oil concentration.
In reality, the hardening effect may have occurred faster than it was shown by the rheology testing because the oxygenation is continuous and film thicknesses are even smaller.
4. Conclusion
The application of different vegetable oils and animal fats temporary decreased the viscosity of the asphalt rubber to a greater degree than it did to the other modified asphalts. Several vegetable oil application methods were tested and unless rubber activation showed the best results - direct blending was chosen for practical purposes.
After choosing the appropriate raw materials and by using direct blending the viscosity was decreased by 36-38% (135-180℃), compared to the control AR.
To accurately predict the viscosity decreasing effect, a modified Arrhenius model was developed (R2=0.98) in order to obtain a quick estimation method of the viscosity of vegetable oil (0-2wt %) containing asphalt rubber as a function of temperature (135-180℃).
By comparing the viscosity decrement with different polymer modified asphalts it was found that the transport processes between the vegetable oil and the crumb rubber further reduces the viscosity of the crumb rubber containing binders.
The hardening effect was shown by using frequency sweeps and viscosity curves. It was found that there is a material sensitivity at high speed frequencies and low shear rates.
Regarding the reproducibility of the process further investigation is needed.
Binder Properties 473
5. Bibliography
Abdelrahman M.,”Controlling the performance of crumb rubber modifier (CRM) binders through the addition of polymer modifiers, 85th Annual Meeting of the Transportation Research Board, Transportation research record, ISSN 0361-1981, 2006, No. 1962, paper 127.
Arnold, T. S., Needham, S., Youtcheff J., “The use of phosphoric acid as a modifier for hot mix asphalt”. Transportation Research Board 88th Annual Meeting, Washington, D.C., January 11–15, 2009, paper 09-1564.
Barnes H. A., Handbook of elementary rheology, ISBN 0-9538032-0-1, 2000.
Bell, C. A.: “Aging of aphalt-aggregate systems”, SR-OSU-A-003A-89-2, 1989.
Biro, S., Bartha, L., Deak, G., Geiger, A., Chemically stabilized asphalt rubber compositions and a mechano-chemical method for preparing the same, WO/2007/068990, 2007.
Biro, S., Shatanawi, K., Amirkhanian, S., Hancsok, J., Utilization of waste vegetable oils to temporarily decrease the viscosity of rubberized asphalt binders, provisional patent application, serial number: 61/097992, 2008.
Boza F. M., Partal P., Navarro F. J., et al.,”Rheology and microstructure of asphalt binders”, Rheologica Acta, 2001, vol. 40, no. 2, p. 135-141.
Chilingarian G.V., Yen, T.F., Asphaltenes and asphalts - Vol. 1, ISBN-13: 978-0444882912, 1994.
D’Angelo J., Harm E., Bartoszek J., et al., ”Warm-mix asphalt: European practice”, FHWA-PL-08-007, 2008.
Fazekas, B., “Effects of physical and chemical properties of crumb rubbers on the properties of asphalt rubbers”, Department of Hydrocarbon and Coal Processing, University of Veszprem, Hungary, Thesis, 2005.
Gawel I., Stepkowski R., Czechowski F. ”Molecular interactions between rubber and asphalt”, Ind. Eng. Chem. Res., Vol. 45, 2006, p. 3044-3049.
Hveem, F. N., Zube E., Skog, J., “Proposed new tests and specifications for paving grade asphalts“ Proceedings, Association of Asphalt Paving Technologists, Vol. 32, 247-327, 1963.
Khattak, M. J., Baladi G. Y., Drzal L. T.: “Low temperature binder-aggregate adhesion and mechanistic characteristics of polymer modified asphalt mixtures, Journal of materials in civil engineering, Vol. 19, No. 5, May 2007, p. 411-422.
Liang Z., Bituminous compositions prepared with process treated vulcanized rubbers, US 5959007, 1999.

474 Asphalt-Rubber 2009
Memon, M., Crumb rubber modified asphalt with enhanced settling characteristics, US 5938832, 1999.
Miskolczi N., Nagy R., Bartha L., Halmos P., Fazekas B. “Application of energy dispersive X-ray fluorescence spectrometry as multielemental analysis to determine the elemental composition of crumb rubber samples”, Microchemical journal, ISSN 0026-265X , Vol. 88, No. 1, 2008, p. 14-20.
Pasquier, M., Bituminous Binder, Composition and Use, US 6156113, 2000.
Petersen J.C., ”Chemical composition of asphalt as related to asphalt durability: state of the art”, Transportation Research Record 999, Transportation Research Board, 1984, p. 13-30.
Petersen J.C., ”A thin-rim accelerated aging test for evaluating asphalt oxidative aging” Proceedings, Association of Asphalt Paving Technologists, Preprint Volume, 1989.
Potgieter, C.J., Coetsee, J.S., “Bitumen rubber asphalt: year 2003 design and construction procedures in South Africa”, Proceedings of the Asphalt Rubber 2003 Conference, 2003. December, Brasilia, Brazil. ISBN: 85-903997-1-0, 49-65.
Romagosa H., Corun R., ”SBS Polymer Supply Outlook”, Newsletter of The Association of Modified Asphalt Producers, August 6., 2008.
Shahidi F., Bailey’s industrial oil and fat products, ISBN 0-471-38460-7, Vol. 1-6, 2005.
Shatnawi, S., “Asphalt rubber maintenance treatments in California”, Proceedings of the Asphalt Rubber 2003 Conference, 2003. December, Brasilia, Brazil. ISBN: 85-903997-1-0, 38-39.
Speight, J.G., Handbook of Petroleum Analysis, ISBN: 978-0471361671, 2001.
Traxler R. N., ”Relation between asphalt composition and hardening by volatilization and oxidation”, Proceedings, Association of Asphalt Paving Technologists, Vol. 30, 1961, p. 359-377.
Traxler R.N., ”Durability of asphalt Cements” Proceedings, Association of Asphalt Paving Technologists, Vol. 32, 1963, p. 44-58.
Xiaohu L., Ulf I., ”Modification of road bitumens with thermoplastic polymers” Polymer Testing, 2001, vol. 20, p. 77–86.
Zareh A., Way, G., ”35 years of asphalt rubber use in Arizona”, Proceedings of the Asphalt Rubber Conference 2006, ISBN 962-405-091-0, 17-38, 2006.
Zettler R.,”Road manager: warm mix stands up to its trials”, Better Road, Vol. 76, No. 2, 2006, p. 16-21.

Binder Properties 475
Evaluation of Current Modified Asphalt Binders Using the Multiple Stress Creep Recovery Test
Carl Thodesen* — Szabolcs Biro** — John Kay***
*Ecopath Industries14821 N. 73rd St., Scottsdale AZ, 85260, USA
[email protected]@[email protected]
ABSTRACT. Due to increasing concerns regarding the availability of SBS polymer, a number of alternative options have been proposed to provide polymer modifiers for the asphalt binder industry. This paper focuses on the evaluation of six specific polymer modified binders: SBS modified binder, Reacted ethylene terpolymer (Elvaloy), Ethyl vinyl acetate (EVA), Asphalt Rubber, Hybrid (SBS and CRM) binder, and polyphosphoric acid (PPA). The goal of this project was to evaluate the various modified binders with respect to binder properties as determined by the Multiple Stress Creep Recovery (MSCR) test. The MSCR test was developed as a method to determine the performance of polymer modified binders, as opposed to simply detecting the presence of a modifier. The results indicated that wet process style asphalt rubber and SBS tended to yield the best results; however, hybrid SBS-CRM binder also exhibited good MSCR properties.
KEYWORDS: Multiple stress creep recovery, SBS, crumb rubber, EVA, PPA, CRM binder.

476 Asphalt-Rubber 2009
1. Introduction
1.1 Modified asphalt use
The use of polymer modified asphalt (PMA) has been increasing steadily in the past decade; the introduction of such new materials comes in response to government authorities and paving contractors in search of superior paving materials as an effort to mitigate the damaging effects of increased traffic loading. Furthermore, with an ever increasing population and higher loading on the pavements, PMAs are becoming a more cost effective paving solution due to their increased pavement life and decreased maintenance costs.
Typically, asphalt pavements made with modified asphalts exhibit greater resistance to fatigue cracking, thermal cracking, rutting, stripping, and temperature susceptibility than conventional binders. Studies have shown that polymer modified asphalt binders tend to exhibit increased viscosity and elevated performance grades (Yildirim, 2005). The ideal modifier will improve the binder’s resistance to distresses occurring at both ends of the performance grade spectrum.
To date the most common polymer modifier used for asphalt modification has been the elastomer styrene-butadiene-styrene (SBS). While elastomeric polymers have shown the greatest potential for use in asphalt modification, there has also been some use of plastomeric polymers. It has been estimated that approximately 75% of all polymer modified asphalts utilize elastomeric modifiers, while only 15% of modifiers used are plastomeric. The remaining 10% of modified asphalts use other types of modification including materials such as sulphur and acid (Diehl, 2000).
Shortages in SBS supply have been occurring due to widespread shortages in butadiene. This material is a byproduct of ethylene production, more specifically as a byproduct of ethylene produced by cracking liquid feeds. However, in recent times many crackers have been employing gas feeds, thus significantly reducing the quantities of butadiene being produced. An additional drawback lies in the fact that the primary use for butadiene is in tires (70%), while SB and SBS for PMA production accounts for only 6% of butadiene usage. Due to these concerns, prudent planners have been advised to work with the assumption that the availability of SBS polymers will remain tight in the immediate future (Association of Modified Asphalt Producers, 2008).
For these reasons a number of modification agents have been recommended for use as surrogate materials to satisfy the continued demand for conventional PMA. Prior to widespread adoption of any of these modifiers, it is necessary to evaluate the various alternatives using similar testing procedures to evaluate the binder properties of the various polymer modified binders. Consequently, the multiple stress creep recovery (MSCR) test was employed in this project as it offers a method for characterizing PMAs. More specifically this test method was developed as procedure for discriminating between PMAs (D’Angelo, J., 2008; D’Angelo, J., 2007).
Binder Properties 477
SBS
SBS has been the most common additive for modifying asphalt binder as it has been shown to significantly improve the rheological properties of the asphalt binder. It has been suggested that SBS copolymers strength and elasticity are due to the physical cross linking of the molecules into a three dimensional network. The strength is contributed by the polystyrene endblocks, while the polybutadiene rubbery matrix provides binders with improved elasticity (Airey, 2004; Roberts et al., 1996).
The mechanism driving the improvements is thought to be derived from the swelling of the polymer due to absorption of the light oils present in the asphalt. This leads to the formation of a three dimensional network within the PMA; ultimately providing a rubber-elastic network within the binder. Important factors contributing to the efficiency of the PMA include the properties of the base binder, the concentration of SBS, and also the compatibility of the SBS and base binder (Airey, 2004).
Ethylene glycidyl acrylate terpolymer (Elvaloy)
Elvaloy has been described as an ethylene glycidyl acrylate terpolymer that reacts chemically with asphalt. For this reason, improved storage separation properties have been associated with the use of this product (Yildirim, 2005). It has been proposed that the increased storage stability associated with Elvaloy is due to the fact that after reaction the Elvaloy reactive terpolymer is covalently bonded with the asphaltene molecule, and will therefore not separate (Dupont, 2002).
Studies have shown that Elvaloy modified binders show increased high temperature viscosities, however they demonstrate limited viscosity changes at colder temperatures. As such, Elvaloy modified binder enhances the high temperature properties of the asphalt mix. Furthermore, Elvaloy modified binders also tend to exhibit significant improvements in the moisture susceptibility properties of the asphalt mix (Witczak et al., 1995).
Ethylene vinyl acetate (EVA)
Ethyl vinyl acetate is an asphalt modifier which is typically added to the hot asphalt binder at temperatures between 149-171℃. Benefits of this polymer modifier include the fact that only moderate agitation is necessary, furthermore the blends can be stored for weeks without succumbing to separation. Consistent with many other polymer modified asphalts, the compatibility of the EVA and asphalt binder is vital for achieving the desired properties (Roberts et al., 1996).
Studies have shown that at lower polymer contents (3% by weight), EVA modified binders exhibit dispersed polymer particles in a continuous bitumen matrix. EVA modified binder properties, such as morphology and storage stability, are influenced by the characteristics of the base bitumen and binders. Generally, increases in EVA concentration yield greater improvements in the binder; however, these increases also lead to reductions in storage stability (Isacsson & Lu, 1999). Other studies have shown that, when EVA and SBS modified

478 Asphalt-Rubber 2009
binders are compared to neat binders, SBS binder exhibit a significantly higher elastic recovery than neat binders. Also, EVA binders tend to exhibit fewer improvements in elastic recovery while losing ductility and elastic recovery at a greater rate (Valkering & Vonk, 1990).
Polyphosphoric acid (PPA)
The addition of PPA has long been known to increase the performance grade (PG) of the asphalt binder. However, this material has also been met with some scepticism, whereby some state agencies have gone as far as to ban the use of PPA all together.
Studies have shown that PG grade of the asphalt binder tends to increase with the addition of PPA. This increase has been attributed to the stiffening of one of the two main phases in the asphalt. This study indicated that the stiffening effects were base binder dependent, however the following mechanisms were proposed to explain the stiffening of the PPA modified asphalt: Formation of PPA aducts; Alkylation of aromatics; cross linking of neighbouring asphalt segments; formation of ionic clusters; and the cyclization of alkyl aromatics (Baumgardner et al., 2006).
Furthermore it has been suggested that the addition of PPA to asphalt contributes to more interactions within the asphaltenes network, thus increasing the elastic behaviour. This occurs through the increases in the complex modulus values (G*) and decreases in the phase angle (δ). Typically the amount of PPA added to asphalt binder is between 0.5 -1.5%, furthermore these additions typically result in a PG grade increase of the asphalt binder (Martin, 2004).
Additional benefits of PPA modification include its suitability for use with other polymers, studies have shown that PPA can successfully substitute partial quantities of SBS. Thus it provides economical solutions for reaching desired performance grades (Martin, 2004).
Asphalt rubber
Crumb rubber is obtained through the grinding of scrap tires; given the environmental concerns surrounding the accumulation of waste tires, the beneficial use of scrap tires provides an environmentally sustainable method of disposing of the millions of tires generated annually globally. For example, it is estimated that approximately 290 million tires are disposed of annually in the US, disposal of these tires is becoming more of an issue as many states ban the disposal of tires in landfills (Environmental Protection Agency, 2008). Therefore, an added benefit of using this material as a paving material lies in the environmental benefits associated with doing so.
Research has shown that the addition of crumb rubber to virgin asphalt produces binders with improved resistance to rutting , fatigue cracking, and thermal cracking (Dantas Neto et al., 2003; Xiao et al., 2007) as well as reduces the thickness of asphalt overlays and reflective cracking potential (Amirkhanian, 2003). Crumb rubber modification of binders has also been shown to increase the elasticity of the binder (Huang et al., 2006a; Huang et al., 2006b).

Binder Properties 479
Hybrid crumb rubber SBS modified asphalt (SBS+CRM):
Hybrid systems, such as SBS and CRM binder, provide some distinct advantages. Specifically, the use of multiple polymers allows for PMA properties not achievable with a single modified. These binder types have also been used commonly in terminally blended crumb rubber modified binder.
2. Materials and Testing Method
2.1 Materials
The modified binders prepared in this evaluation were prepared using the following base materials.
2.1.1 Binder
The base binder used to prepare the various modified binders in this study was of Russian origin and of a PG grade of 58-22, the specifics of this binder are provided in table 1.
Table 1. Unmodified base binder
Virgin binder PG 58-22
G*/sin δ, kPa 0.45Viscosity at 135℃, mPas 570Viscosity at 180℃, mPas 90After RTFOT, change of mass, % +0.028After RTFOT, G*/sin δ, kPa 0.78After PAV, creep stiffness at -12 ℃, MPa 96After PAV, m-value at -12 ℃ 0.44After PAV, G*·sin δ, kPa 1353Flash point (Cleveland method, open cup), ℃ >250
2.1.2 Modifiers
The gradation of crumb rubber used to prepare the binders containing crumb rubber is presented in table 2. This gradation conforms to the gradation specified by the Arizona Department of Transportation (ADOT) in asphalt rubber projects. The crumb rubber was manufactured using the ambient grinding process.

480 Asphalt-Rubber 2009
Table 2. Crumb rubber gradation
Sieve Number No. 10 No. 16 No. 30 No. 50 No. 200Opening size (mm) 2.000 1.190 0.600 0.300 0.075Upper Specification (% passing) 100 100 100 45 5Lower Specification (% passing) 100 65 20 0 0
The modifiers and concentrations used to prepare the various modified binders are presented in table 3.
Table 3. Modified asphalts prepared
Modified Asphalt Additive used Concentration(% by weight of total blend)SBS Calprene 501C 3Asphalt rubber Ambient crumb rubber 20SBS-CRM Calprene 501C 10
Ambient crumb rubber 1EVA EVATENE 3325 6Elvaloy Elvaloy 4170 1SBS-PPA Calprene 501C 2
Polyphosphoric acid 0.2
2.2Material Preparation Method
Modified asphalt binder samples were prepared in accordance with standard procedures when possible, the purpose of this project was to provide a comparison of standard polymer modified asphalt binder samples. All the modified binders were prepared using the same virgin binder source.
2.2.1 Elvaloy
The Elvaloy modified asphalt was prepared by adding 1% (by weight of total blend) of Elvaloy 4170 to the virgin binder at a temperature of 193℃. High shear blending was applied to the modification agent and binder mixtures for 150 minutes in accordance with previous studies (Khattak et al., 2007).
2.2.2 EVA
The EVA modified asphalt was prepared by adding 6% (by weight of total blend) EVA (EVATENE 3325) to the heated neat asphalt binder at a temperature of 180℃. Blending

Binder Properties 481
was done continuously for 180 minutes at a constant temperature of 180℃ using high shear blending (Xiaohu, L., & Ulf, I., 2001).
2.2.3 SBS-PPA
The PPA modified asphalt was prepared using both PPA and 2% (by weight of total blend) linear SBS (Calprene 501C). First the neat asphalt was heated to a temperature of 180℃; subsequently 2% linear SBS was added to the heated binder together with 0.2% PPA (by weight of total blend). The various modifiers were blended for 180 minutes using high shear mixing.
2.2.4 Asphalt rubber
The asphalt rubber binder was prepared in accordance with Arizona Department of Transportation specifications. The asphalt was heated up to 177℃ and subsequently 20% crumb rubber (by weight of total blend) was added to the heated binder. Mixing was continued in a high shear mixer for one hour until the viscosity requirement was met.
2.2.5 SBS-CRM
The hybrid SBS-CRM binder was prepare by first heating the binder to 180℃, then 1% (by weight of total blend) linear SBS (Calprene 501C) was added to the heated binder. The SBS was dispersed in the heated binder for 120 minutes at a constant temperature of 180℃ using high shear mixing. Upon completion of the 120 minutes, crumb rubber was added to the heated SBS binder at a concentration of 10% (by weight of total blend), reaction of the crumb rubber with SBS binder was continued at 180℃ for an additional 60 minutes.
2.2.6 SBS
The SBS modified binder was prepare by first heating the binder to 180℃, then 8% (by weight of total blend) linear SBS (Calprene 501C) was added to the heated binder. The SBS was dispersed in the heated binder for 120 minutes at a constant temperature of 180℃ using high shear mixing. Upon completion of the 120 minutes, the 8% SBS concentrate modified binder was diluted with the original virgin binder to yield an overall concentration of 3% SBS in the whole blend.
2.3 Testing Method
All MSCR testing was performed in accordance with ASTM D7405 – 08, this test outlines the test method used to determine the percent recovery and non-recoverable creep compliance by means of the MSCR test. During testing the specimen was loaded at a constant creep stress of 100 Pa for a 1.0 second duration followed by a zero stress recovery period for 9.0 seconds. The creep and recovery cycle was repeated not allowing any rest between cycles. Following completion of the first 10 cycles the procedure was applied to the specimen using a load of 3200 Pa allowing no rest periods following the prior loading (ASTM, 2008).

482 Asphalt-Rubber 2009
2.3.1 Percent Recovery
The purpose of the percent recovery is to determine the presence of elastic response and stress dependence of polymer modified and unmodified asphalt binders. As such the percent recovery provides a relationship between the strain at the creep portion of the loading cycle and strain at the end of the recovery portion, this relationship is provided in equation 1:
r(t,Ν) 10ε1ε
1εε = −( ).100 [1]
Where, : Percent recovery for N=1 to 10
t : Stress applied during creep : Adjusted creep strain (after 1.0 s) of each cycle : Adjusted recovery strain (after 10.0 s) of each cycle
2.3.2 Non-Recoverable Creep Compliance
The non-recoverable creep compliance provides an indication of the stress dependence of the binder; it is calculated as shown in equation 2.
J = τε10nr (τ,Ν) [2]
Where, : Non-recoverable creep compliance for N=1 to 10
: Stress applied during creep
3. Results
The results from the MSCR testing cycles are presented to highlight the principal differences between the various modified binders.
3.1 MSCR Results
As seen in figure 1, the effects of modification agent are quite significant in terms of the creep recovery of the various binder samples. The ability of the binder to recover from repeated stresses appears to be related to the type of modification agent used, while this is no surprise the extent to which the creep was recovered was. It can clearly be seen that the asphalt rubber succumbed the least to the effects of the loading, when using the 100 Pa loading cycles the maximum strain seen in the asphalt rubber sample was approximately 1%. This situation is very different to the reaction of the Elvaloy and SBS-PPA binders, where strains in excess of 100% were witnessed for the later cycles of the 100 Pa loading. Generally it appears that both the SBS, asphalt rubber, and SBS-CRM binders were less susceptible to

Binder Properties 483
the repeated loading cycles at 100 Pa, this can be seen by examining the strain in the latter part of the first 10 cycles. For these binders the repeated stresses appeared to manifest itself less on the ultimate strain than for the Elvaloy, EVA, and SBS-PPA binders. This phenomenon is also witnessed at the 3200 Pa loading cycle, where the Elvaloy, EVA, and SBS-PPA modified binders achieve strain levels approaching 10,000%. The SBS, asphalt rubber, and SBS-CRM appear to be much less susceptible to the higher stress level and demonstrate a much higher capacity to withstand stress without deforming.
In this evaluation the asphalt rubber tended to achieve the best results as it consistently yielded the lowest strain values. This might be due to the effect of the rubber particles in the binder which tend to make the binder behave in a more elastic fashion. Another reason for this occurrence might be due to the ability of the rubber particles in the asphalt rubber to absorb the lighter fractions of the asphalt, thus rendering the binder more difficult to deform. Another interesting observation was the similarity in behaviour of the asphalt rubber, SBS, and SBS-CRM binder. It can clearly be seen that the response to the creep by these binders was very similar. Moreover, the SBS-CRM binder tended to exhibit characteristics of both the asphalt rubber and the SBS modified binder.
0.1
1.0
10.0
100.0
1000.0
10000.0
0 200 400 600 800 1000 1200
Stra
in(%
)
Time (s)
AR Elvaloy EVASBS-CRM SBS-PPA SBS
Figure 1. Complete loading cycle at 70℃

484 Asphalt-Rubber 2009
The various binder properties become more apparent when taking a closer look at the MSCR loading results. In figure 2 the first loading cycle at 100 Pa is shown, it can be seen that even without any previous loading the binder response to the stress varies greatly depending on the modification agent. The Elvaloy and SBS-PPA blend were the most strain susceptible at this setting, while the SBS and the EVA tended to react similarly with regards to strain susceptibility. However, one interesting aspect of this figure lies in examining the difference in the creep response of the EVA and the SBS modified binders; it is apparent that the SBS modified binder achieves a greater level of creep recovery than the EVA. This is likely attributed to the fact that SBS is an elastomer, while EVA is a plastomer. From figure 2 it can be seen that while two polymers might be equally able to reduce strain, there are significant differences in creep recovery.
0
5
10
15
20
25
0 10 20 30 40 50 60 70
Stra
in(%
)
Time (s)
AR Elvaloy EVA SBS-CRM SBS-PPA SBS
Figure 2. First cycle at 70℃ and 100 Pa
3.2 Percent recovery
Figure 3 illustrates the importance of modification agent on binder recovery, from this figure it is apparent that the asphalt rubber samples exhibited the highest percent recovery, regardless of stress level. The binder modified with SBS also performed quite well with percent recoveries exceeding 100% for both stress levels. Consistent with other findings, the SBS-CRM binder also yielded high percent recoveries, however, it was seen that at the higher loading rate the SBS-CRM blend did not recover as much as the SBS and asphalt rubber. The binder modified with Elvaloy, EVA, and SBS-PPA yielded significantly lower percent recoveries, this might be due to the fact that with the exception of the SBS in the PPA blend, all of these modifiers were plastomers. This type of behaviour is known about plastomers;

Binder Properties 485
however, it was somewhat surprising that the SBS-PPA did not achieve a greater level of recovery. It is thought that the PPA might attack the SBS, thus rendering the SBS less elastic.
0
20
40
60
80
100
120
140
160
180
200
0023001
Rec
over
y(%
)
Shear Stress (Pa)AR Elvaloy EVA SBS-CRM SBS-PPA SBS
Figure 3. Percent recovery at 100 and 3200 Pa at 70℃
Similarly, it can be seen that when percent recovery of modified asphalts is examined with respect to temperature, consistent relationships are obtained. As seen in Figure 4, there is a linear relationship between the percent recoveries between the temperatures of 64 and 76℃. It appears that the SBS and the SBS-CRM blends are the least temperature sensitive, however, both of these modified binders tended to yield consistently lower values than the asphalt rubber. The other binders also exhibited significantly lower percent recovery values; however, the temperature susceptibility of these binders was not significantly different from the others.
The elastomeric binders are seen to exhibit excellent properties with respect to percent recovery, with the exception of the SBS-PPA blend. The SBS-PPA blend consistently exhibited the lowest recoveries of any of the binders tested, regardless of testing temperature. These findings are unexpected as the addition of SBS to the PPA blend should ensure a higher degree of elastic recovery; however, these findings do confirm that asphalt modified with PPA exhibit weak properties with respect to elastic recovery, even though they typically experience increase in performance grade. These results also confirm the validity of the MSCR test for evaluating modified asphalts, as it is evident that increase in performance grade do not always correspond with modified binder properties.
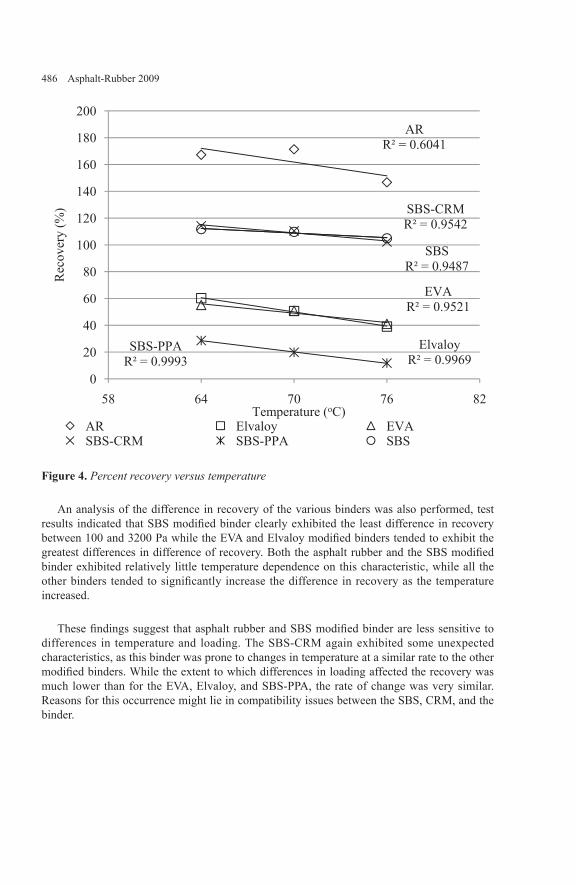
486 Asphalt-Rubber 2009
ARR² = 0.6041
ElvaloyR² = 0.9969
EVAR² = 0.9521
SBS-CRMR² = 0.9542
SBS-PPAR² = 0.9993
SBSR² = 0.9487
0
20
40
60
80
100
120
140
160
180
200
58 64 70 76 82
Rec
over
y(%
)
Temperature (oC)AR Elvaloy EVASBS-CRM SBS-PPA SBS
Figure 4. Percent recovery versus temperature
An analysis of the difference in recovery of the various binders was also performed, test results indicated that SBS modified binder clearly exhibited the least difference in recovery between 100 and 3200 Pa while the EVA and Elvaloy modified binders tended to exhibit the greatest differences in difference of recovery. Both the asphalt rubber and the SBS modified binder exhibited relatively little temperature dependence on this characteristic, while all the other binders tended to significantly increase the difference in recovery as the temperature increased.
These findings suggest that asphalt rubber and SBS modified binder are less sensitive to differences in temperature and loading. The SBS-CRM again exhibited some unexpected characteristics, as this binder was prone to changes in temperature at a similar rate to the other modified binders. While the extent to which differences in loading affected the recovery was much lower than for the EVA, Elvaloy, and SBS-PPA, the rate of change was very similar. Reasons for this occurrence might lie in compatibility issues between the SBS, CRM, and the binder.

Binder Properties 487
ARR² = 0.2262
ElvaloyR² = 0.9981
EVAR² = 0.9999
SBS-CRMR² = 0.9961
SBS-PPAR² = 0.9959
SBSR² = 0.265
-20
0
20
40
60
80
100
58 64 70 76 82
R diff
(%)
Temperature (oC)
AR Elvaloy EVASBS-CRM SBS-PPA SBS
Figure 5. Difference in recovery
1.3 Non-recoverable creep compliance (Jnr)
Examining the Jnr values for the various modified binders it is clear to see the differences between the various modified binders. The EVA, SBS-PPA and Elvaloy modified binders tended to yield the highest Jnr values, while the SBS-CRM binder exhibited properties consistent with high performance asphalt. The SBS and asphalt rubber tended to yield Jnr values of approximately zero, these values suggest that these two binder types were able to recover from the various stresses applied to the binder samples at the assigned temperatures. Clearly, this does not suggest that these two binder types are elastic materials; rather they remain viscoelastic, but that at these specified testing parameters the stress was not sufficient to induce non-recoverable creep.
These findings suggest that while asphalt rubber and SBS may be produced using different materials and methods, their properties with respect to non-recoverable creep compliance could not be differentiated during this test. As the scope of this experiment was to compare various modified binders, the unmodified binder properties are not included in the graphs. However, all the modified binders exhibited improved properties over the unmodified binder. Examining the Jnr values at 76℃, a common temperature for PMAs, it is easy to see the difference between elastomeric (SBS, asphalt rubber, and SBS-CRM) binders and plastomeric binders (EVA and Elvaloy). However, the SBS-PPA does not follow this trend; since this binder contains a SBS, it should perform more similarly to the elastomeric modifiers. This
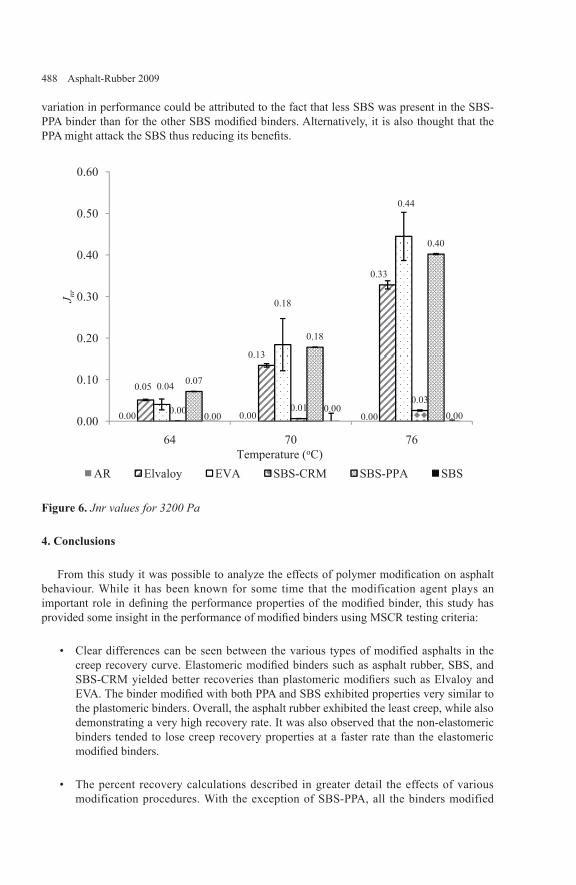
488 Asphalt-Rubber 2009
variation in performance could be attributed to the fact that less SBS was present in the SBS-PPA binder than for the other SBS modified binders. Alternatively, it is also thought that the PPA might attack the SBS thus reducing its benefits.
0.05
0.13
0.33
0.04
0.18
0.44
0.00 0.010.03
0.07
0.18
0.40
0.00
0.10
0.20
0.30
0.40
0.50
0.60
64 70 76
J nr
Temperature (oC)AR Elvaloy EVA SBS-CRM SBS-PPA SBS
0.000.000.00 0.000.00
0.00
Figure 6. Jnr values for 3200 Pa
4. Conclusions
From this study it was possible to analyze the effects of polymer modification on asphalt behaviour. While it has been known for some time that the modification agent plays an important role in defining the performance properties of the modified binder, this study has provided some insight in the performance of modified binders using MSCR testing criteria:
Clear differences can be seen between the various types of modified asphalts in the creep recovery curve. Elastomeric modified binders such as asphalt rubber, SBS, and SBS-CRM yielded better recoveries than plastomeric modifiers such as Elvaloy and EVA. The binder modified with both PPA and SBS exhibited properties very similar to the plastomeric binders. Overall, the asphalt rubber exhibited the least creep, while also demonstrating a very high recovery rate. It was also observed that the non-elastomeric binders tended to lose creep recovery properties at a faster rate than the elastomeric modified binders.
The percent recovery calculations described in greater detail the effects of various modification procedures. With the exception of SBS-PPA, all the binders modified
•
•
Binder Properties 489
with elastomeric modifiers exhibited significantly higher percent recoveries than the binders with plastomeric additives. Of the elastomeric binders, asphalt rubber yielded the highest percent recovery values at both loading settings; however the SBS modified binder was less susceptible to changes in loading. Similarly, the SBS modified binder tended to be slightly less susceptible to temperature changes. However, the asphalt rubber tended to yield the highest percent recoveries over the range of temperatures.
With regards to the difference in recovery between the various loadings, the asphalt rubber and SBS were significantly less affected by variations in temperature than the other binders. The other binders demonstrated significant linear increases in the percentage of difference in recovery between 3200 and 100 Pa. The asphalt rubber and SBS binders, between the temperatures of 64 and 76℃, did not experience any significant change in this property.
Non-recoverable creep compliance values generated from this research indicate that SBS-PPA, Elvaloy, and EVA modified binders increase significantly with increasing temperatures between 64 and 76℃. Therefore as temperature increases these binders become more susceptible to deformations. The SBS and asphalt rubber samples yielded very low Jnr values, this indicates that for this formulation, blending method, and raw materials the testing parameters were not strenuous enough to make the binders creep. For this reason, from a Jnr standpoint it can be concluded that asphalt rubber and SBS are equally adept at withstanding creep.
The findings from this research indicate that when modified binders typically improve their properties, of the various additives used, asphalt rubber came the closest to replicating or exceeding SBS binder properties.
More research needs to be done in this field, specifically more work needs to be done on understanding the reasons for the lack of elastic recovery from the SBS-PPA modified binder.
5. Bibliography
Airey, G. (2004). Styrene Butadiene Styrene Polymer Modification of Road Bitumens. Journal of Material Science , 951-959.
American Society for Testing and Materials. (2008). ASTM D 7405. Standard Test Method for Multiple Stress Creep and Recovery (MSCR) of Asphalt
Binder Using a Dynamic Shear Rheometer. West Conshohocken, PA: ASTM International.
Amirkhanian, S. N. (2003). Establishment of an Asphalt-Rubber Technology Service (ARTS). Proceedings of the Asphalt Rubber 2003 Conference, 2, pp. 577-588. Brasilia, Brazil.
Association of Modified Asphalt Producers. (2008). SBS Polymer Supply Outlook. St. Louis, MO: Association of Modified Asphalt Producers.
•
•
•
•
490 Asphalt-Rubber 2009
Baumgardner, G., Masson, J. F., Hardee, J. R., Menapace, A. M., & Williams, A. G. (2006). Polyphosphoric Acid Modified Asphalt: Proposed Mechanisms. Peterson Asphalt Conference. Laramie, WY: Western Research Institute.
D’Angelo, J. (2007). Effect of Polymer-Asphalt Binder Compatibility and Cross Link Density on Non-Recoverable Compliance in the Multi Stress Creepand Recovery Method. Southeastern Asphalt Users and Producers Group. San Antonio, TX: SAEUPG.
D’Angelo, J. (2008). Effect of SBS Dispersion and Other Additives in PMA Binders on MSCR Test Results. 45th Peterson Asphalt Research Conference. Laramie, WY: Western Research Institute.
Dantas Neto, S. A., Farias, M. M., Pais, J. C., Pereira, A., & Picado Santos, L. (2003). Behavior of Asphalt-Rubber Hot Mixes Obtained with High Crumb Rubber Contents. Proceedings of the Asphalt Rubber 2003 Conference, 2, pp. 147-158. Brasilia, Brazil.
Diehl, C. F. (2000). Ethylene-styrene interpolymers for bitumen modification. 2nd Eurasphalt and Eurobitume (pp. 93-102). Barcelona, Spain: Eurasphalt and Eurobitume.
Dupont. (2002). Dupont Elvaloy Reactive Terpolymer. Retrieved October 2008, from A Reactive Polymer: http://www.dupont.com/asphalt/link2.html
Environmental Protection Agency. (2008, September 24). Retrieved October 9, 2008, from Management of Scrap Tires: http://www.epa.gov/garbage/tires/
Huang, S. C., Pauli, A. T., Beemer, A. G., & Robertson, R. E. (2006a). Influence of Crumb Rubber on the Fatigue Performance of Asphalt Pavement. 10th International Conference on Asphalt Pavements. Quebec City, Canada: International Society for Asphalt Pavements.
Huang, S. C., Pauli, A. T., Beemer, A., Miller, J., & Salmans, S. (2006b). Particle Size Effect of Crumb Rubber on the Long-Term Aging Characteristics of Asphalts. 43rd Annual Peterson Asphalt Research Conference . Laramie, WY: Western Research Institute.
Isacsson, U., & Lu, X. (1999). Characterization of Bitumens Modified with SEBS, EVA and EBA Polymers. Journal of Materials Science , 3737 – 3745.
Khattak, M. J., Baladi, G. Y., & Drzal, L. T. (2007). Low Temperature Binder-Aggregate Adhesion and Mechanistic Characteristics of Polymer Modified Asphalt Mixtures. ASCE: Journal of Materials in Civil Engineering .
Martin, J. V. (2004). Asphalt Chemically Modified with Polyphosphoric Acid. North East Asphalt User/Producer Group. Portsmouth, NH: North East Asphalt User/Producer Group.
Roberts, F. L., Kandhal, P. S., Lee, D. Y., & Kennedy, T. W. (1996). Hot Mix Asphalt Materials, Mixture, Design, and Construction. Lanham, MD: National Asphalt Pavement Association Research and Education Foundation.

Binder Properties 491
Valkering, C. P., & Vonk, W. (1990). Thermoplastic rubbers for the modification of bitumens: Improved elastic recovery for high deformation resistance of asphalt mixes. 15th Australian Road Research Board Conference (pp. 1-19). Vermont South, Australia: Australian Road Research Board.
Witczak, M. W., Hafez, I., & Qi, X. (1995). Dupont Elvaloy Reactive Elastic Terpolymers. Retrieved October 2008, from Laboratory Characterization of Elavaloy® Modified Asphalt Mixtures: http://www.dupont.com/asphalt/link5.html
Xiao, F., Amirkhanian, S. N., & Juang, C. H. (2007). Rutting Resistance of Rubberized Asphalt Concrete Pavements Containing Reclaimed Asphalt Pavement Mixtures. Journal of Materials in Civil Engineering , 19 (6), 475-483.
Xiaohu, L., & Ulf, I. (2001). Modification of road bitumens with thermoplastic polymers. Polymer Testing 20 , 77-86.
Yildirim, Y. (2005). Polymer modified asphalt binders. Journal of Construction and Building Materials , 66-72.


Binder Properties 493
Fuel Resistance of Crumb Rubber Modified Asphalt Binders
Giovanni Polacco* —Filippo Merusi** — Sara Filippi* — Dario Biondi* — Felice Giuliani**
* Department of Chemical EngineeringUniversity of [email protected]
** Department of Civil and Environmental Engineering and ArchitectureUniversity of [email protected]@nemo.unipr.it
ABSTRACT. Due to the chemical affinity between asphalt and hydrocarbons, surface softening, ravelling and deeper damage can arise in asphalt pavements when accidental spilling of oil-derived fuels occurs. Coal-tar pitches, traditionally used for pavement protection in airport systems, filling stations and industrial plants, have been recognized as dangerous for the environment and the human health. Therefore, it is necessary to develop special modified asphalt binders with improved resistance to fuel. With this aim, the effect of crumb rubber modifiers (CRM) was investigated by both solubility tests in jet-fuel A-1 and rheological analysis of the fuel-treated binders. The solubility tests demonstrated that CRM induces an improvement of the fuel resistance, while the rheological measurements allowed to assess the binders residual mechanical performances after the controlled immersion in the fuel. The same tests were also conducted on the unmodified binder in order to have a performance comparison. Final results reveal different aspects related to the compatibility between CRM asphalt binders and service conditions in airports and industrial areas subject to the risk of fuel spilling.
keywords: Fuel Resistance, Solubility, Crumb Rubber Modifiers, Rheology.

494 Asphalt-Rubber 2009
1. Introduction
Bitumen solubility in oil-derived fuels is a frequent cause of pavement premature failure in airport systems, filling stations and industrial plants where the risk of accidental spilling of fuel exists.
Specially in the case of airfields, where high level of performances should meet the limitation of the maintenance operations, fuel spilling is frequently considered a problem of the most importance and coal-tar pitches were traditionally employed as pavement protection. Although tar-based materials show an high level of fuel resistance, nowadays they has been dropped because of the risks to the human health associated with the high concentration of polycyclic aromatic compounds they contain (Deneuvillers et al., 2004). As a consequence of the abandon of coal-tar pitches, the use of resin-based and polymeric overlays was considered as a technical solution (Newman and Shoenberger, 2002, Giuliani and Rastelli, 2007). Due to their high cost and total inefficiency in case of surface cracking, the use of asphalt with improved resistance to fuel was subsequently considered in order to build asphalt pavements that do not require further protection. In this context, a first attempt was made, by Steernberg et al. (2000) who developed a method to preliminarily establish a relation between different asphalt modifiers (such as coal-tar, resins and thermoplastic polymers) and the dissolution of asphalt in jet fuel A-1. The experience of Seive et al. (2004) represents a different approach: they firstly provided a method to measure asphalt mixtures resistance in fuels where the fuel resistance evaluation was based on a kerosene immersion test (KIT). The mass loss during the immersion and the Duriez stability of the recovered asphalt specimen were measured and proposed as empirical parameters for fuel resistance evaluation. More recently, Giuliani et al. (2009-b) carried out an extensive program involving bitumen modified by poly(styrene-co-butadiene) (SBS, both linear and radial), poly(ethylene-co-vinyl acetate) (EVA), poly(ethylene-co-methyl acetate) (EMA) and poly(ethylene-co-acrylic acid) (EAA) investigating and identifying the contribute of polymer modification in asphalt fuel resistance. Despite of the interesting results obtained in such experience, especially in the case of EMA polymers, the effects of alternative modifiers have still not been investigated and can lead to important information for the general development of fuel-resistant bituminous materials.
To the best of our knowledge, further available information on the effect of different polymer modifiers on the fuel resistance of bitumen can be found in two recent patents (Planche et al., 2002 and Thornton, 2006) and actually, in the last years, a few allegedly kerosene-resistant products of undisclosed composition have been produced and commercialized by different industrial groups (Corun et al., 2006). However, no particular differences, in terms of solubility and residual rheological properties after immersion, were observed between commercial anti-kerosene asphalt binders and a normal SBS modified binder (Giuliani and Merusi, 2008).
Although previous studies have shown that the addition of polymers into asphalts has the effect of improving their fuel resistance, the available results indicate that fuel resistant asphalt pavements which do not require further protection can not be obtained using polymer modification only. This conclusion was also confirmed by the fact that asphalt mixtures realized with different binders (unmodified, polymer modified and polymer modified fuel resistant) provide a same poor final fuel resistance evaluated in terms of weight loss after kerosene immersion and brush test, as standardized by the EN 12697-43, 2005 (Giuliani et al.,

Binder Properties 495
2009-a). In this context is developed the experimental investigation presented in this paper, which aims at evaluating the fuel resistance of crumb rubber modified asphalt binders in terms of both solubility in jet fuel A-1 and residual rheological properties after the controlled fuel immersion.
2. Experimental program
2.1 Materials
The used binders consist of traditional bitumen B50/70 (PG 64-22, pen = 76 dmm, TR&B = 49.5℃) subsequently modified in the laboratory at 16% and 20% CRM content referred to the weight of bitumen. The two CRM binders were prepared using crumb rubber (particles’ diameter of 0.6 mm) obtained by cryogenic process. Digestion time and methodology are referred to as ASTM D-6114.
The samples were not subjected to artificial ageing. The main physical and conventional properties of the selected binders are reported in Table 1. The ring and ball softening point procedure was done according to ASTM D36-76 and the penetration was measured at 25℃.
Table 1. Materials.
Binder Type Penetration [dmm] Softening point – TR&B [℃]
CRM-0 Unmodified 77 49.0CRM-16 CRM 16.0 % 26 79.9CRM-20 CRM 20.0 % 24 88.9
The test samples preparation was referred to EN 12594. Both CRM and fuel resistant binders were treated as modified binders, thus reheating and homogenization were carefully carried out at a controlled temperature (160℃ ± 5℃) in order to obtain reproducible results (Anderson et al., 2000). Special attention was then paid to the specimen thermal history and storage conditions (1 hour at 25℃ ± 0.5℃) because of their influence on rheological measurements (Soenen et al., 2005).
2.1 Methods
The samples of asphalt binders were processed by mean of a controlled immersion to determine their solubility in kerosene and to provide the fuel-treated samples for the rheological investigation. According to Giuliani and Merusi (2008), the ball and ring apparatus traditionally used for softening point measurements was utilized as immersion device. The solubility tests were thus done at room temperature on samples having the same geometry used for the conventional softening point determination with the following procedure: 75 mL of jet fuel A-1 were filled into a 100 ml beaker and the kerosene level over the superior specimen surface were kept constants.

496 Asphalt-Rubber 2009
The sample was weighed and placed on a metallic net, with mesh of 0.5 mm that was dipped in the liquid. In all the cases the initial weight was equal to 2.00 g ± 0.1 g. At selected time intervals (5, 10, 20, 30, 60, 90, 120 minutes), the net was removed from the beaker and the sample was wiped with a filter paper and weighed. An electric balance with a precision of 1·10-3 grams was used for the weight measurements. We found that the reproducibility of the tests was satisfactory and decided that reporting the data as the average of at least two measurements would grant sufficient reliability to the expected conclusions. The parameter Rw, defined as the ratio between the specimen weight at each immersion time and the initial specimen weight, is taken as a measure of the tendency of the binder to “dissolve” in the fuel.
( ) ( )tWW
tR iw
0
= (Eq.1)
However, it should be pointed out that, while the samples do completely disintegrate after immersion for a sufficiently long time, i.e., weight loss equal to 100%, a measurable amount of material (e.g., asphaltene, crumb rubber) is in fact insoluble and remains suspended or settles on the bottom of the beaker. Moreover, the recorded weights of the samples may be slightly in excess, due to kerosene soaking. Nevertheless, given the scope of the test, we consider the binder weight loss as a meaningful indicator of the tendency of the asphalt pavement to degrade by the action of the fuel.
The processed samples were recovered after the immersion to provide test specimens for the rheological investigation. The recovery of bitumen from the support always occurred after a drying period of 2 hours with forced ventilation at room temperature (25℃ ± 0.5℃).
Viscoelastic properties of original and fuel-treated binders were evaluated by performing stress-controlled frequency sweeps from 0.1 rad/s to 100 rad/s with a dynamic shear rheometer (DSR). The 25 mm double plate system with a 2.0 mm gap was adopted during the whole experiment. The temperature during the DSR tests was controlled by means of a Peltier conditioning system with a maximum admitted deviation of +0.01℃ and the samples were subjected to a 30 minutes thermal conditioning period before each test.
According to Marasteanu and Anderson (2000), the extension of the linear viscoelastic domain was previously checked by performing stress sweeps tests. Linear viscoelastic conditions were consequently established and shear stress amplitudes ranging from 1⋅104 Pa to 50 Pa were selected according to the temperature to perform the viscoelastic characterization. Frequency sweep of each binders were repeated for different temperatures from 10 to 80℃ and the experimental data were subsequently analyzed to realize master curves of shear complex modulus (G*) and phase angle (δ) at the reference temperature of 30℃. The Williams-Landel-Ferry (WLF) equation was then used to fit the trend of the shift factors (aT) as a function of the test temperature (T).
3. Results and discussion
The results of the binder solubility measurements at 25℃ are reported in Figure 1, where Rw is plotted as a function of the kerosene immersion time.
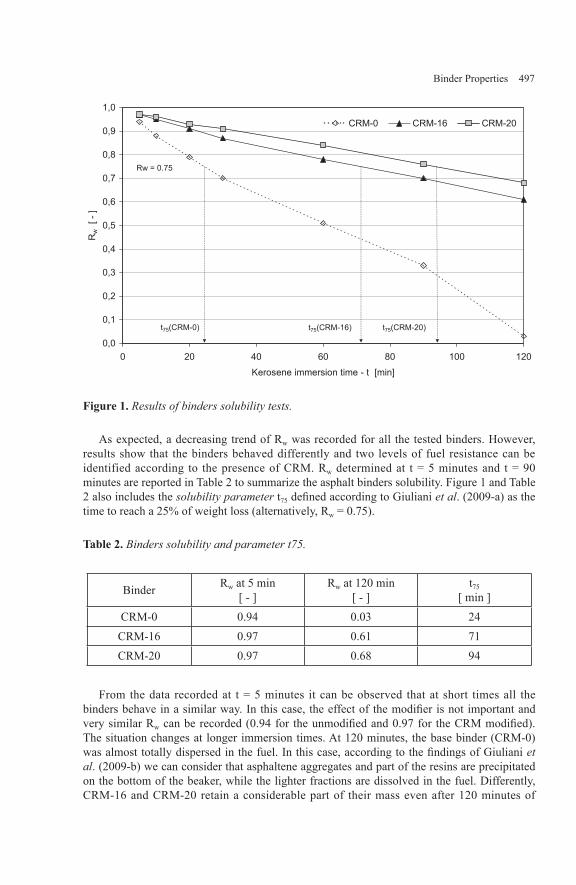
Binder Properties 497
0,0
0,1
0,2
0,3
0,4
0,5
0,6
0,7
0,8
0,9
1,0
0 20 40 60 80 100 120
Kerosene immersion time - t [min]
Rw [
-]
CRM-0 CRM-16 CRM-20
Rw = 0.75
t75(CRM-0) t75(CRM-20)t75(CRM-16)
Figure 1. Results of binders solubility tests.
As expected, a decreasing trend of Rw was recorded for all the tested binders. However, results show that the binders behaved differently and two levels of fuel resistance can be identified according to the presence of CRM. Rw determined at t = 5 minutes and t = 90 minutes are reported in Table 2 to summarize the asphalt binders solubility. Figure 1 and Table 2 also includes the solubility parameter t75 defined according to Giuliani et al. (2009-a) as the time to reach a 25% of weight loss (alternatively, Rw = 0.75).
Table 2. Binders solubility and parameter t75.
Binder Rw at 5 min[ - ]
Rw at 120 min[ - ]
t75
[ min ]CRM-0 0.94 0.03 24CRM-16 0.97 0.61 71CRM-20 0.97 0.68 94
From the data recorded at t = 5 minutes it can be observed that at short times all the binders behave in a similar way. In this case, the effect of the modifier is not important and very similar Rw can be recorded (0.94 for the unmodified and 0.97 for the CRM modified). The situation changes at longer immersion times. At 120 minutes, the base binder (CRM-0) was almost totally dispersed in the fuel. In this case, according to the findings of Giuliani et al. (2009-b) we can consider that asphaltene aggregates and part of the resins are precipitated on the bottom of the beaker, while the lighter fractions are dissolved in the fuel. Differently, CRM-16 and CRM-20 retain a considerable part of their mass even after 120 minutes of

498 Asphalt-Rubber 2009
exposition to the jet fuel. It is also important to underline that binder CRM-20 has a minor solubility than CRM-16 thus suggesting that the CRM content influences the binder solubility. According to this observation, the parameter t75 increases from 24 minutes for CRM-0 to 94 minutes for CRM-20, denoting an high exposure limit time.
Figure 2. Binders solubility tests – CRM-0 (left) and CRM-20 (right) at timm = 1 minute.
The high modifier concentration and the ability to swell in presence of bitumen, together with the consideration that CRM is not soluble in kerosene, suggest an interpretation of the obtained results. It was previously demonstrated by several studies (Airey et al., 2004, Gawel et al., 2006, Ould Henia and Dumont, 2008) that the swelling process of the rubber particles is mainly due to a migration of aromatics and saturates from bitumen into rubber network, similarly to as commonly accepted for the bitumen-polymer interaction (Polacco et al., 2006). On the other hand, only the lighter, and less polar, bitumen fraction, e.g. aromatics and saturates, are completely soluble in kerosene, while resins are partially insoluble and asphaltenes almost totally insoluble (Giuliani et al., 2009-b). Therefore, we can suppose that the increase in kerosene resistance is due to the fact that a certain amount of the soluble fraction is retained and fixed by the CRM.
As reported previously (Giuliani and Merusi, 2008), fuel damage in bituminous binders is also related to a change in rheological properties and mechanical resistance. The evolution of the linear viscoelastic behavior of CRM binders after dipping in the fuel is therefore investigated to assess the residual mechanical properties of the binder and to better analyze the process. The complex modulus |G*| of the binder both before and after the controlled fuel immersion (and subsequent drying period) is reported in figures 3 and 4 for binders CRM-0, CRM-16 respectively. For the sake of brevity, data recorded for CRM-20 are not presented here. However, no particular variations from the situation shown in figure 4 were recorded in that case.
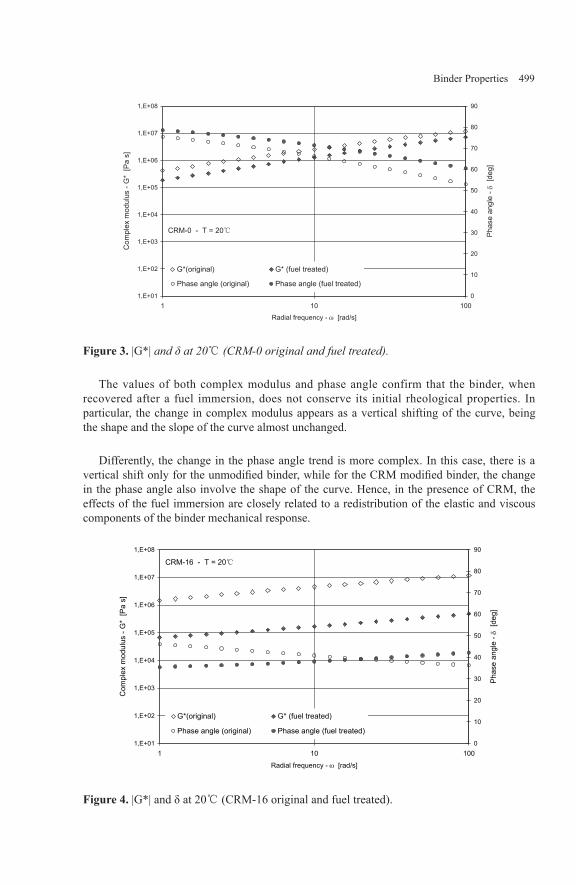
Binder Properties 499
1,E+01
1,E+02
1,E+03
1,E+04
1,E+05
1,E+06
1,E+07
1,E+08
001011
Radial frequency - ω [rad/s]
Com
plex
mod
ulus
-G*
[Pa
s]
0
10
20
30
40
50
60
70
80
90
Pha
sean
gle
- δ [
deg]
G*(original) G* (fuel treated)
Phase angle (original) Phase angle (fuel treated)
CRM-0 - T = 20℃
Figure 3. |G*| and δ at 20℃ (CRM-0 original and fuel treated).
The values of both complex modulus and phase angle confirm that the binder, when recovered after a fuel immersion, does not conserve its initial rheological properties. In particular, the change in complex modulus appears as a vertical shifting of the curve, being the shape and the slope of the curve almost unchanged.
Differently, the change in the phase angle trend is more complex. In this case, there is a vertical shift only for the unmodified binder, while for the CRM modified binder, the change in the phase angle also involve the shape of the curve. Hence, in the presence of CRM, the effects of the fuel immersion are closely related to a redistribution of the elastic and viscous components of the binder mechanical response.
1,E+01
1,E+02
1,E+03
1,E+04
1,E+05
1,E+06
1,E+07
1,E+08
001011
Radial frequency - ω [rad/s]
Com
plex
mod
ulus
-G*
[Pa
s]
0
10
20
30
40
50
60
70
80
90
Pha
sean
gle
- δ [
deg]
G*(original) G* (fuel treated)
Phase angle (original) Phase angle (fuel treated)
CRM-16 - T = 20℃
Figure 4. |G*| and δ at 20℃ (CRM-16 original and fuel treated).

500 Asphalt-Rubber 2009
The above described effects were recorded for all tested binders. Nevertheless, it was observed that the entity of the stiffness reduction depends on binder nature. The reduction in complex modulus and the change in phase angle recorded for all binders at 10 rad/s and 20℃ are reported in Table 3, where |G*|or. is the complex modulus of the original binder, |G*|res. is the complex modulus of the fuel treated binder, δor. is the phase angle of the original binder and δres. is the phase angle of the fuel treated binder.
Table 3. Change in binders rheological properties after the fuel immersion.
Binder G*or.[Pa]
G*res.[Pa]
G*res./G*or.[ - ]
δor.[deg]
δres.[deg]
δor./δres.[ - ]
CRM-0 2.60•106 1.29•106 0.50 66 71 0.93CRM-16 4.06•106 1.68•105 0.04 41 38 1.08CRM-20 3.64•106 3.86•105 0.11 40 40 1.00
A variation in |G*| and δ was recorded for all binders tested. Due to the complex internal structure of asphalt binders, it is not possible to assess this effect from a microscale point of view. However, the variation observed in |G*| and δ clearly depends on the binder nature. Probably due to the presence of kerosene retained into the rubber particles, the CRM modified binders show the most important softening effect, denoted by the decrease in G* at 10 rad/s. Complex modulus G*(ω,T) master curves obtained for binders CRM-0 and CRM-16 were also realized in order to outline the effects of the fuel exposure in the whole temperature range investigated. For the sake of brevity, data obtained for binder CRM-20 are not reported. However no important differences were observed between CRM-20 and CRM-16.
1,0E+00
1,0E+01
1,0E+02
1,0E+03
1,0E+04
1,0E+05
1,0E+06
1,0E+07
1,0E+08
1,0E+09
1,0E-05 1,0E-04 1,0E-03 1,0E-02 1,0E-01 1,0E+00 1,0E+01 1,0E+02 1,0E+03 1,0E+04 1,0E+05 1,0E+06 1,0E+07
Reduced angular frequency - aT ω [rad/s]
Com
plex
mod
ulus
-G*
[Pa]
G* - CRM-16 (original)G* - CRM-16 (fuel treated)G* - CRM-0 (origianal)G* - CRM-0 (fuel treated)
T0 = 30℃
Figure 5. G* master curve for CRM-0 and CRM-16 original and fuel treated (120 min. immersion).
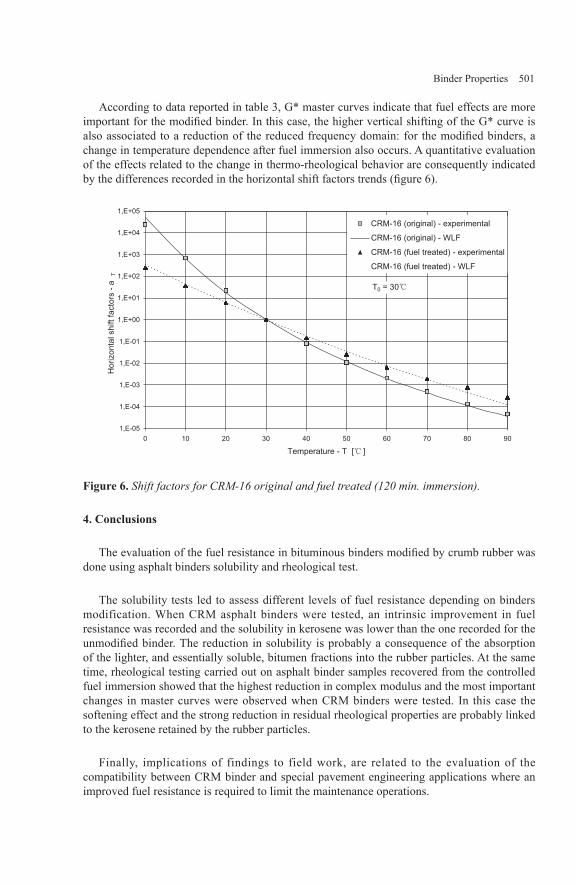
Binder Properties 501
According to data reported in table 3, G* master curves indicate that fuel effects are more important for the modified binder. In this case, the higher vertical shifting of the G* curve is also associated to a reduction of the reduced frequency domain: for the modified binders, a change in temperature dependence after fuel immersion also occurs. A quantitative evaluation of the effects related to the change in thermo-rheological behavior are consequently indicated by the differences recorded in the horizontal shift factors trends (figure 6).
1,E-05
1,E-04
1,E-03
1,E-02
1,E-01
1,E+00
1,E+01
1,E+02
1,E+03
1,E+04
1,E+05
0 10 20 30 40 50 60 70 80 90
Temperature - T [℃ ]
Hor
izon
tals
hift
fact
ors
-aT
CRM-16 (original) - experimental
CRM-16 (original) - WLF
CRM-16 (fuel treated) - experimental
CRM-16 (fuel treated) - WLF
T0 = 30℃
Figure 6. Shift factors for CRM-16 original and fuel treated (120 min. immersion).
4. Conclusions
The evaluation of the fuel resistance in bituminous binders modified by crumb rubber was done using asphalt binders solubility and rheological test.
The solubility tests led to assess different levels of fuel resistance depending on binders modification. When CRM asphalt binders were tested, an intrinsic improvement in fuel resistance was recorded and the solubility in kerosene was lower than the one recorded for the unmodified binder. The reduction in solubility is probably a consequence of the absorption of the lighter, and essentially soluble, bitumen fractions into the rubber particles. At the same time, rheological testing carried out on asphalt binder samples recovered from the controlled fuel immersion showed that the highest reduction in complex modulus and the most important changes in master curves were observed when CRM binders were tested. In this case the softening effect and the strong reduction in residual rheological properties are probably linked to the kerosene retained by the rubber particles.
Finally, implications of findings to field work, are related to the evaluation of the compatibility between CRM binder and special pavement engineering applications where an improved fuel resistance is required to limit the maintenance operations.

502 Asphalt-Rubber 2009
5. Bibliography
Airey, G,. Rahman, M., Collop, A.C. (2004) – “Crumb rubber and bitumen interaction as a function of crude source and bitumen viscosity”, Road Materials and Pavement Design, 5 (4), pp. 453-475.
Anderson, D.A., Marasteanu, M.O., Mahoney, J.M., Stephens, J.E. (2000) – “Factors affecting the variability in the SHRP binder tests”, 79th Annual Report, Transportation Research Board (TRB), Washington D.C., USA, 2000.
Corun, R., Van Rooijen, R.C., De Bondt, A.H. (2006) – “Performance evaluation of jet fuel resistant polymer-modified asphalt for airport pavements”, Proceedings of the 2006 Airfield and Highway Pavement Specialty Conference, Atlanta, Georgia, USA, 2006.
Deneuvillers, C., Letaudin, F. (2003) – “Environmentally friendly fuel resistant surfacing”, Proceedings of World Road Association (PIARC) Conference, Durban, South Africa.
Gawel, I., Stepkowski, R., Czechowski, F. (2006) – “Molecular interactions between rubber and asphalt”, Industrial and Engineering Chemistry Research, 45 (9), pp. 3044-3049.
Giuliani, F., Rastelli, S. (2006) – “Test methods to evaluate fuel resistance of aprons asphalt pavements in airports and heliports”, Proceedings of the Second International Airports Conference: Planning, Infrastructure & Environment, paper 02-017, Sao Paulo, Brazil, August.
Giuliani, F., Merusi, F. (2008) – “Anti-kerosene asphalt binders designed for airfield pavements. A rheological approach to fuel resistance evaluation”, Proceedings of the ISAP Symposium on Asphalt Pavement and Environment, International Society for Asphalt Pavement, Zurich, Switzerland, 2008.
Giuliani, F., Merusi, F., Rastelli, S. (2009-a) – “Experimental evaluation of fuel damage in bituminous materials”, 88th TB Annual Meeting, Transportation Research Board (TRB), Washington D.C., USA, 2009.
Giuliani, F., Merusi, F., Filippi, S., Biondi, D., Polacco, G. (2009-b) – “Effects of polymer modification on the fuel resistance of asphalt bidners”, Fuel, in press.
Marasteanu, M.O., Anderson D.A. (2000) – “Establishing linear viscoelastic conditions for asphalt binders”, Transportation Research Record 1728, pp. 1-6.
Newman, K., Shoenberger, J.E. (2002) – “Polymer concrete micro-overlay for fuel and abrasion resistant surfacing: laboratory results and field demonstrations”, Proceedings of the 2002 Federal Aviation Administration Airport Technology Transfer Conference.

Binder Properties 503
Ould Henia, M., Dumont, A.G. (2008) – “Effect of base bitumen composition on asphalt rubber binder properties”, ISAP Symposium on asphalt pavement and environment, M. Partl, ed., International Society for Asphalt Pavement, pp. 21-30, Zurich, Switzerland.
Planche, J.P., Chaverot, P., Lapalu, L., Ponsardin, M. (2002) – “Procède de préparation de compositions bitume/polymère a résistance aux solvants pétroliers améliorée, compositions ainsi obtenues et leur utilisation comme liant bitumineux”, Demande de Brevet d’Invention No. 02 16312, République Française, Institut National de la Propriété Industrielle, Paris.
Polacco G., Stastna J., Biondi D., Zanzotto L., “Relation Between Polymer Architecture and Nonlinear Viscoelastic Behavior of Modified Asphalts”, Current Opinion in Colloid & Interface Science, 2006; 11(4): 230-45.
Soenen, H., De Visscher, J., Vanelstraete, A., Redelius, P., “The influence of thermal history on binder rutting indicators”, International Journal of Road Materials and Pavement Design, Vol. 6, Issue 2, 2005.
Seive, A., Leroux, C., Teurquetil, F., (2004) – “Fuel performance evaluation of asphalt pavements”, Proceedings of the 3rd Euroasphalt and Eurobitume Congress, pp. 191-202, Vienna, Austria.
Steernberg, K., Read J.M., Seive, A. (2000) – “Fuel resistance of asphalt pavements”, Proceedings of the 2nd Euroasphalt and Eurobitume Congress, pp. 558-567, Barcelona, Spain.
Thornton J. (2006) – “A bituminous binder and its manufacturing process, and a process for improving fuel resistance of such bituminous binder”, EP 1 700 887 A1.