STATISTICAL HAND BOOK OF HARYANA 2019-20 Issued by
231
GOVERNMENT OF HARYANA STATISTICAL HAND BOOK OF HARYANA 2019-20 Issued by: DEPARTMENT OF ECONOMIC AND STATISTICAL ANALYSIS, HARYANA 2021
-
Upload
khangminh22 -
Category
Documents
-
view
1 -
download
0
Transcript of STATISTICAL HAND BOOK OF HARYANA 2019-20 Issued by
GOVERNMENT OF HARYANA
STATISTICAL HAND BOOK
OF
HARYANA
2019-20
Issued by:
DEPARTMENT OF ECONOMIC AND STATISTICAL ANALYSIS, HARYANA
2021
PUBLICATION NO:1255
GOVERNMENT OF HARYANA
STATISTICAL HAND BOOK
OF
HARYANA
2019-20
ISSUED BY:
DEPARTMENT OF ECONOMIC AND
STATISTICAL ANALYSIS, HARYANA
2021
PREFACE
Statistical Hand Book of Haryana 2019-20 is the
10th issue being published by Department of Economic & Statistical Analysis, Haryana. This publication contains selected
socio-economic data in respect of Haryana. The response to this
publication from the Administrators, Research Workers and other users has been very encouraging. Therefore, efforts are
being made continuously to include more and more data to
make it more useful for the users.
This department is grateful to all Departments/
Boards/Corporations who have supplied useful data for this
publication. Suggestions/ comments from users are always welcomed to make this publication more useful in future.
Panchkula
Dated:the 5th March, 2021
N.R. Sheoran Director
Department of Economic and
Statistical Analysis, Haryana

Officers/officials associated in preparation of Statistical
Hand Book of Haryana 2019-20
S/Shri/Smt
1. Dr. Rajvir Bhardwaj Additional Director
2. Sunish K. Katyal Research Officer
3. Veena Sharma Assistant Research Officer
4. Sukhdev Singh Assistant Research Officer
5. Anita Tanwar Assistant Research Officer
6. Kavita Young Professional
7. Sonu Kumar Steno-typist
8. Kapil Dev DEO

Units/Abbreviations used in this publication
Lakh - 100,000
Quintal - 100 Kilograms
Ton - 2240 Lbs or
1.016 Metric Tonnes
M.Ton - 1000 Kilograms
Lb - 0.45359 Kilogram
Kilogram - 1000 Grams
Kilometre - 1000 Metres
Metre - 100 Centimetres
Bale (of cotton) - 170 Kilograms
K.W.H. - Kilo Watt Hour
Sq. Kms. - Square Kilometres
Kg. - Kilogram
N.A - Not available
Accts. - Accounts
R.E. - Revised Estimates
B.E. - Budget Estimates
Hec. - Hectare

i
CONTENTS
Table No. Particulars Page No.
I-Basic Statistics
1.1 Basic Statistics of Haryana 1-10
II-Area and Population
2.1 Area and Population of Haryana :2011 Census 11-15
2.2 Growth of Population in Haryana :1901-2011 16-17
2.3 Increase in Population since 2001 by Districts 18
2.4 Number of villages and towns in Haryana in
2001 and 2011 Census
19-20
2.5 Area and Population by Districts: 2011 21-22
2.6 Rural and Urban Population by sex in Haryana
: 2011
23-24
2.7 Block-wise Population and Number of villages
in Haryana : 2011
25-33
2.8 Number of Households and Persons per
Household in Haryana: 2011
34
2.9 Rural/ Urban Workers and Non – Workers by
Districts : 2011
35-37
2.10 Working Population (Main + Marginal)
Classified into Broad Industrial Category:
2011
38-41
2.11 Age Distribution of Rural and Urban
Population in Haryana : 2011
42-44
2.12 Population by Religion in Haryana: 2011
ii
45-46
Table No. Particulars Page No.
2.13 Scheduled Castes Population by Districts: 2011 47-49
2.14 Scheduled Castes Working Population
Classified into Broad Industrial Categories: 2011
50-55

2.15 Literacy in Haryana by District: 2011 56-58
2.16 Literacy among Scheduled Castes in Haryana
by Districts : 2011
59-61
2.17 Differently Abled Population by District in
Haryana : 2011
62-64
2.18 Area and Population in various States in India
according to 2011 Census
65-70
III- RAINFALL STATISTICS
3.1 Monthly Average Rainfall by Districts 71-73
IV-VITAL STATISTICS
4.1 Birth Rate, Death Rate and Infant Mortality
Rate as per Sample Registration Scheme in
Haryana
74-76
4.2 Number of Births and Sex Ratio as per Civil
Registration Scheme in Haryana
77-80
V-EDUCATION
5.1 Number of Recognised Institutions in Haryana
iii
81-82
Table No. Particulars Page No.
5.2 Classification of Recognized High/Senior
Secondary School, Middle Schools and
Primary (including pre-primary/Balwari)
schools in Haryana
83-88
5.3 Number of Students in all Management
Schools in Haryana
89-92
5.4 Number of Scheduled Castes Students in all
Management Schools in Haryana
93-96
VI - HEALTH AND FAMILY WELFARE
6.1 Number of Medical (Allopathic) Institutions in 97

Haryana
6.2 District- wise Medical Staff in Haryana 98-101
6.3 Ayurvedic,Unani and Homeopathic Institutions
and their Staff in Haryana
102-103
__________________________________

iv Table No. Particulars Page No.
VII-SOCIAL WELFARE SERVICE
7.1 Old Age Samman Allowance, Widow Pension,
Divyang Pension, Ladli, Destitute Children, Non-
School Going Differently Abled Children, Eunuch
and Dwarf and Financial Assistance to Acid Attack
Victims Social Security Schemes
104-113
VIII-SOCIAL SECURITY AND SOCIAL DEFENCE
8.1 Number of Police Stations and Police Posts in
Haryana 114
IX-STATE INCOME
9.1 Movement of Gross and Net State Domestic
product at Current and Constant (2011-12) Prices 115-116
9.2 Gross State Value Added by Economic
Activity at Current Price (2011-12)
117-118
9.3 Gross State Value Added by Economic
Activity at Constant (2011-12) Prices
119-120
9.4 Net State Value Added by Economic Activity
at Current Price (2011-12)
121-122
9.5
9.6
9.7
Net State Value Added by Economic Activity
at Constant (2011-12) Prices
Indices of Net State Domestic Product
(2011-12=100) by broad sectors Percentage change in GSVA of Haryana and India
by broad sectors at Constant (2011-12) Prices
123-124
125
126
V
Table No. Particulars Page No.
X-AGRICULTURE
10.1 Classification of Area in Haryana State 127-132
10.2 District-wise Number and Area of Operational 133-142

Holdings by Size Group in Haryana:2015-16(P)
10.3 Number and Area of Holdings by Ownership
and by Size Group in Haryana: 2015-16 (All
Holdings)
143-144
10.4 Number and Area of Holdings by Ownership
and by Size Group in Haryana: 2015-16
(Belonging to Scheduled Castes only)
145-146
10.5 Area, Production and Average Yield per hectare
of important crops in Haryana (Area in 000
hectares, Production in 000 Tonnes and yield in
Kgs. per hectare)
147-161
10.6 Area under Fruits and Vegetables 162-165
10.7 District-wise percentage Distribution of
Principal Crops in Haryana
166-171
XI- IRRIGATION
11.1 Net Area Irrigated in Haryana 172-173
11.2 Tubewells and Pumping Sets
174

vi
Table No. Particulars Page No.
XII- LIVE STOCK, POULTRY, ANIMAL HUSBANDRY AND
DAIRING
12.1 Live stock and Poultry in Haryana: 2012 175-178
12.2 Veterinary Institutions Functioning in Haryana 179-180
12.3 Staff of Veterinary Institutions in Haryana 181-182
XIII-FORESTS
13.1 Area under Forest in Haryana 183-184
13.2 Percentage of Area under Forests and Forest Area /per lakh of Population in Haryana
185-186
XIV- FISHERIES
14.1 Fisheries Development in Haryana 187-188
XV- COOPERATION
15.1 Selected statistics of Cooperative Societies in
Haryana
189
XVI- INDUSTRIES
16.1 Number of Registered Factories and Workers
Employed in Haryana
190-191
XVII- ELECTRICITY AND POWER
17.1 L.T. and 11 KV. Lines and Number of
Transformers in Haryana
192
17.2 No. of Connections in Haryana
193-194
vii
Table No. Particulars Page No.
18.1
18.2
XVIII- TRANSPORT STATISTICS
Number of non transport vehicles registered in
Haryana
Number of transport Vehicles registered in
195
196-198

18.3
Haryana
Road length maintained by the Public Works
Department in Haryana
199
18.4 Length of Metalled Roads in Haryana 200
18.5 Number of villages connected with metalled
Roads
201-202
XIX - MARKITING AND STORAGE
19.1 District wise Number of regulated Markets and
Sub Yards in Haryana
203-204
19.2 Arrival of Agricultural Produce in Haryana
Markets
205-206
XX - PUBLIC FINANCE
20.1 Over all Budget of Haryana 207
viii
Table No. Particulars Page No.
XXI-PRICES
21.1 Consumer Price Index Number for Working 208-210
Class of Six selected centres of Haryana
XXII- LOCAL BODIES
22.1 Number, Population, Income & Expenditure of
Municipal Committees/Councils/Corporations
in Haryana
211-212
XXIII- MISCELLANEOUS
23.1 District-wise Employees of Haryana
Government
213-214
23.2 Distribution of Haryana Govt. Employees
according to Districts and Classes (2019)
215-216
23.3 Distribution of Haryana Govt. Employees
according to Districts and Classes (2020)
217-218

1
I-BASIC STATISTICS
Basic Statistics of Haryana
Table 1.1
1 2 3
Area Sq. Km. 44,212
Divisions Number 6
Districts Number 22
Sub-Divisions Number 74
Tehsils Number 94
Sub-Tehsils Number 49
Blocks Number 142
Towns (2011 Census) Number 154*
Total Villages (2011 Census) Number 6,841
2. Population (2011 Census)
(i) Total Population Lakh 253.51
Male Lakh 134.95
Female Lakh 118.56
(ii) (ii) Rural Population Lakh 165.09
Percentage to total Percentage 65.12
(iii) (iii) Urban Population Lakh 88.42
Percentage to total Percentage 34.88
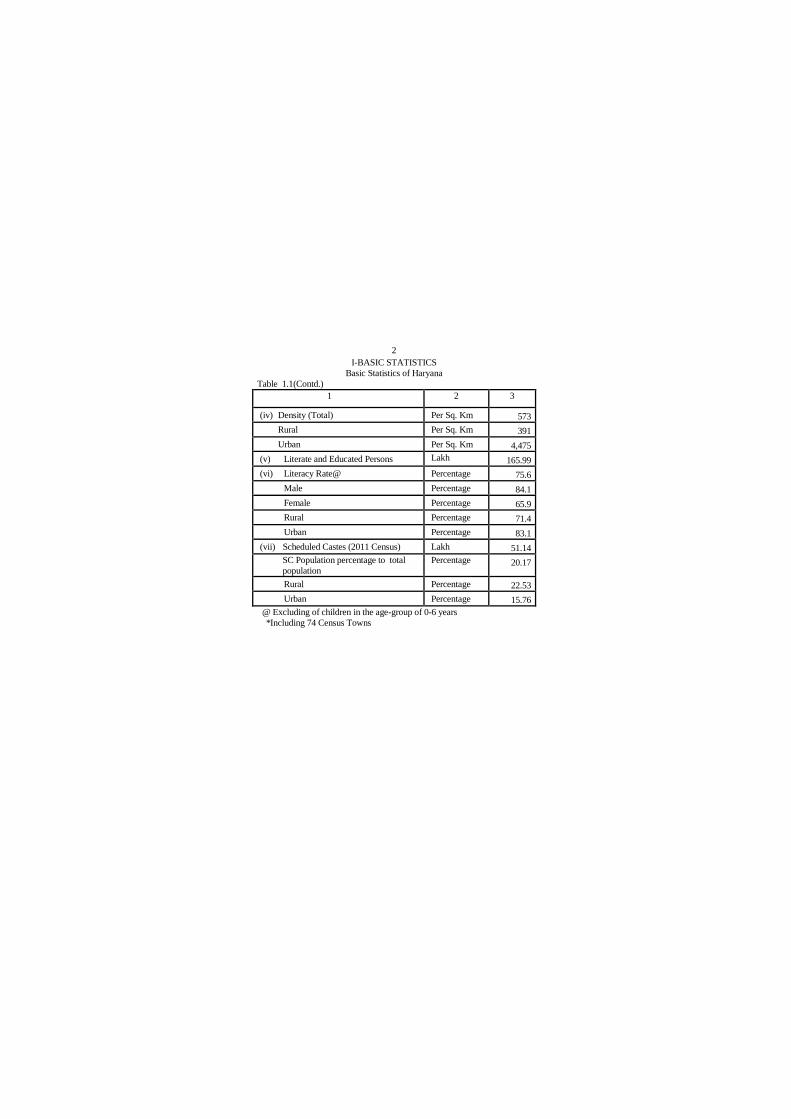
2
I-BASIC STATISTICS
Basic Statistics of Haryana
Table 1.1(Contd.)
1 2 3
(iv) Density (Total) Per Sq. Km 573
Rural Per Sq. Km 391
Urban Per Sq. Km 4,475
(v) Literate and Educated Persons Lakh 165.99
(vi) Literacy Rate@ Percentage 75.6
Male Percentage 84.1
Female Percentage 65.9
Rural Percentage 71.4
Urban Percentage 83.1
(vii) Scheduled Castes (2011 Census) Lakh 51.14
SC Population percentage to total
population
Percentage 20.17
Rural Percentage 22.53
Urban Percentage 15.76
@ Excluding of children in the age-group of 0-6 years
*Including 74 Census Towns
3
I-BASIC STATISTICS
Basic Statistics of Haryana
Table 1.1 (Contd.)
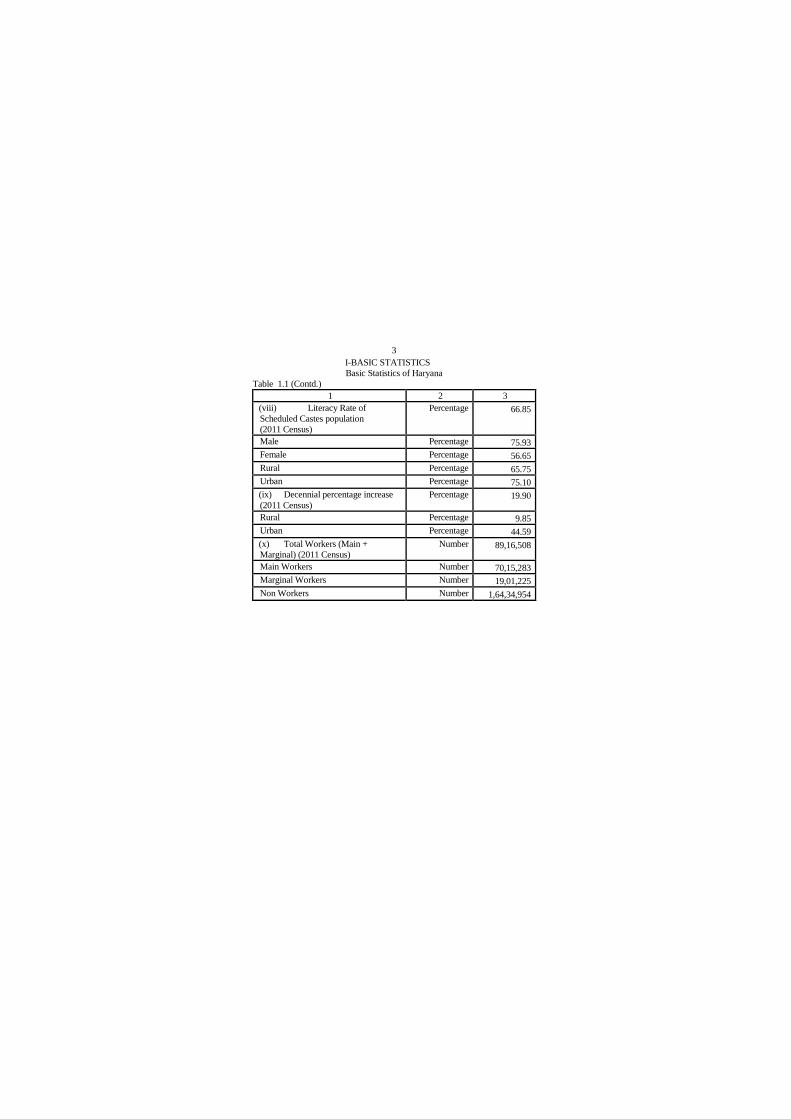
1 2 3
(viii) Literacy Rate of
Scheduled Castes population
(2011 Census)
Percentage 66.85
Male Percentage 75.93
Female Percentage 56.65
Rural Percentage 65.75
Urban Percentage 75.10
(ix) Decennial percentage increase
(2011 Census)
Percentage 19.90
Rural Percentage 9.85
Urban Percentage 44.59
(x) Total Workers (Main +
Marginal) (2011 Census)
Number 89,16,508
Main Workers Number 70,15,283
Marginal Workers Number 19,01,225
Non Workers Number 1,64,34,954
4
I-BASIC STATISTICS
Basic Statistics of Haryana
Table 1.1 (Contd.)
1 2 3
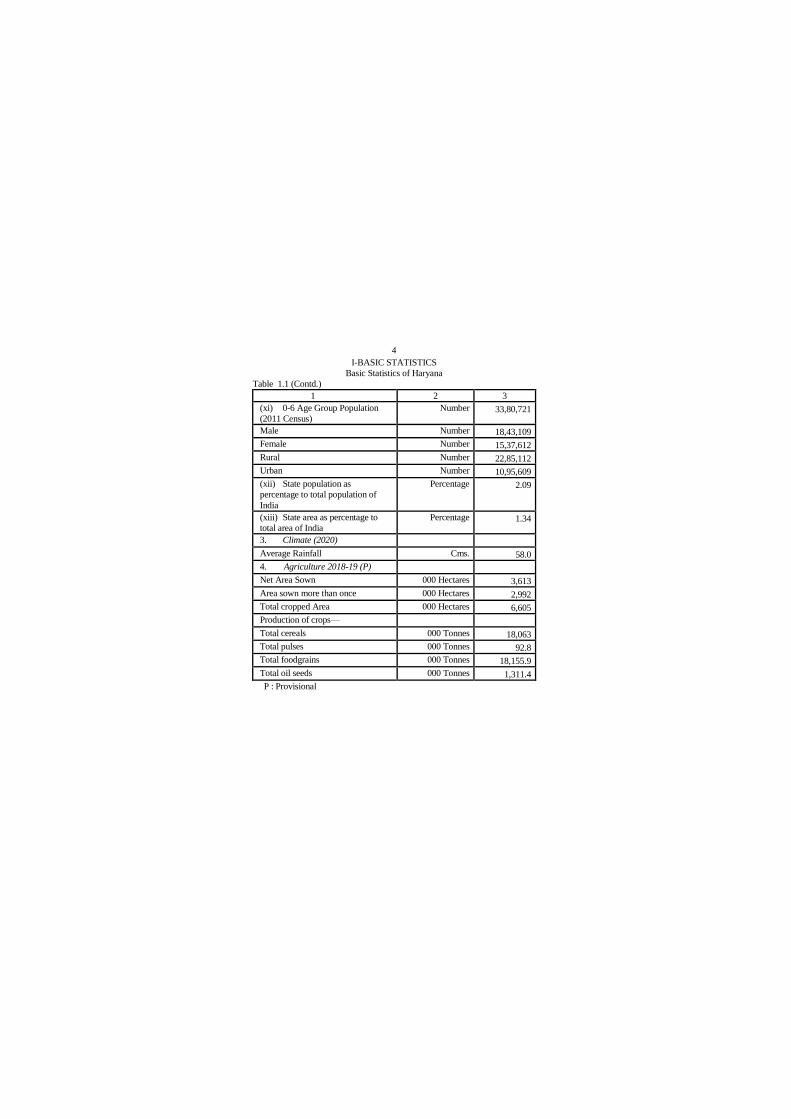
(xi) 0-6 Age Group Population
(2011 Census)
Number 33,80,721
Male Number 18,43,109
Female Number 15,37,612
Rural Number 22,85,112
Urban Number 10,95,609
(xii) State population as
percentage to total population of
India
Percentage 2.09
(xiii) State area as percentage to
total area of India
Percentage 1.34
3. Climate (2020)
Average Rainfall Cms. 58.0
4. Agriculture 2018-19 (P)
Net Area Sown 000 Hectares 3,613
Area sown more than once 000 Hectares 2,992
Total cropped Area 000 Hectares 6,605
Production of crops—
Total cereals 000 Tonnes 18,063
Total pulses 000 Tonnes 92.8
Total foodgrains 000 Tonnes 18,155.9
Total oil seeds 000 Tonnes 1,311.4
P : Provisional
5
I-BASIC STATISTICS
Basic Statistics of Haryana
Table 1.1 (Contd.)
1 2 3
Area, Production and
Yield of Principal Crops
(2018-19)(P)
Rice
Area 000 Hectares 1,446.9
Production 000 Tonnes 4,517
Yield Kgs. per Hec. 3,121
Wheat
Area 000 Hectares 2,553.2
Production 000 Tonnes 12,573
Yield Kgs. per Hectare 4,925
Bajra
Area 000 Hectares 424.7
Production 000 Tonnes 878
Yield Kgs. per Hectare 2,068
Barley
Area 000 Hectares 15.5

6
I-BASIC STATISTICS
Basic Statistics of Haryana
Table 1.1 (Contd.)
1 2 3
Production 000 Tonnes 58
Yield Kgs. Per Hec. 3,866
Maize
Area 000 Hec. 6.2
Production 000 Tonnes 16
Yield Kgs. Per Hec. 2,644
Sugarcane
Area 000 Hec. 108.7
Production* 000 Tonnes 850
Yield* Kgs. Per Hec. 7,824
Rape seed and Mustard
Area 000 Hec. 609.8
Production 000 Tonnes 1,286.5
Yield Kgs. Per Hec. ——
Cotton
Area 000 Hec. 708.9
Production 000 Bales** 2,033
Yield Kgs. Per Hec. 483
Tractors Number 2,38,500
(2019-20) (P)
* In terms of Gur P—Provisional ** Bales of 170 Kgs. Each

7
I-BASIC STATISTICS
Basic Statistics of Haryana
Table 1.1 (Contd.)
1 2 3
5. Irrigation 2018-19
Net area irrigated by—
Govt. Canals 000 Hec. 1,215
Wells/Tubewells 000 Hec. 2,067
Others 000 Hec. —
Total 000 Hec. 3,282
Gross area irrigated 000 Hec. 6,024
Tubewells and Pumping sets Number 7,90,873
(2019-20) (P)
6. Forests 2019-20(P)
Area under Forests Sq. Km. 1,779
7. Animal Husbandry (2019-20)
Veterinary Hospitals Number 1,020
Veterinary Dispensaries Number 1,820
Area stocked for Fisheries Hec. 17,119
Number of developed Gaushalas Number 83
P—Provisional

8
I-BASIC STATISTICS
Basic Statistics of Haryana
Table 1.1 (Contd.)
1 2 3
8. Electricity 2019-20
Power available for sale Lakh KWH 5,21,775
Consumption of Electric Power Lakh KWH 4,30,946
Units sold per capita KWH 1,805
9. Industries (2019)
Registered Working Factories Number 13,384
Estimated Number of workers employed in
working Factories
000
Number 1,001
10. Medical and Health (2019-20)
Hospitals, Dispensaries and Health Centres Number 3,470
Per Capita allocation of expenditure on health
and medical and medical facilities
Rupees 1,530.74
P: Provisional

9
I-BASIC STATISTICS
Basic Statistics of Haryana
Table 1.1 (Concld.)
1 2 3
Education 2019-20(P)
Universities(Including State /
Private/ Deemed / Central /
Technical/Others Universities)
Number 60
Colleges (All types) Number 1,301
High/Senior Secondary Schools Number 8,575
Middle Schools Number 5,704
Primary Schools (Excluding
Pre-Primary)
Number 9,928
Co-operation (2019-20)
All types of Societies Number 22,016
Membership Lakh 53.23
Transport 2019-20(P)
Fleet strength of Haryana
Roadways
Number 3,592
Overall Profit per Kilometre Paise (-)2,413
P: Provisional
10
I-BASIC STATISTICS
Basic Statistics of Haryana
Table 1.1(Concld.)
1 2 3
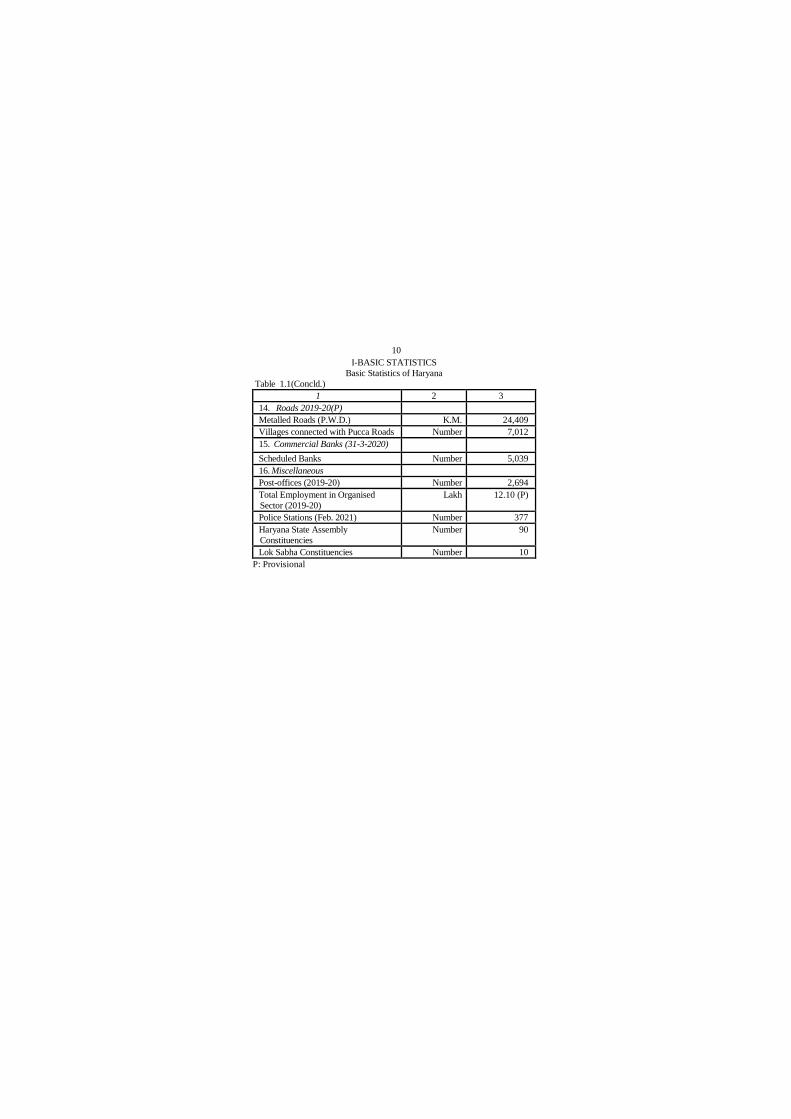
14. Roads 2019-20(P)
Metalled Roads (P.W.D.) K.M. 24,409
Villages connected with Pucca Roads Number 7,012
15. Commercial Banks (31-3-2020)
Scheduled Banks Number 5,039
16. Miscellaneous
Post-offices (2019-20) Number 2,694
Total Employment in Organised
Sector (2019-20)
Lakh 12.10 (P)
Police Stations (Feb. 2021) Number 377
Haryana State Assembly
Constituencies
Number 90
Lok Sabha Constituencies Number 10
P: Provisional
11
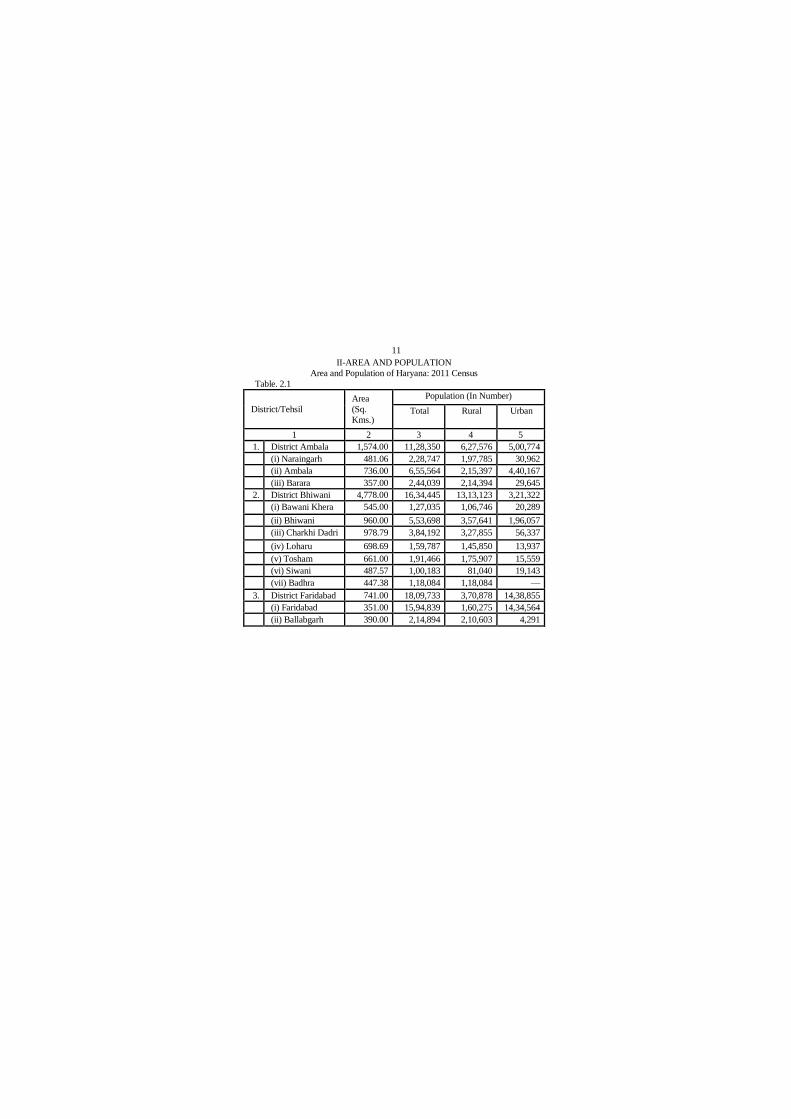
II-AREA AND POPULATION
Area and Population of Haryana: 2011 Census
Table. 2.1
District/Tehsil
Area
(Sq.
Kms.)
Population (In Number)
Total Rural Urban
1 2 3 4 5
1. District Ambala 1,574.00 11,28,350 6,27,576 5,00,774
(i) Naraingarh 481.06 2,28,747 1,97,785 30,962
(ii) Ambala 736.00 6,55,564 2,15,397 4,40,167
(iii) Barara 357.00 2,44,039 2,14,394 29,645
2. District Bhiwani 4,778.00 16,34,445 13,13,123 3,21,322
(i) Bawani Khera 545.00 1,27,035 1,06,746 20,289
(ii) Bhiwani 960.00 5,53,698 3,57,641 1,96,057
(iii) Charkhi Dadri 978.79 3,84,192 3,27,855 56,337
(iv) Loharu 698.69 1,59,787 1,45,850 13,937
(v) Tosham 661.00 1,91,466 1,75,907 15,559
(vi) Siwani 487.57 1,00,183 81,040 19,143
(vii) Badhra 447.38 1,18,084 1,18,084 —
3. District Faridabad 741.00 18,09,733 3,70,878 14,38,855
(i) Faridabad 351.00 15,94,839 1,60,275 14,34,564
(ii) Ballabgarh 390.00 2,14,894 2,10,603 4,291

12
II-AREA AND POPULATION
Area and Population of Haryana: 2011 Census
Table 2.1(Contd.)
1 2 3 4 5
4. District Fatehabad 2,538.00 9,42,011 7,62,423 1,79,588
(i) Fatehabad 1,421.52 4,98,697 4,27,920 70,777
(ii) Ratia 512.55 1,79,550 1,42,398 37,152
(iii) Tohana 603.93 2,63,764 1,92,105 71,659
5. District Gurugram 1,258.00 15,14,432 4,72,179 10,42,253
(i) Pataudi 177.45 1,20,012 78,688 41,324
(ii) Gurugram 333.22 9,77,337 67,331 9,10,006
(iii) Sohna 311.86 1,65,629 1,11,667 53,962
(iv) Maneser 160.80 1,16,606 93,158 23,448
(v) Farukhnagar 274.69 1,34,848 1,21,335 13,513
6. District Hisar 3,983.00 17,43,931 11,90,443 5,53,488
(i) Hisar 2,234.00 10,69,309 6,45,364 4,23,945
(ii) Hansi 847.82 3,86,790 3,00,020 86,770
(iii) Narnaund 440.93 1,40,880 1,23,638 17,242
(iv) Adampur 460.00 1,46,952 1,21,421 25,531
7. District Jhajjar 1,834.00 9,58,405 7,15,066 2,43,339
(i) Jhajjar 610.36 2,58,595 2,08,862 49,733
(ii) Bahadurgarh 516.90 4,03,746 2,26,074 1,77,672
(iii) Beri 329.97 1,55,791 1,39,857 15,934
(iv) Matenhail 376.76 1,40,273 1,40,273 —

13
II-AREA AND POPULATION
Area and Population of Haryana: 2011
Table 2.1(Contd.)
1 2 3 4 5
8. District Jind 2,702.00 13,34,152 10,28,569 3,05,583
(i) Narwana 1,132.19 4,84,321 4,05,416 78,905
(ii) Jind 817.35 4,76,794 3,09,202 1,67,592
(iii) Safidon 489.33 253,629 2,13,298 40,331
(iv) Julana 263.13 1,19,408 1,00,653 18,755
9. District Kaithal 2,317.00 10,74,304 8,38,293 2,36,011
(i) Guhla 553.00 1,95,251 1,56,299 38,952
(ii) Kaithal 1,280.10 6,41,973 4,78,398 1,63,575
(iii) Fatehpur Pundri 483.89 2,37,080 2,03,596 33,484
10. District Karnal 2,520.00 15,05,324 10,50,514 4,54,810
(i) Karnal 830.39 7,14,328 3,85,828 3,28,500
(ii) Assandh 487.95 2,33,204 2,06,079 27,125
(iii) Nilokheri 395.66 2,07,101 1,63,219 43,882
(iv) Indri 361.90 1,62,593 1,45,106 17,487
(v) Gharaunda 444.46 1,88,098 1,50,282 37,816
11. District Kurukshetra 1,530.00 9,64,655 6,85,430 2,79,225
(i) Thanesar 801.00 5,79,172 3,95,133 1,84,039
(ii) Pehowa 547.58 2,55,307 2,02,728 52,579
(iii) Shahbad 181.43 1,30,176 87,569 42,607
12. District Mahendragarh 1,899.00 9,22,088 7,89,233 1,32,855
(i) Mahendragarh 976.66 4,04,381 3,62,264 42,117
(ii) Narnaul 922.34 5,17,707 4,26,969 90,738

14
II-AREA AND POPULATION Area and Population of Haryana: 2011
Table 2.1(Contd.)
1 2 3 4 5
13. District Nuh 1507.00 10,89,263 9,65,157 1,24,106
(i) Punhana 291.30 2,91,978 2,54,632 37,346
(ii) Nuh 465.41 2,87,101 2,65,114 21,987
(iii) Taoru 223.77 1,66,778 1,38,172 28,606
(iv) Ferozepur Jhirka 526.52 3,43,406 3,07,239 36,167
14. District Palwal 1,359.00 10,42,708 8,06,164 2,36,544
(i) Palwal 618.60 5,06,253 3,45,842 1,60,411
(ii) Hathin 364.71 2,69,015 2,54,594 14,421
(iii) Hodal 375.68 2,67,440 2,05,728 61,712
15. District Panchkula 898.00 5,61,293 2,48,063 3,13,230
(i) Kalka 257.35 1,68,073 94,154 73,919
(ii) Panchkula 640.65 3,93,220 1,53,909 2,39,311
16. District Panipat 1,268.00 12,05,437 6,50,352 5,55,085
(i) Panipat 536.31 7,91,634 2,76,259 5,15,375
(ii) Israna 280.06 1,08,196 1,08,196 —
(iii) Samalkha 451.63 3,05,607 2,65,897 39,710
17. District Rewari 1,594.00 9,00,332 6,66,902 2,33,430
(i) Bawal 257.80 1,30,050 1,13,274 16,776
(ii) Rewari 998.50 6,42,872 4,36,188 2,06,684
(iii) Kosli 337.69 1,27,410 1,17,440 9,970
15
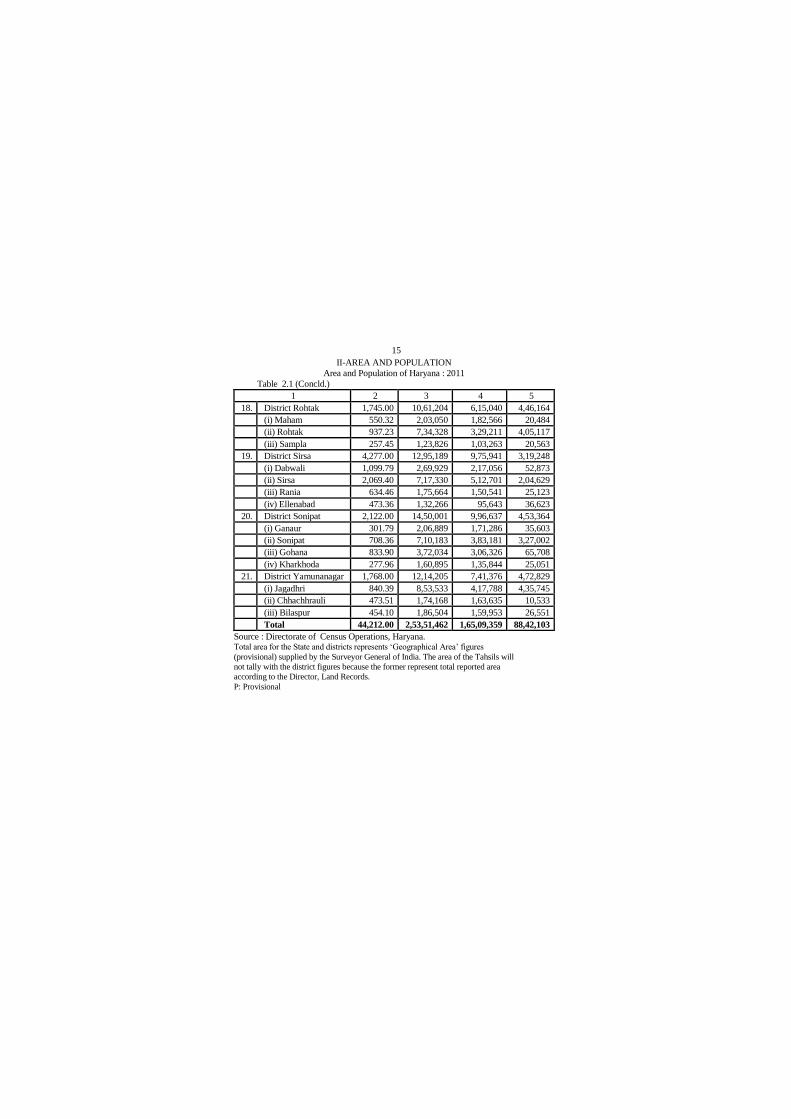
II-AREA AND POPULATION
Area and Population of Haryana : 2011
Table 2.1 (Concld.)
1 2 3 4 5
18. District Rohtak 1,745.00 10,61,204 6,15,040 4,46,164
(i) Maham 550.32 2,03,050 1,82,566 20,484
(ii) Rohtak 937.23 7,34,328 3,29,211 4,05,117
(iii) Sampla 257.45 1,23,826 1,03,263 20,563
19. District Sirsa 4,277.00 12,95,189 9,75,941 3,19,248
(i) Dabwali 1,099.79 2,69,929 2,17,056 52,873
(ii) Sirsa 2,069.40 7,17,330 5,12,701 2,04,629
(iii) Rania 634.46 1,75,664 1,50,541 25,123
(iv) Ellenabad 473.36 1,32,266 95,643 36,623
20. District Sonipat 2,122.00 14,50,001 9,96,637 4,53,364
(i) Ganaur 301.79 2,06,889 1,71,286 35,603
(ii) Sonipat 708.36 7,10,183 3,83,181 3,27,002
(iii) Gohana 833.90 3,72,034 3,06,326 65,708
(iv) Kharkhoda 277.96 1,60,895 1,35,844 25,051
21. District Yamunanagar 1,768.00 12,14,205 7,41,376 4,72,829
(i) Jagadhri 840.39 8,53,533 4,17,788 4,35,745
(ii) Chhachhrauli 473.51 1,74,168 1,63,635 10,533
(iii) Bilaspur 454.10 1,86,504 1,59,953 26,551
Total 44,212.00 2,53,51,462 1,65,09,359 88,42,103
Source : Directorate of Census Operations, Haryana. Total area for the State and districts represents ‘Geographical Area’ figures
(provisional) supplied by the Surveyor General of India. The area of the Tahsils will
not tally with the district figures because the former represent total reported area
according to the Director, Land Records.
P: Provisional

16
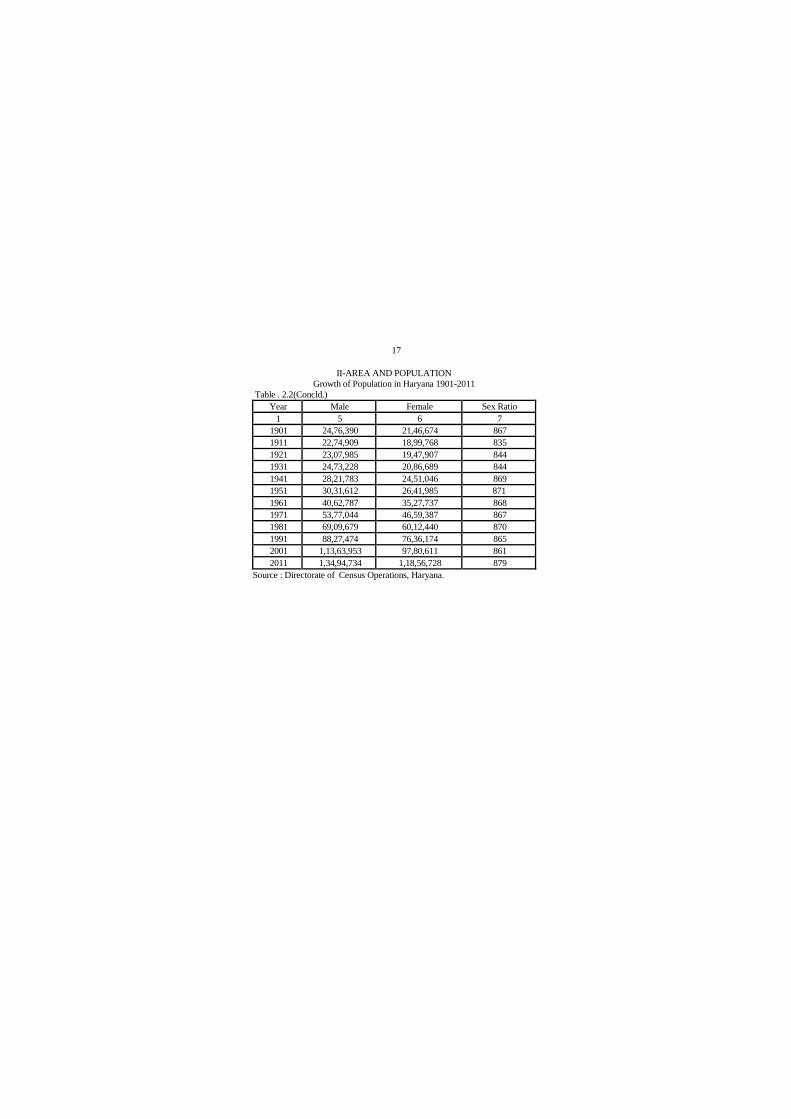
II-AREA AND POPULATION
Growth of Population in Haryana 1901-2011
Table 2.2
Year Population Variation in
population
Decennial Percent-
age Increase
1 2 3 4
1901 46,23,064 — —
1911 41,74,677 (–) 4,48,387 (–)9.70
1921 42,55,892 81,215 1.95
1931 45,59,917 3,04,025 7.14
1941 52,72,829 7,12,912 15.63
1951 56,73,597 4,00,768 7.60
1961 75,90,524 19,16,927 33.79
1971 1,00,36,431 24,45,907 32.22
1981 1,29,22,119 28,85,688 28.75
1991 1,64,63,648 35,41,529 27.41
2001 2,11,44,564 46,80,916 28.43
2011 2,53,51,462 42,06,898 19.90
17
II-AREA AND POPULATION
Growth of Population in Haryana 1901-2011
Table . 2.2(Concld.)
Year Male Female Sex Ratio
1 5 6 7
1901 24,76,390 21,46,674 867
1911 22,74,909 18,99,768 835
1921 23,07,985 19,47,907 844
1931 24,73,228 20,86,689 844
1941 28,21,783 24,51,046 869
1951 30,31,612 26,41,985 871
1961 40,62,787 35,27,737 868
1971 53,77,044 46,59,387 867
1981 69,09,679 60,12,440 870
1991 88,27,474 76,36,174 865
2001 1,13,63,953 97,80,611 861
2011 1,34,94,734 1,18,56,728 879
Source : Directorate of Census Operations, Haryana.

18
II-AREA AND POPULATION
Increase in Population since 2001 by Districts
Table 2.3
District
Population
2011
Population
2001
Variation
in
population
2001-
2011
Percentage
increase
2001-
2011
1 2 3 4 5
Ambala 11,28,350 10,14,411 1,13,939 11.23
Bhiwani 16,34,445 14,25,022 2,09,423 14.7
Faridabad 18,09,733 13,65,465 4,44,268 32.54
Fatehabad 9,42,011 8,06,158 1,35,853 16.85
Gurugram 15,14,432 8,70,539 6,43,893 73.96
Hisar 17,43,931 15,37,117 2,06,814 13.45
Jhajjar 9,58,405 8,80,072 78,333 8.9
Jind 13,34,152 11,89,827 1,44,325 12.13
Kaithal 10,74,304 9,46,131 1,28,173 13.55
Karnal 15,05,324 12,74,183 2,31,141 18.14
Kurukshetra 9,64,655 8,25,454 1,39,201 16.86
Mahendragarh 9,22,088 8,12,521 1,09,567 13.48
Nuh 10,89,263 7,89,750 2,99,513 37.92
Palwal 10,42,708 8,29,121 2,13,587 25.76
Panchkula 5,61,293 4,68,411 92,882 19.83
Panipat 12,05,437 9,67,449 2,37,988 24.6
Rewari 9,00,332 7,65,351 1,34,981 17.64
Rohtak 10,61,204 9,40,128 1,21,076 12.88
Sirsa 12,95,189 11,16,649 1,78,540 15.99
Sonipat 14,50,001 12,79,175 1,70,826 13.35
Yamunanagar 12,14,205 10,41,630 1,72,575 16.57
Total 2,53,51,462 2,11,44,564 42,06,898 19.90
Source : Directorate of Census Operations, Haryana.

19
II-AREA AND POPULATION
Number of Villages and Towns in Haryana as per
2001 and 2011Census
Table 2.4
District
Number of Villages
2001 Census
Inhabited Uninhabited Total
1 2 3 4
Ambala 482 11 493
Bhiwani 437 7 444
Faridabad 143 7 150
Fatehabad 243 — 243
Gurugram 271 10 281
Hisar 272 3 275
Jhajjar 247 13 260
Jind 306 1 307
Kaithal 270 — 270
Karnal 422 12 434
Kurukshetra 407 9 416
Mahendragarh 368 2 370
Nuh 423 22 445
Palwal 270 12 282
Panchkula 224 12 236
Panipat 179 13 192
Rewari 397 13 410
Rohtak 146 1 147
Sirsa 321 4 325
Sonipat 323 13 336
Yamunanagar 613 26 639
Total 6,764 191 6,955

20
II-AREA AND POPULATION
Number of Villages and Towns in Haryana in
2001 and 2011Census
Table 2.4(Concld.)
District
Number of Villages Number of
Towns
2011 Census 2001 2011
Inhabited Uninhabited Total
1 5 6 7 8 9
Ambala 461 9 470 6 15
Bhiwani 442 2 444 6 6
Faridabad 144 5 149 6 3
Fatehabad 245 — 245 4 4
Gurugram 229 13 242 12 9
Hisar 268 1 269 5 11
Jhajjar 247 13 260 5 5
Jind 302 4 306 5 6
Kaithal 267 2 269 4 4
Karnal 417 17 434 7 8
Kurukshetra 407 8 415 4 5
Mahendragarh 369 1 370 5 5
Nuh 412 27 439 — 8
Palwal 268 12 280 — 6
Panchkula 206 13 219 4 8
Panipat 176 10 186 6 12
Rewari 389 14 403 4 9
Rohtak 136 7 143 3 5
Sirsa 327 3 330 5 5
Sonipat 319 13 332 4 8
Yamunanagar 611 25 636 11 12
Total 6,642 199 6,841 106 154
Source : Directorate of Census Operations, Haryana.
21
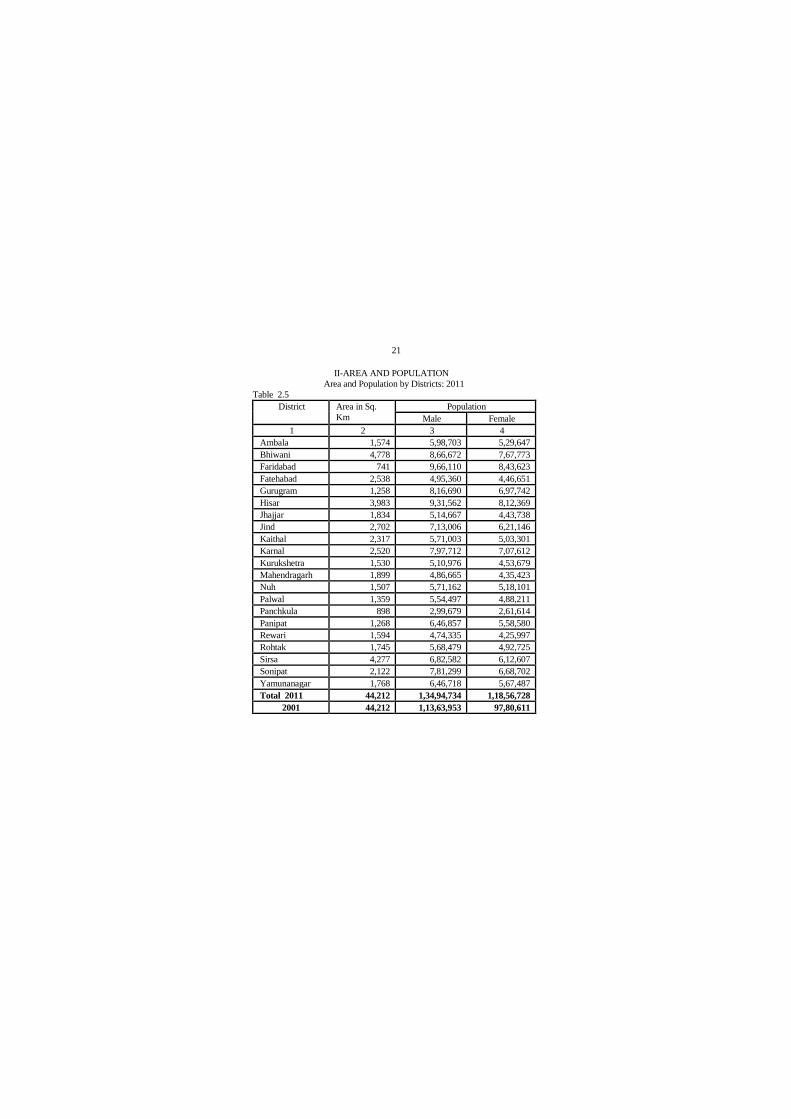
II-AREA AND POPULATION
Area and Population by Districts: 2011
Table 2.5
District Area in Sq.
Km
Population
Male Female
1 2 3 4
Ambala 1,574 5,98,703 5,29,647
Bhiwani 4,778 8,66,672 7,67,773
Faridabad 741 9,66,110 8,43,623
Fatehabad 2,538 4,95,360 4,46,651
Gurugram 1,258 8,16,690 6,97,742
Hisar 3,983 9,31,562 8,12,369
Jhajjar 1,834 5,14,667 4,43,738
Jind 2,702 7,13,006 6,21,146
Kaithal 2,317 5,71,003 5,03,301
Karnal 2,520 7,97,712 7,07,612
Kurukshetra 1,530 5,10,976 4,53,679
Mahendragarh 1,899 4,86,665 4,35,423
Nuh 1,507 5,71,162 5,18,101
Palwal 1,359 5,54,497 4,88,211
Panchkula 898 2,99,679 2,61,614
Panipat 1,268 6,46,857 5,58,580
Rewari 1,594 4,74,335 4,25,997
Rohtak 1,745 5,68,479 4,92,725
Sirsa 4,277 6,82,582 6,12,607
Sonipat 2,122 7,81,299 6,68,702
Yamunanagar 1,768 6,46,718 5,67,487
Total 2011 44,212 1,34,94,734 1,18,56,728
2001 44,212 1,13,63,953 97,80,611

22
II-AREA AND POPULATION
Area and Population by Districts: 2011
Table 2.5(Concld.)
District Population Persons
Per
Sq. Km
Female
Per 1,000
Male Total
1 5 6 7
Ambala 11,28,350 717 885
Bhiwani 16,34,445 342 886
Faridabad 18,09,733 2442 873
Fatehabad 9,42,011 371 902
Gurugram 15,14,432 1204 854
Hisar 17,43,931 438 872
Jhajjar 9,58,405 523 862
Jind 13,34,152 494 871
Kaithal 10,74,304 464 881
Karnal 15,05,324 597 887
Kurukshetra 9,64,655 630 888
Mahendragarh 9,22,088 486 895
Nuh 10,89,263 723 907
Palwal 10,42,708 767 880
Panchkula 5,61,293 625 873
Panipat 12,05,437 951 864
Rewari 9,00,332 565 898
Rohtak 10,61,204 608 867
Sirsa 12,95,189 303 897
Sonipat 14,50,001 683 856
Yamunanagar 12,14,205 687 877
Total 2011 2,53,51,462 573 879
2001 2,11,44,564 478 861
Source : Directorate of Census Operations, Haryana.
23
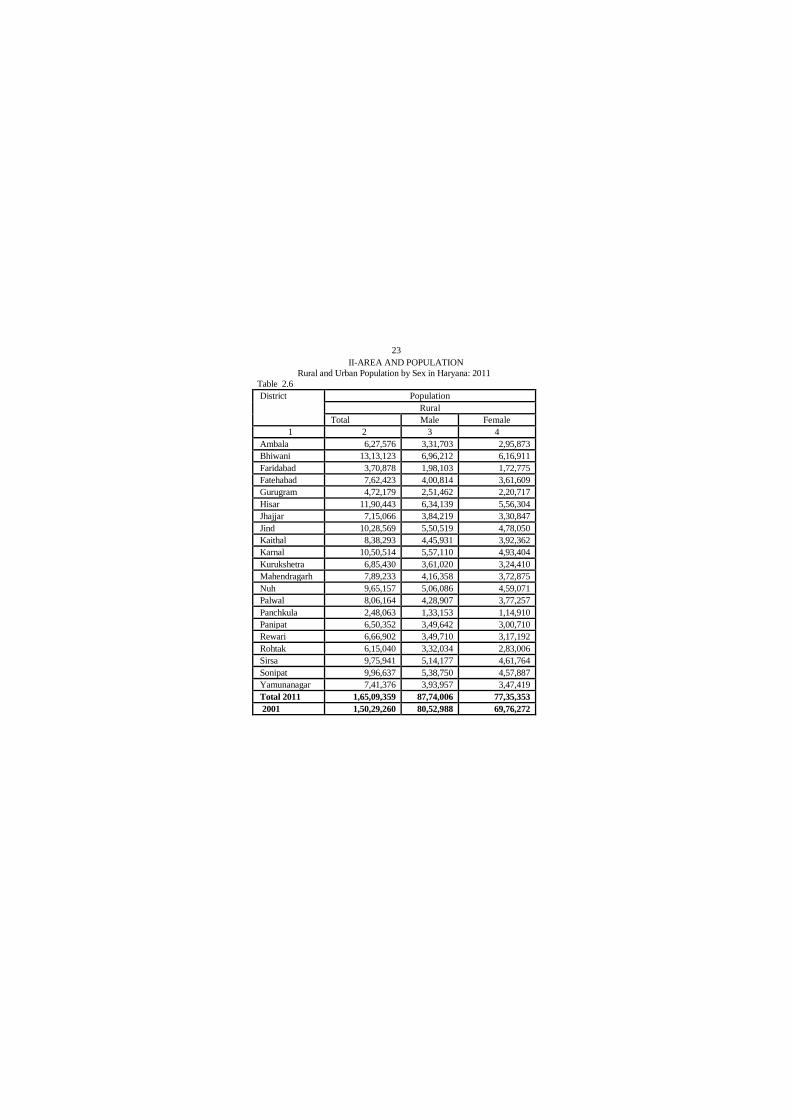
II-AREA AND POPULATION
Rural and Urban Population by Sex in Haryana: 2011
Table 2.6
District Population
Rural
Total Male Female
1 2 3 4
Ambala 6,27,576 3,31,703 2,95,873
Bhiwani 13,13,123 6,96,212 6,16,911
Faridabad 3,70,878 1,98,103 1,72,775
Fatehabad 7,62,423 4,00,814 3,61,609
Gurugram 4,72,179 2,51,462 2,20,717
Hisar 11,90,443 6,34,139 5,56,304
Jhajjar 7,15,066 3,84,219 3,30,847
Jind 10,28,569 5,50,519 4,78,050
Kaithal 8,38,293 4,45,931 3,92,362
Karnal 10,50,514 5,57,110 4,93,404
Kurukshetra 6,85,430 3,61,020 3,24,410
Mahendragarh 7,89,233 4,16,358 3,72,875
Nuh 9,65,157 5,06,086 4,59,071
Palwal 8,06,164 4,28,907 3,77,257
Panchkula 2,48,063 1,33,153 1,14,910
Panipat 6,50,352 3,49,642 3,00,710
Rewari 6,66,902 3,49,710 3,17,192
Rohtak 6,15,040 3,32,034 2,83,006
Sirsa 9,75,941 5,14,177 4,61,764
Sonipat 9,96,637 5,38,750 4,57,887
Yamunanagar 7,41,376 3,93,957 3,47,419
Total 2011 1,65,09,359 87,74,006 77,35,353
2001 1,50,29,260 80,52,988 69,76,272
24
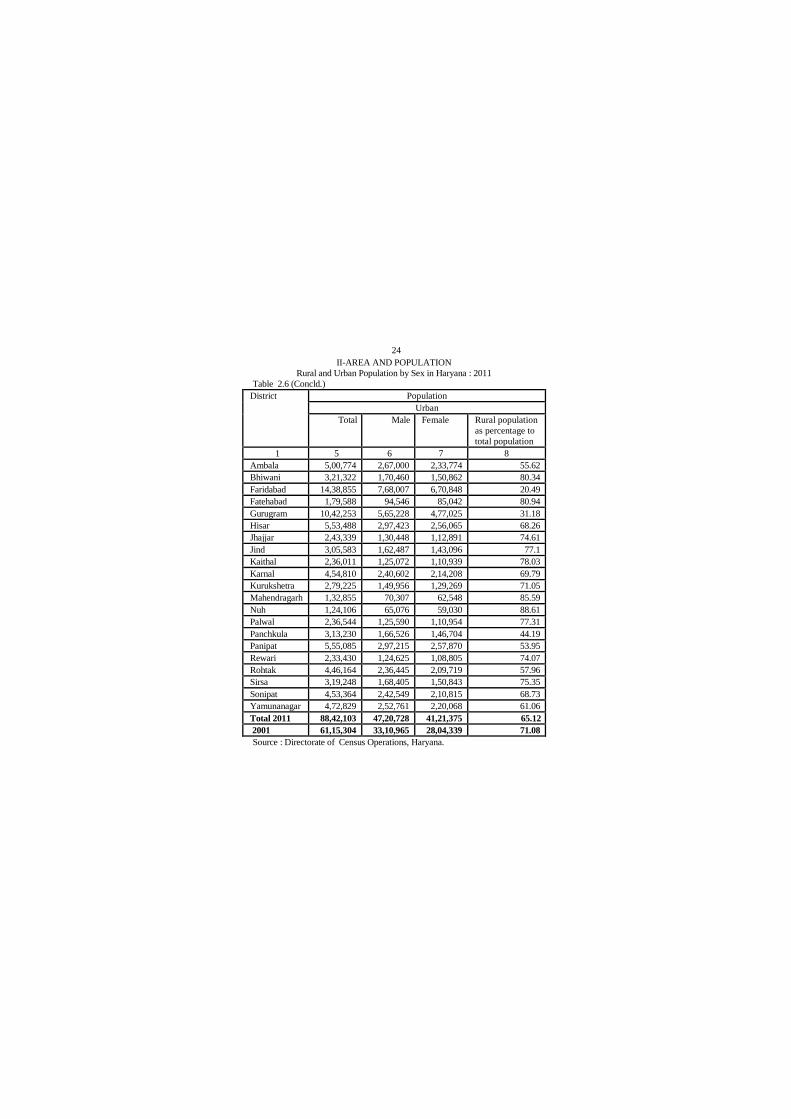
II-AREA AND POPULATION
Rural and Urban Population by Sex in Haryana : 2011
Table 2.6 (Concld.)
District Population
Urban
Total Male Female Rural population
as percentage to
total population
1 5 6 7 8
Ambala 5,00,774 2,67,000 2,33,774 55.62
Bhiwani 3,21,322 1,70,460 1,50,862 80.34
Faridabad 14,38,855 7,68,007 6,70,848 20.49
Fatehabad 1,79,588 94,546 85,042 80.94
Gurugram 10,42,253 5,65,228 4,77,025 31.18
Hisar 5,53,488 2,97,423 2,56,065 68.26
Jhajjar 2,43,339 1,30,448 1,12,891 74.61
Jind 3,05,583 1,62,487 1,43,096 77.1
Kaithal 2,36,011 1,25,072 1,10,939 78.03
Karnal 4,54,810 2,40,602 2,14,208 69.79
Kurukshetra 2,79,225 1,49,956 1,29,269 71.05
Mahendragarh 1,32,855 70,307 62,548 85.59
Nuh 1,24,106 65,076 59,030 88.61
Palwal 2,36,544 1,25,590 1,10,954 77.31
Panchkula 3,13,230 1,66,526 1,46,704 44.19
Panipat 5,55,085 2,97,215 2,57,870 53.95
Rewari 2,33,430 1,24,625 1,08,805 74.07
Rohtak 4,46,164 2,36,445 2,09,719 57.96
Sirsa 3,19,248 1,68,405 1,50,843 75.35
Sonipat 4,53,364 2,42,549 2,10,815 68.73
Yamunanagar 4,72,829 2,52,761 2,20,068 61.06
Total 2011 88,42,103 47,20,728 41,21,375 65.12
2001 61,15,304 33,10,965 28,04,339 71.08
Source : Directorate of Census Operations, Haryana.
25
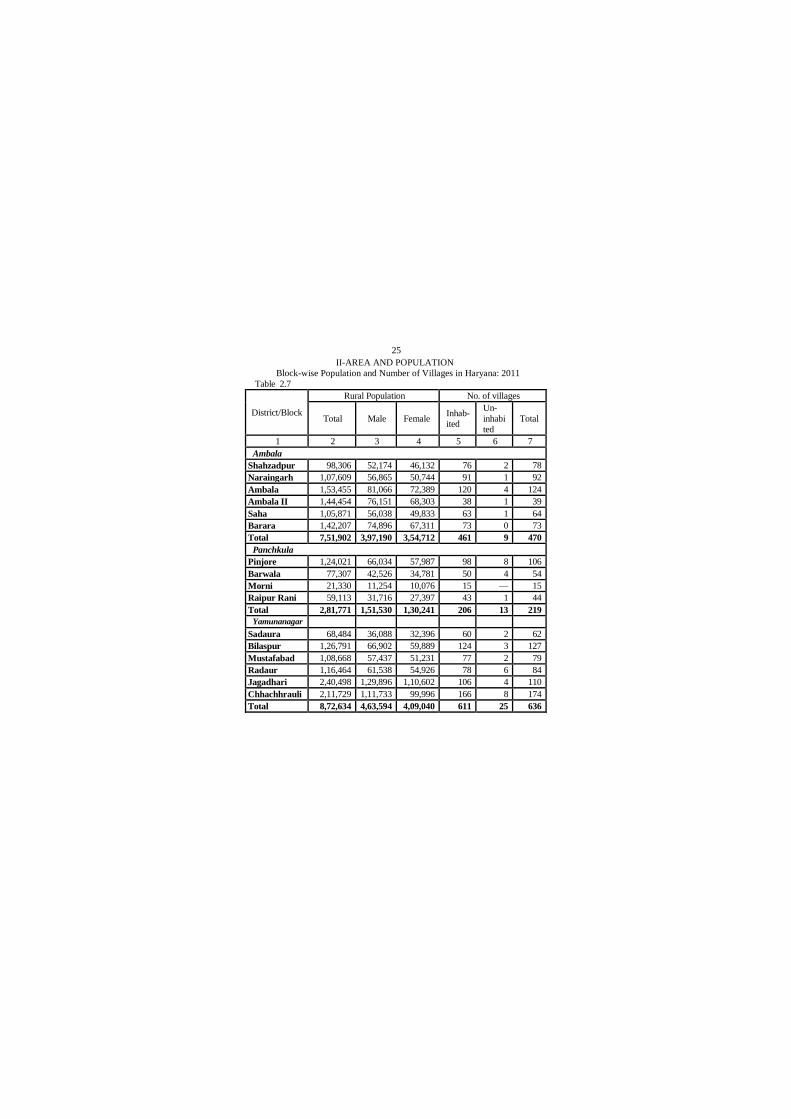
II-AREA AND POPULATION
Block-wise Population and Number of Villages in Haryana: 2011
Table 2.7
District/Block
Rural Population No. of villages
Total Male Female Inhab-
ited
Un-
inhabi
ted
Total
1 2 3 4 5 6 7
Ambala
Shahzadpur 98,306 52,174 46,132 76 2 78
Naraingarh 1,07,609 56,865 50,744 91 1 92
Ambala 1,53,455 81,066 72,389 120 4 124
Ambala II 1,44,454 76,151 68,303 38 1 39
Saha 1,05,871 56,038 49,833 63 1 64
Barara 1,42,207 74,896 67,311 73 0 73
Total 7,51,902 3,97,190 3,54,712 461 9 470
Panchkula
Pinjore 1,24,021 66,034 57,987 98 8 106
Barwala 77,307 42,526 34,781 50 4 54
Morni 21,330 11,254 10,076 15 — 15
Raipur Rani 59,113 31,716 27,397 43 1 44
Total 2,81,771 1,51,530 1,30,241 206 13 219
Yamunanagar
Sadaura 68,484 36,088 32,396 60 2 62
Bilaspur 1,26,791 66,902 59,889 124 3 127
Mustafabad 1,08,668 57,437 51,231 77 2 79
Radaur 1,16,464 61,538 54,926 78 6 84
Jagadhari 2,40,498 1,29,896 1,10,602 106 4 110
Chhachhrauli 2,11,729 1,11,733 99,996 166 8 174
Total 8,72,634 4,63,594 4,09,040 611 25 636

26
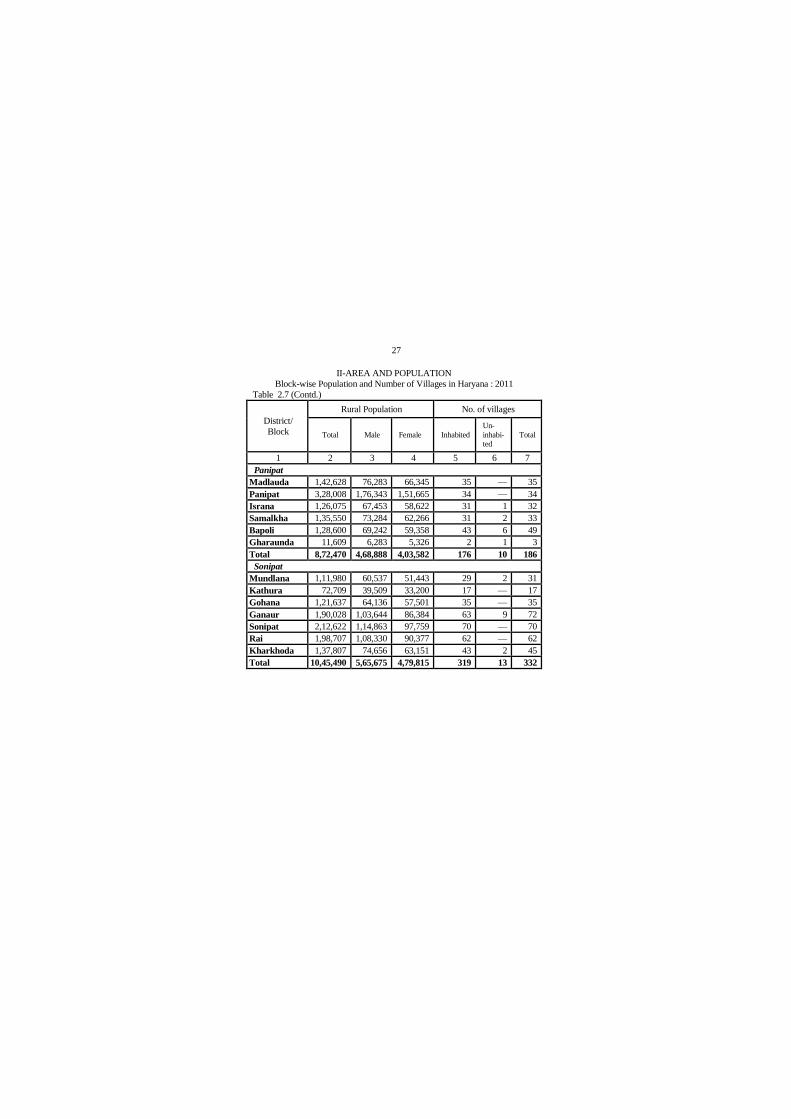
II-AREA AND POPULATION
Block-wise Population and Number of Villages in Haryana: 2011
Table 2.7 (Contd.)
District/
Block
Rural Population No. of villages
Total Male Female Inhab
-ited
Un-
inhabi
-ted
Total
1 2 3 4 5 6 7
Kurukshetra
Shahbad 1,67,766 88,836 78,930 106 1 107
Pehowa 1,59,668 83,646 76,022 79 4 83
Thanesar 2,21,448 1,16,704 1,04,744 112 1 113
Babain 62,177 32,695 29,482 49 — 49
Ladwa 88,097 46,446 41,651 61 2 63
Total 6,99,156 3,68,327 3,30,829 407 8 415
Kaithal
Guhla 1,16,016 61,042 54,974 70 2 72
Siwan 99,367 51,918 47,449 39 — 39
Kaithal 2,11,114 1,12,905 98,209 60 — 60
Kalayat 1,12,458 60,227 52,231 28 — 28
Rajound 1,20,711 64,927 55,784 25 — 25
Pundri 1,93,239 1,02,660 90,579 45 — 45
Total 8,52,905 4,53,679 3,99,226 267 2 269
Karnal
Nilokheri 1,66,841 88,144 78,697 79 1 80
Indri 1,45,707 77,009 68,698 98 10 108
Karnal 2,32,419 1,24,308 1,08,111 84 --- 84
Nissing 1,54,666 81,725 72,941 47 2 49
Assandh 1,79,229 95,082 84,147 48 — 48
Gharaunda 1,95,887 1,03,955 91,932 64 4 68
Total 10,74,749 5,70,223 5,04,526 417 17 434
27
II-AREA AND POPULATION
Block-wise Population and Number of Villages in Haryana : 2011
Table 2.7 (Contd.)
District/
Block
Rural Population No. of villages
Total Male Female Inhabited
Un-
inhabi-
ted
Total
1 2 3 4 5 6 7
Panipat
Madlauda 1,42,628 76,283 66,345 35 — 35
Panipat 3,28,008 1,76,343 1,51,665 34 — 34
Israna 1,26,075 67,453 58,622 31 1 32
Samalkha 1,35,550 73,284 62,266 31 2 33
Bapoli 1,28,600 69,242 59,358 43 6 49
Gharaunda 11,609 6,283 5,326 2 1 3
Total 8,72,470 4,68,888 4,03,582 176 10 186
Sonipat
Mundlana 1,11,980 60,537 51,443 29 2 31
Kathura 72,709 39,509 33,200 17 — 17
Gohana 1,21,637 64,136 57,501 35 — 35
Ganaur 1,90,028 1,03,644 86,384 63 9 72
Sonipat 2,12,622 1,14,863 97,759 70 — 70
Rai 1,98,707 1,08,330 90,377 62 — 62
Kharkhoda 1,37,807 74,656 63,151 43 2 45
Total 10,45,490 5,65,675 4,79,815 319 13 332
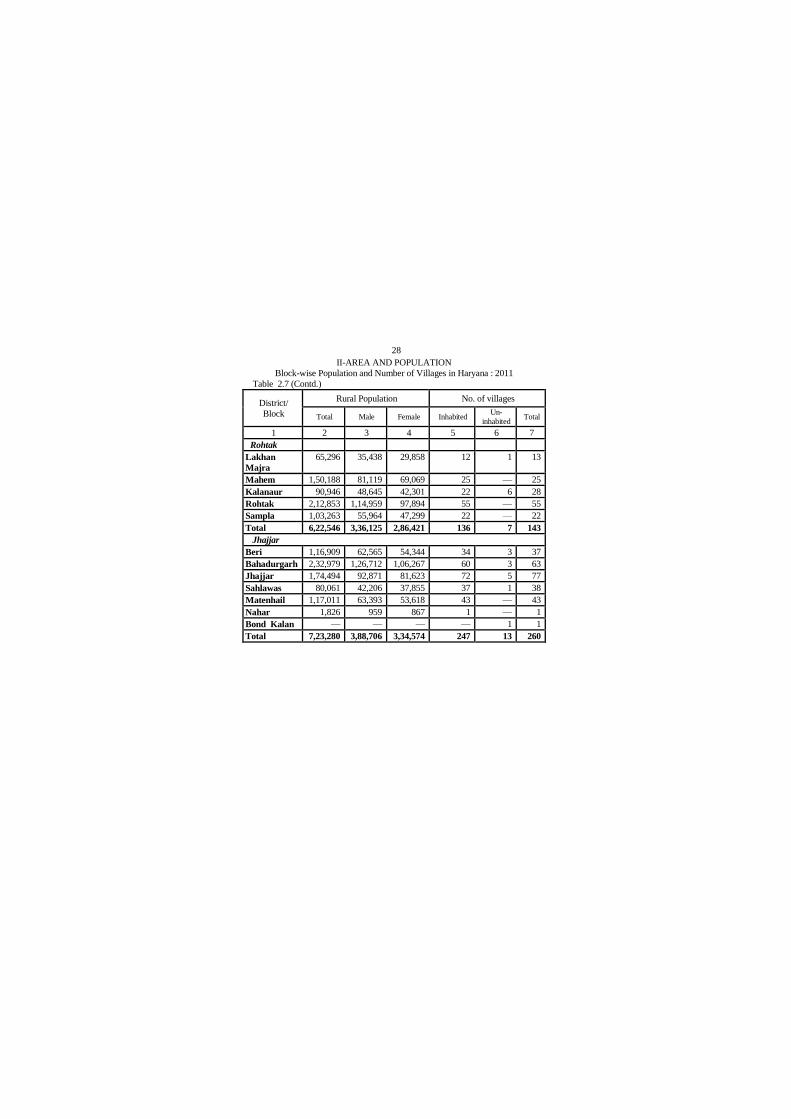
28
II-AREA AND POPULATION
Block-wise Population and Number of Villages in Haryana : 2011
Table 2.7 (Contd.)
District/
Block
Rural Population No. of villages
Total Male Female Inhabited Un-
inhabited Total
1 2 3 4 5 6 7
Rohtak
Lakhan
Majra
65,296 35,438 29,858 12 1 13
Mahem 1,50,188 81,119 69,069 25 — 25
Kalanaur 90,946 48,645 42,301 22 6 28
Rohtak 2,12,853 1,14,959 97,894 55 — 55
Sampla 1,03,263 55,964 47,299 22 — 22
Total 6,22,546 3,36,125 2,86,421 136 7 143
Jhajjar
Beri 1,16,909 62,565 54,344 34 3 37
Bahadurgarh 2,32,979 1,26,712 1,06,267 60 3 63
Jhajjar 1,74,494 92,871 81,623 72 5 77
Sahlawas 80,061 42,206 37,855 37 1 38
Matenhail 1,17,011 63,393 53,618 43 — 43
Nahar 1,826 959 867 1 — 1
Bond Kalan — — — — 1 1
Total 7,23,280 3,88,706 3,34,574 247 13 260

29
II-AREA AND POPULATION
Block-wise Population and Number of Villages in Haryana : 2011
Table 2.7 (Contd.)
District/
Block Rural Population No. of villages
Total Male Female Inhabited Uninh-
abited Total
1 2 3 4 5 6 7
Faridabad
Faridabad 1,88,782 1,01,480 87,302 63 5 68
Ballabgarh 2,06,901 1,10,088 96,813 81 — 81
Total 3,95,683 2,11,568 1,84,115 144 5 149
Palwal
Palwal 2,91,145 1,55,378 1,35,767 119 3 122
Hathin 2,54,594 1,34,538 1,20,056 79 7 86
Hodal 1,71,961 91,927 80,034 37 2 39
Hassanpur 1,20,145 63,906 56,239 33 — 33
Total 8,37,845 4,45,749 3,92,096 268 12 280
Gurugram
Pataudi 1,35,800 71,103 64,697 73 7 80
Farrukhnagar 1,13,493 59,789 53,704 48 5 53
Gurugram 1,34,089 75,429 58,660 34 1 35
Sohna 1,57,688 84,567 73,121 72 — 72
Taoru 5,004 2,635 2,369 — — —
Total 5,46,074 2,93,523 2,52,551 227 13 240
Nuh
Taoru 1,44,179 75,783 68,396 81 2 83
Nuh 2,70,841 1,42,730 1,28,111 103 15 118
Nagina 1,47,426 76,903 70,523 66 1 67

30
II-AREA AND POPULATION
Block-wise Population and Number of Villages in Haryana: 2011
Table 2.7 (Contd.)
District/
Block
Rural Population No. of Village
Total Male Female In
habited
Un-
habit-
ed
Total
1 2 3 4 5 6 7
Ferozepur
Jhirka
1,75,665 91,922 83,743 80 1 81
Punhana 2,62,809 1,37,457 1,25,352 84 8 92
Total 10,00,920 5,24,795 4,76,125 414 27 441
Rewari
Jatusana 1,29,688 67,746 61,942 69 4 73
Khol at Rewari 1,26,620 66,069 60,551 61 1 62
Rewari 1,90,426 1,01,519 88,907 111 6 117
Bawal 1,46,735 77,397 69,338 102 2 104
Nahar 1,16,722 60,598 56,124 46 — 46
Matenhail — — — — 1 1
Total 7,10,191 3,73,329 3,36,862 389 14 403
Mahendragarh
Mahendragarh 2,04,370 1,07,726 96,644 89 — 89
Kanina 1,56,383 82,225 74,158 59 — 59
Ateli Nangal 1,53,623 80,921 72,702 77 — 77
Narnaul 1,24,621 65,919 58,702 67 1 68
Nangal
Chaudhary
1,58,774 84,141 74,633 77 — 77
Total 7,97,771 4,20,932 3,76,839 369 1 370
31
II-AREA AND POPULATION
Block-wise Population and Number of Villages in Haryana : 2011
Table 2.7 (Contd.)
District/
Block
Rural Population No. of Village
Total Male Female In
habited
Un
habited Total
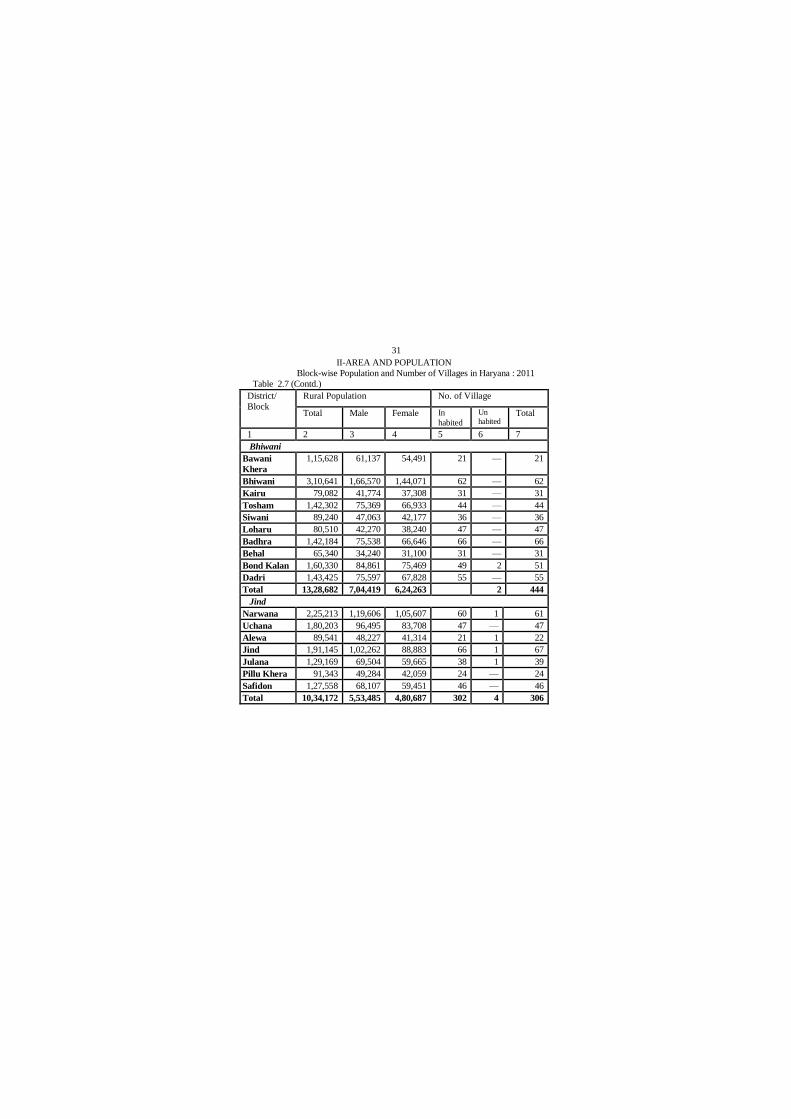
1 2 3 4 5 6 7
Bhiwani
Bawani
Khera
1,15,628 61,137 54,491 21 — 21
Bhiwani 3,10,641 1,66,570 1,44,071 62 — 62
Kairu 79,082 41,774 37,308 31 — 31
Tosham 1,42,302 75,369 66,933 44 — 44
Siwani 89,240 47,063 42,177 36 — 36
Loharu 80,510 42,270 38,240 47 — 47
Badhra 1,42,184 75,538 66,646 66 — 66
Behal 65,340 34,240 31,100 31 — 31
Bond Kalan 1,60,330 84,861 75,469 49 2 51
Dadri 1,43,425 75,597 67,828 55 — 55
Total 13,28,682 7,04,419 6,24,263 442 2 444
Jind
Narwana 2,25,213 1,19,606 1,05,607 60 1 61
Uchana 1,80,203 96,495 83,708 47 — 47
Alewa 89,541 48,227 41,314 21 1 22
Jind 1,91,145 1,02,262 88,883 66 1 67
Julana 1,29,169 69,504 59,665 38 1 39
Pillu Khera 91,343 49,284 42,059 24 — 24
Safidon 1,27,558 68,107 59,451 46 — 46
Total 10,34,172 5,53,485 4,80,687 302 4 306

32
II-AREA AND POPULATION
Block-wise Population and Number of Villages in Haryana : 2011
Table 2.7 (Contd.)
District/
Block
Rural Population No. of villages
Total Male Female Inhab
-ited
Un-
inhabit
ed Total
1 2 3 4 5 6 7
Hisar
Adampur 1,11,542 59,015 52,527 19 — 19
Agroha 1,01,193 53,399 47,794 23 — 23
Hisar-I 2,04,446 1,08,802 95,644 40 — 40
Hisar-II 1,80,374 96,715 83,659 40 — 40
Barwala 1,57,981 83,636 74,345 38 — 38
Narnaund 1,23,638 66,470 57,168 30 1 31
Hansi-I 2,07,569 1,10,907 96,662 40 — 40
Hansi-II 92,451 49,884 42,567 22 — 22
Bhattu Kalan 10,266 5,433 4,833 5 — 5
Uklana 1,05,692 56,111 49,581 12 — 12
Total 12,95,152 6,90,372 6,04,780 269 1 270
Fatehabad
Ratia 1,48,438 77,324 71,114 67 — 67
Jakhal 59,180 30,802 28,378 26 — 26
Tohana 1,11,092 58,758 52,334 50 — 50

33
II-AREA AND POPULATION
Block-wise Population and Number of Villages in Haryana : 2011
Table 2.7 (Concld.)
District/
Block
Rural Population No. of villages
Total Male Female
Inh
ab-
ited
Un-
inhab
ited
Total
1 2 3 4 5 6 7
Bhuna 1,28,552 68,092 60,460 27 — 27
Fatehabad 2,02,163 1,06,004 96,159 47 — 47
Bhattu
Kalan
1,03,457 54,702 48,755 23 — 23
Uklana 17,329 9,220 8,109 4 — 4
Total 7,70,211 4,04,902 3,65,309 244 — 244
Sirsa
Dabwali 1,67,176 87,841 79,335 50 1 51
Odhan 1,06,120 55,866 50,254 40 — 40
Baragudha 1,14,445 60,128 54,317 47 — 47
Sirsa 1,66,227 87,844 78,383 53 1 54
Nathusari
Chopta
1,63,943 86,699 77,244 56 — 56
Rania 1,32,162 69,450 62,712 47 1 48
Ellenabad 1,25,868 66,349 59,519 34 — 34
Total 9,75,941 5,14,177 4,61,764 327 3 330
Source : Directorate of Census Operations, Haryana.
34
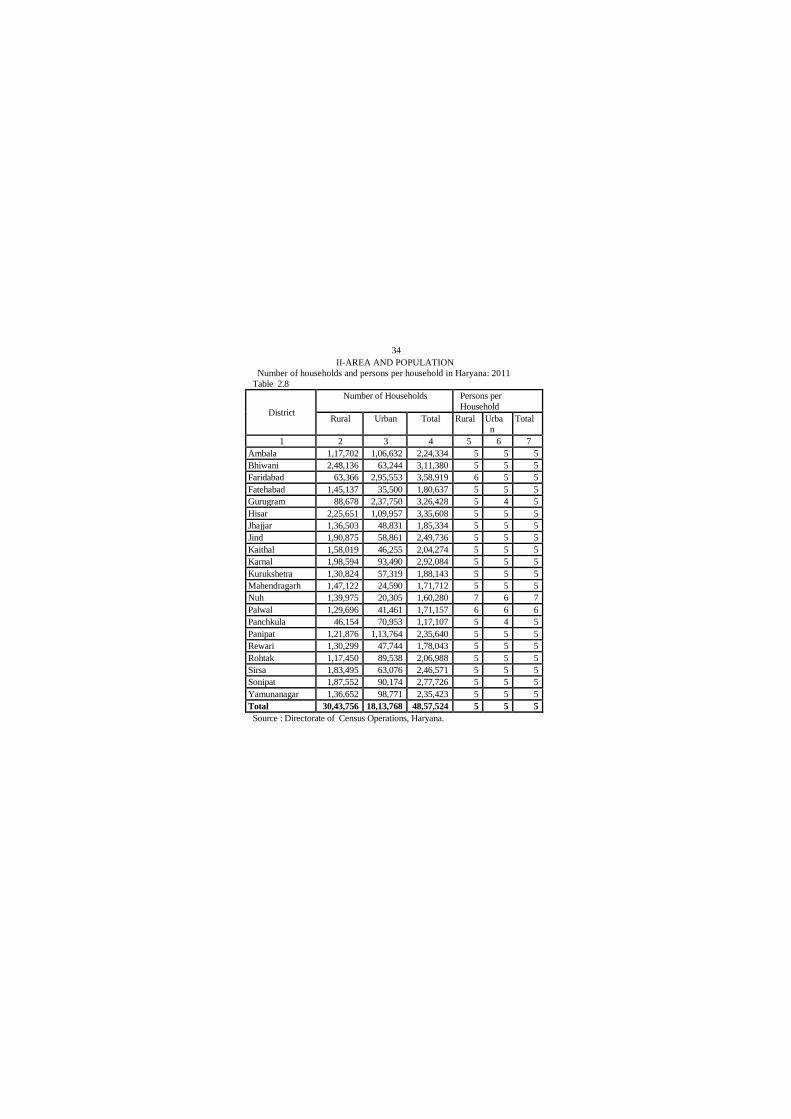
II-AREA AND POPULATION
Number of households and persons per household in Haryana: 2011
Table 2.8
District
Number of Households Persons per
Household
Rural Urban Total Rural Urba
n
Total
1 2 3 4 5 6 7
Ambala 1,17,702 1,06,632 2,24,334 5 5 5
Bhiwani 2,48,136 63,244 3,11,380 5 5 5
Faridabad 63,366 2,95,553 3,58,919 6 5 5
Fatehabad 1,45,137 35,500 1,80,637 5 5 5
Gurugram 88,678 2,37,750 3,26,428 5 4 5
Hisar 2,25,651 1,09,957 3,35,608 5 5 5
Jhajjar 1,36,503 48,831 1,85,334 5 5 5
Jind 1,90,875 58,861 2,49,736 5 5 5
Kaithal 1,58,019 46,255 2,04,274 5 5 5
Karnal 1,98,594 93,490 2,92,084 5 5 5
Kurukshetra 1,30,824 57,319 1,88,143 5 5 5
Mahendragarh 1,47,122 24,590 1,71,712 5 5 5
Nuh 1,39,975 20,305 1,60,280 7 6 7
Palwal 1,29,696 41,461 1,71,157 6 6 6
Panchkula 46,154 70,953 1,17,107 5 4 5
Panipat 1,21,876 1,13,764 2,35,640 5 5 5
Rewari 1,30,299 47,744 1,78,043 5 5 5
Rohtak 1,17,450 89,538 2,06,988 5 5 5
Sirsa 1,83,495 63,076 2,46,571 5 5 5
Sonipat 1,87,552 90,174 2,77,726 5 5 5
Yamunanagar 1,36,652 98,771 2,35,423 5 5 5
Total 30,43,756 18,13,768 48,57,524 5 5 5
Source : Directorate of Census Operations, Haryana.

35
II-AREA AND POPULATION
Rural/Urban Workers and Non-Workers by Districts—2011
Table 2.9
District Main Workers
Total Rural Urban
1 2 3 4
Ambala 3,19,475 1,63,089 1,56,386
Bhiwani 4,45,675 3,63,953 81,722
Faridabad 4,95,316 84,456 4,10,860
Fatehabad 2,86,258 2,36,013 50,245
Gurugram 4,87,441 1,24,933 3,62,508
Hisar 5,31,227 3,73,906 1,57,321
Jhajjar 2,46,457 1,82,688 63,769
Jind 3,85,851 3,06,210 79,641
Kaithal 2,90,663 2,27,767 62,896
Karnal 4,11,533 2,79,139 1,32,394
Kurukshetra 2,85,904 2,03,388 82,516
Mahendragarh 2,12,402 1,79,064 33,338
Nuh 2,04,178 1,79,382 24,796
Palwal 2,16,932 1,64,067 52,865
Panchkula 1,82,831 75,246 1,07,585
Panipat 3,39,016 1,67,683 1,71,333
Rewari 2,50,219 1,82,761 67,458
Rohtak 2,88,949 1,66,788 1,22,161
Sirsa 3,99,169 3,06,128 93,041
Sonipat 3,96,763 2,71,676 1,25,087
Yamunanagar 3,39,024 1,97,468 1,41,556
Total 2011 70,15,283 44,35,805 25,79,478

36
II-AREA AND POPULATION
Rural/Urban Workers and Non-Workers by Districts—2011
Table 2.9(Contd.)
District Marginal Workers
Total Rural Urban
1 5 6 7
Ambala 52,664 32,757 19,907
Bhiwani 1,77,331 1,62,249 15,082
Faridabad 83,913 22,302 61,611
Fatehabad 82,825 76,597 6,228
Gurugram 57,275 33,529 23,746
Hisar 1,60,394 1,33,178 27,216
Jhajjar 80,077 71,145 8,932
Jind 1,37,571 1,23,951 13,620
Kaithal 83,236 73,119 10,117
Karnal 1,04,529 83,975 20,554
Kurukshetra 50,876 43,885 6,991
Mahendragarh 1,26,182 1,18,900 7,282
Nuh 85,786 79,339 6,447
Palwal 92,631 78,161 14,470
Panchkula 28,648 19,481 9,167
Panipat 73,302 54,248 19,054
Rewari 87,508 81,614 5,894
Rohtak 57,018 45,893 11,125
Sirsa 1,02,834 90,615 12,219
Sonipat 1,26,416 1,04,512 21,904
Yamunanagar 50,209 37,857 12,352
Total 2011 19,01,225 15,67,307 3,33,918
37
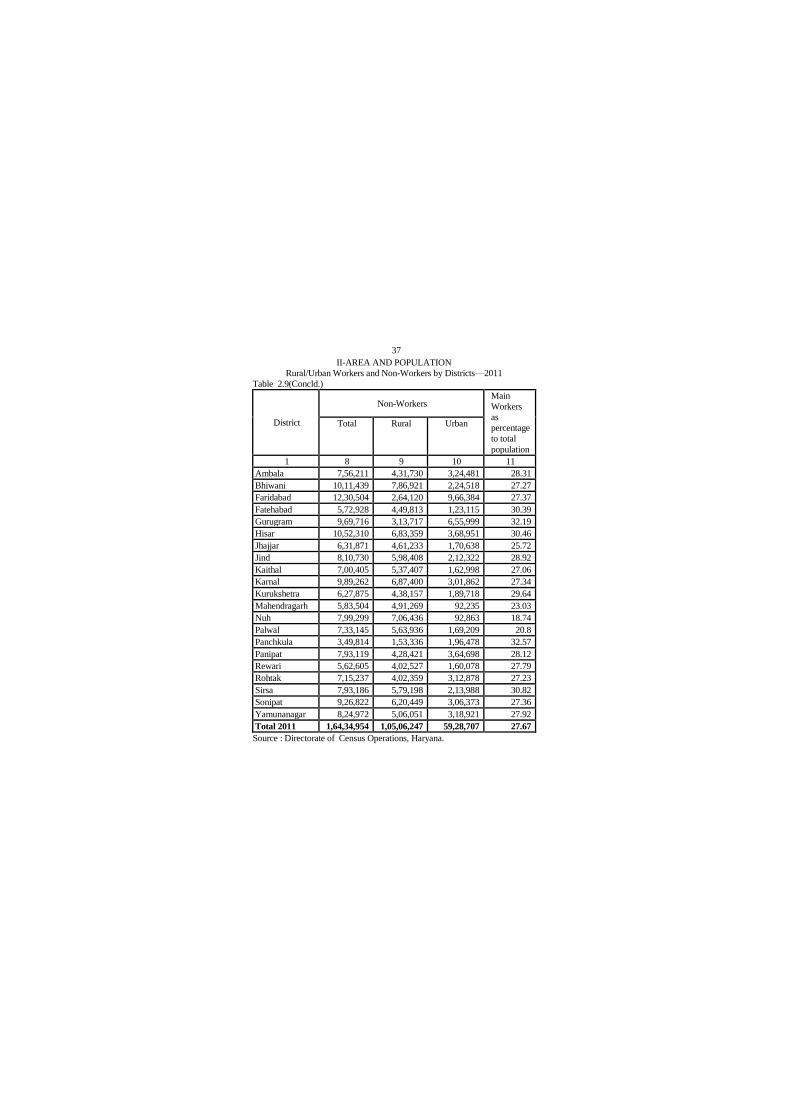
II-AREA AND POPULATION
Rural/Urban Workers and Non-Workers by Districts—2011
Table 2.9(Concld.)
District
Non-Workers Main
Workers
as
percentage
to total
population
Total Rural Urban
1 8 9 10 11
Ambala 7,56,211 4,31,730 3,24,481 28.31
Bhiwani 10,11,439 7,86,921 2,24,518 27.27
Faridabad 12,30,504 2,64,120 9,66,384 27.37
Fatehabad 5,72,928 4,49,813 1,23,115 30.39
Gurugram 9,69,716 3,13,717 6,55,999 32.19
Hisar 10,52,310 6,83,359 3,68,951 30.46
Jhajjar 6,31,871 4,61,233 1,70,638 25.72
Jind 8,10,730 5,98,408 2,12,322 28.92
Kaithal 7,00,405 5,37,407 1,62,998 27.06
Karnal 9,89,262 6,87,400 3,01,862 27.34
Kurukshetra 6,27,875 4,38,157 1,89,718 29.64
Mahendragarh 5,83,504 4,91,269 92,235 23.03
Nuh 7,99,299 7,06,436 92,863 18.74
Palwal 7,33,145 5,63,936 1,69,209 20.8
Panchkula 3,49,814 1,53,336 1,96,478 32.57
Panipat 7,93,119 4,28,421 3,64,698 28.12
Rewari 5,62,605 4,02,527 1,60,078 27.79
Rohtak 7,15,237 4,02,359 3,12,878 27.23
Sirsa 7,93,186 5,79,198 2,13,988 30.82
Sonipat 9,26,822 6,20,449 3,06,373 27.36
Yamunanagar 8,24,972 5,06,051 3,18,921 27.92
Total 2011 1,64,34,954 1,05,06,247 59,28,707 27.67
Source : Directorate of Census Operations, Haryana.

38
II-AREA AND POPULATION
Working Population (Main + Marginal)
Classified into Broad Industrial Categories: 2011
Table 2.10
District Total Workers (Main + Marginal)
As Cultivator
Persons Male Female
1 2 3 4
Ambala 52,871 49,414 3,457
Bhiwani 2,88,543 1,84,450 1,04,093
Faridabad 27,705 22,833 4,872
Fatehabad 1,32,250 92,058 40,192
Gurugram 56,046 41,842 14,204
Hisar 2,61,120 1,65,785 95,335
Jhajjar 1,12,389 81,291 31,098
Jind 2,30,387 1,50,710 79,677
Kaithal 1,28,016 1,04,344 23,672
Karnal 1,12,288 96,503 15,785
Kurukshetra 68,908 63,466 5,442
Mahendragarh 1,49,146 88,508 60,638
Nuh 1,04,237 77,019 27,218
Palwal 91,506 69,851 21,655
Panchkula 26,682 19,285 7,397
Panipat 72,120 57,738 14,382
Rewari 1,02,698 66,206 36,492
Rohtak 95,732 72,913 22,819
Sirsa 1,64,297 1,23,471 40,826
Sonipat 1,42,344 1,03,111 39,233
Yamunanagar 61,516 58,324 3,192
Total 24,80,801 17,89,122 6,91,679
39
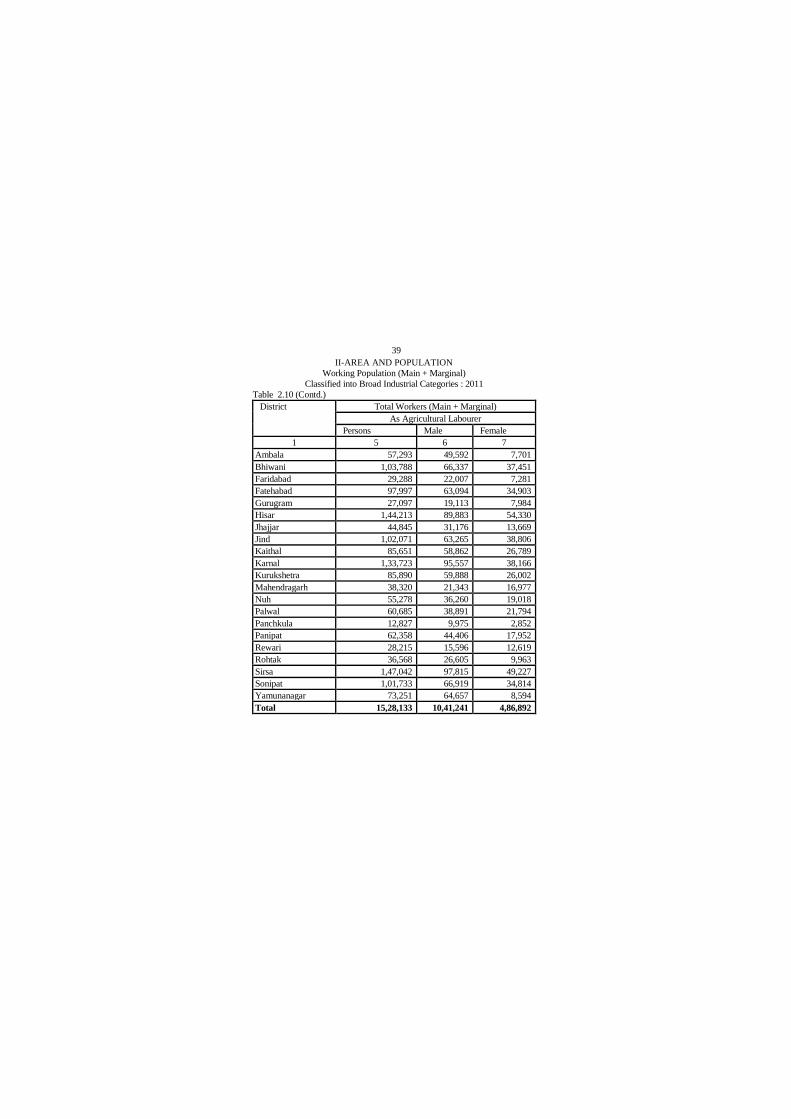
II-AREA AND POPULATION
Working Population (Main + Marginal)
Classified into Broad Industrial Categories : 2011
Table 2.10 (Contd.)
District Total Workers (Main + Marginal)
As Agricultural Labourer
Persons Male Female
1 5 6 7
Ambala 57,293 49,592 7,701
Bhiwani 1,03,788 66,337 37,451
Faridabad 29,288 22,007 7,281
Fatehabad 97,997 63,094 34,903
Gurugram 27,097 19,113 7,984
Hisar 1,44,213 89,883 54,330
Jhajjar 44,845 31,176 13,669
Jind 1,02,071 63,265 38,806
Kaithal 85,651 58,862 26,789
Karnal 1,33,723 95,557 38,166
Kurukshetra 85,890 59,888 26,002
Mahendragarh 38,320 21,343 16,977
Nuh 55,278 36,260 19,018
Palwal 60,685 38,891 21,794
Panchkula 12,827 9,975 2,852
Panipat 62,358 44,406 17,952
Rewari 28,215 15,596 12,619
Rohtak 36,568 26,605 9,963
Sirsa 1,47,042 97,815 49,227
Sonipat 1,01,733 66,919 34,814
Yamunanagar 73,251 64,657 8,594
Total 15,28,133 10,41,241 4,86,892

40
II-AREA AND POPULATION
Working Population (Main + Marginal)
Classified into Broad Industrial Categories : 2011
Table 2.10 (Contd.)
District Total Workers (Main + Marginal)
In Household Industry Other Workers
Person
Male Female Persons Male Female
1 8 9 10 11 12 13
Ambala 15,753 12,943 2,810 2,46,222 2,08,171 38,051
Bhiwani 14,855 9,155 5,700 2,15,820 1,70,736 45,084
Faridabad 32,286 25,550 6,736 4,89,950 4,06,543 83,407
Fatehabad 6,558 4,233 2,325 1,32,278 1,04,113 28,165
Gurugram 18,228 13,764 4,464 4,43,345 3,57,737 85,608
Hisar 16,097 11,787 4,310 2,70,191 2,20,866 49,325
Jhajjar 9,254 6,616 2,638 1,60,046 1,30,937 29,109
Jind 9,114 6,371 2,743 1,81,850 1,47,931 33,919
Kaithal 9,450 6,382 3,068 1,50,782 1,23,108 27,674
Karnal 15,311 11,156 4,155 2,54,740 2,08,430 46,310
Kurukshetra 6,726 4,607 2,119 1,75,256 1,40,595 34,661
Mahendragarh 7,639 5,130 2,509 1,43,479 1,17,954 25,525
Nuh 6,023 3,841 2,182 1,24,426 1,07,522 16,904
Palwal 8,566 6,308 2,258 1,48,806 1,26,414 22,392
Panchkula 9,870 7,064 2,806 1,62,100 1,28,541 33,559
Panipat 15,824 11,228 4,596 2,62,016 2,15,295 46,721
Rewari 9,782 5,386 4,396 1,97,032 1,48,138 48,894
Rohtak 8,521 5,548 2,973 2,05,146 1,67,580 37,566
Sirsa 11,952 7,922 4,030 1,78,712 1,40,254 38,458
Sonipat 18,184 11,702 6,482 2,60,918 2,09,353 51,565
Yamunanagar 12,287 9,840 2,447 2,42,179 2,09,522 32,657
Total 2,62,280 1,86,533 75,747 46,45,294 37,89,740 8,55,554
41
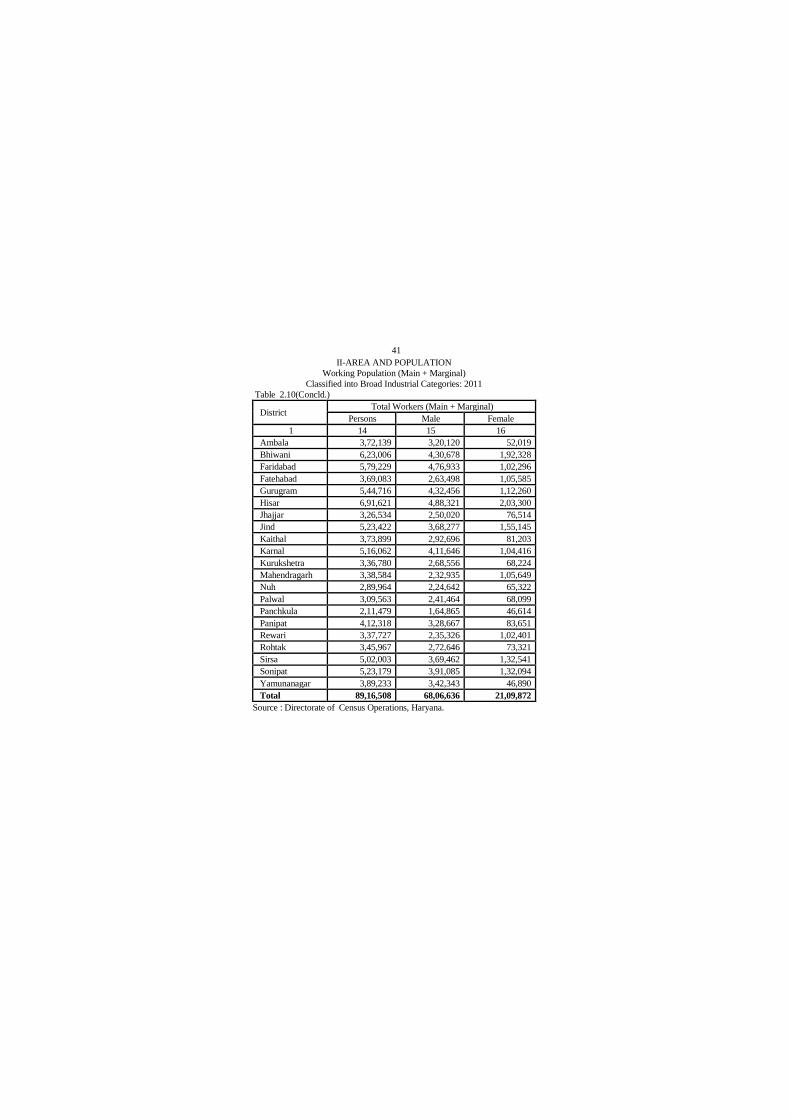
II-AREA AND POPULATION
Working Population (Main + Marginal)
Classified into Broad Industrial Categories: 2011
Table 2.10(Concld.)
District Total Workers (Main + Marginal)
Persons Male Female
1 14 15 16
Ambala 3,72,139 3,20,120 52,019
Bhiwani 6,23,006 4,30,678 1,92,328
Faridabad 5,79,229 4,76,933 1,02,296
Fatehabad 3,69,083 2,63,498 1,05,585
Gurugram 5,44,716 4,32,456 1,12,260
Hisar 6,91,621 4,88,321 2,03,300
Jhajjar 3,26,534 2,50,020 76,514
Jind 5,23,422 3,68,277 1,55,145
Kaithal 3,73,899 2,92,696 81,203
Karnal 5,16,062 4,11,646 1,04,416
Kurukshetra 3,36,780 2,68,556 68,224
Mahendragarh 3,38,584 2,32,935 1,05,649
Nuh 2,89,964 2,24,642 65,322
Palwal 3,09,563 2,41,464 68,099
Panchkula 2,11,479 1,64,865 46,614
Panipat 4,12,318 3,28,667 83,651
Rewari 3,37,727 2,35,326 1,02,401
Rohtak 3,45,967 2,72,646 73,321
Sirsa 5,02,003 3,69,462 1,32,541
Sonipat 5,23,179 3,91,085 1,32,094
Yamunanagar 3,89,233 3,42,343 46,890
Total 89,16,508 68,06,636 21,09,872
Source : Directorate of Census Operations, Haryana.
42
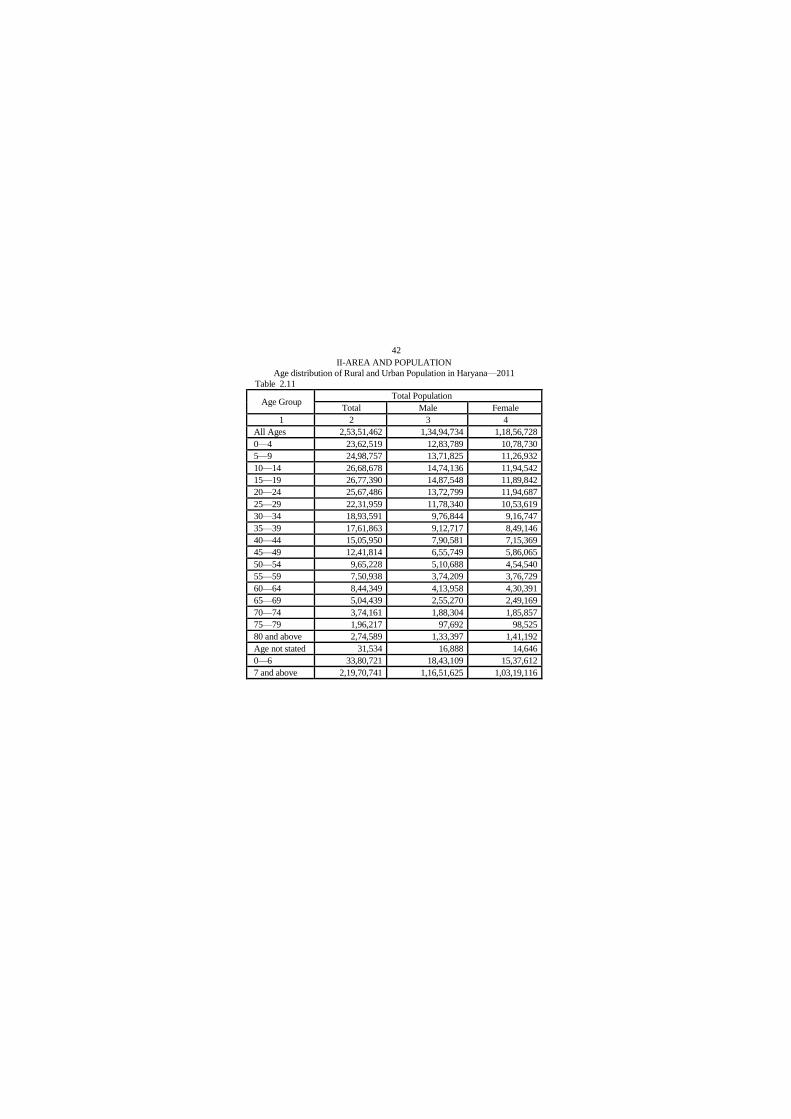
II-AREA AND POPULATION
Age distribution of Rural and Urban Population in Haryana—2011
Table 2.11
Age Group Total Population
Total Male Female
1 2 3 4
All Ages 2,53,51,462 1,34,94,734 1,18,56,728
0—4 23,62,519 12,83,789 10,78,730
5—9 24,98,757 13,71,825 11,26,932
10—14 26,68,678 14,74,136 11,94,542
15—19 26,77,390 14,87,548 11,89,842
20—24 25,67,486 13,72,799 11,94,687
25—29 22,31,959 11,78,340 10,53,619
30—34 18,93,591 9,76,844 9,16,747
35—39 17,61,863 9,12,717 8,49,146
40—44 15,05,950 7,90,581 7,15,369
45—49 12,41,814 6,55,749 5,86,065
50—54 9,65,228 5,10,688 4,54,540
55—59 7,50,938 3,74,209 3,76,729
60—64 8,44,349 4,13,958 4,30,391
65—69 5,04,439 2,55,270 2,49,169
70—74 3,74,161 1,88,304 1,85,857
75—79 1,96,217 97,692 98,525
80 and above 2,74,589 1,33,397 1,41,192
Age not stated 31,534 16,888 14,646
0—6 33,80,721 18,43,109 15,37,612
7 and above 2,19,70,741 1,16,51,625 1,03,19,116
43
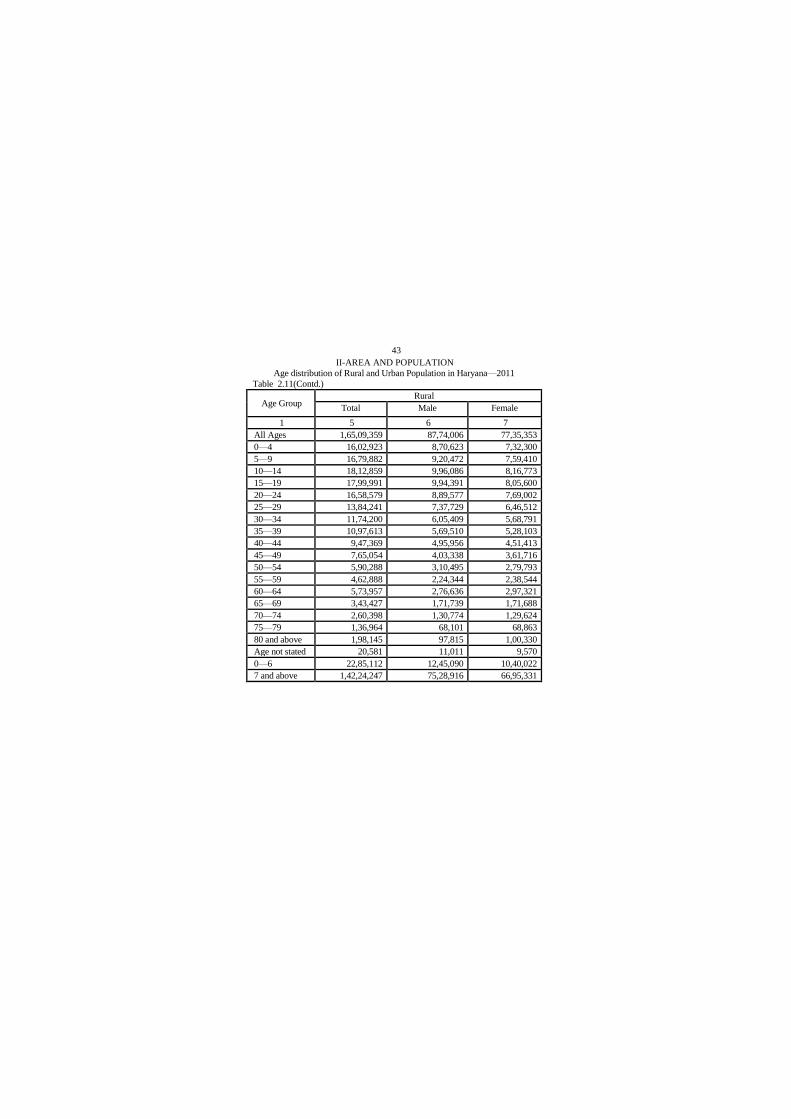
II-AREA AND POPULATION
Age distribution of Rural and Urban Population in Haryana—2011
Table 2.11(Contd.)
Age Group Rural
Total Male Female
1 5 6 7
All Ages 1,65,09,359 87,74,006 77,35,353
0—4 16,02,923 8,70,623 7,32,300
5—9 16,79,882 9,20,472 7,59,410
10—14 18,12,859 9,96,086 8,16,773
15—19 17,99,991 9,94,391 8,05,600
20—24 16,58,579 8,89,577 7,69,002
25—29 13,84,241 7,37,729 6,46,512
30—34 11,74,200 6,05,409 5,68,791
35—39 10,97,613 5,69,510 5,28,103
40—44 9,47,369 4,95,956 4,51,413
45—49 7,65,054 4,03,338 3,61,716
50—54 5,90,288 3,10,495 2,79,793
55—59 4,62,888 2,24,344 2,38,544
60—64 5,73,957 2,76,636 2,97,321
65—69 3,43,427 1,71,739 1,71,688
70—74 2,60,398 1,30,774 1,29,624
75—79 1,36,964 68,101 68,863
80 and above 1,98,145 97,815 1,00,330
Age not stated 20,581 11,011 9,570
0—6 22,85,112 12,45,090 10,40,022
7 and above 1,42,24,247 75,28,916 66,95,331

44
II-AREA AND POPULATION
Age distribution of Rural and Urban Population in Haryana—2011
Table 2.11(Concld.)
Age Group Urban
Total Male Female
1 8 9 10
All Ages 88,42,103 47,20,728 41,.21,375
0—4 7,59,596 4,13,166 3,46,430
5—9 8,18,875 4,51,353 3,67,522
10—14 8,55,819 4,78,050 3,77,769
15—19 8,77,399 4,93,157 3,84,242
20—24 9,08,907 4,83,222 4,25,685
25—29 8,47,718 4,40,611 4,07,107
30—34 7,19,391 3,71,435 3,47,956
35—39 6,64,250 3,43,207 3,21,043
40—44 5,58,581 2,94,625 2,63,956
45—49 4,76,760 2,52,411 2,24,349
50—54 3,74,940 2,00,193 1,74,747
55—59 2,88,050 1,49,865 1,38,185
60—64 2,70,392 1,37,322 1,33,070
65—69 1,61,012 83,531 77,481
70—74 1,13,763 57,530 56,233
75—79 59,253 29,591 29,662
80 and above 76,444 35,582 40,862
Age not stated 10,953 5,877 5,076
0—6 10,95,609 5,98,019 4,97,590
7 and above 77,46,494 41,22,709 36,23,785
Source : Directorate of Census Operations, Haryana.

45
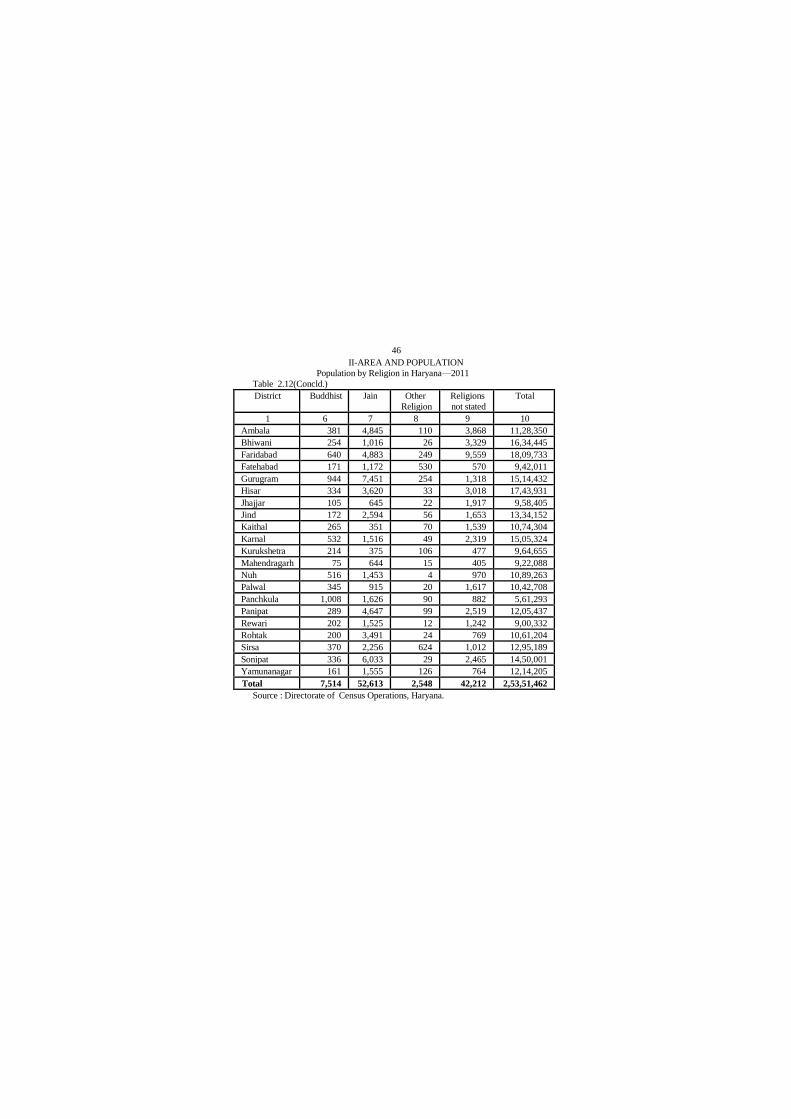
II-AREA AND POPULATION
Population by Religion in Haryana—2011
Table 2.12
District Hindu Sikh Muslim Christian
1 2 3 4 5
Ambala 9,55,096 1,38,202 22,143 3,705
Bhiwani 16,11,031 2,401 15,515 873
Faridabad 15,88,407 34,572 1,61,680 9,743
Fatehabad 7,79,243 1,50,969 8,360 996
Gurugram 14,08,801 15,097 70,842 9,725
Hisar 17,01,061 12,270 21,650 1,945
Jhajjar 9,45,693 1,042 8,247 734
Jind 12,76,669 29,103 23,016 889
Kaithal 9,74,520 87,558 8,232 1,769
Karnal 13,41,002 1,26,207 31,650 2,049
Kurukshetra 8,05,175 1,40,395 15,970 1,943
Mahendragarh 9,13,251 1,737 5,660 301
Nuh 2,21,846 592 8,62,647 1,235
Palwal 8,26,342 3,971 2,08,566 932
Panchkula 4,90,702 40,951 23,451 2,583
Panipat 10,83,936 25,064 86,622 2,261
Rewari 8,89,133 1,804 5,713 701
Rohtak 10,43,887 3,916 8,185 732
Sirsa 9,40,255 3,38,962 9,524 2,186
Sonipat 13,90,149 4,484 45,100 1,405
Yamunanagar 9,84,929 84,455 1,38,569 3,646
Total 2,21,71,128 12,43,752 17,81,342 50,353
46
II-AREA AND POPULATION
Population by Religion in Haryana—2011
Table 2.12(Concld.)
District Buddhist Jain Other
Religion
Religions
not stated
Total
1 6 7 8 9 10
Ambala 381 4,845 110 3,868 11,28,350
Bhiwani 254 1,016 26 3,329 16,34,445
Faridabad 640 4,883 249 9,559 18,09,733
Fatehabad 171 1,172 530 570 9,42,011
Gurugram 944 7,451 254 1,318 15,14,432
Hisar 334 3,620 33 3,018 17,43,931
Jhajjar 105 645 22 1,917 9,58,405
Jind 172 2,594 56 1,653 13,34,152
Kaithal 265 351 70 1,539 10,74,304
Karnal 532 1,516 49 2,319 15,05,324
Kurukshetra 214 375 106 477 9,64,655
Mahendragarh 75 644 15 405 9,22,088
Nuh 516 1,453 4 970 10,89,263
Palwal 345 915 20 1,617 10,42,708
Panchkula 1,008 1,626 90 882 5,61,293
Panipat 289 4,647 99 2,519 12,05,437
Rewari 202 1,525 12 1,242 9,00,332
Rohtak 200 3,491 24 769 10,61,204
Sirsa 370 2,256 624 1,012 12,95,189
Sonipat 336 6,033 29 2,465 14,50,001
Yamunanagar 161 1,555 126 764 12,14,205
Total 7,514 52,613 2,548 42,212 2,53,51,462
Source : Directorate of Census Operations, Haryana.

47
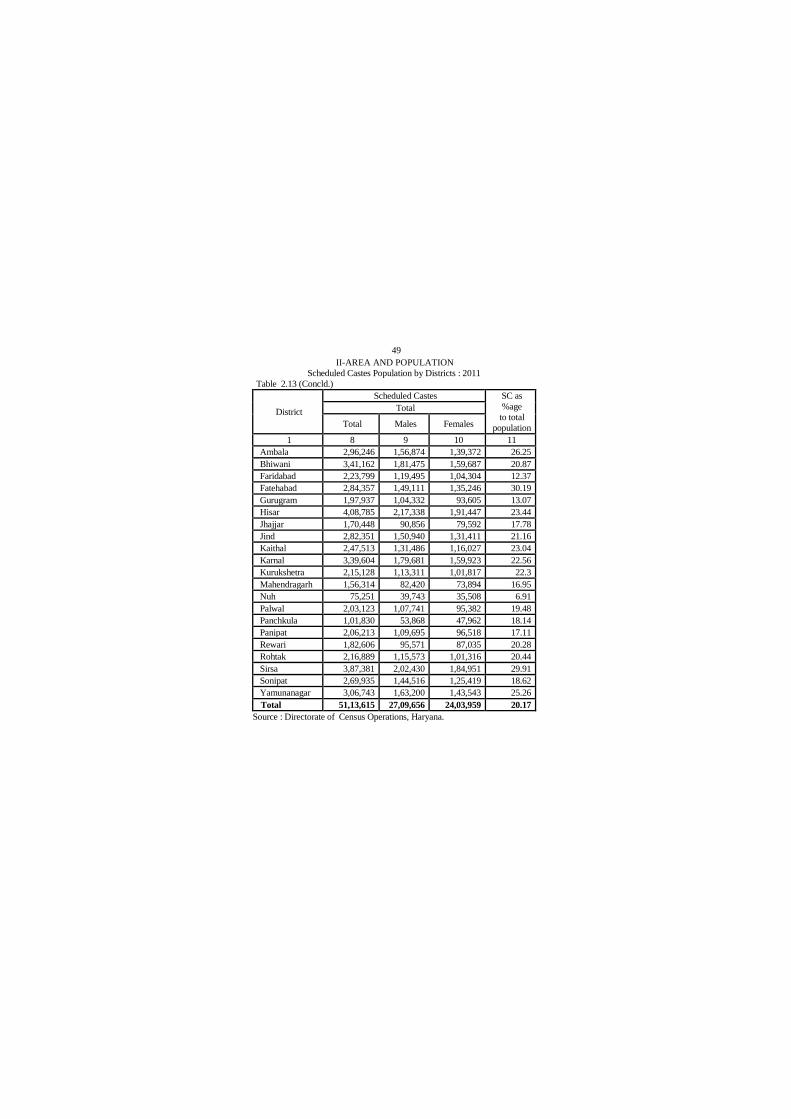
II-AREA AND POPULATION
Scheduled Castes Population by Districts: 2011
Table 2.13
District Scheduled Castes
Rural
Total Males Females
1 2 3 4
Ambala 208,224 1,10,736 97,488
Bhiwani 274,877 1,46,464 1,28,413
Faridabad 71,464 37,920 33,544
Fatehabad 239,215 1,25,461 1,13,754
Gurugram 90,113 47,249 42,864
Hisar 302,577 1,61,528 1,41,049
Jhajjar 130,913 69,894 61,019
Jind 228,804 1,22,596 1,06,208
Kaithal 202,878 1,07,815 95,063
Karnal 259,520 1,37,535 1,21,985
Kurukshetra 173,560 91,213 82,347
Mahendragarh 136,311 72,014 64,297
Nuh 57,238 30,312 26,926
Palwal 148,893 79,214 69,679
Panchkula 51,484 27,259 24,225
Panipat 130,212 69,446 60,766
Rewari 140,637 73,617 67,020
Rohtak 134,935 72,114 62,821
Sirsa 312,059 1,63,211 1,48,848
Sonipat 192,682 103,444 89,238
Yamunanagar 233,513 1,24,252 1,09,261
Total 37,20,109 19,73,294 17,46,815

48
II-AREA AND POPULATION
Scheduled Castes Population by Districts: 2011
Table 2.13 (Contd.)
District Scheduled Castes
Urban
Total Males Females
1 5 6 7
Ambala 88,022 46,138 41,884
Bhiwani 66,285 35,011 31,274
Faridabad 1,52,335 81,575 70,760
Fatehabad 45,142 23,650 21,492
Gurugram 1,07,824 57,083 50,741
Hisar 1,06,208 55,810 50,398
Jhajjar 39,535 20,962 18,573
Jind 53,547 28,344 25,203
Kaithal 44,635 23,671 20,964
Karnal 80,084 42,146 37,938
Kurukshetra 41,568 22,098 19,470
Mahendragarh 20,003 10,406 9,597
Nuh 18,013 9,431 8,582
Palwal 54,230 28,527 25,703
Panchkula 50,346 26,609 23,737
Panipat 76,001 40,249 35,752
Rewari 41,969 21,954 20,015
Rohtak 81,954 43,459 38,495
Sirsa 75,322 39,219 36,103
Sonipat 77,253 41,072 36,181
Yamunanagar 73,230 38,948 34,282
Total 13,93,506 7,36,362 6,57,144
49
II-AREA AND POPULATION
Scheduled Castes Population by Districts : 2011
Table 2.13 (Concld.)
District
Scheduled Castes SC as
%age
to total
population
Total
Total Males Females
1 8 9 10 11
Ambala 2,96,246 1,56,874 1,39,372 26.25
Bhiwani 3,41,162 1,81,475 1,59,687 20.87
Faridabad 2,23,799 1,19,495 1,04,304 12.37
Fatehabad 2,84,357 1,49,111 1,35,246 30.19
Gurugram 1,97,937 1,04,332 93,605 13.07
Hisar 4,08,785 2,17,338 1,91,447 23.44
Jhajjar 1,70,448 90,856 79,592 17.78
Jind 2,82,351 1,50,940 1,31,411 21.16
Kaithal 2,47,513 1,31,486 1,16,027 23.04
Karnal 3,39,604 1,79,681 1,59,923 22.56
Kurukshetra 2,15,128 1,13,311 1,01,817 22.3
Mahendragarh 1,56,314 82,420 73,894 16.95
Nuh 75,251 39,743 35,508 6.91
Palwal 2,03,123 1,07,741 95,382 19.48
Panchkula 1,01,830 53,868 47,962 18.14
Panipat 2,06,213 1,09,695 96,518 17.11
Rewari 1,82,606 95,571 87,035 20.28
Rohtak 2,16,889 1,15,573 1,01,316 20.44
Sirsa 3,87,381 2,02,430 1,84,951 29.91
Sonipat 2,69,935 1,44,516 1,25,419 18.62
Yamunanagar 3,06,743 1,63,200 1,43,543 25.26
Total 51,13,615 27,09,656 24,03,959 20.17
Source : Directorate of Census Operations, Haryana.

50
II-AREA AND POPULATION
Scheduled Castes Working Population Classified into
Broad Industrial Categories: 2011
Table 2.14
District
Total Workers
As Cultivator As Agricultural Labourer
Persons Males Females Persons Males Females
1 2 3 4 5 6 7
Ambala 2,872 2,553 319 20,999 18,869 2,130
Bhiwani 10,958 8,568 2,390 28,087 21,991 6,096
Faridabad 1,165 942 223 3,328 2,634 694
Fatehabad 7,153 5,504 1,649 37,585 29,533 8,052
Gurugram 1,276 1,075 201 5,039 4,054 985
Hisar 9,630 7,248 2,382 49,176 36,656 12,520
Jhajjar 1,660 1,240 420 8,952 7,330 1,622
Jind 4,030 3,002 1,028 31,170 24,119 7,051
Kaithal 2,394 2,027 367 26,313 21,755 4,558
Karnal 4,793 3,989 804 34,648 27,922 6,726
Kurukshetra 2,140 1,939 201 27,303 21,730 5,573
Mahendragarh 1,581 1,231 350 3,861 3,116 745
Nuh 795 636 159 2,194 1,885 309
Palwal 2,832 2,326 506 8,048 6,510 1,538
Panchkula 1,085 790 295 2,745 2,189 556
Panipat 1,558 1,239 319 11,748 9,397 2,351
Rewari 1,402 1,053 349 4,392 3,387 1,005
Rohtak 1,710 1,341 369 10,284 8,324 1,960
Sirsa 10,415 8,188 2,227 62,209 50,182 12,027
Sonipat 2,180 1,711 469 20,886 15,992 4,894
Yamunanagar 2,981 2,722 259 26,994 25,050 1,944
Total 74,610 59,324 15,286 4,25,961 3,42,625 83,336
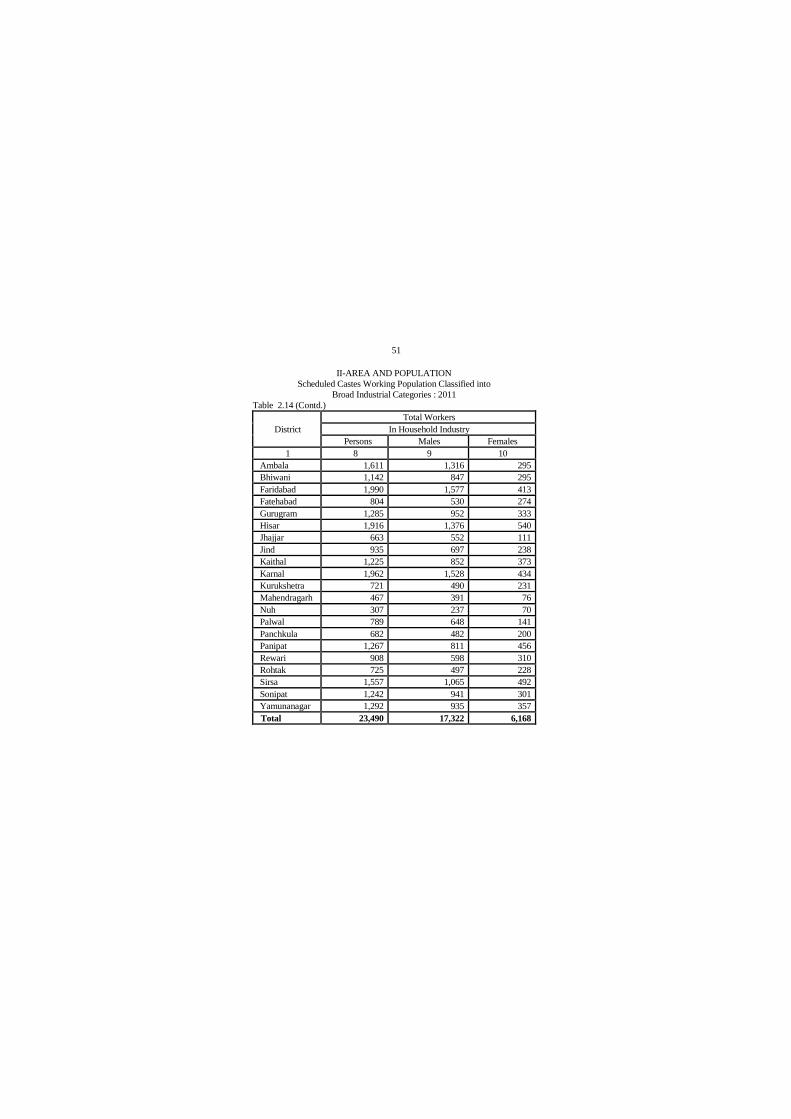
51
II-AREA AND POPULATION
Scheduled Castes Working Population Classified into
Broad Industrial Categories : 2011
Table 2.14 (Contd.)
District
Total Workers
In Household Industry
Persons Males Females
1 8 9 10
Ambala 1,611 1,316 295
Bhiwani 1,142 847 295
Faridabad 1,990 1,577 413
Fatehabad 804 530 274
Gurugram 1,285 952 333
Hisar 1,916 1,376 540
Jhajjar 663 552 111
Jind 935 697 238
Kaithal 1,225 852 373
Karnal 1,962 1,528 434
Kurukshetra 721 490 231
Mahendragarh 467 391 76
Nuh 307 237 70
Palwal 789 648 141
Panchkula 682 482 200
Panipat 1,267 811 456
Rewari 908 598 310
Rohtak 725 497 228
Sirsa 1,557 1,065 492
Sonipat 1,242 941 301
Yamunanagar 1,292 935 357
Total 23,490 17,322 6,168

52
II-AREA AND POPULATION
Scheduled Castes Working Population Classified
into Broad Industrial Categories : 2011
Table 2.14 (Contd.)
District
Total Workers
Other Workers
Persons Males Females
1 11 12 13
Ambala 49,279 42,989 6,290
Bhiwani 36,111 30,874 5,237
Faridabad 48,029 41,360 6,669
Fatehabad 32,260 26,656 5,604
Gurugram 41,413 35,365 6,048
Hisar 45,574 37,796 7,778
Jhajjar 23,325 20,073 3,252
Jind 32,795 27,857 4,938
Kaithal 28,042 23,899 4,143
Karnal 41,529 34,790 6,739
Kurukshetra 32,523 26,816 5,707
Mahendragarh 22,051 19,362 2,689
Nuh 10,016 8,815 1,201
Palwal 24,559 21,933 2,626
Panchkula 26,154 21,120 5,034
Panipat 37,404 30,836 6,568
Rewari 33,717 28,523 5,194
Rohtak 35,459 30,271 5,188
Sirsa 37,300 30,375 6,925
Sonipat 38,290 32,131 6,159
Yamunanagar 47,672 42,769 4,903
Total 7,23,502 6,14,610 1,08,892

53
II-AREA AND POPULATION
Scheduled Castes Working Population Classified
into Broad Industrial Categories : 2011
Table 2.14 (Contd.)
District
Total Workers
Main Workers
Persons Males Females
1 14 15 16
Ambala 74,761 65,727 9,034
Bhiwani 76,298 62,280 14,018
Faridabad 54,512 46,513 7,999
Fatehabad 77,802 62,223 15,579
Gurugram 49,013 41,446 7,567
Hisar 1,06,296 83,076 23,220
Jhajjar 34,600 29,195 5,405
Jind 68,930 55,675 13,255
Kaithal 57,974 48,533 9,441
Karnal 82,932 68,229 14,703
Kurukshetra 62,687 50,975 11,712
Mahendragarh 27,960 24,100 3,860
Nuh 13,312 11,573 1,739
Palwal 36,228 31,417 4,811
Panchkula 30,666 24,581 6,085
Panipat 51,977 42,283 9,694
Rewari 40,419 33,561 6,858
Rohtak 48,178 40,433 7,745
Sirsa 1,11,481 89,810 21,671
Sonipat 62,598 50,775 11,823
Yamunanagar 78,939 71,476 7,463
Total 12,47,563 10,33,881 2,13,682

54
II-AREA AND POPULATION
Scheduled Castes Working Population Classified into
Broad Industrial Categories : 2011
Table 2.14 (Contd.)
District
Total workers
Marginal workers
Persons Males Females
1 17 18 19
Ambala 21,208 15,802 5,406
Bhiwani 49,224 26,963 22,261
Faridabad 14,705 10,097 4,608
Fatehabad 33,541 14,903 18,638
Gurugram 13,388 8,755 4,633
Hisar 52,213 27,151 25,062
Jhajjar 20,950 14,170 6,780
Jind 37,692 19,619 18,073
Kaithal 32,145 17,807 14,338
Karnal 38,749 22,752 15,997
Kurukshetra 17,454 8,152 9,302
Mahendragarh 24,724 14,687 10,037
Nuh 8,027 5,532 2,495
Palwal 22,724 15,303 7,421
Panchkula 6,084 3,772 2,312
Panipat 18,985 11,757 7,228
Rewari 23,077 12,784 10,293
Rohtak 19,654 14,303 5,351
Sirsa 41,021 17,082 23,939
Sonipat 33,991 20,511 13,480
Yamunanagar 18,759 13,507 5,252
Total 5,48,315 3,15,409 2,32,906
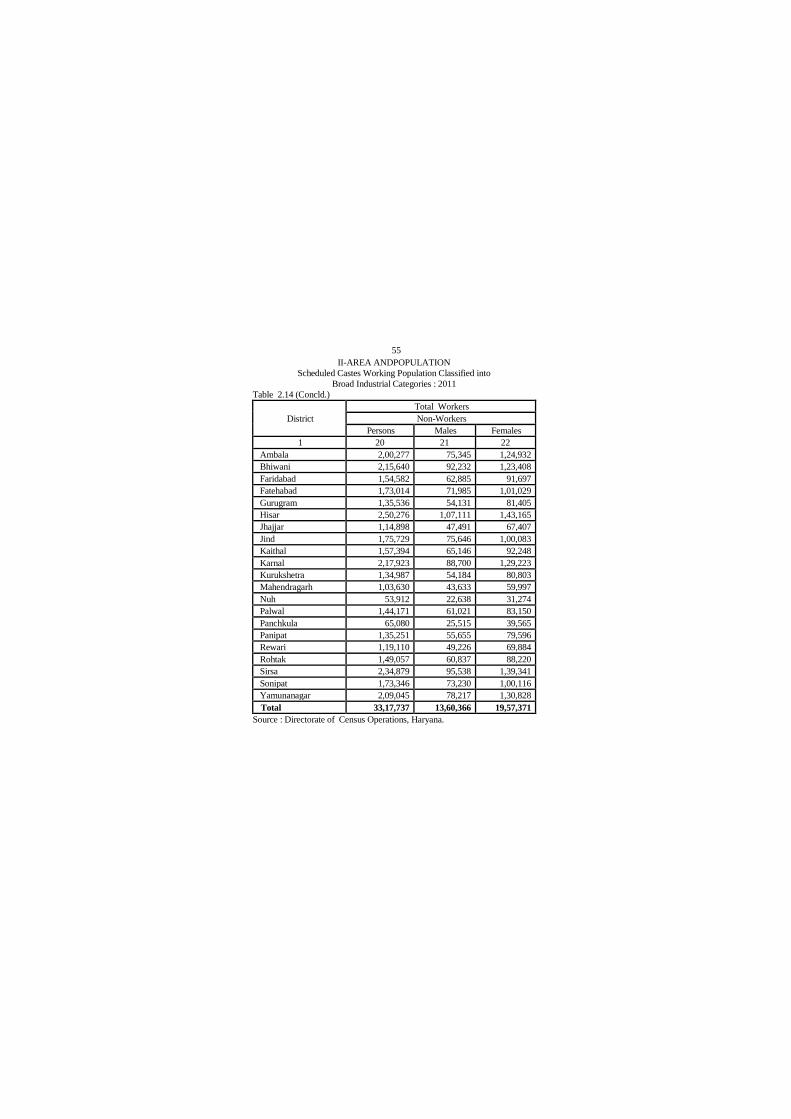
55
II-AREA ANDPOPULATION
Scheduled Castes Working Population Classified into
Broad Industrial Categories : 2011
Table 2.14 (Concld.)
District
Total Workers
Non-Workers
Persons Males Females
1 20 21 22
Ambala 2,00,277 75,345 1,24,932
Bhiwani 2,15,640 92,232 1,23,408
Faridabad 1,54,582 62,885 91,697
Fatehabad 1,73,014 71,985 1,01,029
Gurugram 1,35,536 54,131 81,405
Hisar 2,50,276 1,07,111 1,43,165
Jhajjar 1,14,898 47,491 67,407
Jind 1,75,729 75,646 1,00,083
Kaithal 1,57,394 65,146 92,248
Karnal 2,17,923 88,700 1,29,223
Kurukshetra 1,34,987 54,184 80,803
Mahendragarh 1,03,630 43,633 59,997
Nuh 53,912 22,638 31,274
Palwal 1,44,171 61,021 83,150
Panchkula 65,080 25,515 39,565
Panipat 1,35,251 55,655 79,596
Rewari 1,19,110 49,226 69,884
Rohtak 1,49,057 60,837 88,220
Sirsa 2,34,879 95,538 1,39,341
Sonipat 1,73,346 73,230 1,00,116
Yamunanagar 2,09,045 78,217 1,30,828
Total 33,17,737 13,60,366 19,57,371
Source : Directorate of Census Operations, Haryana.

56
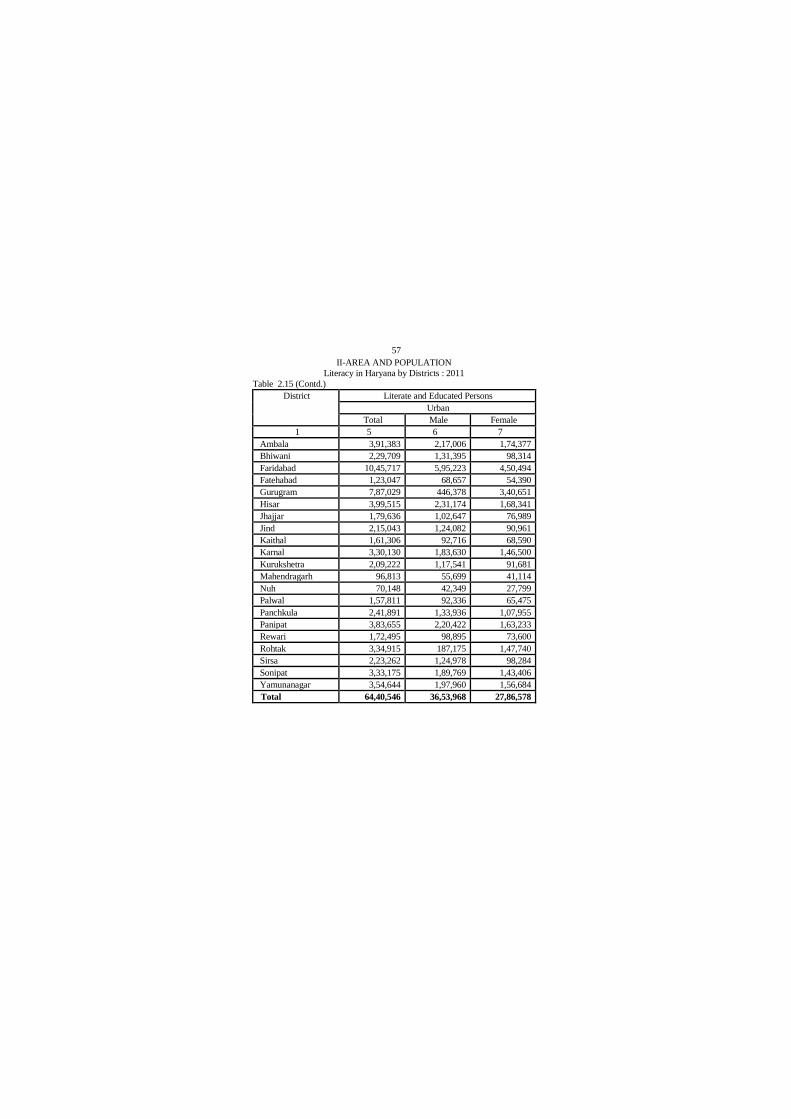
II-AREA AND POPULATION
Literacy in Haryana by Districts : 2011
Table 2.15
District Literate and Educated Persons
Rural
Total Male Female
1 2 3 4
Ambala 4,26,642 2,44,282 1,82,360
Bhiwani 8,40,162 5,11,763 3,28,399
Faridabad 2,27,022 1,39,717 87,305
Fatehabad 4,34,531 2,58,814 1,75,717
Gurugram 3,24,087 1,92,288 1,31,799
Hisar 7,14,796 4,39,026 2,75,770
Jhajjar 4,96,455 2,96,833 1,99,622
Jind 6,17,715 3,77,967 2,39,748
Kaithal 4,85,223 2,93,066 1,92,157
Karnal 6,47,883 3,80,886 2,66,997
Kurukshetra 4,37,671 2,53,287 1,84,384
Mahendragarh 5,33,442 3,24,741 2,08,701
Nuh 3,84,749 2,66,086 1,18,663
Palwal 4,41,985 2,87,360 1,54,625
Panchkula 1,63,427 95,926 67,501
Panipat 4,02,944 2,43,714 1,59,230
Rewari 4,64,452 2,76,558 1,87,894
Rohtak 4,12,667 2,48,850 1,63,817
Sirsa 5,59,635 3,31,990 2,27,645
Sonipat 6,65,141 4,00,112 2,65,029
Yamunanagar 4,77,813 2,76,833 2,00,980
Total 1,01,58,442 61,40,099 40,18,343
57
II-AREA AND POPULATION
Literacy in Haryana by Districts : 2011
Table 2.15 (Contd.)
District Literate and Educated Persons
Urban
Total Male Female
1 5 6 7
Ambala 3,91,383 2,17,006 1,74,377
Bhiwani 2,29,709 1,31,395 98,314
Faridabad 10,45,717 5,95,223 4,50,494
Fatehabad 1,23,047 68,657 54,390
Gurugram 7,87,029 446,378 3,40,651
Hisar 3,99,515 2,31,174 1,68,341
Jhajjar 1,79,636 1,02,647 76,989
Jind 2,15,043 1,24,082 90,961
Kaithal 1,61,306 92,716 68,590
Karnal 3,30,130 1,83,630 1,46,500
Kurukshetra 2,09,222 1,17,541 91,681
Mahendragarh 96,813 55,699 41,114
Nuh 70,148 42,349 27,799
Palwal 1,57,811 92,336 65,475
Panchkula 2,41,891 1,33,936 1,07,955
Panipat 3,83,655 2,20,422 1,63,233
Rewari 1,72,495 98,895 73,600
Rohtak 3,34,915 187,175 1,47,740
Sirsa 2,23,262 1,24,978 98,284
Sonipat 3,33,175 1,89,769 1,43,406
Yamunanagar 3,54,644 1,97,960 1,56,684
Total 64,40,546 36,53,968 27,86,578
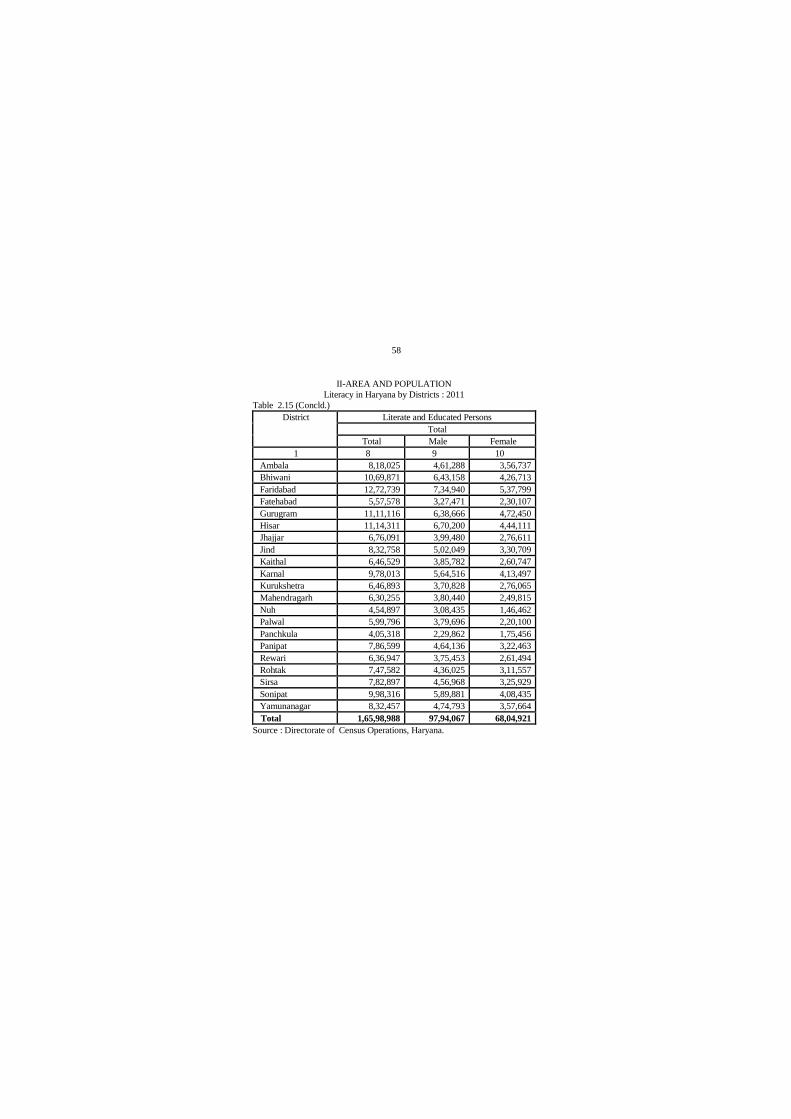
58
II-AREA AND POPULATION
Literacy in Haryana by Districts : 2011
Table 2.15 (Concld.)
District Literate and Educated Persons
Total
Total Male Female
1 8 9 10
Ambala 8,18,025 4,61,288 3,56,737
Bhiwani 10,69,871 6,43,158 4,26,713
Faridabad 12,72,739 7,34,940 5,37,799
Fatehabad 5,57,578 3,27,471 2,30,107
Gurugram 11,11,116 6,38,666 4,72,450
Hisar 11,14,311 6,70,200 4,44,111
Jhajjar 6,76,091 3,99,480 2,76,611
Jind 8,32,758 5,02,049 3,30,709
Kaithal 6,46,529 3,85,782 2,60,747
Karnal 9,78,013 5,64,516 4,13,497
Kurukshetra 6,46,893 3,70,828 2,76,065
Mahendragarh 6,30,255 3,80,440 2,49,815
Nuh 4,54,897 3,08,435 1,46,462
Palwal 5,99,796 3,79,696 2,20,100
Panchkula 4,05,318 2,29,862 1,75,456
Panipat 7,86,599 4,64,136 3,22,463
Rewari 6,36,947 3,75,453 2,61,494
Rohtak 7,47,582 4,36,025 3,11,557
Sirsa 7,82,897 4,56,968 3,25,929
Sonipat 9,98,316 5,89,881 4,08,435
Yamunanagar 8,32,457 4,74,793 3,57,664
Total 1,65,98,988 97,94,067 68,04,921
Source : Directorate of Census Operations, Haryana.
59
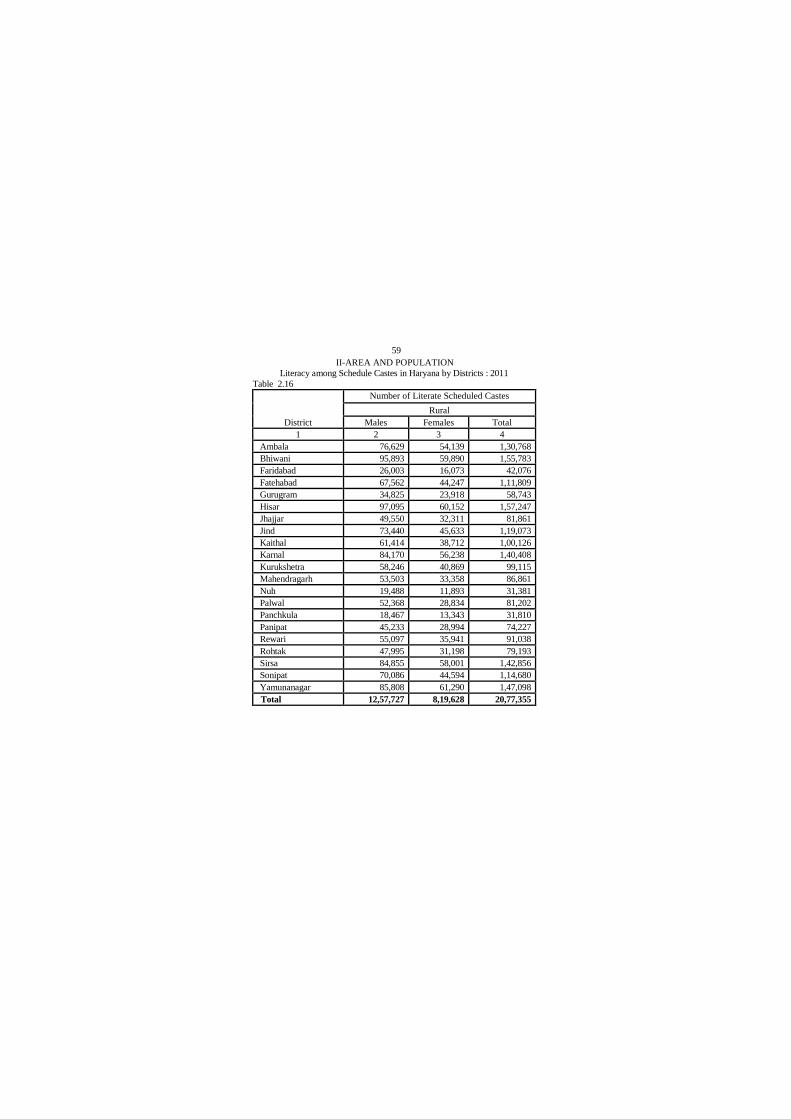
II-AREA AND POPULATION
Literacy among Schedule Castes in Haryana by Districts : 2011
Table 2.16
District
Number of Literate Scheduled Castes
Rural
Males Females Total
1 2 3 4
Ambala 76,629 54,139 1,30,768
Bhiwani 95,893 59,890 1,55,783
Faridabad 26,003 16,073 42,076
Fatehabad 67,562 44,247 1,11,809
Gurugram 34,825 23,918 58,743
Hisar 97,095 60,152 1,57,247
Jhajjar 49,550 32,311 81,861
Jind 73,440 45,633 1,19,073
Kaithal 61,414 38,712 1,00,126
Karnal 84,170 56,238 1,40,408
Kurukshetra 58,246 40,869 99,115
Mahendragarh 53,503 33,358 86,861
Nuh 19,488 11,893 31,381
Palwal 52,368 28,834 81,202
Panchkula 18,467 13,343 31,810
Panipat 45,233 28,994 74,227
Rewari 55,097 35,941 91,038
Rohtak 47,995 31,198 79,193
Sirsa 84,855 58,001 1,42,856
Sonipat 70,086 44,594 1,14,680
Yamunanagar 85,808 61,290 1,47,098
Total 12,57,727 8,19,628 20,77,355
60
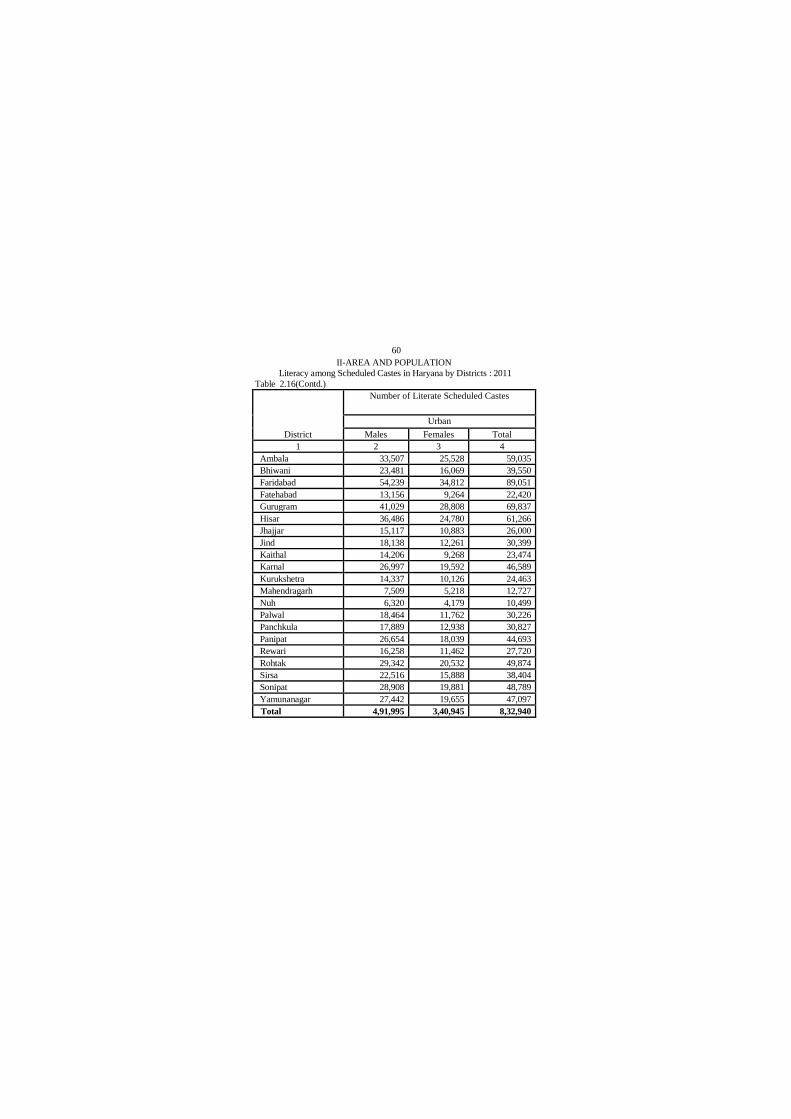
II-AREA AND POPULATION
Literacy among Scheduled Castes in Haryana by Districts : 2011
Table 2.16(Contd.)
District
Number of Literate Scheduled Castes
Urban
Males Females Total
1 2 3 4
Ambala 33,507 25,528 59,035
Bhiwani 23,481 16,069 39,550
Faridabad 54,239 34,812 89,051
Fatehabad 13,156 9,264 22,420
Gurugram 41,029 28,808 69,837
Hisar 36,486 24,780 61,266
Jhajjar 15,117 10,883 26,000
Jind 18,138 12,261 30,399
Kaithal 14,206 9,268 23,474
Karnal 26,997 19,592 46,589
Kurukshetra 14,337 10,126 24,463
Mahendragarh 7,509 5,218 12,727
Nuh 6,320 4,179 10,499
Palwal 18,464 11,762 30,226
Panchkula 17,889 12,938 30,827
Panipat 26,654 18,039 44,693
Rewari 16,258 11,462 27,720
Rohtak 29,342 20,532 49,874
Sirsa 22,516 15,888 38,404
Sonipat 28,908 19,881 48,789
Yamunanagar 27,442 19,655 47,097
Total 4,91,995 3,40,945 8,32,940

61
II-AREA AND POPULATION
Literacy among Scheduled Castes in Haryana by Districts: 2011
Table 2.16 (Concld.)
District
Number of Literate Scheduled
Castes Literate
S.C. as %
age to total
S.C.
Total
Males Females Total
1 8 9 10 11
Ambala 1,10,136 79,667 1,89,803 64.07
Bhiwani 1,19,374 75,959 1,95,333 57.26
Faridabad 80,242 50,885 1,31,127 58.59
Fatehabad 80,718 53,511 1,34,229 47.2
Gurugram 75,854 52,726 1,28,580 64.96
Hisar 1,33,581 84,932 2,18,513 53.45
Jhajjar 64,667 43,194 1,07,861 63.28
Jind 91,578 57,894 1,49,472 52.94
Kaithal 75,620 47,980 1,23,600 49.94
Karnal 1,11,167 75,830 1,86,997 55.06
Kurukshetra 72,583 50,995 1,23,578 57.44
Mahendragarh 61,012 38,576 99,588 63.71
Nuh 25,808 16,072 41,880 55.65
Palwal 70,832 40,596 1,11,428 54.86
Panchkula 36,356 26,281 62,637 61.51
Panipat 71,887 47,033 1,18,920 57.67
Rewari 71,355 47,403 1,18,758 65.04
Rohtak 77,337 51,730 1,29,067 59.51
Sirsa 1,07,371 73,889 1,81,260 46.79
Sonipat 98,994 64,475 1,63,469 60.56
Yamunanagar 1,13,250 80,945 194,195 63.31
Total 17,49,722 11,60,573 29,10,295 56.91
Source : Directorate of Census Operations, Haryana.
* : Excluding of children in the age group of 0—6 years.
62
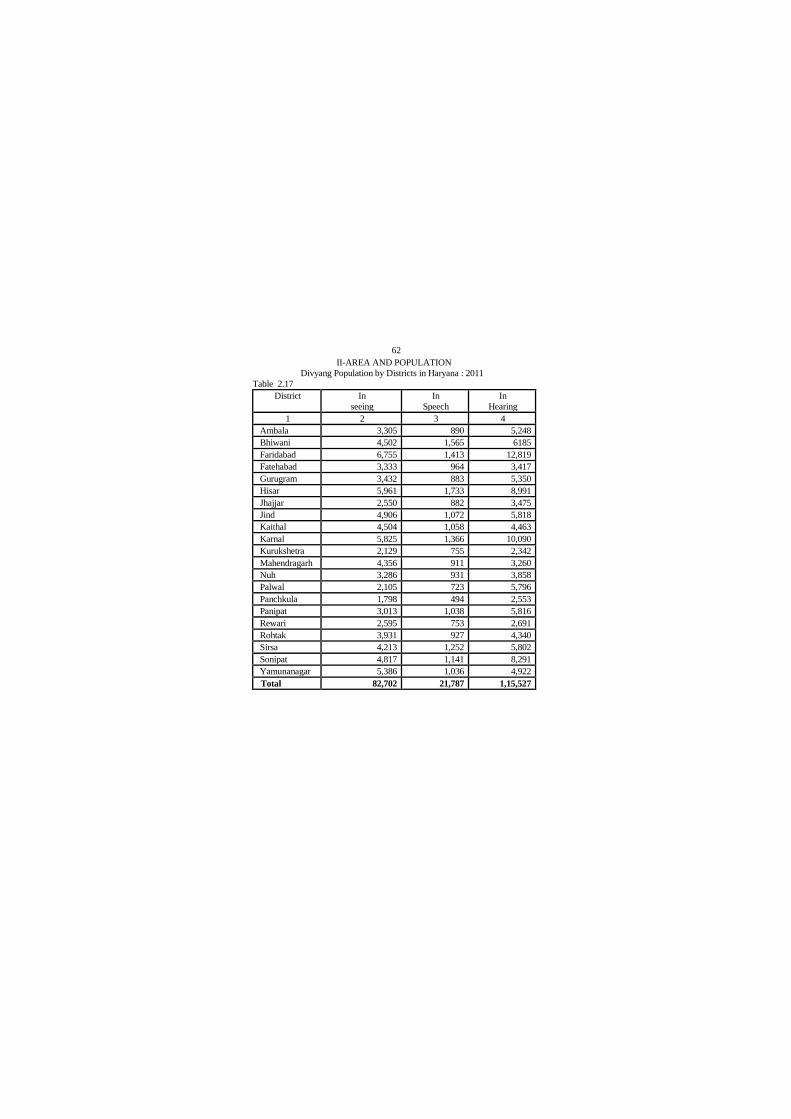
II-AREA AND POPULATION
Divyang Population by Districts in Haryana : 2011
Table 2.17
District In
seeing
In
Speech
In
Hearing
1 2 3 4
Ambala 3,305 890 5,248
Bhiwani 4,502 1,565 6185
Faridabad 6,755 1,413 12,819
Fatehabad 3,333 964 3,417
Gurugram 3,432 883 5,350
Hisar 5,961 1,733 8,991
Jhajjar 2,550 882 3,475
Jind 4,906 1,072 5,818
Kaithal 4,504 1,058 4,463
Karnal 5,825 1,366 10,090
Kurukshetra 2,129 755 2,342
Mahendragarh 4,356 911 3,260
Nuh 3,286 931 3,858
Palwal 2,105 723 5,796
Panchkula 1,798 494 2,553
Panipat 3,013 1,038 5,816
Rewari 2,595 753 2,691
Rohtak 3,931 927 4,340
Sirsa 4,213 1,252 5,802
Sonipat 4,817 1,141 8,291
Yamunanagar 5,386 1,036 4,922
Total 82,702 21,787 1,15,527

63
II-AREA AND POPULATION
Divyang Population by Districts in Haryana : 2011
Table 2.17 (Contd.)
District In Movement Mental
Retardation
Mental Illness
1 5 6 7
Ambala 4,850 1,594 931
Bhiwani 6,603 2,045 917
Faridabad 6,241 1,739 893
Fatehabad 6,196 1,470 830
Gurugram 4,259 1,193 573
Hisar 7,258 2,101 1,096
Jhajjar 4,189 1,045 588
Jind 6,216 1,448 907
Kaithal 6,451 1,349 904
Karnal 7,326 2,190 997
Kurukshetra 5,011 1,291 755
Mahendragarh 5,865 1,330 591
Nuh 4,231 904 409
Palwal 4,316 809 381
Panchkula 2,378 744 415
Panipat 4,636 1,129 791
Rewari 4,637 1,084 561
Rohtak 5,169 1,329 790
Sirsa 7,348 1,684 947
Sonipat 6,165 1,675 765
Yamunanagar 6,681 1,917 1,150
Total 1,16,026 30,070 16,191

64
II-AREA AND POPULATION
Divyang Population by Districts in Haryana : 2011
Table 2.17 (Concld.)
District Multiple
Disability
Any other Total
1 8 9 10
Ambala 1,919 5,112 23,849
Bhiwani 2,667 6,371 30,855
Faridabad 2,354 9,758 41,972
Fatehabad 2,448 5,203 23,861
Gurugram 1,778 5,108 22,576
Hisar 3,230 9,631 40,001
Jhajjar 1,565 4,434 18,728
Jind 2,491 6,145 29,003
Kaithal 2,527 5,776 27,032
Karnal 2,579 9,487 39,860
Kurukshetra 1,700 3,466 17,449
Mahendragarh 2,515 3,469 22,297
Nuh 1,723 3,294 18,636
Palwal 1,372 3,642 19,144
Panchkula 894 2,338 11,614
Panipat 1,836 6,187 24,446
Rewari 1,700 2,349 16,370
Rohtak 2,276 4,771 23,533
Sirsa 2,675 7,260 31,181
Sonipat 3,178 7,293 33,325
Yamunanagar 3,823 5,727 30,642
Total 47,250 1,16,821 5,46,374
Source : Directorate of Census Operations, Haryana.

65
II-AREA AND POPULATION
Area and Population of Various States in India according to 2011 Census
Table 2.18
State Area in sq.
Km. Population
Percentage
Increase
2001-2011
1 2 3 4
India 32,87,469 1,21,05,69,573 17.7
Andhra Pradesh 2,75,045 84580777 11.0
Arunachal Pradesh 83,743 1383727 26.0
Assam 78,438 31205576 17.1
Bihar 94,163 104099452 25.4
Chhattisgarh 1,35,192 25545198 22.6
Goa 3,702 1458545 8.2
Gujarat 1,96,244 60439692 19.3
Haryana 44,212 25351462 19.9
Himachal Pradesh 55,673 6864602 12.9
Jammu & Kashmir 2,22,236 12541302 23.6
Jharkhand 79,716 32988134 22.4
Karnataka 1,91,791 61095297 15.6

66
II-AREA AND POPULATION
Area and Population of Various States in India according to 2011 Census
Table 2.18 (Contd.)
State Area in sq.
Km. Population
Percentage
increase 2001-
2011
1 2 3 4
Kerala 38,852 33406061 4.9
Madhya Pradesh 3,08,252 72626809 20.3
Maharashtra 3,07,713 112374333 16.0
Manipur 22,327 2570390 18.6
Meghalaya 22,429 2966889 27.9
Mizoram 21,081 1097206 23.5
Nagaland 16,579 1978502 (-)0.6
Odisha 1,55,707 41974218 14.0
Punjab 50,362 27743338 13.9
Rajasthan 3,42,239 68548437 21.3
Sikkim 7,096 610577 12.9
Tamil Nadu 1,30,060 72147030 15.6
Tripura 10,486 3673917 14.8
Uttar Pradesh 2,40,928 199812341 20.2
Uttrakhand 53,483 10086292 18.8
West Bengal 88,752 91276115 13.8
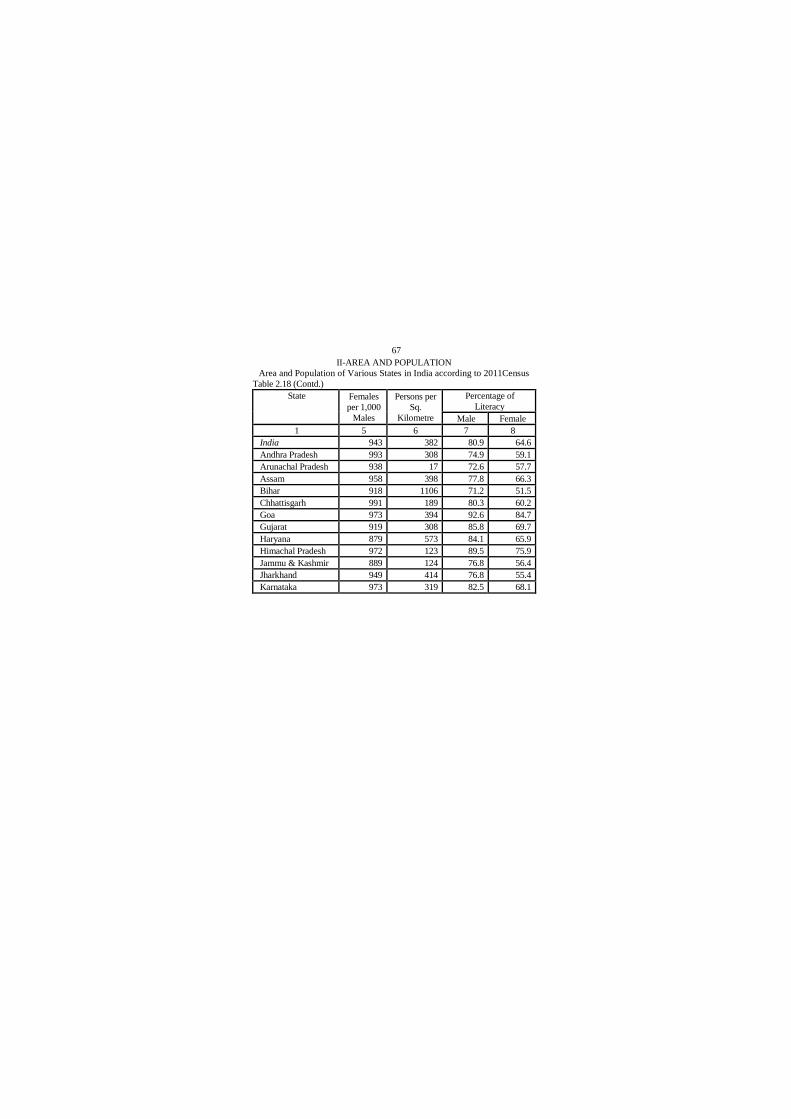
67
II-AREA AND POPULATION
Area and Population of Various States in India according to 2011Census
Table 2.18 (Contd.)
State Females
per 1,000
Males
Persons per
Sq.
Kilometre
Percentage of
Literacy
Male Female
1 5 6 7 8
India 943 382 80.9 64.6
Andhra Pradesh 993 308 74.9 59.1
Arunachal Pradesh 938 17 72.6 57.7
Assam 958 398 77.8 66.3
Bihar 918 1106 71.2 51.5
Chhattisgarh 991 189 80.3 60.2
Goa 973 394 92.6 84.7
Gujarat 919 308 85.8 69.7
Haryana 879 573 84.1 65.9
Himachal Pradesh 972 123 89.5 75.9
Jammu & Kashmir 889 124 76.8 56.4
Jharkhand 949 414 76.8 55.4
Karnataka 973 319 82.5 68.1

68
II-AREA AND POPULATION
Area and Population of Various States in India according to 2011Census
Table 2.18 (Contd.)
State Females
per 1,000
Males
Persons per
Sq.
Kilometre
Percentage of
Literacy
Male Female
1 5 6 7 8
Kerala 1084 860 96.1 92.1
Madhya Pradesh 931 236 78.7 59.2
Maharashtra 929 365 88.4 75.9
Manipur 992 115 86.1 72.4
Meghalaya 989 132 76.0 72.9
Mizoram 976 52 93.3 89.3
Nagaland 931 119 82.8 76.1
Odisha 979 270 81.6 64.0
Punjab 895 551 80.4 70.7
Rajasthan 928 200 79.2 52.1
Sikkim 890 86 86.6 75.6
Tamil Nadu 996 555 86.8 73.4
Tripura 960 350 91.5 82.7
Uttar Pradesh 912 829 77.3 57.2
Uttrakhand 963 189 87.4 70.0
West Bengal 950 1028 81.7 70.5

69
II-AREA AND POPULATION
Area and Population of Various States in India according to 2011 Census
Table 2.18 ( Contd.)
State
Area in Sq.
Km.
Population Percentage
increase
2001-2011
1 2 3 4
Andaman & Nicobar
Island’s
8,249 380581 6.9
Chandigarh 114 1055450 17.2
Dadra & Nagar Haveli 491 343709 55.9
Daman & Diu 111 243247 53.8
Delhi 1,483 16787941 21.2
Lakshadweep 30 64473 6.3
Puducherry 490 1247953 28.1
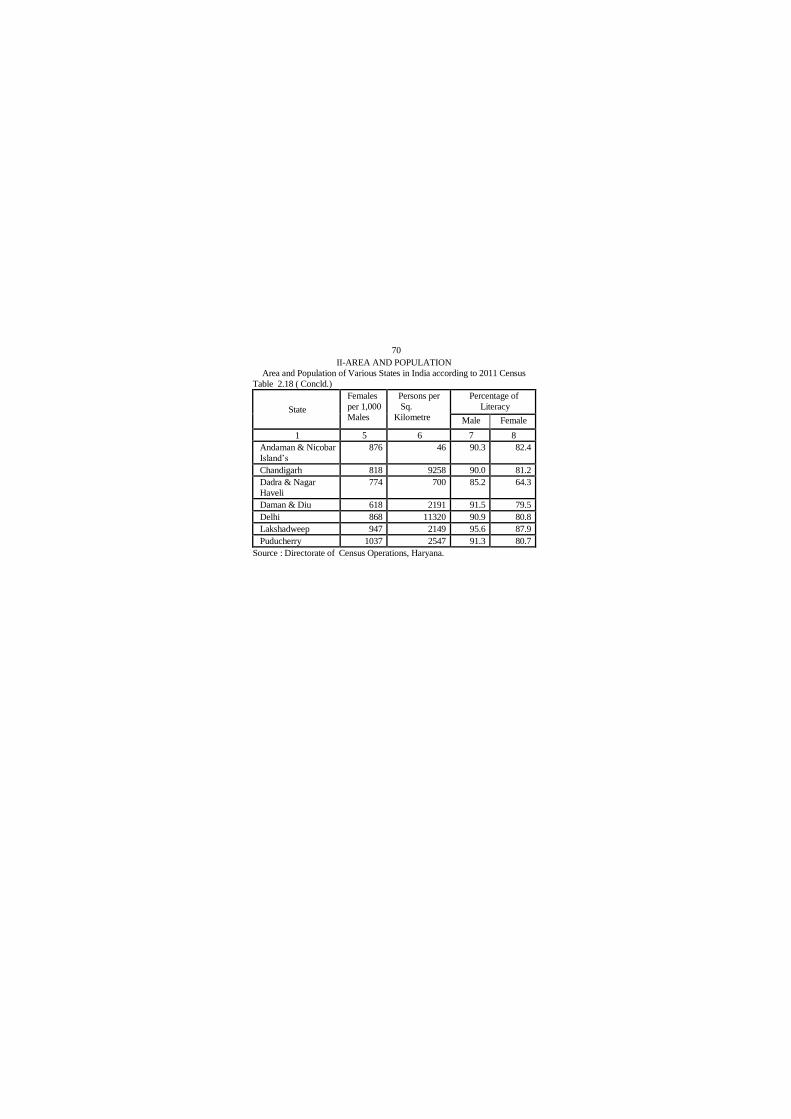
70
II-AREA AND POPULATION
Area and Population of Various States in India according to 2011 Census
Table 2.18 ( Concld.)
State
Females
per 1,000
Males
Persons per
Sq.
Kilometre
Percentage of
Literacy
Male Female
1 5 6 7 8
Andaman & Nicobar
Island’s
876 46 90.3 82.4
Chandigarh 818 9258 90.0 81.2
Dadra & Nagar
Haveli
774 700 85.2 64.3
Daman & Diu 618 2191 91.5 79.5
Delhi 868 11320 90.9 80.8
Lakshadweep 947 2149 95.6 87.9
Puducherry 1037 2547 91.3 80.7
Source : Directorate of Census Operations, Haryana.
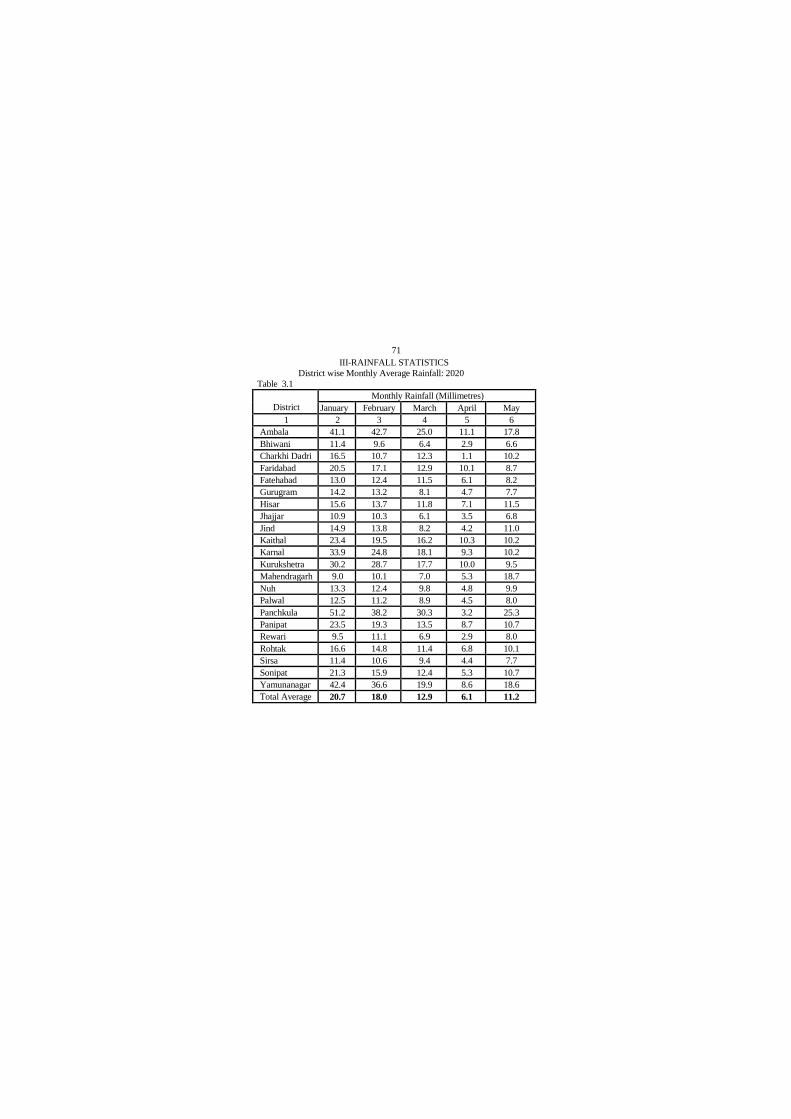
71
III-RAINFALL STATISTICS
District wise Monthly Average Rainfall: 2020
Table 3.1
District
Monthly Rainfall (Millimetres)
January February March April May
1 2 3 4 5 6
Ambala 41.1 42.7 25.0 11.1 17.8
Bhiwani 11.4 9.6 6.4 2.9 6.6
Charkhi Dadri 16.5 10.7 12.3 1.1 10.2
Faridabad 20.5 17.1 12.9 10.1 8.7
Fatehabad 13.0 12.4 11.5 6.1 8.2
Gurugram 14.2 13.2 8.1 4.7 7.7
Hisar 15.6 13.7 11.8 7.1 11.5
Jhajjar 10.9 10.3 6.1 3.5 6.8
Jind 14.9 13.8 8.2 4.2 11.0
Kaithal 23.4 19.5 16.2 10.3 10.2
Karnal 33.9 24.8 18.1 9.3 10.2
Kurukshetra 30.2 28.7 17.7 10.0 9.5
Mahendragarh 9.0 10.1 7.0 5.3 18.7
Nuh 13.3 12.4 9.8 4.8 9.9
Palwal 12.5 11.2 8.9 4.5 8.0
Panchkula 51.2 38.2 30.3 3.2 25.3
Panipat 23.5 19.3 13.5 8.7 10.7
Rewari 9.5 11.1 6.9 2.9 8.0
Rohtak 16.6 14.8 11.4 6.8 10.1
Sirsa 11.4 10.6 9.4 4.4 7.7
Sonipat 21.3 15.9 12.4 5.3 10.7
Yamunanagar 42.4 36.6 19.9 8.6 18.6
Total Average 20.7 18.0 12.9 6.1 11.2
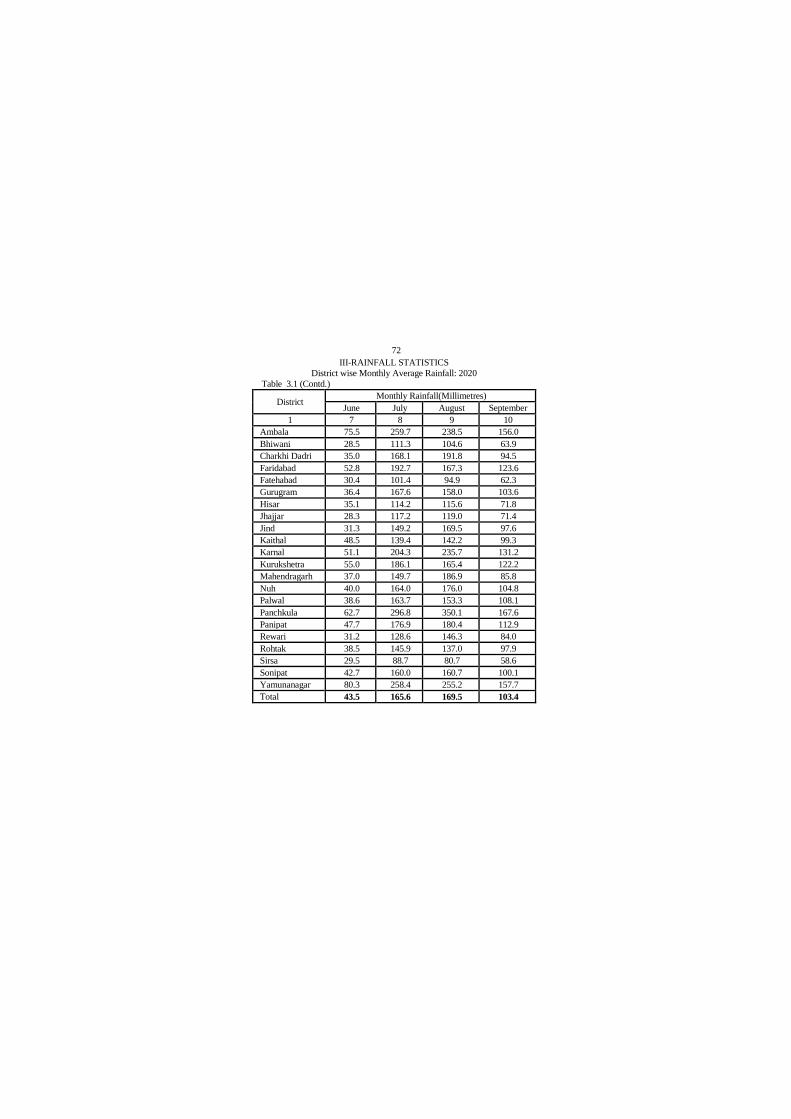
72
III-RAINFALL STATISTICS
District wise Monthly Average Rainfall: 2020
Table 3.1 (Contd.)
District Monthly Rainfall(Millimetres)
June July August September
1 7 8 9 10
Ambala 75.5 259.7 238.5 156.0
Bhiwani 28.5 111.3 104.6 63.9
Charkhi Dadri 35.0 168.1 191.8 94.5
Faridabad 52.8 192.7 167.3 123.6
Fatehabad 30.4 101.4 94.9 62.3
Gurugram 36.4 167.6 158.0 103.6
Hisar 35.1 114.2 115.6 71.8
Jhajjar 28.3 117.2 119.0 71.4
Jind 31.3 149.2 169.5 97.6
Kaithal 48.5 139.4 142.2 99.3
Karnal 51.1 204.3 235.7 131.2
Kurukshetra 55.0 186.1 165.4 122.2
Mahendragarh 37.0 149.7 186.9 85.8
Nuh 40.0 164.0 176.0 104.8
Palwal 38.6 163.7 153.3 108.1
Panchkula 62.7 296.8 350.1 167.6
Panipat 47.7 176.9 180.4 112.9
Rewari 31.2 128.6 146.3 84.0
Rohtak 38.5 145.9 137.0 97.9
Sirsa 29.5 88.7 80.7 58.6
Sonipat 42.7 160.0 160.7 100.1
Yamunanagar 80.3 258.4 255.2 157.7
Total 43.5 165.6 169.5 103.4

73
III-RAINFALL STATISTICS
Monthly Average Rainfall by Districts: 2020
Table 3.1 (Concld.)
District Monthly Rainfall (Millimetres)
October November December Total
1 11 12 13 14
Ambala 25.5 6.0 16.5 915.4
Bhiwani 9.6 2.8 3.5 361.1
Charkhi Dadri 35.6 1.6 3.3 580.7
Faridabad 23.7 2.4 6.6 638.4
Fatehabad 10.2 1.4 6.3 358.1
Gurugram 18.1 2.2 4.8 538.6
Hisar 13.2 3.1 6.1 418.8
Jhajjar 11.9 2.4 3.4 391.2
Jind 13.1 3.8 6.0 522.6
Kaithal 14.3 2.4 7.7 533.4
Karnal 28.9 4.4 9.9 761.8
Kurukshetra 17.8 3.7 10.9 657.2
Mahendragarh 28.1 1.2 5.3 544.1
Nuh 19.0 2.7 5.4 562.1
Palwal 18.4 1.8 4.8 533.8
Panchkula 29.9 12.5 8.3 1076.1
Panipat 18.3 3.4 8.3 623.6
Rewari 13.0 2.8 3.5 447.8
Rohtak 12.7 2.2 6.1 500.0
Sirsa 8.4 2.1 6.4 317.9
Sonipat 16.4 2.8 7.3 555.6
Yamunanagar 27.1 5.3 12.4 922.5
Total 18.8 3.3 6.9 580.0
Source : Ditrctor, Land records, Haryana
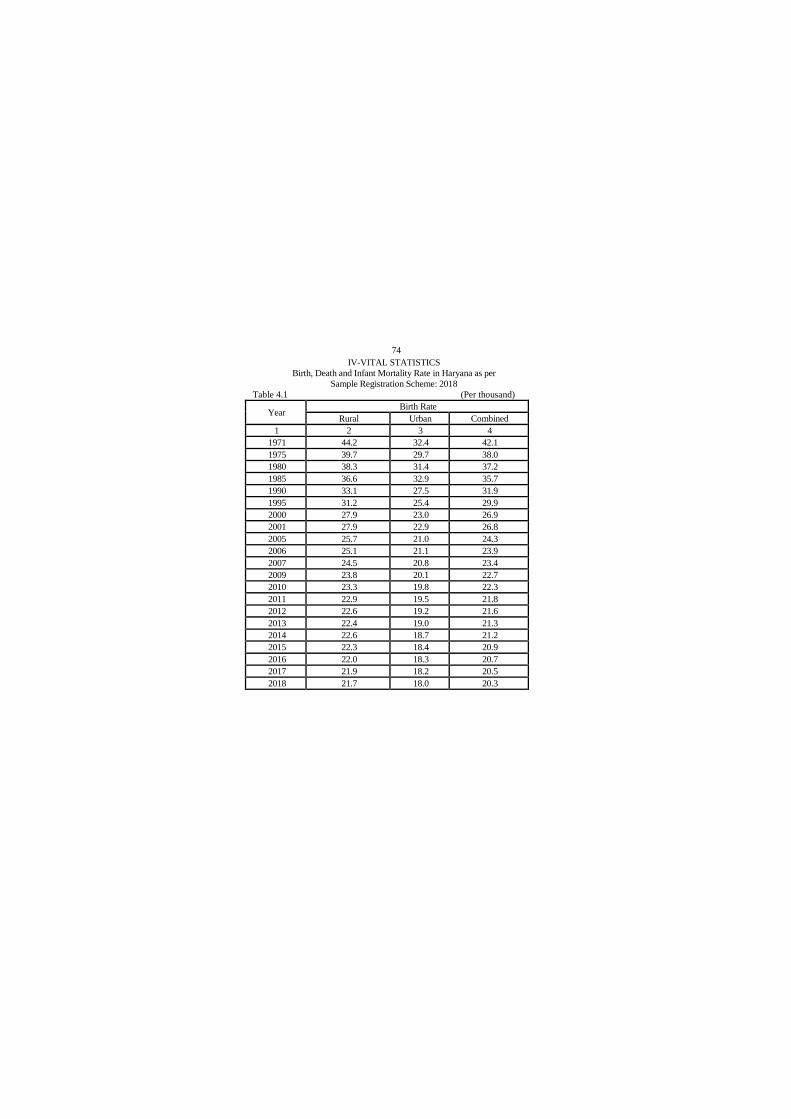
74
IV-VITAL STATISTICS
Birth, Death and Infant Mortality Rate in Haryana as per
Sample Registration Scheme: 2018
Table 4.1 (Per thousand)
Year Birth Rate
Rural Urban Combined
1 2 3 4
1971 44.2 32.4 42.1
1975 39.7 29.7 38.0
1980 38.3 31.4 37.2
1985 36.6 32.9 35.7
1990 33.1 27.5 31.9
1995 31.2 25.4 29.9
2000 27.9 23.0 26.9
2001 27.9 22.9 26.8
2005 25.7 21.0 24.3
2006 25.1 21.1 23.9
2007 24.5 20.8 23.4
2009 23.8 20.1 22.7
2010 23.3 19.8 22.3
2011 22.9 19.5 21.8
2012 22.6 19.2 21.6
2013 22.4 19.0 21.3
2014 22.6 18.7 21.2
2015 22.3 18.4 20.9
2016 22.0 18.3 20.7
2017 21.9 18.2 20.5
2018 21.7 18.0 20.3
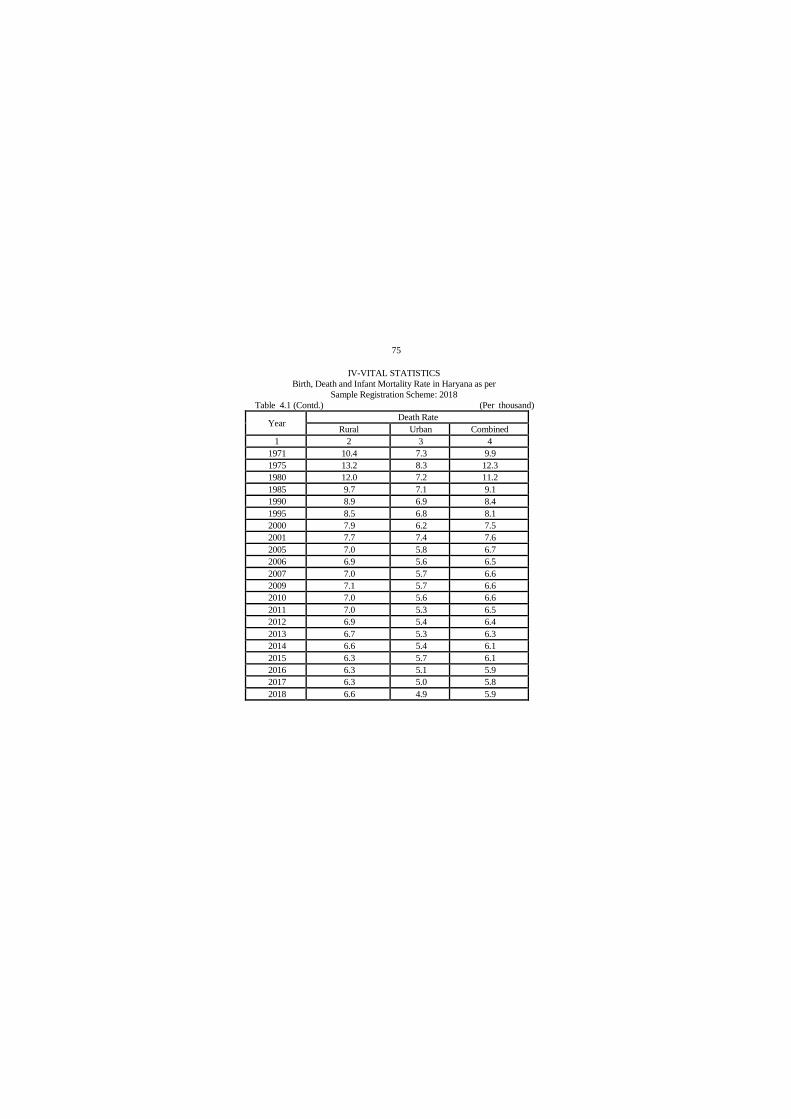
75
IV-VITAL STATISTICS
Birth, Death and Infant Mortality Rate in Haryana as per
Sample Registration Scheme: 2018
Table 4.1 (Contd.) (Per thousand)
Year Death Rate
Rural Urban Combined
1 2 3 4
1971 10.4 7.3 9.9
1975 13.2 8.3 12.3
1980 12.0 7.2 11.2
1985 9.7 7.1 9.1
1990 8.9 6.9 8.4
1995 8.5 6.8 8.1
2000 7.9 6.2 7.5
2001 7.7 7.4 7.6
2005 7.0 5.8 6.7
2006 6.9 5.6 6.5
2007 7.0 5.7 6.6
2009 7.1 5.7 6.6
2010 7.0 5.6 6.6
2011 7.0 5.3 6.5
2012 6.9 5.4 6.4
2013 6.7 5.3 6.3
2014 6.6 5.4 6.1
2015 6.3 5.7 6.1
2016 6.3 5.1 5.9
2017 6.3 5.0 5.8
2018 6.6 4.9 5.9

76
IV-VITAL STATISTICS
Birth, Death and Infant Mortality Rate in Haryana as per
Sample Registration Scheme: 2018
Table 4.1 (Concld.) (Per thousand)
Year Infant Mortality Rate
Rural Urban Combined
1 8 9 10
1971 74.0 58.0 72.0
1975 122.0 58.0 114.0
1980 112.2 52.8 103.5
1985 92.0 58.0 85.0
1990 73.0 53.0 69.0
1995 70.0 65.0 69.0
2000 69.0 57.0 67.0
2001 68.0 55.0 66.0
2005 64.0 45.0 60.0
2006 62.0 45.0 57.0
2007 60.0 44.0 55.0
2009 54.0 41.0 51.0
2010 51.0 38.0 48.0
2011 48.0 35.0 44.0
2012 46.0 33.0 42.0
2013 44.0 32.0 41.0
2014 40.0 29.0 36.0
2015 39.0 30.0 36.0
2016 35.0 27.0 33.0
2017 32.0 25.0 30.0
2018 33.0 25.0 30.0
Source : Director General, Health Services, Haryana.
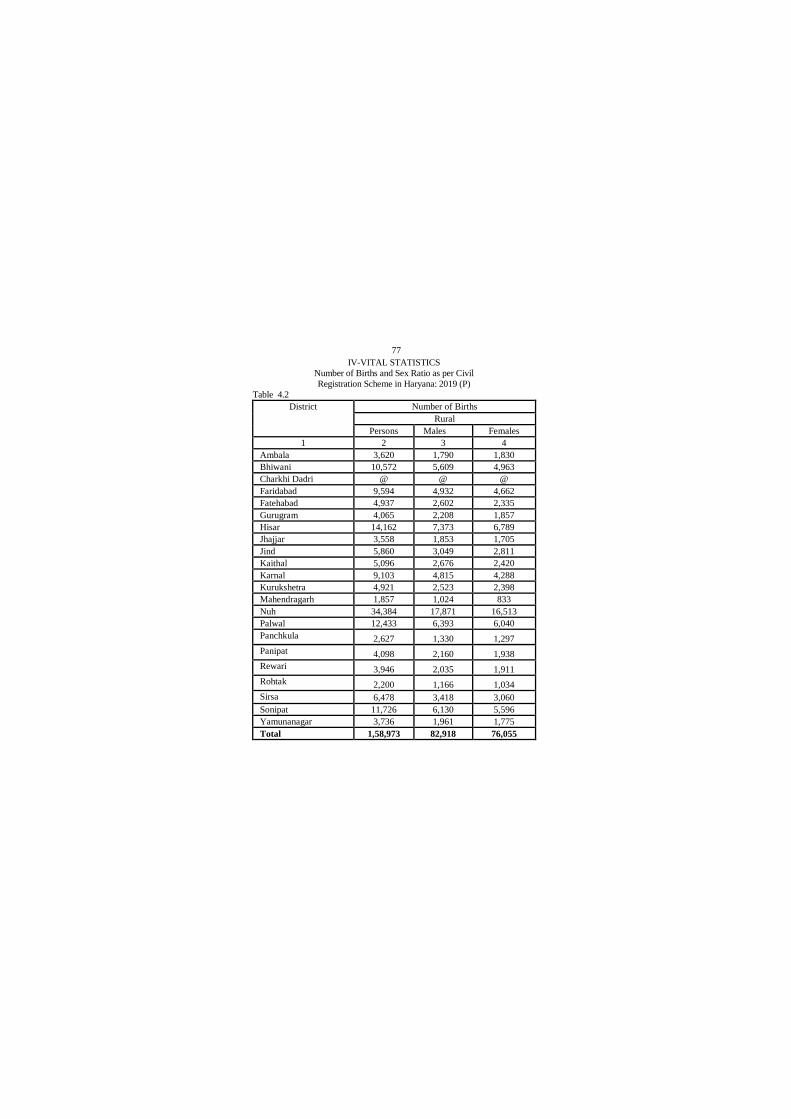
77
IV-VITAL STATISTICS
Number of Births and Sex Ratio as per Civil
Registration Scheme in Haryana: 2019 (P)
Table 4.2
District Number of Births
Rural
Persons Males Females
1 2 3 4
Ambala 3,620 1,790 1,830
Bhiwani 10,572 5,609 4,963
Charkhi Dadri @ @ @
Faridabad 9,594 4,932 4,662
Fatehabad 4,937 2,602 2,335
Gurugram 4,065 2,208 1,857
Hisar 14,162 7,373 6,789
Jhajjar 3,558 1,853 1,705
Jind 5,860 3,049 2,811
Kaithal 5,096 2,676 2,420
Karnal 9,103 4,815 4,288
Kurukshetra 4,921 2,523 2,398
Mahendragarh 1,857 1,024 833
Nuh 34,384 17,871 16,513
Palwal 12,433 6,393 6,040
Panchkula 2,627 1,330 1,297
Panipat 4,098 2,160 1,938
Rewari 3,946 2,035 1,911
Rohtak 2,200 1,166 1,034
Sirsa 6,478 3,418 3,060
Sonipat 11,726 6,130 5,596
Yamunanagar 3,736 1,961 1,775
Total 1,58,973 82,918 76,055

78
IV-VITAL STATISTICS
Number of Births and Sex Ratio as per Civil
Registration Scheme in Haryana : 2019 (P)
Table 4.2 (Contd.)
District Number of Births
Urban
Persons Males Females
1 2 3 4
Ambala 15,612 8,032 7,580
Bhiwani 15,050 7,974 7,076
Charkhi Dadri @ @ @
Faridabad 39,344 20,582 18,762
Fatehabad 13,071 6,829 6,242
Gurugram 35,441 18,504 16,937
Hisar 22,003 11,428 10,575
Jhajjar 8,450 4,448 4,002
Jind 14,926 7,698 7,228
Kaithal 13,542 7,098 6,444
Karnal 16,779 8,810 7,969
Kurukshetra 11,596 6,079 5,517
Mahendragarh 10,921 5,701 5,220
Nuh 13,803 7,238 6,565
Palwal 14,594 7,695 6,899
Panchkula 10,539 5,379 5,160
Panipat 24,598 12,747 11,851
Rewari 14,130 7,390 6,740
Rohtak 25,024 13,108 11,916
Sirsa 16,249 8,483 7,766
Sonipat 16,444 8,723 7,721
Yamunanagar 18,903 9,767 9,136
Total 3,71,019 1,93,713 1,77,306

79
IV-VITAL STATISTICS
Number of Births and Sex Ratio as per Civil
Registration Scheme in Haryana: 2019(P)
Table. 4.2(Contd.)
District Number of Births
Total
Persons Male Female
1 8 9 10
Ambala 19,232 9,822 9,410
Bhiwani 25,622 13,583 12,039
Charkhi Dadri @ @ @
Faridabad 48,938 25,514 23,424
Fatehabad 18,008 9,431 8,577
Gurugram 39,506 20,712 18,794
Hisar 36,165 18,801 17,364
Jhajjar 12,008 6,301 5,707
Jind 20,786 10,747 10,039
Kaithal 18,638 9,774 8,864
Karnal 25,882 13,625 12,257
Kurukshetra 16,517 8,602 7,915
Mahendragarh 12,778 6,725 6,053
Nuh 48,187 25,109 23,078
Palwal 27,027 14,088 12,939
Panchkula 13,166 6,709 6,457
Panipat 28,696 14,907 13,789
Rewari 18,076 9,425 8,651
Rohtak 27,224 14,274 12,950
Sirsa 22,727 11,901 10,826
Sonipat 28,170 14,853 13,317
Yamunanagar 22,639 11,728 10,911
Total 5,29,992 2,76,631 2,53,361

80
IV-VITAL STATISTICS
Number of Births and Sex Ratio as per Civil
Registration Scheme in Haryana: 2019 (P)
Table 4.2(Concld.)
District Sex Ratio of Births (Males per 100 Females)
Total Rural Urban
1 8 9 10
Ambala 104 98 106
Bhiwani 113 113 113
Charkhi Dadri @ @ @
Faridabad 109 106 110
Fatehabad 110 111 109
Gurugram 110 119 109
Hisar 108 109 108
Jhajjar 110 109 111
Jind 107 108 107
Kaithal 110 111 110
Karnal 111 112 111
Kurukshetra 109 105 110
Mahendragarh 111 123 109
Nuh 109 108 110
Palwal 109 106 112
Panchkula 104 103 104
Panipat 108 111 108
Rewari 109 106 110
Rohtak 110 113 110
Sirsa 110 112 109
Sonipat 112 110 113
Yamunanagar 107 110 107
Total 109 109 109
Source: Director General, Health Services, Haryana.
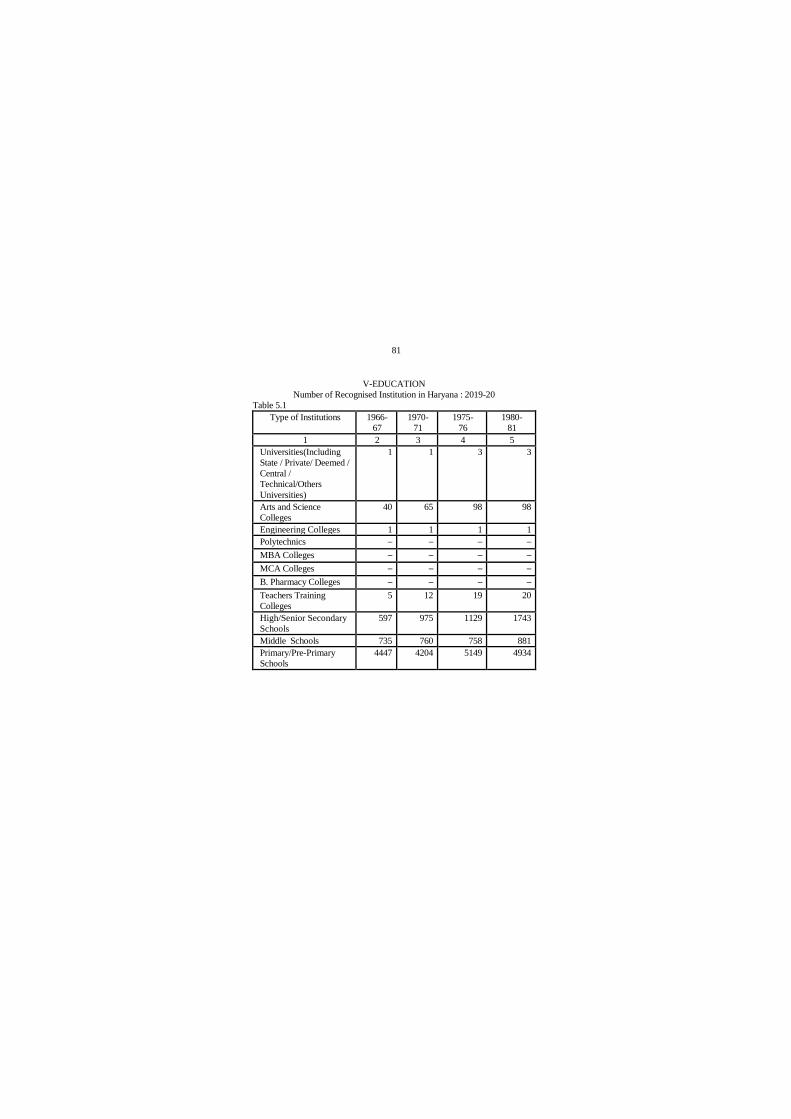
81
V-EDUCATION
Number of Recognised Institution in Haryana : 2019-20
Table 5.1
Type of Institutions 1966-
67
1970-
71
1975-
76
1980-
81
1 2 3 4 5
Universities(Including
State / Private/ Deemed /
Central /
Technical/Others
Universities)
1 1 3 3
Arts and Science
Colleges
40 65 98 98
Engineering Colleges 1 1 1 1
Polytechnics — — — —
MBA Colleges — — — —
MCA Colleges — — — —
B. Pharmacy Colleges — — — —
Teachers Training
Colleges
5 12 19 20
High/Senior Secondary
Schools
597 975 1129 1743
Middle Schools 735 760 758 881
Primary/Pre-Primary
Schools
4447 4204 5149 4934
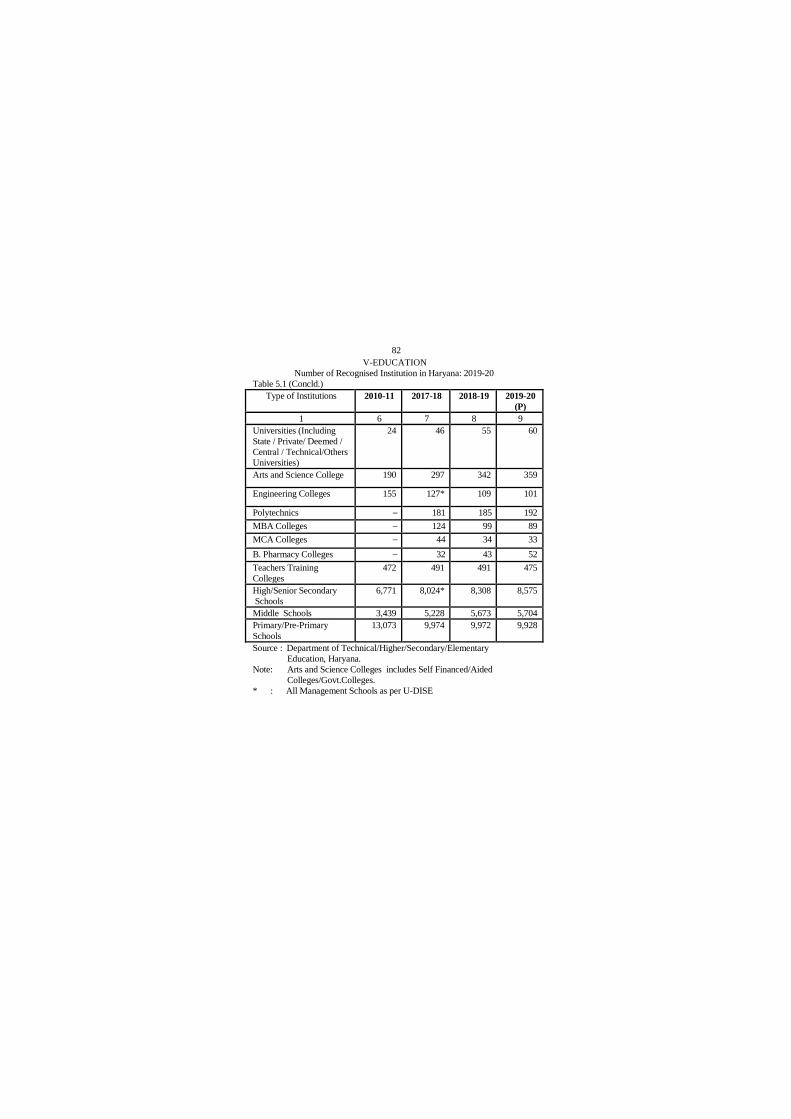
82
V-EDUCATION
Number of Recognised Institution in Haryana: 2019-20
Table 5.1 (Concld.)
Type of Institutions 2010-11 2017-18 2018-19 2019-20
(P)
1 6 7 8 9
Universities (Including
State / Private/ Deemed /
Central / Technical/Others
Universities)
24 46 55 60
Arts and Science College 190 297 342 359
Engineering Colleges 155 127* 109 101
Polytechnics — 181 185 192
MBA Colleges — 124 99 89
MCA Colleges — 44 34 33
B. Pharmacy Colleges — 32 43 52
Teachers Training
Colleges
472 491 491 475
High/Senior Secondary
Schools
6,771 8,024* 8,308 8,575
Middle Schools 3,439 5,228 5,673 5,704
Primary/Pre-Primary
Schools
13,073 9,974 9,972 9,928
Source : Department of Technical/Higher/Secondary/Elementary
Education, Haryana.
Note: Arts and Science Colleges includes Self Financed/Aided
Colleges/Govt.Colleges.
* : All Management Schools as per U-DISE
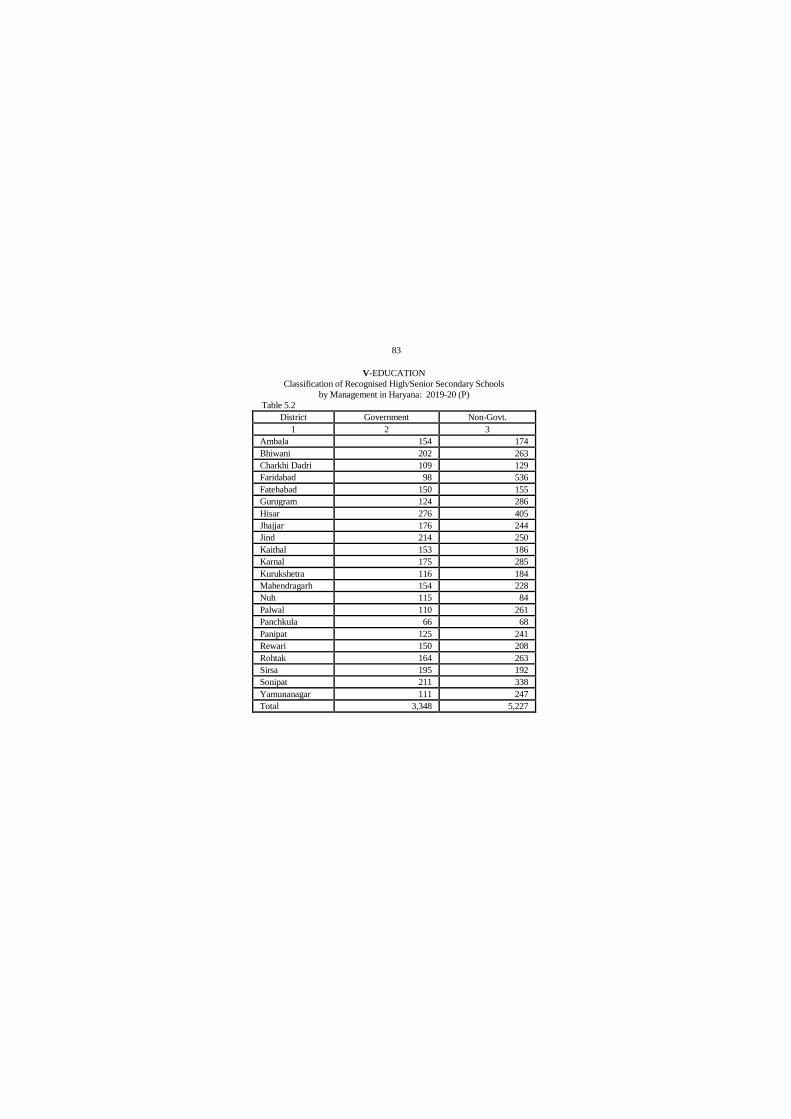
83
V-EDUCATION
Classification of Recognised High/Senior Secondary Schools
by Management in Haryana: 2019-20 (P)
Table 5.2
District Government Non-Govt.
1 2 3
Ambala 154 174
Bhiwani 202 263
Charkhi Dadri 109 129
Faridabad 98 536
Fatehabad 150 155
Gurugram 124 286
Hisar 276 405
Jhajjar 176 244
Jind 214 250
Kaithal 153 186
Karnal 175 285
Kurukshetra 116 184
Mahendragarh 154 228
Nuh 115 84
Palwal 110 261
Panchkula 66 68
Panipat 125 241
Rewari 150 208
Rohtak 164 263
Sirsa 195 192
Sonipat 211 338
Yamunanagar 111 247
Total 3,348 5,227
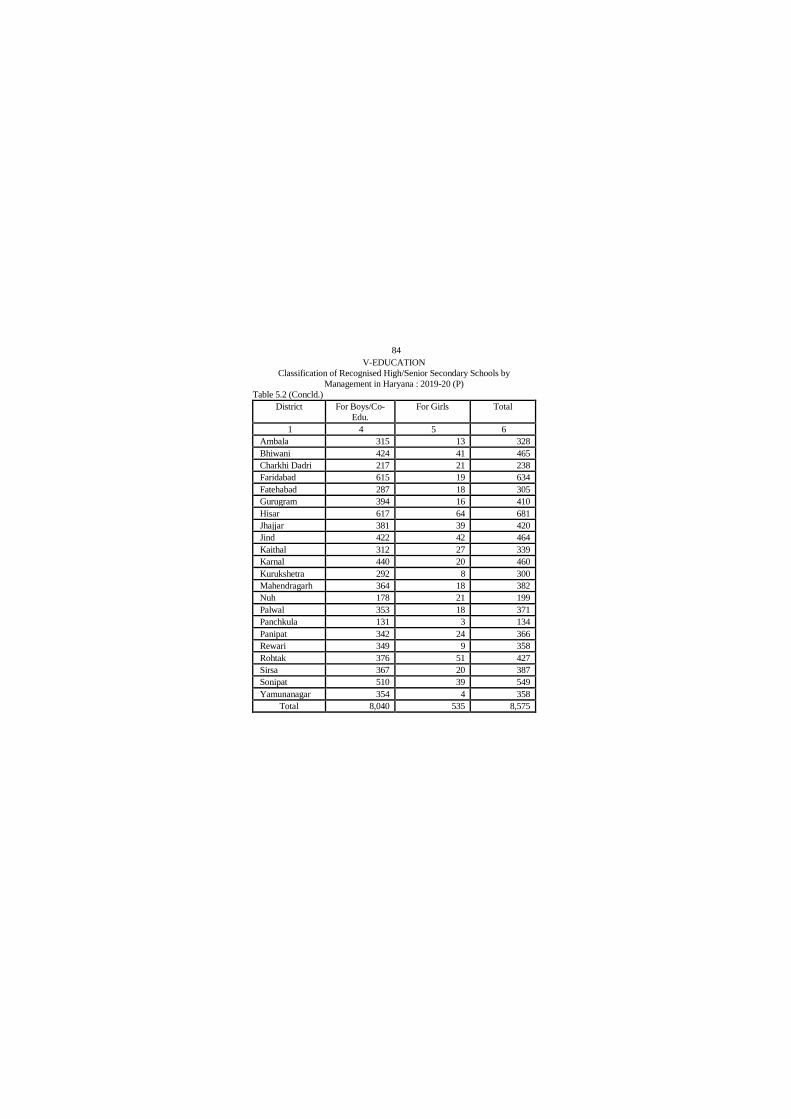
84
V-EDUCATION
Classification of Recognised High/Senior Secondary Schools by
Management in Haryana : 2019-20 (P)
Table 5.2 (Concld.)
District For Boys/Co-
Edu.
For Girls Total
1 4 5 6
Ambala 315 13 328
Bhiwani 424 41 465
Charkhi Dadri 217 21 238
Faridabad 615 19 634
Fatehabad 287 18 305
Gurugram 394 16 410
Hisar 617 64 681
Jhajjar 381 39 420
Jind 422 42 464
Kaithal 312 27 339
Karnal 440 20 460
Kurukshetra 292 8 300
Mahendragarh 364 18 382
Nuh 178 21 199
Palwal 353 18 371
Panchkula 131 3 134
Panipat 342 24 366
Rewari 349 9 358
Rohtak 376 51 427
Sirsa 367 20 387
Sonipat 510 39 549
Yamunanagar 354 4 358
Total 8,040 535 8,575

85
V-EDUCATION
Classification of Recognised Middle Schools
by Management in Haryana : 2019-20 (P)
Table 5.2
District Government Non-Govt.
1 2 3
Ambala 138 99
Bhiwani 108 123
Charkhi Dadri 51 29
Faridabad 42 624
Fatehabad 92 89
Gurugram 86 236
Hisar 104 214
Jhajjar 58 94
Jind 106 96
Kaithal 77 134
Karnal 118 182
Kurukshetra 184 91
Mahendragarh 124 70
Nuh 255 113
Palwal 147 236
Panchkula 78 55
Panipat 55 269
Rewari 97 58
Rohtak 37 92
Sirsa 123 110
Sonipat 83 189
Yamunanagar 238 100
Total 2,401 3,303

86
V-EDUCATION
Classification of Recognised Middle Schools by
Management in Haryana : 2019-20 (P)
Table 5.2(Concld.)
District For Boys For Girls Total
1 4 5 6
Ambala 229 8 237
Bhiwani 218 13 231
Charkhi Dadri 78 2 80
Faridabad 662 4 666
Fatehabad 165 16 181
Gurugram 312 10 322
Hisar 287 31 318
Jhajjar 143 9 152
Jind 177 25 202
Kaithal 200 11 211
Karnal 297 3 300
Kurukshetra 263 12 275
Mahendragarh 179 15 194
Nuh 315 53 368
Palwal 364 19 383
Panchkula 132 1 133
Panipat 317 7 324
Rewari 146 9 155
Rohtak 120 9 129
Sirsa 217 16 233
Sonipat 267 5 272
Yamunanagar 336 2 338
Total 5,424 280 5,704
Source:—Director, Secondary/Middle/Primary Education, Haryana.
*Excluding Primary & Pre Primary schools attached with Middle,
High, Sr. Secondary Schools.

87
V-EDUCATION
Classification of Recognised Primary (Including Pre-primary/Balwari)
Schools by Management in Haryana: 2019-20 (P)
Table 5.2
District Government Non-Govt.
1 2 3
Ambala 478 65
Bhiwani 446 62
Charkhi Dadri 209 10
Faridabad 240 88
Fatehabad 388 61
Gurugram 362 60
Hisar 503 100
Jhajjar 297 53
Jind 429 41
Kaithal 372 55
Karnal 487 95
Kurukshetra 491 59
Mahendragarh 472 32
Nuh 480 16
Palwal 359 49
Panchkula 273 42
Panipat 243 65
Rewari 402 57
Rohtak 210 47
Sirsa 524 51
Sonipat 425 88
Yamunanagar 598 44
Total 8,688 1,240

88
V-EDUCATION
Classification of Recognised Primary (Pre-primary/Balwari) Schools
by Management in Haryana : 2019-20 (P)
Table 5.2 (Concld.)
District Boys Girls Total
1 4 5 6
Ambala 527 16 543
Bhiwani 436 72 508
Charkhi Dadri 190 29 219
Faridabad 305 23 328
Fatehabad 406 43 449
Gurugram 373 49 422
Hisar 497 106 603
Jhajjar 305 45 350
Jind 360 110 470
Kaithal 374 53 427
Karnal 571 11 582
Kurukshetra 534 16 550
Mahendragarh 436 68 504
Nuh 465 31 496
Palwal 371 37 408
Panchkula 313 2 315
Panipat 273 35 308
Rewari 438 21 459
Rohtak 193 64 257
Sirsa 472 103 575
Sonipat 453 60 513
Yamunanagar 631 11 642
Total 8,923 1,001 9,928
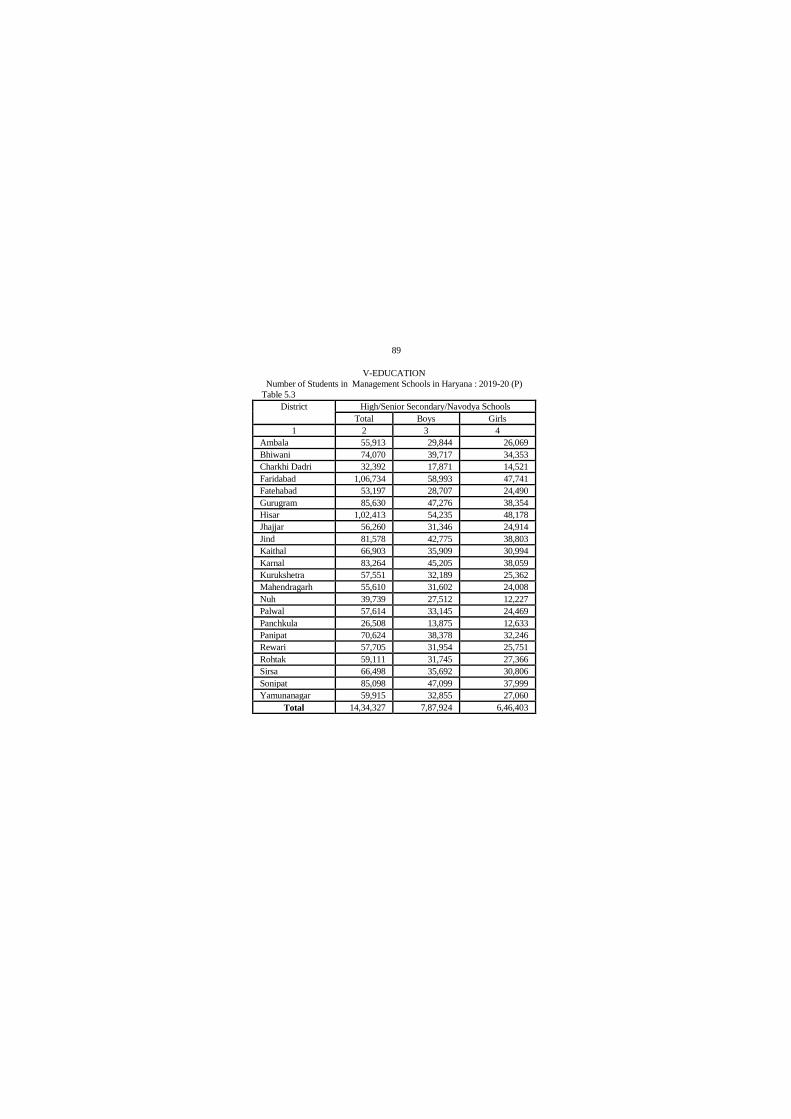
89
V-EDUCATION
Number of Students in Management Schools in Haryana : 2019-20 (P)
Table 5.3
District High/Senior Secondary/Navodya Schools
Total Boys Girls
1 2 3 4
Ambala 55,913 29,844 26,069
Bhiwani 74,070 39,717 34,353
Charkhi Dadri 32,392 17,871 14,521
Faridabad 1,06,734 58,993 47,741
Fatehabad 53,197 28,707 24,490
Gurugram 85,630 47,276 38,354
Hisar 1,02,413 54,235 48,178
Jhajjar 56,260 31,346 24,914
Jind 81,578 42,775 38,803
Kaithal 66,903 35,909 30,994
Karnal 83,264 45,205 38,059
Kurukshetra 57,551 32,189 25,362
Mahendragarh 55,610 31,602 24,008
Nuh 39,739 27,512 12,227
Palwal 57,614 33,145 24,469
Panchkula 26,508 13,875 12,633
Panipat 70,624 38,378 32,246
Rewari 57,705 31,954 25,751
Rohtak 59,111 31,745 27,366
Sirsa 66,498 35,692 30,806
Sonipat 85,098 47,099 37,999
Yamunanagar 59,915 32,855 27,060
Total 14,34,327 7,87,924 6,46,403
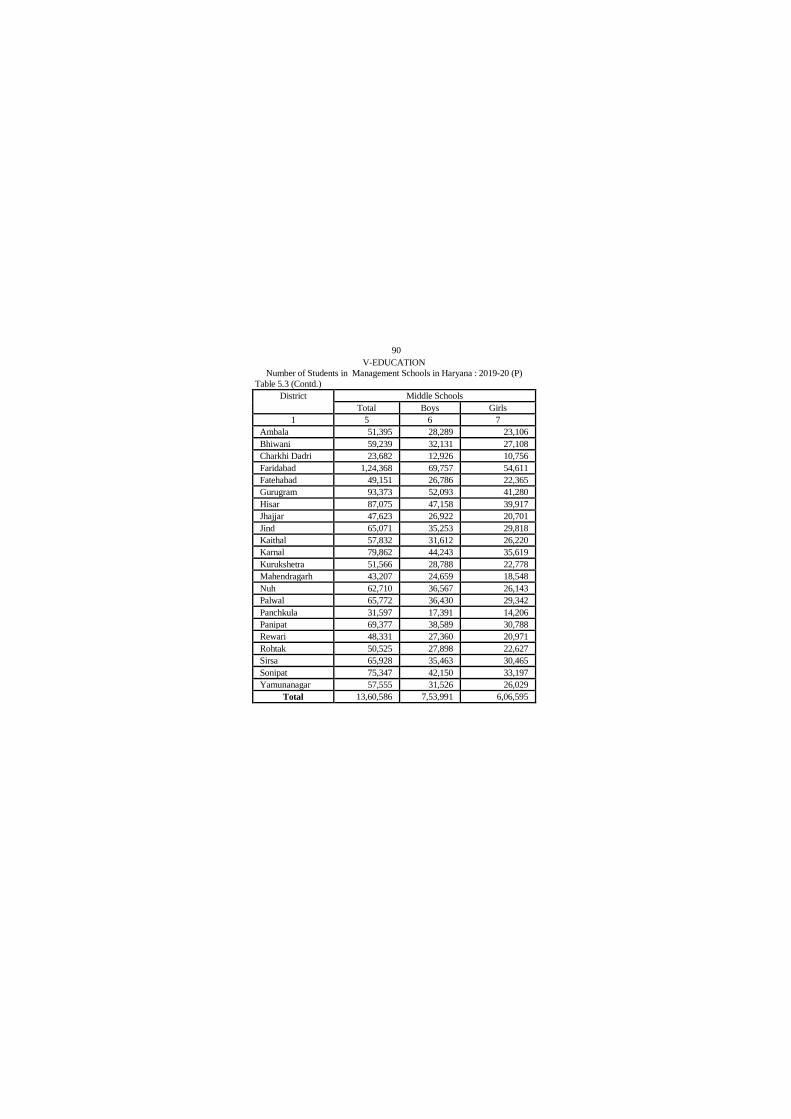
90
V-EDUCATION
Number of Students in Management Schools in Haryana : 2019-20 (P)
Table 5.3 (Contd.)
District Middle Schools
Total Boys Girls
1 5 6 7
Ambala 51,395 28,289 23,106
Bhiwani 59,239 32,131 27,108
Charkhi Dadri 23,682 12,926 10,756
Faridabad 1,24,368 69,757 54,611
Fatehabad 49,151 26,786 22,365
Gurugram 93,373 52,093 41,280
Hisar 87,075 47,158 39,917
Jhajjar 47,623 26,922 20,701
Jind 65,071 35,253 29,818
Kaithal 57,832 31,612 26,220
Karnal 79,862 44,243 35,619
Kurukshetra 51,566 28,788 22,778
Mahendragarh 43,207 24,659 18,548
Nuh 62,710 36,567 26,143
Palwal 65,772 36,430 29,342
Panchkula 31,597 17,391 14,206
Panipat 69,377 38,589 30,788
Rewari 48,331 27,360 20,971
Rohtak 50,525 27,898 22,627
Sirsa 65,928 35,463 30,465
Sonipat 75,347 42,150 33,197
Yamunanagar 57,555 31,526 26,029
Total 13,60,586 7,53,991 6,06,595
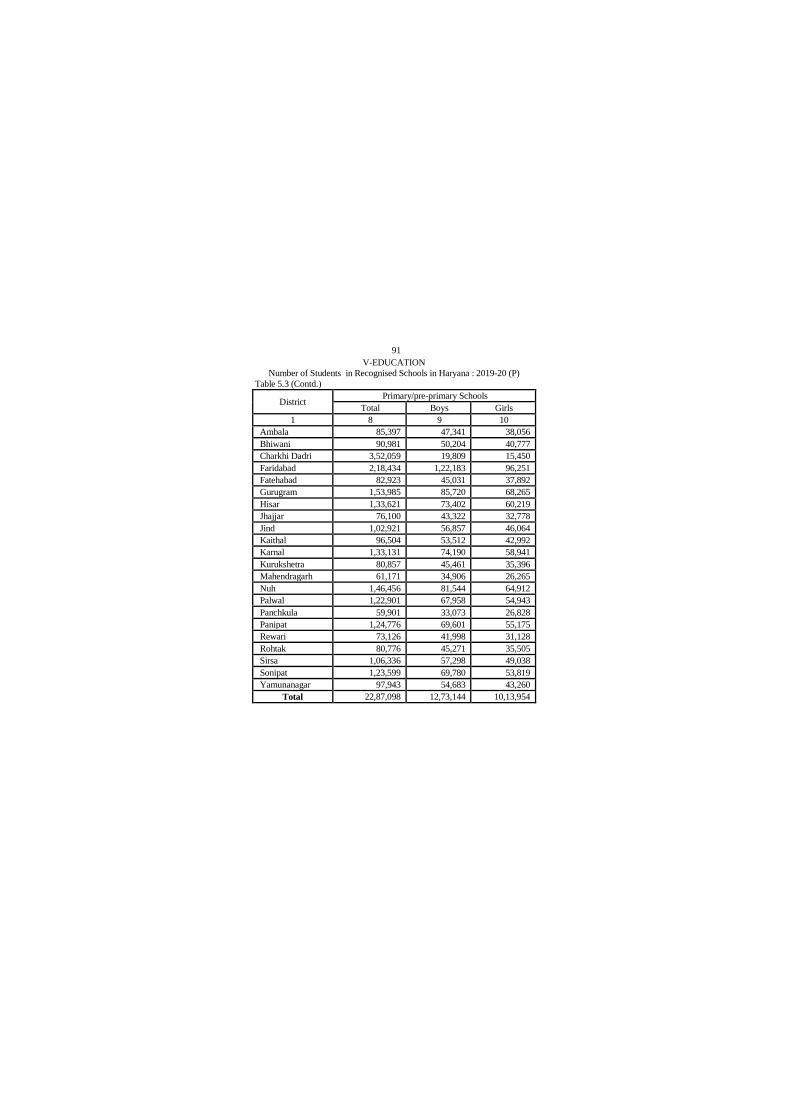
91
V-EDUCATION
Number of Students in Recognised Schools in Haryana : 2019-20 (P)
Table 5.3 (Contd.)
District Primary/pre-primary Schools
Total Boys Girls
1 8 9 10
Ambala 85,397 47,341 38,056
Bhiwani 90,981 50,204 40,777
Charkhi Dadri 3,52,059 19,809 15,450
Faridabad 2,18,434 1,22,183 96,251
Fatehabad 82,923 45,031 37,892
Gurugram 1,53,985 85,720 68,265
Hisar 1,33,621 73,402 60,219
Jhajjar 76,100 43,322 32,778
Jind 1,02,921 56,857 46,064
Kaithal 96,504 53,512 42,992
Karnal 1,33,131 74,190 58,941
Kurukshetra 80,857 45,461 35,396
Mahendragarh 61,171 34,906 26,265
Nuh 1,46,456 81,544 64,912
Palwal 1,22,901 67,958 54,943
Panchkula 59,901 33,073 26,828
Panipat 1,24,776 69,601 55,175
Rewari 73,126 41,998 31,128
Rohtak 80,776 45,271 35,505
Sirsa 1,06,336 57,298 49,038
Sonipat 1,23,599 69,780 53,819
Yamunanagar 97,943 54,683 43,260
Total 22,87,098 12,73,144 10,13,954

92
V-EDUCATION
Number of Students in Recognised Schools in Haryana : 2019-20 (P)
Table 5.3 (Concld.)
District Grand Total
Total Boys Girls
1 11 12 13
Ambala 1,92,705 1,05,474 87,231
Bhiwani 2,24,290 1,22,052 1,02,238
Charkhi Dadri 4,08,133 50,606 40,727
Faridabad 4,49,536 2,50,933 1,98,603
Fatehabad 1,85,271 1,00,524 84,747
Gurugram 3,32,988 1,85,089 1,47,899
Hisar 3,23,109 1,74,795 1,48,314
Jhajjar 1,79,983 1,01,590 78,393
Jind 2,49,570 1,34,885 1,14,685
Kaithal 2,21,239 1,21,033 1,00,206
Karnal 2,96,257 1,63,638 1,32,619
Kurukshetra 1,89,974 1,06,438 83,536
Mahendragarh 1,59,988 91,167 68,821
Nuh 2,48,905 1,45,623 1,03,282
Palwal 2,46,287 1,37,533 1,08,754
Panchkula 1,18,006 64,339 53,667
Panipat 2,64,777 1,46,568 1,18,209
Rewari 1,79,162 1,01,312 77,850
Rohtak 1,90,412 1,04,914 85,498
Sirsa 2,38,762 1,28,453 1,10,309
Sonipat 2,84,044 1,59,029 1,25,015
Yamunanagar 2,15,413 1,19,064 96,349
Total 53,98,811 28,15,059 22,66,952
Source :—Director, Secondary/Middle/Primary Education, Haryana.
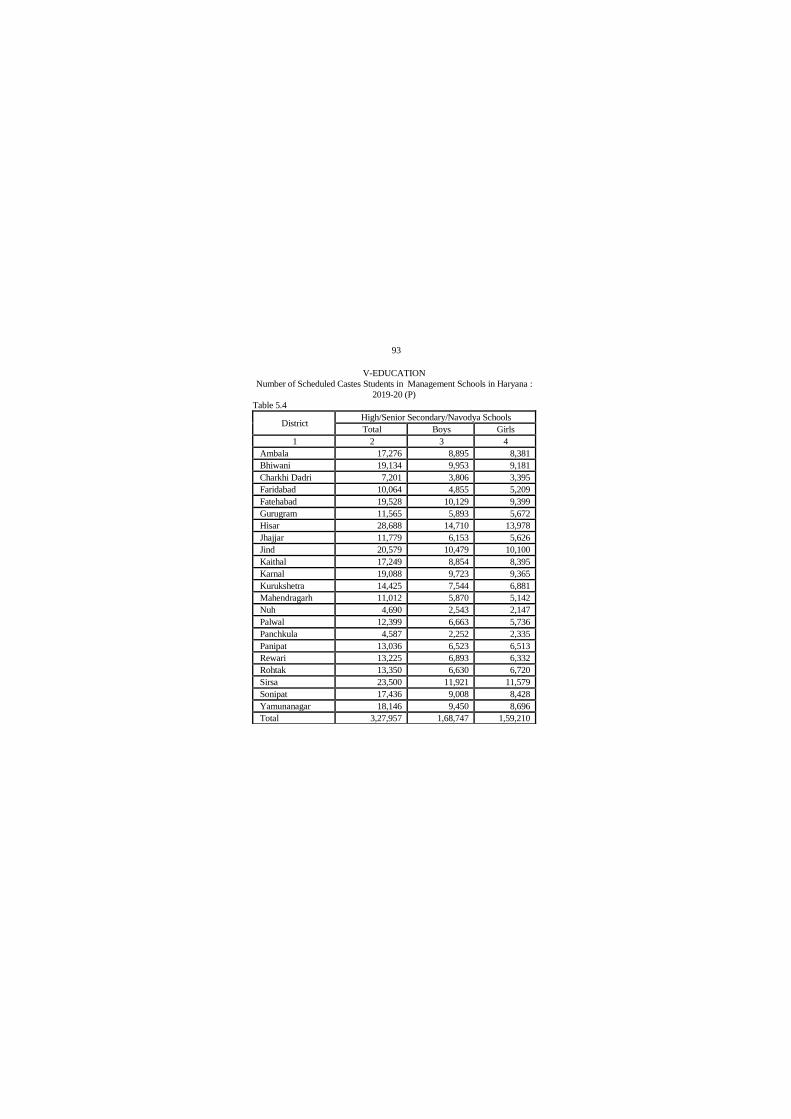
93
V-EDUCATION
Number of Scheduled Castes Students in Management Schools in Haryana :
2019-20 (P)
Table 5.4
District High/Senior Secondary/Navodya Schools
Total Boys Girls
1 2 3 4
Ambala 17,276 8,895 8,381
Bhiwani 19,134 9,953 9,181
Charkhi Dadri 7,201 3,806 3,395
Faridabad 10,064 4,855 5,209
Fatehabad 19,528 10,129 9,399
Gurugram 11,565 5,893 5,672
Hisar 28,688 14,710 13,978
Jhajjar 11,779 6,153 5,626
Jind 20,579 10,479 10,100
Kaithal 17,249 8,854 8,395
Karnal 19,088 9,723 9,365
Kurukshetra 14,425 7,544 6,881
Mahendragarh 11,012 5,870 5,142
Nuh 4,690 2,543 2,147
Palwal 12,399 6,663 5,736
Panchkula 4,587 2,252 2,335
Panipat 13,036 6,523 6,513
Rewari 13,225 6,893 6,332
Rohtak 13,350 6,630 6,720
Sirsa 23,500 11,921 11,579
Sonipat 17,436 9,008 8,428
Yamunanagar 18,146 9,450 8,696
Total 3,27,957 1,68,747 1,59,210

94
V-EDUCATION
Number of Scheduled Castes Students in Management Schools in Haryana:
2019-20 (P)
Table 5.4 (Contd.)
District Middle Schools
Total Boys Girls
1 5 6 7
Ambala 15,134 7,965 7,169
Bhiwani 16,200 8,475 7,725
Charkhi Dadri 5,572 2,920 2,652
Faridabad 9,832 4,949 4,883
Fatehabad 20,744 10,759 9,985
Gurugram 10,237 5,289 4,948
Hisar 27,022 14,108 12,914
Jhajjar 9,786 5,209 4,577
Jind 18,236 9,439 8,797
Kaithal 17,230 9,100 8,130
Karnal 20,108 10,373 9,735
Kurukshetra 14,664 7,615 7,049
Mahendragarh 8,533 4,502 4,031
Nuh 4,787 2,538 2,249
Palwal 14,575 7,579 6,996
Panchkula 5,049 2,640 2,409
Panipat 12,785 6,698 6,087
Rewari 10,617 5,581 5,036
Rohtak 12,016 6,199 5,817
Sirsa 26,694 13,705 12,989
Sonipat 14,777 7,679 7,098
Yamunanagar 15,771 8,195 7,576
Total 3,10,369 1,61,517 1,48,852
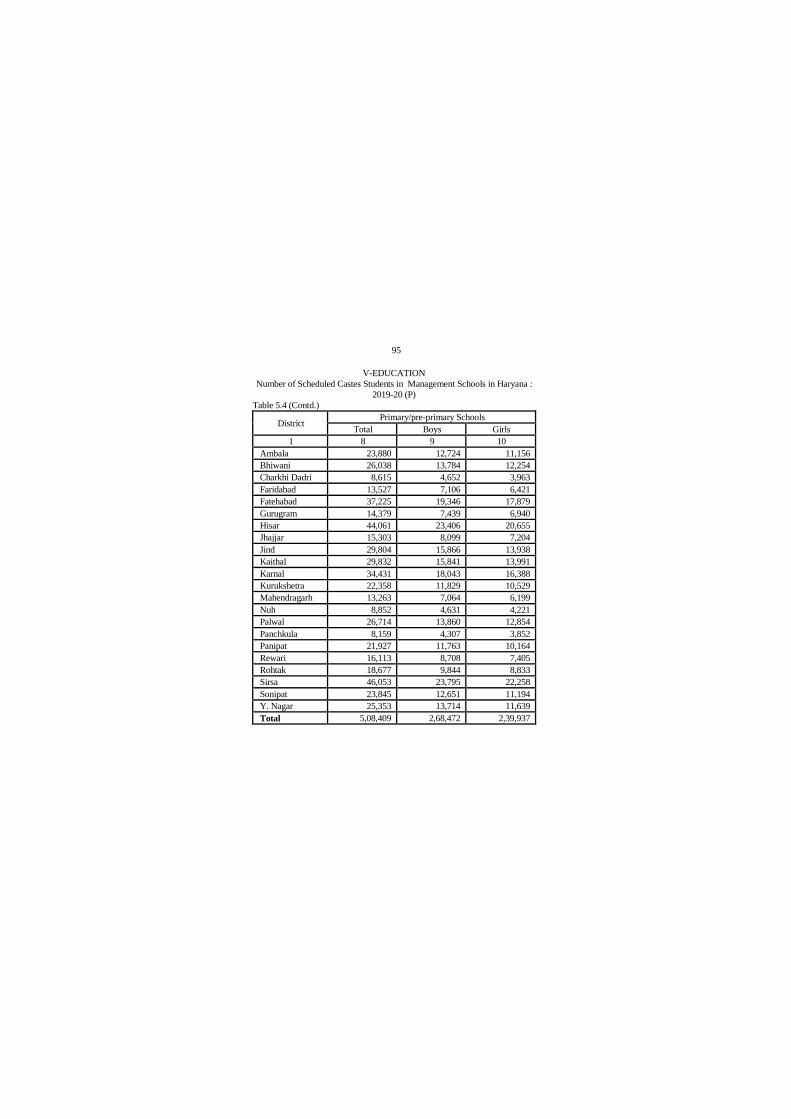
95
V-EDUCATION
Number of Scheduled Castes Students in Management Schools in Haryana :
2019-20 (P)
Table 5.4 (Contd.)
District Primary/pre-primary Schools
Total Boys Girls
1 8 9 10
Ambala 23,880 12,724 11,156
Bhiwani 26,038 13,784 12,254
Charkhi Dadri 8,615 4,652 3,963
Faridabad 13,527 7,106 6,421
Fatehabad 37,225 19,346 17,879
Gurugram 14,379 7,439 6,940
Hisar 44,061 23,406 20,655
Jhajjar 15,303 8,099 7,204
Jind 29,804 15,866 13,938
Kaithal 29,832 15,841 13,991
Karnal 34,431 18,043 16,388
Kurukshetra 22,358 11,829 10,529
Mahendragarh 13,263 7,064 6,199
Nuh 8,852 4,631 4,221
Palwal 26,714 13,860 12,854
Panchkula 8,159 4,307 3,852
Panipat 21,927 11,763 10,164
Rewari 16,113 8,708 7,405
Rohtak 18,677 9,844 8,833
Sirsa 46,053 23,795 22,258
Sonipat 23,845 12,651 11,194
Y. Nagar 25,353 13,714 11,639
Total 5,08,409 2,68,472 2,39,937
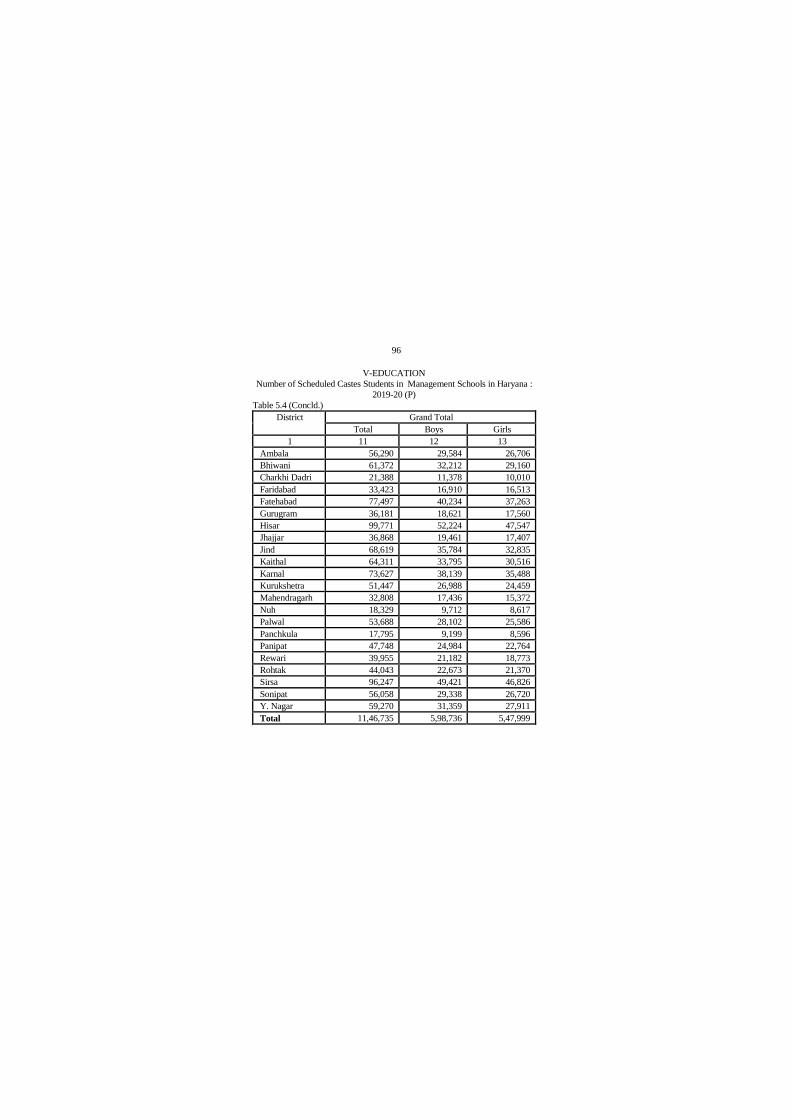
96
V-EDUCATION
Number of Scheduled Castes Students in Management Schools in Haryana :
2019-20 (P)
Table 5.4 (Concld.)
District Grand Total
Total Boys Girls
1 11 12 13
Ambala 56,290 29,584 26,706
Bhiwani 61,372 32,212 29,160
Charkhi Dadri 21,388 11,378 10,010
Faridabad 33,423 16,910 16,513
Fatehabad 77,497 40,234 37,263
Gurugram 36,181 18,621 17,560
Hisar 99,771 52,224 47,547
Jhajjar 36,868 19,461 17,407
Jind 68,619 35,784 32,835
Kaithal 64,311 33,795 30,516
Karnal 73,627 38,139 35,488
Kurukshetra 51,447 26,988 24,459
Mahendragarh 32,808 17,436 15,372
Nuh 18,329 9,712 8,617
Palwal 53,688 28,102 25,586
Panchkula 17,795 9,199 8,596
Panipat 47,748 24,984 22,764
Rewari 39,955 21,182 18,773
Rohtak 44,043 22,673 21,370
Sirsa 96,247 49,421 46,826
Sonipat 56,058 29,338 26,720
Y. Nagar 59,270 31,359 27,911
Total 11,46,735 5,98,736 5,47,999

97
VI-HEALTH AND FAMILY WELFARE
Number of Medical (Allopathic) Institutions in Haryana : 2019-20
Table 6.1
District
Hospi-
tals
CHCs PHCs Dispen
-saries
Sub-
Cen-
tres
District
T.B
Centres
/Clinics
Total
1 2 3 4 5 6 7 8
Ambala 3 5 22 3 104 1 138
Bhiwani 7 7 29 3 144 2 190
Charkhi Dadri 1 3 15 0 76 0 95
Faridabad 2 4 16 7 58 1 86
Fatehabad 3 6 24 1 137 1 169
Gurugram 5 4 15 3 76 1 102
Hisar 6 9 39 4 200 1 258
Jhajjar 4 6 27 3 126 0 166
Jind 4 8 34 1 171 1 208
Kaithal 3 6 27 0 144 0 175
Karnal 4 7 33 7 151 1 193
Kurukshetra 2 6 22 1 119 1 146
Mahendragarh 2 7 25 0 120 1 154
Nuh 1 4 22 0 138 1 163
Palwal 2 5 20 0 89 0 115
Panchkula 3 2 9 13 51 0 77
Panipat 2 7 20 2 89 0 120
Rewari 2 5 21 0 112 0 140
Rohtak 3 7 23 5 115 1 151
Sirsa 4 8 32 1 158 1 197
Sonipat 2 9 38 3 164 1 215
Y. Nagar 3 8 23 1 113 0 143
Total 68 133 536 63 2655 15 3470
Source :—Director General, Health Services, Haryana.
PHCs—Primary Health Centres. CHCs—Community Health Centres.
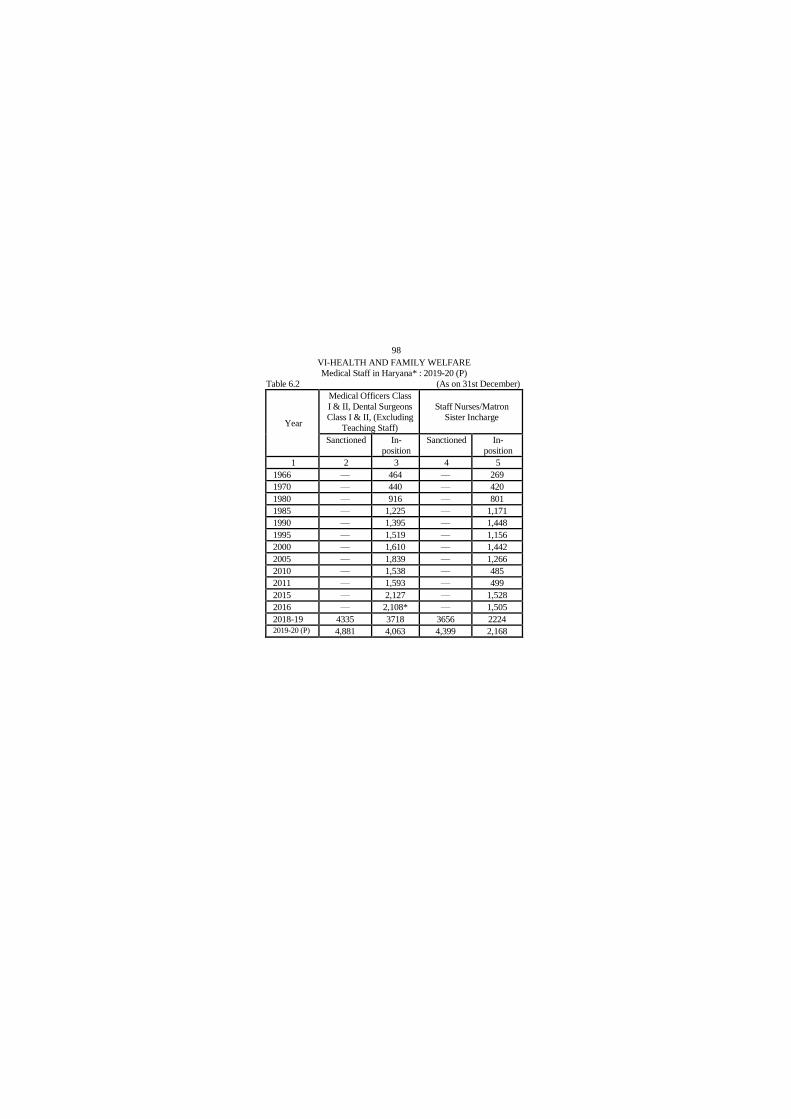
98
VI-HEALTH AND FAMILY WELFARE
Medical Staff in Haryana* : 2019-20 (P)
Table 6.2 (As on 31st December)
Year
Medical Officers Class
I & II, Dental Surgeons
Class I & II, (Excluding
Teaching Staff)
Staff Nurses/Matron
Sister Incharge
Sanctioned In-
position
Sanctioned In-
position
1 2 3 4 5
1966 — 464 — 269
1970 — 440 — 420
1980 — 916 — 801
1985 — 1,225 — 1,171
1990 — 1,395 — 1,448
1995 — 1,519 — 1,156
2000 — 1,610 — 1,442
2005 — 1,839 — 1,266
2010 — 1,538 — 485
2011 — 1,593 — 499
2015 — 2,127 — 1,528
2016 — 2,108* — 1,505
2018-19 4335 3718 3656 2224
2019-20 (P) 4,881 4,063 4,399 2,168
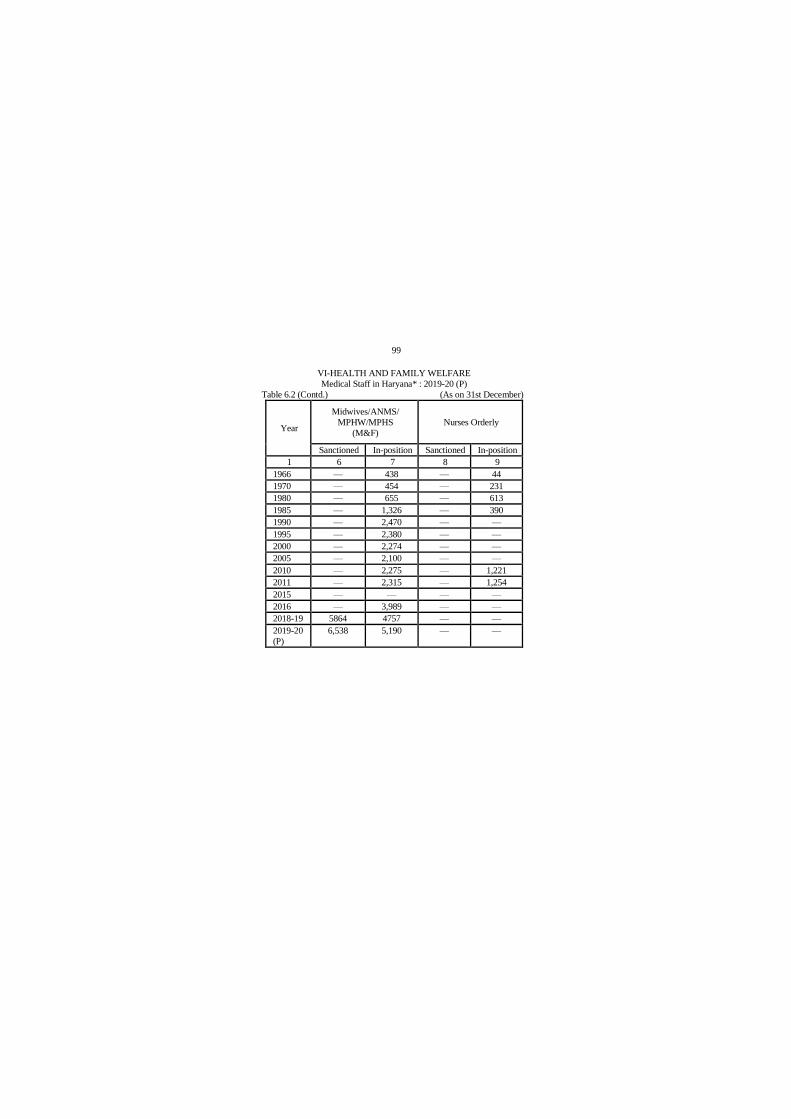
99
VI-HEALTH AND FAMILY WELFARE
Medical Staff in Haryana* : 2019-20 (P)
Table 6.2 (Contd.) (As on 31st December)
Year
Midwives/ANMS/
MPHW/MPHS
(M&F)
Nurses Orderly
Sanctioned In-position Sanctioned In-position
1 6 7 8 9
1966 — 438 — 44
1970 — 454 — 231
1980 — 655 — 613
1985 — 1,326 — 390
1990 — 2,470 — —
1995 — 2,380 — —
2000 — 2,274 — —
2005 — 2,100 — —
2010 — 2,275 — 1,221
2011 — 2,315 — 1,254
2015 — — — —
2016 — 3,989 — —
2018-19 5864 4757 — —
2019-20
(P)
6,538 5,190 — —

100
VI-HEALTH AND FAMILY WELFARE
Medical Staff in Haryana* : 2019-20 (P)
Table. 6.2 (Contd.) (As on 31st December)
Year
Lab. Technicians/
Lab. Technicians
(Malaria) Lab.
Asstt.
Dispensers/
Pharmacists Radio Graphers
Sanct-
ioned
In-
position
Sanct-
ioned
In-
position
Sanct-
ioned
In-
position
1 10 11 12 13 14 15
1966 — 64 — 309 — —
1970 — 226 — 320 — —
1980 — 182 — 615 — —
1985 — 278 — 732 — —
1990 — 424 — 850 — —
1995 — 487 — 815 — —
2000 — 527 — 853 — —
2005 — 527 — 781 — —
2010 — 459 — 736 — —
2011 — 470 — 740 — —
2015 — — — — —
2016 — 622 — 667 — —
2018-19 1148 572 1024 706 299 100
2019-20
(P)
1,260 545 1,050 680 314 95
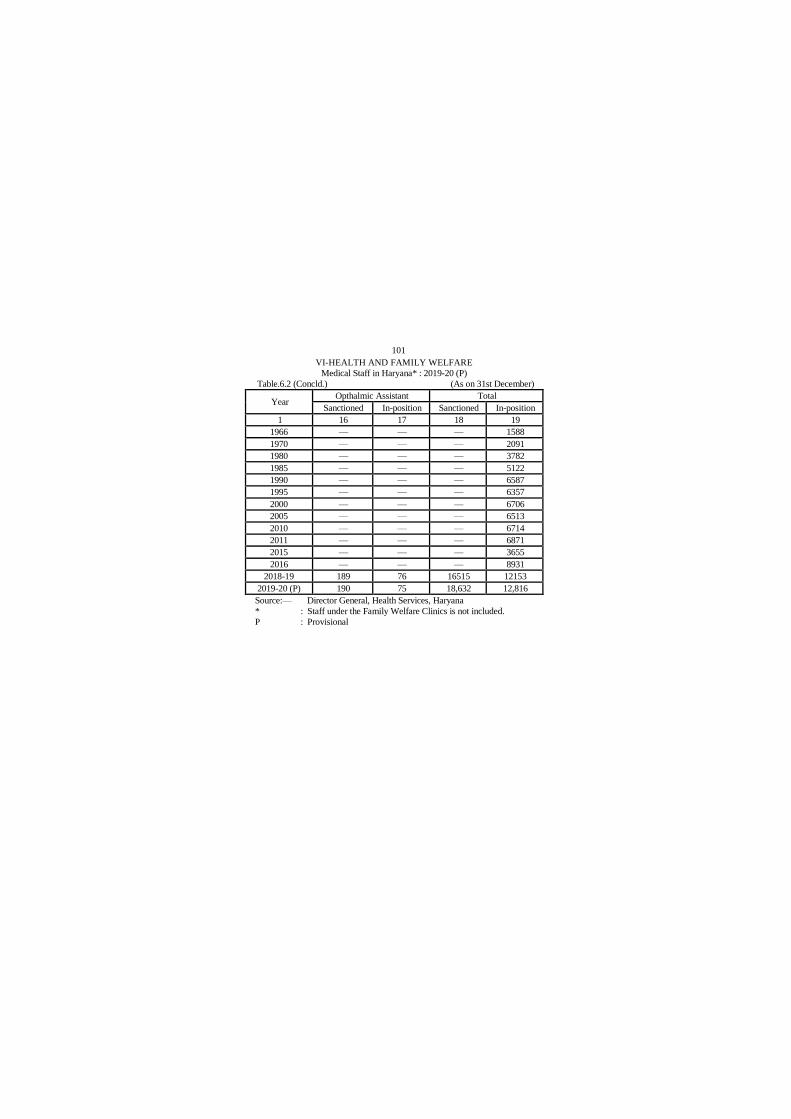
101
VI-HEALTH AND FAMILY WELFARE
Medical Staff in Haryana* : 2019-20 (P)
Table.6.2 (Concld.) (As on 31st December)
Year Opthalmic Assistant Total
Sanctioned In-position Sanctioned In-position
1 16 17 18 19
1966 — — — 1588
1970 — — — 2091
1980 — — — 3782
1985 — — — 5122
1990 — — — 6587
1995 — — — 6357
2000 — — — 6706
2005 — — — 6513
2010 — — — 6714
2011 — — — 6871
2015 — — — 3655
2016 — — — 8931
2018-19 189 76 16515 12153
2019-20 (P) 190 75 18,632 12,816
Source:— Director General, Health Services, Haryana
* : Staff under the Family Welfare Clinics is not included.
P : Provisional
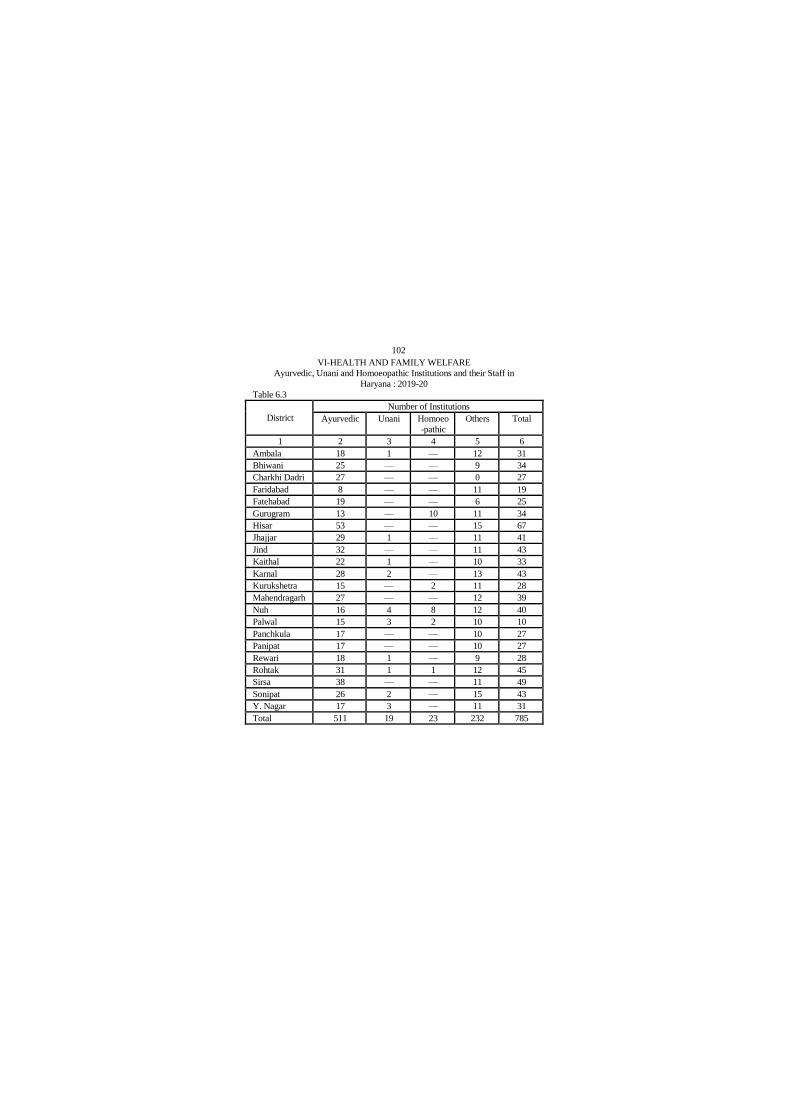
102
VI-HEALTH AND FAMILY WELFARE
Ayurvedic, Unani and Homoeopathic Institutions and their Staff in
Haryana : 2019-20
Table 6.3
District
Number of Institutions
Ayurvedic Unani Homoeo
-pathic
Others Total
1 2 3 4 5 6
Ambala 18 1 — 12 31
Bhiwani 25 — — 9 34
Charkhi Dadri 27 — — 0 27
Faridabad 8 — — 11 19
Fatehabad 19 — — 6 25
Gurugram 13 — 10 11 34
Hisar 53 — — 15 67
Jhajjar 29 1 — 11 41
Jind 32 — — 11 43
Kaithal 22 1 — 10 33
Karnal 28 2 — 13 43
Kurukshetra 15 — 2 11 28
Mahendragarh 27 — — 12 39
Nuh 16 4 8 12 40
Palwal 15 3 2 10 10
Panchkula 17 — — 10 27
Panipat 17 — — 10 27
Rewari 18 1 — 9 28
Rohtak 31 1 1 12 45
Sirsa 38 — — 11 49
Sonipat 26 2 — 15 43
Y. Nagar 17 3 — 11 31
Total 511 19 23 232 785

103
VI-HEALTH AND FAMILY WELFARE
Ayurvedic, Unani and Homoeopathic Institutions and their Staff in
Haryana : 2019-20
Table 6.3 (Concld.)
District
Medical Personnel
Vaidyas/Hakims/
Homoeopathic
Doctors
Dispenser/
Compounder
Patients
treated
1 6 7 8
Ambala 19 19 2,45,249
Bhiwani 25 28 2,37,043
Charkhi Dadri 27 29 1,08,982
Faridabad 8 08 1,08,968
Fatehabad 19 19 1,49,020
Gurugram 23 23 2,83,373
Hisar 53 53 3,36,812
Jhajjar 32 30 2,77,246
Jind 34 34 2,25,239
Kaithal 27 25 2,09,088
Karnal 30 30 2,35,235
Kurukshetra 21 17 1,51,588
Mahendragarh 39 33 2,10,627
Nuh 27 27 1,84,445
Palwal 21 21 2,20,101
Panchkula 22 18 1,58,575
Panipat 18 13 2,22,121
Rewari 19 19 1,48,384
Rohtak 33 34 2,23,596
Sirsa 40 39 2,66,649
Sonipat 29 29 3,06,669
Y. Nagar 20 19 2,19,411
Total 586 567 47,28,421
Source:—Director, Ayurveda, Haryana.
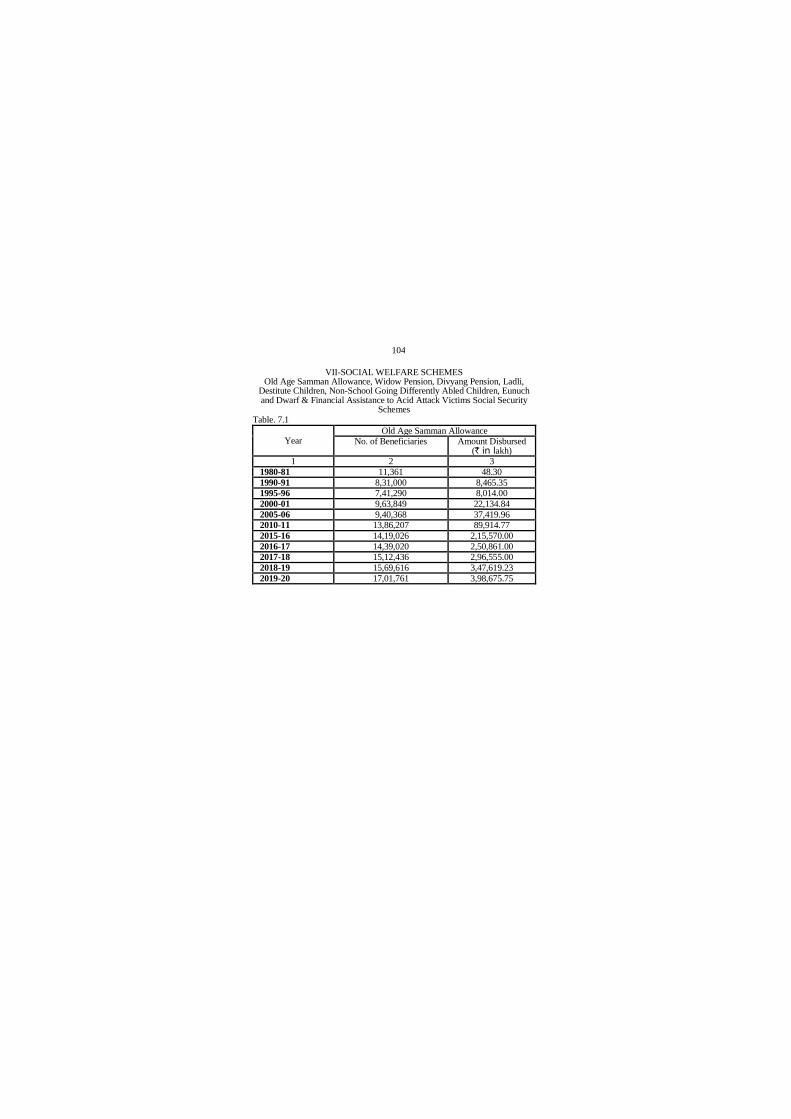
104
VII-SOCIAL WELFARE SCHEMES
Old Age Samman Allowance, Widow Pension, Divyang Pension, Ladli, Destitute Children, Non-School Going Differently Abled Children, Eunuch and Dwarf & Financial Assistance to Acid Attack Victims Social Security
Schemes Table. 7.1
Year Old Age Samman Allowance
No. of Beneficiaries Amount Disbursed (` in lakh)
1 2 3
1980-81 11,361 48.30
1990-91 8,31,000 8,465.35
1995-96 7,41,290 8,014.00
2000-01 9,63,849 22,134.84
2005-06 9,40,368 37,419.96
2010-11 13,86,207 89,914.77
2015-16 14,19,026 2,15,570.00
2016-17 14,39,020 2,50,861.00
2017-18 15,12,436 2,96,555.00
2018-19 15,69,616 3,47,619.23
2019-20 17,01,761 3,98,675.75

105
VII-SOCIAL WELFARE SCHEMES Old Age Samman Allowance, Widow Pension, Divyang Pension, Ladli,
Destitute Children, Non-School Going Differently Abled Children, Eunuch and Dwarf & Financial Assistance to Acid Attack Victims Social Security
Schemes Table. 7.1 (Contd.)
District
Widow Pension
No. of Beneficiaries Amount Disbursed
(` in lakh)
1 4 5
1980-81 542 2
1990-91 1,39,109 719.32
1995-96 1,98,892 1,784.42
2000-01 2,96,107 6,708.38
2005-06 3,75,029 14,237.62
2010-11 5,06,704 43,572.92
2015-16 6,10,321 92,703.00
2016-17 6,32,691 1,10,146.00
2017-18 6,66,808 1,30,577.00
2018-19 6,95,455 1,54,044.11
2019-20 7,34,463 1,71,469.37

106
VII-SOCIAL WELFARE SCHEMES
Old Age Samman Allowance, Widow Pension, Divyang Pension, Ladli,
Destitute Children, Non-School Going Differently Abled Children, Eunuch
and Dwarf & Financial Assistance to Acid Attack Victims Social Security
Schemes
Table 7.1 (Contd.)
District
Divyang Pension
No. of Beneficiaries Amount Disbursed
(` Lakh)
1 6 7
1980-81 — —
1990-91 33,508 167.97
1995-96 39,190 395.68
2000-01 60,247 1,323.17
2005-06 98,461 3,590.08
2010-11 1,34,200 9,209.96
2015-16 141462 21935.00
2016-17 1,44,226 25,243.00
2017-18 1,51,932 29,678.00
2018-19 1,60,433 35,293.81
2019-20 1,71,922 40,642.61

107
VII-SOCIAL WELFARE SCHEMES
Old Age Samman Allowance, Widow Pension, Divyang Pension, Ladli,
Destitute Children, Non-School Going Differently Abled Children, Eunuch
and Dwarf & Financial Assistance to Acid Attack Victims Social Security
Schemes
Table 7.1(Contd.)
District
Ladli Pension Scheme
No. of Beneficiaries Amount Disbursed
(` Lakh)
1 8 9
1980-81 — —
1990-91 — —
1995-96 — —
2000-01 — —
2005-06 — —
2010-11 24,800 1,424.99
2015-16 27,988 4080.00
2016-17 29,765 5,123.30
2017-18 32,718 6,277.00
2018-19 37,350 7,911.02
2019-20 42,486 9,676.34
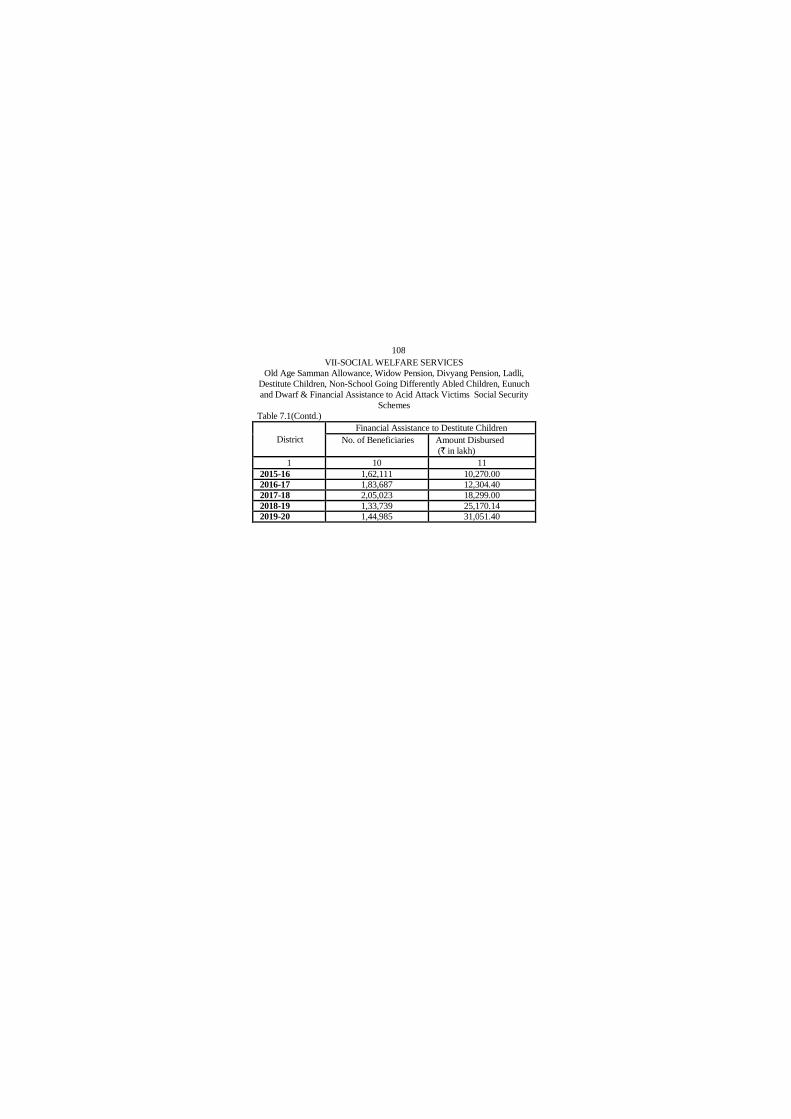
108
VII-SOCIAL WELFARE SERVICES
Old Age Samman Allowance, Widow Pension, Divyang Pension, Ladli,
Destitute Children, Non-School Going Differently Abled Children, Eunuch
and Dwarf & Financial Assistance to Acid Attack Victims Social Security
Schemes
Table 7.1(Contd.)
District
Financial Assistance to Destitute Children
No. of Beneficiaries Amount Disbursed
(` in lakh)
1 10 11
2015-16 1,62,111 10,270.00
2016-17 1,83,687 12,304.40
2017-18 2,05,023 18,299.00
2018-19 1,33,739 25,170.14
2019-20 1,44,985 31,051.40

109
VII-SOCIAL WELFARE SERVICES
Old Age Samman Allowance, Widow Pension, Divyang Pension, Ladli,
Destitute Children, Non-School Going Differently Abled Children, Eunuch
and Dwarf & Financial Assistance to Acid Attack Victims Social Security
Schemes
Table 7.1(Contd.)
District
Financial Assist. to Kashmiri Migrants
No. of Beneficiaries Amount Disbursed
(` in lakh)
1 12 13
2015-16 1 0.0002
2016-17 11 1.16
2017-18 9 1.21
2018-19 9 1.09
2019-20 9 1.08

110
VII-SOCIAL WELFARE SERVICES
Old Age Samman Allowance, Widow Pension, Divyang Pension, Ladli,
Destitute Children, Non-School Going Differently Abled Children, Eunuch
and Dwarf & Financial Assistance to Acid Attack Victims Social Security
Schemes
Table 7.1(Contd.)
District
Financial Assist. to Non-School Going Differently
Abled Children
No. of Beneficiaries Amount Disbursed (` in lakh)
1 14 15
2015-16 5,919 489.96
2016-17 7,346 679.38
2017-18 - 1,070.63
2018-19 11,061 1,573.52
2019-20 13,128 2,073.43
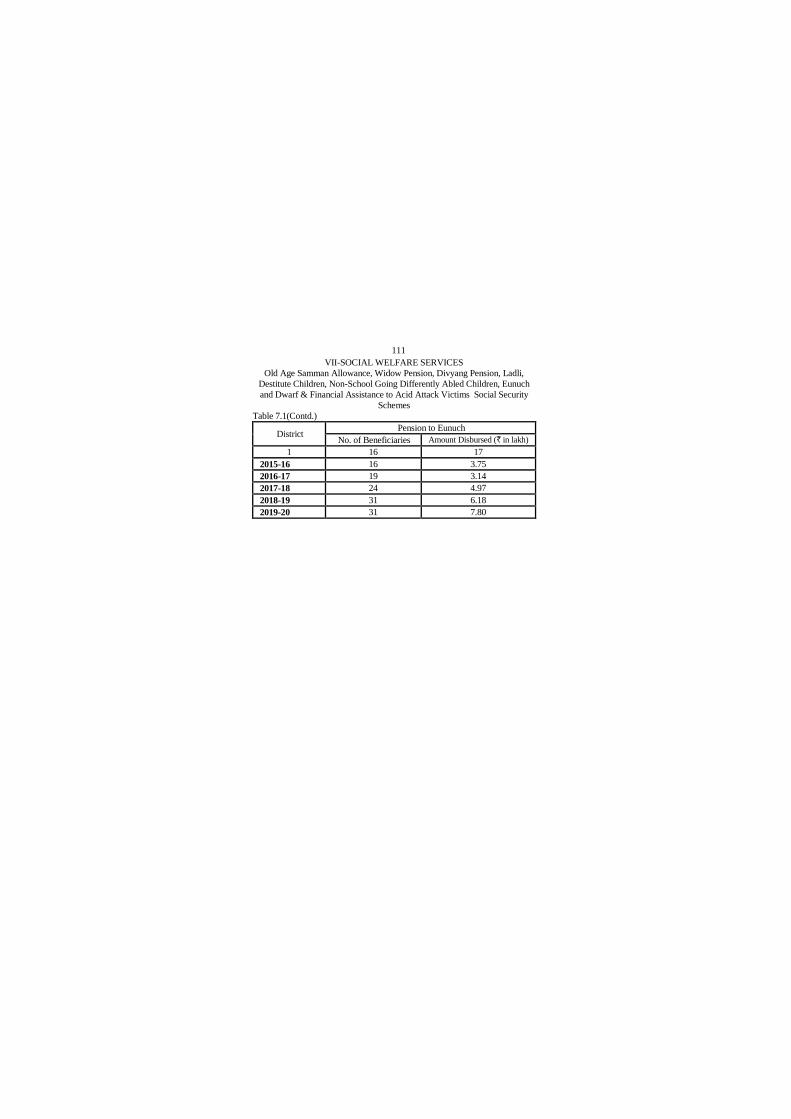
111
VII-SOCIAL WELFARE SERVICES
Old Age Samman Allowance, Widow Pension, Divyang Pension, Ladli,
Destitute Children, Non-School Going Differently Abled Children, Eunuch
and Dwarf & Financial Assistance to Acid Attack Victims Social Security
Schemes
Table 7.1(Contd.)
District Pension to Eunuch
No. of Beneficiaries Amount Disbursed (` in lakh)
1 16 17
2015-16 16 3.75
2016-17 19 3.14
2017-18 24 4.97
2018-19 31 6.18
2019-20 31 7.80

112
VII-SOCIAL WELFARE SERVICES
Old Age Samman Allowance, Widow Pension, Divyang Pension, Ladli,
Destitute Children, Non-School Going Differently Abled Children, Eunuch
and Dwarf & Financial Assistance to Acid Attack Victims Social Security
Schemes
Table 7.1(Concld.)
District
Pension to Dwarf
No. of Beneficiaries Amount Disbursed
(` in lakh)
1 18 19
2013-14 16 0.95
2014-15 19 2.18
2015-16 22 4.00
2016-17 25 4.23
2017-18 28 5.66
2018-19 32 6.58
2019-20 36 8.16

113
VII-SOCIAL WELFARE SERVICES
Old Age Samman Allowance, Widow Pension, Divyang Pension, Ladli,
Destitute Children, Non-School Going Differently Abled Children, Eunuch
and Dwarf & Financial Assistance to Acid Attack Victims Social Security
Schemes
Table 7.1(Concld.)
District
Acid Attack Victims
No. of Beneficiaries Amount Disbursed
(` in lakh)
1 18 19
2013-14 - -
2014-15 - -
2015-16 - -
2016-17 - -
2017-18 - -
2018-19 3 0.46
2019-20 8 5.50
Source :—Director, Social Justice & Empowerment, Haryana.

114
VIII-SOCIAL SECURITY AND SOCIAL DEFENCE
(POLICE, CRIMES AND SUDHARGHAR)
Number of Police Stations and Police Posts in Haryana : 2021* (P)
Table 8.1 (As on February)
District Cyber Crime Police Station
Police Station
Traffic Police Station
Women Police Station
Police
Post
Total
1 2 3 4
Ambala 01 14 01 02 — 18
Bhiwani 0 10 01 01 — 12
Charkhi Dadri 0 05 01 01 — 07
Faridabad 01 25 01 03 — 30
Fatehabad 0 09 01 01 — 11
Gurugram 01 36 03 03 — 43
Hisar 01 14 02 02 — 19
Jhajjar 0 12 02 02 — 16
Jind 0 12 01 01 — 14
Kaithal 0 11 01 01 — 13
Karnal 01 15 01 02 — 19
Kurukshetra 0 11 01 01 — 13
Mahendragarh 0 08 01 01 — 10
Nuh 0 10 02 01 — 13
Palwal 0 11 01 01 — 13
Panchkula 01 08 01 01 — 11
Panipat 0 13 01 01 — 15
Rewari 01 12 01 01 — 15
Rohtak 01 14 01 01 — 17
Sirsa 0 13 01 02 — 16
Sonipat 0 15 01 03 — 19
Y. Nagar 0 15 01 01 — 17
Railway Police Haryana
0 16 0 0 — 16
Total 8 309 27 33 356 733
Source: DirectorGeneral, Police, Haryana
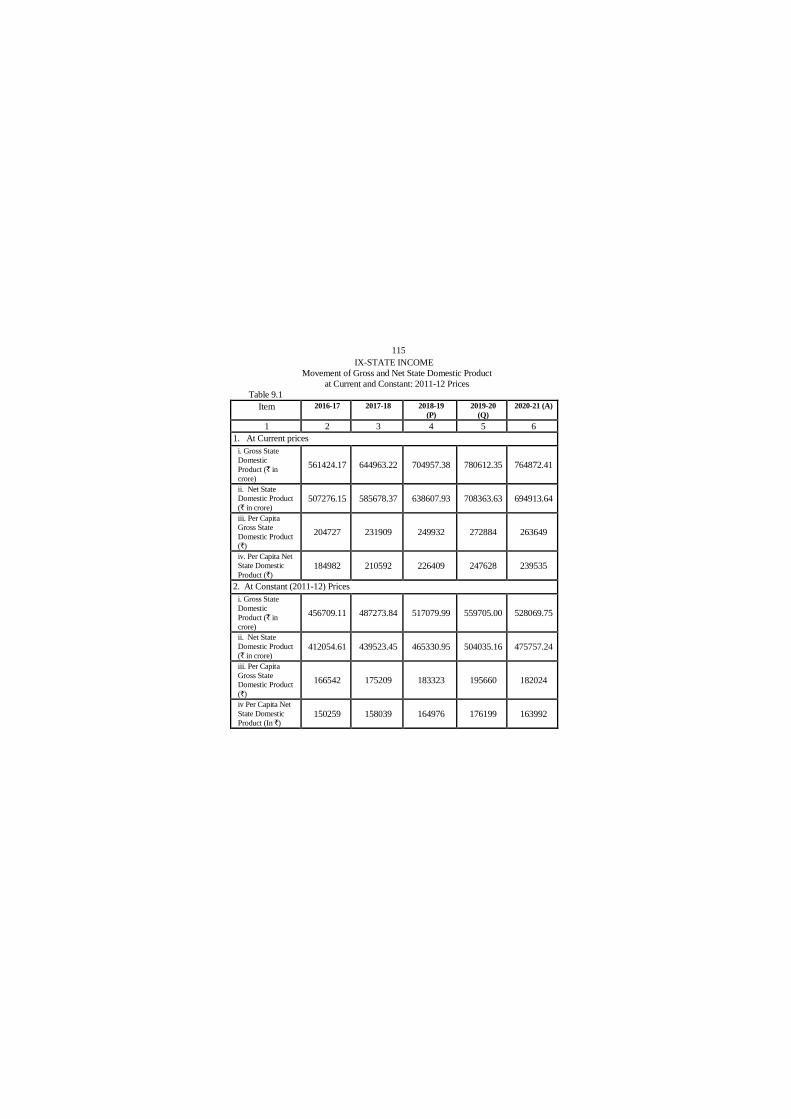
115
IX-STATE INCOME
Movement of Gross and Net State Domestic Product
at Current and Constant: 2011-12 Prices
Table 9.1
Item 2016-17 2017-18 2018-19
(P)
2019-20
(Q)
2020-21 (A)
1 2 3 4 5 6
1. At Current prices
i. Gross State
Domestic
Product (` in
crore)
561424.17 644963.22 704957.38 780612.35 764872.41
ii. Net State
Domestic Product
(` in crore) 507276.15 585678.37 638607.93 708363.63 694913.64
iii. Per Capita
Gross State
Domestic Product
(`)
204727 231909 249932 272884 263649
iv. Per Capita Net
State Domestic
Product (`) 184982 210592 226409 247628 239535
2. At Constant (2011-12) Prices
i. Gross State
Domestic
Product (` in
crore)
456709.11 487273.84 517079.99 559705.00 528069.75
ii. Net State
Domestic Product
(` in crore) 412054.61 439523.45 465330.95 504035.16 475757.24
iii. Per Capita
Gross State
Domestic Product
(`)
166542 175209 183323 195660 182024
iv Per Capita Net
State Domestic
Product (In `) 150259 158039 164976 176199 163992

116
IX-STATE INCOME
Movement of Gross and Net State Domestic Product at Current and
Constant : 2011-12 Prices
Table 9.1(Concld.)
Item 2016-17 2017-18 2018-19
(P)
2019-20
(Q)
2020-21
(A)
1 2 3 4 5 6
3. Index Numbers with 2011-12 as base
A. At current Prices
i. Gross State
Domestic Product 188.7 216.8 236.9 262.4 257.1
ii. Net State
Domestic Product 187.1 216.0 235.5 261.2 256.3
iii. Per Capita
Gross State
Domestic Product 175.9 199.2 214.7 234.4 226.5
iv. Per Capita Net
State Domestic
Product
174.4 198.5 213.4 233.4 225.8
B. At Constant (20011-12) Prices
i. Gross State
Domestic Product 153.5 163.8 173.8 188.1 177.5
ii. Net State
Domestic Product 152.0 162.1 171.6 185.9 175.5
iii. Per Capita
Gross State
Domestic Product
143.1 150.5 157.5 168.1 156.4
iv. Per Capita Net
State Domestic
Product 141.6 149.0 155.5 166.1 154.6
Source : Director, Economic and Statistical Analysis, Haryana.
Q : Quick Estimates
A : Advanced Estimates
P : Provisional
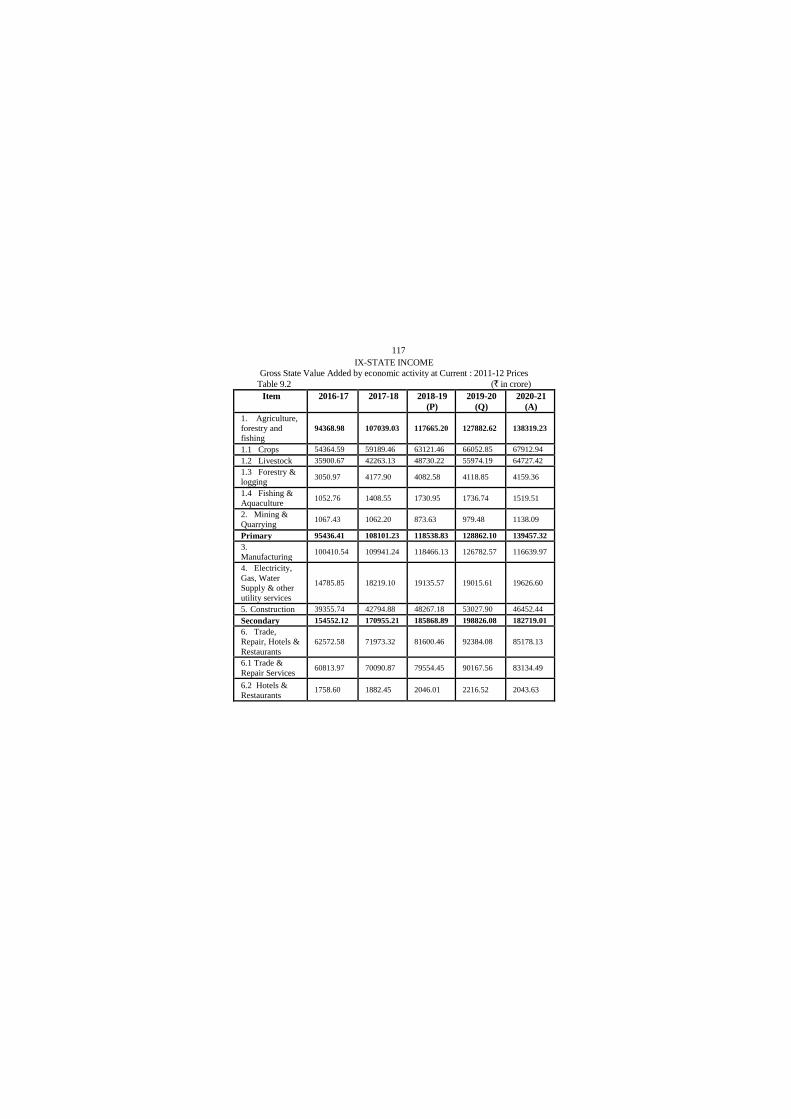
117
IX-STATE INCOME
Gross State Value Added by economic activity at Current : 2011-12 Prices
Table 9.2 (` in crore)
Item 2016-17
2017-18
2018-19
(P)
2019-20
(Q)
2020-21
(A)
1. Agriculture,
forestry and
fishing
94368.98 107039.03 117665.20 127882.62 138319.23
1.1 Crops 54364.59 59189.46 63121.46 66052.85 67912.94
1.2 Livestock 35900.67 42263.13 48730.22 55974.19 64727.42
1.3 Forestry &
logging 3050.97 4177.90 4082.58 4118.85 4159.36
1.4 Fishing &
Aquaculture 1052.76 1408.55 1730.95 1736.74 1519.51
2. Mining &
Quarrying 1067.43 1062.20 873.63 979.48 1138.09
Primary 95436.41 108101.23 118538.83 128862.10 139457.32
3.
Manufacturing 100410.54 109941.24 118466.13 126782.57 116639.97
4. Electricity,
Gas, Water
Supply & other
utility services
14785.85 18219.10 19135.57 19015.61 19626.60
5. Construction 39355.74 42794.88 48267.18 53027.90 46452.44
Secondary 154552.12 170955.21 185868.89 198826.08 182719.01
6. Trade,
Repair, Hotels &
Restaurants
62572.58 71973.32 81600.46 92384.08 85178.13
6.1 Trade &
Repair Services 60813.97 70090.87 79554.45 90167.56 83134.49
6.2 Hotels &
Restaurants 1758.60 1882.45 2046.01 2216.52 2043.63
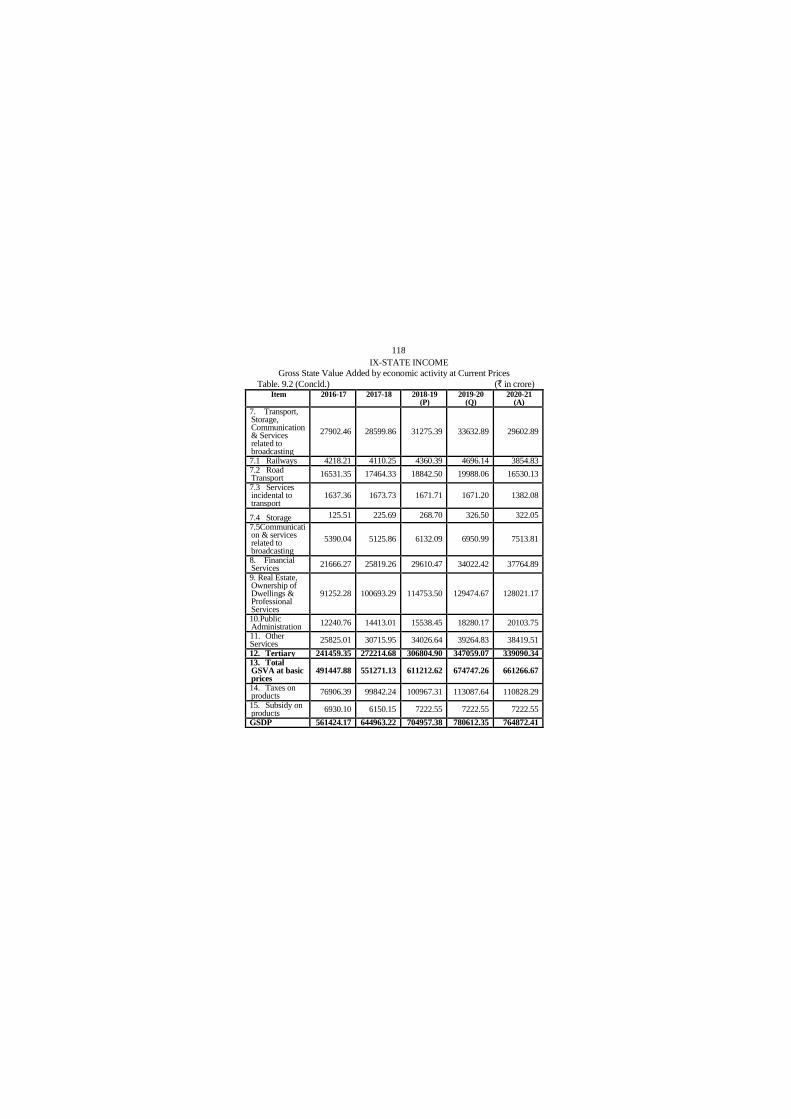
118
IX-STATE INCOME
Gross State Value Added by economic activity at Current Prices
Table. 9.2 (Concld.) (` in crore) Item 2016-17
2017-18
2018-19
(P) 2019-20
(Q) 2020-21
(A)
7. Transport, Storage, Communication & Services related to broadcasting
27902.46 28599.86 31275.39 33632.89 29602.89
7.1 Railways 4218.21 4110.25 4360.39 4696.14 3854.83 7.2 Road Transport
16531.35 17464.33 18842.50 19988.06 16530.13
7.3 Services incidental to transport
1637.36 1673.73 1671.71 1671.20 1382.08
7.4 Storage 125.51 225.69 268.70 326.50 322.05
7.5Communication & services related to broadcasting
5390.04 5125.86 6132.09 6950.99 7513.81
8. Financial Services
21666.27 25819.26 29610.47 34022.42 37764.89
9. Real Estate, Ownership of Dwellings & Professional Services
91252.28 100693.29 114753.50 129474.67 128021.17
10.Public Administration
12240.76 14413.01 15538.45 18280.17 20103.75
11. Other Services
25825.01 30715.95 34026.64 39264.83 38419.51
12. Tertiary 241459.35 272214.68 306804.90 347059.07 339090.34 13. Total GSVA at basic prices
491447.88 551271.13 611212.62 674747.26 661266.67
14. Taxes on products
76906.39 99842.24 100967.31 113087.64 110828.29
15. Subsidy on products
6930.10 6150.15 7222.55 7222.55 7222.55
GSDP 561424.17 644963.22 704957.38 780612.35 764872.41
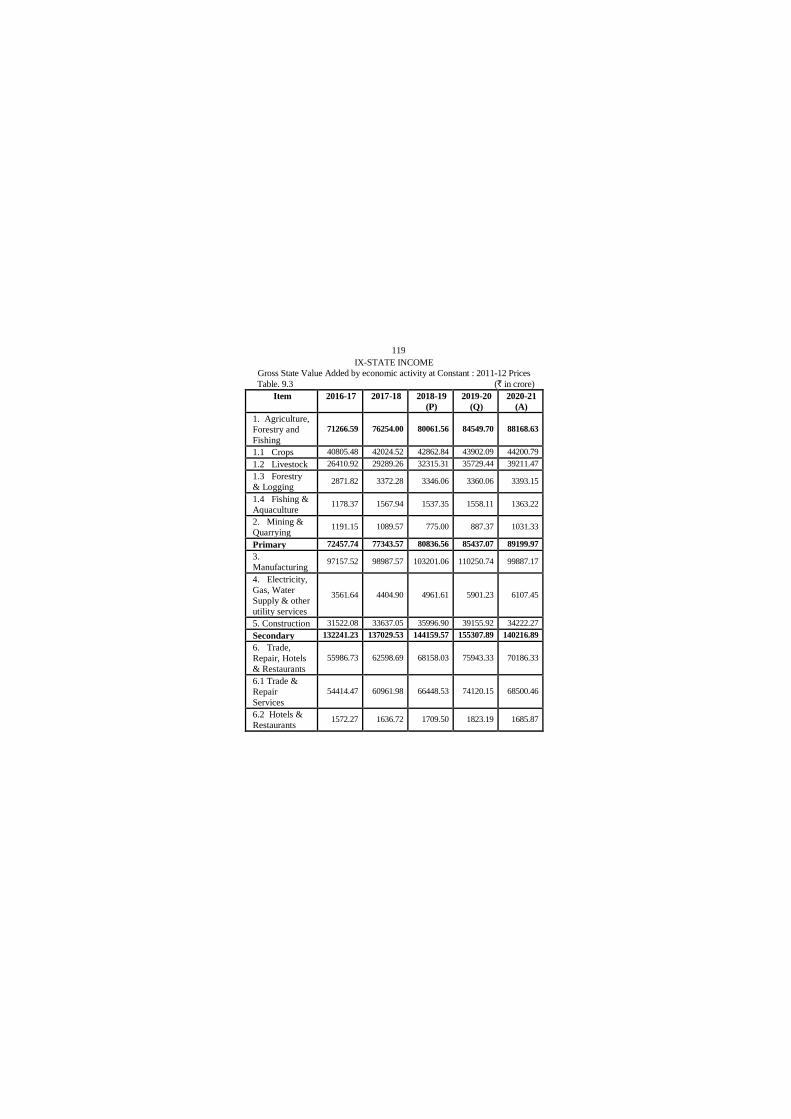
119
IX-STATE INCOME
Gross State Value Added by economic activity at Constant : 2011-12 Prices
Table. 9.3 (` in crore)
Item 2016-17
2017-18 2018-19
(P)
2019-20
(Q)
2020-21
(A)
1. Agriculture,
Forestry and
Fishing
71266.59 76254.00 80061.56 84549.70 88168.63
1.1 Crops 40805.48 42024.52 42862.84 43902.09 44200.79
1.2 Livestock 26410.92 29289.26 32315.31 35729.44 39211.47
1.3 Forestry
& Logging 2871.82 3372.28 3346.06 3360.06 3393.15
1.4 Fishing &
Aquaculture 1178.37 1567.94 1537.35 1558.11 1363.22
2. Mining &
Quarrying 1191.15 1089.57 775.00 887.37 1031.33
Primary 72457.74 77343.57 80836.56 85437.07 89199.97
3.
Manufacturing 97157.52 98987.57 103201.06 110250.74 99887.17
4. Electricity,
Gas, Water
Supply & other
utility services
3561.64 4404.90 4961.61 5901.23 6107.45
5. Construction 31522.08 33637.05 35996.90 39155.92 34222.27
Secondary 132241.23 137029.53 144159.57 155307.89 140216.89
6. Trade,
Repair, Hotels
& Restaurants
55986.73 62598.69 68158.03 75943.33 70186.33
6.1 Trade &
Repair
Services
54414.47 60961.98 66448.53 74120.15 68500.46
6.2 Hotels &
Restaurants 1572.27 1636.72 1709.50 1823.19 1685.87
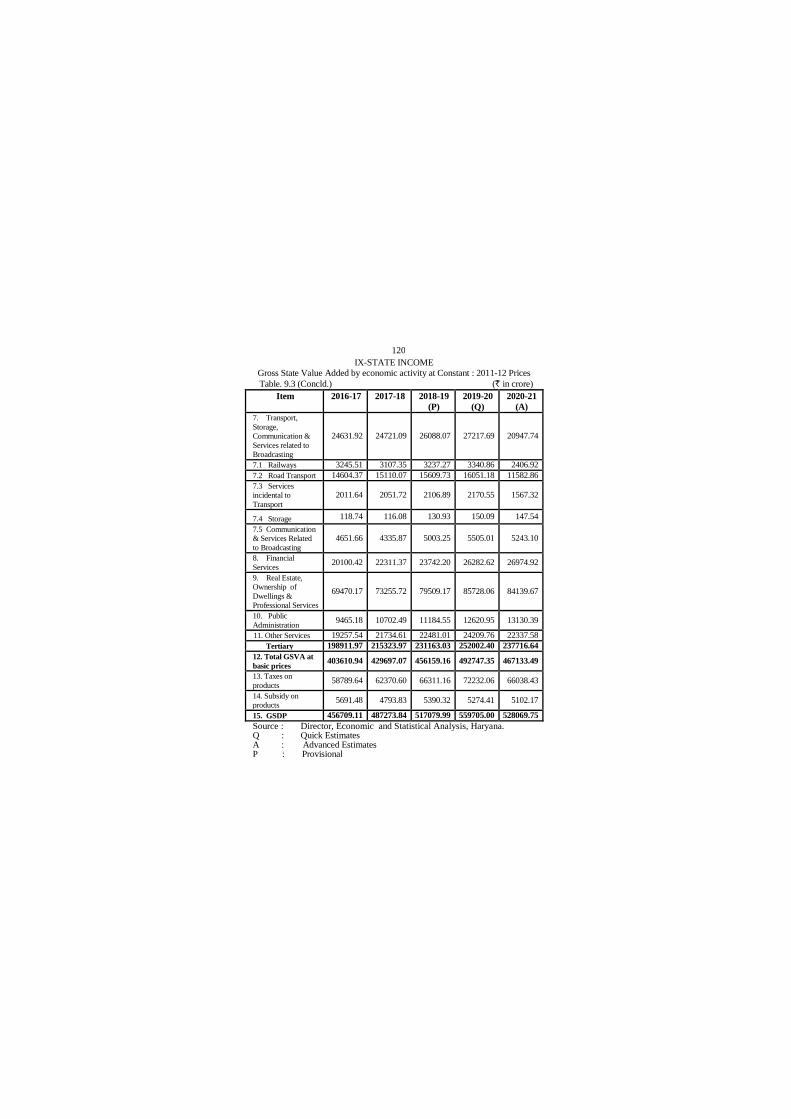
120
IX-STATE INCOME
Gross State Value Added by economic activity at Constant : 2011-12 Prices
Table. 9.3 (Concld.) (` in crore)
Item 2016-17
2017-18 2018-19
(P)
2019-20
(Q)
2020-21
(A)
7. Transport,
Storage,
Communication &
Services related to
Broadcasting
24631.92 24721.09 26088.07 27217.69 20947.74
7.1 Railways 3245.51 3107.35 3237.27 3340.86 2406.92
7.2 Road Transport 14604.37 15110.07 15609.73 16051.18 11582.86
7.3 Services
incidental to
Transport
2011.64 2051.72 2106.89 2170.55 1567.32
7.4 Storage 118.74 116.08 130.93 150.09 147.54
7.5 Communication
& Services Related
to Broadcasting
4651.66 4335.87 5003.25 5505.01 5243.10
8. Financial
Services 20100.42 22311.37 23742.20 26282.62 26974.92
9. Real Estate,
Ownership of
Dwellings &
Professional Services
69470.17 73255.72 79509.17 85728.06 84139.67
10. Public
Administration 9465.18 10702.49 11184.55 12620.95 13130.39
11. Other Services 19257.54 21734.61 22481.01 24209.76 22337.58
Tertiary 198911.97 215323.97 231163.03 252002.40 237716.64
12. Total GSVA at
basic prices 403610.94 429697.07 456159.16 492747.35 467133.49
13. Taxes on
products 58789.64 62370.60 66311.16 72232.06 66038.43
14. Subsidy on
products 5691.48 4793.83 5390.32 5274.41 5102.17
15. GSDP 456709.11 487273.84 517079.99 559705.00 528069.75
Source : Director, Economic and Statistical Analysis, Haryana. Q : Quick Estimates A : Advanced Estimates P : Provisional

121
IX-STATE INCOME Net State Value Added by economic activity at Current : 2011-12 Prices
Table 9.4 (` in crore)
Item 2016-17
2017-18 2018-19 (P)
2019-20 (Q)
2020-21 (A)
1. Agriculture,
Forestry and
Fishing
87859.14 99992.50 110018.48 119822.37 129983.43
1.1 Crops 48430.53 52812.55 56228.55 58853.09 60510.43
1.2 Livestock 35481.30 41791.43 48193.37 55352.87 64008.95
1.3 Forestry &
Logging
3027.09 4139.81 4040.89 4077.66 4117.77
1.4 Fishing &
Aquaculture
920.23 1248.71 1555.67 1538.75 1346.28
2. Mining &
Quarrying
906.96 934.93 699.29 783.59 910.47
Primary 88766.10 100927.43 110717.76 120605.96 130893.90
3.Manufacturing 85010.89 93986.24 101088.79 108145.53 99493.89
4. Electricity,
Gas, Water
Supply & other
utility services
9848.36 12640.89 13116.33 13025.69 13444.22
5.Construction 36941.10 40061.67 45135.25 49581.09 43433.03
Secondary 131800.34 146688.80 159340.37 170752.32 156371.15
6. Trade,
Repair, Hotels &
Restaurants
58903.92 68013.39 76949.78 86770.11 80002.04
6.1 Trade &
Repair Services
57302.69 66248.32 75030.46 84757.51 78146.42
6.2 Hotels &
Restaurants
1601.23 1765.07 1919.32 2012.60 1855.62

122
IX-STATE INCOME
Net State Value Added by economic activity at Current Prices
Table. 9.4 (Concld.) (` in crore)
Item 2016-17
2017-18 2018-19
(P)
2019-20
(Q)
2020-21
(A)
7. Transport, Storage,
Communication &
services related to
broadcasting
23403.98 23118.73 24633.70 26839.76 23406.17
7.1 Railways 2372.41 1876.57 1777.01 1913.84 1570.97
7.2 Road Transport 15453.43 16051.02 17111.43 18568.91 15356.49
7.3 Services incidental
to Transport
1423.35 1442.84 1418.81 1443.91 1194.12
7.4 Storage 106.53 190.87 231.45 278.18 274.38
7.5 Communication &
services related to
Broadcasting
4048.27 3557.42 4095.00 4634.92 5010.21
8. Financial Services 21183.35 25261.81 28946.57 33259.61 36918.17
9. Real Estate,
Ownership of
Dwellings &
Professional Services
79182.38 87072.67 99334.98 112125.07 110866.33
10. Public
Administration 9906.69 11820.32 12804.92 15064.00 16566.75
11. Other Services 24153.10 29083.12 32135.09 37081.71 36283.39
Tertiary 216733.42 244370.04 274805.04 311140.26 304042.85
12. Total NSVA at
basic prices
437299.86 491986.28 544863.17 602498.53 591307.90
13. Taxes on products 76906.39 99842.24 100967.31 113087.64 110828.29
14. Subsidy on products 6930.10 6150.15 7222.55 7222.55 7222.55
NSDP 507276.15 585678.37 638607.93 708363.63 694913.64
Source : Director, Economic and Statistical Analysis, Haryana.
Q : Quick Estimates
A : Advanced Estimates
P : Provisional

123
IX-STATE INCOME
Net State Value Added by economic activity at Constant : 2011-12 Prices
Table 9.5 (` in crore)
Item 2016-17
2017-18 2018-19
(P)
2019-20
(Q)
2020-21
(A)
1. Agriculture,
Forestry and
Fishing
66278.16 70983.73 74517.32 78950.43 82507.96
1.1 Crops 36323.29 37316.87 37919.17 38985.05 39250.30
1.2 Livestock 26043.25 28900.29 31899.42 35239.95 38674.28
1.3 Forestry &
logging
2851.21 3341.20 3313.95 3327.81 3360.57
1.4 Fishing &
Aquaculture
1060.41 1425.37 1384.78 1397.62 1222.81
2. Mining &
Quarrying
1059.03 987.44 639.50 732.08 850.85
Primary 67337.20 71971.17 75156.82 79682.51 83358.81
3. Manufacturing 83353.98 84980.77 88453.53 94495.91 85613.30
4. Electricity,
Gas, Water
Supply & other
utility services
1467.39 1814.82 2044.19 2431.31 2516.27
5.Construction 29218.31 31042.05 33111.09 36023.44 31484.49
Secondary 114039.68 117837.64 123608.80 132950.66 119614.05
6. Trade,
Repair, Hotels &
Restaurants
52736.10 59238.39 64393.32 71482.10 66063.27
6.1 Trade &
Repair Services
51302.93 57700.91 62785.64 69821.18 64527.44
6.2 Hotels &
Restaurants
1433.18 1537.48 1607.67 1660.92 1535.83
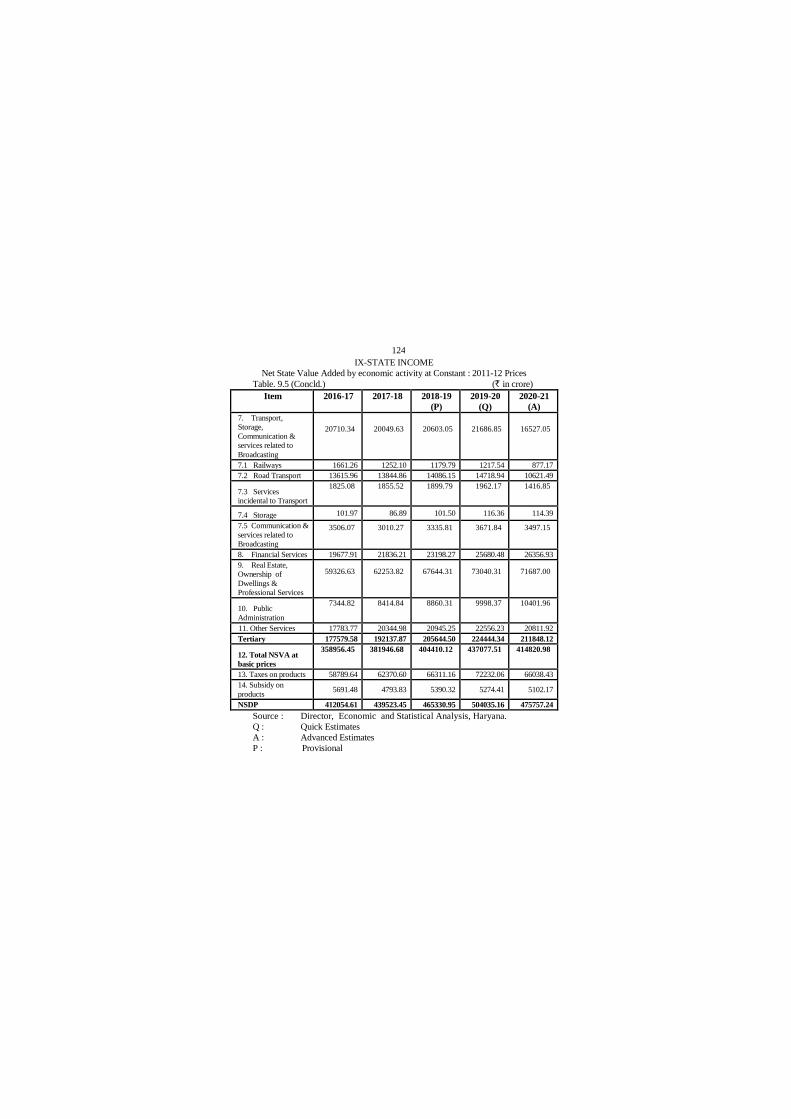
124
IX-STATE INCOME
Net State Value Added by economic activity at Constant : 2011-12 Prices
Table. 9.5 (Concld.) (` in crore)
Item 2016-17
2017-18 2018-19
(P)
2019-20
(Q)
2020-21
(A)
7. Transport,
Storage,
Communication &
services related to
Broadcasting
20710.34 20049.63 20603.05 21686.85 16527.05
7.1 Railways 1661.26 1252.10 1179.79 1217.54 877.17
7.2 Road Transport 13615.96 13844.86 14086.15 14718.94 10621.49
7.3 Services
incidental to Transport
1825.08 1855.52 1899.79 1962.17 1416.85
7.4 Storage 101.97 86.89 101.50 116.36 114.39
7.5 Communication &
services related to
Broadcasting
3506.07 3010.27 3335.81 3671.84 3497.15
8. Financial Services 19677.91 21836.21 23198.27 25680.48 26356.93
9. Real Estate,
Ownership of
Dwellings &
Professional Services
59326.63 62253.82 67644.31 73040.31 71687.00
10. Public
Administration
7344.82 8414.84 8860.31 9998.37 10401.96
11. Other Services 17783.77 20344.98 20945.25 22556.23 20811.92
Tertiary 177579.58 192137.87 205644.50 224444.34 211848.12
12. Total NSVA at
basic prices
358956.45 381946.68 404410.12 437077.51 414820.98
13. Taxes on products 58789.64 62370.60 66311.16 72232.06 66038.43
14. Subsidy on
products 5691.48 4793.83 5390.32 5274.41 5102.17
NSDP 412054.61 439523.45 465330.95 504035.16 475757.24
Source : Director, Economic and Statistical Analysis, Haryana.
Q : Quick Estimates
A : Advanced Estimates
P : Provisional
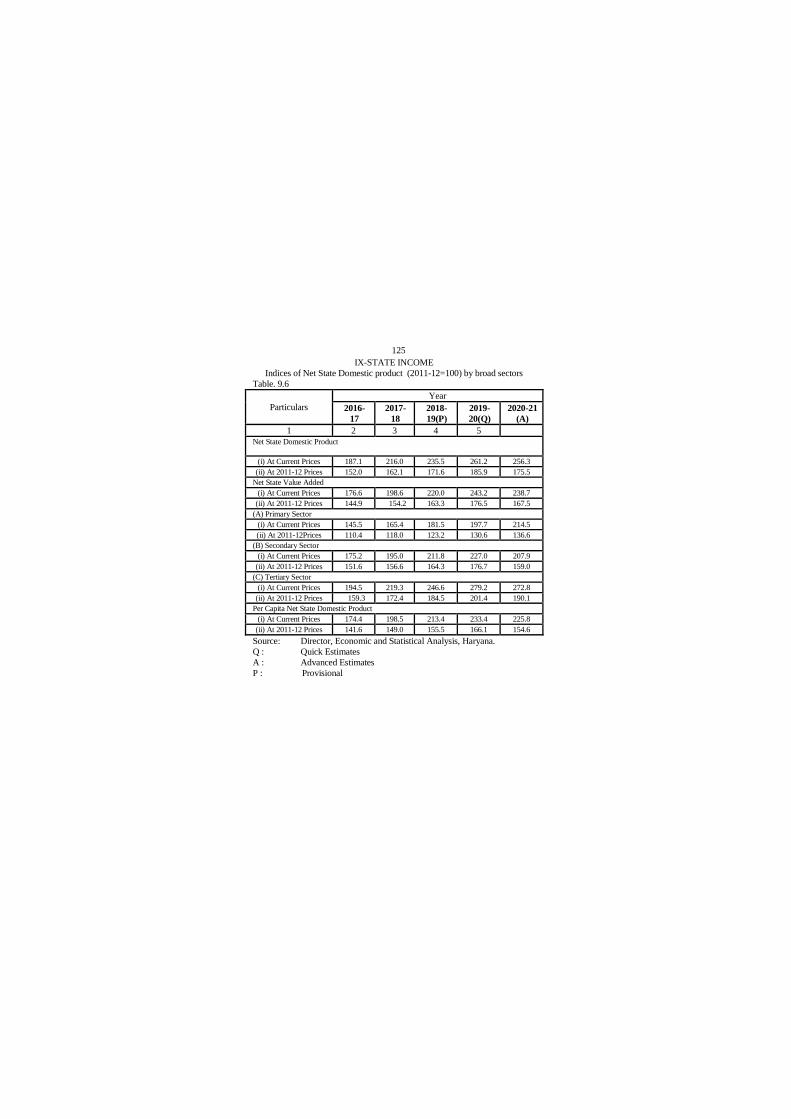
125
IX-STATE INCOME
Indices of Net State Domestic product (2011-12=100) by broad sectors
Table. 9.6
Particulars
Year
2016-
17
2017-
18
2018-
19(P)
2019-
20(Q)
2020-21
(A)
1 2 3 4 5
Net State Domestic Product
(i) At Current Prices 187.1 216.0 235.5 261.2 256.3
(ii) At 2011-12 Prices 152.0 162.1 171.6 185.9 175.5
Net State Value Added
(i) At Current Prices 176.6 198.6 220.0 243.2 238.7
(ii) At 2011-12 Prices 144.9 154.2 163.3 176.5 167.5
(A) Primary Sector
(i) At Current Prices 145.5 165.4 181.5 197.7 214.5
(ii) At 2011-12Prices 110.4 118.0 123.2 130.6 136.6
(B) Secondary Sector
(i) At Current Prices 175.2 195.0 211.8 227.0 207.9
(ii) At 2011-12 Prices 151.6 156.6 164.3 176.7 159.0
(C) Tertiary Sector
(i) At Current Prices 194.5 219.3 246.6 279.2 272.8
(ii) At 2011-12 Prices 159.3 172.4 184.5 201.4 190.1
Per Capita Net State Domestic Product
(i) At Current Prices 174.4 198.5 213.4 233.4 225.8
(ii) At 2011-12 Prices 141.6 149.0 155.5 166.1 154.6
Source: Director, Economic and Statistical Analysis, Haryana.
Q : Quick Estimates
A : Advanced Estimates
P : Provisional
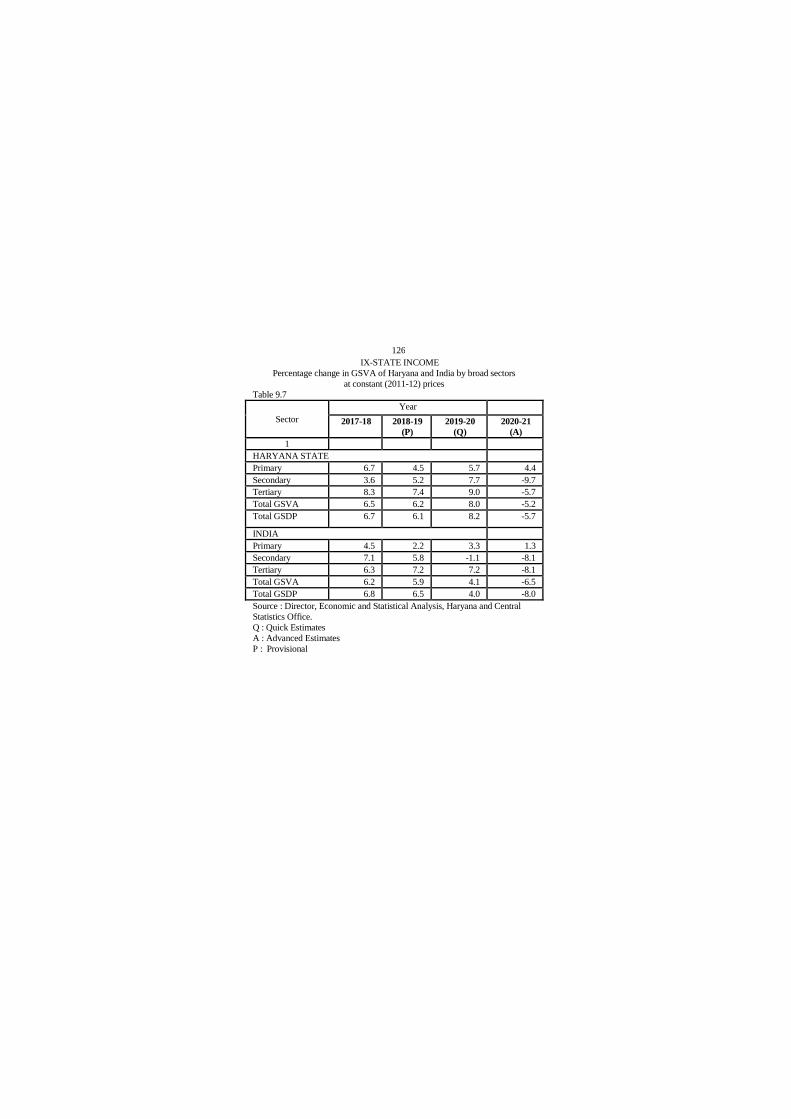
126
IX-STATE INCOME
Percentage change in GSVA of Haryana and India by broad sectors
at constant (2011-12) prices
Table 9.7
Sector
Year
2017-18 2018-19
(P)
2019-20
(Q)
2020-21
(A)
1
HARYANA STATE
Primary 6.7 4.5 5.7 4.4
Secondary 3.6 5.2 7.7 -9.7
Tertiary 8.3 7.4 9.0 -5.7
Total GSVA 6.5 6.2 8.0 -5.2
Total GSDP 6.7 6.1 8.2 -5.7
INDIA
Primary 4.5 2.2 3.3 1.3
Secondary 7.1 5.8 -1.1 -8.1
Tertiary 6.3 7.2 7.2 -8.1
Total GSVA 6.2 5.9 4.1 -6.5
Total GSDP 6.8 6.5 4.0 -8.0
Source : Director, Economic and Statistical Analysis, Haryana and Central
Statistics Office.
Q : Quick Estimates
A : Advanced Estimates
P : Provisional

127
X-AGRICULTURE
Classification of Area in Haryana State : 2018-19 (P)
Table 10.1 (Thousand Hectares)
District Land not available for Cultivation
Total area
according to
village papers
Forests Land put to
non-agricultural
uses
1 2 3 4
Ambala 154 1 3
Bhiwani 328 2 11
Charkhi Dadri 137 0 4
Faridabad 72 @ 2
Fatehabad 249 0 1
Gurugram 120 3 @
Hisar 404 1 6
Jhajjar 191 0 0
Jind 274 1 29
Kaithal 233 1 1
Karnal 246 1 31
Kurukshetra 168 1 1
Mahendragarh 194 2 8
Nuh 148 0 25
Palwal 136 3 5
Panchkula 57 1 9
Panipat 130 1 1
Rewari 151 2 4
Rohtak 167 @ 5
Sirsa 427 1 @
Sonipat 213 @ 8
Yamunanagar 172 14 2
Total 4,371 35 156
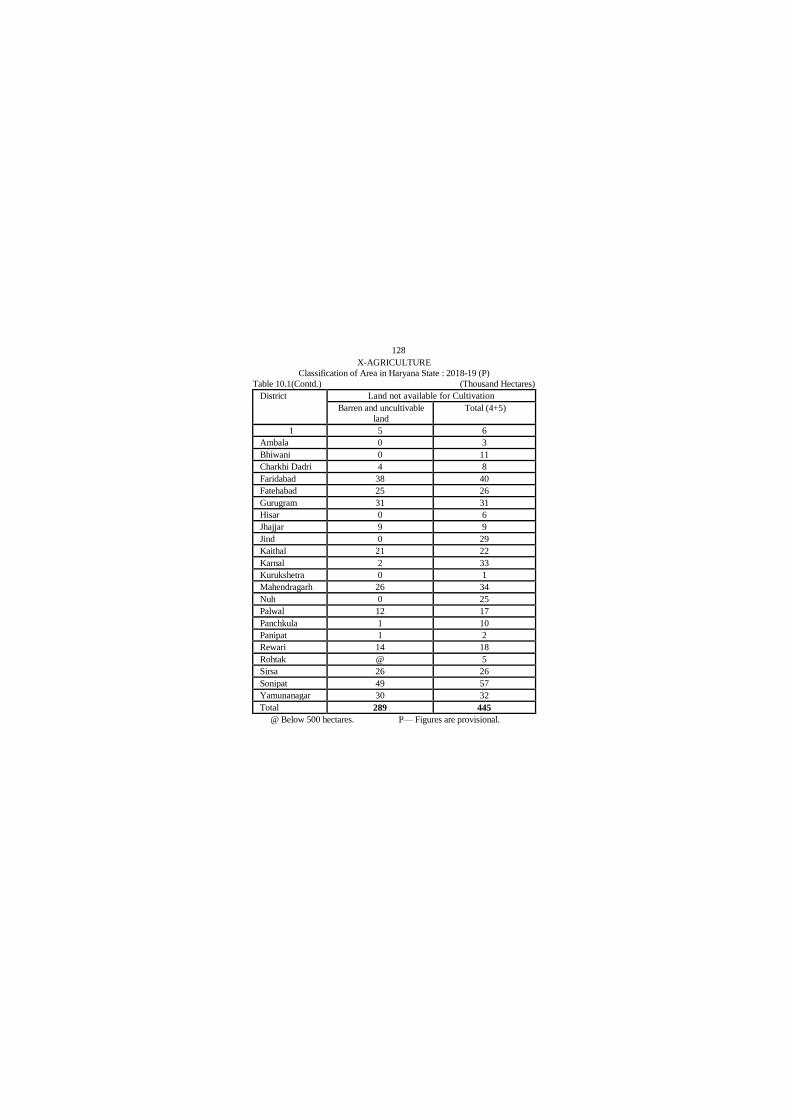
128
X-AGRICULTURE
Classification of Area in Haryana State : 2018-19 (P)
Table 10.1(Contd.) (Thousand Hectares)
District Land not available for Cultivation
Barren and uncultivable
land
Total (4+5)
1 5 6
Ambala 0 3
Bhiwani 0 11
Charkhi Dadri 4 8
Faridabad 38 40
Fatehabad 25 26
Gurugram 31 31
Hisar 0 6
Jhajjar 9 9
Jind 0 29
Kaithal 21 22
Karnal 2 33
Kurukshetra 0 1
Mahendragarh 26 34
Nuh 0 25
Palwal 12 17
Panchkula 1 10
Panipat 1 2
Rewari 14 18
Rohtak @ 5
Sirsa 26 26
Sonipat 49 57
Yamunanagar 30 32
Total 289 445
@ Below 500 hectares. P— Figures are provisional.

129
X-AGRICULTURE
Classification of Area in Haryana State : 2018-19 (P)
Table 10.1 (Contd.) (Thousand Hectares)
District Other uncultivated land excluding Fallow Land
Permanent pastures
and other grazing
lands
Land under misc. tree
crops and groves not
included in net area sown
1 7 8
Ambala 1 @
Bhiwani 0 1
Charkhi Dadri 5 0
Faridabad @ 0
Fatehabad 0 0
Gurugram 1 @
Hisar 0 0
Jhajjar 0 0
Jind 0 1
Kaithal 0 0
Karnal 15 0
Kurukshetra 22 @
Mahendragarh @ 0
Nuh 0 1
Palwal 1 0
Panchkula @ 1
Panipat 20 1
Rewari 3 1
Rohtak 3 @
Sirsa 0 0
Sonipat 1 1
Yamunanagar 2 14
Total 74 21

130
X-AGRICULTURE
Classification of Area in Haryana State : 2018-19 (P)
Table 10.1 (Contd.) (Thousand Hectares)
District Other uncultivated land excluding Fallow Land
Cultivable but barren
land
Total (7+8+9)
1 9 10
Ambala 0 2
Bhiwani 0 1
Charkhi Dadri 0 5
Faridabad 0 @
Fatehabad 0 0
Gurugram 22 23
Hisar 0 0
Jhajjar 0 0
Jind 0 1
Kaithal 0 0
Karnal 0 15
Kurukshetra @ 22
Mahendragarh 0 @
Nuh 0 1
Palwal 0 1
Panchkula 7 8
Panipat 5 25
Rewari 0 4
Rohtak 17 20
Sirsa 0 0
Sonipat 3 5
Yamunanagar 0 16
Total 54 149
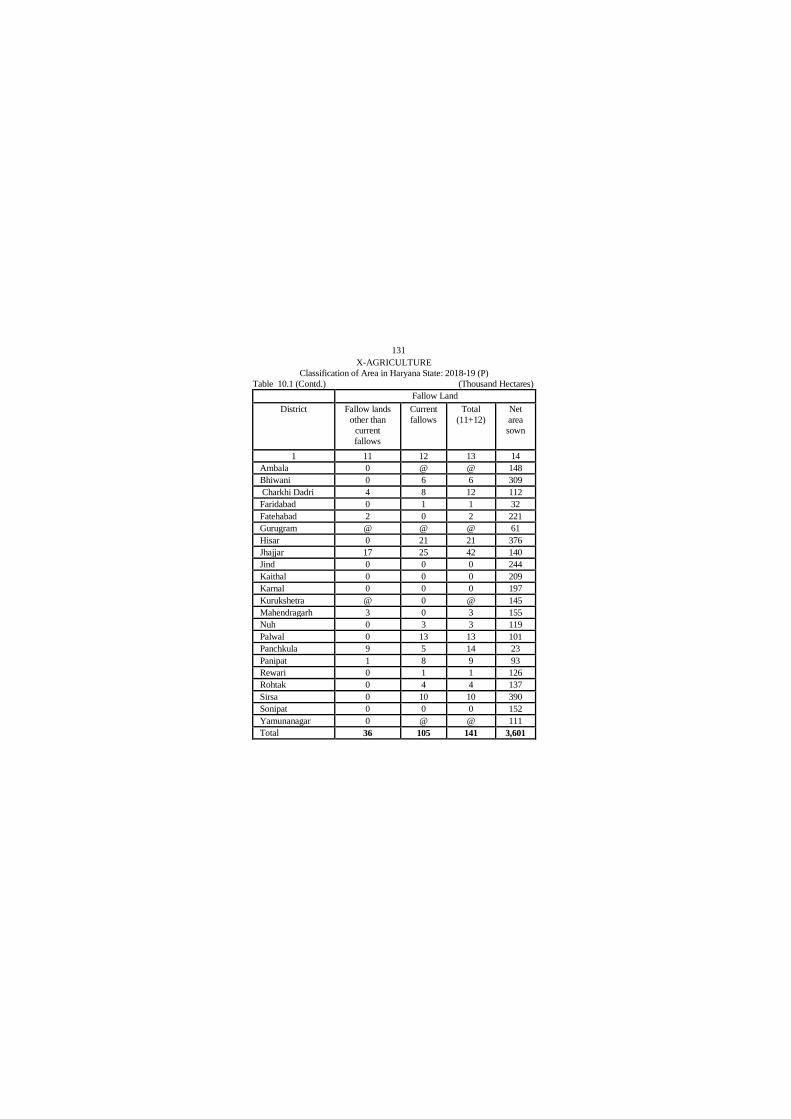
131
X-AGRICULTURE
Classification of Area in Haryana State: 2018-19 (P)
Table 10.1 (Contd.) (Thousand Hectares)
Fallow Land
District Fallow lands
other than
current
fallows
Current
fallows
Total
(11+12)
Net
area
sown
1 11 12 13 14
Ambala 0 @ @ 148
Bhiwani 0 6 6 309
Charkhi Dadri 4 8 12 112
Faridabad 0 1 1 32
Fatehabad 2 0 2 221
Gurugram @ @ @ 61
Hisar 0 21 21 376
Jhajjar 17 25 42 140
Jind 0 0 0 244
Kaithal 0 0 0 209
Karnal 0 0 0 197
Kurukshetra @ 0 @ 145
Mahendragarh 3 0 3 155
Nuh 0 3 3 119
Palwal 0 13 13 101
Panchkula 9 5 14 23
Panipat 1 8 9 93
Rewari 0 1 1 126
Rohtak 0 4 4 137
Sirsa 0 10 10 390
Sonipat 0 0 0 152
Yamunanagar 0 @ @ 111
Total 36 105 141 3,601

132
X-AGRICULTURE
Classification of Area in Haryana State : 2018-19(P)
Table 10.1 (Concld.) (Thousand Hectares)
Fallow Land
District Cultivable
area
(8+9+13+14)
Area sown
more than
once
Total cropped
area (14+16)
1 15 16 17
Ambala 148 67 213
Bhiwani 316 223 532
Charkhi Dadri 124 109 221
Faridabad 33 28 60
Fatehabad 223 211 432
Gurugram 83 43 104
Hisar 397 279 655
Jhajjar 182 114 254
Jind 245 228 472
Kaithal 209 205 414
Karnal 197 193 390
Kurukshetra 145 136 281
Mahendragarh 158 141 297
Nuh 123 69 188
Palwal 114 95 196
Panchkula 45 22 46
Panipat 108 91 185
Rewari 128 74 199
Rohtak 158 77 214
Sirsa 400 353 743
Sonipat 156 142 294
Yamunanagar 125 104 215
Total 3,817 3,004 6,605
Source: Director, Land Records, Haryana.
Note: Totals may not tally due to rounding off the figures
P: Provisional

133
X-AGRICULTURE
District wise Number and Area of Operational Holdings by Size
Groups in Haryana: 2015-16
Table 10.2 (Area in Hectares)
Size Group
(in Hectares)
Ambala Bhiwani
Number Area Number Area
1 2 3 4 5
Below 0.5 16,715 6,607 33,071 12,663
0.5—1.0 9,984 8,013 20,593 15,651
1.0—2.0 10,405 15,644 25,623 38,329
2.0—3.0 5,446 13,470 15,973 39,808
3.0—4.0 2,920 10,122 11,181 38,938
4.0—5.0 2,076 9,222 7,960 35,553
5.0—7.5 2,177 13,331 9,286 56,814
7.5—10.0 1,018 8,764 4,850 41,939
10.0-20.0 885 11,660 5,267 71,178
20.0 and
Above 180 5,505 1,246 46,400
Total 51,806 1,02,338 1,35,050 3,97,272
Average size
of Holdings 1.98 2.94
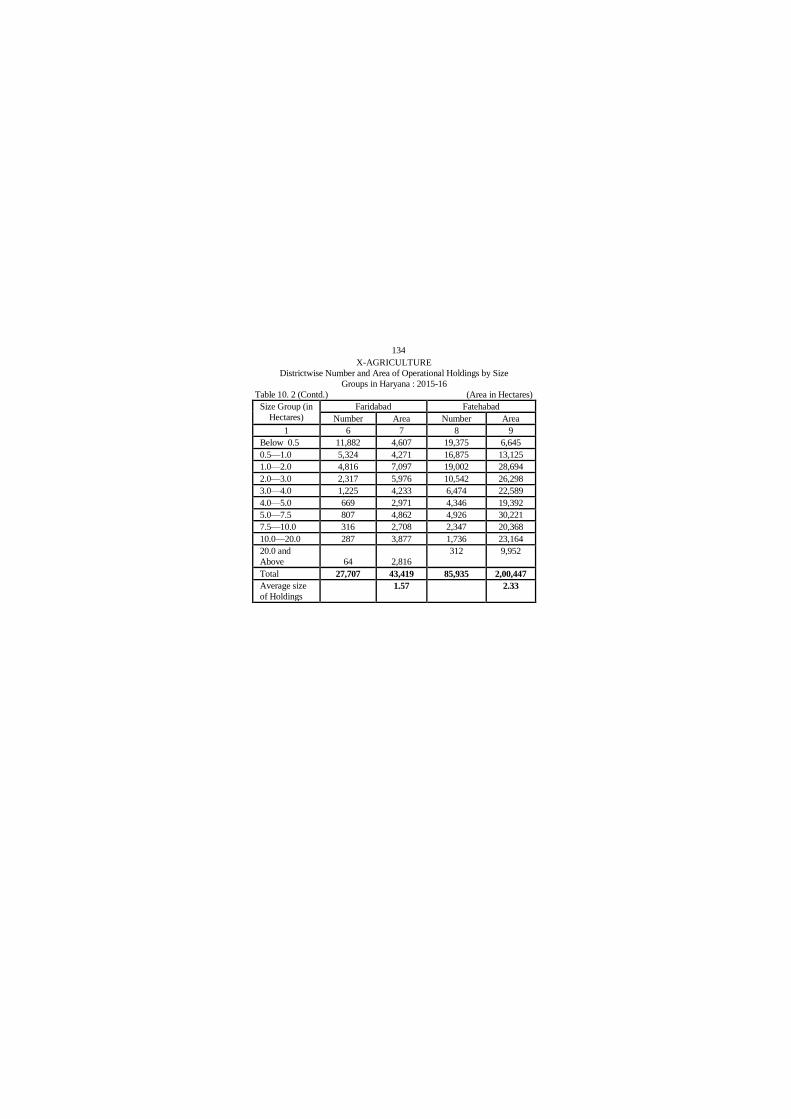
134
X-AGRICULTURE
Districtwise Number and Area of Operational Holdings by Size
Groups in Haryana : 2015-16
Table 10. 2 (Contd.) (Area in Hectares)
Size Group (in
Hectares)
Faridabad Fatehabad
Number Area Number Area
1 6 7 8 9
Below 0.5 11,882 4,607 19,375 6,645
0.5—1.0 5,324 4,271 16,875 13,125
1.0—2.0 4,816 7,097 19,002 28,694
2.0—3.0 2,317 5,976 10,542 26,298
3.0—4.0 1,225 4,233 6,474 22,589
4.0—5.0 669 2,971 4,346 19,392
5.0—7.5 807 4,862 4,926 30,221
7.5—10.0 316 2,708 2,347 20,368
10.0—20.0 287 3,877 1,736 23,164
20.0 and
Above 64 2,816
312 9,952
Total 27,707 43,419 85,935 2,00,447
Average size
of Holdings
1.57 2.33

135
X-AGRICULTURE
Districtwise Number and Area of Operational Holdings by Size
Groups in Haryana : 2015-16
Table 10.2 (Contd.) (Area in Hectares)
Size Group
(in Hectares)
Gurugram Hisar
Number Area Number Area
1 10 11 12 13
Below 0.5 19,206 5,267 22,668 7,574
0.5—1.0 10,256 7,639 19,471 15,016
1.0—2.0 9,726 13,958 23,447 34,616
2.0—3.0 4,221 10,325 13,636 33,575
3.0—4.0 2,186 7,554 9,006 31,132
4.0—5.0 1,331 5,952 5,643 25,211
5.0—7.5 1,318 7,968 6,902 42,212
7.5—10.0 543 4,664 3,697 31,848
10.0—20.0 414 5,384 3,423 45,200
20.0 and Above 106 4,221 704 26,694
Total 49,307 72,934 1,08,597 2,93,077
Average size of
Holdings
1.48 2.70
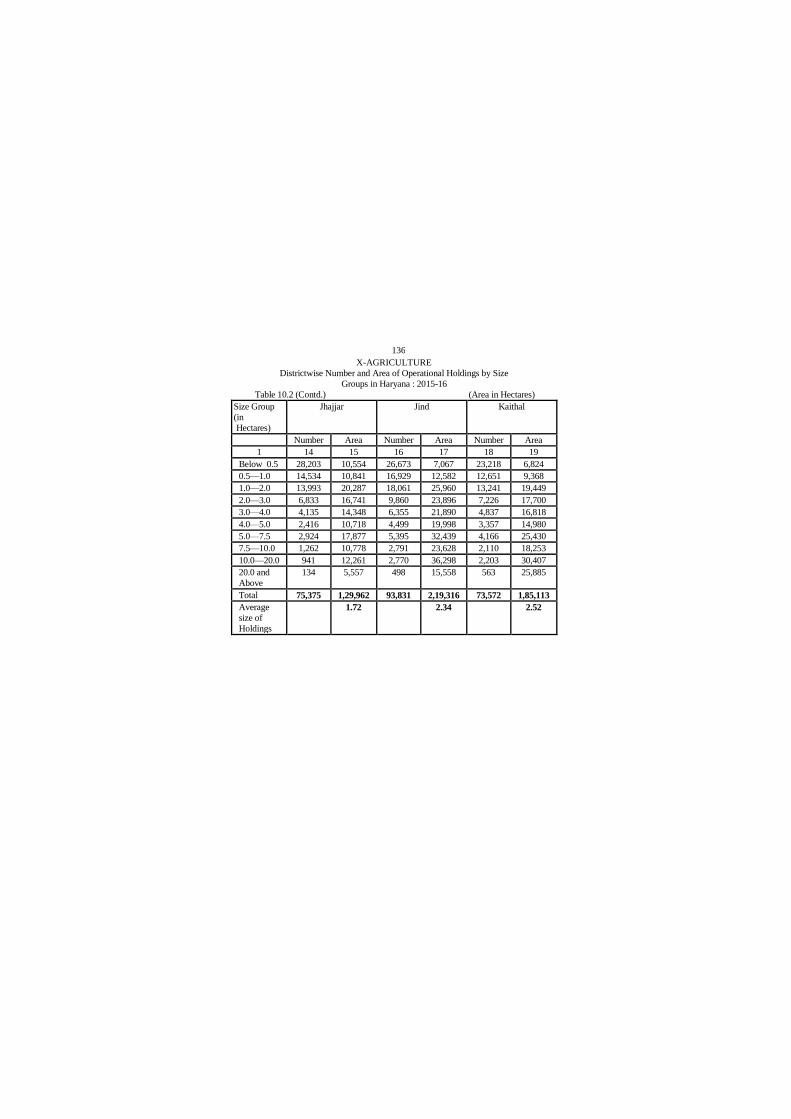
136
X-AGRICULTURE
Districtwise Number and Area of Operational Holdings by Size
Groups in Haryana : 2015-16
Table 10.2 (Contd.) (Area in Hectares)
Size Group
(in
Hectares)
Jhajjar Jind Kaithal
Number Area Number Area Number Area
1 14 15 16 17 18 19
Below 0.5 28,203 10,554 26,673 7,067 23,218 6,824
0.5—1.0 14,534 10,841 16,929 12,582 12,651 9,368
1.0—2.0 13,993 20,287 18,061 25,960 13,241 19,449
2.0—3.0 6,833 16,741 9,860 23,896 7,226 17,700
3.0—4.0 4,135 14,348 6,355 21,890 4,837 16,818
4.0—5.0 2,416 10,718 4,499 19,998 3,357 14,980
5.0—7.5 2,924 17,877 5,395 32,439 4,166 25,430
7.5—10.0 1,262 10,778 2,791 23,628 2,110 18,253
10.0—20.0 941 12,261 2,770 36,298 2,203 30,407
20.0 and
Above
134 5,557 498 15,558 563 25,885
Total 75,375 1,29,962 93,831 2,19,316 73,572 1,85,113
Average
size of
Holdings
1.72 2.34 2.52
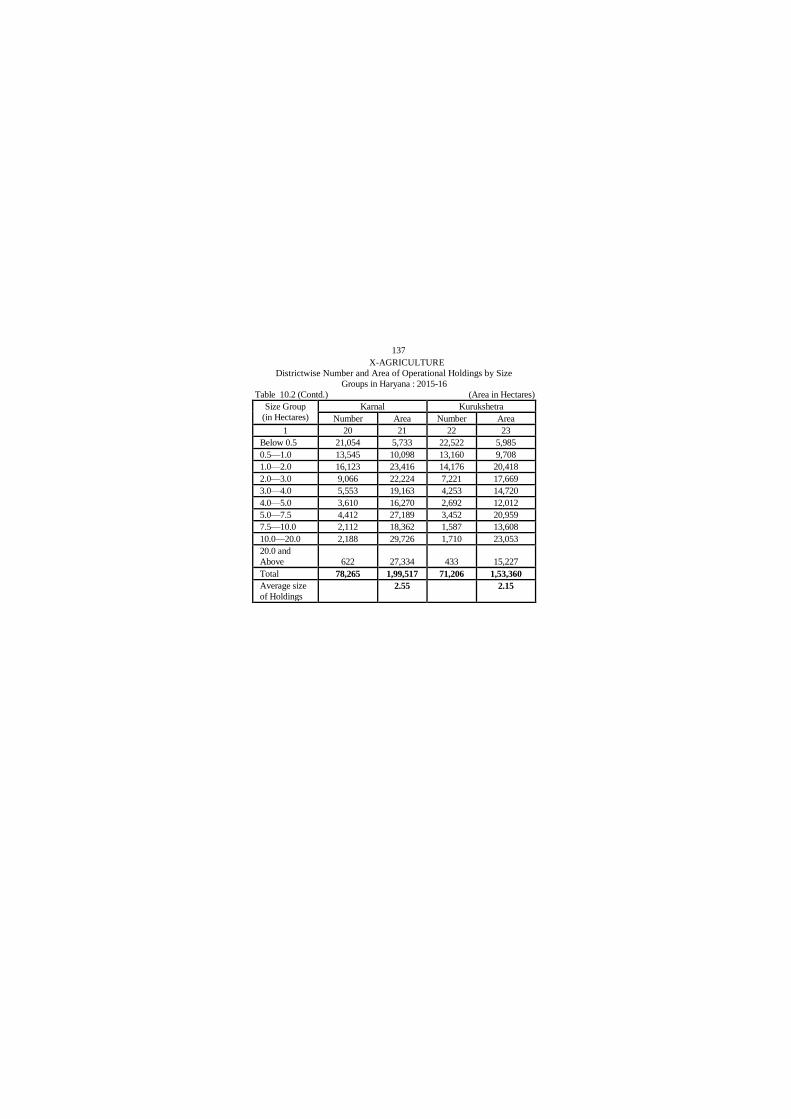
137
X-AGRICULTURE
Districtwise Number and Area of Operational Holdings by Size
Groups in Haryana : 2015-16
Table 10.2 (Contd.) (Area in Hectares)
Size Group
(in Hectares)
Karnal Kurukshetra
Number Area Number Area
1 20 21 22 23
Below 0.5 21,054 5,733 22,522 5,985
0.5—1.0 13,545 10,098 13,160 9,708
1.0—2.0 16,123 23,416 14,176 20,418
2.0—3.0 9,066 22,224 7,221 17,669
3.0—4.0 5,553 19,163 4,253 14,720
4.0—5.0 3,610 16,270 2,692 12,012
5.0—7.5 4,412 27,189 3,452 20,959
7.5—10.0 2,112 18,362 1,587 13,608
10.0—20.0 2,188 29,726 1,710 23,053
20.0 and
Above 622 27,334 433 15,227
Total 78,265 1,99,517 71,206 1,53,360
Average size
of Holdings
2.55 2.15

138
X-AGRICULTURE
Districtwise Number and Area of Operational Holdings by Size
Groups in Haryana : 2015-16
Table 10.2 (Contd.) (Area in Hectares)
Size Group
(in Hectares)
Mahendragarh Nuh
Number Area Number Area
1 24 25 26 27
Below 0.5 25,756 8,881 25,983 7,808
0.5—1.0 14,879 12,148 13,609 10,727
1.0—2.0 14,711 21,134 12,804 18,288
2.0—3.0 7,619 18,670 5,977 15,212
3.0—4.0 4,602 15,921 3,367 11,951
4.0—5.0 2,882 12,870 2,267 10,679
5.0—7.5 3,538 21,567 2,425 14,511
7.5—10.0 1,435 12,286 954 8,421
10.0—20.0 1,355 17,927 769 9,872
20.0 and Above 281 8,806 156 5,551
Total 77,058 1,50,210 68,311 1,13,019
Average size of
Holdings
1.95 1.65

139
X-AGRICULTURE
Districtwise Number and Area of Operational Holdings by Size
Groups in Haryana : 2015-16
Table 10.2 (Contd.) (Area in Hectares)
Size Group
(in Hectares)
Palwal Panchkula
Number Area Number Area
1 28 29 30 31
Below 0.5 32,581 8,497 7,135 2,467
0.5—1.0 17,420 12,520 3,140 2,322
1.0—2.0 13,958 19,920 3,090 4,449
2.0—3.0 6,653 16,266 1,373 3,331
3.0—4.0 3,607 12,441 705 2,432
4.0—5.0 2,121 9,454 454 2,024
5.0—7.5 2,260 13,603 443 2,687
7.5—10.0 816 6,945 187 1,585
10.0—20.0 591 8,257 191 2,653
20.0 and
Above 146 6,117
55 2,435
Total 80,153 1,14,019 16,773 26,386
Average size
of Holdings
1.42 1.57

140
X-AGRICULTURE
Districtwise Number and Area of Operational Holdings by Size
Groups in Haryana : 2015-16
Table 10.2 (Contd.) (Area in Hectares)
Size Group
(in Hectares)
Panipat Rewari
Number Area Number Area
1 32 33 34 35
Below 0.5 26,179 9,447 19,595 6,899
0.5—1.0 11,666 8,871 14,234 10,529
1.0—2.0 10,982 15,815 14,444 20,956
2.0—3.0 5,063 12,415 6,948 17,023
3.0—4.0 3,162 11,189 3,932 13,609
4.0—5.0 1,926 8,713 2,267 10,122
5.0—7.5 1,941 12,264 2,603 15,853
7.5—10.0 705 6,254 988 8,481
10.0—20.0 662 8,964 821 10,735
20.0 and Above 183 12,458 115 4,323
Total 62,469 1,06,390 65,947 1,18,531
Average size of
Holdings
1.70 1.80
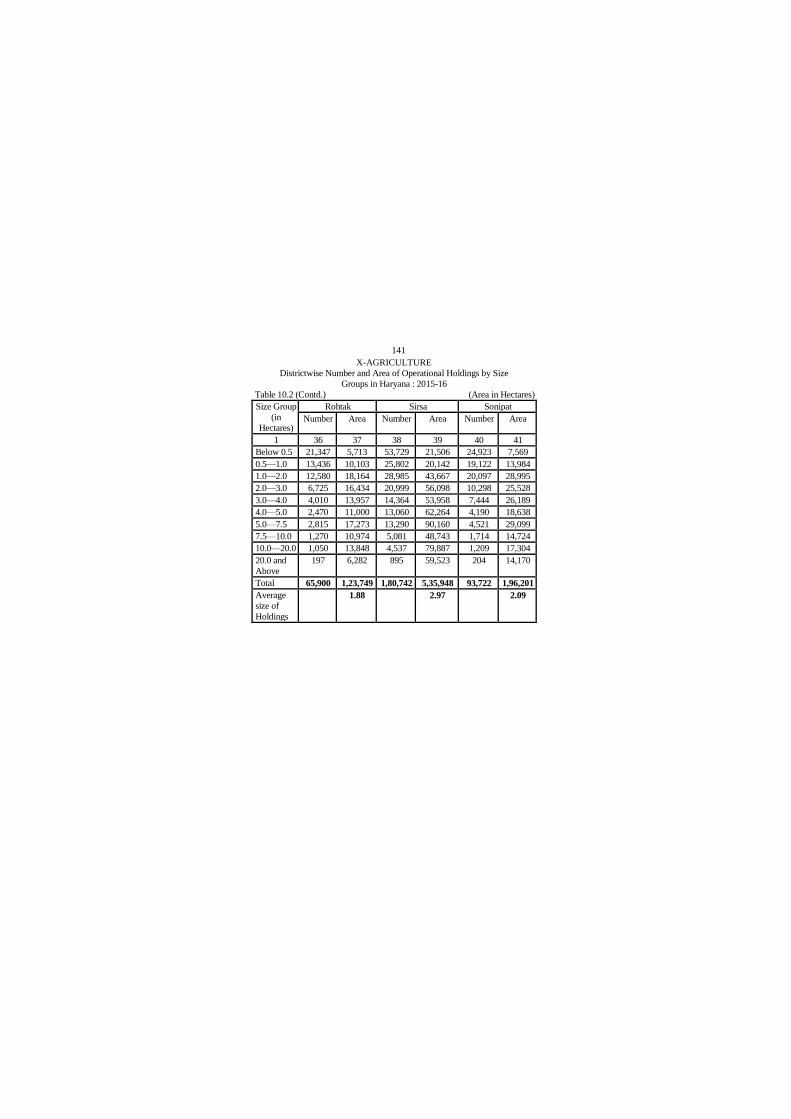
141
X-AGRICULTURE
Districtwise Number and Area of Operational Holdings by Size
Groups in Haryana : 2015-16
Table 10.2 (Contd.) (Area in Hectares)
Size Group
(in
Hectares)
Rohtak Sirsa Sonipat
Number Area Number Area Number Area
1 36 37 38 39 40 41
Below 0.5 21,347 5,713 53,729 21,506 24,923 7,569
0.5—1.0 13,436 10,103 25,802 20,142 19,122 13,984
1.0—2.0 12,580 18,164 28,985 43,667 20,097 28,995
2.0—3.0 6,725 16,434 20,999 56,098 10,298 25,528
3.0—4.0 4,010 13,957 14,364 53,958 7,444 26,189
4.0—5.0 2,470 11,000 13,060 62,264 4,190 18,638
5.0—7.5 2,815 17,273 13,290 90,160 4,521 29,099
7.5—10.0 1,270 10,974 5,081 48,743 1,714 14,724
10.0—20.0 1,050 13,848 4,537 79,887 1,209 17,304
20.0 and
Above
197 6,282 895 59,523 204 14,170
Total 65,900 1,23,749 1,80,742 5,35,948 93,722 1,96,201
Average
size of
Holdings
1.88 2.97
2.09

142
X-AGRICULTURE
Districtwise Number and Area of Operational Holdings by Size
Groups in Haryana : 2015-16
Table 10.2 (Concld.) (Area in Hectares)
Size Group
(in Hectares)
Yamunanagar Total
Number Area Number Area
1 42 43 44 45
Below 0.5 20,801 5,868 5,02,616 1,64,181
0.5—1.0 13,150 9,867 2,99,780 2,27,524
1.0—2.0 13,673 20,182 3,13,937 4,59,439
2.0—3.0 6,707 16,448 1,70,703 4,25,107
3.0—4.0 3,971 13,770 1,07,269 37,66,923
4.0—5.0 2,524 11,256 72,760 3,29,300
5.0—7.5 2,840 17,148 82,441 5,13,467
7.5—10.0 1,343 11,527 37,126 3,24,861
10.0—20.0 1,077 14,484 34,088 4,76,139
20.0 and
Above
203 6,830 7,297 3,11,645
Total 66,289 1,27,380 16,28,015 36,08,587
Average size
of Holdings
1.92 2.22
Source : Agriculture Census, 2015-16.
Note: Totals may not tally due to rounding off.
Figures of Charkhi Dadri district included in district Bhiwani

143
X-AGRICULTURE
Number and Area of Holdings by Ownership and by Size
Group in Haryana : 2015-16 (All Holdings)
Table 10.3 (Area in Hectares)
Size Group
(in
Hectares)
Individual Holdings Joint Holdings
Number Area Number Area
1 2 3 4 5
Below 0.5 2,06,278 68,899 2,92,735 93,944
0.5—1.0 1,03,252 78,435 1,94,170 1,47,097
1.0—2.0 96,589 1,41,299 2,14,772 3,14,005
2.0—3.0 49,006 1,21,616 1,20,190 2,99,797
3.0—4.0 28,984 1,01,839 77,366 2,71,899
4.0—5.0 19,253 87,591 52,842 2,38,733
5.0—7.5 15,400 97,832 65,690 4,07,309
7.5—10.0 4,771 42,998 31,493 2,74,405
10.0—20.0 2,165 32,373 30,034 4,13,289
20.0 and
Above
380 15,047 5,458 2,08,189
Total 5,26,078 7,87,928 10,84,750 26,68,666

144
X-AGRICULTURE
Number and Area of Holdings by Ownership and by Size
Group in Haryana : 2015-16 (All Holdings)
Table 10.3 (Concld.) (Area in Hectares)
Size Group
(in
Hectares)
Institutional Holdings Total Holdings
Number Area Number Area
1 6 7 8 9
Below 0.5 3,603 1,338 5,02,616 1,64,181
0.5—1.0 2,358 1,993 2,99,780 2,27,524
1.0—2.0 2,576 4,136 3,13,937 4,59,439
2.0—3.0 1,507 3,695 1,70,703 4,25,107
3.0—4.0 919 3,185 1,07,269 3,76,923
4.0—5.0 665 2,976 72,760 3,29,300
5.0—7.5 1,351 8,326 82,441 5,13,467
7.5—10.0 862 7,457 37,126 3,24,861
10.0—20.0 1,887 30,477 34,088 4,76,139
20.0 and
Above
1,459 88,410 7,297 3,11,645
Total 17,187 1,51,993 16,28,015 36,08,587
Source : Agriculture Census, 2015-16.

145
X-AGRICULTURE
Number and Area of Holdings by Ownership and by Size
Group in Haryana : 2015-16 (Belonging to Scheduled Castes only)
Table 10.4 (Area in Hectares)
Size Group (in
Hectares)
Individual Holdings Joint Holdings
Number Area Number Area
1 2 3 4 5
Below 0.5 4,431 1,452 3,880 1,143
0.5—1.0 2,339 1,839 2,814 2,237
1.0—2.0 2,090 3,266 3,238 5,132
2.0—3.0 883 2,278 1,765 4,551
3.0—4.0 466 1,681 988 3,560
4.0—5.0 245 1,118 574 2,633
5.0—7.5 130 792 571 3,647
7.5—10.0 23 199 221 1,922
10.0—20.0 7 88 124 1,499
20.0 and Above 2 41 9 223
Total 10,616 12,754 14,184 26,546
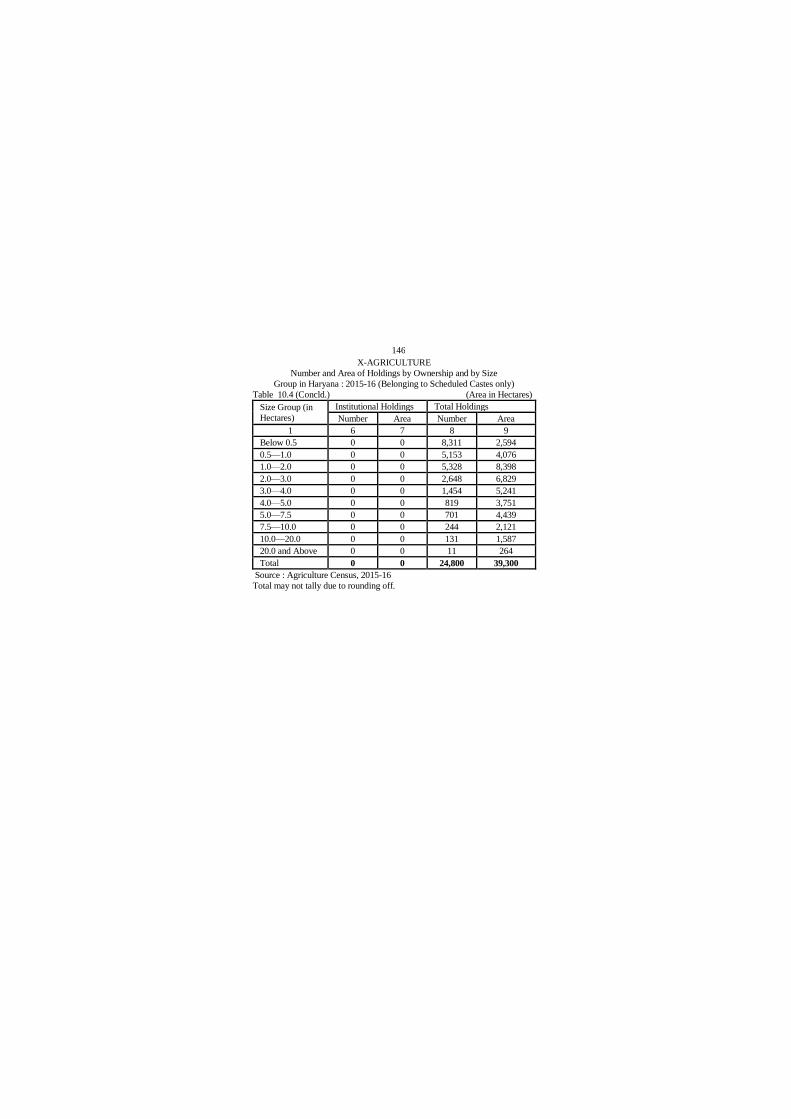
146
X-AGRICULTURE
Number and Area of Holdings by Ownership and by Size
Group in Haryana : 2015-16 (Belonging to Scheduled Castes only)
Table 10.4 (Concld.) (Area in Hectares)
Size Group (in
Hectares)
Institutional Holdings Total Holdings
Number Area Number Area
1 6 7 8 9
Below 0.5 0 0 8,311 2,594
0.5—1.0 0 0 5,153 4,076
1.0—2.0 0 0 5,328 8,398
2.0—3.0 0 0 2,648 6,829
3.0—4.0 0 0 1,454 5,241
4.0—5.0 0 0 819 3,751
5.0—7.5 0 0 701 4,439
7.5—10.0 0 0 244 2,121
10.0—20.0 0 0 131 1,587
20.0 and Above 0 0 11 264
Total 0 0 24,800 39,300
Source : Agriculture Census, 2015-16
Total may not tally due to rounding off.
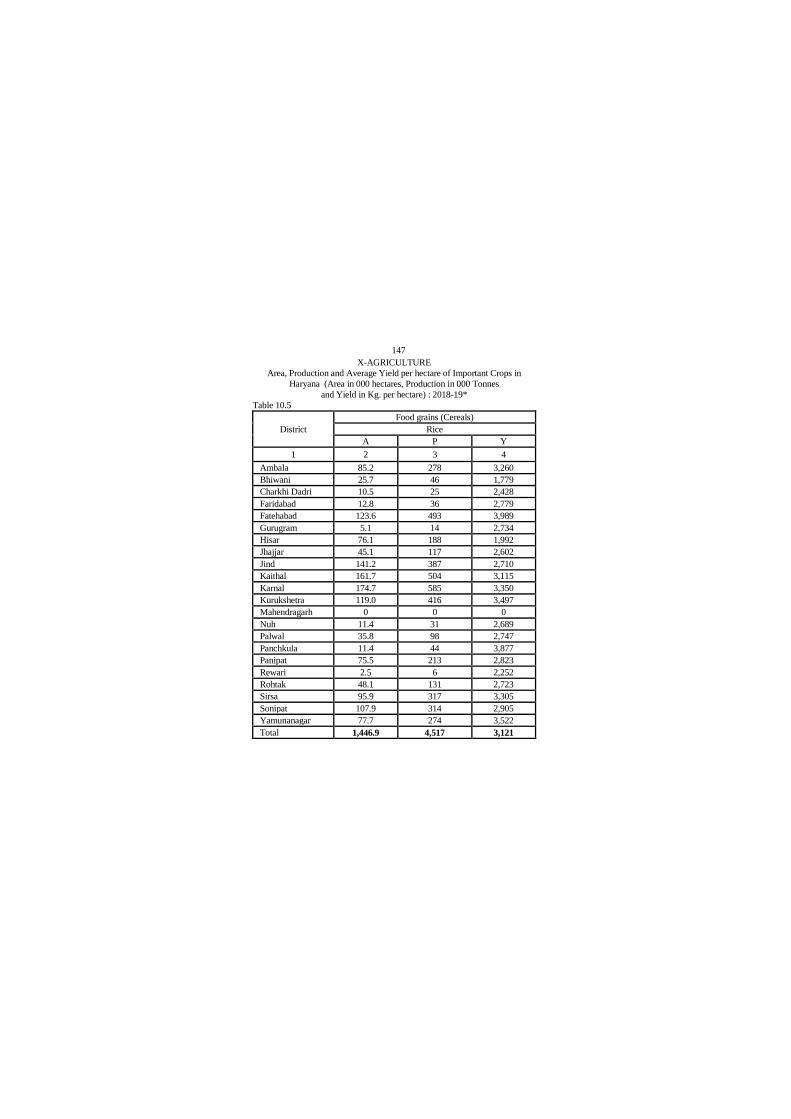
147
X-AGRICULTURE
Area, Production and Average Yield per hectare of Important Crops in
Haryana (Area in 000 hectares, Production in 000 Tonnes
and Yield in Kg. per hectare) : 2018-19*
Table 10.5
District
Food grains (Cereals)
Rice
A P Y
1 2 3 4
Ambala 85.2 278 3,260
Bhiwani 25.7 46 1,779
Charkhi Dadri 10.5 25 2,428
Faridabad 12.8 36 2,779
Fatehabad 123.6 493 3,989
Gurugram 5.1 14 2,734
Hisar 76.1 188 1,992
Jhajjar 45.1 117 2,602
Jind 141.2 387 2,710
Kaithal 161.7 504 3,115
Karnal 174.7 585 3,350
Kurukshetra 119.0 416 3,497
Mahendragarh 0 0 0
Nuh 11.4 31 2,689
Palwal 35.8 98 2,747
Panchkula 11.4 44 3,877
Panipat 75.5 213 2,823
Rewari 2.5 6 2,252
Rohtak 48.1 131 2,723
Sirsa 95.9 317 3,305
Sonipat 107.9 314 2,905
Yamunanagar 77.7 274 3,522
Total 1,446.9 4,517 3,121

148
X-AGRICULTURE
Area, Production and Average Yield per hectare of Important Crops in
Haryana (Area in 000 hectares, Production in 000 Tonnes
and Yield in Kgs. per hectare) : 2018-19*
Table. 10.5 (Contd.)
District
Foodgrains (Cereals)
Jowar
A P Y
1 5 6 7
Ambala 0 0 0
Bhiwani @ 0 0
Charkhi Dadri 1.7 1 528
Faridabad 0.9 2 528
Fatehabad 0 0 0
Gurugram 0.6 @ 528
Hisar 0 0 0
Jhajjar 6.9 4 528
Jind 0 0 0
Kaithal 0 0 0
Karnal 0 0 0
Kurukshetra 0 0 0
Mahendragarh 0.1 0 528
Nuh 8.5 5 528
Palwal 6.7 3 528
Panchkula 0 0 0
Panipat 0 0 0
Rewari 0.3 @ 528
Rohtak 10.6 6 528
Sirsa 0 0 0
Sonipat 3.7 0 528
Yamunanagar 0 0 0
Total 40.0 21 528

149
X-AGRICULTURE
Area, Production and Average Yield per hectare of Important Crops in
Haryana (Area in 000 hectares, Production in 000 Tonnes
and Yield in Kgs. per hectare) : 2018-19*
Table 10.5 (Contd.)
District
Food grains (Cereals)
Bajra Maize
A P Y A P Y
1 8 9 10 11 12 13
Ambala 0 0 0 0.2 1 5,454
Bhiwani 58.0 83 1,444 @ @ 0
Charkhi Dadri 37.4 68 1,839 @ @ 0
Faridabad 3.0 10 3,184 0 0 0
Fatehabad 1.6 4 2,460 @ @ 0
Gurugram 31.5 74 2,341 @ @ 0
Hisar 27.1 54 1,992 @ @ 0
Jhajjar 38.5 93 2,417 0.1 @ 2,644
Jind 10.9 20 1,825 0 0 0
Kaithal 1.0 2 1,868 @ @ 0
Karnal 0.2 1 2,068 @ @ 0
Kurukshetra 0 0 0 @ 0 0
Mahendragarh 99.0 203 2,059 0 0 0
Nuh 25.6 68 2,622 0 0 0
Palwal 6.5 19 2,640 0 0 0
Panchkula 1.9 4 2,482 4.7 12 2,564
Panipat 0.4 1 1,779 0 0 0
Rewari 65.0 135 2,084 @ @ 0
Rohtak 8.0 18 2,249 0.4 1 2,644
Sirsa 4.0 11 2,635 @ @ 0
Sonipat 5.0 10 2,096 0.8 2 2,691
Yamunanagar 0.1 0 1,722 @ @ 0
Total 424.7 878 2,068 6.2 16 2,644
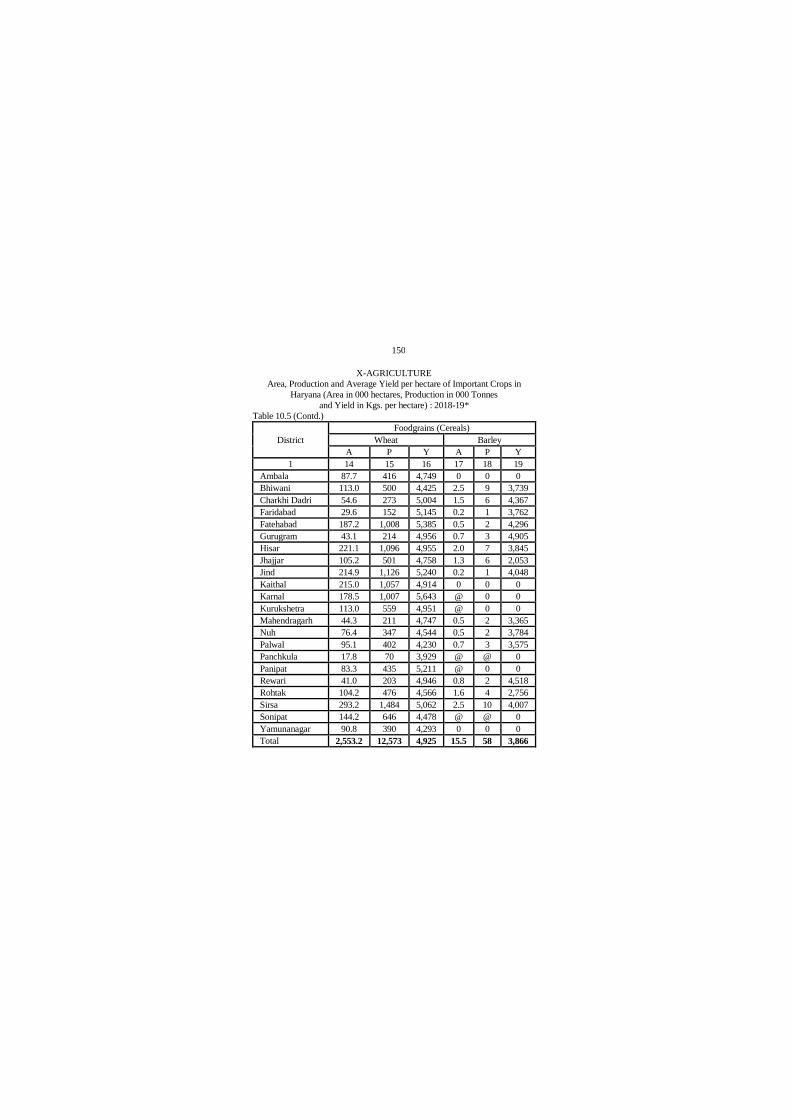
150
X-AGRICULTURE
Area, Production and Average Yield per hectare of Important Crops in
Haryana (Area in 000 hectares, Production in 000 Tonnes
and Yield in Kgs. per hectare) : 2018-19*
Table 10.5 (Contd.)
District
Foodgrains (Cereals)
Wheat Barley
A P Y A P Y
1 14 15 16 17 18 19
Ambala 87.7 416 4,749 0 0 0
Bhiwani 113.0 500 4,425 2.5 9 3,739
Charkhi Dadri 54.6 273 5,004 1.5 6 4,367
Faridabad 29.6 152 5,145 0.2 1 3,762
Fatehabad 187.2 1,008 5,385 0.5 2 4,296
Gurugram 43.1 214 4,956 0.7 3 4,905
Hisar 221.1 1,096 4,955 2.0 7 3,845
Jhajjar 105.2 501 4,758 1.3 6 2,053
Jind 214.9 1,126 5,240 0.2 1 4,048
Kaithal 215.0 1,057 4,914 0 0 0
Karnal 178.5 1,007 5,643 @ 0 0
Kurukshetra 113.0 559 4,951 @ 0 0
Mahendragarh 44.3 211 4,747 0.5 2 3,365
Nuh 76.4 347 4,544 0.5 2 3,784
Palwal 95.1 402 4,230 0.7 3 3,575
Panchkula 17.8 70 3,929 @ @ 0
Panipat 83.3 435 5,211 @ 0 0
Rewari 41.0 203 4,946 0.8 2 4,518
Rohtak 104.2 476 4,566 1.6 4 2,756
Sirsa 293.2 1,484 5,062 2.5 10 4,007
Sonipat 144.2 646 4,478 @ @ 0
Yamunanagar 90.8 390 4,293 0 0 0
Total 2,553.2 12,573 4,925 15.5 58 3,866
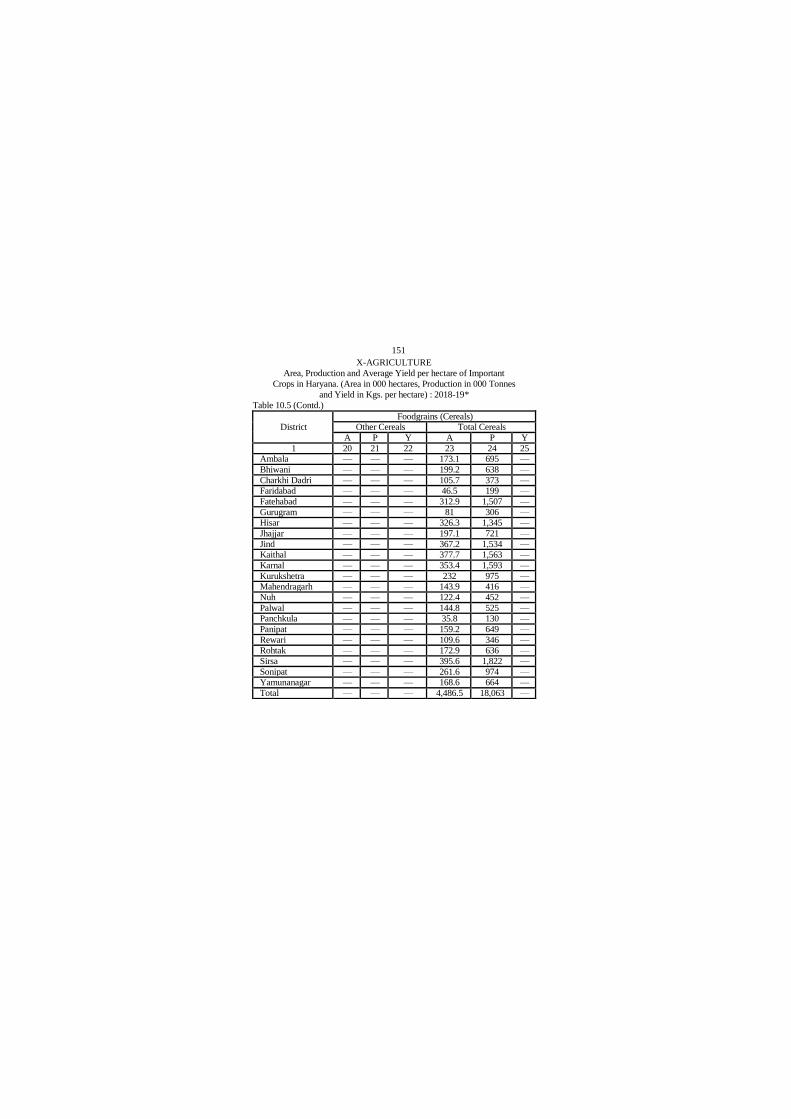
151
X-AGRICULTURE
Area, Production and Average Yield per hectare of Important
Crops in Haryana. (Area in 000 hectares, Production in 000 Tonnes
and Yield in Kgs. per hectare) : 2018-19*
Table 10.5 (Contd.)
District
Foodgrains (Cereals)
Other Cereals Total Cereals
A P Y A P Y
1 20 21 22 23 24 25
Ambala — — — 173.1 695 —
Bhiwani — — — 199.2 638 —
Charkhi Dadri — — — 105.7 373 —
Faridabad — — — 46.5 199 —
Fatehabad — — — 312.9 1,507 —
Gurugram — — — 81 306 —
Hisar — — — 326.3 1,345 —
Jhajjar — — — 197.1 721 —
Jind — — — 367.2 1,534 —
Kaithal — — — 377.7 1,563 —
Karnal — — — 353.4 1,593 —
Kurukshetra — — — 232 975 —
Mahendragarh — — — 143.9 416 —
Nuh — — — 122.4 452 —
Palwal — — — 144.8 525 —
Panchkula — — — 35.8 130 —
Panipat — — — 159.2 649 —
Rewari — — — 109.6 346 —
Rohtak — — — 172.9 636 —
Sirsa — — — 395.6 1,822 —
Sonipat — — — 261.6 974 —
Yamunanagar — — — 168.6 664 —
Total — — — 4,486.5 18,063 —

152
X-AGRICULTURE
Area, Production and Average Yield per hectare of Important
Crops in Haryana. (Area in 000 hectares, Production in 000 Tonnes
and Yield in Kgs. per hectare) : 2018-19*
Table 10.5 (Contd.)
District
Foodgrains (Pulses)
Gram Mash
A P Y A P Y
1 26 27 28 29 30 31
Ambala @ @ @ 0.8 0.5 600
Bhiwani 16.8 16.9 1,003 0 0 0
Charkhi Dadri 1.3 2.2 1,658 0 0 0
Faridabad 0 0 0 0 0 0
Fatehabad 1.1 2.2 1,988 0 0 0
Gurugram @ 0 @ @ @ @
Hisar 11.7 19.3 1,654 0 0 0
Jhajjar 0.2 0.2 1,450 0 0 0
Jind @ 0.1 1,737 0 0 0
Kaithal 0 0 0 0 0 0
Karnal 0.1 0.1 1,383 @ @ @
Kurukshetra 0 0.1 @ 0.1 @ 450
Mahendragarh 9.4 14.1 1,494 0 0 0
Nuh 0.4 0.6 1,716 @ @ @
Palwal 0 0 0 0 0 0
Panchkula 0.1 0.1 1,275 0.2 0.1 500
Panipat 0.1 0.2 2,166 @ @ @
Rewari @ @ @ 0 0 0
Rohtak 0.2 0.2 1,251 0 0 0
Sirsa 3.5 5.9 1,693 0 0 0
Sonipat @ @ @ 0 0 0
Yamunanagar 0 0 0 0.2 0.1 600
Total 44.9 62.2 1385 1.3 0.7 571
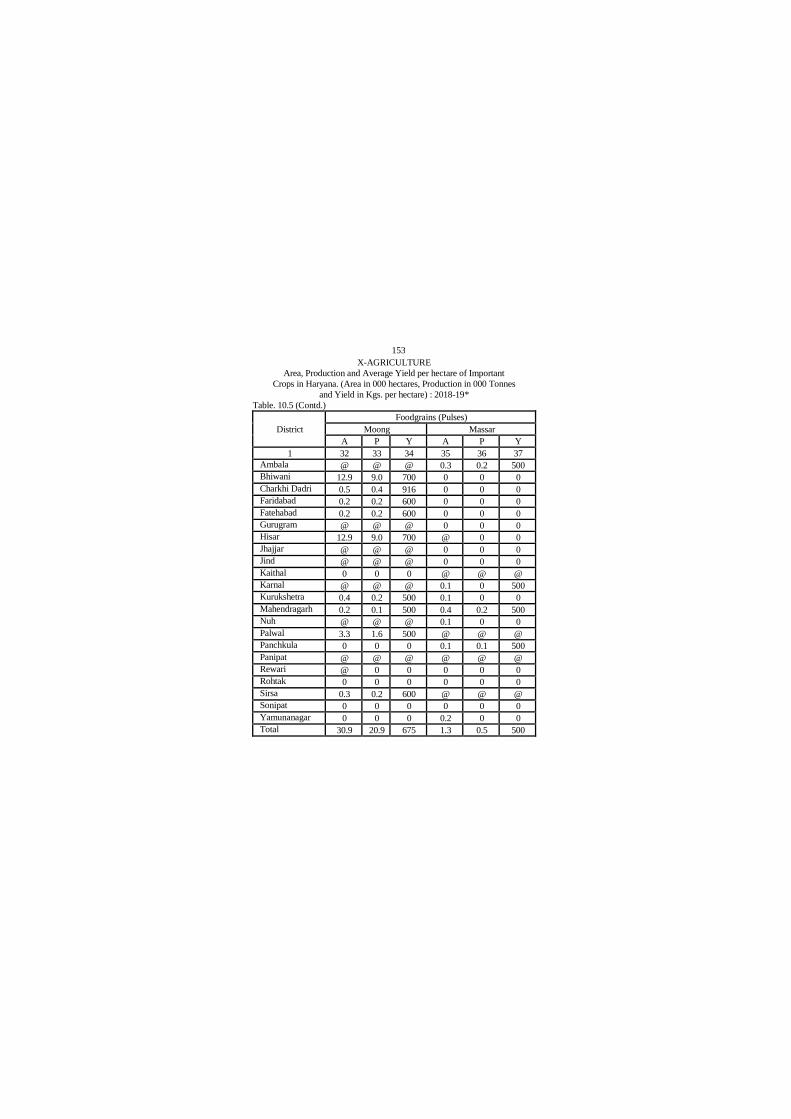
153
X-AGRICULTURE
Area, Production and Average Yield per hectare of Important
Crops in Haryana. (Area in 000 hectares, Production in 000 Tonnes
and Yield in Kgs. per hectare) : 2018-19*
Table. 10.5 (Contd.)
District
Foodgrains (Pulses)
Moong Massar
A P Y A P Y
1 32 33 34 35 36 37
Ambala @ @ @ 0.3 0.2 500
Bhiwani 12.9 9.0 700 0 0 0
Charkhi Dadri 0.5 0.4 916 0 0 0
Faridabad 0.2 0.2 600 0 0 0
Fatehabad 0.2 0.2 600 0 0 0
Gurugram @ @ @ 0 0 0
Hisar 12.9 9.0 700 @ 0 0
Jhajjar @ @ @ 0 0 0
Jind @ @ @ 0 0 0
Kaithal 0 0 0 @ @ @
Karnal @ @ @ 0.1 0 500
Kurukshetra 0.4 0.2 500 0.1 0 0
Mahendragarh 0.2 0.1 500 0.4 0.2 500
Nuh @ @ @ 0.1 0 0
Palwal 3.3 1.6 500 @ @ @
Panchkula 0 0 0 0.1 0.1 500
Panipat @ @ @ @ @ @
Rewari @ 0 0 0 0 0
Rohtak 0 0 0 0 0 0
Sirsa 0.3 0.2 600 @ @ @
Sonipat 0 0 0 0 0 0
Yamunanagar 0 0 0 0.2 0 0
Total 30.9 20.9 675 1.3 0.5 500

154
X-AGRICULTURE
Area, Production and Average Yield per hectare of Important
Crops in Haryana. (Area in 000 hectares, Production in 000 Tonnes
and Yield in Kgs. per hectare) : 2018-19*
Table 10.5 (Contd.)
District
Food grains (Pulses)
Other Pulses Total Pulses
A P Y A P Y
1 38 39 40 41 42 43
Ambala 0.1 0 — 1.2 0.5 —
Bhiwani 0.1 0 — 29.8 25.9 —
Charkhi Dadri 0.1 0.2 — 1.9 2.8 —
Faridabad 0.1 0 — 0.3 0.2 —
Fatehabad 1.4 0.1 — 2.7 2.5 —
Gurugram 0.4 0.4 — 0.4 0.4 —
Hisar 0.1 2.4 — 24.7 30.7 —
Jhajjar 0.4 0.7 — 0.6 0.9 —
Jind 0.1 0.1 — 0.1 0.2 —
Kaithal 0 0 — — — —
Karnal 0.1 0.2 — 0.3 0.3 —
Kurukshetra 0.5 0.8 — 1.1 1.1 —
Mahendragarh 0.4 0.4 — 10.4 14.8 —
Nuh 0.4 0.5 — 0.9 1.1 —
Palwal 0.2 0.2 — 3.5 1.8 —
Panchkula 0.3 0.1 — 0.7 0.4 —
Panipat 1.3 1.6 — 1.4 1.8 —
Rewari 0.4 0.4 — 0.4 0.4 —
Rohtak 0.3 0.4 — 0.5 0.6 —
Sirsa 0.1 0 — 3.9 6.1 —
Sonipat 0.1 0.1 — 0.1 0.1 —
Yamunanagar 0.1 0.1 — 0.5 0.2 — Total 7.0 8.5 — 85.4 92.8 —

155
X-AGRICULTURE
Area, Production and Average Yield per hectare of Important
Crops in Haryana. (Area in 000 hectares, Production in 000 Tonnes
and Yield in Kgs. per hectare) : 2018-19*
Table. 10.5 (Contd.)
District
Oil Seeds
Total Food grains Ground nut (Nuts
in shell)
A P Y A P Y
1 44 45 46 47 48 49
Ambala 174.1 695.1 — — — —
Bhiwani 229.1 664.3 — @ @ @
Charkhi Dadri 107.5 375.9 — — — —
Faridabad 46.8 199.5 — @ @ @
Fatehabad 315.6 1,509.8 — 1.6 1.7 1,101
Gurugram 81.4 306.1 — — — —
Hisar 351.0 1,376.0 — 0.2 0.2 1,079
Jhajjar 197.6 721.3 — @ @ @
Jind 367.4 1,534.1 — — — —
Kaithal 377.7 1,563.0 — — — —
Karnal 353.8 1,593.4 — — — —
Kurukshetra 233.0 976.1 — — — —
Mahendragarh 154.3 430.4 — @ @ @
Nuh 123.3 453.5 — — — —
Palwal 148.3 526.6 — — — —
Panchkula 36.6 130.2 — — — —
Panipat 160.6 650.8 — — — —
Rewari 110.0 346.5 — @ @ @
Rohtak 173.4 636.8 — — — —
Sirsa 399.4 1,828.1 — 1.7 2.1 1,199
Sonipat 261.7 974.2 — — — —
Yamunanagar 169.1 664.2 — — — —
Total 4,571.7 18,155.9 — 3.5 4.0 1,143
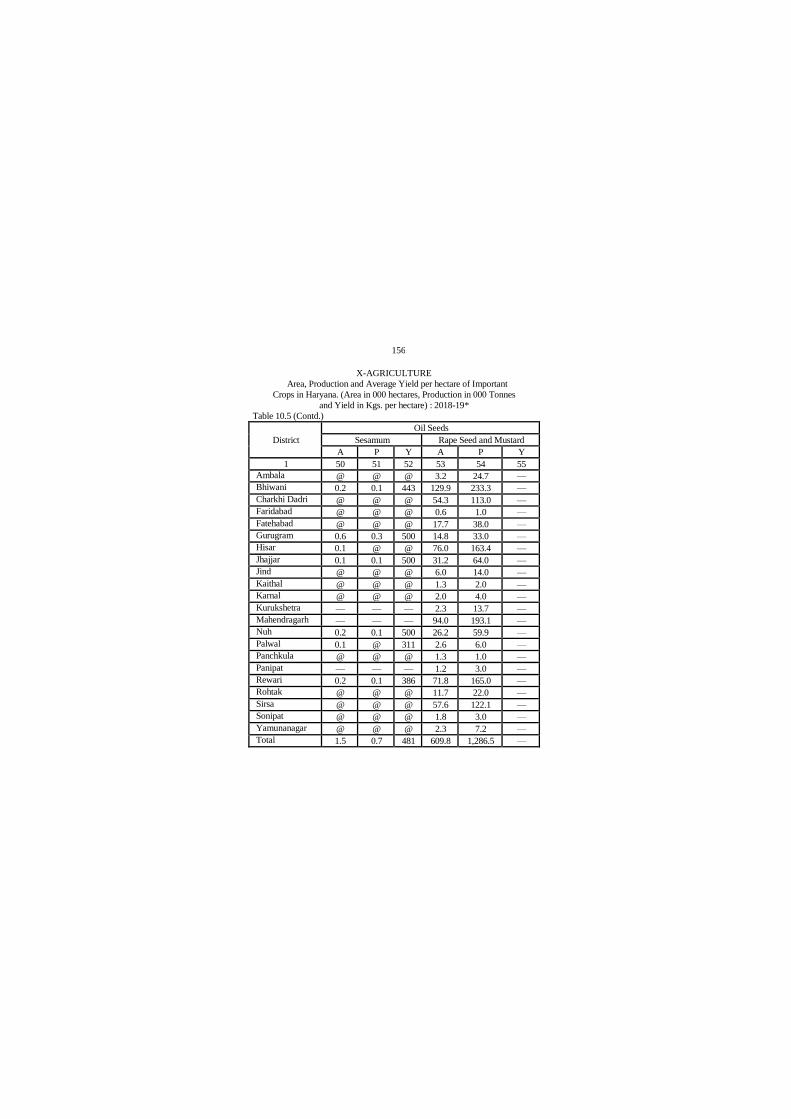
156
X-AGRICULTURE
Area, Production and Average Yield per hectare of Important
Crops in Haryana. (Area in 000 hectares, Production in 000 Tonnes
and Yield in Kgs. per hectare) : 2018-19*
Table 10.5 (Contd.)
District
Oil Seeds
Sesamum Rape Seed and Mustard
A P Y A P Y
1 50 51 52 53 54 55
Ambala @ @ @ 3.2 24.7 —
Bhiwani 0.2 0.1 443 129.9 233.3 —
Charkhi Dadri @ @ @ 54.3 113.0 —
Faridabad @ @ @ 0.6 1.0 —
Fatehabad @ @ @ 17.7 38.0 —
Gurugram 0.6 0.3 500 14.8 33.0 —
Hisar 0.1 @ @ 76.0 163.4 —
Jhajjar 0.1 0.1 500 31.2 64.0 —
Jind @ @ @ 6.0 14.0 —
Kaithal @ @ @ 1.3 2.0 —
Karnal @ @ @ 2.0 4.0 —
Kurukshetra — — — 2.3 13.7 —
Mahendragarh — — — 94.0 193.1 —
Nuh 0.2 0.1 500 26.2 59.9 —
Palwal 0.1 @ 311 2.6 6.0 —
Panchkula @ @ @ 1.3 1.0 —
Panipat — — — 1.2 3.0 —
Rewari 0.2 0.1 386 71.8 165.0 —
Rohtak @ @ @ 11.7 22.0 —
Sirsa @ @ @ 57.6 122.1 —
Sonipat @ @ @ 1.8 3.0 —
Yamunanagar @ @ @ 2.3 7.2 —
Total 1.5 0.7 481 609.8 1,286.5 —

157
X-AGRICULTURE
Area, Production and Average Yield per hectare of Important
Crops in Haryana. (Area in 000 hectares, Production in 000 Tonnes
and Yield in Kgs. per hectare) - 2018-19*
Table 10.5 (Contd.)
District
Oil Seeds
Linseed Other Oilseeds
A P Y A P Y
1 56 57 58 59 60 61
Ambala — — — 2.8 5.3 —
Bhiwani — — — 0 0 —
Charkhi Dadri — — — 0 0 —
Faridabad — — — 0 0 —
Fatehabad — — — 0.2 0.2 —
Gurugram — — — 0 0 —
Hisar — — — 0.7 0.6 —
Jhajjar — — — 0 0 —
Jind — — — 0 0 —
Kaithal — — — 0 0 —
Karnal — — — 0 0 —
Kurukshetra — — — 6.3 11.8 —
Mahendragarh — — — 0.1 0 —
Nuh — — — 0 0 —
Palwal — — — 0 0 —
Panchkula — — — 0.3 1.5 —
Panipat — — — 0 0 —
Rewari — — — 0 0 —
Rohtak — — — 0.1 0 —
Sirsa — — — 1.1 0.8 —
Sonipat — — — 0 0 —
Yamunanagar — — — 0.1 0.1 —
Total — — — 11.7 20.20 —

158
X-AGRICULTURE
Area, Production and Average Yield per hectare of Important
Crops in Haryana. (Area in 000 hectares, Production in 000 Tonnes
and Yield in Kgs. per hectare) : 2018-19*
Table 10.5 (Contd.)
District
Oil Seeds Cotton lint @@
Total Oilseeds American
A P Y A P Y
1 62 63 64 65 66 67
Ambala 6.0 30.0 — 0 @ @
Bhiwani 130.1 233.4 — 103.1 195 321
Charkhi Dadri 54.3 113.0 — 36.1 68 321
Faridabad 0.6 1.0 — 0.5 1 417
Fatehabad 19.5 39.9 — 65.6 239 593
Gurugram 15.4 33.3 — 2.5 8 508
Hisar 77.0 164.2 — 140.8 419 505
Jhajjar 31.3 64.1 — 10.6 32 516
Jind 6.0 14.0 — 61.1 162 451
Kaithal 1.3 2.0 — 6.5 19 483
Karnal 2.0 4.0 — @ @ @
Kurukshetra 8.6 25.5 — 0 @ @
Mahendragarh 94.1 193.1 — 32.4 101 531
Nuh 26.4 60.0 — 5.6 19 566
Palwal 2.7 6.0 — 17.6 55 530
Panchkula 1.6 2.5 — 0 @ @
Panipat 1.2 3.0 — @ @ @
Rewari 72.0 165.1 — 12.8 17 222
Rohtak 11.8 22.0 — 12.7 38 500
Sirsa 60.5 125.0 — 189.5 625 561
Sonipat 1.8 3.0 — 4.6 15 559
Yamunanagar 2.4 7.3 — 0 @ @
Total 626.6 1,311.4 — 702.0 2,013 484

159
X-AGRICULTURE
Area, Production and Average Yield per hectare of Important
Crops in Haryana. (Area in 000 hectares, Production in 000 Tonnes
and Yield in Kgs. per hectare) : 2018-19*
Table 10.5 (Contd.)
District
Cotton lint @@
Desi Total
A P Y A P Y
1 68 69 70 71 72 73
Ambala 0 0 0 0 @ @
Bhiwani 0 0 0 103.1 195 321
Charkhi Dadri 0 0 0 36.1 68 321
Faridabad 0 0 0 0.5 1 417
Fatehabad 1.1 6 498 66.7 245 591
Gurugram 0 0 0 2.5 8 508
Hisar 2.0 3 2 142.8 422 422
Jhajjar 0 0 0 10.6 32 516
Jind 0.1 0 0 61.2 162 451
Kaithal 0 0 0 6.5 19 483
Karnal 0 0 0 @ @ @
Kurukshetra 0 0 0 0 @ @
Mahendragarh 0 0 0 32.4 101 531
Nuh 0 0 0 5.6 19 566
Palwal 0 0 0 17.6 55 530
Panchkula 0 0 0 0 @ @
Panipat 0 0 0 @ @ @
Rewari 0 0 0 12.8 17 222
Rohtak 0 0 0 12.7 38 500
Sirsa 3.7 11 487 193.2 636 559
Sonipat 0 0 0 4.6 15 559
Yamunanagar 0 0 0 0 @ @
Total 6.9 20 427 708.9 2,033 483
@@ In thousand bales of 170 Kg. each.

160
X-AGRICULTURE
Area, Production and Average Yield per hectare of Important
Crops in Haryana. (Area in 000 hectares, Production in 000 Tonnes
and Yield in Kgs. per hectare) : 2017-18*
Table 10.5 (Contd.)
District Sugarcane (Gur) Potatoes
A P Y A P Y
1 74 75 76 77 78 79
Ambala 11.5 83 7,214 3.1 74.0 23,500
Bhiwani 2.6 20 7,396 0 0 0
Charkhi Dadri 1.3 12 9,232 0 0 0
Faridabad 0.4 2 5,507 0 0 0
Fatehabad 1.5 11 7,824 0.7 16.2 24,545
Gurugram @ @ @ 0 0 0
Hisar 1.5 11 7,766 0 0 0
Jhajjar 2.2 17 7,969 0 0 0
Jind 4.7 37 7,852 0.2 4.5 22,727
Kaithal 4.9 47 9,622 @ 0.4 23,529
Karnal 13.3 112 8,399 1.0 29.3 30,020
Kurukshetra 12.0 97 8,109 11.3 283.7 25,000
Mahendragarh 0 0 0 0 0 0
Nuh 0.4 3 7,824 0 0 0
Palwal 2.3 12 5,081 0 0 0
Panchkula 0.5 4 7,824 0.3 6.2 23,396
Panipat 7.6 73 9,546 0.2 5.6 23,932
Rewari @ @ @ 0 0 0
Rohtak 8.6 59 6,911 @ 0.2 18,182
Sirsa 0.1 1 7,824 0.6 12.7 21,562
Sonipat 8.5 81 9,498 @ 0.1 33,333
Yamunanagar 24.8 168 6,769 0.9 21.9 23,523
Total 108.7 850 7,824 18.4 454.8 24,743
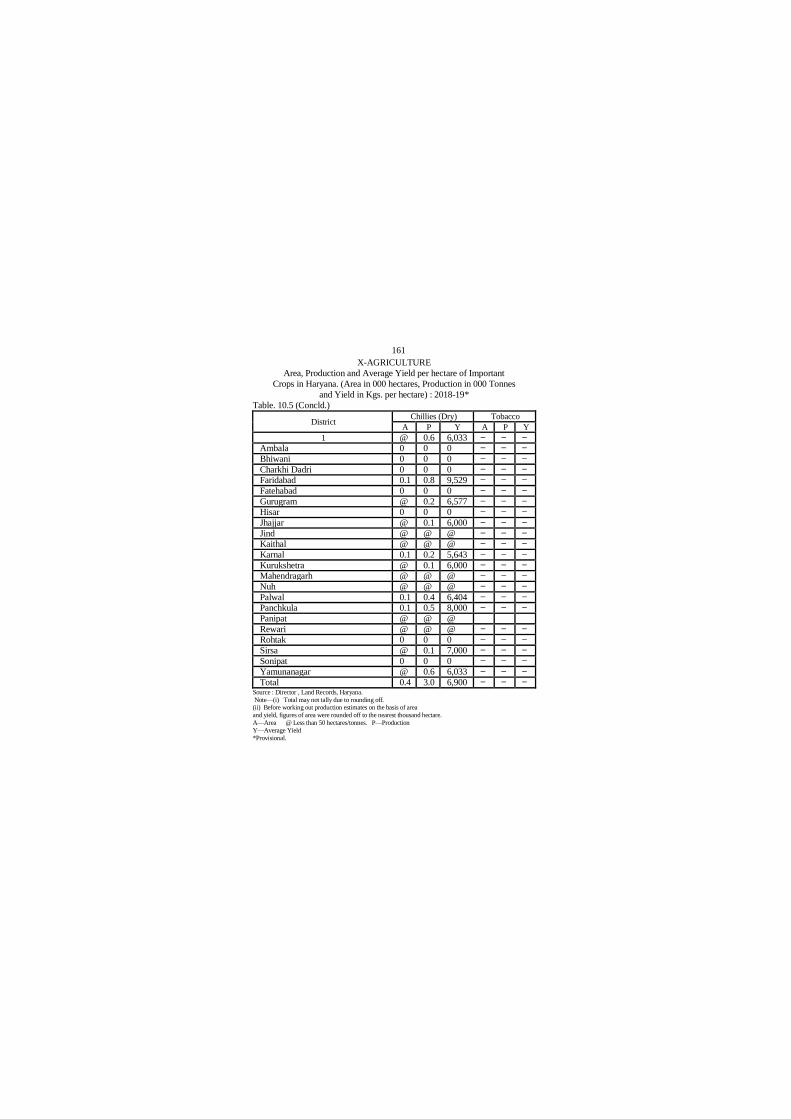
161
X-AGRICULTURE
Area, Production and Average Yield per hectare of Important
Crops in Haryana. (Area in 000 hectares, Production in 000 Tonnes
and Yield in Kgs. per hectare) : 2018-19*
Table. 10.5 (Concld.)
District Chillies (Dry) Tobacco
A P Y A P Y
1 @ 0.6 6,033 — — —
Ambala 0 0 0 — — —
Bhiwani 0 0 0 — — —
Charkhi Dadri 0 0 0 — — —
Faridabad 0.1 0.8 9,529 — — —
Fatehabad 0 0 0 — — —
Gurugram @ 0.2 6,577 — — —
Hisar 0 0 0 — — —
Jhajjar @ 0.1 6,000 — — —
Jind @ @ @ — — —
Kaithal @ @ @ — — —
Karnal 0.1 0.2 5,643 — — —
Kurukshetra @ 0.1 6,000 — — —
Mahendragarh @ @ @ — — —
Nuh @ @ @ — — —
Palwal 0.1 0.4 6,404 — — —
Panchkula 0.1 0.5 8,000 — — —
Panipat @ @ @
Rewari @ @ @ — — —
Rohtak 0 0 0 — — —
Sirsa @ 0.1 7,000 — — —
Sonipat 0 0 0 — — —
Yamunanagar @ 0.6 6,033 — — —
Total 0.4 3.0 6,900 — — — Source : Director , Land Records, Haryana.
Note—(i) Total may not tally due to rounding off. (ii) Before working out production estimates on the basis of area
and yield, figures of area were rounded off to the nearest thousand hectare.
A—Area @ Less than 50 hectares/tonnes. P—Production
Y—Average Yield
*Provisional.

162
X-AGRICULTURE
Area under Fruits and Vegetables: 2018-19 (P)
Table 10.6 (Hectares)
District Grapes Bananas Citrus Mangoes
1 2 3 4 5
Ambala 0 0 0 0
Bhiwani 0 0 0 0
Charkhi Dadri 0 0 0 0
Faridabad 0 0 0 0
Fatehabad 0 0 0 0
Gurugram 0 0 0 0
Hisar 0 0 0 0
Jhajjar 0 0 0 0
Jind 3 0 0 49
Kaithal 0 0 0 0
Karnal 0 0 0 0
Kurukshetra 0 0 0 0
Mahendragarh 0 0 0 0
Nuh 0 0 0 0
Palwal 0 0 0 0
Panchkula 0 0 0 0
Panipat 0 0 0 0
Rewari 0 0 0 0
Rohtak 0 0 0 0
Sirsa 0 0 0 0
Sonipat 0 0 0 0
Yamunanagar 0 0 0 441
Total 3 0 0 490
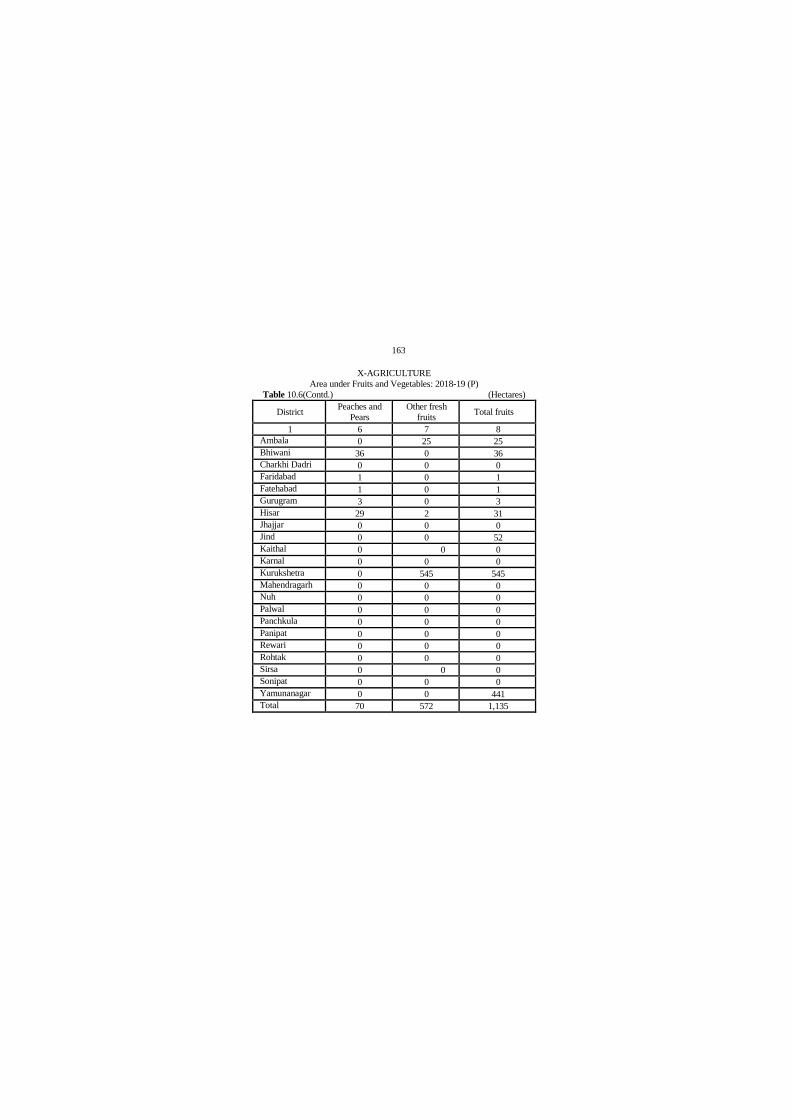
163
X-AGRICULTURE
Area under Fruits and Vegetables: 2018-19 (P)
Table 10.6(Contd.) (Hectares)
District Peaches and
Pears
Other fresh
fruits Total Total fruits
1 6 7 8
Ambala 0 25 25
Bhiwani 36 0 36
Charkhi Dadri 0 0 0
Faridabad 1 0 1
Fatehabad 1 0 1
Gurugram 3 0 3
Hisar 29 2 31
Jhajjar 0 0 0
Jind 0 0 52
Kaithal 0 0 0
Karnal 0 0 0
Kurukshetra 0 545 545
Mahendragarh 0 0 0
Nuh 0 0 0
Palwal 0 0 0
Panchkula 0 0 0
Panipat 0 0 0
Rewari 0 0 0
Rohtak 0 0 0
Sirsa 0 0 0
Sonipat 0 0 0
Yamunanagar 0 0 441
Total 70 572 1,135
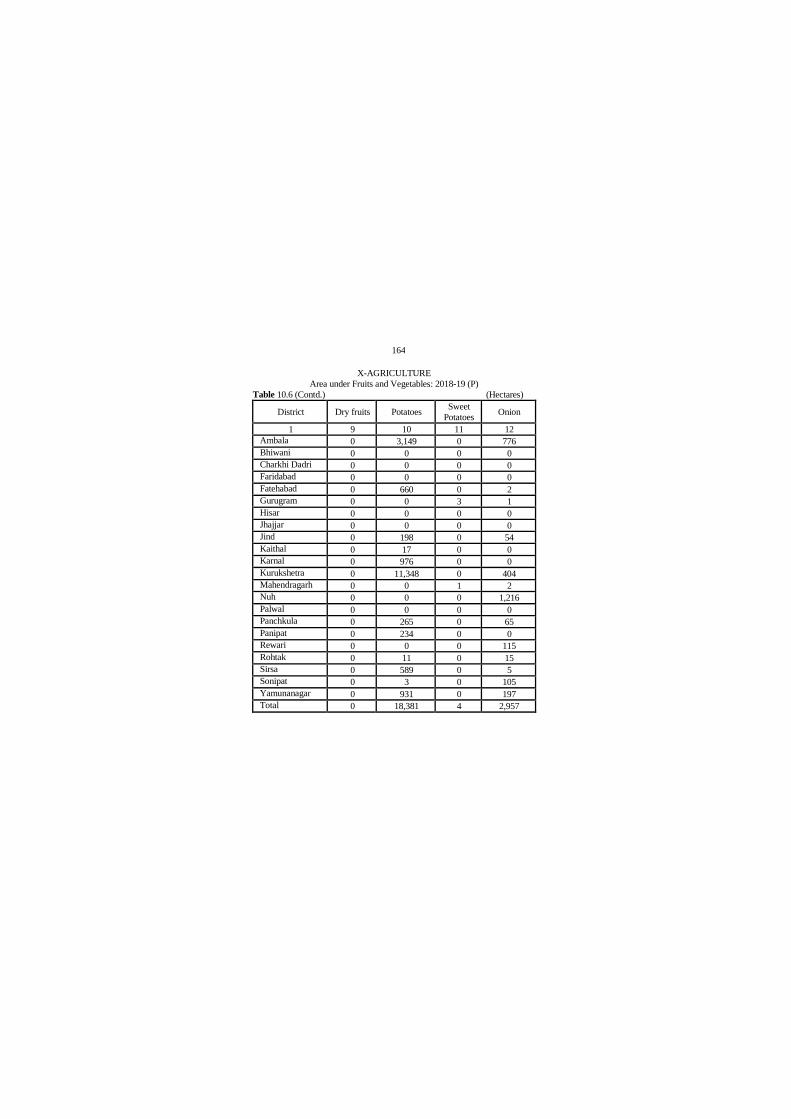
164
X-AGRICULTURE
Area under Fruits and Vegetables: 2018-19 (P)
Table 10.6 (Contd.) (Hectares)
District Dry fruits Potatoes Sweet
Potatoes Onion
1 9 10 11 12
Ambala 0 3,149 0 776
Bhiwani 0 0 0 0
Charkhi Dadri 0 0 0 0
Faridabad 0 0 0 0
Fatehabad 0 660 0 2
Gurugram 0 0 3 1
Hisar 0 0 0 0
Jhajjar 0 0 0 0
Jind 0 198 0 54
Kaithal 0 17 0 0
Karnal 0 976 0 0
Kurukshetra 0 11,348 0 404
Mahendragarh 0 0 1 2
Nuh 0 0 0 1,216
Palwal 0 0 0 0
Panchkula 0 265 0 65
Panipat 0 234 0 0
Rewari 0 0 0 115
Rohtak 0 11 0 15
Sirsa 0 589 0 5
Sonipat 0 3 0 105
Yamunanagar 0 931 0 197
Total 0 18,381 4 2,957

165
X-AGRICULTURE
Area under Fruits and Vegetables : 2018-19 (P)
Table 10.6 (Concld.) (Hectares)
District Other
Vegetables
Total fruits &
vegetables
Total condiments
and spices
1 13 14 15
Ambala 0 3950 117
Bhiwani 0 36 425
Charkhi Dadri 0 0 280
Faridabad 0 1 0
Fatehabad 0 663 148
Gurugram 0 7 3
Hisar 7,465 7,496 413
Jhajjar 0 0 0
Jind 0 304 17
Kaithal 0 17 3
Karnal 0 976 17
Kurukshetra 1,565 13,862 83
Mahendragarh 0 3 145
Nuh 0 1,216 4
Palwal 0 0 4
Panchkula 985 1,315 210
Panipat 0 234 62
Rewari 0 115 66
Rohtak 0 26 2
Sirsa 0 594 0
Sonipat 0 108 30
Yamunanagar 0 1,569 31
Total 10,015 32,492 2,060
Source: Director, Land Records, Haryana.
P: Provisional
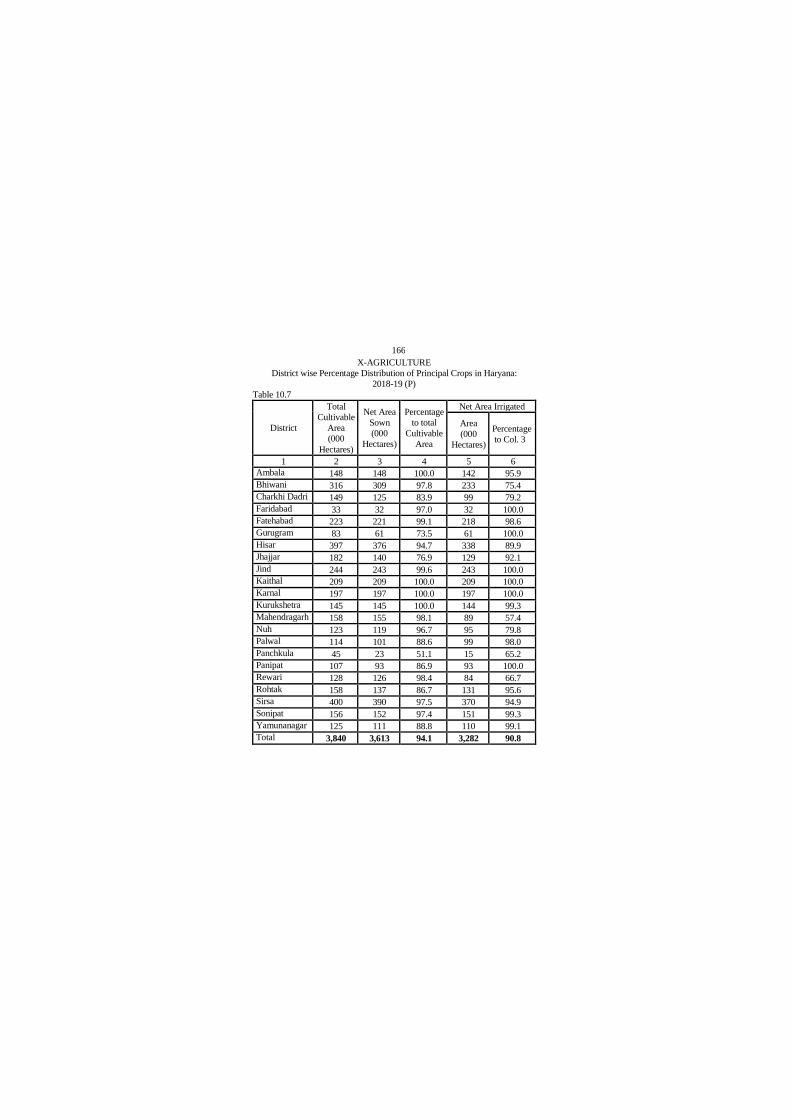
166
X-AGRICULTURE
District wise Percentage Distribution of Principal Crops in Haryana:
2018-19 (P)
Table 10.7
District
Total
Cultivable
Area
(000
Hectares)
Net Area
Sown
(000
Hectares)
Percentage
to total
Cultivable
Area
Net Area Irrigated
Area
(000
Hectares)
Percentage
to Col. 3
1 2 3 4 5 6
Ambala 148 148 100.0 142 95.9
Bhiwani 316 309 97.8 233 75.4
Charkhi Dadri 149 125 83.9 99 79.2
Faridabad 33 32 97.0 32 100.0
Fatehabad 223 221 99.1 218 98.6
Gurugram 83 61 73.5 61 100.0
Hisar 397 376 94.7 338 89.9
Jhajjar 182 140 76.9 129 92.1
Jind 244 243 99.6 243 100.0
Kaithal 209 209 100.0 209 100.0
Karnal 197 197 100.0 197 100.0
Kurukshetra 145 145 100.0 144 99.3
Mahendragarh 158 155 98.1 89 57.4
Nuh 123 119 96.7 95 79.8
Palwal 114 101 88.6 99 98.0
Panchkula 45 23 51.1 15 65.2
Panipat 107 93 86.9 93 100.0
Rewari 128 126 98.4 84 66.7
Rohtak 158 137 86.7 131 95.6
Sirsa 400 390 97.5 370 94.9
Sonipat 156 152 97.4 151 99.3
Yamunanagar 125 111 88.8 110 99.1
Total 3,840 3,613 94.1 3,282 90.8
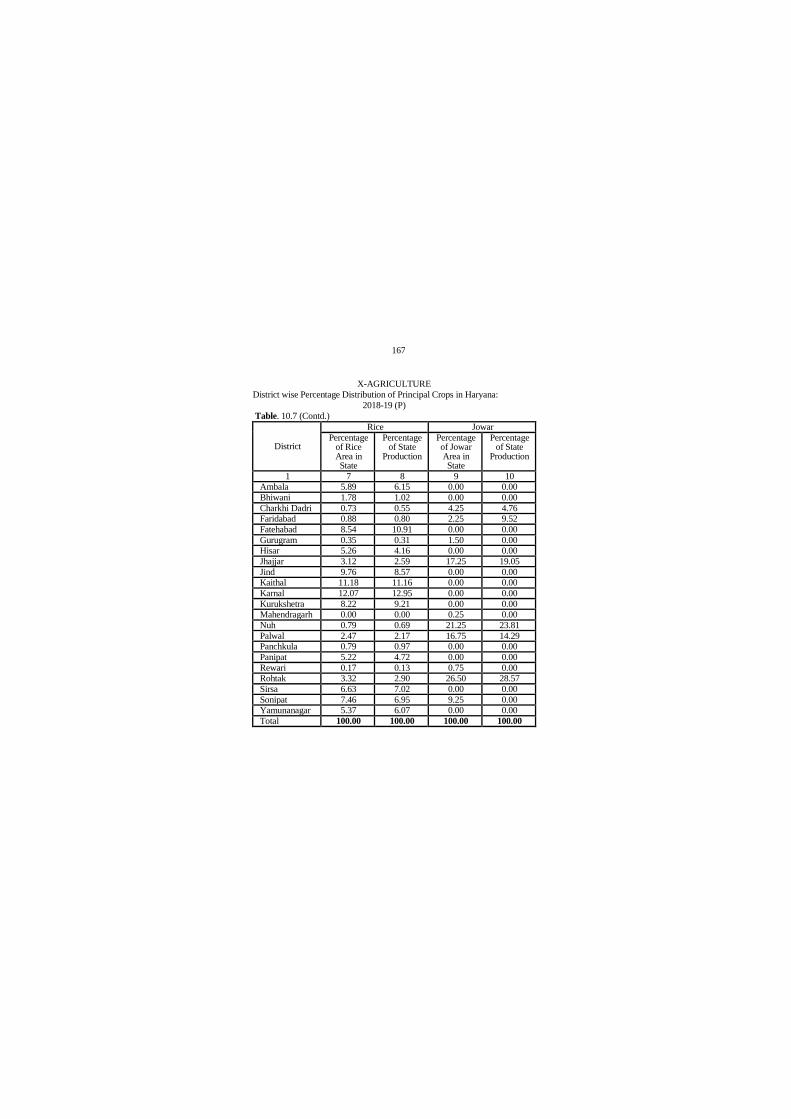
167
X-AGRICULTURE
District wise Percentage Distribution of Principal Crops in Haryana:
2018-19 (P)
Table. 10.7 (Contd.)
District
Rice Jowar
Percentage of Rice Area in State
Percentage of State
Production
Percentage of Jowar Area in State
Percentage of State
Production
1 7 8 9 10
Ambala 5.89 6.15 0.00 0.00
Bhiwani 1.78 1.02 0.00 0.00
Charkhi Dadri 0.73 0.55 4.25 4.76
Faridabad 0.88 0.80 2.25 9.52
Fatehabad 8.54 10.91 0.00 0.00
Gurugram 0.35 0.31 1.50 0.00
Hisar 5.26 4.16 0.00 0.00
Jhajjar 3.12 2.59 17.25 19.05
Jind 9.76 8.57 0.00 0.00
Kaithal 11.18 11.16 0.00 0.00
Karnal 12.07 12.95 0.00 0.00
Kurukshetra 8.22 9.21 0.00 0.00
Mahendragarh 0.00 0.00 0.25 0.00
Nuh 0.79 0.69 21.25 23.81
Palwal 2.47 2.17 16.75 14.29
Panchkula 0.79 0.97 0.00 0.00
Panipat 5.22 4.72 0.00 0.00
Rewari 0.17 0.13 0.75 0.00
Rohtak 3.32 2.90 26.50 28.57
Sirsa 6.63 7.02 0.00 0.00
Sonipat 7.46 6.95 9.25 0.00
Yamunanagar 5.37 6.07 0.00 0.00
Total 100.00 100.00 100.00 100.00

168
X-AGRICULTURE
District wise Percentage Distribution of Principal Crops in Haryana:
2018-19 (P)
Table 10.7 (Contd.)
District
Bajra Maize
Percentage
of Bajra
Area in
State
Percentage
of State
Production
Percentage
of Maize
Area in State
Percentage
of State
Production
1 11 12 13 14
Ambala 0.00 0.00 3.23 6.25
Bhiwani 13.66 9.45 0.00 0.00
Charkhi Dadri 8.81 7.74 0.00 0.00
Faridabad 0.71 1.14 0.00 0.00
Fatehabad 0.38 0.46 0.00 0.00
Gurugram 7.42 8.43 0.00 0.00
Hisar 6.38 6.15 0.00 0.00
Jhajjar 9.07 10.59 1.61 0.00
Jind 2.57 2.28 0.00 0.00
Kaithal 0.24 0.23 0.00 0.00
Karnal 0.05 0.11 0.00 0.00
Kurukshetra 0.00 0.00 0.00 0.00
Mahendragarh 23.31 23.12 0.00 0.00
Nuh 6.03 7.74 0.00 0.00
Palwal 1.53 2.16 0.00 0.00
Panchkula 0.45 0.46 75.81 75.00
Panipat 0.09 0.11 0.00 0.00
Rewari 15.30 15.38 0.00 0.00
Rohtak 1.88 2.05 6.45 6.25
Sirsa 0.94 1.25 0.00 0.00
Sonipat 1.18 1.14 12.90 12.50
Yamunanagar 0.02 0.00 0.00 0.00
Total 100.00 100.00 100.00 100.00

169
X-AGRICULTURE
Districtwise Percentage Distribution of Principal Crops in Haryana :
2018-19 (P)
Table 10.7 (Contd.)
District
Wheat Barley
Percentage
of Wheat
Area in
State
Percentage
Percentage
of State
Production
Percentage
of Barley
Area in
State
Percentage
of State
Production
1 15 16 17 18
Ambala 3.43 3.31 0.00 0.00
Bhiwani 4.43 3.98 16.13 15.52
Charkhi Dadri 2.14 2.17 9.68 10.34
Faridabad 1.16 1.21 1.29 1.72
Fatehabad 7.33 8.02 3.23 3.45
Gurugram 1.69 1.70 4.52 5.17
Hisar 8.66 8.72 12.90 12.07
Jhajjar 4.12 3.98 8.39 10.34
Jind 8.42 8.96 1.29 1.72
Kaithal 8.42 8.41 0.00 0.00
Karnal 6.99 8.01 0.00 0.00
Kurukshetra 4.43 4.45 0.00 0.00
Mahendragarh 1.74 1.68 3.23 3.45
Nuh 2.99 2.76 3.23 3.45
Palwal 3.72 3.20 4.52 5.17
Panchkula 0.70 0.56 0.00 0.00
Panipat 3.26 3.46 0.00 0.00
Rewari 1.61 1.61 5.16 3.45
Rohtak 4.08 3.79 10.32 6.90
Sirsa 11.48 11.80 16.13 17.24
Sonipat 5.65 5.14 0.00 0.00
Yamunanagar 3.56 3.10 0.00 0.00
Total 100.00 100.00 100.00 100.00

170
X-AGRICULTURE
District wise Percentage Distribution of Principal Crops in Haryana:
2018-19 (P)
Table 10.7 (Contd.)
District
Gram Sugarcane
Percentage of Gram Area in State
Percentage of State
Production
Percentage of Sugarcane
Area in State
Percentage of State
Production
1 19 20 21 22
Ambala 0.00 0.00 10.58 9.76
Bhiwani 37.42 27.17 2.39 2.35
Charkhi Dadri 2.90 3.54 1.20 1.41
Faridabad 0.00 0.00 0.37 0.24
Fatehabad 2.45 3.54 1.38 1.29
Gurugram 0.00 0.00 0.00 0.00
Hisar 26.06 31.03 1.38 1.29
Jhajjar 0.45 0.32 2.02 2.00
Jind 0.00 0.16 4.32 4.35
Kaithal 0.00 0.00 4.51 5.53
Karnal 0.22 0.16 12.24 13.18
Kurukshetra 0.00 0.16 11.04 11.41
Mahendragarh 20.94 22.67 0.00 0.00
Nuh 0.89 0.96 0.37 0.35
Palwal 0.00 0.00 2.12 1.41
Panchkula 0.22 0.16 0.46 0.47
Panipat 0.22 0.32 6.99 8.59
Rewari 0.00 0.00 0.00 0.00
Rohtak 0.45 0.32 7.91 6.94
Sirsa 7.80 9.49 0.09 0.12
Sonipat 0.00 0.00 7.82 9.53
Yamunanagar 0.00 0.00 22.82 19.76
Total 100.00 100.00 100.00 100.00
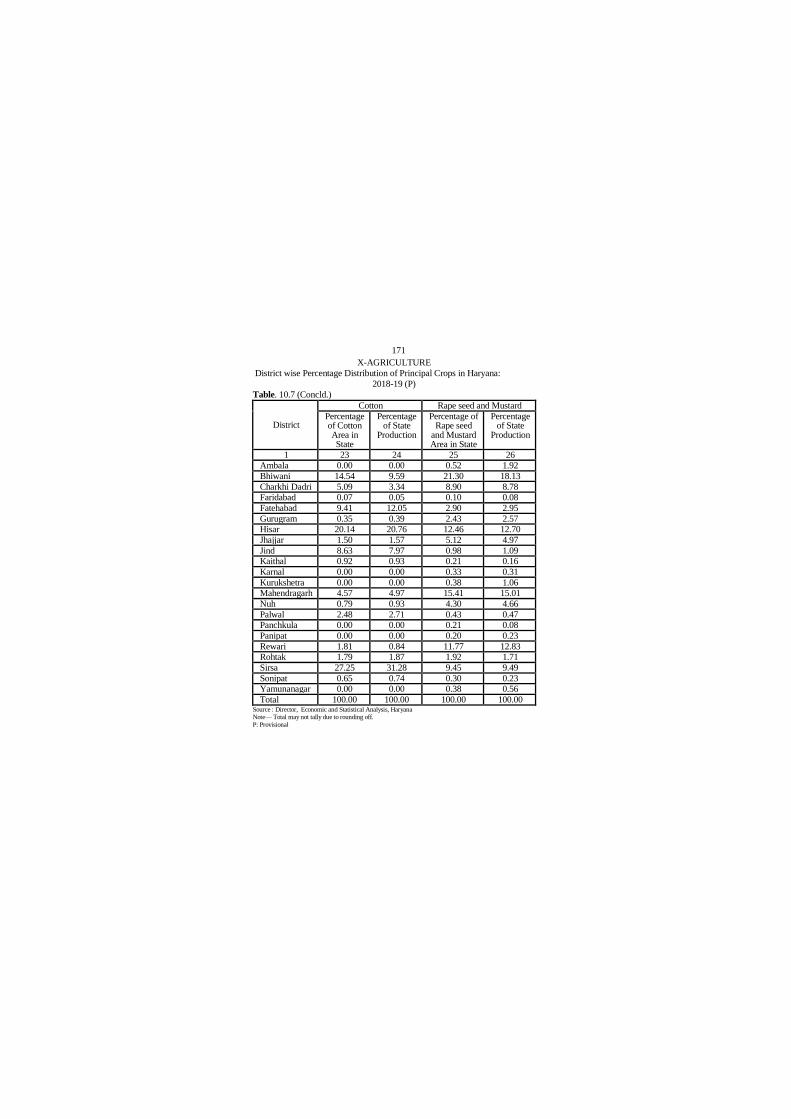
171
X-AGRICULTURE
District wise Percentage Distribution of Principal Crops in Haryana:
2018-19 (P)
Table. 10.7 (Concld.)
District
Cotton Rape seed and Mustard
Percentage of Cotton Area in State
Percentage of State
Production
Percentage of Rape seed
and Mustard Area in State
Percentage of State
Production
1 23 24 25 26
Ambala 0.00 0.00 0.52 1.92
Bhiwani 14.54 9.59 21.30 18.13
Charkhi Dadri 5.09 3.34 8.90 8.78
Faridabad 0.07 0.05 0.10 0.08
Fatehabad 9.41 12.05 2.90 2.95
Gurugram 0.35 0.39 2.43 2.57
Hisar 20.14 20.76 12.46 12.70
Jhajjar 1.50 1.57 5.12 4.97
Jind 8.63 7.97 0.98 1.09
Kaithal 0.92 0.93 0.21 0.16
Karnal 0.00 0.00 0.33 0.31
Kurukshetra 0.00 0.00 0.38 1.06
Mahendragarh 4.57 4.97 15.41 15.01
Nuh 0.79 0.93 4.30 4.66
Palwal 2.48 2.71 0.43 0.47
Panchkula 0.00 0.00 0.21 0.08
Panipat 0.00 0.00 0.20 0.23
Rewari 1.81 0.84 11.77 12.83
Rohtak 1.79 1.87 1.92 1.71
Sirsa 27.25 31.28 9.45 9.49
Sonipat 0.65 0.74 0.30 0.23
Yamunanagar 0.00 0.00 0.38 0.56
Total 100.00 100.00 100.00 100.00 Source : Director, Economic and Statistical Analysis, Haryana Note— Total may not tally due to rounding off.
P: Provisional

172
XI-IRRIGATION
Net Area under Irrigation : 2018-19 (P)
Table 11.1 (000 Hectares)
District Net area irrigated
Government
Canals
Tanks Wells Tubewells
1 2 3 4 5
Ambala 3 — — 139
Bhiwani 60 — — 173
Charkhi Dadri 26 — — 73
Faridabad — — — 32
Fatehabad 64 — — 154
Gurugram — — — 61
Hisar 206 — — 132
Jhajjar 53 — — 76
Jind 178 — — 65
Kaithal 76 — — 133
Karnal 56 — — 141
Kurukshetra 29 — — 115
Mahendragarh 1 — — 88
Nuh 14 — — 81
Palwal 21 — — 78
Panchkula — — — 15
Panipat 54 — — 39
Rewari — — — 84
Rohtak 75 — — 56
Sirsa 269 — — 101
Sonipat 28 — — 123
Yamunanagar 2 — — 108
Total 1,215 — — 2,067
Source :— Director, Land Records, Haryana.
* Provisional

173
XI-IRRIGATION
Net Area under Irrigation: 2018-19 (P)
Table 11.1(Concld.) (000 Hectares)
District Net area irrigated
Other sources Total Percentage to
net area sown
1 6 7 8
Ambala — 142 95.9
Bhiwani — 233 75.4
Charkhi Dadri — 99 88.4
Faridabad — 32 100.0
Fatehabad — 218 98.6
Gurugram — 61 100.0
Hisar — 338 89.9
Jhajjar — 129 92.1
Jind — 243 99.6
Kaithal — 209 100.0
Karnal — 197 100.0
Kurukshetra — 144 99.3
Mahendragarh — 89 57.4
Nuh — 95 79.8
Palwal — 99 98.0
Panchkula — 15 65.2
Panipat — 93 100.0
Rewari — 84 66.7
Rohtak — 131 95.6
Sirsa — 370 94.9
Sonipat — 151 99.3
Yamunanagar — 110 99.1
Total — 3,282 91.1
Source :— Director, Land Records, Haryana.
(a) Means less than 500 hectares.
Total may not tally due to rounding off.
* Provisional
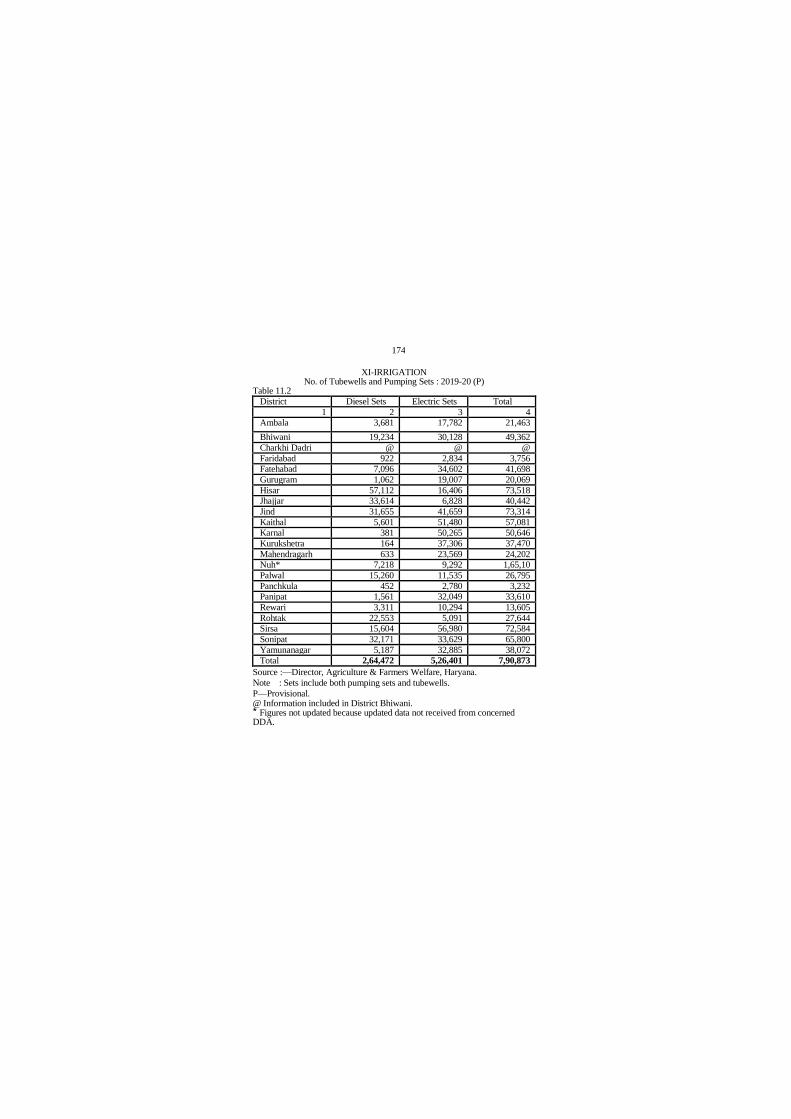
174
XI-IRRIGATION
No. of Tubewells and Pumping Sets : 2019-20 (P) Table 11.2
District Diesel Sets Electric Sets Total
1 2 3 4
Ambala 3,681 17,782 21,463
Bhiwani 19,234 30,128 49,362
Charkhi Dadri @ @ @
Faridabad 922 2,834 3,756
Fatehabad 7,096 34,602 41,698
Gurugram 1,062 19,007 20,069
Hisar 57,112 16,406 73,518
Jhajjar 33,614 6,828 40,442
Jind 31,655 41,659 73,314
Kaithal 5,601 51,480 57,081
Karnal 381 50,265 50,646
Kurukshetra 164 37,306 37,470
Mahendragarh 633 23,569 24,202
Nuh* 7,218 9,292 1,65,10
Palwal 15,260 11,535 26,795
Panchkula 452 2,780 3,232
Panipat 1,561 32,049 33,610
Rewari 3,311 10,294 13,605
Rohtak 22,553 5,091 27,644
Sirsa 15,604 56,980 72,584
Sonipat 32,171 33,629 65,800
Yamunanagar 5,187 32,885 38,072
Total 2,64,472 5,26,401 7,90,873
Source :—Director, Agriculture & Farmers Welfare, Haryana.
Note : Sets include both pumping sets and tubewells.
P—Provisional. @ Information included in District Bhiwani. * Figures not updated because updated data not received from concerned DDA.
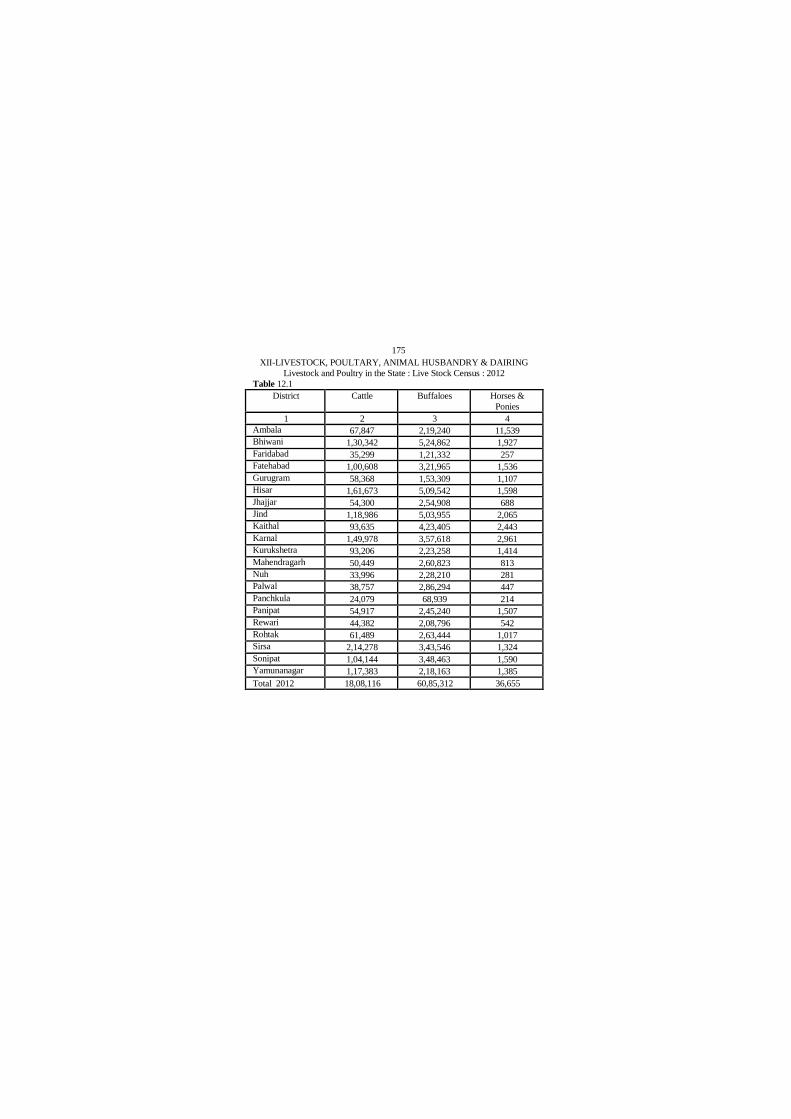
175
XII-LIVESTOCK, POULTARY, ANIMAL HUSBANDRY & DAIRING
Livestock and Poultry in the State : Live Stock Census : 2012
Table 12.1
District Cattle Buffaloes Horses &
Ponies
1 2 3 4
Ambala 67,847 2,19,240 11,539
Bhiwani 1,30,342 5,24,862 1,927
Faridabad 35,299 1,21,332 257
Fatehabad 1,00,608 3,21,965 1,536
Gurugram 58,368 1,53,309 1,107
Hisar 1,61,673 5,09,542 1,598
Jhajjar 54,300 2,54,908 688
Jind 1,18,986 5,03,955 2,065
Kaithal 93,635 4,23,405 2,443
Karnal 1,49,978 3,57,618 2,961
Kurukshetra 93,206 2,23,258 1,414
Mahendragarh 50,449 2,60,823 813
Nuh 33,996 2,28,210 281
Palwal 38,757 2,86,294 447
Panchkula 24,079 68,939 214
Panipat 54,917 2,45,240 1,507
Rewari 44,382 2,08,796 542
Rohtak 61,489 2,63,444 1,017
Sirsa 2,14,278 3,43,546 1,324
Sonipat 1,04,144 3,48,463 1,590
Yamunanagar 1,17,383 2,18,163 1,385
Total 2012 18,08,116 60,85,312 36,655

176
XII-LIVESTOCK, POULTARY, ANIMAL HUSBANDRY & DAIRING
Livestock and Poultry in the State : Live Stock Census :2012
Table 12.1(Contd.)
District Donkeys Mules Sheep
1 5 6 7
Ambala 35 190 12,699
Bhiwani 367 1046 50,270
Faridabad 115 76 2,873
Fatehabad 117 277 17,254
Gurugram 326 310 2,464
Hisar 152 661 49,043
Jhajjar 190 917 19,811
Jind 114 652 28,066
Kaithal 122 425 16,485
Karnal 247 271 15,095
Kurukshetra 15 155 10,044
Mahendragarh 62 411 24,382
Nuh 111 122 8,107
Palwal 135 226 11,622
Panchkula 121 249 3,467
Panipat 34 135 6,913
Rewari 100 839 8,684
Rohtak 104 547 16,122
Sirsa 323 800 41,888
Sonipat 110 496 7,422
Yamunanagar 3 204 9,906
Total 2012 2,903 9,009 3,62,617

177
XII-LIVESTOCK, POULTARY, ANIMAL HUSBANDRY & DAIRING
Livestock and Poultry in the State : Live Stock Census : 2012
Table 12.1 (Contd.)
District Goats Camels Pigs Total
Livestock
1 8 9 10 11
Ambala 7,800 — 5,227 3,24,577
Bhiwani 50,907 5,404 8,514 7,73,639
Faridabad 11,697 8 4,225 1,75,882
Fatehabad 12,962 1,840 4,995 4,61,554
Gurugram 11,555 91 5,537 2,33,067
Hisar 21,960 1,617 8,975 7,55,221
Jhajjar 10,381 112 7,804 3,49,111
Jind 10,310 102 10,929 6,75,179
Kaithal 9,147 6 10,800 5,56,468
Karnal 11,592 95 9,071 5,46,928
Kurukshetra 4,761 1 3,518 3,36,372
Mahendragarh 54,693 3,591 1,500 3,96,724
Nuh 9,350 130 3,453 3,12,581
Palwal 38,171 10 4,308 3,51,149
Panchkula 8,199 48 1,400 1,06,716
Panipat 5,405 2 5,945 3,20,098
Rewari 23,237 1,004 2,688 2,90,272
Rohtak 6,481 14 10,897 3,60,115
Sirsa 41,724 4,766 1,453 6,50,102
Sonipat 8,638 1 11,163 4,82,027
Yamunanagar 10,146 3 4,543 3,61,736
Total 2012 3,69,116 18,845 1,26,945 88,19,518

178
XII-LIVESTOCK, POULTARY, ANIMAL HUSBANDRY & DAIRING
Livestock and Poultry in the State : Live Stock Census : 2012
Table 12.1 (Concld.)
District Dogs Poultry
1 12 13
Ambala 10,421 25,54,380
Bhiwani 15,223 28,26,636
Faridabad 8,629 42,873
Fatehabad 9,501 2,93,332
Gurugram 23,438 5,01,064
Hisar 10,011 36,15,536
Jhajjar 7,730 2,24,841
Jind 3,810 69,40,932
Kaithal 6,984 15,92,210
Karnal 10,345 65,61,140
Kurukshetra 6,830 36,27,391
Mahendragarh 7,646 9,47,864
Nuh 743 46,089
Palwal 1,844 8,430
Panchkula 4,284 61,83,334
Panipat 2,986 22,86,966
Rewari 6,296 7,39,732
Rohtak 5,113 6,94,365
Sirsa 21,491 5,53,373
Sonipat 7,422 15,64,390
Yamunanagar 7,936 10,06,470
Total 2012 1,78,683 4,28,21,348
Source:— Director, Animal Husbandry and Dairying, Haryana.
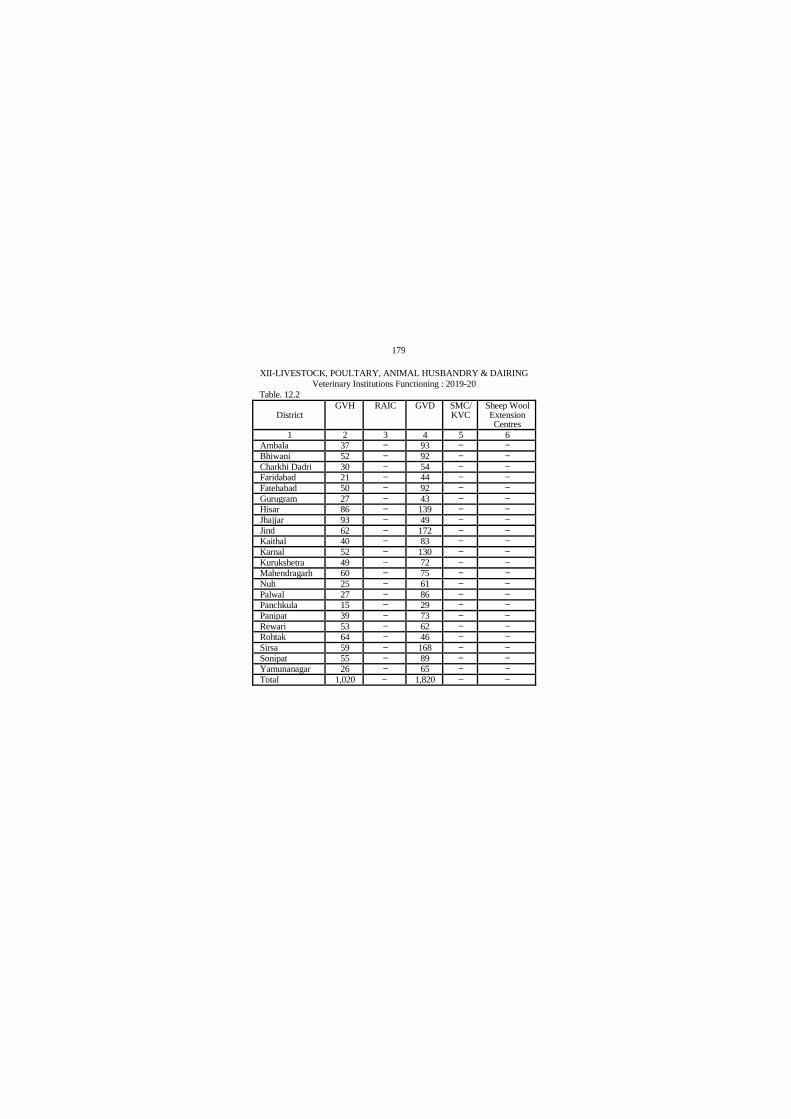
179
XII-LIVESTOCK, POULTARY, ANIMAL HUSBANDRY & DAIRING
Veterinary Institutions Functioning : 2019-20
Table. 12.2
District GVH RAIC GVD SMC/
KVC Sheep Wool Extension Centres
1 2 3 4 5 6
Ambala 37 — 93 — —
Bhiwani 52 — 92 — —
Charkhi Dadri 30 — 54 — —
Faridabad 21 — 44 — —
Fatehabad 50 — 92 — —
Gurugram 27 — 43 — —
Hisar 86 — 139 — —
Jhajjar 93 — 49 — —
Jind 62 — 172 — —
Kaithal 40 — 83 — —
Karnal 52 — 130 — —
Kurukshetra 49 — 72 — —
Mahendragarh 60 — 75 — —
Nuh 25 — 61 — —
Palwal 27 — 86 — —
Panchkula 15 — 29 — —
Panipat 39 — 73 — —
Rewari 53 — 62 — —
Rohtak 64 — 46 — —
Sirsa 59 — 168 — —
Sonipat 55 — 89 — —
Yamunanagar 26 — 65 — —
Total 1,020 — 1,820 — —

180
XII-LIVESTOCK, POULTARY, ANIMAL HUSBANDRY & DAIRING Veterinary Institutions Functioning : 2019-20
Table 12.2 (Concld.)
District
Poultry Farms/ PEC/ IDB Poultry-
cum-Pigery Centres
Piggery Farms
Horse Breeding Centre
Gosadan
1 7 8 9 10 Ambala — 1 — — Bhiwani — — — — Charkhi Dadri — — — — Faridabad — — — — Fatehabad — — — — Gurugram — — — — Hisar — 1 — 1 Jhajjar — — — — Jind — — — — Kaithal — — — — Karnal — — — — Kurukshetra — — — — Mahendragarh — — — — Nuh — — — — Palwal — — — — Panchkula — — — — Panipat — — — — Rewari — — — — Rohtak — — — — Sirsa — — — — Sonipat — — — — Yamunanagar — — — 1 Total — 2 — 2
Source : Department of Animal Husbandry and Dairying, Haryana.
GVH—Govt Veterinary Hospital.
RAIC—Regional Artificial Insemination Centre.
GVD—Govt Veterinary Dispensary.
SMC/KVC—Stockmen Centre/Key Village Centre.
PEC—Poultry Extension Centre includes 12 PEC and one
Poultry Farm (22+13=35).

181
XII-LIVESTOCK, POULTARY, ANIMAL HUSBANDRY & DAIRING
Staff of Veterinary Institutions in the State: 2019-20
Table 12.3
District
Number of Veterinary Surgeons
Number of Animal
Husbandry Assistants
Number of Compounders of Provincialized Dispensaries
1 2 3 4
Ambala 26 — —
Bhiwani 45 — —
Charkhi Dadri 20 — —
Faridabad 45 — —
Fatehabad 16 — —
Gurugram 23 — —
Hisar 73 — —
Jhajjar 70 — —
Jind 33 — —
Kaithal 20 — —
Karnal 35 — —
Kurukshetra 36 — —
Mahendragarh 51 — —
Nuh 12 — —
Palwal 16 — —
Panchkula 20 — —
Panipat 26 — —
Rewari 45 — —
Rohtak 50 — —
Sirsa 40 — —
Sonipat 31 — —
Yamunanagar 16 — —
Chandigarh 1 — —
H.Q. Panchkula 6 — —
Total 756 — —
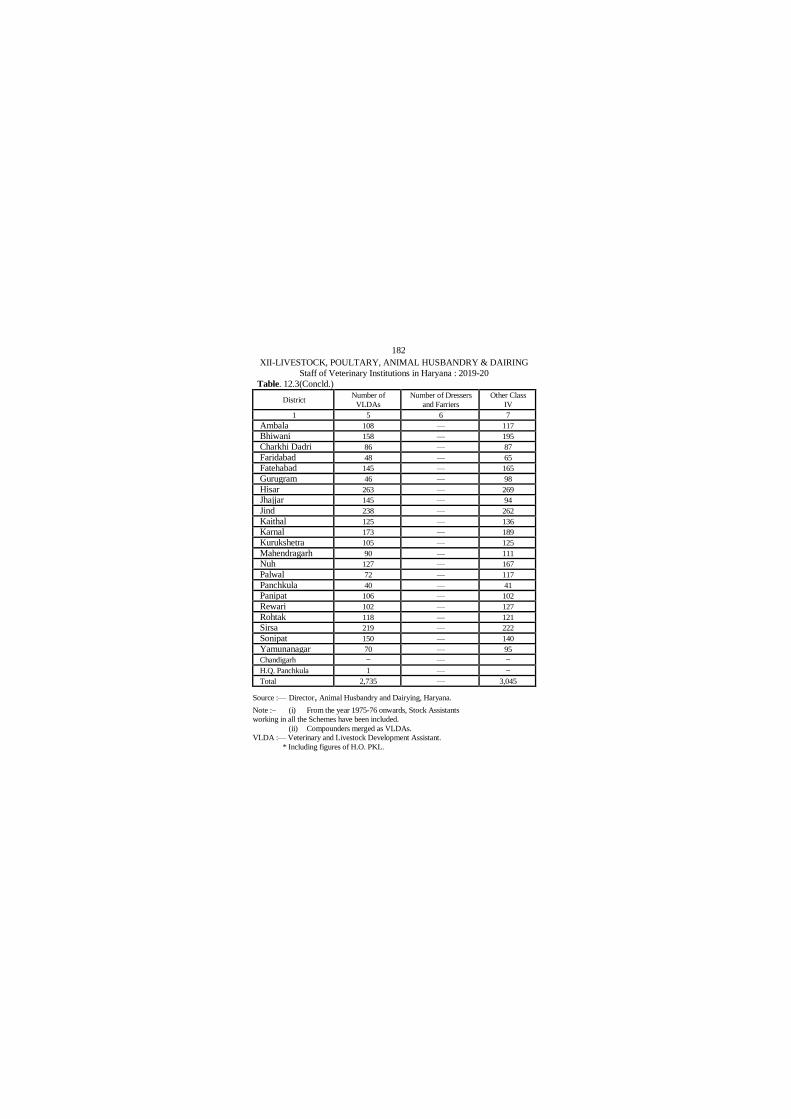
182
XII-LIVESTOCK, POULTARY, ANIMAL HUSBANDRY & DAIRING
Staff of Veterinary Institutions in Haryana : 2019-20
Table. 12.3(Concld.)
District Number of
VLDAs
Number of Dressers
and Farriers
Other Class
IV
1 5 6 7
Ambala 108 — 117
Bhiwani 158 — 195
Charkhi Dadri 86 — 87
Faridabad 48 — 65
Fatehabad 145 — 165
Gurugram 46 — 98
Hisar 263 — 269
Jhajjar 145 — 94
Jind 238 — 262
Kaithal 125 — 136
Karnal 173 — 189
Kurukshetra 105 — 125
Mahendragarh 90 — 111
Nuh 127 — 167
Palwal 72 — 117
Panchkula 40 — 41
Panipat 106 — 102
Rewari 102 — 127
Rohtak 118 — 121
Sirsa 219 — 222
Sonipat 150 — 140
Yamunanagar 70 — 95
Chandigarh — — —
H.Q. Panchkula 1 — —
Total 2,735 — 3,045
Source :— Director, Animal Husbandry and Dairying, Haryana.
Note :– (i) From the year 1975-76 onwards, Stock Assistants
working in all the Schemes have been included.
(ii) Compounders merged as VLDAs.
VLDA :— Veterinary and Livestock Development Assistant.
* Including figures of H.O. PKL.
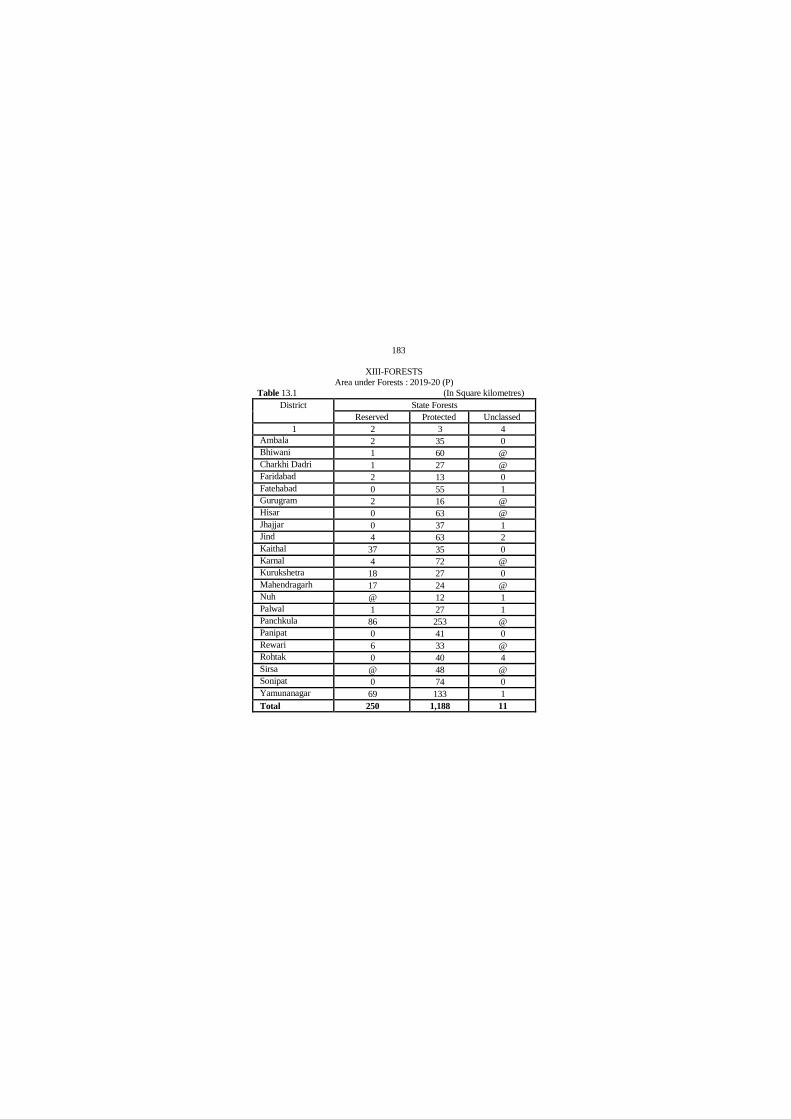
183
XIII-FORESTS
Area under Forests : 2019-20 (P)
Table 13.1 (In Square kilometres)
District State Forests
Reserved Protected Unclassed
1 2 3 4
Ambala 2 35 0
Bhiwani 1 60 @
Charkhi Dadri 1 27 @
Faridabad 2 13 0
Fatehabad 0 55 1
Gurugram 2 16 @
Hisar 0 63 @
Jhajjar 0 37 1
Jind 4 63 2
Kaithal 37 35 0
Karnal 4 72 @
Kurukshetra 18 27 0
Mahendragarh 17 24 @
Nuh @ 12 1
Palwal 1 27 1
Panchkula 86 253 @
Panipat 0 41 0
Rewari 6 33 @
Rohtak 0 40 4
Sirsa @ 48 @
Sonipat 0 74 0
Yamunanagar 69 133 1
Total 250 1,188 11

184
XIII-FORESTS
Area under Forests : 2019-20 (P)
Table 13.1(Concld.) (In Square kilometres)
District Private Forests Total Percentage of
State forests to
total Forests Closed under
Indian
Forests Act
Closed under
land
Preservation
Act
1 5 6 7 8
Ambala @ 16 53 69.81
Bhiwani 2 1 64 95.31
Charkhi Dadri 0 0 28 100.00
Faridabad 0 55 70 21.43
Fatehabad @ 0 56 100.00
Gurugram 0 69 87 20.69
Hisar @ 0 63 100.00
Jhajjar 0 2 40 95.00
Jind @ 0 69 100.00
Kaithal 0 0 72 100.00
Karnal 1 @ 77 98.70
Kurukshetra 0 0 45 100.00
Mahendragarh 5 11 57 71.93
Nuh 2 64 79 16.46
Palwal 0 @ 29 100.00
Panchkula 0 43 382 88.74
Panipat 1 0 42 97.62
Rewari 1 9 49 79.59
Rohtak 0 2 46 95.65
Sirsa 1 0 49 97.96
Sonipat 1 19 94 78.72
Yamunanagar 0 25 228 89.04
Total 14 316 1,779 81.45 Source :—Forest Department, Haryana. @ less than one.
P – Provisional
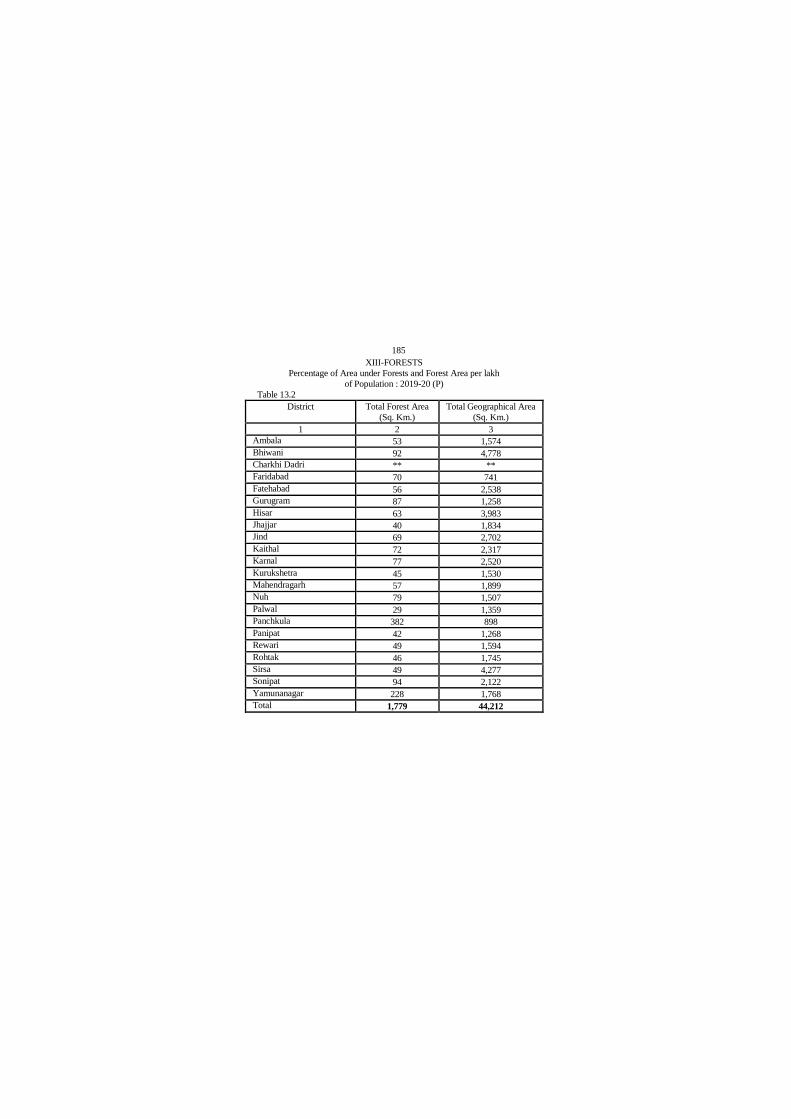
185
XIII-FORESTS
Percentage of Area under Forests and Forest Area per lakh
of Population : 2019-20 (P)
Table 13.2
District Total Forest Area
(Sq. Km.)
Total Geographical Area
(Sq. Km.)
1 2 3
Ambala 53 1,574
Bhiwani 92 4,778
Charkhi Dadri ** **
Faridabad 70 741
Fatehabad 56 2,538
Gurugram 87 1,258
Hisar 63 3,983
Jhajjar 40 1,834
Jind 69 2,702
Kaithal 72 2,317
Karnal 77 2,520
Kurukshetra 45 1,530
Mahendragarh 57 1,899
Nuh 79 1,507
Palwal 29 1,359
Panchkula 382 898
Panipat 42 1,268
Rewari 49 1,594
Rohtak 46 1,745
Sirsa 49 4,277
Sonipat 94 2,122
Yamunanagar 228 1,768
Total 1,779 44,212
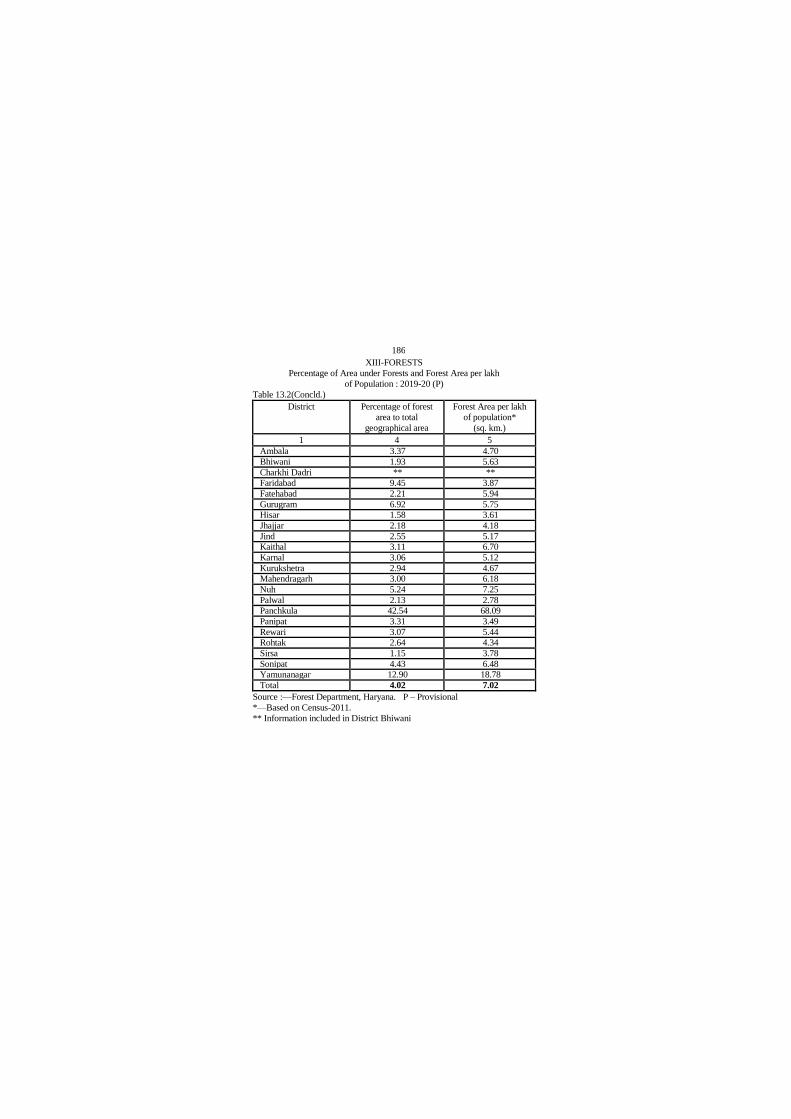
186
XIII-FORESTS
Percentage of Area under Forests and Forest Area per lakh
of Population : 2019-20 (P)
Table 13.2(Concld.)
District Percentage of forest
area to total
geographical area
Forest Area per lakh
of population*
(sq. km.)
1 4 5
Ambala 3.37 4.70
Bhiwani 1.93 5.63
Charkhi Dadri ** **
Faridabad 9.45 3.87
Fatehabad 2.21 5.94
Gurugram 6.92 5.75
Hisar 1.58 3.61
Jhajjar 2.18 4.18
Jind 2.55 5.17
Kaithal 3.11 6.70
Karnal 3.06 5.12
Kurukshetra 2.94 4.67
Mahendragarh 3.00 6.18
Nuh 5.24 7.25
Palwal 2.13 2.78
Panchkula 42.54 68.09
Panipat 3.31 3.49
Rewari 3.07 5.44
Rohtak 2.64 4.34
Sirsa 1.15 3.78
Sonipat 4.43 6.48
Yamunanagar 12.90 18.78
Total 4.02 7.02
Source :—Forest Department, Haryana. P – Provisional
*—Based on Census-2011.
** Information included in District Bhiwani

187
XIV-FISHERIES
Fisheries Development : 2019-20
Table 14.1
District Area stocked
in hectares
Fishing
licenses issued
(Nos.)
Total receipts
from Fisheries
(000 `)
1 2 3 4
Ambala 390 — 50,89,110
Bhiwani 1,073 1 1,97,430
Charkhi Dadri 184 — —
Faridabad 375 — —
Fatehabad 829 — —
Gurugram 306 — —
Hisar 1,881 — —
Jhajjar 1,216 — —
Jind 833 1 4,05,000
Kaithal 834 1 1,49,680
Karnal 752 1 19,92,670
Kurukshetra 447 1 3,81,000
Mahendragarh 195 — —
Nuh 1,529 — —
Palwal 1,265 — —
Panchkula 181 — —
Panipat 773 — —
Rewari 631 1 72,000
Rohtak 879 6 9,06,180
Sirsa 1,109 — —
Sonipat 1,067 14 3,125
Yamunanagar 370 2,910 11,58,920
Total 17,119 2,936 1,03,55,115

188
XIV-FISHERIES
Fisheries Development: 2019-20
Table 14.1(Concld.)
District Number of
cases detected
without
licenses
Compensation
realized (`)
Sale of
confiscated
fish (`)
1 5 6 7
Ambala — — —
Bhiwani — — —
Charkhi Dadri — — —
Faridabad — — —
Fatehabad — — —
Gurugram — — —
Hisar — — —
Jhajjar — — —
Jind — — —
Kaithal — — —
Karnal — — —
Kurukshetra — — —
Mahendragarh — — —
Nuh — — —
Palwal — — —
Panchkula — — —
Panipat — — —
Rewari — — —
Rohtak — — —
Sirsa — — —
Sonipat — — —
Yamunanagar — — —
Total — — —
Source :— Fisheries Department, Haryana.
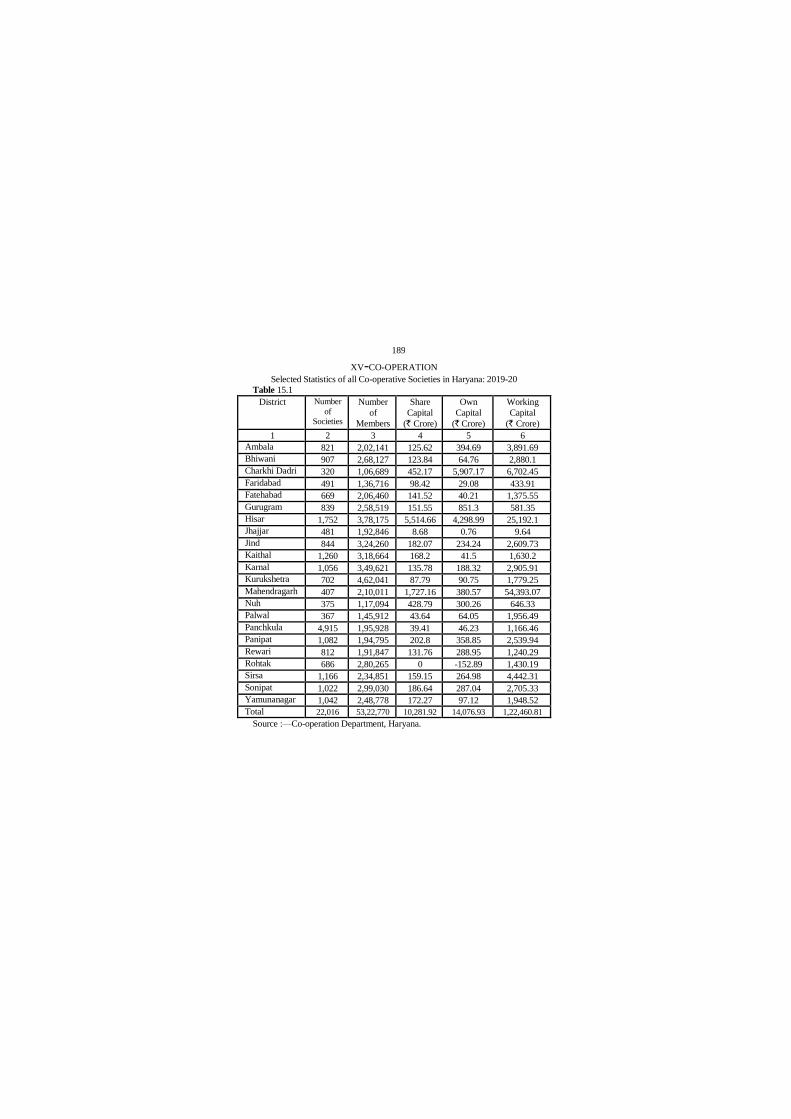
189
XV-CO-OPERATION
Selected Statistics of all Co-operative Societies in Haryana: 2019-20
Table 15.1
District Number
of
Societies
Number
of
Members
Share
Capital
(` Crore)
Own
Capital
(` Crore)
Working
Capital
(` Crore)
1 2 3 4 5 6
Ambala 821 2,02,141 125.62 394.69 3,891.69
Bhiwani 907 2,68,127 123.84 64.76 2,880.1
Charkhi Dadri 320 1,06,689 452.17 5,907.17 6,702.45
Faridabad 491 1,36,716 98.42 29.08 433.91
Fatehabad 669 2,06,460 141.52 40.21 1,375.55
Gurugram 839 2,58,519 151.55 851.3 581.35
Hisar 1,752 3,78,175 5,514.66 4,298.99 25,192.1
Jhajjar 481 1,92,846 8.68 0.76 9.64
Jind 844 3,24,260 182.07 234.24 2,609.73
Kaithal 1,260 3,18,664 168.2 41.5 1,630.2
Karnal 1,056 3,49,621 135.78 188.32 2,905.91
Kurukshetra 702 4,62,041 87.79 90.75 1,779.25
Mahendragarh 407 2,10,011 1,727.16 380.57 54,393.07
Nuh 375 1,17,094 428.79 300.26 646.33
Palwal 367 1,45,912 43.64 64.05 1,956.49
Panchkula 4,915 1,95,928 39.41 46.23 1,166.46
Panipat 1,082 1,94,795 202.8 358.85 2,539.94
Rewari 812 1,91,847 131.76 288.95 1,240.29
Rohtak 686 2,80,265 0 -152.89 1,430.19
Sirsa 1,166 2,34,851 159.15 264.98 4,442.31
Sonipat 1,022 2,99,030 186.64 287.04 2,705.33
Yamunanagar 1,042 2,48,778 172.27 97.12 1,948.52
Total 22,016 53,22,770 10,281.92 14,076.93 1,22,460.81
Source :—Co-operation Department, Haryana.

190
XVI-INDUSTRIES Number of Registered Factories and Workers Employed in Haryana: 2019
Table 16.1
Number of registered factories Under Section 85
District Under
Section
2 m (i)
Under
Section
2 m (ii)
With
Power
Without
Power
Total
1 2 3 4 5 6
Ambala 386 8 64 — 458
Bhiwani 162 2 61 — 225
Charkhi Dadri @ @ @ — @
Faridabad 2,559 58 269 — 2,886
Fatehabad 108 0 23 — 131
Gurugram 2,631 56 86 — 2,773
Hisar 372 3 56 — 431
Jhajjar 685 4 24 — 713
Jind 165 5 32 — 202
Kaithal 109 0 33 — 142
Karnal 507 4 74 — 585
Kurukshetra 181 4 53 — 238
Mahendragarh 46 0 17 — 63
Nuh 28 3 0 — 31
Palwal 82 5 3 — 90
Panchkula 177 4 13 — 194
Panipat 1,018 43 98 — 1,159
Rewari 289 2 21 — 312
Rohtak 309 4 55 — 368
Sirsa 136 0 32 — 168
Sonipat 813 12 92 — 917
Yamunanagar 1,178 11 109 — 1,298
Total 11,941 228 1,215 — 13,384

191
XVI-INDUSTRIES Number of Registered Factories and Workers Employed in Haryana : 2019
Table 16.1(Concld)
Number of registered factories Under Section 85
District Number of registered
working factories
Estimated number of
workers employed in
working factories
1 7 8
Ambala 458 25,395
Bhiwani 225 15,619
Charkhi Dadri @ @
Faridabad 2,886 2,47,859
Fatehabad 131 5,401
Gurugram 2,773 3,12,467
Hisar 431 12,115
Jhajjar 713 41,760
Jind 202 16,230
Kaithal 142 4,496
Karnal 585 37,775
Kurukshetra 238 7,650
Mahendragarh 63 12,269
Nuh 31 3,232
Palwal 90 6,636
Panchkula 194 16,400
Panipat 1,159 66,294
Rewari 312 34,231
Rohtak 368 24,225
Sirsa 168 6,064
Sonipat 917 59,147
Yamunanagar 1,298 45,810
Total 13,384 10,01,075
Source : Labour Commissioner, Haryana.
@ Information included in District Bhiwani

192
XVII-ELECTRICITY AND POWER
L T and 11 KV Lines : 2019-20
Table 17.1 (Circuit Kilometres)
Circle L T Lines 11 KV Lines Number of
Transformers
1 2 3 4
Ambala 5,659 4,816 19,101
Bhiwani 6,107 12,471 42,584
Faridabad 6,752 3,538 16,108
Fatehabad 4,858 8,278 39,004
Gurugram 8,852 6,692 28,973
Hisar 4,878 8,743 25,316
Jhajjar 4,191 3,490 10,721
Jind 6,120 8,308 33,953
Kaithal 7,637 8,037 49,694
Karnal 7,479 13,718 86,319
Kurukshetra 7,060 7,322 42,244
Mahendragarh 8,257 6,782 21,188
Palwal 6,583 7,404 17,817
Panipat 5,642 4,251 20,414
Rewari 7,861 4,815 22,043
Rohtak 3,972 3,747 11,399
Sirsa 6,459 9,861 50,172
Sonipat 6,500 6,632 27,444
Yamuna Nagar 7,702 7,649 29,243
Total 1,22,569 1,36,554 5,93,737
Source : Deputy Secretary, UHBVNL & DHBVNL

193
XVII-ELECTRICITY AND POWER
Number of Connections : 2019-20
Table 17.2
Circle Domestic Commercial Industrial Public
lighting
1 2 3 4 5
Ambala 3,42,523 59,596 6,349 446
Bhiwani 3,03,190 31,934 3,090 145
Faridabad 4,72,128 56,941 25,798 243
Fatehabad 1,92,841 23,115 2,217 50
Gurugram 4,46,091 63,658 12,365 483
Hisar 3,23,962 41,331 4,078 345
Jhajjar 2,08,037 18,732 4,471 121
Jind 2,43,170 26,322 2,942 69
Kaithal 2,19,041 25,295 2,349 145
Karnal 3,29,349 46,053 5,083 249
Kurukshetra 2,07,237 33,679 2,719 224
Mahendragarh 1,86,194 19,199 1,695 39
Palwal 2,85,927 23,600 2,604 32
Panipat 2,31,166 36,865 9,819 159
Rewari 2,20,271 23,589 2,578 145
Rohtak 2,68,297 34,277 3,920 270
Sirsa 2,55,081 34,729 3,751 169
Sonipat 3,19,880 32,416 7,365 203
Yamunanagar 3,37,559 51,711 8,376 193
Total 53,91,944 6,83,042 1,11,569 3,730

194
XVII-ELECTRICITY AND POWER
Number of Connections : 2020-21
Table. 17.2(Concld)
Circle Public
Water
Works
Agricult-
ural
Bulk Others Total
1 6 7 8 9 10
Ambala 1,431 20,973 84 53 4,31,455
Bhiwani 1,412 43,452 54 132 3,83,409
Faridabad 2,463 9,072 62 4 5,66,711
Fatehabad 545 39,211 8 14 2,58,001
Gurugram 1,693 27,743 433 8 5,52,474
Hisar 714 18,256 66 115 3,88,867
Jhajjar 586 10,997 20 98 2,43,062
Jind 721 42,971 46 44 3,16,285
Kaithal 759 57,353 7 10 3,04,959
Karnal 1,160 72,952 49 9 4,54,904
Kurukshetra 869 41,801 26 5 2,86,560
Mahendragarh 1,844 31,996 15 64 2,41,046
Palwal 1,879 18,174 13 10 3,32,239
Panipat 1,011 33,732 30 8 3,12,790
Rewari 881 30,918 29 32 2,78,443
Rohtak 577 6,575 7 81 3,14,004
Sirsa 814 58,930 32 0 3,53,506
Sonipat 939 33,020 60 12 3,93,895
Yamunanagar 1,628 45,462 64 6 4,44,999
Total 21,926 6,43,588 1,105 705 68,57,609
Source : Deputy Secretary, U.H.B.V.N.L. & D.H.B.V.N.L.
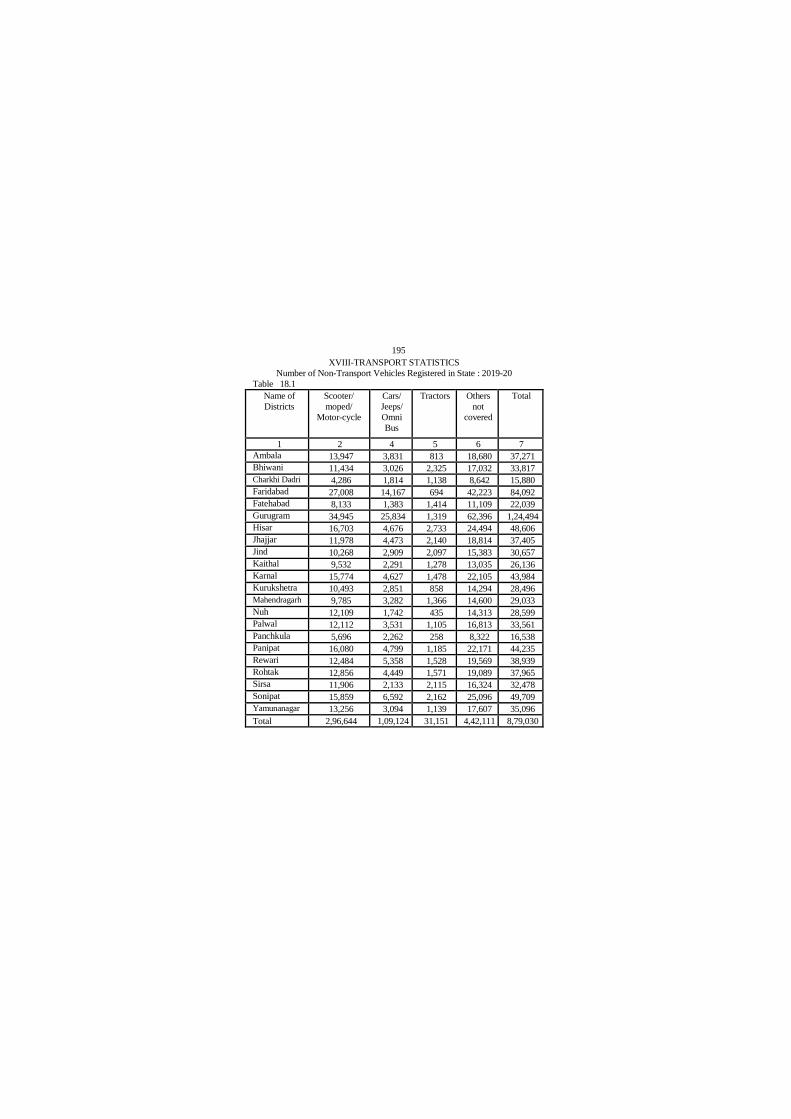
195
XVIII-TRANSPORT STATISTICS
Number of Non-Transport Vehicles Registered in State : 2019-20
Table 18.1
Name of
Districts
Scooter/
moped/
Motor-cycle
Cars/
Jeeps/
Omni
Bus
Tractors Others
not
covered
Total
1 2 4 5 6 7
Ambala 13,947 3,831 813 18,680 37,271
Bhiwani 11,434 3,026 2,325 17,032 33,817
Charkhi Dadri 4,286 1,814 1,138 8,642 15,880
Faridabad 27,008 14,167 694 42,223 84,092
Fatehabad 8,133 1,383 1,414 11,109 22,039
Gurugram 34,945 25,834 1,319 62,396 1,24,494
Hisar 16,703 4,676 2,733 24,494 48,606
Jhajjar 11,978 4,473 2,140 18,814 37,405
Jind 10,268 2,909 2,097 15,383 30,657
Kaithal 9,532 2,291 1,278 13,035 26,136
Karnal 15,774 4,627 1,478 22,105 43,984
Kurukshetra 10,493 2,851 858 14,294 28,496
Mahendragarh 9,785 3,282 1,366 14,600 29,033
Nuh 12,109 1,742 435 14,313 28,599
Palwal 12,112 3,531 1,105 16,813 33,561
Panchkula 5,696 2,262 258 8,322 16,538
Panipat 16,080 4,799 1,185 22,171 44,235
Rewari 12,484 5,358 1,528 19,569 38,939
Rohtak 12,856 4,449 1,571 19,089 37,965
Sirsa 11,906 2,133 2,115 16,324 32,478
Sonipat 15,859 6,592 2,162 25,096 49,709
Yamunanagar 13,256 3,094 1,139 17,607 35,096
Total 2,96,644 1,09,124 31,151 4,42,111 8,79,030
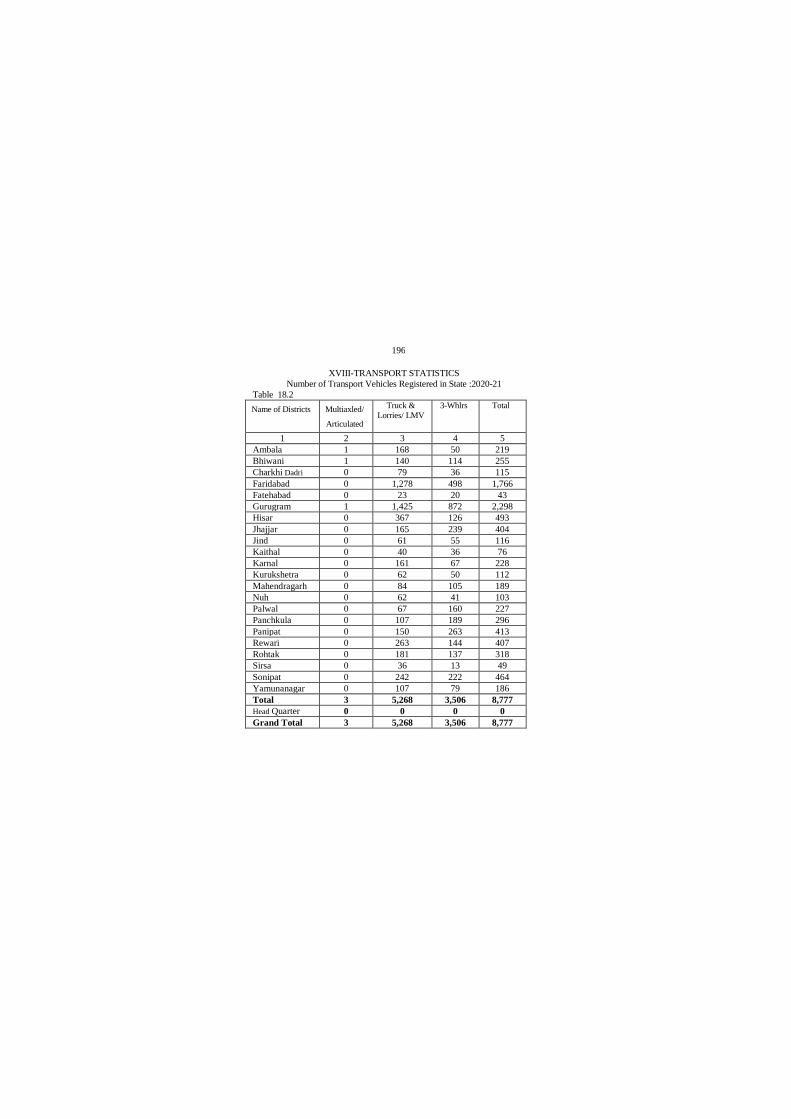
196
XVIII-TRANSPORT STATISTICS
Number of Transport Vehicles Registered in State :2020-21
Table 18.2
Name of Districts Multiaxled/
Articulated
Truck &
Lorries/ LMV
3-Whlrs Total
1 2 3 4 5
Ambala 1 168 50 219
Bhiwani 1 140 114 255
Charkhi Dadri 0 79 36 115
Faridabad 0 1,278 498 1,766
Fatehabad 0 23 20 43
Gurugram 1 1,425 872 2,298
Hisar 0 367 126 493
Jhajjar 0 165 239 404
Jind 0 61 55 116
Kaithal 0 40 36 76
Karnal 0 161 67 228
Kurukshetra 0 62 50 112
Mahendragarh 0 84 105 189
Nuh 0 62 41 103
Palwal 0 67 160 227
Panchkula 0 107 189 296
Panipat 0 150 263 413
Rewari 0 263 144 407
Rohtak 0 181 137 318
Sirsa 0 36 13 49
Sonipat 0 242 222 464
Yamunanagar 0 107 79 186
Total 3 5,268 3,506 8,777
Head Quarter 0 0 0 0
Grand Total 3 5,268 3,506 8,777
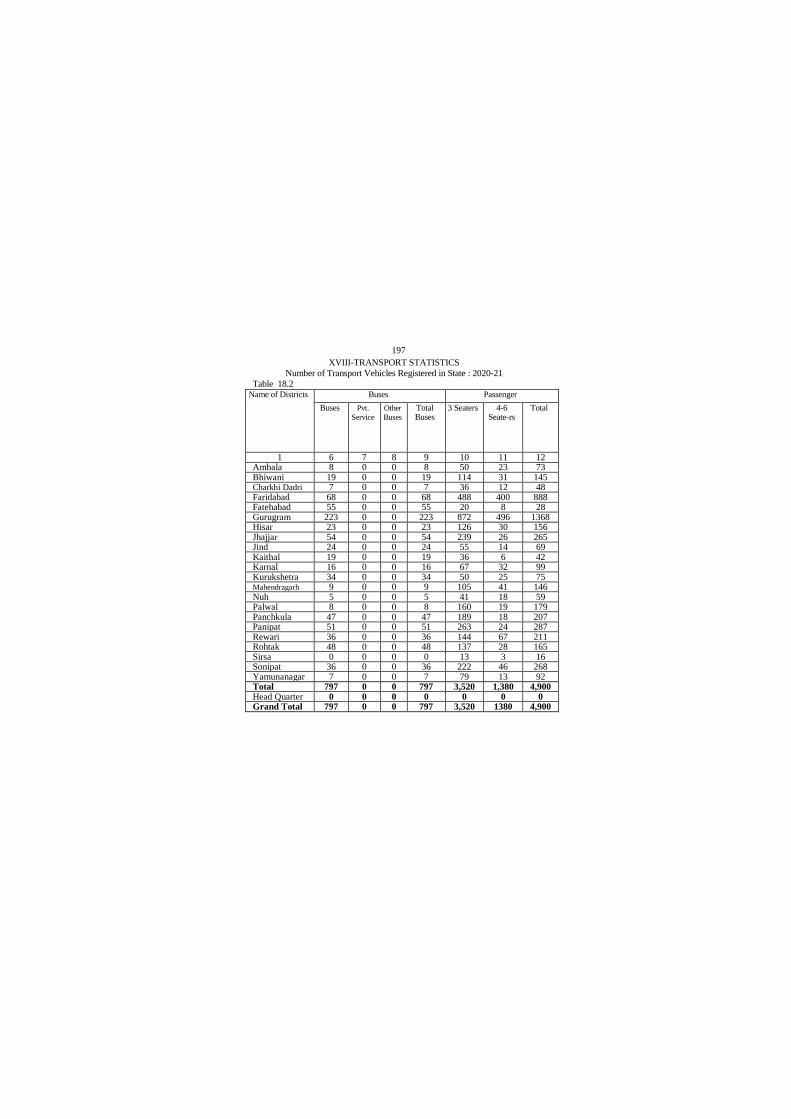
197
XVIII-TRANSPORT STATISTICS
Number of Transport Vehicles Registered in State : 2020-21
Table 18.2 Name of Districts Buses Passenger
Buses Pvt.
Service
Other
Buses
Total Buses
3 Seaters 4-6 Seate-rs
Total
1 6 7 8 9 10 11 12 Ambala 8 0 0 8 50 23 73 Bhiwani 19 0 0 19 114 31 145 Charkhi Dadri 7 0 0 7 36 12 48 Faridabad 68 0 0 68 488 400 888 Fatehabad 55 0 0 55 20 8 28 Gurugram 223 0 0 223 872 496 1368 Hisar 23 0 0 23 126 30 156 Jhajjar 54 0 0 54 239 26 265 Jind 24 0 0 24 55 14 69 Kaithal 19 0 0 19 36 6 42 Karnal 16 0 0 16 67 32 99 Kurukshetra 34 0 0 34 50 25 75 Mahendragarh 9 0 0 9 105 41 146 Nuh 5 0 0 5 41 18 59 Palwal 8 0 0 8 160 19 179 Panchkula 47 0 0 47 189 18 207 Panipat 51 0 0 51 263 24 287 Rewari 36 0 0 36 144 67 211 Rohtak 48 0 0 48 137 28 165 Sirsa 0 0 0 0 13 3 16 Sonipat 36 0 0 36 222 46 268 Yamunanagar 7 0 0 7 79 13 92 Total 797 0 0 797 3,520 1,380 4,900 Head Quarter 0 0 0 0 0 0 0 Grand Total 797 0 0 797 3,520 1380 4,900

198
XVIII-TRANSPORT STATISTICS
Number of Transport Vehicles Registered in State : 2020-21
Table 18.2 (Concld.) Name of Districts Taxis Motor
Cycle on hire
Total Transport
Motor Cabs
Maxi Cabs
Other Taxis
Total Taxis
1 13 14 15 16 17 18 Ambala 23 1 0 24 0 324 Bhiwani 31 5 0 36 0 455 Charkhi Dadri 12 2 0 14 0 184 Faridabad 400 2 0 402 0 3124 Fatehabad 8 1 0 9 0 135 Gurugram 496 19 0 515 0 4404 Hisar 30 7 0 37 0 709 Jhajjar 26 0 0 26 0 749 Jind 14 0 0 14 0 223 Kaithal 6 1 0 7 0 144 Karnal 32 3 0 35 0 378 Kurukshetra 25 2 0 27 0 248 Mahendragarh 41 2 0 43 0 387 Nuh 18 2 0 20 0 187 Palwal 19 1 0 20 0 434 Panchkula 18 2 0 20 0 570 Panipat 24 0 0 24 0 775 Rewari 67 5 0 72 0 726 Rohtak 28 2 0 30 0 561 Sirsa 3 1 0 4 0 69 Sonipat 46 2 0 48 0 816 Yamunanagar 13 4 0 17 0 302 Total 1,380 64 0 1,444 0 15,904 Head Quarter 0 0 0 0 0 0 Grand Total 1,380 64 0 1,444 0 15,904

199
XVIII-TRANSPORT STATISTICS
Road Length Maintained by the Public Works Department in
Haryana : 2019-20 (P)
Table 18.3 (Kilometre)
Year/District Road-Length
Metalled Un-metalled Total
1 2 3 4
Ambala 1,095 0 1,095
Bhiwani 1,200 0 1,200
Charkhi Dadri 941 0 941
Faridabad 497 0 497
Fatehabad 1,507 13 1,520
Gurugram 699 0 699
Hisar 2,137 0 2,137
Jhajjar 1,112 0 1,112
Jind 959 32 991
Kaithal 1,677 0 1,677
Karnal 1,501 0 1,501
Kurukshetra 1,067 0 1,067
Mahendragarh 989 0 989
Nuh 866 0 866
Palwal 740 0 740
Panchkula 525 0 525
Panipat 823 0 823
Rewari 935 45 980
Rohtak 933 0 933
Sirsa 1,725 0 1,725
Sonipat 1,276 0 1,276
Yamunanagar 1,115 0 1,115
Total 24,319 90 24,409
Source :—Engineer-in-Chief, P.W.D. (B&R Branch) , Haryana.
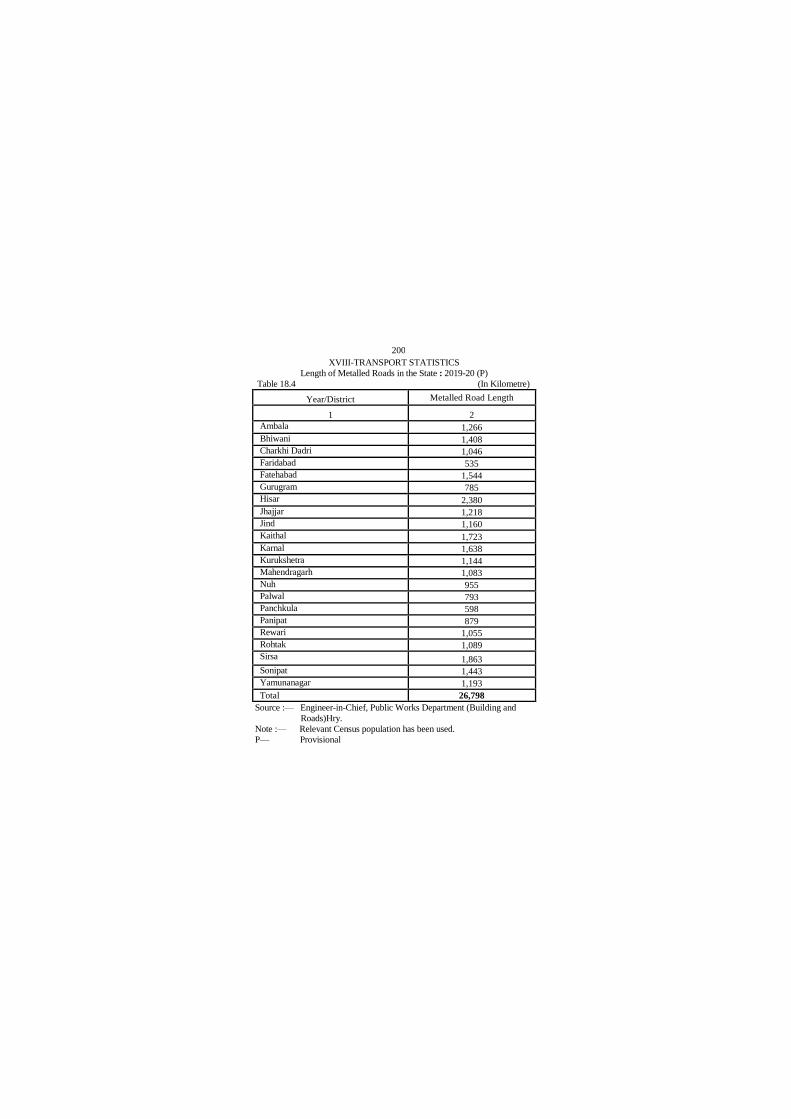
200
XVIII-TRANSPORT STATISTICS
Length of Metalled Roads in the State : 2019-20 (P)
Table 18.4 (In Kilometre)
Year/District Metalled Road Length
1 2
Ambala 1,266
Bhiwani 1,408
Charkhi Dadri 1,046
Faridabad 535
Fatehabad 1,544
Gurugram 785
Hisar 2,380
Jhajjar 1,218
Jind 1,160
Kaithal 1,723
Karnal 1,638
Kurukshetra 1,144
Mahendragarh 1,083
Nuh 955
Palwal 793
Panchkula 598
Panipat 879
Rewari 1,055
Rohtak 1,089
Sirsa 1,863
Sonipat 1,443
Yamunanagar 1,193
Total 26,798
Source :— Engineer-in-Chief, Public Works Department (Building and
Roads)Hry.
Note :— Relevant Census population has been used.
P— Provisional
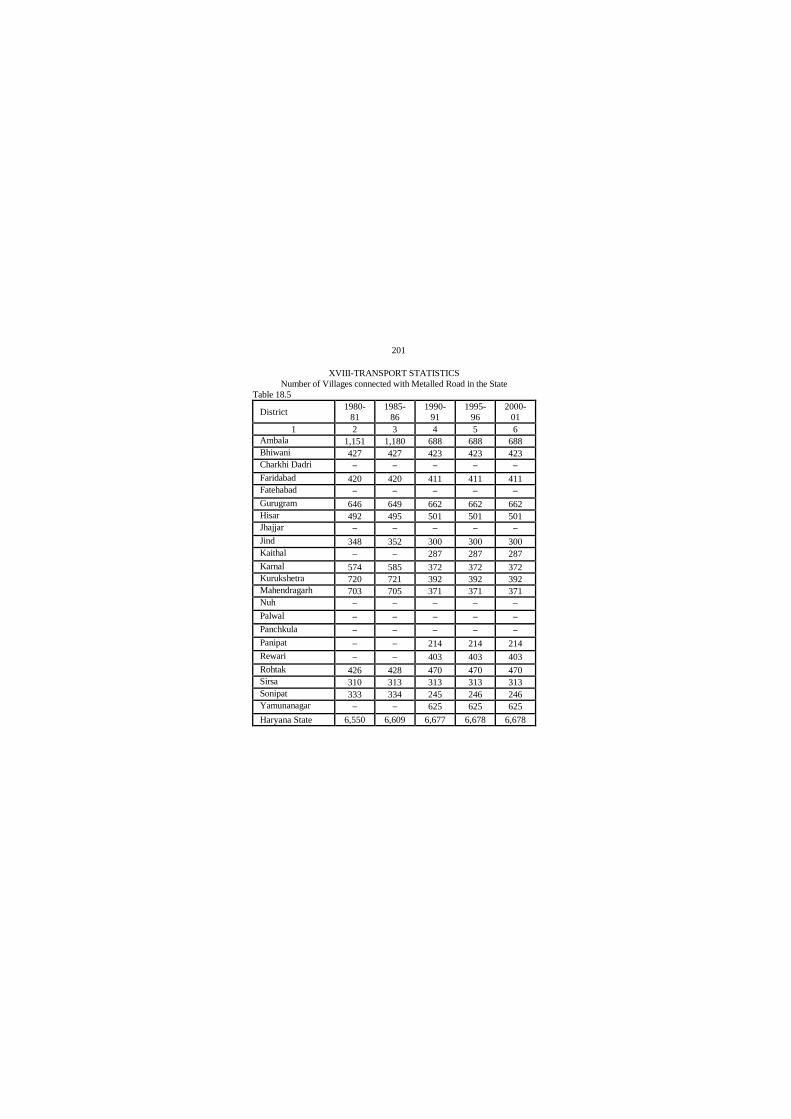
201
XVIII-TRANSPORT STATISTICS
Number of Villages connected with Metalled Road in the State
Table 18.5
District 1980-
81
1985-
86
1990-
91
1995-
96
2000-
01
1 2 3 4 5 6
Ambala 1,151 1,180 688 688 688
Bhiwani 427 427 423 423 423
Charkhi Dadri — — — — —
Faridabad 420 420 411 411 411
Fatehabad — — — — —
Gurugram 646 649 662 662 662
Hisar 492 495 501 501 501
Jhajjar — — — — —
Jind 348 352 300 300 300
Kaithal — — 287 287 287
Karnal 574 585 372 372 372
Kurukshetra 720 721 392 392 392
Mahendragarh 703 705 371 371 371
Nuh — — — — —
Palwal — — — — —
Panchkula — — — — —
Panipat — — 214 214 214
Rewari — — 403 403 403
Rohtak 426 428 470 470 470
Sirsa 310 313 313 313 313
Sonipat 333 334 245 246 246
Yamunanagar — — 625 625 625
Haryana State 6,550 6,609 6,677 6,678 6,678

202
XVIII-TRANSPORT STATISTICS
Number of Villages connected with Metalled Roads
Table 18.5 (Concld.)
District 2005-
06
2010-
11
2015-
16
2018-
19
2019-
20(P)
1 7 8 9 10 11
Ambala 482 482 487 487 487
Bhiwani 222 222 450 259 259
Charkhi Dadri 611 613 — 191 191
Faridabad 407 407 152 152 152
Fatehabad 270 270 249 249 249
Gurugram 421 422 255 255 255
Hisar 179 179 282 282 282
Jhajjar 323 323 265 265 265
Jind 146 146 312 312 312
Kaithal 247 247 275 275 275
Karnal 413 333 445 445 445
Kurukshetra — — 420 420 420
Mahendragarh 694 271 375 368 368
Nuh — 503 447 447 447
Palwal 397 397 288 288 288
Panchkula 367 365 229 227 227
Panipat 437 437 202 202 202
Rewari @ @ 412 412 412
Rohtak 304 304 148 148 148
Sirsa 272 272 335 335 335
Sonipat 243 243 343 343 343
Yamunanagar 321 321 650 650 650
Haryana State 6,756 6,757 7,021 7,012 7,012
. Source :—Engineer-in-Chief, P.W.D. (B. & R.), Haryana
@--Information included in district Bhiwani
P—Provisional
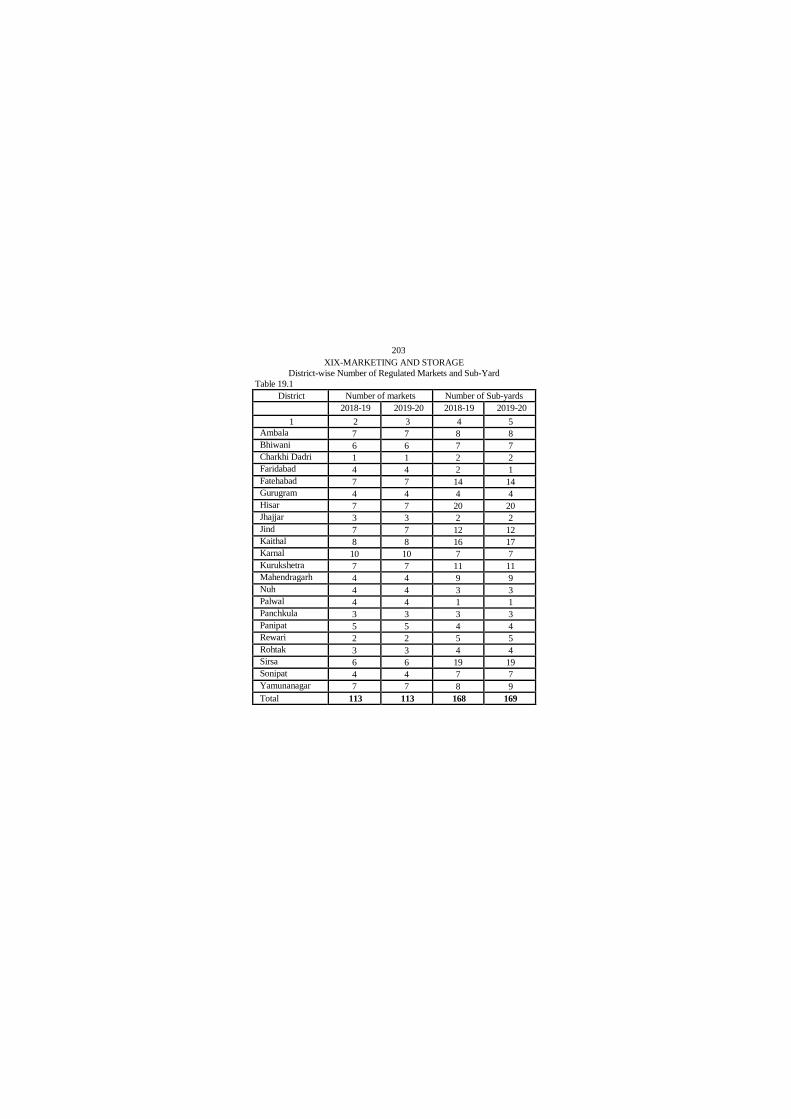
203
XIX-MARKETING AND STORAGE
District-wise Number of Regulated Markets and Sub-Yard
Table 19.1
District Number of markets Number of Sub-yards
2018-19 2019-20 2018-19 2019-20
1 2 3 4 5
Ambala 7 7 8 8
Bhiwani 6 6 7 7
Charkhi Dadri 1 1 2 2
Faridabad 4 4 2 1
Fatehabad 7 7 14 14
Gurugram 4 4 4 4
Hisar 7 7 20 20
Jhajjar 3 3 2 2
Jind 7 7 12 12
Kaithal 8 8 16 17
Karnal 10 10 7 7
Kurukshetra 7 7 11 11
Mahendragarh 4 4 9 9
Nuh 4 4 3 3
Palwal 4 4 1 1
Panchkula 3 3 3 3
Panipat 5 5 4 4
Rewari 2 2 5 5
Rohtak 3 3 4 4
Sirsa 6 6 19 19
Sonipat 4 4 7 7
Yamunanagar 7 7 8 9
Total 113 113 168 169
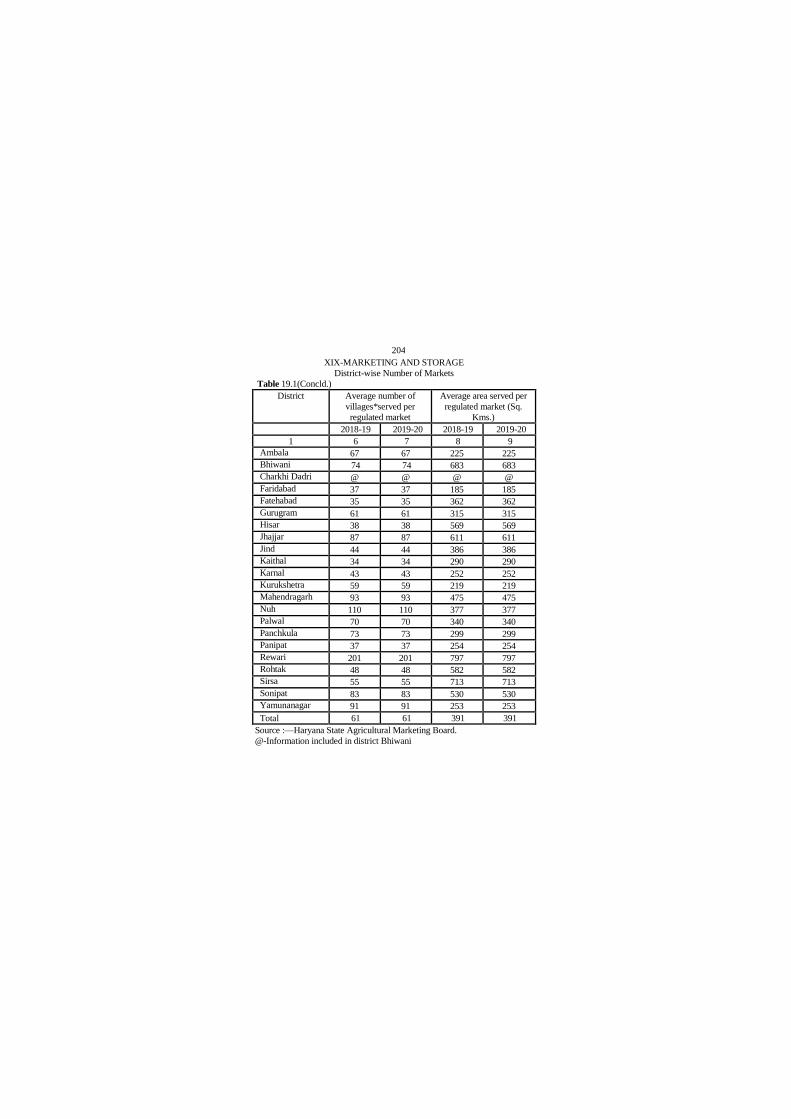
204
XIX-MARKETING AND STORAGE
District-wise Number of Markets
Table 19.1(Concld.)
District Average number of
villages*served per
regulated market
Average area served per
regulated market (Sq.
Kms.)
2018-19 2019-20 2018-19 2019-20
1 6 7 8 9
Ambala 67 67 225 225
Bhiwani 74 74 683 683
Charkhi Dadri @ @ @ @
Faridabad 37 37 185 185
Fatehabad 35 35 362 362
Gurugram 61 61 315 315
Hisar 38 38 569 569
Jhajjar 87 87 611 611
Jind 44 44 386 386
Kaithal 34 34 290 290
Karnal 43 43 252 252
Kurukshetra 59 59 219 219
Mahendragarh 93 93 475 475
Nuh 110 110 377 377
Palwal 70 70 340 340
Panchkula 73 73 299 299
Panipat 37 37 254 254
Rewari 201 201 797 797
Rohtak 48 48 582 582
Sirsa 55 55 713 713
Sonipat 83 83 530 530
Yamunanagar 91 91 253 253
Total 61 61 391 391
Source :—Haryana State Agricultural Marketing Board.
@-Information included in district Bhiwani
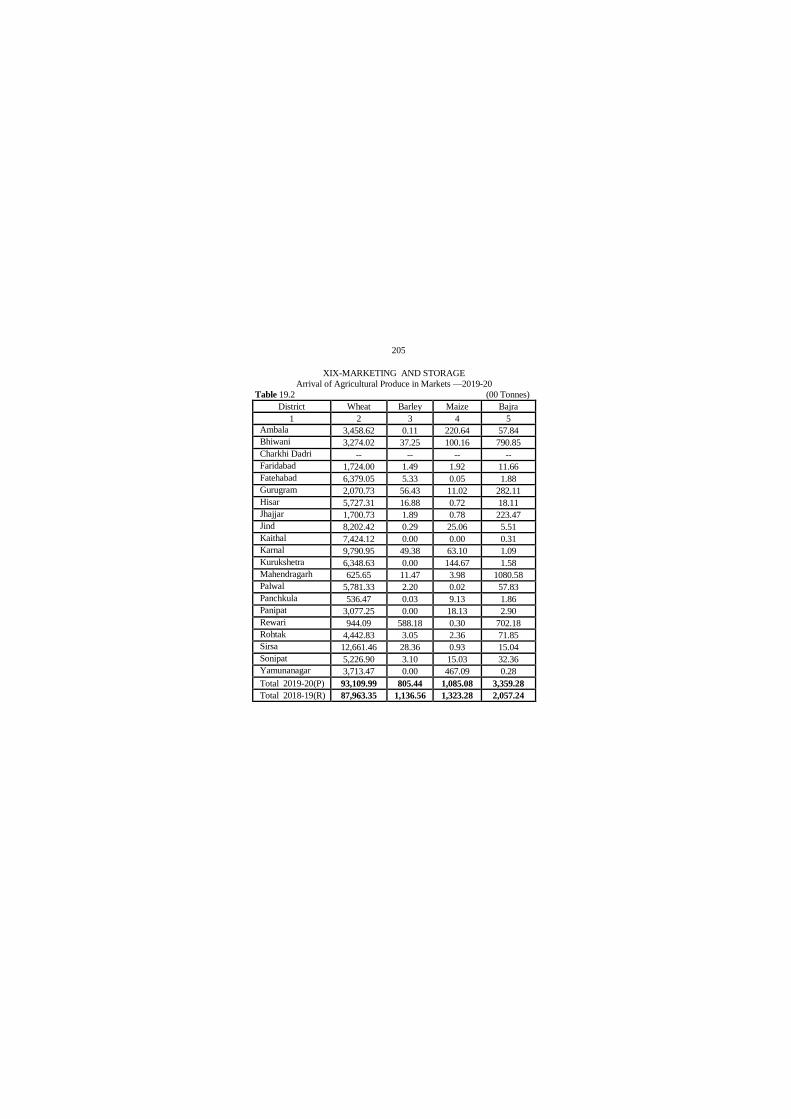
205
XIX-MARKETING AND STORAGE
Arrival of Agricultural Produce in Markets —2019-20
Table 19.2 (00 Tonnes)
District Wheat Barley Maize Bajra
1 2 3 4 5
Ambala 3,458.62 0.11 220.64 57.84
Bhiwani 3,274.02 37.25 100.16 790.85
Charkhi Dadri -- -- -- --
Faridabad 1,724.00 1.49 1.92 11.66
Fatehabad 6,379.05 5.33 0.05 1.88
Gurugram 2,070.73 56.43 11.02 282.11
Hisar 5,727.31 16.88 0.72 18.11
Jhajjar 1,700.73 1.89 0.78 223.47
Jind 8,202.42 0.29 25.06 5.51
Kaithal 7,424.12 0.00 0.00 0.31
Karnal 9,790.95 49.38 63.10 1.09
Kurukshetra 6,348.63 0.00 144.67 1.58
Mahendragarh 625.65 11.47 3.98 1080.58
Palwal 5,781.33 2.20 0.02 57.83
Panchkula 536.47 0.03 9.13 1.86
Panipat 3,077.25 0.00 18.13 2.90
Rewari 944.09 588.18 0.30 702.18
Rohtak 4,442.83 3.05 2.36 71.85
Sirsa 12,661.46 28.36 0.93 15.04
Sonipat 5,226.90 3.10 15.03 32.36
Yamunanagar 3,713.47 0.00 467.09 0.28
Total 2019-20(P) 93,109.99 805.44 1,085.08 3,359.28
Total 2018-19(R) 87,963.35 1,136.56 1,323.28 2,057.24
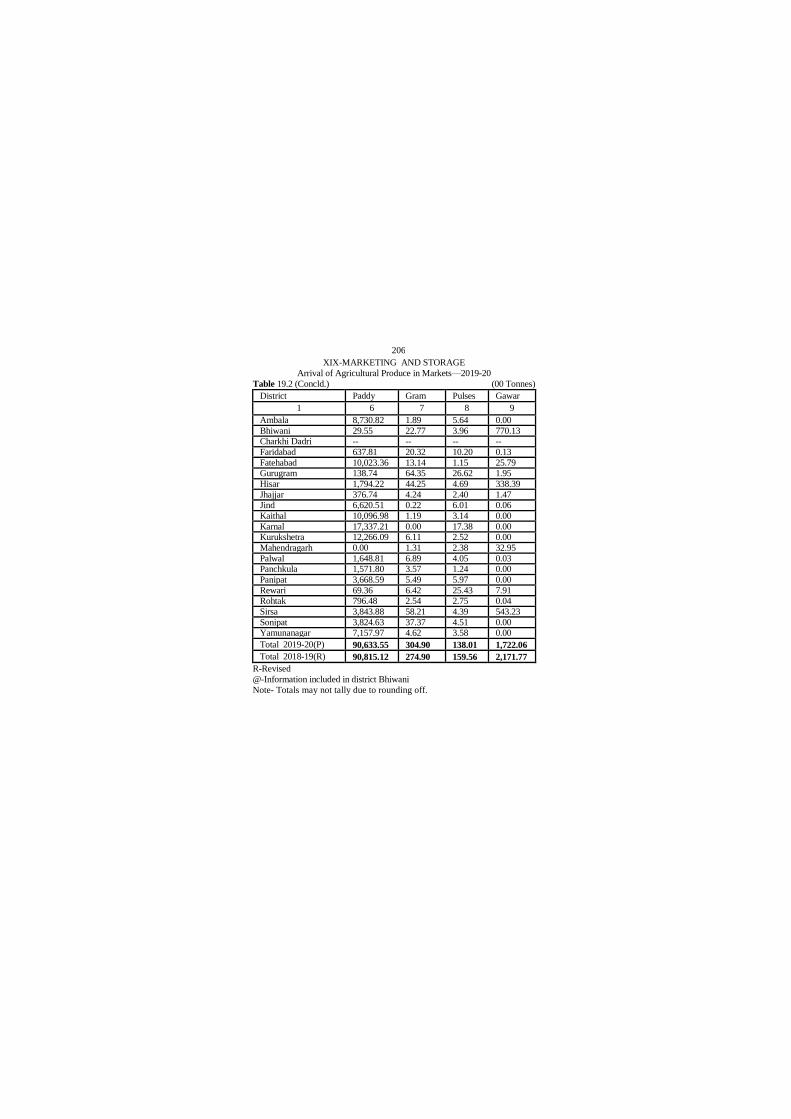
206
XIX-MARKETING AND STORAGE
Arrival of Agricultural Produce in Markets—2019-20
Table 19.2 (Concld.) (00 Tonnes)
District Paddy Gram Pulses Gawar
1 6 7 8 9
Ambala 8,730.82 1.89 5.64 0.00
Bhiwani 29.55 22.77 3.96 770.13
Charkhi Dadri -- -- -- --
Faridabad 637.81 20.32 10.20 0.13
Fatehabad 10,023.36 13.14 1.15 25.79
Gurugram 138.74 64.35 26.62 1.95
Hisar 1,794.22 44.25 4.69 338.39
Jhajjar 376.74 4.24 2.40 1.47
Jind 6,620.51 0.22 6.01 0.06
Kaithal 10,096.98 1.19 3.14 0.00
Karnal 17,337.21 0.00 17.38 0.00
Kurukshetra 12,266.09 6.11 2.52 0.00
Mahendragarh 0.00 1.31 2.38 32.95
Palwal 1,648.81 6.89 4.05 0.03
Panchkula 1,571.80 3.57 1.24 0.00
Panipat 3,668.59 5.49 5.97 0.00
Rewari 69.36 6.42 25.43 7.91
Rohtak 796.48 2.54 2.75 0.04
Sirsa 3,843.88 58.21 4.39 543.23
Sonipat 3,824.63 37.37 4.51 0.00
Yamunanagar 7,157.97 4.62 3.58 0.00
Total 2019-20(P) 90,633.55 304.90 138.01 1,722.06
Total 2018-19(R) 90,815.12 274.90 159.56 2,171.77
R-Revised
@-Information included in district Bhiwani
Note- Totals may not tally due to rounding off.

207
XX-PUBLIC FINANCE
Overall Budget of Haryana
Table.20.1 (` in crores)
Item 2018-19
(Actual)
2019-20
(Revised
Estimates)
2020-21
(Budget
Estimates)
1 2 3 4
Revenue Account
(a) Receipts 65,885.12 77,580.73 89,964.14
(b)Expenditure 77,155.54 92,256.10 1,05,338.09
(c) Surplus(+)/Deficit(-) (-)11,270.42 (-)14,675.37 (-)15,373.95
Capital Account
(a)Receipts 27332.66 30622.60 29787.83
(b)Expenditure 16062.24 15947.23 14413.88
Source:— State Budget Documents/Department of Economic and Statistical Analysis,
Haryana.

208
XXI-PRICES
Consumer Price Index Numbers for Working Class of 6 Selected Centers of
Haryana
Table 21.1 Base Year 1982 = 100
Month Haryana State Bhiwani
Food* General Food General
1 2 3 4 5
January, 20 — 1,263 1,248 1,260
February, 20 — 1,254 1,234 1,251
March, 20 — 1,251 1,228 1,248
April, 20 — 1,263 1,247 1,259
May, 20 — 1,265 1,250 1,261
June, 20 — 1,269 1,256 1,264
July, 20 — 1,284 1,267 1,280
August, 20 — 1,292 1,280 1,288
September, 20 — 1,300 1,294 1,297
October, 20 — 1,314 1,318 1,312
November, 20 — 1,316 1,322 1,314
December, 20 — 1,302 1,299 1,300
2020 — 1,281 1,270 1,278
* Indices for food group of Haryana State are not compiled.
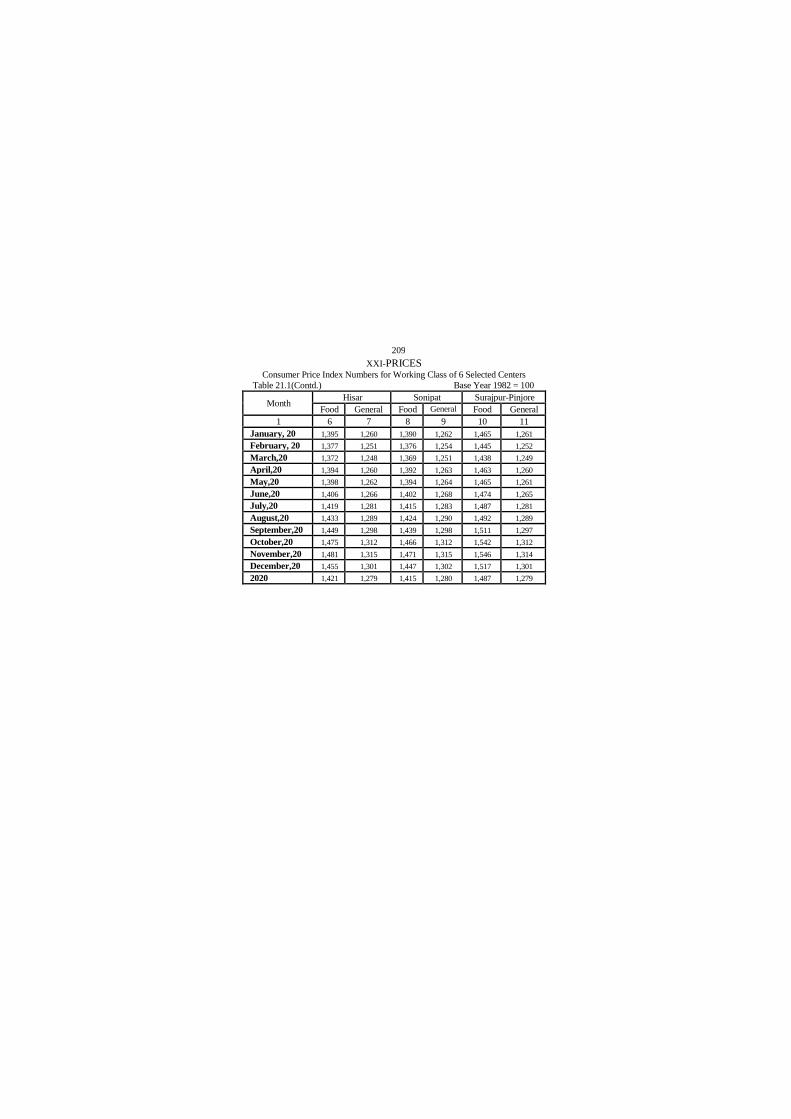
209
XXI-PRICES Consumer Price Index Numbers for Working Class of 6 Selected Centers
Table 21.1(Contd.) Base Year 1982 = 100
Month Hisar Sonipat Surajpur-Pinjore
Food General Food General Food General
1 6 7 8 9 10 11
January, 20 1,395 1,260 1,390 1,262 1,465 1,261
February, 20 1,377 1,251 1,376 1,254 1,445 1,252
March,20 1,372 1,248 1,369 1,251 1,438 1,249
April,20 1,394 1,260 1,392 1,263 1,463 1,260
May,20 1,398 1,262 1,394 1,264 1,465 1,261
June,20 1,406 1,266 1,402 1,268 1,474 1,265
July,20 1,419 1,281 1,415 1,283 1,487 1,281
August,20 1,433 1,289 1,424 1,290 1,492 1,289
September,20 1,449 1,298 1,439 1,298 1,511 1,297
October,20 1,475 1,312 1,466 1,312 1,542 1,312
November,20 1,481 1,315 1,471 1,315 1,546 1,314
December,20 1,455 1,301 1,447 1,302 1,517 1,301
2020 1,421 1,279 1,415 1,280 1,487 1,279
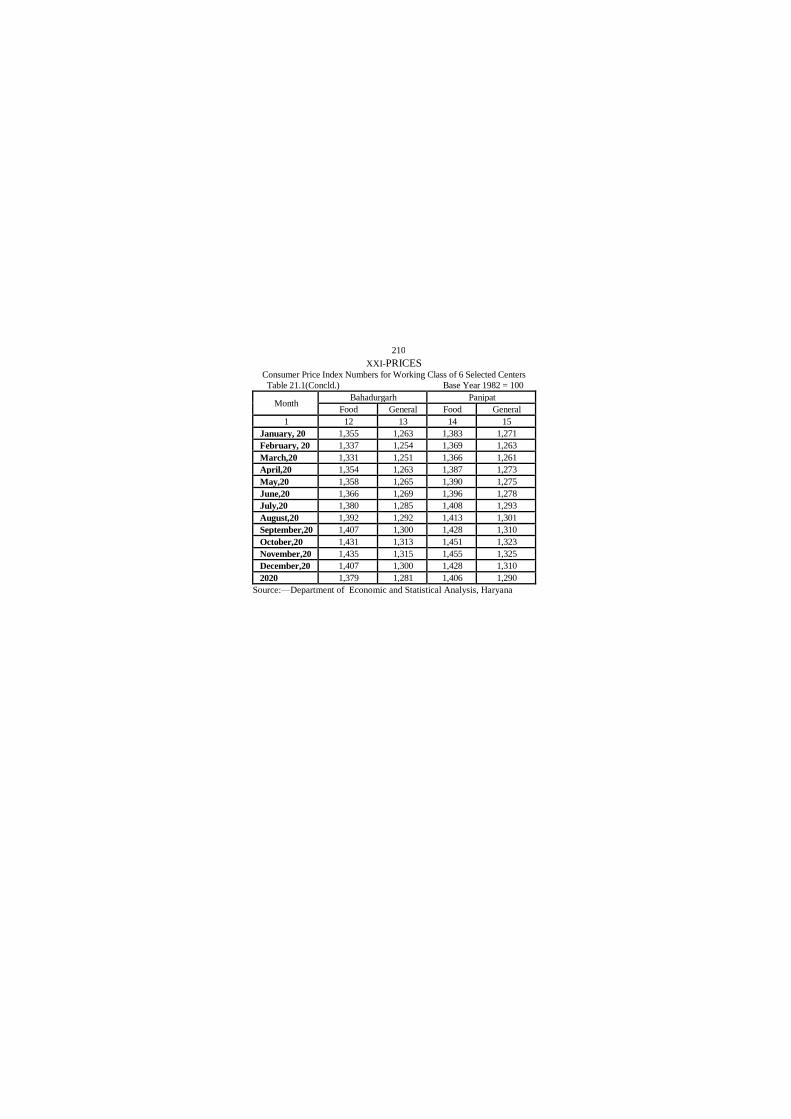
210
XXI-PRICES Consumer Price Index Numbers for Working Class of 6 Selected Centers
Table 21.1(Concld.) Base Year 1982 = 100
Month Bahadurgarh Panipat
Food General Food General
1 12 13 14 15
January, 20 1,355 1,263 1,383 1,271
February, 20 1,337 1,254 1,369 1,263
March,20 1,331 1,251 1,366 1,261
April,20 1,354 1,263 1,387 1,273
May,20 1,358 1,265 1,390 1,275
June,20 1,366 1,269 1,396 1,278
July,20 1,380 1,285 1,408 1,293
August,20 1,392 1,292 1,413 1,301
September,20 1,407 1,300 1,428 1,310
October,20 1,431 1,313 1,451 1,323
November,20 1,435 1,315 1,455 1,325
December,20 1,407 1,300 1,428 1,310
2020 1,379 1,281 1,406 1,290
Source:—Department of Economic and Statistical Analysis, Haryana

211
XXII-LOCAL BODIES
Number, Population, Income and Expenditure of
Municipal Committees/Councils/Corporations (Districtwise) in Haryana
Table 22.1 (` in lakh)
District
Number of Municipal
Committees/ Councils/
Corporations (2018-19)
Population within Muni- cipal Commi- ttees/Councils/
Corporations limits (Census 2011)
1 2 3
Ambala 3 344504
Bhiwani 4 249426
Charkhi Dadri 1 56337
Faridabad 1 1414050
Fatehabad 5 209682
Gurugram 5 977908
Hisar 5 467639
Jhajjar 3 235125
Jind 5 299980
Kaithal 5 253445
Karnal 7 445888
Kurukshetra 4 265499
Mahendragarh 5 132855
Nuh 4 88343
Palwal 3 196490
Panchkula 1 211355
Panipat 2 335680
Rewari 3 190141
Rohtak 4 448658
Sirsa 5 319248
Sonipat 4 415695
Yamunanagar 2 230761
Total 81 7788709
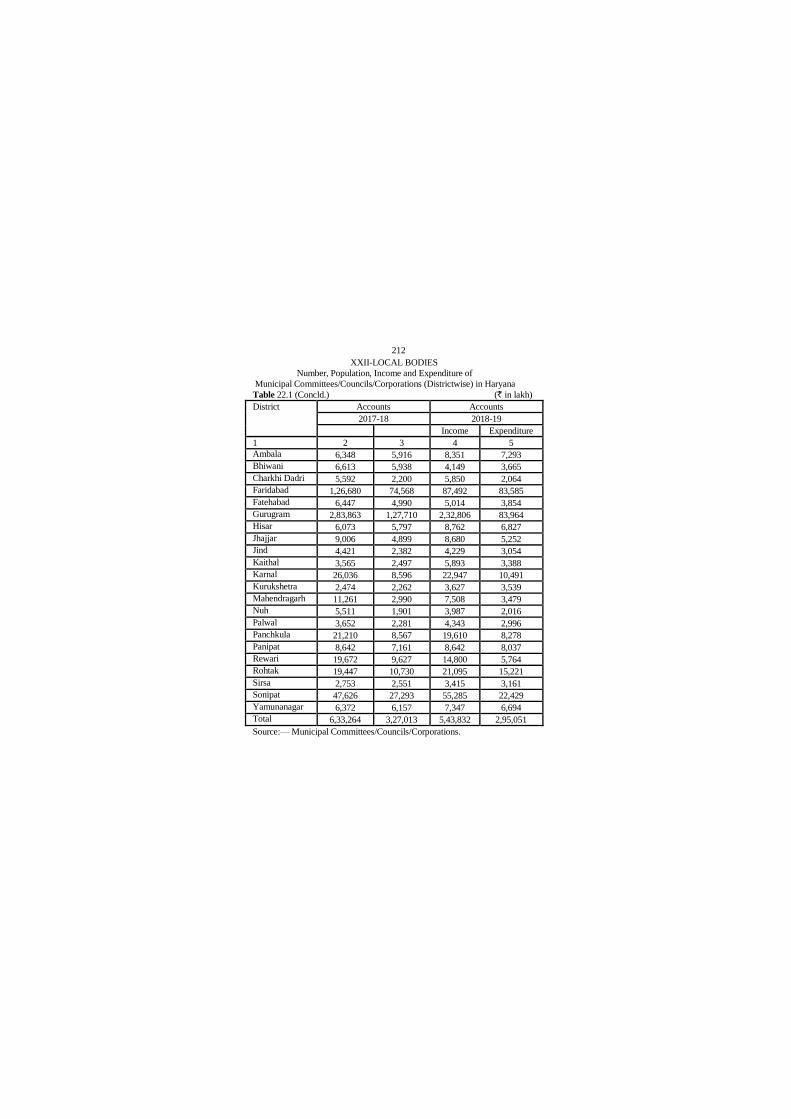
212
XXII-LOCAL BODIES
Number, Population, Income and Expenditure of
Municipal Committees/Councils/Corporations (Districtwise) in Haryana
Table 22.1 (Concld.) (` in lakh)
District Accounts Accounts
2017-18 2018-19
Income Expenditure
1 2 3 4 5
Ambala 6,348 5,916 8,351 7,293
Bhiwani 6,613 5,938 4,149 3,665
Charkhi Dadri 5,592 2,200 5,850 2,064
Faridabad 1,26,680 74,568 87,492 83,585
Fatehabad 6,447 4,990 5,014 3,854
Gurugram 2,83,863 1,27,710 2,32,806 83,964
Hisar 6,073 5,797 8,762 6,827
Jhajjar 9,006 4,899 8,680 5,252
Jind 4,421 2,382 4,229 3,054
Kaithal 3,565 2,497 5,893 3,388
Karnal 26,036 8,596 22,947 10,491
Kurukshetra 2,474 2,262 3,627 3,539
Mahendragarh 11,261 2,990 7,508 3,479
Nuh 5,511 1,901 3,987 2,016
Palwal 3,652 2,281 4,343 2,996
Panchkula 21,210 8,567 19,610 8,278
Panipat 8,642 7,161 8,642 8,037
Rewari 19,672 9,627 14,800 5,764
Rohtak 19,447 10,730 21,095 15,221
Sirsa 2,753 2,551 3,415 3,161
Sonipat 47,626 27,293 55,285 22,429
Yamunanagar 6,372 6,157 7,347 6,694
Total 6,33,264 3,27,013 5,43,832 2,95,051
Source:— Municipal Committees/Councils/Corporations.

213
XXIII-MISCELLANEOUS
District-wise Employees of Haryana Government
Table 23.1 (As on 31st March)
District 2005 2010 2015 2016 2017 2018 2019 2020
1 2 3 4 5 6 7 8 9
Ambala 18,103 18,670 18,716 18,563 18,811 15,089 19,166 19,723
Bhiwani 24,001 24,805 24,950 23,862 23,646 21,079 21,734 21,925
Charkhi
Dadri^^
— — — — — 6,438 8,782 8,378
Faridabad 19,058 13,431 14,234 13,918 14,348 14,895 15,279 15,283
Fatehabad 10,023 12,337 11,755 11,599 11,980 12,229 13,917 13,779
Gurugram 20,350 17,997 18,066 17,901 17,724 17,880 19,706 20,118
Hisar 25,092 24,393 24,017 23,560 23,248 22,061 24,969 24,619
Jhajjar 12,209 12,486 13,430 13,394 13,797 14,845 15,950 15,034
Jind 17,003 17,252 17,556 17,532 17,122 17,876 18,417 18,524
Kaithal 11,733 12,683 14,299 14,401 13,325 14,505 15,475 15,642
Karnal 22,178 20,744 22,292 22,644 20,543 22,242 22,830 23,453
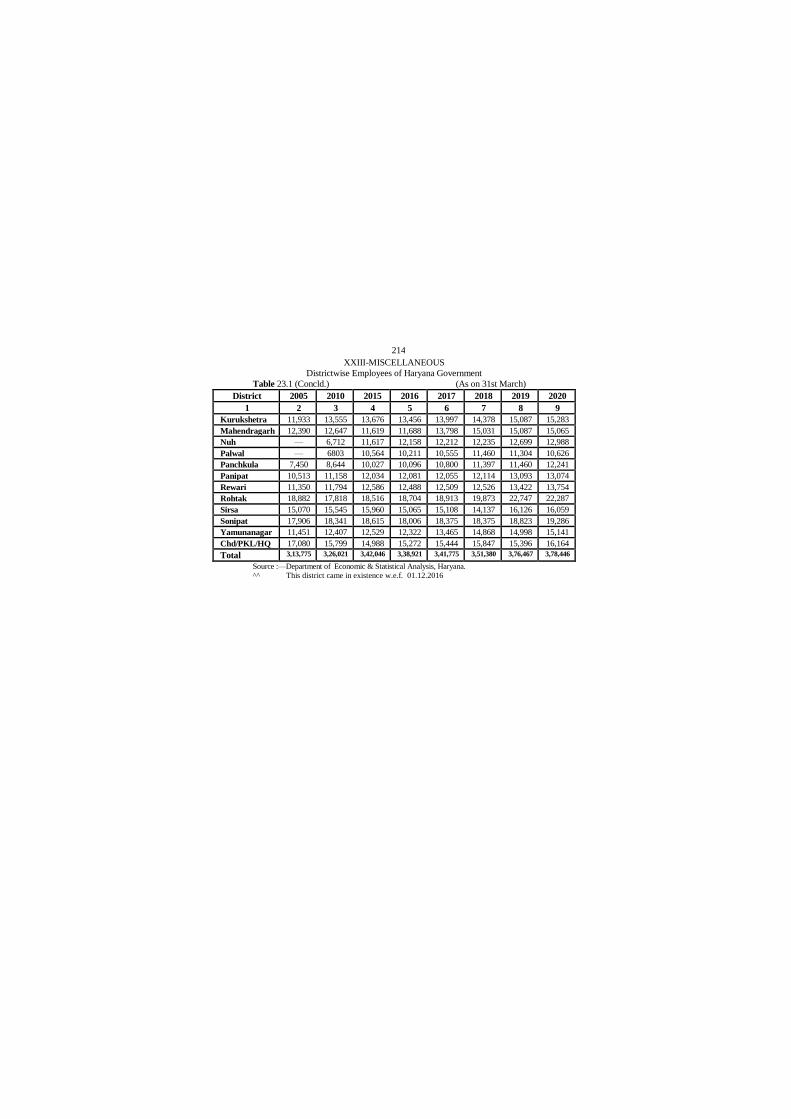
214
XXIII-MISCELLANEOUS
Districtwise Employees of Haryana Government
Table 23.1 (Concld.) (As on 31st March)
District 2005 2010 2015 2016 2017 2018 2019 2020
1 2 3 4 5 6 7 8 9
Kurukshetra 11,933 13,555 13,676 13,456 13,997 14,378 15,087 15,283
Mahendragarh 12,390 12,647 11,619 11,688 13,798 15,031 15,087 15,065
Nuh — 6,712 11,617 12,158 12,212 12,235 12,699 12,988
Palwal — 6803 10,564 10,211 10,555 11,460 11,304 10,626
Panchkula 7,450 8,644 10,027 10,096 10,800 11,397 11,460 12,241
Panipat 10,513 11,158 12,034 12,081 12,055 12,114 13,093 13,074
Rewari 11,350 11,794 12,586 12,488 12,509 12,526 13,422 13,754
Rohtak 18,882 17,818 18,516 18,704 18,913 19,873 22,747 22,287
Sirsa 15,070 15,545 15,960 15,065 15,108 14,137 16,126 16,059
Sonipat 17,906 18,341 18,615 18,006 18,375 18,375 18,823 19,286
Yamunanagar 11,451 12,407 12,529 12,322 13,465 14,868 14,998 15,141
Chd/PKL/HQ 17,080 15,799 14,988 15,272 15,444 15,847 15,396 16,164
Total 3,13,775 3,26,021 3,42,046 3,38,921 3,41,775 3,51,380 3,76,467 3,78,446
Source :—Department of Economic & Statistical Analysis, Haryana.
^^ This district came in existence w.e.f. 01.12.2016

215
XXIII-MISCELLANEOUS
Distribution of Haryana Government Employees as on 31st March, 2019
according to Districts and Classes
Table 23.2
District
Gazetted Non-Gazetted P.T., W.C., T.H, P-1, D.C.
Rates, P-2 & Others
Class I
Class II
Class III Class IV
1 2 3 4 5 6
Ambala 279 1,291 12,164 2,319 3,113
Bhiwani 256 2,513 10,245 3,323 5,397
Charkhi Dadri 93 797 4,102 1,193 2,597
Faridabad 265 747 8,038 1,723 4,506
Fatehabad 181 1,336 6,557 1,553 4,290
Gurugram 367 1,925 12,535 1,785 3,094
Hisar 395 2,565 12,547 3,884 5,578
Jhajjar 329 1,754 7,191 1,615 5,061
Jind 305 2,136 9,397 2,247 4,332
Kaithal 129 1,440 7,917 1,757 4,232
Karnal 422 1,675 12,863 3,123 4,747
Kurukshetra 218 1,405 6,786 1,744 4,934
Mahendragarh 192 1,586 6,619 2,181 4,509
Nuh 174 923 5,515 1,174 4,913
Palwal 138 985 5,694 1,386 3,101
Panchkula 237 2,083 5,143 1,262 2,735
Panipat 162 1,253 6,537 1,596 3,545
Rewari 229 1,508 5,972 1,372 4,341
Rohtak 648 2,222 10,725 2,902 6,250
Sirsa 134 1,629 9,043 1,258 4,062
Sonipat 305 2,136 9,813 2,247 4,322
Yamunanagar 152 1,520 6,512 1,527 5,287
Chandigarh /Pkl(HQ) 547 940 8,781 2,242 2,886
Total 6,157 36,369 1,90,696 45,413 97,832

216
XXIII-MISCELLANEOUS
Distribution of Haryana Government Employees as on 31st March, 2019
according to Districts and Classes
Table 23.2(Concld.)
District Grand Total
(2 to 6)
Percentage to the
total
1 7 8
Ambala 19,166 5.09
Bhiwani 21,734 5.77
Charkhi Dadri 8,782 2.33
Faridabad 15,279 4.06
Fatehabad 13,917 3.70
Gurugram 19,706 5.23
Hisar 24,969 6.63
Jhajjar 15,950 4.24
Jind 18,417 4.89
Kaithal 15,475 4.11
Karnal 22,830 6.06
Kurukshetra 15,087 4.01
Mahendragarh 15,087 4.01
Nuh 12,699 3.37
Palwal 11,304 3.00
Panchkula 11,460 3.04
Panipat 13,093 3.48
Rewari 13,422 3.57
Rohtak 22,747 6.04
Sirsa 16,126 4.28
Sonipat 18,823 5.00
Yamunanagar 14,998 3.98
Chandigarh /Pkl(HQ) 15,396 4.09
Total 3,76,467 100.00
Source :—Department of Economic & Statistical Analysis, Haryana.
CP & CB : Contingency Paid & Contract Basis

217
XXIII-MISCELLANEOUS
Distribution of Haryana Government Employees as on 31st March, 2020
according to Districts and Classes
Table 23.3
District
Gazetted Non-Gazetted P.T., W.C., T.H, P-1, D.C.
Rates, P-2 & Others
Class I
Class II
Class III Class IV
1 2 3 4 5 6
Ambala 329 1,363 11,630 2387 4014
Bhiwani 257 2,527 9,843 3323 5975
Charkhi Dadri 92 843 4,101 1099 2243
Faridabad 272 761 8025 1723 4502
Fatehabad 159 1,452 6379 1560 4229
Gurugram 399 1,957 12736 1736 3290
Hisar 272 2,907 12045 3900 5495
Jhajjar 318 1,729 6929 1399 4659
Jind 181 1,959 8870 2371 5036
Kaithal 140 1,673 8128 1813 3888
Karnal 432 1,711 13174 3280 4891
Kurukshetra 215 1,413 6734 1803 5118
Mahendragarh 194 1,586 6576 2191 4518
Nuh 178 946 5542 1235 5087
Palwal 133 983 5694 1355 2461
Panchkula 289 2,209 5211 1337 3195
Panipat 203 1,262 6851 1655 3103
Rewari 261 1,540 6068 1511 4374
Rohtak 752 2,081 10810 2601 6043
Sirsa 131 1,611 9018 1244 4055
Sonipat 301 2,213 9837 2305 4630
Yamunanagar 152 1,520 6609 1573 5287
Chandigarh /Pkl(HQ) 585 1,015 8890 2418 3256
Total 6,247 37,261 1,89,770 45,819 99,349

218
XXIII-MISCELLANEOUS
Distribution of Haryana Government Employees as on 31st March, 2020
according to Districts and Classes
Table 23.2(Concld.)
District Grand Total
(2 to 6)
Percentage to the
total
1 7 8
Ambala 19723 5.21
Bhiwani 21925 5.79
Charkhi Dadri 8378 2.21
Faridabad 15283 4.04
Fatehabad 13779 3.64
Gurugram 20118 5.32
Hisar 24619 6.51
Jhajjar 15034 3.97
Jind 18524 4.89
Kaithal 15642 4.13
Karnal 23453 6.20
Kurukshetra 15283 4.04
Mahendragarh 15065 3.98
Nuh 12988 3.43
Palwal 10626 2.81
Panchkula 12241 3.23
Panipat 13074 3.45
Rewari 13754 3.63
Rohtak 22287 5.89
Sirsa 16059 4.24
Sonipat 19286 5.10
Yamunanagar 15141 4.00
Chandigarh /Pkl(HQ) 16164 4.27
Total 3,78,446 100
Source :—Department of Economic & Statistical Analysis, Haryana.
CP & CB : Contingency Paid & Contract Basis