
PROCEEDINGS BOOK - ETMS 2021
240
International Engineering and Technology Management Summit 2021– ETMS2021 İstanbul Technical University & Bahçeşehir University 1 PROCEEDINGS BOOK EDITORS Ferhan EB Hür Bersam BOLAT Ömer Yaman ERZURUMLU Tankut ATAN
-
Upload
khangminh22 -
Category
Documents
-
view
5 -
download
0
Transcript of PROCEEDINGS BOOK - ETMS 2021

International Engineering and Technology Management Summit 2021– ETMS2021
İstanbul Technical University & Bahçeşehir University
1
PROCEEDINGS
BOOK
EDITORS Ferhan CEBI
Hür Bersam BOLAT Ömer Yaman ERZURUMLU
Tankut ATAN

ii
INTERNATIONAL ENGINEERING AND TECHNOLOGY
MANAGEMENT SUMMIT
2021
PROCEEDINGS BOOK
İSTANBUL TECHNICAL UNIVERSITY
&
BAHCESEHİR UNIVERSITY
SEPTEMBER 16-17, 2021
ISTANBUL

International Engineering and Technology Management Summit 2021– ETMS2021
İstanbul Technical University & Bahçeşehir University
iii
ISBN: 978-975-561-522-6
Istanbul Technical University Publications. Publication no. 2021.2KNF/4
© Istanbul Technical University. All rights of this book are reserved and all publication rights belong to "ITU Rectorate". All or any part of this book cannot be published, printed, filmed or used indirectly without the permission of the publisher. It cannot be reproduced by DUPLICATION, PHOTOCOPY or any other technique, and cannot be transferred to an environment that can be processed on computers or typesetting machines. The responsibility of all texts and visuals published in the book belongs to the author(s).

International Engineering and Technology Management Summit 2021– ETMS2021
İstanbul Technical University & Bahçeşehir University
iv
PREFACE
The third INTERNATIONAL ENGINEERING AND TECHNOLOGY
MANAGEMENT SUMMIT, organized jointly by Istanbul Technical University,
Bahçeşehir University and American Society for Engineering Management (ASEM), was
held on 16th – 17th of September 2021 fully virtual. While organizing our engineering and
technology management summits, we aimed to contribute to identifying and finding
solutions to business problems that arise in engineering applications and technology use.
We wanted to serve the field by analyzing these problems and solutions by taking into
account today's rapid changes and developments, discussing the future situation and
creating, increasing and diversifying the necessary environments to accomplish them.
We have determined this year's 2021 theme of our summit as "ROLE OF
ENGINEERING AND TECHNOLOGY MANAGEMENT IN TRANSFORMATION
OF BUSINESS PROCESSES". Our ways of doing business, our jobs and professions are
constantly changing and transforming, from the craftsmen of the 18th century who used
to make a product from the beginning to the end, to the experts who do certain parts of
the work, and to today's professions that require the utilization of different competencies.
Most likely, in the near future, we will also encounter new professions that are unknown
today, about which we do not talk about because we do not know, and that require very
different competencies. These transformations undoubtedly directly concern individuals,
companies, societies and even the economy. For this reason, the successful management
of this change process constitutes our theme this year. At the summit, various sessions,
panels and special speeches were held in which academicians, practitioners and students
working in the field shared their research and experiences in order to discuss and highlight
the characteristics of these professions, future business life, conditions and environmental
effects within the scope of engineering management.
At the summit, other problems of the field were also discussed and an attempt was made
to gain a perspective on what should be considered when designing jobs and professions,
and solving problems by those in charge in the engineering Management field. The
realization of this Summit undoubtedly required a lot of effort and support. We would
like to thank everyone who supported and contributed to our summit, especially our ITU
and BAU Rectors, the honorary chairman of our summit, ASEM administration for their
support, the invited speakers for their speeches, the chairs for organizing invited sessions.
We would like to thank our moderators, authors, academics, researchers, students,
professionals and all participants, and also to each of our organizing committee members.
The book covers the abstracts and full papers in English or Turkish as the authors
submitted to the summit. All submissions have been evaluated through a blind review
process. Hoping the online book will be enjoyable and useful to all who are interested in
research and studies and applications in the field of Engineering and Technology
Management.
Best Regards,
Prof. Dr. Ferhan Çebi Prof. Dr. Faik Tunç Bozbura
Istanbul Technical University Bahcesehir University
International Engineering and Technology Management Summit 2021– ETMS2021
İstanbul Technical University & Bahçeşehir University
v
Honorary Chair
Prof. Dr. Sıtkı GOZLU
Co-chairs
Prof. Dr. Ferhan CEBİ
Prof. Dr. F. Tunç BOZBURA
Organizing Committee
Adnan Corum Bahcesehir University, Turkey
Ahmet Beskese Bahcesehir University, Turkey
Alper Camci Bahcesehir University, Turkey
Aziz Kemal Konyalioglu Istanbul Technical University, Turkey
Bersam Bolat Istanbul Technical University, Turkey
Caglar Sivri Bahcesehir University, Turkey
Didem Yildiz Bahcesehir University, Turkey
Dilay Celebi Istanbul Technical University, Turkey
Ethem Canakoglu Bahcesehir University, Turkey
F. Tunc Bozbura Bahcesehir University, Turkey
Ferhan Cebi Istanbul Technical University, Turkey
Gizem Deniz Istanbul Technical University, Turkey
Gul T. Temur Bahcesehir University, Turkey
Hatice Camgoz Akdag Istanbul Technical University, Turkey
K. Selcuk Tuzcuoglu Bahcesehir University, Turkey
Nihan Yildirim Istanbul Technical University, Turkey
Oguzhan Erdinc Bahcesehir University, Turkey Ozan Ridvan Aksu Bahcesehir University, Turkey Rana Ezgi Köse Istanbul Technical University, Turkey
Sait Gul Bahcesehir University, Turkey
Simon Philbin London South Bank University, United Kingdom,
ASEM President
Sitki Gozlu Istanbul Technical University & Bahcesehir University,
Turkey
Tankut Atan Bahcesehir University, Turkey
Tuğçe Beldek Istanbul Technical University, Turkey
Scientific Committee
Adil Oran Middle East Technical University, Turkey
Adnan Corum Bahcesehir University, Turkey
Ahmet Beskese Bahcesehir University, Turkey
Alp Baray Istanbul University-Cerrahpasa, Turkey
Alper Camci Bahcesehir University, Turkey
Alptekin Erkollar ETH Zürich, Federal Institute of Technology, Switzerland
Arzu Karaman Yildiz Technical University, Turkey

International Engineering and Technology Management Summit 2021– ETMS2021
İstanbul Technical University & Bahçeşehir University
vi
Berna Beyhan Sabanci University, Turkey
Bersam Bolat Istanbul Technical University, Turkey
Birdogan Baki Karadeniz Technical University, Turkey
Caglar Sivri Bahcesehir University, Turkey
David Bennett Aston University, UK & Chalmers Uni. of Technology,
Sweden
Didem Yildiz Bahcesehir University, Turkey
Dilay Celebi Istanbul Technical University, Turkey
Dilek Cetindamar Kozanoglu University of Technology Sydney, Australia
Dilek Ozdemir Gungor Izmir Katip Celebi University, Turkey
Dundar Kocaoglu Portland State University, USA
Elif Karaosmanoglu Istanbul Technical University, Turkey
Emre Cevikcan Istanbul Technical University, Turkey
Erkan Bayraktar The American University of the Middle East, Kuwait
Ethem Canakoglu Bahcesehir University, Turkey
F. Tunc Bozbura Bahcesehir University, Turkey
Ferhan Cebi Istanbul Technical University, Turkey
Gul T. Temur Bahcesehir University, Turkey
Gulgun Kayakutlu Istanbul Technical University, Turkey
Gulin Idil S. Bolatan Alanya Alaaddin Keykubat University, Turkey
Hacer Ansal Isik University, Turkey
Hakkı Okan Yeloğlu Baskent University, Turkey
Hatice Camgoz Akdag Istanbul Technical University, Turkey
Hilmi Yuksel Dokuz Eylul University, Turkey
Ilker Murat Ar Ankara Yildirim Beyazit University, Turkey
Jbid Arsenyan Rennes School of Business
John Wang Montclair State University, USA
K. Selcuk Tuzcuoglu Bahcesehir University, Turkey
Lerzan Ozkale Istanbul Technical University, Turkey
Mehmet Mutlu Yenisey Istanbul University-Cerrahpasa, Turkey
Mine Omurgonulsen Hacettepe University, Turkey
Mosad Zineldin Linnaeus University, Sweden
Murat Baskak Istanbul Technical University, Turkey
Nihan Yildirim Istanbul Technical University, Turkey
Nuri Basoglu Izmir Technology Institute, Turkey
Oguzhan Erdinc Bahcesehir University, Turkey
Omur Yasar Saatcioglu Dokuz Eylul University, Turkey
Ozalp Vayvay Marmara University, Turkey
Ozlem Ozdemir Middle East Technical University, Turkey
Roya Javadpour Cal Poly University, USA
Sait Gul Bahcesehir University, Turkey
Sakir Esnaf Istanbul University-Cerrahpasa, Turkey
Seckin Polat Istanbul Technical University, Turkey
Sercan Ozcan University of Portsmouth
Seung Hun Han KAIST, South Korea
Simon Philbin London South Bank University, United Kingdom
Sinan Erzurumlu Babson College, USA

International Engineering and Technology Management Summit 2021– ETMS2021
İstanbul Technical University & Bahçeşehir University
vii
Sitki Gozlu Istanbul Technical University, Bahçesehir University,
Turkey
Tankut Atan Bahcesehir University, Turkey
Timothy Kotnour University of Central Florida, USA
Tufan Vehbi Koc Istanbul Technical University, Turkey
Tugrul Daim Portland State University, USA
Vladimir Kotomin Illionis State University, USA
Weishen Wang College of Charleston, USA
Yaman Omer Erzurumlu Bahcesehir University, Turkey
Yesim Sireli University of North Carolina at Charlotte, USA
Yildirim Omurtag Robert Morris University, USA
Zafer A. Acar Piri Reis University, Turkey

International Engineering and Technology Management Summit 2021– ETMS2021
İstanbul Technical University & Bahçeşehir University
viii
CONTENT
Full Papers
Title Page No
A Citizen Healthcare Monitoring Application in Turkey
Güven Ç., Karpuz U., Camgöz-Akdağ H., Yıldırım N., Konyalıoğlu A.K.,
Beldek T.
2
A Conceptual Evaluation on Token as A New Candidate Payment System
Altunbulak N.
9
A Goal Programming-Ahp Integrated Approach for Covid-19 Vaccine
Distribution
Otar B. Ç., Tekin-Temur G.
14
A Research Model for Agile Leadership in a Changing World
Örnek H. M., Camcı A.
24
Adopting Blockchain Tokenisation Technology for Real Estate Transactions: A
Security Token Offering Procedure and Legal Design Proposal
Erzurumlu Ö. Y.
34
Assessing Industry 4.0 Transformation of SMEs: A Swot Analysis
Yüksel H., Ernur O.
48
Blockchain Application Decision Analysis with Dematel And Vikor Methods:
A Case in the Turkish Banking Sector
Huyut Ü., Tekin-Temur G.
56
Calculation of Potential Resignations in the Companies with SVM
Tombuloğlu-Ulutaş B. Ö., Ulug B., Emir Y.S.
66
Covid-19 Salgınının Bist-100’deki Firmalara Göre Türkiye’deki Sektörlere
Etkisi
Öztürk E., Aksoy M. E.
74
Dabt-Ipa Aşı Dağıtım Planlamasında Kantitatif Yaklaşım: İstanbul-Maltepe
İlçesi Orneği (Covid-19 Dönemi)
Bostancıoğlu B., Özcanlı-Baran P., Köse R.E., Çebi F.
84
Data Mining for Crowdfunding: Exploring the Backers of New Games: In-
Player Communities
Aydalga C., Yıldırım N.
91
Depo Etkinliğinin Veri Zarflama Analizi ile Değerlendirilmesi- Dayanıklı
Tüketim Sektöründe Bir Uygulama
Çelikel-Yazar S., Cömert-Deniz G., Çebi F.
107
Determination of Covid-19 Resilience Ranking For Economies With Entropy-
Based Cocoso Method
Bilgiç B., İrtem S. S.
114
Digital Second-Hand Shopping and Clothing Transformation Project Design
Coşkunsu D., Yüzlek M., Konyalıoğlu A. K., Beldek T., Camgöz-Akdağ H.
120
Pandemi Etkisi ile Uzaktan Calışma ve Verimlilik Artışı 128
Aksoy B., Güney R., Aslan T. N., İnsel R., Camgöz-Akdağ H.
Prioritizing Strategic Decisions in Cold Supply Chain by Dematel And Vikor
Sarpkaya D., Tekin-Temur G.
135

International Engineering and Technology Management Summit 2021– ETMS2021
İstanbul Technical University & Bahçeşehir University
ix
Revealing Trends in Telemedicine Technology Using Patent Analysis
Boonswasd P., Limsiriwattanakul P., Shirahada K.
147
Systems Thinking and Technology Management in The Digital Age
Camcı A.
158
The Factors Affecting the Technology Acquisition of Organizations In Energy
Sector: A Research in Context of the Resource Dependence Theory
Yeloglu H.O., İmancer A. B.
163
The Impact of Big Data Applications on Financial Performance: A Review For
Borsa Istanbul 100 Index
Huyut Ü., Erzurumlu Y. Ö.
172
Türkiye’de Cok Modlu Taşımacılık Uygulamaları
Bulut G., Çorum A.
182
User Experience for Social Responsibility (Ux4sr): Conceptual Framework
Erdinç O.
Ulkemizdeki İşletmelerin Endüstri 4.0 Farkindalik Ve Hazirlik Düzeylerinin
Değerlendirilmesi: 2018 – 2020 Yillarinin Karşilaştirmali Analizi
195
198
Yüksel H.

International Engineering and Technology Management Summit 2021– ETMS2021
İstanbul Technical University & Bahçeşehir University
x
Abstracts
Title Page No
An Integrated Fuzzy Dematel And Fuzzy ANP Approach for Hospital
Information System Selection
Yılmaz M., Atan T., Baş-Güre S.
206
Applying Blockchain Technology to Maintenance Management
Gezer M. , Ozdemir A. İ.
207
Blockchain For Improving Construction Supply Chain Management: A
Systematic Review of The Literature
Al-Hayani A.
209
Blockchain in Energy Sector: A Review of The Literatures and Applications
Seker B. M., Özdemir A. İ., Erol İ.
210
Büyük Verinin Analitik Yöntemlerle İşlenmesi ve İmalat Sanayinde Kullanımı
Güldüren E.
211
Company Efficiency and Effectiveness and R&D Expenditure
Örnek H. M., Karakaya T.
212
Comparison of Different Method Approaches in OHS Risk Assessment On
FMCG Logistics
İyem D., Cem E., Güneri A. F.
213
Cocuk İşçi Nedenli Boykot Tehdidinin Fildişi Sahili Kakao Uretimine Etkisi
Koyuncu O., Toure Y., Menten C.
214
Döngüsel Ekonomiye Geçiş Aşamasında Karşılaşılan Bariyerler için Endüstri 4.0
Odaklı Çözüm Önerileri
Sağnak M., Ada E., Kazançoğlu Y.
218
Effective Partnership: A Key To Drive Open Innovation 220
Manotungvorapun N., Gerdsri N.
Evaluation of Impact of Digitalization on Healthcare Service Efficiency
Öztürk M., Bolat B., Tekin-Temur G.
221
Examining the Factors Affecting the Use of Mobile Payments Systems: A Survey
Study on University Students
Yıldırım A. C.
222
Kasiyersiz Kasa Satışlari ile Ortam Sensörleri Arasındaki Uzun ve Kısa Dönemli
İlişkilerin Analizi
Mert B., Eskiocak İ.D., Zeybek Ö., Yücel M. E.
223
Overcoming The Multi-Glass Ceiling Faced By Immigrant Women Entrepreneurs
In Technology Sector
224
Pugalia S., Agarwal R., Bliemel M., Çetindamar D.
Proje Yönetiminde Dijitalleşme
Limoncuoğlu N., Cekiç B.
225
Sürdürülebilir Biyokütle Enerji Tedarik Zinciri Yönetimindeki Engeller
Dündar H., Ömürgönülşen M.
228

International Engineering and Technology Management Summit 2021– ETMS2021
İstanbul Technical University & Bahçeşehir University
xi
Türkiye’de Endüstri 4.0’a Geçiş Sürecindeki Firmalarda Yaşanan Güçlüklerin
Belirlenmesine İlişkin Bir Araştirma
Gerşil M., Yüksel H.
229

International Engineering and Technology Management Summit 2021– ETMS2021
İstanbul Technical University & Bahçeşehir University
1
FULL PAPERS
International Engineering and Technology Management Summit 2021– ETMS2021
İstanbul Technical University & Bahçeşehir University
2
A CITIZEN HEALTHCARE MONITORING APPLICATION IN TURKEY
1Çiçek Güven 1Uğurcan Karpuz 1Hatice Camgöz Akdağ
1Nihan Yıldırım 1Tuğçe Beldek 1Kemal Konyalıoğlu
1Istanbul Technical University
ABSTRACT
As the development levels of countries increase, the proportion of the elderly in their population is also
increasing. This increase in the elderly population brings that the necessity of increasing the social services
offered to the elderly. Most of the countries that do not have economic difficulties have a smaller number
of households than the rest of the countries. Many older people live in their homes with their life partners
or alone. These individuals are vulnerable to emergencies that they may experience when they are alone at
home. It has been determined that in instant health situations or accidents, taking quick action of elderly
individuals can play an important role in saving their lives. It is also a fact that the elderly people, especially
with the effect of the pandemic period, miss their routine checks with their doctors. Missing these controls
prevents the way of early diagnosis of diseases of possibly elderly individuals. Continuous recording of
health data of these people will help facilitate diagnosis in possible health situations by observing them by
their doctor. For this reason, it is designed to develop a system that records the health data of elderly people,
make these health data viewable by their doctors, ensure that action is taken through the call center in case
of possible emergencies, and provide remote health and location information to the families of elderly
people.
Keywords: elderly people, health tracking, remote control, e-health
International Engineering and Technology Management Summit 2021– ETMS2021
İstanbul Technical University & Bahçeşehir University
3
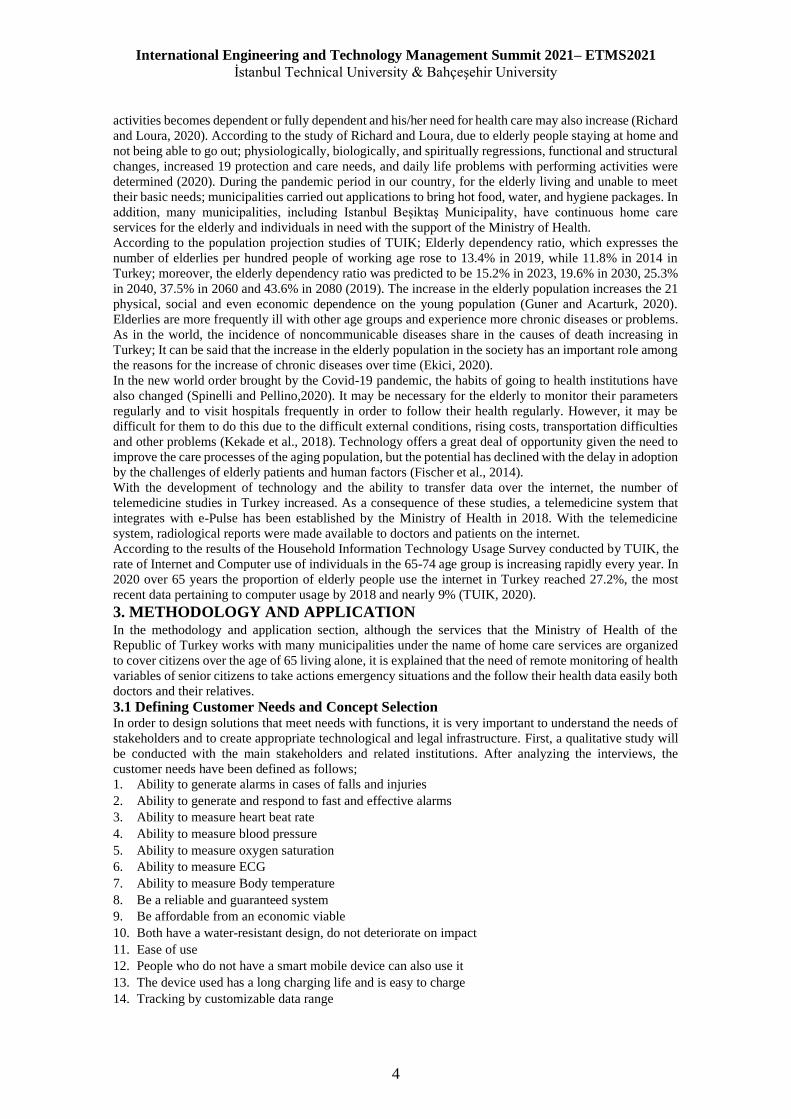
1. INTRODUCTION In Turkey, with the decrease in fertility and death rates, the progress made in the health sector, with the
increase in the standard of living, the age structure of the population has started a demographic conversion
process in which the population ages, changing well-being and birth. However, the ratio of the elderly
population to the total population of more than 10% has become an indicator of the aging of the population.
The elderly population in Turkey has increased at a higher rate than the population in other age groups
(TUIK, 2019). The fact that the population is aging every year and the demographic age balances are
changing further shows the importance of what needs to be done for the elderly population in Turkey. With
the growth of the elderly population in our country, it is essential to address the problems of this age group
to effective solutions.
During the Covid-19 pandemic around the world, there were major changes in the quality of life and daily
life of individuals over the age of 65 who were subjected to restrictions. Curfew restrictions imposed during
this period, outpatient clinics in public hospitals that were converted to pandemic hospitals did not serve
for a long time, and the elderly could not enter crowded places for fear of contracting the virus; health status
monitoring was also disrupted. Although the health status of elderly people, especially those living alone,
cannot be monitored, it has also become difficult to act when there is an emergency.
Turkey Ministry of Health provides home inspection services to elderly people with chronic diseases, and
care services to disabled or needy citizens. In order to improve design, internet-based information
technology systems and the rate of use of these technologies among the elderly and by the elderly are also
decidedly critical. It is aimed to combine technological solutions for monitoring the health of the elderly.
In this study, household demographic studies of individuals aged 65 and over living in Turkey will be
discussed for inclusion in the study while identifying the problem. In order to decipher the solution
proposal, health problems will be brought, the causes of death among people over 65 in Turkey will be
examined and these conditions can be exemplified. Key indicators of the identified health condition will be
examined and added to the study. The Ministry of health will examine the home care services provided to
elderly, disabled or needy citizens with chronic diseases and discuss the limitations of their stay and their
inadequate reasons. Later, the relationship between internet-based information technology systems and the
elderly and the rate of use of these technologies by the elderly will be examined. Later, the relationship
between internet-based information technology systems and the elderly and the rate of use of these
technologies by the elderly will be deconstructed. Studies in the world and literature will be reviewed and
examples will be examined to provide solutions by combining technological solutions to monitor the health
of the elderly. After the literature review, the purpose of the study, the definition of the problem and the
target audience of the project will be explained in detail and the first part of the project will be completed.
2. LITERATURE REVIEW In general, in the world and in our country, individuals aged 65 and over are considered as "elderly
population". While the World Health Organization (WHO) accepts the old age as 65 years and above, the
United Nations studies on aging are generally based on the age group of 60 and over (WHO 2007a, UN
2015). In Turkey, a decrease in fertility and mortality rates developments in healthcare, together standard
of living, welfare and birth with the increase in life expectancy, the population's age structure changes
shape. According to the data, the total population of the elderly in Turkey increased to 9.1% (TUIK, 2019).
According to TUIK’s Household Survey in 2019, 23.5% of 24 million 940 thousand households in Turkey
has reached the conclusion that at least one elderly individual resides. In the same survey, it was concluded
that 24.4% of 5 million 629 thousand 421 households with at least one elderly member were elderly
individuals living alone. 17 A lot of research has been done on the psychological conditions of elderly
people living alone, but there is not enough research on health, general health conditions and error tracking
during the Covid-19 pandemic. Individuals living alone may face the risk of being helpless in an emergency.
Each year, the causes of the deaths in Turkey are reported by TUIK according to age groups and gender.
According to statistics between 2010 and 2018, the rate of death from circulatory diseases does not fall
below 43% and can be seen as a reason that cannot be underestimated. As an example of these diseases;
heart attack, stroke, hypertension, heart failure and high cholesterol can be given (Barrell, 2018).
According to the Quality Life in Old Age report; although the most important factor determining life
expectancy is genetics; lifestyle, environmental factors, cope with diseases and adverse conditions, many
factors, such as dating routes, also play a role in determining life expectancy (2020). Covid-19 pandemic,
which is considered an environmental factor that occurs today, the whole world has taken under the
influence. With the circular of the Ministry of Interior dated March 21, 2020, citizens aged 65 and over are
prohibited from going out to reduce the spread rate of the epidemic in our country and to maintain social
distance between people. Staying at home during the Covid-19 pandemic the elderly individual in daily life
International Engineering and Technology Management Summit 2021– ETMS2021
İstanbul Technical University & Bahçeşehir University
4
activities becomes dependent or fully dependent and his/her need for health care may also increase (Richard
and Loura, 2020). According to the study of Richard and Loura, due to elderly people staying at home and
not being able to go out; physiologically, biologically, and spiritually regressions, functional and structural
changes, increased 19 protection and care needs, and daily life problems with performing activities were
determined (2020). During the pandemic period in our country, for the elderly living and unable to meet
their basic needs; municipalities carried out applications to bring hot food, water, and hygiene packages. In
addition, many municipalities, including Istanbul Beşiktaş Municipality, have continuous home care
services for the elderly and individuals in need with the support of the Ministry of Health.
According to the population projection studies of TUIK; Elderly dependency ratio, which expresses the
number of elderlies per hundred people of working age rose to 13.4% in 2019, while 11.8% in 2014 in
Turkey; moreover, the elderly dependency ratio was predicted to be 15.2% in 2023, 19.6% in 2030, 25.3%
in 2040, 37.5% in 2060 and 43.6% in 2080 (2019). The increase in the elderly population increases the 21
physical, social and even economic dependence on the young population (Guner and Acarturk, 2020).
Elderlies are more frequently ill with other age groups and experience more chronic diseases or problems.
As in the world, the incidence of noncommunicable diseases share in the causes of death increasing in
Turkey; It can be said that the increase in the elderly population in the society has an important role among
the reasons for the increase of chronic diseases over time (Ekici, 2020).
In the new world order brought by the Covid-19 pandemic, the habits of going to health institutions have
also changed (Spinelli and Pellino,2020). It may be necessary for the elderly to monitor their parameters
regularly and to visit hospitals frequently in order to follow their health regularly. However, it may be
difficult for them to do this due to the difficult external conditions, rising costs, transportation difficulties
and other problems (Kekade et al., 2018). Technology offers a great deal of opportunity given the need to
improve the care processes of the aging population, but the potential has declined with the delay in adoption
by the challenges of elderly patients and human factors (Fischer et al., 2014).
With the development of technology and the ability to transfer data over the internet, the number of
telemedicine studies in Turkey increased. As a consequence of these studies, a telemedicine system that
integrates with e-Pulse has been established by the Ministry of Health in 2018. With the telemedicine
system, radiological reports were made available to doctors and patients on the internet.
According to the results of the Household Information Technology Usage Survey conducted by TUIK, the
rate of Internet and Computer use of individuals in the 65-74 age group is increasing rapidly every year. In
2020 over 65 years the proportion of elderly people use the internet in Turkey reached 27.2%, the most
recent data pertaining to computer usage by 2018 and nearly 9% (TUIK, 2020).
3. METHODOLOGY AND APPLICATION In the methodology and application section, although the services that the Ministry of Health of the
Republic of Turkey works with many municipalities under the name of home care services are organized
to cover citizens over the age of 65 living alone, it is explained that the need of remote monitoring of health
variables of senior citizens to take actions emergency situations and the follow their health data easily both
doctors and their relatives.
3.1 Defining Customer Needs and Concept Selection In order to design solutions that meet needs with functions, it is very important to understand the needs of
stakeholders and to create appropriate technological and legal infrastructure. First, a qualitative study will
be conducted with the main stakeholders and related institutions. After analyzing the interviews, the
customer needs have been defined as follows;
1. Ability to generate alarms in cases of falls and injuries
2. Ability to generate and respond to fast and effective alarms
3. Ability to measure heart beat rate
4. Ability to measure blood pressure
5. Ability to measure oxygen saturation
6. Ability to measure ECG
7. Ability to measure Body temperature
8. Be a reliable and guaranteed system
9. Be affordable from an economic viable
10. Both have a water-resistant design, do not deteriorate on impact
11. Ease of use
12. People who do not have a smart mobile device can also use it
13. The device used has a long charging life and is easy to charge
14. Tracking by customizable data range

International Engineering and Technology Management Summit 2021– ETMS2021
İstanbul Technical University & Bahçeşehir University
5
15. User-friendly design
Wristband, wristband with e-sim, body connected devices and smartphones are determined as concept
variables. Using these four variables, 5 different concepts generated. TOPSIS method was applied in
concept selection. Selection criteria are sorted by their importance. After ranking, weights were calculated
by assigning points to each rank. The created concepts are evaluated and sorted according to the selection
criteria, with each concept being rated for each criterion. Thus, the most appropriate concept which contains
smartphone and wristband with e-sim was chosen.
3.2 System Design In the section of system design, process flow charts, data flow and data management are designed for each
function. The aim of the designed system is to ensure that elderly individuals can generate alarms in
emergencies or manually by constantly monitoring their health. The subsystems of the system are age
individuals, elderly relatives, doctors, 112 emergency departments, wearable measuring device,
smartphones, GPS, call center, municipalities and E-Nabız system. These subsystems ensure the operation
and continuity of the existing system. A combination of these subsystems leads to The Citizen Healthcare
Monitoring Project.
The flow begins with the delivery and installation of the wearable measuring device to the elderly person.
If an elderly person has a smartphone, it continues with downloading the phone app and creating an account.
Monitoring health data and generating alarms in abnormal situations or manually triggering an elderly
person's alarm in an emergency are also other steps in the system flow. An elderly person who contacts the
municipality in which he lives to use this system is delivered a wearable measuring device through the
social support services of the municipality in which he is located. After social workers make measurements
of health indicators, they define thresholds in the device according to the guide document prepared by
doctors. Contact information of emergency contact persons is identified to the device with E-SIM, and the
device is properly connected to the elderly person by the attendant.
Figure 1. Process Flow Chart of the Tracking Data and Determining Control Limits
The principle of the system is that the wearable measuring device measures health values and alarms 24/7
in abnormal situations. Prior to the design of the system, interviews with doctors were informed that the
normal health values of each individual could be different. Accordingly, an algorithm has been created to
measure values to be measured at intervals within 1-2 weeks of using the device and to create threshold
values specific to each individual. Systolic blood pressure values are processed by making 2 measurements

International Engineering and Technology Management Summit 2021– ETMS2021
İstanbul Technical University & Bahçeşehir University
6
daily for 14 days, and pulse value is processed by making 24 measurements 1 time per hour for 1 day. The
mean, range and standard deviation of the values are calculated and the lower control limit (LCL) and upper
control limit (UCL) values are found. The system algorithm accepts these values as threshold, setting the
alarm mechanism according to these values.
Figure 2. Control Chart of the Heart Rate
The system architecture has been visualized to show connection between cloud server of system,
smartphone, wristband and e-Nabız integration. These elements of system are in strong relationship with
doctors, call center, elderly relatives and elderly people.
Figure 3. System Architecture
0
20
40
60
80
100
120
140
1 2 3 4 5 6 7 8 9 10 11 12 13 14 15 16 17 18 19 20 21 22 23 24
He
art
Rat
e
Day
ucl=124 lcl=65 Recorded Value

International Engineering and Technology Management Summit 2021– ETMS2021
İstanbul Technical University & Bahçeşehir University
7
Figure 4. Entity Relationship Diagram
The use case diagram designed using both telephone and wristband with e-sim. The use case diagram
summarizes the stakeholder’s actions in system. Relatives of elderly people can access elderly person
account with the help of cloud servers. Health variables and failing sensor has a capability to trigger call
center agent for call elderly person. If elderly person cannot pick up the phone, system trigger the
ambulance to go to elderly person home. Also, doctors can see elderly persons health variables via E-Nabız
integration.
Figure 5. Use Case Diagram
4. CONCLUSION First, the growth rate and health habits of the population over the age of 65 in Turkey were investigated.
Health problems that are the most common cause of death of the elderly population; reasons and habits of
International Engineering and Technology Management Summit 2021– ETMS2021
İstanbul Technical University & Bahçeşehir University
8
going to the hospital were examined according to the data of the Turkish Statistical Institute. Considering
the fact that the person himself cannot do health monitoring at home when addressing the problem, the
habits of people over the age of 65 using technology are also an important factor. Based on this, according
to the data of the Turkish Statistical Institute, the rates of internet and computer use of elderly people were
examined. In 2020, the internet usage rate of individuals over 65 years of age is 27.8%, while the average
10% increase in rates each year is promising. After the problem was identified, stakeholders were identified
and their expectations, effects and interests from this system were not studied. Then, interviews were
conducted with main stakeholders to perform qualitative research, and customer needs were determined
according to the results. After determining customer needs, possible methods that the system can offer to
these needs are determined. Outstanding needs; instant and fast alarm generation, direct connection with
health organizations, manual alarm generation, easy operation and heart values such as pulse, blood
pressure were determined as being able to be measured and monitored. Concepts were created that could
meet these needs, and then using the TOPSIS method, a managerial decision making method; the concept
containing wearable measuring device with E-Sim and mobile application was selected. At the stage of
system design, the sub-supra systems of the system were examined and the operation of the system was
summarized with the block process diagram. The operation of the system is divided into five main processes
and separate process flows are created. Prior to the design of the system, interviews with doctors were
informed that the normal health values of each individual could be different. Accordingly, an algorithm has
been created to measure values to be measured at intervals within 1-2 weeks of using the device and to
create threshold values specific to each individual. The mean, range and standard deviation of the values
are calculated and the lower control limit (LCL) and upper control limit (UCL) values are found. The
system algorithm accepts these values as threshold, setting the alarm mechanism according to these values.
In addition to tracking values and alarms produced accordingly, a manual emergency alarm process is also
designed, in which older people indicate that they need it. Finally, the implementation scenarios of the
project were evaluated stochastically and analyzed as full-funded, semi-funded and unfunded scenarios.
Since the designed system is within the scope of a social project, it has been analyzed in a way that is non-
profit and carried out by receiving annual budget-based funding. Since the biggest expense of the project
is the wearable meter, the bad scenario is calculated assuming that this expense is fully covered by the user.
General assumption and planning; preparation of a budget by calculating annual project costs with unit
costs based on user goals and expectations; then implementation by funding from the budget of the social
support services unit of the municipality where the project is carried out. The project can be targeted in the
future to be more accessible, with more advanced technological devices, at more affordable costs. The
project, designed by taking the pilot district of Şişli municipality, can be expanded throughout Turkey,
improving the quality of life of the elderly population, preventing them from being helpless in emergency
situations.
REFERENCES Barrell A., What diseases affect the circulatory system, 1 May 2018
https://www.medicalnewstoday.com/articles/321695
Ekici E. Care Management of Elderly People During Covid 19 Pandemic. Halic Uni J Health Sci, 2020;3(3)
145-152
Fischer, S.H., David, D., Crotty, B.H., Dierks, M., Safran, C.: Acceptance and use of health information
technology by community-dwelling elderly. Int. J. Med. Inform. 83(9), 624–635 (2014)
Guner, H., Acarturk, C. The use and acceptance of ICT by senior citizens: a comparison of technology
acceptance model (TAM) for elderly and young adults. Univ Access Inf Soc 19, 311–330 (2020).
https://doi.org/10.1007/s10209-018-0642-4
Kekade, S., Hseieh, C. H., Islam, M. M., Atique, S., Mohammed Khalfan, A., Li, Y. C., & Abdul, S. S.
(2018). The usefulness and actual use of wearable devices among the elderly population. Computer
methods and programs in biomedicine, 153, 137–159. https://doi.org/10.1016/j.cmpb.2017.10.008
Richard A, Loura N. COVID-19 and the consequences of isolating the elderly. March 2020, The Lancet
Public Health. DOI: 10.1016/ S2468-2667(20)30061-X
Spinelli, A., & Pellino, G. (2020). COVID-19 pandemic: perspectives on an unfolding crisis. The British
journal of surgery, 107(7), 785–787. https://doi.org/10.1002/bjs.11627
Turkish Statistic Foundation. (2019). Seniors with Statistics. Retrieved from
https://data.tuik.gov.tr/Bulten/Index?p=Istatistiklerle-Yaslilar-2019-33712
Turkish Statistic Foundation. (2020, March). Elderly Statistics, 2020. Retrieved from
https://data.tuik.gov.tr/Bulten/Index?p=Elderly-Statistics-2020-37227
WHO. (2007a), World Health Organization, Global Report on Falls Prevention in Older Age.

International Engineering and Technology Management Summit 2021– ETMS2021
İstanbul Technical University & Bahçeşehir University
9
A CONCEPTUAL EVUALATION ON TOKEN AS A NEW CANDIDATE
PAYMENT SYSTEM
Nazlı Altunbulak
Bahçeşehir University
ABSTRACT The widespread usage of tokens has unveiled the outbreak of tokens, fungible (FT) and non-fungible tokens
(NFT) which settles a new payment method atmosphere all over the world. Previous researches have
focused on blockchain technology and the characteristics of it. Fungible and non-fungible tokens have
differentiated standards in terms of security and structure to be used widely. This study underlines the
possible technologies of tokens to be used by individuals and organizations by considering the necessities
of a new payment method to be used actively. In this investigation, the digital product characteristic and
perception of tokens have been highlighted. The security conditions, standardization procedures and
protocols which are used for a durable token payment structure are given as a highlighting result of the
investigation. Lastly, the conceptual evaluation through the token technology has been mentioned regarding
the tokens as a product with the technology acceptance model.
Keywords: Tokens, payment method, product, digital, Non-fungible tokens

International Engineering and Technology Management Summit 2021– ETMS2021
İstanbul Technical University & Bahçeşehir University
10
1. INTRODUCTION
The emergence of a new product brings a new way of understanding the product and manner of usage it.
As tokens are considered as a digital product, fungible and non-fungible, and a new payment method may
be outlined as an independent and unique way of any digital and physical asset which token symbolizes
stored and used in a digital environment. The specificity of the uniqueness of tokens is inherited by the
Blockchain ecosystem which underlines the digital scarcity as well. Digital scarcity points out the asset to
be contained, transferring it to another agent in the same role (Pilkington 2015). The infrastructure of
blockchain refers the characteristic of tokens to be used in ease and tradability. The framework of
blockchain has been settled in the release of Bitcoin: A Peer-to-Peer Electronic Cash System (Nakamoto,
2008) as a basic description of cryptocurrencies. Afterwards, multiple types of cryptocurrencies are
introduced. The sharing mechanisms has enlarged its area as the increasing participation of collaborators
in several industries (energy market, international payment network owners etc.) which takes the
interoperability to the center for use. In this study, we will be mentioning on tokens as a fresh and unique
product, fungible and non-fungible, as a new candidate for a payment system to be actively used in people’s
lives with the today’s developed methods for tokens in IT industry.
2. LITERATURE REVIEW
Blockchain as a popular technological application has extended its usage in daily lives of individuals and
different sectors in last years. Additionally, blockchain has been considered as time-stamped recording
which is not owned by only one owner, cluster acts as an owner which blockchain points out the bounded
chains each other, names itself. Considering the architecture of the blockchain system as a cloud
manufacturing as a service (CMaSS) is aimed since blockchain has also a bounding structure of users in an
integrated structure. Secondly, CMaaS platforms has a continuous evolve in time with its accessibility
between users (Hasan and Starly, 2020). Considering the increasing popularity of fungible and non-
fungibility tokens, fungibility refers to interchangeability with other units. Whereas, non-fungible
underlines the not ability to interchange with any other unit, it refers to the uniqueness of the items and their differentiation from each other. The term of token is based on the digital-time stamping which covers the cryptographic functions and
making the time stamping process renewable. Additionally, digital time stamping was mentioned as
compromising in terms of revealed private keys, increasing accessibility to key lengths and enhanced
algorithm techniques in time. Time stamping has also seen as a self-renewing mechanism which constructs
the tokens in today’s world as infrastructure (Bayer et al.,1999). NFTs have started with the colored coins
in March 2012 by Yoni Assia (2012). The name comes from the metadata embedding with the Bitcoin
technology. Colored coins have extended its area for the creation of any assets along with NFT. But the
updated standard ERC-20 which was named as the birth of the Ethereum in 2015 has narrowed the effect
of colored coins.
The characteristics of non-fungible tokens listed as uniqueness, traceability, scarcity, divisibility and coded
as (Oliveira et al., 2018):
Uniqueness: The embedded information in token differentiates them in terms of value and tradability
considering along with the usage area (game, digital painting etc.)
Traceability: Transactions are recorded in the non-fungible tokens and updates itself with the changing
owner of it as a cumulative update for keeping the track of the non-fungible token as a digital product.
Scarcity: NFT (non-fungible token) is scarce of its own nature. Considering the long term, this is perceived
as an increasing the bound of the NFT and its owners.
Indivisibility: Since NFTs are digital assets, they cannot be separated or they cannot be bought in terms of
percentages.
Coded: NFTs are codded as the blockchain technology is. In terms of mechanics of the token, NFTs have
common points (Hasan and Starly, 2020). Coded structure also underlines the security content, this is
referred in the upcoming arguments in this study as well.
To identify more on the standardized aspect of the NFT and FT (fungible tokens), the important aspect for
fungible tokens, which was based on ERC-20 standard and NFTs differentiate with ERC-721 standard as a
characteristic from FTs (Entriken et al., 2018). The term fungible refers to the interchangeability of each
unit of a commodity with other units of the same commodity, i.e. two parties could swap the same amount
without any gain or loss (Regner et al.2019). On the contrary non-fungible mentions the non-substitutability
of the token. As mentioned in ERC-721 standard, NFT has a globally unique id that also includes a
metadata. This set up has been made for the protection ownership of assets. Lastly the inference may be
seen as on ERC-721 standard, it enables for token transfer between users and to the third part account.
Considering the blockchain technology and NFTs in a specific area, blockchain system as a payment

International Engineering and Technology Management Summit 2021– ETMS2021
İstanbul Technical University & Bahçeşehir University
11
method should also be considered. With the growth of the e-payment in today’s world, money transferring
methods has also enlarged its area and different payment methods means more to individuals in different
fields for using the payment method. Also considering the payment systems’ previous complications and
future, many problems has occurred due to the “fit-for-purpose” characteristic which lessen the growth of
the payment method (Abrzhevich, 2004). Addition to “fit-for-purpose” characteristic of payment methods,
security, usability, trust and the efficient of the payment systems by users should be considered as well.
(Ozkan et al.,2009).
Payment tokens are one of the payment methods in a digital format. Payment tokens are differentiated from
other tokens as being a transferring value for buying multiplied goods and services (Kharitova,2020). Since
considering the payment concept, security and changing values of money in terms of digital or not, bearing
in mind in the first position. Tokens also has a volatile nature and stablecoin is referred as a possible solution
for consideration. With usage of stablecoin stable set values along with security is solved (Chen, 2018).
NFT find its place in the payment systems world in a narrowed place with the possibility of application of
the advanced methods for tokens. As a payment method, Blockchain and tokens have their own security
base as a payment method with the key management methods. Key management has been satisfied with
the private key creation that satisfies an ownership of tokens and transfers made. International Organization
for Standardization (ISO) / Technical Committee (TC) 307’s ISO 22739:2020 Blockchain and distributed
ledger technologies - Vocabulary highlights this as with the definition of wallet as “an application used to
generate, manage, store or use private and public keys which “can be implemented as a software or
hardware module.”
Secondly, transaction management was handled for the process of the tokens and validation of a new chain
was essential. The plasma cash chain has been defined as a new nonfungible token was issued with the
sparse Merkle tree where the data was indexed with divided branches. Plasma cash chain enables its users
to hold the transaction history of single users and creation of payment channels which nonfungible tokens
were issued to new users (Loïc et al.,2021).
Thirdly, considering the users of nonfungible tokens, for a valid payment system, users should be lending
and borrowing the loans as a secure and collateralized way. Smart contract vault has been used for new
units of the token which was handled as a tokenized debt. For collateralization, an over amount unit of
transfer had been made which is a rule for mitigating the default risks. Structurally schemes identify the
interest rate and collateralization ratio algorithm. If the loan is not paid, the transaction is reverted (Loïc et
al.,2021).
Lastly, the token exchange is applicable with Wyvern Protocol (2020). Wyvern Protocol provides a non-
custodial marketplace for non -fungible tokens. The token exchange occurs when the order for buying is
found in the smart contract vault of participants.
3.CONCEPTUAL EVALUATION The framework of token technology enables the token as a good candidate for a new payment method.
The security handling of the system and the ease of the methods in accessibility of users, identifies the
importance of payment methods for fungible and non-fungible tokens.
The reviewed technologies and fields of usages has identified that the payment methods have a capacity to
expand with the increasing technological structures. Digital technologies that we use frequently as,
contactless digital payments at the point of sale, such as face recognition, Quick Response (QR) codes or
near field communication (NFC), has been popular with the outbreak of coronavirus which reduced the
spreading of the virus to the others (Adıgüzel,2020). Moreover, Adıgüzel underlines that payment methods
have been proven its durability and reliability in the passed digital economy history. Payments systems and
system providers have given the ability of transferring digital tokens and assets which also abled themselves
to have the trust of the attending parties to the system.
As an example of token-based solutions, Groß et al. have identified a new technology called as Distributed
ledger technology (DLT) which has a structure of building trust of the players in the system which has a
point of decentralized structure and transactions can also be denominated in euro as a digital euro in future.
The identification of the proposed framework has been carried out with 3 steps as Contracting the execution,
digital payment infrastructure and monetary unit (Groß et al. 2020). This framework enables token-based
solution to be used in the real world with supporting various kinds of assets in addition to money.
After considering the real time used area and framework of token technology, the second part for token
technology should be de adoption of it. Since tokens are considered as payment assets, this characteristic
makes it also a digital product which should be commonly used to become a popular product, which a
product should be adopted by individuals and organizations. The token technology is a good candidate for
perceiving this aspect and Technology Acceptance Model (TAM). TAM centers this idea that the usage of
a particular system by someone who increases the job performance (Davis,1989). TAM has been offered

International Engineering and Technology Management Summit 2021– ETMS2021
İstanbul Technical University & Bahçeşehir University
12
for perceived usefulness and ease of use for specific technologies. The details of the technology acceptance
model considering the conceptual evaluation is discussed below.
Perceived Usefulness is considered essential which underlines the adoption tendency of any commerce by
users. Zhou and Lou identify that mobile applications increase the socializing and enhancing the usefulness.
Secondly, the caring mechanism of people in adopting new technologies affect the perceive of usefulness
(Devaraj et al.,2008). Referring to the fungible and non-fungible tokens, the eligibility of the usage of
tokens are available in the gaming sector and tokens as a financial asset. Consumers are willing to use them
and share them as a community of ready to absorb the new technology.
Ease of use of the TAM is defined as the determination of the user while adopting the new technology
(Davis,1989) In other words, the capability of the user under the affect of the new product. Gupta and Arora
point out the ease of use as effort expectancy as covering the behavioral attitude to accept the digital product
of a web application called as Moodle (Sánchez and Hueros, 2010). Revisiting the characteristics of non-
fungible tokens may underlined the usefulness of tokens as traceable, unique, scarce, indivisible and coded.
These points highlight the perceived usefulness part of the TAM model for token. Secondly, the ease of use
part of the TAM may be identified with the indivisibility, coded and traceability characteristics of the tokens
that those characteristics contribute the popularity of the expectancy of the tokens as anew payment method.
Lastly, the characteristics mentioned enables to widen the sharing between users since they depend each
other. The token technology can also be identified with this modelling understanding as an innovative
payment candidate.
4.CONCLUSION Studies on cryptocurrency and token technology has a common characteristic of being a digital product. In
today’s world, token payment methods have been promising since the scarcity of the digital products has
been increasing with their usage areas. The blockchain technology has been the base of the token coins
where they have similar infrastructure in terms of security, transferability and tradability in their platform.
Also considering the interchangeability of fungible tokens and disability of the interchangeability of non-
fungible tokens underline the uniqueness of these digital products. The technologies have been protected
and qualified with the security standards, protocols and methods for the sake of collaborators and users in
their own platform. Lastly, TAM and tokens as a candidate payment system is discussed referring to
characteristics of tokens. Addition to reviewed studies, the frequently used applications have been shaped
and token-based solutions may be one of the promising payment methods in future.
REFERENCES
Abrazhevich, D. (2004) Electronic payment systems: A user-centered perspective and interaction design,
PhD Thesis, Technical University of Eindhoven, ISBN 90-386-1948-0
Adıgüzel, Selminaz. (2020). After Covid-19 New Payments Methods in International Trade. ISPEC
International Journal of Social Sciences & Humanities. 4. 1-11. 10.46291/ISPECIJSSHvol4iss4pp271-
284.
Bayer, Dave & Haber, Stuart & Stornetta, W.. (1999). Improving the Efficiency and Reliability of Digital
Time-Stamping. 10.1007/978-1-4613-9323-8_24.
Devaraj, Sarv & Easley, Robert & Crant, J.. (2008). Research Note —How Does Personality Matter?
Relating the Five-Factor Model to Technology Acceptance and Use. Information Systems Research.
19. 93-105. 10.1287/isre.1070.0153.
Entriken, W., D. Shirley, J. Evans and N. Sachs. (2018). “ERC-721 Non-Fungible Token Standard.”
Retrieved from https://eips.ethereum.org/EIPS/eip-721
F. D. Davis, "Perceived usefulness, perceived ease of use, and consumer acceptance of information
technology," MIS Quarterly, vol. 13, pp. 319-340, 1989
Groß, Jonas & Sandner, Philipp & Bechtel, Alexander & Ferreira, Agata. (2020). The Future of Payments
in a DLT-based European Economy: A Roadmap. SSRN Electronic Journal. 10.2139/ssrn.3751204.
Gupta, K. and Arora, N. (2020), "Investigating consumer intention to accept mobile payment systems
through unified theory of acceptance model: An Indian perspective", South Asian Journal of Business
Studies, Vol. 9 No. 1, pp. 88-114.
Hasan, Mahmud & Starly, Binil. (2020). Decentralized cloud manufacturing-as-a-service (CMaaS)
platform architecture with configurable digital assets. Journal of Manufacturing Systems. 56. 157-174.
10.1016/j.jmsy.2020.05.017.
International Organization for Standardization (2020) ISO 22739:2020 - Blockchain and distributed ledger
technologies — Vocabulary (Technical Committee 307). Available at
https://www.iso.org/standard/73771.html
Lesavre Loïc, Varin Priam, Yaga Dylan. (2021). “Blockchain Networks: Token Design and Management
Oveview” U.S. Department of Commerce. Available at https://doi.org/10.6028/NIST.IR.8301

International Engineering and Technology Management Summit 2021– ETMS2021
İstanbul Technical University & Bahçeşehir University
13
Nakamoto, S. (2008). Bitcoin: A Peer-to-Peer Electronic Cash System. Retrieved from
https://bitcoin.org/bitcoin.pdf
Oliveira, Luis & Zavolokina, Liudmila & Bauer, Ingrid & Schwabe, Gerhard. (2018). To Token or not to
Token: Tools for Understanding Blockchain Tokens.
Ozkan, Sevgi& Bindusara, G. & Hackney, Ray. (2009). Towards successful e-payment systems: An
empirical identification and analysis of critical factors. Proceedings of the European and Mediterranean
Conference on Information Systems, EMCIS 2009.
Pilkington, Marc, 2015. “Blockchain Technology: Principles and Applications”, Research Handbook on
Digital Transformations
Regner, Ferdinand & Schweizer, André & Urbach, Nils. (2019). NFTs in Practice – Non-Fungible Tokens
as Core Component of a Blockchain-based Event Ticketing Application.
Sánchez, R.A. and Hueros, A.D. (2010), “Motivational factors that influence the acceptance of moodle
using TAM”, Computers in Human Behavior, Vol. 26 No. 6, pp. 1632-1640
Wyvern Protocol (2020) Wyvern Protocol. Available at https://wyvernprotocol.com
Y. Chen, Blockchain tokens and the potential democratization of entrepreneurship and innovation, Business
Horizons 61(4) (2018) 567-575. DOI: https://doi.org/10.1016/j.bushor.2018.03.006
Zhou, T. and Lu, Y. (2011), “The effects of personality traits on user acceptance of mobile commerce”,
International Journal of Human–Computer Interaction, Vol. 27 No. 6, pp. 545-561.
https://yoniassia.com/coloredbitcoin/ bitcoin 2.X (aka Colored Bitcoin) – initial specs Yoni Assia
2012

International Engineering and Technology Management Summit 2021– ETMS2021
İstanbul Technical University & Bahçeşehir University
14
A GOAL PROGRAMMING-AHP INTEGRATED APPROACH FOR COVID-19
VACCINE DISTRIBUTION
Buse Çisil Otar Gül Tekin Temur
Bahcesehir University/Industrial Eng. Bahcesehir University/Industrial Eng.
ABSTRACT During the COVID-19 pandemic, vaccine distribution strategies have been highly essential to prevent the
spread of the disease. In these effort, the distribution of vaccines from countries to smallest accommodation
has proven to be a vital process in achieving the high coverage of vaccination in the world; whereas finding
the ideal distribution process for the vaccines has become a highly challenging problem, as these
distribution stages have many components and some countries do not fully share their data. Turkey is one
of the countries which got affected by the disease due to its huge amount of population. Hence, this study
aims to model the distribution process of vaccines by using Analytic Hierarchy Process (AHP) integration
of Weighted Goal Programming. The model has been tested on a toy problem and the result is given in
detail.
Keywords: AHP, COVID-19, goal programming, transportation, vaccine distribution

International Engineering and Technology Management Summit 2021– ETMS2021
İstanbul Technical University & Bahçeşehir University
15
1. INTRODUCTION The supply chain controls and coordinates production, shipping, and distribution processes of products for
major suppliers besides minimizing costs subject to satisfy given/known requirements. These requirements
generally are hard to meet with respect to supply or demand relationship. In addition, the risk management
should be done carefully for identifying potential disruptions, potential consequences of the risk and
developing plans to deal with these risks. In general, supply chain management (SCM) tries to minimize
costs, maximize levels of customer service, and fulfill the need of resources.
One of the areas where the supply chain is crucial is healthcare where purchasing, stock and supply
management, transportation are included in strategic planning to be resilient (Ageron, Benzidia, &
Bourlakis, 2018). The healthcare supply chain either starts with a manufacturer of needed medical products
and their distribution or the distribution of products among health institutions. Hence, the supply chain in
healthcare industry distinguishes from the others due to the provided level of customization of services and
uncertainties which makes the whole process more dynamic and complex (Evans & Berman, 2001; Pitta &
Laric, 2004; Mathur, Gupta, Meena, & Dangayach, 2018). During the outbreak of coronavirus disease,
healthcare supply chains such as personal equipments, medical devices, protective equipments and vaccines
has been unprepared to complex and fragmented problems (Mirchandani, 2020). Therefore, supply chain
optimization improves the performance of an organization’s supply chain network where it enables
efficiency, responsiveness and explanation containing design, planning and execution steps.
Generally, vaccines should be transported directly from the supplier by using cold chain protocol
(Mortimer, 2003). However, there are several risks like stock status, storage, and transportation. Hence, a
risk assessment is needed until the vaccine delivered from a manufacturer to a patient.
Turkey is one of the countries which got heavily affected by COVID-19 pandemic. Due to the high rate of
spread of the disease and its impact on the whole world, vaccination studies have accelerated in the world.
Countries, private healthcare companies and universities have worked jointly to develop vaccines as fast as
they can. Besides the excessive amount of research, accessibility of the coronavirus vaccines to humans is
as important as the production process of vaccines.
According to the results of the address-based population registration system of the Turkish Statistical
Institute, the population of Turkey was 83 million 614 thousand 362 and the most crowded city was the
Istanbul with 15 million 462 thousand 452 population (Turkish Statistical Institute, 2020). Turkey firstly
purchased 3 million doses Sinovac vaccines developed in China by Sinovac Biotech. This vaccine was
initially preferred due to its storage conditions and reliability. Then, the Biontech-Pfizer vaccine was also
put into use which is developed by the team of a German company BioNTech and an American company
Pfizer. Family health centers and hospitals in Turkey have been assigned as vaccination centers. In a country
with such a high population, vaccine distribution and stock availability should be examined carefully.
In this study, a goal programming model is developed to distribution of vaccines during COVID-19, the
weights are decided by using AHP. The model is an integrated model and it can be applied to more
comprehensive problems
This paper is organized as follows; in Section 2, literature review is given on the optimization of
transportation models. In Section 3, it has been mentioned about the methods and assumptions. In Section
4, The model is developed by using goal programming and the weights of priorities are decided by using
AHP. Finally, in Section 5, the results are presented with a toy problem and discussions have been made.
2. LITERATURE REVIEW The aim in this study is to develop an optimization model to transport vaccines from the main distribution
center to family health centers. In the literature, there are many different optimization models for
transportation problems especially on demands where the demand is either deterministic or stochastic. A
fuzzy Economic Order Quantity (EOQ) model is developed for three different demand pattern which are
exponential demand, stock-depended demand, and linear demand in fuzzy environment to get more
accurate results (Rajput, Pandey, Singh, & Chauhan, 2019). In another transportation problem for the blood
collection of the Austrian Red Cross blood program, it is taught as a vehicle routing problem with multiple
independent time windows and it is solved with a mixed-integer programming model with heuristic
algorithms (Doerner, Gronalt, Hartl, Kiechle, & Reimann, 2008).
Dealing with something like a pandemic, redistribution of demands and resources between centers in
healthcare can help to decrease the required total capacity. Therefore, different optimization techniques
which are linear programming and mixed integer programming models are applied to find optimal demand
and resource redistribution (Parker, Sawczuk, Ganjkhanloo, Ahmadi, & Ghobadi, 2020). Additionally, an
integer programming model is developed for vaccine procurement and delivery (Jacobson, Sewell, Deuson,
& Weniger, 1999). Transportation and inventory costs for vaccines are tried to be minimized in general,

International Engineering and Technology Management Summit 2021– ETMS2021
İstanbul Technical University & Bahçeşehir University
16
such as formulating the problem as a fixed charge capacitated transportation model, bounded with rim
conditions (Gupta, 2017). Besides, vaccine allocation problems are highly investigated in the literature.
Optimal allocation of vaccines to maximize the benefit of health was essential since it was proven that the
second dose of a vaccine has more effects than the first dose of a vaccine based on the patient follow-ups
which consists of people who have not been infected (Duijzer, Jaarsveld, Wallinga, & Dekker, 2018). For
another disease, influenza, an optimal vaccine distribution model has been developed for heterogeneous
population with different subgroups that guarantees a quality solution by generating a vaccine distribution
policy and sensitivity analysis has been applied on key epidemic parameters for the proposed model
(Enayati & Ozaltın, 2020). Besides, a time-varying linear optimization-based approach which contains an
update for learning the extension of immunity of people after they vaccinated is introduced on the
epidemiological statistics from the differential Susceptible-Exposed-Infected-Recovered-Dead (SEIRD)
model (Roy, Dutta, & Ghosh, 2021). Vaccines must be kept and transported within a certain temperature
range in order not to deteriorate their condition. Transportation should be carried with cold chain trucks. A
novel bi-objective vehicle routing problem is proposed for distribution of vaccines through diverse regions
in order to prevent the disease and the model tries to minimize the social cost which occurs from the
consideration of different priority groups with respect to SIR epidemic model and the cost of the cold chain
trucks (Gamchi, Torabi, & Jolai, 2021).
A different technique to deal with the trade-offs between various objectives in healthcare is the simulation-
based optimization where it finds efficient results with a large number of possible scenarios and linear
programming, integer programming or other heuristic optimization approaches can be used to solve these
type of problems (Lal, Roh, & Huschka, 2015).
Originally, goal programming is developed to solve a multi-objective transportation problem (Lee &
Moore, 1973). However, it has been applied to other multi-objective problems. Besides, different fuzzy
goal programming techniques are proposed in the literature (Abd El-Wahed & Lee, 2006;
Narayanamoorthy & Anukokila, 2014). Multi-Goal Programming is applied to food transportation model
by making reasonable assumptions and it has been observed that demand, risk and cost are crucial factors
in food transportation (Xie & Tang, 2011).
Multi-Criteria Decision Making is a progressive field in operations research. The main purpose is to make
the best selection with various conflicting criteria. There are different types of methods for multi-criteria
decision-making problems. Analytic Hierarchy Process (Saaty, 1980) is proposed by Thomas Saaty in 1980
to decide the best alternative for the decision maker.
In the literature, there are many studies related with goal programming and deciding the weights with AHP
technique. However, to our knowledge this technique is not used to model any vaccine transportation
model.
3. METHODS
3.1 Goal Programming In decision making process, there can be more than one objective function that should be optimized hence
goal programming is used in such situations. This method is mainly introduced by Charnes and Cooper
(Charnes & Cooper, Management Models and Industrial Applications of Linear Programming, 1961) as
an extension of linear programming to solve the decision-making problems with multiple objectives
which has different priorities. Charnes and Cooper (Charnes & Cooper, 1977) are developed the general
goal programming as below:
Minimize: Z = ∑𝑑𝑖+ + 𝑑𝑖
−
𝑚
𝑖=1
subject to the linear constraints:
Goal constraints:
∑∑𝑎𝑖𝑗
𝑛
𝑗=1
𝑚
𝑖=1
𝑥𝑗 + 𝑑𝑖+ − 𝑑𝑖
− = 𝑏𝑖
for i=1,2,3…,m.
System constraints:

International Engineering and Technology Management Summit 2021– ETMS2021
İstanbul Technical University & Bahçeşehir University
17
∑∑𝑎𝑖𝑗
𝑛
𝑗=1
𝑚
𝑖=1
𝑥𝑗 [≤=≥]𝑏𝑖
for i=m+1,…,m+p.
with 𝑑𝑖+ , 𝑑𝑖
−𝑥𝑗 ≥ 0 for i=1,..,m and j=1,..,n where there are m goals, n decision variables and p system
constraints.
Table 1. Definitions for goal programming
The goal programming has different approaches such as preemptive and weighted. In the preemptive goal
programming, the priority levels are decided for the goals and this sequence of problems can be solved
from the most important goal to the least important one, subsequently. The weighted goal programming
introduced the weights of the variables according to the upward/downward deviation and then a single
problem can be solved where the weighted deviation sum is minimized.
3.2 Analytic Hierarchy Process - AHP The following steps are given for a multi-criteria decision problem according to Analytic Hierarchy Process
(AHP) by Thomas Saaty (Saaty, 1980);
• The problem is defined and the solution is specified.
• The problem is organized as a hierarchy by starting from the goal and then subsequently criteria,
sub-criteria and alternatives are defined as levels.
• The pair-wise comparison matrix is constructed according to the Fundamental Scale which is given
in •
• Table 2.
• The consistency test is applied.
• Relative local and global weights are calculated for every level in the hierarchy. A hierarchical
synthesis is used to weight the vectors of priorities by the weights of the criteria. Their sum is
taken over all weighted priority entries corresponding to those in the next lower level. At the end,
an overall priority vector for the lowest level of the hierarchy is known as the result of the AHP.
Table 2. The Fundamental Scale for AHP (Saaty, 1980)
The Analytic Hierarchy Process is useful to help the decision maker to assess and choose the best alternative
depended on the criteria and sub-criteria features of a decision (Velmurugan, Selvamuthukumar, &
Manavalan, 2011).
4. THE PROPOSED METHODOLOGY The model for vaccine distribution from the main center to health clinics is illustrated as below;

International Engineering and Technology Management Summit 2021– ETMS2021
İstanbul Technical University & Bahçeşehir University
18
Table 3. The general illustration of vaccine distribution for three different health centers from the
main distribution center in Bayrampaşa
According to this model, parameters and decision variables are given;
Parameters
To build the model, the following parameters are defined;
Table 4. Parameters and their definitions
The Decision Variables
Table 5. The decision variables and their definitions
(P): Min [Z1, Z2, Z3] = Vaccine Transportation Cost + Travelling and Assigning Cost + Penalty Cost for
Spoilage
∑∑𝑣𝑖𝑗
𝑁
𝑗=1
𝑀
𝑖=0
(𝑡𝑖𝑗 + fr) +∑∑∑𝑓𝑘𝑥0𝑗𝑘 + 𝑝𝑖𝑗(𝑑𝑖𝑗
𝐿
𝑘=1
𝑥0𝑗𝑘)
𝑁
𝑗=1
𝑀
𝑖=0
+∑∑𝑐𝑖𝑗α𝑣𝑖𝑗
𝑁
𝑗=0
𝑀
𝑖=0
Equation 1 The goal programming model
4.1 The Preemptive Goal Programming for Vaccine Transportation Let P be the priority level of goals. P1, P2, and P3 are the priority levels, right hand side values are , and ,
subsequently where values are for the overachievement for the given objective functions and values are
the underachievement for the given objective functions in the problem.
P1: Minimize the total transportation and refrigeration cost.
P2: Minimize the travelling and assigning cost
P3: Minimize the penalty according to deterioration of vaccines
International Engineering and Technology Management Summit 2021– ETMS2021
İstanbul Technical University & Bahçeşehir University
19
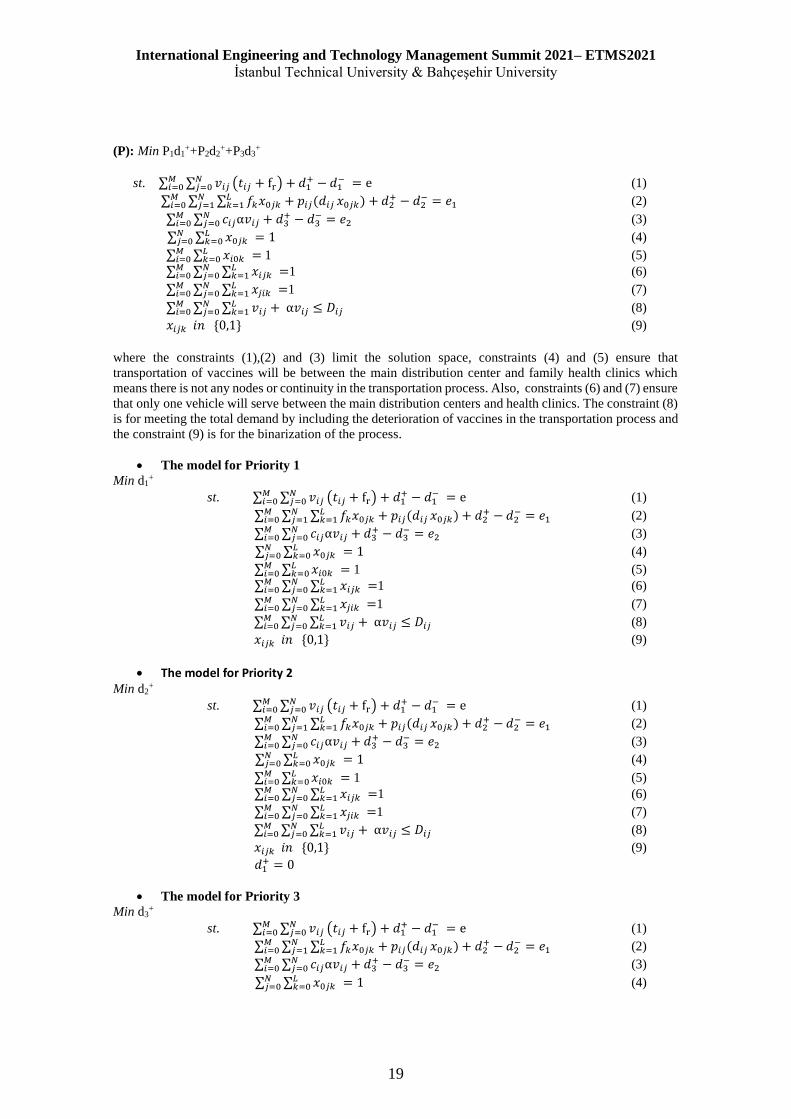
(P): Min P1d1++P2d2
++P3d3+
st. ∑ ∑ 𝑣𝑖𝑗𝑁𝑗=0
𝑀𝑖=0 (𝑡𝑖𝑗 + fr) + 𝑑1
+ − 𝑑1− = e (1)
∑ ∑ ∑ 𝑓𝑘𝑥0𝑗𝑘 + 𝑝𝑖𝑗(𝑑𝑖𝑗𝐿𝑘=1 𝑥0𝑗𝑘)
𝑁𝑗=1
𝑀𝑖=0 + 𝑑2
+ − 𝑑2− = 𝑒1 (2)
∑ ∑ 𝑐𝑖𝑗α𝑣𝑖𝑗𝑁𝑗=0
𝑀𝑖=0 + 𝑑3
+ − 𝑑3− = 𝑒2 (3)
∑ ∑ 𝑥0𝑗𝑘𝐿𝑘=0
𝑁𝑗=0 = 1 (4)
∑ ∑ 𝑥𝑖0𝑘𝐿𝑘=0
𝑀𝑖=0 = 1 (5)
∑ ∑ ∑ 𝑥𝑖𝑗𝑘 𝐿𝑘=1
𝑁𝑗=0
𝑀𝑖=0 =1 (6)
∑ ∑ ∑ 𝑥𝑗𝑖𝑘 𝐿𝑘=1
𝑁𝑗=0
𝑀𝑖=0 =1 (7)
∑ ∑ ∑ 𝑣𝑖𝑗 + α𝑣𝑖𝑗𝐿𝑘=1
𝑁𝑗=0
𝑀𝑖=0 ≤ 𝐷𝑖𝑗 (8)
𝑥𝑖𝑗𝑘 𝑖𝑛 {0,1} (9)
where the constraints (1),(2) and (3) limit the solution space, constraints (4) and (5) ensure that
transportation of vaccines will be between the main distribution center and family health clinics which
means there is not any nodes or continuity in the transportation process. Also, constraints (6) and (7) ensure
that only one vehicle will serve between the main distribution centers and health clinics. The constraint (8)
is for meeting the total demand by including the deterioration of vaccines in the transportation process and
the constraint (9) is for the binarization of the process.
• The model for Priority 1
Min d1+
st. ∑ ∑ 𝑣𝑖𝑗𝑁𝑗=0
𝑀𝑖=0 (𝑡𝑖𝑗 + fr) + 𝑑1
+ − 𝑑1− = e (1)
∑ ∑ ∑ 𝑓𝑘𝑥0𝑗𝑘 + 𝑝𝑖𝑗(𝑑𝑖𝑗𝐿𝑘=1 𝑥0𝑗𝑘)
𝑁𝑗=1
𝑀𝑖=0 + 𝑑2
+ − 𝑑2− = 𝑒1 (2)
∑ ∑ 𝑐𝑖𝑗α𝑣𝑖𝑗𝑁𝑗=0
𝑀𝑖=0 + 𝑑3
+ − 𝑑3− = 𝑒2 (3)
∑ ∑ 𝑥0𝑗𝑘𝐿𝑘=0
𝑁𝑗=0 = 1 (4)
∑ ∑ 𝑥𝑖0𝑘𝐿𝑘=0
𝑀𝑖=0 = 1 (5)
∑ ∑ ∑ 𝑥𝑖𝑗𝑘 𝐿𝑘=1
𝑁𝑗=0
𝑀𝑖=0 =1 (6)
∑ ∑ ∑ 𝑥𝑗𝑖𝑘 𝐿𝑘=1
𝑁𝑗=0
𝑀𝑖=0 =1 (7)
∑ ∑ ∑ 𝑣𝑖𝑗 + α𝑣𝑖𝑗𝐿𝑘=1
𝑁𝑗=0
𝑀𝑖=0 ≤ 𝐷𝑖𝑗 (8)
𝑥𝑖𝑗𝑘 𝑖𝑛 {0,1} (9)
• The model for Priority 2 Min d2
+
st. ∑ ∑ 𝑣𝑖𝑗𝑁𝑗=0
𝑀𝑖=0 (𝑡𝑖𝑗 + fr) + 𝑑1
+ − 𝑑1− = e (1)
∑ ∑ ∑ 𝑓𝑘𝑥0𝑗𝑘 + 𝑝𝑖𝑗(𝑑𝑖𝑗𝐿𝑘=1 𝑥0𝑗𝑘)
𝑁𝑗=1
𝑀𝑖=0 + 𝑑2
+ − 𝑑2− = 𝑒1 (2)
∑ ∑ 𝑐𝑖𝑗α𝑣𝑖𝑗𝑁𝑗=0
𝑀𝑖=0 + 𝑑3
+ − 𝑑3− = 𝑒2 (3)
∑ ∑ 𝑥0𝑗𝑘𝐿𝑘=0
𝑁𝑗=0 = 1 (4)
∑ ∑ 𝑥𝑖0𝑘𝐿𝑘=0
𝑀𝑖=0 = 1 (5)
∑ ∑ ∑ 𝑥𝑖𝑗𝑘 𝐿𝑘=1
𝑁𝑗=0
𝑀𝑖=0 =1 (6)
∑ ∑ ∑ 𝑥𝑗𝑖𝑘 𝐿𝑘=1
𝑁𝑗=0
𝑀𝑖=0 =1 (7)
∑ ∑ ∑ 𝑣𝑖𝑗 + α𝑣𝑖𝑗𝐿𝑘=1
𝑁𝑗=0
𝑀𝑖=0 ≤ 𝐷𝑖𝑗 (8)
𝑥𝑖𝑗𝑘 𝑖𝑛 {0,1} (9)
𝑑1+ = 0
• The model for Priority 3
Min d3+
st. ∑ ∑ 𝑣𝑖𝑗𝑁𝑗=0
𝑀𝑖=0 (𝑡𝑖𝑗 + fr) + 𝑑1
+ − 𝑑1− = e (1)
∑ ∑ ∑ 𝑓𝑘𝑥0𝑗𝑘 + 𝑝𝑖𝑗(𝑑𝑖𝑗𝐿𝑘=1 𝑥0𝑗𝑘)
𝑁𝑗=1
𝑀𝑖=0 + 𝑑2
+ − 𝑑2− = 𝑒1 (2)
∑ ∑ 𝑐𝑖𝑗α𝑣𝑖𝑗𝑁𝑗=0
𝑀𝑖=0 + 𝑑3
+ − 𝑑3− = 𝑒2 (3)
∑ ∑ 𝑥0𝑗𝑘𝐿𝑘=0
𝑁𝑗=0 = 1 (4)

International Engineering and Technology Management Summit 2021– ETMS2021
İstanbul Technical University & Bahçeşehir University
20
∑ ∑ 𝑥𝑖0𝑘𝐿𝑘=0
𝑀𝑖=0 = 1 (5)
∑ ∑ ∑ 𝑥𝑖𝑗𝑘 𝐿𝑘=1
𝑁𝑗=0
𝑀𝑖=0 =1 (6)
∑ ∑ ∑ 𝑥𝑗𝑖𝑘 𝐿𝑘=1
𝑁𝑗=0
𝑀𝑖=0 =1 (7)
∑ ∑ ∑ 𝑣𝑖𝑗 + α𝑣𝑖𝑗𝐿𝑘=1
𝑁𝑗=0
𝑀𝑖=0 ≤ 𝐷𝑖𝑗 (8)
𝑥𝑖𝑗𝑘 𝑖𝑛 {0,1} (9)
𝑑1+ = 0
𝑑2+ = 0
In these type of problems, the priority levels can be decided by using AHP. In Subsection 0, these priorities
are calculated.
4.2 The Weighted Goal Programming with AHP Adaptation by using a Toy Problem for
Vaccine Transportation In this problem, AHP will be adapted to assign weights of goals. The preemptive model in Section 0 is
modeled as a weighted goal programming model. The proposed model to find the weights of goal
programming with AHP is given in Figure 1;
Figure 1. The model to assign the weights with AHP
According to the Figure 1, firstly, the Pair-wise Comparison Matrix with respect to Vaccine Distribution
is defined as follows according to the
Table 2;
Table 6. The Pair-wise Comparison Matrix with respect to Vaccine Distribution
After this Pair-wise comparison matrix is constructed in Table 6, normalized matrix is generated by
dividing every value in the same column to the sum of that column.
Table 7. Normalized Pair-wise Comparison Matrix with respect to Vaccine Distribution
This normalized matrix in Table 7, gives the local weights of the Vaccine Distribution. Local weights can
be found by taking the average of rows. This matrix and local weights lead the matrix to the weighted
comparison matrix of the Location where the Consistency Ratio is %4. The weighted matrix is given in
Table 8;
Table 8. Local Weights of Vaccine Distribution
The goal programming model has been tested for the vaccine transportation from distribution center in
Bayrampasa to family health center in Akçaburgaz, Akevler and Akşamseddin by making the following
assumptions;

International Engineering and Technology Management Summit 2021– ETMS2021
İstanbul Technical University & Bahçeşehir University
21
The vaccine transportation cost should be less than or equals to 500 $
The travelling and assigning cost should be less than or equal to 100$.
The refrigeration cost is 5$.
The vaccine price per unit is taken 3$.
The distance between distribution center Bayrampaşa and health clinic Akçaburgaz is 32.9 km
according to the Google Maps.
The distance between distribution center Bayrampaşa and health clinic Akevler is 22.4 km
according to the Google Maps.
The distance between distribution center Bayrampaşa and health clinic Akşamseddin is 20.4 km
according to the Google Maps.
The first total demand of vaccine between distribution center and family health center should be
greater than 24.595 from Bayrampaşa to Akçaburgaz according to the TUIK (Turkish Statistical
Institute, 2020).
The second total demand of vaccine between distribution center and family health center should
be greater than 12.552 from Bayrampaşa to Akevler according to the TUIK (Turkish Statistical
Institute, 2020).
The third total demand of vaccine between distribution center and family health center should be
greater than 7.546 from Bayrampaşa to Akşamseddin according to the TUIK (Turkish Statistical
Institute, 2020).
According to these local weights (LW) and assumptions we can define the problem;
(P): Min [Z] = Local Weight of Vaccine Transportation * Vaccine Transportation Cost + Local Weight of
Assigning and Travelling Cost * Assigning and Travelling Cost + Local Weight of Penalty Cost * Penalty
Cost
𝐿𝑊1∑∑𝑣𝑖𝑗
𝑁
𝑗=0
𝑀
𝑖=0
(𝑡𝑖𝑗 + fr) + 𝐿𝑊2∑∑∑𝑓𝑘𝑥0𝑗𝑘 + 𝑝𝑖𝑗𝑑𝑖𝑗
𝐿
𝑘=1
𝑥0𝑗𝑘
𝑁
𝑗=0
𝑀
𝑖=0
+ 𝐿𝑊3∑∑𝑐𝑖𝑗α𝑣𝑖𝑗
𝑁
𝑗=0
𝑀
𝑖=0
st. ∑ ∑ 𝑣𝑖𝑗𝑁𝑗=0
𝑀𝑖=0 (𝑡𝑖𝑗 + fr) + 𝑑1
+ − 𝑑1− = e (1)
∑ ∑ ∑ 𝑓𝑘𝑥0𝑗𝑘 + 𝑝𝑖𝑗(𝑑𝑖𝑗𝐿𝑘=1 𝑥0𝑗𝑘)
𝑁𝑗=1
𝑀𝑖=0 + 𝑑2
+ − 𝑑2− = 𝑒1 (2)
∑ ∑ 𝑐𝑖𝑗α𝑣𝑖𝑗𝑁𝑗=0
𝑀𝑖=0 + 𝑑3
+ − 𝑑3− = 𝑒2 (3)
∑ ∑ 𝑥0𝑗𝑘𝐿𝑘=0
𝑁𝑗=0 = 1 (4)
∑ ∑ 𝑥𝑖0𝑘𝐿𝑘=0
𝑀𝑖=0 = 1 (5)
∑ ∑ ∑ 𝑥𝑖𝑗𝑘 𝐿𝑘=1
𝑁𝑗=0
𝑀𝑖=0 =1 (6)
∑ ∑ ∑ 𝑥𝑗𝑖𝑘 𝐿𝑘=1
𝑁𝑗=0
𝑀𝑖=0 =1 (7)
∑ ∑ ∑ 𝑣𝑖𝑗 + α𝑣𝑖𝑗𝐿𝑘=1
𝑁𝑗=0
𝑀𝑖=0 ≤ 𝐷𝑖𝑗 (8)
𝑥𝑖𝑗𝑘 𝑖𝑛 {0,1} (9)
5. RESULTS The results are given in Table 9 and the problem is solved by using LINGO software, which is built to solve
Linear, Nonlinear, Quadratic, Second-Order Cone, Semi-Definite, Stochastic and Integer models efficiently
by using an academic licence. The matrix of the model is given in Figure 2;
Table 9. Results of the AHP-Weighted Goal Programming Integration

International Engineering and Technology Management Summit 2021– ETMS2021
İstanbul Technical University & Bahçeşehir University
22
Figure 2. The matrix representation of the model
Since, the model has been applied to a toy problem because of the restricted public data sharing, as a future
direction, fuzzy AHP can be integrated instead of using AHP. Also, the model can be used for wider routes
from the main distribution center. This study is prepared to give an insight on the efficiency of multi-
criteria decision-making methods on these complex problems which contains a lot of parameters and variables such as distribution process of vaccines during pandemics.
REFERENCES Abd El-Wahed, W. F., & Lee, S. M. (2006). Interactive fuzzy goal programming for multi objective
transportation problem. Omega, 158-166.
Ageron, B., Benzidia, S., & Bourlakis, M. (2018). Healthcare logistics and supply chain-issues and future
challenges. Supply Chain Forum: An International Journal, 1-3.
Charnes , A., & Cooper, W. (1977). Goal Programming and Multiple Objective Optimization. European
Journal of Operational Research, 39-71.
Charnes, A., & Cooper, W. (1961). Management Models and Industrial Applications of Linear
Programming. New York: John Wiley.
Doerner, K. F., Gronalt, M., Hartl, R. F., Kiechle, G., & Reimann, M. (2008). Exact and heuristic algorithms
for the vehicle routing problem with multiple interdependent time windows. Computers and Operations
Research, 3034-3048.
Duijzer, L. E., Jaarsveld, W. L., Wallinga, J., & Dekker, R. (2018). Dose-Optimal Vaccine Allocation over
Multiple Populations. Production and Operations Management, 143-159.

International Engineering and Technology Management Summit 2021– ETMS2021
İstanbul Technical University & Bahçeşehir University
23
Enayati, S., & Ozaltın, O. Y. (2020). Optimal influenza vaccine distribution with equity. European Journal
of Operational Research, 714-725.
Evans, J. R., & Berman, B. (2001). Conceptualizing and operationalizing the business-to-business value
chain. Industrial Marketing Management, 135-148.
Gamchi, N. S., Torabi, S. A., & Jolai, F. (2021). A novel vehicle routing problem for vaccine distribution
using SIR epidemic model. OR Spectrum, 155-188.
Gupta, K. (2017). Inventory and Transportation Cost Minimization in the Delivery Logistics of Swine Flu
Vaccine. Yugoslav Journal of Operations Research, 481-487.
Jacobson, S. H., Sewell, E. C., Deuson, R., & Weniger, B. G. (1999). An integer programming model for
vaccine procurement and delivery for childhood immunization: a pilot study. Heatlh Care Management
Science, 1-9.
Lal, T. M., Roh, T., & Huschka, T. (2015). Simulation Based Optimization: Applications in Healthcare.
Proceedings of the 2015 Winter Simulation Conference (pp. 1261-1271). Huntington Beach, California:
IEEE Press.
Lee, S. M., & Moore, L. J. (1973). Optimizing transportation problem with multiple objectives. AIEE
Transactions, 333-338.
Mathur, B., Gupta, S., Meena, M. L., & Dangayach, G. S. (2018). Healthcare supply chain management:
literature review and some issues. Journal of Advances in Management Research, 265-287.
Mirchandani, P. (2020). Health Care Supply Chains: COVID-19 Challenges and Pressing Actions. Annals
of Internal Medicine, 300-301.
Mortimer, C. (2003). Cold Chain transport and handling of vaccines. Pharmacy Directorate Procedure.
Narayanamoorthy, S., & Anukokila, P. (2014). Goal Programming Approach for Solving Transportation
Problem with Interval Cost. Journal of Intelligent & Fuzzy Systems, 1143-1154.
Parker, F., Sawczuk, H., Ganjkhanloo, F., Ahmadi, F., & Ghobadi, K. (2020, November 6). Optimal
Resource and Demand Redistribution for Healthcare Systems Under Stress from COVID-19.
Pitta, D. A., & Laric, M. (2004). Value chains in healthcare. The Journal of Consumer Marketing, 451-464.
Rajput, N., Pandey, R. K., Singh, A. P., & Chauhan, A. (2019). An optimization of fuzzy EOQ model in
healthcare industries with three different demand pattern using signed distance technique. Mathematics
in Engineering, Science and Aerospace, 205-218.
Roy, S., Dutta, R., & Ghosh, P. (2021, January 21). Optimal Time-Varying Vaccine Allocation Amid
Pandemics With Uncertain Immunity Ratios. 9. IEEE.
Saaty, T. L. (1980). The Analytic Hierarchy Process: Planning, Priority Setting, Resource Allocation. New
York: McGraw-Hill International Book Co.
Turkish Statistical Institute. (2020). Address-based population registration system. Retrieved from
https://data.tuik.gov.tr/Bulten/Index?p=Adrese-Dayali-Nufus-Kayit-Sistemi-Sonuclari-2020-37210
Velmurugan, R., Selvamuthukumar, S., & Manavalan, R. (2011). Multi Criteria Decision Making to Select
The Suitable Method for The Preparation of Nanoparticles using an Analytical Hierarchy Process. Die
Pharmazie, 836-842.
Xie, R., & Tang, J. (2011). Study on the Optimization for Emergency Food Transportation Plan Based on
Goal Programming. International Conference on Transportation, Mechanical, and Electrical
Engineering (pp. 137-140). Changchun, China: TMEE.

International Engineering and Technology Management Summit 2021– ETMS2021
İstanbul Technical University & Bahçeşehir University
24
A RESEARCH MODEL FOR AGILE LEADERSHİP IN A CHANGING
WORLD
Hamit Metin Örnek Assist. Prof. Alper Camcı
Bahcesehir University Bahcesehir University
ABSTRACT The changing world contains more and more complex systems every day. This causes the interactions
occurring within the system to result in different and unpredictable results than expected. Although the
existence of self-organized teams is an important proposition in the concept of "Agile", which was put
forward for the ability to survive in a global competitive environment full of uncertainties, it is observed
that some leadership characteristics that arise naturally within the team have a positive effect on
performance. In this study, agile leadership characteristics that emerged in the changing world were
revealed with a model created with the Cognitive Mapping Method. The distinctive features of the changing
world enable people to acquire new features by using their innate personality traits. While some of these
features are learned features, some of them provide the emergence of agile leadership. The factors used in
the model are grouped under four headings. 1) Characteristics of the Changing World 2) Intrinsic
Personality Traits 3) Learned Personal Traits 4) Emerging Leadership Traits. Those who want to do
research on this subject in the future can reach results that contribute to the literature with an expert sample
space that includes more crowded and different target groups, based on the relationships in this model.
Keywords: Agile, Changing World, Cognitive Mapping, Emerging Leadership

International Engineering and Technology Management Summit 2021– ETMS2021
İstanbul Technical University & Bahçeşehir University
25
1. INTRODUCTION Complexity theory emphasizes that change is an indispensable element. Today, many systems have begun
to be considered as complexity systems. “Emergence”, one of the important features of these systems, can
be defined as the interaction occurring within the system causing a different and unpredictable result than
expected. Today, the most vivid example of this can be shown as the Covid-19 epidemic, which has taken
the whole world under its influence. (Lorenz, 1993, Covid-19 website). It has become imperative to support
the changes that occur due to sudden changes, unexpected developments and uncertainties in the
environment in which businesses are located. In order to get rid of inertia and increase productivity on the
other hand, businesses have been forced to switch to a more flexible structure. (Boyer and Robert, 2006).
The concept of “Agile”, which was introduced for the ability of businesses to survive in a global competitive
environment full of uncertainties, was first introduced academically in 1991 by the Lehigh University
Iacocca Institute in a report explaining how US companies should progress to become a production leader
again. (Nagel – Dove, 1991) However, in this report, how agile will be implemented within the
organization, what kind of organizational structure should be established or how projects will be handled
as agile are not mentioned in detail. In this context, agile transformations first came to the fore in the field
of computer technologies, and with the Agile Software Development Manifesto published in 2001, an
alternative to heavy-duty software development processes based on documentation was created. (Agile
Manifesto website)
Self-management or being able to organize (self-organization) is an important proposition of the agile
software method, as is the case with all Complexity Systems. However, much information and guidance on
how to actually operate self-organization, especially in the software sector, has not been given much space
in the literature, there is a serious lack of information about how teams self-organize in practice. On the
other hand, it is observed that there are leaders who are not officially appointed but appear informally in
autonomous teams without leaders. Research reveals that these informal leaders have positive effects on
performance. This situation seems reasonable because of its effective contribution to self-organization.
(Przybilla et al., 2020)
In this context, research is being conducted to create a theoretical model of agile leadership and to increase
the understanding of which factors make agile teamwork effective. There is no universally accepted
common model. In this study, an agile leadership model is proposed with the help of the behaviors exhibited
by individuals within the framework of internal and acquired competencies within the framework of agile
values and principles, based on the characteristics of complexity systems. The model was created by using
the cognitive mapping method, after interviews with experts in the field.
In the second chapter of the study, there is a literature research on the subject. In the third chapter, the
cognitive mapping method, which is the method used, is explained. In the fourth chapter, the agile
leadership model, which was revealed by using the cognitive map, is detailed. In the last part, the results
obtained in the study are evaluated and suggestions for future research are presented.
2. LITERATURE RESEARCH Adoption of Agile methods is now commonplace. One of the important propositions of a special type of
teamwork supported by agile methods is the existence of self-organizing teams without a formally
appointed leader within the team. However, this proposition brings with it a contradiction. Within agile
development processes, the results of leadership are still needed, such as coordinating and facilitating
activities that drive performance. (Przybilla et al, 2019) Not much information and direction on how self-
organization actually works is not covered in the literature, there is a serious lack of knowledge about how
teams self-organize in practice. On the other hand, it is observed that there are leaders who are not officially
appointed but appear informally in autonomous teams without leaders. Studies reveal the positive effects
of these informal leaders on performance. This situation seems reasonable also because of its effective
contribution to self-organization. (Przybilla et al., 2020)
Przybilla et al published their first studies in 2019 and created the model in their second article in 2020.
The two main factors that make up the natural leadership revealed in the study are "Cognitive Ability and
Expertise" and "Personality Traits". The sub-elements of Personal Traits include “Conscientiousness”,
“Extraversion”, “Openness”, “Agreeablenes” and “Neuroticism”. All other elements except neuroticism
are positive premises for the emergence of the informal leader.
Przybilla et al (2020) discussed agility in terms of software development industry. This is very normal since
the concept of agility first emerged in the software world and there is a lot of research work on this subject.
However, now the concept of agility has been discussed in different sectors and has found application areas.
For example, Tarken (2020) in his study “Agile Leadership in Action During a Crisis – Top 7 Practices to
Build Organizational Resilience and Develop HR Leaders” found that as HR leaders face various
challenges such as Covid-19, racial inequalities and remote working, it is important to respond to these

International Engineering and Technology Management Summit 2021– ETMS2021
İstanbul Technical University & Bahçeşehir University
26
challenges. states that they are looking for new ways and that Agile HR is a program that can help them.
The article suggested to an Agile HR leader for Servant Leadership, “Focus on sharing responsibility in
leadership between the leader and the team, and implement practices that will support this culture change”,
but the practices to support it were not explained. The model is named with the acronym EBIT2DA, which
is created from the initials of the recommended applications, and tips are offered to HR Managers for each
application. The suggested practices in the model are “Experimentation”, “Break down big problems into
smaller components”, “Incremental and Iterative Improvements”, “Time Limitation”, “Teams”, “Develop
Servant Leadership” and “Always be Communicating”.
One of the areas where agility is widely used is innovation projects. The aim of Bushuyeva et al.'s (2019)
study titled "Agile Leadership in the Management of Innovation Projects" is to explore modern approaches
to leadership formation while applying distinctive agile methodologies in terms of decision-making
processes in project management. The results of the studies were carried out on the basis of a competency-
based approach modeled by the International Project Management Association (IPMA). Studies were
conducted within the competency model of ICB4. As a result, agile leadership and leadership behavior
patterns were created in a project management behavioral competency system based on agile technology
methods and tools. These competencies are “Self-reflection and self-management”, “Personal integrity and
reliability”, “Personal communication”, “Relationships and interaction”, “Leadership”, “Teamwork”,
“Conflicts and crises”, “Creativity”, “Ingenuity” and “Harmonization”.
Ralston (2008) often asks, “How important is strong agile management for an agile project?” faced with
the question; states that he believes this is due to the failure of the agile process directly resulting from
ineffective leadership. Drawing on her experience leading teams on large-scale projects in agile skeptic
environments, she emphasizes that the right type of leadership is valuable in helping teams succeed. In this
study, he shares the values that he developed as important in this leadership role. These values are
“Integrity”, “Long-Term Value Relationships”, “Doing the Right Work”, “Foster a Learning
Environment”, “Clear Authority”, “Value People Over Process”, “Mentor Talent”, “Transparency”,
“Result Orientation” and “Leverage Your Strengths”
3. METHOD Within the scope of this study, the imageability levels of agile leadership were tried to be revealed by the
experts by applying the cognitive mapping method. Thus, the strongest elements constituting agile
leadership were revealed and the imagery levels of different experts were compared. Cognitive map is
defined as a combination of relationships between various concepts. Each of the cognitive maps is seen as
a set of propositions that are determined by the individual as true value and stored about the individual's
environment. Rapoport (1977) defines the Cognitive map as 'a set of psychological transformations that
enable people to acquire, encode, store and decode information about their spatial environment, elements,
relative positions, distances and directions, and general structure'.
Laszlo et al. (1993) explain the underlying idea of cognitive maps with these words: "Cognitive maps
created by placing neuronal arrays are of course much more adaptive than depictions drawn on paper. A
cognitive map represents the environment in the organism's brain." (Sihombing, 2013).
The origin of the cognitive mapping method is based on the Graph Theory of the mathematician Euler
(1736). It was introduced by Axelrod (1976) as a structure examining complex social relations. It is a
method used in many social and technical sciences in modeling complex systems and describing cause-
effect relationships between system components. (Ozesmi, 1999). It is also a method used in strategic
decision making (Hodgkinson et al., 2004).
Cognitive maps consist of nodes expressing variables (factors) and paths describing causal relationships
between nodes. In the map, the variables are connected to each other with positive or negative signs and
express the direction of the relationship depending on the direction of the arrow.
In cognitive mapping, a pairwise comparison matrix is prepared. Each variable forming the matrix is
compared with each other according to causal relationships (Eden, 1988). A value of +1 is given if the
causal relationship between the variables is positive, and -1 if it is negative. If there is no relationship, the
value of the matrix element is 0. The signs of the symmetrical elements of the matrix are opposite to each
other, the diagonal elements are zero. The nxn size E square matrix is shown in Equation (1).
𝐸 =
[
0 𝑒21 𝑒31−𝑒21 0 𝑒32−𝑒31 −𝑒32 0
… 𝑒𝑛1… 𝑒𝑛2… 𝑒𝑛3
… … …−𝑒𝑛1 −𝑒𝑛2 −𝑒𝑛3
…… 0]
(1)

International Engineering and Technology Management Summit 2021– ETMS2021
İstanbul Technical University & Bahçeşehir University
27
In this method, which is used especially in strategy development in social sciences, mathematical models
in graph theory were used. In this modeling process, donor degrees (od), receiver degrees (id) and total
variable centrality degree (ci) are calculated (Ozesmi, 1999). The pairwise comparison square matrix in
Equation (2) is used to calculate the degree of centrality of the variables. From the sum of each row and
column elements of the matrix, the vector (Cdi) in Equation (3), which shows the degrees of centrality of
the variables, is created. The highest Cd value in the vector indicates the variable with the most interaction
in the model, and the lowest Cd value indicates the variable with the least interaction.
𝐸 =
[ 𝑒11 𝑒12 𝑒13𝑒21 𝑒22 𝑒23𝑒31 𝑒32 𝑒33
… 𝑒1𝑛… 𝑒2𝑛… 𝑒3𝑛
… … …𝑒𝑛1 𝑒𝑛2 𝑒𝑛3
…… 𝑒𝑛𝑛]
= [𝑒𝑖𝑗]𝑛𝑥𝑛 𝑖 = 1, … , 𝑛; 𝑗 = 1, … , 𝑛 (2)
𝐶𝑑𝑖 = ∑ ��𝑖𝑗𝑁𝑗=1 +∑ ��𝑗𝑖
𝑁𝑗=1 𝑖 = 1, . . . , 𝑛 (3)
In the cognitive mapping process, the variable-based connectivity index (DB) value is calculated with
Equation (4). Here “C” is the number of connections and “n” is the number of variables. The DB value is
in the range [0,1]. As the DB value gets closer to 1, the interaction level between the variables gets stronger,
while it gets weaker as it gets closer to 0.
𝐷𝐵 =2𝐶
𝑛2−𝑛 (4)
The hierarchical index (h) of the map is calculated by Equation (5). In this calculation, the variance values
(𝜎𝑂𝑑2 ) of the vector sums of the rows (𝑂𝑑𝑖 = ∑ 𝑒𝑖𝑗
𝑗𝑗 ) of the pairwise comparison matrix 𝐸 = [𝑒𝑖𝑗] are used.
ℎ =12𝜎𝑂𝑑
2
𝑛2−1 (5)
The value of the hierarchy index is in the range [0,1]. If the hierarchy index is very close to 0, the cognitive
map is “fully democratic”; if it is very close to 1, the cognitive map is described as "fully hierarchical".
(Ozesmi, 1999)
4. RESEARCH METHODOLOGY AND FINDINGS The research was initiated with interviews with three different experts who apply Agile Software
Development processes in their companies. The demographic characteristics of the experts are given in
Table-1.
Table 1. Demographic Characteristics of the Participants
No Age Gender Total
Experience
Agile
Experience
Title
1 34 M 12 8 Startup Company Founder
2 42 F 20 5 Manager at Enterprise Software
Company
3 50 M 28 2 Human Resources manager
Average 42 20 5
As a result of the interviews with the practitioners, 25 factors were determined. The Cognitive Map model
created with these factors starts with the changing world characteristics and ends with the emerging
Emerging Leadership. According to the model, the characteristics of the changing world draw attention to
the acquisition of new characteristics by using some innate internal characteristics of individuals. While
some of these features are learned features, some of them provide the emergence of agile leadership. The
factors used in the model are grouped under four headings. 1) Characteristics of the Changing World 2)
Intrinsic Personality Traits 3) Learned Personal Traits 4) Emerging Leadership Traits

International Engineering and Technology Management Summit 2021– ETMS2021
İstanbul Technical University & Bahçeşehir University
28
Figure 1. Grouping of factors used in the model
The relationship model of these factors was created using the Mental Modeler online cognitive mapping
template as in Figure-2. The presented model-based cognitive map consists of 25 variables and 45 links.
The connectivity index (DB) of the map is 0.55, which is at an acceptable level (DB>0.22). Table 1 shows
the model-based cognitive map pairwise comparison effect values and row-column totals (Od and Id). The
hierarchical index (h) is calculated as 0.04. This value indicates that the cognitive map is fully democratic.
Figure 2. Relationship Model of Factors – Cognitive Mapping Template
Table 1. Pairwise Comparison Matrix N Ç1 Ç2 Ç3 Ç4 Ç1 K1 K2 K3 K4 K5 K6 E1 E2 E3 E4 E5 E6 E7 L1 L2 L3 L4 L5 S Total (Od)
N 1 1 2
Ç1 1 1 1 3
Ç2 1 1
Ç3 1 1
Ç4 1 1 2
Ç1 1 1 1 3
K1 1 1
K2 1 1 2
K3 1 1 2
K4 1 1 1 3
K5 1 1
K6 1 1 2
E1 1 1
E2 1 1
E3 1 1 2
E4 1 1 1 3
E5 1 1 1 3
E6 1 1 2
E7 1 1 1 1 4
L1 1 1
L2 1 1
L3 1 1
L4 1 1
L5 1 1 2
S 0
Total (Id) 0 1 1 1 2 1 1 1 1 1 1 1 1 2 1 2 1 6 2 1 3 3 3 3 5 General Total (Ʃ) 45,00
Mean (µ) 1,80
Variance (σ2) 1,84
Characteristics of the Changing World
• Experimentality
• Transparency
• Observation
• Maximizing predictability
• Controlling risk
Intrinsic Personality Traits
• Honesty
• Extraversion, curiosity
• Flexibility
• Harmoniousness
• Fast Decision Making
• Patience
Learned Personal Traits
• Change oriented
• Result oriented
• Relationship oriented
• Commitment
• Openness to experience
• Cognitive ability
• Respect
Emerging Leadership Traits
• Strategic Vision
• Sharing of reasons
• Collaboration between teams
• Motivation
• Supporting creativity
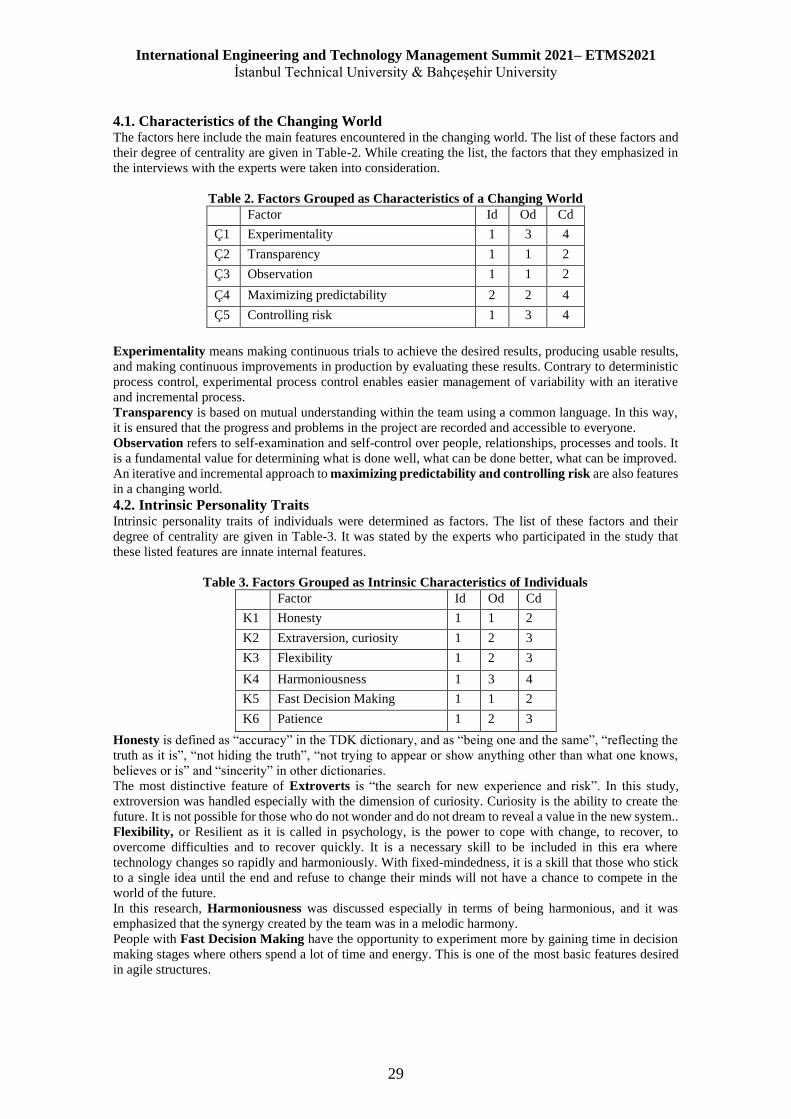
International Engineering and Technology Management Summit 2021– ETMS2021
İstanbul Technical University & Bahçeşehir University
29
4.1. Characteristics of the Changing World The factors here include the main features encountered in the changing world. The list of these factors and
their degree of centrality are given in Table-2. While creating the list, the factors that they emphasized in
the interviews with the experts were taken into consideration.
Table 2. Factors Grouped as Characteristics of a Changing World
Factor Id Od Cd
Ç1 Experimentality 1 3 4
Ç2 Transparency 1 1 2
Ç3 Observation 1 1 2
Ç4 Maximizing predictability 2 2 4
Ç5 Controlling risk 1 3 4
Experimentality means making continuous trials to achieve the desired results, producing usable results,
and making continuous improvements in production by evaluating these results. Contrary to deterministic
process control, experimental process control enables easier management of variability with an iterative
and incremental process.
Transparency is based on mutual understanding within the team using a common language. In this way,
it is ensured that the progress and problems in the project are recorded and accessible to everyone.
Observation refers to self-examination and self-control over people, relationships, processes and tools. It
is a fundamental value for determining what is done well, what can be done better, what can be improved.
An iterative and incremental approach to maximizing predictability and controlling risk are also features
in a changing world.
4.2. Intrinsic Personality Traits Intrinsic personality traits of individuals were determined as factors. The list of these factors and their
degree of centrality are given in Table-3. It was stated by the experts who participated in the study that
these listed features are innate internal features.
Table 3. Factors Grouped as Intrinsic Characteristics of Individuals
Factor Id Od Cd
K1 Honesty 1 1 2
K2 Extraversion, curiosity 1 2 3
K3 Flexibility 1 2 3
K4 Harmoniousness 1 3 4
K5 Fast Decision Making 1 1 2
K6 Patience 1 2 3
Honesty is defined as “accuracy” in the TDK dictionary, and as “being one and the same”, “reflecting the
truth as it is”, “not hiding the truth”, “not trying to appear or show anything other than what one knows,
believes or is” and “sincerity” in other dictionaries.
The most distinctive feature of Extroverts is “the search for new experience and risk”. In this study,
extroversion was handled especially with the dimension of curiosity. Curiosity is the ability to create the
future. It is not possible for those who do not wonder and do not dream to reveal a value in the new system..
Flexibility, or Resilient as it is called in psychology, is the power to cope with change, to recover, to
overcome difficulties and to recover quickly. It is a necessary skill to be included in this era where
technology changes so rapidly and harmoniously. With fixed-mindedness, it is a skill that those who stick
to a single idea until the end and refuse to change their minds will not have a chance to compete in the
world of the future.
In this research, Harmoniousness was discussed especially in terms of being harmonious, and it was
emphasized that the synergy created by the team was in a melodic harmony.
People with Fast Decision Making have the opportunity to experiment more by gaining time in decision
making stages where others spend a lot of time and energy. This is one of the most basic features desired
in agile structures.

International Engineering and Technology Management Summit 2021– ETMS2021
İstanbul Technical University & Bahçeşehir University
30
Patience is the feeling of not losing courage and fortitude under difficult conditions created by change.
Patient people continue on their way, or keep waiting, without losing their morale despite long delays and
provocations.
4.3. Learned Personal Traits The list of learned features and their degrees of centrality are given in Table-4. Experts participating in the
study emphasized that these features are those that can be learned as experience is gained in business life
or through various trainings.
Table 4. Factors Grouped as Learned Personal Traits
Factor Id Od Cd
E1 Commitment 1 1 2
E2 Openness to experience 2 1 3
E3 Result oriented 1 2 3
E4 Relationship oriented 2 3 5
E5 Conginitive ability 1 3 4
E6 Change oriented 6 2 8
E7 Respect 2 4 6
Commitment means to promise and take on something by the specified time. Making promises and
keeping promises are considered as one of the most obvious results of honesty. In the business world, when
disagreements arise over projects to implement long-term strategies and tactical plans, a shared
commitment to fulfilling the purpose of the business and the project helps people stay in touch and work
together for a solution.
People who are capable of Openness to Experience are those who have ideas that can help innovation to
improve products and experiences. They see customers and employees as a part of the value creation
process, which is the essential feature of an agile business.
Result oriented means building trust and dynamic relationships that inspire efforts to achieve desired
organizational results, engage people, and align them with organizational results.
Relationship oriented, as the ability to influence others and win collaborations, creates an environment of
safety that encourages all team members to contribute ideas and share perspectives. These skills are
essential for agile organizations trying to make informed considerations for new ideas.
Cognitive ability is defined as a general ability of individuals to learn, adapt to new situations, make
abstractions, and solve verbal, numerical, conceptual and spatial problems (Anastasi, 1982). Cognitive
ability is considered as understanding complex ideas, solving problems by reasoning, and adapting to
people who can learn from experience (Sternberg, 1997). By observing the behavior of objects with both
deductive and inductive approaches, people with this competence are able to comprehend general
principles, rotate objects in their minds, understand what they read quickly and accurately, and deal
effectively with mathematical concepts. (Reeve, 2007). Lord et al. (1986) determined that people with high
cognitive abilities and/or dominance traits tend to emerge as leaders. Other researchers have determined
that the emergence of the leader is associated with cognitive ability, openness to development,
responsibility, and extraversion. (Taggar et al., 1999), (Kickul and Neuman, 2000).
Change oriented is one of the basic principles that institutions should apply in order to make quick
decisions using the information they obtain and to meet the rapidly developing needs of their customers.
Agility involves seeking out new information and embracing continuous collaborative change without
resistance, prejudice or resentment.
Respect is the key to psychological safety within the team. When faced with errors and difficulties, it is the
most basic feature that is necessary to find the cause together and go to the correct way. Thus, it is really
prevented from repeating the mistake again. Teams that trust and respect each other are willing to do their
best, such teams constantly develop and use their competencies to the maximum in a motivated way.
4.4. Emerging Leadership Traits The leadership characteristics that emerge in people who react to the changing world with their internal and
acquired characteristics, suggested by the experts participating in the study, are given in Table-5.
Table 5. Factors Grouped as Emerging Leadership Traits
Factor Id Od Cd
L1 Strategic Vision 1 1 2
L2 Sharing of reasons 2 1 3
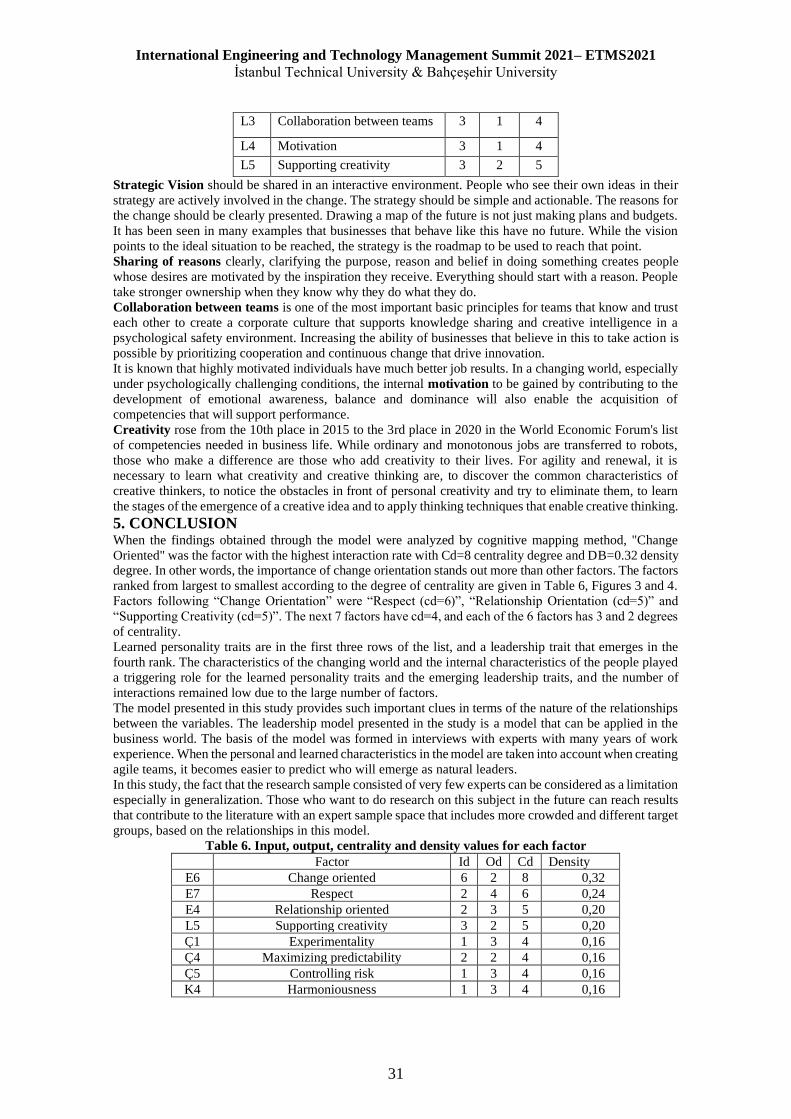
International Engineering and Technology Management Summit 2021– ETMS2021
İstanbul Technical University & Bahçeşehir University
31
L3 Collaboration between teams 3 1 4
L4 Motivation 3 1 4
L5 Supporting creativity 3 2 5
Strategic Vision should be shared in an interactive environment. People who see their own ideas in their
strategy are actively involved in the change. The strategy should be simple and actionable. The reasons for
the change should be clearly presented. Drawing a map of the future is not just making plans and budgets.
It has been seen in many examples that businesses that behave like this have no future. While the vision
points to the ideal situation to be reached, the strategy is the roadmap to be used to reach that point.
Sharing of reasons clearly, clarifying the purpose, reason and belief in doing something creates people
whose desires are motivated by the inspiration they receive. Everything should start with a reason. People
take stronger ownership when they know why they do what they do.
Collaboration between teams is one of the most important basic principles for teams that know and trust
each other to create a corporate culture that supports knowledge sharing and creative intelligence in a
psychological safety environment. Increasing the ability of businesses that believe in this to take action is
possible by prioritizing cooperation and continuous change that drive innovation.
It is known that highly motivated individuals have much better job results. In a changing world, especially
under psychologically challenging conditions, the internal motivation to be gained by contributing to the
development of emotional awareness, balance and dominance will also enable the acquisition of
competencies that will support performance.
Creativity rose from the 10th place in 2015 to the 3rd place in 2020 in the World Economic Forum's list
of competencies needed in business life. While ordinary and monotonous jobs are transferred to robots,
those who make a difference are those who add creativity to their lives. For agility and renewal, it is
necessary to learn what creativity and creative thinking are, to discover the common characteristics of
creative thinkers, to notice the obstacles in front of personal creativity and try to eliminate them, to learn
the stages of the emergence of a creative idea and to apply thinking techniques that enable creative thinking.
5. CONCLUSION When the findings obtained through the model were analyzed by cognitive mapping method, "Change
Oriented" was the factor with the highest interaction rate with Cd=8 centrality degree and DB=0.32 density degree. In other words, the importance of change orientation stands out more than other factors. The factors
ranked from largest to smallest according to the degree of centrality are given in Table 6, Figures 3 and 4.
Factors following “Change Orientation” were “Respect (cd=6)”, “Relationship Orientation (cd=5)” and
“Supporting Creativity (cd=5)”. The next 7 factors have cd=4, and each of the 6 factors has 3 and 2 degrees
of centrality.
Learned personality traits are in the first three rows of the list, and a leadership trait that emerges in the
fourth rank. The characteristics of the changing world and the internal characteristics of the people played
a triggering role for the learned personality traits and the emerging leadership traits, and the number of
interactions remained low due to the large number of factors.
The model presented in this study provides such important clues in terms of the nature of the relationships
between the variables. The leadership model presented in the study is a model that can be applied in the
business world. The basis of the model was formed in interviews with experts with many years of work
experience. When the personal and learned characteristics in the model are taken into account when creating
agile teams, it becomes easier to predict who will emerge as natural leaders.
In this study, the fact that the research sample consisted of very few experts can be considered as a limitation
especially in generalization. Those who want to do research on this subject in the future can reach results
that contribute to the literature with an expert sample space that includes more crowded and different target
groups, based on the relationships in this model.
Table 6. Input, output, centrality and density values for each factor Factor Id Od Cd Density
E6 Change oriented 6 2 8 0,32
E7 Respect 2 4 6 0,24
E4 Relationship oriented 2 3 5 0,20
L5 Supporting creativity 3 2 5 0,20
Ç1 Experimentality 1 3 4 0,16
Ç4 Maximizing predictability 2 2 4 0,16
Ç5 Controlling risk 1 3 4 0,16
K4 Harmoniousness 1 3 4 0,16

International Engineering and Technology Management Summit 2021– ETMS2021
İstanbul Technical University & Bahçeşehir University
32
E5 Cognitive ability 1 3 4 0,16
L3 Collaboration between teams 3 1 4 0,16
L4 Motivation 3 1 4 0,16
K2 Extraversion, curiosity 1 2 3 0,12
K3 Flexibility 1 2 3 0,12
K6 Patience 1 2 3 0,12
E2 Openness to experience 2 1 3 0,12
E3 Result oriented 1 2 3 0,12
L2 Sharing of reasons 2 1 3 0,12
Ç2 Transparency 1 1 2 0,08
Ç3 Observation 1 1 2 0,08
K1 Honesty 1 1 2 0,08
K5 Fast Decision Making 1 1 2 0,08
E1 Commitment 1 1 2 0,08
L1 Strategic Vision 1 1 2 0,08
Figure 3. Grouping of factors according to degrees of Input (Id) and Output (Od)
Figure 4. Comparison of input, output and centrality values for each factor
REFERENCES Anastasi, A. (1982). “Psychological Testing 5th Edition”, NY, MacMillan Publishing Inc.
Axelrod, R. (1976). “Structure of Decision, the Cognitive Maps of Political Elites”, New Jersey: Princeton
University Press.

International Engineering and Technology Management Summit 2021– ETMS2021
İstanbul Technical University & Bahçeşehir University
33
Bennett, N., & Lemoine, J. (2014). “What VUCA really means for you”. Harvard Business Review, Vol.
92, No. 1/2, 2014.
Boyer, M., & Robert, J. (2006). “Organizational inertia and dynamic incentives”. Journal of Economic
Behavior & Organization, 59(3), 324-348.
Bushuyeva, N., Bushuiev, D., Bushuieva, V. (2019). “Agile Leadership of Managing Innovation Projects”,
Innovative technologies and scientific solutions for industries. 2019. No. 4 (10),
https://doi.org/10.30837/2522-9818.2019.10.077
Eden, C. (1988). “Cognitive Mapping”. European Journal of Operation Research, 36, 1-13.
Hodkinson, G.P., Maule, A.J. ve Bown, N.J. (2004). “Causal cognitive Mapping in the Organizational
Strategy Field: A Comparison of Alternative Elicitation Procedures”. Organizational Research
Methods, 7(1), 3-26.
Kickul, J., G., Neuman (2000) “Emergent Leadership Behaviors: The Function of Personality and
Cognitive Ability in Determining Teamwork Performance and KSAS” Journal of Business and
Psychology, 15/1, 27-51
Lord, R. G., De Vader, C. L, G.M., Alliger (1986). “A Meta-Analysis of the Relationship between
Personality Traits and Leadership Perceptions: An Application of Validity Generalization Procedures”,
Journal of Applied Psychology, 71, 402-410.
Lorenz, E. (1993). “The Essense of Chaos”, University of Washington Press, Seatle, 1993, ISBN 0-295-
97514-8
Nagel, R. N., & Dove, R. (1991). “21st century manufacturing enterprise strategy: An industry-led view”.
Diane Publishing.
Ozdemir, N., Cetin, M. (2019). “Cevik Liderlik Olçeğinin Geliştirilmesine Yönelik Güvenilirlik ve
Geçerlilik Calışması: Eğitim Orgütleri Uzerine Bir Uygulama”, R&S – Research Studies Anatolia
Journal, Social and Human Scientific, Vol: 2, Issue: 7; pp: 312-332
Ozesmi U. (1999). “Conservation strategies for sustainable resource use in the Kizilirmak Delta in Turkey”,
(Ph.D. Thesis), Minnesota: University of Minnesota.
Przybilla, L., Wiesche, M., Krcmar, H. (2019). “Emergent Leadership in Agile Teams–an Initial
Exploration”, SIGMIS-CPR '19, June 20–22, 2019, Nashville, TN, USA,
https://doi.org/10.1145/3322385.3322423
Przybilla, L., Präg, A., Wiesche, M., Krcmar, H. (2020). “A Conceptual Model of Antecedents of Emergent
Leadership in Agile Teams”, SIGMIS-CPR ’20, June 19–21, 2020, Nuremberg, Germany,
https://doi.org/10.1145/3378539.3393844
Ralston, L. (2008). “Agile Project Leadership – My Top 10 Value Driven Principles”, Agile 2008
Conference. IEEE Computer Society, 978-0-7695-3321-6/08, 2008 IEEE DOI 10.1109/Agile.2008.47
Reeve, C.L. (2007). “Cognitive Abilities” Encyclopedia of Industrial and Organizational Psychology, (Ed.
S.G. Rogelberg), CA, Sage Publication Inc.
Schwaber, K., Sutherland, J., (2020). “The Scrum Guide, The Definitive Guide to Scrum: The Rules of the
Game”, November 2020
Sihombing, Antony (2013). “Drawing Kampung through Cognitive Maps Case Study: Jakarta”,
Department of Architecture, Faculty of Engineering, Universitas Indonesia.2013 5th International
Conference on Chemical, Biological and Environmental Engineering (ICBEE 2013) doi:
10.1016/j.apcbee.2014.01.061
Sternberg, R.J. (1997). “The Concept of Intelligence and Its Role in Lifelong Learning and Success”,
American Psychologist, 52, 1030-1037.
Taggar, S., Hackett, R., S., Saha. (1999) “Leadership Emergence in Autonomous Work Teams:
Antecedents and Outcomes”, Personnel Psychology, 52, 899-926.
Tarken W. (2020). “Agile Leadership in Action During a Crisis – Top 7 Practices to Build Organizational
Resilience and Develop HR Leaders”, 3rd Quarter 2020 • Workforce Solutions Review •
www.ihrim.org, https://doi.org/10.1145/3378539.3393844
Covid-19 Coronavirus Pandemic Weekly Trends, Graphs, Countries, News, (Web adresine en son
31.07.2021 tarihinde erişim sağlanmıştır. https://www.worldometers.info/coronavirus/ )
Cevik Manifesto (Web adresine en son 31.07.2021 tarihinde erişim sağlanmıştır.
https://agilemanifesto.org/)
ICB4 - Individual Competence Baseline for Project, Programme and Portfolio Management (IPMA ICB),
IPMA, Version 4.0, 2017, 431 p. (Web adresine en son 31.07.2021 tarihinde erişim sağlanmıştır.
https://www.ipma.world/individuals/standard/)

International Engineering and Technology Management Summit 2021– ETMS2021
İstanbul Technical University & Bahçeşehir University
34
ADOPTING BLOCKCHAIN TOKENISATION TECHNOLOGY FOR REAL
ESTATE TRANSACTIONS: A SECURITY TOKEN OFFERING PROCEDURE
AND LEGAL DESIGN PROPOSAL
Yaman Ömer Erzurumlu
Bahçeşehir University
ABSTRACT This study discusses the potential impact of blockchain and tokenization on legal design and market
structure based challenges in real estate investment. We propose a block- chain tokenized security
design, based on a Sukuk-like certificate that draws inspiration from both Islamic finance as well as
Equipment Trust Certificates managed by a Special Purpose Vehicle (SPV). The article addresses the
legal design challenges of real estate crowdfunding, proposing potential solutions that combine
blockchain technology, tokenization, finance, and law. We propose a legal design, security token
offering procedure, and an exchange mechanism built on real estate tokenization. It explores the
implications of adopting blockchain-based technologies to mitigate challenges related to the real
estate market structure. An SPV may issue blockchain tokenized Sukuk-like certificates. These
certificates grant rights related to an investment property. Each series of certificates represents
property and will be a liability of the SPV that owns the property. In general, the tokens used resemble
but remain categorically distinct from asset-backed securities; their performance still depends on the
underlying asset’s performance. The proposed token mechanism could prevent delays in the
transaction process related to transferring ownership of a property. It could split at some point to allow
for the creation of ownership and income rights. The proposed method is easy to implement while
shortening transaction times. The proposed security design potentially protects investors’ legal rights
better without standard application of investors becoming partners in the SPV.
Keywords: Blockchain, Crowdfunding, Tokenisation, Sukuk, SPV, Contract design, Token offering
International Engineering and Technology Management Summit 2021– ETMS2021
İstanbul Technical University & Bahçeşehir University
35
1. INTRODUCTION One of the significant consequences of the 2008 financial crisis is that companies and entrepreneurs
began striving to find funding because banks hesitated to open credit lines. Some legislatures deterred
banks from providing loans. There was a radical change in the funding preferences of both investors
and fund- raisers (Silvestri, 2017). Notably, the 2008 crisis led to a decline in real estate prices, a steep
decline in total investment, and a loss of trust in the banking sector. This lack of confidence in the
banking sector and concerns about the financial industry accelerated the birth of what is known as
the sharing economy. The collaborative, or peer-to-peer, economy has created many alternative
project funding methods using information technology, such as web platforms, to match fundraisers
and fund seekers (Kim and Kim, 2017). This economy led to a model for the efficient use of
resources through direct involvement of the digital community in the value-creation process and
considerable reduction of the role of intermediaries, cutting distributions costs, and increasing
profitability (Nasarre-Aznar, 2018).
As a consequence, the financial technology industry and its alternative technologies have disrupted
traditional financial intermediation. Emerging blockchain technology offers a promising investment
alternative that could be used to tokenize any scarce asset. A recent example is the June 11th 2021
Bloomberg news about the announcement of State Street Corp. US, one of the world’s largest money
managers, set- ting up a digital unit transforming investments as traditional as real estate using
blockchain and tokenisation.
Tokenisation can be defined as the process of removing sensitive data from your business systems,
replacing it with an indecipherable token, and storing the original data in a secure cloud data vault.
Encrypted numbers can be decrypted with the appropriate key. The benefit that blockchain technology
provides entrepreneurs and innovators is this tokenization of scarce assets, a process which also allows
small investors to have fractional ownership of the underlying asset. Moreover, the technology upon
which it relies increases reliability and immutability. Blockchain technology eliminates the need for
third-party entities to verify transactions, allows every transaction history to be traceable, prevents
information on the block- chain from being changed, and allows bilateral settlement of transactions
by eliminating midpoint failures, delays, and collateral costs. Buyers and sellers perceive that the
transparency and cost reduction have the highest influence on the intention to adopt blockchain
technology in a real estate transactions system, followed by the security of transactions (Hoxva and
Sadiku, 2019). Although the technology is promising, successful efforts to develop a stable legal
infrastructure supporting the blockchain ecosystem have not materialized, and the regulatory
environment remains marked by a lack of clarity. A primary issue to consider is the legal design of
the blockchain tokenization process. The blockchain implementation requires an appropriate
architecture of overlaid technologies to support changes to outdated and in- correct data; address
issues of digital identity, privacy, legal compliance, and the enforceability of smart contracts; and to
ensure the scalability of the ledger (Konashecych, 2020).
Practical Perspective
Global Real Estate crowdfunding amounted to 3 billion USD in 2018 (CCAF, 2020). Real Estate
crowd- funding has dominated equity activities comprising 60% of the total activities in this category
globally. The US leads in this model, amounting to 1.79 billion USD in 2018. The amount accounts
for 70% of all US-based tokenized equity activities. Europe and the UK follow with a total of 865
million USD. Re- search conducted at the University of Oxford identifies 17 successful or ongoing
real estate tokenization cases listed above valued at €240m in 2020. The legal structure of these was,
in each case, a single asset or fund (University of Oxford Research, 2020)
Although digitizing property ownership is a promising idea, there are many unsuccessful experiences
around the world such as yourrealshare, dreamblock, realisto, bitrent, realpropertytoken. Building
trust in a free market environment requires a well designed legal framework. Max Property Group has
worked on a blockchain-powered real estate crowdfunding platform for many years. However, its
current projects are based on loan based crowdfunding. The legal rights of investors in many platforms

International Engineering and Technology Management Summit 2021– ETMS2021
İstanbul Technical University & Bahçeşehir University
36
depend on only smart contracts such as Tokenestate, and this causes a legal uncertainty for investors
unless the title dead mechanism in the country supports blockchain technology or fragmental
ownership. Some of active platforms and legal designs are listed in Table 1.
Table 1. Selected active platforms and legal designs
Atlant The property is inserted into a Special Purpose Vehicle (SPV) structure and
tokenized, escrow assets are released to the seller of the real estate asset
Bondkick Loan crowdfunding with utilized tokens.
Elementsestates Issuing tokens represent indirect property ownership. The platform is the real
owner of the property.
Pax (Praetorian
Group)
Pax tokens represent real estate digital ownership but they do not have a legal
provision. Holding PAX token does not provide as holding equity in the
Praetorian Group
Tokenestate Digital ownership, Digital securities represent property ownership.
This article focuses on applying blockchain technology in the real estate sector and, in particular, on
the tokenization of real estate, examples of which are set out in Table 2. We do not attempt to propose
an alternative crowdsourcing platform. Rather, we are proposing a specific protocol to use on
crowdsourcing platforms that contributes to the legal infrastructure supporting tokenization within the
blockchain ecosystem. The article addresses the legal design challenges of real estate crowdfunding,
proposing potential solutions that combine blockchain technology, tokenization, finance, and law.
Specifically, we propose a legal design, security token offering procedure, and an exchange
mechanism built on real estate tokenization. The structure is mainly an SPV using Sukuk-like
certificates, draws inspiration from Islamic finance and Equipment Trust Certificates. The procedure
includes identifying the real estate, announcing its tokenisation to investors, issuing tokens,
purchasing real estate with the collected money, and sending to- kens to investors’ digital wallets. All
taking place without having to be a partner but having exclusive rights in the SPV. The token
mechanism proposed here has practical implications such as preventing de- lays in processing real
estate transactions, enlarging investor basis and the ability to create rights of ownership and rental
income, for example, that are separable. In doing so, the study addresses mainly three issues:
• How would real estate tokenisation legal design and exchange work?
• The opportunities real estate tokenisation proposal could introduce to the legal environment.
• The possible practical implications of real estate tokenisation.
Table 2. Successful Real Estate Tokenization Cases
International Engineering and Technology Management Summit 2021– ETMS2021
İstanbul Technical University & Bahçeşehir University
37
Section 2 discusses the sharing economy and crowdfunding in the real estate sector, and the impact of
blockchain is summarized in Section 3. Section 4 outlines the technical design of the proposed token
mechanism, and Section 5 sets out the key challenges and potential solutions the token mechanism pro-
poses.
2. BACKGROUND
Real estate crowdfunding comprises a platform where entrepreneurs or investors seeking funding to
acquire, construct, or renovate real estate can meet individual and corporate funders looking for
opportunities (Sousa, 2019). There are many crowdfunding methods based on reward, donation, lending,
or invoicing. Real estate crowdfunding is a distinct equity-based form of crowdfunding. Funders'
underlying motivation is a profitable return without having to deal with onerous bureaucracy or buying a
property in its entirety (Cummings et al., 2018). The funding campaigns specially designed for real estate
acquisition generally require significant investment, and the available share of the property is limited. By
joining the online platform, investors who cannot conduct the necessary research to assess real estate
investments could examine due diligence materials and evaluate the real estate project’s potential benefits
such as rental income and capital appreciation.
As compared to the traditional real estate business model, real estate crowdfunding offers some unique
benefits for consumers, real estate owners, and the market. Arguably the most important of these is
fractional ownership of the property. While traditional real estate investment requires the purchase of an
entire property, investors in the crowdfunding platform can obtain fractional ownership within their budget
constraints.
In traditional markets, large investment in a single project increases the risk for individual investors. These
new platforms provide the opportunity to create a portfolio of small investments in a larger number of
projects. Another innovative feature of real estate crowdfunding is that it proposes a solution to the problem
that investors lack knowledge of the market. These platforms collect and present information about the
property, its location, and relevant appraisals. With crowdfunding, investors can now determine the most
appropriate level of their investment, according to a variety of parameters. Fractional ownership enhances
the practicability of the transaction by introducing an easy point-and-click interface that enables customers
to invest in real estate in seconds, whereas in a traditional real estate market, the required documentation
and bureaucracy make buying property a time-consuming process.
Another benefit of real estate crowdfunding is that it expands the market as it reduces structural
inefficiencies. This financial mechanism ensures a larger funding environment compared to traditional real
estate investment. Traditional real estate businesses reach a limited investor base, which extends the time
required to sell real estate and severely restricts the pool of potential investors. The crowdfunding plat-
form expands sales potential by opening projects to a global audience. Real estate crowdfunding further
contributes to the operational and allocational efficiency of the market by removing the intermediaries
and connecting investors worldwide with real estate investment opportunities previously available only to
economically privileged or geographically clustered groups. It helps investors find and invest in real estate
and digitally register their ownership of that property without reliance on traditional entities, namely real
estate agents, lawyers, and notaries. This saves both parties, transaction costs and decreases agency costs.
As Cohen (2016) argues, “speed of execution in a real estate transaction is instrumental towards not only
competing to win a deal but also towards building a firm’s reputation of professionalism and efficiency.
This competency can help [crowdfunding real estate platforms] to build upon [their] current momentum
and continue to grow”. On the other hand, crowdfunding offers a better diversification opportunity for the
investors as its performance are stable with respect to other alternatives (Gibilaro and Mattarocci, 2020).
Nevertheless, the main remaining obstacle is the (lack of) technical literacy of the market participants, who
often remain unable to process (and sometimes access) the information that they need to make purchase
decisions. The “buyer beware” issue, despite the aggregation of this information on crowdfunding
platforms, remains a significant challenge.
Alternatives, such as open-ended real estate funds or real estate investment trusts, may arguably offer a
diversified portfolio of properties (Schweizer and Zhou, 2017). However, heavy investor redemptions (fire
sales), and high correlation with equity markets, particularly during crises, are significant weakness- es of

International Engineering and Technology Management Summit 2021– ETMS2021
İstanbul Technical University & Bahçeşehir University
38
these investment alternatives. More importantly, investors are deprived of the pleasure of selecting a specific
property for investment. Nevertheless, the inability of crowdsourcing initiators to deliver promised results,
the risk of project or platform failure, fraud and low liquidity are some of the significant risks of real estate
crowdfunding platforms. The creation of bankruptcy-remote structures, the legal certainty of transactions,
transparency, liquidity, and finality are the biggest challenges that must be dealt with in identifying
property-technology alternatives (Takanashi, 2020).
3. THE EMERGENCE OF BLOCKCHAIN AND TOKENISATION Since the introduction of blockchain technology as an alternative currency system (Nakamoto, 2008), it has
become popular in the financial sector and other industries, from pharmacy to supply management (Beck
et al. 2017). Blockchain technology and the underlying distributed and decentralized technologies are
defined as “the key technological enablers of recent developments in distributed transaction and ledger
systems” (Lindman et al., 2017). The technology’s digital ledgers, transparency, redundancy, immutability,
and disintermediation make blockchain a serious disruptor of traditional business processes because it
allows trust between parties in a decentralized environment (Zhao et al., 2016).
Blockchain changes the features of current financial services such as settlement, cross-border payments,
remittances, credit-information systems, and smart contracts and addresses issues such as trust, transaction
costs, and fraud (Yoo, 2017; Guo and Liang, 2016). It can address issues related to sharing registers, fund
collection, and management processes and improve corporate governance mechanisms. All these features
put enormous trust in small, distributed shareholders and their being able to control the corporation (Zhou
et al. 2016). Furthermore, blockchain could mitigate the land disputes (Yapicioglu and Leshinsky, 2020)
Arguably the most important benefit of the blockchain is the tokenisation of any scarce asset. This
tokenisation is the foundation of pre-order crowdfunding platforms and ownership stakes in profit-sharing
crowdfunding and other alternative fundraising methods (Chen, 2018). Unlike cryptocurrencies, tokens
are generally governed by smart contracts. Depending on the blockchain platform, they are governed by
standards that enable participants to recognize, transact, and easily exchange tokens in the blockchain
ecosystem. A token’s value generally depends on the value of the underlying assets or services (Massey et
al., 2017). Also, a digital representation of the property to record the physical and contractual information
make tokens useful and valuable (Wouda and Opdenakker, 2019).
Tokens also allow entrepreneurs and innovators to raise funds directly from investors or the public across
the globe without depending on financial institutions. Simultaneously, tokens give investors a fair
opportunity to invest in profitable assets or ventures and enjoy instant liquidity. Initial coin offerings, initial
security or token offerings, or initial exchange offerings are open to continued development via technology
and user-friendly platform design.
For example, utility tokens, a blockchain token phenomenon during 2017 and 2018, provided funds for
many entrepreneurs and innovators to finance their projects. During the unregulated initial coin-offering
period, tokens were issued in return for blockchain tokens or smart contracts. However, the lack of a regu
latory infrastructure saw this initiative ending soon after it began. Compared to a utility token, a security
token, as a digitally traded asset, uses a decentralized system to identify and verify the assets and
transactions. Security tokens will thus avoid the problems faced by utility tokens, as they are similar to
tradition- al securities in that they represent ownership of the company or asset or an interest in the cash
flow of some particular project or operation (Klayman et al., 2017).
With token offerings, the network members can participate in the issuer’s investment and benefit from the
capital gain and dividend (or rental fee). Simultaneously, transactions are verified by multiple, non-related
parties using a public, transparent system. The tokenisation of assets serves to raise capital and is thus
comparable to the securitization [1] of assets. From a legal perspective, the securitization and tokenization
of assets are equivalent. Yet, securitization involves many legal steps and requires compliance with the
applicable securities law.
Crucially, there is an essential difference between traditional security and blockchain tokenisation for the
management of property rights. A token is made using cryptographic methods, and the owner of a token
can transfer the token by creating a transaction message, signing it with their private key, and sending it to

International Engineering and Technology Management Summit 2021– ETMS2021
İstanbul Technical University & Bahçeşehir University
39
the blockchain network. By contrast, trading traditional securities is only possible through financial
intermediaries. Tokenisation allows the creation of fractional rights in a specific asset. It could be described
as multiple parties sharing an asset, which could be real estate (Graglia and Mellon, 2018). The fractional
ownership of real estate provides customers with the opportunity to invest in a high-value property that
they could not otherwise afford. Customers could own a fraction of that property or share the benefits of
ownership, such as rental income and capital appreciation. An intermediary in the proposed system might
bear or reflect all investors’ costs, such as property taxes and agency costs. We propose in our model be-
low an SPV as the unique intermediary. In a typical case, dividing property rights raises challenges
concerning governance, legal structure, and security. With blockchain technology, the costs of allocating,
recording, and trading these rights are easier to track and monitor than in traditional crowdfunding.
Although many real estate crowdfunding platforms are regulated and thus seen as trustworthy by the public,
centralized platforms are susceptible to fraud and information asymmetry. As Wang (2016) notes,
information asymmetry is one of the major obstacles limiting equity crowdfunding prevalence. However,
third-party verification is easier with tokens, and blockchain technology alleviates security and asymmetric
information concerns. A crowdfunding design employing blockchain technology thus protects investors by
reducing information asymmetries, promoting market stability, and ultimately decreasing the likelihood of
market manipulation and systemic risk. Using blockchain technology allows the transparent recording of
investors’ share information and ensures trust between fundraisers and fund seekers to keep contracts more
safe and secure. Digital registration and confirmation of investors’ shares are possible with blockchain
technology regardless of jurisdiction or location (Zhu and Zhou, 2016). Furthermore, regulators may
require these platforms to comply with onerous regulatory burdens related to corporate governance,
minimum capital requirements, trust accounts, internal controls, and compliance infrastructure.
However, despite the promise of these fundamental market innovations that the new technology offers,
there is still uncertainty surrounding the use of blockchain technology. Legal systems are not currently
structured to regulate such technologies, and problems may be encountered in practice. Some problems
may be solved through legal interpretation. However, this is not possible where, as in some cases,
regulations directly prohibit the envisioned transactions. To benefit from blockchain in this challenging
legal context requires the development of alternative legal mechanisms. This study proposes an
alternative, SPV based mechanism to mitigate these potential legal challenges. The following section
presents the technical design of such a mechanism.
4. TECHNICAL DESIGN
Owning and transferring real estate tokens require a compatible digital wallet. This wallet ensures the
private token key is secure and allows uncomplicated reception and dispatch of tokens. For the transfer of
ownership of a token, the sender uses the digital wallet to write one transaction message that should include
the token recipient and seller's addresses and the number of tokens to be transferred. Such transfer of
ownership is usually completed within a few seconds of the transaction message being sent and registered
on the blockchain platform.
The issuer of the token codes a smart contract for the token’s issue on the platform. This smart contract
establishes the number of tokens issued, the number offered for sale, the token price, the divisibility of the
token, accepted forms of payment, the sales window, and any trade restrictions.
When the tokenisation process occurs on the blockchain platform, the platform’s cryptocurrency (such as
Ether or Stellar lumen) is usually the means of payment. The issuer often also allows payment in fiat
currency. The number of real estate tokens and a single token price is mostly related to the underlying
property’s value. For example, if a property has a value of € 1,000 and 1000 real estate tokens are issued,
the fair value of a real estate token is € 1 (minus costs). However, the issuer is free to set any price and sell
only a portion of the tokens created. Finally, the issuer has to determine the tokens’ divisibility, how long
the sales window remains open, and what happens to possibly unsold tokens. If an issuer wishes to restrict
the token's tradability, it can also create a so-called whitelist as part of the smart contract. This list of entities
or addresses is authorized to receive tokens and the smart contract limits transactions to parties on this list.
Limitations on tokens' tradability are often due to regulatory requirements, which differ depending on the

International Engineering and Technology Management Summit 2021– ETMS2021
İstanbul Technical University & Bahçeşehir University
40
country. Where real estate tokens become tradable securities, the legal provisions referred to as Know Your
Customer (KYC) regulations become even more critical. The fulfilment of these requirements in- volves
an elaborate registration process similar to that required for opening an account in the traditional financial
system, including requiring residence and identification checks and other measures to avoid money
laundering (Berentsen and Schär, 2017).
5. BLOCKCHAIN BASED REAL ESTATE TOKENISATION PROPOSAL In this section, we first state the challenges presented by both the legal environment and current market
structure in the adoption of blockchain technology and tokenisation. Later, we summarize the legal de-
sign, security token offering procedure, and exchange mechanism of the proposed model. The section
concludes with a discussion of the potential implications of real estate tokenisation on market structure
based challenges.
5.1 Legal Design and Securities Token Offering Procedure Blockchain-based real estate crowdfunding platforms envision a scenario where people can index their
recurring small investments to the value of a property which they would ultimately like to buy. They do
so in a context where people often struggle to save for larger down-payments on properties while
simultaneously seeing their accumulated savings depreciate. Moreover, the property would not end up
being vacant, as it would be if there were, for example, a foreclosure for failure to make payment within a
traditional funding arrangement. In this new model, when a person cannot continue buying into the
property, the previous investment could still appreciate. The property token owners would still profit from
market appreciation, increasing the number of people willing to invest.
To benefit from this type of blockchain-based real estate crowdfunding platform, investors must first
identify and select a real estate project in which they want to buy fractional rights (tokens). The evaluation
of prospectus materials, presentations, and other bulletins takes place and is incorporated into the price on
the platform. After successfully completing the KYC process, the investor buys real estate tokens through
the platform. Figure 1 illustrates this framework.
Figure 1. Main Structure of Legal Design
Establishment of the legal structure and associated operations is complicated, novel terrain, and for this
reason has largely not been tackled. The primary challenge is the legal design of the tokens. Although some
legal experts express support for such crowdfunding platforms, there is insufficient judicial opinion to
support blockchain-based solutions. Asset tokens representing participation in real assets, corporations, or
related revenue streams are generally treated and regulated as securities. In contrast to the traditional
crowdfunding platforms, tokens that provide dividends from a business operation are accepted as securities
(Kaal, 2018). These tokens meet the criteria of investment contracts as defined by the classic Howey test
of the United States Supreme Court, as those where “a person invests his money, in a common enterprise
and is led to expect profits solely from the efforts of the promoter or a third party” (Howell et al. 2018).

International Engineering and Technology Management Summit 2021– ETMS2021
İstanbul Technical University & Bahçeşehir University
41
They are thus subject to securities regulations. Currently, registering and trading company shares through
blockchain technologies is permitted in a small number of jurisdictions (e.g., Delaware [2] in the United
States).
Whether fractional ownership of a non-financial instrument should be recognized as a security is still
debated (Dewey, 2019). Non-financial instrument backed token issuers claim that these tokens represent
an interest in their blockchain projects and are not securities. However, regulators tend to take a rather
conservative approach on these products. They treat these products as securities because they are taking a
prudential approach or may take the approach of wanting to ensure compliance with securities laws
(especially concerning consumer and investor protection) without unduly hindering innovation (Colomb et
al., 2018). The major issue here is this: existing securities regulations are not designed to address innovative
products, which leads to uncertainty and inconsistency in applying the rules. While blockchain gives
investors greater reliability and transparency, it may not be fair to burden the associated platforms with
onerous legal obligations (Colomb et al., 2018). To meet these regulations, blockchain firms might decide
to prepare a prospectus or offering memorandum for their tokens and meet independent audit requirements
as well as cover insurance and bonding costs. These costs could be undertaken by a Special Purpose Vehicle
(SPV) which is established for the acquisition of the particular asset.
Many traditional crowdfunding platforms sell shares of Special Purpose Vehicles (SPVs), entities created
to acquire a property and undertake its management. While the structure of the legal entity can vary by
jurisdiction, the SPV is almost always formed as a limited partnership. The platform company becomes a
managing partner, and the investors become limited partners of the SPV. The property is then rented out
by the SPV management, which carries out the necessary maintenance and repair and makes decisions on
behalf of investors regarding the property’s sale. One problem, however, with this arrangement is that it
gives rise to agency costs – it is unclear whether the SPV management’s interests will align with those of
the investors. Moreover, it is not sustainable to take on the costs of establishing a new SPV each time a real
estate project is tokenized. It is particularly unreasonable where the property is not expensive and located
in middle- and low-income areas. One solution may be for the SPV to purchase multiple proper- ties at
once and make investors partners for the sake of efficiency. However, investing in this SPV would not be
the same as owning a specific property and is not significantly different from a Real Estate Investment
Trust model. Blockchain tokenisation proposes potential solutions to these possible agency conflicts. The
token can be embedded with the SPV’s and the investor’s rights and legal responsibilities, along with an
immutable record of ownership.
Currently, most of the solutions to overcome these legal challenges have involved creating a “participation
certificate” for each real estate token. Accordingly, the essence of our primary solution draws inspiration
from Islamic finance and its Equipment Trust Certificates. We present an ideal real estate tokenisation
procedure in Figure 2 below. This procedure, undertaken through an SPV, includes identifying the real
estate, announcing its tokenisation to investors, issuing tokens, purchasing real estate with the col- lected
money, and sending tokens to investors’ digital wallets. In doing so, blockchain tokenisation enables the
investors to invest in non-financial real estate assets without them having to become a partner in the SPV.
In Islamic finance, Sukuk is a certificate of equal value to other such certificates, representing undivided
shares in ownership of tangible assets, usufructs, and services, or in the ownership of the assets of particu
lar projects or investment activities (Ahmed et al., 2014). An SPV may issue these certificates by offering
materials such as a prospectus or information memorandum. These certificates represent all rights related
to the property, including rental income and any change in value. The procedure is similar but distinct to
that for the issue of asset-backed securities. The performance of securities depends on the underlying asset
performance. Each series of certificates represents property, and these certificates will be a liability of the
SPV. Issuing matching tokens with participation in the blockchain system is an ideal solution be- cause
investors’ rights are legally protected without them having to become a partner in the SPV.
Such a token mechanism would also prevent delays in the property transaction process related to document
preparation, marketing, due diligence, and contract completion. Moreover, at some point, the token can be
divided to allow for the creation of ownership, income, and rights. It will be necessary to properly determine

International Engineering and Technology Management Summit 2021– ETMS2021
İstanbul Technical University & Bahçeşehir University
42
the obligations and rights transferred via blockchain to know what burdens a property carries and what
rights the titleholder has. In order to maintain the rights of the parties, the blockchain for these transactions
could include features otherwise unique to the technology, such as the possibility of the smart contract being
amended (Garcia-Teruel, 2020).
Although tokenisation can boost transparency and traceability and help mitigate settlement risks, some of
the investor rights that come with tokenisation, such as remote bankruptcy, might be lacking in a block-
chain model (Takanashi et al., 2020). In the proposed model, participation-certificate holders would have
exclusive rights in the SPV, the real estate's official owner. These qualified rights will be specified in the
SPV’s articles of association and cannot be removed, remaining with the investor until they dispose of
that certificate.
Figure 2. Securities Token Offering (STO) Procedure
5.2 Potential Implications of Tokenisation to the Real Estate Market Structure This section discusses the implications of adopting blockchain technology and tokenisation in relation to
the disadvantages related to the character and structure of the real estate market. Ensuring blockchain-
based real estate crowdfunding platforms are well structured from a legal perspective could help address
these challenges.
1. Heterogeneous structure: Properties are relatively unique, and their characteristics can create specific
risks, and average investors cannot measure and manage these risks (Nyström and Lind, 2012).
Potential Implication: Blockchain technology provides an opportunity for investors to monitor and examine

International Engineering and Technology Management Summit 2021– ETMS2021
İstanbul Technical University & Bahçeşehir University
43
all developments related to the real estate, such as new appraisal reports, maintenance, and repair in-
formation, as well as all disclosures concerning the offer process. All this information incorporates into
the price of the token on an ongoing basis. Blockchain defends mainly the owner’s rights, avoids double
purchases, and links the real estate platform to administrative and other facilities required for international
operations.
2. Market illiquidity: Real estate markets are less liquid than securities markets. Investors spend
considerable time identifying the right property, negotiating, and finding the best price (Lin and Liu, 2008).
The real estate market inherently has long-term maturity, but investors' liquidity preferences in
crowdfunding or blockchain markets are much shorter. Simultaneously, a lack of secondary-market
liquidity for a typical crowdfunding startup may make it more difficult for issuers to attract sufficient
investor interest in primary offerings (SEC, 2019).
Potential Implication: Tokenisation allows the large size asset of a real estate property in smaller size
tradable instruments. The aims of a token or ‘share’ are to allow the sale of fractional ownership of property,
mitigate the problem of illiquidity in the real estate market, ensure a low cost of entry, and extend the
investor base in real estate investment. If platforms aim at retail investors, small investors could easily buy
and sell token/shares. They could also sell these tokens for cash if they face unexpected liquidity pressures
(Lee, 2019).
In this way, these platforms present a solution to the illiquidity of long-term real estate investments
(Mazzorana-Kremer, 2019). They could also contribute to financial inclusion by attracting people who
prefer cash and real estate in their investments (Jenik et al., 2017). The ability to resell or exchange real
estate tokens is critical for a blockchain-based platform.
The main reason exchange markets have not developed parallel to crowdfunding markets is the absence
of legal infrastructure and the lack of consistent regulatory approaches. It is possible that regulators may
restrict the transferability of securities sold for a determined period after issuance or for an infinite period.
On the contrary, blockchain technology allows tokenized real estate shares to be bought and sold easily
on exchange markets. Linking tokens with a participation certificate after creation provides a secondary
crowdfunding market. As described in Figure 3, pooling exchange orders would increase liquidity in the
real estate market.
The increase in activity is also valid for asset-backed tokens. If regulations further incentivize exchanges
on these platforms, all stakeholders could benefit. There are potential advantages to these new technologies,
including reduced financing and transaction costs, fast and secure transfer of ownership, the possibility of
24/7 worldwide trading, standardization, flexibility, and high levels of transparency.
3. Information asymmetry: Real estate markets are asymmetric. The seller is better informed than the
buyer because they have private information about their property and its characteristics (De Wit and Van
der Klaauw, 2013). In this sense, the market is an example of “the market of lemons,” a well-known
phenomenon defined by Akerloff (1970). The real estate industry has not been willing to share data openly,
which is a pre-requisite for the successful introduction of property passports (Saull et al., 2020).
Potential Implication: When the legal connection between investors and the platform is established through
an SPV, investors will have access to the same information as sellers or realtors. Blockchain could mitigate
the information asymmetries between new and existing investors concerning the valuation of crowdfunded
securities. Safe and transparent storage on the blockchain will make the underlying data more transparent.
4. The ambiguity of cash flow: New real estate owners in this proposed model (participation-certificate
holders) may be unsure of potential rental flows and the risks faced.
Potential Implication: The specific conditions in which these certificate holders receive a share of the
benefit from the tokenized real estate and the extent of this benefit depends on the terms agreed to on the
issue and distribution of those certificates. These terms may be encoded into the token through the smart
contract and stored in the blockchain network, avoiding unnecessary processes for the distribution of the
benefits.

International Engineering and Technology Management Summit 2021– ETMS2021
İstanbul Technical University & Bahçeşehir University
44
Figure 3. Exchange Mechanism
5. Barriers to entry: Generally, the real estate market is best suited to accredited investors who can meet
the financial pre-requisites and high costs incurred in traditional transactions.
Potential Implication: When the SPV issues tokenized participation certificates, it can remove or decrease
the limits on less-sophisticated individuals' ability to buy the product. The global tradability of certificates
will open up entirely new markets. For example, it is conceivable that a farmer in New Zealand could
acquire a small stake in a property in Canada using only a digital wallet on their phone. The inclusion of
smaller investors would widen the market. In addition, blockchain-system operators are able to link
investors to official digital identity documents, allowing transactions only by those with legitimate access.
Those without legal capacity cannot be issued a participation certificate.
6. Disclosure of data: At present, searching for a suitable property, characterized by analysis of numerous
and often overlapping data sets, is a laborious and resource inefficient task. Time and money are spent on
due diligence before completing the relevant legal transactions. There is a need to compile, synthesize, and
distribute disparate data efficiently.
Potential Implication: An SPV could automate compliance, document verification, and trading via a
blockchain platform. The DVP (delivery vs. payment) process could theoretically be applied to the block-
chain and potentially remove any settlement risks (Takanashi et al., 2020). Furthermore, rental income and
other cash flows can be distributed automatically when due. Trades in participation certificates can be settled
in minutes, depending on the underlying blockchain.

International Engineering and Technology Management Summit 2021– ETMS2021
İstanbul Technical University & Bahçeşehir University
45
6. CONCLUSION Tokenisation refers to establishing a digital share of ownership that can be more easily traded and opens up
an asset potentially to a wider universe of investor. Blockchain allow for the easy and secure buying and
selling of illiquid assets such as real estate. Crowdfunding, as a funding mechanism, allows small investors
to access profitable and reliable markets. The combination of these three concepts could provide significant
benefits to the real estate market. Nevertheless, some legal and market-related challenges would remain.
Most of the solutions to overcome the legal challenges involve creating a participation certificate for each
real estate token. We propose a specific protocol to use on crowdsourcing platforms that contributes to the
legal infrastructure supporting tokenization within the blockchain ecosystem. The protocol does not attempt
to propose an alternative crowdsourcing platform but a potential solution that combines blockchain
technology, tokenisation, finance, and law. Specifically, a legal design, security token offering procedure,
and an exchange mechanism built on real estate tokenization. The mechanism addresses the legal design
challenges of real estate crowdfunding. It explores the implications of adopting blockchain-based
technologies to mitigate challenges related to the real estate market structure. In order to ensure the legal
compliance, prospectus or memorandum offers for the tokens could be prepared meeting independent audit
requirements. The audit cost, possible insurance and bonding costs could be under- taken by a Special
Purpose Vehicle (SPV) which is established for the acquisition of the particularSub asset. However, such
SPVs are almost always formed as a limited partnership. The company becomes a managing partner, and
the investors become limited partners of the SPV.
Our proposed solution is not a classical form of an SPV. It enables smaller investors to participate in the
real estate market and manage their investment on the trading platform without having to be a partner in
the SPV. In the proposed model, participation-certificate holders would have exclusive rights in the SPV,
the real estate's official owner. These qualified rights will be specified in the SPV’s articles of association
and cannot be removed, remaining with the investor until they dispose of that certificate.
The structure is mainly an SPV using Sukuk-like certificates, draws inspiration from Islamic finance and
Equipment Trust Certificates. This procedure, undertaken through an SPV, includes identifying the real
estate, announcing its tokenisation to investors, issuing tokens, purchasing real estate with the collected
money, and sending tokens to investors’ digital wallets. In general, the process is similar to that for asset-
backed securities. The tokens used resemble but remain categorically distinct from asset-backed securities
The SPV issues blockchain tokenized Sukuk-like certificates which grant rights related to an investment
property. Each series of certificates represents property and will be a liability of the SPV that owns the
property. The performance of the tokenized SPV certificate still depends on the performance of the under-
lying asset. The pricing is done on the platform through evaluation of prospectus materials, presentations,
and other bulletins. After successfully completing the KYC process, the investor buys real estate tokens
through the platform. Blockchain tokenization could improve data transparency while mitigating the
market-related challenges such as heterogeneity of assets, illiquidity, informational asymmetry, the
ambiguity of cash flows, barriers to entry, and lack of bankruptcy-remote entities. Blockchain real estate
tokenization could achieve these mainly through diminishing barriers allowing the increasing market
volume and degree of information reflected to the underlying real state value.
REFERENCES Ahmed, E. R., Islam, A., & Alabdullah, T. T. Y. (2014). Islamic Sukuk: Pricing mechanism and rating.
Journal of Asian Scientific Research, Vol.4 No.11, pp.640-648.
Akerlof, G. A. (1970). The Market for "Lemons": Quality Uncertainty and The Market Mechanism. The
Quarterly Journal of Economics, Vol.84 No. 3, pp.488-500.
Beck, M. (2017) Into the Ether with Ethereum Classic. URL: https://ethereumclassic. github. io/assets/etc
(Doctoral dissertation, thesis. pdf. White Paper. Accessed 2019-10-13).
Chen, Y. (2018). Blockchain tokens and the potential democratization of entrepreneurship and innovation.
Business Horizons, Vol. 61 No. 4, pp.567-575.
Berentsen, A. and Schär, F., A Short Introduction to the World of Cryptocurrencies (2018). Federal Re-
serve Bank of St. Louis Research Paper Series, Vol. 100, Issue 1, pp. 1-16, 2018, Available at SSRN:
https://ssrn.com/abstract=3105283 or http://dx.doi.org/10.20955/r.2018.1-16
International Engineering and Technology Management Summit 2021– ETMS2021
İstanbul Technical University & Bahçeşehir University
46
Bloomberg, “You Can Tokenize a Building’ in State Street’s
New Digital Push“ https://www.bloomberg.com/news/articles/2021-06-11/-you-can-
tokenize-a-building-in-state-street-s- new-digital-push retrieved on: June 11th 2021
Cambridge Centre for Alternative Finance (2020): The Global Alternative Finance Market Benchmarking
Report, Judge Business School, University of Cambridge, UK
Cohen, J. (2016). A Study on the History and Functionality of Real Estate Crowdfunding, Joseph Whar-
ton Scholars. Available at https://repository.upenn.edu/joseph_wharton_scholars/19
Collomb, A., De Filippi, P., & Sok, K. (2018). From IPOs to ICOs: The Impact of Blockchain Technolo-
gy on Financial Regulation. Available at SSRN 3185347.
Cummings, M. E., Rawhouser, H., Vismara, S., & Hamilton, E. L. (2020). An Equity Crowdfunding Re-
search Agenda: Evidence From Stakeholder Participation in the Rulemaking Process. Small Business
Economics, 54(4), 907-932.
Dewey, J. (2019). Initial coin offerings a comparative overview of securities regulatory environments in
the US, UK and Asia-Pacific, available at https://www.globallegalinsights.com/practice-
areas/blockchain- laws-and-regulations/5-initial-coin-offerings-a-comparative-overview-of-securities-
regulatory- environments-in-the-us-uk-and-asia-pacific, accessed at 11.10.2019
De Wit, E. R., & Van der Klaauw, B. (2013). Asymmetric information and list-price reductions in the
housing market. Regional Science and Urban Economics, Vol. 43 No. 3, pp. 507-520.
Fenwick, M., McCahery, J. A., & Vermeulen, E. P. (2019). The End of 'Corporate' Governance: Hello'
Platform'Governance. European Business Organization Law Review, Vol. 20 No. 1, pp. 171-199.
Garcia-Teruel, R.M. (2020), "Legal challenges and opportunities of blockchain technology in the real estate
sector," Journal of Property, Planning and Environmental Law, Vol. 12 No. 2, pp. 129-145.
DOI:10.1108/JPPEL-07-2019-0039
Gibilaro, L., & Mattarocci, G. (2020). Crowdfunding REITs: a new asset class for the real estate indus-
try?. Journal of Property Investment & Finance, Vol. 39 No. 2, pp. 84-96.
Graglia, J. M., & Mellon, C. (2018). Blockchain and Property in 2018: At the End of the Beginning. In-
novations: Technology, Governance, Globalization, Vol. 12 No. (1-2), pp. 90-116.
Guo, Y., & Liang, C. (2016). Blockchain application and outlook in the banking industry. Financial In-
novation, Vol. 2 No. 1, https://doi.org/10.1186/s40854-016-0034-9
Hoxha, V. & Sadiku, S. (2019), "Study of factors influencing the decision to adopt the blockchain tech-
nology in real estate transactions in Kosovo", Property Management, Vol. 37 No. 5, pp. 684-700.
Jenik, I., Lyman, T., & Nava, A. (2017). Crowdfunding and financial inclusion. CGAP (Consultative Group
to Assist the Poor) Working Paper.
Howell, S. T., Niessner, M., & Yermack, D. (2018). Initial coin offerings: Financing growth with crypto-
currency token sales (No. w24774). National Bureau of Economic Research.
Kaal, W. A. (2018). Initial Coin Offerings: The top 25 jurisdictions and their comparative regulatory re-
sponses. CodeX Stanford Journal of Blockchain Law & Policy, pp. 1-41.
Kim, H., & Kim, J. (2017). Geographic proximity between lender and borrower: how does it affect
crowdfunding? Review of Accounting and Finance, Vol. 16 No. 4, pp. 462-477.
Klayman, J. A., Cohen, L. R., & Sosnow, R. (2017). There are Two Sides to the Initial Coin Offering
Debate, available at https://www.hoganlovells.com/en/publications/the-two-sides-of-the-initial-coin-
offering-debate, accessed at 10.10.2019.
Konashevych, O. (2020). Constraints and Benefits of the Blockchain Use for Real Estate and Property
Rights. Journal of Property, Planning and Environmental Law, Vol.12 No.2 pp.109-127
Lee, E. (2019). Equity crowdfunding in Hong Kong: potential, challenges, and investor protection. Jour-
nal of Corporate Law Studies, Vol. 19 No. 2, pp. 277-302.
Lin, Z., & Liu, Y. (2008). Real estate returns and risk with heterogeneous investors. Real Estate Econom-
ics, Vol. 36 No. 4, pp. 753-776.
Lindman J, Tuunainen VK, Rossi M (2017) Opportunities and Risks of Blockchain Technologies—A
Research Agenda. In: 50th Hawaii International Conference On System Sciences, Manoa, pp 1–10.
Massey, R., Dalal, D., & Dakshinamoorthy, A. (2017). Initial coin offering: A new paradigm. Deloitte.
Available at https:// www2.deloitte.com/content/dam/Deloitte/us/Documents/ process-and-
operations/us- cons-new-paradigm.pdf
Mazzorana-Kremer, F. (2019). Blockchain-Based Equity and STOs: Towards a Liquid Market for SME
Financing?. Theoretical Economics Letters, Vol.9 No.5, pp. 1534-1552.
Nakamoto, S. (2008). A peer-to-peer electronic cash system. Bitcoin.–URL: https://bitcoin.org/bitcoin.pdf.
Nasarre-Aznar, S. (2018). Collaborative housing and blockchain. Administration, Vol. 66 No.2, pp. 59- 82.

International Engineering and Technology Management Summit 2021– ETMS2021
İstanbul Technical University & Bahçeşehir University
47
Lind, A.-V. (2012). Within Real Estate Diversification and Investment strategies (Dissertation). Retrieved
from http://urn.kb.se/resolve?urn=urn:nbn:se:kth:diva-102297
Saull, A., Baum, A., & Braesemann, F. (2020). Can digital technologies speed up real estate transac- tions?.
Journal of Property Investment & Finance. Vol. 38 No.4, 349-361
Schweizer, D., & Zhou, T. (2017). Do principles pay in real estate crowdfunding?. The Journal of Portfo-
lio Management, Vol. 43 No.6, pp. 120-137.
SEC, (2019), Report to the Commission Regulation Crowdfunding, Available at:
https://www.sec.gov/files/regulation-crowdfunding-2019_0.pdf
Silvestri, G. (2017). When The Crowd Becomes Shareholder: An Enquiry on Italian Equity Crowdfund-
ing Initiatives. Master Thesis. Available at: http://tesi.cab.unipd.it/59469/
Sousa, M. P. (2019). Legal Challenges of Real Estate Crowdfunding (Doctoral dissertation). Available at:
https://repositorio.ucp.pt/bitstream/10400.14/27869/1/Thesis%20-
%20Real%20Estate%20Crowdfunding_Miguel%20Paquete.pdf
Takanashi, Y., Matsuo, S. I., Jacobs, J., Burger, E., Sullivan, C., Angel, J., & Sato, H. (2020). Considera-
tion On Better Tokenization Practices And Regulations Concerning Investor Protection. Journal of Fi-
nancial Transformation, 51, 44-54.
University of Oxford Research (2020): Proptech 2020: The future of real estate, Said Business School,
University of Oxford, available at: https://www.sbs.ox.ac.uk/sites/default/files/2020-
02/proptech2020.pdf
Wang L., (2016). Research on legal protection for investors' interests of Chinese equity crowdfunding.
Anhui University. Hefei, Anhui, China. DOI: 10.1108/IJOEM-01-2020-0091.
Wouda, H. P., & Opdenakker, R. (2019). Blockchain technology in commercial real estate transactions.
Journal of Property Investment & Finance, Vol. 37 No. 6, pp. 570-579.
Yapicioglu, B. and Leshinsky, R. (2020), "Blockchain as a tool for land rights: ownership of land in Cy-
prus", Journal of Property, Planning and Environmental Law, Vol. 12 No. 2, pp. 171-182.
Yoo, S. (2017). Blockchain based financial case analysis and its implications. Asia Pacific Journal of
Innovation and Entrepreneurship, Vol. 11 No.3, pp. 312-321.
Zhao, J. L., Fan, S., & Yan, J. (2016). Overview of business innovations and research opportunities in
blockchain and introduction to the special issue. Financial Innovation. 2-28. DOI: 10.1186/s40854-016-
0049-2.
ENDNOTES [1] Securitization is the issuance of tradable securities, which are often secured by illiquid assets. This is
usually provided with a special purpose vehicle, whose sole purpose is to issue this security. The illiquid
assets would be on the balance sheet's assets side, and the issued securities would be on the liabilities side
of the issued securities.
[2] State of Delaware in the US provides the legal infrastructure for blockchain maintenance of corporate
records

International Engineering and Technology Management Summit 2021– ETMS2021
İstanbul Technical University & Bahçeşehir University
48
ASSESSING INDUSTRY 4.0 TRANSFORMATION OF SMES: A SWOT
ANALYSIS
Okan Ernur Hilmi Yüksel
Dokuz Eylül University Dokuz Eylül University
ABSTRACT The term ‘Industry 4.0’ was introduced in 2011 during the Hannover Fair in Germany. Industry 4.0 is based
on cyber-physical systems aims to unify the physical and digital worlds of production. With Industry 4.0,
value chains, products and services are digitized and integrated. Kagermann et. al (2013) stated that the
environment will become more dynamic and unpredictable, and to protect their competitive advantage,
companies will need new approaches. Industry 4.0 applications have many practical and theoretical
benefits, but, it is still unclear exactly what the challenges and opportunities to the companies face. SMEs
have different characteristics from larger companies, and therefore they need different Industry 4.0
transformation roadmaps. Industry 4.0 provides new paradigms for the industrial management of SMEs.
Moeuf et al. (2018) also expressed that, the introduction of new technologies and practices always have
risks for SMEs and the real requirements and benefits for SMEs are still not fully known.
SWOT analysis is a technique to identify the internal strengths and weaknesses and external opportunities
and threats. Naryanan and Natch (1993) emphasized that SWOT analysis is an important analysis method
that helps managers to analyze the current situation and future potential of the organization. This paper
mainly focuses on the usage of SWOT analysis to identify the internal and external impacts of Industry 4.0
in four categories (Strengths, Weaknesses, Opportunities, and Threats). The purpose of this study is to
examine Industry 4.0 transformation of SMEs located in Aegean Region in Turkey, using SWOT analysis
to conduct their awareness, activities and current situation within strengths, weaknesses, opportunities and
threats in the journey of Industry 4.0 transformation. Detailed analysis of strengths, weaknesses,
opportunities and threats of Industry 4.0 transformation of SMEs will support to formulate appropriate
strategies during the journey of Industry 4.0 transformation of SMEs. In this study, interview method was
used to analyze the SMEs’ Industry 4.0 transformation. Interviews were conducted with 5 SMEs. The
results of the interviews were evaluated by SWOT analyze and revealed strengths, weaknesses,
opportunities and threats of the SMEs in the extent of Industry 4.0 transformation.
Keywords: Swot Analysis, Industry 4.0, SMEs
International Engineering and Technology Management Summit 2021– ETMS2021
İstanbul Technical University & Bahçeşehir University
49
1. INTRODUCTION Organizations would like to figure out about alterations of their environment at times and they examine
their situation according to environmental alterations. SWOT Analyze is one the technique to be used for
this aim. Firstly, Swot Analyze was mentioned in ‘Business Policy’ which has been published by Learned
et al. in 1960s to be detected situation of organizations related to Strengths, Weaknesses, Opportunities and
Threats. SWOT Analyze, is also called as Situation Analysis in Turkish Literature (Güngör and Arslan,
2004: 68) is an important analyze that is used by organizations to determine an efficient organizational
strategy regarding strategic management and strategic planning (Gürel and Tat, 2017: 995). SWOT Analyze
not only helps managers or decision makers to analyze current situations and potentials but also helps in
being awake to organization's environment (Naryanan and Natch, 1993: 197). SWOT Analyze which
reveals strengths, weaknesses, opportunities and threats of organizations helps researchers, planners or
managers to determine organization’s targets and prioritize them. It also helps to create a competitive and
sustainable strategy for decision makers (Ommani, 2011: 9448). Organizations use SWOT Analyze to
gather information that is regarding profitability, product development, sales and marketing strategy. But
Swot does not use only for business environment. It is also used by individuals to analyze personal situation
(Gökoğlan and Kaval, 2020:19).
SMEs face with many difficulties in Industry 4.0 transformation related to their characteristics. SMEs have
different characteristics than large companies so the challenges and the importance of the challenges for
Industry 4.0 transformation in SMEs will also be different. The success of Industry 4.0 transformation in
all companies, SMEs should also plan Industry 4.0 projects. So, analysis of strengths, weaknesses,
opportunities and threats of Industry 4.0 transformation of SMEs is also very important.
2. INDUSTRY 4.0 The term ‘Industry 4.0’ was introduced in 2011 during the Hannover Fair in Germany. The Fourth Industrial
Revolution will be marked by the full automation and digitization processes, and the use of electronics and information technologies in manufacturing and services (Roblek et al,2016). Industry 4.0 refers the fourth
industrial revolution initiated by the integration of the Internet of Things (IoT) and the Internet of Services
(IoS) in the manufacturing process (.Kagermann et.al,2013) Frank and colleagues conceptualized Industry
4.0 as a new industrial maturity stage of product firms, based on the connectivity provided by the industrial
Internet of things (Frank et.al,2019). Piccarozzi and colleagues (2018) stated that “Industry 4.0 is based on
the development of a completely automated and intelligent production, capable of communicating
autonomously with the main corporate players” ( Piccarozzi et.al, 2018) A literature review by Hoprvath
and Szabo (2019) reveals that the driving forces of Industry 4.0 are growing competition, increased
innovation capacity and productivity, increasing customer expectations, the need to save energy and
improve sustainability, financial and performance factors supporting management activities, and
opportunity for business model innovation (Horvarth and Szabo,2019)
3. INDUSTRY 4.0 IN SMEs Industry 4.0 may present many opportunities for increasing productivity, efficiency and flexibility, and for
decreasing costs. However, companies are facing unique challenges in the era of the Fourth Industrial
Revolution, also known as Industry 4.0 Horvarth and Szabo (2019) clarified that it is also unclear how far
the various driving forces and inhibiting factors will affect small and medium-sized enterprises. Industry
4.0 will require considerable investments, and because of the lack of clarity over the gains, firms may be
unwilling to initiate Industry 4.0 transformation (Horvarth and Szabo,2019)
Most firms believe that Industry 4.0 will bring many benefits, a much lower proportion of firms are
investing in and developing plans for Industry 4.0 technologies. In developing countries, SMEs have
significant problems with financial resources, management and labor skills which hinder SMEs to invest
for Industry 4.0 technologies (Yüksel, 2020). SMEs have different characteristics from larger companies,
and therefore a different the Industry 4.0 transformation roadmap. Industry 4.0 provides new paradigms for
the industrial management of SMEs (Maresova, et.al,2018). In addition, for SME, the introduction of new
technologies and practices always have risks and the real requirements and benefits for SMEs are still not
fully known (Moeuf et.al,2018). Small and medium sized manufacturing companies are especially,
uncertain about the financial effort required for the acquisition of such new technology and the overall
impact on their business model (Schumacher, et.al: 2016). Many SMEs are not aware of the advantages
and benefits of increased digitalization; therefore, simply removing these obstacles will not be sufficient
(Zimmerman, 2016). Sevinç et al. (2018) also mentioned the challenges faced by SMEs in Industry 4.0
transformations in the terms of innovations, organization and cost dimensions (Sevinç et.al:2018).

International Engineering and Technology Management Summit 2021– ETMS2021
İstanbul Technical University & Bahçeşehir University
50
4. SWOT ANALYZE Organizations would like to figure out the alterations of the environment of their organizations and to
examine their situation according to these alterations. SWOT Analyze is one of the methods to analyze an
organization's situation according to the environment of the organization.
Firstly, Swot Analyze was mentioned in ‘Business Policy’ which has been published by Learned in 1960
to be detected situation of organizations related to strengths, weaknesses, opportunities and threats. SWOT
Analyze, is also called as Situation Analysis in Turkish Literature (Güngör and Arslan, 2004: 68) is an
important analyze that is used by organizations to determine an efficient organizational strategy regarding
strategic management and strategic planning (Gürel and Tat, 2017: 995). SWOT Analyze not only helps
managers or decision makers to analyze current situations and potentials but also helps in being awake to
organization's environment (Naryanan and Natch, 1993: 197).
SWOT Analyze which reveals strengths, weaknesses, opportunities and threats of organizations helps
researchers, planners or managers to determine organization’s targets and prioritize them. It also helps to
create a competitive and sustainable strategy for decision makers (Ommani, 2011: 9448). SWOT analyze
used to gather information to organizations that is regarding profitability, product development, sales and
marketing strategy. SWOT analyze are not used only for business environment. It is also used by
individuals to analyze personal situation (Gökoğlan and Kaval, 2020:19).
SWOT is an analyze technique which focuses on an organization's internal and external environment. While
SWOT focuses on an organization’s internal and external environment, it tries to determine strengths,
weaknesses, opportunities and threats of organizations. Strengths and weaknesses which are the parts of
SWOT are related with the organizations internal. That means organizations could manage and control
them. The other parts of SWOT are opportunities and threats. These parts are related with the organization’s
external and they can’t be managed or controlled by organizations (Wheelen and Hunger 2012: 16-17).
Internal and external environment factors of SWOT is showed by Figure 1.
Figure 1: Swot Analyze
Bonnici and Galea, 2015: 2.
With reference to Figure 1, the internal environment of SWOT, which is also named as a micro-
environment that has strengths and weaknesses, analyzes workers, strategic location, production capacity,
product and product services and financial situation of organizations. The other part of SWOT is about the
external environment that is also called macro-environment. External environment is related such as the
competitive and technological environment. These environment brings some opportunities and threats for
organizations and focus on the political, economic and social environment (Dyson, 2002: 632).
Organizations that use SWOT to analyze their strengths, weaknesses, opportunities and threats have four
main questions to answer outputs of SWOT. The questions are (Hay and Castilla, 2006: 2);
• How do organizations manage their strengths?
• How do organizations interfere with their weaknesses?

International Engineering and Technology Management Summit 2021– ETMS2021
İstanbul Technical University & Bahçeşehir University
51
• How do organizations benefit from their opportunities?
• How do organizations protect themselves from the threats?
As a result of those questions, organizations could know their current situation and sustain their life with
reference to outputs of SWOT and they use their strengths and opportunities to get competitive in their
industry. They should also be aware of their weaknesses and threats to protect themselves.
In additions all these information, SWOT brings advantages and disadvantages for organizations (Gürel
and Tat, 2017:1003-1005);
Advantages of SWOT:
• SWOT enables an extensive perspective for decision makers and helps them to focus on the main
point without being attached to details.
• SWOT is a kind of matrix analysis method so this matrix helps to connect components of SWOT
to each other.
• SWOT reveals organizations current situations and leads them to compare with their competitors.
• Decisions makers benefit from outputs of SWOT to determine their organization’s targets and
follow steps which bring them to success.
• SWOT leads organizations employees to brainstorm and discuss their overviews.
• SWOT helps decision makers or manager to be interested of strategic event instead of daily plans.
• Finally, SWOT is one of the basic and easy techniques. SWOT becomes a technique that everyone
would apply it.
Disadvantages of SWOT:
• SWOT may not always show all reality due to implementers of it. The underlying reason is human.
Humans have emotions which makes humans take sides while they make a decision or analyze something.
For example, decision makers or managers take a side while they analyze their strengths. That may affect
their decisions and cause mistakes.
• SWOT presents a large perspective for implementers. So It could not be a convenient analysis for
21 century. Because of Environment gets more complex and dynamic day by day. For that reason, SWOT
could be more stable analyzed between the others.
• Lastly, SWOT is a highly cost analysis technique. In addition to cost, Applying of SWOT takes a
long time to determine an organization's current situation. So It could cause missed opportunities and
encounter risks for organizations.
5. SWOT in DIGITAL TRANSFORMATION AGE In 21. Century, Technological developments affect nationals and organizations which need to have global
economic activities. Across the technological pressure, organizations would invest technologic stuff like
software, machine or gadgets etc. to compete in global markets that are related with their industries.
However, organizations have to analyze their situations before they invest for technologies. That analysis
is an important step for organizations because it helps to have plenty of ideas about organizations and it
also forwards decision makers or managers regarding what they should do for their organizations in the
future. In the context of that, organizations could determine their technological needs and analyze their
internal and external environment so that they could reveal technological developments for their industry.
In view of the fact that SWOT is a really reasonable analysis technique. Oreski (2012: 283) stated that Swot
is an applicable analyze for everyone and It helps implementers to analyze their conditions and decide a
strategy for their organizations.
Evolution of SWOT with the digital age’s perspective, technological developments do not be controlled
easily by organizations owing to technology is related to the external environment. Even if most of
researchers think external environment could not be managed, Kurtilla et al. (1999: 42), SWOT admits of
accomplished analyze with evaluate internal and external environment at the same time. So that gains a
proactive perspective for organizations (David, 2011: 16).
New production methods, applications (robots, artificial intelligence etc. that occurred in the digital
transformation age affects entirely organization's structure and activities like management style, services
or production. All of these advances are forced organizations to change their current situations (Ernur and
Tozkoparan, 2018: 2). So organizations which are forced by technologies to change their structure apply
SWOT to determine and find out sources that are necessary to change. By this means organizations remove
the uncertainty for their future.
In substance, organizations are also preferred SWOT to analyze themselves regarding technologic needs or
deficiency in digital transformation age. Using SWOT helps organizations to compare their competitors
and determine their strengths, weaknesses, opportunities and threats. So they may evaluate their financial

International Engineering and Technology Management Summit 2021– ETMS2021
İstanbul Technical University & Bahçeşehir University
52
power or structure and gather many advantages by using them. As a result of that, with reference to outputs
of SWOT, organizations can know their situation and rotate their ways to be successful.
6. RESEARCH OBJECTIVES AND METHODOLOGY In order to analysis of strengths, weaknesses, opportunities and threats of Industry 4.0 transformation of
SMEs, an interview method was used. Interviews were conducted with 5 SMEs and forward some specific
questions to the manager or owner of the SME’S to detect their situation. Questions are shown on the table
1.
Table 1: Questions for the SWOT Analyze
1. Do you have any actions across to technological developments? If ıt is yes. Please, explain it.
2. Do you have any core component which could not be imitated by your competitor?
3. Do you have any plan in the short, middle or long period for digital transformation? If you had,
Could you share it?
4. Can you evaluate your adaptation process and agility of organization in Digital Transformation
based on your competitors?
5. Do you think being a SME affects to reach financial opportunity?
6. Do you think your organization has enough facility space to assemble automation systems that
is a requirement for digital transformation?
7. Does your organization has a good skill employees to use technologic stuff?
8. Do you think your organization has an integration problem between the management
applications and production applications in the digital transformation process?
9. Do you have R&D, IT department? If you have. How much does It budget?
10. Do you work with universities to improve your organizations?
11. Have you ever attended any KOSGEB or TUBITAK projects? Have you ever experienced
this?
12. Do you have ERP software? If you do not. Do you plan to get it ?
13. Do you think economic uncertainty is a threat to your organization?
14. Does your organization have any support like financial or educational etc. from the
government in the Digital Transformation Process?
15. Do you have any special management or leadership method in the Digital Transformation
Process?
16. What do you think about sharing your data (stock, production or financial data etc.) with the
other organizations?
17. Do you think your service providers adequately supports your organization?
18. When you consider your organization's financial condition Do you think about investing in
Industry 4.0 technologies?
19. Do you believe that your organization have a transformational culture and have an agility
structure?
20. Does your organization take precautions regarding cyber attack, data safety etc ?
21. What kind of activities does your organization have regarding Industry 4.0?
22. Are there any threats for your organization When you compare your organization with your
competitor?
23. Do you believe that there is a sufficient legal infrastructure regarding digital transformation?
24. Do you consider Industry 4.0 brings facilitations for your customer?
25. What kind of developments do you consider as threats for your organization in the Digital
Transformation Age?
26. What kind of opportunities does Industry 4.0 bring for your organization?
27. What is your core competency that sets you apart from your competitors?
With reference to table 1, semi-structured interviews were conducted and 27 predetermined questions were
forwarded to the participants of the research. The results of the interviews were evaluated by SWOT and
revealed strengths, weaknesses, opportunities and threats of the SMEs in the extent of Industry 4.0
transformation. Importance of this study is creating awareness regarding Industry 4.0 for SMEs and it ıs
one of the priority studies in the Aegean Region in Turkey.
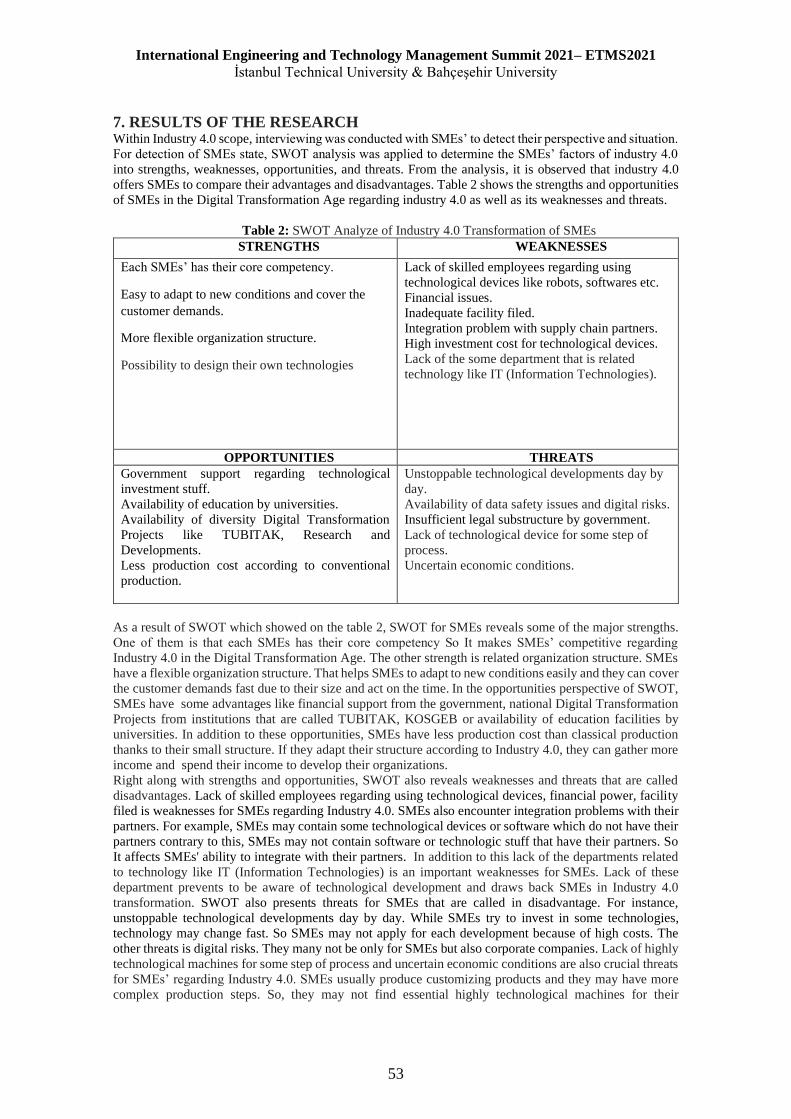
International Engineering and Technology Management Summit 2021– ETMS2021
İstanbul Technical University & Bahçeşehir University
53
7. RESULTS OF THE RESEARCH Within Industry 4.0 scope, interviewing was conducted with SMEs’ to detect their perspective and situation.
For detection of SMEs state, SWOT analysis was applied to determine the SMEs’ factors of industry 4.0
into strengths, weaknesses, opportunities, and threats. From the analysis, it is observed that industry 4.0
offers SMEs to compare their advantages and disadvantages. Table 2 shows the strengths and opportunities
of SMEs in the Digital Transformation Age regarding industry 4.0 as well as its weaknesses and threats.
Table 2: SWOT Analyze of Industry 4.0 Transformation of SMEs
STRENGTHS WEAKNESSES
Each SMEs’ has their core competency.
Easy to adapt to new conditions and cover the
customer demands.
More flexible organization structure.
Possibility to design their own technologies
Lack of skilled employees regarding using
technological devices like robots, softwares etc.
Financial issues.
Inadequate facility filed.
Integration problem with supply chain partners.
High investment cost for technological devices.
Lack of the some department that is related
technology like IT (Information Technologies).
OPPORTUNITIES THREATS
Government support regarding technological
investment stuff.
Availability of education by universities.
Availability of diversity Digital Transformation
Projects like TUBITAK, Research and
Developments.
Less production cost according to conventional
production.
Unstoppable technological developments day by
day.
Availability of data safety issues and digital risks.
Insufficient legal substructure by government.
Lack of technological device for some step of
process.
Uncertain economic conditions.
As a result of SWOT which showed on the table 2, SWOT for SMEs reveals some of the major strengths.
One of them is that each SMEs has their core competency So It makes SMEs’ competitive regarding
Industry 4.0 in the Digital Transformation Age. The other strength is related organization structure. SMEs
have a flexible organization structure. That helps SMEs to adapt to new conditions easily and they can cover
the customer demands fast due to their size and act on the time. In the opportunities perspective of SWOT,
SMEs have some advantages like financial support from the government, national Digital Transformation
Projects from institutions that are called TUBITAK, KOSGEB or availability of education facilities by
universities. In addition to these opportunities, SMEs have less production cost than classical production
thanks to their small structure. If they adapt their structure according to Industry 4.0, they can gather more
income and spend their income to develop their organizations.
Right along with strengths and opportunities, SWOT also reveals weaknesses and threats that are called
disadvantages. Lack of skilled employees regarding using technological devices, financial power, facility
filed is weaknesses for SMEs regarding Industry 4.0. SMEs also encounter integration problems with their
partners. For example, SMEs may contain some technological devices or software which do not have their
partners contrary to this, SMEs may not contain software or technologic stuff that have their partners. So
It affects SMEs' ability to integrate with their partners. In addition to this lack of the departments related
to technology like IT (Information Technologies) is an important weaknesses for SMEs. Lack of these
department prevents to be aware of technological development and draws back SMEs in Industry 4.0
transformation. SWOT also presents threats for SMEs that are called in disadvantage. For instance,
unstoppable technological developments day by day. While SMEs try to invest in some technologies,
technology may change fast. So SMEs may not apply for each development because of high costs. The
other threats is digital risks. They many not be only for SMEs but also corporate companies. Lack of highly
technological machines for some step of process and uncertain economic conditions are also crucial threats
for SMEs’ regarding Industry 4.0. SMEs usually produce customizing products and they may have more
complex production steps. So, they may not find essential highly technological machines for their

International Engineering and Technology Management Summit 2021– ETMS2021
İstanbul Technical University & Bahçeşehir University
54
productions. Uncertain economic conditions is also a serious problem. Uncertain conditions affect SMEs
and prevents them from investing for the future.
8. CONCLUSION Industry 4.0 offers more advantages for organizations than its disadvantages. For example, more efficient,
increased productivity, more flexibility in production system, ease of customization or customer
satisfaction etc (Bakhtari et all. 2020: 221). Even if it brings more advantages for organizations.
Transformation process may not be easy for them, especially SMEs. With that point, this study examine
SMEs regarding Industry 4.0 in The Digital Age. As a result of study, SMEs have some strengths like having their core competency, easy to adapt to new
conditions and cover the customer demands, more flexible organization structure and possibility to design
own technologies. In addition to the strengths of SMEs in Industry 4.0 transformation, SMEs also have
opportunities like government support regarding technological investment stuff, availability of education
by universities, availability of diversity Digital Transformation Projects like TUBITAK, Research and
Developments. So these opportunities help SMEs regarding being competitive. With reference to
explanations, strengths and opportunities of SMEs can be called as advantages for them. The other results
of study for SMEs is about weaknesses and threats. Weaknesses according to SWOT are lack of skilled
employees regarding using technological devices like robots, softwares, financial issues, inadequate facility
filed etc. Threats are unstoppable technological developments day by day, availability of data safety issues
and digital risks, insufficient legal substructure by the government. These weaknesses and strengths can
be dangerous when they are not controlled by SMEs. So It may be also called a disadvantage for SMEs. SMEs are aware of technological developments but they are still at the beginning of the transformation
process. With reference to the study results, SMEs have many challenges. They may follow technological
developments and incorporate technologies to their structure to cope with challenges.
REFERENCES Bakhtari, A.,Waris, M., Mannan, B., Sanin, C., Szczerbicki, E., (2020). Assessing Industry 4.0 Features
Using SWOT Analysis. . Communications in Computer and Information Science, 1178, 216-225.
Brynjolfsson, E. and McAfee, A. (2014) The Second Machine Age: Work Progress, and Prosperity in a
Time of Brilliant Technologies, W.W. Norton & Company, New York.
David, F.R. (2011) Strategic Management: Concepts and Cases, Global Edition. 13th Edition, Pearson
Education, Inc., Upper Saddle River, 235-240.
Dyson, R.G.. (2004). Strategic Development and SWOT analysis at the University of Warwick. European
Journal of Operational Research. 152. 631-640.
Ernur O. and Tozkoparan G. (2018). Dijital Dönüşüm Perspektifinde Endüstri 4.0 Sürecindeki İşletmelerin
Karşılaştığı Durumlar Uzerine Bir Vaka Calışması. Uluslararası Sosyal Bilimler and İnovasyon
Kongresi, Antalya, Turkey, 385-397.
Frank A.G., Mendes G.H., Ayala N.F., Ghezzi A., Servitization And Industry 4.0 Convergence İn The
Digital Transformation Of Product Firms: A Business Model İnnovation Perspective, Technol.
Forecast. Soc. Change 141 (2019) 341–351, https://Doi.Org/10.1016/J.Techfore.2019.01.014.
Gökoğlan, K. and Kaval, U. (2020). Oğrencilerin Kariyer Stratejileri Uzerine Bir Araştırma: Dicle
Universitesi Orneği. Turkish Business Journal, 1 (1) , 15-28.
Güngör, S. and Arslan, M. (2004). Turizm ve Rekreasyon Stratejileri İçin SWOT Analizi, Görsel Kalite
Değerlendirmesi, Turizm Tesislerinin Beğenilirliği ve Turizm Tesisleri Durum Analizi Uygulaması:
Beyşehir İlçesi Orneği. S.U. Ziraat Fakültesi Dergisi. 18. 68-72.
Gürel, E. and Tat, M. (2017). Swot Analysis: A Theoretıcal Review. Journal of International Social
Research. 10. 994-1006.
Hay, G. and Castilla, G.. (2006). Object-Based Image Analysis: Strengths, Weaknesses, Opportunities and
Threats (SWOT). ISPRS Archives – Volume XXXVI-4/C42, 2006. 36.
Hofmann, E. and Rüsch, M. (2017). Industry 4.0 and the current status as well as future prospects on
logistics. Computers in industry, 89, 23-34.
Horvarth D. , Szabo R.Z., Driving Forces And Barriers Of Industry 4.0: Do Multinational And Small And
Medium-Sized Companies Have Equal Opportunities? Technol. Forecast. Soc. Change 146 (2019) 119–
132, https://Doi.Org/10.1016/J. Techfore.2019.05.021
Kagermann H., Wahlster W, Helbig J., Recommendations For Implementing The Strategic Initiative
INDUSRIE 4.0, Industrie 4.0 Working Group Of Acatech, Berlin, 2013.
https://Www.Din.De/Blob/76902/E8cac883f42bf28536e7e8165993f1fd/Re Commendations-For-
Implementing-İndustry-4-0-Data.Pdf.

International Engineering and Technology Management Summit 2021– ETMS2021
İstanbul Technical University & Bahçeşehir University
55
Kagermann H., W. Wahlster W., Helbig J., Securing The Future Of German Manufacturing Industry:
Recommendations For Implementing The Strategic Initiative INDUSTRIE 4.0. Final Report Of The
Industrie 4.0 Working Group, 2013.
http://Forschungsunion.De/Pdf/İndustrie_4_0_Final_Report.Pdf
Kurttila, M., Pesonen, M., Kangas, J. and Kajanus, M. (2000). Utilizing the analytic hierarchy process
(AHP) in SWOT analysis - A hybrid method and its application to a forest-certification case. Forest
Policy and Economics. 1. 41-52.
Learned, E.P., Christensen, C.R., Andrews, K.R. and Guth, W.D. (1965) Business Policy: Text and Cases.
Home- wood/Ill, Irwin.
Maresova P., Soukal I.I. ,Svobodova L.,Hedvicakova M., Javanmardi E., Selamat A., Krejcar O.,
Consequences Of Industry 4.0 in Business And Economics, Economies 6 (46) (2018),
https://Doi.Org/10.3390/Economies6030046.
Moeuf A., Pellerin R., Lamouri S., Giraldo S.T., Barbaray R., The Industrial Management Of SMEs in The
Era Of Industry 4.0, Int. J. Prod. Res. 56–3 (2018) 118–1136,
https://Doi.Org/10.1080/00207543.2017.1372647.
Narayanan, V.K. and R. Nath, 1993. Organization Theory: A Strategic Approach. Richard D. Irwin,
Homewood.
Ommani, A. (2011). Strengths, weaknesses, opportunities and threats (SWOT) analysis for farming system
businesses management: Case of wheat farmers of Shadervan District, Shoushtar Township, Iran. Afr.
J. Bus. Manag.. 5.
Oreski, Dijana. (2012). Strategy development by using SWOT - AHP. TEM J.. 1. 283-291.
Piccarozzi M., Aqilani B.,Gatti C., Industry 4.0 İn Management Studies: A Systematic Literature Review,
Sustainability (2018) 10–3821, https://Doi.Org/ 10.3390/Su10103821
Roblek V., Mesko M., Krapez A., A Complex View Of Industry 4.0, SAGE Open, 2016,
https://Doi.Org/10.1177/2158244016653987. April.
Sammut-Bonnici, T. and Galea, D. (2014). SWOT analysis. In C. L. Cooper (Ed.), Wiley encyclopedia of
management. Hoboken: John Wiley & Sons.
Schumacher A. , Erol S., Sihn W., A Maturity Model For Assessing Industry 4.0 Readiness And Maturity
Of Manufacturing Enterprises, Procedia CIRP 52 (2016) 161–166,
https://Doi.Org/10.1016/J.Procir.2016.07.040.
Sevinç A., Gür S., Eren T., Analysis of The Difficulties Of SMEs in Industry 4.0 Applications By Analytical
Hierarchy Process And Analytical Network Process, Processes 6 (12) (2018) 264,
https://Doi.Org/10.3390/Pr6120264.
Sousa, M. J. and Rocha, Á. (2018). Digital learning: Developing skills for digital transformation of
organizations. Future Generation Computer Systems.
Wheelen, T. L. and Hunger, J. D. (2012) Strategic Management and Business Policy: Toward Global
Sustainability (13th ed.). Pearson Prentice Hall.
Yüksel H., “An Empirical Evaluation Of Industry 4.0 Applications Of Companies in Turkey: The Case of
a Developing Country” Technology in Society, Volume 63, 2020, SSCI,Elsevier
Zimmerman V., KFW Research, Smes And Digitilisation: The Current Position, Recent Developments And
Challenges, 2016. https://Www.Kfw.De/PDF/Download -
Center/Konzernthemen/Research/PDF-Dokumente-Fokus-Volkswirtschaft/Fokus-
Englische-Dateien/Fokus-Nr.-138-August-2016-Digitalisierung_EN.Pdf

International Engineering and Technology Management Summit 2021– ETMS2021
İstanbul Technical University & Bahçeşehir University
56
BLOCKCHAIN APPLICATION DECISION ANALYSIS WITH DEMATEL
AND VIKOR METHODS: A CASE IN THE TURKISH BANKING SECTOR
Ünzile Huyut Gül Tekin Temur
Bahçeşehir University Bahçeşehir University
ABSTRACT Since the first mention of blockchain technology (BC) in 2009, the majority of the studies on this
technology have been carried out mainly in the financial sector. Features such as full automation,
transparency, security and intermediary environment provided by this technology especially for banks and
their users will lead to the expansion of application areas. In the current situation, banks were obliged to
rely on the system they used in all kinds of financial transactions. With blockchain technology, existing
abundantly mediated and non-transparent systems transform itself into a transparent system that is easily accessible by everyone, and open to all kinds of radical innovations. There are points where the application
areas of blockchain technology in banks meet with supply chain management (SCM). Instead of the current
supply management structure, creating a blockchain-based supply management is more suitable for today's
technological transformation. Especially in information technologies (IT) departments where procurement
processes are carried out intensely, procurement processes are generally gathered under three main
headings. These can be defined as hardware / material, software license and consultancy services. In our
study, it is aimed to decide which of the procurement processes carried out in three basic areas in the IT
department of banks to apply blockchain technology as a priority. The DEMATEL (Decision Making Trial
and Evaluation Laboratory) method was applied in line with the opinions of decision makers, consisting of
managers and engineers working within the bank, primarily to determine the criteria and the relationships
and weights between them. Later, the decision of which of the three basic purchasing processes to apply
blockchain technology to the priority was decided by VIKOR (VIseKriterijumska Optimizacija I
Kompromisno Resenje) method.
Keywords: Blockchain, Supply chain management, Information Technology, MCDM, Dematel, Vikor

International Engineering and Technology Management Summit 2021– ETMS2021
İstanbul Technical University & Bahçeşehir University
57
1. INTRODUCTION In today's world, data and information are growing exponentially as a result of advances and innovations
in information and communication technologies (ICT). This exponential growth forces organizations to
acquire new talent and develop new business models to compete or stay up-to-date in their markets
(Francisco et al., 2018). Today, products and information that emerge as an indicator of technological transformations and advances
are multiplying exponentially. The resulting products and information facilitate institutions and individuals
in achieving their goals. Especially for organizations, effective management of supply chain management
provides many benefits such as reducing costs, simplifying transactions, being transparent to users,
increasing trust and providing automation (Nathan et al., 2012). Therefore, finding new methods and
solutions in SCM is of strategic importance for organizations. BC can generate radically innovative ideas
for SCM systems. BC technology, which can be applied especially in the supply systems of banks and
financial institutions, can increase operational efficiency, reduce costs and provide customer satisfaction.
Considering that end users in today's world always prefer transparent and user-friendly systems, the
application of these technologies especially for banks seems to be an unchanging reality (Caradonna, 2018).
With the transformation towards BC in the banking sector, it becomes easier to create products that are
much faster, lower-cost, more reliable, and more compliant with legal regulations. Developments in many
areas such as smart contracts, purchase and sale transactions, digital identity creation, bank procurement
processes, insurance transactions provide advantages for all stakeholders. BC is an important technology
used by many banks, financial and IT institutions to produce the most rational solution to their problems
and to optimize and improve their processes. This technology can eliminate intermediaries in the bank
supply system, show processes without requiring an extra authorization for users, and ensure the safe
transfer of data (Perboli et al., 2018). In addition to all these benefits, there are also negative sides. Its
biggest criticism is the amount of energy consumed to maintain BC technology (Nofer et al., 2017). If we
define BC after a short summary, Blockchain is a technology designed to store and manage data containing
value - such as money, identity, valuable papers - in a safe and secure manner. Blockchain records are
public, transparent, distributed, sequential, and time stamped digital records (Doğantekin, 2018). The
starting point of our study is based on determining which of the 3 basic IT procurement management
processes, which are one of the highest cost items for a bank, should be transformed into blockchain
technology. Effective management of IT technologies supply systems for banks has an important place in
ensuring both internal and external customer satisfaction. More internal customers are tried to be satisfied
with consultancy / material purchases, and an effective IT management is desired with software / license
and consultancy services and better-quality systems and applications. The rest of the work continues as follows. The second section includes a literature review and it is stated
that our study is different from previous studies. The methodology of the Multiple Criteria Decision Making
(MCDM)-based methods used in the third section is mentioned. The analysis of the data and the
implementation steps are specified in section 4. In the last section, 5th section, the evaluation of the results
from our analysis will take place.
2. LITERATURE REVIEW Many studies have been conducted in the past on BC-based SCM analysis. BC-based SCM technologies
have an increasing interest in recent years. Trying to satisfy the end user using today's latest technology is
one of the most important factors in this field. In particular, I would like to mention the work done on the
development of sustainable BC based SCM instead of inefficient SCM (Ar et al, 2020). In addition, the
study examining the usability of BC-based technologies in the field of SCM has also contributed to our
study (Yadav et al., 2019). Other studies in this area are tried to be summarized in Table 1. While
conducting the literature study, a search was made with keywords such as BC, SCM, BC based SCM, SCM
in banking sector.
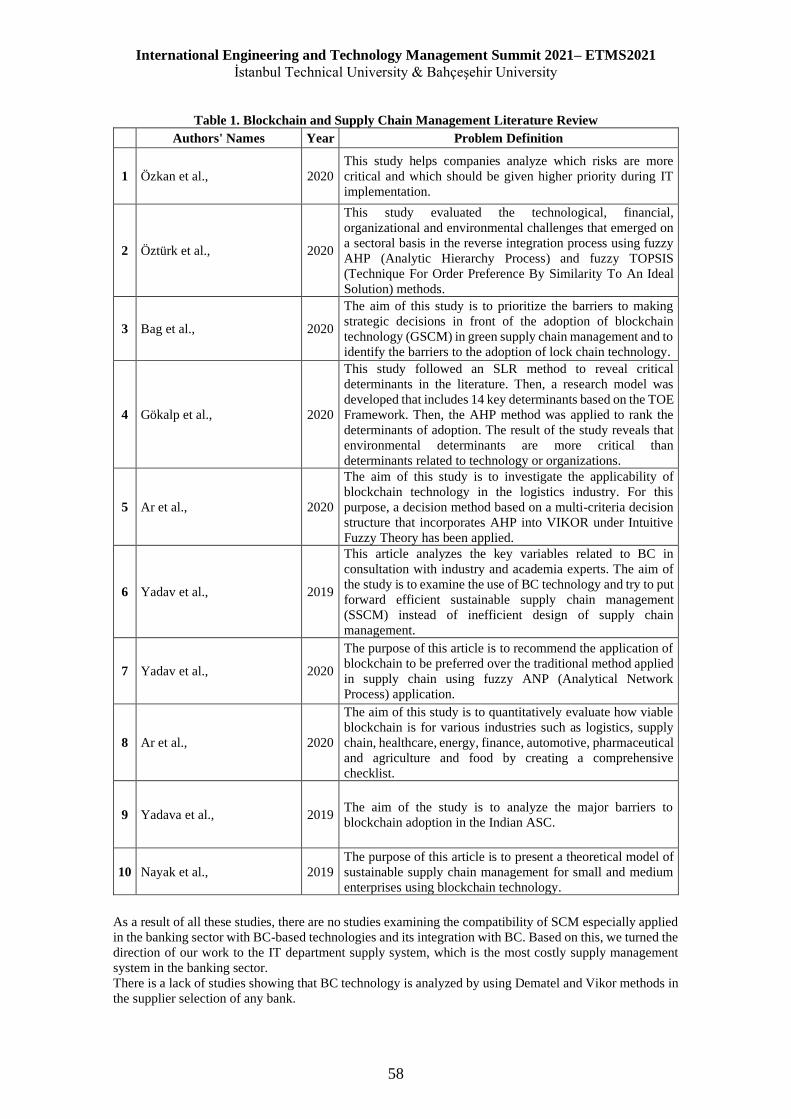
International Engineering and Technology Management Summit 2021– ETMS2021
İstanbul Technical University & Bahçeşehir University
58
Table 1. Blockchain and Supply Chain Management Literature Review
Authors' Names Year Problem Definition
1 Özkan et al., 2020 This study helps companies analyze which risks are more
critical and which should be given higher priority during IT
implementation.
2 Öztürk et al., 2020
This study evaluated the technological, financial,
organizational and environmental challenges that emerged on
a sectoral basis in the reverse integration process using fuzzy
AHP (Analytic Hierarchy Process) and fuzzy TOPSIS
(Technique For Order Preference By Similarity To An Ideal
Solution) methods.
3 Bag et al., 2020
The aim of this study is to prioritize the barriers to making
strategic decisions in front of the adoption of blockchain
technology (GSCM) in green supply chain management and to
identify the barriers to the adoption of lock chain technology.
4 Gökalp et al., 2020
This study followed an SLR method to reveal critical
determinants in the literature. Then, a research model was
developed that includes 14 key determinants based on the TOE
Framework. Then, the AHP method was applied to rank the
determinants of adoption. The result of the study reveals that
environmental determinants are more critical than
determinants related to technology or organizations.
5 Ar et al., 2020
The aim of this study is to investigate the applicability of
blockchain technology in the logistics industry. For this
purpose, a decision method based on a multi-criteria decision
structure that incorporates AHP into VIKOR under Intuitive
Fuzzy Theory has been applied.
6 Yadav et al., 2019
This article analyzes the key variables related to BC in
consultation with industry and academia experts. The aim of
the study is to examine the use of BC technology and try to put
forward efficient sustainable supply chain management
(SSCM) instead of inefficient design of supply chain
management.
7 Yadav et al., 2020
The purpose of this article is to recommend the application of
blockchain to be preferred over the traditional method applied
in supply chain using fuzzy ANP (Analytical Network
Process) application.
8 Ar et al., 2020
The aim of this study is to quantitatively evaluate how viable
blockchain is for various industries such as logistics, supply
chain, healthcare, energy, finance, automotive, pharmaceutical
and agriculture and food by creating a comprehensive
checklist.
9 Yadava et al., 2019 The aim of the study is to analyze the major barriers to
blockchain adoption in the Indian ASC.
10 Nayak et al., 2019 The purpose of this article is to present a theoretical model of
sustainable supply chain management for small and medium
enterprises using blockchain technology.
As a result of all these studies, there are no studies examining the compatibility of SCM especially applied
in the banking sector with BC-based technologies and its integration with BC. Based on this, we turned the
direction of our work to the IT department supply system, which is the most costly supply management
system in the banking sector. There is a lack of studies showing that BC technology is analyzed by using Dematel and Vikor methods in
the supplier selection of any bank.

International Engineering and Technology Management Summit 2021– ETMS2021
İstanbul Technical University & Bahçeşehir University
59
3. THE METHODS DEMATEL and VIKOR methods, which are well known MADM methods, were used in our study. These
methods are thought to be suitable for our data in determining criteria weights and sorting alternatives.
3.1. Dematel (Decision Making Trial and Evaluation Laboratory) Dematel is a method developed by the Genoa Battele Institute that reveals the causal relationship between
glare factors in a particular model (Wu et al., 2007). The most important feature is that it can show the
cause and effect relationship between the criteria and the interaction of the creators with each other (Aksakal
et al., 2010). According to the Dematel method, all criteria interact with each other and the degree of
influence between the criteria can be measured. If this effect has high interaction among other criteria, it is
called the distributive effect, and if it has low interaction with other criteria, it is called the receptive effect
(Seyed-Hosseini et al., 2006). In this study, criteria weights will be determined by using Dematel method
and the interaction of criteria with each other will be tried to be explained. The steps of the Dematel method,
which will be used to determine the weights of the criteria in our study, follow the steps below, respectively.
Step 1: The criteria in this step are based on the matrix created with the answers from the experts as a result
of the survey. These answers were obtained using the comparison scale in Table 2. The decision matrix is
formed as an answer to the question of how much one criterion affects the other.
Table 2. Dematel Influence Degree Scale
Influence Degree Definition
0 There is no influence between compared criteria.
1 Row criterion has a low influence on the column criterion.
2 Row criterion has a medium influence on the column criterion.
3 Row criterion has a high influence on the column criterion.
4 Row criterion has a very high influence on the column criterion.
Step 2: Since the number of experts who evaluated the criteria was more than one, the arithmetic average
of the answers in the questionnaires was taken. The answers that emerge with the average taken are placed
in our asymmetric matrix with diagonals of "0" and this matrix is called (X).
(1)
Step 3: In this step, the largest sum of each row and column is found. Then, by dividing each element of
the matrix by the value of “s”, normalization is done and the new normalized matrix (C) is obtained. s = max(max∑ 𝑋𝑖𝑗 , ∑ 𝑋𝑖𝑗 ,
𝑛𝑖=1 𝑛
𝑗=1 (2)
C= X
s
Step 4: In this step, matrix C is subtracted from the unit matrix, inverted and multiplied by matrix C again.
As a result, matrix (F) is obtained.
𝐼𝑖𝑚 C1, C2, … , CH
𝐻 −∞
F= C1, C2, … , CH = 𝐶(1 − 𝐶)−1 (3)
Step 5: After determining the (F) matrix, the row and column totals are found. These row and column
totals, expressed as Di and Ri, indicate whether the criteria are affected by each other. Then for each
criterion + is calculated, this sum expresses the total effect between the criteria and the importance of the
criteria. If value is negative, it is considered as the affected criterion, and if it is positive, it is considered
as the affecting criterion.

International Engineering and Technology Management Summit 2021– ETMS2021
İstanbul Technical University & Bahçeşehir University
60
Step 6: In the last step, we can obtain the criteria weights using the formulas below. We determine the
weights by taking the square root of the sum of the squares of the + and calculations. Then, by dividing
each weight by the total weight, the "normalization process" is done.
Wia = √(𝐷𝑖 +𝑅𝑖)2 + (𝐷𝑖 − 𝑅𝑖 )2 (4)
Wi =Wia
∑ Wia𝑛𝑖=1
3.2. Vikor (VIseKriterijumska Optimizacija I Kompromisno Resenje) The VIKOR method is a method that calculates the selection or ranking of alternatives in cases where there
are conflicting criteria (Büyüközkan et al., 2008). In this method, closeness values to the most suitable
alternative are calculated and closeness values are compared for each alternative and criterion (Opricovic
et al., 2007). The VIKOR method was first used in a study evaluating the fuel use of public transportation
vehicles in Taiwan. In this study, TOPSIS, VIKOR and SAW (Simple Additive Weighting) methods were
compared and although they obtained similar results with these three methods, they stated that TOPSIS and
VIKOR methods had better distinguishing ability in explaining the evaluation results compared to the SAW
method, and VIKOR method, unlike TOPSIS method, could offer more alternatives to decision makers.
(Opricovic et al., 2007). The steps of applying the VIKOR method are as follows.
Step 1: First of all, the scoring of the alternatives according to the scale in Table 3 is done by the experts.
Step 2: Each criterion is expressed as a benefit or cost criterion as follows. The best 𝑓𝑖
∗ and worst
𝑓𝑖− values are determined and expressed as 𝑖 = 1,2,3, … , 𝑛 and 𝑗 = 1,2,3, … , 𝐽
𝑓𝑖∗ = max 𝑓𝑖𝑗 𝑓𝑖
− = min𝑓𝑖𝑗 (5)
Table 3. Linguistic terms for alternatives (Ar et al., 2020)
Linguistic Variable Scale
Equally Important (EI) 1
Intermediate (IV) 2
Moderately More Important (MI) 3
Intermediate (IV2) 4
Strongly More Important (SI) 5
Intermediate (IV3) 6
Very Strong Importance (VSI) 7
Intermediate (IV4) 8
Extremely More Important (EMI) 9
Step 3: Multiply the criteria weights determined for each criterion, 𝑆𝑗 and 𝑅𝑗 values are calculated.
𝑆𝑗 = ∑ 𝑊𝑖 ⟨𝑓𝑖∗ − 𝑓𝑖𝑗 ⟩
𝑛𝑖=1 / ⟨𝑓𝑖
∗ − 𝑓𝑖− ⟩ (6)
𝑅𝑗 = 𝑚𝑎𝑥𝑖[𝑊𝑖⟨𝑓𝑖∗ − 𝑓𝑖𝑗 ⟩/⟨𝑓𝑖
∗ − 𝑓𝑖− ⟩]
Step 4: In this step, 𝑆* = 𝑚𝑖𝑛 𝑗 𝑆j, 𝑆− = 𝑚𝑎𝑥𝑗 𝑆j, R* = 𝑚𝑖𝑛 𝑗Rj, 𝑅− = 𝑚𝑎𝑥𝑗Rj is calculated. 𝑄𝑗 Values is
like this. The parameter v used in the formulation of 𝑄𝑗 , calculated as below, represents the maximum
group benefit, and (1-v) represents the minimum regret of opposing views (Opricovic et al., 2007).
𝑄𝑗 = 𝑣(Sj − S∗)
(𝑆−− S∗)+ (1− 𝑣)
(Rj − R∗)
(𝑅−− R∗) (7)
Step 5: As a result of the above formulas, the alternatives can be ranked from largest to smallest. As a result
of the ranking, it can be determined that the best alternative is the alternative with the smallest Q value.
Step 6: In this step, it will be mentioned that two conditions must be met in order for the best alternative to
be selected. For the first condition; The DQ value needs to be calculated. It is expressed as DQ=1/(j-1). The
value accepted as A1 represents the smallest best alternative among the calculated Q values, and the value
accepted as A2 represents the second smallest alternative, the second smallest among the Q values. For the
first condition, Q values satisfying the A1 – A2 ≥ DQ equality are included in the order.
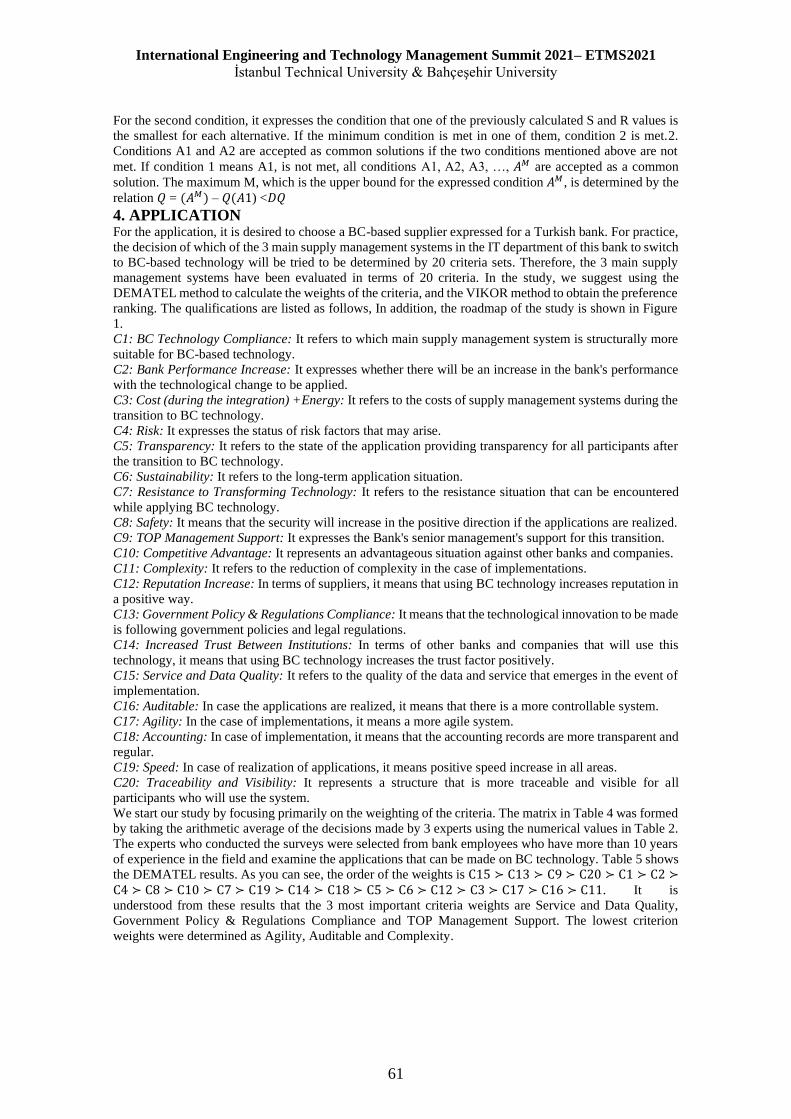
International Engineering and Technology Management Summit 2021– ETMS2021
İstanbul Technical University & Bahçeşehir University
61
For the second condition, it expresses the condition that one of the previously calculated S and R values is
the smallest for each alternative. If the minimum condition is met in one of them, condition 2 is met.2.
Conditions A1 and A2 are accepted as common solutions if the two conditions mentioned above are not
met. If condition 1 means A1, is not met, all conditions A1, A2, A3, …, 𝐴𝑀 are accepted as a common
solution. The maximum M, which is the upper bound for the expressed condition 𝐴𝑀 , is determined by the
relation 𝑄 = (𝐴𝑀) – 𝑄(𝐴1) <𝐷𝑄
4. APPLICATION For the application, it is desired to choose a BC-based supplier expressed for a Turkish bank. For practice,
the decision of which of the 3 main supply management systems in the IT department of this bank to switch
to BC-based technology will be tried to be determined by 20 criteria sets. Therefore, the 3 main supply
management systems have been evaluated in terms of 20 criteria. In the study, we suggest using the
DEMATEL method to calculate the weights of the criteria, and the VIKOR method to obtain the preference
ranking. The qualifications are listed as follows, In addition, the roadmap of the study is shown in Figure
1.
C1: BC Technology Compliance: It refers to which main supply management system is structurally more
suitable for BC-based technology.
C2: Bank Performance Increase: It expresses whether there will be an increase in the bank's performance
with the technological change to be applied.
C3: Cost (during the integration) +Energy: It refers to the costs of supply management systems during the
transition to BC technology.
C4: Risk: It expresses the status of risk factors that may arise.
C5: Transparency: It refers to the state of the application providing transparency for all participants after
the transition to BC technology.
C6: Sustainability: It refers to the long-term application situation.
C7: Resistance to Transforming Technology: It refers to the resistance situation that can be encountered
while applying BC technology.
C8: Safety: It means that the security will increase in the positive direction if the applications are realized.
C9: TOP Management Support: It expresses the Bank's senior management's support for this transition.
C10: Competitive Advantage: It represents an advantageous situation against other banks and companies.
C11: Complexity: It refers to the reduction of complexity in the case of implementations.
C12: Reputation Increase: In terms of suppliers, it means that using BC technology increases reputation in
a positive way.
C13: Government Policy & Regulations Compliance: It means that the technological innovation to be made
is following government policies and legal regulations.
C14: Increased Trust Between Institutions: In terms of other banks and companies that will use this
technology, it means that using BC technology increases the trust factor positively.
C15: Service and Data Quality: It refers to the quality of the data and service that emerges in the event of
implementation.
C16: Auditable: In case the applications are realized, it means that there is a more controllable system.
C17: Agility: In the case of implementations, it means a more agile system.
C18: Accounting: In case of implementation, it means that the accounting records are more transparent and
regular.
C19: Speed: In case of realization of applications, it means positive speed increase in all areas.
C20: Traceability and Visibility: It represents a structure that is more traceable and visible for all
participants who will use the system.
We start our study by focusing primarily on the weighting of the criteria. The matrix in Table 4 was formed
by taking the arithmetic average of the decisions made by 3 experts using the numerical values in Table 2.
The experts who conducted the surveys were selected from bank employees who have more than 10 years
of experience in the field and examine the applications that can be made on BC technology. Table 5 shows
the DEMATEL results. As you can see, the order of the weights is C15 ≻ C13 ≻ C9 ≻ C20 ≻ C1 ≻ C2 ≻C4 ≻ C8 ≻ C10 ≻ C7 ≻ C19 ≻ C14 ≻ C18 ≻ C5 ≻ C6 ≻ C12 ≻ C3 ≻ C17 ≻ C16 ≻ C11. It is
understood from these results that the 3 most important criteria weights are Service and Data Quality,
Government Policy & Regulations Compliance and TOP Management Support. The lowest criterion
weights were determined as Agility, Auditable and Complexity.
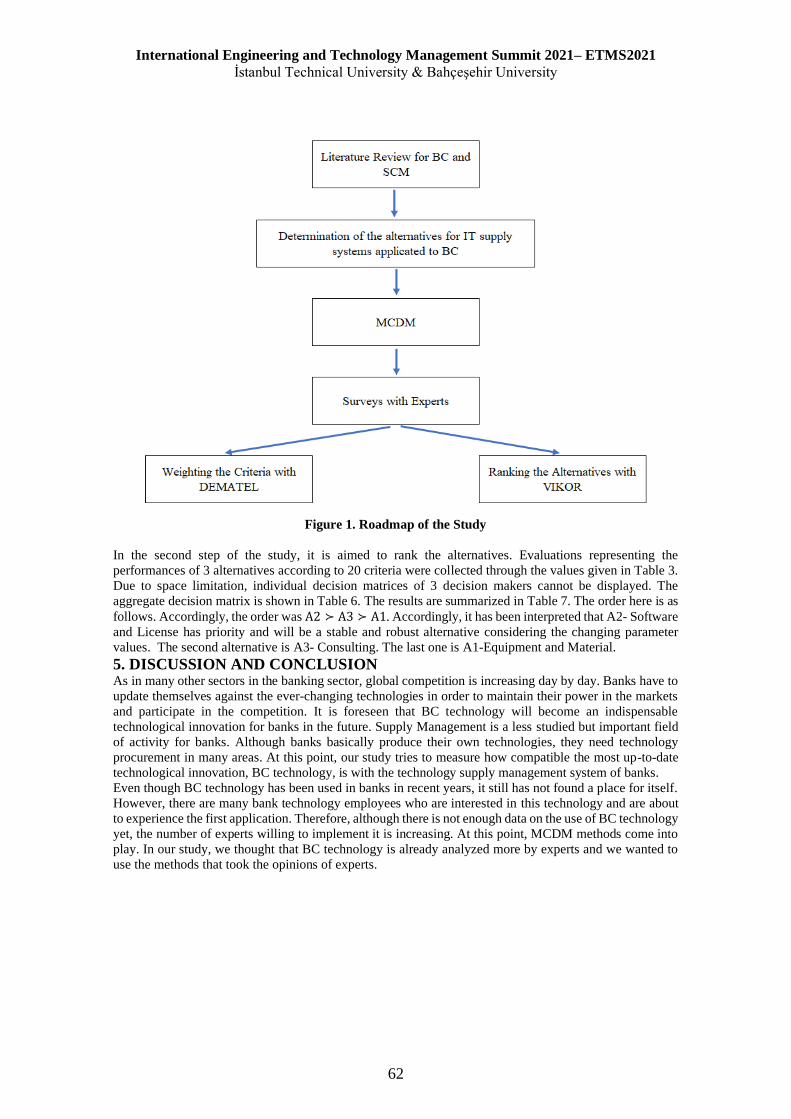
International Engineering and Technology Management Summit 2021– ETMS2021
İstanbul Technical University & Bahçeşehir University
62
Figure 1. Roadmap of the Study
In the second step of the study, it is aimed to rank the alternatives. Evaluations representing the
performances of 3 alternatives according to 20 criteria were collected through the values given in Table 3.
Due to space limitation, individual decision matrices of 3 decision makers cannot be displayed. The
aggregate decision matrix is shown in Table 6. The results are summarized in Table 7. The order here is as
follows. Accordingly, the order was A2 ≻ A3 ≻ A1. Accordingly, it has been interpreted that A2- Software
and License has priority and will be a stable and robust alternative considering the changing parameter
values. The second alternative is A3- Consulting. The last one is A1-Equipment and Material.
5. DISCUSSION AND CONCLUSION As in many other sectors in the banking sector, global competition is increasing day by day. Banks have to
update themselves against the ever-changing technologies in order to maintain their power in the markets
and participate in the competition. It is foreseen that BC technology will become an indispensable
technological innovation for banks in the future. Supply Management is a less studied but important field
of activity for banks. Although banks basically produce their own technologies, they need technology
procurement in many areas. At this point, our study tries to measure how compatible the most up-to-date
technological innovation, BC technology, is with the technology supply management system of banks.
Even though BC technology has been used in banks in recent years, it still has not found a place for itself.
However, there are many bank technology employees who are interested in this technology and are about
to experience the first application. Therefore, although there is not enough data on the use of BC technology
yet, the number of experts willing to implement it is increasing. At this point, MCDM methods come into
play. In our study, we thought that BC technology is already analyzed more by experts and we wanted to
use the methods that took the opinions of experts.

International Engineering and Technology Management Summit 2021– ETMS2021
İstanbul Technical University & Bahçeşehir University
63
Table 4. The Arithmetic Average of the Decisions Matrices
C1 C2 C3 C4 C5 C6 C7 C8 C9 C10 C11 C12 C13 C14 C15 C16 C17 C18 C19 C20
C1 0 1 2 1 3 2 1.67 3 4 2 3 3 2 3 4 4 4 4 3 3
C2 4 0 3 2 3 2 3 3 3 3 4 3 3 3 4 4 3 3 3 0.67
C3 4 2 0 2 1 2.33 2 1 0 2 2 1.67 0.67 2 2 1.33 2 3 2 1
C4 3 3 2 0 2 3 2 2.67 4 4 3 3 2 3 3 3.33 3 3 2 4
C5 2 1 2 3 0 2 1 2 1 2 1 2 1 2 2 3 2 1 2 3
C6 2 3 2 2 3 0 2 2 2 2 1 3 3 2 1.33 2 1 2.67 2 1
C7 3 2 3 3 4 2 0 2 3 3 3 3 3 3 2 3 3 4 3 3
C8 3 4 3 3 4 2 3 0 3 2 3.67 2 3 3 3 2 3 2 3 2
C9 4 3 4 4 4 4 3 4 0 2 3 3 3 2 2.67 3 3 3 4 3
C10 2 3 2 2 3 3 3 3 2 0 2 2 2 2 3 2 3 3 3 3
C11 2 1 1 1 2 2 1 0 2 2 0 2 2 1 2 1 2 1 2 1.67
C12 3 3 3.67 3.33 2 2 2 1 2 2 1 0 1 2 1 1 1 1 2 1
C13 4 3.67 4 4 4 3 3 3 3 4 3 2 0 4 3 4 3 3 3.33 3
C14 2 2 3 2 3 2.67 3 3 2 3 2 2 2 0 1 3 1 3 2 2
C15 4 4 4 3 4 4 3 4 4 4 3 4 3 4 0 3 3 4 4 4
C16 2 1 0.33 2.67 2 1 1 1 1 1 1 2 2 1 1 0 0 2 1 1
C17 2.67 2 2 2 1 1 1 2 1 1 2 2 2.67 3 2 3 0 3 3 2
C18 2 2 2 2 2 2 1 1 3 3.33 2 3 2.67 3 1 3 1 0 2 3
C19 2 3 2.33 2 2 3.67 3 2 3 2 3 2 3 2 0.67 2 2 2 0 3
C20 4 2 3 2 3 4 2 3 4 4 3 4 4 4 4 3 4 2 3 0
Table 5. Ranking of Criteria Weights
Criteria Symbol Weight Rank
BC Technology Compliance C1 0.0559 5
Bank Performance Increase C2 0.0536 6
Cost C3 0.0438 17
Risk C4 0.0535 7
Transparency C5 0.0465 14
Sustainability C6 0.0460 15
Resistance to Transforming Technology C7 0.0505 10
Safety C8 0.0512 8
TOP Management Support C9 0.0573 3
Competitive Advantage C10 0.0508 9
Complexity C11 0.0403 20
Reputation Increase C12 0.0448 16
Government Policy& Regulations
Compliance C13 0.0577 2
Increased Trust Between Institutions C14 0.0484 12
Service and Data Quality C15 0.0605 1
Auditable C16 0.0420 19
Agility C17 0.0434 18
Accounting C18 0.0479 13
Speed C19 0.0495 11
Traceability and Visibility C20 0.0566 4

International Engineering and Technology Management Summit 2021– ETMS2021
İstanbul Technical University & Bahçeşehir University
64
Table 6. The Aggregate Decision Matrix C1 C2 C3 C4 C5 C6 C7 C8 C9 C10 C11 C12 C13 C14 C15 C16 C17 C18 C19 C20
A1 -
Equipment-
Material
3.3 4.0 5.0 5.0 4.7 5.7 3.7 6.7 5.7 4.7 5.3 2.7 6.7 4.3 7.3 4.0 1.7 4.7 5.7 5.3
A2 -
Software-
License
8.0 3.7 7.3 8.3 7.7 7.0 6.3 9.0 8.0 5.0 6.0 5.3 7.7 5.3 8.7 5.0 3.3 5.7 7.0 8.7
A3 -
Consulting 3.3 4.7 6.0 5.3 4.7 4.7 2.7 8.0 4.7 3.7 5.0 6.3 7.0 3.3 8.3 3.7 2.0 7.0 4.3 5.3
Table 7. Ranking the Alternatives
Si Ri Qi v=0.00 Qi v=0.25 Qi v=0.50 Qi v=0.75 Qi v=1.00
A1 0.6869 0.0605 3 1.0000 3 1.0000 3 1.0000 3 1.0000 3 1.0000
A2 0.2811 0.0536 1 0.0000 1 0.0000 1 0.0000 1 0.0000 1 0.0000
A3 0.5874 0.0573 2 0.5308 2 0.5868 2 0.6428 2 0.6988 2 0.7548
In this study, it was desired to use MCDM methods due to the expert knowledge-intensive definition of BC
technology in the current period. The criteria weights were determined using DEMATEL, one of the
MCDM methods, and then the alternatives were listed with the VIKOR method.
As a result of the study, it was concluded that the priority application of BC technology is more important
than the others in the Software License area in the IT department of the Turkish bank where we applied. In
addition, when the criteria weights are examined, it is understood that this area is the most suitable area for
BC technology. Among the other alternatives, consultancy procurement management is in the second place,
while Equipment and Material procurement Management has been determined as the least applicable
procurement management system for BC technologies.
BC-based technological transformations seem to manifest themselves in many sectors, including banking.
Therefore, a lot of work can be done on this subject. In the future, a fuzzy integrated version of the
methodology can be applied. In addition, sensitivity analysis can be performed.
REFERENCES
Aksakal, Erdem, and Metin Dağdeviren. "ANP ve DEMATEL yöntemleri ile personel seçimi problemine
bütünleşik bir yaklaşim." Gazi Universitesi Mühendislik Mimarlık Fakültesi Dergisi 25.4 (2010).
Ar, Ilker Murat, et al. "Evaluating the feasibility of blockchain in logistics operations: A decision
framework." Expert Systems with Applications 158 (2020): 113543.
Bag, Surajit, et al. "Barriers to adoption of blockchain technology in green supply chain management." Journal of Global Operations and Strategic Sourcing (2020).
Büyüközkan, Gülçin, and Da Ruan. "Evaluation of software development projects using a fuzzy multi-
criteria decision approach." Mathematics and Computers in Simulation 77.5-6 (2008): 464-475.
Caradonna, O. (2018). Gartner supply chain executive conference. Gartner Group.
https://www.gartner.com/en/newsroom/press-releases/2019-05-07-gartner-predicts-90– of-blockchain-
based-supply-chain
Doğantekin, S. Yeni Sihirli Kelime Blockchain. Erişim Adresi: https://medium.com/@sdogantekin/yeni-
sihirli-kelime-blockchain-68864a30fee9 (30.04.2021).
Erol, Ismail, et al. "Assessing the feasibility of blockchain technology in industries: evidence from
Turkey." Journal of Enterprise Information Management (2020).
Francisco, Kristoffer, and David Swanson. "The supply chain has no clothes: Technology adoption of
blockchain for supply chain transparency." Logistics 2.1 (2018): 2.
Gökalp, Ebru, Mert Onuralp Gökalp, and Selin Çoban. "Blockchain-Based Supply Chain Management:
Understanding the Determinants of Adoption in the Context of Organizations." Information Systems
Management (2020): 1-22.
Nathan, Andrew J., and Andrew Scobell. "How China Sees America: The Sum of Beijing's Fears." Foreign
Aff. 91 (2012): 32.

International Engineering and Technology Management Summit 2021– ETMS2021
İstanbul Technical University & Bahçeşehir University
65
Nayak, Gurudutt, and Amol S. Dhaigude. "A conceptual model of sustainable supply chain management in
small and medium enterprises using blockchain technology." Cogent Economics & Finance 7.1 (2019):
1667184.
Nofer, Michael, et al. "Blockchain." Business & Information Systems Engineering 59.3 (2017): 183-187.
Opricovic, Serafim, and Gwo-Hshiung Tzeng. "Extended VIKOR method in comparison with outranking
methods." European journal of operational research 178.2 (2007): 514-529.
Özkan, Betül, et al. "Evaluating Blockchain Risks by Using a MCDM Methodology Based on Pythagorean
Fuzzy Sets." International Conference on Intelligent and Fuzzy Systems. Springer, Cham, 2019.
Oztürk, Cihat, and Abdullah Yildizbaşi. "Barriers to implementation of blockchain into supply chain
management using an integrated multi-criteria decision-making method: a numerical example." Soft
Computing (2020): 1-19.
Perboli, Guido, Stefano Musso, and Mariangela Rosano. "Blockchain in logistics and supply chain: A lean
approach for designing real-world use cases." Ieee Access 6 (2018): 62018-62028.
Seyed-Hosseini, S. Mohammed, Nina Safaei, and M. J. Asgharpour. "Reprioritization of failures in a
system failure mode and effects analysis by decision making trial and evaluation laboratory
technique." Reliability engineering & system safety 91.8 (2006): 872-881.T. L. Saaty, “How to make a
decision: The analytic hierarchy process,” European Journal of Operational Research, vol.48(1), pp. 9-
26, 1990.
Wu, Wei-Wen, and Yu-Ting Lee. "Developing global managers’ competencies using the fuzzy DEMATEL
method." Expert systems with applications 32.2 (2007): 499-507.
Yadav, Sachin, and Surya Prakash Singh. "An integrated fuzzy-ANP and fuzzy-ISM approach using
blockchain for sustainable supply chain." Journal of Enterprise Information Management (2020).
Yadav, Sachin, and Surya Prakash Singh. "Blockchain critical success factors for sustainable supply
chain." Resources, Conservation and Recycling 152 (2020): 104505.
Yadav, Vinay Surendra, et al. "Blockchain technology adoption barriers in the Indian agricultural supply
chain: an integrated approach." Resources, Conservation and Recycling 161 (2020): 104877.

International Engineering and Technology Management Summit 2021– ETMS2021
İstanbul Technical University & Bahçeşehir University
66
CALCULATION OF POTENTIAL RESIGNATIONS IN THE
COMPANIES WITH SVM
Bidar Özgür Tombuloglu Baha Ulug Yavuz Selim Emir
Bahçeşehir University-Dsource Bahçeşehir University Bahçeşehir University
ABSTRACT One of the main trends caused radical changes in the paradigms in the business world is
digitalization. Even though digitalization brings many opportunities for the companies and the
countries, on the other hand brings new problems with it; one of problems is meeting the needs
of the labor market talent pool. New era requires new skill sets. Because of that, finding and
keeping skilled-talented employees are becoming one of the major goals of the companies.
Companies put KPI’s for that purpose and measure employee engagement and voluntarily
employee turnover. With this paper it is aimed to create an algorithm with SVM to find out
potential resignations in the company and help companies create strategies to keep talent in the
company and increase employee engagement.
Keywords: Digitalization, Machine Learning, Resignations, SVM

International Engineering and Technology Management Summit 2021– ETMS2021
İstanbul Technical University & Bahçeşehir University
67
1. INTRODUCTION
In order to ensure the continuity of the business models where the customer is constantly in the
system, it creates the need for a decision-making algorithm that will not cause economic damage
to the company. This mechanism should also not ignore customer satisfaction as well. One of
the most important data science methods frequently used in this field is Churn Analysis. This
method, which measures the customer's potential to leave, can also be used in accordance with
the needs of the human resources departments of the companies. Because not losing customers
is as important as losing talented personnel.
‘High turnover has several detrimental effects on an organization. It is difficult to replace
employees who have niche skill sets or are business domain experts. It affects ongoing work
and productivity of existing employees. Acquiring new employees as replacement has its own
costs like hiring costs, training costs etc. Also, new employees will have their learning curves
towards arriving at similar levels of technical or business expertise as a seasoned internal
employee ‘’ (Ajit, 2016). In addition, this analysis can be used in other applications of human
resources departments. As Sandep Yadav and Aman Jain points out that the predictive attrition
model helps in not only taking preventive measure, but also making better hiring decisions. In
this study implementation of various classification method helps in predicting whether a
particular employee might leave the organization in the near future by deriving trends in the
employee’s past data. It was intuited that salary or other financial aspect like promotions are
not the sole reasons behind the attrition of employees (2018).
Research shows that in some cases, it will be less costly to retain personnel by identifying
existing personnel who are considering leaving the institution rather than looking for new
personnel, granting privileges or establishing stronger ties. Accordingly, the most basic features
affecting employees' firms are listed as follows: 'Employee Satisfaction', 'Employee CTC
Level', 'Appraisal Rating' and 'Number of Projects / Tasks Assigned Per Quarter'(Srivastava and
Eachempati, 2021). These criteria can be given importance to prevent the resignation of
qualified personnel. On the contrary, less costly salary adjustments can be made for the
personnel who do not plan to leave the company, but who do not have sufficient performance
in terms of performance. Some of the most commonly used methods were SVM with various
kernels, Random Forests and Naive Bayes. Research is usually done to compare the
performance of different algorithms. SVM and Random Forests models are the ones with the
highest success among these algorithms (Yiğit and Shourabizadeh, 2017). From the experiment,
it is found that Naïve Bayes, Decision Tree, and random forest are the models that have the
highest accuracy compare to others. Thus, those three models are used in the study. Naïve
Bayes, Decision Tree, and Random Forests are the most favored models for the reason of its
flexibility and easy to understand. Naïve Bayes is one of a notable models in text categorization
domain, which is known for its higher success rate. However, its success rate in the employee
prediction is still limited (Alamsyah and Salma, 2018). It has been observed that SVM is more
successful than some other methods. SVMs success over Random Forests and Naïve Bayes classifier is attributed to introducing individual class penalties in SVMs. True positives
accuracy is very high compared to other methods. Random forests and Naïve Bayes compete with SVMs on the total accuracy front; however, they fail to impress along the TP recognition
rate (Saradhi and Palshikar, 2011). However, according to some studies, experimentation results
that Decision Tree is consistently more successful in identifying churners than SVM or MLP
across all evaluation metrics (Cooper, 2020). Accuracy rates in the developed models are
generally at satisfactory levels. Though total accuracy along with TP and TN accuracy is
encouraging, it is not good enough for large organizations. If the total number of employees is
140,000, the above learning algorithms would predict around 28,000 employees as potential
churners (Saradhi and Palshikar, 2011).
In this article, it is aimed to try SVM algorithms to carry the results we obtained with AHP and
feature vector calculation from MCDM methods and to see if SVM performed more accurate. The

International Engineering and Technology Management Summit 2021– ETMS2021
İstanbul Technical University & Bahçeşehir University
68
two-years data of Nobel Pharmaceuticals was studied and the potential employees who could be
dismissed were calculated with an accuracy of 63 (Ulutas, 2020). It is understood that the data
must be accurate and complete to make the calculations more precise. In the next steps, it is aimed
to ensure the accuracy of the matrix used in the calculation of the vectors by working closely with
the institution, thus ensuring that the weights are calculated correctly and eliminating the
deficiencies in the data set. In addition, data set regularization, exploratory data analysis, different
kernel methods of SVM were used and the results were compared.
2. DATA SET DESCRIPTION
Nobel Pharmaceuticals Employee data used for the project. Nobel Pharmaceuticals for
2017, 2018, 2019 and 2020 were provided in the desired format. However, deficiencies were
detected especially in the reason for leaving the job, performance, and talent data.
Since there were no reasons for leaving the job in 2017 and 2018 data of Nobel Pharmaceuticals,
it was decided to work on 2019 and 2020 data. The columns that will be included in the
calculation in this study are as follows: Age, Gender, University Category, Performance, Seniority, Grade, CR (which is expressed as a salary according to the market average.) and
Status. As can be easily understood in this dataset, the target variable is Status. The other seven
attributes are independent attributes. In order to use some columns, we had to go through some
stages. These procedures can be explained as follows. According to the ranking of the best
universities in the YÖK system, the first 20 universities were included in the A category, and
the following 20 universities were included in the B category. With the same method, all
universities were marked from A to E. Then these letters were converted to integer values in
the EDA section. The performance value is the value given to all employees, with a minimum
of 1 and a maximum of 5. Blank values are filled with the average employee score of 3. Thus,
the effects on the result are minimized. Seniority, on the other hand, corresponds to seniority
in the workplace. Empty values are filled as 6.5. The CR value represents the monthly salary
of the employee according to the average salary in the market. if he receives less than seventy
percent of his market salary, his change of job is considered definitive and is awarded 1. This
value decreases as the salary increases according to the market. If he receives a higher salary
than the market rates, it drops to 0.3.
Table 1. Final Attributes of Employee
No. Attribute Name Description
1. Age Employee age
2. Gender Male and Female
3. Seniority Level of employee position in the company
4. Grade Employee role market value
5. Performance Last performance score
6. CR Ratio of salary by market
7. University University category
8. Status Churn and Not Churn
The columns that will be included in the calculation in this study are as follows: Age, Gender, University
Category, Performance, Seniority, Grade, CR (which is expressed as a salary according to the market
average.) and Status also given as in Table I.
The visualization process allows us to get to know the data better and to predict which models are
better suited to our dataset. The histogram for different attributes is shown in Figure 1. The ages
show a bimodal distribution whereas all others are unimodal. Seniority and salary are right skewed,
but grade and university category are left skewed.
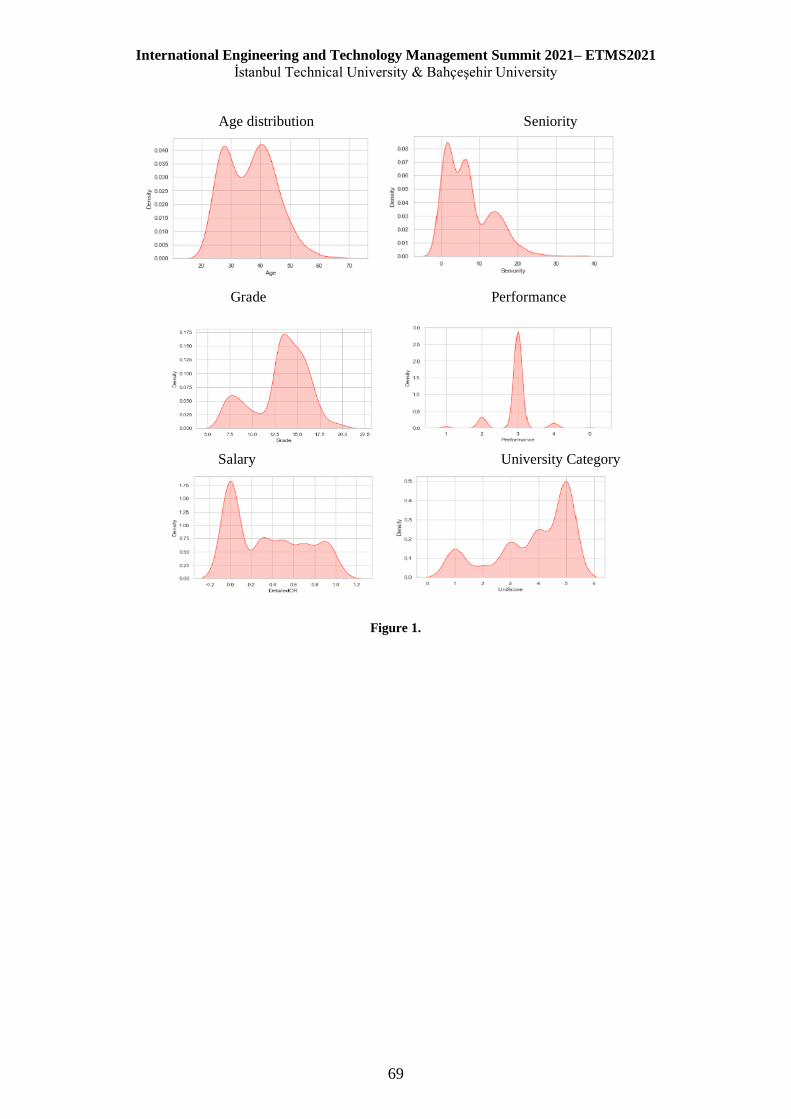
International Engineering and Technology Management Summit 2021– ETMS2021
İstanbul Technical University & Bahçeşehir University
69
Age distribution Seniority
Grade Performance
Salary University Category
Figure 1.

International Engineering and Technology Management Summit 2021– ETMS2021
İstanbul Technical University & Bahçeşehir University
70
Figure 2.
Those with a status of 1 decided to leave. Figure 3. Distribution of resigned and continuing personnel
Table 2. Train and Test Data Distribution
Current Status of Employee Training Data Test Data
Resigned 329 69
Retained 931 246

International Engineering and Technology Management Summit 2021– ETMS2021
İstanbul Technical University & Bahçeşehir University
71
Figure 4. Correlation matrix summary
3. METHODS Here it will be imported Pandas libraries for dataset operations, Seaborn and Matplotlib for visualization
operations, and Sklearn libraries to implement machine learning algorithms and evaluate their results..
Due to missing some columns, we had to reduce the number of rows in our data from 3000 to nearly a
thousand. Because many rows did not contain data in the Seniority, Grade and Salary columns, which would
provide us with the most important information.
Support Vector Machine
Support Vector Machine is one of the methods used for classification. Basically, it tries to separate two
classes with a line or plane. It also makes this separation according to the elements at the boundary. SVM
was recommended to us by our professor since our data set is not too large and it is known to be a very
powerful algorithm in data classification projects.
Hard Margin vs Soft Margin
To make this classification, a line separating the two classes is drawn and the green region between ±1 of
this line is called the Margin. The wider the margin, the better the separation of two or more classes.
Sometimes points can enter the Margin region. This is called Soft Margin. Hard Margin works if our data is
linearly separable and is very sensitive to outliers. Therefore, in some cases, Soft Margin should be
preferred.
Figure 5.

International Engineering and Technology Management Summit 2021– ETMS2021
İstanbul Technical University & Bahçeşehir University
72
The balance between the two is controlled by the C hyperparameter in the SVM. The larger the C, the
narrower the Margin.
Parameters
● C: Regularization parameter. There is an inverse relationship between the amount of regularization
and
C. It should definitely be a positive number.
● Kernel: The values this parameter takes {'linear', 'poly', 'rbf', 'sigmoid', 'precomputed'}
● Degree: If polynomial (“poly”) is used as the kernel method, this parameter is for determining the
polynomial degree.
● Gamma: A high gamma value fits the training dataset exactly and this can cause overfitting. This is
because a low gamma value only considers nearby points when calculating the dividing line. The
higher the gamma value, the more points it uses in calculating the parting line. Otherwise, underfitting
may occur with a gamma value that is too small.
Note that a kernel imposes certain restrictions on weights of characteristics-managed portfolios. These
weights cannot be chosen fully flexibly but can be controlled by the kernel parameter c. Simple algebra
shows that c effectively shifts weights between higher- and lower-terms in the features mapping. For
instance, for polynomial kernels, as c → 0, a kernel contains only higher-order terms. Similarly, as c → ∞,
a kernel puts the entire weight on the first-order terms and thus effectively collapses to the linear kernel
(Kozak, 2019).
Kernel Trick
SVMs can efficiently perform nonlinear classification using what is called the kernel trick, implicitly
mapping their inputs into high-dimensional feature spaces. The kernel trick allows constructing the
classifier without explicitly knowing the feature space. Recently, SVM has attracted a high degree of
interest in the machine learning research community. Several recent studies have reported that the SVM
(support vector machines) generally are capable of delivering higher performance in terms of classification
accuracy than the other data classification algorithms. SVM is a technique suitable for binary classification
tasks (Joshi and Chawan, 2018).
Some classifiers such as logistic regression is linear, but some classifiers such as KNN are non-linear. SVM
also tries to separate classes with a linear line. However, linear classification methods are not always as
successful as non-linear ones. In general, data classes are separated from each other by using a point in one
dimension, a line in two dimensions, a plane in three dimensions, and a hyperplane in multidimensional
space. For classes that cannot be separated linearly, the method called the kernel trick is applied. In this
method, by applying the kernel function, classes that are normally not linearly separable are made linearly
separable and more successful results are obtained.
In the simplest terms, it is aimed to make the unsolvable-inexplicable data in low dimensions separable
from each other, because of additional operations by bringing them to higher dimensions.
● Radial Kernel
K(x (i) , x (j) ) = exp(− ||x (i) − x (j) ||^2 / 2σ^ 2 )
It is an analysis model in which Support Vector Machines are determined and the classification process
is carried out by calculating the extent to which each point resembles certain points with the normal
distribution method.
In this model, the distribution width is controlled by the hyper parameter value (Gamma – Gamma : γ).
● Polynomial Kernel
K(x ^(i) , x^ (j) ) = (x ^ (i) ^T x^ (j) + 1)^d
where d is the degree of the polynomial, e.g., d = 2 for quadratic.
Dimensioning on data models is converted from 2nd dimension to Nth dimension.
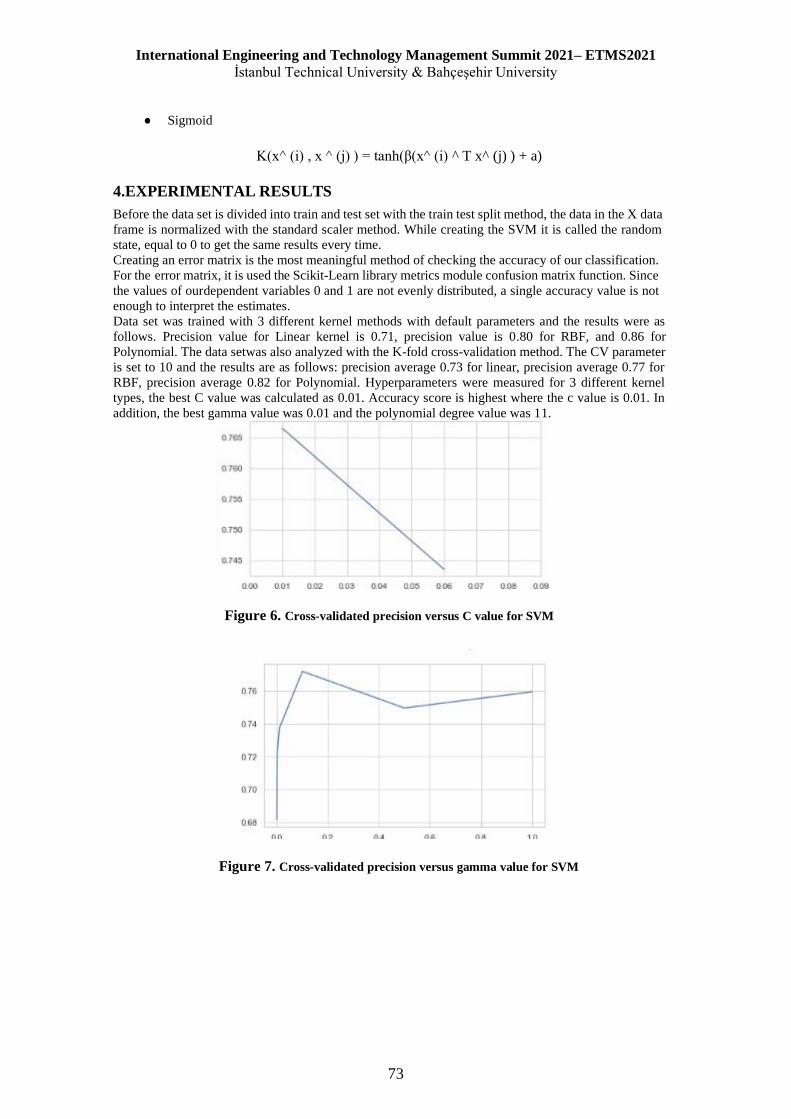
International Engineering and Technology Management Summit 2021– ETMS2021
İstanbul Technical University & Bahçeşehir University
73
● Sigmoid
K(x^ (i) , x ^ (j) ) = tanh(β(x^ (i) ^ T x^ (j) ) + a)
4.EXPERIMENTAL RESULTS
Before the data set is divided into train and test set with the train test split method, the data in the X data
frame is normalized with the standard scaler method. While creating the SVM it is called the random
state, equal to 0 to get the same results every time.
Creating an error matrix is the most meaningful method of checking the accuracy of our classification.
For the error matrix, it is used the Scikit-Learn library metrics module confusion matrix function. Since
the values of our dependent variables 0 and 1 are not evenly distributed, a single accuracy value is not
enough to interpret the estimates.
Data set was trained with 3 different kernel methods with default parameters and the results were as
follows. Precision value for Linear kernel is 0.71, precision value is 0.80 for RBF, and 0.86 for
Polynomial. The data set was also analyzed with the K-fold cross-validation method. The CV parameter
is set to 10 and the results are as follows: precision average 0.73 for linear, precision average 0.77 for
RBF, precision average 0.82 for Polynomial. Hyperparameters were measured for 3 different kernel
types, the best C value was calculated as 0.01. Accuracy score is highest where the c value is 0.01. In
addition, the best gamma value was 0.01 and the polynomial degree value was 11.
Figure 6. Cross-validated precision versus C value for SVM
Figure 7. Cross-validated precision versus gamma value for SVM

International Engineering and Technology Management Summit 2021– ETMS2021
İstanbul Technical University & Bahçeşehir University
74
Figure 8. Polynomial Degree
Cross-validated precision versus degree for SVM
5.CONCLUSION AND DISCUSSION Before the study, it had been obtained an accuracy value of about 0.6 as a result of getting weights of the
vectors with the AHP method, which is one of the MADM’s and feature vector calculation (Ulutas, 2020).
However, since our data set is unstable (the ratio between those who continue to work and those who stay
is 1/3), it is expected to be 0.66 for the accuracy value anyway.
In this study we chose to use the SVM algorithm in order to increase the accuracy value in the continuation
of the study because it is known to be a very powerful algorithm in data classification projects.
As a result of parameter optimization in SVM, a higher accuracy value emerged. Polynomial Kernel is the
most ideal and it showed a precision as 0.86. Apart from this, data of more than one company can also be
added. In the future, more detailed data (salary, social status, number of children) can be added to the data
set and different models can be compared (Decision Trees, Deep Learning).
Table 3. Model Comparison
Kernel Precision F-Score Accuracy
Linear 0.71 0.67 0.80
Polynomial 0.86 0.69 0.83
Gaussian 0.80 0.75 0.85
Sigmoid 0.57 0.57 0.73
Evaluation Measurement
The frequently preferred confusion matrix was used to measure the performance of
classification problems as show in table I. It is a table with 4 different combinations of
estimated and actual values.
1) True Positive: The number of records correctly labeled as churn
2) False Positive: The number of records incorrectly labeled as churn
3) False Negative: The number of records incorrectly labeled as not churn
4) True Negative: The number of records correctly labeled as not churn
Table 4. Confusion Matrix
Predicted
Not Churn Churn
Actual Not Churn True Positive (TP) False Negative (FN)
Churn False Positive (FP) True Negative (TN)

International Engineering and Technology Management Summit 2021– ETMS2021
İstanbul Technical University & Bahçeşehir University
75
Table 5. Parameter Description
Parameter Description
CA Accuracy classification score
F1 Weighted average of the precision and recall
Precision Ration of measurement on how appropriate the model in predicting the
class
Recall The proportion of positives that are correctly identified
Accuracy: The number of all the correct predictions
Accuracy = (TP + TN) / (TP + FP + TN + FN)
F1: Harmonic average of precision and recall
F1 = 2 (Precision x Recall) / (Precision + Recall)
Precision: The ratio of the values estimated as true are actually true.
Precision = TP / TP + FP
Recall: The ratio of how many of the records needed to predict as true are true.
Recall = TP / TP + FN
As a result, the disadvantage of SVM is that it is not suitable for large datasets due to high training time
and also spends more time in training during model training compared to other classification algorithms.
It works poorly with conflicting classes and is also sensitive to the type of kernel used. It is a very fast
and highly accurate method for low-scale-capacity datasets. Applicable for Linear and Non-Linear
datasets. It is a result- oriented effective solution in high-dimensional datasets. High accuracy values can
be achieved with a low maintenance-maintenance (Gamma/C).
REFERENCES Alamsyah, A., & Salma, N. (2018, August). A comparative study of employee churn prediction model. In
2018 4th International Conference on Science and Technology (ICST) (pp. 1-4). IEEE.
Ajit, P. (2016). Prediction of employee turnover in organizations using machine learning algorithms.
algorithms, 4(5), C5.
Cooper, H. (2020). Comparison of Classification Algorithms and Under sampling Methods on Employee
Churn Prediction: A Case Study of a Tech Company.
Gelron, A. (2019). Hands-on machine learning with Scikit-Learn, Keras and TensorFlow: concepts, tools,
and techniques to build intelligent systems (2nd ed.). O’Reilly.
Joshi, T. N., & Chawan, P. M. (2018). Logistic regression and svm based diabetes prediction system.
International Journal For Technological Research In Engineering, 5, 4347-4350.
Kozak, S. (2019). Kernel trick for the cross-section. Available at SSRN 3307895.
M. M. Hossain and M. S. Miah, “Evaluation of different SVM kernels for predicting customer churn,” in
2015 18th International Conference on Computer and Information Technology, ICCIT 2015, 2016, pp.
1–4, doi: 10.1109/ICCITechn.2015.7488032.
Saradhi, V. V., & Palshikar, G. K. (2011). Employee churn prediction. Expert Systems with Applications,
38(3), 1999-2006.
Srivastava, P. R., & Eachempati, P. (2021). Intelligent Employee Retention System for Attrition Rate
Analysis and Churn Prediction: An Ensemble Machine Learning and Multi-Criteria Decision-Making
Approach. Journal of Global Information Management (JGIM), 29(6), 1-29.
Tombuloglu, B.O., (2020). Calculation of potential resignations in the companies with MDM AHP
Methods.
Yadav, S., Jain, A., & Singh, D. (2018, December). Early prediction of employee attrition using data mining
techniques. In 2018 IEEE 8th International Advance Computing Conference (IACC) (pp. 349-354).
IEEE.
Yiğit, İ. O., & Shourabizadeh, H. (2017, September). An approach for predicting employee churn by using
data mining. In 2017 International Artificial Intelligence and Data Processing Symposium (IDAP) (pp.
1-4). IEEE.

International Engineering and Technology Management Summit 2021– ETMS2021
İstanbul Technical University & Bahçeşehir University
76
COVID-19 SALGINININ BIST-100’DEKİ FİRMALARA GÖRE
TÜRKİYE’DEKİ SEKTÖRLERE ETKİSİ
Erdinç Öztürk Mahmut Esat Aksoy
Bahçeşehir University Bahçeşehir University
ÖZET 2019 yılının sonunda Cin’in Wuhan kentinde ortaya çıkan yeni tip koronavirüs (Covid-19) kısa sürede tüm
dünyayı etkisi altına almıştır. Covid-19 un etkisi ekonomiler üzerinden genelde negatif olsa da sektörler ve
hatta sektördeki firmalar bazında farklı etkileri olduğu açıktır. Bu çalışmada Borsa İstanbul’da işlem gören
belli başlı firmalar incelenmiş, sektör ve firmalar üzerindeki etkileri araştırılmaya çalışılmıştır. Calışmada
salgın öncesi ve salgın sonrası firmaların finansal göstergelerindeki değişimler saptanmaya çalışılmış ve
sebepleri konusunda tespitler yapılmıştır. Hizmet odaklı sektörlere bakıldığında farklı şekillerde
etkilenmeler olduğu görülür. Bu sebepten dolayı hizmet odaklı sektörler salgından etkilenen ve
etkilenmeyen olarak 2 grupta incelenmiş, bunların yanında imalat sektörlerindeki firmalar ise ayrı bir grup
olarak ele alınmıştır. Elde edilen sonuçlara göre salgından etkilendiği kabul edilen sektörlerde salgın
nedeniyle karlılıkta belirgin bir düşüş gözlemlenmiştir. Bununla birlikte likidite ve borç oranlarındaki
dengenin korunmuş olması sürdürülebilirlik açısından değerli görülmektedir. Bu firmaların salgın sürecinin
başında yüksek etkilenmelerine rağmen yıl içinde verilen doğru kararlar ile likidite ve borç dengelerini
korudukları da görülmektedir. Salgından etkilenmediği düşünülen hizmet odaklı sektörler için ise beklenti,
finansal oranlar kontrol edilerek doğrulanmıştır. Hatta bu gruptaki firmalarda likidite ve karlılık oranlarında
iyi yönde bir değişim de görülmektedir. İmalat sektöründeki firmaların ise salgın sürecinden genel anlamda
olumsuz etkilenmedikleri görülmekte, hatta likidite ve karlılık açısından olumlu etkilendikleri de tespit
edilmektedir.
Anahtar Kelimeler: BIST 100, Covid 19, hizmet sektörü, mali durum

International Engineering and Technology Management Summit 2021– ETMS2021
İstanbul Technical University & Bahçeşehir University
77
1. GİRİS 11 Mart’ta Türkiye’de ilk kez bir koronavirüs vakası görüldüğü kamuoyuyla paylaşılmıştır. Dünya Sağlık
Orgütü’nün hastalığın bir “pandemi” olduğu açıklamasıyla neredeyse eş zamanlıdır. 12 Mart 2020
tarihinden itibaren Türkiye’de ilk kısıtlama kararları devreye girmiş ve kademeli bir şekilde hayata geçen
bu kısıtlamaların kapsamı zamanla genişletilmiştir.
Salgın Türkiye'de sosyal, ekonomik, siyasi, iktisadi, idari, hukuki, askerî, dinî ve kültürel alanlarda birçok
önemli etkilere ve sonuçlara neden olan radikal kararlar alınmasına yol açmıştır. Ulkede ilkokul, ortaokul
ve liselerde eğitim-öğretim askıya alınırken, bütün üniversitelerde bahar dönemi dersleri iptal edilerek
sınavlar ertelenmiştir.
Tüm restoranlar, kafeler, müzeler, dershaneler, kurslar, alışveriş merkezleri, oteller; berber, kuaför ve
güzellik merkezleri; kahvehaneler, spor salonları, konser mekanları, gece kulüpleri, dernek lokalleri ve
düğün/nişan salonları geçici süreliğine kapatılırken; tüm vatandaşların ormanlarda, park ve bahçelerde
piknik ve mangal yapmaları yasaklanmıştır. Ulkedeki bütün futbol ligleri ertelenmiş ve tüm spor
müsabakaları bir sonraki açıklamaya kadar iptal edilmiştir.
Salgının ekonomik etkilerini en aza indirgemek için birçok düzenlemeye gidilmiş ve destek paketleri
açıklanmıştır. 17 Mart 2020 tarihinde “Ekonomik İstikrar Kalkanı” adında bir destek paketi yürürlüğe
konulmuştur. Bu paket içerisinde iş dünyasına yönelik yer alan önlemler şu şekildedir (Akbulak, 2020):
Kredilerle ilgili olarak;
- Nakit akışı bozulan firmaların kredi anapara ve faiz ödemelerinin asgari olarak 3 ay ötelenmesi,
- Gerektiğinde ihracatçı firmalara stok finansmanı desteği yapılması,
- Kredi Garanti Fonu’nun 25 milyar TL’den 50 milyar TL’ye çıkarılması,
- 500 bin liranın altındaki konutlar için kredilendirme miktarının %80’den %90’a çıkarılması ve
asgari peşinatın ’a düşürülmesi,
- Nisan, Mayıs, Haziran ayı vadeli açık reeskont kredi anapara ve faiz ödemelerinin Ekim, Kasım,
Aralık aylarına ertelenerek azami vadenin 1 yıl uzatılması ve vadesi dolanların ise taahhüt kapama
süresinin 1 yıl uzatılması,
- Mayıs ve Haziran aylarında vadesi gelecek olan Hazine destekli kredi ödemelerinin faizsiz olarak
6 ay ertelenmesi.
Turizmle ilgili olarak;
- Konaklama vergisinin 2021 yılına kadar ertelenmesi,
- İç havayolu taşımacılığından 3 ay süre ile KDV oranın ’den %1’e indirilmesi,
- TURSAB aidatlarının 2020 yılında alınmaması,
- Kısa çalışma ödeneği şartının 450 güne, hizmet şartının ise 60 güne düşürülmesi,
- Askıdaki personelin kısa çalışma ödeneğinden faydalanması ve asgari ücret desteğinin 2020
sonuna kadar uzatılması,
- İşçi çıkarmayan turizm firmalarına 36 ay vade ve %7.5 faiz ile “işe devam kredisi” hakkı
tanınması,
- Yeni sezonda yapılacak yardımların üst limiti ve destek verilecek özel tiyatro sayısının artırılması,
başvuruların Temmuz’da, yeni sezon ödemelerin ise Eylül’de yapılması,
- Nisan, Mayıs ve Haziran dönemlerindeki muhtasar, SGK prim hizmet ve KDV beyannamelerinin
6 ay ertelenmesi.
İstihdamla ilgili olarak;
- Muhtasar beyannamelerin 3 ay ertelenmesi,
- Asgari ücret desteğinin devam ettirilmesi,
- Esnek ve uzaktan çalışma modellerinin etkin halde getirilmesi,
- Kısa Calışma Odeneği’nin devreye alınması ve bu ödenekten yararlanamayan veya ücretsiz izne
çıkarılan vatandaşlara 3 ay, aylık 1170 lira maaş desteği sağlanması,
- 2 aylık telafi çalışma süresinin 4 aya çıkarılması,
- Nisan, Mayıs ve Haziran’a denk gelen muhtasar ve KDV ile SGK prim ödemelerinin 6’şar ay
ertelenmesi,
- 8 Nisan 2020’den itibaren 3 ay süre ile işten çıkarmaların yasaklanması, (Bu daha sonra Haziran
2021 sonuna kadar uzatılmıştır)

International Engineering and Technology Management Summit 2021– ETMS2021
İstanbul Technical University & Bahçeşehir University
78
- İşverenin istemesi halinde çalışanlarını ücretsiz izne çıkarıp 39 lira 24 kuruş günlük ödeme
yapması (Akbulak, 2020).
Türkiye’de birçok firmanın ve sektörün salgından etkilendiği açıktır. Bir yıllık döneme bakıldığında
sektörlerin ve firmaları etkilenmesinin farklı şekillerde olduğu görülür. Ozellikle hizmet sektörlerinde
firmaların hizmet içerikleri ve salgında öne çıkan ihtiyaçlara göre farklı etkilendiği gözlemlenmektedir.
Bu çalışmada firmalar genel olarak 3 grup altında ele alınarak salgında etkilenme durumları araştırılmaya
çalışılmıştır. Hizmet odaklı sektörlerde olumsuz etkilenen firmalar, hizmet odaklı sektörlerde etkilenmeyen
veya olumlu etkilenen firmalar ayrıştırılmış, imalat sektörü de ayrı bir grup olarak ele alınmıştır.
2. LİTERATÜR ARASTIRMASI Salgın başlangıcının ilk aylarından itibaren salgının ekonomik etkileri üzerine araştırmalar yapılmaya
başlanmıştır. Covid-19 Borsa İstanbul’daki etkilerini inceleyen Kılıç (2020) çalışmasında, 2020 Şubat-Mart
ayları arasındaki kapanış verileri ile borsa endekslerini karşılaştırmıştır. Yöntem olarak olay etüdü (event
study) kullanan Kılıç, belirlenen dönem için genelde negatif etkilenme olmasına karşın bazı sektörlerin
pozitif etkilendiğini ve özellikle de negatif etkilenmenin turizm ve tekstil firmalarında olduğunu ortaya
koymuştur.
Gümüş ve Hacıevliyagil (2020) turizm ve ulaştırma sektörleri özelinde yaptıkları çalışmalarında, 2020 Mart
ve Temmuz arası ölüm ve vaka sayıları ile borsa endeksleri arasındaki ilişkiyi incelemişlerdir. Araştırma
sonucunda vaka sayıları ile endeks serileri arasında anlamlı bir ilişki tespit edilmezken, salgındaki ölüm
sayıları ile %5 anlamlılık düzeyinde bağımsız değişkenlerin uzun dönemde eşbütünleşik olarak birlikte ters
yönde hareket ettiği bulunmuştur. Kısa dönemde ise meydana gelen sapmaların yüzde 0.0004’ünün bir
sonraki dönemde düzeltilerek uzun dönem dengesine çok düşük bir hızla ulaştığı tespit edilmiştir.
Zeren ve Hızarcı (2020) çalışmalarında, 23 Ocak 2020 ve 13 Mart 2020 arasındaki günlük verileri
kullanmışlar ve Covid-19 günlük ölüm ve vaka sayılarının borsalar üzerindeki olası etkilerini Maki (2012)
eşbütünleşme testi kullanılarak araştırmışlardır. Bu araştırmanın sonuçları salgından kaynaklı ölüm
sayılarına göre borsaların verilerinin değiştiriğini, vaka sayılarına her ülke borsasının değişik tepkiler
verdiğini doğrulamıştır.
Covid-19 salgının Türkiye’de ekonomik büyümeye sektörel ve sektörler arası etkilerini inceleyen Koyuncu
ve Meçik (2020), çalışmalarında VAR analizini kullanmışlardır. Bu çalışmada Ocak 2015 – Mayıs 2020
dönemi aylık verilerini kullanarak sanayi üretim endeksi, imalat sanayi kapasite kullanım oranı, inşaat
sektörü maliyet endeksi, perakende ticaret ve hizmet sektörü, istihdam oranı, ihracat ve ithalat sektörü
endekslerini analiz etmişlerdir. Sonuçta Covid-19 salgını kapsamında incelenen dönem süresince negatif
etkiye en geç tepki veren sektörün inşaat sektörü olduğu ortaya koymuşlar, sanayi sektörü, perakende
ticaret ve hizmet sektörü ile imalat sektörünün ise en erken etkilenen sektörler olduğunu belirlemişlerdir.
Covid-19 salgın sürecinin BIST’de işlem gören sanayi şirketlerine etkisinin inceleyen Gür (2020)
çalışmasında 16 Mart 2020 ve 30 Haziran 2020 arası günlük verilerini kullanarak, COVID-19 vaka
sayılarının BIST-Sanayi Endeksi üzerindeki etkilerini, uzun dönem için Bayer-Hanck (2013) eşbütünleşme
analizi kullanarak ve kısa dönem ilişkiler için hata düzeltme modeli yardımıyla belirlemeye çalışmıştır.
Calışma sonucunda, uzun dönemde COVID-19 vaka sayılarının BIST-Sanayi Endeksi üzerinde %3.4
azaltıcı etkisi olduğu ve kısa dönem için ise %4,8 azaltıcı etkisi olduğunu ortaya konmuştur.
Orhan ve Tırman (2020) çalışmalarında BIST-100 de işlem gören firmalar için 11.03.2020 ve 11.04.2020
tarihleri arasındaki verilerinin yine geçmiş iki yılın aynı dönem verileri ile karşılaştırıp kısa dönemde
salgının etkilerini araştırmaya çalışmışlardır. Bu çalışmada sağlık ve ilaç sektörünün %9,21 getiri ile en
olumlu etkilenen sektör olduğu ve giyim ve tekstil sektörünün de -%17,40 ile en olumsuz etkilenen sektör
olduğunu ortaya koymuşlardır. Yine bu çalışmada en az riskli firmaları ise çok sektörlü holding firmaları
ve metalurji ve mekanik sanayi olduğu da belirtilmektedir.
Salgının etkilerinin görülmesiyle birlikte ekonomik tedbirler için önlem paketleri açıklanmıştır. Bu
ekonomik tedbirlerin ne derece faydalı olduğu konusunda da çalışmalar mevcuttur. Eroğlu (2020)
çalışmasında 2020 yılı sonu itibariyle yıl içinde alınan mali tedbirlerin değerlendirmesini yapmıştır. Bu
çalışmada ilgili literatürden, yayınlanmış raporlardan ve istatistik verilerden hareketle mevcut durumu
değerlendirmiştir. Dünya ve Türkiye ekonomisinde meydana gelen değişimler ve salgınla mücadele
kapsamında Amerika, İtalya, Almanya, Fransa, İspanya, Cin ve Türkiye gibi ülkelerde alınan mali tedbirler
ortaya konulmuştur. Bu çalışmada ortaya çıkan sonuç, Covid-19’un ekonomik ve toplumsal etkilerine

International Engineering and Technology Management Summit 2021– ETMS2021
İstanbul Technical University & Bahçeşehir University
79
kıyasla alınan mali tedbirlerin kapsamının dar tutulmuş olması ve uzun vadeli çözümlerden ziyade kısa
vadeli sorunlara çözüm getirilmeye çalışıldığıdır.
3. KULLANILAN VERİ VE YÖNTEM Calışmada Borsa İstanbul BIST-100 de bulunan firmalar, ilgili sektörler altında gruplandırılarak
incelenmiştir. Kamu Aydınlatma Platformu’ndan (KAP) alınan veriler kullanılarak belirlenen firmaların
2019 ve 2020 yıllarındaki bilanço ve gelir tabloları baz alınmıştır. 2019 yılı salgın öncesi dönem, 2020 yılı
ise salgın dönemi olarak kabul edilmiştir. Calışmaya 74 firma dahil edilmiş ve aşağıdaki gruplamalar
oluşturularak incelenmeye çalışılmıştır:
Tablo 1. Değerlendirilen sektörler ve firma sayıları
Hizmet Odaklı Olup Olumsuz Etkilenen
Sektörler
Turizm 8
Ulaştırma ve Lojistik 8
Hizmet Odaklı Olup Etkilenmeyen
Sektörler
Teknoloji ve Yazılım 5
Perakende Ticaret 6
Enerji 8
İlaç 5
İmalat Sektörleri
Gıda ve İçecek 10
Tekstil 12
Dayanıklı Tüketim Maddeleri 6
Otomotiv 6
Toplam 74
Belirtilen sektörlerdeki tüm firmalar için aşağıdaki finansal oranlar değerlendirmeye alınmıştır:
Tablo 2. Değerlendirmede Dikkate Alınan Finansal Oranlar
Likidite
Cari Oran Dönen V / KVBorç
Asit Test Dönen V-Stok / KVBorç
Nakit Oran Nakit / KVBorç
Karlılık
Brüt Kar Marjı Brüt Kar/ Satış
Esas Faal. Kar Marjı FVOK / Satış
Net Kar Marjı Dönem Karı / Satış
Varlıkların karlılığı ROA FVOK / Toplam Varlık
Ozsermayenin Karlılığı ROE Net Kar / Özsermaye
Borç Oranları
Toplam Borç Oranı Toplam Borç / Toplam V.
Kısa Vadeli Borç Oranı Kısa Vadeli Borç / Toplam Borç
Faiz Dönme Cabukluğu FVÖK/Net Finansal Gider
Verimlilik Oranı
Varlıkların Dönme Cabukluğu Satışlar / Toplam Varlık
Alacakların Devir Hızı Satışlar / Ticari Alacaklar
Alacak Tahsilat Süresi 365 / Alacak Devir Hızı
Stok Devir Hızı* SMM / Stoklar
Stok Tüketim Süresi* 365/ Stok Devir Hızı
Borç Dönme Cabukluğu SMM / Ticari Borçlar
Borç Ödeme Süresi 365/Borç Dönme Cabukluğu
Operasyonel Döngü Süresi Alacak Tahsilat Süresi + Stok Tüketim Süresi
Nakit Döngü Süresi
Alacak Tahsilat Süresi+Stok Tüketim Süresi +
Borç Ödeme Süresi
Not: * Hizmet odaklı sektörler için stoklarla ilgili oranlar değerlendirilmemiştir.
Yukarıda belirtilen finansal oranların değerlendirmeye tabi tutulan firmalar için ortalaması ve her belirlenen
bir sektör grubu bazında ortalamaları 2019 ve 2020’deki verilerine göre oluşturulmuştur. Bu
ortalamalardaki değişimler T-Test yöntemi ile analiz edilmiştir.
4. ARASTIRMA BULGULARI Salgından olumsuz etkilendiği düşünülen birinci grup sektörlere baktığımızda likidite oranlarının çok fazla
etkilenmediği söylenebilir. Buna karşın karlılık oranlarında bariz bir düşüş olduğu ortalama
değişimlerinden anlaşılmaktadır. Firma bazında baktığımızda ise 2019 da kar açıklamış birçok firmanın
zarar ettiği gözlemlenmiştir.

International Engineering and Technology Management Summit 2021– ETMS2021
İstanbul Technical University & Bahçeşehir University
80
Tablo 3 – Etkilenen Sektörler için Likidite Oran Ortalamaları
2019 2020
Cari Oran 1,93 2,81
Asit Test 1,06 2,34
Nakit Oran 0,24 0,22
Tablo 4 – Etkilenen Sektörler için Karlılık Oran Ortalamaları
2019 2020
Brüt Kar Marjı 0,35 0,24
Esas Faal. Kar Marjı 0,41 0,07
Net Kar Marjı 0,26 -0,07
Borç oranları değişimine bakıldığında ise büyük değişimler gözlenmemekte birlikte zarar etme
durumundan dolayı faiz dönme çabukluğunun negatif olduğu gözlemlenmektedir.
Tablo 5 – Etkilenen Firmalar Borç Oran Ortalamaları
2019 2020
Toplam Borç oranı 0,51 0,51
Kısa Vadeli Borç Oranı 0,55 0,54
Faiz Dönme Cabukluğu 15,45 -4,85
Verimlilik oranlarını ise etkileyen en önemli faktör satışların düşmesi olmuştur. Bu açıdan birçok firmada
varlıkların dönme çabukluğu oranının ciddi şekilde düştüğü görülmektedir. Bunun yanısıra borç
oranlarında büyük değişimlerin olmaması borç dönme çabukluğu ve borç ödeme sürelerine de yansımıştır.
Fakat burada dikkat çeken nokta alacak devir hızı ve tahsilat sürelerindeki değişimdir. Firma detaylarını
incelediğimizde satışların büyük oranda azalmasına karşın alacakların aynı oranda azalmadığını
gözlemlenmiştir. Bu da bu devir hızının azalması ve tahsilat sürelerinin artması şeklinde karşımıza
çıkmıştır.
Tablo 6 – Etkilenen Firmalar Verimliklik Oran Ortalamaları
2019 2020
Varlıkların Dönme
Cabukluğu 0,39 0,21
Alacakların Devir Hızı 26,93 17,94
Alacak Tahsilat Süresi 32,80 57,70
Borç dönme çabukluğu 13,02 15,07
Borç ödeme süresi 67,14 41,21
Operasyonel döngü süresi 54,47 56,93
Nakit döngü süresi 109,71 102,64
Tüm bu incelemelerden bu gruptaki firmalarda özellikle satışların ciddi oranda düşmesi ve buna bağlı
olarak karlılıklarındaki düşüşün firmaları etkilediği görülmektedir. Bununla birlikte likidite ve borç
oranlarındaki dengenin korunmuş olması sürdürülebilirlik açısından değerli görülmektedir. Salgın
durumunun devam etmesi bu firmaların uzun dönem performanslarını etkileyeceği muhakkaktır. Bu analiz
çalışmasının daha sonraki dönemleri de içine alacak şekilde tekrar yapılması uzun dönemdeki etkilerin
anlaşılabilmesine olanak tanıyacaktır.
Salgından etkilenmediğini veya olumlu etkilendiği düşünülen ikinci grup sektörler ise ağırlıklı olarak
enerji, teknoloji, perakende ve ilaç sektörleridir. Likidite açısından firmaların etkilenmediği hatta
durumlarının daha iyi yönde değiştiği görülmektedir. Karlılık açısından bakıldığında ise benzer bir durum
söz konusu olmaktadır. Bu firmaların salgın sürecinde tüm yıl baz alındığında çalışmalarını sürdürdüğü
bilinmektedir. Hatta belli oranda nakit ve karlılıklarında artış olduğu da tespit edilmiştir.

International Engineering and Technology Management Summit 2021– ETMS2021
İstanbul Technical University & Bahçeşehir University
81
Tablo 7 – Etkilenmeyen Firmalar için Nakit Oran Ortalamaları
2019 2020
Cari Oran 1,03 1,13
Asit Test 0,83 0,91
Nakit Oran 0,28 0,40
Tablo 8 – Etkilenmeyen Firmalar için Karlılık Oran Ortalamaları
2019 2020
Brüt kar marjı 0,26 0,30
Esas faal. Kar marjı 0,14 0,16
Net kar marjı 0,04 0,05
Borç oranları incelendiğinde firmaların durumlarını koruduğu görülmektedir. Burada salgın döneminde
herhangi büyük bir farklılaşma tespit edilmemiştir.
Tablo 9 – Etkilenmeyen Firmalar için Borç Oran Ortalamaları
2019 2020
Toplam Borç oranı 0,71 0,71
Kısa Vadeli Borç Oranı 0,66 0,65
Faiz Dönme Cabukluğu 1,50 1,87
Verimlilik açısından bu firmaları incelediğimizde dikkate alınacak bir değişim saptanmadığı
görülmektedir. Bazı oranlardaki değişimlerin salgının yol açtığı operasyonel koşullardaki değişimlerden
dolayı gerçekleştiği de düşünülmektedir.
Tablo 10 – Etkilenmeyen Firmalar için Verimlilik Oran Ortalamaları
2019 2020
Varlıkların Dönme
Cabukluğu
0,75 0,84
Alacakların Devir Hızı 5,37 6,54
Alacak Tahsilat Süresi 73,50 62,70
Stok devir hızı 8,18 7,79
Stok tüketim süresi 38,29 46,36
Borç dönme çabukluğu 7,30 11,18
Borç ödeme süresi 67,88 67,92
Operasyonel döngü süresi 69,47 71,63
Nakit döngü süresi 240,86 247,91
İkinci grupta incelediğimiz bu sektörler için tüm finansal oranlarda salgın öncesi ve salgın dönemi arasında
kayda değer bir farklılık saptanmamıştır. Hatta likidite ve karlılık oranlarında iyi yönde bir değişim de
görülmektedir. Bu gruptaki sektörlerin etkilenmediği veya olumlu etkilendiği verilerle de
doğrulanmaktadır. Bu gruptaki sektörlerde özellikle ilaç sektörünün diğerlerine oranla olumlu etkilendiği
ayrıca gözlemlenmiştir.
Uçüncü grupta ise imalat sektörleri incelenmiştir. İmalat sektöründe bulunan gıda, tekstil, otomotiv ve
dayanıklı tüketim maddeleri üretimi yapan işletmeler salgın sürecinde likidite oranlarının genel anlamda
sabit kaldığı gözlenmiştir. Ama firmaların nakit oranlarında bir artış söz konusudur. Bu durumda brüt kar
marjlarını pozitif yönde etkilemiştir. Bu durum firmaların satışlarındaki artış olarak da kabul edebilir.
Tablo 11 – İmalat Sektörleri Likidite Oran Ortalamaları
2019 2020
Cari Oran 1,55 1,79
Asit Test 1,05 1,24
Nakit Oran 0,24 0,40

International Engineering and Technology Management Summit 2021– ETMS2021
İstanbul Technical University & Bahçeşehir University
82
Tablo 12 – İmalat Sektörleri Karlılık Oran Ortlamaları
2019 2020
Brüt kar marjı 0,26 0,30
Esas faal. Kar marjı 0,11 0,15
Net kar marjı 0,04 0,07
Borçlanma oranlarına bakıldığında iki dönem arasında belirgin bir değişiklik olmadığı gözlemlenmiştir.
Tablo 13 – İmalat Sektörleri Borç Oranları Ortalamaları
2019 2020
Toplam Borç oranı 0,61 0,61
Kısa Vadeli Borç Oranı 0,68 0,65
Faiz Dönme Cabukluğu 2,23 3,24
Verimlilik oranlarını inceldiğimizde özellikle alacak tahsilat süresinin arttığı göze çarpmaktadır. Bunun da
salgın dönemindeki ödeme güçlüklerinden kaynaklandığı söylenebilir. Burada diğer bir göze çarpan artış
ise stok tüketim süresindedir. Salgından kaynaklı stok eritme süresinin uzamasının yıl içindeki belli
kapanma dönemlerinden etkilendiği anlaşılmaktadır. Bu oranlardaki farklılaşmanın aynı zamanda
operasyonel ve nakit döngü sürelerinde direkt olarak etkisi de göze çarpmaktadır.
Tablo 14 – İmalat Sektörleri Verimlilik Oran Ortalamaları
2019 2020
Varlıkların Dönme Cabukluğu 1,06 0,86
Alacakların Devir Hızı 6,01 6,87
Alacak Tahsilat Süresi 110,71 119,85
Stok devir hızı 5,49 4,93
Stok tüketim süresi 125,64 152,11
Borç dönme çabukluğu 4,31 4,02
Borç ödeme süresi 106,70 118,40
Operasyonel döngü süresi 211,70 240,73
Nakit döngü süresi 318,53 359,00
İmalat sektörlerini genel olarak değerlendirdiğimizde salgın sürecinden olumsuz etkilenmedikleri
görülmekte, hatta likidite ve karlılık açısından olumlu etkilendikleri de tespit edilmektedir. Verimlilik
oranları açısından farklılıklar görülse de bu farklılıkların salgın sürecindeki operasyonel etkilerden kaynaklı
olduğu anlaşılmaktadır.
5. SONUÇ Salgın dünyada ve Türkiye’de birçok sektör ve firmayı etkilemiştir. Türkiye’de geçici ve dönemsel
kapamalar olsa da 2020 yılı içerisinde sanayi ve hizmet faaliyetleri belli koşullarda devam etmiştir.
Literatür araştırmasından özellikle salgının ilk dönemlerinde belli sektörlerin olumsuz etkilendiği
anlaşılmaktadır. Araştırmamızda daha çok 2020 yılı bir bütün olarak alınmış ve salgın öncesi bir bütün
dönem olarak 2019 yılı ile karşılaştırılmıştır. Bu karşılaştırma salgından etkilenen hizmet odaklı sektörler,
salgından etkilenmeyen hizmet odaklı sektörler ve imalat sektörleri atında 3 bölümde yapılmıştır.
Genel olarak ilk grupta ele alınan salgından etkilenen hizmet odaklı sektörlerde özellikle satışların oranda düşmesi ve buna bağlı olarak karlılıklarındaki ciddi düşüş göze çarpmaktadır. Bununla birlikte likidite ve
borç oranlarındaki dengenin korunmuş olması sürdürülebilirlik açısından değerli görülmektedir. Salgının
ilk aylarının baz alındığı çalışmalarda bu gruptaki firmaların genelde çok olumsuz etkilendiği ortaya
konulmuştur. Fakat yıl içinde alınan doğru kararlar ile belli bir dengeyi de sağladıklarını da anlıyoruz.
İkinci grupta incelediğimiz salgından etkilenmeyen hizmet odaklı sektörler için tüm finansal oranlarda
salgın öncesi ve salgın dönemi arasında kayda değer bir farklılık saptanmamıştır. Hatta likidite ve karlılık
oranlarındaki iyi yönde değişim bu sektörlerin etkilenmediği veya olumlu etkilendiğini doğrulanmaktadır.
Burada özellikle ilaç sektöründe firmalar bir miktar daha olumlu etkilenme göstermiştir.
İmalat sektörlerin genel olarak değerlendirdiğimizde salgın sürecinden olumsuz etkilenmedikleri
görülmekte, hatta likidite ve karlılık açısından olumlu etkilendikleri de tespit edilmektedir. Verimlilik

International Engineering and Technology Management Summit 2021– ETMS2021
İstanbul Technical University & Bahçeşehir University
83
oranları açısından farklılıklar görülse de, bu farklılıkların salgın sürecindeki operasyonel etkilerden
kaynaklı olduğu anlaşılmaktadır.
Salgın durumunun devam etmesi bu firmaların uzun dönem performanslarını etkileyeceği muhakkaktır. Bu
analiz çalışmasının daha sonraki dönemleri de içine alacak şekilde tekrar yapılması uzun dönemdeki
etkilerin anlaşılabilmesine olanak tanıyacaktır.
KAYNAKÇA Akbulak, Y. (2020). “Covid-19 salgının ekonomik etkileri için ne yaptık?” Erişim tarihi: 15.05.2021,
https://www.dunya.com/kose-yazisi/covid-19-salginininekonomik-etkileri-icin-ne-yaptik/470268
Bahar, O. & İlal, N. (2020). ” Coronavirüsün (Covid-19) turizm sektörü üzerindeki ekonomik etkileri”,
International Journal of Social Sciences and Education Research, Cilt 6, Sayı 1, 125 - 139
Eroğlu, E. (2020). “Covid-19’un Ekonomik Etkilerinin ve Pandemiyle Mücadele Sürecinde Alınan
Ekonomik Tedbirlerin Değerlendirilmesi”, International Journal of Public Finance, 5(2), 211-236.
Gümüş A., Hacıevlıyagıl, N. (2020). “Covid-19 Salgın Hastalığının Borsaya Etkisi: Turizm Ve Ulaştırma
Endeksleri Üzerine Bir Uygulama”. Journal of Academic Approaches, C: 11 S: 1 YIL: 2020
Kılıç, Y. (2020). “The Effect of COVID-19 (Coronavirus) in Borsa Istanbul”. Journal of Emerging
Economies and Policy 2020 5(1) 66-77
Koyuncu, T. Meçik, O. (2020). “Covid-19 Pandemisinin Türkiye'de Ekonomik Büyümeye Sektörel Ve
Sektörler Arası Etkileri”, Yönetim ve Ekonomi Araştırmaları Dergisi Cilt/Volume: 18 Sayı: 4
Aralık 2020 ss./pp. 112-131
Nakiboğlu, A. & Işık, S. (2020). “Kovid-19 Salgınının Ekonomi Uzerindeki Etkileri: Türkiye’de İşletme
Sahipleri Uzerinde Bir Araştırma”, Turkish Studies, Volume 15,765-789,
http://dx.doi.org/10.7827/TurkishStudies.43368
Orhan, Z. H. Tırman, N.(2020). “Analysis of the Impact of Covid-19 on Different Sectors in Turkey During
Early Periods of the Pandemic” İşletme Araştırmaları Dergisi, (Journal Of Busıness Research-
Turk) 2020, 12(2), 2312-2326 https://Doi.Org/10.20491/İsarder.2020.978
Zeren, F., & Hızarcı, A. (2020). “The Impact of COVID-19 Coronavirus on Stock Markets: Evidence from
Selected Countries”. Muhasebe ve Finans İncelemeleri Dergisi, 3(1), 78-84.

International Engineering and Technology Management Summit 2021– ETMS2021
İstanbul Technical University & Bahçeşehir University
84
DABT-IPA ASI DAĞITIM PLANLAMASINDA KANTİTATİF YAKLASIM:
İSTANBUL-MALTEPE İLCESİ Örneği (COVID-19 DÖNEMİ)
Büşra Bostancıoğlu Pınar Ozcanlı-Baran
İstanbul Teknik Universitesi İstanbul Teknik Universitesi
İşletme Mühendisliği Şehir ve Bölge Planlama
Rana Ezgi Köse Ferhan Çebi
İstanbul Teknik Universitesi İstanbul Teknik Universitesi
İşletme Mühendisliği İşletme Mühendisliği
ABSTRACT
The COVID-19 virus, which threatens the whole world and is called a pandemic by the World Health
Organization (WHO), was first seen on 31 December 2019. During the epidemic in Turkey, schools were
closed due to the danger of contamination and education is carried out as online education. The DaBT-IPA
(Diphtheria, Acellular Pertussis, Tetanus, Inactive Polio Vaccine) vaccine, which is made by the Ministry
of Health and is compulsory in the first grades of primary school, could not be applied because the schools
were closed during this period. In this direction, a real-life case has been simulated in the vaccination
centers to be selected and the process of directing the vaccines to be supplied to the selected places so that
the DaBT-IPA vaccine can be given to first-year primary school students. In order to solve the related
problem in the study, linear and integer programming are applied.
Keywords: Integer Programming, Linear Programming, Vaccine Distribution Centers, Vaccine Supply

International Engineering and Technology Management Summit 2021– ETMS2021
İstanbul Technical University & Bahçeşehir University
85
1. GİRİS Aşılama, çocukların ve yetişkinlerin sağlığını korumada ve bulaşıcı hastalıkları önlemede en etkili, en
güvenilir ve maliyet etkin yaklaşımdır. Aşılama alanındaki gelişmelere paralel olarak ulusal bağışıklama
çizelgelerinin güçlendirilmesi ve gelişmelerin hayata geçirilmesi kaçınılmaz olmuştur. Doğal olarak her
ülkenin kendi sosyal koşullarına, hastalıkların görülme sıklığına ve mali durumuna göre bir ulusal aşı
takvimi uygulaması beklenmektedir (Arısoy vd. 2015). Dünya Sağlık Orgütü (DSO) 1974 yılında bağlattığı
“Genişletilmiş Bağışıklama-EPI Programı” kapsamında aşının özellikle çocuk sağlığı açısından önemine
vurgu yapmıştır (Ayçiçek, 2004). Ulkemizde 1981 yılında Sağlık Bakanlığı tarafından başlatılan
"Genişletilmiş Bağışıklama Programı" (GBP), 1985 yılından sonra "Türkiye Aşı Kampanyası" ile ivme
kazanmış ve kapsamı giderek genişletilmiştir (Arslan ve Gülcü, 2018).
Bu kapsamda okullarda uygulanan çocuk aşılarından biri de DaBT-İPA adındaki dörtlü karma aşıdır. Bu
aşı; Difteri, Aselüler Boğmaca, Tetanoz ve İnaktif Cocuk Felci adındaki ağır seyreden ve sıklıkla ölümle
sonuçlanabilen dört hastalığa karşı etkili, karma, ölü bakteri ve virüs aşısıdır. Türkiye’de bu aşı Sağlık
Bakanlığı tarafından birinci sınıflarda zorunlu olarak uygulanmaktadır. Ancak 2019 yılında başlayan ve
günümüzde hala etkin olarak devam eden COVID-19 pandemisi sebebiyle örgün öğrenime ara verilmiş ve
uzaktan eğitim modeline geçiş yapılmıştır. Bu sebeple DaBT-İPA aşılaması kesintiye uğramış ve 2020-
2021 eğitim-öğretim yılında ilkokul birinci sınıfa başlamış olan öğrencilerin aşısı tamamlanamamıştır.
2021-2022 eğitim-öğretim döneminde yüzyüze eğitim modeline yeniden geçiş yapılması beklenirken,
öğrenciler için önem arz eden bu aşının tamamlanması oldukça önem arz etmektedir.
Aşı merkezi seçim ve dağıtım problemi literatürde sıkça karşılaşılan bir problem olmakla beraber, özellikle
COVID-19 döneminden sonra önemi gittikçe artmıştır. Aşı dağıtım problemi, dağıtım problemlerinden biri
olarak kabul edilmektedir. Dağıtım problemleri literatürde farklı bilim insanı tarafından çalışılmış ve çeşitli
yöntemler önerilmiş bir problemdir. Weber A. (20.yy. başlarında), çalışmasında üç talep noktasından
birisini taşıma maliyeti minimum olacak şekilde diğer iki tesise hizmet veren tesis olarak belirlemeye
çalışmıştır. Talep noktaları ile hizmet noktası arasındaki toplam mesafeyi minimum kılmak için bir model
ortaya koymuştur. Revelle, C., ve Hogan, K., tarafından yapılan çalışmada, bir talep noktasının ikinci defa
kapsanması olarak ifade edilen yedek kapsamayı, acil servis istasyonlarının yerleşiminin modellenmesinde
bir karar kriteri olarak önerilmiştir (Hogan ve ReVelle, 1986). Bu çalışmada 2 farklı yedek kapsama modeli
ortaya konmuştur. Silva vd, grip aşısına yönelik politika belirlenmesinde matematiksel modelleme
yöntemlerinden yararlanmıştır (Silva vd, 2015). Song, vd. (2015), çalışmasında hastane yer seçimi için,
tamsayılı doğrusal programlama ve lagrange yöntemi kullanarak Pekin’de bir vaka çalışması yapmışlardır.
(Yarmand vd, 2014), aşılamanın iki aşamada gerçekleştiği bir karar verme sürecini ortaya koymuşlardır.
Bu çalışmanın ilk aşamasında sınırlı sayıda aşı dozları hastalığın yayıldığı bölgelere dağıtılmış, İkinci
aşamada ise ek dozlar hastalığın patlak vermediği diğer bölgelere tahsis edilmiştir. Her bölgedeki salgının
yayılma durumuna göre farklı aşı miktarlarının uygulanacağı bir model simülasyonu oluşturulmuştur. Aşı
tahsisini iki aşamalı bir stokastik doğrusal programla (2-SLP) ile tanımlamışlar ve lineer programlama
yönteminden faydalanmışlardır. Bununla birlikte aşı dağıtım probleminde kullanılması planlanan diğer bir
yöntem de küme örtüleme problemidir. Güngör ve Eroğlu, (1997), Küme Ortüleme Problemi’nin yapısal
özelliklerini ve problemlerin çözüm yollarını araştırmanın ardından bir iş yerindeki (iş takibi vb. amaçlarla)
yerleştirilecek gözetleme kulelerinin optimum yerleşim planı için bir uygulama geliştirmişlerdir. Belirli bir
alanın gözetlenebilmesi için minimum maliyetli gözetleme kulelerinin yerleşim yerlerinin belirlenmesi
şeklinde bir küme örtüleme problemi tanımlanmaktadır. Bu şartlara uyan kule yerleri modele dâhil edilerek
maliyet minimizasyonu bakımından en uygun kule yerleri belirlenmiştir. Bu çalışmada, aşı merkezlerinin
belirlenmesinde küme örtüleme probleminden faydalanılmıştır.
Bu çalışmada Maltepe İlçe Sağlık Müdürlüğü adına, 2020-2021 eğitim-öğretim yılında ilkokul birinci sınıfa
giden öğrencilerin aşılanması için seçilecek aşı yerlerinin belirlenmesi ve seçilen yerlere tedarik ile ilgili
aşılama süreci ile ilgili olası bir gerçek yaşam vakası simüle edilmiştir.
Problemin ilk aşamasında aşı merkezlerinin hangi mahallelerde açılacağı tespit edilmiş, ikinci aşamada ise
seçilen hastanelerden hangi mahalleye ne kadar aşı gideceği belirlenmiştir. İlk aşama aşı merkezlerinin
optimal lokasyonlarının seçilmesi küme kapsama problemidir (set covering problem). Bu aşamada
kurulması planlanan aşı merkezleri sadece seçilen mahallede muhtarlıklara yakın kurulabilmektedir. İkinci
aşamada da seçilen hastanelerden (aşı tedarik eden) kurulan aşı merkezlerine aşı dağıtımı nasıl yapılacağı
planlanmaktadır. Burada mesafe ve hastanenin devlet ya da özel olmasına göre minimum maliyetle
sağlanmasının amaçlandığı bir ulaşım sorunudur.

International Engineering and Technology Management Summit 2021– ETMS2021
İstanbul Technical University & Bahçeşehir University
86
2. METOD VE UYGULAMA Küme örtüleme problemi 0-1 tam sayılı programlama modelinin özel bir uygulamasıdır. Küme kapsama
modelinde tüm çocukların kapsanması ve aşılamanın optimal şekilde sağlanması için maliyeti de minimum
yapacak model ortaya konmuştur.
2.1 Model 1 Model 1 kapsamında kurulacak aşı merkezleri lokasyonlarının belirlenmesi amaçlanmıştır.
Varsayımlar
• Aşı merkezleri sadece ilçenin mahalle muhtarlıklarına kurulabilir.
• Mahalle muhtarlıkları tüm mahalleyi temsil eder.
• Mahalle muhtarlığında aşı merkezi varsa o mahalle kapsanır.
• Mahalle muhtarlığında aşı merkezi yoksa o mahalle ancak o mahallenin muhtarlığına 2 km veya daha
az mesafede olan bir aşı merkezinde aşılanabilir.
• Bir aşı merkezinin kaç mahalleyi kapsayabileceği konusunda bir sınır yoktur.
• İlçedeki aşılanma sadece ilçe sınırları içindeki mahalle muhtarlıklarında yapılmaktadır.
• Mahalle muhtarlıkları arasındaki mesafe en kısa yürüme yoluna göre hesaplanmıştır.
• İlçede en fazla 5-9 yaş nüfusa sahip mahallede aşı merkezi bulunması zorunludur.
Oncelikle mahalle birimlerinin konumları belirlenmiştir ve “Google Haritalar” kullanılarak mahallelerin uzaklık matrisi oluşturulmuştur (Tablo 2). Tablo 1'de ise mahalle adlarında basitlik sağlamak adına
oluşturulan lejant görülmektedir.
Tablo 1. Mahalle lejantları
Mahalle Kısaltma Mahalle Kısaltma
Altayçeşme AC Feyzullah FE
Altıntepe AT Fındıklı FI
Aydınevler AE Girne GI
Bağlarbaşı BB Gülensu GU
Başıbüyük BU Gülsuyu GUL
Büyükbakkalköy BK İdealtepe I
Cevizli C Küçükyalı K
Cınar CI Yalı Y
Esenkent E Zümrütevler Z
Maltepe ilçesi 18 mahalleden oluşmaktadır; Altayçeşme, Altıntepe, Aydınevler, Bağlarbaşı, Başıbüyük,
Büyükbakkalköy, Cevizli, Cınar, Esenkent, Feyzullah, Fındıklı, Girne, Gülensu, Gülsuyu, İdealtepe,
Küçükyalı, Yalı, Zümrütevler.
Tablo 2. Mahallelerin uzaklık matrisi
Mahalleler AC AT AE BB BU BK C CI E FE FI GI GU GUL I K Y Z
AC 0 3,7 2,8 1,7 4,6 9,1 2,4 2,1 4 0,7 6 2,1 3,4 2,7 1,6 2,9 1,5 2,1
AT 3,7 0 2,5 4,3 5,5 10,5 5,7 1,6 7,2 3,9 3,1 4,3 6,5 5,9 2,7 1,5 4,5 5,1
AE 2,8 2,5 0 3,5 3,1 8,3 5 1,5 5,5 3,3 4,2 2,1 4,6 4,3 1,6 1 4,1 2,8
BB 1,7 4,3 3,5 0 4,5 8,7 1,8 2,9 3,4 0,8 6,9 2,3 2,9 2,4 2,4 3,8 1,1 2,2
BU 4,6 5,5 3,1 4,5 0 5,3 5,7 4,6 5,9 4,8 5 2,6 4,5 4,6 4,2 4,2 5,5 3,2
BK 9,1 10,5 8,3 8,7 5,3 0 9,2 9,6 7,2 10,4 8,4 7,7 6,4 7,4 9,6 9,1 9,5 7,4
C 2,4 5,7 5 1,8 5,7 9,2 0 4,3 2,5 2,1 8,2 3,6 3,1 2,2 3,8 5,1 2,6 2,6
CI 2,1 1,6 1,5 2,9 4,6 9,6 4,3 0 5,8 2,4 4,1 3,1 5 4,5 1,1 1 3,3 3,8
E 4 7,2 5,5 3,4 5,9 7,2 2,5 5,8 0 4,1 9,3 3,8 1,5 1,5 5,3 6,1 4 2,9
FE 0,7 3,9 3,3 0,8 4,8 10,4 2,1 2,4 4,1 0 6,4 2,6 1,5 3,1 2,1 3,3 1 2,6
FI 6 3,1 4,2 6,9 5 8,4 8,2 4,1 9,3 6,4 0 6 8,8 8,3 4,6 3,2 7,3 6,8
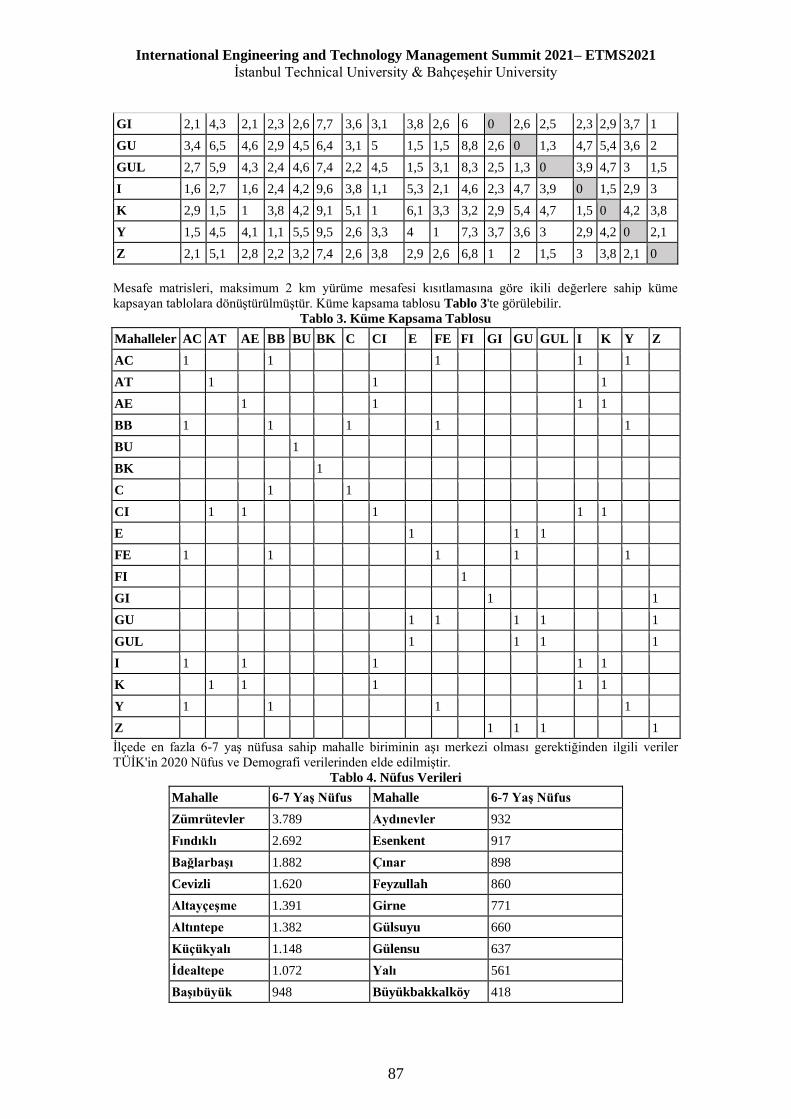
International Engineering and Technology Management Summit 2021– ETMS2021
İstanbul Technical University & Bahçeşehir University
87
GI 2,1 4,3 2,1 2,3 2,6 7,7 3,6 3,1 3,8 2,6 6 0 2,6 2,5 2,3 2,9 3,7 1
GU 3,4 6,5 4,6 2,9 4,5 6,4 3,1 5 1,5 1,5 8,8 2,6 0 1,3 4,7 5,4 3,6 2
GUL 2,7 5,9 4,3 2,4 4,6 7,4 2,2 4,5 1,5 3,1 8,3 2,5 1,3 0 3,9 4,7 3 1,5
I 1,6 2,7 1,6 2,4 4,2 9,6 3,8 1,1 5,3 2,1 4,6 2,3 4,7 3,9 0 1,5 2,9 3
K 2,9 1,5 1 3,8 4,2 9,1 5,1 1 6,1 3,3 3,2 2,9 5,4 4,7 1,5 0 4,2 3,8
Y 1,5 4,5 4,1 1,1 5,5 9,5 2,6 3,3 4 1 7,3 3,7 3,6 3 2,9 4,2 0 2,1
Z 2,1 5,1 2,8 2,2 3,2 7,4 2,6 3,8 2,9 2,6 6,8 1 2 1,5 3 3,8 2,1 0
Mesafe matrisleri, maksimum 2 km yürüme mesafesi kısıtlamasına göre ikili değerlere sahip küme
kapsayan tablolara dönüştürülmüştür. Küme kapsama tablosu Tablo 3'te görülebilir.
Tablo 3. Küme Kapsama Tablosu
Mahalleler AC AT AE BB BU BK C CI E FE FI GI GU GUL I K Y Z
AC 1 1 1 1 1
AT 1 1 1
AE 1 1 1 1
BB 1 1 1 1 1
BU 1
BK 1
C 1 1
CI 1 1 1 1 1
E 1 1 1
FE 1 1 1 1 1
FI 1
GI 1 1
GU 1 1 1 1 1
GUL 1 1 1 1
I 1 1 1 1 1
K 1 1 1 1 1
Y 1 1 1 1
Z 1 1 1 1
İlçede en fazla 6-7 yaş nüfusa sahip mahalle biriminin aşı merkezi olması gerektiğinden ilgili veriler
TUİK'in 2020 Nüfus ve Demografi verilerinden elde edilmiştir.
Tablo 4. Nüfus Verileri
Mahalle 6-7 Yaş Nüfus Mahalle 6-7 Yaş Nüfus
Zümrütevler 3.789 Aydınevler 932
Fındıklı 2.692 Esenkent 917
Bağlarbaşı 1.882 Cınar 898
Cevizli 1.620 Feyzullah 860
Altayçeşme 1.391 Girne 771
Altıntepe 1.382 Gülsuyu 660
Küçükyalı 1.148 Gülensu 637
İdealtepe 1.072 Yalı 561
Başıbüyük 948 Büyükbakkalköy 418

International Engineering and Technology Management Summit 2021– ETMS2021
İstanbul Technical University & Bahçeşehir University
88
Zümrütevler, Maltepe'de en yüksek 6-7 yaş nüfusa sahip olduğundan, her durumda bir aşı merkezine sahip
olması gerekmektedir.
İndeksler
i: mahalle
j: mahalle
Parametreler
dit = {1, eğer i ve j mahalleleri arasındaki mesafe 2 km'den az ise
0, Diğer
Değişkenler
xj = {1, eğer j. mahallede aşı merkezi açıldıysa
0, Diğer
Amaç Fonksiyonu
𝑀𝑖𝑛𝑖𝑚𝑖𝑧𝑒 𝑍 = ∑ 𝑥𝑖𝑁𝑗=1
Kısıtlar
∑ 𝑑𝑖𝑗 ∗ 𝑥𝑗𝑁𝑗=1 ≥ 1 ∀𝑖 (1)
𝑥𝐸𝑛 𝑓𝑎𝑧𝑙𝑎 𝑛ü𝑓𝑢𝑠𝑎 𝑠𝑎ℎ𝑖𝑝 𝑚𝑎ℎ𝑎𝑙𝑙𝑒 = 1 (2)
𝑥𝑖𝑗 ∈ 0,1 (3)
Model 2 Model 2 için ilçelerdeki kamu ve özel hastanelerden ne kadar aşı temin edileceğinin belirlenmesi birincil
girdi olmuştur.
Varsayımlar
• Aşılar aşı merkezlerine sadece ilçe sınırları içerisinde bulunan seçilmiş hastanelerden temin edilebilir.
• Bir hastane birden fazla merkeze aşı tedariki sağlayabilir veya hiçbirine sağlamayabilir.
• Hastanelerin aşı temini aşağıdaki şekilde hesaplanmıştır;
• Seçilen hastanelerin toplam acil servis çalışanı toplamı ilçenin toplam 5-6-7 yaş nüfusu ile
orantılanmıştır ve her hastanenin temin edebileceği aşı miktarı bu orana göre %25’lik bir fazlalık ile
belirlenmiştir.
• Bir ünite aşının nakliye maliyeti, devlet hastanesi kaynaklı ise 1,00 TL, özel hastane kaynaklı ise 1,30
TL olacaktır.
Model 2 varsayımlarına dayalı olarak, hastanelerin aşı tedarik kapasiteleri belirlenmiştir ve Tablo 5’te
belirtilmiştir.
Tablo 5. Hastaneler, acil servis çalışan sayısı ve maksimum aşı kapasiteleri
Hastaneler Acil Servis Calışanı Maksimum Aşı Kapasitesi
MD 15 6414
MU 9 3849
MP 18 7697
SP 18 7697
BA 6 2566
TOPLAM 66 28223
Tablo 6, Model 1'de bulunan optimum muhtarlıklar ile hastaneler arasındaki kilometre cinsinden uzaklıkları
içeren matristir. Matris, daha önce bulunan aşı tedarik kapasiteleri ve Model 2 için belirtilen maliyet
varsayımlarına dayalı olarak GAMS'e girdi olarak verilmiştir.

International Engineering and Technology Management Summit 2021– ETMS2021
İstanbul Technical University & Bahçeşehir University
89
Tablo 6. Muhtarlıklar ile hastaneler arasındaki mesafe (km)
Hastaneler/ Mahalleler BB BU BK CI FI GU Z
MD 1,70 3,90 8,50 2,80 6,30 3,50 2,20
MU 0,45 4,50 8,80 3,00 6,60 3,20 2,50
MP 2,00 7,00 9,90 4,20 7,90 3,10 3,50
SP 4,30 1,30 6,60 4,80 4,30 4,40 3,00
BA 3,00 7,20 10,80 5,20 9,00 4,20 4,50
İndeksler
i: hastane tipi
j: mahalle
Parametreler
Si: i hastanesinin tedarik kapasitesi
Dj: j mahallesinin aşı talep miktarı
Hi: i hastanesinden tedarik maliyeti
Cij: i hastanesinden j mahallesine olan mesafe
Değişkenler
xij: i hastanesinden j mahallesine gönderilen toplam aşı miktarı
Amaç Fonksiyonu
𝑀𝑖𝑛𝑖𝑚𝑖𝑧𝑒 𝑍 = ∑ ∑ 𝐶𝑖𝑗 ∗ 𝐻𝑖 ∗ 𝑥𝑖𝑗 𝑅𝑗=1
𝑁𝑖=1
Kısıtlar
∑ 𝑥𝑖𝑗𝑁𝑖=1 ≥ 𝐷𝑖 ∀𝑗 (1)
∑ 𝑥𝑖𝑗𝑅𝑗=1 ≤ 𝑆𝑖 ∀𝑖 (2)
𝑥𝑖𝑗 ≥ 0 (3)
3. BULGULAR Modeller GAMS yardımıyla çözülmüştür. Model 1’den elde edilen bulgulara göre Bağlarbaşı, Başıbüyük,
Büyükbakkalköy, Cınar, Fındıklı, Gülensu ve Zümrütevler'de aşı merkezi kurulması gerekmektedir.
Model 2’den elde edilen bulgular aşağıdaki tabloda görülmektedir.
Tablo 7. Aşı merkezi kurulması gereken mahalleler ve aşı gönderecek hastanelerin göndereceği aşı
miktarı
Hastanelerin Tedarik Ettiği Aşı Miktarı BB BU BK CI FI GU Z
Maltepe Devlet 61 0 0 5.432 0 0 921
Maltepe Üniversitesi 3.849 0 0 0 0 0 0
MedicalPark 2.405 0 0 0 0 2.215 0
SüreyyaPaşa Göğüs 0 948 418 0 2.692 0 3.639
Bezmialem 0 0 0 0 0 0 0

International Engineering and Technology Management Summit 2021– ETMS2021
İstanbul Technical University & Bahçeşehir University
90
4. TARTISMA VE SONUÇ COVID-19 salgını dünya çapında sağlık krizine sebep olmuştur. Bu dönemde yapılan kısıtlamalar ve evde
kal çağrılarıyla yüz yüze eğitim yerine uzaktan eğitime devam edilmiştir. Okulların açılmaması sebebiyle
ilkokul birinci sınıf öğrencilerine yapılan DaBT-İPA aşısı yapılamamıştır. Calışma aşı yapılamayan ilkokul
birinci sınıf öğrencileri için aşı merkezlerinin seçimini ve bu merkezlere aşı tedarikini içermektedir. Ornek
alan olarak Maltepe ilçesi seçilmiştir. Yapılan hesaplamalar sonucunda optimal bir çözüm veren ilçenin
İstanbul’un diğer ilçeleri için örnek niteliğinde olması beklenmektedir. İstanbul’un tüm ilçelerine uygulama
aşamasının ardından Türkiye’deki diğer şehirlere de genelleştirilebilir. Kabul edilen varsayımların diğer
ilçe ya da şehirlerarasında farklılık göstermesi sebebiyle diğer bölgelerde farklı varsayımlara ihtiyaç
duyulabilir. Her bölgenin çocuk nüfusu ve aşılama merkezlerinin kapasitesi farklı olabilir.
Calışmada ilkokul birinci sınıf öğrencilerinin okula başlama yaşı 6 ve 7 yaş aralığında değiştiği için üç yaş
grubundaki Maltepe’deki çocuk nüfusu dikkate alınmıştır.
İkinci modelde aşı tedarik etme birim fiyatının özel ve kamu hastanesi olması ile ilişkili olduğu
varsayılmıştır. Ancak bu durum özel ya da kamu fark etmeksizin birim fiyatı değişebileceği göz önünde
bulundurulmalıdır.
Sonuçta bu çalışma yalnızca Maltepe bölgesinde belirli kısıtlar altında yapılmıştır. Aşı merkezlerinin seçimi
için optimal çözüm üretilmiştir.
REFERANSLAR Arısoy, E., Ciftçi, E., Hacımustafaoğlu, M., Kara, A., Kuyucu, N., Somer, A., & Vardar, F. (2015). Clinical
Practical Recommendations for Turkish National Vaccination Schedule for Previously Healthy
Children (National Vaccination Schedule) and Vaccines not Included in the Schedule - 2015. National
Vaccination Schedule and Additional Vaccines, 1-11.
Ayçiçek, A. (2004). Şanlıurfa Kırsal Alanında 2-23 Aylık Cocukların Aşılanma Hızı. Cocuk Sağlığı ve
Hastalıkları Dergisi, 183-188.
Gülcü, S., & Arslan, S. (2018). Cocuklarda Aşı Uygulamaları: Güncel Bir Gözden Geçirme . Düzce
Universitesi Sağlık Bilimleri Enstitüsü Dergisi, 34-43.
Güngör, İ., & Eroğlu, A. (1997). Küme Ortüleme Problemi ve Bir Uygulama. Süleyman Demirel
Universitesi İktisadi ve İdari Bilimler Fakültesi Dergisi, 377-386.
Hogan, K., & ReVelle, C. (1986). Concepts and Applications of Backup Coverage. Management Science,
1434-1444.
Liu, C., Li, B., & Song, L. (2015). Optimal selection of location for community hospitals a case of
Huilongguan region in Beijing. International Conference on Information and Automation, Lijiang.
Çhina.
Silva, M., Perrier, L., Cohen, J., Paget, W., Mosnier, A., & Späth, H. (2015). A literature review to identify
factors that determine policies for influenza vaccination. Health Policy, 697-708.
Yarmand, H., Ivy, J., Denton, B., & Lloyd, A. (2014). Optimal two-phase vaccine allocation to
geographically different regions under uncertainty. European Journal of Operational Research, 208-
219.

International Engineering and Technology Management Summit 2021– ETMS2021
İstanbul Technical University & Bahçeşehir University
91
DATA MINING FOR CROWDFUNDING: EXPLORING THE BACKERS OF
NEW GAMES: IN-PLAYER COMMUNITIES
Can Aydalga Nihan Yıldırım
Istanbul Technical University Istanbul Technical University
ABSTRACT In memory of our beloved Professor Selime Sezgin (1952-2020), who the authors of this paper had the honour of
being her student, we wrote this paper following the findings of a master thesis she co-instructed.
Collaborative open innovation approaches like user-led innovation, co-development and crowdfunding in
the video game industry emerged as determinants of entrepreneurial success, especially for indie and small
scale game development projects. Primarily lead users may act as supporters or backers in independent
game production. In economic slowdown, increased budget constraints, and limited investment funds,
options like crowdfunding may remedy entrepreneurs. However, limited studies exist on understanding the
potential supporters and funders in the game development industry. On the other hand, gamers hardly accept
participating in interviews and surveys, challenging the field research on gamers’ opinions. Though gamer
communities as established social networks may offer big, valuable data, the application of data mining or
machine learning methods on gamer community data is still rare in research and practice, even in this era
of data analytics. This paper aims to explore the users in the gamer community with the potential to be
backers in crowdfunding projects of video game development and the applicability of data mining methods
on community data. As a case study, we used basic clustering and classification methods (K-means and K-
Nearest Neighbor) to identify game players who have positive opinon towards participating in the
crowdfunding. Acceptable accuracy in classification and meaningful clusters was provided by mining the
gamers’ data without any bias. The proposed model and its derivations may enable the rapid identification
of collaborative users and backers in various contexts of user involvement in game development projects.
Keywords: Game Development, Data Mining, Crowdfunding, Open Innovation

International Engineering and Technology Management Summit 2021– ETMS2021
İstanbul Technical University & Bahçeşehir University
92
1. INTRODUCTION Developers are key players in this value chain of the video games industry. Production of video games for
consoles and PC is characterized by high initial development costs, which are generally assumed by
publishers (Gonzalez-Piñero, 2017). However, for independent game development, which stands as a
promising channel with the potential of utmost creative and radical innovativeness, crowdfunding can help
develop and deploy independent games in the video game market in all regions of the world. Crowdfunding
has grown in recent years, especially with the advancement of Kickstarter and similar websites, enabling
the small-sized video game development companies’ access to funds (Gaskel, 2016).
Most of the academic studies regarding video games explored players' engagement to games (Smith, 2014;
Cole and Griffiths, 2007). Moreover, there is a significantly increasing trend for user-led innovation and
crowdfunding in the video game industry. The involvement of the video game players in the production
process became a necessity for the developers to secure funds for their game development projects and to
form a gamer community around their products. Smith (2014) claimed that while communication between
developers and video game players are somewhat limited in the games during development is under the
purview of publishers, the interaction between game developers and players continue all through the
development process within the crowdfunding sphere. Using social network data enables large sample sizes
and adapting mining and learning algorithms to the problem domain.
Providing an alternative contemporary model of project and entrepreneurship financing platforms to
support new product development, hence innovativeness. Crowdfunding opens requests to potential funders
and backers in exchange of monetary or non-monetary returns (Belleflamme et al., 2010). Using the power
of crowds through microfinance, it changes the paradigms of traditional funding with the rise of web-based
technologies and applications (Gierczak et al., 2016). Stakeholders of a crowdfunding platform are the
campaigner looking for financing for their projects, the backers or funders of the project by a micro return
expectation from it and the intermediary platform like Kickstarter (Tomczak and Brem, 2013). According
to Bouncken et al. (2015), utilizing social media plays a critical role in enhancing funders' engagement.
In the literature review, the effects of social networks on crowdfunding as an empirical research subject
consider that the interlinks between the funder and the developer are determining the success of
crowdfunding. In this context of co-development and open innovation, this effect offers a research
opportunity to explore gamers' intentions or potentials on taking part in crowdfunding of game development
projects. Though there is criticism about the adaptability of data mining or machine learning techniques to
research in social sciences or business research discipline (Hall, 2018), this study attempts to contribute to
the efforts to open a gateway among rising disciplines of innovation management and data analytics. We
also present a case study on predicting the potential backers from the gamer community in independent
game development projects.
Hence, this research topic's motivation is rooted in the fact that there are only limited studies on
crowdfunding on game development industry and very few examples that utilize data mining in this
domain. Game communities are unique kinds of social networks with intense interaction and rapid
communication. Since interviewing and surveying gamers on their intentions has been a challenge for
researchers, using data analytics to explore gamers' characteristics or opinions in communities stands as a
promising option. Though we are in an era of data analytics, gamer communities are rarely utilized to
determine the lead users and understand users' intentions for participating in co-development and co-
funding processes.
By using the filtering technique in limiting the Steam Community member data by “taking part in threads
or discussions which included the “crowdfunding” keyword”, we naively conducted a content analysis as
a parallel technique, which is widely adapted in using basic algorithms of k-means for clustering and K
nearest neighbor for classification in data mining practices.
For theoretical contribution, besides revisiting the importance of co-development, user-led open innovation
and co-funding concepts in the video and digital game industry, this study aims to develop a model for
predicting crowdfunders in game development through basic data mining methods. Though rarely adopted
yet, predictive techniques are expected to be a solid methodological option in marketing, CRM, financing
fields in the new future. Our case is a sample of using data mining method without a need of coding, through
using widely used and easily accessible data analysis tools (like Weka) which social scientists can utilize.
As a practical implication, game developers (Especially independent and indie game genres) can utilize
crowdfunding to finance their projects. In this case, they can revisit gamer communities to use the social
network effect as leverage of funding. By the increasing threats of pandemics, economic slow-down,
financing the development projects stands as a challenging issue and needs new and courageous approaches
more than ever. To provide the sustainability of innovative projects and, in particular, to sustain game
development within high budget constraints, crowdfunding offers room of opportunity.

International Engineering and Technology Management Summit 2021– ETMS2021
İstanbul Technical University & Bahçeşehir University
93
By using the prediction methods which our study provided a humble but valuable use-case for being one
of the few, development team can have the chance to invite or motivate the potential backers to participate
in crowdfunding campaign. This roadmap will also enable establishing a “co-development” community
that may ramp up open innovation to build a bridge between the independent game industry and the gamer
community. In an era where individuals face the harsh reality of climate change, pandemics, economic
threats, limited mobility and forced social distances, video and digital games provide an alternative universe
where individuals can feel more free and adventurous industry matters more than before.
This study aims to explore the intentions and potentials of the lead players to be a part of game development
funding in video game industry by using data mining clustering methods on the data collected from the
game player Steam Community (having more than 125 million active users by 2015 (Saed, 2015), Study
also aims to provide a case study on the opportunities of using data mining for identifying the clusters of
users that can be collaborated during game development and specifically in crowdfunding.
After a detailed literature review on the video game industry, business models, value chain, game
development process and user involvement in development, the methodology and data collection methods
are explained in the paper. After clustering and nearest neighbour data mining methods are applied to the
Steam Community player data, findings of the potential contributor and funder gamers are presented. The
last section presents the conclusion and discussion of the results.
2. LITERATURE REVIEW
2.1 Video and Computer Game Industry
The video and computer game industry performs the development, marketing and sales of video computer
games (Zackariasson and Wilson, 2012). Johns (2006) defined video games as interactive media. Wolf and
Perron (2003) argued that terms such as electronic software, electronic games, entertainment software and
other referenced phrases used to describe video games are too broad and could include any game with
electronic components (Wong, 2011). Digital games are artistic-creative software products. Just like films,
the original audiovisual medium, digital games have become a significant form of audiovisual expression
and narrative of our digital culture, shaping our perception of the world and ourselves (Freyermuth, 2015).
As a part of interactive media, digital games enable active participation and transformation into a player
personality (Castendyk & Müller-Lietzkow, 2017).
The video game industry seems to be fragile, as it had faced a crash during 1983 and needs to be
strengthened to prevent a similar downturn which recent decline of sales reflects serious concerns.
Rossignol (2016) elaborated on the video game crash in 1983:
- It happened because video game developers and console creators rushed many sub-par video game and
console titles during the 1980s.
- The video game industry was very profitable, and to maximize profits, video and computer game
developers and console creators attacked the market as a gold rush. Plenty of companies disregarded
the quality to satisfy their needs to develop games or consoles to be a part of the race. Lack of quality
was the reason as anyone could make a video game at that time, and there was no control or supervision
of the standards.
- Hence, the market lost its trust and led to Wall Street losing its collective cool, which caused the video
game industry to demise.
- However, Nintendo Entertainment System saved the industry with quality consoles and titles like
Game Boy, Super Mario and Zelda.
Many video and computer game developers working under difficult conditions such as long working hours
without any overtime compensation are quitting their jobs to create their video games. Thus, many video
games have been rapidly created and introduced to the market in the video game industry as were in the
80s (TheNerdCritic, 2016; Gibson, 2017).
The value chain of the Video Game industry is presented with five critical sectors. Developers are the key
players in this value chain of the video games industry. Video games production is characterized by high
initial development costs that are generally assumed by publishers (Gonzalez-Piñero, 2017). The digitized
version of the game industry value chain also shifted the focus to open innovation, user involvement, and
digital funding ecosystems (Betzler, & Leuschen, 2020).
The cost of games has increased logarithmically between 1985-2017, in $M of 2017 USD on a log scale,
where the development cost was less than $1 in 1985; in 2017, it cost almost $100.000 (Koster, 2018).
However, the costs per byte of the game are rapidly decreasing in video games industry. The vast majority
of games cost under $50 million U.S. dollars to make, except triple-A console and PC titles that have
enormous budgets. Koster (2018) also points out that the games that poke out at having high revenues per

International Engineering and Technology Management Summit 2021– ETMS2021
İstanbul Technical University & Bahçeşehir University
94
byte are “evergreen” games that rely strongly on community, user-created content and player skill (sports-
like). Individuals create independent Video Games (often referred to as indie games) or small teams
without financial support from video game publishers relying on innovation design and digital distribution
(McLean, 2017). Contemporary indie games share a particular, albeit oblique, offshoot of this general
rebelliousness: nostalgia for the 8- and 16-bit eras (Lipkin, 2017). Independent video and computer games
target a niche market as there is a significant demand from the players (Vidyarthi, 2011). One of the most
critical challenges for indie games is the resources (Reichert, 2012). Because they have fewer resources
than big studios, they have much smaller teams and a low budget for technology and marketing (New York
Film Academy, 2014). Therefore, their teams have to do more than their assigned job like marketing and
customer relations. Mainly, the project director or game producer is the one to interact with the video game
players; hence this interaction is limited to the announcement of features or answering simple questions.
So, independent video game developers sometimes involve their players in their development process as
testers or promoters.
Another significant challenge for independent games is their lower brand recognition compared to the big
studios. Many outstanding games are not sold well because of their low brand recognition (Reichert, 2012).
Forums are providing a space for players to congregate and discuss tangential and often wayward topics:
- Independent games can sometimes be tangential to the community, like art sections and conversation
threads or as active as tournament hosting threads.
- In these forums, the community is created by the regulars, the most loyal and frequent players. These
regulars are most beneficial for the independent developers as they are the most vocal and most active
part of bringing other users' involvement.
- Online social presence allowed indie games to transcend beyond play and stray. They made a reason
to keep playing for years and continuing still (Pedersen, 2014).
Forums also enable developers to understand the user characteristics (Aoyama and Izushi, 2008);
Furthermore, developers care about accountability and customer relationships. Hence game developers
have to be transparent, honest and forthcoming with what they are planning and how they interact with the
game players. Therefore, development teams continuously monitor social gatherings to gauge how the
community feels about specific issues (Te, 2014). In this context, gamer communities stand as a driving
force of independent game development and a valuable shareholder in the game development ecosystems,
encouraging the usage of community data in field research on attitudes and supportive potentials in game
development.
2.2 Crowdfunding and Video/Computer Game Development
Crowdfunding is the practice of funding a project or venture by raising many small amounts of money from
a large number of people, mainly via the Internet (Goran, 2018; Prive, 2012; Solesvik, 2016). It can foster
innovation by offering new sources of capital to innovation‐driven firms and thereby reduce the funding
gap for innovative startups (Hervé and Schwienbacher, 2018; Marina, 2016; Solesvik, 2016).
Crowdfunding also offers a way for the crowd to participate in the innovation process by providing
feedback to the entrepreneur (Hervé and Schwienbacher, 2018; Claus and Krippner, 2018). Simply,
crowdfunding is to process where people can pledge money to a project. There are numerous crowdfunding
platforms, including Kickstarter, RocketHub, Indiegogo and investment platforms like 1000 Angels. While
each platform offers its unique features, the general concept is the same. Entrepreneurs can create a profile
and upload a short video that contains an introduction to their projects, a list of rewards per donation type
and some images (screenshots) to elaborate (Prive, 2012). Kickstarter is the most well-known site that
players can pledge money to their new game project. Crowdfunding is an alternative source of finance,
which has emerged outside of the traditional financial system (Hepworth, 2016). Crowdfunding campaigns
were widely searched for success in literature (Belleflamme et al., 2013, Burtch et al., 2013, Agrawal et al.,
2015, Stewart, 2009).
To be revisited in our study’s problem domain, crowdfunding literature also significantly referred to the
impact of social networks and proxies (Kaur and Gera, 2017; Frydrych et al., 2014 or Mollick and
Kuppuswamy, 2014). Kaur and Gera (2017) investigated social media as a tool to promote, publicize and
fetch funds for crowdfunding campaigns and Verschoore and Zuquetto (2016) proposed a framework based
on social network analysis for crowdfunding projects.
However, for independent games, crowdfunding is the central financial system that supports their game
projects. The player's inputs in the crowd trigger the crowdfunding process and influence the outcome of
the process where each player acts as an agent of the offering, selecting and promoting game projects that
they believe (Smith et al., 2011; Pandita, 2015). Players may play a donor role oriented towards providing
help on games due to nostalgia or genre preference (Smith et al., 2011). Recently they can buy equity and

International Engineering and Technology Management Summit 2021– ETMS2021
İstanbul Technical University & Bahçeşehir University
95
contribute to the development and growth of the offering (Prive, 2012). Likewise, developers can show
there is an audience and market for their project. In case the campaign becomes unsuccessful in the
crowdfunding process, they can provide at least market feedback.
Furthermore, crowdfunding creates a community where developers can engage with their audiences
(Wikipedia, 2017; Edwards, 2016). Players can also engage with the development process, following the
process through updates and sharing feedbacks. Also, offering early access release to the content provides
developers with instant access to good market testing feedback (Wikipedia, 2017; Edwards, 2016).
Developers are required to release features and content information of their game during the early phases
to get financial support for their games and expose themselves to the risk (Agrawal, Catalini and Goldfarb,
2014). Building a community for a video game project is a crucial thing to do for the developers. It can
affect the game outcome because without a community development team cannot understand their
mistakes; hence, Indie game developers should know how to design a video game and how to engage with
their community (Lien, 2014). The problem with the developers is that most of them work in blockbuster
triple-A games which requires specialization. However, indie game developers have to spend time in
engaging in community development more than developing their games. Avid game design theorist Stewart
(2009) stated that a commercial game has additional needs, persuading people to invest in them. Also,
developers need to repeat this persuasive case many times. As the game meets the players’ functional
expectations, players highly perceive that future games developed by the funded developer will meet their
expectations. However, game crowdfunding projects have significantly lower success rates than other
product categories (Cha, 2017).
By analyzing 447 crowdfunding campaigns, Cha (2017) explored the factors that influence the success of,
and capital pledged for campaigns in the video games industry. It was concluded that human capital,
geography, media choice, and the intensity of media use influence crowdfunding success for video games
(Cha, 2017). The ultimate responsibility of developers making a commercial game is to increase customer
satisfaction. Crowdfunding sites like Kickstarter offer independent game developers the opportunity to get
funding directly from gamers. However, unlike traditional investors, backers haven’t received any equity
in the company until recently. Fig websites, which is the brainchild of game developer Justin Bailey and
backed by Spark, allows crowdfunding backers the chance to purchase equity. Equity investment is open
to accredited investors now and will be available for the unaccredited players later. Crowdfunding will
continue to play an essential role in the game industry, especially now that more players are playing with
the game by modding and creating videos. They commit a few dollars to a project that gamers believe fits
nicely into a mindset (Gaudiosi, 2015). Thurner, Kroenert and Goersch (2019) published an article with
very similar motivations with this research of ours. However, this paper focuses on a particular case study
that analyses a German indie game developer's changing business model that tried different funding
alternatives for their game development. Thurner et al. (2019) concluded that through crowdfunding
platforms like Kickstarter, the entire development process cannot be funded as it requires high capital;
however, a combination of crowdfunding with early access and a platform specialising in early
commercialization of games can work better.
Spanish indie studio’s first game, The Game Kitchen, was an early crowdfunding case for new indie games.
The Last DoorOur that was funded episode by episode asking for tiny sums of money (the first episode
asked for a little less than £4,000), creators managed to achieve critical acclaim from their fans. They built
a nice community (Jaleo.com, 2019). It was concluded that for an indie studio, having a community
supporting game developer besides the psychological easiness of putting money in a campaign that looks
like achieving its goal if the expectations from crowdfunding the game are set low. Despite their valuable
offerings for being a signalling mechanism in crowd funding (Lin et al., 2009), using traditional social
networks for promotion can be harder than working with a gamer community to keep the excitement.
To this extent, understanding the intentions of gamers for crowdfunding within a community occur as a
critical issue for indie game development crowdfunding, which encourages the research questions of our
study.
3. METHODOLOGY Basic research questions of this research are:
- As a part of user involvement in game development, do game players/users of video games intend to take
part in crowdfunding activities?
- As a case study, can data mining be used to identify the game players interested in crowdfunding of video
game development projects?

International Engineering and Technology Management Summit 2021– ETMS2021
İstanbul Technical University & Bahçeşehir University
96
3.1 Data Collection: Using Previous Community Data rather than Surveying
In the starting point of our research, we conducted interviews and surveys with the gamers to find out their
intentions for collaborating in game development and funding. Interviewing would be very advantageous
for gaining insights on the concept we study, while surveying would enable us to use quantitative analysis
methods for reliability and validity. However, 2/3 of the gamers we contacted through e-mail for
appointment for interviews did not reply our mails, while the rest of them refused to take place in the study
as a respondent. We resent the mails to these gamers to ask whether they can take place in a survey, and
we received only 0,1% responses to our survey questions. Hence we concluded that using a survey to asking
video game players about user-led innovation fails to collect data since many video game players do not
show any interest in the video game industry except the news about their games.
However, the best available source of data was residing in Steam Community, where the data had never
been utilized to understand gamers' intentions on “taking place in co-development of games and
crowdfunding”. As a digital video game distribution platform for PC platforms, Steam has the most
members in the market. As of now, Steam had daily 13 million active users who play games. Therefore,
Steam became the most numerous and effective platform to create a sample data set. Steam is a digital
distribution platform developed by Valve Corporation to offer video games, multiplayer gaming, streaming,
and social network services. Steam provides video game players the installation and automatic upgrading
of video games and community features like friend list and groups, cloud saving and in-game voice and
chat functions (Wikipedia, 2016).
Razis et al. (2020) stated that semantics for social networks (like gamer communities) can be used in
modelling predictive solutions. In similar problem domains, data mining can be advantageous to find
patterns and relationships in the “social network data” without data collection with surveys to predict that
might affect the relevant business. However, the application of the mining and learning techniques have
been rarely adapted to open innovation context. In this context, this study attempts to overcome the data
collection problem faced by utilizing the Steam community data.
We filtered the threads and posts in the Steam Community forum using the keyword “crowdfunding” and
achieved almost 200 users who posted. After reading the posts, we eliminated the irrelevant posts and
gathered data of video game players who had relevant posts and messages. We categorized the attributes
of the nickname, hours played, number of games, membership years, activity level, preferred games,
achievements, country and opinion on crowdfunding (negative or positive). However, gathering data was
not a smooth process as some of the video game players’ accounts were hidden for the public view.
3.2 Analysis Tools- Method Selection:
We used data mining methods to examine the profile of the video game players who are in favor of or
participated in crowdfunding projects before.
Data mining is the process of searching through large data sets to identify patterns and establish a
relationship between them to solve problems (Hughes, 2017). The advantages of data mining are the ability
to find patterns and relationships in the data that may be used to predict that might affect the relevant
business. Hence, it has been chosen as the appropriate tool in this study. Data mining parameters include
Sequence or Path Analysis, Clustering, Classification and Forecasting. Clustering is a method for predicting
the instance class from pre-labelled instances. Moreover, clustering aims to find a natural grouping of
instances given un-labelled data (Stefanowski, 2008/2009; James, 2013).
This study used a simple K-means (introduced by MacQueen, 1967) clustering model To group data and
identify video game players involved in crowdfunding. The K-Nearest Neighbor classification model was
used to test the comparative accuracies. These two methods are known as the basic and naïve methods of
data mining. Since there exist no studies which we can refer to in Gamers’ classification and clustering
problem domain, we aimed to propose an initial model for data mining practice in this problem. Further
research can improve the model by using other classification algorithms like Support vector machines,
logistic regression, decision tree/random forest, etc. As Cherif (2018) proposed, we utilized Clustering and
Attributes Filtering methods and then practised the K-Nearest Neighbors algorithm (KNN) to optimize the
mining application’s performance.
For game telemetry, data clustering is known as a valid method that uses unsupervised neural networks
(learning from trained data) for grouping data into small clusters which each have similar data distinct from
one other (Han et al., 2012; Zhang et al., 2016; Odierna and Silviera, 2018). By Simple K-Means algorithm,
we aimed to define the number of clusters (k) and initialize cluster centroids of the dataset. The basic idea
of the K-means algorithm is to allocate data set (D) into (k) clusters. To determine k clusters, the k center
is defined (by Remote-first algorithm) and distance from centre to each point and the points nearest to the

International Engineering and Technology Management Summit 2021– ETMS2021
İstanbul Technical University & Bahçeşehir University
97
center in the trained data set is calculated as C1, C2…Ck (clusters). As the centres will change by the re-
calculation of k cluster centroids, the data must be trained repeatedly to find the stable centre (Zhang et al.,
2016).
An increasing number of clusters will always "increase the performance".
The objective function of K-means is (MacQueen, 1967):
J=∑i=1k∑j=1n∥x(j)i−cj∥2J=∑i=1k∑j=1n‖xi(j)−cj‖2
where is a chosen distance measure between a data point and the cluster centre, is an indicator of the
distance of the n data points from their respective cluster centers (Velmurugan and Santhanam, 2011). With
such an objective, the lower JJ means the "better" model.
The algorithm is composed of the following steps (Ji et al., 2015):
1. Place K points into the space represented by the objects that are being clustered. These points represent
initial group centroids.
2. Assign each object to the group that has the closest centroid.
3. When all objects have been assigned, recalculate the positions of the K centroids.
4. Repeat Steps 2 and 3 until the centroids no longer move, producing a separation of the objects into groups
from which the metric to be minimized can be calculated.
Although it is possible to prove that the procedure will permanently terminate, the k-means algorithm does
not necessarily find the most optimal configuration, corresponding to the global objective function
minimum.
The algorithm is also significantly sensitive to the initial randomly selected cluster centers (Amiri et al.,
2010). The k-means algorithm can be run multiple times to reduce this effect. K-means is a simple algorithm
adapted to many problem domains (Amiri et al., 2010). On the other hand, behavioural data from computer
games can be exceptionally high-dimensional, of massive scale and cover a temporal segment reaching
years of real-time and a varying population of users (Bauckhage et al., 2015).
4. FINDINGS AND THE PROPOSED MODEL
4.1 Clustering Application Gamer’s opinion on crowdfunding is the clustering problem. All the attributes were selected to define the
clusters in the data set from Steam Community. WEKA is a collection of machine learning algorithms for
data mining tasks that can be applied directly to a data set. It contains tools for data pre-processing,
classification, regression, clustering, association rules and visualization, and it is also well suited for
developing a new machine learning scheme ((Medfloss.org, 2020; WEKA, 2020). WEKA contains a
collection of visualization tools and algorithms for data analysis and predictive modelling, together with
graphical user interfaces for easy use (Medfloss.org, 2020; WEKA, 2020; Ian, Eibe and Mark, 2011). We
preferred this software because of the free availability under the GNU General Public License and
portability advantages.
Selecting Attributes of Data Set: The selected attributes were collected to create a database of the video
game players. Crowdfunding was used as a keyword to search which video game players discussed
crowdfunding in the Steam Community. In 2016 all threads and discussions in the Steam Community forum
regarding crowdfunding were read by authors. From the community’s game player data structure, we
identified the following attributes which define the type and level of involvement in game playing. Then
we collected data about the attributes for the selected game players to create a database for mining the
cluster of gamers with Positive or Negative opinions on Crowdfunding (as a threshold for Gamers to be a
Crowdfunder in game development). To train the model, users who meet this requirement are supposed to
be Crowdfunder. After assigning clusters to gamers, the final dataset consists of 151 over the following
nine variables (features). Meaning of each feature given in the table below (Table 1):

International Engineering and Technology Management Summit 2021– ETMS2021
İstanbul Technical University & Bahçeşehir University
98
Table 1. Features used in Gamers Clustering modelling
Variable Meaning Type of variable
Nickname Nicknames of video game players in Steam. Alphabetic, hidden by Numeric Ids
Hours_Played+ How many hours a video game player plays each game. Numeric
No_of_Games+ How many games each video game player has games in their virtual library Numeric
Membership_years How many years video game players were involved in playing video games on
Steam Numeric
Activity_Level Determines how much video game players are active in the Steam Community. Numeric
Preferred_Games How often a video game player plays a certain genre Numeric (converted in
Table 3)
Achievements How many achievements a video game player earned from the video games Numeric
Country Which country of origin each video game player is from Alphabetic
Opinion
Opinion of each video game player regarding the crowdfunding. The positives
are or want to be involved in a crowdfunding campaign. The negatives do not trust the crowdfunding campaign as they are afraid of fraud.
Numeric
As mentioned before, the keyword “crowdfunding” was used to search which video game players discussed
crowdfunding in the Steam Community (Filtering method is used). The first 151 video game players
involved in a crowdfunding discussion were selected from the results. Simple K-means is a type of latent
class analysis. Dolnicar (2002a; 2002b) discussed the sample size requirements for clustering applications
as follows:
- There are no rules of thumb about the sample size necessary for cluster analysis; however, this may
lead to uncritical application with low case numbers and high variable numbers.
- Half of the clustering studies (which were published till the publication of Dolnicar (2002) work with
samples including fewer than 300 objects, and 22% of these data sets was smaller than 100.
- Concerning sample sizes and variable numbers, it is recommended to consider dimensionality and
avoid too many dimensions when the data is limited
Forman (1984) suggested that 2m could be used (where m = number of clustering variables) in latent class
analyses (as we have seven clustering variables as shown in Figure 3), this number is found as 128, which
is less than our actual data size (n=151). When using clustering algorithms of this kind, it is expected to
reduce the dimensionality of the data to reduce the overfitting risk. Hence, we worked on the dimensions.
All the discussions where the selected players took place, were read and the researcher gathered the chosen
attribute values from the profiles of these video game players and added them to an excel file. However,
the “Country” attribute had to be removed as most of the records lack data about this attribute. “Nickname”
attribute was not used in this study because every nickname is different from each other, so it couldn’t be
enumerated. We selected Nickname attribute via the “Ignore Attribute” function. The widest genre of video
games was selected to enumerate the “Preferred Games” attribute, (A video game genre is a specific
category of games related by similar gameplay characteristics (Rollings and Adams, 2013). The users who
had taken part in discussions about crowdfunding were examined. The numerical attributes were selected
to define clusters.
Clustering The Data Set: We mined and stored the data in an MS Excel sheet and then imported them to
WEKA Clustering application platform. We used the non-supervised Clustering method of SimpleKMeans
to create a general pattern, where we investigated each attribute.
Mathematical Formulation for K-means Algorithm is as follows:
D= {x1, x2, xi, ……., xm} à data set of m records
xi= (xi1,xi2,,xin) each record is an n-dimensional vector
Table 2 presents a sample of the data set. Then, the game classification is shown in Table 3.

International Engineering and Technology Management Summit 2021– ETMS2021
İstanbul Technical University & Bahçeşehir University
99
Table 2: Sample of Data retrieved from Steam Community in 2016 December
Table 3: Definition of Games
Game Name Code
OLShooter 1
Modder Garrys Mod 2
JPRG 3
Horror 4
Action 5 Adventure 6
Simulation 7
Card Games 8
X 9
Open World 10 Multiplayer 11
Early Access 12
Strategy 13
Top Down shooter 14
Truck Simulator 15
Puzzle 16 Indie 17
ARPG 18
Racing 19
Analysis of Results: Clustering by Training the Data: After the attribute selection in WEKA for 151 players,
a large number of data involved around the cluster center of Simple K-Means must be selected for proper
analysis. This model consists of four user clusters and Selected cluster data had more than 89% precision.
Player Nr.
Hours
played
No of
Games
Membership
years
Activity
Level
Preferred
Games 1
Preferred
Games 2 Achievement Country
Opinion
1=Positive
-1= Negative
1 600 100 9 8 1 0 N/A 1
2 2000 100 2 43 2 0 N/A 1
3 20 100 9 9 3 0 USA 1
4 700 100 6 31 4 1 2100 France 1
5 0 500 11 58 5 6 2600 USA -1
6 160 30 3 7 7 0 USA -1
7 200 470 6 13 8 0 USA 1
8 80 50 6 6 N/A 0 USA 1
9 5 200 5 10 1 0 Singapore 1
10 20 690 5 14 10 6 0 USA 1
11 500 300 10 48 11 0 Ireland 1
12 980 950 4 45 1 0 Portugal 1
13 850 50 5 9 12 0 USA 1
14 80 40 5 24 13 300 N/A -1
15 20 2600 10 115 14 3100 N/A 1
16 350 520 9 19 11 1 0 N/A 1
17 100 180 3 29 11 0 USA 1
18 0 330 11 14 13 3 0 Belgium 1
19 0 9 2 3 15 0 N/A 1
20 100 470 5 11 10 0 Polland 1
21 500 60 1 20 13 3 0 N/A 1
22 70 240 8 20 16 4700 UK 1
23 30 100 2 14 17 880 N/A 1
24 1000 10 1 1 13 17 0 N/A 1
25 40 950 10 20 13 3 0 N/A 1
26 40 95 4 22 13 17 1130 N/A 1
27 50 230 5 11 19 0 N/A 1
28 150 10 5 4 19 0 N/A 1
29 50 100 12 9 19 0 N/A 1
30 50 240 7 10 19 0 N/A 1
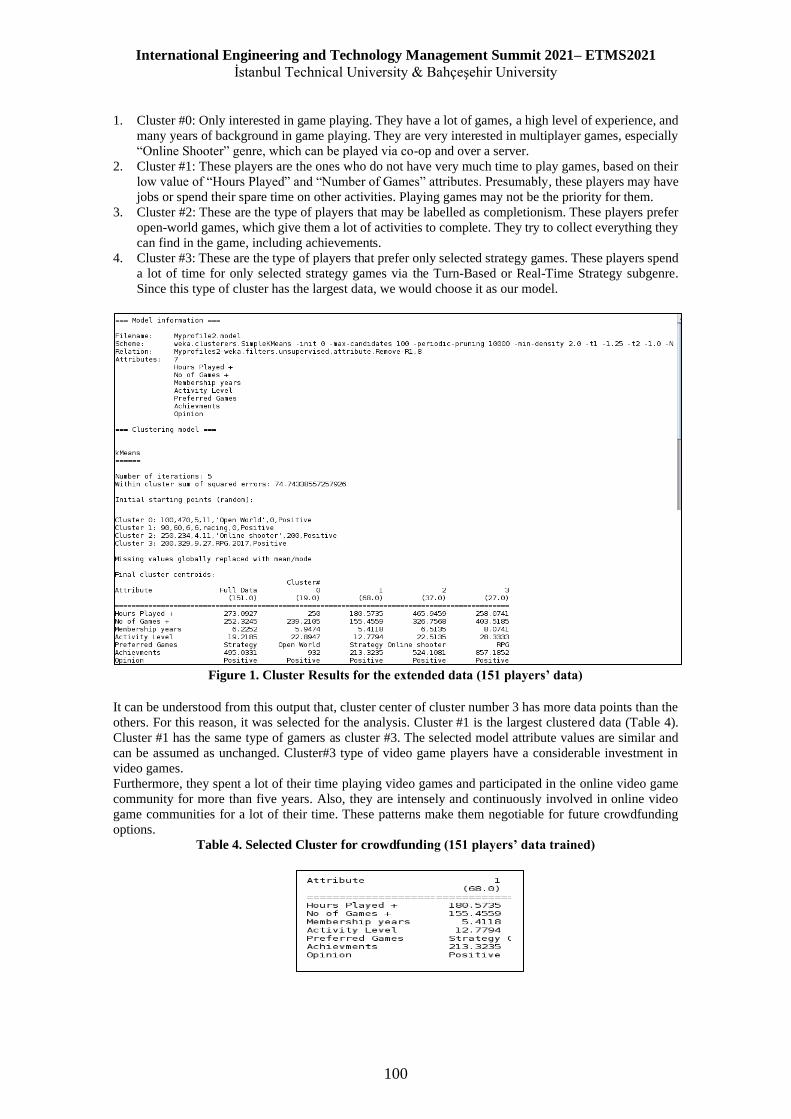
International Engineering and Technology Management Summit 2021– ETMS2021
İstanbul Technical University & Bahçeşehir University
100
1. Cluster #0: Only interested in game playing. They have a lot of games, a high level of experience, and
many years of background in game playing. They are very interested in multiplayer games, especially
“Online Shooter” genre, which can be played via co-op and over a server.
2. Cluster #1: These players are the ones who do not have very much time to play games, based on their
low value of “Hours Played” and “Number of Games” attributes. Presumably, these players may have
jobs or spend their spare time on other activities. Playing games may not be the priority for them.
3. Cluster #2: These are the type of players that may be labelled as completionism. These players prefer
open-world games, which give them a lot of activities to complete. They try to collect everything they
can find in the game, including achievements.
4. Cluster #3: These are the type of players that prefer only selected strategy games. These players spend
a lot of time for only selected strategy games via the Turn-Based or Real-Time Strategy subgenre.
Since this type of cluster has the largest data, we would choose it as our model.
Figure 1. Cluster Results for the extended data (151 players’ data)
It can be understood from this output that, cluster center of cluster number 3 has more data points than the
others. For this reason, it was selected for the analysis. Cluster #1 is the largest clustered data (Table 4).
Cluster #1 has the same type of gamers as cluster #3. The selected model attribute values are similar and
can be assumed as unchanged. Cluster#3 type of video game players have a considerable investment in
video games.
Furthermore, they spent a lot of their time playing video games and participated in the online video game
community for more than five years. Also, they are intensely and continuously involved in online video
game communities for a lot of their time. These patterns make them negotiable for future crowdfunding
options.
Table 4. Selected Cluster for crowdfunding (151 players’ data trained)

International Engineering and Technology Management Summit 2021– ETMS2021
İstanbul Technical University & Bahçeşehir University
101
4.2 K- Nearest Neighbor Method for Classification K-Nearest Neighbors algorithm (KNN) is one of the simplest algorithms widely used in predictive analysis.
(Cherif, 2018). It is a non-parametric method operated in regression and classification, identifying a positive
integer K first in training data nearest to the test observation. Conditional probability is estimated for classes
late applies the Bayes rule so, the classification of test observation to the classes with the highest probability
(Zhu, Chen, Hirdes & Stolee, 2007). Cherif (2018) proposed using the KNN algorithm based on clustering
and attributes filtering, as we practised in the previous section to optimise its performance and accelerate
its process. Despite its simplicity, K-nearest neighbour is a machine learning technique widely and
predicted with high accuracy in medicine and health, which is a required field (El-Houby, 2018; Zhu, Chen,
Hirdes & Stolee, 2007). Despite its limitations, we utilized the nearest neighbor classification for being
comparable to KSimple Means clustering and discussed the results comparatively.
Our bias is that points near the boundary have fewer neighbours because some neighbours may be outside
the boundary in using the nearest neighbour algorithm, which we corrected during Clustering
(Datacadamia.com, 2018). In Weka (Datacadamia.com, 2018), KNN is called IBk (instance-bases learning
with parameter k), and it's in the lazy class folder as the K parameter. Also, IBk's KNN parameter specifies
the number of nearest neighbours to use when classifying a test instance, and a majority vote determines
the outcome. Weka's IBk implementation has the “cross-validation” option that can help by choosing the
best value automatically for KNN (which is the same as k).
A 10-fold cross-validation set was selected with a split percentage of 66% for the training set, taking 100
gamer data as training and 51 as test data to partition the training data set and test data set. (In data mining,
the complete data set should be split into training and test data sets to test the validity of results.) When
cross-validation is performed with the Nearest Neighbour Method classification method (Table 5), our
model predicted that this method incorrectly classified 10.6% of players in terms of having positive and
negative attitudes for Crowdfunding in game development. Correctly classified is 89.4%, which is a
satisfactory accuracy rate. Game players would collaborate for game development when invited.
Table 5. Cross Validation of the Model with The Nearest Neighbor Results
Precision is found to be 0,894, F-measure and Recall is satisfactory for accuracy.
Table 6. Detailed Accuracy By Class
5. CONCLUSION AND DISCUSSION
This study provides a sample practice and a case study from Steam Community on using data mining
methods to select a cluster of targeted video game players and accurate classification of those having a
positive opinion to support independent video game developers in crowdfunding as a tool of open
innovation.
There is a significantly increasing trend for user-led innovation and crowdfunding in the video game
industry. The production process of the video game industry has a demand-pull nature; thus the success of
a video game depends on understanding the user's demand. The involvement of the video game players in
the production process became a necessity for the developers to secure funds for their game development
projects and to form a gamer community around their products. Therefore, user-led innovation with the
K-Means
ClusteringI 29
NI 4
K-Nearest
NeighborsI 26
K = 5 NI 7 9443
1168 87.9
8511
236 88.2
Classifier Predicted classActual class
Balanced model accuracy (%)I NI
Class TP Rate FP Rate Precision Recall F-Measure MCC ROC Area PPC Area
Positive 1,000 1,000 0.894 1,000 0.944 0 0.415 0.878
Negative 0 0 0 0 0 0 0.415 0.093
Weighted Average 0.894 0.894 0.799 0.894 0.844 0 0.415 0.795

International Engineering and Technology Management Summit 2021– ETMS2021
İstanbul Technical University & Bahçeşehir University
102
involvement of the sharing economy and web-based collaboration techniques like crowdfunding became
much more important for identifying the market needs and introducing successful products or games.
Aoyama and Izushi (2008) and Jisun (2010; 2011) suggested that industries and products with a group of
hobbyists previously organized or disorganized are the most likely sources of active user-led innovation.
Moreover, they claimed that blind faith users and user communities in the innovation process may become
fatal. Even though Aoyama and Izushi (2008) study showed that hobbyist as the extreme users are the most
likely source of active user-led innovation today, and game industry is among the most unique contexts
with a cultural base among users that can enable successful co-development and co-funding. The
relationship between developers and video game players can evolve to be a part of a common platform
where the features, funds, or strategies of a video game project can be negotiated and contested. However,
there are limited studies in literature that explored the ways to enable the appropriate selection of
contributive game players. Using the rich data sets in player communities can be utilized for applying
contemporary quantitative approaches in this domain.
Within this context, we aimed to present a knowledge discovery model by mining the gamers’ data in the
Steam community to define users/gamers who can participate in crowdfunding campaigns of a new game
development. From previous research, we recognized that the social network or community data about the
computer game player communities have recently begun to be utilized for marketing and customer relations
management issues in the video and computer games industry. However, to understand gamers' intentions
for being involved as crowd-funder, gamer community data is rarely utilized. Additionally, interviewing
and surveying gamers are relatively more difficult when researching gamers’ intentions. Hence using this
accumulative data of communities and applying data mining provides room for the opportunity both for
researchers and marketers.
Clustering results (by using k-means algorithm for grouping game players) revealed a cluster of gamers,
and classification by K-Nearest neighbor method provided a precision of 89,4% with an F-Measure of
0.944, which is acceptable for accuracy. In this way, data mining methods could be helpful to demonstrate
the tendencies of video game players. By using the filtering on community members who participated in
discussions about crowdfunding, the challenges of infrastructural requirements of big data were also
eliminated.
Further Research: Due to the lack of data through in-depth interviews, content analysis or surveys about
the intentions of gamers for being crowdfunders of game development projects, we accept the limitation of
being unable to compare the results of the study with the outcomes of equivalent research which used other
techniques(such as qualitative methods of content analysis, interviews).
This study intends to include more data via other platforms, surveys and game player data in the future.
These platforms are Steam community, Reddit fan pages, official forums, social media platforms and
YouTube channels from where enumerated data can be collected in one database or data mart. This type of
database will serve data mining to design, upgrade, and create modular expansions. Furthermore, this type
of data can be useful to identify and understand the targeted video game players. Moreover, gaining
perspectives on additional aspects of crowdfunding process as a user-led innovation tool, including social
groups other than developers and video game players may be useful.
Further research into how developers balance the need of video game players with the professional investors
contributing additional funding to the video game projects may be needed. Also, research strategies of the
developers may deploy to ensure that their content will be attractive for a wider audience while
simultaneously satisfying the needs of their hardcore video game players. However, the proposed case is
not limited to game development context and applicable to all crowdfunding cases that may utilize a social
network or community to access the potential backers.
It can be argued that the applied methods (which are clustering by Simple k-Means and classification by
nearest neighbor) are too simplistic in this era of prescriptive analytics where advanced methodologies and
mining/ML algorithms are rapidly being introduced and validated. In further research, the applicability of
various data mining methods can be applied to this problem domain. However with the limitedly available

International Engineering and Technology Management Summit 2021– ETMS2021
İstanbul Technical University & Bahçeşehir University
103
gamer data from Steam Community, even applying these basic data mining methods was proved to be
useful in this study, encouraging the forthcoming attempts. Besides, since the study introduces the
possibility of using the data analytic methods without a coding practice (through using Excel and Weka),
it is valuable as an initial case to encourage researchers and pracititoners towards experiencing data
analytics in such problem domains, where advanced data mining and learning algorithms had rarely been
applied.
By expanding the data set, adding few features will provide many valuable additional insights about the
gamers who intend to participate in crowdfunding.
ACKNOWLEDGEMENT
This article is dedicated to the precious memory of our beloved professor Selime Sezgin,
since it is produced from the master thesis completed by Can Aydalga, titled "Impacts of
user-led innovation in video game industry” and completed in İstanbul Bilgi Universitesi
on 2017 conducted under her and Dr. Yildirim’s advisory. She was a leader in combining
different disciplines and adapting innovative approaches to various domains of
knowledge. This paper dares to combine concepts from different domains (crowdfunding,
video games and data analytics) as as attempt to follow her footsteps.
REFERENCES Agrawal, A. Catalini, C. and Goldfarb, A. (2014) “Some Simple Economics of Crowdfunding”, National
Bureau of Economic Research
Amiri, B., Hossain, L., Mousavi, S. (2010). Application of Harmony Search Algorithm on Clustering,
Lecture Notes in Engineering and Computer Science. 1 (Proceedings of the World Congress on
Engineering and Computer Science 2010 Vol I WCECS 2010, October 20-22, 2010, San Francisco,
USA).
Aoyama, Y. and Izushi, H. (2008). “User-led Innovation and the video game industry”, Submitted to IRP
Conference, London, May 22-23, 2008.
Bauckhage, C., Drachen, A., Sifa, R. (2015). "Clustering Game Behavior Data", IEEE Transactions on
Computational Intelligence and AI in Games, 7(3), 266-278.
Betzler, D. & Leuschen, L. (2020). Digitised value chains in the creative industries: Is there a convergence
of Swiss film and game production?, Creative Industries Journal, DOI:
10.1080/17510694.2020.1796440
Burtch, G., Ghose, A., & Wattal, S. (2014). Cultural differences and geography as determinants of online
prosocial lending. MIS Quarterly: Management Information Systems, 38(3), 773-794.
https://doi.org/10.25300/MISQ/2014/38.3.07
Castendyk, O., & J. Müller-Lietzkow (2017). Abschlussbericht zur Studie: Die Computer- und
Videospielindustrie in Deutschland. Hamburg: Hamburg Media School, Audiovisual Media Research
and Competence Center.
Cha, J., (2017). Crowdfunding for Video Games: Factors that Influence the Success of and Capital Pledged
for Campaigns, International Journal on Media Management, 19(3), 240-259. DOI:
10.1080/14241277.2017.1331236
Cherif, W. (2018). Optimization of K-NN algorithm by clustering and reliability coefficients: application
to breast-cancer diagnosis, Procedia Computer Science, 127, 293-299.
https://doi.org/10.1016/j.procs.2018.01.125.
Claus, I. And Krippner, L. (2018). Contemporary Topics in Finance: A Collection of Literature Surveys,
Journal of Economic Surveys, 32 (5), pp. 1221-1228.
Cole, H.; Griffiths, D. M. (2007) “Social Interactions in Massively Multiplayer Online Role-Playing
Gamers”, Cyber Psychology and Behavior, 10(4), pp. 575-585.
Datacademia, (2018). Machine Learning - K-Nearest Neighbors (KNN) algorithm - Instance based
learning, Available at:
https://datacadamia.com/data_mining/knn?referer=https://gerardnico.com/data_mining/knn
Dolnicar, S. (2002b). A Review of Unquestioned Standards in Using Cluster Analysis for Data-Driven
Market Segmentation. University of Wollongong Faculty of Commerce – Papers, Research Online
https://ro.uow.edu.au/commpapers/273, [Accessed in May 2019]

International Engineering and Technology Management Summit 2021– ETMS2021
İstanbul Technical University & Bahçeşehir University
104
Dolnicar, S., (2002a). A Review of Unquestioned Stanards in Using Cluster Analysis for Data-driven
Market Segmentation, CD Conference Proceedings of the Australian and New Zealand Marketing
Academy Conference 2002 (ANZMAC 2002), Deakin University, Melbourne, 2-4 December 2002.
Edwards, S. (2016) “The Comprehensive Guide to Marketing Your Crowdfunding Campaign”, Audience
Bloom, https://www.audiencebloom.com/the-comprehensive-guide-to-marketing-your-crowdfunding-
campaign/ [Accessed 20 Dec. 2017].
El Houby, E. M. (2018). A survey on applying machine learning techniques for management of diseases.
Journal of Applied Biomedicine, 16(3), 165-174.
Formann AK (1984) Die Latent-Class-Analyze: Einfuhrung in die Theorie und Anwendung. Beltz,
Weinheim
Freyermuth, G. S. (2015). Games, game design, game studies. Eine Einführung. Bielefeld: Transcript
Verlag
Frydrych, D., Bock, A.J., Kinder, T., Koeck, B., (2014). Exploring entrepreneurial legitimacy in
rewardbased crowdfunding. Venture Capital, 16, 247-269.
Gaskel, A. (2016) “The Rise of Investment Crowdfunding”, Forbes, Mar 15, 2016
https://www.forbes.com/sites/adigaskell/2016/03/15/the-rise-of-investment-
crowdfunding/#65c958ba4d9b [Accessed 12 Jan 2017].
Gaudiosi, J. (2015) “Soon Everyone Will Be Able to Buy Equity in Video Games”, Fortune Tech, August
2015, (http://fortune.com/2015/08/18/fig-crowdfunding-games-equity/) [Accessed 12 Jan 2017]
Gibson, A. (2017) “How Publishers’ Anti-Consumer Practices Are Ruining Gaming”, n4g.com,
http://n4g.com/news/1962042/how-publishers-anti-consumer-practices-are-ruining-gaming [Accessed
10 Mar 2017]
GONZÁLEZ-PIÑERO, Manuel. (2017) Redefining The Value Chain Of The Video Games Industry.
Knowledge Works National centre for cultural industries.Rapport 01/2017. ISBN: 978-82-93482-15-4
(PDF). Available
in:https://kunnskapsverket.org/sites/default/files/Redefining%20the%20Value%20Chain%20of%20Vi
deo%20Games%20Industry%202017_final.pdf [Accessed in May 2018]
Goran C., 2018. "Crowdfunding", The SAGE Encyclopedia of the Internet, [Accessed in May 2020]
Han, J., Kamber, M, Pei, J. (2012). Data Mining: Concepts and Techniques. 1. ed. Estados Unidos: Morgan
Kaufmann, Pages 1-32
Hepworth, I., (2016). Alternative Finance and Fintech - a financial revolution or hype? , The Marketing
Eye, 3rd May 2016 , https://www.themarketingeye.com/blog/alternative-finance-and-fintech-financial-
revolution-or-hype/, [Accessed in May 2019]
Hervé, F. and Schwienbacher, A. (2018), CROWDFUNDING AND INNOVATION. Journal of Economic
Surveys, 32: 1514-1530. doi:10.1111/joes.12274
Hughes, A. (2017) “Data Mining Definition”, What is data mining? - Definition from WhatIs.com",
SearchSQLServer, https://searchsqlserver.techtarget.com/definition/data-mining [Accessed Jan 2016]
Ian H. W.; Eibe, F., Hall, M. A. (2011) “Data Mining: Practical machine learning tools and techniques. 3rd
Edition” Indiana University (1996) Statistical Yearbook: Cinema, Television, Video and New Media in
Europe
Jaleo.com, (2019). Kickstarter: is crowdfunding a good idea?, Blog Post by Jaume Esteve, 22 January 2019,
Available at: http://jaleopr.com/blog/kickstarter-crowdfunding-indie-game/ [Accessed in November
2019]
James, G., Witten, D., Hastie, T., Tibshirani, R.,(2013). An Introduction to Statistical Learning. Springer
Texts in Statistics. Springer, NY.
Ji, J., Pang, W., Zheng, Y., Wang, Z., Ma, Z. and Zhang, L. (2015). A novel cluster center initialization
method for the k-prototypes algorithms using centrality and distance. Applied Mathematics and
Information Sciences, 9(6), 2933-2942.
Jisun C. (2010). Creative industries and global co-development: Lessons from the first successful case in
Korean online games, Creative Industries Journal, 3:2, 125-136, DOI: 10.1386/cij.3.2.125_1
Jisun, C. (2011). Evolution of innovation focus of online games: From technology-oriented, through
market-oriented, and to design-oriented soft innovation. Asian Journal of Technology Innovation -
ASIAN J TECHNOL INNOV. 19. 101-116.
Kaur, H. & Gera, J (2017). Effect of Social Media Connectivity on Success of Crowdfunding Campaigns.
Procedia Computer Science. 122. 767-774. 10.1016/j.procs.2017.11.435.
Koster, R., (2018). The cost of games, January 23, https://venturebeat.com/2018/01/23/the-cost-of-games/
[Accessed in October 2019]

International Engineering and Technology Management Summit 2021– ETMS2021
İstanbul Technical University & Bahçeşehir University
105
Kuppuswamy, V., Bayus, B.L., (2017). Crowdfunding creative ideas: The dynamics of project backers in
Kickstarter. A shorter version of this paper is in" The Economics of Crowdfunding: Startups, Portals,
and Investor Behavior"-L. Hornuf and D. Cumming (eds.).
Lien, T. (2014) “How Tiny Brains’ developers learned the importance of community the hard way”,
Polygon, Jan 17, 2014 https://www.polygon.com/2014/1/17/5320130/how-tiny-brains-developers-
learned-the-importance-of-a-community-the [Accessed 28 August 2016]
Lin, M., Prabhala, N., Viswanathan, S., 2009. Social networks as signaling mechanisms: Evidence from
online peer-to-peer lending. WISE Papers, Nr. 2009:9, Available at:
http://people.stern.nyu.edu/bakos/wise/papers/wise2009-p09_paper.pdf, [Accessed in May 2018]
Lipkin, N. (2017). Examining Indie’s Independence: The Meaning of “Indie” Games, the Politics of
Production, and Mainstream Co-optation, Loading, The Journal of the Canadian Game Studies
Association Vol 7(11): 8-24 http://loading.gamestudies.ca , [Accessed 24 Jan 2019]
MacQueen, J. B. (1967). "Some Methods for classification and Analysis of Multivariate Observations,
Proceedings of 5-th Berkeley Symposium on Mathematical Statistics and Probability", Berkeley,
University of California Press, 1:281-297
Marina S., (2016). "Crowdfunding and Entrepreneurial Finance", International Journal of Entrepreneurial
Behavior & Research, Vol. 22 Issue: 1, pp.175-177, https://doi.org/10.1108/IJEBR-09-2015-0206
McLean, M. (2017) “Defining Independence: What makes an Indie Game Indie?”,
https://venturebeat.com/2010/07/13/what-makes-an-indie-gameindie/ [Accessed Jan 2019]
Medfloss.org (2020). WEKA, Medical Free/Livre and Open Source Software,
https://www.medfloss.org/node/559, [Accessed in July 2018]
Mollick, E.R. and Kuppuswamy, V., (2014). After the campaign: Outcomes of crowdfunding. UNC Kenan
Flagler Research Paper
New York Film Academy (2014), “How to Form Solid Indie Game Development Team”, NYFA Student
Resources, November 15, 2014. https://www.nyfa.edu/student-resources/forming-solid-indie-game-
development-team/ [Accessed 5 Jan 2019]
Odierna, B. A. and Silviera, I. F., (2018). Player Game Data Mining for Player Classification, SBC –
Proceedings of SBGames 2018, 991-996; ISSN: 2179-2259.
Pandita, S., (2015). Crowdfunding: Alternative for Venture Capital;
http://knowstartup.com/2015/07/crowdfunding-alternative-for-venture-capital/ [Accessed in May
2018]
Pedersen, J. (2014). “The Importance of Community Gaming and the Indie Gaming Sphere”, Gamasutra,
UBM Technology Group, 03/04/14,
(http://www.gamasutra.com/blogs/JustinPedersen/20140304/212269/The_importance_of_community
_gaming_and_the_the_Indie_gaming_sphere.php) [Accessed 15 April 2017]
Prive, T. (2012) “What is Crowdfunding and How Does It Benefit The Economy”, Forbes, Nov 27, 2012
https://www.forbes.com/sites/tanyaprive/2012/11/27/what-is-crowdfunding-and-how-does-it-benefit-
the-economy/#5288e52ebe63 [Accessed 27 Jan 2017]
Reichert, K. (2012) “Top 5 Problems Faced By Indie Game Developers”, Gamasutra, UBM Technology
Group,
https://www.gamasutra.com/blogs/KateReichert/20121101/180767/Top_5_Problems_Faced_By_Indi
e_Game_Developers.php [Accessed in June 2017]
Rollings, A., & Adams, E. (2003).Andrew Rollings and Ernest Adams on game design. USA7New Riders.
Rossignol, D. (2016). “Why the American video game industry crashed in 1983, explained.”, A.V. Club,
22/02/2016, https://news.avclub.com/why-the-american-video-game-industry-crashed-in-1983-e-
1798244560 [Accessed in June 2017]
Saed, S. (2015). “Steam has over 125 million active users, 8.9M concurrent peak”, Vg 24/7, 24 February
2015, https://www.vg247.com/2015/02/24/steam-has-over-125-million-active-users-8-9m-concurrent-
peak/ [Accessed in June 2017]
Smith, A., Troutt, M., Lawrence, E., Thorne, N., (2011). Socially Responsible Games, An Interactive
Qualifying ProjectSubmitted to the Facultyof theWORCESTER POLYTECHNIC INSTITUTE,
https://web.wpi.edu/Pubs/E-project/Available/E-project-030411-
170044/unrestricted/Socially_Respnsible_Games.pdf [Accessed in May 2018]
Smith, N., A. (2014). “The backer- developer connection: Exploring crowdfunding’s influence on video
game production”, New Media and Society, 17(2), 198-214.
Stefanowski, J. (2008/2009). “Data Mining - Clustering, SE Master Course”, Poznan University of
Technology.
International Engineering and Technology Management Summit 2021– ETMS2021
İstanbul Technical University & Bahçeşehir University
106
Stewart, B. (2009). “Game Development as a Customer Satisfaction”, Gamasutra, 06/22/09,
https://www.gamasutra.com/blogs/BartStewart/20090622/83932/Game_Development_as_Customer_
Satisfaction.php [Accessed in June 2017]
Te, Z. (2014). “Sony says indie games are the ‘heartbeat’ of gaming”, Gamespot, May 5, 2014,
https://www.gamespot.com/articles/sony-says-indie-games-are-the-heartbeat-of-gaming/1100-
6419441/ [Accessed in June 2017]
TheNerdCritic, (2016). “Are We Headed for Another Video Game Crash?”
http://n4g.com/news/2044545/are-we-headed-for-another-video-game-crash-no-and-heres-why
[Accessed in June 2017]
Thurner, T. W., Kroenert, M. K., & Goersch, A. (2019). Shifting business models in the electronic gaming
industry-from publisher backing to co-creation and crowdfunding. International Journal of
Entrepreneurship and Innovation Management, 23(3), 246-260.
Velmurugan, T. and Santhanam, T. (2011). A Survey of Partition based Clustering Algorithms in Data
Mining: An Experimental Approach. Information Technology Journal, 10, 478-484.
Verschoore, J. R. and Zuquetto, R. D. (2016). A Social Network Approach for Crowdfunding. In book:
International Perspectives on Crowdfunding: Positive, Normative and Critical Theory, Edition: 1,
Chapter: 8, Publisher: Emerald, Editors: Jerome Meric, France Julienne Brabet, France Isabelle Maque,
151-167
WEKA Official Web Page (http://www.cs.waikato.ac.nz/ml/weka/)
WEKA Web Site, (2020). WEKA; The workbench for machine learning, Available at:
https://www.cs.waikato.ac.nz/ml/weka/ , [Accessed in October 2018]
Wikipedia, (2016). Steam (service) Community, https://en.wikipedia.org/wiki/Steam_(service) [Accessed
in May 2018]
Wikipedia, (2017). Crowdfunding, https://en.wikipedia.org/wiki/Crowdfunding [Accessed in May 2018]
Wong, H. (2011) “A Study of the Video Game Industry in U.S Metropolitan Areas Using Occupational
Analysis”, Masters Theses 1911, University of Massachusetts Amherst ScholarWorks@UMass
Amherst, Retrieved from:
https://scholarworks.umass.edu/cgi/viewcontent.cgi?article=1823&context=theses [Accessed in May
2018]
Zackariasson, P. and Wilson, T.L. eds. (2012) “The Video Game Industry: Formation, Present State, and
Future.”, Routledge, NY, USA.
Zhang, L. (2016). Application of K-Means Clustering Algorithm for Classification of NBA Guards.
International Journal of Science and Engineering Applications, 5 (1), SSN-2319-7560.
Zhu, M., Chen, W., Hirdes, J. P., & Stolee, P. (2007). The K-nearest neighbor algorithm predicted
rehabilitation potential better than current Clinical Assessment Protocol. Journal of clinical
epidemiology, 60(10), 1015-1021.

International Engineering and Technology Management Summit 2021– ETMS2021
İstanbul Technical University & Bahçeşehir University
107
DEPO ETKİNLİĞİNİN VERİ ZARFLAMA ANALİZİ İLE
DEĞERLENDİRİLMESİ- DAYANIKLI TÜKETİM SEKTÖRÜNDE BİR
UYGULAMA
1Selvihan Çelikel Yazar 1Gizem Deniz Cömert 3Ferhan Çebi
1Istanbul Technical University
ABSTRACT
Firmaların ana damarlarından biri olan tedarik zinciri operasyonları işletmelerin en büyük maliyet
kalemlerinden birisidir ve yönetilmesi oldukça zor bir süreçtir. Kültürel, siyasi, sosyal birçok farklı etmenin
de sürece etki ettiği göz önüne alındığında firmaların tedarik zinciri süreçlerini iyi analiz etmeleri
gerekmektedir. Tedarik zincirin temel yapılarından olan depolar ise firmalar için operasyonların daha çok
manuel yürütüldüğü ve iş yükünün fazla olduğu birimlerdir. Bu anlamda depolardaki iyileşmeye açık
alanların doğru bir şekilde belirlenebilmesi firmalar açısından oldukça önemlidir. Bu doğrultuda dayanıklı
tüketim sektöründe faaliyet gösteren bir firmanın 10 farklı deposunun etkinlikleri veri zarflama analizi
yöntemi ile analiz edilmiştir. Girdi değişkenleri olarak forklift sayısı, çalışan işi sayısı ve depo giderleri ele
alınırken, çıktı değişkeni olarak günlük yüklenen ürün adeti dikkate alınmıştır. Girdi yönelimli CCR
modeli kullanılarak yapılan analiz sonucu her deponun girdi hedef değerleri hesaplanmıştır. Bu hesaplama
sonucunda etkin çalışmayan depolar belirlenerek alınması gereken aksiyonlar konusunda analizler
yapılmıştır.
Keywords: Veri Zarflama Analizi (VZA), Performans değerlendirme, Depo etkinliği, Tedarik zinciri,
Depo performansını etkileyen indikatörler

International Engineering and Technology Management Summit 2021– ETMS2021
İstanbul Technical University & Bahçeşehir University
108
1. GİRİS
Şirketler sürekli gelişen ve değişen dünyada ayakta kalabilmek için faaliyetlerini verimli ve etkin bir şekilde
yürütmek zorundadır. Eski yöntem rekabet koşulları yerine yenilikçi yöntemlere yönelmek rekabette de ön
plana çıkmalarını sağlamaktadır. Geçmişten günümüze kadar işletmeler süreçlerini en iyi şekilde
yönetebilmek için çeşitli analiz yöntemleri kullanmıştır. Bu analiz yöntemlerinden biri olan veri zarflama
analizi birçok işletmeninin süreçlerini analiz etmek için kullandığı yöntemlerin başında gelmektedir.
Ozellikle benzer süreçleri yürüten bölümler arasında kıyaslama yapmayı sağlayan bu yöntem ile süreçlerin
verimlilik ve etkinlikleri ölçülerek, bölümlerin hangi işleri nasıl yürütmesi gerektiği konusunda
yorumlamalar yapılabilmekte ve aksiyon planları oluşturulabilmektedir.
Verimlilik en temel tanımıyla, bir işletmenin ortaya koyduğu çıktının, bu çıktı meydana gelirken kullandığı
girdilere oranıdır. Gerçek çıktı miktarının, standart çıktı miktarına oranı olan etkinlik ise eldeki kaynakları
en iyi şekilde kullanarak, minimum israfla yönetebilmektir. Etkinlik ölçümü için oran analizi, parametreli
ve parametresiz yöntemler olarak çeşitli yöntemler kullanılmaktadır.
Oran analizi, tek bir girdi ve tek bir çıktının birbiri arasındaki ilişkisi temeline dayanmaktadır. Az bilgiye
ihtiyaç duyması ve tek girdi, tek çıktı söz konusu olması açısından kolay yorumlanabilmektedir ancak buna
karşın çok sayıda girdi ve çıktının olduğu durumlarda yetersiz kalmaktadır (Bal, 2010). Parametrik
yöntemler etkinlik ölçümü gerçekleştirilecek işletmelerin girdileri ile çıktıları arasında fonksiyonel bir ilişki
olduğu varsayımı yapılır ve bu fonksiyonun parametrelerinin tahmin edilmesine çalışılır. Parametrik
yöntemlerle performans ölçümünde, regresyon teknikleri ile tahmin yapılırken, üretim fonksiyonu
çoğunlukla, bir tek çıktı birçok girdi ile ilişkilendirilerek tanımlanmaktadır. Parametrik yöntemlere bir
seçenek olarak ortaya çıkan parametrik olmayan yöntemler, etkinlik ölçümü yaparken genel olarak
matematiksel programlama çözüm tekniği kullanılır. Parametrik olmayan yöntemler, üretim fonksiyonunun
ardında herhangi bir analitik formun varlığını öngörmez. Bu özelliklerinden dolayı parametrik yöntemlere
göre daha esnektir. Ayrıca, birçok girdili ve birçok çıktılı üretim ortamlarında etkinlik ölçümü için çok
uygun bir yapıya sahiptir (Yolalan, 1993). Parametrik olmayan etkinlik ölçüm yöntemlerinden yaygın
olarak kullanılan ve matematik programlama tabanlı etkinlik ölçüm yöntemi olan ve literatürdeki adıyla
Veri Zarflama Analizi akla gelen ilk yöntemdir.
Bu çalışmada, raporlanan çalışmanın amacı iki yönlüdür: (i) hem bireysel depoların hem de depo
gruplarının teknik verimlilik açısından değerlendirilebileceği faydalı yöntemler geliştirmek; ve (ii) etkin
olmayan depoların referans alabileceği depolar ve özellikleri hakkında bilgiler verilmiştir. Analiz
sonucunda elde edilen bulgular değerlendirilerek, ikiden fazla depoya sahip büyük ölçekli firmalarda depo
performanslarının iyileştirilmesine yönelik çalışmalara pratik ve hızlı bir çözüm sağlanması amaçlanmıştır.
Bu çalışmanın kalan kısımları şöyle özetlenmiştir. İkinci bölümde, veri zarflama analizi ve depo
performansını etkileyen faktörlere ilişkin önceki araştırmalar gözden geçirilmiştir. Verinin toplanması ve
matematiksel modele ilişkin bilgiler üçüncü bölümde verilmiştir. Elde edilen hesaplama sonuçları bölüm
4'te tartışılmış ve son bölümde iyileştirmeye yönelik tavsiyeler ve gelecekte yapılabilecek çalışmalar
özetlenmiştir.
2. LİTERATÜR Veri zarflama analizi ilk defa Charnes ve arkadaşları tarafından 1970'lerin sonlarında birden fazla girdi ve
çıktıyı değerlendirerek, yönetim ve performans ölçümüne olanak sağlayan parametrik olmayan bir doğrusal
programlama aracı olarak tanıtılmış ve günümüze kadar değişken sayısı ve modelin karmaşıklığı artarak
yeni modeller ile gelişimini devam ettirmiştir (Ji and Lee, 2010; Liu et.al.,2016). Bu yöntem ile birden fazla
karar verme biriminin, üretim fonksiyonuna gerek olmadan birden fazla girdi ve çıktıya göre göreceli
karşılaştırılarak değerlendirilmesine olanak sağlanmıştır (Hosseinzadeh et al.,2013). Pratik ve hızlı bir
yöntem olması sebebiyle, literatüre girdiğinden bu yana sağlık, enerji, finans, hizmet, tedarik zinciri, üretim
vb. birçok alanda benimsenerek çalışmalarda performans değerleme yöntemi olarak kullanılmıştır (Cooper
et.al, 2011). Orneğin, eğitim kurumları ve üniversitelerin performans değerlendirmesi (Avkıran,2001;
Johnes ve Yu,2008; Sarrico ve ark., 1997); banka ve çeşitli finans kuruluşlarının etkinliklerinin incelenmesi
(Grigorian, 2002; Paradi and Zu,2013), sağlık kuruluşlarının etkinliğinin ve hizmet kalitesinin
değerlendirilmesi (Nayar ve Ozcan, 2008; Kohl ve ark.,2019), sürdürülebilirlik üzerine performans
değerlendirmesi (Yu ve Wen,2010; Gerdessen ve Pascucci,2013) vb. birçok alanda veri zarflama analizi
çalışmaları literatürde yer almaktadır.
Tedarik zinciri, belirsiz durumlar ve çeşitli kriterler içermesi sebebiyle performans değerlendirmesine en
çok konu olan alanlardan biridir. Depo, tüm tedarik zinciri prosesinde hayati bir rol oynadğından deponun
etkinliği de genel performans iyileştirmesinde önemli bir katkıya sahiptir. Bu konuda çokça çalışmalar
yapılarak, depo etkinliğinin belirlenmesinde kullanılabilecek modeller (Korpella,2007, Xu et al.,2009),
performansa etki eden indikatörlerin saptanması (Staudt ve ark., 2015; Wong ve Wong, 2007, Hamdan,

International Engineering and Technology Management Summit 2021– ETMS2021
İstanbul Technical University & Bahçeşehir University
109
2005), depo performans değerlendirmesi vaka analizlerini (Johnson ve McGinnis, 2011; Dixit, 2020; Xu et
al.,2009) sunulmuştur.
3. ARASTIRMA METODOLOJİSİ 3.1 Kullanılan Yöntem Calışmada, Charnes ve arkadaşları tarafından literatüre sunulan, çıktıları maksimize etmek amacıyla çıktıya
yönelik olarak oluşturulan, ölçeğe göre sabit getiri varsayımına dayanan CCR modelinden faydalanılmıştır.
Bu modelin formulü aşağıdaki gibidir (Ozden, 2009).
𝐸𝑛𝑏 ∑ 𝑢𝑟𝑌𝑟𝑘𝑠𝑟=1 (1)
∑𝑢𝑟 𝑌𝑟𝑗 − ∑𝑣𝑖 𝑋𝑖𝑗
𝑚
𝑖=1
𝑠
𝑟=1
≤ 0 (2)
∑𝑣𝑖
𝑚
𝑖=1
𝑋𝑖𝑘 = 1 (3)
𝑢𝑟 , 𝑣𝑖 ≥ 0 (4)
Modelde; amaç Enb enbüyükleme olmak üzere değişkenler aşağıdaki gibi ifade edilmiştir.
𝑢𝑟: k karar birimi tarafından r’inci çıktıya verilen ağırlık,
𝑌𝑟𝑘 : k karar birimi tarafından üretilen r’inci çıktı,
𝑌𝑟𝑗 : j’inci karar birimi tarafından üretilen r’inci çıktı,
𝑣𝑖: k karar birimi tarafından i’inci girdiye verilen ağırlık,
𝑋𝑖𝑗 : j’inci karar birimi tarafından kullanılan i’inci girdi,
𝑋𝑖𝑘 : k karar birimi tarafından kullanılan i’inci girdi,
3.2 Verilerin toplanması ve değişkenlerin tanımlanması
Araştırma kapsamında, dayanıklı tüketim sektöründe yer alan büyük ölçekli bir firmanın farklı bölgelerde
aynı ölçekteki 10 deposuna ilişkin 2016 - 2020 yılları arasındaki faaliyetleri incelenerek elde edilen veriler
sonucunda teknik verimlilik ölçümü için bu verilerden toplam 4 değişken seçilmiş olup bunlar girdiler ve
çıktılar olmak üzere Tablo 1’de belirtilmiştir.
Tablo 1. Araştırmada kullanılan değişkenler
Girdiler Cıktılar
Forklift sayısı Günlük yüklenen ürün adeti
Calışan işçi sayısı
Depo giderleri
Değişken sayısı:3 Değişken sayısı:1

International Engineering and Technology Management Summit 2021– ETMS2021
İstanbul Technical University & Bahçeşehir University
110
Girdi ve çıktıların belirlenmesi aşamasında, “n” karar birimi sayısını, “m” girdi sayısını ve “s” çıktı sayısını
gösterecek şekilde n > 2(m + s) kuralı dikkate alınmıştır.
4. SONUÇLAR
2016 – 2020 yılları arasındaki girdi ve çıktı değişkenlerinin değerleri alınarak DEAFrontier Excel eklentisi
yardımıyla çözülmüş olup, her deponun göreli etkinlik değerleri hesaplanarak aşağıdaki tabloda
paylaşılmıştır.
Tablo 2. Depoların göreli etkinlik değerleri
Depolar
Yıllara Göre Firmaların Etkinlik Değerleri
2016 2017 2018 2019 2020
D1 1 1 1 1 1
D2 0,971 0,808 0,830 0,832 0,769
D3 0,976 1 1 1 0,831
D4 0,998 1 1 1 0,97
D5 0,977 1 1 0,946 0,889
D6 1 0,913 0,935 0,978 0,937
D7 0,988 0,990 1 1 1
D8 1 1 1 1 0,956
D9 0,986 0,971 0,924 0,973 0,915
D10 0,998 0,962 0,937 0,94 0,914
Etkinlik Ortalaması 0,989 0,964 0,963 0,967 0,918
Etkin Bulunan Depo Sayısı 3 5 6 5 2
Depoların Etkinlik Yüzdesi 30% 50% 60% 50% 20%

International Engineering and Technology Management Summit 2021– ETMS2021
İstanbul Technical University & Bahçeşehir University
111
Tablo 2’ye göre 2016-2020 yıllarında göreli olarak etkin çalışan tek depo D1’dir. 2016 yılında 3 depo, 2017
ve 2019 yıllarında 5 depo, 2018 yılında 6 depo, 2020 yılında ise 2 depo göreli olarak tam etkin faaliyet
göstermiştir. 2016-2020 yıllarına ait ortalama etkinlik değerleri sırasıyla 0,989, 0,964, 0,963, 0,967 ve
0,918 olarak hesaplanmıştır. Depoların yıllara göre etkinlik yüzdeleri ise sırasıyla %30, %50, %60, %50 ve
%20 olarak hesaplanmıştır. Bu değerlere göre depoların etkinlik değerlerinde dalgalanmalar olduğu
görülmektedir.
Firmanın 10 deposu için 2016 – 2020 yıllarına ait girdi ve çıktı değerleri analiz edilerek veri zarflama
analizi tekniği girdi yönelimli CCR modeli ile göreli etkinlikleri belirlenmiştir. Yıllar bazında değerleri
karşılaştırdığımızda D1 deposu 2016-2020 yıllarında tam etkin performans gösterebilmiştir. 2016 yılında
etkin çalışma konusunda yüksek performans gösteren D2 deposu, 2017, 2018, 2019 ve 2020 yıllarında
etkinlik noktasında çok daha kötü performans göstermiştir. D3 deposu 2016 yılında yaklaşık %98 etkinlikle
çalışırken, 2017, 2018 ve 2019 yıllarında etkin olarak çalışabilmiş, 2020 yılında ise etkinliğinde ciddi bir
düşüş yaşamıştır. Bu düşüş için COVID-19 pandemisinin etkisinin yüksek olduğu net bir şekilde
söylenebilmektedir. D4 deposu 2016 yılında neredeyse tam etkin performans gösterirken 2017, 2018 ve
2019 yılı dahil etkin bir şekilde çalışmış, 2020 yılında ise bir miktar düşüş yaşamıştır. D5 deposu 2016
yılında yaklaşık %98 etkinlikle çalışırken, 2017 ve 2018 yılında istediği performansı sağlamış ve tam etkin
faaliyette bulunabilmiştir. 2019 ve 2020 yıllarında ise pandeminin de etkisiyle etkinlik değerlerinde düşüş
yaşamıştır. 2016 yılında etkin olarak çalışan D6 deposu, diğer yıllarda düşüş yaşamış ve tam etkin faaliyette
bulunamamıştır. 2018, 2019 ve 2020 yıllarında tam etkin faaliyet gösteren D7 deposu, 2016 ve 2017
yıllarında %99 gibi bir oranla neredeyse tam etkin faaliyet göstermiştir. İlk dört yıl tam etkin faaliyet
gösterebilen D8 deposu, 2020 yılında düşüş yaşayarak etkinlik noktasında %96 seviyelerinde kalmıştır. D9
ve D10 depoları hiçbir yıl tam etkin faaliyette bulunamamış ve dalgalanmalar yaşamıştır. 2020 yılında
depolarda yaşanan etkinlik düşüşlerinde pandeminin etkisini gözardı etmemek gerekmektedir.
Girdi yönelimli CCR modeli kullanılarak hesaplanan hedef değerlere göre yıllık ve depo bazlı beklenen
ortalama değişim yüzdeleri aşağıdaki gibi hesaplanmıştır.
Tablo 3. Gerçek değer ile hedef değer arasındaki yıllık ortalama değişim yüzdeleri
Girdiler Forklift sayısı Calışan işçi sayısı Depo Giderleri
2016 0% -1% -1%
2017 -3% -7% -8%
2018 -3% -4% -7%
2019 -2% -4% -7%
2020 -14% -9% -12%
Tablo 5’te verilen değerlere göre depoların en etkin çalıştığı yılın 2016 olduğu görülmektedir. 2017 yılında,
2016’ya göre daha kötü bir performans gösteren depolar 2018 yılında bir miktar iyileşme yakalamıştır.
2019 yılında da yaklaşık bir performans sergileyen depoların 2020 yılında COVID-19 pandemisinin
olumsuz koşullarından etkilenmiş olduğu net bir şekilde görülmektedir.
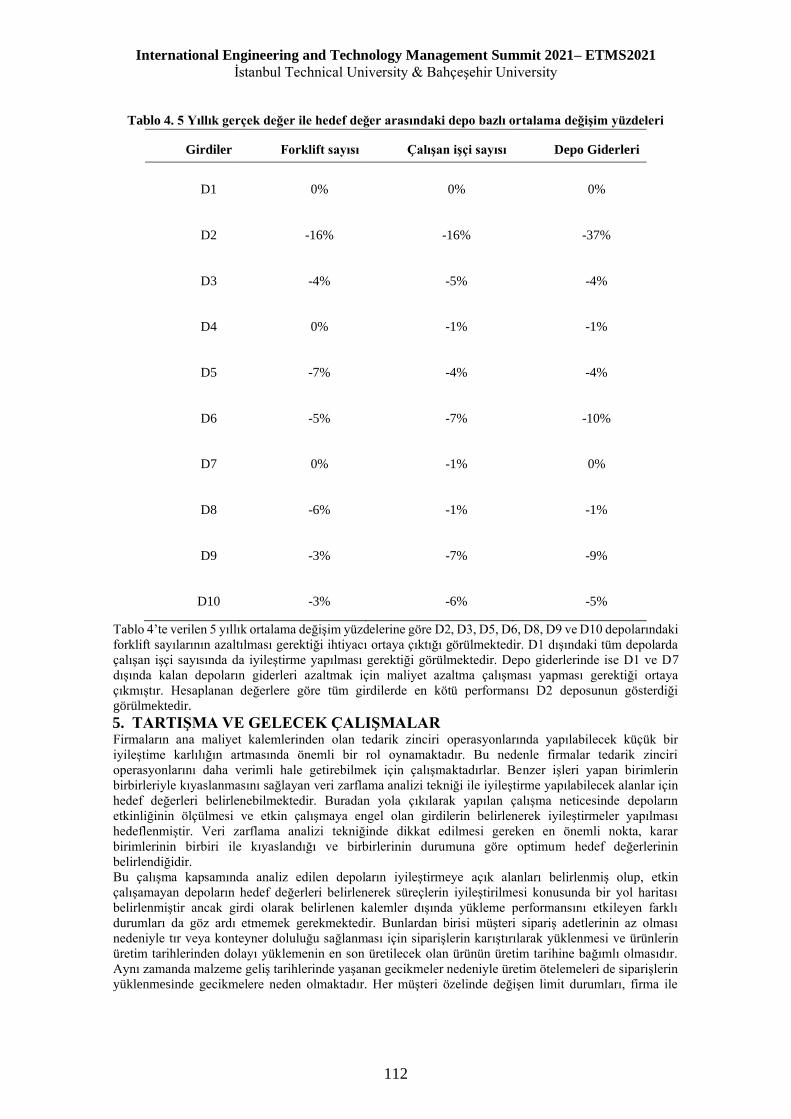
International Engineering and Technology Management Summit 2021– ETMS2021
İstanbul Technical University & Bahçeşehir University
112
Tablo 4. 5 Yıllık gerçek değer ile hedef değer arasındaki depo bazlı ortalama değişim yüzdeleri
Girdiler Forklift sayısı Calışan işçi sayısı Depo Giderleri
D1 0% 0% 0%
D2 -16% -16% -37%
D3 -4% -5% -4%
D4 0% -1% -1%
D5 -7% -4% -4%
D6 -5% -7% -10%
D7 0% -1% 0%
D8 -6% -1% -1%
D9 -3% -7% -9%
D10 -3% -6% -5%
Tablo 4’te verilen 5 yıllık ortalama değişim yüzdelerine göre D2, D3, D5, D6, D8, D9 ve D10 depolarındaki
forklift sayılarının azaltılması gerektiği ihtiyacı ortaya çıktığı görülmektedir. D1 dışındaki tüm depolarda
çalışan işçi sayısında da iyileştirme yapılması gerektiği görülmektedir. Depo giderlerinde ise D1 ve D7
dışında kalan depoların giderleri azaltmak için maliyet azaltma çalışması yapması gerektiği ortaya
çıkmıştır. Hesaplanan değerlere göre tüm girdilerde en kötü performansı D2 deposunun gösterdiği
görülmektedir.
5. TARTISMA VE GELECEK CALISMALAR Firmaların ana maliyet kalemlerinden olan tedarik zinciri operasyonlarında yapılabilecek küçük bir
iyileştime karlılığın artmasında önemli bir rol oynamaktadır. Bu nedenle firmalar tedarik zinciri
operasyonlarını daha verimli hale getirebilmek için çalışmaktadırlar. Benzer işleri yapan birimlerin
birbirleriyle kıyaslanmasını sağlayan veri zarflama analizi tekniği ile iyileştirme yapılabilecek alanlar için
hedef değerleri belirlenebilmektedir. Buradan yola çıkılarak yapılan çalışma neticesinde depoların
etkinliğinin ölçülmesi ve etkin çalışmaya engel olan girdilerin belirlenerek iyileştirmeler yapılması
hedeflenmiştir. Veri zarflama analizi tekniğinde dikkat edilmesi gereken en önemli nokta, karar
birimlerinin birbiri ile kıyaslandığı ve birbirlerinin durumuna göre optimum hedef değerlerinin
belirlendiğidir.
Bu çalışma kapsamında analiz edilen depoların iyileştirmeye açık alanları belirlenmiş olup, etkin
çalışamayan depoların hedef değerleri belirlenerek süreçlerin iyileştirilmesi konusunda bir yol haritası
belirlenmiştir ancak girdi olarak belirlenen kalemler dışında yükleme performansını etkileyen farklı
durumları da göz ardı etmemek gerekmektedir. Bunlardan birisi müşteri sipariş adetlerinin az olması
nedeniyle tır veya konteyner doluluğu sağlanması için siparişlerin karıştırılarak yüklenmesi ve ürünlerin
üretim tarihlerinden dolayı yüklemenin en son üretilecek olan ürünün üretim tarihine bağımlı olmasıdır.
Aynı zamanda malzeme geliş tarihlerinde yaşanan gecikmeler nedeniyle üretim ötelemeleri de siparişlerin
yüklenmesinde gecikmelere neden olmaktadır. Her müşteri özelinde değişen limit durumları, firma ile

International Engineering and Technology Management Summit 2021– ETMS2021
İstanbul Technical University & Bahçeşehir University
113
müşteri arasında yapılan anlaşmalar, konteyner tedarik süreçleri, yükleme tipleri, gümrük süreçleri ve
uluslararası ihracat konuları da depoların yükleme performansını etkileyen temel konulardandır. 2019 sonu
itibariyle beklenmedik şekilde ortaya çıkan ve tüm dünyada hızla yayılan COVID-19 pandemisi de
firmaları operasyonel süreçleri yönetme noktasında zor durumda bırakmış ve depoların yükleme
performansını olumsuz şekilde etkilemiştir. Depoların verimliliğine etki eden çok sayıda değişken
mevcuttur ve bu değişkenler firmalar tarafından tedarik zinciri operasyonlarını iyileştirebilmek amacıyla
dikkatli şekilde analiz edilmelidir.
REFERANSLAR Bal, V., (2010). Bilgi Sistemlerinin Sağlık İşletmeleri Performansına Etkilerinin Veri Zarflama Analizi ile
Olçümü: Türkiye’deki Devlet Hastanelerinde Bir Araştırma. Isparta: Süleyman Demirel Universitesi
Sosyal Bilimler Enstitüsü.
Cooper, William & Seiford, Lawrence & Zhu, Joe. (2011). Data Envelopment Analysis: History, Models,
and Interpretations. 10.1007/978-1-4419-6151-8_1.
F. Hosseinzadeh Lotfi, G. R. Jahanshahloo, M. Khodabakhshi, M. Rostamy-Malkhlifeh, Z. Moghaddas, M.
Vaez-Ghasemi, (2013)."A Review of Ranking Models in Data Envelopment Analysis", Journal of
Applied Mathematics, vol:2013, p.20,
Francielly Hedler Staudt, Gülgün Alpan, Maria Di Mascolo & Carlos M. Taboada
Rodriguez (2015).Warehouse performance measurement: a literature review, International Journal of
Production Research, 53:18, 5524-5544,
Grigorian, David A., (2002). Determinants of Commercial Bank Performance in Transition: An Application
of Data Envelopment Analysis (September 2002).
Hamdan, A. (2005). A methodology to establish warehouse productivity measures and warehouse
efficiency using DEA (Order No. 3179124). Available from ProQuest Dissertations & Theses Global.
(305357405). Ji Y, Lee C. Data Envelopment Analysis. The Stata Journal. 2010;10(2):267-280.
Jill JOHNES, Li YU(2008). Measuring the research performance of Chinese higher education institutions
using data envelopment analysis, China Economic Review,Volume 19, Issue 4,Pages 679-696,
Johanna C. Gerdessen, Stefano Pascucci(2013). Data Envelopment Analysis of sustainability indicators of
European agricultural systems at regional level,Agricultural Systems,Volume 118,Pages 78-90,
John S. Liu, Louis Y.Y. Lu, Wen-Min Lu(2016). Research fronts in data envelopment analysis,
Omega,Volume 58, Pages 33-45,
ISSN 0305-0483,
Joseph C. Paradi, Haiyan Zhu (2013). A survey on bank branch efficiency and performance research with
data envelopment analysis,
Omega,Volume 41, Issue 1,Pages 61-79,
Jukka Korpela, Antti Lehmusvaara, Jukka Nisonen (2007). Warehouse operator selection by combining
AHP and DEA methodologies,
International Journal of Production Economics,Volume 108, Issues 1–2,2007,Pages 135-142,
Kohl, S., Schoenfelder, J., Fügener, A. et al. The use of Data Envelopment Analysis (DEA) in healthcare
with a focus on hospitals. Health Care Manag Sci 22, 245–286 (2019). https://doi.org/10.1007/s10729-
018-9436-8
Nayar, P., Ozcan, Y.A. Data Envelopment Analysis Comparison of Hospital Efficiency and Quality. J Med
Syst 32, 193–199 (2008). https://doi.org/10.1007/s10916-007-9122-8
Necmi K Avkiran (2001). Investigating technical and scale efficiencies of Australian Universities through
data envelopment analysis,
Socio-Economic Planning Sciences,Volume 35, Issue 1,Pages 57-80.
Özden, U. (2009). Veri zarflama analizi (VZA) ile Türkiye’deki vakıf üniversitelerinin etkinliğinin
ölçülmesi . İstanbul Universitesi İşletme Fakültesi Dergisi , 37 (2) , 167-185 . Retrieved from
https://dergipark.org.tr/en/pub/iuisletme/issue/9243/115660
Peng Wong, W. and Yew Wong, K. (2007), "Supply chain performance measurement system using DEA
modeling", Industrial Management & Data Systems, Vol. 107 No. 3, pp. 361-381.
Sarrico, C., Hogan, S., Dyson, R. et al. (1997). Data envelopment analysis and university selection. J Oper
Res Soc 48, 1163–1177 (1997). https://doi.org/10.1057/palgrave.jors.2600475
Yan Yu, Zongguo Wen (2010).Evaluating China's urban environmental sustainability with Data
Envelopment Analysis,Ecological Economics,Volume 69, Issue 9,Pages 1748-1755
Yolalan, R., 1993. İşletmeler Arası Göreli Etkinlik Olçümü. Ankara: MPM Yayınları.

International Engineering and Technology Management Summit 2021– ETMS2021
İstanbul Technical University & Bahçeşehir University
114
DETERMINATION OF COVID-19 RESILIENCE RANKING FOR
ECONOMIES WITH ENTROPY-BASED COCOSO METHOD
Boğaç Bilgiç Şevket Süleyman İrtem
Istanbul University Burdur Mehmet Akif Ersoy
University
ABSTRACT
Although the whole world is fighting against Covid-19, different regions are able to control this epidemic
more effectively. To make this situation more understandable, various scores have been developed that
measure the Covid-19 resilience of regions. To make the data more consistent, studies were conducted
considering 53 economies with more than $200 billion like as Bloomberg’s Covid-19 resilience score.
While various parameters are used, while these rankings are made, the weights of the parameters are
considered equal in some studies. Since it would be difficult to decide on the weight values of the
parameters according to expert opinions, the criterion weight values were determined with Shannon's
Entropy Method in this study. The Covid-19 resilience ranking of economies was also done with the
Combined Compromise Solution (CoCoSo). While making this ranking, Oxford’s lockdown severity, the GDP growth forecast for 2021, universal healthcare coverage, human development index, 1-month cases
per 100000, 3-month case fatality rate, total deaths per 1 million, people covered by vaccines were taken
into account.
Keywords: Combined compromise solution (CoCoSo), Covid-19 resilience score, Shannon’s Entropy
Method.

International Engineering and Technology Management Summit 2021– ETMS2021
İstanbul Technical University & Bahçeşehir University
115
1. INTRODUCTION With the emergence of Covid-19 in December 2019, all countries started to take precautions. Considering
the current situation of the countries and the measures they have taken, estimations have started to be made
about how resistant they are to this pandemic. The most famous of these resilience rankings is Bloomberg's
resilience score. In this study, Shannon's Entropy Method, which does not need subjective evaluations of
decision makers, was used in criterion weights instead of equivalent weights used when calculating
bloomberg's resilience score. Thus, the weights were created completely objectively and the uncertainties
about which parameters were more effective were tried to be eliminated. Combined compose solution
(CoCoSo) was chosen from multi-criteria decision making (MCDM) techniques. The CoCoSo method was
created by integrating SAW (Simple Additive Weighting) and EWP (Exponentially Weighted Product)
methods. CoCoSo has high stability and reliability in ranking alternatives. Adding new alternatives to the
assays or removing an existing alternative from the assays has less of an impact on the final sequencing
results obtained with this method than with other MCDM techniques. The method first finds utility values
of alternatives from different perspectives through different addition operators and then obtains a
compromise solution. The following 8 parameters were used for this sorting.
Lockdown Severity: A high score indicates that social and economic activities are tightly constrained by
government policy. This means that people experience more interruptions in their lives, resulting in a lower
ranking. This indicator is based on an index produced by the University of Oxford that assesses the number
and severity of government policies that limit people's social contact as a way to contain epidemics.
2021 GDP Growth Forecast: GDP change forecast for 2021.
Universal Healthcare Coverage: The power of a health system achieved through the effectiveness of 23
aspects of health insurance, from preventive measures such as childhood immunizations to the treatment of
serious diseases such as cancer.
Human Development Index: Well-being of a population defined by three measures: life expectancy, access
to education, income per capita.
1-Month Cases Per 100000: Covid-19 cases per 100000 people over the past month.
3-Month Case Fatality Rate: Covid-19 deaths as a share of cases over the past three months.
Total Deaths Per 1 Million: Covid-19 deaths per one million people since the start of the pandemic.
People Covered by Vaccines: Percentage of population covered by Covid-19 vaccines given, a calculated
figure based on the number of doses administered and the mix of vaccine types used (While the number of
vaccines made in two-dose vaccines was divided by two, the number of vaccines made in single-dose
vaccines was taken into account).
2. LITERATURE REVIEW Bloomberg's Covid-19 Resilience Ranking (Bloomberg, 2020) was created taking into account the many
datasets, indicators and indices produced by organizations around the world. While creating this ranking,
the 53 largest economies were ranked, taking into account 12 parameters. All indicators were scored
between 0-100 and each parameter was considered to be of equal weight.
The entropy method was developed by Shannon (1948). Later, it was used as a subjective weighting method
especially in multi-criteria decision making problems where it is difficult to determine the weights of the
parameters (Li et.al.,2011), (Zhou et.al.,2011), (He et.al.,2016).
Combined Compromise Solution (CoCoSo) is a new method proposed by Yazdani et.al. (2018). The logical
and meaningful integration of certain rules and techniques in the field of decision-making methodologies
will add values and advantages to certain knowledge. In decision theory, the MCDM family has developed
in many areas and applications. CoCoSo proposes a new strategy to solve a MCDM problem through some
specific changes in the main structure. In their study, the stability of the CoCoSo algorithm has also been
confirmed by some comparative analysis and evidence. The CoCoSo method has found its place in the
literature and studies have been carried out in different branches recently (Mishra et.al.2021). This method
was also used in studies on temporary hospital location selection during the Covid-19 epidemic (Zolfani
et.al, 2020).
3. METHODOLOGY
3.1 Shannon’s Entropy Method Since each criterion has a different priority and importance level in multi-criteria decision making, it cannot
be assumed that all of them have equal weights. There are many methods in the literature to find criterion
importance weights. These can generally be divided into two groups as subjective and objective methods.
While only the preferences of the decision makers are taken into account in the subjective methods, the
weights are determined by using the available data without considering the preferences of the decision
maker in the objective methods. Shannon's entropy method is one of them. Shannon (1948) proposed
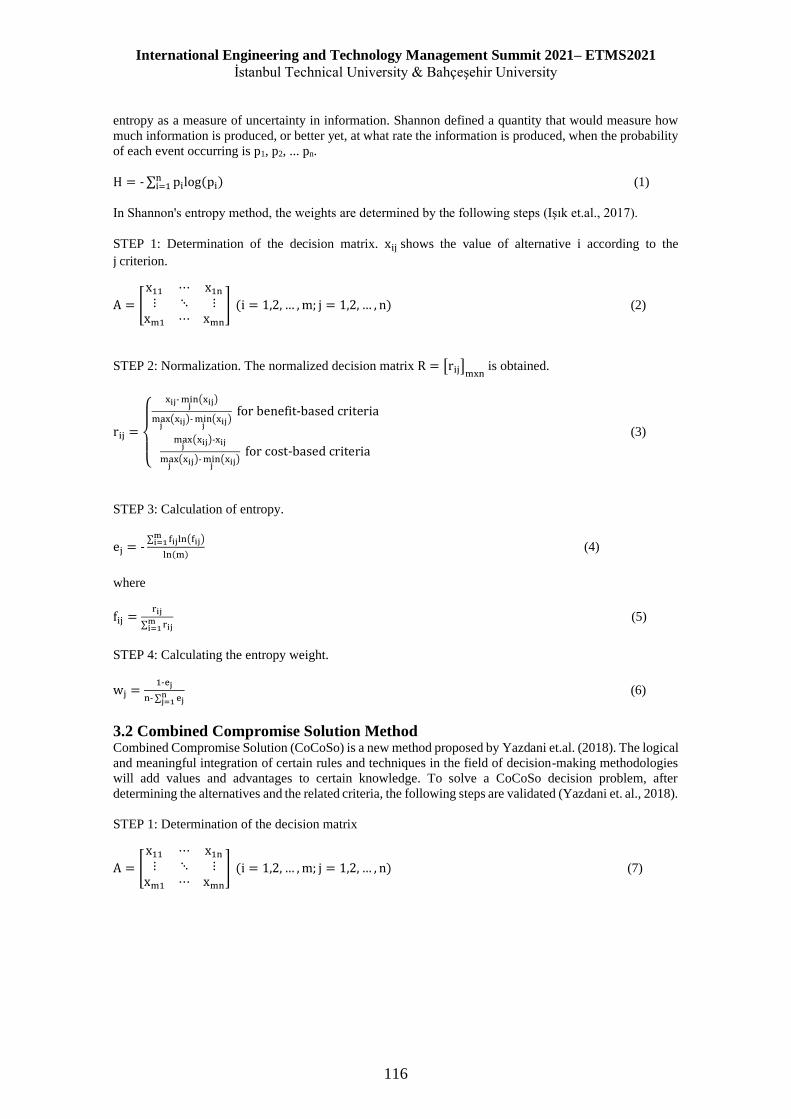
International Engineering and Technology Management Summit 2021– ETMS2021
İstanbul Technical University & Bahçeşehir University
116
entropy as a measure of uncertainty in information. Shannon defined a quantity that would measure how
much information is produced, or better yet, at what rate the information is produced, when the probability
of each event occurring is p1, p2, ... pn.
H = -∑ pilog(pi)ni=1 (1)
In Shannon's entropy method, the weights are determined by the following steps (Işık et.al., 2017).
STEP 1: Determination of the decision matrix. xij shows the value of alternative i according to the
j criterion.
A = [
x11 ⋯ x1n⋮ ⋱ ⋮xm1 ⋯ xmn
] (i = 1,2, … ,m; j = 1,2, … , n) (2)
STEP 2: Normalization. The normalized decision matrix R = [rij]mxn is obtained.
rij =
{
xij-minj(xij)
maxj(xij)-minj
(xij) for benefit-based criteria
maxj(xij)-xij
maxj(xij)-minj
(xij) for cost-based criteria
(3)
STEP 3: Calculation of entropy.
ej = -∑ fijln(fij)mi=1
ln(m) (4)
where
fij =rij
∑ rijmi=1
(5)
STEP 4: Calculating the entropy weight.
wj =1-ej
n-∑ ejnj=1
(6)
3.2 Combined Compromise Solution Method Combined Compromise Solution (CoCoSo) is a new method proposed by Yazdani et.al. (2018). The logical
and meaningful integration of certain rules and techniques in the field of decision-making methodologies
will add values and advantages to certain knowledge. To solve a CoCoSo decision problem, after
determining the alternatives and the related criteria, the following steps are validated (Yazdani et. al., 2018).
STEP 1: Determination of the decision matrix
A = [
x11 ⋯ x1n⋮ ⋱ ⋮xm1 ⋯ xmn
] (i = 1,2, … ,m; j = 1,2, … , n) (7)

International Engineering and Technology Management Summit 2021– ETMS2021
İstanbul Technical University & Bahçeşehir University
117
Table 1. Criteria taken into account when ranking the Covid-19 (Bloomberg,2021)
STEP 2: Normalization. The normalized decision matrix R = [rij]mxn is obtained.
rij =
{
xij-mini(xij)
maxi(xij)-mini
(xij) for benefit criterion
maxi(xij)-xij
maxi(xij)-mini
(xij) for cost criterion
(8)
STEP 3: Sivalue is achieved based on grey relational generation approach
Si = ∑ (wjrij)nj=1 (9)
ECONOMYLOCKDOWN
SEVERITY
2021 GDP
GROWTH
FORECAST
UNIVERSAL
HEALTHCARE
COVERAGE
HUMAN
DEVELOPMENT
INDEX
1-MONTH
CASES PER
100,000
3-MONTH
FATALITY
RATE
TOTAL
DEATHS PER
1 MILLION
PEOPLE
COVERED BY
VACCINES
Norway 53 0.04 94 0.96 102 0.00 147 0.48
Switzerland 44 0.04 93 0.96 138 0.01 1,259 0.51
New Zealand 22 0.06 83 0.93 3 0.00 5 0.16
France 41 0.06 91 0.9 352 0.02 1,714 0.54
U.S. 50 0.07 82 0.93 274 0.02 1,846 0.54
Austria 49 0.03 86 0.92 70 0.01 1,192 0.53
Finland 44 0.03 91 0.94 147 0.00 177 0.49
Ireland 54 0.07 90 0.96 466 0.00 1,018 0.56
Mainland China 79 0.09 70 0.76 0.0001 0.00 3 0.55
Belgium 47 0.05 87 0.93 304 0.01 2,177 0.60
Singapore 51 0.07 92 0.94 30 0.00 6 0.64
Germany 68 0.03 86 0.95 36 0.02 1,093 0.54
Denmark 47 0.03 84 0.94 338 0.00 439 0.61
Netherlands 42 0.03 90 0.94 965 0.00 1,056 0.57
Sweden 37 0.04 90 0.95 78 0.01 1,451 0.49
Turkey 65 0.06 69 0.82 248 0.01 605 0.41
Israel 41 0.05 81 0.92 252 0.00 746 0.61
U.A.E. 63 0.03 63 0.89 468 0.00 195 0.77
Canada 63 0.06 90 0.93 38 0.01 702 0.64
Spain 48 0.06 90 0.9 1,197 0.00 1,738 0.58
Greece 54 0.05 80 0.89 548 0.02 1,236 0.47
Saudi Arabia 54 0.02 64 0.85 100 0.01 235 0.37
South Korea 50 0.04 89 0.92 67 0.00 41 0.23
Romania 31 0.06 70 0.83 9 0.09 1,781 0.25
U.K. 44 0.07 88 0.93 1,472 0.00 1,907 0.63
Japan 50 0.03 96 0.92 63 0.02 119 0.31
Italy 75 0.05 89 0.89 103 0.02 2,117 0.54
Australia 68 0.05 89 0.94 11 0.00 36 0.22
Czech Republic 35 0.04 82 0.9 53 0.03 2,835 0.46
Hong Kong 66 0.07 75 0.95 1 0.01 28 0.36
Portugal 64 0.04 84 0.86 786 0.00 1,697 0.56
Poland 50 0.05 73 0.88 7 0.08 1,988 0.45
Chile 85 0.08 74 0.85 331 0.02 1,837 0.66
Russia 47 0.04 69 0.82 469 0.03 1,042 0.19
Brazil 46 0.05 65 0.77 606 0.03 2,590 0.32
Mexico 44 0.06 61 0.78 193 0.06 1,851 0.24
Egypt 44 0.03 55 0.71 4 0.06 161 0.03
Nigeria 53 0.02 38 0.54 2 0.01 10 0.01
Colombia 70 0.06 74 0.77 1,135 0.02 2,342 0.25
Taiwan 71 0.06 79 0.91 4 0.05 33 0.14
Thailand 54 0.02 72 0.78 384 0.01 59 0.12
Peru 70 0.10 76 0.78 177 0.09 5,941 0.18
Iraq 76 0.01 58 0.67 595 0.01 456 0.02
India 82 0.09 47 0.65 85 0.02 305 0.16
Pakistan 64 0.04 39 0.56 24 0.03 104 0.06
Vietnam 79 0.07 60 0.7 93 0.01 5 0.02
Iran 75 0.03 70 0.78 661 0.01 1,061 0.06
Bangladesh 86 0.05 54 0.63 177 0.02 119 0.03
Philippines 72 0.05 55 0.72 144 0.02 249 0.07
Argentina 75 0.06 61 0.85 1,004 0.02 2,303 0.33
South Africa 72 0.05 60 0.71 766 0.02 1,181 0.06
Malaysia 81 0.05 67 0.81 908 0.01 253 0.27
Indonesia 69 0.04 49 0.72 395 0.03 310 0.12
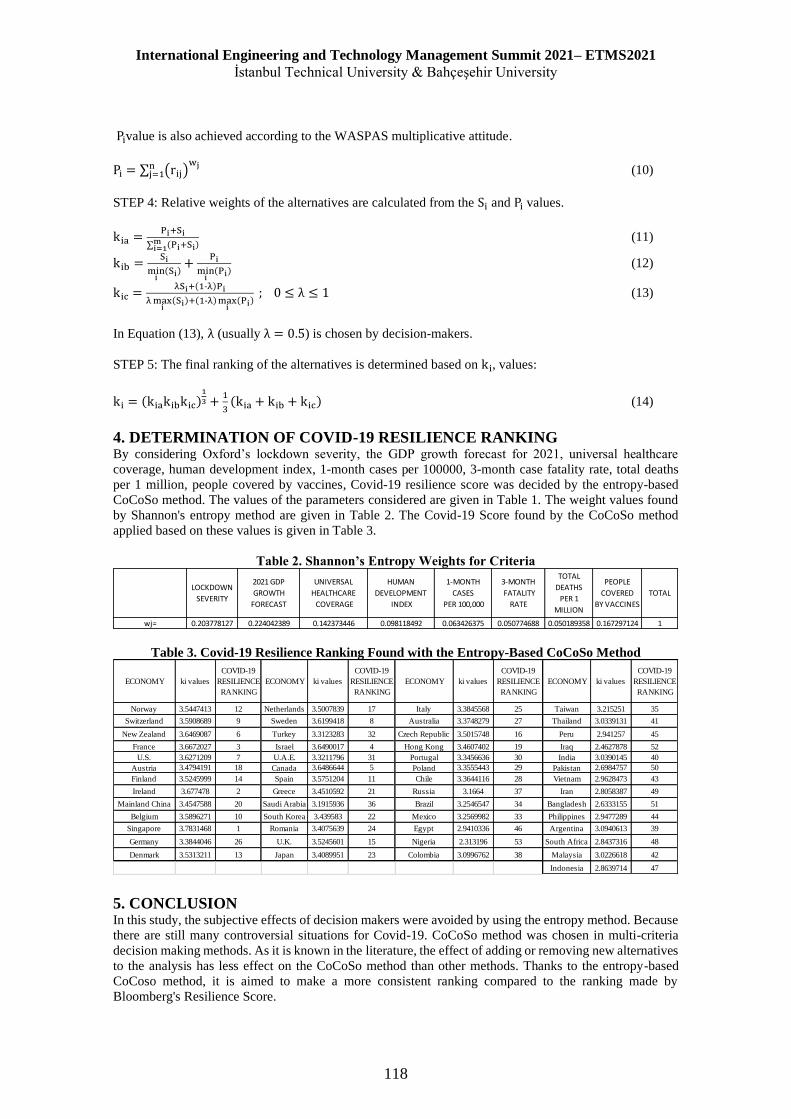
International Engineering and Technology Management Summit 2021– ETMS2021
İstanbul Technical University & Bahçeşehir University
118
Pivalue is also achieved according to the WASPAS multiplicative attitude.
Pi = ∑ (rij)wjn
j=1 (10)
STEP 4: Relative weights of the alternatives are calculated from the Si and Pi values.
kia =Pi+Si
∑ (Pi+Si)mi=1
(11)
kib =Si
mini(Si)
+Pi
mini(Pi)
(12)
kic =λSi+(1-λ)Pi
λmaxi(Si)+(1-λ)maxi
(Pi) ; 0 ≤ λ ≤ 1 (13)
In Equation (13), λ (usually λ = 0.5) is chosen by decision-makers.
STEP 5: The final ranking of the alternatives is determined based on ki, values:
ki = (kiakibkic)1
3 +1
3(kia + kib + kic) (14)
4. DETERMINATION OF COVID-19 RESILIENCE RANKING By considering Oxford’s lockdown severity, the GDP growth forecast for 2021, universal healthcare
coverage, human development index, 1-month cases per 100000, 3-month case fatality rate, total deaths
per 1 million, people covered by vaccines, Covid-19 resilience score was decided by the entropy-based
CoCoSo method. The values of the parameters considered are given in Table 1. The weight values found
by Shannon's entropy method are given in Table 2. The Covid-19 Score found by the CoCoSo method
applied based on these values is given in Table 3.
Table 2. Shannon’s Entropy Weights for Criteria
Table 3. Covid-19 Resilience Ranking Found with the Entropy-Based CoCoSo Method
5. CONCLUSION In this study, the subjective effects of decision makers were avoided by using the entropy method. Because
there are still many controversial situations for Covid-19. CoCoSo method was chosen in multi-criteria
decision making methods. As it is known in the literature, the effect of adding or removing new alternatives
to the analysis has less effect on the CoCoSo method than other methods. Thanks to the entropy-based
CoCoso method, it is aimed to make a more consistent ranking compared to the ranking made by
Bloomberg's Resilience Score.
LOCKDOWN
SEVERITY
2021 GDP
GROWTH
FORECAST
UNIVERSAL
HEALTHCARE
COVERAGE
HUMAN
DEVELOPMENT
INDEX
1-MONTH
CASES
PER 100,000
3-MONTH
FATALITY
RATE
TOTAL
DEATHS
PER 1
MILLION
PEOPLE
COVERED
BY VACCINES
TOTAL
wj= 0.203778127 0.224042389 0.142373446 0.098118492 0.063426375 0.050774688 0.050189358 0.167297124 1
ECONOMY ki values
COVID-19
RESILIENCE
RANKING
ECONOMY ki values
COVID-19
RESILIENCE
RANKING
ECONOMY ki values
COVID-19
RESILIENCE
RANKING
ECONOMY ki values
COVID-19
RESILIENCE
RANKING
Norway 3.5447413 12 Netherlands 3.5007839 17 Italy 3.3845568 25 Taiwan 3.215251 35
Switzerland 3.5908689 9 Sweden 3.6199418 8 Australia 3.3748279 27 Thailand 3.0339131 41
New Zealand 3.6469087 6 Turkey 3.3123283 32 Czech Republic 3.5015748 16 Peru 2.941257 45
France 3.6672027 3 Israel 3.6490017 4 Hong Kong 3.4607402 19 Iraq 2.4627878 52
U.S. 3.6271209 7 U.A.E. 3.3211796 31 Portugal 3.3456636 30 India 3.0390145 40
Austria 3.4794191 18 Canada 3.6486644 5 Poland 3.3555443 29 Pakistan 2.6984757 50
Finland 3.5245999 14 Spain 3.5751204 11 Chile 3.3644116 28 Vietnam 2.9628473 43
Ireland 3.677478 2 Greece 3.4510592 21 Russia 3.1664 37 Iran 2.8058387 49
Mainland China 3.4547588 20 Saudi Arabia 3.1915936 36 Brazil 3.2546547 34 Bangladesh 2.6333155 51
Belgium 3.5896271 10 South Korea 3.439583 22 Mexico 3.2569982 33 Philippines 2.9477289 44
Singapore 3.7831468 1 Romania 3.4075639 24 Egypt 2.9410336 46 Argentina 3.0940613 39
Germany 3.3844046 26 U.K. 3.5245601 15 Nigeria 2.313196 53 South Africa 2.8437316 48
Denmark 3.5313211 13 Japan 3.4089951 23 Colombia 3.0996762 38 Malaysia 3.0226618 42
Indonesia 2.8639714 47

International Engineering and Technology Management Summit 2021– ETMS2021
İstanbul Technical University & Bahçeşehir University
119
REFERENCES Bloomberg. (2020). Methodology: Inside Bloomberg’s Covid Resilience Ranking,
https://www.bloomberg.com/news/articles/2020-11-24/inside-bloomberg-s-covid-resilience-ranking
(10.08.2021)
Bloomberg (2021). The Covid Resilience Ranking the Best and Worst Places to Be as Reopening,
Variants Collide. https://www.bloomberg.com/graphics/covid-resilience-ranking/ (10.08.2021)
He Y., Guo H., Jin M. & Ren P. (2016). A linguistic entropy weight method and its application in linguistic
multi-attribute group decision making. Nonlinear Dyn 84, 399–404.
Işık A. T. & Adalı E. A. (2017). The Decision-Making Approach Based on the Combination of Entropy
and Rov Methods for the Apple Selection Problem, European Journal of Interdisciplinary Studies,
Volume 3, Issue 3.
Li X.,Wang K., Liu L.,Xin J., Yang H. & Gao C. (2011). Application of the Entropy Weight and TOPSIS
Method in Safety Evaluation of Coal Mines, Procedia Engineering 26, 2085 – 2091.
Mishra A. R. & Rani P. (2021). Assessment of sustainable third party reverse logistic provider using the
single-valued neutrosophic Combined Compromise Solution framework, Cleaner and Responsible
Consumption, Volume 2, 100011.
Shannon, C.E. (1948). A Mathematical Theory of Communication. The Bell System Technical Journal,
Vol. 27, pp. 379–423, 623–656.
Yazdani M., Zarate P., Kazimieras Z. E. & Turskis Z. (2019). A combined compromise solution (CoCoSo)
method for multi-criteria decision-making problems, Management Decision, Vol. 57 No. 9, pp. 2501-
2519.
Zhou Y., Ma L., Yang J. & Xia C. (2011). Entropy Weight Health Index Method of Power Transformer
Condition Assessment, The Proceedings of 2011 9th International Conference on Reliability,
Maintainability and Safety, pp. 426-431.
Zolfani S. H., Yazdani M., Ebadi T. A. & Derakhti A. (2020) Application of a Gray-Based Decision Support
Framework for Location Selection of a Temporary Hospital during COVID-19 Pandemic. Symmetry,
12, 886.
International Engineering and Technology Management Summit 2021– ETMS2021
İstanbul Technical University & Bahçeşehir University
120
DIGITAL SECOND-HAND SHOPPING AND CLOTHING
TRANSFORMATION PROJECT DESIGN
1Deniz Coşkunsu 1Merve Yüzlek 1A. Kemal Konyalıoğlu
1Tuğçe Beldek,
1Hatice Camgöz Akdağ
1Istanbul Technical University
ABSTRACT
Consumption is increasing in the world and the fashion industry continues to increase its influence. High
demand and the huge amount of output make the most sustainable use of resources and waste management
inevitably important. In this sense, second-hand shopping and clothing transformation along with upcycling
are considered as areas open to development. Business models and solutions developed for this purpose
have created a highly competitive environment, especially in the digital environment. It is necessary to
define the needs and pain points of the user well and to develop appropriate solutions. In this study, a market
analysis to determine opportunities and a survey study to understand customer concerns were made.
Afterwards, an exemplary business model and value delivery was worked on. Value proposition canvas,
stakeholder analysis, system analysis, application design and communication plan were made.
Keywords: second-hand shopping, clothing transformation, upcycling, waste

International Engineering and Technology Management Summit 2021– ETMS2021
İstanbul Technical University & Bahçeşehir University
121
1. INTRODUCTION Textile industry contains the process of designing, manufacturing, and distributing clothing and its material
so the raw material passes through a process where a lot of energy and chemical stuff are involved but
unfortunately while the clothes are produced, it brings a lot of waste with itself and the production and
distribution process is not really sustainable and have a direct impact on the environment and planet. The
problem can be defined as that the fashion and textile industry impose people to throw away clothes every
single year and this leads to a lot of waste and negative environmental impact.
Waste management has a big role to make the situation sustainable and throughout the year, new concepts
are developing to change the current situation. Second hand clothing and transformation became a part of
the activity due to many reasons. People are shopping from second hand stores and transforming their
clothes without throwing them away because in this concept, it says that clothes are not a trash, they need
a transformation process to recreate their clothing and there are many examples available for this situation
so it shows that if people transform their clothing and do second hand shopping, it has a positive impact on
the environment.
2. LITERATURE REVIEW Second hand clothing is getting very popular and it is kind of a new concept to human life. The reasons can
be basically considered as economical and environmental problems. Economic slowdown and purchasing
power are really affecting people. It shapes their lifestyle. Especially economic depreciation and exchange
rates are affecting the prices of clothes. Since they are more expensive, people turn their faces to second
hand stores.Thus, Second hand clothing sales are increasing rapidly nowadays. The report says that for
example in America, the second-hand stores are expected to raise their number and value over the ten years
so in 2019, it is around 28 billion dollars so after ten years later, it is expected to become 80 billion dollars.
Also, the report also says that in 2019, second hand shopping enlarged much faster than traditional clothing
retailing (Park, H., & Armstrong, C., 2020).
Upcycling is a new terminology and used in the textile industry lately. It means recreating used or thrown
materials into something handy and wearable (Singh et al., 2019). This idea puts a higher value to the
unused clothing and turns them into a high-quality material. When it comes to the recycling process,
customers feel uncomfortable sometimes due to used pieces but this new terminology puts a different
perspective. This technique is used in the textile industry because transforming clothes by the upcycling
style overreach from the traditional ones and this helps the industry to constitute much less waste so it has
a positive impact on the planet. Many companies already applied this method in their brands and it seems
like it is going to be the new perspective in the future of the fashion industry. Modular fashion is in the
term of transformable fashion and it again supports sustainability by contributing to producing less waste.
It has a meaning of the clothing that can be removable and detachable pieces therefore the clothes may
pretty easily change and adapt the new trends by lasting over the years (Peter, 2018).
3.MARKET ANALYSIS Nowadays, digital second-hand shopping is booming and clothing transformation is also a hot topic.
Fashion industry is so huge and to differentiate, it is crucial to state business models and value
determinations well. Also people’s shopping desires and styles change based on their needs from time to
time. Also to obtain sustainable shopping, some criterions which are open to development should be
considered such as authenticity, reliable delivery and pricing solutions. All listed solutions in Table-1 are
for different customer types and needs and have different value propositions.
Table 1. Digital Second-Hand Shopping and Clothing Transformation Solutions
Digital Second-Hand Shopping Clothing Transformation
Solutions from the World Solutions in Turkey Company & Local Solutions
We Are Cow Moda Cruz H&M
Re-Fashion Dolap Tailors
Vestiaire Collective Gardrops Fashion Designers
Tradesy Sahibinden
Thrift+
Hewi
ThredUp

International Engineering and Technology Management Summit 2021– ETMS2021
İstanbul Technical University & Bahçeşehir University
122
On We Are Cow website, in addition to selling the vintage pieces collected on the website, it sells second-
hand pieces by redesigning and transforming them with the design team. In the rework category, damaged
vintage pieces are transformed into new stylish pieces bearing the signature of their own design team (We
Are Cow, n.d.). In the Cow Custom category, handmade clothes designed and produced by the design team
from 100% recycled materials are offered for sale (We Are Cow, n.d.).
Re-fashion sells second hand clothes for women on its site. In the upcycle category, it sells rag bags for
those who want to upcycle them. Rag bags include the clothes that cannot be sold by Re-fashion due to
small defects such as a broken zip, stain or small tear (Re-fashion, n.d.). When one person upcycles the rag-
bag, takes photos of clothes and sends it to Re-fashion. If they are sold, the person takes %80 of their
revenue (Re-fashion, n.d.). The website also has a donation clothes category. In that category, to donate
clothes you need to order a donation bag for free, then you can fill the bag with clothes you no longer wear
and send it to Re-fashion (Re-fashion, n.d.).
Vestiaire Collective sells second hand luxury clothes, bags, watches, jewelry, photographs and similar
products for women, men and children. Before sending a new purchase to the customer, the seller sends it
to the site's dedicated team. If they verify authenticity and quality standards, conformity with the seller's
description and the condition of the product, it is sent to the customer's delivery address (Vestiaire
Collective, n.d.). Each cloth also has its own authenticity cost. Also, the site offers direct shipping options
to the customers without authenticity cost.
Tradesy is the largest used second-hand luxury merchandising platform in the USA. All products on the
platform are intended for women. Clothing, bags, accessories, shoes are sold on the website and every item
on Tradesy is authenticated (Tradesy, n.d.). Tradesy gives a seller a pricing suggestion when he/she creates
his/her listing. Moreover, Tradesy has a Tradesy for Business option. In this option, sellers can sell his/her
products faster thanks to Tradesy’s marketing actions. Sellers can control his/her pricing and get discounted
commission for high-volume sales (Tradesy, n.d.).
Thrift+ offers high-speed sale of products on the website. All sent items pass through quality control. Items
that don't pass quality checks are donated to charity partners. There are products that both for women and
men on the website and prices are affordable.
Hewi sells luxury second hand products in the category of women, men and kids. There is an important
point that Hewi gives customer's payment to the seller if only the customer receives the item safely and
correctly from the seller shipping them (Hewi, n.d.).
ThredUp is an American company and actually one of the market leaders in second hand shopping and the
company is the world's largest fashion resale marketplace.They are concerned about waste management so
they mention people to recreate their wardrobe by generating less waste.
In Turkey, there are 4 second-hand shopping solutions which are Dolap, Gardrop, Moda Cruz and
Sahibinden in that area. People can create a profile, sell or buy clothings thanks to those solutions. Except
for Sahibinden, they have the feature of scoring the seller, which increases the trust in the seller. Dolap is
the main player in the sector.
In the clothing transformation category, H&M emphasizes and points out people that instead of buying and
producing new garments, turn the old clothes that people do not wear, decrease the waste and make an
effect toward sustainability. Moreover, fashion designers and tailors can meet personnel clothing
transformation and upcycling needs.
4. PRIMARY DATA ANALYSIS According to the survey conducted in Turkey on 303 people, 79.3% of whom are women, 19.6% are men,
86.6% of people do not do second-hand shopping. This situation shows that the second-hand shopping
sector is a sector in need of development in Turkey. 285 hygiene (75.6%) say that hygiene is very important
for them when they do second-hand shopping since it makes them feel uncomfortable and causes them to
be itchy, they prefer not to buy second-hand clothes. While 49.8% of the participants have a problem of
trusting the seller, 40.1% doubt the quality of the product. 39% are worried about size inconsistency, while
36.1% are concerned about brand authenticity. When asked about what they think, whether or not second-
hand shopping and clothing transformation should be increased regarding sustainability in 1-5 scale. 1
indicates that they definitely do not agree and 5 says that they definitely agree. 41.2% (157) say that they
definitely agree that second-hand shopping and clothing transformation should be increased to support
sustainability. The other question is asking what people do after using their clothes for a certain period of
time.
According to the answers, it will be giving insights and ideas about how people react to clothing
transformation. By 55.4% of respondents indicate that they leave the clothes to the recycle centers after
using them for a certain period. It follows that 16.7% of respondents are saying that they use the clothes

International Engineering and Technology Management Summit 2021– ETMS2021
İstanbul Technical University & Bahçeşehir University
123
after getting them repaired by a tailor etc. The 16.7% of respondents give a really important feedback related
to the clothing transformation because they kind of do internal clothing transformation by using local
sources and it brings the idea how to do it professional to have a good impact on the environment.
5. VALUE PROPOSITION
Figure 1. Value Proposition Canvas
Users/customers can be categorized into three groups which are buyer, seller and tailor/fashion designer.
Facilitating customer’s jobs which are buying clothes online and searching for clothing with fair price for
buyers, reaching the customer to gain financial benefit for tailors/fashion designers and selling their clothes
for sellers is aimed.
The project mobile application which is StilCüzdanım offers users to dijital second-hand shopping and
clothing transformation chance. The platform’s gain creators to customers can be listed as clothing
transformation option through tailors/fashion designers, membership option to tailors/fashion designers,
buyers and sellers, and lower pricing of clothings compared to their first-hand prices.
Thanks to the platform, sellers can sell their clothes and gain financial benefit from them, buyers can buy
clothings with fair prices compared to first-hand versions in the comfort of their home or wherever they are
and tailors/fashion designers can reach the customer online easily.
One of the buyer's pain points can be stated as a trusting problem to the seller and her/his product quality
or originality. This pain will be relieved thanks to the seller scoring option in the app and one of the policies
of the platform where the seller can collect the sales fee when the buyer confirms that the delivery has been
safely received and that the product meets the specified standards. Also the buyer can return the product if
he/she does not like it. Another pain point of the buyer is the possibility of body inconsistency. The pain
can be relieved thanks to body measurements part in the product sharing stage and buyer’s right to return
the product.
6. STAKEHOLDER ANALYSIS The stakeholder analysis provides a process to gather information about key stakeholders, their relations
and contributions into the project. The project can determine its steps with the stakeholder analysis and
have a deep knowledge about the stakeholders’ importance level. The stakeholders of the project listed
down below and the reason why they have been chosen as a stakeholder is because they have a negative
and positive effect on the project. It can be a person or an organization.13 stakeholders have been obtained
in the analysis and their relations have been shown whether it is direct or indirect and internal or external.
Classifying them into groups helps for further research about their impacts.
Grouping the key stakeholders into direct and indirect benefits to see their effects because especially the
project manager and project team members are really crucial for the success and maintenance of the project
but if the project does not take the benefit of their skills, the strategic planning would fail since they are one
of the main elements. Also, the stakeholders’ interest and concern into the project and determining them
help to take precautions.
People in the project should really consider abusers and rivals so that if the project owners want to be really
successful in the market, put the project into a really good place, be known very well and gain the trust of
the customers, they should take well-designed precautions and plan a way very strategically. Also, the

International Engineering and Technology Management Summit 2021– ETMS2021
İstanbul Technical University & Bahçeşehir University
124
possible actions against stakeholders can be taken. The analysis is a process of evaluating the project and
seeing potential changes in the system by seeing their interest and efficiency level.
Table 2. Stakeholder Analysis
Direct Indirect Indirect
Internal External Internal External Internal External
Project Manager Customers Fashion Designers &
Tailors
System
Viewer Unmotivated
team
members
Maltreaters
Government Rivals
Project Team
Members Investors Influencers
Municipalities
Foundations
7. SYSTEM DESIGN The design of the system enables to see requirements for the project. Therefore, the detailed flowchart and
data flow diagram are created to see the big picture of the system. In the detailed flowchart diagram, the
detailed steps are given so it will be known about the way the customer will be choosing. In the data flow
diagram, it will show the flow of the system with the required information.
7.1. Process Analysis of the System
7.1.2. Detailed Flowchart
Figure 2. Detailed Flowchart Table
The figure 2 above shows the basic process the user follows while using the application.

International Engineering and Technology Management Summit 2021– ETMS2021
İstanbul Technical University & Bahçeşehir University
125
7.1.3. Data Flow Diagram
Figure 3. Data Flow Diagram
The figure 3 above shows basic data flow in the application.
8. APPLICATION DESIGN The user interface is designed to be friendly and easily reachable anytime when customers want to purchase
second-hand clothes, apply for clothing transformation and scroll over the items. The brands and products
will be categorized and according to the feedback and insights, both product portfolio range and the user
interface will be optimized. The customers can like their favorite products and brands so that they can reach
out to the desired items. Customers need to create a user account for purchasing second-hand clothes and
request for clothing transformation. The ordering system will start once the customer adds the product to
the shopping cart and fills out the required information like address, payment type, card information etc.
Later, they accept the data privacy issues and accept the payment, the order activity gets started and the
product will be prepared for the customer. The categorization will help customers to easily reach out to the
products or brands that they are looking for.

International Engineering and Technology Management Summit 2021– ETMS2021
İstanbul Technical University & Bahçeşehir University
126
Figure 4. General View of Mobile Application Interface
9. COMMUNICATION PLAN In order to have a clear communication way and set the roles of the stakeholders, the communication plan
must be done very strategically. Therefore, team members and the project manager can know how to give
a message to the target group. Otherwise, it could be very messy when it comes to communicating. There
is a very significant linkage between the stakeholder analysis and communication plan. Once everything is
steadying, the better decisions will be taken for the project.
The table in the down below shows the communication type, its frequency, definition of the
communication, audience, objective and owner of the communication. This shows how much update will
be given to the project team members, stakeholders and any other external or internal audience. If this
communication plan is followed regularly, especially the internal audience will be much satisfied and it
would directly affect the external stakeholders in a positive way. Due to the pandemic situation, the
communication type most will be taken in online platforms and if there would be a convenience condition,
it could turn out to be face to face meetings. The project manager has a significant role in order to ensure
and provide robust communication because the target of the meeting, email, presentation or newsletter will
be in her/his responsibilities. For sure, project team members will also help for a flawless communication
plan but still it will be her/his responsibility to ensure a dynamic environment.
Table 3. The Communication Plan
Description Frequency Method Target Responsible Purpose
Name of the
communication
How often
it will
happen
Way of
communication
Who will be
the
audience
Who is
owner
What is the aim
Team Meeting 2 times in
a day
Meeting
(Online, F2F)
Project
Team
Project
Manager
Catching up the
updates of the
project
Stakeholder
Enhancement
Every 2
weeks
Email and
presentation
Stakeholders Project team
and manager
Progress report of
the activities
Project
Condition
Meeting
Monthly Meeting
(Online, F2F)
Stakeholders
and project
team
member
Project
manager
Reviewing critical
and strategic
decisions
Catch up Report Monthly Email and
newsletter
Customer Project
manager and
team
members
Giving latest
updates and
progress about the
project
International Engineering and Technology Management Summit 2021– ETMS2021
İstanbul Technical University & Bahçeşehir University
127
10. CONCLUSION Throughout the research, it is obtained that every year a lot of clothes are getting produced and this leads
to a huge amount of garment waste. The landfills are filled with the fashion waste so that the industry has
a direct effect on the breakdown of the planet by using the resources like energy and water unrestrainedly.
This problem might have seen a small part of the degradation but when it comes to the big picture, it is
obviously not leading a sustainable world for the future generations. The second-hand shopping and
clothing transformation are the solutions for this problem to decrease its impact on the environment. Many
companies already took some actions toward these solutions and adapted themselves but unfortunately this
only covers a small portion.
The existing solutions about second hand shopping and clothing transformation are available both in Turkey
and in the world but Turkey needs to take more steps about this problem because both clothing
transformation and second-hand shopping are only at the local level and not everyone is conscious about
their footprints. The tailors and designers are transforming clothes but the companies are not really doing
something for this problem. Istanbul is a good spot for second hand shopping but due to the pandemic
situation, almost everything needs to be turned into an online platform. As a result, both obtaining from the
literature research and existing solutions, the deficiency of applications in these methods should be fulfilled.
The aim of the project is to make a positive impact on the environment in terms of decreasing the garment
waste by applying digital second-hand shopping and clothing transformation. The recommendations of the
project topic can be said that the textile garment waste is at a critical level and not every organization and
individuals are conscious about their actions so the implementations of digital second-hand shopping and
clothing transformation will be decreasing the garment waste and contribute to the cycle of clothes with the
cooperation and collaboration so both companies and customers should prefer these types of applications.
The user-friendly app interface provides users to reach out to the application any time and make an order
for second-hand clothing transformation and create a request for clothing transformation. As a result, this
project contributes to sustainability and provides a great opportunity for customers to decrease their
garment waste and take strategic decisions in terms of financial situation and ecological balance by
transforming their clothes and selling, purchasing second-hand clothes.
REFERENCES About Us. We Are Cow, (n.d.) . Retrieved January 25, 2021, from https://wearecow.com/pages/about
Buy & Sell Designer Bags, Shoes & Clothes. Tradesy. (n.d.). Retrieved January 25, 2021, from
https://www.tradesy.com/.
CUSTOM. We Are Cow. (n.d.). Retrieved January 25, 2021, from
https://wearecow.com/collections/custom-1.
Donate Clothes. Re. (n.d.). Retrieved January 25, 2021, from https://re- fashion.co.uk/pages/donate-clothes.
How does the Quality Control process work for buyers?. Vestaire Collective. (n.d.). Retrieved January 25,
2021, from https://faq.vestiairecollective.com/hc/en- gb/articles/360009480958
How Luxury Resale Works. HEWI. (n.d.). Retrieved January 25, 2021, from
https://www.hardlyeverwornit.com/how-it-works.
Park, H., & Armstrong, C. (2020, November 16). Secondhand clothing sales are booming – and may help
solve the sustainability crisis in the fashion industry. Retrieved December 15, 2020, from
https://theconversation.com/secondhand-clothing-sales-are- booming-and-may-help-solve-the-
sustainability-crisis-in-the-fashion-industry-148403
Peter, J. (2018, October 22). Transformable Fashion: The Biggest Sustainable Clothing Trend That Never
Was. Retrieved January 24, 2021, from
http://www.fashionstudiesjournal.org/longform/2018/9/15/transformable-fashion
Why rag bags. (n.d.). Retrieved January 25, 2021, from https://re- fashion.co.uk/pages/why-rag-bags.
REWORK/RE-WORKED DRESSES. We Are Cow. (n.d.). Retrieved January 25, 2021, from
https://wearecow.com/collections/rework-re-worked-dresses.
Sell What You Have, Buy What You Crave. Sell Designer Clothes Online at Tradesy. (n.d.). Retrieved
January 25, 2021, from https://www.tradesy.com/sell-landing/.
Singh, J., Sung, K., Cooper, T., West, K., & Mont, O. (2019). Challenges and opportunities for scaling up
upcycling businesses – The case of textile and wood upcycling businesses in the UK. Resources,
Conservation and Recycling, 150(August), 104439. https://doi.org/10.1016/j.resconrec.2019.104439
Thrift+. (n.d.). What fees does Thrift+ charge? Thrift+ Help Centre. Retrieved January 25, 2021, from
https://thrift-4.helpscoutdocs.com/article/179-what-fees-does-thrift- charge.
Tradesy for Business. Tradesy. (n.d.). Retrieved January 25, 2021, from
https://www.tradesy.com/business/.
International Engineering and Technology Management Summit 2021– ETMS2021
İstanbul Technical University & Bahçeşehir University
128
PANDEMI ETKISI ILE UZAKTAN CALISMA VE VERIMLILIK ARTISI
Başar Aksoy Ramazan Güney Tuba Nur Aslan
İstanbul Teknik
Üniversitesi
İstanbul Teknik
Üniversitesi
İstanbul Teknik
Üniversitesi
Rabia İnsel Hatice Camgöz Akdağ
İstanbul Teknik
Üniversitesi
İstanbul Teknik
Üniversitesi
ÖZET
Günümüz ekonomik şartlarında artan küreselleşme, teknoloji kullanımı ve rekabet çerçevesinde işletmeler
varlıklarının devamlılığı için yeni arayışlar içerisine girmektedir. Pandeminin de etkisi ile birlikte uzaktan
çalışma kavramı önem kazanmıştır. Calışma içerisinde pandeminin uzaktan çalışma üzerine etkileri,
uzaktan çalışmanın avantajları ve dezavantajları incelenmiş ve yapılan literatür araştırmaları baz alınarak
uzaktan çalışma ile verimlilik artışı sağlamaya yönelik öneriler iletilmiştir. Artan küreselleşme hareketleri,
teknolojik ilerlemelerdeki hızlanmalar, ekonomik sınırların ortadan kalkması, mal ve hizmet sürelerinin
kısalması gibi gelişmeler işin ve iş organizasyonunun yeniden yapılanmasını zorunlu kılmış, işçi ve
işverenleri daha yoğun bir rekabet mücadelesi ile karşı karşıya bırakmıştır. Cağın getirdiği yeniliklere ve
gelişen teknolojilere ideal seviyede uyum sağlamak esneklik olarak ifade edilmektedir. Esnek çalışmanın
işverene en önemli katkıları arasında üretkenliğin ve çalışan bağlılığının artması, işçi devri ve
devamsızlığın azalması yer almaktadır. Calışan açısından bakıldığında ise özgüvenin, motivasyonun,
üretkenliğin, bağlılığın artması ve iş-yaşam dengesinin iyileşmesi ana katkılar arasında gösterilmektedir.
Artan iş yoğunlukları nedeniyle esnek çalışma kavramını özellikle zaman yönünde negatif şekilde
değerlendiren ve ek bir kazanç olmaksızın çalışanlarını fazladan çalıştıran iş verenler de karşımıza
çıkmaktadır, bu nedenle kavramın yapısı ve çerçevesi dikkatli bir şekilde planlanmalıdır. Calışanın hak
kaybına, iş verenin ise kazanç kaybına uğramayacağı şekilde bir düzenlemeye gidilmesi gerekir.
Yapılan çalışmanın içerisinde uzaktan çalışma kavramı, literatür araştırmaları ile Covid-19’un uzaktan
çalışma üzerine etkileri, uzaktan çalışmanın avantajları ve dezavantajları incelenerek verimlilik artışı için
çeşitli öneriler iletilmiştir.
Anahtar Kelimeler: Covid-19, avantaj ve dezavantajlar, verimlilik artışı, Uzaktan Çalışma
International Engineering and Technology Management Summit 2021– ETMS2021
İstanbul Technical University & Bahçeşehir University
129
1. GİRİS Artan küreselleşme hareketleri, teknolojik ilerlemelerdeki hızlanmalar, ekonomik sınırların ortadan
kalkması, mal ve hizmet sürelerinin kısalması gibi gelişmeler işin ve iş organizasyonunun yeniden
yapılanmasını zorunlu kılmış, işçi ve işverenleri daha yoğun bir rekabet mücadelesi ile karşı karşıya
bırakmıştır. Cağın getirdiği yeniliklere ve gelişen teknolojilere ideal seviyede uyum sağlamak esneklik
olarak ifade edilmektedir. Esneklikle değişen koşullara en kısa ve en iyi şekilde uyum sağlamak ve rekabet
gücünü arttırmak amaçlanmaktadır. Esneklik ile zamanda ve mekânda kesin sınırlar ortadan kaldırılır,
çalışanlara bazı özgürlükler verilerek motivasyon artışı sağlanır. (Oztürkoğlu, 2013)
Esnek çalışmanın işverene en önemli katkıları arasında üretkenliğin ve çalışan bağlılığının artması, işçi
devri ve devamsızlığın azalması yer almaktadır. Calışan açısından bakıldığında ise özgüvenin,
motivasyonun, üretkenliğin, bağlılığın artması ve iş-yaşam dengesinin iyileşmesi ana katkılar arasında
gösterilmektedir. Calışan ve işveren arasında güven ilişkisi esnek çalışma sürecinde çok önemlidir.
(Amritha, Ramana, & Narayana Reddy, 2017) Esnek çalışma zaman ve mekân konularında çalışanlara
esneklik sağlamakta ve bu sayede iş-yaşam dengeleri çerçevesinde çalışanlar daha çok söz sahibi
olmaktadır. Artan iş yoğunlukları nedeniyle esnek çalışma kavramını özellikle zaman yönünde negatif
şekilde değerlendiren ve ek bir kazanç olmaksızın çalışanlarını fazladan çalıştıran iş verenler de karşımıza
çıkmaktadır, bu nedenle kavramın yapısı ve çerçevesi dikkatli bir şekilde planlanmalıdır. Calışanın hak
kaybına, iş verenin ise kazanç kaybına uğramayacağı şekilde bir düzenlemeye gidilmesi gerekir.
Oztürkoğlu araştırmasında esnek çalışma modellerini zaman ve mekân çerçevesinde; kısmi süreli çalışma,
iş paylaşımı, esnek iş süresi, uzaktan çalışma, ödünç iş ilişkisi, yoğunlaştırılmış iş haftası, yıllık iş süreleri
modeli, emekliliğe yumuşak geçiş modeli ve vardiya modelleri olarak sınıflandırmıştır. Esnek çalışma
modelleri içerisinde en radikal olanı uzaktan çalışma modeli olarak nitelendirilmektedir. (Oztürkoğlu,
2013)
Makale içerisinde uzaktan çalışma kavramı literatür araştırmaları ile Covid-19’un uzaktan çalışma üzerine
etkileri, uzaktan çalışmanın avantajları ve dezavantajları incelenerek verimlilik artışı için çeşitli öneriler
iletilmiştir.
2. LİTERATÜR
2.1 Uzaktan Calışma
Uzaktan çalışma hafta içi her sabah geleneksel bir ofise gitmeden, teknolojik ilerlemeler ve esneklik
sayesinde verimlilik adına yarı zamanlı veya tam zamanlı olarak işverenin bulunduğu konumun dışında
evden, ortak çalışma alanından, yurt dışından vb. yürütülen işi ifade etmektedir. (Uluslararası Calışma
Ofisi, 2020) Uzaktan çalışma sürecinde bilgisayar, telefon, monitör gibi teknik ekipmanlar ve yazılımın iş
veren tarafından sağlanması kritik önem taşımaktadır.
Yeni nesil işverenler işin nerede yapıldığına değil işin istenilen nitelikte ve şartlarda yapıldığına
odaklanmaya başlamışlardır. Bu durum uzaktan çalışmanın yaygınlaşmasını kolaylaştıran bir etmendir.
(Oztürkoğlu, 2013)
Geleceğin iş gücü raporuna göre yeni nesil yöneticilerin %69’u çalışanlarının uzaktan çalışmasını
desteklemekte ve araştırma 2028 yılında ekiplerin %73’ünün uzaktan çalışacağını belirtmektedir.
(Upwork, 2020)
Uzaktan çalışma ile birlikte iş verenlerde çalışanın iş takibinin doğru bir şekilde yapılması kaygısı
oluşmaktadır. Bu çerçevede termin süreleri takibi, bağlantı noktaları ve bağlantı zamanlarının canlı
kontrolü, çevrimiçi süreler, işlerin kalitesinin değerlendirilmesi gibi konular dijitalleşen iş dünyasının
imkanları sayesinde daha çok gündeme gelmektedir. (Gülmez, 2019)
2.2 Pandemi ile Birlikte Uzaktan Calışma Kavramı
Covid-19 ve takibinde gelen kısıtlamalar uzaktan çalışma eğilimini ön plana çıkartmıştır. Pandemi
öncesinde de uzaktan çalışma çeşitli ülkelerde ve iş kollarında genellikle ay içerisinde sınırlı kalacak
şekilde uygulanmaktadır. Covid-19 ile beraber mevcutta uzaktan çalışma kültürüne bilgi teknolojileri
kapsamında hazır olan şirketler daha hızlı uyum sağlarken, buna yönelik bir adım atmayan şirketlerin uyum
sağlaması biraz daha zor olmuştur.
Amerika’daki yöneticiler ile yapılan bir araştırmaya göre pandemi öncesinde ekiplerinin %20’sinden daha
azının evden çalıştığı durumda pandemi ile beraber bu oranın %80’e çıktığı görülmüş. Pandemi öncesinde
evden çalışmaya karşı işin doğası gereği çalışanın ofiste olması gerekir, çalışanları uzaktan yönetmek zor,
çalışanların doğru ekipmanlar-yazılımlar ile desteklenmesi mümkün değil, üst yönetim uzaktan çalışmayı

International Engineering and Technology Management Summit 2021– ETMS2021
İstanbul Technical University & Bahçeşehir University
130
desteklemiyor gibi gerekçelerle uzaktan çalışma konusuna sıcak bakmayan yöneticilerin birçoğu pandemi
sürecinde bunun yapılabildiğini ve etkinliğini deneyimleme fırsatı yakalamıştır. (Forbes, Birkett, Evans,
Chung, & Whiteman, 2020)
Deloitte 2020 yılında Türkiye genelinde 17 farklı ilde 334 katılımcı ile yaptığı araştırmada Covid-19 salgını
çerçevesinde uzaktan çalışma sistemine geçiş ve alınan/alınmayan aksiyonların çalışanlar üzerindeki
etkilerini incelemiştir. Araştırmaya göre katılımcıların %24,2'lik kısmının salgın öncesinde uzaktan çalışma
uygulaması uygulamasının bulunmaktadır. Pandemi ile beraber %48,7’sinin tüm çalışanları ile uzaktan
çalışmaya geçtiklerini, %43,2’sinin kısmi olarak geçiş yaptığını %8,1’lik kısmın ise mecburi bir durum
olmadığı müddetçe şirkette/sahada çalışmaya devam ettiklerini göstermiştir. Uzaktan çalışmaya geçiş il
bazında incelendiğinde İstanbul’daki şirketlerin buna daha hızlı uyum sağladığı görülmüş ve evden çalışma
uygulamasında en çok zorluk yaşanan konunun kültür ve alışkanlıklar olduğu belirlenmiştir. Calışanlar
uzaktan çalışma süresince en çok sosyalleşmeye ihtiyaç duymuşlar ve iletişim eksikliği hissetmişlerdir.
Uzaktan çalışma modeline hızlı geçiş yapan sektörlerin başında E-Ticaret, Medya ve Reklam sektörleri
gelmektedir. Uzaktan çalışmanın verimlilik üzerine etkisi incelendiğinde katılımcıların %38,2’lik kısmı
verimliliğe olumlu bir etkisi olduğunu savunurken %22,6’lık kısım olumsuz etkilediği görüşündedir, kalan
%39,2’lik katılımcı ise olumlu – olumsuz bir etkisi olmadığını savunmuştur. Gelen olumsuz
değerlendirmeler ağırlıklı olarak kültür ve alışkanlık kapsamında değerlendirilebilecek konulardan
kaynaklanmaktadır. Salgın sonrasında katılımcıların uzaktan çalışmaya bakış açıları incelendiğinde
%72,9’u uzaktan çalışmanın devam etmesi gerektiğini belirtmiştir. Anketteki genel oranlara bakıldığında
sektör ve departmanların kendi dinamikleri çerçevesinde cevapların farklılıklar gösterdiği söylenebilir.
(Deloitte, 2020)
2.3 Uzaktan Calışmanın Avantajları
Uzaktan çalışma rahat, esnek ve sağlıklı bir ortam oluşturarak maddi ve vakit tasarrufu sağlamış,
çalışanların ev ile daha fazla ilgilenebilme imkânı oluşturarak iş verimliliğini ve yaratıcılığı arttırmıştır.
(Tuna & Türkmendağ, 2020)
Uzaktan çalışma deneyimi olan 212 akademisyen ile uzaktan çalışma ve iş-yaşam dengesi üzerine yapılan
araştırmaya göre uzaktan çalışmanın avantajları; esnek çalışma saatleri (%80,7), ulaşım ve trafik sorunun
olmaması, (%76,9), işin her yerde yapılabilmesi (%69,8), zorunlu sosyal ilişkilerin ve işi bölen unsurların
olmaması (%57,5), çalışma ortamının rahatlığı (%55,2) ve çocuklarla/aileyle daha fazla zaman geçirme
(%43,4) olarak belirlenmiştir. (Uysal & Yılmaz, 2020)
Uzaktan çalışma merkezi çalışma konumlarına olan ihtiyacı ve taşıma maliyetlerini düşürmekte, trafik
sıkışıklığını ve hava kirliliğini azaltarak merkezi çalışmaya sürdürülebilir bir alternatif olmaktadır.
(Belzunegui-Eraso & Erro-Garcés, 2020)
Farklı bir araştırma ile yöneticilerin çalışanlarının uzaktan çalışma deneyimlerine bakış açıları incelenmiş,
üretkenliğin ve konsantrasyonun arttığı yönünde geri dönüşler alınmıştır. Pandemi öncesinde yöneticilerin
%57,3’ü çalışanlarının kariyerlerinde ilerleyebilmek ve üretken olabilmek için ofise gelmelerini
savunurken pandemi ile beraber bu oran %37,5’e düşmüş, yöneticilerin %68,1’i esnek çalışmayı
performans arttırıcı bir araç olarak görmeye başlamıştır. (Forbes, Birkett, Evans, Chung, & Whiteman,
2020)
2.4 Uzaktan Calışmanın Dezavantajları
Tuna ve Türkmendağ tarafından 58 beyaz yakalı çalışan üzerinde yapılan araştırmaya göre evden çalışma
sürecinde bazı amirler katı ve agresif tavırlar ile kontrolcü bir şekilde işleri yürütmeye çalışırken bazı
amirler ise destekleyici ve anlayışlı bir tutum sergilemişlerdir. Katılımcılar evden çalışma sürecinde
sosyalleşme ve takım çalışmasının yavaşladığını, bireysel sorumlulukların arttığını ve bu durumların da iş
motivasyonunu büyük ölçüde etkilediğini belirtmişlerdir. Calışmanın bulguları arasında çalışma zamanını
esnemesi ve uzaması, ev hayatında çocuklu ortamlarda süregelen toplantıların zorluğu, iş yeri disiplininin
bozulması ve iş yükünün artması gibi negatif durumlar bulunmaktadır. (Tuna & Türkmendağ, 2020)
Calışma zamanının uzaması ve iş yükünün artması, takibinde hata yapma yüzdesinin artmasına ve verimin
düşmesine neden olabilmektedir. Uzaktan çalışmanın yaygınlaşması ile beraber birçok şirketin çalışanlarını
sömürdüğü ve evde çalışma ortamının oluşturulması için yeterli adımlar atılmadığı gözlemlenmektedir. Bu
kapsamda çalışanı korumaya yönelik yasal düzenlemelerin getirilmesi gerekmektedir. (Duran, 2021)
212 akademisyen ile yapılan uzaktan çalışma deneyimi araştırmasına göre uzaktan çalışmanın
dezavantajları arasında; özel hayat/aile yaşamı ile iş hayatı sınırlarının belirsizleşmesi (%72,6),
hareketsizlik (%70,2) sosyal etkileşimden mahrum kalma (%59,4), işin hiçbir zaman bitmemesi ve çalışma
International Engineering and Technology Management Summit 2021– ETMS2021
İstanbul Technical University & Bahçeşehir University
131
psikolojisinden kurtulamama (%53,7), ev ortamının sağladığı rahatlığın dikkat dağıtıcı etki yaratması
(%53,3), işin sürekli bölünmesi (%47,6) gibi faktörler yer almaktadır. (Uysal & Yılmaz, 2020)
Araştırmalara göre çalışanların terfi gibi konularda uzaktan çalışma sürecinde kendilerini yeteri kadar
gösterememe gibi tedirginlikleri bulunmaktadır, iletişimin azalmasının kariyer yolunda bir problem
oluşturabileceği düşünülmektedir.
Uzaktan çalışma ile yoğun çalışma temposunda sürekli bilgisayar başında günü geçirmek, hareket
miktarının azalmasına ve karpal tünel, bel ağrısı, boyun ağrısı gibi meslek hastalıklarına yol açmaktadır.
(Gülmez, 2019)
3. METODOLOJİ “Pandeminin Calışanlar Uzerindeki Etkisi” başlığı ile beyaz yaka olarak çalışan insanlarla paylaştığımız
anketimizde 10 soru bulunmaktadır. Calışanların pandemi sürecinde hangi şekilde çalıştığını, hangi çalışma
grubunun ne gibi faydalar sağladığını, zorluklar yaşadığını ve pandemi sonrası çalışma hayatlarına nasıl
devam etmek istediklerinin cevaplarını aldık. Anketimiz herhangi bir yaş grubu olmadan beyaz yaka
çalışanlarla, online platfrom üzerinden form doldurularak cevaplandırılmıştır. 227 kişinin katılımı
sağlanmıştır.
4. ANALİZ VE DEĞERLENDİRME 227 kişinin katılımıyla gerçekleştirilmiş olan ankette katılanların %50’si tamamen uzaktan çalıştığını,
%28,76’sının hibrit bir biçimde, %20,35’inin tamamen ofisten çalıştığını belirtmiştir. Pandemi sürecinde
tamamen uzaktan çalışan katılımcıların %82,3’ü şirketinin pandemi sürecini yönetiminden memnunken,
hibrit çalışanların %69,23’ü, tamamen ofisten çalışanların ise %58,7’si süreçten memnun olduklarını
belirtmişlerdir. Katılımcılarının çoğunluğu şirketlerinin pandemi süreci yönetiminden memnun olsalar da
tamamen uzaktan çalışanların ofise kısmi veya tamamen gidenlere göre memnuniyeti gözle görülür şekilde
ciddi oranda fazladır. Bu pandemi sürecinde ofise uğramak zorunda bırakılan çalışanlar şirketlerinin
yönetiminden rahatsız olabilmektedirler.
Pandemi döneminden sonra şirketinizin çalışma yöntemi nasıl olacak sorusuna karşılık verilen cevapların
büyük çoğunluğu hiçbir fikrim yok şeklinde olmuştur. Şirketlerin büyük çoğunluğu halen pandemi
sonrasında nasıl çalışacaklarını çalışanlarına aktarmamış durumdalar. Ancak bir fikrim yok dışındaki
cevaplara baktığımızda ise genel olarak tamamen uzaktan çalışanların hibrit sisteme, hibrit sistemde
çalışanların ise tamamen ofise dönecekleri gibi bir sonuç gözlemlenmektedir.
Pandemi döneminden sonra hangi sistemde çalışmaya devam etmek istersiniz sorusuna verilen cevaplar da
hibrit sisteme yatkınlığı göz önüne sermektedir. Pandemi süreci boyunca hibrit sistemde çalışanların
%87,69’luk kısmı hibrit çalışmaya devam etmek isterken, %7,69’u tamamen uzaktan, geri kalan %4,62’lik
dilim ise tamamen ofise dönerek çalışmaya devam etmek istiyor. Pandemi döneminde tamamen uzaktan
çalışanların ise %60,18’lik kısmı pandemi sonrasında hibrit çalışma şekline geçmek istiyor. %38,05’lik
dilim ise tamamen uzaktan çalışmanın kalıcı olmasını istiyor. Geri kalan %1’lik çok küçük bir bölüm ise
tamamen ofise dönmek istiyor. Anket sonuçlarına göre pandemi dönemi boyunca tamamen uzaktan
çalışmaya geçmiş şirketlerin pandemi sonrasında tamamen ofise dönme kararı olursa çalışan
memnuniyetinde gözle görülür bir düşüş olabilir. Bunun dışında pandemi döneminde tamamen ofiste
çalışmış çalışanların %45,65’lik kısmı hibrit çalışma isterken %47,83’lük kısmı tamamen ofisten çalışmaya
devam etmek istiyor. Pandemi boyunca ofisten çalışmaya devam eden çalışanların yalnızca %6,52’lik çok
küçük bir kısmı tamamen evden çalışmak istiyor. Yani tamamen uzaktan çalışmayı deneyimlememiş
çalışma grubunun tamamen uzaktan çalışmaya karşı bir önyargı beslediği görülmektedir.
Uzaktan çalışma şeklinin hayat kalitenize etkisi sorusuna aldığımız cevaplarda hem hibrit hem de tamamen
uzaktan çalışanların büyük çoğunluğunun memnun olduğu görülmüştür. Tamamen ofiste çalışanlar uzaktan
çalışmadıkları için bu soruya vermiş oldukları cevapları değerlendirmeye katılmamıştır. Tamamen uzaktan
çalışanların, hibrit çalışanların hayat kalitesini arttırma seviyesine göre bir adım önde oldukları
gözlemlenmiştir. Tamamen uzaktan çalışanların %31,86’sı artırdı, %21,24’ü çok artırdı cevabını vermiştir.
Buna karşılık hibrit çalışanların %41,54’ü, %10,77’si ise çok artırdı demiştir. İki çalışan türü için de çok
düşürdü cevabı yok denecek kadar azdır.
Sizin için pandemi dönemindeki çalışma biçiminizin en zor yanı neydi sorumuza aldığımız cevaplarda
kayda değer farklılık yalnızca iki seçenek arasında çıkmıştır. Tamamen uzaktan çalışanlar için çalışma
temposunun yoğunlaşması seçeneği %33 ile tamamen ofisten ve hibrit çalışanlara göre ayrışırken, hibrit
çalışanların motive olamamak seçeneği %35 ile diğer iki çalışma türünden ayrılmıştır. Sosyalleşememe

International Engineering and Technology Management Summit 2021– ETMS2021
İstanbul Technical University & Bahçeşehir University
132
tüm çalışma tiplerinde çalışan insanlar için ortak bir sorun olarak görünmektedir. Tamamında %30’un
üstünde sosyalleşememe oranı görülmektedir.
5. UZAKTAN CALISMA ILE VERIMLILIK ARTISI, ÖNERILER Uluslararası Calışma Ofisinin Temmuz 2020’de yayınladığı “Covid – 19 Ortamında ve Sonrasında Uzaktan
Calışma Kılavuzu” ile uzaktan çalışmada çalışanların esenliğinin sağlanması ve üretkenliğin
sürdürülebilirliğini 8 ana başlık altında incelenmiştir ve şirketlerin uzaktan çalışmanın sürdürülebilirliği
kapsamında alması gereken aksiyonlar belirtilmiştir. Calışma süresi ve iş örgütlenmesine odaklanma,
performans yönetimine odaklanma, dijitalleşmeye odaklanma, iletişime odaklanma, iş sağlığı ve
güvenliğine odaklanma, yasal ve sözleşmesel sonuçlara odaklanma, eğitime odaklanma ve iş-yaşam
dengesine odaklanma konularında şirketlerin içinde bulundukları kültür çerçevesinde aksiyonlar alması
gerekmektedir. (Uluslararası Calışma Ofisi, 2020)
Araştırmalara bakıldığında bazı faktörler hem avantaj hem de dezavantaj olarak gösterilmektedir. Ev
ortamının uzaktan çalışma sürecinde rahatlık ve odaklanmayı sağlaması yanında ev ortamı rahatlığının
dikkat dağıtıcı bir etki oluşturduğu durumlar da bulunmaktadır. Buradan çalışanların uzaktan çalışma
sürecine uyumları ve ihtiyaçlarının bireysel olarak değerlendirilmesi gerektiği ortaya çıkmaktadır. Her
çalışanın ev ortamı çalışmaya uygun olmayabilir, farklı motivasyon kaynakları ve beklentileri olabilir,
yöneticilerin çalışanlar ile yakından iletişim kurmaları ve bu motivasyon kaynaklarını ve performans
sorunlarını yakından takip etmeleri büyük önem taşımaktadır.
Uzaktan çalışma sürecinde yöneticilere birçok sorumluluk düşmektedir. Bu sorumlulukların başında
çalışanlar ile şeffaf bir ilişki kurulması ve çalışan ihtiyaçlarının, motivasyon kaynaklarının doğru bir şekilde
takip edilebilmesi, iş önceliklendirmelerinin doğru yapılması, çalışanların kişisel durumlarının gözetilerek
çalışma esnekliği sağlanması, çalışanlar arası iş dağılımının eşit bir şekilde yapılması gibi konular
gelmektedir. Bu süreçte yöneticilerin sıklıkla özellikle pozitif yönde geri bildirim vermeleri çalışan
performansını arttıracaktır. Artan iş yoğunluğu çerçevesinde iş yaşam dengesinin düzenlenmesi noktasında
da çalışanların desteklenmesi ve yönlendirilmesi gerekir. Yöneticiler bu çerçevede gerekirse eğitimler ile
desteklenmelidir.
Daha önce ofisten çalışan, Covid-19 sürecinde uzaktan çalışmaya başlayan yaklaşık 1000 yetişkin ile
yapılan bir araştırmada Z kuşağı çalışanlarının üçte ikisi ve Y kuşağının beşte üçünden fazlası toplantılar
ve video görüşmeleri ile işlerini yapmalarının zorlaştığını söylemiştir. Evden çalışmaya başladıklarından
beri şirkete yönelik güncel durumlar hakkında daha az bilgilendirildiklerini, daha az iletişimde
hissettiklerini belirtmişler. (O'Halloran, 2020)
Araştırmalara göre çalışırken mola vermek çalışma verimini arttırırken stresi azaltmaktadır. Buna yönelik
yakın zamanda Microsoft toplantılar arasında zaman bırakılmasıyla beynin stres seviyesi üzerine bir
araştırma yayınlamıştır. Araştırmada mola vermeden çalışan bir grup ile toplantılar arasında 5-10 dakika
mola vererek çalışan bir grup karşılaştırılmış ve karşılaştırma sonucunda iki grubun beyin dalgaları
incelendiğinde mola vererek çalışan grubun gün içerisinde stres seviyelerinde küçük dalgalanmalar olurken
mola vermeden çalışan grubun stres seviyesinin sürekli olarak arttığı gözlemlenmiştir. Toplantılar arasında
ara vermenin beynin kendini yenilemesine imkan tanıyarak üretkenliği ve odaklanmayı da arttırdığı
belirtilmektedir. (Microsoft, 2021) Sanal toplantıların aktif katılım sağlayacak ilgili kişiler ile amacın net
bir şekilde tanımlandığı ve önden hazırlık yapılarak doğru iletişim ile yürütülmesi toplantıların verimini
arttıracak ve sayılarını azaltacaktır. Calışanlarda tükenmişlik sendromunun önlenebilmesi için çalışanlara
uzaktan çalışma dönemlerinde odaklanabilecekleri ve dinlenebilecekleri zamanların ayrılması
desteklenmelidir.
Deloitte araştırmasında çalışanlar için sık ve açık iletişimin iş konuları ve sosyal etkileşimler çerçevesinde
önemini iletmiş, etkili çalışmak konusuna vurgu yaparak doğru bir çalışma alanı ve doğru planlama ile
ilerlenmesi gerektiği belirtmiştir. Teknolojinin etkin kullanılması gerektiğini belirterek etkili iletişimde
beden dilinin %55 öneme sahip olması nedeniyle görüntülü iletişim araçlarına daha sık yer verilmesini ve
erişilebilirlik ile çalışanlar arası proaktif bir iletişim kurmayı önermiştir.
Yöneticiler ve liderler için tavsiyeleri içerisinde beklentileri doğru yönetmek, uzaktan çalışma ile sağlanan
faydaya odaklanarak pozitif yaklaşımlarla rol model olmak, ekip içi ve bireysel iletişimi sıkı tutmak,
performansı değerlendirmek ve gelişen teknolojiyi yakından takip ederek iş çıktılarında en iyi sonuçlara
ulaşmayı hedeflemek yer almaktadır. (Deloitte, 2020) Yöneticilerin çalışanları ile geri bildirimler ve
destekleyici yaklaşımlar üzerinden şeffaf bir iletişim kurmaları çalışanların da karşılığında daha açık bir
iletişime yönelmelerini sağlamaktadır.

International Engineering and Technology Management Summit 2021– ETMS2021
İstanbul Technical University & Bahçeşehir University
133
Uzaktan çalışmanın en önemli noktalarından birisi de sosyalleşmedir, bu ihtiyaç çerçevesinde çalışanlar
pandemi sonrasında mekan bağımsız çalışma olanağı sayesinde birlikte çalışma ortamlarını daha çok tercih
edecek ve mola verdiklerinde sosyallik ihtiyaçlarını karşılayabileceklerdir. (Gülmez, 2019)
6. SONUÇ Pandemi ile beraber şirketler uzaktan çalışmanın uygulanabilirliğini ve çalışma etkinliğini arttırdığını
gözlemleyerek bu şekilde daha çok kar edebildiklerinin farkına varmıştır. Google, Microsoft, Twitter, Koç
Holding, Akbank gibi bazı iş verenler zorunluluk kapsamında geçiş yaptıkları uzaktan çalışma düzenini
benimseyerek pandemi sonrasında da ofis çalışanlarının büyük bir kısmının tamamen evden çalışacağını
duyurmuştur.
Yapılan araştırma ve anketler çalışanların Covid-19 kısıtlamaları sonrasında da daha sık uzaktan çalışma
istekleri olduğunu belirlemiştir. Ekiplerin salgın öncesinde evden çalışmasına direnen liderler de bu süreçte
uzaktan çalışmayı deneyimlemiş ve bunu desteklemeye başlamışlardır. (Uluslararası Calışma Ofisi, 2020)
Birleşik Krallık genelinde 1000 KOBİ sahibi ile yapılan çalışmada üç KOBİ’den birinin salgın sonrasında
da esnek çalışmayı planladıkları görülmüştür. (Smith, 2020)
Uzaktan çalışmanın şirkete getirdiği avantajlar ve yapılan araştırmalar dikkate alındığında uzaktan
çalışmanın yeni normalde hayatımızda önemli bir yer tutacağını söyleyebiliriz. Ancak şirketler uzaktan
çalışmanın çalışan üzerinde oluşturduğu dezavantajları da göz önüne almalı ve çalışan ihtiyaçlarını
karşılayacak, memnuniyetlerini arttıracak adımları atmaları gerekmektedir.
Yöneticilerin uzaktan çalışma sürecinde adil, etkili ve verimli bir çalışma için planlama konusuna ağırlık
vermeleri gerekecektir. Doğru planlama ve iş bölümü ile iş - yaşam dengesi sağlanabilmektedir. Calışma
saatleri ve sosyal yaşam saatlerini içerecek şekilde günü planlamak uzaktan çalışma sürecini çok daha
verimli hale getirecek ve paralelde çalışan memnuniyetini arttıracaktır.
Uzaktan çalışma yeni bir iş modeli olarak geleceğin iş dünyasında sıkça yer alacaktır. Şirketlerin ve
çalışanların içinde bulundukları çevre ve getirdiği dinamikler ile beraber bu yönde stratejik aksiyonlar
almaları kaçınılmazdır. Bu süreçte güven ve açık iletişim en önemli faktörler içerisinde yer almaktadır.
REFERENCES Agostoni, L. (2020). Remote Working: Advices to Reduce Risks and Boost Productivity. IASON.
Amritha, A., Ramana, D. V., & Narayana Reddy, T. (2017). Significance of Flexible Working Hours on
Work Life Balance. IOSR Journal of Business and Management, 32-34.
Belzunegui-Eraso , A., & Erro-Garcés, A. (2020). Teleworking in the Context of the Covid-19 Crisis.
Sustainability, https://doi.org/10.3390/su12093662.
Deloitte. (2020). İşin Geleceği: Uzaktan çalışma sisteminde organizasyonel dayanıklılığı korumak.
Deloitte.
Duran, A. (2021, Şubat 16). "Evden çalışma" çalışanı sömürüyor mu? Retrieved from Deutsche Welle:
https://www.dw.com/tr/evden-%C3%A7al%C4%B1%C5%9Fma-
%C3%A7al%C4%B1%C5%9Fan%C4%B1-s%C3%B6m%C3%BCr%C3%BCyor-mu/a-56581034
Forbes, S., Birkett, H., Evans, L., Chung, H., & Whiteman, J. (2020). MANAGING EMPLOYEES
DURING THE COVID-19 PANDEMIC: Flexible working and the future of work. University of
Birmingham, Kent Academic Repository, KAR id:85918.
Gülmez, L. (2019, Ocak). Ekonomik Daralma Dönemlerinde Uzaktan Calışma. Retrieved from İnsan
Kaynakları ve Yönetim Dergisi: https://hrdergi.com/ekonomik-daralma-donemlerinde-uzaktan-calisma
Microsoft. (2021). Microsoft Worklab. https://www.microsoft.com/en-us/worklab/work-trend-
index/brain-research adresinden alındı
O'Halloran, J. (2020, 04 30). Coronavirus: Young employees struggle with remote working. Retrieved from
ComputerWeekly.com: https://www.computerweekly.com/news/252482375/Coronavirus-young-
employees-struggle-with-remote-working
Oztürkoğlu, Y. (2013). TUM YONLERİYLE ESNEK CALIŞMA MODELLERİ. Beykoz Akademi
Dergisi, 109-129.
Smith, J. (2020, 08 24). One in three SMEs plan to increase flexible working after pandemic. Retrieved
from Flexible working, News: https://workplaceinsight.net/one-in-three-smes-plan-to-increase-
flexible-working-after-pandemic/
Tuna, A. A., & Türkmendağ, Z. (2020). Covid-19 Pandemi Döneminde Uzaktan Calışma Uygulamaları ve
Calışma Motivasyonunu Etkileyen Faktörler. İşletme Araştırmaları Dergisi, 3246-3260.

International Engineering and Technology Management Summit 2021– ETMS2021
İstanbul Technical University & Bahçeşehir University
134
Uluslararası Calışma Ofisi. (2020, Temmuz). COVID-19 Ortamında ve Sonrasında Uzaktan Calışma -
Uygulama Kılavuzu. Retrieved from https://www.ilo.org/wcmsp5/groups/public/---europe/---ro-
geneva/---ilo-ankara/documents/publication/wcms_759299.pdf
Upwork. (2020, 05). Third Annual “Future Workforce Report” Sheds Light on How Younger Generations
are Reshaping the Future of Work. Retrieved from https://www.upwork.com/press/releases/third-
annual-future-workforce-report
Uysal, N., & Yılmaz, M. C. (2020). Akademisyenlerde İş Yaşam Dengesi ve Uzaktan Calışmaya İlişkin
Görüşlerin Belirlenmesi. Uluslararasu Sosyal Bilimler Akademik Araştırmalar Dergisi, 26-37.

International Engineering and Technology Management Summit 2021– ETMS2021
İstanbul Technical University & Bahçeşehir University
135
PRIORITIZING STRATEGIC DECISIONS IN COLD SUPPLY CHAIN BY
DEMATEL AND VIKOR
Dilan SARPKAYA Gül TEKİN TEMUR
Bahçeşehir University Bahçeşehir University
ABSTRACT In a developing and changing world, industries and companies need to maintain their presence. For this
reason, they also have to develop their supply chain operations to maintain their competitive advantage in
the market. The developing world, on the other hand, affects not only the way they do business, but also
the environmental order in a very high way. Worldwide, not only individuals but also companies are taking
improvement and development steps towards environmental awareness. The cold supply chain is important
because it covers carbon emissions, fuel consumption, waste and efficiency. In this study, the strategic
decisions of manufacturers involved in the cold supply chain are prioritized with decision-making trial and
evolution laboratory (DEMATEL) and the effect of the relations between criteria is included. The most
critical factors resulting from DEMATEL has been used as an input to rank and select strategic decision
alternatives in cold food chain with VIKOR method.
Keywords: DEMATEL, cold supply chain, perishable products, VIKOR
International Engineering and Technology Management Summit 2021– ETMS2021
İstanbul Technical University & Bahçeşehir University
136
1. INTRODUCTION The supply chain can be described as a network of organizations responsible for the creation and
distribution of products and services from design to execution to the end consumer, while supply chain
management is simply better communication within and among supply chain actors (Mangan et. al., 2014).
Cold supply chains are also termed as temperature-controlled supply chains. From the point of origin to the
point of consumption, the process involves a logistics and supply system that offers a sequence of facilities
for sustaining optimal conditions for commodities within a defined temperature range (Tsai and Pawar,
2018). It helps to enhance and preserve the shelf life of goods such as fresh agricultural goods, seafood,
frozen food, photographic film, chemicals, and pharmaceutical medicines, among others (Roy and Kumar,
2017).
In the action plan published by the Ministry of Agriculture and Forestry of the Republic of Turkey, food
losses and food wastes are also defined in separate ways and the action plan is presented. Food losses are”
the reduction in the amount of edible food available for human consumption at various stages of the supply
chain". In addition to numerical losses in food products, there may also be deterioration in quality, which
can lead to losses in terms of economic and nutritional value. Food waste is mainly due to the decision to
scrap or discard reliable food while the food system still has value (social, economic and nutritional) at the
distribution, service sector and household level (FAO, 2019). Considering the importance of new plant
investment and product development, relationship between manufacturers and retailers play crucial role.
The major supermarkets now deal with just a handful of suppliers in key product areas and take every
opportunity to pass responsibility for quality control and procurement, storage and distribution upstream to
their key suppliers, in return for which the chosen few are rewarded with volume growth (Fearne and
Hughes, 1999).
The food market is becoming increasingly consumer-driven, as seen by an increase in knows how to handle,
goods, recipes, and product releases; improved logistical performance owing to retailer supply chain
restructuring; and low retail margins, putting downward pressure on manufacturer pricing (Pieter van Donk,
Akkerman & van der Vaart, 2008). Various developments in the food supply chain, through agriculture to
retail consumer goods, have resulted in flexibility needs that counteract the capabilities of the food
processing Industries' internal structure such as short lead times and small batches (Wezel et. al., 2005).
Considering freshness and security of products, cold chain management can improve the process (Gogou,
Katsaros, Derens, Alvarez & Taoukis, 2015). Óskarsdóttir and Oddsson (2019) indicated that it is important
to be able to ensure product quality and safety in the global food trade. This is not an easy process because
food processing entails several steps, and the final products must be delivered to a variety of markets,
including regional, national, and international markets, depending on the consumer. Food safety is a major
concern in the food sector, but as the food manufacturing industry has grown and the food supply chain has
become more specialized, food safety and quality control have gain much more attention (Hsiao, Chen &
Chin, 2017).
According to Gustavsson et. al. (2011), when food waste is analysed, eggs, meat, fish and seafood, dairy
products, roots and tubers, fruits and vegetables, and so on, most of the commodities have a close share of
each other. In the same study, the causes of food losses were tried to be analysed. These are the reasons for
low-income countries: poor storage facilities, poor infrastructure and transportation, lack of refrigeration,
stubborn market facilities, poor packaging. The reasons in high-income countries are: quality standards
(discoloured, broken), poor temperature management especially in retail during display, limited focus on
waste and lack of planning, leftovers.
It is believed that with the increase of technological developments, greenhouse gas emissions to the
environment also increase with the fact that it is responsible for global warming, causing climate change
(Ojo et. al., 2020). When perishables are held in the supply chain for an excessive amount of time, energy
demand would increase, and this process ends up with a high carbon footprint results (Vrat, Gupta,
Bhatnagar, Pathak & Fulzele, 2018). In addition to that, with the improvement of people's standard of living
over time, the demands for the consumption of fresh food and fresh agricultural products increased rapidly,
food safety garnered great interest (Daofang, Zhu & Lin, 2015).
Most of the cold supply chain studies in the literature are related to the transportation systems of products
and are aimed at minimizing operational costs and reducing environmental pollution (Vrat, Gupta,
Bhatnagar, Pathak & Fulzele, 2018). However, cold supply chain management is the way of integrating
existing market operations along with the value chains, including special activities for perishable goods
preservation, where more suppliers of certain raw materials or manufacturing cells of certain semi-products
emerge in order to generate value for the end consumer (Bogataj, Bogataj & Vodopivec, 2005). In this
context, strategic decisions made by organizations also affect the cold supply chain processes. In this study,
it is aimed to analyse the cause-and-effect relationship between strategic decisions taken by firms and to

International Engineering and Technology Management Summit 2021– ETMS2021
İstanbul Technical University & Bahçeşehir University
137
determine the most effective factor. The most effective factor will be optimized. In terms of strategic
decisions of cold chains, there are lack of studies that includes mathematical models and case studies for
decision making especially for storage activities (Chaudhuri et. al., 2018). For strategic decisions, there are
alternatives in the literature that could be taken into account: cost, investment/ROI, consumer related issues,
market challenge (Aramyan, 2007), governmental issues (Dai, Wu & Si, 2021), collaboration among supply
chain members (Cao and Zhang, 2011), organizational skilfulness (Cetinkaya, 2011), top management
support (Joshi et al., 2012).
In the next sections, the literature on the subject is reviewed and the importance of the subject is stated, in
section 3 the reason of chosen method explains, the steps that applied and the process flow are specified in
the 4th section as the proposed methodology section, the results of the applications and conclusions are
included in the 5th section.
2. LITERATURE REVIEW Raut et. al. (2019) studied third party logistics selection and evaluation through fuzzy DEMATEL tool. The
study focused more specifically on fruits and vegetable supply chain process in order to improve food losses
during cold supply chain activities. Authors concluded that cold third party logistics providers play crucial
role to increase effectiveness of food supply chain. Since the sector is very volatile and fuzzy, logistics
providers’ equipment with efficient precooling and temperature variability controlling resulted as most
important factor for selection criteria.
Industry 4.0 has recently emerged as an area that has been the subject of a variety of studies. In this context,
the potential effects of Industry 4.0 in the sustainable food supply chain are examined by Ojo et. al. (2018).
In the study, a novel model is presented new tools resulting from technological advances. In this model, a
new supply chain system is proposed by integrating sustainable food chain processes and components
included in Industry 4.0. Integrated supply chain system includes big data, cloud computing, cyber-physical
system, automation and robotics, internet of things.
Oskarsdottir and Oddsson (2018) conducted a study which specifically applied to meat and fish companies’
supply chain. In order to obtain cold supply chain effectively, use of traceability systems are advantageous.
Along with the developing technology, there are also advances and diversities in tracking systems. With
the decision support framework created, it is aimed that users choose the appropriate tracking system for
their cold food chain. Again, thanks to this framework, all decision-makers operating in the cold food chain
can use it.
Food cold chain systems need to be accurately detected and identified in order to predict quality of the
product (Ruan, 2020). Quality prediction model of a food cold chain system based on performance
evaluation model/fuzzy comprehensive evaluation method constructed. Quality distribution, food cold
chain in terms of management, warehousing, customer and logistics activities are considered as main
activities. Authors applied the study to fresh agricultural products and concluded that quality management
system identified by big data is more accurate and the total system is more optimized.
Shashi et. al. (2020) mentioned that there is still lack of literature about food cold chain management which
actually should improve by industries, governments, research centres and academia. Also scholars can
develop joint researches according to their research fields. In terms of methodology, they systematically
reviewed published articles for past 25 years. Bibliometric analysis and network analysis indicated four
research areas that uncovered in food cold chain. These four areas are: use of RFID technologies, production
and operation planning models, waste of after harvest and food cold chain critical issues.
Similar to Shashi et. al. (2020), bibliometric analytics and network analytics are used by Vrat et. al. (2018)
for sustainable cold chain for perishable food products. A literature review of the study was conducted for
articles published between 1985 and 2017 for specific keyword sets. Perishable products need careful
management in the supply chain process. Logistics of perishable products can negatively affect the
environment. Also reviews indicated that, published articles can be divided into three groups of research
areas: perishable products’ sustainable transportation, sustainable cold chain strategies integration and
refrigerated containers’ adverse environmental effect. However, as a result of literature review analytics,
there is lack of researches about sustainable freight transportation. Since 2015 researches in that area is in
an increasing trend.
Peng (2019) asserted fresh food logistics transportation especially in China is in development stage. Cold
chain logistics implications and researches are still in the development stage and transportation costs should
be optimize. This is why, improved generic algorithm is applied by author in order to cope with urban cold
chain transportation path problem in China. Compared to traditional algorithm, cost reduction in terms of
financial and human resources, energy savings, capacity and time constraints’ relief and transport
efficiency, accuracy are resulted in this model.

International Engineering and Technology Management Summit 2021– ETMS2021
İstanbul Technical University & Bahçeşehir University
138
Qiu and Zhao (2019) conducted conceptual model for the taxonomy of food cold chain logistics. In other
words, the study discussed The taxonomy of sprawl patterns, the related characteristics of each particular
sprawl pattern, and their relationships with the operational efficiency of the food cold chain logistics
(FCCL) network. Beijing city region in China is selected as a study area. The location is indicated as the
most important growing coastal metropolitan areas. Standard deviational ellipse analysis and kernel
analysis are used methodologies in the article.
Considering downward, backward, sales and after sales transportation activities, Golestani et. al. (2021)
studied green hub location problem. In the study, multi item temperature joint distribution and perishable
products’ features are focused in cold supply chain network. They aimed to achieve green hub allocation
both tactical and strategic decisions are included. Moreover, the first objective is to minimize the total cost
(transportation costs, temperature costs, hub deployment, carbon emission cost), while the cost of carbon
emission is also added as a parameter, and thus environmental costs are also taken into account. The second
objective is defined as higher quality of perishable products that delivered to customers.
Special issue on next generation cold supply chain analysed by Tsai and Pawar (2018) literature review in
terms of risks and uncertainties. It is indicated that China and India which are also most crowded
populations have more post-harvest food waste because inefficient cold supply chain systems. Therefore,
these and similar problems should be examined on the basis of country and context. Because of the high
level of uncertainty and vulnerability, the risk and resilience of supply chain activities also increases. It is
also mentioned that these risks can be prevented by taking advantage of the benefits of digitalization. In
addition, the study of factors that cause perishable products to deteriorate can also affect the efficiency of
supply chain operations.
3. METHODS In the developing world, with the increasing importance of the cold food chain from an economic,
environmental and social point of view, it may be necessary to determine the points that are important for
the improvement and development of the cold chain process. Important points are examined in terms of
strategic decisions. Farm-level decision making, agricultural policy, and SCM decisions can be analysed
actual issues by multi-criteria decision making (MCDM) as a tool that increase its importance day by day
(Yazdani et al., 2019). Latest studies indicate that use of MCDM models enable the process and provide
trustworthy results. Hodgett (2016) mentioned distinction between MCDM methods’ categories; multi
attribute (MA) methods and outranking methods. According to MA approaches combine a decision issue
into a function that is optimized to produce a numerical result for each option. To sort or rank the
alternatives, outranking techniques determine pairwise outranking assessments of each pair of options. The
Decision Making Trial and Evaluation Laboratory (DEMATEL) is developed by Geneva Research Centre
between 1972 and 1976. The method analyses cause and effect relationships between factors in complex
systems and interdependent relationships among defined factors which defined by experts through various
techniques (Si et al., 2018). DEMATEL method application steps are provided below:
Step 1: Criteria are evaluated by experts with the pairwise scale. Scale values are 4: Extreme importance,
3:Vital importance, 2:Essential importance, 1:Moderate importance, 0: Equal importance.
Step 2: An initial influence relation matrix Z is created taking into account the evaluations of experts. If
more than one expert opinion is taken, the arithmetic mean of the scores is taken and the diagonals of the
matrix are zero. All cells in this matrix are taken value between 0 and 1.
𝑧𝑖𝑗 = (1
𝑙)∑ 𝑧𝑖𝑗
𝑚𝑙𝑚=1 (1)
Step 3: A normalized influence relation matrix X is created by dividing the value in each cell by the max
value in the sum of each row and column.
𝑋𝑖𝑗 = 𝑧𝑖𝑗 / (max∑ 𝑧𝑖𝑗𝑛𝑖=1 ) 𝑋𝑖𝑗 = 𝑧𝑖𝑗 / (max∑ 𝑧𝑖𝑗
𝑛𝑗=1 ) (2)
Step 4: In order to obtain the total relation matrix T, the matrix X is subtracted from the unit matrix, the
opposite is taken and multiplied by the matrix X again.
𝑇 = ((𝐼 − 𝑋)−1 × 𝑋) (3)
Step 5: Sum of rows and sum of columns in total relation matrix is defined as R and C respectively. R
represents direct or indirect influence of the criteria on other criteria. C represents the criteria is directly or
indirectly affected by other criteria specifies the sum. For each criterion, R+C and R-C are calculating with
summation and extraction of rows and columns. R+C indicates the importance of the criteria in the system

International Engineering and Technology Management Summit 2021– ETMS2021
İstanbul Technical University & Bahçeşehir University
139
and R-C indicates causal relationship. If R-C is positive, the criteria is effecting others (cause group),
influenced otherwise (effect group).
Step 6: Influential relation map is drawn which the horizontal axis holds R+C values, while the vertical
axis holds R-C values. Alpha, which is the threshold value, could be determined to show the effects and
effects of the criteria. This value can be determined variously, such as obtaining expert opinions, literature
review, brainstorming, and the average of the T matrix. Since criteria above the threshold value are affected,
the direction of the effect is indicated by the arrow, and if criteria is below threshold value, it is indicated
by the correct arrow affected by the affecting criterion.
Step 7: The sum of the square of R+C and the square of R-C is taken into the root, each weight is divided
by the sum of the weights, resulting in the weights of the criteria.
𝑊𝑖𝑗 = √(𝐶𝑖 + 𝑅𝑖) 2 + (𝑅𝑖 − 𝐶𝑖) 2, 𝑊𝑖 = 𝑊𝑖𝑎/∑ 𝑊𝑖𝑎𝑛𝑖=1 (4)
VIKOR is a concept derived from Serbian, consisting of the initials of the phrase VIseKriterijumska
Optimizacija I Kompromisno Resenje. Considering the history of the method, the 1998 study of Opricovic’s
study was the first real application of the VIKOR and it achieved international recognition thanks to the
work of Opricovic and Tzeng in 2004 (Karaoğlan, 2016). Along with this method, the optimization of
multi-criteria systems is aimed, and a compromise solution is tried to be determined in the direction of
alternative factors and within the scope of evaluation criteria (Kuru ve Akın, 2012). Below are the steps of
the VIKOR method, and the criterion weights are already known.
Step 1: For each criterion, the best and worst values are determined and defined as f+ and f -, respectively.
All criteria are divided into beneficial criteria and non-beneficial criteria and are selected as follows,
respectively.
𝑓𝑖+ = 𝑚𝑎𝑥𝑗𝑓𝑖𝑗 𝑓𝑖
− = 𝑚𝑖𝑛𝑗𝑓𝑖𝑗 𝑓𝑖+ = 𝑚𝑖𝑛𝑗𝑓𝑖𝑗 𝑓𝑖
− = 𝑚𝑎𝑥𝑗𝑓𝑖𝑗 (5)
Step 2: Calculation of Sj and ji values for each criterion. Sj indicates the maximum group utility and Rj
indicates minimum individual regret of the opponent. Wi is the calculated weight of each criterion.
𝑆𝑗 = ∑ 𝑤𝑖(𝑓𝑖+ − 𝑓𝑖𝑗
)/(𝑓𝑖+ − 𝑓𝑖
−)𝑛𝑖=1 , 𝑅𝑗 = max[ ∑ 𝑤𝑖(𝑓𝑖
+ − 𝑓𝑖𝑗 )/(𝑓𝑖
+ − 𝑓𝑖−)]𝑛
𝑖=1 (6)
Step 3: Calculation of Qj value.
𝑄𝑗 = 𝑣𝑆𝑗
𝑆∗+ (1 − 𝑣)
𝑅𝑗−𝑅∗
𝑅−−𝑅∗ , 𝑠∗ = 𝑚𝑖𝑛𝑆𝑗 , 𝑆
− = 𝑚𝑎𝑥𝑆𝑗 , 𝑅∗ = 𝑚𝑖𝑛𝑅𝑗 , 𝑅
− =
𝑚𝑎𝑥𝑅𝑗 , 𝑣 𝑖𝑠 𝑤𝑒𝑖𝑔ℎ𝑡𝑒𝑑 𝑠𝑡𝑟𝑎𝑡𝑒𝑔𝑦 𝑜𝑓 𝑆𝑗 𝑎𝑛𝑑 𝑅𝑗 (7)
Step 4: Rankin alternatives according to Q, S and R values with decreasing order.
Step 5:Tthe alternative with the smallest value 𝑄 (a') must bear the two conditions shown below in order to
be called the best among the alternatives.
C1. Acceptable advantage (a’’): It is the second best alternative in the sorting process performed by the
value𝑄. 𝐷𝑄 = 1/(𝑗 − 1) is calculated by indicates the number of alternatives if the acceptable advantage is
𝑄 (𝑎") − 𝑄(𝑎') ≥ 𝐷𝑄 depends on the condition.
C2. Acceptable stability (a’): According to the values of 𝑆 and/or 𝑅, a’ should also be the best alternative.
If this condition is met, the consensus set of solutions is stable in the decision-making process.
If one of the conditions is not met, consensus sets of solutions are suggested, including the following:
Where the second condition is not met, the alternatives (a’) and (a’’) are considered common solutions.
If the first condition is not met, all of a’,a’’,…,𝑎𝑚 its alternatives are considered common solutions.
Maximum M, which is the upper limit for the alternative 𝑎𝑚 here, 𝑄 = 𝑎𝑚 − 𝑄 (𝑎’) < 𝐷𝑄 the relationship
is determined by.
4. PROPOSED METHODOLOGY As a result of literature surveys, factors affecting strategic decisions in cold food chain processes were
identified. As stated earlier in previous headings, cost, investment/roi, stability of raw materials, technical
compatibility, flexibility, collaboration among supply chain members, organizational skilfulness, top
management support, risks, governmental issues, consumer-related issues, including the environment, these
sub-factors were determined. There are four factors that cover these sub-factors; economy, capability,
organization and environment.

International Engineering and Technology Management Summit 2021– ETMS2021
İstanbul Technical University & Bahçeşehir University
140
Figure 1. Process flow of research methodology
A DEMATEL questionnaire containing the determined factors and sub-factors was prepared and presented to the expert opinion. Experts consist of fresh fruit and vegetable producers, milk and dairy products
producers and academician who specialized in supply chain studies. Similar to other causal dependency
methods such as causal maps, fuzzy cognitive maps, Bayesian networks, DEMATEL also indicates causal
dependency of criteria unlike structural dependency methods such as analytical hierarchy process,
analytical network process and hierarchical TOPSIS (Gölcük and Baykasoğlu, 2016). DEMATEL also used
to find which criteria affects most strategic decision. In this study, DEMATEL method will be useful in
terms of prioritizing the importance of strategic decisions that go through the improvement of cold food
chain processes, ranking the factors affecting decisions, and visualizing the relationship between them. In
order to analyse the criteria contained in DEMATEL, criteria affecting cold food chain strategic decisions
were determined primarily through a literature review. The criteria and sub-criteria were evaluated by
submitting three expert opinions through the survey.
After the DEMATEL method is completed, the weights of the sub-criteria contained here are used as input
in the VIKOR method. The VIKOR method was applied using these weights. The aim of using the VIKOR
method is to analyse which of the strategic decisions in the cold food chain are more important based on
sub-criteria. The VIKOR survey, which includes alternative strategic decisions and sub-criteria, was again
presented to three expert opinions. Experts rated the degree of importance between sub-criteria and strategic
decision alternatives with values between 0-100. The analysis was completed by following the VIKOR
steps in the method section.
5. APPLICATION As mentioned earlier, the aim of this study is to analyse the relationship between criteria affecting strategic
decisions in the cold food chain process by DEMATEL method and to analyse which of the strategic
decisions to choose by VIKOR method. This study based supply chain actors who operates as a
manufacturer, and the opinions of experts operating in three different business branches supported the
study. The first of the experts is a producer of fresh fruit and vegetables, producing in Turkey and carrying
out sales activities at home and abroad. The second specialist is a manufacturer of milk and dairy products
and is a manufacturer with high brand value in Turkey. The third specialist is responsible as an academic
in the field of Industrial Engineering and does important work on supply chain issues.
As a result of assessments which provided by experts, initial influence relation matrix Z was created. Based
on the survey data, the DEMATEL method was applied separately for 4 main factors and 12 sub-factors.
As an example of the analysis, tables created for the main factors are as follows.
Literature Review
• Analysis of strategic decision significance in CFSC
Executive View
• Analysis of strategic decision significance in CFSC
DEMATEL
• Analysis of strategic decision alternatives in order to examine their interrelation and prioritization of alternatives
VIKOR
• Ranking criterion that effect CFSC strategic decisions

International Engineering and Technology Management Summit 2021– ETMS2021
İstanbul Technical University & Bahçeşehir University
141
Table 1. Initial Influence Relation Matrix Z
Initial
Influence
Relation
Matrix Z
Economic Capability Organization Environment
Economic 0 2,667 2 3,667
Capability 3 0 3,333 1
Organization 3 2,667 0 2,333
Environment 1 0,333 2 0
Table 2. Normalized Influence Relation Matrix X
Normalized
Influence
Relation
Matrix X
Economic Capability Organization Environment
Economic 0 0,3636 0,2727 0,5000
Capability 0,4091 0 0,4545 0,1364
Organization 0,4091 0,3636 0 0,3182
Environment 0,1364 0,0455 0,2727 0
Table 3. Normalized Influence Relation Matrix X
Total
Relation
Matrix T
Economic Capability Organization Environment
Economic 2,8912 2,7366 3,2166 3,3422
Capability 3,3058 2,5904 3,4141 3,2288
Organization 3,2967 2,8424 3,1023 3,3412
Environment 1,5800 1,3116 1,7126 1,5138
Table 4. Main Criteria Weights
R C R+C R-C Weights
Normalized
Weights
Economic 12,1866 11,0736 23,2602 1,1131 23,287 0,265
Capability 12,5391 9,4809 22,0200 3,0581 22,231 0,253
Organization 12,5826 11,4458 24,0284 1,1369 24,055 0,274
Environment 6,1179 11,4260 17,5440 -5,3081 18,329 0,209
Table 5. Sub-criteria Rankings
Sub-criteria Weights Normalized weights Rank
Cost 0,370 0,053 4
Investment/ROI 0,359 0,051 5
Stability of raw materials 0,271 0,039 8
Technical compatibility 0,345 0,049 6
Flexibility 0,415 0,059 3
Collaboration among SC members 0,241 0,034 10
Organizational skilfulness 2,000 0,286 1
Top management support 2,000 0,286 1
Risks 0,280 0,040 7
Governmental issues 0,231 0,033 12
Consumer related issues 0,252 0,036 9
Environment 0,237 0,034 11
When the main factors are evaluated by the DEMATEL method, the ones that have the most impact as the
weight of influencing strategic decisions in the cold food chain are organization, economics, capability and
environment, respectively. If R-C and R+C values are considered, as indicated before, the factor that has
the most impact on the system, is the organization. In terms of the relationship between factors, economics,
capability and organization also have the role of influencing other factors. On the other hand, only the
environmental factor is affected by the other three factors specified earlier.
in terms of sub-criteria, the order in which they affect the system such as strategic decisions, differs
according to the main groups of factors to which they belong.

International Engineering and Technology Management Summit 2021– ETMS2021
İstanbul Technical University & Bahçeşehir University
142
In other words, it is observed that sub-factors of various factors can take remote places in the ranking. In
terms of ranking, flexibility, cost, investment and technical compatibility are at the forefront.
Organizational skills, top management support, environmental factors and collaboration among supply
chain members are in the last place.
The above table shows the weights and normalized weights of each selected sub-criterion as a result of the
DEMATEL method. Three alternatives have been taken from the strategic decisions of producers in the
cold food chain to continue strategic decision selection with VIKOR method. These three alternative
decisions are product type selection, warehouse location selection and logistics provider selection.
Based on the arithmetic average of experts’ scoring, the VIKOR decision matrix is formed as follows. The
weight rating of each sub-criterion is also found in this table. After that, the status of each sub-criterion to
be beneficial or non-beneficial was determined. How this decision was taken is described in the methods
section. By looking at whether it is beneficial criteria or not, the best and worst values of the criteria can be
reached again from this table. After all these steps are completed, the weighted normalized decision matrix
is calculated for each alternative and criterion, as can be seen from the table. Based on the values here, Si,
Ri, S*, S -, R* and R - values were determined.

International Engineering and Technology Management Summit 2021– ETMS2021
İstanbul Technical University & Bahçeşehir University
143
Table 6. Decision Matrix
weights 0,053 0,051 0,039 0,049 0,059 0,034 0,286 0,286 0,040 0,033 0,036 0,034
Decision Matrix Cost
Invest
ment
/ROI
Stability of raw
materials
Technical
compati
bility
Flexi
bility
Collaboration among
SC members
Organiza
tional
skilfulnes
s
Top
manage
ment
support Risks
Gover
n
menta
l
issues
Consu
mer
related
issues
Market
challenge
Product type
selection 80,00 85,00 91,67 80,00 83,33 65,00 63,33 53,33 83,33 75,33 85,00 83,00
Warehouse
location selection 93,00 85,00 28,33 80,00 73,33 63,33 63,33 56,67 71,67 73,33 53,33 53,33
Logistics
provider selection 90,00 63,33 36,67 56,67 66,67 76,67 80,00 70,00 76,00 66,67 83,33 83,33
n-
benefi
cial
benefi
cial beneficial beneficial
benef
icial beneficial beneficial
benefici
al
n-
benefi
cial
n-
benefi
cial
n-
beneficial
n-
beneficial
best (xi+) 80,00 85,00 91,67 80,00 83,33 76,67 80,00 70,00 71,67 66,67 53,33 53,33
worst (xi-) 93,00 63,33 28,33 56,67 66,67 63,33 63,33 53,33 83,33 75,33 85,00 83,33

International Engineering and Technology Management Summit 2021– ETMS2021
İstanbul Technical University & Bahçeşehir University
144
Table 7. Weighted Normalized Decision Matrix Weighted
Normalized
Decision
Matrix
Cost Investment
/ROI
Stability
of
raw
materials
Technical
compatibility
Flexi
bility
Colla
boration
Organiza
tional
skillfulness
Top
management
support
Risks
Govern
mental
issues
Consumer
related
issues
Market
challenge
Product type
selection 0,000 0,000 0,000 0,000 0,000 0,030 0,286 0,286 0,040 0,033 0,036 0,033
Warehouse
location
selection
0,053 0,000 0,039 0,000 0,036 0,034 0,286 0,229 0,000 0,025 0,000 0,000
Logistics
provider
selection
0,041 0,051 0,034 0,049 0,059 0,000 0,000 0,000 0,015 0,000 0,034 0,034
Table 8. Alternative Selection
Si Ri Qi Qi Qi Qi Qi
Product type selection 0,744 0,286 1,00 1,00 1,00 1,00 1,00
Warehouse location selection 0,701 0,286 1,00 0,98 0,95 0,93 0,90
Logistics provider selection 0,317 0,059 0,00 0,00 0,00 0,00 0,00
s+ /r+ 0,317 0,059
s- /r- 0,744 0,286
qi 0 0,25 0,5 0,75 1
DQ: 0,5/Condition check 1,00 0,98 0,95 0,93 0,90
As a final step, five different qi values were used to calculate Qi values and analyse the conditions of acceptance or not. qi values are 0, 0.25, 0.5, 0.75 and 1 respectively.
According to conditions that mentioned in methods part, for all qi values, alternatives are met. Logistics provider selection alternative is selected respectively in the
ranking according to both values.

International Engineering and Technology Management Summit 2021– ETMS2021
İstanbul Technical University & Bahçeşehir University
145
6. CONCLUSION
Cold supply chains are also termed as temperature-controlled supply chains. From the point of origin to the
point of consumption, the process involves a logistics and supply system that offers a sequence of facilities for
sustaining optimal conditions for commodities within a defined temperature range (Tsai and Pawar, 2018). In
this study, the strategic decisions of manufacturers involved in the cold supply chain are prioritized with
decision-making trial and evolution laboratory (DEMATEL) and the effect of the relations between criteria is
included. The most critical factors resulting from DEMATEL has been used as an input to rank and select
strategic decision alternatives in cold food chain with VIKOR method.
The study, which was completed with the contribution of three expert opinions, was based on 4 main criteria
and 12 sub-criteria. Three strategic decisions have been analysed with these criteria affecting strategic decisions.
Considering the results of the DEMATEL method, the most important of the main criteria was determined as
an organization and followed by economics, capability and the environment, respectively. Out of these four
main criteria, the environmental criterion is affected by other criteria. From 12 sub-criteria, organizational
skilfulness, top management support, flexibility and cost are included in top four rankings. Which of the sub-
criteria in the cold food chain is more important and which strategic decision selection will be made was
analysed using the VIKOR method. Here, decisions on product type selection, warehouse location selection
and logistics provider selection are determined as alternatives. The sub-criterion weights found in DEMATEL
were used as inputs when selecting strategic decisions in VIKOR. As for strategic decisions, logistics provider
selection was chosen as a first selection. Warehouse location selection and product type selection are following
respectively.
Considering all analysis that made, economics, organization, capability and environment factors are all have
significant impact on cold food chain processes. In terms of strategy, the most important role is on logistics
provider selection. For further researches, sensitivity analysis can indicate how each criteria and sub-criteria
change the impact of strategic decisions. Also logistics provider selection which is selected as a most important
decision for cold food chain in this study can be optimized by linear programming and other methods. In terms
of optimization, fuel consumption, CO2 emissions may be taken into account to sustain better achievements for
environment.
REFERENCES Bilgen, B. and Celebi, Y. (2013), “Integrated production scheduling and distribution planning in dairy supply
chain by hybrid modelling”, Annals of Operations Research, Vol. 211 No. 1, pp. 55-82.
Bogataj, M., Bogataj, L., & Vodopivec, R. (2005). Stability of perishable goods in cold logistic chains.
International Journal Of Production Economics, 93-94, 345-356. doi: 10.1016/j.ijpe.2004.06.032.
Chaudhuri, A., Dukovska-Popovska, I., Subramanian, N., Chan, H., & Bai, R. (2018). Decision-making in cold
chain logistics using data analytics: a literature review. The International Journal Of Logistics Management,
29(3), 839-861. doi: 10.1108/ijlm-03-2017-0059.
Dai, D., Wu, X., & Si, F. (2021). Complexity analysis of cold chain transportation in a vaccine supply chain
considering activity inspection and time-delay. Advances In Difference Equations, 2021(1). doi:
10.1186/s13662-020-03173-z.
Daofang, C., Zhu, J., & Lin, D. (2015). Cold Chain Logistics Distribution Network Planning Subjected to Cost
Constraints. International Journal Of Advanced Science And Technology, 75, 1-10. doi:
10.14257/ijast.2015.75.01.
FAO. 2019. The State of Food and Agriculture 2019. Moving forward on food loss and waste reduction. Rome.
Licence: CC BY-NC-SA 3.0 IGO. http://www.fao.org/3/ca6030en/ca6030en.pdf .
Fearne, A., & Hughes, D. (1999). Success factors in the fresh produce supply chain: insights from the UK.
Supply Chain Management: An International Journal, 4(3), 120-131. doi: 10.1108/13598549910279567.
Giannakourou, M.C. and Taoukis, P.S. (2003), “Application of a TTI-based distribution management system
for quality optimization of frozen vegetables at the consumer end”, Journal of Food Science, Vol. 68 No. 1,
pp. 201-209.
Gogou, E., Katsaros, G., Derens, E., Alvarez, G., & Taoukis, P. (2015). Cold chain database development and
application as a tool for the cold chain management and food quality evaluation. International Journal Of
Refrigeration, 52, 109-121. doi: 10.1016/j.ijrefrig.2015.01.019.
Gölcük, İ., & Baykasoğlu, A. (2016). An analysis of DEMATEL approaches for criteria interaction handling
within ANP. Expert Systems With Applications, 46, 346-366. doi: 10.1016/j.eswa.2015.10.041.

International Engineering and Technology Management Summit 2021– ETMS2021
İstanbul Technical University & Bahçeşehir University
146
Gustavsson, J., Cederberg, C., Sonesson, U., Van Otterdijk, R., Meybeck, A., 2011. Global Food Losses and
Food Waste. Extent, Causes and Prevention. FAO.
Hodgett, R.E. Comparison of multi-criteria decision-making methods for equipment selection. Int J Adv Manuf
Technol 85, 1145–1157 (2016). https://doi.org/10.1007/s00170-015-7993-2.
Hsiao, Y., Chen, M., & Chin, C. (2017). Distribution planning for perishable foods in cold chains with quality
concerns: Formulation and solution procedure. Trends In Food Science & Technology, 61, 80-93. doi:
10.1016/j.tifs.2016.11.016.
J. Mangan, C. Lalwani, T. Butcher and R. Javadpour, Global logistics and supply chain management, 1 ed.,
Chichester: Wiley, 2014.
Karaoğlan, S. (2016). DEMATEL ve VIKOR Yöntemleriyle Dış Kaynak Seçimi: Otel İşletmesi Orneği,
Akademik Bakış Dergisi, 55, 9-24.
Kuru, A. ve Akın, B. (2012). Entegre Yönetim Sistemlerinde Cok Kriterli Karar Verme Tekniklerinin
Kullanımına Yönelik Yaklaşımlar ve Uygulamaları. Oneri, 10-38, 129-144.
Mahajan, R., Garg, S., & Sharma, P. (2013). Frozen Corn Manufacturing and Its Supply Chain: Case Study
Using SAP–LAP Approach. Global Journal Of Flexible Systems Management, 14(3), 167-177. doi:
10.1007/s40171-013-0040-y.
Ojo, O., Coutroubis, A., & Shah, S. (2020). Potential Impact of Industry 4.0 in Sustainable Food Supply Chain
Environment. N.A.. doi: 10.1504/ijism.2020.10030052.
Óskarsdóttir, K., & Oddsson, G. (2019). Towards a decision support framework for technologies used in cold
supply chain traceability. Journal Of Food Engineering, 240, 153-159. doi: 10.1016/j.jfoodeng.2018.07.013.
Pieter van Donk, D., Akkerman, R., & van der Vaart, T. (2008). Opportunities and realities of supply chain
integration: the case of food manufacturers. British Food Journal, 110(2), 218-235. doi:
10.1108/00070700810849925.
Roy, S., & Kumar, K. (2017). Strategic Planning of Cold Supply Chain Towards Good Manufacturing Practices.
Advances In Business Information Systems And Analytics, 200-215. doi: 10.4018/978-1-5225-2234-
8.ch011.
Saha, S., & Nielsen, I. (2020). Strategic Integration Decision under Supply Chain Competition in the Presence
of Online Channel. Symmetry, 13(1), 58. doi: 10.3390/sym13010058.
Si, S., You, X., Liu, H., & Zhang, P. (2018). DEMATEL Technique: A Systematic Review of the State-of-the-
Art Literature on Methodologies and Applications. Mathematical Problems In Engineering, 2018, 1-33. doi:
10.1155/2018/3696457.
Tarim Ve Orman Bakanliği Avrupa Birliği Ve Diş İlişkiler Genel Müdürlüğü. (2021). Türkiye’nin Gida
Kayiplari Ve İsrafinin Onlenmesi, Azaltilmasi Ve Yönetimine İlişkin Ulusal Strateji Belgesi Ve Eylem
Plani. Retrieved from https://gidanikoru.com/_uploads/eylem_plani_tr.pdf.
Tsai, K., & Pawar, K. (2018). Special Issue on Next-Generation Cold Supply Chain Management: Research,
Applications and Challenges. The International Journal Of Logistics Management, 29(3), 786-791. doi:
10.1108/ijlm-08-2018-340.
Van Wezel, W., Van Donk, D., & Gaalman, G. (2005). The planning flexibility bottleneck in food processing
industries. Journal Of Operations Management, 24(3), 287-300. doi: 10.1016/j.jom.2004.11.001.
Vrat, P., Gupta, R., Bhatnagar, A., Pathak, D., & Fulzele, V. (2018). Literature review analytics (LRA) on
sustainable cold-chain for perishable food products: research trends and future directions. OPSEARCH,
55(3-4), 601-627. doi: 10.1007/s12597-018-0338-9.
Yazdani, M., Gonzalez, E., & Chatterjee, P. (2019). A multi-criteria decision-making framework for agriculture
supply chain risk management under a circular economy context. Management Decision, ahead-of-
print(ahead-of-print). doi: 10.1108/md-10-2018-1088.
Aramyan, L. (2007). Measuring supply chain performance in the agri-food sector. PhD thesis, The Netherlands:
Wageningen University.
Cetinkaya, B. (2011), “Developing a sustainable supply chain strategy”, in Cuthbertson, R., Cetinkaya, B.,
Ewer, G., Klaas-Wissing, T., Piotrowicz, W. and Tyssen, C. (Eds), Sustainable
Supply Chain Management. Practical Ideas for Moving Towards Best Practice, Springer, Berlin and Heidelberg,
pp. 17-55.

International Engineering and Technology Management Summit 2021– ETMS2021
İstanbul Technical University & Bahçeşehir University
147
REVEALING TRENDS IN TELEMEDICINE TECHNOLOGY USING PATENT
ANALYSIS
ABSTRACT
Following the Covid-19 pandemic, several healthcare providers pushed Telemedicine-based services to
minimize direct contact between medical staffs and patients. Therefore, telemedicine-related businesses
have high growth opportunities. Transforming businesses from opportunities seen through innovation
will provide a competitive advantage. The intellectual property is commonly used to indicate innovative
and technological capabilities. This article discusses the insights gained from a study of patents related
to telemedicine technologies. The purpose of the study is to identify technology trends and global future
R&D trends in telemedicine by conducting a patent analysis in the period of 2002-2021. We discovered
that the latest year's patents are involved the integration of novel technologies into telemedicine, such
as 5G and blockchain, AI, remote sensing, biometric and voice identification, as well as the association
with the COVID-19 pandemic. The insights gained are being used to assist the strategic planning of
technological development paths and their potential applications in telemedicine. The analysis results
were used to assess the degree of complexity of digital transformation in telemedicine, which led to the
development of a technology roadmap.
Keywords: Patent Analysis, Technology Trends, Telemedicine
Porruthai Boonswasd Pakawat
Limsiriwattanakul
Kunio Shirahada
Japan Advance Institute of
Science and Technology
Police General Hospital Japan Advance Institute of
Science and Technology

International Engineering and Technology Management Summit 2021– ETMS2021
İstanbul Technical University & Bahçeşehir University
148
1. INTRODUCTION Advancement of technology and invention have driven continuous business innovation. As a result, establishing
a strategy to discover innovative prospects has become a key challenge in the field of innovation (Geum and
Kim, 2020). Identifying potential for technological innovation has recognized as a crucial challenge in the
literature on innovation (Cozzens et al., 2010; Geum et al., 2016), however patent research generate ideas
ranging from technological monitoring to the identification of technological opportunities (Lee et al., 2009b).
The most discussed innovation and technology nowadays is telemedicine, especially the recent pandemic
situation (Babulak and Perner, 2020). The lockdown and restricted direct contact have accelerated the
development of telemedicine system. As defined by the American Telemedicine Association (ATA)
“Telemedicine is the use of medical information exchanged from one site to another via electronic
communications to improve a patient’s clinical health status”. Telemedicine is one of the progressive ICT
services available in the healthcare industry. It can be used to develop innovative healthcare technology for
promoting medical quality and efficiency (Zhaoa et al., 2018). Telemedicine has adopted a various approach,
such as the use of commonly used applications to change the interaction process and the development of
specialized systems. Telemedicine implementation depends on the capacity of infrastructure, personnel and
organization readiness to invest in digital transformation (Ritter and Pedersen, 2020; Mendonça and Dantas,
2020; Kutnjak et al., 2019)
This research aims to identify technology trends and global future R&D trends in telemedicine by conducting
a patent analysis in the period of 2002-2021. Figure 1 provides an overview of the telemedicine process, to
better illustrate the scope of the patent analysis presented in this paper (Ritter and Pedersen, 2020). The
standard operation of telemedicine is to interact via the web and carry out the consultation process using
high-resolution images or video conferencing provided from the patient' side to the diagnosis, for remote
monitoring of any vital signs, and to provide curative and preventative care (Abugabah et al., 2020). The
reveal technology trends that will occur in the future lead to the organization development for digital
transformation. The findings of this study will be used to assess organizational capabilities regard to the
complexity level of digital transformation in telemedicine, which could lead to long-term technology
planning.
The paper is organized as follows. In section II, we present the theoretical background related to patent,
patent analysis and digital transformation. Section III shows methodology and preliminary results
including data collection, data analysis, patent investigation and patent analysis. Section IV presents
discussion and conclusions.
Figure 3. Schematic of Telemedicine including Remote patient monitoring (RPM), store & forward,
telephone encounters, direct to consumer, and facilitated visits. (Adopted from Portnoy et al., 2020)
2. THEORETICAL BACKGROUND
In this section, we present some concepts related to patent, patent analysis and digital transformation.
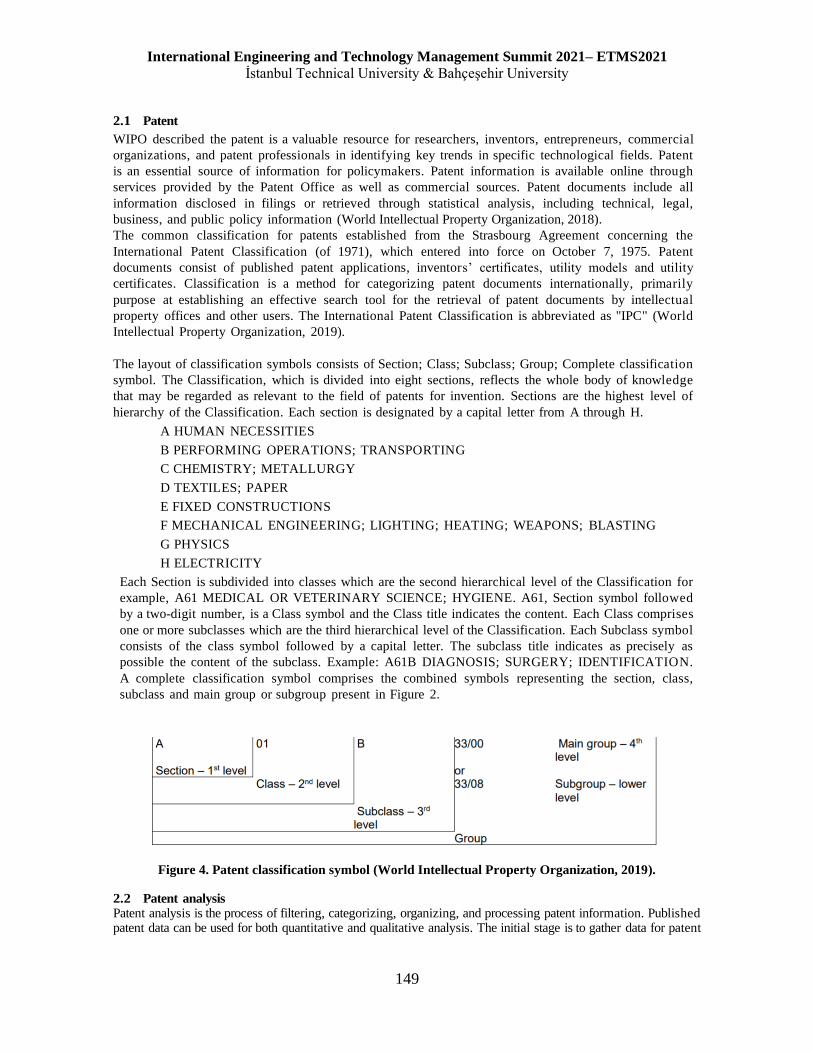
International Engineering and Technology Management Summit 2021– ETMS2021
İstanbul Technical University & Bahçeşehir University
149
2.1 Patent
WIPO described the patent is a valuable resource for researchers, inventors, entrepreneurs, commercial
organizations, and patent professionals in identifying key trends in specific technological fields. Patent
is an essential source of information for policymakers. Patent information is available online through
services provided by the Patent Office as well as commercial sources. Patent documents include all
information disclosed in filings or retrieved through statistical analysis, including technical, legal,
business, and public policy information (World Intellectual Property Organization, 2018).
The common classification for patents established from the Strasbourg Agreement concerning the
International Patent Classification (of 1971), which entered into force on October 7, 1975. Patent
documents consist of published patent applications, inventors’ certificates, utility models and utility
certificates. Classification is a method for categorizing patent documents internationally, primarily
purpose at establishing an effective search tool for the retrieval of patent documents by intellectual
property offices and other users. The International Patent Classification is abbreviated as "IPC" (World
Intellectual Property Organization, 2019).
The layout of classification symbols consists of Section; Class; Subclass; Group; Complete classification
symbol. The Classification, which is divided into eight sections, reflects the whole body of knowledge
that may be regarded as relevant to the field of patents for invention. Sections are the highest level of
hierarchy of the Classification. Each section is designated by a capital letter from A through H.
A HUMAN NECESSITIES
B PERFORMING OPERATIONS; TRANSPORTING
C CHEMISTRY; METALLURGY
D TEXTILES; PAPER
E FIXED CONSTRUCTIONS
F MECHANICAL ENGINEERING; LIGHTING; HEATING; WEAPONS; BLASTING
G PHYSICS
H ELECTRICITY
Each Section is subdivided into classes which are the second hierarchical level of the Classification for
example, A61 MEDICAL OR VETERINARY SCIENCE; HYGIENE. A61, Section symbol followed
by a two-digit number, is a Class symbol and the Class title indicates the content. Each Class comprises
one or more subclasses which are the third hierarchical level of the Classification. Each Subclass symbol
consists of the class symbol followed by a capital letter. The subclass title indicates as precisely as
possible the content of the subclass. Example: A61B DIAGNOSIS; SURGERY; IDENTIFICATION.
A complete classification symbol comprises the combined symbols representing the section, class,
subclass and main group or subgroup present in Figure 2.
Figure 4. Patent classification symbol (World Intellectual Property Organization, 2019).
2.2 Patent analysis Patent analysis is the process of filtering, categorizing, organizing, and processing patent information. Published patent data can be used for both quantitative and qualitative analysis. The initial stage is to gather data for patent
International Engineering and Technology Management Summit 2021– ETMS2021
İstanbul Technical University & Bahçeşehir University
150
analysis by searching technology themes and retrieving patent document (Guo et al., 2012). The data retrieved in accordance with the technological theme will be evaluated. The patent analysis is divided into two parts: enterprise technical strength assessment and IPC technological structure in order to find creative ideas. This process is designed for fuzzy front-end based on patent analysis (Lee et al., 2009a). Using data mining to provide insights into the business-focused for specific technology themes is a complementing role of patent analysis.
Abraham and Moitra (2001) proposed a four-part patent analysis technique which included statistical summary, trends and correlations, patterns, and international comparisons. The classification of technology levels in individual patents relying on abstract reading was based on knowledge of the specific area of study and defines the scale reflecting a revolutionary advance.Xin et al. (2021) presented a patent analysis approach by view the overall growth trend, technology life cycle, geographical distribution and collaboration networks to understand the developing situation and patent cooperation network in the AI-medical field.
2.3 Digital Transformation and Technology Roadmapping
In organization, digital transformation and operational management are enormous challenges. Since digital transformation is a complex and time-consuming process that necessitates the involvement of all corporate resources, including personnel, technology, physical, organizational, and financial (Kutnjak et al., 2019).
In terms of digitization and digitalization, Ritter and Pedersen (2020) defined and characterized as follows: "Digitization" is known as the process of transforming analog data to digital data. The application of digital technologies is referred as "digitalization". It means structuring numerous and diverse domains of social life around digital communication and media infrastructures.
In the context of telemedicine, 'Digitization' refers to the conversion of medical examination data from analog to digital covering all relevant system such as storage, access, control and usage. The 'digitalization' refers to the use of technology to adopt 'converted data' into telemedicine processes such as connecting to the EHR application (Electronic Health Records) or remote patient monitoring.
Telemedicine contributes to the digital transformation of a health care industry. The technologies have become more feasible as hardware, software components and network capabilities have evolved. However, the use of technologies that promote digital transformation still is done reluctantly in the field of public health in many countries even developed countries (Mendonça and Dantas, 2020; Abugabah et al., 2020).
For long-term planning in digital transformation, it requires an understanding of relevant technologies and development trends so that practicable guidelines and roadmaps can be determined. Technology roadmapping are a common approach for integrating strategy, technology and target-driven marketing planning in order to determine the technology required based on market demand analysis. Technology roadmap was actually applied to develop disruptive technology roadmap (Lee et al., 2009a). Technology-driven roadmapping has 4 layers to develop business opportunities based on technology assets. Starting from R&D planning, going through technology planning, product planning, and end with market planning (Li et al., 2014). It is also an important tool for communicating development plan.
3. METHODOLOGY AND FINDING
This study has analyzed global patent information and provides a detailed study of important patents.
3.1 Data collection
This research investigated patents from 126 databases using the PatSnap platform and application, searching
for specific keywords relevant to telemedicine and technology in patents database using Boolean operators.
Telemedicine ‘OR' telehealth ‘AND' technology field are the particular keywords. The patent dataset used in
this study has been updated with patent information published until July 8, 2021. The domain collection
resulted consists of 2,210 applications in 1,285 simple families, with 186 simple families (261 applications in
total) granted as patents.
3.2 Data analysis
The patent data retrieved in accordance with the telemedicine Technology were statistically summarize data in
order to examine trends and correlations using the PatSnap application and Microsoft Excel. Patent analysis
was conducted by reading abstracts and titles, as well as examining each patent document in detail for a
thorough understanding (Abraham and Moitra, 2001). The targeted investigations include trends and features of

International Engineering and Technology Management Summit 2021– ETMS2021
İstanbul Technical University & Bahçeşehir University
151
the key patents that have been widely applied. The analysis results are used to determine the complexity level of
digital transformation in telemedicine from an expert perspective.
3.3 Patent investigation
Preliminary patent assessments rely on information obtained from PatSnap applications for an overview of
patents related to telemedicine technologies. Figure 3 retrieved from PatSnap shows the annual patenting trend
in the technology field by rate of patent application. The number of published patent applications is shown in
green, while the trend in granted patents is shown in yellow line. The United States, China, and have filed the
most patents for telemedicine technology. According to the Figure 3, the number of patent applications is steadily
increasing. However, as compared to the application, the percentage of grants is relatively low. There are
numerous explanations, according to World Intellectual Property Organization records, such as the specification
failing to support the claims or a lack of novelty on the grounds.
Figure 5. Application and granted trend
Cell diagram in Figure 4, the keywords and phrases of the patents belonging to the top organizations in the technology field. The relative coverage is represented by the number of cells under each organization, with each cell representing the number of patents. Networks between organizations and technology field are illustrated. We can observe where the leading telemedicine technology firms are investing. According to the Figure 4, ROM Tech Inc. focuses on treatment plan, telemedicine session, medical device and healthcare provider. Samsung Electronics Co., Ltd. is an organization focusing on a variety of technologies including remote medical, medical service, medical information, medical image, medical equipment and remote examination service. Reliant Immune Diagnostics Inc. has developed several technologies such as mobile device, healthcare provider and telemedicine session. While 3M Innovative Properties Co. has focused on telemedicine application. The remaining patents introduced by various companies focus on telemedicine technologies such as the human body, remote monitoring, telemedicine service, telemedicine device, patient datum, medical datum, and real-time diagnosis.
Figure 6. Top current assignees in the technology field

International Engineering and Technology Management Summit 2021– ETMS2021
İstanbul Technical University & Bahçeşehir University
152
Figure 7. Key Technologies
In this study, only patents that were granted and still active were selected. The remaining 186 simple families were analyzed. The intellectual property of telemedicine has discovered a wide range of technologies, including telemedicine application, remote medical, mobile device, microelectronic sensor, medical device, patient station, and medical service. Figure 5 visualizes the top 10 technology areas the patents within the technology field fall into, with the size of the box corresponding to the number of patents. Top 5 of technology areas is shown in Table I.
TABLE I. TOP 5 OF KEY TECHNOLOGY AREAS
IPC
Code Explanation
Simple
Families Percentage
A61B5 Measuring for diagnostic purposes, i.e., diagnosis by ultrasonic,
sonic or infrasonic waves 67 25.28%
G06Q50 Systems or methods specially adapted for specific business sectors,
i.e., utilities or tourism 30 11.32%
H04L29 Transmission of digital information, i.e. Telegraphic communication 29 10.94%
G16H40
Healthcare informatics, i.e., information and communication
technology (ICT) specially adopted for the handling or processing of
medical or healthcare data.
27 10.19%
G06F19 Digital computing or data processing equipment or methods,
specially adapted for specific applications 27 10.19%
Figure 8. Key Technologies
Figure 6 visualizes the majority of top assignees are focused on medical devices for diagnosis purposes as we
can see from the main IPC Group in A61B5. The following major focus are H04L29 and G16H10. H04L29
relates to telegraphic communication such as telegraphic and telephonic communication in terms of

International Engineering and Technology Management Summit 2021– ETMS2021
İstanbul Technical University & Bahçeşehir University
153
arrangements, apparatus, circuits or systems. While G16H10 refers to the handling or processing of patient-
related medical or healthcare data. However, most of the patents of the top assignees cover information and
communication technology as well as data processing equipment and method with the main IPC class G16 and
G06. The most recent year of granted patent applications is 2020-2021, there are 15 applications. The main IPC
subclass, A61B and G16H were chosen for in-depth examination of technological developments since they
have the largest number and correspond to the majority of top assignees.
3.4 Patent analysis
The first main IPC subclass to be examined is A61B. Figure 7 shows that A61B has 43 active applications from
a total of 186 granted patents from 2004 to 2021. WIPO defines A61B as the medical science covers
instruments, implements, and processes for diagnostic, surgical and person-identification purposes, including
obstetrics, instruments for cutting corns, vaccination instruments, fingerprinting, psycho-physical tests.
The active patent application represents a decade of telemedicine innovations in the invention of devices related
to remote monitoring, evaluation, monitoring and treatment. Most of these technologies are focused on devices
used for physical examination and diagnostic. Figure 8 illustrates the details.
Among the A61B which is medical science covers instruments, implements, and processes for diagnostic, the
patent applications represented an attempt to link analog data to telemedicine systems that had to be digitized.
This process is known as digitization.
The medical specialist assessed the implementation of these inventions was not a great challenge for healthcare
professionals. Besides a novel application that employs microelectronic sensor for gut motility monitoring. The
application provides a swallowable capsule comprising pseudo conductive high-electron-mobility transistors
(PC-HEMTs), and its use in an intestinal an gut diagnostics as well as gut motility monitoring. This innovative
device required specialized knowledge. As a result, clinicians have to study about the Fourier spectra recorded
with the PC-HEMT sensor from the gut and its readings.
The most challenges will be passed on to the patients who will be required to use the novel treatment. The
challenging aspect of digital transformation is convincing patients to adopt remote healthcare systems, learning
on digital devices and applications as well as investing in these technologies.
Figure 9. G16H and A61B applications in comparison to all granted patents from 2001-2020
The second main IPC subclass has been investigated is G16H, which was added as a new IPC subclass on
January 1, 2018. (European Patent Office, 2018). G16H is defined by WIPO as healthcare informatics, which
is information and communication technology (ICT) that is specifically adapted for the handling or processing
of medical or healthcare data. As illustrated in Figure 7, 27 simple families were found. We discovered that the
number of applications was considerably greater in 2020, with 9 out of total 27 applications filed, indicating
the inventor's interest. The University of Virginia Patent Foundation submitted the first application in 2014,
which was eventually classified as this subclass. The patent title is Techniques facilitating mobile telemedicine
for stroke patients.
The characteristics of the early patents application from 2014-2016 were the analog-to-digital transmission
0
5
10
15
20
25
G16H and A61B in comparison to all granted patents
G16H A61B All granted patents

International Engineering and Technology Management Summit 2021– ETMS2021
İstanbul Technical University & Bahçeşehir University
154
method and enhancing data transmission efficiency through the effort of integrating multiple devices into the
telemedicine system. The application of artificial intelligence (AI) in medical diagnostics emerged in 2016 by
Ricoh Company called the virtual doctor and in 2017 by a start-up company named GINGER.IO, INC. The
application functions that help physicians diagnose and communicate a systematic procedure to the patient
occurred in 2018 by a start-up company. We discovered that the latest year's patents are involved the integration
of novel technologies into telemedicine, such as 5G and blockchain, AI, remote sensing, biometric and voice
identification, as well as the association with the COVID-19 pandemic. Figure 8 illustrates details.
The anticipation of the situation when introducing inventions in the main IPC subclass, G16H, is an escalation
from digitization to digitalization. This is because patents in this subclass represent the incorporation of digital
devices and data into telemedicine processes, such as remote patient monitoring or Electronic Health Records
(HER) application. The process that will occur is not only the conversion of analogue data into digital form, but
also the incorporation of digital technology into the core processes of the organization. It is consistent with the
definition of digitalization, which comprises converting business processes to use digital technologies.
Figure 10. The details of patent in the main IPC subclass, A61B and G16H from 2004-2021.
4. DISCUSSION AND CONCLUSIONS
In this study, we have investigated technology trends in the telemedicine by conducting a patent analysis
in the period of 2002-2021 to reveal the global direction of R&D to forecast technological developments.
The analysis results were utilized to determine the degree of complexity of digital transformation in
telemedicine.
Currently, telemedicine systems are increasingly being used, with the key driving factor being the
coronavirus outbreak to reduce direct contact between medical staff and patients. The technology
exploited varies greatly, ranging from the transition from face-to-face to online interaction via
applications or online meeting systems to specialized applications and medical devices. It illustrates the
growing trend of telemedicine technology and inevitable adoption of these technologies by service
providers and patients.
Revealing technology trends using patent analysis can support organization foresight in term of digital
transformation. In the case of information and communication technology (ICT) in medical or healthcare
data from G16H, we are witnessing rapid changes in system integration with novel technologies.
Therefore, the system infrastructure planning must be anticipated for this rapid technological
development. Furthermore, the capability of personnel to support these technologies is critical. The

International Engineering and Technology Management Summit 2021– ETMS2021
İstanbul Technical University & Bahçeşehir University
155
organization must be prepared to develop personnel, systems, as well as convey their usage to service
recipients. The technological advancements and trend of integrating novel technologies into telemedicine
discovered through patent analysis in recent years can be incorporated into technology roadmapping for
digitalization strategy.
Patent analysis is one of numerous strategies for anticipating technological trends that are about to reach
the market. Academic research, on the other hand, shows potential future technological developments
that are likely to succeed. It also indicates academic and private-sector participation in research and
funding. Future studies should thus consider both patents and academic research.
ACKNOWLEDGEMENT
Researchers do not have any affiliation (financial or otherwise) with a commercial organization that may
have a direct or indirect connection to the content of this study. The license of Patsnap, patent data search
and analysis tool, is supported by Department of Intellectual Property, Ministry of Commerce, Thailand.
REFERENCES Abraham, B.P., Moitra, S.D., 2001. Innovation assessment through patent analysis. Technovation.
https://doi.org/10.1016/S0166-4972(00)00040-7
Abugabah, A., Nizamuddin, N., Alzubi, A.A., 2020. Decentralized telemedicine framework for a smart
healthcare ecosystem. IEEE Access 8, 166575–166588. https://doi.org/10.1109/ACCESS.2020.3021823
Babulak, E., Perner, P., 2020. Corona Virus Global Health Transformation to Telemedicine, the Quality-of-
Service Provision, and the Cybersecurity Challenges Handheld Devices: Past, Current and Future Trends
View project Flaw detection in radiagraphic images View project 13, 61–81.
Cozzens, S., Gatchair, S., Kang, J., Kim, K.S., Lee, H.J., Ordóñez, G., Porter, A., 2010. Emerging technologies:
Quantitative identification and measurement. Technol. Anal. Strateg. Manag. 22, 361–376.
https://doi.org/10.1080/09537321003647396
Geum, Y., Kim, M., 2020. How to identify promising chances for technological innovation: Keygraph-based
patent analysis. Adv. Eng. Informatics 46, 101155. https://doi.org/10.1016/j.aei.2020.101155
Guo, J., Jiang, P., Guo, J.W., Tan, R.H., 2012. Research of idea generation process for fuzzy front end based
on patent analysis, in: IEEE International Conference on Industrial Engineering and Engineering
Management. https://doi.org/10.1109/IEEM.2012.6837931
Kutnjak, A., Pihir, I., Tomicic Furjan, M., 2019. Digital transformation case studies across industries -
Literature review. 2019 42nd Int. Conv. Inf. Commun. Technol. Electron. Microelectron. MIPRO 2019 -
Proc. 1293–1298. https://doi.org/10.23919/MIPRO.2019.8756911
Lee, S., Yoon, B., Lee, C., Park, J., 2009a. Business planning based on technological capabilities: Patent
analysis for technology-driven roadmapping. Technol. Forecast. Soc. Change.
https://doi.org/10.1016/j.techfore.2009.01.003
Lee, S., Yoon, B., Park, Y., 2009b. An approach to discovering new technology opportunities: Keyword-based
patent map approach. Technovation 29, 481–497. https://doi.org/10.1016/j.technovation.2008.10.006
Li, X., Zhou, Y., Xue, L., Huang, L., 2014. Roadmapping an Emerging Industry with Bibliometrics and Patent
Analysis: A Case of OLED Industry in China.
Mendonça, F.M., Dantas, M.A.R., 2020. Covid-19: Where is the Digital Transformation, Big Data, Artificial
Intelligence and Data Analytics? Rev. do Serviço Público 71, 212–234.
https://doi.org/10.21874/rsp.v71i0.4770
Portnoy, J.M., Pandya, A., Waller, M., Elliott, T., 2020. Telemedicine and emerging technologies for health
care in allergy/immunology. J. Allergy Clin. Immunol. 145, 445–454.
https://doi.org/10.1016/j.jaci.2019.12.903
Ritter, T., Pedersen, C.L., 2020. Digitization capability and the digitalization of business models in business-
to-business firms: Past, present, and future. Ind. Mark. Manag. 86, 180–190.
https://doi.org/10.1016/j.indmarman.2019.11.019
Xin, Y., Man, W., Yi, Z., 2021. The development trend of artificial intelligence in medical: A patentometric
analysis. Artif. Intell. Life Sci. 1, 100006. https://doi.org/10.1016/j.ailsci.2021.100006
World Intellectual Property Organization. WIPO Guide to using patent information, 2018. [Online]. Available: https://patentscope.wipo.int/

International Engineering and Technology Management Summit 2021– ETMS2021
İstanbul Technical University & Bahçeşehir University
156
World Intellectual Property Organization. Guide to the international patent version 2019. [Online]. Available:
https://www.wipo.int/edocs/pubdocs/en/wipo_guide_ipc_2019.pdf
Appendix
TABLE II. INVENTION IN THE MAIN IPC SUBCLASS A61B FROM 2004-2021
Application
year
Invention in the main IPC subclass A61B
2004 Breathing interval measurement 2008 Telemedicine monitoring system, A telemedicine device to measure the internal body
temperature of the patient by estimating the temperature fall of a skin surface through a
moisture sensor. 2009 Remote medical diagnosis device including bio-mouse and bio-keyboard 2010 Blood testing apparatus having fingerprint recognizing function for remote medical treatment
and blood information management systems, A device for gait training and gait analysis,
Biomedical device capable of using the earphone-and-microphone plug to transmit data,
Electronic stethoscope , telemedicine and medical device 2011 Telemedical stethoscope, Estimating cardiac pulse recovery from multi-channel source data,
Device and a system for remotely acquiring user physiological detection data, Apparatus and
method for classifying body mass index by using facial characteristic information 2012 Video-based estimation of heart rate variability 2013 Method and system for estimating momentary cardiovascular performance reserve,
Smartphone-based otoscope, A connection device for an otorhinoendoscope 2014 Adaptive pattern recognition for psychosis risk modelling
2015 Otoscope using smart phone for telemedicine
2016 Cardiac monitor system and method for home and telemedicine application, Observing device
for telemedicine and Image processing device, Telemedicine Booth, Ingestible electronic to
vital sign monitoring internally from the gastrointestinal tract, Method and system for modeling
behavior and heart disease state, System and method for ophthalmological imaging adapted to
a mobile processing device, The personal identification method based on optimal period
waveform of photoelectric volume pulse wave, Massage Chair providing Healthcare Service
by Communication, Telemedicine massage chair system for diagnosing a health condition of a
massage chair user by collecting body information from a user, The vital-signs system includes
patient monitoring devices generating streaming vital signs, alarms and alerts which are
aggregators generating streaming audio, video, and GPS for transmission
2017 Portable digital slit lamp for cataract screening, Microelectronic sensors for non-invasive
monitoring of physiological parameters, Microelectronic sensors for monitoring of
cardiovascular and pulmonary, electrocardiography signals, heart activity signals and its
variability, Microelectronic sensor for intestinal and gut diagnostics and gut motility
monitoring, Stroke detection and prevention system and method
2018 Remote laser treatment system with dynamic imaging, Integrated medical device and home
based system to measure and report vital patient physiological data via telemedicine, Self-
directed health screening systems
2019 Digital stethoscope, Home telemedicine radio channel system, Telemetric ultrasound device
for diagnosing sensorineural hearing loss
2020 Portable device including stethoscope, endoscope and microscope, Digital stethoscope
TABLE III. INVENTION IN THE MAIN IPC SUBCLASS G16H FROM 2004-2021
Application
year
Invention in the main IPC subclass G16H
2014 A method for facilitating mobile telemedicine for a suspected stroke case.
2015 A method of speeding up telemedicine image transmission.

International Engineering and Technology Management Summit 2021– ETMS2021
İstanbul Technical University & Bahçeşehir University
157
2016 Advanced telemedicine system with virtual doctor, A system and method for integration of
telemedicine into multimedia video visitation systems in correctional facilities, The integration
of a point-of-care blood analyzer into an electronic patient care reporting system (ePCR)
system.
2017 A method and system for characterizing and/or treating poor sleep behavior, A method and
system for providing automated conversations, A method and system for enhancing care
determination in a user's condition associated to a mobile device, Multi-broker messaging and
telemedicine database replication, ICU telemedicine system for varied Electronic Medical
Record (EMR) systems, Smartphone based telemedicine system
2018 System and method for mass remote cardiac monitoring, A telemedicine device based on the
Internet of things that is convenient for the elderly to take medicine, A method for creating a
unique transaction ID (UTID) securely representing a medical diagnostic transaction between
a user/patient and a telemedicine professional, Programmable medical devices that comprise
general programmable medical device (GPMD) and a patient medical device controller (PPS).
2019 A patient medical support system including at least one article of medical equipment and a two-
way audio-visual system, Modular telehealth cart with thermal imaging and touch screen user
interface, A systems and methods for transitions of care.
2020 A remote medical consultation method and system based on 5G communication and
blockchain, Methods and systems of telemedicine diagnostics through remote sensing, Methods
and systems of biometric identification in telemedicine using remote sensing, System, method,
and apparatus for real-time access to networked radiology data, Corporate telemedical complex
for prevention of epidemic emergency situations, Technology of remote medical rehabilitation
of patients with coronavirus infection, Telemedicine system and method for using voice
technology, Telemedicine system with disinfection station, Telemedicine system using
stethoscope
International Engineering and Technology Management Summit 2021– ETMS2021
İstanbul Technical University & Bahçeşehir University
158
SYSTEMS THINKING AND TECHNOLOGY MANAGEMENT IN THE DIGITAL
AGE
Alper Camcı
Bahçeşehir University
ABSTRACT
Technology is one of the most important factors in the development of human societies. Since the first industrial
revolution, companies that manage technological change well have been successful. Today, when we are about
to move from the fourth industrial revolution (Industry 4.0) to the fifth industrial revolution, technology
management has become more complex than ever and has become a phenomenon that has social and global
effects beyond just affecting the profitability of companies. Managing technology, which has evolved since the
Second World War and has become a strategic management discipline, has become more complex and non-
linear. Systems thinking is an approach in understanding complex socio technical systems. As the complexity
of the technology management increases, systems thinking tools become ideal candidates to understand and
predict the systems behavior in complex socio technical systems.
Keywords: Technology Management, Systems Thinking, Causal Loop Diagrams, Digital Age, Industry 5.0,
Systems Complexixty
International Engineering and Technology Management Summit 2021– ETMS2021
İstanbul Technical University & Bahçeşehir University
159
1. TECHNOLOGY MANAGEMENT Technology Management is a critical function for organizations and has been evolving as a Management
discipline since after the World War 2. The evolution of the discipline follows the increased complexity in the
environment. As the World becomes more complex and uncertain and with the onset of the digital age,
technology Management will have to evolve even more. Technology and technological innovations are among
the most important factors in contrubuting to the wealth and well being of human societies (Ayres, 1988, Gancia
and Zilibotti, 2009). Technology greatly influences not only a country's wealth, but also its place, power, and
influence on the world stage. Similarly, technology and technological innovations are the most important
sources of competitive advantage for companies.
The word technology is a combination of two words from ancient Greek, techne and logos. “Tekhne” means
art, skill, craft, or the way, style or means by which something is acquired, “logos” means the expression, or
word, in which inward thought is expressed. Accordingly, technology means words, discourse, or knowledge
in general about the way things are acquired, created. One of the most important features of technology is that
it is in constant change with innovations. Technological changes are one of the most important factors in the
development of humanity, and depending on the speed of these changes, changes in societies are also increasing.
Dankbaar et al. (1993) defined technology management as “all management activities related to the research,
development, adaptation and deployment of technologies in an enterprise and the supply of technology and the
utilization of technologies for the production of goods and services”. Badawy (1998), who developed a wider
and strategic perspective, defined technology management as the integration of business strategy and
technology strategy in a company. This integration requires the coordination of research, production and service
functions with the company's functions such as marketing, finance and human resources (Badawy, 1998).
Emergence of modern technology management concepts coincides with the great changes happened in the
world after 1930s mainly the great economic depression and World War 2. The main chronological steps in
Technology Management are given as following:
1930s - 1970s: In this period the concept of technology push became the dominant philosophy in technology
management, and R&D management was the basis of technological advances (Drejer, 1997). DeVries (2000)
argues that in this period, the task of science is the precursor of technology, and the view that basic science
research will lead to industrial technologies is dominant.
1970s- 1980s: During the 1970s, the focus of technology management evolved from the R&D to innovation
(Drejer, 1997). While the R&D management school focused on discontinuous disruptive innovation, the
innovation school focused on continuous innovation that could be commercialized (Drejer, 1997). The
innovation management school assumed that technological changes are highly unpredictable but still
predetermined by the technology S-curves, suggesting that technology can be predicted to some extent (Drejer,
1997). The most well-known S-curve in this approach is also called Moore's law, which states that the number
of circuits that microprocessors can carry doubles in certain periods. In the 1970s and 80s, the competition,
continuous progress and change brought about by globalization, as well as the increasing crises in the world,
caused technology management to become a complex and unstable discipline, and as a result, planning came to
the fore in technology management (Drejer, 1997). Technology planning school has led to the creation and use
of methods to eliminate risk and uncertainty in technology. One of the most frequently used methods is
technology portfolio management, in which limited resources are transferred to various technology
development projects depending on the returns, risks and uncertainties of these projects (Dickinson et al., 2001).
1980s – 1990s: Strategic technology management emerged in the 1980s and 90s (Drejer,1997). The
developments in computer technologies and the application of computer-based systems in all areas of
organizations, the acceleration of globalization and technological changes, but the fact that most of the new
technologies are not accepted by the market in practice and that the social effects of technological changes in
companies are not well managed have caused technology management to take a strategic dimension. (Drejer,
1997).One of the most important technology management tools under the strategic technology management
approach is the technology road mapping method. The technology roadmapping method (Willyard and
McClees, 1987), first developed by Motorola in the 1970s to increase the alignment between technology and
product development, has become widespread over time and has been widely adopted by many organizations
in different sectors at the company, industry and national levels (Phaal et al., 2004). Technology roadmapping
is a visual-dominated, flexible planning technique used to support strategic and long-term planning by matching
the short- and long-term goals of various levels of breakdown with specific technology solutions (Phaal et al.,

International Engineering and Technology Management Summit 2021– ETMS2021
İstanbul Technical University & Bahçeşehir University
160
2004). Despite its popularity, technology road mapping does not provide benefits in cases of increasing
technological change and uncertainty and requires the introduction of new advanced methods (Kanama and
Kondo, 2007).
2000s – 2010s: As the world enters the 21st century, the widespread globalization, the disappearance of market
entry barriers, and the widespread use of computers, the Internet, and increasingly mobile smart devices have
also begun to undergo major changes in technology management. In this period, the preferences of the end
customers came to the fore and companies that could not adequately anticipate and meet these preferences were
doomed to disappear from the market, no matter how big and powerful they were. For these reasons, technology
management has focused on producing solutions that will respond to customers' needs as quickly as possible.
In the 2000s and 2010s, when digitalization trends developed, two of the most important phenomena affecting
technology management emerged are, the end of large-scale technological innovations and the increasing
importance of big data and big data analytics in technology management (Salgues, 2018). According to Salgues
(2018), with the beginning of the 21st century, new disruptive technological innovations have been replaced by
more product and service innovations. One reason for this is that the most important factor that drives
innovations is that it attracts markets rather than technology push, and another reason is that especially new
disruptive technological innovations depend on developments in scientific studies, and these developments
become rarer and require huge expenses with each passing year (Brooks, 1994). For these reasons, companies
have turned to product, service and business model innovations by using existing technologies.
2020s: The year 2020 will be remembered as a special year engraved in the collective memory of humanity,
due to the global Covid-19 pandemic. Covid-19 pandemic as well as other incidents like the global chip
shortage, blocking of the Suez Canal by a large container ship as well as large scale environment related
catastrophes during the same period signaled the start of a new era in which old ways of thinking may not be
sufficient for business environment. The European Commission Directorate General for Research and
Innovation labeled the new period as Industry 5.0 and published two guiding reports. The first report mentioned
the following technologies as the enablers of Industry 5.0 (Müller, 2020):
• Individualized human-machine-interaction
• Bio-inspired technologies and smart materials
• Digital twins and simulation
• Data transmission, storage and analysis technologies
• Artificial intelligence
• Energy efficiency, renewable energy sources, storage and autonomy technologies
While these technology areas serve as a guide for the direction where technology development leads, the second
study, published within the European Commission Research and Innovation General Directorate, aims to draw
the general framework of Industry 5.0 in a more general sense. This study defines Industry 5.0 as a broad
philosophy that goes beyond just producing goods and services for profit. This philosophy has three key
elements: people-orientation, sustainability and resilience (Breque et al., 2018).
The basic premise of these two reports is that in the new era managing technology will be even more complex
than in previous eras and this complexity is increased by non-technological factors such as society, environment,
politics, etc. In such complex environments new ways of thinking is needed to make sense of the whole picture
and one approach has been in use over the years and it is called systems thinking.
2. SYSTEMS THINKING AND TECHNOLOGY MANAGEMENT Arnold and Wade (2015) defined systems thinking as a set of synergistic analytical skills used to develop the
ability to describe and understand systems, predict their behavior, and modify them to produce desired effects.
According to systems thinking, systems consist of elements, the connections between them and the system
purpose. Based on this approach, when the environment in which a company competes is considered as a
system, the purpose of the technology management system can be explained as offering the technologies to the
market in its products that will meet the needs of its customers in the market in order for the company to survive.
To achieve this goal, the company has to operate in a multi-element and interactive environment. In previous
periods, while this system consisted of companies, their competitors, suppliers and customers in general terms,
the number of system elements in the today’s environment has increased to include humans, society, general
economy and environment.

International Engineering and Technology Management Summit 2021– ETMS2021
İstanbul Technical University & Bahçeşehir University
161
One of the most common approaches used in systems thinking to visualize a complex dynamic system, with its
variables and how they are related to each other, is causal loop diagrams. Causal loop diagrams consist variables
(nodes), links between variables (arrows), the sign of the link (positive or negative)" i.e. enhancing effects or
"negative" i.e. diminishing effects), and the sign of a loop in the system (the type of behavior of the system). In
complex systems, the mechanism in which a change in one variable ultimately indirectly affects the same
variable is called feedback and it is shown in loops. These feedback loops can be either positive (enhancing) or
negative (diminishing). The complexity and unpredictability of the systems largely stem from these feedback
loops as they are usually nonlinear in nature.
The applications of systems thinking to technology management in literature are quite recent and rare. Kapsali
(2011) suggests that systems thinking methods provide the flexibility to manage innovativeness, complexity
and uncertainty in innovation projects more successfully. Tamim (2020) explores the online education as a
complex system using systems thinking tools. In a concept paper Weissenberger-Eibl et al.(2019) proposes a
holistic framework for conceiving companies as systems and using scenario techniques to support a systematic
analysis of the company’s environment.
In the new environment, the systems will be more complex. So further studies are needed to develop more
robust analytical tools for systems thinking especially in technology management. This paper suggests a
combination of qualitative and quantitative tools to analyze the behavior of complex technology systems based
on real hard data and expert opinions.
REFERENCES Arnold, R. Ve & Wade, J. (2015). A Definition of Systems Thinking: A Systems Approach. Procedia Computer
Science. 44. 669-678. 10.1016/j.procs.2015.03.050.
Ayres, R. (1988), Technology: The Wealth of Nations Technologıcal Forecastıng And Socıal Change 33, 189-
201
Badawy MK. Technology Management Education: Alternative Models. California Management Review. 1998;40(4):94-116. doi:10.2307/41165966
Breque, M.,De Nul, L. Petridis, A. (2021) Industry 5.0:Towards a sustainable, human-centric and resilient
European Industry. European Commission Directorate-General for Research and Innovation. Doi:
10.2777/308407
Brooks, H.(1994). The relationship between science and technology. Research Policy 23, 477-486
Dankbaar, B., Kuhlmann, M.S. and Tsipouri L. (1993), Research and Technology Management in Enterprises:
Issues for Community Policy, Overall Strategic Review, EUR, 15438-EN, Brussels.
De Vries, M.,J. (2000) Innovations and Technology Education, Proceedings PATT-10 conference, April 4-5,
2000
Drejer, A. (1997). The discipline of management of technology, based on considerations related to technology.
Technovation, (5), 253-265.
Gancia, G., Zilibotti, F. (2009), Technological change and the wealth of nations Annual Review of Economics,
1 (1), 93-120.
Kanama, D ve Kondo,A. (2997) The limitations of the technology roadmap and importance of new management
tools in science-based innovation: the case of nanotechnology in japan, 2007 IEEE International Conference
on Industrial Engineering and Engineering Management, Singapore, 2115-2119, doi:
10.1109/IEEM.2007.4419565.
Kapsali, M.(2011), Systems thinking in innovation project management: A match that works,International
Journal of Project Management,29(4) 396-407, https://doi.org/10.1016/j.ijproman.2011.01.003.
Müller, J. (2020) Enabling Technologies for Industry 5.0. Results of a workshop with Europe’s technology
leaders. European Commission Directorate-General for Research and Innovation. Doi: 10.2777/082634
Phaal, R., Farrukh, C.J.P. and Probert, D.R. (2004), “Customizing roadmapping”, Research Technology
Management, 47 (2), pp. 26-37.
Salgues, B. (2018). Society 5.0: Industry of the Future, Technologies, Methods and Tools. ISTE Ltd., London.
Tamim, S.R. (2020), Analyzing the Complexities of Online Education Systems: A Systems Thinking
Perspective. TechTrends 64, 740–750. https://doi.org/10.1007/s11528-020-00538-9
Weissenberger-Eibl, M.A.; Almeida, A.; Seus, F. (2019). A Systems Thinking Approach to Corporate Strategy
Development. Systems 7, 16. https://doi.org/10.3390/systems7010016

International Engineering and Technology Management Summit 2021– ETMS2021
İstanbul Technical University & Bahçeşehir University
162
Willyard, C.H., McClees, C. W. (1987-09-01). "Motorola's Technology Roadmap Process". Research
Management. 30 (5): 13–19. doi:10.1080/00345334.1987.11757057. ISSN 0034-5334.

International Engineering and Technology Management Summit 2021– ETMS2021
İstanbul Technical University & Bahçeşehir University
163
THE FACTORS AFFECTING THE TECHNOLOGY ACQUISITION OF
ORGANIZATIONS IN ENERGY SECTOR: A RESEARCH IN CONTEXT OF THE
RESOURCE DEPENDENCE THEORY
ABSTRACT
In this study, it was attempted to explain the inter-organizational technology acquisition within the context
of the resource dependence theory as one of the theories that best describes the type of acquisition. The
necessity of evaluating the theory, which is thought to affect the acquisition strategy significantly in the context
of inter-organizational relations, with the factors that reveal acquisition constitutes the intention of this study.
While this evaluation was made, the study asked the basic research question: which factors affect the
technology acquisition of organizations in the energy sector in Turkey? Based on the questions asked within
the scope of scale, it is observed that four variables affect acquisition to reduce the organization’s options
and to choose the optimal acquisition strategy accordingly: motivation, absorptive capacity, resources, and
technological compatibility levels. In line with this information, it was attempted to reveal what organizations
are doing, what strategies they follow and their shortcomings within the context of acquisition.
Keywords: Resource Dependence Theory, Technology Acquisition, Strategic Cooperation, Absorptive
Capacity
Hakkı Okan Yeloglu Ali Burak İmancer
Baskent University Baskent University

International Engineering and Technology Management Summit 2021– ETMS2021
İstanbul Technical University & Bahçeşehir University
164
1.INTRODUCTION In the literature, there are many studies examining the relationship between resource dependence the- ory and
technology acquisition. Focusing on this relationship examining the power and impact of inter-organizational
interdependence on mergers and acquisitions, business partnerships and alliances. Literature review has shown
that the acquisition process should be carefully monitored and discussed thoroughly. However, there is not yet
a study examining technology acquisition in the context of resource dependence in the domestic literature, and
the lack of a research that will guide the literature on this subject is seriously felt. One of the main motivations
of research is to be able to overcome this deficiency. In addition, cooperation-based inter-organizational
relations, which come to the fore with the rapid increase of technology needs in many sectors, are one of the
important issues that need to be researched. The main research question of the study carried out with these
motivations is the question of what the factors that affect the technology acquisition of organizations in the
energy sector in Turkey. The scale study used in the research is used for the first time in a study in this
direction. At the end of the study a map is revealed by addressing the relationship between technology
development and resource dependency theory. Through this map, the situations of the companies operating in
the energy sector are evaluated in the context of the acquisition and analyzes are carried out. The contribution
of this map to the application is to see that the importance of each identified issue according to each other will
vary from one technology acquisition to another.
Considering the energy needs that have a priority in protecting the existence and power of states; the crucial
importance between resource dependency and strategic alliance becomes clear. From this point of view, it is
noteworthy that mergers and strategic cooperation in the world energy sector have intensified in recent years.
At this point, it is seen that the work to be done on technology acquisition in Turkey has become much more
crucial, especially with the right, scientific and inclusive technology transfers in the energy sector, the steps
taken to take technology to the next level will be cleared.
2.THEORETICAL BACKGROUND Organizations interact with others for the necessary resources, and control over resources ensures that other organizations have power over the organization. Organizations need resources to survive. To obtain resources,
the organization must contact other organizations that control those resource. When the organization cannot
control the resources it needs, resource acquisition will become a problem and uncertain issue. Resources of
other organizations may not always be reassuring, especially when resources are scarce. The organization’s
survival is partly explained by its ability to cope with unexpected situations in the surrounding; Engaging in
exchange to secure a steady flow of necessary resources is the focal point of many organizational activities. In
this sense, organizations are dependent on their environment. Resource dependency theory states that
organizations inevitably encounter their environment, which includes limitations and uncertainties Pfeffer and
Nowak (1976). It seems that the theory adopts the open system approach. Interdependence is a result of the
open systemic nature of organizations. In this sense, organizations should be in contact with environmental
factors to obtain the resources necessary for their survival.
In the portrait drawn by the resource dependency approach based on the revised institutional foundations, it is
seen that the main concern of organizations is to maintain their existence. Organizations need to be able to
provide and maintain the resources they need to survive. This can be achieved by stabilizing resource provision
and continuing the support of resource providers. The support of the funders depends on meeting their
expectations and demands. By creating different forms of inter-organizational regulation, organizations take
steps to manage these resource dependencies, are restricted by the environment they are located, and are
significantly affected by this environment Pfeffer and Salancik (1978). According to resource dependency
theorists, the arrangements between organizations, therefore, reducing power imbalances in the organization
with critical resources and focus mainly on point Pfeffer and Nowak (1976) that is dependent on the
environment between parties in mutual dependencies Casciaro and Piskorski (2003) is regarded as a necessary
tool to manage.
Resource dependency theory, unlike other theories, focuses on organizational control of the environment, as
well as on resources, power, and dependence in inter-organizational relationships Cohen and Levinthal (1990).
Definition and explanation of the original side of resource dependency views, organization, environment, and
organization-environment relations.
The most fundamental advantage of technology acquisition, which is an important element in the organization’s
growth strategy, is that it shortens the process from formulating an original technical understanding to turning
International Engineering and Technology Management Summit 2021– ETMS2021
İstanbul Technical University & Bahçeşehir University
165
it into a commercial commodity Reuer and Ragozzino (2006). In technology acquisition, the goal is to gain a
competitive advantage in an environment where product life is shortened and the costs, speed and complexity
of technological developments are thoroughly increased Pfeffer and Salancik (2003).
Technological acquisition for new technologies is becoming more complex. Because technological options for
product development are increasing, it is becoming increasingly difficult to choose between the available
options Davis and Cobb (2010); Narayanan (1998). The complexity of the technological acquisition process is
exacerbated in high-tech markets due to increased competition over time, reduced product life and dynamic
customer needs. Advanced technology acquisitions, as expressed by many researchers (Bower, 2001; Ranft and
Lord, 2000, 2002), express a reaction to the innovation process that dominates many sectors. By a common
definition, the ability to innovate often pushes organizations to achieve technology-based goals. The goal here
is to access the technology resources that make innovation
possible (Hitt, Harrison and Ireland, 2001; King, Covin and Hegarty, 2003).
Technology dependence causes uncertainties and constraints in the development of new products and
technologies and manufacturing processes (Song et al., 2005). Outsourced technology-based limitations to this
type of uncertainties to be able to resolve high-tech industries that operate in organizations, mostly through
technology alliances and acquisitions, with the motivation of improving existing resources and Skills Act
(Makri, Hitt, and lane, 2010). Therefore, it is important to examine whether technological interdependence
consistently explains technology alliances and acquisitions through the theoretical perspective presented by
resource dependency theory (Lin and Hao, 2017).
Researchers focusing on technological innovation state that innovations aiming research and usage are
important for the organization’s survival (Benner and Tushman, 2002). Some studies claim that technology
alliances and acquisitions can be used as a necessary way to explore the new field of technology or use existing
technological skills (Phene, Tallman and Almeida, 2012). Interdepartmental interdependence in the context of
technology is a matter of how technologies interact with and depend on other technologies during work (Bailey,
Leonardi and Chong, 2010: 713). Acquisitions or alliances between the focus organization and the partner
organization with component technologies are considered tactical by the managers of participating
organizations (Lin and Hao, 2017). The aim of these tactics is to manage high interdependence of technology,
because the technologies in the hands of both actors are embedded in the large technology system (Puranam et
al., 2009). Intensive technology is essentially based on bilateral and mutual technology dependence, meaning
that the technology of both actors is completely interdependent.
Interdependence between organizations is described as an important driving force in M&A (Meyer, Estrin,
Bhaumik and Peng, 2009; Pfeffer, 1972b). Because having a resource supplier provides permanent access to
the desired inputs, increases the knowledge of the organization, and facilitates the practice of creating and
implementing a common strategy. As a result, to avoid capacity issues related to integration and mergers and
acquisition (Vermeulen and Barkema, 2001) organizations, so the necessary resources can choose the option
about producing a relatively less invasive and sometimes inside. Bowing to the demands of other organizations
or groups in which the organization exchanges resources is a way to adapt to the environment. Obedience to
pressure from the outside environment is a situation that organizations will want
to avoid. Therefore, in these cases, they tend to take measures that can protect themselves a little bit and provide
space for movement. These measures alliances (Dussauge and others, 2000; Park and others, 2002), joint
ventures (Pfeffer and Nowak, 1976) and M&A (Pfeffer, 1972b; Reuer and Ragozzino, 2006).
The probability of structural integration between the acquiring organization and the target organization is higher
when the acquiring organization acquires technology, which is a component rather than an independent product.
The appeal of the goal, therefore, is not only about merging with the resources of the acquiring organization,
but also about interdependence between the parties (Puranam, Singh and Chaudhuri, 2009). All these inter-
organizational relations show that resource dependence theory is the main approach to answer the question of
when organizations establish inter-organizational relations (Pfeffer and Nowak, 1976).
3.METHODOLGY
Before making any decision on the proposed acquisition of technology, the organization that decides to acquire
the technology must evaluate the content in which the acquisition will take place and identify important issues.
A structural approach will help reduce the complexity of all possible scenarios and focus on important
questions. For this purpose, three basic questions that organizations should consider when defining the content
of acquisition can be put forward (Mortara and Ford, 2012: 6); where organizations want to acquire new
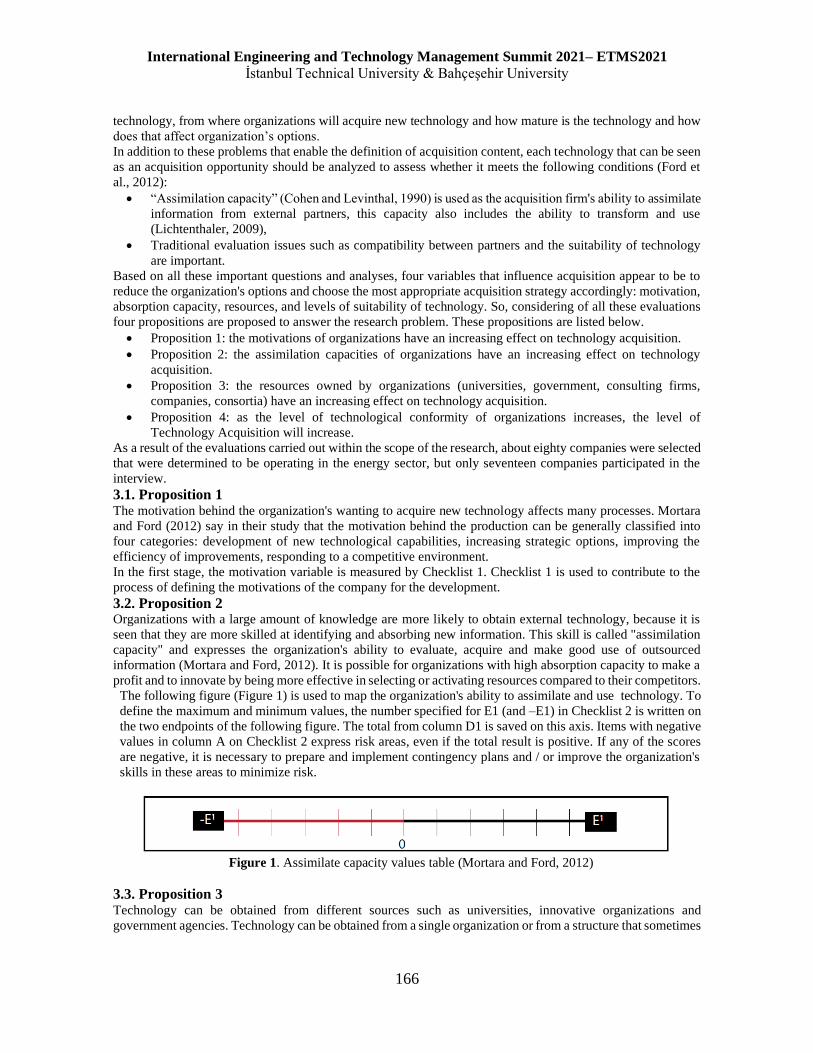
International Engineering and Technology Management Summit 2021– ETMS2021
İstanbul Technical University & Bahçeşehir University
166
technology, from where organizations will acquire new technology and how mature is the technology and how
does that affect organization’s options. In addition to these problems that enable the definition of acquisition content, each technology that can be seen
as an acquisition opportunity should be analyzed to assess whether it meets the following conditions (Ford et
al., 2012):
• “Assimilation capacity” (Cohen and Levinthal, 1990) is used as the acquisition firm's ability to assimilate
information from external partners, this capacity also includes the ability to transform and use
(Lichtenthaler, 2009),
• Traditional evaluation issues such as compatibility between partners and the suitability of technology
are important.
Based on all these important questions and analyses, four variables that influence acquisition appear to be to
reduce the organization's options and choose the most appropriate acquisition strategy accordingly: motivation,
absorption capacity, resources, and levels of suitability of technology. So, considering of all these evaluations
four propositions are proposed to answer the research problem. These propositions are listed below.
• Proposition 1: the motivations of organizations have an increasing effect on technology acquisition.
• Proposition 2: the assimilation capacities of organizations have an increasing effect on technology
acquisition.
• Proposition 3: the resources owned by organizations (universities, government, consulting firms,
companies, consortia) have an increasing effect on technology acquisition.
• Proposition 4: as the level of technological conformity of organizations increases, the level of
Technology Acquisition will increase.
As a result of the evaluations carried out within the scope of the research, about eighty companies were selected
that were determined to be operating in the energy sector, but only seventeen companies participated in the
interview.
3.1. Proposition 1 The motivation behind the organization's wanting to acquire new technology affects many processes. Mortara
and Ford (2012) say in their study that the motivation behind the production can be generally classified into
four categories: development of new technological capabilities, increasing strategic options, improving the
efficiency of improvements, responding to a competitive environment.
In the first stage, the motivation variable is measured by Checklist 1. Checklist 1 is used to contribute to the
process of defining the motivations of the company for the development.
3.2. Proposition 2 Organizations with a large amount of knowledge are more likely to obtain external technology, because it is
seen that they are more skilled at identifying and absorbing new information. This skill is called "assimilation
capacity" and expresses the organization's ability to evaluate, acquire and make good use of outsourced
information (Mortara and Ford, 2012). It is possible for organizations with high absorption capacity to make a
profit and to innovate by being more effective in selecting or activating resources compared to their competitors.
The following figure (Figure 1) is used to map the organization's ability to assimilate and use technology. To
define the maximum and minimum values, the number specified for E1 (and –E1) in Checklist 2 is written on
the two endpoints of the following figure. The total from column D1 is saved on this axis. Items with negative
values in column A on Checklist 2 express risk areas, even if the total result is positive. If any of the scores
are negative, it is necessary to prepare and implement contingency plans and / or improve the organization's
skills in these areas to minimize risk.
Figure 1. Assimilate capacity values table (Mortara and Ford, 2012)
3.3. Proposition 3 Technology can be obtained from different sources such as universities, innovative organizations and
government agencies. Technology can be obtained from a single organization or from a structure that sometimes

International Engineering and Technology Management Summit 2021– ETMS2021
İstanbul Technical University & Bahçeşehir University
167
includes multiple organizations, which sometimes take the form of a consortium. The level of strategic cohesion
between potential partners is also an important contributing issue at the point of compliance. Other factors that
will affect the compliance of partners may include the way of working and the structure of each organization
(Mortara and Ford, 2012).
In this stage Checklist 3 is used to evaluate the harmony between partners or partners and the organization.
With the merger of technology and partner, the necessity of pouring these two concepts into the same graph
arises. By multiplying the sum of all weights by three (maximum value), the required scathing is determined
for each checklist (E).
3.4. Proposition 4 In this section, first of all, the targets set in the area of technology development are focused on, then make sure
that the proposed acquisition process coincides with these goals. While determining the value of a technology
in its first stage, uncertainties related to both technology and the market are faced, and uncertainties surrounding
the transaction are added to these (Mortara and Ford, 2012)].
Here Checklist 4 is used to assess whether the acquired technology is appropriate. The results of the two
checklists (Checklist 3-4) are poured into the chart, as shown in Figure 2. If the company's last position in
Figure 2 is in the pink area, it will be understood that this will be difficult to get. If the last position is positioned
in the white area, the match will be positive and the process of development will be positive in the context of
technology and partnership. If the final position is in the blue area, it will be understood that the technology is
quite promising. However, it will be the result that the partner may not be suitable or ready. In this case, it will
be required to develop strategies to eliminate risks. The Checklist (2-3-4) will contribute to an assessment of
whether a proposed acquisition will be successful.
4. RESULTS AND DISCUSSION 4.1. Evaluation of Proposition 1 According to the results obtained by the scale in the study, it is understood that participating companies are
more prone to external technology acquisition. It also turns out that firms also consider time and cost advantages.
The results obtained because of interviews conducted in participating companies show that most of these
companies do not agree with their cooperation. It is also known that most of the participating companies that
produce energy have a single customer. Companies in this situation sell all the energy they produce to the state.
Therefore, there is no competitive situation in the market.
When we return to the relevant proposition again, it cannot be said that all the main titles provide motivation to
organizations at the point of technology acquisition. But it is especially noticeable that the issue of reducing
costs motivates most participating firms. According to all these findings, “the motivations of organizations have
an increasing effect on technology acquisition." his proposition has been considered partially correct.
4.2. Evaluation of Proposition 2 When we look at the Absorption Capacity Values for all participating firms, it is seen that no firm is on the
negative side. The relevant approach makes an important contribution by enabling the assessment of the
necessary strategies to overcome deficiencies and identifying areas of interest. Even if the final value obtained
at the end of the evaluation is positive, special attention should be paid to these elements, as elements that
appear on the negative side of the scale are likely to express possible narrow throats that need contingency
plans. In addition, from the findings, it is understood that many participating firms gave a zero rating to the title
“our intellectual property (FM) stock associated with this technology”.
Looking at the results of the research, D1 (Final score), which determines the ability to assimilate, remains on
the positive side for all companies. This, in turn, shows that the companies participating in the interview
dominate the process of producing and learning innovation. But according to the results from checklist 2, it is
understood that some participating companies have difficulty sharing information with their partners.
One of the important findings obtained is that it is understood that many companies lack knowledge and / or
are uninterested in the subject of intellectual property. In the literature, it is pointed out that intellectual property
is another important issue that should be considered when acquiring a technology in its first stage through
development styles such as alliances, consortia, and business partnerships (Mortara and Ford, 2012).
In this context, it is concluded that this weakness will indirectly affect the financial performance of the
organization and will also negatively affect the motivation of the organization to cooperate. Considering all
these findings, “the assimilation capacities of organizations have an increasing effect on technology

International Engineering and Technology Management Summit 2021– ETMS2021
İstanbul Technical University & Bahçeşehir University
168
acquisition.” his proposition has been supported and accepted as correct.
4.3. Evaluation of Proposition 3 Type when looking at your prospective partner or partners is a matter of the quality of the resources that they
have, but the findings considering the environment of organizations in the context of the acquisition of the
participating companies’ valuable resources and they do not see in this context, it is understood that most of the
respondents do not prefer to enter the company's business units. Looking at the results of the research, it is
understood that participating companies that do not enter a partnership and/or do not prefer to do not have
expectations from other companies in the environment in this context but try to protect the resources they have.
According to the findings obtained because of the research, companies that prefer to partner at the point of
technology acquisition work with universities to acquire technologies that they cannot develop within their
bodies. A few of the participating companies also go on the path of acquiring technologies that they do not have
a chance to acquire domestically from companies originating abroad that have developed their skills in this
regard. Especially simulation, remote monitoring programs, weather forecasting programs and special software
programs prepared for port systems can be sorted within these technologies. Another important source of
motivation behind the acquisition is revealed at the point where a technology-based alliance is established
between a large organization and a small organization that provides new technology (Vanhaverbeke et al.,
2002). This assessment, which coincides with the results of the research, is often encountered in many sectors
today, including the energy sector. Among the participating companies, it is seen that there are companies that
cooperate with Start-up and consulting firms, and from the results obtained, firms look positively at these
business associations in the context of acquisition. According to all these findings, “the resources that
organizations have (universities, government, consulting firms, companies, consortia) have an increasing effect
on technology acquisition. "his proposition has been considered partially correct.
4.4. Evaluation of Proposition 4 Looking at the positions of all the companies participating in the interview in the technology and partnership
map (Figure 2), it is seen that these companies are in the positive overlap zone (white area) or on the positive
technology axis. From here, it is revealed that the companies that participated in the interview and stayed in the
positive overlap zone (white area) showed positive suitability and competence in their technology and
partnership preferences. But it seems that all other companies are positioned on the axis of positive technology.
It is believed that the participating companies do not have sufficient motivation to enter partnerships and/or
business associations, and that the element of competition does not live intensively in the sector where the
research is conducted, are the main factors behind this positioning.
According to the findings obtained because of the study, it is understood that many of the participating
companies, apart from the issue of intellectual property, dominate the topics that are the subject of research.
However, it is observed that the subject of intellectual property is not fully understood by the participating
companies and that there is not enough interest in this issue during the acquisition process. According to all
these findings, “as the level of technological conformity of organizations increases, the level of Technology
Acquisition will increase.” his proposition has been supported and accepted as correct.
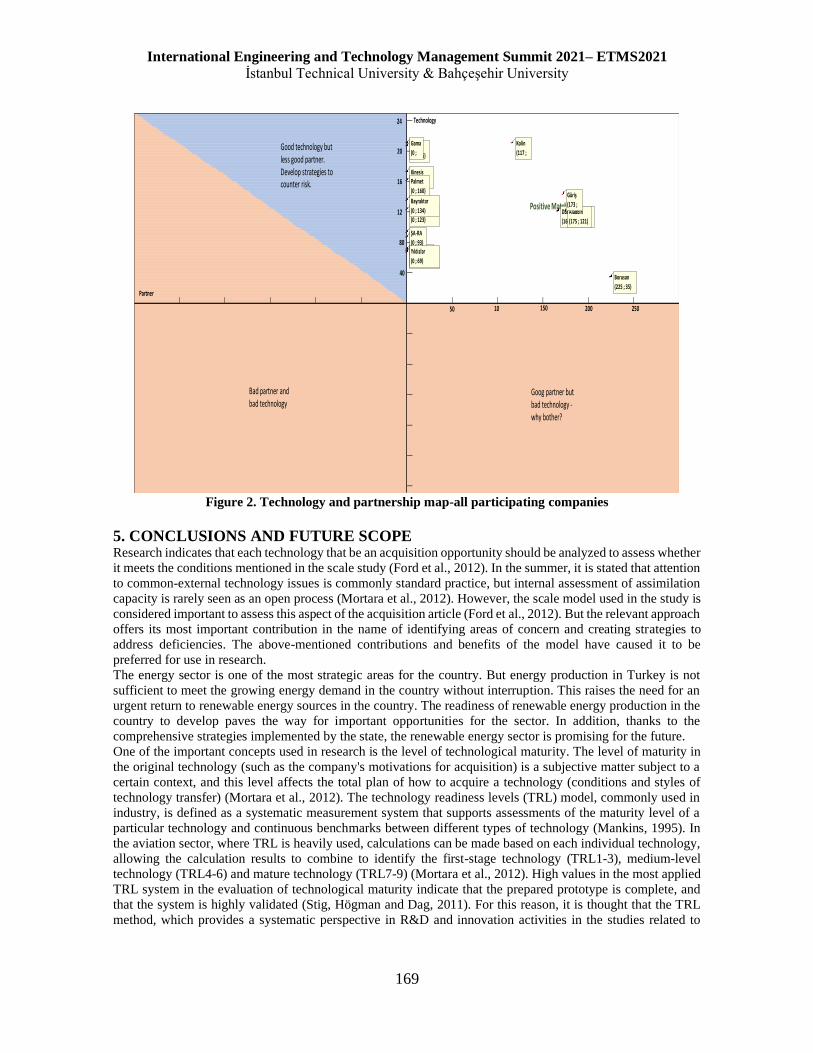
International Engineering and Technology Management Summit 2021– ETMS2021
İstanbul Technical University & Bahçeşehir University
169
Figure 2. Technology and partnership map-all participating companies
5. CONCLUSIONS AND FUTURE SCOPE Research indicates that each technology that be an acquisition opportunity should be analyzed to assess whether
it meets the conditions mentioned in the scale study (Ford et al., 2012). In the summer, it is stated that attention
to common-external technology issues is commonly standard practice, but internal assessment of assimilation
capacity is rarely seen as an open process (Mortara et al., 2012). However, the scale model used in the study is
considered important to assess this aspect of the acquisition article (Ford et al., 2012). But the relevant approach
offers its most important contribution in the name of identifying areas of concern and creating strategies to
address deficiencies. The above-mentioned contributions and benefits of the model have caused it to be
preferred for use in research.
The energy sector is one of the most strategic areas for the country. But energy production in Turkey is not
sufficient to meet the growing energy demand in the country without interruption. This raises the need for an
urgent return to renewable energy sources in the country. The readiness of renewable energy production in the
country to develop paves the way for important opportunities for the sector. In addition, thanks to the
comprehensive strategies implemented by the state, the renewable energy sector is promising for the future.
One of the important concepts used in research is the level of technological maturity. The level of maturity in
the original technology (such as the company's motivations for acquisition) is a subjective matter subject to a
certain context, and this level affects the total plan of how to acquire a technology (conditions and styles of
technology transfer) (Mortara et al., 2012). The technology readiness levels (TRL) model, commonly used in
industry, is defined as a systematic measurement system that supports assessments of the maturity level of a
particular technology and continuous benchmarks between different types of technology (Mankins, 1995). In
the aviation sector, where TRL is heavily used, calculations can be made based on each individual technology,
allowing the calculation results to combine to identify the first-stage technology (TRL1-3), medium-level
technology (TRL4-6) and mature technology (TRL7-9) (Mortara et al., 2012). High values in the most applied
TRL system in the evaluation of technological maturity indicate that the prepared prototype is complete, and
that the system is highly validated (Stig, Högman and Dag, 2011). For this reason, it is thought that the TRL
method, which provides a systematic perspective in R&D and innovation activities in the studies related to
Bad partner and bad technology
Goog partner but bad technology -why bother?
Positive Match
Partner
Technology
Good technology but less good partner. Develop strategies to counter risk.
50 10 150 200 250
40
80
12
16
20
24
Enermet
(0 ; 71)
Kinesis
(0 ; 172)
Starkraft
(0 ; 123)
Yesilyurt
(0 ; 67)
Borusan
(225 ; 35)
DBE Energy
(166 ; 120)
Aladdin
(175 ; 121)
Palmet
(0 ; 160)
Ayen
(0 ;
87)
Bayraktar
(0 ; 134)
Kolin
(117 ;
210)
ŞA-RA
(0 ; 93)
Kalyon
(0 ; 206)
Gama
(0 ;
210)
Güriş
(173 ;
142)
Yıldızlar
(0 ; 69)

International Engineering and Technology Management Summit 2021– ETMS2021
İstanbul Technical University & Bahçeşehir University
170
technology acquisition, will contribute significantly to the summer.
The (BTUP) model used in the research offers an alternative framework (Phaal et al., 2011). According to this
model, a technology goes through stages such as first creating the basic foundations of science, then supplying
the technology, implementing it from there, and finally moving it to the market. In the BTUP model, indicators
that reveal the transition between one stage and another are important measures of the maturity of a technology.
Phaal and others (2011) in their study approach, all industrial sectors (BTUP) specific firm-level innovations
(BTUP) at varying levels in any “value creation and capture” system that can focus on, in addition, it is flexible
and scalable. Again, the same authors say that the transitions between the stages of Science-Technology,
Technology-Implementation and implementation-market are related to significant changes in the interests of
stakeholders and perspective. Because of all this wide and alternative framework, the BTUP model was
preferred for use in research.
In today's world, where the human factor is important, studies examining the relationship between technology
acquisition and the human interaction process are expected to increase. In this context, it is thought that it is
worth considering the perspectives of employees participating in cooperation-based activities and information
management activities through the human dimension of open innovation.
REFERENCES Ahuja, G., and Katila, R. (2001). Technological Acquisitions and the Innovation Performance of Acquiring
Firms: A Longitudinal Study. Strategic Management Journal, 22(3): 197–220.
Bailey, D. E., Leonardi, P. M., & Chong, J. (2010). Minding the gaps: Understanding technology
interdependence and coordination in knowledge work. Organization Science, 21, 713–730.
Benner, M. J., & Tushman, M. L. (2002). Process management and technological innovation: A longitudinal
study of the photography and paint industries. Administrative Science Quarterly, 47, 676–706.
Bower, J. L. (2001). Not all M&As are alike—And that matters. Harvard Business Review, 79(3): 92-101.
Casciaro, T., & Piskorski, M.J. (2003). Power Imbalance and Interorganizational Relations: Resource
Dependence Theory Revisited.
Casciaro, T., & Piskorski, M.J. (2005). Power imbalance, mutual dependence, and constraint absorption: A
closer look at resource dependence theory. Administrative Science Quarterly, 50: 167-199.
Chatterjee, S. (1986). Types of Synergy and Economic Value: The Impact of Acquisitions on Merging and
Rival Firms. Strategic Management Journal, 7(2), 119-139. Retrieved April 17, 2020, from
www.jstor.org/stable/2486162
Cohen W, Levinthal D. (1990). Absorptive capacity: a new perspective on learning and innovation.
Administrative Science Quarterly, 35: 128–152.
Davis, G. F., & Cobb, J. (2010). Resource Dependence Theory: Past and future. Research in the Sociology of
Organizations, 28 21-42.
Durrani, T. S., Forbes, S. M., Broadfoot, C., & Carrie, A. S. (1998). Managing the technology acquisition
process. Technovation, 18(8–9), 523−528.
Dussauge, P., Garrette, B., & Mitchell, W. (2000). Learning from competing partners: Outcomes and durations
of scale and link alliances in Europe, North America and Asia. Strategic Management Journal, 21: 99-126.
Ford, Simon & Mortara, Letizia & Probert, David. (2012). Disentangling the Complexity of Early-Stage
Technology Acquisitions. Research-Technology Management.
Hitt, M., Harrison, J. and Ireland, R. (2001). Mergers and Acquisitions: Creating Value for Stakeholders. New
York: Oxford University Press.
King, D., Covin, J. and Hegarty, W. (2003). Complementary resources and the exploitation of technological
innovations. Journal of Management, 29, 589–606.
Lichtenthaler, U. (2009). Absorptive Capacity, Environmental Turbulence, and the Complementarity of
Organizational Learning Processes. Academy of Management Journal, 52, 822-846.
Lin, Liang-Hung & Ho, Yu-Ling. (2017). External technology sourcing through alliances and acquisitions: a
technology interdependence perspective. Total Quality Management & Business Excellence, 29. 1-21.
Makri, M., Hitt, M., Lane, P.J. (2010). Complementary technologies, knowledge relatedness and innovation
outcomes in high-technology M&As. Strategic Management Journal, 31, 602–628.
Mankins, J. (1995). Technology Readiness Levels. Advanced Concepts Office. Office of Space Access and
Technology. NASA
Meyer, K. E., Estrin, S., Bhaumik, S. K., & Peng, M. W. (2009). Institutions, resources, and entry strategies in

International Engineering and Technology Management Summit 2021– ETMS2021
İstanbul Technical University & Bahçeşehir University
171
emerging economies. Strategic Management Journal, 30: 61-80.
Mortara, L., Ford, S. (2012). Technology Acquisitions. A guided approach to technology acquisition and
protection decisions. Institute for Manufacturing, University of Cambridge, Cambridge.
Park, S. H., Chen, R., & Gallagher, S. (2002). Firm resources as moderators of the relationship between market
growth and strategic alliances in semiconductor Start-ups. Academy of Management Journal, 45: 527-545.
Pfeffer, J. (1972b). Merger as a response to organizational interdependence. Administrative Science Quarterly,
17: 382-394.
Pfeffer, J., P. Nowak. (1976). Joint venture and interorganizational interdependence. Administrative Science
Quarterly, 21: 398–418.
Pfeffer, J., & Salancik, G. R. (1978). The external control of organizations: a resource dependence perspective.
New York: Harper & Row.
Pfeffer, J., & Salancik, G. R. (2003). The external control of organizations: a resource dependence perspective.
Stanford (Calif.): Stanford business books.
Phaal, R., Farrukh, C. J. P., & Probert, D. R. (2001). Technology management process assessment: A case
study. International Journal of Operations & Production Management, 21(8), 1116−1132.
Phene, A., Tallman, S., & Almeida, P. (2012). When do acquisitions facilitate technological exploration and
exploitation? Journal of Management, 38, 753–783.
Puranam P, Singh H, Chaudhuri S. (2009). Integrating Acquired Capabilities: When Structural Integration Is
(Un)necessary. Organization Science, 20(2): 313–328.
Rabier MR. (2017). Acquisition Motives and the Distribution of Acquisition Performance. Strategic
Management Journal, 38(13): 2666–2681.
Ranft, A. L., and Lord, M. D. (2000). Acquiring new knowledge: The role of retaining human capital in
acquisitions of hightech firms. Journal of High Technology Management Research, 11: 295-319.
Ranft, A. L., and Lord, M. D. (2002). Acquiring new technologies and capabilities: A grounded model of
acquisition implementation. Organization Science, 13(4): 420–441.
Reuer, J.J., & Ragozzino, R. (2006). Agency hazards and alliance portfolios. Strategic Management Journal,
27: 27-43.
Robertson, N. (1993). Technology acquisition for corporate growth. Research Technology Management, 36(2),
26−30.
Narayanan, K. (1998). Technology acquisition, de-regulation and competitiveness: A study of Indian
automobile industry. Research Policy, 27(2), 215−228.
Saji, K.B., Jain, K. and Krishnamoorthy, S. (2005). Technology transfer through IJVs: determinants of
transferor transferee relationship. International Journal of Technology Transfer and Commercialization,
Vol. 4 No. 2, pp. 148-61.
Song, M., Bij H., Weggeman, M. (2005). Determinants of level of knowledge application: a knowledge based
and information-processing perspective. Journal of Product Innovation Management, 22 (5), 430–444.
Stig, D.C., Högman, U., & Bergsjö, D. (2011). Assessment of Readiness for Internal Technology Transfer – A
Case Study.
Vermeulen, F., & Barkema, H. (2001). Learning through acquisitions. Academy of Management Journal, 44:
457-476.

International Engineering and Technology Management Summit 2021– ETMS2021
İstanbul Technical University & Bahçeşehir University
172
THE IMPACT OF BIG DATA APPLICATIONS ON FINANCIAL
PERFORMANCE: A REVIEW FOR BORSA ISTANBUL 100 INDEX
Ünzile Huyut Yaman Ömer Erzurumlu
Bahçeşehir University Bahçeşehir University
ABSTRACT Since 2007, when big data applications (BDA) started to be talked about in the world, its effects have been seen
in many areas and its effects are still increasing. Since this date, the data produced and not used in many channels
both in the world and in Turkey has now started to be analyzed for better customer and user experience. Better
customer and user experience can mean more product and service sales. Therefore, the fact that companies start
to implement these applications as a priority will provide us with useful information in terms of determining
whether they have positive effects on their financial performance and increasing the use of this technology. In
this study, all companies in Borsa Istanbul (BIST) 100 in Turkey were examined and it was determined when
they started to implement big data applications. Then, the financial performances of companies that started to
implement these practices between 2007 and 2016 and those that implemented them between 2017 and 2020
were compared. In order to do this, the financial ratios determined in the first stage were analyzed by using a
simple linear regression model and then by panel data testing, considering the temporal values of the data. As
a result of the analysis, a significant effect is explained on the financial performances of the companies that
apply big data implementations (BDI) in the year before the application and in the following year. With panel
data analysis, it was concluded that the companies that first started BDI applications were more advantageous
than the companies that started later.
Keywords: Big Data, Financial Performance, Financial Ratio, Linear Regression

International Engineering and Technology Management Summit 2021– ETMS2021
İstanbul Technical University & Bahçeşehir University
173
1. INTRODUCTION Big data (BD) is defined as a huge amount of data sets that cannot be analyzed and managed with the data
processing tools used since its emergence (Ohlhorst, 2013). Developed information and communication
technologies creates a huge amount of data; with the help of web pages, applications, blogs, social media,
internet of things and all sensors and many other data-collecting and creating hardware and software.
These collected data can be used in marketing, public relations, banking, security, or business itself. Data
analytics, also known as big data and business analytics in the business world, is a science that gains importance
all over the world. Monino and Sedkaoui (2016), define big data as a term as “big data is used when the volume
of data used for the organization reaches a critical level and new technological approaches to storage, processing
and usage methods are required for this”. Big data is creating the processed necessary big volume of information
resources or wisdom and experience for learning and applying analytics. Its usage areas are wide and used for
the dissemination of various applications, the global competitiveness of large and medium-sized companies. It
is important to integrate big data technologies for corporations to create cheap and very efficient resources, to
the public and private sectors. (Kim et al., 2014). “Data is just crude oil, if it is not refined, it has value but is
not usable” (Palmer, 2020)
In Akter et al., (2016)’s research 87 percent of firms commit that big data will change the competitive landscape,
and 89 percent of them believe they will lose considerable market share if they do not adopt big data within the
next few years (Akter et al, 2016). Corporate Finance Institute explains the big data and finance sector relation
as “The exponential growth of technology and increasing data generation are fundamentally transforming the
way industries and individual businesses are operating. The financial services sector, by nature, is considered
one of the most data-intensive sectors, representing a unique opportunity to process, analyze, and leverage the
data in useful ways.” (Cif, 2020).
In the second part of this study, there is a literature review investigating the effects of big data applications on
firm performance and the hypothesis that expresses the starting point of the study. In the third part, the collection
of necessary data for the implementation of the study, the method details and analysis are included. In the fourth
and last part, the conclusion part is included.
2. LITERATURE REVIEW The idea of Analyzing Big Data first emerged in 2007. Since then, many studies have focused on investigating
the effects of BDI on firm performance. Especially in recent years, more studies are expected on the results of
big data applications. It has been seen in the studies carried out so far on this subject that the studies conducted
for the companies examined in sectoral, organizational and theoretical terms prove that big data applications
using quite different methods, investments in big data analytics and developing big data technology make
significant contributions to company performance. To mention some of these studies, a theoretical study by
(Wamba et al., 2019), a model was developed to measure the quality of BDA and the effects of this model on
firm performance were measured. As a result of the study, Big data analytics quality (BDAQ) proves that
perceived technology, talent and information quality have significant effects on BDAQ and that BDAQ makes
the relationship between firm performance desirable. In another theoretical study, (Ferraris et al., 2019)
examined the integration of knowledge management produced from BDA with company knowledge, and it was
concluded that, theoretically, firms that developed BDA capabilities more than others in technological and
managerial areas increased their performance.
Müller Fay Brocke's study (Brocke, 2018) analyzes the direction, sign and magnitude of the relationship
between BDA and firm performance according to the measurements of BDA assets. As a result of the study, he
mentions that Big data applications add value for companies competing in the sector, but there is no increase in
productivity for those who do not use BDI. In the study of (Maroufkhani et al., 2019), the factors that may have
an impact on big data analytics in the structure of companies were identified and various types of performance
that big data analytics could handle were categorized. As a result of the study, it has been proved that small and
medium-sized enterprises (SMEs) play an important role in the adoption of BDI practices and that the adoption
of BDA can increase the financial and market performance of SMEs. The basis of the research conducted by
(Mahda et al., 2016), is to ensure the effectiveness of BDA and measure its effect on firm performance and
compare this effect with the expectations of managers in BDA. As a result, it is proved that having basic BDA
ability affects firm performance. In the work of (Vitari et al., 2019), he examines the integration of probability
theory with the resource-based view theory of the firm. As a result, based on the resource-based view theory, it
is proven that investments in big data analytics have an effect on increasing firm performance. Abhishek Behl's

International Engineering and Technology Management Summit 2021– ETMS2021
İstanbul Technical University & Bahçeşehir University
174
study (Behl, 2020) aims to analyze how big data analytics capabilities of technology startups in India and China
help them gain competitive advantage and improve firm performance, and it says that technological investments
in Big data analytics have a significant impact on firm performance. proves its effect. The aim of the study by
(Akter et al., 2019) is to explore the information quality dynamics of Big data analytics, which provides more
and more value to companies in making sound decisions and solving business problems. As a result of the study,
he mentioned four factors in determining BDA quality and proved that these factors have a significant, positive
effect on firm performance mediated by business value and user satisfaction.
To mention the studies conducted in the field using different methods, Yasmina's (Yasmina et al., 2020) study
investigates the effect of BDA capabilities on firm performance by using an integrated multi-criteria decision-
making (MCDM) methodology. It has proven that BDA capabilities play an important role in increasing
company performance, like other capabilities of the company. Mikalef 's (Mikalef et al., 2019) study examines
the compatibility between big data analytics resources and governance practices, dynamic capabilities and
environmental conditions in increasing big data analytics capability and performance gains. In the study,
positive results have been proven by examining the effects of BDA investments on performance based on
complexity theory. Finally, in the study of Caputo (Caputo et al., 2019), it has been tried to create a bridge that
can combine human and technology dimensions to improve company performance. The study concludes that
the investment in big data applications has a significant impact on increasing the human resources and economic
performance of the company by investigating the intermediary effect.
There is lack of studies, although many studies have been conducted on firm performance with BDI in the
world, there is no theoretical or empirical study examining the effects of big data applications on firm
performance in Turkey. For this reason, the study was carried out by examining the first 100 companies in the
Turkish Stock Exchange. Based on the literature study, the hypothesis of the study was determined as follows.
Hypothesis 1: The performance of companies using big data applications in the BIST 100 index in Turkey is
significantly better than their performance before using BDI.
Hypothesis 2: Financial performance of companies in the BIST 100 index in Turkey, which primarily use big
data applications, are better than those that enter later.
3.DATA COLLECTION, METHOD AND APPLICATION
3.1. Data Collection In this study, certain keywords of the companies in BIST 100 were searched on Google and the results were
obtained whether they used the company's big data applications and when they started to apply. The keywords
used in this search are given in Table 1. Big data of the selected keywords in Table 1, were considered to be at
well-defined technical terms. These keywords are often used together with big data applications in the literature.
Table 1. Keywords used to identify companies using big data application
Keywords
1 Analysis Techniques 24 Data Science
2 Analytics and Reporting 25 Data Scientist
3 Analytics Projects 26 Data Warehouse Application
4 Analytics Solutions 27 Decision Support Systems
5 Analytics Systems 28 Digital Analytics
6 API 29 Hadoop
7 Artificial Intelligence 30 HANA
8 Behavioral Analytics 31 Historical Data Analytics.
9 Big Data 32 Intelligence Technology
10 Big Data Analytics 33 Intelligent Diagnostics System
11 Big Data Applications 34 Intelligent Systems
12 Big Data Mining 35 Machine Learning
13 Big Data Platform 36 Predictive Analytics Software

International Engineering and Technology Management Summit 2021– ETMS2021
İstanbul Technical University & Bahçeşehir University
175
14 Big Data Projects 37 Predictive Modeling
15 Big Data Technology 38 Social Intelligence
16 Big Data Toolset 39 Text Mining
17 Big Data Visualization 40 Visual Analytics
18 Business Analytics 41 Warehouse Miner
19 Business Intelligence 42 Warehousing Technology
20 Business Process Analysis 43 Watson
21 Cloud Computing Services
22 Cloud Services
23 Crowdsourcing Solution
In the light of the collected data, the result of which year BIST 100 companies use big data has emerged. Since
different financial ratios will be used for companies and banks in these results, banks have been subjected to a
separate analysis. Companies that started BIG data applications right after 2006 and 2007, the first dates of
these applications in the world, were defined as "First Movers", and those that started in the following years as
"Second Movers". Table 2 below shows the number of first and second movers companies according to the
years of using big data applications. Afterwards, 5 companies were excluded from the analysis due to the
deficiencies in the collected data. In addition, information on the sectors of the companies subject to the
application is shown in Table 3.
Table 2. Number of Companies Implementing Big Data
Number of Companies Implementing Big Data
First Movers
2007 1
13
2008 1
2009 1
2011 2
2013 1
2014 2
2015 3
2016 2
Second Movers
2017 2
12 2018 9
2019 1
After the determination of the companies applying Big Data, the necessary balance sheet and income statement
data items were obtained for the ratios expressing the financial performances. The financial statements required
to calculate the financial ratios were obtained from the official website of KAP (Public Disclosure Platform).

International Engineering and Technology Management Summit 2021– ETMS2021
İstanbul Technical University & Bahçeşehir University
176
Table 3. Sectors of Companies used in the Analysis
Banks and Financial Institutions 11
Energy 1
Food, Beverage and Tobacco 2
Production 7
Chemistry Pharmaceutical oil rubber and
Plastic Products 3
Technology, Informatics,
Communication 6
Textiles, Apparel and Leather 1
Logistics 2
Total 33
Details and brief explanations of the financial ratios used in the analysis are given. Accordingly, 9 ratios were
used in the analysis. Care has been taken to select these ratios from the ratios that best express the firm's
performance. The financial ratios used in the research were formed from the ratios used to measure the liquidity,
profitability, financial structure and effectiveness of the firm. These ratios provide important and remarkable
information about the financial structures of companies. In Table 4 below, the financial ratios used in the study
have been tried to be explained in detail.
Table 4. Financial ratios used in the analysis
Dimensions Ratio Definition
Financial Structure Total Debt Ratio Total Debt/Total Assets
Profitability
Gross Margin Gross Profit/Sales
Core Operating Profit Margin EBIT/Sales
Profitability of Assets ROA EBIT/Total Asset
Return on Equity ROE Net Profit/Equity
Receivable Turnover Rate Sales/Account Receivables
Efficiency Asset Turnover Ratio Sales/Total Assets
Liquidity
Cash Ratio Cash/Short Term Debt
Acid Test Ratio Current assets -Inventory /
Short Term Debt
Core Operating Profit Margin: Profit Margin: It is obtained by dividing the company's profit before interest
and tax by sales. It is an indicator of how much profit margin the company makes from its activities.
Total Debt Ratio: This ratio is expressed as the ratio of the sum of the long-term and short-term liabilities owned
by the enterprise to the total assets owned by the enterprise. It is important in that it is a ratio that shows what
percentage of the firm's assets are financed by foreign resources.
Return on Equity: It is obtained by dividing the net profit for the period by the equity. It expresses the net
income per unit of capital. A high ratio indicates that the business has made a good investment and keeps its
expenses under tight control.
Return on Assets: It is expressed as the ratio of net profit for the period to total assets. This ratio shows how
effective the company's assets are in generating profits. The larger this ratio, the more successful the company
is at generating profits.

International Engineering and Technology Management Summit 2021– ETMS2021
İstanbul Technical University & Bahçeşehir University
177
Gross Profit Margin: It is obtained by dividing interest and tax-free profit by net sales. If this ratio is high, it
can be interpreted that the company is efficient.
Receivable Turnover Rate: It is expressed as the ratio of net sales to trade receivables. It shows the relationship
between trade receivables in the balance sheet and net sales in the income statement.
Turnover of Assets: It is a ratio obtained by dividing the firm's sales by total assets.
Cash Ratio: It expresses the division of the firm's liquid assets, expressed as cash and cash, by short-term
liabilities. It refers to the measurement of the ability to quickly meet debts with cash.
Acid-Test Ratio: The Acid-Test ratio is the ratio obtained by subtracting the stocks from the current assets of
the firm and then dividing by the short-term liabilities. The purpose of removing stocks from current assets is
the possibility that stocks will not turn into cash quickly. (Abacioglu, 2017)
While all of the financial ratios mentioned above are used for companies using big data applications determined
in BIST 100, two ratios are used for banks that use big data application and are the subject of our study. The
ratios used in the study for banks are return on assets and return on equity.
3.2. The Methods
3.2.1. Linear Regression In this study, the linear regression method, which is the most suitable for the data structure, was used to analyze
the data. It is seen in many studies that financial performance analyzes are made that it is desired to be able to
determine the effect of the determined independent variables on the selected dependent variable. At this point,
many analyzes have been developed in order to properly determine the emerging relationship. One of these
analyzes developed is the linear regression model, which is widely used in the literature. There are many types
of regression analysis.
It was decided that the most suitable model was the linear regression model in line with its suitability for the
study, the quality of the obtained data set and the purpose of the study.
The formula used in linear regression analysis is expressed as follows.
𝑦 = 𝛼 + 𝛽𝑥 + 𝜀 (1)
As expressed in the formula, it can be defined as the simplest form of regression analysis. According to this
formula, there is one dependent variable and one independent variable. In the study, a total of 13 years' data,
including the years 2008 and 2020, of the companies examined were analyzed in two separate periods, the year
after the BDI implementation (t+1) and the year before the BDI implementation (t-1). In this way, it has been
tried to compare the performances of the companies before the BDI implementation and after the
implementation.
3.2.2. Panel Data The reason for using panel data in this study is to analyze whether it is an advantageous situation to be a first
mover, with 13 years of data of the companies that are the subject of the study, by giving "0" to first movers
among companies using big data applications and "1" to those determined as second movers. has been studied.
Since there is a temporal situation on this data, panel data was used.
𝑌𝑖 = 𝛼1 + 𝛼2𝐷𝑖 + 𝛽𝑖𝑡𝑋𝑖 + 𝑢𝑖 (2)
Here, Y is the dependent variable, X is the independent variable, α is the constant parameter, D is the dummy
variable, β is the slope parameter, and u is the error term. The sub-index i represents the units (such as individual,
company, city, country), and the sub-index t represents time (such as day, month, year). First and second movers
dummy were used as variables in our study.
3.3. Application In the study, first of all, the companies applying BDI, which is my first hypothesis, were analyzed using linear
regression, the year after the BDI implementation, expressed as t+1, and the year before the BDI
implementation, expressed as t-1. The results of this method are shown below. First t-1 data, then t+1 data are
seen.

International Engineering and Technology Management Summit 2021– ETMS2021
İstanbul Technical University & Bahçeşehir University
178
Table 5. Anova Result
ANOVA Model Definition t-1 t+1
F Sig. F Sig.
Total Debt Ratio Total Debt/Total Assets 6806.716 .000* 8361.934 .000
Gross Margin Gross Profit/Sales 223.380 .000* 116.696 .000
Core Operating Profit Margin EBIT/Sales 9.619 .006* 15.648 .001
Profitability of Assets ROA EBIT/Total Asset 3.717 .068 3.607 .072
Return on Equity ROE Net Profit/Equity 129.779 .000 94.278 .000
Receivable Turnover Rate Sales/Account Receivables 203.813 .000* 81.027 .000
Asset Turnover Ratio Sales/Total Assets 56841.796 .000* 39361.967 .000
Cash Ratio Cash/Short Term Debt 1.970 .176 0.699 .413
Acid Test Ratio Current assets -Inventory /
Short Term Debt
22.077 .000* 15.870 .001
The shares of the ratios used as dependent variables in the model are taken separately. The denominators were
also determined as the independent variable. In our linear regression analysis, at t-1 and t+1 time, all ratios
except our model, “Main Operating Profit Margin and Quickness of Turning Assets” financial ratios turned out
to be significant. In other words, the model meaningfully explains the performance of firms in terms of these
ratios for the years before all firms started using BDI.
Table 6. The Result Table Is Related to The Significant Rates
Coefficients t-1 t+1
Model Definition t Sig. t
Sig.
Acid Test Ratio
Current assets -
Inventory / Short
Term Debt
2.961 0.008 2.786 0.011
82.503 0 91.444 0
Cash Ratio Cash/Short Term
Debt
2.884 0.009 3.947 0.001
14.946 0 10.803 0
Gross Margin Gross Profit/Sales 0.216 0.831 0.485 0.633
3.101 0.006 3.956 0.001
Core Operating Profit Margin EBIT/Sales 0.043 0.966 0.466 0.647
1.928 0.068 1.899 0.072
Profitability of Assets ROA EBIT/Total Asset 1.018 0.321 0.768 0.452
11.392 0 9.71 0
Return on Equity ROE Net Profit/Equity 0.483 0.634 -0.003 0.997
14.276 0 9.002 0
Total Debt Ratio Total Debt/Total
Assets
-3.354 0.003 -2.143 0.045
238.415 0 198.399 0
Asset Turnover Ratio Sales/Total Assets 3.77 0.001 2.636 0.016
1.403 0.176 0.836 0.413
Receivable Turnover Rate Sales/Account
Receivables
0.691 0.497 -0.001 0.999
4.699 0 3.984 0.001

International Engineering and Technology Management Summit 2021– ETMS2021
İstanbul Technical University & Bahçeşehir University
179
According to the results in Table 6, the data of all financial ratios except “Main Operating Profit Margin and
Quickness of Turning Assets” explain the financial performance in a meaningful way. To be more specific, it
is seen that companies expressed as t-1 and t+1 time have a positive effect on financial performance before and
after using BDI. At this point, we can conclude that their performance in the year after they started implementing
BDI is explained in a meaningful way.
If we examine our panel data analysis, where we can see the effects of big data on company performance, we
can benefit from Table 7 below. According to the table, in terms of "Acid Test Ratio", "Cash Ratio", and
"Profitability of Assets ROA" ratios, it is concluded that companies that apply BDI and are “first movers” and
companies that are “second movers” differ significantly.
According to these results, companies that start BDI applications early show better performance, especially in
the ratios expressed as liquidity ratios and ROA indicator, which expresses profitability, by differentiating
from the companies that started to implement BDI later.
4. CONCLUSION In this study, which we conducted to examine the effect of companies in BIST 100 using big data applications
in Turkey on their financial performance, data from 33 companies, 25 of which are commercial companies and
8 banks, were used. In order to find out whether the companies in BIST 100 use big data applications and in
which year they started to use them, all companies were scanned with the relevant keywords. As a result, 38
companies were identified and it was decided to work with 33 companies in terms of data quality. The data of
these companies between 2007 and 2020 were collected. After determining the financial ratios that have an
effect on firm performance, it was decided that the most appropriate method for the analysis of the model was
the linear regression method.
At the end of the study, the point that is especially desired to be stated is that the companies that incorporate
and use BDI applications as soon as this technology starts, which are expressed as first mover, are differentiated
in terms of financial performance compared to the companies that are expressed as “second movers” that start
using this application later on. Considering the results of the analysis, the significant difference in the
profitability ratio of first mover companies is remarkable. Other differentiated financial ratios are those that
show the liquidity performance of the firm. The fact that the liquidity of the companies is in a solid structure
shows that they have the potential to invest more in the coming years.
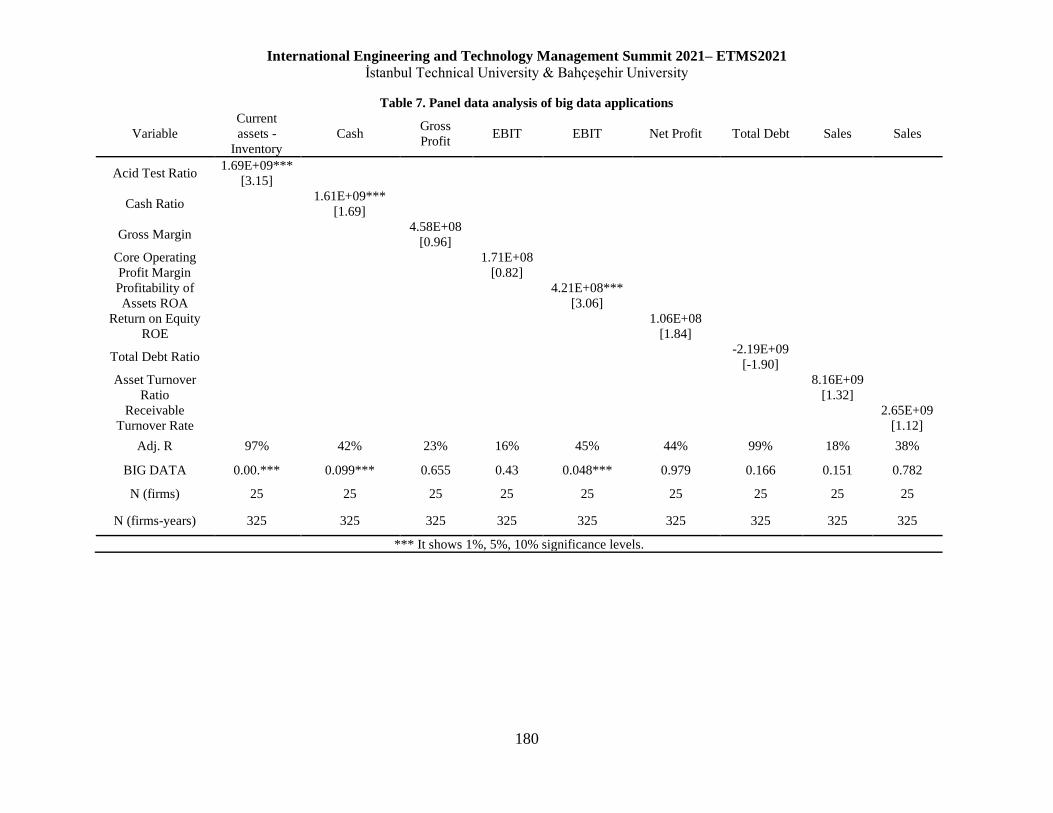
International Engineering and Technology Management Summit 2021– ETMS2021
İstanbul Technical University & Bahçeşehir University
180
Table 7. Panel data analysis of big data applications
Variable
Current
assets -
Inventory
Cash Gross
Profit EBIT EBIT Net Profit Total Debt Sales Sales
Acid Test Ratio 1.69E+09***
[3.15]
Cash Ratio 1.61E+09***
[1.69]
Gross Margin 4.58E+08
[0.96]
Core Operating
Profit Margin
1.71E+08
[0.82]
Profitability of
Assets ROA
4.21E+08***
[3.06]
Return on Equity
ROE
1.06E+08
[1.84]
Total Debt Ratio -2.19E+09
[-1.90]
Asset Turnover
Ratio
8.16E+09
[1.32]
Receivable
Turnover Rate
2.65E+09 [1.12]
Adj. R 97% 42% 23% 16% 45% 44% 99% 18% 38%
BIG DATA 0.00.*** 0.099*** 0.655 0.43 0.048*** 0.979 0.166 0.151 0.782
N (firms) 25 25 25 25 25 25 25 25 25
N (firms-years) 325 325 325 325 325 325 325 325 325
*** It shows 1%, 5%, 10% significance levels.

International Engineering and Technology Management Summit 2021– ETMS2021
İstanbul Technical University & Bahçeşehir University
181
REFERENCES
Akter, S., Wamba, S. F., Gunasekaran, A., Dubey, R., & Childe, S. J. (2016). How to improve firm
performance using big data analytics capability and business strategy alignment? International Journal
of Production Economics, 182, 113–131
Akter, Shahriar, et al. "How to improve firm performance using big data analytics capability and business
strategy alignment?." International Journal of Production Economics 182 (2016): 113-131
Caradonna, O. (2018). Gartner supply chain executive conference. Gartner Group.
https://www.gartner.com/en/newsroom/press-releases/2019-05-07-gartner-predicts-90– of-blockchain-
based-supply-chain
Behl, Abhishek, et al. "A conceptual framework for the adoption of big data analytics by e-commerce
startups: a case-based approach." Information Systems and e-Business Management 17.2 (2019): 285-
318.
Caputo, Francesco, et al. "Innovating through digital revolution: The role of soft skills and Big Data in
increasing firm performance." Management Decision (2019).
Corporate Finance Institute. (2020, July 24). Big Data in Finance. Retrieved June 18, 2021, from Corporate
Finance Institute website: https://corporatefinanceinstitute.com/resources/knowledge/other/big-data-
in-finance/
Data is the New Oil. (2011). Retrieved June 17, 2021, from ANA Marketing Maestros website:
https://ana.blogs.com/maestros/2006/11/data_is_the_new.html
Ferraris, Alberto, et al. "Big data analytics capabilities and knowledge management: impact on firm
performance." Management Decision (2019).Nofer, Michael, et al. "Blockchain." Business &
Information Systems Engineering 59.3 (2017): 183-187.
Ji-fan Ren, Steven, et al. "Modelling quality dynamics, business value and firm performance in a big data
analytics environment." International Journal of Production Research 55.17 (2017): 5011-5026.
Kim, G. H., Trimi, S., & Chung, J. H. (2014). Big-data applications in the government sector.
Communications of the ACM, 57(3), 78-85.
Maroufkhani, Parisa, et al. "Big data analytics and firm performance: A systematic
review." Information 10.7 (2019): 226.Nayak, Gurudutt, and Amol S. Dhaigude. "A conceptual model
of sustainable supply chain management in small and medium enterprises using blockchain
technology." Cogent Economics & Finance 7.1 (2019): 1667184.
Maroufkhani, Parisa, Wan Khairuzzaman Wan Ismail, and Morteza Ghobakhloo. "Big data analytics
adoption model for small and medium enterprises." Journal of Science and Technology Policy
Management (2020).
Mikalef, Patrick, et al. "Big data analytics capabilities: a systematic literature review and research
agenda." Information Systems and e-Business Management 16.3 (2018): 547-578.
Monino, Jean-Louis and Soraya Sedkaoui. Big Data, Open Data and Data
Development. 3. London: ISTE Ltd, 2016
Müller, Oliver, Maria Fay, and Jan Vom Brocke. "The effect of big data and analytics on firm performance:
An econometric analysis considering industry characteristics." Journal of Management Information
Systems 35.2 (2018): 488-509.Erol, Ismail, et al. "Assessing the feasibility of blockchain technology in
industries: evidence from Turkey." Journal of Enterprise Information Management (2020).
Ohlhorst, F. (2013). Big Data Analytics: Turning Big Data into Big Money. New Jersey: Wiley Publicity
Vitari, Claudio, and Elisabetta Raguseo. "Big data analytics business value and firm performance: linking
with environmental context." International Journal of Production Research 58.18 (2020): 5456-5476.
Wamba, Samuel Fosso, Shahriar Akter, and Marc De Bourmont. "Quality dominant logic in big data
analytics and firm performance." Business Process Management Journal (2019).Büyüközkan, Gülçin,
and Da Ruan. "Evaluation of software development projects using a fuzzy multi-criteria decision
approach." Mathematics and Computers in Simulation 77.5-6 (2008): 464-475.
Yasmin, Mariam, et al. "Big data analytics capabilities and firm performance: An integrated MCDM
approach." Journal of Business Research 114 (2020): 1-15.

International Engineering and Technology Management Summit 2021– ETMS2021
İstanbul Technical University & Bahçeşehir University
182
TÜRKİYE’DE COK MODLU TASIMACILIK UYGULAMALARI
Gizem Bulut Adnan Çorum
Bahçeşehir Universitesi Bahçeşehir Universitesi
ÖZET Ulkemizde her geçen yıl artmakta olan uluslararası ticaret hacmi ile taşımacılık ve dağıtım sistemleri
giderek önem kazanmıştır. Diğer yandan çevre kirliliğindeki artışlar, trafiğin artışı ve kazaların meydana
gelmesi gibi etkenler güvenli, ekonomik ve çevreci olan taşıma sistemlerine ilgiyi arttırmıştır. Taşımacılık
türlerinde çevreye daha az emisyon salınımı yapan çok modlu taşımacılık uygulamaları önem kazanmıştır.
Ulkemizde faaliyet gösteren lojistik firmalarından bazıları çok modlu taşımacılık modelini kullanmaktadır.
Cok modlu taşımacılık sisteminde demiryolları, denizyolları, karayolları farklı şekillerde kombine edilerek
kullanılmaktadır. Bu çalışmada çok modlu taşımacılık uygulamalarını kullanan köklü firmaların
yöneticileri ile yapılan görüşmeler ile Türkiye-Avrupa güzergahları, modelleri, faaliyet alanları ve yapmış
oldukları uygulamalar incelenerek analizler yapılmıştır. Avrupa ülkelerine çok modlu taşımacılık
alanındaki faaliyetlerin avantaj ve dezavantajları araştırılarak en çok kullanılan sistem olan Ro-Ro’nun, çok
modlu taşımacılık entegrasyonu incelenmiştir. Ulkemizde faaliyet gösteren Ro-Ro gemi işletmelerinin
yöneticileri ile yapılan görüşmeler ile Ro-Ro gemilerinin kullandığı hatlar ve Ro-La tren hatları
incelenmiştir.
Anahtar Kelimeler: Uluslararası Taşımacılık, Çok Modlu Taşımacılık, Lojistik

International Engineering and Technology Management Summit 2021– ETMS2021
İstanbul Technical University & Bahçeşehir University
183
1. GİRİS Dünyada ticaret hacminde meydana gelen artışlarla birlikte; ülkeler arasındaki sınırlar ortadan kalkmaya
başlamıştır. Bu nedenle lojistik faaliyetlerden uluslararası taşımacılık son dönemlerde tüm dünyada en
önemli sektörler arasına girmiştir. Ulaştırma ve taşımacılık faaliyetleri iktisadi anlamda, büyüme ve
rekabetin temel unsurudur.
Ulusal ve uluslararası alanda, lojistik faaliyetlerin artmasıyla birlikte; taşımacılık alanının meydana
getirmiş olduğu olumsuz durumlar daha belirgin olmaya başlamıştır. Cevre kirliliğindeki artışlar, trafiğin
artışı ve kazaların meydana gelmesi; güvenli, ekonomik ve çevreci olan taşıma sistemlerine ilgiyi
arttırmıştır. Günümüzde artık firmaların çevre hassasiyetleri çok yüksek oranda gelişmiştir. Şirketlerde ve
ofislerde çevre dostu malzemeler ve uygulamalar kullanılmaktadır. Taşımacılıkta firmalar karayolu
taşımacılığını daha az kullanarak çevreye katkı sağlayacaklarını düşünmektedirler. Bu noktada ise
karayolunu daha az kullanan modeller devreye girmektedir. Karma taşımacılık sisteminin kullanıldığı,
çevreye duyarlı ve güvenli olan çok modlu taşımacılık sistemi uygulanmaya başlanmıştır.
Ulkemizin uluslararası alanda taşıma koridoru görevi görebilmesi; çok modlu taşımacılığın etkin ve verimli
bir biçimde kullanılmasıyla olanaklı hale gelecektir. Cok modlu taşımacılık; demiryolu, denizyolu,
karayolu gibi taşımacılık türlerinin birlikte kullanılabilmesi nedeniyle avantajlı olan taşımacılıktır. Tüm
bunlara ek olarak; ülkemizin içerisinde bulunduğu coğrafi koşullar çok modlu taşımacılığa uygun bir
yapıdadır.
Ulkemizde Avrupa taşımacılık alanında yoğun bir şekilde kullanılmakta olan çok modlu taşımacılığın italat
ve ihracatta payı büyüktür. Dünyada faaliyet gösteren firmalar çok modlu taşımacılıkla ilgili olarak düzenli,
sistemli olan ve çevreye duyarlı faaliyetleri yapmaktadırlar. Bu kapsamda; bu alanda faaliyet gösteren
firmaların yapmış olduğu uygulamalar gelişmiş ve gelişmekte olan ülkeler için önemlidir.
Türkiye’de faaliyet gösteren lojistik firmaları ve Ro-Ro gemi işletmeleri üst düzey çalışanları ile yapılan
görüşmeler sonucunda Türkiye ile Avrupa ülkeleri arasında uygulanmakta olan modeller analiz edilerek,
avantaj ve dezavantajları belirtilmiştir.
Türkiye ile Avrupa arasındaki çok modlu taşımacılık uygulamaları analizi doğrultusunda; en fazla
kullanılan taşma aracı Ro-Ro gemileri olduğu saptanmıştır. Bu nedenle; Türkiye’de bu alanda faaliyette
bulunan üç farklı firmanın satış müdürleri ile yapılan görüşmeler doğrultusunda değerlendirmeler
yapılmıştır. U.N. Ro-Ro işletmesi bu kapsamda ülkemizde ve Avrupa arasından taşımacılık hizmeti veren
en büyük Ro-Ro gemi şirketi olmaktadır. Bu firmanın Ro-Ro seferleri, Ro-La tren hatlarıyla ilgili ayrıntılı
bilgiler üzerinde durulmuştur. Ro-Ro işletmesi alanında hizmet veren ikinci büyük firma; Alternative Ro-
Ro şirketidir. Bu firmanın kullanmış olduğu limanlar, seferler ayrıntılı bir şekilde ele alınmıştır. Uçüncü
olarak ülkemizde faaliyet gösteren diğer firma ise; Ulusoy Denizcilik A.Ş.’dir. Ulusoy Denizciliğin
kuruluşuyla ilgili bilgiler toplanarak, seferleri ve gemilerinden bahsedilmiştir.
Türkiye’deki çok modlu taşımacılık yapan lojistik firmaları ile görüşülmüştür. Ulkemizde bulunan Ekol
Lojistik A.Ş., Sarp Intermodal, Reysas Taşımacılık, Mars Lojistik, Rail Cargo Lojistik firmalarının bu
alanda ilgili faaliyetleri açıklanmıştır. Bu firmaların birçok taşımacılık alanında hizmet verdikleri
görülmektedir. Türkiye Avrupa ülkeleri arasındaki çok modlu taşımacılık uygulamalarıyla ilgili bilgilerden
bahsedilmiştir. Firmalarla ilgili genel bilgilere yer verilmiş, yapmış oldukları uygulamalar
değerlendirilmiştir. Şirketlerin üst düzey yetkilileri ile yapılan görüşmeler sonunda çok modlu taşımacılık
modellerinin analizi ele alınmıştır. Cok modlu taşımacılığın avantaj ve dezavantajları sunulmuştur.
2. TÜRKİYE AVRUPA ARASI COK MODLU TASIMACILIK Cok modlu taşımacılık; birden fazla taşıma modunun kombine edilmesi ile oluşmaktadır. Cok modlu
taşımacılık türleri; multimodal (çoklu) taşımacılık ve intermodal taşımacılık (modlar arası taşımacılık)
olmak üzere ikiye ayrılmaktadır. Bu iki modelin farkı; intermodal modeller de malzemeler elleçlenmeden
nihai müşteri noktasına aktarılır, multimodal taşımalarda ise malzemeler elleçlenip başka modlara
aktarılmaktadırlar. Ulkemizde faaliyet gösteren birçok lojistik firması artık Avrupa taşımacılık oklarını
intermodal ve multimodal taşımacılık modeline çevirmiştir, bu şirketlerin uyguladıkları çok modlu
taşımacılık uygulamaların çoğu Ro-Ro gemi işletmeleri üzerinden oluşmaktadır. Avrupa ülkeleri ile yapılan
ithalat ve ihracatlar da kullanılan çok modlu taşımacılık uygulamaları; ülkelere göre denizyolu taşımacılığı
+ karayolu taşımacılığı, denizyolu taşımacılığı + demiryolu taşımacılığı + karayolu taşımacılığı ve
demiryolu taşımacılığı + karayolu taşımacılığı gibi kombinlenmektedir. Türkiye de bu modelleri kullanan
şirketler arasında ciroları en yüksek olanlar ile görüşülüp uygulamaları hakkında bilgi alınmıştır. Bu
araştırmanın amacı Türkiye de hizmet veren lojistik firmaların Avrupa ülkelerine sunduğu çok modlu
taşımacılık modellerini saptayabilmek ve bu modellerin avantaj ve dezavantajlarına belirlemektir. Artık
dünya çok farklı noktalara evrilmektedir. Dünyanın en önemli şirketleri düzenli, sistematik, çevre
hassasiyeti olan uygulamalara yönelmiştir. Yapılan bu araştırma ile Türkiye de Avrupa ülkelerine
uygulanan modeller belirlenmiş, avantaj ve dezavantajları analiz edilmiştir.

International Engineering and Technology Management Summit 2021– ETMS2021
İstanbul Technical University & Bahçeşehir University
184
2.1 Türkiye’de Ro-Ro Gemi İşletmeleri Ulkemizde çok modlu taşımacılık denildiğinde akla ilk gelen taşıma aracı Ro-Ro olarak adlandırılan
gemilerdir. Karayolu taşıtlarının ve dorselerin denizyolu ile bir noktadan diğer bir noktaya varmasını
amaçlayan bu araçlar intermodal ve multimodal taşımacılığın bel kemikleridir. Multimodal ve intermodal
taşımacılığın en önemli parçası olan bu gemilerin işletmeciliğini yapan şirketlerin üst düzey yetkilileri ile
görüşülmüş ve aşağıdaki bilgilere ulaşılmıştır. Ulkemiz de Ro-Ro işletmeciliği yapan üç tane firma
bulunmaktadır.
Birinci firma U.N. Ro-Ro işletmeleri A.Ş.’dir. 1994 senesinde 48 Türk nakliyecisi birleşerek bu şirketi
kurmuştur. U.N. Ro-Ro işletmesi Türkiye ve Avrupa arasındaki en büyük Ro-Ro gemi işletmesidir. 500
çalışanı bulunan şirket 12 adet gemisi ve Türkiye ve Avrupa arasında 250000 araç taşıma kapasitesi ile
%40’lık pazar payına sahiptir. Türkiye’nin en büyük Ro-Ro filosuna sahip bu şirket Türkiye’de lider dünya
da ise gemi sayısı ve kapasiteleri açısından dördüncü sırada yer almaktadır. Filosunda 12 adet gemi
bulunmaktadır. Ro-Ro gemi hatları ve Ro-La tren hatlarından Türkiye de intermodal taşımacılık yapan tüm
lojistik firmaları yararlanmaktadır.
İkinci firma Alternative Ro-Ro işletmesidir. Bu şirket Ekol Lojistik grup firmasıdır, 2012 yılında kurulan
bu şirketin öncelikli kurulma nedeni Ekol Lojistik firmasına ait araçların taşınması içindir, fakat hızlı
büyüyen bir şirket haline gelip başka nakliyeci firmalara da hizmet vermeye başlamıştır. Bünyesinde altı
adet Ro-Ro gemisi vardır. Görüşmede Ro-Ro gemilerinde %100 kapasite ile çalıştıkları ve şirketin yıllık
cirosunun yaklaşık 80 milyon Euro olduğu öğrenildi. Şirketin Türkiye’de pazar payı %35’tir.
Alternative Taşımacılık A.Ş. intermodal alanda Ro-Ro yatırımlarına devam etmekte ve Türkiye de bu
sektörü büyütmektedir, bu şirket Ekol lojistik gibi büyük firmanın desteği ile önümüzdeki yıllarda daha
büyüyeceğini yaptığı yatırımlar ile kanıtlamaktadır.
Üçüncü firma Ulusoy Denizcilik A.Ş.’dir. 1981 yılında denizcilik sektörüne giren Ulusoy grup, 2000
yılından itibaren Trieste-Ceşme Ro-Ro seferlerine başlamıştır. Trieste Salzburg arası Ro-La tren hizmeti
de sunan şirket Türkiye’deki tüm uluslararası taşımacılık yapan nakliyecilere hizmet vermektedir. Nisan
2018’de dördüncü Ro-Ro gemisini programına katan şirket yoğunluklarının devam etmesi halinde yeni
gemi alabileceğini belirtmektedir.
2.2 Türkiye’de Cok Modlu Taşımacılık Yapan Lojistik Firmaları ve Avrupa
Ülkelerine Entegrasyonları Ulkemizde 2017 yılı verilerine göre Avrupa ülkelerine 75 milyon dolar değerinde ihracat, 85 milyon
değerinde de ithalat gerçekleştirilmiştir. Ekol Lojistik, Sarp Intermodal Hizmetleri, Reysaş Lojistik, Mars
Lojistik, Rail Cargo Lojistik firmaları çok modlu taşımacılık modellerini en yüksek cirolu uygulayan
firmalardır. Bu modeller öncelik hizmetlerindendir. Bu sebepten bu firmaların uygulamaları detaylı olarak
anlatılmıştır. Türkiye-Avrupa arası çok modlu taşımacılık modellerini saptayabilmek için söz konusu
şirketlerde çalışan üst düzey yetkililer ile görüşmeler yapılmış ve gelen cevaplar ile şirketlere ait genel
bilgiler ve Avrupa ülkeleri ile yapılan çok modlu taşımacılık uygulamalar belirlenmiştir.
1990 yılında kurulan Ekol Lojistik A.Ş. Türkiye’nin ileri gelen lojistik firmalarındandır. Yıllık yaklaşık
600 milyonluk cirosu ile her geçen yıl büyüdüğünü ve sektörün en önemli oyuncularından olduğunu
kanıtlamaktadır. 1700 adet çekicisi, 3300 adet konteyner ve treyleri bulunmaktadır. Calışan sayısı yaklaşık
2500 beyaz yaka, 4700 mavi yaka olmak üzere toplam 7200 kişidir. Calışanların en fazla %37 oran ile 26-
35 yaş arasında olduğu görülmektedir, bu oran ile gençlere istihdam sağladığı görülmektedir.
Ekol Lojistik müşterilerinin ihtiyacına göre birçok alanda hizmet sunmaktadır. Kara taşımacılığı, Deniz ve
Hava taşımacılığı, Demiryolu taşımacılığı, Ro-Ro taşımacılığı, intermodal taşımacılık, ulusal dağıtım, fuar
ve etkinlik, proje taşımacılığı, depo yönetimi, gümrükleme gibi alanlar da hizmetler sunmaktadır.
Malzemelerin aciliyetine göre; en uzun termin süresinden en hızlısına göre; standart, ekspres, süper ekspres
ve speedy olmak üzere termin süreleri değişen dört ayrı hizmet sunmaktadır, bu hizmetler müşterilerin
isteğine göre değişmektedir, zaman hassasiyetli malzemeler de termin sürelerini azaltmak için ekspres,
süper ekspres ve speedy adı verilen araçlar kullanılmaktadır. Almanya, Fransa, İtalya, Slovenya,
Macaristan, Slovenya, Cekya, İsviçre, İngiltere gibi birçok ülkeye ve ülkeden taşımacılık hizmeti
sunmaktadır.
Ekol Lojistik Türkiye’de intermodal taşımacılık ve multimodal taşımacılık denildiğinde akla ilk gelen
şirketlerdendir. Yaptığı yatırımlar ve öncelikle sırf kendi araçlarını taşıyabilmek adına kurduğu Ro-Ro gemi
işletmeciliği yapan şirketi ile bu alana ne kadar önem verdiğini göstermektedir. Alternative Taşımacılık
A.Ş.’yi öncelikle bu gaye ile kurmuştur, ancak şirketin büyümesi ile başka nakliyecilere de hizmet sunmaya
başlamıştır.
Cok modlu taşımacılıkta Yalova Ro-Ro terminalinden Trieste ve Lavrian’a, İzmir Alsancak limanından ise
Trieste ve Sete’ye ulaşan Ekol Lojistik’e ait konteyner ve treylerler, karşılıklı Ro-La blok tren hatları ile

International Engineering and Technology Management Summit 2021– ETMS2021
İstanbul Technical University & Bahçeşehir University
185
Avrupa’nın birçok noktasına ulaştırılmaktadır. Trieste’den Köln, Ludwigshafen, Kiel ve Ostrava kentlerine
blok trenler ile, Sete’den ise blok tren ile Paris’e, karayolu taşımacılığı ile ise Batı Avrupa ülkelerine
taşımacılık yapmaktadır. Aynı zaman da Trieste Limanının işletmeciliğini yapan Europe Multipurpose
Terminals firmasının %65 hissesinin sahibi olan Ekol Lojistik, çok modlu çözümler sunma noktasında bu
limanın ortağı olma avantajını kullanmaktadır. Bu liman Avrupa’nın birçok noktasına demiryolları ile
bağlıdır. Bu şirketin çok modlu taşımacılık modeli; denizyolu, demiryolu ve karayolu olmak üzere 3 ayrı
taşıma modu kullanılarak yapılmaktadır, malzemeler Ro-Ro gemileri ile Yalova ve Alsancak
terminallerinden Trieste ve Sete limanlarına taşınmaktadır, bu limanlardan ise Trieste’den Ludwigshafen,
Köln, Kiel, Ostarava kentlerine, Sete kentinden ise Paris’e demiryolu ile ulaştırılır, nihai müşteri depoları
hangi lokasyonda ise o lokasyona karayolu ile devam edilip, yükler teslim edilmektedir. İthalat süreçlerinde
ise bu durum tam tersidir, müşteri depolarından alınan yükler Almanya Ekol deposunda veya anlaşmalı
acenta depolarında konsolide edildikten sonra demiryolu ile limanlara getirilip Ro-Ro gemileri ile
Türkiye’ye getirilir. Termin süreleri Türkiye –Almanya dokuz gün, Türkiye-İtalya arası beş gün, Türkiye-
Hollanda arası sekiz gün, Türkiye – Fransa arası dokuz gün, Türkiye- Avusturya arası altı gün olarak
belirtilmektedir. Ancak şirket termin sürelerinin son müşterilerin depolarının olduğu lokasyonları ile
bağlantılıdır ve buna bağlı olarak değişebilir.
Diğer modeli ise denizyolu ve karayolu modları ile organize edilmektedir. Yükler Ro-Ro gemileri ile ilgili
limanlara getirilip, bu noktalardan ise karayolu ile nihai müşteri depolarına sevk edilmektedir. Avrupa
otoyollarında tonaj kısıtlamaları olduğu için bu model yüksek tonajlı malzemeler için tercih edilmektedir.
İthalat sürecinde ise malzemeler müşterilerin deposundan karayolu ile limanlara getirilip, limanlardan Ro-
Ro gemileri ile Türkiye’ye getirilmektedir.
Şekil 1’de firmanın Avrupa-Türkiye arası kullandığı intermodal rotaları gösterilmektedir; mavi çizgiler
denizyolu, turuncu çizgiler blok trenler ile sağlanan demiryolu, siyah çizgiler ise dedike olmayan trenler
ile sağlanan demiryolu bağlantısını göstermektedir.
Sekil 1. Ekol Lojistik Türkiye-Avrupa Intermodal Rotaları
Sarp Intermodal Hizmetleri İç ve Dış A.Ş. Türkiye’de intermodal taşımacılık yapmak üzere kurulan ilk
şirkettir. Firma 2014’te faaliyete geçmiştir. Bu hizmeti sunmak amacı ile kurulması açısından önemi
büyüktür. 2014’te yılda 11 milyonluk TL ciro ile başlayan yolculuğuna bugün yılda 80 milyon TL üzerinde
ciro ile devam etmektedir. 350 adet kendisine ait olmak üzere toplam 1500 adet konteynır filosu ve 40 adet
öz mal çekici araç ile İstanbul, Mersin, Bursa ve Trieste’deki kendisine ait olan Sarp Intermodal ofisleri
aracılığıyla hizmet vermektedir. Avrupa’da bulunan acenta ağı ile İtalya, Avusturya, Almanya, İngiltere,
İrlanda, Fransa, Macaristan gibi ülkelere intermodal taşımacılık hizmeti sunmaktadır. Sarp Intermodal
hizmetleri tüm modlar ile entegre hizmet sunmaktadır. Hangi modların kullanılacağı ise nihai müşteri
depolarının lokasyonuna göre belirlenmektedir. Belirleme kriterleri arasında malzemelerinin acil olup

International Engineering and Technology Management Summit 2021– ETMS2021
İstanbul Technical University & Bahçeşehir University
186
olmaması da bulunmaktadır. Intermodal taşımalarda karayolunun kullanımı, diğer taşıma modları
denizyolu ve demiryoluna oranla çok daha azdır.
Sarp intermodal müşterileri için Türkiyedeki tüm Ro-Ro çıkışı olan limanları kullanmaktadır, bunlar;
Ambarlı, Pendik, Ceşme, Mersin limanlarıdır. Ro-Ro gemi işletmecisi şirketlerden de hizmet almaktadır,
hangi liman ile çıkış yapacağını gemilerin doluluk oranına, çıkış günlerine ve müşteri taleplerine göre
belirlemektedir, anlaşmalı olduğu Avrupa’daki acentaları ile limanlardan indirilen yüklerinin demiryolları
ile ulaşmasını istediği kentlere aktarmakta ve oradan sonra acenta depolarına getirip nihai müşteri
depolarına ulaşmasını sağlamaktadır. Bu nokta da Avrupa da acentalarından hizmet almaktadır.
Türkiye –Almanya modeli:
Toplam termin süresi yedi-sekiz gün olarak değişmektedir. Haftanın altı günü çıkış yapılmaktadır. Ambarlı-
Pendik-Ceşme- Mersin limanlarından Trieste’ye Ro-Ro gemileri ile, Trieste’den Lambach, Munich ve
Duisburg’e demiryolu ile hizmet sunulmaktadır. Son müşterilerin depolarının lokasyonuna göre en yakın
acenta deposuna demiryolları kullanılarak trenler ile yükler aktarılıp, en sonunda karayolu ile teslim
yapılmaktadır. İthalatların da ise aynı yöntemler ile müşteri depolarından malzemeler alınıp demiryolu ile
limanlara getirilip limanlardan da Ro-Ro gemileri ile çıkışlar yapılmaktadır. Şekil 2’de mavi çizgiler deniz
yolu taşımacılığını yeşil çizgiler ise demiryolu taşımacılığını göstermektedir.
Sekil 2. Sarp Intermodal Türkiye-Almanya İntermodal Taşımacılık Modeli
Türkiye- Fransa modeli:
Toplam termin süresi dokuz gündür; dört ayrı seçenek bulunmaktadır, son müşteri depolarının lokasyonuna
göre bu rotalar seçilmektedir. İlk rota; haftanın altı günü Ambarlı- Pendik-Ceşme ve Mersin limanlarından
Ro-Ro gemileri ile Trieste’ye çıkışlar yapılmaktadır. Trieste Lambach arası trenler ile bağlantı
sağlanmaktadır. İkinci rota ise haftanın üç günü Ambarlı- Pendik-Ceşme ve Mersin limanlarından Ro-Ro
gemileri ile Trieste’ye çıkışlar yapılmaktadır. Trieste Duisburg arası trenler ile ulaşım sağlanmaktadır.
Uçüncü rota ise haftanın 3günü Pendik limanından Toulon’a Ro-Ro gemileri ile çıkışlar yapılmaktadır,
Tolulon’dan Lyon ve çevre bölgelere karayolu ile taşımacılık yapılmaktadır. Son rota ise haftada üç kez
Ambarlı- Pendik-Ceşme ve Mersin limanından Ro-Ro gemileri ile Trieste’ya yapılan çıkıştır. Demiryolu
ile Melzo’ya ve oradan da demiryolu ile Paris’e yükler ulaştırılmaktadır. Şekil 3’te mavi çizgiler deniz yolu
taşımacılığı, yeşil çizgiler ise demiryolu taşımacılığını göstermektedir.

International Engineering and Technology Management Summit 2021– ETMS2021
İstanbul Technical University & Bahçeşehir University
187
Sekil 3. Sarp Intermodal Türkiye-Fransa İntermodal Taşımacılık Modeli
Türkiye –Hollanda ve Belçika Modeli:
Uç ayrı seçenek bulunmaktadır; son müşteri depolarının lokasyonuna göre bu rotalar seçilmektedir. İlk
rotada haftanın altı günü Ambarlı- Pendik-Ceşme ve Mersin limanlarından Ro-Ro gemileri ile Trieste’ye
çıkışlar yapılmaktadır. Trieste Duisburg arası trenler ile bağlantı sağlanmaktadır. Duisburg şehrinden
karayolu ile devam edilip müşteri depolarına malzemeler teslim edilmektedir, transit süre toplam sekiz
gündür. İkinci rotada ise haftanın altı günü Ambarlı- Pendik-Ceşme ve Mersin limanlarından Ro-Ro
gemileri ile Trieste’ye çıkışlar yapılmaktadır. Trieste’den Novara aktarmalı Zeebrugge arası demiryolu ile
aktarım sağlanmaktadır, toplam transit süresi 8 gündür. Uçüncü rotada ise haftanın üç günü Halkalı’dan
Budapeste aktarmalı Neuss şehrine demiryolu ile ulaşım sağlanmaktadır, Neuss kentinden Zeebrugge
kentine karayolu ile ulaşılmaktadır, toplam transit süresi dokuz gündür. Şekil 4’te mavi çizgiler deniz yolu
taşımacılığı, yeşil çizgiler ise demiryolu taşımacılığını göstermektedir.
Sekil 4. Sarp Intermodal Hizmetleri Türkiye-Hollanda & Belçika İntermodal Taşımacılık Modeli
Türkiye-İtalya Modeli:
Beş ayrı seçenek ile Türkiye- İtalya arası intermodal çözümler sunan Sarp intermodal şirketi bu rotaları
müşterilerinin depolarının lokasyonuna göre seçmektedir. İlk rota Ambarlı limanından kalkan Ro-Ro
gemileri ile direkt Trieste limanına ulaşım sağlamaktır. İkinci rota Pendik limanından kalkan Ro-Ro
gemileri ile Trieste limanına ulaşım sağlamaktadır. Uçüncü rota Ceşme limanından kalkan Ro-Ro gemileri
ile Trieste limanına ulaşım sağlamaktadır. Dördüncü rota Mersin limanından kalkan Ro-Ro gemileri ile

International Engineering and Technology Management Summit 2021– ETMS2021
İstanbul Technical University & Bahçeşehir University
188
Trieste limanına ulaşım sağlanmaktadır, Trieste’den Melzo kentine giden trenler ile bu kentlere yakın
depolara malzemeler teslim edilmektedir. Son rota ise Pendik limanından kalkan Ro-Ro gemileri ile Bari
limanına aktarım yapılıp, oradan blok trenler ile Segrate kentine ulaşım sağlanmaktadır. Transit süresi beş-
altı gün olarak değişmektedir. Şekil 5’te mavi çizgiler deniz yolu taşımacılığı, yeşil çizgiler ise demiryolu
taşımacılığını göstermektedir.
Sekil 5. Sarp Intermodal Hizmetleri Türkiye-İtalya İntermodal Taşımacılık Modeli
Türkiye –Macaristan & Slovakya & Çekya & Polonya modeli:
Haftanın üç günü Halkalıdan kalkan trenler ile Budapeşte şehrine taşıma yapılmaktadır. Budapeşte ve
Sopron kenti arası trenler ile aktarma yapılıp; Sopron şehrinden Prag, Varşova, Bratislava kentlerine
karayolu ile malzemelerin teslimi sağlanmaktadır. Termin süresi müşterilerin depolarının lokasyonuna göre
değişkenlik göstermekte olup, yedi-sekiz gün olarak değişmektedir. Şekil 6’da yeşil çizgiler demiryolu
taşımacılığını, siyah çizgiler ise karayolu taşımacılığını göstermektedir.
Sekil 6. Sarp Intermodal Hizmetleri Türkiye-Macaristan & Slovakya & Çekya & Polonya
İntermodal Taşımacılık Modeli
Türkiye –Avusturya Modeli:
İki ayrı rota ile Avusturya ülkesine taşımacılık yapan Sarp intermodal şirketinin ilk rotası haftanın altı günü
çıkış ile Ambarlı-Pendik-Çeşme-Mersin limanlarından Trieste limanına Ro-Ro gemileri ile malzemeleri
ulaştırıp Lambach kentine trenler ile malzemeleri ulaştırmaktır. Müşterilerin depolarının lokasyonuna göre
acenteleri tarafından malzemeler karayolu ile son alıcılara teslim edilmektedir. Bu rotanın termin süresi
beş- altı gündür, İkinci rota ise haftanın üç günü çıkış ile Halkalı’dan direkt kalkan trenler ile Sopron
aktarmalı ile Viyana ve Lambach’a trenler ile malzemeler ulaştırılmaktadır. Bu rotanın termin süresi altı-yedi gün olarak değişmektedir. Şekil 7’de yeşil çizgiler demiryolu taşımacılığını, mavi çizgiler ise
denizyolu taşımacılığını göstermektedir.

International Engineering and Technology Management Summit 2021– ETMS2021
İstanbul Technical University & Bahçeşehir University
189
Sekil 7. Sarp Intermodal Hizmetleri Türkiye-Avusturya İntermodal Taşımacılık Modeli
Türkiye –İsviçre Modeli:
İki ayrı seçenek bulunmaktadır; İlk rota haftanın altı günü Ambarlı-Pendik-Ceşme ve Mersin limanlarından
Ro-Ro gemileri ile Trieste’ye yapılan çıkışlardır. Trieste ile Lambach kenti aktarmalı trenler ile Karlsruhe
kentine ulaşılıp karayolu ile Zürih kentine malzemeler ulaştırılmaktadır. Transit süre toplam sekiz-dokuz
gündür. İkinci rota ise haftanın üç günü Halkalı’dan Sopron-Viyana-Lambach-Karlsruhe aktarmalı trenler
ile sağlanan ulaşımdır. Bu noktadan karayolu ile Zürih kentine malzemeler ulaştırılmaktadır. Bu rotanın
termin süresi ise altı-yedi gün olarak değişmektedir. Şekil 8’de mavi çizgiler deniz yolu taşımacılığı, yeşil
çizgiler ise demiryolu taşımacılığını, siyah çizgiler ise karayolu taşımacılığını göstermektedir.
Sekil 8. Sarp Intermodal Hizmetleri Türkiye-İsviçre İntermodal Taşımacılık Modeli
Türkiye-İngiltere & İrlanda Modeli:
Uç ayrı seçenek bulunmaktadır. İlk rota; haftanın altı günü Ambarlı- Pendik-Ceşme ve Mersin
limanlarından Ro-Ro gemileri ile Trieste’ye yapılan çıkışlardır. Trieste’den Novara kentine demiryolu,
Novara’dan Zeebrugge’a trenyolu, Zeebrugge’dan Teesport’a denizyolu ile malzemeler aktarılmaktadır.
Termin süresi 10 gün olarak belirtilmektedir. İkinci rotada ise; haftanın üç günü çıkış ile Halkalıdan
Budapeşte’ye demiryolu, Budapeşte-Neuss arası demiryolu, Neuss-Zeebrugge arası karayolu ile aktarılan
malzemeler denizyolu ile Teesport kentine getirilmektedir. Termin süresi 11 gündür. Üçüncü rota ise;
haftanın altı günü Ambarlı-Pendik-Ceşme ve Mersin limanlarından Ro-Ro gemileri ile Trieste’ye yapılan
çıkışlardır. Malzemeler Trieste, Melzo, Rotterdam arası tren ile aktarılıp, Rotterdam’dan Tilbury ve
Dublin’e denizyolu ile aktarılmaktadır. Termin süresi 10 gündür. Şekil 9’da mavi çizgiler deniz yolu
taşımacılığını, yeşil çizgiler demiryolu taşımacılığını, siyah çizgiler karayolu taşımacılığını göstermektedir.

International Engineering and Technology Management Summit 2021– ETMS2021
İstanbul Technical University & Bahçeşehir University
190
Sekil 9. Sarp Intermodal Hizmetleri Türkiye-İngiltere & İrlanda İntermodal Taşımacılık Modeli
Detaylı olarak anlatılan rotalar Türkiye’den söz konusu Avrupa ülkelerine ulaştırılması noktasında Sarp
İntermodal firmasının sunduğu intermodal çözümlerdir, Türkiye’den çıkışlar olarak anlatılan rotaların tam
tersi uygulanarak ithalatlar organize edilmektedir.
Reysaş Taşımacılık ve Lojistik Tic. A.Ş. 1990 yılında araç taşımacılığı ile lojistik sektörüne girmiştir. 1994
yılında yurtiçi ve yurtdışı taşımacılık, petrol taşımacılığı, uluslararası ve yurtiçi demiryolu taşımacılığı,
gümrüklü/gümrüksüz depolama hizmetleri ile ek servisleri vermeye başlayan şirket 2006 yılında İstanbul
Menkul Kıymetler Borsasında işlem görmeye başlayarak Türkiye’de ilk ve tek halka açık Lojistik firması
ünvanını almıştır. Lojistik şirketleri arasında cirosu ile sektörün liderlerinden olan bu firmanın sunduğu
hizmetler uluslararası kara taşımacılığı, yurtiçi komple taşımacılık, yurtiçi dağıtım hizmetleri, uluslararası
demiryolu taşımacılığı, yurtiçi demiryolu taşımacılığıdır. Pek çok ayrı alanda hizmet veren şirketin, bu
modelleri birbirine entegre ederek intermodal çalıştığı projeleri bulunmaktadır.
Şirketin tercih ettiği çok modlu taşımacılık kombini; demiryolu ve karayolu entegresidir. İstanbul-
Halkalı’dan Killingholme’a kadar uzanan bir hatta intermodal çalışmaktadırlar. Bu hatlar ve demiryolu
taşımacılıkları için Reyline Uluslararası taşımacılık A.Ş.’yi kurmuşlardır. Bu model en büyük
müşterilerinden biri olan Toyota için kurulmuştur. 2004 yılında Toyota’ya hizmet vermek amacı ile kurulan
bu rota hafta da bir tren ile başlamıştır daha sonra çıkışların ve müşterilerin artması ile haftalık beş tren
çıkışı noktasına gelmiştir. 2017 yılı itibari ile bu Halkalı’dan kalkan trenlerdeki malzemelerin %70’i
Reyline Taşımacılık müşterilerine aittir.
Şekil 10’da intermodal çözümler gösterilmiştir. Halkalı-Rotterdam arası demiryolu ile Rotterdam-
Killinghome arası denizyolu ile taşımacılık yapmaktadır. İkinci rotası ise; Pendik limanından kalkan Ro-
Ro gemileri ile Trieste’ye, Trieste’den Rotterdam’a karayolu ile bağlantı sağlayıp, Rotterdam’dan
Killinghome kentine taşımacılık yapmaktadır. Şekil 10’da kullandıkları rota ve geçtikleri lokasyonlar
gösterilmiştir.
Sekil 10. Reyline Uluslararası taşımacılık Türkiye-İngiltere İntermodal Taşımacılık Modeli
Mars Lojistik Uluslararası Taşımacılık Depolama Dağıtım ve Tic. A.Ş. 1989 yılında kuruldu. Türkiye’nin
en büyük 250 şirketi arasında yer almaktadır. Uluslararası taşımacılık, depolama, dağıtım, hava ve deniz
kargo, gümrükleme gibi alanlarda hizmet vermektedir. 1200’den fazla çalışanı olan şirketin yıllık cirosu

International Engineering and Technology Management Summit 2021– ETMS2021
İstanbul Technical University & Bahçeşehir University
191
230 milyon Euro civarındadır. Bu ciro ile sektörün büyük oyuncularından biridir. Otomotiv, gıda, tekstil,
kimya, enerji, kozmetik gibi birçok sektöre hizmetler sunmaktadır.
1865 adet araç filosu, dört ülke de 17 ofisi ve dört deposu bulunan şirket intermodal taşımacılık alanında
yatırımlarına devam etmektedir. 2012 yılında bu alana giriş yapan Mars Lojistik ilk olarak 30 milyon
Euroluk yatırım ile Trieste ile Bettembourg şehirleri arasında başlattığı demiryolu taşımacılığı ile bu
sektöre adım atmıştır. Şirket Almanya ve Türkiye arasındaki intermodal hatlarının daha da geliştirilmesi
için çalışmakta ve farklı bir noktada yeni intermodal hizmet sunabilmek için fizibilite çalışmalarına devam
etmektedir. Türkiye’deki çeşitli illerden alınan malzemeler karayolu ile İstanbul, İzmir ve Mersin
limanlarına getirilmektedir. Cekicilerden ayrılan treyler Ro-Ro gemileri ile Trieste’ye ulaştırılmaktadır.
Dorseler Trieste’de konteynır taşıma forkliftleri ile vagonlara bindirilip Lüksemburg’a kadar demiryolu ile
taşınmaktadır. Trieste ile Bettembourg arasında trenler ile haftada altı kez karşılıklı sefer yapılmaktadır.
Bettembourg Multimodal terminalinde tekrar çekicilere bağlanan dorseler; Lüksemburg, Belçika,
Hollanda, İngiltere, Fransa ve Almanya’daki çeşitli lokasyonlara doğru karayolu ile iletilmektedir. Mars
Lojistik intermodal çözümler sunma noktasında yatırımlarına devam etmekte ve mevcut rotalarını
geliştirmeye yönelik araştırmalara ağırlık vermektedir.
Rail Cargo Logistics Uluslararası Taşımacılık Lojistik ve Ticaret Limited Şirketi 2003 yılında kurulmuştur
ve Rail Cargo Group mensubudur. Rail Cargo Logistics %100 Avusturya Sermayeli olup direk Rail Cargo
Group çatısı altında Avusturya Devlet Demiryollarına bağlıdır. Türkiye de intermodal çözümler sunan
şirketlerin başında gelen bu şirket demiryolu ve karayolu modlarını birleştirerek müşterilerine hizmet
sunmaktadır.
Şu an mevcut olarak çalışan haftada beş ithalat ve beş ihracat treni olmak üzere 10 trenleri mevcuttur. Tren
rotaları şu şekildedir: Halkalı Garından kalkıp Bulgaristan ve Romanya’yı geçerek Sopron Terminaline
ulaşan bu hattın termin süresi beş gündür. İthalatta ise aynı rotanın tersi kullanılmaktır. Bu rota ile Rail
Cargo Lojistik firmasının avantaj sağladığı yerler Avusturya, Macaristan, Slovakya, Cek Cumhuriyeti’dir.
Sopron terminalinden çekicilere aktarılan dorseler karayolu ile devam etmektedir. İkinci rota ise; Halkalı
Gar-Bulgaristan-Romanya-Macaristan-Avusturya-Neuss Terminalidir. Termin süresi yedi-sekiz gündür.
İthalatta ise aynı rotanın tersidir. Bu rota ile avantaj sağladığı yerler: Almanya Ruhr bölgesi, Hollanda ve
Belçika’dır. Şirket yükleme tipi olarak parsiyel hizmet verememektedir yüklemeler komple olarak
yapılmaktadır. Intermodal hizmetler sunun bu şirket Türkiye’de intermodal alanında büyük
oyunculardandır.
2.2.1 Cok Modlu Taşımacılık Uygulamalarının Avantajları a. Maliyet odaklılık birçok şirketin yönetim stratejilerindendir. Maliyetlerini kısacak yöntemler, modeller
araştırılıp uygulamaya konulmaya çalışılmaktadır. Taşımacılık alanında maliyeti kısan en önemli model
çok modlu çözümlerdir. Karayolu taşımacılığına kıyas ile maliyeti daha azdır, bu nedenle birçok şirket
tarafından tercih edilmektedir. Karayolu taşımacılığının daha uygun navlunları ile deniz yolu
taşımacılığının daha az termin süreleri ile malların son müşterilere teslim edilmektedir. Cok modlu
taşımacılık modelleri maliyetleri azaltmaktadır, bunun nedeni ise karayolu kullanımın azalması ile daha az
kullanılan akaryakıt, daha az ödenen otoyol ve köprü ücretleri, daha az insan gücüdür.
b. Cok modlu taşımacılık modellerinde en az kullanılan ve hatta bazı entegrasyonlarda hiç kullanılmayan
mod karayolu taşımacılığıdır. Bu nedenledir ki intermodal çözümler yeşil lojistiği desteklemektedir. Mazot
tüketiminin azalmasını sağlayan çok modlu taşımacılık modelleri doğayı ve çevreyi korumaktadır. Cevre
dostu taşımacılık sistemleri olarak egsoz emisyonunu ve trafik kirliliğini de ortadan kaldırmaktadır. Cok
modlu taşımacılık çözümleri doğayı desteklemektedir. Lojistik firmalarının bazı müşterileri sırf doğayı
desteklediği için ve sosyal sorumluluk adına çok modlu taşımacılığı kullanmaktadır. Günümüzde artık
firmaların çevre hassasiyetleri çok yüksek oranda gelişmiştir. Şirketlerde ve ofislerde çevre dostu
malzemeler ve uygulamalar kullanılmaktadır. Taşımacılık adına çevreye ise karayolu taşımacılığını daha
az kullanarak katkı sağlayacaklarını düşünmektedirler. Bu nedenledir ki sadece çevre dostu olduğu için bu
modelleri seçen şirketlerde bulunmaktadır. Karayolunun kullanımı minimum olduğundan, çevre dostu bir
ulaşım modu elde edilmektedir. Bu intermodal çözümler karbon emisyonlarında en az %40 oranında
azalma sunmaktadır. Şirket yetkilileri “Yeşil Lojistik” uygulamalarının gittikçe önem kazandığını tüm
dünyada olduğu gibi, Türkiye'deki son tüketicilerin artık satın aldıkları hizmetlerin çevre dostu olmasını
talep ettiklerini belirtmektedir. Cevre dostu lojistik hizmetler sunmanın müşterilerin tercihinde belirleyici
bir özellik olduğunu belirtilmektedir.
c. Cok modlu taşımacılık modelleri kötü hava şartlarından etkilenmemektedir. Bu durum özellikle kış
aylarında çok büyük bir avantajdır. Kar nedeni ile kapanan yollar ve köprüler gibi olumsuz şartlarına maruz
kalınmamaktadır. Yağmur ve kar nedeni ile oluşabilecek kaza riskleri de en aza inmektedir. Yaz aylarında
ise asfaltların erimesi nedeni ile yolların kapanması gibi sorunlar yaşanabilmektedir. Bu gibi nedenler ile
termin süreleri uzamaktadır Olumsuz hava şartları aynı zamanda belirsizliğe de neden olmaktadır. Şartların

International Engineering and Technology Management Summit 2021– ETMS2021
İstanbul Technical University & Bahçeşehir University
192
ne zaman düzeleceği bilinemediğinden malzemelerin ne zaman teslim edileceği konusunda net bilgi
verilememektedir ve müşteriler mağdur olmaktadır. Ancak çok modlu taşımacılık modelleri bu olumsuz
şartlardan etkilenilmemektedir.
d. Unimodal taşımacılık ile gidilemeyen tüm noktalara çok modlu taşımacılık modelleri ile gidilebilir.
Orneğin limanı olmayan bir kente denizyolu ile ulaşılamaz, demiryolları ağı olmayan bir şehre tren ile
ulaşılamaz ancak belirli noktalara demiryolu ve denizyolu ile gelinip son noktaya karayolu veya başka mod
ile ulaşılabilir.
e. Tırlardaki takip sistemleri gibi demiryolundaki her konteynerin de takip sistemi vardır. Bu sayede
müşteriler demiryolundaki ürünlerinin de takiplerini yapabilmektedirler. Terminallerden aktarılan
dorselere eklenen takip cihazları ile müşteriler yüklerinin nerede olduklarını gerçek zamanlı takip
edebilmektedirler.
f. Cok modlu taşımacılık modelleri sistematik, düzenli ve daha organizedir. Ro-Ro gemilerinin, blok
trenlerin sefer saatleri belli olduğu için verilen termin süreleri değişmez. Lojistik firmalarının söz verdiği
transit süreleri ile malzemeler teslim edilmektedir.
g. Avrupa’da bazı yollarda tonaj kısıtlatmaları bulunmaktadır. Bu durum karayolu taşımacılığında
kısıtlamalara yol açmaktadır. Yüksek tonajlı malzemeler karayolu ile iletilirken sorun yaşanabilir, şirketler
ceza alabilir. Bu durum önlemek için çok yüksek tonajlı malzemeler, çok modlu çözümler ile
taşınılabilmektedir.
h. Sınır kapılarındaki yığılma ve kuyruklar günden güne büyüyen talep nedeni ile artmaktadır. Bu durum
tırların ülkelere girişini geciktirmekte ve termin sürelerini uzatmaktadır. Ancak sunulan intermodal
çözümler ile sınır kapılarına uğramadan Türkiye’ye giriş ve çıkış yapılmaktadır.
i. Karayolu taşımacılığına kıyasla daha güvenlidir. Hırsızlık, soyulma, yüklerin karışması, yüklerin
kaybolması, yüklerin hasarlanması gibi durumlar ile daha az karşılaşılmaktadır.
j. Türkiye’nin jeopolitik konumu çok modlu taşımacılık modelleri için çok uygundur, Ulkemizin üç
tarafının denizler ile çevrili olması Ro-Ro gemi taşımacılığına olanak vermektedir. Asya ve Avrupa kıtaları
arasında köprü görevi görmektedir. Canakkale ve İstanbul boğazlarına sahiptir, bu denizyolu taşımacılığı
için çok büyük bir avantajdır. Aynı zamanda bu coğrafi yapı uzun ve etkin bir demiryolu sistemine de
olanak vermektedir. Ulkemiz çok modlu taşımacılık modellerinin kullanımı açısından çok uygundur, bu
coğrafi uygunluk hizmet sağlayıcılar ve hizmet alan firmalar için büyük bir üstünlüktür.
k. Pendik, Ambarlı ve Mersin Limanlarından ihraç yükü taşımakta olan lojistik firmaları özel tüketim
vergisi ve katma değer vergisinden muaf olarak akaryakıt alabilmektedir.
l. Lojistik firmaların anlaşmalı oldukları acentelerin çoğu intermodal çözümler konusunda tecrübeli
oldukları için Avrupa’da hizmet alınan partner şirketler bu alanda uzmanlıkları ile yol gösterici
olmaktadırlar. Avrupa’daki partnerlerin bu alandaki uzmanlığı, bilgisi ve tecrübesi Türkiye’deki firmalara
yol göstermektedir.
m. Birçok lojistik firmalarının AR-GE ve iş geliştirme departmanları bulunmaktadır. Bu departmanlar
sayesinde çok modlu taşımacılık modelleri geliştirilebilmektedir. Bu modellerin kullanım sürecini daha
kolaylaştırmak, termin sürelerini daha azaltmak, daha efektif çözümler sunmak için araştırmalar ve yeni
rotalar için fizibilite çalışmaları yapılmaktadır.
n. Artan rekabet ortamı birçok lojistik firmasını çok modlu çözümler sunmaya sevk etmektedir, rekabet bu
alanın gelişmesini sağlamaktadır.
o. Türkiye’nin önemli ulaştırma koridorlarına sahip olması nedeni ile yapılacak yatırımlar, başlayan ve
devam eden projeler sayesinde çok modlu taşımacılık modelleri gelişecektir.
p. Türkiye- Avrupa Birliği ilişkileri kapsamında geliştirilen Trans Avrupa Ulaştırma Ağları (TEN-T)
projesi kapsamında çok modlu taşımacılık sistemlerine olumlu anlamda etkileri olacak demiryolu projeleri
yapılmaktadır.
r. Ro-Ro gemilerinin ve blok trenlerin kullanılması birçok aracın trafikten uzak kalmasını sağlamaktadır.
Bu sayede trafik ve gürültü kirliliği azalmaktadır. Daha az kullanılan çekiciler daha az yıpranmaktadır ve
daha uzun ömürlü olmaktadır.
Şirketlerin çok modlu taşımacılık modellerini seçmelerinin en önemli nedeni düşük maliyettir. İkincisi ise
çevre ve doğa dostu olmasıdır.
2.2.2 Cok Modlu Taşımacılık Uygulamalarının Dezavantajları a. Karayolu taşımacılığına kıyasla termin süreleri daha uzundur. Acil durumlarda çok modlu taşımacılık
modelleri tercih edilmemektedir. Almanya-Türkiye arası karayolu ile dört gün sürerken, intermodal
taşımacılık modelleri ile sekiz günü bulabilmektedir. Artan transit süreleri müşteriler için en büyük
problemdir. Standart hizmetler intermodal çözümler ile, ekspres ve süper ekspres hızlı çözümler ise
karayolu taşımacılığı ile verilmektedir.

International Engineering and Technology Management Summit 2021– ETMS2021
İstanbul Technical University & Bahçeşehir University
193
b. Demiryolu ulaşımına yeterli önemin verilmemesi nedeniyle mevcut sistemlerin eski, hızları düşük, tek
raylı olması ve güzergâhların yetersiz olması.
c. Denizyolu ulaşımına yeterli önemin verilmemesi mevcut eskimiş ve yeni teknolojilerden uzak terminaller
ile hizmetler sunulmaya çalışılması.
d. Ro-Ro gemileri ortalama 250 treyler kapasitesi ile hizmet sunmaktadır. Tehlikeli ve yanıcı madde
bulunan taşıma ünitelerinde herhangi bir sorun yaşanması halinde tüm gemi tehlikeye girebilmektedir.
e. Bazı müşteriler ise intermodal çözümler kullanmak istememektedirler. Karayolu dışında bir hizmet
almak istememektedirler. Bu önyargının nedeni ise çok modlu taşımacılık teknolojileri onları
korkutmaktadır. Bunun sebebi modelin az bilinmesi, detaylı açıklanıp müşterilere avantajlarının
sunulmamasıdır. Bazı şirketler bu taşımacılık sistemlerinden korkmaktadır.
f. Cok modlu taşımacılık alanında yetiştirilmiş nitelikli elamanların azlığı nedeni ile lojistik firmalar
personel bulmak konusunda sıkıntılar yaşamaktadır.
g. Her ülkenin kendine özgü ağırlık sınırlamaları vardır, özellikle demiryolları için, her ülkenin
sınırlamaları değişmektedir. Cok modlu taşımacılık uygulamaları kullanan şirketlerin bu sınırlamaları takip
etmesi ve organizasyonları ona göre yapmaları gerekmektedir.
h. Her ülkenin kendine has yönetmelikleri bulunmaktadır. Orneğin İngiltere’de konteynerler üç saat içinde
boşaltılmalıdır.
i. Demiryolu taşımacılığının Avrupa'da çeşitli düzenlemeleri vardır. Konteynerler kapasiteleri ve
yüksekliklerine göre tünellerden geçebilmektedir. Demiryolu taşımacılığı her konteyner için uygun
olmamaktadır.
j. Demiryolu ve karayolu entegrasyonu kullanan firmaların yaşadıkları en büyük problem demiryolu hacim
kısıtlamalarıdır. Düzenlemelerden kaynaklı hacimlerinin elverdiği şekilde büyümelerine izin
verilmemektedir.
k. Karayolu taşımacılığına kıyasla daha az esnektir. Karayolu taşımacılığında araçlar her noktaya
yönlendirilebilir. Çok modlu taşımacılık modelleri kullanılırken, modların kullanımı sistemlidir.
Organizasyonun esnetilmesi çok daha zordur, bu da bazı müşterilerin bu modelleri seçmemesine neden
olmaktadır.
l. Tüm taşımacılık modlarında altyapı yetersizliği söz konusudur. Karayolu taşımacılığı ele alındığında
yolların, köprülerin yetersizliği, demiryolu taşımacılığı ele alındığında raylı sistemlerin yetersizliği,
denizyolu taşımacılığı ele alındığında limanların, terminallerin ve gemilerin yetersizliği söz konusudur. Bu
altyapı yetersizlikleri çok modlu taşımacılıkta daha çok problem demektir.
m. Çok modlu taşımacılık yatırımları maliyetlidir. Alınacak Ro-Ro gemileri, oluşturulacak tren hatları,
kurulacak terminallerinin maliyetleri yüksektir. Yapılan yatırımların geri dönüşümü uzun yılları
bulmaktadır. Bu nedenle şirketler kendi modellerini kurmak yerine işletmeci firmalardan kiralayarak bu
hizmetlerden yararlanmaktadır. Cok modlu taşımacılık modellerini arttıracak ve destekleyecek yatırımlar
ne yazık ki azdır.
n. Lojistik organizasyonlardaki mal yükleme, boşaltma gibi prosedürlerin karmaşıklığı ve bu süreçlerdeki
uzun formaliteler bu modellere ilgiyi azaltmaktadır.
o. Bazı ilave ücretler, liman ücretleri gibi ödemeler bu modellerin büyümesine engel olmaktadır.
p. Bu alandaki teknolojileri takip etmedeki yetersizlikler.
r. Süreçte uygulanan karışık gümrük prosedürleri
s. Liman ve demiryolu işletmelerinin bazılarının kamu kuruluşu bazılarının ise özel işletmeler tarafından
işletilmesi nedeni ile organizasyon ve iletişim de sorunlar yaşanmaktadır.
3. SONUÇ Ulkeler arasında artan ticaret ile taşımacılık sistemleri gelişmektedir. Taşımacılık ne şekilde olursa olsun
topluma fayda sağlamalıdır. Dünyada ve Türkiye’de gelişen çevre hassasiyeti sayesinde birçok firma çok
modlu taşımacılık faaliyetlerini uygulamaktadır. Cok modlu taşımacılık tek bir taşıma zinciri içerisinde en
az iki değişik taşıma sisteminin kullanılmasıyla yapılan taşıma türüdür. Bu sebepten karayolu
taşımacılığına ek olarak demiryolu ve denizyolu taşımacılığının en az birinin kullanımı gereklidir. Küresel
olarak taşımacılık ele alınırsa; sevkiyat başlangıcı ve bitişi karayolu ya da demiryolu ön planda
tutulmaktayken; ara taşımalarda ise denizyolu taşımacılığı dikkat çekmektedir. Cok modlu taşımacılıkta
farklı taşımacılık çeşitlerinin bir araya getirilmesi, coğrafyalar üzerinde en ekonomik taşıma türünün
belirlenmesine olanak sağlar bu da toplam taşıma maliyeti azaltmaktadır. Bu nedenle; çok modlu
taşımacılığın getirmiş olduğu yararlar dikkate alınarak, ekonomik ve çevresel etkileriyle taşımacılık
faaliyetleri planlanmalıdır. Hız, ulaşım zamanı ve mesafeye göre en uygun taşımacılık türünün belirlenerek,
avantajlı ve uygun olan hatların tespit edilmesi gerekmektedir.
Türkiye ile Avrupa arasındaki çok modlu taşımacılık uygulamaları analizi doğrultusunda; en fazla
kullanılan taşma aracının Ro-Ro gemileri olduğu saptanmıştır. Türkiye-Avrupa arası intermodal çözümleri

International Engineering and Technology Management Summit 2021– ETMS2021
İstanbul Technical University & Bahçeşehir University
194
saptayabilmek için şirket yöneticileri ile görüşmeler yapılmış şirketlere ait genel bilgiler ve Avrupa ülkeleri
ile yapılan çok modlu taşımacılık uygulamaları sunulmuştur. Tüm lojistik firmalar Ro-Ro gemi
işletmelerinden hizmet almaktadır. Malzemeler Ro-Ro gemileri ile Türkiye’nin belirli limanlarından
Trieste liman kentine getirilerek Ro-La adı verilen trenler ile Avrupa’nın birçok kentine demiryolu ile
ulaştırılıyor ve son teslim kentine karayolu ya da demiryolu ile devam edilmektedir. Bu uygulamalarda
çoğunlukla görülen son müşterilerin adreslerine göre her konuma sunulan bir intermodal çözüm olmasıdır.
Cok modlu taşımacılık alanında ülkemizde faaliyet gösteren ve cirosu yüksek olan firmalardan elde edilen
bilgilere göre bu taşımacılığın avantaj ve dezavantajları tespit edilmiştir. Cok modlu taşımacılığın birçok
avantajı vardır. Cok modlu taşımacılık karayoluna göre daha az maliyetlidir. Akaryakıtın az kullanılması,
insan gücüne ihtiyacının fazla olmaması maliyeti azaltmaktadır. Karayolunun daha az kullanılmasından
dolayı çevre dostudur. Mazot tüketiminin azalmasını sağlayan çok modlu taşımacılık modelleri doğayı ve
çevreyi korumaktadır. Bu modelde; taşımacılık türleri hava koşullarından etkilenmemektedir özellikle kış
aylarında büyük avantaj sağlar. Unimodal taşımacılık türünde gidilemeyen yerlere bu taşımacılık türünde
gitmek mümkündür. Müşteriler takip sistemi ile demiryolundaki ürünlerin takibini yapabilmektedir. Bu
taşımacılık modelleri diğer modlara göre daha sistematik ve düzenlidir. Karayolu taşımacılığında
karşılaşılan sınırlarda meydana gelen yığılmalar çok modlu taşımacılık sistemlerinde görülmemektedir.
Ulkemizin jeopolitik durumu çok modlu taşımacılık için elverişli olmakla birlikte; Ro-Ro taşımacılığına da
imkan sağlamaktadır. Rekabetin artması nedeniyle lojistik firmaları çok modlu çözümler bulmaya
yönelmektedir. Bu durum çok modlu taşımacılığın gelişmesini sağlamaktadır. Şirketlerin çok modlu
taşımacılık modellerini seçmelerinin en önemli nedenleri düşük maliyetli olması ve çevreyi ve doğayı
desteklemesidir. Sosyal sorumluluk adına bu modelleri kullanan şirketler bulunmaktadır.
Cok modlu taşımacılığın dezavantajları da bulunmaktadır. Cok modlu taşımacılıkta karayolu taşımacılığına
göre termin süreleri uzun olmaktadır; örneğin Almanya- Türkiye arası karayolu ile termin süresi beş gün
iken, çok modlu taşımacılık çözümleri ile bu mesafe dokuz günü bulmaktadır. Demiryollarına gerekli
önemin verilmemesinden dolayı olan sistemler eski, yavaş ve güzergahlar yetersizdir. Ro-Ro gemilerine
yüklenen tehlikeli ve yanıcı maddeler içeren malzemeler diğer tüm dorseler için tehlike oluşturur. Bu
taşımacılık sistemi karayoluna göre daha az esnektir. Bu sistemlere yatırımlar maliyetlidir, Ro-Ro gemileri
için oluşturulacak olan terminallerin maliyeti fazladır. Bu nedenle çok modlu taşımacılık yapılacağında
maliyetin, uygulamanın, avantaj ve dezavantajların iyi değerlendirilmesi gerekir.

International Engineering and Technology Management Summit 2021– ETMS2021
İstanbul Technical University & Bahçeşehir University
195
USER EXPERIENCE FOR SOCIAL RESPONSIBILITY (UX4SR):
CONCEPTUAL FRAMEWORK
Oğuzhan Erdinç
Bahçeşehir University
ABSTRACT User Experience for Social Responsibility (UX4SR) is a proposed concept for using User Experience (UX)
tools, techniques and approaches for social responsibility (SR). UX is the key to success in digital field in
that it determines effectiveness and acceptance of digital systems, as well as user performance, satisfaction
and preferences. Contemporary SR projects heavily rely on digital platforms and technologies, thus, UX
techniques and applications can be utilized to serve SR efforts in many ways, such as improving the UX of
existing SR-related systems, or developing new systems by using innovative and interactive digital
technologies. Overall, UX knowledge can enable SR community to build systems and experiences with
better UX features. This study will present the UX4SR conceptual framework and provide a perspective
for UX and SR practitioners and researchers to create a collective collaboration baseline for employing UX
tools and techniques to support SR efforts.
Keywords: Social Responsibility, User Experience

International Engineering and Technology Management Summit 2021– ETMS2021
İstanbul Technical University & Bahçeşehir University
196
1. INTRODUCTION User Experience (UX) has become the key to success of digital systems as it became evident that the digital
systems can be effective and preferable only when the end users can use the systems smoothly. Thus, UX
has gained utmost importance in digital transformation and digitalization in the industries (Paun, 2017)).
UX has become an integral part of digital industry, and a sub-industry in itself, in which improvement of
digital systems is the primary goal. On the research front, UX studies address user behavior, effects of new
and innovative, interactive technologies and systems. UX efforts can be useful not only for industrial and
business related digital systems but also systems and tools used for the interactive systems and technologies
which are extensively used in many fronts of Social Responsibility (SR) efforts. For instance, one of the
main reasons for abandonment of the assistive technologies for the handicapped is the lack of user-
friendliness, which can be addressed by UX improvements (Carneiro et.al, 2015). Furthermore, UX test
and research techniques such as user test, heuristic evaluation, eye tracking (Tullis and Albert, 2013) can
be very useful in developing digital technologies that would enhance the quality of life and the abilities of
the special population groups such as Augmented Reality systems developed for the wheelchair users
(Chagas de Oliveira et.al., 2016).), or for improving the social innovation platforms. Thus, the
essential question for UX4SR effort is how one can make use of UX knowledge for SR purposes.
The UX4SR concept was first introduced by the author in the speech he gave at World Usability Day 2019
event organized by UX Professionals Association (UXPA) Istanbul Chapter at Bahçesehir University,
November 18, 2019, which inspired the idea to form a UX4SR research group within UXPA-Istanbul
Chapter. This paper summarizes the essentials of UX4SR conceptual framework.
2. CONCEPTUAL FRAMEWORK UX4SR Conceptual framework addresses two fields with regards to SR- related systems.
• Improvement of existing systems: First, UX evaluation tools and techniques can be applied to the
existing SR-related digital systems; these systems include but are not limited to websites of non-
governmental organizations, digital social innovation (DSI) systems, collective support apps and
platforms. Heuristic evaluation, user test and UX questionnaires can serve to test and improve these
systems (Tullis and Albert, 2013). Second, UX of assistive systems and accessibility systems that help
disabled people can be improved such that users can be offered higher quality of life.
• Development of new interactive systems: The recent developments coupling interactions and digital
technologies are stunning; innovative technologies such as Virtual Reality (VR), Augmented Reality
(AR), Mixed Reality (MR), Brain-Computer Interaction (BCI) bring not only new capabilities, also
novel ways of UX to our everyday lives. As new interactions and innovations emerge, UX4SR
perspective can be applied to integrate experiences and digital technologies in order to develop new
SR-related systems, for instance, improve the quality of life for elderly or disabled people (Chagas de
Oliveira et.al., 2016).
UX4SR Conceptual framework is depicted in Figure-1 below.
Figure 1. UX4SR Conceptual Framework.

International Engineering and Technology Management Summit 2021– ETMS2021
İstanbul Technical University & Bahçeşehir University
197
3. CONCLUSION The present study proposed UX4SR a new framework that aims to link UX and SR efforts. UX4SR
framework can guide researchers and practitioners in studies to help society in many different ways,
primarily for improving existing systems and developing new interactive systems for SR purposes.
Following this statement, field applications and case studies are necessary to observe the benefits of UX4SR
framework and potential extensions of the framework.
REFERENCES Carneiro L., Rebelo F., Filgueiras, and Noriega P. (2015) ‘Usability and user experience of technical aids
for people with diasabilities? A preliminary study with a wheelchair’, Procedia Manufacturing, (3),
6068-6074
Chagas de Oliveira, L., Soares A.B., Cardoso A., Andrade A.O., and Junior E.A.L. (2016) ‘Mobile
augmented reality enhances indoor navigation for wheelchair users’, Research on Biomeidcal
Engineering, 32 (2), 111-122.
Paun G. (2017) ‘Bottom line: Why good UX design means better business’, Forbes, March 23, 2017
[https://www.forbes.com/sites/forbesagencycouncil/2017/03/23/the-bottom-line-why-good-ux-design-
means-better-business/?sh=838026c23960]
Tullis T., and Albert B. (2013) ‘Measuring the User Experience: Collecting, Analyzing, and Presenting
Usability Metrics (Interactive Technologies)’, 2nd Edition, Morgan Kaufmann.

International Engineering and Technology Management Summit 2021– ETMS2021
İstanbul Technical University & Bahçeşehir University
198
ÜLKEMİZDEKİ İSLETMELERİN ENDÜSTRİ 4.0 FARKINDALIK VE
HAZIRLIK DÜZEYLERİNİN DEĞERLENDİRİLMESİ: 2018 – 2020
YILLARININ KARSILASTIRMALI ANALİZİ
Hilmi Yüksel
Dokuz Eylül University
ÖZET Ulkemizdeki işletmelerin Endüstri 4.0’a ilişkin farkındalık ve hazırlık düzeyleri artmaktadır.2018 yılında
83 işletmenin katılımıyla bir anket çalışması yürütülmüştür. 2020 yılında da 104 işletmenin katılımıyla
anket soruları da artırılarak anket çalışması tekrarlanmıştır. Bu çalışmada, 2018 yılında 83 işletmenin
katılımıyla ve 2020 yılında 104 işletmenin katılımıyla ülkemizdeki işletmelerin Endüstri 4.0 farkındalık ve
hazırlık düzeylerine ilişkin gerçekleştirilen anket çalışmaları ile elde edilen bulgular analiz edilmektedir.
Bu kapsamda, ülkemizde bu 2 yıllık süreçte işletmelerde Endüstri 4.0’ a ilişkin farkındalık ve hazırlık
düzeyindeki gelişmeler ve Endüstri 4.0 teknolojilerinin uygulamalarına ilişkin değişim
değerlendirilmektedir.

International Engineering and Technology Management Summit 2021– ETMS2021
İstanbul Technical University & Bahçeşehir University
199
1. GİRİS Birinci Endüstri Devrimi’nde işgücü odaklı üretim, su ve buhar gücünün kullanılmaya başlanılması ile
birlikte makineleşmiştir. İkinci Endüstri Devrimi elektrik ile birlikte gelişen montaj hattı ve yığın üretim
ile ilerlemiştir. Uçüncü Endüstri Devrimi elektronik ve bilgi teknolojileri ve daha yüksek oranda
otomatikleştirilmiş üretim uygulamaları ile ortaya çıkmıştır. Dördüncü Endüstri Devrimi ise makinelerin,
üretim süreçlerinin ve üretim kontrol sistemlerinin birbirleriyle bağlantılı olarak oluşturduğu ağ ile
ilerleyecektir. Endüstri 4.0, Dördüncü Endüstri Devrimi’ni nitelemektedir. İlk üç endüstri devrimi sırasıyla
makineleşme, elektrik ve bilgi teknolojileri ile gelmişti. Dördüncü Endüstri Devrimi de üretim ortamı ile
bütünleşik olarak nesnelerin interneti ve hizmetlerin interneti ile gelmektedir. Dördüncü Endüstri
Devrimi’nin, diğer endüstri devrimlerine göre farkı Dördüncü Endüstri Devrimi’nin işletmelerimizi,
üretimimizi ve dünyamızı dönüştürürken, bu dönüşüm sürecinde reaktif olarak rol alabilme ve
yönlendirebilme olanağımızın daha yüksek olmasıdır.4.Endüstri Devrimi’ni niteleyen Endüstri 4.0, önceki
endüstri devrimlerinde olduğu gibi başta endüstri olmak üzere tüm işletmeleri, istihdamı, eğitimi, toplumu,
ekonomiyi ve birçok alanı etkileyecektir. Endüstri 4.0 yolculuğunda ilk aşamalardan birisi de işletmelerde
Endüstri 4.0’ın mevcut durumunun ortaya konulabilmesidir. İşletmelerin Endüstri 4.0 yolculuğunda
izleyeceği aşamalar mevcut durumlarına ve önceliklerine göre farklılıklar gösterecektir. Endüstri 4.0
sürecinde işletmeler çeşitli engellerle karşılaşabilmektedirler. Bu engelleri yönetebildikleri ölçüde de
Endüstri 4.0 teknolojileri için gerçekleştirdikleri yatırımların getirilerine ulaşabilecek, beklenen yararları
elde edebileceklerdir. İşletmelerin Endüstri 4.0 sürecinde başarılı olabilmeleri için değerlendirmeleri
gereken birçok faktör bulunmaktadır. Endüstri 4.0 sadece teknoloji ile ilişkili olarak düşünülmemeli,
işletimlerin organizasyon yapılarında, iş yapış şekillerinde ve organizasyon kültürlerinde değişimi
gerektirdiği anlaşılmalıdır. İşletmelerin Endüstri 4.0 dönüşümünde hazırlık ve farkındalık düzeylerinin
belirlenmesi, işletmelerde Endüstri 4.0 dönüşümünün yaygınlaştırılması ve Endüstri 4.0 uygulamalarının
başarısının artırılması açısından önemlidir.
2. ENDÜSTRİ 4.0 DÖNÜSÜMÜ Endüstri 4.0, değer zincirinde özerk biçimde birbirleriyle iletişim halinde olan teknoloji ve cihazlara dayalı
üretim süreçlerinin organizasyonunu ifade etmektedir. Endüstri 4.0 fabrikaları, bilgisayar destekli
sistemlerin fiziksel süreçleri izlediği, fiziksel dünyanın bir kopyasını yarattığı ve kendi kendini organize
eden mekanizmalara dayalı, merkezi olmayan kararlar verebilen geleceğin akıllı fabrikalarının bir modeli
olarak değerlendirilebilir. Uretim endüstrilerinin bilgisayarlı otomasyonu ile birlikte fiziksel nesneler, bilgi
ağının içerisinde bütünleştirilecektir. Böylelikle üretim sistemleri, fabrikalarda ve organizasyonlarda
işletme süreçleri ile dikey olarak ağ bağlantılı iletişim içerisinde olacak ve siparişin verilmesinden sevkiyata
kadar gerçek zamanlı olarak yönetilebilen mekânsal olarak dağınık değer ağları ile yatay olarak
bağlanacaktır. (Forschungsunion and Acatech, 2013). Endüstri 4.0, üretimin fiziksel ve dijital dünyasını
birleştirmeyi amaçlayan siber fiziksel sistemlere dayanmaktadır. Endüstri 4.0 ile birlikte değer zincirleri,
ürünler ve hizmetler dijitalleşmekte ve bütünleştirilmektedir. Bilgi teknolojileri, makineler ve insanlar
birbirleriyle bağlanmakta ve gerçek zamanlı olarak iletişim halinde olmaktadır. Böylelikle nesnelerin
interneti ile birlikte daha esnek ve verimli üretimin gerçekleştirilmesi amaçlanmaktadır.(PwC,2016).
Endüstri 4.0’ın teknolojik özü sensörler, veri işlemciler ve aktüatörler vb. bileşenlerden oluşan siber fiziksel
sistemlerden oluşmaktadır. Böylelikle gerçek ve sanal dünya birleştirilmekte ve değer zinciri boyunca
insanlar ve nesneler arasında verinin gerçek zamanlı olarak iletimi sağlanmaktadır. Nesnelerin interneti ile
veri gerçek zamanlı olarak paylaşılmakta, fabrikalar, insanlar ve makineler arasında bir ağ
oluşturulmaktadır. Oluşturulan bu ağ ile birlikte üretim sürecinin verimliliği artırılmakta ve üretim
sürecinin gereksinimlerine dinamik olarak cevap verilebilmektedir (Yüksel ,2019)
Geleceğin işletmeleri, siber fiziksel sistemler olarak makinelerinin, fabrikalarının ve depolarının
bağlantısında küresel ağlar kuracaklardır. Bu siber fiziksel sistemler kendi aralarında bilgi paylaşımını
gerçekleştirerek birbirleri ile akıllı sistemlerle bağlantı kuracak, birbirlerini kontrol edebileceklerdir. Siber
fiziksel sistemler; akıllı fabrikalar, akıllı makineler, akıllı depo alanları ve akıllı tedarik zincirleri şeklinde
olacaktır. Bu uzgörünün merkezinde üretimin gerçekleşme şeklini değiştirecek olan akıllı ürünlere ve akıllı
makinelere dayalı olarak akıllı fabrikalar yer alacaktır.(Gilchrist,2016)
Hermann vd. (2015) tarafından literatüre bağlı olarak yapılan tanıma göre de Endüstri 4.0’ın dört bileşeni;
siber fiziksel sistemler, nesnelerin interneti, hizmetlerin interneti ve akıllı fabrikalardır. Makine-makine
iletişimi ve akıllı ürünler gibi teknolojiler ayrık birer Endüstri 4.0’ın bileşenleri olarak belirtilmemiş,
makine-makine iletişimi, nesnelerin internetinin sağlayıcıları ve akıllı ürünler de CPS’nin alt bileşeni olarak
değerlendirilmiştir. Yazarlar büyük veri ve bulut bilişimi, Endüstri 4.0’ın uygulamalarında üretilmiş veriyi

International Engineering and Technology Management Summit 2021– ETMS2021
İstanbul Technical University & Bahçeşehir University
200
faydalı hale getiren ancak ayrık Endüstri 4.0 bileşenleri olmayan veri hizmetleri olarak nitelendirmişlerdir
(Bartodziej, 2017).
Endüstri 4.0, otomasyonunda ilerisine gidecek biçimde değer zincirindeki ağların bütünleştirilmesi şeklinde
olan devrimin sonucu olarak çıkan bir kavramdır. Bu bütünleşmenin en önemli karakteristikleri; değer
zincirindeki tüm aşamaların gerçek zamanlı iletişimidir. Sonuç olarak akıllı ve kendi kendini uyarlayabilen
endüstriyel süreçler ortaya çıkmıştır. Bu vizyon ile birlikte daha hızlı, daha esnek, daha etkin ve daha iyi
kalitede ürünler üreten bir endüstriyel yolculuk nitelenmektedir. (Tüsiad, The Boston Consulting
Group,2016)
3.ARASTIRMANIN AMACI VE YÖNTEMİ
Araştırmanın amacı, ülkemizdeki işletmelerin Endüstri 4.0 farkındalık ve hazırlık
düzeylerinin saptanmasıdır. Araştırma 2018 ve 2020 yıllarında gerçekleştirilmiştir. Bu
bakımdan bu iki yıllık süreçte işletmelerin Endüstri 4.0 dönüşüm yolculuğuna ilişkin
değerlendirmede yapılması mümkün olmaktadır. 2020 yılının başlangıcı ile birlikte
pandemi sürenin de ülkemizdeki işletmeleri etkilemeye başladığı görülmektedir. Bu
bakımdan pandeminin başlangıcının, işletmelerin Endüstri 4.0 dönüşümü ve
uygulamalarını nasıl etkilediği de araştırmanın bir çıktısı olmaktadır.
4.ARASTIRMANIN BULGULARI Grafik 1’de 2018 ve 2020 yılında gerçekleştirilen araştırmalara göre işletmelerin Endüstri 4.0 farkındalık
düzeyleri ve grafik 2’de de 2018 ve 2020 yılında gerçekleştirilen araştırmalara göre işletmelerin Endüstri
4.0 bilgi düzeyleri belirtilmektedir.
Grafik 1:
2018 Yılı Farkındalık Düzeyi 2020 Yılı Farkındalık Düzeyi
Grafik 2:
2018 Yılı Bilgi Düzeyi 2020 Yılı Bilgi Düzeyi
Grafik 3’de 2018 ve 2020 yılında gerçekleştirilen araştırmalara göre işletmelerin Endüstri 4.0’a ilişkin
planları belirtilmektedir.

International Engineering and Technology Management Summit 2021– ETMS2021
İstanbul Technical University & Bahçeşehir University
201
Grafik 3: 2018 yılı Endüstri 4.0 Planlar 2020 yılı Endüstri 4.0 Planlar
İşletmelere Endüstri 4.0’a ilişkin planları sorulduğunda 2018 yılında araştırmaya katılan işletmelerin %31’i
henüz düşünmüyoruz derken, 2020 yılındaki yürütülen araştırmaya göre henüz düşünmüyoruz olarak
belirten işletme oranı %18,4 olmuştur. 2020 yılındaki araştırmada 2018 yılındaki araştırmaya göre
değerlendirme sürecinde olduklarını belirten işletme oranında % 10’luk bir düşüş görülürken, planlar
yapma aşamasındayız olarak belirten işletmelerin de % 11 oranında arttığı görülmektedir. Bu 2 yıllık
süreçte, işletmelerde Endüstri 4.0’a ilişkin planları oluşturma bakımından kısmi bir artışın olduğu ifade
edilebilir.
Grafik 4’de 2018 ve 2020 yılında gerçekleştirilen araştırmalara göre işletmelerin Endüstri 4.0’a ilişkin
stratejik planlarının durumu belirtilmektedir.
Grafik 4:
2018 Yılı Stratejik Plan 2020 Yılı Stratejik Plan
Grafik 5’de 2018 ve 2020 yılında gerçekleştirilen araştırmalara göre işletmelerin ERP entegrasyon düzeyi
belirtilmektedir.
Grafik 5:
2018 yılı ERP entegrasyon düzeyi 2020 yılı ERP entegrasyon düzeyi

International Engineering and Technology Management Summit 2021– ETMS2021
İstanbul Technical University & Bahçeşehir University
202
2018 yılındaki araştırmada işletmelerinde ERP entegrasyon düzeyi sorulduğunda %18 işletme çok az ve
%11 işletme az olarak belirtirken, 2020 yılında çok az ve az olarak belirten işletme oranı sırasıyla %9 ve
%10 olmuştur. 2018 yılında fazla ve çok fazla olarak belirten işletme oranları sırasıyla %21 ve % 13 iken,
2020 yılında %26 ve %24 olarak ifade edilmiştir. Bu bakımdan iki yıllık süreçte ERP projelerine başlayan
işletme sayısında artış olurken, 2020 yılında 2018 yılına göre işletmelerin süreçlerinde ERP entegrasyon
düzeyinin artış gösterdiği de belirtilebilir.
Grafik 6’da 2018 ve 2020 yılında gerçekleştirilen araştırmalara göre işletmelerin Endüstri 4.0 için
ayırdıkları bütçe düzeyi belirtilmektedir.
Grafik 6:
2018 yılında ayrılan 2020 yılında ayrılan
bütçe bütçe
Grafik 7’de 2018 ve 2020 yılında gerçekleştirilen araştırmalara göre işletmelerin Endüstri 4.0 için
ayrılmasını düşündükleri bütçe düzeyi belirtilmektedir.
Grafik 7’de
2018 yılında ayrılması 2020 yılında ayrılması
düşünülen bütçe düşünülen bütçe
İşletmelere gelecek iki yılda Endüstri 4.0 için ayırmayı düşündükleri bütçeye ilişkin de değerlendirme
yapmaları istenmiştir. 2018 yılında gerçekleştirilen araştırmaya göre gelecek 2 yıl içinde Endüstri 4.0
projeleri için düşük ve orta düzeyde bütçe ayırmayı düşündüklerini belirten işletme oranları sırasıyla %36
ve %28,5 iken, 2020 yılında araştırmaya katılan işletmelerin % 28’i düşük düzeyde ve % 36’sı orta
düzeyde bütçe ayırmayı düşündüklerini belirtmişlerdir.

International Engineering and Technology Management Summit 2021– ETMS2021
İstanbul Technical University & Bahçeşehir University
203
Tablo 1’e göre 2020 yılında yürütülen araştırmada işletmelerin, Endüstri 4.0 projelerinde karşılaşılan en
önemli 3 güçlüğü belirtmeleri istendiğinde katılımcıların %46’sı finansal ve kaynak eksikliğini belirtirken,
işletme içinde teknik beceri ve uzmanlık eksikliğini güçlük olarak belirten işletme oranı %34’tür. 2020
yılındaki araştırmada 2018 yılındaki araştırmaya göre Endüstri 4.0’a ilişkin bilgi eksikliğini güçlük olarak
belirten işletme oranı %37’den %18’e düşerken, üst yönetimi desteğini ve önderliğini ve dijital kültür
eksikliğini güçlük olarak belirten işletme yüzdelerinde önemli artışlar olduğu görülmektedir. İşletmeler,
Endüstri 4.0 dönüşüm yolculuğuna başladıkça, Endüstri 4.0’ın sadece teknoloji ile sınırlı olmadığını,
Endüstri 4.0’ın başarısında organizasyon yapısının, liderliğin ve işletmenin dijital kültürünün de çok önemli
rollerinin olduğunu fark etmektedirler.
Tablo 1: İşletmelerin Endüstri 4.0 Dönüşümünde Karşılaştıkları Güçlükler
2018 2020
Finansman ve kaynak eksikliği 42 46
İşletme içinde teknik beceri ve uzmanlık eksikliği 46 34
Ust yönetimi desteği ve önderliği 14 24
Endüstri 4.0’ a ilişkin bilgi eksikliği 37 18
Veri gizliği ve güvenliği konuları 10 19
Doğru teknolojilerin eksikliği 20 22
Endüstri 4.0 strateji ve vizyonun eksikliği 23 20
Dijital kültür eksikliği 19 27
Yasal düzenlemelerdeki değişiklikler 6 6
Başarılı uygulama örneklerinin eksikliği 23 16
Karşılaşılabilecek riskler 14 11
Yol haritasının olmaması nasıl bir yol izleneceğine ilişkin bilgi
sahibi
olunmaması 18 13
Organizasyon yapısının uygun olmaması 13
Endüstri 4.0 dönüşümü ve teknolojileri için standartların eksikliği 18
2020 yılındaki yürütülen araştırmada teknolojik ve yenilik yönetimi için en çok hangi alanlarda kaynak
ayırmaktasınız sorusuna işletmelerin %79’u üretim süreçleri olarak belirtirken, %42’si bilgi teknolojileri olarak belirtmişlerdir. İşletmelerinde nesnelerin internetini uygulama alanları sorulduğunda ise
katılımcıların %63’i üretim sürecini izlemek amacıyla nesnelerin interneti uygulamalarının olduğunu
belirtirken, makinelerin izlenmesi ve kontrolü amacıyla %41, kalite kontrol amacıyla %28, stok
seviyelerini kontrol etmek amacıyla %27, önleyici bakım amacıyla %24, parçaları ve ürünleri işletme
içerisinde izlemek amacıyla %24 işletme tarafından nesnelerin interneti uygulamalarının olduğu
belirtilmiştir. İşletmeler veri toplanmasında ve analizindeki öncelikli amaçları sorulduğunda ise
katılımcıların %86’sı üretim sürecini izlemek olarak belirtmiştir. Performans ölçümleri amacıyla belirten
katılımcı oranı %70, kalite yönetimi için olarak belirten katılımcı oranı %49 ve karar vermede destek olması
için olarak belirten katılımcı oranı ise %48 olmuştur.
Tablo 2’de 2018 ve 2020 yılındaki araştırmalara göre işletmelerin Endüstri 4.0 teknolojilerini uygulama
düzeylerine belirttikleri değerlendirmeler verilmiştir. 2018 yılında ve 2020 yılındaki araştırmaya göre
işletmeler tarafından en yüksek oranda kullanıldığı belirtilen Endüstri 4.0 teknolojisi Siber güvenlik
olmuştur. Endüstri 4.0 teknolojilerini uygulama düzeyi bakımından 2020 yılında 2018 yılına göre bir artış
olduğu değerlendirilebilir.

International Engineering and Technology Management Summit 2021– ETMS2021
İstanbul Technical University & Bahçeşehir University
204
Tablo 2: İşletmelerin Endüstri 4.0 Teknolojilerini Uygulama Düzeylerine İlişkin Değerlendirmeleri
Nesneleri
n İnterneti
Büyü
k Veri
Bulut
Teknolojisi
Artırılmış
Gerçeklik
Siber
Güvenlik
3 Boyutlu
Yazıcılar
Özerk
İşbirlikçi
Robotlar
Dikey yatay
Entegrasyon
Yapa
y
Zeka
2018 Ortalama 2,02 2,36 2,42 1,60 2,69 1,63 1,46 1,94 1,56
Standart sapma
1,14 1,22 1,30 0,91 1,39 1,10 0,86 1,00 0,88
KOBİ
ortalama 1,94 2,12 2,13 1,60 2,08 1,52 1,48 1,47 1,49
Büyük
işletmeler ortalama
2,11 2,59 2,70 1,59 3,30 1,74 1,44 2,41 1,63
2020 Ortalama 2,39 2,49 2,74 1,63 2,97 1,82 1,77 2,28 1,83
Standart
sapma 1,46 1,43 1,54 1,13 1,41 1,19 1,22 1,32 1,27
KOBİ
ortalama 2,00 2,02 2,62 1,60 2,64 1,74 1,51 2,04 1,49
Büyük işletmeler
ortalama
2,71 2,88 2,84 1,66 3,25 1,88 1,98 2,48 2,11
5.SONUÇ
2020 yılında ve 2018 yılında ülkemizde işletmelerin Endüstri 4.0 farkındalık ve hazırlık
düzeylerinin belirlenmesi amacıyla gerçekleştirilen araştırmaya göre, işletmelerde
Endüstri 4.0 farkındalık düzeyinde bir artış olduğu görülmekle birlikte bilgi düzeyindeki
artış farkındalık düzeyindeki artışa göre daha düşük kaldığı görülmektedir. 2020 yılında
2018 yılına göre daha yüksek oranda bir işletmenin Endüstri 4.0 yatırımlarına ilişkin
planları oluşturmaya ve Endüstri 4.0 teknolojilerine yatırım yapmayı hedefleri arasında
ele almaya başladıkları görülmektedir. 2020 yılında Endüstri 4.0 planlarını oluşturmaya
başlayan ve Endüstri 4.0 projeleri için bütçe ayıran işletmelerin oranında kısmi olsa da
bir artış görülmektedir. 2020 yılında 2018 yılına göre işletmelerde dikey ve yatay
entegrasyon düzeylerinde ve ERP sistemlerini entegrasyon düzeylerinde artışın olduğu
belirtilebilir. 2020 yılının başlangıcı ile birlikte yaşanan pandemi süreci de işletmelerin
dikey ve yatay entegrasyonun gerekliliğinin daha çok farkında olmalarına neden
olmuştur.
6.KAYNAKÇA Bartodziej C. J. 2017. The Concept Industry 4.0: An Empirical Analysis of Technologies and Applications
in Production Logistics, SpringerGabler, Almanya, s:33
Gilchrist A. 2016. Industry 4.0: the Industrial Internet of Things, Apress, s:195
Forschungsunion and Acatech, 2013, Securing the Future of Geman Manufacturing Industry
Recommendations for Implementing the Strategic Inıtiative Industrie 4.0 Final Report of the Industrie
4.0 Working Group
PwC, 2016, 2016 Global Industry 4.0 Survey Industry 4.0:Building the Digital Enterprise,
https://www.pwc.com/gx/en/industries/industries-4.0/landing-page/industry-4.0-building-your-digital-
enterprise-april-2016.pdf
Yüksel H.,2019, Endüstri 4.0 Dönüşüm Rehberi, Aristo Yayınevi,İstanbul
Tüsiad, The Boston Consulting Group, 2016, Türkiye’nin Küresel Rekabetçiliği İçin Bir Gereklilik Olarak
Sanayi 4.0 Gelişmekte Olan Ekonomi Perspektifi, Tüsiad- T/2016-03/576

International Engineering and Technology Management Summit 2021– ETMS2021
İstanbul Technical University & Bahçeşehir University
205
ABSTRACTS

International Engineering and Technology Management Summit 2021– ETMS2021
İstanbul Technical University & Bahçeşehir University
206
AN INTEGRATED FUZZY DEMATEL AND FUZZY ANP APPROACH FOR
HOSPITAL INFORMATION SYSTEM SELECTION
ABSTRACT To improve the working efficiency and productivity of hospitals, the Hospital Information System (HIS)
plays an important role. Many criteria should be taken into account during the selection of a hospital
information system. This study aims to determine these HIS selection criteria considering the needs of the
hospital management and staff using multi-criteria decision-making (MCDM) methods. Towards that end,
an integrated fuzzy DEMATEL based Analytic Network Process (DANP) method is applied. DEMATEL
is utilized to determine the criteria set, and to handle the important and causal relationships between selected
criteria whereas the fuzzy Analytic Network Process (ANP) is used to calculate the weights of the criteria
and prioritize them. As a first step, a questionnaire is applied to hospital authorities after an in-depth
literature review. A decision-making tool for selecting a HIS which typically needs to be reviewed
periodically in public hospitals will also be developed.
Keywords: Fuzzy DANP, Hospital Information System, Multi-criteria Decision-Making
Melike Yılmaz Tankut Atan Seda Baş Güre
Bahçeşehir University Bahçeşehir University Işık University

International Engineering and Technology Management Summit 2021– ETMS2021
İstanbul Technical University & Bahçeşehir University
207
APPLYING BLOCKCHAIN TECHNOLOGY TO MAINTENANCE
MANAGEMENT
Muzaffer Gezer Ali Ihsan Ozdemir, PhD.
Ankara Yıldırım Beyazıt University
Ankara Yıldırım Beyazıt University
ABSTRACT
Blockchain technology mainly offers a distributed ledger system which enables a shared, transparent,
traceable and reliable data registration. Ultimately Blockchain technology is also evolving into a house
large sums of undisputed data that can be explored for various ends.
Maintenance activities can be viewed as an effort to compensate for the unreliability of an engineering
product. In other words, maintenance is an effective method that reduces the frequency of failure of
repairable systems, restores system performance and extends the remaining life of the system. Providing
zero-time and low-stock maintenance services offers significant cost savings and increased productivity.
The subject of maintenance of engineering products covers finding and applying solutions to decision
making problems in a very wide area. The development of effective maintenance strategies is provided by
appropriate data collection and data analysis, and by revealing models that will help the decision-making
process. Thus, it is assessed that with the help of the capabilities, that are enabled by blockchain technology,
in data collection, current maintenance models can be improved, as well as new ones can be proposed.
The approach to maintenance in management has evolved from a "breakdown and troubleshooting"
perspective to a process-centered approach such as eliminating the root causes of the failure. With the more
scientific approach of maintenance activities, the trend has evolved to take preventive measures rather than
corrective reactions.
Maintenance activities also involve the distributed effort of many actors. And it is also widely known that
conflict of interests is an important issue among many of these actors. Thus, trust issue, and trust in to the
available data, is a central problem in the overall maintenance process. Blockchain technology has the
potential to fulfill the trust gap. Blockchain ensures that information can be exchanged reliably on an
untrusted network with some untrusted participants.
In our research maintenance models and blockchain technology is brought together and the potential impact
on models is theorized. We aim to identify the disruptive effects of blockchain technology to the current
maintenance models parallel with Industry 4.0, IoT and AI concepts. Our study has already identified that
there is a strong correlation between data volume, data transfer, data storage and data processing capabilities

International Engineering and Technology Management Summit 2021– ETMS2021
İstanbul Technical University & Bahçeşehir University
208
and evolution in maintenance activities form corrective efforts to preventive measures. We also aim to
analyze the potential contributions of blockchain technology in the current version of maintenance efforts.
In the research, hypothesis are further intended to be tested using field and/or simulation techniques.
Since there has not been sufficient number of studies in the literature the research will start with an
exploratory research design. Current effort is to tie the data into an overarching theory.
Keywords: Blockchain, maintenance, maintenance models, maintenance management, preventive
maintenance, Industry 4.0, Machine learning, AI, IoT.

International Engineering and Technology Management Summit 2021– ETMS2021
İstanbul Technical University & Bahçeşehir University
209
BLOCKCHAIN FOR IMPROVING CONSTRUCTION SUPPLY CHAIN
MANAGEMENT: A SYSTEMATIC REVIEW OF THE LITERATURE
Ahmad Al-Hayani
Ankara Yıldırım Beyazıt University, Department of Management
ABSTRACT
The Blockchain technology (BcT) is rapidly growing and widely used in almost all applications, including
supply chain management systems, government organizations, IT sectors, business etc. Information and
communication technology has altered the ease which knowledge and access to information can be shared
around the world. Although it has greatly increased inter-organization communication, companies that are
part of a supply chain are still hesitant to share sensitive information through it because they do not trust
the other members of the chain. The blockchain application comes to the rescue here because it is a
decentralized certificate authority that helps to solve all of the problems mentioned, but companies are
generally unaware of its features due to its novel nature and a lack of case studies to refer to. The
construction industry has frequently been chastised for being slow to adopt emerging technologies and for
failing to effectively disseminate those technologies through its supply chains. Extensive fragmentation, a
lack of collaboration and transparency, traditional procurement structures and low profit margins are
frequently blamed. Blockchain Technology can play a role in resolving such issues. The primary purpose
of the review was to investigates how to prepare construction supply chains for Blockchain technology.
Based on the findings of the review, we suggest an application framework for construction supply chain
practitioners involved in the supply chain management and payment management. The frameworks will
guide the practitioners to plan their investments to build a blockchain based construction supply chain.
Finally, Discuss the future directions of research and the limitations of the study.
Keywords: Blockchain Technology, Construction Industry, Supply Chain

International Engineering and Technology Management Summit 2021– ETMS2021
İstanbul Technical University & Bahçeşehir University
210
BLOCKCHAIN IN ENERGY SECTOR: A REVIEW OF THE LITERATURES
AND APPLICATIONS
Muhammed Batur Şeker Ali İhsan Ozdemir İsmail Erol
Ankara Yıldırım Beyazıt University
ABSTRACT
Due to the rapidly growing economic activities, electricity generation and its environmental impact have
become two major concerns in energy policy making. Meanwhile rapid rising population of the world
makes energy need more. For that reason finding sufficient energy sources is becoming crucial problem to
be solved. Thanks to its critical features and characteristics, blockchain technology may help to provide
contributions to solve main problems of energy sector. Being distributed, transparent, secure, reliable,
interoperable, scalable, having immutable records and smart contracts are some of main features of
blockchain technology to be key technology to solve problems of energy industry.
In addition to this, wholesale electricity distribution, peer-to-peer energy trading in renewable energy
microgrid architecture, electricity data management, electric vehicles, energy supply chains, commodity
trading, utility providers, legal reporting and compliance are fields which are going to be affected by new
rising blockchain technology.
In this study, it will be explained what are critical features of blockchain technology to leverage energy
industry. Addition to this, the study examines governance types of blockchain systems can be used in
energy sector: Such as, public-open, public-closed, private-open and private-closed. Moreover, the
definition of consensus algorithms are described, such as, Proof of Work (PoW), Proof of Stake (PoS),
Delegated Proof of Stake (DPoS), Practical Byzantine Fault Tolerance (PBFT), Proof of Authority (PoA)
and Proof of Activity (PoAc) are mentioned. Finally, the study gives some examples of the use cases
developed by using blockchain technology in energy industry. Thanks to these steps, not only blockchain
literature which includes governance types and consensus types is reviewed, but also use cases of
blockchain technology in energy fields are illustrated by the article.
Keywords: blockchain, energy, governance type, consensus algorithm, use cases
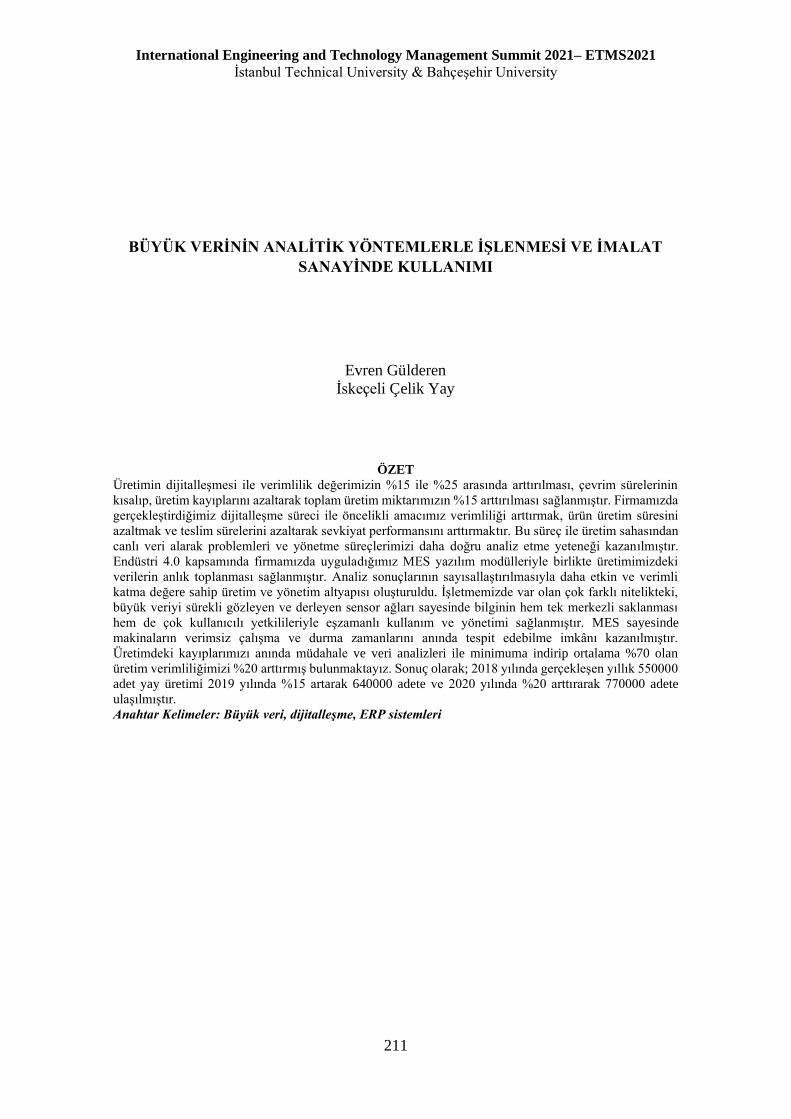
International Engineering and Technology Management Summit 2021– ETMS2021
İstanbul Technical University & Bahçeşehir University
211
BÜYÜK VERİNİN ANALİTİK YÖNTEMLERLE İSLENMESİ VE İMALAT
SANAYİNDE KULLANIMI
Evren Gülderen
İskeçeli Çelik Yay
ÖZET
Üretimin dijitalleşmesi ile verimlilik değerimizin %15 ile %25 arasında arttırılması, çevrim sürelerinin
kısalıp, üretim kayıplarını azaltarak toplam üretim miktarımızın %15 arttırılması sağlanmıştır. Firmamızda
gerçekleştirdiğimiz dijitalleşme süreci ile öncelikli amacımız verimliliği arttırmak, ürün üretim süresini
azaltmak ve teslim sürelerini azaltarak sevkiyat performansını arttırmaktır. Bu süreç ile üretim sahasından
canlı veri alarak problemleri ve yönetme süreçlerimizi daha doğru analiz etme yeteneği kazanılmıştır.
Endüstri 4.0 kapsamında firmamızda uyguladığımız MES yazılım modülleriyle birlikte üretimimizdeki
verilerin anlık toplanması sağlanmıştır. Analiz sonuçlarının sayısallaştırılmasıyla daha etkin ve verimli
katma değere sahip üretim ve yönetim altyapısı oluşturuldu. İşletmemizde var olan çok farklı nitelikteki,
büyük veriyi sürekli gözleyen ve derleyen sensor ağları sayesinde bilginin hem tek merkezli saklanması
hem de çok kullanıcılı yetkilileriyle eşzamanlı kullanım ve yönetimi sağlanmıştır. MES sayesinde
makinaların verimsiz çalışma ve durma zamanlarını anında tespit edebilme imkânı kazanılmıştır.
Uretimdeki kayıplarımızı anında müdahale ve veri analizleri ile minimuma indirip ortalama %70 olan
üretim verimliliğimizi %20 arttırmış bulunmaktayız. Sonuç olarak; 2018 yılında gerçekleşen yıllık 550000
adet yay üretimi 2019 yılında %15 artarak 640000 adete ve 2020 yılında %20 arttırarak 770000 adete
ulaşılmıştır.
Anahtar Kelimeler: Büyük veri, dijitalleşme, ERP sistemleri

International Engineering and Technology Management Summit 2021– ETMS2021
İstanbul Technical University & Bahçeşehir University
212
COMPANY EFFICIENCY AND EFFECTIVENESS AND R&D EXPENDITURE
Hamit Metin Ornek Turhan Karakaya
Bahçeşehir University Bahçeşehir University
ABSTRACT This study aims to measure the financial efficiency of 30 companies making R&D expenditure using Data
Envelopment Method. The calculations made within the scope of the study covers the financial data
published in Public Disclosure Platform (KAP) reported between the years 2016 - 2020. In these
calculations, seven different input variables (Current Ratio, Total Debt Ratio, Equity Multiplier, Short-
term Debt Ratio, Rate of Asset Turnover (Asset Turnover), Equity Ratio and Equity Turnover), three output
variables [return on Equity, Asset Profitability (Total Return on Assets) and Net Profit Margin (Profitability
of Sales) were used. As a result of the study, financial efficiency analyses of companies traded in various
indices of İstanbul Stock Exchange (BIST) were presented in detail based on the index data calculated. It
was concluded that 2 companies are the most efficient companies compared to the other companies on an
average of 5 years. 7 companies in 2016, 9 companies in 2017, 8 companies in 2018, 12 companies in 2019,
and 10 companies in 2020 operated relatively effectively. Accordingly, 2018 was the year in which more
effective operations were performed compared to other years.
Key Words: DEA, Data Envelopment, Efficiency, Financials, Financial Ratios

International Engineering and Technology Management Summit 2021– ETMS2021
İstanbul Technical University & Bahçeşehir University
213
COMPARISON OF DIFFERENT METHOD APPROACHES IN OHS RISK
ASSESSMENT ON FMCG LOGISTICS
Dilşan İyem Ecem Cem Ali Fuat Güneri
Yildiz Technical University Yildiz Technical University Yildiz Technical University
ABSTRACT
Since it deals with human life, the field of Occupational Health and Safety (OHS) risk assessment and risk
management always maintains its importance. This study is a comparative study with new approaches to
determine the most appropriate method in OHS risk assessment. In the study; The Fine-Kinney method,
which is widely used in OHS risk assessment due to its ease of use and because it facilitates access to a
hierarchy within close risks by containing hesitation and fuzziness, Hesitant Fuzzy AHP methods have
been used and these methods have been compared both in their plain form and as hybrid models that are
integrated with each other. The data set constitutes the OHS risk factors in a fast-moving logistics operation
and work accidents between 2014 and 2019 regarding these factors. The study was carried out with two
separate groups of experts who have at least 3 years of experience in the FMCG (Fast-Moving Consumer
Goods) logistics and have never worked in the field of fast consumption logistics but have at least 3 years’
experience in occupational health and safety. In this way, it has been tried to gain a perspective on the
necessity of specialization in the field, which has been the subject of discussion in the field of OHS for a
long time. In this study, 3 methods were compared with each other. These are Fine-Kinney, Hesitated Fuzzy
AHP (H-FAHP) and hybrid model which combined Fine-Kinney and H-FAHP. Each method was evaluated
with 2 separate groups of experts. In the 6 different comparisons obtained as a result of the study, In the 6
different comparisons obtained as a result of the study, the best 2 approaches were revealed as the hybrid
model in which Fine-Kinney and HF-AHP and Fine-Kinney were used together with experienced experts.
The result revealed in the study especially emphasizes the importance of experience in the sector. By
looking at the ranking obtained, it can be said that specialization in the field creates significant differences
in terms of Occupational Health and Safety.
Keywords: ASG, Fine-Kinney, FMCG Logistics, Hesitant Fuzzy AHP, Risk Assessment

International Engineering and Technology Management Summit 2021– ETMS2021
İstanbul Technical University & Bahçeşehir University
214
COCUK İSCİ NEDENLİ BOYKOT TEHDİDİNİN FİLDİSİ SAHİLİ KAKAO
ÜRETİMİNE ETKİSİ
Onur Koyuncu Yacouba Toure Cem Menten
1. CALISMANIN AMACI Bu çalışmanın temel amacı, Fildişi Sahili kakao sektöründe çocuk işçi çalıştırılması problemi kaynaklı
boykot tehdidinin kakao üretim miktarı üzerindeki etkisinin ölçülmesi ve olası senaryolar üzerinden kakao
üretimi ve toplumsal refahın sürdürülebilirliği üzerine bir değerlendirme yapmaktır.
2. METODOLOJİ Fildişi Sahili dünyanın en büyük kakao üreticisi ülkesi konumundadır. Fildişi Sahili kakao üretim
sektöründe çok sayıda çocuk işçi çalıştırılmasından dolayı 1999 yılında boykot tehdidi ile karşı karşıya
kalmıştır. Calışma kapsamında yapılan analizlerde öncelikle, Fildişi Sahili’ndeki kakao üretimi üzerindeki
boykot tehdidinin çocuk işçi sayısı üzerindeki etkisinin incelenmesi hedeflenmiştir. Daha sonra boykot
tehdidinden arındırılmış beklentiler üzerinden çocuk işçi sorununun kakao üretimi ve toplumsal refahın
sürdürülebilirliği üzerine analizler yapılmıştır. Orneklem verileri, Dünya Bankası ve Batı Afrika Devletler
Merkez Bankası (Banque Centrale des États de l'Afrique de l'Ouest, BCEAO) veri tabanından elde
edilmiştir. Bu bağlamda, 1998-2014 yılları arasındaki Fildişi Sahili makroekonomik verileri kullanılmıştır.
Boykot tehdidinin çocuk işçi sayısı üzerindeki etkisinin incelenmesi adına yapılacak regresyon
analizlerinde bağımlı değişken olarak çocuk işçi sayısı, diğer makroekonomik faktörler de bağımsız
değişkenler olarak belirlenmiştir. 1998-2014 dönemi için bağımlı değişken olarak düşünülen Fildişi
Sahili’ndeki çocuk işçi verisinde yeterli sayıya ulaşılamamıştır. Verisine ulaşılamayan veya eksik veriye
sahip yıllar için tahminleme yapılarak yıllık çocuk işçi verileri hazırlanmıştır. Ulaşılan çocuk işçi sayısı
verileri üzerinden geçmesinden ötürü 5. kuvvet polinom fonksiyonu tahminleme açısından en uygun
fonksiyon olarak bulunmuş, veriye ulaşılamayan yıllar için çocuk işçi sayıları tahmin edilmiştir. Böylelikle,
çoklu regresyon modeli kurulabilmesine olanak sağlanmıştır. Cok sayıda bağımsız değişken varlığı
nedeniyle, kurulacak modele bağımlı değişkeni sadece uygun bir şekilde açıklayabilecek bağımsız
değişkenleri dahil edebilmek için tanı testi ve ön seçim yapılmıştır. Model kurma aşamasında, değişkenler
arasında ilişki olup olmadığını incelemek adına korelasyon analizi yapılmış, bağımlı değişken ile aralarında
düşük ilişki bulunan bağımsız değişkenler modelden çıkarılmıştır. Sonrasında, bağımlı değişken ile yüksek
korelasyon ilişkili ve kendi aralarında yüksek ilişkili olmayan değişkenlerden kurulan regresyon modelinde
çoklu bağıntı sorunu olup olmadığını tespit edebilmek için korelasyon matrisi kurulması ve varyans şişirme
çarpanı (VIF) hesaplanması olmak üzere iki teknik kullanılmıştır. Korelasyon matrisi kurularak modelde
çoklu bağıntı sorunun olduğu sonucuna ulaşılmış ve varyans şişirme çarpanı hesaplanarak bu sorunun

International Engineering and Technology Management Summit 2021– ETMS2021
İstanbul Technical University & Bahçeşehir University
215
varlığı kesinleştirilmiştir. Coklu bağıntı sorununun çözümünde ise kademeli regresyon yöntemi
kullanılarak ideal modelde yer alacak bağımsız değişkenler belirlenmiştir. Fakat, nihai modelin sonuçları
özellikle çocuk işçi sayılarının tahminlendiği yıllar için regresyon parametrelerinde değişmeler
gözlemlendiğinden güvenilir bulunmamıştır. Bu nedenle, boykot tehdidinin çocuk işçi problemi üzerindeki
etkisinin ölçülmesine ek olarak boykot tehdidinin Fildişi Sahili kakao üretim miktarı üzerindeki etkisi
ölçülmüştür.
Orneklemde, Fildişi Sahili’nin 1981-2015 yılları arasındaki kakao üretim verileri kullanılarak boykot
tehdidi öncesi dönem (1981-1998) ve boykot tehdidi sonrası dönem (2000-2015) için üretim miktarları
karşılaştırılmıştır. Bu doğrultuda iki dönem için ayrı doğrusal regresyon modelleri kurulmuştur. Bu iki
doğrusal modeli karşılaştırmak adına eğimlerin eşitliği boş hipotezi kurulmuş ve sonrasında istatistiksel
eşitlik testi uygulanmıştır. Sonrasında, kakao üretimi ve toplumsal refah sürdürülebilirliğini modellemek
amacıyla 1999-2015 yılları arasında (boykot tehdidi sonrası) Fildişi Sahili’ndeki kakao üretimindeki
kayıplar araştırılmıştır. Bu amaçla 1981-1998 (boykot tehdidi öncesi) yılları arasındaki kakao üretim
miktarı verileri kullanılarak 1999-2015 yılları için beklenen kakao üretim miktarları tahmin edilmiştir.
Boykot tehdidi sonrası dönem için mevcut ve beklenen kakao üretim verileri arasındaki farkın birim başına
düşen kakao fiyatı ile çarpılması ile bu dönemdeki Fildişi Sahili kakao üretimindeki maddi kayıplar
hesaplanmıştır. Böylece çocuk işçi probleminin Fildişi Sahili refahı ve kakao üretimi sürdürülebilirliği
üzerindeki etkisi maliyet olarak tanımlanmıştır. Son olarak, boykot tehdidi sonrası Fildişi Sahili kakao
üretim miktarlarındaki düşüşün kakao üretimindeki diğer ana aktör ülkeler için bir fırsat oluşturup
oluşturmadığı ve doğan arz açığının bu rakip ülkelerce kapatılıp kapatılmadığı araştırılmıştır. Fildişi Sahili
ile rakipleri arasında karşılaştırma yapabilmek için, 1981-2015 dönemindeki kakao üretim miktarları
kullanılarak üç farklı periyod (A: 1981-1998 (boykot tehdidi öncesi), B: 2000-2008 (boykot sonrası ilk
dönem) ve C: 2008-2015 (boykot sonrası ikinci dönem)) için regresyon modelleri kurulmuştur.
Bulgular: Kakao boykot tehdidinin Fildişi Sahili’ndeki kakao üretim sektöründe çalışan çocuk işçiler
üzerindeki etkisini incelemek adına 1998-2014 dönemindeki makroekonomik veriler kullanılmıştır.
Oncelikle, çocuk işçi sayısı bağımlı değişken, diğer 17 adet faktör ise bağımsız değişkenler olarak
belirlenmiştir.
Mevcut bağımsız değişkenlerin çok sayıda oluşu, değişkenler için ön seçim yapılması zorunluluğunu
doğurmuştur. Korelesyon katsayısı analizi ile yedi adet bağımsız değişken modelden çıkarılarak temel
modelde yer alacak değişken sayısı 10’a düşürülmüştür. On seçim sonucu regresyon tahmini için belirlenen
10 adet bağımsız değişken şu şekildedir: Toplam nüfus (TPM), Toplam nüfus büyüme oranı (TPGTH),
Kentsel nüfus büyüme oranı (UPGTH), Kırsal nüfus büyüme oranı (RPGTH), 0-14 yaş çocuk nüfusu
(CZF), Toplam ihracat (TEMT), Kakao üretimi (CPT), Yıllık kakao ihracatı (CEM), Toplam gayri safi yurt
içi hasıla (TGDP) ve Kişi başına düşen gayri safi yurt içi hasıla (GDPC). Söz konusu değişkenler ile kurulan
temel regresyon modelinin analiz sonuçlarına göre değeri %99,5, düzeltilmiş değeri %98,6’dır. Aynı
zamanda Durbin Watson İstatisiği değeri 1,860 olarak hesaplanmıştır. Bu değerin 2’ye yakın oluşu modelin
anlamlı oluşunun göstergesidir. Standart hata değerlerinin yüksek, t-istatistiği değerlerinin düşük ve P-
Olasılık değerlerinin beklenen değer olan 0,05’ten yüksek çıktığı görülmüştür.
Analiz sonuçları, modelin anlamlı bir model olmadığı ve modelde çoklu bağıntı probleminin olabileceğini
göstermiştir. Coklu bağıntı probleminin olup olmadığını test etmek için korelasyon matrisi kurulmuş ve
TPM, CEM, TGDP, TPGTH, GDPC değişkenlerinin işaretlerinin farklı iken, UPGTH, CZF, RPGTH,
TEMT, CPT değişkenlerinin ise işaretlerinin aynı kaldığı tespit edilmiştir. Bu durumda modelde çoklu
bağıntı probleminin var olabileceği düşünülmüştür. Coklu bağıntı probleminin varlığını test etmek için
kullanılan bir diğer teknik olan varyans şişirme çarpanı (VIF) hesaplanmıştır. Yapılan hesaplamalar sonucu
CPT değişkeni hariç tüm bağımsız değişkenlerin varyans şişirme çarpanı değerlerinin 10’dan yüksek bir
değere sahip olduğu görülmüştür. Bu sonuca göre modelde çoklu bağıntı probleminin varlığı
kesinleştirilmiştir.
Coklu bağıntı sorununu çözmek adına kademeli regresyon yöntemi kullanılmıştır. Bu yöntemin ilk
aşamasında bir sonraki modelde yer alacak bağımsız değişkenler belirlenmektedir. Bağımlı değişken ile
yüksek, kendi aralarında düşük korelasyon katsayısı bulunan bağımsız değişkenlerin (UPGTH, RPGTH,
CZF, CPT ve GDPC) teker teker eklenmesi ile yöntemin ikinci aşaması uygulanmış ve toplam 13 adet
regresyon modeli kurulmuştur. Kurulan regresyon modelleri arasında, VIF ve otokorelasyon problemi
bulundurmamasından ötürü 12. modelin en uygun model olduğu görülmüştür. Model 12’nin regresyon
analizi sonuçlarına göre, modeldeki tüm bağımsız değişkenlerin P değerleri 0,05’ten daha düşük olarak
hesaplanmış ve bu da modelin anlamlılığını ifade etmektedir. Ayrıca, kurulan 11. modelde değeri 0,678
iken, model 12’de 0,767’dir. Aynı zamanda, Durbin-Watson istatistiği için 1,436 değerine ulaşılmıştır.
Boykot tehdidinin çocuk işçi sorunu üzerine etkisinin araştırılması konusunda, nihai modelin (12. model)
sonuçları güvenilir bulunmamıştır. Cünkü, özellikle çocuk işçi sayısı verilerine ulaşılamayan yıllar için

International Engineering and Technology Management Summit 2021– ETMS2021
İstanbul Technical University & Bahçeşehir University
216
yapılan tahminlemelerde doğrusal fonksiyonların kullanımı ya da polinom kuvvetlerinin değiştirilmesi,
regresyon modelinin parametrelerinde değişmelere yol açmaktadır. Bu nedenle, boykot tehdidinin çocuk
işçi sorunu yerine kakao üretim miktarı üzerindeki etkisinin incelenmesi tercih edilmiştir.
Bu doğrultuda, öncelikle boykot tehdidi öncesi dönem (1981-1998) ve boykot tehdidi sonrası dönem (2000-
2015) için ayrı doğrusal regresyon modelleri kurularak her iki dönem karşılaştırılmıştır. Dönemleri
karşılaştırmak için hipotezler kurulmuş ve istatistiksel eşitlik testleri uygulanmıştır. Analiz sonuçlarına göre
%95’lik tek kuyruklu güven aralığında, boykot tehdidinin kakao üretim miktarını olumsuz etkileyerek,
zamana bağlı kakao üretim artış hızını %33 civarında düşürdüğü görülmüştür. Yapılan eşitlik testinde boş
hipotez () reddedilmiş, kurulan model üzerine “boykot” kukla (dummy) değişkeni eklenerek yeni bir model
kurulmuştur. Yapılan regresyon analizi sonucunda kakao boykot tehdidinin üretim miktarını etkilediği
görülmüş, bu doğrultuda kakao boykot tehdidinin yol açtığı maddi kayıplar hesaplanmıştır. 1981-1998
yılları arasındaki üretim verileri kullanılarak 1999-2015 (boykot tehdidi sonrası) yılları için beklenen
değerler tahmin edilmiştir. Boykot tehdidi sonrası dönem için mevcut kakao üretim miktarı ile beklenen
üretim miktarı arasında 7,572,136 ton fark tespit edilmiştir. Kilogram başına düşen kakao fiyatları ile
bulunan farkın çarpılması ile USD 8,741,472,758’lık maddi kayıp hesaplanmıştır. Altı aylık bir zaman
dilimini kapsayan kakao üretim sürecinde ortalama olarak bir yetişkin işçinin yapacağı iş, iki çocuk işçi
tarafından yapılabilmektedir. Kakao üretim faaliyetlerinde yetişkin bir işçiye altı aylık asgari ücret olarak
USD 420 ödenmektedir. Bu bilgiler ışığında, boykot tehdidi sonrası dönemde oluşan yaklaşık USD 8,75
milyar kayıp ile 17 yılda 20,8 milyon yetişkin işçi istihdam edilebileceği hesaplanmıştır. Yıllık olarak
hesaplandığında ise bu sayı 1,23 milyon yetişkin işçi istihdamına denk gelmektedir. Sadece bu şekilde yılda
2,46 milyon çocuğun çalışma zorunluluğunun ortadan kaldırılabileceği görülmüştür. Bunlara ek olarak, 17
yıl için hesaplanan maddi kayıp, 2016 yılı Fildişi Sahili Gayri Safi Yurt İçi Hasılası’nın %24,2’sine karşılık
gelmektedir. Fildişi Sahili’nde 1998-2015 döneminde eğitim ve kamu harcamaları, GSYİH’nin %4,21’ine
ve modern tarım ekipmanları için harcamaların ise GSYİH’nin %0,81’ine karşılık geldiği düşünüldüğünde,
yaşanan zararın büyüklüğü gözler önüne serilmektedir. Bu bulgular ayrıca kakao üretiminin
sürdürülebilirliği ve çocukların kaçak işçilik yerine eğitime yönlenmeleri üzerinden ülke geleceği ve refahı
açısından iyi değerlendirilemeyerek ciddi bir fırsatın kaçırıldığını göstermektedir.
Calışmanın sonraki aşamasında, 1981-2015 döneminde kakao üretim verileri kullanılarak A: 1981-1998
(boykot tehdidi öncesi dönem), B: 2000-2008 (boykot tehdidi sonrası ilk dönem) ve C: 2008-2015 (boykot
tehdidi sonrası ikinci dönem) olmak üzere üç farklı dönem için regresyon modelleri kurulmuş ve
karşılaştırılmıştır. Oncelikle, boykot tehdidinin hemen sonrasında kakao üretiminde duraklamanın olup
olmadığını test edebilmek adına A ve B dönemleri karşılaştırılmıştır. Analiz sonucuna göre, %95 tek
kuyruklu güven aralığında A ve B modellerinin istatistiksel açıdan eşit olmadığı görülmüş ve boş hipotez
reddedilmiştir. 1998-2008 dönemi için kakao üretiminde duraklamanın varlığı tespit edilmiştir. Boykot
tehdidi sonrası ikinci dönem için üretim hızında iyileşme olup olmadığını tespit edebilmek için B ve C
dönemleri karşılaştırılmış, model B ve model C’nin istatistiksel açıdan eşit olmadığı görülmüş ve
reddedilmiştir. Bunun sonucunda, 2008-2015 döneminde kakao üretiminde iyileşme olduğu görülmüştür.
Boykot tehdidi sonrası ikinci dönemdeki kakao üretimi hızındaki iyileşmenin boykot tehdidi öncesi üretim
hızı arasındaki farkın tespiti adına Model C ile Model A karşılaştırılmıştır. Yapılan test sonucu, boş hipotez
reddedilerek 2008-2015 dönemindeki kakao üretim hızındaki iyileşmenin boykot tehdidi öncesi (1981-
1998) dönemdeki kakao üretimi hızından daha iyi olduğu görülmüştür. Tüm bu karşılaştırmaların sonucu
olarak, Fildişi Sahili boykot tehdidi nedenli üretim hızında duraklama yaşamadan, C dönemindeki gibi
üretim hızında iyileşme yaşayabilse idi yaşadığı maddi kaybın yanı sıra kazanç da sağlayabileceği
görülmüştür.
Son olarak, 1981-2015 döneminde Fildişi Sahili kakao üretiminde ana rakipleri olan Gana ve Nijerya ile
karşılaştırılmıştır. Boykot tehdidi sonrası dönemi için (2000-2015 yılları) Fildişi Sahili dönemin ilk
yarısında kakao üretiminde eski hızını kaybettiği ve ikinci yarıda tekrar yakaladığı, Nijerya’daki kakao
üretim hızının hafif bir düşüş sergileyerek yaklaşık olarak sabit kaldığı ve Gana’daki kakao üretiminin ise
Fildişi Sahili kakao üretimindeki duraklama dönemi ile birlikte ciddi oranda bir yükselme yaşadığı ve
sonraki yıllarda da devam ettiği görülmüştür. Buna göre, Fildişi Sahili kakao üretim sektöründe yaşanan
duraklama kaynaklı arzdaki boşluk Gana tarafından doldurulmuştur. Bu bulgu da Fildişi Sahili’nin hali
hazırda üretim konusunda sürdürülebilirlik sorunları yaşadığının bir kanıtı olup sonuçların refah kaybı
şeklinde olduğunu düşündürmektedir.
3. CALISMANIN KISITLARI Bu çalışmada yaşanan kısıtlar arasında en önemlisi Fildişi Sahili’nde çalışan çocuk işçi sayısı verisine
incelenen dönemde her yıl için ulaşılamamasıdır. Ek olarak, boykot tehdidinin kakao üretimi üzerindeki
etkisinin sadece Fildişi Sahili ülkesi ile sınırlandırılması kısıtlar arasında yer alabilir. Bu noktada, kakao

International Engineering and Technology Management Summit 2021– ETMS2021
İstanbul Technical University & Bahçeşehir University
217
üretiminde ana aktör ülkelerin tümü için boykot tehdidinin etkisi değerlendirilebilir ve ülkeler arası
karşılaştırmalar yapılabilir.
4. PRATİK UYGULAMALAR Calışma, boykot tehdidinin bile bir ülke ekonomisine etkisini göstermesi açısından sürdürülebilirliğin
önemini vurgulamakta ve makro politikaların oluşturulmasında yol gösterici bir çerçeve sunmaktadır. Bu
çalışmada ortaya konan temel fikirler, az gelişmiş ülkelerde görülmesi olası kaçak çocuk işçi istihdamının
sürdürülebilirlik ve toplum refahı tehdidi oluşturması nedeniyle sektörden bağımsız genellenebilir
kavramlardır. Uygulamaya yönelik bir özeleştiri olarak ise veri setinin elverişliliği kısıtının tekrar
belirtilmesi uygun görülmektedir.
5. ÖZGÜNLÜK Calışmanın, ele aldığı problemler, yaklaşım ve sonuçları açısından özgün olduğu değerlendirilmektedir.
Kullanılan analiz yöntemleri açısından metodolojik bir yenilik getirmemekte olup, bilinen yöntemlerin
orijinal ve gerçek bir soruna çözüm üretmek amacıyla kullanılmaları söz konusudur.
Anahtar Kelimeler: Boykot, Kakao Ekonomisi, Çocuk İşçi, Çoklu Regresyon, Fildişi Sahilleri
Makale Türü: Araştırma Makalesi

International Engineering and Technology Management Summit 2021– ETMS2021
İstanbul Technical University & Bahçeşehir University
218
DÖNGÜSEL EKONOMİYE GECİS ASAMASINDA KARSILASILAN
BARİYERLER İCİN ENDÜSTRİ 4.0 ODAKLI CÖZÜM ÖNERİLERİ
ÖZET Doğrusal ekonomiden döngüsel ekonomiye geçiş, sürdürülebilir bir tedarik zinciri için zorlu bir süreçtir ve
ilgili risklerle başa çıkmak için yenilikçi süreç yaklaşımlarına ve teknolojilerine ihtiyaç vardır. Endüstri 4.0
ilkeleri, optimal sürdürülebilir tedarik zinciri çözümlerine ulaşmak için büyük bir potansiyele sahiptir. Bu
ilkelerin verimliliği ve kaynak kullanımını artırarak sürdürülebilir tedarik zinciri operasyonlarına değer
katması beklenmektedir. Bu nedenle Endüstri 4.0, tedarik zinciri yönetiminin verimliliğini ve
sürdürülebilirliğini geliştirerek döngüsel ekonomiye geçiş aşamasında organizasyonları desteklemektedir.
Bu çalışmanın amacı, sürdürülebilir tedarik zincirinde doğrusal ekonomiden döngüsel ekonomiye geçişin
potansiyel riskleri için önerilen Endüstri 4.0 tabanlı çözüm önerilerini araştırmaktır. Bu çalışmanın ana
katkısı, doğrusal ekonomiden döngüsel ekonomiye geçişle ilgili risklerin daha iyi anlaşılması ve
sürdürülebilir bir tedarik zinciri bağlamında bu risklerin üstesinden gelmenin bir yolu olarak Endüstri 4.0
tabanlı çözüm önerileri için çözümler getiriyor olmasıdır. Calışmanın uygulaması Türkiye'de bir lojistik
firmasında yapılmıştır. Entegre bir CKKV (Cok Kriterli Karar Verme) yaklaşımı kullanılarak döngüsel
ekonomiye geçiş sırasında karşılaşılan bariyerler incelenmiştir. Bulanık Analitik Ağ Süreci ile önem
ağırlıkları tespit edilmiş, bulunan önem ağırlıkları dikkate alınarak bulanık VIKOR yöntemi ile Endüstri
4.0 çözüm önerileri değerlendirilmiştir. Calışmada, döngüsel ekonomiye geçiş sırasında karşılaşılan
bariyerler ekonomik ve finansal bariyerler, politika bariyerleri, organizasyonel bariyerler, çevresel
bariyerler, sosyal bariyerler, insan kaynakları yönetimi bariyerleri, yönetsel bariyerler ve operasyonel ve
teknoloji bariyerleri olarak, Endüstri 4.0 tabanlı çözüm önerileri ise “büyük veri analizi ile tedarik
zincirinde maliyet ve performansın sürekli izlenmesi”, “basitleştirme ve standardizasyon için modüler
süreçler”, “işlemler arası işbirliği için entegre iş süreçleri”, “”tersine zincir ortaklarıyla stratejik işbirliği
için büyük verileri kullanma”, “uyumlu politikalar ve süreçler için gelişmiş insan-makine etkileşimi”,
“sürdürülebilir hedefler için tedarik zinciri faaliyetlerini izlemek için nesnelerin interneti teknolojilerinin
kullanımı”, “altyapı desteği ve tesisi geliştirmek için sanallaştırma”, “tedarik zinciri teknolojisini
geliştirmek için siber fiziksel sistemlerin kullanımı”, “atıkları en aza indirmek ve kolayca geri dönüştürülen
ürünler sağlamak için ürün tasarımı sırasında 3B baskı ve sanallaştırma uygulamaları” ve son olarak
“tedarik zinciri üyeleri arasında hızlı ve etkin bir koordinasyon sağlayan gerçek zamanlı yetenekler” olarak
Muhittin Sağnak Erhan Ada Yiğit Kazançoğlu
İzmir Katip Celebi
Üniversitesi
Yaşar Universites Yaşar Universites

International Engineering and Technology Management Summit 2021– ETMS2021
İstanbul Technical University & Bahçeşehir University
219
belirlenmiştir. Buna göre, ekonomik ve finansal bariyerler, çevresel bariyerler ve operasyonel ve teknoloji
bariyerleri en önemli bariyerler olarak bulunmuş, “atıkları en aza indirmek ve kolayca geri dönüştürülen
ürünler sağlamak için ürün tasarımı sırasında 3B baskı ve sanallaştırma uygulamaları”, “tersine zincir
ortaklarıyla stratejik işbirliği için büyük veri kullanımı” ve “işlemler arası işbirliği için entegre iş süreçleri”
çözüm önerileri ise en önemli çözüm önerileri olarak tespit edilmiştir.
Anahtar Kelimeler: Döngüsel ekonomi, sürdürülebilirlik, endüstri 4.0, bulanık analitik ağ süreci,
bulanık VIKOR

International Engineering and Technology Management Summit 2021– ETMS2021
İstanbul Technical University & Bahçeşehir University
220
EFFECTIVE PARTNERSHIP: A KEY TO DRIVE OPEN INNOVATION
Nisit Manotungvorapun Nathasit Gerdsri
Bangkok University Mahidol University
ABSTRACT External partners play a key role as contributors of complementary technology and other resource to firms
who adopt open innovation especially in the form of collaborative R&D activity. However, there are
evidences of failures or ineffectiveness found in collaborations. Many firms pursuing open innovation have
been searching for a systematic approach to manage partnership with purposes of maximizing external
technology utilization and minimizing conflicts in interactions. This research addresses the significance of
effective partnership to the success of open innovation and introduces the systematic approach to
partnership management.

International Engineering and Technology Management Summit 2021– ETMS2021
İstanbul Technical University & Bahçeşehir University
221
EVALUATION OF IMPACT OF DIGITALIZATION ON HEALTHCARE
SERVICE EFFICIENCY
ABSTRACT The digitalization has been affected all industries and sectors in various dimensions including economic,
technical, and social. Especially health sector has been emerged by the effect of new concepts and
techniques developed with digital solutions. Hospitals are titled “digital” if they are increasing the
efficiency in terms of labor, operations, quality and safety by the help of automation systems, smart
information systems, highly developed technologies, digital control systems, IOT and sensor-based
solutions, cyber security systems, big data and digital communication devices etc. In this study, a
methodology is proposed to evaluate the efficiencies of digitalization in hospitals. For this reason, Data
Envelopment Analysis (DEA) is utilized, and input/output sets are created for efficiency assessment. DEA
is a nonparametric approach that assesses the efficiency within a group of homogeneous decision-making
units (DMUs) (here, they are hospitals) with various input and output parameters. The inputs of the DEA
system will be digital resources. Their output will be the number of patients cured using digital resources.
In order to figure out how the proposed model works, an efficiency measurement is conducted for a
numerical example. In the example, it will be shown which DMU's are efficient and which are inefficient,
as well as opinions on the requirements that must be met for inefficient DMU's to be efficient will be shared.
Keywords: Data Envelopment Analysis, Digitalization, Efficiency, Healthcare Service
Müge Öztürk
Bahcesehir University
Bersam Bolat
Istanbul Technical University
Gül T. Temur
Bahcesehir University

International Engineering and Technology Management Summit 2021– ETMS2021
İstanbul Technical University & Bahçeşehir University
222
EXAMINING THE FACTORS AFFECTING THE USE OF MOBILE
PAYMENTS SYSTEMS: A SURVEY STUDY ON UNIVERSITY STUDENTS
Ahmet Coşkun Yıldırım
Başkent University
ABSTRACT
Diffusion of technologies and technology adaptation have a mutual connection in many aspects. This
relationship is valid for many industries, especially for the services sector such as banking. Mobile payment
systems are a repercussion of digitalization and customer preference for such payment systems is an
indicator of adoption of digital transformation and its by-products. One of the most important pioneering
groups that initiate the usage of this kind of new technologies are the youngsters. In this respect, the aim of
this current study is to examine the factors affecting the use of mobile payment systems by university
students. For this purpose, Technology Acceptance Model (TAM) was used as a theoretical framework,
and financial literacy was added to the variables used in the existing model. TAM is a suitable tool for
clarifying the adoption and diffusion of technological by-products of digitalization in finance and for
determining the individuals’ intentions to accept and use this technology. The data were collected through
an online survey using the convenience sampling method. The findings revealed that, 90% of participants
have been using mobile payment systems. The average duration of usage is 3 years, and the frequency of
use is quite high (average value of 3.85 on a 1 to 5 scale). In addition, the respondents stated that they have
been using their mobile phones for an average of 7 years. Perceived ease of use, average monthly spending,
and duration of use of mobile phones increase the duration of use of mobile payment systems. However,
when an individual perceives herself/himself to be more knowledgeable about mobile payment systems,
the usage time of mobile payment systems decreases. Another interesting result is that, as the number of
finance courses taken, the frequency of online shopping and the enjoyment from the usage of mobile
payment systems (finding these systems more enjoyable and fun to use) increase, the frequency of mobile
payment systems usage increase as well. Finally, financial institutions and banks can facilitate the use of
these systems and improve their distribution channels, taking into account the mobile phone usage intensity
of their customers and improving their technology to provide user friendly systems. In addition, to increase
the frequency of use of mobile payment systems, banks can develop the design of their own products,
inform their customers about financial aspects and cooperate with online shopping service providers
accordingly. It is the competition between banks and GSM operator companies in Turkey that will shape
the future of the usage of mobile payment systems.
Keywords: mobile payment systems, Technology Acceptance Model, university students

International Engineering and Technology Management Summit 2021– ETMS2021
İstanbul Technical University & Bahçeşehir University
223
KASIYERSIZ KASA SATISLARI ILE ORTAM SENSÖRLERI ARASINDAKI
UZUN VE KISA DÖNEMLI İLISKILERIN ANALIZI
Buse Mert Defne İdil Eskiocak Ömer Zeybek Mehmet Erkin Yücel
Migros ARGE
Merkez
Migros ARGE
Merkez
Migros ARGE
Merkez
Migros ARGE
Merkez
ÖZET Gelişen iletişim teknolojileri birçok sektörde olduğu gibi Perakende sektöründe de önemli bir paradigma
değişikliğine yol açmıştır. Bu süreç içerisinde, mağazacılık sektöründe insan eli ile takip edilen birçok süreç
otomatikleştirilmiş ve sensörler aracılığı ile takip edilebilir / yönetilebilir hale gelmiştir. Perakende
sektörünün gerek operasyonel ihtiyaçlarının çeşitliliği gerekse sektörde müşteri deneyiminin oynadığı kilit
rol mağazalarda ortam koşullarının düzenli olarak takip edilmesini ve ihtiyaç duyulan düzenlemelerin ivedi
olarak yapılmasını gerektirmektedir. Sensör teknolojisinde yakın zamanda kaydedilen gelişme ile
mağazalara kurulacak algılayıcıların hem maliyetleri düşmüş hem de kurulum ve bakım süreçleri
kolaylaşmıştır. Bu nedenle son dönemde birçok perakendeci mağazalarını nesnelerin interneti konseptine
uygun hale getirmek için kurulumlara başlamıştır.
Bu çalışmada Türkiye’nin önde gelen gıda perakendecilerinden birinin Nesnelerin İnterneti (IoT) pilot
çalışması kapsamında kurulum yapılan 11 örnek mağazası incelenmiştir. Bu mağazalarda Kasiyersiz Satış
Uniteleri bölgelerine yerleştirilen sıcaklık, nem, hava kalitesi, ışık sensörlerinin 15 dakikalık ölçümlerinin
ortalamaları kullanılarak bir zaman serisi veri tabanı oluşturulmuştur. İkinci aşamada bu ölçümler ile
Kasiyersiz Satış Unitesi kanalından yapılan 15’er dakikalık toplam satışlar ilişkilendirilmiştir. Mağazalarda
ünitelerin yerleştirildiği bölgedeki ortam koşulları ile satışların arasındaki ilişkinin analiz edilmesi amacıyla
Ekonometrik Zaman Serisi (ETS) modelleri ailesinden Gecikmesi Dağıtılmış Otoregresif Modeli (ARDL)
yöntemi kullanılmıştır. Satış ve sensör verileri arasında uzun dönemli eş-bütünleşim varlığı varsayımı ile
hareket eden bu modeler, tahmin edilen eş-bütünleşik denklem (uzun dönem) ve hata düzeltme modeli
(kısa dönem) aracılığı ile açıklayıcı sensör değişkenlerinin satışlar üzerindeki kısa ve uzun dönemli anlamlı
etkilerini ortaya koyabilmektedir.
Uygulanan eş-bütünleşim testi sensör okumaları ile satışlar arasında uzun dönemli bir ilişki olduğunu ortaya
koymuştur. Bu doğrultuda tahmin edilen uzun ve kısa dönemli etki modelleri üç sensörün de satışlar
üzerinde istatistiksel olarak anlamlı bir etkisi olduğunu göstermektedir.
Anahtar Kelimeler: Nesnelerin İnterneti, İş Analitiği, Perakende

International Engineering and Technology Management Summit 2021– ETMS2021
İstanbul Technical University & Bahçeşehir University
224
OVERCOMING THE MULTI-GLASS CEILING FACED BY IMMIGRANT
WOMEN ENTREPRENEURS IN TECHNOLOGY SECTOR
Sancheeta Pugalia Renu Agarwal
University of Technology Sydney University of Technology Sydney
Martin Bliemel Dilek Çetindamar
University of Technology Sydney University of Technology Sydney
ABSTRACT Australia has emerged as one of the largest innovation-driven startup hub according to Global
entrepreneurship 2019 report. It is also the home of one of the largest migrants and has a history of migrant
entrepreneurs. With the growing interest in innovation startups and migrant entrepreneurs, the present study
explores the barriers faced by immigrant women entrepreneurs (WEs) in the technology sector and their
strategic responses. Using Bourdieu’s theory as a stimulating framework, various responses strategies are
explored. Twenty-two interviews were conducted with immigrant WEs running a technology venture which
were then analysed using grounded theory methodology. These interviews help in gaining understanding
as to how the four types of capital - social, cultural, economic and symbolic - help in navigating multi-level
barriers – individual, firm and institution-level - to build a technology venture. Immigrant WEs are
distinctively positioned given their ethnicity and gender influence in key decisions related to venture. This
study contributes to the literature by exploring the barriers and strategies of this niche population. The
research output can certainly help the future researchers to develop programs and policies which will assist
these migrant WEs’ technology venture.

International Engineering and Technology Management Summit 2021– ETMS2021
İstanbul Technical University & Bahçeşehir University
225
PROJE YÖNETİMİNDE DİJİTALLESME
1. CALISMANIN AMACI Bu çalışmanın temel amacı, proje yöneticilerinin, rekabete ayak uydurmak ve her zamankinden daha hızlı
bir şekilde teslimat yapmak için ekiplerini ve süreçlerini çevrimiçi ortama nasıl taşımaları gerektiğini
tartışmak ve Endüstri 4.0'ın proje yönetimi profesyonelleri için getirdiği yenilikleri gözeterek, proje
yönetiminin dijital dönüşümünde ihtiyaç duyulan faktörler üzerine bir değerlendirme yapmaktır.
2. METODOLOJİ Endüstri 4.0'ı karakterize eden dokuz adet teknolojiyi belirtmektedir. Bu teknolojiler; otomatik robotlar,
simülasyon, yatay ve dikey sistem entegrasyonu, endüstriyel nesnelerin interneti, siber güvenlik, bulut
tabanlı hizmetler, eklemeli üretim, artırılmış gerçeklik ve büyük veri analizidir (Russmann et al., 2015).
Dijital dönüşümde kullanılan teknolojiler organizasyonlarda ilerleme sağlar ve proje yönetimini optimize
etmeye yardımcı olarak gerçek zamanlı karar vermeye ve proje üzerinde gerçekleştirilen faaliyetlerin daha
iyi kontrolüne yol açar. Bununla birlikte; Endüstri 4.0, üretimde "daha hızlı ve daha doğru karar verme" ve
"üretime tamamen yeni bir yaklaşım" getiren "yeni bir paradigmayı" temsil etmektedir. Bu yeni yaklaşım,
yalnızca otomatikleştirilen, esas olarak bireysel fabrikalarda değil, aynı zamanda nesneler, ürünler ve
insanlar arasında birbirine bağlı olan endüstriyel değer zincirine yol açmaktadır (J. M. Müller et al., 2018;
Silva, 2017). Literatürde, proje yönetimi alanında dijitalleşme ile ilgili çalışmalar incelendiği zaman
çalışmaların özellikle 2017 senesinden sonra yoğunlaştığı görülmektedir. Satokangas (2013), tarafından
proje yönetimi çalışmasının nasıl daha fazla geliştirilebileceğini ve bu çalışmaların dijital proje yönetimi
ile nasıl desteklenebileceğini değerlendirmiştir. (Feise, 2019)(Feise, 2019), bir bilgi teknolojileri şirketinde;
dijitalleşmenin proje takımları üzerindeki etkilerini araştırmışlardır. Bajwa ve Deichmann (2018), bulut
tabanlı proje yönetimi araçlarının proje yöneticileri tarafından benimsenme düzeyini araştırmıştır. Esteves
et al., (2020), Endüstri 4.0'da proje yönetiminin önemini ve dördüncü sanayi devriminde proje
yöneticilerinin sahip olması gereken yetenekleri incelemiştir. Blaskovics (2018), dijitalleşmenin; proje
yöneticileri üzerindeki etkilerini araştırmıştır. (Barthel & Hess, 2019) yaptıkları çalışmada dijital dönüşüm
projeler ile geleneksel proje yönetimleri arasındaki farkını incelemiş bu durumu dört nicel vaka çalışması
üzerinde ele almışlardır. (Pinto et al., 2021), dijital dönüşüm projelerinin analizini ve seçimini yapabilmek
için kullanılması gereken senaryoları araştırmış ve Brezilyalı yedi telekomünikasyon operatöründe GTM
(ground theory method)’i uygulamıştır.(Kaya, 2014), İsveç'te ürün geliştirme çalışmalarındaki sapmaları
yönetmek için yaygın olarak kullanılan “Digital Pulse Methodology”i şirketlerin küresel projelerini de
kapsayıcı bir şekilde genişletmiştir. (Milin & Arsenijević, 2012), proje yönetiminde yazılım araçlarının
Nur Limoncuoğlu Bülent Çekiç
Hacettepe Üniversitesi Hacettepe Üniversitesi

International Engineering and Technology Management Summit 2021– ETMS2021
İstanbul Technical University & Bahçeşehir University
226
kullanımı ile projelerin başarısı arasındaki bağlantıyı araştırmıştır. Yapılan araştırmaya katılanların
%70'inden fazlasının çalışmalarında proje yönetimi için herhangi bir yazılım aracı kullanmadığı ancak bu
durumun proje yönetim sürecinin kalitesini doğrudan düşürdüğünü ve proje üzerinde olumsuz etkileri
olduğunu belirtmişlerdir. (Ribeiro et al., 2021), Endüstri 4.0’da proje yöneticilerinin sahip olması gereken
bilgi ve becerileri incelemiştir. (Morford, 2020) proje bazlı şirketlerde dijitalleşme ve proje yönetiminin
arasındaki ilişkiyi açıklamış ve dijitalleşmenin proje yönetim ofislerine uygulanması çalışmıştır.(Taner &
Bicer, 2020) Endüstri 4.0’da kullanılan teknolojilerin proje yönetimine etkileri alanında çalışma
yapılmıştır.
Dijitalleşme ve buna bağlı olarak bilgi teknolojisindeki hızlı ilerlemeler; projeyi maliyet, zaman ve kalite
gibi kriterlere uyumlu bir halde yürütülebilmek için kullanılan çeşitli araç ve tekniklerde de değişikliklere
yol açmıştır (Bajwa ve Deichmann, 2018). Bu durum proje yönetimi bilgi alanlarında da değişikliklere yol
açmıştır. Proje yönetimi, organizasyon içinde kontrolden sorumlu bir yapıda olduğu için başlangıçta
projenin doğru planlanmaması projenin ilerleyen aşamalarında kuruluş için ciddi sorunlara yol
açabilmektedir (Esteves et al., 2020). Birçok kuruluş karmaşık projeleri yönetmek için yeterli olmayan
proje yönetimi çözümlerini kullanmaktadır. Kuruluşların çoğu, gelişmiş proje yönetimi uygulamalarını
kullanarak elde edilebileceği faydalardan habersizdir (Braglia, M., Frosolini, 2014). Endüstri 4.0’ın
gelişiyle birlikte şirketler; büyüme ve gelişmesine yön veren yeni teknolojileri şirketlerinde değerlendirmek
ve yeni senaryoya uyum sağlamak zorunda kalmıştır. Bu değişikliklerin bir sonucu olarak, proje yönetimi
birçok şirketin dijital dönüşüm başarısı için kritik bir hale gelmiştir (Santos, 2018). Dijitalleşme, teknik
süreçleri, organizasyonel formları ve yönetimsel uygulamaları etkileyen, sektörler ve ülkeler arasında
meydana gelen bir olgudur. Genellikle değişim için bir aracı olarak kullanılan proje yönetimi, dijital
dönüşümün yönlendirilmesinde ve uygulanmasında da önemli bir role sahiptir(Braun, T., Ekstedt, E.,
Lundin, R. A., & Sydow, 2020).
Bulgular: Gartner’ın BT Sözlüğü; dijitalleştirmeyi analogdan sayısala geçiş süreci, dijitalleşmeyi ise bir iş
modelini değiştirmek ve değer üreten fırsatlar yaratmak için dijital teknolojilerin kullanılması olarak
tanımlamaktadır. Dijital teknolojiler; firmaların, müşterilerine daha verimli, daha kaliteli ve daha
sürdürülebilir hizmetler sunmasına olanak sağlamaktadır. Dijitalleşme; yeni organizasyonel prosedürler, iş
modelleri veya ticari teklifler geliştirmek için dijitalleştirilmiş ürün veya sistemlerin kullanılması demektir
(Brynjolfsson & McAfee, 2014). Dijital Dönüşüm ise dijital teknolojilerin ve yeni iş modellerinin
endüstrilere dahil edilmesine ek olarak müşterilere değer sağlayan değişiklikleri kapsamaktadır (Piccinini
et al., 2015).
Birçok firma dijital dönüşümü, sadece kâğıt üzerindeki verilerin dijital ortamına aktarmak olarak
yorumlamaktadır. Aslında dijitalleşme bundan çok daha fazlasını ifade etmektedir. Dijitalleşmenin
kuruluşlar üzerindeki en büyük etkisi, bilginin daha erişilebilir ve daha şeffaf olmasını sağlamaktır
(Kuusisto, 2015). Dijital dönüşüm, işletmelerin geleneksel fikirlerini ve iş modellerini yeniden düşünmeye
teşvik ederek şirket süreçlerinin daha esnek bir yapı kazanmasına olanak sağlamaktadır.
Dijital dönüşüm, işletmelerdeki değer zincirlerini değiştirmekte ve şirketlerin iş yapma şekillerini yeniden
düşünmelerine neden olmaktadır. 2000 yılından beri Fortune 500 listesinde yer alan şirketlerin yarısından
fazlasının yok olmasının da temel nedeni dijitalleşmeye uyum sağlayamamasıdır (Ambition, 2019). Yeni
ortamda başarılı olmak için işletmelerinin mutlaka dijital dönüşümüne yönelmeleri gerekmektedir (Baur ve
Wee, 2015). Günümüzde işletmeler dijitalleşmeye uyumlu hale gelebilmek için iş süreçlerini tekrar
tasarlamaya başladılar. Son zamanlarda, uluslararası kuruluşlar hatta hükümetler bile, dijital dönüşümün
etkilerine ilişkin stratejik öngörü çalışmaları geliştirmeye başladılar (Ebert & Duarte, 2018).
Dijitalleşme, bazı araştırmacılar tarafından "ikinci makine çağı" (Brynjolfsson & McAfee, 2014) veya
"bilgisayarlaştırma" (Bowles, 2014; Frey & Osborne, 2013) olarak adlandırılırken özellikle Almanya'da
"Endüstri 4.0" terimi kullanılmaktadır. (Marnewick & Marnewick, 2020)’e göre kuruluşların iç ve dış
çevreleri dördüncü sanayi devrimi ile daha uyumlu hale geldikçe gelecekteki proje ekipleri hem insanlardan
hem de insan olmayan sistemden oluşacaktır. İşletme düzeyinde, bulut bilişim büyümekte ve şirketler sanal
ağlarda giderek daha fazla veri depolamaktadırlar. Coğu küresel şirket artık sanal ekiplerle çalışmakta ve
verilerini bölgesel merkezler arasında sürekli bir akış içinde paylaşmaktadırlar (Thiry, 2013).
Geçtiğimiz yıllarda dijitalleşme, neredeyse tüm iş alanlarında olduğu gibi proje yönetiminde de
değişikliklere yol açmıştır. Geleneksel proje yönetimi stratejilerinin, Endüstri 4.0’a uyumlu bir hale gelmesi
gerekmektedir (Nang, Thee Zin Win; Kham, 2018). Endüstri 4.0'a uyumlu bir proje yönetimi metodoloji
kullanan işletmelerin; üretkenliklerini artacak, toplam maliyetleri azaltacak ve bu durumda rekabette
avantaj kazanacaklardır.
Günümüzün proje yöneticilerinin, rekabete ayak uydurmak ve her zamankinden daha hızlı bir şekilde
teslimat yapmak için ekiplerini ve süreçlerini çevrimiçi ortama taşımaları gerekmektedir. İşletmeler,
süreçlerini Endüstri 4.0’a uyumlu hale getirirken; Endüstri 4.0'ın proje yönetimi profesyonelleri için de
International Engineering and Technology Management Summit 2021– ETMS2021
İstanbul Technical University & Bahçeşehir University
227
getirdiği yenilikler de göz önünde bulundurmalı ve bu yenilikleri mutlaka şirketlerin proje yönetim
süreçlerine dahil etmelidirler. Son yıllarda Endüstri 4.0 için nitelikli insan kaynağının yetiştirilmesi ve
mevcut insan kaynağının geliştirilmesi amacıyla üniversiteler ve eğitim merkezleri tarafından proje
yönetiminde dijital dönüşümü temel alan sertifika programları düzenlenmektedir. Aynı zamanda birçok
şirket dijital dönüşüm ile ilgili çalışmalarına sistematik bir bakış kazandırmak amacıyla dijital dönüşüm
birimlerini oluşturmaya başlamışlardır.
3. CALISMANIN KISITLARI Bu çalışmada yaşanabilecek kısıtlar arasında en önemlisi olarak, veri setine ilişkin büyüklüğün yetersizliği
olarak öngörülebilir. Bu olası durum önerilecek modelin güvenilirliğine etki etmeyecek boyuta
indirgenmeye çalışılacaktır.
4. PRATİK UYGULAMALAR Calışma, özellikle Endüstri 4.0 kavramıyla beraber dijital dönüşümün baskısı altına giren işletmelerdeki
proje yönetim unsurlarının gerek metodolojik gerekse de pratikteki uygulamaları açısından
değerlendirilmesine odaklanmıştır. Literatürle tespit edilen dijital dönüşüme ilişkin değişken ve
parametrelerin, proje yönetim süreçlerinde ne boyutta etkin olduğunun tespiti de çalışma sonucunda ortaya
çıkarılmaya çalışılacaktır. Aynı zamanda ilişkili faktörlerin birbiriyle olan ilişkisi ve bu ilişkilerin
büyüklüğünü açıklayan, pratik hayat problemlerinde etkin çözüm sunan bir model önerisi de sunulmaya
çalışılacaktır.
5. ÖZGÜNLÜK Calışmanın, ele aldığı problem, yaklaşım ve sonuçları açısından özgün olduğu değerlendirilmektedir.
Kullanılacak analiz yöntemleri açısından metodolojik bir yenilik getirmemekte olup, bilinen yöntemlerin
orijinal ve gerçek bir soruna çözüm üretmek amacıyla kullanılmaları söz konusudur.
Anahtar Kelimeler: Proje Yönetimi, Dijital Dönüşüm, Endüstri 4.0
Makale Türü: Genişletilmiş Ozet

International Engineering and Technology Management Summit 2021– ETMS2021
İstanbul Technical University & Bahçeşehir University
228
SÜRDÜRÜLEBİLİR BİYOKÜTLE ENERJİ TEDARİK ZİNCİRİ
YÖNETİMİNDEKİ ENGELLER
Hasan Dündar Mine Ömürgönülşen
Cankırı Karatekin Üniversitesi Hacettepe Üniversitesi
1. CALISMANIN AMACI Bu çalışma, yenilenebilir enerji kaynağı olarak görülen biyokütleden enerji üretimi tedarik zinciri
yönetiminde ekonomik, çevresel ve sosyal sürdürülebilirliği olumsuz etkileyen faktörlerin neler olduğunu
saptamaktır. Calışma kapsamında, yenilenebilirlik ve sürdürülebilirlik kavramları arasındaki ilişki
geleneksel tedarik zinciri yönetiminden modern tedarik zinciri yönetimine doğru tartışılarak, literatüre katkı
sağlamak amaçlanmaktadır.
2. METODOLOJİ Biyokütleden enerji üretim sürecinde sürdürülebilirliği olumsuz etkileyen unsurları tespit edebilmek için
literatürde daha önce yapılan çalışmalar incelenmiştir. Buna göre bu çalışmada, sürdürülebilirliği etkileyen
unsurlara göre karşılaşılan engeller, ekonomik, çevresel, sosyal, veri toplama, teknoloji ve süreç modelleme
ile ilgili engeller olarak sınıflandırılmıştır.
3. BULGULAR Elde edilen bulgulara göre, biyokütleden enerji üretim sürecini etkileyen en önemli unsur, doğa olaylarına
bağlı olarak üretim girdilerini etkileyen belirsizliklerdir. Ayrıca, biyokütleden enerji üretimi sürecinde
sürdürülebilirliği etkileyen kararlar, tesis, biyokütle ve nihai ürün temelli karar süreçleri olarak
sınıflandırılarak enerji üretim sürecini etkileyen faktörler basitleştirilerek özetlenmiştir.
4. ARASTIRMANIN KISITLARI Bu çalışmanın kısıtı, yalnızca literatür taraması yapılarak daha önceki çalışmaların bulguları
değerlendirilmesidir. Bundan sonra yapılacak olan çalışmalarda, sürdürülebilirlik boyutlarının tamamını
dikkate alan çok amaçlı karar destek sistemleri geliştirilerek karar vericilere fayda sağlanabilir.
5. CALISMANIN ORİJİNALLİĞİ Literatürde biyokütleden enerji üretim sürecinde tedarik zinciri yönetimi çerçevesinde sürdürülebilirliği
olumsuz etkileyen faktörlerin tespit edilmesi konusunda, bilinebildiği kadarıyla, yapılan bir çalışmaya
rastlanılmamıştır. Buradan yola çıkarak, elde edilen bulguların bundan sonra yapılacak olan çalışmalara
yol gösterici olacağı düşünülmektedir.
Anahtar Kelimeler: Sürdürülebilirlik, Biyokütle Enerji, Tedarik Zinciri Yönetimi
International Engineering and Technology Management Summit 2021– ETMS2021
İstanbul Technical University & Bahçeşehir University
229
TÜRKİYE’DE ENDÜSTRİ 4.0’A GECİS SÜRECİNDEKİ FİRMALARDA
YASANAN GÜCLÜKLERİN BELİRLENMESİNE İLİSKİN BİR ARASTIRMA
Mustafa GERŞİL Hilmi Yüksel
Celal Bayar Üniversitesi Dokuz Eylül Üniversitesi
ÖZET 2011 Hannover fuarı yeni bir sanayi devrimini tanıtıyor ve dünya üzerindeki üretim teknolojilerinin adeta
bilim kurgu filmlerindeki gibi olağanüstü bir boyuta hızla evrileceğinin ilk sinyallerini veriyordu.
2011 yılından bugüne dek geçen 10 yıl içerisinde Büyük veri, Bulut Bilişim, İşbirlikçi Robotlar, Nesnelerin
interneti (IOT), Siber Fiziksel sistemler, 3-D Yazıcılar, Sanal Gerçeklik, Arttırılmış Gerçeklik, Eklemeli
İmalat, Simülasyon vb.diğer kavramlar Dijital Uretim Teknolojilerinin kilometre taşları haline gelmiştir.
Ustelik bu kavramların büyük kısmı sadece fiziksel mal üretiminde değil, hizmet üretiminde de geniş
ölçüde yer bulmuştur.
Bu çalışmada Manisa Organize Sanayi Bölgesinde ülkemizin ilk 500 büyük sanayi kuruluşları arasında yer
alan, farklı sektörlerdeki büyük ölçekli firmaların Endüstri 4,0’a geçiş süreçleri incelenmiş, firmalarda
yetkili personellerden uzman görüşlerine başvurulmuştur. Bu bağlamda, firmaların Endüstri 4.0 geçiş
sürecinde yaşadıkları zorluklar, kullandıkları araçlar, dijital dönüşümün sonuçları hakkında katılımcılardan
bilgi alınmış, ülkemiz şartlarında bu sürece geçmeyi düşünen firmalar açısından dikkat edilmesi gereken
noktalar belirlenmeye çalışılmıştır.