August 10-13, 2020 Council Meeting Webinar Briefing Book ...
Upload
khangminh22Category
view
1download
0

6th International Water Conference Proceedings [ 3 ]
6th InternatIonalWater
ConferenCe
29th - 30th December, 2020 Islamabad
Conference Proceedings
w w w . r i p h a h . e d u . p k
Riphah Institute of Public PolicyR I P H A H I N T E R N AT I O N A L U N I V E R S I T Y

EditorsDr Rashid AftabKashif ZaheerDr Musab Yousufi
Research Coordinator Sana Naseem
ISBN 978-969-23348-6-0

6th International Water Conference Proceedings [ 5 ]
It is with great pride, enthusiasm, and anticipation that Riphah Institute of Public Policy in collaboration with Pakistan Coun-cil of Research Water Resources, The Asia Foundation and Pakistan Institute of Development Economics is publishing its second Research booklet on water related issues. An enormous amount of work has gone into the development of this booklet through organizing 06 International Water Conferences
The subject of “WATER” is of prime importance from academ-ic and development perspective and a strong hypothesis says that increased water shortages around the world will lead to war between states. It goes something like this: as water is central to all human activities, including food production, no state can allow its water resources to be compromised. Since the Global World is focusing on the world’s water crisis hence United Na-tions has also taken up the subject under SDGs 2015-30.
Pakistan once a water abundance country is now water deficit country, the challenge require to undertake concrete on holistic approach to address the precious resources i.e “water” in con-text with its availability without compromising the quality for multipurpose use and for the future generations.
This booklet summarizes those efforts in a distinct way to get aware from water issues through evidence based academic de-bates and sharing national and international expertise. I appre-ciate, the efforts done by RIPP in order to have a complete aca-demic awareness serial about “water” issues for its sustainable utilization for the socio economic development of the country.
Mr Hassan KhanChancellor
Riphah International University
6th International Water Conference Proceedings [ 5 ]

[ 6 ] 6th International Water Conference Proceedings
This booklet provides a glimpse into a few of the many quality research activities. This booklet is a compilation of outstanding papers, abstracts, and policy recommendations from numerous disciplines submitted by students & scholars who have been involved in different research activities.
Water has become Pakistan’s important issue with respect to development and governance. These issues relates with water availability in dams and rivers, Trans boundary issues, safe water issues, water for agriculture and much more. World is striving towards concept of blue economy to address these issues. This requires water to fuel our economy, create water jobs, invest in water efficient technologies, and create water markets for water savings and systems. It is necessary for Pakistan to make water as the important part of national development agenda. Therefore a comprehensive water policy is required but unfortunately, Pakistan has issues in the execution of the water policy. Academia can play a pivotal role in development of water policy through in-depth discussion on water issues and challenges observed in the society.
This booklet comprises the academia debates on water related issues being faced by Pakistan. RIPP has organized a series on climate change events to address water issues, energy issue and recommended fruitful suggestions to the authorities for the development of the country.
Prof. Dr Anis Ahmad Vice Chancellor
Riphah International University
[ 6 ] 6th International Water Conference Proceedings

6th International Water Conference Proceedings [ 7 ]
Its matter of great pleasure to appreciate the collaborators and Riphah Institute of Public Policy, for publishing these conference proceedings. Pakistan’s economy is propelled mainly by the agriculture and agro- based industry. The era of 60s brought in a green revolution along-with focused attention to the industrial sector. We, however, in the later decades neglected the basic ingredient on which both these sources were to flourish and that ingredient is WATER! We have adopted a fragmented approach thus hampering the country`s progression. With every passing day the need to build water reservoirs is being felt more than ever. Water availability for agriculture, industry and even for household is depleting and it is apprehended that we may become a water stressed country if remedial measures are not taken.
Today, countries around the world have developed plans to cater for their depleting and scarce water resources. Pakistan is blessed with a confluence of streams and rivers flowing through our land. We had inherited one of the best canal irrigation systems in the world. But we failed to take stock of the situation, as with the increase in population the need for water for cultivable land also increased. The canal system, however, was not expanded adequately to compensate for the new demand. This shortfall was met with ground pumping resulting in the decrease in the water table across the country especially in Balochistan.
Pakistan’s water storage capacity is limited to only 30 days which is reducing with time due to sedimentation. In case the new water reservoirs are not constructed, the irrigation supplies would reduce substantially to the level which we had in 60s when there were no reservoirs. This situation would create serious water conflicts in the society which can only be addressed by taking timely action. There is a need for building of large water reservoirs.
I hope this booklet will help students, scholars, policy makers and related stakeholders in formulating polices or conducting research in the water issues.
Dr. Saad Naeem Zafar Deputy Vice Chancellor
Riphah Institute of Public Policy
6th International Water Conference Proceedings [ 7 ]
[ 8 ] 6th International Water Conference Proceedings
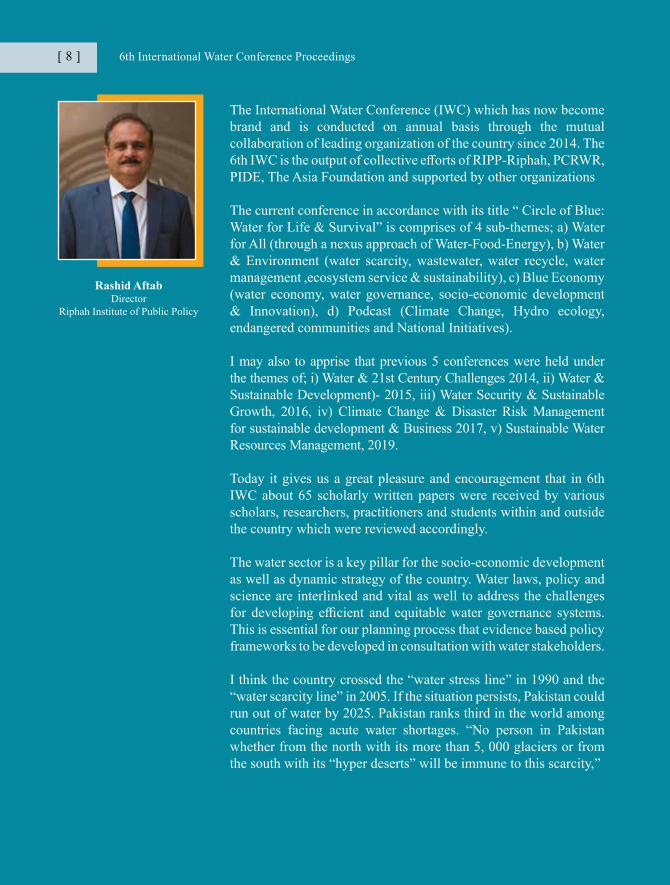
The International Water Conference (IWC) which has now become brand and is conducted on annual basis through the mutual collaboration of leading organization of the country since 2014. The 6th IWC is the output of collective efforts of RIPP-Riphah, PCRWR, PIDE, The Asia Foundation and supported by other organizations
The current conference in accordance with its title “ Circle of Blue: Water for Life & Survival” is comprises of 4 sub-themes; a) Water for All (through a nexus approach of Water-Food-Energy), b) Water& Environment (water scarcity, wastewater, water recycle, water management ,ecosystem service & sustainability), c) Blue Economy (water economy, water governance, socio-economic development & Innovation), d) Podcast (Climate Change, Hydro ecology, endangered communities and National Initiatives).
I may also to apprise that previous 5 conferences were held under the themes of; i) Water & 21st Century Challenges 2014, ii) Water & Sustainable Development)- 2015, iii) Water Security & Sustainable Growth, 2016, iv) Climate Change & Disaster Risk Management for sustainable development & Business 2017, v) Sustainable Water Resources Management, 2019.
Today it gives us a great pleasure and encouragement that in 6th IWC about 65 scholarly written papers were received by various scholars, researchers, practitioners and students within and outside the country which were reviewed accordingly.
The water sector is a key pillar for the socio-economic development as well as dynamic strategy of the country. Water laws, policy and science are interlinked and vital as well to address the challenges for developing efficient and equitable water governance systems. This is essential for our planning process that evidence based policy frameworks to be developed in consultation with water stakeholders.
I think the country crossed the “water stress line” in 1990 and the “water scarcity line” in 2005. If the situation persists, Pakistan could run out of water by 2025. Pakistan ranks third in the world among countries facing acute water shortages. “No person in Pakistan whether from the north with its more than 5, 000 glaciers or from the south with its “hyper deserts” will be immune to this scarcity,”
Rashid Aftab Director
Riphah Institute of Public Policy
[ 8 ] 6th International Water Conference Proceedings
6th International Water Conference Proceedings [ 9 ]
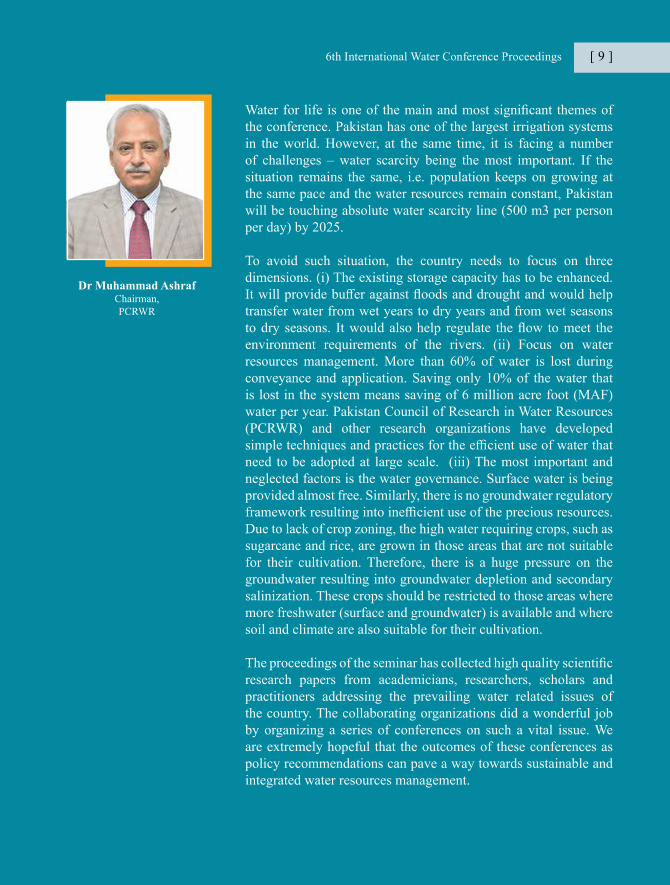
Water for life is one of the main and most significant themes of the conference. Pakistan has one of the largest irrigation systems in the world. However, at the same time, it is facing a number of challenges – water scarcity being the most important. If the situation remains the same, i.e. population keeps on growing at the same pace and the water resources remain constant, Pakistan will be touching absolute water scarcity line (500 m3 per person per day) by 2025.
To avoid such situation, the country needs to focus on three dimensions. (i) The existing storage capacity has to be enhanced. It will provide buffer against floods and drought and would help transfer water from wet years to dry years and from wet seasons to dry seasons. It would also help regulate the flow to meet the environment requirements of the rivers. (ii) Focus on water resources management. More than 60% of water is lost during conveyance and application. Saving only 10% of the water that is lost in the system means saving of 6 million acre foot (MAF) water per year. Pakistan Council of Research in Water Resources (PCRWR) and other research organizations have developed simple techniques and practices for the efficient use of water that need to be adopted at large scale. (iii) The most important and neglected factors is the water governance. Surface water is being provided almost free. Similarly, there is no groundwater regulatory framework resulting into inefficient use of the precious resources. Due to lack of crop zoning, the high water requiring crops, such as sugarcane and rice, are grown in those areas that are not suitable for their cultivation. Therefore, there is a huge pressure on the groundwater resulting into groundwater depletion and secondary salinization. These crops should be restricted to those areas where more freshwater (surface and groundwater) is available and where soil and climate are also suitable for their cultivation.
The proceedings of the seminar has collected high quality scientific research papers from academicians, researchers, scholars and practitioners addressing the prevailing water related issues of the country. The collaborating organizations did a wonderful job by organizing a series of conferences on such a vital issue. We are extremely hopeful that the outcomes of these conferences as policy recommendations can pave a way towards sustainable and integrated water resources management.
Dr Muhammad AshrafChairman, PCRWR
6th International Water Conference Proceedings [ 9 ]
[ 10 ] 6th International Water Conference Proceedings
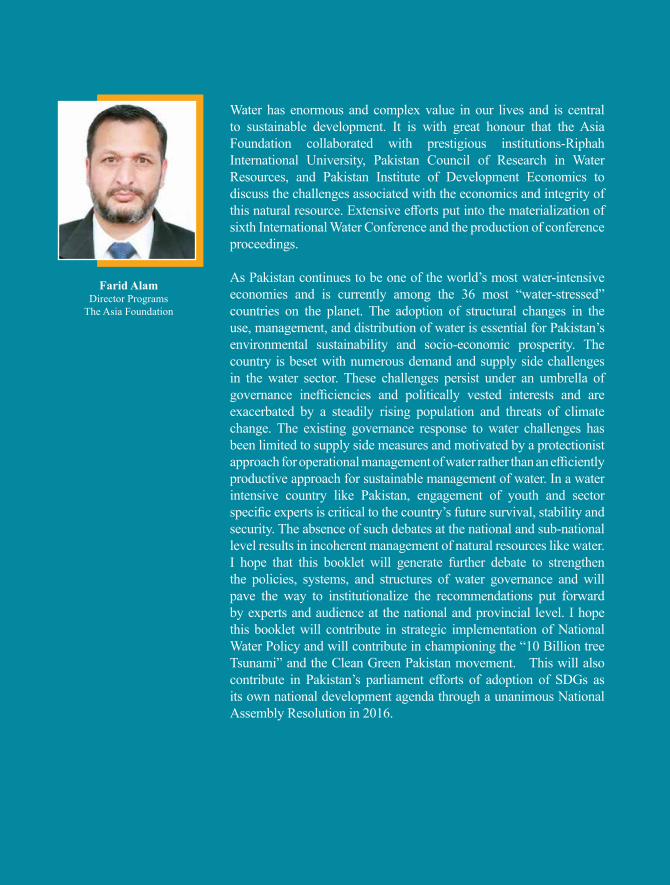
Water has enormous and complex value in our lives and is central to sustainable development. It is with great honour that the Asia Foundation collaborated with prestigious institutions-Riphah International University, Pakistan Council of Research in Water Resources, and Pakistan Institute of Development Economics to discuss the challenges associated with the economics and integrity of this natural resource. Extensive efforts put into the materialization of sixth International Water Conference and the production of conference proceedings.
As Pakistan continues to be one of the world’s most water-intensive economies and is currently among the 36 most “water-stressed” countries on the planet. The adoption of structural changes in the use, management, and distribution of water is essential for Pakistan’s environmental sustainability and socio-economic prosperity. The country is beset with numerous demand and supply side challenges in the water sector. These challenges persist under an umbrella of governance inefficiencies and politically vested interests and are exacerbated by a steadily rising population and threats of climate change. The existing governance response to water challenges has been limited to supply side measures and motivated by a protectionist approach for operational management of water rather than an efficiently productive approach for sustainable management of water. In a water intensive country like Pakistan, engagement of youth and sector specific experts is critical to the country’s future survival, stability and security. The absence of such debates at the national and sub-national level results in incoherent management of natural resources like water. I hope that this booklet will generate further debate to strengthen the policies, systems, and structures of water governance and will pave the way to institutionalize the recommendations put forward by experts and audience at the national and provincial level. I hope this booklet will contribute in strategic implementation of National Water Policy and will contribute in championing the “10 Billion tree Tsunami” and the Clean Green Pakistan movement. This will also contribute in Pakistan’s parliament efforts of adoption of SDGs as its own national development agenda through a unanimous National Assembly Resolution in 2016.
Farid AlamDirector Programs
The Asia Foundation

6th International Water Conference Proceedings [ 11 ]
Water is at the core of life and is critical for socio-economic development, energy and food production, healthy ecosystems and for human survival itself. Around 1.2 billion people, or almost one-fifth of the world’s population, live in areas of physical scarcity, and 500 million people are approaching this situation. Another 1.6 billion people, or almost one quarter of the world’s population, face economic water shortage (where countries lack the necessary infrastructure to take water from rivers and aquifers). At global level 2.1 billion people lack access to safely managed drinking water services and 4.5 billion people lack safely managed sanitation services. Globally 340,000 children under five die every year from diarrheal diseases.
Water associated issues are amongst the key challenges faced by Pakistan. Water (Quantity/Quality) crisis we are probably missing the real point in that all that is done to ensure security of supply is done largely on the basis of this fundamental understanding that the country is generally not endowed with water resources. With increased development pressure, we are bound to have serious challenges of increased pollution and higher demands on water supply whichever angle we look at it – infrastructure development and maintenance, resource protection, water services provision, climate change impact, water and energy, water governance, water pricing and so on.
We can indeed argue about concepts and theoretical constructs of the business of water, however, the bottom line is that we have no choice except judiciously managing the resources and ensure provision of the services in a manner that improves the lives of our people in a sustainable manner. The level of awareness of conservation and demand management has to increase significantly if we are to succeed.
The 6th International water conference (6IWC) was organized with the collective efforts of PIDE, Riphah Institute of Public Policy, Riphah International University, PCRWR and Asia Foundation to highlight the primary and secondary issues in Water Quantity/Quality of Pakistan. The Conference helped to evaluate some of the existing productivity strategies in accordance with national requirements for Agriculture, Industry and municipal Sector and its effective and efficient utilization. This 6IWC served as a platform for experts, academics and practitioners for the scientific deliberation through an institutional approach to highlight the key grey areas and viable strategies to address these challenges. In the light of the conference deliberations, a policy perspective for the water sector to be developed for an effective management of water resources.
Dr. Junaid Alam MemonDirector, Pakistan Institute of
Development Economics (PIDE)

6th International Water Conference Proceedings [ 13 ]
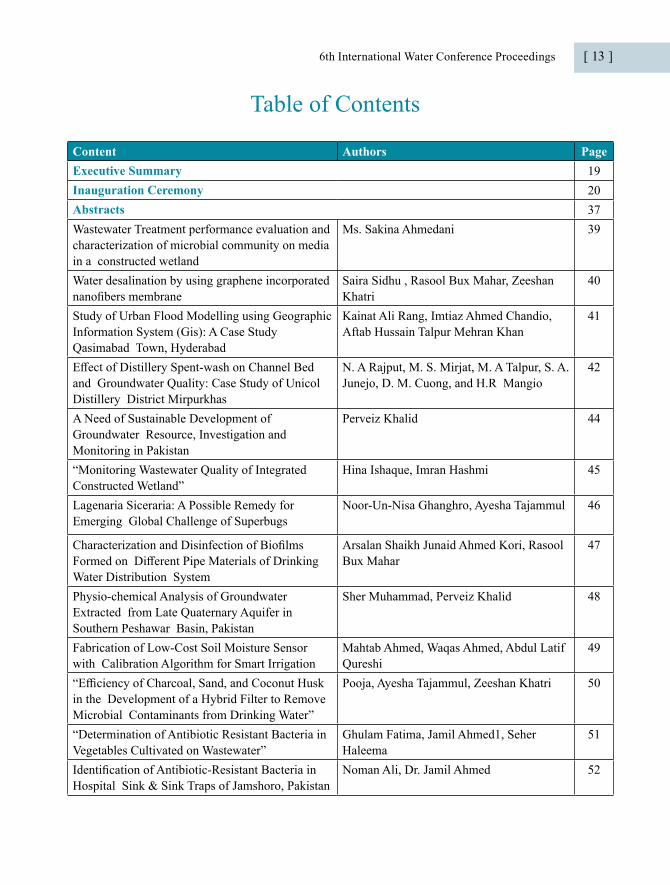
Table of Contents
Content Authors PageExecutive Summary 19Inauguration Ceremony 20Abstracts 37Wastewater Treatment performance evaluation and characterization of microbial community on media in a constructed wetland
Ms. Sakina Ahmedani 39
Water desalination by using graphene incorporated nanofibers membrane
Saira Sidhu , Rasool Bux Mahar, Zeeshan Khatri
40
Study of Urban Flood Modelling using Geographic Information System (Gis): A Case Study Qasimabad Town, Hyderabad
Kainat Ali Rang, Imtiaz Ahmed Chandio, Aftab Hussain Talpur Mehran Khan
41
Effect of Distillery Spent-wash on Channel Bed and Groundwater Quality: Case Study of Unicol Distillery District Mirpurkhas
N. A Rajput, M. S. Mirjat, M. A Talpur, S. A. Junejo, D. M. Cuong, and H.R Mangio
42
A Need of Sustainable Development of Groundwater Resource, Investigation and Monitoring in Pakistan
Perveiz Khalid 44
“Monitoring Wastewater Quality of Integrated Constructed Wetland”
Hina Ishaque, Imran Hashmi 45
Lagenaria Siceraria: A Possible Remedy for Emerging Global Challenge of Superbugs
Noor-Un-Nisa Ghanghro, Ayesha Tajammul 46
Characterization and Disinfection of Biofilms Formed on Different Pipe Materials of Drinking Water Distribution System
Arsalan Shaikh Junaid Ahmed Kori, Rasool Bux Mahar
47
Physio-chemical Analysis of Groundwater Extracted from Late Quaternary Aquifer in Southern Peshawar Basin, Pakistan
Sher Muhammad, Perveiz Khalid 48
Fabrication of Low-Cost Soil Moisture Sensor with Calibration Algorithm for Smart Irrigation
Mahtab Ahmed, Waqas Ahmed, Abdul Latif Qureshi
49
“Efficiency of Charcoal, Sand, and Coconut Husk in the Development of a Hybrid Filter to Remove Microbial Contaminants from Drinking Water”
Pooja, Ayesha Tajammul, Zeeshan Khatri 50
“Determination of Antibiotic Resistant Bacteria in Vegetables Cultivated on Wastewater”
Ghulam Fatima, Jamil Ahmed1, Seher Haleema
51
Identification of Antibiotic-Resistant Bacteria in Hospital Sink & Sink Traps of Jamshoro, Pakistan
Noman Ali, Dr. Jamil Ahmed 52

[ 14 ] 6th International Water Conference Proceedings
Content Authors PageAssessment of Indoor Air Quality In Term of Microorganisms In Uspcas-W
Danish Ahmed khokhar, Imtiaz Ali, Aqsa Channa, Aneera Latif, Kantesh Ahmed, Rija Shakir
53
Estimation of Actual Evapotranspiration Using Satellite Data: A Case Study of Wheat Crop in the Khairpur East Canal Command Area During 2017-2019
Zenobia Talpur, Nabeel Ali Khan, Arjumand Z. Zaidi
54
Removal of Arsenic from Drinking Water using Peanut Shell Biomass
Attiqa Nizamania, Ayesha Tajammula, Zeeshan Khatrib
55
Development of Envelope Curve for Chenab, Ravi and Sutlej River basins and Estimation of Upper Bound
Muhammad Muneeb Khan, Muhammad Waseem, Noor Muhammad Khan, Numan Zahid Khan
56
Pakistan Water Crisis and Behavioral Approach of Denizens Towards its Conservation on the Bank of River Kabul
Suleman Amin & Zilakat Khan Malik 57
Fixed Bed Column Study for Water Defluoridation through Bio-Adsorbent Material
Abdul Manan, Altaf Hussain 58
Water for All: Food – Energy – Water - Nexus Ms. Rubina Jaffri, Noor Muhammad Baloch, Zaffar Tahir
59
Review on: Silent and Salient Effects of Diverse Water Contamination and Depletion on Animal
Muhammad Sulman Ali Taseer, Muhammad Younus Rana, Muhammad Muddassir Ali, Raheela Akhtar, Qaiser Akram, Muhammad Asif Idrees, Beenish Zahid
60
Prevalence of antibiotic-resistant bacteria in the household sanitary systems of Hyderabad Sindh
Maheen Shaikh 61
Monitoring of canal water quality using SEBA Hydrometrie, MPS K-16
Abdul Moiz, Shahbaz Nasir Khan and Naveed Ahmad Khan
62
Impact of Groundwater Use on the Health of Rural Households
Muhammad Salman Awan Muhammad Ashfaq
63
Assessment of Microbial Quality of Water used by Poultry Slaughtering Facilities in Association with Sanitation Conditions and Hygienic Status of
Sadaf Tagar and Naveed Ahmed 64
Exploring the Phytoaccumulation Efficiency of Various Wetland Plant Species to Remove Chromium in Constructed Wetlands
Fazila Younas, Irshad Bibi, Nabeel Khan Niazi, Muhammad Afzal, Safdar Bashir Zubair Aslam and Muhammad Mahroz Hussain
65
Chromium concentration, its speciation and geochemical behavior in tannery industry wastewater of district Kasur, Punjab, Pakistan
Fazila Younas, Irshad Bibi, Nabeel Khan Niazi, Muhammad Afzal, Safdar Bashir Zubair Aslam and Muhammad Mahroz Hussain
66

6th International Water Conference Proceedings [ 15 ]
Content Authors PageEvaluating the antimicrobial activity using Punica granatum plant species against Microbes
Bakhtawar Pirzada, Ayesha Tajammul Zubair Ahmed
67
Arsenic-contaminated Irrigation Impact on Growth and Uptake of Arsenic in Different Rice Genotypes
Muhammad Mahroz Hussaina, Irshad Bibia, Nabeel Khan Niazia,b,, Jorg Rinklebec, Muhammad Farrakh Nawazd, Safdar Bashire, Fazila Younas
68
Targeting Arsenic Safe Drinking Water Wells by using Sediments colour tool of Punjab, Pakistan
Muhammad Mahroz Hussain1, Irshad Bibi, Nabeel Khan Niazi, Muhammad Farrakh Nawaz, Jörg Rinklebe, Safdar Bashir, Zubair Aslam, Fazila Younas
69
Assessment of Water Sanitation and Hygiene and Water Quality in Primary Schools to Estimate The Risk of Waterborne Diseases
Jamil Ahmeda, Li Ping Wonga, Yan Piaw Chuac, Joshua V. Garnd
70
UASB: an approach towards Wastewater Treatment
Muhammad Touseef, Shahbaz Nasir Khan, Muhammad Umer, Touseef Ahmad Babar De
71
Dr. Amjad Hayat 72
Proposal of Canal Top Solar PV Plant for Reducing Capital Cost and Evapouration of Water
Fahad Javaid 74
Spatial Crop Management Using Remotely Sensed Soil Moisture Contents Estimation Under Semi-Arid Condition
Kinza Farooq, Muhammad Naveed Tahir 75
Water, Women Everywhere, but Not a Drop to Drink?’ Reading Saraswati and Paroshni as Allegories for Water Governance, Ecofeminism and Environmental Activism in Mustansar Hussain Tarar’s ‘Bahao’
Raza Naeem 76
Utilizaion of Spent Wash and its Impact on Soil Properties and Wheat Growth
Ashique A Chohan 77
Wastewater Monitoring of Integrated Constructed Wetland
Hina Ishaque, Imran Hashmi 78
Assessment of Biotoxicity Potential of Lambda Cyhalothrin on Common Carp
Mehwish Niaz, Imran Hashmi 79
Analysis of Biofilm Formation along the Surface of Galvanized iron pipe in a Drinking Water Distribution System
Huda Kamal, Imran Hashmi 80
Evaluating the Biotoxicity Potential and Photodegradation of Sulfamethoxazole in Water Using Common Carp
Laraib Shahid, Imran Hashmi 81
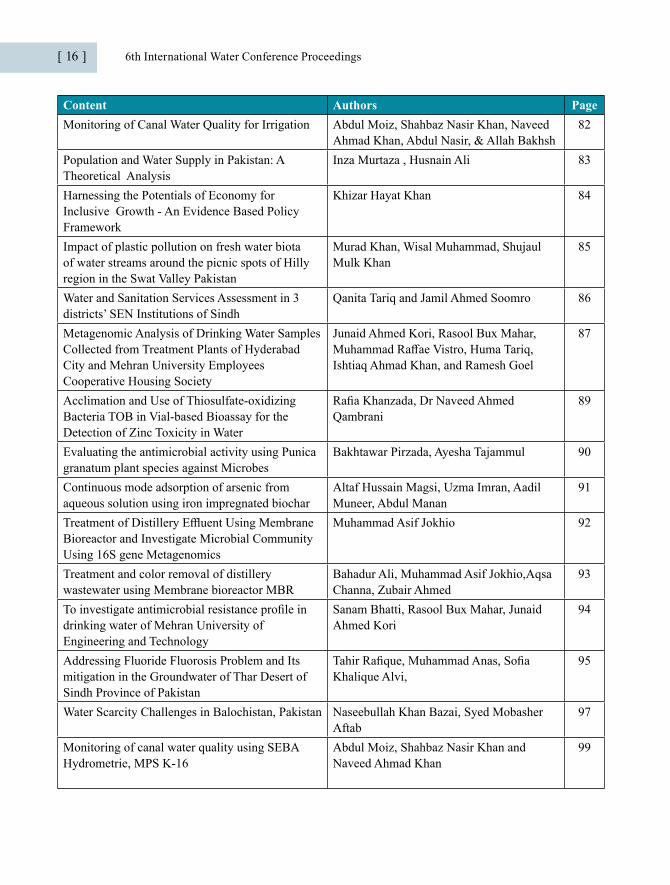
[ 16 ] 6th International Water Conference Proceedings
Content Authors PageMonitoring of Canal Water Quality for Irrigation Abdul Moiz, Shahbaz Nasir Khan, Naveed
Ahmad Khan, Abdul Nasir, & Allah Bakhsh82
Population and Water Supply in Pakistan: A Theoretical Analysis
Inza Murtaza , Husnain Ali 83
Harnessing the Potentials of Economy for Inclusive Growth - An Evidence Based Policy Framework
Khizar Hayat Khan 84
Impact of plastic pollution on fresh water biota of water streams around the picnic spots of Hilly region in the Swat Valley Pakistan
Murad Khan, Wisal Muhammad, Shujaul Mulk Khan
85
Water and Sanitation Services Assessment in 3 districts’ SEN Institutions of Sindh
Qanita Tariq and Jamil Ahmed Soomro 86
Metagenomic Analysis of Drinking Water SamplesCollected from Treatment Plants of Hyderabad City and Mehran University Employees Cooperative Housing Society
Junaid Ahmed Kori, Rasool Bux Mahar, Muhammad Raffae Vistro, Huma Tariq, Ishtiaq Ahmad Khan, and Ramesh Goel
87
Acclimation and Use of Thiosulfate-oxidizing Bacteria TOB in Vial-based Bioassay for the Detection of Zinc Toxicity in Water
Rafia Khanzada, Dr Naveed Ahmed Qambrani
89
Evaluating the antimicrobial activity using Punicagranatum plant species against Microbes
Bakhtawar Pirzada, Ayesha Tajammul 90
Continuous mode adsorption of arsenic from aqueous solution using iron impregnated biochar
Altaf Hussain Magsi, Uzma Imran, Aadil Muneer, Abdul Manan
91
Treatment of Distillery Effluent Using MembraneBioreactor and Investigate Microbial Community Using 16S gene Metagenomics
Muhammad Asif Jokhio 92
Treatment and color removal of distillery wastewater using Membrane bioreactor MBR
Bahadur Ali, Muhammad Asif Jokhio,Aqsa Channa, Zubair Ahmed
93
To investigate antimicrobial resistance profile indrinking water of Mehran University of Engineering and Technology
Sanam Bhatti, Rasool Bux Mahar, Junaid Ahmed Kori
94
Addressing Fluoride Fluorosis Problem and Its mitigation in the Groundwater of Thar Desert of Sindh Province of Pakistan
Tahir Rafique, Muhammad Anas, Sofia Khalique Alvi,
95
Water Scarcity Challenges in Balochistan, Pakistan Naseebullah Khan Bazai, Syed Mobasher Aftab
97
Monitoring of canal water quality using SEBAHydrometrie, MPS K-16
Abdul Moiz, Shahbaz Nasir Khan and Naveed Ahmad Khan
99
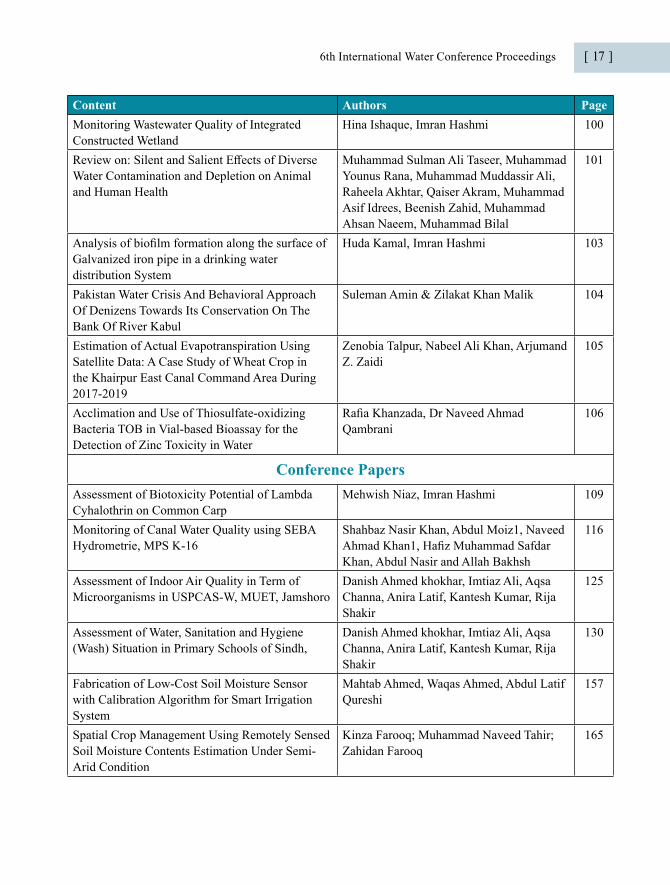
6th International Water Conference Proceedings [ 17 ]
Content Authors PageMonitoring Wastewater Quality of IntegratedConstructed Wetland
Hina Ishaque, Imran Hashmi 100
Review on: Silent and Salient Effects of Diverse Water Contamination and Depletion on Animal and Human Health
Muhammad Sulman Ali Taseer, Muhammad Younus Rana, Muhammad Muddassir Ali, Raheela Akhtar, Qaiser Akram, Muhammad Asif Idrees, Beenish Zahid, Muhammad Ahsan Naeem, Muhammad Bilal
101
Analysis of biofilm formation along the surface ofGalvanized iron pipe in a drinking water distribution System
Huda Kamal, Imran Hashmi 103
Pakistan Water Crisis And Behavioral Approach Of Denizens Towards Its Conservation On The Bank Of River Kabul
Suleman Amin & Zilakat Khan Malik 104
Estimation of Actual Evapotranspiration Using Satellite Data: A Case Study of Wheat Crop in the Khairpur East Canal Command Area During 2017-2019
Zenobia Talpur, Nabeel Ali Khan, Arjumand Z. Zaidi
105
Acclimation and Use of Thiosulfate-oxidizing Bacteria TOB in Vial-based Bioassay for the Detection of Zinc Toxicity in Water
Rafia Khanzada, Dr Naveed Ahmad Qambrani
106
Conference Papers Assessment of Biotoxicity Potential of Lambda Cyhalothrin on Common Carp
Mehwish Niaz, Imran Hashmi 109
Monitoring of Canal Water Quality using SEBA Hydrometrie, MPS K-16
Shahbaz Nasir Khan, Abdul Moiz1, Naveed Ahmad Khan1, Hafiz Muhammad SafdarKhan, Abdul Nasir and Allah Bakhsh
116
Assessment of Indoor Air Quality in Term of Microorganisms in USPCAS-W, MUET, Jamshoro
Danish Ahmed khokhar, Imtiaz Ali, Aqsa Channa, Anira Latif, Kantesh Kumar, Rija Shakir
125
Assessment of Water, Sanitation and Hygiene (Wash) Situation in Primary Schools of Sindh,
Danish Ahmed khokhar, Imtiaz Ali, Aqsa Channa, Anira Latif, Kantesh Kumar, Rija Shakir
130
Fabrication of Low-Cost Soil Moisture Sensor with Calibration Algorithm for Smart Irrigation System
Mahtab Ahmed, Waqas Ahmed, Abdul Latif Qureshi
157
Spatial Crop Management Using Remotely Sensed Soil Moisture Contents Estimation Under Semi-Arid Condition
Kinza Farooq; Muhammad Naveed Tahir; Zahidan Farooq
165
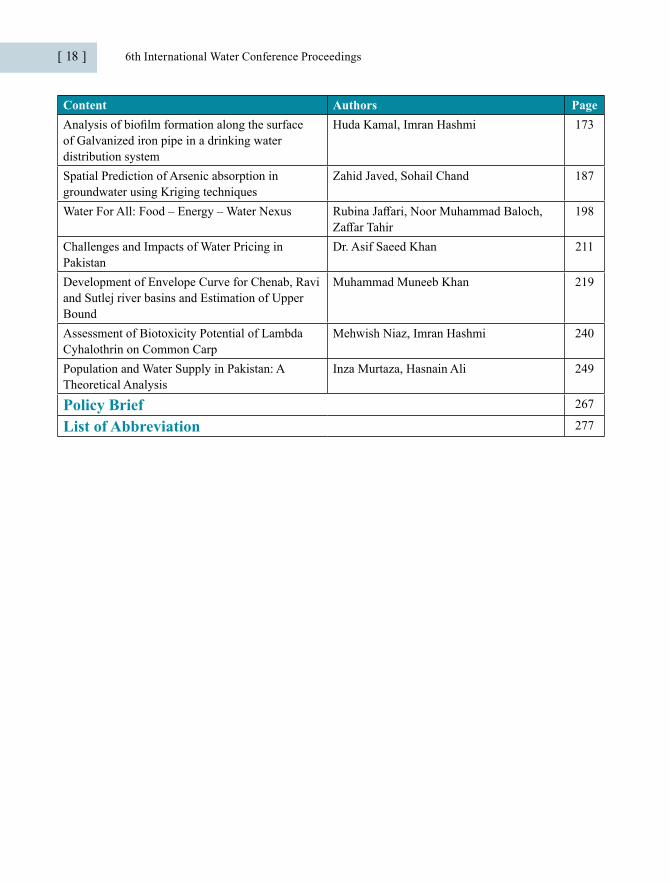
[ 18 ] 6th International Water Conference Proceedings
Content Authors PageAnalysis of biofilm formation along the surface of Galvanized iron pipe in a drinking water distribution system
Huda Kamal, Imran Hashmi 173
Spatial Prediction of Arsenic absorption in groundwater using Kriging techniques
Zahid Javed, Sohail Chand 187
Water For All: Food – Energy – Water Nexus Rubina Jaffari, Noor Muhammad Baloch, Zaffar Tahir
198
Challenges and Impacts of Water Pricing in Pakistan
Dr. Asif Saeed Khan 211
Development of Envelope Curve for Chenab, Ravi and Sutlej river basins and Estimation of Upper Bound
Muhammad Muneeb Khan 219
Assessment of Biotoxicity Potential of Lambda Cyhalothrin on Common Carp
Mehwish Niaz, Imran Hashmi 240
Population and Water Supply in Pakistan: A Theoretical Analysis
Inza Murtaza, Hasnain Ali 249
Policy Brief 267
List of Abbreviation 277

6th International Water Conference Proceedings [ 19 ]
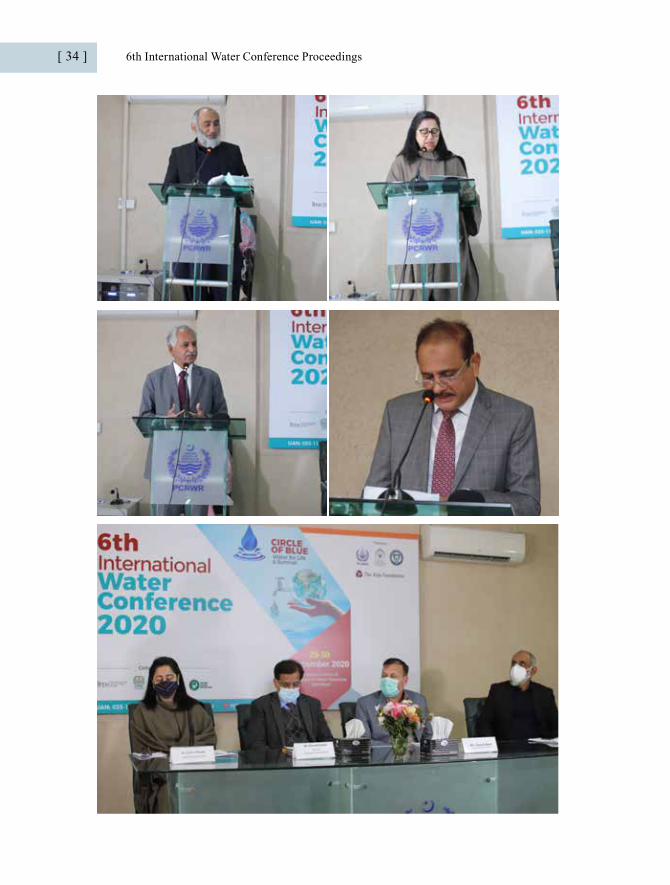
The “6th International Water Conference (6IWC)-2020” was organized by Riphah Institute of Public Policy, Riphah International University in collaboration with; Pakistan Council of Research in Water Resources (PCRWR), The Asia Foundation and Pakistan Institute of Development Economics (PIDE) from 28-29 December, 2020, Islamabad.The conference brought together scholars, policy makers, academicians, researchers, public officials, technologists, students, research and development organizations, Universities, developmental sectors to deliberate, discuss and share their expertise to understand the dynamics and challenges of Water Quantity and Quality and viable action plans and interventions for the sustainable utilization of water resources.The physical inaugural session of the conference was Co-chaired by; Mr. Ahmad Kamal, Chairman Federal Flood Commission, Dr. Muhammad Ashraf, Chairman PCRWR, Prof. Dr. Durre Nayab, Acting Vice Chancellor, PIDE, Mr. Fareed Alam, Director Programs, The Asia Foundation and Prof Dr. Saad Nadeem Zafar, Deputy Vice Chancellor, Riphah International University, Islamabad. The speakers stressed that, the water plays is a major component in the blue economy hence its pricing has to be rationalized. Further there is need of effective and judicious utilization of water resources and its management in accordance with demand driven model and setting national priorities and vibrant institutional framework. There is an urgent need to minimize the water losses and to make the system more efficient by using new innovative technologies and methods of Water Governance. The WEF (water-energy-food) Nexus approach has to pursue, which is critical for optimal scenarios and specific dynamic resource interlinkages between the sectors in order to reap positive synergies and to effectively manage tradeoffs.The inaugural session followed by 62 virtual paper presentations by the national/international scholars in accordance with the following four sub-themes of the conference:Theme 1: Water for All: Food, Energy, Water Quality Management, Health of Living BeingsTheme 2: Water & Environment: Water and Wastewater Treatment, Water Recycling, Water Management, Ecosystem Service and SustainabilityTheme 3: Blue Economy: Water Economy, Socio- Economic Development and Innovation in Water SectorTheme 4: H2O Podcast: Climate Change, Hydro ecology, Survival of endangered communities and national Initiatives.In order to realize and highlight the global, regional and national water actions & initiatives related to food –energy nexus, sustainable utilization of blue resources and maintenance of hydro ecological integrity while utilizing the aforementioned strengths, the organizers of the conference attempted to accomplish the goals and targets of the conference effectively.Another imperative aim of the conference is to encourage participation of various stakeholders and edify their roles by solving water related problems through policy initiatives and voluntary actions at all levels. Secondly, another purpose is to deliver the clear message to all Blue users’ communities to save the Shrinking Circle of Blue.
Executive Summary of 6IWC

[ 20 ] 6th International Water Conference Proceedings
Riphah Institute of Public Policy, Riphah International University organized Its 6th International Water Conference (6IWC) from 29-30 December, 2020 in collaboration with leading water related organizations. Pakistan Council of Research in Water Resources (PCRWR), The Asia Foundation and Pakistan Institute of Development Economics.
The inaugural session of the 6IWC was held on 29th December 2020 at PCRWR Headquarters Islamabad. Dr. Rashid Aftab (Director Riphah Institute of Public Policy) delivered the welcome note and introduced the Riphah and legacy of IWCs which being organized by RIPP on regular annual basis since 2014 and has now become a national brand.
He said, the IWC which has become brand and is conducted on annual basis in collaboration of leading organization of the country since 2014. The 6IWC is the output of collective efforts of RIPP-Riphah, PCRWR, PIDE, TAF and supported by other organization like IPDS and RIP. He added, I may also to apprise that previous 5 conferences were held under the themes of; i) Water & 21st Century Challenges-June-2014, ii) Water and Sustainable Development)-June-2015, iii) Water Security & Sustainable Growth-Agust-2016, iv) Climate Change & Disaster Risk Management for sustainable development & BusinessesDec-2017, v) Sustainable Water Resources Management.-Jan-2019. It gives us a great pleasure and encouragement that in 6th IWC about 65 scholarly written papers were received by various scholars, researchers, practitioners and students within and outside the country which were reviewed accordingly.
He further emphasized, the water sector is a key pillar for the socio-economic development as well as dynamic strategy of the country. Water laws, policy and science are interlinked and vital as well to address the challenges for developing efficient and equitable water governance systems. This is essential for our planning process that evidence based policy frameworks to be developed in consultation with water stakeholders. I think the country crossed the “water stress line” in 1990 and the “water scarcity line” in 2005. If the situation persists, Pakistan could run out of water by 2025. Pakistan ranks third in the world among countries facing acute water shortages.
Inaugural Session
6th International Water Conference Proceedings [ 21 ]
No person in Pakistan whether from the north with its more than 5, 000 glaciers or from the south with its “hyper deserts” will be immune to this scarcity,” On the other hand Pakistan has the world’s fourth highest rate of water use. No country’s economy is more water-intensive than that of Pakistan. The bulk of Pakistan’s farmland is irrigated through the world’s largest canal network. Agriculture consumes almost all annual available surface water which is largely not taxed and the issue has been intensified by climate change as well as lacks the infrastructure to save floodwater.
Another challenge is “water politics”. The impact of the water crisis has been immense and are actually fighting for resources. Around 65 per cent of water from the Indus and its tributaries flows through Punjab and Sindh while Khyber Pakhtun Khwa and Balochistan are deprived of their fair share of water. The head-works of the canals from Ravi and Sutlej are situated in India. Despite the 1960 Indus water treaty, India holds back water during summer. The construction of India’s Kishan-Ganga project will have a great impact on the water supply and will speed up water scarcity issue to an alarming level. The groundwater - the last resort of water supplies -- is being rapidly depleted. A bigger issue is water wastage that occurs at many levels. It is now for us to direct efforts to save water. Formulation of a national action plan, devising a realistic strategy with a population-based distribution of water, reducing water losses from seepage and controlled drainage of underground aquifers are all steps that need to be taken. It is important to spread awareness among the masses. Recycling at household level should be done on a daily basis. Rainwater barrels should be exploited. He gave some aspects of Policy vs Reality and said, The country tethering on the edge of water scarcity ought to de-incentivise the growing of water-intensive crops.
The KPK acknowledges that irrigated agriculture is the backbone of the economy and consumes around 95 percent of the water resources. Furthermore, around one million tube wells in the country pump about 55 MAF of underground water for irrigation, which is 20 percent more than what’s available from canals— signalling how highly water-intensive the agriculture sector is. This is all unsustainable. On the other hand, while there is great water wastage in the rural sector, providing potable water to the cities has become a challenge.
One of the more achievable targets set by the KPK is the access to clean and safe drinking water and sanitation facilities for all. Towards that end, the policy has also urged the promotion of greater urban water management and revision of urban water tariffs. It also encourages enhancing recovery and reducing system losses, treatment of industrial effluents and provision of sustainable supply of water for everyone. But it is still the agricultural sector whose water utilization needs to be under the microscope. Till now, the policy seems divorced from the Financial compulsions of those whose livelihoods are associated with the agricultural sector. If the water policy will help address the indiscriminate wastage of this precious resource, but our systems are inefficient. The National Water Policy does spell a range of issues with respect to water but it doesn’t have details that can help to operationalize it.

[ 22 ] 6th International Water Conference Proceedings
In context with China Pakistan Economic Corridor (CPEC), investments are going to increase,” the question about how CPEC is going to integrate with water demands and we should know the supply and demand side. There is also need that NWP to be linked with national, regional and international commitments such as Pakistan’s Vision 2025 and Sustainable Development Goals (SDGs) and a nexus approach of WFE to be adopted. This is very much imperative that Policy decisions at all levels are required to be increasingly multifaceted especially in the light of socio-economic and technical reforms and the need to ensure that decision-making contributes to sustainability in the development process. He said, I hope this conference will provide and effective platform to engage eminent scholars, emerging scholars, practitioners, researcher,s policy actors and students to share their knowledge and expertise through deliberation, exchange of ideas and discussion.
Mr. Ahmad Kamal, Chairman Federal Flood Commission, Govt of Pakistan was the chief guest of the inaugural session and speaking on the occasion he rendered that generating knowledge, awareness and knowledge management is crucial for good water resources management in the country and highlighted various initiatives pertaining to water resources to enhance the capacity and utilization in terms of demand and supply.
Dr. Muhammad Ashraf, Chairman PCRWR stressed on the importance of setting research priorities according to the issues in hand, which is water scarcity and prevailing scenario of unfair utilization of water resources. Usage of water can be efficiently enhanced with integrated manner. Pakistan can undo the myth of water scarcity issue with this technique. In flash floods of 2010, 2014 it is being observed after 30 days it was said that Mangla and Tarbalial meets the deadlines. In these floods we lost 90 million hector water that is equal to 90 million US dollar. Pakistan is among the top 10 climate change effected of the globe. This is challenge for us to transfer the water from wet season to dry year. Now in the world the countries have started integrated water resources. They are shifting excess water from excessive basins to lower water areas.
We normally losses more than 60% in the procedures, systems and mechanizing of water delivery towards the irrigation land. Only 04 crops take 80% of the water. We are exporting rice at the cost of fresh water and importing edible oil. Sugar cane also consumes major chunk of water. We don’t have appropriate water techniques, tools, cropping patterns and consuming behavior. There are more consequences on the eco system. We pump water from the ground and waste it into national canals. We are polluting our own eco system. Whatever you give to the nature, the nature responds. There is need of behavior change and crop mix in the agriculture system. In addition we have one of the highly inefficient industrial sectors in context of water usage. They are no check on them for water usage and resultantly they are consuming water as free commodity. Water governance is one of the important and neglected areas. Water sector is unregulated in our country. Ground water usage is one of the examples for that. Any person can plant any pump in their areas. They can use and even sale the water to their fellows. Water is a common commodity and needs water recharging. Water recharging is very costly and needs
6th International Water Conference Proceedings [ 23 ]
regulations at the provincial and federal level. Population management, water governance, behaviors and cropping patterns can help the nation in avoiding the water scarcity.
Prof Dr. Saad Naeem Zafar, Deputy Vice Chancellor, Riphah International University stressed on the need of the application of new technological application like Artificial Intelligence and Data Sciences for the water sector for intelligent decision making.
He started his talk with the Hadees narrated by Hazrat Abdullah ibn Amr reported that once the Messenger of Allah (peace an blessings be upon him) passed by Sa’d (Allah have blessing on him) while he was performing ablution. The Prophet said, “What is this extravagance?” Sa’d said (Allah have blessing on him), “Is there extravagancewith water in ablution?” The Prophet said, “Yes even if you were on the banks of a flowing river.” (Sunan Ibn Majah 425).
He said, I feel privileged to be part of the two days 6th international Water Conference organized jointly by RIPP-RIU, Pakistan Council of Research in Water Resource, The Asia Foundation and Pakistan Institute of Development Economics. Our country is endowed with mountains in the north and to the Arabian Sea in the south. Nature has been very kind in providing us all kinds of natural resources including abundance of water. We were quite sufficient in our per capita water availability in the early decades after independence, however, it has declined five times at present. Pakistan’s economy is propelled mainly by the agriculture and agro-based industry. The era of 60s brought in a green revolution along attention to the industrial sector. We, however, in the later decades neglected the basic ingredient on which both these sources were to flourish and that ingredient is WATER! We have adopted a fragmented approach hampering the country`s progression. With every passing day the need to build water reservoirs is being felt more than ever. Water availability for agriculture, industry and even for household is depleting and it is obvious that we may become a water stressed country if remedial measures are not taken.
In Pakistan the shortfall was met with ground pumping resulting in the depleting the water table across the country especially in Balochistan. Pakistan’s water storage capacity is limited to only 30 days which is reducing with time due to sedimentation. In case the new water reservoirs are not constructed, the irrigation supplies would reduce substantially to the level which we had in 60s when there were no reservoirs. This situation would create serious water conflicts, which can only be addressed by taking timely action. There is a need for building of large water reservoirs. The other area of concern pertains to power generation, which serves as a lifeline to the industrial sector of the country. There is an ever widening gap between demand and supply of power generation. This energy shortfall is seriously hampering the industrial growth, as a result, our GDP has been stunted while foreign reserves have depleted. The power generation sector is badly plagued with circular debt and one of the reasons for this is our over reliance on thermal rather than hydel means of power production. Pakistan has the potential of generating 40000 megawatts of hydropower. The need of the hour is to shift to efficient and cost effective means of power generation.

[ 24 ] 6th International Water Conference Proceedings
We need to build more Delay Action Dams. Provision of safe drinking water is a fundamental right, as is also envisaged in the constitution. It is therefore, the responsibility of the state to provide this basic facility to every citizen of the country. This is encouraging that now we have a National Water Policy (2018) which is being vetted by all the provinces through Council of Common Interest however ,its effective and efficient implementation is very much required and the Government and other stakeholders have to pursue dedicated efforts for water conservation and management which would require a synergized approach based on integrated water resources management principles. Furthermore, in order to ensure a behavioral change a campaign on water conservation is also required to be developed and launched. The above measures have become even more important in the wake of Climate Change and its impacts which have seriously affected the overall patterns of the water availability.
He urged, the Water Actors to adopt world best practices which include but are not limited to; building of water reservoirs and dams, planning for water conservation, water audit techniques, water pricing, enhancing the irrigation efficiency and water productivity, water reuse and recycling methods, satellite telemetry system for equitable distribution, adoption of drip and sprinkler irrigation techniques for water conservation and management. Universities and R& D organizations can play a very important role for conducting evidence based research hence a close nexus between Universities, Govt and Industry is pre-requisite for enhancing the water productivity. On the behalf of Riphah I am to extend my full cooperation.
Being a professional of Computer Sciences/System Engineering, I believe that during the pres-ent digital revolution the fast-growing field of data science can offer water utilities the opportuni-ty to make real change for their users. The world is producing data rapidly, but there is still a real gap between what is being used for decision-making and what is produced. Data Science and Analytics, Innovation and Technology can bridge up the gap. Similarly, Artificial Intelli-gence (AI) based solutions for the water sector which can address real challenges and provide tangible benefits to the water sector.
Prof. Dr. Durr e Nayab, Acting Vice Chancellor, Pakistan Institute of Development Economics (PIDE University) highlighted irrational water pricing structure and indicated that Pakistan is running out of fresh water at an alarming rate, and it is likely to suffer a shortage of 31 mil-lion acre- feet (MAF) of water by 2025 if the present trend of population growth of 2.9% and demand persists and this shortfall will be devastating for a country with an agriculture-based economy. Mr Farid Alam, Director of Programs at The Asia Foundation, was of the view that Water-Energy-Food nexus approach is important as all these sectors are dependent to each other and it is very important to account for climate change in the framework. He stressed that the water, energy and food security nexus means that water, energy and food se-curity are intimately linked. Rising population, shrinking agricultural land, increasing demand for water resources, widespread land degradation and inadequate infrastructure appear to be major concerns in Pakistan.

6th International Water Conference Proceedings [ 25 ]
Virtual Technical Sessions:
Key thematic areas of the conference were; i) Water for all (Water, Food Energy Nexus), ii) H2O Podcast, iii) Blue Economy, iv) Water and Environment. 6 parallel technical sessions were held virtually involving 62; postgraduate students, experts, researchers, academicians, policy practitioners, international speakers etc. The thematic sessions were held on the following paper presentations.
[ 26 ] 6th International Water Conference Proceedings
Titles of the papers presented;
• Treatment of Distillery Effluent Using Membrane Bioreactor and Investigate Microbial Community Using 16S gene Metagenomics
• Treatment and color removal of distillery wastewater using• Membrane bioreactor MBR• To investigate antimicrobial resistance profile in drinking water of
Mehran University of Engineering and Technology• Water Scarcity Challenges in Balochistan, Pakistan• Lagenaria siceraria: A possible remedy for emerging global
challenge of superbugs• Characterization and disinfection of biofilms formed on different
pipe materials of drinking water distribution system• Addressing Fluoride Fluorosis Problem and Its mitigation in the
Groundwater of Thar Desert of Sindh Province of Pakistan• Water for All• Physio-chemical analysis of groundwater extracted from Late• Quaternary Aquifer in Southern Peshawar Basin, Pakistan
Water For All (Water, Food, Energy Nexus) Session Organizers: Asia Foundation & PCRWR
Session Moderator: Mr. Faizan Ul HassanPresentation on Water For All (Water, Food, Energy Nexus)by Mr Farid Alam, Director Program (The Asia Foundation)
Sess
ion
1 - D
ay 1
6th International Water Conference Proceedings [ 27 ]
Titles of the papers presented;
• Development of Envelope Curve for Chenab, Ravi and Sutlej river basins and Estimation of Upper bound
• “Analysis of biofilm formation along the surface of Galvanized iron pipe in a drinking water distribution system”
• Wastewater Treatment performance evaluation and characterization of microbial community on media in a constructed wetland
• Water desalination by using graphene incorporated nanofibers membrane
• Study of urban flood modeling using geographic information system (GIS): A case of study Qasim Abad Town, Hyderabad
• Effect of Distillery Spent-wash on Channel Bed and Groundwater• Quality: Case Study of Unicol Distillery District Mirpurkhas• Assessment of indoor air quality in terms of microorganisms in
USPCAS-W• A Need of Sustainable Development of Groundwater Resource,
Investigation and Monitoring in Pakistan• Removal of Arsenic from Drinking Water using Peanut Shell
Biomass• Citric Acid functionalized Bougainvillea spectabilis: A novel,
sustainable and cost effective biosorbent for removal of heavy metal (Pb2+) from waste water
• Acclimation and Use of Thiosulfate-oxidizing Bacteria TOB in Vial-based Bioassay for the Detection of Zinc Toxicity in Water
• Better Groundwater Management to Improve Rural Livelihoods in Punjab-Pakistan
H2O Podcast
Session Organizers: Riphah & PIDESession Moderator: Dr. Musab Yousufi/Dr Junaid Alam MemonDate: 29th December, 2020, Tuesday Time: 3:00 PM Presentation on National Water Policy by Dr Rashid Aftab (Director, Riphah Institute of Public Policy)
Sess
ion
2 - D
ay 1

[ 28 ] 6th International Water Conference Proceedings
Titles of the papers presented
• Fluoride Removal Through Biochar in Drinking Water• Fabrication of Low-Cost Soil Moisture Sensor with Calibration
Algorithm for Smart Irrigation.
• Monitoring of canal water quality using SEBA Hydrometrie, MPS K-16
• Photocatalytic Inhibition of Selective Microbes and Degradation of Organic Dyes
• “Efficiency of Charcoal, Sand, and Coconut Husk in the Development of a Hybrid Filter to Remove Microbial Contaminants from Drinking Water”
• “Determination of Antibiotic Resistant Bacteria in Vegetables Cultivated on Wastewater”
• Monitoring Wastewater Quality of Integrated Constructed Wetland”
• Identification of Antibiotic-Resistant Bacteria in Hospital Sink & Sink Traps of Jamshoro, Pakistan
• Performance Evaluation of Constructed Wetland to treat the Wastewater Generated at US-Pcasw Building
• Chromium concentration, its speciation and geochemical behavior in tannery industry wastewater of district Kasur, Punjab, Pakistan
• Targeting arsenic safe drinking water wells by using sediments colour tool of Punjab, Pakistan
• Development of point-of-use filtration system for harvested rainwater using natural indigenous material
Water For All (Water, Food, Energy Nexus)
Session Moderator: Mr. Faizan Ul HassanSession Organizers: Asia Foundation & PCRWRDate: 30th December, 2020, Wednesday Time: 10:00 AM
Sess
ion
1 - D
ay 2

6th International Water Conference Proceedings [ 29 ]
• Assessment of the water sanitation and hygiene and water quality in primary schools to estimate the risk of water borne diseases.
• Monitoring of canal water quality for irrigation
• Population and Water supply in Pakistan
• Continuous mode adsorption of arsenic from aqueous solution using iron impregnated biochar
[ 30 ] 6th International Water Conference Proceedings
Titles of the papers presented
• Pakistan Water Crisis And Behavioral Approach of Denizens Towards its Conservation on The Bank of River Kabul
• Estimation of Actual Evapotranspiration Using Satellite Data:• A Case Study of Wheat Crop in the Khairpur East Canal
Command area during 2017-2019• Spatial crop management using remotely sensed soil moisture
contents estimation under semi arid condition• Utilization of sepnt WASH and its inpact on soil properties and
wheat growth• Wastewater Monitoring of Integrated Constructed Wetland• Assessment of Biotoxicity Potential of Lambda Cyhalothrin on
Common Carp• Monitoring of canal water quality using SEBA Hydrometrie, MPS
K-16• Screening of chlorine-resistant bacteria from drinking water
supply in Hyderabad• Prevalence of antibiotic-resistant bacteria in the household
sanitary systems of Hyderabad Sindh Pakistan • Green Synthesis of Bismuth Nanoparticles using Native Algae and
their antibacterial activity• Performance Evaluation of Membrane Bioreactor Using
anaerobic/ anoxic/aerobic Conditions Combined for Indigo Dye Effluent.
Blue Economy
Session Organizers: Riphah & PIDESession Moderator: Dr. Musab Yousufi/ Dr. Junaid Alam MemonDate: 30th December, 2020, Wednesday, Time: 10:00 AM Presenta-tion on Blue Water Economy by Mr Farid Alam (Asia Foundation)Harnessing the Potentials of Economy for Inclusive Growth - An Evi-dence Based Policy Framework
Sess
ion
2 - D
ay 2
6th International Water Conference Proceedings [ 31 ]
Titles of the papers presented
• Impact of Groundwater Use on the Health of Rural Households• Arsenic-contaminated irrigation impact on growth and uptake of
arsenic in different rice genotypes• Review on: Silent and Salient Effects of Diverse Water
Contamination and Depletion on Animal and Human Health• Fixed bed Column Study for water defluoridation through Bio-
Adsorbent material• Impact of plastic pollution on fresh water biota of water streams
around the picnic spots of Hilly region in the Swat Valley Pakistan• Water and Sanitation Services Assessment in 3 districts’ SEN
Institutions of Sindh”• Metagenomic Analysis of Drinking Water Samples Collected
from Treatment Plants of Hyderabad City and Mehran University Employees Cooperative Housing Society
• Acclimation and Use of Thiosulfate-oxidizing Bacteria TOB in Vial-based Bioassay for the Detection of Zinc Toxicity in Water
• Evaluating the antimicrobial activity using Punica granatum plant species against Microbes.
• Wastewater Treatment performance evaluation and characterization of microbial community on media in a constructed wetland
• “Monitoring Wastewater Quality of Integrated Constructed Wetland”
• Removal of Arsenic from Drinking Water using Peanut Shell
Water and Environment
Session Organizers: Asia Foundation & PCRWRSession Moderator: Dr. Hifza RasheedDate: 30th December, 2020, Wednesday, Time: 3:00 PMPresentation on Water and Environment by Dr. Hifza Rasheed, Director, PCRWR
Sess
ion
3 - D
ay 2
[ 32 ] 6th International Water Conference Proceedings
Biomass• Innovative Management of Flashflood Water Can Ensure Food• Education, advocacy and awareness is critical to solve the water crisis in order to cope
with future water consumption among the users.• Water Value chain in terms of quantity and quality required interventions in accordance
with National Water policy through a holistic approach.• Since water sector is critical for the socio-economic development there is a need that
our planning process that evidence based policy frameworks has to be developed in consultation with water stakeholders with effective water governance system.
• Water per capita availability has declined five time in the last 70 years and on the demand side Pakistan is the world’s fourth highest rate of water use, there is an urgent requirement for the adoption of efficient irrigation practices and building of water infrastructure for water storage.
• The National Water Policy-2018 is consensus oriented policy approved by CCI however its effective implementation is very much required in consultation with the provinces.
Conference outreach and feed strategy:
Social media solutions combined all the content shared under the hashtag #water4life. This content perfectly helped to interact with the audience and as a result, empowered the engagement. The live social media feed showed the content at one place. This hashtag was ranked as best hashtag by twitter rating agency.
The conference strategy was led in three modes to sensitize at virtual world.
• Pre Conference,• During Conference• Post Conference
The following aspects were covered:
1. Increasing engagement and organic reach: Interaction and visibility are key when it comes to analytics and social media. By including a live Twitter, Facebook, and YouTube feed at the conference helped in encouraging people to interact (engage).
2. Driving conversions: Positive feedback that’s visible to others leads to conversions. That’s a no-brainer. So, if people are talking about your intervention in a positive light, you’re sure to have more people buying your argument or whatever it is you’re trying to promote. 6 IWC hit the panel and started a new conversation on water issues.
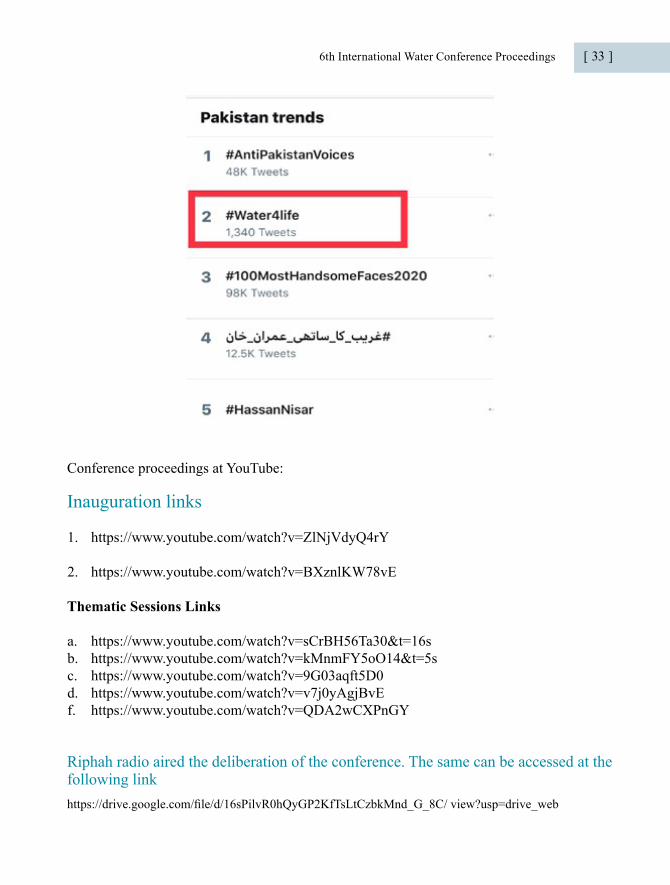
6th International Water Conference Proceedings [ 33 ]
Conference proceedings at YouTube:
Inauguration links
1. https://www.youtube.com/watch?v=ZlNjVdyQ4rY
2. https://www.youtube.com/watch?v=BXznlKW78vE
Thematic Sessions Links
a. https://www.youtube.com/watch?v=sCrBH56Ta30&t=16sb. https://www.youtube.com/watch?v=kMnmFY5oO14&t=5sc. https://www.youtube.com/watch?v=9G03aqft5D0d. https://www.youtube.com/watch?v=v7j0yAgjBvEf. https://www.youtube.com/watch?v=QDA2wCXPnGY
Riphah radio aired the deliberation of the conference. The same can be accessed at the following linkhttps://drive.google.com/file/d/16sPilvR0hQyGP2KfTsLtCzbkMnd_G_8C/ view?usp=drive_web
[ 34 ] 6th International Water Conference Proceedings

6th International Water Conference Proceedings [ 35 ]


6th International Water Conference Proceedings [ 37 ]
ConferenCe AbstrACts

6th International Water Conference Proceedings [ 39 ]
Abstract:
Present study finds the Constructed Wetland System as the suitable technology to treat the institutional waste water as high concentrations of contaminants and pathogenic microorganisms can be removed with this natural treatment system.A small scale subsurface constructed wetland (CW) pilot plant was designed , implemented and operated for real domestic waste water in educational institute. Monitoring and evaluation of performance of this pilot unit was carried out through weekly basis for physico chemical as well as biological analysis of inlet an outlet of waste water. Influent waste water was characterization in term of BOD, 293±76mg/L, COD 629±38mg/L, TSS 155±45mg/L, TN 182.2±10mg/L, and these values were close to the literature cited. CW System performance gave promising results in removal of BOD, COD, TSS and TN 85%, 79%, 91%, and 75% respectively. In addition the changes in the total bacterial community from gravel biofilm were examined by using denaturing gradient gel electrophoresis (DGGE) and sequencing of polymerase chain reaction (PCR)-amplified fragments of the 16S rRNA gene recovered from DGGE bands.
Wastewater Treatment performance evaluation and characterization of microbial community on media in a constructed wetland
Ms. Sakina Ahmedani [email protected]

[ 40 ] 6th International Water Conference Proceedings
Abstract
Desalination is one of the earliest methods known to the man for obtaining salt-free water. Membrane distillation (MD) has gained great interest in desalination technology. The Air Gap Membrane Desalination (AGMD) is an emerging technology to produce fresh water from brackish/saline water. AGMD method has gained attention because of its benefit of small scale desalination with the help of alternative energy sources. The present work involves the development of a laboratory scale AGMD unit, build to test the efficiency of desalination by using novel nanofibers membrane. The membrane was synthesized to obtain effective and energy efficient desalination method. To obtain the objective of the study, super hydrophobic nanofibers were synthesized by electrospinning using polyethylene terephthalate (PET) as the main polymer. Electrospinning, a simplistic method was used to fabricate graphene incorporated nanofibers membrane. The synthesis of nanofibers was carried out at 16v with a distance of 12cm between needle to the collector. SEM and EDS were carried out for the characterization of the nanofibers. Analysis of the characterization of the nanofibers has shown that incorporation of rGO has significantly enhanced the membrane properties and structure. Different concentrations (1-10 w %) of rGO was incorporated in the membrane and fluctuations in the desalination efficiency was analyzed at varying concentrations. The prepared nanofibers were installed as the treatment membrane in the AGMD and the performance of the membrane was increased by incorporating reduced graphene oxide rGO in it. The system (AGMD) was operated at low temperature (30-70℃) and commercial (PET) flat bead free membrane has excellent salt rejection (80-85%) using the 1000ppm NaCl solution as feed. On the basis of these experimental results, a system can be designed for the treatment of salinity for ground and seawater.
Keywords: Water Treatment, Desalination, rGO/PET blend, Hydrophobic Nanofibers, Electrospinning, Air gap membrane distillation.
Water desalination by using graphene incorporated nanofibers membrane
Saira Sidhu1 , Rasool Bux Mahar1 , Zeeshan Khatri2
1USPCASW Mehran University of Engineering and Technology, Jamshoro 76062, Pakistan2Department of Textile Engineering Mehran University of Engineering and Technology, Jamshoro 76062, [email protected]; [email protected] *
6th International Water Conference Proceedings [ 41 ]
Abstract
Urban flooding can be regarded as the most substantial infrastructure ruining factor around the globe. Urban rainwater flood is unpredictable phenomenon due to non-uniform nature of urban land uses. Urban floods can cause infrastructural damages, environmental damages, affect the daily lives of people, and in extreme cases, can be fatal. Hence, it is necessary to address urban planning and development issues related flooding in developing countries. Where often lacking of advanced flood modeling for urban development is can be a triggering issue to be addressed. Therefore, this study was used in urban land use modeling to get the flow of Flood and rainwater. Hydrological modeling tool in ArcGIS was used to develop urban Land Use Topographic model/map to the prediction of urban flood drain. The study was conducted to determine the morpho graphic factors at Qasimabad Town, Hyderabad, Sindh Pakistan. The produced map identified flood-hazard areas those areas and settlements at high risk of rainwater flooding. Results found that some of the areas comes under the low lying where most water accumulates by developing streams link map. The outcome of the research my help government and regulatory authorities for future laying urban infrastructure as well as to know the existing urban development trends. This study may guideline for existing developed areas which are always faced urban rain water and drainage disposal problem of existing infrastructure. This proposed method may also be useful in planning upcoming new development projects. Therefore, it is utmost GIS application for improving aforementioned urban environmental problem in cities.
Study of Urban Flood Modelling using Geographic Information System (Gis): A Case Study Qasimabad Town, Hyderabad
Kainat Ali Rang1, Imtiaz Ahmed Chandio1, Aftab Hussain Talpur1 Mehran Khan2*
1,2,3. Mehran University of Engineering and Technology, Jamshoro.2. US-Pakistan Center for Advanced Studies in Water, Mehran University of Engineering and Technology, [email protected], [email protected], [email protected], [email protected]
[ 42 ] 6th International Water Conference Proceedings
Abstract
The effect of treated spent wash on channel bed and groundwater qualities was investigated during 2014-15 at Unicol distillery as study area in district Mirpurkhas. For this purpose, samples of spent wash, soil/water were collected and determined for parameters related to physical and chemical properties. The impact of spent wash on channel bed and on the adjacent soils at different distances showed that highest soil EC (18.40 dS m-1) and TDS (11776 ppm) were determined for spent wash channel bed at surface soil and EC decreased with increasing distance from channel bed at sub-surface layers; while the highest overall soil pH (7.43) was observed at 450m distance at 30-45 cm soil depth. The highest total N (0.16%) and available K (0.53%) was observed at channel bed and at surface soil with highest available P (4.80%) at channel bed in sub-surface (15-30 cm) soil. The groundwater samples obtained from tube well and hand pump were also analysed for physical and chemical properties and compared with the spent wash from channel bed. The lower Na (1578.7 ppm) was determined in hand pump water samples than tube well water (2588.3 ppm); while highest (7050 ppm) in spent wash. The HCO3 was lower in tube well water (247.00 ppm) than hand pump water (430 ppm); and highest (6166.70 ppm) in spent wash. The Chloride (Cl) content was lower (2117 ppm) in hand pump water samples than tube well water (5259 ppm); and highest in spent wash (14097 ppm). The groundwater EC was lower (11.077 dS m-1) hand pump water than tube well water (17.262 dS m-1) and highest (47.090 dS m-1) in spent wash. Similarly, the lower magnesium (465.3 ppm) was determined in hand pump water samples than tube well water (553.3 ppm) and exceptionally high (1300.7 ppm) in spent wash. The SAR of hand pump water samples was lower (11.583) than tube well water (20.390) and outstandingly high (35.693) for spent wash. In case of calcium content, it was lower in tube well water (359.33 ppm) than hand pump water (593.33 ppm) and exceptionally higher in spent wash (764.33 ppm). It was concluded that soil EC and TDS were lower at farther locations from spent wash channel bed
Effect of Distillery Spent-wash on Channel Bed and Groundwater Quality: Case Study of Unicol Distillery District Mirpurkhas
N. A Rajput*, M. S. Mirjat*, M. A Talpur*, S. A. Junejo**, D. M. Cuong, ***, and H.R Mangio***** Department of Irrigation and Drainage, Sindh Agriculture University, Tandojam, Pakistan.** Department of Geography University of Sindh, Jamshoro, Pakistan.*** Department of Soil Science, Sindh Agriculture University, Tandojam, Pakistan **** Department of Energy and Environment, Sindh Agriculture University, Tandojam, Pakistan

6th International Water Conference Proceedings [ 43 ]
at sub-soils. The surface soil contained higher organic matter; no effect of spent wash on soil organic matter was recorded. The soil pH was relatively higher at spent wash channel bed and its adverse effects were noted upto 300 meter distance. Total N was slightly (P>0.05) higher at channel bed than distant locations, while phosphorus was significantly higher at spent wash channel bed. The available potassium was also significantly influenced by the spent wash; and P was higher at channel bed, and decreased at the farther locations adjacent to the channel bed. The EC level, Na, HCO3, Cl, Mg and Ca contents as well as SAR for spent wash samples were manifold higher than the tube well and hand pump water samples.
Keywords: spent-wash, hand pumps, tube wells, ground water quality, drainage channel bed quality.

[ 44 ] 6th International Water Conference Proceedings
Abstract
Groundwater is the earth’s largest accessible store of fresh water and constitutes about 95% of all fresh water. It is one of the largest sources of fresh water for domestic and industrial purpose in Pakistan. Pakistan is facing water scarcity due to increase in population and over-abstraction of water. Thus, it is needed of sustainable groundwater resources development by using modern techniques. For any developmental activity, both surface and groundwater sources are the main components depending on their quality and availability. In an area where surface water is not feasible for the desired activity, groundwater is the second alternative, if it has the anticipated amount and quality. Therefore, site investigation/ exploration, sometimes called a pre-construction evaluation, must be performed primarily for an effective and sustainable utilization of groundwater resources. Urbanization and over growing of population have negative impact on groundwater. In Pakistan millions of cubic meters of water is pumped without monitoring the purpose and use of this abstraction. This monitoring should be multi-fold and cover abstraction, contamination, and wastage of water on local and national scale. Surface water and rainwater can be stored in the forms of lakes and surface reservoirs which can be act as recharge boundary to recharge aquifer. Therefore, groundwater management policy must be adopted for sustainable supply of fresh water to the people.
A Need of Sustainable Development of Groundwater Resource, Investigation and Monitoring in Pakistan
Perveiz Khalid1
Institute of Geology, University of the Punjab 54590 Lahore, Pakistan*corresponding author email: [email protected]

6th International Water Conference Proceedings [ 45 ]
Abstract
Due to rapid urbanization and drastically population growth, water stress has become an alarming situation in developing countries. Integrated Constructed Wetlands (ICW), a phytoremediation technique is considered as a successful, economical, and environmentally friendly alternative for conventional wastewater treatment technologies for monitoring the water quality in terms of nutrients removal (i.e., nitrogen and phosphorus) and other contaminants. Current study aimed at monitoring the water quality of ICW at NUST campus, H-12, Islamabad. Water samples from various stages of the ICW were analyzed for various physicochemical parameters including pH, Temperature, Turbidity, Electrical Conductivity (EC), Dissolved Oxygen (DO), Chemical Oxygen Demand (COD), Total Suspended Solids (TSS), Total Dissolved Solids (TDS), Total Kjeldahl Nitrogen (TKN), Nitrate, and Phosphate. Water samples were collected and analyzed in the month of September 2019, including inlet, sedimentation tank, eight ponds planted with Typha latifola, Pistia stratiotes, Centella asiatica and collection tank (outlet) to measure the removal efficiency at each stage. The prevalent removal efficiency for NO3-N, TKN, TP and COD were 98.74, 69.50, 80.28 and 85.02% respectively. Thus, study depicts that the ICW serve as environmentally friendly and an equally efficient technology and has a considerable potential for the removal of pollutants from wastewater.
Keywords: Integrated Constructed Wetlands (ICW), Wastewater, Physicochemical Parameters, Removal Efficiency.
“Monitoring Wastewater Quality of Integrated Constructed Wetland”
Hina Ishaque, Imran Hashmi*Institute of Environmental Sciences and EngineeringSchool of Civil and Environmental EngineeringNational University of Sciences and TechnologySector H 12, [email protected]; *[email protected]

[ 46 ] 6th International Water Conference Proceedings
Abstract
Water-borne pathogens are responsible for developing antibiotic resistance at an alarming rate around the world. A wide range of bacteria are more than ever considered as superbugs and immune to current antibiotics. As a result, these superbugs are emerging in hospitals and the world outside. There is a significant development of new resistant strains of bacteria these days, which are somewhat more lethal compared to the parent strain. Bacteria are immune to antimicrobial drugs by various mechanisms that include antibiotic inactivation, target alteration, resistance efflux mechanism and Plasmidic Efflux. The most important determinant of the entry mode is the chemical structure of the drug molecule. The drugs currently available in clinics are not successful against the antibiotic resistance formed by some bacterial species. However, antimicrobials based on plants have immense potential to combat these superbugs without any known side effects. In the current study, our aim was to investigate the certain natural products that were active in our research against Clarithromycin resistant bacteria. Lagenaria siceraria (bottle gourd) showed best activity against gram positive bacteria as compared to gram negative bacteria. Highest potential agent of Lagenaria siceraria (bottle gourd) showed activity against Shigella flexneri about 13.3mm±1.7 at 30µl/50ml concentration of bottle gourd among four isolated gram negative bacteria and 25.3mm±1.7 zone of inhibition against Staph aureus. Different behaviors of isolated bacteria were observed at different optical density using UV-visible spectrophotometry at 600nm. Among them best activity was observed at 1 ml/50ml. However, further research on the role of bacteria in the growth of antibiotic resistance is needed to achieve full applications of antibiotics. Specifically, creative approaches to discovering novel antibiotics and their speedy and plant-based control are mandatory.
Keywords: Lagenaria siceraria, bottle gourd, clarithromycin-resistance, natural products.
Lagenaria Siceraria: A Possible Remedy for Emerging Global Challenge of Superbugs
Noor-Un-Nisa Ghanghro1, Ayesha Tajammul1*1WaSH Sciences, USPCAS-W, MUET, Jamshoro, [email protected]; [email protected]*
6th International Water Conference Proceedings [ 47 ]
Abstract
Drinking water is contaminated by various microorganisms’ causes’ biofilm formation in the drinking water distribution system. Biofilms release microorganism including pathogens again into distribution system, thus contaminated water causes several health issues for the human life. A reactor, containing PPR, UPVC, GI pipe materials, in the real distribution system was operated for 6 months for biofilm formation, followed by disinfection of the biofilms by 15 mg/l hypochlorite disinfectant in order to check if this dose removes biofilms from used real distribution system pipe materials. Biofilm were scrapped after 5, 10, 15, 20 hours of post disinfection. Moreover, basic water quality parameters were assessed including temperature, pH, turbidity, DO, EC, TDS, free chlorine, salinity, and heavy metals. DNA extraction was carried from bulk water and biofilms using CTAB method. Bacterial viability test was carried by using fluorescence microscope. Water quality parameters within the range such as temperature (13-31.5C), dissolved oxygen (7.2-8.9 mg/l), turbidity (2.50-7.86 NTU), TDS (355-786 mg/l), pH (7.1-8.26). In conclusion, biofilm we removed with 1.5 mg/l of hypochlorite with at least 20 hours disinfectant contact time
Keywords: Contamination, Disinfection, DNA, Biofilm, bacterial viability, drinking water distribution system.
Characterization and Disinfection of Biofilms Formed on Different Pipe Materials of Drinking Water Distribution System
Arsalan Shaikh1 Junaid Ahmed Kori2, Rasool Bux Mahar1*
1US-Pakistan Center for Advanced Studies in Water, Mehran University of Engineering and Technology, Jamshoro.2Dr. Panjwani Center for Molecular Medicine and Drug Research, International Center for Chemical and Biological Sciences, University of Karachi, [email protected], [email protected], [email protected]*corresponding author: [email protected]

[ 48 ] 6th International Water Conference Proceedings
Abstract
Groundwater is one of the major water resources in Nowshera District – a part of Peshawar Basin – of Pakistan. This water is abstracted in the form of tubewells boreholes, wells and handpumps drilled in the Late Quaternary aquifer mainly composed of sand and gravels. The quality of groundwater was investigated. Physio-chemical analysis of 12 water samples sparsely located tubewells and hand pumps was performed. To check chemical characteristics of each water sample, we measured the concentrations of calcium (Ca), magnesium (Mg), sodium (Na), Potassium (K), carbonate (CO3), bicarbonate (HCO3), chloride (Cl), sulfate (SO4) and hardness of water. Physical characteristics like temperature, color, taste, odor or smell, pH-value, electrical conductivity (EC) and total dissolved solids (TDS) are also analyzed. These obtained results are compared with recommended drinking water quality standards of the World Health Organization (WHO) and National Standards for Drinking Water Quality (NSDWQ) of Pakistan. This comparison revealed that most of water sample and within permissible limits except sample number 4, 6 and 9, which are taken in the vicinity of industrial zones. Some streaks of heavy metals like Pb, Cr, Fe, Hg etc. are also reported in these samples. The average values of the groundwater characteristics are 0.03 S/m for electrical conductivity, 400 – 800 ppm total dissolved solids and 0.024 m2/min for transmissivity. The samples collected from tubewells near to Kabul River have good quality due to recharge boundary.
Physio-chemical Analysis of Groundwater Extracted from Late Quaternary Aquifer in Southern Peshawar Basin, Pakistan
Sher Muhammad*1, Perveiz Khalid1
Institute of Geology, University of the Punjab 54590 Lahore, Pakistan*corresponding author email: [email protected]
6th International Water Conference Proceedings [ 49 ]
“Proper and adequate disburse of irrigation water to the crops is one of the main factors in growing crops and getting the supreme yield. The primary objective of the irrigation management is to maintain/provide irrigation water to the field according to the crop requirement/demand among all stakeholders. However, it has been observed that distribution of water is not always uniform, which may also decrease the normal yield of crops. The appropriate amount of water required at the field will provide a good yield that can only achieved by using modern technologies like smart soil moisture sensors. In agriculture based economic countries such as Pakistan, the use of water via irrigation for agriculture production has its own importance. The demand of irrigation water is high and requires more data about the soil moisture in the agricultural field to manage the required soil moisture level to get high crop yield. In such conditions, automation technologies can play an important role in the efficient use of limited water resources. Actually, the farmers did not know about the actual moisture of the land and irrigate the land, making plant water stressed and decreed crop yield.
Therefore, in this study, fabricate a smart soil moisture sensor with locally available components that will only provide required amounts of water to the field to save water and produce more crop yield. Capacitive soil moisture sensor used, that was 93% accurate and 75% low-cost then the market available device. Calibration equation of sensor computed (soil moisture in percentage =1045e-0.014*sensor value), this equation has a value of R2 = 0.98, which shows more reliability on the sensor device. The fuzzy logic algorithm designed to control the pump for smart irrigation management that can saves up to 45% water.” Keyword: Smart irrigation, Moisture sensor, Soil moisture, Automatic irrigation, Water saving, Agro technology, crop yield and water efficiency
Fabrication of Low-Cost Soil Moisture Sensor with Calibration Algorithm for Smart Irrigation
[1] Mahtab Ahmed, [2] Waqas Ahmed, [3] Abdul Latif Qureshi [1] MS student, USPCAS-W, Mehran University of Engineering and Technology, Janshoro, Pakistan[2] Assistant Professor, USPCAS-W, Mehran University of Engineering and Technology, Janshoro, Pakistan[3] Professor, USPCAS-W, Mehran University of Engineering and Technology, Janshoro, Pakistan[1] [email protected], [2] [email protected],[3] [email protected],
[ 50 ] 6th International Water Conference Proceedings
In order of priority to develop bright and smart products the valorization of biowaste and the substances derived from the biowaste is most firm and steadfast study in recent years, by reducing the bio-waste residue by re-entering bio-waste in environmental cycle to recover the natural resources is the most sustainable and eco-friendly development of society. Biowaste such as coconut shell activated charcoal, corn cob activated charcoal, coconut fibers and sand were used in studies to investigate their strength to remove microbial and physical contamination from drinking water. Three different column lengths (5 cm, 10 cm, and 15 cm) of all biowaste were set in plastic reusable bottles and contaminated drinking water pass through each column. The results showed that for the removal of microbes and turbidity all the 15 cm layers of Charcoals, Sand, and Coconut fiber showed good results. The results of the hybrid filter for the removal of E. coli, salmonella typhi, shigella flexneri and turbidity were 98.7%, 98.5%, 99.7% and 99% respectively.
Keywords: Biowaste, Drinking Water, Charcoal, E. coli, Hybrid Filter
“Efficiency of Charcoal, Sand, and Coconut Husk in the Development of a Hybrid Filter to Remove Microbial Contaminants from Drinking Water”
“Pooja¹, Ayesha Tajammul¹, Zeeshan khatri²”1. “USPCAS-W, MUET Jamshoro, Sindh Pakistan”2. “Textile Department, Mehran university engineering and technology Jamshoro, Pakistan”First and corresponding author: Pooja, Tel; +92-343-3136110, email: [email protected] author: Dr. Ayesha Tajammul, Tel; +92-331-2101105, email: [email protected] author: Dr. Zeeshan Khatri, Tel; +92-333-8701888, email, [email protected]

6th International Water Conference Proceedings [ 51 ]
Deaths from antibiotic-resistant bacteria are under-reported, but available data indicate that a large number of neonatal deaths occur due to antibiotic resistant in Pakistan. Environment play a key role in the dissemination of antibiotic resistant genes as 50 to 90% antibiotics are excreted in urine or feces either as metabolites or in partially degenerated form. Bacteria have developed the plethora of antibiotic resistant genes to survive in the presence of antibiotics which easily transmit by horizontal transfer between bacteria. Consequently, occurrence of antibiotics in wastewater increases the opportunity for survival of drug-resistant pathogens as drug susceptible strains are killed. This study highlights the comparative correlation of food toxicity irrigated with fresh and wastewater, evaluating the pathogenic bacteria and antibiotic resistant isolates by using spread plate technique and disk diffusion method. It is being observed that Isolates of E. coli and Shigella spp. from both the groups are resistant to Azithromycin, Cefixime and Ampicillin but susceptible for Meropenem and Ciprofloxacin. On the other hand isolates of Staphylococcus aureus and enterococcus of vegetables irrigated with freshwater are resistant to Azithromycin and Cefixime while susceptible for Ampicillin, Meropenem and Ciprofloxacin but penicillin acquired resistance through wastewater as wastewater irrigated vegetables was resistant to ampicillin. Results of the present study indicate that farming of vegetables via wastewater pose extra burden of antibiotic resistance gene.
Keywords: wastewater, vegetable’s, antibiotic resistance
“Determination of Antibiotic Resistant Bacteria in Vegetables Cultivated on Wastewater”
Ghulam Fatima1i, Jamil Ahmed1, Seher Haleema1 1Water, Sanitation & Health Sciences, U.S.-Pakistan Center for Advanced Studies in Water, Mehran University of Engineering & Technology, Jamshoro 76020, Pakistan First and Corresponding author: Ghulam Fatima, Tel: +92-313-1672747, email: [email protected] Author: Dr. Jamil Ahmed, Tel: +92-333-2855283,email:[email protected] Author: Seher Haleema, Tel: +92-336-0802113, email: [email protected]
[ 52 ] 6th International Water Conference Proceedings
Antibiotics are characterized as one of the most useful drug group to manage the bacterial infections in humans.Because of the increasing issues of resistance, Antibiotic resistance has been percieved as a major health threat to humans.Antibiotic Resistant bacteria caused many infections which gives result in higher rates of mortality, long stay at healthcare facilities, and higher healthcare cost.Pakistan is a developing country, where antibiotics can be easily purchased without a prescription of doctors, hence numerous patients buy antibiotics under the guidance of an unqualified or unauthorized person.There is a particular significance of Gram Negative bacterial resistance as there is a lack of novel antibiotics which works against these bacteria and world wide they are increasing in prevalence.Hand washing sinks are a major reservoir of Antibiotic-Resistant bacteria in Hospitals, which indicates an alarming rise in hospital outbreaks.
The study identified the presence of the resistant bacteria in the sink traps of the hospitals of the district Jamshoro, Pakistan. We select 40 hospitals out of 63 through stratified random sampling and the list of those hospitals were collected from the Health department Govt: of Sindh. The study has two parts, The assessment of WASH facilities through the questionnaire survey which includes the three major sections, Water, Sanitation and Hand hygiene. And in the other part collected samples from those facilities were analyzed for Antibiotic Resistance by using streak and spread method or Antibiotic sensitivity method in the Water Quality lab at USPCASW MUET Jamshoro..
The results found that 84.62% of the isolated of Gram Negative bacterial growth, display resistance to all tested antibiotics (Ertapenem, Cefixime, Aztreonam, and Ciprofloxin).However 7.69% of isolates display resistance to three antibiotics out of four and those are Ertapenem, Cefixime, and Aztreonam. While remaining 7.69% of isolates were only resistance to Ertapnenem and Aztreonam. The results of assessment of Wash facilities through questionnaire survey found unsatisfactory on the basis of recorded data.
Identification of Antibiotic-Resistant Bacteria in Hospital Sink & Sink Traps of Jamshoro, Pakistan
Noman Ali, Dr. Jamil AhmedWater, Sanitation & Health Science(WaSH)Mehran University of Engineering & Technology Jamshoro

6th International Water Conference Proceedings [ 53 ]
Assessment of Indoor Air Quality In Term of Microorganisms In Uspcas-W
Authors: Danish Ahmed khokhar1*, Imtiaz Ali1, Aqsa Channa1, Aneera Latif1, Kantesh Ahmed1, Rija Shakir1
USPCAS-W at Mehran University of Engineering & Technology Jamshoro, Sindh Pakistan 76062.Corresponding author: Danish Ahmed khokhar Email Address: [email protected]
Abstract
Majority of time many people spend their time in indoor atmosphere and Indoor Air Quality (AIQ) has been affected by the tightening of the building for achieving higher efficiency by the tightening of the building. Airborne bacteria under favorable conditions able to grow causing indoor air pollution. The objective of this study was to monitor the airborne fungi and bacteria in the United State Pakistan Advance study in water center, MUET Jamshoro. Six different locations were selected for media sampling 1. Reception Hall 2. Canteen room 3. Classroom 4. Library of the department 5. Water lab 6 washroom. The growth concentration of bacterial and fungal at different time period i.e. 30 minutes, 60 minutes and 90 minutes. TSB type of media has been prepared to identify different bacterial and fungal cultural. Almost all the locations of department were heavily contaminated with bacteria and fungi and different airborne microbes. It was observed that increase in cultural as time was increasing, and different concentration obtain at different locations. Some places were also above the permissible level of WHO. This research based on study of specific bacterial and fungi in different locations of USPCAS-W, MUET, Jamshoro.
Keywords: Airborne microbes, Bacteria, Fungal, Indoor air, Media.
[ 54 ] 6th International Water Conference Proceedings
Estimation of Actual Evapotranspiration Using Satellite Data: A Case Study of Wheat Crop in the Khairpur East Canal Command Area During 2017-2019
Zenobia Talpur, Nabeel Ali Khan, Arjumand Z. ZaidiUS-Pakistan Center for Advanced Studies in Water Mehran University of Engineering & Technology, Jamshoro, Sindh
Abstract
For fair and equitable distribution of water at the farm level, it is necessary to know the amount of water used by the crops grown there. The main water supply to the agricultural fields in Pakistan is through the Indus Basin Irrigation System (IBIS) comprising barrages, canals, distributaries, and watercourses. The system losses are said to affect the water supply at the farm level. Estimation of losses is not easy, but analyzing the difference between the water inflows (water at the canal head, precipitation, groundwater, water from other sources) and actual water used by the crop can be utilized to calculate overall losses. The gauge network of the IBIS is only sufficient to monitor canal inflows, but outflows or the water used by the crops are not easy to measure. Actual evapotranspiration (ET) is the measure of water used by the crops that can be easily derived from satellite data. To present the methodology, freely available Landsat satellite data from Earth Engine Evapotranspiration Flux (EEflux) are used to calculate water consumption of wheat crop grown in the Khairpur East canal command area (CCA) during the Rabi seasons of 2017-2018 and 2018-2019. Wheat is the most grown crop in the region and, therefore, has a significant overall water requirement. The results showed that the water consumptions of the wheat crop in the Rabi seasons of 2017-2018 and 2018-2019 were 309 mm and 390mm, respectively. Subtracting the total water inflows during the cropping season from cumulative amount of water used by all crops (wheat plus other) grown in the CCA indicates non-beneficial use of water or in other words the system losses. Accurate estimation of ET flux using satellite data is instrumental in regions where ground measurements are not available for precise irrigation scheduling and water resource management

6th International Water Conference Proceedings [ 55 ]
Removal of Arsenic from Drinking Water using Peanut Shell Biomass
Attiqa Nizamania, Ayesha Tajammula, Zeeshan Khatrib
a US Pakistan Center of Advanced Studies in Water, Mehran University, Jamshoro, 76062 Pakistanb Department of Textile Engineering, Mehran University, Jamshoro, 76062 Pakistan.Email: [email protected] author: Ayesha Tajammul, Tel: +92331-2101105, email: [email protected] author: Attiqa Nizamani, Tel: +92347-3977737, email: [email protected]
Drinking water contamination is a global spreading problem, in which Arsenic contamination is one of the most highlighted problems. From a developed country like the USA to undeveloped countries like Bangladesh and Pakistan are facing this problem. Around 60 million of the Pakistan’s population is exposed to arsenic contamination by using groundwater for drinking purposes. There are different removal methods for arsenic such as; ion exchange, membrane filtration, coagulation, and adsorption. In this study biomass of peanut shell (PS) was used as an adsorbent. For this study batch experiment was performed with different parameters. PS biomass was used with different dosages (200mg, 400mg, 600mg, 800mg, and 1000mg) in the presence of different concentrations (100ppb, 150ppb, and 200ppb) of As. Their effects on pH (2-9) and time intervals (1 to 5 hrs) were also measured. PS biomass showed the best removal at 150ppb, the best dosage was observed 200mg, the best pH was observed 3pH, and the best time interval was observed 1hr. With all the best-selected parameters about 96% of arsenic removal was observed. In conclusion, PS can be a potential candidate for the removal of arsenic from the drinking water.
Keywords: Arsenic, Biomass, Adsorbent, Peanut shell.
[ 56 ] 6th International Water Conference Proceedings
Development of Envelope Curve for Chenab, Ravi and Sutlej River basins and Estimation of Upper Bound
Muhammad Muneeb Khan1, 2, Muhammad Waseem1, Noor Muhammad Khan3, Numan Zahid Khan1, 1Centre of Excellence in Water Resources Engineering, University of Engineering and Technology, Lahore.2National Engineering Services of Pakistan (NESPAK), 1-C Block-N, Model Town Extension, Lahore. 3Department of Civil Engineering, University of Engineering and Technology, Lahore
The estimation of maximum flood discharge is important tool for design of hydraulic structures and hydrological safety measures. However, reliable prediction of extreme flood events in a region is an important challenge for hydrologist and engineers especially for a site with inadequate flood measurements. Among the various available approaches, envelope curves are effective approach for estimation of flood peaks in data scanty region like Chenab, Ravi and Sutlej river basins in Pakistan. Hence, envelope curves associated with regression models has been developed in current study to determine the flood peaks and estimation of upper bound. To perform the analysis on an average 50 years data of 11 gauging stations was collected from Irrigation Department, Government of Punjab. Moreover, the outcomes of flood frequency analysis (using Gumbel Extreme Value Type-I, Log Pearson Type-III and Log Normal) were plotted with corresponding catchment area to obtain Creager’s and Dicken’s outer envelope curves envelope curves for selected rives. The analysis resulted in a decreasing trend of peak discharge with respect to the increasing catchment area. This is because due to the fact that India being the upper riparian has built dams on these rivers and the drainage areas adjoining these rivers in Pakistan are subject to less precipitation. Furthermore, it was evident that the Creager’s Regional coefficient decreases from 2.65 to 0.87 and from 3.72 to 1.22 for 100 and 1000-year return period flood, from river Chenab to river Sutlej. Similarly, the Dicken’s regional coefficient decreases from 14.25 to 2.75 and from 19.75 to 3.81 for 100 and 1000-year return period flood, from river Chenab to River Sutlej. Consequently, the developed curves and models could be used for efficient, safe and precise hydraulic structures design in Chenab, Ravi and Sutlej river basins in Pakistan.
Keywords: Gumbel Extreme Value Distribution, Log-Pearson Type-3 Distribution, Log-Normal Distribution, Barrage, Bridges, Peak Discharge, Envelope Curves.

6th International Water Conference Proceedings [ 57 ]
Pakistan Water Crisis and Behavioral Approach of Denizens Towards its Conservation on the Bank of River Kabul
Suleman Amin & Zilakat Khan Malik Ph.D Scholar, Department of Economics, University of Peshawar, Peshawar, Pakistan. Email: [email protected] Professor, Department of Economics, University of Peshawar, Peshawar, Pakistan. Email: [email protected] Corresponding Author: Suleman Amin, Ph.D Scholar, Department of Economics, University of Peshawar, Peshawar, Pakistan. Email: [email protected]
Abstract
Approximately two third of the Earth’s surface is covered with the life-sustaining liquid, water. Studies depict that by the middle of the century, more than half of the humanity will reside in water-stressed areas, which also include Pakistan. Pakistan is among the list of those countries, which are confronting chronic water issue. Pakistan is water stressed country and the situation is going to be more critical in future. The degradation and over exploitation of water resources by human is not a new phenomenon. Water as common pool resource is commonly available for people either free or they pay small amount of money which do not attract the attention of the users to use carefully. The behavior of people is the key problem in over exploitation of resources of water. People either use the water resources carelessly, which do not attract their attention to conserve water for the reason of facing water problems in future. The study shows that Behavioral change is an effective way of tackling the water shortage and ensuring the efficient management of water resources. Behaviors of people for conservation of water were highly depend upon education level, age, past history of respondents water shortage problem, awareness, attitude of family, friends and surrounding of respondents.
Keywords: Water Crisis, Water Conservation, Water Leakage, Consumer Behavior. Water Wastage.
[ 58 ] 6th International Water Conference Proceedings
Fixed Bed Column Study for Water Defluoridation through Bio-Adsorbent Material
Abdul MananAltaf Hussain Email. [email protected] Center of Advance Study in – WaterMehran University of Engineering and Technology, Jamshoro
Fluoride has both detrimental and beneficial effects on people depending on the concentration and consumption periods, concentration of fluoride in drinking water less than 1.5 mg/l is beneficial for proper growth and strengthening of our bone, however concentration of fluoride in drinking water greater than 1.5 mg/l could lead to severe health hazard. The study presented in this research, investigated the feasibility of using neem seed bio-sorbents for fluoride removal from water through fixed bed column study. Data indicated that treated neem seed could remove fluoride from groundwater with variable bed depth, flow rate, fluoride concentration and column diameter. Results obtained from this study indicated that columns with the optimum bed thickness, lowest flow rate, and highest fluoride concentration showed best column performance. Bio-sorbents used in this study are re-generable and re-usable for more than five cycles. The initial materials cost needed to remove one gram of fluoride also found to be lower than the available alternatives. This makes the process more promising solution to be used for fluoride removal.

6th International Water Conference Proceedings [ 59 ]
Water for All: Food – Energy – Water - Nexus
Ms. Rubina Jaffri, Sr. Gen. Manager, [email protected] Muhammad Baloch, Sr Manager, [email protected] Tahir Prog. ManagerMentoring, Evaluation & Research Department, Health And Nutrition Development Society (HANDS).Ms. Rubina Jaffri Senior General Manager, [email protected]
Abstract
Water is composed of Hydrogen and Oxygen; it exists in gaseous, liquid and solid states. Greek Philosopher Thales regarded water as sole fundamental building block of matter. Water is held divine in religions. In Islam it is sacred:
Allah created every living creature from water. Allah creates whatever He wills.
Allah is He Who created the heavens and the earth, and sends down water from the sky, and with it produces fruits for your sustenance [Quran:The Light - An Nur (24:45)].
This Nexus is seeped & weaved in dependency factors and Water Rights of Nations. Pakistan dependent on River Indus for crop production, electricity generation, storage, irrigations, domestic & industrial use. Sugar & Rice crops require more water and constant irrigation. Rice water requirements is 60 -70 acre inches; Sugarcane need 96 acre inches. Cotton; the only fibre crop of Pakistan; needs to be irrigated 7-8 times. Lintels, Oil seeds and fodder need adequate waters and in time.
Food security and energy depend on hydel system. Currently only 63.1 % of the country’s households are “food secure” implying more than 37% households are food insecure. Share of Hydel electricity generation is 25.8 % of total generation of 87324 (GWh). From time to time Pakistan faces water scarcity problem due to increase in climate variability and extreme weather. However, India as Upper Riparian, Controls Water Flow into Pakistan. In times of conflicts, floods or when politically motivated, India is able to reduce rivers flows and deprive Pakistan of its Life Sustaining Waters.
Keywords: Water, Food, Life, Transnational Basin, Water Conflict, Survival
[ 60 ] 6th International Water Conference Proceedings
Review on: Silent and Salient Effects of Diverse Water Contamination and Depletion on Animal and Human Health
Muhammad Sulman Ali Taseer1*, Muhammad Younus Rana1, Muhammad Muddassir Ali2, Raheela Akhtar3, Qaiser Akram1, Muhammad Asif Idrees1, Beenish Zahid1, Muhammad Ahsan Naeem4, Muhammad Bilal1 1 Department of Pathobiology, Khan Bahadar Chaudhary Mushtaq Ahmad College of Veterinary and Animal Sciences Narowal, Sub-Campus University of Veterinary and Animal Sciences, Lahore, Pakistan 2 Institute of Biochemistry and Biotechnology, University of Veterinary and Animal Sciences, Lahore, Pakistan 3 Department of Pathology, University of Veterinary and Animal Sciences, Lahore, Pakistan 4 Department of Basic Sciences, Khan Bahadar Chaudhary Mushtaq Ahmad College of Veterinary and Animal Sciences Narowal, Sub-Campus University of Veterinary and Animal Sciences, Lahore, Pakistan
Agriculture is considered as the backbone of Pakistan’s economy and contributes almost 18.5 percent to total Gross Domestic Product (GDP). Over the years, livestock subsector has surprisingly surpassed the crop subsector as the biggest contributor to the value addition in agriculture. Presently it contributes 60.5 percent to the overall agricultural and 11.2 percent to the GDP during 2018-19. Livestock sector is a source of 35-40% of income for over 8 million rural families and providing them food security by supplementing high valve protein of animal origin. A dire curtailment of the total amount of groundwater is a silent and ultimate threat to the livestock health. As the factors of water depletion are important so are the effects of its depletion and contamination on animal health and productivity. Along with the continuous decrease in its reservoirs, water is getting a drastic number of toxic contaminations from industrial waste. Industrial waste in Pakistan is extensively being dumped in to soil, water and air. This waste contains many kind of heavy metals such as aluminum, mercury, cobalt and silver and most of them are carcinogenic in nature and results in heavy metal poisoning in humans, suffocation in fisheries, destroy aqueous environment and cause diseases such as cholera, typhoid fever and diarrhea in livestock. As 86% of composition of milk is water, dry cows drink almost 8-10 gallons of water per day while in third trimester of pregnancy they can drink up to 15 gallons per day. When animals drink heavy metal or industrial waste contaminated water, it attacks on animal’s intestine and ultimately nutrient absorption. Poor absorbance of dietary nutrients leads to weight and poor productivity which ultimately affects the economy of the farmer and country. If water reservoirs depletion will be continued, it will not be available for animals ad libitum and will cause dehydration in animals and poor feed conversion ratio along with reduced reproducibility.
6th International Water Conference Proceedings [ 61 ]
Prevalence of antibiotic-resistant bacteria in the household sanitary systems of Hyderabad Sindh Pakistan
Author: Maheen Shaikh
Abstract
Antibiotic drugs are vital for the treatment of many life threatening diseases (i.e. pneumonia, typhoid, tuberculosis etc.) and often preserve human life. Among pharmaceutical medicines antibiotics have great importance, owing to its effectiveness to treat bacterial infections and many life threatening diseases.Among many countries, Pakistan is a country where antibiotics are used without doctor’s prescription. This leads to antimicrobial resistance (AMR) that is common in the community. In community level transmission of bacteria via faecal-oral route is important in the transmission of human pathogens due to poor sanitation and hygiene practices of the community.
Ertapenem, Cefixime and Ciprofloxacin are commonly recommended for the treatment of many infectious diseases. So, through conducting this study we characterize the prevalence of antimicrobial resistant (AMR) enterobacteriaceae in the community latrines of Hyderabad Sindh.
For this we had taken 20 samples of Hyderabad city use Kirby-Bauer test to determine the resistant, susceptible and intermediate antibiotics.The results shows that Susceptibility profiles were generally the same for E. coli and Klebsiella. 90% of E. coli and 70% of Klebsiella isolates showed resistance to Cefixime. Whereas 18 out of 20 E. coli samples and 16 out of the 20 Klebsiella isolates were resistant to at least one of the three antibiotics. Only 15% samples are resistant to meropenem.
Keywords: antibiotic resistance, pharmaceutical, enterobacteriaceae, Klebsiella, community latrines

[ 62 ] 6th International Water Conference Proceedings
Monitoring of canal water quality using SEBA Hydrometrie, MPS K-16
Abdul Moiz, *Shahbaz Nasir Khan and Naveed Ahmad KhanDepartment of Structures and Environmental Engineering, Faculty of Agricultural Engineering and Technology, University of Agriculture Faisalabad, Pakistan*Corresponding Author: [email protected]
Abstract
Surface water is the major source for irrigation in Pakistan. That’s why monitoring of the quality of surface water is important for better crop production. Irrigation with poor quality water not only decreases crop production but also harmful to human health. The present study was conducted on the section of Rakh Branch Canal passing from city Faisalabad to city Sumundri, Pakistan. A general survey was conducted for collecting primary information like sampling points, start and endpoint, Industries and construction sites along the canal. For sampling, ten points were selected at the appropriate distances. Thirty samples were collected by taking three samples from each point. These samples were collected by 2 ft depth from the surface of the water. Then the samples were tested for different parameters like pH, EC (electrical conductivity), TDS (total dissolved solids), salinity, anions (chloride, calcium, ammonium, nitrate) using SEBA Hydrometrie MPS K-16 instrument. Test results were compared with the guidelines given by the FAO. EC, TDS, pH, Chloride, Calcium, Ammonium and Nitrate of samples ranged from 0.286-0.295 mS, 191.103-197.674 ppm, 7.986-8.406 pH, 7.927-10.907 ppm, 34.015-37.139 ppm, 0.066-0.152 ppm and 4.479-9.679 ppm respectively. There was a little variation in the results of measured parameters due to some contamination from construction sites and domestic waste contamination. Overall, all parameters were found within the permissible limits given by FAO. Hence, all the results of different parameters showed that the water of this section of the Rakh Branch Canal is suitable for irrigation purposes and better crop production. It is recommended that there should be regular monitoring of more water quality parameters on the different sections of all major and minor canals to maintain its quality.
Keywords: Surface water quality, FAO, SEBA Hydrometrie MPS K-16

6th International Water Conference Proceedings [ 63 ]
Impact of Groundwater Use on the Health of Rural Households
Muhammad Salman Awan* Muhammad Ashfaq**Institute of Agricultural and Resource Economics, University of Agriculture Faisalabad, Pakistan
Abstract
Water pollution is growing at an alarming rate. Due to rapid growth of polluted water, Pakistan is suffering from the shortage of safe drinking water. Contaminated water is a great threat to human health which is increasing the mortality rate. Almost 20-30% hospital cases and 60% infant deaths are being caused by waterborne diseases. The current study was conducted in 4 different villages of district Sahiwal and 110 respondents were interviewed by using a well-structured questionnaire. This study investigated how human health was adversely affected and what expenses they had to bear on health treatment after drinking poor quality groundwater. Primary data were collected and analyzed by using Microsoft Excel and Eviews software. The study revealed that hair fall, typhoid, diarrhea, hepatitis were common diseases among the respondents, which were found up to 58%, 49%, 44% and 42%, respectively. On the other hand, premature graying of hair, yellowish teeth and bloating were found among 14%, 4% and 1% respondents and their family members, respectively. The study shows that the average monthly fee of doctor, medication cost, traveling cost, dietary cost, home remedies, cost of precautionary measures were 491.10, 1027.20, 138, 281.82, 13.20 and 11.82 rupees per month respectively. The total monthly health cost of respondents on treating water related diseases was Rs.1963. Findings of the study revealed that income, number of visits to the doctor, number of diseases and family size had positive impact on health cost of the respondents. Conversely, treated drinking water, groundwater quality and adoption of precautionary measures had negative impact on the health cost of respondents. The study also showed that the values of number of diseases, adoption of precautionary measure, groundwater quality, and treated drinking water were statistically insignificant. The coefficients of family size, number to visit doctors and income were statistically significant at 1%, 5% and 10% level of significance. Study recommended that there is a serious need of proper monitoring system of groundwater and dumping of industrial wastes into water bodies. Industries should be forced to follow waste discharge standards.
Keywords: Impact assessment, Groundwater, Health Cost, Sahiwal.

[ 64 ] 6th International Water Conference Proceedings
Assessment of Microbial Quality of Water used by Poultry Slaughtering Facilities in Association with Sanitation Conditions and Hygienic Status of Butchers
Sadaf Tagar and Naveed Ahmed* U.S. Pakistan Center for Advanced Studies in Water, Mehran University of Engineering and Technology, Jamshoro, 76062, Pakistan Sadaf Tagar email: [email protected] Naveed Ahmed email: [email protected]
Abstract
The water used by poultry butchers for cleaning the hands and slaughtering tools may act as transfer of pathogens to the human body via meat consumption. The present study, was conducted in district Jamshoro to assess the quality of water used by the slaughtering workers. After conducting questionnaire survey 38 water samples were collected from the containers of poultry shops from different areas of Jamshoro and 1 water sample was collected from source (hand pump). The samples were analyzed for the presence of Salmonella, Shigella, and E. coli by spread plating method. Isolates were identified by colony characteristics and number of distinct colonies on each plate of the sample were enumerated using colony counter and colony forming units (CFU/ml) of the samples were calculated. Premises of butchers’ shops, utensils, water containers, and personal hygiene of butchers were very poor owning to the lack of knowledge, illiteracy, and nature of the work. The overall prevalence of Salmonella, Shigella, and E. coli in water was 64.28%, 78.57% and 71.42% respectively. Assuming the recent outbreak of extensively drug resistance (XDR) Salmonella typhi the antimicrobial resistance of Salmonella spp. was also determined by using Disc Diffusion method after confirming it with Triple Sugar Iron (TSI) Agar Test and Urease test. Antibiotics used in this regard were, Ampicillin (1µg), Ceftazidime (30 µg), Gentamicin (10 µg), Erythromycin (15 µg) and Streptomycin (10 µg). Out of 27 salmonella isolates 91% of isolates showed resistance to Cefotaxime, 50% to streptomycin 8% to Gentamicin, 50% to Erythromycin and 16% to Ceftazidime. All the isolates (100%) show high resistance to Ampicillin. The frequent use of antibiotics in poultry sector for control of diseases could be the reason of development of antibiotic resistance in poultry. To improve the quality of water there is need to create the awareness among the poultry butchers to adopt the hygiene and sanitation standards to increase the safety of meat. Keywords: Poultry, XDR Salmonella, Water, butcher shops, sanitation and Hygiene

6th International Water Conference Proceedings [ 65 ]
Exploring the Phytoaccumulation Efficiency of Various Wetland Plant Species to Remove Chromium in Constructed Wetlands
Fazila Younas1, Irshad Bibi1,*, Nabeel Khan Niazi1,2, Muhammad Afzal3, Safdar Bashir4
Zubair Aslam5 and Muhammad Mahroz Hussain1
1Institute of Soil and Environmental Sciences, University of Agriculture Faisalabad, Faisalabad 38040, Pakistan, 2School of Civil Engineering and Surveying, University of Southern Queensland, Toowoomba, Queensland, Australia, 3National Institute for Biotechnology and Genetic Engineering (NIBGE), Faisalabad, Pakistan4Sub-campus Depalpur, Okara, University of Agriculture Faisalabad, Okara, Pakistan5Department of Agronomy, University of Agriculture Faisalabad, Faisalabad 38040, Pakistan
Abstract
Constructed wetlands (CWs), consisting of vegetated wetland plants, may reduce the level of chromium (Cr) from contaminated water; but the selection of wetland plant species for efficient Cr removal needs to be further investigated. In this study, we explored the potential of various wetland plant species in constructed wetlands (CWs) to treat Cr-contaminated water. Ten indigenous wetland plant species were planted in the CWs to explore their efficiency to accumulate Cr from water. In all the wetland plant species, concentration of Cr was higher in root compared to shoot. Constructed wetlands planted with B. mutica removed the highest Cr from water at 15 and 30 mg/L Cr levels. However, no significant difference in growth of these wetland plants was observed between the control and contaminated CWs. All the wetland plants at 15 mgL-1 Cr showed 47% to 99% Cr removal efficiency. At high level (30 mgL-1) of Cr, all the wetland plant species showed Cr removal efficiency from 36 % to 92 %. This B. mutica have great efficiency to remediate Cr from the contaminated water in CWs.
Keywords: Chromium, Wetland Plant Species, Contaminated Water, Constructed Wetlands
[ 66 ] 6th International Water Conference Proceedings
Chromium concentration, its speciation and geochemical behavior in tannery industry wastewater of district Kasur, Punjab, Pakistan
Fazila Younas1, Irshad Bibi1,*, Nabeel Khan Niazi1,2, Muhammad Afzal3, Safdar Bashir4 Zubair Aslam5 and Muhammad Mahroz Hussain1 1Institute of Soil and Environmental Sciences, University of Agriculture Faisalabad, Faisalabad 38040, Pakistan, 2School of Civil Engineering and Surveying, University of Southern Queensland, Toowoomba, Queensland, Australia, 3National Institute for Biotechnology and Genetic Engineering (NIBGE), Faisalabad, Pakistan, 4Sub-campus Depalpur, Okara, University of Agriculture Faisalabad, Okara, Pakistan, 5Department of Agronomy, University of Agriculture Faisalabad, Faisalabad 38040, Pakistan, *Corresponding author Email: [email protected]: Fazila Younas ([email protected]) (Poster presentation)
Abstract
Wastewater from tannery industry is complex in composition and leads to water contamination, especially due to the high organic loading and chromium (Cr) content. Two major forms of Cr i.e. hexavalent Cr (Cr (VI)) and trivalent Cr (Cr (III)), are predominantly found in tannery industry wastewater. Hexavalent Cr is the most toxic form of Cr which does not have any essential metabolic functions in the living organisms. In this study, we determined the Cr concentration and its speciation in tannery industry wastewater samples collected from several tannery industries in district Kasur of Punjab, Pakistan. All the wastewater samples (n = 86) showed elevated total Cr concentration (mean: 16 mg L−1; SD: ± 34 mg L−1). The concentration of Cr (VI) and Cr (III) ranged from 1.5 to 17 mg L−1 and 10 to 174 mg L−1, respectively. The Cr (VI) concentration in most of the tannery industry wastewater samples exceeded the National Environmental Quality Standard (NEQS; 0.25 mg L−1) and the United States Environmental Protection Agency (US EPA; 0.1 mg L−1) safe limits in wastewater. Geochemical modeling revealed that the presence of Cr-bearing mineral phases such as Cr (OH)3, Cr2O3 and MgCr2O4 may be carriers of Cr and control Cr concentration and its speciation in tannery industry wastewater of study area. The results indicate that the wastewaters from the tanneries do not satisfy the legal ranges of selected parameters (pH, cations, anions, chemical oxygen demand and biochemical oxygen demand) and discharge to inland water and to sewer without any treatment. It is concluded that some suitable and eco-friendly remediation strategies are needed to treat Cr contaminated tannery industry wastewater such as employing constructed wetland technology.
Keyword: Chromium, geochemical modeling, tannery industry, wastewater

6th International Water Conference Proceedings [ 67 ]
Evaluating the antimicrobial activity using Punica granatum plant species against Microbes
Bakhtawar Pirzada1, Ayesha Tajammul2
Zubair Ahmed3
[email protected]@[email protected], sanitation and health sciences, Uspcas-w, Mehran University Jamshoro, Pakistan
Punica granatum is the fruit plant having pomegranate which contain antimicrobial properties. This study is to explore the antimicrobial activity of Punica granatum leaves extract against floor pathogens using disc diffusion method. The dried leaves of Punica granatum were extracted in water and their potential activity were studied. The inhibitory effect of this extract was observed on gram positive and gram negative bacteria at different concentration in terms of zone of inhibition through disc diffusion method. Two concentration were used 100 ml and 50 ml. The zone of inhibition of Punica granatum extract against E.coli ranges from 14 mm to 22 mm and for Staphylococcus aureus 16mm to 24 mm. The Punica granatum shows greater result which suggest that Punica granatum might be used as a natural disinfectant against pathogens
Keywords: Punica Granatum, Pathogens, Zone of inhibition, disinfection, Gram positive.
[ 68 ] 6th International Water Conference Proceedings
Arsenic-contaminated Irrigation Impact on Growth and Uptake of Arsenic in Different Rice GenotypesMuhammad Mahroz Hussaina, Irshad Bibia*, Nabeel Khan Niazia,b,, Jorg Rinklebec, Muhammad Farrakh Nawazd, Safdar Bashire, Fazila Younasa
a Institute of Soil and Environmental Sciences, University of Agriculture Faisalabad, Faisalabad, Pakistanb School of Civil Engineering and Surveying, University of Southern Queensland, Toowoomba, Queensland, Australiac Laboratory of Soil- and Groundwater-Management, Institute of Foundation Engineering, Water- and Waste-Management, School of Architecture and Civil Engineering, University of Wuppertal, Germanyd Department of Forestry & Range Management, Faculty of Agriculture, University of Agriculture Faisalabad, Faisalabad, Pakistane Sub-campus Depalpur, Okara, University of Agriculture Faisalabad, Okara, Pakistan
Arsenic (As) contamination is emerging as a serious health and environmental issue globally especially in the South and South-east Asian countries including Pakistan, India and Bangladesh. In contrast to oxic soil environments, mobility and bioavailability of As to rice under (reduced) paddy soil conditions is an emerging issue to food security and human health. This is because rice is a staple food of about 3 billion people throughout the world including in India, Pakistan and Bangladesh and it accumulates As in paddy soil environments. The objectives of the present study were to: (1) explore the accumulation of As in different parts of rice (Oryza sativa L.) plants of the two contrasting rice genotypes (Kainat and KSK-385), and (2) evaluate the effect of As on morphological and biochemical parameters of rice plants. Six types of organic (farmyard manure (FYM), cow dung (CD), biogas slurry (BGS), mixed biomaterials waste (MBW)) and inorganic (gypsum, lignite) amendments were applied to determine their impact on soil As availability and uptake by the two rice genotypes. Arsenic-contaminated irrigation water was applied to rice plants after 20 days of transplantation at three intervals during the experiment: one at transplanting stage; second at booting stage; and third at reproductive stage. Results revealed that shoot length, root length and total biomass of the Kainat and Basmati-385 genotypes were significantly higher in CD and FYM applied treatments compared to control. Arsenic concentration in the plant roots, shoots and grain ranged from 60–171, 5.2–46 mg/kg DW, respectively, compared to control treatment for both the rice genotypes. The translocation factor (TF) spanned 0.07 to 0.51 with the minimum values obtained for CD and Bios treatments in both the rice genotypes (TF: 0.07 and 0.29). This study shows that the organic amendments, particularly FYM, CD and Bios, have the ability to reduce As accumulation by the rice genotypes investigated here, although Kainat possessed the minimum grain As content, and as such could be suitable for assessment under the field conditions in the remediation of As-contaminated paddy soils.

6th International Water Conference Proceedings [ 69 ]
Targeting Arsenic Safe Drinking Water Wells by using Sediments colour tool of Punjab, PakistanMuhammad Mahroz Hussain1, Irshad Bibi1, Nabeel Khan Niazi1,2,*, Muhammad Farrakh Nawaz4, Jörg Rinklebe5, Safdar Bashir6, Zubair Aslam7, Fazila Younas1
1 Institute of Soil and Environmental Sciences, University of Agriculture Faisalabad, Faisalabad, Pakistan, 2 School of Civil Engineering and Surveying, University of Southern Queensland, Toowoomba, Queensland, Australia, 3 Department of Environmental Sciences, COMSATS University Islamabad, Vehari Campus, Vehari, Pakistan, 4 Department of Forestry & Range Management, Faculty of Agriculture, University of Agriculture Faisalabad, Faisalabad, Pakistan, 5 Laboratory of Soil- and Groundwater-Management, Institute of Foundation Engineering, Water- and Waste-Management, School of Architecture and Civil Engineering, University of Wuppertal, Germany, 6 Sub-campus Depalpur, University of Agriculture Faisalabad, Okara, Pakistan, 7 Department of Agronomy, University of Agriculture Faisalabad, Faisalabad, Pakistan
Abstract
Arsenic (As) toxicity is an emerging international issue affecting more than 200 million people. Southeast Asian countries are more at As toxicity risk due to its release from Himalayas, Ganges and Brahmaputra mountains which is consider to be its major hotspot for geogenic As release. Most of these countries relies upon the groundwater for drinking and irrigation purpose from shallow to deep wells. While, this study was planned to develop a sediment colour tool based on the local driller’s perception of sediment color, As concentration of underground sediments and groundwater and respective colour of aquifer sediments. Two wells were dug up to the depth of 120 ft from both As-contaminated and -uncontaminated areas based on the data of groundwater As concentration from previous studies in selected area. Underground sediments samples were collected (n = 20) at equal depth intervals of 6 ft. The color of each sediment sample was compared with the Munsell Color Chart. All the sediment samples were assigned with Munsell Colour and Munsell Code, which eventually led to identify different colour shades which were narrowed to four colors (black, white, off-white and red) as perceived and used by the local drillers. Results showed that the sediments having dark colour (10YR 4/2 to 10YR 2/2 as per Munsell chart were high in total As concentration (range: 25 to 277 mg/kg; mean: 54 mg/kg; median:83.4 mg/kg). The majority of sediment samples collected form As-uncontaminated well were white to red in colour which indicates safe water following the Pakistan drinking water standard for As (50 μg/L) where mean As concentration of As-uncontaminated area was 2.56 mg/kg while its median value was 3.11 mg/kg. This is the first study in Pakistan which unveils that the sediment colour along with total As concentration of sediments could be used to train local drillers for identifying the As-safe and -unsafe wells for drinking. This study will also enable the local driller to identify the As-contaminated and -uncontaminated wells for safe drinking water purpose.

[ 70 ] 6th International Water Conference Proceedings
Assessment of Water Sanitation and Hygiene and Water Quality in Primary Schools to Estimate The Risk of Waterborne Diseases
Authors: Jamil Ahmeda*,b, Li Ping Wonga*, Yan Piaw Chuac, Joshua V. Garnd
a* Centre for Epidemiology and Evidence-Based Practice, Department of Social and Preventive Medicine, Faculty of Medicine, University of Malaya, Kuala Lumpur 50603, MalaysiabUS- Pakistan Center for Advanced Studies in Water, Mehran University of Engineering & Technology, Jamhsoro, Pakistan.c Faculty of Education, University of Malaya, Kuala Lumpur 50603, MalaysiadSchool of Community Health Sciences, University of Nevada, Reno, USA
Primary school children in developing nations are often lacking safe drinking water, improved sanitation and hygiene, resulting high burden of gastrointestinal diseases that leads to poor school performance. In low income countries school children are potentially vulnerable to waterborne diseases due consumption of unsafe water. For timely decision making Quantitative Microbial Risk Assessment (QMRA) is the widely accepted model to predict probability of infection with better accuracy. We used multi-stage random-sampling procedure to accomplish sample size of 425 primary-schools from the 10 representative districts of the province (Sindh). Water, Sanitation and Hygiene (WASH) services were assessed, structured observations and interviews were used to ascertain the schools’ WASH conditions.
The Basic WASH facilities coverage (58% water, 19.3% sanitation and 13.6% hygiene) in the primary schools of Sindh remains overall low on WHO WASH service ladder criteria. Based on microbiological results, the QMRA model applied to estimate the health risks poses through waterborne infections among school children. The QMRA results showed varying degrees of health risk. The water samples were found contaminated due to Shigella spp. (63%), V. cholerae (49%), E. coli (49%), and Salmonella spp (53%). The South Sindh presents greatest risk of illness and infection due to the Rotavirus, and Campylobacter. However, children in the North and Center regions of study province had comparatively lesser probability of waterborne infections. The probability of illness per year among children of Karachi was estimated high from the Rotavirus (22.6%) and Campylobacter (70%). The Pearson correlation was run to see the relationship (P< 0.01) among selected pathogens, the vibro-cholera shows strong correlation with Shigellae, rotavirus, campylobacter, and salmollea typhi. Overall the risk of illness due to the selected bacterial infection was found distressing. We recommend updating and implementing WASH policies in schools of Sindh to reduce the burden of WASH related diseases at school.
Key-words: Water Sanitation and Hygiene (WASH); water quality; infection; primary school children; health risk assessment.
6th International Water Conference Proceedings [ 71 ]
UASB: an approach towards Wastewater Treatment
Muhammad Touseef*, Shahbaz Nasir Khan, Muhammad Umer, Touseef Ahmad BabarDepartment of structures & Environmental Engineering, University of AgricultureFaisalabad, Pakistan*Corresponding Author:[email protected]
Abstract
Water is the essential part of our life. World has been facing water crises since few decades. Water’s Quality is detoriated day by day. World has decided to meet-up these Challenges. To overcome these challenges, some techniques are developed. The Up-flow anaerobic sludge blanket reactor (UASB) is high-quality way due to the fact it has greater potential to deal with water having a high content of methane and low content of suspended solids. It is additionally environment-friendly because the emission of CO2 is much less and biogas production is greater through which we can run our system.In the UASB Reactor, Enough Quantities of Anaerobic Sludge is inoculated on the initial stage. Afterward, its up-flow feeding will be started very soon. This initial stage is very important for the operation of the system and this stage is known as the start-up of the system. When the system is started working progressively then feeding rate should be increased. Over time, very intense sludge will be developed at the bottom of the Reactor. Above the Sludge bed, there is an area that contained bacterial growth and that is named as Sludge blanket. The mainly outcomes of this technique are wastewater treatment and energy production. UASB can be treated the industrial waste water with high organic content and additionally Municipal wastewater with high COD load. Due to anaerobic digestion of sewage, higher amount of hydrogen can be obtained. By this technique, we can get our main objectives e.g. wastewater treatment and biogas production.
Keyword: UASB Reactor, Anaerobic, Energy, Suspended Solids

[ 72 ] 6th International Water Conference Proceedings

6th International Water Conference Proceedings [ 73 ]
[ 74 ] 6th International Water Conference Proceedings
Proposal of Canal Top Solar PV Plant for ReducingCapital Cost and Evapouration of Water
Fahad JavaidDepartment of Electrical Engineering University of [email protected] IslamDepartment of Electrical Engineering University of [email protected] FarooqDepartment of Electrical Engineering University of [email protected]
Abstract
Energy and water crises is very severe issue in Pakistan due to increase in population. Demand is increasing day by day and now a days cost of electricity generation and scarcity of water are major concerns. Cost of electricity generation is high in Pakistan as compare to other Asian countries. Geographical position of Pakistan has potential of about 1.748 GWh per year from renewable energy resources.
But only 2% demand of electricity is fulfilling from renewable energy resources. Solar energy has the greatest potential in Pakistan. Different installing techniques can be used for acquiring energy from the sun. Now a days Canal top power plant is common trending technique. Most of Thermal power plants are located near the bank of canals in Pakistan. Paper proposed a location and structure that canal top power plant should be mounted near the thermal power plants. This idea will save the evaporation of water from canal, cost of transmission line and Grid station and will save space on the ground. Electricity from solar power plant will integrate with transmission line and grid available for thermal power plant. Almost 9 million litter water will save annually by installing 1MW solar power plant on canal.
Keywords: TPP (Thermal power plant), SPP (Solar power plant),

6th International Water Conference Proceedings [ 75 ]
Spatial Crop Management Using Remotely Sensed Soil Moisture Contents Estimation Under Semi-Arid Condition
Kinza Farooq1; Muhammad Naveed Tahir2
1Institute of Geo-informatics and Remote sensing, Arid Agriculture University, Rawalpindi, Punjab, 46300.2Department of Agronomy, PMAS- Arid Agriculture University, Rawalpindi, Punjab, 46300Corresponding author:[email protected] of Electrical Engineering University of [email protected]
Soil moisture is an important factor for improving crop productivity and also to understand hydrology and climate spatially. Generally, estimation of soil moisture through remote sensing is a not an easy task because of terrain effects and flora in hilly region. However, the spatial data provided by satellite remote sensing is essential for numerous applications. Soil moisture content was estimated using triangle method based on the vegetation indices including normalized difference vegetation index (NDVI), vegetation cover index (VCI) and fractional vegetation cover (FVC) derived for Landsat7 and Landsat8 imagery. Satellite derived soil moisture contents were validated with ground based soil moisture estimation. Wheat yield samples were also collected manually from the same location where soil moisture content was measured. Triangle method was proved an appropriate technique for estimation of soil moisture and spatial crop management through remote sensing. Results were analyzed based on the highest coefficient of determination (R2) and root mean square error (RMSE). FVC showed better outcomes with R2 value of 0.86 and RMSE = 3.790 as compared to NDVI and VCI with Landsat7. Relationship between soil moisture content derived from VCI with wheat yield showed higher value of R2 = 0.95 and RMSE = 3.760 with Landsat8. In this study it was feasible to calculate soil moisture along with better precision and this can be utilized in various agriculture and crop management operations for improving crop productivity.
Keywords: soil moisture estimation, vegetation indices, spatial crop management, remote sensing, Landsat7 and Landsat8
[ 76 ] 6th International Water Conference Proceedings
‘Water, Women Everywhere, but Not a Drop to Drink?’ Reading Saraswati and Paroshni as Allegories for Water Governance, Ecofeminism and Environmental Activism in Mustansar Hussain Tarar’s ‘Bahao’
Raza [email protected]
Abstract
But why this happened, Paroshni? We were living in comfort and living life as we wished, and everything was in its place, then why the rains haven’t fallen now? Why have the great waters lost their way?’‘We ourselves create a way of life and when there is an upheaval in this way of life, we become lifeless. Yes, we have ourselves created that way of life, so we cannot break it…and when it breaks, we ourselves break with it. Any way of life…when it is broken, somewhere something happens to break it.’
Mustansar Hussain Tarar’s neglected trilogy of novels (‘Bahao’, ‘Rakh’ and ‘Qurbat-e-Marg main Muhabbat’) pose the question as to the fate of civilizations when rivers supporting them begin to dry up. In the first novel of the trilogy ‘Bahao’, women play seminal roles as ecofeminists and environmental activists; and thus, by extension, better managers of water. The river which supports Mohenjodaro is conceptualized as a woman: ‘Saraswati, who is the mother of great waters…and the seventh stream, its waters come, roaring grandly and loudly’; Gagri is solely responsible for hunting exotic birds; Pakli is the sculptor of exquisite seals which she hopes will immortalize her name long after the Saraswati has dried up; and Paroshni is not only cast as the environmental activist who first discovers and then must warn her fellow countrymen about the impending drying up of the river, but in her own personal relations with men and decisions relating to motherhood, she exhibits a remarkable degree of gender equality. Thus the fate of the land is intimately tied to the role of both water and women as symbols and carriers of fertility. Based on first-time original translations into English from Tarar’s masterpiece, as well as rare interviews with the author himself, on the occasion of Tarar’s 80th birthday (2019), I argue that the novel and its central question of the drying up and decline of rivers leading to the collapse of ancient civilizations has found a new relevance in our own time, given the perils of global warming (with an added human dimension), water depletion and overuse, the survival of endangered communities and the fact that Pakistan is one of the most water-scarce countries with a rapidly-growing population.
6th International Water Conference Proceedings [ 77 ]
Utilizaion of Spent Wash and its Impact on Soil Properties and Wheat Growth
Ashique A Chohan1 1Faculty of Agricultural Engineering, Sindh Agriculture University Tando [email protected]
Abstract
The present study was conducted on Latif farm at Sindh Agriculture University Tando Jam to evaluate the efficiency of spent wash with chemical fertilizers. Soil sample were taken before and after the harvesting from various depths. Wheat crop (TJ-83) were sown and spent wash was utilized for irrigation with different proportion as 0% (100% canal water), 10%, 20%, 30% diluted with canal water. The soil parameters (pH, EC, N, P, K,) were analyzed before and after harvesting, however spent wash parameters (COD, BOD, pH, EC, N, P, K) were also analyzed for comparing the impact of spent wash on soil properties with different depths. Statistically analysis showed significant effect of spent wash concentration on soil parameters.
Maximum values of ph (8.0) and N (0.92 %) of soil samples was recorded at 30% spent wash concentration EC (0.15ms/cm). The highest values of P (4.36 ppm) and K (180ppm) of soil samples were noted at 20% spent wash concentration. Analysis of variance showed significant effect of soil depth on soil parameters after harvesting of wheat crop. Maximum pH (8.0) and P (4.36ppm) content of soil samples were observed highest at 12” soil depth. With minimum content of soil N (0.92%) was recorded. However maximum K (180ppm) content were noted in soil samples taken from 6” depth. Analysis of variance showed a significant effect of spent wash concentration on agronomical parameters of wheat crop. Highest plant height (72cm), Weight of grain per spike (1.373g) and Number of grain per spike (79) were observed in wheat crop grown at 30% spent wash concentration, followed by at 10% spent wash concentration and then lowest at 20% spent wash concentration. However Seed Index (24.33g) was highest in wheat crop grown at 30% spent wash concentration followed by 20% spent wash concentration and then at 10% spent wash concentration.
Keywords: Spent wash, soil depths, Plant growth parameters, physicochemical properties of soil and spent wash
[ 78 ] 6th International Water Conference Proceedings
Wastewater Monitoring of Integrated Constructed Wetland
Hina Ishaque, Imran Hashmi* Institute of Environmental Sciences and Engineering School of Civil and Environmental Engineering National University of Sciences and Technology Sector H 12, Islamabad. [email protected]; *[email protected]
Abstract
Integrated Constructed Wetlands (ICW), a phytoremediation technique is considered as a successful, economical and environmentally friendly alternative for conventional wastewater treatment technologies for monitoring the water quality in terms of nutrients removal (i.e. nitrogen and phosphorus) and other contaminants. Current study aimed at monitoring the water quality of ICW at NUST campus, H-12, Islamabad. Water samples from various stages of the ICW were analyzed for various physicochemical parameters including pH, Temperature, Turbidity, Electrical Conductivity (EC), Dissolved Oxygen (DO), Chemical Oxygen Demand (COD), Total Suspended Solids (TSS), Total Dissolved Solids (TDS), Total Kjeldahl Nitrogen (TKN), Nitrate, and Phosphate. Water samples were collected and analyzed in the month of September 2019, including inlet, sedimentation tank, eight ponds planted with Typha latifola, Pistia stratiotes, Centella asiatica and collection tank (outlet) to measure the removal efficiency at each stage. The results revealed that ICW is effective in improving water quality. The prevalent removal efficiency for NO3-N, TKN, TP and COD were 98.74, 69.50, 80.28 and 85.02% respectively. Thus, study depicts that the ICW serve as environmentally friendly and an equally efficient technology, and has a considerable potential for the removal of pollutants from wastewater. Keywords: Integrated Constructed Wetlands (ICW), Wastewater, Physicochemical Parameters

6th International Water Conference Proceedings [ 79 ]
Assessment of Biotoxicity Potential of Lambda Cyhalothrin on Common Carp
Mehwish Niaz, Imran Hashmi*Institute of Environmental Sciences and EngineeringSchool of Civil and Environmental EngineeringNational University of Sciences and TechnologySector H12, Islamabad. [email protected]; *Corresponding Author: [email protected]
Abstract
Pesticide contamination is one of the many dynamics contributing to polluting our freshwater sources. Traditional agricultural practices cause various toxic chemical to enter into our water bodies through run off and contaminate them. Water is main component of food chain and presence of Lambda Cyhalothrin pose a threat to human health too. This study aimed at exposing fish to similar toxic environment and analyzing its impacts through acute toxicity bioassay. After acclimatizing fish, acute bioassay was performed in semi-static tank by exposing common carp to various concentrations of lambda cyhalothrin. Behavioral alterations and die off rate of fish was observed at 24hr time interval according to OECG (Organisation for Economic Co-operation and Development) guidelines. After repeated experiments, LD50 value of common carp for LC was found to be at 1.25µg/l. In addition to this, physicochemical parameters of tank water were also determined at 24,48, 72 and 96 hours. Furthermore, temperature fluctuated within 96 hours exposure, pH increased after every 24 hour while DO and turbidity decreased during the same time interval.
Keywords: Lambda cyhalothrin, acute toxicity, common carp, LD-50.
[ 80 ] 6th International Water Conference Proceedings
Analysis of Biofilm Formation along the Surface of Galvanized iron pipe in a Drinking Water Distribution System
Huda Kamal, Imran Hashmi* Institute of Environmental Sciences and Engineering (IESE) School of Civil and Environmental Engineering (SCEE) National University of Sciences and Technology (NUST) [email protected] *[email protected]
Abstract
Safety of drinking water is essential for the health of living beings. Drinking water distribution systems (DWDSs) function to provide drinking water to consumers so that it should be clean and safe for consumption. However, drinking water can be contaminated by the presence of diverse microbes which could survive and grow in the DWDSs leading to the formation of biofilms along the surface of pipes. The detachment of biofilms from the pipe surface causes the quality of water to deteriorate. In this study biofilm formation on the surface of Galvanized iron (GI) pipe in the chlorinated DWDS of National University of sciences and technology (NUST) was investigated. Physicochemical analysis of drinking water, Heterotrophic plate count of biofilm grown on the upper, middle and lower part of the inserted GI pipe was analysed. Polymerase chain reaction (PCR) was conducted for the isolated strain to report 16SrRNA bacteria. The results showed that only free and total chlorine of drinking water were below the required standard whereas all the other selected parameters were within permissible limits. The results highlighted that microorganisms were found concentrated in the Upper and lower parts of GI as compare to the middle part. Through morphological identification it was clearly evident that different bacterial communities were present in different parts of the inserted pipe (GI). However, the bacterial communities present in the middle part of the pipe were highly diverse thus highlighting that possible pathogens were found in the middle of the pipe wall. The results of this study report that the biofilm formation on the middle part of pipe wall (GI) contains potential risk for drinking water safety. Keywords: Drinking water, Drinking water distribution system (DWDS), Biofilm, Galvanized iron (GI).

6th International Water Conference Proceedings [ 81 ]
Evaluating the Biotoxicity Potential and Photodegradation of Sulfamethoxazole in Water Using Common Carp
Laraib Shahid, Imran Hashmi* Institute of Environmental Sciences and Engineering School of Civil and Environmental Engineering National University of Sciences and Technology, Sector H-12 Islamabad [email protected] ; *[email protected]
Abstract
Humans are exposed to wide variety of man-made chemicals through different routes of contamination. Higher concentration of pharmaceuticals active ingredients like sulfamethoxazole (SMX) is detected in surface waters of Pakistan due to untreated wastewater and runoff from agricultural usage. Sulfamethoxazole has been widely used as a sulfonamide antibiotic for the prevention and treatment of infections. To alleviate the impact of commonly used antibiotic on aquatic life and humans, it is necessary to assess its biotoxicity potential. Acute toxicity bioassay was performed in semi-static tanks to determine 24, 48, 72 and 96 hr lethal dose of sulfamethoxazole for common carp by exposure to different concentrations ranging from 200-2000 mg/L. Lethal dose (LD50) was found out to be at 1000 mg/L after 96 hr. As photolytic degradation is the most efficient method for SMX removal, it was carried out using 11W mercury lamps (UV-C, 254 nm) and photodegradation rate was measured via UV-Visible spectrophotometer. Moreover changes in physico-chemical parameters of water depicts increase in pH, decrease in DO, turbidity, electrical conductivity, free and total chlorine. Furthermore temperature also fluctuated during the experimental conditions and ranged between 18 to 20 degree Celsius. Keywords: Sulfamethoxazole, Biotoxicity, Common carp, Lethal dose (LD50), photodegradation
[ 82 ] 6th International Water Conference Proceedings
Monitoring of Canal Water Quality for Irrigation
Abdul Moiz1, *Shahbaz Nasir Khan1, Naveed Ahmad Khan1, Abdul Nasir1, and Allah Bakhsh2
1Department of Structures and Environmental Engineering, Faculty of Agricultural Engineering and Technology, University of Agriculture Faisalabad, Pakistan2Department of Irrigation and Drainage, Faculty of Agricultural Engineering and Technology, University of Agriculture Faisalabad, Pakistan*Corresponding Author: [email protected]
Abstract
Surface water is the major source of irrigation in Pakistan. That’s why monitoring of the quality of surface water is important for better crop production. Irrigation with poor quality water not only decreases crop production but also harmful to human health. The present study was conducted on the section of Rakh Branch Canal passing from city Faisalabad to city Sumundri, Pakistan. A general survey was conducted for collecting primary information like sampling points, start and endpoint, Industries and construction sites along the canal. For sampling, ten points were selected at the appropriate distances. Thirty samples were collected by taking three samples from each point. These samples were collected by 2 ft depth from the surface of the water. Then the samples were tested for different parameters like pH, EC (electrical conductivity), TDS (total dissolved solids), salinity, anions (chloride, calcium, ammonium, nitrate) using SEBA Hydrometrie MPS K-16 instrument. Test results were compared with the guidelines given by the FAO. EC, TDS, pH, Chloride, Calcium, Ammonium and Nitrate of samples ranged from 0.286-0.295 mS/cm, 191.103-197.674 ppm, 7.986-8.406 pH, 7.927-10.907 ppm, 34.015-37.139 ppm, 0.066-0.152 ppm and 4.479-9.679 ppm respectively. There was a little variation in the results of measured parameters due to some contamination from construction sites and domestic waste contamination. Overall, all parameters were found within the permissible limits given by FAO. Hence, all the results of different parameters showed that the water of this section of the Rakh Branch Canal is suitable for irrigation purposes and better crop production. It is recommended that there should be regular monitoring of more water quality parameters on the different sections of all major and minor canals to maintain its quality.
Keywords: Surface water quality, FAO, SEBA Hydrometrie MPS K-16

6th International Water Conference Proceedings [ 83 ]
Population and Water Supply in Pakistan: A Theoretical Analysis
Inza Murtaza , Husnain Ali
Abstract
Water Scarcity is one of the major modern day problems amidst climate change and rapid urbanization. This paper examines the trends in water supply and population for the case of Pakistan. The study utilizes time series data for Pakistan from period 1975-2018. The projections of water supply and population are made for the period 2018-2040 using time series forecasting. Further, the study decomposes water supply for agriculture, industrial and municipal sectors respectively. The study finds severe water crisis looming at the door for Pakistan and suggests increasing the efficiency of water utilization with a special focus on water recycling. A concentrated effort is the need of the time for Pakistan in all the three sectors analyzed in this study.
Keywords: Resources, Water Supply, Water Demand, Population, Time Series

[ 84 ] 6th International Water Conference Proceedings
Harnessing the Potentials of Economy for Inclusive Growth - An Evidence Based Policy Framework
Khizar Hayat Khan, MPHIL Public Policy, PIDE, Islamabad
Abstract
‘Blue Economy’ is basically a concept to seek economic growth, social inclusion and improvement of liv, elihoods as well as ensuring environmental sustainability. Its core idea is decoupling of socio-economic growth and developments through ocean-related sectors and activities. Numerous challenges are presents to encounter the idea of sustainability. In order to harvest these resources, both governments and private organizations are continuously exploiting the oceans. The benefits are in abundance which encourage the private sectors to invest more in blue economy to maximize it profits. Therefore, a number of private firms are operating in the maritime businesses such as fishing, trade, shipping, tourism and offshore oil exploration. The benefits of these resources are as high as one may think; therefore, massive overexploitation and degradation are taking place with an impact that reaches far beyond shores of oceans. Blue Economy approach recognizes and places renewed emphasis on the critical need to address effectively the sound management of resources in and beneath international waters to achieve inclusive growth and development through sustainable ocean governance mechanisms. Every country must take its share of the responsibility to protect the high seas, which cover 64 % of the surface of our oceans and constitute more than 90% of their volume.
Keywords: Blue Economy, Inclusive Growth, Sustainability, Evidence based Policy Framework

6th International Water Conference Proceedings [ 85 ]
Impact of plastic pollution on fresh water biota of water streams around the picnic spots of Hilly region in the Swat Valley Pakistan
Murad Khan1, Wisal Muhammad2, Shujaul Mulk Khan3,*1Department of Plant Sciences, Quaid-i-Azam University Islamabad Pakistan2Department of Botay, Islamia College University Islamabad Pakistan* Corresponding author: [email protected]
Abstract
The presence of Blue water Ecosystem in the upper region of Swat has a diverse biomass of different species at different tropic levels. Among species involved in the food chain of these freshwater systems are Navicula subtilissima, Zygnema Cruciatum (Producer), Water bugs and other aquatic insects (Primary Consumer) of low temperature and Schizothorax labiatus, Schizothorax plagiostomus (Secondary consumer). There is a drastic imbalance and disturbance in their communities due to water pollution. Plastic bottles are on top among the pollutants which are thrown by visitors especially at the picnic spots around these water bodies. Fish species have been observed to emigrate from the picnic spots towards deep, speedy and clean habitats in these aquatic ecosystems. Decomposition rate of these bottles is negligible and hence affecting aquatic fauna and flora Food in a very negative manner. Count of heavy metals in neutral and pure water remains below 0%. Due to such pollution this figure recorded in winter 2019-2020 was 13 % with an increasing trend. Regulatory authorities must pay attention to this issue on priority base and initiate remedial as well as preventive measures for the water of uphill beautiful streams and lakes.
Keywords: Plastic Bottles, Pollution, Swat Valley, Freshwater Ecosystem
[ 86 ] 6th International Water Conference Proceedings
“Water and Sanitation Services Assessment in 3 districts’ SEN Institutions of Sindh”
Qanita Tariq1 and Jamil Ahmed Soomro2
Research Scholar, Water, Sanitation and Health Science Department, US: - Pakistan Center for Advanced Studies in Water, MUET Jamshoro1, Assistant Professor US: - Pakistan Center for Advanced Studies in Water, MUET, Jamshoro2 76090, Pakistan
Abstract
According to the WHO fact sheet on Disability and Health, world’s largest minority consists of 1 billion people. Global population of PWDs is 15%. UNDP suggests that 80% of these live in developing world. Despite Census 2017 remaining the most expensive state drill in country’s history, no attention was paid towards head count of PWDs in census 2017. Children in SEN are the most vulnerable population and it is likely that vulnerable populations are most exploitable therefore it is important to study their problems. This study therefore attempts to find the availability, functionality and quality of Water and sanitation services across 3 districts’ Special Education Needs intuitions of Sindh. A cross-sectional study was conducted in 6 SEN institutions of Sindh using mixed-mode survey in which 43 differently able students were included. Sampling was purposive and wherever needed, help was sought by Pakistan sign language experts for communication with respondents. Drinking water samples were tested for physicochemical parameters and pathogen like (E.coli).
A total of 43 pupils (25 boys and 18 girls) respondents were made part of the study. Water was not available and instead purchased by K (A), K (B) and J institutions. Also J had no provision for separate toilets, creating privacy issues for both genders. All Institutions were found to have E.coli (highest: uncountable and Lowest:2 c.f.u/100 ml) except H#3, where commercial filter system was functional. Sample-HM had the highest turbidity of 1047.8NTU.
In conclusion, it is paramount that peoples’ potential be enabled and willingness be mobilized through the study like this to find out the WASH status, to influence the decision-makers to do more to provide the vital services of safe water, sanitation and hygiene.
Keywords: WASH assessment, differently able/ PWDs, Sindh Education

6th International Water Conference Proceedings [ 87 ]
Metagenomic Analysis of Drinking Water Samples Collected from Treatment Plants of Hyderabad City and Mehran University Employees Cooperative Housing Society
Junaid Ahmed Kori12, Rasool Bux Mahar1*, Muhammad Raffae Vistro1, Huma Tariq1, Ishtiaq Ahmad Khan3, and Ramesh Goel4
1U.S.-Pakistan Center for Advanced Studies in Water, Mehran University of Engineering and Technology, Jamshoro-76062 Pakistan.2Dr. Panjwani Center for Molecular Medicine and Drug Research, International Center for Chemical and Biological Sciences, University of Karachi, Karachi-75270, Pakistan.3Jamil-ur-Rahman Center for Genome Research, Dr. Panjwani Center for Molecular Medicine and Drug Research, International Center for Chemical and Biological Sciences, University of Karachi, Karachi-75270, Pakistan.4Department of Civil and Environmental Engineering, University of Utah, Salt Lake City-84112-0561, USA. [email protected],
Abstract
The quality assessment of water, supplied to the end user, is an essential part to assess the physical, chemical and biological status of water, which impacts on human health. For the quality assessment of drinking water treatment plants and distribution systems of Hyderabad city and Mehran University of Engineering and Technology, Jamshoro, Pakistan, 13 surface drinking water samples were collected from three treatment plants, two of Hyderabad city, including WASA treatment plant and its distribution system (n=5), Hala Nakka treatment plant and its distribution system (n=6) and Mehran University Employees Cooperative Housing Society (MUECHS) treatment plant and its distribution system (n=2). Physicochemical parameters of all drinking water samples were in the range compared to EPA and WHO guidelines, except in L-12 sample. Notably, no free-chlorine was detected in all samples. In metagenomics analysis, targeting V3-V4 hyper-variable region of 16S rRNA gene, by using QIIME2 showed high bacterial prevalence in all samples. On average, 348 OTUs were observed per sample. Among all samples, treated water sample from the Hala Nakka Treatment Plant (HNTR) was most diverse sample in bacterial composition (Shannon 7.51 and Simpsons reciprocal indices 0.98). Overall, Proteobacteria, Bacteroidetes, Cyanobacteria, Verrucomicrobia, and Actinobacteria were the five most abundant phyla (relative abundances of 43.6, 37.9, 8.5, 2.5, and 2.4 percent, respectively). Notably, Cyanobacteria are well known toxin producers which effect the human, and animal health. At genus level, Flavobacterium (4.86%) and Aquirestis (3.77%) were the
[ 88 ] 6th International Water Conference Proceedings
most abundant genera. Functional predictions, based on 16 SrRNA gene by PICRUSt, predicted 6909 KEGG orthologies, relating to 245 KEGG pathways. Among the predicted pathways of KEGG orthologies, pathways to human infections were also found. In conclusion, this study gave a deep insight of bacterial contamination in drinking water samples of Hyderabad City and MUECHS treatment plants and water quality status in Hyderabad and Mehran University of Engineering and Technology.
Keywords: Metagenomics; Bioinformatics; Next generation sequencing; Drinking Water Distribution System (DWDS); Water quality, PICRUSt.
6th International Water Conference Proceedings [ 89 ]
Acclimation and Use of Thiosulfate-oxidizing Bacteria TOB in Vial-based Bioassay for the Detection of Zinc Toxicity in Water
Rafia Khanzada1, Dr Naveed Ahmed Qambrani1*
1WaSH Sciences1 and Environmental Engineering* USPCAS-W, MUET, Jamshoro, [email protected]; [email protected]*
Abstract
Heavy metals pollution load increases with increase the use, consumption and production of these metals in man-made activities. Among other heavy metals zinc is common and hazardous metal which highly consumed in vehicles materials, galvanized surface, alloy, paint, anti-corrosive agent, paints and in other product as well. Use of efficient and rapid method for improvement of monitoring limits help to avoid the exposure and anti-health effects (gastrointestinal and neurological disease and disorder). This study evaluated the effectiveness of thiosulfate-oxidizing bacteria (TOB) for the assessment of zinc toxicity in water. The assessment mechanism compares the bacterial activity in presence of zinc with control in the absence of zinc. Three parameters EC, pH and sulfate formation used to determine the toxicity effect. Thiosulfate-oxidizing bacteria bioassay followed the oxidation process to oxidize the thiosulfate under aerobic condition produce sulfuric acid (as sulfate and hydrogen ion). Firstly, bacteria accumulated in master culture reactor at fed-batch mode by using distillery sludge as source of bacteria. For batch test vail-based reactor was fabricated with different dose of zinc (0-10 mg/L) incubated at 300C with agitation of 1500 rpm. The bacterial activity decreased with increase the zinc dose which determine by the change pH and EC of the reactors. It was observed with increase the exposure time decrease the oxidation process of bacteria. The quantitative determination of toxicity was obtained as EC50. The maximum inhibition growth in toxicity test EC50 of zinc was 1.16 mg/L with incubation time of 24-h calculated by hillslope EC50 method sigma-plot software which was lower than observed EC50 in previous studies with different bioindicator.
Keywords: bioassay, TOB bioassay, assessment method, EC50, toxicity.
[ 90 ] 6th International Water Conference Proceedings
Evaluating the antimicrobial activity using Punica granatum plant species against Microbes.
Bakhtawar Pirzada1, Ayesha Tajammul2
[email protected]@gmail.comWater, sanitation and health sciences, Uspcas-w, Mehran University Jamshoro, Pakistan
AbstractPunica granatum is the fruit plant having pomegranate which contain antimicrobial properties. This study is to explore the antimicrobial activity of Punica granatum leaves extract against floor pathogens using disc diffusion method. The dried leaves of Punica granatum were extracted in water and their potential activity were studied. The inhibitory effect of this extract was observed on gram positive and gram negative bacteria at different concentration in terms of zone of inhibition through disc diffusion method. Two concentration were used 100ml and 50ml. The zone of inhibition of Punica granatum extract against E.coli ranges from 14mm to 22mm and for Staphylococcus aureus 16mm to 24mm. The Punica granatum shows greater result which suggest that Punica granatum might be used as a natural disinfectant against pathogens
Keywords: Punica Granatum, Pathogens, Zone of inhibition, disinfection, Gram positive

6th International Water Conference Proceedings [ 91 ]
Continuous mode adsorption of arsenic from aqueous solution using iron impregnated biochar
Altaf Hussain Magsi1, Uzma Imran1, Aadil Muneer1, Abdul Manan1
US:-Pakistan Center for Advanced Studies in Water, Mehran University of Engineering and Technology, Jamshoro, [email protected] , [email protected], [email protected] , [email protected] , [email protected]
Abstract
In this study, Adsorption experiments were conducted on the contaminant of arsenic in aqueous solution. Acacia nilotica was used as a feedstock material for the preparation of adsorbent. Biochar was fabricated by heating 550o c under oxygen-limited conditions through pyrolysis. Then, it was processed and modified with iron nitrate (HNO3) to improve its efficiency on arsenic adsorption. After this, adsorbent (pristine and iron impregnated biochar) were subjected to different characterization processes for the determination of its properties and mechanism to adsorb arsenic from aqueous solution. The adsorbent was characterized through different techniques including scanning electron microscopy, Fourier-transform infrared spectroscopy, and X-ray Diffraction were used for analyzing the physical and chemical properties and understand the mechanism to adsorb the specific contaminant. Apart from this, lab-scale column experiments were performed to evaluate the adsorption capacity of the pristine and iron impregnated biochar on an arsenic-contaminated aqueous solution. Then, Breakthrough studies at different conditions of Initial concentrations, flow rate; bed depth were conducted to optimize the process of adsorption for achieving maximum removal efficiency of Arsenic up to safe limits for consumption. Thomas model was used to determine the adsorption and modified biochar had high adsorption capacity compared to pristine biochar. It was found that modified biochar had removal efficiency more than pristine biochar. This lab-scale study using column experiments effectively highlighted the remediation of arsenic from groundwater.
Keywords: Adsorption, fixed-bed column, adsorbent, adsorbate, arsenic, process parameters

[ 92 ] 6th International Water Conference Proceedings
Treatment of Distillery Effluent Using Membrane Bioreactor and Investigate Microbial Community Using 16S gene Metagenomics
Muhammad Asif Jokhio1
AbstractDistillery industry is generating wastewater called (spent wash) which produce molasses based byproducts. They are producing untreated wastewater and disposed directly into rivers canals, which is caused environmental pollution. Only few are treating their effluent, many treatment methods are available but Membrane bioreactor (MBR) showing better results nowadays. In this study, MBR is used for treatment of distillery effluent and also investigate microbial community structure using 16S rRNA gene. The MBR reactor was inoculated with distillery effluent and synthetic wastewater and pH was maintained between 7 to 8. Total two samples were withdrawn, one from Initial phase and one for Final phase of the reactor, samples were collected in 50ml sterile tubes for DNA extraction using Gene Jet DNA purification kit. For 16S rRNA gene metagenomics was sequenced by using Illumina MiSeq sequencer (Illumina Inc. USA). In Metagenomic profile using QIIME2 online based tool for analysis of raw data. Results were revealed that highest relative abundant phylum was Proteobacteria (64%) in Initial phase, while Final phase Bacteroidetes (44%) was found most abundant phylum. At class level Alphaproteobacteria (32%) found in Initial phase, while in Final phase Bacteroidia (33%) found most abundant class. At genus level most abundant genera were found Pseudomonas, Clostridium and Runella ,in both phases etc. These genera have capable for removing phosphorus, organic acids and sulphite reduction as well as used for wastewater treatment processes.
Keywords: Distillery wastewater, 16S rRNA gene, Membrane bioreactor
6th International Water Conference Proceedings [ 93 ]
Treatment and color removal of distillery wastewater using Membrane bioreactor MBR
Bahadur Ali1*, Muhammad Asif Jokhio2, Aqsa Channa2, Zubair Ahmed2
1Institute of environmental engineering and management Mehran University of Engineering and Technology (MUET) Jamshoro, Pakistan2US-Pakistan Center of Advanced Studies in Water Mehran University of Engineering and Technology (MUET) Jamshoro, Pakistan [email protected], [email protected], [email protected] author: [email protected]
Abstract
Sugar distillery industry one of the largest industry in Pakistan with GDP growth rate of 3.2%. The large volume of Distillery wastewater called (spent wash) is being discharged directly into rivers, canal causing environmental pollution. In present study, to treat the effluent of distillery wastewater using Membrane bioreactor (MBR) at pilot scale laboratory of US-Pakistan Center of Advanced Studies in Water Mehran University of Engineering and Technology (MUET) Jamshoro, Pakistan. To check the chemical oxygen demand (COD) and color removal using 4% solution of Aluminum Sulfate (Al2SO4) as a coagulant, the dose of (Al2SO4) range from (0.2 ml to 6 ml) was carried out using Jar test, pH range from (8 to 8.6) was used during optimization process. Results were revealed that COD removal efficiency 60-70%was observed at initial stage of MBR. It was observed that optimum dose 4 ml for color removal efficiency 70% at pH 9. Furthermore, this study will be optimized at different materials such as Moringa oliefera seeds Granular activated carbon (GAC), and powdered activated carbon (PAC). In conclusion, it was shown that (Al2SO4) is cheap source for color removal from spent wash.
Keywords. Membrane bioreactor MBR, Distillery wastewater, Chemical oxygen demand
[ 94 ] 6th International Water Conference Proceedings
To investigate antimicrobial resistance profile in drinking water of Mehran University of Engineering and Technology
Sanam Bhatti1*, Rasool Bux Mahar1, Junaid Ahmed Kori1
1U.S.-Pakistan Center for Advanced Studies in Water, Mehran University of Engineering and Technology, Jamshoro-76062 [email protected], [email protected], [email protected] Author:[email protected]
Abstract
Increase of Antimicrobial resistance (AMR) among all major microbial pathogens and antimicrobial drugs is an ever-increasing global public health threat. In order to determine antimicrobial resistance profile in the supplied water to a simulated Biofilm Annular Reactor. Water samples were collected from annular reactors and were analyzed for AMR. Standardized Kirby Bauer Disc Diffusion test was performed to determine the Antibiotic sensitivity testing of Pathogenic bacteria including Vibrio Cholera, E. Coli, Pseudomonas, Salmonella,and and Shigella. Listed pathogens were isolated through membrane filtration method on selective media. AMR was checked in MH media against eleven antibiotics i.e., Azithromycin (AZM 15 µg), Ampicillin (AMP10 µg), Amoxycillin (AML 5µg), Bacitracin (B 10 µg), ciprofloxacin (CIP 5µg), cefixime (CFM 5 µg), Imipenem (IPM µg10), Metronidazole (MTZ µg5), Meropenem (MEM µg10), Rifampicin (RD µg5), Streptomycin (S µg10). After 24 hours incubation at 37oC zones were measured by vernier caliper. The results showed Vibrio Cholera, E. Coli, Pseudomonas, Salmonella,and and Shigella were highly resistant against Bacitracin (B 10 µg), Metronidazole (MTZ 5 µg) and cefixime (CFM 5 µg). However, they were sensitive to the Imipenem (IPM 10 µg), ceftriaxone (CRO 30µg), and ciprofloxacin (CIP 5µg). It has been concluded that all the observed pathogens showed high resistant. However, ceftriaxone (CRO 30µg), Imipenem (IPM µg10) were most effective drug of choice.
Keywords: Antimicrobial resistance; bulk water; Biofilm Annular Reactor; bacterial pathogens; multiple drugs.

6th International Water Conference Proceedings [ 95 ]
Addressing Fluoride Fluorosis Problem and Its mitigation in the Groundwater of Thar Desert of Sindh Province of Pakistan
Tahir Rafique1*, Muhammad Anas1,2, Sofia Khalique Alvi,1
1 Applied Chemistry Research Center, PCSIR Laboratories Complex, Karachi, Pakistan2 Department of Chemistry, University of Karachi, Karachi, Pakistan
Abstract
Presence of fluoride in high concentrations in groundwater is quite a frequent problem and occurs across various areas of Asia, Africa, and North & South American continents. Thar Desert, located in the south-eastern part of Sindh province has also been identified as the most fluoride affected area in Pakistan. The quality of groundwater depreciates to alarming levels due to high fluoride concentrations up to 32 mg/L and exceeds the WHO permissible limit of 1.5 mg/L. The presence of fluoride in high concentrations in drinking water is known to cause various health problems such as dental and skeletal fluorosis (permanent bone and teeth deformities) in humans and animals. Other skeletal problems linked to fluoride toxicity include stiffness, rheumatism and permanent crippling rigidity and the occurrence of these diseases are quite common in the areas of Thar Desert. It therefore becomes necessary to keep the level of fluoride in drinking water within the maximum permissible limit.
Adsorption technique has been considered as a preventive measure to control the adverse health effects of consumption of fluoride rich groundwater for drinking purpose. Sequential studies were carried out to mitigate this problem. In this concern, a batch to pilot plant approach was adopted using alumina as an adsorbent. Batch mode studies were conducted to investigate the performance of alumina under optimized condition of variable of time, dosage, concentration of fluoride, initial pH. In order to evaluate the mechanism of interaction between solid/liquid phases of alumina and fluoride, different isotherm and kinetic models were applied on the obtained data which was found to be in good agreement with these models. Thermodynamic parameters like enthalpy, entropy and Gibbs free energy were also estimated to assess the feasibility of process.
Dynamic mode studies were conducted in column to estimate break through curve, sorption capacity at break through point, exhaustion point and desorption studies. Considering the fluoride level in drinking water as per the guidelines of WHO, the threshold was set at 1.5 mg/L for break through curve studies. Desorption efficiency of NaOH solution of various strength was also optimized and 1% strength was found to be very efficient in this case. Different models for fixed bed column were also applied to study the dynamic solid/liquid phases of

[ 96 ] 6th International Water Conference Proceedings
alumina and fluoride. After successful application of alumina in batch and column mode, a pilot scale plant was developed with a bed depth of 60 kg. Two cycles of adsorption were carried out to estimate break through point followed by desorption studies after each cycle.
The obtained results provided worthwhile information to infer an estimated efficiency and in designing a real time Defluoridation Water Treatment Plant which has been installed in a fluoride affected area of Thar Desert for provision of fluoride safe drinking water to local masses.
6th International Water Conference Proceedings [ 97 ]
Water Scarcity Challenges in Balochistan, Pakistan
Naseebullah Khan Bazai1*, Syed Mobasher Aftab2
1Retired Additional Chief Secretary, Balochistan2Faculty of Engineering and Architecture, Balochistan University of IT, Quetta. *[email protected]
Abstract
Water is of fundamental importance for human development, the environment, and economy water has brought civilization, livelihood, sustenance and wellbeing. Water has remained instrumental to our past development and critical for our future development. However uneven temporal and spatial distribution, demographic densities, and climate change have made the present-day water management difficult and complex phenomenon.All the basic planetary and ecosystem will be endangered if the water is not governed properly. Tapping the water in our era and region to meet the challenges of the growing requirement of different social sectors has become highly imperative as water is critical for sustainable development and poverty eradication as well as maintenance of peace and security. In Balochistan, about 70% of the population is concentrated in rural areas, their economy is based on agriculture and livestock accounting for 60% of the GDP, engaging 65% of the labour force and using 93% of the available water from different resources. Therefore, the availability of water is highly critical for sustenance and economic growth.The water crisis is looming high in the province as such there is a need to formulate integrated policy covering water laws, flood disaster management and land use planning laws aimed to enhance water productivity, storage capacity, protection from the devastating floods to increase agriculture productivity and for the sustainable socio-economic development.Baluchistan has remained water-scarce throughout the past and the availability of water has remained deficient. The situation is aggravated during the past three decades for the natural reasons and mishandling by the consumers, there is deficient water for domestic supply, drinking purposes and for the commercial and agriculture activities.As per the UN standard, the availability of 135 liters of water per capita per day is an ideal arrangement for the comfortable urban life. But, hardly 45-60 liter per capita water is made available to 60% of the population.Baluchistan having an area of 347,185 Km2, with a cultivated area of 21,000 Km2, out of which only 9,800Km2 is irrigated area, whereas 8,000 Km2 is Saliaba (flood Irrigated) area and 2,600 Km2 is Khushkaba (rain-fed) area. The province has a pastoral economy, 70% of the population is, directly and indirectly, related to the agriculture economy. A huge sizeable vagrant agriculture land is available in the province which can be brought under cultivation with the availability of water.More and more agriculture produce
[ 98 ] 6th International Water Conference Proceedings
of different varieties to ensure the food security for the country as well as for sizeable foreign exchange earnings through its imports. The water budget of the province is highly segmented as different sources contribute.In case of any deficient production, the risk factor enhances.As compared to the water budget of other provinces which is a highly integrated water budget and the different sources of water production in the province does support and supplements each other against any risk/deficient production from a particular source.Balochistan receives 10,500 Mm3 water from the Indus River system in the form of perennial and flood flows,about 36% utilized of that water. From the Non-Indus River System province received 16,000 Mm3 as flood runoff and groundwater,while utilized 38%. Balochistan receives 26,500 Mm3 water from all resources and being hardly utilized 9,800 Mm3of water which is about 37% of total water. These figures represent mismanagement and poor utilization of all water resources in the province. An efficient water management system is required that includes enhanced water storage capacity, proper distribution networks and efficient utilization enhanced productions.
Addressing water issues requires intervention at individual and state-level focusing on both demands and supply sides. At individual level household, industrial and agriculture sectors water needs to be used efficiently and judiciously added with water pricing. To curb the water pollution and its recycling, controlling pollution growth and adopting a sustainable portion of urbanization are the major issues that require immediate attention for the future socio-economic development of the province. The province is highly vulnerable to the phenomenon of climate change, in the shape of extreme weather events, erratic monsoon rains causing frequent and intense floods. Frequent spells of droughts are common and silting up of the irrigation infrastructure.The rise in temperature will create water stress conditions particularly in the arid and semi-arid regions leading to a reduction in agriculture productivity. There is an increase intrusion of saline water in fresh groundwater resources of coastal areas. The deficient availability of water will increase stress between the upper and lower riparian’s due to the sharing of scarce water resources. A comprehensive strategy is requiredtoefficiently encounter the situation.Formulation and enforcement of water conservation strategies along with integrated water resource management and development.Effective legislative framework, and enhancement in the capacity of the water engineers and managers with a wide range of community awareness.
Keywords; Water Scarcity, Saliaba, Khushkaba, Balochistan.

6th International Water Conference Proceedings [ 99 ]
Monitoring of canal water quality using SEBA Hydrometrie, MPS K-16
Abdul Moiz, *Shahbaz Nasir Khan and Naveed Ahmad KhanDepartment of Structures and Environmental Engineering, Faculty of Agricultural Engineering and Technology, University of Agriculture Faisalabad, Pakistan*Corresponding Author: [email protected]
Abstract
Surface water is the major source for irrigation in Pakistan. That’s why monitoring of the quality of surface water is important for better crop production. Irrigation with poor quality water not only decreases crop production but also harmful to human health. The present study was conducted on the section of Rakh Branch Canal passing from city Faisalabad to city Sumundri, Pakistan. A general survey was conducted for collecting primary information like sampling points, start and endpoint, Industries and construction sites along the canal. For sampling, ten points were selected at the appropriate distances. Thirty samples were collected by taking three samples from each point. These samples were collected by 2 ft depth from the surface of the water. Then the samples were tested for different parameters like pH, EC (electrical conductivity), TDS (total dissolved solids), salinity, anions (chloride, calcium, ammonium, nitrate) using SEBA Hydrometrie MPS K-16 instrument. Test results were compared with the guidelines given by the FAO. EC, TDS, pH, Chloride, Calcium, Ammonium and Nitrate of samples ranged from 0.286-0.295mS, 191.103-197.674ppm, 7.986-8.406pH, 7.927-10.907ppm, 34.015-37.139ppm, 0.066-0.152ppm and 4.479-9.679ppm respectively. There was a little variation in the results of measured parameters due to some contamination from construction sites and domestic waste contamination. Overall, all parameters were found within the permissible limits given by FAO. Hence, all the results of different parameters showed that the water of this section of the Rakh Branch Canal is suitable for irrigation purposes and better crop production. It is recommended that there should be regular monitoring of more water quality parameters on the different sections of all major and minor canals to maintain its quality.
Keywords: Surface water quality, FAO, SEBA Hydrometrie MPS K-16

[ 100 ] 6th International Water Conference Proceedings
“Monitoring Wastewater Quality of Integrated Constructed Wetland”
Hina Ishaque, Imran Hashmi*Institute of Environmental Sciences and Engineering School of Civil and Environmental Engineering National University of Sciences and Technology, Sector H 12, [email protected]; *[email protected]
Abstract
Integrated Constructed Wetlands (ICW), a phytoremediation technique is considered as a successful, economical and environmentally friendly alternative for conventional wastewater treatment technologies for controlling the quality of water in terms of nutrients removal (i.e. nitrogen and phosphorus) and other contaminants. Current study aimed at monitoring the water quality of Integrated Constructed Wetland (ICW) at NUST campus, H-12, Islamabad. Water samples from various stages of the Integrated Constructed wetland (ICW) were analyzed for various physicochemical parameters including pH, Temperature, Turbidity, Electrical Conductivity (EC), Dissolved Oxygen (DO), Chemical Oxygen Demand (COD), Total Suspended Solids (TSS), Total Dissolved Solids (TDS), Total Kjeldahl Nitrogen (TKN), Nitrite, and Phosphate. Water samples were collected and analyzed in the month of September 2019, including inlet, sedimentation tank, eight ponds planted with Typha latifola, Pistia stratiotes, Centella asiatica and collection tank (outlet) to measure the removal efficiency at each stage. The results revealed that Integrated Constructed Wetland (ICW) is effective in improving water quality. The prevalent removal efficiency for NO2-N, NH3-N, TP and COD were 61.05, 50.34, 86.54 and 71.34% respectively. Thus, the study depicts that the Integrated Constructed Wetlands (ICW) serve as environmentally friendly and an equally efficient technology, and has a good potential for the removal of pollutants from wastewater.
Keywords: Integrated Constructed Wetlands (ICW), Wastewater, Physicochemical Parameters.
6th International Water Conference Proceedings [ 101 ]
Review on: Silent and Salient Effects of Diverse Water Contamination and Depletion on Animal and Human Health
Muhammad Sulman Ali Taseer1*, Muhammad Younus Rana1, Muhammad Muddassir Ali2, Raheela Akhtar3, Qaiser Akram1, Muhammad Asif Idrees1, Beenish Zahid1, Muhammad Ahsan Naeem4, Muhammad Bilal1
*Corresponding Author: [email protected]
1 Department of Pathobiology, Khan Bahadar Chaudhary Mushtaq Ahmad College of Veterinary and Animal Sciences Narowal, Sub-Campus University of Veterinary and Animal Sciences, Lahore, Pakistan 2 Institute of Biochemistry and Biotechnology, University of Veterinary and Animal Sciences, Lahore, Pakistan 3 Department of Pathology, University of Veterinary and Animal Sciences, Lahore, Pakistan 4 Department of Basic Sciences, Khan Bahadar Chaudhary Mushtaq Ahmad College of Veterinary and Animal Sciences Narowal, Sub-Campus University of Veterinary and Animal Sciences, Lahore, Pakistan
Abstract
Agriculture is considered as the backbone of Pakistan’s economy and contributes almost 18.5 percent to total Gross Domestic Product (GDP). Over the years, livestock subsector has surprisingly surpassed the crop subsector as the biggest contributor to the value addition in agriculture. Presently it contributes 60.5 percent to the overall agricultural and 11.2 percent to the GDP during 2018-19. Livestock sector is a source of 35-40% of income for over 8 million rural families and providing them food security by supplementing high valve protein of animal origin. A dire curtailment of the total amount of groundwater is a silent and ultimate threat to the livestock health. As the factors of water depletion are important so are the effects of its depletion and contamination on animal health and productivity. Along with the continuous decrease in its reservoirs, water is getting a drastic number of toxic contaminations from industrial waste. Industrial waste in Pakistan is extensively being dumped in to soil, water and air. This waste contains many kind of heavy metals such as aluminum, mercury, cobalt and silver and most of them are carcinogenic in nature and results in heavy metal poisoning in humans, suffocation in fisheries, destroy aqueous environment and cause diseases such as cholera, typhoid fever
[ 102 ] 6th International Water Conference Proceedings
and diarrhea in livestock. As 86% of composition of milk is water, dry cows drink almost 8-10 gallons of water per day while in third trimester of pregnancy they can drink up to 15 gallons per day.
When animals drink heavy metal or industrial waste contaminated water, it attacks on animal’s intestine and ultimately nutrient absorption. Poor absorbance of dietary nutrients leads to weight and poor productivity which ultimately affects the economy of the farmer and country. If water reservoirs depletion will be continued, it will not be available for animals ad libitum and will cause dehydration in animals and poor feed conversion ratio along with reduced reproducibility.
Keywords: Water depletion, Genotoxicity, Contamination, Livestock Health, Human Health

6th International Water Conference Proceedings [ 103 ]
Analysis of biofilm formation along the surface of Galvanized iron pipe in a drinking water distribution system”
Huda Kamal, Imran Hashmi*Institute of Environmental Sciences and Engineering (IESE)School of Civil and Environmental Engineering (SCEE)National University of Sciences and Technology (NUST)[email protected]*[email protected]
Abstract
Safety of drinking water is essential for the health of living beings. Drinking water distribution systems (DWDSs) function to provide drinking water to consumers so that it should be clean and safe for consumption. However, drinking water can be contaminated by the presence of diverse microbes which could survive and grow in the DWDSs leading to the formation of biofilms along the surface of pipes. The detachment of biofilms from the pipe surface causes the quality of water to deteriorate. In this study biofilm formation on the surface of Galvanized iron (GI) pipe in the chlorinated DWDS of National University of sciences and technology (NUST) was investigated. Heterotrophic plate count of biofilm grown on the upper, middle and lower part of the inserted GI pipe was analyzed. Polymerase chain reaction (PCR) was conducted for the isolated strain to report 16SrRNA bacteria. The results highlighted that microorganisms were found concentrated in the lower and upper parts of GI as compare to the middle part. Through morphological identification it was clearly evident that different bacterial communities were present in different parts of the inserted pipe (GI). However, the bacterial communities present in the middle part of the pipe were highly diverse thus highlighting that possible pathogens were found in the middle of the pipe wall. The results of this study report that the biofilm formation on the middle part of pipe wall (GI) contains potential risk for drinking water safety.
Keywords: Drinking water, Drinking water distribution system (DWDS), Biofilm, Galvanized iron (GI).
[ 104 ] 6th International Water Conference Proceedings
Abstract
Approximately two third of the Earth’s surface is covered with the life-sustaining liquid, water. Studies depict that by the middle of the century, more than half of the humanity will reside in water-stressed areas, which also include Pakistan. Pakistan is among the list of those countries, which are confronting chronic water issue. Pakistan is water stressed country and the situation is going to be more critical in future. The degradation and over exploitation of water resources by human is not a new phenomenon. Water as common pool resource is commonly available for people either free or they pay small amount of money which do not attract the attention of the users to use carefully. The behavior of people is the key problem in over exploitation of resources of water. People either use the water resources carelessly, which do not attract their attention to conserve water for the reason of facing water problems in future. The study shows that Behavioral change is an effective way of tackling the water shortage and ensuring the efficient management of water resources. Behaviors of people for conservation of water were highly depend upon education level, age, past history of respondents water shortage problem, awareness, attitude of family, friends and surrounding of respondents.
Keywords: Water Crisis, Water Conservation, Water Leakage, Consumer Behavior. Water Wastage.

6th International Water Conference Proceedings [ 105 ]
Estimation of Actual Evapotranspiration Using Satellite Data: A Case Study of Wheat Crop in the Khairpur East Canal Command Area During 2017-2019
Zenobia Talpur, Nabeel Ali Khan, Arjumand Z. ZaidiUS-Pakistan Center for Advanced Studies in Water Mehran University of Engineering & Technology, Jamshoro, Sindh
Abstract
For fair and equitable distribution of water at the farm level, it is necessary to know the amount of water used by the crops grown there. The main water supply to the agricultural fields in Pakistan is through the Indus Basin Irrigation System (IBIS) comprising barrages, canals, distributaries, and watercourses. The system losses are said to affect the water supply at the farm level. Estimation of losses is not easy, but analyzing the difference between the water inflows (water at the canal head, precipitation, groundwater, water from other sources) and actual water used by the crop can be utilized to calculate overall losses. The gauge network of the IBIS is only sufficient to monitor canal inflows, but outflows or the water used by the crops are not easy to measure. Actual evapotranspiration (ET) is the measure of water used by the crops that can be easily derived from satellite data. To present the methodology, freely available Landsat satellite data from Earth Engine Evapotranspiration Flux (EEflux) are used to calculate water consumption of wheat crop grown in the Khairpur East canal command area (CCA) during the Rabi seasons of 2017-2018 and 2018-2019. Wheat is the most grown crop in the region and, therefore, has a significant overall water requirement. The results showed that the water consumptions of the wheat crop in the Rabi seasons of 2017-2018 and 2018-2019 were 309 mm and 390mm, respectively. Subtracting the total water inflows during the cropping season from cumulative amount of water used by all crops (wheat plus other) grown in the CCA indicates non-beneficial use of water or in other words the system losses. Accurate estimation of ET flux using satellite data is instrumental in regions where ground measurements are not available for precise irrigation scheduling and water resource management.
[ 106 ] 6th International Water Conference Proceedings
Abstract
Heavy metals pollution load increases with increase the use, consumption and production of these metals in man-made activities. Among other heavy metals zinc is common and hazardous metal which highly consumed in vehicles materials, galvanized surface, alloy, paint, anti-corrosive agent, paints and in other product as well. Use of efficient and rapid method for improvement of monitoring limits help to avoid the exposure and anti-health effects (gastrointestinal and neurological disease and disorder). This study evaluated the effectiveness of thiosulfate-oxidizing bacteria (TOB) for the assessment of zinc toxicity in water. The assessment mechanism compares the bacterial activity in presence of zinc with control in the absence of zinc. Three parameters EC, pH and sulfate formation used to determine the toxicity effect. Thiosulfate-oxidizing bacteria bioassay followed the oxidation process to oxidize the thiosulfate under aerobic condition produce sulfuric acid (as sulfate and hydrogen ion). Firstly, bacteria accumulated in master culture reactor at fed-batch mode by using distillery sludge as source of bacteria. For batch test vail-based reactor was fabricated with different dose of zinc (0-10 mg/L) incubated at 300C with agitation of 1500 rpm. The bacterial activity decreased with increase the zinc dose which determine by the change pH and EC of the reactors. It was observed with increase the exposure time decrease the oxidation process of bacteria. The quantitative determination of toxicity was obtained as EC50. The maximum inhibition growth in toxicity test EC50 of zinc was 1.16 mg/L with incubation time of 24-h calculated by hillslope EC50 method sigma-plot software which was lower than observed EC50 in previous studies with different bioindicator.
Keywords: bioassay, TOB bioassay, assessment method, EC50, toxicity.
Acclimation and Use of Thiosulfate-oxidizing Bacteria TOB in Vial-based Bioassay for the Detection of Zinc Toxicity in Water
Rafia Khanzada, Dr Naveed Ahmad Qambrani
6th International Water Conference Proceedings [ 107 ]
ConferenCe PAPers

6th International Water Conference Proceedings [ 109 ]
Assessment of Biotoxicity Potential of Lambda Cyhalothrin on Common Carp
Mehwish Niaz, Imran Hashmi*Institute of Environmental Sciences and Engineering School of Civil and Environmental EngineeringNational University of Sciences and TechnologySector H12, [email protected]; *Corresponding Author: [email protected]
Abstract
Pesticide contamination is one of the many dynamics contributing to polluting our freshwater sources. Traditional agricultural practices cause various toxic chemical to enter into our water bodies through run off and contaminate them. Water is main component of food chain and presence of Lambda Cyhalothrin pose a threat to human health too. This study aimed at exposing fish to similar toxic environment and analyzing its impacts through acute toxicity bioassay. After acclimatizing fish, acute bioassay was performed in semi-static tank by exposing common carp to various concentrations of lambda cyhalothrin. Behavioral alterations and die off rate of fish was observed at 24hr time interval according to OECG (Organisation for Economic Co-operation and Development) guidelines. After repeated experiments, LD50 value of common carp for LC was found to be at 1.25µg/l. In addition to this, physicochemical parameters of tank water were also determined at 24,48, 72 and 96 hours. Furthermore, temperature fluctuated within 96 hours exposure, pH increased after every 24 hour while DO and turbidity decreased during the same time interval.
Keywords: Lambda cyhalothrin, acute toxicity, common carp, LD-50.
1. Introduction:
Pyrethroid is the class of pesticides that are widely used because of their efficient insecticide potential. Lambda cyhalothrin and Cypermethrin; the pesticides that belong to the class pyrethroid, are considered micropoisonous to mammals and highly toxic to aquatic organisms (Oudou HC et al, 2002). These pyrethroids are more toxic to mammals and birds at low thanhigh temperature and are over 100 times more toxic to fish due to not only their high sensitivity to toxic agents via gills but also insufficient hydraulic enzymes for pyrethroids in fish. (Aydin et al, 2005). Its excessive employment may lead to contamination and environmental
[ 110 ] 6th International Water Conference Proceedings
degradation.
The major routes of transport of insecticides and other pesticides from crop fields to adjacent streams are via surface run-off, drains, ground-water, wind-drift and atmospheric deposition. (Norum et al, 2010). This stresses the need for the development of a sustainable method to counter such contamination. In natural water systems, lambda-cyhalothrin and cypermethrin can be degraded by photochemical processes, which have proven to be an efficient method to transform persistent and biodegradable poorly toxic substances. (Minero et al. 2007). Fish components can be used for environmental monitoring because they can accumulate the contaminants directly from diet and water (Chaudhry and Jabeen et al, 2011; Kafilzadeh et al, 2012).
2. Materials and Methods:
2.1. Study Site:
This study is concerned with the water quality assessment of Rawal Lake (Fig. 1). It is the major source of water supply for Rawalpindi city and is fed by the Kurang River and connecting streams. In 2017, high contamination in Rawal lake was reported that caused massive killing of fish. (DAWN 16 July, 2017)
2.2. Experimental Organism:
Common carp (Cyprinus carpio) was selected as the test specie for this study (Fig 2). It was sourced from Punjab Hatchery Rawal Town, Islamabad. The fish were transported from hatchery to Environmental Toxicology Laboratory (IESE, NUST) in aerated polythene bags and immediately transferred to the glass aquaria upon arrival. They were then allowed to settle for a period of 7 days in order to get them acclimatized to the laboratory conditions. The glass aquaria (3ft by 2 ft) were equipped with air pumps for regular supply of oxygen. Fish was fed regularly during acclimatization period while feeding was stopped during experiments.
2.3. Morphometric Parameters:
Two different sizes of fish were used for these two phased experiments. For acute toxicity assay, fingerlings/juvenile fish were used while for UV light exposure, small fish were used. The details are tabulated in Table 1.
Morphometric Parameters Toxicity Assay UV exposure
Fish Length (cm) 5.08 12
Fish Weight (g) 10 39
Table 1. Detailed morphometric parameters of experimental organism
6th International Water Conference Proceedings [ 111 ]
2.4. Chemicals:
Lambda Cyhalothrin (C23H19C1F3NO3) is a synthetic insecticide belonging to the class pyrethroid. Its chemical name is α-cyno-3-(2-chloro-3,3,3-trifluoro-1-propenyl)-2,2-dimethyl cyclopropanecarboxylate, with a CAS registry number 91465-08-6. The commercial formulation of Lambda cyhalothrin named “Libra” was used in the experiments, having 25mg/l of LCT. The chemical formula of lambda cyhalothrin is depicted in Figure 3.
2.4.1. Acute Toxicity Assay:
In first phase of laboratory experiments, acute toxicity assay was performed. The experiments were carried out according to the OECD guidelines in order to ascertain LD-50 value of common carp for Lambda Cyhalothrin. The principle of this test is to expose fish to the test chemical for a time period of 96 hrs in order to observe changes in behavior and appearance of fish. The aim of this procedure is to ascertain that particular concentration which gives a 50% mortality rate of the exposed fish, hence LD-50. A total of six different concentrations of LCT were selected from literature, which were 0.25, 0.5, 0.75, 1.0, 1.25 and 1.5µg/l. Then, healthy and even sized juvenile fish were selected randomly and introduced in each tank. These experiments were conducted in 8 different sets of batches with varying concentrations of Lambda Cyhalothrin over a period of 96 hrs.
In second phase, the fish were given UV light exposure with the help of a UV lamp (11W) at the LD-50 concentration of LCT to evaluate the resulting changes. A solution of Lambda Cyhalothrin (commercial formulation) was prepared in distilled water. Two fish tanks were prepared with 30 liters of water each and 1.25µg/l LCT. One tank was given the exposure of UV light for 20 mins while the other was kept as control. After the exposure, a total of 12 fish were added in both tanks. The exposed tank was then covered with a wooden box in order to avoid any interferences of sunlight. These experiments were conducted over a period of 96 hours as done for any toxicity assay. The water samples were withdrawn and analyzed after every 24 hrs to monitor changes in the physicochemical parameters.
3. Result and Discussion:
3.1. Acute Toxicity Assay:
In acute toxicity assay, no mortality was observed and the fish remained healthy and normal in control tank. However, in treated tanks, varying mortality rate was recorded. The batches were repeated five times in order to attain a consolidated result. The following graph (Fig. 4) shows a comparison of different die off rates according to varying concentrations. Based on

[ 112 ] 6th International Water Conference Proceedings
these observations, LD-50 value for LCT was calculated as 1.25µg/l.
Comcentration (µg/l)
00.25 0.5 0.5 0.75 0.75 0.75 0.75 1 1 1.25 1.5
20
40
60
80
100
Die Off Rate Time (hrs)
3.2. Physicochemical parameters:
For complete understanding of effects of LCT degradation on water quality parameters, it was imperative to have a baseline data. To accomplish this, the physicochemical parameters of tap water were analyzed before conducting UV exposure experiments. A total of seven parameters of tap water were investigated according to standard protocols which are listed in detail in Table 2.
Parameter Value Instrument/Method used
pH 8.28 Multimeter, 156 Hach sension, Germany
Dissolved Oxygen (mg/l) 8.5 Winkler Method
Electrical Conductivity (µS/cm) 896 720 WTW probe
Temperature (ºC) 28.5 720 WTW probe
Turbidity (NTU) 0.71 2100P, portable Turbidity meter, Hach
Chlorine (mg/l) 0 Colorimeter (Hanna HI 96734 )
Hardness (as MgCO3 and CaCO3) 306 EDTA Titration Method
Table 2. Standard Protocol employed for physicochemical properties

6th International Water Conference Proceedings [ 113 ]
In UV exposure experiments, the water samples were drawn after every 24 hours from both control and exposed tanks and physicochemical parameters were evaluated according to the standard protocol. The results are summarized in Table 3.
Control Tank (Time hrs) Experimental Tank (Time hrs)
0 24 48 72 0 24 48 72
pH 8.70 8.90 9.08 9.12 8.66 9.03 9.06 9.09
DO 10.8 10 8.8 8.8 11 10.5 9.8 8
EC 888 840 782 766 869 837 829 829
Table 3. Variation of physicochemical properties over 96 hours.
Keeping this in view, UV experiments were conducted by exposing fish to the same concentration of Lambda Cyhalothrin. But at 24 hrs exposure time, almost 4 out of a total of 12 fish in exposure tank and 2 in control tank were found dead. This could be due to change in ambient conditions. However, water samples were collected and physicochemical analysis was performed. At 48 hrs, 2 more fish in experimental tank and 8 in control tank were found dead. Hence, the experiment was discontinued at 72hrs instead of 96 hrs time.
The changes in physicochemical parameters over the period of 72 hrs are depicted in the following figures (Fig 4,5 and 6). The LD-50 value reported in literature was around 1.25µg/l. Habeeba and David 2016, also reported LC-50 of lambda cyhalothrin for common carp as 1.62 µg/l which is very close to the value estimated in prevalent study. The difference in these values may be attributed to varying temperature, fish size, fish health and other environmental factors.
The pH of control and experimental tank revealed an increasing trend (Fig 5). This could be linked to the fact that lambda cyhalothrin might have degraded into metabolited with higher pH. The change however was very small.
Over the period of 72 hrs, there was a general decrease in the concentration of electrical conductivity as well as dissolved oxygen (Fig 6 and 7). Reduced electrical conductivity could be attributed to the fact that with time, the amount of organic matter increased within the fish aquaria resulting in reduced conductivity.
The dissolved oxygen in both control and treated tank also showed a decreasing trend (Fig 7). The reason for such trend in treated/ experimental could be that it was covered with a wooden box in order to eliminate interference of other light sources; which reduced oxygen levels.
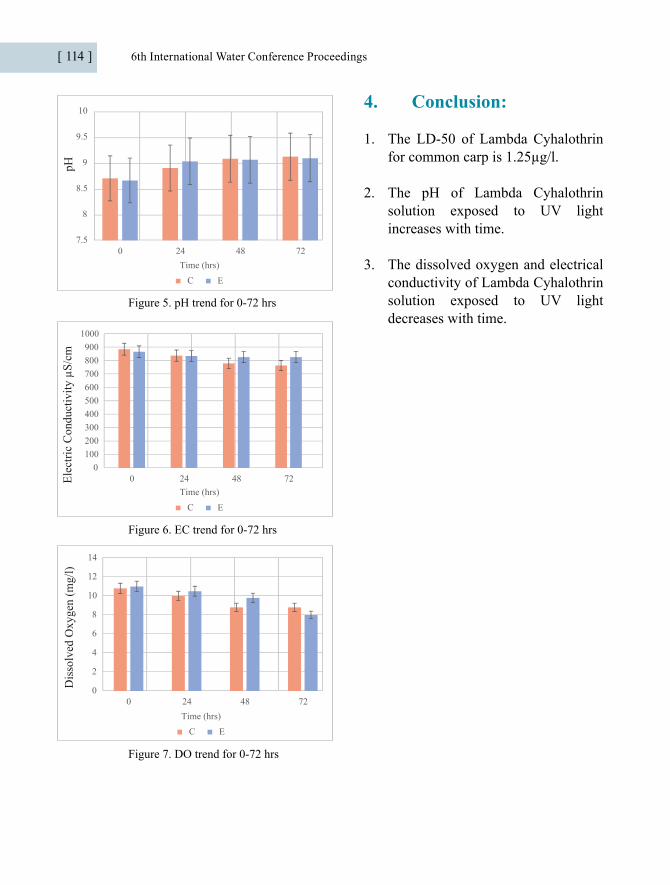
[ 114 ] 6th International Water Conference Proceedings
7.5
8
8.5
9
9.5
10
0 24 48 72
pH
Time (hrs)C E
Time (hrs)C E
Dis
solv
ed O
xyge
n (m
g/l)
Elec
tric
Con
duct
ivity
µS/
cm
0100200300400500600700800900
1000
0 24 48 72
Time (hrs)C E
0
2
4
6
8
10
12
14
0 24 48 72
Figure 5. pH trend for 0-72 hrs
Figure 6. EC trend for 0-72 hrs
Figure 7. DO trend for 0-72 hrs
4. Conclusion:
1. The LD-50 of Lambda Cyhalothrin for common carp is 1.25µg/l.
2. The pH of Lambda Cyhalothrin solution exposed to UV light increases with time.
3. The dissolved oxygen and electrical conductivity of Lambda Cyhalothrin solution exposed to UV light decreases with time.
6th International Water Conference Proceedings [ 115 ]
References:
1. Bibi, N., A. Zuberi, M. Nadeem, I. Ullah, H. Sarwar and B. Atika, 2014. Evaluation of acute toxicity of Karate and its sub-lethal effects on protein and acetylcholinesterase activity in cyprinus carpio. Int. j. Agric. Biol., 16: 731-737.
2. Djouaka, R., Soglo, M., Kusimo, M., Adéoti, R., Talom, A., Zeukeng, F., Paraïso, A., Afari-Sefa, V., Saethre, M., Manyong, V., Tamò, M., Waage, J., Lines, J. and Mahuku, G, (2018). The Rapid Degradation of Lambda-Cyhalothrin Makes Treated Vegetables Relatively Safe for Consumption. International Journal of Environmental Research and Public Health, 15(7), p.1536
3. Farhat Jabeen, Abdul Shakoor Chaudhry, 2011. Chemical compositions and fatty acid profiles of three freshwater fish species. Food Chemistry 125(3) 991-996.
4. https://www.oecd-ilibrary.org/environment/test-no-210-fish-early-life-stage-toxicity-test_9789264203785-en
5. Kafilzadeh, Farshid, Shiva, Amir Houshang, Malekpour, Rokhsareh, Azad, Hamid Noorani, 2012. Determination of Organochlorine Pesticide Residues in Water, Sediments and Fish from Lake Parishan, Iran. World Journal of Fish and Marine Sciences 4 (2): 150-154.
6. MineroC,LauriV,FallettiG,MaurinoV,PelizzettiE,VioneD,2007.Spectrophotometric characterisation of surface lakewater samples: implications for the quantification of nitrate and the properties of dissolved organic matter. Ann Chim 97(10):1107-16.
7. Oudou HC, Hansen HCB, 2002. Sorption of lambda-cyhalothrin, cypermethrin, deltamethrin and fenvalerate to quartz corundum, kaolinite and montmorillonite. Chemosphere 49: 1285-1294.
8. Rahmi Aydın, Kenan Köprücü, Mustafa Dörücü, Sibel Şimşek Köprücü & Murat Pala, 2005. Acute Toxicity of Synthetic Pyrethroid Cypermethrin on the Common Carp (Cyprinus carpio L.) Embryos and Larvae. Aquaculture International13, 451–458.
9. Ulrik Norum, Nikolai Friberg, Maria R. Jensen, Jakob M. Pedersen, Poul Bjerregaard, 2010. Behavioral changes in three species of freshwater microinvertebrates exposed to the pyrethroid lambda-cyhalothrin: Laboratory and stream microcosm studies. Aquatic Toxicology. 98, 328-335.
10. Umme Habeeba and M David, 2016. Studies on acute and behavioral toxicity of lambda cyhalothrin on freshwater fish cyprinus carpio. International Journal of Toxicology and Applied Pharmacology 6(1): 1-6.

[ 116 ] 6th International Water Conference Proceedings
Monitoring of Canal Water Quality using SEBA Hydrometrie, MPS K-16
Shahbaz Nasir Khan1, Abdul Moiz1, Naveed Ahmad Khan1, Hafiz Muhammad Safdar Khan1, Abdul Nasir1 and Allah Bakhsh2
1Department of Structures and Environmental Engineering, Faculty of Agricultural Engineering and Technology, University of Agriculture Faisalabad, Pakistan 2Department of Irrigation and Drainage, Faculty of Agricultural Engineering and Technology, University of Agriculture Faisalabad, Pakistan *Corresponding Author: [email protected]
Abstract
Surface water is the major source of irrigation in Pakistan. That’s why monitoring of the quality of surface water is important for better crop production. Irrigation with poor quality water not only decreases crop production but also harmful to human health. The present study was conducted on the section of Rakh Branch Canal passing from city Faisalabad to city Sumundri, Pakistan. A general survey was conducted for collecting primary information like sampling points, start and endpoint, Industries and construction sites along the canal. For sampling, ten points were selected at the appropriate distances. Thirty samples were collected by taking three samples from each point. These samples were collected by 2 ft depth from the surface of the water. Then the samples were tested for different parameters like pH, EC (electrical conductivity), TDS (total dissolved solids), salinity, anions (chloride, calcium, ammonium, nitrate) using SEBA Hydrometrie MPS K-16 instrument. Test results were compared with the guidelines given by the FAO. EC, TDS, pH, Chloride, Calcium, Ammonium and Nitrate of samples ranged from 0.286-0.295mS/cm, 191.103-197.674ppm, 7.986-8.406pH, 7.927-10.907ppm, 34.015-37.139ppm, 0.066-0.152ppm and 4.479-9.679ppm respectively. There was a little variation in the results of measured parameters due to some contamination from construction sites and domestic waste contamination. Overall, all parameters were found within the permissible limits given by FAO. Hence, all the results of different parameters showed that the water of this section of the Rakh Branch Canal is suitable for irrigation purposes and better crop production. It is recommended that there should be regular monitoring of more water quality parameters on the different sections of all major and minor canals to maintain its quality.
Keywords: Surface water quality, FAO, SEBA Hydrometrie MPS K-16
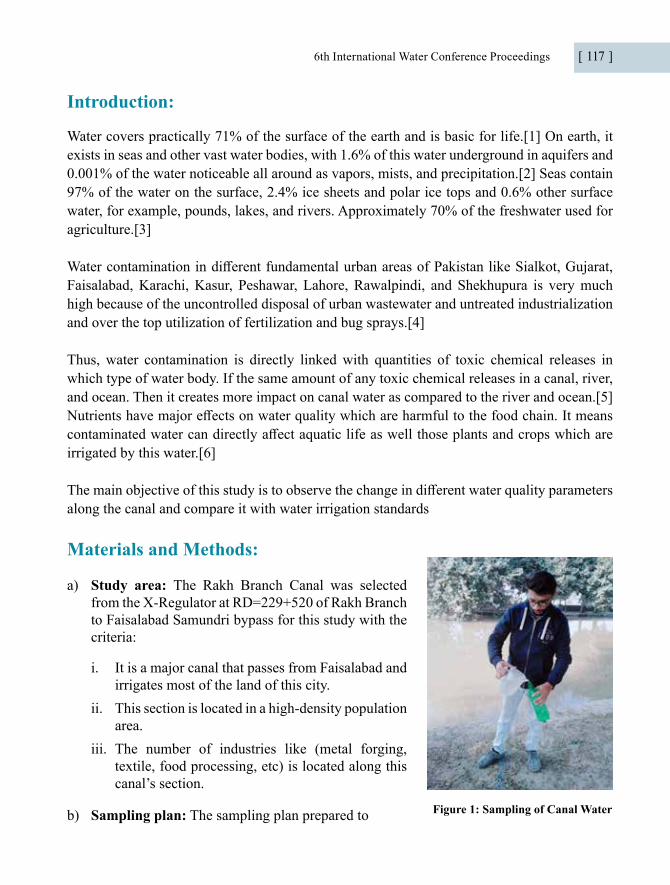
6th International Water Conference Proceedings [ 117 ]
Introduction:
Water covers practically 71% of the surface of the earth and is basic for life.[1] On earth, it exists in seas and other vast water bodies, with 1.6% of this water underground in aquifers and 0.001% of the water noticeable all around as vapors, mists, and precipitation.[2] Seas contain 97% of the water on the surface, 2.4% ice sheets and polar ice tops and 0.6% other surface water, for example, pounds, lakes, and rivers. Approximately 70% of the freshwater used for agriculture.[3]
Water contamination in different fundamental urban areas of Pakistan like Sialkot, Gujarat, Faisalabad, Karachi, Kasur, Peshawar, Lahore, Rawalpindi, and Shekhupura is very much high because of the uncontrolled disposal of urban wastewater and untreated industrialization and over the top utilization of fertilization and bug sprays.[4]
Thus, water contamination is directly linked with quantities of toxic chemical releases in which type of water body. If the same amount of any toxic chemical releases in a canal, river, and ocean. Then it creates more impact on canal water as compared to the river and ocean.[5] Nutrients have major effects on water quality which are harmful to the food chain. It means contaminated water can directly affect aquatic life as well those plants and crops which are irrigated by this water.[6]
The main objective of this study is to observe the change in different water quality parameters along the canal and compare it with water irrigation standards
Materials and Methods:
a) Study area: The Rakh Branch Canal was selected from the X-Regulator at RD=229+520 of Rakh Branch to Faisalabad Samundri bypass for this study with the criteria:
i. It is a major canal that passes from Faisalabad and irrigates most of the land of this city.
ii. This section is located in a high-density population area.
iii. The number of industries like (metal forging, textile, food processing, etc) is located along this canal’s section.
b) Sampling plan: The sampling plan prepared to Figure 1: Sampling of Canal Water

[ 118 ] 6th International Water Conference Proceedings
check the different water quality parameters in canal water samples taken from ten different points of Rakh Branch Canal. A total of thirty samples were collected. All the samples were collected at specific depth from the center of the width of the canal. Three samples from each point. These samples were collected from 2 ft depth from the canal’s surface.
c) Location of sample points: The location of sample points found with the assistance of coordinates of points.
The coordinates of the sample points taken with the assistance of the Global Position System receiver (GPS Receiver).
d) Testing of samples: Samples tested for physical parameters (conductivity, total dissolved solids, salinity, and pH) and chemical parameters (chloride, ammonium, nitrate, and calcium)[7] by using “SEBA HYDROMETRIE, MPS-K16”.
e) Calibration: Seven different sensors to find the different parameters inserted in the“MPS-K16” probe and every probe has its own method of calibration.
i. Software: Calibration and adjustment of sensors can be done via PC using the software “Sebaconfig”. The connection from periveral devices to PC is done with a Converter (RS485/RS232 or RS485/USB) or accordingly interface cable.
ii. Conductivity sensor: Calibration done by dip the conductivity and temperature sensor together into a 0.1 molar KCl solution. The software starts the calibration automatically after dipped the sensors in the solution. The uncompensated measuring value of the probe will be taken over when it is constant and forms the new cell constant together with the uncompensated rated value of the solution.
iii. pH sensor: Two-point-calibration needed for this different calibration solution with specified pH and the same temperature as necessary. For the sour and neutral range, the buffer solutions pH 4 and 7 used, for the basic and neutral range pH 7 and 10. These buffer solutions provided by SEBA as special accessories. The software has done calibration of the pH sensor, automatically by dipping the pH-sensor together with the temperature sensor into the solutions one by one.
Figure 2: GIS Mapping of Sampling Points
6th International Water Conference Proceedings [ 119 ]
iv. Chloride, ammonium, nitrate and calcium sensors: These probes calibrated one by one with ST-NO3, ISA, ST-Cl solutions. pH, temperature, and ORP sensors used during calibrations as reference.[8]
f) Measurement procedure: After calibration, all sensors washed by distilled water to make sure these cleaned. Then, run the software “SEBA Configuration” and attached the “LogCom-2” with probes and battery. Then, Plug the “USB-RS232” cable to connect with the computer. Then, took the sample in the beaker, placed the K-16 probe in the sample and gave the run command to the software. After a few seconds, the measured values shown in the software and then export these values to the excel sheet.
Results and Discussion:
Temperature:
Temperature values at all sampling points in our study area were almost near to each other. The average value which is shown in the data table is about 10°C. Sampling was done in the winter season. So, the temperature of the stream was slightly low. We took the samples about the 15-20 Km study area along the stream and there was a very little difference in the temperature values of the first point and the last one. That’s means in that area there was no industrial contamination. Because industrial waste effluents increase the stream water temperature.
Table 1: Temperature of Samples
SampleDistance Temperature
SampleDistance Temperature
Km C Km C1 0 10.94 6 13.46 11.402 3.44 11.31 7 17.2 10.993 6.54 11.42 8 18.69 11.234 8.61 10.87 9 20.79 11.015 11.05 11.18 10 23.5 10.75

[ 120 ] 6th International Water Conference Proceedings
Show salinity value ranges at sampling points with GIS
LegendRakh_Branch_Chanal Salinity
0.1375000.137501 - 139000.139001 - 1400000.140001 - 1410000.141001 - 142000
0 5 10 15 20 25
10.7
10.8
10.9
11
11.1
11.2
11.3
11.4
11.5
Distance (Km)
Temperature

6th International Water Conference Proceedings [ 121 ]
Show Temperature ranges at sampling points with GIS
LegendRakh_Branch_Chanal Temp
10.750500 - 10.8710010.871001 - 11.0130011.013001 - 11.23350011.233501 - 11.31450011.314501 - 11.422000
TDS:
Total dissolved salts present in the water determine the TDS value. These salts are dissolved in the water. Irrigation water quality can vary greatly by the amount of dissolved salts and their types. These salts are present in relatively small but significant amounts. When fields are irrigated with this water then salts are also applied to it. With time, water evaporates or is used by the crop but salts remain behind in the soil. As a result, salinity problems rise and crop yield reduces.[11] average TDS results were also closed, which taken at all selecting points.
PH:
From the technical point of view, defined as the -log [H+] simply says determine the concentration of H+ and OH- ions in the water sample. PH determines either the sample is alkaline in nature or acidic. If the pH of irrigation water is out of a specific range then it harms irrigation equipment and soil.[12] All the sampling average values in the same limits and according to data water were slightly basic.
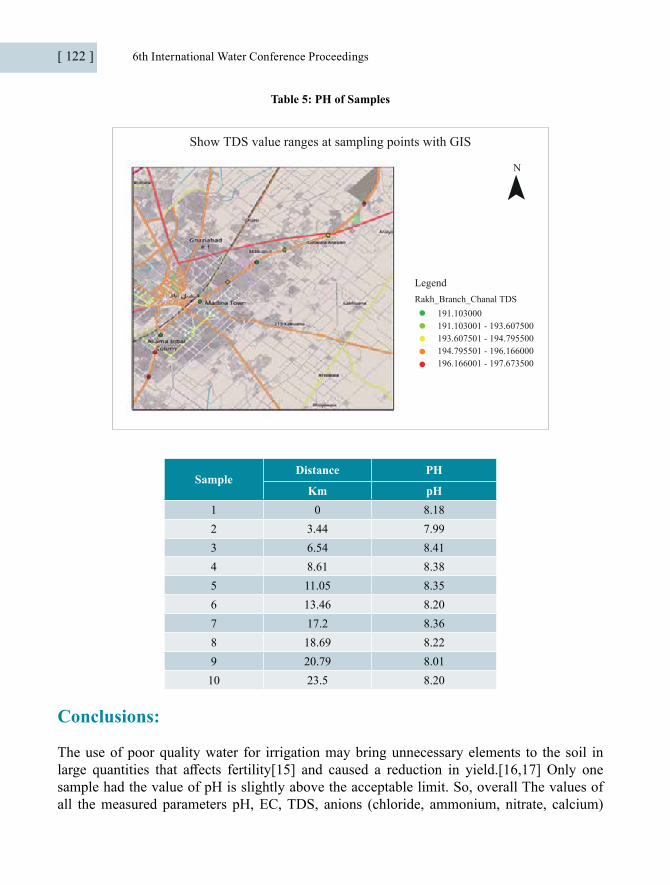
[ 122 ] 6th International Water Conference Proceedings
Table 5: PH of Samples
191.103000191.103001 - 193.607500193.607501 - 194.795500194.795501 - 196.166000196.166001 - 197.673500
LegendRakh_Branch_Chanal TDS
Show TDS value ranges at sampling points with GIS
SampleDistance PH
Km pH1 0 8.182 3.44 7.993 6.54 8.414 8.61 8.385 11.05 8.356 13.46 8.207 17.2 8.368 18.69 8.229 20.79 8.0110 23.5 8.20
Conclusions:
The use of poor quality water for irrigation may bring unnecessary elements to the soil in large quantities that affects fertility[15] and caused a reduction in yield.[16,17] Only one sample had the value of pH is slightly above the acceptable limit. So, overall The values of all the measured parameters pH, EC, TDS, anions (chloride, ammonium, nitrate, calcium)

6th International Water Conference Proceedings [ 123 ]
were within the limits for irrigation purposes, which are defined by Food and Agriculture Organization (FAO).
It is recommended that the water of the section of Rakh Branch Canal passes from Faisalabad can be used for irrigation purposes. The contamination in that water is almost negligible. So, the land that will be irrigated by this water is free from contamination. As a result, crops that grow in this land are free from contamination that causes serious health issues.
References:
1. Gleick, P.H., ed. (1993). Water in Crisis: A Guide to the World’s Freshwater Resources. Oxford University Press. p. 13, Table 2.1 “Water reserves on the earth”. Archived from the original on 8 April 2013.
2. Water Vapor in the Climate System Archived 20 March 2007 at the Wayback Machine, Special Report, [AGU], December 1995 (linked 4/2007). Vital Water Archived 20 February 2008 at the Wayback Machine UNEP.
3. Baroni, L.; Cenci, L.; Tettamanti, M.; Berati, M. (2007). “Evaluating the environmental impact of various dietary patterns combined with different food production systems”. European Journal of Clinical Nutrition. 61 (2): 279–286. DOI:10.1038/sj.ejcn.1602522. PMID 17035955.
4. Bhutta, M.N., M. Ramzan and C.A. Hafeez. 2002. Groundwater quality and availability in Pakistan. Proc. Seminar on Strategies to Address the Present and Future Water Quality Issues, March 6-7, 2002. Pakistan Council of Research in Water Resources, Islamabad, Pakistan.
5. Chris Woodford. (2019). Water pollution: an introduction. https://www.explainthatstuff. com/waterpollution.html
6. Rozina Khatun. (2017). Water Pollution: Causes, Consequences, Prevention Method and Role of WBPHED with Special Reference from Murshidabad District. International Journal of Scientific and Research Publications. ISSN 2250-3153.
7. Roy, Ritabrata. (2018). An Introduction to water quality analysis. International Journal for Environmental Rehabilitation and Conservation. IX (2): 94-100. ISSN: 0975- 6272.
8. SEBA HYDROMETRIE, MPS Water quality Probes – manual www.seba.de
9. T.A. Bauder, R.M. Waskom, P.L. Sutherland, and J. G. Davis. Irrigation Water Quality Criteria. Colorado State University, U.S. Department of Agriculture, and Colorado counties cooperating. Extension. 7/03. Revised 10/14.
10. Fipps, Guy (2003). Irrigation Water Quality Standards and Salinity Management Strategies. Available electronically from http://hdl.handle.net/1969.1/87829.
[ 124 ] 6th International Water Conference Proceedings
11. Dhirendra Mohan Joshi, Alok Kumar, and Namita Agrawal. (2009) Assessment Of The Irrigation Water Quality Of River Ganga In Haridwar District. Vol.2,No.2 (2009), 285-
292. ISSN: 0974-1496
12. Food and Agriculture Organization (FAO), “Miscellaneous Problems, FAO Irrigation and Drainage Paper 56,” FAO, Rome, 1998.
13. Food and Agriculture Organization (FAO), “Toxicity Problems, FAO Irrigation and Drainage Paper 56,” FAO, Rome, 1998.
14. Food and Agriculture Organization (FAO), “Water Quality Evaluation, FAO Irrigation and Drainage Paper 56,” FAO, Rome, 1998.
15. Latha, M.R., R. Indirani, S. Sheeba and H.J. Francis,2002. Groundwater quality of Coimbatore district, Tamil Nadu. J. Ecobiol., 14(3): 217-221.
16. Tanwir, F., A. Saboor and N.Naima(2003). Soil Salinity and the Livelihood Strategies of Small Farmers: A Case Study in Faisalabad District, Punjab, Pakistan. Int. J.Agri. Biol. 05(4):440–441.
17. Rukhsana, A., A. Amir, U. Rahmat, M.Jahangirand M.Yousaf(2005). Effect of Soil Salinity/Sodicityon the Growth and Yield of Different Varieties of Cotton. Intl. J.Agri. andBiol.07 (4):606-608.

6th International Water Conference Proceedings [ 125 ]
Assessment of Indoor Air Quality in Term of Microorganisms in USPCAS-W, MUET, Jamshoro
Authors: Danish Ahmed khokhar1*, Imtiaz Ali1, Aqsa Channa1, Anira Latif1, Kantesh Ahmed1, Rija Shakir1USPCAS-W at Mehran University of Engineering & Technology Jamshoro, Sindh Pakistan 76062.Corresponding author: Danish Ahmed khokharEmail Address: [email protected]
Abstract
People spend their majority of time in indoor atmosphere and Indoor Air Quality (AIQ) has been affected by the tightening of the building for achieving higher efficiency. Airborne bacteria under favorable conditions able to grow, that may cause indoor air pollution. The objective of this study was to monitor the concentration of airborne bacterial and fungal colonies in the United State Pakistan Advance study in water center, MUET Jamshoro. Six different locations were selected for sampling which were Reception Hall, Canteen room, Classroom, Library, Water lab, and washroom. Number of bacterial and fungal colonies were determined at 30, 60 and 90 minutes. TSB type of media with Agar was used for culture preparation. In all samples, many bacterial and fungal colonies were achieved. Almost all the locations of department were contaminated with airborne microbes. Rate of colonies forming enhanced by increasing time at all points. Some places were also above the guidelines of WHO regarding indoor air quality.
Keywords:Airborne microbes, Microorganisms, Indoor Air Quality, Bacterial colonies, Fungal colonies.
Introduction:
The indoor environment is conducive to the proliferation of microbial growth and the generation of airborne microorganisms. Mainly due to moisture and temperature levels and the availability of organic substrates[1]. Several investigation has been carried out to determine the relationship between temperature, humidity and the concentration of microorganisms[2]. People tend to spend the majority of their time indoors. Tightening of buildings in the modern architectural trends for higher affected the indoor air quality (IAQ). All buildings in general and hospitals, research centers in specific airborne microorganisms which are matter of great concern for public health, show variation in concentration with time[3]. Airborne bacteria. under favorable

[ 126 ] 6th International Water Conference Proceedings
conditions able to grow causing indoor air pollution and propagate on variety of buildings materials and indoor surfaces[4].
People spends 80% to 90% of their time in indoors environments by breathing on average 14m3 of air per day[5]. In recent years there has been a growing interest in indoor microbial studies.
The different activity of people in the indoor places is considered to be main factor contributing to the airborne microbial contamination. Activities like sneezing, coughing, walking and different type of gathering and also washing of food stuffs, house plants, textile, carpets occasionally release various microbes and fungal spores in the air[6].
The environment factors mainly include temperature, moisture, movement of air, building structure and location which enhance microorganisms growth and causes many negative health impacts[7]. Fungal spores, viruses and bacteria are the main microbial components whereas skin fragments, dust mite particles and pollen grains are the non-microbial components of bio-aerosols [8]. Particles present in indoor having serious and different risks can contaminate the indoor environment which are considered to be protected, if their recommended concentrations of maximum limits exceeded to those related to outdoor exposures[9].
Thus, microbiological air quality is an important factor which should be considered when indoor workplaces are deigned. Different health impacts associated with indoor air pollution such as: irritation of the eye, nose and throat, headaches, dizziness, and fatigue, respiratory diseases, heart disease and cancer[10].
The objective of the study was to monitor the airborne bacterial and fungal colonies collected in the indoor air at different locations under the USPCAS-W, MUET, Jamshoro. Additionally, the study determined the causes of growth of airborne bacteria and fungi. This study provides information about concentration of microorganisms and describes bacterial and fungal loads at different places. Moreover, to see the impacts of environment on their multiplication and growth with time.
Material and Methods
Media preparation
For determining the number of bacterial and fungal colonies in indoor air, the media were prepared according to [11]. Tryptone Soya Broth (TSB) with Agar was selected for making media. 350 ml of de-ionized water were taken in a sampling bottle in which 10.5mg of TSB was added with 4.5mg of agar. The media was mixed homogeneously by using magnetic stirrer with 120C temperature. Media was Autoclaved at 121C for 15mints to obtain the media free from microbial contamination. 25ml of obtained media was inserted in petri dishes under

6th International Water Conference Proceedings [ 127 ]
horizontal laminar flow hood. Media preparation scheme is follows:
Study Area
US-Pakistan Center for Advanced Studies in Water (USPCAS-W) building was selected for this activity. Six locations were selected for sampling which are Reception Hall, Canteen room, Classroom, Library, Water lab and First floor washroom, for assessing the indoor air quality in terms of measuring the different concentration of bacterial and fungal colonies.
Sampling Procedure
Three points were founded at each location to obtain the average results, and at each point three controlled and three uncontrolled samples were kept simultaneously. Each sample was kept about 1m above the floor and 3m away from one another. Three-time intervals were selected which are 30, 60 and 90 mints. At the end of each interval of time, the samples were incubated at normal temperature and pressure. All samples from all locations were taken simultaneously. After incubation, bacterial and fungal colonies were counted through J-2 Colony counter.
Results and Discussion
The indoor air microbial load of six locations of USPCAS-W building was estimated by taking 108 samples. Number of colonies per sample verses number of locations were compared at three-time intervals. The results of microbial and fungal colonies are presented in graph 1 and 2 respectively.
Con
cent
ratio
n
Locations
Reception
2826242220181614121086420
Canteen Washroom Water Lab Library Class Room
1/2 Hours
1 Hours
1.5 Hours

[ 128 ] 6th International Water Conference Proceedings
The obtained results indicate that the higher number of bacterial colonies have been recorded in washroom, class-room and reception hall at 90mints exposure. While, the minimum number of bacterial colonies been recorded in water lab at 30mints exposure. Control samples were obtained simultaneously, but no colony was observed in any sample. Obtained results showed that maximum number of fungal colonies were present in the sample taking from washroom at 90mints exposure and minimum fungal colonies were present in sample taking from water lab at 30mints exposure.
Measured concentration was various at all positions of all locations. Many factors can be included in variation of concentrations of bacterial and fungal colonies such as number of workers, plants, present stuff inside the rooms, improper ventilated conditions and seasonal variations. As compared with WHO guidelines, obtained results were little unfavorable for workers works under such hidden polluted environment. In situation of more workers on daily basis, it may cause chronic health impacts, and also may reduce productivity of work. Due to absence of accurate standards about microbial contaminations, it was bit hard to analyze their health impacts in detail. Regular cleaning, proper ventilation, and use of antibacterial things may reduce the growth of microorganisms under closed buildings, and indoor air quality may be improved.
Conclusion
This study has demonstrated that bacteria and fungi comprised the most significant proportional of microorganisms in the indoor environment. The larger proportion of bacteria and fungi are determined in the washroom, the reason may be improper ventilation, and the design of the building. Further study found that other places like reception and classroom also determined as a contaminated place.
References
1. GOH, I., OBBAR, <paper 10.pdf>. 2000
2. Kim, K.-H., E. Kabir, and S.A.J.J.o.E.S. Jahan, Airborne bioaerosols and their impact on human health. 2018. 67: p. 23-35.
3. Rajasekar, A., R.J.B. Balasubramanian, and Environment, Assessment of airborne bacteria and fungi in food courts. 2011. 46(10): p. 2081-2087.
4. Zhu, H., et al., Experimental study of indoor and outdoor airborne bacterial concentrations in Tempe, Arizona, USA. 2003. 19(3-4): p. 201-211.
5. Brochu, P., et al., Physiological daily inhalation rates for free-living individuals aged 1 month to 96 years, using data from doubly labeled water measurements: a proposal for air

6th International Water Conference Proceedings [ 129 ]
quality criteria, standard calculations and health risk assessment. 2006. 12(4): p. 675-701.
6. Kalogerakis, N., et al., Indoor air quality—bioaerosol measurements in domestic and office premises. 2005. 36(5-6): p. 751-761.
7. Graudenz, G., et al., Association of air-conditioning with respiratory symptoms in office workers in tropical climate. 2005. 15(1): p. 62-66.
8. Rodrigues, M.L. and J.D.J.P.n.t.d. Nosanchuk, Fungal diseases as neglected pathogens: A wake-up call to public health officials. 2020. 14(2): p. e0007964.
9. Schwartz, S., et al., Isavuconazole for the treatment of patients with invasive fungal diseases involving the central nervous system. 2020. 58(4): p. 417-424.
10. Khan, M.S.B. and H.D. Lohano, Household air pollution from cooking fuel and respiratory health risks for children in Pakistan. Environ Sci Pollut Res Int, 2018. 25(25): p. 24778-24786.
11. Hayleeyesus, S.F. and A.M. Manaye, Microbiological quality of indoor air in university libraries. Asian Pac J Trop Biomed, 2014. 4(Suppl 1): p. S312-7.
[ 130 ] 6th International Water Conference Proceedings
Abstract:
Background: The United Nation’s Sustainable Development Goals include the target to ensure access to water and sanitation for all, however very few studies have assessed comprehensive school Water Sanitation and Hygiene (WASH) service in Pakistan. Objectives: The objective of this study was to characterize WASH services, water quality and to assess how recent WASH interventions and policy were associated with the school performance in primary school children of Pakistan. Method: A representative cross-sectional study on 425 schools was conducted from January through July 2019 in primary schools of the Sindh province of Pakistan. WASH assessment tool developed by World Health Organization (WHO) was adopted. Structured observations and interviews were used to ascertain the schools’ WASH conditions. The primary exposures of interest were the implementation of previous WASH interventions and National WASH policy in the school and WASH coverage. The drinking water quality was assessed using health risk assessment models. The water quality data analysed and presented using SPSS, OriginPro and GIS applications. Results: The Basic WASH facilities coverage (58% water, 19.3% sanitation and 13.6% hygiene) in the primary schools of Sindh remains overall low on WHO WASH service ladder criteria. Also, there was inconsistency in all three inclusive domains of WASH (availability, accessibility, and functionality) facilities. The school performance was significantly associated (P<0.000) with the presence of WASH interventions and or WASH policy. Among all parameters, dissolved oxygen (DO), pH and nitrate remained within WHO and Pak NEQS water quality standard limit, while fluoride (16%), Pb (67%) As (13%) Cd (17%) Fe (15%), chloride (34%), Total Dissolved Solids (TDS) (33%), Electrical Conductivity turbidity (46%) and hardness (11%) of schools exceed standard limits. Whereas, among microbiological parameters; majority of drinking water points had total coliform (81%) and fecal coliform contamination (55%)
Assessment of Water, Sanitation and Hygiene (Wash) Situation Iin Primary Schools of Sindh, Pakistan
Authors: Danish Ahmed khokhar1*, Imtiaz Ali1,Aqsa Channa1, Anira Latif1, Kantesh Ahmed1, Rija Shakir1USPCAS-W at Mehran University of Engineering & Technology Jamshoro,Sindh Pakistan 76062.Corresponding author: Danish Ahmed khokharEmail Address: [email protected]

6th International Water Conference Proceedings [ 131 ]
contamination, almost half of drinking water samples were contaminated with Shigella spp. (63%), Salmonella spp. (53%), E. coli (49%), and V. cholerae (49%).
Conclusion: The present study provided a comprehensive overview of the existing WASH situations in schools and the impact of WASH interventions and national WASH policy on educational outcomes. The assessment unveiled several WASH gaps that exists, including high heavy metals and microbial contamination, Adoption of national WASH policy and financing of evidenced based WASH interventions recommended in primary schools to improve educational outcomes.
Keywords: WASH, Primary Schools, Drinking Water, Pathogens, Health risk, Hazard Quotient, Pollution index, Metal index, WQI, WASH Interventions, WASH Policy.
Introduction
The inequalities in access to water and sanitation by wealth quantile and setting (School and household etc.) were considered vital for progress monitoring for the Sustainable Development Goal (SDGs), (Assembly, 2015) The United Nations Millennium Development Goals 2A and now SDG 4.1 and 4.2, put high emphasis on girls and boys free, equitable and quality primary education (MDGs & SDGs). However, inadequate Water Sanitation and Hygiene (WASH) services in the school environment have been widely reported as major hindrance to achieve these goals (Assembly, 2015; UNICEF %J World Health Organization: Geneva, 2016).
According to recent Joint Monitoring Programme (JMP) around 1.8 billion people are still using fecally contaminated water, and more than 2.4 billion people are deprived of basic sanitation services (UNICEF %J World Health Organization: Geneva, 2016).
Improved access to water and basic sanitation services still remains a major threat to health and economy of Pakistan. It is estimated that unsafe drinking water and inadequate sanitation cost Pakistan’s economy about PKR 343.7 billion every year; in terms of health cost and lost earnings that is equal to almost 6% of its GDP (Nishat & Sanitation Programme, 2013).
There has been less attention to WASH in schools, compared to in household settings, but school WASH is important as children spend large amounts of time at school (Agol D et al., 2018, & Karen AJ et al, 2017, Spears D et al, 2013). Secondly, in schools the intense levels of person-to-person contact expose children to the diseases related to poor sanitary conditions(Garn, Trinies, Toubkiss, Freeman, & hygiene, 2017; Shallwani, 2019; Strunz et al., 2014). Thirdly, the under-nutrition increases chances of pathogens to cause diseases due to poor immunity (Cumming, Cairncross, & nutrition, 2016; Irfan, Zaidi, & Waseem, 2017). Lastly, when these children grow up will act as peer educators to their families (Spears & Lamba, 2013)

[ 132 ] 6th International Water Conference Proceedings
Inadequate water, sanitation and hygiene affect children’s capacities in several ways. First, WASH inadequacies may lead to poor health outcomes, including increased soil-transmitted helminth (Strunz et al., 2014) infections, schistosomiasis((USPCAS-W), 2019), stunting (Dangour et al., 2013), diarrheal diseases(Walker, Black, & Infection, 2010; Wolf et al., 2014), trachoma(M. E. Stocks et al., 2014), malaria infections (Okabayashi et al., 2006), and morbidity from chemical contaminants in water (i.e. arsenic and lead) (M. Snehalatha, Uddin, Ahmed, & Sharif, 2015). Second, these WASH associated morbidities may lead to school children being absent from their schools (Freeman et al., 2014; Talaat et al., 2011). Third, lack of appropriate sanitation facilities might lead to menstruating girls being absent (UNICEF, 2014). Finally, poor environmental conditions in school(s) could also make learning and teaching very difficult(Freeman et al., 2014; Garn et al., 2017). According to the Multiple Indicator Cluster Survey (MICS) Survey 2014, only 45% of children ages 5-10 living in Sindh province (state) of Pakistan were enrolled in primary schools (Siddique, Tagar, Khoso, & Tagar, 2019). The low school enrollment have been linked with poor WASH services in several studies (Freeman et al., 2014; MONDAL; Strunz et al., 2014). In Pakistan school WASH policy is in place since 2016 and its efficiency has not been evaluated so far (Drinking Water, Sanitation and Hygiene Sindh Strategic Sector Plan 2016) (School Education Department, 2016). In some countries data showed progress in school WASH targets and policies, however, challenges and gaps reported as a result of inefficient coordination, non-comprehensive standards, and inadequate monitoring mechanism. Additionally, discrepancies and variations are observed among the region. Inadequate policies’ affecting pupils school performance (Chatterley et al., 2018). Hence, JMP report emphasis on updating national WASH Policies in the light of evidence based information).
Problem Statement and Rationale of the study (Chatterley et al., 2018).
Improved access to water and basic sanitation services still remains a major threat to health and economy of Pakistan. It is estimated that unsafe drinking water and inadequate sanitation cost Pakistan’s economy about PKR 343.7 billion every year (Irfan et al., 2017; Rauniyar, Orbeta Jr, & Sugiyarto, 2011).
Despite adopting water and sanitation strategies in Pakistan (agency, 2018), availability, access and use of WASH services still remains a big challenge (Shallwani, 2019).
Our questions, relating to assessing WASH facilities in primary schools, have important public health significance. In schools, there are intense levels of person-to-person contact, potentially exposing children to diseases related to poor sanitary conditions. Poor WASH conditions may thereby lead to numerous poor health outcomes (agency, 2018; Freeman et al., 2014; Garn et al., 2017; Rauniyar et al., 2011; Wolf et al., 2014). Under-nutrition—a problem common to Pakistan—exacerbates the problem of pathogen transmission because of poor immunity (Irfan et al., 2017; UNICEF, 2018a). According to the Multiple Indicator Cluster Survey (MICS) 2014, the prevalence of chronic under-nutrition in children in Sindh province (study area) of
6th International Water Conference Proceedings [ 133 ]
Pakistan is around 48% and morbidity and mortality due to waterborne diseases in this age group is also high (G. N. Khan et al., 2016). Children who have access to and practice WASH will later in life act as peer educators to their families. Lastly, lack of well-maintained may have been a contributor to low school enrollment during last few decades (Shallwani, 2019). As a result, recent efforts by national and international organizations (INGO’s & NGO’s) have focused much more on WASH in schools. However, each organization is working on their own and there is no national or provincial (state) level forum to cater this information to avoid overlap and make use of successful WASH interventions, nor a large
Our research will provide a further understanding of Water, sanitation and hygiene facilities availability, access, functionality, and water quality in primary schools of Sindh province of Pakistan, and will identify successes and failures of ongoing and recent Government and NGO WASH efforts in these schools (school WASH policy and interventions) and their impacts on WASH practices, health and educational outcomes (Shallwani, 2019).
We expect to see that some donor programs are better than others. Furthermore, this study will enhance the knowledge and capacity building of researchers and decision makers through dissemination of information through peer-reviewed publications (i.e., articles and book chapters). The wide range of water quality parameters from different geographic locations of Pakistan would (Shallwani, 2019) help policy makers / researchers developing an inventory for water quality parameters.
Our research will fill an important gap in the literature, as there is dearth of literature on comprehensive school WASH in Pakistan. The findings will help to inform current school drinking water and sanitation policy revision, while developing linkages to SDGs-6 (Assembly, 2015).
Method
We conducted a cross-sectional survey of primary schools in the Sindh province of Pakistan. The Country is located in the southeast quadrant of Pakistan, Sindh province is the second largest province in Pakistan with a population of around 48 million(Pakistan, 2017-18). The study was conducted from January 2018 through April 2019. 10 districts were randomly selected from the 29 districts in the province (see figure 1). Sindh has the poorest school indicators compared to other provinces. Despite the province being the economic hub of the country, almost half of the school going age children are out of the school(Nayyar, Talpur, & Jariko, 2019).

[ 134 ] 6th International Water Conference Proceedings
Figure 1. Surveyed schools in the Sindh province of Pakistan
Participants:
All the primary schools of Sindh Province (State) registered with the government, were considered as relevant study population N=42900 (Sindh, 2019)
As done in other studies (Garn et al., 2017; Trinies, Garn, Chan, & Freeman, 2016). Sindh has three regions each divided into districts. Each region has different socio-demographic and geographic characteristics; thus, WASH conditions vary in each region. Therefore, a multi-stage cluster sampling was used to enroll schools (see figure 2).

6th International Water Conference Proceedings [ 135 ]
Figure:2 Selection of Schools using multi-stage cluster sampling technique
Variables:
425 schools were assessed using the WHO WASH assessment tool (Adams, Bartram, Chartier, Sims, 2009). The headmaster of each school was interviewed, drinking water samples and structured observations of WASH were collected. For assessment of WASH facilities (process indicators) contains 5 points:
such as
1) Availability 14 items2) Accessibility 6 items3) Functionality 14 items4) Hygiene practices 2 items and5) Drinking water quality: Physico-chemical parameters 9 items, Heavy metals 5 items
and microbial 2 items.
The WASH factors contain 3 points 1) Socio-demographic 6 items 2) WASH related interventions 3 items 3) National WASH policy (School Education Department, 2016) contains 1 item. The outcome indicators were measured using UN SDG-6 (advance service, basic, limited and no service) WASH service ladder criteria (UNICEF, 2018a) having 4 items. The impact indicators (school performance) contain 3 items (enrollment, dropout, and absenteeism).

[ 136 ] 6th International Water Conference Proceedings
The ODK Collect Android Software was used to collect data (Garn et al., 2017). The instrument was translated into local language by two professional translators. The questionnaire was translated into both English and Sindhi to ensure ease of use. It was pre-tested among six schools to evaluate clarity of the translated questions, the appropriateness of the wordings based on the cultural and belief, and the duration of time taken to answer the questionnaire. The potential confounders include duration of intervention, type of schools, drinking water source, additional funding or WASH intervention done by other than school management. Duration, type of school, and type of intervention were addressed by stratification.
Data Source Measurement:
The data collection at schools consisted of three parts. Firstly, structured interviews were conducted with each school head to ascertain the sociodemographic characteristics, WASH interventions, WASH policy, water, sanitation and hygiene facilities availability, accessibility and functionality specific to the school. Secondly, data concerning the physiochemical, biological, and metalogic quality of water samples were collected. Thirdly, direct observations of water, sanitation, and hygiene facilities were made. Data were collected using Open Data Kit (ODK) on Android cell-phones. Sociodemographic data collected from the school head, include the type of school (governmental, private, boys, girls, mixed gender), school location (urban, rural), and sex-specific enrollment numbers.
The water quality samples were analyzed onsite using multimeters and offsite at the National Water Quality Laboratory ((USPCAS-W), 2019) . The water quality parameters were compared to the WHO recommendations and National Environmental Quality Standards (NEQS) (agency, 2018; Organization, 2016). Two data collectors and one lab research assistant with relevant experience and qualifications were recruited. Water quality parameters: The surveys for drinking water quality were conducted according to the recommendations of National Environmental Quality Standards (NEQS) (agency, 2018). Indicators known to have detrimental effects of human health were assessed using standard methods for sampling. These indicators include pH, turbidity, temperature, electric conductivity, hardness, DO, TDS, fluoride, phosphate, chloride, arsenic (AS), cadmium (Cd), lead (Pb), iron (Fe), manganese (Mn) nitrates and fecal coliform. The samples were collected from point of use (POU) tap, hand pump or any other sources of drinking water from each school. Sterile bottles were used to collect 300 ml samples of water. A trained lab technician conducted onsite tests for water pH, turbidity, temperature, electric conductivity, and TDS using relevant portable devices (pH meter, EC / TDS meter, turbidity meter and DO meter). A 300 ml sample from each school (from the same source used for onsite tests) was collected for all others lab-based analysis (trace metals, fecal coliform, chloride, fluoride and phosphate, nitrate, hardness). The samples were shipped in a 4oC icebox to the National Water Quality Laboratory. The indicators of interest were compared across schools and to the WHO recommendations and National Environmental Quality Standards (NEQS) (agency, 2018). These comparisons were conducted in order to determine current WASH conditions and recommendations for

6th International Water Conference Proceedings [ 137 ]
WASH improvements. Structured observations of WASH facilities were carried out to assess the present condition, and functionality of school water, sanitation, and hygiene facilities. Information such as the number of toilets (for both boys, girls, disabled, and teachers), toilet conditions (e.g., presence of doors, lock, roof, functionality, cleanliness, etc.), the number and location of handwashing facilities (e.g., presence of soap, water, etc.), drainage structure, number of bins, was also collected.
Two data collectors and one supervisor assistant with relevant experience and qualification were recruited. The field team was trained on survey administration. The questionnaire was pre-tested and necessary changes were made in the language and style of the questionnaire to improve comprehensibility. All enumerators were trained during this piloting process. The pilot testing was conducted in schools not participating in the study. The necessary changes were made in language and style of the questionnaires to improve comprehensibility and to identify and address practical problems with the implementation phase. The supervisor was involved in supervision of data collection as well as in sample analysis, transfer of the required samples to laboratory and data entry.
Bias:
Potential biases were addressed at multiple levels. Study tools were validated and piloted before survey implementation, a well-qualified and experienced field team was recruited, ODK mobile based software was utilized to avoid data entry errors, and the national reputable water quality laboratory ((USPCAS-W), 2019) was used to analyzed the water quality parameters.
Study Size:
At the time of the study 42,900 primary schools were registered with the Government of Sindh Province Education Department (Sindh, 2019). 425 primary schools were randomly selected using multi-stage cluster sampling design. The sample size was calculated based on the prevalence of substandard WASH indicators in schools observed in a similar study in India that found that 50% of surveyed schools had inadequate WASH infrastructure (MONDAL).
The sample size for our study is larger than several other school-based studies emphasizing WASH (Garn et al., 2017; Morgan, Bowling, Bartram, Kayser, & health, 2017; Akina Shrestha et al., 2017) giving this study the potential to have greater statistical power and generalizability.
Ethics Statement
Ethical approval from the Institutional Review Board of Liaquat University of Medical and Health Sciences (LUMHS), Pakistan and University of Malaya, Malaysia (Sciences, 2019; University Of Malaya, 2019) was obtained (approval number MMC/3236 and UM.TNC.2/ UMREC respectively) prior to the commencement of the study. A permission letter from
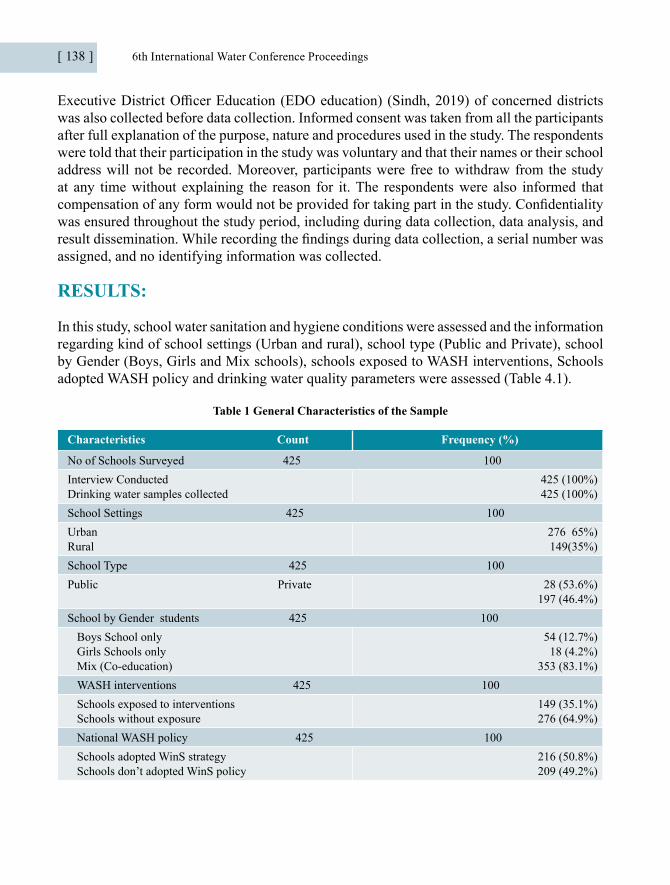
[ 138 ] 6th International Water Conference Proceedings
Executive District Officer Education (EDO education) (Sindh, 2019) of concerned districts was also collected before data collection. Informed consent was taken from all the participants after full explanation of the purpose, nature and procedures used in the study. The respondents were told that their participation in the study was voluntary and that their names or their school address will not be recorded. Moreover, participants were free to withdraw from the study at any time without explaining the reason for it. The respondents were also informed that compensation of any form would not be provided for taking part in the study. Confidentiality was ensured throughout the study period, including during data collection, data analysis, and result dissemination. While recording the findings during data collection, a serial number was assigned, and no identifying information was collected.
RESULTS:
In this study, school water sanitation and hygiene conditions were assessed and the information regarding kind of school settings (Urban and rural), school type (Public and Private), school by Gender (Boys, Girls and Mix schools), schools exposed to WASH interventions, Schools adopted WASH policy and drinking water quality parameters were assessed (Table 4.1).
Table 1 General Characteristics of the Sample
Characteristics Count Frequency (%)
No of Schools Surveyed 425 100Interview ConductedDrinking water samples collected
425 (100%)425 (100%)
School Settings 425 100Urban Rural
276 65%)149(35%)
School Type 425 100Public Private 28 (53.6%)
197 (46.4%)School by Gender students 425 100
Boys School onlyGirls Schools onlyMix (Co-education)
54 (12.7%) 18 (4.2%)
353 (83.1%)WASH interventions 425 100 Schools exposed to interventionsSchools without exposure
149 (35.1%)276 (64.9%)
National WASH policy 425 100Schools adopted WinS strategySchools don’t adopted WinS policy
216 (50.8%)209 (49.2%)
6th International Water Conference Proceedings [ 139 ]
Water Sanitation and Hygiene Situation
A representative sample of four hundred twenty-five primary schools of sindh province were assessed. The study sample represent (53.6%) public and (46.1%) private schools. While with regards to gender of the pupil, most of the schools were of mixed type represents boys and girls (83.1%) compared to separate schools for boys (12.7%) and girls (4.2%). The improved drinking water source was reported in 352 (82.8%) schools, while it was accessible in 310 (72.9%) schools and drinking water points were observed functional and well maintained only in 160 (37.6%). Availability to improved sanitation system exist in 293 (68.9%) schools, with accessibility to small and disable children was observed in 225 (52.9%) schools out of which 138 (32.5%) schools’ toilets were observed functional and were routinely maintained. Availability to handwashing facilities was observed in 244 (57.4%) schools, which were found accessible to children in 151 (35.5%) schools and only 56 (13.6%) schools found to have functional (with water and soap) handwash facilities, as shown in table 2.
The WASH service in schools was further categorized according to UN WASH criteria (UNICEF, 2018a): the drinking water service in most of the schools were categories as; basic (58%) to limited service (20%). The sanitation service in schools was mainly classified as limited (51%) to no service (29%), similarly, hygiene service also mainly falls to limited (52%) to no service (34%), as shown in table 2.
Generally, in schools the availability, accessibility, functionality of wash facilities, hygiene practices has no significant association by area or district (p>0.05), except functionality of handwashing station and water quality was found to have positive and significant association by area (p<0.05). We further assessed the impact of wash facilities in school with regards to sociodemographic variables, where school by type of gender (boys, girls and mix) found to have significant impact on availability of water, sanitation, hand wash (HW), menstrual hygiene management (MHM) facilities and functionality of sanitation, hygiene, mhm facilities, hygiene practices and water quality (p<0.05). This study also measured the impact of wash related interventions on different domains of wash facilities and practices at schools. Overall, the schools offered any wash intervention found to have significant impact on availability of; water, sanitation, MHM, HW facilities, accessibility to hygiene, mhm facilities, functionality of water, mhm, hygiene facilities and hygiene practices. Similarly, the schools adopted wash policy found to have positive and significant impact on availability of water, sanitation facilities, access to hygiene, sanitation facilities, functionality of water, hygiene facilities and hygiene practices (p<0.05). Surprisingly, the schools exposed to wash interventions and policy shown to have no significant impact on water quality (p>0.05).
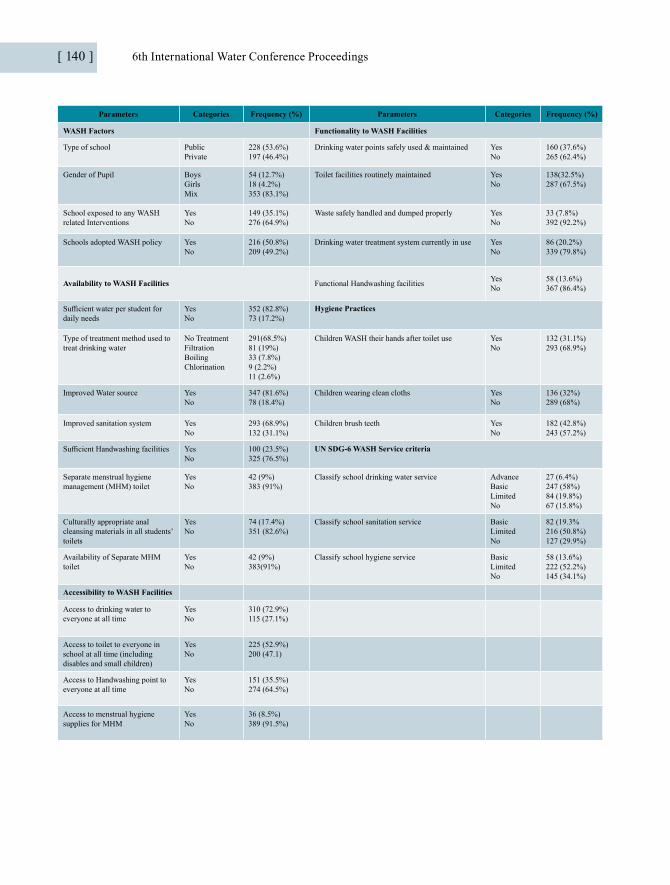
[ 140 ] 6th International Water Conference Proceedings
Parameters Categories Frequency (%) Parameters Categories Frequency (%)
WASH Factors Functionality to WASH Facilities
Type of school PublicPrivate
228 (53.6%)197 (46.4%)
Drinking water points safely used & maintained YesNo
160 (37.6%)265 (62.4%)
Gender of Pupil BoysGirlsMix
54 (12.7%)18 (4.2%)353 (83.1%)
Toilet facilities routinely maintained YesNo
138(32.5%)287 (67.5%)
School exposed to any WASH related Interventions
YesNo
149 (35.1%)276 (64.9%)
Waste safely handled and dumped properly YesNo
33 (7.8%)392 (92.2%)
Schools adopted WASH policy YesNo
216 (50.8%)209 (49.2%)
Drinking water treatment system currently in use YesNo
86 (20.2%) 339 (79.8%)
Availability to WASH Facilities Functional Handwashing facilities YesNo
58 (13.6%)367 (86.4%)
Sufficient water per student for daily needs
YesNo
352 (82.8%)73 (17.2%)
Hygiene Practices
Type of treatment method used to treat drinking water
No TreatmentFiltrationBoilingChlorination
291(68.5%)81 (19%)33 (7.8%)9 (2.2%)11 (2.6%)
Children WASH their hands after toilet use YesNo
132 (31.1%)293 (68.9%)
Improved Water source YesNo
347 (81.6%)78 (18.4%)
Children wearing clean cloths YesNo
136 (32%)289 (68%)
Improved sanitation system YesNo
293 (68.9%)132 (31.1%)
Children brush teeth YesNo
182 (42.8%)243 (57.2%)
Sufficient Handwashing facilities YesNo
100 (23.5%)325 (76.5%)
UN SDG-6 WASH Service criteria
Separate menstrual hygiene management (MHM) toilet
YesNo
42 (9%)383 (91%)
Classify school drinking water service AdvanceBasicLimitedNo
27 (6.4%)247 (58%)84 (19.8%)67 (15.8%)
Culturally appropriate anal cleansing materials in all students’ toilets
YesNo
74 (17.4%)351 (82.6%)
Classify school sanitation service BasicLimitedNo
82 (19.3%216 (50.8%)127 (29.9%)
Availability of Separate MHM toilet
YesNo
42 (9%)383(91%)
Classify school hygiene service BasicLimitedNo
58 (13.6%)222 (52.2%)145 (34.1%)
Accessibility to WASH Facilities
Access to drinking water to everyone at all time
YesNo
310 (72.9%)115 (27.1%)
Access to toilet to everyone in school at all time (including disables and small children)
YesNo
225 (52.9%)200 (47.1)
Access to Handwashing point to everyone at all time
YesNo
151 (35.5%)274 (64.5%)
Access to menstrual hygiene supplies for MHM
YesNo
36 (8.5%)389 (91.5%)
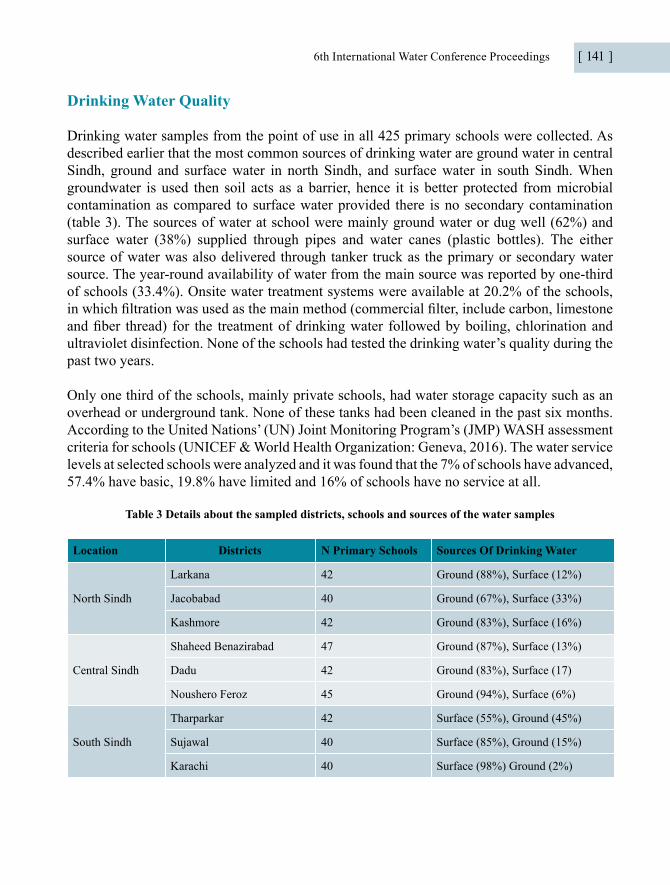
6th International Water Conference Proceedings [ 141 ]
Drinking Water Quality
Drinking water samples from the point of use in all 425 primary schools were collected. As described earlier that the most common sources of drinking water are ground water in central Sindh, ground and surface water in north Sindh, and surface water in south Sindh. When groundwater is used then soil acts as a barrier, hence it is better protected from microbial contamination as compared to surface water provided there is no secondary contamination (table 3). The sources of water at school were mainly ground water or dug well (62%) and surface water (38%) supplied through pipes and water canes (plastic bottles). The either source of water was also delivered through tanker truck as the primary or secondary water source. The year-round availability of water from the main source was reported by one-third of schools (33.4%). Onsite water treatment systems were available at 20.2% of the schools, in which filtration was used as the main method (commercial filter, include carbon, limestone and fiber thread) for the treatment of drinking water followed by boiling, chlorination and ultraviolet disinfection. None of the schools had tested the drinking water’s quality during the past two years.
Only one third of the schools, mainly private schools, had water storage capacity such as an overhead or underground tank. None of these tanks had been cleaned in the past six months. According to the United Nations’ (UN) Joint Monitoring Program’s (JMP) WASH assessment criteria for schools (UNICEF & World Health Organization: Geneva, 2016). The water service levels at selected schools were analyzed and it was found that the 7% of schools have advanced, 57.4% have basic, 19.8% have limited and 16% of schools have no service at all.
Table 3 Details about the sampled districts, schools and sources of the water samples
Location Districts N Primary Schools Sources Of Drinking Water
North Sindh
Larkana 42 Ground (88%), Surface (12%)
Jacobabad 40 Ground (67%), Surface (33%)
Kashmore 42 Ground (83%), Surface (16%)
Central Sindh
Shaheed Benazirabad 47 Ground (87%), Surface (13%)
Dadu 42 Ground (83%), Surface (17)
Noushero Feroz 45 Ground (94%), Surface (6%)
South Sindh
Tharparkar 42 Surface (55%), Ground (45%)
Sujawal 40 Surface (85%), Ground (15%)
Karachi 40 Surface (98%) Ground (2%)
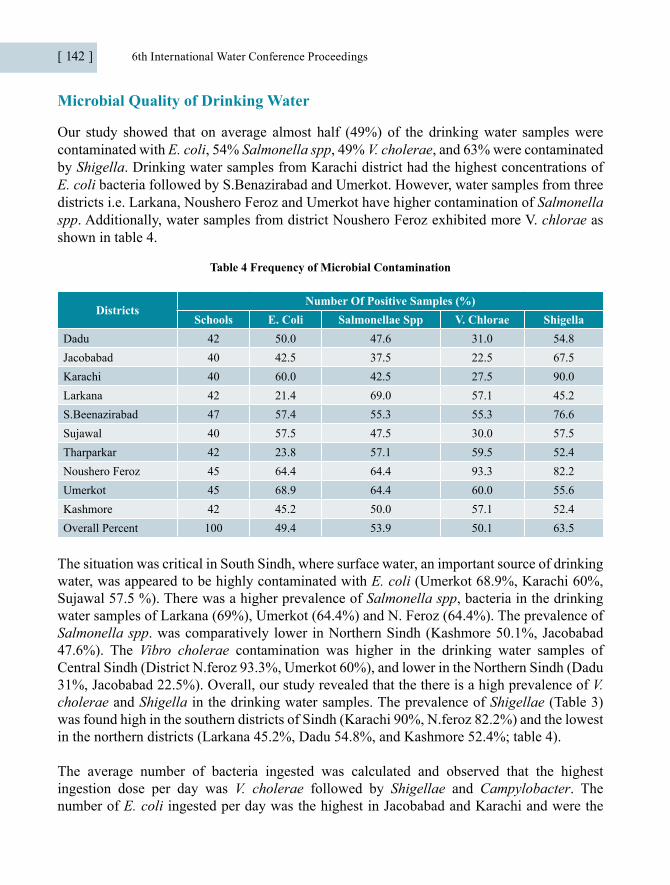
[ 142 ] 6th International Water Conference Proceedings
Microbial Quality of Drinking Water
Our study showed that on average almost half (49%) of the drinking water samples were contaminated with E. coli, 54% Salmonella spp, 49% V. cholerae, and 63% were contaminated by Shigella. Drinking water samples from Karachi district had the highest concentrations of E. coli bacteria followed by S.Benazirabad and Umerkot. However, water samples from three districts i.e. Larkana, Noushero Feroz and Umerkot have higher contamination of Salmonella spp. Additionally, water samples from district Noushero Feroz exhibited more V. chlorae as shown in table 4.
Table 4 Frequency of Microbial Contamination
DistrictsNumber Of Positive Samples (%)
Schools E. Coli Salmonellae Spp V. Chlorae ShigellaDadu 42 50.0 47.6 31.0 54.8Jacobabad 40 42.5 37.5 22.5 67.5Karachi 40 60.0 42.5 27.5 90.0Larkana 42 21.4 69.0 57.1 45.2S.Beenazirabad 47 57.4 55.3 55.3 76.6Sujawal 40 57.5 47.5 30.0 57.5Tharparkar 42 23.8 57.1 59.5 52.4Noushero Feroz 45 64.4 64.4 93.3 82.2Umerkot 45 68.9 64.4 60.0 55.6Kashmore 42 45.2 50.0 57.1 52.4Overall Percent 100 49.4 53.9 50.1 63.5
The situation was critical in South Sindh, where surface water, an important source of drinking water, was appeared to be highly contaminated with E. coli (Umerkot 68.9%, Karachi 60%, Sujawal 57.5 %). There was a higher prevalence of Salmonella spp, bacteria in the drinking water samples of Larkana (69%), Umerkot (64.4%) and N. Feroz (64.4%). The prevalence of Salmonella spp. was comparatively lower in Northern Sindh (Kashmore 50.1%, Jacobabad 47.6%). The Vibro cholerae contamination was higher in the drinking water samples of Central Sindh (District N.feroz 93.3%, Umerkot 60%), and lower in the Northern Sindh (Dadu 31%, Jacobabad 22.5%). Overall, our study revealed that the there is a high prevalence of V. cholerae and Shigella in the drinking water samples. The prevalence of Shigellae (Table 3) was found high in the southern districts of Sindh (Karachi 90%, N.feroz 82.2%) and the lowest in the northern districts (Larkana 45.2%, Dadu 54.8%, and Kashmore 52.4%; table 4).
The average number of bacteria ingested was calculated and observed that the highest ingestion dose per day was V. cholerae followed by Shigellae and Campylobacter. The number of E. coli ingested per day was the highest in Jacobabad and Karachi and were the
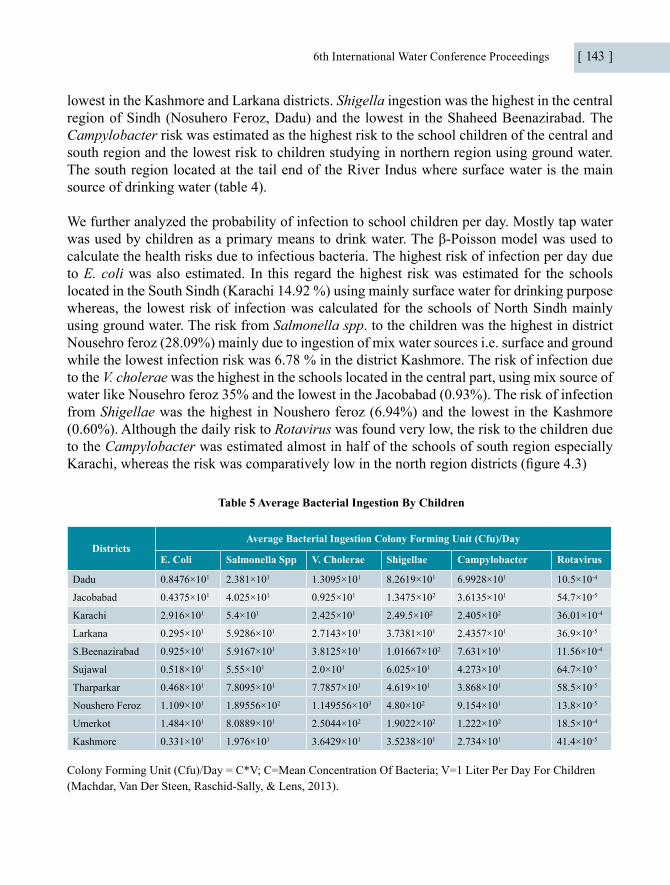
6th International Water Conference Proceedings [ 143 ]
lowest in the Kashmore and Larkana districts. Shigella ingestion was the highest in the central region of Sindh (Nosuhero Feroz, Dadu) and the lowest in the Shaheed Beenazirabad. The Campylobacter risk was estimated as the highest risk to the school children of the central and south region and the lowest risk to children studying in northern region using ground water. The south region located at the tail end of the River Indus where surface water is the main source of drinking water (table 4).
We further analyzed the probability of infection to school children per day. Mostly tap water was used by children as a primary means to drink water. The β-Poisson model was used to calculate the health risks due to infectious bacteria. The highest risk of infection per day due to E. coli was also estimated. In this regard the highest risk was estimated for the schools located in the South Sindh (Karachi 14.92 %) using mainly surface water for drinking purpose whereas, the lowest risk of infection was calculated for the schools of North Sindh mainly using ground water. The risk from Salmonella spp. to the children was the highest in district Nousehro feroz (28.09%) mainly due to ingestion of mix water sources i.e. surface and ground while the lowest infection risk was 6.78 % in the district Kashmore. The risk of infection due to the V. cholerae was the highest in the schools located in the central part, using mix source of water like Nousehro feroz 35% and the lowest in the Jacobabad (0.93%). The risk of infection from Shigellae was the highest in Noushero feroz (6.94%) and the lowest in the Kashmore (0.60%). Although the daily risk to Rotavirus was found very low, the risk to the children due to the Campylobacter was estimated almost in half of the schools of south region especially Karachi, whereas the risk was comparatively low in the north region districts (figure 4.3)
Table 5 Average Bacterial Ingestion By Children
DistrictsAverage Bacterial Ingestion Colony Forming Unit (Cfu)/Day
E. Coli Salmonella Spp V. Cholerae Shigellae Campylobacter Rotavirus
Dadu 0.8476×101 2.381×101 1.3095×101 8.2619×101 6.9928×101 10.5×10⁻⁴
Jacobabad 0.4375×101 4.025×101 0.925×101 1.3475×10² 3.6135×101 54.7×10⁻⁵
Karachi 2.916×101 5.4×101 2.425×101 2.49.5×102 2.405×10² 36.01×10⁻⁴
Larkana 0.295×101 5.9286×101 2.7143×101 3.7381×101 2.4357×101 36.9×10⁻⁵
S.Beenazirabad 0.925×101 5.9167×101 3.8125×101 1.01667×10² 7.631×101 11.56×10⁻⁴
Sujawal 0.518×101 5.55×101 2.0×101 6.025×101 4.273×101 64.7×10⁻⁵
Tharparkar 0.468×101 7.8095×101 7.7857×101 4.619×101 3.868×101 58.5×10⁻⁵
Noushero Feroz 1.109×101 1.89556×10² 1.149556×10³ 4.80×10² 9.154×101 13.8×10⁻⁵
Umerkot 1.484×101 8.0889×101 2.5044×10² 1.9022×10² 1.222×10² 18.5×10⁻⁴
Kashmore 0.331×101 1.976×101 3.6429×101 3.5238×101 2.734×101 41.4×10⁻⁵
Colony Forming Unit (Cfu)/Day = C*V; C=Mean Concentration Of Bacteria; V=1 Liter Per Day For Children (Machdar, Van Der Steen, Raschid-Sally, & Lens, 2013).
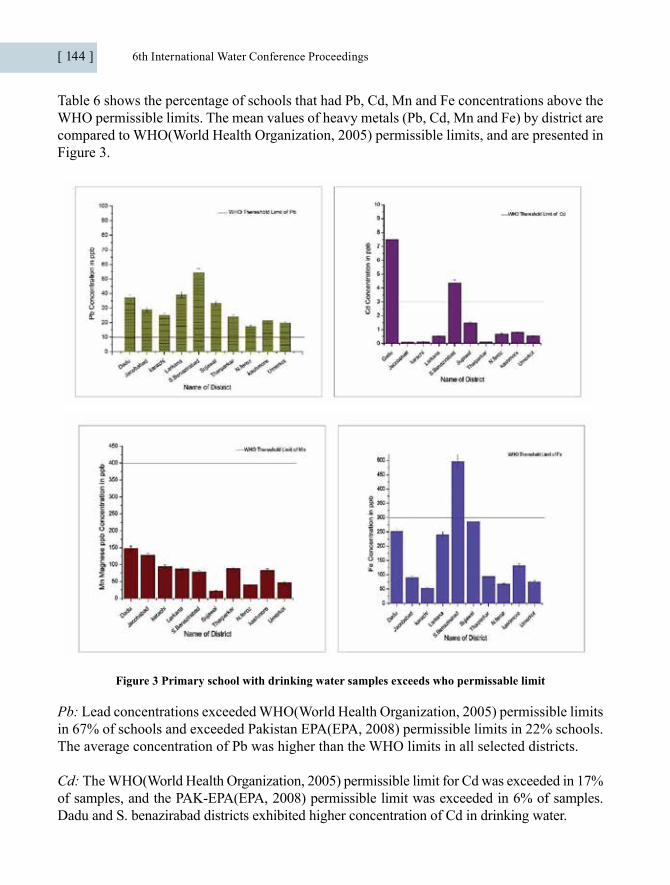
[ 144 ] 6th International Water Conference Proceedings
Table 6 shows the percentage of schools that had Pb, Cd, Mn and Fe concentrations above the WHO permissible limits. The mean values of heavy metals (Pb, Cd, Mn and Fe) by district are compared to WHO(World Health Organization, 2005) permissible limits, and are presented in Figure 3.
Figure 3 Primary school with drinking water samples exceeds who permissable limit
Pb: Lead concentrations exceeded WHO(World Health Organization, 2005) permissible limits in 67% of schools and exceeded Pakistan EPA(EPA, 2008) permissible limits in 22% schools. The average concentration of Pb was higher than the WHO limits in all selected districts.
Cd: The WHO(World Health Organization, 2005) permissible limit for Cd was exceeded in 17% of samples, and the PAK-EPA(EPA, 2008) permissible limit was exceeded in 6% of samples. Dadu and S. benazirabad districts exhibited higher concentration of Cd in drinking water.

6th International Water Conference Proceedings [ 145 ]
Mn and Fe: Mn concentrations exceeded WHO permissible limits in 4% of the schools’ drinking water. Fe concentrations exceeded WHO permissible limits in 15% of schools’ drinking water. On average, Mn and Fe values were found under WHO limits across the various districts.
An ILCR is a commonly referenced benchmark to safeguard public health. The incremental lifetime cancer risk (ILCR) for the study population was analyzed for Pb and Cd. Permissible limits were considered to be 10-4 for this study. An ILCR of 10-4 (Bamuwamye, Ogwok, & Tumuhairwe, 2015) is the chance that a single person may develop cancer out of 10,000 persons subjected to a carcinogen.(USEPA, 1991) Pb and Cd exposure was measured on the basis of mean CDI values. The ILCR averages for Pb at the district level were all above the predefined tolerable limit of 10-4; most districts had individual schools both above and below this cutoff (Figure 4). In contrast, the Cd ILCR averages at the district level were all below the tolerable limit of 10-4; three districts had at least one school that was above the tolerable limit (Figure 4).
According to their relative importance for drinking purposes to each water quality parameter. The drinking water quality was categorized into five categories based on WQI values (Kachroud, Trolard, Kefi, Jebari, & Bourrié, 2019; Sharma et al., 2014). The water quality with regards to phsiochemical quality was characterized according to the zones. Among zones, the schools in South zone were the most vulnerable and had the poorest water quality indicators. The average TDS, turbidity and chloride concentrations in south zone districts (Sujawla, Umerkot and Tharparkar) exceeded the WHO and Pak EPA guideline values (EPA 2010; Organization, 2017). The Pearson correlation results showed that all the dissolved salts indicated good positive correlation with TDS and EC values. The drinking water quality for physichemical parameters (TDS, Turbidity, pH, Chloride, EC, Hardness, DO, Nitrate, Phosphate) were

[ 146 ] 6th International Water Conference Proceedings
further characterized assessed using WQI model. The WQI of schools (Figure 5) in central
Sindh mainly depending on ground water showed that almost half (53%) of the schools have excellent drinking water, 21% possess good quality drinking water, followed by 18% with poor water, 6% with very poor water, and 1% with water that is unsuitable for drinking. The WQI of North Sindh with a mixed sourced water supply showed that the maximum number of school children consumed good type of water (49%), followed by excellent quality (36%), poor (13%), and very poor (1%). In the southern part of Sindh province, which depends mainly on surface water, almost 1/3 of schools in each group have access to either excellent water (33%), good water (34%), or poor water (29%), while few school children consumed water which was of very poor or unsuitable to drink quality (3%). Among all three regions, schools in central Sindh have more access to drinking water with excellent quality (54%), while schools of the south districts of Sindh were more vulnerable with 33% of school children consuming poor or very poor drinking water.
Figure 5 Consolidated water quality index of primary schools of Sindh.
There were several limitations in our study. Firstly, several design improvements that future studies might consider. It is important to match control and intervention schools to control for confounding factors. It is also important to supplement surveys by triangulating self-reported data with observational data to ensure these data are of good quality. Future studies could assess existing policies, governmental structure, funding allocation, and other potential explanations for the variation. Secondly, students might not be drinking from the school water sources, but instead drink from their personal water bottles, brought from home. Thirdly, we only

6th International Water Conference Proceedings [ 147 ]
studied six pathogens, based on our limited resources; however, there are other waterborne pathogens which may be considered in future studies. Further, our estimates of pathogenic E. coli, of Campylobacter, and of Rotavirus were based on predicted doses, using assumptions from the literature and using our measure of total E. coli. Finally, our results have not taken into consideration the uncertainty of the risk of our estimates (e.g., like Monte-Carlo analysis would do).
Discussion
Our findings revealed that the WASH facilities coverage in Pakistani schools remains overall low on criteria defined by UN joint monitoring program(UNICEF, 2018a) on WASH (i.e. basic WASH service; 58% water, 19.3% sanitation and 13.6% hygiene). These percentages in similar settings are somehow consistent with the Nepal and Bhutan in the same region, however, we found less WASH facilities coverage when compared to many similar lower middle income countries (i.e. India, Bangladesh, Jordan and Uganda)(UNICEF, 2018a). The coverage of WASH facilities are influenced by several factors apart from the country’s economic status, such as culture, literacy rate, level of awareness, policy reforms etc.(Morgan, Bowling, Bartram, & Kayser, 2017; M. U. Snehalatha, R Ahmed, M Sharif, AJ, 2015; M. E. O. Stocks, Stephanie Haddad, Danny Addiss, David G McGuire, Courtney Freeman, Matthew C, 2014; UNICEF, 2014) WASH facilities are considered appropriate when aligned with the needs of the school students, taking into account the gender, disable and small children and are consistent with national and or international goals.(U.N, 2015; UNICEF, 2018b; W. H. O. UNICEF, 2016) The appropriateness of WASH services are determined by availability, accessibility and are functionality to all. In our study all these three inclusive domains of WASH (availability, accessibility, and functionality) facilities were found inconsistent. For example, drinking water was available to 82% of primary schools, which was accessible to 72% Schools and the drinking water point(s)were observed functional and well maintained in only 37.6% schools. Similarly, the improved sanitation system was available to 68.9% of the schools, while accessible to everyone (including small and disable children) at all time (52.9%), however only 32.5% have functional toilet and were observed routinely maintained. Also, in some schools the student toilet ratio exceeds 90 pupil per toilet. The insufficient toilets facilities possibly increase chances of open defecation that leads to health risk of waterborne diseases including diarrhea, that may affect the school attendance(Morgan, Bowling, Bartram, & Kayser, 2017). With regards to handwash (HW) facilities, it was available to 57.4% schools, accessible to 35.5% schools, but HW facilities were functional only at 13.6% schools.
Our study characterized water, sanitation, and hygiene (WASH) conditions in 425 primary schools of Sindh, Pakistan, and estimated the risk of waterborne infections in schoolchildren. Overall, the risk of illness due to the bacterial infection (E. coli, Salmonella spp., V. cholerae, Shigella, and Campylobacter) was high.
We observed that, on average, almost half (49%) of the drinking-water samples were
[ 148 ] 6th International Water Conference Proceedings
contaminated with E. coli, 54% with Salmonella spp., 49% with V. cholerae, and 63% with Shigella. South Sindh mainly depends on surface water for drinking water, and that water appears to be highly contaminated with E. coli (Umerkot 68.9%, Karachi 60%, and Sujawal 57.5%). The high risks of infections that we found in the present study are congruent with other available studies of drinking water in Pakistan (Daud et al., 2017; Memon, Soomro, Akhtar, & Memon, 2011; M. Sarfraz, N. Sultana, & M. I. Tariq, 2018). The latest Pakistan demographic and health survey in the community settings of the study area reported a high prevalence of waterborne diseases, such as diarrhea, dysentery, cholera, and typhoid (Studies& Islamabad, 2017-18), which aligns with the high-risk pathogens we found in our study.
Recently, a prestigious hospital of the study area has reported the emergence of the first large-scale spread of an extensively drug-resistant (XDR) Salmonella typhi, exhibiting resistance toTrimethoprim–sulfamethoxazole, ampicillin, chloramphenicol, fluoroquinolones, and third-generation cephalosporins (Klemm et al., 2018). The ongoing outbreak has resulted in more than 300 cases, including 187 pediatric cases since November 2016 (Klemm et al., 2018). The WHO maintained that the Sindh province of Pakistan is under high risk of acquiring XDR Salmonella spp., because of poor access to clean water, as well as unimproved sanitation and hygiene (WHO, 2018). In our study, there was a higher prevalence of Salmonella spp. in the drinking-water samples from South and Central Sindh districts, especially in Umerkot (64.4%) and N. Feroze (64.4%). The prevalence of Salmonella spp. was comparatively lower in Northern Sindh (Kashmore 50% and Jacobabad 37%).
The percentage of schools that had Pb, Cd, Mn, Fe and As concentrations above the WHO permissible limits were presented in results. The mean values of heavy metals (Pb, Cd, Mn and Fe) by district are compared to WHO(World Health Organization, 2005) permissible limits. The results regarding PH and heavy metals’ (HM) concentrations of drinking water from sampled primary schools are and are discussed by heavy metal type in the following paragraphs.
Lead (Pb) concentrations exceeded WHO(World Health Organization, 2005) permissible limits in 67% of schools and exceeded Pakistan EPA(EPA, 2008) permissible limits in 22% schools. The average concentration of Pb was higher than the WHO limits in all selected districts. In a previous study, done in community settings of northern parts of Pakistan,(Nawab et al., 2018) concentrations of Pb above the WHO permissible limits were found in 86% of samples. The observed difference may be due to the different origination of water sources and landscapes (mountainous vs. plain land in our study) and different potential sources of contamination.(K. Khan et al., 2013; Nawab et al., 2018) Schools’ drinking water sources in our study might be contaminated through human, animals, agriculture and/ or industrial waste, and seepage routes as compared to mountainous land where potential contamination routes might be weathering of rocks, discharges of wastewater, and fossil fuel combustion.(Muhammad, Shah, & Khan, 2011; Nawab et al., 2018; M. Sarfraz, N. Sultana, & M. I. J. S. U. B.-B. Tariq, Chemia, 2018).

6th International Water Conference Proceedings [ 149 ]
The WHO(World Health Organization, 2005) permissible limit for cadimium Cd was exceeded in 17% of samples, and the Pak-EPA(EPA, 2008) permissible limit was exceeded in 6% of samples. Dadu and S. Benazirabad districts exhibited higher concentration of Cd in drinking water. The origins of the water contamination by Cd may include from large drains (e.g., Right Bank Outfall Drainage and Left Bank outfall drainage), which may carry untreated municipal waste, agricultural pesticide and fertilizers, waste from sugar mills, and from Mancher lake contamination (wastewater mixes in lake water used for drinking).(Abbas et al., 2010; Shakir et al., 2016; Waseem et al., 2014).
The WQI values demonstrated a positive relationship (p < 0.01) with EC, TDS, chloride, and turbidity. Based on these correlations, it is evident that EC, TDS, chloride, and turbidity were the most influential factors for the computed WQI values of drinking water sources in the study settings. During the last two decades, drinking water quality status in the study area has deteriorated possibly due to the rapid expansion in human population, resulting in an increase in anthropogenic activities, as evidenced in previous studies (Shahab, Shihua, Rashid, Hasan, & Sohail, 2016; AK Shrestha & Basnet, 2018). Therefore, it can be inferred that the precautionary measures taken by the concerned authorities in the country to protect water quality have been inadequate. Furthermore, the industrial, domestic, and agricultural waste along with the climatic changes are also major threats to the drinking water quality in Pakistan (A. Khan, Qureshi, & Pollution, 2018; Qureshi, Mahessar, Leghari, Lashari, & Mari, 2015). The WQI results showed that among all three regions, schools in central Sindh have more access to drinking water with excellent quality (54%), while schools of the south districts of Sindh were more vulnerable with 33% of school children consuming poor or very poor to unsuitable drinking water. The southern part of Sindh adjoins the seacoast where drinking water quality deteriorates due to dumping of urban and industrial waste. This area also has limited freshwater resources (Jamil Ahmed et al., 2020; J. Ahmed et al., 2020).
Conclusion
The present study provided a comprehensive overview of the existing WASH situations and water quality in schools and subsequently the impact of WASH interventions and national WASH policy on educational outcomes.The basic water sanitation and hygiene facilities coverage in Pakistani schools remains overall low on criteria defined by UN joint monitoring program. Additionally, all three inclusive areas of WASH (availability, accessibility and functionality) facilities were found inconsistent. Based on the findings of water sanitation and hygiene assessment we recommended adoption of national WASH policy and financing of evidenced based WASH interventions in primary schools to improve educational outcomes. Additionally, the Educational monitoring and information system (EMIS) in the study province is already integrated with WHO WASH core indicators, the EMIS should be implemented in all schools in order to improve WASH monitoring.
Funding: This study was financially supported by the USAID (Seed Grant No: P-II/07).
[ 150 ] 6th International Water Conference Proceedings
Acknowledgments: The researchers wanted to acknowledge USAID for providing monetary support; US-Pakistan Center for Advance Studies in Water, Mehran University of Engineering and Technology for providing the platform to accomplish this research project. Division of Public Health at the University of Utah and School of Community Health Sciences at the University of Nevada, Reno for providing technical support.
Conflicts of Interest: The authors declare no conflict of interest.
References
(USPCAS-W), U. S.-P. C. f. A. S. i. W. (2019). Mehran University of Engineering and Technology (MUET) Jamshoro. Retrieved from http://water.muet.edu.pk/about-us/
Abbas, M., Parveen, Z., Iqbal, M., Riazuddin, M., Iqbal, S., Ahmed, M., . . . Technology. (2010). Monitoring of toxic metals (cadmium, lead, arsenic and mercury) in vegetables of Sindh, Pakistan. Kathmandu University Journal of Science, Engineering, 6(2), 60-65.
Adams, J., Bartram, J., Chartier, Y., & Sims, J. (2009). Water, sanitation and hygiene standards for schools in low-cost settings: World Health Organization.
Agency, E. p. (2018). Government of Pakistan. Retrieved from http://environment.gov.pk/ information-services/
Ahmed, J., Wong, L. P., Chua, Y. P., Channa, N., Mahar, R. B., Yasmin, A., . . . Garn, J. V. (2020). Quantitative Microbial Risk Assessment of Drinking Water Quality to Predict the Risk of Waterborne Diseases in Primary-School Children. International Journal of Environmental Research Public Health, 17(8), 2774.
Ahmed, J., Wong, L. P., Chua, Y. P., Yasmin, A., Channa, N., & VanDerslice, J. A. (2020). Estimation of Hepatitis A Virus Infection Prevalence Through Drinking Water Supply of Primary Schools of Sindh, Pakistan. Hepatitis Monthly, 20(5), e98412. doi:10.5812/ hepatmon.98412
Assembly, G. J. S., Transforming our world: the. (2015). Sustainable development goals. 2030.
Bamuwamye, M., Ogwok, P., & Tumuhairwe, V. (2015). Cancer and non-cancer risks associated with heavy metal exposures from street foods: Evaluation of roasted meats in an urban setting. Journal of Environment Pollution Human Health, 3(2), 24-30.
Chatterley, C., Slaymaker, T., Badloe, C., Nouvellon, A., Bain, R., Johnston, R. J. J. o. W., Sanitation, & Development, H. f. (2018). Institutional WASH in the SDGs: data gaps
6th International Water Conference Proceedings [ 151 ]
and opportunities for national monitoring. 8(4), 595-606.
Cumming, O., Cairncross, S. J. M., & nutrition, c. (2016). Can water, sanitation and hygiene help eliminate stunting? Current evidence and policy implications. 12, 91-105.
Dangour, A. D., Watson, L., Cumming, O., Boisson, S., Che, Y., Velleman, Y., . . . Uauy, R. J. C. D. o. S. R. (2013). Interventions to improve water quality and supply, sanitation and hygiene practices, and their effects on the nutritional status of children. (8).
Daud, M., Nafees, M., Ali, S., Rizwan, M., Bajwa, R. A., Shakoor, M. B., . . . Murad, W. (2017). Drinking water quality status and contamination in Pakistan. BioMed research international, 2017.
EPA, G.o.P. (2010). National standard for drinking water quality. The gazette of Pakistan Retrieved from http://www.environment.gov.pk/images/rules/ SRO2010NEQSAirWaterNoise.pdf
EPA, P. (2008). National Standards for Drinking Water Quality. Government of Pakistan Retrieved from http://www.environment.gov.pk/
Freeman, M., Clasen, T., Dreibelbis, R., Saboori, S., Greene, L., Brumback, B., . . . Infection. (2014). The impact of a school-based water supply and treatment, hygiene, and sanitation programme on pupil diarrhoea: a cluster-randomized trial. 142(2), 340-351.
Garn, J. V., Trinies, V., Toubkiss, J., Freeman, M. C. J. T. A. j. o. t. m., & hygiene. (2017). The role of adherence on the impact of a school-based water, sanitation, and hygiene intervention in Mali. 96(4), 984-993.
Irfan, M., Zaidi, S. M. H., & Waseem, H. F. J. P. J. o. P. H. (2017). Association of socio-demographic factors with diarrhea in children less than five years: a secondary analysis of multiple indicator cluster survey sindh 2014. 7(2), 85-89.
Kachroud, M., Trolard, F., Kefi, M., Jebari, S., & Bourrié, G. (2019). Water quality indices:Challenges and application limits in the literature. Water, 11(2), 361.
Khan, A., Qureshi, F. R., & Pollution. (2018). Groundwater quality assessment through water quality index (WQI) in New Karachi Town, Karachi, Pakistan. Asian Journal of Water, Environment, 15(1), 41-46.
Khan, G. N., Turab, A., Khan, M. I., Rizvi, A., Shaheen, F., Ullah, A., . . . Yaqoob, M. J. B. n. (2016). Prevalence and associated factors of malnutrition among children under-five years in Sindh, Pakistan: a cross-sectional study. 2(1), 69.
[ 152 ] 6th International Water Conference Proceedings
Khan, K., Lu, Y., Khan, H., Zakir, S., Khan, S., Khan, A. A., . . . Wang, T. (2013). Health risks associated with heavy metals in the drinking water of Swat, northern Pakistan. Journal of environmental sciences, 25(10), 2003-2013.
Klemm, E., Shakoor, S., Page, A., Qamar, F., Judge, K., Saeed, D., . . . Baker, S. (2018). Emergence of an extensively drug-resistant Salmonella enterica serovar Typhi clone harboring a promiscuous plasmid encoding resistance to fluoroquinolones and thirdgeneration cephalosporins. mBio, 9: e00105-18.
Machdar, E., Van Der Steen, N., Raschid-Sally, L., & Lens, P. (2013). Application of quantitative microbial risk assessment to analyze the public health risk from poor drinking water quality in a low income area in Accra, Ghana. Science of the Total Environment, 449, 134-142.
Memon, M., Soomro, M. S., Akhtar, M. S., & Memon, K. S. (2011). Drinking water quality assessment in Southern Sindh (Pakistan). Environmental monitoring assessment, 177(1-4), 39-50. Mondal, p. Environmental education: the relevance discipline for sustainable development.
Morgan, C., Bowling, M., Bartram, J., & Kayser, G. L. (2017). Water, sanitation, and hygiene in schools: Status and implications of low coverage in Ethiopia, Kenya, Mozambique, Rwanda, Uganda, and Zambia. International journal of hygiene environmental health, 220(6), 950-959.
Morgan, C., Bowling, M., Bartram, J., Kayser, G. L. J. I. j. o. h., & health, e. (2017). Water, sanitation, and hygiene in schools: Status and implications of low coverage in Ethiopia, Kenya, Mozambique, Rwanda, Uganda, and Zambia. 220(6), 950-959.
Muhammad, S., Shah, M. T., & Khan, S. (2011). Health risk assessment of heavy metals and their source apportionment in drinking water of Kohistan region, northern Pakistan. Microchemical journal, 98(2), 334-343.
Nawab, J., Khan, S., Xiaoping, W., Rahman, A., Ali, H., Qamar, Z., . . . Muhammad, J. (2018). Spatial distribution of toxic metals in drinking water sources and their associated health risk in district buner, Northern Pakistan. Human Ecological Risk Assessment: An International Journal, 24(3), 615-626.
Nayyar, Y., Talpur, M. A., & Jariko, G. A. J. G. (2019). Analyzing the Household Determinants of Poverty And Their Impact on Public Primary School Dropouts In Rural Sindh, Pakistan. 52(2).
Nishat, M. J. W., & Sanitation Programme, I., Pakistan. (2013). The economic impacts of inadequate sanitation in Pakistan.
6th International Water Conference Proceedings [ 153 ]
Okabayashi, H., Thongthien, P., Singhasvanon, P., Waikagul, J., Looareesuwan, S., Jimba, M.,. . . Kobayashi, J. J. P. i. (2006). Keys to success for a school-based malaria control program in primary schools in Thailand. 55(2), 121-126.
Organization, W. H. (2016). Quantitative microbial risk assessment Application for water safety management. Retrieved from https://apps. who. int/iris/bitstream/handle/10665/246195/9789241565370 - eng . pdf;jsessionid= 52BFCFF95D81CB14F27E72B57EB440E4?sequence=1
Organization, W. H. (2017). Guidelines for drinking-water quality, 4th edn, incorporating the 1st addendum. 13, 631. Retrieved from https://www.who.int/water_sanitation_health/ publications/drinking-water-quality-guidelines-4-including-1st-addendum/en/
Pakistan, G. o. (2017-18). 6th population and housing census-2017-18. Retrieved from http://www.pbs.gov.pk/sites/default/files/DISTRICT_WISE_CENSUS_RESULTS_ CENSUS_2017.pdf
Qureshi, A. L., Mahessar, A. A., Leghari, M. E.-U.-H., Lashari, B. K., & Mari, F. M. (2015). Impact of releasing wastewater of sugar industries into drainage system of LBOD, Sindh, Pakistan. International Journal of Environmental Science Development, 6(5), 381.
Rauniyar, G., Orbeta Jr, A., & Sugiyarto, G. J. J. o. d. e. (2011). Impact of water supply and sanitation assistance on human welfare in rural Pakistan. 3(1), 62-102.
Sarfraz, M., Sultana, N., & Tariq, M. I. (2018). Assessment of groundwater quality and associated health risks in rural areas of sindh (pakistan). Studia Universitatis Babes-Bolyai, Chemia, 63(1).
Sarfraz, M., Sultana, N., & Tariq, M. I. J. S. U. B.-B., Chemia. (2018). Assessment of groundwater quality and associated health risks in rural areas of sindh (pakistan). 63(1).
School Education Department, G. o. S. (2016). Water, Sanitation & Hygiene (WASH) in Public Sector Schools Strategic Plan for
Sindh. Retrieved from http://www.sindheducation.gov.pk/Contents/Menu/WASH%20in%20 Public%20Sector.pdf
Sciences, L. U. o. M. H. (2019). Research Ethics Committee (REC). Retrieved from https:// www.lumhs.edu.pk/rec/

[ 154 ] 6th International Water Conference Proceedings
Shahab, A., Shihua, Q., Rashid, A., Hasan, F. U., & Sohail, M. T. (2016). Evaluation of Water Quality for Drinking and Agricultural Suitability in the Lower Indus Plain in Sindh Province, Pakistan. Polish Journal of Environmental Studies, 25(6).
Shakir, S. K., Azizullah, A., Murad, W., Daud, M. K., Nabeela, F., Rahman, H., . . . Häder, D.-P. (2016). Toxic metal pollution in Pakistan and its possible risks to public health. In Reviews of environmental contamination and toxicology (pp. 1-60): Springer.
Shallwani, S. (2019). Conceptualizing Early Schooling in Pakistan: Perspectives from Teachersand Parents. In Early Childhood and Development Work (pp. 133-152): Springer.
Sharma, P., Meher, P. K., Kumar, A., Gautam, Y. P., Mishra, K. P., & Ecology. (2014). Changes in water quality index of Ganges river at different locations in Allahabad. Sustainability of Water Quality, 3, 67-76.
Shrestha, A., & Basnet, N. (2018). An evaluation of physicochemical analysis and water quality index of Ratuwa River of Damak, Jhapa, Nepal. International Journal of Recent Research and Review, 1-9.
Shrestha, A., Sharma, S., Gerold, J., Erismann, S., Sagar, S., Koju, R., . . . health, p. (2017). Water quality, sanitation, and hygiene conditions in schools and households in Dolakha and Ramechhap districts, Nepal: results from a cross-sectional survey. 14(1), 89.
Siddique, M. A., Tagar, A. A., Khoso, Z. A., & Tagar, H. K. J. A. i. S. S. R. J. (2019). Role of Infrastructure to improve quantity and enhance quality of School Education in Sindh Province of Pakistan. 6(3).
Sindh, G. o. (2019). Retrieved from http://www.sindheducation.gov.pk/
Snehalatha, M., Uddin, R., Ahmed, M., & Sharif, A. J. A. t. l.-c. c. a. i. s. u. (2015). School WASH programmes in Bangladesh: how much does it cst.
Snehalatha, M. U., R Ahmed, M Sharif, AJ. (2015). School WASH programmes in Bangladesh: how much does it cst. Applying the life-cycle costs approach in selected upazilas.
Spears, D., & Lamba, S. (2013). Effects of early-life exposure to sanitation on childhood cognitive skills: evidence from India’s total sanitation campaign: The World Bank.
Stocks, M. E., Ogden, S., Haddad, D., Addiss, D. G., McGuire, C., & Freeman, M. C. J. P. m. (2014). Effect of water, sanitation, and hygiene on the prevention of trachoma: a systematic review and meta-analysis. 11(2), e1001605.

6th International Water Conference Proceedings [ 155 ]
Stocks, M. E. O., Stephanie Haddad, Danny Addiss, David G McGuire, Courtney Freeman, Matthew C. (2014). Effect of water, sanitation, and hygiene on the prevention of trachoma: a systematic review and meta-analysis. PLoS medicine, 11(2), e1001605.
Strunz, E. C., Addiss, D. G., Stocks, M. E., Ogden, S., Utzinger, J., & Freeman, M. C. J. P. m. (2014). Water, sanitation, hygiene, and soil-transmitted helminth infection: a systematic review and meta-analysis. 11(3), e1001620.
Studies, N. I. o. P., & Islamabad, P. (2017-18). Pakistan Demographic and Health Survey. Retrieved from Islamabad, Pakistan: http://nips.org.pk/abstract_files/PDHS%20 2017-18%20-%20key%20%20findings.pdf
Talaat, M., Afifi, S., Dueger, E., El-Ashry, N., Marfin, A., Kandeel, A., . . . El-Sayed, N. J. E. i. d. (2011). Effects of hand hygiene campaigns on incidence of laboratory-confirmed influenza and absenteeism in schoolchildren, Cairo, Egypt. 17(4), 619.
Trinies, V., Garn, J., Chan, H., & Freeman, M. J. A. J. T. M. H. (2016). The impact of a comprehensive school WASH program on absenteeism, diarrhea, and respiratory infection symptoms: A matched-control trial in Mali. 94, 1418-1425.
U.N, G. A. (2015). Sustainable development goals. Retrieved from http://www.naturalcapital. vn/wp-content/uploads/2017/02/UNDP-Viet-Nam.pdf
UNICEF. (2014). Global initiative on out-of-school children: Eastern and Southern Africa regional report. In: Paris, France: UNESCO. Retrieved from http://www. uis. unesco. org/Library ….
UNICEF. (2018a). Drinking water, sanitation and hygiene in schools: global baseline report 2018.
UNICEF. (2018b). Drinking water, sanitation and hygiene in schools: global baseline report 2018. Retrieved from https://data.unicef.org/resources/wash-in-schools/
UNICEF %J World Health Organization: Geneva, S. (2016). WHO. Core Questions and Indicators for Monitoring WASH in Schools in the Sustainable Development Goals.
UNICEF & World Health Organization: Geneva, S. (2016). WHO. Core Questions and Indicators for Monitoring WASH in Schools in the Sustainable Development Goals.WHO and UNICEF.
UNICEF, W. H. O. (2016). WHO. Core Questions and Indicators for Monitoring WASH inSchools in the Sustainable Development Goals. Retrieved from Geneva, Switzerland:
[ 156 ] 6th International Water Conference Proceedings
UNIVERSITY OF MALAYA, M. (2019). RESEARCH ETHICS COMMITTEE (UMREC). Retrieved from https://www.um.edu.my/research-and-community/information-for-researchers/research-governance/um-research-ethics-committee
USEPA, U. S. E. P. A. (1991). Environmental Risk: Your Guide to Analyzing and Reducing Risk. Chicago, IL: U.S. EPA; 1991(5). Retrieved from https://ntrl.ntis.gov/NTRL/ dashboard/searchResults/titleDetail/PB2007108439.xhtml
Walker, C. F., Black, R. J. E., & Infection. (2010). Diarrhoea morbidity and mortality in older children, adolescents, and adults. 138(9), 1215-1226.
Waseem, A., Arshad, J., Iqbal, F., Sajjad, A., Mehmood, Z., & Murtaza, G. J. B. r. i. (2014). Pollution status of Pakistan: a retrospective review on heavy metal contamination of water, soil, and vegetables. 2014.
WHO, W. H. O. (2018). Emergencies preparedness, response. Retrieved from https://www. who.int/csr/don/27-december-2018-typhoid-pakistan/en/
Wolf, J., Prüss Ustün, A., Cumming, O., Bartram, J., Bonjour, S., Cairncross, S., . . . Health, I. (2014). Systematic review: assessing the impact of drinking water and sanitation on diarrhoeal disease in low and middle income settings: systematic review and meta regression. 19(8), 928-942.
World Health Organization, W. (2005). Nutrients in drinking water (7117242299). Retrieved from
6th International Water Conference Proceedings [ 157 ]
Fabrication of Low-Cost Soil Moisture Sensor with Calibration Algorithm for Smart Irrigation System
Mahtab Ahmed, [2] Waqas Ahmed, [3] Abdul Latif Qureshi,
Abstract
Proper and adequate disburse of irrigation water to the crops is one of the main factors in growing crops and getting the maximum yield. The irrigation management’s primary objec-tive is to maintain/provide irrigation water to the field according to the crop requirement/ demand among all stakeholders. However, it has been observed that the distribution of water is not always uniform, which may also decrease the expected yield of crops. The appropriate amount of water required at the field will provide a satisfactory outcome that can only be achieved using modern technologies like smart soil moisture sensors.
In agriculture-based economic countries such as Pakistan, water use via irrigation for agricul-ture production has its importance. The demand for irrigation water is high and requires more data about the soil moisture in the agricultural field to manage the necessary soil moisture lev-el to get a high crop yield. In such conditions, automation technologies can play an essential role in the efficient use of limited water resources. The farmers did not know about the land’s actual moisture and rinse the ground, making plant water-stressed and decreed crop yield.
Therefore, in this study, fabricate a smart soil moisture sensor with locally available components that will only provide the required amounts of water to the field to save water and produce more crop yield. The capacitive soil moisture sensor used was 93% accurate and 75% low-cost than the available market. Calibration equation of sensor computed (soil moisture in percentage =1045e-0.014*sensor value), this equation has a value of R2 = 0.98, which shows more reliability on the sensor device. The fuzzy logic algorithm is designed to control the pump for smart irrigation management that saves up to 45% water.
Keywords: Smart irrigation, Moisture sensor, Soil moisture, Automatic irrigation, Water saving, Agrotechnology, crop yield, and water efficiency.

[ 158 ] 6th International Water Conference Proceedings
1. Material & Methods
Fabrication of the sensor system was started with collecting components that were crucial to getting low-cost and durable components after the test. The second part is to design the assembling arrangement for selected elements. The arrangement design was implemented on the breadboard and then processed in permanent soldering to make it ready for 15 days initial field test.
Fabrication was the first step to start this study. After that fabrication, the calibration was performed to make our sensor system more accurate as it gives precise data to the user. To calibrate the sensor system, this study selects four common types of soils and collect the sample. Sample collected and analyzed at lab for gravimetric moisture content and the sensor’s capacitance value noted every time during gradually increases the water content in the sample. In that, way we get four type of different data of gravimetric v/s sensor capacitance that plotted for equation generation. The four equation was format but to conclude for universal equation we generate one universal equation by using algorithm that may give accurate result for every soil type.
Validation of the sensor system is must when it come to the accuracy of the sensor. In this study, we use regression analysis and statically test to validate or sensors data. (Figure 2).
Figure 1: Fabrication and soil analysis for this study Figure 3: Hardware of the Sensor Unit
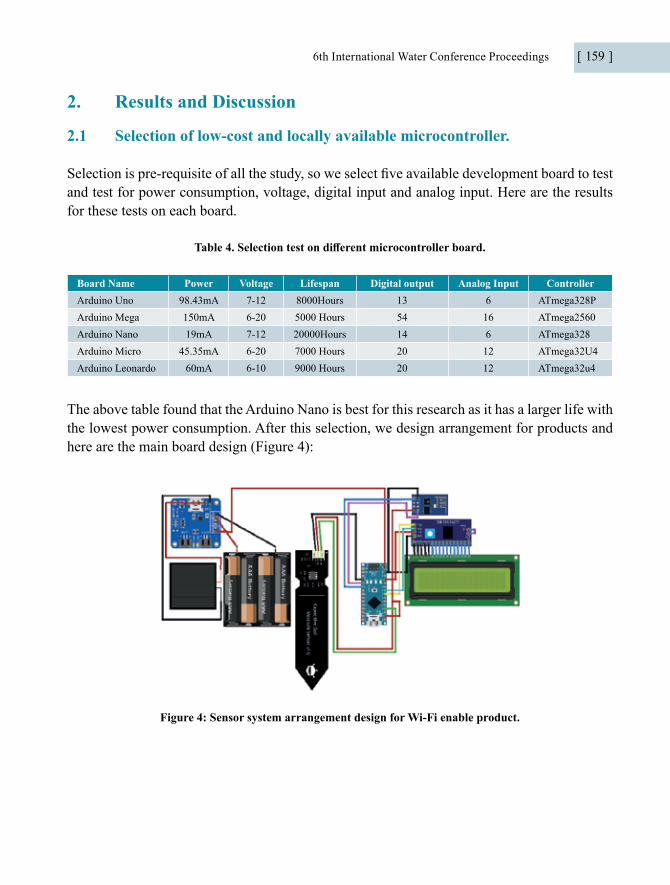
6th International Water Conference Proceedings [ 159 ]
2. Results and Discussion
2.1 Selection of low-cost and locally available microcontroller.
Selection is pre-requisite of all the study, so we select five available development board to test and test for power consumption, voltage, digital input and analog input. Here are the results for these tests on each board.
Table 4. Selection test on different microcontroller board.
Board Name Power Voltage Lifespan Digital output Analog Input ControllerArduino Uno 98.43mA 7-12 8000Hours 13 6 ATmega328PArduino Mega 150mA 6-20 5000 Hours 54 16 ATmega2560Arduino Nano 19mA 7-12 20000Hours 14 6 ATmega328Arduino Micro 45.35mA 6-20 7000 Hours 20 12 ATmega32U4Arduino Leonardo 60mA 6-10 9000 Hours 20 12 ATmega32u4
The above table found that the Arduino Nano is best for this research as it has a larger life with the lowest power consumption. After this selection, we design arrangement for products and here are the main board design (Figure 4):
Figure 4: Sensor system arrangement design for Wi-Fi enable product.

[ 160 ] 6th International Water Conference Proceedings
2.2 Field testing of fabricated sensor system.
For performance testing, we have selected a site on the field and install our fabricated sensor.That sensor consist of thee probe on; top, middle and bottom.
Figure 5: Moisture of soil at different times.
In order to evaluate performance, we used moisture data for 15 days for evaluating the soil water in the field as we see in the figure 5 initially moisture is gradually but after placing inlet near the sensor location the increase and decrease in moisture varies. Top soil is directly have greater variation in soil moisture as it face climate directly. The less variation was occurs in the bottom of the soil.
3.3 Calibration of the sensor system
Calibration is an important part of this study, so for that we took and analyzed four types of soil in the Sindh region. The results from calibration of capacitive soil moisture sensor generate these graphs with calculated equations.

6th International Water Conference Proceedings [ 161 ]
Figure 6: Calibration for four different soil for CSMS. The above four-calibration equation can use to calculate gravimetric soil moisture by using sensor capacitance but these equation are specific for each soil type to generate universal equation and for that we use combination of these four data set and calibrate for universal soil equation.
Figure 7: Calibration equation for CSMS.
3.4 Development of decision support system.
This study’s heart was the decision support system that automate the irrigation process in the field to achieve that we use fuzzy logic algorithm. Fuzzy logic algorithm is very popular that
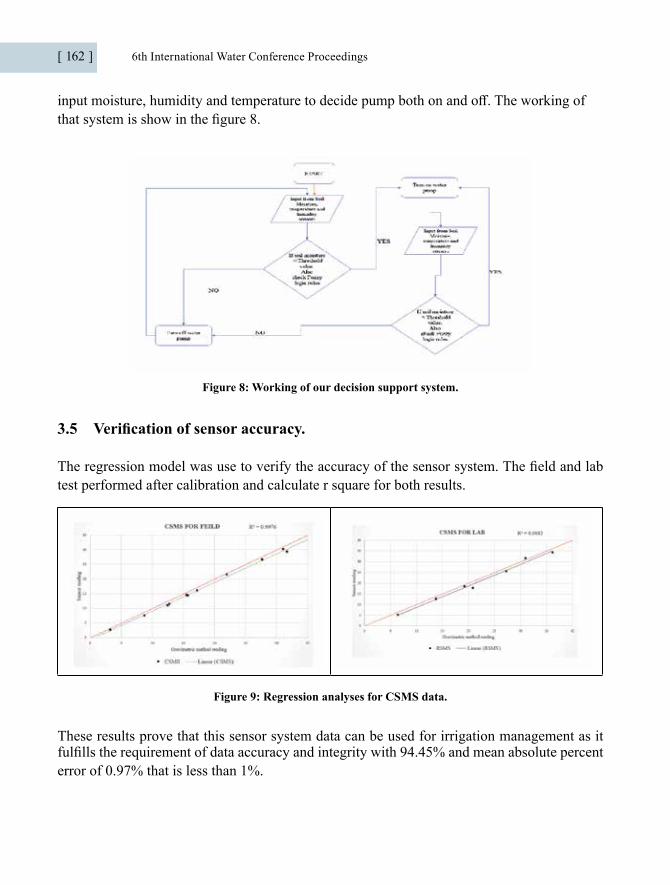
[ 162 ] 6th International Water Conference Proceedings
input moisture, humidity and temperature to decide pump both on and off. The working of that system is show in the figure 8.
Figure 8: Working of our decision support system.
3.5 Verification of sensor accuracy.
The regression model was use to verify the accuracy of the sensor system. The field and lab test performed after calibration and calculate r square for both results.
Figure 9: Regression analyses for CSMS data.
These results prove that this sensor system data can be used for irrigation management as it fulfills the requirement of data accuracy and integrity with 94.45% and mean absolute percent error of 0.97% that is less than 1%.

6th International Water Conference Proceedings [ 163 ]
Acknowledgments:
The U.S.-Pakistan Center for Advanced Studies in Water (USPCAS-W), Mehran University of Engineering & Technology, Jamshoro, Pakistan, is gratefully acknowledged for providing financial support for the project “Closed-loop secondary level canal monitoring for equitable and reliable distribution of water” under the Industry-Academia Research Project grants from USAID funding.
Thanks are due to the technical support from University of Utah, USA for enhancing knowledge through conducting training for development, installation and maintenance of different IOT sensors for specific measurement.
Conclusion:
The goal of this study was to fabricate low-cost sensor system with smart irrigation system. From the analysis of the results, it is observe that our sensor system is low-cost and provide greater accuracy as market available high-lost sensor provide. The calibration equation is formulated is ‘soil moisture = 1045.7*e-0.014*capacitance of soil’’ that provide correlation greater than 90% and have higher data integrity. The soil moisture placed at top of soil may help more than depth sensor as it varies according to the climatic condition.
Recommendation/Comments:
• The smart irrigation grid for other distributaries (like-wise Mir minor) must be arranged through installing sensors at its head and tail reach.
• Training/awareness on the end-user application for visualization of flow rates from sensors data to SIDA/Area Water Board/FO representatives be provided.
• For the better performance, the sensors and the stilling basins needs regular maintenance and security.
• Training of discharge measurement using current meter should be carried out with aligned departments/NGOs.
References:
Raut, S., Sarma, K. S. S., & Das, D. K. (2010). Studies on irrigation distribution equity and crop growth performance in a Canal Command using remote sensing. Journal of the Indian Society of Remote Sensing, 38(1), 55–65. https://doi.org/10.1007/s12524-010-0012-z

[ 164 ] 6th International Water Conference Proceedings
Molden, B. D. J., and Gates, T. K., (1991). Performance measures for evaluation of irrigation water delivery systems, ASCE, Irrigation and Drainage,116(6), 804–823.
Ray, S. S., Dadhwal, V. K., & Navalgund, R. R. (2002). Performance evaluation of an irrigation command area using remote sensing: A case study of Mahi command, Gujarat, India. Agricultural Water Management, 56(2), 81–91. https://doi.org/10.1016/S0378-3774(02)00006-9
Devi, B Sarojini, M.V.RANGHASWAMI, C. M. (2012). Performance Evaluation of Water Delivery System in Canal Command Area of PAP Basin, Tamil Nadu. India, Water Week, 3 (April), 10–14.
Falkenmark, Malin, and David Molden. “Wake up to realities of river basin closure.” International journal of water resources development 24.2 (2008): 201-215
Wang, Ning, Naiqian Zhang, and Maohua Wang. “Wireless sensors in agriculture and food industry-Recent development and future perspective.” Computers and electronics in agriculture 50.1 (2006): 1-14.
Dursun, M. and Ozden, S. (2011). A wireless application of drip irrigation automation supported by soil moisture sensors, Scientific Research and Essays Vol. 6(7), pp. 1573-1582, 4 April, 2011,
Muhammad, A. (2016). Managing river basins with thinking machines. 2016 IEEE Conference on Norbert Wiener in the 21st Century, 21CW 2016, 18–23. https://doi.org/10.1109/ NORBERT.2016.7547453
6th International Water Conference Proceedings [ 165 ]
Spatial Crop Management Using Remotely Sensed Soil Moisture Contents Estimation Under Semi-Arid Condition
Kinza Farooq1; Muhammad Naveed Tahir2; Zahidan Farooq31Institute of Geo-informatics and Remote sensing, Arid Agriculture University, Rawalpindi, Punjab, 46300.2 Department of Agronomy, PMAS- Arid Agriculture University, Rawalpindi, Punjab, 46300.3University of Engineering & Technology, (UET), Lahore, Punjab [email protected]
Abstract
Soil moisture and land surface temperature are key variables that controls the variation of arid zone crop production. It is not easy to get a huge estimation of soil moisture by applying ground based network. Now days numerous new techniques have introduced and triangle method is one of them vegetation index and land surface temperature to calculate topographical soil wetness status (Carlson et al., 1994) and it was presented by Prince. In this study two new indices (Fractional Vegetation Cover (Fr) and Vegetation condition Index (VCI) are presented and these are based on one of triangle method index NDVI. NDVI is not strongly linked with the soil moisture variations because when inadequacy of water appear the leaves are quiet green while LST is still vulnerable to soil wetness states. The primary design of triangle technique is that (LST) is strongly related with top soil moisture and the flora that covers the soil. This research was organized in district Rawalpindi during the winter seasons of 2016. Collected soil samples from 63 different sites by using GPS position then the yield from an area of 1m2 was harvested from same sites (63 sites) then the yield converted in kg/ hectare. For remote sensing evaluation the data of Landsat8 was downloaded from USGS. The coefficient of determination (R2) between VCI with soil moisture contents and grain yield showed R2=0.849 and 0.948 respectively. Fractional vegetation cover showed better outcomes as compared to NDVI. The coefficient of determination (R2) between NDVI with soil moisture and grain yield showed R2=0.849 and 0.92. In case of fractional vegetation cover with soil moisture contents and grain yield showed R2=0.888 and 0.93.
Keywords: soil moisture estimation, vegetation indices, spatial crop management, remote sensing and Landsat8

[ 166 ] 6th International Water Conference Proceedings
1. Introduction
Soil moisture plays an important role in cultivated area management. There are two main constituents of soil moisture: Moisture that is present in upper soil at 10cm called top soil moisture and the other component is rhizome section condensation is held in 200 cm upper area of soil. (Esfahani et. al. (2015).
In 21st century society is facing a complex and sustainable matter of food security. Food supply of world is affected by climate changes, unsustainable use of land and increase in the population growth rate will bring remarkable stresses on world supply of food demand. Different methods have been used for example with the help of best irrigation practices proper fertilizer applications and development of new varieties as a result we can get higher yield. The average universal climatic condition becomes predicted with certain intensity of accuracy with the advancement in techniques to assess the actual effect on moisten-soil-plant life. This network is critical as significance for global financial system and food productivity (Mishra et. al. (2013).
Now days numerous new techniques have been introduced and triangle method is one of them to estimate soil moisture contents. In this method vegetation index and land surface temperature to calculate topographical soil moisture status (Carlson et al., 1994).
The (TM) Triangle Method is classify as a thermal infrared method (Wang and Qu 2009) and uses the two parameter LST Land Surface Temperature and NDVI Normalized Difference Vegetation Index for measuring the soil moisture through remote sensing along with satellite imagery. The Triangle technique was firstly presented by Price (1990) and later elaborated upon by many other peoples (Carlson et al. 1994; Carlson et al. 1995; Gillies and Carlson 1995; Lambin and Ehrlich (1996); Gillies et. al. (1997); Owen et. al. (1998); Jiang and Islam (1999), (2001), (2003); Chauhan et. al. (2003). This method has been proved by numerous investigations (Gillies et. al. (1997); Carlson (2007); Wang et al. (2007); Mekonnen (2009) presenting adequate performance (with R2 range between 0.6 -1.0) to estimate soil moisture.
Soil moisture interaction with many factors of environment needs strong measurements. The development in technology and accurate apparatus not only determines moisture of soil but also explain its variability at defined regions. The technique of interpolation formed between ordinary points does not produce results because technique does not explore top soil roughness, vegetation states, contour and different necessary conditions. This work is planned for accurate estimation of soil moisture contents and its relationship with different indices on Landsat8 data.
The important objectives of this work were
1) To calculate and mapped soil wetness at spatial resolution by using remotely sensed data
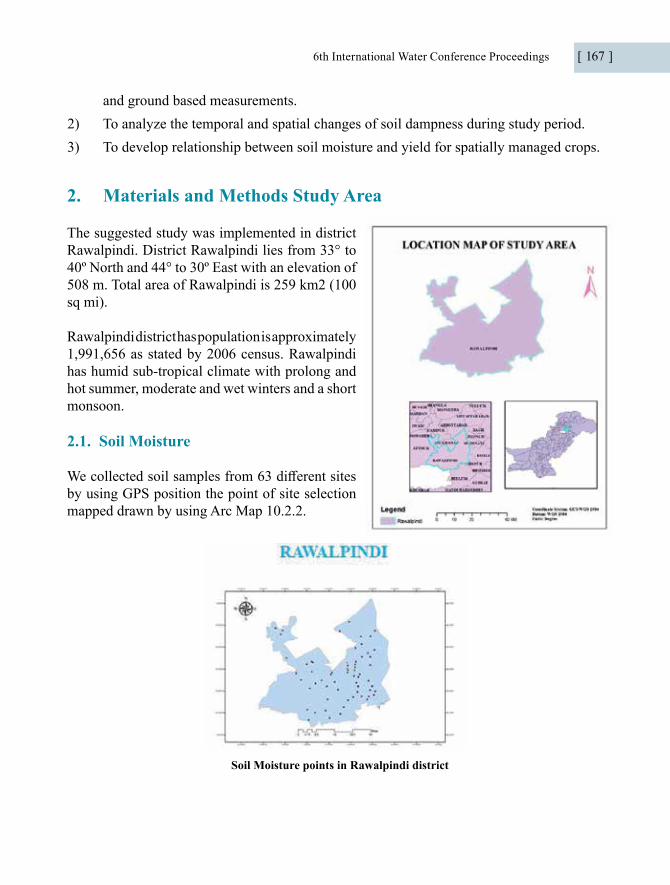
6th International Water Conference Proceedings [ 167 ]
and ground based measurements.2) To analyze the temporal and spatial changes of soil dampness during study period.3) To develop relationship between soil moisture and yield for spatially managed crops.
2. Materials and Methods Study Area
The suggested study was implemented in district Rawalpindi. District Rawalpindi lies from 33° to 40º North and 44° to 30º East with an elevation of 508 m. Total area of Rawalpindi is 259 km2 (100 sq mi).
Rawalpindi district has population is approximately 1,991,656 as stated by 2006 census. Rawalpindi has humid sub-tropical climate with prolong and hot summer, moderate and wet winters and a short monsoon.
2.1. Soil Moisture
We collected soil samples from 63 different sites by using GPS position the point of site selection mapped drawn by using Arc Map 10.2.2.
Soil Moisture points in Rawalpindi district
[ 168 ] 6th International Water Conference Proceedings
We collected the soil with the help of auger up to 30cm depth and weighted with the help of weighting balance at the collected sites. After weighing the soil sample dried in oven at 105ºC for 24 hours then cool it at room temperature. Then the soil moisture contents were calculated by using following formula
Moisture Content=Wet weight-Dry weight/Dry weight *100
2.2. Grain Yield Estimation
The yield from an area of 1m2 was harvested from the same sites (63 sites) where we collected the soil samples for moisture. Then the yield converted in kg/hectare.
2.3. Digital Image Analysis
There are many different tools and software available for the analysis of satellite images. After assembling images from available source then the images were passed through various analysis processes. In images analysis process GIS and ERDAS are used.
Preparatory Activities
2.4. Land Surface Temperature (LST) of Landsat8
Use thermal bands for LST and in Landsat8 there are two thermal bands. Band 10 which corresponding to the thermal and band 11 also with different wavelengths. The first thing we went to USGS (http://earthexplorer.usgs.gov/) to learn how to convert my Digital numbers to radiance which is the very first to go. Most of the operations can be done on raster calculator.
Convert Digital Numbers into Radiance
This conversion can be done by following formula:Lλ = MLQcal + AL
Where Lλ = Spectral radiance
6th International Water Conference Proceedings [ 169 ]
ML =Band specific multiplicative rescaling factor obtained from metadata fileQcal = Digital numbersAL=Band specific additive rescaling factor obtained from metadata.Find radiance from this formula of both thermal bands of landsat 8 data.Convert Spectral Radiance to Satellite Brightness Temperature
Temperature can be estimated by using following formula:
T = K2
ln (K1 +1)Lλ
Mean
After calculating satellite brightness temperature for both band 10 and band 11 so we used average of these two bands and calculate mean by using Cell Statistics Tool on Arc Map 10.2.2
Proportion of Vegetation
This can be estimated by following formula:
Pv =(NDVI-NDVImin/NDVImax-NDVImin)2
Deriving LSE
This can be done by following equation:
e = 0.004Pv+0.986Derive LST
This can be estimated by following equation:
BT/1+w*(BT/P)*ln(e))
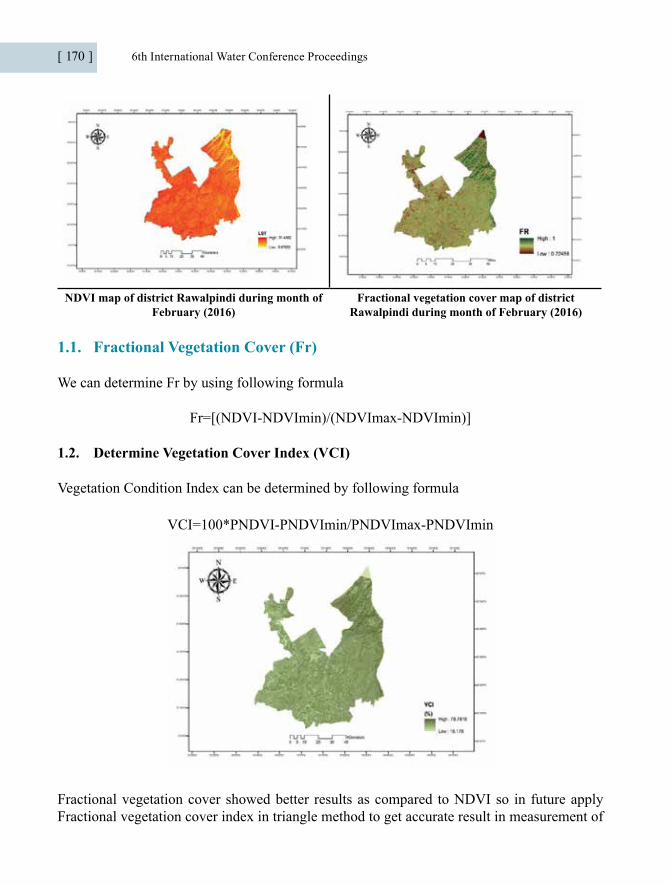
[ 170 ] 6th International Water Conference Proceedings
NDVI map of district Rawalpindi during month of February (2016)
Fractional vegetation cover map of district Rawalpindi during month of February (2016)
1.1. Fractional Vegetation Cover (Fr)
We can determine Fr by using following formula
Fr=[(NDVI-NDVImin)/(NDVImax-NDVImin)]
1.2. Determine Vegetation Cover Index (VCI)
Vegetation Condition Index can be determined by following formula
VCI=100*PNDVI-PNDVImin/PNDVImax-PNDVImin
Fractional vegetation cover showed better results as compared to NDVI so in future apply Fractional vegetation cover index in triangle method to get accurate result in measurement of

6th International Water Conference Proceedings [ 171 ]
soil moisture contents along with spatial crop management in rainfed areas.
Literature Cited
http://earthexplorer.usgs.gov/).
Carlson., T. N, Gillies, R. R, and Perry, E. M. 1994. A method to make use of thermal infrared temperature and NDVI measurements to infer surface soil water content and fractional vegetation cover. Remote sensing reviews, 9(1-2), 161-173.
Carlson., T. N, Gillies, R. R, and Schmugge, T. J. 1995. An interpretation of methodologies for indirect measurement of soil water content. Agricultural and forest meteorology, 77(3), 191-205.
Chauhan., N. S, Miller, S, and Ardanuy, P. 2003. Spaceborne soil moisture estimation at high resolution: a microwave-optical/IR synergistic approach. International Journal of Remote Sensing, 24(22), 4599-4622.
Esfahani.,L.H,A.Torres-Rua,A.Jensen,M.Mac.2015.Assesment of surface soil moisture using high-resolution multi-spectral imagery and artificial neural networks.Remote Sens.7:2627-2646.
Gillies., R. R, and Carlson, T. N. 1995. Thermal remote sensing of surface soil water content with partial vegetation cover for incorporation into climate models. Journal of Applied Meteorology, 34(4), 745-756.
Gillies., R. R, Kustas, W. P, and Humes, K. S. 1997. A verification of the’triangle’method for obtaining surface soil water content and energy fluxes from remote measurements of the Normalized Difference Vegetation Index (NDVI) and surface e. International journal of remote sensing, 18(15), 3145-3166.
Jiang., L, and Islam, S. 1999. A methodology for estimation of surface evapotranspiration over large areas using remote sensing observations.Geophysical research letters, 26(17), 2773-2776.
Jiang., L, and Islam, S. 2001. Estimation of surface evaporation map over southern Great Plains using remote sensing data. Water Resources Research, 37(2), 329-340.
Jiang., L, and S. Islam. 2003. An intercomparison of regional latent heat flux estimation using remote sensing data. International Journal of Remote Sensing, 24(11), 2221-2236.
Lambin., E. F, and Ehrlich, D. 1996. The surface temperature-vegetation index space for land cover and land-cover change analysis. International journal of remote sensing, 17(3), 463-487.
[ 172 ] 6th International Water Conference Proceedings
Mekonnen., D. F. 2009. Satellite remote sensing for soil moisture estimation: Gumara catchment, Ethiopia. International Institute for Geo-information Science and Earth Observation, Enschede.
Mishra.,V.,JF.Cruise,JR.Mecikalski,CR.Hain,MC.Anderson.2013.A remote sensing driven tool for estimating crop stress and yields. Remote Sens.5:3331-3356. 10.3390/rs 5073331.
Owen., T. W, Carlson, T. N, and Gillies, R. R. 1998. An assessment of satellite remotely-sensed land covers parameters in quantitatively describing the climatic effect of urbanization. International journal of remote sensing, 19(9), 1663-1681.
Price., J. C. 1990. Using spatial context in satellite data to infer regional scale evapotranspiration. IEEE transactions on Geoscience and Remote Sensing, 28(5), 940-948.
Wang., X., Xie, H, Guan, H. and Zhou, X. 2007. Different responses of MODIS derived NDVI to root zone soil moisture in semi arid and humid regions. Journal of Hydrology 340:12 24.
Wang., L, and Qu, J. J. 2009. Satellite remote sensing applications for surface soil moisture monitoring: A review. Frontiers of Earth Science in China, 3(2), 237-247.
Wang., L, Qu, J. J, Zhang, S., Hao, X., and Dasgupta, S. 2007. Soil moisture estimation using MODIS and ground measurements in eastern China. International Journal of Remote Sensing, 28(6), 1413-1418.

6th International Water Conference Proceedings [ 173 ]
Analysis of biofilm formation along the surface of Galvanized iron pipe in a drinking water distribution system
Huda Kamal, Imran Hashmi*Institute of Environmental Sciences and Engineering (IESE) School of Civil and Environmental Engineering (SCEE) National University of Sciences and Technology (NUST) [email protected]*[email protected]*Correspondence: [email protected] (J.A.); [email protected] (L.P.W.)
Abstract
In this study biofilm formation on the surface of Galvanized iron (GI) pipe in the chlorinated DWDS of National University of sciences and technology (NUST) was investigated. Physicochemical analysis of drinking water and heterotrophic plate count of biofilm grown on the upper, middle and lower part of the inserted GI pipe was analysed. Polymerase chain reaction (PCR) was conducted for the isolated strain to report 16SrRNA bacteria. The results showed that only free and total chlorine of drinking water were below the required standard whereas all the other selected parameters were within permissible limits. The results highlighted that microorganisms were found concentrated in the upper and lower parts of GI pipe as compared to the middle part. Morphological identification indicated that different bacterial communities harboured different parts of GI pipe, however highest bacterial diversity was observed in the middle part. Improving water disinfection through proper chlorination is highly recommended to prevent biofilm formation.
Keywords: Drinking water, Drinking water distribution system (DWDS), Biofilm, Galvanized iron (GI).
1. Introduction:
The most crucial element for survival during the course of life is to acquire safe and clean drinking water (Simoes and Simoes, 2013).Drinking water distribution systems (DWDSs) function to provide clean and safe water for consumers (Ren et al, 2015). But however DWDSs are not free from microorganisms, they nurture viruses, protozoa and bacteria in flowing water and biofilms (Wang et al, 2014). Biofilms are comprised of heterogeneous microbial

[ 174 ] 6th International Water Conference Proceedings
communities which are arranged and fixed in a matrix of extracellular polymers also referred to as extracellular polymeric substances (EPS) which are released by microorganisms (Simoes and Simoes, 2013). Biofilms are found growing on the surface of pipes in DWDSs. It is an accepted belief that more than 90% of the microbial biomass is present on the grown pipe wall biofilm (Liu et al, 2013).
The transfer of biofilms from the surface of pipe wall not only causes the discoloration of drinking water but also set free microorganisms in the flowing drinking water (Liu et al, 2017). Common issues related to biofilms in DWDSs are mainly corrosion of pipe walls, decaying of water quality and growth of opportunistic pathogens (Ren et al, 2015). Biofilms can serve as a habitat for opportunistic pathogens such as Mycobacterium,Legionella, Acanthamoeba, and Pseudomonas aeruginosa (Wang et al, 2014).
It has been described that microbial community in biofilms is affected by many factors such as availability of nutrients, temperature, hydraulic conditions, precipitation, concentration & type of disinfectants and pipe materials (Camper, 1994). The most important factor considered in controlling the microbiome in drinking water is the pipe material (Ren et al, 2015). It has been stated that the number of bacteria on cast-iron pipes was the highest as compare to polyvinyl chloride (PVC) pipes (Camper, 1994). Lin et al reported the growth of biofilm on household taps of three different materials stainless steel, cast iron and PVC, it was concluded that taps made up of cast iron had the highest microbial diversity and richness as compare to PVC and stainless steel taps (Lin et al, 2013). Iron is considered as an important element in the growth and multiplication of bacteria and encourages the spread of biofilm (Ren et al, 2015). Kerr et al studied biofilm attachment and bacterial diversity on the surface of three different pipe materials cast iron, medium density polyethylene (MDPE) and unplasticized polyvinyl chloride (uPVC), greatest bacterial diversity was observed on cast iron pipes whereas MDPE and uPVC encouraged low bacterial growth (Kerr et al, 1998). It is stated in many studies that plastic pipes promote less bacterial growth as compare to iron and steel pipes but however there are some dubious results that describe pipe materials such as polyethylene (PE) and polyvinyl chloride (PVC) encouraging fast biofilm growth as compare to cement and iron alloys (Zhu et al, 2014).
It has been described that microbial community in biofilms is affected by many factors such as availability of nutrients, temperature, hydraulic conditions, precipitation, concentration & type of disinfectants and pipe materials (Camper, 1994). The most important factor considered in controlling the microbiome in drinking water is the pipe material (Ren et al, 2015). It has been stated that the number of bacteria on cast-iron pipes was the highest as compare to polyvinyl chloride (PVC) pipes (Camper, 1994). Lin et al reported the growth of biofilm on household taps of three different materials stainless steel, cast iron and PVC, it was concluded that taps made up of cast iron had the highest microbial diversity and richness as compare to PVC and stainless steel taps (Lin et al, 2013). Iron is considered as an important element in the growth and multiplication of bacteria and encourages the spread of biofilm (Ren et al, 2015).
6th International Water Conference Proceedings [ 175 ]
Kerretal studied biofilm attachment and bacterial diversity on the surface of three different pipe materials cast iron, medium density polyethylene (MDPE) and unplasticized polyvinyl chloride (uPVC), greatest bacterial diversity was observed on cast iron pipes whereas MDPE and uPVC encouraged low bacterial growth (Kerr et al, 1998). It is stated in many studies that plastic pipes promote less bacterial growth as compare to iron and steel pipes but however there are some dubious results that describe pipe materials such as polyethylene (PE) and polyvinyl chloride (PVC) encouraging fast biofilm growth as compare to cement and iron alloys (Zhu et al, 2014).
Microbes in biofilms have highest resistant against treatment and disinfection as compare to microbes in flowing water (September et al, 2007). Biofilms have public health impacts and can cause numerous infections and contribute in the spreading of waterborne diseases. It is stated that biofilms are responsible for 80% of the infectious and chronic inflammatory diseases caused by pathogenic bacteria (Bitton, 2014). The aim of this study was (1) Physicochemical analysis of drinking water, (2) Assessment of radial-spatial distribution of microbial biomass along the surface of GI pipe, (3) Effect of pipe material (GI) on microbial biomass.
2. Materials and methods:
• Drinking water distribution system:
This study was undertaken in a DWDS of a Residential University, named National University of Sciences and Technology (NUST) in Pakistan. Water distribution system of the university is fed with ground water sources. There are a total of 9 tube wells and water is pumped through these water catchment areas and transferred to 3 underground storage tanks or 2 overhead reservoirs. Water is either directly supplied to the DWDS or is stored in overhead reservoir with a storage time of 2-3 days. Before distribution of water, the water is treated with chlorine. Tube wells have a pumping capacity of 0.2 million gallons per day (MGD) and feed a population of around 11400 people. The DWDS consisted of three types of pipe material (PPR, uPVC and GI) with a service age of one month to six years. However in this study pipe material galvanized iron (GI) was selected for biofilm formation and analysis. The reason for the selection of GI pipe was that many studies in the past has proven iron pipes to accumulate more microbial biomass as compare to plastic pipes as iron pipes provide rough surface for more bacterial attachment. Table 1 highlights the properties of Galvanized iron pipe.
Preliminary surveys were conducted and finally it was decided to insert coupon of selected pipe material (GI) in the real DWDS of NUST. Circular pipe coupon was inserted to allow biofilm to grow. A single sampling location was selected after assessing the sampling network. Fire hydrant (joining distribution lines) was selected as a point to take sample. This was done in order to avoid leakages and ensure feasible sampling.
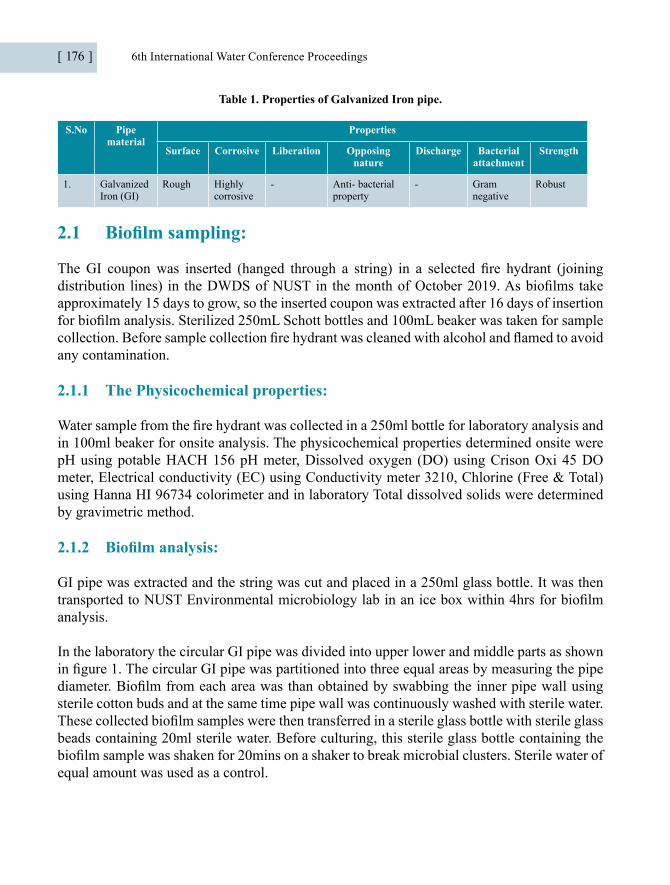
[ 176 ] 6th International Water Conference Proceedings
Table 1. Properties of Galvanized Iron pipe.
S.No Pipe material
Properties
Surface Corrosive Liberation Opposingnature
Discharge Bacterialattachment
Strength
1. Galvanized Iron (GI)
Rough Highly corrosive
- Anti- bacterialproperty
- Gram negative
Robust
2.1 Biofilm sampling:
The GI coupon was inserted (hanged through a string) in a selected fire hydrant (joining distribution lines) in the DWDS of NUST in the month of October 2019. As biofilms take approximately 15 days to grow, so the inserted coupon was extracted after 16 days of insertion for biofilm analysis. Sterilized 250mL Schott bottles and 100mL beaker was taken for sample collection. Before sample collection fire hydrant was cleaned with alcohol and flamed to avoid any contamination.
2.1.1 The Physicochemical properties:
Water sample from the fire hydrant was collected in a 250ml bottle for laboratory analysis and in 100ml beaker for onsite analysis. The physicochemical properties determined onsite were pH using potable HACH 156 pH meter, Dissolved oxygen (DO) using Crison Oxi 45 DO meter, Electrical conductivity (EC) using Conductivity meter 3210, Chlorine (Free & Total) using Hanna HI 96734 colorimeter and in laboratory Total dissolved solids were determined by gravimetric method.
2.1.2 Biofilm analysis:
GI pipe was extracted and the string was cut and placed in a 250ml glass bottle. It was then transported to NUST Environmental microbiology lab in an ice box within 4hrs for biofilm analysis.
In the laboratory the circular GI pipe was divided into upper lower and middle parts as shown in figure 1. The circular GI pipe was partitioned into three equal areas by measuring the pipe diameter. Biofilm from each area was than obtained by swabbing the inner pipe wall using sterile cotton buds and at the same time pipe wall was continuously washed with sterile water. These collected biofilm samples were then transferred in a sterile glass bottle with sterile glass beads containing 20ml sterile water. Before culturing, this sterile glass bottle containing the biofilm sample was shaken for 20mins on a shaker to break microbial clusters. Sterile water of equal amount was used as a control.
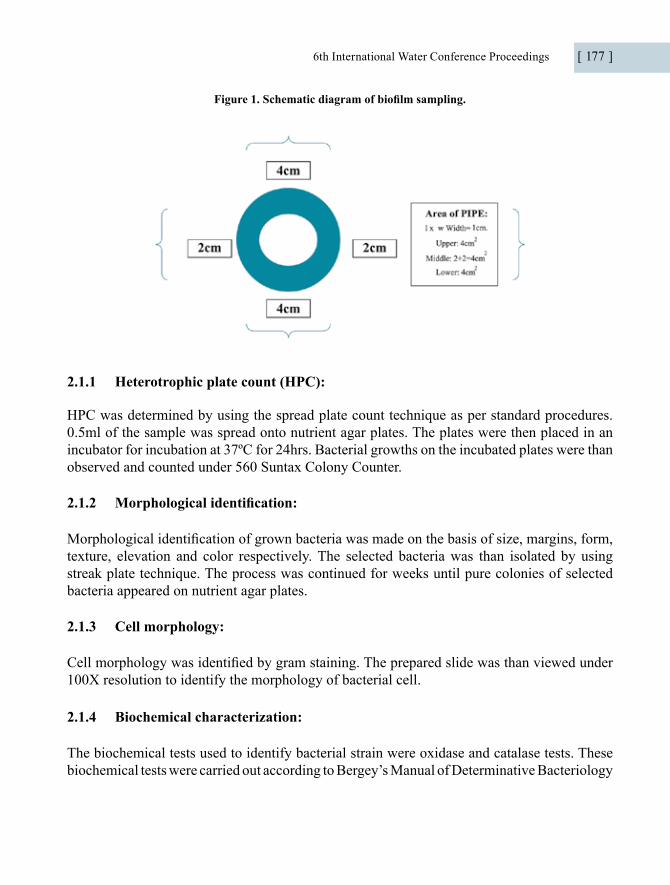
6th International Water Conference Proceedings [ 177 ]
Figure 1. Schematic diagram of biofilm sampling.
2.1.1 Heterotrophic plate count (HPC):
HPC was determined by using the spread plate count technique as per standard procedures. 0.5ml of the sample was spread onto nutrient agar plates. The plates were then placed in an incubator for incubation at 37ºC for 24hrs. Bacterial growths on the incubated plates were than observed and counted under 560 Suntax Colony Counter.
2.1.2 Morphological identification:
Morphological identification of grown bacteria was made on the basis of size, margins, form, texture, elevation and color respectively. The selected bacteria was than isolated by using streak plate technique. The process was continued for weeks until pure colonies of selected bacteria appeared on nutrient agar plates.
2.1.3 Cell morphology:
Cell morphology was identified by gram staining. The prepared slide was than viewed under 100X resolution to identify the morphology of bacterial cell.
2.1.4 Biochemical characterization:
The biochemical tests used to identify bacterial strain were oxidase and catalase tests. These biochemical tests were carried out according to Bergey’s Manual of Determinative Bacteriology

[ 178 ] 6th International Water Conference Proceedings
2.2 DNA extraction and PCR:
DNA of the selected bacterial strain was extracted by using Norgen Biotek corporation “Bacterial genomic DNA isolation kit”. The size of the extracted DNA was than determined through Gel electrophoresis and was visualized in UV-transilluminator.
Bacterial identification was made by Sanger’s method of reading linear DNA (Deoxyribonucletide acid) sequences using special nucleotide bases. PCR-Thermocycler (Extragene 9600) was used based on16S rRNAusing 27F and 1492R primers, shown in table 2.
Table 2. Selected Primers
Primers Sequence F & R Target genes Reference27F 5′ AGAGTTTGATCCTGGCTCAG 3′ 16S rRNA Lin et al., 20131492R 5′ GGTTACCTTGT TACGACTT 3′ 16S rRNA
After obtaining the PCR products, the gel electrophoresis of PCR products were obtained which were viewed under UV-transilluminator.
3. Results and Discussion:
3.1 Physicochemical properties of drinking water:
Table 3, shows the results of physicochemical properties of drinking water obtained directly from the distribution network.
pH: The pH of water evaluates the acid-base balance of water (Meride and Ayenew, 2016). The value of pH obtained in this study was 7.5 which satisfy the WHO and PSDWQ limits which is 6.5-8.5 respectively. According to the observed value of pH the water was fit for drinking. Any variation in pH is due to increase in temperature which could suppress carbon dioxide solubility in water or it could be when domestic waste water can enter the distribution lines due to leakage in lines and can cause fluctuations in water pH (Amin et al, 2012).
According to a study carried out by Amin et al drinking water samples were collected from the distribution systems of ten areas in Peshawar. The mean pH of water was found to be 7.33 respectively which was within the permissible standards set by WHO and PSDWQ (Amin et al, 2012). Another study carried out by Douterelo et al in which water samples were obtained from the DWDS in Northwest of England in the month of (February, June & October 2012) and (February 2013). The pH of water in these months was found within the limit in the range of 6.40-8.45. 6.40 in the month of June 2012 and 8.45 in the month of February 2013. Showing that seasonal variations (temperature) have an impact on pH of water (Douterelo et al, 2016).

6th International Water Conference Proceedings [ 179 ]
A low pH can cause corrosion of pumps, metallic plumbing fixtures and pipes (Amin et al, 2012). Acidic pH can cause the destruction of metal pipes which could result into aesthetic problems like water having sour or metallic taste (Sorlini et al, 2013).
Dissolved oxygen (DO): DO is one of the important parameters of water quality which is of peculiar importance to aquatic organisms. Temperature effects the amount of dissolved oxygen present in water. In warm season or during high temperature the amount of oxygen dissolved in water is low whereas during cold season or during low temperature the amount of dissolved oxygen in water is high (Yasin et al, 2015).The value of dissolved oxygen (DO) obtained in this study from the DWDS was 7.9mg/L which satisfies the WHO guidelines of 6-8mg/L.
Electrical conductivity (EC): Pure water is a good insulator of electric current rather than a good conductor. An increase in the ion concentration of water increases the electrical conductivity of water (Meride and Ayenew, 2016). The value of Electrical conductivity (EC) obtained in this study from the DWDS was 883µS/cm which satisfies the WHO guidelines of 2500µS/cm. EC of water is directly linked to the amount of total dissolved solids present in the water. Higher the EC of water the higher the amount of dissolved solids present, which causes the water to have salty taste (Amin et al, 2012).
According to a study carried out by Amin et al mean value of EC of drinking water samples from 10 locations in Peshawar was 667.1µS/cm (Amin et al., 2012). Another study carried out by Meride and Ayenew in which water samples were obtained from 10 locations in Wondo genet campus in Ethiopia the value of EC was found to be 192.14µS/cm. They were found within the WHO standards (Meride and Ayenew, 2016).
Water with high conductivity that is greater than 2500µS/cm is recommended not safe for drinking as it can cause kidney failure, deposition of stones in intestines and hypertension (Rahman et al, 2015).
Free & Total chlorine: In drinking water chlorine is used as a disinfectant to eliminate microbial contamination in distribution systems so that the consumers could enjoy pollution free water. The amount of chlorine dosage used defines the effectiveness and concentration of residual chlorine needed to eliminate microbial contamination (Malcolm et al, 2017). However in many DWDSs the amount of chlorine used is not enough to eradicate microbial growth in water.
The value of free and total chlorine obtained in this study from the DWDS was 0.01mg/L and 0.12mg/L respectively which do not satisfy the WHO limit of residual chlorine which is 0.2-0.5mg/L at the consumer end and 0.5-1.5mg/L at the source. A low amount of free and total chlorine detected in our water samples simply suggest that water due to low level of residual chlorine will be loaded with microbes.
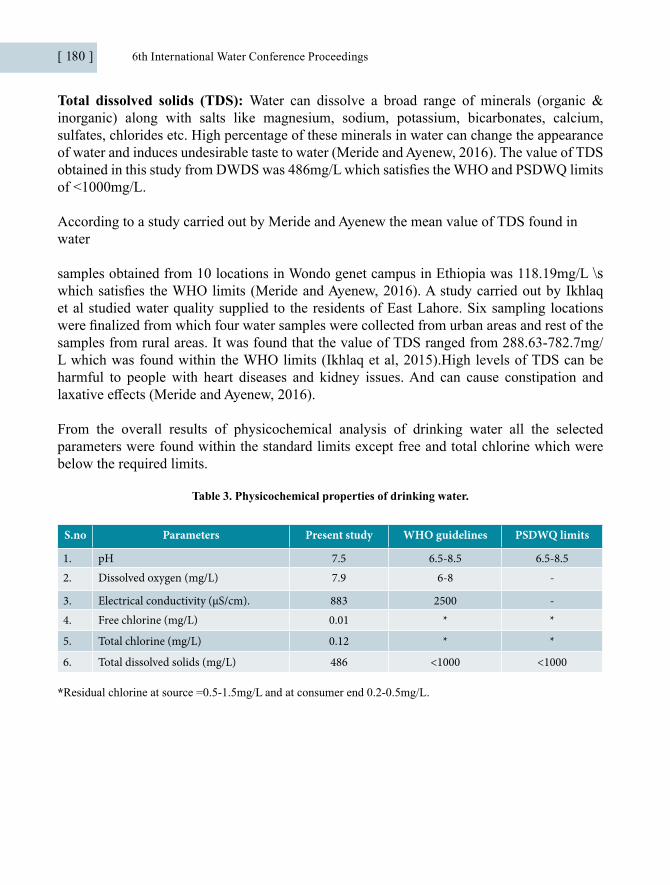
[ 180 ] 6th International Water Conference Proceedings
Total dissolved solids (TDS): Water can dissolve a broad range of minerals (organic & inorganic) along with salts like magnesium, sodium, potassium, bicarbonates, calcium, sulfates, chlorides etc. High percentage of these minerals in water can change the appearance of water and induces undesirable taste to water (Meride and Ayenew, 2016). The value of TDS obtained in this study from DWDS was 486mg/L which satisfies the WHO and PSDWQ limits of <1000mg/L.
According to a study carried out by Meride and Ayenew the mean value of TDS found in water
samples obtained from 10 locations in Wondo genet campus in Ethiopia was 118.19mg/L \s which satisfies the WHO limits (Meride and Ayenew, 2016). A study carried out by Ikhlaq et al studied water quality supplied to the residents of East Lahore. Six sampling locations were finalized from which four water samples were collected from urban areas and rest of the samples from rural areas. It was found that the value of TDS ranged from 288.63-782.7mg/L which was found within the WHO limits (Ikhlaq et al, 2015).High levels of TDS can be harmful to people with heart diseases and kidney issues. And can cause constipation and laxative effects (Meride and Ayenew, 2016).
From the overall results of physicochemical analysis of drinking water all the selected parameters were found within the standard limits except free and total chlorine which were below the required limits.
Table 3. Physicochemical properties of drinking water.
S.no Parameters Present study WHO guidelines PSDWQ limits
1. pH 7.5 6.5-8.5 6.5-8.52. Dissolved oxygen (mg/L) 7.9 6-8 -
3. Electrical conductivity (µS/cm). 883 2500 -4. Free chlorine (mg/L) 0.01 * *
5. Total chlorine (mg/L) 0.12 * *
6. Total dissolved solids (mg/L) 486 <1000 <1000
*Residual chlorine at source =0.5-1.5mg/L and at consumer end 0.2-0.5mg/L.
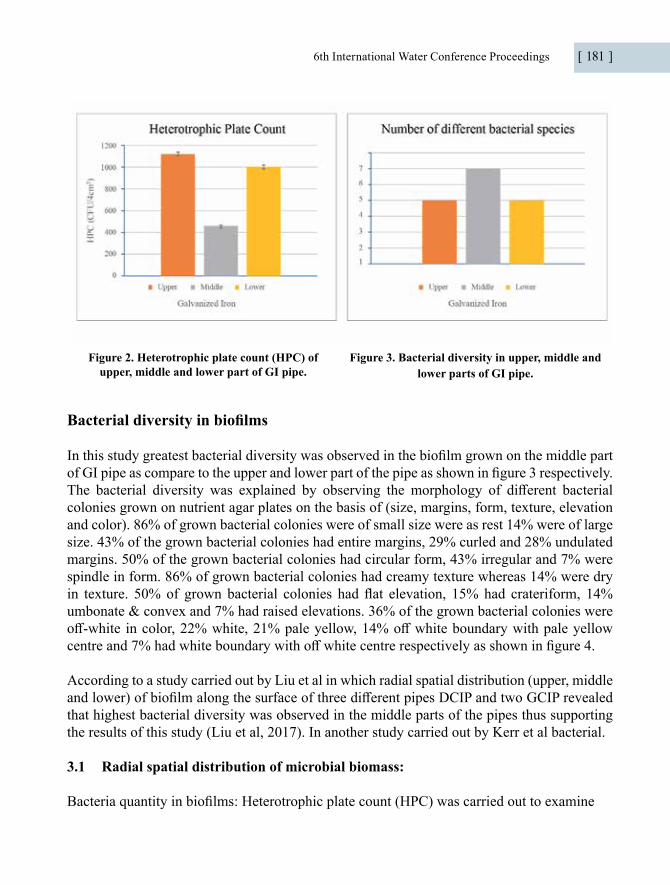
6th International Water Conference Proceedings [ 181 ]
Figure 2. Heterotrophic plate count (HPC) of upper, middle and lower part of GI pipe.
Figure 3. Bacterial diversity in upper, middle and lower parts of GI pipe.
Bacterial diversity in biofilms
In this study greatest bacterial diversity was observed in the biofilm grown on the middle part of GI pipe as compare to the upper and lower part of the pipe as shown in figure 3 respectively. The bacterial diversity was explained by observing the morphology of different bacterial colonies grown on nutrient agar plates on the basis of (size, margins, form, texture, elevation and color). 86% of grown bacterial colonies were of small size were as rest 14% were of large size. 43% of the grown bacterial colonies had entire margins, 29% curled and 28% undulated margins. 50% of the grown bacterial colonies had circular form, 43% irregular and 7% were spindle in form. 86% of grown bacterial colonies had creamy texture whereas 14% were dry in texture. 50% of grown bacterial colonies had flat elevation, 15% had crateriform, 14% umbonate & convex and 7% had raised elevations. 36% of the grown bacterial colonies were off-white in color, 22% white, 21% pale yellow, 14% off white boundary with pale yellow centre and 7% had white boundary with off white centre respectively as shown in figure 4.
According to a study carried out by Liu et al in which radial spatial distribution (upper, middle and lower) of biofilm along the surface of three different pipes DCIP and two GCIP revealed that highest bacterial diversity was observed in the middle parts of the pipes thus supporting the results of this study (Liu et al, 2017). In another study carried out by Kerr et al bacterial.
3.1 Radial spatial distribution of microbial biomass:
Bacteria quantity in biofilms: Heterotrophic plate count (HPC) was carried out to examine

[ 182 ] 6th International Water Conference Proceedings
the quantity of bacteria in biofilm grown on the upper, middle and lower parts of a galvanized iron pipe as shown in figure 2 respectively. The age of the biofilm grown on the pipes was 16 days and the HPC of upper, middle and lower parts of GI ranged from 460-1120 CFU/4cm2. Highest quantity of bacteria was observed on upper part of GI pipe 1120 CFU/4cm2 whereas lowest quantity of bacteria was observed on the middle part of GI pipe 460 CFU/4cm2. It was thus stated that biomass in biofilms were found concentrated in the upper and lower parts of GI pipe.Studies related to radial spatial distribution of biofilms along the surface of different pipes are limited and yet to be explored.
A similar study carried out by Liu et al in which radial spatial distribution of microbial biomass (upper, middle and lower) along the surface of ductile cast iron pipe (DCIP) and two gray cast iron pipes (GCIP) with different pipe ages were investigated. It was found that microbial biomass was found concentrated in the upper and lower area of the DCIP and GCIP. And the numbers of heterotrophic plate count were from 105 to 107 CFU/cm2 (Liu et al, 2017).
For the same pipe the temperature, water quality and pipe material is same but the main factors that contribute in microbial distribution along the surface of pipe wall is particle deposition, gravity and water flow. It is stated that due to gravity the highest microbial biomass should be present in the lower part of the pipe wall. But according to the results of our study greatest microbial biomass was found on the upper part of the GI pipe wall. It could be that the biofilms had adequate biomass to have good adhesion property that prevents them from falling or being washed of by flowing water. The middle part of the pipe wall has the lowest amount of microbial biomass the possible reason could be that the biomass accumulating in this area has repeated interaction with the flowing water (Liu et al, 2017).
Corrosion of GI pipe was also observed which was attributed to the quantity and powerful activity of microbes.
Figure 4. Morphology of grown bacterial colonies.
Number of different bacterial species
7
6
5
4
3
2
1
0
Upper
Middle
Lower
Galvanized Iron
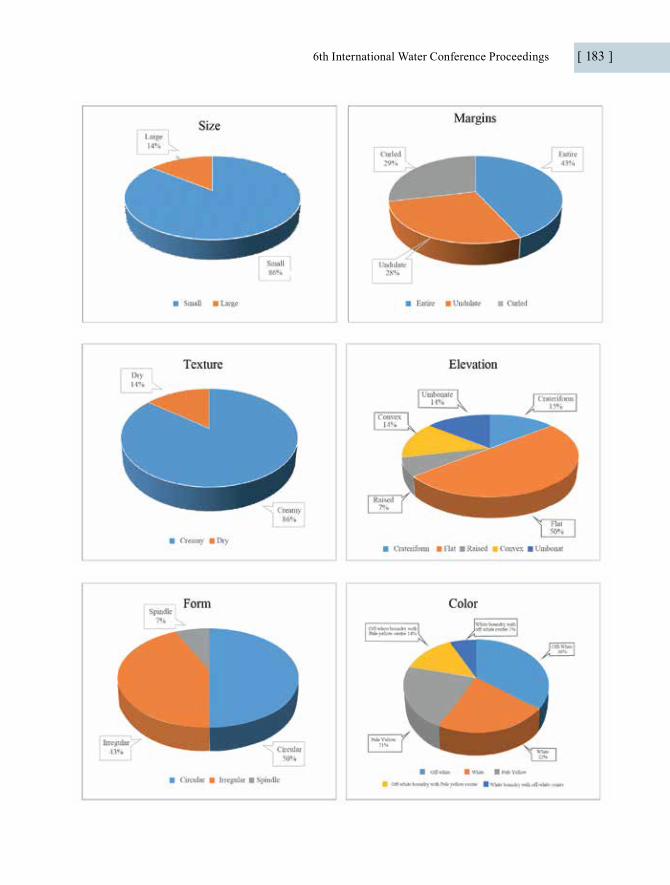
6th International Water Conference Proceedings [ 183 ]
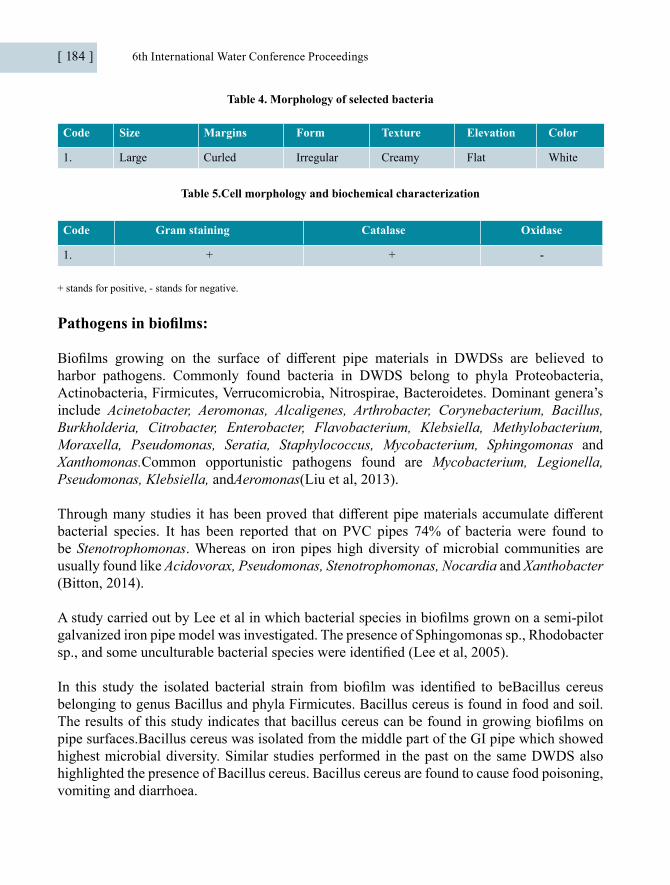
[ 184 ] 6th International Water Conference Proceedings
Table 4. Morphology of selected bacteria
Code Size Margins Form Texture Elevation Color
1. Large Curled Irregular Creamy Flat White
Table 5.Cell morphology and biochemical characterization
Code Gram staining Catalase Oxidase
1. + + -
+ stands for positive, - stands for negative.
Pathogens in biofilms:
Biofilms growing on the surface of different pipe materials in DWDSs are believed to harbor pathogens. Commonly found bacteria in DWDS belong to phyla Proteobacteria, Actinobacteria, Firmicutes, Verrucomicrobia, Nitrospirae, Bacteroidetes. Dominant genera’s include Acinetobacter, Aeromonas, Alcaligenes, Arthrobacter, Corynebacterium, Bacillus, Burkholderia, Citrobacter, Enterobacter, Flavobacterium, Klebsiella, Methylobacterium, Moraxella, Pseudomonas, Seratia, Staphylococcus, Mycobacterium, Sphingomonas and Xanthomonas.Common opportunistic pathogens found are Mycobacterium, Legionella, Pseudomonas, Klebsiella, andAeromonas(Liu et al, 2013).
Through many studies it has been proved that different pipe materials accumulate different bacterial species. It has been reported that on PVC pipes 74% of bacteria were found to be Stenotrophomonas. Whereas on iron pipes high diversity of microbial communities are usually found like Acidovorax, Pseudomonas, Stenotrophomonas, Nocardia and Xanthobacter (Bitton, 2014).
A study carried out by Lee et al in which bacterial species in biofilms grown on a semi-pilot galvanized iron pipe model was investigated. The presence of Sphingomonas sp., Rhodobacter sp., and some unculturable bacterial species were identified (Lee et al, 2005).
In this study the isolated bacterial strain from biofilm was identified to beBacillus cereus belonging to genus Bacillus and phyla Firmicutes. Bacillus cereus is found in food and soil. The results of this study indicates that bacillus cereus can be found in growing biofilms on pipe surfaces.Bacillus cereus was isolated from the middle part of the GI pipe which showed highest microbial diversity. Similar studies performed in the past on the same DWDS also highlighted the presence of Bacillus cereus. Bacillus cereus are found to cause food poisoning, vomiting and diarrhoea.
6th International Water Conference Proceedings [ 185 ]
3.1 Effect of pipe material on microbial biomass
Pipe materials used for supplying water in a distribution network mainly consists of three types of material, metallic, cementitious and plastic in nature. With passing years many types of pipe materials have been used in the construction of DWDSs, mainly pipe material aboriginal to the + stands for positive, - stands for negative.
region has been used. It is stated that pipe material of a DWDS is directly related to the quality of water. Surface of plumbing materials are thought to enhance the growth of biofilm if the material provides sufficient nutrients for bacterial multiplication (Momba et al, 2000).
In this study biofilm growth on galvanized iron pipes were observed. Galvanized iron pipes are iron pipes which are dipped in zinc to prevent rusting or corrosion of pipes. 16 days old biofilm growth on GI pipe coupon was observed and chlorine as a disinfectant was used in the DWDS. Heterotrophic bacterial growth and corrosion was clearly observed. Iron is one of those pipe materials that promotes bacterial growth due to its rough surface as compared to plastic pipes.According to a study carried out by Ren et al biofilm formation along the surface of five different pipe materials ductile cast iron pipe (DCIP), gray cast iron pipe (GCIP), galvanized steel pipe (GSP), stainless steel clad pipe (SSCP) and polyvinyl chloride (PVC) was observed. The quantity of biofilm in iron pipes was found to be highest as compare to other pipes. The amount of total and heterotrophic bacteria grown on iron pipes were found to be 5-30 times and 36-93 times greater than the total and heterotrophic bacteria grown on PVC pipes. The only possible reason discussed is that iron pipes have high surface roughness and the corrosion of iron pipes is a result of a combination of chemical reactions that reduces the performance of disinfectant residuals thus enhancing biofilm growth (Ren et al, 2015).
Another study carried out by Niquette et al observed the growth of biofilm on seven different pipe materials like PVC, PE, asbestos cement, cemented steel, tarred steel, gray iron and cemented cast iron respectively. The results of this study also confirmed that greatest bacterial biomass about 10-45 folds was found on gray iron as compare to plastic pipes. Cement pipes were found to have moderate bacterial growth (Niquette et al, 2000).
In a study carried out by Douterelo et al four different pipe material were investigated for biofilm growth (Cast iron, Asbestos cement, Medium density polyethylene and Unplasticized polyvinyl chloride) by increasing flushing to monitor results. It is said that the flow rate of water in pipes can result in the detachment of bacterial cells from the pipe wall. It was found out that CI pipes were more sensitive to changes in flow as compare to other pipes. Increase in the flow of water can detach bacterial cells from CI pipe wall. Thus flushing can be used as a control for biofilm growth on different pipes but this does not entirely removes biofilm from pipe surfaces (Douterelo et al, 2018).

[ 186 ] 6th International Water Conference Proceedings
However in this study only one pipe material GI was used to observe bacterial growth. For further study galvanized iron pipe should be compared with the rest of the pipes in the DWDS (PPR and uPVC) for better understanding of the effect of pipe material on biofilm growth. In addition to this the age of biofilm should be increased to study any variations in bacterial growth and communities.
Conclusion:
Safety of drinking water is necessary for the proper functioning of life. From the results of selected physicochemical analysis only free and total chlorine detected were lower than the required limit. Proper dosages of chlorine should be added to maintain chlorine residuals at the consumer end. Biofilm formation on the surface of DWDSs can have adverse effects on the health of human beings. Biofilm forming potential (BFP) varies in different pipe materials. Iron pipes through studies in the past are believed to have the highest BFP as iron is itself a nutrient that promotes the growth of biofilms, plus iron pipes provide rough surface for more microbial biomass attachment. In this study microbial biomass on the upper, middle and lower parts of the GI pipe was in the order Upper > Lower > Middle. Whereas diverse bacterial communities were found on the middle part of the GI pipe thus indicating that more pathogens were found on the middle part of the pipe by reporting the presence of Bacillus cereus. The study states that the middle part of the GI pipe has potential risks for drinking water safety.
6th International Water Conference Proceedings [ 187 ]
Spatial Prediction of Arsenic absorption in groundwater using Kriging techniques
Zahid Javeda, Sohail Chanda,*aCollege of Statistical and Actuarial Sciences,University of the Punjab, Lahore 54590, Pakistan.Emails: [email protected] (S. Chand), [email protected] (Z. Javed)
Abstract
Arsenic is a natural element that dispersed extensively in the crust of earth. It is found in all the atmospheric pollutants including water, air, food and soil. Furthermore, arsenic adversely affects groundwater that leads to the highest risk for human health. The present study aimed to explore the distribution of arsenic contaminant in groundwater of city Lahore, Pakistan. For this purpose we have collected seventy groundwater samples from various locations of the study area and each sample is tested in the laboratory to assess the arsenic level according to the standard testing methods. Descriptive analysis reveals that the level of arsenic in 94% samples is beyond the permissible limits given by World Health Organization (WHO) and Pakistan Environment Protection Agency (Pak EPA). Geospatial techniques are also applied for advance statistical analysis. The parameters (Sill, Range & Nugget) of variogram play a key role for geospatial prediction. These parameters were estimated by fitting the best fitted variogram models (Gaussian, Spherical, Matern & Exponential) using appropriate statistical estimation techniques. Cross validation statistic (RMSPE) was used to check the performance of the fitted models. The prediction of ungauged locations and spatial structure of arsenic in groundwater of study area was evaluated by Bayesian Kriging and Ordinary Kriging. Results showed deterioration of groundwater quality to the great extent that calls for immediate and pertinent steps to reduce the human as well as ecological health hazards.
Key words: Groundwater, Health effects, Water Quality, Kriging, Lahore.
1. Introduction
Water is important for the survival and development of life on earth. Groundwater is an important source of freshwater and plays an important part in sustaining agricultural, industrial and human activities [1] . Rapid population, industrial and urban development has increased groundwater contamination [2]. Pakistan has ample surface and ground water resources Mostly, the clean water and drainage systems have parallels in the country. Therefore, groundwater is becoming contaminated due to leakage and melding [4]. Industries are also the most important source
[ 188 ] 6th International Water Conference Proceedings
of water pollution. Industrial emissions are harmful to humans as well as the environment [5]. About 92% sewage water discharges directly into rivers and groundwater [6]. In Pakistan, groundwater levels are dipping by one meter per year because of extraction for agricultural and drinking purposes [7]. According to a World Bank report, only 36% of people in Pakistan have access to safe and clean groundwater [8].
According to the survey, water quality is declining because of water contamination. Estimates suggest that by 2025, the population of the country will increase from 141 million to 221 million, with per capita water accessibility will decrease from 5,600 m³ to 1,000 m³ [9]. Arsenic is the major pollutants found in various parts of Pakistan. People are at higher risk for high quantity of arsenic in groundwater [10], which can lead to cancer [11] , birth defects [12], neonatal mortality and other ailments [13].
Geostatistical analysis is well known for diagnosing physiochemical parameters of groundwater. Furthermore, the spatial techniques give the maximum results for finding the problem under study. Geographic Information Systems (GIS) and Kriging found very useful techniques towards water quality management [14]. Ishako, Ahmed and Abubakar [15] observed groundwater quality in Jada, Northam, Nigeria, using GIS mapping and IDW interpolation techniques. In Ardabil, Iran, [16] ordinary kriging was used to estimate the spatial pattern of groundwater quality. Abbas and Cheema [17] estimated that the quality of groundwater was unsatisfactory and arsenic contamination had adversely affected human health in Sheikhupura, Pakistan. Maghami et al. [18] assessed that groundwater quality of 27 wells was tested using various precipitation methods in Abadeh. Numerous studies have been conducted in Pakistan to predict water quality parameters using various interpolation techniques [19]–[24].
The purpose of this study is to predict the quality of groundwater in Lahore, Pakistan. For this purpose, Ordinary Least Square (OLS), Maximum Liklihood (ML) and Restricted Maximum Likelihood (REML) were used to estimate the parameters of the variogram model. Ordinary Kriging and Bayesian Kriging techniques were employed to estimate the concentration level of groundwater quality parameters. Cross-validation statistics are used to compare the performance of geospatial interpolation techniques.
2. Methodology
2.1 Study area and data description
Lahore is the most dynamic city of the Province Punjab, Pakistan. Geographically, it has extended from 31°15′N to 31°45′N in the north of the Asian plate and from 74°01′E to 74°39′E in the east. Lahore is bounded on the north by Sheikhupura district and in east it is connected to international border India [25]. The latest census report of Pakistan shows that the average annual population growth rate of Lahore district was 7.77% with total population 11.13 million [26]. Climate change in temperature patterns and rainfall rates has reduced in Lahore. In hot
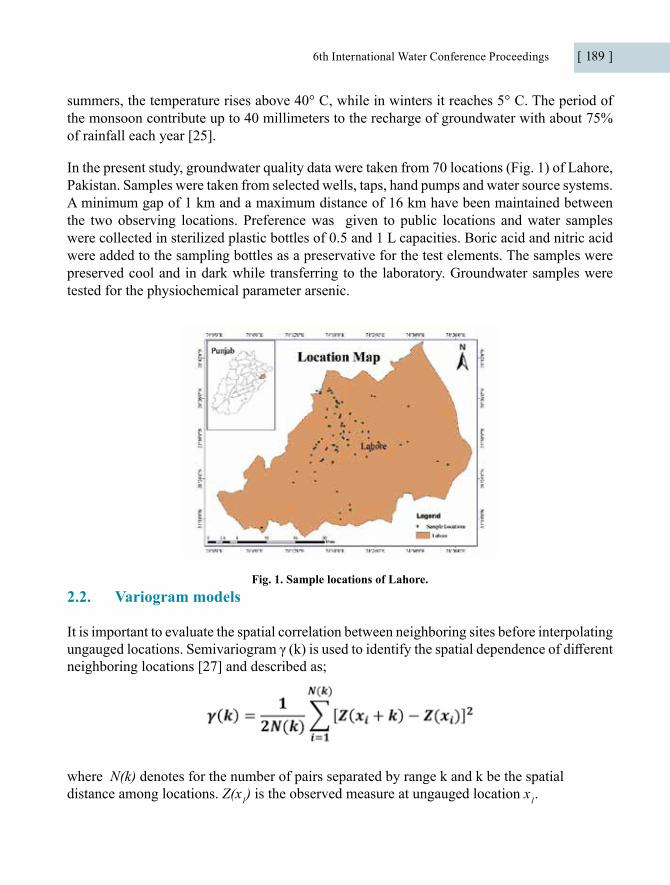
6th International Water Conference Proceedings [ 189 ]
summers, the temperature rises above 40° C, while in winters it reaches 5° C. The period of the monsoon contribute up to 40 millimeters to the recharge of groundwater with about 75% of rainfall each year [25].
In the present study, groundwater quality data were taken from 70 locations (Fig. 1) of Lahore, Pakistan. Samples were taken from selected wells, taps, hand pumps and water source systems. A minimum gap of 1 km and a maximum distance of 16 km have been maintained between the two observing locations. Preference was given to public locations and water samples were collected in sterilized plastic bottles of 0.5 and 1 L capacities. Boric acid and nitric acid were added to the sampling bottles as a preservative for the test elements. The samples were preserved cool and in dark while transferring to the laboratory. Groundwater samples were tested for the physiochemical parameter arsenic.
Fig. 1. Sample locations of Lahore.2.2. Variogram models
It is important to evaluate the spatial correlation between neighboring sites before interpolating ungauged locations. Semivariogram γ (k) is used to identify the spatial dependence of different neighboring locations [27] and described as;
where N(k) denotes for the number of pairs separated by range k and k be the spatial distance among locations. Z(x1) is the observed measure at ungauged location x1.
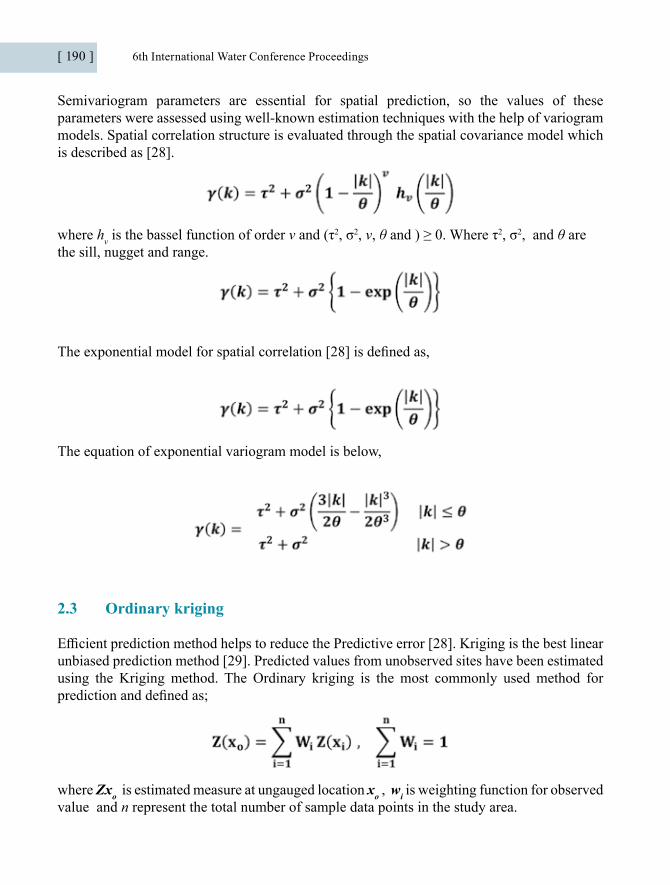
[ 190 ] 6th International Water Conference Proceedings
Semivariogram parameters are essential for spatial prediction, so the values of these parameters were assessed using well-known estimation techniques with the help of variogram models. Spatial correlation structure is evaluated through the spatial covariance model which is described as [28].
where hv is the bassel function of order v and (τ2, σ2, v, θ and ) ≥ 0. Where τ2, σ2, and θ are the sill, nugget and range.
The exponential model for spatial correlation [28] is defined as,
The equation of exponential variogram model is below,
2.3 Ordinary kriging
Efficient prediction method helps to reduce the Predictive error [28]. Kriging is the best linear unbiased prediction method [29]. Predicted values from unobserved sites have been estimated using the Kriging method. The Ordinary kriging is the most commonly used method for prediction and defined as;
where Zxo is estimated measure at ungauged location xo , wi is weighting function for observed value and n represent the total number of sample data points in the study area.
6th International Water Conference Proceedings [ 191 ]
2.4. Bayesian Kriging
In Bayesian Kriging several prior distributions were used for the model parameters. Prior distribution of the parameters is joint with the likelihood of the dependent variable using Bayes theorem to derive the posterior distribution [30]. Mathematical, it is described as;
Where π(θ) is the joint prior distribution of parameters and is likelihood. Where p(θ│y) is the posterior distribution [31].
2.5. Cross Validation Statistics
Root mean square prediction error (RMSPE) was used to measure the performance of spatial prediction and Kriging techniques. The mathematical equation of the measure is defined as [32]
Z* (xi ) is the estimated measure of same location. A model with the minimum value of ME and RMSE is considering best model.
3. Results and Discussions
This part includes a short note on the results of the data under study in a concise way. There include only indicated experimental outcomes numerical or graphical, which are consistent to research objectives. Initially, the visual examination is taken after that a few spatial descriptive measures are calculated which plays a basic role in spatial modeling. Later on, the estimation of model parameters by more than one method is considered. Finally, kriging techniques are applied for spatial interpolation. The software used as analysis-tool is R-language and ArcGIS.
The most important assumption in spatial prediction is normality of the data. The normality was checked by graphically which was shown in figure 2, and also numerically by Shapiro-Wilk (W=0.9706) test. Both the techniques showed that the data is normal. The permissible limit according to the various national and international organizations for arsenic level is 10 shown in the table 1.
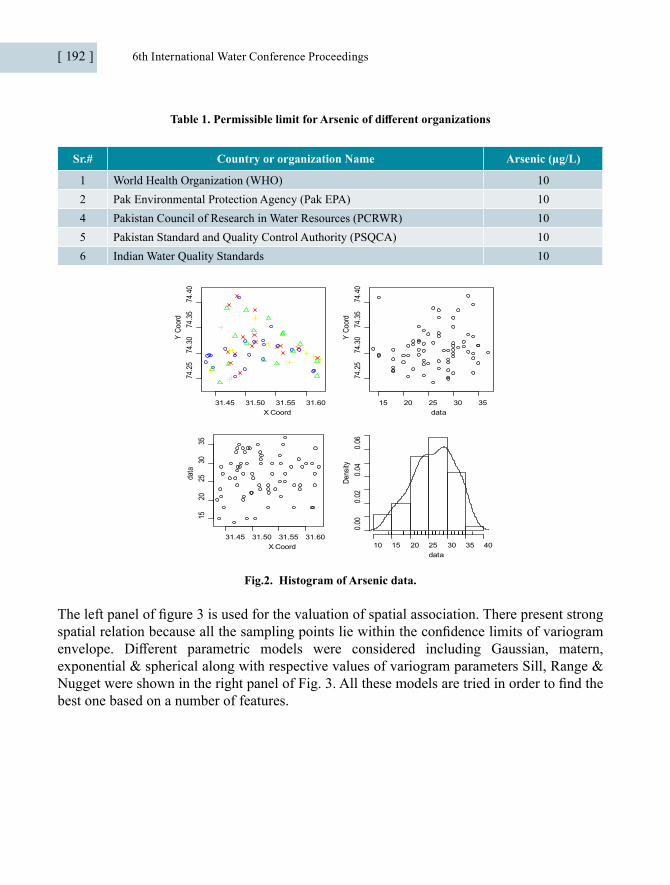
[ 192 ] 6th International Water Conference Proceedings
Table 1. Permissible limit for Arsenic of different organizations
Sr.# Country or organization Name Arsenic (µg/L)
1 World Health Organization (WHO) 102 Pak Environmental Protection Agency (Pak EPA) 104 Pakistan Council of Research in Water Resources (PCRWR) 105 Pakistan Standard and Quality Control Authority (PSQCA) 106 Indian Water Quality Standards 10
31.45 31.50 31.55 31.60
74.2
574
.30
74.3
574
.40
X Coord
Y Co
ord
15 20 25 30 35
74.2
574
.30
74.3
574
.40
data
Y Co
ord
31.45 31.50 31.55 31.60
1520
2530
35
X Coord
data
data
Dens
ity
10 15 20 25 30 35 40
0.00
0.02
0.04
0.06
Fig.2. Histogram of Arsenic data.
The left panel of figure 3 is used for the valuation of spatial association. There present strong spatial relation because all the sampling points lie within the confidence limits of variogram envelope. Different parametric models were considered including Gaussian, matern, exponential & spherical along with respective values of variogram parameters Sill, Range & Nugget were shown in the right panel of Fig. 3. All these models are tried in order to find the best one based on a number of features.
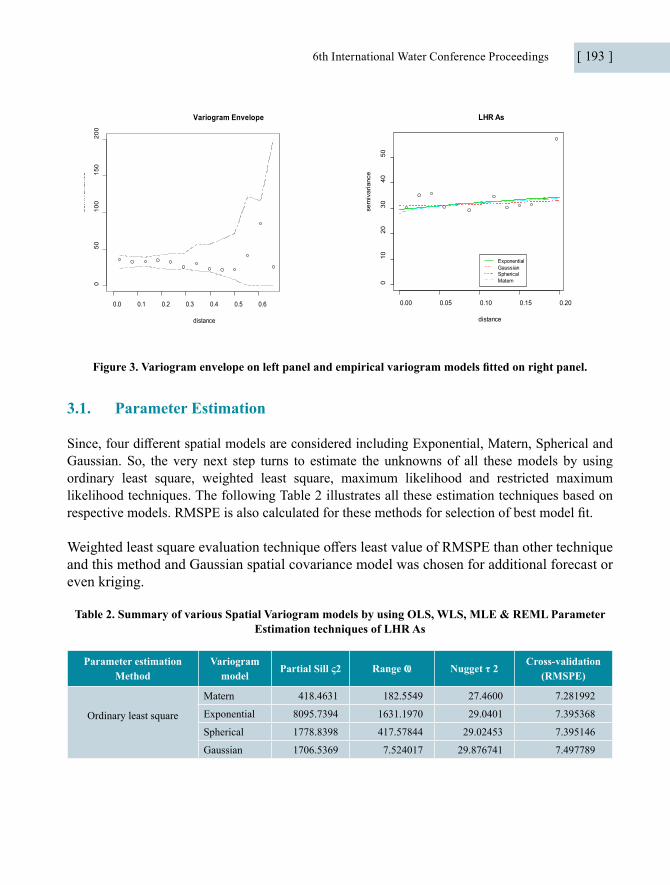
6th International Water Conference Proceedings [ 193 ]
0.0 0.1 0.2 0.3 0.4 0.5 0.6
050
100
150
200
Variogram Envelope
distance
sem
ivar
ianc
e
0.00 0.05 0.10 0.15 0.20
010
2030
4050
LHR As
distance
sem
ivar
ianc
e
ExponentialGaussianSphericalMatern
Figure 3. Variogram envelope on left panel and empirical variogram models fitted on right panel.
3.1. Parameter Estimation
Since, four different spatial models are considered including Exponential, Matern, Spherical and Gaussian. So, the very next step turns to estimate the unknowns of all these models by using ordinary least square, weighted least square, maximum likelihood and restricted maximum likelihood techniques. The following Table 2 illustrates all these estimation techniques based on respective models. RMSPE is also calculated for these methods for selection of best model fit.
Weighted least square evaluation technique offers least value of RMSPE than other technique and this method and Gaussian spatial covariance model was chosen for additional forecast or even kriging.
Table 2. Summary of various Spatial Variogram models by using OLS, WLS, MLE & REML Parameter Estimation techniques of LHR As
Parameter estimationMethod
Variogrammodel
Partial Sill ς2 Range Ҩ Nugget τ 2Cross-validation
(RMSPE)
Ordinary least square
Matern 418.4631 182.5549 27.4600 7.281992
Exponential 8095.7394 1631.1970 29.0401 7.395368
Spherical 1778.8398 417.57844 29.02453 7.395146
Gaussian 1706.5369 7.524017 29.876741 7.497789
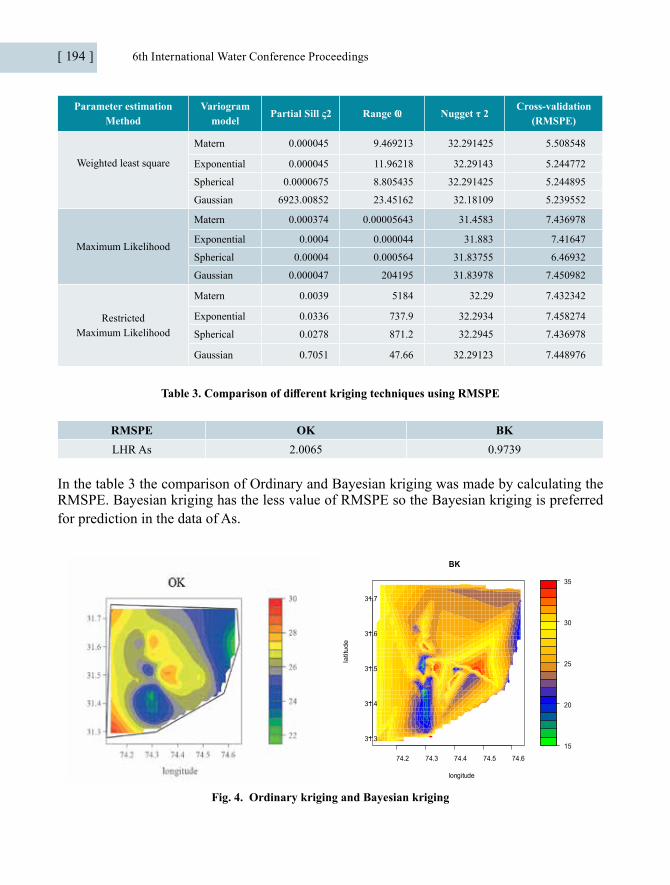
[ 194 ] 6th International Water Conference Proceedings
Parameter estimationMethod
Variogrammodel
Partial Sill ς2 Range Ҩ Nugget τ 2Cross-validation
(RMSPE)
Weighted least square
Matern 0.000045 9.469213 32.291425 5.508548
Exponential 0.000045 11.96218 32.29143 5.244772
Spherical 0.0000675 8.805435 32.291425 5.244895
Gaussian 6923.00852 23.45162 32.18109 5.239552
Maximum Likelihood
Matern 0.000374 0.00005643 31.4583 7.436978
Exponential 0.0004 0.000044 31.883 7.41647
Spherical 0.00004 0.000564 31.83755 6.46932
Gaussian 0.000047 204195 31.83978 7.450982
RestrictedMaximum Likelihood
Matern 0.0039 5184 32.29 7.432342
Exponential 0.0336 737.9 32.2934 7.458274
Spherical 0.0278 871.2 32.2945 7.436978
Gaussian 0.7051 47.66 32.29123 7.448976
Table 3. Comparison of different kriging techniques using RMSPE
RMSPE OK BKLHR As 2.0065 0.9739
In the table 3 the comparison of Ordinary and Bayesian kriging was made by calculating the RMSPE. Bayesian kriging has the less value of RMSPE so the Bayesian kriging is preferred for prediction in the data of As.
15
20
25
30
35
74.2 74.3 74.4 74.5 74.6
31.3
31.4
31.5
31.6
31.7
BK
longitude
latit
ude
Fig. 4. Ordinary kriging and Bayesian kriging
6th International Water Conference Proceedings [ 195 ]
Ordinary and Bayesian kriging were used to predict the arsenic concentration in groundwater of Lahore. The highest level of arsenic is 37 with longitude 74.3005 and latitude 31.562 highlighted with red in the above figure. The green color shows that the level of arsenic is within permissible limits. The area with longitude 74.3986 and latitude 31.6042 has (14) minimum level of arsenic. It was observed that the level of arsenic increases in south east and south west part of the study area.
4. Conclusion
The present study aimed to explore the distribution of arsenic contaminant in groundwater of city Lahore, Pakistan. For this purpose we have collected seventy groundwater samples from various locations of the study area. Descriptive analysis reveals that the level of arsenic in 94% samples is beyond the permissible limits given by World Health Organization (WHO) and Pakistan Environment Protection Agency (Pak EPA). These parameters of variogram were estimated by fitting the best fitted variogram models (Gaussian, Spherical, Matern & Exponential) using appropriate statistical estimation techniques. Cross validation statistic (RMSPE) was used to check the performance of the fitted models. The prediction of ungauged locations and spatial structure of arsenic in groundwater of study area was evaluated by Bayesian Kriging and Ordinary Kriging. It was observed that the level of arsenic increases in south east and south west part of the study area. Arsenic adversely affects groundwater that leads to the highest risk for human health. It is evident from the study that the water quality of Lahore is not satisfactory. Results showed deterioration of groundwater quality to the great extent that calls for immediate and pertinent steps to reduce the human as well as ecological health hazards.
References
[1] D. Long et al., “Have Grace satellites overestimated groundwater depletion in the Northwest India Aquifer?,” Sci. Rep., vol. 6, pp. 243–258, 2016.
[2] P. C. Mishra, “Some Aspects of the Quality of Water in and around Rourkela,” 2005.
[3] M. K. Daud et al., “Drinking Water Quality Status and Contamination in Pakistan,” Biomed Res. Int., vol. 2017, pp. 1–18, 2017.
[4] A. A. Patoli and B. B. Patoli, “High prevalence of Multi-drug resistant Escherichia Coli in drinking water samples from Hyderabad,” Gomal J. Med. Sci., vol. 8, pp. 23– 26, 2010.
[5] F. Kausar, A. Qadir, S. R. Ahmad, and M. Baqar, “Evaluation of Surface Water Quality on Spatiotemporal Gradient Using Multivariate Statistical Techniques : A Case Study of River Chenab , Pakistan,” Pol. J. Environ. Stud., vol. 28, no. 4, pp. 2645–2657,
[ 196 ] 6th International Water Conference Proceedings
2019.
[6] EPA, “Wellhead protection: a guide for small communities,” in Office of Research and Development Office of Water, Washington, 1993.
[7] “Country Report,” www. unesco.org/education/wef/countryreprts/pakistan/ rapport- 1.html, 2000., 2000. [Online]. Available: www. unesco.org/education/wef/ countryreprts/pakistan/rapport- 1.html, 2000. .
[8] “WB Report,” https://www.pakistantoday.com.pk/2019/03/22/64-pakistanis-deprived-of-safe-drinking-water-says-wb-report., 2019.
[9] D. A. Arshad, A. Intikhab, “Low- cost filter for flood affected areas of Pakistan,” J. Environ. Agric. Food Chem., vol. 10, no. 10, pp. 2945–2950, 2011.
[10] J. A. Baig et al., “Evaluation of arsenic and other physico-chemical parameters of surface and ground water of Jamshoro, Pakistan,” J. Hazard. Mater., vol. 166, no. 2–3,ap. 662–669, 2009.
[11] C. Ferreccio, C. González, V. Milosavjlevic, G. Marshall, A. M. Sancha, and A. H. Smith, “Lung cancer and arsenic concentrations in drinking water in Chile,” Epidemiology,a. 673–679, 2000.
[12] A. H. Milton et al., “Chronic arsenic exposure and adverse pregnancy outcomes in Bangladesh,” Epidemiology, pp. 82–86, 2005.
[13] M. M. Rahman, J. C. Ng, and R. Naidu, “Chronic exposure of arsenic via drinking water and its adverse health impacts on humans,” Environ. Geochem. Health, vol. 31, no. 1, pp. 189–200, 2009.
[14] K. Marko, N. S. Al-Amri, and A. M. M. Elfeki, “Geostatistical analysis using GIS for mapping groundwater quality: case study in the recharge area of Wadi Usfan, western Saudi Arabia,” Arab. J. Geosci., vol. 7, no. 12, pp. 5239–5252, 2014.
[15] J. M. Ishaku, A. S. Ahmed, and M. A. Abubakar, “Assessment of groundwater quality using chemical indices and GIS mapping in Jada area, Northeastern Nigeria,” J. Earth Sci. Geotech. Eng., vol. 1, no. 1, pp. 35–60, 2011.
[16] P. Hosseinzadeh Talaee, “Analysis of groundwater quality in the northwest of Iran,” Desalin. Water Treat., vol. 56, no. 9, pp. 2323–2334, 2015.
[17] M. Abbas and K. J. Cheema, “Arsenic levels in Drinking Water and Associated Health Risk in District Sheikhupura, Pakistan.,” J. Anim. Plant Sci., vol. 25, no. 2015, pp. 719–724, 2015.
[18] Y. Maghami, R. Ghazavi, A. A. Vali, and S. Sharafi, “Evaluation of spatial interpolation

6th International Water Conference Proceedings [ 197 ]
methods for water quality zoning using GIS Case study, Abadeh Township,” 2011.[19] M. Ahmad, S. Chand, and H. M. Rafique, “Geostatistical cokriging and multivariate
statistical methods to evaluate groundwater salinization in Faisalabad, Pakistan,” Desalin. Water Treat., vol. 84, no. 2017, pp. 93–101, 2017.
[20] M. Ahmad and S. Chand, “Spatial distribution of TDS in drinking water of tehsil Jampur using ordinary and Bayesian Kriging,” Pakistan J. Stat. Oper. Res., vol. 11, no. 3, pp. 377–386, 2015.
[21] Z. Javed, S. Saeed, N. Hashmi, and M. Ahmad, “Spatial distribution of arsenic concentration in drinking water using kriging techniques,” Sci. Int., vol. 27, no. 2, pp. 1089–1095, 2015.
[22] Z. Javed, S. Chand, and R. Amer, “Geospatial analysis of groundwater quality in the major cities of Pakistan,” Desalin. Water Treat., vol. 198, pp. 61–70, 2020.
[23] S. R. Gilani, Z. Mahmood, M. Hussain, Y. Baig, and Z. Abbas, “A Study of Drinking Water of Industrial Area of Sheikhupura with Special Concern to Arsenic , Manganese and Chromium,” Pak. J. Engg. Appl. Sci., vol. 13, no. July, pp. 118–126, 2013.
[24] J. Hassan, “A Geostatistical approach for mapping groundwater quality ( Case Study : Tehsil Sheikhupura ),” Int. J. Sci. Res., vol. 3, no. 4, pp. 239–245, 2014.
[25] A. M. Muhammad and T. Zhonghua, “Municipal solid waste and its relation with groundwater contamination in Lahore, Pakistan,” Res. J. Appl. Sci. Eng. Technol., vol. 7, no. 8, pp. 1551–1560, 2014.
[26] Pb. Statistics, “of Pakistan Bureau of Statistics.” Pakistan: Government of Pakistan, 2017.
[27] N. Cressie, “Fitting variogram models by weighted least squares,” J. Int. Assoc. Math. Geol., vol. 17, no. 5, pp. 563–586, 1985.
[28] R. Srivastava and E. Isaaks, “An introduction to applied geostatistics: Oxford University Press,” New York, 1989.
[29] D. G. Krige, “A Statistical Approaches to Some Basic Mine Valuation Problems on the Witwatersrand,” J. Chem. Metall. Min. Soc. South Africa, vol. 52, pp. 119–139, 1951.
[30] P. Bickel, P. Diggle, S. Fienberg, U. Gather, I. Olkin, and S. Zeger, Model-based Geostatistics. 2006.
[31] P. J. Diggle, P. J., & Ribeiro Jr, “Model-based geostatistics,” Springer, 2006.
[32] N. Johnston, K., Ver Hoef, J. M., Krivoruchko, K., & Lucas, “Using ArcGIS geostatistical analyst,” Esri Redlands, CA., vol. 300, 2001.
[ 198 ] 6th International Water Conference Proceedings
Water For All: Food – Energy – Water NexusI begin this Paper in the Name of Allah The Most Gracious, The Most Merciful
Rubina Jaffari, Noor Muhammad Baloch, Zaffar Tahir
I begin this Paper in the Name of Allah The Most Gracious, The Most Merciful WATER has been described and defined variously by many entities and scientists the world over. To get a feel of this mesmerizing compound, I take this liberty first, to put forth some earthly understandings and definitions and second, portray it in the light of Devine revelations.
Definition & Divinity
Water is defined as: A substance composed of the chemical elements hydrogen and oxygen and existing in gaseous, liquid, and solid states. It is one of the most plentiful and essential of compounds. A tasteless and odourless liquid at room temperature, it has the important ability to dissolve many other substances. Indeed, the versatility of water as a solvent is essential to living organisms. Life is believed to have originated in the aqueous solutions of the world’s oceans, and living organisms depend on aqueous solutions, such as blood and digestive juices, for biological processes. In small quantities water appears colourless, but water actually has an intrinsic blue colour caused by slight absorption of light at red wavelengths.
The Greek Philosopher Thales regarded water as the sole fundamental building block of matter:
It is water that, in taking different forms, constitutes the earth, atmosphere, sky, mountains, gods and men, beasts and birds, grass and trees, and animals down to worms, flies and ants. All these are different forms of water.
Around 450 BC, the Greek philosopher Empedocles wrote that the world was comprised of four things: earth, air, fire and water. Plato referred to them as the four elements.The Philosopher Aristotle also thought that Water was one of the four fundamental elements that everything was made-up of; the other three being Earth, Fire and Air. This belief continued, it formed and remained the central part of Alchemy. The Galenic Theory was also widely accepted and its proponents believed that human body was made up of four humors or liquids: Blood, Black Bile, Yellow Bile and Phlegm. Each of these Humor was associated with one of the Elements: Air, Water, Earth and Fire. Thus, we see the reverence and importance of water and its associations with life from past times.

6th International Water Conference Proceedings [ 199 ]
Belief in Water gods
Water was, and still is, held divine. Drawing from the ancient times, there exists numerous Water related Deities. They form the bedrock of Egyptian, Indian, Chinese, Caribbean, Hawaiian, American, African, European and many other Mythologies. Their water gods were created, named and worshipped. In this respect a paper listed 270 water gods and goddesses from 44 different cultures. To mention a few, the largest number of 52 gods was in Greek mythology followed by 32 in Chinese mythology. There are 10 gods and goddesses in Hindu/ Vedic mythology. In nutshell; man from time immemorial has identified and deemed water as thecore for all life. In his limited wisdoms, he has carved many gods & goddess who supple them and are responsible for germinating, growing, supporting, guiding, protecting and caring.
Importance of Water in the Light of Quranic Revelations
Contrary to Ancient beliefs, Quran,600 years after Christianity in 610, lifted veils from ignorance and, a new light seeped into the minds, body and souls. The Lights of Quranic Revelations not only jolted and awakened the weak unbelieving people from darkness and ignorance but it enlightened and laid the foundations for wisdom seeking and contemplating. I will now dwell upon these With Reference to Water:
Quran has dwelt at length describing its qualities and miracles and cited many instances. Water has been mentioned numerous times in the Quran and, if my count is right; I reckon it is NO LESS THAN 153 times interspaced in 53 Chapters (Sura). Each of these Sura signify the Glory of Allah and reminds all the living species and us – the mortal beings, the importance of water for all and, has rendered them most beautifully thus:
It is He who created the heavens and the earth in six days—and His Throne was upon the waters (.)[Hud(11:7)].
Do the disbelievers not see that the heavens and the earth were one mass, and We tore them apart? And We made from water every living thing. Will they not believe? [The Prophets – Al-Anbiya (21:30)].
Allah created every living creature from water. Some of them crawl on their bellies, some walk on two feet, and others walk on four. Allah creates whatever He wills. Allah is Capable of everything.[The Light -AnNur (24:45)].
Allah is He Who created the heavens and the earth, and sends down water from the sky, and with it produces fruits for your sustenance. And He committed the ships to your service, sailing through the sea by His command, and He committed the rivers to your service. [Ibrahim (24:32)].
[ 200 ] 6th International Water Conference Proceedings
The God Sent Nexus for All
There is God Sent universal, wide and deep inter-twined relationship between Food, Energy and Water. We mortals call and denotes this relationship as “Nexus”. “Nexus”; though it sounds uncanny and creepy is a linking Noun and denotes relationship. We see in these Quranic Revelations abundance of relationships between water, food and energy. Mighty Allah has pointed this to its mortal beings so that Water as One Blessing is Shared by all. The following
Quranic renderings highlight these Nexus between Food, Energy and Water.
And it is He who sends down water from the sky. With it We produce vegetation of all kinds, from which We bring greenery, from which We produce grains in clusters. And palm-trees with hanging clusters, and vine-yards, and olives, and pomegranates—similar and dissimilar. Watch.
The nexus or relationship of land, water and food is a Heavenly Sealed Binding for sustenance of life and, for germination and growth of flora & fauna; for the ultimate benefits of the weak, feeble, indecisive and ungrateful mankind. Man is therefore, reminded of these Heavenly Nexus in most sublime, beautiful, magnificent and awe-inspiring language of the Quran in Sura 80 [He Frowned (Abasa), Ayats (24-32)]:
(24). Let man consider his food.(25).We pour down water in abundance. (26). Then crack the soil open.(27).And grow in it grains.(28). And grapes and herbs. (29). And olives and dates.(30). And luscious gardens.(31). And fruits and vegetables. (32). Enjoyment for you, and for your livestock.
An in-depth analysis of the Ayats, most beautifully, not only highlights the intricate relationships of water and production of food for sustenance but, also kindle lights of hopes & plenty; for all –Man & Animals.
Importance of Water & Water Treaties
Rivers flow through many countries and borders and, as in the past and even now, there has always arisen water related disputes regarding the legal ownership and rights of this life sustaining resources. The former UN Secretary-General Kofi Annan also spoke on water and expressed his fears:
“Fierce national competition over water resources has prompted fears that water issues contain the seeds of violent conflict. If all the world’s peoples work together, a secure and sustainable water future can be ours.”
The importance of water for all, as I emphasize and repeat; for life sustenance, for food production
6th International Water Conference Proceedings [ 201 ]
and, for electricity generation; is reflected in many Water related Treaties negotiated and signed between Countries. These Treaties cover Trans-boundary Waters Basins. They ensure the continuity of natural water flows & links and, very strongly reinforce Food – Energy
– Water Nexus and their inter-dependency regimes because, they have tremendous and far reaching and wide impacts related to ecology of the regions, water management, production of food, fish and raw materials for agro-based industries, forestations, development of canals for riverine transportations, flood controls, dams & reservoir buildings, for energy generation and supply to urban and industrial consumption points and ultimate consumers – Man, Plant and Livestock.
Trans-Boundary Water Treaty
The first Trans-Boundary Water Treaty is reported to have been negotiated, signed and implemented in 2500 BC. This Treaty was implemented between two Sumerian City States
– Lagash and Umma to end their Water dispute with reference to River Tigris. In current global situations, it is reported that “there are 276 Trans – Boundary River Basins and, 200 Trans- Boundary Aquifers. Their Data indicate that 148 Countries include territory within one or more Trans-Boundary River Basins, 39 Countries have more than 90% of their Territory within one or more Trans-Boundary River Basins and, 21 Countries lie entirely within one or more of these watersheds.
Pakistan Case
In Pakistan Indus River forms the Lifeline for supply of bulk water through network of dams, barrages and irrigation canals. This ensures natural protection of soils from desertification & erosions, protection of flora & fauna, production of food, fodder & industrial goods; for generation of electricity and, quenching the thirsts of more than 218 million people in Pakistan. The nature and importance of this Trans-National and Life Sustaining River can be better understood as depicted:
The Indus River is considered one of the largest rivers in Asia with a drainage area of about 950,000 Sq.km. It originates from the Tibetan Plateau near Lake Mansarovar, flows through Ladakh, Gilgit and Baltistan, flows through the entire length of Pakistan and finally merges into the Arabian Sea (.)…
The Food – Energy – Water Nexus is seeped and weaved, in dependency factors. These cannot be isolated. The gorges of Indus flows are too deep, far reaching, Trans National all life transcending and encompassing. Water Rights of Nations have always been and remains today, the flash points for Water related Conflicts. In this instance the First Water Conflict in Indian Sub-Continent emerged. In this instant, I will borrow a leaf from History:

[ 202 ] 6th International Water Conference Proceedings
A reported conflict emerged before partition between Sindh and Punjab, during 1941. This dispute was settled in 1945 through the Roy Commission, agreement that was termed the “Sindh-Punjab Agreement”. According to this agreement, no construction would be allowed upstream of the river without the consent and approval of Sindh.
Therefrom, this Life Sustaining River has been the bone of contention between Pakistan and India since Independence (14/15 August 1947). Consequently, flash points for Water Wars between Pakistan and India has developed. In view of the gravity of this problem and to address it, the Indus Water Treaty (IWT) – between Pakistan and India was signed in 1960. In nutshell, from Agreements and Clause of the IWT, the following rules for water distribution emerged:
Three eastern rivers, namely Bias, Sutlej and Ravi, came under the control of India while the three western rivers, namely Chenab, Jhelum and Indus, came under the control of Pakistan. Moreover, India was also allowed to irrigate 1.3 million acres from western rivers.
The Nexus of Food – Energy – Water is well established, entrenched and encompasses all living beings. It has been beautifully portrayed and highlighted by Koichiro Matsuura, Director General of the United Nations Educational, Scientific and Cultural Organization (UNESCO):
“Water is probably the only natural resource to touch all aspects of human civilization -- from agricultural and industrial development to the cultural and religious values embedded in society”.
In case of Pakistan this relationship or Nexus stands out very firmly. It is very deep, binding and has far reaching socio-economic dependence and consequences:
Pakistan’s agriculture sector plays a central role in the economy as it contributes 18.9 percent to GDP and absorbs 42.3 percent of labour force. It is also an important source of foreign exchange earnings and stimulates growth in other sectors.
The interdependence and relationship between Food & Water can very well be understood when we look into the cropping patterns of the country:
Pakistan has two cropping seasons, “Kharif” being the first sowing season starting from April-June and is harvested during October-December. Rice, sugarcane, cotton, maize, moong, mash, bajra and jowar are “Kharif” crops. “Rabi”, the second sowing season, begins in October-December and is harvested in April-May. Wheat, gram, lentil (masoor), tobacco, rapeseed, barley and mustard are “Rabi” crops.

6th International Water Conference Proceedings [ 203 ]
Water Requirements
It is apparent that crops like sugar cane, rice, cotton, require much more water than other crops. Thus, there is increased need and demand for water for these crops. Therefore, Food
– Energy – Water Nexus is seeped, intertwined & weaved in Regional Water Politics, Fallouts of the dependency factors and, Water Rights of Nations. Crops in Pakistan is dependent on River Indus, its dams, barrages and canals for irrigations & water releases. Sugarcane and rice require more water than other crops. Rice need constant irrigation and, overall water requirements is 60-70 acre inches; Sugarcane need 96 acre inches, Cotton; the only fibre crop of Pakistan; requires 7-8 irrigations. Lintels, Oil seeds & fodder need adequate waters in time.
All these: wheat, cotton, rice, tobacco, lintels are important food and industrial crops. They contribute significantly to GDP, rural economies, Labour absorption & employments. Their sowings and yields are inter-dependent and, are governed by two factors: (i), Vagaries of nature as bestowed upon mankind and (ii), Man-made hurdles and water barriers. Subsequently, the quantity of water available in Pakistan; as per Indus Basin Treaty; has become the Bone of Contention and ignition point for water wars with India.
As population increase, demand for food, water and energy follow suit. Therefore, we may infer that, the relationship of Demand & Supply is directly proportion to population increase. As more and more mouths are added each year, the burden of providing food & water to these hungry added souls become more resource demanding and steeper.
Water Footprint of Crops in Pakistan
The demand for more food produces increased demand for Agricultural products which produces increased demands for inputs i.e. water, fertilizer and seed. Unfortunately the Water Footprint of Crops in Pakistan, compared to Global Average, show that Pakistan uses more water for production of almost all crops (Table- I).

[ 204 ] 6th International Water Conference Proceedings
Table 1. Water Footprint of Major &Some Minor Crops of Pakistan
Category CropAverage (M3KG-1)
Global Pakistan
Cereals
Wheat 1.79 0.95Maize 1.20 1.23Barley 1.40 2.45
Sorghum 2.98 4.80Millet 4.40 4.70
Oil
Soybean 2.11 5.96Groundnut 2.73 8.30Rapeseed 2.56 3.31Sunflower 3.31 4.30
SugarSugar Beat 0.12 0.50Sugar Cane 0.20 0.38
FruitCitrus 0.60 0.90
Banana 0.78 3.48Grapes 0.59 2.59
Cotton Cotton 9.31 16.08
VegetablesPotato 0.27 0.23Tomato 0.21 0.86Cabbage 0.27 0.30
Tea Tea 8.71 16.35Tobacco Tobacco 3.84 1.14
(Source: Adapted Table 2).
Water Prone Economy
The input factors for increased food demand This results in creation of Agro Based Water Prone Fragile Economy which can be summed up:
Pakistan has the world’s fourth highest rate of water use. Its water intensity rate – The amount of water, in cubic meters, used per unit of GDP – is the world’s highest. This suggest that NO country’s economy is more water intense than Pakistan’s.

6th International Water Conference Proceedings [ 205 ]
To address the Food – Energy – Water Nexus, the existing state of agricultural productivity; in view of depleting water resources and increased energy demands from industry and home; needs Revision of Agricultural practices and adaption of Revolutionary modern methods for crop production in the country. Already Pakistan is facing extremely high water stress and is Ranked/Placed in 14th Place in the Extremely Stressed Group of Countries in order of Severity.
The current precarious state of depleting water resources in Pakistan can better be understood as reported:
The country’s water availability has reduced to 935 cubic metres per capita (per person per year) from 5,260 cubic metre per capita in the last 70 years .If an effective strategy is not chalked out to conserve water, it will further fall to 860 cubic metres per capita. Experts believe that in 2040, it is expected to decline to 500 Cubic Metre.
The continued perilous, dangerous and extreme State of Per Capita Water Availability in the country is highlighted in Fig.1. It shows that Pakistan became Water Stress country around 1991 and in another 10 years reached close to Water Scarcity. Further declines in water availability will push Pakistan to Absolute Water Scarcity.
Fig.1. Pakistan’s Declining Water Levels
India’s Stranglehold
The total area constituting the Indus Basin is 1,120,000 KM². This is shared by four countries:Pakistan, India, China and Afghanistan. The proportions of Basin share is 47% for Pakistan which constitutes 65% of its total area. 39% for India constituting 14% of its total area. 8% for
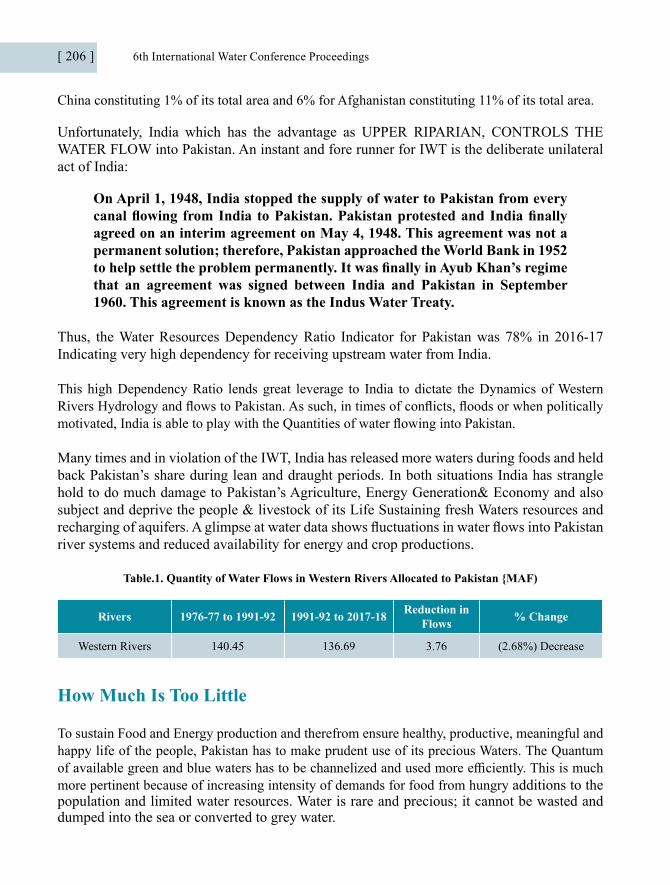
[ 206 ] 6th International Water Conference Proceedings
China constituting 1% of its total area and 6% for Afghanistan constituting 11% of its total area.
Unfortunately, India which has the advantage as UPPER RIPARIAN, CONTROLS THE WATER FLOW into Pakistan. An instant and fore runner for IWT is the deliberate unilateral act of India:
On April 1, 1948, India stopped the supply of water to Pakistan from every canal flowing from India to Pakistan. Pakistan protested and India finally agreed on an interim agreement on May 4, 1948. This agreement was not a permanent solution; therefore, Pakistan approached the World Bank in 1952 to help settle the problem permanently. It was finally in Ayub Khan’s regime that an agreement was signed between India and Pakistan in September 1960. This agreement is known as the Indus Water Treaty.
Thus, the Water Resources Dependency Ratio Indicator for Pakistan was 78% in 2016-17 Indicating very high dependency for receiving upstream water from India.
This high Dependency Ratio lends great leverage to India to dictate the Dynamics of Western Rivers Hydrology and flows to Pakistan. As such, in times of conflicts, floods or when politically motivated, India is able to play with the Quantities of water flowing into Pakistan.
Many times and in violation of the IWT, India has released more waters during foods and held back Pakistan’s share during lean and draught periods. In both situations India has strangle hold to do much damage to Pakistan’s Agriculture, Energy Generation& Economy and also subject and deprive the people & livestock of its Life Sustaining fresh Waters resources and recharging of aquifers. A glimpse at water data shows fluctuations in water flows into Pakistan river systems and reduced availability for energy and crop productions.
Table.1. Quantity of Water Flows in Western Rivers Allocated to Pakistan {MAF)
Rivers 1976-77 to 1991-92 1991-92 to 2017-18 Reduction in Flows % Change
Western Rivers 140.45 136.69 3.76 (2.68%) Decrease
How Much Is Too Little
To sustain Food and Energy production and therefrom ensure healthy, productive, meaningful and happy life of the people, Pakistan has to make prudent use of its precious Waters. The Quantum of available green and blue waters has to be channelized and used more efficiently. This is much more pertinent because of increasing intensity of demands for food from hungry additions to the population and limited water resources. Water is rare and precious; it cannot be wasted and dumped into the sea or converted to grey water.

6th International Water Conference Proceedings [ 207 ]
Unfortunately the Number of Dams and other storage facilities and infrastructures in the country is not adequate. Pakistan has only 3 large Dams, 85 small Dams, 19 Barrages, 44 Canals System, 12 Interlink Canals, and more than 107000 Watercourses. The total length of these Canals is more than 56000 Km, Length of Watercourse is 1.6 Million Km. and, Irrigated Area is 36 Million Acres. Yet the capacity of these storage and networks is not enough and on an average 39.4 MAF of Blue Water is allowed to drain into the sea.The Economic value of this Blue Water; drained every year; is estimated to be USD 70 Billion which is more than 3 times the Foreign Reserves of Pakistan.
For survival we have to examine &understand threadbare the relationship between Population, Food (crop) and Water. For, without water both man and plant will not survive. Unfortunately sweet water depletion is not only threatened by Population growth but also by increasing pollution and saltwater intrusion. It is estimated that about 36% of the ground water is classified as highly saline. The water requirements for food production or Water-Food Nexus can best be understood vide Fig.2.
Fig.2. Cubic Meters of Water Required for Production of One Ton Produce
Source: Adapted Fig.3.20, Pakistan’s Water Economy Running Dry, WB
There are two food items (Beef and Sugar) for whose production huge quantities of water is required. Therefore, to conserve water and survive, we have to make changes in our food and water consumptive mix. A sub-set of life style change can be to Substitute Beef with vegetables &poultry and reduced cane sugar consumption. Surely by adapting life style changes Pakistan can save water; this aspect is brought out by simple Arithmetic of Water.
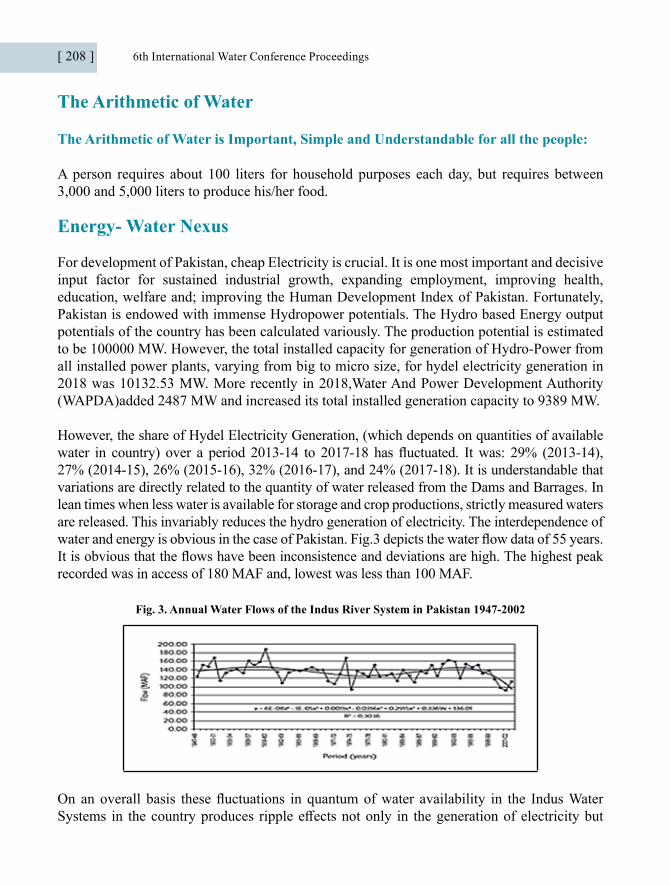
[ 208 ] 6th International Water Conference Proceedings
The Arithmetic of Water
The Arithmetic of Water is Important, Simple and Understandable for all the people:
A person requires about 100 liters for household purposes each day, but requires between 3,000 and 5,000 liters to produce his/her food.
Energy- Water Nexus
For development of Pakistan, cheap Electricity is crucial. It is one most important and decisive input factor for sustained industrial growth, expanding employment, improving health, education, welfare and; improving the Human Development Index of Pakistan. Fortunately, Pakistan is endowed with immense Hydropower potentials. The Hydro based Energy output potentials of the country has been calculated variously. The production potential is estimated to be 100000 MW. However, the total installed capacity for generation of Hydro-Power from all installed power plants, varying from big to micro size, for hydel electricity generation in 2018 was 10132.53 MW. More recently in 2018,Water And Power Development Authority (WAPDA)added 2487 MW and increased its total installed generation capacity to 9389 MW.
However, the share of Hydel Electricity Generation, (which depends on quantities of available water in country) over a period 2013-14 to 2017-18 has fluctuated. It was: 29% (2013-14), 27% (2014-15), 26% (2015-16), 32% (2016-17), and 24% (2017-18). It is understandable that variations are directly related to the quantity of water released from the Dams and Barrages. In lean times when less water is available for storage and crop productions, strictly measured waters are released. This invariably reduces the hydro generation of electricity. The interdependence of water and energy is obvious in the case of Pakistan. Fig.3 depicts the water flow data of 55 years. It is obvious that the flows have been inconsistence and deviations are high. The highest peak recorded was in access of 180 MAF and, lowest was less than 100 MAF.
Fig. 3. Annual Water Flows of the Indus River System in Pakistan 1947-2002
On an overall basis these fluctuations in quantum of water availability in the Indus Water Systems in the country produces ripple effects not only in the generation of electricity but
6th International Water Conference Proceedings [ 209 ]
also on industries that use energy for production of value added products both for domestic consumptions and exports. In the long run the implications of these variations will have adverse effects on the overall life of the Dam and Ancillary Structures and also in the storage capacity of water due to silting.
Table.1. Quantity of Water Flows in Western Rivers Allocated to Pakistan {MAF)
Rivers 1976-77 to 1991-92 1991-92 to 2017-18 Reduction in Flows % Change
Western Rivers 140.45 136.69 3.76 (2.68%) Decrease
How Much Is Too Little
To sustain Food and Energy production and therefrom ensure healthy, productive, meaningful and happy life of the people, Pakistan has to make prudent use of its precious Waters. The Quantum of available green and blue waters has to be channelized and used more efficiently. This is much more pertinent because of increasing intensity of demands for food from hungry additions to the population and limited water resources. Water is rare and precious; it cannot be wasted and dumped into the sea or converted to grey water.
Unfortunately the Number of Dams and other storage facilities and infrastructures in the country is not adequate. Pakistan has only 3 large Dams, 85 small Dams, 19 Barrages, 44 Canals System, 12 Interlink Canals, and more than 107000 Watercourses. The total length of these Canals is more than 56000 Km, Length of Watercourse is 1.6 Million Km. and, Irrigated Area is 36 Million Acres. Yet the capacity of these storage and networks is not enough and on an average 39.4 MAF of Blue Water is allowed to drain into the sea. The Economic value of this Blue Water; drained every year; is estimated to be USD 70 Billion which is more than 3 times the Foreign Reserves of Pakistan.
Increased Pollutions and Sea Water Intrusion
For Survival we have to examine & understand threadbare the relationship between Population, Food (crop) and Water. For, without water both man and plant will not survive. Unfortunately sweet water depletion is not only threatened by Population growth but also by increasing pollution and saltwater intrusion. It is estimated that about 36% of the ground water is now classified as highly saline.
Lifestyle Changes for Survival
The water requirements for food production or Water-Food Nexus can best be understood vide Fig.2. There are two food items (Beef and Sugar) for whose production huge quantities of water is required. Therefore, to conserve water and survive, we have to make changes in
[ 210 ] 6th International Water Conference Proceedings
our food and water consumptive mix. A sub-set of life style change can be to Substitute Beef with vegetables & poultry and reduced cane sugar consumption. Surely by adapting life style changes Pakistan can save water; this aspect is brought out by simple Arithmetic of Water.
The Arithmetic of Water
The Arithmetic of Water is Important, Simple and Understandable for all the people:
A person requires about 100 liters for household purposes each day, but requires between 3,000 and 5,000 liters to produce his/her food.
Improve Land and Water Productivity
Pakistani’s major issues are also related to Land Productivity and Water Use. More specifically Pakistan’s crop yield per hectare is one of the lowest levels in the world.
Pakistan Produces:
• 3.1 tons of wheat from one hectare, which is just 38% of the 8.1 tons produced in France – the world’s best productivity.
• 2.5 tons of cotton per hectare, which is 52% of the 4.8 tons produced in China.• 63.4 Sugarcane tons per hectare, which is 51% of the 125.1 tons in Egypt• 4.6 tons maize per hectare, which is 41% of the 11.1 tons that France is producing.• In the case of rice crop, Pakistan produces 2.7 tons from every hectare, which is merely
29% of the 9.2 tons per hectare in the US.• Hard Days are ahead. We have to make every effort for Survival and Sustenance.
Whatever little each one of us make to save water, will added up.• Qatra, Qatra, Dariya Banta Hai (Drop by drop river is formed).
6th International Water Conference Proceedings [ 211 ]
1. Introduction
The growing public interest in water issues have triggered a national water debate and many questions related to water governance. Despite growing awareness about water insecurity, the response from the government and the public at large is least matching to the severity of the issue. A complete lack of awareness amongst the public about the impending threat of water scarcity and the huge wastage of sweet water; excessive watering of crops is endemic with total disregard for efficiency and conservation. The paper provides a debate regarding the issue of water pricing both for urban consumer and the farmers (rural consumer) and access the impact on efficiency and productivity of this precious resource for a semi-arid country.
2. Historic Perspective
Pakistan is a country of 122 Million people with approximately 60% population living in rural areas. Before the partition of Indian subcontinent irrigation department was one of the most profitable and productive section of the government. Land revenue functionaries were very efficient and farmers never complained about non-availability or malfunctioning of irrigation authorities. That indicates that water pricing at that time was effective and equitable. In the last 70 years an efficient Irrigation department has been transformed into a least productive and one of the corrupt departments of the government. This deterioration in performance encourages a kind of irresponsible behaviour in rural areas about the importance of water as a least valued commodity. The political interference in controlling the surface water, further weakening the performance of irrigation departments in all the provinces, especially after the 18th amendment the absolute control has been shifted provincial governments run by varied political parties. The situation calls for rapid legal and developmental interventions on
Challenges and Impacts of Water Pricing in Pakistan
Dr. Asif Saeed KhanEconomist, Auckland New ZealandE-mail address: [email protected]

[ 212 ] 6th International Water Conference Proceedings
efficient management of the country’s water resources and their cost-effective and equitable distribution.
On the other hand, urbanization is expanding at a rapid speed and big urban centres demands a secure water supply either from surface water or from ground water. However, the urban water supply authorities are working without any long-term policy directions and mostly incapable to meet the secure water supplies to big urban centres. Improving urban water management by increasing system efficiency and reducing non-revenue water through adequate investments in all the urban water supply authorities. The main issues to address are drinking water demand, sewage disposal, handling of wastewater and industrial effluents. The time has come to promote behavioural changes to reduce wastage of water by raising public awareness through media campaigns and incorporating water conservation lessons in syllabi/curricula at primary, secondary and tertiary levels.
3. What is water pricing?
Water pricing is a means of exercising a public policy about water. Water prices have been steadily rising in the past years due to the high demand and the fact that water quality has deteriorated and demands additional processing before it is provided to consumers. To safeguard a sustainable water supply, besides the pricing considerations for water, communities must finance the establishment of water and sanitation infrastructures that will guarantee uninterrupted supply and an acceptable water quality. However, water utilities are natural monopolies, they are regulated and reduce production and charge excessive prices. The peculiar factor with these regulated authorities is that they encourage their customers to buy less of their product (Jaeger et al., 2013). This is not the case for other businesses, which encourage customers to buy as much as possible and then they increase their profits by economies of scale. This indicates sub-optimal management practices in the garb of welfare maximization rather than sustainable viability in growth and development (Grafton, 2017). Moreover, in the developing countries least progress has been made toward efficient water pricing in agriculture sector compared to urban and industrial sectors. Agriculture water is still heavily subsidized, transmitting distorted messages to farmers and ultimately cause huge water use inefficiencies.
In many countries, policymakers face the dilemma of how to respond to increasing physical water scarcity—the decline in water supply per capita (Falkenmark et al., 1989; Jaeger et al., 2013). The traditional focus on supply-based ‘solutions’ to water scarcity and investing only in water supply infrastructure is an insufficient response to the demand- and supply-side causes of water scarcity (Grafton, 2017). To cost-effectively manage spatial and intertemporal trade-offs across alternative uses, policymakers must consider a wide range of options beyond maintaining or investing in water supplies. these policy options include, but are not limited to, demand-based water conservation measures, such as water pricing, and the evaluation of water values across alternative uses to identify and resolve water misallocations (Grafton et al., 2017).

6th International Water Conference Proceedings [ 213 ]
4. There are four issues highlights water pricing:
First, the dichotomies between price and value, and costs, are defined to explain the paradox of water pricing: the price of water almost never equals its value and rarely covers its cost. Second, the dilemmas of water pricing are highlighted across efficiency and equity, objectives for water pricing, and the instruments available to decision-makers.
Third, the challenges of decision-making should be evaluated and illustrated in relation to water pricing.
Fourth, an adaptive process is needed that includes participatory assessment of risks and options to guide water-pricing decision-making.
The above said issues are appropriately described by Adam Smith in the diamond-water paradox (Smith, 2007). Water is essential for life, has a high value in use but commands a low market price; jewellery diamonds, which are luxury goods, have a low use value but command a high market price. The difference in price is explained by dichotomies between economic value, price, and cost. This ‘paradox’ holds just as true today, more than 200 years after it was popularized by Smith.
5. Water Pricing challenges in Pakistan
The canal system, which has been in operation for more than 100 years, is believed to have become too obsolete to cater for the needs of modern agriculture and is, therefore, in desperate need for rehabilitation. But resource-poor Pakistan cannot undertake the rehabilitation work on its own and must depend on foreign loans or at least ensure full recovery of annual operation and maintenance (O and M) expenditures [Chaudhiy (1985); Duane (1975) and Hotes (1984)]. There is also a growing realisation on the part of the government, as well as the donors, that past investment in irrigation has not paid the expected returns mainly due to the sub-optimal and often wasteful utilisation of existing irrigation facilities. Farmers are faced with unreliable and inadequate water supply due to an inflexible and highly inefficient irrigation water delivery system. Surface irrigation is a public sector activity and is heavily subsidised since water rates are abysmally low, thus putting an enormous fiscal drain on national exchequer. Apart from generating investment funds, the cost recovery, with higher water charges, would also lead to greater water-use efficiency and an equitable income distribution at the farm level [Chaudhry (1985) and Hotes (1984)]. Can this all be accomplished by simply raising water charges? The paradox of water pricing based on price, value, and cost.
A review of water pricing literature reveals that a variety of methods for pricing water have been developed over time. These methods differ in their implementation, the institutions they require, and the information on which they are based [Tsur and Dinar (1997)]. A wide range of literature addresses irrigation water management in general and water pricing in particular
[ 214 ] 6th International Water Conference Proceedings
[Rhodes and Sampath (1988); Cummings and Nercissiantz (1992); Le Moigne, et al (1992); Sampath (1992); Small and Carruthers (1991); Shah (1993); Plasquellec, Burt, and Wolter (1994); Tsur and Dinar (1995)]. Several studies [Rhodes and Sampath (1988); Sampath (1992); and Dinar and Subramanian (1997)] focus on water pricing methods practised in various countries. These methods include volumetric, output, input, per unit area, tiered pricing, two-part tariffs, betterment levy and water markets. The best water price is a price that reflects opportunity costs or is marginal cost based, but it is hard to implement. Two-part tariff pricing ensures cost recovery and is a more realistic immediate objective from the point of view of financial viability of water distribution system. The most common method used to charge for irrigation water is reported to have been the average cost based. Marginal costs are more relevant but full marginal cost pricing has never been recommended anywhere in the water sector since the situation of increasing average cost frequently prevails in water development projects [Dinar and Subramanian (1997)].
The second dilemma of water pricing is highlighted across efficiency and equity, objectives for water pricing, and the instruments available to policy makers. Pricing of water may affect allocation considerations by various users. Efficiency of water use is attainable whenever the pricing method affects the demand for irrigation water. The volumetric, output, input tiered, and two-part tariff schemes all satisfy this condition and can achieve efficiency, though the type of efficiency (short or long run, first or second best) vary from one method to the other Dinar and Subramanian (1997). These methods also differ in the amount and type of information, and the administrative cost needed in their implementation. Pricing schemes that do not influence water input directly, such as per unit area fee, lead to inefficient allocation. Such methods, however, are in general easier to implement and administer and they require a modest amount of information. Concerning equity performance, the extent to which water pricing methods can affect income redistribution is rather limited. Farm income disparities are due mainly to such factors as farm size and location, and soil quality, but not to water (or other input) prices. When farmers are per-hectare identical in production, face the same prices, and not affected by quantity quotas on inputs or outputs, the income distribution profile under most water pricing methods is proportional to the initial farm size distribution profile. Since measures of income inequality are not sensitive to proportional shifts in income, inequality is due solely to the farm size inequality and is independent of the pricing method or water rates used Dinar (1997). For a water pricing scheme to influence income distribution, it must involve certain quantity quota rules. This lend some support to the view that income redistribution policies should not be carried out via water prices Seagraves and Easter, (1983); not because it involves wrongdoing but because water prices serve as a poor means to reduce income inequality. However, pricing schemes that involve water quota rules can reduce income inequality. Thus, the dilemma of water pricing is inconclusive and serves as ineffective tool to reduce income inequality in Pakistan.
The challenges of decision-making in relation to water pricing, and search for an adaptive process which includes participatory assessment of risks and options to guide an effective

6th International Water Conference Proceedings [ 215 ]
pricing decision in Pakistan. Within the pricing structure, focus needs to be on raising “Abiana” rates within agriculture and tariffs within domestic and industrial sector to bring them at par with the cost required to operate and maintain the water supply system. Besides, it would help in encouraging a more rationale use of water. At the same time, regulatory policies are needed to ensure sustainability of underground aquifers. Within the domestic and industrial sectors, proper provision of water connections to households and industrial units, along with metering devices, is also crucial to regulate the quantity consumed and charge rates accordingly. This would also regulate the use of water and reduce issues of equity between households. In addition, the unregulated use of groundwater needs to be contained.
6. Conclusion
The widening gap between water demand and supply has now become a major social and economic concern that requires a comprehensive national policy to deal with new challenges of water scarcity in both urban and rural areas of Pakistan. The focus of suggested reforms in the National Water Policy is not on improving efficiency in water consumption and management. Moreover, Pakistan’s regulatory institutions are lacking an effective capacity- building in modernizing water use practices. Efficient pricing of irrigation water has always been a key challenge for policy makers, recognizing that recovery of all costs may not be possible. Adequate pricing of water is considered desirable in a general economic sense to help in the efficient allocation of water, and in a financial sense to guarantee the fiscal sustainability of the higher quality water supply systems. Low pricing of water can result in major misallocation of water, waste of water resources, and fiscal deficit for the government agencies charged with water management responsibilities and thus may result in poor service delivery to the users. While devising water pricing policy, some of the parameters may be O&M needs of the system, costs associated with infrastructure rehabilitation, incentives for efficient use of water and simple tariff rate structure, and environmental considerations.
Thus, the way forward in estimating the value of water, includes critical reflection on societal objectives of poverty alleviation and food security and thus incorporate the net benefits from return flows and non-irrigation uses of water. However, as the current level of water fee (Abiana) charged is a portion of the O&M cost, there is a need to develop a methodology for estimation of full value of water. There is a need to develop strategy for costing and charging of water fee, so that rapid increase in Abiana and water fee may not affect the users adversely. Furthermore, inter-sectoral strategy is also needed for charging in different sub-sectors of water use. It is evident from the global experiences that raising water tariffs, levying effluent charges, and encouraging water markets can play significant roles in improving economic efficiency and environmental sustainability of water use. Therefore, a holistic approach is needed for the estimation of full cost of water and then a phase-wise strategy for charging of the water price.
[ 216 ] 6th International Water Conference Proceedings
References
Ahmad, Munir (2001) Agricultural Productivity Growth Differentials in Punjab, Pakistan: A District-level Analysis. The Pakistan Development Review 40:1, 1- 25.
AH, M, and D. Byerlee (2000) -Productivity Growth, and Resource Degradation in Pakistan’s Punjab: A Decomposition Analysis. A Draft for the World Bank. Washington, D.C.: The World Bank.
Battese, G. E., S. J. Malik, and M. A. Gill (1996) An Investigation of Technical Inefficiencies of Production of Wheat Farmers in Four Districts of Pakistan. Journal of Agricultural Economics 47: 1, 37-49.
Battese, G. E. (1997) A Note on the Estimation of Cobb-Douglas Production Function When Some Explanatory Variables Have Zero Values. Journal of Agricultural Economics 48:2.
Chaudhry, M. G., S. A. Majid, and G. M Chaudhry (1993) The Policy of Irrigation Water Pricing in Pakistan: Aims, Assessment and Needed Redirections. The Pakistan Development Review 32:4, 809-821.
Chaudhry, M. G., and A. R. Kemal (1974) Wheat Production Under Alternative Production Functions. The Pakistan Development Review 13:2, 222-226.
Cummings, R. G., and Vahram Nercissiantz (1992) The Use of Water Pricing as a Means for Enhancing Water Use Efficiency in Irrigation: Case Studies in Mexico and the United States. Natural Resources Journal 32 (Fall), 731-55.
Dinar, A., and Ashok Subramanian (1997) Water Pricing Experiences: An International Perspective. Washington, D. C: World Bank. (A World Bank Technical Paper No. 386.)
Dinar, A., M. W. Rosegrant, and Meinzen-Dick (1997) Water Allocation Mechanisms: Principles and Examples. World Bank and IFPRI. (Policy Research Working Paper 1779.)
Easter, K. William, Mark W. Rosegrant, and Ariel Dinar (1998) The Future of Water Markets: A Realistic Perspective. In K. William Easter, Mark W. Rosegrant and Arial Dinar (eds.) Markets for Water: Potential and Performance. Norwell MA: Kluwaer Academic Publishers.
Hufbauer, G. C, and M. M. Akhtar (1970) The Determination of Water Rates. Lahore:Planning and Development Board.

6th International Water Conference Proceedings [ 217 ]
Le Moigne, Guy, Shawki Barghouti, Gershon Feder, Lisa Garbus, and Mei Xie, (eds.) (1992) Country Experiences with Water Resources Management: Economic, Institutional, Technological, and Environmental Issues. World Bank, Washington, D. C. (Technical Paper 175.)
Lewis, J. N. (1969) Criteria for Determination of Water Rates in West Pakistan. Lahore: Planning and Development Board. Shamim A. Sahibzada McGovern S. (1999) Two Part Pricing. Feature Article, AECgroup, Brisbane Regional Economy: September (through internet).
Musgrave, Warren F. (1997) Australia. In Ariel Dinar and Ashok Subramanium (eds.) Water Pricing Experiences: An International Perspective. World Bank, Washington, D.C. (Technical Paper No. 386.)
Narlove, Mark (1965) Estimation and Identification of Cobb-Douglas Production Function.Chicago.
Naqvi, S. N. H., A. R. Kemal, Rashid Aziz, and Associates (1982) The P. I.D. E Econometrics Model of Pakistan’s Economy (1959-60 to 1978-79). Islamabad: Pakistan Institute of Development Economics.
Naqvi, S. N. H., A. H. Khan, N. Khilji, and A. M. Ahmed (1983) The P.I.D.E. Macro-econometrics Model of Pakistan’s Economy, Volume I. Islamabad: Pakistan Institute of Development Economics.
Naqvi, S. N. H., and A. M. Ahmed (1986) The P.I.D.E. Macro-econometrics Model of Pakistan’s Economy (Preliminary Results Revised). Islamabad: Pakistan Institute of Development Economics.
Pakistan, Government of (1998) Prices of Major Agricultural Crops. Islamabad:Agricultural Prices Commission of Pakistan.
Pakistan, Government of (2001) Pakistan Economic Survey 2000-2001. Islamabad:Finance Division.
Plasquellec, H., Charles Burt, and H. W. Wolter (1994) Modern Water Control in Irrigation: Concepts, Issues, and Applications. World Bank, Washington, D.C. (Technical Paper 246.)
Rhodes, ü. К, and R. K. Sampath (1988) ttticiency, bquity, and Cost Recovery Implications of Water Pricing and Allocation Schemes in Developing Countries. Canadian Journal of Agricultural Economics 36, 103-17.
[ 218 ] 6th International Water Conference Proceedings
Sahibzada, Shamim A. (2002) Efficient Irrigation Water Development in Pakistan: Pricing Issues and Options. Unpublished Ph.D. Dissertation. Binghamton University, State University of New York.
Sampath, R. K. (1992) Issues in Irrigation Pricing in Developing Countries. World Development 20:7 “, 967-77.
Shah, Tushaar (1993) Groundwater Markets and Irrigation Development: PoliticalEconomy and Practical Policy. Bombay: Oxford University Press.
Abstract
The estimation of maximum flood discharge is important tool for design of hydraulic structures and hydrological safety measures. However, reliable prediction of extreme flood events in a region is an important challenge for hydrologist and engineers especially for a site with inadequate flood measurements. Among the various available approaches, envelope curves are effective approach for estimation of flood peaks in data scanty region like Chenab, Ravi and Sutlej river basins in Pakistan. Hence, envelope curves associated with regression models has been developed in current study to determine the flood peaks and estimation of upper bound. To perform the analysis on an average 50 years data of 11 gauging stations was collected from Irrigation Department, Government of Punjab. Moreover, the outcomes of flood frequency analysis (using Gumbel Extreme Value Type-I, Log Pearson Type-III and Log Normal) were plotted with corresponding catchment area to obtain Creager’s and Dicken’s outer envelope curves envelope curves for selected rives. The analysis resulted in a decreasing trend of peak discharge with respect to the increasing catchment area. This is because due to the fact that India being the upper riparian has built dams on these rivers and the drainage areas adjoining these rivers in Pakistan are subject to less precipitation. Furthermore, it was evident that the Creager’s Regional coefficient decreases from 2.65 to 0.87 and from 3.72 to 1.22 for 100 and 1000-year return period flood, from river Chenab to river Sutlej. Similarly, the Dicken’s regional coefficient decreases from 14.25 to 2.75 and from 19.75 to 3.81 for 100 and 1000-year return period flood, from river Chenab to River Sutlej. Consequently, the developed curves and models could be used for efficient, safe and precise hydraulic structures design in Chenab, Ravi and Sutlej river basins in Pakistan.
Development of Envelope Curve for Chenab, Ravi and Sutlej river basins and Estimation of Upper Bound
Muhammad Muneeb Khan1, 2,
[email protected] of Civil Engineering, University of Engineering and Technology, Lahore
6th International Water Conference Proceedings [ 219 ]
Keywords: Gumbel Extreme Value Distribution, Log-Pearson Type-3 Distribution, Log-Normal Distribution, Barrage, Bridges, Peak Discharge, Envelope Curves.
Correspondence: Muhammad Muneeb Khan (Email: [email protected])
1. I Ntroduction
The Design Flood can be estimated for Ungauged Catchments through Rational Approach, Empirical Equations and Envelope Curves, while for Gauged Catchments the Design Flood can be estimated through Frequency Analysis and Unit Hydrograph approach.
Various regression type equations relating to catchment area, river bed-slope and return periods to the flood peak discharge are available in the literature. Such relations are purely regional in nature. The formula holds good for the region only where the investigations were carried out. Among various types of empirical relations, Rational Formula is the most rational method of calculating peak discharge for small catchments. It can be considered as the representative of all other empirical relations. The formula is called rational because of the Units of the quantities considered being numerically consistent.
Attempts were made to correlate the peak discharge with the catchment area of a region under the assumption of fairly homogeneity in the hydrometeorological and basin characteristics. Investigators of various countries tried to develop and put forth curves correlating catchment area with peak discharges for the region under their study. Such curves are known as Envelope Curves in which a log-log paper is used to plot various drainage area () as abscissa against the corresponding discharges () as ordinate. A smooth curve enveloping all data points on the log-log plot should necessarily be a straight line.
Flood frequency analysis for the flood estimation of gauged catchment, considers the annual peak flows at a site for all the years. It gives only the magnitude of flood peak of desired recurrence interval but does not provide information about the complete hydrograph or the flood volume. Prediction of Flood Peaks from the flood data of recorded maximum series are reliable when analysis is carried out for return periods of less than the data length.
2. Review of Literature
Jarvis (1925) was a pioneer in the determination of envelope curves when formulating the maximum flood envelope curve for the United States from the analysis of 888 fluviometric stations. Later, Crippen and Bue (1977) and Crippen (1982) improved these curves by using data for the creation of other 17 curves and analyzing a total of 883 stations. Decades later,
[ 220 ] 6th International Water Conference Proceedings
Vogel et al. (2001) found out that the curves obtained by these authors were still valid for 740 monitoring stations from 1988 to 1994.
Creager et al. (1945) formulated another mathematical equation for the calculation of the envelope curves. This equation was obtained based on data from 760 stations, including 730 located in the United States and some others located in different countries. Since then, this equation, better known as ‘Creager’, has been widely used in many parts of the world (Kadoya, 1992, Ohnishi et al. 20014). Francou and Rodier (1967) also developed an equation, widely used in several countries.
Enzel et al. (1993) used Paleohydrology tools to estimate the maximum flows of rivers in Arizona and Utah over hundreds and thousands of years. Even with the increase in the observation period, the flows found did not exceed the maximum value of the discharges estimated by the curves generated from the historical data effectively measured for those basins. This fact, according to the authors, would confirm the hypothesis of the existence of a maximum physical value for floods. Castellarin et al. (2005) proposed a new methodology for the calculation of these curves, which was later improved by Castellarin (2007). The authors, besides creating a new type of curve, proposed the calculation of the probability of equality or exceedance for the maximum event values.
Bayazit and Onoz (2004) have developed envelope curves for different river basins in Turkey. They stated that envelope curves obtained by plotting the largest flood peaks versus the drainage area is a good idea in the actual estimation of flood discharges, with the methods associated with flood frequency analysis as well as Probable Maximum Food (PMF). They developed the envelope curve for the river basins within Turkey using the results associated with DSI (state hydraulic functions administration) study using the data input together until 1990. A curve for Turkey was developed while using recent data too, and then compared with the envelope curves for the world.
John and Crippen (1982) have stated that maximum flood experienced inside a region could be described with a graph (long-long-scale) on which maximum observed floods tends to be plotted against drainage area. An envelope curve covering all the plotted points has an upper bound value for the maximum observed floods. They developed envelope curves for 17 regions in the U.S.A and tend to eb described through equations. These curves don’t provide the actual frequency associated with flood since they’re developed based on observed flood, but inside the region to which they can apply, they provide evidence regarding the magnitude of flood which was occurred.
Matalas et al. (2007) stated that Envelope curves provide a summary of flood events occurred
6th International Water Conference Proceedings [ 221 ]

across a region, but their use is limited because of the inability to assign them exceedance likelihood. Analytical results are reported for the case whenever floods follow to a Gumbel or even Generalized Extreme Value distribution, and these results are contrasted along with those associated with previous research that searched for the estimation of exceedance probability associated with exceptionally large floods like the flood of record. A case study related to Flood of Records (FOR) as well as PMF discharges for 226 rivers across the United State of America, indicates that regular estimates of exceedance probability related to both PMF and FOR envelope curves can be acquired using the actual theoretical approach introduced right here.
Several other studies have evaluated the envelope curves as an estimator of maximum floods. Biondic et al. (2007) analyzed the maximum flows of the Danube River in Croatia and compared the results using Creager et al. (1945) and Francou and Rodier (1967) methodologies. They found the first methodology as the one with higher values, except for very small or very large basins. Campos-Aranda (2011) made a similar analysis in Mexico, using the two methodologies mentioned as well as the Lowry’s methodology, which was presented by Ramirez-Orozco et al. (2005). He concluded that the applicability of the curves is a function of the basin size.
In Turkey, Bayazit and Onoz (2004) used data from a study conducted by the DSI (State Hydraulic Work Administration) to obtain eight envelope curves applicable to the estimation of maximum floods in the country and compared their results with the ones developed in China and the United States. A similar study was conducted by Pegram and Parak (2004) in South Africa. In Germany, Guse et al. 2010 used the same methodology as well as the knowledge of the GEV (Generalized Extreme Value) probability distribution to obtain Maximum values of floods. In Pakistan, Ahsen et al. (2016) applied the envelope curves for the Indus and Jhelum rivers, proving the applicability of this methodology as a tool for estimating and comparing parameters for those values found in the Danube River.
3. Study Area
Study Area comprise of Chenab, Ravi and Sutlej river basins. Chenab river is a major river that flows in India and Pakistan, and is one of the 5 major rivers of the Punjab region. It rises in the upper Himalayas in the Lahaul and Spiti Districts of Himachal Pradesh, state, India, and flows through the Jammu region of Jammu and Kashmir into the plains of Punjab, Pakistan, before flowing into the Indus river near the city of Uch Sharif. The waters of the Chenab were allocated to Pakistan under the terms of the Indus Water Treaty 1967.
River Ravi is a Transboundary river crossing north-western India and eastern Pakistan. It is one of the six rivers of the Indus system in Punjab. The waters of Ravi are allocated to India under the Indus Water Treaty 1967. Sutlej River is the longest of the five rivers that flow
[ 222 ] 6th International Water Conference Proceedings
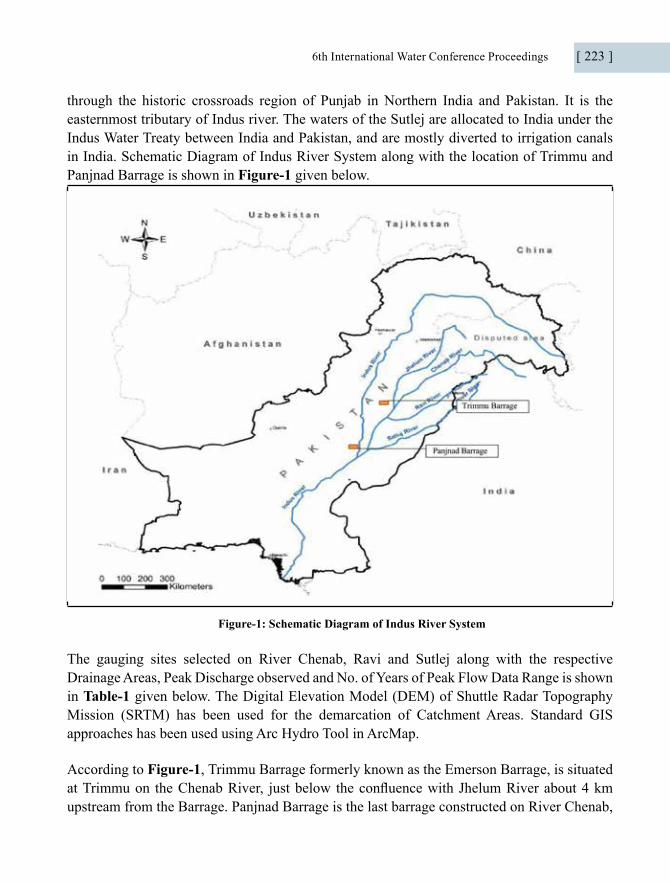
through the historic crossroads region of Punjab in Northern India and Pakistan. It is the easternmost tributary of Indus river. The waters of the Sutlej are allocated to India under the Indus Water Treaty between India and Pakistan, and are mostly diverted to irrigation canals in India. Schematic Diagram of Indus River System along with the location of Trimmu and Panjnad Barrage is shown in Figure-1 given below.
Figure-1: Schematic Diagram of Indus River System
The gauging sites selected on River Chenab, Ravi and Sutlej along with the respective Drainage Areas, Peak Discharge observed and No. of Years of Peak Flow Data Range is shown in Table-1 given below. The Digital Elevation Model (DEM) of Shuttle Radar Topography Mission (SRTM) has been used for the demarcation of Catchment Areas. Standard GIS approaches has been used using Arc Hydro Tool in ArcMap.
According to Figure-1, Trimmu Barrage formerly known as the Emerson Barrage, is situated at Trimmu on the Chenab River, just below the confluence with Jhelum River about 4 km upstream from the Barrage. Panjnad Barrage is the last barrage constructed on River Chenab,
6th International Water Conference Proceedings [ 223 ]
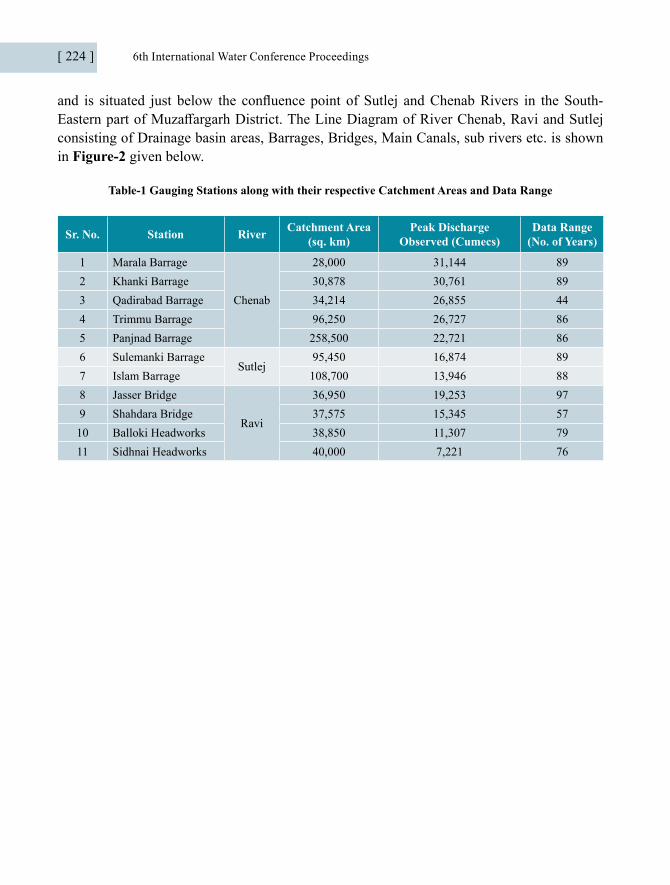
and is situated just below the confluence point of Sutlej and Chenab Rivers in the South-Eastern part of Muzaffargarh District. The Line Diagram of River Chenab, Ravi and Sutlej consisting of Drainage basin areas, Barrages, Bridges, Main Canals, sub rivers etc. is shown in Figure-2 given below.
Table-1 Gauging Stations along with their respective Catchment Areas and Data Range
Sr. No. Station River Catchment Area (sq. km)
Peak DischargeObserved (Cumecs)
Data Range (No. of Years)
1 Marala Barrage
Chenab
28,000 31,144 892 Khanki Barrage 30,878 30,761 893 Qadirabad Barrage 34,214 26,855 444 Trimmu Barrage 96,250 26,727 865 Panjnad Barrage 258,500 22,721 866 Sulemanki Barrage
Sutlej95,450 16,874 89
7 Islam Barrage 108,700 13,946 888 Jasser Bridge
Ravi
36,950 19,253 979 Shahdara Bridge 37,575 15,345 5710 Balloki Headworks 38,850 11,307 7911 Sidhnai Headworks 40,000 7,221 76
[ 224 ] 6th International Water Conference Proceedings
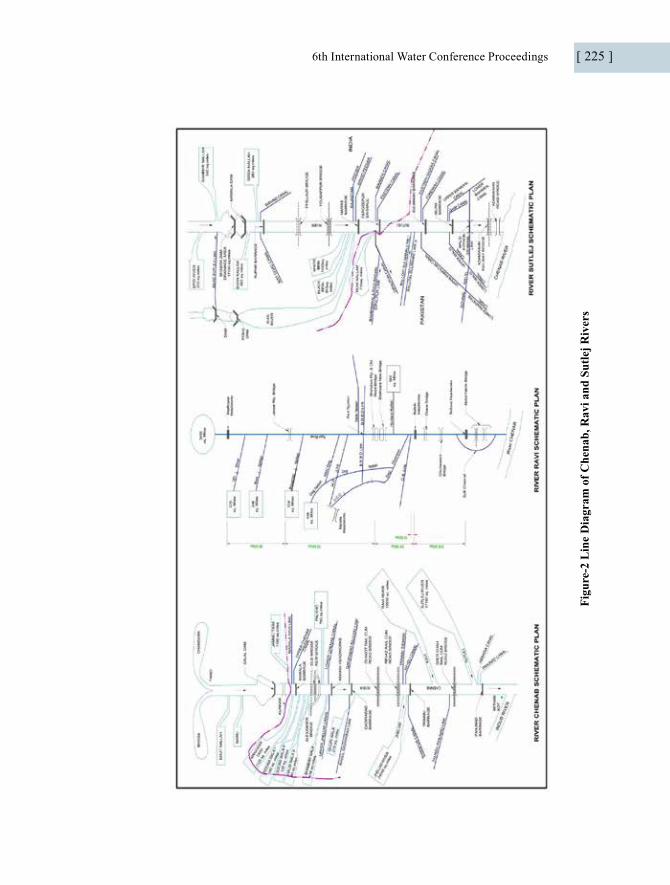
Figu
re-2
Lin
e D
iagr
am o
f Che
nab,
Rav
i and
Sut
lej R
iver
s
6th International Water Conference Proceedings [ 225 ]

4. Methodology
The annual peak flow data of the 11 No. Gauging stations for a period ranging from 44 years to 89 years (depending upon the data availability) was collected from Irrigation Department, Government of Punjab. The Frequency Analysis for the determination of Peak flow for 10, 50, 100, 1,000 and 10,000 years return period were estimated by using different frequency distributions. Three distributions (Gumbel Extreme Value Type-I, Log Pearson Type-III and Log Normal) were used for the estimation of discharges at different return periods. The Frequency Analysis was also performed by using Hyfran Plus software for results validation. The discharge values for different return periods estimated by flood frequency analysis and Hyfran Plus were approximately same. A brief description of the frequency distribution methods used for the frequency analysis is given below.
a. Gumbel Extreme Value Type-I Distribution
Extreme value Type-I distribution is also known as Gumbel distribution since Gumbel first introduced it in 1941 for Flood Frequency Analysis. The Gumbel probability distribution is widely used for the extreme value analysis of Hydrologic and Meteorological data like floods, maximum rainfalls and other events. The equation for Gumbel’s Distribution as well as to the procedure with a return period “T” is given as:
Where,
[ 226 ] 6th International Water Conference Proceedings
b. Log Pearson Type-III
For Log-Pearson Type-III Distribution, the series are first transferred to Logarithmic Scale. The mean, standard deviation and coefficient of skewness are computed from the log transferred series. The following equations are used for the frequency analysis.
Where “n” is the No. of year records. To compute flood of required return period “T”, find frequency factor “K” from Log-Pearson Type-III distribution Table (Annexed as Annexure-B & C) corresponding to return period “T” versus the skewness coefficient of the log transferred series. Knowing, σy , yavg and K and using Chow’s general equation, compute the event (YT), of desired return period “T” in Logarithmic scale. By taking antilog of YT evaluate XT which is the desired value of the event for the return period “T”.
c. Log Normal
In this distribution, logarithmic values of sample data are assumed to follow normal distribution. The distribution is same as Log Pearson Type-III when Cs. In log normal distribution Cv and Cs are related as Cs=3Cv+Cv
3. Chow (1964) derived the frequency factors for log normal distribution (Frequency Table annexed as Annexure-D) and the same has been used in the current studies.
DID and NAHRIM [7] had made a summary of the recommended frequency types based on various locations in the world. The summary is given in Table-2 shown below, from the table it can be seen the “Generalized Extreme Value” had been accepted throughout the world. The Extreme Value Distribution had been further subdivided into three forms called EVI (or Gumbel Distribution), EVII (or Fréchet Distribution) and EVIII (or Weibull Distribution).
6th International Water Conference Proceedings [ 227 ]

Table-2 Summary of the Recommended Frequency Types
Location Recommended Frequency Distribution No. of SitesUK (1999) GLO 98India (1999) GPA 93Indiana, USA (1997) LN3, GEV, LP3 1490Continental, USA (1996) LN3, GEV, LP3 19World (1995) GEV -Ontario-Quebec Canada (1997) GEV 183Saskatchewan Canada (1994) LN3, PE3 180Bangladesh (1993) GEV 31Australia (1993) GEV, GPA, LN3, LP3 61South Wester USA (1993) LN3, LN2, GEV, LP3 383N. Brunswick, Canada (1992) GEV 53Nova Scotia, Canada (1992) GEV 25New Zealand (1991) Rainfall EVI, EVII, GEV 275Central Victoria, Australia (1991) GEV 53Eastern, USA (1998) GEV 55
The Punjab Barrages has been rehabilitated and upgraded, and the design discharge for the 100-Year return period of these barrages have been evaluated by using the Gumbel Extreme Value Type-1 Distribution. Therefore, in our study, Gumbel Extreme Value Type-I Distribution has been selected as the most suitable distribution keeping in view of the nature of the Hydrological Data and the overall usage of Extreme Value Distribution all over the world in general and especially in Pakistan. The discharge values for 100 and 1000 years return period evaluated by Gumbel Extreme Value Type-I Distribution has been selected for the design discharge at the 11 No. Gauging Stations.
The discharge values evaluated for 10, 50, 100, 1,000 and 10,000 years return period using Gumbel Extreme Value Type-1, Log-Pearson Type-III and Log Normal Distribution for the 11 No. gauging stations has been given in Table-3.
[ 228 ] 6th International Water Conference Proceedings
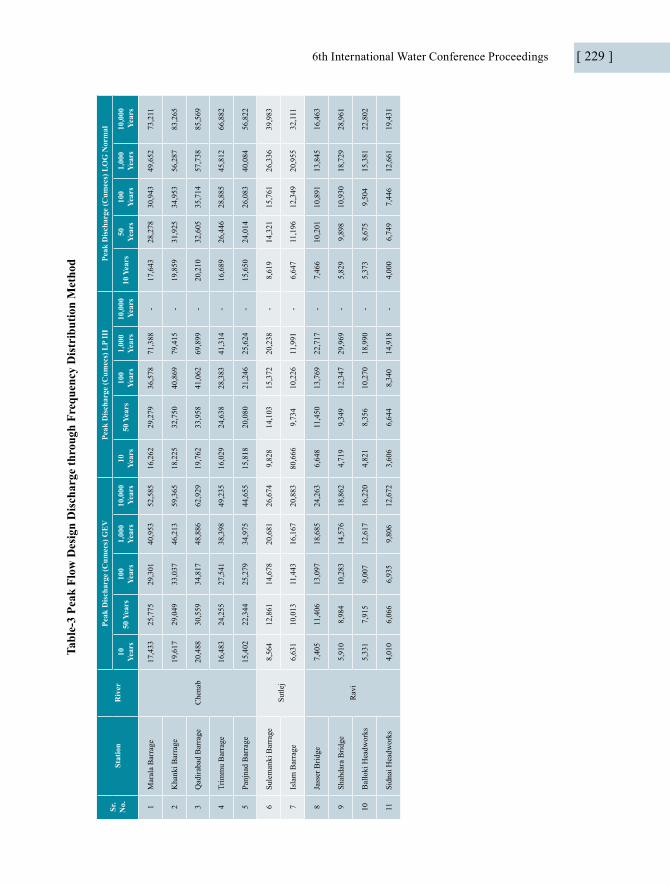
Tabl
e-3
Peak
Flo
w D
esig
n D
isch
arge
thro
ugh
Freq
uenc
y D
istr
ibut
ion
Met
hod
Sr.
No.
Stat
ion
Riv
erPe
ak D
isch
arge
(Cum
ecs)
GE
VPe
ak D
isch
arge
(Cum
ecs)
LP
III
Peak
Dis
char
ge (C
umec
s) L
OG
Nor
mal
10
Year
s50
Yea
rs10
0
Year
s1,
000
Ye
ars
10,0
00
Yea
rs10
Ye
ars
50 Y
ears
100
Ye
ars
1,00
0
Year
s10
,000
Y
ears
10 Y
ears
50
Year
s10
0
Year
s1,
000
Ye
ars
10,0
00
Yea
rs
1M
aral
a B
arra
ge
Che
nab
17,4
3325
,775
29,3
0140
,953
52,5
8516
,262
29,2
7936
,578
71,3
88-
17,6
4328
,278
30,9
4349
,652
73,2
11
2K
hank
i Bar
rage
19,6
1729
,049
33,0
3746
,213
59,3
6518
,225
32,7
5040
,869
79,4
15-
19,8
5931
,925
34,9
5356
,287
83,2
65
3Q
adira
bad
Bar
rage
20,4
8830
,559
34,8
1748
,886
62,9
2919
,762
33,9
5841
,062
69,8
99-
20,2
1032
,605
35,7
1457
,738
85,5
69
4Tr
imm
u B
arra
ge16
,483
24,2
5527
,541
38,3
9849
,235
16,0
2924
,638
28,3
8341
,314
-16
,689
26,4
4628
,885
45,8
1266
,882
5Pa
njna
d B
arra
ge15
,402
22,3
4425
,279
34,9
7544
,655
15,8
1820
,080
21,2
4625
,624
-15
,650
24,0
1426
,083
40,0
8456
,822
6Su
lem
anki
Bar
rage
Sutle
j8,
564
12,8
6114
,678
20,6
8126
,674
9,82
814
,103
15,3
7220
,238
-8,
619
14,3
2115
,761
26,3
3639
,983
7Is
lam
Bar
rage
6,63
110
,013
11,4
4316
,167
20,8
8380
,666
9,73
410
,226
11,9
91-
6,64
711
,196
12,3
4920
,955
32,1
11
8Ja
sser
Brid
ge
Rav
i
7,40
511
,406
13,0
9718
,685
24,2
636,
648
11,4
5013
,769
22,7
17-
7,46
610
,201
10,8
9113
,845
16,4
63
9Sh
ahda
ra B
ridge
5,91
08,
984
10,2
8314
,576
18,8
624,
719
9,34
912
,347
29,9
69-
5,82
99,
898
10,9
3018
,729
28,9
61
10B
allo
ki H
eadw
orks
5,33
17,
915
9,00
712
,617
16,2
204,
821
8,35
610
,270
18,9
90-
5,37
38,
675
9,50
415
,381
22,8
02
11Si
dnai
Hea
dwor
ks4,
010
6,06
66,
935
9,80
612
,672
3,60
66,
644
8,34
014
,918
-4,
000
6,74
97,
446
12,6
6119
,431
6th International Water Conference Proceedings [ 229 ]

4.1 Development of Envelope Curves
Envelope curve is also used for the estimation of flood which has occurred in a certain size of the catchment. Envelope curve obtained by plotting the largest flood peaks versus the drainage area provides an upper bound value of flood within a certain catchment.
Creager’s Curve
Creager’s Curve (Creager et. Al 1945) is frequently used in Hydrologic Evaluations. An increase in flood wave diffusion with drainage area effectively means that the peak discharge per unit of drainage area will be inversely related to the drainage area as first discovered by Jarvis and Creager in 1945. According to Creager Formula the flood peak discharge “Q” is given by:
Q = 46 Cc A0.894×A-0.048 Equation-2
Where, Q = Maximum Flow rate in (Cumecs), Cc = Creager’s Regional Coefficient. and A = Drainage Area, (km2).
Dicken’s Formula (1865)
Dicken proposed the following form of the catchment flood peak relation for the regions of Central and North India Catchments.
Q = C A3/4 Equation-3
Where A is the catchment area in km2, Q is the maximum flood discharge (Cumecs) and C is a coefficient varying from 2.8 to 28 depending upon the location of the place.
For the development of envelope curve, available flood peak data from 11 No. gauging stations on river Chenab, Sutlej and Ravi were collected and plotted on a log-log graph paper as flood peaks versus catchment area. This resulted in a scattered data plot. Then plotted points were enveloped by a smooth curve using linear relationship between peak discharge and area of the respective catchment.
5. Results & Discussions
The Combine envelope curve of Chenab, Ravi and Sutlej river basins is shown in Figure-3. This envelope curve shows the relationship between catchment area and maximum peak discharge observed at each gauging stations of Chenab, Ravi and Sutlej river basins. The outer
[ 230 ] 6th International Water Conference Proceedings
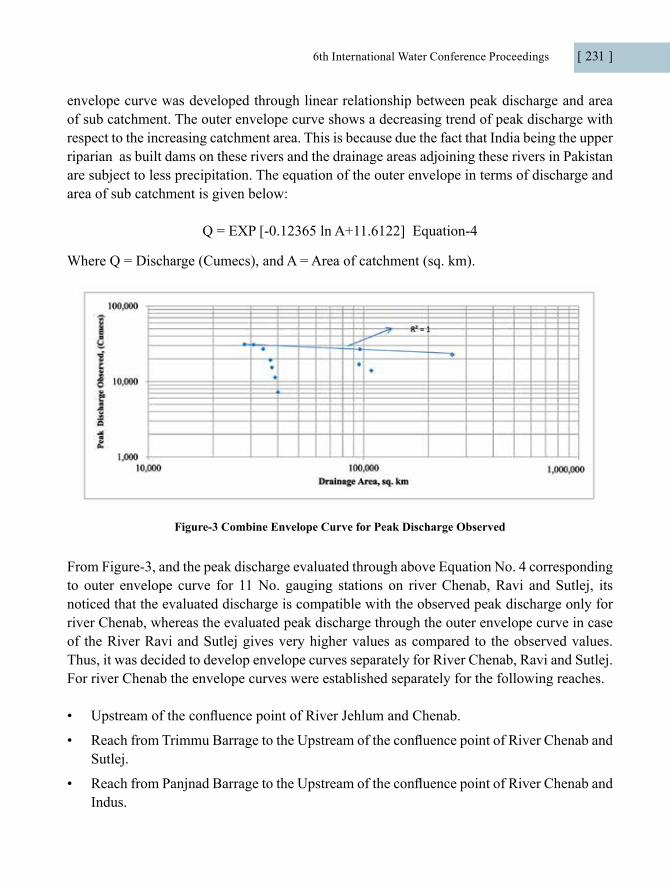
envelope curve was developed through linear relationship between peak discharge and area of sub catchment. The outer envelope curve shows a decreasing trend of peak discharge with respect to the increasing catchment area. This is because due the fact that India being the upper riparian as built dams on these rivers and the drainage areas adjoining these rivers in Pakistan are subject to less precipitation. The equation of the outer envelope in terms of discharge and area of sub catchment is given below:
Q = EXP [-0.12365 ln A+11.6122] Equation-4
Where Q = Discharge (Cumecs), and A = Area of catchment (sq. km).
Figure-3 Combine Envelope Curve for Peak Discharge Observed
From Figure-3, and the peak discharge evaluated through above Equation No. 4 corresponding to outer envelope curve for 11 No. gauging stations on river Chenab, Ravi and Sutlej, its noticed that the evaluated discharge is compatible with the observed peak discharge only for river Chenab, whereas the evaluated peak discharge through the outer envelope curve in case of the River Ravi and Sutlej gives very higher values as compared to the observed values. Thus, it was decided to develop envelope curves separately for River Chenab, Ravi and Sutlej. For river Chenab the envelope curves were established separately for the following reaches.
• Upstream of the confluence point of River Jehlum and Chenab.
• Reach from Trimmu Barrage to the Upstream of the confluence point of River Chenab and Sutlej.
• Reach from Panjnad Barrage to the Upstream of the confluence point of River Chenab and Indus.
6th International Water Conference Proceedings [ 231 ]
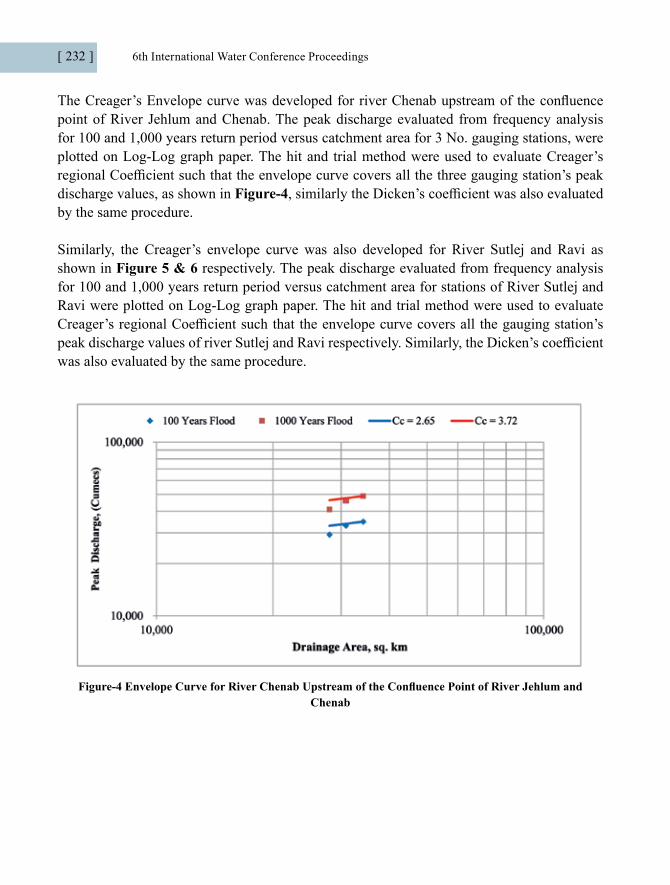
The Creager’s Envelope curve was developed for river Chenab upstream of the confluence point of River Jehlum and Chenab. The peak discharge evaluated from frequency analysis for 100 and 1,000 years return period versus catchment area for 3 No. gauging stations, were plotted on Log-Log graph paper. The hit and trial method were used to evaluate Creager’s regional Coefficient such that the envelope curve covers all the three gauging station’s peak discharge values, as shown in Figure-4, similarly the Dicken’s coefficient was also evaluated by the same procedure.
Similarly, the Creager’s envelope curve was also developed for River Sutlej and Ravi as shown in Figure 5 & 6 respectively. The peak discharge evaluated from frequency analysis for 100 and 1,000 years return period versus catchment area for stations of River Sutlej and Ravi were plotted on Log-Log graph paper. The hit and trial method were used to evaluate Creager’s regional Coefficient such that the envelope curve covers all the gauging station’s peak discharge values of river Sutlej and Ravi respectively. Similarly, the Dicken’s coefficient was also evaluated by the same procedure.
Figure-4 Envelope Curve for River Chenab Upstream of the Confluence Point of River Jehlum and Chenab
[ 232 ] 6th International Water Conference Proceedings
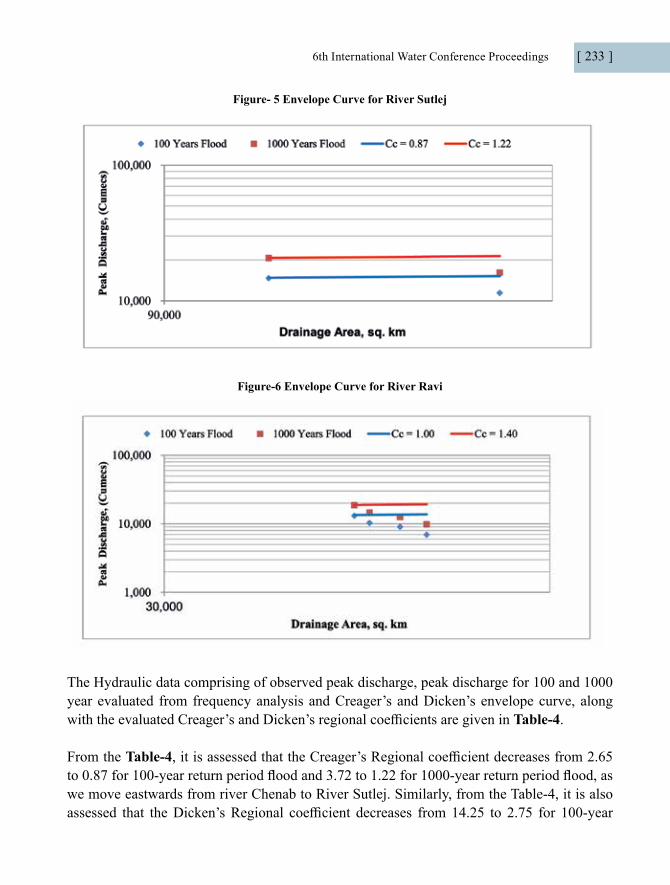
Figure- 5 Envelope Curve for River Sutlej
Figure-6 Envelope Curve for River Ravi
The Hydraulic data comprising of observed peak discharge, peak discharge for 100 and 1000 year evaluated from frequency analysis and Creager’s and Dicken’s envelope curve, along with the evaluated Creager’s and Dicken’s regional coefficients are given in Table-4.
From the Table-4, it is assessed that the Creager’s Regional coefficient decreases from 2.65 to 0.87 for 100-year return period flood and 3.72 to 1.22 for 1000-year return period flood, as we move eastwards from river Chenab to River Sutlej. Similarly, from the Table-4, it is also assessed that the Dicken’s Regional coefficient decreases from 14.25 to 2.75 for 100-year
6th International Water Conference Proceedings [ 233 ]

return period flood and from 19.75 to 3.81 for 1000-year return period flood, as we move eastwards from river Chenab to River Sutlej.
The Creager’s Coefficient from reach Trimmu Barrage to Panjnad Barrage evaluated as 1.62 and 2.26 for 100 and 1,000-year return period flood. While the Creager’s Coefficient from reach Panjnad Barrage to Upstream of the confluence point of river Panjnad and Indus, evaluated as 1.10 and 1.67 for 100 and 1,000-year return period flood.
The Dicken’s Regional Coefficient from reach Trimmu Barrage to Panjnad Barrage evaluated as 5.05 and 7.05 for 100 and 1,000-year return period flood. While the Dicken’s Regional Coefficient from reach Panjnad Barrage to Upstream of the confluence point of river Panjnad and Indus, evaluated as 2.25 and 3.06 for 100 and 1,000-year return period flood.
Table-4 Design Discharge Estimation through Creager and Dicken Envelope Curve
Sr. No
Station River Catchment Area
sq. km.
Peak Discharge Observed (Cumecs)
Peak Discharge from Frequency
Analysis
Outer Envelope by Regression Analysis for
Observed Peak
Discharge
Creager’s Regional
Coefficient “Cc”
Creager’s Discharge (Cumecs)
Dicken’s Regional
Coefficient “C”
Dicken’s Discharge (Cumecs)
100 Years
1000 Years
100 Years
1000 Years
100 Years
1000 Years
100 Years
1000 Years
100 Years
1000 Years
1 Marala Barrage
Chenab
28,000 31,144 29,301 40,953 31,133
2.65 3.72
32,958 46,266
14.25 19.75
30,845 42,750
2 Khanki Barrage 30,878 30,761 33,037 46,213 30,759 33,861 47,533 33,194 46,005
3 Qadirabad Barrage 34,214 26,855 34,817 48,886 30,371 34,820 48,879 35,848 49,684
4 Trimmu Barrage Chenab 96,250 26,727 27,541 38,398 26,725 1.62 2.26 27,584 38,481 5.05 7.05 27,596 38,525
5 Panjnad Barrage Chenab 258,500 22,721 25,279 34,975 23,652 1.10 1.67 23,146 35,140 2.25 3.06 25,795 35,081
6 Sulemanki BarrageSutlej
95,450 16,874 14,678 20,681 26,7530.87 1.22
14,785 20,7332.75 3.81
14,934 20,690
7 Islam Barrage 108,700 13,946 11,443 16,167 26,326 15,233 21,361 16,463 22,809
8 Jasser Bridge
Ravi
36,950 19,253 13,097 18,685 30,084
1.00 1.40
13,414 18,780
5.00 7.00
13,325 18,656
9 Shahdara Bridge 37,575 15,345 10,283 14,576 30,021 13,474 18,864 13,494 18,892
10 Balloki Headworks 38,850 11,307 9,007 12,617 29,898 13,594 19,032 13,836 19,371
11 Sidnai Headworks 40,000 7,221 6,935 9,806 29,790 13,700 19,179 14,142 19,799
[ 234 ] 6th International Water Conference Proceedings
Conclusions
Envelope curves for maximum floods of the Chenab, Ravi and Sutlej river basins can be used for flood estimation studies in these river basins because it seems to provide more realistic discharge estimation as compare to empirical formulas which are applicable only for small catchments. This study shall be highly useful for the determination of design flood discharge for the hydraulic design of bridges and cross drainage works across river Chenab, Ravi and Sutlej. Consequently, the developed curves and models could be used for efficient, safe and precise hydraulic structures design in Chenab, Ravi and Sutlej river basins in Pakistan.
List of References:
1. Bayazit, M., Onoz, B., 2004. “Envelope Curves for Maximum Floods in Turkey, 927-931.
2. Biondic, D., Barbalic, D., Petras, J., 2007. Creager and Francou Rodier envelope curves for extreme floods in the Danube River basin in Croatia, Pub Kick-off meeting held in Brasilia, proceedings, November, 2002, 221-227.
3. Castellarin, A., 2007. Probabilistic envelope curves for design flood estimation at ungauged sites. Water Resources Research, 43.
4. Guse, B., Thieken, A., Merz, B., 2007. Estimation of Upper bounds using envelope curves. Disaster reduction in climate Change, 15, Karlsruhe University.
5. John, R., Crippen, B., 1982. Envelope Curves for Extreme Flood Events, Journal of the Hydraulic Division, 108, 1208-1212.
6. Matalas, C., Vogel, R., Castellarin, A., 2007. An assessment of exceedance probabilities of envelope curves.
7. DID and NAHRIM (2003). “Frequency Analysis of rainstorm and Flood”. In a seminar, “Frequency Analysis of Flood and low flows and Introduction to MASMA concept, at Kuching, Sarwak, 15-17 July, 2003.
6th International Water Conference Proceedings [ 235 ]

Annexure-AGumbel Frequency Table
n YN σN n YN σN n YN σN
8 0.4843 0.9043 35 0.5403 1.1285 64 0.5533 1.1793
9 0.4902 0.9288 36 0.5410 1.1313 66 0.5538 1.1814
10 0.4952 0.9497 37 0.5418 1.1339 68 0.5543 1.1834
11 0.4996 0.9676 38 0.5424 1.1363 70 0.5548 1.1854
12 0.5035 0.9833 39 0.5430 1.1388 72 0.5552 1.1873
13 0.5070 0.9972 40 0.5436 1.1413 74 0.5557 1.1890
14 0.5100 1.0095 41 0.5442 1.1436 76 0.5561 1.1906
15 0.5128 1.0206 42 0.5448 1.1458 78 0.5565 1.1923
16 0.5157 1.0316 43 0.5453 1.1480 80 0.5569 1.1938
17 0.5181 1.0411 44 0.5458 1.1499 82 0.5572 1.1953
18 0.5202 1.0493 45 0.5463 1.1519 84 0.5576 1.1967
19 0.5220 1.0566 46 0.5468 1.1538 86 0.5580 1.1980
20 0.5236 1.0628 47 0.5473 1.1557 88 0.5583 1.1994
21 0.5252 1.0696 48 0.5477 1.1574 90 0.5586 1.2007
22 0.5268 1.0754 49 0.5481 1.1590 92 0.5589 1.2020
23 0.5283 1.0811 50 0.5485 1.1607 94 0.5592 1.2032
24 0.5296 1.0864 51 0.5489 1.1623 96 0.5595 1.2044
25 0.5309 1.0915 52 0.5493 1.1638 98 0.5598 1.2055
26 0.5320 1.0961 53 0.5497 1.1653 100 0.5600 1.2065
27 0.5332 1.1004 54 0.5501 1.1667 150 0.5646 1.2253
28 0.5343 1.1047 55 0.5504 1.1681 200 0.5672 1.2360
29 0.5353 1.1086 56 0.5508 1.1696 250 0.5688 1.2429
30 0.5362 1.1124 57 0.5511 1.1708 300 0.5699 1.2479
31 0.5371 1.1159 58 0.5515 1.1721 400 0.5714 1.2545
32 0.5380 1.1193 59 0.5518 1.1734 500 0.5724 1.2588
33 0.5388 1.1226 60 0.5521 1.1747 750 0.5738 1.2651
34 0.5396 1.1255 62 0.5527 1.1770 1000 0.5745 1.2685
[ 236 ] 6th International Water Conference Proceedings

Annexure-B
Frequency Factor for the Pearson Type-III Distribution with Positive Skew Coefficients(After Water Resources Council, 1967)
Recurrence interval (Years)
1.0101 1.0526 2 5 10 25 50 100 200 1000
Percent chance (z)
Skew coeffi-cient Cs 99 95 50 20 10 4 2 1 0.5 0.10
3.0 -0.667 -0.665 -0.396 0.420 1.180 2.278 3.152 4.051 4.970 7.250
2.9 -0.690 -0.688 -0.390 0.440 1.195 2.277 3.134 4.013 4.904 —
2.8 -0.714 -0.711 -0.384 0.460 1.120 2.275 3.114 3.973 4.847 —
2.7 -0.740 -0.736 -0.376 0.479 1.224 2.272 3.092 3.932 4.783 —
2.6 -0.769 -0.762 -0.368 0.499 1.238 2.267 3.071 3.889 4.718 —
2.5 -0.799 -0.790 -0.360 0.518 1.250 2.262 3.048 3.845 4.652 6.600
2.4 -0.832 -0.819 -0.351 0.537 1.262 2.256 3.023 3.800 4.584 —
2.3 -0.867 -0.850 -0.341 0.555 1.274 2.248 2.997 3.753 4.415 —
2.2 -0.905 -0.882 -0.330 0.574 1.284 2.240 2.970 3.705 4.444 6.200
2.1 -0.946 -0.914 -0.332 0.592 1.294 2.230 2.942 3.656 4.372 —
2.0 -0.990 -0.949 -0.307 0.609 1.302 2.219 2.912 3.605 4.298 5.910
1.9 -1.037 -0.984 -0.294 0.627 1.310 2.207 2.881 3.535 4.223 —
1.8 -1.087 -1.020 -0.282 0.643 1.318 2.193 2.848 3.499 4.147 5.660
1.7 -1.140 -1.056 -0.268 0.660 1.324 2.179 2.815 3.444 4.069 —
1.6 -1.197 -1.093 -0.254 0.667 1.329 2.163 2.780 3.388 3.990 5.390
1.5 -1.256 -1.131 -0.240 0.690 1.333 2.146 2.743 3.330 3.910 —
1.4 -1.318 -1.168 -0.225 0.705 1.337 2.128 2.706 3.271 3.828 5.110
1.3 -1.383 -1.206 -0.210 0.719 1.339 2.108 2.666 3.211 3.745 —
1.2 -1.449 -1.243 -0.195 0.732 1.340 2.087 2.626 3.149 3.661 4.820
1.1 -1.518 -1.280 -0.180 0.745 1.341 2.066 2.585 3.087 3.575 —
1.0 -1.588 -1.317 -0.164 0.758 1.340 2.043 2.542 3.022 3.489 4.540
0.9 -1.660 -1.353 -0.148 0.769 1.339 2.018 2.498 2.957 3.401 4.395
0.8 -1.733 -1.388 -0.132 0.780 1.336 1.993 2.453 2.891 3.312 4.250
0.7 -1.806 -1.423 -0.116 0.790 1.333 1.967 2.407 2.824 3.223 4.105
0.6 -1.880 -1.458 -0.099 0.800 1.328 1.939 2.359 2.755 3.132 3.960
0.5 -1.955 -1.491 -0.083 0.808 1.323 1.910 2.311 2.686 3.041 3.815
0.4 -2.029 -1.524 -0.066 0.816 1.317 1.880 2.261 2.615 2.949 3.670
0.3 -2.104 -1.550 -0.050 0.824 1.309 1.849 2.211 2.544 2.856 3.525
0.2 -2.178 -1.586 -0.033 0.830 1.301 1.818 2.159 2.472 2.763 3.380
0.1 -2.252 -1.616 -0.017 0.836 1.292 1.785 2.107 2.400 2.670 3.255
0.0 -2.326 -1.645 0.000 0.842 1.282 1.751 2.054 2.326 2.576 3.090
6th International Water Conference Proceedings [ 237 ]

Annexure-C
Frequency Factor for the Pearson Type-III Distribution with Negative Skew Coefficients(After Water Resources Council, 1967)
Recurrence interval (Years)
1.0101 1.0526 2 5 10 25 50 100 200 1000
Percent chance (z)
Skew coeffi- cient Cs 99 95 50 20 10 4 2 1 0.5 0.10
0.0 -2.326 -1.645 0.000 0.842 1.282 1.751 2.054 2.326 2.576 3.090
-0.1 -2.400 -1.673 0.017 0.846 1.270 1.716 2.000 2.252 2.482 2.950
-0.2 -2.472 -1.700 0.033 0.850 1.258 1.680 1.945 2.178 2.388 2.810
-0.3 -2.544 -1.726 0.050 0.853 1.245 1.643 1.890 2.104 2.294 2.675
-0.4 -2.615 -1.750 0.066 0.855 1.231 1.606 1.834 2.029 2.201 2.540
-0.5 -2.686 -1.774 0.083 0.856 1.216 1.567 1.777 1.955 2.108 2.400
-0.6 -2.755 -1.797 0.099 0.857 1.200 1.528 1.720 1.880 2.016 2.275
-0.7 -2.824 -1.819 0.116 0.857 1.183 1.488 1.663 1.806 1.926 2.150
-0.8 -2.891 -1.839 0.132 0.856 1.166 1.448 1.606 1.733 1.837 2.035
-0.9 -2.957 -1.858 0.148 0.854 1.147 1.407 1.549 1.660 1.749 1.910
-1.0 -3.022 -1.877 0.164 0.852 1.121 1.366 1.492 1.588 1.664 1.880
-1.1 -3.087 -1.894 0.180 0.848 1.107 1.324 1.435 1.518 1.581 —
-1.2 -3.149 -1.910 0.195 0.844 1.086 1.282 1.379 1.449 1.501 —
-1.3 -3.211 -1.925 0.210 0.838 1.064 1.240 1.324 1.383 1.424 —
-1.4 -3.271 -1.938 0.225 0.832 1.041 1.198 1.270 1.318 1.351 1.465
-1.5 -3.330 -1.951 0.240 0.825 1.018 1.157 1.217 1.256 1.282 —
-1.6 -3.388 -1.962 0.254 0.817 0.994 1.116 1.166 1.197 1.216 —
-1.7 -3.444 -1.972 0.268 0.808 0.970 1.075 1.116 1.140 1.155 —
-1.8 -3.499 -1.981 0.282 0.799 0.945 1.035 1.069 1.187 1.097 1.130
-1.9 -3.553 -1.989 0.294 0.788 0.920 0.996 1.023 1.037 1.044 —
-2.0 -3.605 -1.996 0.307 0.777 0.895 0.959 0.980 0.990 0.995 —
-2.1 -3.656 -2.001 0.319 0.765 0.869 0.923 0.939 0.946 0.949 —
-2.2 -3.705 -2.006 0.330 0.752 0.844 0.888 0.900 0.905 0.907 0.910
-2.3 -3.753 -2.009 0.341 0.739 0.819 0.855 0.864 0.867 0.869 —
-2.4 -3.800 -2.011 0.351 0.725 0.795 0.823 0.830 0.832 0.833 —
-2.5 -3.845 -2.012 0.360 0.711 0.771 0.793 0.798 0.799 0.800 —
-2.6 -3.889 -2.013 0.368 0.696 0.747 0.764 0.7968 0.769 0.769 —
-2.7 -3.932 -2.012 0.376 0.681 0.724 0.738 0.740 0.740 0.741 —
-2.8 -3.973 -2.010 0.384 0.666 0.702 0.712 0.714 0.714 0.714 —
-2.9 -4.013 -2.007 0.390 0.651 0.681 0.683 0.689 0.690 0.690 —
-3.0 -4.051 -2.003 0.396 0.636 0.660 0.666 0.666 0.666 0.667 3.090
[ 238 ] 6th International Water Conference Proceedings
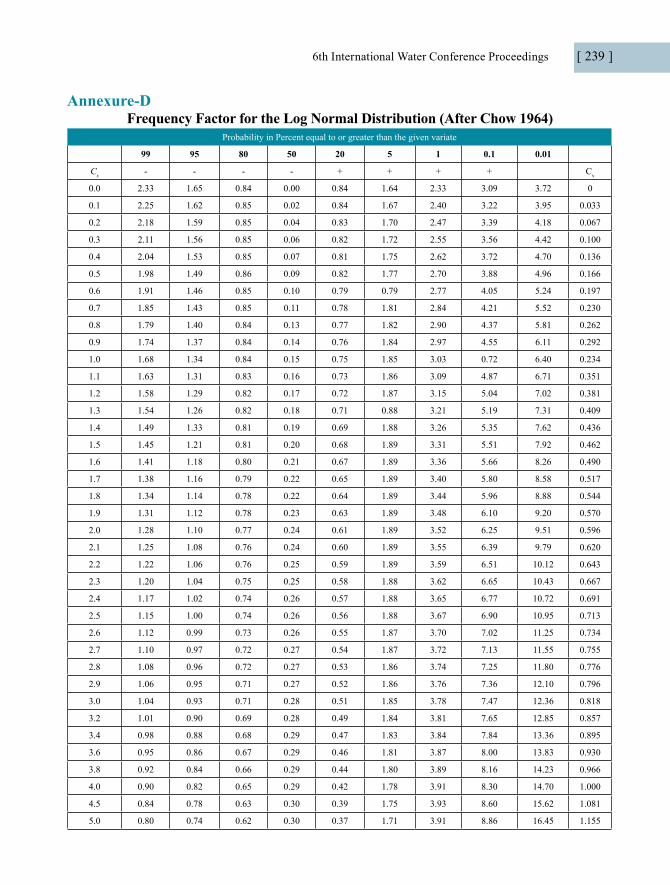
Annexure-DFrequency Factor for the Log Normal Distribution (After Chow 1964)
Probability in Percent equal to or greater than the given variate
99 95 80 50 20 5 1 0.1 0.01
Cs - - - - + + + + Cv
0.0 2.33 1.65 0.84 0.00 0.84 1.64 2.33 3.09 3.72 0
0.1 2.25 1.62 0.85 0.02 0.84 1.67 2.40 3.22 3.95 0.033
0.2 2.18 1.59 0.85 0.04 0.83 1.70 2.47 3.39 4.18 0.067
0.3 2.11 1.56 0.85 0.06 0.82 1.72 2.55 3.56 4.42 0.100
0.4 2.04 1.53 0.85 0.07 0.81 1.75 2.62 3.72 4.70 0.136
0.5 1.98 1.49 0.86 0.09 0.82 1.77 2.70 3.88 4.96 0.166
0.6 1.91 1.46 0.85 0.10 0.79 0.79 2.77 4.05 5.24 0.197
0.7 1.85 1.43 0.85 0.11 0.78 1.81 2.84 4.21 5.52 0.230
0.8 1.79 1.40 0.84 0.13 0.77 1.82 2.90 4.37 5.81 0.262
0.9 1.74 1.37 0.84 0.14 0.76 1.84 2.97 4.55 6.11 0.292
1.0 1.68 1.34 0.84 0.15 0.75 1.85 3.03 0.72 6.40 0.234
1.1 1.63 1.31 0.83 0.16 0.73 1.86 3.09 4.87 6.71 0.351
1.2 1.58 1.29 0.82 0.17 0.72 1.87 3.15 5.04 7.02 0.381
1.3 1.54 1.26 0.82 0.18 0.71 0.88 3.21 5.19 7.31 0.409
1.4 1.49 1.33 0.81 0.19 0.69 1.88 3.26 5.35 7.62 0.436
1.5 1.45 1.21 0.81 0.20 0.68 1.89 3.31 5.51 7.92 0.462
1.6 1.41 1.18 0.80 0.21 0.67 1.89 3.36 5.66 8.26 0.490
1.7 1.38 1.16 0.79 0.22 0.65 1.89 3.40 5.80 8.58 0.517
1.8 1.34 1.14 0.78 0.22 0.64 1.89 3.44 5.96 8.88 0.544
1.9 1.31 1.12 0.78 0.23 0.63 1.89 3.48 6.10 9.20 0.570
2.0 1.28 1.10 0.77 0.24 0.61 1.89 3.52 6.25 9.51 0.596
2.1 1.25 1.08 0.76 0.24 0.60 1.89 3.55 6.39 9.79 0.620
2.2 1.22 1.06 0.76 0.25 0.59 1.89 3.59 6.51 10.12 0.643
2.3 1.20 1.04 0.75 0.25 0.58 1.88 3.62 6.65 10.43 0.667
2.4 1.17 1.02 0.74 0.26 0.57 1.88 3.65 6.77 10.72 0.691
2.5 1.15 1.00 0.74 0.26 0.56 1.88 3.67 6.90 10.95 0.713
2.6 1.12 0.99 0.73 0.26 0.55 1.87 3.70 7.02 11.25 0.734
2.7 1.10 0.97 0.72 0.27 0.54 1.87 3.72 7.13 11.55 0.755
2.8 1.08 0.96 0.72 0.27 0.53 1.86 3.74 7.25 11.80 0.776
2.9 1.06 0.95 0.71 0.27 0.52 1.86 3.76 7.36 12.10 0.796
3.0 1.04 0.93 0.71 0.28 0.51 1.85 3.78 7.47 12.36 0.818
3.2 1.01 0.90 0.69 0.28 0.49 1.84 3.81 7.65 12.85 0.857
3.4 0.98 0.88 0.68 0.29 0.47 1.83 3.84 7.84 13.36 0.895
3.6 0.95 0.86 0.67 0.29 0.46 1.81 3.87 8.00 13.83 0.930
3.8 0.92 0.84 0.66 0.29 0.44 1.80 3.89 8.16 14.23 0.966
4.0 0.90 0.82 0.65 0.29 0.42 1.78 3.91 8.30 14.70 1.000
4.5 0.84 0.78 0.63 0.30 0.39 1.75 3.93 8.60 15.62 1.081
5.0 0.80 0.74 0.62 0.30 0.37 1.71 3.91 8.86 16.45 1.155
6th International Water Conference Proceedings [ 239 ]

Abstract:
Pesticide contamination is one of the many dynamics contributing to polluting our freshwater sources. Traditional agricultural practices cause various toxic chemical to enter into our water bodies through run off and contaminate them. Water is main component of food chain and presence of Lambda Cyhalothrin pose a threat to human health too. This study aimed at exposing fish to similar toxic environment and analyzing its impacts through acute toxicity bioassay. After acclimatizing fish, acute bioassay was performed in semi-static tank by exposing common carp to various concentrations of lambda cyhalothrin. Behavioral alterations and die off rate of fish was observed at 24hr time interval according to OECG (Organisation for Economic Co-operation and Development) guidelines. After repeated experiments, LD50 value of common carp for LC was found to be at 1.25µg/l. In addition to this, physicochemical parameters of tank water were also determined at 24,48, 72 and 96 hours. Furthermore, temperature fluctuated within 96 hours exposure, pH increased after every 24 hour while DO and turbidity decreased during the same time interval.
Keywords: Lambda cyhalothrin, acute toxicity, common carp, LD-50.
1. Introduction:
Pyrethroid is the class of pesticides that are widely used because of their efficient insecticide potential. Lambda cyhalothrin and Cypermethrin; the pesticides that belong to the class pyrethroid, are considered micropoisonous to mammals and highly toxic to aquatic organisms (Oudou HC et al, 2002). These pyrethroids are more toxic to mammals and birds at low than high temperature and are over 100 times more toxic to fish due to not only their high sensitivity
Assessment of Biotoxicity Potential of Lambda Cyhalothrin on Common Carp
Mehwish Niaz, Imran Hashmi*Institute of Environmental Sciences and EngineeringSchool of Civil and Environmental EngineeringNational University of Sciences and TechnologySector H12, Islamabad. [email protected]; *Corresponding Author: [email protected]
[ 240 ] 6th International Water Conference Proceedings

to toxic agents via gills but also insufficient hydraulic enzymes for pyrethroids in fish. (Aydin et al, 2005). Its excessive employment may lead to contamination and environmental degradation.
The major routes of transport of insecticides and other pesticides from crop fields to adjacent streams are via surface run-off, drains, ground-water, wind-drift and atmospheric deposition. (Norum et al, 2010). This stresses the need for the development of a sustainable method to counter such contamination. In natural water systems, lambda-cyhalothrin and cypermethrin can be degraded by photochemical processes, which have proven to be an efficient method to transform persistent and biodegradable poorly toxic substances. (Minero et al. 2007). Fish components can be used for environmental monitoring because they can accumulate the contaminants directly from diet and water (Chaudhry and Jabeen et al, 2011; Kafilzadeh et al, 2012).
2. Materials and Methods:
2.1. Study Site:
This study is concerned with the water quality assessment of Rawal Lake (Fig. 1). It is the major source of water supply for Rawalpindi city and is fed by the Kurang River and connecting streams. In 2017, high contamination in Rawal lake was reported that caused massive killing of fish. (DAWN 16 July, 2017).
Figure 1. Map of study area
6th International Water Conference Proceedings [ 241 ]

2.1. Experimental Organism:
Common carp (Cyprinus carpio) was selected as the test specie for this study (Fig 2). It was sourced from Punjab Hatchery Rawal Town, Islamabad. The fish were transported from hatchery to Environmental Toxicology Laboratory (IESE, NUST) in aerated polythene bags and immediately transferred to the glass aquaria upon arrival. They were then allowed to settle for a period of 7 days in order to get them acclimatized to the laboratory conditions. The glass aquaria (3ft by 2 ft) were equipped with air pumps for regular supply of oxygen. Fish was fed regularly during acclimatization period while feeding was stopped during experiments.
Figure 2. Common carp inside glass aquaria
2.2. Morphometric Parameters:
Two different sizes of fish were used for these two phased experiments. For acute toxicity assay, fingerlings/juvenile fish were used while for UV light exposure, small fish were used. The details are tabulated in Table 1.
Morphometric Parameters Toxicity Assay UV exposure
Fish Length (cm) 5.08 12
Fish Weight (g) 10 39
Table 1. Detailed morphometric parameters of experimental organism

2.3. Chemicals:
Lambda Cyhalothrin (C23H19C1F3NO3) is a synthetic insecticide belonging to the class pyrethroid. Its chemical name is α-cyno-3-(2-chloro-3,3,3-trifluoro-1-propenyl)-2,2-dimethyl cyclopropanecarboxylate, with a CAS registry number 91465-08-6. The commercial formulation of Lambda cyhalothrin named “Libra” was used in the experiments, having 25mg/l of LCT. The chemical formula of lambda cyhalothrin is depicted in Figure 3.
Figure 3. Chemical formula of Lambda Cyhalothrin
2.4. Experiment:
2.4.1. Acute Toxicity Assay:
In first phase of laboratory experiments, acute toxicity assay was performed. The experiments were carried out according to the OECD guidelines in order to ascertain LD-50 value of common carp for Lambda Cyhalothrin. The principle of this test is to expose fish to the test chemical for a time period of 96 hrs in order to observe changes in behavior and appearance of fish. The aim of this procedure is to ascertain that particular concentration which gives a 50% mortality rate of the exposed fish, hence LD-50. A total of six different concentrations of LCT were selected from literature, which were 0.25, 0.5, 0.75, 1.0, 1.25 and 1.5µg/l. Then, healthy and even sized juvenile fish were selected randomly and introduced in each tank. These experiments were conducted in 8 different sets of batches with varying concentrations of Lambda Cyhalothrin over a period of 96 hrs.
In second phase, the fish were given UV light exposure with the help of a UV lamp (11W) at the LD-50 concentration of LCT to evaluate the resulting changes. A solution of Lambda Cyhalothrin (commercial formulation) was prepared in distilled water. Two fish tanks were prepared with 30 liters of water each and 1.25µg/l LCT. One tank was given the exposure of UV light for 20 mins while the other was kept as control. After the exposure, a total of 12 fish were added in both tanks. The exposed tank was then covered with a wooden box in order to

avoid any interferences of sunlight. These experiments were conducted over a period of 96 hours as done for any toxicity assay. The water samples were withdrawn and analyzed after every 24 hrs to monitor changes in the physicochemical parameters.
3. Result and Discussion:
3.1. Acute Toxicity Assay:
In acute toxicity assay, no mortality was observed and the fish remained healthy and normal in control tank. However, in treated tanks, varying mortality rate was recorded. The batches were repeated five times in order to attain a consolidated result. The following graph (Fig. 4) shows a comparison of different die off rates according to varying concentrations. Based on these observations, LD-50 value for LCT was calculated as 1.25µg/l.
Figure 4. Graph depicting LD-50 of Lambda Cyhalothrin
3.1. Physicochemical parameters:
For complete understanding of effects of LCT degradation on water quality parameters, it was imperative to have a baseline data. To accomplish this, the physicochemical parameters of tap water were analyzed before conducting UV exposure experiments. A total of seven parameters of tap water were investigated according to standard protocols which are listed in detail in Table 2.
[ 244 ] 6th International Water Conference Proceedings

Parameter Value Instrument/Method used
pH 8.28 Multimeter, 156 Hach sension, Germany
Dissolved Oxygen (mg/l) 8.5 Winkler Method
Electrical Conductivity (µS/cm) 896 720 WTW probe
Temperature (ºC) 28.5 720 WTW probe
Turbidity (NTU) 0.71 2100P, portable Turbidity meter, Hach
Chlorine (mg/l) 0 Colorimeter (Hanna HI 96734 )
Hardness (as MgCO3 and CaCO3) 306 EDTA Titration Method
Table 2. Standard Protocol employed for physicochemical properties
In UV exposure experiments, the water samples were drawn after every 24 hours from both control and exposed tanks and physicochemical parameters were evaluated according to the standard protocol. The results are summarized in Table 3.
Control Tank (Time hrs) Experimental Tank (Time hrs)
0 24 48 72 0 24 48 72
pH 8.70 8.90 9.08 9.12 8.66 9.03 9.06 9.09
DO 10.8 10 8.8 8.8 11 10.5 9.8 8
EC 888 840 782 766 869 837 829 829
Table 3. Variation of physicochemical properties over 96 hours.
Keeping this in view, UV experiments were conducted by exposing fish to the same concentration of Lambda Cyhalothrin. But at 24 hrs exposure time, almost 4 out of a total of 12 fish in exposure tank and 2 in control tank were found dead. This could be due to change in ambient conditions. However, water samples were collected and physicochemical analysis was performed. At 48 hrs, 2 more fish in experimental tank and 8 in control tank were found dead. Hence, the experiment was discontinued at 72 hrs instead of 96 hrs time.
The changes in physicochemical parameters over the period of 72 hrs are depicted in the following figures (Fig 4,5 and 6). The LD-50 value reported in literature was around 1.25µg/l. Habeeba and David 2016, also reported LC-50 of lambda cyhalothrin for common carp as 1.62 µg/l which is very close to the value estimated in prevalent study. The difference in these values may be attributed to varying temperature, fish size, fish health and other environmental factors.
6th International Water Conference Proceedings [ 245 ]
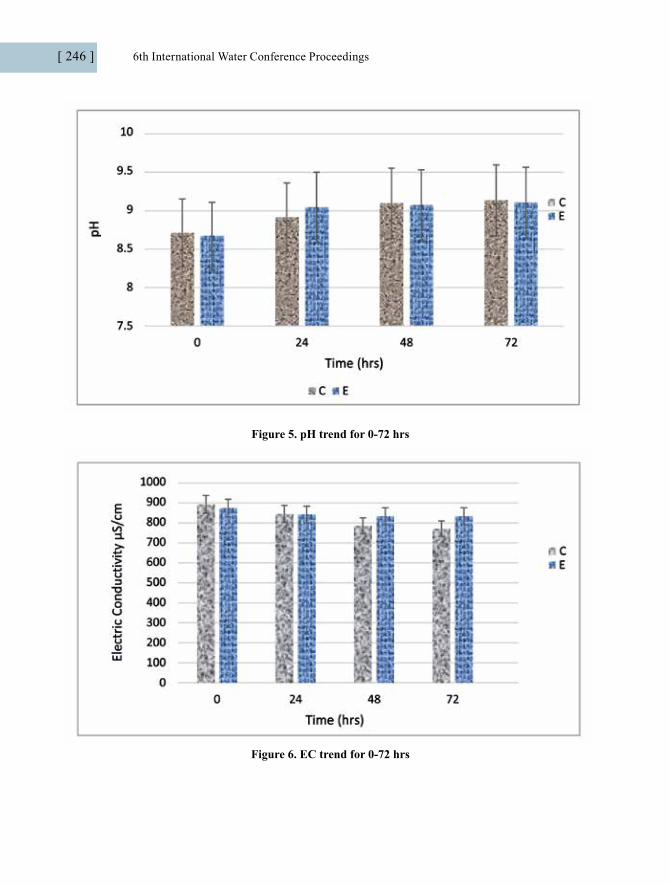
Figure 5. pH trend for 0-72 hrs
Figure 6. EC trend for 0-72 hrs
[ 246 ] 6th International Water Conference Proceedings
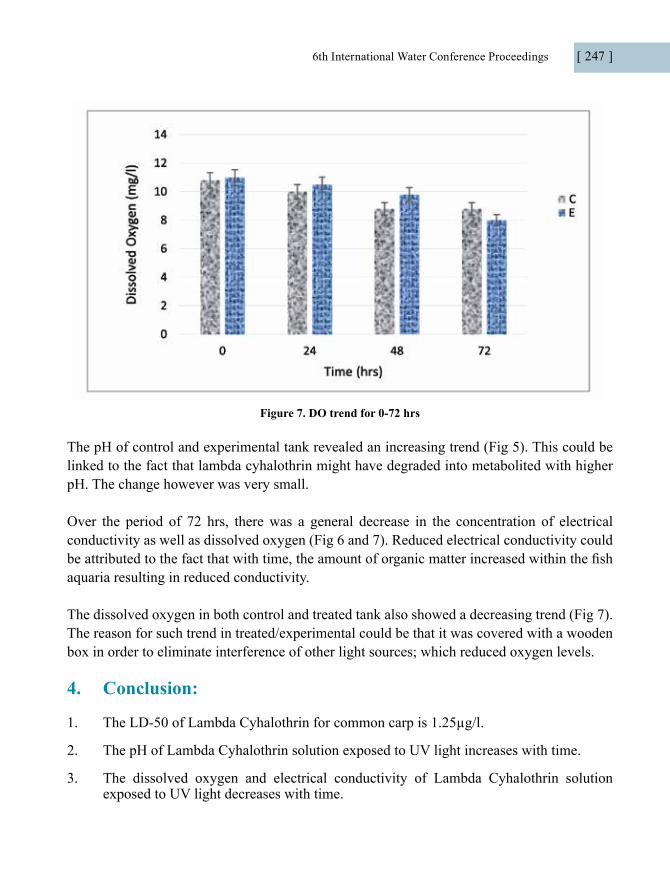
Figure 7. DO trend for 0-72 hrs
The pH of control and experimental tank revealed an increasing trend (Fig 5). This could be linked to the fact that lambda cyhalothrin might have degraded into metabolited with higher pH. The change however was very small.
Over the period of 72 hrs, there was a general decrease in the concentration of electrical conductivity as well as dissolved oxygen (Fig 6 and 7). Reduced electrical conductivity could be attributed to the fact that with time, the amount of organic matter increased within the fish aquaria resulting in reduced conductivity.
The dissolved oxygen in both control and treated tank also showed a decreasing trend (Fig 7). The reason for such trend in treated/experimental could be that it was covered with a wooden box in order to eliminate interference of other light sources; which reduced oxygen levels.
4. Conclusion:
1. The LD-50 of Lambda Cyhalothrin for common carp is 1.25µg/l.
2. The pH of Lambda Cyhalothrin solution exposed to UV light increases with time.
3. The dissolved oxygen and electrical conductivity of Lambda Cyhalothrin solution exposed to UV light decreases with time.
6th International Water Conference Proceedings [ 247 ]
References:
1. Bibi, N., A. Zuberi, M. Nadeem, I. Ullah, H. Sarwar and B. Atika, 2014. Evaluation of acute toxicity of Karate and its sub-lethal effects on protein and acetylcholinesterase activity in cyprinus carpio. Int. j. Agric. Biol., 16: 731-737.
2. Djouaka, R., Soglo, M., Kusimo, M., Adéoti, R., Talom, A., Zeukeng, F., Paraïso, A., Afari-Sefa, V., Saethre, M., Manyong, V., Tamò, M., Waage, J., Lines, J. and Mahuku, G, (2018). The Rapid Degradation of Lambda-Cyhalothrin Makes Treated Vegetables Relatively Safe for Consumption. International Journal of Environmental Research and Public Health, 15(7), p.1536
3. Farhat Jabeen, Abdul Shakoor Chaudhry, 2011. Chemical compositions and fatty acid profiles of three freshwater fish species. Food Chemistry 125(3) 991-996.
4. https://www.oecd-ilibrary.org/environment/test-no-210-fish-early-life-stage-toxicity-test_9789264203785-en
5. Kafilzadeh, Farshid, Shiva, Amir Houshang, Malekpour, Rokhsareh, Azad, Hamid Noorani, 2012. Determination of Organochlorine Pesticide Residues in Water, Sediments and Fish from Lake Parishan, Iran. World Journal of Fish and Marine Sciences 4 (2): 150-154.
6. Minero C, Lauri V, Falletti G, Maurino V, Pelizzetti E, Vione D, 2007. Spectrophotometric characterisation of surface lakewater samples: implications for the quantification of nitrate and the properties of dissolved organic matter. Ann Chim 97(10):1107-16.
7. Oudou HC, Hansen HCB, 2002. Sorption of lambda-cyhalothrin, cypermethrin, deltamethrin and fenvalerate to quartz corundum, kaolinite and montmorillonite. Chemosphere 49: 1285-1294.
8. Rahmi Aydın, Kenan Köprücü, Mustafa Dörücü, Sibel Şimşek Köprücü & Murat Pala, 2005. Acute Toxicity of Synthetic Pyrethroid Cypermethrin on the Common Carp (Cyprinus carpio L.) Embryos and Larvae. Aquaculture International13, 451–458.
9. Ulrik Norum, Nikolai Friberg, Maria R. Jensen, Jakob M. Pedersen, Poul Bjerregaard, 2010. Behavioral changes in three species of freshwater microinvertebrates exposed to the pyrethroid lambda-cyhalothrin: Laboratory and stream microcosm studies. Aquatic Toxicology. 98, 328-335.
10. Umme Habeeba and M David, 2016. Studies on acute and behavioral toxicity of lambda cyhalothrin on freshwater fish cyprinus carpio. International Journal of Toxicology and Applied Pharmacology 6(1): 1-6.
[ 248 ] 6th International Water Conference Proceedings

Abstract:
Water Scarcity is one of the major modern day problems amidst climate change and rapid urbanization. This paper examines the trends in water supply and population for the case of Pakistan. The study utilizes time series data for Pakistan from period 1975-2018. The projections of water supply and population are made for the period 2018-2040 using time series forecasting. Further, the study decomposes water supply for agriculture, industrial and municipal sectors respectively. The study finds severe water crisis looming at the door for Pakistan and suggests increasing the efficiency of water utilization with a special focus on water recycling. A concentrated effort is the need of the time for Pakistan in all the three sectors analyzed in this study
Keywords: Resources, Water Supply, Water Demand, Population, Time Series
1. Introduction:
Natural resources are pivotal for the economic development of a country. There are two important aspects for development of a country in the context of natural resources; availability of natural resources, and the optimal use of available resources. In order to develop a country must efficiently explore and utilize its resources. In Pakistan, Baluchistan is affluent province in mineral resources (natural gas, copper and gold), KPK has abundance in gems, Sindh has coal reserves and Punjab is rich in mineral salt and uranium production. Of all the natural resources, water is a fundamental human need without which a life cannot be sustained on the planet. This makes the water crucial and essential for the life humans, animals and plants alike.
Population and Water Supply in Pakistan: A Theoretical Analysis
Inza Murtaza1, Husnain Ali2
6th International Water Conference Proceedings [ 249 ]
[ 250 ] 6th International Water Conference Proceedings
In Pakistan, water is an essential element for power generation, fisheries, domestic use, industries, transportation, agricultural irrigation, mining and livestock. Human demand for water is incessantly increasing due to rapid population growth. According to World Health Organization (WHO) report, contaminated and impure drinking water instigated to 80% diseases. According to international Monetary Fund (IMF), Pakistanis ranked 3rd among the countries that are facing water scarcity. United Nations Development Program and Pakistan Council of Research in Water Resources (PCRWR) reported that by 2025, South Asian countries can face alarming situations of absolute water scarcity. It is also predicted that Pakistan is in danger of being most water-stressed country by 2040.1
When world bank issued 893$ million for international Indus Basin fund, and finally Indus water treaty was signed between India and Pakistan on 19 September 19602. Two rivers Jhelum and Chenab were decided to be made part of Pakistan while Ravi, Sutlej, Bias were added in the assets of India. India constructed different barrages and dams over Jhelum and Chenab rivers and ruled-out treaty that became the one of main reason of water shortage in Pakistan (TRIBUNE, MARCH 18 2018). On the other hand, population growth rate in Pakistan is 1.93% which is exerting extra pressure on limited water resources. At this growth rate water demand will be doubled in 2025. Water consumption will be higher and current water supply will not be able to meet this high consumption rate.
One third population of the world is tackling different kinds of water scarcity. Cumulative use of water among various sectors of economy is another important factor causing water scarcity. Water is used in agriculture, industrial and domestic sectors at rate of 69%, 23% and 8% respectively. Increasing water stress in Pakistan is mainly attributed to the mismanagement of water resources. Although natural droughts and cycles also play some role but these natural cycles can be predicted and managed accordingly using latest technologies. Chairman of Pakistan Council of Research in Water Resources (PCRWR) said that increasing population rate refers to rapid increase in water demand and thus water supply decreases for people and global warming is one also one of the reasons for water shortage1.
In 1960, per capita water availability was 5,600 cubic meters and now it is 1,000 cubic meters. It is an alarming situation by itself. Malthus theory of population is applicable to the Pakistan in context of water crisis; where population explosion could lead to a definitive water stress. According to Malthus, population increases with geometric mean and food increases with arithmetic mean2. By applying same condition on Pakistan, it can be seen that population is increasing rapidly leading to higher demand for food and water. Different national and international companies invested to explore water resources and tried to fulfill water demand. 1 2Baloch, S. M. (2018, July 07). Water crisis: Why is Pakistan running dry? Retrieved from DW.com: https://www.dw.com/en/water-crisis-why-is-pakistan-running-dry/a-44110280 2 For further details see; The essential unity of all regions by Bhagwan Das.
6th International Water Conference Proceedings [ 251 ]
This study analyses and forecasts future water supply and explores the relationship between projected water supply and projected population growth for different sectors of economy by using forecasting technique.
2. Literature Review:
Human demand for water is continuously growing with increasing population growth (Butler, 2006). Data illustrated that water demand increased about 5 times from 1960 to 2018, this becomes the main reason for water shortage. Government must consider this issue on a serious note and should take steps to meet water demand (Wang, 2010). It is observed that limited literature considers this issue of drinking water in under-develop countries (Naugle’s and Wittington, 2010). Another issue arising in Pakistan is rapid increase in urbanization (Kugelman, 2013). It is the responsibility of federal and local governments to provide fresh drinking water to the public (UNESCO, 2014).
There was published a lot of literature from three decades. This literature is divided into two rivulets. First one is focused on price level and tariffs on water demand by using econometrics models and techniques. Second rivulet involves the contribution of modelers and civil engineers (Donkor et al. 2012). Different studies and books intricate analysis on this issue (Donkor et al. 2012) or provide guidelines for the enactment of forecasting techniques (Billings & Clive 2008), (Donker, E, Mazzuchi, T. A., Soyer, R. & Roberson, J. A., 2012).
The increasing trend of population is higher in urban areas as compare to rural and it is also expected that population will increase by 2.3 billion from the year 2009-2050 that’s why water scarcity will be concentrated in urban settings (Hans a. , 2014). Water scarceness already distresses most of the region all over world; 1.9 billion people around the globe are living in absolute water scarcity and two-third population from all over the world living under water hassle (UNICEF, 2013). In the three billion people, 90% are expected to be in developing countries population by 2050, most of them are already facing water scarcity (jain, 2014).
In Pakistan 96% of water is used in agriculture sector, 2% in industrial sector and remaining 2% in domestic sector. John Waterbury and Malin Falkenmark established “supply side” criteria, according to this criteria Pakistan is considered as water deficit country (Asif m bhatti, 2010). From 122 countries Pakistan water worth ranked as 80th.(Water quality ranking list). Contaminated water can cause severe diseases. 5000 children died every day because of unhygienic water, 1.6 million children died worldwide because they have no access to clean water (UNICEF/WHO, 2006). All over the world around 884 million people have to drink impure water (WHO/UNICEF, 2010).
[ 252 ] 6th International Water Conference Proceedings
Population of Texas grows with double rate whereas water supply has insignificant changes (UNDP, 2018). A study addressed the issue of the violation of Indus basin treaty from India and identified it as a major cause of cross border tension between Pakistan and India by using no-cooperative game theory model. It concludes that ongoing water stress will results in Nash equilibrium of bilateral aggregation (Aslam, 2013). Water conservation and water quality in Pakistan are not meeting its requirement (Ayaz ahmed, 2007). India’s intension to build chain of dams is a threat for Pakistan and an alarming situation for the peace of south Asia (riffat & iftekhar, 2015).
A report on water management reviews the local and provincial government responsibilities of water and sanitation in Pakistan. It specifically examines KP and Punjab provinces’ water management system and highlighted major challenges facing both management authorities.3 Atlantic council’s report highlighted Indus water treaty between India and Pakistan and its impact on Pakistan especially during dry period, treaty is silent on how India will share water shortages during dry period and ground water extraction and environmental effects are also not covered under this treaty. Interprovincial water issues also there since pre-partition.4
In a study on water conflict between India and Pakistan was conducted to check the public opinion. Interview surveys were conducted from international experts and it is concluded that historical relations become a hindrance for the good relationship of both counties (Sohail, 2015). Pakistan water availability decreased 5000 cubic meter to 1500 cubic meter from 1950s to 2018.5 Another study reviewed water demand forecasting in long term by using three different case studies; USA, UK, and Australia using their development tools of water scarcity level and concluded that there are no hard and fast tools that can be used to control scarcity level. It might vary according to region as California and San Francisco handle their water issue differently (Rinaudo, 2015). India-Pakistan water war is contentious, on this track Pakistan would starve for water. India has been leading this strange war since last 25 years. This study considers various water supply aspects by using qualitative techniques. (Mashkoor, Ahmed, & Ghumroo, 2016).
3. Projection Methodology:
This study uses time series forecasting technique to analyze inclusive trend in population and water supply. In general conception when historical data is used for baseline analysis which has number of specific periods, following equation would represent it;
F(i+1) ={(D(i)+D(i-1)+…+D(i -(n-1)}/n3 Water management/governance system in Pakistan; Rachel cooper; university of Birmingham, 20 November (TRIBUNE, MARCH 18 2018)2018.4 Water insecurity: a threat for Pakistan and India; Shahid Ahmed, ATLANTIC COUNCIL.5 Running on empty Pakistan’s water crises; Woodrow Wilson international center for scholar, Asia Program.

6th International Water Conference Proceedings [ 253 ]
The given formula shows slow retort as it had higher changes in real tendencies. To make a smooth process of forecasting Microsoft Excel forecasting syntax is used here. Syntax in Microsoft excel is;
FORECAST(x-value, known _ y _values, known_ x _values)
‘X’ values forecast the ‘y’ values, known ‘y’ values functions to estimate ‘y’ value and known x values are organized to evaluate ‘y’ value. The population of Pakistan is forecasted from the year 1975 to 2043. Population data (1975-2017) are taken as y values, years (1975-2017) as x values then forecast are obtained by using this formula. Water supply also is also projected from 1975 to 2043. Water withdrawal data is taken from World Development Indicators and FAO’s Aquastat used as a proxy for water supply projection. Water withdrawal data (1975-2012) taken as y value, years (1975-2012) as y value and projected it till 2043 by using given formula. Quarterly water supply data available on WDI, for the continuity of projection process water supply data projected data in two stages. At 1st stage quarterly data is converted into yearly form for best comparison of population and water supply in Pakistan then based on this given data future values are forecasted by using forecasting technique from 2012-2043.
4. Population Projection:
As noted here population of Pakistan has increased manifold since 1975 due to high population growth rate with Pakistan ranking 6th in the world in terms of population. Rapidly increasing population leads to high water demand. Water supply is limited with its resources as compared to increasing water demand. Next generation requires more quantity of water for their survival. Population growth rate had peak points at the time 1980 to 1990. Population is projected from the year 2018 to 2043. It shows increasing trend in population 2018 onwards. Population data is taken from Pakistan Bureau of Statistics, census 2017. It shows continuous increasing trend in population.
Table 1: Population
Year Population (In millions) Year Population (In millions)1975 66.787901 2023 219.6325151991 110.73042 2028 238.5051442000 138.523285 2033 257.3777352008 163.644603 2038 276.250582013 181.712595 2043 295.30932018 200.757303
Source; WDI and author’s estimations
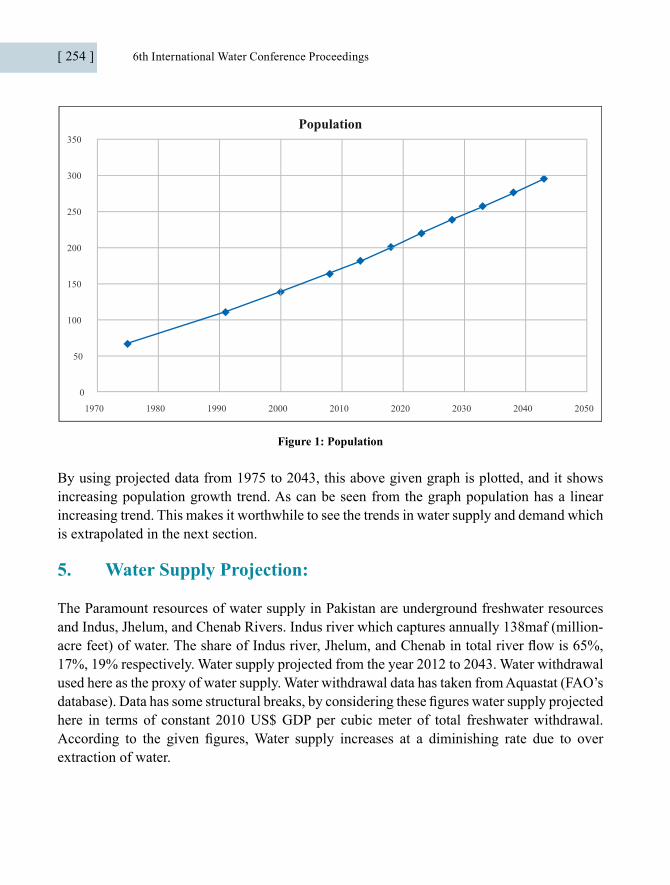
[ 254 ] 6th International Water Conference Proceedings
0
50
100
150
200
250
300
350
1970 1980 1990 2000 2010 2020 2030 2040 2050
Population
Figure 1: Population
By using projected data from 1975 to 2043, this above given graph is plotted, and it shows increasing population growth trend. As can be seen from the graph population has a linear increasing trend. This makes it worthwhile to see the trends in water supply and demand which is extrapolated in the next section.
5. Water Supply Projection:
The Paramount resources of water supply in Pakistan are underground freshwater resources and Indus, Jhelum, and Chenab Rivers. Indus river which captures annually 138maf (million-acre feet) of water. The share of Indus river, Jhelum, and Chenab in total river flow is 65%, 17%, 19% respectively. Water supply projected from the year 2012 to 2043. Water withdrawal used here as the proxy of water supply. Water withdrawal data has taken from Aquastat (FAO’s database). Data has some structural breaks, by considering these figures water supply projected here in terms of constant 2010 US$ GDP per cubic meter of total freshwater withdrawal. According to the given figures, Water supply increases at a diminishing rate due to over extraction of water.
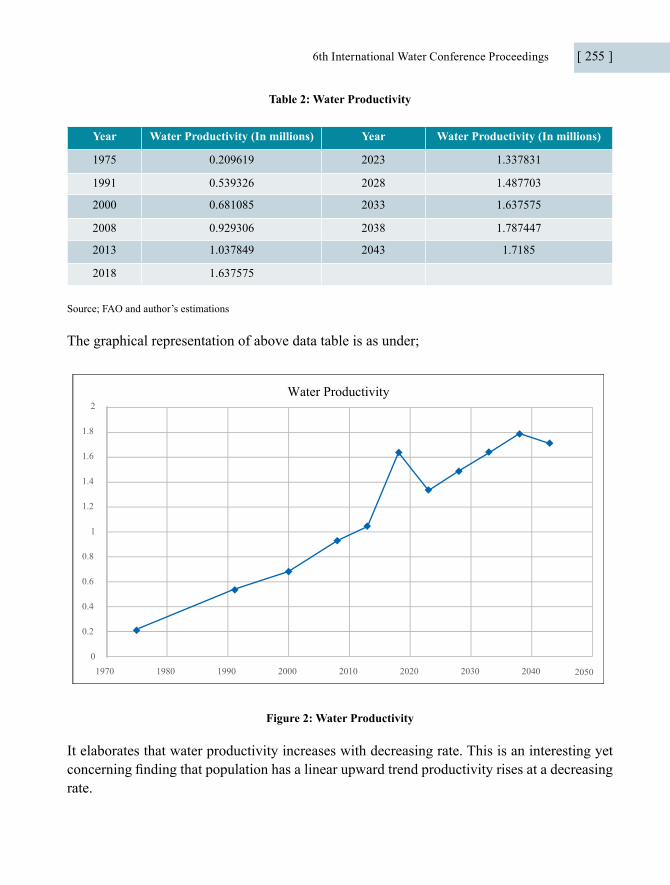
6th International Water Conference Proceedings [ 255 ]
Table 2: Water Productivity
Year Water Productivity (In millions) Year Water Productivity (In millions)
1975 0.209619 2023 1.337831
1991 0.539326 2028 1.487703
2000 0.681085 2033 1.637575
2008 0.929306 2038 1.787447
2013 1.037849 2043 1.7185
2018 1.637575
Source; FAO and author’s estimations
The graphical representation of above data table is as under;
Water Productivity
0
0.2
0.4
0.6
0.8
1
1.2
1.4
1.6
1.8
2
1970 1980 1990 2000 2010 2020 2030 2040 2050
Figure 2: Water Productivity
It elaborates that water productivity increases with decreasing rate. This is an interesting yet concerning finding that population has a linear upward trend productivity rises at a decreasing rate.
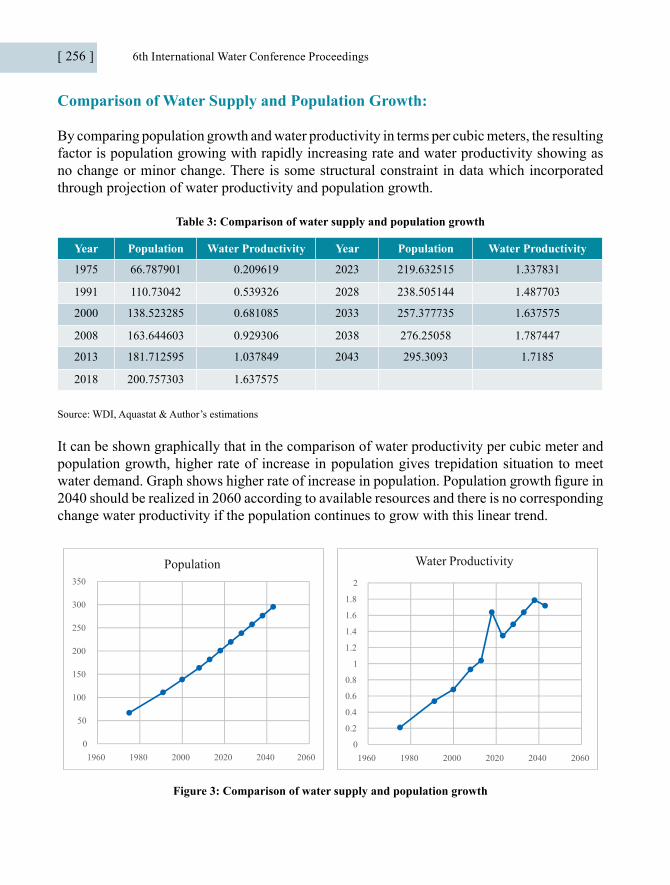
[ 256 ] 6th International Water Conference Proceedings
Comparison of Water Supply and Population Growth:
By comparing population growth and water productivity in terms per cubic meters, the resulting factor is population growing with rapidly increasing rate and water productivity showing as no change or minor change. There is some structural constraint in data which incorporated through projection of water productivity and population growth.
Table 3: Comparison of water supply and population growth
Year Population Water Productivity Year Population Water Productivity
1975 66.787901 0.209619 2023 219.632515 1.337831
1991 110.73042 0.539326 2028 238.505144 1.487703
2000 138.523285 0.681085 2033 257.377735 1.637575
2008 163.644603 0.929306 2038 276.25058 1.787447
2013 181.712595 1.037849 2043 295.3093 1.7185
2018 200.757303 1.637575
Source: WDI, Aquastat & Author’s estimations
It can be shown graphically that in the comparison of water productivity per cubic meter and population growth, higher rate of increase in population gives trepidation situation to meet water demand. Graph shows higher rate of increase in population. Population growth figure in 2040 should be realized in 2060 according to available resources and there is no corresponding change water productivity if the population continues to grow with this linear trend.
0
50
100
150
200
250
300
350
1960 1980 2000 2020 2040 2060
Population Water Productivity
0
0.2
0.4
0.6
0.8
1
1.2
1.4
1.6
1.8
2
1960 1980 2000 2020 2040 2060
Figure 3: Comparison of water supply and population growth
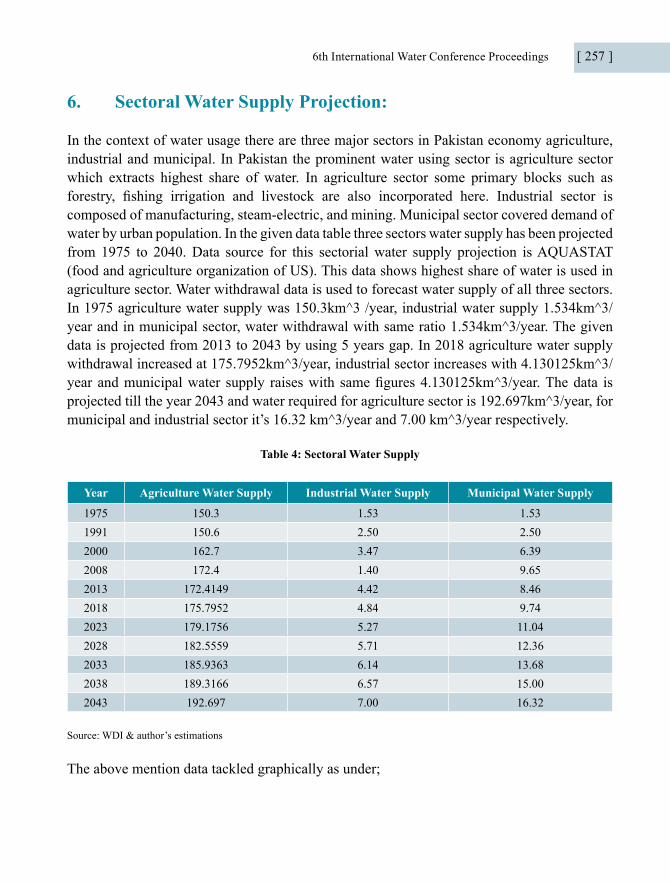
6th International Water Conference Proceedings [ 257 ]
6. Sectoral Water Supply Projection:
In the context of water usage there are three major sectors in Pakistan economy agriculture, industrial and municipal. In Pakistan the prominent water using sector is agriculture sector which extracts highest share of water. In agriculture sector some primary blocks such as forestry, fishing irrigation and livestock are also incorporated here. Industrial sector is composed of manufacturing, steam-electric, and mining. Municipal sector covered demand of water by urban population. In the given data table three sectors water supply has been projected from 1975 to 2040. Data source for this sectorial water supply projection is AQUASTAT (food and agriculture organization of US). This data shows highest share of water is used in agriculture sector. Water withdrawal data is used to forecast water supply of all three sectors. In 1975 agriculture water supply was 150.3km^3 /year, industrial water supply 1.534km^3/year and in municipal sector, water withdrawal with same ratio 1.534km^3/year. The given data is projected from 2013 to 2043 by using 5 years gap. In 2018 agriculture water supply withdrawal increased at 175.7952km^3/year, industrial sector increases with 4.130125km^3/year and municipal water supply raises with same figures 4.130125km^3/year. The data is projected till the year 2043 and water required for agriculture sector is 192.697km^3/year, for municipal and industrial sector it’s 16.32 km^3/year and 7.00 km^3/year respectively.
Table 4: Sectoral Water Supply
Year Agriculture Water Supply Industrial Water Supply Municipal Water Supply
1975 150.3 1.53 1.531991 150.6 2.50 2.502000 162.7 3.47 6.392008 172.4 1.40 9.652013 172.4149 4.42 8.462018 175.7952 4.84 9.742023 179.1756 5.27 11.042028 182.5559 5.71 12.362033 185.9363 6.14 13.682038 189.3166 6.57 15.002043 192.697 7.00 16.32
Source: WDI & author’s estimations
The above mention data tackled graphically as under;

[ 258 ] 6th International Water Conference Proceedings
Agriculture water supply
0
50
100
150
200
250
1960 1980 2000 2020 2040 2060
Comparative Water Supply
Industrial Water Supply Municipal Water Supply
0.00
2.00
4.00
6.00
8.00
10.00
12.00
14.00
16.00
18.00
1960 1980 2000 2020 2040 2060
Figure 4: Sectoral Water Supply
In this graph agriculture water usage shows increasing trend with higher supply as compare to other sectors.
i) Agriculture sector:
Agriculture sector is the dominating sector of Pakistan GDP. Pakistan GDP depends on agriculture sector at the rate 25%. It included different sub-sector’s water demand like irrigation, dairies, poultries, fisheries, forestry etc. Here agriculture share of GDP can be used to analyze water demand in agriculture sector. Agricultural GDP data projected from the year 2018 to 2040. It shows that the share of GDP in agriculture sector increases and it can also observe that water demand in this sector will be increases in future.
Table 5: Agricultural GDP
Year Agricultural GDP (In million USD) Year Agricultural GDP (In million USD)
1975 3387.17 2023 91214.75
1991 10421.92 2028 109220.09
2000 17851.83 2033 127225.42
2008 38267.96 2038 145230.76
2013 55104.28 2043 163236.09
2018 73209.42
Source: WDI & author’s estimations
Graphical representation of data is as under;
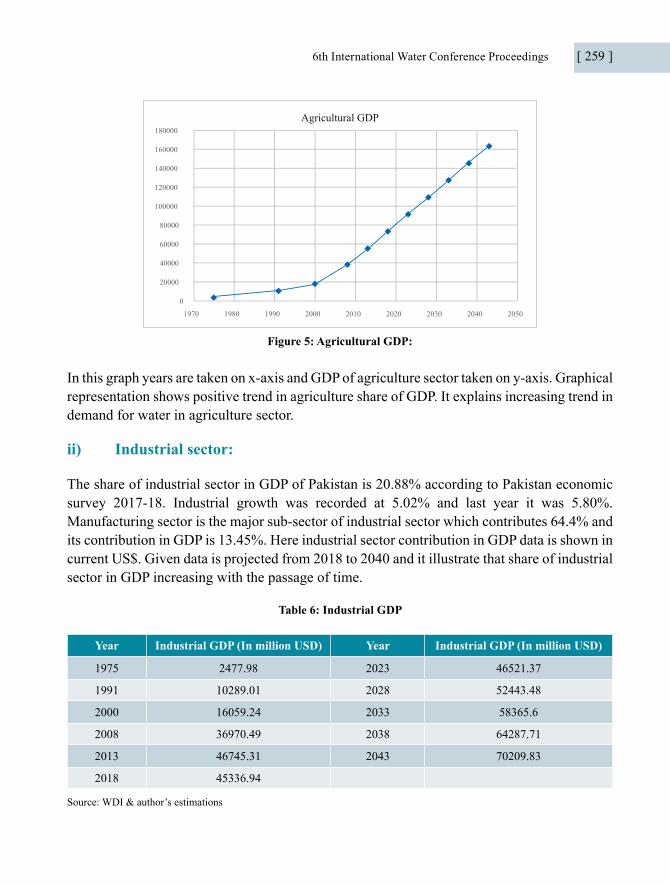
6th International Water Conference Proceedings [ 259 ]
0
20000
40000
60000
80000
100000
120000
140000
160000
180000
1970 1980 1990 2000 2010 2020 2030 2040 2050
Agricultural GDP
Figure 5: Agricultural GDP:
In this graph years are taken on x-axis and GDP of agriculture sector taken on y-axis. Graphical representation shows positive trend in agriculture share of GDP. It explains increasing trend in demand for water in agriculture sector.
ii) Industrial sector:
The share of industrial sector in GDP of Pakistan is 20.88% according to Pakistan economic survey 2017-18. Industrial growth was recorded at 5.02% and last year it was 5.80%. Manufacturing sector is the major sub-sector of industrial sector which contributes 64.4% and its contribution in GDP is 13.45%. Here industrial sector contribution in GDP data is shown in current US$. Given data is projected from 2018 to 2040 and it illustrate that share of industrial sector in GDP increasing with the passage of time.
Table 6: Industrial GDP
Year Industrial GDP (In million USD) Year Industrial GDP (In million USD)
1975 2477.98 2023 46521.37
1991 10289.01 2028 52443.48
2000 16059.24 2033 58365.6
2008 36970.49 2038 64287.71
2013 46745.31 2043 70209.83
2018 45336.94
Source: WDI & author’s estimations

[ 260 ] 6th International Water Conference Proceedings
By using above figures a graph plotted here to show the trend of industrial sector contribution in GDP in the future.
0
10000
20000
30000
40000
50000
60000
70000
80000
1970 1980 1990 2000 2010 2020 2030 2040 2050
Industrial GDP
Figure 6: Industrial GDP
iii) Municipal sector:
Urban population is used to check the contribution of municipal sector and to analyze water demand for the municipal sector. Urban population is projected from the year 2018 to 2043. Data period is from 1975 to 2017 for projection purpose. Observation started from 1975 when urban population was 17.59 million. In 1991 urban population doubled and reached 34.13 million people. In 2005 population increase triple time, here it is 52.30. In 2017 population increases with higher figure 69.92m. From the year 2018 population has been projected till 2043 and urban population is forecasted to increase from 69.92m to 94.34m.
Table 7: Urban Population
Year Urban Population (In millions) Year Urban Population (In millions)
1975 17.59 2023 72.49
1991 34.13 2028 78.91
2000 45.69 2033 85.34
2008 56.6 2038 91.77
2013 64.71 2043 98.19
2018 69.92
Source: WDI & author’s estimations
This data series can be incorporate graphically
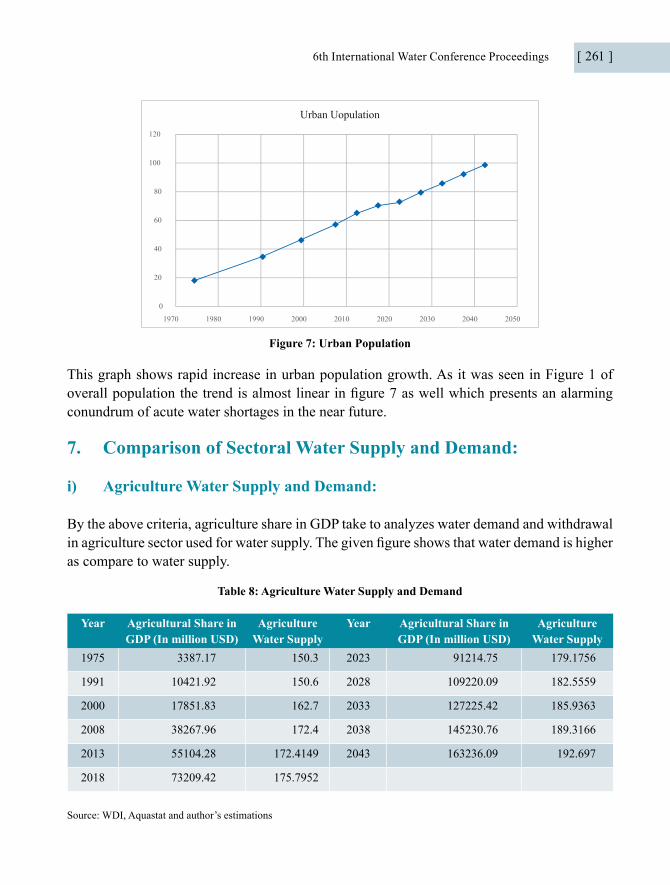
6th International Water Conference Proceedings [ 261 ]
0
20
40
60
80
100
120
1970 1980 1990 2000 2010 2020 2030 2040 2050
Urban Uopulation
Figure 7: Urban Population
This graph shows rapid increase in urban population growth. As it was seen in Figure 1 of overall population the trend is almost linear in figure 7 as well which presents an alarming conundrum of acute water shortages in the near future.
7. Comparison of Sectoral Water Supply and Demand:
i) Agriculture Water Supply and Demand:
By the above criteria, agriculture share in GDP take to analyzes water demand and withdrawal in agriculture sector used for water supply. The given figure shows that water demand is higher as compare to water supply.
Table 8: Agriculture Water Supply and Demand
Year Agricultural Share in GDP (In million USD)
Agriculture Water Supply
Year Agricultural Share in GDP (In million USD)
Agriculture Water Supply
1975 3387.17 150.3 2023 91214.75 179.1756
1991 10421.92 150.6 2028 109220.09 182.5559
2000 17851.83 162.7 2033 127225.42 185.9363
2008 38267.96 172.4 2038 145230.76 189.3166
2013 55104.28 172.4149 2043 163236.09 192.697
2018 73209.42 175.7952
Source: WDI, Aquastat and author’s estimations

[ 262 ] 6th International Water Conference Proceedings
By using this data water supply and demand trends can be shown as under;
0
20000
40000
60000
80000
100000
120000
140000
160000
180000
1960 1980 2000 2020 2040 2060
Agricultural GDP
0
50
100
150
200
250
1960 1980 2000 2020 2040 2060
Agriculture Water Supply
Figure 8: Agriculture Water Supply and Demand
As evident in this graph water demand shows positive trend whereas water supply in comparison to demand is marginal. There exists a big difference in demand and supply of water in agriculture and the analysis as well as current practices present a gloomy picture ahead.
ii) Industrial Water Demand and Supply:
For the comparison of industrial water demand and supply data used from 1975 to 2043.industrial GDP used to examine water demand and water withdrawal took to investigate water supply.
Table 9: Industrial Water Demand and Supply
Year Industrial GDP Industrial Water Supply Year Industrial GDP Industrial Water
Supply1975 2477.98m 1.534 2023 46521.37m 2.629772
1991 10289.01m 2.5 2028 52443.48m 2.698208
2000 16059.24m 3.47 2033 58365.60m 2.766644
2008 36970.49m 1.4 2038 64287.71m 2.83508
2013 46745.31m 2.4929 2043 70209.83 m 2.903516
2018 45336.94m 2.561336
Source: WDI, Aquastat and author’s estimations
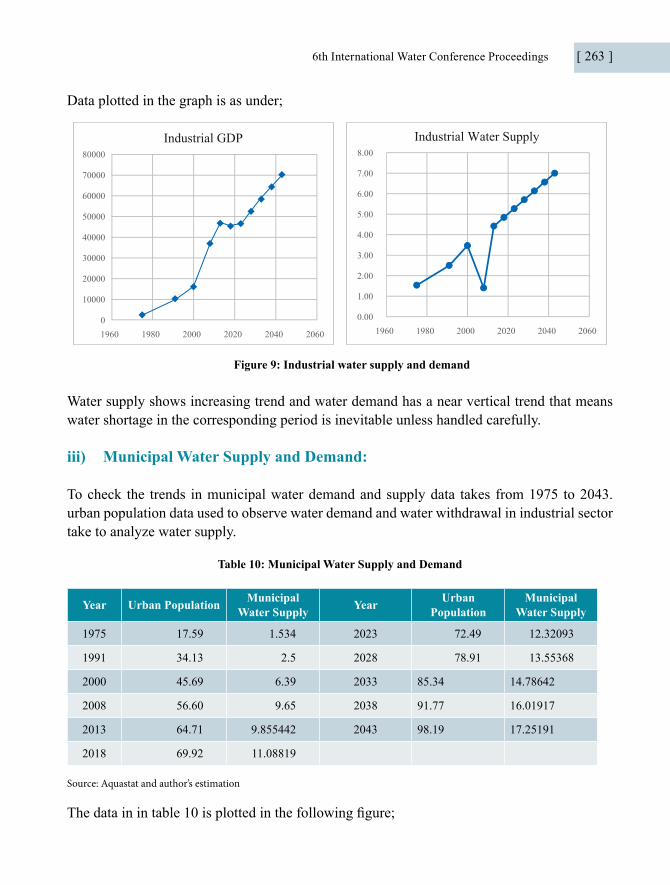
6th International Water Conference Proceedings [ 263 ]
Data plotted in the graph is as under;
Industrial GDP
0.00
1.00
2.00
3.00
4.00
5.00
6.00
7.00
8.00
1960 1980 2000 2020 2040 2060
Industrial Water Supply
0
10000
20000
30000
40000
50000
60000
70000
80000
1960 1980 2000 2020 2040 2060
Figure 9: Industrial water supply and demand
Water supply shows increasing trend and water demand has a near vertical trend that means water shortage in the corresponding period is inevitable unless handled carefully.
iii) Municipal Water Supply and Demand:
To check the trends in municipal water demand and supply data takes from 1975 to 2043. urban population data used to observe water demand and water withdrawal in industrial sector take to analyze water supply.
Table 10: Municipal Water Supply and Demand
Year Urban Population Municipal Water Supply Year Urban
PopulationMunicipal
Water Supply
1975 17.59 1.534 2023 72.49 12.32093
1991 34.13 2.5 2028 78.91 13.55368
2000 45.69 6.39 2033 85.34 14.78642
2008 56.60 9.65 2038 91.77 16.01917
2013 64.71 9.855442 2043 98.19 17.25191
2018 69.92 11.08819
Source: Aquastat and author’s estimation
The data in in table 10 is plotted in the following figure;
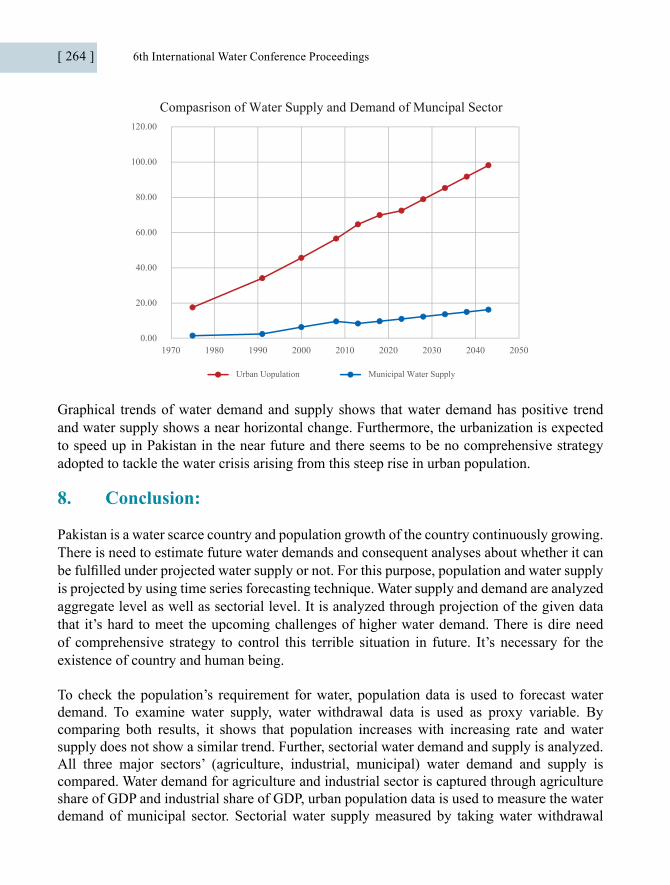
[ 264 ] 6th International Water Conference Proceedings
0.00
20.00
40.00
60.00
80.00
100.00
120.00
1970 1980 1990 2000 2010 2020 2030 2040 2050
Compasrison of Water Supply and Demand of Muncipal Sector
Municipal Water SupplyUrban Uopulation
Graphical trends of water demand and supply shows that water demand has positive trend and water supply shows a near horizontal change. Furthermore, the urbanization is expected to speed up in Pakistan in the near future and there seems to be no comprehensive strategy adopted to tackle the water crisis arising from this steep rise in urban population.
8. Conclusion:
Pakistan is a water scarce country and population growth of the country continuously growing. There is need to estimate future water demands and consequent analyses about whether it can be fulfilled under projected water supply or not. For this purpose, population and water supply is projected by using time series forecasting technique. Water supply and demand are analyzed aggregate level as well as sectorial level. It is analyzed through projection of the given data that it’s hard to meet the upcoming challenges of higher water demand. There is dire need of comprehensive strategy to control this terrible situation in future. It’s necessary for the existence of country and human being.
To check the population’s requirement for water, population data is used to forecast water demand. To examine water supply, water withdrawal data is used as proxy variable. By comparing both results, it shows that population increases with increasing rate and water supply does not show a similar trend. Further, sectorial water demand and supply is analyzed. All three major sectors’ (agriculture, industrial, municipal) water demand and supply is compared. Water demand for agriculture and industrial sector is captured through agriculture share of GDP and industrial share of GDP, urban population data is used to measure the water demand of municipal sector. Sectorial water supply measured by taking water withdrawal
6th International Water Conference Proceedings [ 265 ]
data of all three major components of economy. By comparing water demand and supply, the study concludes that there are not significant changes in water supply as compared to water demand. During floods lots of water flows down toward sea, and its overflow costs in the form of human and property losses. To deal with this burning issue government needs to construct dams and follow water conservation policies.
Policy implications:
By considering above discussion it is evident that population of Pakistan is increasing rapidly but minor changes occur in water supply. Due to rapid population growth water demand will be higher in future. If population increases with the same ratio then it can be impossible to fulfill freshwater demand because there are no substantial changes in water supply. The study suggests that following policies should be adopted immediately to control this stressful situation. Firstly, there is need to introduce new laws to control the population, it is also suggested that population can be control significantly if 20 years age opted as legal age for marriage. Awareness campaigns about water education should be launched. Adoption of latest water conserving technology should also be considered at the local level. Water recycling is another potential are which has received little official attention in Pakistan.
References
(n.d.). Retrieved from UNESCO: http://www.unesco.org/bpi/wwdr/
(n.d.). Retrieved from unesco: http:///www.unesco.org/bpi/wwdr/
(2006). UNICEF/WHO.
Asif m bhatti, s. n. (2010). domestic water demand forecasting and managment under changing socio-economic scenario.
aslam, R. (2013). Pakistan’ water volunerability and the risk of inter-state conflict in South Asia. Forman journal of economic studies, 23.
Ayaz ahmed, H. i. (2007). water resources and conservation strategy of Pakistan. The Pakistan development review, 13.
Billings, R. B & Jones, C.V. (2008). Forcasting urban water demand. Denver, CO: American water work association.
Butler, D. M. (2006). Water demand mangment.
Donker, E, Mazzuchi, T. A., Soyer, R. & Roberson, J. A. (2012). Urban water demand forecasting: a review of methods and models. journal of water Resources planning and managment,10.1061/(ASCE)WR.1943-5452.0000314.
Hans, A. (n.d.).

[ 266 ] 6th International Water Conference Proceedings
Hans, a. (2014, october). Water as Resource: Different Perspective in literature. international journal of engineering research and technology(IJERT).
jain, A. (2014). Complaceny: Compounding the urban water crises. india journal of public adminitration, 105-116.
kugelman, M. (2013). Urbanizaion in Pakistan: Causes and consequences,. Norwegian peacebuilding Resources Centre.
mashkoor, A., Ahmed, o., & Ghumroo, T. (2016). water war(the india water offenses on defenseless Pakistan unfolding indian strategy and its impact. MPRA, 9.
Nauges, C. W. (2009). Estimation of water demand in developing countries: An overview. the world bank research observer,25(2), 263-294.
riffat, f., & iftekhar, a. (2015). water issues and its implication over India-Pakistan relations. JPUHS.
Rinaudo, J.-D. (2015). Long term water demand forecastinng. understanding and managing urban water in transition, 29.
sohail, m. t. (2015). evaluation of historic Indo-Pak relations, water resource issues and its impact on contemporary bilateral affairs. Asia pacific journal of multidisciplinary research.
TRIBUNE, T. E. (MARCH 18 2018).
UNDP. (2018). Population and water demand projection. texas.
UNESCO. (2012). Facts and figures from the WWRD4. Paris united nnation world assesment programme.
UNESCO. (2014). Water in the post-2015 development agenda and sustainable development goals,discuss paper, UNESCO International Hydrological Progress.
UNICEF, F. (2013). water in India: situation and prospects.New Delhi: UNICEF.
Wang, X. G. (2010). Climate and water managment Adaptation for China. (Xth Kovacs Colloquium, Paris, France), 258-260.
Water quality ranking list. (n.d.). Retrieved from www.unesco.org/bpi/wwdr/: http://
Water quality ranking list. (n.d.). Retrieved from unesco: http://www.unesco.org/bpi/wwdr/
WHO/UNICEF. (2010). Progress on sanitation and drinking-water. Geneva,New York: WHO.

6th International Water Conference Proceedings [ 267 ]
PoliCy brief

6th International Water Conference Proceedings [ 269 ]
Blue spheres representing relative amounts of Earth’s water in comparison to the size of the Earth. Most countries in the East and North Africa suffer from acute water scarcity, such as Mexico, Pakistan, South Africa, and large parts of China and India. Water scarcity (shortage of water) affects all social and economic sectors and threatens the sustainability of the natural resources base. It is expected a rise in population from the present 6.5 billion to 8.9 billion by 2050. 1.8 billion People will be living in countries or regions with absolute water scarcity, and two-thirds of the world population could be under conditions of water stress and ecosystems around the world will suffer even more.
Pakistan could “run dry” by 2050 as its water shortage is reaching an alarming level. Country’s water availability has reduced to 935 cubic meters per capita (per person per year) from 5,260 cubic meter per capita in the 1950’s. If an effective strategy is not chalked out to conserve and utilization water, it will further fall to 860 cubic meters per capita. Experts believe that in 2040, it is expected to decline to 500 cubic meters per capita. This crisis may leads to serious threat to the country’s stability, therefore, viable implementation plans to be undertaken to address these challenges.
The irrigation network of Pakistan is one of the largest contiguous irrigated systems in the World. The snow-clad peaks of the mountain ranges in the North continuously re-charge the system. The descending snow-melt and monsoon waters flow into the country’s Indus River System and its tributaries required climate change centric water strategies by considering agro-climatic zones of the country. Water is one of the renewable resources, but due to the increased human and industrial activities and its lavish use making it vanish over time. Not only the water resources are being overused but also made polluted ruthlessly thus compromising the quality of water which is directly related to health implications.
The national and provincial/local water policies/plans and subsequent programmes interventions that directly or indirectly affect water resources management is critical. These include policies and plans for land use (particularly at the local level), environmental protection and conservation, economic development (in such areas as energy, agricultural, industrial developments), and trade. In most counties, water is dealt with by many ministries, for example, agriculture, transport and navigation, power, industry and environment, but there may be little coordination between them. In addition, their focus is likely to be more on development type issues rather than on water resource management.
In Pakistan, National Drinking Water Policy and National Water Policy was developed in September 2009, April 2018 respectively through the stakeholder consultation and considering various national/ international studies/reports but water sector is facing significant challenges arising simultaneous arising from the climatic variation, eco-system health, competing interests, institutional capacity, and the introduction of new regulatory approaches. It is
Policy Recommendations
[ 270 ] 6th International Water Conference Proceedings
therefore important to recognize that the tools for the effective coordinating policies and ensuring their implications at execution level are taken into account (and that other sectoral interests are recognized in water policies) including the institutional arrangements.
In the conference, the integrated approach was adopted by taking into account the main three thematic areas: Water for All, Water and Environment, Blue Economy and H2O Podcast.
There is a need to address all of the above areas to be linked with the existing Policy dilemma to figure out required policy initiatives at local, provincial and national level in Pakistan.
6th International Water Conference Proceedings [ 271 ]
1. Water Energy & Food Nexus: Policy Framework
Though not very sudden, but incremental spike in the resources-usage, coupled with “climate change” over last few decades, particularly in the emerging economies of China, India, Brazil and to an extent Pakistan, lead us all the way to resource scarcity. If, BAU (Business as Usual) has not been harnessed, more resonating impact of the resources unavailability will not be very far in future rather colloquial of “no water”, “no energy” and “hungry stomachs” are already common place. Despite the strong linkages among Water, Energy and Food, a continuity of approach in the developmental sector (Academia & Practitioners) over the decades, has always been in the “silos”. To maximize W-E-F in its output from resource perspective, a mechanism of awareness on part of policy makers is very important. The SDGs will be the first litmus test for the nexus model and the resources linkages.
2. Water Productivity, Energy Mix and Value Chain:
To optimize returns to farmers and businesses on the basis of agricultural and pastoral outputs, there is a need to fund the value chain to increase water productivity. Hydropower is Pakistan’s smartest and cheapest alternative, so hydropower schemes are given top priority (small, medium, large) to comply with the aim of Government to increase 60 percent of hydropower share in the energy mix.
3. Hydro-Food-Energy Nexus Approach:
A Nexus Approach to help understand the deep and dynamic interrelationships between water, electricity and food, so that our scarce resources can be used and handled sustainably.
4. Water Quality Management - Governance structure and Strategic Requirement
At the municipal level, the fundamental shortcoming of the current institutions is the overlapping of institutional jurisdiction (TMA, WASA, PHEDs, District Councils) that makes governance of water sector in urban settings ineffective. With regard to the industrial wastewater which impairs water quality, National Environment Quality Standards (NEQS) have long been in effect but their implementation has been lacking. Owing to 18th amendment, coordination is missing between federal and provincial units. A plan of action needs to be devised to address the capacity gaps of Environmental Protection Departments (EPDs) as well as Tehsil Municipal Administrations (TMAs) in terms of implementing relevant policies.
5. Low Cost and Sustainable Approach to Monitor Water Quality:
Fair control of drinking water supplies and, where possible, the use of low-cost, quick and

[ 272 ] 6th International Water Conference Proceedings
sustainable approaches for the drinking water purification in order to ensure healthy and safe drinking water. In addition, longitudinal research involving metals, microbial, and physicochemical parameters could be explored in the future in order to gain a deeper insight into the quality of drinking water in current settings.
6. Waste Water treatment and the role of Environmental Protection Department
Provision of knowledge and technology for the treatment of wastewater by industries is integral to any pollution management strategy. EPDs should work with the industrial sector entities (small, medium and large) to address their concerns. Pilot projects developed by international organizations such as United Nations Industrial Development Organization (UNIDO) should be mainstreamed across industries so as to address this issue.
7. Provision of Safe and Reliable water and Sanitation facilities
The provision of water and sanitation facilities in Pakistan are insufficient and needs to be addressed. In developing a reliable framework to allow service providers to maintain a reasonable level of water quality and quantity, sustainable cost recovery is important
8. Water and Public Health:
Water scarcity (shortage of water) and deteriorated water quality affects all social and economic sectors and threatens the sustainability of the natural resources base. Due to lack of safe drinking water, inadequate sanitation, and poor hygiene leads to diseases such as diarrhea, cholera, dysentery, typhoid, and polio. To avoid the said issues different strategies can be developed to save water such as preparation of effective water policies, planning with preventive approch is required for water budget, proper use of irrigation water, and use of wastewater for irrigation. People should be educated and aware to conserve water by cooperating and using it efficiently.
An effective groundwater monitoring system and actions in respect of the dumping of industrial wastes into water. Industries should be forced to follow waste discharge standards. Because lethal effect of trace metals derived from ground water have obvious effect on liver, skin and kidneys. There should be a monitoring unit at local level to allow the water resource to be used for potable/drinking purpose.
9. Climate Change & Water Resources:
Water resources in Pakistan are affected by climate change as it impacts the behavior of glaciers, rainfall patterns, greenhouse gas emissions, recurrence of extreme events such as floods and droughts.
There is need to conduct analysis of key challenges and shortcomings towards climate response
6th International Water Conference Proceedings [ 273 ]
strategies and actions. In this regard ,the nexus of water and agriculture, post 18th amendment provincial coordination and Climate Change Act, transboundary and riparian issues, and the obligations of Sustainable Development Goals (SDGs) as well as Sendai Framework for Disaster Risk Reduction have to be been taken in to account.
10. Water Loss across Indus Basin and Policy Options
Across the Indus basin in Pakistan, poor enforcement of environmental regulations, low investment in wastewater treatment, and unmanaged and unlicensed expansion of pumping infrastructure has contributed to an increase in groundwater contamination from industrial, domestic, and natural sources. Policy actions too have been tardily applied and are curative rather than preventive, hence ,more focus to be on implementation and monitoring the same as well as proactive approach to be pursued.
11. Groundwater Management & Salt Balance (Realistic Model):
Regulation of groundwater in Pakistan requires realistic action and a legal system. Introduction of suitable management methods to be propagated in order to achieve salt balance in the Indus basin through a phased program covering enhanced drainage and other steps.The management of groundwater across Pakistan requires realistic action and a legal system. Introduction of suitable management methods (which could vary from one region to another) must be propagated to achieve salt balance in the Indus basin by means of a phased program covering increased drainage and other steps.
12. Underground Sewage Network and Delivery System:
In water supply delivery systems, physical leakages are high, often accounting for the loss of more than 40 percent of water output. In most cities and towns, underground sewerage networks are still in a state of disrepair, resulting in sewage leaks and, subsequently, contamination of underwater aquifers and water sources. Government support is scarce and several other industries compete for it. Finance would need to be drawn from other sources to fulfill even a fraction of the capital expenditure requirements. International funding, industrial loans and private investments are among these options.
13. Participatory Irrigation Management:
Institutional changes implemented for stakeholder involvement in decision-making in the form of Participatory Irrigation Management-PIM culminated in institutional competition (lock-in) and backfired due to various social and political factors at the expense of crop production, economic efficiency and fair distribution of irrigation water among farmers. The framework of PIM may be redefined by using effective mechanism to minimize trust deficit among the stakeholders.
[ 274 ] 6th International Water Conference Proceedings
14. Water Laws and Its Enforcement Mechanism
Even though laws such as PEPA 1997 are important in the country, their enforcement is extremely poor and the level of compliance is therefore low, especially in the industrial and housing sectors. Poor law enforcement can also be determined by the fact that the country’s environmental tribunals are not even functional. For the conservation of freshwater resources, effective law enforcement and compliance are essential.
15. National Water Policy and Implementation Strategy:
In case of governance and strategic management relevant policies are in place, such as the National Environment Policy, the National Water Policy, the National Drinking Water Policy, etc., there is no consistent strategy for enforcing them so far. An efficient execution of these policies,a simple and realistic consensus oriented plan needs to be chalk out.
16. Reflection of Evidence and Research in the National Water Policy:
During the implementation process, the National Water Policy lacks control of appraisal measures and does not have a policy rubric to define priority goals and, in the absence of such a rubric, the policy is unable to differentiate between activities that operate and actions that do not. The NWP displays a lack of policy research ,hence ,immediately a dedicated research Centre to be established to monitor and to provide a clear policy direction.
17. National Water Policy: Evidence based Supply Oriented Approach
There is a need to divide the water sector into supply-side and demand-side components. Establishing an institutional structure for allocating water is a fundamental role of social policy for any nation. The choice of structure is ultimately a compromise between the physical nature of the resource, human reactions to policies and competing social objective. There is a need to reorient the policy options toward the supply oriented approach with research and evidence based results.
18. Development of STPAM System based:
There is a need to improve the human capabilities, capacities and expertise in water sector by creating a system of selection, training, performance assessment and motivation based on merit. Thus a pool of water human capital in accordance with new technologies and demand driven disciplines like; hydrology, water resources engineers, irrigation engineers, water diplomacy, policy and transboundary law experts, environmental sciences, resources and sustainability, geography and environmental management, planning etc may be developed.

6th International Water Conference Proceedings [ 275 ]
19. Water Management in Supply, Service & Domestic Sector:
It is important that service providers move towards best practices in water management. In addition, in any water-scarce region, water conservation, re-use, and industrial water recycling are areas that are considered crucial. In the agricultural sector, best management practices can also be used, such as moving from high delta crops to those crops requiring less water input, etc. An incentive-based public campaign should be undertaken that stresses the need to conserve water at all levels. In homes, a large proportion of non-revenue water must be compensated for by overflowing taps, tank overflows, irresponsible use of potable water for washing cars and watering lawns and plants.
20. National Security by Transboundary Hydro-Diplomacy:
National Water Security to be observed by undertaking various initiatives like; Trans-boundary Coordination on Mutual Water Supplies, strengthen the Water laws & their interpretation and committees and coordination units for the growth of water institutions and the structure of governance. Further Group of Stakeholders to Foster Social Responsibility by highlighting Water Issues and national mass awareness and advocacy campaign to be initiated.
21. Holistic Water Management and Governance Approach:
Waterlogging, depletion, and salinization are shown to be linked problems that require a holistic management approach. This is for the management of not only water volumes but also water quality — salinity and naturally occurring contaminants, such as arsenic, fluoride and pollutants. This necessitate to appoint provincial lead agencies and agree on scale of management, regulatory reform, interim management arrangements, and stakeholder or community engagements.
22. Water Governance Structure:
NWP should focus on policy implementation and policy evaluation. The plenty of government organizations and institutions working on the same policies so this duplication leads to inefficiency. The government has to define their role, map their activities and allocate the specific jobs/objectives. In the National Water Policy Framework, core actors aligned with the supply-driven direction of the water sector are influential in the form of hydraulic bureaucracies, federal and regional politicians, and irrigators, so interest groups can be brought on board at the implementation stage of environmental-social-governance. There must be national research agenda for the implementation of such policies. Strategic partnerships with NGOs, interdependent water sector experts, donors, and farmer organizations to promote good governance in water sector.

[ 276 ] 6th International Water Conference Proceedings
23. Water Pricing:
Pricing of water with successive higher rates of units and their usage according to their consumption pattern must be related to the direct rates to sustain the water resources with subsequent economic implication.
24. Blue Economy and Global Responsibility:
Blue Economy’ is a concept to seek economic growth, social inclusion, and improvement of livelihoods as well as ensuring environmental sustainability. The Blue Economy approach recognizes and places renewed emphasis on the critical need to address effectively the sound management of resources in and beneath international waters to achieve inclusive growth and development through sustainable ocean governance mechanisms. Every country must take its share of the responsibility to protect the high seas, which cover 64 % of the surface of our oceans and constitute more than 90% of their volume. There is a need for an integrated National Maritime Policy. Increasing the awareness and knowledge among the decision-makers as well as the general public and capacity building through public-private partnerships are required.
25. Untapped Economic Potential: Blue Economic Commission
Being an important maritime state in the Indian Ocean region (IOR), Pakistan is progressively apprehending the marvels of the Blue Economy. The country is blessed with over 1000 km long coastline and the Exclusive Economic Zone (EEZ) covering about 240,000 Sq. Km. In addition, extension of continental shelf (50,000 Sq. Km) was also approved by United Nations Commission on the Limits of the Continental Shelf (UNCLCS) in 2015. Its present-day maritime revenue projection stands at $183 million but there is still untapped potential which has not discovered yet. There is an immense requirement to develop a Blue Economic Commission at national level that would be responsible to generate revenue from the untapped potential of blue economy.
6th International Water Conference Proceedings [ 277 ]
List of Abbreviation
• IWC International Water Conference.• RIPP Riphah Institute of Public Policy • TAF The Asia Foundation • PIDE Pakistan Institute of Development Economics• PCRWR Pakistan Council of Research in Water Resources• WEF Water-energy-food• CPEC China Pakistan Economic Corridor• NWP National Water Policy• SDGs Sustainable Development Goals• AI Artificial Intelli-gence.• MAF Mil-lion acre- feet • GIS Geographic information system• TOB Thiosulfate-oxidizing Bacteria• CCI Council of Common Interests • DGGE Denaturing gradient gel electrophoresis• PCR Polymerase chain reaction• MD Membrane distillation • AGMD Air Gap Membrane Desalination• PET Polyethylene terephthalate• TDS Total dissolved solids• EC Electrical conductivity • SAR Specific Absorption Rate• ICW Integrated Constructed Wetlands• COD Chemical Oxygen Demand • TSS Total Suspended Solids• TKN Total Kjeldahl Nitrogen• CTAB Cetyl trimethylammonium bromide• DNA Deoxyribonucleic Acid• NSDWQ National Standards for Drinking Water Quality • USPCASW U.S.-Pakistan Centers for Advanced Studies in Water• TSB Tryptone soya broth
[ 278 ] 6th International Water Conference Proceedings
• IBIS Indus Basin Irrigation System• CCA Canal command area• ET Evapotranspiration• PS Peanut shell• AMR Antimicrobial resistance• FAO Food and Agriculture Organization.• CFU Colony forming units• XDR Extensively drug resistance• TSI Triple Sugar Iron• NIBGE National Institute for Biotechnology and Genetic Engineering• CWS Constructed wetlands• FYM Farmyard manure• CD Cow dung• BGS Biogas slurry• MBW Biomaterials waste• TF Translocation factor • QMRA Quantitative Microbial Risk Assessment • UASB Up-flow anaerobic sludge blanket • NDVI Normalized difference vegetation index • VCI Vegetation cover index • FVC Fractional vegetation cover • RMSE Mean square error• DO Dissolved Oxygen• COD Chemical Oxygen Demand• DWDS Drinking water distribution systems• GI Galvanized iron • PCR Polymerase chain reaction• LD Lethal dose• MUECHS Mehran University Employees Cooperative Housing Society.• HNTR Hala Nakka Treatment Plant• GAC Granular activated carbon• PAC Powdered Activated Carbon• MPS Multi-Parameter Sensor
6th International Water Conference Proceedings [ 279 ]
• SCEE School of Civil and Environmental Engineering• OECD Organisation for Economic Co-operation and Development• CAS Chemical Abstract Service• IQA Indoor air quality• MDGs Millennium Development Goals• JMP Joint Monitoring Programmed• INGO International organizations• WASH Water, sanitation and hygiene• NEQS National Environmental Quality Standards• AS Chloride, arsenic• CD Cadmium• ODK Open Data Kit • EDO Executive District Officer• MHM Menstrual hygiene management• USEPA United States Environmental Protection Agency• HM Heavy metals• EMIS Educational monitoring and information system• LAT Land Surface Temperature• USGS United States Geological Survey• GPS Global Positioning System• VCI Vegetation Cover Index• EPS extracellular polymeric substances• PVC Polyvinyl chloride• MDPE medium density polyethylene• UPVC unplasticized polyvinyl chloride• MGD million gallons per day• PPR• HPC Heterotrophic plate count• PSDWQ• DCIP ductile cast iron pipe• GCIP gray cast iron pipes• SSCP stainless steel clad pipe• BFP Biofilm forming potential

[ 280 ] 6th International Water Conference Proceedings
• EPA Environment Protection Agency• OLS Ordinary Least Square• REML Restricted Maximum Likelihood• RMSPE Root mean square prediction error• IWT Indus Water Treaty


riphah International University Islamabad Ground Floor, 4-Evacuee Trust Complex,
Agha Khan Road, Near Marriott Hotel, F-5, Islamabad.Phone: +92 (51) 843 8370-7
ISBN: ISBN 978-969-23348-6-0
Copyright © 2022 FDOKUMEN