proceeding - CATEA 2019 - Sekolah Tinggi Pariwisata Trisakti
346
-
Upload
khangminh22 -
Category
Documents
-
view
0 -
download
0
Transcript of proceeding - CATEA 2019 - Sekolah Tinggi Pariwisata Trisakti


i
PROCEEDING
China Asean Tourism Education Alliance (CATEA) International Conference
” Uniting Conservation, Community, and Sustainable Tourism Facing Tourism 4.0”
Published by:
Sekolah Tinggi Pariwisata Trisakti
ISBN: 978-623-91018-0-0
Editors : Dr. Rahmat Ingkadijaya, Sekolah Tinggi Pariwisata Trisakti, Indonesia
Rina Suprina, M.Hum.M.SiPar, Sekolah Tinggi Pariwisata Trisakti, Indonesia
Devita Gantina, M.Par, , Sekolah Tinggi Pariwisata Trisakti, Indonesia
Dr. Pan Junyang. Guilin Tourism University, China
Prof. Theodore Benetatos, IMI Switzerland
Asst. Prof. Sakchai Sektarnawat, Ph.D. Burapha Universiry, Thailand
Lay out : Marissa Pusparini, M.P.Par.
Design : Suryo Danar Saputra, S.Pd.
Reviewers : Dr. Myrza Rahmanita
Dr. Himawan Brahmantyo
Dr. Sri Sulartiningrum
Astuti Kusumawicitra, PhD.
Distributed by:
Sekolah Tinggi Pariwisata Trisakti
Jl. IKPN Tanah Kusir, Bintaro, Jakarta
Indonesia.
Telp. +62 21 7377738
Fax. +62 21 73887763
First published in 2019
Copyright © 2019 by Sekolah Tinggi Pariwisata Trisakti (STP Trisakti)
All rights reserved. No part of this publication may be reproduced or transmitted in any form
or by any means, electronic or mechanical, include photocopying, recording or by any
information storage and retrieval system, without permission in writing from the copyright
owner. On no account may any part of this publication be reproduced without the written
permission of STP Trisakti or the authors concerned.

ii
COMMITTEE
STEERING COMMITTEE
Fetty Asmaniati, SE, MM President
Trisakti School of Tourism
Djoni Wibowo, SE.MM Vice President of Academic & Student Affairs
Trisakti School of Tourism
Dr. Nurbaeti Vice President of Finance & Public Affairs
Trisakti School of Tourism
Ismeth Emier Osman, SE.MM Vice President of Marketing & Cooperation
Trisakti School of Tourism
Cheng Daopin President
Guilin Tourism University, The Republic of China
Prof. Zhang Xianchun Dean
Guilin Tourism University, The Republic of China
Zhang Hailin Executing Deputy Director, Research Department
Guilin Tourism University, The Republic of China
Dr. Andrew Chua Principal and Executive Chairman
East Asia School of Business, Singapore
ORGANIZING COMMITTEE
Chairperson : Surya Fajar Budiman, SST.MMPar
Vice Chairperson : Nurima Rahmitasari, M.SiPar
Treasurer : Nelwati, S. Kom., MM
Secretariat : Nirmala Hapsari
Call for Paper and Poster Session : Rina Suprina, M.Hum.M.SiPar
Dra. Purwanti Dyah Pramanik, M.Si
Devita Gantina, M.Par
Nurti Rahayu, M.Par
Program Chair : Michael Krishna, M.Par.
Emenina Tarigan, M.Par
IT, Publication and Documentation : Triana Rosalina Dewi, SE.MM.
Malik Mustofa, S.Kom., MM.
Sponsorship : Novita Widyastuti S. SST., M.SiPar
Jeffry Sudirja, M.SiPar.

iii
FOREWORD
Praise the Lord and thank the Almighty God who continues to devote His
grace to all of us, and with His permission the China ASEAN Tourism
Education Alliance (CATEA) International Conference with the theme
"Uniting Conservation, Community and Sustainable Tourism Facing 4.0",
can be implemented well and this proceeding can be published.
The theme was chosen on the grounds to provide academic attention to
the importance of developing and strengthening tourism and improving communication in the
face of conservation, community and sustainable tourism and global tourism technology,
especially facing technology 4.0.
National and international academics have produced many researches on strengthening and
developing business, communication, and technology to deal with the globalization, but there
are still many that have not been disseminated and widely publicized, so that they are not yet
accessible to people in need. On this basis, this International Conference is one of the venues
for national and international Academics to present their research, as well as exchange
information and deepen research area, and develop sustainable cooperation.
This year, the CATEA international conference accommodated 36 papers from authors
coming from various countries, namely Indonesia, Malaysia, Thailand and China. The
number of institutions participated in the paper presentations is 13 which consists of 10
institutions from Indonesia and 3 from abroad. Researchers from various fields of study from
Indonesia and several ASEAN countries have discussed various topics in the fields of
conservation, community and sustainable tourism in order to provide ideas and solutions to
strengthen tourism education role in facing tourism technology 4.0.
Finally, we would like to sincerely thank the President of Trisakti School of Tourism,
steering committee, organizing committee, speakers, presenters, participants, and sponsors
who have made this international conference fruitful and successful. May Allah SWT, God
Almighty bless all our good efforts.
Jakarta, June 10th
, 2019
Surya Fadjar Boediman, SST. MMPar.
Conference Chair

iv
MESSAGE FROM THE PRESIDENT OF TRISAKTI SCHOOL OF TOURISM (TST)
Assalamu’alaikum Wr. Wb.
Dear distinguished keynote speakers, invited speakers, presenters, and
participants.
First of all, on behalf of Trisakti School of Tourism (TST), I would like to
welcome you to the 3rd
China ASEAN Tourism Education Alliance
(CATEA) International Conference 2019. CATEA was co-founded by the ASEAN China
Center and Guilin Tourism University along with 18 Tourism schools and enterprises in
China and ASEAN in 2017. The purpose of establishing CATEA is to promote the
cooperation between tourism schools in China and ASEAN and upgrade the education
quality. This is in line with TST, who was established in 1969 under Trisakti Foundation and
has continuously focused on improving tourism education quality. For this reason, TST is
pleased to host this prestigious international conference.
Let me express my sincere gratitude to those who have participated in this event: The
Ministry of Tourism, The Ministry of Research Technology and Higher Education, Secretary
General of ASEAN, The Embassy of the Republic of Indonesia to People’s Republic of
China, The Embassy of People’s Republic of China to ASEAN Country, ASEAN Tourism
Research Assosiation (ATRA), Guilin Tourism University, Burapha University International
College Thailand, Suan Dusit University Thailand, Huaqiao University, China, Wuxi Institute
of Technology China, East Asia Institute of Management, Singapore, AAHRMEI
Philippines, The AITTEI (HILDIKTIPARI), Shanghai Institute of Tourism, China, Sichuan
Tourism University, China, Institute of Tourism Studes, Macao, China, University of
Indonesia, and other national institutions who participated in paper presentation paralel
sessions.
I wish you all the best and success participating in this 3rd
CATEA International Conference
2019.
Wassalamu’alaikum Wr. Wb.
Jakarta, June 10th
, 2019
Fetty Asmaniati, SE.MM
President

v
TABLE OF CONTENTS
Cover………………………………………………………………………….............. i
Committee…………………………………………………………………………....... ii
Forewords ……………………………………………………………………………... iii
Message from The President of Trisakti School of Tourism …………………………. iv
Table of Content ………………………………………………………………………. v
Rundown CATEA 2019……………………………………………………………… viii
Paper Presentation - Room 301 (Tourism & Destination) ……………………………. x
Paper Presentation- Room 302 (Tourism) ……………………………………………. xi
Paper Presentation- Room 303 (Tourism, Destination, & Gastronomy) ……………… xiii
Poster Display- Room 304 (Tourism, Destination, & Gastronomy) ………………….. xv
What You Didn’t Know of Human Resource Development.....................................
Purwanti Dyah Pramanik
1
The Impact of Halal Tourism Promotion (Sharia Tourism) Towards the Students’ of
STP Trisakti Visiting Decision to Twelve Halal Tourism Destinations.....................
Anita Swantari, Rina Fitriana
12
Factors Affecting the Ragunan Zoo Visitors’ Satisfaction.......................................
Rina Fitriana, Riska Septi Dinantika
22
The Effect of Incube Artisan Coffee House on The Interest of Students Entrepreneurs
at Stp Trisakti.................................................................................
Novita Widyastuti Sugeng, Vienna Artina Sembiring
30
Ice Green Banana with Coating Iota, Kappa and Its Characteristics (Experimental
Study of Molecular Gastronomy) ...........................................................................
Robiatul Adawiyah, Vienna Artina.S, Wijayanti Dewi.P
40
The Influence of Study Motivation Abroad to Students’ Happiness.............................
Sheivianah Disya, Lestari Ningrum
48
Strategies for Developing Natural-based Tourism Destination in the Dieng Plateau as
a Sustainable Tourism..... .......................................................................................
Ayu Setya Kemalasari, Malidya Puspita Ayu, Meisa Sofia
56
How Millennials in Indonesia Perceive in Studying Abroad to China...........................
Adella Gloria Harjanto, Lestari Ningrum
66
Indonesians Go to China, are They Satisfied? .............................................................
Savitri Hendradewi, Lestari Ningrum
78
Ecotourism Development Strategy at Situ Gede Bogor...........................................
Imam Ardiansyah
89
The Potential of Culinary Studio Business in North Jakarta.......................................
Diena Mutiara Lemy, Ryan Grady
101

vi
The Influence of Service Quality Towards Customer Satisfaction in Air Asia’s Low
Cost Airline Services..............................................................................................
Ani Puspawigati
112
The Relationship between the Implementation of Service Quality and Guest
Satisfaction at Hotel X Jakarta...............................................................................
Hari Iskandar
122
Accessibility Approach to Tourism: A Case of Anjungan TMII.................................
Ika Triana, Nurul Sukma Lestari, Rachel Dyah Wiastuti
132
Employee Personality Traits Towards Cyberloafing Activities in Hotel Industry..........
Rachel Dyah Wiastuti, Livensa, Nurul Sukma Lestari, Ika Triana
139
The Impact of Jakarta Good Guide Service Quality Towards the Satisfaction of
Jakarta Walking Tour Tourists.....................................................................................
Deivy Zulyanti Nasution, Rina Fitriana, Opalma Siahaan
148
Sustainable-tourism’s Competitiveness in Cibodas Botanical Garden..........................
Hengky, Sunda Ariana, Suheriyatmono
158
Community Empowerment Strategy: Ecospa Tourism Prospects in Nglanggeran
Tourism Village Gunung Kidul Yogyakarta..............................................................
Lastiani, Baiquni, Eni, Wahyono
165
How and When Does Multitasking Affect Customer Orientation?................................
Juan Liu, Seonghee Cho, Meiying Zhong, Ya Guo
175
The Impact Analysis of Service Quality Towards Behavioral Intentions with
Perceived Value and Customer Satisfaction as its Intervening Variables on Trisakti
School of Management...................................................................................................
Andhalia Liza Marie, Rintis Eko Widodo
188
How Community Perception of Ecotourism Affect the Participation of Ketambe
Village Community in Mount Leuser National Park, Southeast Aceh...........................
Rina Suprina, Nurbaeti, Marissa Pusparini
198
Building Tourism Institutions for Cultural Life that Support Tourism..........................
Riyono Gede Trisoko
206
Community Perception of Food Preferences in Bogor...................................................
Deddy Wijayanto, Christin Setiawan
213
Determinants of E-service Quality Towards Continuing Using Mobile Application
for Hotel Reservation: The Case of Agoda Application.................................................
Krittipat Pitchayadejanant, Kritta-orn Chewwasung, Parinya Nakapthom, Kritiya
Srikasem, Manatchanan Lekmeechai, Chanitta Chaiyawet,Sirintip Suriwong,
Chen Wei Tso
218
vii
Experiential Value for International Tourists’ Satisfaction and Loyalty Toward Beach
Activities in Pattaya City, Thailand.................................................................................
Parinya Nakapthom, Aristeidis Gkoumas, Krittipat Pitchayadejanant, Pavel
Shvedov, Kulanattha Mcbriar,Thanatda Budda,Sarinna Saisot, Pimpapisa Indang
226
The Influence of Instagram Travel Influencer on Visiting Decision of Tourist
Destinations for Generation Y....................................................................................
Regina Dewi Hanifah
235
Discrepance Dynamics on Ecotourism Development in Sembilang National Parks,
Indonesia..........................................................................................................................
Nurbaeti, Fetty Asmaniaty, Adam Rachmatullah
248
Study of Stakeholders' Perception, Motivation and Preferences Towards Ecotourism
Development in Siberut National Park, Indonesia..........................................................
Devita Gantina, Adam Rachmatullah, Fetty Asmaniaty
263
Training and Development in a Malaysian Airport Service Provider: The Impact on
Employees’ Performance...................................................... ...................................
Idaya Husna Mohd, Ummu Hani Ahmad Mansor, Muhammad Hafizi Zamri, Tuan
Badrol Hisham Tuan Besar
278
Micro, Small, and Middle Enterprise: Sago Food in Contemporary Culinary................
Aliffatqul Maulana, Saptarining Wulan, Djoni Wibowo
285
Developing Archipelagic Tourism on Nain Island within Bunaken National Park in
North Sulawesi, Indonesia..............................................................................................
Bet El Silisna Lagarense, Agustinus Walansendow
289
Examining the Impacts of Sport Tourism Event in Strengthening Local Economy:
The Case of Manado Fiesta 2018 in Manado, Indonesia................................................
Bet El Silisna Lagarense, Taufiq Hidayah, Fitri Abdillah
297
The Influences of Behavioral Factors Moderated by Information Technology and
Competitive Advantages on Sustainability of MSME Craft Business in North
Sulawesi...........................................................................................................................
Agustinus Walansendow, Silvya Mandey, Herman Karamoy, Lisbeth Mananeke
304
The Quality of Polymia Hand Sanitizer Towards Effectivity of Food Handlers............
I Nyoman Sudiartha, Putu Eka Wirawan
315
The Importance of Destination Image for Tourists Visiting Kepulauan Seribu............
Fachrul Husain Habibie, Devita Gantina, Lintang
321

viii
RUNDOWN CATEA 2019
Hosted by:
TRISAKTI SCHOOL OF TOURISM, INDONESIA & GUILIN TOURISM
UNIVERSITY, CHINA
Thursday, June 20th, 2019
Date Time Activities
Thursday
June 20, 2019
08.00-08.50
09.00-09.15
09.15-09.45
09.45-10.15
10.15-11.45
Registration of participants
Inauguration Ceremony of “THE CHINA ASEAN TOURISM
EDUCATION ALLIANCE (CATEA) ANNUAL ASSEMBLY &
INTERNATIONAL FORUM ON CHINA ASEAN TOURISM
EDUCATION 2019”
Venue: Auditorium of Trisakti School of Tourism, Indonesia
Theme: Uniting Conservation, Communities and Sustainable
Tourism Facing 4.0
Welcome Indonesia Traditional Dance
Indonesia Anthem: Indonesia Raya
ASEAN Anthem
Welcome Speech by:
1. Fetty Asmaniati SE. MM. – President, Trisakti School of
Tourism, Indonesia
2. Dr. Djanadi Bimo Prakoso, MPA, MSc. – Chairman, Trisakti
Foundation, Indonesia
3. Harry Tjan Silalahi, SH. – Governing Board of Trisakti
Foundation
4. Lin Na - Party Secretary, Guilin Tourism University, China
5. Roatlomang Kong - Representative of Secretary General of
ASEAN - China Center, China
Keynote Speaker by:
Dr. Ir. Arief Yahya, M.Sc., - Minister of Tourism of The Republic
of Indonesia
Official Opening Ceremony by Dr. Ir. Arief Yahya, M.Sc.,
Minister of Tourism of The Republic of Indonesia
Photo session
Speakers by:
1. Prof. Dr. Ismunandar, Ph.D – Director General, Directorate of
Learning and Students Affairs, Ministry of Research
Technology and Higher Education of the Republic of Indonesia
2. Drs. Djauhari Oratmangun - Ambassador of the Republic of
Indonesia to People’s Republic of China
3. H.E. Amb. Huang Xilian - Ambassador of the People’s
Republic of China to ASEAN
4. Romeo Jr Abad Arca – ASEAN Head of Community Relations
Division
5. Prof. Datuk Seri Dr. Victor Wee - General Secretary, ASEAN
Tourism Research Association (ATRA)

ix
Date Time Activities
12.00–13.00
PAPER
PRESENTATIO
N SESSION
(13.00-17.00)
PANNEL
SESSION
(13.00-17.05)
13.00–15.00
15.00-15.30
15.30-17.00
Lunch
Paper Presentation of THE CATEA 2019
Venue: Class Room of #301, #302, #303 (Level 3)
(Divided into 3 session rooms with 30 papers and 6 posters)
Panel Session Presentation addressed by delegates from China-
ASEAN universities
Venue: Auditorium of Trisakti School of Tourism
The 1st Panel Session
Theme: Uniting Conservation Facing 4.0
Moderator:Dr. Myrza Rahmanita (Head of Tourism &
Hospitality Department of Trisakti School of Tourism, Indonesia)
Panel Discussion by:
1. Dr. Diena M. Lemy, A.Par., M.M - The AITTEI (Hildiktipari),
Indonesia
2. Dr. Parinya Nakpathom, B. – Burapha University International
College, Thailand
3. Zhang Hailin - Guilin Tourism University, China
4. Dr. Pornchanit Kaew-Nate – Suan Dusit University, Thailand
5. Wei Zhuangchun – Guangxi Webster Education Group, China
6. Prof. Jatna Supriatna, M.Sc., Ph.D - University of Indonesia,
Indonesia
Coffee Break
The 2nd Panel Session
Theme: Communities and Sustainable Tourism Facing 4.0
Moderator: Agus Riyadi, SST. Par., M.Sc., CHIA
Panel Discussion by:
1. Dr. Robin Yap – Tourism Management Institute of Singapore,
Singapore
2. Dr. Gloria Baken Siy - Founder & Presidents AAHRMEI
(Association of Administrators in Hospitality, Hotel &
Restaurant Management Educational Institution), Philippine
3. Kang Nian - Shanghai Institute of Tourism, China
4. Yucheng Xiang - Sichuan Tourism University, China
5. Li Juan - Wuxi Institute of Technology, China
6. Dr. Ahmed Abdel Fattah - Institute for Tourism Studies,
Macao, China
7. Dr. Sri Mariati – Trisakti School of Tourism, Indonesia
8. Huang Yuanshui – College of Tourism, huaqiao University,
China
Closing Seminar by Chairperson of Organizing Committee

x
PAPER PRESENTATION - ROOM 301 (TOURISM & DESTINATION)
Thursday, 20th June 2019
Time: 13.00 – 15.30
MODERATOR: Dr. Rahmat Ingkadijaya
No. TIME AUTHOR PAPER TITLE INSTITUTION CONCENTRATION
1 13.00 – 13.15 1. Ayu Setya Kemalasari
2. Malidya Puspita Ayu
3. Meisa Sofia
Strategies for Developing Natural-based
Tourism Destination in the Dieng Plateau
ITB Tourism
2 13.15 – 13.30 Imam Ardiansyah Ecotourism Development Strategy at Situ
Gede Bogor
Universitas Bunda
Mulia
Destination
3 13.30 – 13.45 1. Anita Swantari
2. Rina Fitriana
The Impact of Halal Tourism Promotion STP Trisakti Tourism
4 13.45 – 14.00 1. Rina Fitriana
2. Riska Septi Dinantika
Factors Affecting the Satisfaction of Visitors
of Ragunan Zoo
STP Trisakti Tourism
5 14.00 – 14.15 1. Novita Widyastuti Sugeng
2. Vienna Artina Sembiring
The Effect of Incube Artisan Coffee House
on The Interest of Students Entrepreneurs at
STP Trisakti
STP Trisakti Tourism
6 14.15 – 14.30 1. Sheivianah Disya
2. Lestari Ningrum
The Influence of Study Motivation abroad to
Student’s Happiness
STP Trisakti Tourism
7 14.30 – 14.45 Ani Puspawigati
The Influence of Service Quality towards
Customer Satisfaction in Air Asia’s Low
Cost Airline Services
Universitas Bunda
Mulia
Tourism
8 14.45 – 15.00 1. Hengky
2. Sunda Ariana
3. Suheriyatmono
Sustainable-tourism’s Competitiveness in
Cibodas Botanical Garden
Universitas Bina
Darma
Tourism
9 15.00 – 15.15 Riyono Gede Trisoko Building Tourism Institutions for Cultural
Life That Support Tourism
STP Riau Tourism
10 15.15 – 15.30 1. Adella Gloria Harjanto
2. Lestari Ningrum
How Millennials in Indonesia Perceive
Studying Abroad to China STP Trisakti Tourism

xi
PAPER PRESENTATION- ROOM 302 (TOURISM)
Thursday, 20th June 2019
Time: 13.00 – 15.30
MODERATOR: Dr (Cand) Munawaroh, SE.MM
No. TIME AUTHOR PAPER TITLE INSTITUTION CONCENTRATION
1 13.00 – 13.15 Hari Iskandar
The Relationship between the
Implementation of Service Quality and
Guest Satisfaction at Hotel X Jakarta
Universitas Bunda Mulia
Tourism
2 13.15 – 13.30
1. Ika Triana
2. Nurul Sukma Lestari
3. Rachel Dyah Wiastuti
Accessibility Approach to Tourism: A
Case of Anjungan TMII
Universitas Bina
Nusantara
Tourism
3 13.30 – 13.45
1. Rachel Dyah Wiastuti
2. Livensa
3. Nurul Sukma Lestari
4. Ika Triana
Employee Personality Traits towards
Cyberloafing Activities in Hotel Industry
Universitas Bina
Nusantara
Tourism
4 13.45 – 14.00
1. Deivy Zulyanti Nasution
2. Rina Fitriana
3. Opalma Siahaan
The Impact of Jakarta Good Guide
Service Quality towards the Satisfaction
of Jakarta Walking Tour Tourists
STP Trisakti Tourism
5 14.00 – 14.15
1. Aliffatqul Maulana
2. Saptarining Wulan
3. Djoni Wibowo
Micro, Small, and Middle Enterprise:
Sago Food in Contemporary Culinary STP Trisakti
Tourism
6 14.15 – 14.30
1. Lastiani
2. Baiquni
3. Eni
4. Wahyono
Community Empowerment
Strategy:Ecospa Tourism Prospects in
Nglanggeran Tourism Village Gunung
Kidul Yogyakarta
UGM
Tourism

xii
No. TIME AUTHOR PAPER TITLE INSTITUTION CONCENTRATION
7 14.30 - 14.45
1. Juan Liu
2. Seonghee Cho
3. Meiying Zhong
4. Ya Guo
How and When Does Multitasking Affect
Customer Orientation?
1. Wuxi Institute of
Technology
2. University of Missouri
3. Jiangnan University
Tourism
8 14.45 – 15.00
1. Andhalia Liza Marie
2. Rintis Eko Widodo
The Impact Analysis of Service Quality
Towards Behavioral Intentions with
Perceived Value and Customer
Satisfaction as its Intervening Variables
on Trisakti School of Management
1. STP Trisakti
2. Saint Mary College
Tourism
9 15.00 – 15.15 1. Deddy Wijayanto
2. Christin Setiawan
Community Perception of Food
Preferences in Bogor
STP Trisakti Tourism
10 15.15 – 15.30 Regina Dewi Hanifah
The Influence of Instagram Travel
Influencer on Visiting Decision of
Tourist Destinations for Generation Y
Akademi Pariwisata
Bunda Mulia Tourism

xiii
PAPER PRESENTATION- ROOM 303 (TOURISM, DESTINATION, & GASTRONOMY)
Thursday, 20th June 2019
Time: 13.00 – 15.30
MODERATOR: Dr. Himawan Bramantyo
No. TIME AUTHOR PAPER TITLE INSTITUTION CONCENTRATION
1 13.00 – 13.15
1. Krittipat Pitchayadejanant
2. Kritta-orn Chewwasung
3. Parinya Nakapthom
4. Kritiya Srikasem
5. Manatchanan Lekmeechai
6. Chanitta Chaiyawet
7. Sirintip Suriwong
8. Chen Wei Tso
Determinants of E-service Quality towards
Continuing using Mobile Application for
Hotel Reservation: The Case of Agoda
Application
Burapha University
International College,
Thailand
Tourism
2 13.15 – 13.30
1. Parinya Nakapthom
2. Aristeidis Gkoumas
3. Krittipat Pitchayadejanant
4. Pavel Shvedov
5. Kulanattha Mcbriar
6. Thanatda Budda
7. Sarinna Saisot
8. Pimpapisa Indang
Experiential Value for International
Tourists’ Satisfaction and Loyalty toward
Beach Activities in Pattaya City, Thailand
Burapha University
International College,
Thailand
Tourism
3 13.30 – 13.45
1. Idaya Husna Mohd
2. Ummu Hani Ahmad Mansor
3. Muhammad Hafizi Zamri
4. Tuan Badrol Hisham Tuan Besar
Training and Development in a Malaysian
Airport Service Provider: The Impact on
Employees’ Performance
Universiti Teknologi
Mara, Puncak Alam,
Malaysia
Tourism

xiv
No. TIME AUTHOR PAPER TITLE INSTITUTION CONCENTRATION
4 13.45 – 14.00
1. Bet El Silisna Lagarense
2. Agustinus Walansendow
Developing Archipelagic Tourism on Nain
Island within
Bunaken National Park in North Sulawesi,
Indonesia
Politeknik Negeri
Manado
Tourism
5 14.00 – 14.15
1. Bet El Silisna Lagarense
2. Taufiq Hidayah
3. Fitri Abdillah
Developing Sport Tourism Event to
Strengthen Destinations Image: The Case
of as Manado Fiesta 2018, in Indonesia
Politeknik Negeri
Manado
Universitas Negeri
Semarang
University Negeri
Jakarta
Destination
6 14.15 – 14.30
1. Agustinus Walansendow
2. Silvya Mandey
3. Herman Karamoy
4. Lisbeth Mananeke
The Influences of Behavioral Factors
Moderated by Information Technology and
Competitive Advantages on Sustainability
of MSME Craft Business in North Sulawesi
Politeknik Negeri
Manado
Sam Ratulangi
University
Tourism
7 14.30 – 14.45
1. Savitri Hendradewi
2. Lestari Ningrum
Indonesians Go to China, are They
Satisfied?
STP Trisakti Destination
8
14.45 – 15.00
1. Diena Mutiara Lemy
2. Ryan Grady
The Potential of Culinary Studio Business
in North Jakarta
UPH Gastronomy
9 15.00 - 15.15
1. Robiatul Adawiyah
2. Vienna Artina.S
3. Wijayanti Dewi.P
Ice Green Banana with Coating Iota, Kappa
and Its Characteristics (Experimental Study
of Molecular Gastronomy)
STP Trisakti Gastronomy

xv
POSTER DISPLAY- ROOM 304 (TOURISM, DESTINATION, & GASTRONOMY)
Thursday, 20th June 2019
Time: 13.00 – 15.30
No. AUTHOR PAPER TITLE INSTITUTION CONCENTRATION
1
1. Rina Suprina
2. Nurbaeti
3. Marissa Pusparini
How Community Perception of Ecotourism Affect the
Participation of Ketambe Village Community in Mount Leuser
National Park, Southeast Aceh.
STP Trisakti Tourism
2
1. Devita Gantina
2. Adam Rachmatullah
3. Fetty Asmaniaty
Study of Stakeholders' Perception, Motivation and Preferences
towards Ecotourism Development in Siberut National Park,
Indonesia STP Trisakti
Tourism
3
1. Fachrul Husain Habibie
2. Devita Gantina
3. Yulia Lintang K
The Importance of Destination Image for Tourists Visiting
Kepulauan Seribu STP Trisakti
Tourism
4 1. I Nyoman Sudiartha
2. Putu Eka Wirawan
The Quality of Polymia Hand Sanitizer Towards Effectivity of
Food Handlers
The Bali International Institute
of Tourism
Gastronomy
5 Purwanti Dyah Pramanik What You Didn’t Know of Human Resource Development STP Trisakti Tourism
6
1. Nurbaeti
2. Fetty Asmaniaty
3. Adam Rachmatullah
Discrepance Dynamics on Ecotourism Development in
Sembilang National Parks, Indonesia STP Trisakti Tourism

1
Proceedings of CATEA 2019
Proceedings of CATEA 2019
ISBN 978-623-91018-0-0
What You Didn’t Know of Human Resource Development
Purwanti Dyah Pramanik
Sekolah Tinggi Pariwisata Trisakti
Abstract: This paper aimed to enhance HRD professional’s knowledge about human resource development
(HRD) practices, the basic of human resource development, and the evolution human resource development.
Understanding them is going to assist HRD professional to implement HRD on the right track. It’s also
improving him/her while practicing HRD in his/ her organization. The method used literature study. The
study found that (1) HRD is a part of Human Resource (HR), and its subfield are Training and Development
(T&D) and Organization Development (OD); (2) HRD is held for the sake of learning and performance
changes to be better; and (3) HRD was an evolution and born paralel with world changes, this makes HRD
still exist up to right now.
Keywords: Human Resource Development; Learning; and Performance; and Evolution.
1. Introduction Human Resource Development (HRD) practice is implemented in numerous levels. It’s used
in the level of individual, organization, and society (Swanson, 2001). At the level of individual
HRD is for developing a person who could be a child or an employee with a certain skills needed.
This skill is coached to assist them attaining their personal goals. For example a father who has a
restaurant coaches his child to be able to prepare a dish. The father wants give new skill to his child
in order to sustain his business. In the context of employees, the skill is given by the employee’s
supervisor. For example the supervisor coaches a reservation staff to prepare guest’s forecasting.
This skill is taught to enhance the employee’s competency. By completing this skill, the
reservation staff is assisted to be grown, on the other hand this skill is helping the organization to
reach its objectives. Individual’s goal was generated from organizational goal. If each individual
goal is attained, the organizational goal is automatically achieved. The type of organizations could
be profit or nonprofit organization (Santos, 2017). At the level of society, the attainment of the
goal is broader. It relates to people’s objectives in a certain area. For example, human resource
development in rural communities of Kerala (Kokkranikal, 2007). The practical of human resource
development covers all activities from the smallest up to the largest environment, and HRD
professionals have to implement human resource practice properly.
The basic of human resource development (HRD) are two cores. They are individual and
organizational learning and individual and organization performance (Swanson, 2001). Individual
and organizational learning is meant that the process of HRD has to change both individual and
organization be better by having new expertise. For example the guest complains of the guest
room. He/she reserved deluxe room with pool view, but the receptionist provides deluxe room
with street view. Then the supervisor coaches the employee how to handle check-in guest. By
coaching this skills, the employee of oneness with and belonginees to the organization (Zhang,
2017) hopes the same mistakes won’t be happened in the future. Due to eliminate this complaint
through coaching process, both of them wants to improve the performance as well. The HRD
professional has to concern that the purpose of HRD includes individual and organizational
learning and organization and organizational performance.

Purwanti Dyah Pramanik
What You Didn’t Know of Human Resource Development
2
Proceedings of CATEA 2019
Human resource development is an evolution process. Its transformation takes several decades.
It starts from 100 B.C. – 300 A.D since Greek and Romans era (Swanson, 2001). At the beginning,
HRD process implement in the smallest society -namely family-. Then it’s adopted by
organization, and finally society. In its growth, HRD is influenced by the world changes. The
HRD professional who responsible for employee development has to ensure that their practice
meets the changing needs of organization (Johnston, 2001). HRD professionals have to understand
HRD history, due to respect the importance of HRD.
2. Literature Review
2.1 Human resource development practice Human resource development practice is still new knowledge (Kumpikaite, 2014) even its
practices has been implemented well. The people who deal with human resource development
must understand: (1) the purpose of human resource development; (2) the definition of human
resource development; (3) the origin context of human resource development; and (4) finally the
core beliefs of human resource development.
The purpose of human resource development
Since we discuss of human resource development, it means we discuss of the function of
human being in the system for gaining benefit. Of course human resource development is intended
for the growth both individual and organization as well. There must be equal between corporate
profit and employee dignity (Thaakadipuram, 2010). The previous study argued that human
resource development has two cores (Swanson, 2001). There are (1) individual and organizational
learning and (2) individual and organizational performance. In the context of individual and
organizational learning relates to the term of learning organization. This kind of organization
emphasizes knowledge management and training as a system which creates intellectual capital.
There are six key features of learning organization: continuous learning and improvements,
knowledge generation and sharing, systematic changes, learning culture, flexibility and
experimentation, and valuing employees. The essence of learning organization isn’t just training
but self-development (Kumpikaite, 2008). It contributes organizational competitiveness (Johnston,
2001). The lack of competitiveness is reducing performance (O’Neil, xxxx). Those objectives are
described from the definition of human resource development.
The definition of human resource development
Many scholars explain human resource development in a wide range of definitions. Human
resource development is activities which are dominated by intention to improve of individual,
group, work process, and organization expertise and performance (Swanson, 2001). A sustained
investment in people will improve tourism sector (Semone, 2012). Another scholar argued human
resource development is a long term process or an activity for improving employees’ knowledge,
expertise, productivity, and satisfaction at the level of individual or group, in order to reach
organization, community, nation, and society benefits (McLean & McLean, 2000). For better
understanding, table 1 mentions some definitions of human resource development.
According to the definitions above HRD is able to judge as a process or activity, but this paper
prefers to use process terminology. Why? Process refers to a system to deal with a variety of
persons, at a variety of times, and locate inside or outside the organization. At the organization
HRD refers to the department, function, or job. For example at Hotel Sultan Jakarta, there is
‘HRD department’ (department). It responsible for developing employees (function) and It is lead
by HRD Manager (job). HRD has two major domains, which is called Organizational
Development (OD) and Training and Development (T & D). OD is a process of development that
stresses at organization level and link to individuals. T & D is a process of development that
stresses at individual and link to organization. Those are for support career development, quality,
and performance (Swanson, 2011). That’s why in term of ‘Training within Industry’ (Dooley in
Swanson, 2001), the development is lead to improve (1) performance-based training; (2) work
process; and (3) human relations in the workplace.

Purwanti Dyah Pramanik
What You Didn’t Know of Human Resource Development
3
Proceedings of CATEA 2019
Table 1. Some definition of human resource development (HRD) Author Definition Key component
Swanson (1995)
HRD is a process of developing and unleashing human expertise through organization development and personnel training and
development for the purpose of improving performace (p.208)
Training and development; organization development; performance improvement
at the organization, work process, and
individual levels
Hill (1999)
HRD activity is the training and development of people in a work organization
Training and development
Johnston
(2001)
HRD is mostly of meeting business needs through learning. Learning organization
Kumpikaite (2008)
HRD is a process, covering training of new employees, their adaptation, professional development, re-skilling, career
development and reserve formation, in order to improve and
develop personal and team work performance, having combine organizational and personal employees’ objectives and needs,
and allowing employees continually develop, in this way
achieving the best possible results of the organization.
Training and development, career development, performance improvement
Thaakadipuram
(2010)
HRD is identified as leadership development Leadership development
Alagaraja
(2017)
HRD is an essential resource as a strategic asset in the
organization
Strategic asset
HRD Core beliefs
In his or her activities, HRD professional is influenced by core beliefs. Three core beliefs of
HRD are: (1) organizations are a place that consist of people who has expertise to achieve his/her
own and organization goals; (2) human expertise in an organization is developed through HRD for
gaining mutual benefits between individual and organization; and (3) HRD encourages individual/
group, work process, and organizational integrity since HRD professional has some more
information than other people in the organization.
HRD principles
HRD has a set of principles (Gilley and Maycunich, 2000:77-89): (1) Be discipline; (2)
Concern of fulfilling stakeholders’ needs and expectation; (3) Has responsiveness and
responsibility; (4) Evaluate the process for sustainability; (5) Design for the sake of organization
effectiveness; (6) Keep good relationship to reach operational efficiency; (7) Keep on
organization’s strategic goals; (8) Partnership concept; (9) Result oriented; (10) Credible; (11)
Make use of strategic planning based on analysis process; (12) Use purposeful and meaningful
measurements; (13) Promotes diversity and equity values at the workplace.
HRD title in organizations
HRD could relate to many processes, such as: (1) training; (2) training and development; (3)
employee development; (4) technical training; (5) management development; (6) executive and
leadership development; (7) human performance technology; (7) organization development, and
(8) organizational learning. Based on these basic thinking, there are number of titles for people
who engage to HRD. Those are: (1) management development manager; (2) organization
development specialist; (3) training coordinator; (4) chief learning officer; (5) director of
organizational effectiveness; (6) director of executive development; and (7) talent and culture
manager. Talent implies to consider sustained competitive advantages (Collings, 2009) for
maximizing organizational performance (Nijs, 2014).
We may find misunderstanding between theory and practice of HRD, such as: (1) career
development; (2) organizational and process effectiveness; (3) performance improvement; (4)
strategic organizational planning; (5) human resource management (HRM); or (6) human resources
(HR) (Swanson. 2001). Actually, the most related domain among them is HRM and HR. Their
connection describe in figure 1. Human resource management is the process of acquiring, training,
appraising, and compensating employees, and of attending to their labor relations, health and
safety, and fairness concern (Dessler, 2011), pension benefit (Maloney, 2016). Human resource
includes people who are ready and available to participate in, paid or unpaid, socially productive
and value-added activities (Wang, 2009).

Purwanti Dyah Pramanik
What You Didn’t Know of Human Resource Development
4
Proceedings of CATEA 2019
Figure 1. The link of HR, HRD, and HRM
(Swanson, 2001)
2.2 Basic of HRD
Discussing the basic of HRD covers: (1) the responsibility of HRD; (2) HRD processes; (3)
The challenges of attaining a systematic approach; and (4) Ethics and integrity standards.
The responsibility of HRD
Three responsibilities of HRD include (1) the goal improvement; (2) the problem orientation;
and (3) system thinking.
According to American Heritage Dictionary (1993:684) improvement means make better. It
implies to positive change conditions for example in the area of someone expertise or quality in the
future. The organization (through HRD) helps employees to attain better expertise or quality to
complete their job, in order to achieve organizational benefit. It makes sense that HRD process has
to clearly link to business outcome (Krempl and Pace, 2001: 55).
HRD in the context of problem orientation refers to efforts of solve the problem. Problem
usually occurs among people in doing their operational jobs. If there is gap between actual
performance and performance expectation, there might be the problem. In this case HRD becomes
the changes agent to make the situation better such as creating better operational technique. Every
problem is an opportunity for improvement.
In their activities, HRD professional concern of implementing systems thinking. Working
based on it means connecting their activities and organizational requirements. Systems thinking
were created by Boulding (1956). They argued that systems thinking consist of (1) inputs; (2)
processes; and (3) outputs. Outputs will give feedback both to processes and input which is called
doing ‘follow-up’ for better performance. The systems thinking are influenced by environment.
The environment relates to external aspect of systems thinking such as the environmental of
economics, politics, socio-cultural, technology, and ecology (Harrison, 2005). In systems thinking,
the idea of HRD identifying the problem (=opportunity), then taking action for better performance.
The perspective of systems thinking is broader than the process thinking. The basic system
thinking model is described in figure 2.
Figure 2. Basic system thinking model
Unfortunately HRD professional has to aware three requirements for implementing system
thinking as follows: (1) clearly define the name and the purpose of the system; (2) clearly mention
the elements of the system; and (3) understand the links among the elements. Defining the name
and the purposes of the system is the essential thing before we decide to change a person to go to
another way. If organization finds difficulties to do it internally, it is able to consult to external
expertise. Indentifying elements of the system is important to see the problem (=opportunity) in a
broader perspective. For example we talk about performance; we have to understand that

Purwanti Dyah Pramanik
What You Didn’t Know of Human Resource Development
5
Proceedings of CATEA 2019
performance is influenced by people competences, motivation, and opportunities such as
equipments or media (Robbins,1998). Finally, understanding the links of each element will help
professional to find the reasons why some people aren’t perform well. This part could be done by
analyzing the previous experiences (Swanson, 2001).
In practice, HRD is a complex work. It could seen in: (1) HRD and its environment and
organization perspective; (2) adult learner (andragogy) perspective; (3) organizational perspective;
and (4) global context. In the point of HRD and its environment and organization perspective, as
shown in figure 3, HRD process is influenced by external and internal factors (Alagaraja, 2013).
External factors are environment which includes economics, politics, socio-cultural (Swanson,
2001), technology, and ecology (Harrison, 2005) aspects. Internal factors are the organization
itself. Since we talk about organization, HRD has to concern of vision, mission, goal, strategy,
organization structure, technology and human resources. The organizational system consists of
inputs, processes (of HRD), and outputs. Inputs, processes, and outputs fluctuate, it depends on
external (environment) and internal (organization) situations.
Figure 3. HRD in its environment and organization
(Swanson, 2001: 18; Harrison, 2005:34)
For adult learner (andragogy) perspective as described in figure 4, there are two elements: (1)
organization; and (2) employees. Organization is as agent of change, and employee as a leaner.
The concept is initialed by Knowles, Holton, and Swanson (1998). They focus to learning process
of the learning purpose and situation. Next, organizational perspective that is concerned of nine
performance variables (Rummler and Brache, 1995) and it is divided into three performance levels.
The three performance levels are: (1) organization; (2) work process,; and (3) individual
performance, as described in figure 5. Finally, global context refers to the issue of “farther, faster,
deeper, and cheaper than ever before” (Freidman, 2000, p. 9). It implies HRD professional has to
absorb new paradigm (Rhinesmith, 1995), include: (1) learning new trends of technology; (2)
thinking out of the box; (3) realizing organization as a process (not just a structure); (4) keeping
strengthen of social skill (be able to work in divert on ability, experience, and culture); (5) being
able to manage change and uncertainty; (6) learning sustainability.

Purwanti Dyah Pramanik
What You Didn’t Know of Human Resource Development
6
Proceedings of CATEA 2019
Figure 4. Andragogy in Practice (Knowles, Swanson, & Holton, 1998.)
Figure 5. Nine Performance Variables (Rummler & Brache, 1995)
HRD process
HRD as a process mean HRD as a system. HRD as a system has the elements of inputs,
processes, outputs, and feedback. Those could be understood as phases of HRD. HRD itself is
able to break down into two parts: (1) personnel training and development (T & D); and (2)
organization development (OD). HRD, T & D, and OD has five phases in its process as described
in figure 6. Phases of analyze, asses, and evaluation are the most strategic phases of HRD.
Figure 6. Five phases of HRD, T & D, and OD (Swanson, 2001)

Purwanti Dyah Pramanik
What You Didn’t Know of Human Resource Development
7
Proceedings of CATEA 2019
The challenges of attaining a systematic approach
There are three challenges of attaining a systematic approach (Swanson, 2001): (1) HRD
process change to HRD event; (2) HRD process takes time; and (3) characteristic of stakeholders.
Firstly, HRD process holds by inviting people to attend class, where they listen to instructor’s
opinions with none of understanding its benefit for them. Actually, the HRD process should
concern to participants’ satisfaction and provide skilled staff as well (Pine, . Secondly, HRD
process needs time, starting from having input, analyzing, preparing proposal, creating problem
solving, implementing idea, doing assessment, up to getting outputs. Thirdly, Stakeholders in
HRD process could be HRD professional, participants, management (as decision maker). Good
relationships among them are essential, or HRD process won’t be completed properly.
Ethics and integrity standards
Developing care of people in an organization isn’t an easy work. It’s explained above that
HRD work include T & D and OD, and its objective is improving individual, organizations,
communities, and society. The key person in HRD process is HRD professional. He or she has to
engage of HRD practice, research, consulting, instruction, facilitation, and teaching or in other
words, HRD professional has to concern of Ethics and Integrity (The Academy of HRD/ AHRD,
1999). It states that HRD professional must have the goal of welfare and protection of the
individuals, groups, and organizations. Achieving welfare means that the organizations not only
care of company’s profit but also employee’s dignity. Having protection means being respect to
stakeholders’ privacy and maintaining all data or information confidentially (Swanson, 2001).
2.3 The evolution of HRD
The evolution of HRD could be understood by knowing its history. Discussing HRD history
is going to improve the knowledge of the HRD profession of origin, HRD development and the
importance of HRD. The discussion includes (1) labor and learning; (2) The origin of
contemporary HRD.
Labor and learning
HRD was born since our most primitive ancestor who learned how to use wood, stone, and
fibers before fire and metal was known. They learned to fulfill their needs for surviving their life.
Next, they imitate tools consciously (Bennet, 1926). At the beginning learning process was a
conscious process. The person who achieved mastery of making a particular tool became a trainer.
At that time men (husband) used to have higher education (Davidson, 1900).
In 100 B.C. – 300 A.D. Greek and Romans contributed educational infrastructure and created
schools. At that time, individual has opportunity to develop him/herself (Moore, 1936).
Educational process was about all phases of life such as nature, man, and the supernatural. Next, it
also included moral dimension, for example the ethical rights, but there was training manual.
Greek tended to apply the method of apprenticeship training. It was also noted that only a special
people who allowed to participate in education (Swanson, 2001).
The Greek movement of education was followed by Romans, in the domain of law, political
infrastructure which changes social, economic, and culture. Romans adopted skills through family
apprenticeship. The manual hadn’t been used. Father was a central trainer who shared skill to his
children. Before the invasion Barbarian, Romans education declined and then it was replaced by
Christian Church (Swanson, 2001).
300-1300 A.D. was the middle ages, The Christian Church implemented moral discipline and
educational process received new characters. In this era, there was (1) monastic school influence;
(2) apprenticeship model; and (3) Organization of Merchant and Craft Guilds. The influence of
monastic school is applying discipline based on spiritual value. Learning skills such as literature,
arts, painting, music, sculpture held in monastery for being independent economically. They also
established various shops such as bakeries. Apprenticeship model was developed not only for
improving skills but also for achieving better knowledge, moral, religious, and civic engagement.
It was for preparing young generation to be a good worker. The phases of apprenticeship were
apprentice, journeyman, and master (Davis, 1978). Organization of Merchant and Craft Guilds
was similar to association of craftsmen or labor union. This association was establish to protect
each other especially for low price of craft products. The people who wanted to a member must

Purwanti Dyah Pramanik
What You Didn’t Know of Human Resource Development
8
Proceedings of CATEA 2019
have standard of competence that’s why educational facility was provided, include training and
apprenticeship. At that time books were written.
1400-1800 A.D. was the renaissance era. Social, politics, and science were developed in the
renaissance era. Martin Luther, John Locke, Jean-Jacques Rousseau, and Johan Pestalozz played
important roles. The renaissance ideas were: (1) secularism; (2) sensory learning; and (3)
apprenticeship; and (4) manual training. Martin Luther (1483-1546) argued that churches
shouldn’t dominate people education. Luther encouraged education for all people, not only for the
rich but also for the lower level society, no matter male and female. He encouraged courses of
mathematics, music, history, and science. Sensory learning idea was stated by John Locke (1632–
1704). He created the combination of education, moral and intellectual. According to him,
education must base on logical thinking and have benefit for life. Next, Jean-Jacques Rousseau
(1712-1778) who was strengthens moral values for educational process. He came to conclusion
that experience is the best teacher. It contributed to develop technical training. Johan Pestalozz
was known as father of manual training. He developed educational process which started from the
simple to the complex one.
The origin of contemporary HRD
Education process started when European came to North America. Their coming lead to the
policy of education for free. Then America began industrial era in the eighteenth century, and the
education emphasized to work in industry. Unfortunately, industrial era declined apprenticeship
because apprenticeship seemed unsuited to work nature in industry. Industrial workers should be
trained in another way. After that, in the 1800s the government established training and corporation
schools which used to be called factory schools. This kind of schools provided skills need by
workers and its concept was adopted by some companies such as General Electric, Ford, and
Goodyear. Then, before 1884, the concept of factory schools was implemented in public high
schools in Cleveland, Boston, Minneapolis, and other cities (Bennett, 1937). In 1874, the first
Chautauqua Assembly which was funded by an Ohio industrialist was established. This technical
training which was known as vocational education was supported by the government. And at 1900s
the number of vocational education increased significantly. In the twentieth-century, the need of
linking training and business was urgent. It encouraged establishing The National Association of
Corporation Schools which focuses on needs of personnel or HRD. In World War I Allen and
Kane (Swanson, 2001) introduced four-step training method. The four-step training method was:
(1) find problem; (2) create a specific plan; (3) act; (4) check outputs. Next, in World War II,
Training within industry (TWI) was established, and at that the four-step training method is going
to attain (1) performance; (2) quality; and (3) human relations. The performance was for
individual and organizational level. In order to link TWI and performance, there was created Job
Instruction Training (JIT) and Job Safety Program (JSP). JIT was prepared for supervisor who
must able to break down the job for their sub-ordinate. JSP was for employees to help them work
safely in new environment at the industry. For reaching TWI and quality was created Job Method
Training (JMT). This program was for guiding employees if they found problem of quality. This
was the basic of HRD analysis implementation. Job Relations Training (JRT) program was given
to supervisors to improve their ability in human relations with their employees. And this became
the origins of contemporary HRD (Swanson, 2001).
One of HRD elements is OD, that was developed from 1940-1960. There were (1) the Human
Relations School of Thought; (2) Laboratory Training; (3) Survey Research and Feedback; (4)
problem solving usage; (5) an acknowledgment of sociotechnical and systems and quality of work
life, and (6) a strategic change; (6) contemporary work organization; and (7) work nature. Human
relations model was used from the 1940s to the early 1950s. In laboratory training, people could
interact with others and shared experiences. OD did survey and collect data as feedback from
participants. OD spirit was solve the problem, and the process included requiring data collection,
analysis, planning and implementation, and evaluation. During the late 1940s to early 1950s socio-
technical system was popular. This system combined technical aspect and human aspects in an
organization (Cummings and Woley, 1993). In the 1960s, OD concerned to strategic change
effectiveness at work, such as leadership, multilevel involvement, organizational strategy,

Purwanti Dyah Pramanik
What You Didn’t Know of Human Resource Development
9
Proceedings of CATEA 2019
structure, culture, and system. In the twenty-first-century an organization is going to be slim
vertically and horizontally. Some job were eliminated which was called job enlargement and job
enrichment (Robbins, 1998). Employees will need training in those situations. The nature of work
changes because the environment was different. Digitalization completed routine works and
people needs to be completed by non-routine skills (The World Bank, 2019).
How was management and leadership development (MLD) in The United States? MLD was
an element of HRD. This program was for managerial levels excluded supervisors. MLD program
was for preparing leaders of the organization in the future, it’s similar to management trainees or
Officer Development Program nowadays. In the USA MLD became business school in the 1800s.
Then in 1911 Frederick Taylor published a new approach of management, which its title was The
Principles of Scientific Management. This concept was developed by Elton Mayo in 1827 by
developing managerial skills what is known as human behavior and interpersonal skills beside
technical skills (Wren, 1979: 313). Several years later, in 1929-1939 the business was in the
depression era. At that time, General Motors initiated to build a program for experienced
executive who were fired to attend MLD program. Later, it was the booming of MLD activities.
In 1953-1970 MLD became the body of knowledge of management. The modern management era
was in 1970-2000, MLD was adopted by non-university and non-profit organization, such as
Wilson Learning and the Aspen Institute. Finally, right now HRD is known as one of career
options.
3. Conclusion Human resource development (HRD) has been implemented since several decades before, but
as knowledge it is still knew. HRD is an element of Human Resource (HR). And its domain is
different with Human Resource Management (HRM). Scholar argued that the mutual benefit of
individual and organizational would be the purposed of HRD process. As a process, HRD
concerns of training and development (T&D) and organization development (OD). The structure is
described figure 7. As a new knowledge HRD respect to the belief that there a chain of HRD
among people, organization, and HRD professional. In this chain people as parts of an
organization is coached to be capable to reach their own goal and after that be able to attain
organization objectives. On the other hand those capable people are improved through HRD, and
for that HRD professionals must have superlative integrity. Their integrity are measured based on
HRD principles. Those HRD principles have to be implemented by any HRP professional which
recently are named in various title, such as in Fairmont Hotel HRD manager is named ‘Talent and
Culture’ manager and its department is called ‘Talent and Culture’ department.
Figure 7. HRD positioning
The spirit of HRD is solve the problem holistically which is called system thinking to reach
both individual and organization goals. In its process HRD has to consider external and internal
situation. Don’t confused five phases on HRD, T&D, and OD. HRD phases starts from analyze,
propose, create, implement, and asses. In its implementation, HRD has some challenges so that
HRD professional should build good relationship among stakeholders to succeed. At the end, HRD
implementation is welfare of individual, organization, community, and society.
The history of HRD took a long time in practices. The idea of HRD comes from individual is
coached by his/her father to have technical skill. Later, the people think of depending each other to

Purwanti Dyah Pramanik
What You Didn’t Know of Human Resource Development
10
Proceedings of CATEA 2019
sustain their skills by establishing association. This situation encourages government to take a part
in developing human resource, and next it’s followed by private sectors. Due to the changes of
the world situation, managerial skills are developed.
References Journal
Alagaraja,M.,”Mobilizing Organizational Alignment through Strategic Human Resource
Development,”Human Resource Development International, 16(1), 76 (2013).
Boulding, K.E.,”General System Theory-The Skeleton of Science,” Management Science, 2, 197-208 (1956).
Collings, D.G., and Mellahi,K., “Strategic Talent Management: A Review and Research Agenda,” Human
Resource Management Review. 19, 304 (2009).
Hill, R., and Stewart, J.,”Human Resource Development in Small Organizations,” Human Resource
Development International, 2(2), 108 (1999).
Johnston, R.,”Challenges in Human Resource Development Practitioner Preparation,”Studies in Continuing
Education, 23(1), (2001).
Kokkranikal, J.J., and Baum, T.,”Human Resources Development for Tourism in Rural Communities: A
Case Study of Kerala,” Asia Pacific Journal of Tourism Research, 7(2), 64(2007).
Kumpikaite, V.,”Human Resource Development in Learning Organization.” Journal of Business Economics
and Management, 9(1), 25-31 (2008).
Maloney,M., and McCarthy,A.,”Understanding Pension Communications at the Organizational Level:
Insights from Bounded Rationality Theory and Implications for HRM,” Human Resource
Management Review, xxx,xxx-xxx (2016).
McLean, G.N., and McLean,L.,”If We can’t define HRD in one country, How can we define it in another? “
Human Resource Development International, 4(3), (2001).
Nijs, S., Gallardo, E., Dries, N., and Sels, L.,”A Multidisciplinary Review into the Definition,
Operationalization, and Measurement of Talent,” Journal of World Business, 49, 180 (2014).
O’Neil, T.A., and Salas, E.,”Creating Performance Teamwork in Organizations,” Human Resource
Management Review, xxx,xxx-xxx (xxxx).
Pine, R.,”Standardization of Tourism Education and Training to Address the Increasing Demand for Tourism
Staff in the East Asia/ Pacific Region,” Asia Pacific Journal of Tourism Research, 6(1), 20 (2007).
Rhinesmith,S.H.,”Open the Door to A Global Mindset,” Training and Development, 495, 34-44 (1995).
Santos, E.L., “The Scientific Field od Administration: An Analysis from The Circle of Theoretical matrices,”
Cadernos EBAPE.BR 15(2), 214 (2017).
Semone, P.,”A Case Study: Enhancing Laos’ Tourism Sector Performance through Destination Human
Resource Development,”Asia Pacific Journal of Tourism Research, 17(2), 164 (2012).
Swanson, R.A.,”Human Resource Development: Performance is the Key,” Human Resource Development
Quarterly, 62(2), 207-213 (1995).
Thaakadipuram, T.,”Leadership Wholeness: A Human Resource Development Model,” Human Resource
Development International, 13(4), 465 (2010).
Wang, G.G., and Sun, J.Y.,”Perspectives on Theory,” Human Resource Development International, 12(1), 96
(2009).
Zhang, Y., Guo, Y., Newman, A., “Identity Judgements, Work Engagement and Organizational Citizenship
Behavior: The mediating Effects Based on Group Engagement Model,” Tourism Management, 61,
190-197 (2017).
Book
American Heritage Dictionary (3rd
ed.). Boston: Houghton Mifflin, 1993.
Bennett, C.A., “History of Manual and Industrial Education 1870 to 11917, “ Peoria, IL: Bennett, 1937.
Cummings, T.G., and Worley, C.G.,”Organizational Development and Change (5th
ed.),” St. Paul, MN:
West, 1993.
Davis, E.G.,”Education in Industry: A Historical Overview,” Education Canada Spring, 1978.
Dessler, G.,”Human Resource Management.” Boston: Pearson, 30, (2011).
Dooley, C.R.,”The Training within Industry Report.”Washington, D.C.: War Manpower Commission Bureau
of Training,” Training within Industry Service, 2001.
Friedman, T.L.,”The Lexus and the olive Tree,” New York: Anchor, 2000.
Gilley, J.W., and Maycunich, A., “Organizational Learning, Performance, and Change,” Cambridge, M.A:
Perseus, 2000.
Harrison, J.S., and Enz, .A., “Hospitality Strategic Management: Concept and Cases,” New Jersey: John
Wiley & Sons, Inc., 2005.

Purwanti Dyah Pramanik
What You Didn’t Know of Human Resource Development
11
Proceedings of CATEA 2019
Knowles, M.S., Holton,E.F., and Swanson,R.A.,”The Adult Learner: The Definitive Classic in Adult
Education and Human Resource Development, (5th
ed.),” Houston: Gulf, 1998.
Krempl, S.F., and Pace, R.W., “Training across Multiple Locations: Developing a System that Works,” San
Franssisco: Berrett-Koehler, 2001.
Robbins, S.P., “Organizational Behavior: International Edition Concepts, Controversies, and Application,”
New Jersey: Prentice-Hall International,Inc., 190, 534-535, (1998).
Rummler, G.A., and Brache, A.P.,”Improving Performance: How to Manage the White Space on the
Organization Chart (2nd
ed.),” San Fransisco: Jossey-Bass, 1995.
Swanson, R.A., Holton III,E.F., “Foundation of Human Resource Development,” San Fransisco: Berret-
Koehler Publisher, Inc., 2001.
The World Bank: A world Bank Group Flagship Report : The changing nature of work. Washington: The
World Bank Group, 2019.
Wren, D.A.,”The Evolution of Management Thought (2nd
ed.),” New York: Wiley, 1979.

12
Proceedings of CATEA 2019
Proceedings of CATEA 2019
ISBN 978-623-91018-0-0
The Impact of Halal Tourism Promotion (Sharia Tourism)
Towards the Students’ of STP Trisakti Visiting Decision to
Twelve Halal Tourism Destinations
Anita Swantari
1, Rina Fitriana
2
1Sekolah Tinggi Pariwisata Trisakti
2Sekolah Tinggi Pariwisata Trisakti
Abstract: This study discusses the impact of halal tourism promotion (sharia tourism) towards visiting decision
to twelve halal tourism destinations, since a major halal tourism potential is expected to have the impact towards
the regional economy. The present study employs qualitative method by administering a questionnaire to the
students of STP Trisakti. The finding revealed that the halal tourism promotion in Indonesia is categorized as
good. This can be seen from the result of the data analysis given to 96 respondents that showed that most
respondents responded that they agreed with the given statements. The average value of the entire respondents’
answers were 2.9964 with the interval of 2,50 – 3,24. The result of the study showed that the visiting decision is
categorized as willing to visit halal tourism destinations which have been appointed by the Ministry of Tourism.
This can be seen from the result of the data analysis given to 96 respondents with the average responds agree to
visit.
Key Words: Halal Tourism; Visiting Decision
1. Introduction In some countries in the world, tourism sector provides economical benefits to the countries. The
achieved benefits include foreign currency exchange, government revenue, regional development
stimulus, and the creation of labor. One of the obtained prospects from tourism is the presence of
Sharia Tourism or Halal Tourism. This becomes one of the ways to promote global economy for
moslem residents in the world. Moslem tourist’ contribution, outside Hajj and Umrah, in the year of
2012 reached more than US$126 billions, or equivalent with Rp. 4.125 Trillions.
Indonesia has become one of favorite destinations for sharia tourism for the many supporting
aspects and concepts of Moslem, which attract moslem tourists by providing worship places at
airports, halal restaurants, and sharia hotels. The sharia tourism itself is considered as one of new
ways to develop tourism in Indonesia which upholds Islam values and culture. However, the halal
tourism in Indonesia is not very popular yet. Even many of Indonesian people notice the “existence”
of the halal tourism. Whereas, be seen from the numbers of domestic tourist visit to halal tourism
destinations, it can be said that halal tourism is good enough and possesses quite high prospect to be
developed. This is inversely proportional with the numbers of foreign tourists that are quite
inconsiderable.

Anita Swantari, Rina Fitriana
The Impact of Halal Tourism Promotion (Sharia Tourism) Towards the Students’ of STP Trisakti Visiting Decision to
Twelve Halal Tourism Destinations
13
Proceedings of CATEA 2019
Table 1. Data of Domestic Tourist Visit to Halal Tourism Destinations
Destination Year Number of Domestic
Tourist Visit (Person/s
Number of Domestic Tourist
Visit (Person/s)
Aceh 2017 2.288.625 75.758
Sumatera Barat 2017 16.947.577 56.876 56.876
Riau 2017 6.534.683 102.654
Lampung 2017 11.395.827 245.372
Banten 2017 21.308.357 403.463
DKI Jakarta 2014 9.024.013*) 2.319.295
2017 - 2.658.055
Jawa Barat 2017 59.644.070 4.984.035
Jawa Tengah 2017 40.118.470 781.107
Yogyakarta 2017 1.327.592 276.388
Jawa Timur 2017 58.650.000 247.166
Nusa Tenggara Barat 2017 2.078.654 1.430.249
Sulawesi Selatan 2016 8.426.528 236.491
*) Semester 1
Source: Government Tourism Office and Creative Economy of each Province; BPS
Basically, the halal tourism development is not something exclusive, instead, it is inclusive
considering non-moslem tourists can also enjoy the sharia services. All circles of all ages can
concurrently enjoy this kind of tourism. One respondent of aspirants that the observer took was the
students of STP Trisakti. Considering the students of Trisakti come from various religions and has a
background of tourism. This potential becomes one of the references for society from different
religion in enjoying halal tourism. Therefore, the aim of this research is to find out how halal tourism
promotion can impact on Trisakti students’ visit decision.
2. Theoretical Review According to Pavlove in Razzaq, Hall, & Prayag (2015), Halal or Islamic tourism is defined as
the tourism and hospitality that are created by the consumers and producers which are in accordance
with Islam tenets. The Minister For Tourism, Arief Yahya, in a forum group discussion entitled Halal
Tourism & Lifestyle 2015 at Jakarta Convention Centre, Senaya, Jakarta, Tuesday (12/5), stated his
personal opinion that the name of halal tourism should be universal. He proposed the terminology
“Universal Tourism”, since halal tourism is not merely about culinary stuffs. There are other things
such as fashion, finance, health, and so on. therefore, the word “universal”, according to him,
represents the entire tourists that come to Indonesia, both Moslems and non-moslems (Putri, 2015).
The president of Islamic Nutrition Council of America, Muhammad Munir Caudry, said that
“halal tourism is a new concept in tourism. This is not a kind of religious tourism, like Umrah and
Hajj. Halal tourism is a kind of tourism that serve vacations that adapt the vacation style and the needs
and demands from moslem travelers” (Wuryasti, 2013). Based on the aforementioned definition, the
concept of halal can be viewed from two perspectives, namely the perspective of religion and the
perspective of industry. The perspective of religion means that related to food, it decide which food
may be consumed by the moslem consumers as they believe it. Meanwhile, based on the perspective
of industry, for food producer, the concept of halal is defined as a business opportunity. For the food
producers whose consumers are majority moslems, they need to guarantee that their products are halal
to promote its value, which is called intangible value. For instance, food products that attach halal
label on the packaging is more attractive for moslem consumers (Hamzah & Yudiana).
3. Methods The methods employed in the present study was a descriptive correlational study which used
questionnaire as the instrument for collecting the data. The study described the phenomenon or the

Anita Swantari, Rina Fitriana
The Impact of Halal Tourism Promotion (Sharia Tourism) Towards the Students’ of STP Trisakti Visiting Decision to
Twelve Halal Tourism Destinations
14
Proceedings of CATEA 2019
relationship among phenomena which are carried out systematically, factual, and accurately. It also
defined the relationship that occurs between the independent variable and dependent variable
(Kusmayadi and Sugiarto, 2000:29). The unit analysis in the present study was the students of STP
Trisakti. This is due to the students of STP Trisakti were the learners of tourism so that they can
promote the halal tourism in Indonesia. Besides, after graduated from STP Trisakti, they would be
eligible to be fresh tourist aspirants.
Variables
1. Independet Variable. It is the variable that influences or answers the causes of the changing
or occurring the dependent variable.
2. Dependent variable. It is the variable that is influenced or is the cause of the independent
variable. Variables that are being studied in the present study are Variable X and Variable Y,
in which variable X is the halal tourism promotion and Variable Y is the Visiting Decision.
3. Measuring Scale
In the present study, several scales are utilized, namely:
1) Nominal scale. It is the scale which is used to label, symbolize, or name a category, in
which the given numbers in one category is merely label and does not contain
mathematical meanings or levels. For instance, 1,2,3, and so on (Sarjono, 2011:1).
Nominal scale enables to acknowledge the sex of respondents.
2) Likert scale or ordinal scale. This is used to measure one’s attitude, opinion, and
perception towards a social phenomenon (Sugiyono, 2010:93). The use of Likert scale in
this study is to be used at the core of the study, to promote halal tourism and visiting
decision.
Table 2. Variable, Sub-variable, and Measuring Scale of Variable Demography Factor, Sub-Variable Indicator
of Demography Measuring Scale
Variabel Sub-variable Indicator Measuring Scale
Demography a. Sex
b. Age
c. Religion
d. Last Education
e. Frequency for touring
f. Options for halal tourism
destination
a. Male & Female
b. < 20 dan 21-25
c. Moslem & Non Moslem
d. SMA & SMK
e. Once, Twice, > Twice
f. Aceh, Sumatera Barat,
Riau, Lampung, Banten,
DKI Jakarta, Jawa
Barat, Jawa Tengah,
Yogyakarta, Jawa
Timur, Nusa Tenggara
Barat, Sulawesi Selatan
a. Nominal
b. Nominal
c. Nominal
d. Nominal
e. Nominal
f. Nominal
Table 3. Variable, Sub-variable, and Halal Tourism Promotion Measuring Scale
Variable Sub-variable Indicator Measuring Scale
Halal Tourism
Promotion
Source: Kotler
dan Keller
(2007:72)
a. Frequency of promotion
b. Quality of promotion
c. Quantity of promotion
d. Time of promotion
e. Conformity of promotion
a. Know the halal tourism
through frequent
notices from 1.
Electronic media, 2.
Printed media, internet,
travel fairs/ other
events.
b. Clear information
conveyed by all media
Likert
Likert
Likert
Likert
Likert

Anita Swantari, Rina Fitriana
The Impact of Halal Tourism Promotion (Sharia Tourism) Towards the Students’ of STP Trisakti Visiting Decision to
Twelve Halal Tourism Destinations
15
Proceedings of CATEA 2019
Variable Sub-variable Indicator Measuring Scale
c. Tourists frequently
notice information of
halal tourism from all
media
d. The long period of halal
tourism promotion of
all media
e. Convenient destinations
conveyed in all media
4. Findings and Discussion Respondents are 96 students of Trisakti School of Tourism whose age is around 18 to 23 years
old. 70,8% respondents are female, and the rest 29,2% are male students. 66,7% of the respondents
are non-Molsem, while the rest 32,3% are Moslem. 39,6 of the students state that they go for vacation
once a month, meanwhile 33,3% students say that they go for vacation twice a month, and the rest
27,1% states that they go for vacation more than twice a month. From 12 halal destinations, the main
three destinations with highest frequency are NTB (20,8%), Yogyakarta (229%) and DKI Jakarta
(11,5%)
Halal Tourism Promotion (Variable X)
Based on the result of the questionnaire administered to the students of STP Trisakti, it was
found that the average of frequency of halal tourism promotion was good by value of 3,0300.
Moreover, the quality of halal tourism promotion was good by value of 3,0807. Whereas, the quantity
of halal tourism promotion was also good by value of 2,9115. Besides, the sub-indicator of promotion
time by value of 2,9349 was considered good as well. lastly, the conformity of promotion according to
the students of STP Trisakti was also good by value of 3,0286. The table of these aspects are as
follow:
Table 4. Average of Promotion sub-variable
Sub-Indicator Average (Mean)
Frequency of Promotion 3,0300
Quality of Promotion 3,0807
Quantity of Promotion 2,9115
Time of Promotion 2,9349
Conformity of Promotion 3,0286
Source: SPSS 24 data analysis
Visiting Decision (Variable Y)
In the descriptive test of the variable of visiting decision which was pointed as Variable Y
(dependent), the results of the respondents’ answers of each statement of visiting decision to halal
tourism destinations stated in the questionnaire were discussed.
Table 5. I want to visit halal tourism destinations according to information from electronic media (Y1.1)
Frequency Percent
Valid Strongly disagree 2 2,1
Disagree 10 10,4
Agree 49 51,0
Strongly agree 35 36,5
Total 96 100,0
Source: SPSS 24 Data Analysis

Anita Swantari, Rina Fitriana
The Impact of Halal Tourism Promotion (Sharia Tourism) Towards the Students’ of STP Trisakti Visiting Decision to
Twelve Halal Tourism Destinations
16
Proceedings of CATEA 2019
The table above showed that the amount of 49 students of STP Trisakti (51%) agreed and 2
students (2,1%) disagreed. According to the above table, mostly the students of STP Trisakti agreed
that they want to visit halal tourism based on the information from electronic media.
Table 6. I want to visit halal tourism destinations according to information from
internet (Y1.3)
Frequency Percent
Valid Strongly disagree 2 2,1
Disagree 6 6,3
Agree 51 53,1
Strongly agree 37 38,5
Total 96 100,0
Source: SPSS 24 Data Analysis
The table above showed that as many as 51 students of STP Trisakti (53,1%) agreed and 2
students of STP Trisakti (2,1%) strongly disagreed. Based on the table above, most of the students of
STP Trisakti agreed that they want to halal tourism destinations based on the informnation from
internet.
Table 7. I want to visit halal tourism destinations according to the information from travel
fair exhibitions or other enets (Y1.4)
Frequency Percent
Valid Strongly disagree 3 3,1
Disagree 9 9,4
Agree 53 55,2
Strongly agree 31 32,3
Total 96 100,0
Source: SPSS 24 Data analysis
According to the table, 53 students of STP Trisakti (55,2%) agreed and 3 students of STP
Trisakti (3,1%) strongly disagreed. Therefore, it can be concluded that majority of students of STP
Trisakti agreed that they want to visit halal tourism destinations according to the information from
travel fair exhibitions or other events.
Desire to buy products
Table 8. I want to buy halal tourism package according to the information from electronic
media (Y2.1)
Frequency Percent
Valid Strongly disagree 2 2,1
Disagree 13 13,5
Agree 52 54,2
Strongly agree 29 30,2
Total 96 100,0
Source: SPSS 24 Data analysis
The table above showed that 52 students of STP Trisakti (54%) agreed and 2 students of STP
Trisakti (2,1%) strongly disagreed. Based on the table above, the majority of students of STP Trisakti
sgreed that they want to buy halal tourism package according to the information from electronic
media.

Anita Swantari, Rina Fitriana
The Impact of Halal Tourism Promotion (Sharia Tourism) Towards the Students’ of STP Trisakti Visiting Decision to
Twelve Halal Tourism Destinations
17
Proceedings of CATEA 2019
Table 9. I want to buy halal tourism package according to the information from printed media
(Y2.2)
Frequency Percent
Valid Strongly disagree 8 8,3
Disagree 23 24,0
Agree 45 46,9
Strongly agree 20 20,8
Total 96 100,0
Source: SPSS 24 Data Analysis
The table above showed that as many as 46,9 % or 45 students of STP Trisakti agreed and as
many as 8,3% or 8 students of STP Trisakti strongly disagreed. Therefore according to the above
table, the majority of students of STP Trisakti agreed that they want to buy halal tourism package
according to the information gained from printed media.
Table 10. I want to buy halal tourism package according to the information from internet
(Y2.3)
Frequency Percent
Valid Strongly disagree 3 3,1
Disagree 11 11,5
Agree 55 57,3
Strongly agree 27 28,1
Total 96 100,0
Source: SPSS 24 Data Analysis
The table above showed that as many as 57,3% or 53 students of STP Trisakti agreed and 3,1%
or 3 students of STP Trisakti strongly disagreed. Therefore according to the table above, the majority
of students of STP Trisakti agreed that they want to buy halal tourism package according to the
information gathered from internet.
Table 11. I want to buy halal tourism package according to the information from travel fair exhibitions or other
events (Y2.4)
Frequency Percent
Valid Strongly disagree 4 4,2
Disagree 15 15,6
Agree 47 49,0
Strongly agree 30 31,3
Total 96 100,0
Source: SPSS 24 Data Analysis
The table above showed that as many as 47 students of STP Trisakti (49%) agreed and 4 students
of STP Trisakti (4,2) strongly disagreed. It can be concluded that the majority of the students of STP
Trisakti agreed that they want to buy halal tourism package according to the information from travel
fair exhibitions or other events.
Table 12. Average of Visiting Decision Sub-variable
Sub-Indicator Average (Mean)
Desire to use products 3,1328
Desire to buy products 3,0260
Priority to buy product 2,9063
Willingness to sacrifice 3,0451
Source: SPSS 24 Data Analysis

Anita Swantari, Rina Fitriana
The Impact of Halal Tourism Promotion (Sharia Tourism) Towards the Students’ of STP Trisakti Visiting Decision to
Twelve Halal Tourism Destinations
18
Proceedings of CATEA 2019
It can be seen from the table above that the average of the sub variable of visiting decision
according to the students of STP Trisakti was considered good with the average value of 3,0449, as
can be seen from the table 4.48 below.
Therefore, the total average of the visiting decision variable was 3,0449 which is categorized as
that the students of STP Trisakti want to visit to halal tourism destinations according to the tables
presented in chapter 3 on table 3.6 which stated the interval average measurement criteria proposed by
Sudjana (2002) in Catthalia (2016:50)
Findings and Discussion of the Correlation Coefficient Test
The result of the correlation coefficient between the halal tourism promotion and the visiting
decision of the students of STP Trisakti was 0,819 and therefore has showed a strong relationship.
The relationship between the two variables was also considered positively so that they resulted in the
correlation in the same direction. Since the coefficient was in the same direction, it can be concluded
that the more halal tourism promotion, the higher visiting decision will be made.
Findings and Discussion of the Determination Coefficient Test
Based on the result of the determination coefficient test, it is explained how much influence of
the promotion towards the visiting decision. Based on the table above, the determination coefficient
(r2) was 0,670. It can be formulated as follow:
= 2 100%
= 0,670 100% = 67%
This means that according to the calculation above, the influence of promotion towards the visiting
decision was in the value of 67%. Whereas the rest (100% - 67% = 33%) was influenced by other
factors which were not discussed in the present paper.
Findings and Discussion of the Simple Linear Regression Test
Based on the above table, the regression is formulated as follow:
= +
= 8,848 + 0,513
From the formulation, , α means constant which has value of 8,848. This means that if the halal
tourism promotion (X) = 0, thus the visiting decision of the students of STP Trisakti (Y) was positive,
which was as many as 8,8848%. Meanwhile, b means the regression coefficient which has value of
0,513. This means that if the halal tourism promotion (X) increases by 1%, the visiting decision of the
students of STP Trisakti (Y) will increase by 0,513%. If the halal tourism promotion increases, the
students’ visiting decision will increase as well. In reverse, if the halal tourism promotion decreases,
the students’ visiting decision will also decrease.
Therefore we can conclude that actually the visiting decision of STP Trisakti students are
obviously impacted by the promotion done by those destinations. To increase the visit, the promotion
must also be increased.
5. Conclusion and Suggestions 5.1 Conclusion
Based on the discussion of the previously elaborated chapters about the impact of halal tourism
promotion towards the students of STP Trisakti’ visiting decision which had been tested by
administering a questionnaire and analyzed by using SPSS (Statistical Pakcage for Social and
Science) version 24, it can be concluded that:

Anita Swantari, Rina Fitriana
The Impact of Halal Tourism Promotion (Sharia Tourism) Towards the Students’ of STP Trisakti Visiting Decision to
Twelve Halal Tourism Destinations
19
Proceedings of CATEA 2019
1. The result of the study showed that the halal tourism promotion in Indonesia is categorized as
good. This can be seen from the data analysis given to 96 respondents which average
responds agree with the proposed statements.
2. The result of the study showed the students of STP Trisakti’ visiting decision as categorized
as having desire to halal tourism destinations appointed by the Ministry of Tourism. This can
be seen from the result of the data analysis given to 96 respondents with the average responds
were agree to visit.
3. The halal tourism promotion and the students of STP Trisakti’s visiting decision had a strong
and significant relationship.
4. The halal tourism promotion had a great impact on the visiting decision of the students of
STP Trisakti by value of 67%. The rest, by value of 33%, was influenced by other factors
which were not discussed in the present study.
5.2 Suggestion
Based on the analysis that has been completed, there are suggestions for further research, as
follow:
1. The Ministry of Tourism and other tourism practitioners have conducted well done
promotion. However, this needs to be improved so that all Indonesian domestic tourists
acknowledge the existence of halal tourism. Based on the present study, the sub-variable of
quantity of promotion was considered low. Thus, it is suggested to reconsider promotions in
each media, such as printed media, electronic media, internet, and also travel fair exhibitions
of halal tourism.
2. Travel agents should make halal tourism packages so that tourists, both moslems and non-
moslems, can enjoy brand new tourism. By offering halal tourism packages, it is expected to
increase the visiting decision of tourists, not only students, from Indonesia and from outside
the country. Based on the result of the study, the factor of priority for buying products in the
visiting decision variable gained the lowest result among the others.
3. For further research, it can be improved several independent variables which are related to the
visiting decision, since there are still many factors that influence the visiting decision which
have not been explored in the present study.
References
Andriani, D dkk. 2015. Pengembangan Wisata Syariah. Jakarta: Kementrian Pariwisata.
Arikunto, S. 2010. Prosedur Penelitian: Suatu Pendekatan Praktik (Edisi Revisi). Jakarta: Rineka
Cipta.
Asisten Deputi Penelitian dan Pengembangan Kebijakan Kepariwisataan, Deputi Bidang
Pengembangan Kelembagaan Kepariwisataan, Kementrian Pariwisata. 2015. Kajian
Pengembangan Wisata Syariah. Laporan Akhir. Jakarta.
Badan Pusat Statistik Provinsi Aceh. 2018. “Aceh Province in Figure”. Katalog. Edisi 1102001.11.
Aceh.
Badan Pusat Statistik Provinsi Banten. 2018. “Provinsi Banten Dalam Angka”. Katalog. Edisi
1102001.36. Banten.
Badan Pusat Statistik Provinsi Daerah Istimewa Yogyakarta. 2018. “Provinsi Daerah Istimewa
Yogyakarta Dalam Angka”. Katalog. Edisi 1102001.34. Yogyakarta.
Badan Pusat Statistik Provinsi DKI Jakarta. 2018. “Provinsi DKI Jakarta Dalam Angka”. Katalog.
Edisi 1102001.31. Jakarta.
Badan Pusat Statistik Provinsi Jawa Barat. 2018. “Provinsi Jawa Barat Dalam Angka”. Katalog. Edisi
1102001.32. Jawa Barat.

Anita Swantari, Rina Fitriana
The Impact of Halal Tourism Promotion (Sharia Tourism) Towards the Students’ of STP Trisakti Visiting Decision to
Twelve Halal Tourism Destinations
20
Proceedings of CATEA 2019
Badan Pusat Statistik Provinsi Jawa Tengah. 2018. “Provinsi Jawa Tengah Dalam Angka”. Katalog.
Edisi 1102001.33. Jawa Tengah.
Badan Pusat Statistik Provinsi Jawa Timur. 2018. “Provinsi Jawa Timur Dalam Angka”. Katalog.
Edisi 1102001.35. Jawa Timur.
________. 2018. “Statistik Provinsi Jawa Timur 2017”. Katalog. Edisi 8401014.35. Jawa Timur.
Badan Pusat Statistik Provinsi Lampung. 2018. “Provinsi Lampung Dalam Angka”. Katalog. Edisi
1102001.18. Lampung.
Badan Pusat Statistik Provinsi Nusa Tenggara Barat. 2018. “Provinsi Nusa Tenggara Barat Dalam
Angka”. Katalog. Edisi 1102001.52. Nusa Tenggara Barat.
_______. 2018. “Statistik Daerah Provinsi Nusa Tenggara Barat”. Katalog. Edisi 1101002.52. Nusa
Tenggara Barat.
Badan Pusat Statistik Provinsi Sulawesi Selatan. 2018. “Provinsi Sulawesi Selatan Dalam Angka”.
Katalog. Edisi 1102001.73. Sulawesi Selatan.
Badan Pusat Statistik Provinsi Sumatera Barat. 2018. “Provinsi Sumatera Barat Dalam Angka”.
Katalog. Edisi 1102001.13. Sumatera Barat.
Buntara, Vivian. 2017. “Pengaruh Evaluasi Praktik Kerja Industri Terhadap Motivasi Belajar
Mahasiswa Sekolah Tinggi Pariwisata Trisakti”. Skripsi. Jakarta: Sekolah Tinggi Pariwisata
Trisakti.
Chattalia, Nadia. 2016. “Analisis Pengaruh Promosi Terhadap Keputusan Pembelian Pada Taman
Santap Rumah Kayu Gading Serpong”. Skripsi. Jakarta: Sekolah Tinggi Pariwisata Trisakti.
CNN Indonesia. 2016. “Tim Percepat Wisata Halal Sukses Saring Ratusan Kontestan”. Dalam
https://www.cnnindonesia.com/gaya-hidup/20160828212044-307154365/tim-percepatan-
wisata-halal-sukses-saring-ratusan-kontestan. (diakses tanggal 3 November 2018).
Dinas Komunikasi dan Informatika Provinsi Jawa Timur. 2018. “Sepanjang 2017, Kunjungan
Wisatawan Nusantara ke Jatim Capai 58,65 Juta Orang”. Dalam
http://kominfo.jatimprov.go.id/read/umum/sepanjang-2017-kunjunganwisatawan-nusantara-ke-
jatim-capai-58-65-juta-orang-. (diakses tanggal 3 November 2018).
Dinas Pariwisata Provinsi Riau. 2018. “Pariwisata Riau Sumbang Pendapatan Rp 4,2 Triliun”. Dalam
http://pariwisata.riau.go.id/detail/pariwisata_riau_sumbang_pendapatan_rp_42_ triliun.
(diakses tanggal 3 November 2018).
Dinas Pariwisata Daerah Istimewa Yogyakarta. 2017. “Statistik Kepariwisataan”. Lapran Tahunan.
Yogyakarta.
Fitri, Aulia. 2016. “Sekilas Tentang Pariwisata Halal”. Dalam http://disbudpar.acehprov.go.id/sekilas-
tentang-wisata-halal/. (diakses tanggal 3 November 2018).
Hamzah, Maulana dan Yudi Yudiana. 2015. “Analisis Komparatif Potensi Industri Halal dalam
Wisata Syariah dengan Konvensional”. Dalam
http://catatanek18.blogspot.com/2015/02/analisis-komparatifpotensiindustri.html. (diakses
tanggal 12 November 2018).
Haryadi, Sarjono dan Winda Julianita. 2011. SPSS vs LISREL sebuah pengantar Aplikasi untuk Riset.
Jakarta: Salemba Empat.
Hsu, Jane Lu dan Kai-Ming Chang. 2008. Purchase of Clothing and Its Linkage to Family
Communication and Lofestyles Among Young Adults. Journal of Fashion Marketing and
Management (online). Vol 12 No. 2. 2008pp 147-163.
Husein, Umar. 2008. Metode Penelitian untuk Skripsi dan Tesis Bisnis. Jakarta: PT Raja Grafindo
Persada.
Junaidi. 2010. “Download Tabel r Lengkap”. Dalam
https://junaidichaniago.wordpress.com/2010/05/24/download-tabel-r-lengkap/. (Diakses
tanggal 4 Desemeber 2018).
Kementrian Pariwisata. Pesona Wisata Syariah Indonesia. Jakarta.
Khadafi, Ahmad. 2017. “Saat Islam Menjadi Agama Mayoritas di Dunia”. Dalam tirto.id. 6 April.
Jakarta.
Kodhyat, H. 1998. Sejarah Pariwisata dan Perkembangannya di Indonesia. Jakarta: Grasindo.

Anita Swantari, Rina Fitriana
The Impact of Halal Tourism Promotion (Sharia Tourism) Towards the Students’ of STP Trisakti Visiting Decision to
Twelve Halal Tourism Destinations
21
Proceedings of CATEA 2019
Kotler, Philip dan Gary Armstrong. 2001. Prinsip-prinsip Pemasaran: Jilid I, Edisi Kedelapan. Jakarta:
Erlangga.
______. 2003. Marketing Managemnt. New Jersey. Prentice Hall. Jakarta.
Kotler dan Keller. 2007. Manajemen Pemasaran. Jilid 1. Alih bahasa oleh Benyamin Molan. Edisi 12.
Jakarta: PT Indeks.
______. 2007. Manajemen Pemasaran. Edisi 12, jilid 1. Jakarta: PT Indeks.
Kusmayadi dan Sugiarto, Endar. 2000. Metode Penelitian dalam Bidang Kepariwisataan. Jakarta: PT
Gramedia Pustaka Utama.

22
Proceedings of CATEA 2019
Proceedings of CATEA 2019
ISBN 978-623-91018-0-0
Factors Affecting the Ragunan Zoo Visitors’ Satisfaction
Rina Fitriana
1, Riska Dinantika
2,
1Sekolah Tinggi Pariwisata Trisakti
2Sekolah Tinggi Pariwisata Trisakti
[email protected], [email protected]
Abstract: Jakarta is one out of ten cities in the world whose tourism sector has improved rapidly, based on
the study conducted by WorldTravel and Tourism Council (WTTC) in 2017. Many tourism places can be
found in Jakarta. One of the tourism places, which is quite well known, is Ragunan Zoo. The present study
was aimed at investigating the impacts of factors of product quality, service quality, emotional, price and
cost towards the visitors of Ragunan Zoo’s satisfaction. The method employed in the study was descriptive
qualitative method. The sample collecting technique was purposive sampling, consisting of 100 respondents
who have visited Ragunan Zoo. The data collection method was conducted by administering a questionnaire
by using Likert scale and was analyzed by using SPSS application. The present study utilized answer index
analysis. The result of the answer index analysis showed that the quality of product, the quality of service,
the emotional factor, the price, and the cost factors reached the account of 77,156 and showed that the
visitors of Ragunan Zoo’s satisfaction was high.
Keywords: Quality of products; quality of service; emotional factor; price; cost; visitors’ satisfaction
1. Introduction Tourism is an activity of recreation, vacation, and traveling which is being favored by many
circles nowadays. Tourism is one of the needs for people who carry on tours for various purposes.
Indonesia has various tourism places which are attractive to visit. One of the tourism places
lies in its capital, Jakarta. Even though it has the reputation as a city that has a lot of traffic
disorders, Jakarta still has its own charms. This is proved with the result of the study conducted by
World Travel and Tourism Council (WTTC) in 2017 which stated that Jakarta belonged to Ten
Tourism cities which have grown rapidly in the world.
Jakarta is potential for various kinds of tourism, started from historical tourism, cultural
tourism, marine tourism, culinary tourism, created tourism, and so on. Many tourism objects in this
city can be options for vacationing with family for the people from Jakarta and from outside
Jakarta as well. one of the destinations is Ragunan Zoo.
Ragunan Zoo is a zoo located in Ragunan area, Pasar Minggu, South Jakarta. This zoo was
built in 1864 and was the first zoo in Indonesia. It is also the biggest zoo in Indonesia, and the
second biggest in the world after San Diego Zoo in Canada.
Ragunan Zoo is one of the tourism destinations that become crowded in weekends or during
national holidays. Besides, with the affordable price of the tickets, visitors can freely watch various
actions of the animals and enjoy some children play provided by the management. The following is
the numbers of Ragunan Zoo visitors since 2015 until July, 2018. Table 1. Data of Visitors in 2015 to 2018 (July)
NO YEAR ADULT CHILDR
EN
GROUP NUMBER OF
VISITORS ADULT CHIL
DREN
1 2015 3.826.405 1.274.143 17.081 39.272 5.156.901
2 2016 3.897.808 1.237.831 10.022 32.216 5.177.877
3 2017 4.044.830 1.287.791 5.755 31.192 5.369.568
4 2018 (per Juli) 2.474.483 797.250 4.420 12.853 3.289.006
Source: Ragunan Zoo Management Unit

Rina Fitriana, Riska Dinantika
Factors Affecting the Ragunan Zoo Visitors’ Satisfaction
23
Proceedings of CATEA 2019
The increasing total visitors have proved that actually many of them were satisfied. However,
this is in reverse with the opinions found concerning the experience of visiting the Ragunan Zoo on
one of the internet site (www.tripadvisor.co.id). Some opinions stated that there are inadequate
facilities and infrastructure, as well as the lack of management role in running the place.
Inadequate facilities are especially shown by insufficient rest rooms, distant parking location,
unclean area, lack of good service, and other issues.
Based on these findings, the writer concludes that behind the increasing numbers of visitors,
there are actually hidden complexities faced by the Zoo. Thus, the writers are interested in
conducting a research on the factors affecting to the Ragunan Zoo visitors’ satisfaction. The study
aims to analyze the factors affecting the Zoo visitors’ satisfaction.
2. Theoretical Review 2.1 Definition of Tourism
Constitution of Indonesia Republic No. 10 Year 2009 defines tourism as all kinds of activities
of tourism which is encouraged by various facilities and services provided by the society,
entrepreneur, and the government. Meanwhile Norval (In Mulyadi, 2009; 8) stated, “The sum total
of operation, mainly of an economic nature, which directly relate to the entry, stay and movement
of foreigners inside and outside a certain country, city or region.” Burkat in Damanik (2006)
defines tourism as the temporary displacement in a short period to some destinations outside the
places they usually live and work, and their activities during their stay on the destination places.
Burkat in his book entitled “Tourism, Past, Present, and Future” stated that “tourism is one’s
temporary displacement in a short term to the destinations outside the places they usually live and
work, and their activities during their stay on the destination places (in Soekadijo, 2000:3).
2.2 Visitors
According to International Union of Official Travel Organization (IUOTO), visitors are
individuals that come to a country or other residence for certain purposes except for working on a
paid job. Visitors are divided into two categories:
1. Tourists that are visitors who temporarily settle for about twenty four hours in a
country, and his travel is classified as follow:
a. Leisure, recreation, vacation, health, study, religious or sport activities.
b. Business, family affair, conference, on a mission, et cetera.
2. Traveler or Excursionist, which mean temporary visitors who visit an
object/destination but not spending the night (its duration is less than twenty four
hours/one day)
So in this study, the ones that are called visitors are actually travelers or excursionists because
they only visit the zoo for hours and therefore do not spend the night.
2.3. Visitors’ Satisfaction
The word satisfaction originally comes from a Latin word satis that means enough and facere
that means conduct or produce. Satisfaction is defined as providing consumers’ need as expected.
Kotler and Keller (2009:138-139) revealed that satisfaction is the happy or disappointed feelings
that come from the comparison between what impacted of a product and its expectation. Lovelock
and Wright (2007:102) stated that satisfaction is the emotional condition after purchasing.
According to Kotler (In Lupiyoadi, 2001:158), satisfaction means the level of feeling in which
one (in this case the visitor) states his comparison of received the products or service with his own
expectations. Oliver in Supranto (2001:233) explained that satisfaction is one’s level of feeling
after comparing the felt results and his expectations. Meanwhile, according to Sunyoto (2013:35)
definition of consumers’ satisfaction is one’s satisfaction after comparing the results which he is
feeling and his expectations. In this research, the consumers are visitors.
2.4. Factors Affecting Visitors’ Satisfaction
Lupiyoadi (2001:158) in determining the level of customer satisfaction, there are five main
factors that must be considered, namely:

Rina Fitriana, Riska Dinantika
Factors Affecting the Ragunan Zoo Visitors’ Satisfaction
24
Proceedings of CATEA 2019
A. Product quality
Rational consumers always demand qualified products at every sacrifice made to obtain these
products. In this case a good product quality will provide added value in the minds of the
consumers. Irawan (2004: 37) states that product quality is one of the factors determining customer
satisfaction. Customers will be satisfied if after buying and using the product it turns out the
quality of the product is good. Muljadi (2012: 89) states three important aspects of tourism
products so that prospective tourists or visitors make a visit, namely tourist attractions, amenity
and accessibility. In this study, customers in tourism are visitors.
B. Quality of Service
Customers will be satisfied if they are given qualified service. Satisfied customers will show
the possibility to re-buy the same product or service. Irawan (2004: 37) states service quality as
one of the factors encouraging customer satisfaction. The satisfaction that comes from quality of
service is usually difficult to imitate. Service quality has several dimensions that are famous as
SERVQUAL, namely as follows (Lupiyoadi, 2006):
a. Tangibles, or physical evidence, which include physical facilities (buildings, warehouses,
etc.), equipment and equipment used (technology) and the appearance of employees.
b. Reliability, which is the ability to provide services that are promised accurately and reliably
consists of timeliness, the same service for all customers without errors, a sympathetic attitude
and high accuracy.
c. Responsiveness, defined as a willingness to help and provide services that are fast and
appropriate to customers, with the delivery of clear information.
d. Assurance, which is guarantee and certainty, namely knowledge, politeness and the ability of
company employees to foster trust in customers to the company. It consists of several
components including communication, credibility, security, competence, and courtesy.
e. Empathy means to give genuine and individual or personal attention to customers by trying to
understand consumer desires.
C. Emotional Factors
Customers who are proud and confident because they believe people will be amazed at them
when using special brands tend to have a higher level of satisfaction. Satisfaction obtained is
brought by the social value or self-esteem given by those certain brands.
Irawan (2004: 37) believes emotional factors will encourage customer satisfaction due to the
emotional value provided by the brand. Emotional factor defined as a sense of pride, confidence, a
symbol of success, a part of a group of important people and so on are examples of emotional
values that underlie customer satisfaction (Irawan 2008: 39).
D. Price
Products that have the same quality but set the prices relatively cheap will provide higher value
to consumers. Irawan (2004: 37) states that price is one of the factors that drive customer
satisfaction. Price is the amount of the determined exchange value inherent in a product, calculated
based on costs incurred so as to get a profit (Irawan, 2008: 38)
E. Costs
Customers who do not need to incur additional costs or to waste time getting a product or
service tend to be more satisfied. Irawan (2004: 37) states that cost and convenience as one of the
factors that encourage customer satisfaction. Customers will be more satisfied if it is relatively
easy, comfortable and efficient in getting a product or service.
2.5. Zoo
According to Forestry Minister’s Regulation Number p.54/Menhut-II/2006 about
conservation institutions, zoo is a place that has the main function as the conservation institution
that make an effort to upkeep and breed various animals based on the animals well-being principles
in order to build and develop new environment, as a means for the animals protection and
preservation through natural reintroduction, rehabilitation, and rescue activities and is used as the
means for education, research, science and technology development and a means for healthy
recreation activity.

Rina Fitriana, Riska Dinantika
Factors Affecting the Ragunan Zoo Visitors’ Satisfaction
25
Proceedings of CATEA 2019
3. Research Method 3.1 Research Method and Unit Analysis
The research method used in this paper is the descriptive method, which is used to investigate
knowledge as much as possible to make a description systematically, factually, and accurately
about facts, features, and the relationship among the phenomenon under discussion
(Hidayat:2010). Descriptive method employed in the research is quantitative.
According to Hamidi (2005:75-76), unit analysis is the individuals, groups, things, or social
events such as individual or group activities as the subject of the study. Thus, the analysis unit in
the present study is the satisfaction of the Ragunan Zoo visitors.
3.2 Variable and Measuring Scales
Research variable means the attribute or feature, or value of individuals, objects, or events
being studied (Sugiyono, 2011:60-64). The variable in this study the factors affecting the Ragunan
Zoo Visitors’ satisfaction. Table 2. Variables, Sub Variables, Indicators and Measuring Scales
VARIABLE SUB
VARIABLES INDICATORS
MEASURING
SCALES
Respondent
Identity
Sex Male
Nominal Female
Age
≤ 20 years old
Ordinal 21 - 30 years old
31 - 40 years old
≥ 40 years old
Domicile
Jakarta
Nominal
Bogor
Depok
Tangerang
Bekasi
Lainnya
Occupation
Student
Nominal
Civil Servant
Private Employees
Enterpreneur
Others
Visiting
Frequency
Once
Nominal Twice
More than twice
Factors
Affecting the
Visitors’
Satisfaction
Product
Quality
Attaction
Nominal Amenity
Accesibility
Service
Quality
Tangibles
Nominal
Reliability
Responsiveness
Assurance
Empathy
Emotional Confidence Nominal

Rina Fitriana, Riska Dinantika
Factors Affecting the Ragunan Zoo Visitors’ Satisfaction
26
Proceedings of CATEA 2019
VARIABLE SUB
VARIABLES INDICATORS
MEASURING
SCALES
Factor Pride
Price The conformity between price
and products Nominal
Cost Cost efficiency in achieving
product Nominal
Source: Processed secondary data, 2018
The nominal scale means the grouping or the categorization of events or phenomenon into
classes or categories, so that the attributes and the features belong to one class or group is similar.
Nominal scale is the lowest level of measuring scale since it can only distinguish one event with
another only based on names (predicates). According to Sugiyono (2014:98) ordinal scale means
the measuring scale which does not only categorize but also rank the measured construct. This
scale is often called ranking scale. The variable measurement used in this study is Likert scale that
is used to measure attitude, opinion, and perception of an individual about someone or a group of
people about a social phenomenon. By using Likert scale, the respondents were asked to fill the
questionnaire that show their agreement level towards some statements. The agreement level of
Likert scale consists of five options, as follow: Strongly agree (SA), Agree (A), Quite Agree (QA),
Disagree (D), Strongly disagree (SD).
3.3 Sampling Procedure
Sugiyono (2006) defined population as the generalization area which consisted of object or
subject that has the certain quality and characteristics set by the researcher to be studied and
concluded. Population of the present study was the Ragunan zoo visitors in the year of 2017 as
many as 5.369.568 visitors.
Sample is the part of population that has certain features or condition which will be studied
(Riduwan, 2007:56). This study uses purposive sampling that is the technique for sample collection
which is not in the basis of random sampling, area, or strata, rather, based on considerations that
focus on certain aims (Arikunto:2006). Based on the aforementioned elaboration, the sample used
in this study was those who have visited Ragunan Zoo. The total visitors of Ragunan Zoo in 2017
were 5.369.568 visitors. Using Slovin formulation with the margin error of 10%, it is found out
that the sample is 100 respondents.
3.4 Data Collection Procedures
Based on the source for collecting the data used in the current study, the data collection were
divided into two kinds:
1. Primary Data, which is obtained through observation and technique.
2. Secondary Data that is collected in the available form through the information publication
published by various organizations or companies, including electronic media, mass media,
internet, magazines, journals, and so on.
3.5 Data Analysis Method
The activities in data analysis include group the data based on the variable and the kinds of
respondents, tabulate the data based on the variable from the whole respondents, present the data of
each studied variable and calculate to answer the research questions. The following are methods
that were used in the study: validity test, reliability test, and answer indexed analysis.
3.6 Research Site and Time
The present study was conducted since June 2018 until July 2018. The study was conducted
during that time considering the months are the best time to carry on the research because those
months are holiday season. The study took place at Ragunan Zoo.

Rina Fitriana, Riska Dinantika
Factors Affecting the Ragunan Zoo Visitors’ Satisfaction
27
Proceedings of CATEA 2019
3. Findings and Discussion
Table 3. Average Results of the Factors Affecting the Visitors’ Satisfaction
Evidence SP P KP TP STP
Total Average
Average
Of Each
Topic
Total
Of
Average R J R J R J R J R J
A. Product Quality
77,156
Animal Collection 30 150 49 196 16 48 4 8 1 1 403 80,6
76,04
Main Facilities 12 60 36 144 35 105 13 26 4 4 339 67,8
Supporting Facilities 25 125 42 168 27 81 5 10 1 1 385 77
Cleanliness 12 60 53 212 28 84 6 12 1 1 369 73,8
Accesibility 31 155 47 188 19 57 2 4 1 1 405 81
B. Service Quality
Appearance 16 80 48 192 34 102 2 4 0 0 378 75,6
72,84
Reliability 13 65 44 176 37 111 6 12 0 0 364 72,8
Responsiveness 13 65 45 180 32 96 9 18 1 1 360 72
Assurance 11 55 53 212 30 90 6 12 0 0 369 73,8
Empathy 9 45 39 156 45 135 7 14 0 0 350 70
C. Emosional Factor
Developing Knowledge 24 120 53 212 18 54 4 8 1 1 395 79 77,1
Pride 20 100 43 172 30 90 7 14 0 0 376 75,2
D. Price
Entrance Ticket 29 145 54 216 14 42 3 6 0 0 409 81,8 78,4
Food & Bavarage 14 70 51 204 31 93 4 8 0 0 375 75
E. Cost
Travelling Cost 29 145 55 220 13 39 3 6 0 0 410 82 81,4
Cost During Visit 29 145 49 196 20 60 1 2 1 1 404 80,8
Source: Processed Primary Data, 2018
Table 4. Index Value Interval Scales
Index Value Interval Evidence
20,00 – 46,67 Low
46,68 – 73,33 Medium
73,34 – 100,00 High
Based on the average results on table 4, it can be concluded that the quality of products, the
quality of services, the emotional factor, prices, and costs had the average total value of 77,156,
included in high score category. It can be concluded that the visitors’ satisfaction based on the five
factors was high.
1. Quality of products
The quality of products has the average value of 76,04, which is categorized as high.
There were attraction, amenity, and accessibility. From the three indicators, the
accessibility was the most influential indicator in the quality of product with the average
value 81, since the respondents found it easy to access the Ragunan Zoo due to its
strategic location.
2. Quality of Services
The quality of services has the average value 72,84, which means it was categorized as
Medium. There were physical evidence, reliability, responsiveness, assurance, and

Rina Fitriana, Riska Dinantika
Factors Affecting the Ragunan Zoo Visitors’ Satisfaction
28
Proceedings of CATEA 2019
empathy. From the five indicators, the physical evidence was the most influential
indicator in the quality of services with the average value 75,60. The respondents found
that the employees of Ragunan Zoo were well-dressed
3. Emotional Factor
The emotional factor has the average value 77,10 which was categorized as high. There
were the sense of the development of knowledge and pride. From the two indicators, the
sense of developing knowledge was the most influential indicator with the average value
79. The respondents found that there were new information from the animals at the
Ragunan Zoo.
4. Prices
Prices possessed the average value 78,40 which was categorized as High. There were the
price of entrance tickets and the price of food and beverages. From the two indicators, the
price of the entrance tickets was the most influential indicators with the average value
81,80, since the respondents found that the offered price was very affordable.
5. Costs
Costs has the average value 81,40, which was categorized as High. There were traveling
cost and the costs spent during visit of the tourism site. From the two indicators, the costs
for traveling was the most influential indicator with the average value 82, this was due to
the respondents found that the traveling costs was quite affordable
5. Conclusion and Recommendation 5.1. Conclusion
Based on the study on “the analysis of Factors Affecting the Ragunan Zoo Visitors’
Satisfaction”, the writers draw the conclusion as follow:
1. From the result of answer index analysis, it was found that the quality of products, the
quality of services, the emotional factors, the prices, and the costs had the total value as
many as 77,156, and categorized as high. Therefore it can be concluded that the visitors
has high satisfaction on the zoo.
2. The answer index analysis shows that the most influential factors was the costs with the
value of 81,40, and categorized as high. This showed that the spent cost was the highest
factor affecting the Ragunan Zoo visitors’ satisfaction.
3. The second influential factor was the price with the average value 78,40 and categorized as
high. This showed that the price conformity with the gained products affect the Ragunan
Zoo visitors’ satisfaction.
4. The third influential factor was the emotional factor with the average value 77,10. It was
categorized as high. This showed that one’s emotional feeling can affect the Ragunan Zoo
visitors’ satisfaction.
5. The next influential factor was the quality of products with the average value 76,04. It was
categorized as high. This showed that the attraction, available facilities, and the
accessibility became the factors affecting the Ragunan Zoo visitors’ satisfaction.
6. The last influential factor was the quality of services with the average value 72,84. It was
categorized as Medium. This showed that the employees and the officials’ ability in
serving the visitors can affect the Ragunan Zoo visitors’ satisfaction.
5.2. Recommendation
Based on the findings and the conclusion, there are some recommendations to improve the
Ragunan Zoo visitors’ satisfaction, as follow:
1. Improve the service to the visitors. The employees and officials should always serve the
visitors kindly and friendly and give fast and appropriate services.
2. Better maintenance in cleanliness. Additional equipment such as soaps for washing hands
and tissues need to be placed at every rest room in order to make the visitors more
convenient. Other areas need to be kept clean as well, such as animal cages and so on.
3. Expand parking areas, considering the Ragunan Zoo get very crowded at weekends and at
national holidays since most of the visitors taking their own vehicles. This is important to
avoid traffic disorders around the zoo area.

Rina Fitriana, Riska Dinantika
Factors Affecting the Ragunan Zoo Visitors’ Satisfaction
29
Proceedings of CATEA 2019
4. Add signposts for the ways around the animal cages. Most of times, the visitors find it
difficult to find certain animal cage since the location is remote from the main way. To
help the visitors find the cages, it is suggested that the management of the zoo spread maps
at the entrance free of charge.
5. Provide continuation tickets, including the ticket to enter primate centers, children zoo, etc.
References
Arikunto, Suharsimi. 2006. Metodologi penelitian. Yogyakarta: Bina Aksara.
Damanik, Janianton dan Helmut F. Weber. 2006. Perencanaan Ekowisata dari Teori ke Aplikasi.
Yogyakarta: Andi Offset.
Djaali. 2008. Skala Likert. Jakarta: Pustaka Utama.
Hamidi. 2005. Metode Penelitian Kualitatif: Aplikasi Praktis Pembuatan Proposal Dan Laporan Penelitian.
Malang: UMM Press.
Hidayat, Aziz Alimul. 2010. Metode Penelitian Kesehatan Paradigma Kuantitatif. Jakarta: Heath Books.
Kusumah, Wijaya dan Dedi Dwitagama. 2011. Mengenal Penelitian Tindakan Kelas. Edisi ke 2. Jakarta: PT
Indeks.
Lupiyoadi, Rambat. 2001. Manajemen Pemasaran Jasa, Teori dan Praktek. Edisi Pertama. Jakarta: Salemba
Empat.
Riduwan. 2007. Metode dan Teknik Penyusunan Skripsi. Bandung: CVAlfabeta.
Ruslan, Rosady. 2004. Metode Penelitian Public Relations dan Komunikasi.Jakarta: Raja Grafindo Persada
Soekadijo. 2000. Anatomi Pariwisata. Jakarta: PT Gramedia Pustaka Utama.
Sugiyono. 2016. Metode Penelitian Kuantitatif, Kualitatif dan R & D. Bandung: CV Alfabeta.
Sunyoto, Danang. 2013. Teori Kuesioner dan Analisi Data untuk Pemasaran dan Perilaku Konsumen.
Yogyakarta: Graha Ilmu.
Supardi. 2006. Metodologi Penelitian. Mataram: Yayasan Cerdas Press.
Supranto, J. 2001. Pengukuran Tingkat Kepuasan Pelanggan untuk Menaikkan Pangsa Pasar. Jakarta: PT
Rineka Cipta
Sutrisni. 2010. Analisis Pengaruh Kualitas Produk, Kualitas Pelayanan, Desain Produk, Harga dan
Kepercayaan terhadap Loyalitas Pelanggan Indosat IM3 pada Mahasiswa Fakultas Ekonomi
Universitas Diponegoro Semarang. Skripsi Fakultas Ekonomi, Universitas Diponegoro. Semarang:
tidak diterbitkan.
Umar, Husein. 2003. Metodologi Penelitian Untuk Skripsi dan Tesis Bisnis. Jakarta: PT Gramedia Pustaka
Utama.
Other Sources
http://gardanasional.id/post/5258/wttc-merilisjakarta-masuk-10-besar-pertumbuhan-wisata-tercepat-di-dunia
[diakses 20 Juni 2018]
https://pariwisatantthits.wordpress.com/2016/12/17/undang-undang-no-10-tahun-2009-tentang-
kepariwisataan/
[diakses 26 Juni 2018]
http://tikaerlitasaputri.blogspot.com/2012/12/pengertianpariwisatakepariwisataan.html [diakses 25 Juni
2018]
https://www.isaw.or.id/campaigns/indonesian-zoo-watch/what-is-azoo/?lang=id
[diakses 27 Juni 2018]
https://www.tripadvisor.co.id/ShowUserReviews-g294229-d1055740r149846201-Ragunan_Zoo-
Jakarta_Java.html
[diakses 1 Sept 2018]
www.ragunanzoo.jakarta.go.id. Website resmi Taman Margasatwa Ragunan
[diakes 28 Juli 2018]

30
Proceedings of CATEA 2019
Proceedings of CATEA 2019
ISBN 978-623-91018-0-0
The Effect of Incube Artisan Coffee House on the Interest of
Students Entrepreneurs at STP Trisakti
Novita Widyastuti Sugeng
1, Vienna Artina. S
2
1Sekolah Tinggi Pariwisata Trisakti
2Sekolah Tinggi Pariwisata Trisakti
[email protected], [email protected]
Abstract : Business incubator is a company or institution that provides a program designed to foster and
accelerate the success of business development through a series of capital programs followed by partnership
support or coaching other business elements with the aim of making the business become a profitable, and
finally have a positive impact on society. Trisakti School of Tourism (STP) has just inaugurated a student
business incubator named In.cube Artisan Coffee House, where management and presentation will be handled
entirely by students.The research is used kuantitatif deskriptif method that is carried out with the main
objectively. Population in this study is 50 They are all member of the Incube, so in this study it takes as many as
50 samples. The result is STP Trisakti is indeed needed to develop business incubators, such as with Sebastian
Coffee & Kitchen, cooperation is carried out to support operations such as coffee machines, coffee grinders, and
others. It is to be interacted with the members of the Trisakti Coffee Society more intensity of association with
the members of their environment who are professional because they interact with partners who have similar
desires in entrepreneurship will facilitate the implementation of the desire for entrepreneurship.
Keywords : STP Trisakti; InCube; Entrepreneurs
1. Introduction
The situation in developing countries in recent years shows that the created economic
development cannot provide better and faster employment opportunities. Therefore, the problem of
unemployment faced from year to year is increasing, especially in Indonesia.
One way to reduce unemployment is to prepare educated students who are able to pioneer their
own business and even create jobs for others. Growing the entrepreneurial interest of students in
higher education can be used as a first step, because to start a business or entrepreneurship, it requires
interest in the prospective entrepreneur.
In Indonesia alone, there are several universities or colleges that already have entrepreneurship-
based education programs through the form of business incubators which directly involve students in
conducting studies and practices on business ideas.
Business incubator is a company or institution that provides a program designed to foster and
accelerate the success of business development through a series of capital programs followed by
partnership support or coaching other business elements with the aim of making the business become
a profitable, organization and financially sound company. , as well as being a sustainable company, to
finally have a positive impact on society.
Business incubators began to be developed in Indonesia since 1992, at the initiative of the
government working with universities. The creation of business incubators within higher education
institutions and educational institutions is a synergy of the functions and roles of higher education
institutions and educational institutions as a means of realizing intellectual and professional human
resources.
One of the universities that participated in the development of business incubators is the Trisakti
Tourism College, which is one of the high schools engaged in tourism. Not long ago, Trisakti School
of Tourism (STP) has just inaugurated a student business incubator named In.cube Artisan Coffee
House, in this case as a business incubator center at the Trisakti STP, where management,
management and presentation will be handled entirely by Trisakti STP students .

Novita Widyastuti Sugeng, Vienna Artina. S
The Effect of Incube Artisan Coffee House on the Interest of Students Entrepreneurs at STP Trisakti
31
Proceedings of CATEA 2019
With the presence of In.cube Artisan Coffee House, the hope is that it can facilitate students who
have an interest and talent in entrepreneurship to start entrepreneurship with the basis of science,
technology and art that is being studied. The goal is to form soft skills so that students behave
according to the character of entrepreneurship and after taking formal education on campus have the
spirit to be independent by building a business and creating jobs in the future.
Based on the identification of problems that have been mentioned, the problems can be
formulated as follows:
Based on the explanation above, several problems can be formulated in this study, including:
1. What are the dominant factors of the business incubator variable In.cube Artisan Coffee House
and entrepreneurial interest variable members of the Trisakti Coffee Society?
2. How much influence does the business incubator In.cube Artisan Coffee House have on the
entrepreneurial interests of members of the Trisakti Coffee Society?
The purpose of the research is to be achieved:
1. To find out the dominant factors of the business incubator variable In.cube Artisan Coffee
House and entrepreneurial interest variables members of the Trisakti Coffee Society.
2. To find out the magnitude of the influence of business incubator In.cube Artisan Coffee House
on entrepreneurial interests of members of the Trisakti Coffee Society.
Research Accomplished
The previous study is the result of research that has been done previously associated with
research that will be done by the author of the site selection. The studies that have been done before is
as follows:
No. Research Topic Method Result
1
2
Determinants of Interest
in Student
Entrepreneurship (An
Learning Evaluation).
Anak Agung Gede
Mantra Suarjana dan Luh
Mei Wahyuni (2017)
Entrepreneurship
Development Program in
the Form of Business
Incubators at Universities
for Beginner Business
Owners.
Hery Budiyanto, Agus
Suprapto, Dina
Poerwoningsih (2017)
The research sample of 125
respondents was taken by purposive
sampling technique. While the data
analysis technique used is multiple
regression techniques with the help of
SPSS 20 application.
The Entrepreneurship Development
Program in Higher Education is carried
out in the form of a Student Business
Incubator which is a program with the
mission of producing independent
science and technology-based
entrepreneurial students, through an
integrated program involving
Incubator lecturers, Resource Persons,
Entrepreneurial Institutions and
Entrepreneurs outside the campus.
The results of the data analysis with a
significance of 0.05 indicate that income
expectations, family environment and
entrepreneurship education (partially)
have a positive and significant effect on
the interest in student entrepreneurship.
The results of his research namely
Student Business Incubator is the right
program to foster entrepreneurial spirit
and alleviate new entrepreneurs from
college students because it is considered
to be able to support and as a
continuation of entrepreneurial activities
3
The Effect of
Entrepreneurial
Personality,
Entrepreneurship
Knowledge, and the
Environment on the
Interests of Vocational
Entrepreneurship.
Eka Aprilianty (2012)
The population is students of the
Agriculture Cluster Vocational School
in the Special Region of Yogyakarta.
The sample of 113 respondents was
determined using the proportional
random sampling technique. Data
analysis used descriptive statistics and
inferencing statistics.
The research shows that interest in
entrepreneurship is relatively low
(48.67%), potential entrepreneurial
personality has a significant influence on
the interest in entrepreneurship (27.3%),
entrepreneurial knowledge has a
significant effect on the interest in
entrepreneurship (13.7%), the family
environment has a significant influence
towards interest in entrepreneurship
(22%). There is a joint influence between
the potential of entrepreneurial
personality, entrepreneurial knowledge,
and family environment of 42.2 percent
of the interest in entrepreneurship.
Novita Widyastuti Sugeng, Vienna Artina. S
The Effect of Incube Artisan Coffee House on the Interest of Students Entrepreneurs at STP Trisakti
32
Proceedings of CATEA 2019
2. Literature Review
2.1 Business Incubator In the context of economic development, incubators are an economic development tool designed
to help the formation and growth of new companies in a community, a building or a special region.
Incubators provide some service support, in addition to flexible rooms for rent, shared equipment and
administrative services in a guided workplace (Mahnke, 2010).
Hewick (2006) provides a definition of incubation as the concept of fertilizing qualified
entrepreneurs in a work space managed by an institution called an incubator. While business
incubators are physical buildings (buildings) intended to support qualified businesses through
mentoring, training, professional networking, and assistance in finding funding until they graduate
and can survive in a competitive environment.
While in the Republic of Indonesia Presidential Regulation Number 27 of 2013 concerning the
Development of Entrepreneurial Incubators, incubation is a process of coaching, mentoring, and
development provided by entrepreneurial incubators to incubation participants, while entrepreneurial
incubators are intermediary institutions that carry out the incubation process for incubation
participants (tenants, incubator clients, or incubates) and have physical buildings for daily business
spaces for incubation participants. Tenant business activities can be carried out in an incubator
building as an inwall tenant by renting a space provided by an incubator. If tenants carry out their
business activities outside the incubator, they are referred to as outwall tenants.
Scillitoe and Chakrabarti (2010) suggest that business incubators are a new and popular form of
organization created through the assistance of economic development agents to support and accelerate
the development and success of a business to achieve certain economic goals.
Business incubator is an innovative form of organization that aims to produce value by
combining the entrepreneurial spirit of the pilot business with the availability of sufficient resources
for middle to upper scale businesses (Hamdani, 2006).
Understanding Business Incubator according to Agustina (2011) is an institution that helps new
entrepreneurs in starting their businesses to improve development prospects and endurance, so that
they can later survive in a real business environment.
Systemically, a business incubator is a vehicle for the transformation of the formation of human
resources that are not or less creative and productive into human resources that have entrepreneurial
motivation creatively, innovatively, productively and cooperatively as the first step in creating
entrepreneurs who have competitive and comparative advantages and have vision and mission.
2.1.1 Concept and Model of Business Incubator Service Services provided by Business Incubators to tenants according to the Ministry of KUKM (2012)
cover the 7S scope / concept, namely:
1) Space, which is providing space for tenant business activities;
2) Shared office facilities, namely the provision of office facilities that can be shared. For example,
means of fax, telephone, photocopy, meeting room, computer, and secretary;
3) Service, namely conducting guidance and management consulting: marketing, finance,
production, technology, etc.;
4) Support, which is to provide research support and business development assistance and access to
technology use;
5) Skill Development, namely improving the ability of tenant human resources through training,
business plan preparation, management training, etc .;
6) Seed Capital, namely the provision of initial business funds and efforts to obtain capital access to
financial institutions; and
7) Synergy, namely the creation of business networks both between local and international
businesses.
2.2 Entrepreneurship
Hendro (2011) states that entrepreneurship is the main actor in economic development and its
function is to innovate or new combinations for innovation. A similar statement was also expressed by

Novita Widyastuti Sugeng, Vienna Artina. S
The Effect of Incube Artisan Coffee House on the Interest of Students Entrepreneurs at STP Trisakti
33
Proceedings of CATEA 2019
Bygrave (in Alma, 2007), namely: "Entrepreneurs who are destined for the existing economic order
by introducing new products and services.
Which has the understanding that Entrepreneurship or entrepreneurship is someone who is able
to create something new both goods or services in an organization and is able to break down the
existing economic system. Entrepreneurs are someone who is strong at something.
Entrepreneurship is someone who organizes and directs new businesses. Entrepreneurship must
take risks that are related to business start-up processes (Sudaryono, 2010). Meanwhile according to
Suryana (2010) entrepreneurs are people who make creative and innovative efforts by developing
ideas, and concocting resources to find opportunities (Opportunity) and improvement (Preparation)
life Nitisusastro (2012) gives the opinion that entrepreneurship is someone who organizes, operates
and calculates risks for a business that brings profit.
As according to Kasmir (2011), entrepreneurship is a person who has the soul to dare to take risks to
open a business on various occasions.
From some of the meanings above, it can be concluded that entrepreneurship is a person who has
the ability to capture opportunities and dare to take the risk of running a business with the aim of
making a profit. An entrepreneur is required to have creative and innovative qualities.
2.3 Interest in Entrepreneurship
2.3.1 Understanding Interest
Purwanto (2010) says in language interest means a tendency of a high heart towards something.
Interest is a nature that is relatively settled in a person. Interest has a huge influence on one's activities
because with interest he will do something that interests him. Conversely, without interest someone is
not possible to do something.
In terms of Sardiman (2006) argues that interest is a condition that occurs when a person sees
traits or temporary meanings of situations that are associated with their own desires or needs. Interest
as a motive that causes individuals to engage actively with something that is interesting. Interest is the
tendency of the soul to stay in the direction of something valuable for people.
Slameto (2010) explains that interest is a feeling of being more like and feeling attached to a thing
or activity, without being told. Interest is basically the acceptance of a relationship between oneself
and something outside of oneself. The stronger or nearer the relationship, the greater the interest.
Interest is a tendency that persists in the subject to feel interested in a particular field and feel
happy to be involved in it (Widiyatnoto, 2013).
According to Suhartini (2011), interest is a mental set consisting of a mixture of feelings, hopes,
establishment, tendencies that direct individuals to a particular choice.
2.4 Definition of Entrepreneurship / Entrepreneurship Interest
The interest in entrepreneurship can be seen as an intention to create a new organization or
business or as a risk-taking behavior to start a new business (Kurnianti, 2015).
Fuadi (2009: 93) states that an interest in entrepreneurship is the desire, interest, and willingness to
work hard or be strong-willed to strive to fulfill their needs without feeling afraid of the risks that will
occur, and willing to learn from failure.
Mahesa & Rahardja (2012) describes that the interest in entrepreneurship is the tendency of the
heart in the subject to be interested in creating a business which then organizes, organizes, carries
risks and develops the business it creates itself.
The interest in entrepreneurship is the choice of one's activities because they feel interested,
happy and desirous of entrepreneurship and dare to take risks to achieve success (Suryana, 2011).
While according to Santoso in Suryaman (2006), entrepreneurial interest is a psychological
phenomenon to focus attention and do something about the entrepreneur with a feeling of pleasure
because it brings benefits to him. The essence of this opinion is concentration of attention
accompanied by pleasure.
2.5. Factors that influence Entrepreneurship Interest
The factors that encourage interest in entrepreneurship according to Bygrave in Buchari Alma
(2013), are:
1) Personal factors, concerning aspects of personality, including:

Novita Widyastuti Sugeng, Vienna Artina. S
The Effect of Incube Artisan Coffee House on the Interest of Students Entrepreneurs at STP Trisakti
34
Proceedings of CATEA 2019
a) There is dissatisfaction with one's work.
b) There is a termination of employment, there is no other job.
c) Encouragement due to age.
d) Courage takes risks.
e) Commitment or high interest in the business.
2) Environmental factors, concerning relationships with the physical environment, including:
a) There is competition in the world of life.
b) There are sources that can be utilized such as capital, savings, inheritance, buildings, and strategic
locations.
c) Take part in business course training or business incubators.
d) Government policy, ease of business location, credit facilities and business guidance.
3) Sociological factors, concerning relationships with families and so on, including:
a) The existence of relationships or relationships for others.
b) There is a team that can be invited to cooperate in trying.
c) There is encouragement from parents to open a business.
d) There is family assistance in various facilities.
e) The existence of previous business experience.
Alma (2013) states that the thing that most encourages a person to enter an entrepreneurial career
is the existence of personal attributes and personal environment. Furthermore Buchari Alma (2013)
adds that with the personality possessed by someone can attract others to sympathize with him, people
are interested in his conversation, people are amazed by him. Entrepreneurs who have such
personalities often succeed in carrying out their business.
According to Kurniati (2015) factors that influence the interest in entrepreneurship in broad
outlines can be grouped into two factors, namely intrinsic factors and extrinsic factors. Intrinsic
factors are factors that arise because of the influence of stimuli from within the individual itself.
3. Material & Methodology
The research is used descriptive research methods that conducted with the main objective to create
a picture or a description of a situation objectively. The unit of analysis of this study are the effect of
incube artisan coffee house on the interest of students entrepreneurs at STP TRISAKTI.
Likert scale is a tool to measure attitudes, opinions and perceptions of a person or a group of social
phenomenon (Sugiyono, 2014). Each item instrument that uses a Likert scale has a gradation from
very positive to very negative, which may include words such as strongly agree, agree, doubtful,
disagree, strongly disagree.
There are 2 Sub Variable :
A. Characteristics Biography
1. Sex
2. Age
3. Membership
B. Business Incubator :
a. Space
b. Shared Office Facilities
c. Service
d. Support
e. Skill Development
f. Seed Capital
g. Synergy
Sampling technique used purposive sampling if researchers have certain considerations in setting
an example according to the purpose of the research. Population in this study is the member of Incube
, where, according to data from member of Trisakti Coffee Society at 100 Trisakti STP, Using of
formula slovin the population number is 50, so in this study takes as many as 50 samples.

Novita Widyastuti Sugeng, Vienna Artina. S
The Effect of Incube Artisan Coffee House on the Interest of Students Entrepreneurs at STP Trisakti
35
Proceedings of CATEA 2019
4. Result and Discussion
4.1 History of Business Incubators In.cube Artisan Coffee House In.cube Artisan Coffee House or better known as In.cube is a business incubator with a coffee
shop concept which was established on December 15, 2017. In.cube Artisan Coffee House is located
inside the STP Trisakti campus, precisely at the charm canteen of the 2nd floor. In .cube Artisan
Coffee House operates every Monday to Friday from 8am to 8pm. Due to its location within the
Trisakti STP campus, the majority of buyers or customers in In.cube are the STP Trisakti community
itself.
The Business Incubator In.cube Artisan Coffee House was initially formed because the academic
study program, Pak Fachrul Husein Habibie and Pak Agus Riyadi proposed to make the second floor
canteen charm as a place to guide students in training and honing the ability to become an
entrepreneur. This desire arose because at that time Trisakti STP still did not have a place for students
to practice entrepreneurship and the desires of Trisakti STP students who were quite high in learning
and practicing entrepreneurship which were felt to be lacking during the teaching and learning process
at Trisakti STP. After assessing the conditions on the ground that happened such as paying attention
to what was becoming a trend in the field of F & B, came the idea to create a coffee shop.
The things that make In.cube stand up are thanks to the full support of the academic field,
support from the F & B field and one of them is the support of the Trisakti Bartending Club which is
one of the clubs in the Trisakti STP that has been around for a long time, where In.cube can become a
place or place for them to fulfill their dreams in learning about cafes or coffee shops.
4.2 Characteristics of Respondents
4.2.1 Characteristics of Respondents based on Gender
Data collection based on total sex of respondents was 50 people with a number of male
respondents as many as 27 people (54%) and female respondents as many as 23 people (46%). The
number of men who consumed more coffee than women, the results of the study were 50.8% of men
compared with 32.8% of women.
4.2.2 Characteristics of Respondents by Age
The total respondents were 50 people with the number of respondents at the age of 17-18 years as
many as 9 people (18%), at the age of 19-20 years as many as 18 people (36%), at the age of 21-22
Sub Variable Statement
Space
Campus provides a comfortable room to run a business
Spacious business incubator room In.Cube Artisan Coffee House is sufficient to run
a business
Shared office facilities Campus provides facilities to run a business, such as business equipment needs
Campus provides facilities for business needs, such as water and electricity
Service
The campus provides guidance in business planning at the business incubator
In.Cube Artisan Coffee House through the appointed lecturer team
Campus always provides direction on the operational activities of business
incubators In.Cube Artisan Coffee House
Support
Campus always provides support for business activities in the business incubator
In.Cube Artisan Coffee House
Campus always provides opportunities for students to learn to develop businesses
independently
Skill Development Campus provides training or training on how to manage the business
Campus provides training or training regarding knowledge about coffee
Seed Capital Campus provides convenience in establishing a business incubator
Campus provides initial funding to build business incubators for students
Synergy
Campus collaborates with the industries needed to develop business incubators such
as equipment or raw materials
Campus always promotes the existence of business incubator In.Cube Artisan Coffee House to business partners outside the campus

Novita Widyastuti Sugeng, Vienna Artina. S
The Effect of Incube Artisan Coffee House on the Interest of Students Entrepreneurs at STP Trisakti
36
Proceedings of CATEA 2019
years as many as 22 people (44%) , at the age of 23-24 years as many as 0 people (0%), and at the age
of> 24 years as many as 1 person (2%). Thus it can be concluded that the most members at Trisakti
Coffee Society are at the age of 21-22 years, which are as many as 22 people (44%). Characteristics
of Respondents by Length of Membership
total respondents were 50 people with the number of respondents who had been members for 1-2
months as many as 10 people (20%), who had been members for 3 - 4 months as many as 17 people
(34%), and who had become members for anggota 5 months as many as 23 people (46%). Thus it can
be concluded that the members who joined the Trisakti Coffee Society for the longest were for ≥ 5
months and amounted to 23 people (46%).
4.2.3 Validity Test Results
Test Validity is used to determine whether or not valid questions have been made in the
questionnaire. The author uses Sugiyono's theory which states that statements are considered valid if r
count exceeds 0.30 or compares them with r table. R table = 0.273
4.2.4 Reliability Test Results This study uses the Cronbach's Alpha technique, Siregar states that a statement is said to be
reliable if the value of Cronbach's Alpha> 0.60. The value of Cronbach's Alpha is 0.918, then the
reliability level for variable X (Business Incubator) is Very Reliable. Which means, each item in the
questionnaire is stated to be able to obtain accurate, thorough, and consistent answers.
the value of Cronbach's Alpha is 0.916, then the reliability level for variable Y (Interest in
Entrepreneurship) is Very Reliable. Which means, each item in the questionnaire is stated to be able
to obtain accurate, thorough, and consistent answers.
4.2.5 Descriptive Statistics Test Results
1. Space
Respondents who stated disagreed as many as 2 people (4%), disagree as much as 1 person (2%),
agree as many as 17 people (34%) and strongly agree as many as 30 people (60%). So it can be
concluded that the majority of members of the Trisakti Coffee Society feel strongly agree that the
campus provides a comfortable room to run a business. respondents who stated they did not
agree as much as 1 person (2%), disagreed as many as 8 people (16%), agreed as many as 15
people (30%) and strongly agreed as many as 26 people (52%). So it can be concluded that the
majority of members of the Trisakti Coffee Society feel strongly agree that the area of the
business incubator In.Cube Artisan Coffee House is sufficient to run a business. This can be seen
from the seating capacity that can accommodate 45 to 50 people for a total of 10 tables.
2. Shared office facilities Respondents who stated that they disagreed were 12 people (24%), agreed as many as 15 people
(30%) and strongly agreed as many as 23 people (46%). So it can be concluded that the majority
of Trisakti Coffee Society members feel strongly agree that the campus provides facilities to run
a business, such as the needs of business equipment. Respondents who agreed as many as 16
people (32%) and strongly agreed as many as 34 people (68%). So it can be concluded that the
majority of members of the Trisakti Coffee Society feel strongly agree that the campus provides
facilities to run businesses, such as water and electricity for operational activities.
3. Service Respondents who stated they disagreed as much as 4 people (8%), agreed as many as 15 people
(30%) and strongly agreed as many as 31 people (62%). It can be concluded that the majority of
members of the Trisakti Coffee Society feel strongly agree that the campus provides guidance in
business planning at the business incubator In.Cube Artisan Coffee House through the appointed
lecturer team.
respondents who stated they did not agree as much as 1 person (2%), disagree as many as 7
people (14%), agree as many as 24 people (48%) and strongly agree as many as 18 people (36%).
So it can be concluded that the majority of members of the Trisakti Coffee Society feel that the
campus always provides direction on the operational activities of business incubators In.Cube
Artisan Coffee House.

Novita Widyastuti Sugeng, Vienna Artina. S
The Effect of Incube Artisan Coffee House on the Interest of Students Entrepreneurs at STP Trisakti
37
Proceedings of CATEA 2019
4. Support
respondents who stated they did not agree as much as 1 person (2%), disagree as much as 6
people (12%), agree as many as 25 people (50%) and strongly agree as many as 18 people (36%).
So it can be concluded that the majority of members of the Trisakti Coffee Society feel that the
campus always provides support for business activities in the business incubator In.Cube Artisan
Coffee House respondents who stated strongly disagree as much as 1 person (2%), disagree as
much as 1 person (2%), disagree as much as 6 people (12%), agree as many as 13 people (26%)
and strongly agree as many as 29 people (58 %). Then it can be concluded that the majority of
members of the Trisakti Coffee Society feel strongly agree that the campus always provides
opportunities for students to learn to develop their business independently.
5. Skill Development respondents who stated that they disagree as much as 1 person (2%), disagree as many as 8
people (16%), agree as many as 23 people (46%) and strongly agree as many as 18 people (36%).
It can be concluded that the majority of members of the Trisakti Coffee Society feel that the
campus provides training or training on how to manage the business.
respondents who stated that they disagree as many as 2 people (4%), disagree as much as 5
people (10%), agree as many as 15 people (30%) and strongly agree as many as 28 people (56%).
So it can be concluded that the majority of members of the Trisakti Coffee Society feel strongly
that the campus provides training or training regarding knowledge about coffee.
6. Seed Capital respondents who said they did not agree as much as 1 person (2%), disagree as many as 10
people (20%), agree as many as 22 people (44%) and strongly agree as many as 17 people (34%).
So it can be concluded that the majority of members of the Trisakti Coffee Society feel that the
campus provides convenience in establishing a business incubator.
respondents who stated they disagreed as many as 6 people (12%), agreed as many as 14 people
(28%) and strongly agreed as many as 30 people (60%). It can be concluded that the majority of
members of the Trisakti Coffee Society feel strongly agree that the campus provides initial
funding to build business incubators for students.
7. Synergy respondents who stated that they disagree as much as 1 person (2%), disagree as much as 3
people (6%), agree as many as 16 people (32%) and strongly agree as many as 30 people (60%).
It can be concluded that the majority of members of the Trisakti Coffee Society feel strongly
agree that the campus makes cooperation with the industries needed to develop business
incubators such as equipment or raw materials.
respondents who stated strongly disagree as much as 1 person (2%), disagree as much as 1
person (2%), disagree as much as 4 people (8%), agree as many as 12 people (24%) and strongly
agree as many as 32 people (64 %). It can be concluded that the majority of members of the
Trisakti Coffee Society feel strongly agree that the campus always promotes the existence of the
business incubator In.Cube Artisan Coffee House to business partners outside the campus.
5. Conclusion
5.1 Conclusion
Based on the results of the analysis of questionnaire calculations in the previous chapter, the
researcher can draw conclusions about "The Effect of Business Incubator In.cube Artisan Coffee
House on the Entrepreneurship Interest of Trisakti Coffee Society Members" are as follows:
1. The most dominant factor in the business incubator variable is found in the sub variable synergy
with a value of 4.48. So it can be concluded that according to Trisakti Coffee Society members,
Trisakti STP is indeed conducting cooperation with the industries needed to develop business
incubators, such as with Sebastian Coffee & Kitchen, cooperation is carried out in the use of
coffee beans to equipment to support operations such as coffee machines, coffee grinder, and
others. In addition, the Trisakti STP is also considered to always promote the existence of the
In.Cube Artisan Coffee House business incubator to off-campus business partners when making
visits outside the campus or during visits from outside guests to the Trisakti STP. The most

Novita Widyastuti Sugeng, Vienna Artina. S
The Effect of Incube Artisan Coffee House on the Interest of Students Entrepreneurs at STP Trisakti
38
Proceedings of CATEA 2019
dominant factor in the entrepreneurial interest variable is in the income sub-variable with a value
of 4.58. So it can be concluded that according to Trisakti Coffee Society members, they do have
an interest in entrepreneurship because they want to earn a large income with their own business
and without relying on others.
2. The magnitude of the influence of business incubators on entrepreneurial interest is 27.4% which
indicates that business incubators are quite significant in influencing entrepreneurial interests of
members of the Trisakti Coffee Society and the remaining influence which is equal to 72.6% is
influenced by other factors not discussed in this study.
5.2 Suggestion 1. The skill development factor in business incubator variables has the lowest mean value, which is
4.27. It is recommended to the campus or business incubator to provide better training or training
and should be done more routinely so that members of the Trisakti Coffee Society can develop
their abilities better.
2. Community environmental factors in the entrepreneurial interest variable have the lowest mean
value, which is 4.16. It is recommended to the members of Trisakti Coffee Society to interact
more or increase the intensity of association with members of their environment who are
professionals as entrepreneurs because determining friends as interaction partners who have
similar desires in entrepreneurship will facilitate the implementation of the desire for
entrepreneurship.
3. In this study it is known that business incubators only have an influence of 27.4% on
entrepreneurial interest. The remaining 72.6% is influenced by other factors not discussed in this
study. It would be better if the next study can examine other factors that are felt to influence
entrepreneurial interests such as examining other independent variables such as self-efficacy,
locus of control and so on, so as to increase entrepreneurial interest in members of the Trisakti
Coffee Society.
References
Agustina, T. S. 2011. Peran Inkubator Bisnis Perguruan Tinggi dalam Meminimalkan Resiko Kegagalan Bagi
Wirausaha Baru pada Tahap Awal (Start-Up). Jurnal Ekonomi dan Bisnis Airlangga (JEBA)| Journal of
Economics and Business Airlangga, 21(1). Diambil dari
<http://journal.lib.unair.ac.id/index.php/ME/article/view/834>. Diakses pada tanggal 08 Agustus 2018.
Alma, B. 2007. Kewirausahaan untuk Mahasiswa dan Umum. Bandung. Alfabeta.
Alma, B. 2013. Kewirausahaan. Bandung. Alfabeta.
Food and Nutrition Sciences dari Scientific Research, tahun 2013 vol. 4 hlm. 748-757, ‘Gender Differences in
Coffee Consumption and Its Effects in Young People’.
Fraenkel, J.R dan Wellen, N.E. 2008. How to Design and Evaluate research in Education. New York: McGraw-
Hill.
Fuadi, I.F, 2009. Hubungan Minat Berwirausaha dengan Prestasi Praktik Kerja Industri Siswa kelas XII Teknik
Otomotif SMK Negri 1 Adiwerna Kabupaten Tegal. Jurnal PTM, Jilid IX, 92-98.
Hamdani, D, 2006. Conceptualizing and Measuring Business Incubation. Statistics Canada, and Innovation
and Electronic Information Division Science.
Hartaji, Damar A. 2012. Motivasi Berprestasi Pada Mahasiswa yang Berkuliah Dengan Jurusan Pilihan
Orangtua. Fakultas Psikologi Universitas Gunadarma.
Hendro, 2011. Dasar-Dasar Kewirausahaan. Jakarta. Erlangga
Hewick, L, 2006. Canadian Business Inkubator. Proceedings. Seminar International Best Practices for
Increasing Inkubator Efficiencies, Jakarta
Kasmir, 2011. Kewirausahaan. Jakarta. PT. Raja Grafindo Persada.
Kementerian Koperasi dan UKM RI, 2012. Pedoman Pendirian dan Pengelolaan Inkubator Bisnis Deputi
Bidang Pengembangan dan Restrukturisasi Usaha. Jakarta
Kurnianti, Edy Dwi, 2015. Kewirausahaan Industri. Yogyakarta. Depublish.
Mahesa, A & Rahardja, E. 2012.” Analisis Faktor-faktor Motivasi yang Mempengaruhi Minat Berwirausaha”.
Diponegoro Journal of Management, 1,1, 130-137.
Mahnke, L, 2010. Promotion of Start-Ups and Entrepreneurship. Bahan Presentasi Workshop National Steering
of Regional Economic Development RED Steer 2010 Germany. 9 Juli – 8 Agustus 2010. Germany.
Nitisusastro, M, 2012. Kewirausahaan dan Manajemen Usaha Kecil. Bandung: CV. Alfabeta.

Novita Widyastuti Sugeng, Vienna Artina. S
The Effect of Incube Artisan Coffee House on the Interest of Students Entrepreneurs at STP Trisakti
39
Proceedings of CATEA 2019
Purwanto, N, 2010. Psikologi Pendidikan. Bandung. Remaja Rosdakarya.
Sardiman, A. M, 2006. Interaksi dan Motivasi Belajar Mengajar. Jakarta. Rajawali.
Scillitoe, J.L, Chakrabarti, A.L, 2010. The Role of Incubator Interactions In Assisting New Ventures.
Technovation. Vol 30 (2010): 155-167.
Slameto, 2010. Belajar dan Faktor-faktor yang Mempengaruhinya. Jakarta. Rineka Cipta.
Sudaryono, dkk. 2010. Kewirausahaan. Yogyakarta. CV. ANDI
Sugiyono. 2014. Metode Penelitian Kuantitatif Kualitatif dan R&D. Bandung: Alfabeta.
Sugiyono, 2014. Metode Penelitian Bisnis. Bandung : C.V Alfabeta
Suhartini, Lieli dan Hani Sirine. 2011. Faktor-Faktor Yang Berpengaruh Terhadap Niat Kewirausahaan. Satya
Wacana Vol. 13, No 2, 2011.
Suryaman, Maman. (2006). Minat Berwirausaha Pada Mahasiswa Pendidikan Teknik Elektro Fakultas Teknik
Universitas Negeri Semarang.
Suryana, 2006. KEWIRAUSAHAAN Pedoman Praktis: Kiat dan Proses Menuju Sukses. (edisi 3). Jakarta.
Salemba Empat.
Suryana, 2010. Kewirausahaan. Jakarta. Salemba Empat.
Suryana. 2011. Kewirausahaan Pendekatan Karakteristik Wirausahawan Sukses. Jakarta, Prenada Media
Group.
Widiyatnoto, Erfikas, 2013. Pengaruh Jiwa Kewirausahaan Dan Budaya Keluarga Terhadap Minat
Berwirausaha pada Siswa SMK N 1 Winosari dan SMK N 2 Winosari di Kabupaten Gunung Kidul.
Universitas Negeri Yogyakarta.

40 Proceedings of CATEA 2019
Proceedings of CATEA 2019
ISBN 978-623-91018-0-0
Ice Green Banana with Coating Iota, Kappa
and Its Characteristics
(Experimental Study of Molecular Gastronomy)
Robiatul Adawiyah.
1 Vienna Artina.S
2 and Wijayanti Dewi.P
3
1,2,3 Sekolah Tinggi PariwisataTrisakti
[email protected], [email protected], [email protected]
Abstracts: Molecular gastronomy is a scientific study on gastronomy that studies physiochemical
transformations of food ingredients during the cooking process and sensory phenomena when they are
consumed. this knowledge is characterized by the use of scientific methods to understand and control the
molecular, physiochemical, and structural changes that occur in food at the stage of manufacture and
consumption. Molecular gastronomy is not the same as the type or style of cooking. The type of research
conducted is experimental research. conducting experiments, experiments are carried out in the form of finding
out the comparison of the results of the application of iota and kappa coating techniques from the types of
carrageenan and agaratin. In serving food using iota and kappa can be applied using other food ingredients
which can be served cold. Chef Andrian Ishak will make a menu at Namaaz Dining using ice banana green and
combine several gastronomy molecular techniques so that the ice banana ijo can be known by various groups
and become an equally unique dessert with an existing menu.
Key words: Ice Green Banana; Molecular Gastronomy; IOTA and KAPPA
1. Introduction
Two hundred years ago, the word gastronomy first appeared in modern times precisely in France
in the poem written by Jacques Berchoux (1804). Although the word's popularity has been increasing
ever since, gastronomy is still difficult to define. The gastronomic word comes from the ancient Greek
gastros which means "stomach" or "stomach" and nomos which means "law" or "rule".
In addition, gastronomy also includes detailed knowledge of national food and beverages from
various major countries around the world. The role of gastronomy is as a basis for understanding how
food and drink in certain situations through gastronomy is possible to build a picture of differences or
similarities in approaches or behaviors towards food and beverages used in various countries and
cultures. Namaaz Dining is a restaurant that applies gastronomy molecular into the culinary
archipelago. Maybe the word "Molecular Gastronomy" sounds strange to us, because its age is still
fairly young. There are still many things that can be explored and further developed in this field. This
certainly can be an opportunity for those who are interested in pursuing and developing it. In fact, this
field was first created in mid 1992. Molecular Gastronomy was first triggered at a culinary event
entitled "Science and Gastronomy" in Errice, Italy. Physicist Nicholas Curti and chemist Herve This
at that time along with professional chefs discussed how to serve food in a completely different view.
Molecular gastronomy is a scientific study on gastronomy that studies physiochemical
transformations of food ingredients during the cooking process and sensory phenomena when they are
consumed. this knowledge is characterized by the use of scientific methods to understand and control
the molecular, physiochemical, and structural changes that occur in food at the stage of manufacture

Robiatul Adawiyah, Vienna Artina.S, Wijayanti Dewi.P
Ice Green Banana with Coating Iota, Kappa and Its Characteristic (Experimental Study of Molecular Gastronomy)
41
Proceedings of CATEA 2019
and consumption. Molecular gastronomy is not the same as the type or style of cooking. The art of
cooking based on the science of molecular gastronomy is called the art of molecular cooking as a
modern gastronomic determinant.
1.1 Research purposes
The purpose to be achieved in writing and observing this paper is based on the formulation of the
problem as follows:
1. To find out the results of changes in color, taste, aroma, and texture of green bananas
developed with Methode of coating Iota and Kappa.
2. To find out the method of serving food using techniques coating iota and kappa.
Tabel 1. Previous Research about Ice Green Banana
No. Research Topic Method Result
1 Studies of the Quality
of Microbiology of
Ijo Banana Ice for
Sale in Several Places
in Malang City
Viewed Based on
Plate Numbers Total
Bacterial Colonies
and Coliform MPN
Value.
Florentina Renge
This type of research is
observational descriptive
research. The research was
conducted at the
Microbiology Laboratory of
the Biology Department,
Faculty of Mathematics and
Natural Sciences, State
University of Malang, from
January 2011 to March
2011. The samples used
were ice banana ijo which
was sold by traders in 5 sub-
districts in Malang, namely
Lowokwaru, Sukun, Klojen,
Blimbing and
Kedungkandang.
Shows that:
1) Plate Number The total bacterial
colonies in banana ice samples sold
in several places in Malang City are
6.7 x 10 7 cfu / mL samples.
2) MPN coliform values and faecal
coliform MPN values in ijo banana
ice samples sold in several places in
Malang City are> 2.4 x 10³ cells /
mL samples.
3) Plate Number The total bacterial
colonies in ijo banana ice samples
turned out to exceed the standards set
by the Head of POM Agency, RI
Number HK.00.06.1.52.4011 in
2009, which is a maximum of 1 x
104 cfu / mL sample. Judging from
these figures, it can be concluded
that the microbiological quality of
green banana ice sold in several
places in Malang City does not meet
the requirements for consumption
eligibility.
4) The MPN coliform value and the
coliform faecal MPN value exceeded
the standards set by the Indonesian
Food and Drug Administration,
Number HK.00.06.1.52.4011 in
2009. Judging from the MPN
coliform value and the coliform
faecal MPN value, it can be
concluded that the quality of ice
microbiology Green bananas sold in
several places in Malang City do not
meet the requirements for
consumption eligibility
2 Optimization of
Activities Bacteriosin
by Lactobacillus
brevis Fromes
Banana Green.
Nia Purnama
Ningsih1
, Rafika
Sari2
, Pratiwi
Antibacterial activity test
against indicator bacteria
using agar diffusion method.
The results showed that Lactobacillus
brevis has the potential to be used as a
biopreservative agent in food which can
inhibit Gram positive (Staphylococcus
aureus) with the highest activity at pH 6
and a temperature of 40 ° C with
inhibitory zones of 12.10 mm and 12.40
mm and Gram negative (Escherichia
Robiatul Adawiyah, Vienna Artina.S, Wijayanti Dewi.P
Ice Green Banana with Coating Iota, Kappa and Its Characteristic (Experimental Study of Molecular Gastronomy)
42
Proceedings of CATEA 2019
No. Research Topic Method Result
Apridamayanti3
coli) with the highest activity at pH 6 and
temperature 40 ° C with inhibitory zones
in a row which is 9.30 mm and 8.5 mm.
Confirmation using inhibitory zone
enzymes when added to the catalase
enzyme of 7 mm and in Escherichia coli
bacteria and 10 mm in Staphylococcus
aureus bacteria. Brevicin is activated by
the trypsin enzyme so that it does not
form a inhibitory zone in the colony.
2. Literature Review
2.1 Traditional Indonesian Food
Traditional food is food and drink that is usually consumed by certain people, with a distinctive
taste that is accepted by the community. Traditional foods are food and beverages, including snacks
and mixed or ingredients that are used traditionally and have long been developing specifically in
Indonesian regions or communities (Nuraida and Dewanti, 2001). Traditional food is one of the most
important things in human life. This type of food also has a symbolic meaning, in the sense that it
means social, religious, and others. Ice banana green is one of the typical foods of South Sulawesi,
especially Makassar. This food is made from the main ingredients of bananas wrapped in green flour
mixture. Which is cooked in a way steaming on the cage. The dough is made from flour, water,
coconut milk and green coloring made from solid leaves and or suji leaves.
2.2 Molecular Gastronomy
According to Jozef Youssef (2013), molecular gastronomy (molecular gastronomy) is a field of
study that investigates / studies chemical and physical reactions and transformations that occur from
food ingredients during the cooking process and sensory phenomena when they are consumed.
Molecular cooking is a modern cooking technique that emphasizes several important elements in a
food, between texture, taste, sensation and eating experience, and also some important elements in the
five human senses, such as vision, smell, mind. In essence, molecular gastronomy aims to provide a
new experience and sensation, when a familiar dish is reconstructed so that it becomes a shocking
emotional and sensory experience with manipulationform. Molecular gastronomy can be interpreted
as "art and science" in choose, prepare, serve, and eat food. According to Paul Hamlyn in his book
entitled Larousse Gastronomique (1988) the definition of gastronomy is:
"The art of good eating which monselet defines as" the joy off all situation and of all age ". The result
was from the Greek gastros (Stomach) and Nomos (Law), which came to general use in France in
180, the year that La Gastronomie and I des champs a table by J. Berchoux was published. Two years
later, Le Gastronome a Paris by CrozeMagnanAppere ”. Molecular Gastronomy is a scientific study
of gastronomy or more fully is a branch of science that studies the physicochemical transformation of
food ingredients during the cooking process and sensory phenomena when they are consumed. This
science is characterized by using scientific methods to understand and control the molecular, physical,
and structural changes that occur in food at the stage of manufacture and consumption. The word
"molecular" in molecular gastronomy refers to molecular biology that reviews materialsingredients to
the molecular stage. Then the scientific method used includes in-depth observation, making and
testing, experiment control, science objectivity, and reproducibility of experiments. It should be noted
that molecular gastronomy is not the same as type or style of cooking (Paul Hamlyn, 1988).
Another term used to refer to molecular gastronomy is avant-garde cuisine where the avant-garde
comes from the word advance guard which literally means the front row of a soldier heading to the
battlefield. The term is used to describe disciplines that have crossed the boundaries that are
considered normal, for example because of the discovery of new techniques or other uses of existing
techniques (Paul Hamlyn, 1988).
Molecular gastronomy is the science of investigating physical and chemical transformations in
cooking techniques, which focus on several important elements in food such as texture, taste,
sensation, and eating experience. Molecular gastronomy tends to be considered complicated, and very

Robiatul Adawiyah, Vienna Artina.S, Wijayanti Dewi.P
Ice Green Banana with Coating Iota, Kappa and Its Characteristic (Experimental Study of Molecular Gastronomy)
43
Proceedings of CATEA 2019
lack of information explains what Molecular Gastronomy is and it is quite an obstacle to its
development in Indonesia. One example is fake caviar made from a mixture of chemicals such as
sodium alginate from seaweed and calcium chloride as a membrane coating.
For chefs, knowledge of molecular gastronomy can enable them to explore the world of kulinar
scientifically further which can be applied one of them as molecular cooking art. As a results
technology or interesting new dishes can be created. While for consumers it is expected to get a
surprise and satisfaction with delicious and interesting food. The person mentioned as the father of
Molecular Gastronomy is Herve This, a French physicist. It is said that his interest in molecular
gastronomy originated from his failure to make soufflé cakes, realizing that cooking is actually the
same as science. There must be a systematic preparation and method with the right calculation so as
not to damage the ingredients and nutrients in the food, but also maintain the taste. Molecular
gastronomy was first triggered at a culinary event entitled "Science and Gastronomy" in Errice, Italy.
Physicist Nicholas Curti and chemist Herve This at that time along with professional chefs discussed
how to serve food in a completely different view.
In this case, Curty and This combines general principles in the realm of physics and chemistry
such as the extraction of boiling points, the texture of food, and the properties of certain chemicals.
Through this workshop, Curty and This separately spread its extreme culinary knowledge to all
corners of the world. Molecular gastronomy also expanded as many new recipes were discovered,
until finally this development reached Indonesia by involving traditional cuisine when Namaaz
Dinning opened in 2012.
Basic Techniques for Molecular Gastronomy
According to Jeremia Kevin (2006), there are 4 types of Molecular Gastronomy
Technique namely:
a. Foams, natural flavors (juices, fruits, herbal aromatic infusions) are mixing processes of natural-
flavored by stabilizing the taste using gelatin or lecithin. Using hand-held blenders for the mixing
process to produce the desired foam. The foam adds a significant flavorless substance that
integrates new flavors without changing physical composition.
b. Spherification, a modern cooking technique, makes foods that are bubble-shaped and filled with
liquid or spherification. The concept is a simple reaction between Calcium and Alginate.
c. Gelification or jelly, the process of making food into bentul gel, made from gelatin, carrageenan,
gelatin or gellan gum.
d. Emulsification, the emulsifying process usually used is soy lecithin. This can make the liquid
turn into super soft granules. Based on the explanation above, the writer will make ice banana ijo
using one of the gellification techniques in serving ice banana ijo:
2.3 Definition of Carrageenan
Carrageenan is a compound extracted from hydrocolloid seaweed. Carrageenan is used in food as
a gel-making thickener and emulsification. Dissolved in water or alkaline then deposited using
alcohol. Carrageenan can be used in foods up to a concentration of 1500mg / kg (Adria, 2006).
a. IOTA
One of the fewest types of seaweed in nature that is the most stable carrageenan in an acidic
solution is accompanied by forming a strong gel in a solution containing calcium salts.
b. KAPPA
Is the type of seaweed that is most widely found in nature. This type of carbohydrate will be cut
off by acidic solutions, but after the gel is formed, this carrageenan will be resistant to degradation.
The carrageenan Kappa forms a strong gel in the solution that forms potassium salts.
2.4 Coating Technique Using Iota and Kappa in Presentation of Ice
Banana Green Iota and kappa coating is a combination of agar agar and gelatin which together
play a role in being able to cover objects with frozen conditions and this iota and kappa coating has a
hot nature and when it encounters frozen objects, iota and kappa can work to quickly coat objects
frozen and can follow the shape of the object, this iota and kappa coating technique can also be called
a gel coating or solid speherification because it can release objects with gelatin produced by iota and

Robiatul Adawiyah, Vienna Artina.S, Wijayanti Dewi.P
Ice Green Banana with Coating Iota, Kappa and Its Characteristic (Experimental Study of Molecular Gastronomy)
44
Proceedings of CATEA 2019
kappa can be a quick coating made of gellatin used in Namaaz dinning as a substitute for
spherification which is usually made from calcium lactate and alginate which is commonly used to
make artificial membranes and can coat objects in it using gel.
3. Material & Methodology
The research method according to Sugiono (2004) is a scientific way to obtain data with specific
purposes and uses. The research method used in this study is an experimental method. The
experimental method is the effort of the researcher intentionally manipulating a variable (with the
intention of raising or not giving rise to a variable) then examining the effect or effect (Purwanto and
Sulistyastuti, 2017). The number of trained panelists used in this study were 5 people who worked as
Executive Chefs, and Chefs to find out the difference in taste, aroma, texture and color of the
experiments carried out. Table 2. List of Panelist
(Source : cookpad, 2018)
Innovation is a renewal process by creating things that are different from before. By conducting
experiments, experiments are carried out in the form of finding out the comparison of the results of
the application of iota and kappa coating techniques from the types of carrageenan and agaratin. The
type of research conducted is experimental research.
1. Not knowing the shape, taste, texture, color and aroma of the making of green ice banana
developed by coating techniques using Iota and Kappa in its implementation using the research
method conducted by the author is a method of data analysis in this study in the form of
experiments. The author conducted an experiment by making iota and kappa coating
techniques, iota and kappa coatings will be used in the presentation of ijo banana ice, the
authors will observe the differences in ijo banana ice with the presentation using iota and kappa
and ijo banana ice coating techniques in general in terms of shape, taste, texture, color and
aroma.
2. Not knowing the method of serving ice banana ijo using iota and kappa coating techniques
To find out about the results of the food presentation using the iota kappa coating technique, the
authors conducted observations and interviews with Chef AndrianIshak in Namaaz Private
Dinning to get an assessment and the opinion of Chef AndrianIshak as molecular gastronomy
chef in Indonesia. Tabel 3. Recipe of Ice Green Banana
No. Ingredients Quantity
1 Multipurpose Flour 50 gr
2 Rice Flour 50 gr
3 Extract Coconur Milk 100 ml
4 White Sugar 1 table spoon
5 Salt ¼ tea spoon
6 Pandan Paste As needed
7 Banana 2 pcs
8 Water 150 ml
9 IOTA 1,8 % of water used
10 KAPPA 1,4 % pf water used
(Source: study experiment, 2019)
No. Panelist Establishment Gender Age
1 Andrian Ishak Namaaz Dining Male 38 years
2 Jufriadin Namaaz Dining Male 42 years
3 Budi Supriyadi Hotel Ciputra Male 28 years
4 Eko Adi
Setiawan Hotel Ciputra Male 27 years
5 Nopika Hotel Ciputra Female 27 years

Robiatul Adawiyah, Vienna Artina.S, Wijayanti Dewi.P
Ice Green Banana with Coating Iota, Kappa and Its Characteristic (Experimental Study of Molecular Gastronomy)
45
Proceedings of CATEA 2019
Table 4. Process of Making Ice Green Banana
No Picture Process
1
Prepare all ingredients and measure it
2
Put all ingredients and mix well
3
Wait until the temperature low and put into the piping bag
4
Steam banana with steamer
5
Crush it and put into piping bag
6
\ Continue with making vla for serving ice green banana with slow cooking methode
7
Put vla into the piping bag
8
Prepare mold and then fill up ¼ with outside of skin of ice green banana, start
with green color first.
9
Then fill up mold ¼ part of vla with pink color amd put the rest until done.
Next, Put in the freezer
10
Wait until freeze and make whole round nicely.
(Source: study experiment, 2019)

Robiatul Adawiyah, Vienna Artina.S, Wijayanti Dewi.P
Ice Green Banana with Coating Iota, Kappa and Its Characteristic (Experimental Study of Molecular Gastronomy)
46
Proceedings of CATEA 2019
Tabel 5. IOTA and KAPPA
No Name of
Ingredients
Picture Quantity
Doze
1
Iota
1,8% from water
content
2 Kappa
1,4% water cintent
4. Result and Discussion After the process of making ice banana ijo coating using iota and kappat has succeeded, it has
been known the shape, taste, texture, color and aroma of the green banana ice. The following are
differences in the shape, taste, texture, color and aroma of the development of Ijo ice banana
techniques using iota and kappa techniques From the table above, it can be seen that Ijo ice banana
uses iota and kappa coating techniques that have a very good shape by 5 trained / expert panelists and
it can be seen from the color of ijo banana ice using iota and kappa which have less bright colors
because they have to use double steam on the skin mixture green banana ice before frozen.
Not knowing the method of serving food using iota and kappa coating techniques
To find out about the results of serving food using the iota kappa coating technique, the authors
conducted observations and interviews with chef andrianishak in Namaaz Private Dinning to get an
assessment and the opinion of Chef Andrian Ishak as molecular chef gastronomy in Indonesia.
Research on the presentation of green banana ice using iota and kappa received a good response
from Chef Andrian because with this method of coating iota kappa, Chef Andrian called it a solid
spherification because it is similar to general spherification. In serving food using iota and kappa can
be applied using other food ingredients which can be served cold.
Chef AndrianIshak will make a menu at Namaaz Dining using ice banana ijo and combine several
gastronomy molecular techniques so that the ice banana ijo can be known by various groups and
become an equally unique dessert with an existing menu.
5. Conclusion
5.1 Conclusion Conclusions about results of changes in color, taste, aroma, and texture of green banana ice were
developed with iota and kappa coating techniques. Conclusion about color, taste, aroma and texture
The overall conclusion from direct observation of the results of changes in color, taste, aroma and
texture of ice banana ijo with coatingiota and kappa techniques are:
1. The process of making ice banana ijo through printing and frozen so that it can be served using
a coating technique with iota and kappa requires a longer time compared to ice banana ijo in
general. The aroma of ice banana ijo with the presentation using iota and kappa was preferred
over the original ice green banana, this was revealed by 5 expert panelist. Shape / Texture of ice
green banana with presentation using iota and kappa preferred expert panelists. Ice green
banana flavor by serving using iota and kappa was more delicious compared to ice green
banana in general.
2. Ice green banana with iota and kappa has a finer texture than ice green banana in general, while
ice green banana generally gives a chewy taste. Colors produced from serving ice green banana
with iota and kappa more interesting. The method of making ice green banana in general is
almost the same only at the presentation stage using coating techniques using iota and kappa.

Robiatul Adawiyah, Vienna Artina.S, Wijayanti Dewi.P
Ice Green Banana with Coating Iota, Kappa and Its Characteristic (Experimental Study of Molecular Gastronomy)
47
Proceedings of CATEA 2019
3. Iota and kappa coating methods can be applied for Indonesian food to make it more attractive.
The taste of serving ice green banana with iota and kappad is quite tasty. The texture of serving
Ice green banana uses iota and kappa judged soft. Overall, from the respondent's assessment
results, the presentation of ice green banana using iota and kappa can be well received by
expert panelists.
5.2 Suggestion In this study it is recommended to:
1. Innovate using molecular gastronomy techniques and formulas that do not yet exist in terms
of serving ice banana ijo or any food that can be served more interesting especially
Indonesian food.
2. Iota and Kappa can be agaratin for fast coatings with the condition of freezing or cold base
material meeting with hot iota and kappa coatings and made of agar alloy and gelatin.
3. For further research it can be investigated the hedonic test / preference test and the nutritional
content contained in green banana ice products with Iota and Kappa techniques.
References
Adria, Ferran.2006. Modern GastronomyA to Z a Scientific and GastronomicLexicon USA
BakingFundamental2007 :50
Hamlyn,Paul.Larousse Gastronomique. 1988. Paris How BakingWorks30 :2008
Kevin,Jeremia, 2013 http://www.channel4.com/4food/features/a- beginners-guide-to-molecular-
gastronomy.Diaksespada 7 April,2016Pukul01.26 wib
https://www.scribd.com/doc/286503949/Materi-Sup-Dan-Sotodiaksespada 7May2016
Pendit,NyomanS.2005.Ilmu Pariwisata Sebagai Pengantar Perdana .PT.Pradnya Paramitha. Jakarta.
SangjinKo2012: 3
Youssef,Josef.2013. Molecular Cooking at Home.London:Quintet Publishing
www.cookpad.com diakses in 15 april 2017
www.wikipedia. Orgdi akses in 20 agustus 2017Moorthy,S.N.2004. tropical sourse of starch.CRC press,Baco
Raton.Florida.
YasaBoga. 2015 Indonesia Delicasies Jakatra.Gramedia Pustaka Utama
48 Proceedings of CATEA 2019
Proceedings of CATEA 2019 ISBN 978-623-91018-0-0
The Influence of Study Motivation Abroad to Students’
Happiness
Sheivianah Disya1, Lestari Ningrum
2
1Sheivianah Disya, Sekolah Tinggi Pariwisata Trisakti 2Lestari Ningrum, Sekolah Tinggi Pariwisata Trisakti
[email protected], [email protected]
Abstract: Studying abroad has been a very foreign idea up until a few years ago when the number of Indonesian
students studying abroad kept steadily increasing. Studying abroad not only affects students’ life but also their
state of happiness, there have been only a few of research done on this subject to understand the benefits o f
studying abroad. This research objective is to know the influence of study motivation abroad to students’
happiness. The number of respondents in this research is 100 people, with research method of descriptive with
quantitative approach. As for data analysis method, the researcher uses validity test, reliability test, and
coefficient correlation which are processed by using the spss version 25.00. The result of this research shows
that the highest factor affecting motivation is family with mean value of 3.41, as for happiness the highest factor
affecting it is challenge with mean value of 3.66. The magnitude of the influence of study motivation towards
students’ happiness accounted for 41.6%. Future research and study is expected to be more proactive in
understanding the influence of students’ motivation in studying abroad towards their happiness.
Keywords: Motivation; Happiness; Study Abroad; Influence; Students
1. Introduction According to UNESCO Institute for Statistics (2019), the total number of Indonesian students
studying abroad in 2018 reach over 45 thousand students. This number proves us that the young
generation in Indonesia put more interest in studying abroad, whether it is to the countries in Asia or
to countries of another continent such as in Europe, US, etc. There are various reasons for the younger
generation in Indonesia to study abroad, some students study abroad for the aim to experience other
cultures, to have a better income in the future, or having different kinds of challenges in another
country, etc.
In the recent years, we have seen a lot of local universities establishing collaboration with
universities abroad in order to create a double degree program intended for students who are trying to
pursue career both domestically and also internationally. For example, in Trisakti Institute of
Tourism, they have several collaborations with universities from Switzerland, Korea, Thailand, and
also China to help students to achieve international career in the hotel industry. Not only it helps
students to achieve international career, but it also helps the students to achieve their own life
satisfaction which could also lead to happiness.
The term ‘study abroad’ itself can mean different things to different people but to most, studying
abroad means to study outside of their current living country, experts have concluded that the term
means: “Study abroad programs constitute all educational programs that occur in a foreign country
outside of the geographical boundaries of the country of origin, offering students the opportunity to
earn academic credit through international experiences” (Lee, Therriault & Linderholm, 2012).
Language skills are the ultimate 21st century social skill, linked to creativity, problem solving,
and the ability to effectively communicate (Stein-smith, Kathleen, 2017) this creates a standard for the
younger generation or what we know as millennials to at least speak a second language in order to be
able to compete in the future industries. In this case having to study abroad, will be a help for students
to master a second language and in some cases a third language or even more, by studying abroad

Sheivianah Disya, Lestari Ningrum
The Influence of Study Motivation Abroad to Students’ Happiness
49 Proceedings of CATEA 2019
students will not only help their present self with more knowledge of other cultures, but also for their
future self.
There have been studies done in other countries, for example a study done in Japan by Anna
Esaki-Smith concluded “Japanese students who had studied overseas previously were more optimistic
about their own personal futures than those who were not interested in study abroad” This research
tells us that by studying abroad the Japanese students gain a positive trait by being more optimistic
about themselves and that differentiate them with the rest of Japanese students who didn’t go abroad
to study. This also means that the Japanese students are far more satisfied with the present, and will be
with the future because of the more optimistic mind they have received from the experiences in
studying abroad.
However, there are still a lot of people who perceive studying abroad as something very foreign,
or some people assume it’s terrifying having to face different cultures, languages, etc. They thought
having to study abroad can lead to unsatisfactory life. This assumption leads to parents forbidding
their children to study abroad, whereas in reality the younger generation in late days have higher
desire of studying abroad. In order to prove that studying abroad will give better life expectation in
the future, this research is conducted. The same thing that sending a
Having their children studying abroad for success is the desire of every parent. However, it would
be better when parents send their children to study abroad by choosing a school or college located in a
small town. Because besides children becoming more independent will form their mentally more
resilient (Asdhiana, September 23, 2019). Based on the background that has been outlined, then this
research formulates the problems that will be researched as follows:
a. How is the motivation of Indonesian students studying abroad?
b. How is the happiness of Indonesian students studying abroad?
c. How much does motivation affects happiness of students studying abroad?
2. Related Works/Literature Review 2.1. Motivation
It was stated that “Among other internal attributes, motivation is strongly linked to possession of
autonomy, a desired and expected outcome of higher education.” (Cunningham, 2013). In another
research it was suggested that individuals feel the need to be autonomous, competent, and related.
‘Autonomy’ refers to an individual’s choosing his own behaviors, ‘competence’ refers to his adapting
to the environment, and ‘relatedness’ means his being close to others (Nayir, 2017)
From the theories above, we can conclude that the theories emphasized the word ‘autonomy’
which means that motivation is desired by the individuals’ choice and that it can’t be force to exist. In
this case, student’s motivation to study abroad is assumed to be coming from the student’s own desire
and is not affected by other people.
It was found that students are motivated with certain activity which is classified as an intrinsic
motivation; the presence of challenge, giving students control, creates curiosity, and including fantasy
(Wulandari, 2016).
2.2. Happiness
“Happiness appears as an overall evaluation of the quality of the individual’s own experience in
the conduct of his vital affairs. As such, happiness represents a conception abstracted from the flux of
affective life, indicating a decided balance or positive affectivity over long periods of time”.
(Veenhoven, 2006). This statement tells us that experience is one of the most important part of being
happy, and this means by studying abroad to find new experience may be crucial in deciding student’s
learning experience to be fun and will eventually lead to happiness.
In another theory of objective-list theory it was stated that happiness consists of a human life that
achieves certain things from a list of worthwhile pursuits: such a list might include career
accomplishments, friendship, freedom from disease and pain, material comforts, civic spirit, beauty,
education, love, knowledge, and good conscience (Seligman & Royzman, 2003). This theory shows
that pursuing something or in other words having a goal in life might help someone to achieve
happiness. Solely having a goal will not make someone happy, but accomplishing the goal in the end
might make someone to feel satisfied with their life and in the end will feel happy as well. By

Sheivianah Disya, Lestari Ningrum
The Influence of Study Motivation Abroad to Students’ Happiness
50 Proceedings of CATEA 2019
studying abroad, the students must have one or two goals that they want to achieve, such as having
better careers, new knowledge, better education, etc. and after graduating from abroad, the students
will feel satisfied about being able to graduate and have better life standards.
Happiness is defined as the subjective enjoyment of one's life as-a-whole. In other words: how
much one likes the life one leads. Synonyms are 'life-satisfaction' and 'subjective well-being'. (World
Database of Happiness, 2011). Which means happiness comes from ourselves, our satisfaction
towards life nd not others’ to interfere also how we manage to enjoy life we currently live.
It is explained that the aspects of happiness consist of cognitive component that comes from
several aspects, which are; oneself, family, peer groups, health, financial, work, and free time
(Maharani, 2015). Other than that happiness can be reached from affective component in the shape of
positive and negative. Which will be used later in this research as the variables in this study.
2.3. Study Abroad
According to (Stebleton, M. Soria, K. and Cherney, B, 2013), Studying abroad had a positive
impact on student development, and was also related to increased levels of engagement after the
experience in the senior year, as students were more engaged after they returned from their study
abroad experience.
In another journal it is stated that, study abroad may enhance intercultural competence and
personal development, reflected in the participants’ personal essays on their living experience. They
gained a better understanding of their own and other countries’ culture and cultural differences,
increased their level of self-confidence, global-mindedness, patience, assertiveness, maturity, self-
awareness, flexibility and adaptability (Maharaja, 2018).
From the theories stated by the researcher, it can be concluded that both of the theory share the
same point which is that students coming back from studying abroad tend to receive positive impacts
on themselves, however they also have different points that they emphasize. In one theory it
emphasizes on how students are more engaged on things that they are doing, and in the other theory it
shows that studying abroad will not only affect one factor in themselves but to different varieties of
aspects in their life.
3. Material & Methodology 3.1. Data
Primary and secondary data are used in research, secondary data are obtained through books,
journals and online media as a complement, while the primary data can be through the distribution of
polls via online media. The sampling technique of research studies carried out with the goal of too
much population or reach is too broad so it is not possible to take data retrieval on the entire
population and in data statistically unknown how many people in Indonesia who is studying abroad.
Then, with the purpose of sampling techniques selected respondents who have conducted foreign
studies and the calculation of samples obtained as much as 100 people, based on the theory of Hair, et
al (2010) using the formula N x 10.The respondents include Indonesian students studying in Malaysia,
Thailand, Hongkong, Taiwan, China, Korea, Europe, and US.
3.2. Method
The research will be conducted using descriptive research method with quantitative approach with
the objective to determine the correlation between motivation and studying abroad and happiness in
students coming from Indonesia. Descriptive method is the way of research conducted to determine
the value of an independent variable, either one variable or more (exogenous) without making
comparisons or connecting with other variables (Sugiyono, 2011). In this research two variables will
be used; Independent Variable is a variable which the value will not be changed because of the effect
of other variable and also might be able to influence the value-changing of another variable and
Dependent Variable is a variable in which the value will be influenced by another variable. In this
research the Independent Variable is Motivation and the Dependent Variable is Happiness.
To measure each sub-variable, there will be three scales used in this research which are: Nominal
Scale, Nominal Scale, and Ordinal Scale. The Ordinal Scale will be using 4 levels, with the category
of Strongly Disagree, Disagree, Agree and Strongly Agree). The population of this study are active

Sheivianah Disya, Lestari Ningrum
The Influence of Study Motivation Abroad to Students’ Happiness
51 Proceedings of CATEA 2019
students who are currently studying abroad or going to study abroad, with 100 respondents from Hair
calculated.
To measure each sub-variable, there will be three scales used in this research which are: Nominal
Scale, Nominal Scale, and Ordinal Scale. The Ordinal Scale will be using 4 levels, with the category
of Strongly Disagree, Disagree, Agree and Strongly Agree). The population of this study is active
students who are currently studying abroad or going to study abroad, with 100 respondents from Hair
calculated. So to ensure and warrant to 98 primary data obtained valid, it will be carried out test
validity tests to see if 98 respondents understand, understand even experiencing the statements
themselves submitted to them (Morrisan, 2014:103) and the reliability test to prove whether the
respondent could answer the proposed statement consistently (Morrisan, 2014:99).
The study used interval class formula to analyze the mean value (Dogan, 2010) to answer the first
and second research objectives, while correlation and regression were used to address the third
research objectives. Interpretation of variables based on an interval class formula, obtained as follows,
for the motivation of learning and happiness 1-1.75 very low/very unhappy, 1.75-2.50 Low/unhappy,
2.50-3.25 high/Happy, 3.25-4.00 Very High/ Very happy.
3.3. Respondents
The respondents have a notable role to express the opinion in this research. The respondents
include Indonesian students currently studying abroad and Indonesian students who are going to study
abroad in the near future. The age of the respondents is one of the most important variable in a
research in order to classify the characteristics discussed in the research, in this research the
respondents’ age is grouped in an interval of 3 years, which includes; 15-18, 19-22, 23-26, and >27, in
which the interval between 19-22 has the highest number of respondents (60%), followed by 15-18
(28%), 23-26 (11%), and >27 (1%). Gender is also an important variable because it affects the state
of mind a person, the number of female respondents in this research has a higher percentage compared
to the male which has a ratio of 63% : 37%. Most of the respondents chose to study in China with a
total number of 28 respondents, followed by Thailand with 18 respondents, Malaysia with 10
respondents, South Korea with 9 respondents, 6 respondents in Netherlands, 4 in Australia, Taiwan,
UK, and Hongkong, 3 in Japan and German, 2 in Canada, and each 1 representative from Brazil,
France, New Zealand, Swiss, and The US.
4. Results and Discussion 4.1. Result
Table 1. Validity Test Result
Item-Total Statistics
Scale Mean if
Item Deleted
Scale Variance
if Item Deleted
Corrected Item-
Total
Correlation
Cronbach's
Alpha if Item
Deleted
Intrinsic Oneself 31.07 18.871 .203 .835
Extrinsic Family 30.29 17.856 .511 .791
Intrinsic Financial 30.36 18.088 .418 .802
Extrinsic Work 30.36 18.026 .460 .797
Intrinsic Free Time 30.46 17.612 .560 .786
Intrinsic Challenge 30.11 17.894 .670 .780
Intrinsic Challenge 30.13 17.477 .610 .781
Intrinsic Curiosity 1 30.33 18.470 .470 .796
Intrinsic Curiosity 2 30.30 17.324 .605 .781
Intrinsic Curiosity 30.67 16.799 .561 .785

Sheivianah Disya, Lestari Ningrum
The Influence of Study Motivation Abroad to Students’ Happiness
52 Proceedings of CATEA 2019
Pearson-correlation method is used to determine the degree of validity, and to find the correlation
coefficient between each item of variables. From 100 sample, the obtained degree of freedom is 98,
with t_table = 1.66, and r_table = 0.17. By comparing the Corrected Item-Total Correlation (t-
Critical) with r_table, all the statements exceed the value of r table, thus the statements relating to
Motivation are valid.
By comparing the Corrected Item-Total Correlation (t-Critical with r_table (0,17), all of the
statements within the Happiness Variables are deemed as valid. This test highlight student’s happiness
connection with studying abroad, therefore the respondents understands the statements well enough.
Table 2. Reliability Test Result
Reliability Statistics
Cronbach's Alpha N of Items
.810 10
Out of 100 respondents and 10 indicator items, the reliability test resulted in .810 Cronbach’s
Alpha. Which according to Johnson, B., & Christensen, L. (2012) is considered to be valid if the
coeffieient of Cronbach’s Alpha is equal to or more than 0.70. Thus it can be concluded that all 10
statements can be consistently answered and can relate to the statements. Table 3. Correlation Test Result
Correlations
Motivation Happiness
Motivasi Pearson Correlation 1 .645**
Sig. (2-tailed) .000
N 100 100
Kebahagiaan Pearson Correlation .645**
1
Sig. (2-tailed) .000
N 100 100
**. Correlation is significant at the 0.01 level (2-tailed).
Correlation, also called as correlation analysis, is a term used to denote the association or
relationship between two (or more) quantitative variables (Thatte & Gogtay, 2017). In this research,
Sugiyono’s interval is used to calculate the correlation value. The result is the motivation of studying
abroad has a strong relationship to their happiness. It can also be interpreted that apparently studying
abroad leads to happiness. Table 4. The Result of Mean Motivation
Self Family Financial Work Free Time Motivation
N Valid 100 100 100 100 99 100
Missing 0 0 0 0 1 0
Mean 2.7000 3.4900 3.4300 3.4200 3.3333 3.2730
Based on the information above, the highest result of motivation variable from the respondent is
family (3.49) with the statement “Having a lot of experience to be shared to my family in the future is
my reason of being happy currently/ will be studying abroad”. Means that the respondents are very
motivated to be able to share their experience during their stay abroad to their current family and their
future family. The second highest motivation variable of financial (3.43) with a statement of “the
opportunity to earn higher salary when I work in my origin country in the future is one of the reasons
I feel happy studying abroad” this shows that one of the motivation to study abroad is that the students
will have a higher chance of having higher salary. The next one is variable work (3.42) with the
statement “The opportunity to work abroad is one of the reason I like studying abroad” which means
one of the reasons Indonesian students go abroad to study is that they will have an opportunity to
work abroad. The variable Free Time (3.33) with the statement “The satisfaction of studying abroad is

Sheivianah Disya, Lestari Ningrum
The Influence of Study Motivation Abroad to Students’ Happiness
53 Proceedings of CATEA 2019
one of the reasons I like studying abroad” which means that the students are satisfied with their time.
While the lowest result of motivation variable comes from oneself (2.7) with the statement “Being
considered more respectful by other people is one of the reasons I feel happy currently/ will be
studying abroad” this means that wanting to be respected more does not have a high effect on the
reason Indonesian students going abroad to study. Table 5. The Result of Mean Happiness
Statistics
Challenge Curiosity Fantasy Happiness
N Valid 100 100 99 100
Missing 0 0 1 0
Mean 3.6600 3.4650 3.1111 3.4100
The happiest point of happiness variable is they achieved when they are studying abroad is
challenge (3.66). The challenges they will go through will be different compared to the challenges
they will go through studying in their own country, and that with all that challenges they will learn
how to be more independent because they live far from their home and that they would have to do
everything themselves with their desire of being viewed as an adult. The second highest happiness
variable is curiosity (3.46), they are interested in studying abroad because they are curious about the
experience of living in a foreign country and that studying abroad would increase their learning
quality. Meanwhile the lowest result of happiness variable is score by fantasy (3.11) which means a
student’s imagination of the expectation in studying abroad has the smallest impact on their
happiness. Table 6. The Result of regression
Model Summary
Model R R Square
Adjusted R
Square
Std. Error of
the Estimate
1 .645a .416 .410 .42326
a. Predictors: (Constant), Motivasi
Based on the table above, it is seen that R = 0.645 is the previous correlation, with R square =
0.416 as the result of regression formula, which means that the Motivation of studying abroad has an
influence towards the level of happiness of 41.6%, while the remaining 58.4% is influenced by other
factors that are not observed in this study.
4.2. Discussion
The respondents in this research are the millennials who according Ardhashbc003. (2015,
February 3) because they are born around the industrial revolution 4.0 which is the digital era. It
concerns the society because it is feared that the millennials would form a poor verbal social and
communication, however if we see the result of this research about their motivation to study abroad
far from their family having the highest mean breaks the statement from Ardhashbc003. (2015,
February 3) Studying abroad means that the students will have to live alone and far from their family,
this will create an opportunity for the students to socialize and make new friends in order to survive
which also breaks the statement “millennials would form a poor verbal social and communication”.
The level of happiness in millennials who study abroad is located in challenge, which is a
different challenge with the challenge they face in Indonesia, to them studying abroad is an interesting
challenge because everything from learning, living, and making friends has to be done by themselves.
If we see the characteristics of the Z generation as the most respondents in this research (60%), that
they are more independent compared to the previous generation (Y), they prefer social activities
compared to the previous generation, very fond of technology and are skilled in operating technology,
tend to choose to work and self-study, very realistic, and have awareness to work harder to earn

Sheivianah Disya, Lestari Ningrum
The Influence of Study Motivation Abroad to Students’ Happiness
54 Proceedings of CATEA 2019
professional life that they want to achieve, it’s natural if the highest variable is challenge, they will
always seek opportunities which will grant the work and life they want in the future.
The respondents of this research are filled with students who are classified as millennials, with the
most number of students in the category of 19-22 years old with the total of 60% followed by 15-18
years with the total of 28% and 12% for the remaining category. it was state “At the other end of the
spectrum can be found a humble, empathetic happiness seeker who wants their life to be meaningful
and make their mark upon the world” (Bottrell, 2017). If we compare it to the happiness variable of
challenge having the highest average, we can see that the millennials are looking to prove themselves
and to mark their part in the world, they prefer to go beyond the ordinary and basic things by going
through different challenges in studying abroad considering that it will generate different outcomes as
well.
If the two variables are connected to each other we can conclude that by studying abroad students
will have the opportunity to face different challenges in which one of them is to have to live far from
their family and at the same time that motivation will lead to happiness of the students’ experience to
be told to their family once they are back home. It can be seen in the correlation test that the relation
between study motivation to students’ happiness shows that study motivation of students’ studying
abroad has a strong connection with their happiness in life.
It is stated that Motivation is a desire to succeed a goal which is meaningful to individual
(Hassanzadeh & Madinejad, 2009) by having a motivation, students’ will have a goal to achieve in the
future and that goal if it’s already reached will eventually lead to their satisfaction which will also
ends with their own happiness. With the influence of motivation to happiness scoring 41.5%, shows
that students’ own motivation needs to exist in order for them to enjoy their time studying abroad.
5. Conclusion a. The average value of motivation as shown in table 4 is 3.27. With sub-variable factors,
especially family which has the value of 3.4900. Which shows that the students’ motivation to
study abroad is very high. This means that students have a high desire of studying abroad and
will try their best in order to achieve the dream of studying abroad.
b. The average value of happiness as shown in table 5 is 3.41. With sub-variable factors, especially
challenge which has the value of 3.6600. This result shows that the level of students enjoys the
idea of them studying abroad. Which means having to study abroad will increase students’ life
satisfaction and will lead to happiness in their life.
c. The influence of Motivation variable towards Happiness variable is 41.6%, while the remaining
58.4% is influenced by other factors. Which shows that the correlation of both variable is quite
high. By having a motivation to study abroad means students will have an end goal in the future
where they want to stand. While trying to achieve that goal they tend to choose a better education
in which means they will study abroad, and in the end when they reached the goal that they
desire, happiness will be achieved.
Acknowledgement. I would like to express my deepest appreciation to my mentor, Ms. Lestari
Ningrum, S. Hum, M. Hum, M. Si for the endless support you’ve given me, for believing in me, and
for the opportunities you have given me. Thankyou. I’d like to acknowledge the assistance of each
and every respondent who have helped me in my research. Without them I wouldn’t be able to finish
this research. Last but not least I would like to extend my sincere gratitude to the committee who have
organized this affiliation.
References Ardhashbc003. (2015, February 3). Perbedaan Karakter dan Pola Pikir Generasi Baby Boomers hingga Generasi
Alpha. Retrieved from https://goo.gl/45vD3R. May 13,2019
Asdhiana, I Made. (2019, September 23). Sekolah ke LN, Pilih Kota Kecil. Retrieved from
https://edukasi.kompas.com/read/2010/09/23/21181457/Sekolah.ke.LN..Pilih.Kota.Kecil, May 13,
2019.
Dogan, N & Dogan, I. Determination of The Number of Bins/Classes Used in Histograms and Frequency

Sheivianah Disya, Lestari Ningrum
The Influence of Study Motivation Abroad to Students’ Happiness
55 Proceedings of CATEA 2019
Tables: A Short Bibliography. TurkStat, Journal of Statistical Research. Vol. 07(78). (2010)
Bottrell. C,”An Interpretive Phenomenological Analysis Exploring the Concepts of Happiness as an Emotion, in
a Millennial Generation,” Journal of Applied Psychology and Social Science, 3 (2), 13-38 (2017).
British Council. Retrieved from https://www.britishcouncil.org/voices-magazine/are-japanese-students-happier-
after-they-study-overseas, May 14th
, 2019.
Cunningham, Kimberly. “The Effect of Motivation on Student Success in a First-Year Experience Course”
Ph.D. dissertation, The Faculty of the Educational Leadership Doctoral Program, Western Kentucky
University, 2013.
Hair, Joseph F, Black, William C, Babin Barry J and Anderson Rolph E, “Multivariate Data Analysis a Global
Perspective, Seventh Edition, Pearson. 2010.
Relationship between Happiness and Achievement Motivation: A Case of University Students, (n.d), Retrieved
from http://pu.edu.pk/images/journal/JEE/PDF-Files/Article%20No.%205_JEE_Vol_23_No_I.pdf
ResearchGate,
https://www.researchgate.net/publication/265758415_Happiness_The_Three_Traditional_Theories
Retrieved 12 May 2019. Johnson, B., & Christensen, L,”Educational Research: Quantitative, Qualitative, and Mixed Approaches,”
London: SAGE Publications, Inc, 2012. Lee, C. Therriault, D. and Linderholm, T. “Applied Cognitive Psychology, Appl. Cognit. Psychol.”, On the
Cognitive Benefits of Cultural Experience: Exploring the Relationship between Studying Abroad and
Creative Thinking. 1(1), (2012).
Maharaja, “The Impact of Study Abroad on College Students’ Intercultural Competence and Personal Development,” International Research and Review: Journal of Phi Beta Delta Honor Society for
International Scholars. Vol 7. 19. (2018).
Maharani, Tingkat Kebahagiaan (Happiness) pada Mahasiswa Fakultas Ilmu Pendidikan Universitas Negeri
Yogyakarta. Program Studi Bimbingan dan Konseling Jurusan Psikologi Pendidikan dan Bimbingan
Fakultas Ilmu Pendidikan Universitas Negeri Yogyakarta. (2015).
Morissan, ”Teori Komunikasi: Individu Hingga Massa”, Jakarta:Kencana, 2014.
Nayir. ”The Relationship between Student Motivation and Class Engagement Levels,” Eurasian Journal of
Educational Research, vol. 71, 62. (2017).
Seligman, M. Royzman, E,”Happiness: The Three Traditional Theories,” 2003.
Sugiyono,” Metode Penelitian Kuantitatif, Kualitatif, dan Kombinasi,” Bandung: Alfabeta. 2012.
Stebleton, M. Soria, K. and Cherney, B., “The High Impact of Education Abroad: College Students’ Engagement in International Experiences and the Development of Intercultural Competencies,” The
Interdisciplinary Journal of Study Abroad. vol. 1, 5. (2013).
Stein-smith, Kathleen,”The Multilingual Advantage: Foreign Language as a Social Skill in a Globalized
World,” International Journal of Humanities and Social Science, vol. 7, 48. (2012).
Thatte, NJ. Gogtay, UM., “Principles of Correlation Analysis,” Journal of The Association of Physicians of
India, vol. 65, 78 (2017).
UNESCO Institute of Statistics. (2019) Retrieved from http://uis.unesco.org/en/uis-student-flow, April 28 th,
2019. Veenhoven, Ruut. “How Do We Assess How Happy We Are?”. In the Proceedings of New Directions in the
Study of Happiness: United States and International Perspectives, University of Notre Dame, 5 (2006).
World Database of Happiness. (2011) Retrieved from
https://worlddatabaseofhappiness.eur.nl/FocussedFindingsArchive2011.pdf, May 29th, 2019.
Wulandari, Kajian “Tentang Motivasi Belajar Seni Tari Melalui Kegiatan Apresiasi Seni Pada Mahasiswa
PGSD,” Metodi DIdaktik. vol. 10, 3 (2016).

56
Proceedings of CATEA 2019
Proceedings of CATEA 2019
ISBN 978-623-91018-0-0
Strategies for Developing Nature-based Tourism Destination in
the Dieng Plateau as a Sustainable Tourism
Ayu Setya Kemalasari1*
, Malidya Puspita Ayu2, and Meisa Sofia
3
1Department of Tourism Planning, Institut Teknologi Bandung
2Department of Tourism Planning, Institut Teknologi Bandung
3Department of Tourism Planning, Institut Teknologi Bandung
[email protected], [email protected] and [email protected]
*Corresponding Author
Abstract: The Dieng Plateau has a beautiful nature-based tourism destination including Kawah Sikidang,
Telaga Merdada, Kawah Sileri, Sumur Jalatunda, Kawah Candradimuka, Telaga Warna Telaga Pengilon, and
Curug Pitu, which visited both by domestic and foreign tourists. Along with the tourism development, the Dieng
Plateau experienced environmental degradation due to a large number of potato farms that took clean water
sources from telaga coupled with the lack of consideration of the carrying capacity. This is not in accordance
with the vision that realizes the Dieng Plateau and its surroundings as a quality and sustainable tourism. This
qualitative-descriptive study aims to formulate a strategy for developing nature-based tourism in the Dieng
Plateau to achieve tourism sustainability through several stages, namely (1) identify the current development of
nature-based tourism, (2) formulate the problems and constraints using SWOT analysis, and (3) develop
strategies and activities with phasing strategies that are divided into short and long-term. The results show the
tourism development in the area is still on the developing stage relate to public facilities, tourism facilities, and
accessibilities. It means to be a sustainable nature-based tourism destination, the Dieng Plateau needs
collaboration for both region on developing the potential tourism resource and optimize local participation.
Keywords: Dieng Plateau; Development; Nature-based Tourism Destination; Sustainable Tourism
1. Introduction
Dieng is derived from the Sanskrit, namely from the word "Di" which means pointing to a place
and "Hyang" which means heaven or gods. So the word Dieng itself has the meaning of a
mountainous place where the gods and goddesses reside. Geographically, Dieng is located at an
altitude of 2,000 - 2,500 meters above sea level. With the beauty of the landscape and its natural
formations, there are various tourist attractions both developed and resources or potential. Surrounded
by hills, potato and carica plantations, protected areas and because of Dieng is an area formed by an
ancient volcanic eruption, therefore many craters and lakes are found. In addition, based on its history,
Dieng has a historical heritage site in the form of a temple that has existed since the era of the glory
Hindu kingdom. Nevertheless, these temples are not as grand as Prambanan and Borobudur Temple.
However, when viewed from its age, the temples in Dieng are said to be older or even the oldest
temples in Java.
Nature-based tourism in Dieng Plateau has a greater impact on society and the environment when
compared to its culture-based tourism. This is because nature-based tourism in Dieng does not face
seasonality, while cultural-based tourism in Dieng is currently limited to peak season only when the
annual event of Dieng Culture Festival is held for almost 10 consecutive years. Therefore, the
discussion in this study will focus more on developing natural-based tourism in Dieng Plateau. The
natural attractions in Dieng Plateau include (1) Kawah Sikidang, (2) Telaga Merdada, (3) Kawah
Sileri, (4) Sumur Jalatunda, (5) Kawah Candradimuka, (6) Curug Pitu, (7) Telaga Warna and Telaga

Ayu Setya Kemalasari, Malidya Puspita Ayu, and Meisa Sofia Strategies for Developing Nature-based Tourism Destination in the Dieng Plateau as a Sustainable Tourism
57
Proceedings of CATEA 2019
Pengilon. Dieng Plateau as a tourist destination is not only visited by domestic tourists, but also by
foreign tourists. Based on the tourism development potential of Dieng, tourism development is
expected to contribute to local communities and the government. Because of Dieng is located between
two administrative districts, namely Banjarnegara Regency and Wonosobo Regency, it is hoped that
the development of tourism in Dieng Plateau can contribute to improving the economic structure of
the two regions. Dieng Plateau with the development of nature-based tourism requires public
awareness as a tourism business actor to be able to have sensitivity for the surrounding environment.
To create sustainable tourism, environmental sustainability is an important aspect prioritized in
development so that people who depend on the use of natural resources can continue to benefit.
Natural-based tourism development in Dieng Plateau is an alternative way for local people who
depend on potato farming as their main commodity. About 77.36% of the people work as farmers
with relatively low productivity, namely 16.6 tons/hectare of potatoes, 22.1 tons/hectare of cabbage
and 8.8 tons/hectare of carrots (Pradana, et al., 2015). The existence of environmental degradation due
to the process of farming that is too economically oriented and less attention to the carrying capacity
of the physical environment of the soil for potato farming results in a decrease in productivity from
year to year. Therefore, tourism in Dieng began to be intensively developed with its natural potential.
Not a few people started the initiative by opening businesses in the tourism sector, ranging from
restaurant owners, stalls around tourist attractions, souvenir shops, tour guides, transportation
services, to accommodation providers in the form of homestays. The rise of tourism businesses in
Dieng Plateau has not been followed by policies that regulate and limit the extent to which the
development of these businesses can be carried out.
Notably, around tourist attractions, there can be found a lot of people selling food, drinks, and
souvenirs. This case can be seen in Kawah Sikidang where the lack of organized tourism facilities can
give an impression that is less comfortable for visitors because the view of the crater that should be
enjoyed as far as the eye can be is blocked by a row of community-owned stalls that are too close to
the crater. Because of the tourism is relied on nature, it is important for the government and
community to be sensitive to potential disasters or hazard. The importance of regulation tourism
facilities services in nature-based tourism is aiming to anticipate natural disasters in the form of crater
eruptions such as that occurred in Kawah Sileri in 2017. Based on the background described above,
the discussion of this research aims to identify internal factors and external factors owned by Dieng
Plateau with the nature-based tourism development and to formularize proper development strategies
in order to optimize potential without endangering the environment.
In discussing the strategies for developing nature-based tourism in Dieng Plateau, specifically,
tourism products will be the focus of this research which includes the elements of tourist attraction,
accessibility and amenities. Identification regarding tourism products is seen both in Banjarnegara
Regency (Dieng Kulon Village and Karangtengah Village) and Wonosobo Regency (Dieng Wetan
Village and Jojogan Village). This research aimed to identify the current development of nature-based
tourism destination in Dieng Plateau, identify the problems and constraints, and develop the strategy
and relevant actions to optimize sustainable nature-based tourism development of Dieng Plateau.
2. Related Works/Literature Review
The literature used in this study serves to strengthen the urgency to formulate strategies for
developing natural-based tourism destinations in realizing sustainable tourism in the Dieng Plateau,
comprised of the concept of nature-based tourism destination, sustainable tourism, developing the
tourism destination, and precedent of existing research related to this study.
2.1 Nature-based Tourism Destination
Warpani (2007) states that a tourist destination called tourism area which is located in one or
more administrative areas related to tourist attraction, public facilities, tourism facilities, accessibility,
and communities that are interrelated and complement the realization tourism. Tourist attraction is
anything that is unique, beauty, and value in the form of diversity that is the target or destination of
tourist visits. Tourist attractions are divided into 3 types, namely:
Nature-based tourism, including mountain scenery, nature reserves, lakes, beaches,
volcanic craters, hot springs, flora and fauna;

Ayu Setya Kemalasari, Malidya Puspita Ayu, and Meisa Sofia Strategies for Developing Nature-based Tourism Destination in the Dieng Plateau as a Sustainable Tourism
58
Proceedings of CATEA 2019
Recreational tourism, including slides, swimming pools, reservoirs and recreational parks;
and
Cultural tourism, including ancient fortifications, ancient mosques, ancient churches,
museums, monuments, temples, regional arts, traditional houses, and traditional
ceremonies.
Nature-based tourism is the focus to be discussed, which is a form of recreational and tourism
activities that utilize natural resource potential, both in natural conditions and after cultivation,
allowing tourists to obtain physical and spiritual freshness, gain knowledge and experience and foster
inspiration and love for nature. Nature-based tourism is a recreational and tourism activity that utilizes
the potential of nature to enjoy natural beauty both unspoiled and already cultivated, so that there is a
tourist attraction to the place. It is used as a life balance after a very active activity solid, and city
atmosphere. So that by doing nature-based tourism our bodies and minds become refreshed. Nature-
based tourism allows tourists to obtain physical and spiritual pleasure. In doing nature-based tourism,
stakeholders must preserve the area still natural, provide economic benefits and maintain the integrity
of the local culture so that it can become a tourist village, so that the village has tourism potential
equipped with supporting facilities such as transportation or lodging.
Furthermore, Suwantoro (2004) mentioned that nature-based tourism is a form of activity that
utilizes the potential of natural resources and environmental management. Nature-based tourism uses
the environmental planning approach especially about environmental conservation but takes into
account the needs of visitors for facilities and needs in carrying out their activities. Nature-based
tourism can be in the form of beaches, mountains, natural scenery, marine tourism or water tourism.
Related to the characteristics of the Dieng Plateau, there are several types of tourism including
agricultural tourism and wildlife sanctuary tourism. From the standpoint of conservation, nature-based
tourism provides incentives for local communities and landowners to conserve wildlife habitats upon
which the industry depends – it promotes conservation by placing an increased value on remaining
natural areas. As nature-based tourism becomes more important to the local economy (Marpaung,
2002), communities have additional incentive to conserve their remaining natural areas for wildlife
and wildlife enthusiasts. The nature-based tourism will continue to focus on achieving habitat
conservation by providing information and assistance to private landowners, communities, businesses,
and local community leaders wishing to make nature-based tourism an integral part of their business
and community. By empowering people at the local level, we hope to build and provide guidance to a
growing industry that holds great promise for sustainable economic development and conservation of
wildlife habitat.
Forms of tourism which maintain a dependent, enhancive or incidental relationship with the
natural environment, or some aspect thereof, in terms of their utilized attractions and/or settings. The
following is the specific types of nature-based tourism listed in Review of Nature Based Tourism
(2007).

Ayu Setya Kemalasari, Malidya Puspita Ayu, and Meisa Sofia Strategies for Developing Nature-based Tourism Destination in the Dieng Plateau as a Sustainable Tourism
59
Proceedings of CATEA 2019
Figure 1. Specific Types of Nature-based Tourism
2.2 Developing the Tourism Destination
Gunn (2002) mentioned that tourism is a temporary movement of people to a place outside their usual
residence and work. While tourism is the whole relationship and the symptoms that arise from the
journey of people with the intention of staying live and there is no connection with activities to make
a living. Destination development is a way to advance aspects of consideration of tourism
destinations, which are then called tourism products. The development of tourism products includes:
Type of tourists based on their characteristics;
Transportation provided and can be used by tourists in the region;
Tourist attractions in the form of something to see, something to do, and something to buy;
Tourism facilities such as restaurants or eating places, banks, money changers, tourist
information, public security facilities, guard posts;
Tourist information and promotions are usually in the form of advertisements and pamphlets;
and
Institutional role.
Development is a strategy that is used to advance, improve the conditions of tourism an object
and tourist attraction so that tourists can visit it and be able to provide benefits to the community
around tourist objects and attractions as well as the government. Besides that, tourism development
aims to provide benefits for tourists and the host community. With the existence of tourism
development, it is expected to be able to improve the living standards of the people through profits
economy brought to the region. In other words, tourism development through the provision of
infrastructure facilities, tourists and local residents will benefit from each other (Paturusi, 2001).
The development should pay close attention to various aspects of nature-based tourism includes a
system of these 7 (seven) components, consist of:
Institutional aspects include the utilization and improvement of institutional capacity, as a
mechanism that can regulate various interests, operationally an organization with
appropriate HR and regulations and has high efficiency;
Facilities and infrastructure aspects that have two sides of interest, namely (1) tools to
meet the needs of natural tourism, (2) as controls in order to maintain environmental
balance, construction of facilities and infrastructure can increase carrying capacity so that
utilization efforts can be carried out optimally;
Management aspects, namely by developing professionalism and management patterns of
natural tourism objects that are ready to support natural tourism activities and are able to
utilize the potential of sustainable natural attractions;

Ayu Setya Kemalasari, Malidya Puspita Ayu, and Meisa Sofia Strategies for Developing Nature-based Tourism Destination in the Dieng Plateau as a Sustainable Tourism
60
Proceedings of CATEA 2019
Business aspects that provide opportunities and regulate the use of natural tourism objects
for commercial tourism purposes to third parties and open employment opportunities for
the local community;
Marketing aspects by using high technology and working with various parties both
domestically and abroad;
Aspects of community participation through business opportunities that help to improve
community welfare; and
Research and development aspects covering the physical aspects of the environment, and
social, economic aspects of natural attractions. It is hoped that later it will be able to
provide information for regional development and development, wisdom and direction for
the use of natural attractions.
Development of natural tourism objects is very closely related to increasing the productivity of
natural resources in the context of economic development, so that it is always faced with conditions of
interaction of various interests involving local government, society, and the private sector in a
regional spatial system (Pendit, 1990).
2.3 Precedent: The Tourism Development Impact on the Life of Local Communities. Case
Study: Dieng Tourism Area, Wonosobo Regency
Tourism potential in the Dieng Plateau includes mountainous nature, beautiful rural nuances, arts,
food and non-food handicrafts, children's or traditional games that can be packaged as popular tourism
assets. The Dieng Plateau is not only having potential, but also faces complex problems. The
complexity of the problems faced by the Dieng Plateau is not limited to tourism development but also
related to conservation, culture, and agriculture (Paramitasari, 2010). Preservation of the environment
and culture involves many parties who then the issue of coordination and cooperation is a challenge.
The need to understand that tourism is not limited by administrative boundaries for both regions to be
able to identify well the needs of sectors that work together and overcome problems related to poor
tourism management. Because there are several tourist attractions whose management is not under the
authority of the regional government but rather the authority of the Natural Resources Conservation
Agency (BKSDA).
Based on the concept mentioned above, in utilizing the existing tourism potential, opportunities
for developing supporting activities can also be identified for each tourism potential in the Dieng
Plateau. The activities that can be carried out to support the potential of natural tourist attractions
include tracking, outbound, water tourism, tour guides, and borrowing fishing gear. Besides, nature-
based tourism is expressed through various forms or tourism including ecotourism, geotourism, cycle
tourism, adventure tourism, and wildlife tourism which relies on experiences directly related to
natural attractions. Ismayanti (2009) concluded that potential nature-based tourism have several
objectives including (a) obtain benefits both in terms of the economy in the form of economic growth
and from a social perspective in the form of increasing people's welfare, b) eliminating poverty by
opening employment and overcoming unemployment, (c) fulfilling the recreational needs of the
community, as well as raising the image nation and strengthen national identity, foster a sense of love
for the homeland through the exploitation of domestic attraction, (d) preserve nature, environment and
resources, as well as promote culture through tourism marketing, (e) strengthen friendship between
Banjarnegara dan Wonosobo Regency with understand religious values, customs and people's lives.
Realizing sustainable tourism through utilize tourism resources, namely the economic, social,
environmental and institutional aspects that exist so that they can meet the needs of present and future
generations. Fadlina (2015) also explained some dimensions that are considered as sustainable
tourism including:
• Ecological and environmental sustainability, referring to the basic physical development
process that continues to preserve tourism resources;
• Economic sustainability refers to the efficiency of managing current and future financial and
investment sources;

Ayu Setya Kemalasari, Malidya Puspita Ayu, and Meisa Sofia Strategies for Developing Nature-based Tourism Destination in the Dieng Plateau as a Sustainable Tourism
61
Proceedings of CATEA 2019
• Socio-cultural sustainability refers to the maintenance of cultural characteristics and social
integration where traditional values are maintained; and
• Institutional sustainability refers to increasing participation and strengthening institutional
collaboration. The tourism institution is generally known as Penta Helix, namely ABCGM -
Academician, Business, Community, Government, Media, which shows that the community
is an important element in tourism development
3. Material & Methodology
3.1. Data
The data was collected based on literature studies, observations and semi-structured interviews
with key stakeholders in Dieng Plateau (Kelompok Sadar Wisata Dieng Pandawa and Unit Pelaksana
Teknis Daerah Kawasan Wisata Dataran Tinggi Dieng). Overall the research process consisted of
three phases comprised of data collection through literature review obtained from documents and
publications and direct observation, analysis and discussion where researchers process empirical data
through analysis of content, assessment and verification of findings, formulation of conclusions and
recommendations as to the final stage.
3.2. Method
This research implemented a qualitative research design based on the data collected from three
different ways (literature, observation and interview). The methodology added to this study is a
primary survey updated in February 2019 to provide the latest description of tourist attractions in
Dieng Plateau. Conducting interviews with community leaders and governmental staffs in planning
and tourism office to find out how people use, manage and conserve the nature-based as tourism
products. As well as the addition of ancillary components that were not discussed in the existing
literature review. To get the right and applicative strategy, SWOT (Strength, Weakness, Opportunity,
Threat) analysis is used to support the research. SWOT analysis is essentially as a brainstorming
session about the key variables that affect the sector’s performance (Henricks, 1999). The SWOT
analysis technique was used in order to explain current constraints and future possibilities from
internal and external factors that influencing the development of nature-based tourism in Dieng
Plateau.
4. Results and Discussion
4.1. Identification of the Nature-based Tourism Attractions
The Dieng Plateau is a mountainous region that has a distinctive highland beauty with
temperatures ranging from 12°-20° during the day and 6°-10° at night being its main attraction. That
fact makes Dieng known as a destination based on natural resources. There are nature-based tourist
attractions in Dieng Plateau which are obtained from direct field observations.
Kawah Sikidang
Kawah Sikidang is one of the main tourist attractions that must be visited by tourists when they
visit. The main attraction of Sikidang is the steamy sulfur crater which is the largest active crater in
Dieng Plateau. There are artificial tourist attractions that are managed by local people such as rental
motorbikes, photo spaces, taking pictures with animals (owl), flying fox and boiling eggs with water
from the crater. Although there are a lot of tourist attractions, the conditions of the facilities are not
managed well.
Telaga Merdada Telaga Merdada is a lake formed from a rainwater reservoir on the surface of a sunken plain, so
that when the dry season the water volume will decrease and even dry out. Apart from being managed
as a tourist attraction, the water is a source of irrigation for the surrounding agriculture. The tourists
usually come to see sunset and tracking to the Pangonan Hill and Semurup Hill to enjoy the
surrounding scenery. Tourism facilities and accessibility are complete enough but these are not
managed well because of the decrease in tourist number.

Ayu Setya Kemalasari, Malidya Puspita Ayu, and Meisa Sofia Strategies for Developing Nature-based Tourism Destination in the Dieng Plateau as a Sustainable Tourism
62
Proceedings of CATEA 2019
Kawah Sileri
It is the widest crater on the Dieng Plateau with a water surface that continues to emit volcanic
symptoms with white smoke. In 2017 and 2019 Sileri Crater erupts that makes the location is closed
for tourism activities. Compared to the other craters Kawah Sileri has beautiful green views and it still
rarely visited by tourists because of its location and threat of the eruption. There is gardu pandang to
see all the crater areas from the higher.
Sumur Jalatunda Located 6 km from Dieng Plateau, Sumur Jalatunda generally looks like the pond and famous for
the appeal of its myth that relates with puppet stories. To reach the viewing post for seeing the
beautiful landscape and enjoy Sumur Jalatunda from above, tourists have to pass 257 steps.
Kawah Candradimuka Kawah Candradimuka is one of the crater in Dieng located 7 km from Dieng Plateau. Three
active craters are found with different temperatures. These craters are formed because of the land
crack removing the sulfur. Kawah Candradimuka is still not visited by many tourists, both local and
foreign because of the distance that is far from Dieng Plateau, tourism facilities which are not
complete yet and minim road access.
Telaga Warna and Telaga Pengilon
Telaga Warna is the second largest lake in the Dieng Plateau besides Telaga Menjer. The Telaga
Warna panorama can be seen well from the top of the hill known as Batu Pandang Ratapan Angin.
The special things of Telaga Warna are because the water can be changing every time, depending on
the weather, viewpoint, and visibility. The color consists of green, navy blue, yellowish white, and
sometimes colorful like a rainbow. Right next to Telaga Warna there is the second lake called Telaga
Pengilon, whose water surface remains clear and does not change because it has a very low sulfur
content. The water is usually used as irrigation for agriculture. The other attractiveness, there are
natural caves namely Gua Sumur Eyang Kumulasari, Gua Pengantin, Gua Jaran Resi Kendaliseto, and
the most famous Cave Semar. Activities that can be done in Telaga Warna and Telaga Pengilon are to
see the beauty of the lake from close range.
Curug Pitu
Located in Kemiri Village, Sigaluh Subdistrict, Banjarnegara Regency is a tourist place with the
beauty of a waterfall that has seven levels around 30 meters with a large pond below. Tourists can
enjoy the natural atmosphere by playing water, swimming, and tracking to the peak of the waterfall.
Curug Pitu can be reached for one hour from the Dieng Plateau. Although it is quite far from Dieng
Plateau, Curug Pitu is one of Banjarnegara priority tourism destination. So that the development
Dieng Banjarnegara and Dieng Pitu are the concern of the government.
The Dieng Plateau is still on the developing stage, it can be seen on the quality and quantity of public
and tourism facilities, accessibilities and the number of tourists visits so that to reach a sustainable
tourism destination professional improvement and management are needed.
Table 2. The Number of Tourist in Dieng Plateau
Years Domestic Tourists Foreign Tourists Total
2008 80,613 3,812 84,425
2009 109,458 5,235 114,693
2010 106,083 5,360 111,443
2011 104,911 5,175 110,086
2012 159,048 7,373 166,421
2013 176,659 7,433 184,092
2014 290,290 7,360 297,650
2015 340,892 7,875 348,767
2016 385,665 5,804 391,469
2017 354,418 4,180 358,598
2018 330,780 2,986 333,766 Source: Unit Pelaksana Teknis Daerah Kawasan Wisata Dataran Tinggi Dieng, 2019

Ayu Setya Kemalasari, Malidya Puspita Ayu, and Meisa Sofia Strategies for Developing Nature-based Tourism Destination in the Dieng Plateau as a Sustainable Tourism
63
Proceedings of CATEA 2019
It can be seen that tourist visits are dominated by domestic tourists until 2018. However, there has
been a significant decline of foreign tourists from 2016 to 2018 and domestic tourists starting in 2017.
4.2. Discussion
Nature-based tourism planning and development should be based on the potentials, capabilities,
and capacities of each tourist attraction. In general, because of Dieng Plateau is located in two areas
administrative so Dieng Plateau facing the coordination problems of both governments. To assess the
internal and external factors that affect the nature-based tourism development process of Dieng
Plateau, the index of those factors have to be determined first. The determination of the index in both
internal and external factors are some of the most important factors that affect nature-based tourism
development. Those indexes include not only tourism with the attractions, accessibilities, amenities,
accommodation but also environmental, socio-cultural, economical, ancillary and regulation factors.
The internal factor include strengths and weaknesses and the external factor include opportunities and
threats are given in Table 3 as follow.
Table 3. SWOT Analysis
Strength Weakness
1 Having a variety of tourist attraction with very
interesting and diverse nature-based tourism
potential
1 Preservation of some nature-based as tourism is
uncontrolled
2 Foreign tourist markets started to increase 2 There is so much poor condition road
3 The availability of souvenir shops and the number
of restaurants in the area of tourist attractions
3 There is no particular transportation heading to
Dieng Plateau so it is difficult for tourists to use
travel services to tourist attractions
4 The availability of the Tourist Information Center
(TIC)
4 Public facilities not in a good standard of
availability
5 Dieng Culture Festival as one of the main
promotion of Dieng Plateau as a tourist destination
5 ATM facilities are only in a certain location
6 The cold weather supports nature-based tourism 6 Low public awareness of potato farming
unsustainable development
7 Potato farming in an ideal development can support
agri-tourism
7 There is no proper visitor management
8 The hospitality of indigenous people can attract
tourists
8 There is no regulation for developing each
tourist attraction
9 The strength of the local's lifestyle
Opportunity Threat
1 The number of tourists supports the local economic 1 Lack of promotion
2 Technology and information development 2 Land ownership of the outside investor
3 Chances for greater development in both of
regencies as one
3 The policy between Banjarnegara Regency and
Wonosobo Regency are not in line yet for the
tourism development 4 The existence of similar attractions in the province
area
As mentioned before, nature-based tourism development is one of the approaches to the
principles of sustainability. Having lots of nature-based potentials or resources as tourism products
presents a good opportunity for the implementation of nature-based tourism in Dieng Plateau. The
cold weather, the hospitality of indigenous and the strength of the local’s lifestyle is three of the
strengths in the development. Dieng Plateau which located in two administratives area of Wonosobo
and Banjarnegara get a chance for a greater development in both area with the number of tourists and
as the highest nature-based tourism location in Central Java Province. However, the distance from the
capital and hardness of accessibility such as poor condition road, there is no particular transportation
heading to Dieng Plateau and unavailability of good standard public facilities being the reasons for its
slow development.
Regulation is needed for nature-based tourism development, the absence of regulation that can
control the development is the weakness of Dieng Plateau. This is because the policies both of
Banjarnegara Regency and Wonosobo Regency do not have the same interest in developing

Ayu Setya Kemalasari, Malidya Puspita Ayu, and Meisa Sofia Strategies for Developing Nature-based Tourism Destination in the Dieng Plateau as a Sustainable Tourism
64
Proceedings of CATEA 2019
sustainable tourism. However, if the two regions could collaborate in the tourism development of
Dieng Plateau, it will give a positive impact on tourism development because Dieng has a great
potential to be developed as a nature-based tourism destination. Dieng Plateau is also the only tourist
attraction that serves cool weather in Central Java Province so that also gives the advantage to support
the Dieng Plateau tourism development and attract tourist. The availability of regulation is also can
control the growth of potato farming that threatens the water quantity and quality in Dieng Plateau.
The table below shows several patterns of strategies along with supporting activities used in the
development of nature-based tourism in the Dieng Plateau, comprised of S-O (increase the strengths
by optimizing opportunities), S-T (increase the strengths to minimize the threats), W-O (reduce
weaknesses by optimizing opportunities), and W-T (reduce weaknesses to minimize the threats). The
strategies and activities are then grouped into short-term and long-term phase to make it easier for
tourism stakeholders to prioritize which are more urgent to be implemented with the resources
available in the Dieng Plateau.
Table 3. Strategy Phasing
Strategy Activities Short-term Phase Long-term Phase
S-O Community-based tourism
development for sustainability √
A wiser of land use for farming √
Collaboration both of Banjarnegara
Regency and Wonosobo Regency in
tourism development in Dieng
Plateau
√
The development of Dieng Plateau
tour packages √
Developing agri-tourism √
Increasing small enterprises √
S-T
Tourism promotion through various
media √
The policy which regulate the land
ownership in Dieng Plateau √
W-O Tourism development based on the
carrying capacity of each tourist
attractions
√
Improvement and development in
accessibility for ease and accessible
from any direction to tourist
attractions
√
Tourism facilities services
improvement √
Increasing the roles of Provincial
Government for a regional tourism
development
√
W-T Collaborative visitor management in
Dieng Plateau √
A strict conservation regulation √
Local training for a professional
tourism actor/personnel √
5. Conclusion
Based on the research objectives and the results of the identification discussion on the Dieng Plateau,
it can be concluded that:
1. As the result of the identification on the nature-based tourism attraction in Dieng Pandawa, it
can be concluded the tourism development in the area is still on the developing stage relate on

Ayu Setya Kemalasari, Malidya Puspita Ayu, and Meisa Sofia Strategies for Developing Nature-based Tourism Destination in the Dieng Plateau as a Sustainable Tourism
65
Proceedings of CATEA 2019
public facilities, tourism facilities and accessibilities. It means, to be a sustainable tourism
destination, professional action is needed.
2. Because of the location Dieng Pandawa in two administrative areas (Wonosobo and
Banjarnegara), it faces coordination problems. Starting from internal problems such as
preservation of some nature-based as tourism is uncontrolled, no visitor management, low
quality of accessibilities, transportation and facilities. The other problem is caused by external
such as there is no regulation that could make effective coordination happened between
Wonosobo and Banjarnegara. So that the answer to make Dieng Plateau as a sustainable
tourism destination are a collaboration for both regions, developing the potential tourism
resource and optimize community-based tourism.
References
Journal Papers
Henricks, M. (1999). Augmented title: Strength-weakness-opportunity-threat analysis. Entrepreneur, 27(72),
199-210.
Ngabekti, S., Setryowati, D.L, & Sugiyanto, R. (2007). Tingkat Kerusakan Lingkungan di Dataaran Tinggi
Dieng sebagai Database Guna Upaya Konservasi. Jurnal Manusia dan Lingkungan, 14(2), 93-102.
Pradana, A., Sara, F.H., & Wahdaningrum, W. (2015). The analysis of Environmental Degradation and Carica
Agroforestry System as an Attempt of Environmental Restoration in Dieng Plateau. International
Journal of Environmental Science and Development, 6(11), 861–867.
Rahadjana, D.T. (2012). Membangun Pariwisata Bersama Rakyat: Kajian Partisipaso Lokal dalam Membangun
Desa Wisata di Dieng Plateau. KAWISTARA, 2(3), 225-328.
Book
Badan Rehabilitasi Lahan dan Konservasi Tanah Jawa Tengah. (2004). Pengkajian Reboisasi Lahan dan
Konservasi Tanah di Jawa Tengah. Semarang, Indonesia: BRLKT Jawa Tengah.
Bruntland, G. H. (1987). Our Common Future. Oxford: Oxford University Press.
Gunn, C. A. (2002). Tourism Planning: Basics, Concepts, Cases. New York: Routledge.
Marpaung, H. (2002). Pengetahuan Kepariwisataan. Bandung: Alfabeta.
Nature Based Tourism Advisory Committee. (2009). Review of Nature Based Tourism: Report to the Minister
for the Environment and the Minister for Tourism. Australia: Author.
Paturusi, S. A. (2001). Perencanaan Tata Ruang Kawasan Pariwisata, Materi Kuliah Perencanaan Kawasan
Pariwisata, Program Pasca Sarjana Universitas Udayana. Denpasar: Universitas Udayana.
Pendit, Nyoman S. (1990). Ilmu Pariwisata Sebuah Pengantar Perdana. Jakarta: Pradnya Paramita.
Suwantoro, Gamal. (2004). Dasar-dasar Pariwisata. Yogyakarta: Penerbit Andi.
Warpani, Suwardjoko P. (2007). Pariwisata Dalam Tata Ruang Wilayah. Bandung: ITB Press.
Thesis
Paramitasari, I. D. (2010). Dampak Pengembangan Pariwisata terhadap Kehidupan Masyarakat Lokal: Studi
Kasus Kawasan Wisata Dieng Kabupaten Wonosobo (Proyek Akhir), Universitas Sebelas Maret,
Indonesia.
Fadlina, S. (2015). Strategi Pengembangan Kawasan Calon Geopark Tasikmalaya Selatan–Pangandaran
sebagai Daya Tarik Wisata di Provinsi Jawa Barat (Proyek Akhir), Institut Teknologi Bandung,
Indonesia.
Wahyudi. (2010). Kajian Kerja Sama Daerah dalam Pengelolaan dan Pengembangan Kawasan Wisata
Dataran Tinggi Dieng (Tesis), Universitas Diponegoro, Indonesia.

66
Proceedings of CATEA 2019
Proceedings of CATEA 2019
ISBN 978-623-91018-0-0
How Millennials in Indonesia Perceive in Studying
Abroad to China
Adella Gloria Harjanto1 Lestari Ningrum
2
1Adella Gloria Harjanto, Trisakti School of Tourism
2Lestari Ningrum,Trisakti School of Tourism
[email protected]. [email protected]
*Corresponding Author
Abstract: China, officially the People’s Republic of China (PRC), is a country in East Asia and the world’s
most populous country. With a population of 1.3 billion, China is the second largest economy and is
increasingly playing an important and influential role in development and in the global economy. Asian
universities increased from holding just 8 spots to 18 in 2015 on the World University League Tables published
by the Times. Hongkong, Japan, and Singapore are major contributors to this, as well as China. The researcher
intends to find out how millennials percept studying abroad to China. Method used in this research was
descriptive. Sampling technique used in this research was non probability sampling using Hair et.al theory and
the data were analyzed by using IBM SPSS. Millennials in Indonesia were interested in deepening new culture,
that was the reason why they percept studying to China could be interesting.
Keywords: Millennials; Studying Aboard; China; Perception.
1. Introduction
China, officially the People’s Republic of China (PRC), is a country in East Asia and the world’s
most populous country. Since initiating market reforms in 1978, China has shifted from a centrally-
planned to a more market-based economy and has experienced rapid economic and social
development. With a population of 1.3 billion, China is the second largest economy and is
increasingly playing an important and influential role in development and in the global economy.
China has been the largest single contributor to world growth since the global financial crisis of 2008.
Nevertheless, it is undeniable that China is much richer as a whole than it used to be, and this is
largely thanks to the economic reform, including lowering its tariffs and liberalizing some sectors of
the economy, that accompanied China’s accession to the WTO. In this sense, its economic status has
changed. While it is still developing, it is much closer to the developed countries than before.
Generally, it is millennial’s families that have the say in where they study. But it is not just
wealthy families sending their millennial children abroad; many middle-class parents are also
choosing to do so. A poll by 51jobs.com in Shanghai found: “Of the 607 parents who took part in the
survey, 76.8% responded that they plan to send their children to study overseas even if the cost of
tuition and living expenses may reach 1 million Yuan (US $163,111).”
There has been a shift in the balance of scales of higher education from the West to the East.
Asian universities increased from holding just 8 spots to 18 in 2015 on the World University League
Tables published by the Times. Hongkong, Japan, and Singapore are major contributors to this, as
well as China.
Seeta Bhardwa in Denis Simon (2018), the executive vice-chancellor of Duke Kunshan
University, thinks that there are many reasons why students would choose to study in China.

Adella Gloria Harjanto, Lestari Ningrum How Millennials in Indonesia Perceive in Studying Abroad to China
67
Proceedings of CATEA 2019
“Students who are now studying in the Asia-Pacific region have all sorts of career opportunities,” he
said. They can use their knowledge of the East and the West, and they can learn new languages and
new cultures. In fact, research predicts that China will be teaching at least 500,000 international
students by 2020.
The number of people that are interested in studying to China have been increasing because of
medias, for example in Kenya, research by Zhang and Jane (2016) stated that medias in China
generally help in promoting publics’ awareness about China, and people looked up to their roles as a
provider in alternative information with a potential to benefit China and Kenya relationship.
According to the data published by IIE Atlas report 2015, countries that sent most students to
China are South Korea, USA, Thailand, Russia and Japan. As economic ties tighten between China
and rest of the world, some countries have launched campaigns to motivate their countrymen to learn
Chinese. For example, during President Xi's visit to USA in September 2015, President Obama
announced the 1 million strong program which aims to expand the number of US K-12 students
studying Mandarin to 1 million by 2020.
Thus, the purpose of this research was to examine how millennials in Indonesia percept studying
abroad to China. The research questions for this study were:
1. How millennials percept studying abroad to China?
2. Which is the highest sub-variable of perception scored by respondents?
2. Related Works/Literature Review Perception. According to Quinn in Sarlito (2012:93) “Perception is a combination of process
from a sensation received by the result of brain work”. Pareek in Sobur (2003:446) said “Perception
can be defined as a process of accepting, sectioning, interpreting, testing, and giving a reaction to
data”. This explanation support Sarwono’s opinion (2012:86) “Perception happens when accepting
stimulus from outside world that are captured by supporting organs that then enter inside of a brain”.
According to Yue (2016), there are several factors that could affect perceptions:
a. Observer, an implementation from what a person sees depends on that person characteristics.
b. Attitude, a person’s attitude really affect perception that he/she has towards his/her
surroundings.
c. Motives, reasons behind a person’s behavior that could stimulate and give strong influence on
the formation of their perspectives towards everything.
d. Interest, our attention focuses on things that are currently being faced make our perspectives
different.
e. Experience, events that someone has gained.
f. Expectation, an illustration that forms an image of any circumstances.
Learning. E.R Hilgard in Sanjaya, Wina, 2009:112 defines learning as a “permanent change in
behavior that occurs as a result of prior experience”. Learning is defined as a process of change in
attitude and behavior after the interaction with learning resources. Learning resources can through
books, neighborhood, teachers and others. Gredler, While (1986) claimed that process of changing
attitudes and behaviors that are substantially in an artificial environment and very little dependency on
the natural situation.
Millennials. A generation is a group which can be identified by year of birth, age, location and
significant events that create their personality (Guha, 2010; Smola & Sutton, 2002). Over the past
sixty years, there have been three generations dominating the workplace: Baby Boomers, Generation
X and Millennials (Kaifi, et al. 2012). The most recent generation to enter the workforce are the
Millennials, who are individuals born between 1980 and 2000. They are called Millennials because of
their closeness to the new millennium and being raised in a more digital age (Kaifi et al., 2012). This
generation was influenced by computers and a greater acceptance of non-traditional families and
values (Andert, 2011). Millennials are known to be achievement focused. They have a need not only
to do well, but to excel and surpass all goals and aspirations (Kaifi et al., 2012; Kowske et al., 2010).
This leads them to seek out new learning opportunities.

Adella Gloria Harjanto, Lestari Ningrum How Millennials in Indonesia Perceive in Studying Abroad to China
68
Proceedings of CATEA 2019
3. Material & Methodology The researcher intends to find out how millennials percept studying abroad to China.
Questionnaire was used as the instrument of this research and was spread through social media in
Google Form. Method used in this research was descriptive. It involves gathering data that describe
events and then organizes, tabulates, depicts, and describes the data collection (Glass & Hopkins,
1984). And the approach used in this research was quantitative through a survey based on social
media (Sugiyono, 2017:35) with using primary and secondary data. The examined variables are
quantified using ordinal scale with five levels (Strongly Agree- Agree- Quiet Agree- Disagree-
Strongly Disagree), and for respondents’ biography data were quantified using nominal and interval
scale.
Sampling technique used in this research was non probability sampling using Hair et.al theory
(2010) with a reason that the chosen respondents were those who will be and are studying in China.
This sampling technique needed to be used because the populations were taken widely and the amount
of accurate data statistically were not found. So, the formula for this sampling technique was nx10,
8x10 = 80.
The data were analyzed by using IBM SPSS (Statistical Package for Social Science) version
25.0. Reliability test (Ghozali, 2011) and Validity test are used to ensure the consistency level from
the respondents in answering and their certainty in understanding, comprehending, and experiencing
the proposed statements (Sugiarto et al. 2015:142).
Reliability concerns the extent to which a measurement of a phenomenon provides stable and
consist result (Carmines and Zeller, 1979). Reliability is also concerned with repeatability. Validity
explains how well the collected data covers the actual area of investigation (Ghauri and Gronhaug,
2005). Validity basically means “measure what is intended to be measured” (Field, 2005). Descriptive
statistics are used to summarize data in an organized manner by describing the relationship between
variables in a sample or population.
Calculating descriptive statistics represents a vital first step when conducting research and should
always occur before making inferential statistical comparisons. Descriptive statistics include types of
variables (nominal, ordinal, interval, and ratio) as well as measures of frequency, central tendency,
dispersion/variation, and position. Since descriptive statistics condense data into a simpler summary,
they enable health-care decision-makers to assess specific populations in a more manageable form
(Stoltzfus, Kaur P, J, Yellapu V. 2018). In this research, perception is interpreted in 5 interval scale; Table 1. Interpretation of Variables Interval
Class Interval Perception
1.00 – 1.80 Strongly Uninterested
1.80 – 2.60 Uninterested
2.60 – 3.40 Interested Enough
3.40 – 4.20 Interested
4.20 – 5.00 Strongly Interested
Continuous variables are further categorized as either interval or ratio. Interval variables are
measured along a continuum and have a numeric value, but without zero points, so the lowest point is
1.00. Interval is made from 5/5 – 1 which equals 0.8. Then the lowest point (1.00) is added to 0.8
which later be the highest point of the first perception. 0.8 will continuously be added to the last
highest point which becomes the next highest point for other perceptions until reach the maximum
point of 5.00.
4. Results and Discussion 4.1 Results
Data processing techniques in this study use a computation calculation SPSS (Statistical Product
and Service Solution) Version 25.0 for Windows because this program has a high statistical ability
and the data – 20 – management system in the graphical environment use a simple descriptive menus
and dialog boxes, making it easy to understand how to operate it (Sugiyanto, 2012).

Adella Gloria Harjanto, Lestari Ningrum How Millennials in Indonesia Perceive in Studying Abroad to China
69
Proceedings of CATEA 2019
Table 2. The Result of Validity Test
D
Degrees of freedom are the number of values in a distribution that are free to vary for any
particular statistic (Healey, 1990). Degree of freedom is also used to count the intended population by
r table, the formula is n-2 where n is the total population or the sample of respondents.
R table can be found by searching the t table first [transform – compute variable – target variable
– type t_0.05 (0.05 was chosen because the researcher wanted to count t table with the significant
level of 5%) – type the formula: IDF.T(0.95df) in numeric expression (0.95 was the conviction
level)], and the result will be shown in data view. After the result had been shown in the data view,
the researcher intended to find the r table [transform – type r_0.05 in compute variable – type the
formula: t_0.05/SQRT (df+t_0.05**2) in numeric expression. The amount of r table for this research
is 0.43.
The colored numbers from the Table 4.1 are considered as the t table, it was used in validity test
to see if respondents were really understood the provided declaration in the questionnaire. R table and
t table were compared with the rules of: t table > r table (t table is bigger (in numerical) compared to r
table). If t table > r table, then the declaration is not valid which leads that respondents did not
understand the situation provided in the declaration. From the result in Table, all declarations
provided in the questionnaire are valid because of r table > t table.
Table 3. The Result of Reliability Test
The reliability of the instrument refers to the stability and consistency od the instrument
developed (Creswell, 2010). The reliability level of the instrument is represented by Alpha Cronbach
(Creswell, 2010). Pallant (2001) states Alpha Cronbach’s value above 0.6 is considered high
reliability and acceptable index (Nunnally and Bernstein, 1994). Whereas, the value of Alpha
Cronbach is less than 0.6 is considered low. Alpha Cronbach values in the range of 0.60 – 0.80 are
considered moderate, but acceptable. This shows that the questionnaire is valid because of r table
(From Table 4.2) > t table (From Table 4.1).
Item-Total Statistics
Scale Mean if Item
Deleted Scale Variance if
Item Deleted Corrected Item-Total Correlation
Cronbach's Alpha if Item Deleted
Behavior1 30.25 12.467 .274 .774
Behavior2 29.56 13.462 .372 .754
Motive1 30.00 12.000 .447 .740
Motive2 30.25 10.733 .527 .726
Motive3 30.00 10.933 .520 .726
Interest 29.88 11.317 .655 .705
Experience 29.69 12.229 .540 .728
Expectation 30.13 11.850 .450 .739
Reliability Statistics
Cronbach's Alpha N of Items
.763 8

Adella Gloria Harjanto, Lestari Ningrum How Millennials in Indonesia Perceive in Studying Abroad to China
70
Proceedings of CATEA 2019
Figure 1. The Results of Respondents’ Data (Gender)
The figure shown above is the result of respondents’ gender. Which shown that from 80
respondents, 62.5% of them were women and 37.5% of them were men.
Figure 2. The Results of Respondents’ Data (Age)
The figure shown above is the result of respondents’ age. Which shown that from 80
respondents, 66.3% of them aged 19-22 years old, 25% of them aged 15-18 years old, 8.8% of them
aged 23-26 years old, but none of them aged above 27 years old.
Men
Women
15-18 years old
19-22 years old
23-26 years old
>27 years old

Adella Gloria Harjanto, Lestari Ningrum How Millennials in Indonesia Perceive in Studying Abroad to China
71
Proceedings of CATEA 2019
Figure 3. The Results of Respondents’ Data (Major)
The table shown above are the results of respondents’ major. The highest percentage with 66.3%
is Hospitality, Leisure, and Sport. And the second highest one is Business Management with 10%.
Table 4. The Result Frequency of Behavior
Respondents’ perception in studying abroad to China make them more tolerant towards changes,
approved by 55% of them, only 3% of them that did not agree with the thought of studying to China
then they will be more open minded, and 17% of them thought the changes of their attitude to be more
open minded were only in the level ‘enough’.
Open Minded
Frequency Percent Valid Percent Cumulative Percent
Valid 1.00 1 1.3 1.3 1.3
2.00 2 2.7 2.7 4.0
3.00 17 22.7 22.7 26.7
4.00 34 45.3 45.3 72.0
5.00 21 28.0 28.0 100.0
Total 75 100.0 100.0

Adella Gloria Harjanto, Lestari Ningrum How Millennials in Indonesia Perceive in Studying Abroad to China
72
Proceedings of CATEA 2019
Indonesia is a nation with diverse cultures and race that could ease out society to better
understanding cultures and habits from each tribe. China is a big nation that has a lot of tribes as well
as Indonesia. 69% respondents’ perception towards studying in China will elevate their tolerance
towards different cultures.
Table 5. Motive
Indonesia is a country that still puts formal diploma as a standard for work, so it is not surprising
that 56% of respondents are motivated to study in China because they are interested in a degree from
abroad. And 86.6% of their motivations want to feel the learning environment which is shared by
them will be different and full of challenges.
China’s economy grew 7 times as fast as America’s over the past decade (316% growth vs 43%).
Also, there are 56 recognized ethnicities (Lee, Becki. 2018). The economy is on an upward trajectory
and there has no sign of it slowing down anytime soon. Working alongside Chinese investors is the
motive why Indonesian student think about going to China because, China’s next project is not a far-
fetched reality these days.
Shock Cultures
Frequency Percent Valid Percent Cumulative Percent
Valid 2.00 1 1.3 1.3 1.3
3.00 5 6.7 6.7 8.0
4.00 32 42.7 42.7 50.7
5.00 37 49.3 49.3 100.0
Total 75 100.0 100.0
Learning Environment
Frequency Percent Valid Percent Cumulative Percent
Valid 1.00 1 1.3 1.3 1.3
3.00 9 12.0 12.0 13.3
4.00 25 33.3 33.3 46.7
5.00 40 53.3 53.3 100.0
Total 75 100.0 100.0
Interested in The Title
Frequency Percent Valid Percent Cumulative Percent
Valid 1.00 1 1.3 1.3 1.3
2.00 5 6.7 6.7 8.0
3.00 13 17.3 17.3 25.3
4.00 25 33.3 33.3 58.7
5.00 31 41.3 41.3 100.0
Total 75 100.0 100.0
Mattering Mandarin
Frequency Percent Valid Percent Cumulative Percent
Valid 2.00 3 4.0 4.0 4.0
3.00 5 6.7 6.7 10.7
4.00 28 37.3 37.3 48.0
5.00 39 52.0 52.0 100.0
Total 75 100.0 100.0

Adella Gloria Harjanto, Lestari Ningrum How Millennials in Indonesia Perceive in Studying Abroad to China
73
Proceedings of CATEA 2019
Table 6. Interest
Chinese society values order above all else. The predominant religious and philosophical views
promote maintaining stability, and balance. They believe that the universe has a natural design, and
everything can be explained by that design. Order and hierarchy are the foundations of their society
(Doctoroff, 2011). Indonesian students percept that it can be interesting given little-known facts
about Chinese history that nearly no one knows about. It certainly an impressive conversation topic at
social gatherings.
Table 7. Experience
China has several languages, all of which share the same script, with Mandarin as its official
language (Flower, 2010). China’s rich cultural heritage has influenced western society in art, food,
medicine, clothing, music, philosophy, and much more. They invented print and moveable type
(Flower, 2010). By the diversity and the challenging cultures China offers, Indonesian students hope
to gain new experiences that they wouldn’t be able to get in Indonesia or in any other countries.
Table 8. Expectation
Within the Chinese culture, individuals highly value the opinions of their friends and family. This
is referred to as maintaining “face.” "Fundamentally “face,” represents a person’s reputation and
feelings of prestige (both real and imagined) within their workplace, society, their family unit and
among their friends" (Learnchinesebusiness.com, 2013). By that means, Indonesian students who had
decided to go to China wished to have a higher expectation towards themselves.
Frequency Percent Valid Percent Cumulative Percent
Valid 2.00 3 4.0 4.0 4.0
3.00 15 20.0 20.0 24.0
4.00 29 38.7 38.7 62.7
5.00 28 37.3 37.3 100.0
Total 75 100.0 100.0
Frequency Percent Valid Percent Cumulative Percent
Valid 2.00 1 1.3 1.3 1.3
3.00 5 6.7 6.7 8.0
4.00 23 30.7 30.7 38.7
5.00 46 61.3 61.3 100.0
Total 75 100.0 100.0
Frequency Percent Valid Percent Cumulative Percent
Valid 2.00 1 1.3 1.3 1.3
3.00 16 21.3 21.3 22.7
4.00 32 42.7 42.7 65.3
5.00 26 34.7 34.7 100.0
Total 75 100.0 100.0

Adella Gloria Harjanto, Lestari Ningrum How Millennials in Indonesia Perceive in Studying Abroad to China
74
Proceedings of CATEA 2019
Table 9. The Result of Mean
Based on the Table 4.7 with the references from Table 3.1, respondents were strongly interested to
go to China to gain new experiences, acknowledge its’ culture, feel the foreign environment and to
master Chinese that will be useful in the future as world business language. Respondents were
interested to go to China to have a higher expectation towards themselves, with the degree that they
will achieve once they graduated, and will be more open-minded.
4.2 Discussion
Respondents’ perception towards studying in China make them more tolerant towards the
changes, approved by 55%, this thing can be assumed with the characteristics of generations. Baby
Boomers has the characteristics of live to work, competitive, focused, disciplined, and want to make a
difference. Generation X has the characteristics of crave independence, focused on results, think
globally, adapt to change and thrive on flexibility. Generation Z has the characteristics of realists,
individualistic, competitive, transparent, and tech innate (first generation to grow up with modern
technology). And last but not least, the Millennials, the characteristics of millennials are fully
transparent, value diversity, love technology, do well with detailed instructions and think that
education is a highly expensive necessity.
Gracibelt Rendon, who chose to study in China to differentiate herself from others in the
workplace, explains: “There is a saying that my friends who went to university together share, which
is; if you survive living in China, you can survive and be prepared to face anything in the world. [The
experience] allows you to be an open-minded person, ready to adapt and be flexible, which at the end
of the day is what every employer is looking for. Studying in China gives you experience about how
things work in this part of the world and helps you to become more independent.” Gracibelt Rendon’s
thought support the statement that stated by studying in China help students to be more open minded
by their interest in interact with people (Ardhashbc003, 2015, February 3rd
).
5. Conclusion 1. Millennials in Indonesia were interested in deepening new culture, that was the reason why
they percept studying to China could be interesting.
2. The highest sub-variable of perception scored by respondents is experience. They percept
that by studying abroad to China, then they will gain new experiences that they couldn’t get
by studying in Indonesia.
Statistics
Beha vior1
Beha vior2 Motive1 Motive2 Motive3 Interest
Expe rience
Expec tation
N Valid 75 75 75 75 75 75 75 75
Missing 0 0 0 0 0 0 0 0
Mean 3.9600 4.4000 4.3733 4.0667 4.3733 4.0933 4.5200 4.1067

Adella Gloria Harjanto, Lestari Ningrum How Millennials in Indonesia Perceive in Studying Abroad to China
75
Proceedings of CATEA 2019
Acknowledgement.
I would like to express my deepest appreciation to all those who provided me the possibility to
complete this journal. A special gratitude I give to a lecturer in Trisakti School of Tourism for this
journal, Mrs. Lestari Ningrum, whose contribution in stimulating suggestions and
encouragement, helped me to coordinate my project especially in writing this journal.
Furthermore, I would also like to acknowledge with much appreciation the crucial role of
Regular- Guilin Tourism University class of 2018 who participated well in answering all of the
statements given in the questionnaire. A special thanks goes to Kevin Surya who is in Wu Xi
University China and Grady who is in Hebei Normal University China, who helped me to spread the
questionnaire to their classmates.
References
Ardhashbc003. (2015, February 3). Perbedaan Karakter dan Pola Pikir Generasi Baby Boomers hingga Generasi
Alpha. Retrieved from https://goo.gl/45vD3R.
Andert, 2011. Understanding the Millennial Generation. Retrieved from
https://www.researchgate.net/publication/324922926_Understanding_the_Millennial_Generation. 6th
May 2019.
Bhardwa, Seeta. (2018, February 7). Why More Students are Choosing to Study in China. Retrieved from
https://www.timeshighereducation.com/student/blogs/why-more-students-are-choosing-study-china.
28th
April 2019.
Carmines and Zeller, 1979 Guha, 2010; Development of a career-orientation scale for public health nurses.
Retrieved from
https://www.scirp.org/(S(i43dyn45teexjx455qlt3d2q))/reference/ReferencesPapers.aspx?ReferenceID=
741313. 17th
May 2019.
Field,”Discovering statistics using SPSS (2nd edition)”, Andy Field, London: Sage Publications Ltd 2005, Pbk
£27.99 ISBN 0-7619-4452-4. Retrieved from
https://www.researchgate.net/publication/247826587_Discovering_statistics_using_SPSS_2nd_edition
_Andy_Field_London_Sage_Publications_Ltd_2005_Pbk_2799_ISBN_0-7619-4452-4. 17th
May 2019.
Flower, K.,”Culture smart! China”, London, England: Kuperard. 2010.
Ghauri and Gronhaug, 2005. Research Methods in Business Studies: A Practical Guide.Retrieved from
https://www.researchgate.net/publication/248818202_Research_Methods_in_Business_Studies_A_Pra
ctical_Guide. 17th
May 2019.
Ghozali, “Aplikasi Analisis Multivariate Dengan Program SPSS”. Semarang: Badan
Penerbit Universitas Diponegoro. 2011.
Glass & Hopkins, 1984. The Effect of a Research Ethics Course on Graduate Students’ Moral Reasoning.
Retrieved from http://ww.richard-t-hull.com/publications/effect_research_ethics.pdf. 17th
May 2019.
Gredler, While (1986). Understand According to Experts Learn.
Retrieved from http://educations-article.blogspot.com/2016/10/understand-learning-according-to-
experts.html. 2nd
May 2019.
Hair, Joseph F, Black, William C, Babin Barry J and Anderson Rolph E,”Multivariate Data Analysis A Global
Perspective,”Seventh Edition. Pearson. 2010.
Healey and Barrett, 1990. Structure and Agency in Land and Property Development
Processes: Some Ideas for Research. Retrieved from
https://journals.sagepub.com/doi/10.1080/00420989020080051. 17th
May 2019.
History of Chinese education, five necessities of Chinese culture. (2005).
Retrieved from http://www.chinatownconnection.com/Chinese_education.html.17th
May 2019.
Kaifi, Nafei, Khanfar & Kaifi, 2012. Understanding the Millennial Generation.
Retrieved from
https://www.researchgate.net/publication/324922926_Understanding_the_Millennial_Generation.
Accessed in 4th
May 2019.

Adella Gloria Harjanto, Lestari Ningrum How Millennials in Indonesia Perceive in Studying Abroad to China
76
Proceedings of CATEA 2019
Kaur P, Stoltzfus J, Yellapu V. Descriptive statistics. Int J Acad Med (2018);4:60-3
Kowske et al., 2010. Understanding the Millennial Generation. Retrieved from
https://www.researchgate.net/publication/324922926_Understanding_the_Millennial_Generation. 2nd
May 2019.
Lee, Becki. 2018. What are the Motivations to Learn Chinese?
Retrieved from https://www.quora.com/What-are-the-motivations-to-learn-Chinese. 17th
May 2019.
Moskal, B.M., & Jon.A. Leydens, “Scoring rubric development: Validity and Reliability,”Practical Assessment,
Research & Evaluation Volume 7 Number 10, November (2000). ISSN=1531-7714
[Available online: http://pareonline.net/getvn.asp?v=7&n=10].
Pak, Jennifer. (2012, February 22). Is English or Mandarin the Language of the Future? Retrieved from
https://www.bbc.com/news/magazine-17105569.
31st March 2019.
Sanjaya, Wina, 2009:112. Bab II: Kajian Teori. Retrieved from https://eprints.uny.ac.id/9485/14/BAB%20II-
08301244055.pdf. 2nd
May 2019.
Sarwono, Sarlito Wirawan, “Psikologi Remaja,” Jakarta: PT. Raja Grafindo Persada 2012.
Sobur. 2003. Persepsi Karyawan Crew Alpha Terhadap Kebijakan 12 Jam Kerja
di Pt. Kaltim Prima Coal Sangatta. Retrieved from ejournal.ilkom.fisip-
unmul.ac.id/.../ejournal_mitra%20(03-07-13-07-14-58).docx. 17th
May 2019.
Simon and Huan. (2018, April 28). The WTO still considers China a ‘developing nation’. Here’s the big
problem with that. Retrieved from https://www.cnbc.com/2018/04/25/what-trump-gets-right-about-
china-and-trade.html. 31st March 2019.
Sugiarto, T. Hendratono, D. Sudibyo,”Metodologi Penelitian Hospitaliti & Pariwisata,” Tangerang : PT.
Matana Publishing Utama. 2015.
Sugiyanto, 2012. Pengaruh Gaya Belajar Experiential Learning dalam Peningkatan Prestasi Akademik dan
Penerapannya dalam Pembelajaran. Retrieved from
https://journal.uny.ac.id/index.php/paradigma/article/view/5804. 17th
May 2019.
Sugiyono, 2017. Bab III: Metode Penelitian. Retrieved from
http://repository.unpas.ac.id/32694/6/BAB%20III.pdf. 15th
May 2019.
Smith, Travis J and Tommy Nichols.,” Understanding the Millennial Generation”, Journal of Business Diversity
Vol. 15(1) (2015). Retrieved from
https://www.researchgate.net/publication/324922926_Understanding_the_Millennial_Generation. 2nd
May 2019.
Smola & Sutton, 2002. Generation Differences : Revisiting Generational Work Values for the New Millennium.
Retrieved from
https://www.researchgate.net/publication/227533994_Generational_Differences_Revisiting_Generat
ional_Work_Values_for_the_New_Millennium. 16th
May 2019.
Shanta Pandey and Charlotte Lyn Bright,” What Are Degrees of Freedom?’, Social Work Research Volume 32
Number 2 June (2008).
Retrieved from http://www.montefiore.ulg.ac.be/~kvansteen/MATH0008-
2/ac20122013/Class11Dec/Supplementary%20info_AppendixD_DegreesOfFreedom.pdf. 11th
May
2019.
Stoltzfus, Kaur P, J, Yellapu V. 2018. Descriptive Statistics.
Retrieved from http://www.ijam-web.org/article.asp?issn=2455-
5568;year=2018;volume=4;issue=1;spage=60;epage=63;aulast=Kaur. 11th
May 2019.
Taherdoost, Hamed,”Validity and Reliability of the Research Instrument; How to Test the Validation of a
Questionnaire Survey in a Research”, International Journal of Academic Research in Management
Volume 5, Issue 3, (2016), ISSN: 2296-1747
Retrieved from
https://www.researchgate.net/publication/319998004_Validity_and_Reliability_of_the_Research_Instr
ument_How_to_Test_the_Validation_of_a_QuestionnaireSurvey_in_a_Research. 4th
May 2019

Adella Gloria Harjanto, Lestari Ningrum How Millennials in Indonesia Perceive in Studying Abroad to China
77
Proceedings of CATEA 2019
Yue.X.D,”Adult Playfulness Humor Styles, and Subjective Happiness,” Journal of Psychological Reports.p.2-
11. (2016).
Zhang, Yanqiu & Jane Muthoni Mwangi ,”A Perception Study on China’s Media engangement in Kenya:from
merida present to power influence?,” Chinese Journal of Communications Volume 9, (2016) - Issue 1:
The Voice of China in Africa: Media, Communication Technologies and Image Building

78
Proceedings of CATEA 2019
Proceedings of CATEA 2019
ISBN 978-623-91018-0-0
Indonesians Go to China, are They Satisfied?
Savitri Hendradewi1, Lestari Ningrum
2
1
Savitri Hendradewi, Trisakti School of Tourism 2Lestari Ningrum, Trisakti School of Tourism
[email protected], [email protected]
Abstract: This study aims at determining travel motivation, sub-variable of the highest satisfaction, and how
much travel motivation affects Indonesians’ visit to China. The methods used were survey, descriptive, and
correlation with quantitative approach. Interval class formulas (Nurhayati, 2016) were used to analyze mean
values (Aziz, 2017) in answering the first and second research objectives; correlation and regression were for
answering the third study objective. The primary data were obtained through questionnaire consisting of 16
statements, made with online media, and disseminated through social media. There were 124 respondents. The
population data of 1,333,666 Indonesian tourists visiting China in March 2019 was taken from CEIC. Through
Slovin sampling technique (error value of 5%), the study obtained 100 samples and 118 respondent data were
tested for reliability and validity. Secondary data were obtained from journals, books and online media. The
motivation of Indonesians visiting China was high (3.7063). It was either to unwind and refresh, or enjoy
ancient historical knowledge. Their highest satisfaction seemed to be their positive impressions from visiting
tourist objects and getting memories in beautiful photographs. Their contentment from traveling to China was
in the satisfied category (3.7043). Motivation for a vacation in China influenced respondents' satisfaction at
60.9%.
Keywords: Travel motivation; Tourist Satisfaction; China’s Destination; Tourist
1. Introduction
Traveling is one of the human desires that can be realized in the simplest activities which do not
require a long time and a lot of costs. It can be done starting from just visiting the nearest tourist
attraction in the city, domestically, to traveling abroad. Generally, the reason that encourages
someone to travel is to get away from fatigue due to workload or pressure or to experience changes
in the atmosphere. Someone who travels is usually driven by a desire in himself and often does not
realize it. The desire is called motivation. Motivation is fundamental in the study of tourists and
tourism (Cha, et al. (1995), Gnoth (1997), Swanson and Horridge (2006), Sophonsiri, Suvenus
(2011) because motivation is a trigger for the process of travel, even though it is often not fully
realized by the tourists themselves (Pitana and Gayatri, 2005).
Agmasari, 1/30/2019 in booking.com, found a relation between tourism and citizenship status. It
turns out that citizenship influences one's style of travel. "For most travelers, the main motivation for
traveling is to relax. It is not surprising that 90 percent of Indonesian citizens claim that taking time
to relax is an important drive for traveling.” Besides taking the time to relax, other Indonesian
tourists’ motivation is to spend time with family (Ingkadijaya, 2018), to discover sensations and
experiences what you cannot have at home, and to go to places your friends have never visited.
Travel costs are predicted to be more expensive and they motivate travels for the purpose of proving
social status. This motive is found in 75 percent of Indonesian tourists, 75 percent of Indian tourists,
and 80 percent of Filipino tourists.
When determining tourist destinations, Indonesians tend to consider five things: cleanliness,
extraordinary natural beauty, personal security, delicious local cuisine, and interesting and friendly

Savitri Hendradewi, Lestari Ningrum
Indonesians Go to China, are They Satisfied?
79
Proceedings of CATEA 2019
local people. When compared with research from Van Vuuren and Slabbert (2011) in Santosa and
Lucia (2018) about the behavior and motivation of tourists in South Africa which shows that the
main motivation of tourists there is to rest and relax, enrich their knowledge and experience at the
new tourism destination, do activities related to recreation, develop personal values, and have
experiences in interacting with other people (social drive), then there appears to be a lot of
motivations that underlie a person's reasons for traveling.
One of the foreign tourist destinations that is in great demand by Indonesians is China, including
Hong Kong and Macau. In 2030, China is predicted to become the most popular tourist destination in
the world, taking the place of the most visited country, France. The prediction was released in the
latest research by Euromonitor International, a London-based global research company engaged in
market analysts and data (Pratiwi, November 7, 2018). China is also the top 10 favorite destination for
Indonesians according to Agmasari, November 1, 2019, in addition to traveling within Indonesia itself
and the neighboring countries such as Singapore and Malaysia, followed by other countries Japan,
Maldives, Nepal, and Myanmar. China, according to Worldatlas, is the fourth country in the world
that was most visited by tourists after France, Spain and the United States in 2017.
Table 1. The World's Most Visited Countries
Rank Country International Visitors
(millions), 2017
1 France 86.9
2 Spain 81.8
3 United States 76.9
4 China 60.7
5 Italy 58.3
6 Mexico 39.3
7 United Kingdom 37.7
8 Turkey 37.6
9 Germany 37.5
10 Thailand 35.4
Sources: Worldatlas
The large number of tourists visiting China is certainly due to the attracting factors of diverse
and interesting tourist destinations and objects in big cities such as Beijing with its Beijing Palace and
Forbidden City where tourist can get to know the history and culture of China; Shanghai which has
Shanghai World Financial Center as one of the 8 tallest buildings in the world where people can walk
in the height of its transparent walls; Pearl Night Cruise on the Pearl River in Guangzhou; Zhangye
National Park in Southwest China which is famous for rainbow hills and valleys; and of course The
Great Wall and Terracotta Warriors. According to CEIC records on the number of Indonesian tourists
visiting China, the latest data in March 2019 it was amounted to 1,338,666 tourists; in February 2019
there were 1,264,055 people; and the highest number was in July 2018 which were 1,540,549 visitors.
Looking at these monthly records, these data are not small numbers.
Table 2. Data of Indonesian Tourists Visiting China
Sources: CEIC

Savitri Hendradewi, Lestari Ningrum
Indonesians Go to China, are They Satisfied?
80
Proceedings of CATEA 2019
Is the relatively increasing number of Indonesian tourists to China considered as one of the
factors indicating visitors satisfaction? Tourist satisfaction is fulfillment of tourists needs and wants
that can be measured from the comfort of facilities, security, infrastructure, attractions, and pleasant
atmosphere. Al-Ababneh (2013) stated that service quality in facilities, accessibility, and tourist
attraction have direct impacts on tourist satisfaction and will further impact on the high or low number
of tourist visits. Thus, the intention of returning tourists to the tourist attraction is influenced by the
impression obtained by the tourists and it is a manifestation of their satisfaction of the tourist
attractions, facilities, and service quality. In addition, Munhurrun, et. al (2016) stated that a new
dimension of "adventure and discovery" also plays an important role in predicting tourist satisfaction.
Accordingly, this study aims to determine the highest travel motivation of Indonesian tourists on
vacation to China and the highest sub-variables of their contentment and to find out how much travel
motivation can affect their satisfaction in traveling.
2. Related Works/Literature Review 2.1. Tourism According to the Tourism Act No. 10 of 2009, article 1, travel is traveling activities undertaken
by a person or a group of people to visit a particular place for the purpose of recreation, personal
development, or learning the uniqueness of the visited tourist attraction in a temporary time. The
World Tourism Organization (WTO) stated that tourism consists of activities of people who are
traveling somewhere and staying in different places outside their usual neighbourhood and these are
usually done not more than 1 (one) year in a row for leisure, business, and other purposes.
Furthermore, WTO classifies tourism into three (3) types: international travel, internal tourism, and
domestic tourism. In international travel, there are inbound and outbound tourism. Inbound tourism is
tourism activities which are undertaken by visitors who are non residents in a particular country which
is not their country of origin. Whereas outbound tourism is tourism activities conducted by residents
who visit a country outside their home country. Internal tourism is visiting activities done by residents
of a country to their own countries. Domestic tourism is tourism activities conducted by residents who
visit areas or destinations within the scope of their country of origin. Based on the definition from
Tourism Act, the travel activities of tourists from Indonesia to China with various destinations are
included in the category of international travel.
2.2. Travel Motivation McIntosh (1977), in Sari (2014), grouped travel motivation into four: physical motivation,
cultural motivation, social motivation, and fantasy motivation. In physical motivation, travel is driven
by the desire to restore the physical condition by resting, relaxing, exercising, or health maintaining
activities that bring back the excitement. In the cultural motivation, travel is driven by the desire to
know the culture, customs, traditions and other local arts, including those relating to cultural
objects/heritage/or cultural monuments. While in social motivation, tourists’ travel is driven by a
desire to visit someone, avoid work routines, find new friends, or do things that are considered
bringing themselves some prestige. Finally, in fantasy motivation, travel is driven by the imagination
that someone in other areas can escape the humdrum of their daily routines. An opinion from
Chetthamrongcha (2017) stated that motivation has also been referred to as
psychological/biological/social needs and wants, including internal (or emotional) and external forces.
These forces describe how individuals are pushed by motivation variables into making travel
decisions and how they are pulled or attracted by destination attributes. Most studies using tourist
motivation variables are always in conjunction with decision making (such as research conducted by
Kim, et al., 2007, Chetthamrongcha (2017). In addition, some studies have raised motivational
variables in travel, special pull and push factor motivations (such as research conducted by Ningrum,
et.al. (2017), and Jodyanne Kirkwood (2009).

Savitri Hendradewi, Lestari Ningrum
Indonesians Go to China, are They Satisfied?
81
Proceedings of CATEA 2019
2.3. Satisfaction Customer satisfaction in this digital era is very vulnerable to changes, because various sources of
information are very easy to obtain. If consumers feel dissatisfied, they will quickly move to other
services by just flicking their fingers to other online media, especially if the consumers are the Y and
Z generations who tend to have everything to be quickly obtained according to their wishes and
expectations. Satisfaction is an attributing phenomenon which together with other consumption
emotions exist in the consumer's self (Oliver, 1997 in Tjiptono & Chandra 2016: 206). Knowing
customers satisfaction is paramount for evaluation in this study, since it will work as a reflection for
Indonesian tourism to understand the wants of the most respondents, namely the generation Y and Z,
who for the next 5 to 10 years will still dominate the target of Indonesian tourism market.
Furthermore, both generations are more interested in local tourism. Some experts proposed
dimensions that can measure customers’ satisfaction, including Irawan (2008) who stated that:
1. Price is a sensitive dimension. Some consumers expect the price offered must be affordable, but
the quality of products and/or services offered must be good. But there are some consumers who
believe that high prices or good quality products and/or services are always in line with good
products and/or services and expensive prices. There cannot be good and very satisfying products
and/or services at low prices;
2. Quality of service. It is sometimes difficult to get service quality that meets consumer
expectations, because the quality of service is closely related to at least 3 elements, namely
human, system, and applied technology. This is crucial especially in tourism services that will be
connected with various aspects which will be assessed and felt simultaneously by tourists;
3. Product quality. Satisfaction will be formed if consumers can use the products purchased
according to the uses and benefits of the product. Likewise in services, consumers will be
satisfied if services in the tourism sector can provide comfort, excitement, and benefits to the
physical and spiritual of the tourists;
4. Feeling factor. If consumers are proud of using a product and or of experiencing a service and
they are confident about it, then satisfaction can be formed;
5. Ease. If consumers can use products they have purchased or enjoy the services they have bought
easily, then consumers will be satisfied;
According to Rambat, Lupiyoadi (2001: 158) in Ningrum (2016), there are five main factors that must
be considered by companies in determining the level of customer satisfaction, namely:
According to Rambat, Lupiyoadi (2001: 158) in Ningrum (2016), there are five main factors that
must be considered by companies in determining the level of customer satisfaction, namely:
1. Product quality
Customers will be satisfied if the results of their evaluation show that the products they use are of
high quality. Rational customers always demand for quality products for each sacrifice made to
obtain the product. In this case, good product quality will add value to the minds of customers.
2. Service quality
Referring to the quality of service, especially in the field of services, customers will be satisfied
if they get good service or if it meets what is expected. Satisfied customers will show the
possibility to re-purchase the same product. Satisfied customers tend to give a perception of the
company's products.
3. Emotional factor
Customers will feel proud and confident that other people will be amazed at them using products
with certain brands that tend to have a higher level of satisfaction.
4. Price
Products that have the same quality, but set a relatively cheap price will provide a higher value to
their customers.
5. Costs
Customers do not need to incur additional costs or spend more time to get a product or service to
be satisfied with it.

Savitri Hendradewi, Lestari Ningrum
Indonesians Go to China, are They Satisfied?
82
Proceedings of CATEA 2019
This study uses three sub-variables of Lupiyoadi’s theory, namely service quality, emotional and
price factors which have been appropriately analyzed to be applied for tourist satisfaction.
In the study of determining variables, the number of variables and sub-variables is very important
(Sugiyono, 2010). Determination of the number of sub-variables to be used must be adjusted to the
respondents' characteristics of research objects because basically the research instruments must be
tested for validity so that they can be comprehended, understood and experienced by the respondents
(Sudjana, 2000), for that matter this study for customer satisfaction variables only uses 3 (three) of 5
(five) variables because it has been matched with the characteristics of respondents and research
objects and proven valid for 16 legitimate instruments.
3. Material & Methodology 3.1. Data
This research data used primary data made with online media and distributed through social
media to respondents who have had a vacation in various places in China, including Hong Kong,
Beijing, Quilin, Macao, Schenzhen, Shanghai, Guangzhow, Chengdu, Zuzhaico, Jiuzhaigou,
Zhangjiajie, Fuzhou, Ningxia, Tibet, Hangzhou, Huangshan, Kunming, Tianjin, Zhuhai, Suzhou,
Harbin, Dalian, Taishan, Rugao with tourist attractions including Disneyland, Forbidden City, The
Great Wall, Tiang an Men, The Bund, Summer Palace, West lake, Wang Fu Chung, Temple of
Heaven, Xiamen, Inner Mongolia, Xi'an Old Mosque, Terracotta Warriors, Panda Forest
performances of crystal silk health center arts, Tomb of Sa'ad bin Abu Waqas, Iowu, Windows of the
world, Oriental Pearl Tower, Nanjing Road, Victoria Peak, A-ma Temple, Avenue of Star, Bird Nest,
Hall of Frame, Ladies market, Ming Tomb, Chinese Splendid, Seaside park, Pearl Oriental Shanghai,
Victoria Harbor, Shinxilla Glass Walk, Lotus Garden, Hansan Temple, Gulangyu St. Paul Ruins,
Xinghai Square, Sun Island, Dong’ao Island, 731 Museum, Shenyang 918 Museum, Shenyang Palace,
St.Sophia Church, Harbin Show Carving Festival, Central Street, St. Petersburg Phase. Paul, Madame
Tussaud, Mao Er Shan, Volgamanor, Emei Shan, and Xiamen Ying ShiCheng.
Secondary data of this research was obtained from several journals, books, and online media.
The primary data obtained were 124 respondents. Population data of visit were taken from CEIC as
many as 1.333.666 Indonesian tourists visiting China in March 2019. Therefore, by using Slovin data
sampling technique with 5% error value, the number of the sample obtained was 100. Until the
specified time target, the data managed to be obtained by this study was 124 respondents who filled
out the 16 questionnaire questions which were distributed through online media. Accordingly, this
study determined 118 respondents data be used for reliability and validity tests. They would be tested
for validity to see whether the 118 respondents understood and even experienced the statement
proposed to them (Morrisan, 2014: 103) and reliability to prove whether the respondents responded to
the statements submitted consistently (Morrisan, 2014: 99). The scale used in this study consisted of
ordinal scales of 5 levels ranging from very agree to strongly disagree to respond to the proposed
statements. It also used the nominal and interval scale for respondents' data of age, sex, occupation,
traveling community, vacation frequency to China, travel mode, and cities and tourist attractions
visited.
3.2. Method The research used survey, descriptive, and correlation method with a quantitative approach. The
methods used were considered to be able to answer the purpose of this study, which was to find out
the highest travel motivation for Indonesian tourists on vacation to China and to discover the highest
sub-variables of satisfaction, and how much travel motivation could affect tourists satisfaction. The
study used interval class formulas (Nurhayati, 2016) to analyze mean values (Aziz, 2017) in
answering the first and second objectives of the research. While correlation and regression were used
to answer the third research objective. Variable interpretation based on the interval class formula was
as follows, for the travel motivation of 1-1.80 meant very low; 1.80-2.60 was low; 2.60-3.40 was no
motivation; 3.40-4.20 was high; and 4.20-5.00 meant very high. While for satisfaction 1-1.80 meant
very dissatisfied; 1.80-2.60 was dissatisfied; 2.60-3.40 was unable to answer satisfied or not because
they did not experience it; 3.40-4.20 was satisfied; and 4.20-5.00 meant very satisfied.

Savitri Hendradewi, Lestari Ningrum
Indonesians Go to China, are They Satisfied?
83
Proceedings of CATEA 2019
4. Results and Discussion 4.1. Result
Based on the validity test, 16 statement items are declared valid (understood and experienced by
the respondents) with each item having the t_table value greater than the value of the r_tabel (0.15),
using the degree of Freedom formula (N-2 ) of 118 samples used in the calculation of the overall 124
respondents. While the reliability test value shows the number 0.890 which means the level of
consistency of respondents in responding to the 16 statements in this study is high.
Table 3. Case Processing Summary
N %
Cases
Valid 118 100.0
Excluded 0 .0
Total 118 100.0
a. Listwise deletion based on all variables in the
procedure.
Table 4. Reliability Statistics
Cronbach's
Alpha
N of Items
.890 16
Based on the results of the respondents' gender frequency data, female tourists are the highest
number (69.4%) while men are only 30.6%. This is in accordance with the predictions made by
Kertajaya (2009) that women will be the second potential target market who decide to travel to China
in the current 4.0 digital era. Therefore, this study has proven the predictions (Figure 1). The
respondents’ age frequency data of Indonesian tourists traveling to China is 37.1% and are dominated
by Generation Y and the millennials aged from 20 to 23 years old. This is due to the fact that they
have a tendency to love seeking new experiences such as adventure tours, explorations, and travel
(Facebook 2016 online survey research). Most of the respondents who traveled to China were
Generation Y (at 24 to 30 years of age in this study). Based on research from Lenggogini, December
18, 2017, the millennial’s life purposes is to have fun. Thus, they work to save for pursuing their
version of enjoyment. They generally shop for large financial interests, such as planning to purchase
vehicles and houses and also for consumptive matters, such as buying music concert tickets and
spending for tourism purposes which make them the first potential target market in many aspects. The
second, third and fourth highest tourists traveling to China are occupied by generations aged 31-41
years (21%), 53-63 years (20.2%) and 42-52 years (19.4%), which overall were Generation X (Figure
2). Most tourists’ jobs are employees (42.7%) who have funds to travel and it can be seen from the
data that the millennial generation, as the majority respondents of this study, have jobs (Figure 3),
while the second majority respondents mostly are students (24.2%).
Figure 1. Gender
Figure 2. Age
Figure 3. Occupation
Family (Figure 4) is still the main choice for the millennial and Y generation tourists to go on a
vacation (55.6%) with friends (33.1%), while those who decide to travel alone are only 11.3%. The

Savitri Hendradewi, Lestari Ningrum
Indonesians Go to China, are They Satisfied?
84
Proceedings of CATEA 2019
highest frequency of Indonesians on vacation to China (Figure 5) is more than 2 times (41.1%) and
the second highest is only one time when they filled out this questionnaire. Travel agent services are
still the most preferable choice for Indonesian tourists to travel to China (39.5%), traveling alone is
actually enjoyed (33.9%) and forming their own group turns out to be the third choice for Indonesian
tourists (24.2%), while the backpacker is not a choice (Figure 6).
Figure Figure 4. Holiday
Community
Figure 5. Frequency
Visit to China
Figure 6. Travel
Methods
The mean value obtained from primary data shows that physical motivation is the highest
value (3.84) followed by cultural motivation (3.79), social motivation (3.65) and fantasy motivation
(3.5). Overall, it can be said that Indonesian tourists on vacation to China are highly motivated
(3.7063). According to the characteristics of the Y and Z/millennial generation which can also be
called nomadic tourists, they are motivated because they see tourism objects in China through virtual
reality or augmented reality which is widely presented on social media. It is natural that they are the
most highly motivated for vacation because they need to refresh and get away from their work fatigue.
Furthermore, their motivation to travel to China is because they want to gain knowledge of the
history, ancient culture and dances that are available there. This is a good phenomenon for the Y and
Z generation. The fact that they were born and are living in the industrial era of 4.0 where almost
everything is digitalized to them, it is exceptional that they are still able to appreciate and enjoy
cultures. The phenomenon of a decreasing interest in ancestral culture has been predicted by Bustami
(2019) to be happening in the industrial era of 5.0. On the contrary, this study showed positive results
in the era of 4.0, against the prediction. The Y and Z/ Millennial generation fantasy motivation to visit
China is the lowest because some respondents stated that they had never visited the viral tourism
objects there, such as the Glass Bridge at high altitudes. Although unique and viral tourism objects are
these generations’ dream destination to visit, since most travel agent services have their own packages
of destinations and/or tourism objects to visit, then it is likely that the viral tourism object is not one
of them.
Table 5. Statistics of Motivation’s Variable Mean
Physical
Motivasion
Cultural
Motivasion
Social
Motivasion
Fantasy Motiva sion
N Valid 124 124 124 124
Missing 0 0 0 0
Mean 3.8495 3.7984 3.6532 3.5242
In terms of satisfaction factors, the highest level of respondents satisfaction is on the pride
(emotion) (3.9) of having traveled to China by having memories in the form of their photographs at

Savitri Hendradewi, Lestari Ningrum
Indonesians Go to China, are They Satisfied?
85
Proceedings of CATEA 2019
the tourist attractions. This also fits the Y and Z generation characters who always want to appear
different from their community by posting photos of them on vacation to China on their social media.
Price (3.6) is the second thing that satisfies them because with a considerable distance from Indonesia,
going on vacation to China is regarded as affordable. These two generations are smart in seeking
information from various online sources, so it is very easy for them to get promotional prices for both
airline tickets and accommodation. With respect to service (3.5) in the form of easy access to very
complete information, the Y and Z generation finds it easier to decide on vacation to China. Since
they are used to living in the digital era, thus getting the information they want is indeed very easy.
Table 6. Statistics of Satisfaction Variable Mean
Service
Satisfaction
Emosional
Satisfaction
Price Satisfaction
N Valid 124 124 124
Missing 0 0 0
Mean 3.5161 3.9597 3.6371
Physical motivation is the highest motivation of the respondents of this study. It only affects
37.2% of their satisfaction on vacation to China. While the relationship between physical motivation
that occurs with satisfaction is at a strong level (0.610) according to Sugiyono (2014: 250). The strong
relationship between physical motivation and satisfaction occurs because of the cause and effect
relation between the two variables. The motivation of the most respondents having vacation in China
to relieve fatigue after working hard was approved as much as 70.9% of respondents; to get refreshing
and overtime was 80.6%; because of the historical, beautiful, unique and magnificent tourist objects in
China that they saw and visited and recognized was as much as 75.8% of respondents and they were
proud to be able to capture through photos and post on their respective social media. This makes the
relationship with these two variables strong.
But why does the physical motivation only affect 37.2% of satisfaction? This is likely to
occur because the motivation to have a vacation in China is not only due to a reason to unwinding the
fatigue after hard work, but there are also some other reasons. For example, 19.3% of respondents
said refreshing was not their purpose, as well as the other 29% who said relieving fatigue after work
was never their motivation. Despite these, if all respondents' assessment of motivation is combined,
their influence became quite large. This was proven in Table 4.6 where the overall motivation of the
respondents on holiday to China can affect their satisfaction by 60.9%. This is due to the motivation
to see the culture, to be able to gather with other people on the journey, and motivation to fantasize
with the tourism objects they see and visit. Furthermore, it is strengthened with their satisfaction on
the prices ranging from airline tickets, accommodation, tour packages and entry tickets to rides and
attractions that are very affordable for the Y and Z generations. As Hirschman (1984) once stated,
motivation is related to cognitive and affective and emotional domains. Therefore, all activities
carried out by tourists must be seen as a whole involvement of the mind and/or senses.
Table 7. Correlation and Regression between variable physical motivation and Satisfaction
Model R R Square Adjusted R Square
Std. or of the Estimate
1 .610a .372 .366 .47904
a. Predictors: (Constant), physical motivation
Table 8. Correlation and Regression between variable Motivation and Satisfaction
Model R R Square Adjusted R Square
Std. Error of the Estimate
1 .780a .609 .606 .37790
a. Predictors: (Constant), motivasi

Savitri Hendradewi, Lestari Ningrum
Indonesians Go to China, are They Satisfied?
86
Proceedings of CATEA 2019
4.2. Discussion The number of women as a potential market, as Kertajaya (2009) predicted, and the Y and Z
(millennial) generations domination open a big opportunity to the Indonesian tourism market.
According to the data of this study, the Y and Z/Millennial generation, on average, have income, so
they can travel, which should be directed more to local tourism. It is in accordance with the
characteristics of Y and millennial generations who tend to be nationalist when choosing tourist
destinations (Lenggogini, Sari, December 18, 2017). Women both at work and as housewives have
become a source of major influence to their surrounding environment (Kaihatu, Thomas S, et al.
2014), especially their nuclear and extended families in deciding both family needs and even
traveling. Evidently, the family is the first choice this study has chosen as a community on vacation.
In accordance with the culture of Indonesian society in general, the family is the first priority, so for
the Y and millennial generation who are the highest number of respondents in this study and most of
them have income, their family culture is still strong. This is contrary to some projections and
research (Ardhashbc003, February 3, 2015) which state that the future risks of the millennial
generation are the weakening manners and respect for each other. Based on the results of this study,
these predictions can be denied, because they have not been proven otherwise.
Facts show that China is a destination choice that is quite often visited by Indonesian tourists in
respect to the country’s big number of tourist objects and vast regions like Indonesia which also has
many tourism objects across the country. This fact is in line with the most respondents’ (Y and
millennial generation) similar characteristic that is love to find new experiences, including adventure
tours, exploration, and travel. Indonesian tourists who may be on their first vacation to China prefer
using the services of a travel agent with a local guide. While those who visit for the second time or
more prefer traveling alone without using travel agent services or a local guide. In the current
industrial era of 4.0, it is predicted that the role of a tour guide can be replaced by information
technology. Unfortunately, this assumption cannot be proven at this time through the results of this
study, especially for tourists who visit a particular country for the first time. But the tour guide role
can no longer be needed for tourists who visit the same country for the second time or more.
The characteristics of generation Y and Z (Sipayo.com, May 3, 2017) that tend to be hard-
working, ambitious, and looking for challenges to gain the professional life they desire, demand them
to live so intensely and often work overtime. With respect to generation Z, they are very serious about
their career progress, but they live and work with the aim of having fun. So, it is only natural that their
motivation for vacation for refreshing and running away from the fatigue of daily work is the highest.
Motivation on vacation with the aim of obtaining pleasure in fantasies predicted by some tourism
enthusiasts (Renzulli, June 13, 2017) is something that is particularly sought after by the Z generation,
something that the Minister of Tourism, Mr. Arif Yahya, refers to as the characteristic of nomadic
tourism. In this research, where the majority of respondents were a mix between Y and Z generations,
fantasy motivation is not the main holiday destination but is the final choice.
It has been determined that one of the characteristics of Generation Z in terms of job satisfaction
is they prioritize respect over the establishment. The same applies to the level of satisfaction in
receiving services. The Z generation prioritizes the services they receive which respect them as
consumers. Moreover, with their sophisticated capabilities in information technology makes it
possible for them to search for information simply by tapping their fingers on computers or gadgets to
choose or switch services and/or products they will buy. In terms of traveling to China, generation Y
and Z value their highest satisfaction from the pride of being able to post their photos on their social
media so that they gained recognition from their community. Those who were satisfied could visit the
same country again several times to explore other objects. Likewise, with the prices and information
they get, they can do it again more easily. There is no need for them to make a long plan because they
can find affordable prices from various information that is widely available for a vacation in China.

Savitri Hendradewi, Lestari Ningrum
Indonesians Go to China, are They Satisfied?
87
Proceedings of CATEA 2019
5. Conclusion
1. The main motivations of the Y and Z generations, as the highest respondents, on vacation to
China, were to release fatigue and refresh after hard work and enjoy the knowledge of ancient
history, and the motivation of Indonesian tourists to visit China is high (3,7063).
2. They got the highest satisfaction because they were impressed when visiting tourism objects, were
pleased when they also got memories in the form of beautiful photos, and their contentment with
their visit to China was in the satisfied category (3.7043).
3. Motivation to have a vacation in China influenced respondents' satisfaction by 60.9%.
4. What can be learned from the results of this study for Indonesia with the same number of tourism
objects as China is to understand the motivation and satisfaction sought by the Y and Z
generations who for the time being and for the next 5 to 10 years are expected to control the target
of Indonesia's tourism market, by developing the concept of nomadic tourism more seriously and
well prepared.
5. Further research can continue similar study using the same variables with more respondents or by
using other dependent variables, for example using the theory of happiness.
Acknowledgment. An expression of gratitude is given to the tour leaders involved, the parents of
students of Santa Theresia Tourism Senior High School Jakarta, Indonesia and the colleagues who
had visited China as tourists and took part in this research.
References
Agmasari,Silvita. (2019, January 31). Motivasi dan Faktor Lain yang mempengaruhi Orang Indonesia Berwisata.
Retrieved form https://travel.kompas.com/read/2019/01/31/122925827/motivasi-dan-faktor-lain-yang-
mendorong-orang-indonesia-berwisata, 5th
May, 2019.
_____________. (2019, January 31). Membandingkan Motivasi Berwisata Setiap Penduduk Negara. Retrieved
from https://travel.kompas.com/read/2019/01/31/160600127/membandingkan-motivasi-berwisata-setiap-
penduduk-negara, 5th
Mei, 2019. Al-Ababneh, M,”Service Quality and its impact on Tourist Satisfaction,” Interdisciplinary Journal of
Contemporary Research in Business vol. 4 nomor 12 April 2013, p.164-176. Aziz, Tengku Ariefanda, M. Syamsul Ma’rif, & Anggraini Sukmawati., “Pengaruh Rekrutmen dan Seleksi
Terhadap Kinerja”, Jurnal Aplikasi Bisnis dan Manajemen, 3(2) (2017). ISSN 2528-5149.
Ardhashbc003. (2015, February 3). Perbedaan Karakter & Pola Pikir Generasi Baby Boomers Hingga Generasi
Alpha. Retrieved from https://ardhashbc003.wordpress.com/2015/02/03/perbedaan-karakter-pola-pikir-
generasi, 11th
April,2019.
Cha, S., Mccleary, K.W., & Uysal, M,”Travel motivations of Japanese overseas travelers: A factor-cluster
segmentation approach,” Journal of travel research, Vol.34:33-39(1995).
CEIC. (n.d). Retrieved from https://www.ceicdata.com/en/indicator/indonesia/visitor-arrivals, 5 th
Mei, 2019
Chetthamrongchai P., “The Influence of Travel Motivation, Information Sources and Tourism Crisison Tourists’
Destination Image”,J Tourism Hospit 6: 278. doi: 10.4172/2167-0269.1000278. (2017).
Gnoth, J,”Tourism motivation and expectation formation,” Annals of Tourism Research, 24(2), 283-304 (1997)..
Haanpaa, Leena,”Shooping For Fun of For Needs? A Study of Shooping Values, Styles and Motives of Finnish
Consumers in 2001-2003” (The First manuscript), In the proceeding of The 7th
Conference of Europe
Association, Torun, Poland, September 9-12, 2005. (2005).
Hirschman, Elizabeth C., “Experience Seeking: a Subjectivist Perspective of Consumption,” Journal of Business
Research, Vol.9, No. 2, 132-140. (1984).
Indonesia. Undang-Undang Nomor 10 Tahun 2009 Tentang Kepariwisataan
Ingkadijaya, Rahmat,”Family Tourist - Is Different Motive, Different Choice Of Tourist Activity?,” E-Journal
Of Tourism, [S.L.], P. 72-84, Sep. 2018. ISSN 2407-392x.
Irawan, Handi.,” Membedah strategi Kepuasan pelanggan, Cetakan pertama”, Jakarta : Pradnya Paramitha,.
Kelompok Gramedia. 2008.
Jodyanne Kirkwood,"Motivational factors in a push‐pull theory of entrepreneurship", Gender in Management:
An International Journal, Vol. 24 Issue: 5, pp.346-364, https://doi.org/10.1108/17542410910968805
(2009)

Savitri Hendradewi, Lestari Ningrum
Indonesians Go to China, are They Satisfied?
88
Proceedings of CATEA 2019
Kaihatu, Thomas.S, Leonid Julivan Rumambi dan S. Pantja Djati. (2014, July 25), Membidik Pasar ibu di
Indonesia Sebuah Kajian Efektivitas Pemilihan Media. Retrieved, from
http://www.researchgate.net/publication/43649463_membidik_pasar_ibu, 11th
April,2019.
Kertajaya, Hermawan., “New Wave Marketing,” Jakarta: Gramedia Pustaka Utama, 2009.
Kim, HH, Shin, CM, Park, CH, Kim, KH, Cho, KH & Eun, HC., “Eicosapentaenoic acid inhibits UV-induced
MMP-1 expression in human dermal fibroblast,” Journal of Lipid Research, vol. 46, pp.1712-20 (2005).
doi: https://doi.org/10.24922/eot.v5i2.41704. Lenggogini,Sari. (2017, December 18). Memahami Selera Wisatawan Milenial, retrieved, from
https://travel.kompas.com/read/2017/12/18/193326627/memahami-selera-wisatawan-milenial?page=all..
Kompas.com, . 24 th
Januari, 2019.
Munhurrun,P.Ramseook, P. Naidoo, V.N. Seebaluck, P. Pillai,”The Impact of Destination Service Quality on
Tourist Satisfaction and Loyalty:Evidence from Mauritius,” In the Proceedings of the International
Academic Research Conference on Marketing & Tourism (MTC16Paris Conference) ISBN: 978-1-
943579-40-2 Paris, France. 1-3 July, 2016. Paper ID: PM611 McIntosh.,”Karakteristik Wisatawan,” Yogyakarta:ANDI,1977.
Morissan.,”Teori Komunikasi: Individu Hingga Massa,” Jakarta:Kencana,2014.
Ningrum, Lestari, Fachrul Husain Habibie, Faditya Rosianty, “Kepuasan Peserta Event Hunting Foto di 5 kota
di Indonesia (dalam ruang lingkup ekonomi kreatif),” Jurnal Ilmiah Pariwisata, [S.l.], Vol. 21, n. 1, p. 25-
33, july 2016. ISSN 2599-0209. Available at:
<http://jurnalpariwisata.stptrisakti.ac.id/index.php/JIP/article/view/41>. .(2016). Date accessed: 09 th
April,
2019.
Ningrum, Lestari and Syarifah Mawaddah.” Push and Pull Factors for Medical Tourism Toward Purchase
Decision,” Beau Bassin, Mautitius: Lambert Academic Publishing. ISBN : 978-620-2-06764-5, 2017
Nurhayati, Tini.,”Pengaruh Rekrutmen Terhadap Kinerja Karyawan (Studi Kasus Pada Hotel Bintang Lima
Pekanbaru),” Jurnal Online Mahasiswa Fakultas Ilmu Sosial dan Ilmu Politik, 3(1), 4-5. (2016).
Olliver, Richard, “Satisfaction a Behavior Perspective on The Customer,” New York. Mc Graw Hill. 1997.
Pitana, I Gde and Gayatri, Putu G,“Sosiologi Pariwisata”, Yogyakarta: Andi Offset, 2005
Pratiwi, Pricilia Indah. (2018, November 7). 2013 Cina Diprediksi Jadi Negara yang Paling Banyak Dikunjungi.
Retrieved from https://kbr.id/berita/internasional/11-
2018/2030_cina_diprediksi_jadi_negara_yang_paling_banyak_dikunjungi/98052.html, 5 th
Mei, 2019.
Rambat, Lupiyoadi,”Manajemen Pemasaran Jasa Berbasis Kompetensi, Edisi 3,” Jakarta : Salemba Empat,
2001
Renzulli,Kerri Anne.(2017,June 13). This is The Age When You Become ‘old’, According to Four Different
Generations. Retrieved form https://goo.gl/cTymz4, 12 th
February, 2019.
Santoso, Singgih and Lucia Nurbani Kartika, “Motivasi dan Perilaku Wisatawan Generasi Muda Saat Berwisata
di Yogyakarta”, JRMB Volume 13, No. 1 p. 51, Juni 2018 (2018)..
Sari, Fitria,”Tinjauan Terhadap Motivasi Wisatawan berkunjung ke Objek Wisata Air Terjun AEK Martua
Kabupaten Rokan Hulu Provinsi Riau,” Jurnal Jom FISIP Volume I No.2. (2014).
Sipayo.com. (2017,May 3). Karakter 4 Generasi, Baby Boomer, X,Y, dan Z dalam Dunia pekerjaan. Retrieved
form https://goo.gl/epGLC9, 12 th
February, 2019.
Sudjana,“Metode Statistika,” Bandung: Tarsito, 2000.
Sugiyono, “Metode Penelitian Pendidikan: Pendekatan Kuantitatif, Kualitatif, dan R&D,” Bandung: Alfabeta,
2010.
Sugiyono, “Metode Penelitian Kuantitatif, Kualitatif, dan Kombinasi (Mixed methods,” Bandung: Alfabeta,
2014.
Sophonsiri, Suvenus, Paradee Yasothornsrikul and Kawpong Polyorat, “Travel Motivation of Domestic College
Students in Thailand”, In the proceeding of The 9th
Apachrie Conference Hongkong 2011Hospitality and
Tourism Education: From a Vision to an Icon. (2011). Swanson, K.K., & Horridge, P.E,”Travel motivations as souvenir purchase indicators,” Tourism Management,
27, 671-683(2006).
Tjiptono, Fandy dan Gregorius Chandra,”Service, Quality & satisfaction,” Yogyakarta. Andi, 2016
Vuuren, C. Van dan Slabbert, Elmarie,”Travel Motivations And Behaviour Of Tourists To A South African
Resort,” Book of Proceedings I – in The International Conference On Tourism & Management Studies
– Algarve: p. 295-304. (2011).
Worldatlaas.(n.d). Retrieved from https://www.worldatlas.com/articles/10-most-visited-countries-in-the-
world.html, 5 th
May 2019.

89
Proceedings of CATEA 2019
Proceedings of CATEA 2019
ISBN 978-623-91018-0-0
Ecotourism Development Strategy
at Situ Gede Bogor
Imam Ardiansyah
Hospitality and Tourism Study Program, Bunda Mulia University
Abstract: This study aims to determine the potential and strategy for developing natural ecotourism in the Situ
Gede Bogor. The research method used through survey and interview. The objective of this study is to identify
the existing conditions,The analysis of the quality and potential of Situ Gede Ecotourism in Bogor as a tourist
attraction so that the development directions in the city of Bogor can be formulated as a tourist attraction. Based
on Internal Analysis of Strategic Factor Analysis Summary (IFAS) and External Strategic Factor Analysis
Summary (EFAS) the following calculations are carried out: the number of strengths and opportunities (S + O)
= 1.46+ 1.37 = 2.83, number of weaknesses and opportunities (W + O) = 1.43 + 1.37 = 2.80, number of
strengths and threats (S + T) = 1.46 + 1.63 = 3.09, number of weaknesses and threats (W + T) = 1, 43 + 1.63 =
3.06. The calculation results show that the number of strengths and threats get the greatest results so that the
chosen strategy is the Strategy Strength - Threats. This strategy uses the power it has to avoid threats that come
from the outside environment. The development strategy is to increase public awareness by providing
socialization about the benefits of the existence of the Situ Gede Ecotourism Area.
Keywords: Ecotourism; IFAS; EFAS; Development Strategy; Situ Gede Bogor
1. Introduction
The entire tourist attraction object is a resource that has high economic value as well as a means
of education and environmental preservation. The use of natural resources and the environment as
well as concern for the surrounding community in conservation areas is in line with the vision of
ecotourism development namely biodiversity conservation and its ecosystem as well as local
community empowerment. Ecotourism is one of the fastest growing segments of the sustainable
tourism industry, which focuses on wildlife conservation, environmental protection, poverty
alleviation and economic development (Anup,2016).
In all attempts to define and theoretical approaches to ecotourism (Cheia,2013), the most common
feature is that it is based on the work of nature, even in the most sensitive and restrictive areas to
human access, and simultaneously, the concern for conservation or environmental protection.
Ecotourism benefit (Cusak & Dixon, 2006) helps in the conservation of natural, cultural and built
resources and maintains the quality of life of local area. With an objective of environmental
conservation, it creates sustainable economic development and balances the conflicting goals of
economic development and biodiversity conservation. In ecotourism (Degang & Xiaoting,2006) local
people realize the importance of conservation and protect the environment in an active manner. They
maintain national standards of atmospheric quality, sound quality, drinking water, sewage, lampblack
and all kinds of establishments. Community-based ecotourism is the best option in an area which is

Imam Ardiansyah Ecotourism Development Strategy at Situ Gede Bogor
90
Proceedings of CATEA 2019
conserved, owned and managed by a community to gain income by operating a tourism enterprise
(Das & Syiemlieh, 2009).
Bogor which has a geographical position in the middle of the Bogor Regency region and its
location close to the capital city of DKI Jakarta, makes it strategic in the development and growth of
economic activities. Bogor Botanical Gardens and Bogor Palace are attractive tourist destinations.
The position of Bogor City between the destinations of Puncak or Cianjur is also a strategic potential
for economic growth to date. There are around 14 attractions in the city of Bogor. The main tourist
attraction of Bogor City in 2018 included the Botanical Gardens, Bogor Palace, and Cimanggu
Country Club. This is measured by the level of tourist visits to the place which is relatively higher
than the level of visits to other tourist objects, as can be seen in Table 1 below.
Table 1. Number of Visits to Tourism Objects in Bogor 2013-2017
No Tourism
Object
2013 2014 2015 2016 2017
1 Kebun Raya
Bogor
1.040.083 1.185.381 1.113.369 940.086 1.432.666
2 Istana Bogor 45.276 150.098 112.017 117.887 661.592
3 Country
Club
Cimanggu
203.956 256.568 321.808 328.670 479.338
4 Museum
Zoologi
127.989 215.531 212.604 211.745 362.349
5 Museum
Etnobotani
32.288 44.809 3.872 3.804 6.333
6 Museum
Tanah
26.477 38.719 38.809 39.843 46.772
7 Museum
PETA 22.398 36.102 13.405 13.173 15.667
8 Museum
Perjuangan
Bogor
30.618 37.556 31.867 29.930 26.667
9 Prasasti
Batutulis
28.899 29.337 16.327 15.182 22.868
10 Situ Gede 26.387 50.743 36.640 37.211 31.236
11 Plaza
Kapten
Muslihat
30.756 30.756 33.829 19.429 24.446
12 Jungle Fest - 181.250 221.446 116.388 121.438
13 The Jungle 305.745 426.820 653.101 665.745 589.820
14 Rancamaya
Country
Golf
40.079 80.519 39.120 41.211 95.366
Based on the description above, tourism in Bogor has the potential to be more inviting to the
number of tourists who will come to visit and it is also necessary to know the priority scale of the
development of tourism objects so that it can attract more domestic and foreign tourists. The process
of tourism development is closely related to various aspects and components of development, both
community development and the development of the state and nation. In order for all these
components to be able to benefit from tourism development proportionally and contribute according

Imam Ardiansyah Ecotourism Development Strategy at Situ Gede Bogor
91
Proceedings of CATEA 2019
to tourism development, tourism development is generally directed through two approaches, namely
sustainable development approaches and market approaches. Tourism development is not intended to
exploit tourism resources but is sought to empower these resources so that they can provide the best
benefits for people who live in tourist sites.
Based on the data filed in Situ Gede the conditions that are poorly maintained and of concern due
to waste caused by the increased of tourist that comes, siltation due to sedimentation and the result of
unclear boundaries between the land and the community's land that makes an attempt to encroach on
the area and use it without permission by the community. In addition, the lack of tourism support
facilities such as accommodation, restaurants and other facilities as well as tourism promotion makes
the potential of the site less visible. The current situation of Situ Gede makes the potential of the area
as a tourist attraction not being utilized properly, so that the interest of tourists to visit will slowly
decreased if is not well maintain.
Based on the description above, ecotourism in Bogor has the potential to be more inviting to the
number of tourists who will come to visit and it is also necessary to know the priority scale of the
development of tourism objects so that they can attract more domestic and foreign tourists to increase
foreign exchange. The problems that exist in the description of the problem formulation, this study
aims to analyze how the strategy in developing the ecotourism area in Situ Gede Bogor.
2. Literature Review
2.1 Ecotourism
Eco tourism, natural resources, cultural heritage, rural lifestyle and an integrated tourism is a type
of local economic activities. Therefore, ecotourism in naturel and cultural areas was carried out with a
number of elements in their natural landscape and cultural landscape (water, vista, topography,
vegetation, clean air), as well as in the variety of recreational activities suitable for all kinds of
environments. Therefore, ecotourism and its natural assets and raw materials to create, as well as
directing people to travel is an attractive force (Kiper, 2011). Ecotourism is an alternative tourism
model that respects host communities and their sociocultural and natural environment and has
balanced development as its target (Jafari, 2005). According (OMT,2014) Ecotourism is currently
defined as a purposeful travel to natural areas to understand the culture and natural history of the
environment, taking care not to alter the integrity of the ecosystem, while producing economic
opportunities that make the conservation of natural resources beneficial to local people.
In their analysis of the concept (Donohoe & Needham,2006) identified six principles underlying
ecotourism: reliance on nature, conservation purposes, environmental education, sustainability,
equitable distribution of benefits, ethical responsibility for both local population and tourists.
Ecotourism generates local benefits and also affects the way tourists perceive, experience and learn
about nature, its landscape, flora, fauna and habitats, as well as cultural relics (Kiper, 2013).
Therefore, ecotourism has the potential to increase environmental awareness of both the local
population and tourists. Hence, it is highly recommended that visitors are educated and prepared in
advance to interact with the host community (Dubin and Durham, 2008).
Ecotourism is a model of tourism that envisages an alternative way of development that conserves
natural areas and promotes social welfare and economic diversification within a framework of
sustainability in economically marginalised communities (poor, indigenous, rural) (Garraway, 2009).
The destinations are located in marginalised areas characterised by lack of monetary resources, local
skills and mechanisms to ensure fair distribution of benefits, in addition to poor commercial links and
experience in planning, finance and product development (Coria and Calfucura, 2012). Government
intervention to overcome economic difficulties has been absent, resulting in migratory flows towards
the central regions, weak domestic economic relations and a lack of effective policies and economic
control over decisions that affect local welfare (Hall and Boyd, 2005). Although empowerment is
necessary for development, sustainability and preservation of natural resources, the ability of
localities to receive large numbers of tourists must be considered so as to avoid a risk of benefits not
reaching the community.

Imam Ardiansyah Ecotourism Development Strategy at Situ Gede Bogor
92
Proceedings of CATEA 2019
2.2 Strategy Development
A strategy defined as a deliberate conscious set of guidelines that determines decisions into the
future (Mintzberg & Henry, 2007) . It is explicit, developed consciously and purposefully, and made
in advance of the specific decisions to which it applies. Mintzberz, points out that people use
"strategy" in several different ways, the most common being these four:
1. Strategy is a plan, a "how," a means of getting from here to there.
2. Strategy is a pattern in actions over time; for example, a company that regularly markets very
expensive products is using a "high end" strategy.
3. Strategy is position; that is, it reflects decisions to offer particular products or services in
particular markets.
4. Strategy is perspective, that is, vision and direction.
Strategy is not all about competitive position, about differentiating yourself in the eyes of the
customer, about adding value through a mix of activities different from those used by competitors
(Porter,2008). Porter defines competitive strategy as "a combination of the ends (goals) for which the
firm is striving and the means (policies) by which it is seeking to get there."
2.3 SWOT Analysis
SWOT is an acronym for the internal Strengths and Weaknesses of a firm and the environmental
Opportunities and Threats. The analysis is based on the assumption that an effective strategy derives
from a sound “fit” between a firm’s internal resources and its external situation (Pearce & Robinson,
2008). SWOT analysis outlines the strategic strengths, weaknesses, opportunities, and threats to
determine an organization’s competencies as well as identify future opportunities explained the
definition of strengths, weaknesses, opportunities, and threats:
1. Strengths are those points where a company has a competitive advance in comparison with
their competitors.
2. Weaknesses are those points where a company has a competitive disadvantage in
comparison with their competitors.
3. Opportunities are characteristics of the external environment that have the potential to help
the organization to achieve its strategic goals.
4. Threats are characteristics of the external environment that may prevent the organization
from achieving its strategic goals.
An EFAS (External Factors Analysis Summary) table is one way to organize the external factors
into the generally accepted categories of opportunities and threats as well as to analyze how well a
particular company’s management (rating) is responding to these specific factors in light of the
perceived importance (weight) of these factors to the company (Hunger & Wheelen, 2010). IFAS
(Internal Factor Analysis Summary) table is one way to organize the internal factors into the generally
accepted categories of strengths and weaknesses and to analyse how well a particular company’s
management is responding to these specific factors in light of the perceived importance of these
factors to the company.
3. Material & Methodology 3.1 Study Area
The research was conducted on the edge of the Dramaga Forest, which is a research forest owned
by the Forestry Research and Development Agency, the Ministry of Forestry, the lake which has an
area of about 6 hectares is a daily recreation area for Bogor residents. This tourist location is
approximately 10 km from the center of Bogor City, or about 3 km north of Bubulak Terminal. Situ
Gede is actually close to, or in one system, with several others nearby. Namely Situ Leutik (now
gone), Situ Panjang, and Situ Burung. The latter is located in Cikarawang Village, Dramaga District,
Bogor Regency. Geographically it is located on 6 ° 33′8.1 ″ LS, 106 ° 44′46.5 ″ BT.

Imam Ardiansyah Ecotourism Development Strategy at Situ Gede Bogor
93
Proceedings of CATEA 2019
3.2 Data Collection
The source of this research data is in the form of qualitative and quantitative data that can be
calculated or processed using statistics to draw conclusions, such as weighted average and assessment
of tourists on the development of ecotourism of Situ Gede Bogor. The data was taken by purposive
sampling by using a sampling tourism destination that was perform through questionnaire assessment,
including visitor perception to assess of 100 visitors who had visited Situ Gede Bogor. The visitor
took the assessment including visitor perceptions on supporting ecotourism attraction.
3.3 Data Analysis
The obtained data was analyzed by using the SWOT analysis, comparing the internal and
external factors in the form of IFAS (Internal Factor Analysis Summary) matrix and EFAS (External
Factor Analysis Summary) matrix quantitatively. Each factor was given a value rating from 1 to 4 (1=
the underlying weakness; 2= minor weakness; 3= sufficient strength; and 4= great strength). The final
result could be determined by the amount of weight multiplied by the value. The results of
EFAS/IFAS matrix became coordinate points in the SWOT diagram. IFAS matrix, if the value was
more than 2.5 showed that there was more strength than weakness. This also applied to EFAS matrix,
if the value was more than 2.5, it showed that there was more opportunities than threats. In addition,
the determination of performing SWOT analysis was to analyze the advantages and disadvantages of
an ecotourism location as well as suggestions for improvement of ecotourism plan.
4. Results and Discussion
4.1 Visitor Perception on Ecotourism Situ Gede Bogor
Characteristics of Respondents
Results of a survey conducted with a sample of 100 respondents that visited Situ Gede Bogor
from the period of February – March 2019. The general profile of respondents was presented in Table
2.
Table 2. Profile Respondent
Variable Total %
Gender
Male
Female
62
38
Age
15 – 25
26 – 35
36 – 45
46 – 55
56
23
42
15
12
8
Occupation
Student
Employee
Entrepreneur
Other
24
42
18
16
Visits
1-2 times
3-5 times
5 times
35
55
10

Imam Ardiansyah Ecotourism Development Strategy at Situ Gede Bogor
94
Proceedings of CATEA 2019
Visitor Perception on Ecotourism Situ Gede Bogor
One effort to achieve success in developing a region is by involving the local community in
activities. With the community involvement in the development and management of tourist attractions
it will have a positive impact on the sustainability and sustainability of the ecosystem around the
object. Most of the people (75%) stated that they did not know what was meant by ecotourism. Only
20 % of respondents knew the function of a tourist attraction and only 15% knew the impact of the
existence of a tourist attraction.
Table 3. Visitor Perception at Situ Gede Bogor
No Activities Yes No Number Respondent
1 Knowledge :
a. The meaning of natural tourism
b. Function of Tourism Objects
c. Impacts that arise
25
32
20
75
68
80
100
100
100
2 Development of Tourism Objects 27 73 100
3 Participation in Tourism Activities 42 58 100
Table 4. Visitor Comment at Situ Gede Bogor
No Visitor Comment
1 Need to add facilities and infrastructure such as: public toilets, changing rooms,
trash bins, security facilities
2 The government must be more serious in developing natural attractions
3 It is necessary to place supervisors to avoid accidents to visitors
4 Environmental cleanliness must always be maintained
5 Need to add children's play area
6 Outbound facilities and water sports facilities need to be made
4.2 SWOT Analysis Development of Ecotourism in Situ Gede, Bogor
SWOT analysis is a qualitative analysis used to identify various factors systematically to
formulate a strategy for an activity. This analysis is based on logic that can maximize the strength and
opportunity of an activity, which can simultaneously minimize weaknesses and threats (Rangkuti,
2008). In accordance with the conditions and potential and responses from the local community and
visitors, a SWOT analysis was conducted (Strengths, Weakness, Opportunity and Threats. So the
results of the analysis can be used as a basis for developing Situ Gede ecotourism in the future. It is
expected that SWOT analysis ecotourism development can be more directed and in accordance with
the potential that exists. With this SWOT analysis all aspects related to ecotourism are grouped into
two namely internal groups and external groups. Internal groups are strengths and weaknesses, while
external groups are opportunities (opportunities) and challenges / threats. Based on the information
and research at the location, a description of the SWOT analysis was obtained as follows:
1. Strength
a. Have a very diverse tourism potential, namely beautiful panorama, endemic flora and fauna
wealth, and customs that are still maintained.
b. The community is very friendly, open and ready to accept tourists.
c. Availability of good road access to tourist sites.
d. Support of the local community in preserving nature around the area of Situ Gede.
e. Local community support is very strong to facilitate ecotourism in the Situ Gede.
f. In addition, funding was also provided by the Local Government to develop facilities in the
area around the Situ Gede area and the existence of the “Kelompok Sadar Wisata”.

Imam Ardiansyah Ecotourism Development Strategy at Situ Gede Bogor
95
Proceedings of CATEA 2019
2. Weakness
a. Tourist signs and restrictions are not yet available.
b. Lack of promotion for tourists.
c. Inadequate availability of supporting facilities for cleanliness, such as trash bins and public
toilets.
d. The local government has not fully paid attention to natural tourism as a source of increasing
community welfare and local revenue sources.
3. Opportunities
a. A safe and conducive condition will attract tourists.
b. Decreasing natural resources that cannot be renewed, such as; coal, petroleum and others,
which raises the thought of looking for potential natural resource alternatives that can be
developed.
c. The community has begun to know the impact of excessive damage to natural resource use.
d. Community attention to natural sustainability is increasing, so that it is expected to make
ecotourism a target where they overcome boredom (back to nature).
4. Threat
a. The development of ecotourism will certainly have a negative impact on both the region and
the socio-cultural community, such as the existence of environmental pollution from the
smoke of motorized vehicles by tourists and the presence of foreign cultures that are
accidentally displayed by foreign tourists.
b. The existence of illegal logging in the production forest area and protected forest around Situ
Gede Forest will make the lake water discharge decrease and will cause high erosion on the
surface.
c. The protected forest area in Situ Gede Forest has not been managed optimally.
Furthermore, the description above is compiled in a development strategy based on a
combination of strengths with opportunities to be S-O strategies, strengths with threats become S-T
strategies, weaknesses with opportunities become W-O strategies, and weaknesses with threats
become W-T strategies. In complete analysis of internal and external factors the development of Situ
Gede ecotourism is summarized in the Internal Strategic Factor Analysis Summary (IFAS) and
External Strategic Factor Analysis Summary (EFAS) on table 5.
Table 5. EFAS/IFAS Table Summary
Internal Strategic Factor Analysis Summary (IFAS) Weight Rating Score
Strengths
1. Has a very diverse tourism potential, namely
beautiful panorama, endemic flora and fauna wealth,
and customs that are still maintained.
2. The community is very friendly, open and ready to
accept tourists.
3. Availability of good road access to tourist sites.
4. Support of the local community in preserving nature
around the area of Situ Gede.
5. Local community support is very strong to facilitate
ecotourism in the Situ Gede area.
6. In addition, funding was also provided by the local
Government of Bogor to develop facilities in the area
around the Situ Gede area and the existence of the
Group “ Sadar Wisata”
0,12
0,08
0,07
0,08
0,08
0,09
4
3
2
2
1
4
0,48
0,24
0,14
0,16
0,08
0,36

Imam Ardiansyah Ecotourism Development Strategy at Situ Gede Bogor
96
Proceedings of CATEA 2019
Total Strengths 0,52 1,46
Weaknesses
1. Tourist signs and restrictions are not yet available.
2. Lack of promotion for tourists.
3. Inadequate availability of supporting facilities for
location cleanliness, such as trash bins and public
toilets.
4. The Local Government of Bogor has not fully paid
attention to natural tourism as a source of increasing
community welfare and local revenue sources.
0,12
0,09
0,14
0,13
1
4
4
3
0,12
0,36
0.56
0.39
Total Weaknesses 0,48 1.43
Total (S+W)
1.00 2,89
External Strategic Factor Analysis Summary (IFAS) Weight Rating Score
Opportunities
1. A safe and conducive condition will attract tourists
2. Decreasing natural resources that cannot be renewed,
such as; coal, petroleum and others, which raises the
thought of looking for potential natural resource
alternatives that can be developed.
3. The community has begun to know the impact of
excessive damage to natural resource use.
4. Community attention to natural sustainability is
increasing, so that it is expected to make ecotourism a
target where they overcome boredom.
0,12
0,14
0,11
0,14
4
1
3
3
0,48
0.14
0,33
0,42
Total Opportunities
0,51 1.37
Threats
1. The development of ecotourism will certainly have a
negative impact on both the region and the socio-
cultural community, such as the existence of
environmental pollution from the smoke of motorized
vehicles by tourists and the presence of foreign
cultures that are accidentally displayed by foreign
tourists.
2. The existence of illegal logging in the production
forest area and protected forest around Situ Gede
Forest will make the lake water discharge decrease
and will cause high erosion on the surface.
3. The protected forest area in Situ Gede Forest has not
been managed optimally.
0,16
0,15
0,18
4
3
3
0,64
0,45
0,54
Total Threats 0,49 1,63
Total (T+O) 1,00 3
Description: 1) Weight scale starts from 1.0 (most important) to 0,0 (not important), based on the
influence of these factors on the strategic position of development. All of these weights should not
exceed the total score of 1.00. 2) Rating scale starts from 4 (outstanding) up to 1 (poor), based on the
influence of these factors on conditions. Positive variables (all variables included in the power
category) are given values ranging from +1 to +4 (very good) by comparing them with the industry
average or with the main competitor. While the variables are negative, the opposite.

Imam Ardiansyah Ecotourism Development Strategy at Situ Gede Bogor
97
Proceedings of CATEA 2019
Based on IFAS and EFAS, the calculation is as follows: number of strengths and opportunities (S
+ O) = 1.46+ 1.37 = 2.83, number of weaknesses and opportunities (W + O) = 1.43 + 1.37 = 2 , 80,
number of strengths and threats (S + T) = 1.46 + 1.63 = 3.09, number of weaknesses and threats (W +
T) = 1.43 + 1.63 = 3.06. The calculation results show that the number of strengths and threats get the
greatest results so that the chosen strategy is the Strategy ST that uses the power it has to avoid threats
that come from the outside environment.
The strategy position chart of Situ Gede ecotourism development will be illustrated through the
following formulation, determining the axis of the external factor = OT = 1.37 - 1.63 = - 0.26 and the
internal factor axis = SW = 1.46-1.43 = 0,03. These results can be seen in the position of developing
Situ Gede ecotourism which is located in Quadrant II, namely the ST strategy. The ST strategy is a
strategy to use all of the power to avoid threats by increasing public awareness by providing
socialization about the benefits of the existence of the Situ Gede Bogor.
Opportunities
1.0
III I
0.5
Weaknesses Strengths
0.03
1.0 0.5 0.5 1.0
0.26
IV 0.5 II
1.0
Threats
Figure 1. Grand strategy matrix ecotourism development Situ Gede Kota Bogor
4.3 Statement of results
Based on the SWOT analysis the Situ Gede Ecotourism area was on a positive point on the Y
axis. Based on internal and external factors, Situ Gede Ecotourism Area could be combined into a
form of strategy analysis to see the linkages between the two factors. This analysis is useful in
planning efforts in the development of the Situ Gede Ecotourism area. In the formulation of the
strategy, it is made in a SWOT analysis matrix that can be seen in Table 6.

Imam Ardiansyah Ecotourism Development Strategy at Situ Gede Bogor
98
Proceedings of CATEA 2019
Table 6. Matriks SWOT Analysis
Internal
External
Strengths
Has a very diverse tourism
potential.
People who are very
friendly, open and ready to
accept tourists
Availability of good road
access to tourist sites.
Support of the local
community in preserving
nature around the area of
Situ Gede.
Strong local community
support to facilitate
ecotourism in the Situ Gede
area.
In addition, funding was also
provided by the Bogor
Government.
Weakness (W)
Tourist signs and
prohibitions are not yet
available.
Weak promotion for
tourists.
Inadequate availability of
supporting facilities for
location cleanliness, such as
trash bins and public toilets.
The City of Bogor has not
fully paid attention to
natural tourism as a source
of increasing community
welfare and local revenue
sources.
Opportunities (O)
Safe and conducive
conditions will attract
tourists.
Decreasing natural
resources that cannot be
renewed, such as; coal,
petroleum and others,
which raises the thought
of looking for potential
natural resource
alternatives that can be
developed.
Communities have begun
to know the impact of
excessive damage to
natural resource use.
Community attention to
natural sustainability is
increasing
Strategy S-O
Enhance the safety of
tourism objects.
Improving the quality of
Human Resources.
Improve the quality of
services for tourists.
Made as a tourist
destination while studying
for students.
Empowering the
community to be a guide
for tracing the track.
Increase tourism
marketing
Strategy W-O
Marketing as a promotional
step through electronic
media and non-electronic
media.
Collaborating with the
government and the private
sector to improve facilities
and infrastructure.
Collaborating with investors
to help develop.
Easy accessibility to tourism
objects can be achieved by
repairing damaged roads or
widening and construction
of tourist information boards
Threats (T)
The development of
ecotourism will certainly
have a negative impact
on both the region and
the social culture of the
community
The existence of illegal
logging in production
Strategy S-T
Increase public awareness
by providing information
about the benefits of
tourism objects for them.
Invite the community to
participate in maintaining
the preservation of forests
and tourism objects in
Strategy W-T
Increase cooperation
between local communities,
tourism actors and the
government optimally.
Increased awareness to the
public about the importance
of ecotourism development.
Increase cooperation

Imam Ardiansyah Ecotourism Development Strategy at Situ Gede Bogor
99
Proceedings of CATEA 2019
forest areas and
protected forests around
Situ Gede Forest.
Protected forest areas in
Situ Gede Forest that
have not been managed
optimally.
them.
Optimizing the potential
of nature and the
uniqueness of tourism
objects.
between stakeholders in
developing ecotourism.
Conduct counseling on
Group called “Sadar
Wisata”
5. Conclusion
The main strengths offered by the Situ Gede Ecotourism Area in Bogor was the presence of flora
and fauna, beautiful natural scenery, lakes, rivers, and forests. In addition, tourist locations could be
used as research sites for students. Based on analysis, Situ Gede Ecotourism Area was in quadrant II,
which meant that this tourism object was in a favorable situation where Situ Gede Ecotourism Area
had internal strength and external threats. This strategy used the power to avoid external threats by
increasing public awareness by providing information on the benefits of Situ Gede, inviting people to
participate in protecting the environment and the community, maintaining the preservation of forests
and tourism objects in them and optimizing the potential of nature and the uniqueness of tourism
objects. Cooperation between stakeholders in developing ecotourism is the purpose intensive strategy
about the importance of ecotourism development
References
Anup, K. (2015). Role of ecotourism in environmental conservation and socioeconomic development in
Annapurna conservation area, Nepal. International Journal of Sustainable Development & World
Ecology, 251-258.
Cheia, G. (2013). Ecotourism: Definition and Concepts. Journal of tourism, 56-60.
Coria, J., & Calfucura, E. (2012). “Ecotourism and the development of indigenous communities: the good, the
bad, and the ugly. Ecological Framework, 47-55.
Cusack, D., & Dixon, L. (2006). Commimity-Based Ecotourism and Sustainability. Journal of, 157-182.
Das, N., & Syiemlieh, H. (2009). Ecotourism in Wetland Ecology. Anatolia. Journal of Tourism and Hospitality
Research, 445-450.
Degang, W., & Xiaoting, H. (2006). Coincidence and Upgrade: A Typical Case Study of Rural Ecotourism
Development. Chinese Journal of Population Resources and Environment, 45-53.
Donohoe, H., & Needham, R. (2006). Ecotourism: the evolving contemporary definition. Journal of Ecotourism,
192-210.
Dubin , J., & Durham, W. (2008). Educating ecotourists: lessons from the field. Ecotourism and and
Conservation, 141-152.
Garraway, J. (2009). Ecotourism as a means of community development: the case of the indigenous populations
of the Greater Caribbean. 11-20.
Hall, M., & Boyd, S. (2005). Nature-based Tourism in Peripheral Areas: Development or Disaster. Channel
View Publications.
Hunger, J., & Wheelen, T. (2003). Strategic Management. Yogyakarta: Andi.
Jafari, J. (2005). El turismo como disciplina científica. Política y Sociedad, 39-56.
Kiper , T. (20115). Role of Ecotourism in Sustainable Development, Advances in Landscape Architecture.
Retrieved from www.intechopen.com/books/advances-in-landscape-architecture/role-of-ecotourism-in-
sustainabledevelopment .
Kiper, T. (2011). The Determination Of Nature Walk Routes Regarding Nature Tourism In North-Western
Turkey. Journal of Food, Agriculture & Environment, 622-632.

Imam Ardiansyah Ecotourism Development Strategy at Situ Gede Bogor
100
Proceedings of CATEA 2019
Mintzberg, & Henry. (2007). Tracking Strategies : Toward a General Theory. New York: Press Inc.
OMT. (2014). Global Report on Adventure Tourism. Madrid: World Tourism Organization (UNWTO).
Pearce, J., & Robinson, R. (2008). Strategic management. South Carolina: McGraw-Hill Higher Education.
Porter, M. (2008). Competitive Strategy. Tangerang: Karisma Publishing.
Rangkuti, F. (2005). Analisis SWOT: Teknik Membedah. Jakarta: Gramedia Pustaka Utama. Jakarta: Gramedia
Pustaka Utama.

101
Proceedings of CATEA 2019
Proceedings of CATEA 2019
ISBN 978-623-91018-0-0
The Potential of Culinary Studio Business in North Jakarta
Diena Mutiara Lemy1, Ryan Grady
2
1 Hospitality Management Study Program
Universitas Pelita Harapan Tangerang, Indonesia 1 Hospitality Management Study Program
Universitas Pelita Harapan Tangerang, Indonesia
*[email protected] and [email protected]
*Corresponding Author
Abstract: Hospitality industry are one of the growing industries in the world. In the hospitality industry, there
are also a food service industry which also are one of the growing industries. The business may also be
supported as the increasing number of gross domestic regional product in Jakarta. The main purpose of the
research is to study the market demand to analyze whether Culinary Studio Business is feasible in North Jakarta.
Culinary Studio is a space for the market who have passion in culinary, baking and coffee making to do many
activities regarding that passion. This feasibility research will be done by the help of survey, theoretical
research, and data gathering. To give further explanation about the business feasibility study, marketing mix
elements which are (8P’s) will be discussed.
Keywords: hospitality industry; culinary; marketing mix;
1. Introduction
Hospitality industry are one of the growing industries in the world. Besides serving in
accommodation and food service, but it can be also divided into smaller groups like entertainment,
events, catering, restaurants, etc. estimated that 1 in 11 jobs worldwide are from the hospitality
industry (Bender and Partlow, 2015). In the hospitality industry, there are also a food service industry
which also are one of the growing industries. Since food and beverage industries are growing
overtime, the interest from both consumers and producers of the culinary industry also increased from
time to time. Because the food and beverage industries are growing, the standards skills of the
producers of the culinary industry must be trained and develop in order to catching up with the
today’s growing market. Therefore, formal education and non-formal education is needed in order to
catching up with the growing market.
According to UNESCO Institute for Statistics (UIS) (2012), there are three forms of education
which are non-formal education, formal education and informal learning. Non-formal education is an
education that is institutionalized, intentional and planned by an education provider. Non-formal
education mostly leads to qualifications that are not recognized as formal or equivalent to formal
qualifications by the relevant national or sub-national education authorities or to no qualifications at
all.
Cooking schools have been popular these days especially for tourists in searching of the
authenticity (Bell, 2015). As the growing interest of non-formal education is increasing, the cooking
class as part of the education. the table below shown that the gross enrollment rate of vocational
school is increasing from time to time. Yun, Hennessey, and MacDonald (2011) stated that cooking
schools as culinary experiences becoming a popular tourist globally. In addition to the popularity of
cooking school, nowadays the name Culinary Studio is also becoming popular. Culinary Studio is a
space for the market who have passion in culinary, baking and coffee making to do many activities

Diena Mutiara Lemy, Ryan Grady
The Potential of Culinary Studio Business in North Jakarta
102
Proceedings of CATEA 2019
regarding that passion. The activities may include cooking and baking course, video shooting for
culinary programs, workshops and many more.
Table 1. Certified Fields in Hospitality Industry in Indonesia
Certified Fields Target Achievement
Hotel and Restaurant 18.000 40.000
Travel Agents 1.800 2.000
Spa 3.400 9.400
MICE 800 300
Tour Leader 300 200 Source : Performance Report of Ministry of Tourism (2018)
According to the performance report conducted by Ministry of Tourism (2018), the table shows
that the certified fields in hotel and restaurant are increasing 2,12 times more than the target
According to New Zealand Trade and Enterprise (2018) Indonesia’s food service is continue to
growing rapidly and making it the largest market in ASEAN that worth up to US$ 30 billion. As
the middle-class Indonesians are also increasingly time-poor, especially in the big cities. Jakarta is
infamous for their traffic jams, with around 10 million people on the roads every day. Getting to
and from work can take hours, making it a challenge to prepare meals at home. This might be a
chance for a food service industry to open up a business and compete in the food service industry
in Jakarta especially in North Jakarta where the population itself are increasing from time to time.
The food service business is not only in terms of opening catering or restaurant business, but also
by having facilities that can accommodate the cooking activities including: cooking course,
cooking demo, food programs shooting and many other activities. This kind of facilities can be
called a culinary studio.
The research also includes the study of market demand analysis and also will help to analyze
whether Culinary Studio is feasible or not feasible by providing a space for a young generation
who have the passion in culinary, baking and coffee making. This feasibility research will be done
by the help of survey, theoretical research, and data gathering. To give further explanation about
the business feasibility study, marketing mix elements which are (8P’s) will be discussed.
Every organization has a marketing mix. It includes the marketing strategy factors which are
the product, place, promotion, price, people, packaging, programming, partnership that are used to
satisfy needs of specific customer groups according to Morrison (2010, p.27). Morrison (2010, p.
27) also stated that marketing success is based both on marketing strategy factors (the marketing
mix) and marketing environment factors.
The research objectives is to analyze every aspect related to the business and to further find out
whether the business will be feasible or not. To determine whether the business will be feasible or
not, by doing the business feasibility study it will also try to analyze the market by market and
marketing aspect, which includes supply and market demand analysis, competitors, Strength
Weakness Opportunity Threat (SWOT) analysis, Porter’s five forces analysis, as well applying the
marketing mix.
2. Literature Review 2.1. Market and marketing aspect
Analyzing marketing opportunities and problems is the foundation for starting and sustaining a
successful business, A good market analysis should be the basis for a long-term market plan Morrison
(2010, p.134-135) stated. The market must consists of the people or firms who were given benefit
from the use of the product, who have the meaning to buy and who will be offered the opportunity to
do so according to Schaper (2014, p.152). In order to develop and establishing a successful business,
the analyzation of target market is needed. According to Morrison (2010, p.144), the market potential
analysis must use a combination of secondary and primary research. Secondary research is a study of
published information available from other sources. Primary research is data collected for the first
time data collection.

Diena Mutiara Lemy, Ryan Grady
The Potential of Culinary Studio Business in North Jakarta
103
Proceedings of CATEA 2019
Wirtz, Chew, and Lovelock (2012, p.70) stated that to have a good marketing strategy, one should
be able to identify the counter strategies to offset or improve the firm’s position in the marketplace.
Analyzation of competitors should be done accordingly since competitors may affecting the business.
The presence of competitors not always be bad. because the analysis will allow the business to decide
which strategy should be applied to different target market. The competitor analysis should be
including both direct and indirect competitors:
1. Direct competitors: According to Garvey, Dismore, and Dismore (2011), direct competitors is
a the type of competitor that offering similar products like ambience, price, or food.
2. Indirect competitors: According to Baines, Fill, dan Rosengren (2017, p.152), Indirect
competitors are those who were having the same target market but provide different offering to
satisfy the market trend.
According to Enz (2010, p. 60) Porter’s Five Forces analysis may be define as a force that
determine the type and level of competition in an industry and, by doing the analysis it will increasing
the industry’s profit potential; including customers, suppliers, entry barriers, substitute products or
services, and rivalry among existing competitors. Therefore, this analysis is very important in order to
learn the markets, as the Porter’s Five Forces may enable a company to adjust the business strategy to
better use the resources and to generate higher earnings for the investors. Porter’s Five Forces analysis
are:
1. Potential New Entrants: New entrants is increasing competition in a sector, which may
affecting the price and the profits. The new entrants may add capacity, introducing new
products or processes and bring a fresh perspective and new ideas. there are several factors that
influence those barriers which are:
a. Economies of scale that leads to a higher volume.
b. Start-up costs like high capital requirements prevent the entering of small competitors.
c. Product differentiation from those competitors or substitutes.
d. High switching costs
e. The existence of distribution channels to new entrants.
f. Inimitable resources, such as due to the patented and subsidized resources by government
g. The existence of government policies to limit the cooperation.
2. Competitive Rivalry Within Industry: According to Enz (2010, p.64), there are some factors
that may lead to a high level of a competition, which are:
a. There are lots of competitors in the industry with no specific dominant position.
b. There is a slow industry growth that results in bigger competition to achieve high sales
volume.
c. Standard or generic products are found in the market.
d. High fixed costs exist that force a firm to increase sales volume to cover the costs.
e. High exit barriers due the lost of investment when they leave
3. Threat of Substitutes: According to Enz (2010, p.68), the possibility of substitutes of the
product or service depends on how the boundaries of the industry are drawn. High-level of
threat of substitutes exists when there are product substitutions for the products or services
offered and the buyers preferred to use the substitutes instead
4. Bergaining Power of Supplier: Economic power of suppliers may result in an increase in prices
and thus, reduce in profit for an organization. In addition, the suppliers can reduce the product
or service quality or not delivering the supplies when needed. There are several conditions in
which supplier power is greater, such as follows:
a. There are only few suppliers that limit the buyer-supplier negotiation ability.
b. They sell products and services that do not have substitution, and therefore the buying
industry must pay higher or get lower quality.
c. Suppliers do not sell bulk-size to the buying industry as they consider the buying
industry is not an important customer.

Diena Mutiara Lemy, Ryan Grady
The Potential of Culinary Studio Business in North Jakarta
104
Proceedings of CATEA 2019
d. Suppliers have dependent customers.
e. Suppliers have product differentiation that lead to high switching costs.
f. Suppliers can easily integrate forward and become direct competitor to their former
buyers.
g. Suppliers have information advantage on firms they are supplying.
h. Suppliers are well organized.
Enz (2010, p.16) stated that a SWOT analysis is a strategy used to evaluate the internal business
strength and weaknesses, and also the opportunities and threats from the outside. Analyzing each
factor is very important to develop the business as the analysis may be able to reveal a competitive
advantages and its prospects, and also prepare for the back up plan. According to Kotler and
Armstrong (2016, p. 80), SWOT analysis are:
1. Strength: strength may be defined as the internal capabilities that may help a company reaching
its objectives.
2. Weakness: weakness may include internal limitations that may interfere with the company’s
ability to achieve its objectives.
3. Opportunities: opportunities may be defined as a favorable factors or trends in the external
environment that the company may be able to exploit to its advantage
4. Threats: threats may be defined as current and emerging external factors that may challenge the
company’s performance
Every organization needs a marketing mix. According to Morrison (2010, p.27), marketing success
may be supported by the presence of the marketing mix or marketing strategy factors and market
environment factors. The marketing mix are:
1. Product: Wirtz, Chew, and Lovelock (2010, p.98) stated that there are two types of products
which are core product and supplementary services. Core product is the major part that
contributes to customers’ service experience. On the other hand, supplementary service plays the
role to facilitate and enhance the core product. As core product usually be commoditized,
supplementary services need to be differentiated and position the core product.
2. Price: Price is a critical aspect because it serves as both technique in marketing and also a major
profit determinant.
3. Place (distribution) : Place in the 8Ps of marketing refers mainly to distribution, how company
delivers the products or services to the people through distribution channel. There are two types of
distribution which are direct and indirect strategy. Direct distribution is how company delivering
the product or service straight to the customers. On the other hand, indirect distribution means to
having the product given to suppliers or distributors, before the product reaches to customers
hand.
4. Promotion: Promotion is one of the most important aspects when it comes to establishing
business. The main goal of promotion is to communicate to customers as a means to affect their
buying decisions, as to purchase or even repeated the order of that particular product or service.
Promotion communicates are necessary information and knowledge about the business to the
customers by informing, persuading, and reminding them
5. People: There are commonly two groups of people in hospitality and travel marketing industry
which are the guests and the hosts. Maintaining the guest-host relationship is the key function to
this industry
6. Packaging: Packaging refers as a mix of few related products and/or services that the organization
offers in a single price
7. Programing: programming aims to increase customer purchase through conducting a special
events, activities, or programs. In addition, programming might enhance the value of a package or
other services.
8. Partnership: partnership is a cooperative promotion and marketing tool that ranging from short
term cooperative promotions to strategic or long-term joint marketing agreements that may
involved some combination of the product or services.

Diena Mutiara Lemy, Ryan Grady
The Potential of Culinary Studio Business in North Jakarta
105
Proceedings of CATEA 2019
3. Methodology
This research will be done in the descriptive quantitative method, where the researcher would like
to see the potential of culinary studio at Pantai Indah Kapuk area. In this research, the researcher were
distributed the questionnaire in the shopping mall, offices, and restaurants around North Jakarta area,
especially Pantai Indah Kapuk where the business will be established. The researcher also distributed
the questionnaire around West Jakarta, South Jakarta, and Tangerang area in order to know if the
respondents were interested in the business establishment.
According to Hair, et al. (2014), in order to get the number of respondents needed for the analysis,
the question exists in the marketing mix will be multiplied with five. In this case, the researcher need
to have the data of minimum 255 respondents (51 x 5 ) that is valid and by that number, the researcher
had distributed 300 questionnaire to be used for the analysis, but the valid questionnaire only 260
respondents since there are some questions that left unfilled.
Before distributing the questionnaire to the respondents, the writer conducted a small unstructured
interview to the respondents in order to understand the market’s and analyze whether the respondents
aware and interested about the baking and coffee studio idea. The example of the questions that being
asked to the respondents such as “Have you ever heard about the terms of baking and coffee studio
before?”, “Are you interested in joining the baking and coffee demo or workshop for the learning
purposes?”. If the respondents have not known about the concept of the baking and coffee studio, the
researcher will explain about the idea so the respondents have the overview about the idea.
The questionnaire will consists in two parts, first part was asking about the respondents profile,
the second part was asking about the concern of the market condition, and also the marketing mix 8ps.
To able to know the reliability of the questionnaire, a reliability and validity tests is needed in
order to know whether the questionnaire is valid and reliable or not. According to Sekaran and Bougie
(2016, p.220), validity tests is a process to proof of how well an instrument that is developed whether
it is stable and the measurement were consistent.
Table 2. Validity Test of the Questionnaire
Validity Quantity
Valid 260
Excluded* 0 Source : Data Analysis (2018)
According to Sekaran and Bougie (2016, p.223), reliability tests is a measure that indicates the
extent to which it is error free or without bias and ensuring that the measurement were consistent
across time and the various items in the instrument. In order to test the reliability of the questionnaire,
Cronbach’s Alpha test is one of the indicator system whether the questionnaire is reliable or not.
Sekaran and Bougie (2016, p.290) stated that cronbach’s alpha is a reliability coefficient that indicates
how well the items in a set that are positively correlated to one another. In addition, reliabilities that
less than 0.60 are considered to be poor, those in the 0.70 range were acceptable and those over 0.80
are considered to be good. The cronbach’s alpha of Culinary studio will be stated below:
Table 3. Cronbach’s Alpha of Culinary Studio
Cronbach’s Alpha N of items
.960 51 Source : Data Analysis (2018)
The score of Cronbach’s Alpha of Culinary Studio were 0.960. This means that the questionnaire
consider as valid and reliable.

Diena Mutiara Lemy, Ryan Grady
The Potential of Culinary Studio Business in North Jakarta
106
Proceedings of CATEA 2019
4. Results and Discussion
Table 4. First Part Questionnaire Results
Questions Options
Results
Qty. Percentage
(%)
Gender
Male 62 23,85
Female 198 76,15
Total 260 100
Age
17 – 22 193 74.23
23 – 28 52 20
29 – 34 11 4.23
35 – 40 2 0.77
≥ 40 2 0.77
Total 260 100
Jakarta 134 51.54
Bandung 14 5.38
Bogor 11 4.23
Domicile Tangerang 85 32.69
Surabaya 9 3.08
Other 7 2.69
Total 260 100
Married 16 6.15
Marital Status Single 244 93.85
Total 260 100
Education
SMP 0 0
SMA 53 20.38
D1 – D3 21 8.08
S1 – D4 183 70.38
S2 3 1.16
S3 0 0
Total 260 100
Occupation
Student 199 76.54
Entrepreneur 20 7.69
Employee 35 13.46
Housewife 5 1.92
Other 1 0.38
Total 260 100
Average
Income Per
Month
>Rp 5.000.000 – Rp 7.500.000 188 72.31
>Rp 7.500.000 – Rp 10.000.000 29 11.15
>Rp 10.000.000 – Rp 15.000.000 12 4.62
>Rp 15.000.000 13 5.00
Other 18 6.92
Total 260 100
Preferable day
to join
Weekdays 75 28.85
workshop or Weekend 185 71.15
Classes Total 260 100

Diena Mutiara Lemy, Ryan Grady
The Potential of Culinary Studio Business in North Jakarta
107
Proceedings of CATEA 2019
Table 4. First Part Questionnaire Results (Continued)
Questions Options
Results
Qty. Percentage
(%)
Purposes in
joining the
courses
Hobby Only 88 33.85
Learning Purposes 139 53.46
Business Purposes 33 12.69
Total 260 100
Cake decorating class 112 18.21
Learning about cake, dessert
making
160 26.02
Preferable
Products
Learning about modern and
traditional cuisine
108 17.56
Learning about latte art technique
and free pouring
108 17.56
Learning about espresso basic 62 10.08
Learning about modern manual
brewing using V60, Chemex, or
Siphon
65 10.57
Total 615 100
Source of
Information
Print Media Advertising 35 5.85
Internet / Website 144 24.08
Social Media Advertising 223 37.29
Brochure, Flyer, Banner 33 5.52
TV / Radio 21 3.51
Friend’s Recommendation 142 23.75
Other 0 0
Total 598 100
Rp 200.000 – Rp 300.000 / Hour 168 64.62
Proper Range Rp 300.000 – Rp 400.000 / Hour 60 23.08
of Rent Fee Rp 400.000 – Rp 500.000 / Hour 23 8.85
>Rp 500.000 / Hour 9 3.46
Total 260 100
Additional
Facilities
Café 80 30.77
Bakery / Cake Shop 92 35.38
Coffee Experience Bar & Lounge 78 30
Kids Club 10 3.85
Total 260 100
Agree 256 98.46
Café as the
additional
Disagree 4 1.54
facilities Total 260 100
Purpose of
Visiting Café
To enjoy the food and beverages 175 26.12
To spend free time 131 19.55
To gather with family and friends 175 26.12
Meeting or Business 65 9.70
Doing Homework or Assignments 124 18.51
Total 670 100
Diena Mutiara Lemy, Ryan Grady
The Potential of Culinary Studio Business in North Jakarta
108
Proceedings of CATEA 2019
Based on the questionnaire results above, it may be concluded that the demographic tendency of 260
respondents are as follows:
1. Most of the respondents are female, with the total number of 198 respondents or 76.15%, while
the rest of the respondents are male with total number of 62 or 23.85%. Although most of the
respondents are female, but the target market of the business will be comes from both male and
female.
2. Based on the questionnaire results, most of the respondents are people from age 17 to 22 years
old with total number of 193 respondents or 74.23%. The least number of respondents are from
the people from 35 years above which are 4 respondents or 1.54%. It may be concluded that the
target market of the studio will be ranging from 17 – 34 years old.
3. Most of the respondents are from Jakarta, with total number of 134 or 51.54%. This may be
concluded that the target market based on domicile area will be mainly from Jakarta.
4. Most of the respondents are single with total number of 244 respondents or 93.85%, while the
rest are married with total number of 16 respondents or 6.15%.
5. Based on the questionnaire results, most of the respondents are have the higher education
background which are a bachelor degree with total number of 183 respondents or 70.38%.
Although the respondents are mostly came from the higher educational background, the
establishment will not look at the the educational background.
6. The majority of the respondents were the students with the total number of 199 respondents or
76.54%. The least majority of the respondents are from housewife with total number of 1.92%.
This may be conclude that the majority of the target market will be focusing on the students, and
employees who have the hobbies in food and beverages production.
7. The average income of the respondents are ranging from Rp5.000.000 to Rp7.500.000 with total
number of 188 respondents or 72.31%, while the least income of the respondents are people who
were ranging from Rp10.000.000 to Rp15.000.000. This means that most of the respondents have
the buying power of the products or services, and this may be an advantage for the establishment
in their tendency to spend their money on products or services that the establishment may offers.
8. 71.15 % of the respondents chose to have their workshop conducted in weekend, while the other
28.85% chose to have their workshop conducted in weekdays. The studio will conducted most of
the workshop and classes in weekend since most of the target market will be students,
entrepreneur and employees who’ve been already busy in their workdays.
9. Based on the questionnaire results, the majority of respondents with total number of 139
respondents or 53.46% wants to join the classes for learning purposes. While the least of
respondents with total number of 33 respondents or 12.69% chose to join the classes in order to
develop their businesses.
10. Majority of the respondents prefer the products or services that offers are a variety of cake and
dessert making, a decorating class with the total number of 160 or 26.02% for the cooking
category, while in the coffee category, the majority of the respondents chose to learn how to do a
proper latte art and free pouring with the total number of 108 or 17.56%. Therefore, the author
will mainly conduct the cake and dessert making and decorating class, and also the study of a
free pouring technique and variety of latte art.
11. Based on the questionnaire results, most of respondents prefer to have the information regarding
the existence of the baking and coffee courses were easily obtained through social media
(37.29%), through website (24.08%), and from family and friends recommendation (23.75%).
Therefore, the establishment will mainly promoting the business by using social media such as
Instagram, Facebook and Twitter and an interactive website in order the customer may know the
products or services that the establishment were offering.

Diena Mutiara Lemy, Ryan Grady
The Potential of Culinary Studio Business in North Jakarta
109
Proceedings of CATEA 2019
12. Majority of the respondents consists of 168 respondents or 64.62% stated that they are willing to
pay the rental fee of the studio with range of Rp 200.000 – Rp 300.000 per hour. The least of 9
people are willing to pay the rental fee of the studio for up to Rp 500.000 per hour. This may
affect the respondents’ buying power towards the services offered by the baking or coffee studio.
13. Most of the respondents which consists of 92 respondents or 35.38% agree to have the bakery /
cake shop as the additional facilities of the establishment. The least 10 people agree to have kids
club as the additional facilities of the establishment. This may conclude that most of the
respondents were enthusiasts in the additional facilities added in the establishment to add an
addition of attractiveness.
14. Based on the questionnaire results, majority of the respondents with the total of 256 respondents
or 98.46% agree to have the café as the additional facilities in the establishment. While the other
4 respondents not agree to have the café as the additional facilities for the establishment. This
may determine if Café will be added to the facilities or not in order to add the attractiveness of
the establishment.
15. There are 2 options that are equal which are to enjoy the food and beverages and to gather with
family and friends with total number of 175 respondents or 26.12%. While the least 65
respondents went to café in order to have their business or meeting purposes. Therefore, the
attractiveness of the food and beverage must be pointed out in order to attract the customer to
come to the café.
The marketing mix’s questionnaire is using a likert scale, meaning that the choices of the answers is
vary from Strongly Disagree (STS), Disagree (TS) , Slightly Disagree (ATS), Slightly Agree (AS) ,
Agree (S), and Strongly Agree (SS). The questionnaire results will be explained as follow:
1. Product: Respondents are agree to the baking and coffee studio that offers various classes and
workshops. This may be proven by the mean of each variable are exceeding five which is most
of the respondents are agree with the variable. The respondents also agrees that there must be a
stratification in classes which are beginner, intermediate and advanced for both baking or
cooking class and coffee master class that teaches by the well known instructor in the industry.
2. Price: Respondents mostly agree to pay the cooking demo or workshop ranging from Rp200.000
– Rp450.000, the price for joining a basic, intermediate, and advanced cooking class for
Rp5.000.000 – Rp7.500.000, the price for joining a basic, intermediate, and advance coffee
brewing class for Rp3.000.000 – Rp6.500.000, the price for joining a coffee demo or workshop
ranging from Rp150.000 – Rp450.000, the price for joining hands on training for Rp650.000 –
Rp1.500.000, the price to rent the studio for half day or full day ranging from Rp1.000.000 –
Rp2.500.000, the price to rent the studio for commercial purposes ranging from Rp250.000 –
Rp500.000 / hour, food and beverages sold in the café ranging from Rp20.000 – Rp50.000, the
price for cake and pastry sold in the bakery ranging from Rp5.000 – Rp500.000, and the price
for each cup of coffee in the coffee experience bar and lounge ranging from Rp35.000 –
Rp50.000 per cup. Although the most of the mean scores below five, but most of the
respondents chose the score number 5 which are agree with the prices of each variables.
3. Place : Most of the respondents agree to have the studio located in the strategic area, where the
studio will offer a reservation through phone, online booking service and walk in for rental, and
booking classes and workshops. The studio will be located in strategic area in North Jakarta
specifically Pantai Indah Kapuk area where it will have a direct distribution on delivering
products and services. This may be proven by the mean of each variable are exceeding five
which is most of the respondents are agree with the variable.
4. Promotion: Most of the respondents agree that the promotions will be using a variety of medias
such as printed media, social media, by using a discount vouchers, promotion using kitchen
utensils and also inviting social media influencer to experience the facilities and services and
promote it through their social media with total Mean 5,16.
5. People: Based on the questionnaire results, the respondents agree and would like to have the
employee that have a neat uniform during the shift, an employee who is reliable in giving the
customers needs and wants, an employee who is responsive and knows with what customers

Diena Mutiara Lemy, Ryan Grady
The Potential of Culinary Studio Business in North Jakarta
110
Proceedings of CATEA 2019
needs and wants, employee who have product knowledge about the business and also sense of
empathy to the customerPackaging: Packaging refers as a mix of few related products and/or
services that the organization offers in a single price. This may be proven by the mean of each
variable are exceeding five which is most of the respondents are agree with the variable
6. Packaging: Based on the questionnaire results, respondents agree to have the packaging such as
offering a special price for those who signing up the classes more than two classes, offer a
special price for those who brings their friend to join the workshop or classes, offer a special
package for those who purchase the hampers and taking the class, offer a special price for group
or corporate, and a membership program for customer who rent the studio more than one time
7. Programing: Based on the questionnaire results, majority respondents agree to have the cooking
class special for kids with a kids friendly menu with total number of respondents 112 or 43.1%,
and also holding a millennials workshop partnered with nearby schools to teach millennials how
to cook a traditional cuisine, offer a special event such as Eid Mubarak, Chinese New Year, and
Christmas.
8. Partnership: Based on the questionnaire results, overall score of the variable more than five,
respondents mostly agree the business is partnering with certain business such as banks in order
to allow the payment using debit or credit card, partnering with supplier in order to suppress the
cost of the production and to obtain the best quality of product, partnering with website and apps
who offer a discount voucher such as Fave, Go-Pay, OVO, partnering with nearby education
centers to give special promotion or benefit, and partnering with related business to give special
promotion or benefit.
5. Conclusion
Reviewing from the questionnaire results, the researcher concludes that the business will be able
to develop since the majority of respondents were interested in the concept of the Culinary studio.
Most of the respondents are looking forward in learning new technique in cooking, baking especially
in learning new decorating technique and creating a decadent traditional and modern cuisine. The
respondents are also interested in the newly development of barista class, where they may learn a
coffee brewing technique, latte art and foaming method without have to work in coffee shop first. The
respondents also enthusiast with the addition facilities of café to make the business more attractive.
With most of the questionnaire results are positive and consider as valid and reliable, the development
of the project will follow the results of the questionnaire.
References
Baines, P., Fill, C., Rosengren, S., & Antonetti, P. (2017). Fundamentals of marketing. Oxford: Oxford
University Press.
Bender, S. B., & Partlow, C. G. (2015). A profile of the hospitality industry. Pg. 1-3
Bell, C. (2015). Tourists infiltrating authentic domestic space at Balinese home cooking schools.
Tourist Studies, 15(1), 86-100.
Enz, Cathy A. (2010). Hospitality strategic management : concepts and cases. 2nd ed. Hoboken, New Jersey:
John Wiley & Sons, Inc.
Garvey, M. Dismore, A. G., & Dismore, H. H. (2011). Running a Restaurant for Dummies. New Jersey: John
Wiley & Sons. Inc.
UIS (2012). The International Standard Classification of Education 2011. Montreal: UNESCO Institute for
Statistics. Available: http://www.uis.unesco.org/Education/Documents/isced-2011-en.pdf.
Accessed on 18 February 2019
Schaper, M., Volery, T., Weber, P., & Gibson, B. (2014). Entrepreneurship and small business. Milton (Qld.):
Wiley.
Sekaran, U., & Bougie, R. J. (2016). Research Methods For Business: A Skill Building Approach Seventh
Edition. John Wiley & Sons.
Kotler, P., & Keller, K. L. (2012). Marketing Management. Pearson Education Limited.
Kotler, P., & Armstrong, G. (2016). Principles of marketing. Hoboken: Pearson Higher Education.

Diena Mutiara Lemy, Ryan Grady
The Potential of Culinary Studio Business in North Jakarta
111
Proceedings of CATEA 2019
Ministry of Tourism (2016). Paparan Kemenpar untuk KiDi ke-6 2016. Available from
https://web.kominfo.go.id/sites/default/files/Paparan%20Kemenpar%20u
tuk%20KIDI%202016.pdf Accessed on 5 August 2018
Morrison, A. M. (2010). Hospitality and travel marketing. Brantford, Ont.: W. Ross MacDonald School
Resource Services Library.
Wirtz, Jochen & Chew, Patricia & Lovelock, Christopher. (2012). Essentials of Services Marketing, 2nd
edition.
New Zealand Trade and Enteprise (2018). Indonesia foodservice market plating up fresh potential. Available
from https://www.nzte.govt.nz/about/news/blogs/indonesia-fresh potentialfoodservice Accessed
on 2 October 2018
Yun, D., Hennessey, S. M., & MacDonald, R. (2011). Understanding culinary tourists: Segmentations based
on past culinary experiences and attitudes toward food-related behavior.

112
Proceedings of CATEA 2019
Proceedings of CATEA 2019
ISBN 978-623-91018-0-0
The Influence of Service Quality Towards Customer Satisfaction
in Air Asia’s Low Cost Airline Services
Ani Puspawigati
Bunda Mulia University
*Corresponding Author
Abstract: This study examines the relationship between airlines service quality and customer satisfaction
among Air Asia air passengers in Indonesia. The study applied quantitative approach through a cross–sectional
survey using a questionnaire. The questionnaire was designed based on a modified SERVQUAL model
containing five service quality dimensions tangibles, reliability, responsiveness, assurance, and emphaty. A five-
point likert scale was used with following options; much better than expected, better than expected, just as
expected, worse than expected and much worse than expected, with five different scores assigned in descending
order from 5 to 1 respectively A sample of 160 respondents was selected using purposive sampling techniques.
The findings reveal that there is no significant relationship between reliability and customer satisfaction among
Air Asia airlines in Indonesia. However, the study established that there is a significant relationship between the
four service quality attributes (tangibles, responsiveness, assurance, and emphaty) and customer satisfaction.
Consequently, it is recommended that Air Asia airlines should introduce continuous training on good customer
relations, remaining responsive and proactive while maintaining safety and well-being of the passengers. The
study also suggests that airlines should consider forming strategic flight alliance Air Asia in order to provide for
flights availability and adequate market coverage in an attempt to enhance service reliability.
Keywords: Service Quality; Customer Satisfaction; Airline Passengers
1. Introduction
The need for air transportation services in Indonesia continues to increase from year to year, this
is due to various things, such as one of which is the most prominent geographical factor of Indonesia
consisting of several islands that will take time Long as residents travel from one area to another,
therefore emerging air transportation services with all the facilities it provides, especially in terms of
effective and efficient time that passengers will get when Using the aircraft as a means of mobility.
This shows that the business of air transportation services in Indonesia is a business that has very
large and good prospects. But with competition between airlines that will be stricter over time, many
factors that airlines must think about matters that will affect the success of an airline. One of the
factors that affects the success of an airline is whether an airline has provided their best quality of
service so that it can create a sense of satisfaction in the minds of customers after using the airline.
Today's high mobility demands that want a fast and cheap means of transportation create a huge
chance of success for low cost carrier (LCC) airlines, the key is the airline must be able to fulfill what
the customers need and want. LCC is an airline business with the principle of low cost to suppress
operational cost so that it can capture all segments of the market with a minimalist service. But does
not make airlines applying LCC become cheap and weak in terms of safety. With the presence of low-
cost airlines, it is very helpful when the community needs the transportation of air that is increasingly
higher from year to year. Especially in Indonesia as one of the most widespread countries in the world
with many separate islands with a distance far enough to make the means of air transportation become
a favorite for people who want to travel far between islands with faster than other means of transport.

Ani Puspawigati
The Influence of Service Quality Towards Customer Satisfaction in Air Asia Low Cost Carrier Airline Services
113
Proceedings of CATEA 2019
But in the source of the website that contains about the customer's review and complaint to the
quality of service provided by Air Asia after customers have experience using airlines Air Asia shows
that there are still many complaints indicating that Customer satisfaction level is still not maximal
because services are not yet running the maximum according to customers when flying with airlines
Air Asia. There are three trusted sources of websites that researchers use to show these complaints:
www.airlinequality.com, www.complaintsboard.com, and www.tripadvisor.com.
These websites contain about a wide variety of reviews or complaints of passengers when having
flight experience using a particular airline, and which researchers take on the quality of service Air
Asia airline. Special website www.airlinequality.com, this website is a website affiliated or related to
the agency Skytrax which is a British consulting firm that conducts research on airlines. Skytrax is an
independent aviation rating agency that is believed to be a global standard benchmark in assessing
airline excellence. Skytrax is also conducting surveys to determine airlines, airports, inflight
entertainment, staff, and other best air travel elements. Skytrax is known for the world's Worldwide
awards and annual World Airport Awards. The following complaints are (1) uncomfortable seating,
(2) annoyed with the sound of the Flight Attendant (stewardess) who chatted loudly when not much
work, (3) Air Asia's online flight booking system is experiencing interference and there is no
assistance from Air Asia's airline customer service call centers, (4) Flight Attendant Transfers
unlicensed passenger goods, (5) Uncomfortable chairs, lack of taste and skills in serving the customer,
and the lack of hygiene on board Air Asia airline, (6) Delay is very bad. Passengers are not getting
compensated, but only an apology, (7) Air Asia's airline system fault, making the passenger's order
data change. When passengers come to the office of Air Asia data is constantly changing, when I have
made payment, while from Air Asia there is no refund or even admit that the fault is on airline Air
Asia. In fact, passengers have shown their evidence. It shows that Air Asia is not customer friendly.
Based on the exposure of Air Asia customer complaints after having a flying experience with the
airline Air Asia above, it can be seen that there are still many complaints of service quality provided
by Air Asia that customers according to the maximum. From this complaint, it is known that the
customer of the service provided by Air Asia is still not carried out well and maximally, resulting in a
dissatisfaction to the customer. Passenger satisfaction service arises when a company can provide
passengers with benefits that exceed passenger’s expectation and this is considered value-added. If
customers are satisfied with the product or service, they will buy more, and do so more often.
Passenger gratification is an essential goal for each airline providing passenger services. The on board
experience is still something special for the customer. The customer has a wide choice to select the
suitable airline product according to their requirements. Therefore, airlines are continuously working
on. In-flight and out-flight service product development and innovation to differentiate themselves
from competitors. During the last few years a variety of in-flight product innovations have entered
into the market. This includes the aircraft seat on long haul flights as an important product element
which is continuously being improved and renewed according to its life cycle and changing customer
requirements. The current development of business class seat roll-outs shows the significance of this
product element which influences the buying decision of the passenger especially on long haul flights.
If the passenger is not satisfied, due to the negative experience, the client will reconsider the buying
decision for further flights and will probably switch to another airline. This kind of situation belongs
to the daily business in the passenger airline industry. The objectives are identify the factors those
leads to customer satisfaction in airline industry, passenger complaints on flight problems, ticketing
problems, refunds, fares, customer services, advertising, and to examine the level of customer
satisfaction in Air Asia airline industry.

Ani Puspawigati
The Influence of Service Quality Towards Customer Satisfaction in Air Asia Low Cost Carrier Airline Services
114
Proceedings of CATEA 2019
1.1. The Structure
The research will be conducted using the concept of quality service. This concept is one of the
right concepts applied to see the extent to which customers feel satisfied as a service user of LCC
airline. It is hoped that making this research can clearly know what factors are influential with
reliability, responsiveness, assurance, emphaty, and tangibles, thus giving a positive and significant
effect on the satisfaction of Customer. The research questions are as follows:
a. How is service quality in Air Asia?
b. How is customer satisfaction in Air Asia?
c. How far does the influence of service quality affect toward Air Asia's customer
satisfaction?
The objectives of the study are: (1) To know the service quality consisting of tangibles,
reliability, responsiveness, assurance, and emphaty to customer satisfaction in Air Asia, (2) To know
the customer satisfaction in Air Asia, (3) To know the influence of service quality toward customer
satisfaction in Air Asia.
The benefits of this research are:
1. Theoretical benefits: (1) This research is expected to add insight into the author's thinking in
identifying and analyzing a problem so that the results can be used as an information, motivation and
reference for the reader, (2) can enrich the concept or theory that supports the development of science
quality management services, especially those related to the influence of quality of service to
customer satisfaction in the services of LCC.
2. Practical Benefits: (1) This writing is expected to provide an overview and positive input for
the airline in determining decision-making strategies on the service and satisfaction of flight service
customers, (2) Can contribute positively to stakeholders to continuously improve the company's
performance as well as employees in providing quality service according to the expectations of the
customers.
2. Related Works/Literature Review
Service quality is generally viewed as a multidimensional concept because customers evaluate a
variety of dimensions on a company’s products or services. Service quality is the result of the
comparison that customers make between their expectations about a service and their perceptions of
the actual service performance (Zeithmal, 1988; Parasuraman, Zeithaml and Berry 1985). Customer
satisfaction, on the other hand, is defined as an emotional feeling by the customers after experiencing
a certain service which in turn leads to an individual overall attitude towards purchasing of service
(Oliver, 1981). It is a person’s feelings of pleasure or disappointment resulting from comparing a
product’s perceived performance or outcome with their expectations (Kotler & Keller, 2009). Cronin
and Taylor (1992) found empirical support for the idea that perceived service quality led to
satisfaction and argued that service quality is actually an antecedent of customer satisfaction (Cronin,
Brady, & Hult, 2000; Anderson, Fornell & Lehman, 1994). Customer satisfaction is often seen as a
multidimensional construct along the same dimensions that constitute service quality (Sureshchandar,
Rajendran & Anantharaman, 2002). Despites strong correlations between service quality and
customer satisfaction, the two constructs are in fact different from the customer’s point of view
(Baker, 2013). Brady and Cronin (2001) try to clarify the specification and nature of the service
quality and satisfaction constructs and found empirical support for the conceptualization that service
quality was an antecedent of the super ordinate satisfaction construct. In the aviation industry, Huang
(2009) states that service quality affects customer satisfaction, and that customer satisfaction affects
customer behavior, including repurchase intention and word of mouth. Similarly, Yunus, Jamil and
Rashid (2013) argue that the quality of service delivery by airlines has a significant effect on customer
satisfaction, which in turn, significantly affect customer loyalty. Other dimensions of airline services
include safety, customer complaint handling, courtesy of crew, on-time departure and arrival, comfort
and cleanliness of seats, flexibility, friendliness and honesty (Hynes & Dredge, 1998). In addition,
Wang, Shu, Lin and Tseng (2011) examine nine evaluation criteria of service quality in the airline
companies and found that passengers are more concern with comfort, internal decoration and the
services of airline companies.

Ani Puspawigati
The Influence of Service Quality Towards Customer Satisfaction in Air Asia Low Cost Carrier Airline Services
115
Proceedings of CATEA 2019
3. Material & Methodology
3.1. Data
The data collected through questionnaire method. The Statistical Package for Social Science
(SPSS 17.0) software was used to analyse the data using test of validity and reliability, multiple
regressions analysis and hypotheses test. The researcher used Cronbach’s Alpha to check the
consistency of the intended measure. Hair et al. (2010) point out that 0.6 is the minimum acceptable
level of Cronbach’s Alpha for any construct to acquire an adequate reliability. Consequently, the
entire construct have adequate reliability. Based on test of validity is point out that 0.3 is the minimum
acceptable level of correlation.
3.2. Method
Quantitative research method was adopted in this study. This is because of the need to allow for
numerical representation and manipulation of observations for the purpose of describing and
explaining the phenomena that those observations reflect (Jia, Cheae, Pei and Yam, 2012). The
population of the study consists of all Air Asia air passengers in Jakarta. A proportionate stratified
random sampling was used for the study. According to Ross (2005), variables used to stratify
populations in education research include location, size, age, sex, grade level, and socio-economic
status. Soekarno Hatta International Airport were selected because it is the key ones based on Air
Asia passenger traffic.
Also, only those within the age group of 18 years and above were selected. This is based on the
researcher’s believe that this age group is matured enough to express their views openly. When
computed, the total sample size for the study was 160 respondents. Research questionnaire was the
main instrument employed for this study. The questionnaire contains three sections. Section one elicit
data on the demographic variables and flight behaviour of the respondents.
Section two lists the five service quality attributes where respondents were asked to evaluate each
service attribute using a five-point Likert scale with following options; much better than expected,
better than expected, just as expected, worse than expected and much worse than expected, with five
different scores assigned in descending order i.e 5, 4, 3, 2 and 1 respectively. Lastly, section three
assesses customers overall satisfaction with the services of Air Asia Airlines in Indonesia using five
point Likert scale ranging from excellent (5) to very not good (1). The scales used to measure each
service quality dimensions were adapted from work of Parasuraman et al. (1988), for the two
constructs of reliability and responsiveness; Archana and Subha (2012), for in-flight services; Huang
(2009), for check-in process and baggage handling services. While the scale for customer satisfaction,
the dependent variable, were adopted from the work of Angelova and Zekiri (2011) and Jia, et.al,
(2012). Generally, service quality was measured using 13 items and satisfaction was measured by 3
items thereby producing a 16 item instrument for the study. Analysis data of this research using
validity and reliability test, multiple regression test, t test, f test, and determination coefficient.
Tabel 1. Operational Variables In This Research
Variable Concept Sub Variable Indicator
Service Quality
The comparison
between
expectation of
service with actual
performance
perceptions
Tangibles Availability of main
facilities like office,
lounge for customer,
etc
Employees
performance;
Cleanliness of the
employees
Reliability Speed of Service
Time accuracy of
schedule
Responsiveness Speed of Response

Ani Puspawigati
The Influence of Service Quality Towards Customer Satisfaction in Air Asia Low Cost Carrier Airline Services
116
Proceedings of CATEA 2019
Variable Concept Sub Variable Indicator
to Complaints
Concern for Assist
Assurance Concern for
Customers
Staff attitude
Emphaty Communication to
customer needs
Attention from the
employees
Customer
Satisfaction
The expectation of
the customer to
perceived
performance
Repurchase
Willingness to be a
loyal customer
Expectation of
services
3.3. Equations and Mathematical Expressions
The skeletal thinking is a conceptual model of how the theory relates to factors that have been
identified as important issues. Based on the motivation variable of travel travel can increase traveler's
visit then the theory that has been stated before, then the framework of thought can be described as
follows:
Tabel 2. Research Paradigm
The hypothesis designed for this paper is based on the following assumptions:
• H1: Assurance has positive relationship with customer satisfaction.
• H2: Reliability has positive relationship with customer satisfaction.
• H3: Tangibles has positive relationship with customer satisfaction.
• H4: Empathy has positive relationship with customer satisfaction.
• H5: Responsiveness has positive relationship with customer satisfaction.
• H6: Service quality has positive relationship with customer satisfaction.
Service Quality
Tangibles
Emphaty Responsiveness Reliability Assurance
Customer Satisfaction

Ani Puspawigati
The Influence of Service Quality Towards Customer Satisfaction in Air Asia Low Cost Carrier Airline Services
117
Proceedings of CATEA 2019
Multiple regression analysis was conducted to determine the relationship between the dependent
variable (satisfaction) and independent variables (check-in process, in-flight services, airline
reliability, staff responsiveness and baggage handling). The results show the overall relationship
between the predictors and the dependent variable (R2) to be 0.667 with F value = 24.150. Therefore,
the predictors accounted for approximately 35% of the variance in the customer satisfaction at 0.05
significance level.
Tabel 3. Multiple Regression Result
Coefficientsa
Model
Unstandardized
Coefficients
Standardized
Coefficients
t Sig. B Std. Error Beta
1 (Constant) 3.941 1.123 3.510 .001
TangiblesX1 .218 .107 .130 2.026 .044
ReliabilityX2 .061 .044 .083 1.369 .173
ResponsivenessX3 .186 .097 .173 1.919 .057
AssuranceX4 .667 .154 .393 4.319 .000
EmphatyX5 .279 .102 .178 2.735 .007
a. Dependent Variable: CustomerSatisfactionY
Table 3 shows the results of the multiple regression analysis. It shows that out of the five
predicting variables, reliability is the only variable that failed to predict the criterion with the t value
1.369 < 1.654, therefore, it has no significant relationship with customer satisfaction. Conversely, the
remaining four independent variables (tangibles, responsiveness, assurance, and emphaty) are found
to have significant relationship with customer satisfaction; tangibles (2.025 > 1.654), responsiveness
(1.919 > 1.654) assurance (4.319 > 1.654), and emphaty (2.735 > 1.654). Consequently, four
hypotheses were accepted (H2, H3, H4 and H5), while one hypothesis (H1) was rejected as a result of
having no significant relationship with customer satisfaction.
ANOVAa
Model Sum of Squares df Mean Square F Sig.
1 Regression 701.471 5 140.294 24.150 .000b
Residual 894.623 154 5.809
Total 1596.094 159
a. Dependent Variable: CustomerSatisfactionY
b. Predictors: (Constant), EmphatyX5, ResponsivenessX3, TangiblesX1, AssuranceX4,
ReliabilityX2
Based on the results of the hypothesis test with the F test resulted in a fcalculate value of 24,150
with a probability level of 0.000. The probability value 0.000 < 0.1 then the regression model
deserves to be used in predicting customer satisfaction. Because F count (24,150) > F table (2.74) can
be said that the dimensions of tangibles, reliability, responsiveness, assurance, and emphaty on
variable quality services are jointly influential significantly towards customer satisfaction.
The coefficient of determination in this study was done to determine the proportion or percentage
of the total variation in the bound variables described by the free variables. The value of coefficient of

Ani Puspawigati
The Influence of Service Quality Towards Customer Satisfaction in Air Asia Low Cost Carrier Airline Services
118
Proceedings of CATEA 2019
determination is between zero and one. A small R2 value means the ability of independent variables in
explaining the variation of a very limited dependent variable with the following result:
Model Summary
Model R R Square
Adjusted R
Square
Std. Error of the
Estimate
1 .667a .444 .426 2.400
a. Predictors: (Constant), EmphatyX5, ReliabilityX2,
ResponsivenessX3, TangiblesX1, AssuranceX4
Kd = 0.667 x 100%
= 66.7%
The R2 value of 66.7% indicates that the variable influence of service quality to customer
satisfaction of 66.7% means service quality variables have an effect on customer satisfaction of 33.3%
while the rest is influenced by other variables not stated in this research.
4. Results and Discussion
4.1. Result
The result shows that reliability has no significant relationship with customer satisfaction among
Air Asia airline passengers in Indonesia. Consequently, it can be inferred that passengers’ satisfaction
cannot be increased by improving the dimension of reliablity. The tangibles, responsiveness,
assurance and emphaty of airlines staff to passengers’ requests has significant and positive
relationship with customer satisfaction in the operation of airlines in Indonesia. Consequently, an
improvement in airlines’ staff promptness in handling complaints and timely apology or explanation
for cancelled or delayed flight, will lead to a corresponding increase in the level of customers
satisfaction. In addition, the study also reveals that there is significant relationship between baggage
handling services and customer satisfaction among Air Asia airline passengers in Indonesia. This
means that efficient baggage handling services will significantly increase customer satisfaction among
Air Asia airlines in Indonesia.
The results of the first hypothesis test with the T test for the dimensions of tangibles are
significant, with a T value 2.026 > T table 1.654 with a sig value of 0.044 if the value of sig < 10% or
0.1 means significantly influential. This indicates that the dimensions of service quality on quality of
service affect to customer satisfaction in Air Asia Airlines. Thus the dimensional hypothesis of
service quality has been proven and declared acceptable that the quality of service affects the
customer satisfaction and already answer the first hypothesis (H1) of this research.
The results of the second hypothesis test with the T test for the dimension of reliability are
significant, with a value of T value 1.369 > T table 1,654 with a sig value of 0.73 if the sig value of <
10% or 0.1 means rejected. The dimensional hypothesis of reliability has not been proven and not
stated to be acceptable.
The results of the third hypothesis test with the T test for the dimension of responsiveness is
significant, with T value 1.919 > T table 1,654 with a sig value of 0.057 if the sig value of < 10% or
0.1 means significantly influential. This indicates that the dimension of responsiveness on quality of
service affects customer satisfaction and has been proven and is stated to be acceptable.
The results of the fourth hypothesis test with the T test for the dimension of assurance is
significant, with T value 4.319 > T table 1.654 with a sig value of 0.000 if the sig value of < 10% or
0.1 means significantly influential. This indicates that the dimension of assurance on quality of
service affects customer satisfaction and has been proven and is stated to be acceptable.

Ani Puspawigati
The Influence of Service Quality Towards Customer Satisfaction in Air Asia Low Cost Carrier Airline Services
119
Proceedings of CATEA 2019
The results of the fifth hypothesis test with the T test for the dimension of emphaty is significant,
with T value 2.735 > T table 1.654 with a sig value of 0.007 if the sig value of < 10% or 0.1 means
significantly influential. This indicates that the dimension of responsiveness on quality of service
affects customer satisfaction and has been proven and is stated to be acceptable.
Service quality of Air Asia Airlines can be seen in the table result of a descriptive analysis of the
variables of service quality, in which each of the items that have been disseminated to visitors related
to aspects of tangibles, reliability, responsiveness, assurance, and emphaty are in the good category.
This is also the result of the frequency results of the survey response results for the service quality
variable in which the respondent's response to the given questionnaire shows the highest response
result of the respondent.
Customer satisfaction of Air Asia Airlines can be seen in the table results of a descriptive
analysis of customer satisfaction variables, in which each of the items of the statement has been
distributed to the category of good. This also corresponds to the result of the frequency of data
dissemination of the questionnaire for customer satisfaction variables where the respondent's response
to the given questionnaire showed the highest response result of the respondent.
The effect of service quality on customer satisfaction are four hypotheses were accepted (H2, H3,
H4, H5 and H6), while one hypothesis (H1) was rejected as a result of having no significant
relationship with customer satisfaction.
The R2 value of 66.7% indicates that the variable influence of service quality to customer
satisfaction of 66.7% means service quality variables have an effect on customer satisfaction of 33.3%
while the rest is influenced by other variables not stated in this research.
The R2 value of 66.7% showed that the impact of service quality variables on customer
satisfaction. This means that service quality variables have an effect on customer satisfaction of
66.7%. While the remaining 33.3% is influenced by other variables not stated in this research. So that
it can answer the third problem in this research.
5. Discussion and Conclusion
Based on the results of the data research has been obtained tested using SPSS 17.0 software. The
reliability test indicates that the Cronbach Alpha value of each variable is greater than 0.60 which
means that the questionnaire that is the indicators of the variable is reliable or powerful. It can be seen
from the test results that have been done as follows: Variable quality service (X) Cronbach Alpha
value of 0.844, and customer satisfaction (Y) of 0.746. After the results of the validity and reliability
test are valid and reliable, it can be continued with other tests to determine the impact of service
quality on customer satisfaction in the Low Cost Carrier Air Asia airline.
The result of hypotheses 1 test indicates that there is a positive and insignificant influence on the
quality of service variables consisting of tangibles, reliability, responsiveness, assurance and emphaty
Indicators of customer satisfaction in the airline Flight Low Cost Carrier Air Asia. These results
suggest that a good assessment of the products that match the level of whether or not the quality of
service provided encourages customers to be loyal to the product.
Overall, customers will make comparisons between those provided by what is gained, quality of
service (service quality) is built on the comparison of two main variables, namely customer perception
of the real service they receive (perceived service) with the actual service expected. Results of the
customer experience in the use of service products will produce customer assessment of the service
products. If the product is able to satisfy the wishes of customers then the customer will give a
positive assessment of the service product. With the assessment, customers will still want to use the
service products. These results explain that in general customers will take into account the quality of
service that can be obtained from the money they will spend. The image of good quality of service is
not based on the viewpoint or perception of the service provider, but rather based on the perspective
or perception of customers, customers who consume and enjoy the services of the company, so they
are the Should determine service quality.
The F test results showed that simultaneous influence of all independent variables of quality
service to customer satisfaction showed significant results. It is shown from the magnitude of the F
value of 24,150 with a significance rate of 0.000. Some aspects of knowing customer satisfaction is to

Ani Puspawigati
The Influence of Service Quality Towards Customer Satisfaction in Air Asia Low Cost Carrier Airline Services
120
Proceedings of CATEA 2019
minimize the gaps between management and customers, the company must be able to build a joint
commitment to create a vision in improving the service process, and give customers the opportunity to
raise complaints.
The results of the first hypothesis test with the T test for the tangibles indicator are significant
with the calculated T value 2,026 > T table 1,654 with a sig value of 0044 if the sig value is < 10% or
0.1, meaning it affects significantly. Based on the results of the research on the tangibles indicator is
defined that Air Asia already has the facilities and the needs of adequate infrastructure and
infrastructures that fit the need of customers. With adequate facilities and infrastructures, customers
become satisfied as expected in service can be achieved well.
The result of the second hypothesis test with the T test for the reliability indicator is no effect and
is significant with the calculated T value of 1,369 > T table 1,654 with a sig value of 0173. Based on
the results of the research on the reliability indicator can be interpreted Air Asia has priority in terms
of timeliness, such as open on time, strategic location and the cost provided also according to the
service provided. However, some of the things that still make customers have a less content
perception because some services or employees have not had a good knowledge in providing services.
The results of the third hypothesis test with the T test for the responsiveness indicator is
significant with the calculated T value of 1,919 > T table 1,654 with a sig value of 0057 if the sig
value is < 10% or 0.1, meaning it significantly affects. Based on the results of the research on the
responsiveness indicators interpreted that the employees of Air Asia work in response, serve with
friendly, polite and not to be disappointed. Employees are chosen and taught to give good service, if
employees are polite, friendly then the consumers will be happy and satisfied in receiving service.
Even so sometimes some employees are less than maximized in providing services to consumers, it is
evidenced by some consumers feel less satisfied with the attitudes given by the employees.
The results of the fourth hypothesis test with the T test for the assurance indicator is significant
with the calculated T value 4,319 > T table 1,654 with a sig value of 0.000 if the sig value is < 10% or
0.1, meaning it affects significantly. Based on the results of the research on the assurance indicator
defined that Air Asia provides safety and security for customers, both from parking, safe and
comfortable facilities for customers, clean and strategic place. It is a good value because customers
will feel comfortable and satisfied.
The results of the fifth hypothesis test with the T test for the emphaty indicator are significant
with the calculated T value of 2,735 > T table 1,654 with a sig value of 0.007 if the sig value is < 10%
or 0.1, meaning it affects significantly. Based on the results of the research on the emphaty indicator
is interpreted that Air Asia gives good attention to consumers. Air Asia receives all criticism and
advice from customers, the suggestion that builds will serve as a improvement for future progress.
The R2 value of 66.7% indicates that the variable influence of service quality to customer
satisfaction of 66.7% means service quality variables have an effect on customer satisfaction of
66.7%. While the remaining 33.3% is influenced by other variables not stated in this study. So that it
can answer the third problem in this research.
Generally, this research has established that airline passengers in Indonesia value inflight
services, reliability of airline services, staff responsiveness and efficient baggage handling services.
To this end, it can be inferred that on-time departure and arrival, dependable flight schedule, excellent
safety records and provision of acceptable remedies against cancelled/delayed flight play a major role
in determining customer satisfactions. In the light of this development, it can be stated that airlines
stand to lose their customers if they fail to improve the reliability of their operations. Consequently, it
is recommended that Air Asia airlines should provide continuous training on good customer relations,
remain responsive and proactive to their customers demand as well as ensuring on-time departure and
arrival in their flight operations. The study also suggests that to improve service reliability airlines
should consider forming strategic flight alliance Air Asia in order to provide for flights availability
and adequate market coverage.

Ani Puspawigati
The Influence of Service Quality Towards Customer Satisfaction in Air Asia Low Cost Carrier Airline Services
121
Proceedings of CATEA 2019
References
Baker, D. M. (2013). Service Quality and Customer Satisfaction in the Airline Industry: A Comparison between
Legacy Airlines and Low-cost Airlines. American Journal of Tourism Research, 2(1), 67-77. Available
online at http://worldscholars.org. Accessed on 13/05/2019
Cronin, J., Brady, M. K., and Hult, G.T. (2000). Assessing the Effects of Quality, Value, and Customer
Satisfaction on Customer Behavioral Intentions in Service Environments, Journal of Retailing, 76(2),
193-218.
Cronin, J. J., and Taylor, S. A. (1992). Measuring Service Quality: A Reexamination and Extension. Journal of
Marketing, 56 (July), 55–68.
Hair, J. F., Andersen, R. E. and Tatham, R. L.(2010). Multivariate Data Analysis (7thed.), Upper Saddle River,
New Jersey: Pearson Prentice Hall.
Huang, Y. K. (2009). The Effect of Airline Service Quality on Passengers’ Behavioural Intentions Using
SERVQUAL Scores: A Taiwan Case Study. Journal of the Eastern Asia Society for Transportation
Studies, 7 (8), 1-14.
Hynes, J. and Dredge, F. (1998). Managing Customer Services. England: Gower Publishing Limited.
Jia, E. A., Cheae, L. S., Pei, T. P. and Yam, Y.C. (2012). A Study of Customer Satisfaction Towards Service
Quality in Airasia Malaysia (Unpublished B.Sc. Project). Universiti Tusku Abdulrahman, Malaysia.
Kotler, P. L. and Keller, K. L. (2009), Marketing Management, 13th ed., Pearson Education/Prentice Hall.
Oliver, R. L. (1981). Measurement and Evaluation of Satisfaction Processes in Retail Settings.Journal of
Retailing, 57, 25-48.
Parasuraman, A., Zeithaml, V. A. and Berry, L. (1985). A Conceptual Model of Service
Parasuraman, A., Zeithaml, V.A. and Berry, L., (1988). SERVQUAL: A Multiple Item Scale for Measuring
Customer Perceptions of Service Quality. Journal of Retailing, 64, 12–40.
Ross, K. N. (2005). Sample Design Educational Survey Research, Paris: International Institute for Educational
Planning/ UNESCO.
Wang, R., Shu, L. H., Lin, Y. H. and Tseng, M.L. (2011). Evaluation of Customer Perception on Airline Service
Quality in Uncertainty. Procedia Social and Behavioural Sciences, 25, 419-437.
Yunus, S. N. M. Jamil, B. and Rashid, W. E.W. (2013). Service Quality towards Customer Loyalty in
Malaysia‟s Air Asia Low Cost Airline Services, International Journal of e-Education, e-Business, e-
Management and e-Learning, 3(4), 333-336

122
Proceedings of CATEA 2019
Proceedings of CATEA 2019
ISBN 978-623-91018-0-0
The Relationship between the Implementation of Service Quality
and Guest Satisfaction at Hotel X Jakarta
Hari Iskandar
Bunda Mulia University
Abstract : A Hotel is becoming more increasingly supporting our tourism industry in accommodation sector.
Such growth has raised many questions the quality of service and impact on guest satisfaction. The growth of
hotel nowadays giving the inspiration to do research about service quality and guest satisfaction. The research
describes about the relationship between the implementation of service quality and guest satisfaction at Hotel X
Jakarta. The purpose of study is to analyze the relationship between two variables and conclusion also
recommendation for better service delivering to the guest. The study research took quantitative method as a
study method and using such as F-Test, T-Test, Validity, and Reliability analysis. The research result shows all
variables from service quality have relationship to guest satisfaction. Respondent profile is from the age range
26-35years old and based on year 2019 most of them is millennial generation so they need the efficiency and
effectiveness such as speed of check in, finding the reservation and service quality from the restaurant. All the
services have the impact from tangible, responsiveness, reliability, assurance, and empathy. Hotel need to
improve and maintain the quality and value to the guest. Service qualities have the impact and relationship to
the guest satisfaction.
Keywords: Quality; Satisfaction; Service; Hotel; Guest
1. Introduction 1.1 Background of study
Nowadays, there are many kinds of industry appear in our country. We have Agriculture, trading,
industry, construction, and Hospitality also Tourism sector. Based on the data from Central Bureau of
Statistic shown that Hospitality and Tourism is the top 5 biggest growth industry in Indonesia.
Economic and financial situation in the one nation is depending on the tourism condition at one
country. The role of the tourism sector is playing important situation. We as a human being at one
country need to support the growth of the tourism sector and becoming a good people to support the
tourism.
Figure 1. Central Bureau of Statistic

Hari Iskandar
The Relationship between the implementation service quality and guest satisfaction at Hotel X Jakarta
123
Proceedings of CATEA 2019
Hotel as a part of tourism industry is also growth in any kind of economic situation. Every single
hotel has their own characteristic and purpose of the business. They need to make good action plan,
target market and how they can achieve their goals. Based on the data, the growth of the opening hotel
from 3 stars until 5 stars have significantly increase.
Figure 2. Colliers International Indonesia Hotel data
Because of the growth of the hotel significantly increase, hotel need to offer many kind of
facilities, value, good service and competitive price in the market. Guest satisfaction is the biggest
part need to be concerned.
Hadi Irawan ( 2007:37) said there are five factors need to be concerned such as product quality,
Service quality, emotional, price, and cost. As a part of to minimize the unsatisfied guest, hotel must
give good quality of product to the guest such as good quality of room, food and beverage. Not only
product, we need to think about the service quality to be offered. Every guest is expecting good
service quality from the hotel. We need to put our mind that “Every Guest is a King” and finally the
hotel will get good image from us and will returning back again.
Hotel X Jakarta is a private hotel company in West Jakarta. In order to do their operational, hotel
X always gives their best service, give a new effort so they can compete with other competitor in the
surrounding area. By giving good service quality will lead to guest satisfaction and give good interest
and image to the hotel.
Because of the situation explained above, the study has decided to do research about “The
Relationship between the implementation service quality and guest satisfaction at Hotel X
Jakarta”
1.2 Problem Identification
Every hotel wants to give best service quality to the guest who come and stay at the hotel.
Satisfaction get from the hotel will bring the guest always come back to the hotel and become loyal
guest. The problem identification from the research is the compete of the hotel business nowadays
more struggle, so we need to give good service quality to the guest because Service Quality have
impact towards Guest satisfaction.

Hari Iskandar
The Relationship between the implementation service quality and guest satisfaction at Hotel X Jakarta
124
Proceedings of CATEA 2019
1.3 Purpose of Study
Based on the problem identification above, the purpose of study is to analyze whether service
quality dimensions have impact to the guest satisfaction.
1.4 Hypothesis
H0: Service Quality (Tangible, Reliability, Responsiveness, Assurance, and Empathy) has no impact
to Guest Satisfaction
H1.1: Service Quality (Tangible) has impact to Guest Satisfaction
H1.2 : Service Quality (Reliability) has impact to Guest Satisfaction
H1.3 : Service Quality (Responsiveness) has impact to Guest Satisfaction
H1.4 : Service Quality (Assurance) has impact to Guest Satisfaction
H1.5 : Service Quality (Empathy) has impact to Guest Satisfaction
1.5 Research Model
As is indicated by the name of this model, Parasuraman, Zeithaml and Berry (1985)SERVQUAL
is a measure of service quality. Essentially it is a form of structured market research that splits overall
service into five areas or components which is Tangible, Empathy, Reliability, Responsiveness and
Assurance and will describe as Variable X. Guest Satisfaction will describe as Variable Y.
Figure 3. Research Model
2. Related Works/Literature Review 2.1 Marketing Definition
Marketing is a business term that experts or people have their own definition in the different
ways. In fact, even at company level people may perceive the term differently. Basically, it is a
management process through which products and services move from concept to the customer. It
includes identification of a product, determining demand, deciding on its price, and selecting
distribution channels. It also includes developing and implementing a promotional strategy.
Based on the Philip Kotler, our Marketing Guru, Marketing is the social process by which
individuals and groups obtain what they need and want through creating and exchanging products and
value with others. In the other way, Wiliam j.Shultz dan Buchari Alma (2005:2) “marketing or
distribution is the performances of business activities that direct the flow goods and service from
producer to consumer or user”.
2.2 Service Quality
Service Quality could be defined as focusing on meeting needs and requirements and how well
the service delivered matches customer expectations. Perceived service quality is a global consumer
judgement or attitude, relating to service and results from comparisons by consumers of expectations
of service with their perception of the actual service performance (Mohd. Adil, Ghaswyneh and
Albkour, 2013).
The SERVQUAL scale constitutes an important landmark in the service quality literature and has
been extensively in different setting (Gupta, 2004). SERVQUAL provides a technique for assessing
and managing service quality (Parasuraman, Zeithaml and Berry, 1985) and then further developed
for the next eight years by the same researchers. SERVQUAL measures service quality through
Tangible
Reliability
Responsiveness
Assurance
Empathy
Guest
Satisfaction

Hari Iskandar
The Relationship between the implementation service quality and guest satisfaction at Hotel X Jakarta
125
Proceedings of CATEA 2019
comparing customer expectation and actual company performance to seek up the gap between
expectation and reality (Mohd. Adil, 2013).
SERVQUAL comprise 22 items in Likert type questionnaire to measure five dimensions :
Tangibility, reliability, responsiveness, assurance and empathy.
2.3 Guest Satisfaction
Customer satisfaction is the key of long term success of any kind of business include hotel. Hotel
needs to maintain stable and close relationship with the guest in order to develop satisfaction. We
believe that every hotel deliver a quality service is the essential for success and survival in today
society. Guest satisfaction measurement are normally done by asking some questions to the guest by
questionnaire form or doing interview directly.
Smith (2012) explained that there are four keys of customer satisfaction measurement for
effective measurement as below:
1. Overall Satisfaction measure
This aspect of question reflects the overall opinion of guest satisfaction experience with a
product which they have used.
2. Loyalty Measurement
This aspect of question measure the core NPS (Net Promoter Score) of the customer.
3. A series of attribute satisfaction measurement
This aspect of question measure the guest satisfaction and perception of a specific attribute of
a brand or business.
4. Intentions to repurchase measurements (behavioral measure)
This aspect of question the guest tendency to come back to a specific brand to make another
purchase in the future.
Satisfaction level is very important to be measured, so a business would know the customer
thinks, feels, and want from them.
3. Material & Methodology This type of study is quantitative method; the author would like to find out the relationship
between each of the hotel service quality indicator to guest satisfaction. To add more information, the
author complete with some interview session with the hotel guest who stay at during the period.
3.1 Type of data and collection method
The data in this research is primary data, which collected through questionnaire among the guest
who stay in the hotel X, with the sample size is 100 users to analyze their satisfaction level of hotel
service quality indicator. The reason to use primary research is to look for direct evidence and
information in order to better understanding of the research objects. The population is 100
respondents.
3.2 Likert Scale
Likert scale always useful during questionnaire preparation. Likert scale starts from five
preferences step with the details as below:
1 = Strongly disagree
2 = Disagree
3 = Netral
4 = Agree
5 = Strongly Agree
3.3 Variables
There will be two (2) variables in the research, hotel service quality and guest satisfaction. Hotel
Service quality will consist of 5 variables dimensions according to SERVQUAL theory which:
a. Tangible
b. Reliability
c. Responsiveness

Hari Iskandar
The Relationship between the implementation service quality and guest satisfaction at Hotel X Jakarta
126
Proceedings of CATEA 2019
d. Assurance
e. Empathy
All the indicators above will be tested for each of its relation with the guest satisfaction in the Hotel
X.
3.4 Population and Samples
The population in this research is based on the data guests who stay at the hotel X. The
questionnaire has been distributed into 100 respondents. Sugiyono (2011:62) said Samples is part of
total and characteristic belongs to Population. Isaac and Michael has developed the theory and said
research technique using 5% error.
3.5 Multiple Regression Analysis
The author uses multiple regression analysis to examine the five independent variable
dimensions. Multiple regressions is a statistical tool used to developed a self-weighting estimating
equation that predicts values for dependent variable. Multiple correlation analysis is used to analyze
whether there is significant impact between independent and dependent variable.
Below is the value classifications according to Sugiyono (2007):
0.00-0.199 = Very Weak
0.20-0.399 = Weak
0.40-0.599 = Average
0.60-0.799 = Strong
0.80-1.000 = Very Strong
3.6 Reliability and Validity Analysis
The research can be valid and reliable if the author have been tested with validity and reliability
analysis from the data gathered from the respondents.
3.6.1 Validity analysis
Formula for Validity analysis:
r = n. (Ʃxy) – (Ʃx) (Ʃy)
n. Ʃx2 - (Ʃx
2) n.Ʃy
2- (Ʃy)
2
Note:
r=Coefficient Correlation
x= Independent Variable (Service Quality)
y= Dependent Variable (Guest Satisfaction)
n= Total Respondents
Validity test can be done by overseeing the correlation between each score from the
questionnaire by using coefficient correlation pearson. If the significant value (P Value) > 0,05 means
no significant relationship and if the P value < 0.05 means there is significant relationship.
3.6.2 Reliability Analysis
Reliability is synonymous with the consistency of a test, survey, observation, or other measuring
device. A questionnaire can be reliable if the answer among the question is consistent or stable time to
time.
3.7 F Test
The F-Test is conducted to analyze if there is significant impact between of all the independent
variables as a whole which the service quality dimensions (Tangible, Reliability, Responsiveness,
Assurance and Empathy) toward the dependent variable which is guest satisfaction.

Hari Iskandar
The Relationship between the implementation service quality and guest satisfaction at Hotel X Jakarta
127
Proceedings of CATEA 2019
3.8 T-test
T-test will be used to analyze if there is any partial independent variables (Service Quality) have
impact between dependent variables (guest satisfaction) with the significant value α=0,05
3.9 Determination Coefficient
Coefficient Determination is a method to know and analyze how much the impact of independent
variable (X) towards dependent variable (Y).
KD = ( r2 X 100% )
KD : Determination Coefficient
r : Correlation coefficient
4. Results and Discussion 4.1. Profile Respondents
4.1.1 Gender
Figure 4. Gender Profile
From 100 questionnaires distributed, we got 47 % or 47 persons are female and 53% or 53
persons are Male.
4.1.2 Age
Figure 5. Age Profile
From 100 questionnaire distributed, we have the data 2% or 2 persons is more than 45 years old,
12% is 17-25 years old, 34% is 36-45 years old and 52% is from 26-35 years old.
4.1.3 Monthly Income
The monthly income from 100 respondents is 3 persons is below 2 million, 33 persons is 2-6
million, 54 persons is from 6-10 millions, and 10 persons is more than 10 millions.
53%
47%
Gender Profile
Pria Wanita
12%
52%
34%
2%
Age
17-25
26-35
36-45
>45

Hari Iskandar
The Relationship between the implementation service quality and guest satisfaction at Hotel X Jakarta
128
Proceedings of CATEA 2019
Figure 6. Monthly Income Profile
4.2. Result of Questionnaire
4.2.1. Descriptions
From the N Statistic is 100 respondents filled up the questionnaires, the result is with the range
minimum is 68 and maximum is 121 for Variable X (Service Quality). Range Minimum is 76 and
maximum is 138 for Variable Y (Guest Satisfaction).
4.2.2. Validity Test Result
Based on the result above, we can conclude that the result is valid shown from Sig(2-tailed) is
0.000 is less than 0.01. (0.000<0.01). The result shown that there is a relationship between service
quality(X) with guest satisfaction(Y) at Hotel X Jakarta.
4.2.3. Reliability Test Result
Reliability Statistics
Cronbach's Alpha N of Items
.991 2
Because of the value of reliability test is 0.991, since all the cronbach’s alpha values are more
than 0.5, we can conclude that the items is reliable
4.2.4. Normality Test
Normality test is conducting to test if the dependent variable and independent variable have or
not have normal distribution. From the table shows that the pattern diagonally upwards and around the
normal line. Therefore, the regression model is normal assumption.
3
33
54
10
0
20
40
60
2jt 2-6jt 6-10jt 10 jt
Monthly income

Hari Iskandar
The Relationship between the implementation service quality and guest satisfaction at Hotel X Jakarta
129
Proceedings of CATEA 2019
4.2.5 Coefficient Determination (R
2)
From the result of SPSS, the value of R
2 is 0.985, which mean 98.5% variation from five
independent variables (Tangible, Empathy, Reliability, Responsiveness, Assurance) and the other
(100% - 98.5% = 1.5%) can be explained from other factor.
4.2.6 F-Test Result (ANOVA)
F-Test used to analyze there is relationship between all the independent variable as a whole
which is Service quality toward independent variable, which is guest satisfaction.
ANOVA is a form of hypothesis test and the hypothesis is:
H0: Service Quality (Tangible, Reliability, Responsiveness, Assurance, and Empathy) has no impact
to Guest Satisfaction
H1.1: Service Quality (Tangible) has impact to Guest Satisfaction
H1.2 : Service Quality (Reliability) has impact to Guest Satisfaction
H1.3 : Service Quality (Responsiveness) has impact to Guest Satisfaction
H1.4 : Service Quality (Assurance) has impact to Guest Satisfaction
H1.5 : Service Quality (Empathy) has impact to Guest Satisfaction
From ANOVA test result shown that F-Statistic is 6599.80 with the F-Table in this research is
3,93 (using excel function), we can conclude that all the Variables have impact to the guest
satisfaction and H1 is accepted.

Hari Iskandar
The Relationship between the implementation service quality and guest satisfaction at Hotel X Jakarta
130
Proceedings of CATEA 2019
4.2.5. T-Test Result and Regression Result
Based on T-Test result we can conclude that
Y = A +b1x1+ b2x2 + b3x3 + b4x4 + b5x5 ……………………….. Equation 1
Y = -0.191 + 1.944X1+2.115X2+2.003 X3+1.978X4+2.291 X5 …….. Result
Where; Y is guest satisfaction, A is 11.54 which is the constant, X1 is tangible, X2 is reliability, X3
is responsiveness, X4 is assurance and X5 is Empathy.
4.2.6 Hypothesis Testing
Previously, the hypothesis is:
H0: Service Quality (Tangible, Reliability, Responsiveness, Assurance, and Empathy) has no impact
to Guest Satisfaction
H1.1: Service Quality (Tangible) has impact to Guest Satisfaction
H1.2 : Service Quality (Reliability) has impact to Guest Satisfaction
H1.3 : Service Quality (Responsiveness) has impact to Guest Satisfaction
H1.4 : Service Quality (Assurance) has impact to Guest Satisfaction
H1.5 : Service Quality (Empathy) has impact to Guest Satisfaction
Because of all the T-value from the table above is more than 1.98 as t-table, so we can conclude that
H0 is rejected and we received H1 which is service quality have impact to the guest satisfaction.
Variable Hypothesis Statement T-test Result
Score
Remarks
Tangible H1.1 Variable Tangible has impact to
guest satisfaction
44.10 H1.1
ACCEPTED
Reliability H1.2 Variable reliability has impact to
guest satisfaction
41.28 H1.2
ACCEPTED
Responsiveness H1.3 Variable responsiveness has impact
to guest satisfaction
50.66 H1.3
ACCEPTED
Assurance H1.4 Variable assurance has impact to
guest satisfaction
41.19 H1.4
ACCEPTED
Empathy H1.5 Variable empathy has impact to
guest satisfaction
44.96 H1.5
ACCEPTED
5. Conclusion 5.1 Conclusion
Based on research study, the authors suggest several conclusion and recommendation for the Hotel X
could take to improve service quality so they can give better service for guest satisfaction:
1. Respondent profile is most likely from the age range 26-35years old and based on year 2019
most of them is millennial generation so they need the efficiency and effectiveness such as
speed of check in, finding the reservation and service quality from the restaurant.
Hari Iskandar
The Relationship between the implementation service quality and guest satisfaction at Hotel X Jakarta
131
Proceedings of CATEA 2019
2. All the services have the impact from tangible, responsiveness, reliability, assurance, and
empathy. The hotel just need to improve and maintain the quality, add more service and value
so the guest will always happy and returned back to the hotel.
3. All the dimension from service quality have the impact and relationship to the guest
satisfaction.
5.2 Recommendation
Based on the analysis, the following recommendations are proposed. The hotel need to more
focus on the young people market segment because of the guest most likely from 26-35 years old. The
hotel is also need to improve and change the condition of the room, pricing strategy, and more closely
add some value like free special gift takeaway so everybody will happy. As a hotelier, we need to add
more value to the guest such as simply calling their name, remembering their needs or request. Simple
service but the moment of truth is appear in this case.
References Book
Buchori Alma, “Manajemen Pemasaran Jasa”, Salemba Empat, 2016.
Tjiptono Fandy, “Manajemen Pemasaran”, BPFE, 2012.
Sugiyono,“Metode Penelitian : Kuantitatif, Kualitatif, dan R&D, 23th edition”, CV Alfabeta,
2016.
Wursanto, “Dasar-Dasar Ilmu Pemasaran”, Andi Offset, 2013.
Zeithaml, Valarie A., Parasuraman, A., &Berry, L.L. “Delivering quality service: balancing customer
perceptions and expectations.” New York, The Free Press,2010
Journal Papers
Barsky, J. D. ”Customer satisfaction in the hotel industry: meaning and measurement. Hospitality Research
Journal,” 16 (1), 51-73(1992).
Parasuraman, A., Zeithaml, V. A., & Berry, L. L. ”SERVQUAL: A multi-item scale for measuring consumer
perceptions of service quality”. Journal of Retailing, 64, 12-40(1988).
Online
Central Bureau Statistic, www.bps.go.id, Retrieved 01 May 2019.
Colliers International, www.colliers.com , Retrieved 01 May 2019.
Service Performance, http://www.serviceperformance.com/the-5-service-dimensions-all-customers-care-about/,
Retrieved 01 May 2019

132
Proceedings of CATEA 2019
Proceedings of CATEA 2019
ISBN 978-623-91018-0-0 Accessibility Approach to Tourism: A Case of Anjungan TMII
Ika Triana1, Nurul Sukma Lestari
2, and Rachel Dyah Wiastuti
3
1Binus Business School, Bina Nusantara University
2Business Hotel Management Department, Bina Nusantara University
3Hotel Management Department, Bina Nusantara University
[email protected]*, [email protected], and [email protected]
Abstract: Anjungan at Taman Mini Indonesia Indah is made to provide information about various tribes'
traditional houses in Indonesia. The aim of this study is to determine the Anjungan accessibility based on
UNWTO Accessible Tourism concept as a part of sustainable tourism. Data were gathered from direct field
observation and interview on March to April 2019. In Anjungan, there are thirty-three replica of provinces in
Indonesia. The findings refine the Anjungan accessibility based on seven categories; parking area,
communication, signage, horizontal movement, vertical movement, public hygiene facilities, and pricing. The
results show good compliance with pricing there is no increase in fees for visitors with special requirements.
However, a vertical movement is almost not implemented and is limited access to public toilets and defects
available. Therefore, this study contributes to information services so that everyone can visit the Anjungan at
TMII to be able to learn about the history and culture of each province.
Keywords: Accessibility; Accessible; Accessible Tourism; Sustainable Tourism; Anjungan; TMII
1. Introduction Taman Mini Indonesia Indah is one of the biggest amusement parks in Indonesia, with the total
area around 150 ha (Wardijono, Wardhani, Chandra, & Pamungkas, 2018). Taman Mini Indonesia
Indah or known as TMII was built in 1972 and officially opened on 20th April 1975, which he first
idea came from Ibu Tien Soeharto (TMII Pesona Indonesia, 2016). In the beginning, the park only
had “Anjungan Daerah”, that was the replica from twenty-six provinces in Indonesia, and now it has
thirty-three provinces. Anjungan Daerah was made to provide information about various tribes'
traditional houses in Indonesia, including historical objects, traditional clothes, art equipment and
handicrafts (Triastuti & Rakhmani, 2011). Anjungan TMII can be defined as a theme park. Based on
Ho & Ap, a theme park is a building, attraction or landscape that has a specific theme by combining
entertainment, food, souvenir shops and the environment that suits the theme (Ho & Ap, 2009).
A theme park is an improvement of the amusement park (Richard, Kaak, & Orlowski, 2017). A
theme park is one of the tourist attractions, which is managed to meet the needs of visitors such as
fun, recreation, leisure and education (Raluca & Gina , 2008). As (Calvo-Mora, Navarro-García, &
Periañez-Cristóbal, 2015) one of a tourist attraction, Anjungan TMII must fulfill the basic requirement
for tourism that is tourism for all. Where tourism is a social product that must be enjoyed by all
people regardless of their individual, social and economic level (Calvo-Mora, Navarro-García, &
Periañez-Cristóbal, 2015). Based on estimation from the World Health Organization said that 15% of
the global population, roughly 1 billion people, live with some form of disability (World Tourism
Organization, 2016). People with disabilities include temporary disabilities such as injuries, pregnant
women, people with baby strollers, tourists with luggage and elderly people must still be able to enjoy
the same conditions as normal people (Prescott, 2015).
Due to the increasing number of people with special needs, accessible tourism has become one of
the most popular tourism concepts ( Wee & Sanmargaraja, 2015). People with special
needs/disabilities often feel disappointed when they come to a tourist destination because they cannot
experience the same value with normal people, because the place has not to implement accessible

Ika Triana, Nurul Sukma Lestari, and Rachel Dyah Wiastuti
Accessibility Approach to Tourism: A Case of Anjungan TMII
133
Proceedings of CATEA 2019
tourism yet ( Ambrose, 2012). Information regarding accessibility is a basic requirement for tourists
with disability (Mulyaningrum, Lestari, & Wiastuti, 2018).
The tourist experience has become a focus of the tourism industry because it can determine
whether the tourist will come back or not ( Lin & Kuo, 2016). If the tourism industry can minimize or
control the aspect of accessible tourism, it is not impossible for tourism to established sustainable
tourism, because tourism is very beneficial for various parties involved (UNEP, 2005). The
accessibility needs to be improved in the maximum way to sustain in the tourism business
(Mulyaningrum, Lestari, & Wiastuti, 2018).
The purpose of this study is to know how far has Anjungan TMII implemented accessible tourism
in each area of thirty-three provinces.
2. Literature Review 2.1 Tourism for All
Tourism for all is a public necessity that is also very profitable for business (Pacific Asia Travel
Association, 2015). All industries and businesses engaged in tourism must have the same goal, that is
to create tourism universally accessible and without any obstacles (European Commision).
Accessibility, sustainability and equality are known as tourism for all (UNWTO, 20 16). That is,
ensuring that persons with disabilities have access, on an equal basis with others, to the physical
environment, transportation, information, communication and public facilities (UNWTO, 2016).
2.2 People with Disability
A person who has long term physical, mental, intellectual or sensory impairment can be
categorized as people with disabilities (World Tourism Organization, 2013). People with disabilities
have various needs, capability, and contribution to their societies (UNHCR, 2017)
2.3 Accessible Tourism
Accessibility covers many things besides the environment with no barrier but also related to
accessibility on the internet site, signage, the way of communication, transportation and a staff who
have knowledge about disability in the tourism industry (Wee & Sanmargaraja, 2015). The general
purpose of accessible tourism is to provide access to all tourism product and services, whatever the
situation or condition in all tourist destinations (Zsarnoczky, 2017). Beside of offering barrier-free
access for disabilities people, accessible tourism also provides universal design condition that can
help people with disabilities temporary or permanent, people with a baby stroller, elder people and
create a secure situation for the employee to works (World Tourism Organization, 2013)
UNWTO has general requirements for tourism facilities and sites, should comply with (World
Tourism Organization, 2013):
a. Parking area; a special space must provide for person with disabilities, near with the entrance,
should be a proper signage, and must be monitored to prevent the space wont used by non-
disabled people.
b. Communication; the use of sign language, braille, and various methods used to communicate by
persons with disabilities must be provided and facilitated.
c. Signage; the information, ticket counter should have an accessible area reserved for use by
person with disabilities, located near with entrance. Announcement should be both visual and
audible. Services and facilities should be used universal symbol.
d. Horizontal Movement; all the corridor and passageways must be free of barrier, wide enough to
permit two wheelchairs side by side, otherwise provide passing points.
e. Vertical Movement;
Elevators should have a plenty number of elevators wide enough for a person using a
wheelchair to enter and move easily. Specially designed and equipped for easy use by such
persons and for the vision impairment, should be equipped with emergency systems
accessible to the hearing impaired.
Stairs and ramps, whenever possible, the built at the same level or equipped with ramps
where there is a change in floor levels.

Ika Triana, Nurul Sukma Lestari, and Rachel Dyah Wiastuti
Accessibility Approach to Tourism: A Case of Anjungan TMII
134
Proceedings of CATEA 2019
f. Public Hygiene Facilities; accessible toilet and washbasin must locate at the same place with
normal toilet. Accessible toilets must be adjusted for the area of the room and equipment must
also be adjusted to the needs. Must be provide a system that allow persons inside the toilet stalls
to find and use emergency lighting signs and switches.
g. Prices; the price shall not give rise to an increase in rates for customers with disabilities.
2.4 Sustainable Tourism
Sustainable tourism is a tourism that takes full account of the present and the future of economic,
social and environmental impacts, addressing the needs of visitors, industry, people environment and
host community (UNEP, 2005). Sustainable tourism as a protection and tourism resource that can be
used for the future and the availability of resources for present and future generations (Junaid, 2015).
As a leading to management of all resources in such a way that economic, social and aesthetic
needs can be fulfilled while maintaining cultural integrity, essential ecological processes, biological
diversity and life support systems (A Simple User’s Guide to Certification for Sustainable Tourism
and Ecotourism). Sustainable tourism impacts on increasing regional income, creates economic
development for the local environment and opens many employment opportunities for the local
community (Halter & Randle, 2012).
3. Methodology This paper was gathered from a qualitative descriptive research. The complete summarization of
specific events in daily terms that experienced by individual or group can be said as qualitative
descriptive research (V. Lambert & Lambert, 2012). The objects of this research were Anjungan
Daerah that was referred in the official website of Taman Mini Indonesia Indah,
http://www.tamanmini.com/pesona_indonesia/. There are thirty-three Anjungan Daerah in Indonesia,
that refers to the number of provinces in Indonesia.
The primary data was collected from field research through interview and observation, conducted
within two months from March to April 2019. A secondary data was gathered from the library,
journal, documentation, UNWTO report, a photograph of the actual condition, and collected brochure
from each Anjungan.
Every observation took five to six hours of field research. Where the researcher uses a checklist
for guideline. The content of the checklist consisted of parking area, communication, signage,
horizontal movement, vertical movement, public hygiene facilities, and price.
3.1. Table and Figure
No. Nama Anjungan Abb
18 Nusa Tenggara Barat NB
19 Nusa Tenggara Timur NT
20 Kalimantan Selatan KS
21 Kalimantan Tengah KT
22 Kalimantan Barat KB
23 Kalimantan Timur KR
24 Sulawesi Selatan SS
25 Sulawesi Tenggara ST
26 Sulawesi Tengah SH
27 Sulawesi Barat SB
28 Gorontalo GO
29 Sulawesi Utara SU
30 Maluku MU
31 Maluku Utara MA
32 Papua PA
33 Papua Barat PB
No. Nama Anjungan Abb
1 Pemerintah Aceh AC
2 Sumatera Utara SU
3 Kepulauan Riau KR
4 Riau RI
5 Sumatera Barat SB
6 Jambi JI
7 Bangka Belitung BB
8 Sumatera Selatan SS
9 Bengkulu BU
10 Lampung LG
11 Banten BN
12 DKI Jakarta DJ
13 Jawa Barat JB
14 Jawa Tengah JT
15 D.I Yogyakarta DY
16 Jawa Timur JT
17 Bali BI

Ika Triana, Nurul Sukma Lestari, and Rachel Dyah Wiastuti
Accessibility Approach to Tourism: A Case of Anjungan TMII
135
Proceedings of CATEA 2019
4. Results and Discussion 4.1. Result
4.1.1 Parking Area
There are thirty-three Anjungan in TMII and almost all the Anjungan had parking area for both
cars and motorcycles. For example, parking area that was in the Anjungan Aceh, Bangka Belitung,
Gorontalo, Sumatera Barat, Bengkulu, Jambi which provide a large enough parking area for visitors.
Anjungan Kepulauan Riau was located next to Anjungan Bangka Belitung, Banten and Papua Barat in
an area where there was no barrier for each of the Anjungan, including for the parking area. So, the
visitors can park their vehicles and can directly visit all four Anjungan without leaving the area like
other Anjungan.
In terms of security there were no staff on duty to manage the parking area and also there were no
surveillance cameras, so the visitors must take care of their luggage. In addition, the parking area
provided on some Anjungan was not too large, so visitors who use the bus should park it in the
parking area provided by Taman Mini Indonesia Indah, or in the roadside parking.
Taman Mini Indonesia Indah provides bicycle rental and there are tour bus facilities. For tour
buses, visitors should pay Rp 10,000 for two trips. So, visitors who use private vehicles or buses can
park their vehicles in the public parking area of TMII and can use bicycles or tour bus to surround all
the Anjungan in TMII. In addition, there was a motorbike rental although it looked like it was not a
facility provided by TMII.
On every Anjungan in TMII, there was no parking area for disabled visitors. So, if there are
visitors who use wheelchairs for example, it was very difficult for them to park their vehicles, because
in addition to its location that was not too close to the entrance, the parking area was not broad and
inadequate parking conditions, such as rocky conditions or grassy.
4.1.2 Communication
When entering the Anjungan area, visitors were presented with an extensive map of Indonesia and
/ or a map of the area of each Anjungan. Then when you enter the room that displays a replica of an
art instrument, custom home, traditional clothes, etc, there was a reception desk that provided
pamphlets or information sheets about the area as additional information for visitors. In addition, there
were officers who were also ready to help visitors to ask further questions about the Anjungan.
However, before entering Anjungan or traditional house in the Anjungan area, visitors were
required to remove footwear in accordance with the instructions. Each Anjungan had information
such as removing footwear before entering a room written in two languages, namely Indonesian and
English, and there were also those who use the local language of the area, such as the Anjungan Bali
and the Anjungan Jawa Barat. For example, at the Anjungan Bali there were various kinds of
traditional Balinese houses and there was a signboard to name the traditional house which was not
only in Indonesian but also use Balinese script.
At the Anjungan Jawa Barat the visitors were greeted with a sign that read "Wilujeng Sumping"
which means “Welcome” at the main gate. But indeed, most of the information that exists was related
to traditional clothes, traditional art tools, and the names of existing rooms using Indonesian and
English.
Unfortunately no braille information was provided so that visitors who had limitations in viewing
cannot get an information about that Anjungan.
4.1.3 Signage
In all Anjungan there was no ticket counter for ticket sales because visitors could enter the
Anjungan area for free. However, when entering the room on the Anjungan there was one table and
officer such as a receptionist who overseen welcoming guests, recording a list of visits, and provided
information for visitors.
Sign direction such as the direction of toilets, musholla, motorbike parking, eating places were
provided in the form of writing in Indonesian not in pictograms (universal design).
Information related to signs for visitors with disabilities was also not provided by TMII, for
example such as special parking signs for people with disabilities. In this case, usually people with

Ika Triana, Nurul Sukma Lestari, and Rachel Dyah Wiastuti
Accessibility Approach to Tourism: A Case of Anjungan TMII
136
Proceedings of CATEA 2019
disabilities who could still drive their own vehicles and used wheelchairs needed to be provided a
wider parking area to facilitate accessibility to get into and out of their vehicles.
In every Anjungan there was not equipped with audio announcement only with visual, where
some of the visual announcement was written in Bahasa.
4.1.4 Horizontal Movement
The front yard of each Anjungan was wide enough for some visitors who used wheelchairs.
Although in some Anjungan the situation was not very accommodating to visitors with a wheelchair
or carrying a baby stroller, because the Anjungan’s front yard was in the form of a cement field and
has holes in them.
For the inside of the Anjungan, most of it consists of rooms that were quite spacious and free
from obstacles. But unfortunately, visitors with disabilities still couldn’t enter most of the traditional
houses on the Anjungan because most traditional houses on Anjungan are stilt houses that had to use
stairs to enter the area.
4.1.5 Vertical Movement
Most of the Anjungan only had wooden stairs, and even then, many had started to be brittle,
making it difficult for visitors with disabilities. In the Anjungan Jawa Timur, Sumatera Utara and
Jambi provided a ramp at the front door so that it would be easier for visitors with a wheelchair or
bring a baby stroller to enter the courtyard area on the Anjungan. But once again visitors with
disabilities still couldn’t look at the inside of the traditional house because there was only wooden
stair access. Whereas for the Anjungan Jawa Timur it had more access, especially for visitors with
disabilities to be able to enjoy the area because it provided a ramp so that it was easy for visitors who
use wheelchairs. Anjungan Jawa Timur had the traditional houses on one level only.
4.1.6 Public Hygiene Facilities
Each Anjungan provides toilets and hand washing places. But there was no toilet for visitors with
disabilities. The toilets cubicles were very small, dark, and many still provided squat toilets. The
placement of the toilet location was difficult to reach, especially for visitors with disabilities. In terms
of location the placement of the toilet was located at the back of each Anjungan, where the road to
reach it was very difficult to pass by wheelchairs or visitors carrying a baby stroller. Because at the
end of the road that leads to the toilet there were steps and a narrow distance so that it would be very
difficult for the wheelchair to maneuver.
4.1.7 Prices
There was no difference in price for ordinary visitors and those with disabilities to entering the
free ticket price Anjungan. Visitors were only charged a ticket when they enter TMII.
4.2. Discussion
Due to common requirements for accessibility for parking areas, the Anjungan in TMII had not
met accessibility requirements because there were still Anjungan that did not provide parking spaces
so that visitors park their vehicles outside the Anjungan area. In addition, there was no specific area
for disability. The parking area was not wide enough. It could only accommodate about 6-7 cars, but
if the area of the motorbike could accommodate about more than 10 motorbikes However, not all
Anjungan had special motorized parking spaces. For example, on the Anjungan Sumatera, a
motorbike parking area was placed under a traditional house in the form of a stilt house. Not only in
terms of facilities, but in each Anjungan, there was no staff working in the parking area and the
unavailability of CCTV surveillance cameras.
Due to common requirements of accessibility for communication, the Anjungan in TMII had
fulfilled the requirements because information was provided starting from the notification of opening
or closing the Anjungan to information regarding the notification of items on the Anjungan and
provided in Indonesian and English. However, visitors who lack vision were not helped because the
information available was not provided in Braille.

Ika Triana, Nurul Sukma Lestari, and Rachel Dyah Wiastuti
Accessibility Approach to Tourism: A Case of Anjungan TMII
137
Proceedings of CATEA 2019
Due to common requirements of the accessibility for signing, only some of them provided
pictograms, and most were only provided in Indonesian such as the Musholla, Parking, Souvenirs, and
eating places. Just the sign into the restroom was provided in English, which was "toilet". And there
was no audio announcement in every Anjungan
Due to common requirements of accessibility for horizontal movement, there were only three
Anjungan that provided a ramp from the gate to the Anjungan. But for the Anjungan Jawa Timur
there was a ramp around the area. For other Anjungan there were too many steps and stairs, making it
difficult for visitors to use wheelchairs or other visitors with disabilities.
Due to the common requirements of the accessibility for vertical movement, all Anjungan at TMII
did not provide elevators or escalators for visitors. All of them used ladders and for Anjungan that
have traditional houses such as houses on poles, it was also quite difficult not only for visitors who
had disabilities but also ordinary visitors because the stairs were almost all rather steep, and some
were already brittle, such as on the Anjungan Kalimantan Barat.
Due to common requirements for accessibility for public hygiene facilities, Anjungan in TMII
provided toilets. The toilet was quite clean, it's just that the location was rather cornered, and the place
was too small and dark. Also provided a place for hand washing which was placed adjacent to the
toilet.
Due to common requirements of accessibility for prices, the Anjungan did not rate entry tickets,
so visitors could visit the Anjungan several times they wish. The ticket price was only charged when
entering the TMII region and the price charged to people and vehicles. And there was no additional
charge for dissability visitor.
5. Conclusion Thirty-three regional Anjungan in TMII implemented accessibility requirements partially based
on accessibility tourism standards. There were still things that needed to be improved from the seven
accessibility tourism categories; parking area, communication, signage, horizontal movement, vertical
movement, public hygiene facilities and prices. From the seven categories, which still needed to be
improved were the parking area, horizontal movement and vertical movement. As for communication,
signage and prices were considered as implemented. However, there were some accessible standards.
The must be improved was the availability of information in braille and audio announcement. In
conclusion, to encourage Anjungan tourism sustainability, Anjungan are required to support its
accessibility standards by providing the Anjungan that can be accessed by everyone. The more
Anjungan that could be accessible by everyone, the more visitors are willing to come and revisit the
intention. And to be aware of that, TMII needed to provide Anjungan facilities that could be accessed
by everyone and improved the quality of staff so that they could help visitors to enjoy their visits
throughout the Anjungan.
Acknowledgement. This research is fully supported by Binus Research Grant.
References Ambrose, I. (2012). Best Practice in Accessible Tourism: Inclusion, Disability, Ageing Population and Tourism.
(D. Buhalis, S. Darcy, & I. Ambrose, Eds.) London: Channel View Publications.
Lin, C.-H., & Kuo, B.-L. (2016). The Behavioral Consequences of Tourist Experience. Tourism Management
Perspectives, 18, pg.84-91.
Raluca, D. C., & Gina , S. (2008). Theme Park - The Main Concept of Tourism Industry Development. Annals
of the University of Oradea, Economic Science Series, 17(2), pg.641.
Wee, S., & Sanmargaraja, S. (2015). Barriers of Accessible Tourism in the National Parks in Malaysia: Case
Study in Tanjung Piai National Park. Australian Journal of Basic and Applied Sciences, 9(31), 452-
458.
Calvo-Mora, A., Navarro-García, A., & Periañez-Cristóbal, R. (2015). Tourism for All and Performance: An
Analysis of Accessibility Management in Hotels. In M. Peris-Ortiz , J. Álvarez-García , & C. Rueda-
Armengot, Achieving Competitive Advantage through Quality Management (pp. pp 111-132).
Switzerland: Springer, Cham.
European Commision. (n.d.). Retrieved May 6, 2019, from
https://ec.europa.eu/growth/sectors/tourism/business-portal/accessibility_en

Ika Triana, Nurul Sukma Lestari, and Rachel Dyah Wiastuti
Accessibility Approach to Tourism: A Case of Anjungan TMII
138
Proceedings of CATEA 2019
Government of Western Australia. (2015, October 15). Retrieved from
http://www.disability.wa.gov.au/understanding-disability1/understanding-disability/what-is-disability/
Halter, R., & Randle, D. (2012, Aprl 27). Sustainable Tourism: A Key to Global Solutions. Retrieved April 6,
2019, from Huffpost: https://www.huffpost.com/entry/sustainable-tourism-a-key_b_1301966
Ho, P., & Ap, J. (2009). Tourism and hospitality studies: Theme parks and attractions. Hongkong: Education
Bureau.
Junaid, I. (2015). Sustainable Tourism in Toraja: Persepective of Indigenous People. ASEAN Journal on
Hospitality and Tourism, 14(1), 45 - 55.
Mulyaningrum, N. I., Lestari, N. S., & Wiastuti, R. D. (2018). ACCESSIBILITY DEVELOPMENT: A GUIDE
TO SUSTAIN MODERN MARKET FOR URBAN SHOPPER’S DIVERSITY. International
Conference on Community Development. 1(1), pp. 578-588. Jakarta: ICCD. Retrieved from
https://doi.org/10.33068/iccd.Vol1.Iss1.87
Mulyaningrum, N. I., Lestari, N. S., & Wiastuti, R. D. (2018). Accessible Information in Tourism: Case of
Casual Italian Restaurant. National Conference of Creative Industry: Sustainable Tourism Industry for
Economic Development (pp. 230-240). Jakarta: Universitas Bunda Mulia.
Pacific Asia Travel Association. (2015). Retrieved from https://sustain.pata.org/tourism-for-all/
Prescott, M. (2015, August 3). Accessible Tourism. Transforming Communities Through Tourism. Vancouver,
Vancouver, Canada: Link BC.
Richard, B., Kaak, K., & Orlowski, M. (2017, July 3). Theme Park Tourism. (L. L. Lowry, Ed.) New York:
SAGE Publications, Inc. doi: http://dx.doi.org/10.4135/9781483368924
Soewadji, J. (2012). Pengantar Metodologi Penelitian. Jakarta: Mitra Wacana Media.
Sustanible Tourism. (n.d.). Retrieved April 6, 2019, from
https://nmssanctuaries.blob.core.windows.net/sanctuaries-
prod/media/archive/management/pdfs/sustain_tourism_mod10_curr.pdf
TMII Pesona Indonesia. (2016). Retrieved from http://www.tamanmini.com/pesona_indonesia/
Triastuti, E., & Rakhmani, I. (2011). Cyber Taman Mini Indonesia Indah: Ethnicity and Imagi-Nation in
Blogging Culture. Internetworking Indonesia Journal, 3(2), pg.5-13.
UNEP. (2005). Making Tourism More Sustainable & WTO. Paris: UNEP & UNWTO.
UNHCR. (2017). UNHCR - The UN - Refuge Agency. Retrieved from https://www.unhcr.org/people-with-
disabilities.html
UNWTO. (2016). Accessible Tourism for All: An Opportunity within Our Reach. Madrid: World Tourism
Organization.
UNWTO. (2016). Highlights of the 1st UNWTO Conference on Accessible Tourism in Europe. San Marino:
World Tourism Organization.
V. Lambert & Lambert, C. (2012). Qualitative Desrcriptive Research: An Acceptable Design. Pacific Rim
International Journal of Nursing Research, 16(4), 255.
Wardijono, B., Wardhani, I., Chandra, Y., & Pamungkas, B. (2018). 3D Virtual Environment of Taman Mini
Indonesia Indah in a Web. 4th International Seminar of Mathematics, Science and Computer Science
Education. 1013. Bandung: IOP Publishing. doi:https://doi.org/10.1088/1742-6596/1013/1/012158
World Tourism Organization. (2013). Recommendations on Accesible Tourism for all. Madrid: UNWTO.
World Tourism Organization. (2013). Recommendations on Accesible tourism for all. Madrid: UNWTO.
World Tourism Organization. (2016). World Tourism Day 2016 “Tourism for All - promoting universal
accessibility” Good Practices in the AccessibleTourismSupply Chain. Madrid: UNWTO.
Zsarnoczky, M. (2017). Accessible tourism in the European Union. Engines of Urban and Regional
Development 6th Central European Conference in Regional Science (pp. 30-39). Banska Bystrica:
CERS.

139
Proceedings of CATEA 2019
Proceedings of CATEA 2019
ISBN 978-623-91018-0-0
Employee Personality Traits Towards Cyberloafing Activities in
Hotel Industry
Rachel Dyah Wiastuti1*
, Livensa2, Nurul Sukma Lestari
3, Ika Triana
4
1,2,3
Hotel Management Department, Bina Nusantara University 4Binus Business School, Bina Nusantara University
[email protected], [email protected], [email protected], and [email protected]
Abstract: This research aimed to determine the influence of personality traits towards cyberloafing activities of
room division employee at Hotel XYZ. The quantitative method is used by collecting data through a
questionnaire using mini-IPIP 20 Personality Traits theory. Population is 48 people who work as rooms division
employee at Hotel XYZ. Statistic descriptive, correlation, regression, and hypothesis are analysis methods used
in this research. The results define five personality traits which are extraversion, agreeableness,
conscientiousness, neuroticism, intellect, and two cyberloafing activities; e-mail activity and browsing activity.
Findings revealed that the majority of room division employees, either male or female, either in Guest Service
or Housekeeping Department showed conscientiousness personality traits, followed by intellect and
agreeableness. This research also shows that e-mail activities became the major cyberloafing dimension
complied by the employee. Personality traits indicate low correlation and no significant influence toward
cyberloafing activity of room division employees at Hotel XYZ. This research implication was to provide a
recommendation for hotel management in understanding employees’ personality.
Keywords: Big Five Personality; Cyberloafing; Cyberloafing Activity; Personality Traits; Hotel Employee
1. Introduction The development of internet and technology makes it easy to find fast sources of information
according to the needs, including business enterprise (Rahayuningsih, 2017). This causes employees
and companies demand more efficient and effective work technology in producing goods and services
(Ardilasari & Firmanto, 2017). The survey by Asosiasi Penyelenggara Jasa Internet Indonesia (APJII)
in 2017 showed that the majority of internet users in Indonesia were in the age of 19-34 years
(49.52%) and 35-54 years (29.55%). Meanwhile, based on the latest education level, the three largest
percentages of internet users came from Graduate or Postgraduate (88.24%), Undergraduate (78.23%)
and Senior High School/ Islamic Senior High School or Packet C National High School (70.54%).
This data shows that the majority of internet users are workers, as evidenced by the characteristics of
several studies that use employees as respondent. For example, in a study by Astuti & Sudharma
(2013) at Bakung’s Beach Cottages Hotel in Kuta-Bali, the characteristics of employees’ age were
between 21-45 years with the latest level of education of Senior High School, Diploma, and
Undergraduate. The same result was also shown in the study by Gunawan, Solang, & Kartika (2013)
at the Sheraton Surabaya Hotel, where the characteristics of employees’ age were between 17-55
years with the level of education of Senior High School, Diploma and Undergraduate. This results
lead to the use of the internet for personal interests while working, known as 'cyberloafing', consists of
browsing activities (surfing in cyberspace) and e-mail (electronic mail) according to Lim & Teo
(2005). Employees who engage in cyberloafing can weaken computer security and facilitate hacking
(Sopian, 2016). Cyberloafing also results in a decrease of employee productivity because the focus of
its work is diverted to notification of mobile phone and social media (Wardhani, 2018). McCarter (in
Shintia, 2017) suggests that someone who did cyberloafing activity will require approximately 23
minutes getting the concentration back to work. The results of various studies indicate that several

Rachel Dyah Wiastuti, Livensa, Nurul Sukma Lestari, Ika Triana
Employee Personality Traits Towards Cyberloafing Activities in Hotel Industry
140
Proceedings of CATEA 2019
factors cause cyberloafing, one of them is the type of personality (Jia & Jia, 2015). Personality is an
individual characteristic that shows the tendency of the identity through thought, emotion, and
behavior which is a product of an interaction between genetic and environmental influence (Wibowo,
2017). This type of personality plays a significant role in explaining various attitudes and behaviors in
the workplace, including cyberloafing (Jia & Jia, 2015). This happens because as human, they are
aware of their choices (Mishra & Pandey, 2014). Furthermore, Donellan et al. (2008) sparked the
theory of big five personality traits as a type of personality that can influence cyberloafing.
Five personality traits consist of extraversion who is happy with the social and material world (Jia
& Jia, 2015), agreeableness who has the ability to be involved in a group (Abidin et al., 2014),
conscientiousness as a cautious individual; listening to conscience, and oriented to the task and
objective (Jia & Jia, 2015), neuroticism describes someone who has negative emotion, such as worry
and discomfort (Titisari, 2014), and intellect as intelligent, analytical, full of initiative, broad-minded,
and happy to find new ideas (Abidin, et.al, 2014). The objectives of this study are (1) to determine the
personality traits of employees in room division at Hotel XYZ, (2) to determine the cyberloafing
activities of room division employees at Hotel XYZ, and (3) to determine the correlation and the
influence of personality traits towards cyberloafing activities of room division employees at Hotel
XYZ. The results of this study can provide information to the Hotel XYZ management regarding the
type of personality and employee cyberloafing that can be used as a strategy for evaluating and
improving in the future.
2. Literature Review Over the past few decades, many studies have been conducted on the impact of personality types
on cyberloafing activities. The results of the study indicate that conscientiousness is the character of
an individual who tends to follow the norm and rule (Varghese & Barber, 2017). The desire to
continue to improve performance is one of the behaviors possessed by an individual with high
conscientiousness, so the individual tends to avoid deviant behavior in the workplace such as
cyberloafing. This is similar to an individual with a high level of agreeableness who tend to be
cooperative and trustworthy, so they are reluctant to violate company’s rule and engage in
cyberloafing (Varghese & Barber, 2017). High neuroticism individual has unstable emotion and
always feel uncomfortable, so they choose to commit deviant behaviors such as cyberloafing to avoid
assignment to feel more comfortable with their world (Andreassen et al., 2014).
On the other hand, an individual with high extraversion tends to do cyberloafing because they
tend to seek social interaction in real life and cyberspace by accessing social media and looking for
infotainment news to be discussed (Donnellan et al., 2008). An individual with high intelligence love
new things and tend to take part in various training to improve their abilities. When in the learning
period, there is a minimal possibility of cyberloafing. However, this learning and training do not occur
every day, so the individual tends to do cyberloafing when they are not having new learning and
training (Jia, Jia, & Karau, 2013). There are six hypotheses in this study, as follows:
H1: Personality traits have a significant influence on cyberloafing activities in room division
employees at XYZ Hotel
H2: Extraversion personality traits influences cyberloafing in room division employees at XYZ
Hotel
H3: Agreeableness personality traits influences cyberloafing in room division employees at XYZ
Hotel
H4: Conscientiousness personality traits influences cyberloafing in room division employees at
XYZ Hotel
H5: Neuroticism personality traits influences cyberloafing in room division employees at XYZ
Hotel
H6: Intellect personality traits influences cyberloafing in room division employees at XYZ Hotel
3. Methodology 3.1. Method
This study uses a quantitative approach, namely to examine specific samples by collecting data
using research instrument and statistical data analysis with the aim of testing hypotheses (Sugiyono,

Rachel Dyah Wiastuti, Livensa, Nurul Sukma Lestari, Ika Triana
Employee Personality Traits Towards Cyberloafing Activities in Hotel Industry
141
Proceedings of CATEA 2019
2016). Figure 1 shows the design of this study that uses two variables: Personality Traits as
independent variable and Cyberloafing as the dependent variable with six hypotheses.
Figure 1. Research Design
3.2. Data Collection Techniques
Primary data were obtained from questionnaire and interview. The questionnaire contains a list of
questions or statements made based on an indicator of research variable and given to respondent
(Widodo, 2017). The questionnaire used a Likert scale designed by Rensis Likert (Noor, 2016),
namely 5 as strongly agree, 4 as agree, 3 as neutral, 2 as disagree, and 1 as strongly disagree, which
consisted of three parts. The first part is the profile of respondent consisting of gender, department,
age, education, length of work, and domicile. The second part is 20 questions about the personality
traits based on the scale of Mini-IPIP 20 (Mini-International Personality Item Pool). The third part is
13 statements about Cyberloafing based on Lim & Teo (2005).
Interviews were conducted to five respondents to find out the employee's response to
cyberloafing, the reason they do cyberloafing, and explain the most dominant traits of personality
from the result of descriptive statistical analysis. Interview used open questions that give respondent
the freedom to answer questions by expressing opinion verbally to the interviewer (Morissan, 2015).
3.3. Population and Sample
The population in this study is 48 room division employees at Hotel XYZ. The hotel name is
anonymous due to hotel requirements. Hotel XYZ is a four-star international chain hotel that is
strategically located in the center of Jakarta, precisely on HR Rasuna Said. The sampling technique
used is non-probability method, where each member of the population does not have the same
opportunity as a sample (Noor, 2016). The type of non-probability sample used is saturated sampling
which makes the entire population as a research sample (Noor, 2016). To find out whether each
questionnaire indicator is valid and reliable, reliability test and validity test are conducted (Sujarweni,
2014). The test results indicate that 33 questionnaire questions have r-count with a nominal greater
than r-table (0.2845), thus it can be stated that all questionnaire questions are valid (Morris, 2015).
While the reliability coefficient value (r11) is greater than 0.6 for all questions so that it can be
declared reliable (Siregar, 2014).
3.4. Data Analysis Technique
Descriptive statistical is used to answer the first and second research objectives by looking at the
mean value of each question (Sujarweni, 2014). Correlation analysis and regression analysis are used
to answer the third research objective regarding correlation (Siregar, 2014) and the influence between
variables (Noor, 2016). T-test is used to find out whether there is a significant relationship between
the personality traits and cyberloafing (Siregar, 2014). Significance T-test is used to test the H1
hypothesis. Chi-square test is used to test the relationship between variables in the H2 until H6
hypotheses (Santoso, 2018). All data analysis is carried out using IBM SPSS version 25.

Rachel Dyah Wiastuti, Livensa, Nurul Sukma Lestari, Ika Triana
Employee Personality Traits Towards Cyberloafing Activities in Hotel Industry
142
Proceedings of CATEA 2019
4. Results and Discussion 4.1. Respondent Profiles
Based on Table 1, the majority of respondents or are male (64.6%), working in the public area
department (39.6%), aged under 25 years (45.8%), education level is high school (75%), length of
work under one year (33.3%), and domicile in Jakarta (70.8%). Table 1. Profile of Respondent
Profile Selected Answer n %
Gender Male 31 64.6%
Female 17 35.4%
Department Public area 19 39.6%
Rooms 16 33.3%
Guest service 10 20.8%
Linen & uniform 3 6.3%
Age < 25 Year 22 45.8%.
25-30 Year 15 31.3%
31-35 Year 10 20.8%
36-40 Year 1 2.1%
Education Elementary/ Junior High 2 4.2%
Senior High School 36 75%
Diploma I, II, III 4 8.3%.
Diploma IV/ S1 6 12.5%
Length of work < 1 year 16 33.3%
1-2 year 12 25%
2-3 year 9 18.8%
3-5 year 11 22.9%
Domicile Jakarta 34 70.8%
Bogor 5 10.4%
Bekasi 4 8.3%
Depok 3 6.3%
Tangerang 2 4.2%
4.2. Descriptive Statistic of Personality Type
Table 2 shows the descriptive statistics of the Personality Traits which are divided into five types.
The majority of room division employees at XYZ Hotels showed personality traits of
conscientiousness with the highest mean value of 3.67. Then followed by the type of intellect
personality (mean 3.25), agreeableness (mean 3.21), and extraversion (mean 3.06). Meanwhile, the
neuroticism personality traits is the least describes the respondents with a mean of 2.91. The diversity
of respondents' responses to a statement can be seen in the standard deviation of each item statement,
if the value of the standard deviation is higher than the responses given are increasingly diverse.
First, room division employees at XYZ Hotel expressed a neutral attitude towards agreeing to the
type of extraversion personality with an average of 3.06 where employees like to be involved in
various activities. This is indicated by the high level of employee participation in various hotel
internal events such as birthday and moment week hotel. Furthermore, employees also make
maximum preparation for the event during work hours feeling happy. Even employees are willing to
keep coming to the hotel even on holiday, both in preparation and on the day of the event.
Second, room division employees at XYZ Hotel expressed a neutral attitude towards agreeing to
the agreeableness personality type with an average of 3.21 where employees have a high empathy
spirit. This is indicated by the high initiative of all employees to raise fund when there are other
employees affected by the disaster and coordinate to make a visit.
Third, the conscientiousness personality type is the dominant personality type in room division
employees in XYZ Hotels with the highest average of 3.67 where employees like order and
procedure. This is indicated by the tendency of employees who work in a static order every day and
follow the procedure. According to NR (2018), the sequence and procedure make him undergo a job
feeling safe and could be used as evidence if there are work constraints in the future whereas MK
(2018) argues that the sequence and procedure make work more regular to get maximum work results.
Whereas, TN (2018) says that the sequence and procedure is one of the mottoes in his life. For DW

Rachel Dyah Wiastuti, Livensa, Nurul Sukma Lestari, Ika Triana
Employee Personality Traits Towards Cyberloafing Activities in Hotel Industry
143
Proceedings of CATEA 2019
(2018), who holds managerial level, the order and procedure are the references in working, especially
for employees under his responsibility so that the work standards are according to the provision of the
hotel. WN (2018) also argues that sequence and procedure make life easier, especially in order of
priority, both in daily life and when working.
Table 2. Descriptive Statistic of Personality Types
Dimension Indicators SD Mean
Extraversion
(3.06)
Happy to be involved in various activities 0.676 3.73
Do not talk much 0.907 2.67
Prefer being behind the scenes 0.887 2.65
Happy to talk with people 0.834 3.17
Agreeableness
(3.21)
Easy to sympathize with others 0.751 3.77
Not interested in other people's problems 0.949 2.31
Not interested in other people's lives 0.885 2.94
Have a high empathy spirit 0.816 3.81
Conscientiousness
(3.67)
Often messing things up 1.059 3.33
Complete work as soon as possible 0.824 3.79
Forget to put things into place 0.849 3.71
Like sequence and procedure 0.781 3.83
Neuroticism
(2.91)
Often feel relaxed 0.967 2.96
Rarely feel upset 1.059 3.33
Easy to feel disappointed 0.907 2.67
Often changes emotions suddenly 0.887 2.65
Intellect
(3.25)
Difficult to understand abstract idea 0.982 3.19
Like imagination 0.957 3.25
Not interested in abstract idea 0.834 3.17
Do not have a good imagination 0.761 3.37
Table 3.Types of Personality by Age and Department
Fourth, the type of neuroticism personality is the least dominant type of personality in room
division employees at XYZ Hotel with an average of 2.91. Fifth, the room division employees at XYZ
Hotel express a neutral attitude towards agreeing to the type of intellect personality with an average of
3.25 where employees do not have a good imagination. This happens because work and routine are
carried out repeatedly every day which is a demand of the standards and from the hotel management.
Based on Table 3, the most dominant type of personality in room division male employees in
XYZ Hotel is conscientiousness, followed by agreeableness, intellect, and extraversion and
neuroticism to be the least dominant type. Moreover, the most dominant type in room division female
employees at XYZ Hotel is conscientiousness, followed by intellect and agreeableness. This show the
order differences with the male employees, where the agreeableness personality type is second, and
Personality Type Mean
Male Female Guest Service Housekeeping
Extraversion 2.97 3.20 3.35 2.97
Agreeableness 3.21 3.21 3.33 3.17
Conscientiousness 3.69 3.62 3.78 3.64
Neuroticism 2.81 3.06 3.20 2.82
Intellect 3.20 3.32 3.50 3.18
Personality Type Mean
Male Female Guest Service Housekeeping
Extraversion 2.97 3.20 3.35 2.97
Agreeableness 3.21 3.21 3.33 3.17
Conscientiousness 3.69 3.62 3.78 3.64
Neuroticism 2.81 3.06 3.20 2.82
Intellect 3.20 3.32 3.50 3.18

Rachel Dyah Wiastuti, Livensa, Nurul Sukma Lestari, Ika Triana
Employee Personality Traits Towards Cyberloafing Activities in Hotel Industry
144
Proceedings of CATEA 2019
intellect is third. The other two personality types have the same order, namely the type of extraversion
and neuroticism personality. Conscientiousness and intellect personality types are also the most
dominant types of personality in the Housekeeping and Guest Service departments.
4.3. Descriptive Statistic of Cyberloafing
Table 4 shows the descriptive statistics of cyberloafing activities which are divided into two
dimensions; email activity and browsing activity. The majority of room division employees at XYZ
Hotel tend to be neutral towards cyberloafing with a mean of 2.93. E-mail activity is the activity most
often carried out by room division employees at XYZ Hotel with an average value of 3.10. Based on
the interview, the level of cyberloafing activity is quite low because hotel occupancy is quite high,
which is above 80% every day. Thus, room division employees at XYZ Hotel are preoccupied with
their work and have no desire to carry out cyberloafing activities (NR, MK, & WN, 2018). New
employees have the opportunity to do cyberloafing when the condition of the hotel is quiet, which is
usually in the range of 08.00 - 09.30 hrs and 22.00 - 23.00 hrs for the Guest Service department and at
13.00-14.00 hrs and 21.00-22.00 hrs for the Housekeeping department (NR & WN, 2018).
Table 4. Descriptive Analysis of Cyberloafing
Dimension Indicator SD Mean
Email Activity
(3.10)
Visit and check personal e-mail 0.914 3.12
Read personal e-mail 0.982 3.19
Reply and send personal e-mail 0.934 2.98
Browsing
Activity
(2.76)
Access sites that are not related to work 0.838 2.35
Access daily news site 0.938 3.19
Access infotainment or gossip news 0.964 2.42
Access sport site 1.153 2.90
Access media social and chatting service 0.713 3.71
Download music, video and application, either through
website and play store 1.060 3.06
Open, search, and apply for jobs on job site 0.909 3.06
Access, check, and buy items on online shopping site 1.077 2.77
Play online game 1.265 2.38
Visit, read, download, and watch adult site 0.707 1.73
First, email activity is the activity most often carried out by room division employees in XYZ
Hotel as read personal email being the most dominant. This happens because work in Guest Service
and Housekeeping often uses email to carry out internal and external communication. This resulted in
employees combining company email activity with personal email by opening both e-mail accounts at
the same time (NR, TN, WN & DW, 2018).
Second, browsing activity is rarely carried out by room division employees at XYZ Hotel. The
employee routines are dominant with physical activities and the condition of the hotel that tend to be
busy so that it is quite unlikely to browse while working (NR, MK, & WN, 2018). Although browsing
activity is rarely done, employees are frequently accessing social media and chat services. This
happens because opening a social media account becomes a refreshment during work according to
NR, WN, MK, DW, & TN (2018) as well as being the first thing that comes to mind when they have
free time between work. In addition, chat services are also often used because it is one of the inter-
departmental communication tools and tends to be mixed with personal interests, such as asking
family condition (DW, WN & MK, 2018) and replying to message from friend and relative (NR &
TN, 2018). This is in line with the results of the 2017 APJII survey which stated that the majority of
internet users in Indonesia use chat services (89.35%) and social media (87.13%).
4.4. Correlation and Regression Analysis
Table 5 shows the correlation coefficient between the two variables, which is 0.216. This shows a
weak correlation between personality traits and cyberloafing in the interval of 0.20-0.399 (Siregar,
2014). In addition, there is a coefficient of determination (R2) of 0.047 or 4.7%. This states that
personality traits contribute 4.7% to cyberloafing activity. The remaining 95.3% is determined by

Rachel Dyah Wiastuti, Livensa, Nurul Sukma Lestari, Ika Triana
Employee Personality Traits Towards Cyberloafing Activities in Hotel Industry
145
Proceedings of CATEA 2019
other variables not examined in this study. Based on Table 6, the results of the significance test
indicate that personality type does not have a significant effect on cyberloafing activity in room
division employees at XYZ Hotel, this is evidenced by the value of t count that valued less than t table
(1.499 <2.0129) and Sig. of 0.141, where this value is greater than the value of Sig. which should be
(0.05). Table 5. Model Summary
Model R R Square Adjusted R Square Std. Error of the Estimate
1 0.216a 0.047 .026 7.621
a. Predictors: (Constant), Personality Type
Table 6. t-Test result
Coefficientsa
Model Unstandardized
Coefficients
Standardized
Coefficients
t Sig.
B Std. Error Beta
1 (Constant) 23.583 8.922 2.643 .011
Personality Type .206 .138 .216 1.499 .141
a. Dependent Variable: Cyberloafing activity
4.5. Hypothesis Testing
Table 7 is the recapitulation results from six research hypotheses, namely (1) personality type
have no significant influence on cyberloafing in room division employees at Hotel XYZ, (2)
extraversion personality influences cyberloafing activities in room division employees in XYZ Hotel,
(3) personality agreeableness has no effect on cyberloafing activities in room division employees at
XYZ Hotel, (4) conscientiousness personality does not affect cyberloafing activities in room division
employees in XYZ Hotel, neuroticism personality does not affect cyberloafing activities in room
division employees in XYZ Hotels, and intellect personality influences cyberloafing activities on
division employees rooms at XYZ Hotel.
Overall, the personality traits does not significantly influenced cyberloafing activity because three
of the five types of personality (agreeableness, conscientiousness, and neuroticism) do not influence
cyberloafing activities, only two types of personality (extraversion and intellect) that influence
cyberloafing. Table 7. Hypothesis Test Results
Hypothesis Test Decision
H1 Personality traits have a significant influence on cyberloafing
activities in room division employees at XYZ Hotel
Tcount<ttable
(1.499 < 2.0129)
Rejected
H2 Extraversion personality trait influences cyberloafing in
room division employees at XYZ Hotel
χ2 count> χ
2 table
(14.863 > 12.592)
Accepted
H3 Agreeableness personality trait influences cyberloafing in
room division employees at XYZ Hotel
χ2 count≤ χ
2 table
(4.627 ≤ 12.592)
Rejected
H4 Conscientiousness personality trait influences cyberloafing in
room division employees at XYZ Hotel
χ2
count≤ χ2
table
(1.770 ≤ 9.488)
Rejected
H5 Neuroticism personality trait influences cyberloafing in room
division employees at XYZ Hotel
χ2 count≤ χ
2 table
(6.371 ≤ 12.592)
Rejected
H6 Intellect personality trait influences cyberloafing in room
division employees at XYZ Hotel
χ2 count> χ
2 table
(14.911 > 12.592)
Accepted
5. Conclusion There are three conclusions based on the research objective. First conclusion is the majority of
room division employees in Hotel XYZ show conscientiousness personality trait, followed by
intellect, agreeableness, and extraversion. Meanwhile, the neuroticism personality is the least
described room division employees in Hotel XYZ. This is supported by the result of descriptive
statistic of personality traits based on gender and department which shows that conscientiousness
personality is the most dominant trait for male and female employees, as well as employees in the
guest service and housekeeping department. The most dominant indicator of the conscientiousness

Rachel Dyah Wiastuti, Livensa, Nurul Sukma Lestari, Ika Triana
Employee Personality Traits Towards Cyberloafing Activities in Hotel Industry
146
Proceedings of CATEA 2019
personality is to like sequence and procedure. Second conclusion is room division employees at Hotel
XYZ show a tendency to be neutral towards cyberloafing. Email activity is the most dominant
cyberloafing activity that includes reading, checking, and replying personal email with reading as the
most complying. Third conclusion is personality traits have low relationship without significantly
influenced cyberloafing activities. However, personality traits contribute 4.7% towards cyberloafing
activities.
Practical suggestions for Hotel XYZ management is to enforce the rule for labeling each storage
area and familiarize employees to always put items that have been used to its original place. All
company regulations should be discussed at each briefing activity so that employee knows the
regulations. To minimize cyberloafing activity, managers and supervisors should maximize the use of
internal communication tools between employees, such as handy-talkie and log book. Academic
suggestions is that further research can add control or moderator variables, such as internet usage
policy at work (Jia, Jia, & Karau, 2013) and job pressure (Varghese & Barber, 2017). The purpose of
adding this variable is to find out other variables that influence cyberloafing. Research with the same
variables can also be applied to various types of research objects, such as restaurant and travel agent.
References Abidin, R., Abdullah, C., Hasnan, N., & Bajuri, A. (2014). The Relationship of Cyberloafing Behavior with Big
Five Personality Traits. Australian Journal of Basic and Applied Sciences, 8(12), 61-66. Retrieved
Maret 20, 2018, from http://ajbasweb.com/old/index.html
Andreassen, C. S., Torsheim, T., & Pallesen, S. (2014). Predictors of Use of Social Network Sites at Work - A
Specific Type of Cyberloafing. Journal of Computer-Mediated Communication, 19, 906-921.
Retrieved April 1, 2018 doi:10.1111/jcc4.12085
Ardilasari, N., & Firmanto , A. (2017). Hubungan Self Control dan Perilaku Cyberloafing Pada Pegawai Negeri
Sipil. Jurnal Ilmiah Psikologi Terapan, 5(1), 19-39. Retrieved April 11, 2018, from
http://ejournal.umm.ac.id/index.php/jipt/article/viewFile/3882/4333
Asosiasi Penyelenggara Jasa Internet Indonesia. (2017). Hasil Survei Penetrasi dan Perilaku Pengguna Internet
Indonesia 2017. Retrieved from Asosiasi Penyelenggara Jasa Internet Indonesia:
http://apjii.or.id/survei2017
Astuti, N. K., & Sudharma, I. N. (2013). Pengaruh Kompensasi Dan Motivasi Terhadap Kepuasan Dan Kinerja
Karyawan Pada Hotel Bakung’s Beach Cottages Kuta-Bali. E-Jurnal Manajemen Universitas
Udayana, 2(11), 1585-1594. Retrieved April 14, 2018, from
https://ojs.unud.ac.id/index.php/Manajemen/article/view/5882
D.W. (2018, Mei). Personal communication. (Livensa, Interviewers)
Donellan, M., Oswald, F., Baird, B. M, & Lucas, R. E. (2006). The mini-IPIP scales: tiny-yet-effective measures
of the Big Five factors of personality. Psychological assessment, 18(2), 192-203. Retrieved Maret 20,
2018, doi:http://dx.doi.org/10.1037/1040-3590.18.2.192
Gunawan, J. S., Solang, P. D., & Kartika, E. W. (2013). Organizational Citizenship Behavior Yang Berpengaruh
Pada Kinerja Karyawan Dan Kepuasan Konsumen Di Hotel Sheraton Surabaya. Jurnal Hospitality dan
Manajemen Jasa, 1(2), 120-133. Retrieved April 14, 2018, from
http://publication.petra.ac.id/index.php/manajemen-perhotelan/article/view/961
Jia, H., Jia, R., & Karau, S. (2013). Cyberloafing and Personality: The Impact of the Big Five Traits and
Workplace Situational Factors. Journal of Leadership and Organizational Studies, 20(10), 1-8.
Retrieved April 5, 2018 doi:10.1177/1548051813488208
Jia, R., & Jia, H. H. (2015). An Individual Trait-Based Investigation of Employee Cyberloafing. Journal of
Information Technology Management, XXVI(1), 58-71. Dipetik Retrieved Maret 20, 2018, dari
https://www.semanticscholar.org/paper/An-Individual-Trait-based-Investigation-of-Employee-Jia-
Jia/b951f6966694edc295bbd692b8872e26b5fdf564
Lim, V., & Teo, T. (2005). Prevalence, perceived seriousness, justification and regulation of cyberloafing in
Singapore: An exploratory study. Information & Management, 42(8), 1081-1093. Retrieved Maret 20,
2018 doi:https://doi.org/10.1016/j.im.2004.12.002
M.K. (2018, Mei). Personal communication. (Livensa, Interviewers)

Rachel Dyah Wiastuti, Livensa, Nurul Sukma Lestari, Ika Triana
Employee Personality Traits Towards Cyberloafing Activities in Hotel Industry
147
Proceedings of CATEA 2019
Mishra, M., & Pandey, S. (2014). A Theoretical Model on The Determinants of Workplace Deviance Among
Employees in the Public Sector Organizations of India. International Journal of Business Behavior,
2(3), 1321-1337. Retrieved April 3, 2018, from
https://papers.ssrn.com/sol3/papers.cfm?abstract_id=2551815
Morissan. (2015). Metode Penelitian Survei. (3rd ed.). Jakarta: Kencana.
N.R. (2018, Mei). Personal communication. (Livensa, Interviewers)
Noor, J. (2016). Metodologi Penelitian: Skripsi, Tesis, Disertasi & Karya Ilmiah (Ke7 ed.). Jakarta: Penerbit
Kencana.
Rahayuningsih, T. (2017). Perilaku Cyberloafing Ditinjau Dari Kecerdasan Adversitas dan Komitmen Kerja.
Jurnal Psychopolytan, 1(1), 49-53. Retrieved April 8, 2018, from
http://jurnal.univrab.ac.id/index.php/psi/article/view/403
Santoso, S. (2018). Menguasai Statistik dengan SPSS 25. Jakarta: PT Elex Media Komputindo.
Shintia, D. (2017, September 01). Browsing Kepentingan Pribadi Pada Jam Kerja? Berarti Anda Cyberloafing.
Retrieved from Jawa Pos: https://www.jawapos.com/read/2017/09/01/154554/browsing-kepentingan-
pribadi-pada-jam-kerja-berarti-anda-cyberloafing
Siregar, S. (2014). Metode Penelitian Kuantitatif Dilengkapi Dengan Perbandingan Perhitungan Manual dan
SPSS. (2nd ed). Jakarta: Kencana Prenadamedia Group.
Sopian, S. (2016, Mei 05). Tentang Kami: Male Indonesia. Retrieved from Male Indonesia:
https://male.co.id/detail/2941/Jelajah-Internet-dari-Kantor-Mempermudah-Hacker-Digital-Life
Sugiyono. (2016). Metode Penelitian Kuantitatif, Kualitatif, dan R &D. Bandung: Alfabeta
Sujarweni, V. (2014). Metodologi Penelitian: Lengkap, Praktis, dan Mudah Dipahami. Yogyakarta: Pustaka
Baru Press.
T.N. (2018, Mei). Personal communication. (Livensa, Interviewers)
Titisari, P. (2014). Peranan Organizational Citizenship Behavior Dalam Meningkatkan Kinerja Karyawan.
Jakarta: Mitra Wacana Media.
Varghese, L., & Barber, L. (2017). A Preliminary Study Exploring Moderating Effect of Role Stressor on The
Relationship Between Big Five Personality Traits and Workplace Cyberloafing. Cyberpsychology:
Journal of Psychosocial Research on Cyberspace, 11(4), article 4. Retrieved Maret 30, 2018
doi:10.5817/CP2017-4-4
W.N. (2018, Mei). Personal communication. (Livensa, Interviewers)
Wardhani, A. (2018, Januari 24). Sulit Fokus Saat Kerja? Ini 5 Penyebabnya. Retrieved from Liputan 6:
https://www.liputan6.com/lifestyle/read/3235030/sulit-fokus-saat-kerja-ini-5-penyebabnya
Wibowo. (2017). Perilaku Dalam Organisasi Edisi Ketiga. Depok: Rajawali Press.
Widodo. (2017). Metodologi Penelitian Populer & Praktis. Jakarta: Raja Grafindo Persada.

148
Proceedings of CATEA 2019
Proceedings of CATEA 2019
ISBN 978-623-91018-0-0
The Impact of Jakarta Good Guide Service Quality Towards the
Satisfaction of Jakarta Walking Tour Tourists
Deivy Zulyanti Nasution1, Rina Fitriana
2,, Opalma Siahaan
3
1Sekolah Tinggi Pariwisata Trisakti
2Sekolah Tinggi Pariwisata Trisakti
3 Sekolah Tinggi Pariwisata Trisakti
[email protected], [email protected], [email protected]
____________________________________________________________________________________
Abstract: Jakarta Good Guide is the association of guides - tour guides who have received training and licenses
from the DKI Jakarta Tourism Office. Jakarta Good Guide offers Jakarta walking tour product named walking
tour to see the beauty of Jakarta such as culture, historical building and Jakarta’s food. Jakarta good guide has
approximately 21 routes and the visiting of domestic tourist always increases in every year. The purpose of the
study was to determine the effect of service quality on the satisfaction of tourists in the Jakarta walking tour.The
sample of this study were tourists who took the Jakarta walking tour (City center 2, China Town, Tourism
Museum). This study used descriptive quantitative method to determine the relationship between service quality
and tourist satisfaction. Data in the study were collected by using questionnaires, interviews, observation and
literature studies used validity test, reliability test, descriptive test, correlation coefficient and determination,
simple linear regression and t test hypothesis.The results of the study in the correlation coefficient between
service quality and tourist satisfaction is equal to 0.754 with a significant level of 0.000 which means strong,
then tourist satisfaction (Y) is influenced by service quality (X) in City center 2, China Town, Museum Tourism
by 52% . Based on the hypothesis test t that the service quality variable has a significant effect on the
satisfaction of tourists in the Jakarta walking tour.
Keywords: Service quality; tourist satisfaction; walking tour
1. Introduction Tourism sector nowadays is a promising global business due to its tourists’ movement and the
ability of tour travels to encourage the world’s economy growth (Hermantoro, 2011:17). UNWTO
predicted that in 2020 there will be tourists’ movement by the total expenditure as many as USD
2.000 ; it is estimated about 5 billions of expenditure on a daily basis (Hermantoro, 2011:17). The
tourists’ satisfaction is a necessary component for increasing the numbers of tourists. As cited in
Newlands & Hooper (2016:308), “As Service are intangible, consumers tend to homogenize quality
assessment criteria subjectively. Perceived service quality has been referred to as elusive”.
Jakarta as the Capital of Indonesia is a metropolis city filled with skyscrapers, shopping centres,
and tourism objects has the most museums in Indonesia. it is also a city that keeps the history of
Indonesia Nation. In order to reserve history of the past times and to attract tourists’ attention, the
government tourism office organize trainings for tour guides that encourage understanding so that
they can share the history appropriately and attractively to every tourist.
Jakarta Good Guide is a group of tour guides that have been trained and achieved license from
the Government Tourism Office of Special Region of Capital (DKI) Jakarta. Jakarta Good Guide
notices the potentials and opportunities that Jakarta possesses from tourism, culture, and culinary
objects. Jakarta Good Guide does not set rates for its programs, or also known as “Pay as you wish”.
Even though the Walking Tour tourism has not yet been familiar by tourists, the tourists’ visit
increases each year.
Be Seen from the progress aspect, the number of tourists that join the Walking Tour program is
fluctuated. The Walking Tour Program is actually in demand since it offers attractive tour programs,
does not set particular rates, licensed tour guides, easy to access meeting point to begin the tour, and

Deivy Zulyanti Nasution, Rina Fitriana, Opalma Siahaan
The Impact of Jakarta Good Guide Service Quality Towards the Satisfaction of Jakarta Walking Tour Tourists
149
Proceedings of CATEA 2019
is accessible by public transportation. The tourists who join the Walking Tour program increase each
year. However, the increasing of the visitors has not been gone along with the services given by the
Jakarta Good Guide in Walking Tour Program.
After administering a survey and an interview to the visitors who had joined the walking tour
program, a finding revealed that some visitors were not satisfied with the service. Some of the reasons
were the lack of tour guides who were fluent in languages other than Mandarin, English, and French,
the absence of 24 hours customer service to help visitors decide the options in the desired Walking
Tour Program, and the distance of The Walking Tour about 1,8 Kilometres with three hours of travel.
2. Literature Review 2.1 Tourism
In the Constitution of Indonesia Republic No. 10 Year 2009 concerning Tourism, it is stated that
Tourism means all kinds of activities of tourism which is encouraged by various facilities and services
provided by the society, entrepreneur, and the government. According to Inskeep (in Cahyana, et.al.,
2011: 7), Special environmental features such as high mountains, unusual geological formations,
cave, geysers, hot spring, waterfalls, and mild forms of volcanic activity are important attraction for
both general sight-seeing and special interest tourist. Norval (In Mulyadi, 2009; 8) stated that The
sum total of operation, mainly of an economic nature, which directly relate to the entry, stay and
movement of foreigners inside and outside a certain country, city or region.
2.2 Tour Guides
According to the World Federation of Tour Guide Association, A tourist guide is a ; a person
who guide visitors in the language of their choice and interprets the cultural and natural heritage of an
area which person normally possesses an area-specific qualification usually issued and /or recognized
by the appropriate authority. Prof. E. Amato from ILO, Guiding Technique, stated that “Tour Guide is
a person employed either by the travellers, a travel agency or any others tourist organization, to
inform, direct and advice the tourist organization, to inform, direct and advice the tourists before and
during their short visits”.
2.3 The Classification of Tour Guides
In the Article no 2, Chapter 2 of the Decree of the Minister of Tourism, Post, and
Telecommunication, tour guides are classified as Early tour guides and Middle level tour guides. An
early tour guide can promote to be a middle level tour guide after five years of active tour guiding. In
practice, there are various tour guides which are distinguished by their expertise, and the site and tour
object in which they are working.
2.4 The Definition of Tourists
According to UN-WTO (United Nations of World Tourism Organization), as cited by Pitana &
Diarta (2010:36), a tourist visits other country with various purposes rather than to work in an activity
which is funded by the visited country.
2.5 Service Purchasing
Levit and Tjiptono (2006) noticed that the more sophisticated technology in a generic product
gets, the more the selling depends on the quality and the availability of customers service. Product
selling is usually in accordance with the service awarding. This is supported by Lupiyoadi and
Hamdani (2006) who stated that the cost for getting the new consumers is five times more expensive
than that for maintaining the consumers.
2.6 Theories on the Service Quality
2.6.1 Service Characteristics and Definition of Service
Berry in Yazid (2005) stated that “Service is intangible deeds (action, procedures, activities),
process, and work”. Various research and literature of the management and service marketing
revealed that service has four characteristics that distinguish goods and services which is called IHIP

Deivy Zulyanti Nasution, Rina Fitriana, Opalma Siahaan
The Impact of Jakarta Good Guide Service Quality Towards the Satisfaction of Jakarta Walking Tour Tourists
150
Proceedings of CATEA 2019
Paradigm (Intangibility, Heterogeneity, Inseparability, and Perishability) (Lovelock and Gummeson
in Tjiptono, 2004).
1. Intangibility means that a service is an action, experience, process, performance, and attempt.
Therefore, service is unseen, invisible, unscented, unheard, and untouchable until it is
purchased and consumed.
2. Inseparability means that a service is commonly on sale before it is produced and consumed
at the same time and place.
3. Variability/heterogeneity means that a service is a non-standardized output. This means that
there are various forms, qualities, and types depending on who, when, and where the service
is produced.
4. Perishability means that a service is not long-lasted and cannot be stored.
5. Lack of Ownership means the basic difference between goods and services. When purchasing
services, customers might only have one personal access to the services for certain periods.
Definition of Service
According to Lovelock (2007:172) service is: An act or performance offered by one party to the
other parties and An economy activity that creates value and gives benefits to the customers at certain
time as a result of change obtained by the customers.
2.6.3 The Quality of Service
The quality of service is defined as how far is the difference between the reality and the
customers’ expectation of the service they obtain. Crosby in Tjiptono (2012) stated that “quality is
free” means that the cost to produce quality products is far more affordable than the consequence of
the company’s failure in fulfilling the quality standard. Kotler (Alma, 2007:286) explained that the
service quality is the way a company works in providing simultaneous quality improvement towards
the products and services. To measure the quality of services, SERVQUAL (Service Quality) was
developed which cover five dimension of quality of services according to Zeithami (2004), as follow:
1. Reliability is the ability to provide promised, accurate, and satisfying services as soon as
possible.
2. Responsiveness is the motivation to provide assistance to the customers and provide services
responsively.
3. Assurance includes the knowledge, competency, politeness, and trustworthiness possessed by
the staffs, free of harms, risks, and doubts.
4. Empathy covers the convenience in establishing relationship, good communication, personal
empathy, and understanding of the customers’ individual needs.
5. Tangibles includes physical facilities, equipment for employees, and communication devices.
2.7 Customers’ Satisfaction
2.7.1 Definition of Customers’ Satisfaction
In linguistics, the word satisfaction comes from a Latin word satis that means enough and facere
that means conduct or produce. Satisfaction is defined as providing consumers’ need as expected.
Kotler and Keller (2009:138-139) revealed that satisfaction is the happy or disappointed feelings that
come from the comparison between what impacted of a product and its expectation. Lovelock and
Wright (2007:102) stated that satisfaction is the emotional condition after purchasing.
Wilkie in Tjiptono (2005:24) defined satisfaction as emotional reaction on the evaluation towards
the consuming experience of a service. According to Tse & Wilton (in Tjiptono, 2008:169), the
visitors’ satisfaction means “the customers’ response towards the perception evaluation upon the
difference between the expectation before purchasing and the product actual result as perceived after
using or consuming that product.
2.7.2 Factors Influencing the Customers’ Satisfaction
According to Wilkie (2007), there are five elements in customers’ satisfaction, as follow:
a) Expectations

Deivy Zulyanti Nasution, Rina Fitriana, Opalma Siahaan
The Impact of Jakarta Good Guide Service Quality Towards the Satisfaction of Jakarta Walking Tour Tourists
151
Proceedings of CATEA 2019
The customers’ expectation towards a good or service is formed before he purchases the good
or service. When purchasing, a customer expects what they obtain matches their expectations,
desire, and belief. Gasperz (2002) stated that the factors affecting the customers’ perception
and expectation are the needs, past time experience, and marketing communication.
b) Performance
Performance means the customers’ experience of the actual goods and services when being
used without getting affected with their expectations.
c) Comparison
Comparison is carried out by comparing the performance of goods and services before
purchase and the perception of the actual performance of the goods and services. The
customers will be satisfied when the expectation before purchase is appropriate or even
beyond their perception towards the products’ actual performance.
d) Confirmation / disconfirmation
The customers’ expectation is affected by their experience of using the services which is
different from other people’s experiences. Confirmation occurs when the expectation is
appropriate with the products’ actual performance. Disconfirmation occurs when expectation
is different with the product’s actual performance.
e) Discrepancy
Discrepancy indicates the difference between the performance level and expectation.
Negative disconfirmations means the actual performance is under the expectation level. An
extensive discrepancy causes high level of dissatisfaction. Otherwise, positive
disconfirmation means the actual performance is above the expectation level.
3. Research Methods and Analysis Unit The present study was conducted by employing quantitative method, which means that the study
was carried out to find answers of the problems or general descriptions of a phenomenon which are
based on theories, assumptions, or conditions that need to be answered through a research (Iskandar,
2009).
3.1Variables and Measuring Scale
A variable is an attribute or feature or value of someone, an object, or an activity with certain
variations which is determined by the researcher to be studied and concluded (Sugiyono, 2007). The
Independent variable in the present study is the quality of services given by Jakarta Good Guide (X)
and the dependent variable is the satisfaction of the customers who take part in Jakarta Walking Tour
(Y).
Nominal scale is used to measure the variables of sex demography and kinds of occupation. The
interval scale is used to measure the age demography variable and the frequency of visit. The study
also used Likert Scale to measure one’s or a group’s attitudes and opinion towards the social
phenomenon being measured.
3.2 Procedures of Sample and Population Collection
The sample collection in the present study, as follow:
1. Population
According to Widianto (2012), population is a group of subjects or objects which are
generated from the result of the research. In the current study, the population are the entire
customers who have taken part in Jakarta Walking Tour Program.
2. Sample
According to Sugiyono (2011), sample is a part of total and characteristics that belong to that
population. The sample collection technique in the present study was Simple Random
Sampling, that means that the samples were chosen randomly without regarding strata in the
population (Sugiyono, 2012). The method for determining the sample measurement was
Slovin Method with mistake tolerance of 10 % of the total customers of 5.373 population in a
year. Thus, the collected sample were as many as 99.5 or 100 respondents.

Deivy Zulyanti Nasution, Rina Fitriana, Opalma Siahaan
The Impact of Jakarta Good Guide Service Quality Towards the Satisfaction of Jakarta Walking Tour Tourists
152
Proceedings of CATEA 2019
3.3 Data Collection and Analysis Method
The data collection method employed in the present study was a questionnaire, that means a data
collection method by establishing a list of written questions to obtain the necessary information,
literature, and documents.
The analysis of the study used SPSS Program (Statistical Package for Social Science) for
Windows.
3.3.1Validity Test
According to Sugiyono (2004), valid means that the instrument could be used to measure the
subject that will be measured. To find out the level of validity of an instrument, the formulation of
Product Moment developed by Pearson is used: If the r count > r table, the questionnaire is valid.
Otherwise, if the r count < r table, the questionnaire is not valid.
3.3.2 Reliability Test
Sugiyono (2004) stated that reliability test is used to measure the research variable consistency.
A variable is reliable if it provides coefficient value Alpha more than 0,60.
3.3.3 Interval
In the present study, the biggest data was 5, the smallest data was 1, and the number of class was
5. Therefore, P = ( 5 – 1) / 5, P = 0,8.
3.3.4 Correlation Coefficient
The analysis of correlation coefficient was used to find out the level of relationship between the
two variables. The coefficient value according to Sugiyono (2008) was around -1 up to +1.
3.3.5 Simple Linear Regression
According to Ramdani (2012) regression means the analysis conducted when the relationship of
the two variables was causal or functional relationship.
4. Findings and Discussion 4.1 Respondents’ Demography Visitors taking part in Jakarta Walking Tour were male as many as 43 % and female as many as
57 %.
Visitors taking part in the Jakarta Walking Tour ranging from 16 years old up to 25 years old
were the biggest respondents that was 57 persons (57 %). The visitors of age ranging from 26 up to 35
years old were 35 persons (35%), and those of age 36 up to 45 years old were 8 persons (8%).
Based on the result on the table and diagram above, it can be noticed that the visitors of Jakarta
Walking Tour were mostly unmarried (66 persons, 66 %). The respondents who were married were as
many as 34 persons (34 %).
The visitors taking part in Walking Tour who worked as private employees were as many as 45
persons (45%) which were the most respondents. The second sequence consisted of the respondents
who worked as civil servants as many as 31 persons (31%). The third sequence were those who were
students as many as 15 persons (15%). The fourth sequence consisted of entrepreneurs as many as 9
persons (9%).
As many as 68 persons (68 %) were the visitors taking part in Walking Tour for the first time.
The second sequence were the visitors who have taken part in Walking Tour twice up to three times
as many as 25 persons (25 %). The third sequence were those who have taken part in the walking tour
more than four times (7 persons, 7%).
4.1.2 Result of the Validity Test
The result of the validity test by using SPSS data analysis proved that the entire statements on the
questionnaire of the present study had the r count which were more than those on the r table. Thus, it
can be concluded that the entire statements on the questionnaire of the total of 30 questions were
Valid.

Deivy Zulyanti Nasution, Rina Fitriana, Opalma Siahaan
The Impact of Jakarta Good Guide Service Quality Towards the Satisfaction of Jakarta Walking Tour Tourists
153
Proceedings of CATEA 2019
4.1.3 Result of Reliability Test
Cronbach’s Alpha as many as 0,878 ( variable of the quality of Services) and 0,799 (Variable of
the customers’ satisfaction) indicated that the measurement that was used in the data collection was
reliable.
Table 1. Distribution of the Frequency of Service Quality Variable
INDICATORS SCALE MEAN
STB TB KB B SB
Reliability
Provide appropriate and on time service during Tour 0 0 1 50 49
4.48
Provide convenience to register for Walking Tour 0 0 1 35 64
4.63
Tour Guides were reliable in solving problems occur during
Tour 0 0 2 59 39 4.37
Average 4.49
Responsiveness
Promptness in responding to problems and complaints from
the participants of Walking Tour 0 0 9 67 24
4.15
Professional in providing services 0 0 2 47 51 4.49
Tour Guides’ responsiveness in dealing with problems such
as rain, demonstration, and so on. 0 0 19 46 35
4,16
Average 4.27
Assurance
Tour Guides possess the license and wide knowledge 0 0 9 28 63 4.54
Assurance of security and trustworthiness towards the
provided services, such as route, tour guides. 0 0 8 60 32 4.20
Tour guides were polite during Tour 0 0 3 19 78 4.75
Average 4.50
Emphaty
Your Convenience in communicating with the Jakarta Good
Guide party 0 0 3 43 54 4.51
Tour guides’ concern of the visitors’ needs 0 0 1 64 35 4.34
Tour guides remember your name appropriately during tour. 0 8 46 46 0 3.38
Average 4.08

Deivy Zulyanti Nasution, Rina Fitriana, Opalma Siahaan
The Impact of Jakarta Good Guide Service Quality Towards the Satisfaction of Jakarta Walking Tour Tourists
154
Proceedings of CATEA 2019
INDICATORS SCALE MEAN
STB TB KB B SB
Tangibles
Tour Guides’ appearance was neat and attractive 0 0 16 65 19 4.03
Modern equipment used by tour guides during tour, such as
speaker and pointer 0 5 23 46 26 3.93
Attractive route to visit 0 0 16 35 49 4.33
Average 4.10
Based on the table above, the highest average was on the question number 9, as many as 4,75, by
question that tour guides were polite during the tour. The lowest average was on the question number
13 as many as 3,38, by question that tour guides remember your name appropriately during the tour.
The variable of the quality of services got the highest answer, which was on the sub-variable of
assurance, with the average of 4.50. the lowest value was on the sub variable of empathy with the
average of 4,08.
Based on the table above, on the sub-variable of assurance, there were three questions in which
the highest average was on the question number 12 with value of 4,75 (agree/ good).
On the second sub-variable, reliability, there were three questions in which the highest average
was on the question number 2 with the value of 4,63 (agree/god) and the lowest average question was
on number 3 with the value of 4,37 (agree/good).
On the third sub-variable, responsiveness, there were three questions in which the highest
average was on the question number 5 with the value of 4,49 (agree/good) and the lowest question
was on question number 4 with the value of 4,15 (agree/good).
The fourth sub-variable was tangibles. There were three questions in which the highest average
was on the question number 15 with value of 4,33 (agree/good) and the lowest question was on
number 14 with the value of 3,93 (agree/good).
On the Fifth sub-variable, there were three questions in which the highest average was on
question number 10 with the value of 4,51 (agree/good) and the lowest question was on number 12
with the value of 3,38 (not good).
It can be concluded that the quality of services provided by the Jakarta Good Guide was good
since there were assurance of security for every visitors, the tour guides’ responsiveness in dealing
with problems occurring during tour, and the tour guides’ concerns and knowledge of the tourism
object.
Table 2. Distribution of Frequency of the Variable of the Customers’ Satisfaction
INDICATORS SCALE MEAN
STB TB KB B SB
Expectations
The Service that you obtained was in accordance with
your expectation 0 0 0 40 60
4.60
Route and destination that you visited was in accordance
with your expectation 0 0 22 36 42
4.20
The condition and the beautiful destination of the tourism
object during tour 0 0 22 52 26
4,04
Average 4.28

Deivy Zulyanti Nasution, Rina Fitriana, Opalma Siahaan
The Impact of Jakarta Good Guide Service Quality Towards the Satisfaction of Jakarta Walking Tour Tourists
155
Proceedings of CATEA 2019
INDICATORS SCALE MEAN
STB TB KB B SB
Performance
Tour Guides used easy to understand language when
explaining about a destination 0 0 3 58 39
4.36
Tour Guides were able to answer questions from visitors
properly 0 0 4 62 34
4.30
Tour guides provide the best answers to every question 0 0 12 50 38
4,26
Average 4.31
Comparison
The experience was proportionate with the cost 0 0 1 56 43 4.42
Jargon “Pay as you wish “ was proportionate with the
given services 0 0 0 57 43 4.43
Jakarta good guide was the comparison before joining
other walking tour in Jakarta 0 0 5 52 43 4.40
Average 4.42
Confirmation / disconfirmation
You are satisfied and happy with the services you obtain
during the walking tour 0 0 0 49 51 4.50
You are satisfied with the route offered by Jakarta Good
Guide 0 0 0 50 50 4.50
This Walking Tour is beneficial for you to add insight
about the history and culture of the Special Region of
Jakarta 0 0 9 13 78 4.69
Average 4.56
Discrepancy
The route was pedestrian friendly 0 0 11 48 41 4.30
Your assessment towards the last experience with the
Jakarta Good Guide 0 0 2 59 39 4.40
Secure and convenient tourism object for visitors 0 0 13 58 29 4.16
Average 4.29
Based on the table above, the highest average was on the question number 13 with the value of
4,69 stating that the walking tour is beneficial to add insight about the history and culture of the

Deivy Zulyanti Nasution, Rina Fitriana, Opalma Siahaan
The Impact of Jakarta Good Guide Service Quality Towards the Satisfaction of Jakarta Walking Tour Tourists
156
Proceedings of CATEA 2019
Special Region of Jakarta. The lowest average was on the question number 3 with the value of 4,04
stating that The condition and the beautiful destination of the tourism object during tour.
The variable of customers’ satisfaction which obtained the highest answer was the sub-variable of
confirmation/disconfirmation with the average value of 4,56, and the lowest was the variable of
discrepancy with the value of 4,28.
Based on the table above, on the sub-variable confirmation/disconfirmation, there were three
questions in which the highest average value was on the question number 12 with the value of 4,69
(agree/good) and the lowest question was on number 10 with the value of 4,50 (agree/good).
The second sub-variable was comparison, in which there were three questions in which the
highest average was on the question number 8 with the value of 4,43 (agree/good) and the lowest
question was on number 9 with the value of 4,40 (agree/good).
The third sub-variable was performance, in which there were three questions in which the highest
average was on question number 14 with the value of 4,36 (agree/good) and the lowest question was
on number 6 with the value of 4,26 (agree/good).
The fourth sub-variable was expectations, in which there were three questions in which the
highest average was on question number 1 with the value of 4,60 (agree/good) and the lowest
question was on number 3 with the value of 4,04 (agree/good).
The fifth sub-variable was discrepancy, which there were three questions in which the highest
average was on question number 10 with the value of 4,40 (agree/good) and the lowest question was
on number 15 with the value of 4,16 (agree/good).
It can be concluded that the satisfaction of the customers towards Jakarta Good Guide was
categorized as good since the walking tour routes offered were various. It can be seen from the level
of conformity of the tour guides’ performance and the walking tour options as expected by the
visitors.
4.1.4 Result of the Correlation Coefficient and Determination Test
The relationship between the services towards the customers’ satisfaction in the present study
was as many as 0,754 with the significant level 0,000 which means strong. Since level 0,000 means
less than 0,50, thus it can be stated that H0 was accepted and Ha was rejected, which means that there
was a strong and significant relationship between the quality of services and the customers’
satisfaction.
R Square indicated the value of 0,519, which means that the customers’ satisfaction (Y) was
affected by the quality of services (X) as many as 52%. The rest, as many as 48%, was affected by
other variable which was not included in the study.
4.1.5 Result of Simple Linear Regression Test
Based on the SPSS analysis, it can be found that the regression formula was concluded as follow.
Y = 26.358 + 0.609X, in which α means the constant as many as 26.358. This means that if the
quality of services (X) = 0, the Customers’ satisfaction (Y) was positive with the value of 26.358.
Whereas b is the regression coefficient as many as 0,609 which means that if the quality of services
(X) improves 1, the Customers’ satisfaction (Y) improves 0,609. Besides, it was found that the t count
was 10.277 which means that the quality of services affected the desire of the visitors to take part in
Jakarta walking tour.
5. Conclusion and Suggestion 5.1. Conclusion
1. From the result of the data analysis of the quality of services (X), the mean value was 4,29,
which means “good”. This means that the provided quality of services was good, indicated by
the highest indicator stating that tour guides were polite and friendly during tour with the
mean value 4,47. The lowest average value was on the question stating that tour guides
remember your name properly during tour, with the mean value 3,38.
2. From the data analysis of the visitors’ satisfaction (X), the mean value was 4,37, which means
“good”. The visitors were satisfied with the quality of services provided by the Jakarta Good
Guide with the highest indicator stating that the walking tour is beneficial to add insight of the

Deivy Zulyanti Nasution, Rina Fitriana, Opalma Siahaan
The Impact of Jakarta Good Guide Service Quality Towards the Satisfaction of Jakarta Walking Tour Tourists
157
Proceedings of CATEA 2019
history and culture with the mean value 4,69. The lowest average was on the question stating
that the beautiful destination/tourism object during tour with the value of 4,04.
3. The quality of services improved the visitors’ satisfaction taking part in Jakarta Walking
Tour. The correlation coefficient between the quality of services provided by Jakarta Good
Guide was 0,754 with the significant level of 0,000, which means that the relationship was
strong.
4. The impact of the quality of services variable towards the visitors’ satisfaction variable
indicated the determination coefficient as many as 52% and the rest, 48% was affected by
other variable which was not included in the study.
5. The formulation of regression obtained from the data analysis showed the regression
coefficient value as many as 0,609. This showed that if the quality of services (X) improves 1,
the Customers’ satisfaction (Y) improves 0,609. Besides, it was found that the t count was
10.277 which means that the quality of services affected the desire of the visitors to take part
in Jakarta walking tour.
5.2 Suggestion
From the present study, there were some suggestions, as follow.
1. On the result of the quality of services (X), the lowest value was the statement that tour
guides remember your name properly during tour. The writer suggests that Jakarta Good
Guide provides paid hat souvenirs to enable every tour guide remember the visitors taking
part of walking tour and help the past visitors acknowledge their tour groups.
2. On the result of the visitors’ satisfaction (Y), the lowest value was the statement of the
destination condition. The writer suggests that Jakarta Good Guide conduct licensing
coordination so that Jakarta Good Guide can stop for a while in front of the houses that
possess histories. Jakarta Good Guide needs to check the condition of the destination so that
they can choose destinations that have accessibility, amenity, and attraction that are visitors
friendly.
3. There is a relationship between the quality of services and the visitors’ satisfaction to improve
the visitors’ visits. One of the elements that needs to be improved is the empathy. The writer
suggests that tour guides can acknowledge this situation when visitors get exhausted due to
hot weather, and the condition of pavements in Jakarta which are not pedestrian friendly
nowadays.
References Book Ismayanti., Pengantar Pariwisata. Jakarta: PT. Gramedia Widisarana, 2010
Kotler, Philip & Kevin Lane Keller., Marketing Management, 13th Edition. Jakarta: Erlangga, 2009
Kotler, Keller., Marketing Management 1 12th Edition. Jakarta : PT Indeks
Kusumasitta., “Relevansi Dimensi Kualitas Pelayanan dan Kepuasan Pelanggan Bagi Pengunjung Museum di
Taman Mini Indonesia Indah”. Jurnal Manajemen dan Pemasaran Jasa. No.1. Vol (7). 158 – 163, 2014
Lupiyoadi, Rambat., Manajemen Pemasaran Jasa. Jakarta : PT. Salemba Empat, 2001
Sugiyono., Memahami Penelitian Kualitatif. Bandung: Alfabeta, 2014
Sugiyono., Metode Penelitian Kuantitatif, Kualitatif, dan Research and Development, Bandung: Alfabeta, 2008
Tjiptono, Fandy., Strategi Pemasaran, Edisi Kedua, Cetakan Ketujuh, Yogyakarta: Andi, 2009
Tjiptono, Fandy & Gregorius Chandra. 2011. Service, Quality & Satisfaction Edisi Tiga. Yogyakarta:
Andi
Wilkie, William L. 1994. Consumer Behavior. New York: Third Edition, John Wiley & Sons Inc. Republic of Indonesia Legislation (Act) No 10 year ( 2009 ) on Tourism
Yoeti, Oka. 2010 Pengantar Ilmu Pariwisata Edisi Revisi. Bandung: Publisher: Angkasa
Online :
https://jakartagoodguide.wordpress.com/ Retrieved 19 February 2019 at 21:00 WIB
http://www.cosmopolitan.co.id/article/read/6/2018/14293/15-museum- menarik-di-jakarta-yang-wajib-kamu-
kunjungi Retrieved 04 April 2019 at 23:00 WIB

158
Proceedings of CATEA 2019
Proceedings of CATEA 2019
ISBN 978-623-91018-0-0
Sustainable-tourism’s Competitiveness in Cibodas Botanical
Garden
Hengky1, Sunda Ariana
2, Suheriyatmono
3
1Dept. of Management, Universitas Bina Darma
2Dept. of Management, Universitas Bina Darma 3Dept. of Accounting, Universitas Bina Darma
Abstract: Housing development is increasing to the island of Java - Indonesia. Similarly, the number of
motorized vehicles increased sharply. Both of these developments cause changes in land-use and vehicle
pollution. The development of the population also increases every year. These three factors require
improvements in quality of air, water, and recreational areas to support the lives of people living on the island.
Cibodas botanical garden is a source of oxygen for life in West Java, which sustains 17% of the lives of living
Indonesian. The purpose of this quantitative - qualitative study is to analyze the competencies of sustainable
tourism. The finding of this study indicated that the operation of the botanical garden supported by regional
income and the ticket retribution obtained from tourists. Demand of tourists had not fully fulfilled. Therefore, it
is necessary to manage competency-based sustainable tourism that can handle the problem. This study uses the
concept of sustainable and competitive tourism competencies that provide information about it to stakeholders
in managing the botanical garden better in the future.
Keywords: Competitive tourism; Sustainable tourism; Demand of tourists
1. Introductions Mr. Johannes Ellias Teijsmann established Cibodas Botanical Garden on April 11, 1852. He is a
botanist from the Netherlands, this place was named Bergtuin te Tjibodas which later developed and
changed into Cibodas Botanical Garden. The purpose of establishing the Cibodas Botanical Garden at
that time was for quinine plantations (Cinchona Calisaya). However, the soil structure is not suitable
for the Cibodas Botanical Garden is devoted to the collection of typical wetland high vegetation.
Starting in 2003 the status of the Botanical Gardens became a Technical Implementation Unit of the
Plant Conservation Center. The location of this Botanical Garden is at the foot of Mount Gede and
Mount Pangrango (Septyan, 2018). Today's a number of diversity plants lost at an unprecedented level. It is difficult to cause a
decrease in the number of plants - animals associated with ecosystem (Budeanu, Miller, Moscardo, &
Ooi, 2016). Therefore, it is (Boley, McGehee, & Tom Hammett, 2017) necessary integrated welfare
too (Hebdon, 2018). The diversity welfare (Bramwell & Lane, 2013) Various parties, including the government, ignored the construction of botanical gardens to realize
the development and management of sustainable botanical gardens. The function of the botanical
garden, in addition to plant and animal conservation, is also for tourism activities. Tourism
development aimed at creating income equality and equal opportunities in business. Improving the
tourism sector will open job openings - business opportunities to increase people - government
incomes will encourage related sectors to develop (Chen & Sun, 2018).

Hengky, Sunda Ariana, Suheriyatmono
Sustainable-tourism’s Competitiveness in Cibodas Botanical Garden
159
Proceedings of CATEA 2019
There are several obstacles to the botanical garden such as factors related to external users of the
Garden Plant Conservation accommodate the interest in visiting the botanical garden and external
preferences for the results of Science. Besides, planning that did not look at all stakeholders' interests
made they did not reach the target. Moreover, coordination that still needs to be improve on the
stakeholders around the botanical garden environment. However, the amount of human resources,
especially field technical personnel, which diminishes over time due to full-time employment (Chen
& Sun, 2018; Leung & Baloglu, 2013). The purpose of this study is to analyze the competencies of
sustainable tourism.
2. Literature review European experts document more than 100 years and stabilize nomenclature for more than 100
years and standardize environmental assessment (Brannstrom et al., 2017; Mucina et al., 2016;
Wilson, Peet, Dengler, & Pärtel, 2012). Although ultimately leads to the emergence of ecological
aesthetics from attachments, relationships and holism where humans themselves come to understand
their existence as closely related to non-human self (Neves, 2009).
The food sourced we eat came directly from plants or from animals that mostly consume plant-
based diets. Almost all food comes from plants grown on farms. Unfortunately, the average American
are no longer closely related to agriculture. In this area, there has been a transformation of 70% of
them worked directly in agriculture. As a result, the population clustered in urban environments
increasingly. Eighty percent of the total population lives in the city center. Most people no longer live
near agricultural production and did not only to see it (Novy & Dotson, 2015).
Based on harmony, the community, especially children that draw them to the botanical garden
helps the government and managers to rethink the accepted educational practices about plants in the
botanical garden (Rahm, 2018). The need for good understanding of the protection against the global
environment by governments, institutions, non-governmental organizations contributed to botanical
gardens need to strengthened, as well as government policies and commitments. Significant new
resource commitments are important prerequisites (Blackmore, Gibby, & Rae, 2011).
Shanghai Chenshan Botanical Garden collaborates with the local government in the Green City
Master Plan to increase plant diversity and join rural garden projects. It also provides technical
support for urban development by introducing urban horticulture and phytoremediation. As a
botanical garden, it aims to attract and educate people with landscapes, seasonal flower shows, and
cultural events. The garden helps visitors understand plant conditions and ways to protect plants in
support of sustainable urban development (Chazdon et al., 2017).
Sustainability is a word that heard everywhere lately in terms the subject is energy, lodging,
fishing or gardening. Plant conservation in the botanical garden still did not fully utilize for crop
protection programs. Management decisions can easily help decision-making organizations interested
in plant conservation that supported sustainable lifestyle programs to save the lives and environment
of our children (Noureddine & ZeinEddine, 2018).
Tourism sustainability is very important to the maintenance of local ecosystem services for
carbon sequestration, biodiversity conservation, and climate regulation. It can affect atmospheric
circulation patterns and composition on a regional to global scale. This biome-wide rehabilitation will
greatly affect the carbon sequestration regime and preservation of biodiversity and have implications
for the sustainability of economic development in the area (Sellmann & Bogner, 2013).
Response analysis shows that respondents assess non-destructive resource used and increase
visitor satisfaction as the highest value. Conversely, the role of regulating park law enforcement,
management monitoring and stakeholder participation receives the smallest rating. The application of
certain elements of sustainable tourism requires social-cultural for the community relation and
participation in safeguarding the conservation plant that supported by government plants and policies
to increase natural conservation efforts due to urbanization and at the same time can increase
economic contribution to local communities (Hengky & Kikvidze, 2018).

Hengky, Sunda Ariana, Suheriyatmono
Sustainable-tourism’s Competitiveness in Cibodas Botanical Garden
160
Proceedings of CATEA 2019
The selection of resources affects the heterogeneity of botanical gardens and institutions and
resources. The institution covers internal culture and defines economic behavior that is socially
acceptable. A heterogeneity process modelled combines insight into resource-based views on an
institutional perspective of organizational theory (Johansson, Greif, & Fleischer, 2007; Oliver, 1997;
Ratten, 2018).
3. Method The research conducted from Jan 2017 to February 2018, which began with reviewing the
literature to find relevant information related to the activities of tourists, travel agents, tour guides and
departments related to botanical gardens (Figure 1). The data collected: 270 of the 300 respondents
returned the questionnaire compiled in Indonesian and English (Each questionnaire consisted of 6
questions). The questionnaire distributed purposively among nine-groups (each group = 13
respomndents) (Table 2) from April - November 2017.
Figure 1. Cibodas Botanical Garden at an altitude of approximately 1,300 - 1,425 meters (above sea level), 84.99 hectares. The average
temperature is 20.06 ° C, humidity is 80.82% and the average rainfall is 2,950 mm per year (Suhatman, 2010).
The indicators of sustainability: (1) social-cultural for the community relations; (2) increase
natural conservation efforts; and (3) supported by government plants and policies. These indicators
make it possible to validate activities for applying certain elements of competitive advantage from
sustainable tourism based on the following criteria: (1) respect for socio-cultural life, (2) support
government programs and policies, and (3) institutional perspective of organizational (Le Blanc,
2015).
This is an indicator of the superiority in sustainable botanical gardens (Christian, Gamayanto,
Wibowo, & Astuti, 2018; Mucina et al., 2016; Rahm, 2018; Sellmann & Bogner, 2013):
1. Presents a natural atmosphere of the environment
2. Provides enormous benefits of human life
3. Conservation innovations
4. Make human life much better
5. Practices teach about plants
6. Involve the community relation
7. Utilize for crop protection programs
And

Hengky, Sunda Ariana, Suheriyatmono
Sustainable-tourism’s Competitiveness in Cibodas Botanical Garden
161
Proceedings of CATEA 2019
1. The ability to manage institutions and resources
2. Institution covers internal culture
3. Economic behavior - socially acceptable
4. Combines insight into resource-based views on an institutional perspective
All of these factors asked to the respondents to gather information about their opinions on the
level of their agreement. The statement according to the significance level according to the Likert
scale (Norman, 2010) through six levels. It namely on a scale of one (strongly disagree), and 6
(strongly agree ). In accordance with the consistency of the respondents, the questions were asked to
them five times different times (Cavazos-Rehg et al., 2016).
The collected data processed by using content analysis. It will produce a Kappa coefficient value
(K) whose value meets the requirements if it exceeds 0.6. On the other hand, if the Kappa (K) valued
is below 0.6, the opinion of the respondent is not fulfilling the requirements. The opinions of the
respondents that have quantified as kappa (κ). All analyze performed using SAS / STAT software
(SAS Institute Inc., NC, USA).
We also held two group discussions. First, 50 respondents discussed sustainable management at
the Cibodas Botanical Garden. Second, 50 respondents discussed the competitive advantage of
sustainable tourism in the Botanical Gardens. These meetings are a general discussion (Lucero et al.,
2018). These semi-structured discussion from the survey based on the questionnaire.
Number of respondent groups
Table 1. Group of respondents
Cibodas travelled agent 15
Ministry of Tourism staff 11
Tourist bused driver 12
Taxi driver / Grabe car 16
General car driver 12
Reception, reservation and 14
Department of Infrastructure; Social and Environmental Impact analysis 10
Member of the Cibodas local community 11
Cibodas tour guide 12
The respondents discussed 11 indicators of the advantages of sustainable tourism.
4. Result This study found the Cibodas Botanical Garden (CBG) matched to sustainable tourism
(Coeffisien Kappa = 0.61). K values> 0.6 indicated that CBG performance falls into the category of
sustainable tourism (Table 2). It is with the main indicators that natural atmosphere of the
environment supported by providing enormous benefits of human life in conservation innovations and
utilizing for crop protection programs.
Table 2.
Cibodas Botanical Garden - tourism. Value Freq
Presents a natural atmosphere of the environment 34 0,1753
Provides enormous benefits of human life 31 0,1598
Conservation innovations 28 0,1443
Make human life much better 25 0,9259
Practices teach about plants 23 0,1186

Hengky, Sunda Ariana, Suheriyatmono
Sustainable-tourism’s Competitiveness in Cibodas Botanical Garden
162
Proceedings of CATEA 2019
Cibodas Botanical Garden - tourism. Value Freq
Involve the community in relation to place, land and the world 26 0,1340
Utilize for crop protection programs 27 0,1392
Coefficient Kappa 0,6158
Table 3.
Cibodas Botanical Garden - Tourism Competitiveness Value Freq
The ability to manage institutions and resources 29 0,2636
Institution covers internal culture 27 0,2455
Economic behavior - socially acceptable 30 0,2727
Combines insight - resource-based views on an institutional perspective 24 0,2182
Coefficient Kappa 0,6111
The sustainable tourism competitiveness of CBG validated in Table 3 by the results of the
tabulation of the Kappa Coefficient = 0.61, the indicator of economic behavior - social acceptable is
important. It proofed the competitiveness of sustainable tourism in the CBG. Another indicator is that
this tourist place is very cool and fresh. The temperature is around 17-27 degrees Celsius. CBG has an
area of around 80 hectares and stores various objects that it could be enjoy or visit. Sakura Park
located 100 meters from the entrance is the most favorite object of visitors. As in Japan, this Sakura
tree can grow well on CBGs. This is due to the contour of the land, climate, and altitude of the place
almost the same as the natural habitat. Within a year, Cherry Blossoms in this garden can bloom twice
and each time blooms for four days, while the blooming time is around January-February and July-
August.
In Sakura Park, there are 7 types of Sakura trees with a total of 435 trees. The garden has 134
types of mosses. Most of them come from around the CBG. This garden also has 3 types of
Rhododendrons, namely Rhododendron Javanicum (Java), Rhododendron Macgregoriae (Papua), and
Rhododendron Mucronatum (Japan).
In this CBG, there are also two waterfalls, namely Cibogo and Ciismun. At the location of the
waterfall, we can take a bath or just soak the feet in the bottom puddle. The scenery is also no less
interesting. Falling water will make the atmosphere cheerful again and again reflect the thoughts of
the visitors. In this Botanical garden also has a greenhouse that stores various collections of plants.
Greenhouses made to maintain the temperatures needed by plants in them as in their natural habitat. In
addition, It also a greenhouse functions to increase the collection of botanical garden plants. There are
three types of plants in greenhouses, namely orchids, cactus, and succulent plants.
A number of other locations that can be visit are the lake in the middle of the botanical garden,
Clear River, moss garden, collection of medicinal plants, fern collections, fountains located near to
the gate three (3), Araucaria road, and Rhododendron Park. Just like the Bogor Botanical Gardens,
here are also rare Giant Carrion Flowers that they bloom at certain times. The Carrion Flower is
located north of the greenhouse. Collection of plants in botanical gardens that are typical of tropical
upland plants is also diverse. There are around 4 000 examples of plants from 98 species of Cactus,
262 species of Orchids, and 71 types of succulent collections. The Botanical Garden also collected 74
types of ferns. It approximately 164 types of medicinal plants. With a large collection of plants in the
garden, visitors that come not only recreation but also add insight into various types of plants in
Indonesia and even abroad.
The vision of the CBG is to become one of the best botanical gardens in the world in the field of
tropical plant conservation, especially wet tropical highland plants, research, environmental education
services, tourism, and environmental services. In order to realize this vision, the manager of the CBG
is very concern about all aspects including managing institutional perspective and resource-based
view of the function of environmental services. It is an important factor of developing
competitiveness. Some of the studies include estimation of carbon stocks and biomass in Cibodas
Biosphere Reserve, and the association for carbon stocks and plants.

Hengky, Sunda Ariana, Suheriyatmono
Sustainable-tourism’s Competitiveness in Cibodas Botanical Garden
163
Proceedings of CATEA 2019
Another effort as a form of environmental services in the CBG is a strategy of restoration -
rehabilitation of degraded's land and prone to landslides in the Citarum and Cisadane River Basin
ecosystems as climate change mitigation efforts. The rise of development around the CBG
Conservation Area, West Java, threatens the sustainability of ecosystems, especially plants. Even
though, it cannot be proven directly, the most obvious impact is the increase in average temperature
from 19 - 21 0C (Mutiara, 2018). The temperature changes that began to be fall for two years ago
were not only causing the weather to get hotter, but also potentially threatened the plant growth cycle.
In addition, there is a shift in the time of flowering and fertilization of cherry blossoms. Usually, the
process occurs to January - February. However, it has now shifted to March. In fact, the cherry
blossoms are now much shorter. Previously, the flowering period lasted for a week. In 2016, cherry
blossoms only bloom within three days.
The main problem that it must be deal with immediately is the threatened plant collection of the
CBG. A part of them (46 of 1,851 species) is on the conservation program. These endangered plants
are diverse, but generally come from orchid species spread in various parts of Indonesia. In addition,
there are also rare plants of the type of lianas or vines that grow on other plants. Among them is
Kadsura.
Rare plants that are still in the botanical garden. There are various other collections of plants are
actually great potentials that they need to be preserved. In fact, it should continue to be developed.
Generally, Liana plants that used as shelter for pergola. It used as a place for ecotourism in the
botanical garden.
5. Conclusion This study found the CBG implementing the competitiveness concept on managing and
controlling sustainable tourism but they have a handicap to deal the threatened plant collection on
their conservation program. Some of the plants in the conservation program had threatened with
extinction. In general, these plants come from orchid species that spread in various regions in
Indonesia. In addition, there are a number of rare plants endangered species.
Therefore, botanical garden managers need to increase their capacities and ability is always be
oriented to the expectations of tourists in accordance with their competencies, especially in public
services in the future. Furthermore, planning that takes into account the resources of the botanical
garden. So that, the target set is more realistic. Moreover, it is necessary to increase communication
between stakeholders that made the policy harmonization occurs. Nevertheless, the recruitment of
accountable and competent employees, adjusted to the budgeting capabilities of the botanical garden.
Reference Blackmore, S., Gibby, M., & Rae, D. (2011). Strengthening the scientific contribution of botanic gardens to the
second phase of the Global Strategy for Plant Conservation. Botanical Journal of the Linnean Society,
166(3), 267–281. https://doi.org/10.1111/j.1095-8339.2011.01156.x
Boley, B. B., McGehee, N. G., & Tom Hammett, A. L. (2017). Importance-performance analysis (IPA) of
sustainable tourism initiatives: The resident perspective. Tourism Management, 58.
https://doi.org/10.1016/j.tourman.2016.10.002
Bramwell, B., & Lane, B. (2013). Getting from here to there: systems change, behavioural change and
sustainable tourism. Journal of Sustainable Tourism, 21(1), 1–4.
https://doi.org/10.1080/09669582.2012.741602
Brannstrom, C., Gorayeb, A., de Sousa Mendes, J., Loureiro, C., Meireles, A. J. de A., Silva, E. V. da, …
Oliveira, R. F. de. (2017). Is Brazilian wind power development sustainable? Insights from a review of
conflicts in Ceará state. Renewable and Sustainable Energy Reviews, 67, 62–71.
https://doi.org/10.1016/J.RSER.2016.08.047
Budeanu, A., Miller, G., Moscardo, G., & Ooi, C. S. (2016). Sustainable tourism, progress, challenges and
opportunities: An introduction. Journal of Cleaner Production.
https://doi.org/10.1016/j.jclepro.2015.10.027
Cavazos-Rehg, P. A., Krauss, M. J., Sowles, S., Connolly, S., Rosas, C., Bharadwaj, M., & Bierut, L. J. (2016).
A content analysis of depression-related tweets. Computers in Human Behavior, 54, 351–357.
https://doi.org/10.1016/J.CHB.2015.08.023

Hengky, Sunda Ariana, Suheriyatmono
Sustainable-tourism’s Competitiveness in Cibodas Botanical Garden
164
Proceedings of CATEA 2019
Chazdon, R. L., Brancalion, P. H. S., Lamb, D., Laestadius, L., Calmon, M., & Kumar, C. (2017). A Policy-
Driven Knowledge Agenda for Global Forest and Landscape Restoration. Conservation Letters, 10(1),
125–132. https://doi.org/10.1111/conl.12220
Chen, G., & Sun, W. (2018). The role of botanical gardens in scientific research, conservation, and citizen
science. Plant Diversity, 40(4), 181–188. https://doi.org/10.1016/J.PLD.2018.07.006
Christian, H., Gamayanto, I., Wibowo, S., & Astuti, Y. P. (2018). The Impact & Innovation of E=K.MC2
in Singapore Botanic Garden (SBG): The Business Strategy to Gain Competitive Advantage. Journal of
Economics and Management Sciences, 1(1), p166. https://doi.org/10.30560/jems.v1n1p166
Hebdon, B. (2018). 10 great botanical gardens around the world: readers’ tips | Travel | The Guardian. Retrieved
November 19, 2018, from https://www.theguardian.com/travel/2018/aug/16/10-great-botanical-gardens-
around-world-readers-travel-tips
Hengky, S. H., & Kikvidze, Z. (2018). Tourism sustainability in the Bogor Botanical Gardens, Indonesia. Urban
Forestry & Urban Greening, 30, 8–11. https://doi.org/10.1016/J.UFUG.2018.01.007
Johansson, G., Greif, A., & Fleischer, G. (2007). Managing the design/environment interface: studies of
integration mechanisms. International Journal of Production Research, 45(18–19), 4041–4055.
https://doi.org/10.1080/00207540701474823
Le Blanc, D. (2015). Towards Integration at Last? The Sustainable Development Goals as a Network of Targets.
Sustainable Development, 23(3), 176–187. https://doi.org/10.1002/sd.1582
Leung, X. Y., & Baloglu, S. (2013). Tourism Competitiveness of Asia Pacific Destinations. Tourism Analysis,
18(4), 371–384. https://doi.org/10.3727/108354213X13736372325876
Lucero, J., Wallerstein, N., Duran, B., Alegria, M., Greene-Moton, E., Israel, B., … White Hat, E. R. (2018).
Development of a Mixed Methods Investigation of Process and Outcomes of Community-Based
Participatory Research. Journal of Mixed Methods Research, 12(1), 55–74.
https://doi.org/10.1177/1558689816633309
Mucina, L., Bültmann, H., Dierßen, K., Theurillat, J.-P., Raus, T., Čarni, A., … Tichý, L. (2016). Vegetation of
Europe: hierarchical floristic classification system of vascular plant, bryophyte, lichen, and algal
communities. Applied Vegetation Science, 19, 3–264. https://doi.org/10.1111/avsc.12257
Mutiara, P. (2018). Development Threatens Cibodas Ecosystem. Retrieved October 30, 2018, from
http://mediaindonesia.com/read/detail/100501-pembangunan-ancam-ekosistem-cibodas
Neves, K. (2009). Urban Botanical Gardens and the Aesthetics of Ecological Learning: A Theoretical
Discussion and Preliminary Insights from Montreal’s Botanical Garden. Anthropologica. Canadian
Anthropology Society. https://doi.org/10.2307/25605463
Noureddine, O. H., & ZeinEddine, R. B. (2018). American Scientific Research Journal for Engineering,
Technology, and Sciences. American Scientific Research Journal for Engineering, Technology, and
Sciences (ASRJETS) (Vol. 42). Retrieved from
http://asrjetsjournal.org/index.php/American_Scientific_Journal/article/view/3989
Novy, A., & Dotson, D. (2015). Botanical Gardens Are Well Positioned to Share Agriculture with the Public.
CSA News, 60(8), 40. https://doi.org/10.2134/csa2015-60-8-13
Oliver, C. (1997). Sustainable competitive advantage: combining institutional and resource-based views.
Strategic Management Journal, 18(9), 697–713. https://doi.org/10.1002/(SICI)1097-
0266(199710)18:9<697::AID-SMJ909>3.0.CO;2-C
Rahm, J. (2018). Youths’ navigations of botanical gardens: bids for recognition, ways to desettle practice.
Environ. Educ. Res., 1–13. https://doi.org/10.1080/13504622.2018.1469731
Ratten, V. (2018). Social innovation in sport: the creation of Santa Cruz as a world surfing reserve. International
Journal of Innovation Science, IJIS-12-2017-0135. https://doi.org/10.1108/IJIS-12-2017-0135
Sellmann, D., & Bogner, F. X. (2013). Climate change education: quantitatively assessing the impact of a
botanical garden as an informal learning environment. Environmental Education Research, 19(4), 415–
429. https://doi.org/10.1080/13504622.2012.700696
Septyan, A. R. (2018). Enjoy Natural Beauty at Cibodas Botanical Garden. Retrieved October 30, 2018, from
https://foresteract.com/menikmati-keindahan-alam-di-kebun-raya-cibodas/
Suhatman, A. (2010). Cibodas Botanic Gardens. Retrieved November 21, 2018, from
https://www.bgci.org/garden.php?id=40
Wilson, J. B., Peet, R. K., Dengler, J., & Pärtel, M. (2012). Plant species richness: the world records. Journal of
Vegetation Science, 23(4), 796–802. https://doi.org/10.1111/j.1654-1103.2012.01400.x

165
Proceedings of CATEA 2019
Proceedings of CATEA 2019
ISBN 978-623-91018-0-0
Community Empowerment Strategy:
Ecospa Tourism Prospects in Nglanggeran Tourism Village
Gunung Kidul Yogyakarta
Lastiani1, Baiquni
2, Eni
3, Wahyono
4
1Lastiani Warih Wulandari -Graduate Student of Tourism Study Gadjah Mada University
2M. Baiquni Lecturer of Geography Faculty Gadjah Mada University
3 Eni Harmayani Lecturer of Agricuktural Technology Faculty Gadjah Mada University
4Wahyono Lecturer of Farmacy Faculty Gadjah Mada University
Abstract: This article focuses on the factors that led to the success of empowerment for community-based
tourism. Community-based tourism is characterized as a form of tourism village in Nglanggeran village located
in Gunung Kidul, Yogyakarta. Community participation as a process in decision making and the development of
sustainable natural and cultural resources is influenced by the empowerment of the community itself. The
impact of community empowerment strategies can contribute to the needs of rural communities,
entrepreneurship and contribute to local economic and cultural goals. The Ecospa consists of a community of
people who get identified needs in certain communities that have the potential for ecotourism. The connection of
spa products contributes to supporting ecospa tourism. Ecospa is one of the tourism strategies with community
empowerment to form spa entrepreneurs by involving socio-economic factors and transfer of knowledge with
skills training. The method of research uses qualitative methods and direct observation on community
empowerment. This paper considers the realization of community empowerment through relationship marketing
partnerships involving three sectors (socio-economic, community empowerment, entrepreneurship) which are
often called marketing relationship partnerships
Keywords: Community Empowerment; Ecospa; Tourism Village
1. Introduction Community-based tourism is often referred to as CBT. Community-based tourism is more
proactive in maintaining control over tourism decision-making, communities that direct tourists
values and interests. The basic principles of Community Based Tourism (CBT) are related to
economic sustainability, natural and cultural resources, institutional strengthening, and equitable
distribution of benefits for all members of the community. Regarding the principle of economic
sustainability above, it is a guarantee that Community Based Tourism (CBT) can create a mechanism
that can maintain the economy in good and sustainable conditions so that tourism can be relied on to
increase community income or welfare. Tourism is a very potential industry that can make a positive
contribution. It can also exploit resources, socio-culture and environmental damage. Challenges and
excellence in tourism can have a positive effect on society, especially for tourists. However, it can
also be a negative effect because of the emergence of many tours that are needed by the community.
The basic principle of community-based tourism is to place the community as the main actor through
community empowerment in various tourism activities. This happens so that the benefits of tourism
can be enjoyed to the maximum extent possible because tourism communities have the potential to
make a positive economic contribution.
The principle of economic sustainability in community-based tourism is that every individual
in the community is directed to be part of the tourism economy chain, for which individuals are given
the skills to develop a small business. Indonesia's social and economic problems are poverty and
unemployment. Indonesia is the world's fourth most populous country, in 2017 the number of
unemployed people rose to 7.04 million according to the Central Statistics Agency. The problem of
unemployment can be solved by building an entrepreneurial spirit as an economic driver, providing

Lastiani, Baiquni, Eni, Wahyono
Community Empowerment Strategy: Ecospa Tourism Prospects in Nglanggeran Tourism Village Gunung Kidul Yogyakarta
`
166
Proceedings of CATEA 2019
business opportunities, business perspectives and practical aspects in solving social and economic
problems including poverty alleviation efforts. Change of concept in alleviating poverty where rural
poverty can be overcome through community empowerment. The concept of community
empowerment refers to how local communities have a large influence both socially and in community
organizations, so that they can influence their environment, and this is what underlies the increasing
community to influence the growth of entrepreneurial spirit in the community.
Community-based tourism is a concept of tourism management that is focused on the
involvement of the community. In real life sometimes what happens is not as desired. There are times
when some private parties are more involved in managing existing tourism. This has resulted in the
community receiving little benefit from community-based tourism (Trejos&Chiang,2009).
Community-based tourism is a type of tourism that involves the community as the main actor in
managing tourism potential in its environment (Yusof, Ibrahim, Muda, & Amin, 2012).
People basically cannot manage their own tourism potential, they need encouragement from
outside. In implementing community-based tourism development, the government and the community
have their respective roles. The government plays a role in producing policies that are oriented to the
interests of the community. While the community is involved in managing the tourism potential in the
vicinity (Sobandi & Sudarmadji, 2015). Community involvement in the tourism industry can be seen
from the decision making process in the development process (Prabhakaran, Nair, & Ramachandran,
2014). Community-based tourism is tourism development that is able to sustain economic benefits
obtained sustainably so as to improve the quality of life of the community (López-Guzmán, Sánchez-
Cañizares, Pavón, & others, 2011).
Ecotourism is one of the tourism activities that is environmentally sound by prioritizing aspects
of nature conservation, aspects of socio-cultural empowerment, the economy of local communities
and aspects of learning and education. Traditional spa ecotourism is an Ecospa which in principle is a
community-based spa that emphasizes the authenticity of the environment by increasing the value of
local wisdom and minimizing negative impacts on the environment while supporting the social and
economic development of the community.
Spa health tourism in Indonesia has great potential because Indonesia has various advantages
including in terms of spa treatments from various regions in Indonesia, spa treatment support
materials, and human resources for spa therapists. Yogyakarta as a center of education and culture
with the support of various objects and tourist attractions is the most important part of the goal of
developing tourism in Yogyakarta. A strategy is needed to market highly competitive tourism to
produce added value as special interest tourism. One example of special interest tourism is the Spa
industry. Spa treatments that have self-care procedures in accordance with local wisdom are called
traditional spas, which are health efforts and refresh the body using water and spice therapy in the
tourist village of Nglanggeran, Gunung Kidul.
Ecospa tourism based on community empowerment is rooted in people's culture with one of the
tourism activities that uses local wisdom as its object. This type of tourism is included in special
interest tourism. This distinctive feature makes spa Indonesia have a unique position compared to
other countries in the world so that Indonesian spas are expected to compete in International forums.
The ecospa is a new thing that still needs to be researched and developed. Traditional spas associated
with the use of spices, herbal plants are used as ingredients for relaxation and holistic healing to
become a habit that has been handed down from generation to generation and packaged into ecospa
tourism.
1.1 Ecospa Tourism Based on Community Empowerment
Traditional spa ecotourism (ecospa tourism) is a spa based on community empowerment rooted
in a culture of people who use local wisdom. Ecospa is included in special interest tourism objects. In
Indonesia, there are several provinces that have special interests, one of which is the province of Bali.
Phillip F. Mc Kean (1973) wrote that "the Balinese tradition will prosper in a direct proposition for
the success of the tourism industry" (Wood, 1979).
A holistic approach (Benge and Tara, 2004) is a spa using care facilities that aim to harmonize
human life through three-dimensional alternative therapies, namely body, mind, and emotions (body,
mind and soul) channeled through the six senses. The six senses in question include through the
senses of the eye (through the color /therapeutic atmosphere in the spa room), the senses of the nose

Lastiani, Baiquni, Eni, Wahyono
Community Empowerment Strategy: Ecospa Tourism Prospects in Nglanggeran Tourism Village Gunung Kidul Yogyakarta
`
167
Proceedings of CATEA 2019
(through smell with distinctive aroma therapy to cause pleasant effects), the senses of the ears
(through therapeutic music that gives rise to peace of mind), senses tongue (through healthy foods and
drinks), the senses of the skin (through gentle massage so as to create a comfortable feeling called
therapeutic massage, the senses of the muscles, through pressure on certain body parts so that it will
provide a relaxing effect).
The principle of spa health services refers to the body of knowledge of traditional medicine in
Indonesia. In spa health services, the basic concepts of traditional Indonesian care systems include
cosmological, holistic, and cultural (biopsychososiocultural) approaches which include traditional
foods and drinks such as herbs written in the fiber of the center. Herbs can be consumed by drinking
or applying to the body, stomach, forehead, and soak the body (Gardjito and Harmayani, 2017).
Shifting the demands and desires of spa consumers makes a change in the demand for spa
treatments in big cities shifting consumets desires to special and unique places such as on the
mountain, near the coast, even above the sea. Indonesia's natural wealth provides various types of
minerals and materials needed for spa treatments by offering holistic care by utilizing human
resources and natural resources as a standard for spa treatments available at the ecospa.
Center for International Forestry Research: Community Based Tourism Development No. 9
(June, 2014) states that the meaning of community empowerment-based tourism is tourism
development with high levels of local community involvement and can be accounted for from social
and environmental aspects. In developing community-based tourism, the most important thing is to
maximize community participation in various aspects of tourism development
The development of community-based tourism is the most important thing is to maximize the
participation of the community in various aspects of tourism development. The community as a
determinant is directly involved starting from the planning process to implementation. Thus it can be
said that community-based tourism can be used as one form of a new paradigm of tourism
development through the principles of developing sustainable tourism development for the sake of
achieving a more even distribution of people's welfare.
Community empowerment-based ecospa tourism development places more emphasis on the
principles of sustainable development. Some of these sustainable principles focus on increasing the
skills of workers to be able to increase competitiveness in obtaining decent jobs and increasing
economic cooperation. The sustainable economic aspect in it is a form of shared responsibility
between the government, the private sector, and the community in the creation of capital, labor, and
employment opportunities for the community. The aspect of community participation is also one of
the developments in sustainable development through increasing and optimizing the role of the
community in the process of environmental development which is a source of community income.
1.2 Ecospa Tourism in Nglanggeran Gunung Kidul
According to tourism statistics in Yogyakarta in 2015 there were around 119 tourism villages in
five districts in Yogyakarta (Special Region Tourism Statistics Book of Yogyakarta, 2015).
Administratively, Gunungkidul Regency is divided into eighteen sub-districts consisting of 144
villages and 1,431 hamlets with the district capital in Wonosari with a distance of about 40 km to the
southeast. Geographically, Gunungkidul is one of five regencies in Yogyakarta with an area of about
1,485.36 km2 or approximately 46.63% of the total area in Yogyakarta (Gunungkidul Tourism Office,
2016). Its strategic location as a tourism area makes Gunungkidul district a priority for tourist
destinations in Yogyakarta.
The potential tourism in Nglanggeran Village is Mount Nglanggeran and now known as Gunung
Api Purba. Nglanggeran area in Gunung Kidul regency, precisely the Village of Gunung Api Purba
became one of the tourism icon in Yogyakarta. The development of this area is involving the
participation of the surrounding community who has entrepreneurial spirit. These entrepreneurial
spirits will build tourism especially in Nglanggeran ecotourism area. The development of ecotourism
area of Gunung Api Purba have started by Karang Taruna Bukit Putra Mandiri of Nglanggeran since
1999. The various activities carried out by Karang Taruna Bukit Putra Mandiri as a group in rural
community. Tourist attractions are managed by rural community that concern of tourism. They called
“Pokdarwis” (Kelompok Sadar Wisata/aware of tourism activities) as Pesona Purba ecotourism
village in Nglanggeran. Many local tourists and there are also occasional foreign tourists visit Gunung
Api Purba, Nglanggeran. They enjoy many tourist attractions such as climbing, tracking and

Lastiani, Baiquni, Eni, Wahyono
Community Empowerment Strategy: Ecospa Tourism Prospects in Nglanggeran Tourism Village Gunung Kidul Yogyakarta
`
168
Proceedings of CATEA 2019
sightseeing at Embung. Moreover, they can come to Griya Coklat to see how to make food and
beverages using chocolate as its ingredients such as dodol chocolate, chocolate drink, and other snack
made of chocolate are available in “Griya Coklat”. Nglanggeran Village was chosen because it is a
developed ecotourism village and there is a Purba Ayu spa group which is part of the tourism
conscious group (Pokdarwis/Kelompok Sadar Wisata).
Ecopa tourism development is carried out in the Purba Volcano ecotourism area, Nglanggeran,
Gunungkidul, Yogyakarta. The reason for choosing the location in Nglanggeran village, Gunung
Kidul district is an ecotourism village. In accordance with the vision of the Nglanggeran ecotourism
village, which is to make the Nglanggeran Purba Volcano ecotourism area a leading tourist area with
a community-based environment
The Purba Ayu spa group was developed into an ecospa group. This study aims to get an
overview of the development of ecospa-based tourism for community empowerment through
marketing partnerships. Ecospa tourism is carried out by several therapists from community groups
who have received spa training and some have been certified. This is evident in the process of
community empowerment activities as a tourist support in helping provide facilities and programs for
tourist activities.
The added value of traditional spa health ecotourism (ecospa tourism) contributes positively to
increasing tourist attraction, especially in the Yogyakarta. Based on this, the research location was
taken in the Nglanggeran, Purba Volcano ecotourism village, Gunungkidul Regency. Nglanggeran
Gunungkidul Village is located 23 kilometers from Yogyakarta. Nglanggeran Village was chosen
because it is a developed ecotourism village and there is a Purba Ayu spa group which is part of the
tourism conscious group (Pokdarwis). The Purba Ayu spa group was developed into an ecospa group.
The community that manages the ecotourism area, Purba Volcano in Nglanggeran tourist village
consists of community members who carry out natural tourism service activities that develop tourism
in a professional manner. The management of Nglanggeran tourist village is quite successful in
conducting promotions and activities that can attract local and foreign tourists to be able to enjoy the
beautiful natural wealth of Purba Volcano in Nglanggeran Village, making chocolate in “Griya
Coklat” , located in Gunungkidul Regency.
Tourism potential in Gunungkidul is very diverse and especially in Patuk Subdistrict located in
Nglanggeran, Purba Volcano, Gunung Kidul with cultural tourism such as traditional tourism village
groups that join the Nglanggeran tourism group (Pokdarwis). The Purba Ayu Spa group is a group of
traditional tourist villages that do ecopa tourism services in Nglanggeran, Gunung Kidul.
2. Literature Review Purba Volcano ecotourism area, Nglanggeran is a business activity that has a primary mission to
create social impacts that improve quality of life, especially for the lower middle class. The
community in developing tourism in a tourist village has several characters. First, people have the
intention to become entrepreneurs with a basic social basis. Second, it becomes a useful bridge and
functions as an agent of change that is able to develop authentic ideas in overcoming the social
limitations that exist in communities in the Nglanggeran region. Third is to distribute ideas to build a
business so that the people in Nglanggeran tourism village become prosperous.
Concern for the importance of entrepreneurial spirit in the tourist village of Nglanggeran which
builds the basis of the influence of relations in the development of marketing and empowerment of
community-based tourism to increase capacity (capacity building) of the community. Patterns of
interaction and favorable conditions between companies, consumers, suppliers, or other organizations
are ways of marketing to consumers to improve company growth and customer satisfaction.
Consumer satisfaction is a business asset if consumers can be served well so that consumers can
obtain satisfaction and have an impact on increasing revenue and long-term growth in the business.
Patterns of interaction and favorable conditions between companies, consumers, suppliers, or
other organizations are ways of marketing to consumers to improve company growth and customer
satisfaction. Consumer satisfaction is a business asset if consumers can be served well so that
consumers can obtain satisfaction and have an impact on increasing revenue and long-term growth in
the business.

Lastiani, Baiquni, Eni, Wahyono
Community Empowerment Strategy: Ecospa Tourism Prospects in Nglanggeran Tourism Village Gunung Kidul Yogyakarta
`
169
Proceedings of CATEA 2019
Entreprenuersip is a comprehensive relationship between marketers, suppliers and customers
who have a different concept than the usual marketing concept. The concept of marketing relationshi
separates customer activities and marketing activities. Relationship marketing are interactive
processes not exchanges and transactions because the principles of marketing and marketing
partnerships are interdependent and work together between producers and customers (Sheth and
Parvatiyar, 2002).
Tourism Village with local wisdom that takes into account the growth of entrepreneurship can
have an impact on the growth of tourism-based community empowerment. In addition to the added
value for entrepreneurs given by the Pesona Purba community in Purba Volcano, Nglanggeran, it also
has a positive influence on the development of community-based tourism empowerment.
Management of natural and human resources which directly involves the potential to enable the
growth of an entrepreneurial spirit among the community itself. Of course, this will help the
development of community-based tourism empowerment. Local communities and uniqueness
activities that have been developed as various tourist attractions, among others, can be seen in the
following table: Table 1. Potential and Attraction in Nglanggeran Gunung Kidul
I. Natural Attraction :
The main attraction
The supporting
attraction
Attraction:
The presence of Gunung Api Purba and beautiful natural
panorama as well as agricultural areas and rice fields in the
village Nglanggeran
There is Embung area (mini reservoir) above hill area of 0.34 Ha
for irrigation fruit farm of 20 Ha with beautiful scenery.
II. Cultural Attraction :
The main attraction
The supporting
attraction
Attraction:
The ceremonial of kirab rasulan culture, art attractions jathilan,
and traditional ceremony.
The daily life of the village community which always helps each
other and they are so friendly, kenduri culture, karawitan and
some local culture that are still nurtured.
III. Craft Attraction:
The main attraction
The supporting
attraction
Attraction:
There is wooden crafts in the form of masks and bracelets
There is the learning package to make a craft such as batik mask
IV. Culinary Attaction:
The main attraction
The supporting
attraction
Attraction:
There is special food named cocoa dodol and Brownies Cassava
There is a processingcooking workshop as an educational
package for making cocoa dodol and brownis cassava
V. Man-Made Attraction:
The main attraction
The supporting
attraction
The Ecospa
Attraction:
Outbond game rides,flying fox,mbung (mini reservoir)
Nature education package (farming, cocoa cultivation,
environmental care package)
Energetic and young human resources
Representative locations
SPA package for tourist (massage, scrub, masker etc)
Making SPA product education training pack
Source: Pokdarwis, 2018
The development of potential and attractiveness has an impact on the growth of entrepreneurship
as a competitive advantage and a positive image for tourism villages. In particular, it can be seen in
Purba Nglanggeran Volcano, visitors get satisfaction based on community empowerment.
Ecospa is a form of entrepreneurship in Nglanggeran, Gunung Kidul. Community development
does business by empowering themselves to produce social changes that lead to shared prosperity.
The aim of the ecospa as a form of entrepreneurship at Nglanggeran Gunung Kidul is first, that the
ecospa business is to create spa tourism that creates social benefits and benefits distributed to the
community. Second, ecospa tourism is owned by the community, not individual business. Third, the
process and results of business profits are directly given to the community in accordance with the
rules of the community group.

Lastiani, Baiquni, Eni, Wahyono
Community Empowerment Strategy: Ecospa Tourism Prospects in Nglanggeran Tourism Village Gunung Kidul Yogyakarta
`
170
Proceedings of CATEA 2019
2.1 The Process of Community Empowerment at Purba Ayu Spa Toward Ecospa Tourism
Community empowerment has seven stages or steps that are carried out, namely the preparation
stage, the assessment phase, the alternative planning stage of the program or activity, the planning
phase of planning, the implementation stage, the evaluation phase, and the termination stage
(Soekanto, 1987:63). The stages in community empowerment at the Purba Ayu Spa group towards the
ecospa can be explained as follows:
2.1.1 The stages The stages in this preparation involve the community as a planning process, namely participation
in decision making that has the following indicators. The indicators as (1) Indicators of Participation
This planning process involves the community in planning with meetings.(2) Contribution of thoughts
to express opinions between groups for recommendations on suggestions and criticism as a plan of
action.
Schedule Meetings and discussions with the community
2.1.2 Process Towards Action (Do)
This process requires action through the following stages (1) Meeting to discuss the need for a
new ecotourism package in the village of Nglangeran, Gunungkidul (2) Providing opportunities for
the community to participate in ongoing decisions and policies for ecospa tourism (3) Build a group
of Purba Ayu Spa for ecospa tourism
Memo of understanding to appoint Purba Ayu as an ecospa community empowerment group Nglanggeran
Gunungkidul by Pokdarwis
2.1.3 Checking Process by Conducting Spa Training and Education Activities
Training and education about making spa ingredients and aroma therapy, making spa food and drinks (spa
cuisine). Purba Ayu spa group education and training training was evaluated by licensed spa education and
training institutions

Lastiani, Baiquni, Eni, Wahyono
Community Empowerment Strategy: Ecospa Tourism Prospects in Nglanggeran Tourism Village Gunung Kidul Yogyakarta
`
171
Proceedings of CATEA 2019
2.1.4 Field Preparation Action Process (action)
The ecospa tourism was formed as part of a group that is aware of tourism to develop a spa
destination package in Nglanggeran Gunung Kidul.
2.1.5 Stage of Assessment Process
In this stage of the assessment, the Purba Ayu spa group identifies markets/groups of tourists who
come in either small groups or groups (individuals /families).
2.1.6 . Stage of Implementation Program
Participation in implementing as an indicator of cooperation between the Purba Ayu spa group
and the community or industry to establish partnerships with one of the modern spas that also require
spa care products
2.1.7 Stage of Evaluation Program
Evaluation program to establish an internal monitoring system for community empowerment and
network systems by utilizing resources for ecospa tourism promotion

Lastiani, Baiquni, Eni, Wahyono
Community Empowerment Strategy: Ecospa Tourism Prospects in Nglanggeran Tourism Village Gunung Kidul Yogyakarta
`
172
Proceedings of CATEA 2019
3. Material & Methodology 3.1. Data
Data analysis is an activity that describes the results of research data into material information
that can be used to draw conclusions in research. Data analysis method used to solve problems using:
(a) Observation
(b) Deep interviews
3.2 Method
The research method used in this study uses qualitative descriptive methods. This study uses
action research is research that focuses on the application of actions with the aim of improving the
quality or solving problems in a group of subjects studied and observed the level of success or the
impact of actions.
4. Results and Discussion 4.1 Result
The purpose of community empowerment has several objectives. The aim of community
empowerment is to improve institutions (better institutions), improve business (better business),
improve income (better income), improve the environment (better environment), improve life (better
living) and improve community (better community).
a) Better institutions: Institutional improvement is the improvement of activities or actions taken
and is expected to improve institutions including the development of business partnership
networks. The purpose of this institutional improvement, especially in the Purba Ayu spa group,
provides an action in the development of new tourism destinations in Nglanggeran by networking
business partnerships, especially in the spa sector. Purba Ayu spa empowerment has built better
partnerships and realizes the importance of the spa business as a new tourist attraction that can
attract tourists. The Purba Ayu spa group by forming this Purba Ayu spa group built a better
partnership. Tour guides who like to travel only want to see embung, go up to Ancient
Volcanoes, shop at chocolate shops and tour shopping previously. Spa that attracts interesting
tourists. The best Purba Ayu spa is a form of institutional improvement. Related to mothers in the
form of joint tourism seen in ecospa.as tourism was formed as a form of institutional
improvement. The involvement of mothers in managing shared tourism is seen in ecospa tourism.
b) Better Business: Training and education activities for the ecospa group are carried out by modern
spas. Activities carried out by providing knowledge about the spa business are expected to
increase the existing ecotourism business or business. The positive contribution of the modern
spa to the ecospa tourism is adding to Purba Ayu spa's new destination making efforts to open
ecospa tourism by increasing knowledge of the spa
c) Better Income: The Purba Ayu spa community earns additional income from the sale of spa
products made by this group. The making of spa materials was carried out by the Purba Ayu spa
group directly when there were tourists who came to do ecospa tours. The existence of ecospa
tourism will increase family income for the Purba Ayu group. Ecospa tour packages as part of a
tour package in the Purba Volcano ecotourism village, Nglanggeran, Gunungkidul can increase
Purba Ayu's spa income
d) Better Environment: Communities are aware of environmental management and the use of
resources in their environment. Products used to support spa treatments from the environment
around the tourist village of Nglanggeran. The use of a lot of chocolate produced in this area was
previously only processed as food and drink and through ecospa tourism can make scrubs and
masks from chocolate ingredients to support spa treatments. Other local ingredients such as
turmeric, lemongrass, and other spices are easily obtained in the environment of the Nglanggeran
ecotourism village. The community began to plant these plants in the yard of each member of the
group empowering the Purba Ayu spa.
e) Better Living: Improved living better through Ecospa is expected to improve the living
conditions of families and communities. Knowledge of spa treatments provides additional
discourse about the importance of health by doing spa treatments that provide holistic health for
the health of body, soul, and mind (body, soul, and mind).

Lastiani, Baiquni, Eni, Wahyono
Community Empowerment Strategy: Ecospa Tourism Prospects in Nglanggeran Tourism Village Gunung Kidul Yogyakarta
`
173
Proceedings of CATEA 2019
f) Better Community: Ecospa tourism provides knowledge about health that leads to a better life in
improving people's welfare. The application of ecospa-based tourism to community
empowerment as part of ecotourism in the tourist village of Nglanggeran Gunungkidul can help
improve people's welfare. The benefits obtained from the results of community empowerment
indirectly affect the level of community welfare, especially in the Purba Ayu spa community.
5. Conclusion (a) Ecospa tourism can develop in the Nglanggeran Tourism Village with the use of the environment
or natural resources by raising local wisdom. The utilization of local wisdom materials such as
chocolate scrubs and masks is a support for spa treatments.
(b) Tourists can travel by gaining knowledge about how to make scrubs and chocolate masks as well
as being able to experience spa treatments directly using the scrubs and chocolate masks.
(c) Tourist product knowledge of spa treatment support materials is very useful so tourists can find
out the importance of spa treatments as part of their lifestyle for health. Such knowledge can be a
provision for tourists as a step in gaining knowledge about how to behave well being.
(d) Products supporting spa treatments such as lulur and masks were made directly by the Purba Ayu
spa group. This group is formed from people who are members of a tourism conscious group
(Pokdarwis). This group consists of housewives who have acquired the knowledge of skills in
making spa care support materials such as scrubs, masks and other spa ingredients.
Empowerment in the skills of making spa care support products provides benefits. The benefits
gained by the Purba Ayu spa group in particular and benefits for tourism conscious groups in
general by selling Ecospa Tourism packages.
Reference
Adarsh Batra, 2006.“Tourism Marketing For Sustainable Development”, ABAC Journal, 26(1), hal 59-65
Adam, Richard, N.1969.” A Nutritional Research Program in Guatemala, In Health, Culture and
Communty”,Case Studies of Public Reactions to Health Programs, Benyamin D. Paul (ed), Russel
Sage Foundation, New York USA. hal 448-457.
Baiquni, 2001, Participatory Rural Appraisal, Pendekatan dan Metode Partisipatif Dalam Pengembangan
Masyarakat, Penerbit:YPB Yayasan Pembangunan Berkelanjutan
Crouch, G.I and J.R Ritchie,1997,”Tourism, Competitiveness and Social Prosperity”, Journal of Business
Research,p.44.
Marc Cohen and Geratd Bodeker (2008), Understanding the Global SPA Industry SPA
Management, Elseiver Ltd.
Phillip Kotler, 1997, Marketing management: Analysis, Planning, Implementing and control, edisi 9,
Penerbit:PT Prehalindo Jakarta
Pride Hughes Kapoor, 2014,Introduction to Business, edisi 11, Penerbit:Salemba Empat Jakarta
Peter A.Johnson, 2010, “Realizing Rural Community Based Tourism Development:Prospect for Social-
Economic Entreprises”, Journal of Rural and Community Development, 5 (1/2), hal. 150-162
Rami F. Tawil, 2011, “Classifying the Hotel Spa Tourist: A Multidimensional Qualitative Approach”,
International Journal of Humanities and Social Science, 1(20), hal. 155-167
Rachmi Primadiati, 2002; Aromaterapi: Perawatan Alami untuk Sehat dan Cantik, Penerbit: Gramedia Pustaka
Utama
Risal A. Furinto, 2009, Marketing Reloaded : Kompilasi Konsep dan Praktek Pemasaran, Penerbit:Salemba
Empat Jakarta.
Romulo A. Virola and Florande S. Polistico.2007,Measuring Pariwisata health and Wellness in the Philippines.
10th National Convention on Statistics (NCS). EDSA Shangri La Hotel
Sophie Benge, 2000; Asian Secrets of Health, Beauty and Relaxation, Penerbit: Periplus
SpaFinder.2008. Issues 5th Annual Spa Trends R ep ort ,10 SPA Trends to Watch in 2008, www.acyb
ernews.com/spa finder-iss ues-5 th- annual-spa-trends-report-10-spa-trends-to-watch- in-2008/
S.M. Hashemi, J. Jusoh, S. Kiumarsi, Shno Mohammadi.2015,”Influence factors of SPA and Wellness Tourism
on Revisit Intention: The mediating role of international tourist motivation and tourist satisfaction”,
International Journal of Research Granthaalayah.A knowledge repository 2350-0530(O) ISSN-2394-
3629(P), 3(7),hal 1-11

Lastiani, Baiquni, Eni, Wahyono
Community Empowerment Strategy: Ecospa Tourism Prospects in Nglanggeran Tourism Village Gunung Kidul Yogyakarta
`
174
Proceedings of CATEA 2019
Winkelman Michael,2009. Culture and Health: Applying Medical Anthropology. SanFrancisco: Jossey-Bass
Published
X.Font, R.C Buckley, 2001, Tourism Ecolabeling : Certification and Promotion of Sustainable Management,
Penerbit: CABI Publisihing
Yanita Widyastuti, Anik Wahyuati, 2014, “Analisa Relationship Marketing terhadap Loyalitas Pelanggan”,
Jurnal Ilmu & Riset Manajemen Vol. 3 No. 6, hal 1-21

175
Proceedings of CATEA 2019
Proceedings of CATEA 2019
ISBN 978-623-91018-0-0
How and When Does Multitasking Affect Customer Orientation?
Juan Liu1*
, Seonghee Cho2, Meiying Zhong
3, Ya Guo
3
1. Wuxi Institute of Technology, Wuxi, Jiangsu, China
2. University of Missouri, Columbia MO, USA
3. Jiangnan University, Wuxi, Jiangsu, China
Abstract: This research aims to investigate how and when multitasking affects customer orientation by
examining the mediating role of work engagement and moderating roles of polychronicity and employee voice.
The survey was conducted on 536 hotel employees in China and SPSS macro PROCESS was employed to
analyze the data. The results indicate that work engagement fully mediates the association between multitasking
and customer orientation; polychronicity boosts and employee voice buffers the mediating process. While prior
studies have overwhelmingly reported the detrimental effect of multitasking on task performance, this study
empirically reveals the motivational merit of multitasking to contextual performance and demonstrates how and
when this favorable impact is stronger and weaker. The findings suggest reinforcement of multitasking in work
that emphasizes contextual performance rather than task performance and to employees who are less engaged in
voice behavior or to those who are more engaged in voice behavior but highly polychronic.
Key words: Multitasking; customer orientation; work engagement; polychronicity; employee voice.
1. Introduction Multitasking is a prevalent job requirement in contemporary workplace (Salvucci & Taatgen,
2011), as it is not only a cost-effective approach to help organizations to cope with problems of
insufficient qualified workforce (DiPietro, 2008), but also often used as a motivational antidote to the
boringness of simple jobs (Parker, 2014). Multitasking bears both time pressure and job overload, thus
successful completion of multitasks can promote personal growth and achievement (LePine et al.,
2005). Consequently, multitasking, as a work stressor, has been considered as a challenge stressor
which is motivational, rather than a hindrance stressor which is obstructive (Cavanaugh et al., 2000).
Nevertheless, some of the previous studies have reported detrimental effect of multitasking on task
performance such as work efficiency and work accuracy (Rohrer & Pashler, 2003; Ruthruff et al.,
2003). In the meanwhile, empirical research on the association between multitasking and contextual
performance is surprisingly scarce. This pinpoints the urgency to examine the impact of multitasking
on job performance more deeply, especially its impact on contextual performance.
Customer orientation which is one of the most important indicators of contextual performance,
determines organization’s success in the keen competition of the business world (Chen et al., 2005;
Raab et al., 2016). Given the prevalence of multitasking and the importance of customer orientation, it
is critical to understand how and when multitasking affects customer orientation. The implication of
answering these two questions is twofold: on one hand, if multitasking is deleterious for customer
orientation, as it is for task performance, intervention strategies need to be developed accordingly to
diminish the negative impact of multitasking on customer orientation; on the other hand, if
multitasking is beneficial for customer orientation, as it is suggested theoretically, more effective
management strategies can also be developed accordingly to make better use of multitasking to
enhance customer orientation. However, little effort in literature has been made to empirically
investigate the impact of multitasking on customer orientation. Drawing upon a set of psychological
theories, namely the transactional theory of stress (Lazarus, 1991), job demand-resources model
(Bakker & Demerouti, 2008), the trait activation theory (Tett & Guterman, 2000), and resource
relocation framework (Bergeron, 2007), this study proposes a moderated mediation model that is

Juan Liu, Seonghee Cho, Meiying Zhong, Ya Guo
How and When Does Multitasking Affect Customer Orientation?
176
Proceedings of CATEA 2019
multitasking positively affects customer orientation through work engagement and its direct and
indirect impacts differ at different levels of polychroncity and employee voice. The aim of the present
study is to investigate how and when multitasking affects customer orientation by examining the
mediating role of work engagement and the moderating roles of polychronicity and employee voice in
the mediating process. The following literature review section elaborates how the hypotheses are
developed.
2. Literature Review 2.1 Multitasking and Customer Orientation
Multitasking is defined as being involved in two or more overlapping tasks at one time (Kalisch
& Aebersold, 2010). Benbunnan-Fich (2011) pointed two principles for multitasking, namely task
independence and performance concurrency. The principle of independence refers that ongoing tasks
are self-contained and the principle of concurrency means that these multiple tasks are carried out
with some overlap in a specific period of time. Business organizations call upon their employees to
multitask mainly for two reasons: saving cost especially during short staffing (DiPietro, 2008), and/or
intrinsically motivating employees either by eliminating boringness if work is simple and repetitive or
by activating employees’ competency (Parker, 2014).
The outcome of multitasking on individual job performance has been studied, but mostly on task
performance rather than contextual performance. As Motowidlo and Van Scotter (1994) pointed out,
job performance could be categorized into task performance and contextual performance. Task
performance is defined as work behavior that is related to the organization’s technical core, either by
executing its technical processes or by maintaining and servicing its technical requirements, such as
efficiency and accuracy (Miao, 2011; Motowidlo & Van Scotter, 1994); whereas contextual
performance refers to individual behaviors that are not directly related to their main task functions,
but serves as critical catalyst for task activities and processes thereby shape the organizational, social,
and psychological context, such as customer orientation and helping coworkers (Motowidlo & Van
Scotter, 1994; Werner, 2000). In the keen competition of business market, to make sustainable
success, organizations not only need high task performance such as high productivity and cost
efficiencies, but also need high contextual performance, such as customer orientation (Alge et al.,
2002; Kim et al., 2005). Prior studies overwhelmingly revealed the detrimental effect of multitasking
on task performance (Douglas et al., 2017). For instance, multitasking resulted in longer reaction time
and more task errors (Karayanidis et al., 2010; Rohrer & Pashler, 2003; Ruthruff, et al., 2003). Few
studies reported inconsistent findings. Adler & Benbunan-Fich (2012) reported a U-shape impact of
multitasking on productivity and accuracy; and Weigl et al. (2013) showed that multitasking did not
decrease work efficiency of physicians. Despite of these precious findings on the relationship between
multitasking and task performance, research in the association between multitasking and contextual
performance is surprisingly scarce. It is thus urgent to fill this research gap by examining the impact
of multitasking on contextual performance, such as customer orientation.
Customer orientation as a contextual performance refers to employee’s disposition to be helpful,
thoughtful, considerate, and cooperative to customers (Hogan et al., 1984). High customer-oriented
employees are treasures of business companies, as they have the most important traits that are needed
for customer satisfaction including friendly, helpful, and considerate to their customers (Allworth &
Hesketh, 2000; Hennig-Thurau, 2004). The relationship between multitasking and customer
orientation can be theoretically explained by the transactional theory of stress (Lazarus, 1991). The
transactional theory of stress posits that employees perceive stressors differently as either challenge
and hindrance stressor. Challenge stressor appraised by individuals as potentially promoting their
personal growth and achievement is positively associated with motivation and job outcomes (LePine
et al., 2005). Examples of challenge stressors include time pressure, job overload, outcome
responsibility, and etc. (Cavanaugh et al., 2000). Hindrance stressor perceived by individuals as
potentially constraining their personal development and work-related accomplishment is negatively
associated with motivation and job outcomes (Crawford et al., 2010; Rudell & Judge, 2009).
Examples of hindrance stressors includes bureaucratic obstacles and task ambiguity (Cavanaugh et al.,
2000). Multitasking with the characteristics of time pressure, job overload, and promoting personal
growth may therefore be considered as a challenge stressor. As challenge stressors are typically

Juan Liu, Seonghee Cho, Meiying Zhong, Ya Guo
How and When Does Multitasking Affect Customer Orientation?
177
Proceedings of CATEA 2019
motivational and predict positive job outcome, multitasking may potentially motivate employees to be
more customer-oriented. Thus, first hypothesis can be developed as:
H1. Multitasking increases employee customer orientation.
2.2 Mediating Role of Work Engagement
Work engagement denotes a positive affective-motivational state of fulfillment characterized by
vigor, dedication, and absorption (Schaufeli et al., 2001). Engaged employees have high levels of
energy and enthusiasm toward their work and typically work more effectively and productively
(Macey & Schneider, 2008; May et al., 2004). Work engagement has been confirmed to result in
multiple positive-performance outcomes, such as higher job satisfaction, a lower intent to leave, more
proactive behaviors, and higher organizational commitment (Leiter & Bakker, 2010).
In literature, work engagement has been widely studied in the framework of Job Demand-
Resources Model (JDR Model; Bakker & Demerouti, 2007; Bakker & Demerouti, 2008). According
to the JDR Model, job demands, particularly those perceived as challenge stressors by employees
have motivational power to increase work engagement, which in turn fosters positive employee
outcomes, such as customer orientation. In other words, job demands (e.g. challenge stressors) link to
employee outcomes (e.g. customer orientation) via work engagement (Agarwal et al., 2012). The
mediating role of work engagement has been empirically tested in different research contexts. For
example, Park et al. (2014) reported that learning organization culture affected employees’ innovative
work behaviors through work engagement; De Spiegelaere et al. (2014) revealed that work
engagement mediated the impacts of both job insecurity and autonomy on innovative work behavior;
Karatepe et al. (2014) indicated that work engagement fully mediated the effects of work overload
and job responsibilities on organizational commitment and job performance; Lyu et al. (2016) found
that abusive supervision negatively affected service employees’ customer-oriented organizational
citizenship behavior by undermining work engagement.
As for in the context of the present study, if employees are assigned multitasks in which more
responsibilities and time pressure challenge their abilities, completion of the multitasks would make
them feel senses of achievement and self-actualization, and thereby would facilitate them to be more
engaged in work. Accordingly, they may be motivated to be more customer-oriented in their work.
Therefore, second hypothesize is developed as:
H2. Work engagement mediates the relationship between multitasking and customer orientation.
2.3 Moderating Role of Polychronicity
Polychronicity refers to the preference for doing several tasks simultaneously (Hall, 1959). As
Persing (1999) emphasized, polychronicity is not the behavior of doing several things at once, but a
relatively enduring preference for doing several things at once. Thus, polychronic individuals perceive
that combining activities and handling any subsequent interruptions is the preferred way of working
during a particular time period (Conte & Jacobs, 2003). Polychronic individuals enjoy engaging in
several activities at once and less irritated by multitasks, but monochronic individuals in contrast tend
to focus on a single task or project for the same time period (Bluedorn et al., 1999).
As for the moderating effect of polychronicity on multitasking, the trait activation theory can be
the theoretical foundation. Trait activation theory uses person-situation interaction to explain behavior
on the basis of responses to trait-relevant cues in situations (Tett & Guterman, 2000). The theory
posits that when individual’s trait matches cues in a situation, namely trait and situation relevant,
favorable behavioral outcomes will be manifested including positive reaction to the situation and
better performance. According to its definition, polychronicity is a personality trait relevant to
multitasking. When polychronic people are requested to perform multitasks, the work situation
(multitasking) matches their personality trait (polychronicity), in this case, polychronic people will
react more positively to the multitasking demand and deliver better work performance such as work
engagement and customer orientation. Therefore, another two hypotheses are developed as:
H3. Polychronicity boosts the impact of multitasking on work engagement.
H4. Polychronicity boosts the impact of multitasking on customer orientation.

Juan Liu, Seonghee Cho, Meiying Zhong, Ya Guo
How and When Does Multitasking Affect Customer Orientation?
178
Proceedings of CATEA 2019
2.4 Moderating Role of Employee Voice
Employee voice refers to discretionary and upward communication by an employee of ideas,
suggestions, solutions, or concerns about work-related problems (LePine & Van Dyne, 1998). It is
employee’s proactive extra-role work behavior and aims to improve the status quo (Duan et al., 2017;
Parker & Collins, 2010). Numerous studies have indicated positive predicting role of employee voice
on desirable outcomes such as individual job performance and organizational effectiveness (e.g.,
Frazier & Bowler, 2015; Kim et al., 2010; Ng & Feldman, 2012; Whiting et al., 2008). Because of the
potential benefits of employee voice, scholars have been encouraging organizations to promote
employee voice behavior (Morrison, 2014).
However, resource allocation framework (Bergeron, 2007) suggests that, allocating one’s
resources including time and energy to extra-role work behavior such as employee voice may
decrease one’s in-role work performance, and vice versa. For instance, Long et al. (2015) revealed
that increased challenge stressor in workplace came with decreased voice behavior as employees had
to reserve personal resource. These findings suggest the moderating role of employee voice in the
association between multitasking and job outcomes including work engagement and customer
orientation. When an employee with certain resources is more engaged in voice behavior, he/she may
have to allocate fewer resources to multitasking and thereby may result in inferior performance such
as lower levels of work engagement and customer orientation. In contrast, if an employee is less
engaged in voice behavior, he/she may be able to allocate more resources to multitasking and in turn,
be more engaged in work itself and more customer-oriented. Therefore, another two hypotheses are
developed as:
H5. Employee voice buffers the impact of multitasking on work engagement.
H6. Employee voice buffers the impact of multitasking on customer orientation.
The proposed research framework is illustrated in Figure 1.
Figure 1. Proposed Research Model
3. Methods 3.1 Sample and Procedure
A total of eight hotels in a tourism city in China were invited to participate in this study. The
survey was distributed to 2000 employees of the eight hotels. A research assistant contacted each
hotel to ask them if they would like to help with the research and dropped the questionnaires if they
Multitasking
Work Engagement
Polychronicity
Customer Orientation
Employee Voice

Juan Liu, Seonghee Cho, Meiying Zhong, Ya Guo
How and When Does Multitasking Affect Customer Orientation?
179
Proceedings of CATEA 2019
agree to do the survey. The research assistant came back to pick up the completed questionnaires after
one week. Of these 2000, a total of 536-including 342 non-managers and 194 managers-were returned,
yielding a 26.8% response rate.
The survey was administered in Chinese. The commonly used back-translation procedure was
followed. The scales were first translated from English into Chinese by one researcher who is fluent in
both English and Chinese, and then were translated back into English by another researcher who is
also fluent in both English and Chinese (Brislin 1980). The third English-Chinese fluent researcher
checked the English and Chinese translations, and several employees in the surveyed hotels were
consulted to ensure that the items could be generalized to the research context (Schaffer & Riordan
2003).
There are several reasons to conduct this study in the hotel industry in China. First, the hotel
industry is characterized as requiring employees to work on multiple activities simultaneously (Jang
& George, 2012). For example, hotel front desk clerks are commonly required to perform multiple
aspects of the front desk function, extending to areas such as reservations, concierge, and telephonist;
some hotels expect even more from their employees so that they can extend to aspects of food and
beverage service (Baum & Odgers, 2001). Second, the hotel industry as a service industry with
intensive employee-customer interaction has the highest desire for customer orientation (Alge, et al.,
2002; Allworth & Hesketh, 2000). Third, China has been the second largest economy with the fastest
growth rate in the world (Muratova et al., 2019). In the meanwhile, 11% of China GDP is contributed
by the tourism sector, ranking No. 1 in the world, compared to 10.4% of the world’s average (Zhang,
2018). The tourism industry including the hotel industry is expected to continue to grow rapidly and
steadily (Yang & Cai, 2016).
3.2 Measures
Multitasking was measured by four items on a five-point Likert scale developed by König et al
(2010). Examples of multitasking measurement items include: “During a typical work hour, I am
occupied with several things simultaneously.” and “During a typical work hour, I work on more than
one task.”
Schaufeli et al. (2006)’s 9-item Work and Well-being Survey (UWES) was employed to measure
work engagement on a five-point Likert scale. Examples include: “At my work, I feel energetic.”,
“My job inspires me.”, and “Time flies when I am working’.
Five items from Susskind et al. (2003)’s study were used to measure customer orientation at 5-
point Likert scale. Example items include: “When performing my job, the customer is most important
to me.” and “It is best to ensure that our customers receive the best possible service available.”.
Polychronicity was assessed by 10 items on a five-point Likert scale adapted from Bluedorn et al.
(1999). Example items are “I like to juggle several activities at the same time.” and “I believe it is best
for people to be given several tasks and assignments to perform.”.
Six items developed by Van Dyne and LePine’s (1998) were used to measure employee voice.
Examples are “I develop and make recommendations concerning issues that affect my company.” and
“I speak up in this company with ideas for new projects or changes in procedures.”.
3.3 Treatment of Common Method Variance
Common method variance may affect the empirical results, because the data in this study were
collected through self-reported questionnaires. Furthermore, work engagement, employee voice, and
customer orientation are all positively oriented variables. We consequently took several precautions,
following Podsakoff et al. (2003), to minimize common method biases. First, to increase the
candidness of respondents, we presented them with detailed information about the precautions taken
to guarantee their confidentiality and anonymity. Second, to decrease respondents’ apprehension
about being evaluated, we assured them that there were no “right” or “wrong” answers in the survey.
Finally, we separated the work engagement, customer orientation and employee voice items on
different pages of the questionnaire to incur the psychological separation effect on respondents.
4. Results 4.1 Descriptive Statistics and Intercorrelations

Juan Liu, Seonghee Cho, Meiying Zhong, Ya Guo
How and When Does Multitasking Affect Customer Orientation?
180
Proceedings of CATEA 2019
As listed in Table 1, there were more females (52.4%) than males (47.1%). The average age of
the respondents was 27. As for education, 31.2% (n=167) of the respondents graduated from
vocational schools, followed by 19.4% (n=104) graduated from technical schools and 18.3 % (n=98)
graduated from regular colleges with bachelor’s degree. Most of the respondents were non-managers
(63.8%, n=342), and full-time workers (90.1%, n=483). Table 2 displays the means and standard
deviations by genders, reliability coefficients, and correlation coefficients for the study variables. The
numbers in parentheses are the Cronbach’s alpha reliability coefficients for these variables.
Table 1. Demographic Information of the Study Respondents (N=536)
Characteristics n Mean %
Age 536 27
Gender
Female 281 52.4
Male 252 47.1
Education
Elementary school 4 .7
Middle School 62 11.6
Technical School 104 19.4
High School 83 15.5
Vocational College 167 31.2
Bachelor’s Degree 98 18.3
Graduate Degree 7 1.3
Position Type
Managerial Position 175 32.6
Non-Managerial Position 342 63.8
Work Status
Full-Time 483 90.1
Part-Time 47 9.8
Table 2. Descriptive Statistics, Reliability Coefficients, and Correlations between the Study Variables
Variables Mean SD 1 2 3 4 5 6 7 8 9
1. Age 27.05 7.75
2. Gender -.00
3. Education .02 -.13**
4. PT -.15**
.02 -.33**
5. WS .06 .05 -.13**
.00
6. MT 3.57 .47 .01 -.06 .15**
-.08 -
.04
(.79)
7. WE 4.17 .65 .17**
-.03 .23**
-
.17**
-
.05
.32**
(.93)
8. CO 4.33 .57 .03 -.05 .10**
-
.12**
-
.04
.21**
.45**
(.84)
9. PLCN 2.98 .46 -.08 -.05 .01 -
.11**
.02 .21**
.12**
.10**
(.82)
10. EV 3.90 .77 .06 -.04 .08 -
.22**
.02 .19**
.43**
.46**
.14**
(.91)
**p <0.01,
*p <0.05
Note: PT=Position Type; WS=Work Status; MT=Multitasking, WE= Work Engagement; CO=Customer
Orientation; PLCN=Polychronicity; EV= Employee Voice

Juan Liu, Seonghee Cho, Meiying Zhong, Ya Guo
How and When Does Multitasking Affect Customer Orientation?
181
Proceedings of CATEA 2019
4.2 Testing for the Proposed Model
The simple mediating effect analysis is to answer how independent variables affect dependent
variables, while the simple moderating effect analysis is to answer when independent variables affect
dependent variables (Preacher et al., 2007; Hayes, 2017). Our hypotheses include how (mediating
effect), when (moderating effect) and when of the how (moderated mediating effect) multitasking
influences customer orientation. If the mediation process depends on a value of a moderator variable,
there will be a moderated mediation effect (Muller et al., 2005; Edwards & Lambert, 2007; Hayes,
2017). The moderated mediation means the mediating process between the independent variable and
the dependent variable is different at different values of the moderator variable. To test our model, we
used the SPSS macro PROCESS (http://www.afhayes.com) suggested by Hayes (2017) to test
mediating effect, moderating effect, and moderated mediating effect in a single model. This SPSS
macro PROCESS is specifically developed for assessing the complex models including both mediator
and moderator variables. It has been widely used by academic scholars in recent years (e.g., Borden et
al., 2018; Caniëls, 2019; Chen et al., 2016; Manzi et al., 2018; Shin et al., 2017; Zhou et al., 2017).
Table 3 presents the results generated by Hayes' (2017) SPSS macro PROCESS. It consists of
two parts: a mediator variable model and a dependent variable model. As can be seen from the
mediator variable model and the dependent variable model, after controlling for age, gender,
educational level, position type, and work status, multitasking positively predicted work engagement
(B = .28, p<.05), work engagement positively predicted customer orientation (B = .23, p<.01), but
multitasking did not directly predict customer orientation (B = .02, p=37). These results indicated a
significant full mediating effect of work engagement in the relationship between multitasking and
customer orientation. Thus, H1 was not supported and H2 was supported. Besides, the interaction of
multitasking and polychronicity had a significant effect on work engagement (B = .10, p<.01); but not
on customer orientation (B=-.03, p=.28). The interaction of multitasking and employee voice had a
significant effect on work engagement (B = -.16, p<.01), but not on customer orientation (B = .04,
p=.09). These results indicated that the relationship between multitasking and work engagement was
boosted by polychronicity and buffered by employee voice. Therefore, H3 and H5 were supported,
but H4 and H6 were not supported. As can be seen from the conditional indirect effect analysis
(Table 4, based on the moderators’ values at the mean −1 standard deviation, and mean +1 standard
deviation), the three conditional indirect effects (Low PLCN and Low EV, High PLCN and Low EV,
High PLCN and High EV) were positively and significantly different from zero, but the conditional
indirect effect of Low PLCN and high EV was not significantly different from zero. In other words,
the indirect effect of multitasking on customer orientation through work engagement was observed
when polychronicity and employee voice were at different levels. However, when PLCN was low and
EV was high, the impact of multitasking on work engagement was not significant. Figure 2 vividly
shows the moderating effects of polychronicity and employee voice in the relationship between
multitasking and work engagement. As demonstrated in Figure 2, given the same level of multitasking,
individuals with high polychronicity and high voice behavior were most engaged in work; followed
by those with high polychronicity and low voice behavior, and then those with low polychronicity and
low voice behavior; multitasking did not affect work engagement of individuals with low
polychronicity and high voice behavior. Interestingly, with the same level of increase in multitasking,
individuals with high polychronicity and low voice behavior gained most increase in work
engagement, followed by those with low polychronicity and low voice behavior, and then those with
high polychronicity and high voice behavior.

Juan Liu, Seonghee Cho, Meiying Zhong, Ya Guo
How and When Does Multitasking Affect Customer Orientation?
182
Proceedings of CATEA 2019
Table 3. Conditional Process Analysis
Mediator Variable Model (Work Engagement) B SE t p
Constant -.78⁎
.31 -2.54 .01
Age .02⁎⁎
.00 3.54 <.01
Gender .04 .07 .61 .54
Education .12⁎⁎
.03 4.24 <.01
Position Type -.01 .07 -.17 .87
Work Status -.17 .12 -1.33 .18
Multitasking .28⁎ .04 6.9 .01
Polychronicity .21⁎⁎
.04 4.97 <.01
Multitasking × Polychronicity (interaction 1) .10⁎⁎
.04 2.74 <.01
Employee Voice .20⁎⁎
.04 4.79 <.01
Multitasking× Employee Voice (interaction 2) -.16⁎⁎
.04 -4.10 <.01
R2=.65
⁎⁎⁎ F-value=32.39
R2 (adding interaction 1) =.01
⁎⁎
R2 (adding interaction 2) =.02
⁎⁎
Dependent Variable Model (Customer Orientation) Constant 4.43
⁎⁎ 1.97 22.49 <.01
Age -.00 .00 -.95 .35
Gender -.04 .04 -.93 .35
Education -.00 .02 -.15 .88
Position Type .03 .05 .54 .59
Work Status -.00 .08 -.06 .95
Multitasking .02 .03 .90 .37
Work Engagement .23⁎⁎
.03 7.75 <.01
Polychronicity -.04 .03 -1.55 .12
Multitasking × Polychronicity (interaction 1) -.03 .02 -1.09 .28
Employee Voice .18⁎⁎
.03 6.74 <.01
Multitasking× Employee Voice (interaction 2) .04 .03 1.69 .09
R2=.58
⁎⁎ F-value=20.83
R2 (adding interaction 1) =.001
R2 (adding interaction 2) =.004
Note: LL= low limit, UL= upper limit, CI= confidence interval, M=mean. ⁎
p<.05 ⁎⁎
p<.01
Table 4. Conditional Indirect Effect Analysis
Conditional Indirect Effect Analysis
at IE=M±SD
B SE LLCI ULCI
Low PLCN and Low EV .34⁎⁎
.05 .23 .45
Low PLCN and High EV .01 .08 -.13 .16
High PLCN and Low EV .55⁎⁎
.08 .39 .71
High PLCN and High EV .23⁎⁎
.06 .11 .35
Note: PLCN=polychronicity, EV=employee voice, Low=M-SD, Medium=M, High=M+SD, LL= low limit,
UL= upper limit, CI= confidence interval. ⁎
p<.05 ⁎⁎
p<.01

Juan Liu, Seonghee Cho, Meiying Zhong, Ya Guo
How and When Does Multitasking Affect Customer Orientation?
183
Proceedings of CATEA 2019
Figure 2. Polychronicity and Employee Voice Moderators in the Relationship Between Multitasking and
Work Engagement
5. Discussion and Conclusion In this study, a moderated mediation model was constructed to investigate how and when
multitasking affects customer orientation. The results demonstrated the full mediating effect of work
engagement in the relationship between multitasking and customer orientation. Furthermore, the
moderated mediation model showed that the mediating effect of work engagement was different at
different levels of polychronicity and employee voice. The findings of the study yield both theoretical
and practical implications.
5.1 Theoretical Implications
This study contributes to the literature in several ways. First, previous studies have
overwhelmingly focused on the impact of multitasking on task performance (Douglas et al., 2017)
reporting its detrimental effect on task performance, but little is known about its impact on contextual
performance. The present study fills this gap by demonstrating its direct impact on work engagement
and indirect impact on customer orientation through work engagement. This finding empirically
justifies the motivational merit of multitasking as a challenge stressor (Cavanaugh et al., 2000),
regardless of its detrimental effect on task performance.
Second, despite of its motivational value, multitasking does not directly enhance customer
orientation, but through work engagement. This finding is consistent with previous studies on the
mediating role of work engagement in different research contexts (Bakker & Demerouti, 2007; De
Spiegelaere et al, 2014; Karatepe et al., 2014; Lyu et al., 2016; Park et al., 2014). This finding
answers the question of how multitasking affects customer orientation.
Third, the positive impact of multitasking on work engagement is stronger for polychronic
individuals than for monochronic individuals. This finding provides empirical evidence for the trait
activation theory (Tett & Guterman, 2000), and partially answers the question of when multitasking
affects work engagement which in turn may enhance customer orientation.
Fourth, the positive impact of multitasking on work engagement is also stronger for individuals
who are less involved in voice behavior than for those more involved in voice behavior. This finding
as well partially answers the question of when multitasking affects work engagement, and empirically
justifies the research allocation framework (Bergeron, 2007; Long et al., 2015) which hinted the
resource-saving advantage of employee silence. While majority of prior studies have argued the
Wo
rk E
ng
ag
emen
t
Low Multitasking High Multitasking
Low PLCN and Low EV
High PLCN and Low EV
Low PLCN and High EV
High PLCN and High EV

Juan Liu, Seonghee Cho, Meiying Zhong, Ya Guo
How and When Does Multitasking Affect Customer Orientation?
184
Proceedings of CATEA 2019
positive outcomes of employee voice and have uniformly encouraged employee voice, the buffering
effect of employee voice reported in this study adds new and different information to the literature.
Fifth, the results of the study present the impact of multitasking on work engagement at four
different circumstances with different levels of polychronicity and employee voice, showing the
complicated interplay among the study variables. This is not a common illustration in the extant
literature.
5.2 Practical Implications
The findings of the study also provide practical implications for organization management. First,
although multitasking has detrimental effect on task performance (Rohrer & Pashler, 2003; Ruthruff
et al., 2003), it has merit for contextual performance such as work engagement and customer
orientation. Therefore, multitasking needs to be reinforced for work that is not directly related to
organization’s technical core, such as customer service.
Second, multitasking has stronger positive impact on polychronic employees’ contextual
performance; therefore, polychronic employees need to receive more multitasks than monochronic
employees.
Third, the buffering effect of employee voice indicates that employees with lower level of voice
behavior are also valuable for organizations, as they may have allocated more resources to work itself
than to voice behavior. Even though the impact of multitasking on work engagement is weaker for
monochronic employees, if monochronic employees are less involved in voice behavior, they still can
gain benefit from multitasking. However, this is not the case for monochronic employees who are
highly involved in voice behavior.
5.3 Limitations
There are three main limitations associated with this study. First, this study used a cross-sectional
and correlational design, which constrains causality inferences. In future research, longitudinal
designs or experimental designs are needed to verify the causal relationships between the study
variables herein. Second, this investigation only used hotel employees as its research sample. Such a
sample is not broad enough to generalize the research findings across industries. Future studies need
to test the study model in other industries. Third, this study only examined the impact of multitasking
on customer orientation and work engagement, yet its impact on other types of contextual
performance such as job satisfaction, organizational commitment, and turnover intention etc. also
needs to be investigated in the future research.
5.4 Conclusion
Due to the prevalence of multitasking and importance of customer orientation, it is critical to
understand how and when multitasking affects customer orientation. The results of the study provided
answers to these questions. Our results are noticeable, because they indicated a significant full
mediating effect of work engagement and significant moderating effects of polychronocity and
employee voice on the mediating process. The results of this study ultimately suggest that future
researchers to turn their focus toward the impact of multitasking on contextual performance while
taking individual differences into account.
References
Adler, R. F., & Benbunan-Fich, R. (2012). Juggling on a high wire: Multitasking effects on performance.
International Journal of Human-Computer Studies, 70(2), 156-168.
Agarwal, U. A., Datta, S., Blake-Beard, S., & Bhargava, S. (2012). Linking LMX, innovative work behaviour
and turnover intentions: The mediating role of work engagement. Career Development International,
17(3), 208-230.
Alge, B.J., Gresham, M.T., Heneman, R.L., Fox, J., & McMasters, R. (2002). Measuring customer service
orientation using a measure of interpersonal skills: A preliminary test in a public service organization.
Journal of Business and Psychology, 16(3), 467–476.
Allworth, E., & Hesketh, B. (2000). Job requirements biodata as a predictor of performance in customer service
roles. International Journal of Selection and Assessment, 8(3), 137-147.

Juan Liu, Seonghee Cho, Meiying Zhong, Ya Guo
How and When Does Multitasking Affect Customer Orientation?
185
Proceedings of CATEA 2019
Bakker, A. B., & Demerouti, E. (2007). The job demands-resources model: State of the art. Journal of
Managerial Psychology, 22(3), 309-328.
Bakker, A. B., & Demerouti, E. (2008). Towards a model of work engagement. Career Development
International, 13(3), 209-223.
Baum, T., & Odgers, P. (2001). Benchmarking best practice in hotel front office: The Western European
Experience. Journal of Quality Assurance in Hospitality & Tourism, 2(3-4), 93-109.
Benbunan-Fich, R., Adler, R. F., & Mavlanova, T. (2011). Measuring multitasking behavior with activity-based
metrics. ACM Transactions on Computer-Human Interaction (TOCHI), 18(2), 7, 1-22.
Bergeron, D. M. (2007). The potential paradox of organizational citizenship behavior: Good citizens at what
cost?. Academy of Management Review, 32(4), 1078-1095.
Bluedorn, A. C., Kalliath, T. J., Strube, M. J., & Martin, G. D. (1999). Polychronicity and the inventory of
polychronic values (IPV): The development of an instrument to measure a fundamental dimension of
organizational culture. Journal of Managerial Psychology, 14(3/4), 205–230.
Borden, L., Levy, P. E., & Silverman, S. B. (2018). Leader Arrogance and Subordinate Outcomes: the Role of
Feedback Processes. Journal of Business and Psychology, 1-20.
Brislin, R. W. (1980). Translation and content analysis of oral and written material. Handbook of cross-cultural
psychology, 2(2), 349-444.
Caniëls, M. C. (2019). Proactivity and supervisor support in creative process engagement. European
Management Journal, 37(2), 188-197.
Cavanaugh, M. A., Boswell, W. R., Roehling, M. V., & Boudreau, J. W. (2000). An empirical examination of
self-reported work stress among US managers. Journal of Applied Psychology, 85, 65-74.
Chen, P., Sparrow, P., & Cooper, C. (2016). The relationship between person-organization fit and job
satisfaction. Journal of Managerial Psychology, 31(5), 946-959.
Chen, C. K., Yu, C. H., & Chang, H. C. (2005). An empirical analysis of customer-oriented service activities in
the Taiwanese public sector. Total Quality Management & Business Excellence, 16(7), 887-901.
Conte, J. M., & Jacobs, R. R. (2003). Validity evidence linking polychronicity and big five personality
dimensions to absence, lateness, and supervisory performance ratings. Human Performance, 16(2), 107-
129.
Crawford, E.R., LePine, J.A., & Rich, B.L. (2010). Linking job demands and resources to employee engagement
and burnout: A theoretical extension and meta-analytic test. Journal of Applied Psychology, 95 (5), 834-
848.
De Spiegelaere, S., Van Gyes, G., De Witte, H., Niesen, W., & Van Hootegem, G. (2014). On the relation of job
insecurity, job autonomy, innovative work behaviour and the mediating effect of work engagement.
Creativity and Innovation Management, 23(3), 318-330.
DiPietro, R. B. (2008). "Human capital development: a return on investment perspective". In D. V. Tesone (Ed.),
Handbook of Hospitality Human Resources Management (pp.347-372). Oxford: Butterwork-Heinmann.
Douglas, H. E., Raban, M. Z., Walter, S. R., & Westbrook, J. I. (2017). Improving our understanding of multi-
tasking in healthcare: drawing together the cognitive psychology and healthcare literature. Applied
Ergonomics, 59, 45-55.
Duan, J., Li, C., Xu, Y., & Wu, C. H. (2017). Transformational leadership and employee voice behavior: A
Pygmalion mechanism. Journal of Organizational Behavior, 38(5), 650-670.
Edwards, J. R., & Lambert, L. S. (2007). Methods for integrating moderation and mediation: a general analytical
framework using moderated path analysis. Psychological Methods, 12(1), 1-22.
Frazier, M. L., & Bowler, W. M. (2015). Voice climate, supervisor undermining, and work outcomes: A group-
level examination. Journal of Management, 41(3), 841-863.
Hall, E. T. (1959). The silent language (Vol. 3). New York: Doubleday.
Hennig-Thurau, T. (2004). Customer orientation of service employees: Its impact on customer satisfaction,
commitment, and retention. International Journal of Service Industry Management, 15(5), 460-478.
Jang, J., & George, R. T. (2012). Understanding the influence of polychronicity on job satisfaction and turnover
intention: A study of non-supervisory hotel employees. International Journal of Hospitality Management,
31(2), 588-595.
Hayes, A. F. (2017). Introduction to Mediation, Moderation, and Conditional Process Analysis: A Regression-
Based Approach. Guilford Publications.
Hogan, J., Hogan, R., & Busch, C. M. (1984). How to measure service orientation. Journal of Applied
Psychology, 69(1), 167–173.
Kalisch, B. J., & Aebersold, M. (2010). Interruptions and multitasking in nursing care. Joint Commission
Journal on Quality and Patient Safety, 36(3), 126-132.
Karatepe, O. M., Beirami, E., Bouzari, M., & Safavi, H. P. (2014). Does work engagement mediate the effects
of challenge stressors on job outcomes? Evidence from the hotel industry. International Journal of
Hospitality Management, 36, 14-22.

Juan Liu, Seonghee Cho, Meiying Zhong, Ya Guo
How and When Does Multitasking Affect Customer Orientation?
186
Proceedings of CATEA 2019
Karayanidis, F., Jamadar, S., Ruge, H., Phillips, N., Heathcote, A., & Forstmann, B. U. (2010). Advance
preparation in task-switching: converging evidence from behavioral, brain activation, and model-based
approaches. Frontiers in Psychology, 1, 25, 1-13.
Kim, W. G., Leong, J. K., & Lee. Y. K. (2005). Effect of service orientation on job satisfaction, organizational
commitment, and intention of leaving a casual dining chain restaurant. International Journal of
Hospitality Management, 24 (2), 171-193.
Kim, J., MacDuffie, J. P., & Pil, F. K. (2010). Employee voice and organizational performance: Team versus
representative influence. Human Relations, 63(3), 371-394.
König, C. J., & Waller, M. J. (2010). Time for reflection: A critical examination of polychronicity. Human
Performance, 23(2), 173-190.
Lazarus, R S, (1991). Emotion and Adaptation. New York: Oxford University Press.
Leiter, M.P., & Bakker, A.B. (2010). Work Engagement: Introduction. In A. B. Bakker & M. P. Leiter (Eds.),
Work Engagement: A Handbook of Essential Theory and Research (pp. 1-9). New York, NY:
Psychology Press.
LePine, J. A., Podsakoff N. P., & LePine, M. A. (2005), “A meta-analytic test of the challenge stressor–
hindrance stressor framework: an explanation for inconsistent relationships among stressors and
performance,” Academy of Management Journal, 48(5), 764–75.
LePine, J. A., & Van Dyne, L. (1998). Predicting voice behavior in work groups. Journal of Applied Psychology,
83(6), 853.
Long, C., Li, Z., & Ning, Z. (2015). Exploring the nonlinear relationship between challenge stressors and
employee voice: The effects of leader–member exchange and organisation-based self-esteem. Personality
and Individual Differences, 83, 24-30.
Lyu, Y., Zhu, H., Zhong, H. J., & Hu, L. (2016). Abusive supervision and customer-oriented organizational
citizenship behavior: the roles of hostile attribution bias and work engagement. International Journal of
Hospitality Management, 53, 69-80.
Macey, W. H., & Schneider, B. (2008). The meaning of employee engagement. Industrial and Organizational
Psychology, 1, 3-30.
Manzi, C., Coen, S., Regalia, C., Yévenes, A. M., Giuliani, C., & Vignoles, V. L. (2018). Being in the Social: A
cross-cultural and cross-generational study on identity processes related to Facebook use. Computers in
Human Behavior, 80, 81-87.
May. D. R., Gilson, R. L., & Leiter, M. P. (2004). The psychological conditions of meaningfulness, safety and
availability and the engagement of the human spirit at work. Journal of Occupational and Organizational
Psychology, 77, 11-37.
Miao, R. T. (2011). Perceived organizational support, job satisfaction, task performance and organizational
citizenship behavior in China. Journal of Behavioral and Applied Management, 12(2), 105-127.
Morrison, E. W. (2014). Employee voice and silence. Annual Review of Organizational Psychology and
Organizational Behavior, 1(1), 173-197.
Motowidlo, S. J., & Van Scotter, J. R. (1994). Evidence that task performance should be distinguished from
contextual performance. Journal of Applied Psychology, 79(4), 475-480.
Muller, D., Judd, C. M., & Yzerbyt, V. Y. (2005). When moderation is mediated and mediation is moderated.
Journal of Personality and Social Psychology, 89(6), 852-863.
Muratova, Y., Rigamonti, D., & Wulff, J. N. (2019). The effect of acquisitions on exploration and exploitation
in China. Journal of Strategy and Management.
Ng, T. W., & Feldman, D. C. (2012). Employee voice behavior: A meta‐ analytic test of the conservation of
resources framework. Journal of Organizational Behavior, 33(2), 216-234.
Park, Y. K., Song, J. H., Yoon, S. W., & Kim, J. (2014). Learning organization and innovative behavior: The
mediating effect of work engagement. European Journal of Training and Development, 38(1/2), 75-94.
Parker, S. K. (2014). Beyond motivation: job and work design for development, health ambidexterity, and more.
The Annual Review of Psychology, 65, 661-691.
Parker, S. K., & Collins, C. G. (2010). Taking stock: Integrating and differentiating multiple proactive behaviors.
Journal of Management, 36(3), 633-662.
Persing, D. L. (1999). Managing in polychronic times: Exploring individual creativity and performance in
intellectually intensive venues. Journal of Managerial Psychology, 14(5), 358-373.
Podsakoff, P. M., Mackenzie, S. B., & Podsakoff, N. P. (2003). Common method biases in behavioral research:
A review of the literature and recommended remedies. Journal of Applied Psychology, 88(5), 879-903.
Preacher, K. J., Rucker, D. D., & Hayes, A. F. (2007). Addressing moderated mediation hypotheses: Theory,
methods, and prescriptions. Multivariate Behavioral Research, 42(1), 185-227.
Raab, G., Ajami, R. A., & Goddard, G. J. (2016). Customer Orientation. In Customer Relationship Management
(pp. 23-48). Routledge.

Juan Liu, Seonghee Cho, Meiying Zhong, Ya Guo
How and When Does Multitasking Affect Customer Orientation?
187
Proceedings of CATEA 2019
Rodell, J.B., & Judge, T.A. (2009). Can good stressors spark bad behaviors? The mediating role of emotions in
links of challenge and hindrance stressors with citizenship and counterproductive behaviors. Journal of
Applied Psychology, 94 (6), 1438-1451.
Rohrer, D., & Pashler, H. E. (2003). Concurrent task effects on memory retrieval. Psychonomic Bulletin &
Review, 10(1), 96-103.
Ruthruff, E., Pashler, H. E., & Hazeltine, E. (2003). Dual-task interference with equal task emphasis: Graded
capacity sharing or central postponement?. Perception & Psychophysics, 65(5), 801-816.
Schaffer, B. S., & Riordan, C. M. (2003). A review of cross-cultural methodologies for organizational research:
A best-practices approach. Organizational Research Methods, 6(2), 169-215.
Schaufeli, W. B. (2012). Work engagement: What do we know and where do we go? Romanian Journal of
Applied Psychology, 14 (1), 3-10.
Schaufeli, W. B., Bakker, A. B., & Salanova, M. (2006). The measurement of work engagement with a short
questionnaire: A cross-national study. Educational and Psychological Measurement, 66(4), 701-716.
Schaufeli, W. B., Taris, T., Le Blanc, P., Peeters, M., Bakker, A., & De Jonge, J. (2001). Can work produce
health? The quest for the engaged worker. Psychology, 36, 422–428.
Shin, S. Y., Van Der Heide, B., Beyea, D., Dai, Y. N., & Prchal, B. (2017). Investigating moderating roles of
goals, reviewer similarity, and self-disclosure on the effect of argument quality of online consumer
reviews on attitude formation. Computers in Human Behavior, 76, 218-226.
Susskind, A.M., Kacmar, K.M., & Borchgrevink, C.P. (2007). How organizational standards and coworker
support improve restaurant service. Cornell Hotel and Restaurant Administration Quarterly, 48(4), 370–
379.
Tett, R. P., & Guterman, H. A. (2000). Situation trait relevance, trait expression, and cross-situational
consistency: Testing a principle of trait activation. Journal of Research in Personality, 34(4), 397-423.
Van Dyne, L., & LePine, J. A. (1998). Helping and voice extra-role behavior: Evidence of construct and
predictive validity. Academy of Management Journal, 41, 108-119.
Weigl, M., Müller, A., Sevdalis, N., & Angerer, P. (2013). Relationships of multitasking, physicians’ strain, and
performance: an observational study in ward physicians. Journal of Patient Safety, 9(1), 18-23.
Werner, J. M. (2000). Implications of OCB and contextual performance for human resource management.
Human Resource Management Review, 10(1), 3-24.
Whiting, S. W., Podsakoff, P. M., & Pierce, J. R. (2008). Effects of task performance, helping, voice, and
organizational loyalty on performance appraisal ratings. Journal of Applied Psychology, 93(1), 125.
Yang, Z., & Cai, J. (2016). Do regional factors matter? Determinants of hotel industry performance in China.
Tourism Management, 52, 242-253.
Zhang, Y. (2018). China ranked first in the contribution of tourism to GDP. Retrieved from
http://www.ce.cn/culture/gd/201803/26/t20180326_28605126.shtml on April 29, 2019.
Zhou, Z. K., Liu, Q. Q., Niu, G. F., Sun, X. J., & Fan, C. Y. (2017). Bullying victimization and depression in
Chinese children: A moderated mediation model of resilience and mindfulness. Personality and
Individual Differences, 104, 137-142.

188
Proceedings of CATEA 2019
Proceedings of CATEA 2019
ISBN 978-623-91018-0-0
The Impact Analysis of Service Quality Towards Behavioral
Intentions with Perceived Value and Customer Satisfaction as its
Intervening Variables on Trisakti School of Management
Andhalia Liza Marie
1, Rintis Eko Widodo
2
1 Trisakti School of Tourism, Jakarta
2 Saint Mary College, Jakarta
[email protected], [email protected]
Abstract: The importance of maintaining the quality of education of a country, making education in
Indonesia also continues to make improvements both from the Elementary School level to the University level.
At the University level alone, there is increasing competition between the State and Private Universities to
produce more and more qualified graduates. So many universities are starting to think of strategies to win the
competition. One of them by maintaining the Service Quality they provide. This study aims to determine the
effect of Service Quality on Behavioral Intention or the tendency to behave, with perceived value and customer
satisfaction as intervening variable at Trisakti School of Management (TSM). The results of this study indicate
that service quality has a positive and significant influence on perceived value and behavioral intentions,
perceived value positively and significantly influence customer satisfaction and behavioral intentions, and
customer satisfaction positively and significantly influence behavioral intentions. The results of this study also
show that perceived value and customer satisfaction as intervening variables successfully mediate the
relationship between service quality and behavioral intentions. Keywords: Service quality; perceived value; customer satisfaction; behavioral intention.
1. Introduction University is a formal service provider institution that deals in the field of education, although in
its daily operations it doesn’t highlight profit as its main goal, but providing excellent service to
students is still an obligation as what profit-oriented institutions do, so that over the time, the world of
education is still required to keep on develop in providing good services that suit to their needs and
desires of its consumers and still manage to have good accreditation of University and its Majoring
Programs.
At this moment there is a bigger opportunity for private Universities to attract more prospective
students than state universities seeing by the greater number of private universities. Things that will
lead to tight competition among private universities to improve their quality by providing services that
meet the needs and fulfillment for the students.
There are 2 variables in service quality measurement which are functional quality and technical
quality (Grönroos, 1984). Therefore, the most popular measurement tools for service quality was
developed by Parasuraman et al, (1985) whereas at the beginning consists of 10 variables which are
tangibility, reliability, responsiveness, communication, credibility, security, competence, courtesy,
understanding and access, which then redefined and simplified at the year 1988 into 5 useful
variables; tangibles, reliability, responsiveness, assurance and empathy.
An effective way to measure the perceived value or the value that’s felt by the customer is
defined by the customer itself at their next purchase, which if its good then they will repeat in
using/buying the service or products or they can switch to other products or services. That’s why
consumer satisfaction level must be achieved and maintained. In other words, the better satisfaction
level of the consumers, the bigger consumer retention achieved (Anderson and Sullivan, 1993; Fornell
1992) and their willingness to recommend to others (Zeithaml and Bitner, 1996).

Andhalia Liza Marie, Rintis Eko Widodo
The Impact Analysis of Service Quality towards Behavioral Intentions with Perceived Value and Customer Satisfaction as its
Intervening Variables on Trisakti School of Management.
189
Proceedings of CATEA 2019
Consumer satisfaction will be achieved when the value and customer service that’s provided has
meet or even exceed the consumer expectation in their previous experience. Consumer satisfaction
index model from Europe and America shows that the service quality is the main satisfaction
component (Fornell et al, 1996). Bagozzi (1992) proposes that evaluating service quality of products
or services that will lead to measurement of the emotional satisfaction which in turn encourage
behavioral intentions.
Zeithaml dan Bitner (1996) identify two variables for measuring behavioral intentions that are
profitable and not profitable. The beneficial behavior intention means that customers will convey
positive words, repurchase intention and loyalty (Ladhari, 2008; Zeithaml and Bitner, 1996), while
unfavorable behavioral intentions tend to spread negative words and convey their negative
experiences to other customers and the intention to turn to the competitors. Customer perceived value
has been accepted as a reliable predictor of customer satisfaction and consumer purchasing behavior
intentions (Andreassen and Lindestad, 1992; Choi, 2004; McDougall and Levesque, 2000; Sweeney,
1999; Wu et al, 2014).
2. Literature Review
2.1 Service Quality
Service quality comes from a comparison between what the customer feels the seller will offer
(their expectations) with the service performance from the actual seller (Gronroos 1982). The idea that
service quality is a function of performance gaps is expected to be strengthened by broad-based
exploration studies conducted by Parasuraman et al. (1985).
According to (Kotler, 2012), service quality is the sum of the characteristics of goods and
services that show its ability to satisfy customer needs, for both of those that appear clear and hidden.
For companies engaged in the service sector, providing quality services to customers is an absolute
thing to do if the company wants to reach success.
Service quality can be known by comparing consumer’s perception of services that they really
receive or obtain with the service that they actually expect or wants from all the service attributes
from a company. If the service received or perceived (perceived service) is as expected, then the
quality of service is perceived as good and satisfying, if the service received exceeds consumer
expectations, then the quality of service is perceived as very good and have a good quality. On the
contrary, if the services received are lower than expected, then the quality of service is perceived
poorly (Tjiptono, 2014).
Service quality has several variables which underlie the formation of service quality, according to
Parasuraman there are five variables of service quality (SERVQUAL) which underlie the formation of
service quality, the five variables of service quality are:
1. Tangible,
Tangible is the physical evidence of the services which can be physical facilities of equipment
used as a physical representation of the service.
2. Reliability,
Reliability is the ability to provide services that promise with appropriately and the ability to be
trusted, especially in providing the services punctually and in the right way according what has
been promised without making mistakes.
3. Responsiveness,
Responsiveness is the willingness or the readiness from the employee to provide services needed
by consumers.
4. Assurance,
Assurance that includes knowledge, abilities, politeness, and the trustworthiness of personal
contacts.
5. Empathy,
Empathy which includes personal or company contact attitudes to understand needs or
difficulties, consumers, good communication, personal attention, and ease of communication or
relationships.

Andhalia Liza Marie, Rintis Eko Widodo
The Impact Analysis of Service Quality towards Behavioral Intentions with Perceived Value and Customer Satisfaction as its
Intervening Variables on Trisakti School of Management.
190
Proceedings of CATEA 2019
2.2 Perceived Value
Zeithaml (2009, p. 14) defines perceived value as the overall assessment of consumers from how
the products or services is used based on their perceptions of what is received and what is given.
Perceived value can be defined as the result of a personal comparison between the benefits felt overall
and the perceived sacrifice or costs paid by the customer (Zeithaml, 2009).
Customer perceived value is very important for marketers, because it can affect their buying
behavior in the future. Perceived value has an effect to the prices that consumers are willing to pay for
a product or service. To be able to understand the perceived value of its customers, the company must
be able to identify the foundation factors behind their perceived value. Understanding the factors that
determine consumer’s perceived value can help companies to produce goods or services that can
provide a balanced value between the benefits obtained by consumers of a service and the price they
must pay for these services.
Sweeney and Soutar (2001) through different empirical study has design a measurement scale to
measure the perceived value (PERVAL). Analysis of reliability and validity is done in designing
PERVAL, which results in a five-variables reduction proposed by Sheth et al. (1991a, b) into three,
namely:
1) Functional
Functional variables are related to utilities derived from product and service attributes.
Customers gain value from attributes such as product quality, service quality, or price
(Sweeney et al., 1999). This is an economic analysis and rationally comparing benefits and
sacrifices.
2) Social
Lapierre (2000) defines social value as an image based on the reputation and credibility and
the social impact that the company had.
3) Emotional
The emotional variable of perceived value comes from the feelings and emotions that the
product or service creates an impact on the buyer.
2.3 Customer Satisfaction
According to Zeithaml, Bitner, and Gremler (2009) "satisfaction is a person's feeling of pleasure
or disappointment that results from comparing a product or service's perceive performance (or
outcome) to their expectations" so that it can be defined as the feeling of satisfied or disappointed
customers from comparing from perceived performance according to customer expectations. Kitapci
et al. (2008) stated that customer satisfaction involves cognitive and affective components that
influence the foundation of satisfaction. This is in line with the definition by Worsfold et al. (1994, p.
25), which describes customer satisfaction "as a cognitive and affective evaluation of customers based
on personal experience in all service episodes in a relationship. Affective components have referred to
consumers' feelings about a stimulus or event, for example whether the consumers like a product or
not. The cognitive component refers to consumer’s thought, for example what is believed by
consumers from a product. Cognitive process consists of five mental processes, namely:
understanding, evaluating, planning, choosing, and thinking.
According to Kotler (2010: 211) He suggested the definition of customer satisfaction as follows:
"Satisfaction is the level of a felt state person resulting from comparing a producter's perceived
performance or outcome in relation to the person's expectations". Thus, the level of satisfaction is a
function of the difference between perceived expectations and reality (perceived performance and
expectations). A consumer will experience three levels of satisfaction. If the reality received is lower
than their expectations, then consumers are not satisfied. If reality matches their expectations,
consumers are satisfied. If reality exceeds their expectations, consumers are very satisfied, very
pleased or very happy.

Andhalia Liza Marie, Rintis Eko Widodo
The Impact Analysis of Service Quality towards Behavioral Intentions with Perceived Value and Customer Satisfaction as its
Intervening Variables on Trisakti School of Management.
191
Proceedings of CATEA 2019
2.4 Behavioral Intention
Kotler (2014) behavioral intention is a condition whereas customer has good intention or
attitude that is loyal to the brand, product and the company thus they are willingly to share the
superiority to others. Saha and Theingi (2009) define behavioral intention as a customer’s likelihood
to perform certain behaviors such as positive word-of-mouth about a service provider to others,
having the intention of repurchasing and loyalty to providers of service providers. Zeithaml, Berry
and Parasuraman (1996) say, "The consequences of service-quality perceptions on individual-level
behavioral intentions can be viewed as being desirable to monitor." Which means, the consequences
that arise from perceptions of service quality in the form of intention to behave individually the
individual can be seen as a signal of the company's success or failure to retain its customers.
From few opinions about behavioral intention, it can be concluded that the behavioral intention
variable is the final goal. If a product has a favorable behavioral intention, the company will be able to
survive and win the competition. One of the beneficial behavioral intentions is the presence of a
positive attitude about a product or service provider. This positive attitude can be a positive word of
mouth. This word of mouth is a low-cost promotion that has a tremendous effect on the survival of the
company. If our consumers can spread good news to other people or friends, therefore will encourage
purchases.
In this research, behavioral intentions were measured based on 3 variables, namely:
a. Loyalty to Company: a condition in which a customer repurchases regularly, cannot be influenced
by competitors to change and refer to others.
b. Propensity to Switch: a behavior that indicates the possibility of moving or not to a competitor.
c. Willingness to Pay More: Willingness to make payments that are higher than it should be to get
the benefits received.
Conceptual Framework
H3
H2
Figure 1. Conceptual Framework
Hypothesis: H1: There is a positive relationship between service quality and customer perceived value.
H2: There is a positive relationship between service quality and customer satisfaction.
H3: There is a positive relationship between service quality and customer behavior intentions.
H4: There is a positive relationship between the perceived value of customers and customer
satisfaction.
H5: There is a positive relationship between the perceived value of customers and customer behavior
intentions.
Perceived
Value
Service
Quality
Behaviour
Intentions
Customer
Satisfaction
H1
H2
H3
H4
H5

Andhalia Liza Marie, Rintis Eko Widodo
The Impact Analysis of Service Quality towards Behavioral Intentions with Perceived Value and Customer Satisfaction as its
Intervening Variables on Trisakti School of Management.
192
Proceedings of CATEA 2019
3. Research Methodology 3.1. Population and Sample Research
Population is a generalization area consisting of objects or subjects that have certain quantities
and characteristics set by researchers (Sugiyono, 2016). The population referred to in this research
were students of Trisakti School of Management (TSM), Jakarta.
The sample in this research is part of the population that is expected to be able to represent the
population in the research. The sampling technique in this study was a non-probability sampling
technique. According to Sugiyono (2016) non-probability sampling technique is a sampling technique
that does not provide the same opportunity / opportunity for each element or member of the
population to be selected as a sample.
The sampling technique used by the researchers is quota sampling where this technique is used to
determine the sample of the population that has certain characteristics to the desired number (quota)
(Sugiyono, 2016). The chosen sample was the 2014-2017 Trisakti School of Management students.
3.2. Operational Definition and the Research Variable
1. Service quality (XI) is the perceived level of advantage and control over that level of
advancement to fulfil customer’s desired. (Kotler, 2011:85). The indicators are:
a. Tangible (physical proof)
b. Empathy
c. Reliability
d. Responsiveness
e. Assurance
2. Perceived Valued (Y1)
a. Functional: Measured through the student’s perceived benefit and the suitability costs with
the quality that was given to students.
b. Social: measured by the comfort felt by students, lecturers are able to motivate students, and
lecturers serve students' interests well.
c. Emotional: measured through appropriate decision making in choosing TSM as a place to
gain knowledge, a comfortable environment, and understand student’s needs and interests in
the lecture process.
3. Customer Satisfaction (Y2)
Customer satisfaction is considered as how a person's feelings after receiving a product or service
compared to others whose results are able to meet the customer’s expectations.
4. Behavioral Intention (Z1)
a. Loyalty: Measured through the willingness of students to use services from TSM to train
new employees in their working place in the future.
b. Recommendation: Measured through the willingness of students to suggest and encourage
their friends / relatives to study at TSM, as well as student’s tendency to give a positive
response to their friends / relatives.
c. Paying premium prices: Measured through the payment process and the suitability of
sacrifices (costs) provided with the value felt by the students.
3.3 Path Analysis The research used structural equation modeling (SEM) based on partial least square (PLS) to
answer the problem statement. Partial least square (PLS) was first used for public methods in
estimating the path model that uses latent constructs and multiple indicators in it. Partial least square
(PLS) is used to test a weak theory and problem in assuming normality of data distribution (Jogiyanto,
2008).

Andhalia Liza Marie, Rintis Eko Widodo
The Impact Analysis of Service Quality towards Behavioral Intentions with Perceived Value and Customer Satisfaction as its
Intervening Variables on Trisakti School of Management.
193
Proceedings of CATEA 2019
4. Results and Discussion 4.1. Result
4.1.1. Path Coefficient Evaluation and Coefficient of Determination (R²)
Evaluation of path coefficient is used to show how strong the influence of the independent
variable on the dependent variable. Whereas the determination coefficient is used to measure how
many endogenous variables are influenced by other variables. R2 value above 0.75 and above are
categorized as substantial, 0.50 - 0.75 means moderate, and 0.25 - 0.50 means weak.
Figure 2. Path Coeffiecient
Figure 3. Outer dan Inner Model
Coefficient of Determination (R²) Structural Equations
Per.Val = 0.96*Ser.Qua, Errorvar.= 0.085 , R² = 0.92
(0.064) (0.022)
14.86 3.89
Cus.Sat = 0.92*Ser.Qua, Errorvar.= 0.16 , R² = 0.84
(0.065) (0.036)
14.08 4.43
B.Inten = 0.57*Per.Val + 0.83*Cus.Sat - 0.44*Ser.Qua, Errorvar.= 0.11 , R² = 0.89
(0.24) (0.19) (0.30) (0.047)
2.40 4.41 -1.46 2.38

Andhalia Liza Marie, Rintis Eko Widodo
The Impact Analysis of Service Quality towards Behavioral Intentions with Perceived Value and Customer Satisfaction as its
Intervening Variables on Trisakti School of Management.
194
Proceedings of CATEA 2019
Indirect Effect Indirect Effects of KSI on ETA
Ser.Qua -------- Per.Val - - Cus.Sat - - B.Inten 1.31 (0.31) 4.27
The path coefficient analysis result of this research shows that customer satisfaction level is at
0.54 which is the result of multiplication of 0.96 and 0.57 and perceived value of 0.76 which is the
result of multiplication of 0.92 and 0.83, both intervening variables strengthen the connection between
service quality and behavioral intentions. The connection of service quality to behavioral intentions
directly shows the number -1.46 where the numbers that show this direct connection are smaller than
using perceived value and customer satisfaction as intervening variables of 0.54 and 0.76.
In addition, almost all variables in this model have a path coefficient with positive numbers
except the behavior intentions variable which has a negative path coefficient. So, if the greater the
positive value of the path coefficient on an independent variable towards the dependent variable, then
the stronger the influence of the independent variable on the dependent variable, and vice versa if the
path coefficient value of the negative variable so then it makes the influence weaker.
The value of coefficient of determination (R2) perceived value that was influenced by service
quality was 0.92. Which means that the service quality variable affects the perceived value of 92%
while the other 8% is influenced by other variables outside the research. Then for the customer
satisfaction variable, which is influenced by service quality and perceived value of 0.84. This means
that the service quality variable and perceived value affect customer satisfaction by 84% while the
other 16% is influenced by other variables outside the research. Then, behavioral intentions variables
that are influenced by service quality, perceived value, and customer satisfaction are 0.89. That is,
service quality variables, perceived value, and customer satisfaction affect behavioral intentions by
89% while the other 11% are influenced by other variables outside the research.
4.1.2. T-Statistics and Hypothesis Tests In this research there are intervening variables, namely the link between the dependent variable
and the independent variable. Testing the mediation hypothesis (intervening variable) can be done by
the t-test procedure. T-test experiment is used to get the t-statistical value that is needed if the
researcher wants to do a hypothesis test, so the researcher can say the influence of a variable can be
said to have a significant influence or not. T-test is done using the bootstrapping method.
Bootstrapping method is a re-sampling testing process carried out by a computer system to measure
the accuracy of the sample estimate. Bootstraping is used to measure the accuracy of the sample. If
the bootstrap value is more than (>) 1.96 then it is stated that the variable has a significant effect on
the contrary whereas if the bootstrap value is lower (<) than 1.96, then the effect of the variable is
stated to be weak (Abdillah & Hartono, 2015).
T-statistics on the effect of customer satisfaction on behavioral intentions show a value of 4.41
which means customer satisfaction has a significant effect on behavioral intentions. T-statistics on the
effect of perceived value on behavioral intentions show a value of 2.41, which means that perceived
value has a significant effect on behavioral intentions.
T-statistics on the influence of service quality on behavioral intentions showed -1.46, which
meant that service quality did not significantly influence behavioral intentions. The T-statistic on the
influence of service quality on customer satisfaction shows a value of 14.08, which means that service
quality has a significant influence on customer satisfaction. T-statistics on the influence of service
quality on perceived value showed 14.86, which means that service quality has a significant influence
on perceived value.

Andhalia Liza Marie, Rintis Eko Widodo
The Impact Analysis of Service Quality towards Behavioral Intentions with Perceived Value and Customer Satisfaction as its
Intervening Variables on Trisakti School of Management.
195
Proceedings of CATEA 2019
4.2. Discussion
4.2.1. Service Quality towards Perceived Value The result of this research is that the service quality of Trisakti School of Management has a
significant influence on perceived value with the value of the T-statistic test> with the value of 1.96,
which is 14.86. This research shows the result of that service quality has a significant influence on
perceived value, where it is aligning with the opinion that service quality has a high impact on
customer perceived value (Zameer, Tara, Kausar, & Mohsin, 2015). The quality of service provided is
able to grow and the perceived value felt by students such as the perceived benefits, costs incurred in
accordance with the quality received, students feel comfortable, students feel proud, students feel
motivated, up to lecturers who are able to provide motivation and provide values of life to students.
The connection between service quality and perceived value can also be proven to have a significant
connection, so the value felt by the students can be high because it is supported by good quality of
service from Trisakti School of Management.
4.2.2. Service Quality towards Customer Satisfaction
The results of this research also show that service quality has a significant effect on customer
satisfaction. In the results of this research it is known that there is a significant effect where the T-
statistics test results with a value of 14.08 which is above 1.96. So it is known that the quality service
of higher education influences the satisfaction of Trisakti School of Management students.
4.2.3. Service Quality for Behavioral Intentions
The results of this research show that service quality has no significant effect on behavioral
intentions with the test value of the T-statistic below 1.96 which is -1.46, so it can be concluded that
service quality does not significantly influence behavioral intentions.
4.2.4. Perceived Value of Behavioral Intentions This research has the result that the perceived value of Trisakti School of Management students
has a significant influence on behavioral intentions with the value of the T-statistic test> of 1.96
which is 2.40, so it can be concluded that there is a direct influence of perceived value on behavioral
intentions. This research came out with the results that show that perceived value has a significant
influence on behavioral intentions, which is in align with the opinion (Amoah, Radder, & van Eyk,
2016) that the perceived value of customers has a positive influence on customer satisfaction and
influences customer behavior intentions. Trisakti School of Management students have succeeded in
creating the suitability of the perceived value by students as expected. Proven by the results of this
research from the questionnaire that students do not have any problems with the costs incurred
because they feel the benefits of studying at Trisakti School of Management so as to influence the
behavioral intention of students. The connection between perceived value and behavioral intentions
could also be proven to have a significant connection, so that behavioral intentions that are created in
Trisakti School of Management students are quite high because of the positive perceived value.
4.2.5. Customer Satisfaction for Behavioral Intentions This research came out with the result that customer satisfaction in Higher education has a
significant influence on behavioral intentions with the value of the T-statistic test> of 1.96 which is
4.41, so it can be concluded that there is a significant effect of customer satisfaction on behavioral
intentions. This research also has the results that show that customer satisfaction has a significant
influence on behavioral intentions, which is in line with the opinion (Jandavath & Byram, 2016) that
when customer satisfaction is successfully created it results in positive customer intentions.
4.2.6. Perceived Value and customer satisfaction mediating the Connection between Service
Quality and Behavioral Intentions This research aims to see the influence of service quality on behavioral intention by using
perceived value and customer satisfaction as its intervening variables. Perceived value and customer

Andhalia Liza Marie, Rintis Eko Widodo
The Impact Analysis of Service Quality towards Behavioral Intentions with Perceived Value and Customer Satisfaction as its
Intervening Variables on Trisakti School of Management.
196
Proceedings of CATEA 2019
satisfaction have a significant connection to service quality and behavioral intentions. The direct
influence of the service quality on the behavior intentions value is at -1.46 while the indirect influence
of service quality through perceived value and customer satisfaction on behavioral intentions value is
at 4.27, this indicates that perceived value and customer satisfaction mediate the connection of service
quality to behavioral intentions.
5. Conclusion Based on the results of this research on the analysis of the influence of Service quality on
Behavioral Intentions with Perceived Value and Customer satisfaction as an intervening variable on
Trisakti School of Management shows that service quality has a positive and significant effect on
customer satisfaction and perceived value, but the service quality has a negative and insignificant
effect on behavioral intentions, and customer satisfaction have a positive and significant effect on
behavioral intentions. The results of this research also show that perceived value and customer
satisfaction as an intervening variable mediate the connection between service quality and behavioral
intentions.
Based on the results of the research and discussion above, the researcher will propose a few
suggestions, namely the next research which will conduct a similar theme research is expected to
conduct more in-depth research by involving other variables and even increase the number of
variables studied, and are expected to develop research models and be supported by theoretical
concepts and the latest issues, in addition in future research, can examine things that have not been
studied in this research, namely whether there is a positive effect of perceived value on customer
satisfaction, which can be seen if there is an increase in perceived value, it will create customer
satisfaction based on a positive connection between perceived value and customer satisfaction. So that
it can be seen when the perceived value by students is good, whether the students will feel satisfy.
Other suggestions can be given to Trisakti School of Management in order to always improve the
quality of service so that the ideal customer satisfaction level can be achieved.
References Journal Papers
Amoah, F., Radder, L., & van Eyk, M. (2016). Perceived experience value, satisfaction and behavioural
intentions. African Journal of Economic and Management Studies, 7(3), 419–433.
https://doi.org/10.1108/AJEMS-10-2015-0121
Anderson, J., Thomson, B.L. and Wynstra, F. (2000), “Combining value and price to make purchase decisions
in business markets”, International Journal of Research in Marketing, 17(4), pp. 307-29.
Anderson, J.C., Jain, D.C. and Chintagunta, P.K. (1992), “Customer value assessment in business markets: a
state-ofpractice study”, Journal of Business to Business Marketing, 1(1), pp. 3-30.
Grönroos, C. 1984, “A service quality model and its marketing implications”, European Journal of Marketing,
18(4), pp. 836-844.
Jandavath, R. K. N., & Byram, A. (2016). Healthcare service quality effect on patient satisfaction and
behavioural intentions in corporate hospitals in India. International Journal of Pharmaceutical and
Healthcare Marketing, 10(1), 48–74. https://doi.org/10.1108/IJPHM-07-2014-0043
McDougall, G.H. and Levesque, T.J. (2000), “Customer satisfaction with service: putting perceived value into
the equation”, Journal of Services Marketing, 14(5), pp. 392-410.
Parasuraman, A., Berry, L. and Ziethaml, V.A. (1988), “SERVAQUAL: a multiple item scale for measuring
consumer perception for service quality”, Journal of Retailing, 64(1), pp. 12-40.
Parasuraman, A., Zeithaml, V.A. and Berry, L.L. (1985a), “A conceptual model of service quality and its
implication”, Journal of Marketing, 49, Fall, pp. 41-50.
Parasuraman, A., Zeithaml, V.A. and Berry, L.L. (1985b), “Alternative scales for measuring service quality: a
comparative assessment based on psychometrics tests and diagnostic quality in hotels”, International
Journal of Hospitality Management, 26, pp. 840-53.
Zameer, H., Tara, A., Kausar, U., & Mohsin, A. (2015). Impact of service quality, corporate image and
customer satisfaction towards customers’ perceived value. International Journal of Bank Marketing,
33(4), 442–456. https://doi.org/ http://dx.doi.org/10.1108/IJBM-01-2014-0015.

Andhalia Liza Marie, Rintis Eko Widodo
The Impact Analysis of Service Quality towards Behavioral Intentions with Perceived Value and Customer Satisfaction as its
Intervening Variables on Trisakti School of Management.
197
Proceedings of CATEA 2019
Books
Abdillah, W., & Hartono, J. (2015). Partial Least Square (PLS) – Alternatif Structural Equation Modeling
(SEM) dalam Penelitian Bisnis (Cetakan 1). Yogyakarta: Penerbit Andi.
Jogiyanto. (2008). Metodologi penlitian sistem informasi. Yogyakarta: Andi Yogyakarta.
Ladhari, R. (2008), “Alternative measures of service quality: a review”, Managing Service Quality,
18(1), pp. 65-86. Ladhari, R., & Morales, M. (2008). Perceived service quality, perceived value and
recommendation: A study among Canadian public library users. Library Management, 29(4/5), 352–3
Sugiyono. (2014). Metode Penelitian Administrasi. Bandung: Alvabeta
Zeithaml, V.A. and Bitner, M.J. (1996), Services Marketing, McGraw-Hill, New York, NY.
Ziethaml, V. A., Bitner, M. J., & Gremler, D. D. (2009). Service marketing.

198
Proceedings of CATEA 2019
Proceedings of CATEA 2019
ISBN 978-623-91018-0-0
How Community Perception of Ecotourism Affect Participation of
Ketambe Village Community in Mount Leuser National Park, Southeast
Aceh
Rina Suprina1, Nurbaeti
2, and Marissa Pusparini
3
1Rina Suprina, Sekolah Tinggi Pariwisata Trisakti
2Nurbaeti, Sekolah Tinggi Pariwisata Trisakti
3Marissa Pusparini, Sekolah Tinggi Pariwisata Trisakti
[email protected], [email protected], [email protected]
Abstract: This research was conducted to determine the effect of community perceptions of ecotourism on the
participation of Ketambe Village community in Mount Leuser National Park, Southeast Aceh. In this study the
method used was descriptive correlational method with simple regression analysis by making the Ketambe
Village community as the population in this study. The results of this study show that community perceptions
about ecotourism in Mount Leuser National Park are good or positive. The desire to participate also looks good,
namely participation in working or doing entrepreneurship in the field of tourism, providing land, participation
in maintaining environmental cleanliness and safety, and participation in explaining tourist attraction objects.
The correlation between community perceptions of ecotourism towards the participation of the Ketambe Village
community is 0.511 which indicates that there is a relationship between community perceptions and community
participation. The influence of community perception on community participation is 26.1% and the remaining
73.9% is influenced by other variables.
Keywords: Community Perception, Community Participation, Ecotourism, Mount Leuser National Park.
1. Introduction
Indonesia as a tropical country has udoubtedly beautiful natural landscape and cultural landscape.
Indonesia with its very unique geographical location, located between two oceans and two continents,
is an archipelago with a total of 13,466 islands (UN Economic and Social Council, 2012 in Sunkar
and Brahmantyo, 2013: 184). The islands are spread along the equator and influenced by specific
climate condition. This has resulted a lot of potential resources which makes Indonesia known as a
megabiodiverity country. Conservation International (CI); Nugroho (2011) identified that Indonesia
(1) was second only to Brazil, from 17 megadiversity countries; (2) has two of the world's 25
hotspots; (3) has 18 of the world's 200 ecosystems; (4) has 24 of the 218 endemic areas of birds; (5)
has 10 percent of the flowering plant species in the world; (6) occupies the top rank in the biodiversity
of agricultural and livestock species. From the range of potential ecotourism owned by Indonesia, the
focus of this study was on the potential of ecotourism in Mount Leuser National Park.
Mount Leuser National Park is administratively located in Aceh Province and North Sumatra
Province. Aceh Province delineated by the national park covers the Southwest Aceh District, South
Aceh, Aceh Singkil, Southeast Aceh, Gayo Lues, Aceh Tamiang, while North Sumatra Province
delineated by the national park includes the Dairi, Karo and Langkat Districts. This national park
takes its name from Mount Leuser which rises high at 3404 meters above sea level in Aceh. This
national park includes native ecosystems from the coast to high mountains which are covered by
dense forests typical of tropical area, managed by a zoning system that is used for the purpose of
research, science, education, cultivation support, tourism, and recreation.
One of the villages that has a tourist attraction and can be developed for its ecotourism potential is
Ketambe Village in Southeast Aceh. This village has a variety of tourist attractions and has a location
adjacent to Mount Leuser National Park. People in this village actually feel they have a responsibility

Rina Suprina, Nurbaeti, Marissa Pusparini
How Community Perception of Ecotourism Affect Participation of Ketambe Village Community in Mount
Leuser National Park, Southeast Aceh
199
Proceedings of CATEA 2019
to Mount Leuser National Park because they feel that this forest / region has been passed down from
their ancestors. Most of the youths in Ketambe Village have already understood the tourism activities
in this village, precisely at Lawe Gurah Resort, since many of them work as tour guides. To be able to
develop ecotourism in Mount Leuser National Park to the fullest, it is necessary to know the
community perceptions of ecotourism and their desire to participate. If the community perception
about ecotourism in Mount Leuser National Park is positive, it is expected that they will participate in
developing ecotourism. On the other hand, if their perception is negative, then community
participation will be lower so that it can cause a negative impact on the development of ecotourism in
the area. Therefore, research is needed to study the community perception, their participation, and the
influence of their perceptions of ecotourism on community participation in Ketambe Village,
Southeast Aceh. The results of this study are expected to be useful in developing ecotourism in the
future so that it can run optimally.
2. Literature Review
2.1 Community Based Tourism Management
Murphy (1988), Larry D, Peter F, Wayne D (2010) in Sunaryo (2013) states that the development
of tourism should be a community-based activity. The prior factor that the resources and uniqueness
of the local community are either physical elements or non-physical (traditions and cultures) should
inherent in the community, then it must maintain a major movement in tourism. Sunaryo (2013) also
added that to create tourism development run well, then well managed, the most fundamental thing to
do is how to facilitate the wide involvement of local communities in the development process and
maximizing the value of social and economic benefits of tourism activities for local communities.
Local communities have an equally important position as one of the stakeholders in tourism
development, in addition to government and private industry.
Rahayu et al (2015) explains that the principles of Community-Based Tourism should be done
through:1) recognizing, supporting, and promoting community ownership in tourism; 2) engaging
community members from every stage of tourism development in its various aspects, 3) promoting
pride in the community; 4) improving the quality of life; 5) ensuring environmental sustainability; 6)
protecting the uniqueness and cultural characteristics of local communities; 7) developing cross-
cultural learning; 8) giving respect for cultural differences and human dignity; 9) distributing
advantages and benefits proportionately to members of the community; 10) contributing to a certain
percentage of revenues earned for community development; and11) highlighting the authenticity of
public relations with the environment.
2.2 Ecotourism
Ecotourism according to Weaver (2001) is a form of tourism that fosters learning in the form of
experience and respect for the environment or some of its components, in a related cultural context.
Ecotourism activities aim to make the environment and social culture sustainable. Three important
things in ecotourism according to Weaver (2001) are natural environment, learning, and sustainability.
According to Rahman (2003), the notion of ecotourism has evolved over time but in essence
ecotourism is: 1. A new form of travel which is responsible for the natural area. 2. Adventure that can
create a tourism industry, even in some developing new ideas related to the understanding of
ecotourism. The educational phenomenon is needed in the form of tourism.
To be able to develop ecotourism well, Muntasib (2014) states that there are seven principles of
ecotourism development that must be considered, namely: 1. Direct contact with nature (touch the
nature).2. A useful experience, both personally and socially.3. Ecotourism is not a mass tourism.4.
Ecotourism programs must make physical and mental challenges for tourists. 5. Interaction with the
community and learn local culture. 6. Adaptive to rural accommodation conditions. 7. Experience is
more primary than comfort
According to Hakim (2004), strategies in ecotourism development must encourage conservation
actions so that the goal of sustainable tourism is achieved. Based on the definitions of ecotourism
from various scholars, Fennel (2002) summarizes the notion of ecotourism as a sustainable form of

Rina Suprina, Nurbaeti, Marissa Pusparini
How Community Perception of Ecotourism Affect Participation of Ketambe Village Community in Mount
Leuser National Park, Southeast Aceh
200
Proceedings of CATEA 2019
natural resource-based tourism whose main focus is on experience and learning about nature, which is
managed by minimizing impact, non-consumptive, and locally oriented (control , profit and scale).
Ecotourism is expected to have a positive impact on the environment and for stakeholders in tourism,
including local communities.
2.3 Community Perception on the Impact of Tourism
According to Rakhmat (2007), perception is the experience of the objects, events, or relationships
obtained by concluding information and interpreting the message. Tunjugsari et al (2016) also
explained that perception is a process that starts fromsight to form the challenge that occurs within the
individual so that the individualis aware of everything in the environment through the senses he owns.
According to Umar (2009), there are several factors that can influence people's perceptions,
namely:
a. Actor of perception. When a person views an object and tries to interpret what he sees, that
interpretation is greatly influenced by the personal characteristics of the individual's perceptive
actors.
b. Target or object. The characteristics and targets observed can influence what is perceived. Targets
are not viewed as isolated, so the relationship of a target to its background influences perceptions
such as our tendency to group objects that are close or similar.
Research on the impact of tourism has been carried out and Garcia et al (2015) summarize it by
explaining that there are 3 main focuses commonly studied: economic, socio-cultural and
environmental impacts. Most studies identify these impacts in two opposing aspects, positive and
negative aspects. Thus the public perception of the impact of tourism in terms of economy, social
culture and environment can be positive that tourism brings benefits, or negative that tourism in their
region causes harm to them.
2.4 Community Participation
Conyers (1991) in Pujoalwanto (2012) states that community participation is a tool to obtain
information about the conditions, attitudes, expectations and needs of the local community. Without
the presence of local communities the development program and the projects implemented will
fail.According to Matsumoto (2010), there are several factors that are predicted to have a relationship
with the level of community participation, including: 1) Gender; 2) Age; 3) Income; 4) Education; 5)
Availability of time; 6) Frequency of collection; 7) Community attitudes; 8) Community Comfort; and
10) Social norms
3. Material & Methodology
3.1. Time, and Reseach Location
The study was conducted in October and November 2018 in the Mount Leuser National Park area
which is administratively located in the Ketambe Village area, Lawe Gurah, Kutacane, Southeast
Aceh Regency. This national park includes native ecosystems from the coast to high mountains which
are covered by dense forests typical of tropical rain, managed with a zoning system that is used for the
purpose of research, science, education, supporting cultivation, tourism and recreation
3.2. Methods
The method used in this research is descriptive analysis with a quantitative phenomenological
approach. This approach is used to study human phenomena and their social behavior (Altinay and
Paraskevas, 2008). The data sources used are primary data and secondary data, while data collection
techniques used are: 1) documentation study, 2) Observation; 3) Questionnaire.
The research instrument used was a closed questionnaire with a Likert scale guide on a scale of
1-7. The sampling technique used in this study was purposive sampling with 42 respondents being
sampled. According to Sugiyono (2010), if the sample is divided into categories, then the number of
sample members in each category is at least 30 respondents.
Rina Suprina, Nurbaeti, Marissa Pusparini
How Community Perception of Ecotourism Affect Participation of Ketambe Village Community in Mount
Leuser National Park, Southeast Aceh
201
Proceedings of CATEA 2019
Various qualitative data are processed and presented descriptively tabulatively, while quantitative
data is processed using basic descriptive statistical techniques in the form of frequency distribution.
Frequency distribution indicates the number and percentage of respondents and the object of study
included in the existing category to provide initial information about the respondent or object of
study. Calculation of quantitative data is done with the help of IBM SPSS Statistics 20 software for
Windows. The next test used is the classic simple regression assumption test, to find out how much
influence of community perceptions have on their participation.
4. Results and Discussion 4.1. Analisis of Community Perception
Analysis of community perceptions is seen from seven aspects, namely economic, ecological,
socio-cultural, infrastructure, service facilities, environmental conditions, and conditions of tourist
attraction objects. Assessment is done by giving a score of 1 to 7, which is from strongly disagree to
strongly agree. The results of the analysis of each aspect are as follows:
Economic Perception of Ecotourism
The mean value of the community perception regarding the economic aspects of ecotourism is
6.2. This shows that the community agrees to the economic aspects that will be obtained from the
development of ecotourism activities in Ketambe. The community gives a high score on the
assessment of the criteria for increasing community income with the score = 6.4 meaning close to the
highest score. Furthermore, two scores = 6.3 in the criteria of increasing employment (A) and opening
opportunities for cooperation in various business fields (D). The community in Ketambe and around
the Landscape of Lawe Gurah Resort realize that with the development of ecotourism they can have a
positive economic impact on them directly, indirectly, or additionally. Aside from being able to
increase people's income and create jobs, ecotourism can also open opportunities for various business
partners working in the tourism industry area.
Ecological Perception of Ecotourism
The mean value of the community regarding the ecological aspects of ecotourism is 6.5. This
shows good results, namely agreeing to the ecological aspects that will be obtained from the
development of ecotourism activities in Ketambe. The community gives a high value to the criteria
for fostering public awareness of the National Park (E), increasing ecosystem security (F), and
minimizing the potential for natural disasters (G), with a score of respectively = 6.7. Communities in
Ketambe and around the TNGL Landscape Lawe Gurah Resort are aware that ecotourism
development can have a positive ecological impact on them both directly and indirectly. With
community ecotourism, it is also made aware of the importance of protecting the environment and its
ecosystem, including the TNGL Forest around them. By safeguarding the forest, it also maintains
habitats from the flora and also typical Sumatran fauna such as Mawas (orangutans) and other large
mammals whose status is protected. The flora and fauna that live in it are the main attraction for
tourists visiting Ketambe, TNGL and its surroundings.
Socio-Cultural Perception of Ecotourism
The mean value of the community regarding the socio-cultural aspects of ecotourism is 6.2 . This
shows good results, meaning the community agree to the socio-cultural aspects that will be obtained
from the development of ecotourism activities in Ketambe. The community gives a high score on the
assessment of three criteria, namely increasing community knowledge (A) score = 6.5, developing
social institutions (B) score = 6.4, and preserved cultural values and local wisdom (G) score = 6,3.
Communities in Ketambe and around the TNGL Landscape Lawe Gurah Resort realized that with the
development of ecotourism they could have a positive social-cultural impact for them in terms of
increasing knowledge and skills not only for housewives, but also for the Ketambe community in
general. In addition, ecotourism in terms of socio-culture can maintain the cultural values and local
wisdom of the existing Alas Gayo tradition, such as bines and saman dances. In addition, the existing
social institutions of the community are increasingly tight and strong.

Rina Suprina, Nurbaeti, Marissa Pusparini
How Community Perception of Ecotourism Affect Participation of Ketambe Village Community in Mount
Leuser National Park, Southeast Aceh
202
Proceedings of CATEA 2019
Infrastructure Perception
The mean value of the community regarding aspects of ecotourism infrastructure is 5.7.
Perception on each criterion is in good condition for road access and network criteria (A), tourist
information center (B), parking area (C), telecommunications network, electricity and water (D),
garbage and waste disposal (E) , toilet and bathroom (G). It's just that the criteria for places of
worship (F) have the smallest value (score = 5.3) because there are only one mosque in Ketambe
Village. No other worship facilities were found for different religions.
Perception of Condition of Service Facilities
The mean (mean) of the community regarding aspects of ecotourism service facilities is 5.9. The
perceptions in each criterion are in a fairly good condition for the criteria of information and guidance
centers (A), places to eat (restaurants and food stalls) (B), Souvenirs (local handicrafts) (C), places of
worship (D), facilities health (F), and Toilet / WC (G). Criteria for places to stay (accommodation) (E)
are assessed with a score = 6.1 which is the greatest value of the seven criteria assessed. This is
because the type of accommodation that is available in Ketambe is already in a fairly good condition
in terms of quality, service and cleanliness. The examples of guesthouse with good facilities and
services are Pondok Wisata and Thousand Hill.
Environmental Conditions
The mean value of the community regarding the environmental aspects in Ketambe, TNGL, and
surrounding areas is 6.2. Each criterion is already in good enough condition and good for the seven
criteria. The attitude of the local community (F) and the service of the people in charge (G) have the
highest score, which is 6.4. This shows that most people already have a tourism conscious attitude.
Condition of Tourist Attraction Object
Community perceptions of the conditions of tourist attraction in Ketambe, TNGL, and
surrounding areas showed a score of 6.5 which means that they almost reached the highest score.
Among the indicators of the condition of tourist attraction objects considered the best by the
community are the views of hills and mountains as well as the diversity of fauna in Ketambe, TNGL,
and surrounding areas with scores = 6.7. Orangutan and endemic fauna have become good examples
of tourist attractions in TNGL and Ketambe.
4.2. Analysis of Community Participation
Closely related to the characteristics of ecotourism, community participation is important to
know. Based on the results of this study, the community is willing to participate actively in
developing ecotourism in Mount Leuser National Park. The community agrees (score 6) to participate
by working and doing entrepreneurship in the field of ecotourism and strongly agrees (score 7) to
participate in providing land for the tourism sector, maintaining cleanliness and harmony of the
surrounding environment, maintaining the security of the surrounding environment, and increasing the
ability to explain objects tourist attraction object well.
The community is part of the social elements that contribute to the development of ecotourism in
Mount Leuseur National Park area. The community can participate by working and independently
opening a business in the field of ecotourism such as selling food and souvenirs. In addition, with
regard to resources, the community participates in providing the land needed for a well-developed
ecotourism. Community participation in maintaining cleanliness and harmony and security of the
surrounding environment as a form of fulfillment of comfort in carrying out tourism activities in
Mount Leuser National Park. In connection with the willingness of community participation in terms
of increasing their ability to be able to explain the objects of tourist attraction properly, it needs to be
supported by a capacity building program. According to Rachmatullah et al. (2017), in an effort to
increase human resource capacity, the important thing to do is to facilitate local communities with

Rina Suprina, Nurbaeti, Marissa Pusparini
How Community Perception of Ecotourism Affect Participation of Ketambe Village Community in Mount
Leuser National Park, Southeast Aceh
203
Proceedings of CATEA 2019
various skills in the field of ecotourism. In terms of implementation, at least some programs need to
be initiated, such as training in guiding, hospitality and English conversation.
Figure 1. Community Participation
4.3. The Effect of Perception on Community Participation
To find out whether community perceptions of ecotourism in Ketambe Village affect their
participation, it is necessary to test whether these variables are interconnected. Table 1 is the result of
statistical tests to find out the relationship between perception and participation variables.
Table 1. The effect of communitu perception on their pariticipation
Variable Dimension of
Community
Perception
Rank Spearman
Correlation
Sig
Community
Perception
Economy 0.102 0.519
Ecology 0.244 0.120
Socio Culture 0.402 0.008
Infrastructure 0.450 0.003
Service and
facilities
0.481 0.001
Environment 0.308 0.047
Tourism Object 0.361 0.019
Source: The result of Data calculation (2019)
Economy has a weak relationship with community participation, where the correlation value is
0.102, which is closer to 0. This indicates that the economic factors arising from the development of
Mount Leuser National Park have little influence on community participation.Ecotourism ecology has
a weak relationship, where the correlation value is 0.244 and close to 0. It can be interpreted that the
ecological conditions in Siberut Park have little influence on community participation in developing
ecotourism in Mount Leuser National Park.
Socio-culture has a fairly strong relationship with community participation that is equal to 0.402.
Likewise with infrastructure, namely with a correlation value of 0.450. Community service facilities
have a correlation value of 0.481, environment of 0.308, and ODTW of 0.361. This shows that

Rina Suprina, Nurbaeti, Marissa Pusparini
How Community Perception of Ecotourism Affect Participation of Ketambe Village Community in Mount
Leuser National Park, Southeast Aceh
204
Proceedings of CATEA 2019
community perceptions of social culture, infrastructure, service facilities, environment, and tourist
objects have little effect on community participation.
4.4. Result of Hypothesis Regarding the Influence of Perceptions on Community Participation The results of hypothesis testing regarding the influence of perceptions on community
participation using SPSS can be seen in table 2 as follows:
Table 2. SPSS Output Results Perception Effects on Community Participation
Coefficientsa
Model Unstandardized Coefficients Standardized
Coefficients
t Sig.
B Std. Error Beta
1 (Constant) 3.419 .791 4.321 .000
Community Perception .482 .128 .511 3.761 .001
a. Dependent Variable: Partisipasi_Masyarakat
Source: The result of Data calculation (2019)
Data from table 2 shows that there is a significant effect of Community Perception (X) on their
Participation (Y). This is because the significance is <0.05 (0.001 <0.05) so that Ho is rejected. The
value of direct influence given by community perceptions on community participation is 0.511. This
means that community perceptions will have an influence on their participation in developing
ecotourism in Mount Leuser National Park. The coefficient of determination was obtained at 0.261,
which means that community participation in the development of ecotourism in Mount Leuser
National Park can be influenced by their perception of 26.1% and the remaining 73.9% is influenced
by other variables which are not examined in this study.
5. Conclusion Community perception about ecotourism in Mount Leuser National Park as a whole is positive.
They consider ecotourism in terms of economy, ecology, social culture, infrastructure, service
facilities, environment, and tourism objets to have a positive impact on them. This positive perception
makes the community also want to participate in developing ecotourism. This was evidenced by the
community's assessment in this study, which on average agree to be able to actively participate in the
development of ecotourism in Mount Leuser National Park.
The results of the study also showed that the influence of Ketambe Village community
perceptions of ecotourism on their participation was high. This is evidenced by the correlation value
obtained, which is equal to 0.511. Meanwhile the coefficient of determination was obtained at 0.261,
which means that community participation in the development of ecotourism in Mount Leuser
National Park can be influenced by their perceptions of 26.1% and the remaining 73.9% is influenced
by other variables. Hypothesis testing results obtained by t count of 3.761 with a significance of 0.001
and α = <0.05 so that the hypothesis which states that there is a positive and significant influence
between public perceptions of ecotourism on community participation in Ketambe Village is
accepted.
Acknowledgement. The authors thank the Tropical Forest Conservation Action (TFCA), Trisakti
School of Tourism Jakarta, Leuser National Park staff, and all the respondents who kindly
participated and responded to the questions. The authors also would like to thank the editors and
anonymous reviewers for their valuable comments on the manuscript.

Rina Suprina, Nurbaeti, Marissa Pusparini
How Community Perception of Ecotourism Affect Participation of Ketambe Village Community in Mount
Leuser National Park, Southeast Aceh
205
Proceedings of CATEA 2019
References
Journal Papers
Garcia, F.A, A.B Vazquez, R.C Macias. 2015. Resident's attitudes towards the impacts of tourism. Tourism
Management Perspectives 13 (2015) 33–40
Muntasib, 2014. Potensi dan persepsi masyarakat serta wisatawan terhadappengembangan ekowisata di desa aik
berik, lombok tengah. J. UMPA. 1(2):43-49.
Book
Fennel, D. A. 2002. Ecotourism Programme Planning. Buku. CABI Publishing. New York.
Hakim, L. 2004. Dasar-Dasar Ekowisata. Buku. Bayumedia Publishing. Malang.
Matsumoto, Shigeru. 2011. Waste Separation at Home: Are Japanese Municipal Curbside Recycling Policies
Efficient?. Resources, Conservation, and Recycling 55, Elsevier D.V., page 325-334.
Nugroho I. 2011. Ekowisata dan Pembangunan Berkelanjutan. Yogyakarta (ID): Pustaka Belajar.
Rahayu, W.P. dkk. 2003. Klasifikasi Bahan Pangan dan Resiko Keamanannya. Jakarta: PT. Gramedia Pustaka
Utama.
Rahman, A. 2003. Pengusahaan Ekowisata. Buku. Makalah Pelatihan Ekowisata.Fakultas Kehutanan UGM.
Yogyakarta.
Rakhmat, J. 2007. Persepsi Dalam Proses Belajar Mengajar. Jakarta: Rajawali Pers.
Sunaryo, B. 2013. Kebijakan Pembangunan Destinasi Pariwisata Konsep dan Aplikasinya Indonesia.
Yogyakarta: Gava Media.
Sunkar A, Brahmantyo B. 2013. Eko-Geowisata Di Indonesia. Di dalam: Teguh MA, Avenzora R. Editor.
Ecotourism and Sustainable Tourism Development in Indonesia-The Potential, Lessons and Best
Practice. Pusblished Ministry of Tourism and Creative Economy. Jakarta (ID): PT. Gramedia.
Tunjungsari, K.R. 2016. Persepsi Masyarakat Kuta Terhadap Dampak Pembangunan Hotel Berkonsep City
Hotel di Sunset Road Kuta Bali. Proposal Penelitian. Dikti.
Weaver, D. 2001. Ecotourism. Buku. John Wiley and Sons Australia Ltd.Australia.
Thesis
Pujoalwanto, Basuki. 2011. Arsitektur Partisipasi Masyarakat Desa :Studi di Desa Sendangrejo dan Desa
Sendangtirto, Kabupaten Sukoharjo,Jawa Tengah.Salatiga: Program Pascasarjana Studi Pembangunan
(UKSW)
Umar. 2009. Persepsi dan Perilaku Masyarakat dalam Pelestarian Fungsi HutanSebagai Daerah Resapan Air.
Tesis. Universitas Negeri Semarang.

206
Proceedings of CATEA 2019
Proceedings of CATEA 2019
ISBN 978-623-91018-0-0
Building Tourism Institutions for Cultural Life that Support
Tourism By
Riyono Gede Trisoko
Sekolah Tinggi Pariwisata Riau
Abstract: The strength of culture and the uniqueness of the product has always been the main basis for
choosing villages to pilot the development of rural tourism villages, which in fact is the value of tourism
living. The development movement by making the village the center of economic growth in the community
created by the government is an effective strategy to foster a new economy in a more massive and entrenched
society, therefore it is important to be welcomed as a new value that builds up.
Making an independent village is a force that deserves to be truly prepared so that prosperity is truly felt,
therefore various efforts are needed to orbit pilot villages that have advantages - the superiority of the
existence of culture rooted through mature social behavior in a supportive environment. It can be ascertained
that the bustling rural tourism proclaimed is a life of the people who put their life's spirit of hope into their
daily tourism activities, as a fruit of social maturity, which is part of ethno tourism.
Building a life and living it in truth is a reference for the life of tourism in the countryside, this is because the
village is the basis for the birth of social values by making its citizens as models of life. This event is an
important measure for the requirements for the emergence of tourism institutions.
Keywords: cultural strength; product uniqueness; living life; social maturity; tourism institutions
1. Intruduction The nature of a materialist and idealistic culture, makes humans as their supporters to always
try to make it happen, this is the basis for the emergence of a theory that JJ Hoenigmann is known as
common sense, namely an impulse to behave logically due to natural considerations. In people's daily
lives, those who struggle with tourism for example will always have guidelines or habits about
values that they believe in so that they always try to be realized so that they are always meaningful.
This event will always be a meaningful moment to be known and learned for regional areas that
make tourism as a driver of the economy, this will be obtained later patterns or images to compile a
unique leverage, rooted and humble in a community base in tourism.It is hoped that with this pattern
it will be easy to build a tourism area or destination that is organized as a "thematic" map of tourist
flows, this is what the author calls a tourism institution, so the village tourism development program
will begin by understanding its character, a view more than knowledge the potential of the village to
ethno tourism.

Riyono Gede Trisoko Building Tourism Institutions for Cultural Life that Support Tourism
By
207
Proceedings of CATEA 2019
2. Theoretical Basis The success of a tourist destination in a place will generally be a pride for the region, this is
what M Rahmat (2014) identified as social maturity with a special typology of potential places that
have competitive advantage.The superiority of competitiveness in a community group should be an
important entity for all its members in herding participation (Smith, 2005), because building a
community is always needed a strategy so that growth can later become a source of organized pride,
therefore positive associations that develop in the community must be integrated and inherent
(Avraham, 2008).
Living tourism It is the goal of sustainable tourism development, because the existence of
tourism is a symbol of "ethno tourism" from welfare, which is present through the availability of
various social facilities in the community, so that building tourism will mean building an everyday
society as authentic or autentic happiness (Imam, 2014) as a tourism institution.
3. Research Methodology Comparing regional areas that have succeeded in developing deep-rooted tourism is generally
expected to be the key to success in regional areas that will make tourism a driving force for the
economy, this is generally the case with large areas of community support proving that there are
many who participate in creating tourism. This means that tourism is a daily life, a behavior that must
be a model for other regions especially those who want to make tourism as their economic
locomotive.
In this paper the author takes a comparison of three regions that have been fostered by a number
of universities or community groups such as meranti bay village, Chinese reed villages and village
hamlets in three regencies in Riau province compared to the community of Turi Sleman Salak
village. where each with 20 respondents.
Through this comparison we will get an overview of the social situation which will later be
useful to further develop the tourism structure.
4. Research Results / Analysis The importance of participation signifies the role of tourism institutions for the development of
tourism in an area or destination, this situation provides an overview of the need to form tourism
institutions that are increasingly needed in the hope of creating a thematic tourism ecosystem in a
region.
Considering this matter, in this study, the authors conducted in several regions or
community groups that have implemented the pattern of tourism development which can be seen
from the presence of several universities to provide guidance so that an important picture can be
obtained about tourism institutions through; First, "model village". Second, "culture sub- structure".
Third, "the economic value of tourism culture"
Building a real destination is a process of coordination and support between meeting needs,
orientation or philosophy of producing creative, communicative and valuable and the delivery
process can follow needs as identity (Baun, 2008). This means that in building or placing a model in
a tourist village is a place marketing with broader goals (Ashwort, 2009).
Model village strength is generally seen from outward appearance or characteristics that give
rise to a belief, such as in Teluk Meranti village which has a high bay and river lip so that anyone
who sees it will believe if at a certain time there will be a bono (waves back in high rivers as a result
of differences in sea and river texture).. For example in the village of bandar that displays the
impression of the life of the river banks that are seen from the halfway house to the lower market
which is phenomenal with smokel stories, as well as the unique Chinese reed tourism with activities
of rivers, lakes and large trees, all three give a picture type of rural tourist destination. This can be
seen from the table as follows.

Riyono Gede Trisoko Building Tourism Institutions for Cultural Life that Support Tourism
By
208
Proceedings of CATEA 2019
Table 1. Build Village Character
No
Does the product from the village reflect the expertise of the community
NAME OF VILLAGE
TELUK
MERANTI
BULUH
CINA
KAMPUNG
BANDAR
TURI
SELEMAN
1 Strongly Agree
14 12 15 19
2 Agree 4 6 4 1
3 Disagree 2 2 1 0
4 Very Disagree 0 0 0 0
Total 20 20 20 20
From this table illustrates how rural communities have an awareness of the importance of
products as a shared identity or the character of the usefulness of "reliability" that fosters awarwness.
In the village of Turi, showing different results because the village community has a profession of
farmers whose products become pride or branding. This signifies the importance of products that are
built on character due to the presence of elements in the concept, behavior and expertise that are
prosperous. But even so, in building a society that is ready to be open and competitive, it turns out
that the community is "traditional" in maintaining its characteristics as illustrated in table.2, this is
because people understand that uniqueness has the potential as an attraction.
Table 2. Character as an Attraction
No
Whether the product is soldyour production is sure to have interest because it’s
Interssting
NAME OF
VILLAGE
TELUK
MERANTI
BULUH
CINA
KAMPUNG
BANDAR
TURI
SELEMAN
1 Strongly Agree 15 19 18 19
2 Agree 5 1 2 1
3 Disagree 0 0 0 0

Riyono Gede Trisoko Building Tourism Institutions for Cultural Life that Support Tourism
By
209
Proceedings of CATEA 2019
No
Whether the product is soldyour production is sure to have interest because it’s
Interssting
NAME OF
VILLAGE
TELUK
MERANTI
BULUH
CINA
KAMPUNG
BANDAR
TURI
SELEMAN
4 Very Disagree 0 0 0 0
TOTAL 20 20 20 20
In Table 2 tend to have the same character of answer because each village community feels the
same or authentic pride, which is considered capable to be proud of ..
The success of a community group above, especially in developing village products or making
the village a model village, the authors believe because there is something that is believed to be able
to attract the attention of community members because of being a collective style, this is known as
cultural sub culture (Zailani Tammaka, 2007) , because the value believed to be top of mind that is
able to improve as a sense of place (Howe, 2009) so that the value of lasting lasting cultural life is a
mental map that prides itself as an image (Van de Valde, 2008), more than just an awareness of the
outward potential it appears.
Furthermore, the author believes in the strength of collective culture as a sub culture through
table 3. below explains the correlation between individual circumstances and the atmosphere of
their daily environment, which the author believes in the ability of community members to always
adjust to style through assimilation, acculturation and syncretism which leads to a awareness of
behaving welcoming and celebrating towards a skilled society.
Table 3. Pride that Supports it
No
Whether the product characteristics become pride is also expected to be capable of
everyday
NAMA DESA
TELUK
MERANTI
BULUH
CINA
KAMPUNG
BANDAR
TURI
SELEMAN
1 Strongly Agree 15 19 18 19
2 Agree 5 1 2 1
3 Disagree 0 0 0 0
4 Very Disagree 0 0 0 0
TOTAL 20 20 20 20

Riyono Gede Trisoko Building Tourism Institutions for Cultural Life that Support Tourism
By
210
Proceedings of CATEA 2019
From table 3. above, the writer can find a red thread that explains the impression power as a
belief that forms a social order that is very strong holding on to its culture (Koentjaraningrat,1999),
which can serve as pride (Roseno, 2010), but the people tend not to do it, this is because the pride
that is raised does not depart from the needs or habits that are carried out, but because of external
factors, such as nature or historical descriptions. Therefore the concept of mainstreaming is needed
for the anxiety of cultural failure as something that must be fought together (Zailani Tammaka,
2007).
From the elements and social institutions that are owned by a group or village will form a put
out that appears as a collective awareness that reflects a good level of cognitive on the needs of
business progress in a common framework of building villages as tourism villages as social
awareness and time , 1997).
Therefore in the development of tourist villages in the context of positioning, the authors
consider it necessary for the community to increase "leverage" in order to create out put or soft skills
that support the main attraction.
So that in table 4 below, it will illustrate that the situation of community maturity to accept the
state of nature and cultural heritage as a strength or capital that is prosperous because tourism is
considered capable of moving the wheel of life. According to Rahmat (2014) creativity of
social maturity can be seen from awareness in people's attitudes and behavior reflected in ways of
respecting the environment and life such as knowledge of cultivating land and knowledge utilizing
time.
Table 4. Cultural values that inherit the life of tourism
No
What is your belief as a citizen to inherit cultural values to be able to act and act to
pursue tourism as a support for life
NAME OF
VILLAGE
TELUK
MERANTI
BULUH
CINA
KAMPUNG
BANDAR
TURI
SELEMAN
1 Strongly Agree 0 8 7 18
2 Agree 5 6 11 2
3 Disagree 9 6 2 0
4 Very Disagree 6 0 0 0
Total 20 20 20 20
Appreciating from table 4. above, the author sees that the strength of values developed in the
community life in Turi Sleman village has a positive effect on community constancy in
supporting farming culture, is a "social maturity" so that it has an inheritance of "farming
culture", which in turn can be developed and juxtaposed with tourism.

Riyono Gede Trisoko Building Tourism Institutions for Cultural Life that Support Tourism
By
211
Proceedings of CATEA 2019
5. Conclusion
Figure 1. Diagram Path Tourist Institutions
From this figure, it can be seen that after we look at the potential of a village, what must be
recognized more deeply is the awareness of the values that develop, are adhered to and supported by
the community or environment, because with that knowledge it will be easier to determine the
attitude that must be formed. because the system of life has been measured by what is capable
and needed, through the structure of tourism the process of achieving tourism in the community will
be more precise and faster.
This tourism infrastructure framework is a guide to see in advance about the state of a tourist
destination in full, this is needed because this framework has tools that are quickly understood and
provide guidance, so it is also easy to determine the appropriate pattern for determining the program
set for fostering further more precisely.
Figure 2. Tourism Institution

212 Proceedings of CATEA 2019
References Asworth, Gregory. (2009). Beyond Logo: Brand Managementfor Cities dalam Brand
Management, vol.16/2009: 8,520-531, Pagrave Macmillan.
Howe, Peter D. (2009).Newsworthy Spaces: The Sementic Geographies Of Local News. Aither. USA.
Iman Setiadi. (2016). Psikologi Positif. PT Gramedia, Jakarta.
Koentjaraningrat. (1999). Wujud Kebudayaan. Insan Press. Jakarta
Rahmat Yanand, Ummi Salamah . (2014). Branding Tempat, membangun kota, kabupaten, dan provinsi
berbasis identitas. Makna Informasi, jakarta.
Roseno Adji Alfandi .(2014). Revolution of Hope. Renebook. Jakarta
Sidi Gazalba. (1998). Teori Kebudayaan. Yogyakarta.
Van de Velde, Bart. (2008), City Image In Media, Towaring Researching city Media Image. Master Thesis
Eramus Scholld Of Economics. Eramus Universty of Rotterdam.

213
Proceedings of CATEA 2019
Proceedings of CATEA 2019
ISBN 978-623-91018-0-0
Community Perception of Food Preferences
in Bogor
Dedy Wijayanto1, Christin Setiawan
2
1Sekolah Tinggi Pariwisata Trisakti
2Sekolah Tinggi Pariwisata Trisakti
deddywijayanto@stptrisakti,ac.id, [email protected]
Abstract: A pluralistic society from different backgrounds certainly has different food choices depending on
their origin. Lots of traditional food that still exists and is still maintained by the community including various
cultures. These traditional foods are timeless even though there are many foods that come from outside such as
fast food.The purpose of this study is to identify what foods are typical of the city of Bogor from the many foods
available. Identify the most crucial problems in the development of culinary tourism and the obstacles faced in
the development of culinary tourism. Does the local government in this case intervene in fixing the existence of
culinary tourism. Bogor is the distance from the big cities around it like; Jakarta and Bandung and Sukabumi so
many visitors from these three cities. These tourists have come to Bogor deliberately just to enjoy the culinary
that is characteristic of Bogor city. This research method uses a quantative descriptive approach and data retrieval uses; interview, observation and
submit questionaires to several respondents.
Keywords: perception; potential; preference
1. Introduction Culinary art is one of the attraction for foreign tourists who conduct a trip with the aim to enjoy
various kinds of good food. In fact, the tourism sector can make the mainstay for local governments in
terms of income through its culinary tourism.
Culinary tourism is a tour where tourists can enjoy the results of processed foods and their way
of processing. Usually, culinary tourism serves food that is the characterisitk of the local area.
Tourists who come to Bogor usually come from the surrounding towns for example; Jakarta,
Bandung, Sukabumi, Bekasi and so on. There are various reasons they come to Bogor including;
Visiting, family, Sanak-saudara, friends, medication, relaxing enjoying entertainment or dining.
This type of culinary is a variety of food, although it is not exactly the same as Western a'la
menu. European food there is food; Starters, main meals and desserts and drinks. European food is
distinguished between morning, day and night food. While Indonesia, does not have it at all.
Indonesian food for morning, afternoon and evening is the same. For example, the morning lunch is
cooked rice and rice dinner as well. (Suarni, 2013).
1.1 Indentification Problems
Consumer preference is the choice of a person's likes or dislike of the product (goods or services)
consumed. Preference shows consumers ' liking from a wide range of available products (Wijayanti,
2011 in Aiman, 2017). From the many typical food of Bogor city there are still genuine from Bogor
but some are already mixed with food from other regions.
Then the problem identification is:

Dedy Wijayanto, Christin Setiawan
Community Perception of Food Preferences in Bogor
214
Proceedings of CATEA 2019
- How is the community's perception of local Bogor food?
- Is this food preference influenced by social factors?
- How is the payment method used in the transaction?
- Is influenced by the environment in determining the favorite food
1.2 Research Problems
- How far do tourists love the local food of Bogor?
- What is the most liked food and a community craze?
- How often do people enjoy culinary in Bogor?
- Are there any constraints faced by traders and governments
2. Literature Review 2.1 Preferences
Preference in English has the meaning of choice or choose. The term preference is used to
replace the word preference with the same meaning or interest in something. Consumer preferences
are defined as subjective tastes (individuals), as measured by utilities, from bundles of various items.
According to Kotler (2000), consumer preference shows consumers ' liking from a wide selection of
existing service products. Preference is a fondness (heart tendency) to something. Preference is also
interpreted as a person's liking or dislike of a product, goods or services consumed.
Consumer Prerefention is influenced by:
Actions to compose, identify, and interpret sensory information to provide an overview and
understanding of the environment. Perceptions include all signals in the nervous system, which are the
result of physical or chemical stimulation of the sensing organ. is a process preceded by sensing,
which is a stimulus received by the individual through a receptor tool that is the senses. The sensory
instrument is a liaison between individuals and external worlds. Perception is the stimulus that the
individual senses, organized and then interpreted, so that individuals realize and understand what it
senses.
At a glance the same perspective as the perception, however, Charon (1998) mentions that it is
not perceptual but rather the guiding of our perception.; To what it sees and how it interpretively
affects what it sees and How to get rid of it. Preference has the meaning of choice or choose. The
term preference is used to replace the word preference with the same meaning or interest in
something. Preference is a trait or a desire to choose (Planit, 2001). According to Doris Grober the
general media preference asks media users to sort the user's preferences against a medium (Vivian,
2010).
The culinary destination is to attract as many tourists as possible to come to the area in various
ways. Traditional food is a typical food of the region (Sujerti, 2016).
In an effort to avoid the dominance of foreign cultures and promote the culture of the archipelago,
Indonesian teaching books should insert many cultural elements that include the use of local names,
the mention of places that become regional icons in Indonesia, a description of the regional art, and
the mention of local culinary names. (Setiawan, 2016 and Tyas, 2017).
Customer
Preference
Social Factor
Payment Method
Environmental Factor

Dedy Wijayanto, Christin Setiawan
Community Perception of Food Preferences in Bogor
215
Proceedings of CATEA 2019
Thingking Frame
Robbin (2003) Wardani, (2017)
Perception (from Latin perceptio, Percipio) is the act of composing, recognizing, and interpreting
sensory information to provide an overview and understanding of the environment. Perceptions
include all signals in the nervous system, which are the result of physical or chemical stimulation of
the sensing organ. There is a wide variety of perceptions in society. Perception is often also associated
with a person's view of something can be either positive or negative. While Preference is a choice of
something like food, clothing or anything else.
Hypotheses in the study are as follows.
Ho: No difference in food selection by people in Bogor City
H1: There are differences in food selection by people in Bogor City
3. Research Methodology 3.1 Location and Research Time
The research was planned to be conducted at the Culinary center of Bogor City and took
respondents randomly on January 2019 for 1 week.
The method of study that will be used is to use observation method that is considered suitable for
examining how people behave and view the realities of their lives in their ordinary, routine and
natural environment (Mulayana, 2013). Researchers are trying to understand the meaning of the
subjects adopted in their own conduct and the behavior of others, the objects and their environment,
for example what is important and not important to them and how to treat Those objects. The
population in this research is traders located in the city of Bogor and samples in the study amounted to
35 people taken randomly (random sampling).
3.2 Data source
The source in this study is derived from the population and samples. While data is obtained from
primary data i.e. interviews and secondary data, the study of the library.
In research data sources are the subjects from which data can be obtained. If the research is using
a questionnaire or an interview in the data collection, then the source is called the respondent, which
is the person who responds or answers the researcher's question, whether written or oral.
3.3 Data Collection Techniques
The process of collecting data is determined by variables that exist in the hypothesis. Data
collection is done against pre-defined samples. Data is something that does not have meaning to the
recipient and still needs a processing. Data can have various forms, ranging from images, sounds,
letters, numbers, languages, symbols, even circumstances. All these things can be called as data as
long as we can use as material to see the environment, objects, events, or a concept
Perception
1. Perception behavior
2. Object or
3. Target which is
perception and situation
Preferention
1. Social factor
2. Method of payment
3. Enviroenment factors

Dedy Wijayanto, Christin Setiawan
Community Perception of Food Preferences in Bogor
216
Proceedings of CATEA 2019
3.4 Data Analysis
The Data obtained will be analyzed using nonparametric test-chi-square to find out which one is
the preferention for the community of Bogor visitors. The Chi-Square test is also used to discover
which culinary tourism area is the most demanded and the respondents ' self-data.
4. Results and Discussion From the results of the survey can be known that respondents with male gender as much as 42
people or 50% while females as many as 36 people or 42%. This means that the dating to the city of
Bogor to enjoy the typical food of the city of Bogor most men than women but not too linked far.
Meanwhile, when asked to come from where, the answer is the most coming from the city of Bogor
itself as much as 21 people or 25%, from Jakarta 45 people or 53% Bandung 12 or 14.3% and others
as much as 6 people.
Usually Indonesians always travel in a group with friends or family. The data obtained the
information that went both (2) most 24%, numbering in a group of 3 -5 people there are a number of
54 or 64.3%, and more than 5 people as much as 7.1% of the total Reponden of 84 people.
Most of the dating to enjoy the typical food of the city of Bogor is either a private employee or
public servants as many as 27 people or 32.1%, a student of 15 persons or 17.9%, a
trader/entrepreneur as many as 18 people or 24.4% and the remaining 24 people Or 28, 6 answered
others.
Meanwhile, when asked about how often they dating visit to enjoy the typical food of Bogor City 3
times in the last 6 months as much as 9 people or 17.7%, which more than 3 times as much as 69
people or 82.1%, J replied. As for those who answered the other 4 people or 3.6%.
When asked about their favorite when visiting Bogor City, his favorite food. A total of 42 people
or 12% are looking for Soto Mie and Bogor Sauerkraut. Apparently this is the favorite of food
connoisseurs. Furthermore, Cungring food as much as 18 people or 21%, while who chose Laksa as
much as 9 people or 21%. Fried Taoge 6 people or 36%.
Which is the most desirable culinary tourism place including Jalan Surya Kencana as much as 48
people or 57.1%, road Bangbarung as many as 6 people or 7.1%, Nv prints 9 people or 10.7%.
The reason dating to the city of Bogor because it is pangaruh by social media as much as 24 people or
21%, who said disagree because of the influence of social media as much as 27 people or 21%. In
other words they are dating to Bogor not because of the influence of social media such as; Twitter,
Instagram, Facebook and-others.
The reason they come to the city of Bogor to eat a friend call then, as many as 30 people or 21%
expressed agree while 21 people disagree. For many choices of Bogor city food respondents
answered, disagree as much as 39 and who agrees only 18 people. Payment method also affects
visitors to enjoy the food of Bogor city. When asked about it as much as 21 people said a piece that
expressed disagreement as much as 45 people. Meanwhile, for statements regarding environmental
conditions, a large answer is not affected
5. Conclusion KTA Bogor Special food that became a favorite of the community is, sauerkraut Bogor for 40,
286a, Soto Mie and laksa with the same chi-square of 31, 714a, followed by fried toge of 29, 286a
while Soto kuning amounted to 26, 571a and Last is cungkring by 19, 714.
The acknowledgments
The acknowledgments are addressed to a number of parties;
1. Head of P3M Tourism High school Trisakti. Dra. Rina Suprina.M.Hum.M.Si Par.
2. Chief of Tourism High school Trisakti. Fetty Asmaniaty. SE., MM
3. Christin Setiawan S. ST., M. Par – Assistant researcher
4. Bagas-Student-Pencacah
5. Rafael, Student-Pencacah
6. Nabila Student-Pencacah
And all parties are not likely to be mentioned one per one. For all the help so that it can be held this
research.

Dedy Wijayanto, Christin Setiawan
Community Perception of Food Preferences in Bogor
217
Proceedings of CATEA 2019
References Aiman. A, Asep Agus Handaka, and Walim Lili, 2017. Analysis of consumer preferences in decision
making buying processed fishery products in Tasikmalaya (case studies in traditional market
Cikurubuk, Kec. Mangkubumi
Philip Kotler, Marketing Management, Prehalindo, Jakarta, 10th Cet, 2000, H. 154.
Mayendra, Derry. 2013. The credibility of the political news in Online Media Okezone.com against user
preferences. Scientific writing: University of Gunadarma.
Saad. E. 2016. The influence of culinary socialization, culinary product innovation and culinary product
image of the buying interest of traditional culinary consumers in the city of South Tangerang. University
of Muhammadiyah Prof. Dr. Hamka. E-mail: [email protected]
Suarni, 2013. Corn-based traditional food development supports food diversification. Journal of Cereal Crops
Research. Jl. Dr. Ratulangi No. 174, Maros, South Sulawesi.
Sukerti, Ni Wayan et al (2016). Traditional food reinventarization of Buleleng as the preservation effort of
Balinese culinary art. Journal of Social Sciences and humanities. Ganesha University of
Education. E-mail: [email protected].
Tyas. Agnes Siwi Purwaning. 2017. Identifying Indonesian local cuisine in English language learning.
Journal of Applied Tourism Vol 1 No 1. 2017. Diploma in English, vocational school, Gadjah Mada
University [email protected]
Wardani, Ujang Sumarwan, Lilik Noor Yuliati. 2017. Influence of perception and consumer preference of
Green Product Residence decision
Wijayanti, M. 2011. Customer preference analysis in buying meat. Cow at the traditional market in
Karanganyar Regency. Thesis. Faculty of Agriculture. University of eleven March. Surakarta.

218
Proceedings of CATEA 2019
Proceedings of CATEA 2019
ISBN 978-623-91018-0-0
Determinants of E-service Quality Towards Continuing Using
Mobile Application for Hotel Reservation: Case of Agoda
Application
Krittipat Pitchayadejanant
1*, Kritta-orn Chewwasung
2, Parinya Nakpathom
3
Kritiya Srikasem4, Manatchanan Lekmeechai
5, Chanitta Chaiyawet
6, Sirintip Suriwong
7, Chen
Wei Tso8
1,2,3
Instructor, Burapha University International College 4,5,6,7,8
Undergraduate Students, International Hospitality and Tourism Management, Burapha University
International College
*[email protected], [email protected], [email protected]
*Corresponding Author
Abstract: Agoda application for booking online is popular in Thailand and dramatically increased in every year
because the life style of tourists is changed due to technology adoption. The determinants to find out the effect
between electronic service (e-service) quality and continuing usage help the online travel agents to consider the
application features. As a consequnce, this research aims to find out the determinants of e-service quality that
significantly affect customers’ continuing application usage. E-service quality determinants consist of 5
dimensions: ease of use, application design, responsiveness, information quality and assurance. The respondents
in this study are tourists who come to travel to Bangsaen beach and use Agoda application for hotel reservation
in this travel. With this study, 400 respondents filled in the questionnaire during March and April 2019. The
statistic techniques to analyze for achieving the research objective are exploratory factor analysis (EFA) and
structural equation model (SEM). The result shows information quality and responsiveness are significantly
influent the continuing application usage. The strongest influence on continuing application usage is information
quality and responsiveness, respectively. The finding can assist the online travel agency to reconsider their
website or invented mobile application to support their customers for reserving hotel. According to managerial
point of view, the tourists are looking for the application that updates information regularly, has precise and
clear information. Furthermore, the quick response on customers’ feedback and their request to provide the
necessary information is essential for their continuing application usage.
Keywords: E-Service Quality; Mobile Application; Hotel Reservation
1. Introduction Contemporarily, people are beginning to arrange traveling by themselves. The use of online travel
agencies and internet-based accommodation booking platforms have increased significantly over the
past decade (Guttentag, 2015). Potential guests can gather information about the accommodation
structure without contacting the accommodation or turn to the travel agency. They can prepare their
travel routes while viewing the screen, checking room availability and comparing prices and facilities
(Runfola, Rosati, Guercini, 2013). Hotel booking applications offer the most convenient way of
landing the best booking deals. According to previous researches, consumers are turning to the
internet to take advantage because of easy booking and price comparing. Currently, the trend of
consumers searching information via online before making decision has increased obviously.
The advancement of internet technology has forced hoteliers to invest significant amounts of
money and put effort to develop and maintain their information channels both offline and online.
Especially online channel, researchers have considered on developing and testing online hotel

Krittipat Pitchayadejanant, Kritta-orn Chewwasung, Parinya Nakpathom, Kritiya Srikasem, Manatchanan Lekmeechai,
Chanitta Chaiyawet, Sirintip Suriwong, Chen Wei Tso
Determinants of E-service Quality Towards Continuing Using Mobile Application for Hotel Reservation: Case of Agoda
Application
219
Proceedings of CATEA 2019
booking models (Liu & Zhang, 2014; Qi, Law, & Buhalis, 2013; Scaglione, Schegg, & Murphy,
2009). Studies have shown that the adoption of hotel websites is positively related to performance
(Scaglione et al., 2009). In addition, hotel revenue without booking via online has decreased. As a
consequence, booking applications are inevitably looked over because they are online source and
comfortable for customers.
Main reason for using application is providing a better user experience in speed and ease of use.
However, the popular booking application in Thailand is Agoda. Agoda hotel booking application is
the tool for you to find hotels and other accommodation all over Thailand. The aim of this research is
to find out how the accommodation booking application are analysis tourists demand on which
information or content they are concerned in booking application and which information that they still
lack. Online hotel booking technology has become a major tool for selling hotel services.
2. Literature review
2.1 Online Booking
An online booking system is a software that can be used for reservation management. It allows
tour and activity operators to accept bookings online and better manage their phone and in person
bookings (Odgers, T. 2017). Online booking means booking through the Internet (Bhatiasevi &
Yoopetch, 2015). Generally, hotel management has to concern costs controlling but still provide
convenient booking facilities for travelers. Hence, using online booking tools (OBTs) such as hotel
websites, online travel agency websites, and airline websites, are applicable to serve the guests. With
online booking, customers can book airline tickets, hotel accommodation and other travel-related
products or services using mobile phones or other portable mobile devices connected to the wireless
network (Yang, Chu, & Yang, 2006). Recently, the online booking technology has widely adopted by
service providers, hoteliers and customers because it is easy for checking information, inquiries and
booking online (Carlson Wagonlit Travel, 2011). The customers are convenient for payment because
they can be processed in multiple currencies and transaction data are protected and retrieved securely.
2.2 Agoda application
Agoda application is the largest and fastest growing online hotel booking platform in Asia. Many
hotels deal with Agoda; it is useful because it helps traveler in finding the cheapest hotels no matter
wherever they are in the world. It offers the most affordable price which provide everything you
request. This application is easy to use and let you check the price, hotel location and
recommendation. You can switch to the map and see the rates of hotels in your preferred location.
Agoda provides the comparison indicators in order to prevent the catchy information. This application
is such eco-system because the travelers can give the feedback about their experience towards the
destination via application. The bookers can read the feedback for assisting their decision.
2.3 E-Service Quality
Electronic service (E-service) is defined as services provided through electronic networks
including with providing products, environments and delivery in any business model. With the
adoption of electronic services in the commercial sector, people have realized the importance of
measuring and monitoring the quality of electronic services in the virtual world. The quality of
electronic services has become as interesting issues in service industry. E-service quality is service
provider through a given electronic channel without human intervention in order to enhance
customer’s experience. E-service consists of five factors that measure and evaluate e-service quality
which are ease of use, application design, responsiveness, information quality, and assurance (Tan, C.
W., Benbasat, I., & Cenfetelli, R. T., 2013).

Krittipat Pitchayadejanant, Kritta-orn Chewwasung, Parinya Nakpathom, Kritiya Srikasem, Manatchanan Lekmeechai,
Chanitta Chaiyawet, Sirintip Suriwong, Chen Wei Tso
Determinants of E-service Quality Towards Continuing Using Mobile Application for Hotel Reservation: Case of Agoda
Application
220
Proceedings of CATEA 2019
2.3.1 Ease of use
Based on to Constantinides (2004), usability is associated with the success or failure of a website
and the experience of a customer's website. He claims that this function is really imperative for the
website. Zeithaml, V. A., Parasuraman, A., & Malhotra, A. (2002) claims that ease of use is a key
consideration when customers judge the quality of service of a website. Terminological usability and
ease of use are synonyms of online settings. Relevant elements of this dimension are: website
function, speed, general design and website organization (Zeithaml et al., 2002). Nah and Davis
(2002) defined usability as being able to find a person's way on the network, find the information
needed, know what to do next, and, most importantly, do it with minimal effort. The core of this
usability concept is ease to navigate and search information. Usability dimension included
functionality, information access and navigation (Constantinides, 2004; Ribbink et al., 2004).
Zeithaml et al. (2002) discussed the accessibility of information and the scope of information
affecting the quality of service. Ribbink et al. (2004) discussed the dimension of ease of use that is
especially important for new guests. They also believe that this is an important condition for
consumer satisfaction because it is closely related to the development of customer experience.
2.3.2 Application design
According to Lee & Lin (2005), application design is necessary for online application. It is shown
clearly on the interface which customers watch when they access to the application. Thus, it can gain
the first impression of the customer, keep their attention and let them interact when they enter the
application. The design method also is important with the first attraction which increases the customer
trust and customer satisfaction. This theory is suitable to apply for service application because service
application also has the same characteristic and display as retailer websites (Constantinides, 2004).
Ribbink et al., (2004) claim that the design of the display is a conditional factor which has the ability
to check overall service quality.
2.3.3 Responsiveness
Responsiveness is one of factor presenting service quality (Zeithaml et al., 2002). It involves being
able to answer customer questions and solve customer problems (Kassim & Abdullah, 2010). Fan &
Tsai (2010) believed that effective customer support was one of the important factors determining the
success of online entrepreneurs and websites. Ribbink et al. (2004) claimed that online customers
want to respond quickly to their requests and get useful advice from service providers. They also
emphasized that professional responses can have a positive impact on customer satisfaction.
Gummerus et al. (2004) and Kassim and Abdullah (2010) agreed and stated that responsiveness did
not only improve customer satisfaction, but also increased customer trust in the service. Therefore, the
responsive dimension is qualified as being as one dimension of service quality (Ribbink et al., 2004).
According to Gefen (2002) and Zeithaml et al. (2002), companies can research customer needs and
customer behavior by gathering customer responsiveness which affecting to the customer's impression
and customer loyalty.
2.3.4 Information Quality
In the hotel website, the quality of information is very influential for hotel customers due to
usually customer do inspect hotel website for hotel information surveillance. According to the
information quality, one of the most vital factors in determining the success of a hotel website (Wong
& Law, 2005). All details and information should communicate concurrently and be understandable to
the customer precisely. Customers will satisfy when the website can provide accurate information to
customer honestly. There are various hotel websites indicators that should aware, for instance,
features, connections to other sites, usefulness of content, visual appearance and rate information
(Wong & Law, 2005).
2.3.5 Assurance
In order to motivate visitors to book hotel accommodation through the website, customers need to
ensure that the application or website will keep their information confidentially and safely. In this

Krittipat Pitchayadejanant, Kritta-orn Chewwasung, Parinya Nakpathom, Kritiya Srikasem, Manatchanan Lekmeechai,
Chanitta Chaiyawet, Sirintip Suriwong, Chen Wei Tso
Determinants of E-service Quality Towards Continuing Using Mobile Application for Hotel Reservation: Case of Agoda
Application
221
Proceedings of CATEA 2019
context, safety refers to conditions that protect against the dangers, risks or injuries. On the other
hand, privacy refers to the ability of hiding individuals or groups important information of customers.
Hotel websites are available online and accessible to everyone, hotel customers care about the security
and privacy of the information they shared on the site. For illustration, customers may be required to
disclose their personal information, such as name, address, age, gender, personal financial status,
credit card number, social security number or social security number, for online booking. This
information may be exposed to a variety of risks, such as online scams, online hacking, etc. (Law and
Jogaratnam, 2005). Therefore, the hotel website should be able to provide good protection and the
personal information of all customers is kept in a safe place. When customers trust the hotel booking
site, they will be more interested in using online booking. Payment can be processed in multiple
currencies and your transaction data is protected with Secure Sockets Layer connection to ensure
secure transactions (Constantinides, 2004).
2.4 Loyalty
During the term of using the service, partly from the behavior of consumers, including the
reliability of the application itself is the main factor, making customers trust and loyalty to the
application. If consumers feel satisfied with products or services, they will become a recurring
customer. Furthermore, loyal customers hold constancy of sales by increase in purchasing power and
help company to reduce expenses to attract attention. Besides, loyal customers advance the
competitive edge for companies and not to be susceptible of the changing price. In addition, loyal
customers convey optimistic behavior about the company. It is high priority to achieve loyal
customers in the virtual world than in the physical world.
Figure 1. Proposed Framework
Accordingly, to the above theoretical framework, the following research hypotheses are
formulated:
Hypothesis 1: Ease of use directly and positively influences E-Loyalty.
Hypothesis 2: Application design directly and positively influences E-Loyalty.
Hypothesis 3: Responsiveness directly and positively influences E-Loyalty.
Hypothesis 4: Information quality directly and positively influences E-Loyalty.
Hypothesis 5: Assurance directly and positively influences E-Loyalty.
3. Research Methodology The questionnaire is developed as the research instrument and consisted of five parts. The first part
is socio-demographic characteristics which are age, gender, education level and personal annual
income. Secondly, 20 items related to e-service quality dimension which included 5 dimensions which
are ease of use, application design, responsiveness, information quality and assurance are developed.
Thirdly, 4 items of customers’ loyalty are developed. Lastly, the recommendation was the last part in
order to know deeply tourists’ perspective in Agoda application. Respondents in this study are the
people who already have the experience of Agoda application and give the score with 5-point Likert
scale. The reliability test of the questionnaire is 0.908.

Krittipat Pitchayadejanant, Kritta-orn Chewwasung, Parinya Nakpathom, Kritiya Srikasem, Manatchanan Lekmeechai,
Chanitta Chaiyawet, Sirintip Suriwong, Chen Wei Tso
Determinants of E-service Quality Towards Continuing Using Mobile Application for Hotel Reservation: Case of Agoda
Application
222
Proceedings of CATEA 2019
4. Data analysis
4.1 Socio -Demographic
The socio-demographic characteristics are presented in Table 1. The number of gender between
male and female is close to the half but the majority of respondents’ age is 18-25 years old because
they are proactive to use technology for online booking. Of course, the majority of occupation are
students.
Table 1. Socio-Demographic Characteristics of Respondents
Variable
N=400
Percentage
Valid Percentage
Cumulative
Percentage
Socio-Demographic Characteristic
Gender
Male 193 48.3 48.3 48.3
Female 207 51.8 51.8 100.0
Age
18-25 284 71.0 71.0 71.0
26-35 54 13.5 13.5 84.5
36-45 17 4.3 4.3 88.8
46-55 36 9.0 9.0 97.8
55 and above 9 2.3 2.3 100
Occupation
Student 271 67.8 67.9 67.9
Employee 44 11.0 11.0 78.9
Business Owner 43 10.8 10.8 89.7
Government officer 30 7.6 7.6 96.3
Housewife 12 3.1 3.1 100
4.2 Factor Analysis
According to table 2, shows the assessment of factor loading and reliability of each construct. The
result of the table shows that all constructs are acceptable; composite reliability greater than 0.7. The
analysis shows the total variance explained 62.013% which satisfies in social sciences research. With
the restriction of analysis, there is one item is not extracted in any factor, thus, it has been deleted.
Table 2. Principle component analysis factor loading and composite reliability
Constructs and items Standardized
loadings
Composite
reliability
Assurance
1. Agoda application protects private customer information.
2. Payment system of Agoda application is safe.
3. Agoda application secures customer transaction.
4. Payment policy explains in detail and easy to understand.
0.776
0.756
0.754
0.658
0.816
Responsiveness
5. Agoda application responds request quickly.
6. It is easy to contact Agoda staff.
7. Agoda concerns providing feedback.
8. Agoda application provides necessary information.
0.804
0.756
0.736
0.581
0.800
Ease of use
9. Agoda application is easy to find information.
10. Agoda application helps to save times in booking.
11. Agoda application is easy to use.
12. Agoda application interface is friendly.
13. Agoda application displays attractive service information.
0.737
0.732
0.687
0.637
0.524
0.787
Quality of Information
14. Agoda application has completed hotel booking information.
0.796
0.746

Krittipat Pitchayadejanant, Kritta-orn Chewwasung, Parinya Nakpathom, Kritiya Srikasem, Manatchanan Lekmeechai,
Chanitta Chaiyawet, Sirintip Suriwong, Chen Wei Tso
Determinants of E-service Quality Towards Continuing Using Mobile Application for Hotel Reservation: Case of Agoda
Application
223
Proceedings of CATEA 2019
Constructs and items Standardized
loadings
Composite
reliability
15. Agoda application has updated regularly.
16. Agoda application delivers good information.
17. Agoda application has clear communication to customers.
0.713
0.707
0.595
Application Design
18. Agoda application has good design.
19. Agoda application provides understandable information.
0.848
0.771
0.713
4.3 Structural Equation Model (SEM) Analysis
According to the result of research model, the measurement indicators of model results very well
fitting: CMIN/DF = 1.856, GFI = 0.919, AGFI = 0.900, CFI = 0.948, RMR = 0.033, and RMSEA =
0.046.
Table 3. E-service quality dimensions affecting loyalty
Model Unstandardized
Coefficient
Standard
Error
Standardized
Coefficient P-value Result
Ease of use 0.104 0.100 0.089 0.298 H1 is not rejected
Application design 0.109 0.154 0.056 0.481 H2 is not rejected
Responsiveness 0.323 0.087 0.307 0.000** H3 is rejected
Assurance -0.103 0.077 -0.107 0.180 H4 is not rejected
Quality of
information 0.388 0.083 0.371 0.000** H5 is rejected
** P-Value < 0.05
In Table 3, the result of E-service quality dimensions of Agoda application affecting to customer
loyalty are responsiveness (ꞵ = 0.307, p-value = 0.000) and quality of information (ꞵ = 0.371, p-
value = 0.000). In contrast, three dimensions do not affect the customer loyalty which are ease of use
(ꞵ = 0.104, p-value = 0.298), application design (ꞵ = 0.109, p-value = 0.481), and assurance (ꞵ = -
0.103, p-value = 0.180). The dimension that has the most effect to customer loyalty is quality of
information; secondly, it is responsiveness.
5. Conclusion and Implication According to the result, the respondents has already used the Agoda application more than one
time. In addition, the respondents are growing up with technology, then they are familiar with the
application. Hence, the ease of use, application design, and assurance are not their difficulties to
escape from their usage and being loyalty. Therefore, the result shows these three dimensions have no
effect toward being loyalty of customer. Surprisingly, there are only two dimensions: quality of
information and responsiveness affecting to be loyalty of customer. As a consequence, Agoda
application has implemented the ease of use, application design, and assurance very well so that the
customer are used to its application until they do not realize the dimensions are special or outstanding
to affect their being loyalty.
For attracting this group of customer for being loyalty, the application should be good response to
customers’ request: reducing the waiting time for booking. The application should be abruptly
retrieved the requested information and shown. In addition, the information should be delivered
correctly and updated regularly.

Krittipat Pitchayadejanant, Kritta-orn Chewwasung, Parinya Nakpathom, Kritiya Srikasem, Manatchanan Lekmeechai,
Chanitta Chaiyawet, Sirintip Suriwong, Chen Wei Tso
Determinants of E-service Quality Towards Continuing Using Mobile Application for Hotel Reservation: Case of Agoda
Application
224
Proceedings of CATEA 2019
Figure 2. Result of study
Acknowledgement
This research is fully supported by Burapha University International College (BUUIC)
References
Constantinides, E. (2004). Influencing the online consumer's behavior: the Web experience. Internet
research, 14(2), 111-126.
Emir, A., Halim, H., Hedre, A., Abdullah, D., Azmi, A., & Kamal, S. B. M. (2016). Factors influencing online
hotel booking intention: A conceptual framework from stimulus-organism-response
perspective. International Academic Research Journal of Business and Technology, 2(2), 129-134.
Fan, W. S., & Tsai, M. C. (2010). Factors driving website success–the key role of Internet customisation and the
influence of website design quality and Internet marketing strategy. Total Quality Management, 21(11),
1141-1159.
Gefen, D. (2002). Reflections on the dimensions of trust and trustworthiness among online consumers. ACM
SIGMIS Database: the DATABASE for Advances in Information Systems, 33(3), 38-53.

Krittipat Pitchayadejanant, Kritta-orn Chewwasung, Parinya Nakpathom, Kritiya Srikasem, Manatchanan Lekmeechai,
Chanitta Chaiyawet, Sirintip Suriwong, Chen Wei Tso
Determinants of E-service Quality Towards Continuing Using Mobile Application for Hotel Reservation: Case of Agoda
Application
225
Proceedings of CATEA 2019
Gummerus, J., Liljander, V., Pura, M., & Van Riel, A. (2004). Customer loyalty to content-based web sites: the
case of an online health-care service. Journal of services Marketing, 18(3), 175-186.
Kassim, N., & Asiah Abdullah, N. (2010). The effect of perceived service quality dimensions on customer
satisfaction, trust, and loyalty in e-commerce settings: A cross cultural analysis. Asia pacific journal of
marketing and logistics, 22(3), 351-371.
Law, R., & Jogaratnam, G. (2005). A study of hotel information technology applications. International Journal
of Contemporary Hospitality Management, 17(2), 170-180.
Nah, F. F. H., & Davis, S. (2002). HCI research issues in e-commerce. Journal of Electronic Commerce
Research, 3(3), 98-113.
Ribbink, D., Van Riel, A. C., Liljander, V., & Streukens, S. (2004). Comfort your online customer: quality, trust
and loyalty on the internet. Managing Service Quality: An International Journal, 14(6), 446-456.
Tan, C. W., Benbasat, I., & Cenfetelli, R. T. (2013). IT-mediated customer service content and delivery in
electronic governments: An empirical investigation of the antecedents of service quality. MIS quarterly, 77-
109.
Wong, J., & Law, R. (2005). Analysing the intention to purchase on hotel websites: a study of travellers to Hong
Kong. International Journal of Hospitality Management, 24(3), 311-329.
Zeithaml, V. A., Parasuraman, A., & Malhotra, A. (2002). Service quality delivery through web sites: a critical
review of extant knowledge. Journal of the academy of marketing science, 30(4), 362-375.

226
Proceedings of CATEA 2019
Proceedings of CATEA 2019
ISBN 978-623-91018-0-0
Experiential Value for International Tourists’ Satisfaction and
Loyalty Toward Beach Activities in Pattaya City, Thailand
Parinya Nakapthom1*
, Aristeidis Gkoumas2, Krittipat Pitchayadejanant
3,
Pavel Shvedov4, Kulanattha Mcbriar
5, Thanatda Budda
6, Sarinna Saisot
7, Pimpapisa Indang
8
1Instructor, International Hospitality and Tourism Management, Burapha University International College
2Instructor, International Hospitality and Tourism Management, Burapha University International College
3Instructor, Logistic Management, Burapha University International College
4Undergraduate Students, International Hospitality and Tourism Management,
Burapha University International College
[email protected]*, [email protected], and [email protected] (9 pts)
Abstract: Pattaya has been one of famous tourism destination in Thailand due to natural resources, plenty of
accommodations, variety food and beverages, quality of services, attractive beach activities, and etc. In
accordance with, overall satisfaction of beach activities could be a key indicator for choosing a destination to
revisit, re-purchase and recommend to others. This study focuses on experiential value for international tourists’
satisfaction and international tourists’ loyalty toward beach activities in Pattaya City, Thailand. A total of 400
questionnaires were distributed to international tourists who were taking beach activities at Pattaya City,
Thailand during March 1-15, 2019. The statistical methods conducted to analyze the data are descriptive
statistics and linear regression analysis. The linear regression model shows that experiential value as the
predictor, in order to predict the satisfaction and loyalty of international tourists towards beach activities in
Pattaya City, Thailand. The finding shows that there are 2 components affecting to international tourists’
satisfaction which are value for money (B = 0.170, p = 0.004) and experience value (B = 0.375, p = 0.000),
respectively. In addition, the international tourists’ satisfaction has a positive effect to international tourists’
loyalty with affecting size as (B = 0.573, p = 0.000). The research finding can announce the Pattaya Municipal
and business owners to maintain experiential value for beach activities in Pattaya City, Thailand. According to
managerial point of view, international tourists are seeking for new experience in tourism destination. As a
consequence, Pattaya Municipal and business owners should develop and create various of activities. It is not
only beach activities but also land based activities and water sport activities to attract international tourists to
revisit Pattaya City, Thailand.
Keywords: Experiential Value; Beach Activities; Tourists’ Satisfaction and Loyalty; Pattaya City
1. Introduction
Thailand is one of the most famous tourist destinations in the world. Thailand is the 50th largest
country in the world and it is ranked as the 3rd largest in Southeast Asia, consisting of 6 regions, 77
provinces. Bangkok is the capital city where is located in Central region of Thailand and it is the
largest city in Thailand in terms of population density. Moreover, Bangkok is the center of
government, education, transportation, finance, banking, commerce, communication, prosperity of the
country and tourist attractions. However, Bangkok is not only the hotspot of tourists’ attraction in
Thailand but there are also located I each region of Thailand. For instance, the Northern region is
Chiangmai, the Northeastern region is Khonkean, the West region is Karnchanaburi, the Southern
region is Phuket and the Eastern region is Chonburi.
Chonburi is the hotspot in the Eastern region of Thailand because this province is located away
from Bangkok approximately 70 kilometers. Moreover, the famous of tourist attraction in the world is

Parinya Nakapthom, Aristeidis Gkoumas, Krittipat Pitchayadejanant, Pavel Shvedov, Kulanattha Mcbriar, Thanatda Budda,
Sarinna Saisot, Pimpapisa Indang
Experiential Value for International Tourists’ Satisfaction and Loyalty Toward Beach Activities in Pattaya City, Thailand
227
Proceedings of CATEA 2019
located in this province where is Pattaya city. It is recognized as being among the world’s and Asia-
Pacific’s most popular destinations for international tourists. Inside Thailand (2016) presents Pattaya
city which is especially the sandy beach that stretches along the coastline is considered as another
beauty of Thailand. It is an area that is declared as a special area for sustainable tourism by the Special
Administrative Development Organization for Sustainable Tourism Development (Kantapoltitima,
2017). There are many businesses running in Pattaya city to provide several of activities providing to
Thai and international tourists.
Nowadays, there are variety types of activities that is created for tourist to experience and
typically for its inherent or an exhibited natural or cultural value, historical significance, natural, built
beauty, entertaining and adventure offering leisure and amusement. (Szotowski, 2016). Alternatively,
to support the large number of tourists that come to join the beach activities. Public facilities are also
important, it support the tourist by making them more convenient and lead them to tourist satisfaction
and tourist loyalty (Mrnjavac, 2018).
The objective aims to study on experiential value for international tourists’ satisfaction and
international tourists’ loyalty toward beach activities in Pattaya City, Thailand. The result of research
might be attracted international tourists to be more interested in traveling and doing beach activities in
Pattaya city. Thus, making tourists who have never done in beach activities can easily access and be
open minded to such activities too.
2. Literature Review
2.1. Pattaya City
Pattaya is located in the Eastern coastline of Thailand’s Gulf of Siam, 150 km southeast of
Bangkok (Longjit and Pearce, 2013). Tourists can travel easily from Suvarnabhumi Airport, also there
are variety of accommodations, wonderful activities, plenty of tourist attractions and excellent
restaurants. Including many forms of entertainment and because of this convenience that makes
Pattaya become a place for weekend getaway or place to spend on. There are several of Hotel levels
offered from Luxury and facilitating hotels until small guesthouse to choose.
National Statistics Office (2019) shows the number of populations in Pattaya city which is totally
320,262 resident and counted on census 2017. Most of these people counted are Thai, with most
migrant populations not recognized, although the details are quite complex as there are even
indigenous Thais without nationality, and migrant workers have since been largely regularized.
Therefore, the census population even does not represent the total figure. Moreover, there are three
seasons, which are summer (during March to May), Rainny (during June to October) and winter
(during November to February) generally warm and moist throughout the year. There is a small
difference between the coldest months to the hottest month, which the average temperature
throughout the year is around 27 Celsius (Kantapoltitima, 2017).
In addition, tourists can travel in Pattaya city in all seasons because there are many sports and
activities to choose from both land and water. Including golf, fishing, diving, theme parks, museums
and botanical gardens. Botanical gardens here in Pattaya also provide entertaining activities for the
tourists that come with a group of family. In the night time, Pattaya is still lively with the light of the
charming nightlife. There are many restaurants, nightclubs, bars, discos and cabaret shows. Which
Pattaya's income comes mainly from tourism industry, this place attracts tourists from all over the
world. Pattaya has many things that is interesting including beautiful beaches and islands that provide
many activities. There are more than 30 islands located around Pattaya within a radius of 48
kilometers from around Sriracha to the north, to the area of Sattahip in the south. Some islands are
closed due to the control of the Thai Navy. The other islands, most of them are beautiful dive sites the
ocean waters are abundant with various coral and tropical fish. (Kantapoltitima, 2017)
One of the most tourist’ attraction in Pattaya city is beautiful beaches that are surrounding
Pattaya area such as Jomtien Beach, Na Jomtien Beach, Pattaya Beach, Nuan Beach, Samae Beach,
Sang Warn Beach, Tawaen Beach, Ta Yai Beach, Tien Beach, Thong Land Beach, Wong Amat
Beach, Wong Prachan Beach and Naklua Beach. Pattaya Beach is a quiet beach in day time because
Pattaya beach is very natural, good atmosphere, suitable for tourists who want mostly prefer to relax
with family or for couples who are in honeymoon. In the night time, there are shops and restaurants
serving tourists throughout the beach road that are very suitable for relaxation. Moreover, tourists

Parinya Nakapthom, Aristeidis Gkoumas, Krittipat Pitchayadejanant, Pavel Shvedov, Kulanattha Mcbriar, Thanatda Budda,
Sarinna Saisot, Pimpapisa Indang
Experiential Value for International Tourists’ Satisfaction and Loyalty Toward Beach Activities in Pattaya City, Thailand
228
Proceedings of CATEA 2019
could spend a time with various activities such as swimming, windsurfing, jet skis, banana boats and
water sports and beach activities.
2.2. Beach Activities
Pattaya is a city of traveling which also has many interesting places with various of land and
water activities. This is a reason why most tourists choose Pattaya city for their vacation
(Aekthanawat, 2016). Pattaya has many interesting activities such as Bungee Jumping, Riding
bicycle, Aerial sports, Riding bicycle Go-kart and motor Riding a horse Shooting activity Thai
boxing. But the highlight of Pattaya city is beach activities which is the best place for doing the water
sports because there are many activities for guests such as such as Banana-boat, Jet Ski, Wind-surfing,
Fishing, squid fishing, Parasailing, Snorkeling, Sunbathing and Picnic.
However, tourist might be enjoying sport activities on the beach they are also have Volleyball,
football, running, aerobic. On the beach, Pattaya tourists can play volleyball or football on the beach it
is the best activities of tourist moreover there also have Aerobic dance on the beach in the evening.
Sitges (2016) presents that Pattaya City is also well-known that it has many beautiful beaches.
According, to the beaches that attract many tourists, there are various public facilities that support
tourists to make the tourists convenient and lead to tourist satisfaction and loyalty These are the lists
of public facilities around Pattaya beach such as toilets facilities, shower rooms, sun loungers on the
beach, mats on the beach and eating and drinking at the beach.
2.3. Experiential value
The main reason why international tourists want to repeat visiting Thailand because most tourists
are very impress and satisfy in all tourist component in Pattaya city. This reason is a main impact to
Pattaya that tourists would inform their friends and relatives about their good experience in Thailand
(Htun, Padungyoscharoen and San, 2015). Moreover, one of the satisfaction factors of tourist in
Pattya city is labelled as activities experiences. This includes the challenging or exciting, meeting new
people and gain more knowledge (Vuuren and Slabbert, 2017). The example of challenging and
exciting experience is, tourist might feel like stuck in a rut in their daily life or yearning for something
exciting and different. Tourists are craving new experiences and new challenges. Travel is the ideal
place to test themselves. It pushes people to their limits and gets them outside their comfort zone
(Virtuoso, 2016).
Morriss and Charlotte, 2015) said that peer pressure from others whether it be in socializing
activities will also have an effected and an influence on what tourist decide to do in any leisure
activities. However, Christopoulos and Aubke, 2014) presents to gain knowledge and be expertise is a
key ingredient by which the tourism sector can adjust and adapt to its dynamic environment.
Moreover, Peariasamy (2018) supports staff performance is one of determining factor is the person’s
skills in terms of professionalism on having enough knowledge to inform the tourists, giving the best
suggestions for tourist. Staff should be friendliness which is pointed to good customer service. This
can build good relationships with tourists. Furthermore, communicating with tourists (Bennett, 2018)
and willingness to give service (DeFranzo S., 2013) which are two important factors to support
experiential value of tourist. Communicating with tourists is incredibly important that you develop the
best communication skills possible with tourists. Some of these skills include speaking clearly,
effectively, efficiently, and politely. Excellent communication skills are important because
communicating in this way shows tourists that staffs understand what they actually mean instead of
what they are simply saying. If the staff feel appreciated and valued, they will likely be more pleasant
and show a greater willingness to assist each customer and ensure each customer interaction is
handled in accordance with the high standards set forth by the company.
2.4. Tourists’ Satisfaction and Loyalty
The positive relationship between tourists’ satisfaction and tourists’ loyalty is most important to
attract and motivate tourists to travel in tourism destination. Most tourists prefer to travel in the
tourism attraction to seek a destination to provide stimulating, high quality and gaining best
experience. Due to, the perception is generally referred to the anticipated results or performance of the
goods and service transaction in the future (Nakpathom and Pitchayadejanant, 2017). Understanding

Parinya Nakapthom, Aristeidis Gkoumas, Krittipat Pitchayadejanant, Pavel Shvedov, Kulanattha Mcbriar, Thanatda Budda,
Sarinna Saisot, Pimpapisa Indang
Experiential Value for International Tourists’ Satisfaction and Loyalty Toward Beach Activities in Pattaya City, Thailand
229
Proceedings of CATEA 2019
tourists’ perception will support the important clues in developing destination attractiveness and
improving tourist goods and services.
Tourist satisfaction comes from attractions, accessibility, lodging, dining, environment, shopping
and events & activities. If all of the components above are in a good performance it will lead to tourist
satisfaction. Additionally, to make tourist satisfaction the perception of tourists should be more than
their expectation (Crompton, 1979). When the tourist satisfies, it has the direct relationship among
post purchase behavior, place attachment, intentions revisit and novelty seeking which are revisiting,
Word of Mouth (WOM) and Recommending others which will lead to destination loyalty (George &
George, 2004).
Frangos et al. (2014) informs that tourist loyalty identifies the tourist satisfaction of the product,
service, culture and sightseeing of a particular destination and developing to tourist loyalty. Moreover,
tourist loyalty also means the characteristics of tourists to return and use the service repeatedly or
suggest that others come to travel or use the service and suggest another people by word-of-mouth
(WOM) (Shoemaker and lewis, 1999 and Yoon and Uysal, 2005).
Murphy, Prichard and Smith (2000) identifies the positive relationship of tourist satisfaction and
loyalty which combines with environment, infrastructure, quality, value and intention to revisit with
tourist experience and perceptions. Tourist has direct relationship with perceived quality, satisfaction
and intention to return and willingness recommend others which will be the result of destination
loyalty.
According to Fakeye and Crompton (1991) presents tourist perception which comes from
destination image which is an individual’s mental representation of knowledge, feelings and overall
perception of a particular destination. The authors also indicated that the tourists’ evaluation of a
destination experience influences their image of the destination. The destination image is consisting of
travel environment, natural attractions, historical & cultural attractions, accessibility, infrastructure,
relaxation and price & value. It is also including attractions, accessibility, lodging, dining,
environment, shopping and events & activities. (Rajesh, 2013).
3. Material & Methodology
3.1. Study Objectives
1) To explore the international tourists’ behavior toward beach activities in Pattaya city, Thailand
2) To explore the experiential value factor for international tourists’ satisfaction and international
tourists’ loyalty towards beach activities in Pattaya city, Thailand
3.2. Questionnaire Design
In order to design what international tourists interest the beach activity in Pattaya city Thailand.
The collection of information was facilitated by using questionnaire which is consisted into four parts.
The first part, socio-demographic characteristics was asking the socio-demographic characteristics
including age, gender, status, country of resident, occupation. Part two of questionnaire is consisted of
determining factors for choosing an activity including 4 attributions which were safety of activity,
value for money, experiential value and staff performance. The third part identifies international
tourists’ satisfaction and international tourists’ loyalty. The recommendation was the last part in order
to know deeply international tourists’ perspective to beach activity in Pattaya city, Thailand.
Respondents in study were requested to evaluate the experience value of beach activity and loyalty
using a 5- point likers scale ranging from 1-5 by 5 as’ very high satisfaction, as a 4 satisfaction, 3 as’
neutral, 2 as low satisfaction’ 1 as very low perception.
3.3. Data Analysis
Data analysis was completed by using Statistical Programmed for social sciences (SPSS). Data
were evaluating by using a range of statistical techniques. Frequencies and percentage score for
nominal variable. Including with socio-demographic were summarized. The experience value of
beach activity towards international tourists’ satisfaction and international tourists’ loyalty level were
evaluating by linear regression.

Parinya Nakapthom, Aristeidis Gkoumas, Krittipat Pitchayadejanant, Pavel Shvedov, Kulanattha Mcbriar, Thanatda Budda,
Sarinna Saisot, Pimpapisa Indang
Experiential Value for International Tourists’ Satisfaction and Loyalty Toward Beach Activities in Pattaya City, Thailand
230
Proceedings of CATEA 2019
3.4. Research hypotheses
From numerous studies, exploring attitude of international tourist satisfaction and tourist loyalty,
were develop and presented in Figure 1.
Figure 1. Research hypotheses
Accordingly, to the above theoretical framework, the following research hypotheses are
formulated:
H1: Safety of Activity has a positive affected on international tourists’ satisfaction
H2: Value for money has a positive affected on international tourists’ satisfaction
H3: Experience value has a positive affected on international tourists’ satisfaction
H4: Staff performance has a positive affected on international tourists’ satisfaction
H5: International tourists’ satisfaction has a positive affected on international tourists’ loyalty
4. Results and Discussion
According table 1 identifies international tourists’ demographic characteristics which the
majority of respondents’ gender is female. Most of their age is between 26-35 years old. Most of
respondents are students which is still single. Most of international tourists come from various
continents as shown in table. Table 1. International tourists’ demographic characteristics
International tourists’ demographic characteristics N=400 Percentage
Gender Male 197 49.3
Female 203 50.8
Age Less than 15 years old 8 2
16-25 years old 113 28.3
26-35 years old 124 31
36-45 years old 90 22.5
46-55 years old 50 12.5
More than 56 years old 15 3.7
Marital Status Single 220 55
Married 153 38.3
Divorced 12 3
Separate 13 3.2
Others 2 0.5
Occupation Student 117 29.3
State enterprise officer 21 5
Government officer 3 0.8
Business owner 39 9.8
Worker 184 46
Unemployed 36 9
Continent of residence Australia 23 5.8

Parinya Nakapthom, Aristeidis Gkoumas, Krittipat Pitchayadejanant, Pavel Shvedov, Kulanattha Mcbriar, Thanatda Budda,
Sarinna Saisot, Pimpapisa Indang
Experiential Value for International Tourists’ Satisfaction and Loyalty Toward Beach Activities in Pattaya City, Thailand
231
Proceedings of CATEA 2019
International tourists’ demographic characteristics N=400 Percentage
America 38 9.4
Europe 175 43.4
Asia 167 41.4
The behavior of international tourists’ for traveling in Pattaya city is shown in table 2. For
traveling in Pattaya destination, the tourists prefer to travel with their family. They will travel in
Pattaya city. Moreover, most of international tourists have previous experience and revisiting again as
the majority have been to Thailand from 2-5 times.
Table 2. The behavior of international tourists’ for traveling in Pattaya city
The behavior of international tourists’ for traveling in Pattaya city N=400 Percentage
Whom do you travel with Alone 45 11.3
Family 146 36.5
Friends 171 42.7
Co-worker 35 8.7
Tour group 3 0.8
How many times visiting Pattaya First time 126 31.5
2-5 times 240 60
More than 5 Times 34 8.5
The purpose of visiting Thailand of tourists, the majority, is relaxation (88%), life experience
(22.30%), culinary trends (12.0%), education and visiting family and relatives (11.5%), business trip
(10.3%), honeymoon (10.0%), health (9.5%), and conservation (4.0%), respectively. Hence, Thailand
is the destination for tourists to take the rest and relax. Especially, in Pattaya, there are many attractive
destinations to welcome the tourists: attraction, culture, communities, extreme sports, art and
architecture, and etc. With these conglomerations, the tourists are enjoyed and willing to take the rest
and gaining new experience in Pattaya.
Table 3. Frequency purpose of visiting
Purpose of Visit Percentage
Relaxation 88.5
Conservation 4.0
Culinary trends 12.0
Education 11.5
Business 10.3
Health purpose 9.5
Honeymoon 10.0
Visiting family & relatives 11.5
Increase life experience 22.3
According to table 4, generally, the tourists will receive the information from social media
(74.3%) as the top source to receive the information. Secondly, they will listen to friends and family
(52.8%). In addition, travel agency is the third rank (18.3%) that the tourists will receive travel
information from. Nowadays, tourists switch their obtaining information into digital platforms to send
and receive information. As a consequence, the travel destination should promote activities and
promotion through social media in order to reach the tourists.
Table 4. Sources of public relation
Sources Frequency Percentage
Travel agency 73 18.3
Social media 297 74.3
Exhibitions 15 3.8
Books and travel guides 43 10.8
Friends and family 211 52.8
Newspaper 27 6.8

Parinya Nakapthom, Aristeidis Gkoumas, Krittipat Pitchayadejanant, Pavel Shvedov, Kulanattha Mcbriar, Thanatda Budda,
Sarinna Saisot, Pimpapisa Indang
Experiential Value for International Tourists’ Satisfaction and Loyalty Toward Beach Activities in Pattaya City, Thailand
232
Proceedings of CATEA 2019
Sources Frequency Percentage
TV and Radio 26 6.5
Travel brochures 58 14.5
Table 5 shows beach activities in Pattaya that tourist prefers to do. Travelers are more concerned
on relaxation which are sunbathing, picnic, and taking a picture with sightseeing. We can see that
minority selected activities are physical activities such as volleyball, wind surfing, and football. This
suggests us on a point that tourists want to have their peaceful time and to have a break from rush and
turmoil.
Table 5. Interested beach activities in Pattaya
Beach Activities Frequency Percentage
Banana boat 82 20.5
Jet skiing 83 20.8
Wind surfing 19 4.8
Snorkeling 63 15.8
Parasailing 36 9.0
Fishing 43 10.8
Sunbathing 236 59.0
Picnic 260 65.0
Sight seeing 244 61.0
Volleyball 18 4.5
Football 27 6.8
Exercise 42 10.8
According to table 6 shows the result of multiple regression between perception and international
tourists’ satisfaction. There are two significant dimensions which are experience value and value for
money. However, between these two dimensions, the most effect towards satisfaction is experiencing
value (ꞵ = 0.338, p-value = 0.000). The international tourists come to Thailand in order to gain new
experience and secondly, travelling in Thailand is value for money (ꞵ = 0.147, p-value = 0.004)
because the living expenditure and living allowance in Thailand is cheap but tourists gain lots of
experience and benefits.
Table 6. Result of Multiple regression between perception and international tourists’ satisfaction
Dimension Unstandardized Coefficient Standard Error Standardized Coefficient P-value
Safety of activity 0.079 0.057 0.072 0.165
Value for money 0.170 0.058 0.147 0.004**
Experiences value 0.375 0.054 0.338 0.000**
Staff performance -0.010 0.045 -0.011 0.832
** significance level < 0.05
For the non-significant dimensions, safety of activity and staff performance, the tourists come to
Thailand; not because of extreme activities but because of they would like to take relax. Hence, they
do not concern the importance of safety of activity. There is no effect between safety of activity and
international tourists’ satisfaction. For staff performance, this dimension does not have impact on
international tourists’ satisfaction because travelers do not want to get assistance in case unnecessary.
With the staff approaching them, they feel being controlled and unsatisfied.
Table 7. Result of regression between international tourists’ satisfaction and loyalty
Dimension Unstandardized Coefficient Standard Error Standardized Coefficient P-value
Satisfaction 0.573 0.034 0.642 0.000
** significance level < 0.05
In Table 8, the result of the regression between international tourists’ satisfaction and
international tourists’ loyalty. It shows that satisfaction is really high impact as shown that p-value is

Parinya Nakapthom, Aristeidis Gkoumas, Krittipat Pitchayadejanant, Pavel Shvedov, Kulanattha Mcbriar, Thanatda Budda,
Sarinna Saisot, Pimpapisa Indang
Experiential Value for International Tourists’ Satisfaction and Loyalty Toward Beach Activities in Pattaya City, Thailand
233
Proceedings of CATEA 2019
below 0.005 which indicates that when the overall tourists are satisfied, this leads to tourists’ loyalty
positively. According to the result, table 8 shows the conclusion of hypothesis testing on the effect.
Table 8. Result of Hypothesis Conclusion
Hypotheses Independent Dependent Result
H1 Safety of Activity International tourists’ satisfaction Do not reject
H2 Value for money International tourists’ satisfaction Reject
H3 Experience value International tourists’ satisfaction Reject
H4 Staff performance International tourists’ satisfaction Do not reject
H5 International tourists’ satisfaction International tourists’ loyalty Reject
5. Conclusion
International tourists who visit Pattaya city, Thailand, has the motivation to participate the
tourists’ attraction and attend the new experience. From the research finding, international tourists
interest beach activities in Pattaya city to gain more experience. Moreover, if international tourists
satisfy on beach activities, this will affect to international tourists’ loyalty.
The overall result of experiential value from the international tourists’ satisfaction dues to staff
performance and safety of activity. This reason is the same as finding as Peariasamy (2018) who
presents the high level of tourists’ satisfaction, should motivate by staff performance. staff
performance who work with beach activities in Pattaya city, should prepare their skills in terms of
professionalism such as knowledge of activities, high communication skill, positive thinking with
difference type of tourists and so on. Moreover, staffs should be friendliness which is pointed to good
customer service. This affects to good relationships with tourists. However, the result of staff
performance is as same as Christopoulos and Aubke (2014) which bases on knowledge and be
expertise which is a key ingredient by which the tourism sector can adjust and adapt to its dynamic
environment.
In addition, safety of activity is high impact of experience value to make international tourists’
satisfaction. From research finding, international tourists focus on safety of beach activities because
Pattaya city has many news of safety which destroy the reputation and might be a barrier to
international tourists. Pattaya city should promote the beach activities with the safety policy including
land, beach and water activities.
On the other hand, international tourists travel and spend their time with beach activities, to
simply catch a break from a busy life. The mainly activity on the beach should be relaxing and full fill
with family activities. where international tourists do not prefer to worry and can just lie down on the
beach such as sunbathe and enjoy the beauty of nature. Pattaya city could provide the best activities to
let international tourists discover and get high value experience activities on their own.
Overall international tourists are satisfied in staff performance and safety of activity. This
affects to international tourists’ loyalty and in future pays back with word of mouth (WOM), return to
Pattaya city. However, staffs should continue to develop and improve their abilities, so, international
tourists would not lose to interest and have more motivation to return back in Pattaya city again.
References
Aekthanawat, I. (2016). Expectation and recognition of Chinese tourist to destination of Tourist attraction at
Pattaya. Master dissertation, Graduate School of Commerce Burapha University, Thailand.
Bart, N. Joao, R. and Eveline V. (n.d.). Describing the Relationships between Tourist Satisfaction and
Destination Loyalty in a Segmented and Digitalized Market. Amsterdam: Tinbergen Institute.
Bennett, S. (2018). The Importance of Good Communication with Customers. Available at
https://study.com/academy/lesson/the-importance-of-good-communication-with-customers.html.
Retrieved on 15 April, 2019.
Business Queensland. (2016). Principles of good customer service. Available at
https://www.business.qld.gov.au/running-business/consumer-laws/customer-service/ improving/
principles. Retrieved on 15 April, 2019.

Parinya Nakapthom, Aristeidis Gkoumas, Krittipat Pitchayadejanant, Pavel Shvedov, Kulanattha Mcbriar, Thanatda Budda,
Sarinna Saisot, Pimpapisa Indang
Experiential Value for International Tourists’ Satisfaction and Loyalty Toward Beach Activities in Pattaya City, Thailand
234
Proceedings of CATEA 2019
Crompton, J. (1979). An Assessment of the Image of Mexico as a Vacation Destination and the influence of
Geographical Location upon that Image. Journal of Travel Research, 17(4): 18-43.
Martin, D. and Joomis, K. (2007). Building Teachers: A Constructivist Approach to Introducing Education.
Belmont, Wadsworth.
Fakeye, P. C. and Crompton, J. L. (1991). Image differences between prospective, first-time, and repeat visitors
to the lower Rio Grande Valley. Journal of Travel Research, 30:10-16.
George, B. P. and George, B. P. (2004). Past Visits and the Intention to Revisit a Destination: Place attachment
as the seeking as the moderator. Journal of Tourism Studies, 15(2):51-66.
Howie L. (2014). Security Guards and Counter-terrorism: Tourism and Gaps in Terrorism Prevention.
International Journal of Religious Tourism and Pilgrimage, 2(1): 38-47.
Hoof J. (2016). The Importance of Personal Possessions for the Development of a Sense of Home of Nursing
Home Residents. Journal of Housing for the Elderly, 30(1): 34-50.
Htun H., Padungyoscharoen S. and San S., (2015). Influences of motivation toward revisit Intention, destination
loyalty and positive word-of-mouth. APHEIT JOURNAL, 4(2): 115-130.
Inside Thailand, (2016). Thailand’s Most Popular Destinations among International Travelers. Available at
https://thailand.prd.go.th/ewt_news.php?nid=2698&filename=index. Retrieved on 15 April, 2019.
Jankingthong, W. (2015). Structural Equation Model of Factors Affecting Thai Tourist Loyalty Toward
National Parks Land in Southern Thailand. Silpakorn University Journal, 35(2): 1-18.
Kantapoltitima J. (2017). Image and Attitude of Foreign Tourist towards Tourism in Pattaya, Chonburi
Provinces, Affecting and Visitation. Master dissertation, Faculty of Tourism and Hotel, Dhurakij Pundit
University, Thailand.
Blut, M., Evanschitzky, H., Vogel, V. and Ahlert, D. (2007). Switching Barriers in the Four-Stage Loyalty
Model.
Advances in Consumer Research, 34: 726-734.Longjit, C. and Pearce, D.G. (2013). Managing a mature coastal
destination: Pattaya, Thailand. Journal of Destination Marketing and Management, 2: 165-175.
Murphy, P., Pritchard, M. P. and Smith, B. (2000). The destination product and its impact on traveler
perceptions. Tourism Management, 21(1): 43-52.
Parasakul, L. (2015). The motivations and the Attitudes Affecting the satisfaction level of chinese Tourist’s
visiting Thailand. Dhurakij Pundit University, Thailand.
Peariasamy, T. and Mansor, N. (2018). On-the-job knowledge sharing: how to train employees to share job
knowledge. Jurnal Kemanusiaan bil. 12: 87-101.
Rajesh, R. (2013). Impact of Tourist Perceptions, Destination Image and Tourist Satisfaction on Destination
Loyalty: A Conceptual Model. Revista de Turismo y Patrimonio Cultural, 11(3): 67-78.
Rampton, J. (2017. Different Motivations for Different Generations of Workers. Available at
https://www.inc.com/john-rampton/different-motivations-for-different-generations-of-workers-boomers-
gen-x-millennials-gen-z.html. Retrieved on 15 April, 2019.
Rittichainuwat, B.N., Qu, H. and Mongkhonvanit, C. (2007). Understanding the motivation of Travelers on
repeat visits to Thailand. Journal of Vacation Marketing, 14(1): 5-21.
Sitges, T. (2016). Facilities Available on Each of Sitges Beaches. Available at https://www.sitges-tourist-
guide.com/en/attractions/sitges-beach.html. Retrieved on 15 April, 2019.
Sombatnantana, N. (2013). The behavior of Chinese tourist who come to Thailand for tourist purpose. Available
at http://thesis.swu.ac.th/swuthesis/Man_Econ/Atchara_S.pdf. Retrieved on 18 April, 2019.
Sondalini, M. and Witt, H. (2016). What is Equipment Reliability and How Do You Get It? Available at
http://www.lifetime-reliability.com/free-articles/reliability-improvement/What_is_Equipment_
Reliability _and_How_Do_You_Get_It.pdf. Retrieved on 20 April, 2019.

235
Proceedings of CATEA 2019
Proceedings of CATEA 2019
ISBN 978-623-91018-0-0
The Influence of Instagram Travel Influencer on Visiting
Decision of Tourist Destinations for Generation Y
Regina Dewi Hanifah
Hotel Operation Study Program, Akademi Pariwisata Bunda Mulia
Abstract: The growing development of Instagram in the community, especially in Indonesia, also varies the
character of the people who use social media. A person's personality can be seen from his Instagram account to
the interests and habits of someone. There are several facts related to today's social media users, where 85.2% of
the respondents follow influencers on their social media. This phenomenon is the background of researchers
where, many tourists today rely heavily on information that they only know from Instagram, both from direct
destination, travel bloggers/influencer even from their own friends especially users in Generation Y, who lived
on the internet and they are very competent to use it to find information about products. The aim of this paper is
to find out the influence of Instagram Travel Influencer on Visiting Decisions, for tourists who use Instagram as
social media for their main information searching tools.The data in this study are quantitative and use analysis
of Coefficient Correlation Test, Simple Linear Regression Analysis, and Correlation Product Moment. Data
collection techniques used are interviews, observations, questionnaire, literature studies and document from
Travel Influencer. The results of this study is there is a strong relationship as 0.634 shown from Influencer
Travel to visiting decisions for a tourist destination. Also 59.1% of the dependent variables can be predicted
from a combination of all independent indicators.Through the analysis of this study, all tourist destination
suggested to work together with Travel Influencer to promote their place. With Instagram, users can easily find
information to evaluate alternatives before deciding to visit a tourist destination. It can maximize revenue from
each company or tourist destination in promotion.
Keywords: Instagram; Travel Influencer; Visiting Decision; Tourist Destination; Generation Y
1. Introduction
1.1 Background
The development of social media in Indonesia in particular has grown rapidly since the support of
infrastructure in terms of devices, internet networks, and technology. According to Stevenson (2012)
Social media can be defined as web websites and applications that allow users to create and share
content or to participate in social networks. Based on a survey conducted by eMarketer.com, the level
of social media usage in Indonesia is very high and increases every year. And predicted to continue to
increase to 109.8 million users in 2019. Figure 1. Social Media Users and Penetration in Indonesia 2013-2019
Source: www.eMarketer.com (2018)

Regina Dewi Hanifah
The Influence of Instagram Travel Influencer on Visiting Decision of Tourist Destinations for Generation Y
236
Proceedings of CATEA 2019
One of the social media that is currently widely used by the public is Instagram. This social media
is not much different from other social networks such as Facebook, Twitter and Path. The different
thing is Instagram is more focused on photos and videos in the delivery followed by the message
given to the photos and videos that they upload. Most Instagram accounts are made for personal use
or for professional use, even though sometimes the combination is both. Professional users including
travel companies, accounts from tourist destinations and professional travel photographers. Personal
accounts can include travel bloggers, famous figures, and any members of the general public. How to
use that is quite easy to make everyone have this account to be able to interact with one another,
especially for those who want to be able to keep in touch with their relationships remotely.
The growing development of Instagram in the community, especially in Indonesia, also varies the
character of the people who use social media. A person's personality can be seen from his Instagram
account to the interests and habits of someone. It can be seen from any accounts that are followed by
users, if they are interested in fashion, then they will follow a fashion designer account or even a
model to satisfy their interests. Likewise with someone who has an interest in traveling, then they
might follow a tourist destination account, even travel companies often join a blogger travel account
where they specialize in interesting and new tourist attractions to explore. It can be said that social
media now has the power to influence individuals to do something new. An example is to grow
interest and decide on purchases from an Instagram user. The influence of social media is different,
but what is common is that information originating from social media will have an influence on
purchasing decisions that will be taken by consumers (Nurgiyantoro, 2014).
1.2 Rational
In the world of tourism there have been many changes that have occurred in the past decade.
Where Generation X is looking for more information about the purpose of his vacation from a travel
agent or travel operator and prefer to order directly at the destination. Whereas millennial generations
are more critical and more detailed in comparing prices, promotions, and activities that can be done in
each destination destination. That's why entrepreneurs using social media also direct their content to
attract the millennial generation. Generation Y has access to computers, the internet and, importantly,
Generation Y has lived on the internet and they are very competent to use it to find information about
products. This generation is also a user of technology that seems extraordinary. Even to communicate,
understand, learn, search, and to do many things they use internet technology. This has become a
necessity for this generation, they have relied on the internet.
The launch of Instagram into the world of social networking in 2010 has facilitated this growth
even further. This phenomenon occurs because information is easier and easily accessible, making
tourists more smooth and spontaneous in their travel habits. Social media users, especially Instagram,
can almost follow other travelers and travelers, get an insight into their overall experience; where they
go, when they leave, what they see, with whom they go. Many tourist destinations are becoming more
commercial and researchers believe that social media has a big impact on this.
Based on Lestari in mudazine.com (2018), there are several facts related to today's social media
users, where 85.2% of the respondents follow influencers on their social media. Nearly half of the
respondents, which is around 48.3%, are quite affected by Influencers on social media. This is a
phenomenon where users of social media more easily decide on the purchase of a product because of
the Influencers they follow, because they believe and can rely on their Influencers to choose a product
that can be said to be good.
Basically a visiting decision is a decision taken by someone before visiting a place or region by
considering several factors. Tourist visiting decisions are influenced by pull factors and driving
factors (Crompton in Kozak and Decrop, 2009). The driving factor is an internal factor that
encourages a person to travel, while the pull factor is an external factor originating from a destination
that can attract someone to choose the destination (Crompton in Kozak and Decrop, 2009).
This phenomenon is the background of researchers where, many tourists today rely heavily on
information that they only know from Instagram, both from direct destination, travel bloggers, even
from their own friends. The blogger travel account which is currently also becoming the main
reference for tourists is a limitation for this research, where travel bloggers have followers, namely
Instagram users who are interested in traveling / traveling. Good for those who already have plans for

Regina Dewi Hanifah
The Influence of Instagram Travel Influencer on Visiting Decision of Tourist Destinations for Generation Y
237
Proceedings of CATEA 2019
their trip or for those who only like to see photos from that account. Most of the Instagram users who
are interested in blogger travel accounts are those who are in Generation Y. Based on previous
research, Beham (2015) stated that social media has an influence on the purchasing decision process
in a travel trip especially for Generation Y. Decision making is very important when they are at tourist
sites, and are looking for something interesting to do.
From the description above, the authors are interested in conducting further research to reveal the
extent to which the Influence of Instagram Travel Influencers on Visiting Decisions of Tourist
Destinations for Generation Y.
1.3 Problem Statement
1. How is the Influence of Instagram Travel Influencers on Visiting Decisions of Tourist
Destinations for Generation Y?
1.4 Objectives
1. The aim of this paper is to find out the influence of Instagram Travel Influencer on Visiting
Decisions, for tourists who use Instagram as social media for their main information searching
tools
2. To be able to see the effectiveness of uploading Influencer Travel content to followers on social
media
3. To be able to find out the number of tourists who trust Travel Influencers as a source of
information before traveling
1.5 Research Limitation
The research will only measure the fourth stage in the purchasing decision process, namely the
purchase decision, where in this study the type of decision that is measured is the decision to visit
tourists. Measurements also use pull factors and push factors. This is supported by (Crompton in
Kozak and Decrop, 2009: 17), which states that pull factors and push factors are one of the theories
that are often used in tourism research. Push and pull factors are internal and external factors that
motivate tourists to make decisions. In addition, the author only focuses on the millennial generation
as the most social media users for Instagram at this time. In this research, Travel Influencer in
Instagram limited into two public account of Influencer from Indonesia who always generate a travel
picture and explain their experience in their account.
2. Related Works/Literature Review
2.1 Social Media
According to Putri (2012) social media is a medium designed to facilitate interactive or two-way
social interactions. Social media based on internet technology that changes the pattern of information
dissemination from previously one to many audiences, becomes a large audience to many audiences.
Furthermore, Kotler and Keller (2012) explain that social media is a means for consumers to share
text, image, audio and video information with each other and with companies and vice versa.
According to Mayfield (2008: 5), social media has the following characteristics:
1) Participation
Social media can encourage users to make contributions and feedback in the form of
comments to other users so that there is no limit between users.
2) Openness
Almost all types of social media services allow users to freely provide feedback in the form of
voting, commenting or disseminating information. In social media there is almost no limit to
accessing and using content on social media.
3) Conversation
The spread of content through traditional media in the form of spread from one to many only,
but on social media relations that occur take place in two directions.
4) Community
Social media can form communities that consist of people who share the same interests and
interests. In the community members can communicate with each other effectively.

Regina Dewi Hanifah
The Influence of Instagram Travel Influencer on Visiting Decision of Tourist Destinations for Generation Y
238
Proceedings of CATEA 2019
5) Connectedness
Most types of social media are growing rapidly due to the ease of users to connect with other
users, ease of accessing sites, resources and users in the context of finding information.
2.2 Visiting Decisions
In addition, Woodside and Martin (2008) argue that tourist visiting decisions are influenced by
two factors, namely:
1) Pull Factors
Pulling factors are external factors originating from destinations that can attract someone to choose
the destination (Crompton in Kozak and Decrop, 2009). Pull factors are the desire to travel, find
information, and evaluate alternative trips. Pull factors arise due to the presence of external variables
and aspects of consideration of the destination. External variables and aspects of consideration of the
destination which is information also affect someone's desire to travel.
2) Push Factors
The push factor is an internal factor that encourages a person to travel (Crompton in Kozak and
Decrop, 2009). The push factors are motivation, needs and desires, and expectations. The push factor
arises due to the presence of travel stimuli as well as social and personal factors of tourist behavior.
2.3 Previous Study
According to Beham (2015) stated that social media influences the purchasing decision process in
a tourist trip, especially for generation Y. This decision making is very important when they are at
tourist sites, and looking for something interesting to do. Besides those research, Parsons (2017)
found that social media and Instagram can influence an individual’s decision to visit a tourist
destination. Although there are many varying elements which come into the tourist’s decision-making
process (Minazzi, 2014), findings have predominantly been consistent with that of literature reviewed.
Various aspects of social media influence various individuals to different extents, both intrinsically
and extrinsically.
3. Material & Methodology
3.1. Data
Based on the type of data used in this study, this type of research is quantitative. Sugiyono (2012)
states that quantitative methods can be interpreted as research methods that are based on positivist
philosophy, used to examine certain populations or samples, collecting data using research
instruments, analyzing quantitative or statistical data, with the aim of testing hypotheses that have
been set. Shortened by Sugiyono (2012) that it is called quantitative because research data in the form
of numbers and analysis using statistics. According to the level of exploration, this type of research is
associative, according to Sugiyono (2012), explaining that associative research is research that aims to
determine the relationship of two or more variables.
3.2. Method
3.2.1 Collecting Data Method
This study uses the data collection methodology as follows:
1. Primary Data Collection
According to Sugiyono (2012), primary data is data whose source directly provides data to data
collectors. To get the primary data used in the study, the methods used are as follows:
• Interview
The author conducted an interview with one of the Travel Influencers to obtain research
permits and information related to the research topic
• Observation
The author researches directly by being one of the Instagram account users of one of the
Influencers Travels to be able to see the extent of the material and content provided by the
Influencer to their followers.
• Questionnaire

Regina Dewi Hanifah
The Influence of Instagram Travel Influencer on Visiting Decision of Tourist Destinations for Generation Y
239
Proceedings of CATEA 2019
The questionnaire was distributed by millennial Instagram users who acted as responders
using the Likert measurement scale. According to Tehubijuluw and Sugiarto (2014), the Likert
scale is a scale that measures respondents' agreement or disagreement with statements relating to
their beliefs against certain objects. Actually the Likert scale is an ordinal scale, but it is often
modified and assumed to be an interval scale.
In the preparation of this questionnaire the Likert scale was modified into 4 alternative answer
choices by eliminating the hesitation category. This is done to prevent respondents from being neutral
or not choosing so as to reduce the amount of information that can be collected from respondents.
This is in accordance with the opinion of Arikunto (2009) which suggests that if researchers argue
that there are weaknesses with five alternatives because respondents tend to choose alternatives in the
middle (because they feel safe and easiest because they almost do not think) and that reason is true.
Based on those theory, the author in making questionnaires will use the Likert scale as follows:
Table 1. Likert Scale
Assesment Point
Strongly Disagree 1
Disagree 2
Agree 3
Strongly Agree 4
Source: Arikunto (2009)
2. Secondary Data
According to Sugiyono (2012), secondary data is data whose source does not directly
provide data to data collectors, for example through other people or documents. To get secondary
data used in research, the methods used are as follows:
• Literature review
The author gets information and inputs by reading books, journals and articles related to this
research.
• Documents
Online articles on the development of the tourism industry, especially the use of social media
in making decisions about visiting someone
3.2.2 Population and Sample
1. Population
According to Sugiyono (2012), population is a generalization area consisting of objects or
subjects that have certain qualities and characteristics set by researchers to be studied and then
conclusions drawn. While the sample is part of the number and characteristics possessed by the
population. The population of this study is Instagram users who follow Travel Influencer and had mad
the same tourist visit after Travel Influencer post it on his/her Instagram Account, within period
Januari to March 2019. From that time, the authors get 97 persons who did the tourist visit.
2. Sample
Sampling technique is a sampling technique (Sugiyono, 2012). Basically sampling techniques
can be grouped into two types, namely Probability Sampling and Nonprobability Sampling
techniques. Nonprobability sampling is a sampling technique that does not provide the same
opportunity or opportunity for each element or member of the population to be chosen as a sample
(Sugiyono, 2012). Nonprobability sampling includes systematic sampling, quota sampling, accidental
/ incidental sampling, purposive sampling, saturated sampling / census sampling, and snowball
sampling. As for this research, a purposive sampling technique was used for Instagram users whose
accounts joined one of the Influencers' Travels and had made the same tourist visit after the Travel
Influencer uploaded it on his account. From the number of followers of one of the Indonesian
Influencers Travel, the author took a sample of followers of Travel Influencers who also visited the
same tourist attractions as Travel Influencers from January to March 2019. The sample in this study is

Regina Dewi Hanifah
The Influence of Instagram Travel Influencer on Visiting Decision of Tourist Destinations for Generation Y
240
Proceedings of CATEA 2019
limited to Instagram users who have age included in the Millennial Generation. Social researchers
often classify generations born between the 1980s and 2000s as the millennial generation. Millennial
generation can say that today's young generation is in the age range of 15-38 years, as adults in
Indonesia are 17 years and above, this study limits the lower millennial generation to that limit with a
range of 17-38 years. Based on that limitation the authors get 43 people whose categorized in the
millennium / Y generation.
3.2.3 Analysis Data Technique
1. Validity Test
The first step in processing the data in this study is to examine the validity of the questionnaire
that has been prepared by the researcher. According to Siregar (2013), validity or merit is to show the
extent to which a measuring instrument is able to measure what it wants to measure. To test the
validity, the author uses the type of construct validity, which means that validity is related to the
ability of a measuring instrument in measuring the understanding of a concept that is measured
(Siregar, 2013).
To determine the level of validity and validity of the items used product moment correlation
(Priyatno, 2009). According to Masrun in Sugiyono (2012), if the correlation coefficient is ≥ 0.3 and
is significant (p <0.05), then the instrument is declared valid. Measuring the validity of each statement
item is done by correlating the measurement of item scores with variable scores (total score items)
using the α significance level of 0.05 or 5% (Priyatno, 2009).
2. Reliability Test
Reliability test aims to test the extent to which the measurement results remain consistent if
measurements are made twice or more for the same symptoms using the same tool (Siregar, 2013). In
this study, the authors used consistency internal reliability tests. This test is done by trying the
measuring instrument once, then the data obtained is analyzed by certain techniques (Siregar, 2013).
Measurement of reliability can be calculated manually using the Cronbach Alpha technique with
the following formula:
r11 = instrument reliability coefficient
k = the number of questions
ơt2 = varians total
∑ơb2 = number of item variance
According to Siregar (2013: 57), the basis for decision making in determining an instrument can
be said to be reliable, if:
If r alpha positif and r alpha > 0,6, then the item is reliable
If r alpha positif and r alpha < 0,6, then the item is not reliable
If r alpha > 0,6 but in negatif, then the item is not reliable
3. Simple Linear Regression
Regression analysis is used to predict how far the value of the dependent variable (Y) if the
independent variable (X) is changed. Sugiyono (2012), explains that regression analysis is used to
make predictions, how changes in the value of the dependent variable when rising independent
variables are increased or decreased in value. According to Sugiyono (2012) the formula for linear
regression analysis is as follows:
Ŷ = a + bX
Ŷ = Subjects in the dependent variable are predicted
a = Price Y if X = 0 (constant price)

Regina Dewi Hanifah
The Influence of Instagram Travel Influencer on Visiting Decision of Tourist Destinations for Generation Y
241
Proceedings of CATEA 2019
b = Numbers of directions or regression coefficients, which indicate the number of
increases or decreases in the dependent variable based on independent variables. If b (+) then
goes up, and if (-) there is a decrease
X = Subjects on independent variables that have certain values
4. Correlation Product Moment
Correlation analysis is used for the closeness of the relationship between two variables and to
find out the direction of the relationship that occurs. In this study used Pearson product moment
correlation analysis because it uses interval scale data. Pearson product moment correlation uses the
criterion that the correlation value (r) ranges from 1 to -1, the value gets closer to 1 or -1 meaning the
relationship between the two variables gets stronger, whereas the value close to 0 means the
relationship between the two variables is getting weaker. Positive values show a directional
relationship (X rises then Y rises) and a negative value indicates a relationship (X rises then Y drops).
Product moment correlation can be calculated manually using the following formula (Arikunto,
2010):
rxy = Correlation Coefficient
X = Question item score
Y = The total score obtain
∑X2 = Amount of square value of X
∑Y2 = Amount of square value of Y
N = Respondent
n = the number of samples in the study
According to Sugiyono (2012), to be able to provide an interpretation of the strength of the
correlation relationship, the guidelines can be used as follows: Table 2. Table of Guidelines for Interpreting the Correlation Coefficients
Correlation Coefficient
Interval
Interpretation of
Relationships
0,00 – 0,199 Very Low
0,20 – 0,399 Low
0,4 – 0,599 Average
0,6 – 0,799 Strong
0,8 – 1,000 Very Strong
Source: Sugiyono (2012)
5. Coefficient of determination
Coefficient of determination (R2) used to determine the contribution / contribution that has been
given by the independent variable on the dependent variable. R2 is in interval 0 ≤ R
2 ≤ 1. R
2 calculated
by below equation:
R2 = (r)
2 x 100%
Where:
R2 = coefficient of determination
r = correlation coefficient
The better the estimation / contribution in describing the data, the closer the value of R to value
1.
4. Results and Discussion 4.1. Result
Instagram was developed by a startup named Burbn, Inc. which was initiated by Kevin Systrom
and Mike Krieger. Instagram is one of the most widely used social media in Indonesia, due to the ease
of the features in it. Its use also uses more photos or videos on the main page where users can share
this with other users. The friendship system in this social media uses the terms following and

Regina Dewi Hanifah
The Influence of Instagram Travel Influencer on Visiting Decision of Tourist Destinations for Generation Y
242
Proceedings of CATEA 2019
followers. Where for followers are other users who follow the account and following means Instagram
users follow other users. An Instagram account can also be set as a public account that can be seen by
all Instagram users without having to be friends, or it can be a private account where someone's posts
can only be seen if they have become friends.
All diverse material is shared on Instagram every day. To make it easier for users, Instagram uses
the hashtag to categorize the posts of its users. Therefore, someone who has an interest in a particular
field can easily find what they need. As mentioned previously, a person's personality can be seen from
searches that are often done on social media, because it shows the interests, interests and habits of
someone. Social media has become a cultural phenomenon where the world becomes smaller and
people are more connected to one another. One of the most popular interests of course is traveling. To
be able to decide to carry out these activities, of course, a source of information is needed to be
evaluated and the activities or places to be chosen are chosen, using how much it costs and when to
travel. This is a series of decision making that requires varied information and with social media that
is very easy to use, Instagram supports its users to be able to find that information. Plus the number of
users who specialize in posting only those things, so that their followers will certainly find it easier to
find information by following the account. Here comes the Travel Influencers, where they fill their
social media with informative material in accordance with the experiences they have lived and posted
on their social media accounts.
4.1.1 Validity Test
The first test performed is testing the validity of the questionnaire.Validity test used to measure
whether or not a legitimate or valid questionnaires. A questionnaire is valid if the questions on the
questionnaire were able to reveal something that will be measured by the questionnaire. Table 3. Validity Test
Correlations
Sum
Participation1 ,821
Participation2 ,737
Participation3 ,897
Openness1 ,737
Openness2 ,321
Openness3 ,737
Conversation ,881
Community1 ,860
Community2 ,834
Connectedness1 ,809
Connectedness2 ,592
Connectedness3 ,592
PullFactor1 ,858
PullFactor2 ,321
PullFactor3 ,705
PushFactor1 ,858
PushFactor2 ,321
PushFactor3 ,809
Masrun in Sugiyono (2012), if the correlation coefficient ≥ 0.3 and significant (p <0.05) are
obtained, then the instrument is declared valid. Based on the data above with each coefficient value
that is owned for each question, then 18 questions submitted to the respondent are declared valid.

Regina Dewi Hanifah
The Influence of Instagram Travel Influencer on Visiting Decision of Tourist Destinations for Generation Y
243
Proceedings of CATEA 2019
4.1.2 Realibility Test
After all otherwise valid indicator of the reliability test performed to measure the reliability of a
questionnaire. Test reliability was measured by Cronbach ‘s Alpha Value (α), if the value of
Cronbach’s alpha (α) is greater than 0,60 then the research data is considered good enough and
reliable to be used to test the research hypothesis. Reliability testing can also be done by comparing
the alpha value with the alpha value if the item delete where the alpha value for each sub dimension
should not be equal to or greater than alpha comparison. Table 4. Reliability Statistics
Cronbach's Alpha N of Items
,947 18
Based on realibility test above it shows that overall reliability value is 0.947, with 18 question
items. The value per item shown in the next table where if the indicator is removed then the value of
the overall reliability will be up or down but does not exceed the value of alpha comparison.
4.1.3 Demographic Data of Respondent
Table 5. Gender
Frequency Percent Valid Percent
Cumulative
Percent
Valid Man 26 60,5 60,5 60,5
Woman 17 39,5 39,5 100,0
Total 43 100,0 100,0
This study using 43 sample as respondent, who follow Instagram Account of Travel Influencer in
Indonesia. Most of them are Man with 60.5% from total. This point indicate, that the Travel
Influencer they follow having perspective for men more than to woman. It was supported by
statement of Arief, as a Travel Influencer who made a content applied to a man instead of woman for
travel activity.
Table 6. Age
N Range Minimum Maximum Mean Std. Deviation
Age 43 17 18 35 26,63 3,976
Valid N
(listwise) 43
In this study, all sample are limited to Y Generation, which cut off from 17 – 38 years. Based on
that age, the authors had 43 sample who suitable to categorize. Based on table above, the minimum
age of followers was 17 and the maximum age of followers was 35 years. Within the average of age
was 26-27 years. It shows that travellers in Millenial Generation was spread from the oldest into the
youngest. And many of them did travelling on 26-27 because most of them already has a job instead
of followers within range 17-22 who still in School or College and having limited budget to follow
any travel suggestion from the Influencer. Table 7. Following Session
Frequency Percent
Valid
Percent
Cumulative
Percent
Valid <1 year 20 46,5 46,5 46,5
>2 years 4 9,3 9,3 55,8
1-2 years 19 44,2 44,2 100,0
Total 43 100,0 100,0
Based on the length of time the user follows an Influencer Travel and finally follows to
choose the same destination with Influencer Travel can be seen from the table above. Where
46.5% of all samples even just followed the Travel Influencer under 1 year. This indicates
that it does not take long for an Influencer Travel to be trusted by users on Instagram as one

Regina Dewi Hanifah
The Influence of Instagram Travel Influencer on Visiting Decision of Tourist Destinations for Generation Y
244
Proceedings of CATEA 2019
of the information used in choosing a travel decision to a tourist destination. Next are those
who have joined the Travel Influence account with a range of 1-2 years, as many as 44.2%
who have chosen the same tourist destination with their Travel Influencers. This tendency is
shown that the Y generation easily have confidence in the Influencers who are on their
Instagram to later become the basis for decision making, especially for traveling.
4.1.4 Normality Test
In this study to test normality, the author uses the Test-Non-parametric Statistics Kolgomorov
Smirnov (K-S). The K-S test is carried out with the following guidelines:
1. If the value of significant> 0.05 then the distribution is normal
2. If the value of significant <0.05 then the distribution is not normal Table 8. One-Sample Kolmogorov-Smirnov Test
Variable
X
Variable
Y
N 43 43
Normal Parametersa,b
Mean 43,02 21,37
Std. Deviation 4,480 2,000
Most Extreme
Differences
Absolute ,142 ,147
Positive ,133 ,094
Negative -,142 -,147
Test Statistic ,142 ,147
Asymp. Sig. (2-tailed) ,29c ,20
c
a. Test distribution is Normal.
b. Calculated from data.
c. Lilliefors Significance Correction.
Based on the results of the Normality Test of the Kolmogorov-Smirnov data above, it can be seen
that the sig value is in the Asymp column. Sig (2 tailed) is 0.29 for Variables X and 0.20 for Variable
Y, where the value is both> 0.05. So that both data are declared valid.
4.1.5 Coefficient Correlation Test Result Table 9. Correlations
Jumlah X Jumlah Y
Kendall's tau_b Variable X Correlation Coefficient 1,000 ,634**
Sig. (2-tailed) . ,000
N 43 43
Variable Y Correlation Coefficient ,634** 1,000
Sig. (2-tailed) ,000 .
N 43 43
**. Correlation is significant at the 0.01 level (2-tailed).
Based on the data above, it can be seen that the correlation coefficient value is 0.634. Based on
Sugiyono (2012), the interpretation of the relationship between the two variables belongs to the strong
category.
4.1.6 Simple Linear Regression Analysis
Table 10. Coefficientsa
Model
Unstandardized Coefficients
Standardized
Coefficients
t Sig. B Std. Error Beta
1 (Constant) 6,488 1,907 3,403 ,001
Travel
Influencer ,346 ,044 ,775 7,848 ,000
a. Dependent Variable: Visiting Decision

Regina Dewi Hanifah
The Influence of Instagram Travel Influencer on Visiting Decision of Tourist Destinations for Generation Y
245
Proceedings of CATEA 2019
The equation obtained from the table above is:
A constant value of 6.488 and a constant value b of 0.346. From these results a regression equation is
found:
Y= a+Bx
Y= 6,488 +0,346X
In other words a constant of 6.488 if there is no influence from Travel Influencer on Instagram,
then the big decision to visit a tourist destination is 0.346. The value of b is a positive value,
indicating that the relationship between positive variables. This means that if X rises in value by one
unit then Y will increase by 0.346.
4.1.7 t-Test Result
In the distribution table above can be seen the value of tcount is 7.848 where tcount> ttable or
7.848> 1.682, the explanation states there is a relationship or influence between Influencer Travel on
Instagram to the decision to visit a tourist destination.
4.1.8 F-Test Result
Table 11. ANOVAa
Model Sum of Squares df Mean Square F Sig.
1 Regression 100,889 1 100,889 61,593 ,000b
Residual 67,158 41 1,638 Total 168,047 42
a. Dependent Variable: Variable Y b. Predictors: (Constant), Variable X
Based on table above that the value of F-Count of all independent variables of 61,593> from F-
Table (4,08), then H0 rejected and H1 accepted. Means all independent variables has a significance
influence simultaneously towards the dependent variable.
4.1.9 Coefficient Determination Test
The coefficient of determination is a parameter to measure how far the ability of models
(especially the independent variable) in explaining the variation of the dependent variable. Testing the
coefficient of determination used to describe how much the dependent variable variation can be
explained by the variation of all the dependent variables. Coefficient determination test observed
through the value of adjusted R2.
Table 12. Model Summaryb
Model R R Square
Adjusted R
Square
Std. Error of
the Estimate
1 ,775a ,600 ,591 1,280
a. Predictors: (Constant), Travel Influencer in Instagram
b. Dependent Variable: Visiting Decision
To calculate Influence of Instagram Travel Influencer on Visiting Decision on Travel
Destinations used numbers R Square (number correlates in squared) or the coefficient of
determination. In the above table views known coefficient of determination of Adjusted R2 value is
0.591. This means that 59.1% of the dependent variables can be predicted from a combination of all
independent indicators, while the remaining 40.9% are all factors that are not included in this research
model.
4.2. Discussion
Indonesia is the country with the largest number of Instagram users, amounting to
approximately 89% of its users who are 18-34 years old. Wherever active users are, they access
instagram with a minimum period of once in a round. Indonesian people also use Instagram to find

Regina Dewi Hanifah
The Influence of Instagram Travel Influencer on Visiting Decision of Tourist Destinations for Generation Y
246
Proceedings of CATEA 2019
inspiration, share travel experiences, the latest trends, and communities that have encouraged small
businesses to grow. This is what discusses how account owners can become a Travel Influencer who
trust their experiences by other users.
Based on the results above, it is stated that there is a strong relationship as 0.634 shown from
Influencer Travel to visiting decisions for a tourist destination. Where this supports previous research
made by Beham (2015). According to him, social media influences the purchasing decision process in
travel, especially for generation Y. This is supported by Thurm (2014), according to his research, the
influence of social media in the choice of objectives.
The results from this study also show that there is no need to wait long as followers in Instagram
to be able to choose or choose a visiting decision for tourist destination. Supported by previous data,
which showed 46.5% of correspondents choose a destination based on Travel Influencers already
following Instagram of Travel Influencer under 1 year. Meanwhile person who following Instagram
of Travel Influencer after 2 years only 9.3%. It didn’t show that more longer person following the
account, will be influenced by the Travel Influencer perspective and experience.
5. Conclusion
This study revealed that Travel Influencer in Instagram could influence their Generation Y
followers to choose a tourist destination based on what their posted in their account. Using
characteristics of social media, it shown that all of participation, openness, conversation, community
and connectedness has influence the followers to increase their pull and push factor to visit a tourist
destination. Which most of followers age 26-27 will choose a same place of their Travel Influencer
supported by factor of economy and cost. It really effective to Generation Y to get information from
Instagram, based on what Travel Influencer experienced in tourist destination, because Travel
Influencer will post a picture and express their feeling in caption or reply the question in their account
in comment coloumn. It makes all of followers in Instagram feels enough to get information from
Instagram of Travel Influencer.
Through the analysis of this study, all tourist destination suggested to work together with Travel
Influencer to promote their place. And Travel Influencer give an honest review for their followers. All
operator must realized that the world has been technologically literate and facilitated by social media,
especially Instagram. With Instagram, users can easily find information to evaluate alternatives before
deciding to visit a tourist destination. This can maximize revenue from each company or tourist
destination in promotion.
Regarding the limitations of this study, it needs to be acknowledged that a small sample size has
been used. Hence, the findings may not represent the overall thought of Generation Y-ers who follow
all Travel Influencers. To redress the problems listed above, future researchers are encouraged to
expand the sample size to get a better overview of Generation Y travellers, and understand listed
frequent travellers or non-frequent travellers. It is to make sure person who has interesting in
travelling or only one time occasion when visit a tourist destination. In further research, it better to
have perspective and point from traveller of aspect outside the social media to choose the reason in
choosing travel destination on preparation stage.
References
Journal Papers
Bendahao,C ., & Berbou, H., “The Impact of Culture on the Use of Social Media in Travel Destination Search”.
The Journal of Macro Trends in Social Science, 1(1), 59-73.(2015).
Crampton, S. M., & Hodge, J. W., “Generation Y: uncharted territory”. Journal of Business & Economics
Research, 7(4), 1-6. (2009).
Xiang, Z., Magnini, V.P., & Fesenmaier, D.R., “Information technology and consumer behavior in travel and
tourism: Insights from travel planning using the internet”. Journal of Retailing and Consumer Services,
22, 244–249. (2015).
Book
Arikunto, S.,”Prosedur Penelitian Suatu Pendekatan Praktik“Rineka Cipta,2010
Buhalis, “eTourism: Information technology for strategic tourism management, 1st Edition,” Pearson, 2003

Regina Dewi Hanifah
The Influence of Instagram Travel Influencer on Visiting Decision of Tourist Destinations for Generation Y
247
Proceedings of CATEA 2019
Decrop, A., & Kozak, M., “Decision strategies in tourism evaluation. Unpublished”. In M. Kozak, & A. Decrop
(Eds.), Handbook of Tourist Behavior: Theory and Practice (Vol. 16, pp. 65-80). Routledge. 2009.
Han, J., Kamber, M., and Pei, J., “Data Mining: Concepts and Techniques, 3rd
edition,” Morgan Kaufmann,
2011.
Kotler, Philip & Keller, Kevin Lane., “Principles of Marketing, 14th Edition”Pearson, 2012
Nurgiyantoro, Burhan, “Stilistika” Gadjah Mada University Press, 2014
Priyatno, Dwi., “5 Jam belajar olah data dengan spss 17” Andi, 2009
Siregar, Syofian, “Metode Penelitian Kuantitatif Dilengkapi Dengan Perbandingan Perhitungan Manual &
SPSS”, Kencana, 2013.
Stevenson, A.”Oxford Dictionary of English, 3rd edition” Oxford University, 2012
Sugiyono, P.D, “Metode Penelitian Kuantitatif Kualitatif dan R&D”, Alfabeta, 2012
Tehubijuluw, Florentina K., & Sugiarto, “Metodologi Penelitian”, Matana Bina Utama, 2014
Woodside, Arch G. and Martin, Drew, “Tourism Managemenet: analysis behaviour and strategy”CAB
International,2008
Online
https://dailysocial.id/post/apa-itu-instagram/Retrieved 01 November, 2018
https://mudazine.com/anitalstr/influencers-media-sosial-milenial/ , Retrieved 30 October, 2018
https://techno.okezone.com/read/2016/01/14/207/1288332/pengguna-instagram-di-indonesia-terbanyak-
mencapai-89/Retrieved 16 October, 2018
https://tekno.kompas.com/read/2018/03/01/10340027/riset-ungkap-pola-pemakaian-medsos-orang-indonesia,
Retrieved 25 October 2018
http://www.emarketer.com/Article/Millennials-Seek-Online-Advice-Opinions-Booking-Travel/1009531,
Retrieved 30 October, 2018
Thesis
Azariah, D. R.,”Mapping the travel blog: A study of the online travel narrative”. Ph.D., School of Media,
Culture, and Creative Arts, Department of Communication and Cultural Studies, Curtin University, 2012
Beham, Angelika., “Role of Social Media in Generation Y travellers’ travel decision making process”, thesis,
Bisnis Administration in Tourism and Hospitality Management, Vienna University, 2015
Parsons, Hannah L., “ Does Social Media Influence an Individual’s Decision to Visit Tourist Destinations?
Using a case study of instagram”, thesis, Event Management, Cardiff Metropolitan University, 2017
Putri, Cindy Paramitha R.,”Analisis Faktor Pengaruh Promosi Berbasis Sosial Media Terhadap Keputusan
Pembelian Pelanggan Dalam Bidang Kuliner (Studi Kasus : PT XYZ)”, thesis, Binus University, 2012
Thurm, Marie C., “The impact of travel blogging on the tourist experience: An e-ethnographic
investigation”Tilburg University, 2014

248
Proceedings of CATEA 2019
Proceedings of CATEA 2019
ISBN 978-623-91018-0-0
Discrepance Dynamics on Ecotourism Development in Sembilang
National Parks, Indonesia
Nurbaeti1, Fetty Asmaniaty
2, Adam Rachmatullah
3
1Nurbaeti, Trisakti School of Tourism, Jakarta, Indonesia
2 Fetty Asmaniaty, Trisakti School of Tourism, Jakarta, Indonesia
3 Adam Rachmatullah, Trisakti School of Tourism, Jakarta, Indonesia
[email protected], [email protected], and [email protected]
*Corresponding Author
Abstract: In line with the shifting principle of forestry development from timber management to resourced
based management, it can be said that the current orientation of Indonesian forestry development is on the right
path. On the other hand, the dynamics of discrepancy among actors in ecotourism development is a fundamental
obstacle that always brings discontinuation of a program in the long run. This study used analysis of One Score
One Indicator Scoring System, which aimed to minimize subjectivity and simplify the various components of
statements and/ or questions arranged in the form of questionnaires; which was then analyzed descriptively and
qualitatively as material for consideration to achieve optimum results. Overall, the results of the study showed
that there was a discrepancy between society and the government in ecotourism development; both in the large
domains of economics, ecology and socio-culture. Although there were symptoms of polarization, but
stakeholders agreed that the benefits distribution of ecotourism development was able to create new
employment opportunities, increase community income or increase value, and develop various recolection
demands. For these reasons, the orientation of a partial development should be encouraged and directed to be a
strong motivation in realizing various forms of ecotourism implementation. The aggressive strategies needed to
be done are: 1) Ecotourism Development Planning; 2) Collaboration and Partnership Management.
Keywords: Ecotourism; Discrepancy; One Score One Indicator Scoring System; Sembilang National Park;
Sustainability
1. Introduction In line with the shifting principle of forestry development from timber mangement to resourced
based management, it can be said that Indonesia's current forestry development orientation is on the
right path. In a historical perspective, the shifting in the principle of development originated from a
public movement that began to saturate due to the over exploitation of various forestry resources
throughout the world, especially in developing countries. Avenzora (2013) said that the movement of
the world community in the early 80s was originally a natural trend (movement back to nature) which
later turned into a formal movement along with the emergence of the World Conservation Strategy
declaration in 1980. Then, the importance of enforcing the pillar of conservation has become more
solid because of the establishment of the World Commission on Environment and Development
(WCED) institution in 1983; wherein later conclusions in the form of documents were born which
emphasized the importance of sustainable concepts in various forms of development implementation.
On the other hand, the tourism sector has also adopted the three pilars of sustainability paradigm
as the 21st Agenda was declared in Rio de Janeiro in 1992. One of the 21 agendas is Travel and
Tourism which substantially confirms the implementation of the sustainable development trilogy in
various forms of implementation of tourism. With the foundation of thinking that in principle must be
able to maintain the sustainability of resources, various policy mandates have been carried out to

Nurbaeti, Fetty Asmaniaty, Adam Rachmatullah
Discrepance Dynamics on Ecotourism Development in Sembilang National Parks, Indonesia
249
Proceedings of CATEA 2019
Indonesian tourism sector. In the National Medium-Term Plan, as well as the mandate of the vision
and mission as stated in NAWA CITA, Indonesian Tourism is currently a strategic sector in the pillar
of national economic development. Through the conceptually-themed NAWA CITA movement, the
Ministry of Tourism has at least targeted foreign tourist arrivals are in the number of 20 million and
the movement of domestic tourists by 275 million in 2019 (Avenzora et al, 2018). Tourism as
Indonesia's core economy projects that by 2019 will contribute 20 billion USD in foreign exchange
(Ministry of Culture and Tourism, 2019). In the context of developing ecotourism in conservation
areas, the Work Cabinet mandates in RPJMN in the period of 2015-2019 that ecotourism and tourism
in general are leading sectors and are designated as "National Priority". This is certainly an
opportunity and challenge for all parties committing to drive the macroeconomy through ecotourism
development, and specifically the development of ecotourism in conservation areas.
Among the abundance of ecotourism space resources in Indonesian conservation area, Sembilang
National Park (SNP) is one of the National Parks that has "myriad potential" ecotourism; both eco-
nature tourism and eco-culture tourism. In the National Nature Tourism Development Master Plan
documents in the period of 2018-2078 compiled by Avenzora et al. (2018), it is stated that Sembilang
National Park is an area categorized as "Rising Star", which is a growth area as a support for the main
destination (gravity center). With the determination of SNP as "Rising Star", there are several inherent
characteristics including: 1) having optimum carrying capacity; 2) meso guide recreation activity; 3)
extensive price, and; 4) medium thematic. With the four characteristics inherent in the SNP, SNP is
more appropriate to be the position of the center of intererst and to be also a bench marking in the
development of ecotourism in a region. Beside the completeness and uniqueness of various natural
elements as recently established as a Biosphere Reserve by UNESCO in July 2018, then the
uniqueness of material and immaterial herritage that is owned and/ or made by local communities,
which is also beneficial to be presented to the ecotourists. The uniqueness of the various socio-
cultural aspects found in the SNP environment, which is not only valuable as a diversity of supply, but
also a great opportunity to increase added value and multiplier effects in various fields and businesses.
As the policy mandate inherent in SNP, the existence of SNP with its wealth of ecological
resources, socio-cultural and ecotourism will fall out and not benefit when the dynamics of
discrepancy among actors occurs in ecotourism development. It should be remembered that
ecotourism or tourism is a multi-sector that is interrelated each other, so that an obstacle in one sector
will affect discontinuity which brings gradual destruction. For that matter, carefulness in every step of
ecotourism development is absolutely necessary in an integrated manner. To minimize the possibility
of discrepancy in ecotourism development, Avenzora (2013) has warned that integrated planning is
not only to optimize the function and performance of each related element, but also to meet the need
to unite tourism into the whole development policy. For this reason, this study was not only important
as a demand approach step, but also with regard to the theory of integrated and behavior approach
which was actually crucial in the whole development of ecotourism.
2. Related Works/ Literature Review 2.1. Discrepancy
Before review various literatures which related to this study, previously review various definitive
theories as an effort to understand discrepancies, tourism development, and ecotourism domains as a
science. In the Cambrige Dictionary (2019), discrepancies mean as "a difference between two things
that should be the same." While in the Indonesian Dictionary (KBBI), the word Discrepancy implies
incompatibility or incompatibility; so that it can be interpreted as differences in objectives in various
sectors which will ultimately bring polarization between actors. In mathematics, discrepancy means
incompatibility that describes the deviation of the situation and condition of the desired concept; so
this theory is also often called distribution deviation. Then the discrepancy referred to in this study
can be interpreted as differentiation between actors in the orientation of ecotourism development in
Sembilang National Park. The dynamics of the discrepancy that occurs in ecotourism development
not only brings ineffectiveness and inefficiency in the performance and program that will be carried
out or underway, but also has the potential to create budgetary disharmony and trouble in important
strategic policy that have impact on the slow development of ecotourism itself.

Nurbaeti, Fetty Asmaniaty, Adam Rachmatullah
Discrepance Dynamics on Ecotourism Development in Sembilang National Parks, Indonesia
250
Proceedings of CATEA 2019
2.2. Development
While in development perspective, development is an open concept so it must be defined
continuously along with an understanding of the process of change or because of the emergence of
new problems that require solutions through development practices. Therefore, development can be
understood as a process of structural transformation that presupposes cultural, political, social and
economic changes (Hetne; 2001: 4). While the United Nations Conference on Environment and
Development (UNCED, 1992); Siahaan (2007: 11) defines sustainable development as development
that meets the needs of the present generation without reducing the ability of future generations to
meet their needs. The concept of sustainable development is adopted into the realm of tourism by the
World Commission on Environment and Development (WCED) by mean of a part of sustainable
development that pays attention to current needs by considering the future needs of future generations
(WCED, 1987: 8) ; Blamey, 2001: 11). Then WTO (2013: 17) defines sustainable tourism as "tourism
that takes full account of current and future economic, social and environmental impacts, addressing
the needs of visitors, the industry, the environment and host communities.”
2.3. Ecotourism
While in ecotourism context, the concept of ecotourism in the world was first introduced by
environmental experts who had long been involved in natural travel, namely Hector Ceballos-
Lascurain (1987). Then, in The Ecotourism Society in 1991 cited from Nugroho (2011: 15),
ecotourism is a travel tour to natural areas in order to conserve or save the environment and provide
local livelihood. According to the World Union Conservation Union (WCU); Nugroho (2011: 15),
ecotourism is a tourist trip to areas where the natural environment is still pristine, by respecting its
cultural and natural heritage to support conservation efforts, not to produce negative impacts and
provide socio-economic benefits that respect local participation. Referring to these principles, the
term ecotourism is difficult to define because of the many elements that will be involved (Alikodra;
2012).
While Avenzora (2008) has reminded that the meaning of ecotourism should not only be spatial
or partial, but must include at all these stages while still adhering to the three pillars of sustainability
and sustainable development: ecology, socio-economic and socio-cultural. So holistically, ecotourism
is defined as a tourism activity whose entire stages refer to the principle of sustainable development
which can be done on all forms of tourism/ ecotourism; so it is not just an activity that is only done in
natural, untouched and remote destinations, but in the form of a series of activities consisting of 5
stages, namely: (1) planning, (2) travelling to the destination, (3) activities at the destination, (4)
returning journey from the destination and (5) recollection (Avenzora 2008). From the various
literature theories, it can be interpreted that the ecotourism should not only be interpreted as an
activity which focus on the “remote area” area but also means a concept that can be carried out by
various areas which have ecotourism resources potentials. Therefore in its implementation,
ecotourism concept could be apply in rural or urban areas.
In social research study, Mahbub et al. (2018) conducted a quite interesting research which was to
compare public perceptions between planning of karst mining areas development and planning of
karst ecotourism villages development.This study found that 68% of society did not appove the karst
mining proposal. While in the ecotourism development planning context, the data shows that society
perception of Sambueja Village are positive (73% agree) to the karst ecotourism development
planning proposal. The majority of society stated that they did not mind if Sambueja Village was built
and develop as an ecotourism village, nevertheless requisite refers to the tourism concept which
concern to environmental functions preservation, ecological potentials, and maintaining cultural
values in the local community.
The study of ecotourism development parties polarization in Bukit Barisan Selatan National Park
conducted by Agustina et al. (2018); generally found stakeholders (community tourists and managers)
in the ecotourism hospitality development shows a harmonious perception in symmetrical polarization
form. This indicates that tourism management in Kubu Perahu National Park Tourism Management
unit goes well. The advantages of those findings not only for science but also for the parties to
facilitate the implementation of various ecotourism activities.

Nurbaeti, Fetty Asmaniaty, Adam Rachmatullah
Discrepance Dynamics on Ecotourism Development in Sembilang National Parks, Indonesia
251
Proceedings of CATEA 2019
3. Material & Methodology 3.1. Time and Research Location
The study was conducted from August to November 2018 in Sembilang National Park
(Administrative Region of Sungsang IV Village and Sei Sembilang Hamlet, Banyuasin District, South
Sumatra Province. The location was chosen with the consideration that Sungsang IV Village was an
administrative village located outside the area, while Hamlet Sei Sembilang wass an Administrative
Hamlet included in the SNP area, or in a special zone.
3.2. Methods
The sampling technique used in the study was incidental sampling, in which anyone who
incidentally (incidentally) met the researcher could be used as a sample, if the person was suitable as a
source of data (Sugiyono, 2012: 126). Roscoe (1982, in Sugiyono 2010) stated that if the sample is
divided into categories, then the number of sample members in each category is at least 30
respondents, so the total respondents taken were 60 respondents (30 communities and 30
governments). The framework of the approach used was phenomenology (Altinay and Paraskevas
2008). The research instrument used was a closed questionnaire with a Likert scale guide to a scale of
1-7 (modification of the 1-5 Likert scale). This was because the character of the Indonesian people
articulated a value in great detail (Avenzora 2008).
Various qualitative data would be processed and presented in tabulative descriptive manner,
while quantitative data would be processed using basic descriptive statistical techniques in the form of
frequency distribution. Frequency distribution indicated the number and percentage of respondents
and the object of study included in the existing category to provide initial information about the
respondent or object of study. Thus, the calculation of frequency distribution could be calculated
based on the arithmetic mean and mode. The analysis was conducted with One Score Indicator
Scoring System, which is an analysis model used by developing questionnaire elaboration in
collecting data and evaluating various variables that have been determined by researchers (Avenzora
2008; Avenzora et al. 2013: 517). This method was used to minimize subjectivity and simplify the
various components of statements and/ or questions arranged in the form of questionnaires; which was
then analyzed descriptively qualitatively as material for consideration to achieve optimum results.
Furthermore, SWOT analysis was used as a basic reference for formulating strategies stated in the
IFA and EFA.
4. Results and Discussion 4.1. Respondents Characteristics
Community Respondents. The results of the study show that respondents were dominated by
men with 81%; and married (Figure 1). The average age of the community respondents is 40 years
with the number of dependents family members dependents was 3 people. The population community
categories in Sungsang IV Village and Sei Sembilang Hamlet who were chosen as respondents were
65% are locals, while the outsider population was only 35%. Based on the results of the study and the
secondary data explained that outsiders generally from Bugis (Sulawesi), Malay tribes from Riau, and
Javanese and also from Ogan and Komering. As in various regions of Indonesia, the characteristics of
education of community in coastal areas generally are relatively low. The Sungsang community
where were 10% of respondents uncompleted elementary school, 45% graduated from elementary
school, 16% educated in junior high school and 23% educated in senior high school. It should be
noted, the low level education of coastal communities such as in Sungsang Village is not because of
their low motivation for education, but because of several other factors such as limited school public
facilities in elementary, junior high or high school, far accessibility and limited costs.
As a Buffer Village which is topographically located in the lowlands and the coastal area of the
Musi River estuary, the background of community occupation generally is dominated by 55%
fishermen, both fishermen and fishermenhand. While 26% are entrepreneurs, 10% are Civil Servants,
and so on. The main livelihoods of Sembilang Hamlet’s community are utilizing marine products such
as being fishermen, both taking fish and shrimp or other fisheries. Community who depend on their
lives as fishermen and fishermenhand are composed of various specifications of expertise such as fish
fishermen, anchovy, crabs, salted fish makers, shrimp paste makers, shrimp processing, shellfish

Nurbaeti, Fetty Asmaniaty, Adam Rachmatullah
Discrepance Dynamics on Ecotourism Development in Sembilang National Parks, Indonesia
252
Proceedings of CATEA 2019
ponds, grouper ponds, fish sellers and buyers outside warehouse (seller on the line) and so on. While
who are entepreneurs consist of sellers of ice cubes, fuel oil, gallon water, basic food, clothing,
transportation services, and so on. Then in terms of income base, 42% local community generally
only earns less than 1 million/ month which is below the average of the City Minimum Wage of
Sungsang Regency totally IDR 2,865,688/ month.
Figure 1. Characteristics of Community Respondents
Government Respondents. Primary data shows that the local government chosen as the
respondents were mostly men (83%) with 83% marriage status (Figure 2). The average age of
government respondents is 37 years with the number of dependents of family members are 3 people.
Most of the government respondents were classified as locals who reached 80%. While in terms of
education, the data shows that many of them were educated at senior high school level (53%) and
Bachelor (17%). Occupation background classified into 3 categories due to the limitation of National
Park (NP) managers who did not reach the minimum number of respondents umtil 30 people. Three
occupational background categories shows that respondents who worked as National Park employees
were only 7%, while others were Employees/ Village-District Officers (46%) and Civil servant/
Indonesian Army/ Indonesian National Police and other up to 47%. In terms of income, many of them
are especially village officials who are still honorary (honorary civil servants) less than IDR 2.4
million. However, even though their income is mostly below City Minimum Wage, they become
entrepeneur in services and goods; such as groceries and culinary, local transportation (becak-ojek),
fish-shrimp suppliers, etc.

Nurbaeti, Fetty Asmaniaty, Adam Rachmatullah
Discrepance Dynamics on Ecotourism Development in Sembilang National Parks, Indonesia
253
Proceedings of CATEA 2019
Figure 2. Characteristics of Goverment Respondents
4.2. Dynamics of Ecotourism Perception
Positive Perception of Tourism Economy. The results of the study showed that all elements of
society and the government agreed (Score 6) on the positive perception of the tourism economy
(Figure 3A). This indicates that there is an understanding and awareness of stakeholders on the
economic benefits obtained from various forms of ecotourism activities. People assume that with the
development of ecotourism in their area, various distribution of benefits can be achieved such as the
opening of new jobs, increasing community income or added value, and increasing demand for
culinary processed goods. Gursoy & Rutherford (2004) stated that society also see tourism as a tool to
reduce unemployment because tourism activities create new opportunities for employment and further
increase the income of individuals, communities and government. For the government itself, with the
development of tourism in their region, it will automatically increase Regional Original Income (ROI)
and stimulate infrastructure development. Chase et al. (1998) revealed that the tourism sector can be
relied upon to be an instrument of economic development through government policy innovations and
other mechanisms. Nugroho (2011) noted that the tourism sector in Australia in 1996 presented
economic benefits of at least 5.5% of GDP, 8% of labor and 12% of export value and among the
various space spaces around 46% ecotourists visited National Parks and Botanical Gardens.

Nurbaeti, Fetty Asmaniaty, Adam Rachmatullah
Discrepance Dynamics on Ecotourism Development in Sembilang National Parks, Indonesia
254
Proceedings of CATEA 2019
Figure 3. (A) Positive Perception of Ecotourism Economy; (B) Negative Perception of Ecotourism Economy;
(C) Positive Perception of Ecotourism Ecology; (D) Negative Perception of Ecotourism Ecology;
(E) Positive Perceptions of Socio-Cultural Ecotourism and; (F) Negative Perception of the Socio-
Culture of Ecotourism.
6 7
6 6
6 6 6 6
6 6 6 6 6 6
0
1
2
3
4
5
6
7
Society Government
Rat
e S
cale
(A) Positive Perception of Ecotourism Economy
Increased employment
Increasing community income
Economic value of resources increases
Open opportunities for cooperation in various business fields Demand for goods and services is increasing
Increased investment in the region
Stimulate infrastructure development
5
3
5
4
5
3
5
3
5
3
5
4
5
3
0
1
2
3
4
5
6
7
Society Government
Rat
e S
cale
(B) Negative Perception of Ecotourism Economy
Labor outside the region becomes dominant
Increasing sales of (land) assets of the family
Mastery of assets by outsiders (foreign)
Business control by a handful of people
Economic inequality of people and migrants
Decline in environmental resources
Decreased agricultural production and other primary resources
6 6 6 6 6 6 6 6
6 6 6 6 6 6
0
1
2
3
4
5
6
7
Society Government
Rat
e S
cale
(C) Positive Perception of Ecotourism Ecology
Habitat conditions become increasingly natural Resting place for animals to be looked after The increasing population of animals has been maintained Increasing population of animals and plants
Fostering the love of the local community towards TNS Growing public awareness of SNP
Increased ecosystem security
4
4
4 4
4
4
4
4 4
4
4
4 4
4
0
1
2
3
4
5
6
7
Society Government
Rat
e S
cale
(D) Negative Perception of Ecotourism Ecology
Decreased number of wild animal feed
Reduced wildlife roaming area
Changes in wildlife behavior
Increased pollution in wildlife habitat
Degradation of flora
Degradation of environmental services (water and land) Declining landscape aesthetic value
6 6 6 6 6 6 6 6 6 6
6 6 6
6
0
1
2
3
4
5
6
7
Society Government
Rat
e S
cale
(E) Positive Perception of Ecotourism Socio-Culture
Increasing public knowledge
The development of social institutions
Increasing concern for tourists
Maintaining security stability
Increased creativity and innovation
Increasing social responsibility
4
3
4
3
5
4
4
3
4
3
4
4
5 5
0
1
2
3
4
5
6
7
Society Government
Rat
e S
cale
(F) Negative Perception of Ecotourism Socio-Culture
The emergence of community diseases (drugs, alcohol, prostitution) Pressure on normal quality of life (traffic jams, pollution, etc.) The rise of negative lifestyles imitating tourists (hedonism, consumerism) Increasing juvenile delinquency
The decline of traditional values and local culture
Changes in agrarian lifestyle and conversion of agricultural land Increasing number of migrants

Nurbaeti, Fetty Asmaniaty, Adam Rachmatullah
Discrepance Dynamics on Ecotourism Development in Sembilang National Parks, Indonesia
255
Proceedings of CATEA 2019
Negative Perception of Ecotourism Economics. In various indicators (Figure 3B), the data
shows that the average score produced by the community on the negative perception of ecotourism
economics is rather good (Score 5). This indicates that the community thinks rationalistically about
the various negative possibilities of tourism development, especially the negative impacts of
ecotourism economics. The community considers that in addition to ecotourism development is able
to create a variety of economic benefits, on the other hand ecotourism is also able to minimize social
disparity between indigenous communities and immigrant communities. Archer & Cooper (1998);
Lindberg, (2001); Lai & Nepal (2005) convey the possible negative impacts of ecotourism economics
as follows: “while economic benefits are often welcomed by community members, tourism
development also brings in unfavorable economic effects, such as inflation, over-dependence on
tourism industry, and leakage of tourism revenues.” Unlike the government case as a whole which
states that it agrees or produces an aritmatic mean score of 3 on the negative impact of ecotourism
economics. It is understandable that the government as a regulator and facilitator overshadows
tourism development (ecotourism). In addition, it is understandable that the government also has a
mission to increase their ROI (Regional Original Revenue) in order to achieve economic stability in
the development area. Even the government views tourism as one of the catalysts of nation-building
so that it is expected to be able to create public welfare.
Positive Perception of Ecotourism Ecology. In various indicators, the data (Figure 3C) shows
that the average score produced by the community and the government on the positive perceptions of
ecotourism is good (Score 6). This indicatess that there is a deep awareness from stakeholders that
tourism is able to stimulate desire to keep the environment together. They assume that if the
environment resource is degraded, then various ongoing tourism activities will automatically decrease
the intensity and not impossible to experience collapsing. On that matter, it becomes very important
and crucial if tourism development harmonizes economic and ecological dynamics. Gatewood and
Cameroon (2009: 21) described that the positive impact of tourism on the environment is better
environmental conservation, and it will also lead to an improved process of protecting historical sites
and old buildings, and it will increase ownership of natural resources.
Negative Perception of Ecotourism Ecology. In general, the data (Figure 3D) shows that both
the community and the government provide an ordinary assessment (Score 4) of the negative
perception of ecotourism ecology. It can be said that stakeholders understand that beside ecotourism is
able to provide a distribution of ecological benefits, on the other hand juvenile tourism can provide a
variety of negative environmental impacts such as increasingly polluted and damaged resources. They
know that various natural resources such as water, land, air, flora and fauna are also experiencing
degradation as happened in several tourist areas in Indonesia. In fact, National Park employees know
exactly the ecological negative impacts that will occur if the environmental carrying capacity
(ecology) in the National Park is not enforced; which in the end will have implications for the damage
and degradation of existing flora and fauna. Regarding the negative impact of ecotourism activities,
Kuvan (2005: 263) explained that in general tourism activities are consumptive towards natural
resources and they produce waste that can damage the environment.
Positive Perception of Ecotourism Socio-Culture. The results of the study show that the
average value produced by stakeholders on the positive perception of the socio-cultural tourism
(Figure 3E) is good (Score 6). The community considers that the development of ecotourism carried
out in the region in the future is able to provide various social benefits such as being able to improve
intellectuality through the exchange of information and experience and being able to lift the cultural
dignity and values that they have. This is similar to Pitana's explanation (2010: 143) that most tourists
(61.78%) visit Bali because they are interested in culture; tourists who are interested in nature, flora
and fauna contribute (32.8%); and the rest are interested in other aspects. For the government itself,
various unique natural resources owned by Sembilang National Park, various typical dances owned by
the people in Penyangga Village (Sungsang Village) and various cultural manifestations in the form
of food or dumplings are appropriate and feasible to be developed as culinary attractions.
Negative Perception of Ecotourism Socio-Culture. In various criteria, the data (Figure 3F)
shows that the negative perceptions of ecotourism socio-cultural provided by the community and
government are of moderate meaning (Score 4). This means that both the community and the
government both consider ecotourism beside being able to increase the dignity of culture, on the other
hand ecotourism can also provide logical consequences that lead to negative things such as the

Nurbaeti, Fetty Asmaniaty, Adam Rachmatullah
Discrepance Dynamics on Ecotourism Development in Sembilang National Parks, Indonesia
256
Proceedings of CATEA 2019
commodification of culture that removes sacredness in ritual practices. In addition, another concern is
that it can lead to increasing juvenile delinquency due to the increasingly heterogeneous area of
settlements which also simultaneously raises the hedonism of the public over tourists. Setiawan
(2012) stated that the development of tourism that utilizes cultural heritage is a manifestation of the
commodification of culture. As a result, the changing face of culture no longer rests on actual values
but follows the market's wishes. On this matter, prudence in tourism planning is very absolute to do
and various scientific planning processes are the key to success in ecotourism development.
Perception of Infrastructure. In various indicators, the data (Figure 4A) shows that the public
perception of the infrastructure condition in the National Park, especially the Sembilang area is
classified as poor (Score 2). Communities around the NP area stated that it was difficult for them to
get infrastructure networks in the form of clean water, electricity and even in Sembilang Hamlet,
which could not capture cellular telecommunications networks at all. In addition, the main gate
network to the National Park and information networks / signposts can be said to be nonexistent.
When viewed in detail, the highest score stated by the community on the condition of the
infrastructure is 4 or moderate meaning for various local transportation facilities such as speedboats,
rickshaws and motorcycle. Whereas from perceptive local government, the data shows (Figure 4A)
that the mean arithmetic produced is classified as moderate (Score 4) on the condition of
infrastructure in Sembilang National Park. Local government as a facilitator realizes that the various
existing infrastructures are still fairly limited or even require more intensive development and
development. After the establishment of Sembilang National Park as a biosphere reserve by
UNESCO, infrastructure development is not only oriented towards economic and ecological
repertoire, but also must pay attention to every detail of the ecotourist's needs. This is similar to the
statement that delivered by Hearne and Salinas (2002), namely "an effective approach in providing
services that can balance both ecological conservation and income generation from parks is to
understand and incorporate conservation goals, tourists' preferences for nature appreciation,
infrastructure, and other attributes of protected areas. "
Perception of Service Facilities. The study shows the public perception of the condition of
service facilities (Figure 4B) in the SNP area produces a score of 3 or classified as rather bad. It is
understandable that in fact the conditions of service facilities such as information centers, toilet
facilities, places to eat and places to sell (souvenirs) in the Sembilang National Park area are in poor
condition. Even in Sembilang hamlet, the limitations and availability of clean water are still one of the
fundamental constraints that cause the existing toilet facilities to be not optimal. For these various
problems, it is understandable if the public perception of the condition of service facilities in the SNP
area is based on the behavioristic learning they feel. Different perceptions were stated by the
government on the condition of service facilities in the SNP area, namely produce a score of 4 or
moderate meaning. The average arithmetic stated by the government with a value higher than one
point from the community can be interpreted as one of the nonextremism expressions. One of the
factors that leads to the unfolding of the scale of attitudes is the authority and duty of local
government as a development facilitator. Nevertheless, the government also realizes that various
limitations of public service facilities should be optimized to the maximum extent to support all social
needs of the community elements and potential ecotourists.
Perception of Environmental Conditions. Primary data (Figure 4C) shows the public and
government perceptions of environmental conditions in the SNP area are relatively high or only able
to produce an average value of 5. This indicates that the community is quite aware of the
environmental conditions in the SNP area. One indicator that gains low scores is in term of
environmental cleanliness, namely the score 3. The absence of laystall networks is a factor that causes
poor environmental cleanliness so that the existing garbage is scattered in the residential environment.
The other two indicators that produce high scores (Score 6) for environmental conditions are
indicators of community attitude or hospitality and service of officers towards visitors or the
community.

Nurbaeti, Fetty Asmaniaty, Adam Rachmatullah
Discrepance Dynamics on Ecotourism Development in Sembilang National Parks, Indonesia
257
Proceedings of CATEA 2019
Figure 4. (A) Perception of Infrastructure Condition; (B) Perception of the Condition of Service Facilities; (C)
Perception of Environmental Condition and; (D) Perception of Ecotourism Resources.
Perception of Ecotourism Resources. The results of the study (Figure 4D) shows that there is a
diferentiation in scale of attitudes inter-actors about the condition of ecotourism resources; where the
arithmetic mean given by society is high (Score 6), while the government only gives a rather high
2
4
3
4
2
4
2
4
2
3
2
3
4
4
0 1 2 3 4 5 6 7
Society
Government
Ratie Scale
(A) Perception of Infrastructure Condition Road network to the main gate of SNP
Road network and conditions from the gate to the center / tourist location
Information network / directions
Parking area
Water, electricity and communication network
Waste network
Public transportation (local transportation)
2
4
3
4
2
4
5
6
3
4
3
4
2
4
0 1 2 3 4 5 6 7
Society
Government
Rate Scale
(B) Perception of the Condition of Service Facilities Information and guidance center
Place to eat (restaurants and food stalls)
Souvenir shop (local craft)
Worship place
Place to stay (accommodation)
Health facility
Toilet
4
5
3
4
4
5
5
5
5
6
6
6
6
6
0 1 2 3 4 5 6 7
Society
Government
Rate Scale
(C) Perception of Environmental Condition The beauty of the environment
Environmental Hygiene
Environmental beauty
Environmental comfort
Environmental security
The attitude of the local community
Service of officers to visitors
6
5
6
5
6
6
6
5
6
5
6
6
6
6
0 1 2 3 4 5 6 7
Society
Government
Rate Scale
(D) Perception of Ecotourism Resources Symptoms of natural waterfalls and rock cliffs
Symptoms of rivers and lakes
View of the wilderness
View of meadows and savannahs
Hill and mountain view
Flora diversity
Fauna diversity

Nurbaeti, Fetty Asmaniaty, Adam Rachmatullah
Discrepance Dynamics on Ecotourism Development in Sembilang National Parks, Indonesia
258
Proceedings of CATEA 2019
meaning (Score 5). This indicates that a very high society enthusiasm in order to the discourse of
ecotourism development in their region implemented factually and gradually. While for the
governmentand managers, eventhough the potential of ecotourism resources in SNP and its
surroundings are classified as unique and beauty sites, but it does not mean that every ecotourism
resources must always get a high score; because many of them have several ecotourism resources sites
which have not received a management treatment at all. In addition, the experiences of each
individual government employee (national park managers) also provides more objective thought
considering that many of them have traveled outside region either for travel or even involved in
activities to identify potential ecotourism resources.
Economic Motivation of Ecotourism. In the context of economic motivation, the data shows
that there is no differentiation in attitude scale as both actors agree (Score 6) on the economic
motivation of ecotourism (Figure 5A). For the government and the local community, open ecotourism
development is not only able to open jobs and increase income, but also able to stimulate the
development of local infrastructure to facilitate the people's economic distribution chain in their
environment. Tourism Attitude Research has shown that the economic benefits that can be generated
from the tourism sector include opening employment, earning additional income, increasing
infrastructure development and even enhancing the views of the community or tourists that are useful
for "endorse tourism development" (Archer & Cooper, 1998; Lindberg, 2001; Liu & Var, 1986;
Mehta & Kellert, 1998); Lai & Nepal (2005).
Motivation for Ecotourism Ecology. In general, the data shows that there is no significant
discrepancy between actors for ecological ecotourism motivation. In the diagram (Figure 5B), it is
seen that the community and the government/ manager agree (Score 6) on the overall indicators of
ecotourism ecological motivation. Both actors believe that ecotourism development is able to improve
the psychological and psychomotor of community in maintaining Sembilang National Park area. In
addition, with the existence of the ecotourism downstream industry, then the community will not only
participate in preserving environmental sustainability, but also actively participate in maintaining the
integrity of the functions and aesthetics of all ecological elements in the conservation space and its
residential environment. Nugroho (2011) emphasizes that there are several benefits that can be
achieved from the tourism industry (ecotourism), those are: 1) financial distribution; 2) effectiveness
of planning and management of the environment; 3) the raise of awareness and environmental
protection; 4) alternative employment opportunity, and; 5) regulatory and institutional effectiveness.
Socio-Cultural Motivation of Ecotourism. In various cases, the data shows that there is no
symptom of polarization in the direction of stakeholders on the socio-cultural motivation of
ecotourism. Overall, both the community and the government give a score of 6 or good meaning for
the socio-cultural motivation of ecotourism (Figure 5C). It can be interpreted that there is conceptual
harmony in looking at the socio-cultural benefits of ecotourism. The harmony of cultural motivation is
allegedly due to the degradation of the community's cultural order in various regions due to the strong
development of technology and information; so that alternative development instruments (ecotourism)
are needed which are believed to be able to revitalize the traditional (socio-cultural) order of society to
become more entrenched. Meimand et al. (2017) stated that: “local residents of villages in this study
perceived socio-cultural impacts of tourism positively and greatly support future tourism development
in their area of living”. Among social-cultural factors, intrinsic motivation as non-monetary aspect of
tourism development leads to the high acceptance of tourism by local residents of the Homestay
program in this study (Meimand et al. 2017).

Nurbaeti, Fetty Asmaniaty, Adam Rachmatullah
Discrepance Dynamics on Ecotourism Development in Sembilang National Parks, Indonesia
259
Proceedings of CATEA 2019
Figure 5. (A) Economic Motivation of Ecotourism; (B) Motivation for Ecology of Ecotourism and Social
Affairs; (C) Socio-Cultural Motivation of Ecotourism
4.3. Discussion
In order to harmonize the perception and motivation discrepancy of stakeholders, the first step
that must be taken is to conduct collaborative management and sectoral integration. This can be
realized in a Focused Group Discussion (FGD) activity involving all components of the local
community, government and universities and non-governmental organizations and several travel
agencies. To simplify the design of strategy, the general strategy that is often used is the SWOT
analysis; by concluding aggressive strategy. As with the IFA and EFA, then aggressive strategy can
be interpreted by optimizing several important points including: 1) ecotourism development planning;
2); collaboration and partnership management.
6
6
6
7
6
6
6
6
6
6
6
6
6
6
0 1 2 3 4 5 6 7
Society
Government
Rate Scale
(A) Economic Motivation of Ecotourism Attaining job
Gaining additional income by trading
Increasing the added value of personal assets (land, houses, gardens)
Increasing business fields collectively
Improving regional transportation
Increasing infrastructure development
Creating a market for household production commodities
6
6
6
6
6
6
6
6
6
6
6
6
6
6
1 2 3 4 5 6 7
Society
Government
Rate Scale
(B) Motivation for Ecotourism Ecology Enhancing the beauty and beauty of the destination
Improving the quality of wildlife habitat in the destination
Maintaining the integrity of the national park area
Safeguarding regional security from illegal activities
Preventing forest fires
Protecting wildlife and plants (flora)
Increasing awareness of protecting the environment in the community
6
6
6
6
6
6
6
6
6
6
6
6
6
6
0 1 2 3 4 5 6 7
Society
Government
Skala Sikap
(C) Socio-Cultural Motivation of Ecotourism Improving people's insight and knowledge
Improving social networks
Improving life mentality
Improving social status in the community
Preserving local wisdom and traditional science
Eliminating discrimination and social jealousy
Increasing the dignity of the community at the destination

Nurbaeti, Fetty Asmaniaty, Adam Rachmatullah
Discrepance Dynamics on Ecotourism Development in Sembilang National Parks, Indonesia
260
Proceedings of CATEA 2019
Ecotourism Development Planning. In ecotourism development planning or tourism, it is not
difficult to find a plan that relies solely on supply needs without thinking about the demand approach,
space utilization or behavior approach. By only capitalizing on the cognitive abilities of the planner
and the experience that relies on "copying success stories," it is not uncommon to find tourist areas
that are abandoned and seem to be just "advanced in place" aspect only. Various experiences prove
the managerial failure contribute to the failure of ecotourism development planning, which often
focuses on empowerment and collaboration aspect only. Both aspects are still needed, but fallacy
happens when it is placed in the starting implementation concept; consequenntly, this often leads to
ineffectiveness and inefficiency to be examined in a macro and comprehensive manner. Therefore, the
development concept approach is necessary, which begins with an objective desk study with various
approaches.
In considering various existing ecotourism development planning approaches, one of the good
and comprehensive approach is by adopting the approach that was put forward by WTO (1994);
Avenzora (2013), which begins with: 1) initial study; 2) goal setting; 3) data collection survey; 4)
analysis and synthesis; 5) policies and plan formulations; 6) recommendations; 7) implementation and
monitoring. If the WTO (1994) approach is simplified, the ecotourism development plan can be
simplified into 2 (two) stages, namely the Master Plan and Site Plan and/ or Detail Plan. In the Master
Plan, the planning framework can rely on supply approach, demand approach, integrated approach
and even enrich the behavior approach. After various planning approaches are operated, data analysis
and synthesis will produce a strategic design on macro basis; in which contains Vision, Mission, and
Scenario of Program and Activity Implementation. While in the Site Plan Document and/ or Detail
Plan, the essence contained in them are the development of public sites/ spaces or business spaces
which are detailed up to the implementation of infrastructure development. Various physical
developments in the business space or even public space have been studied with various sites,
ecological and even socio-cultural considerations; so that they don’t degrade the natural or cultural
quality of the landscape.
Collaborative Management and Partnerships. In collaboration and partnership management,
every actor involved in ecotourism development must first agree on the macro orientation of
ecotourism development in the long run. Various actors (Government, Universities, NGOs, Private
Parties and Communities) will act as regulators, conceptors, initiators, collaborators and implementors
as agreed in the legal umbrella. Various experts should remind that ecotourism development is multi-
disciplinary and multi-actor; so that collaboration and partnership management is not only done in one
short project, but must be carried out in stages and gradually.
In its implementation, ecotourism development will be divided into 3 major phases, those are: 1)
harmonization and consolidation phase, namely tactical steps used to elaborate various policies to be
operated; in order to strengthen various existing internal resources. In addition, in this period it can
also be said simply as an effort to collect all interests, policies, directions or objectives of the
development program in the SNP area as a whole and across sectors. In this phase, it is like a market
penetration that aims to win the inter-sectoral market competition process with good integrity. 2)
optimization phase of ecotourism development, namely optimizing various ecotourism development
programs in the SNP area; both in terms of physical material development and organizational
development and human resources. In addition, this phase is also the implementation of various
program targets that have been set to achieve optimal distribution of benefits. 3) The rejuvenation
phase, aims to anticipate the mismanagement of various program optimization program phases, but
also intends to regenerate the sustainability of various programs that have been done in the previous
phase of the program which has not been conducted at all.
5. Conclusion Overall, the results of the study show that the community and the government fully support the
various processes of developing tourism in their region. Stakeholders realize that various distribution
of benefits can be achieved such as the opening of new jobs, increasing community income or added
value, and increasing demand for goods and services. In addition, stakeholders also believe that the
development of tourism is capable of revitalizing various ecological aspects and socio-cultural
settings to become a new order that is more positive; so that all ecological and socio-cultural elements

Nurbaeti, Fetty Asmaniaty, Adam Rachmatullah
Discrepance Dynamics on Ecotourism Development in Sembilang National Parks, Indonesia
261
Proceedings of CATEA 2019
that exist within and outside the region do not get worse and degraded. The various orientation
discrepancies among actors in ecotourism development are always present in every ecotourism
development plan; so that the discrepancy is not used as a fundamental obstacle, but must be
encouraged and made a strong motivation to be consistently involved in integrated and comprehensive
ecotourism development; which is later legalized in a legal entity agreement.
By considering IFA and EFA, the strategic synthesis that must be carried out includes: 1)
Ecotourism Development Planning, beginning with the study of the Master Plan that relies on the
framework of supply approach, demand approach, integrated approach and even enriching with the
behavior approach. Then, the next step is to implement the implementation-study contained in Site
Plan Documents and/ or Plan Details. These documents are needed to design the development of
public sites/ spaces or business spaces which are detailed up to the implementation of infrastructure
development. 2) Collaboration and Partnership Management, in this case every actor involved in
ecotourism development agrees on the macro orientation of ecotourism development in the long term.
In its implementation, ecotourism development will be divided into 3 major phases, namely: a)
harmonization and consolidation phase, b) optimization phase of ecotourism development, c)
rejuvenation phase.
Acknowledgement. The authors thank Belantara Foundation, Trisakti School of Tourism, Sembilang
National Park staff, and all the respondents who kindly participated and responded to the questions.
The authors also would like to thank the editors and anonymous reviewers for their valuable
comments on the manuscript.
References Agustina, M., Winarno, G,D., Darmawan, A., Polarisasi Parapihak dalam Pengembangan Hospitalitas
Ekowisata di Unit Pengelola Wisata Kubu Taman Nasional Bukit Barisan Selatan (TNBBS),” Jurnal
Hutan Tropis, 6 (3): 154-160, (2018).
Alikodra, H.S., “Konservasi Sumberdaya Alam dan Lingkungan; Pendekatan Ecosophy Bagi Penyelamatan
Bumi,” Gadjah Mada University, 2012.
Altinay, L., Paraskevas, A., “Planning Research in Hospitality and Tourism,” Butterworth-Heinemann, 2008.
Avenzora, R., “Ekoturisme-Teori dan Praktek,” BRR NAD-Nias, 2008.
Avenzora, R., “Ekoturisme; Teori dan Implikasi,” In Darusman, D., Avenzora, R., (Eds.), Pembangunan
Ekowisata Pada Kawasan Hutan Produksi; Potensi dan Pemikiran. Program Studi Pasca Sarjana
Manajemen Ekowisata dan Jasa Lingkungan, Fakultas Kehutanan, Institut Pertanian Bogor, 61-95.
(2013).
Avenzora, R., Oktovianus., Suprajanti, S.D., Karyanto, D.W., Kusumawarhani, L., Chrystanto, S.Y., Siregar, J.,
Indriani, D., Putra, C., Gumilar, Nandang., Razak, N., Putri, R.R., Rivai, P., Susanti, M,L., Kiswanto,
H., Diza, A.P., Rahayu, D., “Master Plan; Pengembangan Pariwisata Alam Nasional di Kawasan
Konservasi 2018-2078,” Direktorat Pemanfaatan Jasa Lingkungan Hutan Konservasi, 2018.
Blamey, K.R., “Principles of Ecotourism,” In Weaver, B,D., et al. (Eds.), The Encyclopedia of Ecotourism.
CAB International. (2001).
Cambridge Dictionary Dataset Cambridge University Press, https://dictionary.cambridge.org/ Retrieved 14 Mei,
2019
Ceballos-Lascurain, H., “Tourism, Ecotourism, and Protected Area.” IV World Congress on National Park and
Protected Areas. IUCN, Publication Service Unit, 1996.
[Chase, L.C., Lee, D.R., Schulze, W.D., and Anderson, D.J., “Ecotourism Demand and Differential Pricing of
National Park Access in Costa Rica,” Land Economics, 466-482. (1998).
Gatewood, J.B., Cameroon, C.M., “Belonger Perceptions of Tourism and its Impactsin the Turks and Caicos
Island,” National Science Foundation. 2009.
[Gursoy, D., & Rutherford, D.G., “Host attitudes toward tourism: An Improved Structural Model,” Annals of
Tourism Research, (31): 495–516. (2004).
[Hearne, R.R., Salinas, Z.M., “The use of choice experiments in the analysis of tourist preferences for
ecotourism development in Costa Rica,” Journals of Environmental Management. (65): 153–163.
(2002).
Hetne, B., “Teori Pembangunan dan Tiga Dunia,” PT. Gamedia Pustaka Utama, 2001.
Kamus Besar Bahasa Indonesia (KBBI) Dataset, https://kbbi.web.id/ Retrieved 14 Mei, 2019.
[Kuvan, Y., “The use of Forest for the Purpose of Tourism: The Case of Bleak Tourism Center in Turkey,”
Journal of Environmental Management 75, 263-274 (2005).

Nurbaeti, Fetty Asmaniaty, Adam Rachmatullah
Discrepance Dynamics on Ecotourism Development in Sembilang National Parks, Indonesia
262
Proceedings of CATEA 2019
[Lai, PH., Nepal, S.K., “Local Perspektif of Ecotourism Development in Tawushan Nature Reserve, Taiwan,”
Tourism Management (27): 1117-1129 (2005).
Nugroho, I., “Ekowisata dan Pembangunan Berkelanjutan,” Pustaka Pelajar, 2011.
Pitana, I.G., “Tri Hita Karana – The Local Wisdom of the Balinese in Managing Development,” In Conrady, R.,
Buck, M. (Eds.), Trends and Issues in Global Tourism 2010, Springer. (2010).
[Mahbub, A,S., Wahyunira, A., Achmad., “Persepsi Masyarakat terhadap Rencana Pembangunan Ekowisata
Karst di Desa Sambueja, Kecamatan Simbang, Kabupaten Maros,” Jurnal Perennial. 14 (2): 51-60,
2018.
[Meimand, S,E., Khalifah, Z., Zavadskas, E.K., Mardani, A., Najafipour, A,A., Ahmad, U,N,U., “Residents’
Attitude toward Tourism Development; A Sociocultural Perspective,” Sustainability. 9 (1170): 1-29
(2017).
Siahaan, T.H.N., “Hutan, Lingkungan dan Paradigma Pembangunan,” Pancuran Alam Jakarta, 2007.
[Setiawan, I.K., “Pusaka Budaya Pura Tirta Empul dan Pengembangan Pariwisata,” Jurnal Arkeologi
Universitas Udayana. Februari 2012 Volume XII (2012).
Sugiyono. “Metode Penelitian Kombinasi (Mixed Methods),” Alfabeta Bandung, 2012.
World Tourism Organization (UNWTO). “Sustainable Tourism for Development Guidebook.” Capitán Haya,
2013.

263
Proceedings of CATEA 2019
Proceedings of CATEA 2019
ISBN 978-623-91018-0-0
Study of Stakeholders' Perception, Motivation and Preferences Towards
Ecotourism Development in Siberut National Park, Indonesia
Devita Gantina1, Adam Rachmatullah
2, and Fetty Asmaniaty
3*
1Trisakti School of Tourism, Jakarta, Indonesia
2Trisakti School of Tourism, Jakarta, Indonesia
3Trisakti School of Tourism, Jakarta, Indonesia
[email protected], [email protected], and [email protected]
Abstract: This study aimed to analyze the orientation of the stakeholders in the development of ecotourism in
Siberut National Park. The framework of the approach used in this research was phenomenology, which was
then enriched with the data collection techniques of study documentation, observation and qlose ended
questionnaire. The analytical method utilized was One Score One Indicator, which was an analysis model that
was used through developing elaboration of questionnaires in collecting data and evaluating various variables
that had been determined by researchers. The results of the study revealed that various actors (communities,
govenrment and tourists) stated high scores or were meaningful both for the development of ecotourism in
Siberut National Park area. Data on perception, motivation, and ecotourism reference showed high scores on the
distribution of economic, ecological and socio-cultural benefits. The high economic orientation of the
community and government was an important determinant in maintaining the ecological and socio-cultural
order; so that it made positive energy to be developed in the development of ecotourism as a whole and
integrated. Considering number of objective approaches made, then the synthesis initiated in this study was to
optimize several perspectives including: 1) Ecotourism Political and Regional Policy Perspective; 2) Ecotourism
Planning Perspective in an integrated manner; 3) Ecotourism Marketing Perspective.
Keywords: Ecotourism; Perception; Motivation; Preference; Siberut National Park; Stakeholders
1. Introduction The shift in the paradigm of global tourism development from the concept of mass tourism to
ecotourism has brought new story in the orientation of resource use. At least, the world community
including Indonesia has been aware that neo-classical development has brought serious impact on
ecological or socio-cultural resource. For example, although many people claim that Bali is an
autonomous region which is said that it managed to optimize the tourism sector to 71% of Bali’s
Gross Domestic Regional Product, but on the other hand the condition of Bali can now be said to be
experiencing "over-exploitation of resources and destruction of local tourism." Avenzora (2013)
emphasized that Bali, which at the beginning of its growth was known as a tourist destination that was
very natural and rich in cultural uniqueness, is now said to have transformed into a mass tourism area
that is comprehensive and full of negative impacts. The quality of tourism in Bali can be said to be
disappointing because even tourism income in Bali is increasing, in fact many local cultural heritages
do not get the attention they should (Adyana, 2012). In term of socio-economy, Pitana (Bali Post,
1998); Avenzora (2013) criticized that the relationship and interaction between the tourism sector and
the Balinese Customary Institutions was very bad; which was almost no money-tourism arriving at
Customary Institutions to maintain Balinese culture in sustainable manner, and various tourism
developments in Bali have threatened the sustainability of Indigenous Villages in various sectors.
Externally, the occurrence of these negative implications originated from capitalists who could
not resist patience in the game rules on the concept of sustainable tourism development. The
determinants of financial benefits often invalidate the integrity of resources and other supporting

Devita Gantina, Adam Rachmatullah, and Fetty Asmaniaty
Study of Stakeholders’ Perception, Motivation and Preferences towards Ecotourism Development in Siberut National Park,
Indonesia.
264
Proceedings of CATEA 2019
factors, causing various negative impacts of tourism. Boniface and Fowler (1993) stated that in many
ways tourism is part of neo-colonialism. Mieczowski (1995) underlined that there are four actors that
cause negative impacts on tourism to the environment, namely developers, governments at all levels,
the tourism industry and tourists themselves. From the various views of the dynamics of tourism
development, all actors involved should reflect on themselves to pay close attention to the integrity
and sustainability of resources. This is not only to ensure the existence of all ecological elements that
exist in a destination/ region, but also to maintain socio-cultural repertoire; both material and
immaterial.
Along with the development of the time, the increasing movement of the theme "back to nature"
has at least brought people to care about environmental sustainability. Avenzora said that there is an
inherent dynamic in the form of "the circle of curiousity" which makes tourists tend to travel to places
they have never visited. In the concept of ecotourism, there have been many parties who consider that
ecotourism only limits itself to activities in remote areas only, whereas in fact the aspects of
ecotourism space utilization can be done in any space; both rural area and urban area that are filled
with various tourist facilities. A remote or rural area that has a diversity of ecotourism resources is
National Park (NP). The National Park is a conservation area that has a myriad of resource wealth; its
germplasm, its wildlife and other environmental services.
Among the 54 National Parks in Indonesia, Siberut National Park (SNP) is one of the National
Park that has unique and distinctive flora, fauna and natural phenomena. The uniqueness is because of
its location which is biogeographically different from the islands of Sumatra; thus causing growth
abnormality of various species with a high level of endemicity. In addition to the diversity of plant
species (around 856 species), this area has a high diversity of animal species; where Supriatna (2014)
noted that there were around 31 species of mammals (17 of which were endemic), four endemic
primates, four types of endemic squirrels, four types of mice (one endemic) and 105 species of birds
with one endemic species. In terms of natural phenomena, there are dozens of waterfalls and surf
spots making the SNP area or the Mentawai Islands become one of the best surfing destinations in the
world.
Considering the story and experience of tourism development presented in the previous
paragraph, the various potentials of ecotourism stored in the SNP and surrounding areas must be
managed carefully and consistently to apply the principle of sustainability. In its concept-
implementation, all actors must be brave and consistent in holding back their lust for capitalism not to
be trapped in a purely economic development orientation, but it must be equivalent to the ecological
and socio-cultural pillars. Therefore, harmonization and consolidation are needed consistently by all
development actors, those are the government, the private sector, NGOs, and the community itself.
The study was intended to explore every stakeholder orientation in the development of ecotourism in
Siberut National Park; to design a strategic strategy in a macro and gradual manner.
2. Related Works/ Literature Review At present, there has been a lot of tourism research that focuses on the symptoms of attitudes,
perceptions, motivations or stakeholder preferences. However, the research mostly only takes part of
the variables or criteria that exist only. For example, a study conducted by Sabir et al. (2018) about
"Stakeholders Perception for Ecotourism Development in Tesso Nillo National Park" is quite
interesting to be used as learning. In his research, it was found that the dynamics of forest area
development in Tesso Nilo National Park (TNNP) was characterized by the magnitude of the interest
of the actors involved in it. Then the Kruskal-Wallis Test also showed that p-value = 0.429 <α = 5%
or H1 acceptance, which means that the perception of stakeholders in the development of forest
ecosystems in TNNP is not the same or there are significant differences. If dismissed, the polarization
phenomenon that occurs in TNNP is its disharmony in the orientation of resource use which is more
inclined to financial benefit alone, namely by allowing private companies to develop oil palm
plantations in conservation areas rather than optimizing ecotourism development. This is a
fundamental obstacle why ecotourism development in TNNP seems "advanced in place" and difficult
to achieve optimal distribution of socio-economic benefits.
Other study on "Resident's Attitude toward Tourism Development: A Sociocultural Perspective"
conducted by Meimand et al. (2017); where in his research it was found that overall, the local

Devita Gantina, Adam Rachmatullah, and Fetty Asmaniaty
Study of Stakeholders’ Perception, Motivation and Preferences towards Ecotourism Development in Siberut National Park,
Indonesia.
265
Proceedings of CATEA 2019
population felt the positive impact of socio-cultural tourism so that it strongly supported the
development of tourism in the future in their region. The main factors become the intrinsic motivation
of the local population, namely the creation of jobs and entrepreneurship in the form of home stays
and other home industries. Based on the findings of Meimand et al. (2017), it implies that although
ecotourism development has the potential to "injure" the socio-cultural values that exist in the
community, but on the other hand various perceived benefit distributions are also able to minimize the
various negative impacts; with a note that there is a positive attitude and strong motivation from local
communities to actively participate in ecotourism development.
3. Material & Methodology 3.1. Time, and Reseach Location
The study was conducted from August to December 2018 within the SNP Area and outside the
SNP / Buffer Village area; which is administratively located in the Muntei Village and Matotonan
Village, South Siberut District, Mentawai Island Regency, West Sumatra Province. Topographic
characteristics of SNP (Siberut Island in general) were characterized by flat to hilly topography with
an altitude of less than 400 m dpal (above sea level). The hills had a variation of slope ranging from a
slope of 25% to more than 75% with the highest peak of 384 m above sea level. Climate conditions of
the Siberut National Park region had an equatorial climate that was hot and humid with high rainfall
and no prolonged dry season. Temperature and humidity were relatively constant, with humidity
ranging from 81-85%, while the minimum and maximum temperature averages were 22 ºC and 31 ºC
each day.
3.2. Research Approach
The framework of the approach used was phenomenology; in which researchers described
phenomena that occured in the field based on the experience and cognitive understanding of
researchers (Altinay and Paraskevas 2008). While the data collection techniques used were: 1) Study
documentation, 2) Observation; 3) questionnaire instrument (qlose ended questionnaire).
Documentation study was used to enrich the data while compiling order of ecotourism development
study in objective and comprehensive manner from various literatures (secondary data). In addition,
this documentation study was intended not only to collect secondary data that had relevance as
supporting data, but also to obtain concepts of developing ecotourism in conservation areas (National
Park). While the observations made in this study were to do the number of observation points; both
within the SNP area and outside the Conservation area (Muntei Village and Matotonan Village).
3.3. Research Instrument, Sampling Technique and Research Sampling
The research instrument used was a closed questionnaire (qlose ended questionnaire) with a
Likert scale guide range of 1-7 scale (modification of the 1-5 Likert scale), reasoning the character of
the Indonesian people who articulated a very detailed value (Avenzora 2008). Data obtained from the
questionnaire instrument then analyzed using the One Score One Indicator method, which was an
analysis model that was utilized through the development of questionnaire elaboration in collecting
data and evaluating various variables that had been determined by researchers (Avenzora 2008). The
sampling technique used in this study was purposive sampling. Respondents sampled were divided
into 3 categories, namely: 1) local communities in the SNP buffer zone/ area; 2) Government and/ or
SNP area manager; 3) tourists. According to Roscoe (1982); Sugiyono (2010), if the sample was
divided into categories, then the number of sample members in each category was at least 30
respondents, so the total respondents in this study are 90 people.
3.4. Analysis Method
Various qualitative data would be processed and presented in tabulative descriptive manner,
while quantitative data would be processed using basic descriptive statistical techniques in the form of
frequency distribution. Frequency distribution indicated the number and percentage of respondents
and the object of study included in the existing category to provide initial information about the
respondent or object of study. Thus, the calculation of frequency distribution could be calculated
based on the arithmetic mean or mode. The analysis of One Score One Indicator Scoring System,

Devita Gantina, Adam Rachmatullah, and Fetty Asmaniaty
Study of Stakeholders’ Perception, Motivation and Preferences towards Ecotourism Development in Siberut National Park,
Indonesia.
266
Proceedings of CATEA 2019
which was an analysis model used through the development of a series of questionnaire elaboration in
collecting data and evaluating various variables that had been determined by researchers (Avenzora
2008; Avenzora et al. 2013 :). This method was utilized to minimize subjectivity and simplify the
various components of statements and/ or questions arranged in the form of questionnaire; which was
then analyzed descriptively qualitatively as material for consideration to achieve optimum results.
Then to understand differentiation between actors, there were 2 important issues examined in the
analysis of polarization, namely polarization of direction and rating scale. Direction polarization
occured when scores among actors were divided into two dimensions, namely scores below 4 (3, 2
and 1) and scores above 4 (5, 6 and 7); whereas rating scale polarization occured when there was
absolute score differentiation even though it was in the same dimension (Rachmatullah, 2018).
Furthermore, SWOT analysis was used as a basic reference for formulating strategies stated in the
IFA and EFA.
4. Results and Discussion 4.1. Dynamics of Perception, Stakeholder Motivation and Preference on Ecotourism
Positive and Negative Perception of Ecotourism. The results of the study showed that there was
no differentiation in direction among actors for positive perception of ecotourism (Figure 1). In the
context of the rating scale, the data showed that there were differences in rating scale among actors for
positive perception of ecotourism; in which the community produced arithmetic of Score 7, while the
government and visitors produced Score 5 and Score 6. If examined, the maximum score given by the
community (Score 7) could be interpreted as a strong belief that the development of ecotourism in the
SNP Area was able to increase people's income, open employment opportunities, maintain an
ecological order and revitalize the cultural resources of the Mentawai community. According to
Drumm and Moore (2002), beside ecotourism assessed as being able to minimize ecological impacts,
other benefits obtained were being able to make important contributions in improving the economy of
local community; as the success of ecotourism development was able to fund conservation programs
in various regions of Indonesia. The government that produced a rather high meaning (Score 5) and
visitors (Score 6) for positive perception of ecotourism. For visitors and the government, especially
the SNP manager, even tourism - ecotourism in SNP was currently not able to provide a real
distribution of economic benefits, they believed that in the next few years ecotourism would be able to
contribute to economic and conservation significantly. In recent years, Storalza and Durham (2008)
had estimated that global ecotourism had generated revenue of US$ 300 billion per year.
In various indicators, the data showed that there were differences in direction and rating scale
towards the negative economic perception of ecotourism. The public conveyed the perception of
disagree (Score 2), while the government stated less agree (Score 3) on the negative perception of
economic ecotourism. This contains several fundamental meanings, those are: 1) both the government
and the community share an attitude that tends to be positive thinking on the dynamics of ecotourism
development, because for them if ecotourism development is conducted in their area (SNP area), then
local community labors become a priority thing; 2) the community and the government assume that it
is difficult for them investors in particular to capitalize on ecotourism business through occupational
land ownership because all land / land found on Siberut Island is communal land.
Unlike the case with tourists' responses which agreed (Score 6) on the negative perception of
ecotourism economics. Visitors had concerns that ecotourism development on the other hand had the
potential to cause deterioration of environmental resources and caused business exploitation by some
people. In addition, despite the strong kinship system owned by the Mentawai indigenous people, it is
not impossible if ecotourism development is to cause social inequality between local communities and
migrant communities and cause the dominance of workers from outside the region as they have
encountered in many parts of Indonesia. The critical response made by tourists was in line with the
presentation of The Nusa (1998); Avenzora, (2013) that tourism has ignored the principle of Catur
Purusa Artha which is a basic value system for the life of Balinese people, which then creates various
destructive things for the continuation of culture and nature in Bali. While Goodman (2003) stated
that various tourism activities can degrade and dissolve local cultural values.

Devita Gantina, Adam Rachmatullah, and Fetty Asmaniaty
Study of Stakeholders’ Perception, Motivation and Preferences towards Ecotourism Development in Siberut National Park,
Indonesia.
267
Proceedings of CATEA 2019
Positif Perception of Ecotourism Negative Perception of Ecotourism
Information:
1. Rating Scale: 1 = Strongly disagree; 2 = Disagree; 3 = Less agree; 4 = Ordinary course; 5 = Somewhat
agree; 6 = Agree; and 7 = Strongly agree.
2. Aspect and Indicator of Positive Perception of Ecotourism:
1) Economy: A = Increasing employment; B = Increased income of the community; C = Economic value
of resources increases; D = Opening opportunities for cooperation in various business fields; E =
Demanding for goods and services increases; F = Increased investment in the region; G = Stimulating
infrastructure development.
2) Ecology: A = Habitat condition becomes increasingly natural; B = Animal resting place is maintained;
C = Increased population of animals and plants; D = Growing the love of the local community towards
the National Park; E = Growing public awareness of NP; F = Increased ecosystem security; G = Can
minimize the potential for natural disasters.
3) Socio-Culture: A = Increased public knowledge; B = Development of social institutions; C =
Increased concern for tourists; D = Maintaining security stability; E = Increased creativity and
innovation; F = Increased social responsibility; G = Cultural values and local wisdom are maintained.
3. Aspect and Indicator Negative Perception of Ecotourism:
1) Economy: A = Labor from outside the region becomes dominant; B = Increased sales of assets (land)
of the family; C = Mastery of assets by a few people; D = Ownership of business by a handful of people;
E = Economic disparity of people and migrants; F = Declining value of environmental resources; G =
Decreased agricultural production and other primary resources.
2) Ecology: A = Decreased amount of wild animal feed; B = Reduced wildlife roaming area; C =
Changing behavior of wildlife; D = Increased pollution of animal habitat; E = degradation of flora; F =
degradation of environmental services (water & land); G = The decline in the aesthetic value of the
landscape.
3) Socio-Culture: A = Occurrence of community diseases (alcohol, drugs & prostitution); B = Pressure
on normal quality of life (traffic jams, pollution, etc.); C = The rise of a negative lifestyle imitating
tourists (hedonism and consumerism); D = Increased juvenile delinquency; E = Declining values of
tradition and local culture; F = Change in agrarian lifestyle and conversion of agricultural land; G =
Increasing number of migrants.
Figure 1. Positive and negative perception of ecotourism
Perception of Infrastructure and Existing Conditions of Ecotourism. Overall, there was a
differentiation of perceptions among actors on various aspects of the existing conditions of ecotourism
in the SNP area (Figure 2). In the aspect of infrastructure, the arithmetic mean that tended to be low
from all of these actors was recognition of the current conditions of various infrastructures. For the
community itself, various infrastructures such as access and road networks, telecommunication
networks, electricity and water, as well as up and waste networks were in quite alarming condition.
For example in the Matotonan Buffer Village which was directly adjacent to SNP only had one
telecommunication network unit and there was not even a tourist information center. In addition,
various conditions of service facilities such as place of worship and public toilet in the Matotonan
Buffer Village could also be said in dire conditions; because at some point, the building material had
begun to break down. In the future, variety of ecotourism facilities certainly must be special concern
to facilitate all kinds of tourists and the community needs. Divisekera (2009) investigated that
economic managers in increasing Australian tourism goods and services from foreign tourists were
due to improvements in the areas of accommodation, food, transport, shopping and entertainment.

Devita Gantina, Adam Rachmatullah, and Fetty Asmaniaty
Study of Stakeholders’ Perception, Motivation and Preferences towards Ecotourism Development in Siberut National Park,
Indonesia.
268
Proceedings of CATEA 2019
Information:
1. Rating Scale: 1 = Strongly disagree; 2 = Disagree; 3 = Less agree; 4 = Ordinary course; 5 = Somewhat
agree; 6 = Agree; and 7 = Strongly agree.
2. Aspect and Indicator:
1) Infrastructure: A = Access and road network; B = tourist information center; C = Parking area; D =
Telecommunication, electricity and water network; E = Waste network; F = Place of worship; G =
Toilet or bathroom.
2) Service Facility: A = Information and guidance center; B = Where to eat (restaurant and food stall); C
= Souvenir sale place (local craft); D = Place of worship; E = Place to stay (accommodation); F =
Health facility; G = Toilet/ WC.
3) Environmental Condition: A = The beauty of the environment; B = Environmental cleanliness; C =
Environmental beauty; D = Environmental security; E = Environmental comfort; F = The attitude of the
local community; G = Service of officers to visitors.
4) Ecotourism Resources: A = Symptom of natural waterfall and rock cliff; B = Symptom of river and lake;
C = The view of the wilderness; D = View of meadow and savannah; E = View of hill and mountain; F
= Flora diversity; G = fauna diversity.
Figure 2. Stakeholders Perception on Infrastructure and Existing Condition of Ecotourism.
Even in terms of infrastructure and public facilities in the SNP area they were not yet good
enough, but if viewed in terms of environmental condition and ecotourism resources, the data showed
that there was no difference in direction among actors as shown in Figure 2. If examined more
deeply, then the value of the highest indicator in aspects of environmental conditions was local
community hospitality and environmental security; where both of these were important indicators in
creating sustainable tourism or ecotourism. While from ecotourism resources, the data also showed a
score that was meaningful for various ecotourism potentials. Stakeholders saw that various ecotourism
resources found in the SNP area could be said still natural and many of them were endemic flora and
fauna. Beside the wide variety of flora (around 856 species), this region had a fairly high and unique
fauna diversity; where Supriatna (2014) noted that there were around 31 species of mammals (17 of
which were endemic), four endemic primates, four types of endemic squirrels, four types of mice (one
endemic) and 105 species of birds with one endemic species and 13 endemic species.
Motivation of Community and Government on Ecotourism. In various aspects, the data showed
that there was polarization of rating scale among actors on the motivation of ecotourism (in terms of
economic, ecological and socio-cultural). However, if viewed from the direction domain, the data
showed that there was polarization in the direction in which the average arithmetic community
produced a score of 7, while the government created score of 6 (Figure 3). This can be interpreted as
both actors have strong motivation for developing ecotourism in the SNP area. For the community,
ecotourism development would not only be able to increase economic added value, but also be useful
to preserve a variety of local wisdom that began to be degraded along with the times. These various
local wisdoms will become more entrenched together with the demands of ecotourists who want to
witness an eco-cultural tourism attraction. Darusman, Avenzora and Nitibaskara (2013) explained that
the various potentials of material-culture and immaterial culture possessed by local communities are
also very valuable to be used as cultural attractions that complement various ecotourism activities.

Devita Gantina, Adam Rachmatullah, and Fetty Asmaniaty
Study of Stakeholders’ Perception, Motivation and Preferences towards Ecotourism Development in Siberut National Park,
Indonesia.
269
Proceedings of CATEA 2019
Information:
1. Rating Scale: 1 = Strongly disagree; 2 = Disagree; 3 = Less agree; 4 = Ordinary course; 5 = Somewhat
agree; 6 = Agree; and 7 = Strongly agree.
2. Aspect and Indicator: 1) Economy: A = Getting jobs; B = Getting extra income (trading); C = Increasing added value of
personal assets (house, land and/ or garden); D = Increasing business fields collectively; E =
Improving regional transportation; F = Increasing infrastructure development; G = Creating market
for household production commodities.
2) Ecology: A = Improving the beauty of the destination; B = Improving habitat and wildlife quality; C =
Maintaining the integrity of the NP Region; D = Maintaining the security of the area from illegal
activities; E = Preventing forest fires; F = Protecting wildlife and flora; G = Increasing awareness in
preserving the environment in the community.
3) Socio-Culture: A = Increasing people's insight and knowledge; B = Improving social network; C =
Improving life mentality; D = Improving social status in the community; E = Preserving local wisdom
and traditional science; F = Eliminating discrimination and social jealousy; G = Increasing the
dignity of the people at the destination.
Figure 3. Community and Government Motivation for Ecotourism
While for the government itself, the development of ecotourism in the SNP area was not only
able to generate benefits to increase Regional Original Income (ROI), but also useful to develop
various socio-cultural arrangements of local communities around the SNP area. In addition, it should
be noted that various economic benefits generated from ecotourism were not only able to reduce
poverty in the economic sector, but also able to stimulate local communities to maintain the integrity
of natural and cultural resources in the National Park area. At the same time, the use of ecotourism in
the SNP area could also be relied on to reduce hunting and trade in wildlife. This was similar to
Supriatna's presentation (2014: 4) which stated that the natural tourist attraction of wildlife in several
developing countries can substitute profits lost from hunting and at the same time contribute to
wildlife conservation.
Tourist’s Push and Pull Motivation. In term of push motivation, the existing data (Figure 4)
revealed that the push motivation value of tourist in the SNP area was generally only classified as
moderate (score 4); where the first indicator stated by tourists as low (score 3). While in term of pull
motivation, data illustrated that the value of tourist attracting motivation was only normal (score 4);
where the highest value was on the 3rd
indicator, namely the popularity of tourism. It was
understandable that the Mentawai Islands were one of the best areas for marine ecotourism, especially
surfing attraction, while ecotourism that stood out in the SNP area was a type of cultural and spiritual/
religious ecotourism. In addition, with the recognition of the tattoo (titi), Mentawai as one of the
oldest tattoos in the world, it was not surprising that many Anthropologists throughout the world were
studying various material-immaterial cultures in this region. McIntosh, Goeldner and Ritchie (1995);
Cooper et al. (1998) stated that one of the motivations of tourists in conducting tourism activities is
because of cultural motivation to see and know more about culture in a region. In several studies on

Devita Gantina, Adam Rachmatullah, and Fetty Asmaniaty
Study of Stakeholders’ Perception, Motivation and Preferences towards Ecotourism Development in Siberut National Park,
Indonesia.
270
Proceedings of CATEA 2019
tourist motivation, the average main motivation for someone to do tourism is for the purpose of
relaxation, refreshing the physical and mind (Reindrawati 2010, Fandeli 2002, Abbas, 2000).
Motivation is still the main push factor, while the pull factor is still dominated by natural and cultural
ecotourism resources, such as local lifestyle and eco-activities (Chan et al. 2007, Ros & Iso-Ahola,
1991).
Information:
1. Rating Scale: 1 = Strongly disagree; 2 = Disagree; 3 = Less agree; 4 = Ordinary course; 5 = Somewhat
agree; 6 = Agree; and 7 = Strongly agree.
2. Aspect and Indicator: 1) Push Motivation: A = Regaining creativity and relaxation from daily routines; B = Improving physical
fitness and health; C = Improving the quality of family ties; D = Improving friendship / group quality; E
= Learning and / or understanding something new to increase knowledge; F = Distributing special
hobbies; G = Looking for a beautiful place to take pictures.
2) Pull Motivation: A = A variety of activities that can be done; B = Price / cost of tourism; C = Famous
tourist attraction; D = Easy access to tourism objects; E = Complete facilities and infrastructure; F =
object cleanliness and comfort; G = Promotion and information about interesting tourism objects
Figure 4. Tourist’s Pull and Push Motivation.
Stakeholder Preference on Ecotourism. In various respects, the results of the study indicated
that there were symptoms of differentiation in the direction and rating scale among actors on
ecotourism preference. In term of service facility and infrastructure, the data showed the height (score
7) of people's preference for development of various facility and infrastructure in the SNP area and
Buffer Village (Figure 5). The various service facilities and infrastructures were not only needed to
accommodate all the needs of the community and mere tourists, but also needed to increase
satisfaction, experience and memorable aspects of tourists. While in term of accommodation, data
showed that there was a differentiation in the rating scale among actors on various forms of
accommodation (Figure 5). If examined more closely, people prefered the type of homestay
accommodation as the main type of accommodation, while the government and tourists did not
question the type of accommodation more, but rather accommodations that adopted local architecture
(those were homestay, cottage or commercial villa). Makes and Rahmafitia (2013) said that the choice
of tourists is not solely due to the accommodation facilities offered, but rather to the attributes of
destinations that are around eco-lodges that promote nature and local culture as the main attraction.
Then in term of marketing, the data showed that the community was more enthusiastic to
promote various ecotourism resources by various institutions, both by government, community
groups, NGOs, or even universities. While the government and tourists were more oriented to
integrated and centralized marketing; thus minimizing the inaccuracy of existing data and
information. However, overall stakeholders agreed on various marketing responsibility schemes
conducted by any institution; because in principle, good ecotourism marketing is to be done
comprehensively and systemically by involving all actors massively and integratedly. This is in line
with Pitana's presentation (2015); Ekonomi.bisnis.com Online Media which said that in order to reach

Devita Gantina, Adam Rachmatullah, and Fetty Asmaniaty
Study of Stakeholders’ Perception, Motivation and Preferences towards Ecotourism Development in Siberut National Park,
Indonesia.
271
Proceedings of CATEA 2019
the target of 20 million foreign tourists to Indonesia, an integrated and sustainable tourism marketing
strategy is needed by involving all stakeholders or tourism stakeholders.
Information:
1. Rating Scale: 1 = Very bad; 2 = Bad; 3 = Somewhat bad; 4 = Medium; 5 = rather good; 6 = Good; and
7 = Very Good.
2. Aspect and Indicator: 1) Service Facility: A = Improving physical quality and visitor information center; B = Improving
recreational facilities; C = Repairing equipment rental service facilities; D = Improving worship
facilities; E = Improving environmental health and sanitation facilities; F = Improving administrative and
financial services; G = Increasing café / restaurant facilities and souvenir kiosks.
2) Infrastructure: A = Increased access of main roads and trails; B = Increased and regulated circulation
of visitor movements and parking; C = Improvement and arrangement of water networks; D = Increasing
and regulating the electricity network; E = The increase and regulation of telecommunications networks;
F = The increase and regulation of waste and waste networks; G = Improved disaster management
infrastructure.
3) Accommodation: A = Accommodation that integrates with the local population (homestay); B =
Exclusive and modern accommodation (luxury hotels); C = inclusive and modern (general)
accommodation; D = Accommodation that can be moved (caravan); E = Accommodation that adopts
local architecture (eco-lodge); F = Accommodation prepared independently by tourists (tents); G =
homepods.
4) Marketing: A = Marketing is carried out independently by each Tourism Service Provider; B =
Marketing is carried out centrally by Government Institutions; C = Marketing is carried out centrally by
the Tourism Entrepreneurs Association; D = Marketing is carried out by non-governmental organizations
(NGOs); E = Marketing is carried out by Universities; F = Marketing is carried out by the Cooperative;
G = Marketing is carried out by Regional Owned Enterprises (ROE).
5) Wildlife: A = Expelled; B = Hunted; C = Traps are made; D = Reported to Forestry Officer (FO); E =
Left; F = Moved back to its natural habitat; G = Made as an ecotourism attraction.
Figure 5. Stakeholder Preferences on Ecotourism.
While in the context of wildlife, the data revealed that there was no polarization of direction
among actors on wildlife management preference. If reviewed more closely, all actors opposed any
activity that was degraded by the existence of wildlife. This was evident from the low mean values of
indicators A, B and C; which only produced a score of 2 or meaningful disagree. Unlike the case with
utilization attempts in which the community and other actors articulated their agreement if various
existing wildlife were used as an attraction for ecotourism. On this matter, it can be interpreted as a
high concern from stakeholders and especially the local community as residents in the conservation
area to preserve various wildlife and other ecological arrangements. Mutanga, et al (2015) in their
research found that local communities around the Umfurudzi National Park, Matusadona National
Park, and Cawston Ranch areas had positive perceptions about wildlife conservation.
Community and Government Participation on Ecotourism. The results of the study showed that
from various criteria for ecotourism participation, the average value given by the community was very

Devita Gantina, Adam Rachmatullah, and Fetty Asmaniaty
Study of Stakeholders’ Perception, Motivation and Preferences towards Ecotourism Development in Siberut National Park,
Indonesia.
272
Proceedings of CATEA 2019
positive or produced a score of 7 (Figure 6). This indicated the high enthusiasm of the community in
various ecotourism development programs in the SNP area. In the concept of developing ecotourism,
local community wanted to be included from the initial stages of planning, management to the
evaluation phase. Thus, the public does not only feel as a "stunt man actor" but also is fully involved
as the main actor in order to increase independence in addressing a phenomenon and/ or problem in
management.
Information
1. Rating Scale: 1 = Strongly disagree; 2 = Disagree; 3 = Less agree; 4 = Ordinary course; 5 =
Somewhat agree; 6 = Agree; and 7 = Strongly agree.
2. Indicators:
1) Community participation in ecotourism: A = Working in the field of ecotourism; B =
Entrepreneurship in the field of ecotourism; C = Providing land for the ecotourism sector; D
= Maintain cleanliness and harmony of the surrounding environment; E = Maintaining the
security of the surrounding environment; F = Maintaining the authenticity of customs and
culture; G = Improving ability to explain the object of tourist attraction well.
2) Government participation in ecotourism: A = Willing to issue a budget for each National
Park (TN) development needs; B = Prioritizing the interests of the tourism sector
(ecotourism) compared to other development sectors; C = mobilizing the community to
participate in developing ecotourism in NPs; D = Increasing HR knowledge and skills for the
development of ecotourism in NPs; E = Realizing the cleanliness, safety and comfort of NPs;
F = Improving the quality and amount of advice on public infrastructure in NP; G =
Protecting the interests and rights of local community in term of exploiting land in NP Area. Figure 6. Community and Government Participation on Ecotourism.
The average value produced by the government for ecotourism participation was high in meaning
(Score 6). For the government, the various ecotourism participation (in Figure 6) was a basic
obligation for facilitator (government). According to the NP manager's explanation, the various
criteria had actually been done by the government or management, but the various programs listed
were not carried out consistently and continuously considering the existence of a project's time span.
Nevertheless, at least the government had also conducted moral responsibility for programs to
increase knowledge and skills to the surrounding community to pay attention to aspects of protection,
preservation and utilization of the NP area. For the government itself, the most important thing was to
do every pro-conservation movement to maintain the germplasm in NP.
Most Interested Ecotourism Activities for Tourists. Based on the results of the study, the data
showed that the types of ecotourism activities that were most interesting for tourists in the SNP and
Siberut island in general was selfie photos, the second was surfing, the third was wildlife observation
(flora and fauna), the fourth was hiking, and then the fifth was tracking (Figure 7). This is interesting
why the selfie photo activity was in the first rank as an activity favored by tourists even though there
were so many and varied activities that could be done in this region. If examined, selfie photo activity
as the most desirable activity was a phenomenon that started from the presence of smartphone in the
past 7 years that were also connected with social media (Instagram, Twitter, Facebook, Path, etc.).
Rapid technological advancements in this digital era can be said to have formed new lifestyles for
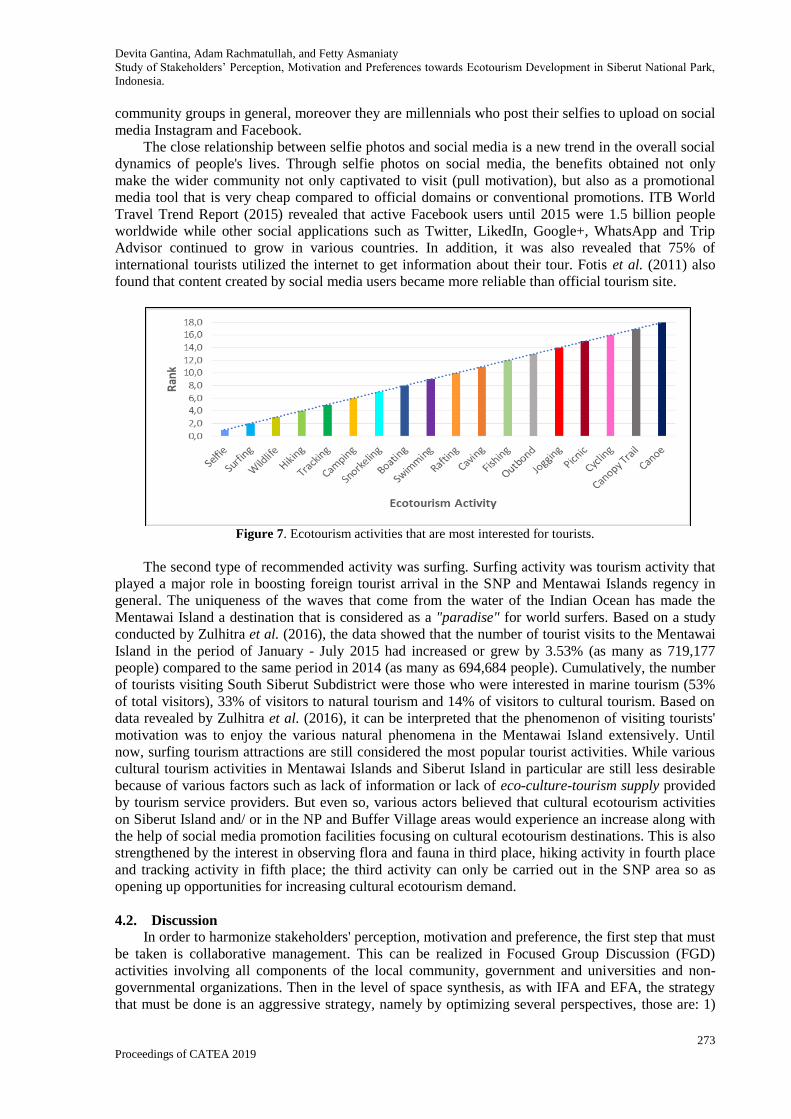
Devita Gantina, Adam Rachmatullah, and Fetty Asmaniaty
Study of Stakeholders’ Perception, Motivation and Preferences towards Ecotourism Development in Siberut National Park,
Indonesia.
273
Proceedings of CATEA 2019
community groups in general, moreover they are millennials who post their selfies to upload on social
media Instagram and Facebook.
The close relationship between selfie photos and social media is a new trend in the overall social
dynamics of people's lives. Through selfie photos on social media, the benefits obtained not only
make the wider community not only captivated to visit (pull motivation), but also as a promotional
media tool that is very cheap compared to official domains or conventional promotions. ITB World
Travel Trend Report (2015) revealed that active Facebook users until 2015 were 1.5 billion people
worldwide while other social applications such as Twitter, LikedIn, Google+, WhatsApp and Trip
Advisor continued to grow in various countries. In addition, it was also revealed that 75% of
international tourists utilized the internet to get information about their tour. Fotis et al. (2011) also
found that content created by social media users became more reliable than official tourism site.
Figure 7. Ecotourism activities that are most interested for tourists.
The second type of recommended activity was surfing. Surfing activity was tourism activity that
played a major role in boosting foreign tourist arrival in the SNP and Mentawai Islands regency in
general. The uniqueness of the waves that come from the water of the Indian Ocean has made the
Mentawai Island a destination that is considered as a "paradise" for world surfers. Based on a study
conducted by Zulhitra et al. (2016), the data showed that the number of tourist visits to the Mentawai
Island in the period of January - July 2015 had increased or grew by 3.53% (as many as 719,177
people) compared to the same period in 2014 (as many as 694,684 people). Cumulatively, the number
of tourists visiting South Siberut Subdistrict were those who were interested in marine tourism (53%
of total visitors), 33% of visitors to natural tourism and 14% of visitors to cultural tourism. Based on
data revealed by Zulhitra et al. (2016), it can be interpreted that the phenomenon of visiting tourists'
motivation was to enjoy the various natural phenomena in the Mentawai Island extensively. Until
now, surfing tourism attractions are still considered the most popular tourist activities. While various
cultural tourism activities in Mentawai Islands and Siberut Island in particular are still less desirable
because of various factors such as lack of information or lack of eco-culture-tourism supply provided
by tourism service providers. But even so, various actors believed that cultural ecotourism activities
on Siberut Island and/ or in the NP and Buffer Village areas would experience an increase along with
the help of social media promotion facilities focusing on cultural ecotourism destinations. This is also
strengthened by the interest in observing flora and fauna in third place, hiking activity in fourth place
and tracking activity in fifth place; the third activity can only be carried out in the SNP area so as
opening up opportunities for increasing cultural ecotourism demand.
4.2. Discussion
In order to harmonize stakeholders' perception, motivation and preference, the first step that must
be taken is collaborative management. This can be realized in Focused Group Discussion (FGD)
activities involving all components of the local community, government and universities and non-
governmental organizations. Then in the level of space synthesis, as with IFA and EFA, the strategy
that must be done is an aggressive strategy, namely by optimizing several perspectives, those are: 1)

Devita Gantina, Adam Rachmatullah, and Fetty Asmaniaty
Study of Stakeholders’ Perception, Motivation and Preferences towards Ecotourism Development in Siberut National Park,
Indonesia.
274
Proceedings of CATEA 2019
ecotourism's regional political and policy perspective; 2) ecotourism planning perspective; and 3)
marketing perspective.
Political Perspective and Ecotourism Regional Policy. Political terminology can be interpreted
simply as an attempt to decide cases wisely. In the context of tourism / ecotourism development, the
importance of political aspect is closely related to the various policies and rules needed to support
various implementations of the development that will be operated. Avenzora (2013) described that
tourism development is somehow based on various policies needed to ensure the functioning of each
role of each stakeholder efficiently and effectively; in line with the fact that tourism is multi-sectoral
in nature so that the role of the government (as a political component) becomes crucial. Furthermore,
competition among regions in participating in the field of ecotourism can be described in the
statement of Hal (1994) whom said "The state is a powerful, resilient, pragmatic and flexible social
structure capable of sustained purposeful action across many areas of social activity of which tourism
is only one."
For the explanation above, the orientation of ecotourism development in the SNP area should be
operated through an integrative and systemic approach; namely by paying attention to macro-oriented
planning to the most micro elements as an embodiment of all aspects harmonization of a single
system unity. To make it easier, all government elements (from the regional to national level) should
coordinate integration as a whole in determining development priorities as well as the high motivation
of the community in the participation of ecotourism in the SNP area. Mill and Morrison (1985); Hall
(1994) proposed 7 forms of public sector involvement in tourism, namely: 1) coordination, 2)
planning; 3) legislation and regulation; 4) entrepreneur; 5) stimulation; 6) the social system of the
tourism system; and 7) basic arrangement for protecting the interests of all parties. In its
implementation, to minimize the limited resources available, various external opportunities in the
form of capital resources can be integrated through partnerships; both with Non-Profit Organizations
(NGOs) or Higher Education Institutions. By establishing collaboration and partnerships, the various
limitations of resources can not only be overcome and minimized, but also able to enrich the maturity
of a program because it runs the principle of democracy as mandated by the 1945 Constitution. Dewi
(2011: 13) stated that with a multi-stakeholder background , it is necessary to have good governance
in order to open and hold collaborative forums where competencies of individuals and institutions /
stakeholder organizations can be put together to produce synergy and produce better outcomes than if
each stakeholder works independently.
Perspective on Ecotourism Planning. The planning aspect in the tourism / ecotourism sector
becomes vital not only because this sector is multi-sectoral one, but also because of the uniqueness
and diversity of resources in creating ecotourism services and products. Avenzora (2013) reminded
that ecotourism planning is an attempt to bring together demand and supply through an objective
approach elaborated through a series of touches of knowledge, art, image and experience based on
logical arguments. While the WTO stated "First tourism should be planned at the national level and
regional levels. At these levels, planning is concerned with tourism development policies, structure
plans, facilities standards, institutional factors, and all the other elements necessary to develop and
manage tourism."
In operated ecotourism planning, many approaches that can be chosen as Gold (1980) described
by utilizing some approaches: 1) demand; 2) resources; 3) utilization of space; 4) behavior. Then
WTO (1994); Avenzora (2013) described that the ecotourism planning process can be outlined in the
form of: 1) initial study; 2) goal setting; 3) data collection survey; 4) analysis and synthesis; 5)
policies and plan formulations; 6) recommendations; 7) implementation and monitoring. It should be
remembered and underlined that every approach in existing planning is good if all stakeholder
orientations can be realized in one domain of vision; so that in its implementation there is no direction
chaos that has an impact on the ineffectiveness and inefficiency of the program that has been planned.
Although currently there is a standard scheme that is regulated in several regulations concerning
ecotourism planning in macro to micro, but in reality the chain of policy in the planning process is
likely to be "overlapping and not lean". Therefore, it is good if all actors agree adopting an integrated
planning approach which was initiated by Avenzora (2008); those are: 1) Master Plan; 2) Site Plan
and; 3) Plan Detail.

Devita Gantina, Adam Rachmatullah, and Fetty Asmaniaty
Study of Stakeholders’ Perception, Motivation and Preferences towards Ecotourism Development in Siberut National Park,
Indonesia.
275
Proceedings of CATEA 2019
Marketing Perspective. In term of general segmentation, all forms of ecotourism activities
conducted in the productive space of natural and cultural landscape are not limited to specific market
segmentation, meaning that there are no age restrictions or any specific background to eco-tourism. In
the context of the branding strategy, the concept-implementation must be driven by the government as
the regulator and catalyst for development with its main promoter is regional or local government
agency of Regional Tourism collaborating with the University (academics) to run the vision and
mission jointly initiated. In addition, the involvement of other stakeholders including the tourism
industry (such as tour and travel service, tour operator, transportation service, hotel service,
restaurant, etc.) is also required to participate in carrying out the overall planning and implementation
of various ecotourism activities. Various empirical researches illustrate that branding can improve the
image of the destination and help increase the number of foreign tourist visits to these destinations
(Telisman-Kosita, 1989). Blain et al. (2005) cited several "success stories" in tourism branding such
as those experienced by tourism in Florida, New York, Tasmania, New Orleans, Louisiana, Texas and
Oregon which generally contain important essence capable of differentiating a tourism destination
from others.
Thus, the myriad of ecotourism resources in each tourist destination located in the Siberut Island
region (SNP area) must also be able to make certain differentiation or uniqueness so that it can build
an icon, image or regional identity as an ecotourism attraction. After discussing normative marketing
strategies, then market segmentations and branding strategies described above must be realized into a
marketing-mixed that includes 4 P (poduct, price, place and promotion). Product is everything that
can be offered to the market to meet the needs and desires of consumers (Kotler and Keller, 2009). In
the case of product, various ecotourism resources declared as tourism product should be arranged in
an ecotourism activity (tour package); so that it can give a more colorful impression and is expected to
be able to optimize the 4 pillars of ecotourism (memory, experience, satisfaction and education). In
addition, by creating a series of one ecotourism program, various aspects of the distribution of
benefits produced will become more economically valuable. Thus, the price offered to eco-tourist
prospective has been arranged in a single domain price.
In the context of place, tourism marketing also needs to understand the characteristics of the
distribution of tourism products themselves. With the characteristics and uniqueness of various
ecotourism products which contain psychological and educational elements for ecotourism, the actual
access limitation or distance to increase ecotourism attractions is not used as a fundamental reason or
obstacle, but must be made as one of the uniqueness in the process of an adventure trip. Thus, the
memory value as part of psychological needs obtained by eco-tourism will produce optimum value. In
term of promotion, a good form of promotion should be done by optimizing audio-visual promotion
media which is currently reaching a trend point, such as Instagram as part of social media or even
documentary recordings that are beautifully and classically broadcast on several television stations
private. With the promotion of audio-visual media, it is expected to provide information basically how
unique the tourist attractions offered to eco-tourist prospective. However, various forms of promotion
that are intended to be operated are not to cause ecotourists prospective to feel lied to by the aesthetics
of various forms of advertaising which have overly manipulated or engineered photos so as to cause
disappointment from the eco-tourist.
Ceremonial activities such as national or international events that have been carried out on
Siberut Island today, such as the Enchantment of Mentawai festival, must be developed and improved
in an integrated manner. If participants are just visiting and enjoying the attributes of MICE
normatively and conventionally or just focusing on the event point in the Enchantment Mentawai
festival; so it's better to arrange the event to be more attractive to a particular space; in order to
explore the uniqueness and integrity of ecotourism resources in Siberut National Park area. By
carrying out various exploration activities at the festival, one of the benefits of the optimization is able
to increase the length of stay of the ecotourists.
5. Conclusion Overall, the parties (community, managers and tourists) stated a high score or good meaning for
the development of ecotourism in the SNP area. Data on perception, motivation, reference and
participation on ecotourism showed high scores on the distribution of economic, ecological and socio-

Devita Gantina, Adam Rachmatullah, and Fetty Asmaniaty
Study of Stakeholders’ Perception, Motivation and Preferences towards Ecotourism Development in Siberut National Park,
Indonesia.
276
Proceedings of CATEA 2019
cultural benefits. The high economic orientation of the community and government is an important
determinant in maintaining the ecological and socio-cultural order; thus making it positive energy to
be managed and presented to tourists. Based on data on the perception, motivation and preference of
stakeholders which have achieved high score, then it should be maintained and even increased in a
perfect / very high direction through various strategic conceptual engineerings; by promoting the
trilogy of sustainable tourism, trilogy of the basic needs of tourists and the pillars of education. Thus,
the success of ecotourism development is not only mere rhetoric, but it must be an implementative
reality.
The orientation of ecotourism development in the SNP area should be operated through an
integrative and systemic approach; namely by paying attention to macro-oriented planning to the most
micro elements as an embodiment of the harmonization of all aspects of a single system unity. To
make it easier, all government elements (from the regional to national level) should coordinate
integration as a whole in determining development priorities as well as the high motivation of the
community in the participation of ecotourism in the SNP area. Considering number of objective
approaches made, then the synthesis initiated in this study is to optimize several perspectives
including: 1) Ecotourism Political and Regional Policy Perspective; 2) Ecotourism Planning in an
integrated manner; 3) Ecotourism Marketing Perspective.
Acknowledgement. The authors thank the Tropical Forest Conservation Action (TFCA), Trisakti
School of Tourism Jakarta, Siberut National Park staff, and all the respondents who kindly
participated and responded to the questions. The authors also would like to thank the editors and
anonymous reviewers for their valuable comments on the manuscript.
References Abbas, R., “Prospek Penerapan Ekoturisme pada Taman Nasional Gunung Rinjani di Nusa Tenggara Barat.”
M.Sc. tesis, Bogor Agricultural University, Bogor, 2000.
Adnyana, I,M,R., Dataset Bali Post, http://www.balipost.com/news/2018/11/01/60172/Kuantitas-Vs-Kualitas-
Pariwisata-Bali.html Retrieved 01 November, 2018.
Altinay, L., Paraskevas, A., “Planning Research in Hospitality and Tourism,” Butterworth-Heinemann, 2008.
Avenzora, R., “Ekoturisme-Teori dan Praktek,” BRR NAD-Nias, 2008.
Avenzora R. 2013. Ekoturisme Teori dan Implikasi. Di dalam: Dadursman D, Avenzora R, editor. Avenzora, R.,
“Ekoturisme; Teori dan Implikasi,” In Darusman, D., Avenzora, R., (Eds.), Pembangunan Ekowisata
Pada Kawasan Hutan Produksi; Potensi dan Pemikiran. Program Studi Pasca Sarjana Manajemen
Ekowisata dan Jasa Lingkungan, Fakultas Kehutanan, Institut Pertanian Bogor, 61-95. (2013).
Boniface, P., Fowler, P,J., “Heritage and Tourism in the Global Village.” Routledge, 1993.
[Blain, Carmen., Stuart, E., Levy, Ritchie, B,R,J., “Destination Branding: Insights and Practice from Destination
Management Organizations.” Journal of Travel Research, 43, 328-338, (2005).
[Chan, J.K.L., Baum, T., “Motivation Factors of Ecotourist in Ecolodge Accomodation: The Push amd Pull
Factors.” Asia Pasific Journal of Tourism Research. 12 (4), 349-364, (2007).
Cooper, C., Fletcher, J., Gilbert, D., Wanhill. “Tourism Principle and Practise.” Longman Publishing, 1998.
Darusman, D., Avenzora, R., Nitibaskara, U, Tb., “Optimalisasi Manfaat Hutan Produksi Melalui Ekowisata,”
In Darusman, D., Avenzora, R., (Eds.), Pembangunan Ekowisata Pada Kawasan Hutan Produksi-
Potensi dan Pemikiran. Program Studi Pasca Sarjana Manajemen Ekowisata dan Jasa Lingkungan
Fakultas Kehutanan, Institut Pertanian Bogor, 223-239. (2013).
Dewi, D,T., “Faktor-Faktor yang Mempengaruhi Collaborative Governance dalam Pengembangan Industri
Kecil; Studi Kasus tentang Kerajinan Royeg dan Pertunjukan Royeg di Kabupaten Ponorogo.” M.Si.
Thesis, Program Studi Magister Administrasi Publik, Universitas Sebelas Maret, Indonesia, 2012.
[Divisekera, S., “Ex-Post Demands for Australian Tourism Goods and Services.” Tourism Economics. 15 (1):
153-180, (2009).
Drumm, A., Moore, A., “Ecotourism Development: a Manual for Conservation Planners and Managers.” The
Nature Conservacy, 2002.
Fandeli, C., Pengusahaan Ekowisata. Fakultas Kehutanan, Universitas Gadjah Mada, 2000.
[Fotis, J., Buhalis, D., Rossides, N. “Social Media Impact on Holiday Travel Planning: The Case of
Rusian and the FSU Markets,” International Journal of Online Marketing. 1 (14) 1-19, (2011) Goodman, R., “Pastoral livelihoods in Tanzania: Can the Maasai benefit from conservation ?,” In Luck, M.,
Kirstges, T., (Eds.), “Global ecotourism policies and case studies: Perspectives and constraints.”
Channel View Publications, 108-114. (2003).

Devita Gantina, Adam Rachmatullah, and Fetty Asmaniaty
Study of Stakeholders’ Perception, Motivation and Preferences towards Ecotourism Development in Siberut National Park,
Indonesia.
277
Proceedings of CATEA 2019
Gold, S,M., “Recreation Planning and Design.” McGraw Hill Book Co, 1980.
Hall, C,M., “Tourism and Politics: Policy, Power and Place.” John Wiley & Sons, 1994.
ITB-Berlin Academy, “ITB World Travel Trends Report 2016 / 2017.” Messe Berlin GmbH, 2015.
Makes, D., Ramafitira, F., “Ecoresort dan Green Hotel Indonesia; Suatu Aplikasi dan Pariwisata Berkelanjutan”.
In Teguh, M,A., Avenzora, R., (Eds.), Ecotourism and Sustainable Tourism Development in Indonesia-
The Potential, Lessons and Best Practice. Pusblished Ministry of Tourism and Creative Economy, PT.
Gramedia, 529-558. (2013).
[Meimand, S,E., Khalifah, Z., Zavadskas, E.K., Mardani, A., Najafipour, A,A., Ahmad, U,N,U., “Residents’
Attitude toward Tourism Development; A Sociocultural Perspective,” Sustainability. 9 (1170): 1-29
(2017).
Mieczowski, Zbigniew., “Environmental Issues of Tourism Recreation.” Univ. Press of America Inc, 1995.
[Mutanga, C,N., Vengesayi, S., Gandiwa, E., Mubako, N., “Community Perceptions of Wildlife Conservation
and Tourism: A Case Study of Communities Adjacent to Four Protected Areas in Zimbabwe.” Tropical
Conservation Science. 8 (2): 564-582, (2015).
Pitana, I,G., Dataset Bisnis Post, https://ekonomi.bisnis.com/read/20151112/12/491491/butuh-pemasaran-
pariwisata-yang-terintegrasi-berkesinambungan- Retrieved 12 November, 2015.
Kotler, P., Keller, L,K., “Marketing Management 13th Edition.” Pearson Education, 2009.
Rachmatullah, A., “Polarisasi Orientasi Pemanfaatan Lahan untuk Pembangunan Ekowisata di Ranah Minang
Sumatera Barat.” M.Sc. Thesis, Departemen Konservasi Sumberdaya Hutan dan Ekowisata, Institut
Pertanian Bogor, Indonesia, 2017.
[Reindrawati, D., “Motivasi Ekoturis dalam Pariwisata Berbasis Alam (Ekoturism): Studi Kasus di Wana
Wisata Coban Rondo, Malang.” Jurnal Masyarakat Kebudayaan dan Politik, 21 (2): 187-192. (2010).
[Ross Dunn, E,L., Iso-Ahola, S,E., Sightseeing Tourist’ Motivation and Satisfaction, Annals of Tourism
Research, 18 (2) 226-237. (1991).
[Sabir, L,O., Avenzora, R., Winarno, D,G., Stakeholders Perception for Ecotourism Development in Tesso Nillo
National Park,” Media Konservasi. 23 (1), 2018.
Supriatna, J., “Berwisata Alam di Taman Nasional.” Yayasan Pustaka Obor Indonesia, 2014.
Storanza, A., Durham, W., “Ecotourism and Conservation in the Americas.” CAB International, 2008.
Sugiyono. “Metode Penelitian Kombinasi (Mixed Methods),” Alfabeta Bandung, 2012.
Telisman-Kosuta. “Tourism Destination Image,” In Stephen, F., Wit, Moutinho, L., (Eds.), Tourism Marketing
and Management, Prentice Hall International. (1989).
[Zulhitra, D., Yuliana., Pasaribu., Strategi Pengembangan Desa Wisata Madobag sebagai Desa Wisata Budaya
di Kabupaten Kepulauan Mentawai. Journal of Home Economics and Tourism, 13 (3), 2016.

278
Proceedings of CATEA 2019
Proceedings of CATEA 2019
ISBN 978-623-91018-0-0
Training and Development in a Malaysian Airport Service
Provider: The Impact on Employees’ Performance
Idaya Husna Mohd1, Ummu Hani Ahmad Mansor
2, Muhammad Hafizi Zamri
3, Tuan Badrol
Hisham Tuan Besar4
Faculty of Business and Management , UiTM Puncak Alam
Abstract : Training and Development is a continuous process in improving performance of the employees, thus
most of the organizations tend to implement training and development in their organization in order to enhance
the employees‟ performance with vision that it will contribute to the success of the organization in the future.
This study intends to examine the impact of training and development on employees’ performance in a
Malaysian airport service provider. The dependent variable is employees’ performance while the independent
variable is training and development, which include of three elements, which are training need assessment,
training and development techniques’ and career development. The researcher used quantitative and descriptive
research methods to complete this research study. Online questionnaire method was used where the
questionnaire were distributed and completed by 351 employees of this organization. Using convenience-
sampling technique, all the data collected were analyzed using descriptive statistic in order to portray the raw
data in a more meaningful way. The finding of this study demonstrated that the variables in this study does give
impact on employees’ performance where all of the variables in this study have positive moderate correlations
respectively. Hence, need assessments is the most contributing variable to the employees’ performance.
Keywords : Training and Development; training needs assessment; training and development techniques;
career development; employee performance; airport service provider
1. Introduction Organizations must ensure that their human capitals are skilled worker, motivated, committed
and competent when performing their works. Which means that the organization must invests their
human capital by providing them training and development, so that they can learn more, increase their
skills and more competent to do their work. So, it shows that the organization is focusing more on the
well-being of the employees by providing them opportunity to learn and sharpened their skills. But
the most common issues when the organization willing to invest in human capital is it is expensive but
the organization will gain more profit in the future through the employees‟ skills and abilities. The
study proposed to investigate the impact of training and development on employees‟ performance in a
Malaysian Airport Service Provider company.
Employees‟ performance is very critical and crucial since it will affect directly or indirectly to
the organization’s overall success. If most of the employees‟ in the organization have a poor
performance, so it shows that the organization itself is not competent and have a poor performance.
When the organization has a poor performance, it will give huge impacts especially to their human
capital as well as the organization profit and business. Thus, when the organization has a poor
performance, it also will make the organization in a hiatus and downfall situation. In short, the
employees also will lose their jobs and most of them will unemployed and have to compete in this
globalization era where nowadays recession rate is quite high. Despite, the government also will have
a poor record of the airport industry if most of the airport has a poor performance and cannot compete
pretentiously with another country’s airports. Thus, it is very important for every airport in Malaysia
to have a good performance in order to compete with other countries.

Idaya Husna Mohd, Ummu Hani Ahmad Mansor, Muhammad Hafizi Zamri, Tuan Badrol Hisham Tuan Besar,
Training and Development in a Malaysian Airport Service Provider: The Impact on Employees’ Performance
279
Proceedings of CATEA 2019
2. Literature Review 2.1 Employees Performance
According to Habib, Mushtaq, & Zahra (2005) training and development are the features of
Human Resource Management (HRM) that helps the organizations to prepare its employees for better
performance and to polish their skills accordingly. Human capital is the assets in every organization.
So, it is very important for every organization to know what training and development programs that
is suitable for the employees in order to enhance their performance. Thus, when the employees have a
better performance in the organization, it can increase the organizations profit and at the same time, it
also good to compete with rivals and stay at the top. According to Cooke (2000) as cited in (Ejakait,
Research on Humanities and Social Sciences, 2016) performance as the accomplishment of a
commitment in such a manner that release performance from all liabilities lay down under the
employment contract. He added that training is a way to increase the employees‟ performance but the
organization has to ensure that training and development that the employees undergo must be
effective. Asare (2008) also defines that performance as the employees‟ effort. Then, he stated that
performance will be measured in terms of input-output relationship and at the same time it must be
measured efficiency with which inputs are utilized to create outputs. Within every organization, most
of the employers usually tend to expect something that are greater from their employees. Thus,
employees‟ performance will be measured against the performance standard policies in the
organizations.
2.2 Needs Analysis
According to Belcourt (1999), managers and HR staffs should stay alert to the kinds of training
that are needed, when are needed, who needs them and which methods will best deliver needed
knowledge, skills and abilities (KSAs). He point that in order to make certain that training is timely
and focused on priority issues, managers should approach needs assessment systematically by
utilizing three types of analysis in need assessment which are organizational analysis, task analysis
and also person analysis. According to Belcourt et al (1999) as cited in (Ejakait, Research on
Humanities and Social Sciences, 2016) , organizational analysis is an examination of the environment
strategies and resources of the organization to determine where training emphasis should be placed.
So basically organizational analysis is it determines the appropriateness of training given the
corporation‟s business strategy, resources available for training, and of course the support by
managers and peers for training activities (Noe, 2013). It is very important for the training to align
with the organizational objective and business strategy. So, the managers and human resource
department must ensure that all the training programs have to be aligned with the organizational
objective and strategy. Moreover, for the training to be successful all of the resources such a s budget,
time, and money have to be adequate. For any organization to function effectively it must have
money, materials, supplies, equipment, ideas about the services or products to offer those who might
used the output which is human resource in order to run the organization (Asfaw, Argaw, & Bayissa,
2015). The support for the training activities and programs also is very important especially support
that comes from the managers and peers because they can boost up employees morale and motivation
during the training is conducting.
2.3 Training And Development Techniques
Training and development technique is divided into on-the-job training and also off-the-job
training. Training and development technique or training method are selecting through the types
which are on-the-job or off-the-job training (Zahra, Iram, & Naeem, 2014) . According to (Mbiya,
Egessa, & Musiega, 2014), on the job training is conducted at one‟s workplace and involves learning
how to perform a given job in the actual job setting. He also added that off the job training is
separating the employees from the job situation or environment and having their purpose away from
the workplace. The effectiveness of the training techniques must be systematic and continues. In other
words, the techniques during the training must be viewed as a long-term process. (Wamwayi, M.
Amuhaya, ElegwaMukulu, & A. Waititu, 2016) Point out that the organization may use onthe-job or
off-the-job training method and the trainers may be sourced from internal or external. For example, in
this organization, one of the training techniques is the on-the-job training. Usually for a large

Idaya Husna Mohd, Ummu Hani Ahmad Mansor, Muhammad Hafizi Zamri, Tuan Badrol Hisham Tuan Besar,
Training and Development in a Malaysian Airport Service Provider: The Impact on Employees’ Performance
280
Proceedings of CATEA 2019
company such as Airport service provider, On-the-job training is very important especially for the
new hires, transferred or promoted employees, cross training employees or upgrading employees. On-
the-job training also can influence the employees‟ performance since (Shem & Ngussa, 2015)
mention that on-the-job training is a key determinant of employees’ performance in the organization.
2.4 Career Development
Career growth or career development is a phenomenon has been a major concern to scholars,
researchers, decision makers and resource experts (Dialoke & Nkechi, 2017). Career development can
be defined as a process for achieving specific employee and organization goals, which includes
providing career information to the employees, helping the employees to identify advancement
opportunity , then promoting job satisfaction and improve the employees‟ productivity (Kirk,
Downey, Duckett, & Woody, 2000). Kirk et al (2000) also explained that career development also can
help the organization to attract the best employees, as well as motivate, develop and retain the best
worker over time. Robbins and Coulter (2002) as cited in Dialoke & Nkechi (2017) also mention that
career is a series of a positions occupied by an individual throughout his or her lifespan. He also
added that career is the constant progress, experience and skills acquisition that most of the employees
need during their lifespan in the organization.
Currently, many organizations try to improve and utilize the human resource department in order
to increase their employee‟s knowledge, skills and abilities. That is the main reason why the
organization provides training and development to their employees. Therefore, this kind of thrust has
raised up career development programs to become the integral part of the organization strategic plans.
As mention by Saleem & Amin, (2013) human resources or professionals personnel are involve in
offering career development support in a variety of ways. He also added that career development
involves taking actions in term of accessing work experiences, which including creating job moves,
and at the same time gaining access formal and more modified forms of learning. Therefore, this kind
of action acquires support and assist from people, which is Human Resource in every organization.
Hence, human resource plays vital roles in order to assist employees to get a proper training, which
can lead to a better career development to every employee in the organization. Based on the studies by
Wamwayi et al (2016) and Shem & Ngussa (2015) the conceptual framework for this study are as
follows:
Independent Variable Dependent Variable
Figure 1. Theoretical Framework
Three hypotheses as follows:
H1: There is a relationship between need assessments and employees‟ performance
H2: There is a relationship between training and development techniques and employees‟
performance
H3: There is an association between career development and employees‟ performance
3. Methodology According to Nachamias as stated in (Everlyne, Mbithi, & Musiega, 2016), research design is a
blueprint that enables the researcher to come up with solutions to problems and guides him in the
various stage of research. A research design is the detailed outline on how the research is conducted.
It is also known as the blueprint for the collection, measurement and analysis of data. It is also the set
of methods that used in collecting and analyzing measures of the variables specified in the research.
Basically, the research design is to ensure that the data that had been obtain through this research
design is effective. So, the choices of the research method are influences by the nature of the research
problem. The sample in this research study is the employees in Malaysia Airport Service Provider
Training and development
Need Asessments
Training and Development
Techniques
Career Development
Employees’ Performance

Idaya Husna Mohd, Ummu Hani Ahmad Mansor, Muhammad Hafizi Zamri, Tuan Badrol Hisham Tuan Besar,
Training and Development in a Malaysian Airport Service Provider: The Impact on Employees’ Performance
281
Proceedings of CATEA 2019
Company which consist of 4000 people. All the employees are scattered in different location even
though there are in the same organization. Some of the employees are in the Airport Management
Centre, KLIA and also KLIA2. Based on Krejcie and Morgan (1970), the number of sample size for
this study is limited for 351 respondents only. In this study, the researcher used the non-probability
sampling techniques specifically convenience sampling since it is convenient, fast and easy to obtain.
The researcher used questionnaire as the tools to obtain the information from the respondents
regarding the study that she conducted which are adopted from Kennedy (2009), Shafloot (2012),
Shafloot (2012), Javed, (2014), Adesola, (2017), Raza, Afridi, & Khan(2017), Malik & Alobaidi
(2016), Sabir, Akhtar, Bukhari, Nasir, & Ahmed (2014), Ngari,(2015).
4. Results and Discussion A total of 351 questionniares were distributed to employees randomly in each department and
units. All the questionnaires were returned to the reseracher and was validated for the analysis. Table
below demonstrated the demographic profile of the respondents.
Table 1. Descriptive Statistics, Cronbach Alpha, and Pearson Correlation of All Study Variables
Demographic Frequency %
Gender
Male
Female
167
184
48 %
52 %
Age
18-25 years old
26-33 years old
34-41 years old
42-49 years old
50 years old and above
71
121
91
40
28
20 %
35 %
26 %
11 %
8 %
Marital Status
Single
Married
115
236
33 %
67 %
Highest Educational Background
Ph.D
Master
Bachelor Degree
Diploma
Certificate
7
41
107
107
89
2 %
12 %
31 %
31 %
24 %
Corporational Tenure
Less than 5 years
5-9 years
10-14 years
15-20 years
More than 20 years
118
86
50
53
44
34 %
25 %
14 %
15 %
12 %
Employee Position
Senior Manager/Manager
Senior Executive/Executive
Non-Executive
Technical
Ohers
32
72
219
24
4
9 %
21 %
62 %
7 %
1 %
Job Tenure
Less than 5 years
5-9 years
10-14 years
15-20 years
More than 20 years
176
80
36
34
25
50 %
23 %
10 %
10 %
7 %

Idaya Husna Mohd, Ummu Hani Ahmad Mansor, Muhammad Hafizi Zamri, Tuan Badrol Hisham Tuan Besar,
Training and Development in a Malaysian Airport Service Provider: The Impact on Employees’ Performance
282
Proceedings of CATEA 2019
Table 2. Descriptive Statistics, Cronbach Alpha, and Pearson Correlation of All Study Variables
Variables EP NA TDT CD
EP (.916)
NA 0.660** (0.902)
TDT 0.635** 0.716** (0.892)
CD 0.579** 0.618** 0.621** (.938)
Mean 4.14 4.13 4.18 4.20
SD .585 .649 .740 .790
Note: ** Correlation is significant at the 0.01 level (2-tailed); Entries in parenthesis indicate
Conbrach Alpha values.
Table 2 above demonstrated the summary finding of the study. Based on the table, it describes
the correlation between the variables in this research. The first research objective is to investigate the
relationship between need assessment (NA) and employees‟ performance. Based on the finding, it
shows that there is a positive moderate correlation between need assessment and employees‟
performance, with 0.660**. This is inline with Wamwayi et al(2016) where it is pointed out that
training need assessment has an impact on employees‟ performance. The second research objective is
to analyze the relationship between training and development (TDT) techniques and employees’
performance (EP). Again the result for both of the variables showed a positive moderate correlation
between the training and development technique and employees‟ performance, with the score of
0.635**. In a study by Shem & Ngussa (2015), it was concluded that orientation, off-the-job and on-
the-job training, coaching/mentoring are positively correlated with job performance. This supports the
second research objective of this study.The last research objective for the research study is to
determine the relationship between career developments (CD) and employees‟ performance. The
findings demonstrated a positive moderate correlation between the career developments and
employees‟ performance which score of 0.579**. This is in line with a study by Dialoke & Nkechi
(2017), stressed out that based on his research study of nonacademic staff of Michael Okpara
University of Agriculture, Nigeria. The findings reveal that there is a positive and significant
relationship between career development and the staff‟s performance.
Table 3 demonstrate the results for multiple regression analysis for this study. The F – test is
significant since the value is 0.000 which is less than 0.005. it shows that all the independent variable
are significantly explained by the dependent variable. Instead, this model predicts that for each unit, it
will increase in need assessment, employees‟ performance by 0.341 units which holding other
independant variable constant. This is also supported by Wamwayi et al (2016) where he pointed out
that training needs assessment has an impact on employees‟ performance. Secondly, for every unit
that increase in the training and development techniques, there will be an increase by 0.241 units of
employees performance, which holding the other independent variable constant. It is also in line with
Shem & Ngussa (2015) statement that orientation, off-the-job and on-the-job training,
coaching/mentoring are positively correlated with job performance. Lastly, for each units that
increase in career development, employees‟ performance will increase by 0.157. This is also
supported by Dialoke & Nkechi (2017) in a study of non-academic staff of Michael Okpara
University of Agriculture, Nigeria, where the findings revealed that there is a positive and significant
relationship between career development and the staff‟s performance. As claimed by the output in the
table above, need asessment is the most contributing factor towards the employees‟ performance in
this study which resulting in (β = 0.341, p = 0.000, p ˂ 0.005). It is the strongest variable with the beta
weight of 0.349.

Idaya Husna Mohd, Ummu Hani Ahmad Mansor, Muhammad Hafizi Zamri, Tuan Badrol Hisham Tuan Besar,
Training and Development in a Malaysian Airport Service Provider: The Impact on Employees’ Performance
283
Proceedings of CATEA 2019
Table 3. Multiple Regression
5. Conclusion Most organization are competitive iregardless industries especially in providing the best product
or services that they can serve to their customers in order to attract them. But, the organization simply
cannot to have a good product and services if they have a poor employees. Employees are the one
who will assist the organization to serve and produce a good quality product and services. So, the
organization must entertain and take care of their employees in order to boost up their morale and
competency to do their jobs. One of the method is by providing the employees a good training and
development programs. Through training and development, the employees can enhance and sharpen
their skills, knowledge and abilities in order to perform better in the future. For the organization,
training and development is one of method that they can use in order to get a return investment.
Which means they will provide training and development to the employees so that in future the
employees will bring profit to the organization. It is like a win-win situation where through training
the employees can sharpen their skills and knowledge while at the same time they can bring profit to
the organization. So, both of the organization and employees will have a good performance in the
future.
References Achi, S. H., & Sleilati, E. (2016). The effect of coaching on employee performance in the human resource
management field: the case study of the lebanese banking sector. International journal of trade and global
market , 137-169.
Adesola, A. B. (2017). The impact of training and development on employee performance in Radisson Blu
Anchorage Hotel. Master thesis Redeemers thesis , 1-80.
Asare, K. (2008). Professional Skills in Human Resource Management, (2nd ed.). Asare-Bediako 7 Associate
Limited: 277 Windy Hills
Asfaw, A. M., Argaw, M. D., & Bayissa, L. (2015). The impact of training and development on employee
performance and effectiveness: a case study of district five administration office, bole sub-city, addis
ababa, ethiopia. Journal on human resource and sustainability studies , 189-202.
Asfaw, A. M., Argaw, M., & Bayissa, G. L. (2015). The impact of training and development on Employee
Performance and effectiveness: case study of district five administration office, bole sub city addis ababa
ethiopia. Journal of Human Resource and Sustainability Studies , 188-202.
Belcourt, M. (1999). Managing Human Resources (2nd ed.). Toronto: Thomson Nelson.
Model Unstandardized
Coefficients
Standardize
d
Coefficients
t Sig.
B Std.
Error
Beta
(Constant) 1.079 .160 6.74
6
.000
Need Asessments .341 .055 .349 6.15
2
.000
Training and
Development
Techniques
.241 .053 .260 4.57
4
.000
Career Development .157 .039 .202 3.99
4
.000
F- Value 121.246
Sigma .000b

Idaya Husna Mohd, Ummu Hani Ahmad Mansor, Muhammad Hafizi Zamri, Tuan Badrol Hisham Tuan Besar,
Training and Development in a Malaysian Airport Service Provider: The Impact on Employees’ Performance
284
Proceedings of CATEA 2019
Cooke, F. (2000). Human Resource Strategy to improve Organizational Performance: A route for British firms
Working Paper No 9 EWERC. Manchester: School of Management.
Dialoke, I., & Nkechi, P. A. J. (2017). Effects of Career Growth on Employees Performance: A Study of Non-
Academic Staff of Michael Okpara University of Agriculture Umudike Abia State, Nigeria. Singaporean
Journal of Business, Economics and Management Studies, 51(122), 1-11.
Ejakait, J. E. (2016). Research on Humanities and social sciences. Effects of training needs assessment on
employee performance in the Postal Corporation of Kenya , Bungoma Country , 140-144.
Ejakait, J. E. (2016). Research on Humanities and Social Sciences. Effects of Training Needs Assessment on
Employee Performancein the Postal Corporation of Kenya, Bungoma Conty , 140-144.
Everlyne, N. A., Mbithi, D. S., & Musiega, D. D. (2016). Influence of Performance Management Practices on
Employee Engagement in Public Universities: A case of Kibabii University Kenya. Journal of Precious
Engineering Research and Applications, 25-35.
Habib, S., Mushtaq, H., & Zahra, F. (2005). Impact of training and development on employees' performance and
productivity: A case syudy of Pakistan. European journal of business and social sciences , 326-330.
Javed, S. (2014). Impact of training and development on employee performance. 1-32.
Kennedy, J. (2009). The impact of training and development on job performance. Master thesis, Kwame
Nkrumah University of Science and Technology , 1-77.
Kirk, J. J., Downey, B., Duckett, S., & Woody, C. (2000). Name your career development intervention. Journal
of Workplace learning , 205-217.
M.Shafloot, F. (2012). The relationship among training policy, knowledge transfer, and performance
improvement: a study of private sector organizations in the kingdom of saudi arabia. Ph.D thesis,
Western Michigan University , 1-124.
Malik, N., & Alobaidli, M. (2016). Proposing a research methodology to evaluate the relation between training
need assessment and employee performance. Master thesis Naval Postgraduate School , 1-57.
Mbiya, D. N., Egessa, D. R., & Musiega, D. D. (2014). The effect of training practices on employees
productivity in the public service: a case of the ministry of interior and co-ordination of national
government, kakamega central, sub county. International journal of social sciences and entrepreneurship ,
1-13.
Ngari, N. M. (2015:16-39). Influence of In-Service training on E,ployee performance; A case of Judiciary's
Lower Courts in Nairobi County, kenya. Nairobi: University of Nairobi.
Noe. (2013). Employee training and development with powerweb card.
Raza, K., Afridi, D. K., & Khan, S. I. (2017). Impact of training on employees performance and job satisfaction:
an empirical study of plastic industry of hayatabad industrial estate. Journal of Business Tourism , 173-
189.
Robbins, S. P., and Coulter, M., (2002). Management (7th Ed). Prentice Hall.
Sabir, R. I., Akhtar, N., Bukhari, F. S., Nasir, J., & Ahmed, W. (2014). Impact of training on productivity of
employees: a case study of electricity supply company in pakistan. International Review of Management
and Business Research , 595-606.
Saleem, D. S., & Amin, S. (2013). The impact of organizational support for career development and supervisory
support on employee performance: an empirical study from pakistani academic sector. European journal
of business and management , 194-207.
Shem, J. M., & Ngussa, B. M. (2015). Effect of training on employees' performance: a case of higher learning in
arusha city, tanzania. International journal of science and research , 1924-1930.
Wamwayi, S. K., M. Amuhaya, D. I., ElegwaMukulu, P., & A. Waititu, D. (2016). Role of training need
assessment in the performance of non-teaching employees at management level in public universities in
kenya. International journal of scientific and research publications , 242-256.
Zahra, S., Iram, A., & Naeem, H. (2014). Employee training and its effect on employees' job motivation and
commitment: developing and proposing a conceptual model. Journal of business and management , 60-
68.

285
Proceedings of CATEA 2019
Proceedings of CATEA 2019
ISBN 978-623-91018-0-0
Micro, Small, and Middle Enterprise: Sago Food in
Contemporary Culinary
Aliffatqul Maulana 1, Saptarining Wulan
2, Djoni Wibowo
3
1 Chef of Trisakti School of Tourism
2 Head of Tourism Department of Trisakti School of Tourism
3 Vice President for Academic Affairs Trisakti School of Tourism
Abstract: At present, enterprise in culinary is booming in all around Indonesia. Related to the program of
President Joko Widodo that determines the tourism as leading sector to generate national income. President of
Indonesia has opened ten priorities of tourism destinations, and culinary is part of tourist fascination. Now,
contemporary culinary is growing very well by young entrepreneurs. However, they prefer present imported
food such as Western, European, Chinese, Japanese, Thai Food, and recently South Korean Food. Usually, the
basic ingredients of imported foods are imported from their origin country. Indonesia that consist of thousands
islands, islets, and ethnics; from Western to Eastern part of Indonesia have rich of traditional culinary.
Development of local food has great potential to create profitable culinary enterprises, and to attract consumers;
local food can be modified into modern culinary. Sago, as local food can create the opportunity of profitable
local culinary enterprises. The purpose of this research is assessing the Sago as local food for profitable culinary
enterprises. The methods applied for this research consist of hedonic and business plan using food truck
concept. The analysis result reveals that Sago Food Truck enterprise in Merauke District with capital one
Million Rupiahs in one-year period, the return on investment (ROI) can be obtained within 2 years and one
months and the average result of hedonic method is 3,98 that means the preferences of foods are high accepted.
Keywords: Micro, small, and middle enterprise; Sago Food, Contemporary Culinary.
1. Introduction At present, the number of the world population is increasing year by year. In Indonesia, the
percentage of population has an increase 1.49% per year. The impact of greater population will need
the larger land area for human settlement and of course for food agriculture. The major staple food in
Indonesia is highly depend on rice. The intake of rice is around 139 kg/individu/year, then decreas to
120 kg/individu/year. The reason of decreasing is not about of local food deversification, however
because of the change diet behaviour, from rice convert to the imported wheat flour. The data in 2017,
Indonesia is the biggest wheat importir in the world. The wheat flour mostly are used for the product
of noodle, bread, and biscuit. The consumption of noodle in Indonesia within period of 2015 is around
14 million packs per year.
The necessity of staple food becomes the major program of President of Indonesia that discribes
into the Nine Nawa Cita programs, and Food is number one within the programs; and Tourism is in
number four.
Furthermore, the President of Indonesia also strongly supports the vocational school to produce
young entrepreneurs in all sectors, one of them is culinary enterprise. At present, enterprise in
culinary is booming in all around Indonesia. Contemporary culinary is growing very well by young
entrepreneurs. However, they prefer present imported food such as Western, European, Chinese,
Japanese, Thai Food, and recently South Korean Food. Usually, the basic ingredients of imported
food are imported from their origin country. Indonesia that consist of thousands islands, islets, and
ethnics; from Western to Eastern part of Indonesia have rich of traditional culinary. Development of
local food has great potential to create profitable culinary enterprises; and to attract consumers; the

Aliffatqul Maulana, Saptarining Wulan, Djoni Wibowo 3
Micro, Small, and Middle Enterprise: Sago Food in Contemporary Culinary
286 Proceedings of CATEA 2019
local food can be modified into modern culinary. Sago, as local food can create the opportunity of
profitable local culinary enterprises.
During the climate change era, one of the most sensitive impacts is on food agriculture. The
amount of paddy production also decreases in this climate change period. Our highly dependent on
rice becomes a problem, and then we have to import the rice to fulfill our rice need. However, we
have abundant in food resources plants such as tuber, corn, and sago. Sago as one of indigenous plants
in Indonesia has highly contains of carbohydrate (sago starch) and huge productivity. Now, using the
new technology, sago starch can be created into rice shape, and it can be cooked like the real rice
using rice cooker or pan.
However, the current problem is how to cook the sago rice, and the most important is the taste.
Why many people is not interested in local food, usually because of uninteresting taste. Our people
have familiar with the taste and texture of rice. Therefore, the important task is the method how to
cook sago rice and how to cook in attractive, interesting and delicious way; and then how to create the
concept of profitable local culinary enterprise.
2. Research Methodology
The methods applied for this research consist of cooking experiment, hedonic assessment method
(Hastuti, 1988 in Setiawan, 2018), and business plan using food truck concept.
3. Results and Discussion 3.1 Sago Rice
The major staple food in Indonesia is highly depend on rice. The intake of rice is around 139
kg/individu/year, then decreas to 120 kg/individu/year. The reason of decreasing is not about of local
food deversification, however because of the change diet behaviour, from rice convert to the imported
wheat flour. The data in 2017, Indonesia is the biggest wheat importir in the world. However,
Indonesia has indigenous plant wich contains of high carbohydrate and huge productivity, that is Sago
Palm.
Development of the new technology has found the machine that can produce analog sago rice
that is made from sago starch. The nutrition of analog sago rice is similar to the natural rice, even the
analog sago rice has advantages of good nutrition, that is: organic; gluten free, and also good for
special needs people; low glycemic index, suitable for the person who has diabetic; and high resistant
starch, appropriate for people who has intestine sensitivity.
The shape of natural rice and analog sago rice is similar, however the color is different; the color
of natural rice is brighter than the analog sago rice. The methods of cooking for both of these types of
rice are almost the same, but the procedure of cooking is different. The procedure of cooking can
influence the results of rice texture.
The procedure of analog sago rice cooking is: 1) boil the water into rice cooker pan, 2) after
boiling the water, pouring the analog sago rice without washed, 3) stir the analog sago rice so that the
analog sago rice and the boiled water can be mixed well; then close the lid of rice cooker and wait
until the analog sago rice well cook. The comparison of the amount between the water and the analog
sago rice is: 2 cups water ≈ 1 cup analog sago rice. If we put too much water, the quality of rice will
be too soft or like porridge. Therefore, we have to consider the comparison of the amount between
water and analog sago rice.
3.2 Menu
There are three selected analog sago rice menus that will be served for Micro, Small, and Middle
Enterprise (MSME) that famous and familiar in the daily menus. Those menus are: fried analog sago
rice, grilled analog sago rice, and kebuli analog sago rice. The ingredients of those menus are easy to
find in all over Indonesia regions. The reason to choose those menus is well-known menus for all
generations.
3.3 Hedonic
The method of this research is using experiment and hedonic. The cooking experiment was
conducted at Kitchen of TST. Those three menus are cooked per menu. After cooking one menu,

Aliffatqul Maulana, Saptarining Wulan, Djoni Wibowo 3
Micro, Small, and Middle Enterprise: Sago Food in Contemporary Culinary
287 Proceedings of CATEA 2019
panelists should try and taste the menu and then they should write down the rank that consists of
color, aroma, taste, and texture. The range of rank is 1 (the lowest) to 5 (the highest). The number of
panelists is 13 persons who are expert in gastronomy. The average of hedonic rank is 3,98 that means
the preferences of foods are high accepted.
3.4 Business Plan of Food Truck Concept
3.4.1 Business Description: Mappi Food Truck is the name of the potential culinary enterprise that will be opened in Mappi
District, Papua Province. This Food Truck will provide food made from sago starch. Related to the
development of technology, at present, sago starch can be made for analog sago rice that similar to the
natural rice. The methods of cooking for both of these types of rice are almost the same, but the
procedure of cooking is different, then the analog sago rice is cooked for fried analog sago rice, grill
analog sago rice, and kebuli analog sago rice. Those analog sago rice menus are provided to eat at the
place or take away. The menu is presented in attractive way and using unique box with Papuan
ornaments for takes away.
3.4.2 Business Objective
The purpose of Mappi Food Truck is to encourage the sago local food that has not been
maximizing used. Huge amount of sago in Papua usually is cooked for Papeda as staple food and
Bagea cookies in recent centuries that very popular in old generation. Therefore, to attract the
preferences for sago in young generation, the local food should be cooked more creative and
innovative within contemporary culinary.
3.4.3 Description of Product/Services
Mappi Food Truck consists of three words, that is Mappi, Food, and Truck. Mappi is
representative the name of Mappi District in Papua, Food is the sago local food that they are selling to
customer, and Truck is a kombi car for the attractive mobility selling the analog sago rice food. This
food truck is very suitable for culinary trade in Papua location, because the condition of geographic in
Papua is hilly and low density, so that very easy and flexible for moving around areas.
3.4.4 Competitor Analysis
At present, there are a lot of new culinary enterprises in Papua. Mostly they are from out side of
Papua. Mappi Food Truck has good taste and innovation, and fair price. There are several competitors
located in the border between Districts of Mappi and Merauke, namely: Taman Festival Kuliner PMI,
Rumah Makan Masakan Padang, Rumah Makan Sate Rusa, Mie Ayam dan Bakso Arema, Ratu
Bandeng Merauke, Ayam Goreng Fatmawati Merauke, and Rumah Makan Panorama.
3.4.5 Marketing Strategy
According to Kotler et.all, (2001), the company divides the market segmentation into the several
smaller segments that can be reached effective and efficient, and the products and services can meet
the consumers’ needs.
The primary target market of the Mappi Food Truck is families, teenagers, and kids who live in
Mappi District and surrounding.
3.4.6 Pricing Strategy
Mappi Food Truck will sell the food with the average price in line with the financial ability of
local people. The price of menu consists of food costing plus 40% margin. Mappi Food Truck will
provide good quality and service.
3.4.7 Sales Strategy
Mappi Food Truck has sales strategy how to generate the amount of selling products. The sales
strategy among others is promotion through brochure, join exhibition and festival, and continuously
updated advertisement through social media (Website,Facebook, Twitter, Instagram, Whatsapp, Line)
to attract consumers.

Aliffatqul Maulana, Saptarining Wulan, Djoni Wibowo 3
Micro, Small, and Middle Enterprise: Sago Food in Contemporary Culinary
288 Proceedings of CATEA 2019
3.4.8 Sales Forecast
Sales Forecast is prediction about the demand level of potential consumers in certain period. The
percentage of annual net income is as follow:
2019 : Rp 494.782.377
2020 : Rp. 540.262.815 (10%)
2021 : Rp. 590.063.831 (10%)
2022 : Rp. 644.626.312 (10%)
2023 : Rp.709.114.009 (10%)
3.4.9 Sales Goals
Sales goal is the target of selling product that should be achieved in certain period to get profit or
Break Even Point (BEP).
Initial Capital : Rp 1.000.000.000,00
Target BEP : 2.1 years
Monthly Sales Target : Rp 80.000.000,-
3.4.10 Organizational Structure
Mappi Food Truck is categorized start-up entrepreneur. During the first development, Mappi
Food Truck has three Heads (Marketing, Accounting, and Purchasing), one Cashier and one Chef.
4. Conclusion Sago palm is one of Indonesia indigenous plant which naturally vigorous growth in wild forest.
The population of sago palm is all around Indonesia, however the hugest population is in Papua and
Maluku. Sago palm is categorized as neglected and underutilized species, because sago palm has little
attention and a little bit ignored by researchers and policy makers. Sago palm in traditional food and
culture can empower indigenous communities and reaffirm their identity. Through the development
of new technology, sago starch can be modified into analog sago rice and cooked in variety of
contemporary food.
Through the creativity of products and marketing strategy, analog sago rice can create the
opportunity of profitable enterprise. Within initial capital Rp. 1.000.000.000,-; the Break Even Point
(BEP) can be obtained in 2.1 years, and the range of annual profit within five years period is around
Rp. 400.000.000,- to Rp. 700.000.000,-. Local people can manage the potential of this enterprise to
increase their income and also to keep their culture, environment, and sustainable food system.
Acknowledgment
The authors would like to express their sincerest gratitude for supporting this research by providing
scholarship through the Department of Research and Development (R&D), Trisakti School of
Tourism (TST).
References
Duncan, T. (2002). Integrated Marketing Communication: IMC Using Advertising and Promotion to Build Brands – 1
st Edition. McGraw Hill/Irwin. New York. Amerika.
Gardjito M., Djuwardi A., Harmayani E. (2013). Pangan Nusantara: Karakteristik dan Prospek untuk Percepatan
Diversifikasi Pangan. Penerbit Prenada Paduosi, S. et all. (2013). Media Group. Jakarta.
Kotler, et.all. (2001). Marketing. Person Education Australia Pty. Ltd. NSW. Australia.
Fighting Poverty, Hunger and Malnutrition with Neglected and Underutilized Species: Needs, Challenges, and
the Way Forward. Bioversity International. Rome, Italia.
Setiawan, I. (2018). Analisis Rencana Usaha Food Truck Berbahan Dasar Sagu di Wilayah Papua. Thesis.
Sekolah Tinggi Pariwisata. Jakarta, Indonesia.
Summer, et.all. (2001). Essential of Marketing. Thomson, Nelson Australia Pty Limited. Australia.
Wulan, S. (2015). Pengembangan Pertanian Berkelanjutan dalam Upaya Mitigasi Perubahan Iklim (Kajian
Komoditas: Padi, Kelapa Sawit dan Sagu). Disertasi. Universitas Indonesia. Jakarta., Indonesia.

289
Proceedings of CATEA 2019
Proceedings of CATEA 2019
ISBN 978-623-91018-0-0
Developing Archipelagic Tourism on Nain Island within
Bunaken National Park in North Sulawesi, Indonesia
Bet El Silisna Lagarense1, Agustinus Walansendow
2
1 Tourism Dept., Manado State Polytechnic, Indonesia
2 Business Administration Dept., Manado State Polytechnic, Indonesia
[email protected], [email protected]
*Corresponding Author
Abstract: The research aims to identify and develop an archipelagic tourism development model to be
implemented on the Nain Island in an integrated manner. This study used the descriptive qualitative methods to
process and analyze data, which were collected through field observations and open interviews with various
stakeholders. The results shown that the development plays an important role in enhancing the economic
growth, reducing poverty and elevating the employment opportunities for people on the Nain Island within
Bunaken National Park. It also contributed positively to strengthening the environmental conservation activities,
through conscious efforts. The main obstacle however was the limited human resources, both in terms of
quantity and quality. There is need to ensure the continuity of the Island's means, in order to assure the active
involvement in the development of archipelagic tourism, with specific and distinctive characteristics.
Keywords: archipelagic tourism; Nain Island; Bunaken National Park
1. Introduction Recently, the development of archipelagic tourism is seen as an important tool in increasing
economic growth, reducing poverty and advancing regional income on the small islands. Therefore,
this study focuses on its development on Nain Island in Bunaken National Park supported by various
parties. Previous researches have shown that tourism positively contributes to the economic, social
and cultural growth of a community. These studies were carried out mainly on the development of the
tourism industry, products, marketing and promotion, as well as systems information. However,
research is yet to be carried out on the development of archipelagic tourism. Since the Bunaken
National Park is famous as a tourist attraction and national strategic region, many community
groups have become involved in managing the area. It has been designated as a National Park with
zoning-based management regulations and approach. The coral biodiversity and reefs of Nain Island
are the most productive to support the livelihoods of fishermen and drivers of archipelagic
tourism. Another important thing is the development of human resources quality which masters its
knowledge. Strengthening and improving the capacity building of human, institutional and natural
resources is required for the development of tourism on this island. Furthermore, its
implementation requires government support, through the management policies in order to make this
islands one of the leading tourism destinations.
2. Related Works/Literature Review 2.1. Tourism Development
Tourism development is an increasing effort which aids in improving the economy of a region. It
includes the proper management of activities which consist of planning, organizing, implementing
and evaluating (Ramly, 2007). It aims at developing the economic, social and cultural activities of the
community. Lagarense (2011) explains that the tourism project development aims to successfully
balance local, regional and global concerns for economics, social and environmental sustainability
and it is an immediate initiative rather than the ongoing process which contributes to sustainability in
the long run. It also comprises of synoptic, incremental, mixed scanning and transactive planning

Bet El Silisna Lagarense, Agustinus Walansendow
Developing Archipelagic Tourism on Nain Island within Bunaken National Park in North Sulawesi, Indonesia
290
Proceedings of CATEA 2019
models (Mitchell, et al, 1997). The implementation of top-down development has led to the
proportions and constellations of roles involving three unequal development stakeholders, where the
state and private sector are dominant while the community remains in a marginal position. For that
reason, an alternative development that is more business-oriented is needed to eliminate the
marginalization and strengthen the community sector which becomes very relevant to be implemented
(Suparjan and Suyatno, 2003). The development of archipelagic tourism through the partnerships
provides a collaborating opportunity in model and strategic creation for tourism management and
development that generate economic benefits. Its goals must be aligned with the objectives of
ecotourism, sustainable and community-based tourism in a fair or equitable manner (Ashley, et al,
2001). The tourism management and development model is a tool used to contribute to economic
growth and poverty reduction owing to its unique characteristics (UNWTO, 2002).
2.1. Archipelagic Tourism and Small Island Tourism
There are many archipelagic destinations that are part of an island. Bardolet and Sheldon (2008)
explain that the planning and development of archipelagic tourism is divided into many levels ranging
from the land, islands, and private ownership. The hierarchy complex governance structures have the
potential to cause conflict during its central planning. There are various community
interests in each island which separates stakeholders. The developers and managers of these islands
are trying to distinguish and compete with themselves using similar type of market. An obstacle faced
in archipelagic tourism is difficulties associated with the development of inter-transportation
infrastructures. The small island is defined as an area that is less than or equal to 2,000 km2 (Law No.
27 of 2007). It is a collection of islands that interactively cooperate in the ecological, economic, social
and cultural perspective.The management of small islands is one of the top priorities in the
development of tourism in Indonesia because each of them has a unique characteristics different from
the big islands. Physically, most are under 1,000 km2 to less than 1 Ha and are separated from the
main island insularly (remote) located. They tend to have endemic species and high marine
biodiversity, such as coral reefs and mangrove ecosystems, reef fishes, and sea grasses. They also
have beautiful coastal ecosystems, clear and clean coastal waters, good waves for surfing, lagoons and
amazing natural scenery (Adrianto, 2004). The utilization of small islands is regulated in Law
Number 27 of 2007 article 23 paragraph (2) and in the Regulation of the Minister of Marine and
Fisheries Number 20 of 2008. Its use and the surrounding waters is prioritized for one or more of the
following interests, 1) conservation, 2) education and training, 3) research and development, 4)
marine cultivation, 5) tourism, 5) sustainable business and fisheries industry, 6) organic farming, and
7) farms. One of the prominent marine and environmental services potentials in small islands is
fisheries and tourism, especially in conserved areas (Dermawan and Aziz, 2012).
3. Material and Methodology
3.1. Data
This study used the qualitative methods with descriptive analysis. The data were collected
through interviews in order to obtain clear information on the management and development model of
Nain Island in the Bunaken National Park. Primary data was also collected by the field observation to
determine those that were less exposed in the interviews (like the attitude or behavior of people
around the research site) and how they responded to the management and the development of
activities carried out in the Nain Island.
3.2. Method
The interview was addressed to the informants or communities from various circles. In addition,
in-depth interviews were carried out because the questions aided in developing detailed perceptions
and recommendations on ways to improve the model. Furthermore, to obtain a more completed data,
interviews were also conducted to tourists visiting the island. In addition, a method of observation was
also conducted to identify if the construction followed the existing planned management model
documented by taking pictures/physical photographs during field observation.

Bet El Silisna Lagarense, Agustinus Walansendow
Developing Archipelagic Tourism on Nain Island within Bunaken National Park in North Sulawesi, Indonesia
291
Proceedings of CATEA 2019
4. Results and Discussion The result of the field observations and in-depth interviews showed the results as follows:
4.1. Social characteristics of Nain Island
Nain Island comprises of Big and Small islands. However, there are no residents living on the
small island, with a village located in each big region (Figure 1). Nain Island is accessed from the port
of Manado using a taxi boat with a 2 hours travel period. The village consists of 9 separate hamlets,
with a large population of 3,286 people, majority of which are Muslims. The village consists of Bajo
and Sangir ethnic groups, and its roads, houses, churches and mosques are made of
cement/concrete. In the village, members of the community are predominantly fishermen and seaweed
cultivators. There are only elementary and middle schools. For the high school, people usually go to
Manado.
Figure 1: Nain Island (Lagarense, 2011)
4.2. Natural characteristics of Nain Island
Nain is a coastal village formed in an island. Majority of its people are Muslim and fishermen
because they came from the Bajo tribe. The village life is very crowded because of its large and
diverse population with a population comprising of Christians and Islam. However, irrespective of
this, the villagers are friendly and live in harmony. Every house on the beach has a 'tomb' or a place to
hang seaweed and salted fish. There is a seaweed cultivation that almost covers the entire sea
region. The Small Nain Island is also fascinating because the turtles are usually seen in
colonies. However, it is faced with various obstacles, hazards, and challenges which needs to be
carried out because they do not understand the importance of ecotourism. Its activity will adversely
affect the community’s ability to manage its seaweed cultivation (Figure 2). The Nain Island
community is very pleased with the development of archipelagic tourism, however, the community
has not felt its significant benefits due to the limitations of empowerment activities. It is believed that
if Nain Island becomes a tourist center, then tourists may be invited to visit the seaweed cultivation
sites without disrupting the current community activities.

Bet El Silisna Lagarense, Agustinus Walansendow
Developing Archipelagic Tourism on Nain Island within Bunaken National Park in North Sulawesi, Indonesia
292
Proceedings of CATEA 2019
Figure 2: Seaweed harvesting communities (Survey, 2019)
As said by key informant that:
Tourism on the Nain Island is still deliberated by the islanders today because they are
still thinking of how to improve, manage and sell the seaweed yield manufactured by its
(Perscom. May 2019).
The road leading to the Nain village located on its Island is made up of concrete and is in
excellent conditions. The distance from the village is about 10-100 meters to the west coast. The
profile of the sloping beach and its shape are winding and sandy beaches which comprise of white
broken coral sands and sized like sugar with a width between 10–20 m. Interesting scenery that can be
seen from the beach, namely Small Nain Island. Tree species exist along the coast called banyan tree
being the most dominant. The coastline distance from the forest is 200 m with lots of sea grasses,
seaweed, and few mangroves in the village. Garbage is seen on the beach with fishing boats located
on the beach. The use of coastal land by the community in the village is> 75%. People use it as a
place to dock boats and hang grasses. From the results of the village mapping, a lot of information
was obtained such as the presence of 6 churches, mosques, elementary and junior high schools,
village halls, health centers, clinics, public grave locations, historical relics, sacred sites, dive sites,
underwater caves and white sand nets.
4.3. Development opportunities of Nain Island for Archipelagic Tourism
The Island is also used as a very good tourist spot by merely looking at the long white sand. It is
no less interesting than other islands, with a mangrove attraction located at the end of Tatami Village
about 45 minutes from Nain Village by sea with the potential of the beauty of white sand (Figure 3). It
has a strength of 61% and a 13% chance evident from the presence of carving crafts, sacred places,
clean water, traditional community activities, coral reefs good for diving, seaweed cultivation,
electricity, VOC historical heritage sites, smooth transportation, and underwater caves. It main
obstacle is the limited knowledge of tourism management and human resources. However, it is
important to socialize its benefits in an integrated manner.

Bet El Silisna Lagarense, Agustinus Walansendow
Developing Archipelagic Tourism on Nain Island within Bunaken National Park in North Sulawesi, Indonesia
293
Proceedings of CATEA 2019
Figure 3: Nain Island tourism potential (Survey, 2019)
At the time of the survey, the weather was rather cold with the decline of rain with high intensity. Sea
transportation was stalled due to heavy rainfall which resulted to the inability of ships to cross 06.00 -
09.00 in the morning.
4.4. SWOT Interpretation The opportunities for tourism activities on Nain Island are very high due to its potential, however
it needs to be properly socialized with the right activities.
Table 1: SWOT Data (Strengths, Weaknesses, Opportunities and Threats)
COMMENT S W O T
Small Nain Island
Underwater Cave
Smooth transportation
VOC historical heritage site
Electricity
Cultivating seaweed
Coral reefs (for diving)
Traditional community activities
Water dog
Carving craft
Clean water
Sacred place
Open insight from the community
Open employment
Make/sell crafts as souvenirs
Need to socialize about the benefits of ecotourism
Lack of capital
Not mastering English
Management is not good, that there are many contributions to the small villages and outsiders
Cultural change
Space for small communities to cultivate seaweed
Source: Survey, 2019
Recently, the community is more focused on seaweed cultivation, making it possible to utilize
the land for cultivation. The community institution is Bunaken National Park Concerned Community
Forum which stated that it has not thought of tourism activities, owing to the community’s inability to
manage and due to its focus on seaweed farming activities.

Bet El Silisna Lagarense, Agustinus Walansendow
Developing Archipelagic Tourism on Nain Island within Bunaken National Park in North Sulawesi, Indonesia
294
Proceedings of CATEA 2019
Figure 3: Community opinion on archipelagic tourism development Nain Island (Survey, 2019)
The results of the mangrove survey showed that they were less than the other islands in the
Bunaken National Park area. The local perceptions specifically on the tourism development
(archipelagic tourism) in the Nain islands are explained. Figure 3 shows that 61% of the general
perceptions of 11 communities stated that archipelagic tourism is the strengths of Nain Island. This
shows that the development of tourism on it has been known and understood by the community, as a
tourist destination with its own uniqueness. However, it is realized that in developing tourism on Nain
Island, the reliable human resources are directly involved. From the aspect of economic social and
capacity, the Island has a very high chance of 13% for archipelagic tourism development in the area
(Figure 4).
Figure 4: Socio-economic issues and capacity of Nain Island
The strategic issues regarding the development of archipelagic tourism on Nain Island as well as
the strengths and opportunities for the development are presented in Table 2.
Table 2: Important Issues about Nain Island Archipelagic Tourism
Potential Issues Sub Issues Responses Percentage
Strength
Natural resources
Land 2 12%
Sea 2 12%
other 1 6%
Infrastructure Public need 1 6%
Transportation 1 6%
Socio-culture Tourism attraction 3 18%
Art and tradition 2 12%
Socio-economy and capacity Capacity 1 6%
Income 1 6%
Opportunity Socio-economy and capacity Capacity 1 6%
Income 2 12%
Sub total 17 100%
Source: Survey, 2019

Bet El Silisna Lagarense, Agustinus Walansendow
Developing Archipelagic Tourism on Nain Island within Bunaken National Park in North Sulawesi, Indonesia
295
Proceedings of CATEA 2019
Table 2 shows the sub-issue of 30% natural resources consisting of 12% sea, underwater caves,
and good coral reefs, is the core zone of Bunaken National Park. The infrastructure sub-issue is 12%,
which is in line with the public interest of 6% where the village already has electricity and smooth
transportation. Approximately 30% of the socio-cultural issues are 12% in terms of art and tradition
including crafts. The socio-economic issues and capacity of 30% are 18% income such as selling
souvenirs and crafts, creates new jobs. The results shows that there is wide range potentials for
archipelagic tourism to be developed in Nain Island.
Figure 5: Issues on the strength and opportunities of Nain Island archipelagic tourism
Figure 5 shows that 29% of the Nain Island community or 17 respondents stated that the
socio-economic aspects and capacity were the important issues and that becomes potentials
assets for archipelagic tourism development in the island.
5. Conclusion Nain Island has the potential to develop archipelagic tourism with 61% strength of and 13%
chance. The great potential lies on the island supported by the resources that include carved crafts,
sacred places, the availability of clean water, dog water, traditional community activities, coral reefs
good for diving, seaweed cultivation, electricity, heritage sites, smooth transportation, underwater
caves, and the existence of Small Nain Island with turtles. The main obstacle in the development of
archipelagic tourism is the low human resources and the limited knowledge of island management. It
is important to socialize its benefits in an integrated manner. Furthermore, the development model of
Nain Island archipelagic tourism requires strengthening and enhancing the capacity of human,
institutional and natural resources. The implementation of the development requires government
support, especially the Tourism Office through management policies.
References Adrianto L, (2004). Pembangunan dan Pengelolaan Pulau-pulau Kecil yang Berkelanjutan. Makalah
disampaikan pada Pelatihan Perencanaan dan Pengelolaan Wilayah Pesisir secara Terpadu, Bogor,
23 Agustus – 25 September 2004. Ashley, C., Roe, D., dan Goodwin, H. (2001). Pro-Poor Tourism Strategies: Making Tourism Work for the
Poor. London: Overseas Development Institute.
Bardolet, E., and P. J. Sheldon. (2008). Tourism in Archipelagos: Hawai’i and the Balearics. Annals of Tourism
Research 35: 900–923.
Lagarense, B.E.L., Stakeholder (2011). Involvement in Waterfront Planning and Development in Manado,
Indonesia, Disertasi Doktor, University of Waterloo, Canada, Published online:
https://uwspace.uwaterloo.ca/bitstream/.../Lagarense_Bet_El_Silisna.pdf.
Mitchell, B., Setiawan, B dan Rahmi, D. H., (2000). Pengelolaan Sumberdaya dan Lingkungan. Gadjah Mada
University Press. Yogyakarta.

Bet El Silisna Lagarense, Agustinus Walansendow
Developing Archipelagic Tourism on Nain Island within Bunaken National Park in North Sulawesi, Indonesia
296
Proceedings of CATEA 2019
Peraturan Menteri Kelautan dan Perikanan No. 20 Tahun 2008 Tentang Pemanfaatan Pulau-pulau Kecil dan
Perairan di Sekitarnya.
Ramly, N. (2007). Pariwisata Berwawasan Lingkungan. Grafindo Khazanah Ilmu. Jakarta.
Suparjan dan Suyatno, H., (2003). Pengembangan Masyarakat. Aditya Media. Yogyakarta.
Undang-Undang No. 27 Tahun 2007 Tentang Pengelolaan Wilayah Pesisir dan Pulau-pulau Kecil.
UNWTO. (2002). Tourism and Poverty Alleviation. Madrid: United Nations World Tourism Organization.

297
Proceedings of CATEA 2019
Proceedings of CATEA 2019
ISBN 978-623-91018-0-0
Examining the Impacts of Sport Tourism Event in Strengthening
Local Economy: The Case of Manado Fiesta 2018 in
Manado, Indonesia
Bet El Silisna Lagarense1, Taufiq Hidayah
2, Fitri Abdillah
3
1Tourism Dept.Manado State Polytechnic, Manado, Indonesia
2 Sport Science Dept. Semarang State University, Semarang, Indonesia
3 Tourism Dept. Podomoro University Jakarta, Indonesia
*[email protected], [email protected], [email protected]
*Corresponding Author
Abstract: This research was based on the efforts of the Manado City Government in carrying out the Fiesta
Festival, in an attempt to introduce, promote and strengthen the image of the city’s destinations as a paragliding
tourism center. The Fiesta Year 2018 was an exploration event in the municipal, which featured seven festivals
(F7), consisted of Fish and Coral, Food, Fashion, Flying, Fair, Fun-music and Faith. The flying element
however involved the implementation of sports events, which included paragliding competition on Mount
Tumpa, conversely promoting the site as a leading tourism destination in the city of Manado. This research was
conducted in a location where participants in the international accuracy, took off at Mount Tumpa, Tongkaina
Village, Bunaken District, Manado City. The design that was implemented was descriptive qualitative, carried
out by direct observations, interviews and documentation. The results indicated that vacationists who came to
witness and converse directly to those involve in the paragliding sports at the Manado Fiesta 2018 were of the
wanderlust type. This was because they were young individuals that were motivated to gain new experiences.
The promotion that embarked by the committee regarding paragliding was very good and clear, further
strengthening the image of the city, as a place of sports tourism, especially paragliding. The results of the
interview showed that the implementation of Manado Fiesta event 2018 was successfully carried out, due to it
being well known for its good promotion as an input of the reflection of the destination as a paragliding, natural
and sea nuances. However, there were a number of corrections that must be made, such as the provision of
transportation to the location of the activities, which included shuttle buses and other utility facilities, such as
trash cans, shelters and places of worship.
Keywords: sports tourism; Manado Fiesta; event
1. Introduction Tourism is the largest service industry in the world, with a multiplier effect that significantly
affects economic growth, which had therefore been adopted by the government as a mainstay sector,
to support the welfare level of the City of Manado. Furthermore, the government has put in efforts to
hold the Manado Fiesta festival, in order to introduce and promote the image of the municipality as a
foreign tourist destination. This Fiesta is an event, which features seven festivals (F7), consisting of
Fish and Coral, Food, Fashion, Flying, Fair, Fun-music and Faith. Various activities were prepared
and one of which was the implementation of tourism sports activities, which included paragliding
competitions. The maiden kickoff was held in 2017, with the theme, "Manado Our Home Together,
Conserve Bunaken Marine Park" and the paragliding competitions were held as a series of the
programme. On Mount Tumpa, in 2018, the theme "Diversity in Harmony" was used, which was a
brand of the Manado tourism as well. Paragliding is one of the branches of aerospace sports with
several standard flight classes, appearances and competition collection. The Indonesian Hang-Gliding
Association (PLGI) is the parent of the sports organization, under Aero Sport Indonesia Federation
(FASI). Furthermore, this sport is one of the tourist attractions, favored by both local and foreign
guests visiting the city at the Tumpa Mountain Forest Park, located in Bunaken sub-district with

Bet El Silisna Lagarense, Taufiq Hidayah, Fitri Abdillah
Examining the Impacts of Sport Tourism Event in Strengthening Local Economy: The Case of Manado Fiesta 2018 in
Manado, Indonesia
298
Proceedings of CATEA 2019
beautiful view of the sea, mountains and the whole city. The sports competition is further expected to
shapen the figure of the destination hence it can be perceived as it ought to be. In order to increase
visits, the feature of a tourist site is an important factor as this is very necessary in the face of
competitions, especially against places with the same level of beauty and attraction.
2. Literature review 2.1. Sport Tourism
According to Gozalova et al (2014), people travel for various reasons, for example, to see other
countries and continents, modernization in the cities and the ruins of ancient monuments. They also
travel to enjoy beautiful places or to observe changes in scenery, to relax or to do business.
Furthermore, it is accurate that the potential of sport, existing in a tourism area is appointed and
developed, in order to attract the interest of tourists, both locally and otherwise. The areas of the site
that are well catered for, have greater tendency to attract tourists, this is in line with the theory by
Goeldner and Ritchie (in Zemla, 2016: 2) that “tourism destination is a particular geographic region,
within which the visitor enjoys various types of travel experiences”. Furthermore, it can be concluded
that the destination of tourism is a specific geographical area, where guests enjoy a variety of travel
experiences, which is expected to further attract the interest of tourists to pay a return visit to the
developed tourist areas. People, who travel, are generally motivated by the activity, which is in line
with the theory of Suwena and Widyatmaja (2017: 58) who stated that, encouragements for traveling
are very natural and can happen to anyone at anytime or anywhere. Furthermore, this does not have to
be arranged systematically and tiered, as Gray, for example, stated that, the first motivation for
touring was to go to a place that had never been visited (wanderlust). A strong desire to engage in
travels or to explore the "new world" was to get first-hand experience of seeing new cultures and
places. The second encouragement was to experience places that offer something unique and specific
(sunlust). Furthermore, it is the desire to obtain the feeling or satisfy special needs, with specific
elements that cannot be found in the place (local).
Various methods, with which tourism is promoted, in various regions of Indonesia, include the
use of sports. The destination of British Columbia (2013: 2), provides the opinion that "Sport tourism
is a significant element in world tourism, which has a highly competitive niche business. As interest
and participation in sports, grows within the leisure industry, the desire for people to compete or to
spectate has equally advanced". Furthermore, it can be concluded that this activity is an important
element in the world of tourism and its position is very aggressive because interest and participation
in sports is advancing, in the entertainment industry as people's desire to travel increases. According
to Astuti (2015), the potential of this event, elevates the involvement of community participation, in
order to increase global competitiveness and foreign exchange income. Furthermore, Grabowska
(2016) revealed that interest in sports tourism is as a result of the increasing need for intense
emotions, impressions and also the amount of free time and income. This was therefore observed in
the development of various methods to spend leisure time, as well as the growth of recreation itself,
which has led to the development of new forms of tourism and sports, as well as continuous
modification.
Previous research on sports tourism, carried out by Yildiz and Cekic (2015), on the title "Sports
Tourism and its History and Contribution of the Olympic Games to Touristic Promotion" indicated
that the importance of sports tourism is not limited by the number of sports participants and fans,
however, it influences the infrastructure investment, obtained by the provinces. Hosting the event also
plays an important role as a future investment in these cities. Investments made turning into a center
of sustainable attraction including sport tourism and the Olympics. It is estimated that the investment
costs, made for these organization, as well as the long-term income are directed towards the future
period must be considered. Sport tourism in recent years has been held to promote travelling in
various regions of Indonesia and in a variety of international competitions, routinely held which
include Ironman on Bintan, Tour de Flores, Tour de Singkarak surfing and paragliding competitions.
Bet El Silisna Lagarense, Taufiq Hidayah, Fitri Abdillah
Examining the Impacts of Sport Tourism Event in Strengthening Local Economy: The Case of Manado Fiesta 2018 in
Manado, Indonesia
299
Proceedings of CATEA 2019
2.2. Paragliding
Paragliding is a free-flying sport, which is interpreted as a parachute that is flown, with the
capability to lift the pilot’s body. This apparatus or plane takes off from a hillside or mountain,
utilizing the wind and the pilot's feet (www.paragliding.web.id). The air is used as a lifting resource,
which causes the gadget to float high in space by two mechanisms, which include, rising wind which
hit the hillside (dynamic lift) and the rising wind caused by thermal (thermal lift). Furthermore, with
these two sources, the pilot can fly very high and reach very long interesting distances without using a
machine. Previous research, carried out by Pavic et al (2013), entitled, "Potential for Paragliding
Tourism Development in Niska Banja (South Serbia)", stated that Niska Banja possesses many
benefits by having this event conducted as a week long activity, further bringing a large number of
fans to the site. Paragliding supporters are prepared to travel long distances, if certain places provide
adequate conditions for practicing paragliding and Niska Banja offered it, hence bringing more
tourists to the travel destination.
2.3. Tourism Destination
According to the World Tourism Organization (Adiati & Basalamah, 2014) the definition of
destination was “Part of destination. A homogeneous tourism region or a group of local government
administrative regions”, which are also a part of the homogeneous tourism areas or a group of
regional government administrative provinces. Furthermore, according to Law Number 10 of 2009 on
tourism that there geographical areas, present in one or more legislative zones, where there are
attraction sites, public and tourism facilities, accessibility and communities that are interrelated, which
complements the realization of tourism. Manado Fiesta 2018 event, that was held in capital of North
Sulawesi province and ecame a tourism destination. Furthermore, this city has many interesting
destinations to visit and the most famous attraction sites are the Bunaken islands or Bunaken National
Marine Park. Besides this, it is also a great tourist place as it has previously been studied by
Tondobala (2012) in a publication, entitled "Feasibility of Manado City Center as a Tourism
Destination", which stated the potential of natural, historical and artificial objects. These advantages
have not been supported by urban design techniques and adequate infrastructure, as well as a stand
alone tourist entities, in crating the image of the city center. The oportunity for this development,
which involves conducting events and activities have not been formulated. However, if designed
properly, they can increase attractions and conversely be capable of realizing animations in the city
center. Therefore, the Manado City Government has a very important role to play in providing support
for the development of tourism.
3. Material and Methodology
3.1. Data
The population in this study included tourists, who observed the paragliding activity at the 2018
Manado Fiesta Festival. Research samples for tourists were determined by accidental sampling, which
included the technique of determining the specimen, based on coincidence as anyone who
accidentally met with the researcher, was considered suitable as a source of data. Furthermore, this
method could be classified as purposive sampling, under the assumption of Non Probability.
Respondents were 20 tourists, considered as representatives of those who came to watch paragliding
sports events at the 2018 Manado Fiesta festival and 10 participants of the competitions. The
information obtained in this research, were processed into narrative tables and descriptive data,
supported by the results of documentation in the field, which included photos to visually display the
actual conditions of the location.
3.2. Method
This was a descriptive qualitative research involving direct observation, interviews and
documentation. This method was used to examine the status of a group of humans, objects, conditions
and a system of thought and events that occur (Antara, 2008). The purpose of this study therefore was

Bet El Silisna Lagarense, Taufiq Hidayah, Fitri Abdillah
Examining the Impacts of Sport Tourism Event in Strengthening Local Economy: The Case of Manado Fiesta 2018 in
Manado, Indonesia
300
Proceedings of CATEA 2019
to systematically, factually and accurately produce an exploratory picture or painting, regarding the
facts, properties and relationships between the various characteristics to be examined. Furthermore, by
using the technique of direct observation, interview guides with in-depth interviews and documented
studies, a description of what actually happened was formed and an attempt to obtain facts, related to
tourist perceptions of paragliding events at the Manado Fiesta festival, in shaping the image of
tourism sports destinations in Indonesia were made.
4. Results and discussion The provinve of North Sulawesi has held an event called Manado Fiesta 2018, which consists of
Fish and Coral, Food, Fashion, Flying, Fair, Fun-music, and Faith. At the site of the event, there was a
sport tourism agenda, entitled "Paragliding International Accuracy Open" held on September 2 to 4,
2018 in Tumpa Manado Mountain Forest Park. The province has a great potential in this aspect as
well as in organizing the International Accuracy Open at the 2018 event, previously a 2018
paragliding competition was held in Manado which was also in preparation for the Sea Games
(manado.tribunnews.com). Paragliding National Championship was held at Bukit Tetempangan,
Manado, North Sulawesi Province. According to the Commander of Sam Ratulangi Air Base, Colonel
Nav Insan Nanjaya this activity was attended by 116 best athletes from all over Indonesia and it lasted
for four days, from June 28 to July 1, 2018. In 2017, Manado of North Sulawesi hosted the world
paragliding championship entitled Paragliding Accuracy World Cup (PGAWC) at the same site on
March 17-19, 2017 attended by 12 countries (www.liputan6.com).
4.1. Participant of Manado Fiesta event 2018
After successfully carrying out the Manado Fiesta 2017 festival, the 2018 edition was themed
“Diversity in Harmony”, which further propelled the tourism brand of the city. Jalan Boulevard Dua
was chosen and introduced as the location by the government as a leading tourism area in North
Manado. The 2018 edition met and enlarged the entire municipal, with the aim to further promote it as
a major international destination with numerous beautiful dive sites. Various events (7 festival
activities) had been prepared in several parts of the city, consisting of Fisco, Flying, Food, Fair,
Fashion, Funtastic and Faith. The event started with fisco, an adventure that showcased the best
underwater attractions around Manado, closely followed by fashion shows, paragliding, music,
culinary shows and a series of worship and thanksgiving to close the main festival. Based on the
agenda, the flying activity was held on September 2-4 2018 in the Tumpa Mountain Forest Park and
titled "Paragliding the International Accuracy Open" and the Paragliding International Accuracy Open
was organized by the Aero Sport Indonesia Federation of North Sulawesi. The research data was
further divided based on tourist characteristics, gender and age and the championship was contested in
two categories of competition, which included landing accuracy of male/female juniors and landing
accuracy of the master and team. There were 89 participants in the championship from various
provinces in Indonesia, which includes West Sumatra, DKI Jakarta, West, Central and East Java,
Central Sulawesi, North Sulawesi, PTP Ats, PTP Garuda and overseas participants, such as Malaysia,
Hungary, Hong Kong and Romania. Furthermore, the special senior category players, used FAI rules
in their assessment and the results of the following interview:
“Participants who take part in this championship are pilots who already have PL 2
licenses and a Sporting License because Paragliding is an international championship
that involves second category for world rankings, especially senior category
participants, who use FAI rules in their assessment” (Pers. com. 2018).
The category in the international championship consisted of teams, masters, junior boys (PL1
licenses), junior girls (PL1 licenses), senior men (PL2 licenses and above) and senior women (PL2
licenses and above). Foreign participants who took part in the Paragliding International Accuracy
Open activities, were specifically from Hungary and Romania, while those who registered, came from
Malaysia, Hungary, Hong Kong and Romania.

Bet El Silisna Lagarense, Taufiq Hidayah, Fitri Abdillah
Examining the Impacts of Sport Tourism Event in Strengthening Local Economy: The Case of Manado Fiesta 2018 in
Manado, Indonesia
301
Proceedings of CATEA 2019
4.2. Impacts of Manado Fiesta event 2018 to local economy
In general, the Manado Fiesta 2018 event impacted on several areas, which included:
4.2.1. Industry and trade sector The event which was held on 1-10 September 2018, positively contributed on the industrial and
trade activities in the city of Manado. Data obtained by the city industry and trade office, from
business people in the following tables:
Table 1. Impacts of MF 2018 on industry
No Type of Industrial Products Increased Sales Turnover
1. Crafts (coconut wood, souvenir key chains, fans, etc.) ±40%
2. Food (abon cakalang, sambal roa, Manado specialty cakes, klapertart, etc.) ±90%
3. Convection ±60%
4. Printing ±80%
5. Kaeng Manado ±90%
6. Beauty salon ±90%
Source: Survey, 2018
Table 2. Impact of MF 2018 on trade activities
No Type of Trade Increased Sales Turnover
1. Traditional Market (6 locations) ±60%
2. Modern Market:
- Supermarket - Mini Market
±50% ±30%
3. Mixed Store ±20%
4. Small shop ±20%
5. Building Material Store (Fisco carnival) ±40%
Source: Survey, 2018
4.2.2. Tourism Sector Outcomes of tourism from Manado Fiesta event 2018 activities, included:
a. The number of foreign tourist visits, as of September 10, 2018 had reached 95,889 people,
especially for those who visited the Fiesta, 29 August-10 September 2018. Data released by
the authority the Sam Ratulangi international airport recorded a total of 4,503 international
travellers (70% were Chinese) and 45,110 were domestic. Furthermore, local tourists from
the surrounding areas of Manado, present from the opening, exhibition, fair, concert, closing
and thanksgiving were estimated to reach 304,000 people.
Tabel 3. Money spending by tourists visiting MF 2018
Country Number of Tourists Spending/Person (RP) Total (Rp)
China 3152 15,000,000 47,280,000,000
Europe, USA, Australia 1351 25,000,000 33,775,000,000
Indonesia (domestic) 45110 6,000,000 270,660,000,000
Manado (Locals) 304000 250,000 76,000,000,000
TOTAL 427,715,000,000
Source: Survey, 2018
b. Money spent by tourists, both domestic and foreign, stimulated the economy of Manado in
fostering development of investment, creating jobs and improving people's welfare. On an
average, finances spent by guests were absorbed in the areas of accommodation, feeding,
transportation, vehicles / boats, souvenirs, entertainment, etc. According to BPS data, the
average expenditure of domestic tourists per person reached 6-7 million rupiah (Table 3)
c. Length of stay, specifically during the Manado Fiesta, increased by 6-7 days because most
travellers requested an extention, in order to witness this event. This further affected 252
business hotels in the city, consisting of 22 star hotels, 99 non-star hotels, 36 resorts and 95
other inns (not including tourists resident in people's homes).
Bet El Silisna Lagarense, Taufiq Hidayah, Fitri Abdillah
Examining the Impacts of Sport Tourism Event in Strengthening Local Economy: The Case of Manado Fiesta 2018 in
Manado, Indonesia
302
Proceedings of CATEA 2019
d. Hotel occupancy rates of about 98% occurred due to the density of tourism events within the
intervals of July, August and September in North Sulawesi, which included TIFF, MURI
Bayangkari (throughout Indonesia), the Manado Fiesta 2018 and other activities.
Furthermore, during this period, the average hotel experienced full booking, thus, many
guests / tourists switched to staying in people's homes or families.
e. Branding: Another impact of this activity was the stronger branding value of Manado, as the
World Tourism City, evidenced by the ceaseless promotion of the event on various media,
locally, nationally and internationally. Furthermore, this also strengthens other numerous
branding, by virtue of attributes, which included "The Singing City in Asia", Blessing City,
Manado Our Great Home, Marijo Ka Manado, Fashion / Trendy City, Culinary City,
Thousand Church Cities, MICE City, etc. Since 2017, the Indonesian Ministry of Tourism
has compared Manado with the tagline "Manado diversity in harmony" because of the
Wonderful branding of Indonesia as one of the tourism destinations, ready to be sold to
international tourists.
f. Tourism Award: The commitment of the city government to develop the tourism sector in
recent years had received attention and appreciation from the Ministry of Tourism, through
Yokatta Wonderful Indonesia Tourism Award 2018, where it was recognized as the Best City
of Tourism. In addition, they also received the 2018 Platinum Indonesia’s Attractiveness
Award, in the Potential City Public Service category.
5. Conclusion Development of the Manado Fiesta 2018 event, especially in the sport aspects, was organized by
the Federation of Aero Sport Indonesia (FASI) North Sulawesi, held on September 2-4 2018, in
Tumpa Mountain Forest Park and titled "Paragliding International Accuracy Open". Respondents in
this study were tourists who witnessed the paragliding event. Participants in the International
Accuracy Open paragliding took off at Mount Tumpa, Tongkaina Village, Bunaken District, Manado
City, while the location for landing was situated in Tiwoho village, Wori sub-district, North Minahasa
regency. The category in the international championship consisted of teams, masters, junior boys
(PL1 licenses), junior girls (PL1 licenses), male seniors (PL2 licenses and above) and female seniors
(PL2 licenses and above). Foreign players in the Paragliding International Accuracy Open activities
were from Malaysia, Hungary, Hong Kong and Romania. The sport tourists who came to attend the
paragliding sporting event at the Manado Fiesta 2018 festival were of the wanderlust type because
they were motivated by the eagerness to obtain new experiences, hence they mainly consisted of
young people. It was however noted that the impact of this big event on the industrial economy, trade
and directly on tourism was felt widely and significantly. Promotional grandeur, conducted by the
committee, regarding paragliding sports was very good, clear and could easily be found in various
media to make it much easier for tourists to identify with its location and schedule. However, there are
some aspects that must be corrected by the committee, which included the provision of transportation
to the location by providing shuttle buses and facilities such as bins, shelters, and places of worship.
Furthermore, in terms of health facilities prepared by the committee, based on the results of
observations in the field, it was seen that several ambulances were deployed at the landing site. The
average response of tourists to paragliding sports activities in the city of Manado was very good
because the location for the activities offer a beautiful view from that height.
References Adiati, M.P., Basalamah Anwar. (2014). Kondisi Pariwisata Berkelanjutan di Bidang Sosial Budaya
Berdasarkan Pengalaman dan Harapan Pengunjung di Pantai Tanjung Papuma Jember. Jurnal Binus
Business Review, Vol. 5, No.1 pp. 80-90.
Antara, Made. 2008. Kumpulan Materi Kuliah Kajian Pariwisata. Denpasar. Universitas Udayana.
Astuti, Marhanani Tri (2015). ‘Potensi Wisata Olahraga Dalam Meningkatkan Kunjungan Wisatawan Sport
Tourism to Increase Tourist Arrival in Indonesia. Jurnal Kepariwisataan Indonesia Vol. 10 No. 1, pp. 31-
40.
Destination British Columbia. (2013). Sport Tourism: The Essential Guide to Understanding and Developing
Sport Tourism in BC. Canada: Destination BC Corp.

Bet El Silisna Lagarense, Taufiq Hidayah, Fitri Abdillah
Examining the Impacts of Sport Tourism Event in Strengthening Local Economy: The Case of Manado Fiesta 2018 in
Manado, Indonesia
303
Proceedings of CATEA 2019
Grabowska, Justyna Mokras. (2016). Sport Tourism: Terminological Discussion. Journal Tourism, 26/1, pp. 13-
18.
Pavic, Lazar., Rancic, Milica., Mijatov, Maja. (2013). Potential for Paragliding Tourism Development in Niska
Banja (South Serbia). Journal Turizam, 17, pp. 110-120.
Suwena, I Ketut., Widyatmaja, I Gusti Ngurah. (2017). Pengetahuan Dasar Ilmu Pariwisata. Denpasar: Pustaka
Larasan.
Tondobala, L. (2012). Kelayakan pusat Kota Manado sebagai destinasi Pariwisata. Media Matrasain, 9(3), 82-
103.
Yildiz, Zafer & Cekic, Sinem. (2015). ‘Sport Tourism and its History and Contribution of Olympic Games to
Touristic Promotion’. International Journal of Science Culture and Sport (IntJSCS) (4), pp 326- 337.
Zemla, Michal. 2016. Tourism Destination: The Networking Approach. Journal Moravian Geographical
Reports, 24 (4): 2-14.

304
Proceedings of CATEA 2019
Proceedings of CATEA 2019
ISBN 978-623-91018-0-0
The Influences of Behavioral Factors Moderated by Information
Technology and Competitive Advantages on Sustainability of
MSME Craft Business in North Sulawesi
Agustinus Walansendow1, Silvya Mandey
2, Herman Karamoy
3, Lisbeth Mananeke
4
1Business Administration Dept., Manado State Polytechnic
2.3.4 Economic and Business Faculty, Sam Ratulangi University, Manado
[email protected], [email protected], [email protected],
Abstract: Micro, Small and Medium Enterprises (MSMEs) are business units managed by community groups,
with a strategic role in national economic development because they absorb a large number of workers. This
study uses a quantitative approach, while a sample of 80 craftsmen, in the form of natural stones, rattan,
bamboo, shells, pottery, coconut shells and shells, and wooden handicrafts, are managed by MSMEs, and have
superior products in North Sulawesi. Furthermore, the data analysis method involved in SmartPLS software,
version 2.0.m3, is run on computer media. Competitive Advantage Construction, provided by R-Square 0.820
contribution and adjusted value 0.813, which means that 81.3% is 18.7% and other factors are not examined
within the scope of this study. R-Square 0.972 and adjustment value 0.9710, which shows that 97.10% is
influenced by it and the remaining 2.90% is influenced by other factors. Information Technology Design,
contributed r-Square of 0.857, with an adjusted value of 0.851, which means that 85.10% is influenced by IT,
while the remaining 4.90% is a result of other factors not examined.
Keywords: Business Sustainability; Entrepreneurial Orientation; Managerial Ability; Individual Character;
Competitive Advantage; Information Technology.
1. Introduction The increasing competition in the craft industry requires business actors to actively utilize
competitive strategies that are relevant to their development, therefore maintaining a continuity
advantage over similar companies. The challenges leads to the exposure of regional borders and so the
economic viability depends on the widened global competition, where only big investors win through
the improvement of non-static performance standards including quality, production costs, product
introduction time and information delivery. Business continuity is however, only obtained by those
who meet or exceed global standards, hence, the development of a dynamic business environment
affects every company, including large, medium and small enterprises. Furthermore, the fiscal crisis
of recovery has been operated for several years and numerous studies have indicated that the
Indonesian economy does not only rely on the role of large businesses, conversely, the MSMEs have
proven to possess relatively better resilience. The results of this study further prove that both during
the crisis and recovery period of the current economic situation as MSMEs have a very strategic and
important role in terms of various aspects, which include (a) The large number of industries, present
in every sector. (b) The great potential in creating more employment opportunities, compared to the
same investment in larger scale businesses. (c) Their contribution to the GDP is quite significant. (d)
The impact on the country's foreign exchange, with a stable export value (Hadiyati, 2009). MSMEs
possess a variety of external weaknesses, which include the reduced ability to adapt to environmental
influenced and the lack of skills to achieve business opportunities. Furthermore, they are also affected
by internal factors, which include shortage in creativity, innovation and poor anticipation of various
other challenges, which could result from a prolonged economic recession. In addition, other core

Agustinus Walansendow, Silvya Mandey, Herman Karamoy, Lisbeth Mananeke
The Influences of Behavioral Factors Moderated By Information Technology and Competitive Advantages on Sustainability
of MSME Craft Business in North Sulawesi
305
Proceedings of CATEA 2019
elements that influence micro investments include a shortfall in managerial ability, the inhibition of
individual character and insufficient access to information technology, due to the fact that some of the
human resources have poor quality of anticipation towards problems. In order to win in the
competition of marketing, manufacturers’ base emphasis on its quality and also depends on the
company's utility of behaviors, which include entrepreneurial orientation, managerial ability,
individual characteristics. Furthermore, these characteristics are collectively used as a strategy in
achieving competitive advantage and ability, facilitated by Information Technology. However, the
main objective of possessing administrative ability is to meet market demands, to enhance the
advantageous use of a product, over other company brands and the basic problem in this area, for
small entrepreneurs, is the incapability of employers to determine a management pattern, appropriate
to the needs at different stages of enterprise development. In each advancement phase, a company
experiences requires a different level of administration in its inception. The production scale is
relatively low, thus a simple family managerial technique is dominated. In line with the steady
internal and external evolutions in the business environment the conventional management style was
not applied due to the pressure and the emergence of new problems. Therefore, small enterprises are
required to always be dynamic in executing plans according to business growth. Furthermore, demand
for using conventional management is relevant only if the small-scale entrepreneurs (craftsmen) have
inadequate abilities and managerial skills.
1.1. Research Objectives
In general, this study aimed to analyze and explain the following:
a. The influenced of behaviors (entrepreneurial orientation, managerial ability and individual
character), through competitive advantage, on the sustainability of MSME business.
b. The consequence of these behaviors, through information technology, on the continuity of the
enterprise
c. The impact of the influence of these behaviors, through competitive advantage and
information technology on the sustainability of MSME business
2. Related Works/Literature Review Several studies have been carried out by experts on the factors that influence the success of
MSMEs on several variables between other outcomes, performance, productivity, market
development, competitive strategies and corporate entrepreneurship. There have not been or have not
been found studies that look at certain variables as variables (X) for continuity (sustainability) (Y).
This research will be conducted to fill gaps or include existing factors such as entrepreneurship,
individual character, management ability, through information technology and competitive advantage
to support the sustainability of craft MSMEs with research in the handicraft industry in North
Sulawesi. The results of research showed that development of craft industries can improve people's
welfare. The study refers to several previous studies as follows:
2.1. Relationship between entrepreneurship orientation and information technology
Abbas (2018) states that the current youth has surely got a business mind and possess huge
motivation to start its own ventures and good prospect is that students are not earning degrees only as
they consider entrepreneurial ventures an effective tool to increase their earnings. Their motivation is
high, and they are also impressed by the recent IT giants thus considering information technology
businesses as an economic booster that can edge declining economies. Similarly Tavakoli (2013)
explains that information technology has created dramatic developments in all social activities
including entrepreneurship and is regarded as the most important tool of modern entrepreneurship.
Also entrepreneurship in IT has so vast activity. Entrepreneurship is requisite of technology
development.
2.2. Relationship between entrepreneurship orientation and competitive advantage
Judgment based on superior knowledge in critical areas increases an entrepreneur’s chance of
success. Knowledge of the market, consumers and enterprise refined ability to judge marketing
strategies in a world of uncertainty. Entrepreneur-specific knowledge tends to increase the vertical

Agustinus Walansendow, Silvya Mandey, Herman Karamoy, Lisbeth Mananeke
The Influences of Behavioral Factors Moderated By Information Technology and Competitive Advantages on Sustainability
of MSME Craft Business in North Sulawesi
306
Proceedings of CATEA 2019
integration when the firm cannot find in the market the necessary capability to accomplish its
innovation strategies (Saes & Ishikawa, 2013). Likewise, Block et al (2014, verifies that the necessity
based start-ups are more likely to pursue a cost leadership strategy and less likely to pursue a
differentiation strategy. Even though the necessity motive is linked to a number of observable
characteristics of the entrepreneurs and to various particularities of the start-up projects, it is found to
have a considerable, direct effect on the choice of strategy.
2.3. Relationship between entrepreneurship orientation and sustainable community
According to Alani et al (2016), attitudinal, perceptual factors, firm size, sector, ownership,
innovative orientation, personality, management skills, motivation, infrastructure, working capital
management, and access to finance (amongst others) are critical to sustainable entrepreneurship
among SMEs. The relativity of the observed critical factors to the ease of doing business in Nigeria by
SMEs towards sustainable entrepreneurship was emphasized in the study. The study recommends the
need for governmental agencies and educational establishments to provide adequate information and
enlightenment to foster sustainable entrepreneurship among SMEs. This furthermore elaborated by
Moore dan Manring (2009) by stating that several successful models of the sustainable SME are
evolving, it may be that networks of SMEs will become essential for addressing the systemic
problems that underlie industrial ecology, enterprise resilience, and global supply chain sustainability.
SMEs represent the majority of all enterprises, and rapidly evolving communication technologies
allow for various routes of network formation. As SMEs succeed in integrating social and
environmental sustainability performance into financial projections and strategic business goals, they
will expand opportunities for innovation by increasing their opportunities for rapid learning.
2.4. Relationship between managerial capabilities and information technology
Firms ought to pay attention to knowledge management in order to enhance dynamic capability
to outcompete rivalry in a turbulent environment. Development of Internet and database technology
facilitates more advanced IT application in modern business administration. New frontiers of business
world are expanded and new business models are launched continuously to serve customers better. As
trends of globalization, shorter life cycles, and stronger IT functions remain, firms are operating in an
increasingly fierce competitive arena (Sher and Lee, 2001). Furthermore, Thomas et al (1997)
explains why some firms struggle while others flourish with the same ITs, and why IT-based
advantages tend to dissipate so rapidly; and they suggest a solution based on an integration of IT with
the firm's infrastructure of human and business complementary resources. ITs carry enormous
productivity power but, like other powerful weapons, misfire in the wrong hands. Supporting the
seemingly universal intuition that tells managers that technology alone is not enough.
2.5. The Relationship Between Managerial Abilities and Competitive Advantages
Kaur and Mehta (2015) describes that there was no consensus among researchers on the true
nature of relationship between dynamic capabilities and competitive advantage of firms. An in-depth
examination of this relationship in the present study was an attempt to provide deeper understanding
of the complex relationships between the two concepts. Also, there were very few studies which had
been done on dynamic capabilities in the Indian context. The present study bridged this gap in the
literature not only by empirically analyzing the dynamic capabilities of Indian multinationals but also
by comparing the level of deployment of dynamic capabilities in Indian-origin MNCs vis-à-vis the
foreign-origin MNCs operating in India. Furthermore, Bellner and Donald MacLean (2015) states that
the strategic management process involves establishing the strategy/structure relation and determining
the highest-level objectives of the firm. It involves an ongoing assessment of the internal and external
environment, and the alignment of the firm’s strategy with the activities that frame the organizational
design, and processes and systems in delivering the mission. Yet, it requires more than effective and
efficient strategic management practices if the firm is to survive and/or grow in regimes of rapid
change. The strategy needed is a dynamic innovation strategy, defined here as the firm’s theory about
how to gain competitive advantage in periods of significant change.

Agustinus Walansendow, Silvya Mandey, Herman Karamoy, Lisbeth Mananeke
The Influences of Behavioral Factors Moderated By Information Technology and Competitive Advantages on Sustainability
of MSME Craft Business in North Sulawesi
307
Proceedings of CATEA 2019
2.6. Relationship between managerial capability and sustainable MSMEs
Small business support providers, policy makers and practitioner should identify, prioritize and
customize the most influential managerial problems in designing entrepreneurial training and
assistance programs (Pansiri and Temtime, 2008). This is supported by Gharakhani and Mousakhani
(2012), by describing that managers need to actively manage their firm’s human capital to stimulate
its capability in managing knowledge acquisition, sharing, and application. Furthermore, research
suggests appropriate investments initiation can enhance organizational performance.
.
2.7. Relationship between individual characters and information technology
According to Lounsbury et al. (2014), IT professionals had significantly higher levels of
agreeableness and tough-mindedness, and lower conscientiousness, emotional stability, extraversion,
assertiveness, customer service orientation, optimism, and work drive. Functional value and person-
occupation fit of this distinctive trait profile for the work of IT professionals in an era of technological
and organizational change. Implications are described for future research as well as the recruitment,
selection, management and promotion of IT professionals, as well as their training, development,
coaching, and mentoring. In addition, Opatha (2007) explains that Individual Character was defined
as the aggregate of all of the relatively persistent moral qualities a person has that combines to form
his/her real nature. It is the degree to which the person possesses the virtues and do not possess the
vices. Virtues are to be nurtured within the individual while vices are to be removed from the
individual for the purpose of developing IC. It was asserted that IC was not the so called personality
and it differed significantly from personality in several ways. It was substantiated by literature that IC
is of utmost importance for individual development, organizational development and nation
development as well.
2.8. Relationship between individual characters with competitive advantage
Jassin (2014) explains that the quality of the organization’s employees, their enthusiasm, and
their satisfaction with their jobs and the company all have a significant impact on the organization’s
productivity, level of customer service, reputation and survival. In other words, in a competitive
environment, people make the difference. Human resources are a critical component in every area of
the organization, from finance to sales to customer service to line management. Managers and
supervisors in every department confront human resource issues every day and are responsible not
only for interactions within their own department, but also interactions between departments. The
primary function of human resources today is to ensure the effective and efficient use of human talent
to accomplish an organization’s goals and objectives. Furthermore, Omerzel and Gulev (2011) state
that Globalization, technical evolution, and deregulation are changing the competitive structure of
markets in such a way that the effectiveness of traditional sources of firms’ competitive advantage is
often debilitated. Competitive advantages based on physical, financial, or even technological assets
are less and less sustainable since these assets are more easily transmittable. This is the reason why
firms need to concentrate on the development of difficult imitable capabilities. Such capabilities relate
to employees of the firm. They develop and apply their abilities, knowledge and skills, organized and
coordinated in ways, which can be also distinctive.
2.9. Relationship between individual characters and sustainable MSMEs
The development of a SME program to equip the management members is very important in an
attempt to ensure the encouragement for SMEs to be successfully developed (Wiese, 2013). It is
furthermore explained that a highly behaviorally integrated is more likely to engage in sustainability-
oriented actions because behaviorally integrated offer its team members an increased chance of being
innovative and generating new ideas as compared to less behaviorally integrated. It is also found that
the generation of novel ideas is higher in teams with younger members, and that highly educated
generate more innovative ideas in the workplace (Jahanshasi and Brem, 2017).

Agustinus Walansendow, Silvya Mandey, Herman Karamoy, Lisbeth Mananeke
The Influences of Behavioral Factors Moderated By Information Technology and Competitive Advantages on Sustainability
of MSME Craft Business in North Sulawesi
308
Proceedings of CATEA 2019
3. Material and Methodology 3.1. Data
Table 1 explains the data collection method used for this study with instruments used.
Table 1. Table of tools / types of data collection methods and instruments
No Types Instrument
1 Questionnaire Checklist (list of matches), Scale, inventory
2 Interview Checklist (list of matches)
3 Observation Observation sheet, observation guide
4 Documentation Checklist, table
Source: Authors
3.2. Method This study involved a quantitative research (Johnson, 2005; and Kasiram 2008: 149-150), using
deductive (rational-empirical or top-down) thinking patterns, in an attempt to understand a
phenomenon, by applying general concepts. Furthermore, positivistic logic was used thereby avoiding
subjective elements, followed with a planned procedure. This technique was utilized to arrange
nomothetic science, which sought so create laws of generalizations on the topic, data collected, and
information sources and also on tools used for collection. Data was however assembled, through
measurement, using objective and standard tools, which were further subjected to calculation or
quantification.
4. Results and Discussion This study drew esearch finding as follows:
4.1. Results of composite reliability
The construct reliability test was measured by composite reliability criteria from the indicator
block. Furthermore, the construction was declared reliable, if the value obtained was above 0.70 and
the following output were recorded:
Table 2. Composite reliability
Description Composite reliability
Individual character 0.932
Managerial ability 0.922
Competitive advantage 0.957
Entrepreneurial orientation 0.787
Sustainability of MSME business 0.969
Information Technology 0.953
Source: Survey, 2019
Table 2 showed the composite reliability output for individual character constructs (0.932),
Managerial Ability (0.922), Competitive Advantages (0.957), Entrepreneurship Orientation (0.787),
Sustainability of MSME Business (0.969) and Information Technology (0.953), were all above 0.70,
hence, it could be concluded that the construct had good reliability.
4.2. Structural model test (inner model) Table 3. R-Square
Description r-Square r-Square Adjusted
Competitive Advantage 0.820 0.813
Sustainability of MSME Business 0.973 0.971
Information technology 0.857 0.851
Source: Survey, 2019

Agustinus Walansendow, Silvya Mandey, Herman Karamoy, Lisbeth Mananeke
The Influences of Behavioral Factors Moderated By Information Technology and Competitive Advantages on Sustainability
of MSME Craft Business in North Sulawesi
309
Proceedings of CATEA 2019
Table 3 illustrated structural model testing, which was performed by observing the R-Square
value, also known as the Goodness-fit model test. Furthermore, of the influence of behaviors
(entrepreneurial orientation, managerial ability and individual characteristics) studied, on competitive
advantage, to accomplish MSME business sustainability, provided an r-square value of 0.820 (82%),
while 18% was due to other variables outside the scope of this study. However, the Influence of these
behaviors, towards information technology, in order to sustain business, provided a value of 0.857.
Therefore the business viability was affected by the behavior towards Competitive Advantage, with
an effect of 85.70 %, while 14.30% was due to other variables.
Figure 1. Full model after bootstrapping, data processing in SmartPls, 2019
The full model of all calculation using SmartPls application explained the details of the effect
of the studied behaviors towards competitive advantage and information technology, to attain a
sustainable enterprise, provided an R-Square value of 0.973(97.30%), while 2.70% was is explained
by other variables, outside of those studied. Based on the full model bootstrapping model (Figure 1),
the direct and indirect influenced could be calculated. The results are as follows:
Direct influence (entrepreneurial orientation to the sustainability of MSME business = 0,767
Indirect influence (entrepreneurial orientation through competitive advantage to the
sustainability of MSME business) = 0.728 x 2.290 = 1,667 +
--------------
Total Influence = 2.434
Direct influence (entrepreneurial orientation on the sustainability of MSME business = 0,767
Indirect influence (entrepreneurial orientation through information technology on
the sustainability of MSME business) = 0.738 x 2.243 = 1,655 +
--------------
Total Influence = 2.422
Direct influence (managerial ability on the sustainability of MSME business = 1.182
Indirect influence (managerial ability through competitive advantage on the
sustainability of MSME business) = 2.978 x 2.290 = 6.819 +
--------------
Total Influence = 8.001
Direct influence (managerial ability on the sustainability of MSME business = 1.182
Indirect influence (managerial ability through information technology on the
sustainability of MSME business) = 2.581 x 2.243 = 5.789 +

Agustinus Walansendow, Silvya Mandey, Herman Karamoy, Lisbeth Mananeke
The Influences of Behavioral Factors Moderated By Information Technology and Competitive Advantages on Sustainability
of MSME Craft Business in North Sulawesi
310
Proceedings of CATEA 2019
--------------
Total Influence = 6.971
Direct influence (individual character on the sustainability of MSME business = 2.635
Indirect influence (individual character through information technology on the
sustainability of MSME business) = 1.434 x2.243 = 3.216 +
--------------
Total influence = 5.851
Direct influence (individual character on the sustainability of MSME business = 2.635
Indirect influence (individual character through competitive advantage on the
sustainability of MSME business)) = 1.434 x 2.290 = 3.283 +
--------------
Total influence = 5.919
Source: Data processing, 2019
4.3. Influence of entrepreneurial orientation on information technology
This study indicated that the nature of entrepreneurial orientation significantly influenced the
development of Information Technology, thus, a better executive coordination, leads to an enhanced
knowledge and skill, in IT. Furthermore, entrepreneurial orientation was measured, using 5 indicators,
which included experience, courage to take risks, proactivity, anticipation and flexibility Lumpkin and
Dess, (1966); Sri Muljaningsi, (2011) and Weerawerdeena, (2003). Conversely, the Information
Technology concept was analyzed, using several indicators, including, wholeness of software and
hardware, Network Systems, etc. Utilization of internet in updating the public, through website,
communication of models and design, application of IT in completing tasks on time, using Whatsapp
application, Facebook, Instagram, etc. Asmani & Ma'mur, (2011) stated that information technology
was not restricted to computer hardware and software processing and storage of information,
however, it also includedtelecommunication, as it aids in sending and disseminating information. The
Smart-Pls results illustrated that entrepreneurial orientation had a positive and significant influence on
Information Technology (0.953), which meant that an enhanced knowledge of IT, leads to efficiency
in its utility.
4.4. Influence of entrepreneurial orientatial on sustainibility of MSME business
The design of entrepreneurial orientation significantly influenced the sustainability of MSME
business, thus, a better executive coordination positively affects the continuity of the enterprise.
Furthermore, entrepreneurial orientation was measured using 5 indicators, as mentioned above while
enterprise viability was measured with core indicators, e.g. (a) Ability to create profits, where (1)
Income is the difference between revenue and expenses/losses within a period (2) Physical, size,
energy, endurance and emotional intelligence are needed to obtain operating revenue. (3) The gains
earned contribute to long-term economic performance. (b) The ability to protect the environment
(planet), where (1) non-renewable resources (e.g. gold, aluminum, sulfur iron, stone, etc.) are
restricted to the creation of handicraft raw materials (2) biodiversity, biological natural resources,
which originates from living things, need to be conserved by MSMEs (3) businesses operated by
MSMEs do not produce pollution. (c) They possess the ability to improve social life (community)
with indicators, that include, (1) business enhances societal life of rural communities (2) They free
participators from extreme poverty (3) They do not cause diseases that are harmful to health (4) Basic
education and skills are the main requirements for craftsmen (5) Efforts needed are not gender
specific (Savit & Weber, in Cambra-Fierro & Benitez, 2011). Smart-Pls calculations showed that
entrepreneurial orientation had a positive and significant influence on the sustainability of MSME
business (0.787), hence, an enhanced entrepreneurial orientation, would enhance business viability.
4.5. Influence of managerial ability on information technology The development of managerial ability, significantly influenced the design of information
technology, hence, an enhanced administrative capability, leads to a better understanding of IT.
Furthermore, managerial abilities were measured using indicators, which include the ablility to
communicate, guide and motivate employees, as well as the capacity to delegate work, in a manner

Agustinus Walansendow, Silvya Mandey, Herman Karamoy, Lisbeth Mananeke
The Influences of Behavioral Factors Moderated By Information Technology and Competitive Advantages on Sustainability
of MSME Craft Business in North Sulawesi
311
Proceedings of CATEA 2019
that condones respect. Furthermore, prepare a workplan hence, every job is completed on time, take
executive decisions and build a solid work team (Abdul Latif 2002), Mulyanto (2007) and Suci
(2009), on the contrary information technology was assessed, using the several core indicators
mentioned previously. The smart-pls calculation showed that the design of managerial ability
significantly influenced the development of IT by 0.471 (47.1%.)
4.6. Influence of managerial ability on sustainability of MSME business
Developing managerial ability using indicators mentioned previously, significantly (positively)
influenced the sustainability of MSME business, which was measured, using a number of core
indicators, as mention previously (Savit & Weber in Cambra-Fierro & Benitez, 2011). Smart-Pls
calculation, further showed that administrative ability had a positive and significant influence on the
sustainability of MSME business (0.887), therefore, a manager that communicates, directs and
motivates employees, as well as delegates work to enhance the feeling of mutual respect, creates
work plans, makes decisions and build a solid work team, the business continuity woul be assured.
4.7. Influence of individual character on information technology
The development of individual character significantly influenced the design of information
technology, hence a better personal behavior,which fostered the utility of information technology.
Furthermore, the administrator personality was measured, using indicators, which included interests,
needs, attitudes and expertise (Stonner and Freeman Saryathi, 2003; Simamora; 2003), while
information technology was assessed, using several core indicators previously mentioned. Smart-pls
illustrates that individual character had a positive and significant influence on information technology
(0.893), hence, personal attitudes and needs on a staff, carrying out a task, influenced their
understanding of information technology.
4.8. Influence of individual character on sustainability of MSME business
Smart-Pls showed that construct of the individual character, had a positive and significant
influence (0.893) on the design of MSME business sustainability, measured using indicators such as
interests, needs, attitudes and expertise (Stonner and Freeman Saryathi, 2003; Simamora 2003).
Furthermore, if a manager exhibited positive attitudes and needs on a person carrying out work, the
sustainability of North Sulawesi craftsmen was enhanced.
4.9. Influence of competitive advantage on sustainability of MSME business
Smart-Pls showed that developing competitive advantage, significantly influenced the
development of sustainability of MSME business (0.958), hence, an improved perception of
competitive advantage, enhanced the viability of the enterprise, measured using indicators, which
included rarely found, not easily replicated, not easily replaced as well as competitive prices, whose
indicator was not used because it was applied on sustainability variables. Furthermore, the continuity
of these enterprises was measured, using a number of core indicators as mentioned previously (Savit
& Weber in Cambra-Fierro & Benitez, 2011). Furthermore, if products had a good competitive
advantage, the sustainability of craftsmen enterprise in North Sulawesi was ensured.
4.10. Influence of information technology on sustainability of MSME business
Smart-pls showed that information technology development, significantly influenced the
sustainability of MSME business (0.971), hence, a better understanding and use of IT, fosters the b
viability in North Sulawesi Province, observed from the magnitude of the effect (0.971) measured,
using several core indicators as mentioned above (Jamal Ma’mur Asmani, 2011). on the contrary
business continuity, based on the opinion of Savit & Weber in Cambra-Fierro & Benitez, (2011), was
measured, using a number of core indicators, including the ability to create profit, protect the
environment (planet) and improve social life (community).

Agustinus Walansendow, Silvya Mandey, Herman Karamoy, Lisbeth Mananeke
The Influences of Behavioral Factors Moderated By Information Technology and Competitive Advantages on Sustainability
of MSME Craft Business in North Sulawesi
312
Proceedings of CATEA 2019
4.11. Theoretical Implication
This research the following results:
a. Formulated a business sustainability model for MSMEs, by combining entrepreneurial
orientation behavior, managerial abilities and individual characters, inherent in a craftsman,
which were further moderated by the ability to manage competitive advantage strategies and
use/understand information technology.
b. Provided a linkage model between the behaviors studied, hence promoting their use in the
theory of MSME advancement in developing country contexts, including Indonesia.
c. Development of MSMEs, with entrepreneurial orientation behaviors, managerial abilities and
individual characteristics, towards competitive advantage and information technology, which
could further be developed in future education systems.
d. Sought to minimize the lack of studies in the domain of MSME business continuity, from the
perspective of developing countries.
e. Applied data on the importance of entrepreneurial-oriented behavior, as well as executing
managerial abilities, followed by good individual character, accompanied by the
use/understanding of information technology and the implementation of competitive
advantage strategies, further leading to the sustainability of MSME craft businesses that
exposed regional identity.
4.12. Practical Implication
a. This study had provided useful information, valuable insights and also brought to light, the
behaviors (entrepreneurial orientation, managerial abilities, individual characters) necessary
to develop businesses, as well as improvement on the understanding of IT and enhancement
of the capability to run competitive strategies in managing MSMEs.
b. This research produced benefits, based on the importance of increasing behavioral
knowledge, which was an influential factor in entrepreneurial success and business continuity.
c. These enterprises were often hereditary and related to regional identity therefore their
sustainability needed to be improved because it had an impact on the regional economy.
d. The influence of maintaining behavior in advancing an enterprise, increasing understanding
of information technology and being able to run a competitive advantage strategy in
management, was essential because business continues to run successfully.
5. Conclusion The competitive advantage development provided an R-Square contribution of 0.820 (81.3%) and
Adjusted value of 0.813, which meant the remaining 18.7% was as a result of other factors not
examined. The development of sustainability of MSME business had a test value of 0.972 (97.10%)
and an adjusted r-Square of 0.9710, indicating that the remaining 2.90% was due to other influenced.
The Information Technology concept had an r-Square value of 0.857 (85.10%) and an adjusted value
of 0.851, which indicated that the remaining 4.90% was as a result of other elements not examined in
the scope of this study. Furthermore, reliability test was assessed, using composite reliability criteria,
from the indicator block that measures the development. Furthermore, the results could be declared
dependable, if their value was bove 0.70. The following were outputs recorded: Individual Character
(0.932), Managerial Ability (0.922), Competitive Advantage (0.957), Entrepreneurship Orientation
(0.787), sustainability of MSME business (0.969), Information Technology (0.953), indicating that all
parameters met the requirements of reliability.
References Journal Papers
Alani, L., Rowland, W., & Ezekiel, A. (2016). Critical Success Factors for Sustainable Entrepreneurship in
SMEs : Nigerian Perspective Mediteranian. Journal Of Social Scences Vol 7.
Bellner, B.W. and Donald MacLean, D. (2015). Dynamic Managerial Capabilities and Competitive Advantage,
Strategic Management Quarterly, Vol. 3, No. 3, pp. 1-23.

Agustinus Walansendow, Silvya Mandey, Herman Karamoy, Lisbeth Mananeke
The Influences of Behavioral Factors Moderated By Information Technology and Competitive Advantages on Sustainability
of MSME Craft Business in North Sulawesi
313
Proceedings of CATEA 2019
Cambra-Fierro, J., & Rocio, R.-B. (2011). Sustainable Business Practices In Spain : A Two-Case Study.
European Business Review. Vol. 23 no. 4.
Hadiyati, E. (2009). Kajian Pendekatan Pemasaran Kewirausahaan dan. Jurnal Manajemen Dan
Kewirausahaan, Vol.11, NO. 2 , 183-192
Kaur, V., & Mehta, V. (2015). Kaur., V. and Mehta, V., (2017). Dynamic Capabilities for Competitive
Advantage: A Comparative Study of IT Multinationals in India, Paradigm 21(1) 31–51. Paradigm
21(1), p. 31-51.
Lounsbury, J., Sundstrom, E., & Gibson, L. (2014). Distinctive Personality Traits of Information Technology
Professionals, . Computer and Information Science, Vol. 7 (3).
Lumpkin, G T, and G G Dess. 1996. “Clarifying the Entrepreneurial Orientationconstruct and Linking It to
Performance.” Academy of Management Review 21(1): 135–72.
Moore, S.B., and Susan L. Manring, S.L., (2009). Strategy development in small and medium sized enterprises
for sustainability and increased value creation, Journal of Cleaner Production 17 (2009) 276–282
Omerzel, D.G., and Gulev, R.E., (2011). Knowledge Resources and Competitive Advantage, Managing Global
Transitions 9 (4): 335–354
Opatha, H.H.D.N.P., (2007) Individual Character: A Perspective, Sri Lankan Journal of Human Resource
Management Vol.1, No.1.
Pansiri, J., & Temtime, Z. (2008). Assessing managerial skills in SMEs for capacity building, . Journal of
Management Development, Vol. 27 (2), p. 251-260.
Suci, R. (Maret 2009). Rahayu Puji Suci (2009), Peningkatan Kinerja Melalui Orientasi Kewirausahaan,
Kemampuan Manajemen, dan Strategi Bisnis (Studi pada Industri Kecil Menengah Bordir di Jawa
Timur). Manajemen dan Kewirausahaan, Vol 11, No1,, p, 46-58.
Tavakoli, A., (2013). Impact of Information Technology On the Entrepreneurship Development, Advances in
Environmental Biology, 7(8): 1421-1426,
Thomas C. Powell, T.C. and Dent-Micallef, A., (1997). Information Technology as Competitive Advantage:
The Role of Human, Business, and Technology Resources, Strategic Management Journal, Vol. 18 (5),
pp. 375-405.
Weerawardena, J. (2003). “Exploring The Role of Market Learning Capability in Competitive Strategy”.
European Journal of Marketing. Vol.37,p.407-429., p.407-429.
Conference Proceedings Papers
Block, J.H., Kohn, H., Miller, D., Ullrich, K., (2014). Necessity Entrepreneurship and Competitive Strategi, IZA
Discussion Paper No. 8219, KFW Bankengruppe Frankfurt and IZA
Sher, P., & Lee, V. (Dec.19-21, 2001). Sher, P.J., and Lee, V.C., (2001). Information Technology as a
Facilitator of Enhancing Dynamic Capability through Knowledge Management, . Paper presented in
the First International Conference on Electronic Business. Hongkong: Sheraton Hotels and Towers
Hongkong.
Book
Asmani, Jamal Ma’mur. 2011. Buku Panduan Internalisasi Pendidikan Karakter di Sekolah. Jogjakarta: Diva
Press.
Kasiram, Moh. 2008. Metodologi Penelitian. Malang: UIN-Malang Pers.
Mulyanto. (2007). Pengaruh Motivasi dan Kemampuan Manajerial Terhadap Kinerja Usaha Pedagang Kaki
Lima Menetap. Jakarta: Benefit.
Simamora Bilson, 2003, Panduan Riset Perilaku Konsumen, Surabaya: Pustaka Utama.
Stoner, Freeman, dan Gilbert Jr. 1996. Manajemen. Jilid 1. PT. Prenhallindo: Jakarta
Online sources
Abbas, S.Y., (2018). Entrepreneurship and Information Technology Businesses in Economic Crisis, The
International Journal of Entrepreneurship and Sustainability : Vol. 5 (3):
http://doi.org/10.9770/jesi.2018.5.3(20)
Jahanshasi, A., & Brem, A. (2017). Sustainability in SMEs: Top Management Teams Behavioral Integration as
Source of Innovativeness, . www.mdpi.com/journal/sustainability , pp. Sustainability 2017, 9, 1899
doi:10.3390/su9101899.
Jassin, R. (2014). Competitive Advantage Through the Employees, . Research Gate:
https://www.researchgate.net/publication/242620997.

Agustinus Walansendow, Silvya Mandey, Herman Karamoy, Lisbeth Mananeke
The Influences of Behavioral Factors Moderated By Information Technology and Competitive Advantages on Sustainability
of MSME Craft Business in North Sulawesi
314
Proceedings of CATEA 2019
Gharakhani,D., and Mousakhani, M., (2012). Knowledge management capabilities and SMEs’ organizational
performance, Journal of Chinese Entrepreneurship, Vol. 4 (1), pp. 35-49, Emerald Group Publishing
Limited 1756-1396, DOI 10.1108/17561391211200920
Saes,S.M.S., and Ishikawa, I., (2013). Entrepreneurship and Competitive Advantage: Examining the Case of
Study of Illy Café: Cases in Entrepreneurship,
https://www.researchgate.net/publication/269402587
Thesis
Wiese, J. (2013). Wiese, J.S., (2013). Factors determining the sustainability of selected small and medium-sized
enterprises, Mini-dissertation submitted in partial fulfilment of the requirements for the degree
Magister in Business Administration, Potchefstroom Campus of t. Potchefstroom: Magister in Business
Administration, Potchefstroom Campus of the North-West University.
Saryathi. 2003. “Pengaruh karakteristik individu terhadap kinerja karyawan Biro SDM Dan Umum Perum
Perhutani Unit II Jawa Timur”. Tesis Airlangga University

315
Proceedings of CATEA 2019
Proceedings of CATEA 2019
ISBN 978-623-91018-0-0
The Quality of Polymia Hand Sanitizer Towards Effectivity of
Food Handlers
I Nyoman Sudiarta1, Putu Eka Wirawan
2
1Sekolah Tinggi Pariwisata Bali International
2Sekolah Tinggi Pariwisata Bali International
[email protected], [email protected]
Abstract: The personal hygiene of a food handler is very important in food safety, especially in terms of hand
hygiene, because it is one way in which food contamination may occur. Hand sanitizer is one product used to
prevent microbial contamination through imroper handling of food which causes several diseases. The leaves of
Indonesian bay leaf (Syzigium polyanthum) and Muntingia (Muntingia calabura) can be used as active
microbial ingredients in hand sanitizers. This study used both qualitative and quantitative descriptive method as
well as experimental method. The qualitative and quantitative descriptive method comprised of identification
and measurement, while the experimental method comprised of the effectivity and patch test of Polymia hand
sanitizer. This study was conducted by preparing the materials, followed by extraction, gel preparation, hand
sanitizer production, effectivity and patch test, inhibition test, and pH measurement. The aim of this study was
to observe the effect of Polymia hand sanitizer, in terms of hygiene and sanitation, towards food handlers. As
conclusions, the level of awareness among food handlers in terms of washing hand before handling foods and
after using the toilet was still low. In the effectivity test, Polymia-based hand sanitizer in group P3 had the
highest favorability rate (mean=7.9). According to the patch test result, the hand sanitizer base with highest skin
irritation rate was P3 (mean=0.1).
Keywords: Polymia Hand Sanitizer; personal higiene; food handler
1. Introduction 1.1 Background
The tourism industry in Bali, especially Denpasar City, is developing fast. This could be
observed by increased number of hotels and restaurants in Denpasar each year (Denpasar Tourism
Directory, 2018). According to the article published by Harian Nasional (2013), titled “51% of Foods
Served by Hotels are Unhygienic”, the Indonesian National Agency of Drug and Food Control
(BPOM) revealed that 51% of Horeka (Hotels, Restaurants & Cafe) served foods that are not in
accordance with the food hygiene standards. The personal hygiene of a food handler is very important
in food safety, especially in terms of hand hygiene, because it is one way in which food contamination
may occur (Little & McLauchlin, 2007, p.169). Cross-contamination also frequently occurs by means
of equipment used by food handlers, such as cutting boards, knives, and others (Knowles, 2012).
Recently, along with better education, people are becoming more aware that foods are supposed
to be clean and healthy. As mentioned in Harian Nasional (2013), a customer named Andrea
Sosrowidjayan said that hygiene is not only about how the food is served, but also about how it is
handled.
Although standard operational procedures (SOP) have been established and several efforts such
as training have been given, negligence caused by food handlers of restaurants in Denpasar still
happens frequently. The authors has been informed by a customer of a restaurant in Denpasar that
they found foreign bodies in their food such as hair strands aside from dirty eating utensils. Food
handlers are usually well-educated in terms of food and personal hygiene, but often the practice (such
as washing hands before handling foods and keeping the work station clean) is not well executed.

I Nyoman Sudiarta & Putu Eka Wirawan
The Quality of Polymia Hand Sanitizer Towards Effectivity of Food Handlers
316
Proceedings of CATEA 2019
Health is one of the most important aspects in life. One way to maintain it is by washing hands
properly. Maintaining body health and washing hands are very important in daily life because our
hands are often contaminated by microbes which may lead to several diseases such as diarrhea.
Various efforts have been made to reduce digestive system disorders caused by microbes,
ranging from prevention to treatment. One practical prevention effort that can be done is to use hand
sanitizer. Hand sanitizers generally contain ethyl alcohol 62%, softener, and moisturizer. Based on the
study by the Centers for Disease Control and Prevention (CDC), hand sanitizers with alcohol content
above 60% can function as antibacterial and antiviral agents. In inhibiting microbial activity, 50-70%
alcohol plays a role as denaturing and coagulating proteins, which will cause damage to the enzyme
so that microbes cannot fulfill their daily needs and eventually their activity stops. (CDC, 2009).
Besides alcohol, the active ingredients of hand sanitizer are triclosan, glycerol, tannin, saponins and
other antimicrobial agents. Antibacterial active ingredients such as tannins can be found from natural
ingredients such as Indonesian bay leaves and Muntingia leaves.
Hand sanitizer is a product that can be used to prevent microbes that contaminate hands which
leads to various diseases. Indonesian bay leaves and Muntingia leaves can be used as antimicrobial
active ingredients in making hand sanitizers. Indonesian bay leaves and Muntingia leaves contain
tannin and flavonoid compounds which function as antibacterial / antimicrobial agents. Combining
Indonesian bay leaf and Muntingia leaves extract with other gel-making ingredients into a product
called Polymia hand sanitizer is expected to produce a safe hand sanitizer which capable of
eradicating bacteria.
1.2 Benefits
The benefits of this research is that the readers, students, general public and goverments are
informed about the the quality of polymia hand sanitizer towards effectivity of food handlers.
2. Literature Review There are two previous studies related to this study. First is the research conducted by Febriani
and Ferdinand (2013) titled "Relationship between Levels of Knowledge of Food Handler Behavior
Seen from Sanitation and Hygiene and Petra Codex 1.0 on the Implementation of Safe Food
Handling". The results of this study indicated that there is a relationship between the level of
knowledge in behavior of food handlers measured by sanitation and hygiene and petra codex 1.0 on
the application of safe food handling to the food product laboratory. The other study is one published
by Desiyanto and Djannah (2013) titled "Effectiveness of Hand Washing Using Hand Sanitizer Liquid
Related to the Germs Count". The results of this study indicated that there was significant difference
in the germs count between hand washing using running water, soap, hand sanitizer A, hand sanitizer
B, and the control group (without hand washing). Antiseptic hand sanitizer is effective for decreasing
the germs count and the most effective method described was hand sanitizer B (containing 60%
alcohol). Based from the two studies above, the similarities lie in terms of focusing on hygiene and
sanitation, while the difference lie in terms the usage of Polymia hand sanitizer.
2.1 Indonesian Bay Leaf (Syzygium polyanthum).
2.1.1 Morphology and Taxonomy of Indonesian Bay Leaf.
Indonesian bay leaf plants grow at an altitude of 5 meters to 1,000 meters above sea level. The
trees can grow in the lowlands to mountains with an altitude of 1,000 meters. They grow in form of
trees or shrubs. It has a height ranging from 18 meters to 27 meters and usually grows wild in the
forest.
The direction of growth of the stem is straight, cylindrical in shape with a grooved surface. Their
woody stems are usually hard and strong with monopodial stems. The tree trunk could always be seen
clear. Most Indonesian bay leaf flower are pansy flowers consisting of 4 to 5 petal and the same
number of crown leaves, sometimes attached.
Bay leaves have a leaf shape that is oval to elliptical or round with a pointed base. The shape of
the tip varies from sharp to blunt with a length of 50 millimeters to 150 millimeters, 35 millimeters
wide to 65 millimeters, with 6 to 10 lateral leaf veins. The length of the leaf stalk is ranging from 5
millimeters to 12 millimeters (Murtini, 2006).

I Nyoman Sudiarta & Putu Eka Wirawan
The Quality of Polymia Hand Sanitizer Towards Effectivity of Food Handlers
317
Proceedings of CATEA 2019
2.1.2 The Contents and Benefits of Indonesian Bay Leaf.
Indonesian bay leaf plants have an essential chemical content of 0.2% (sitral, eugenol),
flavonoids (catechins and routine), tannins and methyl cavicol (methyl chavicol), also known as
estragole or pallylanisole.
These compounds have activities as antioxidants. Tanin and flavonoids are active ingredients that
have anti-inflammatory and antimicrobial effects (Adjirni, 1999; Katzer, 2001; Sumono and Wulan,
2009; Lelono, et al., 2013). Its essential oils generally have an effect as an antimicrobial, analgesic,
and increase the ability of phagocytes. The essential oils of Indonesian bay leaves consist of simple
phenols, phenolic acids such as gallic acid, sesquiterpenoid, and lactone, and also contain saponins,
fats, and carbohydrates. From the literatures, it has been proven that Indonesian bay leaf plant has
pharmacological effects.
2.2 Muntingia Leaves (Muntingia calabura L).
2.2.1 Morphology and Taxonomy of Muntingia Leaves.
Muntingia belongs to an annual plant with a height reaching as high as 12 m. The stem of this
plant is woody, erect, round and has sympodial branches. The branching is horizontal, hanging
towards the tip, downy, with ovoid to lanceolate single leaves. The leaf sheet has a real and
asymmetrical base with a size reaching 14 cm x 4cm, jagged leaf edges, while the bottom of the leaf is
light green with dense hair on the underside of the leaf.
The stem can grow to reach a height of 12 cm, but generally has a diameter of 1-4m and forms
shady shade, while the flowers are white and located at the axilla on the right side of the leaf. It has a
long stem, a flat-edge petals, a round egg shape, a large number of stamens between 10-100 strands.
The Muntingia fruit is round in shape. It tastes sweet, appears green when it is young and red
after it is ripe with plenty of sand-like seeds. The seeds are 0.5 mm in size and yellowish (Kosasih
dkl, 2013).
2.2.2 The contents and Benefits of Muntingia Leaves.
Muntingia plants have long been used by the people of Peru as traditional medicinal plants.
Muntingia leaves are used as headache and anti-inflammatory drugs in Peru. Muntingia leaves contain
flavonoids, tannins, triterpenoids, saponins and polyphenols which show antioxidative and
antimicrobial activity (Haki, 2009).
Flavonoids are commonly found in plants, bound to sugar as glycosides and aglycones.
Flavonoids can function as antimicrobial, antiviral, antioxidant, antihypertensive, stimulating estrogen
formation and treating liver function disorders (Binawati and Amilah, 2013).
2.3. Hand Sanitizer
Hand sanitizer is one of the antiseptic ingredients in the form of a gel that is often used by the
community as a practical hand washing media. The use of hand sanitizers is more effective and
efficient compared to using soap and water so that many people are interested in using it (Miller,
2006; Myers, 2008).
The advantages of hand sanitizer can kill germs in a relatively fast time, because they contain
alcohol compounds (ethanol, propanol, isopropanol) with concentrations of ± 60% to 80% and phenol
groups (chlorhexidine, triclosan). The compounds contained in the hand sanitizer works by denaturing
and coagulating germ cell proteins.
2.4. Personal Higiene
Personal hygiene is an effort to maintain one’s health which aims to prevent the transmission of
an illness and to improve his health status (Perry & Potter, 2005). In using Polymia hand sanitizer, a
food handler must frequently wash his hands to prevent the transmission of bacteria originating from
his body or as a result of interacting with the food itself (Gaman & Sherrington, 2006).
2.5. Conceptual Basis
Based on NSW Food Authority (2011), a food handler is considered as anyone involved in food

I Nyoman Sudiarta & Putu Eka Wirawan
The Quality of Polymia Hand Sanitizer Towards Effectivity of Food Handlers
318
Proceedings of CATEA 2019
business and handles the foods, or those directly in contact with outer surface of food (such as spoons,
forks, and plates).
This is an experimental study using qualitative-quantitative descriptive method. The qualitative
and quantitative descriptive method comprised of identification and measurement, while the
experimental method comprised of testing the inhibitory effect of the constituent extract of the hand
sanitizer towards E. coli bacteria, pH measurement, as well as assessing the effectivity (hedonic test)
and skin irritation test (patch test). The study was carried out on 39 respondents.
3. Methodology 3.1. Location
This study was conducted at the kitchen laboratory of The Bali International Institute of Tourism
Campus, Denpasar, Bali and the laboratory of the Faculty of Agricultural Engineering, Udayana
University.
3.2. Data Analysis
This study used both qualitative and quantitative descriptive method as well as experimental
method. The qualitative and quantitative descriptive method comprised of identification and
measurement, while the experimental method comprised of the effectivity and skin irritation test of
Polymia hand sanitizer. This study was conducted by preparing the materials, followed by extraction,
gel preparation, hand sanitizer production, effectivity and patch test, inhibition test, and pH
measurement.
The result of effectivity and patch test was analysed based on the evaluation from all panelists. It
was carried out by presenting the data as well as providing the assessment criteria, followed by giving
samples to the panelists, carrying out measurements, and simplifying the data in form of graphs to
make it easier to understand.
4. Results and Discussion 4.1. The Effectivity Test of Polymia Hand Sanitizer.
In this study, effectivity test (hedonic test) was carried out to obtain the effectivity rate of food
handlers in using Polymia hand sanitizer. The results on 39 respondents are represented in Figure 4.1.
Figure 1. The Effectivity Test Result of Polymia Hand Sanitizer Based on Figure 1, the mean effectivity of hand sanitizer base, P1, P2, and P3 are 7.5, 7.8, 7.6,
and 7.9 (respectively), which means that the most effective hand sanitizer was P3.
4.2 The Patch Test of Polymia Hand Sanitizer.
In this study, patch test was carried out to obtain the skin irritation rate of the panelists’ skin after
using Polymia hand sanitizer. The results on 39 respondents are represented in Figure 2.
7.3
7.4
7.5
7.6
7.7
7.8
7.9
Basis P1 P2 P3
7.5
7.8
7.6
7.9
Effectivity Test

I Nyoman Sudiarta & Putu Eka Wirawan
The Quality of Polymia Hand Sanitizer Towards Effectivity of Food Handlers
319
Proceedings of CATEA 2019
Figure 2. The Patch Test Result of Polymia Hand Sanitizer
Based on Figure 2, the mean value of hand sanitizer base, P1, P2, and P3 are 0.2, 0.1, 0.1, and
0.1 (respectively), which meant that P3 had the highest rate of skin irritation.
Hand sanitizer made from the combination of Indonesian bay leaf and Muntingia leaves extract
is potential to be further developed and has been proven to be effective when used by food handlers.
The authors discovered that food handlers do not wash their hands due to forgetfulness, requiring
more time to do in case of rush hours, and their belief that they do not touch anything dirty after
using the toilet.
This is not in accordance with the theory of proper time to wash hands, which mentioned that
one should wash their hands after using the toilet; before and after handling raw meat, poultry and
seafood; after handling chemicals; after taking the trash out; after cleaning the tables or dirty utensils;
after holding uniforms or aprons; and after handling money (Gisslen, 2006).
Based on the interview conducted by the authors, the practice of food and personal hygiene in
food handlers was merely due to the regulations that required employees to obey it, as well as
supportive environment, rather than the awareness of food handlers themselves.
5. Conclusion Based on this study, the authors concluded as follows:
a. The awareness of food handlers in terms of wearing clean uniforms, aprons, and shoes at work was
quite high, whiles their awareness in terms of washing hands before handling foods and after using
the toilet was still low.
b. Based on the result of effectivity test (hedonic test), the most favourable Polymia hand sanitizer
was P3 (mean=7.9), so this particular hand sanitizer could be used by food handlers without the
need of frequent hand-washing.
c. Based on the results of patch test, P3 had the highest rate of skin irritation (mean=0.1), which
means it was safe to be used by food handlers..
0
0.05
0.1
0.15
0.2
Basis P1 P2 P3
0.2
0.1 0.1 0.1
Pat
ch T
est
Treatment Group
Patch Test

I Nyoman Sudiarta & Putu Eka Wirawan
The Quality of Polymia Hand Sanitizer Towards Effectivity of Food Handlers
320
Proceedings of CATEA 2019
References
Journal Papers
Adjirni. Warta Tumbuhan Obat Indonesia. Volume 5, Nomor 3. Jakarta:Kelompok Kerja Nasional Tumbuhan
Obat Indonesia. (1999) Ferdinand & Febriani Jurnal Hubungan Tingkat Penegtahuan Dalam Perilaku Food Handler Yang Dilihat Dari
Sanitasi dan Higiene dan Petra Codex 1.0.Jurnal Hospitality Manajemen Universitas Kristen Petra
(2016).
Lelono, R.A.A. dan Tachibana, S. Bioassay-guided isolation and identification of antioxidative compounds from
the bark of Eugenia polyantha. Pakistan Journal of Biological Sciences, 16(16): 812-818. (2013)
Miller, Michael A. Does the clinical use of ethanol-based hand sanitizer elevate blood alcohol levels? A
prospective study. The American Journal of Emergency Medicine, 24(7): 815–817. (2006)
Murtini, S. Pengaruh pemberian ekstrak daun salam (syzygium polyanthum) dengan dosis 540 Mg terhadap
hitung jumlah koloni kuman Salmonella typhimurium pada hepar mencit Balb/C yang diinfeksi
Salmonella typhimurium. Artikel Karya Tulis Ilmiah. Universitas Diponegoro. Semarang. (2006)
Myers, Ronnie. 2008. Hand Hygiene Among General Practice Dentists A Survey of Knowledge, Attitudes and
Practices. The Journal of the American Dental Association, 139: 948-957.
Conference Proceedings Papers
Desiyanto dan Djannah Efektivitas Mencuci Tangan Menggunakan Cairan Pembersih Tangan Antiseptik (Hand
Sanitizer) Terhadap Jumlah Angka Kuman. Kesmas, Vol.7No.2, September 2013,pp.55-112.
ISSN:1978-0575. (2013).
Book
Binawati, D. K., dan Amilah, S. Effect of Cherry Leaf (Muntingia calabura L.)Bioinsecticides Extract Towards
Mortality of Worm Soil (Agrotis ipsilon) and Armyworm (Spodoptera exiqua) on Plant Leek (Allium
fistolum). Wahana, 61(2):51-57. (2013)
McLauchlin.J, Little.C. Hobbs’ food poisoning and food hygiene (7th ed.). English: CRC Press. (2007).
Potter & Perry. Buku Ajar Fundamental Keperawatan Konsep, Proses, dan Praktik.Edisi 4 volume 1.EGC.
Jakarta. (2005).
Gaman, P.M. dan KB Sherrington. Ilmu Pangan Pengantar Ilmu Pangan Nutrisi dan Mikrobiologi. Yogyakarta:
UGM Press. (1994)
Book Chapters
Sumono, A. dan Wulan, S.D.A. Kemampuan air rebusan daun salam (Eugenia polyantha W.) dalam
menurunkan jumlah koloni bakteri Streptococcus sp. Majalah Farmasi Indonesia, 20(3), 112- 117.
(2009)
Online
CDC. Hand Sanitizer Ingredients. Diunduh dari http://www.hand-sanitizerdispenserreviw.com/hand-sanitizer-
ingrediants.httm) (Desember 2012). (2009) Knowles, T. Food safety in the hospitality industry. Retrieved May 06, 2014 from
http://books.google.co.id/books?id=d9elpbqzlwwc&pg=pa138&dq=cross+contamination+food+safety
&hl=id&sa=x&ei=6e90u_mwl4k1uatr4kibq&ved=0cfeq6aewaw#v=onepage&q=cross%20contaminati
on%20food%2 0safety&f=false. (2012).
Katzer, G. Indonesian Bay-Leaf (Eugenia polyantha Wight.),
http://gernotkatzersspicepages.com/engl/Euge_pol.html.diakses 14 November 2015. (2001)
Thesis
Haki M. Efek Ekstrak Daun Talok (Muntingia Calabura L.) terhadap Aktivitas Enzim SGPT pada Mencit yang
diinduksi Karbon Tetraklorida. Skripsi Fakultas Kedokteran Universitas Sebelas Maret. Surakarta.
(2009)
Appendix
Direktori Dinas Pariwisata Kota Denpasar, 2018.
Kosasih, E., Supriatna, N., Ana, E. Informasi Singkat Benih Kersen/Talok (Muntingia calabura L.), Balai
Perbenihan Tanaman Hutan Jawa dan Madura. (2013)

321
Proceedings of CATEA 2019
Proceedings of CATEA 2019
ISBN 978-623-91018-0-0
The Importance of Destination Image for Tourists Visiting
Kepulauan Seribu
Fachrul Husain Habibie1, Devita Gantina
2, Yulia Lintang
3
1Fachrul Husain Habibie, Sekolah Tinggi Pariwisata Trisakti
2Devita Gantina, Sekolah Tinggi Pariwisata Trisakti
3Lintang, Sekolah Tinggi Pariwisata Trisakti
*[email protected], [email protected], [email protected]
*Corresponding Author
Abstract: Visitor fluctuations can be caused by a good destination image, with a good destination image can
encourage visitors to visit it again. Therefore, the formulation of the problem of this research is how the image
of a Kepulauan Seribu destination for visitors or tourists who have visited the Kepulauan Seribu. The results of
this study show the Destination Image of the Kepulauan Seribu is Good. This can be seen from the rate of repeat
visits made by tourists by 58% of 100 respondents. Other results tourists consider the thousand island
communities to be very friendly, and the Kepulauan Seribu are an excellent place for relaxation and rest
Keywords: Destination Image; Tourist; Kepulauan Seribu;
1. Introduction
The tourism industry is a unique combination between various factors so that the operational
planning of a destination is different from other economic sectors. Tourist destinations are a product
but have many links with diverse stakeholders, with different objectives and requirements. A
destination is always different in size, appeal and benefits offered to tourists, in fact there are no two
or more destinations that can be treated equally by tourists. "Tourism management must refer to
management principles that emphasize the values of natural, cultural, community and social values
that enable tourists to enjoy tourism activities and benefit the welfare of the local community" (Pitana
and Diarta, 2009: 81). Successful tourism can increase income, employment and foreign exchange.
How to attract tourists to revisit and or recommend a destination to others is complicated for the
success of developing a destination. Image of a destination. Destination image plays two important
roles in behaviors: (1) to influence the destination choice decision-making process and (2) to
condition the after-decision-making behaviors including participation (on-site experience), evaluation
(satisfaction) and future behavioral intentions (intention to revisit and willingness to recommend)”
Ashworth & Goodall, 1988 (dalam Chen, 2006:2). O’leary & Deegan (2003: 213) suggests that the
destination image makes it easier for tourists to make decisions about their trips and determine
whether their travel experience will be very satisfying.

Fachrul Husain Habibie, Devita Gantina, Yulia Lintang
The Importance of Destination Image for Tourists Visiting Kepulauan Seribu
322
Proceedings of CATEA 2019
Table 1. Number of Tourist Visitors at Tourism Prima Object, 2015 – 2017
No. Destination Unit Foreigner Domestic Total
1 Anyer island (Resort) People 3.233 21.765 24.998
2 Bidadari island (Resort) 430 7.814 8.244
3 Kotok Tengah island
(Resort) 138 226 364
4 Sepa island (resort) 8.714 8.102 16.816
5 Putri island (Resort) 4.999 7.324 12.323
6 Untung Jawa island 16 211.728 211.744
7 Pramuka island 945 96.857 97.802
8 Tidung island 1.622 165.540 167.162
9 Harapan island 511 83.471 83.982
10 Kelapa island 152 44.887 45.039
11 Lancang & Pari island 943 115.089 116.032
12 Macan island (Resort) 1.907 2.587 4.494
13 Kotok island (Resort)* - - -
14 Pelangi island (Resort)* 1.806 2.310 4.116
15 Pantara island (Resort)* 2.221 1.881 4.102
Total 2017 27.637 769.581 797.218
2016 20.932 759.027 779.004
2015 10.836 801.421 812.257
Sorce: Sudin Pariwisata dan Kebudayaan Kab. Adm, Kep. Seribu, 2018
Based on table 1 above shows the fluctuations of visitors to the Kepulauan Seribu. Visitor
fluctuations can be caused by a good destination image, with a good destination image can encourage
visitors to visit it again. Therefore, the formulation of the problem of this research is how the image of
a Kepulauan Seribu destination for visitors or tourists who have visited the Kepulauan Seribu.
Through this research, it will be known that the Kepulauan Seribu Destination Image. So that the
relevant manager or government can know exactly what still needs to be improved so that the
Kepulauan Seribu Destination Image will be good according to tourists who have visited and will
recommend to other communities so that it can increase the income of the people and the regional
government of DKI Jakarta through tourism. In addition, it is expected that the results of this study
will be an additional reference for the next research.

Fachrul Husain Habibie, Devita Gantina, Yulia Lintang
The Importance of Destination Image for Tourists Visiting Kepulauan Seribu
323
Proceedings of CATEA 2019
2. Literature Review
Destination Image
Lopes (2011: 307-308), defining the concept of destination image as an expression of all
objective knowledge, prejudice, imagination and emotional thoughts of an individual or group about a
particular location. Kotler, Haider and Rein in Lopes, (2011: 307-308), defining the image as the sum
of all beliefs, ideas and the impression that someone is related to a destination. Tourist destinations
include everything in the region, both its people, landscapes, other industries, and other things that can
be part of the destination experience, local specialties that tourists can enjoy even though they are not
part of the tourism economy specifically (Hanif, 2016: 44). A destination image / image is a
perception that is formed from various information received by tourists. Every tourism destination has
a certain image that contains beliefs, impressions, and perceptions about a destination, (Destari 2017:
48). Lopes in Galih Handawan (2015: 24), also wrote the latest guidelines for tourism marketing
recognizing that the development of tourism destination images is based on consumer rationality and
emotionality, and as a result of a combination of two (2) major components or dimensions, namely:
cognitive destination image and affective destination image.
2.1. Cognitive Destination Image Supardi (2015: 152), the word cognitive itself comes from the word cognition to which knowing,
means knowing. In a broad sense, cognition (condition) is the acquisition, arrangement, and use of
knowledge, (Muhibin Syah in Supardi, 2015: 152). Cognitive image refers to beliefs and beliefs and
knowledge of attributes of a destination (Destari, 2017 :48). Kresno Agus Hendarto (2006: 4),
Perceptual cognitive evaluation is a process in which individuals receive, choose, organize and
interpret information in order to create a meaningful picture. Perception is an individual process and
depends on internal factors such as trust, experience and hope. Perception can arise when information
about a region or tourist destination has been obtained when tourists have not arrived or after arriving
at a tourist destination and experiencing their own tourism activities. Cognitive component as „the
sum of beliefs and attitudes of an object leading to some internally accepted picture of its attributes‟.
In other words, the cognitive component is formed on the basis of the tourist‟s beliefs of a destination
(Jorgensen, 2004 :18). The cognitive component as some of the beliefs and attitudes of an object that
leads to a description of the attributes received directly from a destination. In other words, cognitive
components are formed on the basis of tourists' beliefs about a tourist destination.
2.2. Affective Destination Image Affective image refers to the emotions and feelings inherent in the destination (Destari, 2017: 48).
The affective component refers to how one feels about that object (Ahmad, 2015: 16). The affective
component is related to the motives of the tourist for choosing one destination at the expense of
another. The affective component becomes operational in connection with the tourist’s evaluation of
destination choice (Jorgensen, 2004: 19). This affective component is related to the motives of
tourists to choose one destination at the expense of the other. The affective component becomes
operational in connection with evaluating tourists for choice goals. Schiffman and Kanuk in Hendarto
(2006: 2), states that the emotions or feelings of consumers about certain products or brands are
affective components of certain attitudes. These emotions or feelings are often considered by
consumer researchers to be very evaluative in nature, which includes a person's assessment of the
object of attitude directly and thoroughly. The overall destination image is a combination of cognitive
and affective components (Mazursky & Jacoby, 1986, Stern & Krakover, 1993), whereas according to
Beerli and Martin (2004) real experience. Affective components refer to what tourists feel at a
destination. Tourists form their feelings towards the destination as a belief or opinion. Therefore, it
was agreed that cognitive image is the antecedent of affective imagery (Ahmad, 2015: 15).
3. Material & Methodology
3.1. Data
This study uses Primary data and Secondary data. Primary data is data obtained by making
observations directly to the location of the study, direct interviews with respondents, and distributing

Fachrul Husain Habibie, Devita Gantina, Yulia Lintang
The Importance of Destination Image for Tourists Visiting Kepulauan Seribu
324
Proceedings of CATEA 2019
questionnaires. Secondary data is data that is obtained from outside the respondent but is related to the
object under study and is supporting the theory. The data is obtained from literature and books as
supporting primary data.
3.2. Method
The research method carried out in this study is a quantitative method, with a descriptive
approach because this study aims to obtain a complete picture of the Destination Image. The time
used is cross-sectional. The technique of collecting data using a questionnaire consisting of two parts,
the first part wants to get data about the profile of tourists and the second part related to their response
to the Kepulauan Seribu Destination Image. The unit of analysis of this study is about 100 tourists
visiting the Kepulauan Seribu. The sampling technique used is non-probability sampling with a
purposive sampling approach, namely researchers selectively purposive sampling (Ferdinan,
2014:179).
4. Results and Discussion
4.1. Result
The result of the data processed showed as follows:
Table 2. Kepulauan Seribu tourists based on the island visited
Island visited Total
Pramuka 41
Bidadari 14
Tidung 19
Bira 16
Lainnya 10
Total 100
Figure 1. Percentage of Kepulauan Seribu Tourists based on the island visited
Based on Table 2. and Figure 1. it can be seen that the respondents most visited Pramuka island
which was as much as 41%. While the other 19% visited Tidung Island, 16% Bira Island, 14% visited
Angel Island, the remaining 10% visited other islands. The number of tourists visited Pramukan
Island because of the popularity of Pramuka Island as well as being one of the centers of the
Kepulauan Seribu government, also due to the condition of the island and the sea which are still very
well maintained and the natural scenery and surroundings are very beautiful. That is why many
tourists are interested in visiting this island because on this island, they can get an unforgettable and
memorable travel experience. In addition, residents of the island are also very friendly and kind, so
they can provide a sense of security and comfort for tourists who visit. Then when viewed from its

Fachrul Husain Habibie, Devita Gantina, Yulia Lintang
The Importance of Destination Image for Tourists Visiting Kepulauan Seribu
325
Proceedings of CATEA 2019
strategic location and located in the middle of the Kepulauan Seribu cluster, Pramuka Island is one of
the favorite places to stay for tourists who plan to go to other islands in the Kepulauan Seribu cluster.
Figure 2. Pramuka Island
Based on the results of processing the data in this study, the characteristics of respondents visiting the
Kepulauan Seribu as follows:
Figure 3. Profile of Respondents based on age
In Figure 3. it can be seen that Pramuka and Bira islands are dominated by female visitors, while
on Bidadari Island and Tidung Island are more visited by male visitors. This is caused by the Bira
Island The uninhabited island in the Kepulauan Seribu offers views that exotic and has not been
visited by many tourists. What's interesting about this island is the charming sunset and the beautiful
stars in the sky at night. And for visitors who like snorkeling and diving, the underwater beauty of
Bira Island is quite amazing with Karimunjawa's charm. Whereas the other islands have a balanced
number of visitors between men and women
Figure 4. Respondents based on age

Fachrul Husain Habibie, Devita Gantina, Yulia Lintang
The Importance of Destination Image for Tourists Visiting Kepulauan Seribu
326
Proceedings of CATEA 2019
Figure 4. shows visitors in the Kepulauan Seribu generally that is equal to 44% aged between 26-
35 years. The age profile if seen based on the island visited can be seen in Figure 5 below.
Figure 5. Age Profile Respondents based on the island visited
Based on Figure 5. it can be seen that the scout and angel islands are the most visitors at the age
of 26-35 years. At this age many choose to enjoy nature because the dive of Bidadari Island is a 25-
minute distance using a speedboat from Ancol Marina. This island has the attraction and history of
Dutch heritage that provides historical values with fortresses that can still be enjoyed and with natural
nature that is very interesting if taking photos from any position.
Whereas the Tidung and Bira islands are dominated by the age of 17-25 years. This happens
mostly at this age, enjoying diving or snorkeling on Bira Island. On Bira Island there are a number of
dive spots that will make travelers enjoy the natural sea. The naturalness of nature provides a
comfortable home for a number of underwater natural animals on Bira Island. The large, healthy-
looking reefs are a safe place for a number of small fish that swim in and out of the reefs.
Respondents by way of travel
Figure 6. Getting around
In figure 6, it shows more dominant (56%) respondents traveling with their friends, then followed
by traveling with family of 28%, through the 11% Tour Group and traveling alone at 5%. This shows
that the tourists visiting the Kepulauan Seribu are more pleased to be in tandem with their colleagues.
This is because in general the respondents are employees (48%) who work in Jakarta for (78%) who
are visiting to eliminate the workload in Jakarta, which every day is always congested on the road to
work from their homes.
Profile of Respondents based on Visit Experience
Figure 7. Profile of Respondents based on Visit Experience

Fachrul Husain Habibie, Devita Gantina, Yulia Lintang
The Importance of Destination Image for Tourists Visiting Kepulauan Seribu
327
Proceedings of CATEA 2019
Based on Figure 7 above, it shows that the dominant respondents (tourists) came to visit the
Kepulauan Seribu and the most dominant came to visit Pramuka Island, the second most dominant
being Tidung Island and the third Dominant Island Bidadari Island.
Profile of Respondents by Origin of Respondents
Figure 8. Profile of Respondents by Origin of Respondents
Based on Figure 8 above shows that the origin of tourists visiting the Kepulauan Seribu is the
most dominant originating from DKI Jakarta around 78%, then from West Java (14%), and those from
the regions of Sumatra, Java and Banten show almost the same results around 3% of the total
respondents. This is because the Kepulauan Seribu are part of the DKI Jakarta Region so that the
Destinations in the Kepulauan Seribu are very close to the DKI Jakarta Propose.
Tourism Destination Image
The result of the data processed about Tourism Destination Image showed the as follows
Figure 9. Respondents' assessment of the Tourism Destination Image
Based on the results of the results of this study in figure 9, the explanation can be described as
follows:
For statement B1 "Kepulauan Seribu offer personal security", the average rating of respondents /
tourists is 3.9. Based on the interpretation table the value of 3.9 falls into the Good category. This
means that personal security offered to tourists visiting the Kepulauan Seribu is good.

Fachrul Husain Habibie, Devita Gantina, Yulia Lintang
The Importance of Destination Image for Tourists Visiting Kepulauan Seribu
328
Proceedings of CATEA 2019
For B2 statement "Kepulauan Seribu is a Clean place", the average rating of respondents /
tourists is 3.48. Based on the interpretation table the value of 3.48 falls into the Good category. This
means that the cleanliness of the Kepulauan Seribu is good.
For statement B3 "Kepulauan Seribu has a good name and reputation", the average rating of
respondents / tourists is 3.48. Based on the interpretation table the value of 3.83 is in the Good
category. This means that according to tourists visiting the Kepulauan Seribu believe that the
Kepulauan Seribu have a good name and reputation.
For statement B4 "Kepulauan Seribu Society is a friendly community", the average rating of
respondents / tourists is 4.32. Based on the table of interpretation the value of 4.32 falls into the Very
Good category. This means that according to tourists visiting the Kepulauan Seribu feel the people of
the Kepulauan Seribu are friendly.
For statement B5 "Kepulauan Seribu has varied cuisine", the average rating of respondents /
tourists is 3.32. Based on the interpretation table, the value of 3.32 is included in the Fairly Good
category. This means that tourists visiting the Kepulauan Seribu believe that the culinary variations in
the Kepulauan Seribu are quite good.
For statement B6 "Kepulauan Seribu is very suitable for a place of rest and relaxation", the
average respondent / tourist scores 4.21. Based on the interpretation table the value of 4.21 falls into
the Very Good category. This means that tourists visiting the Kepulauan Seribu argue that as a place
to rest and relax a Kepulauan Seribu is a very good place. For statement B7 "Kepulauan Seribu has cool air", the average respondent / tourist votes at 3.71.
Based on the interpretation table the value of 3.71 is in the Good category. This means that tourists
visiting the Kepulauan Seribu argue that the Kepulauan Seribu are a good place if tourists want to get
or breathe cool air.
According to Respondents / tourists visiting the Kepulauan Seribu, the image of the Kepulauan
Seribu is 3.8. The 3.8 value is in the Good category. Overall Destination Image.
5. Conclusion
Based on the above analysis, what can be concluded in this study is the Destination Image to the
Kepulauan Seribu is Good. This can be seen from the rate of repeat visits made by tourists by 58% of
100 respondents. Then it was concluded that the community was very friendly. Besides that,
respondents also considered that the Kepulauan Seribu were a very good place to do relaxation and
rest. Because the results of this study are expected to encourage the government and business people
to make better promotions because of the consideration of Citra Destinasi, the Kepulauan Seribu have
been considered good for tourists who have visited the Kepulauan Seribu.
In order to further support the results of this research, further research is needed which is more
in-depth about the motivation of tourists visiting the Kepulauan Seribu. So that the Government and
business people can design attractive programs for tourists in order to increase the level of visits to the
Kepulauan Seribu.
Acknowledgement. This research is fully supported by Kementian Riset dan Teknology Pendidikan
Tinggi.
References
Ashworth, G., & Goodall, B. (1988). Tourist images: Marketing considerations. In B. Goodall, & G. Ashworth
(Eds.), Marketing in the tourism industry. The promotion of destination regions (pp. 213–238).
London: Croom Helm
Buhalis, D. D. (2000). Marketing the competitive destination of the future. Tourism Management, 21(1), 97–
116.
Chen, F.C, & Tsai, D.C.,(2007). How destination image and Evaluative factors affect behavioral intentions?.
Tourism Management. 28(7), 1115-1122
Jerkins,O.H., (1999). Understanding and Measuring Tourist Destination Images. International Journal of
Tourism Researchch. 2. 1-15

Fachrul Husain Habibie, Devita Gantina, Yulia Lintang
The Importance of Destination Image for Tourists Visiting Kepulauan Seribu
329
Proceedings of CATEA 2019
Lee, C., Lee, Y., & Lee, B. (2005). Korea’s destination image formed by the 2002 world cup. Annals of Tourism
Research, 32(4), 839–858.
O’Leary. S., & Deegan. J., (2003). People. Pace, Place : Qualitative and Quantitative iamges of ireland as a
tourism destination in Franch. Journal of vacation Marketing. 9(3). 213-226
Ryan, C. (2002). From motivation to assessment. In C. Ryan (Ed.), The tourist experience (2nd ed., pp. 58–77).
London: Continuum.