CCSIT GRADUATION PROJECTS PROCEEDING 2022
98
CCSIT GRADUATION PROJECTS PROCEEDING 2022
-
Upload
khangminh22 -
Category
Documents
-
view
0 -
download
0
Transcript of CCSIT GRADUATION PROJECTS PROCEEDING 2022

CCSIT GRADUATION
PROJECTS PROCEEDING 2022

2
INTRODUCTION
، تعمل كلية علوم الحاسب وتقنية المعلومات بجامعة اإلمام عبد الرحمن بن فيصل عىل تشجيع ودعم البحث العلميي المستوى العاشر عىل النشر العلمي من خالل ومن هنا شجعت طالب وطالبات كلية علوم الحاسب وتقنية المعلومات ف
ي الكلية وسابقة تفتخر فيها الكلية، فنادرا ي مشاري ع التخرج وما توصلوا اليه من نتائج. كانت هذه تجربة جديدة ف
عملهم ف ي اوعية نشر معتمدة. نتج عن هذه التجربة ان استطاع طالب وطالبات الكلية لبةان ينشر ط
البكالوريوس بحث علمي ف ي هذا الكتيب تجدون األوراق العلمية المنشورة
ي مجالت او مؤتمرات مرموقة. ف نشر عدد من األبحاث الجديرة باالهتمام ف
. 2022/ 2021من طلبة الكلية لعام
The College of Computer Science and Information Technology (CCSIT) at Imam Abdulrahman
Bin Faisal University (IAU) encourages and supports scientific research. As a new experience,
CCSIT encouraged senior students to publish their findings and achievements during their
works in the graduation projects. Proudly, we can announce that our students succeed to publish
their work in journals and conferences with high reputation. In this proceeding you will find
the scientific papers published by our students for the year 2021/2022.

3
CCSIT 2020 GP PUBLICATIONS
Section I: Journal publications
Journal 1: Phishing Email Detection Using Machine Learning Techniques
Journal 2: Intelligent Techniques for Predicting Stock Market Prices: A Critical Survey
Section II: Conference publications
Con1: Sa’ah: Creative Eco-Friendly Mobile Application That Encourages Living Sustainably
Con2: Aknaf Website: Interactive Website to Automate the Institution’s Work Con3: Flourish: Requirements and Design of an Android Application Prototype for Various
Symptoms Management in ADHD Patients
Con4: Machine Learning Based Preemptive Diagnosis of Lung Cancer Using Clinical Data
Con5: Leen: Web-based Platform for Pet Adoption
Con6: Road Damages Detection and Classification using Deep Learning and UAVs
Con7: a comparison between vgg16 and xception models used as encoders for image
captioning
Con8: Smart Inventory System
Section III: Others
Intelligent Watering System

4
JOURNAL PAPERS

Proceedings of Graduation Project Showcase 2022
1 | P a g e
Published In: IJCSNS International Journal of Computer Science and Network Security, VOL.22 No.3, March 2022
https://doi.org/10.22937/IJCSNS.2020.22.3.1
Phishing Email Detection Using Machine Learning Techniques
Hussain Alattas1, Fay Aljohar2, Hawra Aljunibi3, Muneera Alweheibi4, Rawan Alrashdi5, Ghadeer Al
azman6, Abdulrahman Alharby7 and Naya Nagy8
[email protected] [email protected] [email protected] [email protected] 2170002618
@iau.edu.sa [email protected] [email protected] [email protected] University of Imam Abdulrahman bin Faisal, College of Computer Science, and Information Technology, KSA
Abstract Phishing is a social engineering technique that mainly aims to steal
personal or confidential data and may harm the target individual
or organization in many ways. In phishing, fraudsters hide their
identity as legitimate people, banks, or institutions, whether
governmental or private. And since e-mail communication is the
most used method in transmitting confidential or official messages,
fraudsters normally target the email users to send their deceptive
messages in order to extract data. However, this paper presents an
overview of previously conducted studies with respect to detecting
phishing email messages using machine learning. The paper’s
objective is to analyze and assess the procedures of previously
proposed models, datasets, and their results within the specified
scope.
Keywords: Phishing Attacks, Machine Learning, Phishing Emails, Social
Engineering, Email Security.
1. Introduction
Phishing emails represent a threat in the world of the
Internet, as email is the main place to send messages,
whether personally or officially, as many individuals
depend on it and review it daily. The interaction of one
individual in an organization with a phishing message
may lead to the destruction of the entire organization,
this is what we mean by a threat phishing message. In
this paper, we discuss some of the previous research
on detecting phishing attacks in email and some
models and suggested features in detecting these
attacks. We also present a comparative study of classic
machine learning techniques such as Random Forest,
Random Forest, Naive Bayes, Decision Tree, and
Support Vector Machine (SVM). This paper is
sectioned by a problem statement, background, review
of literature that has three sub-sections supervised
machine learning techniques, non-supervised, and
others; moreover, it illustrates a comparison table
between models in the aspect of approaches,
limitations, algorithms, response time, and accuracy.
2. Problem Statement
A phishing attack is generally accomplished by
sending email messages that appear to come from a
trusted source and require the user to enter financial,
personal, or confidential data. The problem is when
the user interacts with the email and sends the
requested response, either by replying to the email by
sending confidential data, visiting a website, or
clicking on a link. Attackers are always coming up
with new and inventive ways to dupe people into
thinking their activities are related to a legitimate
website or email. The user interacts without thinking
when the situation seems to be dangerous, fearful,
urgent, etc. Most end users usually make the decision
based on how they look and feel.
3. Background
In the early 1990s, a huge number of users with false
credit card details created an algorithm for stealing
user information, they registered themselves on
America Online (AOL) site without any validation and
started using system resources. When AOL eliminated
the random credit card generators in 1995, the Warez
group shifted to other techniques, including
communicating with individuals via AOL Messenger
while pretending to be AOL employees and requesting
their personal information. In 1996, American On
line's Usenet group posted the first mention of the term
"phishing" in response [1]. Phishing occurs when
cybercriminals send malicious emails to trick a victim
into falling for a scam. The goal is usually to persuade
users to divulge sensitive information such as financial
data or system credentials. The advantages of phishing
for cybercriminals include its simplicity, low cost, and

Proceedings of Graduation Project Showcase 2022
2 | P a g e
Published In: IJCSNS International Journal of Computer Science and Network Security, VOL.22 No.3, March 2022
https://doi.org/10.22937/IJCSNS.2020.22.3.1
effectiveness. Attackers can easily gain access to
valuable information with very little effort and for a
low price. Due to this, we are going to discuss a variety
of machine learning models to detect such phishing e-
mails and then block them [1]. Machine learning is a
method of analyzing data that automates the process
of constructing analytical models. This branch of
artificial intelligence relies on the idea that computers
can identify patterns, learn from data, and make
decisions without the need for any human interference
[2].
4. Review of literature
As phishing emails constitute the primary gateway to
phishing websites, several papers were examined that
discuss phishing email detection and classification
techniques. A major approach for phishing email
detection and classification is to employ machine
learning techniques.
4.1 Machine Learning and Phishing Emails
Detection
Machine learning is a critical ally in fighting phishing
emails. Mostly, it investigates the content, metadata,
context, and regular user behavior to analyze and
detect phishing. Machine-learning includes several
types such as supervised machine learning which
utilizes label data to train models, and unsupervised
machine learning which utilizes patterns from
unlabeled data to train them. Though, unsupervised
machine learning may give less accurate results
compared to supervised machine learning [3].
Examples of previous work regarding these machine
learning techniques are going to be discussed in the
subsequent sections.
4.1.1 Supervised Machine Learning Techniques
As described in [4], A. Shaheen et al. proposed a
model based on supervised machine learning
algorithms to classify phished and ham mail. In
supervised learning algorithms, a training set is used
to classify test sets. The dataset consists of 1605
emails, 1191 are ham and 414 are phished. Ham
emails are derived from a publicly available dataset,
while phished emails are derived from multiple
sources. After preprocessing and converting the
dataset, features were extracted and used to feed the
classifiers. The features are extracted from the dataset
using the Python programming language and the
Nerve Learning Toolkit. The dataset consists of
extracted features is segmented and fed into five
classifiers: Logistic, Random Forest, SVM, Voted
Perceptron, and Naive Bayes. Results showed that the
classification of emails through SVM and Random
Forest classifiers was highly accurate, achieving the
highest accuracy of 99.8%.
Akash Junnarkar et al. [5] built a comprehensive
system for spam classification using semantics-based
text classification and URL-based filtering. They
establish a spam classification system that followed a
two-step methodology to ensure that all mail received
was either spam or not. The process begins with text
classification and is followed by URL analysis and
filtering to determine whether any links present in the
email are malicious. Five machine learning algorithms
were considered for text classification: K-Nearest
Neighbours, Naive Bayes, Decision Tree, Random
Forest, and SVM. The highest accuracy is obtained
with Naive Bayes and SVM, hitting a 97.83 %
accuracy rate for SVM and 95.48 % for Naive Bayes.
As Naive Bayes and S had the highest accuracy, they
were implemented in the final model to identify
trigger words within the text. Lists of spam trigger
words and blacklisted URLs were compiled using
several datasets. The model was hosted as an API that
was called by JavaScript code in Google Apps script
to process emails in real-time.
In [6], Jameel et al. proposed a phishing detection
model that uses a feed-forward neural network. The
model was created based on the characteristics of
phishing emails. Thus, a set of 18 features were
extracted from the tested email, these email features
appear in the header and the HTML body of the email.
In a subsequent step, a multilayer feedforward neural
network is used to classify the tested email into
phishing or ham email. A total of 9100 phishing and
ham emails have been used to test this model; 4550 of
these emails are phishing emails were collected from
publicly available phishing Corpus
(www.monkey.org), while 4550 of these samples are
ham emails were collected from the Spam Assassin
project's ham corpora. According to the testing results,

Proceedings of Graduation Project Showcase 2022
3 | P a g e
Published In: IJCSNS International Journal of Computer Science and Network Security, VOL.22 No.3, March 2022
https://doi.org/10.22937/IJCSNS.2020.22.3.1
the identification rate of this model was excellent
(98.7%).
A method based on neural networks was proposed by
George et al. [7]. The team used two datasets
consisting of 4500 emails phish and ham. To identify
ham and phish emails, they applied various
algorithms, including Feedforward Neural Network
(FNN) with back propagation, and fist order statistical
measures. As a result, the false-negative rate and the
false positive rate are exceptionally low. With 12
features, 99.95% of the results were classified
correctly.
Kumar et al. [8] investigated the detection of phishing
emails lacking links and URLs. In their proposed
work, they have used NLP and WordNet. Using 600
phishing emails and 400 legitimate emails, they have
compiled a list of features including the absence of
recipients' names, asking for money, or mentioning
money, a sense of urgency, and a sense of urgency that
lures victims to respond. They had based their work
on Stanford Core NLP's application program interface
to identify all the words found in phishing emails.
Harikrishnan et al. proposed [9] (Term Frequency
Inverse Document Frequency) TFID+ (Singular Value
Decomposition) SVD and TFIDF+ (Nonnegative
Matrix Factorization) NMF to evaluate if it is in fact
phishing email or not. The model starts by using email
datasets with and without headers passed to data pre-
processing. Then, to convert words to a numeric
representation it uses TFIDF. After that, it uses SVD
and NMF to extract features. Lastly, to decide whether
it is legitimate or not, classical Machine Learning
(ML) techniques are utilized. The accuracy of the
result for this model was low due to the highly
imbalanced dataset.
Senturkurk et al. [10] proposed a model that begins
with data set training by concentrating on the email's
body and ignoring the attachments and header. After
the data sets are ready, it starts the feature selection.
Then passed it to Waikato Environment for
Knowledge Analysis (WEKA) tool after converting it
to the proper format. Later, a sub-list is initiated below
this new decision node and a sub-decision tree is built.
After that, a different algorithm used: Naïve Bayes and
decision tree. Finally, the result shows it will appear
high accuracy rate when a supplied test is selected and
performing datasets for all operations is in a real-time
environment.
The proposed approach by Hamid et al. [11] is called
the Hybrid Feature Selection (HFS). HFS applies to
6923 datasets from both Nazario and SpamAssassin
datasets. In addition, it analyzes the sender behavior to
resolve a feature matrix utilizing seven email relevant
features to determine whether an email is phishing or
not. Further, in order for HFS to classify the email, it
uses an algorithm named Bayes Net algorithm for
email classifications.
As shown by Adewumi and Akinyelu [12] the Firefly
Algorithm (FFA) is combined with the (SVM) for
machine learning classification to build a hybrid
classifier called FFA_SVM. For the purpose of
evaluating the FFA_SVM algorithm, a database was
constructed of 4000 phishing and ham emails along
with their features. FFA_SVM has outperformed the
standard SVM.
Alayham et al. [13] design and develop a tool that
detects the source code of a phishing site associated
with a Gmail account using a decision tree algorithm
and generates a report of phishing sites attached to a
victim's email as the percentages of phishing emails
stored in the user's mailbox. Also, the application can
send notifications to the user regarding a phishing site
that was detected in the incoming message. The Agile
Unified Process (AUP) methodology was used to
implement the tool.
Husak and J. Cegan [14] Develop an automated tool
to deal with PhiGARo phishing incidents that identify
individuals who respond to phishing attack attempts.
The network traffic of the honeypot is monitored, and
any phishing emails detected are sent to the PhiGARo
tool. The PhiGARo framework is divided into two
parts, the Phishing Incident Handling section and the
Phishing Response and Detection section. Initially, the
phishing incident is reported by the user who
recognizes the phishing message in their mailbox.
PhiGARo is implemented by Incident Handler
manually, then interpreting the results, blocking the
phishing email or URL, and finally notifying the
victims.

Proceedings of Graduation Project Showcase 2022
4 | P a g e
Published In: IJCSNS International Journal of Computer Science and Network Security, VOL.22 No.3, March 2022
https://doi.org/10.22937/IJCSNS.2020.22.3.1
Egozi and Verma [15] created a phishing email
detection tool with 26 features. Features include word
count, stop words, repeating punctuation, and unique
words. 17 machine languages were studied and
categorized under weighted and unweighted, based on
the results, the weighted linear SVM algorithm
represented the best model.
Unnithan et al. [16] proposed a model based on a
variety of mathematical algorithms to measure if an
email is a legitimate email or not. Consists of two
dataset emails with headers and without headers. This
sample is sent to count-based representation Term
Frequency Inverse Document Frequency (TFIDF) and
then combined with domain-level features to convert
the input to an understandable input for machine
learning algorithms. The last step in the model to
decide whether it is a legitimate or phishing email is
passed to several machine learning such as logistic
regression, Naive Bayes, SVM.
4.1.2 Unsupervised Machine Learning
Techniques
Fuertes et al. [17] is described how to develop a
Scrum-based algorithm implementation of automatic
learning, feature selection, and neural networks, with
the goal of attack detecting and mitigating from inside
the email server. The samples were divided into three
different time periods and tested on a different dataset
that was previously merged. Feature Selection, Neural
Networks, Agile Scrum methodology, and Matlab
process tool are used during the implementation of the
proposed algorithm. Because the developed methods
complement each other during detection, the acquired
results from the concept tests are highly promising.
The findings of the three data sets were evaluated, and
the average accuracy was 93.9%, and to validate the
results obtained the source of information from the
Phish Tank blacklist was used.
Andrade et al. [18] create a Python software that uses
a machine-learning algorithm to learn how to
recognize bad URLs, then provides relevant analysis
and information about the bad URLs. The program
also includes an examination of the analysis of
anomalous behavior linked to phishing web attacks, as
well as how machine learning techniques may be used
to counter the problem. This analysis is carried out
using tainted datasets provided by Kaggle Phishing
Dataset and Python tools to develop machine learning
to detect phishing attacks by analyzing URLs to
determine whether they are good or bad based on
specific characteristics of URLs, with the goal of
providing information in real-time so that proactive
decisions can be made to reduce the impact of the
attack. When information is added to machine
learning algorithms and the algorithm is performed,
the accuracy and error are likely to improve.
Unnithan et al. [19] proposed a model based on a
variety of mathematical algorithms to measure if an
email is a legitimate email or not. Consists of two
dataset emails with headers and without headers. This
sample is sent to count-based representation TF-IDF
and then combined with domain-level features to
convert the input to an understandable input for
machine learning algorithms. The last step in the
model to decide whether it is a legitimate or phishing
email is passed to several machine learning such as
logistic regression, Naive Bayes, Support Vector
Machine. The accuracy of this model after testing
4.1.3 Other Machine Learning Techniques
The proposed phishing detection model in [20] by
Viktorov, uses a dataset of phishing and non-phishing
emails from different websites. The model starts with
preprocessing the collected data to extract features
from each email. Second, passed to feature selection
which splits into two scenarios. Those scenarios are
automated and manually. In the manually use
clustering, which is like classification, but it is
unsupervised. third, it is passed to the classification
selection phase. fourth to multi-classifier, that uses
several algorithms to build it such as Logistic
regression, Decision Tree and Sequential minimal
optimization. The results showed that clustering will
increase the accuracy rate.
Rastenis et al. [21] discuss the Multi-Language
Spam/Phishing Classification solution that classifies
an unwanted email to either spam or phishing emails
classes through using the email body content and a
dataset that is constructed by three other known data
sets: Nazario, SpamAssassin, and VilniusTech.
Additionally, it can classify the email even if it is
written in Russian and Lithuanian languages rather

Proceedings of Graduation Project Showcase 2022
5 | P a g e
Published In: IJCSNS International Journal of Computer Science and Network Security, VOL.22 No.3, March 2022
https://doi.org/10.22937/IJCSNS.2020.22.3.1
than just English through integrating with existing
classifying emails solutions and automated
translation.
Fang et al. proposed [22] an approach named THEMIS
(Greek word) that uses unbalanced dataset and divides
the email into two parts: the email’s header and body.
Then, it splits it more into two levels: the char-level,
and word-level for both header and body. Also, it
calculates the likelihood if an email is phishing by
comparing the probability with a classification value
called a threshold, if the probability is greater than this
value then it is a phishing email.
Li et al. have presented [23] the overall function of the
Long Short-Term Memory (LSTM) Network method
for big email data. LSTM cannot use an open-source
dataset; thus, a filter must be conducted manually first
of the nature of the phishing emails the enterprise
receives. After a filter has been established, both
supervised KNN and unsupervised K Means are used
to conduct labeling automation to construct a set of
samples used for phishing email detection.
5 Comparison
This section represents a comparison between given
machine learning techniques discussed in the literature
to detect phishing emails. The comparison is based on
which algorithm(s) or model(s) had been used,
accuracy, Ture Positive Rate (TPR), False Positive
Rate (FPR), datasets used, number of features,
response time, and drawbacks.
5.1 Supervised Machine Learning Techniques Comparison Table.
Author Algorithm(s) used Accuracy TPR FPR Datasets used No. of
Features Response time Drawbacks
Supervised Machine Learning Techniques
[4] Random Forest 99.87% 99.9% 0.2% N. A 9 N. A
Data used may not
reflect real life
scenarios
[5] SVM 97.83 % 53.0% 3.0%
Enron Data set
and spam.csv
Kaggle data
N. A N. A
There is no real-time
learning of email
classifiers in the
provided data sets
[6]
FNN 98.72% 98% 1.2% N. A 18
0.00000067
seconds
Increased numbers of
neurons will increase
training and testing
time
[7]
FNN
99.95% 100% 0.09% N. A 12 0.00000118
seconds N. A
[8] NLP 99.4% N. A N. A N. A N. A N. A
Unable to extract
text from email
attachment
[11] Bayes Net 94% 0.97% 0.13% Nazrario &
SpamAssassin 7 N. A
Graphical form in
phishing emails
cannot be detected
[12] SVM 99.94% N. A 0.01% Dataset consists
of 4000 emails 16 0.16 seconds N. A
Decision Tree 96.5 % 92%-
97%
PhishingCorpus
7
8.54 seconds
Dataset is highly
imbalanced Random Forest 97.1% Slow
Proceedings of Graduation Project Showcase 2022
6 | P a g e
Published In: IJCSNS International Journal of Computer Science and Network Security, VOL.22 No.3, March 2022
https://doi.org/10.22937/IJCSNS.2020.22.3.1
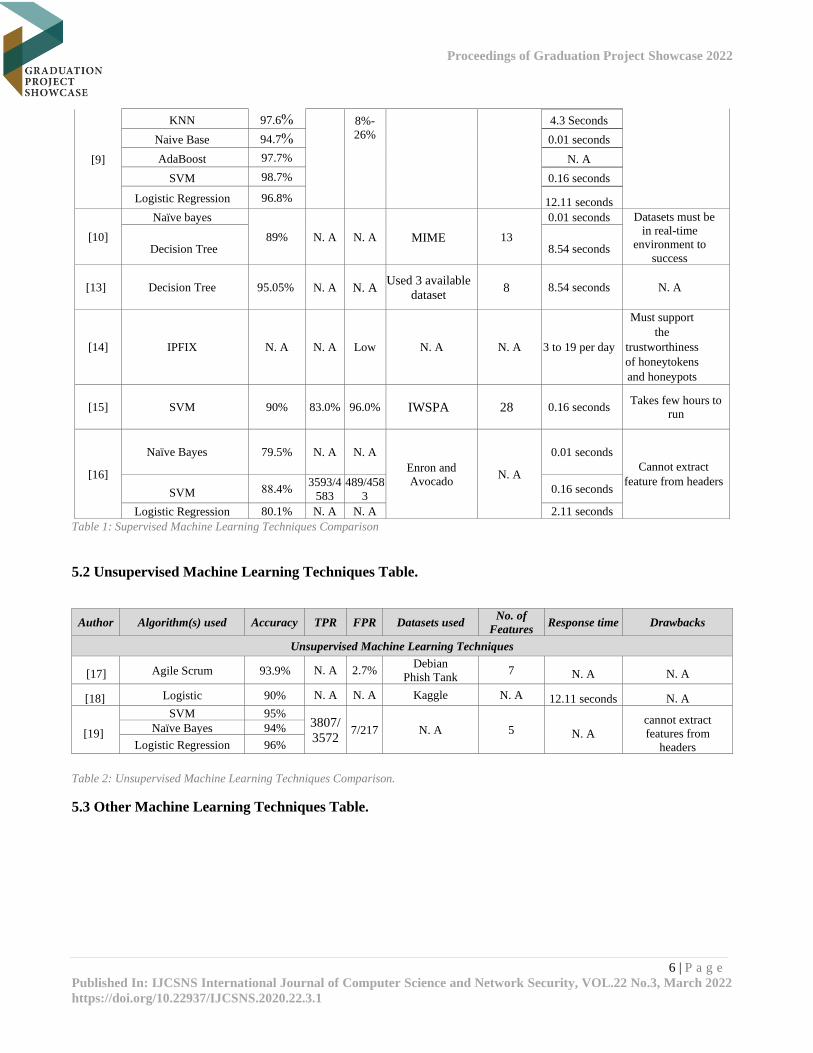
[9]
KNN 97.6 % 8%-
26%
4.3 Seconds
Naive Base 94.7 % 0.01 seconds
AdaBoost 97.7% N. A
SVM 98.7% 0.16 seconds
Logistic Regression 96.8% 12.11 seconds
[10]
Naïve bayes
89% N. A N. A MIME 13
0.01 seconds Datasets must be
in real-time
environment to
success Decision Tree 8.54 seconds
[13] Decision Tree 95.05% N. A N. A Used 3 available
dataset 8 8.54 seconds N. A
[14] IPFIX N. A N. A Low N. A N. A 3 to 19 per day
Must support
the
trustworthiness
of honeytokens
and honeypots
[15] SVM 90% 83.0% 96.0% IWSPA 28 0.16 seconds Takes few hours to
run
[16]
Naïve Bayes 79.5% N. A N. A
Enron and
Avocado N. A
0.01 seconds
Cannot extract
feature from headers SVM 88.4%
3593/4
583
489/458
3 0.16 seconds
Logistic Regression 80.1% N. A N. A 2.11 seconds
Table 1: Supervised Machine Learning Techniques Comparison
5.2 Unsupervised Machine Learning Techniques Table.
Table 2: Unsupervised Machine Learning Techniques Comparison.
5.3 Other Machine Learning Techniques Table.
Author Algorithm(s) used Accuracy TPR FPR Datasets used No. of
Features Response time Drawbacks
Unsupervised Machine Learning Techniques
[17] Agile Scrum 93.9% N. A 2.7% Debian
Phish Tank 7 N. A N. A
[18] Logistic 90% N. A N. A Kaggle N. A 12.11 seconds N. A
[19]
SVM 95% 3807/
3572 7/217 N. A 5 N. A
cannot extract
features from
headers
Naïve Bayes 94%
Logistic Regression 96%

Proceedings of Graduation Project Showcase 2022
7 | P a g e
Published In: IJCSNS International Journal of Computer Science and Network Security, VOL.22 No.3, March 2022
https://doi.org/10.22937/IJCSNS.2020.22.3.1
Table 3: Other Machine Learning Techniques Comparison.
5.4 Analysis
According to the comparisons in Tables 1, 2, and 3,
four main models had been considered as remarkable
models among others based on different parameters
for email classification. These models are SVM, NLP,
Random Forest and Naive Bayes models. Despite the
fact that they had gained popularity in many previous
works regarding email classification techniques SVM,
NLP, Random Forest, and Naive Bayes algorithms
have very high accuracy, TPR, and FPR compared to
other algorithms with fast response times. On the other
hand, two datasets had also gained popularity in the
phishing detection field to extract informative email
features for classification, these are Spam Assassin
and Nazario corpuses. However, our literature study
had shown that there are many effective algorithms of
email classification, yet attackers are becoming more
and more sophisticated with powerful techniques.
Thus, each time ones want to decide which algorithms
or learner are best to distinguish if an email is a
phishing or non-phishing email is now becoming a
difficult challenge.
6 Conclusion
Over the past few years, the problem of phishing
emails has become more common. Phishing is a type
of attack. The intention of phishing is to obtain
personal information, such as passwords, credit card
numbers, or other account information, by using
emails. Phishing emails closely resemble legitimate
ones, making it hard for a layperson to distinguish
them. Machine learning techniques currently play a
major role in phishing email detection and
classification. Several models and approaches are
available for phishing email detection. Each approach
has its own unique advantages and capabilities, as well
as limitations. Hence, this literature review has
summarized and compared several methods and
approaches for protecting against phishing email
attacks.
References
[1] P. Verma, A. Goyal, and Y. Gigras, “Email
phishing: text classification using natural
language processing,” Comput. Sci. Inf. Technol.,
vol. 1, no. 1, pp. 1–12, 2020.
[2] E. Bisong, “What is machine learning?” in ” in
Building Machine Learning and Deep Learning
Author Algorithm(s) used Accuracy TPR FPR Datasets used No. of
Features Response time Drawbacks
Other Machine Learning Techniques
[21]
SVM English
only
(90.07%
±3.17%)
English,
Russian and
Lithuanian
(89.2%±2.1
4)
95.2% N. A
Nazario,
SpamAssassin, and
VilniusTech.
N. A
0.16 seconds
Accuracy lessens 10%
if a mixed dataset is
used for training and
testing
Random Forest Too slow
Decision Tree 8.54 seconds
Naïve Bayes 0.01 seconds
KNN 4.3 Seconds
[22] Threshold value 99.848% 99.0% 0.043
% WordNet, Enron,
and Nazario N. A
Increased
response time N. A
[23]
KNN
95% 98% N. A Collected from a
private enterprise 7
4.3 Seconds Consume time on
constructing the filter K-Means Fast
[20]
Logistic Regression
93% N. A 4.89% Datasets consist
of 4800 emails 47
12.11 seconds Email is not clustered
before classification
which reduced the
accuracy
Decision Tree 8.54 seconds
CART N. A
SMO Medium

Proceedings of Graduation Project Showcase 2022
8 | P a g e
Published In: IJCSNS International Journal of Computer Science and Network Security, VOL.22 No.3, March 2022
https://doi.org/10.22937/IJCSNS.2020.22.3.1
Models on Google Cloud Platform, Berkeley, CA:
Apress, 2019, pp. 169–170.
[3] Gatefy, “How artificial intelligence and machine
learning fight phishing,” Gatefy, 22-Mar-2021.
[Online]. Available: https://gatefy.com/blog/how-
ai-and-ml-fight-phishing/. [Accessed: 13-Mar-
2022].
[4] S. Rawal, A. Shaheen, and S. Malik, “Phishing
Detection in E-mails using Machine Learning,”
Int. J. Appl. Inf. Syst., vol. 12, no. 7, pp. 21–24,
2017.
[5] A. Junnarkar, S. Adhikari, J. Fagania, P.
Chimurkar, and D. Karia, “E-mail spam
classification via machine learning and natural
language processing,” in 2021 Third International
Conference on Intelligent Communication
Technologies and Virtual Mobile Networks
(ICICV), 2021.
[6] N. Ghazi, M. Jameel and L. E. George, “Detection
of phishing emails using feed forward neural
network,” Int. J. Comput. Appl., vol. 77, no. 7, pp.
10–15, 2013.
[7] A. A. Abdullah, L. E. George, and I. J.
Mohammed, “Research Article Email Phishing
Detection System Using Neural Network,”
Research Journal of Information Technology, vol.
6, no. 3, pp. 39–43, 2015.
[8] Aggarwal, Shivam, Vishal Kumar and Sithu D.
Sudarsan. “Identification and Detection of
Phishing Emails Using Natural Language
Processing Techniques.” SIN (2014).
[9] B, Harikrishnan & Ravi, Vinayakumar & Kp,
Soman. (2018), "A Machine Learning Approach
Towards Phishing Email Detection," CEN-
Security@IWSPA 2018.
[10] Ş. Şentürk, E. Yerli and İ. Soğukpınar, "Email
phishing detection and prevention by using data
mining techniques," 2017 International
Conference on Computer Science and
Engineering (UBMK), 2017, pp. 707-712, doi:
10.1109/UBMK.2017.8093510.
[11] I. R. A Hamid, J. Abawajy, and T.-H. Kim,
“Using feature selection and classification scheme
for automating phishing email detection,” Stud.
Inform. Contr., vol. 22, no. 1, pp. 61–70, 2013.
[12] O. A. Adewumi and A. A. Akinyelu, “A hybrid
firefly and support vector machine classifier for
phishing email detection,” Kybernetes, vol. 45,
no. 6, pp. 977–994, 2016.
[13] R. Alayham, C. Ren, J. Arshad and A.
Muhammad, "Email Anti-Phishing Detection
Application", Management & Science University,
2019.
[14] M. Husak and J. Cegan, "PhiGARo: Automatic
Phishing Detection and Incident Response
Framework", Masaryk University, Brno, Czech
Republic, 2021.
[15] G. Egozi and R. Verma, "Phishing Email
Detection Using Robust NLP Techniques",
Department of Computer Science University of
Houston, Houston TX, USA, 2021.
[16] Unnithan, Nidhin A., et al. "Machine learning
based phishing e-mail detection." Security-
CEN@ Amrita (2018): 65-69.
[17] L. Zapata, D. Ona, G. Rodriguez, and W. Fuetres,
"Phishing Attacks: Detecting and Preventing
Infected E-mails Using Machine Learning
Methods", Universidad de las Fuerzas Armadas
ESPE, Sangolqui, Ecuador, 2019.
[18] I. Ortiz-Garc, R. Andrade and M. Cazares,
"Detection of Phishing Attacks with Machine
Learning Techniques in Cognitive Security
Architecture", Politecnica Salesiana,Quito, 2021.
[19] Unnithan, Nidhin A., et al. "Machine learning
based phishing e-mail detection." Security-
CEN@ Amrita (2018): 65-69.
[20] Viktorov, Oleg. "Detecting phishing emails using
machine learning techniques." PhD diss., Middle East
University, 2017.
[21] J. Rastenis, S. Ramanauskaitė, I. Suzdalev, K.
Tunaitytė, J. Janulevičius, and A. Čenys,
“Multilanguage spam/phishing classification by
email body text: Toward automated security
incident investigation,” Electronics (Basel), vol.
10, no. 6, p. 668, 2021
[22] Y. Fang, C. Zhang, C. Huang, L. Liu, and Y.
Yang, “Phishing email detection using improved
RCNN model with multilevel vectors and
attention mechanism,” IEEE Access, vol. 7, pp.
56329– 56340, 2019.
[23] Q. Li, M. Cheng, J. Wang, and B. Sun, “LSTM
based phishing detection for big email data,” IEEE
Trans. Big Data, pp. 1–1, 2020.

Proceedings of Graduation Project Showcase 2022
9 | P a g e
Published In: IJCSNS International Journal of Computer Science and Network Security, VOL.22 No.3, March 2022
https://doi.org/10.22937/IJCSNS.2020.22.3.1
Authors Biography
Muneera Alweheibi, Rawan Alrasheddi, Fay
Aljohar, and Hawra Aljunibi: are currently pursuing
their Bachelors degree in Cyber Security and Digital
Forensics at the department of Networks and
Communications, College of Computer Science and
Information Technology (CCSIT), Imam
Abdulrahman Bin Faisal University, Dammam.
Mainly, their research interests include email security,
Artificial Intelligence and Machine Learning.
Hussain Alattas is currently working in the
department of Networks and Communications
Department, College of Computer Science and
Information Technology, Imam Abdulrahman Bin
Faisal University (IAU), as a lecturer. Hussain has
completed his BS degree in Computer Science from
IAU and MS degree in Cybersecurity and Artificial
Intelligence from The University of Sheffield.
Ghadeer Alazman is currently working in the
department of Networks and Communications
Department, College of Computer Science and
Information Technology, Imam Abdulrahman Bin
Faisal University (IAU), as a teaching assistant.
Ghadeer has completed his BS degree in the science of
Cyber Security and Digital Forensics from IAU.

Proceedings of Graduation Project Showcase 2022
1 | P a g e
Published In: Journal Of Information And Knowledge Management
Review 1
Intelligent Techniques for Predicting Stock Market Prices: A 2
Critical Survey 3
Abstract: The stock market is a field that many people are interested in, regardless of their occupa- 4
tional background. Individuals who have adequate knowledge can buy shares in the market and 5
generate additional income. Nowadays, the cost of living has increased. Hence, the number of peo- 6
ple who are investing in the stock market is increasing dramatically. While anyone can participate 7
in the stock market at any time, there is no guarantee that they will profit from this investment. The 8
stock market is a risky way to invest, given that it is unknown whether the value of a specific stock 9
will rise or fall. Making stock market predictions using artificial intelligence techniques is a possible 10
way to help people anticipate stock market trends. The current research study showed that many 11
factors impact changes in the stock market’s value in general and in the Saudi Arabia Stock Ex- 12
change specifically. To the best of our knowledge, most previous research only considered historical 13
data for predicting stock market trends. The present study aimed to enhance the accuracy of the 14
daily closing price for three sectors of the Saudi stock market by considering historical data and 15
sentiment data. Several intelligent algorithms were considered, and their performance indicators 16
were discussed and compared. In general, this research study found that more accurate stock mar- 17
ket prediction models can be produced by employing both historical data and sentiment data. 18
19
Keywords: stock market, predictions, artificial intelligence techniques, historical data, and 20
sentiment data. 21
22
1. Introduction 23
Living expenses and taxes have been increasing in recent years, while salaries have 24
become insufficient to meet future needs. Consequently, people are more likely to start 25
new firms or look for extra sources of income. One of the widely utilised methods to ac- 26
complish that is to invest in the stock market, which can provide additional income. How- 27
ever, it requires knowledge of the stock market to correctly predict future stock prices in 28
order to avoid the potential risks. 29
The financial market is a simple system that enables individuals to buy, own and 30
then sell shares at any time with a straightforward process conducted on virtual plat- 31
forms. Although it can be beneficial to do so, investing in the stock market might result in 32
significant losses, particularly if an individual lacks an understanding of stock prices and 33
future forecasts. Furthermore, various factors, including the companies' activities and per- 34
formance, supply and demand and news reports, have significant impacts on prices. 35
These issues necessitate the development of stock price prediction applications to accu- 36
rately estimate stock market prices. 37
Since the beginning of the 21st century, artificial intelligence (AI) technologies, includ- 38
ing machine learning (ML) and deep learning (DL), have become popular and increas- 39
ingly applied in different domains. These strategies focus on employing statistical algo- 40
rithms and exploiting data to build smart systems that can learn, comprehend and act in 41
ways that are indistinguishable from humans in a particular scenario. Consequently, re- 42
searchers agree that they significantly enhance the capabilities of computation, pattern 43
matching and analysing data to extract useful insights quickly and accurately. In the field 44
of the stock market, ML or DL algorithms can be trained with different kinds of data, 45
including historical data, representing a stock’s behaviour, and sentiment data from social 46
media, in order to predict the future prices. 47

Proceedings of Graduation Project Showcase 2022
2 | P a g e
Published In: Journal Of Information And Knowledge Management
In this research study, we reviewed and analysed previously published studies that 48
applied AI-based technologies in the field of stock market prediction. Although various 49
literature reviews examining how intelligent-based systems have been used to predict the 50
stock market prices have been published in recent years, none have been as thorough as 51
this one. In this article, we cover 45 research studies published between 2015 and 2021 in 52
the field of stock market prediction. 53
This critical review study also used a novel taxonomy that, to the best of our 54
knowledge, has never been used in earlier studies. It establishes several criteria against 55
which the articles under review can be evaluated and contrasted, including: 56
• The dataset used; 57
• The ML/DL algorithms applied; 58
• The targeted market: local or global; 59
• The kind of features utilised: sentiment data/ historical data/ or both; 60
The performance results were obtained by applying AI techniques. 61
The findings of this literature review point to promising directions for future research 62
and applications in the field of stock market prediction using intelligent algorithms. Re- 63
searchers will be able to use the comparisons and discussions provided in this article to 64
determine which directions to pursue in their research, such as whether to improve intel- 65
ligent-based algorithms or consider other algorithms, which features should be added or 66
removed when building the training dataset, and which evaluation metrics should be 67
used to evaluate the created intelligent systems. 68
The rest of this article is organised as follows. Section 2 presents a literature review, 69
summarising studies focusing on stock markets and the factors that affect stock prices. 70
Section 3 presents a comparison and analysis of the examined research publications, the 71
stock markets they target using ML and DL approaches and their findings. Section 4 pre- 72
sents the study’s conclusions and recommends future research directions. 73
2. Literature Review 74
This section presents an overview of 45 studies that were conducted to predict the 75
future of stock market prices. We reviewed studies that included the idea of applying AI 76
techniques to the stock market to gain a general understanding of the models that were 77
used, to determine how far research has expanded in this field and to identify the ideas 78
that have not been applied in research on the Saudi stock market. Finally, we provide a 79
brief overview of the suggested ideas that we will follow throughout this project. 80
One of the hottest topics that is being discussed is stocks that are being traded, as 81
they are considered to be an additional source of income and savings. The need to increase 82
the source of income has grown after the rise in the cost of living and the increase in the 83
tax burden, as companies make a general appeal for cost-savings to obtain the funds 84
needed for their investments in the form of shares. In the stock market, the profit and loss 85
ratio is based on the participation rate of each individual. Although the stock market can 86
be beneficial to investors, there is a risk in participating in it, as the profit and loss ratio is 87
not guaranteed due to the stock market’s dependence on many factors, such as historical 88
data of the stock, news data, company performance and future expectations, supply and 89
demand and other factors that cause the need for applications that estimate the price of 90
the stock market shares of companies. From this point of view, we will apply AI and DL 91
techniques to estimate stock market prices. AI and DL refer to systems that simulate hu- 92
man intelligence to perform tasks and can be improved based on the information they 93
collect. AI is used in many applications and fields because it provides value to most jobs, 94
companies and industries. After reviewing 45 research studies and applications that ap- 95
plied AI techniques to estimate stock market prices in the future, we found that it pro- 96
vided the results with specific accuracy. Comparing these studies highlights the gap in 97
the research; thus, it will help us develop a new system using AI techniques to estimate 98
stock market prices and close the existing gap in the applied studies [1][2]. 99
The comparison of the research was based on important factors in the application of 100
the system, as follows: 101

Proceedings of Graduation Project Showcase 2022
3 | P a g e
Published In: Journal Of Information And Knowledge Management
• Common dataset used; 102
• Common algorithm used; 103
• Implementation of sentiment data to estimate the market price; 104
• Results obtained by applying AI techniques. 105
The results from the comparison and analysis will help researchers apply new ideas and 106
facilitate a new shift in the field of information systems, enabling the development of al- 107
gorithms that can be used as effective techniques for estimating stock market prices. 108
We found some gaps in our literature review. While conducting our research and 109
looking for similar studies that used the Saudi stock market, we noticed that there was a 110
lack of research that analysed sentiment data. 111
Normally, several evaluation indicators are used to evaluate intelligent models. The 112
ones most commonly used to evaluate intelligent stock market models are: 113
• Precision: also known as positive predictive value; it measures the number of 114
correctly predicted cases that turn out to be positive; 115
• Accuracy: the number of correct predictions divided by the total number of pre- 116
dictions; 117
• Correlation: an indicator of the linear relationships (meaning they change at the 118
same rate); it is a common way of interpreting simple relationships without iden- 119
tifying a cause-effect statement; 120
• Recall: also known as sensitivity; it is measured by examining how many posi- 121
tive outcomes can be predicted correctly; 122
• F1-score: a static statistic that expresses the balance between recall and precision; 123
• Error rate: measures the number of patterns that have been predicted incorrectly 124
by the model; 125
• Sum of squared errors (SSE): a weighted sum of squared errors that does not 126
equal constant variance when using heteroscedastic errors; 127
• Mean absolute error (MAE): an average error between the magnitudes of two 128
observations expressing the same phenomenon; 129
• Mean squared error (MSE): the average squared difference between the esti- 130
mated and actual values; it is a quantifier of the quality of an estimator; 131
• Root-mean-square error (RMSE): a commonly used measurement of the differ- 132
ence between the predicted and observed values (sample or population) pre- 133
dicted by the model; 134
• Mean absolute percentage error (MAPE): measures the accuracy of a forecasting 135
method, which is typically expressed as a ratio; 136
• R-squared (R2): depicts how much of a dependent variable's variance is ex- 137
plained by an independent variable or variables in a regression model. 138
139
140
2.1 Research Depending on Historical Data 141
142
One study [3] used the idea of predicting the stock price to such an extent that it can 143
be sold before its worth decreases or bought before the price increases. This study used 144

Proceedings of Graduation Project Showcase 2022
4 | P a g e
Published In: Journal Of Information And Knowledge Management
different artificial neural networks (ANNs) to foresee the stock price, but the productivity 145
of forecasting by ANNs relies on the learning algorithm used to train the ANN. This study 146
compared three algorithms: Bayesian Regularization, Scaled Conjugate Gradient (SCG) 147
and Levenberg-Marquardt (LM). It used data (ticks) from 30 November 2017 to 11 January 148
2018 (barring occasions) of Reliance Private. Each day had around 15,000 data focuses, 149
and the dataset contained around 430,000 data focuses. The data were acquired from 150
Thomson Reuter Eikon database. (This dataset was bought from Thomson Reuter). Every 151
change in the price of a stock from one trade to another has a tick that refers to it. The 152
stock price at the beginning of each 15-minute period was extracted from the tick data, 153
which represents the optional dataset run on similar algorithms. Thus, these three algo- 154
rithms have a tick-data utilisation precision of 99.9%. Moreover, for every LM, SCG, and 155
Bayesian Regularization, the exactness over the 15-minute dataset decreases to 96.2%, 156
97.0%, and 98.9%, respectively, which is significantly poor in comparison to the results 157
acquired using tick data. The neural networks (NNs) used in this study are weak; in fact, 158
many other NNs, such as long-short term memory (LSTM), give better predictions. Fur- 159
thermore, applying sentiment analysis can help achieve an additional edge in relation to 160
stock price expectations. 161
Another study [4] focused on the worst prediction accuracy domain, which is the 162
short-term prediction, using time series data of stock prices. An Alpha Vantage applica- 163
tion programming interface (API) was used to access the time series data of 82 random 164
stocks traded at the New York Stock Exchange. (NYSE) The API provides access to daily, 165
weekly and monthly time series data. Since this study used short-term prediction, daily 166
time series data were chosen, which includes the daily opening price, daily high and low 167
prices, daily closing price and daily volume. The study started with a simplified problem, 168
which was predicting whether the prices would increase or decrease in the subsequent 169
days using the stock prices and volumes from the previous days. For this classification 170
problem, logistic regression (LR), Bayesian Network, Simple Neural Network and Sup- 171
port Vector Machines (SVM) with a Radial Basis Function (RBF) kernel were conducted. 172
When using only past price data and technical indicators, the accuracy was found to be 173
70%, which is not high compared to other studies. 174
A study conducted by [5] used ML algorithms, such as Random Forest (RF), K-Near- 175
est Neighbours (KNN), SVM and LR, to evaluate the performance in the field of stocks. 176
That study evaluated the algorithms by assessing performance metrics, such as accuracy, 177
recall, precision and F-score, with the aim of identifying which algorithm most effectively 178
predicted the future performance of the stock market. The dataset is from Kaggle and 179
represents data from the National Stock Exchange of India. That study found that RF had 180
the highest accuracy rate for prediction and the highest recall rate, LR achieved the highest 181
precision and F-score and KNN was the worst performing algorithm among the four that 182
were studied. Overall, RF was the best algorithm, with an accuracy rate of 80.7%. After 183
obtaining the results of the four algorithms, the pros and cons of each technique were 184
identified. Thus, it is easy to determine the best and effective algorithm for the model. 185
One study [6] aimed to apply the KNN and non-linear relapse approaches to antici- 186
pate stock prices for some major companies listed on the Jordanian Stock Exchange. The 187
Jordan Steel Company (JOST), Irbid District Electricity (IREL), Arab International for Ed- 188
ucation and Investment (AIEI), Arab Financial Investment (AFIN) and the Arab Potash 189
Company (APOT) are all listed on that stock exchange to assist investors, decision-makers 190
and clients in making better investment decisions. The study used a dataset of the stock 191
information from 4 June 2009, to 24 December 2009 for five randomly chosen companies 192
recorded on the Jordan Stock Market. Each of these companies has around 200 records 193
with three ascribes, including low price, closing price and high price. The study computed 194
the total squared mistakes, RMSE, and the normal errors for the five companies and iden- 195
tified the contrasts between the anticipated values and the real values in the sample data. 196
It found that the number of errors was small, which demonstrates that the actual value 197
and predicted value are close. According to the results, there is high precision in using the 198
KNN algorithm for forecasting stock values. Then, non-linear regression was applied. The 199

Proceedings of Graduation Project Showcase 2022
5 | P a g e
Published In: Journal Of Information And Knowledge Management
outcome indicates that the use of data mining (DM) methods can help decision-makers at 200
various levels when using KNN to examine the data. This study [6] achieved high results 201
using the KNN algorithm as it has a small error ratio, and this yields high precision in 202
contrast with [5], which it did not achieve a high precision result. 203
A DL-based model to predict stock prices was presented in [7]. That study used the 204
historical records of the National Stock Exchange Fifty (NIFTY 50) which contains 50 in- 205
dexes listed in the National Stock Exchange of India from 29 December 2008 to 28 Decem- 206
ber 2018. A multi-step process was used to forecast the opening values of the stock prices 207
of the 50 records. Moreover, the values were predicted week by week, so when a week is 208
over, the actual values of a week are included in the training model before it starts training 209
again. The results using the convolutional neural network (CNN) algorithm show the 210
forecasting performance with a mean of 348.26 in one week, which is better than the mean 211
of 407.14 for two weeks. 212
The study conducted by [8] predicted the ability of various well-known forecasting 213
models, including dynamic versions of a single-factor Capital Asset Pricing Model 214
(CAPM)-based model and Fama and French's three-factor model, to close the gap in the 215
literature. The dataset was collected from the Shanghai Stock Market and it compared the 216
predicting performance of each of the six models with the performance of an ANN model 217
using the same predictor variables; however, it relaxed the model linearity assumption. 218
Surprisingly, there were no statistically significant differences between the CAPM and the 219
three-factor model in terms of forecasting accuracy. Furthermore, each ANN model out- 220
performed the equivalent linear model, showing that NNs might be a valuable tool for 221
predicting stock prices in emerging markets. On average, the overall accuracy of the pro- 222
posed method is equal to 0.0113 MAD, 0.3118 MAPE and 0.2807 MSE. As discussed in [3], 223
by utilising an ANN algorithm, the model provides more accurate results. 224
Another model that analysed the stock market and identified nonlinear relationships 225
between the input data and the output data was proposed in [9]. Two types of ANN algo- 226
rithms were used in this study, RBF and Multi-Layer Feed Forward (MLFF using the 227
Shanghai Stock Exchange composite index in China. The reason for using two ANN tech- 228
niques is that an RBF network can deal with nonlinear functions and operate with the 229
complexity of analysing the rules and laws in the system, while MLFF is used to deal with 230
the complex nonlinear relationship between the input and output data. This study found 231
that RBF outperformed MLFF because the RBF's error is substantially smaller. The appli- 232
cation provided an excellent comparison of two types of ANN algorithms. 233
The study conducted by [10] focused on the efficacy of DL in predicting one-month- 234
ahead stock returns in a cross-section of the Japanese Stock Market. NNs have been used 235
in several studies on stock return predictability. NNs have also been used to make indi- 236
vidual stock return estimates. The MSCI Japan Index dataset consists of data from Decem- 237
ber 1990 to November 2016 and contains 319 indexes. The study used ANNs, Support 238
Vector Regression (SVR) and RF. The result shows that deep NNs outperform shallow 239
NNs, in general, and the top networks also beat typical ML models. Indeed, the findings 240
suggest that DL shows potential as a sophisticated ML method for predicting cross-sec- 241
tional stock returns. A future study could include the use of RNN, which is designed to 242
handle time series data. An analysis of several DL models is also predicted to improve the 243
accuracy of stock return prediction in the cross-section data. 244
Another study [11] aimed to construct a novel ensemble ML framework for daily 245
stock pattern prediction by combining traditional candlestick charting with the latest AI 246
methods. The Chinese Stock Market dataset was used in this research, with a total of 247
65,000 rows of data in each round. A total of six ML models were used in this study: LLR, 248
SVM, KNN, RF, Gradient Boosting Decision Tree (GBDT) and LSTM. After comparing the 249
results of each of these models, RF and GBDT showed a good predictive ability for short- 250
term prediction, whereas the LR prediction level needs to be improved and KNN and 251
SVM only fit in some patterns. The LSTM model has more advantages as a DL, but those 252
advantages were not fully discussed. Overall, the model had an accuracy greater than 253
52%, and an F1-score greater than 50%. This research provides useful information and it 254

Proceedings of Graduation Project Showcase 2022
6 | P a g e
Published In: Journal Of Information And Knowledge Management
is distinct from other studies conducted on the basis of stock market prediction, because 255
it shows in detail the results of each model that used different algorithms. 256
A study conducted by [12] applied an ML algorithm and time series forecasting using 257
Microsoft Excel as the best statistical tools for graphic and tabular representation of the 258
prediction results. That study used data from Yahoo Finance for Amazon (AMZN) stock, 259
AAPL stock and Google stock datasets. They focused on using LR, three-month moving 260
average (3MMA) and Exponential Smoothing (ES) algorithms. Three different prediction 261
methods were considered. Of them, ES based on LR showed the best results with a 16.62 262
average absolute error. The study is distinct from others as it also applied a time-series 263
analysis to predict the stock market prices for the next month. 264
In [13], two effective models were developed using ANN and SVM classification 265
techniques to predict the direction of stock price index movement. Then, the ability to 266
anticipate the direction of movement in the daily Istanbul Stock Exchange (ISE) National 267
Index was tested. The data were from the ISE National Index's daily closing price move- 268
ment from 2 January 1997 through 31 December 2007. The average performance was 269
found to be better for the ANN model (75.74%) than the SVM model (71.52%). The pre- 270
diction performance of these models can be improved in two ways. The first way adjusts 271
the model parameters by conducting a more sensitive and thorough parameter setting. 272
The second way is to employ additional macroeconomic variables, such as foreign ex- 273
change rates, interest rates and the consumer price index, as inputs to the models. 274
One study [14], proposed a model to understand the financial market and build a 275
neural model for the financial market theory with respect to technical analysis, fundamen- 276
tal analysis and time-series analysis. That study used the feedforward multilayer percep- 277
tron ANN algorithm. This algorithm is used because of its efficiency in predicting a time 278
series and its ability to learn and recognise non-linear data. The authors conducted a sur- 279
vey to gather input from qualified professionals on the models, techniques and indicators 280
used in the pricing of stocks. A questionnaire was sent to 50 investors and analysts work- 281
ing in the stock market. The datasets were obtained from Economatica, Brazil’s Central 282
Bank, the São Paulo Stock Exchange and Thomson Reuters. The result is based on the set 283
of error metrics with a window size equal to 3, as it presents a Prediction of Change in 284
Direction (POCID) correct rate of 93.62% and a MAPE of 5.45%. The results could be fur- 285
ther improved by expanding the algorithms used to obtain high accuracy and discover 286
the best algorithm for forecasting stock market prices and trends. 287
Another study examined the prediction power of NN modelling and SVM to forecast 288
Russian stock prices [15]. The dataset was consisted of the daily Moscow Interbank Cur- 289
rency Exchange (MICEX) stock price index, as well as some technical and fundamental 290
indicators from 2002 to 2016, based on statistical and analytical methods. Datasets are used 291
for training, testing and verification in Python for ML. Feedforward NNs were used to 292
predict the MICEX index. Moreover, a back propagation (BP) algorithm was used to train 293
it. The study used the activation function as its baseline and the dependent and independ- 294
ent variables were normalised to the interval [-1,1]. To decrease the potential for overfit- 295
ting problems, the data were split into a 60% training sample and a 20% testing sample. 296
To determine which parameters of the learning algorithm and NN architecture for each 297
sample are optimal, training samples and testing samples were used. The performance of 298
the NN was also evaluated using a validation sample (20%). The NN’s optimal learning 299
parameters were found empirically using a grid search. An optimal configuration was 300
also found by training and testing processes in SVM. Data normalisation in SVM was ac- 301
complished using transformations. The prediction performance of the NNs and SVM was 302
compared based on MSE, RMSE, MAE, MAPE, R2 and the calculated coefficient of deter- 303
mination (cR2). B SVM was found to have a higher predictive power than NN modelling. 304
305
306
307
A genetic algorithm (GA) proposed in [16] was used to forecast prices and trends for 308
the India Stock Market. The dataset was extracted from the India TCS Stock Market for 309

Proceedings of Graduation Project Showcase 2022
7 | P a g e
Published In: Journal Of Information And Knowledge Management
trading values for 259 days, including the opening, closing, lowest and highest prices of 310
each day's trading. The GA is a search algorithm that combines the mechanics of selection 311
and genetics. There are three types of genetic operations: crossover, mutation and selec- 312
tion. Historical data were used to predict future search points with improved performance 313
efficiently. The study was conducted using a time-series analysis, which identifies pat- 314
terns in statistical information by returning information at regular intervals of time. To 315
make a prediction for the opening price of the next week, the closing price values of the 316
previous week are taken by ignoring the negative ‘ve’ sign, since the opening price is al- 317
ways higher than the closing price. In contrast, when predicting the closing price from the 318
opening price the sign changes from a positive ‘ve’ to a negative ‘ve’. However, the sign 319
does not change when predicting low and high prices. The Chi-square test was used to 320
determine whether the prediction was significant or merely a coincidence. According to 321
the test findings, time series and GA significantly improved the prediction system's accu- 322
racy by 99.87%. 323
Another study [17] proposed a practical method for predicting stock development. It 324
did not present any numerical result as the aim was to present the most appropriate anal- 325
ysis for anticipating the stock market. A dataset from the previous year's stock market was 326
employed and divided into training and testing data to improve the accuracy. The RF 327
algorithm and the SVM algorithm were both considered. The results of the calculation 328
showed that the RF algorithm performed better in predicting a stock's market price, which 329
was proven in [5] and [11], as both studies achieved higher performance using RF. 330
Since stock price prediction using time series forecasting is one of the most complex 331
challenges in the financial field, a method was developed in [18] for predicting stock price 332
and time series using a hybrid method of GA and ANN techniques. That study used data 333
from Apple, Pepsi, IBM, McDonald's and LG. Compared to traditional models, the pro- 334
posed solution exhibited a 99.99% improvement in SSE and a 99.66% improvement in time 335
when a hybrid model of GA and BP was applied to a dataset of Apple stocks. When the 336
Pepsi dataset was used, the approach had an SSE of 0.0121281374; traditional methods 337
without using GA had an SSE of 0.4790571631. That study yielded an SSE accuracy of 338
99.42% and a time reduction of 88.75%. Their method could be further improved by com- 339
bining it with other methods, such as SVM or decision tree (DT), or by expanding their 340
study to include a time-series analysis as was done in [16]. 341
In [19], it was reported that ANN is suitable for stock market prediction since it is a 342
popular way to identify unidentified and unseen patterns in data. That study was divided 343
into two modules; one module was for training and the other was for predicting the stock 344
price based on the previous training. A method was proposed to predict the share price 345
using a BP algorithm and an MLFF network. The dataset was obtained from ACI Pharma- 346
ceuticals. Using two input datasets and five input datasets, a difference was found be- 347
tween the anticipated and actual stock price. The error percentage between the predicted 348
price and the actual price decreased when the model had more training. When using five 349
input datasets, the highest error rate was 3.28% and the lowest was 0.12%. The method 350
used to achieve a more error free prediction was done by training the system with more 351
input datasets. Another method could also be conducted to yield better results; for exam- 352
ple, in [18], ANN was also used, but it was combined with GA to improve the results. 353
Another study [20] proposed an intelligent stock market forecasting system using the 354
ability of ANN and a fuzzy inference system. The goal was to notice the patterns in non- 355
linear and disordered systems. The dataset was from BEXIMCO Ltd. Using a model that 356
combined an NN and fuzzy logic, a total of nine inputs were used from the prediction 357
dataset to compare the actual price and the predicted price. The highest error rate of this 358
model was 4.8895% and the lowest was 0.3734%. Training the model with more data, as 359
was done in [19], could improve its performance and generate a more error free predic- 360
tion. 361
The study conducted in [21] utilized SVM to forecast ISE prices in Turkey. The study 362
proposed a method for learning to predict stock price returns by considering a binary 363
classification problem (positive and negative). Positive return forecasts were represented 364

Proceedings of Graduation Project Showcase 2022
8 | P a g e
Published In: Journal Of Information And Knowledge Management
by a class label of +1 and negative predictions were represented by a class label of -1. 365
Learning the learned model involves the use of weighted SVM, RF classifi-ers, Relevance 366
Vector Machine (RVM) and Multiple Layer Perceptron (MPL). A three-layer feed forward 367
technique was implemented with 10 neurons as an input, a neural layer for each technical 368
parameter, and a neuron as an output layer to show the predicted result. To update the 369
weights, the tangent sigmoid was used as a transfer function in conjunction with a gradi- 370
ent descent algorithm. The error and output of the initial network were calculated during 371
adaptive gradient descent. In this way, a near-optimal learning rate for the local environ- 372
ment can be obtained. Additionally, a higher learning rate is guaranteed if stabilised learn- 373
ing occurs. The accuracy of the proposed method was reported to be 70%. In contrast to 374
other studies that utilised the SVM algorithm and produced high accuracy, this study 375
should improve its methods to achieve higher accuracy. 376
Another study [22] proposed a method that can forecast stocks from different mar- 377
kets and industries and predict the trend using ML algorithms, such as polynomial re- 378
gression and LR, in addition to learning techniques for predicting a time series using two 379
special types of NN recursions: spoken short-term memory and LSTM. The historical in- 380
formation contains data for the daily low, high, closing and opening prices and the vol- 381
ume of each stock. The dataset consisted of the five-year window of Alibaba, VinGroup, 382
Reliance and PepsiCo to guarantee that both bullish and bearish trends in this period 383
would be investigated. First, LR and polynomial regression were used to complete the 384
regression analysis and predictive analysis of the stock information. Second, the LSTM 385
model was used according to the qualities of stock market data because of its excellent 386
performance in successive data processing, choosing the Stochastic Gradient Descent 387
(SGD) and Adaptive Moment Estimation (Adam) as the optimizers. Finally, this study 388
used the LSTM combined model enhanced by a one-dimensional CNN (CONV1D) for 389
forecasting, which works on the exactness of the expectation model because there is a high 390
error rate in LSTM. The test results confirmed the efficacy of the original LSTM network 391
by adding two CONV1D layers, which helped improve the overall accuracy. Moreover, 392
the RMSE and MAPE values were smaller when using the Adam enhancer than the SGD 393
enhancer. Thus, the CONV1D-LSTM model improved by Adam is more reasonable and 394
produces better prediction with an accuracy of 54.17% based on the Alibaba dataset, 395
51.56% based on the PepsiCo dataset, 51.38% based on the VinGroup dataset and 50.01% 396
based on the Reliance dataset. This study achieved high accuracy by improving the origi- 397
nal LSTM to create a CONV1D-LSTM model in contrast to [11], which only used the orig- 398
inal LSTM without any adjustments. 399
One study aimed to predict future values of portfolios using an ML algorithm de- 400
pendent on LSTM and RNN to estimate the changes in the closing prices for a portfolio of 401
resources [23]. The objective was to obtain an accurate, trained algorithm. The study used 402
the datasets of two stocks at New York Stock Exchange (NYSE) consisting of the daily 403
opening prices. Two stocks (Google and NKE) are extracted from Yahoo Finance. The data 404
for the Google series covers the period from 19/8/2004 to 19/12/2019 and the data for NKE 405
covers the period between 4/1/2010 to 19/12/2019. LSTM and RNN were applied to build 406
the model, which used 80% of the data for training and 20% of the data for testing. The 407
test results were strongly influenced by both the number of epochs and the length of the 408
data. For the training data, 12 epochs, 25 epochs, 50 epochs and 100 epochs were used. 409
That study found that training with fewer data and more epochs improved the testing 410
results and also improved the forecasting and prediction values, depending on the da- 411
taset. Thus, the model can trace the evolution of the rates of opening prices for both assets. 412
In the future, the study will work to identify the mix of session data length and the number 413
of training epochs that best suit their resources and augment the accuracy expectations. 414
Another study [24] worked to develop a model dependent on technical indicators 415
with LSTM to forecast the price of a stock at 1 minute, 5 minutes and 10 minutes. High- 416
frequency data were used by combining LSTM and classical financial models to predict 417
the closing price. The dataset from Kaggle consisted of S&P 500 intraday trading data. The 418
original data files contained 484 observations. One observation has a time stamp, as well 419

Proceedings of Graduation Project Showcase 2022
9 | P a g e
Published In: Journal Of Information And Knowledge Management
as opening, low, high and closing prices and volume. Data from 11/9/2017 to 16/2/2018 420
were used and had a total of 43,148 sequence data. The dataset was divided into a training 421
set and a validation set. The period of the training set was 11/9/2017 9:30 A.M. to 17/1/2018 422
11:50 A.M. The period of the validation set was 17/1/2018 11:51 A.M. to 16/2/2018 03:59 423
A.M. Following that, experiments were conducted to predict the price at 1 minute, 5 424
minutes and 10 minutes. The basic idea was to check how close each model is to reality to 425
know the extent of the risk that the user may be exposed to while predicting the stock 426
price x-minutes before. For each observation, there is a model with and without technical 427
pointers to improve the analysis. Therefore, this study coincides with establishing the in- 428
fluence of technical indicators in forecasting because the accuracy stays below 50%. The 429
model also affirms that the closing price can be predicted 10 minutes before closing and 5 430
minutes before closing, with the best performance seen 1 minute before closing, without 431
the use of technical indicators. This study may need to focus on sampling and back-testing 432
to best dominate this domain. 433
The capacity of ANN to forecast the everyday NASDAQ stock exchange rate was 434
examined in [25]. That study used short-term historical stock prices and the day of the 435
week as inputs. Using NASDAQ data from 28 January 2015 to 18 June 2015, they applied 436
daily stock exchange rates to develop a powerful model. The initial 70 days (28 January to 437
7 March) were chosen as the training datasets and the last 29 days were used for testing 438
the model’s prediction ability. Networks for the NASDAQ index that forecast two kinds 439
of input datasets (4 days earlier and 9 days earlier) were developed and approved. The 440
determination coefficient (R2) was used to evaluate the performance of the ANNs and the 441
MSE of the modelled output. The study applied the OSS training technique and TANGSIG 442
transfer function in a network with 20-40-20 neurons in hidden layers. The result was a 443
streamlined prepared network with R2 values of 0.9408 for the approval dataset. In this 444
dataset, most of the R2 values for the networks with the OSS training method and TANG- 445
SIG transfer function could be obtained when the number of neurons was 40-40 and the 446
number of hidden layers was 2. For 9 earlier working days, a network with 20-40-20 neu- 447
rons in the hidden layers OSS training method and the LOGSIG transfer function, the up- 448
graded network achieved an R2 of 0.9622. The results show that there is no difference 449
between the prediction ability of the 4 and 9 prior working days as the input parameters. 450
While ANN was used in [18], it was combined with GA to achieve high results. 451
452
The study conducted by [26] proposed trading strategies by combining technical 453
analysis indicators and data on stock market returns with ML approaches. To test the rec- 454
ommended algorithms RF, LR, ANN and SVM were chosen. The data set from Guaranty 455
Trust Bank contained stock data from the Nigerian Stock Exchange (NSE). Therefore, the 456
stacking technique was implemented to discover which of the four algorithms, when used 457
as the top layer and the remaining as the second layer, could effectively predict the stock 458
returns values. When compared to the real value of stock returns, the results of the exper- 459
iment showed that the top layer of the RF algorithm can forecast buy and sell signals. The 460
authors may expand their research by learning from social media news, which has a high 461
correlation with stock prices and market status. 462
The model proposed in [27] was used to predict Saudi stock market prices by em- 463
ploying AI and soft computing techniques. The proposed model is based on Saudi Stock 464
Exchange historical data and it was tested on three companies: SABIC, Saudi Telecommu- 465
nication Company (STC) and Al-Rajhi Bank. The proposed ANN model predicts the next 466
day closing price stock market value with a very low RMSE of 1.8174, a Mean Absolute 467
Deviation (MAD) of 18.2835, a MAPE of 1.6476 and a very high correlation coefficient of 468
up to 99.9%. The ANN model was used because of its ability to learn, memorise and create 469
relationships among data. It has been proven to be a good tool for predicting the Saudi 470
stock market prices, in a context in which little recent research has been conducted. This 471
study could be further strengthened by applying more than one algorithm and comparing 472
the results to achieve the highest possible accuracy rate. 473

Proceedings of Graduation Project Showcase 2022
10 | P a g e
Published In: Journal Of Information And Knowledge Management
Another study [28] used the BP algorithm to predict the Saudi stock market prices by 474
applying different technical indicators, training and transfer functions to evaluate the per- 475
formance of NN methods. Real historical data from the Saudi stock market and OPEC 476
crude oil prices from TADAWUL Stock Market Exchange and historical oil price data 477
from 2003 to 2015 were used to evaluate the effectiveness of the NN methods. The best 478
training function was found to be MATLAB trainbr; it had the highest accuracy in com- 479
parison to other training functions with the ANN algorithm. The highest accuracy of the 480
ANN model using trainbr was 75.7%. 481
One study [29] aimed to test the Saudi stock market weakness using the Kolmogo- 482
rov–Smirnov test and the Market Weak Form Test results for an active market hypothesis. 483
The RNN proposed to create a trading signal with a long momentary memory architecture 484
to predict the following day trading of a few shares on the Saudi Stock Exchange. The 485
Saudi stock lists were then utilised in sequence with a trading algorithm to purchase and 486
sell shares depending on three elements: the current number of shares owned, the current 487
available balance and the current share value. The dataset for the Saudi Stock Exchange 488
consists of three stock shares. An example of chronicled values with 55% exactness is data 489
from June 2018 to August 2019 for SABIC, Alinma Bank and Al-Rajhi Bank. The 55% ac- 490
curacy result and an investment gain of 23% was satisfactory , in comparison to the results 491
obtained with the buy-and-hold trading method, which achieved a 1.2% investment gain. 492
However, more factors could be considered in this study, such as the Fibonacci retrace- 493
ment and implementing a component choice strategy to select the best element among the 494
introduced features. Or, the study could consider trading strategies to prepare an NN and 495
improve a trading agent as opposed to depending on the forecast of future returns. 496
Another study conducted in Saudi Arabia [30] aimed to enhance the forecasting ac- 497
curacy of the Saudi Arabia Stock Exchange (TADAWUL ) data patterns. The study used 498
datasets from TADAWUL, the Saudi Authority for Statistics and the Saudi Central Bank. 499
With a total of 2026 records, the MODWT functions (a mathematical model based on five 500
functions) was combined with the adaptive network-based fuzzy inference system (AN- 501
FIS) model to develop with this model. The results of this model are more accurate (99.1%) 502
than those of traditional models. This forecasting model is capable of decomposing in the 503
stock markets; unlike traditional models, this model excelled because it resulted in a high 504
accuracy percentage as it was a combination of MODWT and ANFIS. 505
A model was proposed in [31] to predict the Saudi stock price trends with regards to 506
its earlier price history by combining a discrete wavelet transform (DWT) and RNN. Past 507
data from TADAWUL was used, with a total of 130,000 records. Two models were pre- 508
sented in this study, DWT+RNN and Auto Regressive Integrated Moving Average 509
(ARIMA). The purpose of using ARIMA was to compare the proposed method 510
(DWT+RNN) with a traditional prediction algorithm (ARIMA). The MAE for the pro- 511
posed method was 0.15996, MSE was 0.03701, and RMSE was 0.19237 RMSE; this demon- 512
strates a significant improvement in comparison to ARIMA, which had an MAE of 6.60949 513
MAE, an MSE of 76.5758 and an RMSE of 8.75076. This integration method could be used 514
to formulate better and improved techniques to reduce the risks of investing and assist 515
investors in making stock-buying and selling decisions. The prediction of this model could 516
be further increased by considering other factors that might affect the accuracy of the 517
price, which is also the case for other research studies. 518
Another method to predict the Saudi stock market was proposed in [32], which con- 519
sidered people’s sentiments about their financial decisions. This study used TADAWUL l 520
All Share Index (TASI) and Global Data on Events, Location and Tone (GDLET) Google 521
database (collection of news from all over the world from different types of media, includ- 522
ing TV, podcasts, radio, newspapers and websites). The goal was to use a time-series anal- 523
ysis to predict the Saudi Stock Market Index by incorporating the GDELT dataset with the 524
TASI. Statistical and ML approaches were used. Of all the models that were tested in this 525
study, LSTM (a special kind of RNN with the ability to learn long-term relationships) had 526
the best performance with an MAE of 0.59. LSTM can give very accurate forecasts, as it 527
had a very low MAE. The study also mentioned how challenging it is to forecast stock 528

Proceedings of Graduation Project Showcase 2022
11 | P a g e
Published In: Journal Of Information And Knowledge Management
market prices since a stock market is dependent on multiple factors, in addition to histor- 529
ical data, that vary in type and extraction complexity. Financial markets can be influenced 530
by economic factors and non-economic factors. The research done in this study was com- 531
plete as more than one model was tested before concluding which model was best; how- 532
ever, it might have been lacking in other areas as a TADAWUL dataset was also used in 533
[31] where it achieved a higher MAE. 534
The study conducted by [33] used several ML algorithms to predict stocks in the 535
Saudi Arabia Stock Exchange, such as Multilayer Perceptron, SVM, Ada-boost, Naive 536
Bayes, Bayesian Networks, KNN and RBF, to forecast the Karachi Stock Exchange price 537
and test the algorithm on Saudi stocks for TASI. The dataset from 10 companies was ob- 538
tained from the Karachi Stock Exchange over a period of six months, from April 2013 to 539
September 2013. Several matrices were used to compare the performance of these algo- 540
rithms, including MAE, RMSE and accuracy. The analysis was categorised by time, most 541
recent data used for testing and historical data for training. The training dataset was split 542
into an 80% training set and a 20% testing set. A 2-fold cross-validation method was per- 543
formed over 80% of the training to determine the optimal parameters. It was found that 544
Ada-boost, Multilayer Perceptron and Bayesian Network were more accurate than the 545
other tested algorithms. 546
547
2.2 Research Depending on Sentiment Data 548
549
To discover the effectiveness of social media of Hewlett-Packard Corporation and 550
news data on stock market prediction, [34] used this data with ML algorithms, such as 551
SVM, and Naive Bayes. The algorithms were applied on 10 subsequent days and S&P 500 552
index price data were gathered for 2 years from 1 July 2016 to 30 June 2018. To improve 553
the performance and quality of stock predictions, spam tweets were scaling down and 554
duplicate tweets were removed from the social media datasets. Moreover, the ML model 555
can provide raw text data in the form of tweets and news headlines. These data are not 556
understandable by ML algorithms and need to be pre-processed. NLP is used to analyse 557
social media and news data to find (positive, neutral or negative) sentiments. Then, ML 558
algorithms are used to learn the relationship between the sentiments of the text and the 559
stock market trends. The result show that the highest prediction accuracies of 80.53% and 560
75.16% are achieved using social media and news, respectively. 561
Since few studies analysed sentiment Arabic tweets on the stock market, a model was 562
proposed to analyse the relationship between Saudi Twitter posts that contain sentiment 563
data with people’s opinions and the Saudi stock market [35]. The data were collected us- 564
ing a desktop application written in C# (Twitter data grabber) to save and label the tweets 565
as positive, negative or neutral, and discard irrelevant data. The tweets were obtained 566
from the Mubashir website in Saudi Arabia. The dataset contains 3335 records collected 567
from 17/3/2015 to 10/5/2015 of all share sectors of the Saudi Arabia Stock Exchange that 568
exist on the TADAWUL website. After labelling the data, normalisation occurs as follows: 569
positive tweets (1), negative tweets (-1) and neutral tweets (0). Moreover, three algorithms 570
were used to build the model: Naive Bayes, SVM and KNN. The evaluation was done 571
using precision and recall methods. Term Frequency-Inverse Document Frequency (TF- 572
IDF) as used to extract the features. A clear correlation was found between news pub- 573
lished on social media (especially Twitter) and the Saudi stock market. This proved the 574
high impact of sentiment data on the Saudi stock market. 575
576
2.3 Research Depending on Both Historical and Sentiment Data 577
578
The system proposed in [36] integrates ML, mathematical operations and some other 579
factors, including news sentiment, to gain better forecasting accuracy and generate prof- 580
itable trades. Two sources of information were used in this study: market news sentiment 581

Proceedings of Graduation Project Showcase 2022
12 | P a g e
Published In: Journal Of Information And Knowledge Management
and historical prices. The study assumed that market news can be classified as positive, 582
negative and neutral. The news sentiment dataset includes information about the number 583
of positive and negative words in news articles related to the companies considered in the 584
training dataset. That dataset was collected from the Reuters platform; it consists of data 585
related to several major companies, such as Apple (AAPL), Google (GOOGL), Amazon 586
(AMZN) and Facebook (FB). Several approaches were used to build the intelligent mod- 587
els: RNN, Deep Neural Network (DNN), SVM and SVR. Various evaluation metrices were 588
used to evaluate the created models. The most important evaluation metrices considered 589
in this study are the directional accuracy (which analyses the direction of the predicted 590
value with respect to yesterday’s closing price), precision (which measures the relevancy 591
of the result), recall (which measures how many true relevant results returned) and F- 592
score (which measures the weighted average of precision and recall). All the intelligent 593
approaches showed high forecasting accuracy. However, SVM showed the best accuracy 594
(82.91%). 595
To make the process of investing in the stock market less time-consuming, simple, 596
easy and less stressful, a model to predict stock fluctuations was proposed [37]. This 597
model will help new investors obtain a deeper understanding of the stock market. The 598
data were obtained from Yahoo Finance. The model was created by considering several 599
features, including stock market prices for the previous year, past values of the currency 600
and commodity markets, historical news headlines, sentiment data and international 601
stock market data. All the smart algorithms that were considered in this study—ANN, 602
RF, SVM, KNN and LSTM—demonstrated high accuracy in predicting stock fluctuations; 603
however, RF had the best accuracy: 80%. 604
Prediction of stock prices with AI and social media was conducted in [38]. The main 605
goal was to create an NN based on LSTM that can forecast stock market movements based 606
on user tweets. Additionally, that study worked on developing an RNN, an LSTM varia- 607
tion capable of predicting short-term price fluctuations. The popularity of RNNs in NLP 608
and stock prediction tasks is attributed to the fact that they consider the temporal effect of 609
events, which is a significant advantage over other NNs. DL methods were employed for 610
this task since hidden layers may take advantage of the inherent relational complexity and 611
extract these implicit links. Consequently, the LSTM structure was chosen as the primary 612
model. The stock price data were the same as the data used in [37] and the Twitter data 613
was obtained from Follow the Hashtag. The degree of association between the sentiments 614
conveyed via tweets and the direction of the stock prices were also explored with the use 615
of a popular sentiment analysis tool known as VADER. This was done to compare the 616
results with those from the LSTM architecture. It was found that VADER was unable to 617
extract any strong relationships between social sentiment and market direction. The mod- 618
el's final testing accuracy was 76.14%. Although the level of accuracy is excellent on its 619
own, Twitter datasets from other technical businesses must be reviewed and compared to 620
the findings of this study. This relative comparison will enable a more realistic assessment 621
of the LSTM network's performance in a broader context. 622
Twitter attribute information was used to predict stock prices in [39]. An NN-based 623
model with several layers of LSTM was utilised. The model was trained using Twitter 624
attributes as well as historical stock values. Twitter API was used to collect data and to 625
retrieve the needed attributes. The results showed that adding Twitter attributes to the 626
model yields a 3% improvement in MSE, which was about 0.002 MSE. Consequently, an- 627
other experiment was done that used the sigmoid function on the follower count; it re- 628
sulted in an MSE of 0.14. Further improvements were made by using a sigmoid function 629
when scaling the tweet follower count attribute, which yielded an MSE of 0.13. This study 630
took Twitter information into consideration, and it succeeded in showing the degree to 631
which the accuracy rates differ when using Twitter attributes with the historical stock rec- 632
ords in the model. 633
A simple LSTM model with complex level embeddings for securities market forecast- 634
ing, while utilising monetary news as predictors, was applied in [40]. First, an RNN model 635

Proceedings of Graduation Project Showcase 2022
13 | P a g e
Published In: Journal Of Information And Knowledge Management
was used for the forecast. Then, a neural language model was used to build a representa- 636
tion for the information. The model was assessed on a dataset of monetary news from 637
October 2006 to November 2013, which was made accessible by Ding et al. (2014) and 638
gathered from Reuters and Bloomberg. The stock price information for all S&P 500 com- 639
panies and the S&P 500 index was acquired from Thomson Reuters Tick History. The test 640
results of the model S&P 500 Index expectation, in relation to the precision of foreseeing 641
stock price development on the test dataset, showed an accuracy of 63.34%. The test con- 642
sequences of individual company forecasts had an accuracy of 64.74%. The character-level 643
language model pre-training performs just like all of the different models, but with the 644
benefit of being easier to implement because it does not have a module for modelling 645
events. Based on the outcome, the study may need to test the utilisation of the character 646
embeddings with more difficult designs and possibly the expansion of different infor- 647
mation to make richer feature sets. 648
A hybrid approach for stock price movement prediction using ML and DL was pro- 649
posed in [41] using the daily historical data of the NIFTY 50 index of India from 2/1/2015 650
to 28/6/2019. Based on the data collected, this study built various predictive models using 651
ML with SVM and ANN algorithms. Moreover, in this research, Twitter data were used 652
to gather public sentiment about stock prices and compare it with the market sentiment. To 653
predict the price movement patterns, several classification techniques were used. In the 654
classification approach, “0” indicated the negative value while “1” indicated the positive 655
value. Hence, if the forecast model expects an increase in the value on the next day, the 656
value of the next day would be “1”. A predicted negative value on the next day would be 657
indicated by a “0”. Additionally, an LSTM was built using a DL network for predicting 658
the stock price, and the accuracies of the ML models and the LSTM model were compared 659
to find the most accurate approach. The result shows a correlation of 0.99, an MAPE of 660
10.75 and Matched Cases of 80%. In comparison to other studies that used the same da- 661
taset, this research reported great performance measures. 662
663
In [42], stock price movements in Indonesia were predicted based on sentiment anal- 664
ysis, technical analysis and fundamental analysis using SVM and NLP. That study had 665
two objectives: predicting the movement of stocks in Indonesia based on sentiment anal- 666
ysis, technical analysis and fundamental analysis using SVM, and measuring their impact 667
on the prediction. The dataset was obtained from nine companies: Astra Agro Lestari 668
(AALI). Astra International (ASII)), Bank Central Asia (BBCA), Merdeka Copper Gold 669
(MDKA), Pakuwon Jati (PWON), Telekomunikasi Indonesia (TLKM), Chandra Asri Pet- 670
rochemical (TPIA), United Tractors (UNTR) and Unilever Indonesia (UNVR). The news 671
sentiments were collected from online media outlets, such as the CNBC Indonesia Twitter 672
account. The historical data of stocks were obtained from the Yahoo Finance website. NLP 673
was used to process human language in sentiment analysis while SVM was used to build 674
the prediction model since it is not readily impacted by data outliers and it can understand 675
complex stock price movement data patterns. The average accuracy rate obtained was 676
65.33%. However, this study could have applied more algorithms to obtain the highest 677
possible accuracy rate. 678
In [43], DL was used to predict the stock market price. That study examined various 679
tactics for projecting future stock prices and used a pre-built model that is tailored to the 680
Moroccan Stock Market as an example. It also compared the outcomes of a single LSTM 681
model, a stacked LSTM model adapted to the Moroccan Stock Market using the BMCE 682
BANK stock price data set and a hybrid model that uses both stacked auto-encoders and 683
sentiment analysis. It was found that DL significantly aided in solving the problem of 684
stock market forecasts; therefore, the study employed LSTM and NNs. The results showed 685
that combining LSTM networks with stacked auto-encoders and sentiment analysis pro- 686
duced results that are suitable for live trading. However, the difficulty was with the 687
amount of data available, which was insufficient for an optimal and profitable DL model. 688
This limitation may be overcome by using data augmentation techniques on current data 689
sets to increase their size and make them suitable for DL projects. 690

Proceedings of Graduation Project Showcase 2022
14 | P a g e
Published In: Journal Of Information And Knowledge Management
ANNs were implemented in [44] to examine the relationship between public senti- 691
ments and the predictability of future stock price development. Three datasets were used 692
from January 2010 to September 2019. The first dataset was the authentic stock prices 693
(Dstock) of three companies (GCB, MTNGH and TOTAL) recorded on the Ghana Stock 694
Exchange. The second was a disorderly dataset, which included 2184 tweets, web news 695
(myjoyonline.com, ghanaweb.com and graphic.com.gh) and 1581 posts. The third dataset 696
contained 263 records from Google Trends, provided by Google. They anticipated the fu- 697
ture stock incentive for a period of 1 day, 7 days, 30 days, 60 days and 90 days. The result 698
was an accuracy ranging from 49.4% to 52.95% based on Google Trends, 55.5% to 60.05% 699
based on Twitter, 41.52% to 41.77% based on a forum post, 50.43% to 55.81% based on web 700
news and 70.66% to 77.12% based on a combined dataset. This study did not achieve as 701
good accuracy as that reported in [3], which also used the ANN algorithm. 702
Another study used the fundamental analysis technique to find future stock trends 703
by considering news articles about Apple published from 1 February 2013 to 2 April 2016 704
[45]. The company’s data is prime and it tries to classify news as good (positive) and awful 705
(negative). The study implemented three classification models and tested them under var- 706
ious scenarios. The findings show that RF returned the best results for all the experiments, 707
with an accuracy ranging from 88% to 92%. The SVM followed with an accuracy of 86%. 708
Naïve Bayes had an accuracy of 83%. The model was able to effectively predict the stock 709
trend in any news article. This presumes that stock patterns can be anticipated by utilising 710
news articles and previous price history due to the model’s high accuracy. However, this 711
study may need to broaden its research focus by adding more company data and by look- 712
ing at the forecast precision. For companies where financial news is inaccessible, the study 713
may use Twitter data for a comparable accuracy, or it can incorporate similar methodolo- 714
gies for algorithmic trading. 715
A model that integrates social media sentiments to predict stock price movements for 716
rising and falling stocks was developed in [46]. SVM handles data efficiently in high di- 717
mensionality and has been shown to perform well in classification. Thus, this study chose 718
SVM with a linear aspect as the prediction model. Several datasets were used for the 719
model. The first was a dataset of historical data prices. The second dataset was the mood 720
information data from social networking sites. Six sets of features were designed to assess 721
the effectiveness of sentiment analysis on message boards: human sentiment, aspect- 722
based sentiment, price only, sentiment classification, joint sentiment/topic-based method 723
and linear discriminant analysis. The results obtained using a topic-sentiment feature 724
were slightly better than those obtained only using sentiments, which had an accuracy of 725
2.54%. Therefore, understanding which topics the sentiments express is very useful in 726
forecasting the stock market. The topic-sentiment feature is better than the sentiment-only 727
feature. The accuracy obtained in this research was only 54.41%, which is unfavourable. 728
Furthermore, one of the weaknesses of their method is that the study only considered the 729
historical price and sentiments taken from social media. It was assumed that they kept 730
trying to find and integrate more factors that could affect stock prices to develop the 731
model with a higher accuracy. 732
A model using sentiment analysis to predict the stock market investment developed 733
by applying ANN for five companies—Apple, Google, Microsoft, Oracle and Facebook— 734
from 1\1\2015 to 22\2\2016 was proposed in [47]. Data were retrieved from Yahoo using 735
the Stock Twits website, which consists of five parameters: opening price, closing price, 736
high price, low price and volume. Validation graphs were used to present the errors using 737
MATLAB to compare the predicted price with the actual price. Four parameters—happy, 738
up, down and rejected—were used to determine if the data was positive, negative or neu- 739
tral. In this study, 75% of the data were used for training, 15% of the data were used for 740
testing and 10% of the data were used for validation. The LM algorithm and MSE for the 741
performance measure were utilised. It would be preferable to use more than one algo- 742
rithm to compare the results and select the best algorithm that outputs the least error. 743
744

Proceedings of Graduation Project Showcase 2022
15 | P a g e
Published In: Journal Of Information And Knowledge Management
After reading 45 research articles in the field of predicting stock market prices using 745
intelligent techniques, we found that many approaches can be employed to predict the 746
stock market price. Each of the reviewed studies proposed a method. Many algorithms can 747
be used for predictions; some studies even proposed a hybrid approach, combining more 748
than one algorithm in their model. While each algorithm differs, the following algorithms 749
are most frequently used to predict stock market prices: SVM, RNN, LSTM, ANN, KNN, 750
LR, and RF. 751
752
Each of the algorithms mentioned above has its advantages; while there is no “best” 753
or “worst” algorithm, there are factors that affect the performance of the algorithm. Thus, 754
before deciding on which algorithm to use, researchers should consider the factors that 755
may affect the outcome, such as: 756
• The size of the available dataset; 757
• Training time; 758
• Accuracy of the desired output; 759
• Number of features available. 760
761
Overall, many factors can affect the final prediction accuracy of each model. Those 762
factors include, but are not limited to, the ones mentioned above. The accuracy of each 763
model can also be improved by providing it with more training. Each of the studies pre- 764
sented in this paper can aid in deciding which algorithm is suitable for each situation. 765
766
3. Comparison and Analysis 767
In the previous section the reviewed articles were classified depending on the histor- 768
ical data, the sentiment data or both. However, some articles can be classified based on 769
several other criteria, including the algorithm used, whether the news was considered and 770
whether the context is local (in Saudi Arabia) or global. Table 1 summarises all previous 771
articles based on these criteria. 772
Table 1: Research comparison & analysis. 773
Authors Year Dataset Algorithm News Result Local/
Global
Selvamu-
thu et al. [3]
2019 Dataset:
1) Tick data of Reliance Pri-
vate Limited.
2) Data from Thomson Reu-
ter Eikon database.
No. Records: approximately
430,000 data points.
Section: Financial section.
Year: from 30 NOV 2017 to
11 JAN 2018.
ANN,
LM,Scaled
Conjugate
Gradient
and Bayes-
ian Regu-
larization
No The algorithms give a
precision of 99.9%.
Every one of LM, SCG,
and Bayesian Regulari-
zation the exactness
over the 15-min da-
taset drops to 96.2%,
97.0%, and 98.9% indi-
vidually.
Global

Proceedings of Graduation Project Showcase 2022
16 | P a g e
Published In: Journal Of Information And Knowledge Management
Zheng et al.
[4]
2017 Dataset: Alpha Vantage API
to access the time series data
of 82 randomly stocks
traded at New York Stock
Exchange.
No. Records: Not men-
tioned.
Section: Not mentioned.
Year: Not mentioned.
Logistic Re-
gression,
Bayesian
Network,
Simple
Neural
Network,
and SVM
No Accuracy rate 70% Global
Pathak et al.
[5]
2020 Dataset: Data of National
Stock Exchange of India
from Kaggle.
No. Records: Not men-
tioned.
Section: Not mentioned.
Year: 2016-2017
RF, SVM,
KNN and
LR
No The best algorithm
was RF with an accu-
racy rate of 80.7%
Global
Alkhatib et
al.[6]
2013 Dataset: The stock infor-
mation of five randomly
choose companies recorded
on the Jordanian stock ex-
change.
No. Records: 1000 records.
Section: Educational, finan-
cial, electrical, investment
sections.
Year: from June 4, 2009, to
December 24, 2009.
KNN No The outcome presents
a decent indication
that the utilization of
data mining methods
could help decision-
makers at different
levels when using
kNN for data exami-
nation.
Global
Sen et al.
[7]
2020 Dataset: historical records of
NIFTY 50 indexes listed in
the National Stock Exchange
of India
No. Records: 50 indexes.
Section: Not mentioned.
Year: 2008-2018.
CNN
No Mean 348.26 for one
week and mean 407.14
for two weeks.
Global
Cao et al.
[8]
2011 Dataset: Shanghai stock mar-
ket.
No. Records: not mentioned.
Section: Not mentioned.
Year: 1999-2008.
ANN No The accuracy in 1999-
2002 with MAD
0.0107, MAPE 0.3125,
and MSE 0.2743.
Global
Liang et al.
[9]
2021 Dataset: Shanghai Stock Ex-
change composite index in
China.
No. Records: 1000 sample.
Section: Not mentioned.
Year: not mentioned.
ANN (RBF
and MLFF)
No Performance of the
RBF is better than
MLFF because the er-
ror of RBF is much
smaller than the MLFF
Global

Proceedings of Graduation Project Showcase 2022
17 | P a g e
Published In: Journal Of Information And Knowledge Management
Abe et al.
[10]
2018 Dataset: MSCI Japan Index
components dataset.
No. Records: 319.
Section: Not mentioned.
Year: from December 1990 to
November 2016.
NN, DNN,
SVR and
Random
Forest
No Deep neural networks
outperform shallow
neural networks in
general, and the top
networks also beat
typical machine learn-
ing models.
Global
Y.Lin et al.
[11]
2021 Dataset: Chinese stock mar-
ket.
No. Records: 65,000.
Section: Not mentioned.
Year: 2000 - 2017
LR, SVM,
KNN, RF,
GBDT and
LSTM
No RF and GBDT have a
good predictive abil-
ity, LR prediction
needs to be improved,
KNN and SVM only fit
in some patterns,
LSTM model has more
unshown advantages.
Global
Ghania et
al. [12]
2019 Dataset: Yahoo Finance for
Amazon (AMZN) stock,
AAPL stock and GOOGLE
stock.
No. Records: January 2019 to
25 July 2019.
Section: Finance and tech-
nology sections.
Year: not mentioned.
LR, 3MMA,
and ES
No LR results were 24.31
3MMA results 21.08,
ES based on LR meth-
odology results were
16.62
Global
Kara et al.
[13]
2011 Dataset: ISE National Index's
daily closing price move-
ment.
No. Records: Not men-
tioned.
Section: Not mentioned.
Year: From January 2, 1997,
through December 31, 2007
ANN and
SVM
No ANN model (75.74%)
SVM model (71.52%).
Global
Oliveira et
al. [14]
2013 Dataset: Economatica, Bra-
zil’s Central Bank,
BM&FBOVESPA and Thom-
son Reuters.
No. Records: 144 observa-
tions per month
Section: Banking Section.
Year: from January 2000 to
December 2011
ANN No Based on the set of er-
ror metrics with win-
dow size equal to 3, as
it presents a POCID
direction correct rate
of 93.62%, and MAPE
of 5.45%.
Global
Lozinskaia
et al. [15]
2017 Dataset: Russian MICEX
stock price index.
No. Records: not mentioned.
Section: financial.
Year: 2002–2016.
neural net-
work mod-
eling and
SVM.
No SVM algorithm pro-
duce better prediction
with
MSE=0.0009, RMSE=
0.0308, MAE= 0.0237,
MAPE= 0.0514,
R2=0.9728, and
cR2=0.5141.
Global

Proceedings of Graduation Project Showcase 2022
18 | P a g e
Published In: Journal Of Information And Knowledge Management
Kumar et
al.[16]
2011 Dataset: India TCS stock
market
No. Records: not mentioned.
Section: financial.
Year: not mentioned.
Genetic Al-
gorithm
(GA)
No Accuracy 99.87% Global
Soni et
al.[17]
2019 Dataset: the stock market
from the earlier year
No. of records: not men-
tioned
Section: not mentioned
Year: 2017
RF, SVM No the best algorithm for
predicting the market
cost of a stock is RF al-
gorithm
Global
Ebadati et
al.[18]
2018 Dataset: Apple, Pepsi, IBM,
McDonalds, and LG
No. of records: not men-
tioned
Section: technology and food
Year: 3-Dec-2014 until
18-Sep-2015
GA with
ANN
No 99.42% SSE 88.75% re-
duction in time
Global
Khan at
al.[19]
2011 Dataset: ACI pharmaceutical
company
No of records: not men-
tioned
Section: pharmaceutical
Year: 31-08-2010 to 30-09-
2010
ANN No highest error rate was
3.28% and lowest was
0.12%
Global
Miah et
al.[20]
2015 Dataset: BEXIMCO Ltd
No. of records: not men-
tioned
Section: conglomerate
Year: 13 days of January
2012
ANN with
fuzzy logic
No highest error rate was
4.8895% and lowest
was 0.3734%
Global
Asad et al.
[21]
2015 Dataset: Istanbul Stock ex-
change (ISE).
No. Records: 100 index.
Section: financial.
Year: not mentioned.
SVM.
No Accuracy is 70%. Global
Wang et al.
[22]
2021 Dataset: Alibaba, Pepsi- co,
VinGroup and Reliance.
No. Records: not mentioned.
Section: commercial.
Year:
Alibaba and Pepsi- co (2014-
2018)
VinGroup (2012-2015)
Reliance (2011-2019)
Linear re-
gression,
Polynomial
regression,
LSTM and
CONV1D
LSTM
No . CONV1D-LSTM al-
gorithm produce bet-
ter prediction with ac-
curcy of (54.17%)
based on Alibaba,
(51.56%) based on
Pepsi-co, (51.38%)
based on VinGroup
and (50.01%) based on
Reliance dataset.
Global
MOGHAR
et al.[23]
2020 Dataset:
New York Stock Exchange
NYSE (GOOGL and NKE).
No. Records: not mentioned.
Section: commercial and
trading
Year:
GOOGL (2004 -2019)
RNN No The result of the test
agrees that the model
can trace the evolution
of the rates of opening
prices for both assets.
Global

Proceedings of Graduation Project Showcase 2022
19 | P a g e
Published In: Journal Of Information And Knowledge Management
NKE (2010 -2019)
Lanbouri et
al. [24]
2020 Dataset: Kaggle
No. Records: 43148
Section: Not mentioned.
Year: 2017 – 2018.
LSTM No Accuracy underneath
50%.
Global
Moghad-
dam et
al.[25]
2016 Dataset: NASDAQ stock
exchange
No. Records: not mentioned.
Section: industry
Year: 2015
ANN No The results show that
there is no difference
between the prediction
ability of the 4 and 8
prior working days as
input parameters.
Global
Oyewola et
al.[26]
2019
Nigerian Stock Exchange
(NSE) utilizing Guaranty
Trust Bank traversing
No. Records: not mention
Section: financial
Year: 2013-2018
LR, RF,
SVM, NN
No Top layer of RF has the
highest accuracy
MAE:0.4929
RMSE:0.6762
MSE:0.4573
MASE:0.2994
Global
Olatunji1 et
al. [27]
2013 Dataset: STC, SABIC and Al-
Rajhi bank
No. Records: 2130 from each
company.
Section: Energy, Telecom,
and banking sections.
Year:
STC: from 27th January 2003
to 22nd December 2010.
SABIC: from 6th January
1993 to 22nd December 2010.
ALRajhi Bank: from 9th Jan-
uary 1993 to 22nd December
2010.
ANN No Very low RMSE (Root
Mean Square Error)
down to 1.8174, very
low MAD (Mean Ab-
solute Deviation)
down to 18.2835, very
low MAPE (Mean Ab-
solute Percentage Er-
ror) down to 1.6476
and very high correla-
tion coefficient of up to
99.9%
Local
Alotaibi et
al. [28]
2018 Dataset: TADAWUL stock
market exchange and oil his-
torical prices
No. Records: not mentioned.
Section: industry section.
Year: 2003-2015.
ANN No Accuracy 75.7%. Local
Alturki et
al.[29]
2020 Dataset: Historical values of
SABIC, Alinma Bank, and
Alrajhi Bank.
No. Records: not mentioned.
Section: Banking section.
Year: from June 2018 to Au-
gust 2019
RNN No The model result was
satisfying contrasted
with obtained utilizing
the buy-and-hold trad-
ing method. So It is
good to think about
more factors to im-
prove the results.
Local
Alenezy et
al. [30]
2021 Dataset: Saudi Arabia stock
market (Tadawul), Saudi
Authority for Statistics, and
Saudi Central Bank
No. Records: 2026
Section: Banking section.
Combining
MODWT
functions
with the
ANFIS
model
No 3.3292731 ME Local

Proceedings of Graduation Project Showcase 2022
20 | P a g e
Published In: Journal Of Information And Knowledge Management
Year: 2011 – 2019
Jarrah et al.
[31]
2019 Dataset: Past data related to
stocks from the stock market
of Saudi (Tadawul)
No. Records: 130000
Section: not mentioned
Year: 2011 – 2016
Combining
(DWT) and
(RNN)
No 0.15996 MAE - 0.03701
MSE - 0.19237 RMSE
Local
Alamro et
al. [32]
2019 Dataset: GDELT developed
by Google and TASI (Tad-
awul All Share Index)
No. Records: not mentioned
Section: not mentioned
Year: not mentioned
LSTM No 0.59 MAE Local
Ghazanfar
et al.[33]
2017 Dataset: Karachi Stock Ex-
change (KSE) and Saudi
Stock Exchange (SSE).
No. Records: not mentioned.
Section: financial.
Year: Apr 2013 to Sep 2013.
SVM,
KNN, Ada-
boost, Na-
ïve Bayes,
Bayesian
Networks,
Multilayer
Perceptron
and RBF.
No Ada-boost, Multilayer
Perceptron and Bayes-
ian Network have
shown good results.
Both
Khan et al.
[34]
2020 Dataset: social media and
news (twitter).
No. Records: 500 indexes.
Section: social media section.
Year: 2016-2018.
SVM Yes Accuracy 80.53%. Global
Al-Rubaiee
et al. [35]
2015 Dataset: all share sectors of
Saudi stock market that exist
in Tadawul website.
No. Records: 3335 records.
Section: social media section.
Year: from 17-3-2015 until
10-5-2015.
naive
bayes,
SVM, and
KNN
Yes The best results ob-
tained:
Recall for SVM: 95.71
Precision for KNN:
95.91.
Local
Moukalled
et al. [36] 2019 Dataset: AAPL, GOOGL,
AMZN and FB from Reuters
platform
No. Records: not mentioned.
Section: Trading.
Year: from January-01-2008
to December 31-2017
RNN,
DNN, SVM
and SVR
Yes Accuracy rate for SVM
APAPL: 82.91%
GOOGL:80.34%
AMZN:75.27%
FB:75%
Global
Patel et al.
[37]
2021 Dataset: India stock market
prices
No. Records: not mentioned.
Section: Financial
Year: 2020
ANN, Ran-
dom For-
est, KNN,
SVM, and
LSTM
Yes accuracy of KNN is
70%
accuracy of LSTM is
63%
accuracy of Random
Forest is 80%
Global

Proceedings of Graduation Project Showcase 2022
21 | P a g e
Published In: Journal Of Information And Knowledge Management
Giani et al .
[38]
2021 Dataset: stock price data was
taken from Yahoo Finance
and the Twitter data was ob-
tained from fol-
lowthehashtag
No. Records: not mentioned.
Section: Financial
Year: not mentioned.
NNs based
on LSTM
Yes accuracy of NNs is
76.14%.
Global
Kar-
lemstrand
et al. [39]
2021 Dataset: Historical stock val-
ues, technical indicators, and
Twitter attribute
No. Records: not mentioned
Section: social media, and
more
Year: historical stock price
data from Yahoo Finance for
up to 10 years
Neural net-
work with
LSTM
Yes 0.13 MSE Global
Pinheiro et
al. [40]
2017 Dataset:
1) Stock price data for all
S&P 500 from Thomson Reu-
ters Tick History
2) Financial news collected
from Reuters and Bloomberg
No. Records: not mentioned.
Section: Financial
Year: Financial news was
from October 2006 to No-
vember 2013
RNN and
NLP
Yes The outcomes suggest
that the utilization of
character-level embed-
dings is competitive
and promising with
more difficult models,
which use technical
pointers and occasion
extraction methods
with the news articles.
Global
Mehtab et
al. [41]
2019 Dataset: Daily historical data
of NIFTY 50 index during
January 2, 2015, till June 28,
2019, of India and twitter.
No. Records: 50 indexes.
Section: not mentioned.
Year: 2015- 2019.
SVM, ANN
and LSTM
Yes Correlation 0.99,
MAPE 10.75, and
Matched Cases 80%.
Global
AR-
DIANTA et
al. [42]
2021 Dataset: Nine companies
from Yahoo Finance website:
Astra Agro Lestari (AALI,
Astra International (ASII),
Bank Central Asia (BBCA),
Merdeka Copper Gold
(MDKA), Pakuwon Jati
(PWON), Telekomunikasi
Indonesia (TLKM), Chandra
Asri Petrochemical (TPIA),
United Tractors (UNTR),
Unilever Indonesia (UNVR).
As well as Twitter accounts
like CNBC Indonesia.
No. Records: 124 transac-
tions per day.
Section:
Agriculture, Miscellaneous
Industry, Finance, Mining,
SVM and
NLP
Yes The average accuracy
rate was 65,33%.
Global

Proceedings of Graduation Project Showcase 2022
22 | P a g e
Published In: Journal Of Information And Knowledge Management
Property, Real Estate, and
Building Construction, Infra-
structure, Utilities, and
Transportation, Basic Indus-
try and Chemicals, Trade,
Service, and Investment, and
the Consumer Goods Indus-
try Sectors.
Year: from 6 July 2020 to 11
January 2021.
Kadiri et al.
[43]
2019 Dataset: BMCE BANK
No. Records: not men-
tioned.
Section: Financial
Year: 2016-2018
LSTM Yes RSM is equal to 2.04 Global
Nti et al.
[44]
2020 Dataset:
1) Authentic stock prices of
three companies (GCB,
MTNGH, and TOTAL)
2) Tweeter, web news
(myjoyonline.com, ghana-
web.com, and
graphic.com.gh), and post-
gathering.
3) Google trends
No. Records:
263 records from Google
trends
1581 post-gathering.
2184 tweets
Section: social media, Finan-
cial.
Year: from January 2010 to
September 2019.
ANN Yes accuracy of (49.4–52.95
%) based on Google
trends, (55.5–60.05 %)
based on Twitter,
(41.52–41.77 %) based
on a forum post,
(50.43–55.81 %) based
on web news, and
(70.66–77.12 %) based
on a combined dataset.
Global
Joshi et al.
[45]
2016 Dataset: Apple Inc. Com-
pany’s data.
No. Records: not mentioned.
Section: social media.
Year: from 1 Feb 2013 to 2
April 2016.
Sentiment
detection
algorithm
Yes Random Forest
worked admirably go-
ing from 88% to 92%
accuracy. The SVM ac-
curacy around 86%.
Naive Bayes algorithm
execution is around
83%.
Global
Nguyen et
al .[46]
2015 Dataset: Tow dataset, histor-
ical price from Yahoo Fi-
nance and mood infor-
mation from Twitter
No. Records: not men-
tioned.
Section: Financial.
Year: from July 23, 2012, to
July 19, 2013
SVM Yes accuracy is 54.41% Global

Proceedings of Graduation Project Showcase 2022
23 | P a g e
Published In: Journal Of Information And Knowledge Management
Khatri et al.
[47]
2016 Dataset: Apple, Google, Mi-
crosoft, Oracle, and Face-
book.
No. Records: Not men-
tioned.
Section: Technology
Year: from 1/1/2015 to
22/2/2016.
ANN Yes MSE for Apple: 0.14
MSE for Google: 0.27
MSE for Microsoft:
0.18
MSE for Oracle: 0.22
MSE for Facebook:
0.28
Global
774
Table 2 displays the most popular intelligent algorithms that were used in prior stud- 775
ies, as well as the outcomes of each algorithm. 776
Table 2: Common Intelligent Algorithms Applied. 777
Algorithm Papers that Applied it No. of Articles Result
KNN [5] [6] [11] [33] [35] [37] 6 Accuracy = 70%
Logistic Regression [4] [5] [11] [12] [26] 5 Accuracy = 78.6%
Simple Neural Net-
work
[4] 1 It is difficult to config-
ure and takes a while to
train
SVM [4] [5] [11] [13] [15] [17]
[21] [26] [33] [34] [35]
[36] [37] [41] [42]
15 Accuracy = 82.91%
Random Forest [5] [10] [11] [17] [26]
[37]
6 Accuracy = 80.7%
ANN [3] [8] [9] [13] [14] [19]
[20] [25] [27] [28] [37]
[41] [44] [47]
14 Accuracy = 77.12%
Bayesian Regulariza-
tion
[3] 1 Accuracy = 98.9%
CNN [7] 1 Mean for one week=
348.26
Mean for two weeks =
407.14
GBDT [11] 1 GBDT has a good pre-
dictive ability for short-
term prediction
RNN
Or
LSTM
[23] [29] [31] [36] [40]
[11] [22] [24] [32] [37]
[38] [39] [41] [43]
5
9
Accuracy = 81.3%
Combining MODWT
with ANFIS
[30] 1 3.3292731 ME
SVR [10] [36] [40] 3 Accuracy = 79.2%
NLP [40] [42] 2 Good performs and
simple in implementa-
tion
NN [10] [26] 2 Accuracy = 62.37%

Proceedings of Graduation Project Showcase 2022
24 | P a g e
Published In: Journal Of Information And Knowledge Management
DNN [10] [36] 2 Accuracy = 81.32%
3MMA [12] 1 21.08 average absolute
error
ES [12] 1 16 average absolute er-
ror
LM [3] 1 Accuracy = 96.2%
SCG [3] 1 Accuracy = 98.9%
Bayesian Network [4] [33] 2 It has shown a good re-
sult.
DWT [31] 1 Combining DWT and
RNN = 0.15996 MAE,
0.03701 MSE, 0.19237
RMSE
Sentiment Detection
Algorithm
[45] 1 Accuracy was going
from 88% to 92%
Naïve Bayes [33] [35] 2 Precision: 56.28
Recall: 73.59
Genetic Algorithm
(GA)
[16] 1 Accuracy 99.87%
Combining GA with
ANN [18] 1 99.42% SSE 88.75% reduc-
tion in time
Linear Regression [22] 1 Accuracy 55.97%
Polynomial Regres-
sion
[22] 1 Accuracy 52.81%
CONV1D LSTM [22] 1 Accuracy 54.17%
Ada-boost [33] 1 It has shown a good re-
sult.
Multilayer perceptron [33] 1 It has shown a good re-
sult.
RBF [33] 1 It has shown a good re-
sult.
778
Table 3 lists all the datasets that were used in previous studies, as well as the type of 779
dataset and the number of studies that have used it. 780
781
Table 3: Common Dataset Used. 782
Dataset/Company/Website No. of Research Historical Data / News
The Jordan steel company (JOST) [6] Historical Data
Irbid district electricity (IREL) [6] Historical Data
Arab international for education and investment
(AIEI)
[6] Historical Data
Arab financial investment (AFIN) [6] Historical Data
kaggork Stock Exchange [4] Historical Data
Data of National Stock Exchange of India from
Kaggle
[5] Historical Data
Tick data of Reliance Private Limited [3] Historical Data

Proceedings of Graduation Project Showcase 2022
25 | P a g e
Published In: Journal Of Information And Knowledge Management
Thomson Reuter Eikon database [3] Historical Data
Stock Exchange of India [7] [37] Historical Data
Shanghai stock market [8] Historical Data
Shanghai Stock Exchange composite index in
China
[9] Historical Data
MSCI Japan Index components dataset [10] Historical Data
Chinese stock market [11] Historical Data
Yahoo Finance for Amazon (AMZN) stock [12] [36] Historical Data
Apple stock [12] [36] [45] [47] Historical Data
GOOGLE stock [12] [23] [36] [47] Historical Data
ISE National Index's daily closing price move-
ment.
[13] Historical Data
Economatica, Brazil’s Central Bank,
BM&FBOVESPA and Thomson Reuters.
[14] Historical Data
BEXIMCO Ltd [20] Historical Data
NKE [23] Historical Data
Kaggle [24] Historical Data
NASDAQ stock exchange [25] Historical Data
STC Dataset [27] Historical Data
SABIC Dataset [27] [29] Historical Data
AlRajhi Bank [27] [29] Historical Data
TADAWUL stock market exchange and oil histori-
cal prices
[28] Historical Data
Alinma Bank [29] Historical Data
Saudi Central Bank [30] Historical Data
Saudi Authority for Statistics [30] Historical Data
Saudi Arabia stock market (Tadawul) [30] [31] Historical Data
GDELT developed by Google [32] Historical Data
TASI (Tadawul All Share Index) [32] Historical Data
Social media and news (twitter) [34] News
Twitter posts of all share sectors of Saudi stock
market that exist in Tadawul website.
[35] News
Facebook Shares [36] [47] News
stock price data was taken from Yahoo Finance
and the Twitter data was obtained from follow the
hashtag
[38] Historical Data and news
Historical stock values [39] Historical Data
Twitter attribute [39] News
Stock price data for all S&P 500 from Thomson
Reuters Tick History
[40] Historical Data
Financial news collected from Reuters and Bloom-
berg
[40] News
Daily historical data of NIFTY 50 of India and
twitter.
[41] Historical Data and news

Proceedings of Graduation Project Showcase 2022
26 | P a g e
Published In: Journal Of Information And Knowledge Management
Astra Agro Lestari (AALI) from Yahoo finance
website
[42] Historical Data
Astra International (ASII) from Yahoo finance
website
[42] Historical Data
Bank Central Asia (BBCA) from Yahoo finance
website
[42] Historical Data
Merdeka Cooprt Gold (MDKA) from Yahoo fi-
nance website
[42] Historical Data
Pakuwon Jati(PWON) from Yahoo finance website [42] Historical Data
Telekomunikasi Indonesia (TLKM) from Yahoo fi-
nance website
[42] Historical Data
Chandra Asri Petrochemical (TPIA) from Yahoo
finance website
[42] Historical Data
United Tractors (UNTR) from Yahoo finance web-
site
[42] Historical Data
Unilever Indonesia (UNVR) from Yahoo finance
website
[42] Historical Data
Twitter account like CNBC Indonesia [42] News
BMCE BANK [43] Historical Data
Authentic stock prices of GCB [44] Historical Data
Authentic stock prices of MTNGH [44] Historical Data
Authentic stock prices of TOTAL [44] Historical Data
2184 tweets, web news (myjoyonline.com, ghana-
web.com, and graphic.com.gh), and 1581 post-
gathering.
[44] News
Google trends [44] Historical Data
Information from social networking sites [46] News
Oracle [47] Both
Microsoft [47] Both
Russian MICEX stock price index [15] Historical Data
Stock of TCS and Infosys [16] Historical Data
Apple [18] Historical Data
Pepsi [18] Historical Data
IBM [18] Historical Data
McDonalds [18] Historical Data
LG [18] Historical Data
ACI pharmaceutical company [19] Historical Data
Istanbul Stock exchange. [21] Historical Data
Alibaba [22] Historical Data
Pepsi- co [22] Historical Data
VinGroup and Reliance [22] Historical Data
Karachi Stock Exchange [33] Historical Data
Saudi Stock Exchange [33] Historical Data

Proceedings of Graduation Project Showcase 2022
27 | P a g e
Published In: Journal Of Information And Knowledge Management
Nigerian Stock Exchange (NSE) utilizing Guar-
anty Trust Bank traversing
[26] Historical Data
783
4. Conclusions 784
People with different levels of knowledge and different backgrounds invest in the 785
stock market. In fact, the stock market offers great opportunities to make money. How- 786
ever, investing may involve great risks that might result in heavy losses. The availability 787
of obtaining accurate data in a timely manner could be the key factor in avoiding losses 788
and generating profits. Thanks to the 4th industrial revolution, several approaches, in- 789
cluding AI, ML and DM techniques, were developed for processing historical data in or- 790
der to generate formative knowledge that might help in decision making. These data pro- 791
cessing techniques (AI, DM and ML) have been proven to be effective in several domains, 792
and the stock market is no exception. 793
This article critically explored several intelligent techniques used to analyse historical 794
data and sentiment data that might affect stock market prices. Thus, it can serve as a start- 795
ing point for researchers and stock market experts who are interested in developing intel- 796
ligent techniques to predict stock prices. KNN, NN, SVM, Bayesian Network, DT and 797
other methods are among the different intelligent algorithms that have been used to create 798
intelligent stock market price prediction models. This article concluded that although 799
static intelligent algorithms have been shown to be effective, a robust model has not yet 800
been developed because these static approaches employ a static dataset and the produced 801
model cannot learn new knowledge after the training phase is completed. Therefore, be- 802
cause the stock market is a dynamic domain, not a static domain, stream DM can be as- 803
sumed to be a new possible direction for building prediction models that can learn new 804
knowledge as soon as it is generated. Furthermore, making use of fog and edge computing 805
will speed up the ability to collect, pre-process and analyse data in a timely manner. 806
Amongst other stream data mining algorithms, Hoeffeding Trees, Sliding Window and 807
Ensemble Learning can provide new research directions in order to build models that can 808
be described as strong, lifelong learning models. However, the availability of an accurate 809
training dataset could be one of the possible challenges. In the near future, it is important 810
to explore the capability of stream data mining techniques to develop intelligent stock 811
price prediction models. 812
References 813
[1] N. Klingler, “What Is an AI Model? Here’s what you need to know - viso.ai,” Viso.ai, Jul. 06, 2021. 814
https://viso.ai/deep-learning/ml-ai-models/ (accessed Nov. 19, 2021). 815
[2] S. Ray, “Commonly Used Machine Learning Algorithms | Data Science,” Analytics Vidhya, Sep. 09, 2017. 816
https://www.analyticsvidhya.com/blog/2017/09/common-machine-learning-algorithms/ (accessed Nov. 19, 817
2021). 818
[3] D. Selvamuthu, V. Kumar, and A. Mishra, “Indian stock market prediction using artificial neural networks on 819
tick data,” Financial Innovation, vol. 5, no. 1, p. 16, Dec. 2019, doi: 10.1186/s40854-019-0131-7. 820
[4] A. Zheng and J. Jin, “Using AI to Make Predictions on Stock Market,” Thesis, pp. 1–6, 2017, [Online]. Available: 821
http://cs229.stanford.edu/proj2017/final-reports/5212256.pdf. 822
[5] S. P. Ashwini Pathak, “Study of Machine learning Algorithms for Stock Market Prediction,” vol. 9, no. 06, 2020. 823
doi: 10.4018/978-1-7998-3645-2.ch007. 824
[6] K. Alkhatib, H. Najadat, I. Hmeidi, and M. K. A. Shatnawi, “Stock Price Prediction Using K-Nearest Neighbor 825
Algorithm,” International Journal of Business, Humanities and Technology, vol. 3, no. 3, pp. 32–44, 2013. 826
[7] J. Sen, S. Mehtab, and G. Nath, “Stock Price Prediction Using Deep Learning Models,” no. October, 2020. 827

Proceedings of Graduation Project Showcase 2022
28 | P a g e
Published In: Journal Of Information And Knowledge Management
[8] Q. Cao, M. E. Parry, and K. B. Leggio, “The three-factor model and artificial neural networks: predicting stock 828
price movement in China,” Annals of Operations Research, vol. 185, no. 1, pp. 25–44, May 2011, doi: 10.1007/s10479- 829
009-0618-0. 830
[9] E. Theses and Y. Liang, “Stock Market Forecasting Based on Artificial Intelligence Technology,” 2021. 831
[10] M. Abe and H. Nakayama, “Deep Learning for Forecasting Stock Returns in the Cross-Section,” in Lecture Notes 832
in Computer Science (including subseries Lecture Notes in Artificial Intelligence and Lecture Notes in Bioinformatics), vol. 833
10937 LNAI, 2018, pp. 273–284. doi: 10.1007/978-3-319-93034-3_22. 834
[11] Y. Lin, S. Liu, H. Yang, and H. Wu, “Stock Trend Prediction Using Candlestick Charting and Ensemble Machine 835
Learning Techniques With a Novelty Feature Engineering Scheme,” IEEE Access, vol. 9, pp. 101433–101446, 2021, 836
doi: 10.1109/ACCESS.2021.3096825. 837
[12] M. A. and M. M. Mohammad Umer Ghania, “Stock Market Prediction Using Machine Learning Techniques,” in 838
Advances in Distributed Computing and Artificial Intelligence Journal, Sep. 2019, vol. 8, pp. 192–197. doi: 839
10.1109/ICAC49085.2019.9103381. 840
[13] Y. Kara, M. Acar Boyacioglu, and Ö. K. Baykan, “Predicting direction of stock price index movement using 841
artificial neural networks and support vector machines: The sample of the Istanbul Stock Exchange,” Expert 842
Systems with Applications, vol. 38, no. 5, pp. 5311–5319, May 2011, doi: 10.1016/j.eswa.2010.10.027. 843
[14] F. A. de Oliveira, C. N. Nobre, and L. E. Zárate, “Applying Artificial Neural Networks to prediction of stock 844
price and improvement of the directional prediction index – Case study of PETR4, Petrobras, Brazil,” Expert 845
Systems with Applications, vol. 40, no. 18, pp. 7596–7606, Dec. 2013, doi: 10.1016/j.eswa.2013.06.071. 846
[15] A. M. Lozinskaia and V. A. Zhemchuzhnikov, “MICEX INDEX FORECASTING: THE PREDICTIVE POWER OF 847
NEURAL NETWORK MODELING AND SUPPORT VECTOR MACHINE,” Вестник Пермского университета. 848
Серия «Экономика» = Perm University Herald. ECONOMY, vol. 12, no. 1, pp. 49–60, 2017, doi: 10.17072/1994- 849
9960-2017-1-49-60. 850
[16] R. Choudhry and K. Garg, “A Hybrid Machine Learning System for Stock Market Forecasting,” vol. 20, no. 1, 851
pp. 315–318, 2011. 852
[17] H. N. Shah, “Prediction of Stock Market Using Artificial Intelligence,” in 2019 IEEE 5th International Conference 853
for Convergence in Technology (I2CT), Mar. 2019, no. April, pp. 1–6. doi: 10.1109/I2CT45611.2019.9033776. 854
[18] O. M. Ebadati E. and M. Mortazavi T., “AN EFFICIENT HYBRID MACHINE LEARNING METHOD FOR TIME 855
SERIES STOCK MARKET FORECASTING,” Neural Network World, vol. 28, no. 1, pp. 41–55, 2018, doi: 856
10.14311/NNW.2018.28.003. 857
[19] Z. Haider Khan, T. Sharmin Alin, and A. Hussain, “Price Prediction of Share Market Using Artificial Neural 858
Network ‘ANN,’” International Journal of Computer Applications, vol. 22, no. 2, pp. 42–47, May 2011, doi: 859
10.5120/2552-3497. 860
[20] M. BadrulAlamMiah, “Price Prediction of Stock Market using Hybrid Model of Artificial Intelligence,” 861
International Journal of Computer Applications, vol. 114, no. 13, pp. 1–5, Mar. 2015, doi: 10.5120/20035-1134. 862
[21] M. Asad, “Optimized Stock market prediction using ensemble learning,” in 2015 9th International Conference on 863
Application of Information and Communication Technologies (AICT), Oct. 2015, no. October 2015, pp. 263–268. doi: 864
10.1109/ICAICT.2015.7338559. 865
[22] Q. Wang, K. Kang, Z. Zhang, and D. Cao, “Application of LSTM and CONV1D LSTM Network in Stock 866
Forecasting Model,” Artificial Intelligence Advances, vol. 3, no. 1, pp. 36–43, Apr. 2021, doi: 10.30564/aia.v3i1.2790. 867
[23] A. Moghar and M. Hamiche, “Stock Market Prediction Using LSTM Recurrent Neural Network,” Procedia 868
Computer Science, vol. 170, pp. 1168–1173, 2020, doi: 10.1016/j.procs.2020.03.049. 869
[24] Z. Lanbouri and S. Achchab, “Stock Market prediction on High frequency data using Long-Short Term Memory,” 870
Procedia Computer Science, vol. 175, no. 2019, pp. 603–608, 2020, doi: 10.1016/j.procs.2020.07.087. 871

Proceedings of Graduation Project Showcase 2022
29 | P a g e
Published In: Journal Of Information And Knowledge Management
[25] A. H. Moghaddam, M. H. Moghaddam, and M. Esfandyari, “Stock market index prediction using artificial 872
neural network,” Journal of Economics, Finance and Administrative Science, vol. 21, no. 41, pp. 89–93, Dec. 2016, doi: 873
10.1016/j.jefas.2016.07.002. 874
[26] D. O. Oyewola, E. G. Gbenga Dada, O. E. Olaoluwa, and K. A. Al-Mustapha, “Predicting Nigerian Stock Returns 875
using Technical Analysis and Machine Learning,” European Journal of Electrical Engineering and Computer Science, 876
vol. 3, no. 2, pp. 1–8, Mar. 2019, doi: 10.24018/ejece.2019.3.2.65. 877
[27] S. O. Olatunji, “Forecasting the Saudi Arabia Stock Prices Based on Artificial Neural Networks Model,” 878
International Journal of Intelligent Information Systems, vol. 2, no. 5, p. 77, 2013, doi: 10.11648/j.ijiis.20130205.12. 879
[28] T. Alotaibi et al., “Saudi Arabia Stock Market Prediction Using Neural Network,” International Journal on 880
Computer Science and Engineering, vol. 9, no. 2, pp. 62–70, Feb. 2018, doi: 10.21817/ijcse/2018/v10i2/181002024. 881
[29] F. A. Alturki and A. M. Aldughaiyem, “Trading Saudi Stock Market Shares using Multivariate Recurrent Neural 882
Network with a Long Short-term Memory Layer,” vol. 11, no. 9, pp. 522–528, 2020. 883
[30] A. H. Alenezy et al., “Forecasting Stock Market Volatility Using Hybrid of Adaptive Network of Fuzzy Inference 884
System and Wavelet Functions,” vol. 2021, 2021. 885
[31] M. Jarrah and N. Salim, “A Recurrent Neural Network and a Discrete Wavelet Transform to Predict the Saudi 886
Stock Price Trends,” International Journal of Advanced Computer Science and Applications, vol. 10, no. 4, 2019, doi: 887
10.14569/IJACSA.2019.0100418. 888
[32] R. Alamro, A. M. B, and A. A. B, Predicting Saudi Stock Market Index by Incorporating GDELT Using Multivariate 889
Time Series Modelling, vol. 1097. Cham: Springer International Publishing, 2019. doi: 10.1007/978-3-030-36365-9. 890
[33] M. A. Ghazanfar, S. A. Alahmari, asmeen F. Aldhafiri, A. Mustaqeem, M. Maqsood, and M. A. Azam, “Using 891
Machine Learning Classifiers to Predict Stock Exchange Index,” International Journal of Machine Learning and 892
Computing, vol. 7, no. 2, pp. 24–29, Apr. 2017, doi: 10.18178/ijmlc.2017.7.2.614. 893
[34] W. Khan, M. A. Ghazanfar, M. A. Azam, A. Karami, K. H. Alyoubi, and A. S. Alfakeeh, “Stock market prediction 894
using machine learning classifiers and social media, news,” Journal of Ambient Intelligence and Humanized 895
Computing, no. May, Mar. 2020, doi: 10.1007/s12652-020-01839-w. 896
[35] H. AL-Rubaiee, R. Qiu, and D. Li, “Analysis of the relationship between Saudi twitter posts and the Saudi stock 897
market,” in 2015 IEEE Seventh International Conference on Intelligent Computing and Information Systems (ICICIS), 898
Dec. 2015, pp. 660–665. doi: 10.1109/IntelCIS.2015.7397193. 899
[36] M. Moukalled and W. E. Mohamad, “Automated Stock Price Prediction Using Machine Learning,” 2019. 900
[37] A. Patel, D. Patel, I. Technology, I. Technology, S. Yadav, and I. Technology, “Prediction of stock market using 901
Artificial Intelligence,” 2021. 902
[38] K. Ranawat and S. Giani, “Artificial intelligence prediction of stock prices using social media,” pp. 1–13, Jan. 903
2021. 904
[39] R. Karlemstrand and E. Leckström, “Using Twitter Attribute Information to Predict Stock Prices,” May 2021, 905
[Online]. Available: http://arxiv.org/abs/2105.01402. 906
[40] S. Pinheiro and M. Dras, “Stock Market Prediction with Deep Learning : A Character-based Neural Language 907
Model for Event-based Trading,” 2017. 908
[41] S. Mehtab and J. Sen, “A Robust Predictive Model for Stock Price Prediction Using Deep Learning and Natural 909
Language Processing,” SSRN Electronic Journal, no. January, 2019, doi: 10.2139/ssrn.3502624. 910
[42] E. I. Ardyanta and H. Sari, “A Prediction of Stock Price Movements Using Support Vector Machines in Indonesia,” 911
vol. 8, no. 8, pp. 399–407, 2021, doi: 10.13106/jafeb.2021.vol8.no8.0399. 912
[43] A. K. Yamani, “SCHOOL OF SCIENCE AND ENGINEERING STOCK MARKET PREDICTIONS USING DEEP,” 913
no. April, 2019. 914

Proceedings of Graduation Project Showcase 2022
30 | P a g e
Published In: Journal Of Information And Knowledge Management
[44] I. K. Nti, A. F. Adekoya, and B. A. Weyori, “Predicting Stock Market Price Movement Using Sentiment Analysis : 915
Evidence From Ghana,” vol. 25, no. 1, pp. 33–42, 2020. 916
[45] K. Joshi, B. H. N, and J. Rao, “Stock Trend Prediction Using News Sentiment Analysis,” International Journal of 917
Computer Science and Information Technology, vol. 8, no. 3, pp. 67–76, Jun. 2016, doi: 10.5121/ijcsit.2016.8306. 918
[46] T. H. Nguyen, K. Shirai, and J. Velcin, “Sentiment analysis on social media for stock movement prediction,” 919
Expert Systems with Applications, vol. 42, no. 24, pp. 9603–9611, Dec. 2015, doi: 10.1016/j.eswa.2015.07.052. 920
[47] S. K. Khatri and A. Srivastava, “Using sentimental analysis in prediction of stock market investment,” in 2016 921
5th International Conference on Reliability, Infocom Technologies and Optimization (Trends and Future Directions) 922
(ICRITO), Sep. 2016, pp. 566–569. doi: 10.1109/ICRITO.2016.7785019. 923
924
925

CONFERENCES PAPERS

Proceedings of Graduation Project Showcase 2022
Sa’ah: Creative Eco-Friendly Mobile Application
That Encourages Living Sustainably.
Sara A. Alshaye, Aseel F. Almuhana, Shaima K. Alharbi, Jumanah M. Abudally, Nouf F. Alghamdi,
Dr.Gomathi Krishnasamy, Mona M. Altassan, Fatema S.Shaikh, Ghada M.Alrugaib
Department of Computer Information Systems
College of Computer Sciences & Information Technology
Imam Abdulrahman Bin Faisal University
Dammam, Saudi Arabia
Email {2180005522, 2180003558, 2180005994,
2180004556, 2180003582, gkrishna, maltassan,
gmalrugaib, fsshaikh}@iau.edu.sa
Abstract— In this time and age, with global warming and pollution rising by the minute, encouragement must be given to lessen their effect and protect our planet. Sa’ah app was developed with the hope of making the effort of reducing the waste that gets thrown out every day, easier. It targets three categories of waste reductions; reduce, reuse, and recycle. We reduce the waste by suggesting alternatives to reusing items and recycling them as well as the option of lending them out or simply donating them. Sa’ah app targets all the netizens by
providing a platform for easy access and real time communication between users for instructiveness and bigger support. It solves the problem of having to make more than one connection and more than one action to reach the desired result by giving access to all the solutions needed in just one platform.
Keywords: Mobile Application; System; Recycle; Donation; Borrow;
Image Processing, Eco-Friendly.
I. INTRODUCTION
Recently, this generation has been conscious and highly active in protecting the environment and are aware of the consequences of their waste. Out of the concept of the Arabic word “ سعه” we are aiming to make the effort - of reducing the waste that gets thrown out every day - easier with “Sa’ah” application. Sa’ah targets this generation's passion to live an eco-friendly life by providing three techniques to make use of the objects the user holds, a donation section, a recycling section, and a borrow section. The app aims to lessen the burden of the user when it comes to getting rid of unwanted objects by offering solutions according to the three categories the app holds. Promoting property value via recycling and reuse alternatives, as well as enabling innovative solutions and encouraging handcrafting users are redirected to a variety of charities and contribution sites.

Proceedings of Graduation Project Showcase 2022
II. LITERATURE REVIEW
This section involves several platforms supporting any of the three concepts that Sa’ah app includes, by briefly providing their services compared with Sa’ah Mobile application competitive features.
A. GoGreen
GoGreen [1] is a mobile application that helps the community and keeps the environment clean by providing scanning option that give the user brief information about the product material and will get information about where to throw the waste. as well as users will receive creative “do it yourself” ideas for the scanned product and eventually, the user will receive Eco-friendly suggested alternatives to the product to reduce causing harm to the environment.
The main drawback of GoGreen is that it doesn’t provide communication or a link between the users, as they cannot share their ideas.
B. OFree
OFree [2] is a mobile application developed to give, get or trade FREE stuff locally. It Saves the time by taking unwanted stuff like furniture, electronics, bikes, suitcases, clothing, but no food to a donation center or haggling over the price in an online selling forum. As well as users’ location will be detected to search for nearby traders that want the extra or unwanted stuff, users then can request an item to arrange for pick up. Users can communicate by private chat as they can make comments on the posts.
OFree is only focusing on the give and take concept which might not be a suitable option for all the users, as it doesn’t provide Recycling solutions.
C. Ea’arah Application
Ea’arah [3] is a free platform works in Saudi Arabia through which users can offer services, and items whether for free or not to other people. The user must specify the living area to view the products available in his area. Users can also use the filter to directly identify the product or to search for customized things, determine their need, and contact the seller or product owner to get it through a private chat as they can make comments in the displayed advertisement.
The app’s location span is limited only to Eastern province which could be a drawback for the app, as it’s only supporting the concept of Borrowing.
D. RecycleCoach
RecycleCoach [4] is a mobile application that teaches the users how to recycle in a correct way and how to sort recyclable items. The app begins by conducting a survey to test and correct the knowledge of the user regarding recycling. It offers a search tool for users to search if an item can be recycled or not, and if yes, how to recycle it. The app also contains a calendar for scheduling recycling days and setting reminders. As it contains a discovery zone with a blog that contains information.
The app is not providing creative recycling solutions and the products cannot be scanned, which is considered a main drawback for the app.
E. FreeSpot
FreeSpot [5] is a mobile application that provides a crowd-sharing platform to connect people to free food, clothing, furniture, events and more that would otherwise go
to waste. This effectively reduces both the amount of food and toxic waste while supplementing meals and material necessities for communities in need. Users can make claims on food, events, furniture and more by opening a private chat with the item's poster as they can Join the campaigns created by nonprofits in the area seeking free items to be donated from the communities they support.
What lacks FreeSpot is that users must give and take hand by hand rather than directing the user to a charity.
This paper proposes an application system Combines three Eco-friendly options (Recycling, Donations and Borrowing). Table 1 as shown below summarizes the main similarities and dissimilarities between the proposed system and discussed systems including users of the system.
Table 1: characteristics of common applications compared to Sa’ah.
III. MOTIVATION
Sa’ah Mobile Application solves many environmental issues and provides solutions that could protect our environment. The main objective is to provide easy and creative ways of recycling and reusing, as well as facilitate the donation and borrowing process by easy directing or providing communication between users who have the same interest. We conducted a survey to know how people are conscious and caring about Sa’ah app concept, the survey filled by 245 users, and we received positive feedback.
The role of information systems is vital in this project as it supports decision making and communication coordination and control ad analysis, so it is applied in every stage of the project.
Application aims and objectives are:
1. Raising environmental responsibility and awareness toward excessive waste by providing 3 ways of item utilization: donation, borrowing, and recycling.
2. Reinforcing the concept of property valuation by providing recycling and reusing solutions.
3. Helping lenders or donators to have more space and get
Characteristics Ofree FreeSpot GoGreen RecycleCoach Ea’arah Sa’ah
Private Chat ✓ ✓
✓
Support
Payment
✓
✓
Shared
Dashboard ✓ ✓
✓ ✓ ✓
Free Trading ✓ ✓
✓ ✓
Products
Scanning
Option
✓
✓
Creative
Recycling
Solutions
✓
supports
Donating
✓
✓
Combines
(Recycling,
Donations and
Borrowing)
✓

Proceedings of Graduation Project Showcase 2022
rid of overstocked items, in return saving borrowers’ money by borrowing and donating solutions.
4. Providing creative solutions and reinforcing handcrafting by suggesting different usages for the scanned item using image processing where the image is the input, and the alternative recycling solutions are the output.
5. Allowing users to access the borrow and recycle stream feed with items’
specifications and return policy.
6. Allowing users to comment and share ideas of any feed in the stream.
7. Directing users to several charities and donation platforms.
8. Providing time and date schedule and borrowing period for the borrowed items
IV. METHODOLOGY
The choice of tools used to implement Sa’ah application has been selected according to what will give the user the best experience. Here are the detailed factors that lead to the choice of programming language and database:
A. flutter Programming language
Flutter program allows to produce the application in two operating systems (Android and IOS) using only one programming language and one codebase and provide the system to a wider audience.
B. Firebase Database
The decisions to use a Firebase real-time database were made according to the demand of real-time and rapid response for the user to have the best experience as well as for the purpose of storing and retrieving users’ information to ensure authentication and other functionality securely.
V. IMPLEMENTATION
Sa’ah is a mobile application that runs on IOS and Android operating systems. The system implemented to serve society and the environment by providing alternative methods to make use of any object the user has, a donation section, a recycling section, and a borrow section.
The main users of the application are admin and user. Each of the main users has different functionalities in respect of their need and privilege. A set of user interfaces have been developed allowing the admin to add, delete, update accounts of the users, as well as block keywords that must not be used within the users for ethical reasons and for better service quality. In addition, the admin can add, delete, deny, and approve the posts with the help of the system moderator.
On the other hand, users of Sa’ah application can interact and benefit from services of the application. The set of user interfaces are described below.
• Dashboard interface
The community communicate through a shared dashboard that Contains post and articles and user can navigate to the multiple pages in the app. • Scan interface
Users can use the camera to take a photo of an item or to
choose a photo from the photo library to be scanned. After scanning two options are available, whether to show relative recycling ideas or to show a suitable donation center that accept the scanned item.
• Add New post Interfaces
Users can add a new post and can turn on the camera or choose a photo from the library to upload object’s picture. The user will be provided to choose from three options, ‘Recycling’ option where the post will be posted on ‘Recycle’ dashboard, ‘Donating’ option where the user will be directed to ‘Donate’ interface that includes a set of charities. And if the user chooses the ‘Borrow’ option, then the post will be posted on ‘Borrow’ dashboard.
• Recycle Interfaces
Recycle interface includes the posts and articles that are only related to Recycling. Users can interact with others as they can share posts, save posts, and make comments.
• Donate Interface
Donate interface includes the charities that can accept the items chosen. Users can read a brief about the charity and will be able to contact the charities list shown easily.
• Borrow Interfaces
Borrow interface includes the posts that are only related to Borrowing. Users can share posts, make comments, save posts, mark the post status, and contact traders to loan the items. As well as ‘Borrow’ dashboard can be filtered and sorted according to the user’s preferences.
The figure below shows the System flow diagram of Sa’ah mobile application. See figure1.
Figure 1: System Diagram of Sa’ah application.

Proceedings of Graduation Project Showcase 2022
VI. CONCLUSION
This paper represents Sa’ah app system that provides creative eco-friendly solutions and encourages living a sustainable life. The goal of Sa’ah app is to protect the environment and to help the people live a minimalistic lifestyle that's suitable for the environment. with the harness of technology Sa’ah app aims to serve society and Promote property value via recycling/reuse, borrowing/lending and donating.
VII. Appendix
This survey was conducted on 245 surveyors. it shows the need
for Sa’ah app and shows how acknowledged people are
regarding sustainability and minimalism concepts. The results
of the survey are shown below as Pie chart.
Question 1 (Have you ever tried living an eco-friendly, sustainable life?)
The answers were mostly "Kind of " followed by "Yes " meaning the majority try to be environmentally responsible. See Fig2.
Figure 2 Question 1
Question 2 (Do you suffer from overstocked belongings?)
The answers were mostly "Yes", followed by "No " and "Kind of " having similar percentages. See Fig3.
Figure 3 Question 2
Question 3 (Are you familiar with the concept of “minimalism”?)
Figure 4 Question 3
Question 4 (Have you ever considered donating or borrowing?)
The answers were mostly "Yes" indicating most people are open to the concept of donation ad borrowing. See Fig5.
Figure 5 Question 4
Question 5 (On a scale from 1 to 5 how much do you think alternative ideas of recycling objects will help in protecting the environment?)
The answers were mostly "high effect" meaning that majority agree that Recycling can and will benefit the environment. See Fig6.
Figure 6 Question 5
Question 6 (Have you ever thrown an item away because you didn't know how to reuse or recycle it?)
The answers were mostly "Yes", this gives more reason for why the application should exist and raise awareness on recycling and its alternatives. See Fig7.
The answers were mostly "No" followed by "Yes" meaning that most people don’t know about this concept and the app should be a way to provide such knowledge. See Fig4

Proceedings of Graduation Project Showcase 2022
Figure 7 Question 6
Question 7 (Do you think people have a background on how to recycle?)
The answers were mostly "Kind of" meaning that most people don’t have enough knowledge on how to live an eco-friendly lifestyle. See Fig8.
Figure 8 Question 7
Question 8 (Do you think borrowing items over the internet in Saudi Arabia can be possible?)
The answers were mostly "Yes" indicating that people are open to the idea and are not totally opposed to it as a very little percentage was "No". See Fig 9.
Figure 9 Question 8
Question 9 (Do you prefer to donate through applications or to go to charities themselves?)
The answers were mostly "Through Application" meaning that most people prefer to use apps to donate which correlates with our applications purpose. See Fig 10.
Figure 10 Question 9
Question 10 (Which of these three appeals to you the most?)
The answer mostly "Donating" meaning the majority tend to donate, followed by recycling, and last was borrowing, meaning people have still yet to practice the idea of lending and borrowing. See Fig 11.
Figure 11 Question10
Figure 12 Question 11
Question 11 (On a scale from 1 to 5 what’s the possibility of downloading an application that can help on the three parts above?)
The answers mostly "High possibility" according to the graph, most people find a high possibility of downloading an application that combines all the options. See Fig 12.

Proceedings of Graduation Project Showcase 2022
6 | P a g e
Published In: 2022 8th International Conference on Advanced Computing and Communication Systems (ICACCS) eCF Paper Id: 374899
REFERENCES
[1] GoGreen is an IOS application that monitors your carbon
footprint. download Today to discover your impact.
GoGreen. (n.d.). Retrieved February 28, 2022, from
http://www.gogreenapp.org/
[2] Gfreeapp is a technology related blog that covers the latest
news. Ofreeapp.com. (2021, December 8). Retrieved
February 28, 2022, from https://ofreeapp.com/
[3] Abdulgader, R. (2018, September 27). إعارة. App Store.
Retrieved February 28, 2022, from
https://apps.apple.com/sa/app/%D8%A5%D8%B9%D8%A7%D
8%B1%D8%A9/id1434242614
[4] Save your municipality's recycling program. Recycle Coach.
(n.d.). Retrieved February 28, 2022, from
https://recyclecoach.com/
[5] Co., F. S. (2019, September 1). FreeSpot Co.. App Store.
Retrieved February 28, 2022, from
https://apps.apple.com/sa/app/freespot-co/id1477121194
[6] Resources, Conservation and Recycling | Vol 136, Pages 1-488
(September 2018) | ScienceDirect.com by Elsevier. (2022).
Retrieved 14 February 2022, from
https://www.sciencedirect.com/journal/resources-conservation-
and-recycling/vol/136/suppl/C
[7] Hornik, J., Cherian, J., Madansky, M., & Narayana, C. (1995).
Determinants of recycling behavior: A synthesis of research results.
The Journal Of Socio-Economics, 24(1), 105-127. doi:
10.1016/1053-5357(95)90032-2
ACKNOWLEDGMENT
We would like to start with expressing all our special thanks and gratitude to Allah for his facilitate and patience he gave us during this project and to enlighten our minds with such things that could help a whole community.
The team members would thank the project supervisor Dr. Gomathi Krishna for guidance and continuous supervision and the Computer Information Systems department and the College of Computer Sciences & Information Technology for providing the necessary support and resource.
As a cooperative team member, we would like to express our gratitude to each other for the cooperative and the hard work that been done, and for all the time that have been spent to prepare this project.
[8] Jenkins, R., Molesworth, M., & Scullion, R. (2014). The
messy social lives of objects: Inter-personal borrowing and
the ambiguity of possession and ownership. Journal Of
Consumer Behaviour, 13(2), 131-139. doi: 10.1002/cb.1469
[9] Hopewell, J., Dvorak, R., & Kosior, E. (2009).
Plastics recycling: Challenges and opportunities.
Philosophical Transactions of the Royal Society B: Biological
Sciences, 364(1526), 2115–2126.
https://doi.org/10.1098/rstb.2008.0311
[10] Cohen, S. (2017). Understanding the Sustainable
Lifestyle, 1–4. Retrieved from
https://www.researchgate.net/profile/Steven-Cohen-
4/publication/325273718_Understanding_the_Sustainable_
Lifestyle/links/5b032498aca2720ba098fef6/Understanding-
the-Sustainable-Lifestyle.pdf?origin=publication_detail.
[11] A. Martin-Woodhead, “Limited, considered and
sustainable consumption: The (non)consumption practices
of UK minimalists,” Journal of Consumer Culture, p.
146954052110396, 2021.
[12] A. Bartl, “Moving from recycling to waste prevention:
A review of barriers and enables,” Waste Management
& Research: The Journal for a Sustainable Circular
Economy, vol. 32, no. 9_suppl, pp. 3–18, 2014

Proceedings of Graduation Project Showcase 2022
1 | P a g e
Published In: 5th International Conference on Multi-Disciplinary Research Studies and Education (ICMDRSE-2022)
Aknaf Website: Interactive Website to Automate the
Institution’s Work
1st Bedour Aljindan
Department of Computer Information
System,
College of Computer Science and
Information Technology,
Imam Abdulrahman Bin Faisal
University,
P.O Box 1982
Dammam 31441, Saudi Arabia
4th Renad Alrabeea
Department of Computer Information
System,
College of Computer Science and
Information Technology,
Imam Abdulrahman Bin Faisal
University,
P.O Box 1982
Dammam 31441, Saudi Arabia
2nd Leena Kanadiley
Department of Computer Information
System,
College of Computer Science and
Information Technology,
Imam Abdulrahman Bin Faisal
University,
P.O Box 1982
Dammam 31441, Saudi Arabia
5th Wafa Alsharekh
Department of Computer Information
System,
College of Computer Science and
Information Technology,
Imam Abdulrahman Bin Faisal
University,
P.O Box 1982
Dammam 31441, Saudi Arabia
3rd Renad Alghamdi
Department of Computer Information
System,
College of Computer Science and
Information Technology,
Imam Abdulrahman Bin Faisal
University,
P.O Box 1982
Dammam 31441, Saudi Arabia
Abstract— Technology is occupying a big part of our lives,
which could become an essential part. All institutions these days
need the use of technology to reach their peak and succeed. yet
unfortunately, there is a large percentage of educational centers
and consulting institutions that do not have a digital strategy,
despite the advantages they could gain from technology. A
meeting was held with the administrators of the Aknaf
institution to discuss the problems they are facing. This project
aims to develop a website for Aknaf institution, which is
interesting because Aknaf still performing all their task
manually without any help of technology. Current commercially
available websites do not cater for all requirements. This paper
will help Aknaf institution to make things easier and to achieve
its desired goal to reach the largest segment of beneficiaries and
save operation costs for the institution. However, such a website
can be extended to work in other consultation institutions.
Keywords—Website, Aknaf, QR code, Technology
I. INTRODUCTION
Technology is becoming an essential factor to
organizations; we are living in the digital age that no sector
can deny the fact it is crucial for their organization success.
Digital technologies affect how a company interacts with
consumers and partners, transforming internal processes and
creating opportunities for discovering and implementing new
techniques for company growth [1].
The goal of Aknaf website is to automate the work for the
institution to reach the largest segment of beneficiaries and
save operation costs. The system has three different levels of
users: the admin, the clerks, and the clients. The admin on the
website is the institution manager. The admin can manage
users, programs, digital library, and consultation
appointment. Also, he/she can view and generate reports and
approve payment receipts. The clerk can manage programs,
consultation appointments and reply to the clients. Also,
he/she can generate QR code for the program’s attendance.
The clients can view programs and book an appointment for
a consultation. Only registered clients can view E-books in
the digital library and make the payment. All users can
customize the settings of the website such as choosing the
website color and modifying profile.
The website focusses on the problem associated with fulfilling institution work and reaching clients. It considers in detail the issues that arise due to the lack of a website that brings together all the operations. Thus, it causes the loss of time and effort of the institution’s administrators and the difficulty of communicating with clients.
II. PROBLEM STATEMENT
The aim is to point out the problem to function better.
Aknaf has very primitive ways regarding fulfilling their work
and reaching clients. They still facing difficulty with
documentation, registration, appointment scheduling since
regular activities still manually accomplished. However,
delivering their voices to the public is one of the main issues
that they are facing, they spend many hours recording the
client’s number and sending a message individually which is
a very untechnical way. Moreover, Aknaf needs to analyze

Proceedings of Graduation Project Showcase 2022
2 | P a g e
Published In: 5th International Conference on Multi-Disciplinary Research Studies and Education (ICMDRSE-2022)
their client’s attitude and preferences to increase their profit
by gaining more audiences, which they need reports to help
them make decisions.
Lack of a database prevents Aknaf from reaching their goals and objectives. Creating a database that records the client’s information will make the work easier and more efficient. Moreover, having an official website for the institution will make operations much easier, faster, and attract more clients. the goal is to solve the institution’s problems and make their operations go faster and smoother.
III. LITERATURE REVIEW
This section defines the similar websites that are used in
charities, training centers, and training courses. It discusses
the similarities and differences between some of these
systems, and the proposed system is described.
A. Saudi Cancer Society Website
Saudi cancer society encourages scientific research to stop
and identify the causes of cancer in the Kingdom. The website
provides many features that benefit visitors such as activities
and events, reports, a questionnaire, an introductory film about
the association, premium partners, about the association,
assembly Services, detection centers, translated books, Media
Center, and a staff portal. The website provides appointment
scheduling for earlier cancer detection. First, it requires
answering a few questions such as name, national ID. after
that the user can schedule an appointment [2].
B. Unit Success Skills Training Center Website
Success Skills Training Center is specialized in the field of human development, training, building, and development of human cadres, with its capabilities, equipment, capabilities, expertise, and trainers capable of providing the highest levels of training, is considered one of the most important houses of expertise in the Arab world. Success Skills Training Center provides many courses to teach people how to be successful, they have a big website that includes all the advanced sections and functions such as, who we are, news, articles, library, training bag, our clients, success partner, courses schedule, reports, and calls us. The user is able to view all the available courses and purchase what he needs which they call training bags. Moreover, the Success Skills Training Center display continuous and brief update about their report which include the numbers of the reports they have, the numbers of images, the number of views, and the number of prints, the user can search for a certain report by filling in the required information [3].
C. Droob Course website
Droob is a national platform that is an infinitive of the Saudi Human Resources Development Fund. Droob website allows users to see what courses are available and register at any one of them. No payment is required since all courses are offered for free. The website has an Ad bar and a FAQ page. Registration on the website is done using the national Saudi ID. The website offers courses in many departments such as IT, languages, finance, health, and others. Contacting Droop is done using either filling out a form or contacting them during working hours on their official number [4].
D. Mnar Website
Mnar is a unified electronic platform that allows the
trainee to review training courses in the Kingdom of Saudi
Arabia under one roof, as well as enabling him to view all data
related to training institutes and trainers [5]. The platform
displays the course and important information such as city,
time, price, language, and target group. One of the features is
that customers' comments on the courses can be viewed and
interacted with. It also allows customers to share courses via
social networking sites. There is also a help box on the site
where customers can leave a message for the organization,
whether for inquiries or technical support. When registering
with the platform, customers will receive the latest training
courses via their e-mail.
E. Udemy Website
Udemy is a platform that offers both paid and free courses,
as well as the ability for instructors to create online courses
on their preferred topics. Furthermore, it assists organizations
of all sizes and types in preparing for the path ahead,
wherever it may lead. Courses are available in a wide range
of categories, including business and entrepreneurship,
academics, arts, health, and fitness, language, IT & Software,
and each course has a rating and reviews. When a user
registers on Udemy, a dashboard appears that contains all
training courses for which the user has registered. The Udemy
website saves all purchases made by users and provides a
receipt for each purchase [6].
This paper proposes a website to act as a middle link
between clients and admins. Table 1 as shown below
summarizes the main similarities and dissimilarities between
the proposed system and discussed systems including users
of the system.

Proceedings of Graduation Project Showcase 2022
3 | P a g e
Published In: 5th International Conference on Multi-Disciplinary Research Studies and Education (ICMDRSE-2022)
Table 1: Summary of similarities and dissimilarities
IV. MOTIVATTION
There are several motivations that have encouraged the team members to develop Aknaf Website:
• The website will be a community service since the team members will develop and deliver the website for free.
• The system will be used in real-time under the name of the team.
• It aims to solve a real-life problem and will help Aknaf enhance its performance because it solves a problem that exists in real life.
V. OBJECTIVES
The objective of the project is to create an official
platform for the institution to use. Having a website is
essential for Aknaf to reach its goal and a wider range of
users. By creating a database and a website hoping to help
Aknaf institution work easier, faster, and more efficiently.
• Help Aknaf institution to reach a wide range of
beneficiaries.
• Ease the process of registration.
• Ease in report generation.
• Ease in programs and consultations scheduling.
• Ease in taking attendance of programs through QR code.
• Ease of displaying and selling the institution's
publications, including books and articles.
VI. METHODOLOGY
The tools used to implement Aknaf Website were chosen based on their compatibility with system requirements. Here are the specific considerations that influence programming language, server, and database selection:
A. PHP Programming Language:
PHP is considered the first server-side language that could be embedded into HTML. It allows website pages to load faster. Also, it may be used on any primary operating system.
B. XAMPP Server:
XAMPP enables a local host or server to test its website by computers or laptops before launching it on the main server. It is a simple, flexible, and lightweight tool that can facilitate website testing and development process [7].
C. MySQL Database:
MySQL controls how quickly things load on a website
and how quickly that stored data can be accessed. It has a
direct effect on website performance, making it an essential
part of web design [8].
VII. IMPLEMNTATION
Aknaf is a website for training and consultation that runs
on the iOS and Windows operating systems. This website will
help the Aknaf institution to automate manual activities, and
it will also help to reach a wide range of beneficiaries.
Moreover, it helps the admin to manage the process of
booking consultation appointments for the clients, and the
clerk to manage the attendance of programs through
generating QR codes, the admin can make a better decision
for programs, and consultation appointments by generating
reports. it helps both admin and clerk in scheduling the
program.
Different users of the system have different levels of
authority. Fig.1 shows the main three users of the system and
their functionality. The following section will specify some
features and functions for admin, clerk, and client.
Sys
tem
System users Similarity Dissimilarity
Saud
i C
ance
r
Soci
ety
Patients, Staff
Both systems
provide an appointment
scheduling
- There is no
dashboard for the
users - There is no QR
scanning for
attendance
Succ
ess
skil
ls
Trainers, and clients
Both systems generate reports.
- There is no QR
scanning for
attendance
Dro
ob
Cou
rse
clients
Both systems allow users to
view what
programs are available and
register at any one
of them.
- There is no QR
scanning for attendance
- The system does
not allow viewing customer
comments
Mna
r W
ebsi
te
Clients
Both view clients'
comments.
- There is no
digital library
- There is no QR scanning for
attendance
Ud
emy
Instructors, and
learners
Both offer paid
and free programs.
- There is no QR
scanning for attendance

Proceedings of Graduation Project Showcase 2022
4 | P a g e
Published In: 5th International Conference on Multi-Disciplinary Research Studies and Education (ICMDRSE-2022)
Fig. 1: Aknaf Use Case Diagram
Fig.2: Sequence diagram (generate QR code)
Fig.3: Activity diagram (rating/add comments)
• Schedule program
In the admin interface, the admin will be able to add
a program and schedule it by sign-in into the dashboard
and then clicking on add program, after that she/he will
be able to fill in all the required information about this
program.
• Generate QR code
QR Codes will be generated for clients to check-in
for the offline and online attending programs. The user
who is responsible is the clerk will sign into the account
and choose a program then click on generate QR it will
be generated by the system. Fig. 2 shows demonstrate the
interaction and relationship between the components.
• Digital library
The clients can view the digital library that contains
articles and books and can choose either to view books
or articles. Books will be available only when a client is
registered on the website, they can also purchase a book.
• Rating/add comments
The website will provide feature to rate e-books/articles
and comments, customer can provide feedback to Aknaf team
by leaving a comment or rate e-books/articles. Fig. 3 shows
the workflow.
• Generate report
Generate report interface is for the admin. The system will generate report with information about the programs, consultation appointment, block users. Fig. 4 shows demonstrate the interaction and relationship between the components.

Proceedings of Graduation Project Showcase 2022
5 | P a g e
Published In: 5th International Conference on Multi-Disciplinary Research Studies and Education (ICMDRSE-2022)
Fig.4: Sequence diagram (generate report)
Fig.6: Activity diagram (color change)
• Managing consultation appointment
In the admin interface, the admin will be able to
manage the appointment times and reasons. The admin will receive the suitable time slots for the consultant then the admin will enter the time slots in the appointment sections.
• Payment management system
The clients must register to the website to be able to enroll in Programs or book consolation appointments. Moreover, they can choose a suitable payment method and then fill in the payment information. Finally, pressing enter to validate the credit card if the card is Rejected the website will display a rejected message to the client if approved the website will display a confirmation message, and the client Program will be automatically added to the client Program list. Fig.5 shows demonstrate the interaction and relationship between the components when the client wants to book an appointment.
Fig.5: Sequence diagram (payment management system)
• Color change
Now a days there is awareness of the color-blind issue, so the website will provide the user the ability to change the theme color of the website. The user will click on the settings, then they will have a color picker option. The users can choose a color that is suitable for them. Fig. 6 shows the workflow.

Proceedings of Graduation Project Showcase 2022
6 | P a g e
Published In: 5th International Conference on Multi-Disciplinary Research Studies and Education (ICMDRSE-2022)
VIII. RESULTS
The project began with meeting with the administrators
that need an online system to solve problems and reach out to
a bigger audience. The aim of the project was to develop a
website based on Aknaf institution requests that will allow its
clients to schedule appointments and programs online rather
than the old manual way and to reach more clients than they
currently have. The admin has important functionalities like
generating reports and QR codes that will help the company
achieve its desired goals faster. The team members
successfully planned and managed the project which led to a
successful implementation of the system proposal. The team
has successfully analyzed all requirements and functionalities
of the system and prepared everything needed for the project
implementation.
IX. DISCUSSIONS
In the line with previous studies, after analyzing all
websites we had noticed there isn’t a website that has the QR
scanning functionality which is the main function of Aknaf
that enables the client to scan the QR code by their phones
and confirms their attendance to the course. All websites
found are very well done and easy to use. Some websites have
more functionality than others, while some lack many key
features such as appointment reminders, report generating,
ratings and reviews.
X. CONCLUSION
This paper represents the work required to construct the
Aknaf Website that facilitates communication for the Aknaf
institution administrators and their clients. However, it can
certainly be applied to other institutions. Therefore, the goal
was to employ the available technology to develop websites
that serve institutions for their growth and attract more
audiences. Clients can use the system to view and book the
institution's multiple programs and can also browse the
institution's digital library. The system also facilitated the
process of booking consultation appointments. On the other
hand, this system gives admins to keep track of processes
such as payment approval. And the capability to manage
users, programs, consultation appointments, and digital
library.
The recommended future work is to develop a mobile
application to reach out to a wider range of clients. Also,
adding features like live chat with the clients to make
communication easier.
ACKNOWLEDGMENT
Firstly, we are thankful to Almighty Allah for his grace, his continued bounty, and for getting us accepted into this scientific conference.
It is the team members' pleasure to acknowledge the support and assistance received from the Computer Information Systems department and the College of Computer Sciences & Information Technology. Also, we would like to acknowledge the help of the Aknaf institutions in providing the team with the necessary information.
Additionally, the members of the team would like to express their gratitude, appreciation, and respect for the hard
work, effort, time, and sincerity they have displayed in this project.
REFERENCES
[1] T. Averina et al, "Impact of digital technologies on the company’s business model," E3S Web of Conferences, vol. 244, 2021. Available: https://www.e3s-conferences.org/articles/e3sconf/pdf/2021/20/e3sconf_emmft2020_10002.pdf [Accessed 05 October 2021].
[2] Saudicancer.org. 2021. الجمعية السعودية لمكافحة السرطان. [online] Available at: <https://www.saudicancer.org/> [Accessed 1 October 2021].
[3] Skills, s., 2021. details. [online] Sst5.com. Available at:
<https://sst5.com/> [Accessed 6 October 2021].
دروب" [4] :Doroob.sa, 2021. [Online]. Available ,"برنامج https://doroob.sa/ar/. [Accessed: 06- Oct- 2021].
[5] Mnar.sa. 2021. منار. [online] Available at:
<https://mnar.sa/> [Accessed 6 October 2021].
[6] "Online Courses - Learn Anything, On Your Schedule | Udemy", Udemy, 2021. [Online]. Available: https://www.udemy.com/. [Accessed: 06- Oct- 2021].
[7] P. Kumari and R. Nandal, "A Research Paper OnWebsite Development OptimizationUsing Xampp/PHP," International Journal of Advanced Research in Computer Science, vol. 8, (5), pp. 1231-1235, 2017. Available: https://www.proquest.com/docview/1912631847/9E98A185D4C34882PQ/1?accountid=136546 [Accessed: 06-Nov-2021]
[8] Mysql.com. n.d. Why MySQL?. [online] Available at: <https://www.mysql.com/why-mysql/> [Accessed 8 November 2021].
Proceedings of Graduation Project Showcase 2022
1 | P a g e
Published In: Conference 2d ASIANCON 2022 Pune, India
Flourish: Requirements and Design of an Android
Application Prototype for Various Symptoms
Management in ADHD Patients
1st Sardar Zafar Iqbal
Department of Computer Information
Systems, College of Computer Science
and Information Technology, Imam
Abdulrahman Bin Faisal University,
P.O Box 1982
Dammam 31441, Saudi Arabia
4th Lubna Alghamdi
Department of Computer Information
Systems, College of Computer Science
and Information Technology, Imam
Abdulrahman Bin Faisal University,
P.O Box 1982
Dammam 31441, Saudi Arabia
7th Hina Gull
Department of Computer Information
Systems, College of Computer Science
and Information Technology, Imam
Abdulrahman Bin Faisal University,
P.O Box 1982
Dammam 31441, Saudi Arabia
2nd Aroob Alkarni
Department of Computer Information
Systems, College of Computer Science
and Information Technology, Imam
Abdulrahman Bin Faisal University,
P.O Box 1982
Dammam 31441, Saudi Arabia
5th Monera Almokainzi
Department of Computer Information
Systems, College of Computer Science
and Information Technology, Imam
Abdulrahman Bin Faisal University,
P.O Box 1982
Dammam 31441, Saudi Arabia
8th Ruba Alsalah
Department of Computer Information
Systems, College of Computer Science
and Information Technology, Imam
Abdulrahman Bin Faisal University,
P.O Box 1982
Dammam 31441, Saudi Arabia
3rd Jumana Aleleyo
Department of Computer Information
Systems, College of Computer Science
and Information Technology, Imam
Abdulrahman Bin Faisal University,
P.O Box 1982
Dammam 31441, Saudi Arabia
6th Rayanh Alyami
Department of Computer Information
Systems, College of Computer Science
and Information Technology, Imam
Abdulrahman Bin Faisal University,
P.O Box 1982
Dammam 31441, Saudi Arabia
9th Maryam Temitayo Ahmed
Department of Computer Information
Systems, College of Computer Science
and Information Technology, Imam
Abdulrahman Bin Faisal University,
P.O Box 1982
Dammam 31441, Saudi Arabia
Abstract— With the advancement of technology, we continue
to discover new ways of providing technological solutions in a
variety of fields. Healthcare is one of those fields that can benefit
from technology. With the assistance of technology, the healthcare
field can perform new discoveries, collect more data on symptoms
of diseases, and provide greater support and care to their
patients.[1][2] ADHD (Attention-Deficit/Hyperactivity Disorder)
is a neurodevelopment disorder that is typically identified during
childhood and lasts into adulthood. Lack of focus, inability to sit
still for long periods of time, forgetfulness, impulsivity, time
management difficulties and disorganization, and emotional
dysregulations are some of the early indications of this illness.
Currently, pharmaceutical and nonpharmacological therapies are
used to treat ADHD patients [3]. However, in addition to medical
diagnosis and treatment, it is one of the diseases in which patients
can benefit from technological solutions such as time
management, task management, mindfulness, etc. In this paper,
we propose the requirements and design of a mobile application
called "Flourish," which is aimed at individuals with Attention-
Deficit/Hyperactivity Disorder (ADHD) to help them better
manage their symptoms and understand how they behave. This
application will be divided into sections to assist users in dealing
with the various symptoms experienced by ADHD patients. It
includes time management and organization, mindfulness and
relaxation, a platform for communicating with other ADHD
patients and specialists, habit tracking, and behavioral patterns.
In the future, we intend to develop a fully working real-time
Android application that will be available to assist patients in
managing their symptoms.
Keywords—ADHD, Use Case Diagram, Android OS, Prototypes,
Communication Platform, mobile application, artificial
intelligence, Axure Software.
I. INTRODUCTION
Attention-Deficit/Hyperactivity Disorder (ADHD) is a
neurodevelopment disorder that is typically identified during
childhood and lasts into adulthood [4]. The world health
organization (WHO) prioritizes the ADHD problem because
if individuals with ADHD are not treated early on, the
symptoms will have an impact on learning and other activities
throughout their lives, especially in youngsters [5]. The early
symptoms of this condition include a lack of focus, being
unable to remain still for a long period of time, forgetfulness,
impulsivity, time management difficulties and
disorganization, and emotional dysregulations [6][7]. ADHD
patients can depict these symptoms all at once and diagnosis

Proceedings of Graduation Project Showcase 2022
2 | P a g e
Published In: Conference 2d ASIANCON 2022 Pune, India
is done through medical tests that include hearing and vision
examinations. The treatment is usually a combination of both
behavioral therapy and medication [8]. Along with treatment
adherence, patients may still need external assistance, this
had led our team to develop the concept of “Flourish” which
is an application meant to provide better support to ADHD
patients without needing to rely on other people. With the
help of technology, we aim to provide an improved quality of
life to the patients by giving them a tool that helps them with
their daily struggles. There have been a variety of studies and
projects that all have the same goal, helping ADHD patients.
In this paper we explore the different systems that have been
developed for those purposes as well as explaining how
“Flourish” is being developed with multiple features that give
support to ADHD patients and also allows them to be more
independent. The
application will consist of four main sections which are:
organization and management, mindfulness and relaxation, a
platform that connects them with others, and lastly a section
that focuses on habit tracking and behavioral patterns which
is an important part in managing the symptoms of ADHD.
The management and organization section will help in
organizing and prioritizing tasks to make an efficient and
effective timetable. The mindfulness and relaxation section
will help them with their emotional instability, the users will
be able to alleviate their symptoms by going through a
wonderful experience which will help them be more relaxed
and comfortable. ADHD patients need to feel contained, so
Flourish will give them a platform that will enable the
patients to communicate with one another and to also
communicate with specialist in the ADHD field (doctors,
counsellors, coaches...etc.) this can be achieved through
direct messaging between users on the application. The last
section which tracks habits, and any behavioral patterns can
aid in the diagnosis or treatment process.
II. BACKGROUND AND LITERATURE REVIEW
ADHD patients face several challenges in their life, from
time management issues to feeling isolated finding the
community who faces the same problems and so on [9]. In
order to help them and make their life easier we used the
power of technology. Many applications were developed to
help them, but each application was specified to solve one
problem, therefore we decided to build an application that
combines all the separate functionalities in one application,
and we added more ideas to improve the experience of the
users. The goal is to provide a platform that contains all the
resources that can help ADHD patients in an effective
manner. The following is a description of existing real-life
systems that were designed to help ADHD patients, along
with the features and limitations of these systems.
A. Brili Routines - ADHD Habit Tracker
This application meant to help ADHD patients achieving
their daily tasks, support them whenever they feel sad and
overwhelmed, and help them to have and build healthy
routines and habits. The limitation of this application is that
it is not free and there are some privacy issues regarding
accessing the photos [10].
B. ADHD - Cognitive Research
The application is made to collect participations from people
who wants to be involved in an ADHD scientific study. Users
can get their evaluation after finishing the assessment and
download the results. The limitation is that there are no other
features that ADHD patient can enjoy or benefit from in the
application [11].
C. My ADHD
My ADHD application provides diagnostic test to help the
users who are curious to see the results. It provides ARSA 1
for adult users, and SNAP-IV for younger users. The
application has three main sections: articles about ADHD,
techniques, and the diagnostics tests. The limitations are that
the application does not include the references of the articles
that it is showing, along with that these articles are limited,
and it is not informative enough for ADHD patients [12].
D. Brain Focus
The application helps ADHD patients to manage their time
and encourage them to finish their tasks. Users can also group
their tasks together based on certain categories, it also
supports multiple languages, and users can receive
notifications when their work session is done. The limitation
here is that there are some issues with the timer, where users
cannot edit the time after setting it [13].
E. SimpleMind
This application uses diagrams and maps to organize user’s
thoughts and illustrate them with the maps they desire. The
users can draw and create as complex diagrams as they want
and keep track with their ideas and thoughts, but the only
limitation with this application is that it is not free [14].
F. ProductiveHabit Tracker
It is also an application that helps users to build healthy habits
and keep track with the progress using statistics and
encourage them to achieve their goals. It is fully
customizable, and it demonstrates a summary of the user’s
tasks and gives them a reminder when there is a delay in
accomplishing the task. The limitation with this application
is that it is not easy to use, and it might be difficult to navigate
through especially for novice users [15].
G. Due Reminders & Timers
This application has the goal to make sure that all the
commitments and obligations of the users are met and on
time. It keeps reminding users of the tasks that they need to
accomplish and keep track of their progress. It has deferent
features where users can countdown the timer, snooze the
notifications, synchronize their tasks with other devices, and
it has many themes that the user can pick from. The limitation
is that the application is not free, and it is not available for
Android phones users [15].
Finally, the Flourish application is designed with the goal of
providing an easy-to-use platform for ADHD patients while
also combining all the resources that they might need in one
place. The application consists of four main sections:
Behavior Tracking, Mindfulness and Relaxation, Time
Management, and Communication. The features of the
application are as follows: it only works for Android devices,

Proceedings of Graduation Project Showcase 2022
3 | P a g e
Published In: Conference 2d ASIANCON 2022 Pune, India
it allows users to have the community of other ADHD
patients and having the ability to communicate with them, it
also helps users with their tasks and organize them in
categories that they desire, and it helps users by providing
them with methods and techniques to regulate their emotions
and have a visualization of their behavioral patterns.
III. PROBLEM STATEMENT
ADHD patients are prone to facing challenges daily, those
challenges can vary from time management and organization
challenges to emotional dysregulation challenges, in addition
to such issues they can feel overwhelmed with the number of
tasks and obligation they need to complete all at once, this
can likely lead to missing important deadlines or big events.
Research shows that people with ADHD face many troubles
regarding emotional dysregulation as they experience several
symptoms such as mood fluctuations, irritability, and temper
tantrums [14]. Due to that kind of distress, they often require
external assistance to be able to stay motivated and no
succumb to their emotions, however that kind of support from
individuals may not always be available to them as they aren’t
always surrounded by people to do so [16]. Therefore, we
have proposed the concept of “Flourish” which can provide
support and availability at all times of the day. The main goal
of the project is to give individuals with ADHD a tool that
allows them to be more independent, gives them the support
they need throughout the day, and to also lessening the
feelings of isolation they may face by providing a platform
where they can communicate with others who experience the
same struggles as them [17].
IV. PROPOSED MODEL STRUCTURE
The proposed model is an artificial intelligence-based
Android application. The goal of a Flourish app is to help
users prioritize their chores based on two factors: deadlines
and difficulty. After that, the user will be given a schedule
with their duties prioritized, allowing them to conveniently
begin and complete tasks. A reward will be given once each
activity is done to serve as motivation. The model structure,
on the other hand, Users may have trouble remembering what
they need to accomplish, so there will be a reminder that will
send an alert when the task approaches its deadline. Other
types of support, such as emotional support, a space to speak
with other ADHD patients or healthcare experts and
specialists, and a component that helps patients track their
habits and uncover their behavioral patterns, will all be
available through our applications.
A. Use case diagram
The use case diagram includes each functional requirement
listed in detail in a table that included the requirement
number, type, name, description, rationale, priority, and
dependencies. Other non-functional requirement included:
Figure 1. system design
Figure 2: Use case diagram

Proceedings of Graduation Project Showcase 2022
4 | P a g e
Published In: Conference 2d ASIANCON 2022 Pune, India
performance requirement, safety requirement, usability,
security requirement, and software quality attributes will be
considered while developing the real time application [18].
B. Requirements and Functions.
The following functionalities will be included in the
proposed mobile application.
A. Task management
The user can input the key tasks they need to complete,
as well as their importance level, and these activities will be
organized properly.
B. Mindfulness and Relaxation
This section contains an explanation of the functional needs and their relevance in assisting ADHD patients with emotion regulation. This feature aids the system in recognizing the problem and suggesting several approaches or tactics for resolving it.
C. Communication Platform
This section describes the functional criteria for
improving communication between patients and other users.
Help patients and monitors to communicate directly.
D. Habit Tracking and Behavioral Patterns
This part will store the ADHD patients' behavioral
patterns and follow their activities. This requirement assists
the user in better understanding what they are doing and
how they act.
E. Manage post
The user can update, remove, or add more information to
their thread. Patients can also respond to one another's
threads. Monitors have the ability to respond as well. Users
can report any objectionable discussions or comments. It aids
in the changing of threads so that others may comprehend
what the sufferer is writing. Patients can help each other by
posting to posts, while monitors can write advise and assist
patients by reacting to threads. With reporting, the
application's quality and efficiency will be improved, as well
as user respect.
V. USER CLASSES AND CHARASTRISTICS
The Flourish app provides services to two categories of
users: children (up to the age of 12) and adult patients (from
13 and above). If the user is a child, their parents or caregivers
will be responsible for logging in and using the application's
capabilities, as children are not allowed to use electronics (as
recommended by doctors), and they have nearly the same
functionality as older users. Older users, on the other hand,
can access all the app's features. There are also administrators
who can oversee the system's users.
VI. SYSTEM DESIGN (PROTOTYPE)
To illustate the interfaces of the application a prototype
was created using the Axure software, the main
interfaces are shown in the figures below along with
breif descriptions of their purpose.
3. Task interface
Figure 4 shows the interface for the organization section where
the user is able view their pending tasks and their progress
Figure 4. Task interface
1. Splash screen
The interface below is the first thing that showed once the
user clicks on the application, it shows the logo of the
application and the logo of the University.
Figure 3. Flash screen interface
2. Login interface
The login interface which allows the user to sign in or sign
up if they don’t have an account to access the features.
Figure 3. Login interface

Proceedings of Graduation Project Showcase 2022
5 | P a g e
Published In: Conference 2d ASIANCON 2022 Pune, India
6. Behavioral patterns interface
Below interface shows the pattern in a diagram for the
user to make it clearer and helps to track their behavior.
7. Recommended technique interface
Whenever the user feels uncomfortable, through these
interfaces they can handle this feeling. Above interface
displays the result and the application’s recommendation.
It also shows the name of technique and its steps to the
user.
VII. CONCLUSION
The advent of a wide variety of mobile apps that demand
usable interfaces has fueled the rise of mHealth due to the
rapid distribution of smart mobile devices and their immense
potential. This work comprises a requirement description and
prototype for an Android mobile application that can be
created to assist ADHD patients with task and time
management. By introducing mindfulness exercises, it will
also assist patients in moderating their behavior. The
application includes a chat feature that allows users to
communicate with each other.
4. Edit task interface
To edit a task’s name and priority the user can click on the
task from the interface in figure 4 and they will be taken to the
interface in figure 5.
Figure 5. Edit task interface
5. Chat interface and selection of person
The chat section allows the users to interact with one
another via text or voice recordings, they are also shown
a list where they can select who they want to start a chat
with. Figure 6 shows the layout of the interface.
Figure 6. Chat interface
Figure 7. Pattern interface
Figure 8. Technique interface
8. Technique steps interface
In figure 9, the steps of the recommended
techniques are shown to the user, they are able to
move from one step to the other through “next
step” button, and they may also stop the session
if they need to.
Figure 9. Steps interface

Proceedings of Graduation Project Showcase 2022
6 | P a g e
Published In: Conference 2d ASIANCON 2022 Pune, India
VIII. FUTURE WORK
As per the planning of the team, in addition to the high-fidelity prototype, a fully functional Android application will be implemented. Some of the features of the application will require the use of speech recognition algorithms to run the application as intended.
REFERENCES
[1] FAROOQUI, M.; GULL, H.; ILYAS, M.; IQBAL, S.;
KHAN, M.A.; KRISHNA, G.; AHMED, M. IMPROVING
MENTAL HEALTHCARE USING A HUMAN CENTERED
INTERNET OF THINGS MODEL AND EMBEDDING
HOMOMORPHIC ENCRYPTION SCHEME FOR CLOUD
SECURITY. J. COMPUT. THEOR. NANOSCI. 2019, 16, 1806–
1812
[2] H. Gull, G. Krishna, M. I. Aldossary and S. Z. Iqbal,
"Severity Prediction of COVID-19 Patients Using
Machine Learning Classification Algorithms: A Case
Study of Small City in Pakistan with Minimal Health
Facility," 2020 IEEE 6th International Conference on
Computer and Communications (ICCC), 2020, pp. 1537-
1541, doi: 10.1109/ICCC51575.2020.9344984.
[3] Powell, L., Parker, J., Robertson, N., & Harpin, V.
(2017). Attention Deficit Hyperactivity Disorder: Is
There an App for That? Suitability Assessment of Apps
for Children and Young People With ADHD. JMIR
mHealth and uHealth, 5(10), e145.
https://doi.org/10.2196/mhealth.7371
[4] Faraone, S. V., Banaschewski, T., Coghill, D.,
Zheng, Y., Biederman, J., Bellgrove, M. A., . . . Wang,
Y. (2021). The World Federation of ADHD International
Consensus Statement: 208 evidence-based conclusions
about the disorder. Neuroscience & Biobehavioral
Reviews. doi:10.1016/j.neubiorev.2021.01.022
[5]J. Mitrpanont, B. Bousai, N. Soonthornchart, K.
Tuanghirunvimon and T. Mitrpanont, "iCare-ADHD: A
Mobile Application Prototype For Early Child Attention
Deficit Hyperactivity Disorder," 2018 Seventh ICT
International Student Project Conference (ICT-ISPC),
2018, pp. 1-4, doi: 10.1109/ICT-ISPC.2018.8523973.
[6] K. George, "Signs and Symptoms of Attention
Deficit Hyperactivity Disorder in Adults -
ActiveBeat", ActiveBeat, 2019. [Online]. Available:
https://www.activebeat.com/your-health/women/8-signs-
and-symptoms-of-attention-deficit-hyperactivity-
disorder-in-adults/.
[7] Wasserstien "Adults with ADHD", in Adult
Attention Deficit Disorder: Brain Mechanisms and Life
Outcomes, 1st ed., L. E., J. Wasserstein and P.
H.Wended, Ed. 2001.
[8] Centers for Disease Control and Prevention. 2021.
What is ADHD?. [online] Available at:
<https://www.cdc.gov/ncbddd/adhd/facts.html#:~:text=
ADHD%20is%20one%20of%20the,)%2C %20
or%20be%20overly%20active.>
[9] M. Brod, E. Schmitt and M. Goodwin, "ADHD
burden of illness in older adults: a life course
perspective", 2011.
[10] A. Leary, "Exploring the Powerful Link Between
ADHD and Addiction", Healthline, 2019. Accessed on:
Sep. 12, 2021. [Online]. Available:
https://www.healthline.com/health/mental-health/adhd-
and-addiction#1
[11] "ADHD - Cognitive Research", Play.google.com,
2020. Accessed on: Sep.12,2021. [Online]. Available:
https://play.google.com/store/apps/details?id=com.cogni
fit.android.adhd&hl=en-GB.
[12] "My ADHD", Play.google.com, 2021. Accessed on:
Sep.12,2021. [Online].Available:
https://play.google.com/store/apps/details?id=tk.tdah&hl
=en-.
[13] T. Angel, "Everything You Need to Know About
ADHD", Healthline, 2021. Accessed on: Oct.20 ,2021.
[Online]. Available:
https://www.healthline.com/health/adhd
[15] A. Doyle, "The 11 Best ADHD Apps for
2022", Healthline, 2021. .
[16] "Index to Journal of Attention Disorders", Journal
of Attention Disorders, vol. 9, no. 4, pp. 669-673, 2006.
Available: 10.1177/108705470600900414 [Accessed 11
September 2021].
[17] "Erratum", Child and Adolescent Psychiatric
Clinics of North America, vol. 9, no. 3, pp. Pages 481-
498, 2016. Available:
https://www.sciencedirect.com/science/article/abs/pii/S1
056499318301020. [Accessed 13 September 2021].
[18] [12]W. Shen and S. Liu, International Conference
on Formal Engineering Methods, 1st ed. Piscataway,
N.J.: IEEE, 2012, pp. pp 68–85.
IEEE conference templates contain guidance text for
composing and formatting conference papers. Please
ensure that all template text is removed from your
conference paper prior to submission to the
conference. Failure to remove template text from
your paper may result in your paper not being
published.

Proceedings of Graduation Project Showcase 2022
1 | P a g e Published In: 7th International Conference on Data Science and Machine Learning Applications (CDMA) IEEE DOI: 10.1109/CDMA54072.2022.00024
Machine Learning Based Preemptive Diagnosis of Lung Cancer Using Clinical
Data
Sunday O. Olatunji1, Aisha Alansari2, Heba Alkhorasani3, Meelaf Alsubaii4, Rasha Sakloua5, Reem Alzah-
rani6, Yasmeen Alsaleem7, Reem Alassaf8, Mehwash Farooqui9, Mohammed Imran Basheer Ahmed10
College of Computer Science and Information Technology, Imam Abdulrahman Bin Faisal University, P.O. Box
1982, Dammam 31441, Saudi Arabia
[email protected] , [email protected], [email protected], [email protected], [email protected], [email protected], [email protected], [email protected],
[email protected], [email protected]
Abstract— Lung cancer is a malignant disease that im-
poses serious complications restricting patients from
performing daily tasks in the early stages and eventu-
ally cause their death. The prevalence of this disease
has been highlighted by numerous statistics worldwide.
The preemptive diagnosis of individuals with lung can-
cer can enhance chances of prevention and treatment.
Therefore, the purpose of this study is to predict lung
cancer preemptively utilizing simple clinical and demo-
graphical features obtained from the “data world”
website. The experiment was conducted using Support
Vector Machine (SVM), K-Nearest Neighbor (K-NN),
and Logistic Regression (LR) classifiers. To improve
models’ accuracy, SMOTETomek was employed along
with GridsearchCV to tune hyperparameters. The Re-
cursive Feature Elimination method was also utilized to
find the best feature subset. Results indicated that SVM
achieved the best performance with 98.33% recall,
96.72% precision, and an accuracy of 97.27% using 15
attributes.
Keywords— Support Vector Machine, Logistic Regres-
sion, K-Nearest Neighbor, Machine Learning, Lung
Cancer, Preemptive Diagnosis.
I. INTRODUCTION
Lung cancer is a type of cancer where the cells in one
or both lungs grow uncontrollably, forming tumors [1].
The cancer cells spread to other organs once it reaches
stage 4, the advanced stage, leading to death [2]. How-
ever, if lung cancer is discovered in its early stage, the
treatment is easy, which can successfully keep the pa-
tient from dying [3]. Unfortunately, the early diagnosis
of the disease is challenging since it can stay silent with-
out any symptoms for over 20 years before it reaches its
advanced stage and becomes lethal [1]. Thus, it is con-
sidered one of the deadliest cancers among other types
of cancer. In 2020, the Global Cancer Observatory
(GCO) reported 2,206,771 new cases along with
1,796,144 deaths internationally, ranking it as the sec-
ond and first, respectively [4]. It is expected that ap-
proximately 150 million people will pass away from
lung cancer in the 21st century. As a result, preventing
and improving the state of patients with lung cancer is a
top international priority [5]. This study aims to take ad-
vantage of new technologies by employing machine
learning techniques in the pre-emptive diagnosis of lung
cancer.
Machine learning is one of the widely utilized Artificial
Intelligence techniques, which consists of various algo-
rithms that are trained and tested based on a dataset to
generate predictions [6]. It offers a variety of tech-
niques, methods, and tools that are beneficial for solv-
ing challenging problems in the medical domain, in-
cluding the early diagnosis of a disease. Machine learn-
ing was ultimately deemed to be successful in improv-
ing the overall quality and efficiency of medical care.
Among the several supervised machine learning tech-
niques, three algorithms shown to be useful in the med-
ical field were employed in this study, namely, Support
Vector Machine (SVM), K-Nearest Neighbor (K-NN),
and Logistic Regression (LR). SVM is the most used al-
gorithm in disease prediction due to its superior predic-
tive accuracy, whereas K-NN is considered a simple al-
gorithm with fast instances classification. On the other
hand, LR can be easily implemented and updated
[7]. The purpose of this study is to predict Lung cancer
in its early stage using simple clinical data. The empiri-
cal results of this study showed that SVM and LR
achieved the highest accuracy rates of 97.27% with 15
features. However, from a medical perspective, SVM
was proven to be the best classifier since it granted
the highest recall rate of 98.33%.
In this study, the remaining sections are organized in the
following order. The second section covers the litera-
ture review of related works. The third section contains
a description of the three utilized machine learning

Proceedings of Graduation Project Showcase 2022
2 | P a g e Published In: 7th International Conference on Data Science and Machine Learning Applications (CDMA) IEEE DOI: 10.1109/CDMA54072.2022.00024
algorithms: SVM, K-NN, and LR. The fourth section il-
lustrates the empirical study, including dataset descrip-
tion, experimental setup, performance measures, and
optimization strategy. The fifth section demonstrates
and discusses the study results, while the last section
contains the conclusion and future work recommenda-
tions for this study.
II. RELATED WORK
The authors in [8] aimed to construct an early Lung can-
cer detection tool to assist general physicians in diag-
nosing cancer 3-6 months before ordinary diagnosis.
The used dataset established by the Australian Govern-
ment Department of Health contained millions of diag-
nosis records, pathology test results, and others. In ad-
dition to ensemble techniques, LightGBM, XGBoost,
Decision Tree (DT), and AdaBoost classifiers were uti-
lized to compose the model. The results indicated that
the ensemble model outperformed the other models
considering the true-positive rate (45%) and the false-
negative rate (35%).
Furthermore, the authors in [9] developed a system to
predict Lung cancer based on multi-criteria decisions.
They gathered the dataset from a web-based survey of
276 individuals with eight attributes. The authors used
analytic hierarchy process (AHP) to assign weights used
by the Artificial Neural Network (ANN) classifier. The
experimental result and discussion showed that the pro-
posed model achieved an accuracy of 80.7%, specificity
of 75.3%, sensitivity of 89.9%, and an F1 score of
86.4%.
Moreover, work in [10] utilized two online datasets to
predict lung cancer using various machine learning al-
gorithms. The first dataset was retrieved from the UCI
website comprising 56 predictors to pre-diagnose three
types of Lung cancer. It was concluded that the Deci-
sion Tree (DT) algorithm achieved the highest accuracy
of 96.9%. Afterward, the authors used the second da-
taset, acquired from the Data-World website, containing
23 clinical features with a 3-stage target class. The re-
sults demonstrated that SVM exceeded all other classi-
fiers with an accuracy of 99.2%.
The study [11] used the same UCI dataset with deep
learning algorithms to early classify Lung cancer. The
recurrent neural network (RNN) and BiLSTM were ap-
plied, achieving the average specificity, sensitivity, pre-
cision, recall, and f-score values were 0.96, 0.98, 0.97,
0.96, and 0.96, respectively.
Meanwhile, the same Data-World website dataset was
used by researchers in [12]. They implemented a hy-
bridization approach between the Genetic Algorithm
(GA), used for feature selection, and the K-Nearest
Neighbor (K-NN), used for classification, to develop a
Lung cancer prognosis model. As a result, the K-NN al-
gorithm revealed a 100% accuracy with six optimal fea-
tures captured by GA. The same dataset was used in
[13], where the authors proposed the analysis of Lung
cancer symptoms for different age groups in the early
stage using machine learning techniques. The result
showed that DT, RF, and XGBoost reached the highest
accuracy of 100% in the Youth and Working group and
93% in the Elderly.
The review of literature related to this study showed no
studies that predicted Lung cancer pre-emptively with
high accuracy using simple clinical and demographical
data. Additionally, to the best of our knowledge, no pre-
vious studies utilized the same dataset used in this
study. Most of the studies attaining high accuracy fo-
cused on predicting the severity rate of the disease.
Therefore, this study explores the effect of employing
simple clinical and demographical data in the pre-emp-
tive diagnosis of Lung cancer using machine learning
techniques to reduce the possible hazards of late detec-
tion of Lung cancer.
III. DESCRIPTION OF PROPOSED TECH-
NIQUES
A. Support Vector Machine (SVM)
Support Vector Machine (SVM) is a popular machine
learning algorithm that researchers successively uti-
lize for its ability to form robust results regardless of
noisy and scarce data [14]. It is a statistical-based super-
vised algorithm, mainly employed in binary classifica-
tion problems, where it operates by constructing a
boundary that divides the training data into two sepa-
rated classes [15]. This boundary is known as the hyper-
plane, which is a subspace with dimension p-1. In order
to find the optimal hyperplane, the margin, which is the
distance between the line and the nearest points to the
line, called support vectors, is calculated [16]. Further
details could be found in [17][18].
B. Logistic Regression (LR)
Logistic Regression (LR) is a machine learning algo-
rithm based on supervised learning and statistical anal-
ysis. It is extensively used for binary classification tasks
with discrete categorical target classes [19]. In 1958, LR
was developed by David Cox and named after the lo-
gistic function, which is the core of its process [20]. It
applies the sigmoid function to a linear combination of
features to restrict them between 0 and 1. Afterward, it
compares the result with the threshold value, which is

Proceedings of Graduation Project Showcase 2022
3 | P a g e Published In: 7th International Conference on Data Science and Machine Learning Applications (CDMA) IEEE DOI: 10.1109/CDMA54072.2022.00024
equal to 0.5 by default. The result is assigned to the pos-
itive class if it is greater than the threshold
value, whereas it is assigned to the negative class if it is
less than the threshold value [19]. Further details could
be found in [21][22].
C. K-Nearest Neighbor (K-NN)
K-Nearest Neighbor (K-NN) is one of the simplest non-
parametric machine learning algorithms that fall below
the supervised learning technique [23]. K-NN is consid-
ered a lazy learner as it does not learn from training data,
but it uses the entire dataset to classify the data points
without building a training model [24]. It categorizes a
new data point by following how its neighbors are clas-
sified and predicting its value based on how closely it
supplements the training set points using a similarity
measure [25]. Further details could be found in
[26][27].
IV. EMPIRICAL STUDIES
A. Description of Dataset
The dataset used for the preemptive prediction of lung
cancer was obtained from the “data world” website,
consisting of clinical and demographical features [28].
The dataset included 16 attributes and 309 instances.
270 instances were lung cancer patients, whereas 39 in-
stances were non-lung cancer patients. After applying
the SMOTETomek sampling technique [29], the data
consisted of 182 positive patients and 182 negative pa-
tients. Table 1 outlines each attribute with its type and
corresponding values.
Table 1 Attribute Description
Attribute Type Value
Gender Nominal Male: M, Female: F
Age Numeric Age of the patient: No range
Smoking Numeric Yes: 2, No:1
Yellow Fingers Numeric Yes: 2, No:1
Anxiety Numeric Yes: 2, No:1
Peer_Pressure Numeric Yes: 2, No:1
Chronic Disease Numeric Yes: 2, No:1
Fatigue Numeric Yes: 2, No:1
Allergy Numeric Yes: 2, No:1
Wheezing Numeric Yes: 2, No:1
Alcohol Numeric Yes: 2, No:1
Coughing Numeric Yes: 2, No:1
Shortness of Breath Numeric Yes: 2, No:1
Swallowing Diffi-
culty Numeric Yes: 2, No:1
Chest Pain Numeric Yes: 2, No:1
Lung_Can-
cer (Class) Nominal
Lung cancer: yes, no lung
cancer: no
B. Statistical Analysis of the Dataset
Table 2 shows the dataset’s statistical analysis, includ-
ing the mean, median, standard deviation, and the cor-
relation between each attribute and the target attribute.
The low standard deviation values demonstrate that the
data are close to the mean, indicating no outliers in the
data. Besides, the similarity between the mean and me-
dian values indicates a symmetric distribution of the
data.
Table 2 Statistical Analysis of the Dataset
Attribute Mean Median Standard
Deviation
Correlation
Coefficient
Gender - - - 0.067254
Age 62.673139 62.0 8.210301 0.089465
Smoking 1.563107 2.0 0.496806 0.058179
Yellow
Fingers 1.569579 2.0 0.495938 0.181339
Anxiety 1.498382 1.0 0.500808 0.144947
Peer_Pressure 1.501618 2.0 0.500808 0.186388
Chronic
Disease 1.504854 2.0 0.500787 0.110891
Fatigue 1.673139 2.0 0.469827 0.150673
Allergy 1.556634 2.0 0.497588 0.327766
Wheezing 1.556634 2.0 0.497588 0.249300
Alcohol 1.556634 2.0 0.497588 0.288533
Coughing 1.579288 2.0 0.494474 0.248570
Shortness of
Breath 1.640777 2.0 0.480551 0.060738
Swallowing
Difficulty 1.469256 1.0 0.499863 0.259730
Chest Pain 1.556634 2.0 0.497588 0.190451
C. Experimental Setup
The experiment was conducted to build a prediction
model that pre-emptively predicts the presence of lung
cancer using simple clinical and demographical fea-
tures. Python programming language was employed to
conduct the experiment, where several libraries were
utilized. The Imblearn library was utilized to balance
the dataset using the SMOTETomek technique with
random state value 139, which performs over-sampling
using the Synthetic Minority Oversampling Technique
(SMOTE) followed by Tomek links that clean the da-
taset [29]. The Sklearn library was utilized to split the
dataset into 70% for training and 30% for testing. Addi-
tionally, it was used to perform the GridsearchCV tech-
nique to obtain the best hyper-parameters using 10-folds
cross-validation. The best obtained hyper-parameters
were then utilized to build three models from the same
library, namely, Support Vector Machine (SVM), Lo-
gistic Regression (LR), and K-Nearest Neighbor (K-
NN) using the 70:30 direct partition technique with the
random state value 0. Subsequently, the Recursive

Proceedings of Graduation Project Showcase 2022
4 | P a g e Published In: 7th International Conference on Data Science and Machine Learning Applications (CDMA) IEEE DOI: 10.1109/CDMA54072.2022.00024
Feature Elimination method was examined to find the
best feature subset yielding the highest performance by
relying on the correlation coefficient calculated by the
Pandas library.
D. Performance Measures
In this study, three performance measures, including
precision, recall, and accuracy, were utilized to evaluate
the performance effectiveness. The precision calculates
the lowest limit of incorrectly classified as lung cancer
(FP), whereas recall aims to find the lowest limit of in-
correctly classified as no lung cancer (FN). On the other
hand, the accuracy evaluates the number of correct pre-
dictions. The equations below show the formulas of
each performance metric.
𝑃𝑟𝑒𝑐𝑖𝑠𝑖𝑜𝑛 = 𝑇𝑃
𝑇𝑃+𝐹𝑃 (1)
𝑅𝑒𝑐𝑎𝑙𝑙 = 𝑇𝑃
𝑇𝑃+𝐹𝑁 (2)
𝐴𝑐𝑐𝑢𝑟𝑎𝑐𝑦 = 𝑇𝑃+𝑇𝑁
𝑇𝑜𝑡𝑎𝑙 𝑛𝑢𝑚𝑏𝑒𝑟 𝑜𝑓 𝑖𝑛𝑠𝑡𝑎𝑛𝑐𝑒𝑠 (3)
E. Optimization Strategy
To achieve the best solution among all possible solu-
tions and to solve classification problems optimally, op-
timization tools must be applied. In this study, the grid
search was used to find the optimal hyperparameters
that produce the highest accuracy. Grid search operates
by defining a search space set as a grid of specified hy-
perparameters with a range of values, then tries all pos-
sible combinations to return the hyper-parameters
that achieve the best performance. 10-folds cross-vali-
dation was used for validation in the optimization strat-
egy.
For the SVM, the searched hyperparameters were cost,
kernel, and gamma. The cost values included the values
(1, 2, 3, 4, 5, 6, 7, 8, 9, 10, 15, 20, 25, and 30). Moreover,
the list of kernel types included (RBF, sigmoid, and lin-
ear). Besides, the gamma values included (1, 0.1, 0.01,
0.001, and 0.0001).
The hyperparameters searched for K-NN include
n_neighbors and metric parameters. The n_neighbors
values searched were (5, 7, 9, 11, 13, 15, 17, 19, 21, 23,
25, 27, 29, 31, 33, 35, 37, and 39). Furthermore, the met-
rics included (Minkowski, Euclidean, and Manhattan).
The Logistic Regression hyperparameters searched
were cost, penalty, and slover. The cost values include
100, 10, 1.0, 0.1, and 0.01. Moreover, the solver values
included (Newton-cg, Lbfgs, Liblinear, Sag, and Saga).
Besides, the penalty values included (None, L1, L2, and
Elasticnet). Table 4 shows the chosen optimal hyper-pa-
rameters for each classifier.
Table 4 The Hyper-parameters for Each Classifier
Classi-
fier
Hyperparame-
ter
Values Without
Sampling
Values With
Sampling
SVM
Cost 7 15
Gamma 1 0.001
Kernel Linear RBF
K-NN n_neighbors 11 5
metric Manhattan Manhattan
LR
Cost 100 0.1
Penalty 12 12
Solver Liblinear Newton-cg
V. RESULTS AND DISCUSSION
The optimal hyperparameters obtained from the
GridsearchCV technique were used to build the models
using the 70:30 direct partition technique. The achieved
training and testing accuracy before and after applying
the SMOTETomek using the optimal hyper-parameters
are outlined in Table 5.
Table 5 Classifiers Training and Testing Accuracy Using the Opti-
mal Hyper-parameters
Classi-
fier
Sampling
Technique
Training
Accuracy
Testing
Accuracy
SVM
Without Sam-
pling 93.98% 93.55%
With Sampling 97.24% 97.27%
K-NN
Without Sam-
pling 86.57% 92.47%
With Sampling 94.49% 92.73%
LR
Without Sam-
pling 93.52% 94.62%
With Sampling 96.46% 97.27%
It is observed that the difference between the training
and testing accuracy is low before and after applying the
sampling technique, which indicates that the models
neither suffered from overfitting nor underfitting. Addi-
tionally, it is noted that the SMOTETomek technique
boosted the testing accuracy of both SVM and LR by
3.72% and 2.62%, respectively. However, it did not
show a remarkable effect on the performance of K-NN.
The highest results were achieved by SVM and LR,
reaching an accuracy of 97.27% after applying the
SMOTETomek sampling technique. In the upcoming
sections, further analysis will be done on the data after
applying feature selection on the SMOTETomek gener-
ated data.
A. Results of Investigating the Effect of Feature Se-
lection on the Dataset
Using the correlation coefficient presented in Table 3,
several feature subsets were selected to compare their
effect on the performance using the best hyper-parame-
ters. The correlation coefficient helps rank the attributes
in descending order based on the correlation value

Proceedings of Graduation Project Showcase 2022
5 | P a g e Published In: 7th International Conference on Data Science and Machine Learning Applications (CDMA) IEEE DOI: 10.1109/CDMA54072.2022.00024
between each attribute with the target class. The Recur-
sive Feature Elimination technique was carried out to
obtain the most appropriate feature subset that provides
the highest results. Table 6 outlines the average accu-
racy of different feature subsets.
Table 6 Average Accuracy for Different Feature Subsets
Features SVM K-NN LR Average
Using 15 Features 97.27% 92.73% 97.27% 95.76%
Using 8 Features 94.55% 90.91% 94.55% 93.33%
Using 4 Features 91.82% 94.55% 91.82% 92.73%
Using 2 Features 81.82% 90.00% 90.00% 87.27%
Using 1 Features 81.82% 81.82% 81.82% 81.82%
The empirical results indicated that the Recursive Fea-
ture Elimination Technique did not improve the accu-
racy of the models, where the highest average accuracy
of 95.76% was attained using 15 features (full features).
This might be caused by the low correlation values be-
tween the attributes and the target class. Therefore, all
the features present in the dataset will be utilized for
building the final models with the best obtained hyper-
parameters.
B. Further Discussion of the Results
The classification performance on the SMOTETomek
generated data using the optimal parameters and full
features for SVM, K-NN, and LR are illustrated in table
7.
Table 7 Classification Performance of the Final Models
Classifier Accuracy Precision Recall
SVM 97.27% 96.72% 98.33%
K-NN 92.73% 98.15% 88.33%
LR 97.27% 98.31% 96.67%
The results indicated that both SVM and LR outper-
formed K-NN with an accuracy of 97.27%. However,
further evaluation measures were executed by analyzing
recall and precision values. SVM produced the highest
recall rate among all other algorithms with 98.33%,
while LR attained the highest precision rate with
98.31%. To investigate the consistency between pre-
dicted and actual findings, confusion metrics were used.
Tables 8, 9, and 10 illustrate the confusion matrices that
characterized the prediction results by the proposed
models.
Table 8 SVM Confusion Matrix
SVM Predicted
Lung Cancer No Lung Cancer
Actual Lung Cancer 59 (TP) 1 (FN)
No Lung Can-
cer 2 (FP) 48 (TN)
Table 9 K-NN Confusion Matrix
K-NN Predicted
Lung Cancer No Lung Cancer
Actual
Lung Cancer 53 (TP) 7 (FN)
No Lung Can-
cer 1 (FP) 49 (TN)
Table 10 LR Confusion Matrix
LR Predicted
Lung Cancer No Lung Cancer
Actual
Lung Cancer 58 (TP) 2 (FN)
No Lung Can-
cer 1 (FP) 49 (TN)
Detecting every potential indication of lung cancer ill-
ness will reduce the error rate and provide patients with
prevention chances. Consequently, to avoid complica-
tions that could arise from misdiagnosing the presence
of a disease, we meticulously examined the number of
false-negative. Hence, the SVM is considered the best
classifier among the investigated ones as it yielded the
lowest FN value of 1, followed by LR with 2 FN, while
K-NN suffered from excessive FN of 7.
VI. CONCLUSION AND RECOMMANDATION
Lung cancer is one of the most dangerous diseases that
are difficult to treat after it spreads and reaches a severe
stage. In this paper, pre-emptive prediction models of
lung cancer were developed using three machine learn-
ing techniques, namely, Support Vector Machine
(SVM), K-Nearest Neighbor (K-NN), and Logistic Re-
gression (LR) using an open-source dataset with clinical
and demographical data. The GridsearchCV technique
with 10-folds cross-validation was utilized to obtain the
best hyper-parameters of each algorithm. Additionally,
the Recursive Feature Elimination technique was inves-
tigated to find the best feature subset. The empirical re-
sults showed that SVM and LR classifiers achieved the
highest accuracy of 97.27% with full features. How-
ever, SVM outperformed LR since it granted the highest
recall rate of 98.33%.
The utilized dataset has a limited number of in-
stances and a weak correlation between the attributes
and the target class. Increasing the number of in-
stances and exploring more correlated attributes with
the target class would contribute to enhancing the re-
sults. Therefore, future work can be done by re-using
the proposed technique with a large dataset and more
features such as Hoarseness, Nail clubbing, and Loss of

Proceedings of Graduation Project Showcase 2022
6 | P a g e Published In: 7th International Conference on Data Science and Machine Learning Applications (CDMA) IEEE DOI: 10.1109/CDMA54072.2022.00024
appetite/weight. Furthermore, further studies can be
conducted by employing ensemble techniques and ex-
amining other feature selection methods to enhance the
performance with the most crucial features. Addition-
ally, the promising empirical result motivated us to ex-
pand the work by investigating a Saudi dataset to con-
tribute to Saudi Arabia’s vision 2030 in the objectives
of the Transformation program in the future.
REFERENCES
[1] “Chronic Disease - Lung Cancer.”
https://www.moh.gov.sa/en/awarenessplatefor
m/ChronicDisease/Pages/LungCancer.aspx
(accessed Oct. 21, 2021).
[2] P. Zhang et al., “Nanotechnology-enhanced
immunotherapy for metastatic cancer,” Innov.,
p. 100174, Oct. 2021, doi:
10.1016/J.XINN.2021.100174.
[3] M. Santarpia et al., “Liquid biopsy for lung
cancer early detection,” J. Thorac. Dis., vol. 10,
no. 7, pp. S882–S897, Apr. 2018, doi:
10.21037/JTD.2018.03.81.
[4] “World,” Accessed: Nov. 19, 2021. [Online].
Available:
https://gco.iarc.fr/today/data/factsheets/populati
ons/900-world-fact-sheets.pdf.
[5] A. R. Jazieh, G. Algwaiz, S. M. Alshehri, and K.
Alkattan, “Lung Cancer in Saudi Arabia,” J.
Thorac. Oncol., vol. 14, no. 6, pp. 957–962, Jun.
2019, doi: 10.1016/J.JTHO.2019.01.023.
[6] J. A. Nichols, H. W. Herbert Chan, and M. A. B.
Baker, “Machine learning: applications of
artificial intelligence to imaging and diagnosis,”
Biophys. Rev., vol. 11, no. 1, p. 111, Feb. 2019,
doi: 10.1007/S12551-018-0449-9.
[7] S. Uddin, A. Khan, M. E. Hossain, and M. A.
Moni, “Comparing different supervised machine
learning algorithms for disease prediction,”
BMC Med. Inform. Decis. Mak., vol. 19, no. 1,
pp. 1–16, Dec. 2019, doi: 10.1186/S12911-019-
1004-8/FIGURES/12.
[8] “Artificial Intelligence in Medicine: 19th
International Conference on ... - Allan Tucker -
Google Books.” .
[9] B. Al-Bander, Y. A. Fadil, and H. Mahdi,
“Multi-Criteria Decision Support System for
Lung Cancer Prediction,” IOP Conf. Ser. Mater.
Sci. Eng., vol. 1076, no. 1, p. 012036, Feb. 2021,
doi: 10.1088/1757-899X/1076/1/012036.
[10] P. R. Radhika, R. A. S. Nair, and G. Veena, “A
Comparative Study of Lung Cancer Detection
using Machine Learning Algorithms,” Proc.
2019 3rd IEEE Int. Conf. Electr. Comput.
Commun. Technol. ICECCT 2019, Feb. 2019,
doi: 10.1109/ICECCT.2019.8869001.
[11] I. Publication, “DEEP LEARNING BASED
BiLSTM ARCHITECTURE FOR LUNG
CANCER CLASSIFICATION,” doi:
10.34218/IJARET.12.1.2020.045.
[12] N. Maleki, Y. Zeinali, and S. T. A. Niaki, “A k-
NN method for lung cancer prognosis with the
use of a genetic algorithm for feature selection,”
Expert Syst. Appl., vol. 164, p. 113981, Feb.
2021, doi: 10.1016/J.ESWA.2020.113981.
[13] A. Bankar, K. Padamwar, and A. Jahagirdar,
“Symptom analysis using a machine learning
approach for early stage lung cancer,” Proc. 3rd
Int. Conf. Intell. Sustain. Syst. ICISS 2020, pp.
246–250, 2020, doi:
10.1109/ICISS49785.2020.9315904.
[14] T. S. Furey, N. Cristianini, N. Duffy, D. W.
Bednarski, M. Schummer, and D. Haussler,
“Support vector machine classification and
validation of cancer tissue samples using
microarray expression data,” Bioinformatics,
vol. 16, no. 10, pp. 906–914, 2000, doi:
10.1093/bioinformatics/16.10.906.
[15] V. Jakkula, “Tutorial on Support Vector
Machine (SVM),” Accessed: Nov. 19, 2021.
[Online]. Available:
https://course.ccs.neu.edu/cs5100f11/resources/
jakkula.pdf.
[16] Y. Lei, “Individual intelligent method-based
fault diagnosis,” Intell. Fault Diagnosis Remain.
Useful Life Predict. Rotating Mach., pp. 67–174,
Jan. 2017, doi: 10.1016/B978-0-12-811534-
3.00003-2.
[17] J. M. Moguerza and A. Muñoz, “Support Vector
Machines with Applications,” Stat. Sci., vol. 21,
no. 3, pp. 322–336, 2006, doi:
10.1214/088342306000000493.
[18] C. Cortes and V. Vapnik, “Support-vector
networks,” Mach. Learn. 1995 203, vol. 20, no.
3, pp. 273–297, Sep. 1995, doi:
10.1007/BF00994018.
[19] H. Belyadi and A. Haghighat, “Supervised
learning,” Mach. Learn. Guid. Oil Gas Using
Python, pp. 169–295, Jan. 2021, doi:
10.1016/B978-0-12-821929-4.00004-4.
[20] A. Bartosik and H. Whittingham, “Evaluating
safety and toxicity,” Era Artif. Intell. Mach.
Learn. Data Sci. Pharm. Ind., pp. 119–137, Jan.
2021, doi: 10.1016/B978-0-12-820045-
2.00008-8.
[21] R. O. Sinnott, H. Duan, and Y. Sun, “A Case
Study in Big Data Analytics: Exploring Twitter
Sentiment Analysis and the Weather,” Big Data
Princ. Paradig., pp. 357–388, Jan. 2016, doi:
10.1016/B978-0-12-805394-2.00015-5.
[22] E. B. Seufert, “Quantitative Methods for Product
Management,” Free. Econ., pp. 47–82, Jan.

Proceedings of Graduation Project Showcase 2022
7 | P a g e Published In: 7th International Conference on Data Science and Machine Learning Applications (CDMA) IEEE DOI: 10.1109/CDMA54072.2022.00024
2014, doi: 10.1016/B978-0-12-416690-
5.00003-8.
[23] P. Nadkarni, “Core Technologies: Data Mining
and ‘Big Data,’” Clin. Res. Comput., pp. 187–
204, Jan. 2016, doi: 10.1016/B978-0-12-
803130-8.00010-5.
[24] R. A. Alassaf et al., “Preemptive Diagnosis of
Chronic Kidney Disease Using Machine
Learning Techniques,” Proc. 2018 13th Int.
Conf. Innov. Inf. Technol. IIT 2018, pp. 99–104,
Jan. 2019, doi:
10.1109/INNOVATIONS.2018.8606040.
[25] T. M. D. Ebbels, “Non-linear Methods for the
Analysis of Metabolic Profiles,” Handb.
Metabonomics Metabolomics, pp. 201–226, Jan.
2007, doi: 10.1016/B978-044452841-4/50008-
4.
[26] D. Chanal, N. Yousfi Steiner, R. Petrone, D.
Chamagne, and M.-C. Péra, “Online Diagnosis
of PEM Fuel Cell by Fuzzy C-Means
Clustering,” Ref. Modul. Earth Syst. Environ.
Sci., Jan. 2021, doi: 10.1016/B978-0-12-
819723-3.00099-8.
[27] J. S. Richman, “Multivariate Neighborhood
Sample Entropy: A Method for Data Reduction
and Prediction of Complex Data,” Methods
Enzymol., vol. 487, no. C, pp. 397–408, Jan.
2011, doi: 10.1016/B978-0-12-381270-
4.00013-5.
[28] “survey lung cancer - dataset by sta427ceyin |
data.world.”
https://data.world/sta427ceyin/survey-lung-
cancer (accessed Oct. 29, 2021).
[29] “SMOTETomek — Version 0.9.0.dev0.”
https://imbalanced-
learn.org/dev/references/generated/imblearn.co
mbine.SMOTETomek.html (accessed Nov. 19,
2021).

Proceedings of Graduation Project Showcase 2022
1 | P a g e
Published In: IEEE IAS Global Conference on Emerging Technologies (GlobConET-2022)
Leen: Web-based Platform for Pet Adoption
Reema Alsuwailem
dept. Computer Information
Systems
Imam Abdulrahmaan Bin Faisal
University
Dammam, Saudi Arabia
Reema Almobarak
dept. Computer Information
Systems
Imam Abdulrahmaan Bin Faisal
University
Dammam, Saudi Arabia
Razan Aboali
dept. Computer Information
Systems
Imam Abdulrahmaan Bin Faisal
University
Dammam, Saudi Arabia
Safa Alrubaiea
dept. Computer Information
Systems
Imam Abdulrahmaan Bin Faisal
University
Dammam, Saudi Arabia
Jazwa Aldossary
dept. Computer Information
Systems
Imam Abdulrahmaan Bin Faisal
University
Dammam, Saudi Arabia
Abstract—This paper concerns pet adoption by building a web-
based platform that supports the idea of using technology for the
pet adoption process in Saudi Arabia, the eastern province in
specific. The difficulty of the adoption process and putting pets up
for adoption is a real problem in our society. In this regard, we put
forward the idea of “Leen” to provide easy and quick services for
this process and make it accessible to all interested people. Our
platform offers many services such as adoption, pet care, donation,
Etc. However, the main point in the “Leen” platform is that all
services provided are free with no fees. A “Leen” platform user
can offer a pet for adoption to find a home with another user
from “Leen”. Also, a user can look for pet care clinics at their
nearest location in the region. Furthermore, a user can directly
donate to trusted adoption associations in Saudi
Arabia. “Leen” platform was built to provide the mentioned
services and more. Eventually, having the platform within reach
of users will provide all the services faster and easier than usual.
Keywords—platform, web-based
I. INTRODUCTION
Due to the remarkable awareness in our society towards dealing with and caring for pets, along with the spread of the “pet adoption” concept in recent years. From this point, we got inspired and came up with our idea to build a web-based platform for all people interested in this field. Our platform aims to act as a midpoint between people who want to offer their pets adoption and those willing to adopt. Therefore, the adoption process will be easier and faster. Besides, providing enjoyment for people who love pets to communicate with others who have the same interests to share their knowledge and personal experiences. All the provided services will be for free. Promoting the principle of free pet adoption without any fees has a positive long-term impact on society. Based on a survey conducted by researchers at the University of Florida in 2011 on (1,928) pet adopters, which aimed to study the impact of free
adoptions on society. As a result of the study, it was found that adoptions which do not require any fees are successful and promoting free adoption may raise the adoption rate without compromising the animal’s life quality, as most users reported they still keep pets they adopted, which were 93% dogs, and 95% cats [1].
II. PROBLEM STATEMENT
Nowadays, we are encountering an issue where people have misleading knowledge about owning a pet, thinking that buying a pet from social media sites is more convenient than adopting one because there is no trusted platform provides the exact requirement they want [2]. However, it is considered a problem due to the potential risks a process carries to the users’ privacy; it may be from fraudulent sellers’ accounts. Thus, the incidence of fraud and deception of users increases significantly; moreover, most social media sites focus solely on money and treat pets as a tool to gain money. In order to solve this problem building a reliable integrated website, which acts as a third-party platform that aims to establish the principle of adopting pets instead of the process of buying one, facilitating user experience, as well as simplifying the process of communication between users to be direct while preserving their privacy and providing completely free services.
III. LITERATURE REVIEW
In the literature reviews below, there have been some studies by researchers proposing implementing technology with pets. This section will discuss how our website technology differs from other authors’ related technology regarding similarities and dissimilarities in pet adoption.

Proceedings of Graduation Project Showcase 2022
2 | P a g e
Published In: IEEE IAS Global Conference on Emerging Technologies (GlobConET-2022)
A. Effect of Visitor Perspective on Adoption Decisions at One
Animal Shelter
One of the methods in adopting a pet is a walk-in shelter to look for an animal. According to a study conducted at one urban animal shelter, adopters can interact with the animal and see if the animal is friendly, energetic, affectionate, and see physical characteristics and looks. In addition, the adopter can also know if the animal is not interactive, friendly, energetic; therefore, it helps the adopter pick an animal according to these characteristics while visiting a shelter. The researcher of this article found that many visitors did not leave with a pet; moreover, some visitors had an intention to adopt a pet but ended up not adopting one. This article categorizes visitors into two categories; the first is just visitors who are not interested in adopting a pet; according to the shelter staff, these visitors waste their time, energy, and resources. The second category is the browser, and they are people who visit the shelter for months and weeks intending to adopt a pet in the future. The writers of this article suggest the shelter work on educating all visitors about animal care and welfare. Moreover, educating those who are not prepared for a new pet [3].
B. How social media helps shelter animals out of the Shadow
Ariel wrote an article about how social media helps animals to be adopted. Social networking sites motivate people to adopt animals. For example, putting a picture of an animal for adoption on a social networking site such as Facebook, Twitter, and Instagram, and sharing it with friends or liking the picture and republishing it helps in animal adoption. Nevertheless, in social media, not all animals get their share of people’s likes [4].
C. A Review of Techniques for Image Classification to
Enhance Online Animal Adoption Speed
According to Pradeepa, animals can be adopted faster using the internet and technology. In addition, developing a computerized application that uses the sheltered animal picture gives it a score to help predict how fast the animal will be adopted; thus, this will help guide the shelter’s animal adoption speed process when posting a picture of the animal. However, the adoption speed cannot be controlled; some animals are not adopted due to having blurry pictures or not being wanted by anyone for adoption; thus, shelters will be overcrowded with animals [5].
D. The Impact of Adopting a Pet in the Perception of Physical
and Emotional Wellbeing
One of the most common reasons people give for possessing pets is the fact that they provide unconditional companionship and a sense of care and protection. However, this study looked at the impact of pets in a therapeutic context and primarily focused on the benefits of keeping pets. It has been found that owning dogs increases their owners’ physical activity and become less likely to have diseases such as obesity. On the other hand, it shows that people who have a pet are more prone to allergies and asthma. Furthermore, the study found that the humanization of pets was key to the emotional impact that adopters perceive, and those who tend to humanize their pets develop an empathetic relationship with them [6].
E. Attitudes and Perceptions Regarding Pet Adoption
This paper discussed the current trends in pet overpopulation and compared findings regarding purchasing from for-profit sources versus adoption from shelters. A survey was sent to registered dog owners in Albany and Rensselaer counties. The findings illustrate that people who are looking for a specific breed and have misperceptions of purebred dogs’ costs tend to go to pet stores and breeders primarily to purchase dogs. As a result, they believe it cannot be satisfied by adopting a shelter dog. However, this study contains two problems. First, responses biases. Second, the lack of comprehensiveness of the study results due to it reflects the respondents’ attitudes in specific regions and does not represent an entire country. In addition, consider this may not reflect the future actual behavior with respect to adoption from shelters [7].
F. COVID-19 Pandemic and Public Interest in Pet Adoption
This study aims to define if the global interest in pet adoption increases after the pandemic declaration and if the effect has been sustainable. Moreover, the data were collected between 2015 and 2020. Eventually, the study concluded that in the early phases of the pandemic, the global interest in pet adoptions has surged. However, it was not sustainable. Following the COVID-19 pandemic, pets may face separation anxiety when their owners return back to work [8].
G. Exploring User Information Needs in Online Pet Adoption
Profiles
This study demonstrated how important to understand adopters’ needs to provide information about pets through analyzing user needs to determine the kinds of information required when searching for a new pet, specifically a dog or cat. Furthermore, Study participants rated several physical and behavioral characteristics based on their significance level. In general, the study shows cat adopters have an interest in cats’ personalities and behavior. On the other hand, dog adopters are interested in dogs’ physical characteristics [9].
H. Shelter Operations: Pet-Friendly Shelters
The study focused on the idea that pet-friendly shelters are most frequently organized by either local animal control offices or county/state animal response teams. The main idea is about sheltering operations involve endangered people who own pets, but most emergency shelters don’t accept pets due to health and safety regulations. If there is no opportunity to bring their pets with them to safety, some pet owners will refuse to vacate or will delay vacating. Pet-friendly sheltering is one of the most concerted methods of providing emergency accommodations for pet owners and their pets. Furthermore, it is a public human emergency shelter that is located within the same area. Eventually, the presence of pet-friendly shelters can increase the likelihood that endangered pet owners will evacuate to safety with their animals during an emergency [10].
I. As animal shelters fill up, new technology helps reunite
lost pets with owners
Sammie wrote about how technology helped pet owners find their animals in shelters with the help of the Petco Love

Proceedings of Graduation Project Showcase 2022
3 | P a g e
Published In: IEEE IAS Global Conference on Emerging Technologies (GlobConET-2022)
website service; Petco Love lost that use of face recognition technology. This technology helps pet owners search for their lost pets by uploading a picture of the pet on the website and looking for a match or the shelter, or anyone who found a pet can upload an image. However, not all animals are lost; some of them were abended by their owners, in addition, no one will look for them [11].
J. Pets and the Net: Helping Animals in Need
This article discusses how the internet can help adopt a pet with a particular condition, a specific color uncommon for someone to adopt, or any pet. By using the internet, shelters and pet owners can help animals in need and build awareness through social media. Some shelters use an emotional method like posting as if they were the animal, and this animal is desperate looking for a home and loving family. However, some shelters might have a low profile; thus, this article’s author provided suggestions like using well-timed hashtags, pet-based influence marketing, Etc. [12].
IV. SIMILAR SYSTEMS
Our benchmark is the “Petfinder” website [13]. The main reference for our project, as we aspire to be the best by providing similar services to theirs, but in a better and more distinctive way so that we are distinguished by services that are not available anywhere and specific to our platform. Furthermore, to be the trusted reference for the Saudi community in promoting the culture of animal adoption. Furthermore, many websites have a similar purpose to our platform and are available online will be mentioned as follow:
A. Adopt a Pet
Adopt a pet is a nonprofit website that helps adopt animals from different shelters and rescues. The website has a simple layout for novice users, and you can find the type or kind of animals you want and filter more personal performance like breed and age [14].
B. The Shelter Pet Project
The Shelter Pet Project is a cooperative effort between the two highest animal welfare organizations, Maddie’s Fund and Humane Society of the United States. Their purpose is to make shelters the first place for adopters to get a new pet, guaranteeing that all pets find loving and caring homes [15].
C. Petango
Partnered with animal welfare organizations across Canada and U.S., Petango is the first adoptable pet search site to offer real-time updates of adoptable pets in shelters exclusively [16].
Eventually, All the mentioned websites will be considered in our project implementation. Furthermore, we will do our best to overcome all the possible functional, and nonfunctional issues found and provide high-quality services for our end-users. Table 1 below demonstrates the uniqueness of our platform against the mentioned websites.
TABLE I. PROPOSED PLATFORM UNIQUENESS
Feature /
Website
Platform Uniqueness
Petfinder Adopt a
Pet
The
Shelter
Pet
Project
Petango Leen
Looking for a
pet by location
Ease of adoption
process
Able instant messaging
between users
Provide
discussion forums
Provide
donation
associations and shelters
Looking for veterinary
Clinics by
location
Provide all
services free with no fees
Provide pet
delivery service
V. MOTIVATION
Shelters are not found in abundance; they are expensive and not well funded. Mostly they start with a group of volunteers, and if they had good funding from a charity or an organization, they might be able to run a shelter. The money is used to maintain the building, cover health bills, food, and equipment. However, those shelters rarely have good funding because they can’t set up a clear plan for the expenses. Currently, there is a large movement and a better understanding of animal adoption than it was before. Therefore, our website is targeted for that reason. Providing a platform for people to be engaged with animal adoption in the comfort of their homes will cause in decreasing the load on the shelters. By adopting an animal, you’re making room for another to be taken in. In worse cases, you will be rescuing abandoned animals off the streets or animals that are in need of care. “Leen” aims to increase the awareness of the “Adopt don’t shop” campaign, instead of paying breeders to buy a pet, you can pay less to rescue an animal that needs a loving home and give more support to spread awareness of adoption.

Proceedings of Graduation Project Showcase 2022
4 | P a g e
Published In: IEEE IAS Global Conference on Emerging Technologies (GlobConET-2022)
VI. METHODOLOGY
“Leen” platform will adopt and follow the waterfall approach model, which go through logical and sequential stages, so those clear objectives are defined for each stage of software development and must be completed in each stage. Then, move to the next stage without considering the previous stages after completing them. The waterfall model consists of several phases (requirement analysis, planning, design, implementation, and testing). Our system requirements are clear, precise, and static. Therefore, the waterfall approach is the most suitable to use. The platform will apply the following tools, programming languages, and techniques during the implementation phase:
• Front-end: HTML, CSS, JS, Bootstrap3, Sweetalert2.
• Back-end: Python, Flask, Twilio, phpMyAdmin, XAMPP.
• UI Mockups: Axure.
VII. ARCHITECTURE
Fig. 1 represents the data flow diagram level 1 that includes the core processes exists in the system, and there are ten processes complete, namely:
• 1.0 Login/signup, it takes the user data and verifies them to get access rights. The user data is checked and updated in the database.
• 2.0 Place rehome ad, after logging in the adoptee user can place a rehome ad for their pet.
• 3.0 Browsing categories, the user can browse in the ads categories.
• 4.0 Display ad, after a user selects an ad, it is displayed to be viewed and requested.
• 5.0 Submit a request, the submission is stored in the database waiting to be accepted or rejected.
• 6.0 Requests responses, the user can check their requests’ status and select them to be viewed.
• 7.0 View requests, view the selected request.
• 8.0 View clinics information, the admin can access and view the clinics information.
• 9.0 Manage users, the admin can access users and manage their data.
• 10.0 Notify users, the admin can manage and send the notifications that users receive.
VIII. IMPLEMENTATION
The following figures illustrate the platform’s interfaces, which are divided into three. Common interfaces accessed by everyone including the platform’s visitors, user interfaces accessed by platform’s users who have accounts, and admin interfaces accessed by the admin only.
A. Common interfaces
• Homepage.
In Fig. 2, this interface is called in the platform “Home”, and it will introduce the user to view “Leen” platform in general. A menu containing a set of options will be located at the top. On the menu, when a user clicks on option, the selected option will be highlighted, and the font will become bold. Further, when a user clicks on “Adopt your pet today !” button, “Look for a pet” interface will be appeared. A search bar will be shown in all interfaces to facilitate the searching process for users.
Figure 1: Platform Architecture

Proceedings of Graduation Project Showcase 2022
5 | P a g e
Published In: IEEE IAS Global Conference on Emerging Technologies (GlobConET-2022)
• About Leen, Services, Contact Us and Login.
In Fig. 3, this interface is called in the platform “About Leen”,
it will explain to the user the reasons behind the exitance for
“Leen” platform. Moreover, for Fig. 4, this interface is called
“Services”, and it will display the main services provided by the
platform. Further, Fig. 5 illustrate “Contact Us”, and it will
provide all the needed information to let the user contact and
reach us easily.
B. Admin interfaces
• Admin Control panel
For the below interface Fig. 7, the admin can view the platform
statistics and the status per region by providing quantitative
results, get access to all the platform’s services and functions,
view and analyze the performance, and track users’ activity
live, Etc.
Figure 2: Homepage interface
Figure 3: About Leen interface
Figure 2: Services interface
Figure 5: Contact Us interface
Figure 6: Login interface
Figure 3: Control panel interface

Proceedings of Graduation Project Showcase 2022
6 | P a g e
Published In: IEEE IAS Global Conference on Emerging Technologies (GlobConET-2022)
C. User interfaces
• Look for a pet service, and adoption request application.
In Fig. 8, this interface provides “Look for a pet” service, the user must answer all the questions and all adoption offers match user’s preferences will be shown. In Fig. 9, this interface will be displayed to the user who wants to adopt a pet from a specific offer and it contains a form that must be filled.
IX. CONCLUSION AND FUTURE WORK
To conclude, this paper presents the work performed in developing a web-based platform that supports the idea of using technology for a pet adoption process in Eastern province in Saudi Arabia specifically. In addition, the platform was designed to provide easy and quick services for pet adoption and to have it accessible to all interested people, services like discussion forums, instant chatting, pet delivery, and nearby veterinary clinics. Furthermore, there are several
recommendations, which might provide some enhancements to our platform in the future, for example expanding to be used in all Saudi Arabia regions, developing an application, and adding a section focusing on providing educational courses related to pets for whom interested in this field.
REFERENCES
[1] “Free pet adoptions study results,” Maddie's Fund, Nov-2012. [Online]. Available: https://www.maddiesfund.org/free-pet-adoptions-study-results.html.
[2] “ ‘Adopt, don’t shop’ number one motto for Saudi pet shelters”, Arab News, 2022. [Online]. Available: https://www.arabnews.com/node/2032371/saudi-arabia.
[3] A. Southland, S. Dowling-Guyer, and E. McCobb, “Effect of visitor perspective on adoption decisions at one animal shelter,” Journal of Applied Animal Welfare Science, vol. 22, no. 1, pp. 1–12, Mar. 2018.
[4] A. Bogle, “How social media helps bring shelter animals out of the shadows,” Mashable, 10-Aug-2016. [Online]. Available: https://mashable.com/article/social-media-shelter-animals.
[5] P. Jeyaraj and A. Aponso, “A review of techniques for image classification to enhance online animal adoption speed,” Proceedings of the 2020 12th International Conference on Computer and Automation Engineering, Feb. 2020.
[6] M. L. Taborda, M. Lemos, and J. J. Orejuela, “The Impact of Adopting a Pet in the Perception of Physical and Emotional Wellbeing,” ResearchGate, vol. 10, no. 2, pp. 53–74, Jun. 2019.
[7] J. M. Frank and P. C. Frank, “Attitudes and Perceptions Regarding Pet Adoption.” faunalytics.org, 2008.
[8] J. Ho, S. Hussain, and O. Sparagano, “Did the COVID-19 pandemic spark a public interest in pet adoption?,” Frontiers in Veterinary Science, vol. 8, May 2021.
[9] Z. M. Becerra, S. Parmar, K. May, and R. E. Stuck, “Exploring user information needs in online pet adoption profiles,” Proceedings of the Human Factors and Ergonomics Society Annual Meeting, vol. 64, no. 1, pp. 1308–1312.
[10] “Shelter Operations: Pet-Friendly Shelters.” SAMHSA, US, 2021.
[11] S. Purcell, “As animal shelters fill up, new technology helps reunite lost pets with owners,” reporter newspapers & Atlanta Intown, 08-Jul-2021.
[12] D. Hughes, “Pets and the net: Helping animals in need: Blog: Online Digital Marketing courses,” Digital Marketing Institute, 18-Feb-2020. [Online]. Available: https://digitalmarketinginstitute.com/blog/pets-and-the-net-helping-animals-in-need
[13] “Urgent Need for Pet Adoption - Find Dogs & Cats & More | Petfinder”, Petfinder. [Online]. Available: https://www.petfinder.com/.
[14] “Adopt a dog or cat today! Search for local pets in need of a home - AdoptaPet.com”, Adoptapet.com. [Online]. Available: https://www.adoptapet.com/.
[15] “The Shelter Pet Project”, The Shelter Pet Project. [Online]. Available: https://theshelterpetproject.org/.
[16] “Petango.com Online Pet Adoption & More. Welcome a homeless pet into your home today.”, Petango.com. [Online]. Available: https://www.petango.com/.
Figure 8: Look for a pet interface
Figure 9: Adoption request application interface
Proceedings of Graduation Project Showcase 2022
1 | P a g e
Published In: IEEE 2nd Asian Conference on Innovation Technology
Road Damages Detection and Classification
using Deep Learning and UAVs Mohammad Aftab Alam Khan1, Mohammad Alsawwaf2, Basheer Arab3, Mohammed AlHashim4, Faisal Almashharawi5,
Omran Hakami6, Sunday O. Olatunji7, Mehwash Farooqui8 and Atta-ur-Rahman9
Department of Computer Engineering, College of Computer Science and Information Technology,
Imam Abdulrahman Bin Faisal University, P.O. Box 1982, Dammam 31441, Saudi Arabia
Email:[mkhan, mkalsawwaf, 2180007157, 2180002260, 2180007096, 2180005916, osunday, mfarooqui,
aaurrahman]@iau.edu.sa
Abstract— The Road health management is particularly important, especially for big cities and countries. Problems that occur on roads like road cracks can be extremely dangerous to drivers' and passengers' lives. In this paper, a road monitoring system is proposed to detect and classify the occurring problems on the road that happened due to obstacles, such as excavations. This work will help in repairing critical road damages faster and save people from accidents that are caused by these damages. The proposed model will detect and classify the problem related to road damage into categories (cracks, potholes, and other damages). This proposed model will be built using a deep learning technique which is convolutional neural networks (CNN). It has been found that CNN is widely used in this area and images detection and classification because it shows high performance. Numerous works have been done in this field, but it is hoped that this proposed technique will achieve better results. The proposed model will be connected with a drone, and it is linked to a web application to demonstrate the results and manage the system. Also, an announcement to government agencies such as the Ministry of Transportation or police could be sent using the web application. Theoretically, the outcomes from of this work shall demonstrate extremely reasonable findings in detecting and classifying road damages from real-time recording.
Keywords: Deep Learning, CNN, Classification, Detection, Road Damages
I. INTRODUCTION
Big cities depend on third parties and companies to maintain road safety. Although, there are few works and applications that identifies road problems quickly and efficiently. With the development and marketing of self-driving cars, road maintenance will become increasingly more crucial [1]. Most governments and road health monitoring authorities detect and classify road damage manually. Nevertheless, manual detection has apparent drawbacks, such as relatively low efficiency, high labour costs, and extremely sluggish computation and processing of numerous data [2]. Saudi Arabia is one of the authorities that depend on a manual approach for detecting and classifying damages on roads. Developing a system that handles this kind of problem using AI technologies will help in increasing the speed of response and efficiency in classifying the damages. Such work has not been conducted yet in the Kingdom of Saudi Arabia. This kind of work will be in line with and will improve the technological development adopted by the Kingdom's vision 2030.
A road collision is one of the leading causes of mortality worldwide. One of the contributing causes of a traffic collision is road damage [3]. With the existence of road damage, problems will exist and affect drivers, cars, and governments. To address this issue, early detection of road deterioration is necessary. For that reason, developing a method to examine roads health regularly would lead to fixing damages faster to overcome accidents because of these damages. This work aims to provide a reliable system used to provide routine checking on highways. Next, provide reports about the damage detected with location, image, and damage type for each damage.
A variety of vision-based damage detection approaches, mostly based on image processing techniques (IPTs) [4]. Yet, the use of such contextually (i.e., employing previous information) image processing is constrained since picture data captured in real-world circumstances varies greatly. Other works like the work in [4], [3], [5], and [6] used deep learning as an optimal solution because it is considered more adaptive to a real-world situation. However, some studies such as [5] propose that an approach of hyper red methods from both techniques will make an enormous difference and outperforms other experiments which are only conducted by one approach. In using the deep learning approach there are several ways to build the model. The most noticed methods are using a pre-trained model like YOLO in [3], [7] and [8] or building an algorithm with optimized parameters from scratch like CNN in [4] and [9]. Based on the review of related works of literature CNN deep learning algorithm is most used in this type of problem.
In this paper, a road monitoring system will be designed to detect and classify the occurring problems on the road that happened due to obstacles, such as excavations. This work will help in repairing critical road damages faster and save people from accidents that are caused by these damages. The model will detect and classify the problem related to road damage into

Proceedings of Graduation Project Showcase 2022
2 | P a g e
Published In: IEEE 2nd Asian Conference on Innovation Technology
categories (cracks, potholes, and other damages). This proposed model is built using a deep learning technique which is convolutional neural networks (CNN). It has been found that CNN is widely used in this area and images detection and classification because it shows high performance. Python programming language will be used to train the model and to build the web application. A python library called Flask will be utilized to develop the web app and the APIs. The proposed model will be installed on a drone, and it is linked to a web application to demonstrate the results and manage the system. Also, an announcement to government agencies such as the Ministry of Transportation or police could be sent. Also, the dataset will be collected from online sources in addition to gathering some data of local roads using a drone. The proposed model should have reasonable accuracy in detecting damages. Add to that, a drone could be programmed to have autonomous navigation that will help in taking images and collecting data. For a user-friendly experience, that model will be integrated with a web application to manage the process and see the results.
This paper is structured as follows; The next section (section II) discusses a review of related works and studies. Section III states the methodology of the proposed system. Section IV talks about the functionalities and limitations. Section V is about the expected results and outcomes and section VI is the conclusion.
II. REVIEW OF RELATED WORK
As this research focuses on detecting and classifying the damages on roads, numerous related studies have been reviewed. These related works different on the used methods and results. It has been noticed that most of the reviewed works used CNN deep learning algorithm. While there are few others that that implied pre-trained models. For example, in the work in [3], the researchers present an autonomous pavement distress detection system based on the YOLO v2 deep learning framework. The dataset is formed of 9053 images that were captured with mobile cameras. These images are divided into 7240 images for training and 1813 images for testing. Images were obtained from seven different municipal administrations in Japan. For distress detection, YOLO v2 achieved an F1 score of 0.8780. For future improvements, the authors are considering using Google street-view images. Where article [10] suggested a sensor-based road health monitoring system. To identify the type of road, the system employs deep learning-based classifiers, which run on resource-constrained devices such as smartphones. In this work, the sensory data of diverse types of roads was performed using two vehicles. The researchers have taken certain convolutional layers in Deep Neural Network (DNN) to extract the spatial features. The algorithm and its variants have a training accuracy of 98%.
However, study [9] proposes a deep-learning-based fracture detecting technique. The method used to build the proposed method was ConvNets or convolution neural net (CNN). A quantitative assessment was performed on a dataset of square image patches composed of 500 images acquired using a moderate smartphone. The collected dataset is split into 64% as training samples, 16% for validation and 20% as testing samples. CNN achieved 89.6% in F1-score which is better than the other algorithms. The work in [11] introduces a real-time automated surveying system for collecting, classifying, and mapping image-based distress data. A qualitative methodology is considered for detecting fractures from gathered data using a convolutional neural network (CNN). The data collection was restricted to 1500 images of cracked asphalt pavement surfaces. A total of 1350 images for training and 150 images for testing. The proposed CNN was able to classify the cracks with an accuracy of 97% during the training.
In [12], the authors propose road surface damage detection using fully convolutional neural networks (CNN) with semi-supervised learning. The dataset is collected with the help of a camera installed in the vehicle while driving. it consisted of 40,536 images. Data augmentation is applied to the training set, 20% of the training set before data augmentation is randomly taken for the validation set. The authors achieved 0.94 accuracies in total with the semi-supervised approach. Also, paper [13] proposing a deep convolutional neural network (CNN) called CrdNet for damage detection. The dataset consists of 7282 grayscale images, and it is collected using a special inspection vehicle. A 6550 of the data is used for the training and 732 for testing. The proposed work had a mean average precision of 90.92%. The work in [14] used several neural network types to detect and Classify Road damage. It takes the densely connected convolution networks to work as the backbone for Mask R-CNN to extract the image feature and the feature pyramid network to combine the multiple scales features. To generate the road damage region a region proposal network. To classify the road damage a convolutional neural network is used. The dataset size of 9053 was captured using a smartphone mounted on a car.
Additionally, [15] proposed that the UAV can be a useful tool for the collection of reliable information about road pavement. In this paper, videos were collected from UAV platforms to process the images to detect the pavement of the road. SVM method is used to evaluate good results by training the collected data and testing random data selected from the trained data. The accuracy reached using the test data up to 92%. In paper [16], a special UAV was used to allow real-time controlling in a specified area to detect the flooring begging that required maintenance. DWT and PCA algorithms were used for the post-processing of images procedures, and SVM (Support Vector Machine) algorithm is used to segment and classify the images. The best achieving classification accuracy was 99.38%. In [5], deep learning and multitemporal methods were developed for automatic detection using Unmanned Aerial Vehicle (UAV). The convolutional neural network (CNN) uses a segmentation method that measures any change that happened in that area. The dataset holds 91,595 images from scene videos. The quantitative result achieves a higher F-measure of 98.70%. In another region, a deep learning approach is used for multiclass instance segmentation to detect concrete damage in [17]. Mask Region-Based Convolutional Neural Network is the algorithm used in this paper to manage the damage of the concrete and employ the image to detect and segment the defect. The result of the algorithm showed the classification of the damage was efficient, and the accuracy was 96.87% used on the picked images. The picked images were

Proceedings of Graduation Project Showcase 2022
3 | P a g e
Published In: IEEE 2nd Asian Conference on Innovation Technology
obtained using a digital camera. The dataset contains 576 images for training and validation, and 144 for testing and 96 images were added to the testing dataset.
The study in [18], the researcher proposed crack detection using google street view. There are two datasets in this paper. The second dataset suffered from imbalanced data. The researcher solved the problem with a resampling technique. The VGG-16 model based on the CNN algorithm was used to build the crack detection. The VGG-16 model achieved a 98.9% accuracy with the first dataset. The first dataset was composed of 27,000 images and split into 17,000, 5000, 5000 training, testing, validation, respectively. Where in paper [19], the researcher proposed Convolutional Neural Network (CNN) model to detect pavement distress. The CNN model used two datasets. The second dataset has 91,280 images and it split into 85% and 15% for training and testing sets respectively. The model reached 83.8% accuracy over the testing set using the second dataset. 2000 images and 105 images were added later to the dataset. In [20], a multiple deep convolutional neural network model is proposed. The single-shot multibox detector (SSD) convolutional neural network model has reached the highest accuracy, reached 87.6%. The model uses 8000 crack images, divided into 4800, 1600, 1600 for training, validation, and testing respectively.
In paper [1], the researchers proposed a deep learning model to detect the cracks in the road surface. The dataset contained a total of 14400 images with different properties. The number of images for all properties in training, testing, and validation sets was 9600,2400, and 2400 respectively. The model was trained with the original brightness and after changing the brightness and comparing the results. The FCN deep learning algorithm was used. The highest F1-score was 0.85 for the dataset with the original brightness. A deep learning model to detect damaged roads with smartphone images in [21]. The dataset is composed of 7231 in the training set and 1813 in the test set. Some of the classes in the dataset are imbalanced. So, data augmentation was used in the training set to solve the imbalanced data. The darknet53 model was used with the YOLO framework to build the final model. The model achieved up to a 0.62 f1-score. In article [22], the researchers proposed a deeper network to detect road damaged. In this paper, two experiments and networks were done. The CNN algorithm was used in both experiments. The first experiment with the second network obtained higher accuracy with 91.3%. The dataset used in the first experiment was composed of 100,000 for crack and 100,000 non-crack images in testing. The training set was randomly selected with 20,000 for crack and 20,000 for non-crack.
III. PROPOSED SYSTEM METHODOLOGY
Road damage detection and classification will take many resources such as time and effort in training the model. In our paper, we decided to use and implement one of the famous deep learning algorithms. The CNN algorithm will be used and see the performance of the algorithm as we decided in chapter 2.
A. Model Building and Evaluation
The CNN algorithm is chosen to train the model and build APIs to communicate with the drone. We will build the CNN model from the scratch. Also, we will try to use the weights in the pre-trained model ResNet as a top layer in the CNN model and analyse their performance to choose the one who obtain the best results in terms of confusion matrix, precession, recall, and accuracy. We need to further analyse in confusion matrix to have an idea about the number of TP, TN, FP, and FN. Furthermore, image processing techniques will be used before building the model. to make sure the images are free from noises such as paper noise, salt noise, and other types of noises. Because we found that in some literature review apply some of the techniques and the accuracy was better than before. Moreover, hyperparameter is an important process to obtain the best model with the optimal parameters. The CNN model will be trained on RTX 3600 ti GPU or Google Collaboratory.
B. Architectural Design Approach
The multilayer architecture design approach is important to implement the web application. This work architecture includes three layers: the presentation layer, application layer, and data layer.
• Presentation layer: this is the first and top layer in the web application. It provides a presentation service that is presented to the end-user through GUI.
• Application layer: this layer is the middle layer in the architecture. This layer provides the business logic of the application.
• Data layer: This layer comes after the application layer, which is concerned with the storage and retrieves the web application data in the database.
The advantage of using multilayer architecture is that it will improve scalability, security, and flexibility. Also, any damage that happens to any layer will not affect the other layers and the system. This will help the system to be more secure. Furthermore, the web application will be more stable, because when a new feature is added to the system will update it in one layer.
1) Architectural Design The architecture design for the entire web application system is shown in figure 1:
• Presentation layer: This layer provides controlling the drone and choosing to start and end points will be displayed in (the name of the page). Also, the reports generated from the drone and the history of the report are listed in the history

Proceedings of Graduation Project Showcase 2022
4 | P a g e
Published In: IEEE 2nd Asian Conference on Innovation Technology
and pending pages. Furthermore, the user can see the road via the camera’s drone and see the detection and classification process.
• Application on layer: This layer will handle the API requests. The drone will communicate with the deep learning model through an API to detect and classify the road state. Also, if the drone detects damage in the road will generate a report and send it to the web application.
• Data layer: This layer will handle the storing and retrieval process to and from the database by using SSMS. It will help the web application to store the reports that come from the drone and store them in the database. then, retrieve the reports and display them in the web application. Also, it stores the old and new drones’ information.
Figure 1: Web Application Architecture Design
IV. APPLICATION FUNCTIONALITIES AND LIMITATIONS
The road monitor system is a useful system that will help the drivers and develop Saudi Arabia in terms of safety. It has many functions that will help to make the road more safety. The system is divided into three parts the deep learning model, drone, and website.
A. Deep Learning Model
The deep learning model is the main part of the paper. It will detect and classify the damage. The functionality of the model will be provided below:
• Detecting the damages in the road
• Classification of the damage type
Figure 2: Model Functionality
B. Drone
The live detection and classification will do using a drone. The drone is responsible for detecting and classifying road surface damage. In this part, we will list all the functionality for the drone below.
• Real-time detection and classification The drone is responsible for detecting and classifying the damaged road. This process is done by capturing the detected road. Then, the drone will communicate with the model throw an API to classify the image.
• Generating reports The drone will send the classified images to the website. Also, the drone will provide additional information with images such as location, and time.

Proceedings of Graduation Project Showcase 2022
5 | P a g e
Published In: IEEE 2nd Asian Conference on Innovation Technology
`
C. Web Application
To see the classified images and make decisions to fix the road or not. The website will provide the capability to accept or reject the images provided by the drone. The functionality of the website will list them below.
• Define report status
After generating the report, the user will choose either to repair the road and it will send the request to the people who responded to fix it, reject if the damage not high, or misclassify the image.
• Controlling the drone
The website will provide a page to control the drone. The user will provide information like starting point and ending point, speed of the drone, and height of the drone.
• Monitor the drone
The user can monitor the road and the classification is done by the drone throw the website. Notification Once the drone generates the report the website will notify the user about the new reports from the drone.
Figure 5: Web-based System Diagram
Figure 3: Drone Diagram Figure 4: Drone Functionality

Proceedings of Graduation Project Showcase 2022
6 | P a g e
Published In: IEEE 2nd Asian Conference on Innovation Technology
Figure 6: Web-based System Functionality
V. RESULTS AND DISCUSSION
In the road damage detection and classification paper, several findings and outcomes are generated because of this study. First, the work is a web application to build an interactive system with the user. Several user interfaces are built in the web application that made the system user-friendly, each interface is arranged to make the system clear for the user, and each interface will be appeared for the users according to his role in the system, the rest of the interfaces will be hidden and not accessible for the unauthorized user in his specific role. Several datasets are collected from different online resources. They will be reviewed to be used to train, validate, and test the model.
In the implementation process for the work, a reasonable accuracy is trying to be achieved for the model using the best algorithms with the proper dataset, and that to build a system that is able and classify the damages on the road, this is one of the aims of the research work. Also, a reliable system is needed to build the model on the drone and control it for the detection process. Also, the system generates reports for the detected damage that appeared on the user screen, and that will make the user able to fix the damage that is on the road.
VI. CONCLUSION
This paper proposes the detection and classification of road damages using deep learning. The system is comprised of a web application and a deep learning model that gives all the components of the system the ability to communicate. Training and testing the model will be done using the CNN deep learning algorithm. Furthermore, an online dataset is being prepared to be used for training the model. The web application, the drone, and the model will all be synchronized by using APIs such as Flask. These proposed techniques are hoped to achieve better results. Also, an announcement could be sent to government agencies such as the Ministry of Transportation and the Police. This research work will be based on real-time video recording, demonstrating extremely reasonable findings for detecting and classifying roads damages.
REFERENCES
[1] T. Lee, Y. Yoon, C. Chun, and S. Ryu, “Cnn-based road-surface crack detection model that responds to brightness changes,” Electron., vol. 10, no.
12, 2021, doi: 10.3390/electronics10121402.
[2] L. Wang, X. H. Ma, and Y. Ye, “Computer vision-based Road Crack Detection Using an Improved I-UNet Convolutional Networks,” Proc. 32nd
Chinese Control Decis. Conf. CCDC 2020, vol. 2, pp. 539–543, 2020, doi: 10.1109/CCDC49329.2020.9164476.
[3] V. Mandal, L. Uong, and Y. Adu-Gyamfi, “Automated Road Crack Detection Using Deep Convolutional Neural Networks,” Proc. - 2018 IEEE Int. Conf. Big Data, Big Data 2018, pp. 5212–5215, 2019, doi: 10.1109/BigData.2018.8622327.
[4] Y. J. Cha, W. Choi, and O. Büyüköztürk, “Deep Learning-Based Crack Damage Detection Using Convolutional Neural Networks,” Comput. Civ.
Infrastruct. Eng., vol. 32, no. 5, pp. 361–378, 2017, doi: 10.1111/mice.12263. [5] D. Han, S. B. Lee, M. Song, and J. S. Cho, “Change detection in unmanned aerial vehicle images for progress monitoring of road construction,”
Buildings, vol. 11, no. 4, pp. 1–14, 2021, doi: 10.3390/buildings11040150.
[6] S. Naddaf-Sh, M. M. Naddaf-Sh, A. R. Kashani, and H. Zargarzadeh, “An Efficient and Scalable Deep Learning Approach for Road Damage Detection,” Proc. - 2020 IEEE Int. Conf. Big Data, Big Data 2020, pp. 5602–5608, 2020, doi: 10.1109/BigData50022.2020.9377751.
[7] Y. K. Yik, N. E. Alias, Y. Yusof, and S. Isaak, “A real-time pothole detection based on deep learning approach,” J. Phys. Conf. Ser., vol. 1828, no.
1, pp. 1–8, 2021, doi: 10.1088/1742-6596/1828/1/012001. [8] H. Maeda, Y. Sekimoto, T. Seto, T. Kashiyama, and H. Omata, “Road Damage Detection and Classification Using Deep Neural Networks with
Smartphone Images,” Comput. Civ. Infrastruct. Eng., vol. 33, no. 12, pp. 1127–1141, 2018, doi: 10.1111/mice.12387.
[9] L. Zhang, F. Yang, Y. D. Zhang, and Y. J. Zhu, “ROAD CRACK DETECTION USING DEEP CONVOLUTIONAL NEURAL NETWORK Lei Zhang , Fan Yang , Yimin Daniel Zhang , and Ying Julie Zhu,” IEEE Int. Conf. Image Process., pp. 3708–3712, 2016.
[10] R. Mishra, H. P. Gupta, and T. Dutta, “A Road Health Monitoring System Using Sensors in Optimal Deep Neural Network,” IEEE Sens. J., vol. 21, no. 14, pp. 15527–15534, 2021, doi: 10.1109/JSEN.2020.3005998.
[11] M. M. Naddaf-Sh, S. Hosseini, J. Zhang, N. A. Brake, and H. Zargarzadeh, “Real-Time Road Crack Mapping Using an Optimized Convolutional
Neural Network,” Complexity, vol. 2019, 2019, doi: 10.1155/2019/2470735. [12] C. Chun and S. K. Ryu, “Road surface damage detection using fully convolutional neural networks and semi-supervised learning,” Sensors
(Switzerland), vol. 19, no. 24, pp. 1–15, 2019, doi: 10.3390/s19245501.

Proceedings of Graduation Project Showcase 2022
7 | P a g e
Published In: IEEE 2nd Asian Conference on Innovation Technology
[13] J. Jabez and B. Muthukumar, “A CNN-Based Length Aware Cascade Road Damage Detection Approach,” Procedia - Procedia Comput. Sci., vol.
48, no. Iccc, pp. 338–346, 2015, [Online]. Available: http://dx.doi.org/10.1016/j.procs.2015.04.191. [14] Q. Chen, X. Gan, W. Huang, J. Feng, and H. Shim, “Road damage detection and classification using mask R-CNN with DenseNet backbone,”
Comput. Mater. Contin., vol. 65, no. 3, pp. 2201–2215, 2020, doi: 10.32604/cmc.2020.011191.
[15] F. Dadrasjavan, N. Zarrinpanjeh, A. Ameri, G. Engineering, and Q. Branch, “Automatic Crack Detection of Road Pavement Based on Aerial UAV Imagery,” Prepr., no. July, pp. 1–16, 2019, doi: 10.20944/preprints201907.0009.v1.
[16] V. Barrile, E. Bernardo, A. Fotia, G. Candela, and G. Bilotta, “Road safety: Road degradation survey through images by UAV,” WSEAS Trans.
Environ. Dev., vol. 16, pp. 649–659, 2020, doi: 10.37394/232015.2020.16.67. [17] P. Kumar, A. Sharma, and S. R. Kota, “Automatic Multiclass Instance Segmentation of Concrete Damage Using Deep Learning Model,” IEEE
Access, vol. 9, pp. 90330–90345, 2021, doi: 10.1109/ACCESS.2021.3090961.
[18] M. Maniat, C. V. Camp, and A. R. Kashani, “Deep learning-based visual crack detection using Google Street View images,” Neural Computing and Applications. 2021, doi: 10.1007/s00521-021-06098-0.
[19] C. Zhang, E. Nateghinia, L. F. Miranda-Moreno, and L. Sun, “Pavement distress detection using convolutional neural network (CNN): A case
study in Montreal, Canada,” Int. J. Transp. Sci. Technol., no. xxxx, 2021, doi: 10.1016/j.ijtst.2021.04.008. [20] X. Feng et al., “Pavement Crack Detection and Segmentation Method Based on Improved Deep Learning Fusion Model,” Math. Probl. Eng., vol.
2020, 2020, doi: 10.1155/2020/8515213.
[21] A. Alfarrarjeh, D. Trivedi, S. H. Kim, and C. Shahabi, “A Deep Learning Approach for Road Damage Detection from Smartphone Images,” Proc. -
2018 IEEE Int. Conf. Big Data, Big Data 2018, pp. 5201–5204, 2019, doi: 10.1109/BigData.2018.8621899.
[22] L. Pauly, H. Peel, S. Luo, D. Hogg, and R. Fuentes, “Deeper networks for pavement crack detection,” ISARC 2017 - Proc. 34th Int. Symp. Autom.
Robot. Constr., no. Isarc, pp. 479–485, 2017, doi: 10.22260/isarc2017/0066.

Proceedings of Graduation Project Showcase 2022
1 | P a g e
Published In: 12th International Conference on Computer Science and Information Technology
(CCSIT 2022)
A COMPARISON BETWEEN VGG16 AND XCEPTION
MODELS USED AS ENCODERS FOR IMAGE
CAPTIONING
Asrar Almogbil1,2, Amjad Alghamdi1, Arwa Alsahli1, Jawaher Alotaibi1
Razan Alajlan1, Fadiah Alghamdi1
1 Department of Computer Science, college of Computer Science and Information
Technology, Imam Abdulrahman Bin Faisal University, Dammam, Saudi Arabia
2 Department of Computer Science, college of Computer Science and Information
Technology, Imam Abdulrahman Bin Faisal University, Dammam, Saudi Arabia
ABSTRACT
Image captioning is an intriguing topic in Natural Language Processing (NLP) and Computer Vision (CV).
The present state of image captioning models allows it to be utilized for valuable tasks, but it demands a
lot of computational power and storage memory space. Despite this problem's importance, only a few
studies have looked into models’ comparison in order to prepare them for use on mobile devices.
Furthermore, most of these studies focus on the decoder part in an encoder-decoder architecture, usually
the encoder takes up the majority of the space. This study provides a brief overview of image captioning
advancements over the last five years and illustrate the prevalent techniques in image captioning and
summarize the results. This research study also discussed the commonly used models, the VGG16 and
Xception, while using the Long short-term memory (LSTM) for the text generation. Further, the study was
conducted on the Flickr8k dataset.
KEYWORDS
Image Captioning, Encoder-Decoder Framework, VGG16, Xception, LSTM.
1. INTRODUCTION
One of the most challenging and important topics in computer vision and natural language
processing is image captioning [1],[2]. Image captioning aims to generate a natural language
description based on the association between the objects in the given image. Image captioning
can be helpful in different applications such as human-computer interaction and providing help
for visually impaired persons [3]. Therefore, several studies have developed an image captioning
model [4,5]. Initially, the studies related to image captioning were focused mainly on generating
natural language descriptions for video [6], following the studies describing neural caption
generation architectures [7, 8], such as the encoder-decoder architectures proposed in [9].
Recently, the encoder-decode architecture has shown much improved outcomes in efficiently
generating natural language descriptions of an image [10]. At first, the CNN layers are used to
extract the features of the image. Then the collected features are used by the Recurrent neural
network (RNN) model to attain the information from the image [11].
This study reviews the current advancement of image captioning models and summarizes the
underlying framework. Although much attention has been paid to the decoder, there has not been
enough focus on the encoder. To fill this gap, this study will compare the performance of two
different encoder models, namely: VGG16 and Xception. Moreover, a comprising that focus

Proceedings of Graduation Project Showcase 2022
2 | P a g e
Published In: 12th International Conference on Computer Science and Information Technology
(CCSIT 2022)
mainly on the performance of two widely used encoder - VGG16 and Xception is poorly
investigated, which will help further researchers to decide on the encoder model.
The rest of the paper is organized as follows. Section 2 presents related work. Section 3 discusses
the materials and methods used in this work. Experiments done are described in Section 4. The
result obtained is illustrated in section 5. Conclusions and future work in Section 6.
2. RELATED WORK
In this section, we will summarize multiple related studies from different sources. The studies
will be organized in chronological order ascendingly. The purpose of the related work is to gain
an understanding of the published studies relevant to the image captioning field.
In [12], they used the MSCOCO dataset and LSTM to encode the text and used CNN as an image
encoder to extract features, and they obtained the best result compared with their benchmark.
Another study [13] used VGG16 as an encoder, which aids in creating image encodings. Then,
the encoded images are fed into an LSTM. The proposed model was enhanced with hyper-
modifying parameters. As a result, the model's accuracy increased to attain state-of-the-art results.
In [14], different models of image captioning were used. A merge architecture was applied in this
study. CNN-5, vgg16, and vgg19 are the different CNN that are used along with the LSTM. The
experiment is done on Flickr8K dataset. A Bilingual Evaluation Understudy (BLEU) evaluation
metric is used to evaluate the models. The result showed that VGG16 is perform better than other
models. The authors in [15] compared different models of image captioning. All models were
conducted on the Flickr8K dataset. The architecture used in this study is encoder-decoder
architecture. For the encoder, two different CNN models are used, which are VGG16 and
InceptionV3. For the decoder part, two types of LSTM were used. The first type is a unidirectional
LSTM that works in one direction. The second type is bidirectional LSTM which works in two
directions. The proposed models used greedy search and beam search algorithms to generate the
captions. The results show that the InceptionV3 with bidirectional LSTM with beam search gave
the best result. The evaluation metric used is BLEU. In [16], the study proposed an image caption
generator in the Bengali language using a merged dataset of two languages by combining flickr8k,
BanglaLkey, and Bornon datasets. The transform-based and visual attention approaches were
used to implement the proposed model. The Transform-based approach used an inceptionV3
encoder and fed to a dense layer that contains an activation function. The visual attention approach
implements an Encoder-decoder framework as well. In the encoder part, the InceptionV3 and
Xception models were used. For the evaluation of the proposed model, the BLEU and Metor were
used.
In [17], the study proposed an image captioning model to use the model on any website to generate
the description of the inputted image. The proposed model followed the CNN-LSTM concepts
and was conducted on the flicker8k dataset. In [18], the study used CNN and RNN models, and
the Xception was trained using the flickr8k dataset. Another study used the xception model
coupled with LSTM in [19] to discover the object found in the image, detect the relationship
among the objects, and generate the proper captions. This study was trained using the fliker8k
dataset. The criteria to evaluate the model was the loss value. In [20], the authors compared the
most popular CNN architecture: Xception, Resnet50, InseptionV3, Vgg16, and Densent201.
Along with the LSTM decoder. The comparison was done to see the effect of the performance by
implementing different encoder models. The study used flicker8K dataset. The evaluation of the
comparison was the loss value and the accuracy to compare the model's performance. The study
[21] proposed different CNN models VGG16, Xception, and inception coupled with bi-
directional layer RNN models for an enhanced image captioning model. The models were trained
using flicker30K and coco datasets. The BLUE score and training and loss are used to evaluate
each model.

Proceedings of Graduation Project Showcase 2022
3 | P a g e
Published In: 12th International Conference on Computer Science and Information Technology
(CCSIT 2022)
3. MATERIALS AND METHODS
This section includes the description of the dataset used in the study and the different encoders:
VGG16 and Xception. Finally, the decoder model.
3.1. Dataset pre-processing
The dataset used in this work is Flicker8k, and it is available on GitHub [22]. Flicker8k
consists of two folders, the first folder contains only images, and the second folder
contains a text file with the image descriptions. For the data pre-processing phase, we
start working on the text file and organize it by mapping the image ID to a list of five
corresponding descriptions. After that, we worked on data cleaning by making all letters
in lower case, removing all the punctuations, and removing words with one character (e.g.
‘A’). Lastly, we saved all changes made in a new text file.
3.2. The Encoder models
3.2.1. VGG16 model
VGG16 is one of the most preferred CNN models as it has a very uniform architecture. Simonyan
and Zisserman developed this model in 2014 [23]. It contains 16 convolutional layers. By having
this amount of layers, the complexity would increase compared to the initial versions of the CNN
architecture. In the below Figures, the size is proportionally getting reduced. The two layers are
convolutional, and the output of these two layers is 224x224, followed by the max-pooling layer,
and the final output after the max-pooling layer of size 2x2 and stride of 2 will be reduced to
112x112. Finally, we have three fully connected layers called dense. Figure 1 shows the
architecture of the VGG16 model.
Figure 1: VGG16 Architecture

Proceedings of Graduation Project Showcase 2022
4 | P a g e
Published In: 12th International Conference on Computer Science and Information Technology
(CCSIT 2022)
3.2.2. Xception model
The Xception model, also called “Extreme Inception” was proposed by Francois Chollet. It is a
kind of CNN model used to extract the features from the image. Also, it is an extension of the
inception model that is also considered a type of CNN model [24], but a better and enhanced
version by reversing some steps to be more efficient and easier to modify [25]. The Xception
model contains 37 layers [20]. The model uses the depthwise separable convolutional layers
approach, which divides the image into K input channel with depth equal to 1, then applies the
filter into each part with depth equal to 1, after that compressed all input channels space then
applying 1*1 convolutional. The accuracy of the Xception model considers the highest among
the CNN model in agreement with the LR in [15]. Therefore, it gives the best result compared to
the other CNN models. Figure 2 illustrate the layers of the Xception model.
Figure 2 : Layers of Xception Model
3.3. The Decoder model
For the decoder model, LSTM based model was used, which takes input from the feature
extraction model to predict a sequence of words, called the caption.
Because LSTM overcomes the RNN's constraints, LSTM is more effective and superior to the
regular RNN. With a forget gate, LSTM can keep relevant information throughout the processing
of inputs while discarding non-relevant information. It can process not only single data points but
also complete data sequences [26].
4. EXPERIMENTAL
For the experiments, our model follows the encoder-decoder framework. Therefore, we tested and
evaluated two different encoder models. Furthermore, we illustrated the conducted processes for

Proceedings of Graduation Project Showcase 2022
5 | P a g e
Published In: 12th International Conference on Computer Science and Information Technology
(CCSIT 2022)
developing the models for each model and how we trained the models. Whereas the decoder
remains fixed during the experiment, as mentioned before, in order to focus on comparing the
performance of the encoder model.

Proceedings of Graduation Project Showcase 2022
6 | P a g e
Published In: 12th International Conference on Computer Science and Information Technology
(CCSIT 2022)
4.1. The encoder
In the feature extraction step, the size of the image features is 224x224. Extracting the features of
the image is done before the last layer. The goal of the last layer is to predict the classification of
an image. For this reason, the last layer is dropped. The models were trained on Flickr8k dataset
as was described in Section 3.
4.1.1 VGG16
• Before optimization
When we started the model's training, we split the dataset into two parts. The first part is for
training, and the second part is for testing. Flicker8k dataset contains a file named
"Flickr_8k.trainImages.txt" that includes 6000 image ID; this file is used for the training part. The
training phase will be done in three steps. The first step, load the features extracted from the
VGG16 model. In the second step, we will initiate a dictionary that contains descriptions for each
image. The third step, create tokenizing vocabulary by using Keras, which provides the tokenizer
class, and it can do the mapping from the loaded description data. In this step, we need to fit the
tokenizer given the loaded photo description text. The create_tokenizer() function is responsible
for fitting the created tokenizer given the loaded photo description text. In addition, it's for
mapping each word of vocabulary with a unique index value.
• After optimization
To optimize the result and reduce the loss obtained, we implement Adam algorithm, which is an
optimizer that increase efficiency of neural network weights.
4.1.2 Xception
• Before optimization
Our CNN-RNN model consists of three main parts: feature extraction (encoder), sequence
processor, and decoder. In the experiment, we used images with a size equal to 299x299. In the
features extraction step, which is done before the last layer of the model, we got an 8091 feature
vector. In training, feature extraction is loaded to the model, and the dataset is divided into two
parts: training with 7091 images and testing with 1000 images. Then, we tokenized the vocabulary
by mapping each word with a unique index value, and each image will have a maximum length
of sentence equal to 31. After that, we created a data generator to train the model to yield the
image in batches.
• After optimization
The Adam algorithm was implemented to optimize the model to improve its performance.
5. RESULT AND DISCUSSION
In this study, a total of four models were tested and evaluated —VGG16, VGG16 with
optimization, Xception, and Xception with optimization. The criteria for the comparison are taken
to be the loss instead of the accuracy value, and the standard metric for comparison used here is
the BLEU score.

Proceedings of Graduation Project Showcase 2022
7 | P a g e
Published In: 12th International Conference on Computer Science and Information Technology
(CCSIT 2022)
Table 1: Evaluation Table
Model BLEU-1 BLEU-2 BLEU-3 BLEU-4
VGG16
Epoch= 100
Loss=3.0345
0.522997 0.279958 0.186401 0.079141
VGG16 with
optimization Epoch = 100
Loss= 3.3746
Optimizer= Adam
0.498937 0.251331 0.168155 0.068864
Xception
Epoch= 50
Loss= 4.3955
0.096406 0.031889
0.020180 0.004638
Xception with
optimization
Epoch= 50
Loss=3.3618
Optimizer= Adam
0.550791
0.309441 0.216791 0.105341
The above table shows each model's performance in terms of the BLEU score, testing loss of the
implemented models, and the number of epoch with the optimizer if used.
Our results demonstrate that Xception with optimization BLEU scores outperformed the other
three models. The highest BLEU score achieved in the study was 0.550791. Both Xception with
optimization and VGG16 before optimization have similar scores. However, the loss of VGG16
was less than Xception with optimization. The main motivation for using the adam algorithm was
to show a significant improvement in the runtime and memory consumption and increase the
efficiency of neural network weights, as mentioned in the previous section. The caption generated
from the Xception with optimization model gives the best probability and more accurate captions
(see Figure 6). In contrast, the captions generated by the other three models (Figure 3-5) were
long sentences compared to Xception with optimization. We can infer from the experiment that
when the sentences are long, the more probable to make mistakes. In most situations, we found
that the short sentences are sufficient to explain an image, whereas lengthier sentences frequently
contain duplicate information and grammatical errors. The main challenge was to reduce the loss
in Xception models, and after using the optimizer, the loss decreased. Yet, it remained higher than
the loss obtained in VGG16 before optimization (see figure 7). Hence, we observed that when the
number of the Epoch is increased, the number of loss models will increase in the Xception models
due to the small size of the dataset.

Proceedings of Graduation Project Showcase 2022
8 | P a g e
Published In: 12th International Conference on Computer Science and Information Technology
(CCSIT 2022)
Figure 3: VGG16 Before Optimization
Figure 4: VGG16 After Optimization
Figure 5: Xception Before Optimization

Proceedings of Graduation Project Showcase 2022
9 | P a g e
Published In: 12th International Conference on Computer Science and Information Technology
(CCSIT 2022)
Figure 6: Xception After Optimization
Figure 7 Testing Loss Curve for Xception Before and After Optimization.
6. CONCLUSION
In this study, we used an encoder-decoder framework that been used in the previous studies. We
evaluated two different encoder models for the purpose of comparing the VGG16 and Xception
encoder models. So far, no study has been published comparing these two models which will help
researchers figure out which model is outperforming the other. The outcome of the comparison
shows that the Xception model, when implemented adam algorithm, will generate the most
accurate caption compared to the other three models. Moreover, the study attempted to use
Flickr8k open-source datasets. Despite the precise caption achieved, there is still a need for a
larger dataset. A large dataset will enhance the model’s performance.
0
1
2
3
4
5
6
0 1 10 50 100
Loss
Number of Epochs
Xecption after optimazation Xecption before optimazation

Proceedings of Graduation Project Showcase 2022
10 | P a g e
Published In: 12th International Conference on Computer Science and Information Technology
(CCSIT 2022)
7. ACKNOWLEDGEMENTS
We would like to thank Ms. Asrar Almogbil for her cooperation on providing the instructions.
We also extend our appreciation to Dr. Nida Aslam and Ms. Abrar Alotaibi for their continuous
efforts in helping and answering our questions during the experiment.
8. REFERENCES
[1] Raimonda Staniut¯ e and Dmitrij ˙ Seˇ sok. A systematic literature review ˇ on image captioning.
Applied Sciences, 9(10):2024, 2019.
[2] Stanislaw Antol, Aishwarya Agrawal, Jiasen Lu, Margaret Mitchell, Dhruv Batra, C Lawrence
Zitnick, and Devi Parikh. Vqa: Visual question answering. In Proceedings of the IEEE
international conference on computer vision, pages 2425–2433, 2015.
[3] Abhishek Das, Satwik Kottur, Khushi Gupta, Avi Singh, Deshraj Yadav, Jose MF Moura, Devi
Parikh, and Dhruv Batra. Visual dialog. In ´ Proceedings of the IEEE Conference on Computer
Vision and Pattern Recognition, pages 326–335, 2017.
[4] A. Ramisa, F. Yan, F. Moreno-Noguer, and K. Mikolajczyk, “Breakingnews: Article annotation
by image and text processing,” IEEE Transactions on Pattern Analysis and Machine Intelligence,
vol. 40, no. 5, pp. 1072–1085, 2018.
[5] H. Ben, Y. Pan, Y. Li et al., “Unpaired image captioning with semantic-constrained self-
learning,” IEEE Transactions on Multimedia, vol. 24, pp. 904–916, 2021.
[6] Vinyals, Oriol, et al. ”Show and tell: A neural image caption generator.” Computer Vision and
Pattern Recognition (CVPR), 2015 IEEE Conference on. IEEE, 2015.
[7] M. Tanti, A. Gatt, and K. P. Camilleri, “What is the Role of Recurrent Neural Networks (RNNs)
in an Image Caption Generator?,” Aug. 2017.
[8] Sulabh Katiyar and Samir Kumar Borgohain. Comparative evaluation of cnn architectures for
image caption generation. arXiv preprint arXiv:2102.11506, 2021.
[9] Sutskever, Ilya, Oriol Vinyals, and Quoc V. Le. ”Sequence to sequence learning with neural
networks.” In Advances in neural information processing systems, pp. 3104-3112. 2014.
[10] F. Huang, X. Zhang, Z. Zhao, and Z. Li, “Bi-directional spatial-semantic attention networks for
image-text matching,” IEEE Transactions on Image Processing, vol. 28, no. 4, pp. 2008–2020,
2019.
[11] S. Li, Z. Tao, K. Li, and Y. Fu, “Visual to text: Survey of image and video captioning,” IEEE
Transactions on Emerging Topics in Computational Intelligence, vol. 3, no. 4, pp. 297–312,
2019.
[12] A. T. S. B. a. D. E. Oriol Vinyals, "Show and Tell: Lessons Learned from the 2015 MSCOCO
Image Captioning Challenge," IEEE TRANSACTION ON PATTERN ANALYSIS AND
MACHINE INTELLEGENCE, vol. 39, p. 12, 2017
[13] V. V. P. M. M. Ashish Pateria, "Enhanced Image Capturing using CNN," International Journal
of Engineering and Advanced Technology (IJEAT), vol. 8, no. 4, p. 6, 2019.
[14] A. a. D. S. a. Y. M. V. Jmail, "IMAGE CAPTIONING: TRANSFORMING SIGHT INTO
SCENE," International Research Journal of Modernization in Engineering Technology and

Proceedings of Graduation Project Showcase 2022
11 | P a g e
Published In: 12th International Conference on Computer Science and Information Technology
(CCSIT 2022)
Science, vol. 02, no. 06, pp. 54-66, 2020.
[15] S. Takkar, A. Jain, and P. Adlakha, “Comparative Study of Different Image Captioning
Models.” Fifth International Conference on Computing Methodologies and Communication,
India, 2021.
[16] F. M. Shah, M. Humaira, M. A. R. K. Jim, A. S. Ami and S. Paul, "BORNON: BENGALI
IMAGE CAPTIONING WITH TRANSFORMER-BASED DEEP LEARNING APPROACH,"
arXiv, p. 20, 2021.
[17] M. M. Patil, "Experiment based on Deep Learning: Image," INTERNATIONAL JOURNAL OF
CREATIVE RESEARCH THOUGHTS - IJCRT , vol. 9, no. 12, p. 6, 2021.
[18] N. L. C. K. Satyabrat Mandal, "Automatic Image Caption Generation System," International
Journal of Innovative Science and Research Technology, vol. 6, no. 6, p. 4, 2021.
[19] V. U. G. S. V. M. Megha J Panicker, "Image Caption Generator," 2021.
[20] S. R. Sahrial Alam, "Comparison of Different CNN Model used as Encoders for Image
Captioning," 2021.
[21] A. P. Yash Indulkar, "Comparative Study for Neural Image Caption Generation Using Different
Transfer Learning Along with Diverse Beam Search & Bi-Directional RNN," 2021.
[22] the dataset available in: https://github.com/goodwillyoga/Flickr8k_dataset
[23] A. D. Hussam, "Compressed residual-VGG16 CNN model for big data places image
recognition," in 2018 IEEE 8th Annual Computing and Communication Workshop and
Conference (CCWC), Las Vegas, 2018.
[24] M. j. Panicke, V. Upadhayay, G. Sethi and . V. Mathur, "Image Caption Generator,"
International Journal of Innovative Technology and Exploring Engineering (IJITEE), vol. 10, no.
3, p. 6, 2021.
[25] F. Chollet, "Xception: Deep learning with depthwise separable convolutions," in Proceedings of
the IEEE conference on computer vision and pattern recognition, 2017.
[26] P. G. Shambharkar, P. Kumari, P. Yadav, and R. Kumar, “Generating Caption for Image using
Beam Search and Analyzation with Unsupervised Image Captioning Algorithm.” Fifth
International Conference on Intelligent Computing and Control Systems, India, 2021.

Proceedings of Graduation Project Showcase 2022
57 | P a g e Published In:
Smart Inventory System
AUTHOR’S NAME (Hussain Khoder, Hussain Alyahya, Ali Almuallim, Zeyad Alquaimi, Mazin Almohsin)
College of Computer Science & Information Technology/Imam Abdulrahman bin Faisal University, King Faisal Road, King
Faisal University City, Dammam 34212
Email: [email protected], [email protected], [email protected] , [email protected], [email protected]
Abstract: Traditional inventory system are now obsolete, the costs of resources and time that traditional
inventory systems carry outweighs the cheap money cost for operation and this is where the smart inventory
system can be beneficial, it might require a bit more money at implementation, but it will save way more time
than traditional inventory systems. The proposed project attempts to create a system that makes inventory
management easier by utilizing NFC cards and readers, as well as sensors that alert administrators to products
that have been removed from the shelves.
I. Introduction:
System inventories are a comprehensive resource to
access all information about items or resources that
an organization owns and have in storage, usually
you would want an information system that can
manage the system inventory but not many
organizations have this kind of luxury, most
organizations opt to do it in papers and the inventory
manager will try to track items’ location and available
items by paper and observation, an information
system that could manage an inventory would act as a
centralized resource that could list all items that are
being held in storage and give all kind of information
that is needed. In this paper we will discuss the
importance of having a system that utilizes
technology instead of the traditional way which only
utilizes paper.
II. Difficulties of Basic Inventory Systems
Operations:
Traditional or manual inventory systems were used
previously by companies until automated systems
came along and replaced them. Why were they
replaced? Traditional or manual inventory systems
take a long time to operate, and this is a waste of
time, every process in these systems such as
controlling, updating, and maintaining the system is
done manually by employees. This means that
manual inventory systems daily and frequently track
stock of the products and processes that take place
inside the inventory. In traditional or manual
inventory systems, the process of tracking products is
done by employees which means that the results
come from the employees counting, by recording all
the processes of removing products that occur in the
inventory manually and repeatedly. In this situation,
the inventory process is difficult for the employees
because every time a product is removed or a product
is added to the inventory, the employee will have to
manually record these operations and update it at the
end of working hours, which may cause data loss, and
cost employees or the company time and money.
(Jane, 2017)
III. Why we need automation in inventory
management?
With the presence of manual inventory systems in
companies, companies will face many problems,
losses, and challenges that will cause loss of time and
money. One of the problems that companies may face
with manual systems is an incorrect calculation of the
company's inventory, which may cause errors in the
rest of the operations. Inventory systems need
accuracy in inventory data such as the number of
existing products stock and products removed by
employees or customers. Automated systems work on
this function using technology and software to update
the system when the product is scanned on the sensor
and thus the manager or person responsible for
management will be Notified of this removal or
addition along with the subtracted or added auto-
generated new inventory stock. Unlike manual
systems, when the employee forgets to record the
removed product, the manager will expect that the
product is still in the inventory stock. Finally,
automated inventory systems update all items and
inventory data automatically at the end of working
hours, which is the opposite of manual systems that
require manual updating at the end of working hours.
Thus, the process of ordering new products will be

Proceedings of Graduation Project Showcase 2022
58 | P a g e Published In:
easier and faster for managers. (Jane, 2017) (Duff,
2022)
IV. Functions of a Smart Inventory That Could
Improve Inventory Management
We created a project that uses many technological
functions to help us create a smart inventory
management system which contains a variety of
technologies that contribute an increase in collected
data, thereby facilitating the management process;
gathering information is a fundamental method for
improving inventory management. As a result, the
smart inventory contains tools and devices that help
in storing information, such as NFC reader, which it
can read the NFC chips and retrieve information from
it, then send this information to the Database, where
all of the information about the items is stored, each
element and item in the stock have an NFC tag that
contain all the necessary information, all items in the
smart inventory counted even if an item was taken all
the data will be record with the information of the
person who took the item. The Database which
contains all recorded data is linked with website,
which helps in organizing all data collected and
managing information accurately and quickly.
Conclusion:
We can see an increase of efficiency after
implementing such projects, this is because
traditional inventories require a lot of time, time
could be wasted looking for the item in shelves or
room or even different warehouses that are in
different buildings or cities, a smart inventory system
would hold all the data which can help with finding
the item and saving the time. There will be an
increase in accuracy of the assets that are recorded,
and we can track all items, so they don’t get lost or
miscalculated. Different branches can also benefit
from such projects in many ways either direct or
indirect by that we can see that compared to the
benefits the cost is negligible.
References: Duff, J. (2022, Apr 1). Smart Inventory Management System – The
Key to Improving Business Efficiency. Retrieved from
mytechmag: https://www.mytechmag.com/smart-
inventory-management-system-the-key-to-improving-
business-efficiency/
Jane, M. (2017, Sep 26). Difficulties in Using a Manual Inventory
System. Retrieved from bizfluent:
https://bizfluent.com/info-7920237-business-rules-
inventory-system.html
Iqbal, R., Ahmad, A., & Gilani, A. (2014). NFC based inventory
control system for secure and efficient communication.
Computer Engineering and applications journal, 3(1),
23-33.
Cheng, R. S., Lin, C. P., Lin, K. W., & Hong, W. (2015). NFC
Based Equipment Management Inventory System. J.
Inf. Hiding Multim. Signal Process., 6(6), 1145-1155.

OTHER DISSEMINATIONS
(POSTERS, BOOK CHAPTERS, WORKSHOPS…)

Proceedings of Graduation Project Showcase 2022
1 | P a g e Published In: King Fahd University of Petroleum and Minerals at “women in science” workshop
The figure above describe the connection between each equipment
The figure above displays the Home interface that
will be shown to the user after registration/login
Conclusion
References :
E. A. Holzapfel, A. Pannunzio, I. Lorite, A. S. Silva de Oliveira and I.
Farkas, "Design and management of Irrigation Systems," ChileanJar,
2009. [Online]. Available:
https://scielo.conicyt.cl/pdf/chiljar/v69s1/AT03.pdf. [Accessed 1
October 2021].
O. Debauche, S. Mahmoudi, M. Elmoulat, S. A. Mahmoudi, P.
Manneback and F. Lebeau, "Edge AI-IoT pivot IRRIGATION, Plant
diseases, and pests identification," Procedia Computer Science, vol.
177, p. 48, 2020.
This figure displays the
Welcome interface that
will be shown to the user
when she/he open the
application
The project end product will be a device that is
connected to sensors to measure soil moisture and
temperature. In addition, the sensor data will be
saved in Firebase real-time database which will be
displayed on a mobile application, this product will
help reduce the water loss as well as taking plants
need for water into consideration.
Results
Intelligent Watering System (IWS) is developed to be
able to detect the soil moisture level and based on
the given percentage the system will automatically
open/close the water source. This system initially will
consist of a soil moisture and temperature sensors, a
water pump, and an Arduino kit. The soil moisture
sensor will measure soil moisture at the root zone, if
the soil is dry then the water source will switch on
automatically with the help of the Arduino kit, and
when the soil moisture sensor sense that the soil is
moist enough the water source will be switched off
immediately. Therefore, there will not be neither over
watering nor under watering of plants. Thus, there will
not be any waste of water especially if the weather
was rainy or humid. Additionally, an application will be
used to monitor the humidity, temperature, and the
soil moisture levels of the plants in all time. This will
help users to monitor their plants from far distances,
so they will know the status of their plants. All these
information comes from the sensors that will be located
inside the soil. Our system will help to reduce watering
problems and will let gardeners take better care of
their plants with less effort.
Introduction
Use of IoT to improve existing solutions
Reduce water usage
Improve the overall health of the plants
Increase the efficiency of gardening
Help gardeners take care of their plants
remotely
Objective
The IWS project was developed to improve the
existing watering system using IoT to enhance the
process of watering plants automatically. The
developing of this project was divided into three
phases:
1. Planning and Gathering Requirements: in this
phase the overall plan of the project is
constructed, and the requirements are identified
and gathered.
2. Design: in the second phase we clarified how the
overall system is going to be designed in order to
achieve the system requirements. This includes
the hardware devices and their connections and
the application used to monitor the hardware.
3. implementation: we divided this phase into two
sections: development of hardware and
development of software. The two sections were
developed simultaneously then they were
connected as the final end product. The hardware
aspect consists of a soil moisture and temperature
sensors, a water pump, and an Arduino kit.
Arduino IDE was used to receive the data from the
sensors and control the water pump accordingly.
In addition, it was used to send the data to
firebase. The application on the other hand was
developed using Android Studio, it receives the
data from Firebase then display it to the user.
Methodology
The Intelligent watering System will be able to
measure the temperature and humidity of the soil
and display it to the user through the mobile
application to provide more insight. He/she will
also be able to open the irrigation system either
automatically or manually
INTELLEGENT WATERING SYSTEM
Authors
Raweyah abdullah
Hadeel Al-otaibi
Ferdous Qabbani
Noof Alborai
Layan Alsahli
Supervisor: Dr. Mohammed AL Qahtani

CCSIT