Graduation progect c %
136
اهداء ى ل ار ا ر ص والإ مة ي ز لع ر وا صب ل ا لإ ب م ا ت ت لإ رة ب% ب ك لل ا ما ع- ن. الإ- ا ي من ل ع. ن م ى ل ا ة دي ام ب ب- الإ ت ق ق< ش ة.. و ن@ ي ب ج زق لع ل ا ل ك. ن م ى ل ا ها- ئ . كان. دعا ن م ى ل زسة. ا غ مار< ي. ن م رة م< ي هدي- لة، ا ب م جة ورد ر ب% ي ي عن ت م ، و ة ن ف عا ل وا حة ص ل ا وب< ث سة لب- ءة، وا ا ق ب لة ال طال- ا والدي ل ك وا ل د ن. ب ي ى الد ل .ا ى ت و خ ى ا ل ا ي ق زو غ ي ق زي ج ي م ه جب. ن م ى ل ا. ة ن@ ي ب ح ل ا ي م ا ب ي ا ب ح ل ي ا ل ع- ى ا ل ا ي ح زا ج م س ل ب ها ئ ا ن ج و ي ح ا ج ي ر س ل. م ع ل ا ا هد هدي- اً عا ت م ج م ك ب ل ا وري ن ل ر ا ب< س ب ل ض ا ق ل ور ا ن ك الد ما ي س رام ولإ لك ا ى ت د ساب- ا ة حظل ل ة ا ى هد ل ل ا ض- ا ي لك وعطاءٍ هد ج. مدان ج هاد ج ء ي< ش بً وما ث ي عل ل ج @ب ت م ل ي الد ى ت- ى ا ل ع ا ض وا ن م ل ل ا م ع ل ا ا هد هدي- ا ة ن ح م ل . وا ان™ ن ح ل ا ب ي ن ت ود د ي لن ا ي م- ى ا ل وا م ت ت- م: ا ه ل ول ق- ا ة زف مع ل لإع وا ط الإ ف غ< ش ي عل ة- ا< ش لب ل وا م- والإ اة ب ح ل ا ى ت و م ي هي وً عا ت م ج ى ت ر س- وا ى ت و خ ى ا ل وا ا ب س ح ب ص- اً ا زف ج ي من ل ع. ن م ل ك ى ل م ا< ث. وري ن ل ر ا ب< س ب ل ض ا ق ل ور ا ن ك ى الد ل وا ي م ما- ا ق ث ز لط ء ا ي ض ي ة رف ب ة دي ب ه ر عب م ة ن™ ك ز ل م ا ه- ئ و دم™ ا ي ن ي ط™ س ل ق ل ا ت ع< ™ ش ل هداء ا< ™ ش رواح- ة لإ و اهدي™ م™ ا كرة , ب ص™ ا ل ا ي م- و ا ى ل ا ع™ ل ا ى ت- ع لإ ™ ض وا ن م ل ™ ل ا م ع ل ا ا ه™ د ه™ دي- ا. م™ا ك™ان ل ™ولإة ل ي ال™د ™ل م- لإ ل ة و اهدي™ م™ا ك ون. , ج™ س ل و ا لإب ق ت مع ل ا ي ق م ه م™ار ع ا ™زاب ه و ر ™ ض ق. ن ي ال™د ط™ال الإي ™ري س- لإ ل و زة هلط™ا ا ا ... ق ل- ا ا ب ب لي ا ب ل داد ر ب ة- اي بس ب ي ر الد م ق ل وا لة ب م ج ها عل ج ي ا و اب ب ت ر د ب ب¯ ت ي لن س ا م< شل ل ا ص ي ة ا س , و اهدي ق ¯ت ي ت. شان ب ا اك ب ه واد ج ل د ا ب ع س ب او1 | Page
Transcript of Graduation progect c %

اهداءلى صرار ا مة والإ ي ر والعز الصب لإ ب م ا ت رة لإت" ب عمال الكب% ن. الإ- ي ا- لى من. علمن ة ا دي ام ب ب ت الإ- ق ق ة.. وش> ن ي@ ب لى من. كلل العزق ج ا
ها لى من. كان. دعائ- زسة. ا مار غ مرة من. ي> هدي ي> لة، ا- مب برة ورد ج ي ي% عن ، ومت ة ن وب الصحة والعاف سة ث> لب اءة، وا- ق طال اللة ب والدي ا-لوا كل د ن. ب cي لى الد ى .ا وت ي الى اخ ي غزوق جزي ق هم ي لى من. جب . ا ة ن ي@ ايب امي الحب لي الحب ع لى ا- زاحي ا لسم ج ها ب ائ احي وجن ج سر ي
ا العمل. هدي هد عا ا- مت كم ج لب وري ا ر الن ب ل بس> اض ور الق ما الدكن ى الكرام ولإ سي cت د ب" سا ة ا- ة اللحظ لى هد ضل ا هد وعطاء لكي ا- جهاد جمدان. ج
ء ي وما بش> ل علي ث ج ب ي لم ت@ ى الد ت" لى ا- ع ا واض ا العمل المن هدي هد ة ا- ان. والمحن الحن ي ب ن ودت" ي د مي الن لى ا- م وا ت ت" ول لهم: ا- ق ا-ة ف الإطلإع والمعزف غ ة علي ش> ا- ش> مل والب اة والإ- ى الحب يموت عا وهي مت ى ج سرت" ى وا- وت خ لى ا ا وا ح سب صب ا ا- ي جزف لى كل من. علمن م ا ث>
. وري ر الن ب ل بس> اض ور الق مامي والى الدكن ق ا- ث» ء الطز ي ض ة ي برف
ة دي معبر هب
ة كن هم الز ائ- ي و دم ن لسطي عت الق هداء الش> رواح ش> ة لإ- مي الصابرة , كما و اهدي الى و ا- ى الع ت" ع لإ- واض ا العمل المن د دي ه ه ا-ان. ولإة لما ك ي ل د ل ال م ة للإ- ون. , كما و اهدي لإب و السج ق ي المعت زاب اعمارهم ق ه و ر ض ن. ق cي د طال ال سري الإي الطاهزة و للإ-
ا ... لق ا- ا ب ب الي داد لب ر ة ب اي- ي بسب مر الد لة والق مب علها ج ج ا و ي اب ب ت" ر د ب ب Åي ت مس الن ا للش> ص ة اي س , و اهدي ق ت Åي شان. ت اكÉ اب هبواد د الج اوبس عب
1 | P a g e

Acknowledgement
Praise is to Allah, who helps us for this work, what we could notaccomplish without his guidance and help. We go a bouquet of thanks and gratitude for our university and our college-honored creative and its dean Esquire Dr. Amer EL-Hamouz, as we cannot but stop at great and generous station that is Department of Mechanical and Mechatronics Representative Dr.Nidal Farhat. Ownerbig hand in the tender and hard work with his students to be the best theoretically and practically, we had to be indebted to him,sincere thanks and appreciation to Dr.Bashir Nouri. Thanks to those who helped us and donated their time for us to give us the interest and expertise, Has a distinctive experience Eng. Waleed Abuzaina, Eng: Saeed Dwekat and Eng Ahmad Abaza.
2 | P a g e

TABLE OF CONTENTS
PROJECT’S ABSTRACT.............................9
CHAPTER 1: INTRODUCTION.......................101.1 General Introduction..................................................10
1.2 Environmental, Physiological, And Healthy Effects Of Gases............101.2.1. General hazards of gases..........................................101.2.2. Health effects....................................................121.2.2.1..................................................Asphyxiation
12
3 | P a g e

1.2.2.2..................................Effects on respiratory system12
1.2.2.3..........................................Physiological effects12
1.3 Gas Detection History.................................................12
1.4 Definition And Type of Gas Sensors....................................16
1.5 Gas Detector Specifications...........................................17
1.6 Combustible Gases.....................................................17
1.7 Performance Specifications............................................18
1.8 Chapter By Chapter Interview..........................................21
CHAPTER 2 METHODS OF GAS DETECTION............272.1. Introduction..........................................................27
2.2. Catalytic Method......................................................272.2.1. Introduction......................................................272.2.2. Principle of Operation............................................272.2.2.1...........................Electrical resistance and resistivity
312.2.2.2................................A catalytic bead sensor circuits
322.2.3. Evolution of the sensor...........................................332.2.4. Characteristics...................................................332.2.4.1.......................................Sensor operation factors
352.2.5. Summary...........................................................37
2.3. Infrared Method.......................................................382.3.1. Introduction......................................................382.3.2. Principle of operation............................................382.3.2.1..........................................Unique gas absorption
412.3.2.2............................Natural frequencies of gas molecules
412.3.3. Components for analysis...........................................432.3.3.1.....................................................Detectors
43
4 | P a g e

2.3.3.1.1.............................................Thermoelectric44
2.3.3.1.2.......................................Thermistor bolometer49
2.3.3.1.3......................................Pyroelectric detector50
2.3.3.1.4.............................................Luft detector51
2.3.3.1.5....................................Photo acoustic detector54
2.3.3.2...............................................Infrared source55
2.3.3.3................................................Optical filter56
2.3.3.4...........................................Gas cell-light path:58
2.3.4. Configuration.....................................................592.3.5. Application.......................................................622.3.6. Characteristics...................................................632.3.7. Comparison between catalytic sensor and infrared sensor...........652.3.8. Summary...........................................................65
2.4. Solid-State Gas Sensors...............................................662.4.1. Introduction......................................................662.4.2. Principle of operation............................................672.4.3. Design the sensor.................................................682.4.4. Characteristics...................................................692.4.5. Summary...........................................................70
2.5. Comparison between detection methods..................................70
2.5.1. Catalytic gas detector..............................................70
2.5.2. IR sensor...........................................................72
2.5.3. Solid-state detectors...............................................72
2.6. Summary...............................................................73
CHABTER 3 GAS SENSOR CALIBRATION..............743.1 Introduction..........................................................74
3.2 Calibration Procedures................................................74
5 | P a g e

3.2.1 Step one: setting the “Zero” reading................................743.2.1.1.............................First method- use clean ambient air
763.2.2 Step two: span calibration..........................................773.2.2.1...........................First method-premixed calibration gas
783.2.2.2................................Second method permeation devices
813.2.2.3........................................Third method gas mixing
81
3.3 Calibration Tools.....................................................83
3.4 Pressure Formula......................................................84
3.5 Calibrating liquid chemical mixtures..................................85
3.6 Summary...............................................................86
CHAPTER 4 CONNECTION AND INTERFACING OF THE COMPONENTS....................................874.1. The Detector..........................................................87
4.2. Amplifiers............................................................88
4.3. ZigBee................................................................90
4.4. Relay.................................................................91
4.5. Electrical Miniature Circuit Breaker (MCB)............................93
4.6. The Motor.............................................................95
4.7. Alarm.................................................................96
4.8. The Mechanism of Operation of The System..............................974.8.1. System work in general:...........................................974.8.2. System work flowchart.............................................98
CHAPTER 5 CONCLUSION.........................1015.1. General Conclusion...................................................101
6 | P a g e

5.2. Future Work..........................................................101
REFERENCES...................................102
Table of Figures
Fig 1.1: Explosive limit............................................11Fig 1.2: The lower explosive limit varies substantially for different gases...............................................................11Fig 1.3: Canary in a cage used as a gas detector....................13Fig1.4: Flams Safety lamp detection method..........................13Fig 1.5: Wheatstone bridge catalytic combustion sensor..............14Fig1.6: Model B LEL Monitor.........................................14Fig 1.7a: MSA Explosimeter Model. Fig 1.7b: Interferometer............................................15Fig 1.8: principle of Interferometer................................15Fig 1.9: Gastech Gastechtor.........................................16Fig1.10: catalytic bead gas sensor..................................16Fig 1.11: Infrared gas sensor.......................................16Fig 1.12: Solid state gas sensor....................................17Fig 1.13: when the gas concentration increases, the output signal becomes smaller in relation to the increase in gas concentration, resulting in poor resolution........................................19Fig 1.14: Typical Sensor Response...................................20Fig 1.15 a: actuator hysteresis with low frequency..................21
7 | P a g e

Fig 1.15 b: actuator hysteresis with high frequency.................21Fig 1.16: relation between true value and measured value and the errorcaused by span......................................................21Fig2.1: circuit for example 1.......................................29Fig 2.2: A catalytic bead sensor Wheatstone bridge–a circuit for measuring an unknown resistance by comparing it with known resistances.........................................................32Fig 2.3: Hot Wire Sensor............................................33Fig2.4: Sensor Output vs. Gas Concentration.........................34Fig 2.5: mechanical wave............................................38Fig 2.6: wave length................................................39Fig 2.7: description of transmittance...............................40Fig 2.8: Electromagnetic Spectrum...................................40Fig 2.9: Water Molecule bonds.......................................41Fig 2.10: Energy absorption by gas molecules........................42Fig2.11: Illustrate of the absorbed and reflected wave length in methane.............................................................43Fig 2.12: thermocouple..............................................44Fig 2.13: Thermocouple circuit......................................45Fig 2.14: Type K....................................................46Fig 2.15: Type E...................................................47Fig 2.16: Type J...................................................47Fig 2.17: Type N....................................................47Fig 2.18: relation between temperature and voltage for each of thermocouple types..................................................48Fig 2.19: Lumped element thermal model of a thermal radiation detector(bolometer).........................................................49Fig 2.20: Pyroelectric crystal......................................50Fig 2.21: Thermal time constant for some pyroelectric material......51Fig 2.21: Luft detector.............................................52Fig 2.22: flow diagram describe principle operation of luft detector.....................................................................53Fig 2.23: Photo acoustic Detector...................................54Fig 2.24: wire filament.............................................55Fig 2.25: chopper baled method......................................55Fig 2.26: Standard Band Pass Filters................................57Fig 2.27: Standard long Pass Filters................................57Fig 2.28: Standard short Pass Filters...............................57Fig 2. 29: Methane Filter Specifications............................58Fig 2.30: Gas Cell-Light Path.......................................588 | P a g e

Fig 2.31: A Basic Infrared Gas Detector Layout......................59Fig 2.32: Two-Detector Layout......................................60Fig 2.33: Double Beams with Chopper Layout..........................61Fig 2.34: signal vs. gas concentration..............................62Fig 2.35: Chip-type Sensor..........................................68Fig 2.36: Schematic Diagram of a Bead-type Sensor...................69Fig 3.1: Ambient air contents.......................................75Fig 3.2: Adding Moisture to Calibration Gases.......................77Fig 3.3: Regulator assembly.........................................79Fig 3.4: Tedlar bag.................................................83Fig 3.5:1000 cc Syringe.............................................84Fig 3.6: Standard Medical Syringes..................................84Fig 4.1: Pyroelectric detector......................................87Fig 4.2: internally circuit and construction of Pyroelectric detector.....................................................................88Fig 4.3: connection circuit between Pyroelectric detector and operation amplifier (OP AMP)........................................88Fig 4.4: Circuit symbol.............................................89Fig 4.5: Inverting amplifier........................................90Fig 4.6: block diagram illustrate how connect ZigBee to the system.. 91Fig 4.7: Relay Design...............................................91Fig 4.8: A. Energized Relay (ON), B. De-Energized Relay (OFF).......92Fig 4.9: connection motor with relay................................93Fig 4.10: External shape of Miniature Circuit Breaker...............93Fig 4.11: internal construction of (MCB)............................94Fig 4.12: several types of Miniature Circuit Breaker................95Fig 4.13: DC motor..................................................95Fig 4.14: the alarm.................................................96Fig 4.15: Flowchart for the work system.............................98Fig 4.16.b: schematic circuit of the system.........................99
Table of Tables
9 | P a g e

Table 2. 1Temperature coefficients of resistanceα, at 20.[3]......29Table 2. 2: results at 20oC.........................................30Table 2. 3: results at 35o Celsius..................................30Table 2. 4: Common Combustible Gas LEL's and UEL’s [4]..............35Table 2. 5: Relative Sensitivity....................................36Table 2. 7: Comparison between catalytic sensor and infrared sensor. 65
10 | P a g e

PROJECT’S ABSTRACT
Every day in this world occur several accidents of the fire andasphyxias and explosions due to the gas devices, which it causesthe death of nearly two and a half million people each yeararound the world. House safety is important of our life, and themain cause of dangerous is gas devices, cooking gas is the mostpopular fuel in our houses, sometimes firefighters can’t controlthe fire when they couldn't reach to gas source, a lot of peoplekilled by gas source, in restaurants and hotels, the controloperation of the gas devise valve will eliminate these problems.
Controller of gas leakage system is work automatically at a certain concentration of gas so when the gas leakage occur their concentration start increasing in air and when the concentration excess the certain limit the transducer calibrated on it, the system is operate and the actuator start up (motor-in our situation) to close the source of gas and also operate the alarming to alert the people in place of the leakage through audio-visual indications that gas leakage occurred in danger amount and the system operated and the source gas is closed.
The controller of gas leakage system consist mainly of the following components:
Measurement system: design and produce transducer that detectsthe gases.
Actuator system: design the way that connect the actuator tothe valve of the gas.
Safety indicator system: design and produce alarm device (through audio-visual Indications).
11 | P a g e

Control system to operate all the component to gather.
In order to produce a control of gas leakage system the followingsteps will be followed. First step research and information collection, a research operation should be achieve to collect larger information about the gases and all component of the system. Second step produce measurement system (transducer), to achieve this step the transducer will be calibrated to active theactuator before the danger limit. Second step is design and produce actuator, the operation of the actuator (motor in this system) must be safely without cause any danger. Third step is design and produce an alarm device, it should be gave a people inplace an indication about status of system. Last step all component will be connected and interface together. Note that allthe design will be achieve through the software, and the experimental application will be in graduate project two.
This project hadn’t been done before and there is no similar one exactly, but there is some applications which have similar ideas and parts of this project but not a complete device for the gas cylinder, such as the transducer of the gas detection, which is called oxygen gas detector or the sensor of fire extinguishing.
CHAPTER 1: INTRODUCTION
1.1 General Introduction
Many scientific applications are used to solve a lot of problems,disasters, and devastating accidents. All aspects of life havebecome dependent on oil, especially cooking gas, whether inrestaurants, homes, and hotels. Despite the great interest that
12 | P a g e

we get from them, but there are many risks that result fromleakage, such as suffocation, explosions and fires.
Essential to the goal of protecting people and facilities fromthe hazards of exposure to gas are the selection of theappropriate gas measurement techniques, timely analysis ofmonitoring data and a plan to respond to a leak. This articlediscusses issues and options to be considered in formulating agas risk management program with a focus on area monitoring andsystem capability.
1.2 Environmental, Physiological, and Healthy Effects of Gases
1.2.1. General hazards of gases The hazards of gas exposure are generally categorized accordingto combustibility, toxic, or the special category of oxygendeficiency. These hazards are typically found in-plant at thesource, at landfills, and in incinerators.
Combustible Gas, in industrial facilities, methane, natural gasand Hydrogen are the combustible gases of primary concern.Methane and natural gas are used in the facility for fuel and canbe present due to pipeline leaks, or poor maintenance, Solvents,propane, and other combustible gases may also be present andrequire monitoring.
The lowest concentration at which a gas will support combustionis called the Lower Explosive Limit (LEL). Below thisconcentration, the gas is too “lean” to support combustion. Thereis a corresponding Upper Explosive Limit above which theconcentration is too “rich” to support combustion, it isimportant that the concentration of gas in a facility remainsbelow the LEL and that appropriate action is executed to insurethe LEL is not reached.
13 | P a g e

Although the concentration at which different gases will combustvaries widely, the Lower Explosive Limit is used as a commonreference in setting alarm levels of gas monitoring systems. Theapproach employs alarm levels that are determined by how closethe gas concentration is to the LEL and not an arbitrary absoluteconcentration of the gas. In this fashion, all gases can becompared to their specific explosive limit and relativecomparisons of risk can be made. For example, the LEL of methaneand Hydrogen are approximately 5.0 and 4.0 percent, respectively,of the gas in air. A safe reference such as 20 percent of the LELcan be used as an alert to the danger of the gas leak (whichcorresponds to 1.0 and 0.8 percent of methane and Hydrogen,respectively, in air). Figures 1.2 and 1.3 demonstrate thisapproach.
For toxic gases, they create both an immediate and long-term riskto personnel and include such gases as Carbon Monoxide, Chlorine,Nitric Oxide, Sulfur Dioxide, Hydrogen Chloride, HydrogenCyanide, Ammonia, Hydrogen Fluoride and many others.
Fig 1.1: Explosive limit
14 | P a g e

Fig 1.2: The lower explosive limit varies substantially for differentgases.
Oxygen Deficiency, where purging or processing with an inert gasas helium, argon, or nitrogen is employed, a leak may result in adepletion of the oxygen concentration in an area occupied byplant personnel. As the concentration of oxygen drops,asphyxiation will result. 1.2.2. Health effectsNatural gas is a fossil fuel. It is formed when layers of buriedplants and animals are exposed to pressure and heat for thousandsof years. Natural gas is primarily composed of methane. Methaneis a highly flammable compound. In its purest form, natural gasis colorless and odorless. Gas manufacturing companies add atinge of warning smell to it that helps in the detection of anynatural gas leakage. Although natural gas plays an important rolein the automobile industry, where it is extensively used as fuelin vehicles, natural gas leakage can pose serious healthproblems.
1.2.2.1. Asphyxiation
One of the major health effects of natural gas leakage isasphyxiation. It is a serious health condition where the body isnot able to get sufficient oxygen supply, which may lead to loss
15 | P a g e
of consciousness, brain damage and death. People with highchemical sensitivity are more susceptible to this disease.
1.2.2.2. Effects on respiratory system
Leakage and subsequent combustion of natural gas releases largeamounts of water vapor, ashes, volatile organic compounds, andtoxic fumes into the atmosphere. These particulates andsubstances pass through our respiratory system and enter deepinto the lungs and body, bringing about respiratory diseases.Associated symptoms such as pneumonia, nausea, vomiting,irregular breathing, memory loss, fatigue, sinus pain andheadache are also reported because of the exposure to natural gasleaks in lower concentrations.
1.2.2.3. Physiological effects
Methanethiol (methyl mercaptan) or ethanethiol (ethyl mercaptan)is the odorant that is added by the natural gas companies todetect its leakage. When inhaled in sufficient amounts,ethanethiol causes physiological effects such as dizziness,headache, vomiting, shivering, fever and unconsciousness. Naturalgas may also contain several contaminants like PCBs(polychlorinated biphenyl), benzene, toluene and radon (radon ispresent in natural gas in its original state). We inhale benzeneand toluene during gas leaks. They pose serious health threats.PCBs, benzene and radon are carcinogenic (cancer-causing).
1.3 Gas Detection HistoryThe first gas monitor used as a gas detector was the canary in acage, which is a kind of bird; Canaries are more susceptible thanhumans are to low oxygen, methane gas, or CO gas. So when thecanary passes out that means a dangerous gas situation, generallytwo canaries used.
Another detection method was used is Flame Safety Lamp (Davey’sLamp), this tool was invented by Sir Humphrey Davey (of England)in 1815, the principle of his tool was based on Oil flameadjustment to specific height in fresh air, flame contained
16 | P a g e

within a glass sleeve and with a flame arrestor. High flame meansmethane gas present, low flame means low oxygen.
In 1926-1927 Catalytic Dr. Oliver Johnson developed Combustion (LEL) Sensor; he was working for Standard Oil Co. of CA (now Chevron). Need was to prevent explosions in storage tanks on oil and gasoline tankers.
The Principle was using hot wire catalytic platinum filament oxidizes flammable gases or vapors at lower levels than they would normally oxidize in air.
Fig 1.3: Canary in a cage used as a gas detector.
Fig1.4: Flams Safety lamp detection method.
Oxidizing gases or vapors cause increase in temperature of hot wires which increases electrical resistance of the wire. Second not wire not in gas stream used as a reference filament.
The Resistance change measured with Wheatstone bridge to deflect a meter as shown in figure 1.5. 17 | P a g e

Fig 1.5: Wheatstone bridge catalytic combustion sensor
Model B LEL Monitor was produced in 1927, the first practicalproduction model of LEL meter weighs 12 lb , Approx. 100 units made, itconsists of two meters one for gas reading & one for sensorvoltage (critical adjustment), made by Dr. Johnson while atStandard Oil Called the “Standard Oil Electric vapor Indicator” .
For the model B two filaments located in a glass tube one tube sealed as the reference element, Instrument remained outside the hazardous area so the flame arrestor on sample inlet prevented flashback into tested space
Fig1.6: Model B LEL Monitor
18 | P a g e

Another model of LEL monitor is model c introduced by the MSA Company (World’s second gas detection company) in 1929/1930, 6 Months later MSA introduced their own LEL meter with same characteristics as Model C.
In 1935 MSA introduced its 2nd design (MSA Explosimeter Model 2A as shown in figure 1.7a), it is a popular rugged unit which is still in use today, it Uses 8 D-cell batteries and unbalanced bridge circuit (no reference filament).
Another devise was produced is (Interferometer) in 1925-1927 by Dr. Uzumi Doi who did initial research in 1927 at the Institute of Physical & Chemical Research in Japan. Dr. Ziro Tsuji of the Institute developed the first working prototype to help prevent explosions on oil tankers, and in coal mines.
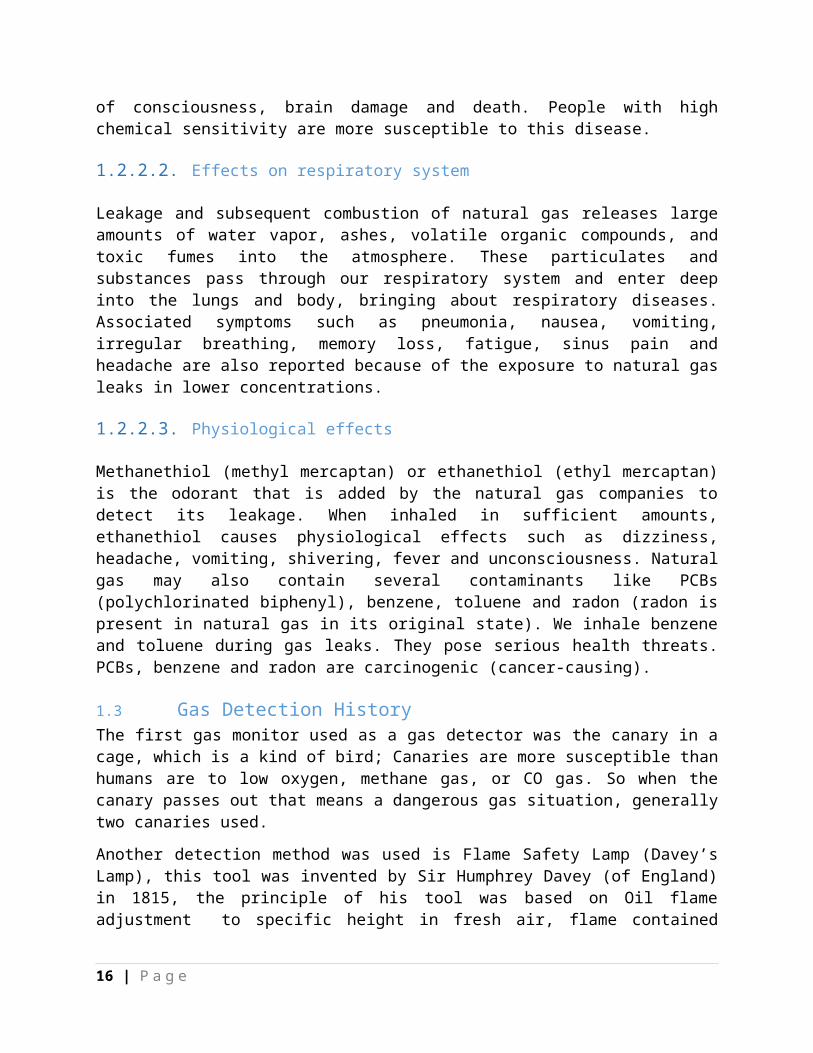
Figure 1.8 explain principle of Interferometer that light diffraction in air to indicate presence of methane or gasoline vapors Light diffraction creates visible fringe lines that shift to indicate gas concentration .
Fig 1.7a: MSA Explosimeter Model. Fig 1.7b:Interferometer.
19 | P a g e
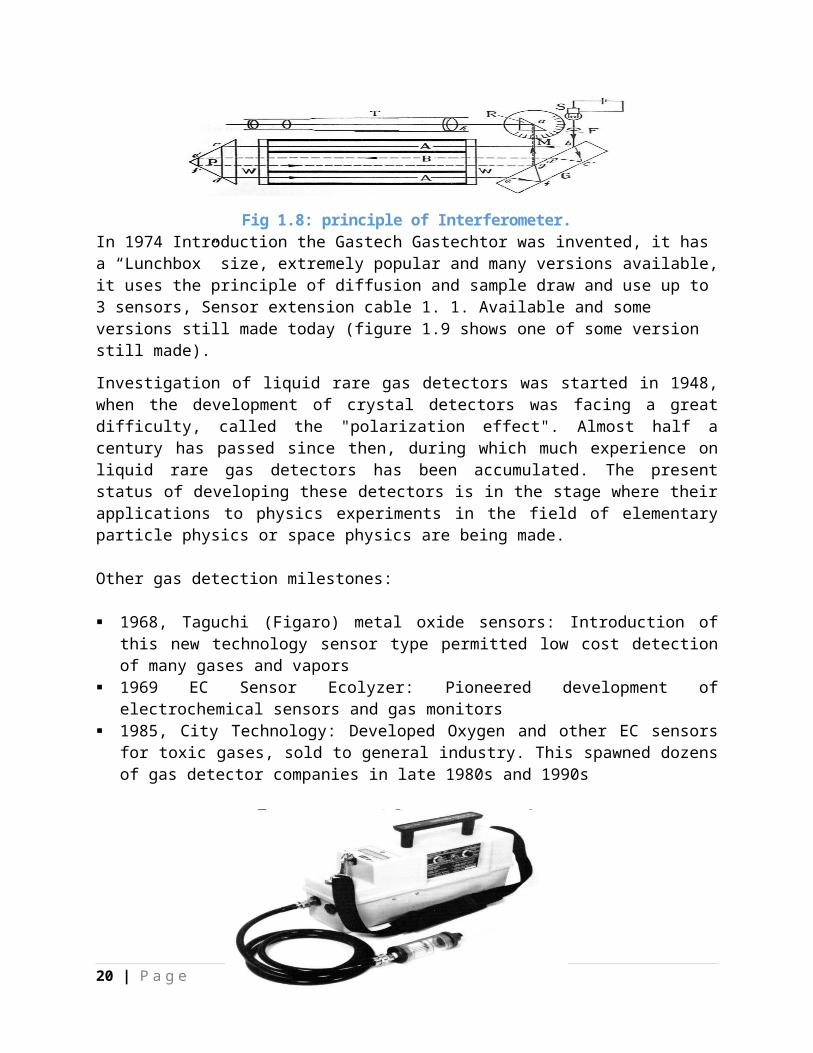
Fig 1.8: principle of Interferometer.In 1974 Introduction the Gastech Gastechtor was invented, it has a “Lunchbox” size, extremely popular and many versions available,it uses the principle of diffusion and sample draw and use up to 3 sensors, Sensor extension cable 1. 1. Available and some versions still made today (figure 1.9 shows one of some version still made).
Investigation of liquid rare gas detectors was started in 1948,when the development of crystal detectors was facing a greatdifficulty, called the "polarization effect". Almost half acentury has passed since then, during which much experience onliquid rare gas detectors has been accumulated. The presentstatus of developing these detectors is in the stage where theirapplications to physics experiments in the field of elementaryparticle physics or space physics are being made.
Other gas detection milestones:
1968, Taguchi (Figaro) metal oxide sensors: Introduction ofthis new technology sensor type permitted low cost detectionof many gases and vapors
1969 EC Sensor Ecolyzer: Pioneered development ofelectrochemical sensors and gas monitors
1985, City Technology: Developed Oxygen and other EC sensorsfor toxic gases, sold to general industry. This spawned dozensof gas detector companies in late 1980s and 1990s
20 | P a g e

Fig 1.9: Gastech Gastechtor.
1.4 Definition and Type of Gas SensorsA gas sensor is transducer that produces an electrical signalwith a magnitude proportional to the concentration of the gasthen it's detect gas molecular, because there are wide range ofapplications and many types of gas the measurement of gases iscomplicated and each application require a unique set ofrequirements.
Types of gas sensors
There are many deferent types of gas sensors, in this project three type of sensing gas methods will be taken.
1. Catalytic bead. 2. Infrared. 3. Solid state.
Fig1.10: catalytic bead gas sensor.
Fig 1.11: Infrared gas sensor.
21 | P a g e

Fig 1.12: Solid state gas sensor.
1.5 Gas Detector Specifications Gas detectors are used to detect toxics and compatible gases inhospital, houses and work area, or used to control application ofmanufacturing system.
Each type of gas sensor could detect a group of gases, don'tlimit according to the kind of gas, like a smoke detector in ahouse cannot distinguish between the smoke caused by a furniturefire and the smoke caused by food burning in the stove or oven.
Gas Concentration Units.1. g/cc: grams per cubic centimeter.2. g/m3: grams per cubic meter.3. mg/cc: milligrams per cubic centimeter.4. mg/m3: milligrams per cubic meter.5. ppb: parts per billion by volume.6. ppm: parts per million by volume.
1.6 Combustible Gases
Flash point
The temperature at which a combustible liquid chemical hassufficient partial Pressure in the air to be ignited, that's isthe temperature at which a combustible liquid gives off enoughvapor to form an ignitable and combustible mixture when air ispresent near the liquid’s surface.
22 | P a g e

Specific gravity
The ratio of density of the liquid to the density of water at aspecified temperature. Specific Gravity of a liquid can beexpressed.
SG=ρ
ρH2O(1.1)
WhereSG = specific gravity.ρ = density of fluid or substance (kg/m3)ρH2O = density of water (kg/m3).
In this project the ratio of the weight per unit volume or massof a substance at 68F (20C) to the mass of an equal volume ofdistilled Water at 39.2F (4C)
Vapor density
The ratio of the weight of a given volume of one gas to theweight of an equal volume of another gas, typically hydrogen, atthe same temperature and pressure. For example, air has a vapordensity of 1; carbon dioxide, 1.52; hydrogen, 0.07; methane,0.55; and propane, 1.52.
1.7 Performance Specifications
1. Accuracy
Accuracy represents the closeness to a defined target. It'sdifference from the true value and the value from the measurementsystem. Accuracy is the most important definition of the qualityof performance for most of the objects we deal with every day.The most accurate instrument may not necessarily be the best in23 | P a g e

the real life. For example, Calipers used in a machine shop aremore accurate than the tailor’s tape but would not be suitablefor use by the tailor.
2. Repeatability
For measurement systems that result in quantitative measurementssuch as weight, concentration, or strength, it is important todetermine the magnitude of any error in the resultingmeasurements. If the error is large, it may be impossible todetermine whether or not an individual sample is within spec. Inaddition, designed experiments rely on the ability to separatereal effects of making changes from the background noise andcould be sabotaged by an inadequate measurement system. Whenquantifying measurement error, it is common to separate the errorinto repeatability (error due to the instrument or measurementprocedure).
3. Zero Air
there are many other components in the ambient air besides O2 andN2 and it is hasn't only , such as water vapor, carbon dioxide,carbon monoxide, and other trace gases. But zero a sensor to asimple mixture of oxygen and nitrogen is not practically, somesensors can zero about dry air or nitrogen. At solid-statesensors, very different readings may result from dry air comparedwith wet air. The easiest way to verify whether a sensor isgiving a real alarm or a false alarm that exposing the sensor toa bag of air collected from a location where the air is normal tobe satisfactorily zeroed the sensors.
4. Linearity
The difference of bias throughout the expected operating(measurement) range of the equipment. Gas sensor input is gasconcentration, and gas sensor output is voltage single, therelation between input and output is linearity or close it, but
24 | P a g e

as the gas concentration increases, the output signal isgradually reduced as in figure 1.13.
Fig 1.13: when the gas concentration increases, the output signalbecomes smaller in relation to the increase in gas concentration,
resulting in poor resolution.
5. Specificity
Detect of a target gas by an instrument without affecting of thepresence of other interfering gases. More sensors are detectingfamily of gases and it is not specific on one gas, but the morespecific sensors are an electrochemical sensor for the detectionof oxygen. Some technique is used with instrument to be more Specificity,For example, a charcoal filter is used to filter out mosthydrocarbons while letting only CO, H2, and CH4 pass through. Insolid-state sensors, the surface temperature of the sensor can beset differently in order to make it more sensitive to one gas andless sensitive to other gases.
6. Interference Ratio
It gives data about the ratio of different gases at monitoringsystem. For example, on a 100ppm carbon monoxide sensor, hydrogen
25 | P a g e

may read at a 3-to-1 ratio. This means that 3 ppm of H2 will readthe same as 1 ppm of CO.When the state gas don't interfere, if the concentration isincrease to high enough then the gas will interfere. For example,while a CO sensor with a charcoal filter has little interferencefrom certain solvents at 100 ppm, when the concentration isincreased to 1,000 ppm, they may interfere drastically.
7. Response/Recovery Time
A times that sensor needing to read a certain percentage of full-scale reading after being exposed to a full-scale concentrationof gas. In figure 1.15 to reach on 80% of full scaleconcentration of gas sensor takes 40 second (on x axis).
Fig 1.14: Typical Sensor Response.
8. Temperature and Humidity
It is an indication of the amount of water vapor in air as a percentage of the total amount possible at a given temperature. The amount of actual vapor is a function of time. For example, at80% relative humidity and a temperature of 25C, water vapor is present at a level of 3%. However, the same 80% relative humidity
26 | P a g e

at a temperature of 48C produces a water vapor level of 10%. In the presence of chemicals, combined with the changing of temperature between day and night, the possible water condensation and resultant corrosive mixtures can compromise the life expectancy of a sensor.
9. Hysteresis
It is defined as the deferent between transition levels assumewhen they approach from the rights side rather than the liftside. Moreover, the difference in response of the sensor whencalibrating from a zero level to mid-scale compared to theresponse when calibrating from full scale to mid-scale, is knownas hysteresis and its quantity is expressed as a percentage offull scale.When the sensor is calibrated to 100 ppm gas but is exposed to 50ppm the sensor may indicate 55 ppm. This variation of 5 ppm is 5%full-scale hysteresis. Most infrared sensors don't exhibithysteresis, but solid state and catalytic do exhibit hysteresis. The deference between on point and of point in alarm setting isalso referred to hysteresis as shown in figure 1.15.
10. Zero and Span Drift
the percentage change of the zero or span calibration over aspecified period of time, a span we can absolved it from relationbetween true value and measured value, then it distance betweenbest fit line and actual line as shown in figure 1.16.
27 | P a g e

Fig 1.15 a: actuator hysteresis with low frequency.Fig 1.15 b: actuator hysteresis with high frequency.
Fig 1.16: relation between true value and measured value and theerror caused by span.
1.8 Chapter By Chapter InterviewThis section show a brief summary of each chapter in thisproject, and will provide a simple explanation for the work stepsthat have been accomplished and related to each chapter in thisproject.
The first chapter introduces the introduction of this research;this chapter will present an overview of natural gas, especiallycooking gas, also explains the sources of these gases andchemical types and construction.
28 | P a g e

This section also will address the risks and hazards of thesegases which are environmental impacts, health, biological andphysiological, and also will speak about the historicachievements related to this topic and presents some of theinventions own detects gases throughout history by briefing ahistorical overview of these inventions.
The second chapter talks in-depth about the methods of gasdetection and the most common detectors used to deal with gasproblems. A gas detector is a device, which detects the presenceof various gases within an area, usually as part of a safetysystem.
Gas detection methods will be mentioned as the following.
The first method is Catalytic gas sensor, Catalytic bead sensorsare used primarily to detect combustible gases. They have been inuse for more than 50 years to prevent methane explosions incoalmines from about 1959. Since then, they have been improvedconsiderably and currently they are more widely used throughoutvarious industrial sectors as reliable sensors.
the principle of operation for catalytic detector will beexplained, including the structure of the deflection bridge andhow does it is used in the electrical circuit, also this chapterwill show the role of bead temperature and its electricalresistance and resistivity in the principle of detection, alsowill mention the types and some standards of material that issuitable to be used in this method.
Catalytic sensor is relatively easy to manufacture. However, thequality of the sensor varies quite drastically from onemanufacturer to another. When making sensor by using thecatalyst, should be consider many of limitation even the sensorwork correctly as the type of the gas that the sensor iscalibrated by it , temperature, and the type of material that isused, and every of these are effecting on the equality of thesensor.
29 | P a g e

The second method that will be mentioned in this chapter is theinfrared radiation (IR) method that is based on using theinfrared as a transmitter light that will be received by thesensor in the other side. The main advantage of IR instruments isthat the detector does not directly interact with the gas (orgases) to be detected. The major functional components of theanalyzer are protected with optical parts. In other words, gasmolecules interact only with a light beam. Only the sample celland related components are directly exposed to the gas samplestream. These components can be treated, making them resistant tocorrosion, and can be designed such that they are easilyremovable for maintenance or replacement.
Among the matters, relating to the manner in which this will bepresented is the principle of operation and how this method willbe used as a gas detector.
This method based on the principle of light absorbing, so if thegas atoms was located within the area between the transmitter andthe receiver, there is three probabilities will happen with thelight waves, some of it will pass through the gas atoms and reachthe sensor, and some will be absorbed by the atoms of gas and thelast probability is to be reflected due to the collision with thegas atoms. So when there is a gas located in the area the sensorwill receive a different light wave. Also this chapter will explain the pyroelectric sensor as areceiver of infrared radiation. Pyroelectricity is acharacteristic of some materials which stimulate generation ofelectric dipole moment due to changes in temperature, resultingthe current which is proportional to the temperature changes.Such pyroelectric materials in which the crystals arespontaneously polarized are called pyroelectrics. This evidenceenables the application of pyroelectrics for detection purposes -as thermal sensors.
The Luft detector also will be mentioned in this chapter, and themost common configuration related to it will be explained. Luftdetector is a German design gas detector, where the word luft is
30 | P a g e

a German word that means the air. This detector include twocells, one used as reference, and the other used in the case ofgas Presence, In the initial state there is no targeted gas inthe sensing cell so the same wave length will be received in thereference chamber and detector chamber (same temperature andpressure) so the micro-flow sensor or diaphragm detect nodifference between the two cells (stable case).
In the second case (the presence of the target gas), when thereis a gas targeted in the sensing cell, the radiation energy thatis received in the detection chamber will be decreased whichcauses the temperature and pressure to drop in the detectorchamber. But the reference chamber has no any change it remainssame as initial state so that the Micro-flow sensor or diaphragmwill detect the change in the temperature and pressure, and thatresult is the detection of gas leakage.
This detector finds many useful applications as an analyzer, and has good potential for-further development.
The infrared detection method is modern method and available fromfew years for detecting hydrocarbon gases. However this methodused widely in many industrial sectors for example it used inpetrochemicals sector, and also used in safety sector and airquality.
The last method of gas detection will be presented is the solid-state method, This method depends mainly on Semiconductormaterials and this method has been discovered by coincidence,where the earlier scientists have been used semiconductorsmaterials in detection of gases, and even had to face a problemin that semiconductors affected by gases surrounding it, and theywere solved this problem by isolating semiconductors materialsfrom gases surrounding by use of dielectric materials.
The name of this type of materials contain two parts “semi“&”conductor”, this because the conductivity of this material notgood as copper and also not bad as rubber, it located betweenthem, hence semiconductors came.31 | P a g e

There are two type of semiconductor; an N-type semiconductorcarries current mainly in the form of negativelycharged electrons (excessive of electrons), p-type semiconductordeficiency of electrons.
This method came as good competitive to the catalytic beadsensor, method that was suffered from many problems. Today, solid-state sensors are available for the detection ofmore than 150 different gases.
For each method of gas detection, this chapter introduces the following
1. Brief introduction for each one.2. Technical and general description for each one. 3. The principle of operation. 4. The basic design of each detector.5. Main characteristic for each one.6. The common application of each one.7. Suitable configurations for each sensor.8. What condition is more suitable for?9. A summary for each one.
The third chapter will explain the method of calibration for eachdetector that was mentioned above, for these detectors there aremany conditions that may operate within, so the detector shouldbe calibrated to operate at the suitable way for each condition.The interval between calibrations different from sensor toanother, usually the manufacturers decide the interval timebetween calibrations. However, it is better to check the sensorduring closed intervals in first 30 days. This time (30 days) isenough to give you an impression about sensitivity of the sensor,and how well the sensor is adapting to its new environment.
Some factors which may not take into consideration during thedesign the sensors, but after that, their harmful impacts appearclearly and affect the sensor’s performance. Any possibleproblems can be identified and corrected during this time.
32 | P a g e

However If the sensor functions properly for 30 continuous days,this provides a good degree of confidence about the installation.
The calibration producer contains two steps, Setting the “Zero” Reading and Span Calibration.
The first step (Setting the “Zero” Reading) includes two methods
1. Using clean ambient air.
2. Use compressed air.
Span gases are special gas mixtures used for testing gasdetection equipment, which requires regular checking andcalibration. The span calibration can be very complicated andexpensive or it can be quite easy. The span calibration dependingon the following:
1. Type of the gas.
2. Range of the concentration.
This step includes three methods
1. Premixed calibration gas.
2. Permeation devices.
3. Gas mixing.
In addition, this chapter will mention the calibration tools Inorder to complete the second step of the calibration process.
The fourth chapter will illustrates the connections andinterference between the components, This chapter will describethe details of components that will be used in the project and
33 | P a g e

how will be the connection between these components and then makecircuit that includes interfacing for all system.
The components that will be mentioned in this chapter is at firstthe pyroelectric detector and its specifications, also thechapter will show the build in circuit of this component and howit will be connected with the operational amplifier with allconfiguration diagrams that will show the principle ofconnection.
The operational amplifiers were also described in this chapterwith the most common types that will be used in the project.Amplifiers are a high gain, integrated circuit designed toamplify signals from D.C. up to many kHz.
Voltage and current amplifiers will be build using transistors.The most common types that will be used are the proportional andcomparator (differential) amplifier.
Another component will be mentioned is Zig Bee, which is an openglobal standard for wireless technology designed to use low-powerdigital radio signals for personal area networks. Zig Beeoperates on the IEEE 802.15.4 specification and is used to createnetworks that require a low data transfer rate, energy efficiencyand secure networking, and it will be used to transmit the signalfrom detection location to the actuator to be operated.
Relies were also mentioned as a device used to close theelectrical circuit when the signal is transmitted from Zig Bee.The characteristics and the internal structure were illustrated.
Electrical Miniature Circuit Breaker (MCB) was introduced in thischapter; it is a switching device, which can be operated manuallyas well as automatically for controlling and protectionof electrical power system respectively. This device was used inorder to break down the circuit of the motor when the currentrises above a specified limit, i.e. when the torque become highdue to the blocking of the gas cylinder valve.
34 | P a g e
At last, the actuator (motor) that is used in the project was mentioned in Addison to alarm, Direct Current permanent magnet DCmotor (Brushless DC) is an electric motor converts electrical energy into kinetic energy and only works on DC power systems. Inaddition, the Alarm will be used to warn the people in place of leakage.
The complete configeration of this system was illustrated at the end of this chapter, starting from the sensing element and through the conditioner, which is the amplifiers and related components, until the location of zigbee which will send the signal to the relay, so that the rely will close the circuit making motor and alarms to be operated.
35 | P a g e

CHAPTER 2 METHODS OF GAS DETECTION
2.1.IntroductionWhen the human Inhales then the nose sends a signal to the smell center in the brain, so that the brain, in turn will process and analyze these smell, and will distinguish whether the smell is nice or bad. With this principle consideration we will design a device that detects gases and distinguishes whether this dangerous gas or not and a control system that will shut down thesource of this gas.
A gas detector is a device which detects the presence of various gases within an area, usually as part of a safety system. This type of equipment will be used to detect a gas leakage and interface with a control system so the process can be automatically shut down.
A gas detector can also sounds an alarm which will operate in thearea where the leakage is occurring. This type of device is important because there are many gases that can be harmful to thehumans, animals and environment. Gas detectors can be used to detect combustible, flammable and toxic gases, and oxygen depletion. This type of device is used widely in industry, housesand can be found in a various locations such as on oil rigs. Gas detectors are usually battery operated. They transmit warnings via a series of audible and visible signals such as alarms and
36 | P a g e

flashing lights, when dangerous levels of gas vapors are detected.
Gas detectors measure the gas concentration, the transducer responds to a calibration gas, which serves as a reference point or scale. As the sensor detects an increase in the concentration of gas above danger limit, the alarm or signal will be activated.
2.2.Catalytic Method2.2.1. IntroductionCatalytic bead sensors are used primarily to detect combustible gases. They have been in use for more than 50 years to prevent methane explosions in coal mines from about 1959. Since then, they have been improved considerably and currently they are more widely used throughout various industrial sectors as reliable sensors.
2.2.2. Principle of OperationCombustible gas mixtures will not burn until they reach an ignition temperature. However, in the presence of certain chemical media, the gas will start to burn or ignite at lower temperatures. This phenomenon is known as a catalytic combustion.Most metal oxides and their compounds have these catalytic properties.A gas molecule oxidizes on the catalyzed surface of the sensor ata much lower temperature than its normal ignition temperature.
All electrically conductive materials change their conductivity as temperature changes. This is called the coefficient of temperature resistance (Ct). Since the electrical resistance of a conductor such as a copper wire is dependent upon collisional processes (Collision processes involving heavy many-electron ionsin neutral atoms) within the wire, the resistance could be expected to increase with temperature since there will be more collisions.
37 | P a g e

Resistance values for conductors at any temperature other than the standard temperature (usually specified at 20 Celsius) on thespecific resistance determined through yet another formula
RT=R0[1+α(T–T0)] (2.1)
Where:
RT: conductor’s resistance at temperature T.R0: Conductor’s resistance at reference temperature Tref, usually 20 but some time 0.α : Temperature coefficient of resistance.T: conductor’s temperature in degrees Celsius.T0: Reference temperature that α is specified at for the conductor material.
The "alpha" (α) constant is known as the temperature coefficient of resistance, and symbolizes the resistance change factor per degree of temperature change. Just as all materials have a certain specific resistance (at 20o C), they also change resistance according to temperature by certain amounts. For pure metals, this coefficient is a positive number,
meaning that resistance increases with increasing temperature. For the elements carbon, silicon, and germanium, this
coefficient is a negative number, meaning that resistance decreases with increasing temperature.
For some metal alloys, the temperature coefficient of resistance is very close to zero, meaning that the resistance hardly changes at all with variations in temperature (a good property if you want to build a precision resistor out of metal wire).
38 | P a g e

Table 2. 1Temperature coefficients of resistanceα, at 20.[3]
Material (Element/Alloy) "α"20Nickel Element 0.005866Iron Element 0.005671
Molybdenum Element 0.004579Tungsten Element 0.004403Aluminum Element 0.004308Copper Element 0.004041Silver Element 0.003819Platinum Element 0.003729
Gold Element 0.003715Zinc Element 0.003847Steel Alloy 0.003
Nichrome Alloy 0.00017Nichrome V Alloy 0.00013Manganin Alloy +/- 0.000015
Example 2.1: determine of the out voltage with respects to change of the temperature.
Let's take a look at an example circuit to see how temperaturecan affect wire resistance, and consequently circuit performance:
Solution:
39 | P a g e

This circuit has a total wire resistance (wire 1 + wire 2) of 30Ω at standard temperature. Setting up a table of voltage,current, and resistance values we get:
Fig2.1: circuit for example 1
Table 2. 2: results at 20oC
At 20o Celsius, we get 12.5 volts across the load and a total of 1.5 volts (0.75 + 0.75) dropped across the wire resistance. If the temperature were to rise to 35o Celsius, we could easily determine the change of resistance for each piece of wire. Assuming the use of copper wire (α = 0.004041) we get:
RT=R0[1+α(T−T0)]
R35=15Ω [1+0.004041(35−20)]
R35=15.909Ω
40 | P a g e

Recalculating the circuit values
Table 2. 3: results at 35o Celsius.
As you can see, voltage across the load went down (from 12.5 volts to 12.42 volts) and voltage drop across the wires went up (from 0.75 volts to 0.79 volts) as a result of the temperature increasing. Though the changes may seem small, they can be significant for power lines stretching miles between power plantsand substations, substations and loads. In fact, power utility companies often have to take line resistance changes resulting from seasonal temperature variations into account when calculating allowable system loading.
The Temperature Coefficient of Copper (near room temperature) is +0.393% per degree °C. This means if the temperature increases1°C the resistance will increase 0.393%.
Examples 2.2: wire resistance
You have 100 feet and its resistance is 1.015 ohms at 20° C (roomtemp). If the temperature of the wire goes up 10°C the resistancewill change by 0.0399 ohms.
Solutions:10°C * 0.00393 per degree * 1.015 Ω = 0.0399 ΩThe wire resistance will now be 1.015Ω + 0.0399 Ω = 1.0549 Ω.
41 | P a g e

2.2.2.1.Electrical resistance and resistivityElectrical resistance of an electrical conductor depends on the following
The length of the conductor.
The material of the conductor.
The temperature of the material.
The cross-sectional area of the conductor.
And can be expressed as
R=ρ lA (2.2)
Where
R = resistance (ohms, Ω).
ρ = resistivity (ohm meter, Ω m).
l = length of conductor (m).
A = cross-sectional area of conductor (m2).
Resistivity of some Common Conductors
Aluminum: 2.6 x 10⁻⁸ Ω m.
Copper: 1.7 x 10⁻⁸ Ω m.
Resistivity of some Common Insulators
Glass: 1 x 10¹⁰ Ω m
Marble: 1 x 10⁸ Ω m
Polystyrene: 1 x 10¹⁴ Ω m
42 | P a g e

Example 2.3: Resistance
The resistance of a 10 meter copper wire with a cross sectional area of 0.8 mm2 can be calculated
Solution
R=1.7x10⁻⁸Ω m∗10m0.8mm2∗10−6m2/mm2
=0.2125Ω.
2.2.2.2. A catalytic bead sensor circuits
Fig 2.2: A catalytic bead sensor Wheatstone bridge–a circuit formeasuring an unknown resistance by comparing it with known
resistances.
The electrical circuit used to measure the output of catalytic sensors is called a Wheatstone bridge.Wheatstone bridges are commonly used in many electrical measurement circuits. As shown in Figure 2.2.
Figure 2.2 shows three circuit branches are arranged in a square.The source of the electrical current is connected, and between the other pair of opposite corners, the output measurement circuit is connected, in the normal case the bridge keeps balanced. A balanced bridge has no output signal. Resistor value
43 | P a g e

R3and R4 are selected with relatively large resistance values to ensure proper function of the circuit. When the gas burns on the active sensor surface, the heat of combustion causes the temperature to rise, which in turn changes the resistance of the sensor. As the bridge is unbalanced, the offset voltage is measured as the signal.The detector cells R2 and R3 are designed to have equal electrical resistance when no combustible gas is present in the sampled air.
It is important that the reference sensor or bead maintains a constant resistance during the exposure to the combustible gas; otherwise, the measured signal will be inaccurate.2.2.3. Evolution of the sensor
Fig 2.3: Hot Wire Sensor.
The original catalytic sensor was a coil-shaped wire. The coiled shape, illustrated in Figure 2.3, was used to obtain a compact geometry for efficient heating and to produce an enough strong signal to function as a gas sensor.
Unfortunately, despite the excellent physical and chemical properties of platinum, it is a poor catalyst for combustion of hydrocarbon gases.
The reference wire ideally should be the same as the active wire,with the same geometry and operating temperature, but should be nonreactive with the gas.
44 | P a g e

2.2.4. CharacteristicsThe sensor’s output is directly in proportion to the rate of oxidation. The maximum output of the signal based on the theoretical combustion reaction formula. Methane, for example:
CH4 + 2O2 + 8N2CO2 + 2H2O + 8N2
Therefore, from a theoretical combustion, one part of methane will require 10 parts of air to complete the combustion, or theoretically 9.09% of methane in a mixture of air.
**Earth's atmosphere is a layer of a mixture of gases surrounded the earth and contains 78% of nitrogen and 21% of oxygen, argon, carbon dioxide and water sailor, hydrogen, helium, neon and xenon.
Figure 2.4 show that for a sensor to detect methane, the output signal will act linearly from 0–5% of methane (which is 100%LEL).As the concentration reaches close to the stoichiometric value of9%, the signal increases very rapidly and peaks at around 10%. The signal starts to drop slowly as the concentration of gas passes approximately 20%; after 20% it drops straight down to a level that reflects no output as the concentration of gas reaches100%. [2]
Where: Lower explosive limit (LEL): The lowest concentration
(percentage) of a gas or a vapor in air capable of producing aflash of fire in presence of an ignition source (arc, flame, heat). The term is considered by several safety professionals to be the same as the lower flammable limit (LFL). At a concentration in air lower than the LEL, gas mixtures are "toolean" to burn. Methane gas has a LEL of 5%. If the atmosphere has less than 5% methane, an explosion cannot occur even if a source of ignition is presented.
Upper explosive limit (UEL): Highest concentration (percentage) of a gas or a vapor in air capable of producing aflash of fire in presence of an ignition source (arc, flame,
45 | P a g e

heat). Concentrations higher than UFL or UEL are "too rich" toburn. [4]
Fig2.4: Sensor Output vs. Gas Concentration.
46 | P a g e

Table 2. 4: Common Combustible Gas LEL's and UEL’s [4]
The gas LEL UELAcetone 2.15% 13.00%Acetylene 2.50% 100%Benzene 1.20% 8.00%Butadiene 1.10% 12.50%Ethane 3.00% 15.50%
Ethyl Alcohol 3.30% 19.00%Ethyl Ether 1.70% 36.00%Ethylene 2.70% 36.00%Hexane 1.10% 7.50%Hydrogen 4.00% 75.6IsoButane 1.80% 8.50%Methane 5.00% 15.00%Methanol 6.00% 36.00%Pentane 1.50% 7.80%Propylene 2.00% 11.10%Propane 2.1% 9.5%Toluene 1.20% 7.00%
Consider propane as another example. The reaction formula for propane is:
C3H8 + 5O2 + 20 N23CO2 +4H2O + 20N2
One part of propane per 25 parts of air for theoretical combustion of propane. The LEL for methane is 5% and for propane is 2.1%. This value is near half of the theoretical combustion value. There is a safety factor of 2 added to ensure safety.
2.2.4.1. Sensor operation factors
There are several factors affecting the operation of the catalytic sensor
47 | P a g e

a. Catalyst Poisoning
There are chemicals which will deactivate the sensor and cause the sensor to lose sensitivity and eventually become totally non responsive to gases. The exact cause of this poisoning is very difficult to identify. Some chemicals, with very small concentrations, will totally destroy the sensor. The most common chemicals that can poison catalytic sensors are those that contain silicon, such as the common oil and lubricants with silicon compounds used as additives in machinery. Sulfur compounds, which are often released with gases, chlorine, and heavy metals also cause the poisoning of the sensor. [2]
b. Sensor Inhibitors
Chemicals such as halogen compounds, which are used in fire extinguishers and Freon used in refrigerants, will inhibit the catalytic sensor and cause it to temporarily lose the ability to function. Normally, after 24 or 48 hours of exposure to ambient air, the sensor starts to function normally.
c. Sensor Cracking
The sensor, when exposed to excessive concentration of gases, excessive heat, and the various oxidation processes that take place on the sensor surface, may eventually deteriorate.
d. Correction Factors
Catalytic sensors are most commonly calibrated to methane for 0-100% LEL full scale range. The manufacturers generally provide a set of correction factors that allow the user to measure different hydrocarbons by simply multiplying the reading by the appropriate correction factor to obtain the reading of a different gas. The reason for using methane as the primary calibration gas is that methane has a saturated single bond that requires the sensor to operate at the highest temperature in comparison to other hydrocarbons. For instance, a typical
48 | P a g e

catalytic sensor for methane gas may require a 2.5-volt bridge voltage to obtain a good signal, while the same sensor will only need 2.3 volts for butane gas. Therefore, if the sensor is set toread butane, it will not read methane properly.In addition, methane gas is a very common gas and is often encountered in many applications. Furthermore, it is also easy tohandle and has the ability to be mixed into different concentrations easily.However, it should be noted that the correction factors are a setof numbers that should be used with great care. The correction factors can vary from sensor to sensor, and they can even change on the same sensor as the sensor ages. Therefore, the best way toobtain precise readings for a specific gas is to actually calibrate the sensor to the gas of interest directly.Table (5) shows an example for a typical sensor that is calibrated for 100% LEL methane gas, the relative sensitivity to other gases is as follows:
Table 2. 5: Relative Sensitivity
Gas ReadingMethane 100%Propane 60%n-Butane 60%n-Pentane 50%n-Hexane 45%Methanol 100%Ethanol 70%
iso-Propyl Alcohol 60%Acetone 60%
Methyl Ethyl Ketone 50%Toluene 45%
e. Percent LEL for Mixtures of Hydrocarbons:
For combustion to take place, the following requirements must be presented:1. Combustible mixture.2. Oxygen.3. Ignition source.
49 | P a g e

This is sometimes referred to as the combustion triangle. But in real life, the process of igniting a combustible mixture is much more complicated. The environmental conditions, such as pressure,temperature, temperature of the ignition source, and even humidity can have an effect on the combustible mixture concentration. If two or more chemicals are involved, it is not even possible to calculate and determine the combustion range of the mixture. Therefore, there is a difficulty in the calibration of the catalytic sensor. Furthermore, a sensor calibrated at a percentage LEL for one gas cannot necessarily be used for other gases. Many instruments on the market today have a scale unit as a percentage of LEL without indicating that the unit is calibrated on methane.
Therefore, if the unit is used for some other gas or mixture of gases, the data can be totally meaningless. For example, a catalytic sensor calibration on methane produces lower readings when exposed to hydrocarbons of higher carbon content. Therefore,if a catalytic sensor exposed to a higher carbon content gas, it will produce much higher readings. This is a very common mistake made by many users of gas detection equipment.
2.2.5. SummaryCatalytic sensor is relatively easy to manufacture. However, the quality of the sensor varies quite drastically from one manufacturer to another. When making sensor by using the catalyst, should be consider many of limitation even the sensor work correctly as the type of the gas that the sensor is calibrated by it , temperature, and the type of material that is used, and every of these are effecting on the equality of the sensor.
Typical Specifications for Catalytic Sensors1. Sensor Type: Diffusion catalytic bead.2. Temperature Range: –40oC to +60oC.3. Response Time: 10 to 15 sec. to 90% of reading.4. Accuracy: ±5%.5. Repeatability: 2%.
50 | P a g e

6. Drift: 5–10% per year.7. Life Expectancy: Up to 3 years; depending on application.8. Sensors can be remotely mounted up to2, 000-3,000 meters,
depending on the manufacturer and cable size used to wire thesensor.
2.3.Infrared Method2.3.1. Introduction Many combustible gases have absorption bands in the infrared region of the electromagnetic spectrum of light and the principleof infrared absorption has been used as a laboratory analytical tool for many years. Since the 1980s, however, electronic and optical advances have made it possible to design equipment of sufficiently low power and smaller size to make this technique available for industrial gas detection products as well.
Gases to be detected are often corrosive and reactive. With most sensor types, the sensor itself is directly exposed to the gas, often causing the sensor to drift or die prematurely.
The main advantage of IR instruments is that the detector does not directly interact with the gas (or gases) to be detected. Themajor functional components of the analyzer are protected with optical parts. In other words, gas molecules interact only with alight beam. Only the sample cell and related components are directly exposed to the gas sample stream. These components can be treated, making them resistant to corrosion, and can be designed such that they are easily removable for maintenance or replacement.
51 | P a g e

2.3.2. Principle of operationThe infrared detection principle incorporates only a small portion of a very wide electromagnetic spectrum.In order to explain the principle of operation some concepts and physical basics of electromagnetic radiation should be described.
a. Wave:
Fig 2.5: mechanical wave.A wave can be described as a disturbance that travels through a medium from one location to another location .There are two types of waves:1- Mechanical waves: are those that require a medium for their transfer including water waves and sound waves.2- Electromagnetic waves: consist of varying electric and magnetic fields. These two fields are perpendicular to each otherand to the direction of travel of the wave. Each vibrates at the same frequency (the frequency of the wave). The waves travel at the same speed in a vacuum equal2.998x108m /s.
Figure 2.5 shows the mechanical wave .10 waves per centimeter to illustrate the concept of the wave.
b. FrequencyNumber of waves per second passing through a point. Because the electromagnetic waves moving at the speed of light (300 million meters per second) Therefore, the frequency is the speed of lightdivided by the wavelength, and is expressed as the number of waves per second, or hertz (Hz). For example the wave of the Figure 2.5 has a frequency of 10 HZ.
52 | P a g e

c. WavelengthWavelength is the distance between two identical adjacent points in a wave (see Figure 2.6). It is typically measured between two easily identifiable points, such as two adjacent crests or bottoms in a waveform. Wavelength is inversely proportional to frequency. That means if two waves are traveling at the same speed, the wave with a higher frequency will have a shorter wavelength. It is commonly expressed in microns (10−6m¿.For example the wave length of the Figure 2.5 is equal to 0.1 cm.
Fig 2.6: wave length
d. Wave number Wave number is defined as the number of waves in one centimeter.It is the reciprocal of wavelength.Wave number = 1/wavelength. From Figure 2.5, the wave number is equal to 10cm−1
e. AbsorbanceIt means the amount of energy that is absorbed by the gas molecules (it is the opposite of transmittance).From Figure 2.7 the absorbance is 25%
The two common important terms in describing the infrared region are the wavelength and the waves number, because they provide a convenient method to express radiation frequency and the mechanisms of interaction between infrared radiation and gas molecules.
For example, methane gas has an absorption wave length of 3.4 micron and it is also equal to 2941cm-1 because both the wave length and the wave’s number are reciprocals to each other.
53 | P a g e

f. Transmittance
The ratio of transmitted radiation energy to the incident energy.
Fig 2.7: description of transmittance.As shown in Figure 2.7 the incident energy=100%, the reflectedenergy=10%, transmitted energy=65%, absorbed energy=25%.
g. Electromagnetic spectrum
Fig 2.8: Electromagnetic Spectrum.Electromagnetic waves propagate through space or matter by oscillating electric and magnetic fields. In vacuum, they travel at the speed of light.
The electromagnetic (EM) spectrum is the range of all types of (EM) radiation. Radiation is energy that travels and spreads out as it goes - the visible light that comes from a lamp and the radio waves that come from a radio station are two types of electromagnetic radiation. The other types of EM radiation that 54 | P a g e

make up the electromagnetic spectrum are microwaves, infrared light, ultraviolet light, X-rays and gamma-rays.
Figure 2.8 shows the distribution of the waves by type from low frequency (radio wave their frequency equal106Hz to the high frequency (gamma wave their frequency equal 1020 Hz).
Notice that the visible light has frequency (4∗1014Hz) is actually only a very narrow portion of the spectrum. Infrared is just below visible light, and this explains why we feel, but do not see, temperature.
The infrared region is the most useful for gas analysis because absorption by gas molecules is unique and selective in this region.2.3.2.1.Unique gas absorption
The complexity of gas affects the number of absorbed peak, so that the increase in the number of atoms leads to an increase in the number of molecules, there for more absorption bands that will occur.
Each gas has its own specific character on the absorption curve, so when the absorption occur by methane gas the curve differ thanthat of propane or butane gas and so on.
As mentioned before each gas has its own specific character on the absorption curve, so this make unique fingerprint for each gas .A library of these curves can then be stored in the memory inside an instrument. When a given gas is scanned by the instrument, the graph is then compared with the stored curves to identify the gas molecules. This method of gas analysis is the most popular in analytical chemistry.
Methane gas has a strong absorption peak at 3.4 microns, which isthe wavelength used for methane detection, and also the most common hydrocarbon gases have strong absorption in the 3.4 micronregion.
55 | P a g e

2.3.2.2.Natural frequencies of gas molecules
There are bonds between gas atoms, these bonds have several of types including covalent bond.
In covalent bonds, atoms aren't joined by rigid links - the two atoms are held together because both nuclei are attracted to the same pair of electrons. The two nuclei can vibrate backwards and forwards - towards and away from each other - around an average position. This bonding vibrates with a fixed frequency called thenatural frequency.
For example the chemical symbol of water is H2O so from this symbol the water contain two atom of hydrogen and one atom of oxygen, and the bond between these atoms are covalent, so this bonding vibrates with a fixed frequency, Figure 2.9 illustrated that principle.
Fig 2.9: Water Molecule bonds.Each structure has a natural frequency. For example, the balcony in a theater has a natural frequency and the bridges have naturalfrequency.
In physics, resonance is the tendency of a system to oscillate ata greater amplitude at some frequencies than others. These are known as the system's resonance frequencies. At these frequencies, even small periodic driving forces can produce largeamplitude oscillations, because the system stores vibrational energy, Figure2.10 illustrates the resonance frequency.
56 | P a g e
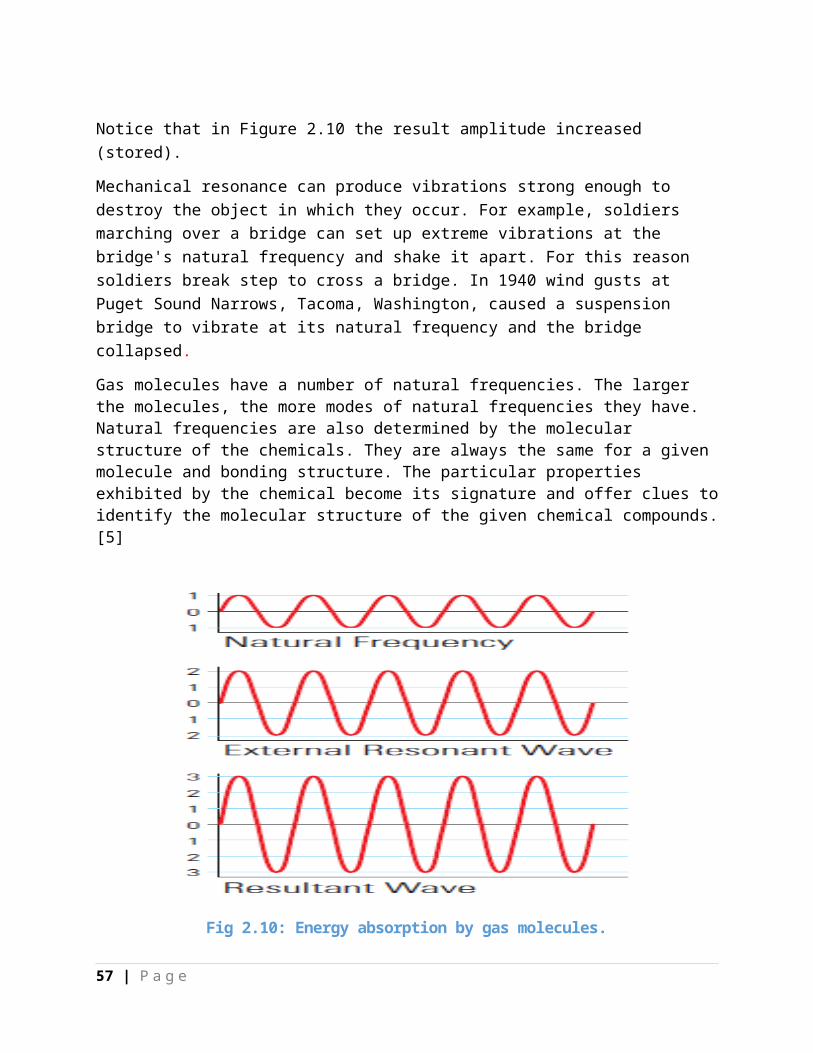
Notice that in Figure 2.10 the result amplitude increased (stored).
Mechanical resonance can produce vibrations strong enough to destroy the object in which they occur. For example, soldiers marching over a bridge can set up extreme vibrations at the bridge's natural frequency and shake it apart. For this reason soldiers break step to cross a bridge. In 1940 wind gusts at Puget Sound Narrows, Tacoma, Washington, caused a suspension bridge to vibrate at its natural frequency and the bridge collapsed.
Gas molecules have a number of natural frequencies. The larger the molecules, the more modes of natural frequencies they have. Natural frequencies are also determined by the molecular structure of the chemicals. They are always the same for a given molecule and bonding structure. The particular properties exhibited by the chemical become its signature and offer clues toidentify the molecular structure of the given chemical compounds.[5]
Fig 2.10: Energy absorption by gas molecules.
57 | P a g e

There are two ways to detect the gas through the infrared method:
Fig2.11: Illustrate of the absorbed and reflected wave length inmethane
When the radiation interacts with gas molecules, part of the energy has the same frequency as the gas molecule’s natural frequency and it is absorbed while the rest of the radiation is transmitted. As the gas molecules absorb this radiation, the molecules gain energy and vibrate more vigorously. This vibrationresults in a rise in the temperature of the gas molecules. The temperature increases in proportion to gas concentration, and is detected by the detector. On the other hand, the radiation absorbed by the gas molecules at the particular wavelength will cause a decrease in the original source strength. This radiation energy decrease and can be detected as a signal also.
Figure 2.11 describes the methane structure and shows the bonds between its atoms also shows the absorbed wavelength and the reflected wavelength.
2.3.3. Components for analysisTo get a useful signal from the system, so there are several available components. However there are no rule for choosing the components. The configuration of these instruments depends on
58 | P a g e

what needs to be accomplished and the estimate of the designer. Following is a description of the major components.
2.3.3.1. DetectorsThe infrared detector that reacts to infrared (IR) radiation. Convert electromagnetic radiation energy or temperature changes into electrical signals there are many types of detectors, and each type has its own performance characteristics. These types are as follows:
Fig 2.12: thermocouple
2.3.3.1.1. ThermoelectricA detector that converts temperature into an electrical signal iscommonly known as a thermocouple.Thermocouple is a temperature- measurement device consisting of two dissimilar conductors that contact each other at one or more spots. It produces voltage when the temperature of one of the spots differs from the reference temperature at other parts of the circuit Figure 2.12 illustrate the construction of thermocouple. [1]
59 | P a g e

Thermocouple is a closed circuit consisting of two junctions (seeFigure2.13), at different temperatures T1andT2 °C. If a high-impedance voltmeter is introduced into the circuit, so that current flow is negligible, then the measured e.m.f. is to a close approximation, the difference of the junction potentials asin equation 1&2. [1]
Where:
T1: Reference or normally ice point.
T2: Measuring point.
Fig 2.13: Thermocouple circuit.Figure 2.13 describe what mention in previous paragraph that the voltage meter use to measure the deference in voltage as in equation 1&2.
60 | P a g e

ET1,T2AB =ET1
AB−ET2AB
(2.3)
ET1,T2AB =a1 (T1−T2)+a2 (T2
1−T22 )+a3(T31−T32 )+… (2.4)
ET1,T2=ET1,T3+ET3,T2(2.5)
Where:
ET1,T2AB : e.m.f.
ET1,T2AB : e.m.f.
ET1,T2AB : e.m.f.
a1&a2: values of constants, depend on the metals A and B.
T1 : The temperature to be measured.
T2: The temperature of the reference.
Example 2.4- output voltage of thermocouple
Suppose that we wish to measure the temperature T1 °C of a liquidinside a vessel with a chromel alumel thermocouple. The measurement junction is inserted in the vessel and the reference junction is outside the vessel, where the temperature is measuredto be 20 °C.
Solution
ET1,T2=ET1,T3+ET3,T2WhereT3 the intermediate temperature.
If T2 = 0 °C, then
ET1,0=ET1,T3+ET3,0
61 | P a g e

T3= 20 °C. The measured e.m.f. is 5.3 mV using a voltmeter.
ET1, T3 =ET1, 20 = 5.3 mV.
ET3, 0 = E 20, 0 is found to be 0.8 mV using thermocouple tables (These tables give thee.m.f. ET, 0 for a particular thermocouple, with measured junction at T °C and referenceJunction at 0 °C.)
From Equation 5, we haveET1, 0 = 5.3 + 0.8 = 6.1 mV; T1 is then found to be 149 °C by looking up the temperature corresponding to6.1 mV.
Types of thermocouple
There are different types of the thermocouple, and it depends on the type of material is it made of, and in the following describeof each types.
Type K This type is made of chromel (90% nickel and 10% chromium)–alumel (95% nickel, 2% manganese, 2% aluminum and 1% silicon).Type K is the most common type of thermocouple and their and its characteristics can be summarized as follows:
1. Their sensitivity approximately 41 µV/°C.2. It is inexpensive.3. Wide variety of sensors are available in its −200 °C to
+1350 °C / -330 °F to +2460 °F range.4. The type K is commonly found in nuclear applications.5. Wire color standard is yellow (+) and red (-), Figure 2.14
illustrate type K.
One of the constituent metals, nickel, is magnetic; a characteristic of thermocouples made with magnetic material is that they undergo a deviation in output when the material reachesits Curie point( Curie temperature (Tc), or Curie point, is the temperature where a material's permanent magnetism changes to
62 | P a g e

induced magnetism. The force of magnetism is determined by magnetic moments) this occurs for type K thermocouples at around 350 °C.
Fig 2.14: Type K Type E This type is made of (chromel–constantan), and their characteristic as the following1. Type E has a stronger signal (has output (68 µV/°C) & higher
accuracy than the Type K or Type J.2. Suited to cryogenic use because their output signal is high.3. It is non-magnetic.4. Wide range is −50 to 740 °C and Narrow range is −110 to 140
°C.6. Wire color standard is purple (+) and red (-), Figure2.15
illustrate type E.
** Constantan is a copper-nickel alloy usually consisting of 55% copper and 45% nickel.
Fig 2.15: Type E. Type J Type J is made of (iron– constantan), their characteristics can be summarized as the following:
1. More restricted range than type K (−40 to +750 °C).2. Shorter lifespan at higher temperatures than the Type K.3. Higher sensitivity than type k of about 50 µV/°C.4. The Curie point of the iron (770 °C) causes a smooth change
in the characteristic.5. Wire color standard is white (+) and red (-), Figure 2.16
illustrate type J.
63 | P a g e

Fig 2.16: Type J. Type N Type N is made of (Nicrosil–Nisil), their characteristics can be summarize as the following:
1. Suitable for use between −270 °C and 1300 °C.2. Sensitivity is about 39 µV/°C at 900 °C, slightly lower
compared to type K.3. The type N is slightly more expensive than other the previous
types.4. Wire color standard is yellow (+) and red (-), Figure 2.17
illustrate type N.
**Nisil is an alloy of nickel and silicon. Typically, the alloy is mostly nickel alloyed with 4.4% silicon.**Nicrosil is a nickel alloy containing 14.4% chromium, 1.4% silicon, and 0.1% magnesium.
Fig 2.17: Type N.
Platinum types B, R and S .
Types B, R, and S thermocouples use platinum or a platinum–rhodium alloy for each conductor. These are among the most stablethermocouples, but have lower sensitivity than other types, approximately 10 µV/°C. Type B, R, and S thermocouples are usually used only for high temperature measurements due to their high cost and low sensitivity.Figure 2.18 represent the relation between the voltage and the temperature for each type of thermocouple, notice that type C hasthe largest temperature range but the type E have the largest output mile volt.
64 | P a g e

Fig 2.18: relation between temperature and voltage for each ofthermocouple types.
Choosing a thermocouple type:
There are many type of thermocouple as shown before so the question now how do choose a thermocouple type?The following criteria are used in selecting a thermocouple:
1. Temperature range.2. Chemical resistance of the thermocouple.3. Abrasion and vibration resistance.4. Installation requirements (may need to be compatible with
existing equipment; existing holes may determine probe diameter).[6]
65 | P a g e

2.3.3.1.2. Thermistor bolometer
Fig 2.19: Lumped element thermal model of a thermal radiationdetector (bolometer).
A bolometer is a detector for radiation or particles, it consist of an absorbing element of heat capacity C which is connected to a heat sink by a weak thermal link. If a power P is absorbed in C, the detector temperature T rises above the temperature of the heat sink T0.
The average thermal conductance G of the weak thermal link is defend by
P=G.(T−T0)
(2.6)Where:P: power absorbed in absorbing element T: detector temperature K.T0: Temperature of the heat sink K.G: Thermal conductance of weak thermal link (W/ (m·K)).
And its dynamic thermal conductance G is given by
G=dPdT
(2.7)
If the power absorbed in the detector changes instantaneously to a new valueP', T changes as a function of time, approaching its new value66 | P a g e

T'=T0+P' /G (2.8)
With a thermal time constantτ=C
G(2.9)
Thermal radiation detectors detect changes in P by measuring changes in T.The bolometer uses an electrical resistance thermometer (thermistor) to measure changes in T .Doped semiconductors such as neutron-transmutation-doped (NTD) Ge crystals, or ion-implanted Si are commonly used for IR-bolometers. [7]
2.3.3.1.3. Pyroelectric detector
Fig 2.20: Pyroelectric crystal.
Pyroelectricity is a characteristic of some materials which stimulate generation of electric dipole moment due to changes in temperature, resulting the current which is proportional to the temperature changes. Such pyroelectric materials in which the crystals are spontaneously polarized are called pyroelectrics. This evidence enables the application of pyroelectrics for detection purposes - as thermal sensors.
Pyroelectric detector does not require cooling of the detector.
Figure 2.20 simply describe the construction of the Pyroelectric crystal circuit. Pyroelectric thermal detector crystal must be as
67 | P a g e

thin as possible in order to ensure faster temperature changes. In this way, once the faster electric signal will be obtained, the thermal time constant value of the material will be smaller.
Thermal Time ConstantThermal time constant of pyroelectric detector is the time for which incident radiation power on its input surface responds withelectric signal at its output. Compared with other thermal detectors, pyroelectric detector response time is much smaller because the pyroelectric crystal does not have to reach the thermal equilibrium as in cases of thermocouples and thermistors .Let Cth and Gth be the thermal capacity and conductance, respectively. Response time of the detector is givenas the ratio of these two quantities named above
τ=CthGth
=c'AbGRA
= cρb4ησ T3
(2.10)Where:c': Volume specific heat (J/cm3K).c: Specific heat of material (J/gmK).ρ: Density (gm/cm3).b: Sensor thickness (μm).GR: Irradiative conductance (W/cmK).A: Detector area (cm2).η: Emissivity of the crystal.σ: Stefan-Boltzmann constant (5.67x10⁻¹²W/cm2K4).T: Temperature (K).
Previous equation indicates that thermal time constant is dependent of thickness and temperature of the detector.Figure 2.21 Shows the temperature is dependent of thickness and temperature of the detector.
68 | P a g e

Fig 2.21: Thermal time constant for some pyroelectric material
2.3.3.1.4. Luft detectorLuft detector is a German design gas detector, where the word luft is a German word that means the air.
This detector contains the following parts:
1. IR source (use to emit the light).2. Motor and chopper (using for modulating the light - will be
described more later).3. Two cells, the first one used as reference and the second cell
used for sensing the target gas.4. IR transparent window (it’s used as filter that permit to
specify wave length to the transparent).5. Chambers, are divided to reference chamber and detector
chamber.
69 | P a g e

6. Micro-flow sensor or Diaphragm, it is divided between sensing cell and reference cell, and also it is used to measure the deference between the two cells to detect the gas.
Fig 2.21: Luft detector
Principle of operation
In the initial state there is no targeted gas in the sensing cellso the same wave length will be received in the reference chamberand detector chamber (same temperature and pressure) so the micro-flow sensor or diaphragm detect no difference between the two cells (stable case).
In the second case (the presence of the target gas), when there is a gas targeted in the sensing cell, the radiation energy that 70 | P a g e

is received in the detection chamber will be decreased which causes the temperature and pressure to drop in the detector chamber. But the reference chamber has no any change it remains same as initial state so that the Micro-flow sensor or diaphragm will detect the change in the temperature and pressure, and that result is the detection of gas leakage.
This detector finds many useful applications as an analyzer, and has good potential for-further development. [2]
**Diaphragm: work by change the capacitance when the pressure droop change.
** Micro-flow sensor: the principle operation of the micro-flow sensor based on different in the temperature between two sides (detector chamber and sensing chamber) so the difference in the temperature appear as difference in voltage between the two sides.
71 | P a g e

Fig 2.22: flow diagram describe principle operation of luft detector.
2.3.3.1.5. Photo acoustic detector
Fig
2.23: Photo acoustic Detector.
Photo acoustic is the detector measures the change in pressure bya condenser microphone, and it’s similar to the luft detector.
The condenser is an electronic component which stores energy in the form of an electrostatic field, which uses a capacitor to convert acoustical energy into electrical energy. And the condensers also tend to be more sensitive and responsive for dynamics, making them well-suited to capture subtle difference inthe sound.
72 | P a g e

The sample gas is passed through a chamber and the chamber is sealed with a fixed volume of sample gas trapped inside. A specific wavelength of infrared radiation is pulsed into the chamber via an infrared transparent window. Consequently the microphone measured the change in pulsating pressure as a frequency change which produces the signal as shows in Figure 2.23. [8]
2.3.3.2.Infrared sourceIs a light emitter, there are many types of light emitters, for example light bulb, light bulb can be used as Infrared Source, also another example of emitters is wire filament, they found in the light pens, and also can be used as infrared source, where the wire filament radiates sufficient energy in the 1-5 micron and this suitable for detecting hydrocarbon gases, carbon dioxideand carbon monoxide.The Features of wire filament that found in pen is simple, inexpensive, long life and long-term stability.
Fig 2.24: wire filament.
73 | P a g e

Modulating the light
There are some kinds of detectors that require modulating light (turn the light on-off) at a certain frequency and one of these methods used to do that is the chopper baled method
The chopper method is a disc with slots distributed regularly andthis disc is connected with motor in order to rotate the disc, the light passes through the slots of the disc to generate pulses, the frequency of these pulses can be controlled by controlling the speed of the motor which controls the rotation speeds of disc.
The features of the chopper method is simple not complex and alsoit can give high frequency, and this frequency can be easily changed by changing the speed of the motor.
Figure 2.25 describes the chopper method, notice that the different between the input pulses and the output pulses depends on the number of slots in the disc and the speed of the chopper.
Fig 2.25: chopper baled method.There is another method for light modulating and this method is filament source, this method is based on a heated wire and is limited to how fast it can be heated up and cooled down, so this causes the pulses to be generated depending on the heating and cooling speed.
74 | P a g e

The filament source method depend on filament temperature and bulb enclosure, and this method provides wavelength in the range of 2-5 microns.
2.3.3.3.Optical filterThere are too many forms of light sources, and each one has its own wavelength. And there are some devices designed to work at specific wavelength and this is done by using the optical filters.
Interference filters
They are composed of transparent glass or quartz substrate on which multiple thin layers of dielectric material, sometimes separated by spacer layers.
Characteristics of the interference filter
1. Long pass filters transmit wavelengths above a cut-off wavelength.
2. Short pass filters transmit wavelengths below a cut-off wavelength.
3. Band pass filters transmit wavelengths in a narrow range around a specified wavelength
Interference filters can be divided into three standards according to their properties as the following:
1. Standard Band Pass Filters It allows the wavelength that lies in specified range to transmit, and doesn’t allow the wave length that lies out of
75 | P a g e

specified range to transmit, Figure 2.26 illustrates standard band pass filters. This optical filter is working to transmit thelight that is in a certain range of wavelength while it blocking the reminder of that wavelength
2. Standard Long Pass Filters It allows the wavelengths that are larger than a specified wavelength to transmit, and doesn’t allow the wavelengths that are less than the specified wave length to transmit, Figure 2.27 illustrates transmittance standard long pass filters.
3. Standard short Pass Filters It allows the wavelengths that are less than a specified wave length to transmit, and doesn’t allow the wavelengths that are larger than the specified wave length to transmit, Figure 2.28 illustrates transmittance standard short pass filters.
Fig 2.26: Standard Band Pass Filters.
For example, Figure 2.26 the filter will transmit the wavelengths lie in the range (620-640) nm.
Fig 2.27: Standard long Pass Filters.
For example, Figure 2.27 the filter will transmit the wavelengths that are larger than 520 nm.
76 | P a g e

Fig 2.28: Standard short Pass Filters.For example, Figure 2.28 the filter will transmit the wavelengths that are smaller than 575 nm.
Figure 2.29 illustrates the methane filter specifications. For example the band width (3.1 -3.7)μm. So as mentioned before the wavelengths that lies in these ranges (3.1 -3.7) μm will be transmitted, and other wavelengths will be reflected. And also notice that the largest transmittance is equal 80% and it corresponds to the peak wave length (3.4) μm
77 | P a g e
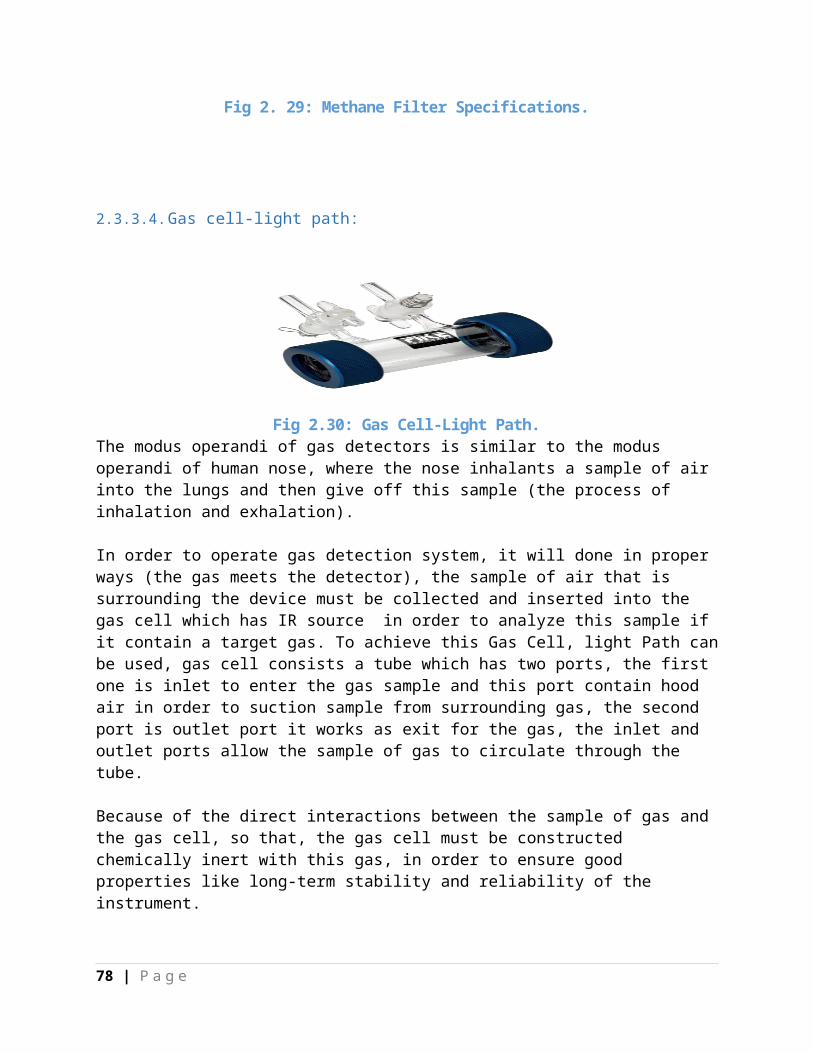
Fig 2. 29: Methane Filter Specifications.
2.3.3.4.Gas cell-light path:
Fig 2.30: Gas Cell-Light Path.The modus operandi of gas detectors is similar to the modus operandi of human nose, where the nose inhalants a sample of air into the lungs and then give off this sample (the process of inhalation and exhalation).
In order to operate gas detection system, it will done in proper ways (the gas meets the detector), the sample of air that is surrounding the device must be collected and inserted into the gas cell which has IR source in order to analyze this sample if it contain a target gas. To achieve this Gas Cell, light Path canbe used, gas cell consists a tube which has two ports, the first one is inlet to enter the gas sample and this port contain hood air in order to suction sample from surrounding gas, the second port is outlet port it works as exit for the gas, the inlet and outlet ports allow the sample of gas to circulate through the tube.
Because of the direct interactions between the sample of gas and the gas cell, so that, the gas cell must be constructed chemically inert with this gas, in order to ensure good properties like long-term stability and reliability of the instrument.
78 | P a g e

2.3.4. ConfigurationThe various IR components can be arranged in several ways to produce a gas analyzer. The design may be relatively simple, or very complex, using many different optical components depending on the applications of analyzer type.
For applications, the selectivity and sensitivity can be compromised for reliability (a simpler design can be implemented). In contrast the applications that require high sensitivity, selectivity, and stability, the design of the analyzer is more complex.
Illustrate some of the basic features of an IR analyzer:
1) Basic Infrared Gas Detector Layout:
Fig 2.31: A Basic Infrared Gas Detector Layout.
Figure 2.31 shows the basic layout, which consist of following
1. IR source (use to emit the light).2. Band pass filter (Previously mentioned).
79 | P a g e

3. The interaction with the gas sample and detector.4. Two hole for entry and exit the sample of the gas.
Principle of operation:- Case (1): the target gas is not entered to the cell of the
detector so that no change in the length of the wavelength. - Case (2): when the target gas is entered from the hole and
then it interaction with the detector and after that exits from the other hole. Consequently there is some change in the wavelength.
**The band pass filter could be placed in front of the light source, instead of placing it in front of the detector. [2]
2) Two-Detector Layout:
Fig 2.32: Two-Detector Layout.Figure 2.32 shows the two-detector layout which consist of following
1. IR sources (use to emit the light).2. Mirror (for reflected the light).3. Active filter/detector.4. Reference filter/detector.
Principle of operation
This layout is similar to the basic layout expect containing two filter detector. The modulated flashing IR sources are reflected
80 | P a g e

back to the detectors by using the mirror. The active detector has a filter for the target gas (the target gas is the gas that will be detected) at a certain wavelength, while the reference detector has a filter with a different wavelength (the active detector is used to detect the target gas and the reference detector is used to ignore the target gas).
In actual operation, the active detector is used to provide the signal while the reference detector provides a base point value or zero point. Consequently the difference between the two detectors providing the actual value span of the instrument.
- Case (1): When no gas is detected the deference between activeand reference is zero, so that, the two detectors provide no change in the value of the signal.
- Case (2): When gas is detected, so that, there is a deference between active and reference, and the two detectors provide the actual value span of the instrument.
Characteristics of the two-detector layout
1. The arrangement offers advantage of reducing the changes that occur in the detector’s sensitivity with time.
2. The intensity of the light source can be changed with time dueto contamination, which will create a zero drift.
**Zero drift is the changes in instrument output when the input signal remains zero, caused by factors such as temperature, contamination or line voltage.
3. In this arrangement, the path length is doubled which leads togenerate a higher signal strength. Double Beams with Chopper Layout
81 | P a g e
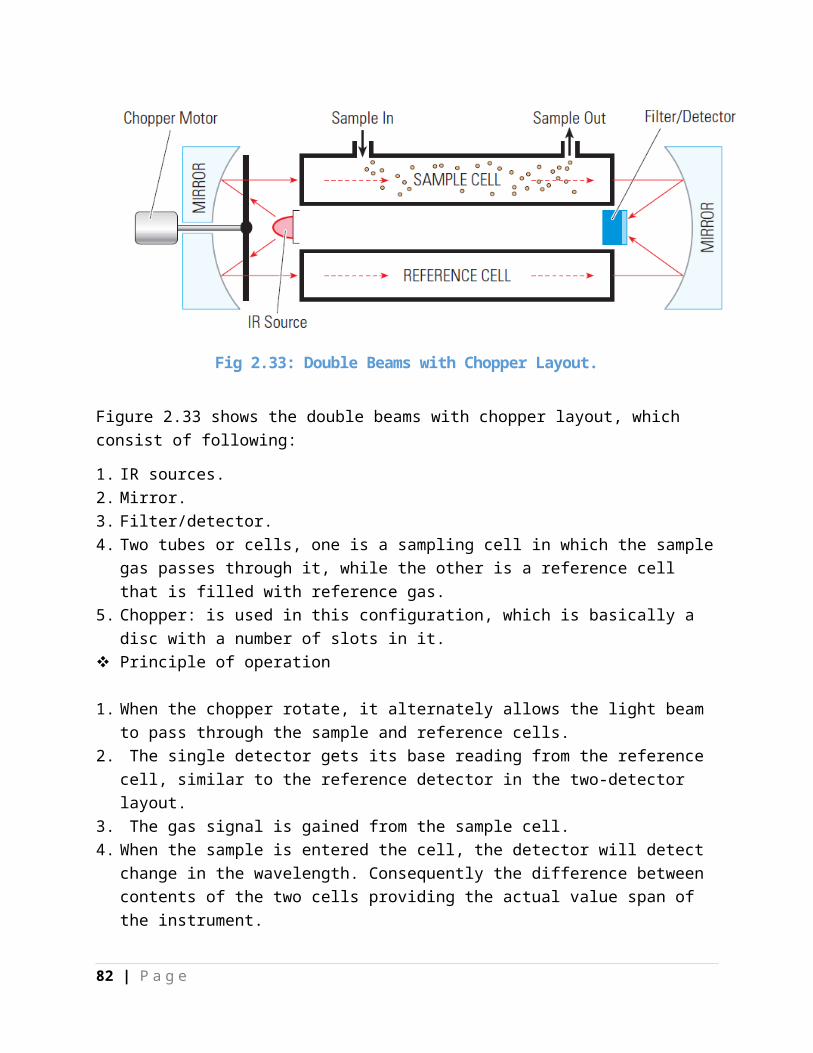
Fig 2.33: Double Beams with Chopper Layout.
Figure 2.33 shows the double beams with chopper layout, which consist of following:
1. IR sources.2. Mirror.3. Filter/detector.4. Two tubes or cells, one is a sampling cell in which the sample
gas passes through it, while the other is a reference cell that is filled with reference gas.
5. Chopper: is used in this configuration, which is basically a disc with a number of slots in it.
Principle of operation
1. When the chopper rotate, it alternately allows the light beam to pass through the sample and reference cells.
2. The single detector gets its base reading from the reference cell, similar to the reference detector in the two-detector layout.
3. The gas signal is gained from the sample cell. 4. When the sample is entered the cell, the detector will detect
change in the wavelength. Consequently the difference between contents of the two cells providing the actual value span of the instrument.
82 | P a g e
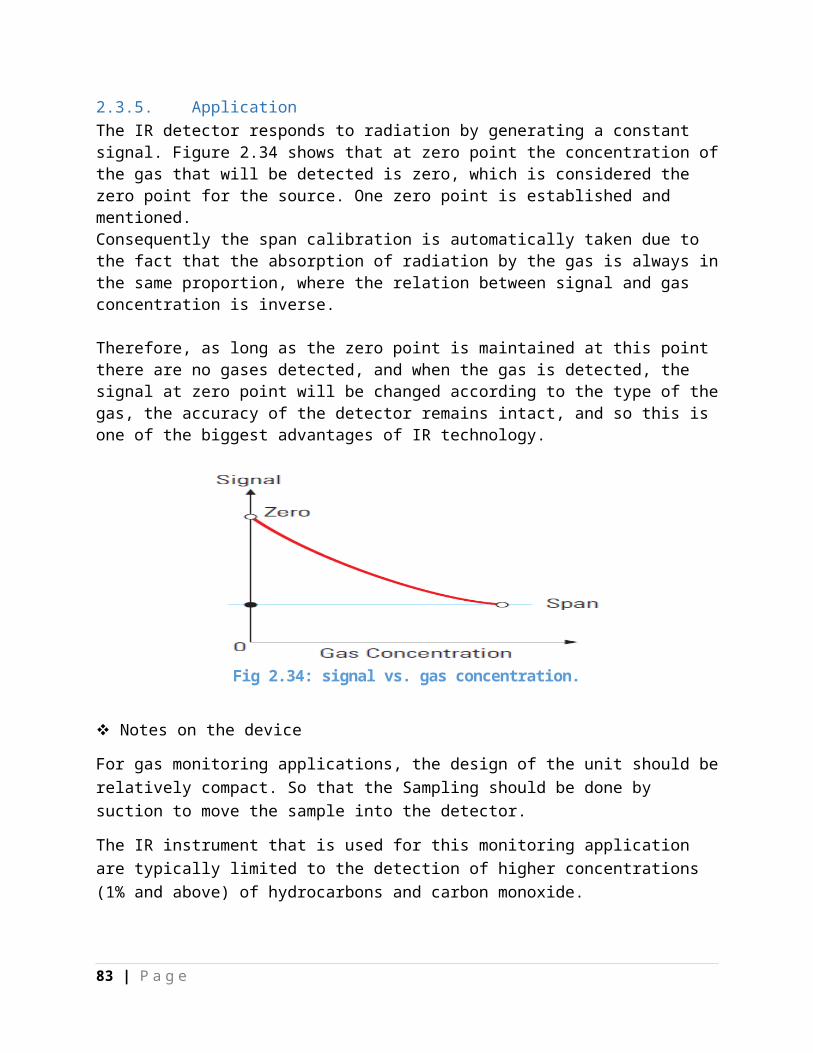
2.3.5. ApplicationThe IR detector responds to radiation by generating a constant signal. Figure 2.34 shows that at zero point the concentration ofthe gas that will be detected is zero, which is considered the zero point for the source. One zero point is established and mentioned. Consequently the span calibration is automatically taken due to the fact that the absorption of radiation by the gas is always inthe same proportion, where the relation between signal and gas concentration is inverse.
Therefore, as long as the zero point is maintained at this point there are no gases detected, and when the gas is detected, the signal at zero point will be changed according to the type of thegas, the accuracy of the detector remains intact, and so this is one of the biggest advantages of IR technology.
Fig 2.34: signal vs. gas concentration.
Notes on the device
For gas monitoring applications, the design of the unit should berelatively compact. So that the Sampling should be done by suction to move the sample into the detector.
The IR instrument that is used for this monitoring application are typically limited to the detection of higher concentrations (1% and above) of hydrocarbons and carbon monoxide.
83 | P a g e

Carbon dioxide absorbs infrared radiation very strongly and can be detected in concentration ranges of 0.1% and higher
With the filter used for the %LEL combustible gases application, the center wavelength is typically at 3.4microns. This is the wavelength of most hydrocarbons, also, the most of the hydrocarbon derivative gases have a strong absorption.
The list of common gases that are detected by IR detector
There are many of the gases that are discovered by IR detector, these gases include:
1. Cycloalkanes such as cyclopropane, cyclohexane, methyl cyclohexane, etc.
2. Alkenes or saturated hydrocarbons such as methane, ethane, propane, butane, pentane, hexane, and heptane, etc.
3. Alkenes or unsaturated hydrocarbons such as ethylene, propylene, butene, pentene, hexene, octene, etc.
4. Cycloalkenes such as cyclohexene.
** There are many other of gases that are detected by infrared method as benzene, toluene, and xylene, ethanol, propanol, and allyl alcohol etc…
2.3.6. CharacteristicsThere are many characteristics that affect the infrared detector and it’s as follow:
1. Temperature
IR detector in the original it used to measure the temperature, but it can operate properly at range (-40C to 60C) without susceptible to ambient temperature fluctuations. This is because most detectors require 10-20 minute to reach equilibrium.
84 | P a g e

The detector unit works at temperature slightly above the ambienttemperature in order to prevent condensation, because the performance of analyzer will be affected if condensation occurred.
2. Humidity
Humidity not have a significant effect in the case of the naturalenvironment, but in the case of the high humidity it cause to corrosive and the failure of the analyzer, Increasingly serious and effect in the corrosive gases where the humidity increases corrosion rate (proportional relationship between humidity and corrosion).
To solve or reduce this problem wet sample of gas must be dried before inserting into detector chamber and also the detector chamber constructed of any material that does not absorb the IR light.
3. Sensitivity
The IR energy absorption is directly proportional to the molecular structure of the hydrocarbon (in addition to the concentration of the hydrocarbon present). For example, the detector is least sensitive to methane CH4with its simple, singlebond. With propane C3H8 and butaneC4H10, however, the sensitivity increases dramatically. An example of the drastic difference between the sensitivity among varying hydrocarbons can be seen bythe fact that an IR detector can be calibrated to 100% pure methane, but only a few percent by volume of propane or butane will saturate the system. In the case of percent lower explosive limit (%LEL) or lower flammable limit (LFL) applications, the volume concentration of each gas to reach 100% LFL or LEL varies,and the response curves are nonlinear; hence, each hydrocarbon must have its own curve programmed into the system. Unlike the catalytic sensor, which has near linear response to gases at the
85 | P a g e

LFL range, the IR unit requires some means to linearism the output.
4. Life Expectancy
Infrared sensor is a solid-state device and it come in solid package so that the life expectancy is long. However, the life expectancy for the IR source is (2 - 5) years but this range can be prolonged by operating the source at a lower-than-designed energy, or instead of that, the IR source can be design to changewhen needed.
2.3.7. Comparison between catalytic sensor and infrared sensor
Table 2. 6: Comparison between catalytic sensor and infraredsensor.
characteristics
Type of detection method resultof the
Comparison
Catalytic sensor infrared sensor
86 | P a g e
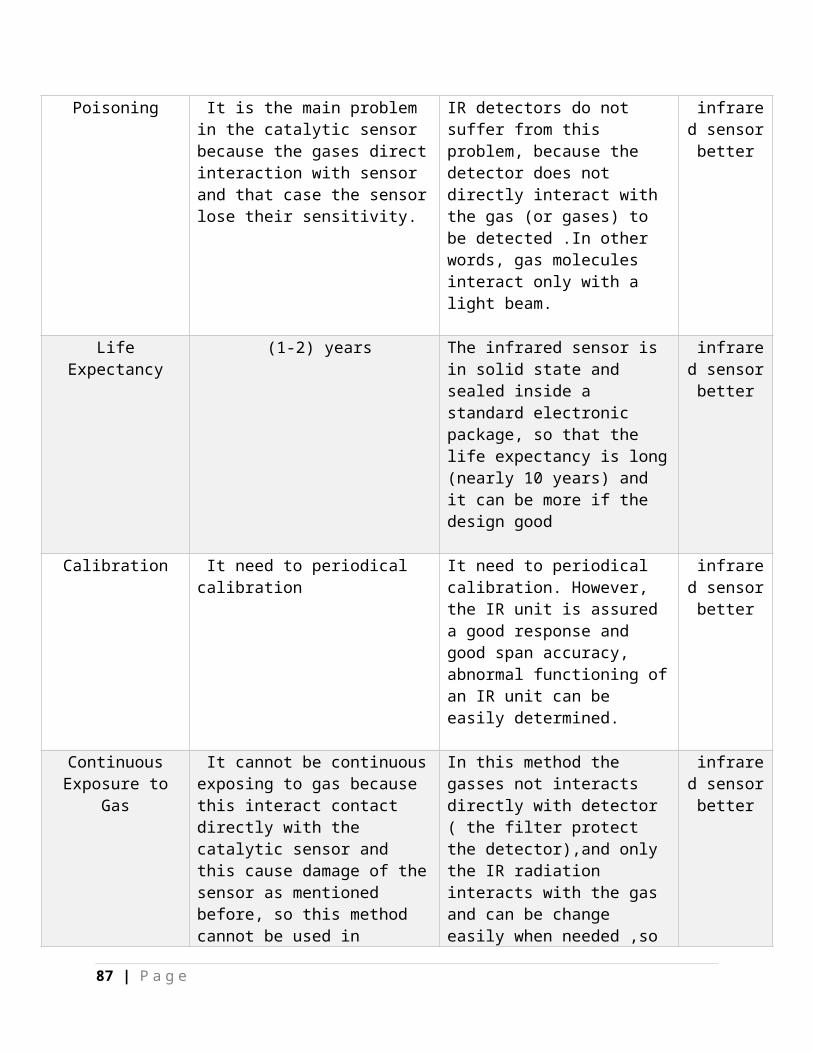
Poisoning It is the main problem in the catalytic sensor because the gases directinteraction with sensor and that case the sensorlose their sensitivity.
IR detectors do not suffer from this problem, because the detector does not directly interact with the gas (or gases) to be detected .In other words, gas molecules interact only with a light beam.
infrared sensorbetter
LifeExpectancy
(1-2) years The infrared sensor is in solid state and sealed inside a standard electronic package, so that the life expectancy is long(nearly 10 years) and it can be more if the design good
infrared sensorbetter
Calibration It need to periodical calibration
It need to periodical calibration. However, the IR unit is assured a good response and good span accuracy, abnormal functioning ofan IR unit can be easily determined.
infrared sensorbetter
ContinuousExposure to
Gas
It cannot be continuousexposing to gas because this interact contact directly with the catalytic sensor and this cause damage of thesensor as mentioned before, so this method cannot be used in
In this method the gasses not interacts directly with detector ( the filter protect the detector),and only the IR radiation interacts with the gas and can be change easily when needed ,so
infrared sensorbetter
87 | P a g e

application like gas stream to monitor for hydrocarbons.
this type can be used in application require continuous exposure to gas like gas stream to monitor for hydrocarbons.
2.3.8. SummaryThe infrared detection method is modern method and available fromfew years for detecting hydrocarbon gases. However this method used widely in many industrial sectors for example it used in petrochemicals sector, and also used in safety sector and air quality.
2.4.Solid-State Gas Sensors2.4.1. IntroductionThis method depends mainly on Semiconductor materials and this method has been discovered by coincidence, where the earlier scientists have been used semiconductors materials in detection of gases, and even had to face a problem in that semiconductors affected by gases surrounding it, and they were solved this problem by isolating semiconductors materials from gases surrounding by use of dielectric materials
You may now ask what semiconductors, a semiconductor is called a semiconductor because it is a type of material that has an electrical resistance which is between the resistance typical of metals and the resistance typical of insulators
The name of this type of materials contain two parts “semi “&”conductor”, this because the conductivity of this material notgood as copper and also not bad as rubber, it located between them, hence semiconductors came.
88 | P a g e

There are two type of semiconductor; an N-type semiconductor carries current mainly in the form of negatively-charged electrons (excessive of electrons), p-type semiconductor deficiency of electrons.
Both previous types modify the conductivity but how do that, thiscan do by process called doping
In doping, you mix a small amount of an impurity into the silicon crystal.
N-type - In N-type doping, phosphorus or arsenic is added to the silicon in small quantities. Phosphorus and arsenic each have five outer electrons, so they're out of place when they get into the silicon lattice. The fifth electron has nothing to bond to, so it's free to move around. It takes only a very small quantity of the impurity to create enough free electrons to allow an electric current to flow through the silicon. N-type silicon is agood conductor. Electrons have a negative charge, hence the name N-type.P-type - In P-type doping, boron or gallium is the dopant. Boron and gallium each have only three outer electrons. When mixed intothe silicon lattice, they form "holes" in the lattice where a silicon electron has nothing to bond to. The absence of an electron creates the effect of a positive charge, hence the name P-type. Holes can conduct current. A hole happily accepts an electron from a neighbor, moving the hole over a space. P-type silicon is a good conductor. [9] Now after explain semiconductor will back to main subject.
The first use of solid-state gas sensors method in detection of gases was at 1968, and it used to detect hydrogen gas at range 0-10 ppm. And then continued on the development of this method.
This method came as good competitive to the catalytic bead sensor, method that was suffered from many problems.
Today, solid-state sensors are available for the detection of more than 150 different gases,
89 | P a g e

Post transition metal
Table2.7:post-transition metalselemen
tchemicalsymbol
polling point( °c )
atomicnumber
aluminum
AL 660.3 13
indium In 156.6 49galliu
mGa 29.77 31
Tin Sn 231.9 50Bismuth
Bi 271.4 83
Lead Pb 327.5 82 Thallium
Ti 303.8 81
If you look to the group 13,14and 15 in the periodical table you will find the post transition metal this lie near the transition metal
Aluminum, Indium, Gallium, Tin, Bismuth, Lead, Thallium this elements known as post-transition element or poor element and there properties as the following
1. Have lower boiling and melting point in comparing to the transition metal but in comparing the other metal it have higher melting and boiling point.
2. Have a higher electro negativity( is a chemical property that describes the tendency of an atom or a functional group to attract electrons (or electron density) towards itself)in compare to the transition metal .
2.4.2. Principle of operationAt the first, the solid-state sensor is consist from the metal oxide metal, as tin oxide (Sno), alumnae oxide (AL2O3).
90 | P a g e

The solid-state sensor is include the following:1. The silica chip:
In this sensor the silica chip must be used to deposit the metal oxide into it, which is make from the thick or thin film-chip sensors.
2. A heating element:At different temperature ranges the finished sensors exhibit different gases response characteristics, this mean that each gasis response at specific temperature. Therefor the heating elementis use to regulate the sensor temperature, which may be a platinum or platinum alloy wire.
3. Heater control that is provided the true temperature accordingto the temperature of the gas.
Now you may ask why we use the heating element the answer is in the following:Because the final sensor designed to exhibit too many gases and each gas has their properties and temperature so that heating unit will be use.
Now you may ask what the heating unit is:Heating unit is a construction from platinum or platinum alloy wire, a resistive metal oxide, or a thin layer of deposited platinum.
Steps working this sensor
1. Firstly, the semiconductor material will be heated to the proper temperature by using the heater, so when the presence of gas at these conditions this will lead to ionization of gas(transfer the electrons), so that the conductivity of the semiconductor will be changed.
2. The built in heater, which heats the metal oxide material to an operational temperature range, that is optimal for the gas to be detected, it’s regulated and controlled by a specific circuit (heater control).
91 | P a g e

3. To measure the conductivity change for the metal oxide, the pair of biased electrodes are inserted into it.
4. The changes in the conductivity of the sensor resulting from the interaction with the gas molecules and is measured as a signal output.
**Notice that typically, the signal strong is become well when the gas concentration is high.
2.4.3. Design the sensorThere are different ways of making solid-state sensors, each arrangement making the sensor’s performance characteristics different.
Two typical styles are the following:1. Chip-type sensor.
Fig 2.35: Chip-type Sensor.Figure 2.35 notices that this arrangement is consist from the following:
1. Termination: is used to hold the parts of the sensor (silicon substrate and heater resistor)
2. Collector: provides the voltage, which change when the conductivity of the silicon change.
3. Heater resistor: ensures low thermal resistance between the element and the exterior environment. And must be rugged and reliable.
4. Silicon substrate: it is a layer which is made from the thick or thin film-chip sensors used to deposit the metal oxide intoit.
2. Bead-type sensor as show.
92 | P a g e

Fig 2.36: Schematic Diagram of a Bead-type Sensor.Figure 2.36 notices that this arrangement is consist from the following:
1. The metal oxide material, which connect to the collector.2. And also the platinum coil wire, which connected to the
heater control. 3. The output voltage for constructing the change in signal.
2.4.4. CharacteristicsThe solid-state sensor is one of the most sensors used for detecting many different gases.
Different response characteristics are achieved by:
1. Varying the semiconductor materials as used tin oxide (Sno) oralumnae oxide (AL2O3).
2. Processing techniques for producing the signal.3. Sensor’s operating temperature.
The following are include the characteristics of the solid-state sensor:
1. Longevity
93 | P a g e

Solid-state sensor whose features that working for a long period of time. Typically the sensor working in clean applications lastsfor 10 years or more. This is a major advantage compared to othersensor types, such as catalytic bead sensors, which typically last only one to two years.
Although that it working for a long period of time, but it more susceptible for many background gases spread about it. Consequently, solid-state sensors may trigger false alarms.
In certain instances, the interferences from other gases are minimized by using appropriate filtering materials that absorb all other gases except the gas to be detected.
For example, a solid-state sensor for monitoring carbon monoxide and hydrogen can be equipped with a charcoal filter which eliminates the majority of interfering gases. This way the sensorperforms very well and becomes very selective for those two gases.
Charcoal filter is a system that uses a bed of activated carbon to remove contaminants and impurities from the air.
2. Versatility
Versatility means that the solid-state sensor can be used for monitoring of many different gases and ranges, or even the same gas with multiple ranges.
2.4.5. SummarySolid state sensor generally are used for detecting many gases, but it requires a continuous maintenance to eliminates or minimizes the use of multiple sensor technologies, which must be designed and maintained differently. And some of gasesthat the solid-state sensors detectable are butane, methane, carbon monoxide, benzene and many other gases.
94 | P a g e
2.5.Comparison between detection methods
2.5.1. Catalytic gas detector
Advantages
The most important advantages of catalytic detectors are as follows:
1. Robust.
2. Simple to operate.
3. Easy to install, calibrate and use.
4. Long lived - usually 2 to 4 years with a low life-cycle cost.5. Immensely flexible with application.
6. Easily calibrated individually to gases such as hydrogen which cannot be detected using infrared absorption.
Disadvantages
The limiting factors in catalytic gas detector technology are as follows:
1. Catalysts can become poisoned or inactive due to contamination
There are chemicals which will deactivate the sensor and cause the sensor to lose sensitivity and eventually become totally nonresponsive to gases. The most common chemicals that can poisoncatalytic sensors are those that contain silicon and sulfur compounds, which are often released with gases. So that it need to checking with the appropriate gas on a routine basis and recalibrating as required.
2. Requires oxygen for detection
95 | P a g e

Because the catalytic detector are based upon the principle that when gas oxidizes it to produces heat so that does not possible that work in place does not contain oxygen.
3. Prolonged exposure to high concentrations of combustible gas may degrade sensor performance.
4. If flooded with a very high gas concentration, may show erroneously low or no response, and sensor may be damaged or rendered inoperable.
5. Chemicals such as halogen compounds, which are used in fire extinguishers and Freon used in refrigerants, will inhibit thecatalytic sensor and cause it to temporarily lose the ability to function. Normally, after 24 or 48 hours of exposure to ambient air, the sensor starts to function normally.
Typical Specifications for Catalytic Sensors
1. Sensor Type: Diffusion catalytic bead.2. Temperature Range: –40°C to +60°C.3. Response Time: 10 to 15 sec. to 90% of reading.4. Accuracy: ±5%.5. Repeatability: 2%.6. Drift: 5–10% per year.7. Life Expectancy: Up to 3 years; depending on application.8. Sensors can be remotely mounted up to 2,000-3,000 meters,
depending on the manufacturer and cable size used to wire the sensor.
2.5.2. IR sensor
Advantages 96 | P a g e

The most important advantages of catalytic detectors are as follows:
1. Immunity to poisoning and contamination (because there is not direct contact between gas and detector)
2. Have the ability to work in environments that there is no oxygen or enriched oxygen.
3. Have an ability to work in case of continuous presence of gas,and perform good reliability.
4. Easy to calibrate more than other methods.5. have an ability to detect the gases at percentage above than
100%LEL
Disadvantages1. Higher initial cost 2. Higher spare parts cost.3. Cannot detect all gases (because there are gases do not absorb
IR radiation such as hydrogen).4. Harsh environment such as dust and humidity, lead to increase
the maintenance cost.5. Temperature range for detector use is limited.6. May not operate properly in case multiple gases.
2.5.3. Solid-state detectors Advantages:
The most important advantages of catalytic detectors are as follows:1. Small sizes.2. Low cost3. Wide range of response gas.4. Short response time.5. Long life time.6. Operate in wide Temperature Range.
Disadvantages
97 | P a g e

The limiting factors in solid-state detectors technology are that:
1. Suffer from limited measurement accuracy.2. Problems of long-time stability.3. Response may slow on aged sensor.4. Needs temperature controlled heater.5. Expensive.6. Higher energy consumption (because use of heater unit and
this require more energy).7. Relatively low sensitivity.8. Sensitive to environment factor (not operate properly in
case of dry environment because it require presence of humidity to allow transfer of electrons).
Typical Specifications for Solid-State Sensors1. Accuracy: ±3% to 10% of full scale.2. Response Time: T80 ranges from 20 seconds to 90 seconds.3. Temperature Range: –20oC to +50oC.4. Humidity: 5–9%.5. Life Expectancy: 10+ years.6. Power Consumption: Approx. 300mW.
*Actual specifications will vary depending on gas and range.
As notice from previous comparison between three methods, became clear that the infrared method (IR) is the best and most appropriate for this project, so that it will use in this project.
2.6.Summary There are different methods for gas detection and each one has their own characteristic and properties, so that use of certain method depend on the type of project depends on the type of that will be working with.
98 | P a g e

In the next chapter the calibration will describe.
CHABTER 3 GAS SENSOR CALIBRATION
3.1 IntroductionThere are many of gas sensors and each one need to calibration and periodically check, it is important to install the sensor in place that easy to calibrate.
The interval between calibrations different from sensor to another, usually the manufacturers decide the interval time between calibrations .However it is better to check the sensor during close intervals in first 30 days .this time (30 days) enough to give you Impression about sensitivity of the sensor, and how well the sensor is adapting to its new environment.
Some factors which may not take into consideration during the design the sensors, but after that, their harmful impacts appears
99 | P a g e

clearly and affect the sensor’s performance. Any possible problems can be identified and corrected during this time. However If the sensor functions properly for 30 continuous days, this provides a good degree of confidence about the installation.
As mentioned previously, during first 30 days there are many problems that detect for, example interference from other gases, inappropriate sensor location, or the loss of sensitivity. After the expiry of the first 30-day period, the periodic inspection interval must be greater than the interval in the first 30 days, for example, be a check and calibration every month, this period or interval is adequate to ensure the effectiveness and sensibility of each sensor.
3.2 Calibration Procedures
The procedures of calibration must include several properties forexample simple, straightforward, easily executed by regular personnel, consistent, traceable and can be executed in any environmental because The calibration will be performed in the field where sensors are installed.
The calibration producer contain two steps as the following:
3.2.1 Step one: setting the “Zero” reading
The aim of this step is to determine the reference point for the sensor .But there is no established standard that can be used to set the zero point to the sensor.
From the method that use to establish the zero point for sensor is use pure nitrogen gas or pure synthetic air.The reason for this is that bottled nitrogen and pure synthetic air are readily available.
100 | P a g e

Popularly believed that using bottled nitrogen or synthetic air is the good method to zero a sensor but this wrong.
Air is a mixture of different gases (see Figure 3.1), the most important components of nitrogen by 78% and 21% oxygen, and restis the water vapor and gases many, including carbon dioxide and argon gas, neon and helium,
As note from the content of air, it is good to use surrounding air to establish the zero point for the sensor
This reference point can be difficult to establish. Therefore, a good reference point can be in the area where air is always considered clean, such as in an office area. This will give a more realistic representation of the zero point because it will be representative of the local ambient air condition.
The synthetic air have low humidity (there are lack water vapor) so that this cause the zero point setting to read lower than in ambient air making the sensor zero appear to drift ,especial in the solid state sensor because this method require presence of water vapor in the air to allow ionization the gas (transfer theelectron). But the ambient air not suffer from this problem because it include water vapor in their contents.
101 | P a g e

Fig 3.1: Ambient air contents.
3.2.1.1. First method- use clean ambient air
This method can be used if the place of application have a clean surrounding air, this depend on the operator judgment that no abnormal condition exists and the instrument is indicating a close to zero reading, the procedure to zero the sensor can be skipped if the previous things occurs. When in doubt, use a plastic bag to get a sample of what is considered to be “clean air” in the facility and expose it to the sensor for a few minutes.
This a quick procedure and also can you use it to distinction thefalse or real alarm.
3.2.1.2. Second method-use compressed air
102 | P a g e

This method based on compressed air, and it have many advantages for example it is easy to regulate, can be carried around in a bottle and also in many facility have a shop air, so that it widely available.However the shop air contains small concentrations of carbon monoxide, hydrocarbons, carbon dioxide, and possibly other interference gases. Also, the air is typically very low in humidity.The previous problems of the air shop can be solved as the following:Use the active charcoal to remove most unwanted gases. And in theproblem related to the low water vapor(low humidity) the humidifier can be used to increase the humidity or can be use thea simple solution to this problem is to add a wet tissue paper inthe sample, line this solution give the adequate humidity to the air.
You might ask what active charcoal, the answer in the following
Activated charcoal or active carbon produced from carbonaceous source materials such as peat, coir and coal, after that treated with oxygen to open up millions of tiny pores between the carbon atoms.
In highly porous charcoals that have surface areas of 200-300 square meters per gram. These so-called active, or activated, charcoals are widely used to adsorb odorous or colored substancesfrom gases or liquids and also adsorb some gases like hydrocarbons.
The huge surface area of activated charcoal gives it countless bonding sites. When certain chemicals pass next to the carbon surface, they attach to the surface and are trapped. [10] Important to note that carbon monoxide is not removed by charcoalfilters. It is therefore imperative to make sure that the CO concentration in the shop air is the same as in the ambient air.
103 | P a g e

Furthermore, a soda ash (Na2Co3) filter should be used to remove carbon dioxide
Nafion tubing is a highly selective, semi-permeable to water vapor. If gases inside Nafion tubing are wetter than gases surrounding the tubing, drying will occur. If the surrounding gases are wetter, humidification will occur. In normal use, a portion of Nafion tubing is used as a portion of the tube betweena gas sample stream and a sensor. If the sample stream is much wetter than ambient air (such as breath samples), the sample falls to ambient humidity. If the sample stream inside is much drier than ambient air (such as calibration cylinder gases), the sample rises to ambient humidity.
Fig 3.2: Adding Moisture to Calibration GasesFigure 3.2 shows the operation of regulate the compressed gas andalso add the Moisture to gas.
3.2.2 Step two: span calibrationSpan Calibration is an important process for all testing instruments and is done by means of exposing the sensor to a known concentration of a target gas.
Span gases are special gas mixtures used for testing gas detection equipment, which requires regular checking and
104 | P a g e

calibration. The span calibration can be very complicated and expensive or it can be quite easy. The span calibration dependingon the following
2. Type of the gas.3. Range of the concentration.
In principle, to get the best calibrations gases and the best accuracy, a mixture of the target gas balanced in the background environmental air of the sensor and it usually requires that the operators be more skilled. So that should be describe the methodsof span calibration.
3.2.2.1. First method-premixed calibration gasThis method the preferred and most popular way to calibrate the gas sensors.At the first the gas mixtures are compressed and stored under pressure in a gas bottle. The bottles are available in several sizes but most field calibrators employ smaller and lightweight bottles. There are two different categories of the small portable bottles:
a. Low-pressure bottlesThe characteristics of the low-pressure bottles are the following
1. Thin-walled.2. Lightweight bottles.3. Usually nonreturnable and disposable.
b. High-pressure bottlesThe characteristics of the high-pressure bottles are following
105 | P a g e

1. Thick-walled of aluminum.2. Use for pure hazardous chemicals.3. Has a service pressure of 2000 psi (13790pa).
In this method the regulator assembly is needed to get on the highly pressurized gas out of the bottle in order to calibrate the sensor. The regulator assembly is consist from following:
1. Pressure regulator
It is a valve that automatically cuts off the flow of a gas at a certain pressure. And the gas pressure regulators are used to regulate the gas pressure and allow high-pressure gas supply bottle to be reduced safely.
2. Pressure gauge
It is a tool that use to measurement the pressure of the gas inside the bottle, which get reading to the pressure of the gas is commonly given in units of kilopascals (kPa) or pounds per square inch gauge (psig).
Pg=PTb−Pat
(3.1)
Where:
Pg.: The gauge pressure
PTb: The Total gas pressure inside cylinder.
Pat: The atmospheric pressure.
Atmospheric pressure is normally about 101.4 kPa (14.7 psi). Notethat compressed gas cylinder with a pressure gauge reading of 0 kPa or 0 psig is not really empty. It still contains gas at atmospheric pressure.[11]
3. An orifice flow restrictor
106 | P a g e

Orifice flow restrictor is a fitting with a hairline hole that allows a constant gas flow at a given pressure difference.
Fig 3.3: Regulator assembly.Figure 3.3 shows the parts of regulator assembly
Principle of operationHigh pressure from the bottle is reduced to a lower pressure, which provides a constant air flow through the orifice. Flow rates between 600-1000 cm3/min are most common. In this method the flow rate can be adjusted by using adjustable pressure regulator.
The way of stored of the gasesThere are two way of stored the calibrate gases:
1. stored under high pressure
The high vapor pressure gases with low reactivity, such as methane, carbon monoxide and carbon dioxide, can be mixed with air and stored under high pressure inside the bottle.
107 | P a g e

2. stored under low pressure
Low vapor pressure gases with high reactivity, such as liquid hydrocarbon solvents, can only be mixed with nitrogen and stored under low pressure inside the bottle. Because of the nitrogen is inert gas so that does not reactive with the target gas.
Notes on span calibration premixed gas:
1. As maintained before the gas can be stored under high or low pressure and each way get different reading when exposed the gas mixture to the sensor especially solid-state sensor are effect on the sensor reading.
2. During calibration, some sensors may need humidity to get a proper reading. Humidity can be added by following the same procedure described in Step 1 for zeroing the sensor.
3. Each type of mixture will have a different amount of time before it expires to used and detailed information about storage and shelf life can be obtained from the manufacturer.
Estimate the volume of a pressurized gas:
To estimate the volume of a pressurized gas we can applying the following equation:
Vmix=V∗PPa
(3.2)
Where:
Vmix = the volume of the gas mixture.
V = the volume of the cylinder.
P = the pressure in the cylinder.108 | P a g e

Pa = the atmospheric pressure (101.6Kpa=14.7psi).
Example 3.1: estimate the volume of a pressurized gas in a cylinder.Given a bottle has a 550 cm3 volume (V). Assume the bottle hasa 1400 psi pressure.
Solution:
The estimated volume of the premixed gas at atmospheric pressure is:
Vmix=V∗PPa
Vmix=550 cm3∗1400psi14.7psi =52,380.95cm3
So that the volume of the mix gas is 52,380.95cm3
If the flow rate of the calibration gas is 1000 cc per minute and it takes approximately one minute per sensor to calibrate,a single cylinder can be used to calibrate approximately 50 times.
3.2.2.2. Second method permeation devicesPermeation is the penetration of the liquids, gases, or vapors tothe solid interface. The process of permeation involves the diffusion of molecules, called the permeant, through a membrane or interface. Permeation works through diffusion; the permeant will move from high concentration to low concentration across theinterface for only molecules or ions with certain properties willbe able to diffuse across interface.
The materials that used in the interface are various polymer, dueto their high permeability. Permeability depends on the
109 | P a g e

temperature of the interaction and the characteristics of both the polymer and the permeant component.
A permeation device is a sealed container containing a pure chemical compound in a two phase equilibrium between its gas phase and its liquid phase that provide an excellent method of producing known gas concentrations in the PPM level for calibration of analytical instrumentation. The gas molecules are either permeated through the permeable container wall or through the end cap.
The rate of the gas molecules permeate depends on
1. The permeability of the material.2. Temperature.
The rate of permeation is constant over long periods of time. At a known rate of permeation at a given temperature, a constant flow rate of air mixed with the permeated chemicals forms a constant stream of calibration gas.
Condition of this method:
1. Constant temperature.2. Flow regulation.
The rate of permeation for a given gas can be:
1. Too high: very high vapor pressure gases permeate too quickly.2. Too low: very low vapor pressure chemicals have a permeation
rate that is too low.
3.2.2.3. Third method gas mixingIn this method we can be make calibration process by using a dilute mixture of gases because that not all calibration gases method are available. Even if they are available, it is very possible that they would not be available in the right concentration or in the proper mixture
110 | P a g e

So that should be determine the volume of the diluent gas according to the following equations:
Vb=CCb
∗V
(3.3)
Va=C−Cb
C∗V
(3.4)
And Va=V−Vb
(3.5)
Where:
Cb = concentration in the bottle.
C = new concentration.
V = total final volume.
Vb = volume of mixture.
Va = volume of air or other dilatant.
Example 3.2: estimate the volume of diluent.
Given 50% LEL methane has a concentration of 2.5% determine the volume of mixture and volume of dilatant (air) at 20% LEL mixturehaving a volume of 2000cm3.
Solution:
Cb= 50% LEL.
111 | P a g e
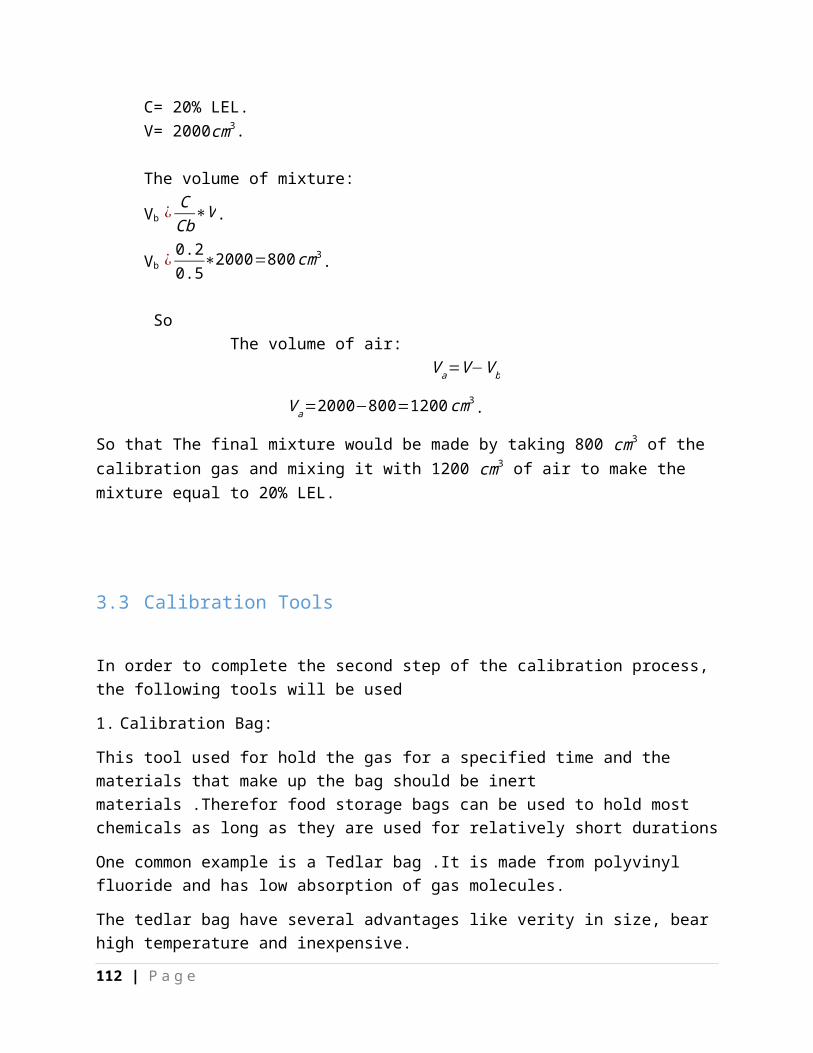
C= 20% LEL.V= 2000cm3.
The volume of mixture:
Vb ¿CCb
∗V.
Vb ¿0.20.5
∗2000=800cm3.
So The volume of air: Va=V−Vb
Va=2000−800=1200cm3.
So that The final mixture would be made by taking 800 cm3 of the calibration gas and mixing it with 1200 cm3 of air to make the mixture equal to 20% LEL.
3.3 Calibration Tools
In order to complete the second step of the calibration process, the following tools will be used
1. Calibration Bag:
This tool used for hold the gas for a specified time and the materials that make up the bag should be inert materials .Therefor food storage bags can be used to hold most chemicals as long as they are used for relatively short durations
One common example is a Tedlar bag .It is made from polyvinyl fluoride and has low absorption of gas molecules.
The tedlar bag have several advantages like verity in size, bear high temperature and inexpensive.
112 | P a g e

Figure 3.4 shows the Tedlar bag notice it have valve and a septum that is used as an injection port.
Fig 3.4: Tedlar bag.
2. Syringe and Needle:
These tools are used accurately measure the amount of gas, the advantage of these tools is a cheap, abundantly available where it can be used medical syringes .But what if needed to take a large volume of air, the solution to this problem is easily by making syringe private using a tube that have diameter 2 inch nearly.
Fig 3.5:1000 cc Syringe
113 | P a g e

Fig 3.6: Standard Medical Syringes
Figurers 3.5 and 3.6 show some syringes and in several sizes.
3.4 Pressure Formula
Previously, preparing a mixture based on a volume relationship was described. Now based on the ideal gas law, the same volume formula can be used as a pressure formula.
Following are some examples of how gas mixtures can be made For ppm gas mixtures
Cppm=Vc
Vc+Vd∗106
(3.6)
Where
Cppm: Gas concentration part per million (PPm).
Vc: Volume of target gas centimeters cubic (cm3)
Vd: Dilutant volume in centimeters cubic (cm3)
114 | P a g e

Using this relation if you have a dilutant volume (container volume) (Vd) = 1000 cm3 and also the gas (CO gas) concentration in part per million (Cppm) = 1000 ppm
Determine the volume of target gas (Vc)
Cppm∗(Vc+Vd)=Vc∗106
1000∗(Vc+1000)=Vc∗106
Vc=1cm3
This mean 1 cc of target gas (CO) with container volume (Vd
=1000cc) will produce gas concentration =1000ppm.
For % range gas mixtures:
C%=Vc
Vc+Vd∗102%
Notice that the Vc in the dominator can be ignore in the case lowppm mixtures.
Most volume particle in gallon so the relation between gallon and centimeters cubic as the following
One gallon is equal to 3785cm3.
3.5 Calibrating liquid chemical mixtures
The ideal gas law states that one gram mole of molecules will occupy 24,500 cm3 of volume at 25 degree centigrade and at 760 mmof mercury or sea level atmospheric pressure. This temperature and pressure is also called the standard condition. At standard conditions, the equation is:
Cppm=24.5∗109∗V∗D
Va∗M
Where
115 | P a g e

V: Volume of liquid centimeter cubic (cm3).
D: Density of the liquid (g/cc).
Va: Volume of the dilutant air (in centimeter cubic (cm3)).
M: Molecular weight of the liquid gram (g).
Example 3.3
If you have a benzene their molecular weight equal 78.1 g, and their density (D) = 0.88g/cm3.
What is the amount of benzene needed to make a 1000 ppm mixture in a 2000 cm3 bottle?
V=Cppm∗Va∗M
(24.5∗109∗D)
V=1000∗2000∗78.1(24.5∗109∗0.88)
7.2*10^-3=0.0072 cc = 7.2 micro liters
3.6 Summary
As notice before calibration step very important, because throughwhich can certain if the device work properly or no and alsoseveral other problems can be detect and correct.116 | P a g e

The next chapter explain the connection between components and items of project
CHAPTER 4 CONNECTION AND INTERFACING OFTHE COMPONENTS
This chapter will be describe the details of components that willbe used in the project and how will be connection between this components and then make circuit that include interfacing for allsystem.
4.1. The Detector As mentioned before there are several detectors can be used in this project, and from these pyro electric (NDIR).
What is a NDIR gas analyzer typically made of?
A large number of materials absorb infrared (IR) radiation due tointra molecular vibrations. For any specific material the
117 | P a g e

strength of absorption varies with the wavelength of the infraredradiation. This principle is often used in gas analysis. An NDIR (Non Dispersive IR) gas analyzer contains an electrically or mechanically modulated IR source, a gas chamber with the gas of interest and a pyro electric detector. Normally a standard narrowband pass filter (NBP) that matches the absorption wavelength of the target gas is integrated in the detector cap and simplified the gas sensor design.So that two NDIR detector will be used in this project, first acting as reference in isolated tube ,and the second use in measured sample of gas in sample tube as figure 4.1.[12]
Fig 4.1: Pyroelectric detector
Fig 4.2: internally circuit and construction of Pyroelectricdetector.
118 | P a g e

Fig 4.3: connection circuit between Pyroelectric detector andoperation amplifier (OP AMP)
4.2. AmplifiersIt is a high gain, integrated circuit amplifier designed to amplify signals from D.C. up to many kHz. We have built voltage and current amplifiers using transistors.
Circuits of this kind with good properties (high gain and high input impedance, for example), packaged as integrated circuits (ICs), are called operational amplifiers or op amps. They are called ``operational'' amplifiers, because they can be used to perform arithmetic operations (addition, subtraction, multiplication) with signals.
Amplifiers are necessary in order to amplify low-level signals, e.g. thermocouple or strain gauge bridge output voltages, to a level which enables them to be further processed. The operationalamplifier can be regarded as the basic building block for modern amplifiers.
Usually there are two input terminals and one output terminal, the voltage at the output terminal being proportional to the difference between the voltages at the input terminals Figure 4.4shows the circuit symbol.
119 | P a g e
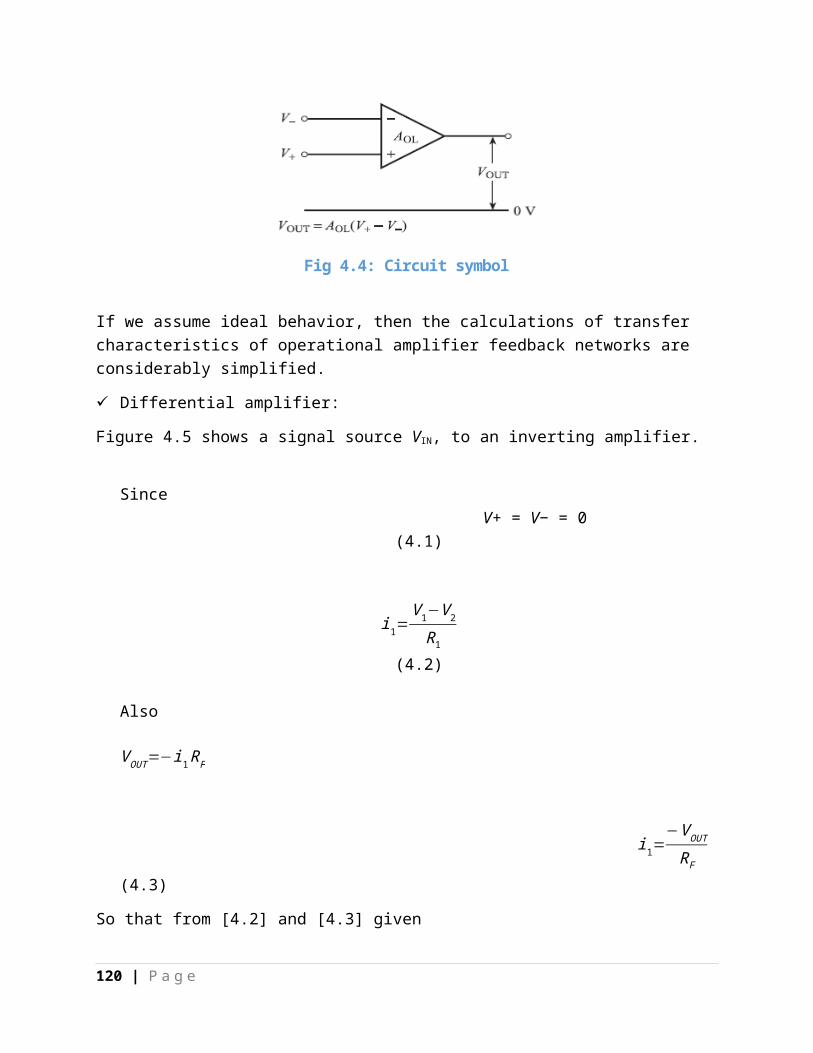
Fig 4.4: Circuit symbol
If we assume ideal behavior, then the calculations of transfer characteristics of operational amplifier feedback networks are considerably simplified.
Differential amplifier:
Figure 4.5 shows a signal source VIN, to an inverting amplifier.
Since V+ = V− = 0
(4.1)
i1=V1−V2
R1
(4.2)
Also
VOUT=−i1RF
i1=−VOUT
RF
(4.3)
So that from [4.2] and [4.3] given
120 | P a g e

V1−V2
R1=
−VOUT
RF
Vout=−(RF
R1V1−
RF
R1V2)
Vout=−RF
R1(V1−V2)
So that
Vout=RF
R1(V2−V1)
(4.4) Thus the output voltage VOUT is proportional to the input
voltage VIN with gain−RF
R1. The resistance R is set equal to the
resistance of R1 in parallel with RF. i.e.
R=RFR¿
RF+R¿
This is to balance the d.c. bias currents to
inverting and non-inverting inputs. [1]
121 | P a g e

Fig 4.5: Inverting amplifier.
4.3. ZigBeeDefinition
ZigBee is an open global standard for wireless technology designed to use low-power digital radio signals for personal areanetworks. ZigBee operates on the IEEE 802.15.4 specification and is used to create networks that require a low data transfer rate,energy efficiency and secure networking.
Applications on ZigBee
1. Building automation systems.2. Heating and cooling control.3. Medical devices.4. Mechanical device.
Some of the characteristics of ZigBee include
122 | P a g e

Global operation in the 2.4GHz frequency band according to IEEE 802.15.4.
Frequency agile solution operating over 16 channels in the 2.4GHz frequency.
Incorporates power saving mechanisms for all device classes, plus support for battery-less devices.
Discovery mechanism with full application confirmation. Pairing mechanism with full application confirmation. Multiple star topology and inter-personal area network (PAN)
communication. Various transmission options including broadcast. Security key generation mechanism.
In this project the ZigBee will be send the output voltage that receives from amplifier and then transmitted to the receiver ZigBee which in turn sending signal to the motor across the relay.
The following figure 4.6 illustrate the work of the ZigBee.
4.4. RelayA relay is an electrically operated switch. Many relays use an electromagnet to operate a switching mechanism mechanically. Relays are used where it is necessary to control a circuit by a low-power signal.
Fig 4.6: block diagram illustrate how connect ZigBee to the system.
123 | P a g e

Fig 4.7: Relay Design.
How relay works?
The diagramshows aninnersectiondiagram ofa relay. Aniron coreissurroundedby a
control coil. As shown, the power source is given to the electromagnet through a control switch and through contacts to the load. When current starts flowing through the control coil, the electromagnet starts energizing and thus intensifies the magnetic field. Thus the upper contact arm starts to be attractedto the lower fixed arm and thus closes the contacts causing a short circuit for the power to the load. On the other hand, if the relay was already de-energized when the contacts were closed,then the contact move oppositely and make an open circuit.As soon as the coil current is off, the movable armature will be returned by a force back to its initial position. This force willbe almost equal to half the strength of the magnetic force. This force is mainly provided by two factors. They are the spring and also gravity. [2]
124 | P a g e

A B
Fig 4.8: A. Energized Relay (ON), B. De-Energized Relay (OFF)
In simple, when a voltage is applied to pin 1, the electromagnet activates, causing a magnetic field to be developed, which goes on to close the pins 2 and 4 causing a closed circuit. When thereis no voltage on pin 1, there will be no electromagnetic force and thus no magnetic field. Thus the switches remain open.
Relays divide into three types
1. Normally Open Contact (NO) – NO contact is also called a makecontact. It closes the circuit when the relay is activated. Itdisconnects the circuit when the relay is inactive.
2. Normally Closed Contact (NC) – NC contact is also known asbreak contact. This is opposite to the NO contact. When therelay is activated, the circuit disconnects. When the relay isdeactivated, the circuit connects.
3. Change-over (CO) / Double-throw (DT) Contacts – This type ofcontacts are used to control two types of circuits. They areused to control a NO contact and also a NC contact with acommon terminal.
125 | P a g e

Fig 4.9: connection motor with relay.After this short explanation for the relay will go back to using the relay in this project.Signal coming from ZigBee will activate the relay, it is then connect the motor with voltage source. [2]
4.5. Electrical Miniature Circuit Breaker (MCB)It is a switching device which can be operated manually as well as automatically for controlling and protection of electrical power system respectively.
Fig 4.10: External shape of Miniature Circuit Breaker
126 | P a g e

Fig 4.11: internal construction of (MCB). Principle operation
There are two arrangement of operation of miniature circuit breaker. One due to thermal effect of over current and other due to electromagnetic effect of over current. The thermal operation of miniature circuit breaker is achieved with a bimetallic strip whenever continuous over current flows through MCB, the bimetallic strip is heated and deflects by bending. This deflection of bimetallic strip releases mechanical latch. As thismechanical latch is attached with operating mechanism, it causes to open the miniature circuit breaker contacts. But during short circuit condition, sudden rising of electric current, causes electromechanical displacement of plunger associated with tripping coil or solenoid of MCB. The plunger strikes the trip lever causing immediate release of latch mechanism consequently open the circuit breaker contact.
As mentioned before the Miniature Circuit Breaker (MCB) will be work in this project as described in the following paragraph.
when gas leakage occur the motor will receive signal to close gasvalve, then motor will be start rotate, when gas valve completely
127 | P a g e

close, motor will be still in rotating, so the torque and currentwill be increasing, as result the bimetallic strip in the (MCB) will be heat and bending, so this will be cause to open the switch and motor will be stop.
Circuit breaker have many type
According to the voltage level of installation types of circuit breaker are referred as
1. High Voltage Circuit Breaker.
2. Medium Voltage Circuit Breaker3. Low Voltage Circuit Breaker.
Fig 4.12: several types of Miniature Circuit Breaker.
The question now is what if the person need to close the gas valve although the absence of gas leak?
To solve this problem can be used two push button the first one will move the motor anti-clockwise direction, and the second one will move motor with clock wise direction.
4.6. The Motor There are several types of motors andfrom these types is DC motor, this typewill be chosen to use in this projectto close the gas valve when gas leakageoccur.
Dc motor
Direct Current permanent magnet DC motor (Brushless DC) is an electric motor converts electrical energy into kinetic energy andonly works on DC power systems.
128 | P a g e
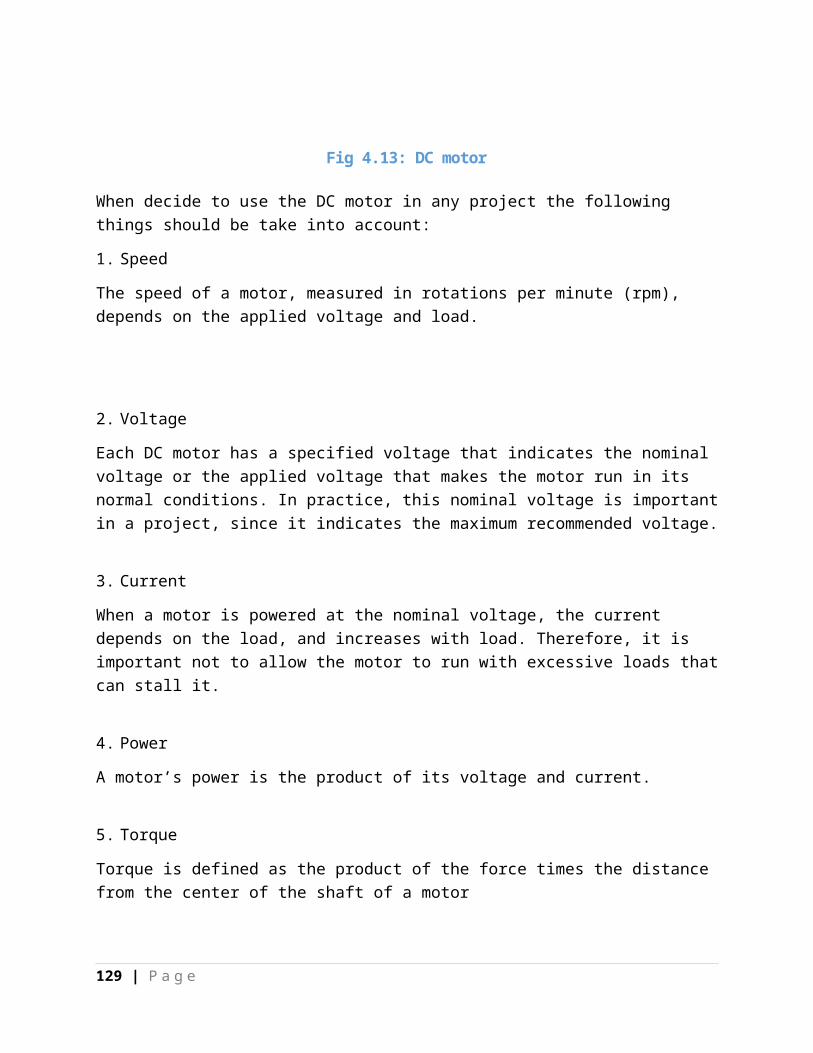
Fig 4.13: DC motor
When decide to use the DC motor in any project the following things should be take into account:
1. Speed
The speed of a motor, measured in rotations per minute (rpm), depends on the applied voltage and load.
2. Voltage
Each DC motor has a specified voltage that indicates the nominal voltage or the applied voltage that makes the motor run in its normal conditions. In practice, this nominal voltage is importantin a project, since it indicates the maximum recommended voltage.
3. Current
When a motor is powered at the nominal voltage, the current depends on the load, and increases with load. Therefore, it is important not to allow the motor to run with excessive loads thatcan stall it.
4. Power
A motor’s power is the product of its voltage and current.
5. Torque
Torque is defined as the product of the force times the distance from the center of the shaft of a motor
129 | P a g e

The shaft of motor will be connected with mechanical part have a shape similar to gas valve and have internal slot to fixing the motor on the valve of gas.
So when the signal reach the motor will be active and rotate to close the gas valve, and motor will be stop by using circuit breaker.
4.7. Alarm Alarm will be used to warn the people in place of leakage.
Fig 4.14: the alarm.
4.8. The Mechanism of Operation of The System
4.8.1. System work in general:When system detect presence of a gas leakage, then motor close valve gas, this is done through the following:
In the beginning, the system is consist of a two cell, each one containing sensor for detected the leakage (pyro electric (NDIR) sensor), the first cell is representing the reference (pure gas (oxygen)), while the other is representing the measure detector.
In case of no gas leakage there is no change in signal between reference and measure detector, while in case of a gas leakage the detector signal will be deferent from the reference signal,
130 | P a g e

so that the output signal that generate from difference will be compare with set point voltage (set point voltage setting at certain concentration for gas leakage) by using anther op-am.
If the signal from difference greater than set point voltage the amplifier output signal, r output signal from amplifier will input to radio communications device (ZigBee wireless), which make sending signal from transmitter to receiving (the receiving is place on source of the gas).
The signal output from ZigBee input to relay, which in turn activation the DC motor by connect the DC motor to the power supply.
Finally, the motor closing the source of gas, notice that there are breaker circuit that make to stop the motor at certain limit.The motor will be added it push bottom switch that will allow to open and close source of gas manually.
131 | P a g e

4.8.2. System work flowchart
Fig 4.15: Flowchart for the work system.
Fig 4.16.a: schematic circuit of the system.
132 | P a g e

Fig 4.16.b: schematic circuit of the system.
Insulation of actuator on gas cylinder.
133 | P a g e

CHAPTER 5 CONCLUSION
5.1. General Conclusion To achieve public safety, especially gas, fire and suffocationsrelated detectors, from canary in a cage to down for modern gasdetectors, it was a great idea to design a gas detector device,could solve the problem by itself, which breaks up the leak fromthe source after sensing it in kitchens, restaurants and hotels.
This requires recognition on some specifications andclassifications of these gases; also, some standards related tothem and will mention the performance specifications, thencomparison between methods of gas detection and the most commondetectors used to deal with gas problem as Catalytic gas sensor, theinfrared radiation (IR) method and solid-state method. In aproject the option of pyroelectric detector (IR) was selected, this ismore accuracy between the Realistic and practical method.
For the build in circuit of the pyroelectric detector componentwas connected with the high gain operational amplifier, voltageand current amplifiers is built using transistors. The mostcommon types that will be used are the proportional andcomparator (differential) amplifiers. Break down the circuit ofthe motor when the current rises above a specified limit, i.e.when the torque become high due to the blocking of the gascylinder valve is principle of Electrical Miniature CircuitBreaker (MCB).
This project is unique in the world, where it is a rare devicerelating to this function, and had never seen or heard aboutduring research, may be available gas detectors or devices for134 | P a g e

closing the cylinder of gas, but no device combines them as thedesign that we followed. It is worth mentioning that wediscovered a similar device made in Israel and had bought by thePalestinian Fire Fighting Department in a high price, Incomparison with this project it provides it with the samefunctions in a cheap price.
5.2.Future WorkDuring the second part of project we will design and manufacture device is able to detect a gas leak and shut down the source of the leak, and this Based on the information that we have collected in thefirst part of project.
REFERENCES [1] Bentley, John P, “Principles of Measurement Systems”, fourth Edition, NY, 2005.
[2] Chou, Jack, “Hazardous Gas Monitors: A Practical Guide to Selection, Operation and Applications”. Inc., USA, October, 1999.
[3] http://www.radio-electronics.com/rec-information/about-us.php.
[4] www.rkiinstruments.com/pdf/FAQ_LEL_UEL.pdf.
[5] Inman, Daniel, Engineering Vibration, third Edition, person prentice hall, New Jersey, 2008.
[6] http://www.omega.com/prodinfo/thermocouples.html.135 | P a g e

[7] http://bolo.berkeley.edu/bolometers/introduction.html.
[8] http://www.mediacollege.com/audio/microphones/condenser.html.
[9] http://searchcio-midmarket.techtarget.com/definition/semiconductor.
[10] http://www.activated-carbon.com/faq.
[11] http://www.ccohs.ca/oshanswers/chemicals/compressed/compress.html.
[12] http://www.infratec-infrared.com/Data/LIE-200.pdf
136 | P a g e