livestock proceeding 2015 vol. 1.pdf
247
Livestock Research Proceeding Regional Review Workshop on Completed Research Activities Proceedings of Review Workshop on Completed Research Activities of Livestock Research Directorate held at Adami Tulu Agricultural Research Center, Adami Tulu, Ethiopia 17-21 November 2015 Editors Amselu Bezabeh, Alemu Lema, Birhanu Shilema, Dawit Abate and Tesfaye Alemu Aredo Oromia Agricultural Research Institute P.O.Box 81265, Finfinne, Ethiopia
-
Upload
khangminh22 -
Category
Documents
-
view
2 -
download
0
Transcript of livestock proceeding 2015 vol. 1.pdf

Livestock Research Proceeding
Regional Review Workshop on Completed Research Activities
Proceedings of Review Workshop on Completed Research Activities of Livestock Research
Directorate held at Adami Tulu Agricultural Research Center, Adami Tulu, Ethiopia 17-21
November 2015
Editors
Amselu Bezabeh, Alemu Lema, Birhanu Shilema, Dawit Abate and Tesfaye Alemu Aredo
Oromia Agricultural Research Institute P.O.Box 81265, Finfinne, Ethiopia
Livestock Research Proceeding
©2017 Oromia Agricultural Research Institute (IQQO)
Correct citation: Amselu B., Alemu L., Birhanu Sh., Dewit A. and Tesfaye A. (eds.). 2017. Regional Workshop on Review of the Completed Research Activities of Oromia Agricultural Research Institute. Proceedings of Review Workshop on Completed Research Activities of livestock Research Directorate held at Adami Tulu Agricultural Research Center, Adami Tulu, Ethiopia 17-21 November 2015. Oromia Agricultural Research Institute (IQQO), Finfinne, Ethiopia. 248 pp.
Organized by: Communication & Partnership Process of IQQO
247

Livestock Research Proceeding
Table of contents Dairy Research Results________________________________________________________ 1
Epidemiological Study of Gastro Intestinal Helminthes Parasites of Calves in Urban, Peri urban and Rural Smallholder Dairy Farms in East Wollega Zone, Western Ethiopia _______________________ 2
Sero-prevalence study on Foot and Mouth Disease in Selected Districts of Western Oromia _______ 10
Effects of Replacement of Formulated Concentrate Mix with Cowpea (Vigna Unguiculata) Hay on Feed Utilization, Milk and Milk Composition of Lactating Horro Bred Cows Fed Natural Grass Hay 15
Poultry Research Results _____________________________________________________ 27
Assessment of major Production and Health Constraints of Chicken in some Districts of East Wollega, Horro Guduru Wollega and West Shoa zones, Ethiopia ____________________________ 28
Feeds Resource and Rangeland Management Research Results _____________________ 38
Evaluation of Integrated Mechanical and Biological Techniques for Restoring Degraded Areas in Semi-Arid Rangelands of Fantale District, East Shoa, Ethiopia ___________________________________ 39
Determination of Optimum Seed and Fertilizer Rate for Vecia sativa 'Gebisa'variety in Bale Highlands ____________________________________________________________________ 47
Inventory of Feed Resources and Nutritional Characterization in Semi-arid of Borana Rangelands, Southern Ethiopia __________________________________________________________________ 51
Evaluation of Oat and Vetch Accessions for Yield and Yield Attributes in BuleHora District of Borana Zone, Southern Oromia, Ethiopia _____________________________________________________ 61
Nutritional Characterization of Adapted Forages Species in Semi-arid of Borana Zone ___________ 66
Effect of Encroaching Acacia Species on Herbaceous Composition, Aboveground Biomass and Soil Nutrient Status in Borana Rangeland, Southern Ethiopia ___________________________________ 70
Adaptation Performances of Cajanus cajan, Lablab purpureus and Medicago sativa Accessions in Yabello district, Borana Zone of Southern Oromia, Ethiopia ________________________________ 80
Yield and Agronomic Performance of Different Forage Grasses and Legume Species for Forage Production in the Mid Rift Valley of Oromia ____________________________________________ 86
Apiculture Research Results __________________________________________________ 91
Adaptation and evaluation performance of bee forage for semiarid agro ecologies of mid rift valley of east shoa zone _____________________________________________________________________ 92
Investigating the effect of honeybee pollination on fruit yield of Apple (Malus sylvestris) in Walmera district ___________________________________________________________________________ 98
Assessing the effect of adulteration on honey and beeswax quality and designing way of identification _____________________________________________________________________ 101
Screening of potential shrubs for bee forage development _________________________________ 108

Livestock Research Proceeding
Development of improved and affordable bee hives ______________________________________ 114
Evaluation of the quality of beeswax from different sources and rendering methods ____________ 117
Investigating the effect of migratory beekeeping on honey production in East and west Shewa Zones of Oromia _______________________________________________________________________ 123
Diagnostic survey on honeybee brood diseases with emphasis to American Foul Brood (AFB) and European Foul Brood (EFB) in Oromia ________________________________________________ 129
Investigating the effect and control of small hive beetle, Aethina tumida (Murray) on honeybees __ 137
Managemental practices to prevent the effect of wax moth, a pest of honeybees (Apis mellifera bandasii ) _______________________________________________________________________ 144
Testing the Toxicity effect of Euphorbia Contifolia on honey bees (Apis mellifera) at field condition ___________________________________________________________________ 149
Identifying the Species, effects and seasonal dynamics of honeybee varroa mites: a newly emerging parasite to Ethiopian honeybee ______________________________________________________ 156
Assessing the optimum prolific age of queen honeybee (Apis mellifera bandasii) ______________ 163
Insecticidal action of honeybees propolis extract against larvae of wax moth (Achroia grisella) ___ 169
Performance evaluation of Apis mellifera bandasii ecotypes ______________________________ 173
On-farm Honeybee Forage Evaluation and Demonstration in the Highland of Bale _____________ 180 *Temaro Gelgelu1, * On-farm participatory Evaluation and demonstration of Splitting Technique of Queen Rearing (STQR) at Ginnir district, Bale Zone, South-eastern Ethiopia __________________ 184
Adaptation trial of promising honey bee forage in Fadis districts of eastern Hararghe zone _______ 189
Adaptation of Improved Bee Forages at Haro Sabu Districts of Kelem Wollega Zone, Ethiopia. ___ 192
Fiseries Research Results ____________________________________________________ 197
Biomass and population characteristics of the unexploited strait fin barb, Barbus paludinosus in Lake Ziway, Ethiopia __________________________________________________________________ 198
Development of all-male tilapia fingerlings through sex reversal by heat treatment: strain evaluation __________________________________________________________________ 203
Fish stock assessment in GilgelGibe Reservoir __________________________________________ 209
Gear selectivity and abundance of fish in Lake Chercher West Hararge Zone Oromia ___________ 214
Hazard analysis of different fish products provided for consumers in Zeway __________________ 218
Post-harvest and nutritional loss assessment of fish at different handling stage from Genale River, Southeastern Oromia ______________________________________________________________ 223
Preliminary study of fish parasite in Lake Abaya ________________________________________ 230

Livestock Research Proceeding
Preface Oromia Agricultural Research Institute (IQQO) has six research directorates whose mandate is contributing to the
growth of agricultural productivity and hence poverty reduction through generation of suitable agricultural
technologies. Livestock research directorate is one these directorates. The general objective this directorate is to
generate and adopt improved livestock technologies the use of which increases the productivity and production of
diverse livestock species and hence improve the livelihood of communities.
To fulfill its objective, the directorate has been organized into six research teams, namely Dairy, meat, apiculture,
poultry, fisheries, and animal feed resources and rangeland management research teams. Each of these teams
generate suitable technologies related to the commodities they address. Currently one or more of these research
teams operate in ten of the seventeen research centers of IQQO. Dairy and meat research teams operate in three
research centers namely, Adami Tulu and Bako Agricultural Research Centers and in Yabello Pastoral and Agro-
pastoral Research Center. Feed resources and range management as well as apiculture research teams operate in
eight research centers namely, Adami Tulu, Bako, Sinana, Mechara, Fedis, Haro Sabu and Bore Agricultural
Research Centers and in Yabello Pastoral and Agro-pastoral Research Center. In addition, apiculture research is also
undertaken in Holeta Bee Research Center. Fishery research team currently operates only in Zeway Fisheries
Resource Research Center, where as poultry research team operates in Adami Tulu and Bako Agricultural Research
Centers.
From each of the above mentioned teams, a number research activities are annually completed as a result of which
physical technologies as well as valuable information are released. However, Even if the importance of reviewing
these completed activities at institute level and compiling them as proceeding is well recognized it has never been
materialized till this time. This livestock research proceeding is then the first of its kind and contains a total of 40
research results (3 from dairy research team, 1 from poultry research team, 8 from feed resources and range land
management research team, 19 from apiculture research teams and 9 from fisheries resource research team). The
information provided in each of these research results are valuable for different beneficiaries depending on the
interest, the level of understanding and the resources they have to utilize the technologies or the information
provided. In addition to reviewing and compiling results of completed activities in this manner each year,
organizing the research results in a simpler form that can be utilized by any beneficiary is expected from the
researcher side.
Tesfaye Alemu Aredo (PhD)
Director, Livestock Research
OARI

Livestock Research Proceeding
1
Dairy Research Results

Livestock Research Proceeding
2
Epidemiological Study of Gastro Intestinal Helminthes Parasites of Calves in Urban, Peri urban and Rural Smallholder Dairy Farms in East Wollega Zone, Western Ethiopia
Tesfaye Mersha, Milkessa Gelana, Tesfaye Mideksa, Habtamu Abera, Misgena Duguma Tegegn
Gudeta and Sisay Ishetu Bako Agricultural Research Center P.O. Box 03, Bako, Ethiopia
Abstract A cross sectional study was conducted from September 2012 to February 2014 in selected areas of East Wollega Zone of Oromia Regional State, western part of Ehiopia to identify major parasites of calves and associated risk factors in the study areas. The study includes all calves under one year of age and has no history of de-worming. Gastro intestinal parasites are one of the most important animal diseases which cause livestock production loss in general and calves health problems in particular. Macc master egg counting was done so as to identify the parasitic infestation level of the study animals. Sedimentation and floatation techniques were also employed to identify the major parasites and chi-square test was used to compare prevalence difference in line with associated risk factors. As study result showed, out of 250 fecal samples collected, 66.4% were positive for different GIT parasites while 33.6% were free from any parasites. The PCV value of parasitaemic (23.27%) and non-parasitaemic (25.83%) animals showed a slight variation with no statistically significant difference (p>0.05). But there is statisticaly significant difference in among risk factors like season, location, age, breed and body condition and GIT prevalence (p<0.05). It can be concluded from the present study that GIT parasites are the major problems of calves’ health which require great emphasis to reduce the effect. Awareness creation and proper control measures of GIT parasites should be given for the stake holders. Keywords: GIT parasites, calves, urban, peri-urban, rural, small holder dairy farms, East Wollega, Ethiopia INTRODUCTION Gastro intestinal parasites are a world-wide problem in livestock as well as in agricultural sector and are responsible for major economic losses. The economic impact of these parasites on animals industry is great. The impact is greater in Africa in general and Ethiopia in particular due to the availability of a wide range of agro-ecological factors suitable for diversified hosts and types of helminthes. The most serious economic consequences of gastrointestinal parasites is based on the overall number of worms, number of genera and species present, general levels of pathogenicity and wide spread distribution (Rickard and Zimmerman, 1992). In recent study, Tibbo (2006) found that parasitic infection of cattle is the major factor responsible for economic losses through reduction in productivity and increased mortality in heavily parasitized animals. Especially parasitic nematodes (roundworms) are extremely important in both human and animal diseases (Tibbo, 2006). In the last two decades, anti-helmentic efficacy against nematodes is reducing due to the rise of parasitic resistance (Subash, 1990). The anti-helmentic resistance has been seen in almost all countries of the world. Anti-helmentic resistance are normally associated with factors such as maturity stage of parasite, sexual phase of parasite, immune response of host which can be related to age and history of infected animal and distribution of worms. Despite the immense progress made to control helmethosis, farmers in Ethiopia continue to incur significant losses due to insufficient availability of information on the epidemiology of the parasites as well as presence of different types of helminthes. Furthermore, parasitosis appears to be a major factor for lowered productivity of Ethiopian livestock sector. The prevalence, genera, species, and severity of gastrointestinal helminthes vary considerably depending on different environmental conditions, such as humidity, temperature, rainfall, vegetation, and management practices (Teklye, 1991). Therefore, the distribution and prevalence of the disease should be

Livestock Research Proceeding
3
presented by geographical areas that could roughly correspond to climatic conditions. In some parts of Ethiopia, surveys have been carried out on the prevalence of helminth parasites most of which are based on information obtained from abattoir survey and animals managed on stations (Fikru et al., 2006). Gastrointestinal parasitism is one of the first ranked researchable topic on calf health in Western Oromia. Moreover, there is no sufficient information on epidemiology of gastrointestinal parasites of calves in the western part of the country. Therefore, the objective of this study is to provide evidence on the epidemiological distribution of the gastrointestinal parasites of calf in smallholder dairy farm and determine putative risk factors within the study area. MATERIALS AND METHODS Study area and duration The study was conducted from September 2012 to February 2014 in selected areas of East Wollega Zone of Oromia Regional State which is found in western part of the country, at about 352km distance from Addis Ababa. The average elevation of the area is 2017m above sea level and its maximum and minimum temperatures are 22.40C and 10.90C, respectively. The dry season of the study area ranges from April to June while the wet season is from October to December. The mean annual rain fall of the area ranges from 800mm to 2400mm (Moti et.al, 2011). Similar to other rural areas of Ethiopia, the dominant economic activity on which the livelihood of peoples across the study areas depends is crop livestock mixed farming system. Study Animals The study animals were 205 calves under one year of age kept under extensive and intensive husbandry management and have no history of de-worming at least for three months prior to starting the study. Study design A cross sectional epidemiological study was carried out on calves of less than one year of age groups in the study area. The study sites and farmers were selected purposively whereas the individual sample was selected by simple random sampling method. Sample size for fecal collection was determined using the formula given by Thrusfield, (2007) which is:
N= where, n= the sample size, p= estimated percent in the population or expected prevalence, z= standard error associated with the chosen level of confidence (1.96) q=100-p and e= acceptable sample error Accordingly, using expected prevalence of 50% at 95% confidence intervals and 5% desired absolute precision, a sample size of 384 calves were needed. However due to logistic problems, fecal samples were collected only from 250 calves. Samples examination methods About 3gm of fecal sample was collected from anus of each sampled calf in to a plastic container during dry and wet season, consecutively. Blood samples were collected, immediately centrifuged and the PCV reading was recorded at the study sites. The fecal samples were preserved with 10% of formalin and taken to Bako Agricultural Research Center (BARC) animal health research laboratory to be examined. Floatation and sedimentation techniques were employed to diagnose eggs of nematodes and trematodes, respectively. Macc master egg counting technique was also used to categorize the severity of the infestation level (Kruse et al., 1982).

Livestock Research Proceeding
4
Data Analysis During the study period the data were collected and stored in the Microsoft Excel spread sheet program and analyzed using SPSS 16. Version software program. The prevalence was calculated by dividing the number test positive animal by total number of calves examined. Chi-square test was used to measure the association between prevalence and risk factors like location, management system, age, sex, season, and body conditions. RESULT Out of 250 fecal samples tested 166(66.4%) were positive for eggs of different species of GIT-helminthes parasites and the rest 82(33.6%) samples were negative for parasitic ova. The mean PCV (%) values of parasitaemic (23.27%) and non parasitaemic (25.83%) was compared and found to be statically non significant (p> 0.05). Association of risk factors with parasite prevalence Association of the different risk factors (season, location, sex, age, breed and body condition) with parasites prevalence is shown in Table 1. Variations were observed in the occurrence of GIT parasites among the risk factors. These are discussed as follows: Season: The prevalence of GIT parasites in dry and wet season was compared to observe the effect of moisture on abundance of the parasites. The result showed a significantly (p<0.05) higher prevalence (80%) in wet season than in dry season which was 53.5%. Location: The prevalence of GIT parasites in different location is summarized in (table1). The result indicated 73.9%, 62.8%, and 61.9% prevalence rate in production system of rural, peri-urban and urban areas, respectively. However, the observed differences were not statically significant (p>0.05). Sex: There was minor prevalence difference observed between sexes. Prevalence of GIT-parasite observed was 68.3% in male calves and 64.6% in female calves. However, the difference was not statically significant (p>0.05) Age: Comparison of association of the prevalence of GIT-parasites with age groups was made taking two age groups (7 months of age and under 7 months of age). According the prevalence of GIT parasite in animals with greater than seven months of age was significantly (p<0.05) higher than that of calves under seven months of age, with respective values of 74.4% and 58.4%. Breed: The present study also tried to identify the presence of any association between prevalence of calf GIT parasites and breed. The study revealed a significant difference (p<0.05) in prevalence of helminthes infection between local and cross bred calves. Their respective values were 62.2% and 75.6%. Body condition: In this study comparison has also been done on the prevalence of calf GIT parasites among the calves body condition scores. Statistically significant variation (p<0.05) was observed among the different body condition categories. The prevalence rates observed in calves of poor, medium, and good body conditions were 79.1%, 65% and 52.1%, respectively.

Livestock Research Proceeding
5
Table 1 Association of risk factors (season, location, age, sex, breed, body condition) with prevalence of GIT parasites
Parameter No. Examined (N=250) No. positive (%) (p-value)
Season 19.547(0.000) Dry season 129 69(53.3)
Wet season 121 96(80.0) Location
3.406(0.096)
Rural 88 65(73.9) Per urban 78 49(62.8) Urban 84 52(61.9) Age
7.172(0.007) <7month 125 73(58.4) 7-12 month 125 93(74.4) Sex
0.389(0.593) Male 123 84(68.3) Female 127 82(64.6) Breed
4.339(0.043) Cross breed 172 107(62.2) Local 78 59(75.6) Body condition
9.147(0.009)
Poor 67 53(79.1) Medium 137 89(65) Good 46 24(52.2) Overall prevalence 250 250(66.4%) Fecal egg count or intensity of infection (EPG) The present study tried to categorize positive calves in to their degree of infestation using fecal egg count. Accordingly to the result indicated that out of 166 infected calves 23.49% were infested severely whereas 31.93% and 44.58% were infested at moderate and low rates, respectively (figure 1).
Figure 1: Fecal egg count or intensity of infection (EPG)
05
101520253035404550
low(<500) medium(500‐100) severe(>1000)
Infection pe
rcen
tage
Degree of infection

Livestock Research Proceeding
6
Type of parasite investigated In the study there were different types of GIT parasites observed. Out of 250 examined calves, 66.4% were positive with one or more types of GIT parasites. The proportion of single parasitic infection was 74.1% and that of mixed parasitic infection was 25.9%. Out of 166 calves infected with single type of gastrointestinal parasites, the infection rates of strongly, coccidian, ascaris, monesia, and fasciola were 35.54%, 22.89%, 6.63%, 5.42% and 3.61%, respectively. The remaining 25.9% were infected with more than one type of the above indicated species (fig. 2).
Figure 2: Types of parasites investigated and their infection percentage DISCUSSION The current study showed that calves from study area were infected with wide variety of gastrointestinal parasites including nematodes, cestodes, trematodes and protozoa. The overall prevalence of GIT-parasites in calves was 66.4% in urban, peri-urban and rural areas of small holder dairy farms. Different prevalence rate of GIT parasites was reported from different corner of Ethiopia as well as other countries due to the difference in management, husbandry, climate, topography, and other factors. The prevalence in the current study is higher than the findings of Tigist et al. (2012) which was reported to be 41.30% in Amhara regional state. Adam and Anteneh (2011) reported 18% in Haramaya district of Oromia Regional State and Bilal et al. (2009) reported 55.56% prevalence in Pakistan. On the contrary the result of this study is lower than the previous 79.1% reported by Hailu et al. (2011) for Jimma town and 97% reported by SA square et al. (2013) in the case of southern Ghana. The result of the current study showed significantly (p<0.05) higher prevalence of gastrointestinal parasite in wet season (80%) than in dry season (53.5%). This finding is in agreement with many reports of the world such as Fikru et al., (2006) and Deressa et al., (1998) in Ethiopia; Alim et al.,(2012), Jeyathilakan et al.,(2008), and Aktaruzzaman et al., (2013) in Bangladesh; Moyo et al.,(1996) in Zimbabuwe, SA square et al. (2013) in Ghana and Nginyi et al., (2001) in Kenya, all of which reported higher parasitic infection during wet or rainy season compared with dry season. This is due to the existence of adequate moisture and optimum temperature favoring the growth and survival of infective stage of parasite in the pasture leading to the high probability of exposure of animals to the parasites which results in higher prevalence of GIT parasite in wet season. In this study the prevalence of gastrointestinal parasite across rural, per urban and urban dairy farmers were identified. Higher prevalence was recorded in rural than per urban and urban dairy farms. The reason for higher prevalence in rural area than that of peri urban and urban dairy farms may be due to difference in management system and awareness of the farmers about the disease. Almost all farmers found in urban area implement intensive management system whereas those farmers found in rural areas
0510152025303540
strongly mixed coccidia ascaris monesia fasciola
Infection pe
rcen
tage
Types of parasites encountered

Livestock Research Proceeding
7
apply extensive management system. Moreover, urban dairy farmers have access to anti-helmentic drugs and better awareness than rural farmers about the importance of de-worming. In the current study comparison between male and female was made with regard to the prevalence of GIT-parasites. The observed prevalence rate was 68.3% in male and 64.6% in female calves. However, the difference was not statistically significant (P>0.05). The absence of association between sex agreed with the findings of Tigist et al., (2012) in Gonder; Fikru et al., (2006) in western Oromia and Hailu et al. (2011) in Jimma town. In contrast, the existence of association between sex and prevalence of parasites were reported (Yeshiwas, 2013; Maqsood et al., 1996; Valcarce and Garcia, 1999). According to these findings, female animals showed higher parasitic infection than males despite similar management practice due to the fact that female animals are more susceptible than male. Hence, sex is determinant factor in influencing prevalence of parasites. Age is supposed to have some association with occurrence of internal parasite because age has an effect on responsiveness to the development of immunity causing lower worm fecundity in adult animals’ (Klooser man et al., 1991) as well as adult animal may acquire immunity to the parasites through frequent challenges and expel the ingested parasite before they establish infection (Dunn, 1987 and Fishes et al., 1989). Bilal et al., 2005 also reported that calves up to six months of age were more affected by gastrointestinal parasite (86.67%) as compared to calves of 7-12 age (66%). However, in contrast to the reports of above authors, the present study revealed that calves under 7 month of age were less infected with parasite (58.4%) than calves 7-12 month of age (74.4%). The reason is that in the study area most of the newly born calves are managed in the house so that they are stall fed where as those calves above seven months of age are managed in free gazing system. Calves in the latter age group than those in the former age group. This finding is in agreement with the work done by Adam and Anteneh, (2011) in Haramaya district which reported the concomitant increase in parasite prevalence with age of animals. This could be due to increase in frequency of contact and due to management factors. There is still controversy among different authors on the issue of breed susceptibility to internal parasite. In this study, the prevalence of gastrointestinal parasite was found to be significant (p<0.05) higher (75.6%) in local bred calves than cross-breed calves (62.2%) which is in agreement with the report by Tigist et al., (2012) in and around Gonder town. This may be due to the fact that the farmers owned cross-breed or farmers that are found in urban areas tend to follow intensive management system where as those farmers who have indigenous breeds tend to follow free grazing system (extensive management). Thus, the chance of exposure of local-breed calves to infective parasitic egg or larvae was higher than that of cross-breed calves. The present study the body condition of calves were significantly associated (p<0.05) with prevalence of GIT-parasite. Calves with poor body condition scores were infected at higher rate (79.1%) than calves with medium (65%) and good (52.2%) body conditions indicating that GIT-parasitic infection could be a major cause for loss of body condition of calves in the study area. This finding is in agreement with the work done by Keyyu et al., (2003) in Tanzania and Tigist et al., (2012) in Ethiopia. However, the report disagrees with the work of Fikiru et al., (2006) and Hailu et al., (2011). In this study, the most prevalent parasite of calves was the strongyle (35.54%) whereas, the least prevalent parasites were monesia (5.42%) and fasciola (3.61%) which is inagreement with the report by Hailu et al., (2011) in small holder dairy farms of Jimma town. Similarly, Yeshiwas, 2013 also reported higher prevalence rate (21.4%) of strongyle species and least prevalence rate (5.8%) of monesia parasite in selected site of Bahidar area.

Livestock Research Proceeding
8
CONCLUSION AND RECOMMENDATION The prevalence calf GIT-helminthes in study area is 66.4% indicating that parasites can be considered as one of the major production constraints of cattle in the study area. The prevalence of the helminthes found to be higher in rural and peri urban areas than in urban dairy farms. The study also revealed that the GIT-parasites were higher in local breeds as well as poor body conditioned calves than cross-bred and good body conditioned calves. Higher prevalence of GIT parasites was recorded in wet season than in dry season. In the present study all risk factors were found to be associated with the prevalence of GIT parasites with the exception of sex. In conclusion, GIT-parasites cannot be ignored as a non important disease in current study area where it may continue to become a hazard to livestock industry of the country in general and inhibit the productivity of small holder dairy farmers of the area in particular. Based on the above conclusion the following recommendations are forwarded: All responsible body in general and small holder dairy farmers in particular should be made aware of the impacts of the GIT-helminthes through veterinary extension like training, booklets, media etc. To minimize parasitic infestation and the existed associated risk factors regular de-worming with appropriate anti-helmentic drugs for each type of parasites should be given and Appropriate management practices such as housing management, feeding management, grazing system (eg. rotational and zero grazing) and health care (eg. acaricide spray) should be applied. References Adam H and Anteneh W (2011): Occurrence of Nematodiasis in Holstein Friesian dairy breed, College of
Veterinary Medicine, HaramayaUniversity, P. O. Box 289, Ethiopia. Journal of Veterinary Medicine and Animal Health Vol. 3(1), pp. 6-10, January 2011
Aktaruzzaman M, Rony SA, Islam MA, Yasin MG and Rahman AKMA (2013): Concurrent infection and seasonal distribution of gastrointestinal parasites in cross-bred cattle of Sirajganj district in Bangladesh, Veterinary World 6(10): 720-724.
Alim, M.A., Das, S., Roy, K., Sikder, S., Mohiuddin., SMasuduzzaman, M.Hossain, M.A. (2012): Prevalence of gastrointestinal parasitism in cattle of Chittagong division, Bangladesh,Wayamba Journal of Animal Science, 4: 247
Bilal MQ, Hameed A, Ahmad T (2009): Prevalence of gastrointestinalParasites in buffalo and cow calves in rural areas of Toba Tek Singh, Pakistan. J. Anim. Plant Sci., 19: 67-70.
Deressa. A (1998): Economic importance of ovine helminth parasites at Sheno, Ethiopian Vet Association Proceedings of the 12th Conference, Addis Ababa, Ethiopia; June 1998:43-51
Dunn, A.M., (1987): Veterinary Helimintology, 2nd ed. William Heilemann Medical Books. London, pp: 511-514
Fikru Regassa, Teshale Sori, Reta Dhuguma, Yosef Kiros, (2006): Epidemiology of Gastrointestinal Parasites of Ruminants in Western Oromia, Ethiopia Intern J Appl Res Vet Med • Vol. 4, No. 1
Fishes SM., and Say RR. (1989): Manual of Tropical Veterinary Parasitology, UK, C.A.B., and pp: 342-347
Hailu D, Cherenet A, Moti Y and Tadele T (2011): Gastrointestinal helminth infections in small-scale dairycattle farms of Jimma town, Ethiopia School of Veterinary Medicine, College of Agriculture and Veterinary Medicine, JimmaUniversity, P. O. Box 307, Jimma, Ethiopia Ethiop. J. Appl. Sci. Technol. 2(1): 31 - 37 (2011)
Jeyathilakan, N., Latha, B.R., Basith, A. (2008): Seasonal prevalence of Schistosomaspindale in ruminants at Chennai Tamil Nadu J Vet AnimSci4 (4): 135-138
Keyyu, J.D., A.A. Kssuku., N.C. Kyvsgaard and A.L. Willingham, (2003): 3rd gastro intestinal nematodes in indigenous zebu cattle under pastoral and nomadic management systems in the lower plan of southern highlands of Tanzania. Veterinary Research Communication, 27: PP. 371-380.

Livestock Research Proceeding
9
Klooserman, A., H.W. Ploeger and K. Franken (1991): Age resistance in calves to Ostertagiaostertagi and cooperiaomcophom. Veterinary Parasitology, 39: PP. 101-113.
Kruse, G.O.W. and M.H. Pritchard (1982): The collection and preservation of animal parasites. Technical Bulletin, No. "1 " The Harold. W. Manter Laboratory, pp: 1-141.
Maqsood M, Iqbal Z, Chaudhry A H (1996): Prevalence and intensity of Haemonchosis with reference to breed, sex and age of sheep and goats”, Pakistan Vet J., Vol. 16, pp. 41–43
Moti Y., Derara B., Damena D., Tasew S. and Hailu D. (2011): Bovine trypanosomosis and gastrointestinal helminthosis in settlement villages of Bedele district, South-western Ethiopia. 17, pp. 41-56.
Moyo. DZ, Bwangamoi. O, Hendrikx .WM, EyskerM (1996): The epidemiology of gastrointestinal nematodes infections in communal cattle and commercial beef cattle on the highveld of Zimbabwe. Vet. Parasitol., 67(1-2): PP. 105-120
Nginyi JM, Duncan JL, and Mello DJ, (2001): Epidemiology of parasitic gastrointestinal nematode infections of ruminants of smallholder farms in central Kenya. Res Vet Sci. 2001; 70(1): PP. 33-39.
Rickard, L.G. and G.L. Zimmerman, (1992): The epidemiology of gastrointestinal nematodes of Cattle in selected areas of Oregon. Vet. Parasite. 43: PP. 271-291
SA Squire, H. Amafu-Dey and J. Beyuo (2013): Epidemiology of gastrointestinal parasites of cattle from selected locations in Southern Ghana. Achimota, Accra, Ghana, p. 3-8.
SPSS (Stastitical Package for Social Science) version 16 SPSS 2006 SPSS 1.00 for windows. 16.00 Ed., SPSS Incorporated, Chicago.
Teklye, B., (1991): Epidemiology of end parasites of small ruminants in sub-Saharan Africa, Proceedings of the 4th National Livestock Improvement Conference, November 13-15, 1991, IAR. Addis Ababa, Ethiopia, pp: 7-11.
Thrusfield M (2007): Veterinary Epidemiology, Blackwell, USA. Tigist Awraris, Basaznew Bogale and Mersha Chanie (2012): Occurrence of Gastro Intestinal Nematodes
of Cattle in and Around Gondar Town, Amhara Regional State, Ethiopia. Pp. 27-31. Tibbo, M., (2006): Productivity and health of indigenous sheep breeds and crossbreeds in central
Ethiopian highlands. Ph.D. Thesis, Faculty of Medicine and Animal Science Department of Animal Breeding and Genetics, Swedish University of Agricultural Sciences, Uppsala, Sweden.Thrusfield M 2005 Veterinary Epidemiology. 3rd ed., UK, Blackwell science Ltd, pp. 233-250.
Valcárcel F and García R C (1999): Prevalence and Seasonal Pattern of CaprineTrichostrongyles in a Dry Area of Central Spain”, J Vet Med., Vol. 6, pp. 673-680.
Yeshiwas Ferede (2013): Epidemiology of gastrointestinal helminthiasis of crossbred calves in selected sites of Bahir Dar zuria and Gozamen districts of Amhara region, North West Ethiopia, int. j. pharm. med. & bio. sc. 2013issn 2278 – 5221 www.ijpmbs.com vol. 2, no. 2, april 2013

Livestock Research Proceeding
10
Sero-prevalence study on Foot and Mouth Disease in Selected Districts of Western Oromia
Tesfaye Mersha1, Habtamu Abera1, Tesfaye Mideksa1, Milkessa Gelana1 & Tegegn Gudeta1 1Bako Agricultural Research Center P.O. Box 03, Bako, Ethiopia
Abstract A cross sectional study was conducted to determine the sero-prevalence and associated risk factors of Foot and Mouth Disease (FMD) virus of cattle at Gobu-Sayo and Horro districts of western Oromia. A total of 271 blood samples were collected from cattle of above 6 months of age and sera were collected and stored at deep fridge(-200C) until sent for analysis. It was found that FMD virus in the study area had low sero-prevalence (4.8%). The study showed that there was no significance (p>0.05) difference in sero-prevalence among the age group, sex, breed and body condition considered. However, there was a significance (p<0.05) difference among locations. The sero-prevalence in Horro (5.2%) district was higher than Gobu-Sayo (0.8%) district. Although its prevalence was low, it can cause a significant impact on livestock productivity and international market. Thus creating awareness and designing appropriate control mechanism will be important. Key words: Sero-prevalence, Blood, Disease, Cattle, Western Oromia Introduction Foot and Mouth Disease (FMD) are caused by a virus of the genus Aphthovirus, family Picorna viridae. There are seven serotypes of the virus namely: A, O, C, SAT-1, SAT-2 SAT-3 and Asia 1. Infection with one serotype does not confer immune protection against another. Within serotypes many subtypes can be identified by biochemical and immunological tests (OIE, 2004). The disease is characterized by high fever, loss of appetite, salivation and vesicular eruptions on the feet, mouth and teats (Thomson, 1994). The disease has a high morbidity although mortality is rare in adult animals. However, myocarditis may occur in young animals resulting in death. The recovered animals remain in poor physical condition over long periods of time leading to economic losses for livestock industries (Sangare, 2002). FMD is endemic to most of sub-Saharan Africa, except in a few countries in southern Africa, where the disease is controlled by the separation of infected wildlife from susceptible livestock as well as by vaccination. Largely due to the endemic character of the disease and it does not normally cause high rates of mortality in adult animals, its outbreaks are not perceived as important and are not reported or investigated further to determine the causative serotypes. However, a number of countries now realize that FMD is one of the trans-boundary diseases that should be controlled to ensure economic stability and access to lucrative international export markets for animal and animal products. The disease is an important constraint to international trade in animals and animal products (Sahle, 2004). It specially restricts world trade in South-North direction. The endemically or sporadically infected countries, which are mainly in the south, generally face total embargoes on the export of their live animals and fresh meat to many other countries in the world (FAO, 1997). The current situation of FMD in Ethiopia is alarming. There is no national control strategy; no legislation exists for imposing restrictions on animals movements. Therefore, livestock are at risk from endemic strains as well as from antigenic variants prevailing in neighbouring countries. The official data may not reflect the reality of the disease along with the unreported cases by farmers and the few samples submitted from diagnosis (Sahle, 2004). There is no clear picture regarding the distribution pattern and prevalence of the disease in Western Oromia. Therefore, the objective of the present study was to determine the sero-prevalence of FMD and to identify some of the risk factors associated with the disease in the study area.

Livestock Research Proceeding
11
Materials and methods Study area The present study was carried out in Gobu-sayo and Horro districts of East Wollega and Horro Guduru Zones of Oromia, respectively. The altitude of the zones varies between 700-2500 meters above sea level, and the mean annual rainfall and temperature varies between 400-2000 mm and 15-27°C respectively. Extensive farming and pastoral systems are practiced in this area with livestock production constituting the major economic activity of the zone. Study design A cross-sectional sero-prevalence survey was conducted and risk factors such as age, sex, peasant association origin, herd type, herd size and cross border migration of livestock were considered. A peasant association is the association of peasants found in a certain locality where they have common grazing and watering resources. A district can have more than two peasant associations. Blood samples were collected from the jugular vein of randomly selected animals using vacuutainer tubes and labelled immediately. The blood samples were allowed to stand overnight at room temperature to allow serum separation. The serum samples were collected and then kept at -20°C until analysis. Finally, the sera were transported from the collection site to the National Veterinary Institute by using an icebox. The serum samples were tested using the FMD non-structural protein ELISA as described below to determine if animals in the herd had been recently infected with FMD virus thereby estimating the sero-prevalence in the herd, district or zones. Sample size Determination A two-stage cluster sampling technique was used to determine the sample size. The sampling frame of peasant associations was prepared with the assistance of a zonal agricultural office and was picked randomly but giving specific attention to agro ecology (low land, mid altitude and highland). To this effect the actual sample size was calculated with the following pre-determined parameters. Confidence interval= 95%, Expected prevalence = 12.5% (NVI record), Desired level of precision= 5% In between cluster variance= 0.0002441, the in between cluster variance was determined by estimating the standard deviation (that is, the average difference expected between individual cluster prevalence and the overall mean cluster prevalence) and then squaring the standard deviation to give the variance components between clusters (Thrusfield, 1995). The average individual owned herd size was determined to be 30 cattle in the study area.
g= 1.962(nvc + Pexp (1-Pexp)) nd2
Ts = 1.962 *g*Pexp (1-Pexp)
gd2 -1.962vc
Where; n= herd size; VC= in between cluster variance; d= desired level of precision; Pexp= expected prevalence; g= number of clusters needed; Ts =Total sample size. Thus, a total of 271 animals were sampled from the selected areas. Data Management and Analysis The data was stored in Microsoft Excel Spreadsheet. Descriptive and analytical statistics was computed using SPSS (2007) Statistic Package for Social Sciences Version 16.SPSSInc Software. Chi-square test analysis was employed to test for association of risk factors with that of Foot and Mouth Disease infection.

Livestock Research Proceeding
12
Result and Discussion The prevalence of FMD virus in different location is summarized in (Table1). The overall result of the study showed that only 4.8% of tested animals were found to be positive of FMD, indicating the lower prevalence of the disease in the study area. The prevalence of the disease showed significant (p<0.05) difference by location. It was found that 8.2% and 0.8% prevalence was observed in Gobu-Sayo and Horro districts, respectively. Table 1. The prevalence of FMD virus in the study district, by sex, breed, age, body condition and study district.
Number Examined
Positive (%) χ2 (p-value)
District 7.97(0.004) Horroo 147 12(8.2) Gobu-Sayo 124 1(0.8) Total 271 13(4.8) Sex 1.98(0.13) Male 135 4(3) Female 136 9(6.6) Total 271 13(4.8) Age 3.41(0.05)
Young (� 2) 108 2(1.9) Adult(>2) 163 11(6.7) Total 271 13(4.8) Breeds 1.15(0.34) Local 250 13(5.2) Cross-bred 21 0 Total 271 13(4.8) Body condition 1.7(0.67) Poor 210 12(5.7) Good 61 1(1.6) Total 271 13(4.8)
It was observed that sex, breed and body condition didn’t cause any significance (p<0.05) difference in prevalence of the FMD virus. However, the prevalence of the disease was significantly (p<0.05) different by age of the animals. Accordingly it was found that younger animal were less susceptible to a disease than older animals. The individual animal sero-prevalence documented in this sero-survey was low as compared to the previous reports of 8.18%, (Molla et al., 2010) and 9.5%, (Megersa et al., 2009) in South Ethiopia. Moreover, our finding was extremely lower when compared to 21 and 26.5% reported by Shale et al. (2004) and Rufael et al. (2008), respectively. The lower prevalence of the disease in Horro and Gobu-sayo districts as compared to Borana pastoral areas (Rufael et al., 2008) might be due to restricted herd

Livestock Research Proceeding
13
mobility, absence communal grazing areas and agro ecology of the area of the study area as compared to Borana areas. According to Ekboir (1999) the movements of infected animals are by far the most important dissemination and transmission means for FMD. In addition Paul et al. (1996) in northern Thiland and Bronsvoort et al. (2004) in Cameroon observed the influence of the movement and keeping animals at homestead in the incidence of FMD and concluded that movement caused significant role in dissemination of the FMD virus. The higher sero-prevalence of FMD in adult animals than in young animals was in agreement with the reports of Rufael et al. (2008) in Borena pastoral area, Molla et al. (2010) in south Omo zone and Megersa et al. (2009) in Gamo gofa and Sidama zones. On the other hand Esayas et al. (2009) reported different finding from Bench Maji zone of southern Ethiopia who documented no significant association between sero-positivity of FMD and age of cattle. The absence significance difference due to sex was in consistent with the previous findings from different parts of Ethiopia (Esayas et al., 2009; Megersa et al., 2009) On the contrary, Hailu et al. (2010) reported higher incidence of FMD among female (16.63%) cattle than male (1.37%) in northwest part of Ethiopia Conclusion and Recommendation The sero-prevalence of FMD was found to be low (4.8%), but this level can cause damage in international livestock trade. If there is no controlling intervention in palace, FMD can be hazardous to livestock industry even with this lower prevalence Therefore, further identification and characterization of the serotypes of FMD virus in the study area is very important in order to deliver effective vaccination service for each serotypes. So that an efficient prevention and controlling measures like movement control, quarantine, regular vaccination, etc. has to be implemented to avoid the economic impact and dissemination of the disease called FMD in the study area. References Bronsvoort BM, Nfon C, Hamman SM, Tanya VN, Kitching RP, Morgan KL. 2004. Risk factors for
herd’s man-reported foot and Mouth Disease. Characterization of foot and mouth disease viruses, Ethiopia, 1981-2007, CDC.Emerg. Infect. Dis., 15: 1409-1417.Ekboir JM .1999. Potential impact of foot and mouth disease in California.The contribution of animal health surveillance and monitoring, California. Agric. Res. Manage., pp. 7-13.
Esayas G, Gelagay A, Tsegalem A, Kassahun A. 2009. Seroprevalence of foot and mouth disease in Bench Maji zone, southwestern Ethiopia. J. Vet. Med. Anim. Health, 1: 5-10.
FAO (Food and Agriculture Organization of the United Nations). 1997.Prevention and control of transboundary animal disease. Prod. and Health Paper. Food and Agricultural Organization of United Nations (FAO/UN), Rome, Italy 133: 59-60.
Gelagay A, Mana M, Esayas G, Berhe G, Tesfaye R, Mesfin S, Nigel PF, Jemma, W, Geoffrey HH, Nick JK. 2009. Genetic Seroprevalence and Risk Factor Assessment in South Omo Zone, South-western Ethiopia. Trans. Emerg. Infect. Dis., 57: 340-347.
Gelaye E, Ayelet G, Abera T, Asmare K.2009. Seroprevalence of foot and mouth disease in Bench Maji zone, Southwestern Ethiopia.J.Vet. Med. Anim. Health, (1): 005–010.
Megersa B, Beyene B, Abunna F, Regassa A, Amenu K, Rufael T .2009.. Risk factors for foot and mouth disease sero-prevalence in indigenous cattle in Southern Ethiopia: the effect of production system. Trop. Anim. Health Prod., 41: 891-898.
Molla B, Ayelet G, Asfaw Y, Jibril Y, Ganga G, Gelaye E .2010.. Epidemiological Study on Foot-and-Mouth Disease in Cattle: Adamawa province of Cameroon. Prev. Vet.Med., 66: 127-39
OIE 2004. .Manual of diagnostic tests and vaccines for testerial animals (mammals, birds, bees).5nd ed. OIE, Paris, France pp. 111-128.
Paul C, Cleanda F, Chris B, Pornchai C, Laurence JG (1996). Village level Risk factors for foot and mouth disease in Northern Thiland. Prev. Vet. Med., 26: 253- 261.
Rufael T, Catley A, Bogale A, Sahle M, Shiferaw Y (2008). Foot and Mouth Disease in the Borana pastoral system, southern Ethiopia and implications for livelihoods and international trade. Trop. Anim. Health Prod., 40: 29–38.

Livestock Research Proceeding
14
Sahle M (2004). An epidemiological study on the genetic relationships of foot and mouth disease viruses in East Africa. PhD Thesis University of Pretoria, South Africa, Unpublished.
Sangare O (2002). Molecular epidemiology of foot-and-mouth disease virus in West Africa.PhD thesis, University of Pretoria, South Africa, Unpublished.
Shale M, Dwarka RM, Venter EH, Vosloo W (2004). Molecular epidemiology of serotype O foot-and-mouth disease viruses isolated from cattle in Ethiopia between 1979-2001. Onders.tJ. Vet. Res., 71: 129- 138.
SPSS (2007).Statsitic Package for Social Sciences.Version 16.SPSSInc., 1989-2007, USA1. Thomson G (1994). Foot and Mouth Disease. In: Infectious diseases of livestock with special reference to
Southern Africa, edited by J.A.W. Coetzer, G.R. Thomson. Cape Town, London, New York: Oxford University Press pp. 825-992.
Thrusfield, M., (1995): Veterinary Edpidemiology. 2nd edition. Blackwell wissenschaftsVelag, Berlin, Germany.

Livestock Research Proceeding
15
Effects of Replacement of Formulated Concentrate Mix with Cowpea (Vigna Unguiculata) Hay on Feed Utilization, Milk and Milk Composition of Lactating Horro Bred Cows Fed
Natural Grass Hay
*Tesfaye Mideksa, Habtamu Abera, Sisay Ishetu and Tesfaye Marsha
Bako Agricultural Research Center (BARC), P.O.Box 03, West Shoa, Bako, Ethiopia *Corresponding author email: [email protected] Abstract The experiment was conducted at Bako Agricultural Research Center (BARC) with an objective of evaluation of the replacement effect of formulated concentrate mix with cowpea hay in the daily ration of lactating Horro cows fed natural grass hay. Five cows of similar milk yield, body weight, age of lactation, but differing in parities were arranged in a 5x5 Latin square design. The animals were provided with natural grass hay based diet adlibitum and supplemented with cowpea hay 0 % (T1), 25 % (T2), 50% (T3) 75% (T4), 100% (T5) to replace concentrate mix. Results of chemical analysis of the experimental feeds indicated that cowpea hay had comparable nutritive value with concentrate mix. The daily dry matter (DM) and crude protein (CP) intake were significantly (P<0.05) differ among the treatments with the highest intake was observed for cows fed 50% cowpea hay (T3). Apparent DM digestibility of T3 (60.65%) was significantly (P<0.001) higher than T5 (47.18%). The milk yield were significant differences among the dietary treatments with lower mean milk yield recorded in T4 and T5 as compared to T1, T2 and T3. This implies that cowpea hay can replace up to 50% concentrate mix without any significant reduction in milk yield. There were also no significance difference in milk composition and live weight change among the dietary treatments. Moreover, economic analysis indicates that use of cowpea hay up to 50% as supplement diet results to better economic gain. Hence, cowpea hay can both biological and economically replace a concentrate diet up to 50% of replacement without significant reduction in milk yield and live weight of lactating cows fed a basal diet of natural grass hay. Further evaluation is important to determine the effect of dietary treatments over the entire lactation period for conclusive economic decision. Key Words: Cowpea, Digestibility, hay, Intake, Milk composition and Milk Yield Introduction In developing countries livestock sector is highly dynamic, to meet rapidly increasing demand for livestock products. This demand is largely driven by human population growth, income growth, urbanization and the production response in different livestock systems. The main constraint facing small scale dairy farmers in smallholder mixed farming, pastoral and agro pastoral production systems across East Africa is the inability to provide sufficient quantity and quality feeds to their livestock on a consistent basis (Hall et al. 2008). The major feed resources in Ethiopia for ruminants are natural pasture and crop residues, which are categorized as poor quality roughage with low intake (Berhanu et al., 2009), due to their tough texture, poor digestibility and nutrient deficiency (Mupangwa et al., 2002). Moreover, the importance of natural pasture as source of feed resource is gradually declining as a result of the expansion of crop production, redistribution of grazing lands to the landless and land degradation (Mulat, 1999). Protein intake is improved by both the addition of a higher protein source feed and by increasing the availability of protein through increased digestibility of the lower quality forage. The use of industrial by-products of oil crops as supplement on low quality roughages are very expensive and unaffordable for

Livestock Research Proceeding
16
rural farmer, so as alternative solution forage legumes is another option as source of protein. Improving the use and nutritional quality of natural grass hay by supplementation of forage legumes hay is important to enhancing dairy cattle productivity. Cowpea (Vigna unguiculata) is an important component in mixed systems and is valued for its potential to produce high levels of hay/fodder for livestock. Studies indicated that cowpea hay addition improves nutrient supply and growth of livestock over the use of low quality forages alone but degree of weight change varies relative to total nutrient supply (Baloyi et al 2008). One benefit of the use of cowpea hay as a supplement is the provision of nitrogen to the rumen microbes, allowing them to improve utilization of the low quality forage. Therefore the objective of this study was to determine the amount of cowpea hay that can replace the recommended amount of formulated concentrate mix with out affecting voluntary feed intake, feed conversion ratio and milk yield and composition of lactating Horro cows fed natural grass hay as basal diet. Materials and Method Description of the Study Area BARC is located in Oromia Regional State West Shoa Zone at about 257 Km from the capital city Addis Ababa on the way to Nekemte town. The centre is located at 8 km from Bako town. The altitude of the research centre is 1650 masl and it lies at about 09°6’N latitude and 37°09’E longitude. The area has a warm sub-humid climate with annual mean minimum and maximum temperature of 13°C and 29.9°C, respectively. Mean monthly minimum and maximum temperatures are about 10.4°C and 33.6°C, respectively, with an average monthly temperature of 21°C. The daily mean minimum and maximum temperatures are 9.4°C and 31.3°C, respectively. The relative humidity of the area was 48.8% for the year 2013/14 cropping calender during which the experiment was conducted. The area is known by unimodal types of rainfall and receives annual rainfall of 1431 mm mainly from May to September with maximum precipitation in the month of June to August. Sixty percent of the soil is reddish brown in colour, and clay-loam in texture (Wakene, 2001). Experimental Animals and Management A total of five Horro breed cows were used for the experiment. Experimental cows with similar lactation performance, at early stage of lactation, similar body weight, but with different parities were selected from the total dairy herd available in BARC. All cows were weighed and drenched with a broad-spectrum anti-helminthics (Albendazole 500 mg) prior to the commencement of the experiment. The calves were separated from their dams five days after parturition and reared according to the standard calf rearing procedures of the research centre. The cows were placed in an individual pen and stall-fed in a well-ventilated barn with concrete floor and appropriate drainage slope and gutters. The cows were hand-milked twice daily at approximately 12-hour intervals in milking room. Feed Preparation and Feeding Cowpea (Vigna unguiculata) and natural grass hay were harvested at appropriate stage and dried, chopped and stored under a hay shade and used throughout the experimental period. The basal feed offer was adjusted daily by allowing 20% of refusal from previous day’s intake. The quantity of concentrate mix offered daily was at the rate of 0.5 kg/l of milk produced by each cow and offered with equal portions during the morning and evening milking time, respectively. The amounts of cowpea given were calculated depend on the amount of CP in the concentrate diet making the feeds isonitrogeneous. Representative and composite samples of all experimental feeds were taken for laboratory analysis.

Livestock Research Proceeding
17
Experimental Design, Treatments and Measurements At the beginning of the experiment, five cows were randomly assigned in a switch over 5X5 Latin square design. There were five periods each consisting 30 days. During the first 15 days of each period, animals were acclimatized to the experimental diet and the remaining 15 days were used to collect data. Hence, the experiments took 150 days; being started in December 2013 and finished in April 2014. The experimental animals were initially randomly allotted to one of the five dietary treatments given below. The concentrate mix is (49.5% maize grain + 49.5% noug seed cake + 1% salt). The treatments were: T1: Concentrate mix (100%) + Natural grass hay ad libitum T2: Concentrate mix (75%) + Cowpea hay (25%) + Natural grass hay ad libitum T3: Concentrate mix (50%) + Cowpea hay (50%) + Natural grass hay ad libitum T4: Concentrate mix (25%) + cowpea hay (75%) + Natural grass hay ad libitum T5: Cowpea hay (100%) + Natural grass hay ad libitum The basal feed was offered ad libitum at a 20% refusal rate and the offer was adjusted every four days. The quantity of concentrate mix offered daily was at the rate of 0.5 kg/l of milk produced by each cow and it was offered with equal portions during the morning and evening milking. Adjustments for concentrate offer was made at the end of each period and for each treatment based on the actual milk produced. The amounts of cowpea hay given was depending on the percentage of crude protein in the concentrate feed and equivalent CP contents were adjusted depending on the CP in the formulated concentrate mix and CP in the cowpea hay. Feed offered and refused was measured and recorded for each cow to determine daily feed and nutrient intake. Water was available to the animal all the time throughout the experimental period. The daily milk yield data of individual cows was taken using a Salter balance. About 100 ml milk sample in the morning and afternoon was taken twice every week during the experiment from each cow into a glass measuring cylinder (100ml capacity) after the milk was thoroughly and gently mixed. Body weight was recorded for two consecutive days at the beginning and end of each experimental period for each treatment to monitor body weight change that may occur as a result of dietary treatments. Apparent Digestibility Apparent digestibility of the diet used in each treatment was determined using total feacal collection methods for a period of 5 consecutive days at each period. Farm personnel were assigned around the clock to scoop faeces into plastic buckets as soon as the animals defecated. Urine contamination was minimized by frequent washing of the concrete floor with high pressure running water using a plastic water tube. Individual cow’s faeces were weighed every morning before 08:00 hours and before fresh feeds were given to the animals. After weighing, the faeces from each cow were thoroughly mixed and a sample was taken and placed in polyethylene bag. Composite samples of about 1% of the daily collected fecal samples were mixed and stored as one sample in a deep freezer (-20 oC) until the end of the collection period. At the end of the collection period, the 5 days pooled samples were subsequently thawed and mixed thoroughly and two subsamples were taken. One sample taken for estimating DM was oven dried at 105oC for 24 hours, while the other sample was oven dried at 65oC for 72 hours, ground to pass a 1mm sieve and stored in sample bottles at room temperature. Composite samples of each of the natural grass hay, cowpea hay, concentrate mixture and faecal DM output were analysed to determine DM, OM, N, NDF, and ADF digestibility. Formulas used to determine Apparent DM and nutrient digestibility were:
Apparent DM digestibility (%) = DM intake- DM excreted in feces X 100
DM intake

Livestock Research Proceeding
18
Apparent nutrient digestibility (%) = Nutrient intake- Nutrient excreted in faeces -X100 Nutrient intake
Invitro Organic Matter Digestibility The two stage rumen inoculums-pepsin method of Tilley and Terry (1963) were used to determine IVOMD. Rumen liquor was collected from ruminally festulated steers and transported to the laboratory using thermos flasks that had been pre-warmed to 39 0C. Rumen liquor was taken in the morning before animals are offered feed. A duplicate sample of 0.5 g of each were incubated with 30 ml of rumen liquor and a buffer in 100 ml test tube in water bath at 39 0C for a period of 48 hour for microbial digestion followed by another 48 hour for enzyme digestion with acid pepsin solution. Blank samples containing buffered rumen fluid were incubated in duplicates for adjustment.
In vitro OM/ DOMD = OM in the feed- (OM in residue – blank) x 100 OM in the feed
Where OM = 100 - Ash (measured after incineration of feed or residue) Metabolisable energy contents of the feeds were estimated from in vitro organic matter digestibility (IVOMD) as described by McDonald et al. (2002) : ME (MJ/kg) = 0.016 IVOMD. Natural grass hay and cowpea hay samples were taken directly from the store of hay every two weeks after the hay chopped to represent the actual feed consumed by the cows. Samples of concentrate were taken from total concentrate mix. Similarly, feed refusals samples were taken four times per week for two weeks for each treatment and composited for each treatment from which sub-sample was taken for analysis per treatment. Partially dried samples were ground using Cyclo-Tec mills to pass 1 mm sieve size for proximate, detergent, and invitro digestibility analysis and kept at room temperature in sealed plastic bags until they were used for analysis. The milk samples were composited per cow and per treatment and two times samples were taken per period for chemical analysis. All samples of feed offered and refusals and faeces were analyzed for DM, ash, N (Kjeldahl-N) according to AOAC (1990). Organic matter (OM) was determined as 100-ash. Neutral detergent fiber (NDF), acid detergent fiber (ADF), and acid detergent lignin (ADL) were determined by the methods of Van Soest and Robertson (1985). Invitro organic matter digestibility of feed offered and refusal was determined using the procedures outlined by Tilley and Terry (1963). The milk samples were used to determine percentage fat, protein and solid not fat (SNF) by Ultrasonic Ekomilk Analyzer (30 w Bulteh 2000, Bulgaria), which have the capacity to measure 20–25 samples per hour. Total milk solids (TS) were calculated as TS = SNF+Fat. Calcium and phosphorous content of the offered feeds were analysed by atomic absorption spectrophotometry and colorimetry (AOAC, 1995) respectively. Partial Budget Analysis A simple partial budget analysis was conducted by using marginal analysis of dietary treatments cost based on calculation of the total cost of supplement feed (concentrate) and the two basal diets. Milk sales price and labour cost incurred during the entire experimentation process were also considered. The milk price was fixed based on the milk price paid to farmers by the Dairy Development Cooperatives (DDC) in the study area. The prices of the natural grass hay, cowpea hay and ingredients used to form concentrate mix were obtained from the current market price during the experimental period. Partial budget analysis by using marginal analysis was employed to compute total cost of production /cow/day, mean milk yield/cow/day, price of milk/cow/day, cost of production/litre of milk, return/cow/day, net return/cow/day and MRR return/cow/day. Calculations employed were;
Net return (NR) = Total revenue (TR) – Total variable cost (TVC)

Livestock Research Proceeding
19
∆NR=ΔTR- ΔTVC
Marginal rate of return (MRR %) = ∆NR - X 100 ∆TVC
Where, ∆NR = Change in net return, ΔTVC = Change in total variable cost and ΔTR Change in total revenue Statistical Analysis Voluntary DM and nutrient intakes, live weight change, milk yield and compositions, and digestibility were subjected to GLM procedure for Latin Square Design using Statistical Analysis System (SAS, 2002). Treatment means were separated using Least Significant Difference (LSD). The models used for the analysis of data were: Yijk = µ + Ci +Pj + Tk + Eijk, Where; µ = Overall mean; Ci = Cow effect (parity); P j= Period effect; Tk = Treatment effect; Eijk = Experimental error Results and Discussion Chemical Composition of Experimental Feeds The DM content was almost similar for all ingredients used in the present study Table1. The OM content was relatively higher in maize grain, followed by the concentrate mix and least in natural grass hay. The neutral detergent fiber concentration showed much variation with the highest value recorded for the natural grass hay followed by cowpea hay and the concentrate mix, respectively. Table 1. Chemical composition, in-vitro dry matter digestibility and metabolizable energy content of experimental feeds (% for DM and as % of DM for values of other components) EME= Estimated Metabolisable Energy (0.016*DOMDM); NGH=Natural Grass Hay; NSC= Noug Seed Cake
The supplements (concentrate mix and Cowpea hay) have the higher CP and lower NDF concentrations relative to natural grass hay. The concentrate mix and cowpea hay have CP contents greater than 15%, a level that is usually required to support lactation and growth (Norton, 1982). The low levels of NDF in both supplements are indicative of high cell soluble matter. The ADF fraction in cowpea hay was slightly higher than that observed for concentrate mix. The IVDMD of cowpea hay (72.9%) observed in the current study lies within the range (53.2-73.6%) and greater than the mean (66.8%) reported by Seyoum (1995) for most herbaceous legumes. The IVDMD of cowpea hay is greater than the IVDMD reported for tropical (56.6%) or temperate legumes (60.7%) (Minson and Wilson, 1980). This might have resulted from the stage of harvest and loss of nutrients during the hay making process in the present trial. Based on chemical and digestibility values suggested by Singh and Oosting (1992), both supplements used in the present study can fully replace each other. Thus, there is an enormous potential for cowpea hay to be used as a supplement to low quality basal feeds.
Feeds offered DM OM CP NDF ADF ADL EME (MJ Kg-1 DM)
IVDMD Ca P
NGH 92.62 88.4 11.72 72.46 48.68 6.32 7.98 49.90 0.12 0.99 Cowpea hay 90.64 89.76 21.03 47.38 31.42 5.4 9.67 72.9 1.03 0.22 Maize grain 89.2 98.3 8.4 5.6 2.40 - 15.6 97.50 0.02 0.92 NSC 92.00 89.00 31.7 32.3 29.8 10 11.1 69.20 0.35 0.83 Concentrate 92.74 94.85 25.27 32.67 17.13 2.10 12.2 70.18 0.28 1.60

Livestock Research Proceeding
20
Dry Matter and Nutrients Intakes Dietary treatments were significantly (P<0.05) affected both basal feed and nutrient intakes of the cows Table 2, but increasing replacement of concentrate with cowpea hay caused a numerically substantial increase in natural grass hay intake for T3 over both the control and 100 % cowpea hay supplemented cows. Cows fed on T3 (50% cowpea hay replaced) had consumed 0.47 kg/ d, 0.51 kg/d, 0.62 and 1.14 kg/d more natural grass hay than those maintained on T1, T2, T4 and T5 respectively. However, replacement of concentrate with cowpea hay at a rate of 50% had significantly (P<0.05) increased total DM intake over those cows, which have received cowpea hay at the rate of 25% replacement. This was equivalent to consuming extra feed of about 0.51kg/d. Table 2. Dry matter and nutrient intakes of Horro cows fed ad libitum of natural grass hay and supplemented with cowpea hay as a partial replacement to concentrate mix.
a- cmeans within rows having different superscript are significantly different at; (*) = P<0.05; SL = Significance level; SEM = standard error of mean; ns = not significant Treatment effects on crude protein intake (CPI) were found to be significant (P<0.05) among the 50% cowpea hay supplemented and 100% cowpea hay supplemented group. Increasing levels of cowpea hay in the total diet didn’t result in a significantly (P>0.05) higher level of CPI though; the overall CPI is much higher than the projected CP requirement (ARC, 1990). The CPI was larger than expected to meet the CP requirement of the cows for both the observed (2.95kg d-1) and the projected (8-10 lit/day) (ARC, 1990) milk yield. In general, the improved CPI with cowpea hay -supplemented groups T3 (50% cowpea hay replaced) might have been attributed to the combined effect of cowpea hay with the concentrate mix. As a rule of thumb, addition of forage legume to a basal diet of low nitrogen content will increase the nitrogen content of the total diet, which in turn is likely to increase feed intake and the rate of degradation of the basal diet in the rumen (Topps, 1997). This, therefore, explains why forage supplementation has increased total DM intake for natural grass hay based treatments comparable to the control diet (T1) in the present trial without significantly (P>0.05) reducing the basal feed intake. The numerically increased DMI obtained for T3 might have arisen from the more balanced intakes of both CP and ME that have led to a more efficient utilization of the fiber in the total diet. This is in agreement with other studies (Mpairwe, 1998). The highest MEI (44.85 MJ/head/day) obtained for 50% cowpea hay replacement of concentrate mix is far from the estimated daily ME (97.6 MJ/head/day) requirement of lactating cows weighing 400 kg and producing 8-10 kg milk of 4.5% butter fat (ARC, 1990). Total ME intake across all the treatments were
Parameters Treatments T1 T2 T3 T4 T5 SEM SL Dry matter intake Total DM (kg/d) 5.53ab 5.49ab 6.0a 5.38ab 4.86b 0.36 0.03 DMI (% BW) 2.64 2.63 2.91 2.61 2.43 0.21 ns DMI (g/kg W0.75) 100.35 100.01 109.87 98.79 91.32 7.51 ns Nutrient intake OM (kg/d) 5.07 ab 5.03 ab 5.51a 4.88 ab 4.37b 0.35 0.04 CP (kg/d) 0.81ab 0.81ab 0.8965a 0.78ab 0.64b 0.06 0.03 ME (MJ/d) 36.06 40.24 40.028 44.85 40.64 3.83 ns NDF (kg/d) 3.20 3.61 3.32 3.75 3.77 0.35 ns ADF (kg/d) 2.38 2.32 2.5301 2.29 2.21 0.16 ns ADL (kg/d) 0.33 0.32 0.35 0.30 0.29 0.024 ns
Livestock Research Proceeding
21
sufficient to meet the daily requirement for ME of cows with a mean daily milk yield of 2.95 kg in the present trial. Metabolisable energy intake either among the cowpea hay supplemented group, or when this group was compared with the control was found to be non-significant (P>0.05) for all dietary treatments considered. Mpairwe (1998) reported that lactating crossbred cows were found to optimize their energy intakes and OM digestibility when a forage legume (Lablab) was supplemented to a basal diet of oat-vetch and maize-lablab basal diet at a modest level of wheat bran supplementation than when the concentrate alone was offered. Apparent Dry Matter and Nutrient Digestibility Treatment effects on mean daily Apparent Dry Matter and Nutrient Digestibilitesa is shown in Table 3. As seen in Table 2, total DM intake tended to be significant (P<0.05) for T3, when compared to T5 dietary treatments. However, increasing level of cowpea hay seems to have significantly (P<0.01) increased DM intake only up to T3. Thus, a tendency for increased ADMD was observed with replacement by cowpea hay from 25% to 50%. However, further increase in the quantity of cowpea hay replacement from 50% to 75% was not accompanied with numerical improvement in ADMD. Thus, apparent DM digestibility of the total diet was observed to be more optimized when cowpea hay was included at the rate of 50% replacement, without any significant (P>0.05) reduction in the basal feed intake. Therefore, cowpea hay at those levels of concentrate replacement can fairly be compared with the concentrate mix (control) as a supplement to low quality basal roughages without any significant reduction (P>0.05) and substitution effect on basal feed intake. Pathak (2005), in his review, reported ADMD of 48.6% for 3% urea treated wheat straw supplemented with a concentrate mix and a small amount of green forage legume for local cows. The differences could also be attributed to the negative relationship arising as a result of the difference between the amount consumed and digestibility (Chilliard et al., 1995). Treatment effects on CP digestibility coefficient were found to be significant (P<0.05) between the 50% cowpea hay supplemented groups and 100% cowpea Hay supplemented group. CP digestibility was optimized at 50% of cowpea hay replacement. The absence of significant difference (P>0.05) with the control for both CPI and digestibility could lead to a definitive conclusion that cowpea hay could partially replace a concentrate mix in the present trial. The mean CP digestibility (65.4%) observed in the present study could safely be compared to the mean CP digestibility of 71.5% reported by Mpairwe (1998) for crossbred cows fed low quality basal diets and supplemented with graded levels of lablab hay and wheat bran. In all cases, the variations were assumed to have occurred from the difference in the type and quality of concentrates/forage legumes used as supplements, breed and/or species of the particular animal used in the experiment and the quality of the basal roughage used. Dietary treatments had significant (P<0.01) effect on apparent acid detergent fibre digestibility (AADFD). Similar finding has also been reported by Bareeba and McClure (1996) in which AADFD digestibility was 42.8% for urea treated maize stover supplemented with 20% alfalfa. In this experiment too, higher levels of cell wall (ADF) digestibility were optimized when the basal material was supplemented with a moderate level of (50%) concentrate replacement.

Livestock Research Proceeding
22
Table 3. Effect of cowpea hay replacement of a concentrate mix on mean daily Apparent Dry Matter and Nutrient Digestibility of experimental cows fed ad libitum natural grass hay
a- cmeans within rows having different superscript are significantly different at; (*) = P<0.05; SL = significance level; SEM = standard error of mean; ns = not significant Milk Yield and Composition Milk yield seemed to have declined with an increase in cowpea hay proportion in the total ration (Table 4). So there seems to be no beneficial advantage of increasing cowpea hay in the total ration beyond 50%. There was no significant difference (P>0.05) in daily milk yield between the control and the cowpea hay supplemented group up to 50% level of cowpea hay replacement. The observed lack of difference for milk yield and quality between the control and cowpea hay supplemented groups up to 50% provides sufficient evidence to accept the result of the current study that showed cowpea hay can partially replace a concentrate mix without any significant reduction in milk yield and quality. Treatment effects were also non-significant (P>0.05) for milk fat, milk protein, and solids not fat. The value of milk protein is high due to the amount of protein intake. The value of milk fat is also high because of the amount of roughage intake is high since roughage and milk fat has positive correlation. The high level of fat reported in this study (Table 4) compared to other studies for poor quality basal feeds supplemented with forage legumes (Mpairwe, 1998) were probably associated with higher and better utilization/intake of dietary fibre (Table 2) from which the precursor for mammary lipid synthesis is derived (Susmel et al., 1995). Table 4. Milk yield and composition, and Live Weight Change of the experimental cows Parameters Treatments SEM
SL T1 T2 T3 T4 T5
Milk yield (kg/d) 3.16ab 3.08abc 3.31a 2.75bc 2.43c 0.17 * Milk fat (%) 6.22 6.68 6.11 6.12 6.08 0.29 Ns Milk Protein (%) 3.35 3.61 3.69 3.49 3.60 0.11 Ns SNF (%) 9.27 8.64 8.85 8.62 8.66 0.295 Ns Live weight change g/day) -58.6 -54.435 -53.58 -52.065 -48.75 5.755 Ns
a- cmeans within rows having different superscript are significantly different at; (*) = P<0.05; SL = significance level; SEM = standard error of mean; ns = not significant Mean Daily Live Weight Change Daily mean live weight change of cows on the different treatments is given in Table 4. Live weight loss was numerically lower in cows on T3 (50% replacement) compared to those cows maintained on T1 and T2. According to Mukassa-Mugerwa (1989), lactating cows will probably lose weight after calving, but weight loss should be minimized through good feeding to allow them to start cycling again to allow annual calving. During the early lactation (first three months after calving) all cows in the current study lost body weight, with a declining trend with advance in lactation.
Apparent digestibility (%)
Treatments T1 T2 T3 T4 T5 SEM SL
DM 56.46a 57.06a 60.65a 54.43ab 47.18b 2.75 0.04 CP 64.02a 62.34ab 65.40a 59.22ab 50.61b 3.05 0.03 OM 59.58a 59.86a 62.87a 57.03ab 49.86b 2.79 0.02 NDF 46.94 54.31 49.63 51.78 49.96 3.71 ns ADF 49.74 ab 47.57
ab 49.74a 44.82ab 43.01 a 2.89 0.01

Livestock Research Proceeding
23
The variation in live weight change with previous researchers could be explained by the difference in the stage of lactation and genetic potential of the animals used in the experiments, the quality of the basal feeds used and the quality and quantity of supplements used in the respective cases. Garnsworthy (1997) noted that cows in early lactation and those of higher genetic merits partition energy towards milk production at the expense of body fat reserve. This author further noted that cows normally lose 0.5-1.0 kg of body weight each day for the first eight weeks of lactation and this is mostly body fat. Therefore, increased energy intakes at this stage of lactation is expected to result in further increases in milk yield, if the cow’s genetic potential has not been reached and/or a reduction in the daily amount of body fat mobilized. Cows on all dietary treatments in the present study were losing body weight progressively during the first period of the lactation cycle, which can be solely attributed to peak lactations. Cows were still losing body weight after the first period of the lactation cycle, but with a generally declining trend. However, improvements in body weight condition of cows have also been observed for all dietary treatments during the last period of the lactation cycle, all of which could probably be associated with availability of more nutrients in the form of protein and energy from the complete ration. Furthermore, the decreased milk yield during this period must have also contributed to a more diversion of the available nutrients to body fat depositions. Taddele et al. (2005) reported a non-significant difference between dietary treatments for milk yield of Boran cows maintained on low quality basal diet (teff straw) supplemented with graded levels of lablab hay replacing a concentrate mix. Partial Budget Analysis The economic feasibility of this study was analysed using partial budget and marginal analysis approaches. According to this analysis, cows in T3 gave the highest net benefit (Birr 3.91 per cow/day), while cows in T5 gave the lowest net benefit of Birr 1.71 per cow/day (Table 5). The minimum rate of return acceptable by the dairy farmer was assumed to be 50% (CIMMYT, 1985). This implies that the dairy farmer expects a minimum rate of return of 50% if he is to adopt a new practice as compared to the practice he used to do. Among the treatments, the largest change in cost that varies was birr 4 per day and the change in net benefits was birr 2.2 per day resulting in 54.9% marginal rate of return was recorded for T3. So for each birr invested in input for a cow, the farmer would recover birr 1(one) and an additional birr 2.2 at a given prices. Therefore, on the basis of MRR the technology is recommended for increasing milk productivity of cows. The result of MRR of the present study was in the profitable range between 158% and 131.85% reported by Shah et al. (2009) who worked on an on-farm trial of urea mineral molasses blocks fed to milking cows and buffaloes, respectively. Table 5. Partial budget analysis for the experimental
Variable Treatments T1 T2 T3 T4 T5
Milk yield (kg/cow/d) 3.16 3.08 3.31 2.75 2.43 Gross field benefit ( ETB /cow/d) 53.72 52.36 56.27 46.75 41.31 Cost of NGH ( ETB/ kg /cow/d) 13.83 13.545 14.63 13.3 11.9 Cost of cowpea hay ( ETB/ kg /cow/d) - 1.84 3.96 4.96 5.84 Cost for Concentrate mix (ETB/kg/cow/d) 7.9 5.8 4.15 1.5 - Cost of Tablet and labour (ETB /cow/d) 15 15 15 15 15 Total variable cost ( ETB /cow/d) 36.73 36.185 36.74 34.76 32.74 Gross income, ETB/head 17.00 16.18 19.53 11.99 8.57 Net benefit ( ETB cow/d) 3.40 3.24 3.91 2.40 1.71 Change in net income 1.69 1.53 2.20 0.69 0.00

Livestock Research Proceeding
24
ETB = Ethiopian Birr; MRR = Marginal rate of return A rational dairy farmer has to make a compromised decision so that he could opt for a more sustainable milk yield and reasonable profit throughout the entire lactation period, although, this study emphasises the importance of additional observations to see the likelihood of lactation curve for all dietary treatments in the remaining part of the lactation cycle for conclusive economic decision. Generally, those cows supplemented with 50% cowpea and 50% concentrate with basal diet of natural grass hay optimise both biological and economic benefits as compared to cows consumed other treatment rations. However, since the cost for most inputs are variable over time, it cannot be taken for granted that the net benefit obtained from this study would be sustainable over years or locations. The increased net benefit obtained for cows in T3 was generally due to the low cost of cowpea production. This implies that whether response to feeding supplemental diet of cowpea is beneficial in economic terms depends on the cost of growing and biomass yield of the forage. In general, it can be understood from the present trial that if farmers establish and use cowpea hay, milk yield from dairy cows can be improved economically Conclusion and Recommendations The daily DM and CP intake were significantly (P<0.05) differ among the treatments with the highest intake observed when cows were fed 50% cowpea hay (T3). Apparent DM digestibility of T3 (60.65%) was higher (P<0.001) than T5 (47.18%). The milk yield were significant differences among the dietary treatments with lower mean milk yield recorded in T4 and T5 as compared to T1, T2 and T3. This implies that cowpea hay can partially replace a concentrate mix without any significant reduction in milk yield and composition. Therefore, milk yield seemed to have declined with an increase in cowpea hay proportion in the total ration beyond 50%. The results of the present study lead to acceptance of the fact that dry season feeding strategy using high protein farmer-grown cowpea hay in association with natural grass hay can be a significant intervention in small scale dairy farms. Furthermore, from the present study, it can be concluded that cowpea hay can both biological and economically replace a concentrate diet up to 50% of replacement without significant reduction in milk yield and live weight conditions of lactating Horro breed cows fed a basal diet of natural grass hay. However, there is a need for further study to determine the effect of such dietary treatments over the entire lactation period for conclusive economic decision. Moreover, in order to verify the importance of the present study at farmer’s level, undertaking on-farm trials using the treatments used in the current study is worthwhile. Acknowledgement The financial support of Oromia Agricultural Research Institute is gratefully acknowledged. The authors are also grateful to Animal Farm Team member of Bako Agricultural Research Center for facilitating different supports required during the conduct of the research work. References ARC ( Agricultural Research Council), 1990. The nutrient requirement of ruminant livestock.
Common Wealth Agricultural Bureaux. Slough, England. UK. AOAC (Association of Official Analytical Chemists), 1995. Official Methods of Analysis. pp. 5-13. (16th
edition), Washington DC, USA AOAC, 1990. (Association of Analytical Chemists). Official methods of Analysis. 15
th edition. AOAC Inc, Arlington, Virginia, USA.
Baloyi, J.J., N.T. Ngongoni, and H. Hamudikuwanda. 2008. The effect of feeding forage legumes as nitrogen supplement on growth performance of sheep. Tropical Animal Health and Production 40: 457–462.
Change in total variable cost 3.99 3.45 4.00 2.02 0.00 MRR, % 0.4238 0.4427 0.5490 0.3406 0

Livestock Research Proceeding
25
Bareeba, F. B. and K. E. McClure, 1996. Effect of ensiling maize stover with alfalfa or urea on intake, digestibility and nitrogen balance by growing lambs. pp. 85-89. In: J. Ndikumana and P. de Leeuw (eds.), sustainable feed production and utilization for smallholder livestock enterprise in sub-Seharan Africa. Proc. of the Second African Feed Resource Network (AFRNET) Workshop Held in Harare, Zembabwe, 6-10 Des. 1993.
Berhanu, G., H. Adane and B. Kahsay, 2009. Feed marketing in Ethiopia: Results of rapid market appraisal. Improving Productivity and Market Success (IPMS) of Ethiopian farmers project Working Paper 15. ILRI (International Livestock Research Institute), Nairobi, Kenya, pp: 64.
CIMMYT, 1985. From Agronomic Data to Farmers Recommendations. Economics Programme.Mexico. 32p.
Chilliard Y., M. Doreau, F. Bocquier and G.E. Lobley, 1995. Digestive and Metabolic adaptation of ruminants to variations in feed supply. Pp.329-360. In: M. Journet, E. Grenet, M.H. Farce, M. Theriez and C. Demarquilly (eds.), Recent development in the nutrition of herbivores. Proc. of the 4th international symposium on the nutrition of herbivores. INRA editions, Paris, France.
Hall A, Sulaiman RV and Bezkorowajnyj P., 2008. Reframing technical change: Livestock fodder scarcity revisited as innovation capacity scarcity - A conceptual Framework. Systemwide Livestock Programme. http://www.vslp.org/front_content.php.
Garnsworthy, P. C., 1997. Fats in dairy cow diets. 104 In: P. C. Garnsworthy and J. Wiseman (eds.), Recent Advances in Animal Nutrition. Nottingham. University press. 87p
McDonald, P., R. A. Edwards, J. F. D. Greenhalgh, C. A. Morgan, 2002. Animal Nutrition (6th
edition). Pearson Educational Limited. Edinburgh, Great Britain. 544p. Minson, D. J. and J. R. Wilson, 1980. Comparative digestibility of tropical and temperate forages. A
contrast between grass and legumes. J. Aust. Inst. Agric. Sci. 46: 247-249. Mpairwe, R. D., 1998. Integration of forage legumes with cereal crops for improved grain yield, forage
production and utilization for smallholder dairy production systems. A thesis submitted to the school of post-graduate studies of Makerere University. 238p.
Mukasa-Mugerwa, E., 1989. A review of reproductive performance of female Bos indicus (Zebu) cattle. ILCA Monograph No.6. ILCA, Addis Ababa, Ethiopia. 134p.
Mulat Alem, 2006. Effects of Supplementing Different Protein Sources on Feed intake and Live Weight Gain of Local Sheep Fed on Finger Millet (Eleucine coracana) Straw Basal Diet. An MSc Thesis Presented to the school of Graduate Studies of Alemaya University of Agriculture, Ethiopia. 61p.
Mupangwa, J.F., N.T. Ngongoni, D.E. Daka and H. Hamudikuwanda, 2002. The effect of supplementing a basal diet of veld grass hay with increasing levels of velvet bean hay (Mucuna pruriens) on nutrient parameters in sheep. Livestock Research for Rural Development, 14 (4). Retrieved September 20, 2010, from http://www.cipav.org.co/lrrd/lrrd14/4/mupa144.htm. Norton, B.W., 2003. The nutritive value of tree.
Norton, B. W., 1982. Difference between species in forage quality. In: J. B.(ed), nutritional limits to animal production from pastures. pp. 89-110. Proc. Of an international symposium held at St. luice, Queens land, Australia, August 24-28, 1981, Common Wealth Agricultural Bureaus, UK.
Pathak, N. N., 2005. Comparison of feed intake, digestibility of nutrients and performance of cattle (B. indicus and B. indicusXB. Taurus crosses) and buffaloes (Swamp and India). In: A. A., Ayantunde, S. Fernandez-Rivera and G. McCrabb (eds.), Coping with Feed Scarcity in Smallholder Livestock Sytems in Developing Countries. Animal Science group, Waginigen, UR, The Nezerlands, University of Reading, UK, ETH. Zurick Swizerland and ILRI, Nairobi, Kenya. 306p.
SAS (Statistical Analysis System), 2002. SAS Institute Inc, NC, USA.

Livestock Research Proceeding
26
Poultry Research Results
Seyoum Bediye, 1995. Evaluation of nutritive value of herbaceous legumes, browse species and oil seed cakes using chemical analysis, In vitro digestibility and nylon bag techniques. MSc. Thesis, Alemaya University of Agriculture, Ethiopia. 209p.
Shah H, Sharif M, Majid A, Hayat U and Munawar A, 2009: From experimental data to farmer recommendation: an economic analysis of on-farm trial of UMMB feed for milking animals in rain-fed Pothwar, Pakistan. Livestock Research for Rural Development. 21(117). Retrieved August 11, 2014, from http://www.lrrd.org/lrrd21/8/shah21117.htm
Singh, G. P.and S. J. Oosting, 1992. A model describing the energy value of straw. Indian Dairyman XLIV: 322-327.
Susmel, P., M. Spanghero, B. Stefanon, and C. R. Mills, 1995. Nitrogen balance and partitioning of some nitrogen catabolites in milk and urine of lactating cows. Liv. Prod. Sci., 44: 207-219.
Taddele Mirkena, Nega Tola and Shiferaw Garoma, 2005. Effect of substituting concentrate diet by lablab hay (L. purpureus) on post-parteum productive performance of lactating Boran cows. 284p. ESAP (Ethiopian Society of Animal Production), proc. of the 12th annual conference of ESAP held in Addis Ababa, Ethiopia. August, 12-14, 2004
Tilley, J. M. A. and R. A. Terry, 1963. A two-stage technique for in Vitro digestion of forage crops. Journal of the British Grassland Society 18:104.
Topps, J. H., 1997. Forage legumes as protein supplement to poor quality diets in the semi- arid tropics. In R.J. Wallace and A.Lahlov-kassi (ed), Rumen Ecology Research Planning. Proc. of a workshop held at ILRI (International Livestock Research Institute), Addis Ababa, Ethiopia, 13-18 March 1995.
Van Soest, P. J.and J. B. Robertson, 1985. Analysis of forage and fibrous foods. A laboratory manual for Animal Science 613 Cornell University, Ithaca, New York, USA.
Wakene Negassa, 2001. Assessment of important physicochemical properties of Alfisols under different management systems in Bako area, Western Ethiopia. An MSc Thesis Presented to the School of Graduate Studies of Alemeya University Ethiopia. 93p.

Livestock Research Proceeding
27
Poultry Research Results

Livestock Research Proceeding
28
Assessment of major Production and Health Constraints of Chicken in some Districts of East Wollega, Horro Guduru Wollega and West Shoa zones, Ethiopia
Dereje Bekele1, Habtamu Abera¹, Fayera Bodena¹, Misgana Duguma2, Mamo Mekonnin¹ and
Gemeda3 Duguma
¹Bako Agricultural Research Center P.O. Box 03, Bako, Ethiopia
²School of Veterinary Medicine, Wollega University, P.O. Box 395, Nekemte, Ethiopia ³International Livestock Research Institute (ILRI), PO Box 5689, Addis Ababa, Ethiopia
Abstract A preliminary survey was carried out in some districts of East Wollega, Horro Gudur Wollega and West Shoa zones of Oromia from January to March 2012 to investigate the production and health constraints of village chicken under farmers’ management condition and generate baseline data for future genetic improvement. Purposive sampling technique was used for sites selection mainly focusing on accessibility and chicken production potential. A total of 100 farmers were interviewed using semi-structured questionnaire. The questionnaire was pre-tested before commencement of the actual work. The average chicken flock size was 9.3+0.7 per household. Traditional poultry production is a common practice in the study areas. No supplementary feed is offered other than grains in wet season when feed is scarce. According to majority of the respondents (78%) chickens are reared for income generation, household consumption (20%) and cultural and religious purposes (2%). There were attributes preferences like feather color and comb type both for market and breeding purposes. According to the respondents red feathered (59%) and white feathered (25%) chickens are the most preferred types. Owners attributed white feather color with high egg production. Diarrhea was the major problem identified by respondents of the study areas. Predators such as eagles were also reported as major bottlenecks to chicken production. We suggest capacity building for farmers and extension staff in areas of ration formulation from locally available feed resources, health management and record keeping for improved production and productivity. Key words: Chicken, diseases, traditional management, Oromia, Ethiopia Introduction The total chicken population in the country is estimated to be 50.38 million (CSA, 2013). Despite such large population, the total output of poultry is very low. Majorities (99 %) of these chickens are maintained under a traditional system with little or no input for housing, feeding or health care (Tadelle and Ogle, 2001). In most parts of Ethiopia, village chicken represents a significant component of the rural household livelihood as a source of cash income and nutrition (Dhuguma, 2009). Indigenous chickens, which are managed under extensive systems accounts for 99% of the total population in Ethiopia (AACMC, 1984). Samson and Endalew (2010) reported that traditional chicken keeping is practiced nearly by all family in rural Ethiopia due to the fact that they provide protein for the rural population and generate family income. Alemu (1987) and Smith, 1990) revealed that poultry production is an ideal starting point for beginning animal agriculture for their ability to adapt to most areas, rapid growth rate, short generation time, low initial investment and small land size requirement In addition, the local chicken sector constitutes a significant contribution to human livelihood and contributes significantly to food security (Dhuguma, 2009). In Ethiopia lack of knowledge about improved poultry production, limitation of feed resources, prevalence of economically important diseases (Newcastle, Coccidiosis etc) as well as institutional and socio-economic constraints remains to be the major challenges in village based chicken productions (Ashenafi et al., 2004). In East Wollega, Horro Guduru Wollega and parts of West Shoa, the average land holding was about 2.3ha of which about 1.8ha (78.3%) being allotted for cropping and 0.5ha (21.7%) for grazing (Solomon Abegaz et al., 2005). This implies that introduction of improved small-scale poultry (chicken) production is crucial to alleviate the poverty in our poor rural farmers. It has been raised many times from agricultural offices of East Wollega Zones during agricultural development

Livestock Research Proceeding
29
partners’ linkage advisory council (ADPLAC) review meeting as research on poultry and goat has been forgotten and needs to be given priority. Therefore, the study was conducted to assess production and health constraints of village chicken production under farmers’ management condition in the study area. Materials and Methods Study Area The survey was carried out in Western Oromia zones of East Wollega, Horro Guduru Wollega and West Shoa. Five districts per zone and two peasant associations (PAs) from each district were included in the current study. Purposive sampling techniques were used to select the districts and PAs. Data on chicken population, productivity, family chicken production objectives, and production, productivity and health constraints were collected using semi structured questionnaire. A total of 100 farmers owing chicken were interviewed. Data Analysis Descriptive statistics like mean, range, frequency and percentage were used to analyze the data using Statistical Package for Social Sciences (SPSS, 2011) Version 16. Results and Discussion Socioeconomic characteristics of the household Family size of respondents ranges from 2-12 persons with an average of 6.74 (±0.24) Table 1. The mean family size obtained in the current study was lower than the 8.5(±3.66) reported by Solomon et al. (2005) for East Wollega (recently divided into Horro Guduru Wollega and East Wollega zones) and west Shoa zones. The mean land holding per household of the interviewed farmers was 2.62 (±0.25) ha and it ranges from 0.25 to 13.5. About 2.15 (±0.20) ha of land was allocated for crop production leaving only 0.81 (±0.07) ha for grazing (Table 1). Based on respondents, grazing land has been decreasing from time to time mainly because of cropland encroachment and the increase in population size. Table 1. Ages, family size and land holding of the respondents
Characters N Min Max Mean SD Family size 100 2.00 12.00 6.74 0.24 Land holding (ha) 97 0.25 13.50 2.63 0.25 Crop land (ha) 96 0.25 12.00 2.16 0.20 Grazing land (ha) 56 0.00 2.50 0.81 0.08
N= Number of respondent, SD = standard deviation Famers acquired foundation flock of chicken through different systems. The majority of respondents obtained by purchase (91.9%), sharing of chicks called “Ribbi” (6.1%) and acquired from parents (2%). Similarly, Mammo (2007) also reported that about 75.5% of chicken producers in Jamma woreda of South Wollo acquired foundation and replacement stocks mainly by purchasing from market.

Livestock Research Proceeding
30
Table 2. Systems through which farmers obtained their chicken
Obtained by N(100) Percent (%) Purchase 90 90.0 Gift from parent 2 2.0 Shared from other people 6 6.0 Breeding 2 2.0
N=Number of respondents In the current study about 74% of the respondents reported that the trend of poultry production has been increasing, while about 24% of the respondents reported that the trend has been decreasing and only 2% of the respondents reported that they don’t have information about the trend of chicken production. Table 3. Trend of poultry production among farming community/private sectors
N= Number of household The average mean price of cockerel was greater than both pullet and hen but the difference is not this much when we compare the average mean price of cockerel and hen Table 4. Fifty percent of the respondents had access to credit service. About 64% of the interviewed farmers who had got the credit service used the money they borrowed to establish improved poultry production, purchase agricultural input (e.g. fertilizer and improved seeds) and ploughing oxen. It was also reported that some of respondents use the credit money for trading. About 37% of the interviewed individuals cannot estimate the time spent daily on poultry management while about 62.9 % can estimate the time spent. About 38% of the respondent said they can spend an hour per day on total poultry management. Table 4. Prices for different types of chicken and egg during the study period Price of different group of chicken and egg
Freq Minimum Maximum Mean SD
Average price of egg 96 1.00 2.50 1.69 0.03 Average price of pullet 96 25.00 71.0 57.19 7.53 Average price of hen 96 25.00 95.00 63.02 1.64 Average price of cock 96 50.00 150.00 99.64 2.04 Average price of cockerel 95 40.00 125.00 67.79 1.57 Production performance of chicken The average age of local pullet to 1st egg is about 5.7 months. The number of clutches/chicken /year is about 4.6 and the average number of eggs per clutch/ local chicken is 14.2 (Table 5). Fisseha et al. (2010) reported longer age (month) of indigenous pullet at 1st laying in Bure (6.42), Fogera (5.9) and Dale (7.1) areas, respectively. Correspondingly, the average number of eggs/hen/clutch reported for same areas were 15.7, 13.2 and14.9. Zemene et al. (2012) also reported 14.1 eggs per hen per clutch and 45.7 eggs per year with average egg weight of 39.6g. Mandla et al. (2006) reported age at first egg of 6.8 and 7.6 months for indigenous chickens, respectively.
Trend of production N Percent (%) Increasing 74 74.0 Decreasing 24 24.0 Have no information 2 2.0

Livestock Research Proceeding
31
Table 5 .Production performance of indigenous chicken in the study area
N=Number of respondents The average number of eggs incubated per local broody hen was about 13.3 and the average eggs hatched from incubated eggs was about 11, indicating that about 2.6 eggs were spoiled Table 6. It means that proportion of hatched eggs of incubated eggs is 82.3. Zemene et al. (2012) reported 12.8 eggs as average number of eggs incubated per hen with average hatchability of 79.1%. Fisseha et al. (2010) also indicated that the average hatchability percentage of eggs from local hens to be 82.6%. Table 6. Hatchability performance of local hen in the study area Hatchability performance N Minimum Maximum Mean Std. Error № of eggs incubated/broody hens 98 8 25 13.29 .30 № of eggs hatched/incubated eggs 98 6 22 10.94 .28 № of spoiled/incubated eggs 90 0 7 2.62 .14 N=Number of respondent Breed ownership and breeding practice of chicken About 95% of the respondents owned local breeds. Only about 3% owned both local and exotic ecotypes and while the rest 2% of the respondents owned exotic breeds. These results confirmed by CSA (2013) showed that 96.9 %, 0.54 % and 2.56 % of the total poultry were indigenous, hybrid and exotic, respectively. The mean number of chicken owned by the respondents was about 9.3, of which 8.13 (87.2%) are indigenous chicks. Table 7. Class of Chicken owned by respondents
N=Number of respondent It was revealed that majority of the respondents (87%) select their chicken for breeding. However, about 6.2% of the respondents do not select chicken for breeding. Most (66.8%) of the respondents who exercise selection both for female and male while about 17.7% of them select only female. Farmers use different production traits and phenotypic characters to select their chicken for breeding purposes. Most of the respondents (37.4%) use egg production performances as indicator to select females for breeding while live weight, feather color, comb and wattle shape are some of the traits used to select males. Next to egg production live weight of the chicken was the most important parameter used for selection (Table 8).
Variables N(100) Mean SD Age at sexual maturity (month) 100 5.46 1.19 №of eggs in one clutch/ local chicken 96 14.21 5.39 № of clutches/ chicken /year 95 4.60 1.22 Mean age of local pullet at 1st egg (month)
100 5.66 2.19
Chicken owned N Minimum Maximum Mean SD Hen 95 1 24 4.00 1.32 Cock 75 1 14 1.89 0.77 Chick 52 1 30 8.13 0.21 Over all chicken 100 1 42 9.32 0.71

Livestock Research Proceeding
32
Table 8. Character for which farmers were selected local chicken, either for market or breeding Character(s) N(100) Percent (%) Egg production 37 37.4 Live weight 28 28.3 Feather color 20 20.2 Comb/wattle shape/type 6 6.1 For all characters 7 7.1 Have no information 1 1.0 N=Number of respondent Feather color had also great importance as far as poultry production is concerned. Majority of the respondent (59%) prefer red color as 1st choice due to its high market demand and egg productivity and about 25% white colored as 2nd choice for its high egg productivity. But still there was hesitation by few of the respondents in accepting chicken with white feather due to the fact that chicken with white feather can be seen easily by predators from far distance especially by eagles and. About 12% of the respondents didn’t use coat color of chicken as a criteria of preference (Table 9). More than 94 % of the respondents had high interest to have exotic chicken breeds. However, the high purchase price and availability problem of the exotic breed inhibited the farmers from having the breed. A farmer need to register in the nearby Livestock Development and Health Agency and should wait for more than six to one year to have two pullets. Disease outbreak and shortage of formulated ration were also raised as major production constraints of the improved breeds. According to respondents view, culling of unproductive chicken was very important. About 66% of the respondents culled unproductive females mainly through selling, while 39.4% of respondents consumed the culled females at home. Table 9. Color preference of farmers for chicken for breeding
Coat color(s) N(100) Percent (%) Red 59 59.0 White 25 25.0 Gebsima 2 2.0 Gray 1 1.0 Black 1 1.0 No coat color preference 12 12.0
N=Number of respondents Chicken Husbandry Practices Housing In spite of the fact that village chickens spent more of the daytime in extensive scavenging in and around the house, housing was among the common flock-management practices. According to the respondents, about 55% respondents share same room with chicken that are kept on a small bed like materials made from local materials locally called perch ‘koti’ that is tied and suspended at the corner of the ceiling/roof 20% of the respondents housed their chicken in different quarter in the roof while14% of the respondents house them separately and about 11% house them in the kitchen. Fisseha et al. (2010) indicated that 77.9% of the respondents keep their chicken at various sheltering places in the main house: including perches inside the house (45.7%), on the floor covered by bamboo made materials (27.1%), on the ceiling of the house (3.6%) and under locally constructed sitting place “medab” (1.4%). The report of Zemene et

Livestock Research Proceeding
33
al. (2012)other farmThe majocalled ‘koAccordingdo not cle All familyThough, bBut most feeding arhead and constructipoultry slchicken to
Figure 1.H Feed andAbout 50scavenginbased on (88.9%) fAccordingpracticed to feed thMajor rea(13.1%) timprove e Table 10. Type of feGrain (maFood left All as its aTotal N=Numb
) showed that m animals, writy of the resoti’ which wg to 76.1% ofean the poultry
y members pboth the husb
of the manare done by wi20% by chil
ion and nestslaughtering ao veterinary c
Household d
d Feeding Ma0% of the resng. Some supthe availabili
farmers in theg to reports osupplementar
heir chickensasons for supto shorten agefficiency of h
. Type of feed
eed/food for saize, sorghumover (bread, “availability
er of respond
about 88.3%which makes t
spondents (91was made frof respondentsy liters at all.
articipate in cand and wife agement activife and childrldren, out of s were constrand treating clinics were d
division of lab
anagement spondent reveplemented thity of such gre Farta districof Halima etry feeding us. According plementation
ge at marketihens’ broodin
d/food offere
supplementatim, wheat and f“injera”, “kol
dents
% of the chickthe bio-securi1.9 %) reportm local mat cleaning of t
chicken husbhave equal rivities like cl
ren. It was repwhich about
ructed by huof sick onesone by husba
bor in chicken
ealed that theheir chicken wrains and sca
ct of Amaharat al. (2007) ased maize, bato responden
n were reporteing or improness (5%) dur
ed as supplem
ion finger millet )lo” and others
ken owners shity of villageted that durinerial and putthe poultry lit
bandry and might in ownerleaning (78%ported that abt 12% them ausbands (69.4 using differ
ands (Figure 1
n husbandry p
e most domiwith grains likarcity of feedsa regional statand Zemene earley, wheat, nts (79.8%), ed to increaseve growth p
ring incubatio
ment for loca
) s)
hared their mae poultry prodng night chickut above headters was done
management prship, decision
% by wife anbout 47% of care owned by4%). Respondrent local me1).
practice in th
inant chickenke maize, sors. Bogale (20te gave supplet al., (2012)finger millet supplementate egg yield (erformance (
on.
al chicken
N 86 12 2 100
ain houses widuction systemken rests on td at the corne while 2.3%
practices in onn was mainly
nd girls), eggchicken are owy male childrdents reporteedicinal herb
he study area
n’s productionrghum, whea
008) also repolementary fee), the majoritand house hotion was don(70.7%), to im(12.1%) of th
Per86.912.2.0 100
ith the chickem extremely
the material loner of the ceof the respon
ne way or any made by husg managemenwned by housren. Poultry
ed that aboutbs and taking
a
n system waat and finger orted that maed to their chity of farmersold waste prone in the mormprove meat he chicken a
cent (%) 9 1
0.0
en and poor.
ocally eiling. ndents
nother. sband. nt and sehold house t 91% g sick
s free millet
ajority icken. s who oducts rning. yield
and to

Livestock Research Proceeding
34
Table 11. Priority of supplementation in chicken
No Class of chicken Frequency Percent (%) 1 Chicks 41 41.4 2 Layers 38 38.4 3 Pullet 3 3.0 4 All age equally ( no priority) 17 17.2
Our findings are in agreement with results reported by Fisseha et al. (2010) in that young chicks and layers are given priority in supplementary feeding. According to respondents, young chickens cannot scavenge and well fed hens lay more eggs. No special container or feed trough was needed to offer supplementary feeds to chicken. Whether it is kitchen leftovers or grains, the owners broadcast the feeds on the ground where they pick it up. The majority of the respondents (92.9%) supplement their chicken during rainy season (mostly from end of June to September) when feed is scarce. Only about 5.2% of the respondents indicated that they supplement their chicken during dry season. Fisseha et al. (2010) also reported that about 84% of the poultry owners in Bure and Fogera areas of north-western Ethiopia provided supplementary feed to their chicken during rainy/wet season (from July to September) than in the dry season. This coincides with a season when grains are depleted even for human consumption. Hatchery and egg storage The majority of the respondents (68%) practiced selecting of eggs for incubation. The selection criteria reported were: size of hens, size and shape of eggs. More than 80% of the respondents reported that they prefer eggs from large hens for incubation while very few farmers (2.5%) did not bother about the size of hen when selecting eggs for incubation. Based on the respondents view eggs from large sized hens preferred due to the fact that chickens from large hens grow faster and larger in size as compared to those chicks from small sizes hens. Large sized eggs and non-deformed eggs were also chosen for incubation. Most of the eggs used for incubation were home laid eggs (94.9 %). About 3.1% of the respondents reported that they had used purchased egg for incubation. Techniques used to identify spoiled eggs from unspoiled eggs reported by respondents were shaking (78.6%), immersing in the water (14.3%) and candling (using direct sun light). Poultry owners allow their hens to incubate eggs mostly (90%) during dry season. The major reason is the availability of feed in the dry season compared to the rainy season. Locally made material called ‘gorbo’ (56%) and clay pots with straw bedding (38.2%) and clay pot without bedding (5.6%) are some of the most important materials used for broody hens during brooding. The average number of eggs laid per clutch from local hens is about 16.5 (8-25) in the study areas. This is comparable with the 16 eggs (8 to 28 eggs) reported by Fisseha et al. (2010) in Bure district of the Amhara regional state. Disease, predation and other health related problems Diarrhea, sudden death and paralysis were the most economically important problems identified in the areas followed by Newcastle disease (Table 12). Table 12. Disease/symptoms identified by respondents
Disease/symptoms identified Frequency Percent (%) Diarrhea, sudden death, paralysis, 75 75.0 Newcastle disease(Fungile) 23 23.0 External parasites 2 2.0

Livestock Research Proceeding
35
In the current study, poultry owners identified only Newcastle disease (Fungile) by local name, but they indicated others by symptoms. Tadalle (1996) also reported that Newcastle disease is probably, the only disease which can be identified by farmers in rural areas on the bases of clinical sign. That was probably why Newcastle disease acquired specific local name such as “Fungile” or “Encurif” in Ethiopia. In the current study, mortality was highest in lower age groups (chicks up to 2 weeks of age) which were reported as 41%. Generally, it was observed in the current study that disease prevalence was decreasing from chicks to adult chicken (Table 13). Most of the respondents (79.6%) keep chickens of different age groups together. Only about 19.4% of the respondents keep the different age groups separately. Table 13. Different age groups as affected by different types of diseases Age group affected Frequency Percent (%) Up to 2 weeks 41 41.0 2 weeks -1 month 22 22.0 Adult 9 9.0 1 month- 3 month 7 7.0 All age groups 21 21.0 Some of the respondents treated their chicken with different traditional medicine and only few of them took their chicken to veterinary clinic. Sick animals are left within the flock, except when unable to walk with them. Owners mix lemon juice in poultry feed (29.3%) and also use juices of different plant leaves (18.7%). About 52% of the respondents reported that they did not know traditional herbs used to treat their chickens. Retarded growth, low egg production performance, reduced hatchability, droopiness and enlargement of hock joint were also some of the problems reported in the current study. About 60% of the respondents indicated that there were no responsive extension services despite the fact that the government assigned more than three extension agents in one station. According to the respondents predators were also important problems for poultry production in the study areas. Common predators identified by respondents were eagle (47%), wild cat and vulture (10%). Halima (2007) and Fisseha et al. (2010) also indicated that predators were the major constraints in village chicken production in north-west Ethiopia. Socio-economic aspects The majority of interviewed farmers (78%) rear chicken for income generation. Respondents also indicated that they produce for home consumption (improve family nutrition) and for ceremonial and religious purposes. Mammo (2007) indicated that the major purpose of poultry keeping was mainly for income generation followed by home consumption and religious purposes in Jamma districts of South Wollo zone, Ethiopia. In the current study, most of the respondents (59%) give chicken products especially egg for infants whereas about 24% the respondents reported that they give chicken products for whole family members. About 7% of the respondents indicated that they give priority to pregnant women, 5% for adults and 4% of respondents nursing mother (Table 14).

Livestock Research Proceeding
36
Table 14. Priority of poultry products in family nutrition
About 37% of the respondents reported that they do not consume chicken meat and chicken products due to the fact that they are expensive. This is in agreement with the report of Mammo (2007) for South Wollo Zone, Ethiopia. Even those owners who have chicken prefer selling than consuming, as they have given priority to generate cash income. Market price for poultry was influenced by different attributes in the study areas. Some of the major attributes were: weight, feather color and comb type. Chicken price was also influenced by season (Table15). Table15. Reasons for the seasonality of chicken and chicken products Reasons Frequency Percent (%) Disease 63 63.0 Demand and supply problems 25 25.0 Religious/ceremonial target 6 6.0 Have no information 4 4.0 Market problems 2 2.0 A large number of respondents (63%) reported that chicken price is lower during rainy/wet season due to diseases such as Newcastle and cossidiosis. About 25% of the respondents attributed price seasonality to demand and supply of chicken in the market. For instance, during rainy season the supply of chicken is high while demand is low. In addition to disease problems, chicken are also considered as enemy to backyard vegetables in rainy season. About 6% of the interviewed farmers reported that both the demand and supply of chicken and chicken products are high during the cultural and religious festivals such as Easter (‘Fasika’), the Ethiopian New Year and Christmas (‘Gena’). Fisseha et al. (2010) also indicated that chicken price was lower during rainy season due to the high risk of diseases and shortage of disposal cash by farmers. Conclusions and recommendations Our results indicated that chicken production is traditional with very weak or no extension services. To improve the current production and productivity of chicken production in the areas, the following points need attention: Strengthening extension services in the area of input provision (feeds, medicines, vaccination) are crucial. Control of diseases, mainly Newcastle, can be achieved mainly through sanitation practices, vaccination and prophylactic treatments. Capacity building of poultry producers in formulating ration from locally available feed materials and strategic supplementation are needed. Introduction and demonstration of movable poultry houses are important to protect the attacks from predators and high productivity. Movable poultry houses can be constructed from locally available materials with minimum coast.
Group of family members Frequency Percent (%) To infants 59 59.0 To pregnant women 7 7.0 Adults 5 5.0 To lactating mother 4 4.0 To older people 1 1.0 To all group in the family 24 24.0

Livestock Research Proceeding
37
Capacity building for farmers and extension agents in record and record keeping can help improving productivity via selection and mating. Linking farmers to pullet producers in order that they can communicate and buy pullets by themselves than looking for extension staff to have pullets References AACMC (Australian Agricultural Consulting and Management Company), 1984. Livestock Sub- Review
Report. Ethiopian Ministry of Agriculture. Addis Ababa, Ethiopia. Alemu, Y.1987. Small Scale poultry production, proceeding of the first National Livestock Improvement
Conference, Addis Ababa, Ethiopia, pp.100-101. Ashenafi, H., S. Tadesse, G. Medhin and M. Tibbo, 2004. Study on Coccidiosis of Animal Health and
Production scavenging indigenous chickens in central Ethiopia. Tropical Animal Health and Production, pp: 36(7): 693-701
Bogale kibiret. 2008. In situ characterization of local chicken eco-types for functional traits and production system in Fogera Woreda Amahara regional states. Thesis Haramaya University, Ethiopia.107p.
CSA, 2013, Ethiopian Statistical Abstract, CSA (Central Statistical Authority), Addis Ababa, Ethiopia. Dhuguma Reta, 2009. Understanding the Role of Africa. Indigenous Chickens during the Long Walk to Food Security in Ethiopia. Livestock Research for Rural Development, 21(8).
Fisseha Moges, Azage Tegegne and Tadelle Dessie. 2010. Indigenous chicken production and marketing systems in Ethiopia: Characteristics and opportunities for market-oriented development. IPMS (Improving Productivity and Market Success) of Ethiopian Farmers Project Working Paper 24. Nairobi, Kenya, ILRI
Halima Hassen Mogesse. 2007. Phenotypic and genetic characterization of indigenous chicken populations in northwest Ethiopia. PhD thesis. Faculty of Natural and Agricultural Sciences, Department of Animal, Wildlife and Grassland Sciences, University of the Free State, Bloemfontein, South Africa.
Halima Hassen, F.W.C. Neser, E. Van Marle-Koster and A. De Kock. 2007. Village based indigenous chicken production system in north-west Ethiopia
Mammo Mengasha, 2007. Survey on village chicken production under traditional management system in Jamma Woreda south wollo, Ethiopia. Msc thesis. Haramaya University.
Mandla, M.K., N. Khandekar and P. Khandekar. 2006. Backyard poultry farming in Bareilly district of uttar Pradesh, India.
Samson Leta and Endalew Bekana, 2010. Survey on Village Based Chicken Production and Utilization System in Mid Rift Valley of Oromia, Ethiopia. Global Veterinaria, 11 (5): 552-559, 2013.
Smith, A, J, 1990. Poultry. The tropical agriculturalist. Macmillan publisher Ltd London and Basingstke. Solomon Abegaze, Gemeda Duguma, Ulfina Galmessa, Biranu Soboka and Fikiru Terefe. 2005. Small
ruminant production system in east wellega and west shewa zones. Taddele D.1996. Studies on village poultry production systems in the central highlands of Ethiopia. Msc
thesis. Swedish University of Agricultural Sciences.70 pp. Tadelle, D. and B. Ogle, 2001. Village Poultry Characterization of Indigenous Chicken Populations
Production System in the Central High Lands of in Northwest Ethiopia.Tropical Animal Health and Production 33: 521-537.
Zemene worku, Abera Melesse and Yosef T/giogs, 2012. Assesiment of Village chicken production system and performance of local chicken populations in Goncha Siso Enesie district of Amahara Regional State, Ethiopia. Paper presented on Ethiopian society of animal production conference held at Addis Ababa, Ethiopia from December 14to17, 2011. ESAP, Addis Ababa 203

Livestock Research Proceeding
38
Feeds Resource and Rangeland Management Research Results
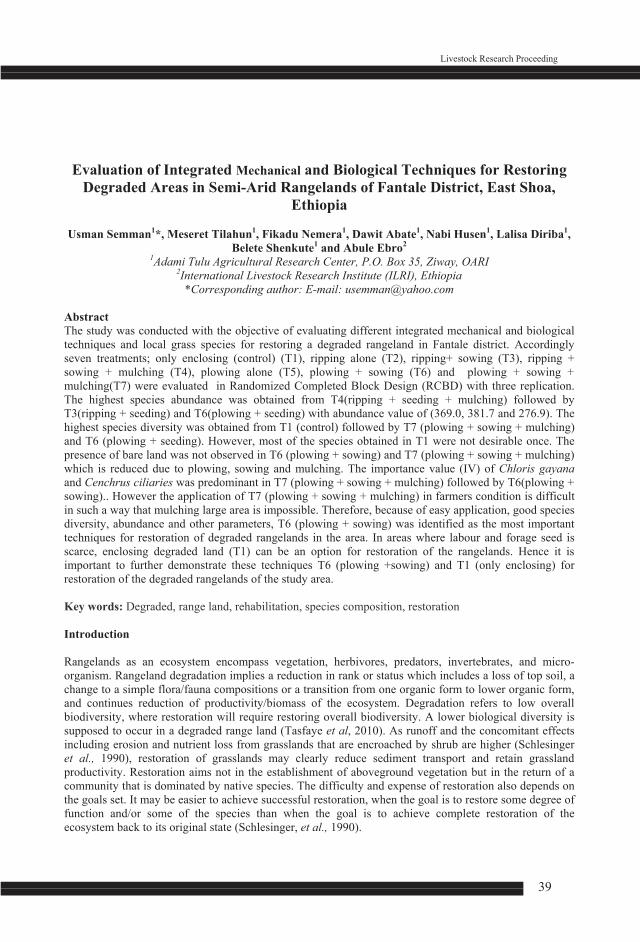
Livestock Research Proceeding
39
Evaluation of Integrated Mechanical and Biological Techniques for Restoring Degraded Areas in Semi-Arid Rangelands of Fantale District, East Shoa,
Ethiopia
Usman Semman1*, Meseret Tilahun1, Fikadu Nemera1, Dawit Abate1, Nabi Husen1, Lalisa Diriba1, Belete Shenkute1 and Abule Ebro2
1Adami Tulu Agricultural Research Center, P.O. Box 35, Ziway, OARI 2International Livestock Research Institute (ILRI), Ethiopia
*Corresponding author: E-mail: [email protected] Abstract The study was conducted with the objective of evaluating different integrated mechanical and biological techniques and local grass species for restoring a degraded rangeland in Fantale district. Accordingly seven treatments; only enclosing (control) (T1), ripping alone (T2), ripping+ sowing (T3), ripping + sowing + mulching (T4), plowing alone (T5), plowing + sowing (T6) and plowing + sowing + mulching(T7) were evaluated in Randomized Completed Block Design (RCBD) with three replication. The highest species abundance was obtained from T4(ripping + seeding + mulching) followed by T3(ripping + seeding) and T6(plowing + seeding) with abundance value of (369.0, 381.7 and 276.9). The highest species diversity was obtained from T1 (control) followed by T7 (plowing + sowing + mulching) and T6 (plowing + seeding). However, most of the species obtained in T1 were not desirable once. The presence of bare land was not observed in T6 (plowing + sowing) and T7 (plowing + sowing + mulching) which is reduced due to plowing, sowing and mulching. The importance value (IV) of Chloris gayana and Cenchrus ciliaries was predominant in T7 (plowing + sowing + mulching) followed by T6(plowing + sowing).. However the application of T7 (plowing + sowing + mulching) in farmers condition is difficult in such a way that mulching large area is impossible. Therefore, because of easy application, good species diversity, abundance and other parameters, T6 (plowing + sowing) was identified as the most important techniques for restoration of degraded rangelands in the area. In areas where labour and forage seed is scarce, enclosing degraded land (T1) can be an option for restoration of the rangelands. Hence it is important to further demonstrate these techniques T6 (plowing +sowing) and T1 (only enclosing) for restoration of the degraded rangelands of the study area. Key words: Degraded, range land, rehabilitation, species composition, restoration Introduction Rangelands as an ecosystem encompass vegetation, herbivores, predators, invertebrates, and micro-organism. Rangeland degradation implies a reduction in rank or status which includes a loss of top soil, a change to a simple flora/fauna compositions or a transition from one organic form to lower organic form, and continues reduction of productivity/biomass of the ecosystem. Degradation refers to low overall biodiversity, where restoration will require restoring overall biodiversity. A lower biological diversity is supposed to occur in a degraded range land (Tasfaye et al, 2010). As runoff and the concomitant effects including erosion and nutrient loss from grasslands that are encroached by shrub are higher (Schlesinger et al., 1990), restoration of grasslands may clearly reduce sediment transport and retain grassland productivity. Restoration aims not in the establishment of aboveground vegetation but in the return of a community that is dominated by native species. The difficulty and expense of restoration also depends on the goals set. It may be easier to achieve successful restoration, when the goal is to restore some degree of function and/or some of the species than when the goal is to achieve complete restoration of the ecosystem back to its original state (Schlesinger, et al., 1990).

Livestock Research Proceeding
40
The arid and semi-arid rangelands of Fantale district is purely pastoral but from the reference year onwards the pastoralists have started producing crops as well. The pastorals employs a communal resource system for livestock production. Livestock production is the main economic activity followed by crop production. Drought, feed, disease and localized conflict are the major constraints of the community. Some traditional grazing enclosures are emerged in recent decades. These enclosures are relatively new trends that allude to a new dimension in the dynamics of community based resource management. However, the rangelands are almost degrading and its productivity is diminishing. Hence, the rehabilitating the degraded land is very crucial to improve the feed resource availability from the rangelands. So the main intention of the study was to evaluate the effect of integrated mechanical and biological techniques for restoring degraded rangeland of the study area. Material and Methods Description of study area The study was conducted at Fantale district, East Shoa, Oromia. Fantale was sparsely populated lowland pastoral livelihood zone. The total land area of Fantale district is 1,169.85 km2 (CSA, 2000). The rainfall is highly irregular with a mean annual rainfall of 550.9 mm. The mean minimum and maximum temperatures are 17.4°C and 32.7°C, respectively. The topography is predominantly plains. Bush and shrubs are the main vegetation used for livestock feed. Procedures of the experiments Degraded site used for the evaluation of different rehabilitation techniques was selected and fenced to avoid livestock trampling and disturbances. Soil sample was collected from the experimental site of 20cm2 area by dividing each into three layer (0-3cm, 3-6cm and 6-9cm) depth. The collected soil labeled and settled in the lattice house at ATARC for evaluation of the availability of natural pastures seed in each layer. The germination test of seeds collected from soil samples also done. The actual trial was established at the commencement of the rain. The experimental treatments consisted of the application of two local grass species (Chloris gayana and Cenchrus ciliaris) and mechanical techniques (plowing and ripping with and without mulching). The experiment has seven treatment (T1 =Control (only enclosing), T2 = Ripping, T3 = Ripping + Sowing, T4 = Ripping + Sowing + Mulching, T5 = Plowing, T6 = Plowing + Sowing and T7 = Plowing + Sowing + Mulching) with three replication arranged in RCBD. The plot size of 9mx9m was used for the trial. The optimum seeding rate (10kg/ha) was applied for the both species. Ripping is slight plowing of the land with simple materials. The mulch treatment consisted of clipped grass material found locally in the area but without the seeds of the grass material. The grass mulch were applied with enough cover of the soil surface in the sown approximately 1cm thick . The importance of mulch is increasing survival rate, better growth and establishment of the seedling resulting from modification of the surface soil microenvironments, such as moisture content and soil temperature. Species composition Species composition of the treatments was identified using quadrants of (50*50) cm2 five times per plot including the control. Statistical Analysis Diversity (H’), Evenness (E), and Similarity coefficient (Sc) of the species for all treatment in the collected quadrants were determined following Shannon-Wiener (1949) diversity indices procedures. Shannon Diversity Index (H’) was computed as:
H’ = - ∑ ���������� Where: H’ = Shannon’s diversity index

Livestock Research Proceeding
41
pi = the proportion of individuals of the ith species S = total number of species in the quadrate The evenness was computed from the Shannon index as:
J= H' = ∑ ���������� H' max lns
Where: J = Species evenness s = the number of species Pi = the proportion of individuals of the ith species ln = log base 10 Similarity coefficient (Sc) was determined by the Czekanowski (1913) coefficient. The coefficient has a value from 0 (0%) to 1 (100%), where 1 reveals complete similarity and 0 complete dissimilarity.
Sc = �∑ �������� ������� ∑ ������ + ∑ ������
Where: Xi and Yi = the abundance of species m = number of species Abundance of each treatment was determined as of Maclntosh (1967a) diversity index (U).
� � ������
���
Where: U = Maclntosh diversity index S = the number of species n = number of the individuals or abundance of the ith species in the quadrant The relative density (RD) and relative frequency (CRF) were computed by:
RD% = Absolute density for a given species x 100% Total absolute density for all species
RF% = Absolute frequency value for a species X 100% Total absolute frequency for all species
Importance value (IV) of each species all treatments was computed following Shabbir and Bajwa (2006). IV is equal to the sum of the relative density (RD) and relative frequency (RF) of species in the stand. IV = RD% + RF% Data on soil seed bank were analyzed by descriptive statics.

Livestock Research Proceeding
42
Result and Discussion Soil seed bank evaluation The result of soil seed bank evaluation indicated that there were seeds to be restored in degraded rangeland at 3-6cm and 6-9cm depth of soil profile (fig-1). However, only Trajus berteronianus and Crysopogon plumuloses grasses were germinated. This suggest the requirement of restoration of degraded grazing lands using different rehabilitation techniques.
Fig:1- Soil seed bank availability in different soil profile Species composition A total of 17 species were restored out of which grasses and herbs/legumes comprises 83.35 and 17.65% of the total species recorded from the experiment respectively (Table 2). Analysis of the relative density shows that Tragus berteronianus which is already present in the soil seed bank showed relatively high density than the rest species in all the treatments. Among the treatments Tragus berteronianus was found the highest in T3 (ripping + seeding) followed by T4 (ripping + seed + mulching) and T2 (ripping) in that order. However relative density was the least in T7 (ripping + seeding + mulching) in which plowing diminishes the Tragus berteronianus growth. The performance of Chloris gayana and Cenchrus ciliaries is high in the T7(ripping + seeding + mulching) followed by T4(ripping + seed + mulching) which all plowing, sowing and mulching plays great role for their growth. Chloris gayana has more density than Cenchrus ciliaries. Hetropogon contortus and Cynadon dactylon was the more dense in T1(control) and T7(ripping + seeding + mulching) respectively, this may be due to the favorable environment created during the experiment (Table1). The result of relative frequency shows that bare land is the highest percentage (42.2) for T1(control) followed by T2 (ripping) (34.4%) and T5(plowing) (25%). However, the frequency decreases and even becomes zero by the combination of plowing, sowing and mulching. Tragus berteronianus is almost has the highest frequency than the rest species in all the treatments and among the treatments it is the highest in T4(ripping + seed + mulching) followed by T2(ripping) and T3(ripping + seeding) in that order. However it is lower in T5(plowing) followed by T1(control). This shows that the amount of Tragus berteronianus which is already present the soil profile are initiated by ripping and mulching but plowing reduce it. This may be due to the disturbance of the soil profile due to plowing. The performance of Chloris gayana and Cenchrus ciliaries seems the highest (25%) in T4(ripping + seed + mulching) But the result is due to the low frequency of the other species and the presence of mulching which facilitated growth. However, the real increment of Chloris gayana and Cenchrus ciliaries is due to plowing, sowing and mulching which is manifested in treatments T7(ripping + seeding + mulching), T6(plowing + sowing) and T5 with values of 19.5%, 18.4 and 12.5%, respectively. Plowing also facilitates the existing soil seed bank that may be deep to the soil. Crysopogon plumulosis, less desirable species, which is already present in the soil seed bank has relatively higher frequency in T2 (ripping) followed by plowing (Table 2).
0
1
2
3
0‐3cm 3‐6cm 6‐9cm
Number Vegetation Restored NumberVegetationRestored

43
Livestock Research Proceeding
Table 1. Relative density, life form, desirability and other parameters of the species composition as influenced by the treatments
* = yes; A= Annual; B = Bare land; D=desirable; HD=highly desirable; LD=Less desirable; Pe= Perennial and UD=undesirable
No Species composition Parameters and Treatments
Relative Density (RD%) Life form
Desirability
Decreaser
Increaser Invader
T1 T2 T3 T4 T5 T6 T7 Grasses 1 Tragus berteronianus 50.6 82.9 89.2 85.7 77.4 75.6 26.3 A LD * 2 Cynodon dactylon 2.8 0.0 5.2 1.4 0.0 13.3 43.6 P HD * 3 Chloris gayana 0.6 0.5 0.5 8.4 3.6 4.7 21.1 P HD * 4 Cenchruis ciliaris 8.0 1.0 0.5 0.7 2.4 1.9 3.0 P HD * 5 Cyperus rotondas 2.8 0.0 0.0 0.0 0.0 0.0 0.8 P LD * 6 Eragrostis tenuifolia 0.0 1.4 0.0 2.3 4.8 0.8 2.3 P D * 7 Eleusine multiflorum 2.3 1.0 0.5 0.2 0.0 0.0 0.0 P D * 8 Crysopogon plumulosus 0.6 7.1 1.2 0.0 3.6 0.8 0.0 P LD * 9 Cenchrus cetigrus 1.1 0.5 0.2 0.0 0.0 0.0 0.0 P D * 10 Hetrapogon contortus 14.2 0.0 0.9 0.0 0.0 0.6 0.0 P D * 11 Sporobolus pyramidalis 0.0 0.0 0.2 0.0 0.0 0.0 0.0 P LD * 12 Aristida somalensis 0.6 0.0 0.0 0.0 0.0 0.0 0.0 P UD * * 13 Bracharia mutica 2.8 0.0 0.0 0.0 0.0 0.0 0.0 P LD * Herbs/legumes 14 Crotalaria incana 2.3 0.5 0.2 0.2 2.4 0.3 0.8 P HD * 15 Herbacious 0.6 0.0 0.0 0.2 1.2 0.3 1.5 P LD * 16 Tribulis cistoides 0.0 0.0 0.0 0.0 0.0 0.0 0.8 A LD * 17 Sedge 0.0 0.0 0.0 0.0 0.0 1.7 0.0 P LD * 18 Bare 10.8 5.2 1.4 0.7 4.8 0.0 0.0 B

Livestock Research Proceeding
44
Table 2. Relative frequency of species composition as influenced by treatments No Species Composition Relative Frequency (RF%) T1 T2 T3 T4 T5 T6 T7 Grasses 1 Tragus berteronianus 20.0 34.4 31.4 32.1 18.8 36.8 26.8 2 Cynodon dactylon 2.2 0.0 14.3 10.7 0.0 13.2 24.4 3 Chloris gayana 2.2 3.1 2.9 25.0 12.5 18.4 19.5 4 Cenchruis ciliaris 6.7 3.1 5.7 7.1 6.3 7.9 9.8 5 Cyperus rotondas 2.2 0.0 0.0 0.0 0.0 0.0 2.4 6 Eragrostis tenuifolia 0.0 3.1 0.0 3.6 12.5 5.3 7.3 7 Eleusine multiflorum 2.2 6.3 5.7 3.6 0.0 0.0 0.0 8 Crysopogon plumulosus 2.2 9.4 8.6 0.0 12.5 5.3 0.0 9 Cenchrus cetigrus 2.2 3.1 2.9 0.0 0.0 0.0 0.0 10 Hetrapogon contortus 4.4 0.0 2.9 0.0 0.0 5.3 0.0 11 Sporobolus pyramidalis 0.0 0.0 2.9 0.0 0.0 0.0 0.0 12 Aristida somalensis 2.2 0.0 0.0 0.0 0.0 0.0 0.0 13 Bracharia mutica 4.4 0.0 0.0 0.0 0.0 0.0 0.0 Herbs/legumes 14 Crotalaria incana 4.4 3.1 2.9 3.6 6.3 2.6 2.4 15 Herbacious 2.2 0.0 0.0 3.6 6.3 2.6 4.9 16 Tribulis cistoides 0.0 0.0 2.9 0.0 0.0 0.0 2.4 17 Sedge 0.0 0.0 0.0 0.0 0.0 2.6 0.0 18 Bare 42.2 34.4 17.1 10.7 25.0 0.0 0.0 Tragus berteronianus takes the highest importance value (IV) in all the treatments in which the highest value goes to T3(ripping + sowing) followed by T4(ripping + sowing + mulching), T2(ripping), T6(plowing + sowing), T5(plowing) and T1(control) in that order. The presence of bare land was important in T1(control), T2(ripping), T5(sowing), T3(ripping + sowing) and T4(ripping + sowing + mulching) respectively but not in T6 and T7 which is reduced due to plowing, sowing and mulching. Chloris gayana, Cenchrus ciliaries, Cynodon dactylon, Crysopogon plumuloses and Hetrapogon contortus are some of the important species which are restored and grouped from desirable (D) to highly desirable (HD). However, Crotalaria incana which is less desirable (LD) and Eragrostis tenuifolia which are less desirable and invader was also restored highly by T5(sowing). The IV of Chloris gayana and Cenchrus ciliaries was predominant in T7(plowing + sowing + mulching), T6(plowing + sowing), T5(plowing) and T4(ripping + sowing + mulching) which can be increased due to plowing sowing and probably mulching. The IV of Cynodon dactaylon was the highest in T7(plowing + sowing + mulching) and T6(plowing + sowing) .

Livestock Research Proceeding
45
Table 3. Importance value of species composition as influenced by the treatments No. Species Composition Treatment and parameters
IV ( Importance Value) T1 T2 T3 T4 T5 T6 T7
Grasses 1 Tragus berteronianus 70.6 117.2 120.7 117.9 96.1 112.4 53.2 2 Cynodon dactylon 5.1 0.0 19.4 12.1 0.0 26.5 68.0 3 Chloris gayana 2.8 3.6 3.3 33.4 16.1 23.1 40.6 4 Cenchruis ciliaris 14.6 4.1 6.2 7.8 8.6 9.8 12.8 5 Cyperus rotondas 5.1 0.0 0.0 0.0 0.0 0.0 3.2 6 Eragrostis tenuifolia 4.4 4.6 0.0 5.9 17.3 6.1 9.6 7 Eleusine multiflorum 4.5 7.2 6.2 3.8 0.0 0.0 0.0 8 Crysopogon plumuloses 2.8 16.5 9.7 0.0 16.1 6.1 0.0 9 Cenchrus cetigrus 3.4 3.6 3.1 0.0 0.0 0.0 0.0 10 Hetrapogon contortus 18.6 0.0 3.8 0.0 0.0 5.8 0.0 11 Sporobolus pyramidalis 0.0 0.0 3.1 0.0 0.0 0.0 0.0 12 Aristida somalensis 2.8 0.0 0.0 0.0 0.0 0.0 0.0 13 Bracharia mutica 2.8 0.0 0.0 0.0 0.0 0.0 0.0 Herbs/legumes 14 Crotalaria incana 6.7 3.6 3.1 3.8 8.6 2.9 3.2 15 Herbacious 2.8 0.0 0.0 3.8 7.4 2.9 6.4 16 Tribulis cistoides 0.0 0.0 2.9 0.0 0.0 0.0 3.2 17 Sedge 0.0 0.0 0.0 0.0 0.0 4.3 0.0 18 Bare 53.0 39.6 18.5 11.4 29.8 0.0 0.0 The Shannon index diversity indicates that there is high species diversity in the T1(control) (1.530605) followed by T7(plowing + sowing + mulching) (1.405598) and T6(plowing + sowing) (0.910798). In line with the diversity index, the species evenness (J) was found to be higher for T1(control) and T7(plowing + sowing + mulching). Similarity coefficient value showed that there is high similarity coefficient between T1(control) and T5(plowing) followed by T7(plowing + sowing + mulching) and T2(ripping). From the comparison of species abundance made among the treatments, T4(ripping + sowing + mulching) (369.0) were more abundant followed by T3(ripping + sowing) (381.7) and T6 (plowing + sowing) (276.9 ) when compared to the other treatments. The value showed that the T1(control) and T7(plowing + sowing + mulching) are lesser in abundance value than the other treatments even though more diverse in species composition (Table 4).

Livestock Research Proceeding
46
Table 4. Abundance, diversity, evenness and similarity of the species composition as influenced by the treatments
Treatments Parameters Abundance (U) Species
Diversity (H') Species Evenness (J)
Similarity Coefficient (Sc)
T1 94.1 1.530605 1 - T2 174.7 0.547753 0.357867 0.002689 T3 381.7 0.460778 0.301043 0.007988 T4 369.0 0.561862 0.367085 0.008033 T5 65.3 0.803969 0.525262 (-0.01226) T6 276.9 0.910798 0.595057 0.007183 T7 73.5 1.405598 0.918328 (-0.0023)
Conclusion and Recommendations Among the tested treatments of integrated mechanical and biological techniques for restoring degraded rangelands, T6 (plowing + sowing), T7(plowing + sowing + mulching) and T1(only enclosing) were performed best having more species diversity than other treatments even though most of the species obtained were undesirable once. The relative density, relative frequency and importance value of Chloris gayana, Cenchrus ciliaries and Cynodon dactaylon (highly desirable) species were also predominant in T7(plowing + sowing + mulching) and T6(plowing + sowing) than in the other treatments. However the application of T7(plowing + sowing + mulching) in farmers condition is difficult in such a way that mulching large area is impossible. Therefore, because of easy application, good species diversity, abundance and other parameters, T6(plowing + sowing) was identified as the most important techniques for restoration of degraded rangelands in the area. In areas where labour and forage seed is scarce, enclosing degraded land (T1) can be an option for restoration of the rangelands. Hence it is important to further demonstrate these techniques T6(plowing +sowing) and T1 (only enclosing) for restoration of the degraded rangelands of the study area. References Czekanowski J., 1913. Zarys Method statystycznyck. Warsaw. Maclntosh R.P., 1967. An index of diversity and the relation of certain concepts of diversity. Ecology 48:
392-404. Schlesinger W. H, Reynolds J. F, Cunningham G.L, Huenneke L.F, Jarrell W.M, Virginia R. A, Whit ford
W.G., 1990. New directions in pastoral development in Africa. Biolo. feedbacks in glo. Desert. Sci. 247, 1043-1048. Scoones I (1995).
Shabbir, A. and Bajawa, R., 2006. Distribution of parthenium weed (Parthenium hysterophorus L.) an alien invasive weed species threatening the biodiversity of Islamabad. Weed Biology and Management 6, 89-95.
Shannon C.E., Weiner W., 1949.The Mathematical Theory of Communication. University of Illinois Press, 117, Urbana, USA.
Tesfaye D, Azage T, Lisanework N, Worku T., 2010. Rangeland condition and feed resources in Metema district, North Gondar zone, Ahmara Region, Ethiopia.

Livestock Research Proceeding
47
Determination of Optimum Seed and Fertilizer Rate for Vecia sativa ‘Gebisa’variety in Bale Highlands
Aliyi Kedu1*, Dawit Abate2, Birhanu Tasew1 and Teklu Wegi1 1Sinana Agricultural Research Center, P.O.Box 208, Bale-Robe,
2Adami Tulu Agricultural Research Center , P.O. Box 35, Zeway,OARI *Corresponding author: E-mail::[email protected]
Abstract The experiment was conducted at high lands of Bale for three years (2011-2013) at three locations; Sinana on station, Selka on farm and Agarfa sub-site using recently released Vecia sativa 'Gebisa' variety. The main objective was to determine optimum seed and fertilizer rate for dry matter and seed yield of vetch under conditions of Bale high lands. The treatments were four levels of seed rate (20 Kg/ha, 25 Kg/ha, 30Kg/ha and 35 Kg/ha) and four levels of DAP fertilizer (0Kg/ha, 50Kg/ha, 100 Kg/ha and 150 Kg/ha) arranged in factorial combination of Randomized Complete Block Design (RCBD) with three replications. The pooled statistical analysis of three years result showed that seed rate had a significant effect on dry matter and seed yield. However, the effect was non-significant on the other considered parameters. The highest dry matter (5.83 t/ha) and seed yield (23.5 Q/ha) was obtained from 35kg/ha and 30 kg/ha seed rate, respectively. While the lowest dry matter (3.85 t/ha) and SY (15.5 Q/ha) were obtained from 20 kg/ha. However fertilizer rate (DAP) had no significant effect on all considered parameters. This doesn't mean to generalized that DAP fertilizer application is not required for vetch production. The insignificant response of fertilizer was probably because of better fertility status of the soil where the trial was conducted. Therefore, Vecia sativa 'Gebisa' variety can be sown without fertilizer at a seed rate of 35 kg/ha and 30 kg/ha for optimum dry matter and seed yield respectively at the study areas of Bale high lands. Key words: Bale highlands, dry matter, fertilizer rate, seed rate, seed yield, Gebisa. Introduction Most of the areas in highlands of Ethiopia are nowadays put under cultivation of cash and food crops. This resulted in keeping large number of livestock on limited grazing area leading to overgrazing and poor productivity of livestock. In highlands of Bale the expansion in the cultivation of cereal crops increased the uses of crop residues for animal feeding. However, crop residues have low nutritive value and could not support reasonable animal productivity. Hence, the problem of balanced diet for livestock is becoming a serious. One of the alternatives to improve livestock feeding quantity and quality is through producing forage legumes. Forage legumes enhance soil fertility, improve yield and nutritive value of crop residues, sustain feed production during the dry season, suppress weed and combat erosion (Humphrey, 1994). Vetch is one of the most important annual forage legumes to because of their; nitrogen fixation, good nutritive value (crude protein, more than 20 %), drought tolerance and high biomass yield. The productivity of a given crop is affected by plant species and cultivars, agronomical techniques, soil type, fertilization and other external factors. Seeding rates is important agronomical technique affecting the yield of any crops. Different relative values between hay and seed yield with seed density were indicated by Tawaha and Turk (2001). Studies with several vetch species indicated that the density influenced growth habit, morphological characters and yield (Aydogdu and Acikgoz, 1995 and Seymour et al., 2002). Fertilizer is also another most important factor which contributes to increase the yield of any crops when used at the optimum level. Turk and Tawaha (2001) concluded that phosphorus application significantly affect the seed yield, number of pods per plant, number of seeds per pod, number of primary branches per plant, 100 seed weight, pod length and seed weight per plant of vetch. Using higher or lower seed and fertilizer rate

Livestock Research Proceeding
48
could have a negative impact on dry matter and seed yield of forage crops. However; optimum level of seed and fertilizer rate for Vecia sativa variety named 'Gebisa' was not determined yet for Bale highlands. Hence; this experiment was initiated with the objective to determine the optimum seed and fertilizer rate for forage biomass and seed yield of Vecia sativa 'Gebisa' under conditions of Bale high lands. Materials and Methods The trial was conducted at high lands of Bale for three years (2011-2013) at three locations; Sinana on station, Selka on farm and Agarfa sub-site. Vecia sativa 'Gebisa' variety was used for the trial. The treatments were four levels of seed rate (20 Kg/ha, 25 Kg/ha, 30Kg/ha and 35 Kg/ha) with four levels of DAP fertilizer (0 Kg/ha, 50Kg/ha, 100 Kg/ha and 150 Kg/ha). The treatments were arranged in factorial combination of RCBD with three replications. The plots size were 2m*2.1m with six rows and the distance between each row, plot and replication was 35 cm, 100 cm and 150 cm respectively. Among six rows two rows were harvested at 50% flowering stage to determine dry matter yield by taking a sample of 500gm of fresh forage and drying in oven. Data of leaf to stem ratio was obtained from a total sample of 200gm separated to leaf and stem; oven dried and weighed. Seed yield was also obtained from two rows of each plot. The rest two rows were used to decrease border effect at each side of the plot. Data on plant height was taken by measuring three plants randomly from each plot and finding their mean while standing percentage was given a value on visual basis. The data obtained accordingly was analyzed using statistical analysis system (SAS) soft ware and means were separated using LSD test. Result and Discussions The pooled statistical analysis of three years result of six season showed that seed rate had a significant (P<0.01) effect on dry matter and seed yield of vetch, while it had no significant effect on other considered agronomic parameters. The highest dry matter (5.83 t/ha) and seed yield (23.5 Q/ha) was obtained from 35kg/ha and 30 kg/ha seed rate, respectively. Whereas, the lowest dry matter (3.85 t/ha) and seed yield (15.5 Q/ha) were obtained from 20 kg/ha. Increase in dry matter yield is associated to higher plant density, higher plant height, more leaf length, more tillers and leaves per tiller this agrees with finding of (Muhammad et al., 1988; Zahid and Bhatti 1994). As stated above in this experiment the dry matter yield showed clearly a significant increasing pattern with increasing seed rates. Seed yield showed an increasing pattern with increasing seed rates up to the third seed rate level (30 kg/ha) and then decreased with a seed rate of 35kg/ha. There was no seed yield difference among the second seed rate treatment (25kg/ha) and the fourth seed rate treatment (35kg/ha). These results also confirmed the findings of Zulfiqar et al., (2006) who found that up to a certain level, increase in seed rate increased seed yield, where as the higher seed rate depressed seed yield. The decrease in seed yield after third seed rate is due to high plant density. However fertilizer rate (DAP) had no significant (p>0.05) effect on all considered parameters. However, this doesn't mean to generalized that DAP fertilizer application is not required for vetch production. The insignificant response of fertilizer was probably because of better fertility status of the soil where the trial was conducted.

Livestock Research Proceeding
49
Table: Mean agronomic and yield performance of Vecia sativa 'Gebisa' with different seed and fertilizer rate (2011-2013) SP PH(cm) DM(t/ha) LSR SY(kg/ha) TKW(gm) Seed rates(Kg/ha) 20 88 97.58 3.85 0.62 15.5 66.17 25 86 94.17 4.34 0.78 19.5 66.5 30 86 95.83 4.93 0.68 23.5 64.83 35 89.17 100 5.83 0.7 19.5 63.33 Fertilizer rates(kg/ha) 0 87.92 97.08 4.83 0.68 19.08 66.5 50 89.33 97.00 4.65 0.70 19.67 63.67 100 86.5 96.92 4.73 0.71 20.17 65.83 150 85.42 96.58 4.74 0.69 19.08 64.83 Significance, Mean, CV% and LSD Seed Ns Ns ** Ns ** Ns Fert Ns Ns Ns Ns Ns Ns Seed*Fert Ns Ns Ns Ns Ns Ns Mean 87.29 96.89 4.74 0.69 19.5 65.2 CV% 5.07 5.94 4.4 24.54 5.97 5.33 LSD (5%) - - 0.17 - 0.97 - PH=plant height, SP=stand percentage, DM=dry matter, SY=seed yield, LSR=leaf to stem ratio, TKW= Thousand Kernel Weight, LSD= least significant difference.CV=Coefficient of variation, ns=Not significant, **=highly significant (p<0.01) Conclusions and Recommendations The study concluded that seed rate had a significant effect on dry matter and seed yield of vetch. The highest dry matter (5.83 t/ha) and seed yield (23.5 q/ha) was obtained from 35kg/ha and 30 kg/ha seed rates respectively. However, DAP fertilizer rate didn't showed significant effect on agronomic and yield parameters of Vecia sativa 'Gebisa' variety. This doesn't mean to generalized that DAP fertilizer application is not required for vetch production. The insignificant response of fertilizer was probably because of better fertility status of the soil where the trial was conducted. On the other hands, Therefore, Vecia sativa 'Gebisa' variety can be sown without fertilizer at a seed rate of 35 kg/ha and 30 kg/ha for optimum dry matter and seed yield respectively at the study areas of Bale high lands. References Aydogdu, L. and E. Acikgoz. 1995. Effect of seeding rate on seed and hay yield in common vetch (Vicia
sativa L.). J. Agron. and Crop Sci., 174: 181-187. Humphrey, L.R.1994.Tropical forages: their role in sustainable agriculture. The University of Queens
land. Australia. Muhammad, N., N.M. Butt and LA. Qamar. 1988. Effect of nitrogen fertilization and harvesting intervals
on the yield and nutritional value of napier grass. Pak. J Agric. Res., 9(3): 478-482. Seymour, M., K.H.M. Siddique, N. Brandon, L. Martin and E. Jackson.2002. Response of vetch (Vicia
spp.) to plant density in south western Australia. Australian J. Exp. Agric., 42: 1043-1051. Tawaha AM., Turk MA. 2001. Effect of date and rate of sowing on yield and yield components of narbon
vetch under semi-arid condition. Acta Agron. Hung. 49 (1):p. 103–105.

Livestock Research Proceeding
50
Turk, M.A and A.M. Tawaha. 2001. Common vetch (Vicia sativa L.) productivity as influenced by rate and method of phosphate fertilization in a Mediterranean environment. Agricoltura-Mediterranea. 131: 3-4, 108-111.
Zahid, M.S. and M.B. Bhatti. 1994. Comparative study on fodder yield and potential of different sorghum hybrids under rain fed conditions. Sarhad J. Agric.,10(4): 35-350.
Zulfiqar A. G., Maqsood Q., Safdar S. and Shafiq Z. M. 2006. Effect of phosphorus fertilizer application on fodder and grain yield of vetch under rain fed conditions of pothowar region. Pak. J. Agri. Sci., Vol. 43(1-2).

Livestock Research Proceeding
51
Inventory of Feed Resources and Nutritional Characterization in Semi-arid of Borana Rangelands, Southern Ethiopia
Bedasa Eba*, Bikila Negasa, Samuel Tuffa, Jaldesa Doyo, Asfawu Ijo, Bantayehu Mulune and Gebayehu Elias
Yabelo Pastoral and Dry land Agricultural Research Centre (YPDARC), Oromia Agricultural Research
Institute, Ethiopia *Corresponding Author: [email protected]
Abstract The study was conducted with the objectives to get conclusive information on feed resources inventory, characterizes their nutritional compositions and to identify the major constraints to implement appropriate feed resource development strategies for pastoralists and agro-pastoralist in semi-arid areas of Borana rangeland. The feed resources available in Borana rangelands include grazing land, hay, crop residues, pods and leaves. Among the feed resources, grazing land is the major one. The conservation methods of these feed resources are mostly in the form of standing hay (enclosure) that communally used. The major constraints to the feed resources are bush encroachment, degradation of rangeland, heavy grazing, moisture deficit and expansion of crop cultivation. Mobility and proper management of rangeland resources such as enclosure, bush control, settlement arrangement, proper grazing systems and restoration of degraded rangelands are the main coping mechanisms suggested by the respondents. The chemical composition of grasses, particularly crude protein (CP) percentage is lower during dry season than wet season. The browse trees have similar chemical composition during both dry and wet seasons. However, the availability of these browse trees in required amount in both seasons is questioned. In line to this, there were no improved forages production practices in the area. Hence, it is important to increase available feed resources in terms of nutritional value either by integrating with improved forages or supplementing with locally available concentrated feed resources. Key words: Feed resources, rangeland, nutritive value, Borana, enclosure Introduction The Ethiopian lowlands, which cover about 60% of the national land area support a great diversity of livestock production system. Coppock (1994) stated that Borana breed cattle is known for their high degree of heat tolerance, resistance to specific disease, feeds and water shortage, and high milk and meat production potential. However, due to different constraints they show correspondingly low performance level demonstrated by juvenile growth rate, low milk yield and long age at first calving and long calving interval. Their low productivity could attribute to absence of appropriate technology to improve inadequate of feed supplies, poor nutrition and management (Mekonnen, 1994). Further, Alemayehu (1998) stated that a major constraint to production systems is the availability of feed resources. Besides this, the Borana rangelands is relegated to marginal land, characterized by climatic variation especially prolonged dry period, and these stated as main problem for feed shortage (Coppock, 1994). Moreover, there is little or no conclusive information on feed resources characterization, nutritional aspect and constraints to implement appropriate development strategies for pastoralists and agro-pastoralist in semi-arid areas of Borana rangeland. Similarly, there is no organized information about the utilization pattern of feed sources that may be helpful as a base line for the future research activity and any other development work.

Livestock Research Proceeding
52
Materials and Method Study area The Borana rangeland is found at the south part of the Ethiopian low lands occupying a total land area of about 95,000km2. Grazing is predominantly communal with emerging privatization of crop and Kallo lands (standing hay). Rainfall delivery is bimodal; with the long rains accounting for 60% of the total rainfall falling between March and May and the short rains comprising of 27% of the total rainfall falling between September and November. Spatial and temporal variability in both the quantity and distribution of rainfall renders the area of Semi-arid, with an average annual rainfall varying from 353 to about 900mm per annum (Kamara and Kirk, 2002). A cool dry season occurs from June to August, while a warm dry season occurs from December to February. The average temperatures vary from an annual minimum of 13.10c to maximum of 25.20c. Site selection and method of data collection A total of 4 districts namely Teltele, Yabello, Arero and Dire were selected based on the secondary data that had been gathered from zonal development offices. Two kebeles were selected from each respective selected district. Fifteen household heads were selected from each kebeles. The structured and pre-structured questionnaire were prepared and pre-tested on some households from the respective study area before the commencement of the actual survey. Then after, appropriate modification and correction was made to facilitate effective convey of the needed information. All necessary data including type of feed available, feeding system, condition of the feed, season of feed availability, major constraints of feed production and mitigation to feed shortages were collected using structural and semi-structural questionnaires. Inventory and sampling of feed resources In each study sites, all the major feed resources were recorded with inclusion of their usages for respective livestock species. Then the feed types that are similar in usage and character from all sites were merged together. The most prioritized feed samples from grasses and leaves of browse trees were collected during wet (April) and dry seasons (January) from Arero, Dire, and Yabelo districts. The feed samples were evaluated for chemical composition using Near Infera Red System (NIRS) at nutritional laboratory of International Livestock Research Institute (ILRI). Data analysis Data on feed resources by types and biomass was subjected to descriptive statistics of SPSS version 17.1 (2003) and general linear procedure of SAS (2000) for chemical composition data. Result and Discussions Available feed resources in pastoral area The major feed sources available in the study area includes natural pasture, standing hay, crop residues, pods, green fodder (browses) and purchased feed. The ownership/utilization for each feed sources varies among the respondents. Natural pasture, pods and green fodder (browses) are mostly communally utilized, whereas crop residues, purchased feeds (mostly concentrates) and minerals (salts) are used privately. Utilization of standing hay is both in communal and private. The study of Sandford (2006) indicated that unless the pastoralists are wisely utilizing the locally available feed resources (natural grazing land), purchasing supplementary feed is not economically feasible except as short term measure to survive their herd during drought problem. Concentrated feed mostly utilized by privately and the resource is also provided for the pastoralists by NGOs and GO.

Livestock Research Proceeding
53
Table 1 Responses of respondent (%) on ownership/utilization system of sources of feed for livestock in semi-arid of Borana Ownership/utilization Types of Feed
Natural pasture (%)
Hay/standing hay (%)
Crop residues (%)
Supplement of minerals (%)
Pods (%)
Green fodder (%)
Concentrate feed (%)
Privately owned 4.2 57.5 95.0 7.5 4.2 5.8 0 Communally owned 95.8 42.5 1.7 4.2 92.5 94.2 14.2 Privately purchased 0 0 3.3 88.3 3.3 0 85.8 Season of feeding different feed sources The feed resources obtained from natural pasture/grazing lands are utilized mainly during wet seasons due to the poor grazing lands productivity as the result of degradation and bush encroachment. Hay/standing hay, crop residues, pods, green fodder (browse) and purchased feed are utilized during dry seasons. This indicates that pastoralists used feed sources by balancing between seasons to overcome the feed shortages prevailing in the area. Minerals usually used both during wet and dry season. Table 2. Responses of respondents (%) on seasons of feeding different feed sources in semi-arid of Borana Seasons of utilization
Feed sources Natural pasture/communal (%)
Hay/standing hay (%)
Crop residues (%)
Supplement of minerals (%)
Pods (%)
Green fodder (%)
Purchased feed (%)
Wet 26.9 5.3 1.2 14.8 1.5 1.9 2.2 Dry 0.9 92.1 98.8 3.7 98.5 98.1 97.8 Both 72.2 2.6 0 81.5 0 0 0 Associated problems related to available feed resources One of the major livestock challenge in rangelands of Borana is inadequacy of feed sources throughout the year. The majorities of the respondents (84%) indicated that livestock feed inadequacy become the apparent problem. According to their response the major feed inadequacy problem is due to bush encroachment, degradation (loss of vegetation and top soil), moisture deficit, heavy grazing and shrinking of grazing land (Table 3). The coping strategies for feed shortage are bush thinning, mobility and enclosure forming. Prescribed fire application and resettlement around road side also some mechanisms that pastoralist’s perceived for coping livestock feed inadequacy. However, prescribed fire application on current rangeland become difficult because of lack of enough fuel loads. Of the coping mechanisms of livestock feed shortages, mobility (21.67%) is the dominant for the respondents. This is because of the ever increasing of uneven rainfall distribution in the area. Hence proper management of bush encroachment and rehabilitation of degraded rangeland with appropriate techniques is required depending on the rangeland conditions of the area.

Livestock Research Proceeding
54
Table 3. Response of respondents on causes of livestock feed shortages in rangelands of Borana Causes of feed inadequacy N %
Heavy grazing 14 11.67 Moisture deficit 35 29.17 Shrinking of grazing land 14 11.67 Farming 10 8.33 Bush encroachment and degradation 37 30.87 Tick problems 5 4.17 Termites 5 4.17 Mobility 26 21.67 Major feed sources for livestock species across seasons The major livestock species found in rangeland of Borana are cattle, sheep, goat, camel and donkey. According to respondents, in all seasons, grasses are the major feed sources for cattle and sheep, whereas browse is the main feed for goat and camel in all seasons. Straw, stubble grazing and forbs are also used for cattle and sheep. Pods and forbs are also sources of feed for camel and goat. The herbaceous vegetation decreased from time to time due to heavy grazing and bush encroachments. During critical feed shortage camels survive by browsing leaves from most of the encroached bush. The type of vegetation used for each livestock as feed sources across each season includes grasses, shrubs/tree, and forbs. There were no herbaceous legumes in the inventoried vegetation as livestock feed. This indicates that the available feed sources are poor in nutritional requirements. Moreover, almost all respondents have not practiced improved adaptive forage production in the area. This indicated as more work to introduce the adaptive fodder to the area. According to respondents, currently many drought resistant grass and forbs are deteriorating from rangeland. This probably indicates that the rangeland becoming in poor condition. Hence, this requires more effort in improving not only the quantity of feed but also on nutrition content of feed sources that satisfy the animal requirements. Table 4.Grass, forbs and herbs used as livestock feed but highly deteriorating from time to time in the semi-arid of Borana Grass species N % Forb and herb species N % Cenchrus ciliaris 19 15.8 Commelina africana L. 6 5 Themeda triandra 20 16.7 Plectranthuscaninus Roth. 6 5 Cymbopogon commutatus 6 5 Cyphostemma adenanthum
(Fresen.) Descoings 17 14.2
Cenchrus ciliaris, Themeda triandra, Chrysopogon aucheri and Cymbopogon commutatus
44 36.7 Commelina africana L.and Plectranthus caninus Roth.
11 9.2
Heteropogon Contortus 7 5.8 Chlorophytum gallabatense Schweinf. ex Baker and Commelina africana L.
6 5
Sorghum sp. 5 4.2 Lippia carviodora Meikle 6 5 All grasses 19 15.8 “Barbeessaa” 4 3.3 No herb extinct 52 43.3 All 12 10

Livestock Research Proceeding
55
Feed resources conservation practices About 54% of the respondents only conserve feed for the dry seasons in the form of enclosure (Kallo). Hay making practiced for cattle especially calf, weak animal and lactating cow to supplement during the dry season. According to respondents, most of hay making practices done when grasses were fully matured. Some of respondents did not consider growth stage of grasses for harvesting to make hay. This indicates that the quality of hay become poor, because quality associated with growth stage of grass to be considered for hay making. In other aspect, most of respondents have not made choice of grass species for hay making. This also reduces the quality of hay if the appropriate grasses are not considered. According to some respondents, Chrysopogon aucheri, Digitaria milanjiana and Aristida Kenyensis are the grasses used for hay making. Table 5. Species of grasses and time of hay making For which livestock species hay made?
N % Age of cutting grasses for hay
N % Common grasses for hay making
N %
Cattle 23 19.2 No growth stage of consideration
35 29.2 All grasses/ No choice 60 50
Oxen 4 18.5 Before flowering
40 33.3 Chrysopogon aucheri and Digitaria milanjiana
37 30.8
Calf, weak animal and lactating animal
6 27.7 When it fully matured enough
45
37.5
Aristida Kenyensis &“Sokoru”
23 19.2
Characteristics of enclosure (kallo) in semi-arid of Borana According to the respondents, enclosure making have been started because of increased feed shortages, heavy grazing and rainfall deficit. The respondents indicated enclosure making have started in the area before 10 to 55 years ago. This may indicate that the starting period of enclosure making in semi-arid Borana varies in different districts. The difference in the staring periods of enclosure making may be due to the feed resource availability in specific location and livestock population increment over time. Table 6. Response of respondents on year of enclosure starts and reasons of enclosure making Reasons of enclosure making N % Start of enclosure
making (years) N %
Feed shortages increased 74 61.7 55 years ago 6 5 Supplement of calves and oxen 14 11.7 29 years ago 16 13.3
Heavy grazing and rainfall deficit 32 26.7 31 years ago 16 13.3
46 years ago 23 19.2
20 year ago 24 20
37 years ago 12 10
10 year ago 16 13.3
15 year ago 7 5.8

Livestock Research Proceeding
56
The average area of enclosure that pastoralist practicing ranged from 5ha to 300ha. Of which about 27% of respondents estimated that the area of enclosure was 200ha. About 68.3% of respondents indicated the areas of enclosure have been increasing. The increment in the size of enclosure has been due to the community perception on the advantages of enclosure. While, 26.7% of the respondents have point out that the sizes of enclosure have been decreasing. This is mainly due to high livestock and human population and expansion of crop cultivation in rangelands. The respondents estimated that the number of households used in one enclosure ranged from70 to 400, while the number of livestock that used in one enclosure ranged from 800 to 2500. Most of the enclosures used during dry seasons. The customary institution ’Abbaa dhedaa’ governs the enclosure utilization and managements. The rule/bylaw used over years has not changed. However, the respondents indicated that the violations of the bylaw have been becoming increased. This may be associated to the prevailing feed shortages in the area. The penalties for the violation of bylaw ranged from 100Birr/herd/day to 500Birr/herd/day in different districts. There were also penalties such as imprisoning, 10 cattle and enforced to fence the enclosure for the violation of bylaw of enclosure utilization. There are problems related to utilization of enclosure among community. The problems include grazing of enclosure that comes from other settlements during dry season, grazing by high number of animals and expansion of private enclosure. The proposed solution by respondents are detail community discussion to improve the rules, increasing communal enclosure, thinning the bush and consolidating the rules. Table 7. Associated problems with utilization of enclosure and proposed solutions as perception of respondents Associated problems with utilization of enclosure
N
%
Possible solutions for utilization of enclosure
N %
Theft of grazing in enclosure 9 7.5 Discussion among community to improve rules
23 19.2
Grazing by high number of animals 14 11.7 Increasing communal enclosure 45 37.5 Ranch development 9 7.5 Conserving feed during rainy
season 12 10.0
Private enclosure formation 9 7.5 The rule should consolidated 13 10.8 Competition during grazing among household
9 7.5 Firing and clearing 13 10.8
Moving animal to other enclosure from other olla during dry season
28 23.3 All 14 11.7
No problems 42 35 Respondents select area of enclosure based on different criteria’s. The most important criteria to establish enclosure are; grass potential in the area, area should be against herding and water direction, no road crossing through and proximate to settlement. Grasses to be considered in the area to establish enclosures includes Heteropogon contortus, Panicum maximum and Pennisetum mezianu. However, most of the respondents (57.5%) indicated that all grasses were considered to establish enclosure. This may lead to the immediate deterioration of enclosure productivity if the grass types is not considered. About 81.8% of respondents indicated that the productivity of enclosure in semi-arid of Borana has been decreasing. The productivity of enclosure decreased due to bush encroachment and livestock population increment.

Livestock Research Proceeding
57
Major available crop residues About 65% of the respondents indicated that most of the available crop residues are maize stover and teff straw. The communities utilized the crop residues for livestock feed, mud enforcement and selling for income generation. They also used as fertilizers for their farmlands. Crop residues are mainly available around bottom land/wet area of grazing land probably due to better fertility and moisture availability. There is no treatment (physical and chemical) for feeding value improvement of crop residues during feeding the animals. Hence, it needs further extension services on the improvement and utilization of crop residues in the area. Table 8. Major crop residues in semi-arid of Borana as respondents’ response Types of crop residues N % Usage of crop residues among
pastoralists N %
Maize stover 23 19.2 Feed 32 26.7
Maize stover and teff straw 78 65 Feed, mud enforcement and market 60 50.0
Maize stalk and teff straw 5 4.2 Feed and mud enforcement 23 19.2
Maize stover and haricot bean 14 11.7 fertilized the area on which it is staked 5 4.2
Chemical composition of selected grasses and browse trees during hot dry season The percentage of DM, Ash, OM, NDF and ADF were similar for the selected grasses during dry season. During dry season, the N (%) and CP (%) were significantly (P<0.05) higher for Cynodon dactylon, Cenchrus ciliaris among the selected grasses species. However, during dry season Panicium maximum Pennisetum mezianum and Chrysopogon aucheri have low N (%) and CP (%). Pennisetum mezianum has the lowest (P<0.05) in TIVOMD (%) among all grasses selected. Table 9. Chemical composition of grasses samples during dry season Grasses Parameters in (%)
DM ASH OM CP NDF ADF ADL TIVOMD
Panicium maximum Pennisetum mezianum Bothriochloa insculpta Chrysopogon aucheri Cynodon dactylon Cenchrus ciliaris Overall Mean CV (%)
91.7±0.2a 12.1±2.5a 87.9±2.5a 6.6±0.5ab 91.3±0.1a 7.6±1.8a 92.4±1.8a 3.3±0.5c 91.7±0.3a 11.4±0.9a 88.6±0.9a 4.7±0.9bc 92.1±0.2a 10.9±0.6a 89.0±0.6a 3.4±0.4c 89.8±0.4c 9.3±0.9a 90.7±0.9a 9.4±0.8a 91.4±0.4a 11.4±2.1a 88.6±2.1a 7.1±1.2ab 91.3±0.2 10.5±0.6 89.5±0.6 5.8±0.6 0.5 22.6 2.7 23.8
75.7±1.6a 52.7±0.6a 6.5±0.1a 39.7±0.9a 79.8±0.1a 52.4±0.5a 8.7±0.2a 27.2±0.1c 77.1±0.5a 52.6±0.5a 7.3±0.4a 40.9±1.9a 76.8±2.1a 50.2±3.4a 7.3±0.9a 40.5±4.4a 72.7±2.7a 46.2±3.4a 5.9±0.8b 47.3±3.6a 74.1±4.1a 46.8±4.1a 5.7±1.0b 45.2±3.3a 75.8±1.0 49.9±1.2 6.8±0.4 40.9±1.9 5.6 9.9 18.7 13.0
During dry season, Biden hildebrandi was lower in DM (%) among selected browse species. Grewia tembensis has the highest ash (%) among the selected browse trees. Pappea capensis and Acacia nilotica have highest OM (%) among the selected browse trees. Acacia brevispica and Acacia nilotica have the highest N (%) and CP (%) among the selected browse trees. This indicates that different browse trees have different merit in terms of chemical compositions.

Livestock Research Proceeding
58
Table 10. Chemical composition of leaves of selected browse trees during dry season Browse trees Parameters in (%)
DM ASH OM CP NDF ADF ADL TIVOMD Acacia brevispica Rhusnatalensis Dalbergia icrophylla Acacia tortilis Pappea capensis Biden hildebrandi Phyllanthus sepialis Grewia tembensis Acacia nilotica overall mean CV (%)
89.8±0.3a 11.3±1.1cd 88.7±1.1bd 20.2±2.6a 89.1±1.3ab 10.9±0.9c 89.0±0.9b 14.6±0.3bc 89.7±1.1a 10.5±0.9c 89.5±0.9b 17.2±2.9ab 88.9±1.4ab 11.8±0.4cd 88.2±0.4bd 16.4±0.8ab 91.9±0.4a 6.4±0.2e 93.6±0.2a 9.9±0.0c 85.8±2.1bc 15.4±1.0bd 84.6±1.0c 13.9±3.1bc 88.4±0.5ab 14.1±2.3bd 85.9±2.3cd 13.4±2.7bc 90.5±0.2a 18.2±0.2a 81.8±0.2e 11.3±1.0c 90.4±0.9a 5.7±0.5e 94.3±0.5a 14.7±0.7bc 89.4±0.4a 11.6±0.9 88.4±0.9 14.6±0.7 1.9 11.8 1.5 16.7
41.7±9.0a 41.5±5.9bc 11.2±5.6ae 78.2±7.1a 49.9±8.4a 40.6±4.3bc 15.7±0.6ab 69.5±1.1ab 44.6±8.8a 38.2±5.3bc 9.9±2.4bce 75.6±4.7ab 45.7±9.3a 36.6±5.5bc 13.4±1.1a 67.5±3.9b 43.3±3.9a 41.2±2.6bc 14.7±0.6a 57.6±0.2c 58.3±17.5a 42.2±8.4bc 14.9±2.9a 69.5±3.5ab 50.7±1.2a 38.4±0.5bc 11.2±0.3ae 69.4±0.3ab 53.1±3.1a 48.9±2.6ac 6.8±1.8e 67.4±1.2b 48.4±6.9a 34.4±3.2b 16.7±1.9a 69.3±1.0ab 48.6±2.4 40.2±1.5 12.7±0.9 69.2±1.3 27.0 18.0 26.0 6.8
Chemical composition of selected grasses and browse trees during wet season The DM(%) , OM(%), ADF(%), ADL(%) and TIVOMD (%) of the selected grasses in wet season are less than the dry season, whereas N(%), CP(%) and ASH (%) increased during wet season. Many factors that affect the nutrient value of herbaceous plants, of which; seasonal variability (Snyman, 1998), species variation (Arzani et al., 2008), soil nutrient status of production location (Tessema et al., 2011), grazing pressure (Henkin et al., 2011) and management aspects (van der Westhuizen et al., 2005). Cynodon dactylon and Panicium maximum have the highest TIVOMD (%), N (%) and CP (%) among the selected grasses. Cenchrus ciliaris has constant N (%) and CP (%) in both seasons.Cynodon dactylon has lower NDF (%), ADF (%) and ADL (%) among the selected grasses during wet season. Alemayehu, (2006) indicated that seasonal shortages and low nutritive value of the available forage hindering growth and sustainable livestock production in the semi-arid Borana. Table 11. Chemical composition of grasses samples during wet season (April-May)
Grass species Parameters in (%)
DM ASH OM CP NDF ADF ADL TIVOMD Cynodon dactylon Panicium maximum Pennisetum mezianum Bothriochloa insculpta Chrysopogon aucheri Cenchrus ciliaris overall mean CV (%)
90.5±1.4a 12.3±0.7ab 87.7±0.7ab 11.9±1.1a 90.9±0.1a 13.3±0.9ab 86.7±0.9ab 10.9±0.2a 91.1±0.1a 11.4±0.1b 88.6±0.1a 5.7±0.2b 91.1±0.1a 14.1±0.9a 85.9±0.9b 6.2±0.2b 91.2±0.4a 12.2±0.9ab 87.8±0.9ab 6.9±0.6b 91.1±0.2a 13.3±0.4ab 86.7±0.4ab 7.3±1.0b 90.9±0.2 12.8±0.3 87.2±0.3 8.1±0.7 1.2 9.7 1.4 15.5
70.9±0.7c 39.2±1.7b 4.7±0.5c 55.7±3.9a 72.7±1.9cd 44.6±2.1a 5.9±0.3b 51.8±4.2ab 77.8±1.2a 47.7±1.8a 6.9±0.1ab 42.6±0.6b 74.1±0.9bde 47.2±1.2a7.0±0.4ab 42.1±1.8b 77.1±1.4ae 49.0±1.5a 7.3±0.1a 45.5±3.6b 73.3±0.3cd 44.6±1.0a 6.4±0.1ab 43.9±1.2b 74.2±0.74 5.3±0.9 6.4±0.3 46.9±1.7 2.3 5.5 8.7 10.4
The chemical compositions of leaves of different browse trees varied between the two seasons (long rainy and hot dry seasons). Some of the chemical composition of browses trees is higher in wet season than in hot dry season, whereas for some browses trees the inverse is observed. Acacia nilotica have highest DM (%) and OM (%) during the wet season among the selected browse trees. However, Acacia brevispica, Dalbergia microphylla, Acacia tortilis, Phyllanthus sepialis and Biden hildebrandi have significant (P< 0.05) N (%) and CP(%) differ among the selected browse trees. Grewia tembensis and Pappea capensis have significantly (P<0.05) lower in TIVOMD (%) among the selected browse trees. But, generally TIVOMD (%) for all browse trees greater during wet season than during dry season.

Livestock Research Proceeding
59
Table 12. Chemical composition of leave of browse tree samples during wet season (April-May)
Browse trees Parameters in (%) DM ASH OM CP NDF ADF ADL TIVOMD
Acacia brevispica Acacia nilotica Grewia tembensis Dalbergia microphylla Acacia tortilis Biden hildebrandi Pappea capensis Rhusnatalensis Phyllanthus sepialis overall mean CV (%)
90.2±0.2cd13.6±2.2be 86.4±2.2be 19.7±1.4ab 94.9±0.7a 4.2±0.7c 95.8±0.7a 12.5±1.4cd 90.1±0.5cd 18.7±0.7a 81.3±0.7c 13.8±1.4bde 89.7±0.4ce 14.2±1.8bd 85.8±1.8bd 22.2±0.6a 91.9±0.2b 12.8±0.8be 87.2±0.8be 17.3±0.4ad 88.7±0.0ce 14.8±1.9bd 85.2±1.9bd 16.4±5.1ae 91.9±0.0bd 11.1±1.4b 88.9±1.4bf 11.6±2.0cd 90.2±1.1cd 16.0±0.1ade 83.9±0.1cdef 13.4±0.4ce 90.4±0.0bde 14.0±1.3bd 85.9±1.3bd 18.9±2.6ab 91.1±0.4 13.1±0.9 86.9±0.9 15.8±0.9 0.9 14.1 2.1 18.7
37.9±6.9a 44.6±2.1ae 13.1±2.2ce 88.1±2.4ab 48.1±6.3a 41.2±1.6bdefg 24.7±0.9a 84.5±3.4abc 51.8±5.6a 50.2±2.3a 8.9±1.7c 76.5±4.8bd 47.9±2.9a 45.5±2.3ad 14.9±1.8cd 91.0±1.8a 45.9±6.5a 41.6±3.3bdefg 19.7±3.2ad 86.2±0.8ab 47.3±1.2a 36.2±2.9cef 12.9±0.6ce 80.9±9.5abc 41.7±1.3a 44.2±1.1afg 18.0±0.9bde 70.4±1.9cd 45.7±9.9a 42.5±3.8ag 20.9±1.9a 75.8±7.9abc 42.7±0.3a 34.6±3.3cg 12.6±0.9ce 86.5±7.1ab 45.9±1.8 42.6±1.2 16.5±1.2 82.2±1.8 19.9 9.6 18.7 8.9
Conclusion and Recommendation The major feed resources in semi-arid of Borana rangeland are from grazing lands and browses. To some extent crop residues and pods from different trees are also used as livestock feeds. However, these feed resources are not adequately available throughout the year. Hence, feed shortage is the main constraints especially in the dry seasons in the semi-arid areas of Borana. Enclosure making and mobility of the herd to search for better feeds are among the mitigation to feed shortage practices by the livestock keepers. The mitigation has becoming difficult because of rangeland degradation and loose of bylaw on enclosure management and utilization among the community. Proper rangeland improvement and management of enclosure should be strengthening to mitigate feed shortages. Variation of chemical composition among grasses species and browses were significantly high. The nutritive value of grasses species, especially CP (%), was less than critical value during the dry season. Hence, the study recommends improving feed sources; mainly rehabilitating rangelands and upgrading the nutritive value of feed sources during the dry season. References Alemayehu Menigistu. 1998. The Borana and the 1991-92 droughts: A Rangeland and Livestock
Resource Study. Institute for sustainable development, French Catholic committee against hunger and for development. Addis Ababa, Ethiopia. 90p.
Alemayehu, M. 2006. Range Management for Eastern Africa: Concepts and Practices. Addis Ababa University Printing Press. Addis Ababa.Pp
Arzani, H., M. R. Sadeghimanesh, H. Azarnivad, G. H. Asadian and E. Shahriyari. 2008. Study of phonological stages effect values of twelve species in Hamadan rangelands. Iran J. Range Desert Res. 16: 86-95.
Coppock, D. L. 1994.The Borana Plateau of Southern Ethiopia: Synthesis ofPastoral research, development and change, 1980-91 ILCA (International Livestock Center for Africa).Addis Ababa, Ethiopia, 418pp.
Henkin, N., E. D. Ungar, L. Dvash, A. Perevolotsky, Y. Yehuda, M. Sternbergs, H. Voet and S. Y. Landau. 2011. Effects of cattle grazing on herbage quality in a herbaceous Mediterranean rangeland. Grass Forage Sci. 66:516-525.
Kamara A. and Kirk, M., 2002.The effect of environmental variability on Livestock and land use management: The Borana Plateau, Southern Ethiopia. Socioeconomics and Policy research Working Paper 35. ILRI (International Livestock Research Institute), Nairobi, Kenya, and IFPRI (International Food Policy Research Institute), Washington, DC, USA.35pp.

Livestock Research Proceeding
60
Mekonnen Hailemariam (1994). Genetic Analysis of Boran, Friesian and Crossbred Cattle in Ethiopia. Ph.D. thesis. Swedish University of Agricultural Sciences. Upsala, Sweden. pp. 84-117.
Sandford S (2006). Pastoral livestock marketing in Eastern Africa: Research and Policy Challenges. Warwickshire CV239QZ, UK: Intermediate Technology Publications Ltd.
SAS Institute. 2000. Statistical Analysis Software. SAS Institute Inc., Cary, NC, USA. SPSS, 2003.Statistical procedure for social science version 17.Statistical procedures for social sciences (SPSS) INC, Chicago, USA.
Snyman, H. A. 1998. Dynamics and sustainable utilization of the rangeland ecosystem in arid and semi-arid climates of southern Africa. J. Arid Environ. 39:645-666.
SPSS, 2003. Statistical procedure for social science version 17.Statistical procedures for social sciences (SPSS) INC, Chicago, USA.
Tessema, Z. K., W. F. de Boer, R. M. T. Baars and H. H. T. Prins. 2011. Changes in soil nutrients, vegetation structure and herbaceous biomass in response to grazing in a semi-arid savanna of Ethiopia. J. Arid Environ. 75:662-670.
Van der Westhuizen, H. C., H. A. Snyman and H. J. Fouche. 2005. A degradation gradient for the assessment of rangeland condition of a semi-arid sour veld in southern Africa. Afr. J. Range Forage Sci. 22:47-58.

Livestock Research Proceeding
61
Evaluation of Oat and Vetch Accessions for Yield and Yield Attributes in BuleHora District of Borana Zone, Southern Oromia, Ethiopia
Bedasa Eba*, Bikila Negasa, Jaldesa Doyo, and Bantayehu Mulune
Yabelo Pastoral and Dry land Agricultural Research Centre (YPDARC), OARI *Corresponding author Email: [email protected]
Abstract The study was conducted at Gerba research sub site of Bullehora district with the intention to evaluate the performances of oat and vetch accessions, to select and recommend the most promising forages to the study area. The accessions were collected from Holeta Agricultural Research Centre (HARC) and International Livestock research Institute (ILRI). The materials were sown in Randomized Completely Block Design (RCBD) with three replications. The analysis of oat accessions showed that there was a significant variation within accessions with respect to plot cover, plant height, dry matter and seed yield. Highest mean dry matter yield were observed for Lampton (10.7 t/ha), Jasari (9.3 t/ha) and CI-8235 (9.1t/ha). While the highest seed yield was recorded for SRCPX80Ab2806 (1142 kg/ha) followed by CI-8251 (1118kg/ha) and 79Ab382 (TX)(80SA94) (1029.4 t/ha) accessions. The result also showed that there were significant differences in agronomic and yield parameters among the tested vetch accessions. The maximum dry matter yield (17.27 t/ha) was obtained by Vicia dasycarpa nomia while the seed yield of Vicia sativa ICARD61509, Vicia dasycarpa nomi, and Vicia villosa collected from Holeta were the highest among the tested vetch accessions. No disease incidences and pests were observed on vetch and oat accessions. In general, there was high dry matter yield variation among oat accessions, whereas the yield difference is magnificent in the case of vetch accession. Hence, it is very important to further evaluate the materials at on-farm conditions and demonstrate the best performing oats and vetch accessions for the farmers to improve feed shortage in study area. Key words: Improved forages, vetch, oat, dry matter, accessions, Introduction Ethiopia has the largest livestock population of any country in Africa. However, nutritional factors are the binding constraint to sustaining livestock production in Ethiopia. Feed shortage becomes very critical in most of the areas mainly due to the high population pressure which leads farmers to cultivate grazing lands (Getinet et al., 2004). On other hand, increasing uncontrolled grazing on scarce common areas has contributed to the degradation of many range and pasture lands (Alemayehu, 2006). The present valuable sources local feed resources are very low in quantity and quality. Hence, if these feed resources supplemented with protein from improved forages, it provide an economic and productive ration for ruminant livestock. A lot of efforts have been made to introduce and evaluate the performance of improved forages such as oats and vetch in different parts of the country. However, there is limited information on the adaptability of improved forages including oats and vetch in the midlands of Borana zone. Hence, this study was conducted with the objectives to evaluate the adaptability of different oat and vetch accessions to the mid-highlands of Borana zone and select the best promising accessions for the agro ecology of the study area. Materials and Methods The study was conducted in midland of Bule-Hora district of Borana zone, at Gerba research station site. It is found on Southern part of Oromia at a distance of 456kms from Addis Ababa. It has an altitude of 2244 m.a.s.l and characterized by bimodal rainfall type. Different accessions of oat and vetch were collected from ILRI and HARC. A RCBD with three replications was employed incorporating for each herbaceous legumes and grasses species. A fine seed-bed was prepared by plowing and harrowing. The materials were planted in rows. Seeding rate for oat and vetch were 80kg/ha and 30 kg/ha, respectively.

Livestock Research Proceeding
62
Seeding was carried out in the main rainy season on cultivated seedbeds. Hand weeding was performed at appropriate time. Data on establishment of forages, seed yield, forage yield and plot coverage were collected. During the fourth week after seeding, emerging plants was counted from each row plot to assess germination percentages. The harvest was taken from the middle of the plots 4m2 at 15cm height above ground. Plant height was determined as an average height of three larger and three smaller heights that randomly selected plants measured from ground level during harvesting stage. All seeds were harvested by hand. Incidences of pests and diseases was observed and recorded regularly. All recorded agronomic and yield data were subjected to statistical analysis using the general linear model (GLM) of the Statistical Analytical System (SAS, 2002) in order to determine attribute differences between different cultivars of the same species. Results and Discussions Mean values of yield and yield attributes of oats The mean plot cover, plant height, dry matter and seed yield of oats varieties depicted in table 1. The analysis showed that the plot cover, plant height, dry matter and seed yield were significantly (P<0.05) different among the accessions evaluated. The highest plot cover were recorded for the accessions of oat of CI-8237 (80.3%), Jasari (80.2%) and CI-8235 (77.5%). These three accessions performed better in covering the plots as compared to the others. The average height of the oats accessions at harvesting stage was ranged between 56.2 and 68.8cm. The highest plant height was observed for the accessions of CI-8235 and SRCPX80Ab2291. The plant height value recorded for this trial is lower as compared to the values obtained by Getinet et al. (2004) and Fekede et al. (2008) that indicted the average height of the tested oats accessions at forage harvesting was ranged between 120 and 169cm. This variation may be due to the difference in environmental conditions and fertilizer application. The highest dry matter yield (18 t ha-1) was obtained from Lampton followed by Jasari (9.3t ha-1) and CI-8235 (9.1t ha-1) accessions. The study of Getinet et al., (2004) indicated that the forage yields of the oat accessions were significantly different and varied in the range of 10.1 to 15.4 t ha-1. The dry matter yield was positively correlated with height for some accessions of oat. This agrees with study of Getinet et al., (2004) that dry matter yield was positively correlated with height. However, for accession of oat of SRCPX80Ab2291, the dry matter yield and height negatively correlated. This may indicates the proportion of leaves and stems very low related to its height and hence height of plants may not underline for the quantity of forages produced per unit area. This also outlined by similar study of Getinet et al., (2004). Similarly, there was seed yield variation of oat accessions with the highest yield recorded for SRCPX80Ab2806 (1142 kg/ha) followed by CI-8251 (1118kg/ha) and 79Ab382 (TX)(80SA94) (1029.4 t/ha). The highest seed yield produced by accessions SRCPX80Ab2806 and CI-8251 confirm that the more forage yielder produce less seed yield. The study was in line with of study of Getinet et al., (2004) that depicted the dry matter yield and seed yield was negatively correlated. There were no disease and pests observed during the evaluation periods.

Livestock Research Proceeding
63
Table 1. Mean agronomic and yield performance of oat accessions tasted at Gerba research sub site of Bullehora district Oat Accessions PC (%) PH (cm) DM yield (t/ha) SY(kg/ha) 79Ab382(TX)(80SA94) 59.8±3.2cde 56.2±1.8b 5476.7±1004.8d 1029.4±131.8ab
79Ab382 (TX)(80SA95 62.2±1.0cd 57.5±3.2b 5627.3±1006.9d 882.4±177.8bc
CI-8235 77.5±2.5a 68.8±0.8a 9151.3±1663.8abc 844.3±128.9bc
CI-8237 80.3±1.3a 67.3±4.3a 6338.7±941.9d 796.2±180.7c
CI-8251 52.7±1.9e 61.3±2.4ab 6986.7±1849.4bcd 1118.0±184.2a
Grayalegris 67.7±4.6bc 61.2±4.9ab 6407.3±1646.7d 746.4±145.8c
Jarsi 80.2±1.4a 65.0±0.9ab 9300.7±2097.5ab 669.8±152.3c
Lampton 74.5±4.8ab 66.8±2.8a 10712.0±3283.0a 676.4±149.3c
SRCPX80Ab2291 58.3±4.2ed 68.7±5.3a 6774.7±1774.3cd 839.4±130.1bc
SRCPX80Ab2806 63.3±0.8cd 64.0±2.6ab 4868.7±853.5d 1142.0±253.5a
Overall 67.7±1.5 63.7±1.1 7164.4±563.5 874.4±53.1 1PC =Plot cover, PH= plant height; DM= Dry matter yield, SY = Seed yield; Figure having the same Letters with in column are not significantly (P>0.05) differ 2Values followed by different letter (s) are significantly (p<0.05) differ Mean values of yield and yield attributes of vetches The analysis result showed that there were significant differences (P<0.05) among vetch accessions tested with respect to plot cover, plant height, dry matter and seed yield. Vicia dasycarpa lana recorded the highest plot cover (68.3%) followed by Vicia vilosa collected from ILRI Vicia villosa collected from Holeta and Vicia dasycarpa nomi (Table 2). The longest height (76.7cm) was recorded by Vicia villosa collected from Holeta while the least (65.8) plant height obtained from Vicia dasycarpa nomi. The study of Teshome et al., (2004) indicated that the height of vetch varies across locations. However, the result of this study in terms of plant height was lowest score when compared to the study of Tekleyohannes et al., (2003) probably due to the fertilizer application. Except for accession Vicia sativa ICARD61744, the performances of the tested accessions were not significantly differ (P<0.05) with the respect to the dry matter yield. Maximum dry matter yield (17.27 t/ha) was obtained by Vicia dasycarpa nomia and following by Vicia villosa collected from Holeta and Vicia sativa ICARD61509. Whereas, the minimum (10.47t/ha) dry matter yield was produced by Vicia sativa ICARD61744. This result was in line with the finding of Tekleyohannes et al., (2003) that indicated the dry matter yield of vetch for three consecutive years was ranged from 0.7-9.4t/ha. Most of the other studies conducted so far were by applying fertilizer on vetch. This may be the reason why the dry matter yield of vetch accession were somewhat lower than other findings. The seed yield of Vicia sativa ICARD61509, Vicia dasycarpa nomi, and Vicia villosa collected from Holeta were the highest among accessions with the value of 1525.7 kg/ha, 1407.0 kg/ha and 1320.7kg/ha respectively. In addition to sole cropping, many studies indicated (Fekede et al., 2004) that vetch are best preformed when sown with the mixture of oat and other grasses. Generally, the tested oat and vetch accessions have shown that they could solve the feed shortage of the study areas if it is demonstrated to the end users.

Livestock Research Proceeding
64
Table 2. Mean agronomic and yield performance of vetch accessions tasted at Gerba research sub site of BulleHora district Vetch accessions PC (%) PH (cm) DM yield (t/ha) SY (kg/ha)
Vicia atropurpurea 59.2±4.2ab 76.0±1.8a 1462.7±214.2ab 1232.2±21.0ab
Vicia dasycarpa lana 68.3±3.6a 71.8±4.1ab 1460.0±323.5ab 1259.7±139.6ab
Vicia dasycarpa nomi 65.3±3.5a 65.8±3.2b 1727.3±104.3a 1407.0±198.2ab
Vicia sativa ICARD61509 62.7±5.1ab 74.3±2.9a 1572.7±215.1ab 1525.7±112.9a
Vicia sativa ICARD61744 52.5±3.4b 72.3±4.1ab 1047.3±111.9b 914.3±167.5c Vicia villosa (collected from Holeta)
66.7±2.1a 76.7±1.4a 1601.3±335.9ab 1320.7±137.4ab
Vicia vilosa (collected from ILRI)
67.8±3.0a 76.2±1.1a 1404.7±102.2ab 1150.3±116.6bc
Overall mean 63.2±1.5 73.3±1.2 1468±83.4 1258.6±55.7 1PC =Plot cover, PH= plant height; DM= Dry matter yield, SY = Seed yield; Figure having the same Letters with in column are not significantly (P>0.05) differ 2Values followed by different letter (s) are significantly (p<0.05) differ Conclusions and Recommendation The analysis of oats and vetch accessions showed variation within accessions with respect to agronomic and yield parameters tested. Highest mean dry matter yield were observed for Lampton, Jasari and CI-8235. While the highest seed yield recorded for SRCPX80Ab2806 followed by CI-8251and 79Ab382 (TX)(80SA94). The highest seed yield produced by accessions SRCPX80Ab2806 and CI-8251 confirm that the more forage yielder produce less seed yield. On the other hands, maximum dry matter yield (17.27 t/ha) was obtained by Vicia dasycarpa nomia and following by Vicia villosa collected from Holeta and Vicia sativa ICARD61509. The seed yield of Vicia sativa ICARD61509, Vicia dasycarpa nomi, and Vicia villosa collected from Holeta were the highest among the tested vetch accessions. No disease incidences and pest observed on vetch and oat accessions. In general, there was high dry matter yield variation among oat accessions, whereas the yield difference is magnificent in the case of vetch accession. Hence, it is very important to further evaluate the materials at the on-farm condition and demonstrate the best performing once for the farmers to improve feed shortage in study area. References Alemayehu, M. 2006. Range Management for Eastern Africa: Concepts and Practices. Addis Ababa
University Printing Press. Addis Ababa. Fekede Fayissa, Getinet Asefa, Lulseged G/Hiwot, Muluneh Minta and Tadesse T/Tsadik, 2004. Evaluation of Napir grass-vetch mixture to improve total herbage yield in the central highlands. In
proceedings of the 13th annual conference of the Ethiopian Society of Animal Production (ESAP) held in Addis Ababa, Ethiopia, August 25-27, 2004
Fekede Feyissa ,Adugna Tolera and Solomon Melaku. 2008.Plant height, herbage yield, grain yield, straw yield and their inter relationships in selected oats (Avena sativa L.) varieties. In: proceedings of the 11th annual conference of the Ethiopian Society of Animal Production in Addis Ababa, Ethiopia, October 8 to 10, 2008.
Getnet Assefa, Fekede Feyissa, Abreham Gebeyehu and Muluneh Minta. 2004. Characterization of selected oats varieties for their important production traits in the highlands of Ethiopia. In:

Livestock Research Proceeding
65
proceedings of the 11th annual conference of the Ethiopian Society of Animal Production. August 28-30, 2003, Addis Ababa, Ethiopia, pp. 305-314.
SAS, 2002. Statistical Analysis System software, Version 9.0, SAS Institute, Inc.Cary,NC,USA Tekleyohannes Berhanu, Teshome Abate, Solomon Bogale and Dagnachew Worku, 2003.On-farm
evaluation of different seeding rates of Oat and Vetch mixtures in barley-based double cropping system of the Bale highlands: In Proceedings of the 10th annual conference of the Ethiopian Society of Animal Production (ESAP) held in Addis Ababa, Ethiopia, August 21-23, 2003
Teshome Abate, Bekele Mechalu and Tekleyohannes Berhanu, 2004.Evaluation of different oat/vetch mixtures for forage yield performance and compatibility in the highland of Bale. In proceedings of the 12th annual conference of the Ethiopian Society of Animal Production (ESAP) held in Addis Ababa, Ethiopia, August 12-14, 2004.

Livestock Research Proceeding
66
Nutritional Characterization of Adapted Forages Species in Semi-arid of Borana Zone
Bedasa Eba*, Bikila Negasa, Jaldesa Doyo, and Asfawu Ijo Yabello pastoral and dry land Agricultural research Centre (YPDARC), OARI
*Corresponding author email: [email protected] Abstract The study was conducted to evaluate the chemical composition of promising adapted forages species in semi-arid of Borana rangelands. Rhodes grass, Elephant grass, Cajanus Cajan, lablab, Sesbania sesban and Rhynchosia ferruginea (local check for legumes) were collected from YPDARC of field trails station. Accordingly, the chemical compositions of all of these promising forages are on acceptable ranges. The crude protein (CP) percentage of forage legumes is high, while the neutral detergent fiber (NDF), acid detergent fiber (ADF) and acid detergent lignin (ADL) are low; which leads as supplement for the low basal diets for the ruminants. The grasses are low in CP (%) and hence need to integrate with protein supplements. The chemical composition of improved forage legumes (Lablab, Cajanus cajan and Sesbania sesban) were comparable to Rhynchosia ferruginea which was considered as local check. Hence, in addition to local forage legumes, improved forages legumes has the potential in semi-arid of Borana for enhancement of feed production and protein supplement for low quality basal diet. Key wards: Improved forages, Nutritive value, Forage legumes, Semi-arid of Borana Introduction Semi-arid of Borana supports the largest livestock population in the Ethiopia. The livelihood of Borana people is mainly dependent on the production of livestock as source of food, income, prestige and security in times of hardship. However, livestock production and productivity is very low because of inadequate feed in quantity and quality which primarily derived from natural pastures and crop residues (Tessema, 1998). Among the technical constraints limiting livestock productivity, issues related to feed are the major ones owing to biological and economic reasons. Feasibility and productivity of livestock production is basically a function of the types of feed and feeding. Although natural pastures have been the main livestock feed sources in Borana zone, grazing lands are gradually being brought into cultivation. High livestock concentration in limited grazing lands caused heavy grazing leading to soil degradation, which in turn has resulted in a decline of year round feed supply especially during dry season. Thus, there is loss of livestock condition in the dry season, mainly because of inadequate grazing and lack of planted forages. One of the options to solve the scarcity of feed is to use agro-industrial by products such as cotton seed cake and ground nut meal. However, supplies of these feeds are inadequate for the existing livestock population and feed prices are high and hence they are not readily available. Hence, for sustainable livestock production there is a need to introduce high yielder and quality of forage legumes and grasses which can be used as supplementary feed in the dry season (Karue, 1974 and FAO, 1981). On the other hand, information on feed quality is one of the decision support tools required to provide rational basis for utilization of feed resources, to improve animal production and productivity and ultimately to increase financial returns to the producers. Laboratory based evaluation have special merit in reducing cost and time to arrive at practical solutions for field level problems. Therefore, the objective of the activity was designed to evaluate the nutritional quality of feed resources which are adapted under semi-arid conditions of Borana zone.

Livestock Research Proceeding
67
Methodology The study was conducted in semi-arid Borana rangelands of Oromia. Feed samples of promising adapted forages species were collected from YPDARC field trails station. Some of the forages considered for analysis were Rhodes grass, Elephant grass, Rhynchosia ferruginea (local), Cajanu scajan, Lablab, Sesbania sesban and Sesbania aculeata. A leaf of browses was sampled from five plants that represents the whole area of plots and bulked together for analysis. For herbaceous and grasses species, three quadrants of a size of 0.5mx0.5m were sampled and bulked for chemical composition analysis. According to the manual of laboratory, the sampled forages were prepared in all stage of the steps. To avoid contamination the samples were properly stored in good materials. The parameters analyzed were DM, Ash, OM, N, CP, NDF, ADF, ADL and TIVDMD. These chemical composition of forages species determined using the Near Infera Red Spectrum (NIRS) at International livestock research institute (ILRI) of nutritional laboratory. Result and Discussions The result of chemical composition of the selected adapted forage varieties was presented in table 1. The CP values of the browse and herbaceous legumes species ranged between 17.55%-28.96%. While, the average CP (%) of Rhodes grass and Elephant grass are by far lower than browse and herbaceous legumes species. This is because of most of tropical grasses are characterized by high fiber content and low protein, energy and mineral contents. The CP content in present study agrees with the study of Alexander et al. (2007). The crude protein contents of Cajanus cajan in this study ranging from 19.55 to 28.96%. This is consistence with the report of Alexander et al., (2007) that indicated crude protein ranging from 16.3-27 % and is an excellent source of protein (Ahmed and Nour, 1997). Cajanus cajan leaves have similar intake and CP content with that of alfalfa (Park et al., 1989). Hence, it was indicated that the use of Cajanus cajan leaves could be an effective substitute for industrial concentrates (Foster et al., 2009). The CP (%) of Dolichos lablab ranged 17.5-19.55%. This study agrees for some accession that evaluated under semi-arid of Kenya (Karachi, 1997). It indicated that the current evaluated Dolichos lablab accessions are at accepted level of protein supplements for poor feed stuffs. The Sesbania sesban have high protein content that ranged from 20.59-28.56% from both years. This in line with the findings of the reports of Manaye et al., (2009); Orwa et al., (2009) that indicated Sesbania sesban has a high level of foliage nitrogen and is an excellent supplement to protein-poor roughage. Furthermore the report of Pravin et al., (2012) indicated that the leaves and tender branches of this tree have high levels of protein (with 20 to 25% crude protein), and easily digestible when consumed by ruminants. However, the amount of NDF (%) and ADF (%) of Rhodes grass and Elephant grass are higher than the forage legumes. The NDF and ADF contents of Rhodes grass in this study are lower than the values reported by Nurfeta (2010). However, the NDF content in this study was higher; while ADF content was lower when compared to report of Gebregiorgis et al. (2011). This inconsistence may be due to the difference of the evaluation methods and stage forages evaluated. The NDF (%) and ADF (%) of Dolichos lablab of this study also agrees with similar author for most of the accessions. The TIVDMD (%) of Rhodes grass was lower than elephant grasses and legumes. This indicates that Rhodes grass feeding need to be integrated with some legume species to fulfill the nutritional requirements of livestock. However, the TIVDMD (%) of Dolichos lablab of this study higher than the report of Karachi, (1997). The current Sesbania sesban cultivar has low NDF, ADF, ADL and high TIVDMD. This indicates that the leaves easily digestible when consumed by livestock. Hence, the climatic condition suited for Sesbania sesban ranges to semi-arid areas. Rhynchosia ferruginea is a local herbaceous legume that has similar chemical composition with the improved legume forages adapted in the area. All of the browse and herbaceous legumes in this study would be good protein supplement.

Livestock Research Proceeding
68
Table 1. Chemical compositions of some adapted improved forges in semi-arid of Borana
Conclusions and Recommendations It is concluded that the browse and herbaceous legumes species evaluated in this study could be good protein supplements to low quality basal diets in semi-arid of Borana. The grasses species are low in protein content and hence need integration when feeding with good quality forages. The NDF contents of all browse and herbaceous legumes are low to moderate. This indicates that the forages have high cell contents, which is related with high digestibility. It is important also to conduct livestock feeding experiments to determine the nutritive value of these promising species in terms of palatability, intake, digestion and effect on production performance of the animals. References Ahmed, MMM, Nour, HS. 1997: Legume hays as a supplement for dairy goats during the dry season.
Small Rumin. Res.26: 189-192. Alexander, G, Ravi, D, Reddy, RCh, Saxena, KB, Hanson, J.Upadhyaya, H D, Blümmel, M. 2007.Forage
yield and quality in pigeon pea germplasm lines. An open access Journal .ICRISAT. Volume 3, Issue 1.
FAO. 1981. FAO Trade Yearbook, 1981. FAO, Rome. Foster, J. L. ; Adesogan, A. T. ; Carter, J. N. ; Blount, A. R. ; Myer, R. O. ; Phatak, S. C., 2009. Intake,
digestibility, and nitrogen retention by sheep supplemented with warm-season legume hays or soybean meal. J. Anim. Sci., 87 (9): 2891-2898
Name of species/years
DM (%)
Ash(%) OM (%)
CP (%) NDF (%)
ADF (%)
ADL (%)
TIVDMD (%)
1st year (2013) Rhodes grass 92.13 13.26 86.74 9.67 74.66 46.42 5.87 52.36 Cajanus cajan werer 92.12 12.22 87.78 19.55 38.33 39.89 11.38 69.84 Dolichos Lablab purple
90.57 10.47 89.68 18.95 46.91 32.90 4.62 74.59
Dolichos Lablab (147)
91.96 11.07 88.93 20.03 44.53 24.45 4.86 68.72
Sesbania sesban 91.11 13.44 86.56 20.59 34.05 34.52 9.34 73.48 Sesbania aculeata 91.30 13.12 86.88 21.01 29.68 31.78 8.55 77.98 Elephant grass 90.51 14.72 85.28 13.73 75.41 42.20 5.99 78.65 2nd year (2014) Dolichos Lablab purple
89.97 11.54 88.46 17.55 41.67 33.05 3.95 78.05
Dolichos Lablab (147)
89.98 10.86 89.14 18.44 42.73 33.14 4.03 79.51
Cajanus (duwarf) 91.04 9.40 90.60 28.96 17.57 20.58 4.66 80.97
Cajanus walaita sodo 91.77 8.35 91.65 26.32 20.63 22.90 6.42 75.80
Sesbania aculeata 90.42 9.61 90.39 23.95 28.56 25.07 3.44 78.90
Sesbania sesban 90.01 9.21 90.79 24.00 25.60 23.21 4.54 79.45
Rhynchosia ferruginea
90.39 10.80 89.20 15.79 52.35 40.00 7.41 64.28

Livestock Research Proceeding
69
Gebregiorgis, F, Negesse, T, Nurfeta, A. 2011.Feed intake and utilization in sheep fed graded levels of dried moringa (Moringa stenopetala) leaf as a supplement to Rhodes grass hay. Trop. Anim. Health Prod.44: 511-517.
Karachi, M., 1997.Growth and nutritive value of Lablab purpureus accessions in semi-arid Kenya.Tropical grassland, vol. 31, 214-218.
Karue, C.N. 1974. The nutritive value of herbage in semi-arid lands of East Africa. 1. Chemical composition. East African Forage Journal. 40: 89-95
Nurfeta, A.2010. Feed intake, digestibility, nitrogen utilization and body weight change of sheep consuming wheat straw supplemented with local agricultural and agro-industrial by-products. Trop. Anim. Health Prod.42: 815-824.
Orwa C, Mutua A, Kindt R, Jamnadass R, Simons A (2009).Agrofores tree Database: a tree reference and selection guide version 4.0 (http://www.worldagroforestry.org/af/treedb/)
Pravin G, Priti G, Shaikh A, Sindha S, Khan MS (2012). Sesbania sesban Linn: A Review on Its Ethnobotany, Phytochemical and Pharmacological Profile. Asian J. Biomed.Pharmaceut. Sci. 2(12):11-14.
Park, YW, Reynolds, GA, Stanton, TL. 1989. Comparison of dry matter intake and digestibility of sun-cured pigeon pea, alfalfa and coastal Bermuda grass by growing dairy goats. Small Rumin. Res.2: 11-18.
Tesema Zewude, 1998. Effect of intercropping, animal forage legumes on maize grain, stover yield production and forage production at adet north western Ethiopia. A search for strategies for sustainable crop production smallholder perspectives of the agronomy and crop physiology society of Ethiopia, 21-22 May 1998, addis Ababa, Ethiopia

Livestock Research Proceeding
70
Effect of Encroaching Acacia Species on Herbaceous Composition, Aboveground Biomass and Soil Nutrient Status in Borana Rangeland, Southern Ethiopia
Bedasa Eba*, Bikila Negasa, Samuel Tuffa, Jaldessa Doyo
Yabelo Pastoral and Dry land Agricultural Research Center (YPDARC), P.O. Box: 085, Borana Zone *Corresponding Author email:[email protected]
Abstract The study was carried out in Yabelo district with the objective to investigate the interaction of invasive acacia species on herbaceous species composition, above biomass and soil nutrient status. Three acacia species Acacia drepanolobium, Acacia mellifera and Acacia reficiens were selected respectively from Dikale, Elawaya and Harowayu kebeles of Yabello district based on their prioritization as encroaching species by local communities. By extending 15m transect from the trunks of each of the three species, three zone (root, canopy and open zone) were demarcated along transect. This was replicated three times for each acacia species. Herbaceous species cover, above ground productivity and soil properties of two layers (0-15cm and 15-30cm) were determined in each zones. The result showed variations in zones with respect to each acacia species. With respect to each acacia species; dry matter yield, species composition and basal cover were highest (P<0.05) at open zone. For the three acacia species there were no difference (P>0.05) in soil texture among the three zones. Chemical soil properties; pH, CEC, K, Ca and Mg were not differed (P>0.05) among layers of soil, zones and their interactions for each acacia species. But, highest percentage of organic carbon and nitrogen were observed under root zone of Acacia derpanolopium and Acacia refencies. In general, the result suggested that all acacia species have negative effect on above biomass where as positive effect on soil nutrient status. Hence, minimizing the density (by thinning) of each acacia species has positive effect to increase productivity of the rangelands and improve fertility of the soil as well. Key words: woody encroacher species, above ground biomass, soil nutrient status, rangelands Introduction East African rangelands including Borana rangelands accompanied by environmental change such as drought can encourage the establishment of undesirable woody species. The appearance of such plants can produce problem because grass production reduced from competition for water, light or nutrient (Tamene, 1990). In addition many woody species are thorny or thicket-forming so that grass production under their canopy is inaccessible to livestock (Part and Grwynne, 1977). When these results combined the range will deteriorated and pastoral production can be reduced. According to Oba (1998) more than 50% of the total land size of Borana plateau is invaded by different bush species. Belesky et al., 1989 investigated that net primary productivity under and near trees of Acacia tortolis and Adansonia digitata were significantly greater ANPP in their canopy zone than in their root. This suggests that tree canopies may improve the water status and the understory species. This study further revealed that realizable N and microbial biomass were significantly higher in soils from the canopy than from the root and grassland zones, whereas organic matter, P, K, and Ca (but not Mg) declined in soil from the base of the trees towards the open grassland. In contrast herbaceous layer productivity is lower under tree canopies than the nearby open grassland (Dye and Spear, 1982; Wiker and Noymier, 1982) as sited in Belesky et al., 1989. The problem of bush encroachment has been well recognized in southern rangeland and some efforts have been done by different organization regarding their control. Despite the interest in bush management, it is remarkable that little information is known about the interaction of the two basic components; trees/shrubs and herbaceous species. Hence, the study aimed to investigate the interaction between trees/shrubs and herbaceous species, to determine the effect of tree canopies, roots on herbaceous species composition, aboveground biomass and soil nutrient and to identify the most noxious shrubs/ trees that negatively affect herbaceous species production.

Livestock Research Proceeding
71
Materials and methods Study area selection and description The study was conducted in Yabelo district within radius of 50km from Yabelo town, Borana Zone, Southern Ethiopia. The study area occupied almost entirely by pastoral populations, and resource use is largely communal, though with crop cultivation and private enclosures that appear to be increasing in recent decades. Rainfall delivery is bimodal; with the long rains accounting for 60% of the total rainfall falling between March and May and the short rains comprising of 27% of the total rainfall falling between September and November. There is spatial and temporal variability in both the quantity and distribution of rainfall with an average annual rainfall varying from 353mm to about 700mm per annum. Annual mean temperature is varying from 19 to 240 C with little seasonal variation (Kamara and Kirk, 2002). Three kebeles which are highly encroached by acacia species were selected from Yabelo district. Accordingly, three acacia species was selected based on prioritization as encroaching species by local community and reviewing past documents in each kebeles. The selected acacia species were namely; Acacia drepanolobium from Dikale kebele; Acacia mellifera from Elawaya kebele, and Acacia refencies from Haroweyu kebele. All sites were enclosed for standing hay for more than 3 years and data were collected during end of short rainy season (September to November). Experimental design and measurements Three plants for each acacia species that were almost similar in height, branches and structural form were selected. A 15m transect was extended from the trunks of each of the three species in the surrounding grasslands. The transect positioned as 1-2m for root zone, 5-10m for canopy zone and 12-15m for open zone depending for each acacia species. Four transect were positioned in four direction (north, south, west and east) randomly from each acacia species but shrubs, termite mounds and other disturbances were avoided. Samples of basal cover and species composition were taken using a 0.5mx0.5m frame quadrant along each the length of transects for three acacia species and three zones (three acacia species x three zones x 3 replication). Herbaceous species cover, composition and above ground productivity was determined in the three zones (root, canopy and open) (Baars et al., 1997). The average of four transect for all parameters (basal cover, composition and dry matter) measured was used for analysis. The root zones were confirmed by digging in deep trenches at various locations around each acacia species. Open zones were demarcated beyond their canopy cover of each acacia species. Soil samples were taken from three acacia species, three zones and two layers of soil (3 acacia species x 3 zones x 2 layers of soil x 3 replication) designed as randomized completely block design (RCBD). All plants within the 0.5mx0.5m quadrant along transect were clipped to ground level. Dry matters of herbaceous were determined after oven drying at 105 °C for 24 hours at YPDARC. To quantify the effects of acacia species on soil properties, soil samples were taken from 0-15cm and 15-30 cm as two layers from root, canopy and open zones for each selected acacia species. During the samples of soil, composite soils were taken in four directions for all zones in respect to each species. Soil samples analysis were done at Holeta agriculture research center. Data analysis Data were subjected to the analysis of variance using SAS version 9.0 (SAS, 2002). Least significance differences (LSDs) at the 5% level of probability were computed to delineated significance differences among treatment means. Result and Discussions Characteristics of acacia and herbaceous species compositions The average height and areal canopy diameter were 5.3m and 4.75m; 6.2m and 8.3m; and 3.3m and 6.9m of Acacia derpanolobium, Acacia mellifera and Acacia refencies, respectively. Most of the herbaceous composition observed at each acacia species were perennial grass and very few were non-grasses that depicted in table 1. The frequencies of most of the species were observed under canopy of each of acacia species. The herbaceous species composition identified was 8, 5 and 7 under canopy of Acacia

Livestock Research Proceeding
72
derpanolobium, Acacia mellifera and Acacia refencies, respectively. The grass compositions were lower at open area of each acacia species than other zones. Table 1. Species composition along the three zones of each acacia species Species of acacia
Zones
Root Canopy Open Acacia derpanolobium
Pennisetum mezianum (2) Achyranthesaspera (2) Sporoboluspyramidalir Chlorisroxburghiana Eleusin spp. Ocmiumspp
Pennisetummezianum Cenchrusciliaries (2) Ocmium spp.(2) Chrotoloria Chloris roxburghiana Comolania Achyranthes aspera Sporobolus pyramidalir
Pennisetummezianum (2) Ocmiumspp Cenchrus ciliaris Ingofera spp. Sporobolus pyramidalir
Acacia mellifera
Chrysopogonplumulosur Achyranthesaspera Heteropogoncontortus Aristida odscensinis Sporobolus pyramidalir Enteropogon macrostachyur
Chrysopogonplumulosur Cenchrusciliaries Heteropogoncontortus Aristidaodscensinis Enteropogonmacrostachyur
Chrysopogon plumulosur Heteropogon contortus (2) Teterapogon contortus Chrysopogonplumulosur
Acacia refencies
Pennisetummezianium Chrysopogonplumulosur Achyranthesaspera (2)
Enteropogonmacrostachyur Lntonianutans Chrysopogonplumulosur Ciodaovat Lntonianutans Achyranthesaspera Chrysopogon plumulosur
Pennisetummezanium Cenchrusciliaries Achyranthesaspera Chrysopogonplumulosur Chrysopogonplumulosur Pennisetummezianum
Effect of zones of each acacia species on herbaceous dry matter, basal and litter cover The results showed that the effects of acacia species under canopy also differ from open area. The above ground dry matter yield of the herbaceous at open zone of Acacia mellifera was higher (P<0.05) than root and canopy zone. The basal cover was also higher (P<0.05) under canopy and open than root zone of Acacia mellifera. Like that of Acacia mellifera, Acacia derpanolobium have negative effect on above herbaceous vegetation that shown in table 2. Dry matter was highest (P<0.05) at open zone of Acacia derpanolobium, whereas basal cover was highest (P<0.05) under canopy zone than open zone. This may be due to accessible for livestock grazing and high competition of woody species over herbaceous vegetation under canopy zones. Effect of Acacia refencies on above herbaceous vegetation showed in table 2. Open zone of Acacia refencies have highest (P<0.05) dry matter yield, basal and litter cover than canopy and root zones of Acacia refencies. This indicates that Acacia refencies affect negatively the above herbaceous vegetation under canopy and root zones.

Livestock Research Proceeding
73
Table 2. Mean±se of dry matter, basal cover, and litter cover at different zones for each acacia species Acacia species name Zones Dry matter (t ha-1) Basal Cover
score Litter cover score
Acacia mellifera Root zone 0.15±0.02c 1.67±0.3b 2.33±0.3b Canopy zone 0.43±0.06b 3.0±0.6a 3.33±0.3ab Open zone 0.76±0.04a 3.33±0.3a 3.67±0.3a
Acacia derpanolopium Root zone 0.14±0.02c 2.67±0.3ab 1.33±0.3a Canopy zone 0.23±0.02b 3.33±0.3a 1.33±0.3a Open zone 0.58±0.02a 2.0±0.0b 1.33±0.3a
Acacia refencies Root zone 0.03±0.01b 1.67±0.3b 1.0±0.0b Canopy zone 0.13±0.01b 2.0±0.0b 1.67±0.3b Open zone 0.66±0.04a 3.0±0.0a 3.0±0.0a
a-b means with different letters within column for each acacia species is significantly different (p<0.05) Soil chemical properties at zones of the each acacia species The responses of three acacia species, namely; Acacia mellifera, Acacia derpanolobium and Acacia refencies on soil status were indicated in table 3. The PH at Acacia refencies encroached area showed difference (P<0.05) across zones and along depths of soil layer. Higher PH found under canopy and 15-30cm soil layer of Acacia refencies encroached area, while there were no difference (P>0.05) of PH level at Acacia mellifera and Acacia derpanolobium encroached area across zones and soil layers. The magnitude of PH under canopy and root zones was higher than open zone for the three acacia species. However, except for Acacia refencies, the PH value under canopy and root zones of Acacia mellifera and Acacia derpanolobium in this study was less than the reports of Samuel (2009). This may be due to the difference of season of soil sampling and small sample of the previous reports. Concentration of OC, P and N increased significantly from the open zone to root zone and from soil layer of 15-30cm to 0-15cm for the three acacia species. The organic carbon (OC) percentages content at the three acacia species encroached area showed differences along zones and soil depth layers. The highest (P<0.05) OC obtained from root zone and 0-15cm of soil layer for three acacia species. The second highest OC percentages content was obtained from canopy zones when compared to open zones of the each acacia species. The magnitude of OC for Acacia mellifera was higher than the two other acacia species. This results of OC percentages of this study lower than the reports of Samuel (2009) for Acacia mellifera area, but similar for Acacia derpanolobium. Similar to OC, Phosphorus content showed same trend, where it was highest (P<0.05) at root zones and 0-15cm soil layers for the three acacia species. The value of P for the three acacia species by far lower than the study of Samuel (2009), but similarity indicated that higher value of P was obtained from canopied for both study. Cation Exchange Capacity (CEC) is vital processes that affect soil fertility. In this result, even though the value of CEC was statistical not significant, it agrees with study of Samuel (2009), where higher CEC was found open area of Acacia mellifera and lower CEC to be found open area Acacia derpanolobium than under canopy and root zones. Nitrogen is one of the most important for growth and physiological process of plants. The total nitrogen in root zones of Acacia derpanolobium and Acacia refencies was higher than open zones. The values of total nitrogen obtained for all acacia species were similar to the reports of Kamara and Haque, 1987 as cited in Ayana, 1999, but lower than the report of Samuel, 2009. This may be due to the difference in land use types where soil sample were collected.

74
Livestock Research Proceeding
Table 3. Soil PH, CEC K, %OC, P, %N, Ca and Mg across the different zones of three acacia species in the respective to depth ranges Depth (cm) under Acacia derpanolobium Depth (cm) under Acacia refencies Depth (cm) under Acacia mellifera
Parameter/zones 0-15 15-30 0-15 15-30 0-15 15-30
PH Mean Mean Mean Root zone 5.97± 0.14a 6.01± 0.14a 5.99±0.1x 7.18±0.12b 7.59±0.12b 7.4±0.08z 5.94±0.58a 6.2±0.58a 6.1±0.4y Canopy zone 5.97±0.14a 5.9±0.14a 5.95±0.1x 7.76±0.12a 8.14±0.12a 8.0±0.08x 6.65±0.58a 7.2±0.58a 6.9±0.4x Open zone 5.8±0.14a 5.75±0.14a 5.78±0.1x 7.47±0.12ab 7.83±0.12ab 7.7±0.08y 6.72±0.58a 6.7±0.58a 6.7±0.4x Mean 5.9±0.8 5.9±0.8 7.5±0.07 7.9±0.07 6.4±0.4 6.7±0.4 CEC (cmol/Kg) Root zone 10.59±1.2a 10.13±1.21a 10.4±0.85x 32.05±3.98a 38.7±3.98a 35.4±2.8x 48.23±17.49a 53.93±17.49a 51.1±12.4x Canopy zone 9.93±1.21a 8.5±1.21a 9.2±0.85x 40.18±3.98a 36.5±3.98a 38.4±2.8x 50.34±17.49a 40.25±17.49a 45.3±12.4x Open zone 9.06±1.21a 10.64±1.21a 9.9±0.85x 31.53±3.98a 37.8±3.98a 34.7±2.8x 49.56±17.49a 54.48±17.49a 52.1±0.1x Mean 9.9±0.7 9.8±0.7 34.6±2.3 37.7±2.3 49.4±10.1 49.6±10.1 K (Meq.K/100g)
Root zone 1.08±0.21a 0.98±0.21a 1.0±0.15x 2.25±0.29a 2.11±0.29a 2.2±0.2x 1.12±0.17a 1.10±0.17a 1.1±0.1x
Canopy zone 1.03±0.21a 0.79±0.21a 0.91±0.15x 2.43±0.29a 1.50±0.29a 2.0±0.2x 1.08±0.17ab 0.51±0.17a 0.7±0.1y
Open zone 0.98±0.21a 1.08±0.21a 1.0±0.15x 2.11±0.29a 1.36±0.29a 1.7±0.2x 0.5±0.167b 0.46±0.17a 0.5±0.1y
Mean 1.0±0.1 1.0±0.1 2.3±0.2 1.7±0.2 0.8±0.1 0.7±0.1
% OC
Root zone 1.61±0.13b 1.08±0.13a 1.3±0.9x 1.96±0.12a 1.56±0.12a 1.8±0.09x 2.28±0.23a 2.17± 0.23a 2.2±0.2x
Canopy zone 1.17±0.13a 0.83±0.13a 1.0±0.9y 1.40±0.12b 1.12±0.12b 1.3±0.09y 2.38±0.23a 1.56±0.23ab 2.0±0.2xy
Open zone 1.17±0.13a 1.08±0.13a 1.1±0.9xy 1.30±0.12b 0.99±0.12b 1.1±0.09y 1.57±0.23b 1.32± 0.23b 1.5±0.2y
Mean 1.3±0.08 1.0±0.08 1.6±0.07 1.2±0.07 2.1±0.1 1.7±0.1 x-y means with different letters superscripts within column within same parameter is significantly different (p<0.05); a-b means with different letters superscripts within row within same parameter is significantly different (p<0.05);

75
Livestock Research Proceeding
Depth (cm) under Acacia
derpanolobium Depth (cm) under Acacia refencies Depth (cm) under Acacia Mellifera
Parameter/zones 0-15 15-30 0-15 15-30 0-15 15-30 Ppmp Mean Mean Mean Root zone 10.0±1.43a 6.07±1.43a 8.0±1.0x 7.27±1.03a 8.67±1.03a 8.0±0.7x 8.73±1.04a 6.53±1.04a 7.6±0.7x Canopy zone 6.33±1.43a 4.73±1.43a 5.5±1.0xy 7.73±1.03a 4.73±1.03b 6.2±0.7xy 6.40±1.04ab 3.47±1.04a 4.9±0.7y Open zone 5.6±1.43a 3.6±1.43a 4.6±1.0y 5.80±1.03a 4.0±1.03b 4.9±0.7y 3.93±1.04b 3.67±1.04a 3.8±0.7y Mean 7.3±0.8 4.8±0.8 6.9±0.6 5.8±0.6 6.4±0.6 4.6±0.6 %N Root zone 0.14±0.01a 0.09±0.01a 0.12±0.01x 0.18±0.01a 0.14±0.01a 0.2±0.01x 0.16±0.03a 0.20±0.03a 0.18±0.02x Canopy zone 0.09±0.001b 0.06±0.01a 0.08±0.01y 0.11±0.01b 0.07±0.01b 0.09±0.01y 0.19±0.03a 0.13±0.03a 0.16±0.02x Open zone 0.08±0.01b 0.07±0.01a 0.07±0.01y 0.11±0.01b 0.08±0.01b 0.09±0.01y 0.16±0.03a 0.12±0.03a 0.14±0.02x Mean 0.1±0.004 0.07±0.004 0.13±0.008 0.098±0.008 0.17±0.02 0.15±0.02 Meq.Ca/100g Root zone 8.99±1.45a 7.03±1.45a 8.0±1.0x 29.82±3.48a 30.34±3.48b 30.1±2.5y 34.75±14.31
a 33.82±14.31a
34.3±10.1x
Canopy zone 6.98±1.45a 8.03±1.45a 7.5±1.0x 34.70±3.48a 41.77±3.48a 38.2±2.5x 36.46±14.31a
34.40±14.31a
35.4±10.1x
Open zone 9.76±1.45a 7.22±1.45a 8.5±1.0x 27.48±3.48a 32.49±3.48ab 30.0±2.5y 35.82±14.31a
34.98±14.31a
35.4±10.1x
Mean 8.6±0.8 7.4±0.8 30.7±2.0 34.9±2.0 35.7±8.3 34.4±8.3 Meq.Mg/100g Root zone 2.45±0.16a 2.34±0.16a 2.4±0.1x 5.15±0.55a 5.13±0.55a 5.1±0.4x 7.31±3.41a 9.69±3.41a 8.5±2.5x Canopy zone 2.22±0.16a 2.59±0.16a 2.4±0.1x 3.99±0.55a 5.78±0.55a 4.9±0.4x 7.79±3.41a 7.53±3.41a 7.7±2.5x Open zone 2.32±0.16a 2.45±0.16a 2.4±0.1x 4.54±0.55a 4.66±0.55a 4.6±0.4x 8.89±3.41a 9.95±3.41a 9.4±2.5x Mean 2.3±0.09 2.5±0.09 4.6±0.3 5.2±0.3 8.0±2.0 9.1±2.0 x-y means with different letters superscripts within column within same parameter is significantly different (p<0.05); a-b means with different letters superscripts within row within same parameter is significantly different (p<0.05);

Livestock Research Proceeding
76
Soil texture for the three acacia species All plants types have different adaptation and preferences to different soil types. For the three acacia species there were no significant difference (P>0.05) in soil texture (% silt, % clay and % sand) among the three zones, but higher % clay observed only for Acacia derpanolopium and Acacia refencies for soil layer of 15-30cm. Sandy soil was the predominant in all three acacia species, where it ranges from 43% to 65%. This report was in line with the study of Samuel (2009) and Abule (2003). Generally, there were no differences among root, canopied and open zones of all study acacia species in soil textures. However, the differences in soil texture among the acacia species were indicated that each bush tree plants have their own specific site to grow. Hence, the more the sandy percentages in study area favor the bush trees, where this was ascribed by study of Troch and Thomson (1993).

77
Livestock Research Proceeding
Table 4. Soil texture across the different zones of three acacia species with the respective depth ranges Depth (cm) under Acacia
derpanolobium Depth (cm) under Acacia refencies Depth (cm) under Acacia mellifera
Parameter/zones 0-15 15-30 0-15 15-30 0-15 15-30 % Silt Mean Mean Mean Root zone 16.0±1.88a 15.0±1.88a 15.5±1.3x 15.0±1.47a 13.3±1.47a 14.2±1.0x 16.3±2.59a 15.0±2.59a 16.5±1.8x Canopy zone 19.2±1.88a 11.7±1.88a 15.4±1.3x 16.7±1.47a 16.7±1.47a 16.7±1.0x 17.5±2.59a 15.4±2.59a 16.5±1.8x Open zone 13.8±1.88a 12.5±1.88a 13.1±1.3x 18.3±1.47a 13.8±1.47a 16.1±1.0x 17.8±2.59a 14.8±2.59a 16.3±1.8x Mean 16.3±1.1 13.1±1.1 16.7±0.8 14.6±0.8 17.2±1.5 15.1±1.5 % Clay Root zone 17.9±0.85a 20.4±0.85b 19.2±0.6y 37.50±2.16a 42.5±2.16a 40.0±1.5a 35.4±10.68
a 35.0±10.68a 35.2±7.6x
Canopy zone 17.1±0.85a 23.3±0.85a 20.2±0.6xy 38.75±2.16a 45.0±2.16a 41.9±1.5a 34.6±10.68a
30.8±10.68a 32.7±7.6x
Open zone 18.8±0.85a 25.0±0.85a 21.9±0.6x 32.91±2.16a 42.9±2.16a 37.9±1.5a 32.5±10.68a
33.8±10.68a 33.1±7.6x
Mean 17.9±0.5 22.9±0.5 36.4±1.2 43.5±1.2 34.2±6.2 33.2±6.2 % Sand Root zone 66.3±6.3ab 62.9±6.31a 64.6±4.5x 47.5±2.53a 44.2±2.53a 45.8±1.8x 48.3±12.74
a 50.0±12.74a 49.2±9.0x
Canopy zone 47.1±6.31b 65.0±6.31a 56.0±4.5x 44.6±2.53a 41.7±2.53a 43.1±1.8x 47.9±12.74a
53.8±12.74a 50.8±9.0x
Open zone 67.5±6.31a 62.5±6.31a 65.0±4.5x 48.8±2.53a 46.3±2.53a 47.5±1.8x 48.8±12.74a
47.1±12.74a 47.9±9.0x
Mean 60.3±3.6 63.5±3.6 46.9±1.5 44.0±1.5 48.3±7.4 50.3±7.4 x-y means with different letters superscripts within column within same parameter is significantly different (p<0.05); a-b means with different letters superscripts within row within same parameter is significantly different (p<0.05)

Livestock Research Proceeding
78
Conclusion and Recommendation The result showed variations in zones (root, canopy and open zone) with respect to each acacia species. With respect to each acacia species; dry matter yield, species composition and basal cover were highest at open zone. While, there were no difference in soil texture among the three zones for the three acacia species. Similarly, the chemical soil properties were not differed among layers of soil, zones and their interactions for each acacia species. However, the highest percentage of organic carbon and nitrogen were observed under root zone of Acacia derpanolopium and Acacia refencies. Hence, all acacia species have negative effect on above biomass where as positive effect on soil nutrient status. Generally, the appearance of the invasive acacia species can have a great effect on herbaceous compositions mainly grasses. It result in reduction of the grass production. They are also thorny or thicket-forming so that grass production under their canopy is inaccessible to livestock. Hence, minimizing the density by thinning of each acacia species have positive effect to increase productivity the rangeland, improve fertility of the soil as well and hence, sustain the health of rangeland management. References Abule Ebro, 2003. Rangeland evaluation in relation to pastoralists’ perception in the middle
Awash valley of Ethiopia. A Ph.D Thesis presented to the University of the free State, Bloemfontein, South Africa.
Ayana Angasa, 1999. Range condition traditional grazing management system in Borena, MSc. Thesis presented to the school of graduate studies of Alemaya University, Dire Dawa, Ethiopia.
Baars, R.M.T., Chileshe, E.C., Kalokoni, D.M., 1997. Technical notes: range condition in high cattle densityareas in the Western Province of Zambia. Tropical Grasslands 31, 569–573.
Belesky, A.J., R.G. Amundson, J.M., Duxbury, S. J. Riba,, A.R. Ali and S.M. Mwonga, 1989. The effect of trees on their physical, chemical and biological environments in a semi-arid savanna in Kenya. Journal of Applied ecology, 26:1005-1024.
Dye, P. J., and Spear, P. T. 1982. The effect of bush clearing and rainfall variability on grass yield and composition in south-west Zimbabwe, Zimbabwe Journal of Agricultural research, 20, 103-118.
Gwynne, M. D and Pratt, D. J., 1977. Rangeland Management and Ecology in East Africa Published by Hodder & Stoughton London Kamara A. and Kirk, M., 2002.The effect of environmental variability on Livestock and land
use management: The Borana Plateau, Southern Ethiopia. Socioeconomics and Policy research Working Paper 35. ILRI (International Livestock Research Institute), Nairobi, Kenya, and IFPRI (International Food Policy Research Institute), Washington, DC, USA.35pp
Kamara, C S and Haque, I 1987 Characteristics of Vertisols at ILCA research and outreach sites in Ethiopia. PSD Working Paper 15. ILCA, Addis Ababa, Ethiopia
Oba, G., 1998. Assessment of indigenous range management knowledge of the Boranapastoralists of Southern Ethiopia. Borana lowland pastoral development program/GTZconsultancy paper. Negelle/Borana, May 1998.
Samuel Tuffa, 2009. Regeneration potential and Soil Seed Bank Flora Assessment in relation to Three Encroaching Acacia Species in Borana Rangelands, Southern Ethiopia, MSc. Thesis presented to Haramaya University, Ethiopia.
SAS Institute, 2002. Statistical Analysis Software. SAS Institute Inc., Cary, NC, USA Tamene Yigezu 1990. Population dynamics of the problem shrubs, Acacia drepanolobium and
Acacia brevispica in the Southern Rangelands of Ethiopia. MSc Thesis, deparment of

Livestock Research Proceeding
79
Animal Sciences, School of fiber Sciences and Technology. University of NSW, Australia
Troch, F.R. and L.M. Thompson, 1993.Soil and soil fertility (5th edition Oxford University Press, New York.

Livestock Research Proceeding
80
Adaptation Performances of Cajanus cajan, Lablab purpureus and Medicago sativa Accessions in Yabello district, Borana Zone of Southern Oromia, Ethiopia
*Bikila Negasa, Bedasa Eba and Jaldessa Doyo Yabelo Pastoral and Dryland Agricultural Research Center (YPDARC), P.O.Box 85, Yabello,
Borana zone, Ethiopia *Corresponding author e-mails: [email protected]
Abstract This study was conducted in Yabelo district of Borana zone, southern Ethiopia with the objective to identify the best performed forage accessions to the semi-arid environments of Borana zone. The forage legumes evaluated includes accessions of Cajanus cajan, Lablab purpureus and Medicago sativa. A Randomized Complete Block Design (RCBD) with three replications was used. Days to 10% flowering was significantly different (P<0.01) among Cajanus cajan accessions collected from the three locations. Cajanus cajan accessions collected from Werer were an early flowering and maturing plant as compared to the accessions collected from Adamitulu and Bako sites. Plant basal cover was significantly different (P<0.05) for all accessions of Medicago sativa. Among the forages tested, Cajanus cajan accessions collected from Werer and Adamitulu, Magna 788 and Magna 80/FG of Medicago sativa and Lablab purpureus 11614 accessions have greater performances in terms of their high forage dry biomass yield and better agronomic parameters. The selected best performed forage accessions will have to be demonstrated to the end users. Key words: Forages, Cajanus Cajan, Medicago sativa, Lablab purpureus, accessions Introduction The livelihood of the community of Borana zone mainly depends on the production of livestock as source of food, income, prestige and security in times of hardship. Although natural pastures have been the main livestock feed sources in the zone, grazing lands are gradually being shrinking due to the expansion of crop land. Concentration of livestock on the shrinking grazing lands caused overstocking leading to soil degradation, which in turn has resulted in a decline of year round livestock feed supply specially during dry season. Thus, there is loss of livestock condition in the dry season, which is greater in the smallholder farmers than on commercial ranches mainly because of inadequate grazing and lack of planted forages in smallholder enterprises. The common solution to scarcity of feed is to use agro-industrial by products such as concentrates. However, supplies of these feeds are inadequate for the existing livestock population and feed prices are high as well as rising and hence they are not readily available. For this reason, renewable sources of feed such as cultivated forages should be enhanced. Forage legumes could be among the alternative feed resources and more appropriate options to produce quality feed supplements in the tropics. Karue, (1974) and FAO, (1981) also indicated that introduction of forage legumes which can be used as supplementary feed in the dry season is important for sustainable livestock production. Borana pastoralists have limited opportunity to improve animal feeds through cultivation of forage crops due to lack of long lasting enough precipitation. Even though some efforts have made to introduce some high yielding forage species into Borana rangeland (Mgono-Bake, 1986; Yohannes, 1989; Hodgson, 1990), the available adapted and productive forage varieties were very limited. Therefore, introduction and adaptation of some un-addressed forages to the semi-arid environments of Borana should become a major focus. Moreover, there is lack of information on the adaptability of improved forage legumes including: Cajanus Cajan, Lablab purpureus and Medicago sativa. Therefore, this study was conducted to introduce and evaluate the performances

Livestock Research Proceeding
81
of different forages legumes under the semi-arid environments of Borana zone and to identify the most promising accessions for the agro ecology of the study area. Materials and Methods Description of the study area The study was conducted in Yabelo district of Borana zone. Yabelo, the capital of Borana zone, is situated at a distance of about 565km to the south of Addis Ababa. Borana rangelands are located at 4-60N and 36-420E sloping gently from 1600masl in the North East to about 1000 m.a.s.l. in the extreme south that borders Northern Kenya and about 1780 masl in the central vicinity. Borana rangelands are occupied almost entirely by pastoral populations and resource use on the Borana rangelands is largely communal, though with crop cultivation and private enclosures that appear to be increasing in recent decades. Rainfall delivery is bimodal with the long rainy season accounting for 60% of the total rainfall occurs between March and May and the short rainy season comprising of 27% of the total rainfall occurs between September and November. Spatial and temporal variability in both the quantity and distribution of rainfall renders the area semi-arid, with an average annual rainfall varying from 353 to about 900mm per annum (McCarthy et al., 2002). The average temperatures vary from an annual minimum of 13.10c to an annual maximum of 25.20c. Acquisition of forages and site selection Seeds of forage legumes including Cajanus cajan, Lablab purpureus and Medicago sativa, were collected from Adami Tulu agricultural research center (ATARC), Bako agricultural research center (BARC) and Werer agriculture research center (WARC) based on the recorded suitability for the semi-arid environments with medium (300-900mm) annual rainfall. Land preparation and plant management A fine seedbed was prepared by ploughing and harrowing. RCBD with three replications was employed for all forages species. Seeding of all plots was carried out as already recommended in the main rainy season on cultivated seedbeds. Sowing was done in four rows per plot and seeds were hand-seeded and drilled in a continuous flow in the rows. Weeding was performed manually and pest and disease incidences were monitored and recorded accordingly. Data collection Forage samples were taken from the two central rows per plot. During the fourth week after seeding, emerged seedlings were counted from rows per plots to assess germination percentages for herbaceous legumes. Percent plant soil cover was estimated from 1mx1m quadrant frame. Herbage yield was harvested at 10% flowering when maximum growth in most entries was reached. The harvest was taken from the middle two rows of each plot at 10cm height above the ground. Plant heights were measured on the harvest date as the distance between the soil surface and the highest point of every plant. Weeding was performed once after full plant establishment was attained. In order to achieve optimum natural infestation, no pesticides or control measures were applied on the crop throughout the experimental period. Data analysis Data on seed yield, forage biomass yield, percent plant soil cover, germination percentage and dry matter content of the plant were subjected to statistical analysis using the general linear model (GLM) of the Statistical Analytical System (SAS, 1994) in order to determine attribute differences between different accessions of the same species.

Livestock Research Proceeding
82
Results and Discussions Yield and agronomic performance of Cajanus cajan accessions Plant establishment for all accessions of Cajanus cajan collected from the three locations were excellent with green leaves. Cajanus cajan accessions collected from Adami Tulu and Werer experienced low degree of leaf damage due to pest infestation. However, leaf damage ranging from no leaf infestation to low degree of leaf infestation was noticed on accession collected from Bako. Low degree of pod damage due to pest infestation was also experienced in all accessions of Cajanus cajan. This agrees with the previous study by Minja et al. (1999) who reported that Cajanus cajan is susceptible to a wide range of insect pests that attack the crop at both the vegetative and reproductive stages. Among the pests, the pod borer is regarded as a major threat to pigeon pea because of its destructiveness and extensive host range while pod sucking bugs and thrips can cause up to 78% (Dialoke et al., 2010) and 47% (Rotimi and Iloba, 2008) yield loss respectively. Agronomic and yield parameters of Cajanus Cajan accessions collected from different locations were depicted in table 1. Days to 10% flowering significantly ranged (P<0.001) from 70 days for Cajanus cajan collected from Werer and 146 days for both Cajnus cajan collected from Adami Tulu and Bako. Therefore, Cajanus cajan collected from Werer is an early maturing and high yielding among the tested accessions. Number of branches per plant ranged from 11 for Cajnus cajan collected from Bako to 16 for Cajanus cajan from Werer. Cajanus Cajan accessions collected from Werer branched heavily and produced large amounts of plant material per hectare. For forage dry biomass yield, the values varied from 1.73 t ha-1 for Cajnus Cajan collected from Bako to 2.4 tha-1 for Cajanus Cajan collected from Werer. Hence, Number of branches per plant is directly related to dry forage biomass which is in line with the works of Sauter et al. (1995). The average plant height for Cajnus Cajan collected from Adami Tulu, Bako and Werer were 107.17, 114.5 and 121.17cm respectively. The result showed that Cajnus Cajan collected from Adami Tulu is the shortest while that of Werer is the tallest Cajanus Cajan accessions. Seed yield was the highest for accessions collected from Werer though the difference was non-significant (P>0.05). Correlation coefficient between parameters of Cajanus cajans Pearson correlation coefficient for the Cajanus cajans parameters was depicted in table 2. Forage dry matter yield was highly correlated with fresh biomass yield (r2=0.89, P<0.01). Number of branches per plant and forage dry biomass yield were moderately correlated (r2 = 0.44, P> 0.05). Table1: Mean value of agronomic and yield performance of Cajanus cajan accessions collected from different ecotypes (areas) Parameters Treatments (Accessions) P-value ±SE of
mean Adami Tulu Bako Werer
Days to 10% flowering 146a 146a 70b 0.0001 0.00 Number of branches 15 11.33 16 0.60 4.59 Fresh biomass(ton/ha) 5.54 4.05 8.75 0.13 1778.56 Dry biomass (ton/ha) 2.23 1.73 2.4 0.45 503.77 Average height (cm) 107.17 114.5 121.17 0.53 11.49 Seed yield (kg/ha) 624 563.3 717 0.81 282.18 a, b Means in the same row with different superscripts differ (P<0.05)
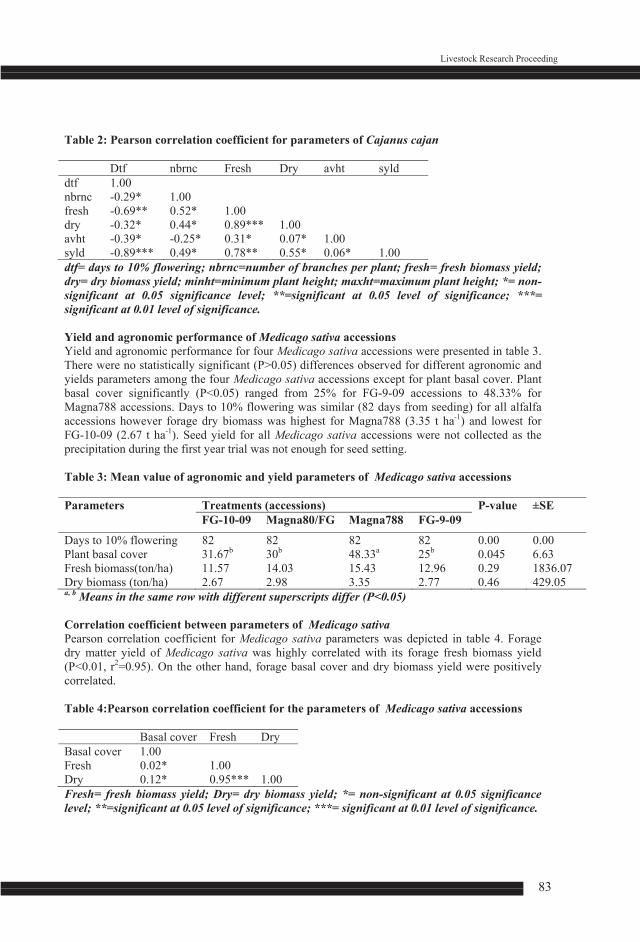
Livestock Research Proceeding
83
Table 2: Pearson correlation coefficient for parameters of Cajanus cajan Dtf nbrnc Fresh Dry avht syld dtf 1.00 nbrnc -0.29* 1.00 fresh -0.69** 0.52* 1.00 dry -0.32* 0.44* 0.89*** 1.00 avht -0.39* -0.25* 0.31* 0.07* 1.00 syld -0.89*** 0.49* 0.78** 0.55* 0.06* 1.00 dtf= days to 10% flowering; nbrnc=number of branches per plant; fresh= fresh biomass yield; dry= dry biomass yield; minht=minimum plant height; maxht=maximum plant height; *= non-significant at 0.05 significance level; **=significant at 0.05 level of significance; ***= significant at 0.01 level of significance. Yield and agronomic performance of Medicago sativa accessions Yield and agronomic performance for four Medicago sativa accessions were presented in table 3. There were no statistically significant (P>0.05) differences observed for different agronomic and yields parameters among the four Medicago sativa accessions except for plant basal cover. Plant basal cover significantly (P<0.05) ranged from 25% for FG-9-09 accessions to 48.33% for Magna788 accessions. Days to 10% flowering was similar (82 days from seeding) for all alfalfa accessions however forage dry biomass was highest for Magna788 (3.35 t ha-1) and lowest for FG-10-09 (2.67 t ha-1). Seed yield for all Medicago sativa accessions were not collected as the precipitation during the first year trial was not enough for seed setting. Table 3: Mean value of agronomic and yield parameters of Medicago sativa accessions Parameters Treatments (accessions) P-value ±SE
FG-10-09 Magna80/FG Magna788 FG-9-09
Days to 10% flowering 82 82 82 82 0.00 0.00 Plant basal cover 31.67b 30b 48.33a 25b 0.045 6.63 Fresh biomass(ton/ha) 11.57 14.03 15.43 12.96 0.29 1836.07 Dry biomass (ton/ha) 2.67 2.98 3.35 2.77 0.46 429.05 a, b Means in the same row with different superscripts differ (P<0.05) Correlation coefficient between parameters of Medicago sativa Pearson correlation coefficient for Medicago sativa parameters was depicted in table 4. Forage dry matter yield of Medicago sativa was highly correlated with its forage fresh biomass yield (P<0.01, r2=0.95). On the other hand, forage basal cover and dry biomass yield were positively correlated. Table 4:Pearson correlation coefficient for the parameters of Medicago sativa accessions Basal cover Fresh Dry Basal cover 1.00 Fresh 0.02* 1.00 Dry 0.12* 0.95*** 1.00 Fresh= fresh biomass yield; Dry= dry biomass yield; *= non-significant at 0.05 significance level; **=significant at 0.05 level of significance; ***= significant at 0.01 level of significance.

Livestock Research Proceeding
84
Yield and agronomic performance of Lablab purpureus accessions Mean value of agronomic and yield parameters of Lablab purpureus are shown in table 3. All the tested parameters were not significantly varied (P>0.05) among the accessions. It takes 56 days for all accessions to reached 10% flowering at harvest. Herbage dry matter yield ranged from 4.11 t ha-1 to 5.29 t ha-1 for the tested accessions. Average plant height ranged from 71.67cm for 147 accessions to 76.33cm for 11614 accessions. Seed yield ranged from 0.5 kg ha-1 for 11640 accessions to 0.74 kg ha-1 for 11614 accessions showing that accession11614 is excellent in both forage and seed yield as compared with the other accession tested under the semi-arid environments of Borana zone. Table3: Mean value of agronomic and yield parameters of Lablab purpureus accessions Parameters Treatments (accessions) P-value ±SE
11614 147 11640
Days to 10% flowering 56 56 56 0.0 0.00 Plant basal cover 41.67 80 51.67 0.19 17.69 Fresh biomass(ton/ha) 27.19 24.21 22.11 0.72 6.07 Dry biomass (ton/ha) 5.29 4.21 4.11 0.63 1.28 Average height (cm) 76.33 71.67 72 0.88 10.6 Emergency (%) 26.67 68.33 33.33 0.14 17.13 Seed yield (kg/ha) 0.74 0.54 0.5 0.72 0.29 Means in the same row with different letter superscripts differ (P<0.05) Correlation coefficient between parameters of Lablab purpureus Pearson’s correlation coefficient for Lablab purpureus parameters are shown in table 4. Basal cover was highly and positively correlated with plant emergency (r2=0.86, P<0.01). Similarly, plant fresh biomass yield was highly correlated with its corresponding forage dry matter yield (r2=0.94, P<0.01). Furthermore, seed yield was highly and positively correlated with both plant fresh (r2=0.95, P<0.01) and dry (r2=0.95, P<0.01) biomass yields. Table 4: Pearson correlation coefficient for parameters of Lablab purpureus. BC Emergency Avht Fresh Dry Syld BC 1.00 Emergency 0.86*** 1.00 Avht -0.42* -0.46* 1.00 Fresh 0.01* -0.31* 0.03* 1.00 Dry -0.07* -0.41* 0.21* 0.94*** 1.00 Syld -0.18* -0.52* 0.26* 0.95*** 0.95*** 1.00 BC= Basal cover; fresh= fresh biomass yield; dry= dry biomass yield; minht=minimum plant height; maxht=maximum plant height; Syld= Seed yield; *= non-significant at 0.05 significance level; **=significant at 0.05 level of significance; ***= significant at 0.01 level of significance. Conclusions and Recommendations The performances of forage legumes accessions; Cajanus cajan, Lablab purpureus and Medicago sativa were tested under Borana semi-arid conditions. Among the tested forage legumes; Cajanus Cajan accessions collected from Werer and Adami Tulu, Magna 788 and Magna 80/FG from Medicago sativa and Lablab purpureus 11614 accessions have greater performances in terms of their high forage dry biomass yield and better agronomic parameters. Moreover, these accessions

Livestock Research Proceeding
85
consistently produced more leaf and were tolerant to moisture stress, which suggests they have a potential as forage protein supplements under semi-arid conditions. Further evaluation is important in investigating the multipurpose potential of Cajanus cajan so that the advantages obtained from this crop will be maximized by the end users. The selected best performed forage accessions will also have to be demonstrated to the end users. Reference Dialoke, S. A., Agu, C. M., Ojiako, F. O., Onweremadu, E., Onyishi, G. O., Ozor, N., Echezona,
B. C., Ofor, M. O., Ibeawuchi, I. I., Chigbundu, I. N., Ngwuta, A. A. and Ugwoke, F. O. 2010. Survey of insect pests on pigeonpea in Nigeria. J. SAT Agric. Res.8, 1-8.
FAO (Food and Agricultural Organizations). 1981. Tropical feeds: Feed information Summaries and nutritive values. FAO Animal Production and Health Series 12. FAO, Rome.
Hodgson R. J. 1990. The Southern Sidamo rangelands project 1985-88: Prospective On development interventions and extension. CARE-Ethiopia, Addis Ababa, Ethiopia. 207pp.
Karue, C. N. 1974. The nutritive value of herbage in semi-arid lands of East Africa. I. Chemical composition. E. Afr. For. J.40:89-95
McCarthy, N., Kamara, A. and Kirk, M. 2002.The effect of environmental variability on Livestock and land use management: The Borana Plateau, Southern Ethiopia. Socioeconomics and Policy research Working Paper 35, ILRI (International Livestock Research Institute), Nairobi, Kenya and IFPRI (International Food Policy Research Institute), Washington, DC, USA.35pp.
Minja, E. M., Shanower, T. G., Silim, S. N. and Singh, L. 1999. Evaluation of pigeonpea pod borer and pod fly tolerant lines at Kabete and Kiboko in Kenya. Afric. Crop Sci.J. 7: 71-79.
Mgongo-Bake, W. 1986. Forage agronomy trials in the southern rangelands. JEPPS (Joint Ethiopian Pastoral Systems Study Programme) Research Memorandum 27, ILCA (International Livestock Center for Africa), Addis Ababa, Ethiopia. Ca 30pp.
Rotimi, J. and Iloba, B. N. 2008. Assessment of yield losses in tall varieties of pigeonpeasdueto the flower thrips, Megalurothrips sjostedti Trybom. (Thysanoptera: Thripidae) Biosci. Res. Comm., 20: 305-308.
SAS (Statistical Analysis System). 1994. SAS User’s Guide. Statistics. SAS Institute Inc. Cary, North Carolina, USA.
Sauter, K. J., Gingera, G. R. and Davis, D. W. 1995. Adaptation of Pigeonpea (Cajanus cajan Millsp.) to a loamy sand site in Minnesota. HortScience, 30(2): 350-352
Yohannes, A. 1989. Introducing Tropical legumes into the southern rangelands of Ethiopia. MSc thesis, University of New South Wales, Kensington, Australia. 185pp.

Livestock Research Proceeding
86
Yield and Agronomic Performance of Different Forage Grasses and Legume Species for Forage Production in the Mid Rift Valley of Oromia
Dawit Abate1*, Usman Semman1, Nabi Husen1, Lalisa Diriba1, Belete Shenkute1, Fikadu
Nemera1, Meseret Tilahun1 and Abule Ebro2 1AdamiTulu Agricultural Research Center , P.O. Box 35, Ziway, OARI
2International Livestock Research Institute (ILRI), Ethiopia *Corresponding author e-mail: [email protected]
Abstract The trial was conducted at AdamiTulu Agricultural Research Center (ATARC) on- station site with the objective to evaluate different forage grasses and legumes for their agronomic and yield performances. The tested forages include perennial grasses, alfalfa, cowpea and lablab varieties/ accessions. The forages were evaluated in Randomized Complete Block Design (RCBD) with four replications. The highest dry matter (DM) from the perennial grasses was recorded by Chloris gayana (4.1 t/ha) followed by Cenchrus cillaris (3.7t/ha). Chloris gayana also resulted in higher seed yield (SY) (118kg/ha) as compared to the other grasses. Alfalfa Magana FG10-09 have resulted in the highest DM yield (3.17t/ha). As compared to the check, Magana FG10-09 produced 76.1% DM yield increment. There were a significant difference (P<0.05) in DM and SY among the evaluated cowpea accessions. The maximum DM yield was recorded for the genotype cowpea IVU 11424 (8.3t/ha); while the maximum SY (25.8kg/ha) was obtained from cowpea 82D 504-4 accession. There was also a significant differences among the lablab accessions in DM and SY with the highest DM yield (3.94 t/ha) was recorded for lablab purpurus CV archer while the maximum value of SY (17.3 kg/ha) was recorded for Lablab purpurus 11609. The SY value of the grasses and legumes were very low mainly due to moisture stress at the flowering and seed setting phases. The best performed forages; Chloris gayana, Alfalfa Magana FG10-09, cowpea IVU 11424 and cowpea 82D 504-4, Lablab purpurus cv archer and Lablab purpurus 11609 have to be further evaluated at on-farm conditions and demonstrate to the end users. Key words: Improved forage, herbaceous legumes, Perennial grasses, Alfalfa, Cowpea Introduction Mixed crop and livestock production system is the main agricultural activities in the West Arsi and East Shoa zone of mid rift valley of Oromia. The zones have a great potential for livestock production. In spite of its potential, the production and productivity of livestock is very low mainly due to the shortage of feed resources. The major livestock feed resources, natural pasture and crop residues are low in quantity and quality. Moreover, natural pasture is overgrazed and continuously shrinking due to expansion of arable land. The crude protein (CP) level of the natural pasture is insufficient to satisfy the minimum requirements of the animals (Bilatu et al. 2013; and Solomon et al. 2008). Saleem and Tedla (1995) also reiterated that herbage from natural pasture are usually inadequate quantitatively and qualitatively to support reasonable livestock production. The existing crop residues have also low in feeding value to satisfy the nutrient requirement of the animals. On the other hands, the smallholder farmers in particular cannot afford to purchase concentrate to correct the nutritional problem of the crop residues. The use of cultivated forage crops has received considerable attention for complementing the conventional feed resources. Cultivated forage crops have high yielder and better quality as compared to the natural pasture. Moreover forage legumes have high protein sources that will enhance the activity of rumen microorganisms, increase intake and digestibility when supplemented for animals consuming poor quality forages. Moreover, they can contribute to soil

Livestock Research Proceeding
87
fertility maintenance and improvement (Mosi and Butterworth, 1985; Smith et al., 1989). Currently, development of cultivated forage varieties for the respective farming systems and agro ecologies has been given due attention to alleviate the feed shortage problems. Hence, this study was also aimed to evaluate different forage grasses and legume species for their agronomic and yield performances in the mid rift valley of Oromia. Materials and Methods The activity was conducted at ATARC on-station site. The forage accessions/varieties were collected from different research centers, International Livestock Research Institute (ILRI) and from abroad. The tested forages include perennial grasses, alfalfa, cowpea and lablab accessions/varieties. The forages were evaluated in RCBD with four replications. The plot size for each treatments were 4m*4m. The seed bed was well prepared and the forages were planted in rows with their recommended seed rate (15kg/ha for perennial grasses and alfalfa, 30kg/ha for cow pea and lablab). All necessary data including plant height, dry matter and seed yield were collected and entered to computer to analyze for different parameters. The collected data were subjected to statistical analysis using the general linear model (GLM) of the statistical analysis system (SAS, 2000). Mean differences were separated by using LSD procedures at 5% of significant level. Result and Discussions Performances of perennial grasses Mean yield and agronomic performance of the tested perennial forage grasses are indicated in the table 1. The highest DM yield (4.1 t/ha) was recorded for Chloris gayana cv Massaba followed by Cenchrus cillaris (3.7t/ha); while the least DM yield (2.5t/ha) was recorded for Panicum coloratum cv Bambatsi. Moreover, Chloris gayana produced the highest plant height (PH) and number of leafs per plant which is the main contributors for dry matter yield. The DM yield recorded for the tested perennial grasses were very low as compared to the other findings (Diriba et al, 2004). The main reason for DM yield reduction could be the insufficient moisture availability during the trial period. Chloris gayana also resulted in higher SY as compared to the other evaluated varieties. However, the SY of the grasses were also highly reduced mainly due to moisture stress during the flowering and seed setting phases. Table 1. Mean yield and agronomic performance of perennial forage grasses tested at ATARC Perennial grasses PH (cm) NLPP DM (t/ha) SY (kg/ha) CP(%) Chloris gayana cv Massaba 45 65 4.1 118 11.2 Panicum coloratum cv bambatsi 46 33 2.5 98 10.4
Cenchrus cillaris 40 51 3.7 87 10.1 Mean 43.66 49.56 3.44 100.8 10.56 1PH= plant height; NLPP= No of leaf per plant; DM= Dry matter yield; SY = Seed yield; CP= crude protein Performances of alfalfa accessions Six varieties of alfalfa accessions were evaluated at ATARC on-station. The analysis showed that the PH and DM yield were significantly (P<0.05) different among the accessions evaluated (Table 2). Alfalfa Magana FG10-09 was resulted in the highest PH and DM yield (3.17t/ha). While the least DM yield (1.8t/ha) was recorded for Medicago Sativa cv hunter river -check. As compared to the check (Medicago Sativa cv hunter river) accessions Magana FG10-09 produced

Livestock Research Proceeding
88
76.1% DM yield increment. The agronomic and yield data obtained were lower for these accessions as compared to the yield recorded by Diriba et al., (2014) where the highest DM yield (4.77t/ha) was recorded for Alfalfa FG9-09. The yield variations observed could be due to the different in agro-climatic conditions (soil, moisture). Differences in trial management could also have its own effect on the agronomic and yield performances of the accessions. However, the CP contents found in all the evaluated alfalfa accessions were higher in this study as compared to the value recorded by Diriba et al. (2014). This is probably due to the nutrient contents of the soil, forage sampling stage and other technical differences in lab analysis. Table 2. Mean yield and agronomic performance of alfalfa accessions tested at ATARC
Alfalfa accessions PH (cm) NLPP DMY (t/ha) CP(%)
Medicago Sativa cv hunter river -(Check) 27.9 b 142.9 1.8b 21.4
Alfalfa Magana FG10-09 35.25a 188.3 3.17a 21.6
Alfalfa Italy 24.16b 137.0 1.83b 20.27
Alfalfa Magana FG-801 28.58 ab 127.4 1.97b 21.5
Alfalfa Magana FG788 29.66 ab 169.8 2.25b 20.8
Alfalfa Magana FG-9-09 27.33b 135.9 2.29b 22.5
Mean 28.8 150.3 2.22
LSD (5%) 6.74 NS 0.66
CV (%) 15.76 24.7 20.1 1PH= plant height; NLPP= No of leaf per plant; DM= Dry matter; CP= crude protein LSD=Least significant difference. CV=Coefficient of variation; 2Figure having the same letters with in column are not significantly (P>0.05) differ, while values followed by different letter (s) are significantly (p<0.05) differ Performances of cowpea accessions Four accessions of cowpea were also tested for their agronomic and yield performances. The analysis indicated that there were a significant difference (P<0.05) in DM and SY among the evaluated cowpea accessions (Table 3). However, the result showed that there were no significant (P>0.05) difference among the PH and number of leaf per plants. The maximum DM yield was recorded for the accession cowpea IVU 11424 (8.3t/ha); while the least DM yield (2.3t/ha) was recorded for the accession cowpea 85F 2687. The DM yield value obtained was higher as compared to the DM yield (6.09 t/ha) recorded by Hasan et al.(2010). The yield variations observed could be due to the different in agro-climatic conditions (soil, moisture) and differences in trial management. With regard to SY the maximum yield (25.8kg/ha) was obtained from cowpea 82D 504-4 accessions. Very low SY could be mainly due to moisture stress. The CP values recorded is comparable to the result obtained by Hasan et al. (2010) where the CP values ranges from 18.78 to 20.22%.

Livestock Research Proceeding
89
Table 3. Mean yield and agronomic performance of cowpea accessions tested at ATARC Cowpea accessions PH (cm) NLPP DMY (t/ha) SY (kg/ha) CP(%)
Cowpea IVU 11424 39.8 78.6 8.3a 17.1b 18.2
Cowpea 82D 504-4 45.8 84.1 5.7ab 28.5a 20.1
Cowpea 82D 889 42.0 77.5 5.1b 13.3b 17.8
Cowpea 85F 2687 42.4 93. 2.3c 10.7b 19.0
Mean 42.5 83.4 5.3 17.4 18.77
LSD (5%) NS NS 2.72 9.3
CV (%) 32.3 28.2 32.8 33.7 1PH= plant height; NLPP= No of leaf per plant; DMY= Dry matter yield; SY = Seed yield; CP= crude protein LSD=Least significant difference. CV=Coefficient of variation; 2Figure having the same letters with in column are not significantly (P>0.05) differ, while values followed by different letter (s) are significantly (p<0.05) differ Performances of lablab accessions The analysis showed that there was a significant differences (p<0.05) in DM and SY among the tested lablab accessions (Table 4). However, there no significant differences (p>0.05) in accessions with regards to PH and number leafs per plant. The highest DM yield was recorded for Lablab purpurus cv archer which gives a yield of 3.94 t/ha while the least DM yield (1.75 t/ha) was recorded by Lablab purpurus 147. The maximum value of seed yield (17.3 kg/ha) was recorded for Lablab purpurus 11609 followed by Lablab purpurus cv archer. The low SY mainly attributed to the shortage of moisture during the flowering and seed setting phases. Lablab also has prolonged flowering and this has effect on seed setting and maturity. Severe moisture deficit during flowering is known to reduce SY of many forage species (Humphreys and Riveros 1996). Table 4. Mean yield and agronomic performance of lablab accessions tested at ATARC
Lablab accessions PH (cm) NLPP DMY (t/ha) SY (kg/ha) CP(%)
Lablab purpurus 11609 27.25 61.5 1.9b 17.3a 14.1 Lablab purpurus cv archer 27.66 67.1 3.94a 13.5a 15.7 Lablab purpurus 147 25.08 49.5 1.75b 3.37b 14.7 Mean 26.6 59.3 2.54 11.4 14.83 LSD (5%) NS NS 2.72 9.3 CV (%) 22.3 25.4 27.1 21.4 1PH= plant height; NLPP= No of leaf per plant; DMY= Dry matter yield; SY = Seed yield; CP= crude protein LSD=Least significant difference. CV=Coefficient of variation; 2Figure having the same letters with in column are not significantly (P>0.05) differ, while values followed by different letter (s) are significantly (p<0.05) differ

Livestock Research Proceeding
90
Apiculture Research Results
Conclusions and Recommendations Among the evaluated forages; Chloris gayana cv Massaba, Alfalfa Magana FG10-09, cowpea IVU 11424 and cowpea 82D 504-4, and Lablab purpurus cv archer were performed best in most important agronomic and yield parameters. However, severe moisture deficit during the trial period have resulted in poor performance of some forage accessions/varieties. On the other hands, the study showed that there was yield and agronomic difference among the evaluated accessions. This variation in their performances will open the room for future varietal development in forage breeding programs. Further studies are important to collect and evaluate locally available forage varieties since local varieties are more adaptable to the existing situation. Moreover, it is important to further evaluate the best performed and selected forage accessions/varieties at on farm conditions and demonstrate to the end users. References Bilatu Agza, Binyam Kassa, Solomon Zewdu, Eskinder Aklilu & Ferede Alemu (2013). Forage
yield and nutritive value of natural pastures at varying levels of maturity in North West Lowlands of Ethiopia. Ethiopian Institute of Agricultural Research (EIAR), Animal Science Research Process, Ethiopia. World Journal of Agricultural Sciences Vol. 1 (3), pp. 108-110.
Driba Geleti, Diriba Diba &Jemal Dekebo 2004. Forage Productivity and Compatibility of Mixtures of Chloris gayana and Panicum Coloratum with Desmodium unicenatum at Bako, Western Ethiopia. In Proceedings of the 12th annual conference of the Ethiopian Society of Animal Production (ESAP) held in Addis Ababa, Ethiopia, August 12-14, 2004
Diriba Geleti, Mekonnen Hailemariam, Ashenafi Mengistu & Adugna Tolera 2014. Biomass yield potential and nutritive value of selected Alfalfa (Medicago sativa L.) cultivars grown under tepid to cool sub-moist agro-ecology of Ethiopia. Journal of Agricultural Research and Development Vol. 4(1). pp. 007-014, January, 2014
Hassan, S.W., F.C. Oad, S.D. Tunio, A.W. Gandahi, M.H. Siddiqui, S.M. Oad and A.W. Jagirani. 2010. Impact of nitrogen levels and application methods on agronomic, physiological and nutrient uptake traits of maize fodder. Pak. J. Bot. 42: 4095-4101
Humphreys L R and Riveros F (1996). Tropical pasture seed production and protection paper 8. 203pp.
Mosi, A.K. and M.H. Butterworth, 1985. The voluntary intake and digestibility of diets containing different proportion of tef (Eragrotis teff) straw and Trifolium tembense hay when fed to sheep. Tropical Animal Production, 10:19-22.
Saleem M and Tedla A (1995). Feed improvement to support intensification of ruminant production systems in the Ethiopian highlands. In: Proceedings of the 3rd Annual Conference of the Ethiopian Society of Animal Production, 27 - 29 April 1995, Addis Ababa, Ethiopia. pp. 296 - 306
SAS Institute. 2000. Statistical Analysis Software. SAS Institute Inc., Cary, NC, USA. SPSS, 2003.Statistical procedure for social science version 17.Statistical procedures for social sciences (SPSS) INC, Chicago, USA.
Solomon Bogale, Solomon Melaku and Alemu Yami (2008): Influence of rainfall pattern on grass/legume composition and nutritive value of natural pasture in Bale Highlands of Ethiopia. Livestock Research for Rural Development. Volume 20, Article #38. Retrieved December 1, 2013, from http://www.lrrd.org/lrrd20/3/boga20038.htm
Smith, T., B. Manyuchi and S. Mikayiri, 1989. Legume supplementation of maize stover. pp. 302-320. In: B. H. Dozewela, A. N. Said, A. Wondmagegnehu and J. K. Kategile (eds.), Utilization of Research Results on Forage and Agricultural By-product Material as Animal Feed Resources in Africa. Proceedings of the first PANESA/ARNAB joint workshop held in Lilongwe, Malawi, 5-9 December 1988. PANESA/ARNAB, ILCA (International Livestock center for Africa), Addis Ababa, Ethiopia.

Livestock Research Proceeding
91
Apiculture Research Results

Livestock Research Proceeding
92
Adaptation and evaluation performance of bee forage for semiarid agro ecologies of mid rift valley of east shoa zone
*Admassu Adi, Tura Bareke and Kibebew Wakjira Holeta Bee Research Center, Oromia Agricultural Research Institute
Email: [email protected] Abstract Availability of adequate perennial and annual sources of nectar and pollen is the most limiting factor in the survival, abundance and distribution of honeybees. The study was conducted with objective of evaluating the performance of Echium plantaginium, Becium grandiflorum, Melilotus alba and Fagophyrum esculentum in mid rift valley regions of East Shoa zone of Oromia. The species were evaluated based on germination rate, number of flower heads per plants, foraging intensity of honeybees and duration of flowering under rain fed and irrigation conditions. Accordingly, E. plantaginium, and Fagophyrum esculentum were highly performed respectively under both condition. Mean number of flower heads per 1m2 were similar under both condition for B. grandiflorum and M. alba while Echium plantaginium was significantly higher (P<0.05) and F. esculentum significantly lower. Honeybees foraging intensity and time for different plant species were significantly different. Even though the plants species used in this experiment showed better performance under both condition, it requires further evaluation particularly on agronomic evaluation (seed rate and fertilizer rate) and nectar yield should be tested. From these investigations, it is concluded that developing better performing plant species through use of irrigation and rain fed conditions will alleviate the shortage of bee forages and help in increasing honey production. Keywords: Bee forage herbs, flowering period, pollen yield and foraging intensity Introduction The success of beekeeping primarily depends on availability of potential bee flora (Baptist and Punchihewa, 1983). Currently the scarcity of bee flora is a major limiting factor in development .of the beekeeping. Mid rift valley region of Oromia is frequently affected by the recurrent droughts and deforestation and hence honey bees’ faces serious food shortage during the dry period. As result the demand for dearth area flora is currently increasing from time to time from different stakeholders of the lowlands. Hence to respond to the demand, it is necessary to identify and evaluate bee plants that adapt to the short and erratic rainfall conditions of the area that could improve the food base of the local honeybees colonies and significantly contribute to honey production. There are different species of plants that are identified as major source of honey and tolerant to semiarid climate of the Ethiopia This includes, Becium grandiflorum (Tebebe) that provides white honey in northern parts of the country, Melilotus alba, and Fagophyrum esculentum (buckwheat) are potential sources of golden honey in other parts of the world. Since these bee forages have good merit, it is essential to evaluate their adaptability and potentialility for honey production in the mid rift valley of east shoa zone of Oomia. Therefore, the objective of this study is to evaluate the adaptation and performance of the aforementioned bee forages in semi arid agro- ecology of east showa zone and identify best performing bee forages that contribute to the production of honey.

Livestock Research Proceeding
93
Materials and methods Description of study areas The study was carried-out at Alage TVET College in Adami-Tullu Jido Kombolcha district of East Shoa zone. The study area is located at an elevation of 2400 m.a.s.l, 09003.5`N and 0380 30.367`E. Bee forage plant selection The bee forage species were selected on the basis of: field observation and information obtained from beekeeper farmers. In addition to this similarity of their growth habit and ease of propagation also considerd. Seed collection For this study, mature seeds and branch cutting /mother plants / of Becium. Grandiflorum, Echium plantaginium, Melolitus. Alba and Fagophryum. Esculentum were collected from comparatively elite plants.. Immediately after collection, seeds were packed and allowed to dry for one to one and half weeks at room temperature. Then packages were maintained at room temperature until day of sowing. Experiment design To evaluate the performance of the selected plant materials, land was prepared. Seeds were sown in row on prepared beds at the plot size of 2mx2m with seeding rate of 10 gram/4m2 and the plots
were arranged in randomized block design with three replications. To keep proper spacing and avoid nutrient competition, spacing was used between the plants and rows of 20 and 30cm, respectively .After sowing of seeds and the seed bed was covered with a thin layer of the same soil and the dried grass stalks were used to cover the seed beds for conserving moisture during the dry season. The grass covers were removed as the seeds germinated and when germinant emerged to the surface of the soil and the necessary agronomic The planting was done both at rain fed and irrigation conditions practices. The data collection was made on days to germinate. average number of flower heads/m2 was counted and flower opening time were recorded at 50% flowering. During the peak flowering the foraging intensity of honeybees on flowers was counted starting from 6: 00 a.m. to 6: 00 p.m minutes at every 2 hour interval for ten days. Pollen yield was determined by collecting 50 matured flower heads having similar age and Pollen was shaked on paper tray after it has been kept for certain days to dry. The pollen weight was taken using sensitive weighing balance. The flower shedding time were also recorded.
Photo showing seed bed prepartion and sowing of seeds

Livestock Research Proceeding
94
Data analysis Finally, the collected data were statistically analyzed using the one-way ANOVA and other descriptive statistics tools. Results and discussions Germination days and time required to set flower Seed germination under rain fed condition began after 5 days of sowing for F. esculentum. In contrast, germination began after 13 days of incubation for B. grandiflorum. On the other hand, Echium. plantaginium and Melolitus alba showed germination days ranging from 9 to 12 days on average. Under irrigation condition seed germination began after 6 days of incubation for F. esculentum and Melilotus alba and this was extended to13 days for E. plantaginium Mean time taken to set flower under rain fed condition for F. esculentum was about 38 days, the shortest of all plants. On contrary, time taken to set flower was increased to 172 days for B. grandiflorum For other plant species studied under similar condition, namely E. plantaginium and M. alba started blooming after 142 and 90 days on average, respectively. Under irrigated condition, mean time taken to set flower for F. esculentum was about 31 days. While the longest mean days was (ca 172) to set flower was recorded for B. grandiflorum. Number for flower head/ m2
Under rain condition the mean number of flower heads per 1m2 was significantly higher (P<0.05) for E. plantaginium and lower for F. esculentum. The number of flower heads produced by E. plantaginium per 1m2 was 1098 compared to that of F. esculentum which produce only 738, indicating the difference of 360 flower heads per 1m2. However, mean number of flower heads per 1m2 were rather similar statistically for other studied species though it was smaller for F. esculentum (Table 1). Under irrigation condition mean number of flower heads per 1m2 were statistically similar for M. alba and B. grandiflorum. However, E. plantaginium and F. esculentum were significantly different (p<0.05) among all plant species. The number of flower heads produced by E. plantaginium from 1m2 was 990 which were also highest under irrigation condition as compared to all other plant species. Followed by M. alba, B. grandiflorum and F. esculentum respectively. F. esculentum was the least which produce only 594, indicating the difference of 396 flower heads per m2 when compared to E. plantaginium (Table1). A number of flower heads per m2 of E. plantaginium and M. alba produced higher number of flower heads under both condition, due to their growing habit and crown size indicating more branching produces more flower heads per plant. Pollen yield of 50 flower heads Pollen yield of all species under study were similar (P < 0.05) under both fed. However, under both fed M. alba was produced the highest pollen yield followed by E. plantaginium, F. esculentum and B. grandiflorum which was the lowest. Honeybees have a marked preference for one kind of pollen over the other, which may be equally abundant. Because diets consisting of the pollen from different plant species may have different nutritional value for the honeybees (Crane, 1990). Start of blooming to shedding Under rain fed the mean time taken from the start of blooming to shedding for species under study was statistically similar (P < 0.05) .However, E. plantaginium took long time which was ca 54 days while F. esculentum took 39 which is the shortest (Table 1). In other way under rain condition the mean time taken from the start of blooming to shedding were significantly different (p<0.05) among each species. Accordingly, E. plantaginium, M. alba and B. grandiflorum took long days from flower opening until shedding with mean days of 59, 53 and 49 days, respectively whereas F. esculentum stay for 43 which was the shortest time (Table 1). Moreover, availability of moisture in the soil also increases the duration of flowering though, it was not supported by quantified data. Bee forage plants which have long flowering period from blooming to shedding

Livestock Research Proceeding
95
are very important for honey production. Interestingly, availability of moisture in the soil observed to increase the duration of the blooming days though, it was not supported by quantified data. Table 1. Mean ± SE number of flower head per 1 m2, pollen yield of 50 flower heads ( gm) and time taken from blooming to shedding (day) of the following plant species under rain fed and irrigation.
Plant species
Mean + SE number of flower head per 1 m2
Mean + SE pollen yield
Mean + SE time taken from blooming to shedding
Rain fed Irrigation Rain fed Irrigation Rain fed Irrigation
E. plantaginium 1098 + 47.6a 990 + 36a 0.4 + 0.08a 0.035 + 0.01a 54 + 4.4a 59 + 2.6a
F. esculentum 738 + 47.6b 594 +112b 0.24 + 0.2a 0.018 + 0.01a 38.7 + 2.7a 43 +0.3c M. alba 1026 + 112ab 720 + 109ab 0.46 + 0.2a 0.058 + 0.02a 53 + 8a 53 + 1.5ab B. grandiflorum 954 + 78ab 630 + 58ab 0.005 + 0.00a 0 + 0a 52.7 + 8.9a 49 + 1.2bc Different letters in the rows shows significant differences. Seed yield Under both rain fed and irrigation M. alba produced higher seed yield followed by E. plantaginium and F. esculentum, respectively. While B. grandiflorum the lowest of all (Table 2 ). Table 2. average seed yield of in quintal/ha under rain fed and irrigation.
Plant species
Average seed yield in qu/ha
Rain fed Irrigation E. plantaginium 1.6 3.1 F. esculentum 0.5 1.5 M. alba 5.7 6.6 B. grandiflorum 0.125 0.0
Foraging intensity of bees The number of bee visit within ten minutes per 1m2 under rain condition, E. plantaginium was highly visited by bees followed by B. grandiflorum, M. Alba and F. esculentum, respectively. Whereas B. grandiflorum was highly visited followed by E. plantaginium, M. alba and F. esculentum, respectively under irrigation condition (Figure 1 and 2). The variation of number of bees count is associated with different factors such as attractiveness of the flower, number of flower heads per plants ,nectar and pollen yield of plants and weather condition of the area. (Debissa Lamessa et al., 2005). This is also in agreement with Crane (1990) the intensity of bee visit is measure of potentiality of plants for nectar and pollen production. M. Alba, E. plantaginium and F. esculentum were visited by bees starting early in the morning under both condition. They were also produced high amount of pollen. As a result of their pollen, they were visited starting early in the morning. Because honeybees usually collect pollen in the morning and nectar in the afternoon. Early in the morning the concentration of nectar is low due to higher humidity to attract the bees. When the day advances due to sunshine and decreasing in relative humidity and wind make the nectar more concentrated. Bees synchronize their behavior

Livestock Research Proceeding
96
with daily floral rhythms, foraging only when nectar and pollen are at their highest levels. At other times, they remain in the hive, conserving energy that otherwise would be exhausted on nonproductive foraging flights (Moore, 2001).
Figure 1. Foraging time and intensity of honeybees at different time of day on different species of plants under rain fed
Figure 2. Foraging time and intensity of honeybees at different time of day on different species of plants under irrigation fed
0.0000
5.0000
10.0000
15.0000
20.0000
25.0000
6am 8am 10am 12am 2pm 4pm 6pm
Echium plantaginium
Fagophyrumesculentum
Melilotus alba
Becium grandflorum
No.
of b
ees /
1m2
Plant species
0.0000
2.0000
4.0000
6.0000
8.0000
10.0000
12.0000
14.0000
16.0000
18.0000
1 2 3 4 5 6 7
Echium plantaginium
Fagophyrum esculentum
Melilotus alba
Becium grandflorum
6 AM 6 PM 10AM 4 PM 2 PM 12 PM 8A M

Livestock Research Proceeding
97
Conclusions and recommendations In conclusion this study revealed that all species under study E. plantaginium, Becium grandiflorum, and M. alba and F. esculentum performed very well under both rain fed and irrigation conditions. Therefore, development of these better performing plant species through use of irrigation and rain fed conditions will alleviate the shortage of bee forages in dearth periods and help to sustain honeybee colonies in increasing honey production. Even though the plants species used in this experiment showed better performance under both condition, it requires further evaluation particularly on agronomic evaluation (seed rate and fertilizer rate), nectar yield and others. References Crane, E. (1990). Bees and beekeeping: science, practice and world resources. Heinnmann
Newness, London. Pp614. Debissa Lamessa, Admassu Addi and Amssalu Bezabih (2005). Botanical inventory Phenology
of bee plants in east shoa Zone. In ESAP proceedings Baptist, B.A. and Punchihewa, R.K.W. (1983): A preliminary Analysis of the principal factors
will affect honey production in Sri Lanka. In: Second International Conference on apiculture in Tropical climates (1989): NewDelhi.P.95.
Moore, D. (2001). Honey bee circadian clocks: behavioral control from individual workers to whole-colony rhythms. J. Insect Physiol. 47:843 -857.

Livestock Research Proceeding
98
Investigating the effect of honeybee pollination on fruit yield of Apple (Malus sylvestris) in Walmera district
*Admasu Adi Tura Barake and Gemechis Legesse Holeta Bee Research Center,
Oromia Agricultural Research Institute *Corresponding author E- [email protected]
Abstract Insect pollination is important for food production globally and apples are one of the major fruit crops which are reliant on this ecosystem service. In this study an attempt was made to investigate the effect of honeybee pollination on fruit yield and quality of Malus sylvestris at Holeta Agricultural Research Center. Variety Anna was used and planted on the plot size of 10m x 10m.The plots assigned into three treatments. After 50% of the flowering, in the first treatment the honeybee colonies were caged with mesh wire for intensive pollination. The second treatment was caged with mesh wire to exclude bees and other insects while the third treatment was left open to be pollinated under natural condition The yield obtained from plots pollinated by honeybees was superior with mean fruit yield of 25.6 Q/ha followed by plots left open to be pollinated by all insect visitors ( 17.6 Q/ha). The lowest yield (14.4 Q/ha) was recorded from the bees and other pollinators excluded plots. The study revealed that honeybee pollination contributes 63.6% to the yield increment of M. sylvestris. Keywords: Pollination, apple, Malus sylvestris, honeybee, fruit yield Introduction The use of honeybee pollination is the most effective and cheapest method of increasing the crop yield as well as the quality of crop production (Kozin, 1976). Many types of commonly grown fruits require pollination in order to bear satisfactory marketable fruits. The greater the number of ovules fertilized, the greater the likelihood that the fruit will successfully compete for the tree nutrients and will continue to develop up to harvest. High seed numbers will ensure better shaped fruit and improved qualities. The Apple plant is belonging to family Roseacae and the flower is bisexual with 5 stigmas and 20-25 stamens. All varieties of apple trees require some cross-pollination to set fruits. Even though some varieties are self-fruitful, they will set fruit more heavily and more regularly if they are cross-pollinated (Delaplane and Mayer, 2000). Wind pollination hardly contributes to the pollination of apple, and most varieties depend on insect pollination. Apple generally grown in most East African countries starting from 2000-3200m.a.s.l. and particularly in Ethiopia apple grows from 2000- 2800 m.a.s.l. which is appropriate crop for highlands (Abayneh and Masresha, 2014). Now days, apple is expanding in most highlands of the country for fruit production and as well as for environmental conservation. The government is promoting this fruit tree at level of smallholder farmers. Moreover, investors are also involved in producing apple plant for fruit production around Walmera district. However, the production of fruits and quality were not as anticipated. This might be improved using insect pollination services. Therefore, this study was initiated to study the effect of honeybee pollination on fruit yield and quality of apple in Walmera district and identify potential insect pollinators of apple other than honeybees.

Livestock Research Proceeding
99
Materials and methods Study area The study was conducted at Holeta Agricultural Research Center, Walmera district located between latitudes 9003`N and longitudes 38030`E. The altitude ranges from 2060 -3380 m.a.s.l. with bimodal rainfall pattern. The main rainy season is from June to September with a mean annual rainfall of 1150 mm. Experimental set up The high yielding apple Anna varieties which was released by Holeta Agricultural Research Center was used for the purpose. A total of 24 Anna trees which have similar height and ages were assigned into three treatments: 8 Anna apple variety trees caged with medium sized honeybee colony by insect prove mesh wire (T1), 8 Anna apple variety tree caged by insect prove mesh wire(T2) and the rest 8Anna apple variety trees left open for control(T3). Data collection Pollination activity by honeybees was observed when the apple trees started flowering and throughout its flowering duration that lasts about 3 days. Pollinators in every treatments were recorded between 10:30 and 14:00 hours every day and sampling order was reshuffled daily to avoid biases in environmental factors. At each treatment, apple trees that have approximately above 50 flowers were selected and number of honeybees visiting at these flowers was recorded for 10 minutes. Every visitor and the number of flowers visited were also recorded. For each treatment, two such 10-minute long observations were conducted and the counts were pooled for analysis. Similarly, the yield data was collected and analyzed using one way ANOVA while the visiting pollinator insects were quantified using simple frequency table. Results and discussions The mean fruit yield in kg per tree was found to be statistically significant among three treatments (P<0.05). The yield obtained from the intensively pollinated by honeybee’s colonies only and honeybees and other insects was statistically significantly higher than the one excluded from any insect pollinators (table1). The fruit yield difference between the treatments indicated that the crop requires insect pollination particularly honeybees for fruit production. This is in line with the findings of Delaplane and Mayer (2000) that apple cultivars are self-incompatible to varying extents, requiring pollen transfer from another “pollinators” cultivar to set fruit in marketable quantities. The contributions of bees to apple fruit production have been appreciated for a long time (Brittain, 1933; Brittain and Eidt, 1933). Table 1. Mean + SE fruit yield of Apple per tree of pollinated with bee, open and without any insect pollinators
Treatment Mean fruit yield in kg/tree Mean fruit yield in quintal/ha
Open 2.2 + 0.37ab 17.6
Caged without bee 1.8 + 0.22b 14.4
Caged with bee 3.2 + 0.4a 25.6
CV (%) 13.75 Various insects belonging to different orders visited Anna apple variety during its flowering time. These include butterflies, flies, stingless bees, wasps, moths, bugs, spiders, carpenter bees, grasshoppers, beetles. The number and percentage of insect visitors were shown in (Table 2). Honeybees, flies and butterfly are the major pollinators of Anna apple variety. When collectively

Livestock Research Proceeding
100
seen, order Hymenoptera is the major pollinator of Anna apple variety and followed by Lepidoptera and Diptera in that order Table 2: The number and percent of the visiting insects of Malus sylvestris, Apple Anna variety
Conclusions and recommendations The study revealed that apple orchards of Anna variety are largely dependent on intensive honeybee pollination. Honeybee pollination increases fruit yield by 63.6% over natural pollination. Therefore, moving honeybee colonies to the apple orchards during its time of flowering is one of the most essential inputs to maximize apple fruit production. References Abayneh Melke and Masresha Fetene (2014). Apples (Malus domestica, Borkh.) Phenology in
Ethiopian Highlands: Plant Growth, Blooming, Fruit Development and Fruit Quality Perspectives. American Journal of Experimental Agriculture, 4: 1958-1995.
Brittain, W.H. (1933). Apple pollination studies in the Annapolis Valley, Nova Scotia. Canadian Department of Agriculture Bulletin, New Series 162:1–198.
Brittain, W.H. and Eidt, C.C. (1933). Seed content, seedling production and fruitfulness in apples. Canadian Journal of Research, 9:307–333.
Delaplane, K.S. and Mayer, N.F. (2000). Crop Pollination by Bees. CABI Publishing, Wallingford.
Kozin, B. (1976). Insect Pollination of Crops. In: (Freitas, B.M. and Pereira, J.O.P. (eds.), Solitary Bees: Conservation, Rearing and Management for Pollination: management and policy. Amasterdam publishing press. Pp.125-134.
No. Insect order Common name Number Percent
1 Lepidoptera Butter fly 22 18.5 Moth 2 1.7 Spider 1 0.84
2 Diptera Fly 24 20.2 3 Hemiptera Bugs 4 3.4 4 Orthoptera Grasshopper 1 0.84
5 Hymenoptera
Wasp 7 5.9 Athalia 4 3.4 Meliponula 2 1.7 Honeybees 40 33.6 Xylocopa 3 2.5 Afrozonalictus 2 1.67
6 Coleoptera 7 5.89

Livestock Research Proceeding
101
Assessing the effect of adulteration on honey and beeswax quality and designing way of identification
Meseret Gemeda and Deressa Kebebe
Holeta bee research center, Oromia Agricultural Research Institute
Corresponding e- mail:[email protected]
Abstract Adulteration of honey and beeswax is becoming a serious and cross cutting problem in Africa in general and in our country in particular and many methods of analysis are available to detect falsification by carrying out chemical analysis. However, in many developing countries a laboratory analyses is not always available. Therefore, the objectives of the study are to identify materials used for adulteration, characterize physical and chemical properties of adulterated honey and beeswax to develop methods of identifying adulterated hive products (honey and beeswax). The survey were conducted in 7 zone of Oromia region (Jimma, Ilu abbabora, West wollega , East wollega , East Shoa, West shoa, and South West Shoa.) and Addis Ababa. The result show that sugar and animal tallow are the major adulterating material while, boiling of sugar with honey, direct adding of grounded or powder of sugar to the honey and melting animal tallow with wax were major adulterating way for honey and bees wax respectively, market loss, health problem, loss of customer, price reduction and loss of trust were, major problems encountered by producer due to adulteration. Solubility and viscosity of honey and breakability, uniformity and smell of beeswax were found good methods to detect adulteration of honey and beeswax at farm get or market respectively. Keywords: Honey, beeswax, adulteration, Introduction Beekeeping has been practiced in Ethiopia for centuries and currently the country is the largest honey producer in Africa. On a world level, Ethiopia is fourth in Beeswax and tenth in honey production (Girma Deffar 1998). However, the majority of beekeepers in the country are still use traditional hives (MOARD, 2003). In Ethiopia, honey is almost exclusively used for local consumption, and to a very large extent (80%) for brewing of mead, locally called ‘Tej’. Ethiopia produces between 24,600 and 43,000 tones of honey per year, and is one of the five biggest wax producers with an average annual export estimated at 3000 tones (EEPD, 2006). From traditional hives, an average of 5–6 kg of honey could be cropped/hive per year. However, in areas where improved technology has been introduced, yields of 15–20 kg/hive per year have been recorded. Low productivity and poor quality of bee products are the major economic impediments for beekeepers (Nuru, 1999). Honey and beeswax should be carefully handled starting from harvesting until it reaches to consumers. One of the problems of honey and beeswax quality in the country is adulteration. Now days there is a cross cutting problem of adulteration of honey and beeswax all over the world in general and in developing countries in particular. Adulteration is becoming a serious and cross cutting problem in Africa in general and in our country in particular. This situation is greatly affecting the quality and marketing of hive products. Chemical analysis is used in many cases to detect adulteration. However as this method require expensive laboratory equipments, the service is not readily available and also this chemical analysis does not serve consumers who want to buy pure products from the market for immediate use. Therefore, this study was initiated to identify adulterant materials and simple methods to detect adulterated honey and beeswax.

Livestock Research Proceeding
102
Material and Methods Survey The survey were conducted in 7 zone of Oromia region ( Jimma, Ilu abbabora,West wollega , East wollega , East Shoa, West shoa, and South West Shoa.) and Addis Ababa which were selected based on potentiality of honey and beeswax marketing. A total of 237 respondents were selected randomly from Beekeepers, Merchants and consumers from 14 districts and 28 kebeles of the study areas and interviewed using pre-structured questionnaire for identifying adulterant materials and to develop simple methods to detect adulterated honey and beeswax. 236 and 6 honey and beeswax samples were collected from beekeepers and merchants for identifying adulterant materials and develop simple methods to detect adulterated honey and beeswax, respectively. Four different ratios of each bee products was prepared as follows Honey 1:1 sugar and honey 1:1 sugar and banana 1:1:1 sugar, banana and honey 2:1:1 sugar, water and honey Beeswax 1:1 beeswax and Candle 1:1 beeswax and animal tallow 1:2:2 beeswax, animal tallow and candle 1:1:1beeswax, animal tallow and candle Result and Discussion Socio-economic characteristics The average age of the beekeepers was 40±12.93 years with range of 20 to 76 years. It was found that 37.9% of the beekeepers were in the age category of 31- 40 years. The remaining 24.1, 20.7%, 12.1% and 5.2 % of the beekeepers found in the age groups of 20-30, 41-50, 51-60, >60 and 51-60 years, respectively. From the total respondents about 92.2 % are Male and the rest are Female Beekeepers. Table 1. Age category of the respondents
Age catagory Beekeepers Merchants Users <20% 9.2 21-30(%) 24.1 33.8 26.8 31-40(%) 37.9 35.4 17.9 41-50(%) 20.7 15.4 30.4 51-60(%) 12.1 12.5 >60(%) 5.2 6.2 12.5 Average age(yrs) 40(12.93) 35(11.21) 41(14.53)Min age (yrs) 20 17 22 Max age (yrs) 76 70 85
The study also showed that from the total respondents about 8.6% illiterate, 6.9% literate or informal school education, 23% 2% high school (9-12), 6.0% not answered and 5.2 % has College diploma. But the majority (about 50%) of the farmers is elementary school (1-8). The average age of the merchants was 35 years with standard deviation of 11.21. It was found that 35.4 % of the merchant were in the age category of 31-40. The remaining 33.8, 15.4 %, 9.2

Livestock Research Proceeding
103
% and 6.2 % of the merchant found in the age groups of 20-30, 41-50, <20 and >60 years, respectively. It was also observed that age of interviewed merchant ranged from 17 to 70 years. From the total respondents about 76.9 % are Male and the rest are Female merchant. The study also showed that from the total respondents about 6.2 % illiterate, 30.8% high school (9-12), 24.8 elementary school (1-8), 3.1% has certificates, and 4.6 % has College diploma, 1.5% has above college diploma and 29.2 % not answered. The average age of the users was 41 years with standard deviation 14.53 it was found that 30.4 % of the users were in the age category of 41-50. The remaining 26.8 , 17.9 %, 12.5 % and 12.5 % of the merchant found in the age groups of 20-30, 31-40, 51-60 and >60 years, respectively. It was also observed that age of interviewed merchant ranged from 22 to 85 years. From the total respondents about 57.1 % are Male and the rest are Female user. The study also showed that from the total respondents about 5.4 % illiterate, 35.7 % high school (9-12), 41.1 elementary school (1-8), 7.1% has certificates, and 5.4 % has College diploma and 1.8% has above college diploma. Perception of the respondent on the adulteration of honey and bees wax Beekeeper The study showed that from the total respondents about 94% and 36 % of repondants were aware of honey and bees wax adulteration, respectively. Whereas the majority of respondent claimed that adulteration of honey and beeswax is done mainly by retailers and collectors and less extent by beekeeper, wholesalers and road side sellers. About 48.3 % and 9% of the consumers were had a chance of buying adulterated honey and bees-wax respectively from district and village market. According to the respondents, sugar, mixture of sugar and banana, mixture of sugar and molasses, plant roots, and candy are used to adulterate honey, while maize flour, animal tallow, paraffin, candle are the ones used to adulterate beeswax. The respondents indicated that adulteration of honey and beeswax are conducted through different ways. These includes boiling sugar with honey directly adding sugar powder to the honey melting of animal fat with wax and boiling of soap ,candle , maize powder or flex with beeswax . Almost 60% of the respondents identify adulterated honey by testing and smelling while 17.2 % estimate by continues flow. But 8.6 % cannot identify even though the rest can identify by using coca cola, thickness of the honey and using fire. 80.2% of the respondents cannot identify adulterated beeswax, 3.4% can identify by colour of the wax while the rest identify by smell, observation uniformity and breakability of the foundation sheet. According to the majority of respondents beekeepers reported that adulteration is done in both honey flow season 50% and also there is the price difference between the pure and the adulterated honey 83.6%. The major problems caused and reported by respondents beekeepers because of adulteration are production minimization, price reduction and health problem. Merchants The study showed that from the total respondents about 60% and 12.3 % bought adulterated honey and bees wax respectively the rest of the respondent they did not bought. According to the result from 60% of respondent bought adulterated honey the majority 27.7% one times, and list 6.2% three times and from 12.3 % the majority of respondent bought adulterated bees wax 4.6 % one and two times and 3.1% five and above five times .The majority respondent mention collectors 16.9 %, retailers 12.3% and roadside sellers 12.3% responsible for adulteration of beeswax. The respondent mention during study the market place they bought adulterated honey and beeswax from zonal level market 13.8%, farm gate 12.3% and woreda level 10.3% market and the rest is from village level and other market place. Also the respondent mention they think

Livestock Research Proceeding
104
adulteration done in woreda level 22.4 % and Village level markets 7.8 % the rest done in zone town, regional and other market places. The major adulterant material of honey are sugar 69.2% , candy and sugar with molasses 6.2 % the rest adulterant materials is sugar with banana, orange and cumber and the list adulterating material mentioned by respondents are Soil and stone 1.5% while 3% they did not know the material . 21.5 % of respondent they did not identify the adulterating but the major adulterating mentioned are animal tallow 20% the rest was animal tallow with candle, lime stone maize flex or powder .21.5% cannot identify adulterated honey and 7.7% not answered some of the respondent can identify by test 21.5% the rest identify by observation, smell, by firing, using coca cola the list identification mention by certification of the honey. Majority of them 86.2% cannot identify adulterated beeswax the rest identify by colour, smell and breakability of the wax. The respondent report that they get pure honey or bees wax from common customer or one beekeeper 66.2% and certification and common trust is the list way mentioned .during the marketing process 53.3% the merchant allow the user to test honey or wax before they bought to get the trust from the user.43% of them sells their honey and bees wax in the market by common trust or believe and only 3% of them sells certified and packed honey. According to the result majority of respondents they do not knew how adulteration is done 64.6% and 33.8% honey and beeswax respectively but boiling of sugar and adding to honey 36.9% and melting of animal tallow with wax 10.8% is the major ways of adulterating honey and wax respectively 43% of them sells their honey and bees wax in the market by common trust or believe and only 3% of them sells certified and packed honey. Adding soil to honey is the list adulterating ways of honey by merchant, adulteration is done in both seasons according to the respondents. Majority of the respondent report there is a price difference between the pure and the adulterated one and market loss, price reduction and health problems are major problems mentioned. Users According to the result the majority of respondent mentions that 16.1% road side seller and collectors 16.1 % major responsible also beekeeper is mentioned 8.7% for adulteration of honey and beeswax while rest done by other actors in the market like, wholesalers and retailers and the users think adulteration is majorly done zone town market, woreda town market and farm gate 32.1%, 21.4% and 17.9% respectively the rest is done in village and regional level markets. Direct adding of crushed or powder of sugar 28.6% and boiling of sugar 25% adulterating with honey is the major ways of adulterating honey and 96.3 % respondents report that they do not know how adulteration of wax is done. Sugar is the major adulterating material 69.6% , other is mix of sugar with banana, molasses and irid (local name) was used us adulterating materials for honey and majority of the respondent do not know bees wax adulterating materials 96.3% . According to the result users respondents reported that the identification method of the pure and adulterated honey the major is by test 46.4% and smell 10.7% and the list identification method reported is using fire and coca cola. Majority of the respondent 98.2% cannot identify adulterated bees wax .the majority was agreed there is price difference between the pure and the adulterated one. Problem encountered because of adulteration list by the respondent majorly loss of satisfaction, health problem and loss value of the product.

Livestock Research Proceeding
105
Laboratory analysis Samples of 1 kg of honey and beeswax each collected from producer and merchant from different zone of each study areas (both market spot and on farm gates). The physical properties or organolephetic test for honey was done in HBRC laboratory but chemical properties test were not done because any standard laboratory found in our country not done any test for honey currently. The physical and chemical property of the collected beeswax and adulterated beeswax prepared by different ration from two adulterating material was analyzed at HBRC and ECAE laboratory. In this study, adulterated beeswax prepared the value obtained from melting point, saponification clouding point, refractive index, ash,% by mass, total Volatile matter, acid value and eater values were not fulfil in the required standard values of 61- 66°C, 85 -105, 1.4400-1.4450, 0.22max, 0.75max, 17-24 and 70-80 respectively according to Ethiopian Conformity Assessment Enterprise (ECAE) laboratory. Physical property adulterated beeswax Bees wax with both animal tallow and candle with equal amount of them and fewer amounts the pure bees wax have smell of animal tallow, light yellow in colour, appearance not uniform inside and, easily or smoothly breakable Adulterated beeswax with candle only and equal amount it have uniform appearance, yellow in colour, breakage is like bees wax, goodsmell. Adulterated beeswax with animal tallow only and equal amount have tallow smell, dark yellow colour, smoothly breakable and appearance it seems like bees wax. Adulterated beeswax with equal amount of animal tallow and candle and pure bees wax have light yellow colour ,smoothly breakable, tallow smell and appearance is not like bees wax . Physical property of adulterated honey Adulterated honey with arid local name, this adulteration changes the colour of the honey into yellow. Adulterated honey with, sugar, honey and water by using heat means by boiling it have light white in colour; test is sweet like sugar, very liquid, look like pure honey but the sugar settle at the bottom of the honey container. Adulterated honey with equal amount honey with sugar melting of sugar it have red colour and it becomes solid .adulterated white honey with sugar by directly adding , have extra white colour and ferment it look like pure honey by necked eye, Adulterated honey with molasses using heat it have black colour looks like honey coffee honey colour. Adulterated honey with banana at the bottom it is in the liquid from and in the upper layer it forms yeast. All the adulterated honey does not fulfil standard honey moisture content quality parameter. Physical test were done for honey sample collected according to the perception of the respondents on the physical identification of the adulterated honey during the test the control group also checked by those identification test method for the control group we used pure honey harvested from HBRC, pure also shows adulteration in different identification test methods shows adulteration from this one is in coca cola test method this may be from the content of coca cola and honey which causes fermentation during mixing the two of the them or the time the honey were harvested until the test is undertaken. Another test method observation done for adulteration detection is how liquid honey comes down into a glass of water. Pure honey does not immediately dissolve in water you will notice that it takes a bit of effort to stir it in the water to dissolve, whereas sugar tends to dissolve easily as you drop them into the water. However, test result is sometimes not that clear because different honey varieties have different viscosity. Some are denser and thicker than others. Obviously, honey in cream form, even if it's adulterated with other substance, will not dissolve as easy as liquid honey in water. In the rest of the identification methods, it shows purity of the control honey according to the precaution of the respondents. Generally, all respondents answered that sugar is the major honey adulterating material, while majority of them do not know adulterating materials of bees wax.

Livestock Research Proceeding
106
Grap
Graph ConcSugaraddinadultecustomDissomethophysiwork
Relativ
e ho
ney adultrants
ph1. Honey ad
h 2.Adultratin
lusion and Rr and animal
ng of crushed erating way mer, price red
olving in the ods of adultecal identificashould be di
01020304050607080
0
20
40
60
80
100
animal
dulterating m
ng material o
Recommendatallow is theor powder offor honey anduction and lwater and c
erated honey ation methodsisseminated t
fat candle can
materials
of bees wax
ation e major adultf sugar to thend bees wax oss of satisfacontinues flow
while breaks of adulteratto the concern
candlend soap
maizeflexorpowde
terating mate honey and mrespectively
action are majw show goo
kability, unifoted beeswax.ned body and
r
i do notknow
c
ani
erial boiling omelting animay. Market losjor problems
od result for ormity and The informad further stud
candleandimal fat
limestone
of sugar withal tallow withss, health procaused due tthe physical
d smell are cation delivdy on the t
beek
user
Mer
h honey, direh wax majooblem, loss oto adulterationl identificatiooncluded aered from thtechniques an
Beekeeper
user
Merchant
keeper
r
chant
ct or of n.
on as
his nd
r

Livestock Research Proceeding
107
procedures used to detect or physical identification of honey and bees wax adulteration is recommended. Reference Bogdanov S, et al. (1999) Honey quality, methods of analysis and international regulatory
standards: review of the work of the International honey comission, Mitt. Lebensm. Girma Deffar 1998 Non-Wood Forest Production in Ethiopia. Addis
Ababa,Ethiopia http://www.fao.org/DOCREP/003/X6690E/X6690E00.htm EEPD (Ethiopian Export Promotion Department). 2006. Exports of honey and beeswax. Draft
report. EEPD, Ministry of Trade and Industry, Addis Ababa, Ethiopia. Nuru Adgaba. 1999. Quality state of grading Ethiopian honey. In: Proceedings of the fi rst
national conference of the Ethiopian Beekeepers Association, Addis Ababa, Ethiopia. Amsalu B, Nuru A, Radloff SE and Hepburn HR. 2004. Multivariate morphometeric analysis of
honeybees in the Ethiopian region. Joseph, T., Awah-Ndukum, J., Fonteh-Florence, A., Delphine, N. D., Jonnas, P. and Ze Antoine,
M. 2007. Physico-chemical and microbiological characteristics of honey from the Sudano-Guinean Zone of west Cameron. African Journal of Biotechnology.
.

Livestock Research Proceeding
108
Screening of potential shrubs for bee forage development
Admasu Adi , *Tura Bareke and Kibebew Wakjira
Holeta Bee Research Center, Oromia Agricultural Research Institute
*Corresponding E- mail: [email protected] Abstract Pollen and nectar of early blooming shrub trees is important for honeybees in the brood rearing season. The quantity and quality of available nectar sources can show huge differences depending on the season, environmental conditions, the blooming stage of the plant, the age of the flowers and the time of the day. The study was conducted to evaluate the adaptation of the screened honeybee forage shrubs for sustainable honey production. The planting materials were Vernonia amygdalina, Buddleja polystachya, Callistemon citrinus, Dovyalis caffra and Chamecytisus proliferus. The species were evaluated based on growth rate, number of flower heads per plants, time to set flower, foraging intensity of honeybees and flowering length. The mean annual growth rate was different from year to year and higher for Chamecytisus proliferus followed by C. citrinus, D. caffra, Buddleja polystachya, , and V. amygdalina in decreasing order. C. citrinus, C. proliferus and V. amygdalina were set flower with the ranges of two to three and half years while B. polystachya, and D. caffra were not flowered up to the end of five years. V. amygdalina was highly visited by honeybees compared to rest. C. citrinus, C. proliferus and V. amygdalina are fast grown bee forage shrubs and provided flower with short period of time and thus promotion of these bee forages is very important, and follow up of B. polystachya, and D. caffra should be continued till necessary data are obtained. Furthermore it is also important to evaluate pollen and nectar yield of the recommended bee forages. Keywords: Bee forage shrubs, flowering period, pollen yield, foraging intensity, growth rate Introduction The success of beekeeping depends not only on honeybee strains and its management but also on the abundance and availability of bee floral plants around bee farming area (Bista and Shivakoti, 2000). Attention not given to maintain the existing bee flora and multiplication of multipurpose plant species in order to make beekeeping sustainable. Inadequate information on bee forage resources are a major obstacle to improve the production and productivity of honeybees in mixed crop farming of Ethiopia. It also important to screen suitable bee forage species that have compatibility with existing farming systems, high nutritive value, fast growth, easy to manage and resistance to diseases and pests. Bee forage trees/shrubs provide bees with ample of food source (nectar and pollen) due to their relatively large canopy spread, and long flowering duration. Bee forage shrubs/trees not only provide nectar and pollen for the honeybees but also used as food, ornamental, shade tree and live fence for the beekeepers. Hence, to gain optimum benefit from honeybee forage shrubs screening and adapting of the well performing multipurpose species is essential to increase honey production. Therefore, the objective of the study was to evaluate and screen well performing shrubs bee plants and recommend best performing for the users.

Livestock Research Proceeding
109
Materials and methods Description of study areas The study was carried-out at Holeta Bee Research Center from 2009 to 2014. The site is located at an elevation of 2400 m.a.s.l, at 09003.5`N latitude and 0380 30.367`E longitudes. The predominant soil type in the study area is red soil. Candidate bee forage plant selection Potential shrubs were identified through interview of farmers, observation of foraging bees on each flower of candidate shrubs during different flowering seasons (Sep/Oct, Dec/ Jan, April/May and Jun/July) and literature review. Accordingly 5 shrub bee forages were put under investigation (table 1) Table 1: Identified candidate bee forage and their range of distribution No Botanical name Common name Growing Agroecological zone
1 Vernonia amygdalina Eebicha(Or), Girawa(Am) 500-2800 m.a.s.l.
2 Buddleja polystachya Anfara(Or) 1000-3300 m.a.s.l.
3 Callistemon citrinus Bottle brush (Eng) 1250-2500 m.a.s.l.
4 Dovyalis caffra Koshim (Amh) 1500-2600 m.a.s.l.
5 Chamecytisus proliferus Tagasaste up to 3200 m.a.s.l.
Seed collection Matured seeds and branch cuttings of Vernonia amygdalina, Buddleja polystachya, Callistemon citrinus, Dovyalis caffra and Chamecytisus proliferus were collected from respective mature plant species. Immediately after collection, seeds were packed and allowed to dry for one and half week at room temperature. The packages were maintained at room temperature until day of sowing. Nursery establishment and experimental setup Seed was sown and seedlings of the species were raised in nursery bed. The seedlings were transplanted to plots size 4mx5m, with 0.5 m spacing between plants and 1m between rows. Completely randomized block design was used with three replications. All necessary data such as, height of plant, flowering date, number of flowers heads per plant and foraging intensity of honeybees were recorded. Growth of each bee forage per day was recorded using Growth Rate formula (Growth rate = Change in Height/Change in Time, because rates are measures of change. Here, the change in height involves subtracting an earlier plant height measurement from a later measurement of the same plant. The change in time is the total amount of time that passed between the two heights measurements. At 50% flowering, number of flower heads/m2 was counted. Foraging bee intensity on flowers was counted starting from 6: 00 a.m. to 6: 00 p.m. for ten minutes at every 2 hour interval. Finally, the collected data were statistically analyzed using descriptive statistics.

Livestock Research Proceeding
110
Results and discussions Plant growth rate According to the result of the study annual growth rate of C. proliferus, V. amygdalina, B. polystachya and D. caffra were decreased as their age increased while C. citrinus was decreased on second year and then increased. Generally, annual growth rate these plants were high between one to two years after planted. The mean growth rate of Buddleja polystachya, Vernonia amygdalina, Callistemon citrinus Dovyalis caffra and Chamecytisus proliferus were 0.81 m, 0.61 m, 0.68 m, 0.66 m and 1.26 m respectively (Table). Buddleja polystachya and Chamecytisus proliferus were fast growth plants in vegetative parts. But B. polystachya takes more time to give flowers. This may be the nature of species. Growth rates are influenced by inherent soil fertility and constant stresses placed on plants in low rainfall. Plants may experience long periods of stagnation in growth leading to a reasonably large variation in the 'average growth rate (Sykora, 1997). Table 2. Annual Growth Rates, Four years Total Annual Growth Rate (4YTAGR), Four years of Mean Annual Growth Rate (4YMAGR), Initial height in meter (m) per six month, Total height (TH) in meter(m) per 4.6 years of Buddleja polystachya, Vernonia amygdalina, Callistemon citrinus, Dovyalis caffra and Chamecytisus proliferus. Plant species Jul 2009-
Jul 2010 Jul 2010-Jul 2011
Jul 2011-Jul 2012
Jul 2012-Jul 2013
4 YTAGR 4YMAGR
IH(m)/ 6 month
TH in m/4.6y
B. polystachya 1.95 0.9 0.2 0.2 3.25 0.81 0.45 3.7
V. amygdalina 1.03 0.7 0.4 0.3 2.43 0.61 0.47 2.9
C. citrinus 0.63 0.4 0.7 1 2.73 0.68 0.47 3.2
D. caffra 0.94 0.6 0.6 0.5 2.64 0.66 0.16 2.8
C. proliferus 1.75 1.4 1.2 0.7 5.05 1.26 0.45 5.5 Total height is the summation of initial height and total annual growth rate of the four years for each species. Time required to setting flower The time required to set flower for V. amygdalina shorter (2.54 years) compared to C. proliferus (3.1 years) and C. citrinus (3.29) (figure 1). However, under similar condition B. polystachya and D. caffra did not flower until the end of the study period (four years evaluation period).

Livestock Research Proceeding
111
Figure 1: Flower setting time for C. citrinus, C. proliferus and V. amygdalina Mean number of flower heads per plants Mean number of flower heads per plant were highest for C. proliferus as compared to C. citrinus and V. amygdalina (table 3) and it was significantly different (p<0.05) from the rest. This is may be due to their growing habit and crown size. Plant with more branching produces more flower heads per plant. John et al., (1987) also revealed that plants with more vegetative growth produce more flowers and seeds. ANOVA value indicated that F-ration is greater than p-value. This means there is more variability between plant species than within species and this is variation was caused by species types. Table 3. Mean number of flower heads per plants (MNFHP) + Standard Deviation (SD) of Vernonia amygdalina, Callistemon citrinus and Chamecytisus proliferus. Plant species N MNFHP + SD ANOVA Vernonia amygdalina 9 73 + 9.2 c F=234 Callistemon citrinus 9 152 + 31 b P=0.002 Chamecytisus proliferus 9 1247.8 + 533.8 a
Flowering duration of bee plants The mean flowering length of C. citrinus was highest which was six months whereas C. proliferus and V. amygdalina stayed almost for three and two months, respectively. From beekeeping point of view it is economical to select plant species with more flower heads and longer flowering period that provides continuous food source for the honeybee colonies.
3.29 3.1
2.54
0
0.5
1
1.5
2
2.5
3
3.5
Callistemon citrinus Chamecytisusproliferus
Vernonia amygdalina
Blo
omin
g tim
e by
year
Plant species

Livestock Research Proceeding
112
Figure 2. Duration of lowering length in days for three plant species Foraging intensity of bees According to the results of this study the foraging time of honeybees to different plant species varied and the peak foraging time ranged from 12 p.m-2 p.m (figure 3). The observations recorded on the foraging intensity of the honeybees showed that visiting bees were few in the early morning and late in the evening. V. amygdalina was highly visited by honeybees when compared with other plant species This may be due to the flowering time of V. amygdalina was in dearth period when there is no bee forages in flower around the area. Foraging is essential to a honeybee colony’s survival. To forage successfully, a bee has to learn and remember not only the color and shape of flowers that contain nectar and pollen, but also how to get to them (Menzel et al., 1996; Collett et al., 2003). The variation of number of bee count is associated with different factors such as attractiveness of the flower, number of flower heads per plants, nectar and pollen yield of plants and weather condition. This is also in agreement with Crane (1990) the intensity of bee visit is measure of potentiality of plants for nectar and pollen production.
Figure 3: Foraging intensity of bees on the three different plant specie
0
50
100
150
200
Callistemoncitrinus
Chamecytisusproliferus
VernoniaamygdalinaTi
me taken from
bloom
ing
to sh
edding
(days)
Plant species
05
1015202530354045
6:00 AM 8:00 AM 10:00 AM 12: 00AM 2:00 PM 4:00 PM 6: 00PM
Num
ber o
f bee
with
in 10 minute
Time of count
Vernonia amygdalina
Chamecytisus proliferus
Callistemon citrinus

Livestock Research Proceeding
113
Conclusions and recommendations In conclusion this study revealed that all plant species included in the study showed good vegetation growth performances. Mean annual growth rate of five years after planted were higher for C. proliferus followed by B. polystachya, C. citrinus, D. caffra and V. amygdalina respectively. However, C. citrinus, C. proliferus and V. amygdalina were set flower with the ranges of two and half to three and half years while B. polystachya, and D. caffra are not flowered up to the end of five years. All bee forages plants bloomed were visited by honeybees well. However, V. amygdalina was highly visited than the rest. The time spent by bees for foraging on the flowers depends on the amount of nectar and pollen present in the flower. The peak foraging time is associated with nectar and pollen potentiality and floral preference of honeybees. Finally C. citrinus, C. proliferus and V. amygdalina are fast growing bee forage shrubs and provided flower with short period of time and their promotion is recommended. However, follow up studies for shrub species of B. polystachya, and D. caffra should be continued to see their potential. The plants species that showed better performance in and after flowering stage also require further evaluation to quantify their nectar and pollen yield. References Bista, S. and Shivakoti, G. (2000). Honeybee Flora at Kabre, Dolakha District. Nepal Agric. Res.
J., Vol. 4 & 5 pp Collett, T. S., Graham, P. and Durier, V. (2003). Route learning by insects. Curr. Opin.
Neurobiol. 13 pp, 718-725. Crane, E., (1990). Bees and beekeeping, science, practice and world resource Heinemann
Newness, London. John B A, Gordon R H and Parrish D J (1987). Plant Science. McGraw-Hill publishing
Company.126582. Menzel, R., Geiger, K., Chittka, L., Joerges, J., Kunze, J. and Muller, U. (1996). The knowledge
base of bee navigation. J. Exp. Biol. 199 pp 141-146. Sykora, N. (1997). Ageing of Trees and Shrubs in Central Australia. Technote.

Livestock Research Proceeding
114
Development of improved and affordable bee hives
Meseret Gemeda and Mebrat Hailu
Holota Bee Research Center, Oromia Agricultural Research Institute
*Corresponding E-mail: [email protected] Abstract Despite the suitability of Ethiopia to improved bee keeping box hive is less adopted due to its high production cost (expensiveness of timber) This study was initiated to develop alternative hive which could be affordable to poor farmers. The hives were made from non timber materials like Shemel (Oxytenathera abyssinica), Bamboo (Arundinaria alpine) in the prototype of Zander hive and evaluated. The suitablity, honey yield and cost of the hive is compared with timber zander hive.. Accordingly the production cost of bamboo(850 ETB), shemel (840ETB) are significantly more than two times cheaper than and timber Movable frame hive(1800 ETB), Further more e There was no statistically significant deference in average honey yield among the types of hives (P>0.05) (table 1). Therefore Bee keepers can to use hives made of bamboo and shimel i. Keywords: bamboo hive, shimel hive; timber movable frame hive Introduction Ethiopia, because of its moderate climate and presence of diverse honeybee floral resources, is suitable for improved beekeeping. To exploit the available apicultural resources, in the last 3-4 decades, many attempts have been made to introduce improved bee hives with its accessories to the rural beekeepers. Despite the presence of less success stories and also great attempts to introduce box hives for many years, the dissemination of the technology is very slow to reach to significant size of beekeepers in the country. Still more than 90% of the beekeeping is practiced in traditional ways using traditional hives. As a result, the production and productivities of beekeeping is very low. Moreover, Currently, timber is becoming very expensive and the cost of one set of timber made hive is 1600 to 1800 Birr. As result, despite a good return of box hive, many farmer beekeepers are unable to afford for initial investment cost to buy economic size (a minimum of 3 hives). As other many countries experiences showed, without adopting improved hives it is very difficult to revolutionize the honey production and become competent in the international honey markets. In this regard seeking of alternative and affordable improved hives is very essential to enhance the apicultural industries of the country. To solve problems related to improved hive construction, some alternatives materials other than timbers were suggested (Crane, 1990) and Claus (1989). In this aspect, there are non timber materials in the country that can be used for the construction of improved hives. Among these, bamboo (Arundinaria alpine) and shimel (Oxytenathera abyssinica) are widely growing in many parts of the country. Particularly bamboo covers 3-4% of the total forest areas of the country (EMA, 1988). Moreover, 1 million hectares of Ethiopian land is covered with bamboo (Arundinaria alpine). Shimel (Oxytenathera abyssinica) is also another dominant plant that occurs extensively in the western lowland areas of the country. Both materials, besides their availability, have good qualities such as longer durability, easily manageable and cheaper. Both plants have the ability to replace the old plant seasonally with young shoot (regenerate) which is useful to utilize the plants in sustainable ways without depleting the available resources. Therefore, the present study was initiated to test the possibility

Livestock Research Proceeding
115
of using these materials for the construction of movable frame hives to reduce the cost and evaluate the performance of the hives Material and methods Matured bamboo and shemel were purchased and allow to dry well. Zander type box hive were constructed using the materials. Five box hives were constructed from each material and also timber made box hives were constructed for comparison and control purposes. After constructed honeybee colonies having equal strength were randomly transferred to all hives. Data on production cost required producing a set of box hives and honey yield was collected and Analyzed using ANOVA.This study was carried out for two years at Holeta Bee Research Center. Result and discussion The production cost of bamboo (Arundinaria alpine) and shemel (Oxytenathera abyssinica) movable frame hives was eight hundred fifty (850) and eight hundred forty (840) birr respectively. While the production cost of a set of timber movable frame hive was one thousand eight hundred (1800) birr. These results indicate that Bamboo and Shimel hives were significantly more than two times cheaper than Timber movable frame hive. However the frames made from bamboo and shemel did not hold the nail as its thickness is less. The average honey yield obtained from bamboo and Shimel movable frame hives were 19.5 and 19.9 kg / hive/season. While that of timber movable frame hive was 20.3 kg /hive/ season. This shows that there was no statistically significant average honey yield difference (p>0.05) among hive types. (Table 1) Table 1. Honey yield of different movable frame hives Treatment Mean honey yield + std.Error Bamboo 19.4733 .20514
Shimel 19.8556 .35721
Timber 20.2833 .39550 *Mean honey yield Conclusion and Recommendation The result reveals that it is possible to construct movable frame hives from Bamboo (Arundinaria alpine) and Shemel (Oxytenathera abyssinica).. The production costs of these two types of hives are more than two times cheaper than that of timber made hive. And no honey yield variation was observe among these hives. Therefore it is important to promote the hives in all parts of country where these materials grow. However the frames made from Bamboo and Shimel are thin to hold nail. Therefore, using frame made from timber or looking for method to strongly fix the bar is paramount important.

Livestock Research Proceeding
116
References Claus, B. 1989. Observation on various rural beekeeping techniques and development in several
African countries. Proc.4th interventional conference on Apiculture in tropical climates, Cairo 1888.
Crane, E.1990.Bees and beekeeping, science, practice and world resource Heinemann Newness, London.
EMP (Ethiopian Mapping Authority), 1988 National Atlas of Ethiopia. EMP, Addis Ababa, Ethiopia.
Nuru Adgaba and Edessa Negera (2005) Study on making top bar hives and frames from cheap and locally available materials, in proceedings of 4th National conference of the Ethiopian Beekeepers Association, Addis Ababa, Ethiopia.

Livestock Research Proceeding
117
Evaluation of the quality of beeswax from different sources and rendering methods
Meseret Gemeda and Deressa Kebebe Holeta Bee Research Center,
Oromia Agricultural Research Institute
Corresponding E-mail [email protected] Abstract To become competent both in local and export markets the quality of the beeswax has to be maintained. However pre- and post-harvest handling and processing of crude beeswax affect its quality and quantity. Hence, the objective of the present study was to evaluate the quality and quantity of beeswax obtained from different sources and compares the effectiveness of different beeswax extraction methods for rendering pure and quality beeswax. Three bees wax sources (comb, sefef and crude honey) and three extraction methods (manual, submerged and solar) were arranged in complete factorial in Randomized Complete Block Design (RCBD) with three replications. Ten kg each of comb, sefef and crude honey were used for extraction and the average amount of pure beeswax obtained was compared. The analysis of variance indicated that there were significant difference among beeswax sources, extraction methods and interaction between beeswax sources and extraction methods on the yield of beeswax and slum gum ((P<0.05). Comparison of beeswax sources revealed that significantly higher beeswax yield (6.76 kg) was recorded from crude honey than from comb and sefer with beeswax yield of 2.68 and 2.59 kg, respectively. Among the beeswax extraction methods, submerged method was found significantly superior to manual and solar extraction methods when comb and sefef sources were used, where as when crude honey was used as a beeswax source, manual and submerged methods were found on par in rendering beeswax. On the other hand, the highest slum gum was recorded from comb and sefef sources particularly when solar extraction method was used. In the case of crude honey source there was no significant difference among the three extraction methods on slum gum record. Statistical analysis indicated that different beeswax sources and extraction methods had no significant deference on melting, saponification clouding point, acid and ester values. The beeswax quality obtained in this study is comparable to require standard quality. Key words: Beeswax source, Extraction method, quality, Introduction Traditional hives that are widely used in developing countries are major source of beeswax. (Crane, 1990). Much of the beeswax of the world comes from developing countries and serves as source of cash income and foreign exchange earrings. Beeswax is used for more than 300 purposes and the demand for it never has been satisfied Most of the wax produced now- a-days are used in the manufacture of cosmetics, such as hand and face creams, lipsticks and pharmaceutical, such as ,various ointments, for coating pills and suppositories (Brone, 1988)). In world market beeswax commands much higher unit price, (three times more) than honey (FAO, 1986). In Ethiopia beeswax has been used as one of the important agricultural export commodities for many years. The average annual beeswax export of the country is about 472.2 tons (MOA, 2003), which is only less than 10% of the total amount of beeswax produced annually.). This is attributed to in many parts of our country Much of the beeswax produced by bees that could be harvested by beekeepers is wasted. The beeswax is left or thrown away because beekeepers do not have awareness on how to collect and render it into marketable blocks (Nuru & Eddessa, 2005) in developing countries in general and

Livestock Research Proceeding
118
in our country in particular. only one-third, or at most one-half, of the world’s production of beeswax comes on to the market, the rest being thrown away or lost (Smith, 1960). Even if beeswax is a non perishable product the way it is processed and handled has a great influence on its quality, quantity and marketing. In the export market the issue of quality products is very important. To become competent both in local and export markets the quality of the beeswax has to be maintained. Processing and marketing of beeswax by producer’s cooperative and small-scale processor have been successfully used in many tropical countries. In Ethiopia however the way of handling and processing of crude beeswax poor. This is may be due to sources and pre and post harvest handling conditions. The efficiency of manual beeswax rendering method is very low, only 50% efficient compared to mechanical presser (Nuru and Eddessa, 2005). The quality of beeswax obtained from tej by product does not seem pure and its color is not light as that of beeswax extracted directly from crude honey. This e may be due to ingredients used in tej like Gesho (Raminus prinodes) stem and leave, fermentation periods or way of storing of crude beeswax (sefef), the color and the quality of beeswax processed and marketed are varied. Moreover, beeswax obtained from different processing methods affects its quality and quantity The quality of beeswax is judged from its color, purity and uniformity. Light color beeswax has the high value in world market. In Ethiopia, no pervious study examined the quality and quantity of beeswax obtained from different sources and different methods of processing. Therefore, this study was initiated to evaluate the quality and quantity of beeswax obtained from different sources, and to compare the effectiveness of different beeswax extraction methods for rendering pure and quality beeswax. Materials and Methods The study was carried out at Holeta Bee Research Center during 2003 and 2004 E.C. The experiment was laid out in Randomized Complete Block Design (RCBD) with three replications. Three beeswax sources (comb, sefef and crude honey) and three extraction methods (manual, submerged and solar) were combined in complete factorial arrangement. Crude beeswax such as sefef was collected from tej makers, while comb was obtained from hives that had been broken or crashed and crude honey was attained directly after honey extraction. Ten kg of each sefef, comb and crude honey were used for three wax extraction methods. Extraction methods Manual extraction method (simple extraction methods) The crude beeswax obtained from different sources were placed separately in clean water and left soaked for 24 hours so that any remaining honey, sheath and water soluble dirty particles were dissolved and washed with clean water in plastic basin or bucket twice. After straining, the wax was melted in sufficient boiling water. Then the wax were poured into sisal and squeezed manually. When the wax ceases to run through, the sisal was twisted and squeezed pulled slowly between two horizontal sticks. The water and wax mixture was left to cool. The wax block obtained was analyzed for its quality, color and the quantity. The extracted and dried refuses (slum gum) were weighed. Submerged wax extraction method The beeswax obtained from different sources were placed separately in clean water and left socked for 24 hours to let any remaining honey was dissolved and washed using clean water in plastic bucket. Then the washed wax tied up in clean cloth (abujedi) sacks. The tied up wax sack were put in twice its volume of clean water and heated at 70 – 80 º C until the wax has melted. The sack is agitated with a stick to cause the wax to float to the top and then pour the melted wax from the boiler. The warm water and wax mixture were poured through a strainer or clean cloth

Livestock Research Proceeding
119
and two sticks were put on sacks containing wax to squeeze the wax out of cloth. Then, the water and wax mixture were allowed to cool and the wax cake were removed and all the necessary data were collected. (Dadant, 1975). Solar wax extraction method The crude beeswax from different sources were melted using solar energy/solar wax extractor at 68 to 70°C. The sun melts pieces of wax placed on the metal base of a shallow box. Melted beeswax runs down the base leaving most of the dross behind through a screen and into a container where it solidifies. The container (mould) in which the wax was to be collected had sloping sides, so that the block of wax was easier to remove. All necessary data including quality amount of beeswax and refuses (slum gum) were collected. Treatments The experiment has 9 treatments with three replication. These are: Treatment 1 Crude beeswax (sefef) and manual wax extraction methods Treatment 2 Crude beeswax (sefef) and submerged wax straining methods Treatment 3 Crude beeswax (sefef) and solar wax extraction methods Treatment 4 Crude beeswax comb and manual wax extraction methods Treatment 5 Crude beeswax comb and submerged wax straining methods Treatment 6 Crude beeswax comb and solar wax extraction methods Treatment 7 Crude beeswax from crude honey and manual wax extraction methods Treatment 8 Crude beeswax from crude honey and submerged wax straining methods Treatment 9 Crude beeswax from crude honey and solar wax extraction methods The beeswax obtained from different sources and methods of extraction were evaluated for their color, cleanness and uniformity. The physical and chemical properties that were relevant to beeswax quality like melting point, saponification cloud point, and acid value and ester value were tested at Ethiopian Conformity Assessment Enterprise laboratory.The color of pure beeswax extracted from each sources and extraction methods were compared with that of pure beeswax prepared for export. Experimental data were analyzed using SAS software, and means for each parameter were separated by the least significant difference (LSD) test at P = 0.05. Result and Discussion Statistical analysis indicated that there were significant difference among beeswax sources and extraction methods on the yield of beeswax and refuses (slum gum). (Table 1 and 2), the interaction between beeswax sources and extraction methods was also significant. Table 1 . Effect of different beeswax sources and rendering methods on beeswax yield (kg) Extraction method (M)
Beeswax Sources (S) Comb Sefef Crud oney Mean
Manual 2.96b 3.03b 7.27a 4.42 Submerged 3.93a 3.93a 7.10a 4.96 Solar 1.23c 0.80c 5.90b 2.64 Mean 2.68 2.59 6.76 C.V. (%) 9.98 S M S x M LSD (0.05) 0.40 0.40 0.69 S.D.± 0.1334 0.1334 0.2310

Livestock Research Proceeding
120
Means within the same beeswax sources followed by the same letter are not significantly different (P=0.05 Table 2. Effect of different beeswax sources & rendering methods on refuses (slum gum) (kg) Extraction method (M)
Beeswax Sources (S) Comb Sefef Crude
Honey Mean
Manual 4.00b 3.80c 1.73a 3.18 Submerged 4.93b 4.17b 1.60a 3.57 Solar 7.47a 7.27a 2.43a 5.72 Mean 5.47 5.08 1.92 C.V. (%) 17.83 S M S x M LSD (0.05) 0.74 0.74 1.28 S.D.± 0.2469 0.2469 0.4277 Means within the same beeswax sources followed by the same letter are not significantly different (P=0.05 Comparison of beeswax sources revealed that crude honey yielded significantly higher pure beeswax and the lesser slum gum as compared to comb and sefef sources. Among the beeswax extraction methods, submerged method was found significantly superior to manual and solar extraction methods when comb and sefef sources were used, where as when crude honey was used as a beeswax source, manual and submerged methods were found on par in rendering beeswax. On the other hand, the highest refuses (slum gum) were recorded from comb and sefef sources particularly when solar extraction method was used. In the case of crude honey source there was no significant difference among the three extraction methods on refuses (slum gum) record. Further, examining quality parameters of the extracted beeswax for color, purity and uniformity revealed that beeswax obtained from crude honey was light in color as compared to that obtained from comb and sefer. One major factor contributing for the deterioration of beeswax quality is inappropriate storage conditions of honey combs and crude beeswax like sefef and comb. Beeswax sample obtained from different sources and extraction method were analyzed for melting point, saponification, acid and ester values. Statistical analysis indicated that different beeswax sources and extraction methods had no significant deference on melting, saponification clouding point, acid and ester values of beeswax (table 3, to 6). In this study, the value obtained from melting point, saponification clouding point, acid and eater values were in the range of in the required Ethiopian and American standard values of 61- 66°C, 85 -105, 17-24 and 70-80 respectively.Further, analysis of beeswax prepared for export purpose has shown similar results for melting point, saponification clouding point, acid and eater values as compared to the findings on this study. Among the extraction methods manual beeswax extraction method needs four or more man power to press 10 kg of melted beeswax. The traditional beeswax pressing method is inefficient and contributing for the losses of 47% of pure beeswax (Nuru 1997), however submerged extraction method is simple and it can be processed by one or two man power. A solar wax extractor produces top quality wax. The temperature only needs to rises above 68 to 70°C to

Livestock Research Proceeding
121
render beeswax sufficiently and also the extractor has to be turned regularly towards the sun and in cloudy weather or weak sunlight there is no yield at all. 3. Effect of different beeswax sources and rendering methods on wax melting point (OC). Extraction methods
Beeswax sources
Comb Sufef Crudehoney Mean Manual 63.4 61.7 64.0 63.0 Submerged 63.6 62.5 63.2 63.1 Solar 62.9 63.6 64.3 63.6 Mean 63.3 62.6 63.8 C.V. (%) 1.66 LSD (0.05) NS Table 4. Effect of different beeswax sources and rendering methods on wax acid value. Extraction methods
Beeswax sources Comb Sefef Crude honey Mean
Manual 16.9 17.1 17.2 17.1 Submerged 19.9 20.1 18.6 19.5 Solar 20.6 20.9 20.2 20.5 Mean 19.1 19.4 18.6 C.V. (%) 3.54 LSD (0.05) NS Table 5. Effect of different beeswax sources and rendering methods on saponification clouding point (C0) of wax. Extraction methods
Beeswax sources Comb Sefef Crude honey Mean
Manual 86.8 94.9 99.0 93.5 Submerged 105.2 106.7 106.7 103.6 Solar 105.0 106.9 106.9 103.2 Mean 99.0 97.2 104 C.V. (%) 11.6 LSD (0.05) NS Table 6. Effect of different beeswax sources and rendering methods on wax Easter value. Extraction methods
Beeswax sources Comb Sefef Crude honey Mean
Manual 69.9 77.7 81.8 76.5 Submerged 85.3 79.0 88.1 84.1 Solar 84.4 76.9 86.8 82.7 Mean 79.9 77.9 85.6 C.V. (%) 14.11 LSD (0.05) NS Note: P/s show the results of mean separation

Livestock Research Proceeding
122
Conclusion and Recommendation Beeswax extracted from crude honey has high quantity, quality. More over it has good light color, uniformity in appearance and high market value. Among the extraction submerged method was found easy and simple to render high quality beeswax. Therefore beekeepers, coopratives and beeswax processores can use crude honey as source of beeswax and submerged extraction method to produce high yield and quality beeswax. References American Beeswax Importers and Refiners Association Inc. 1968. New York. USA. Brone, R. 1988. Honey Bees a Guide to Management: The Crowood press Ltd London. pp. 85. Crane, E. 1990. Bees and beekeeping science, practice and World Resources. Heinemann
Newnes, London.UK. pp 431-.434., 443 Dadant, 1975.The Hive and the Honey Bee, Jorna printing Campaney. U.S.A.,pp 542. FAO, 1986. Tropical and sub tropical apiculture, FAO Agricultural services Bulletin 68, Rome,
Italy. Nuru Adgaba and Eddessa Negera (2005) Profitability of processing crude honey, Thematic
areas ESAP (write in full) 13th annual conference, Addis Ababa, Ethiopia. Smith F. G. 1960. Beekeeping in the Tropics. Longmans, London, pp. 265

Livestock Research Proceeding
123
Investigating the effect of migratory beekeeping on honey production in East and west Shewa Zones of Oromia
* Admasu Adi Tura Barake, Kibebew Wakjira and Tolera Kumsa,
Holeta Bee Research Center Oromia Agricultural Research Institute
*Corresponding e-mail [email protected] Abstract Migratory beekeeping is carried to produce maximum honey yield through taking the advantage of successive nectar flow and is more economical compared to stationary beekeeping. Even though it is not widely practiced in Ethiopia, very few beekeepers practiced migratory beekeeping to take the advantage of successive nectar flow through seasonally shifting resource patterns but not yet quantified. The study was conducted in East and West Shewa to test the possibility of migratory beekeeping for successful honey production. For the study 10 bee colonies (Apis mellifera) were used in standard Zander hive and half of the experimental colonies remained as stationary beekeeping and the rest colonies were migrated. Significant honey yield (P<0.05) difference was observed among migratory sites and also between study zones. An average yield of 27.2+5.1kg honey was harvested at Alage in June and after experimental colonies was migrated to Alaba and an average of 25.2+3.1kg honey was harvested in November. Similarly, an average of 16.86+3.6kg honey was harvested in Holeta in June and after colonies were migrated to Dandi an average of 19.0+4.2kg honey was harvested in November. Seasonal patterns of bee forage availability were assessed during field observation and the results revealed that 36 major bee forage species were identified as an important honey plants. Major bee flora investigated from honey samples wereinclude Eucalyptus globulus, E. comaldulensis, Croton macrostachys, Dichrostachys cinera, Acacia spp, Guizotia scarba, Biddens spp, and Cordia africana .These plants constitute about 73% of total honey plants species found in honey. Keyword: Migratory beekeeping, bee flora, seasonal pattern Introduction Migratory beekeeping is an established fact and profitable feature of commercial beekeeping in developed nations (Clifford, 1924). Migratory beekeeping is carried to produce surplus honey through taking the advantage of successive nectar flow and is more economical compared to stationary beekeeping (Pilati and Boatto, 2014). Lack of knowledge on available bee forage resources, its flowering phenology combined with the poor scientific support of migratory beekeeping, honey production remains low despite the apicultural resource existing in Ethiopia (Tolera and Dejene, 2014). High honey yields are not solely due to the bee species, but also due to information on bee-plant relation and advanced bee management practices (Tolera and Dejene, 2014). Identifying and quantifying the pollen in honey samples is one of the best ways to determine the range of bee forage species used to produce a honey at different seasons based on actual bee flora resources (Atanassova et al., 2004). With its great variety of climatic conditions and an exceptionally long season during which pollen and nectar secreting flora is available in one area or another, migration of colonies is really important dimensions (Sharma and Bhatia, 2001). It is more economical than stationary beekeeping system as it does not only help in boosting honey production of beekeeper but also in increasing productivity of cross-pollinated crops. This can be facilitated with knowledge of the floral resources and evolving appropriate migration schedules for different beekeeping locations (Sharma and Bhatia, 2001). Therefore, detailed study of migratory beekeeping is needed to understand the differences of seasons in different locations and its importance for honey

Livestock Research Proceeding
124
production. Therefore this study was intimated to investigate the effect of migratory beekeeping on honey production, identify the major honey source plants and constraints of migratory beekeeping. Materials and methods Study site selection The experiment was conducted in East Shewa zone (Alage and Alaba) and West Shewa zone (Holeta and Dandi) from September 2013 to June 2015. For the study 10 honeybee colonies (Apis mellifera) were used in Zander hive and half of the colonies (five) remained in beekeeping station at Alage TVET College and Holeta Bee Research Center. The remaining five experimental colonies were migrated between the study areas: to Alaba in East Shewa and to Dandi for experiments conducted in West Shewa depending on the seasonal availability of bee forage. Bee forage availability and Calendar for colony migration were determined through field observation of flowering plants at different seasons. Standard seasonal colonies management was carried out equally for all colonies. Honey was harvested and samples from different harvest were taken and analyzed for its contents of pollen to determine the major source of honey. For the purpose ten gram of honey per sample was taken from stocks sample and dissolved in 25ml of distilled water and centrifuged for 10 minutes and the supernatant liquid was drawn out. The supernatant liquid was decanted off and the pollen sediment was transferred to the slides, covered with cover slips and examined under the light microscope. The pollen count (that is the frequency of the pollen of the different representative bee flora species) was taken and identified using pollen atlas. Results and discussions Migratory beekeeping and bee flora characterization The study revealed that, migratory beekeeping increases the honey production as compared to the stationary beekeeping. Colony migration associated with seasonal changes in forage availability and coincides with a period of reduced or declining floral abundance (McNally and Schneider, 1992). A detailed study of the floral resources at different sites of different seasons was presented in (table 2). Accordingly several bee floral resource differences were exhibited within zones as short and long gap of flowering. Depending up on flowering time of vegetation, migratory beekeeping was scheduled to move bee colonies from resource poor areas to resource rich areas (Alage to adjacent Alaba of East Shewa and from Holeta to Dandi of West Shewa). Honey was harvested in different seasons of the year and, there was difference in honey yield among migratory sites and between zones (table 1). During May to June an average of 27.2+5.1kg of honey was harvested from Alage site dominantly from Eucalyptus spps, and Acacia spp since they are found abundantly in the area. On the other hand during June-August floral abundance was greatly reduced and no blooming trees and shrubs were observed around Alage and hence the brood production is decreased to nil. Colony migration was scheduled to move colonies from Alage to Alaba to utilize the flora resources to produce surplus honey. From period of August-November around Alaba, it was exhibited the greatest abundance of blooming plants from September to November. During this period, the major blooming species consisted of long-blooming shrubs and weeds utilized. Multi-flora species like Guizotia scabra, Bidens species, Trifolium species, Brassica spps, Cordia africana, Hypoestes fokaolii, and pterolbium stellatum, Persea Americana, Ziziphus specie utilized as source of nectar and pollen and colonies can produce surplus honey. Thus an average of 25.2+3.1kg of honey/colony/was harvested after colonies was migrated to Alaba. Similarly migratory beekeeping was scheduled in West Shewa Zone; honey yield was low with an average production of 16.86+3.6kg and 19.0+4.2kg colony/season was obtained around Holeta

Livestock Research Proceeding
125
and Dandi, respectively. Colonies dominantly utilized honey flow from Eucalyptus Spp in May to June at Holeta. The migration of colonies were done to Dandi in late August to exploit Lathyrus sativus, Caesalpinia decapetala, Justicia heterocarpa, Guizotia scarba, Datura arborea, Trifolium spp and Plantago lanceolata. Table1. Average honey yield at different migratory sites
Area of migration N Mean SD Minimum Maximum Alage 5 27.36 3.28 22.00 33.00 Alaba 5 25.20 3.61 18.00 31.00 Holeta 5 16.81 4.95 9.40 24.00 Dandi 5 19.05 3.58 12.40 25.00
The strength of colonies was seasonally assessed based on regular hive inspection and it was found that migration is more important than maintaining colonies by artificial feeding in dearth periods at permanent apiary. Alagae area is richly endowed with diverse bee flora resources which play an important role in preserving the ecosystem of the area. The honey yield per colony in Alagae and Alaba ranged between 22-33 kg and 18-31 kg/hive in Alage and Alaba respectively as compared with 20-25 kg/hive produced elsewhere in the country. This was mainly due to the rich bee flora (table 2) and good bee management techniques and favorable climate (Tolera and Dejene, 2014). From this study, migratory beekeeping is important and the area has huge potential to exploit the natural potential of the area and honey yield can be increased by two fold as compare to actual production potential. Table 2. Major bee flora resources and their time of flowering at each migratory sites
Migration sites
Major bee forage species Common name Time of flowering
Alage Eucalyptus comaldulensis Bargamo dima May- June Eucalyptus citriodora November to May Eucalyptus ficifolia November to May Dichrostachys cinera Jirmee March to early June Rhus spp Xaxessa September Acacia Senegal Laaftoo April to May Acacia tortilis January to May Acacia seyal August to February Ficus sur Harbu December to February Cordia africana Wadessa October to March Croton macsrostachys Bakanisa April to July
Alaba Eucalyptus globules Bargamo dima May- June Guizotia scarab Hadaa September to October Biddens spp September to October Trifolium spp Siddisa September to October Sorghum bicolor Bisinga September to October Hypoestes trifoliam Dargu September to October Cordia africana Waddessa October to March ZizipussSpp Kurkura September to October
Holeta Eulyptus globules Bargamo adii April to June Plantago lanceolta Qortobi September to

Livestock Research Proceeding
126
November Vernonia amygdalina Eebicha January to February Trifolium spp Sidisa September
Biddens spp Ababo masqala September to
November
Brassica carinata Gomena September to
November
Vicia faba Bakela September to
November Acacia abyssinica Laaftoo April to June Hypoestes trifoliam Dargu September to October Lathyrus sativus Gaayyoo October to November
Caesalpinia decapetala Chickpea
October to November
Justicia heterocarpa Guizotia scarab Hadaa September to October Guizotia abyssinica Nougii October to November Datura arborea September to October Trifolium spp Sidisa September to October Plantago lanceolata Qortobii September to October
Pollen analysis of the honey samples The areas selected for migratory beekeeping in Alage and Alaba have good potential for sustaining beekeeping activities because of the diversity of nectar and pollen species. The range in frequency of pollen occurrences of the honey samples varied widely in study area (Table 3). Results from pollen analysis shown the dominance of Eucalyptus spp (32.6%) followed by Dichrostachys cinera (29.5%) and Acacia spp (16.5%) in the pollen spectra of the samples collected during honey harvesting from Alage site. Honey harvested from Alaba site in November also showed dominance of the pollen species of Guizotia scarba (42.5%), bidens species (28.8%), Ziziphyus (14.5%). Some species such as Trifolium species and Sorghum bicolor have a secondary which is very important for supplying the honey bees with nectar and pollen. In the honeys sample examined in June, the contribution Eucalyptus spp was found to be the highly dominant at Holeta (86.8%). Moreover, Lathyrus sativas (43.6%) and Guizotia abyssinica (14.7%) at Dandi are characteristics as common cultivated pollen load and nectar sources. Table 3. The percentage pollen frequency from honey samples
No
Place
Identified bee flora species
Local name
Average pollen counted of each spp
Total average pollen counted /sample
% of each spp in the sample
1 Alage Eucalyptus spp Bargaamoo 243 32.6% Dichrostachys cinera Jirmee 220 29.5% Acacia spp lafto 123 16.5% Justicia schimperiana sansal 118 15.8% Aloe europeana Argiisaa 12 1.6% Grevillea robusta 21 3% 745 2 Alabaa Eucalyptus spp Bargaamoo 70 5.9% Zea mays Boqoolloo 13 1.1%

Livestock Research Proceeding
127
Guizotia scarab Hada 500 42.5% Cordia africana Waddessa 5 0.5% Zizips spp Kurkura 164 14.% Sorghum bicolor Mishingaa 20 1.7% Trifolium spp Siddisa 65 5.52% Biddens spp Keelloo 340 28.8% 1178 3
Holata
Eucalyptus spps
Bargaamoo a
912
86.8%
Acacia abyssinica Lafto badda 13 1.3% Hypoestes trifoliam Darguu 19 1.9% Croton macrostachys Bakanisaa 106 10% 1050 4 Gincii Plantago lanceolata Qorxabee 80 5.3% Lathyrus sativas Gayyoo 655 43.6% Guizotia scarab Hadaa 168 11.2% Caesalpinia decapetala Chick pea 330 22% Guizotia abyssinica Nougii 220 14.7% Justicia heterocarpa Aansalii 40 2.6% Trifolium spp Siddisa 7 0.6% 1500
Profitability of migratory beekeeping Migratory beekeeping could increase the honey production by at least 85% in a year and save the feeding cost by 100% during dearth period. The average honey production in the stationary beekeeping was 27 kg/colony/year with net return of 2700 birr (US$135)/hive. After colonies were migrated, the honey production was 25 kg/colony/migration season with additional return of 2200 birr (US$125)/hive/ migration season. The net returns from honey production showed that differences in cost structure are marginal between migrate and non-migrated colonies. The net returns are almost one fold higher in case of migratory beekeeping compared to stationary beekeeping. Conclusions and recommendations There is greater scope to increase the practicability of migratory beekeeping with the knowledge of floral resources and developing appropriate migration schedules for different beekeeping seasons. Migratory beekeeping increases the honey production twofold compared to the stationary beekeeping and it reduces the feeding cost of honeybee colonies during floral dearth. The diversified flora like Eucalyptus globulus, Eucalyptus comaldulensis, Croton macrostachys , Dichrostachys cinera, Acacia spp, Guizotia scarba, Biddens, Cordia africana have been identified as reflection of common bee flora sources. Clear information on applicability of migratory beekeeping is very important through tracking the seasonal varying bee flora resources in time frames of colony migration. The placement of colonies without formal agreement of landowner migrated area is more completed to manipulate colonies to prepare for surplus honey production in time frame of colony migration. Therefore, migratory beekeeping local strategies should be developed through coordination and communication among beekeepers, landowners and stakeholders.

Livestock Research Proceeding
128
References Atanassova, J., Bozilova, E. and Todorova, S. (2004). Pollen analysis of honey from the region of
three villages in West Bulgaria. Phytologia Balcanica 10 (2-3): 247–252. Crane, E. (1990). Bees and beekeeping: science, practice and world resources. Heinnmann
Newness, London. Pp614. Clifford and M. Zierer (1924). Migratory beekeepers of Southern California. University of
California at Los Angeles. Levouex, J. Maurizio, A. Vorwohl, G. (1978). Methods of Melissopalynology, Bee world, 59:
139-157. McNally, L.C. and Schneider, S.S. (1992). Seasonal cycles of growth, development and
movement of the African honeybee, Apis mellifera scutellata, in Africa. Ins. Soc. 39:167-179.
Pilati, L. and Boatto, V. (2014). Jointness in Sites: The Case of Migratory Beekeeping. DEM Discussion Papers. ttp://web.unitn.it.
Sharma, R. Bhatia, R. (2001). Economics of stationary and migratory beekeeping. Tolera Kumsa and Dejene Takele (2014). Assessment of the effect of seasonal honeybee
management on honey production of Ethiopian honeybee (Apis mellifera) in modern beekeeping in Jimma Zone. Research Journal of Agriculture and Environmental Management. Vol. 3(5), pp. 246-254. http://www.apexjournal.org .

Livestock Research Proceeding
129
Diagnostic survey on honeybee brood diseases with emphasis to American Foul Brood (AFB) and European Foul Brood (EFB) in Oromia
*Alemayehu Gela, Dessalegn Begna and Amssalu Bezabeh
Oromia Agricultural Research Institute Holeta Bee Research Centre
E-mail = [email protected] Abstract Diagnostic survey on major pathogens infesting the broods of honeybees (Apis mellifera scutellata) with emphasis to American foulbrood (AFB) and European foulbrood (EFB) was conducted in suspected zones of Oromia region. Purposive sampling was used to select peasant associations (PAs) in each district and at least three apiaries were randomly selected from each PAs. Random colony inspection and diagnosis for the clinical symptoms of respective brood diseases was conducted for each apiary. From clinically suspected broods, about 15 abnormal/sick brood samples were drown out from cells and smeared on frosted microscopic slide, then labelled for further laboratory confirmation. In the Laboratory, 10% nigrosine solution was added on smeared samples and examined using Zeiss AxioVert A.1 light microscope under Mgn.100X to confirm the presence/absence of brood disease causative agents such as paenibacillus larvae and Melissococcus plutonius spore. The diagnostic result revealed the absence of any observable clinical symptoms for the brood infection by AFB & EFB diseases in all the studied areas. Moreover, laboratory diagnosis confirmed the non-existence of p.bacillus larvae and M. plutonius spore in the diagnosis samples. Apart from this, significant infestation of honeybee colonies by varroa mite (14-100%) was observed in all the studied areas. Out of 204 inspected honeybee colonies from 46 apiaries, 124 (60.78%) were infested by varroa mite. Chalk brood is also another infectious brood disease detected in the colonies with average infestation rate of 13.24%. The study suggested that honeybee colonies were free of devastating pathogens like AFB and EFB diseases in the surveyed zones of Oromia, but significantly infested with varroa mite and chalk brood disease. Further investigation with advanced tests is suggested in the country at all to come into full understandings of devastating honeybee brood diseases in the Ethiopia. Keywords: American Foulbrood, EFB, honeybee, Chalk brood, Varroa , Introduction Honey bees (Apis mellifera L.) are not only important for the honey and bees wax they produce but they are also vital as pollinators of agricultural and horticultural crops sustaining global food security, habitat conservation and ecosystem stability. Around 90% of the world’s food supply is estimated to be pollinated by bees (Pilatic, 2012; Berenbaum, 2007; Delaplane et al., 200). In Ethiopia, beekeeping provides significant additional rural employment and incomes, especially for women who brew most of the tej. Furthermore, bee product commodities such as honey and beeswax play an important role in earning foreign exchanges to the country. Beekeeping is therefore an ideal activity as a source of income generation for small scale and resource poor farmers in developing countries in general. Despite the significant contribution of honeybees, there has been alarming evidence indicating dramatic decline of colonies at unprecedented rates worldwide (Becher et al., 2013; Van der Zee et al., 2012 and Potts et al., 2010). In recent years, serious losses of bees from beehives and decline in bee populations have been reported from different directions (Potts et al., 2010) (Potts, Biesmeijer et al. 2010). In particular, honey bees have been experiencing considerable decline in U.S. and Europe, with yearly estimates of about 30% (Evans & Schwarz, 2011; van Engelsdorp et
Livestock Research Proceeding
130
al., 2010; Oldroyd, 2007). The causes of these losses are not well known, although various hypotheses have been forwarded, including Outbreak of diseases and pathogens, and pests, pesticide poisoning, global climate change, habitat loss and modification (Cornman et al., 2012; Nazzi F et al., 2012; Neumann P and Carreck N, 2010; Henry et al., 2012). Honeybee diseases and pathogens are considered as driving forces for colony losses in most parts of the world. Particularly, honey bee broods are attacked by a range of disease causing organisms such as bacteria, viruses, , fungi and parasitic mites. American foulbrood (AFB) and European foulbrood (EFB) are among the most globally devastating brood diseases of the honeybees, caused by gram-positive rod-shaped bacterium called Paenibacillus larvae (Graaf et al., 2006; Genersch et al. 2006) and Melissoccocus plutonius (Bailey, 1983), respectively. Both pathogens are highly contagious diseases, potentially lethal to infected colonies which are considered as major causes responsible for colony losses in U.S. and Europe by OIE (Office International des Epizooties-the World Organization for Animal Health) (Smith et al., 2013; Otten, 2003). A review by Dietemann et al. (2009) showed that Africa was free of sudden honeybee losses, which warrants stringent preventive conservation measures to avert the losses experienced in other parts of the world. So far in Ethiopia, the existence of less economically important adult honeybee diseases (Nosema apis and Melpighamoebae mellificae) and one economically important brood disease (i.e, chalk brood) were reported (Gezahegn and Amsalu, 1991; Desalegn, 2006). Very recently, the occurrence of varroa destructor mite was reported in the country (Dessalegn B., 2015). Despite these recent reports, knowledge on the occurrence of devastating brood infectious pathogens (like, AFB and EFB) in Ethiopia is scanty. But, the clue from suspected clinical symptoms for AFB and EFB diseases was reported by Amssalu et al., 2012) in some parts of Eastern Hararghe and Bale zones. Making sure and confirm this in major suspected areas remains vital.. Moreover, reports on the death of honeybee colonies due to unknown reasons were repeatedly coming from different parts of Ethiopian regional states. Therefore, this study was aimed to diagnosis and determines the infestation and prevalence rate of major honeybee brood diseases with emphasis to occurrence of AFB and EFB diseases, particularly in most suspected areas of Oromia region and to propose subsequent development interventions as early as possible. Materials and methods Study sites The diagnostic survey covered 15 districts in five major suspected zones of Oromia region, namely: Gursum, Haramaya, Grawa and Mefa districts in East Hararge, Chiro and Darolab districts in West Hararge, Ginir in Bale, Omo nada, Shabe, Dedo and Gomma in Jimma and Yayo, Didu, Borecha, Nopa in Illuababora following the bee brooding and the main honey producing seasons of the region. Purposive sampling was used to select the studied districts in each zone, whereas random sampling was used in selection of apiaries and colonies. A total of 240 honeybee colonies from 15 districts and 46 apiaries were randomly selected and examined for the important clinical symptoms of honeybee brood diseases using respective protocols (Hornitzky, 1989). Diagnosis for clinical symptoms of AFB and EFB Foulbrood diseases have distinctive field symptoms which include characteristics of the brood comb and the cell contents (Matheson and Reid, 1992). In randomly selected apiaries, about three and above colonies were inspected for major clinical symptoms of brood diseases with emphasis to bacterial foulbrood diseases. Typical clinical symptoms such as irregular brood arrangement, sunken and dark capping with puncture holes, dead and decayed larvae with dark “scales” and

Livestock Research Proceeding
131
slighttwistelarvaethe in FurthmatchrobbysnappEFB abovemicro2009 in themicro
Fig.1 LaboTo veexamiand Mbroodwere larvae(magn DiagnBoth symptobservwere the prmagn DiagnDurinvarroapupaestagescontaiPerceformu
t to pronounced larvae withe with unpleanfected coloni
ermore, match sticks into ty thread that ping back in awith slight l
e important oscopic slide
(www.dpi.nse open air a
oscopic exami
. Brood samp
ratory Diagnerify and confination was u
M.pluto spored smeared frommoistened by
e and M.plutnification pow
nosis for chalexternal andtoms. Dry scaved in the cotaken from presence of Aification pow
nosis for Varrng internal ina suspected ce were gentlys on the brooiner. Then thentage infectio
ula:
ced odor wereh creamy-whasant sour odoes by EFB.
ch stick test the body of tadheres to th
a somewhat elength and coclinical symand legibly
sw.gov.au/primand taken to ination.
ple smears pre
nosis for AFBfirm the suspeundertaken ines using referm 8 apiaries oy a drop 10%to spores usiwer of 100X).
lk brood d internal inspales with whitomb cells andpositive colonAscosphoraerawer of 40X.
roa mite spection, a saombs. The cey removed ouods as well ae collected mon and distrib
Infection r
e examined fohite guts visibour and loose
( stretch testthe sick and he tip of the lastic way. Tholour differen
mptoms, broolabeled for fmefacts) (Fig
Holeta bee
epared on fros
B And EFBected smeared
n the laboratorence spores (of 4 districts n
% nigrosine sing Zeiss Ax.
pection was te to dark cold on the bottonies and microa Apis spores
ample of capells were uncaut on white ps in the brooites were cou
bution rate for
rate (%) = PTotal nu
for the occurrble through thely-attached b
t) was condudead larvae astick, stretchhis symptom nce. From anod smear samfurther laborag. 1). The sm
research cen
sted microsco
d brood sampry for the cha(Hornitzky &namely; Gurs
solution and exioVert A.1
conducted foour moulds aom boards ofoscopic exams using Zeiss
pped broods wapped using fpaper. All th
od cells were unted to determr existed disea
Positive # of umber of bee
rence of AFBhe body wallbrown scales
ucted for bothand then gent
hing for up tocalled ‘ropin
ny suspected mples were atory diagnos
meared samplenter, bee he
opic slide (sam
ples during fiaracteristic str
& Wilson 198sum, Chiro, Dexamined forlight micros
or the presenand chalk broof the hives. T
mination takess AxioVert A
with size of fine forceps ahe observed v
collected anmine its infesases was esta
f bee coloniese colonies exa
B in the colonl, melted andwere directly
h diseases byntly removed o 2.5 cm nonness’, typifies
brood showiprepared on
sis accordinges were then alth laborato
mples from G
ield inspectiontrain of Paeni89). A total oDarolabu and r the presencscope under
nce of chalk od mummies Then, samples place in theA.1 light mic
10 X 10 cm2
and the develovarroa mites
nd placed in tstation rates. ablished using
s x 100 amined
nies. Similarlyd yellow whity observed fo
y inserting thto observe th
n breaking anboth AFB an
ing one of thn frosted en
g to Primefacallowed to dr
ory for furthe
Ginir)
n, microscopibacillus larvaf 15 suspecteGinir districte of p.bacilluoil immersio
brood clinicwere carefulls of mummie laboratory fo
croscope unde
2 was cut fromoping larvae owith differen
the might-tigh
g the followin
y, te or
he he nd nd he nd ct, ry er
ic ae ed ts, us on
al ly es or er
m or nt ht
ng

Livestock Research Proceeding
132
Distribution/prevalence (%) = # of sites diseases positive x100
Total number of sites surveyed Result and discussion The results of the study indicate that there were no clinical symptoms for the infection of AFB and EFB diseases in all the surveyed zones. Healthy brood pattern with normal larvae development were observed in surveyed areas. In study areas of W/Hararge, Jimma and Illubabora zones, very strong colonies with fully sealed honey was observed, indicating the non-existence of devastating pathogens in the areas (Fig.2).
Fig.2. Healthy colony with normal brood pattern (a), sealed pupae (b) and sealed honey (c) from Daro Labu, W/Hararge Relatively, bee colonies in E/Hararge and Bale zones were weaker in spite of the absence of bacterial foulbrood clinical symptoms, but with prominent colony infestation with varroa destructor mite and chalk brood. Varroa mite is existed in all the surveyed areas with infestation rate of 74.19%, 14.29 %, 100.00%, 66.67%, and 55.56 % in E/Hararge, W/Hararge, Bale (Ginir), Jimma and Illuababora zones, respectively (Table.1). Moreover, clinical symptoms for the infection of chalk brood is observed in some districts of East Hararge (Reba, Nole & Illalami), West Hararge (Chiro Qala) and Illuababora (Gambo, Giche, Bondo and Wabo) zones with mean infestation rate of 16.13%, 14.29% and 30.16%, respectively (Table.1). Surprisingly, some bee colonies in Daro Labu district of W/Hararge and Gomma and Shebe districts of Jimma zones demonstrated strong and aggressive behaviour despite the fact that they are heavely infested by varroa mite. This may be attributed to exceptional tolerance of African honeybees due to their grooming, hygienic (Spivak & Reuter 2001), and absconding behaviours (Fries & Raina 2003). These inherent behaviours enable honeybees of Africa and that of Ethiopia in particular to avoid complete dissemination in the case of a disease or pest outbreak. It is also reported that African honeybees possess individual immune responses in the form of cellular and humoral immune responses which ensure maintenance of their health status (Evans et al. 2006; Weinstock et al. 2006). This condition is most likely one important reason for the absence of AFB & EFB diseases in Ethiopian honeybees (Amssalu et al., 2012).
a b c

Livestock Research Proceeding
133
Table 1. Occurrence and infection rate (%) of honeybee brood diseases in surveyed zones of Oromia region
Zones No. districts
Colonies (N)
%+ve AFB
%+Ve EFB
%+ve CBD
%+ve Varroa mite
E/Hararge 4 31 0.00 0.00 16.13 74.19 W/Hararge 2 21 0.00 0.00 14.29 14.29 Bale (Ginir) 1 11 0.00 0.00 0.00 100.00 Jimma 4 78 0.00 0.00 0.00 66.67 Illuababora 4 63 0.00 0.00 30.16 55.56 Total 15 204 0.00 0.00 13.24 60.78
Despite the absence of clinical symptoms of AFB & EFB in the study areas, varroa mite is still confirmed to be the most prevalently distributed honeybee disease. Distribution rate of varroa mite in Jimma and Bale Zones (Ginir) is much higher than in West Hararge zone. Hundred percent prevalence rate of varroa mite was demonstrated in Jimma and Bale zone, followed by Illuababora (85.81%) and East Hararge (81.82%) zones. Similarly, chalk brood was relatively more prevalent in moist areas of Illuababora (42.86%) and not observed in hot areas of Bale and Jimma zones (Table. 2). Similar with the study by Aster et al., (2006), CBD is more prevalently distributed in wet and moist ecological zones of the study areas. This is may be due to Ascosphaera apis, the causative agent of the pathogen, best fits to wet ecologies. Notably, different honeybee pests such as wax moths, small hive beetle (Athina tumida) spiders, ants, wasps were observed as leading pests in most inspected colonies during the diagnostic survey and thereby identified as potential problem for the beekeeping industry in the study areas. Table. 2. Occurrence and distribution rate/prevalence (%) of honeybee brood diseases in surveyed zones of Oromia region
Zones No. districts
Apiary sites (N)
%+ve AFB
%+Ve EFB
%+ve CBD
%+veVarroa mite
E/Hararge 4 11 0.00 0.00 27.27 81.82 W/Hararge 2 4 0.00 0.00 25.00 25.00 Bale(Ginir) 1 3 0.00 0.00 0.00 100.00 Jimma 4 14 0.00 0.00 0.00 100.00 Illuababora 4 14 0.00 0.00 42.86 85.71 Total 15 46 0.00 0.00 21.73 84.78
The result of laboratory examination verified the absence of p. larvae and M. pluton spores in line with the field diagnosis for clinical symptoms (Table. 3). The non-existence of p. larvae and M. pluton spores under laboratory investigation demonstrates the absence of AFB & EFB, respectively in each sample. Although the samples were collected from sick and dead larvae, our investigation revealed that the larvae mortality from which each sample was collected is not due to bacterial foulbrood infections. This agree with the idea that aspects like absconding and distinctive hygienic behavior such as removal of diseased larvae from cells, grooming may contribute to the absence of American and European foulbrood in sub-Saharan Africa (Spivak & Reuter 2001; Fries & Raina 2003).

Livestock Research Proceeding
134
Table 3. Microscopic investigation for the presence/absence of p. larvae and M. pluton spores in each sample Sample No. (N)
Sample Code Sample origin (Location)
+ve p. larvae spores
+ve M . pluton spores
Remark
1 Gur01 Jalel 0 0 2 Gur02 Nole 0 0 3 Gur03 Ilalami 0 0 4 Chiro01 Chiro qala 0 0 5 Chiro02 Chiro qala 0 0 6 Daro01 Jilbo 0 0 7 Daro02 Jilbo 0 0 8 Daro02 Jilbo 0 0 9 Gin01 Chancho 0 0 10 Gin02 Chancho 0 0 11 Gin03 Jambare 0 0 12 Gin04 Jambare 0 0 13 Gin05 Ginir 01 0 0 14 Gin06 Ginir 01 0 0 15 Gin07 Ginir 01 0 0 ** Number of samples (N), sample code is district initial with sample No., and sample origin is geographical origin of sample (PA). Conclusions and Recommendations Our study verified that honeybee colonies in the studied areas are relatively free from most globally devastating brood diseases such as AFB and EFB. This study substantiates the hypothesis that bacterial foulbroods may be absent from large parts of Africa which might be due to their strong hygienic and absconding behaviors enabling them to avoid complete dissemination in the case of a bacterial brood disease outbreak. However; varroa mite and chalk brood diseases are the only brood diseases detected in most studied areas. As a result, the sporadic bee larvae deaths occurred in most suspected areas might be associated with the recently reported infection of colonies by varroa mite or chalk brood, or other biotic and abiotic factors. Although the study revealed the absence of any clinical symptoms for the infection of AFB and EFB in all the studied areas, it is difficult to come into conclusion that Ethiopia is free of such pathogens as the large parts of the country were untapped. Moreover; the ongoing risks associated with illegal importation of honey and beekeeping related equipments, apiary products and used appliances will not guarantee for the situation to remain the sameso that our bee colonies are free of contagious pathogens. Though the current diagnosis is entirely based on the clinical symptoms in the field inspection and routine laboratory examination, to be accurate, specific and sensitive detection methods may be required to ensure the absence of the bacterium from suspected materials. Therefore; future studies should look in to advanced biochemical, molecular, biological and bacteriophage sensitivity of suspected bacterial strains, as alternative techniques to identif P. larvae and M .pluton for the occurrence of AFB and EFB, respectively in the untapped areas of the country. In addition, detection and documentation of whether or not spores of AFB and EFB can be found in imported honey is also highly recommended so that regular monitoring of colonies all over the country will be established at the national level.

Livestock Research Proceeding
135
Acknowledgments The authors are indebted to Oromia Agricultural Research Institute, for financial support of this project. Moreover, we thank Holeta Bee Research Centre for all the logistic support and approval of the activity. Our special thanks go to Mis. Hiwot H/Wold and Mis. Gete Daba for their technical assistance during the diagnostic survey data collection and Lab. examination. References Amsalu Bezabeh, Alemayehu Gela, Gemechis Legesse and Kibebew Wakjira 2012. Diagnostic
survey of honeybee diseases and pests in Ethiopia. Livestock Research Proceedings of Annual National workshop EIAR, A.A. Ethiopia. Pp 183-192
BAILEY, L. 1983. Melissococcus pluton, the cause of European foulbrood of honey bees (Apis spp.). Journal of Applied Microbiology 55: 65–69.
Becher, M. A., J. L. Osborne, P. Thorbek, P. J. Kennedy and V. Grimm (2013). "Review: towards a systems approach for understanding honeybee decline: a stocktaking and synthesis of existing models." Journal of Applied Ecology 50(4): 868-880.
Begna, D. (2014). "Occurrences and Distributions of Honeybee (Apis mellifera Jemenetica) Varroa Mite (Varroa destructor) in Tigray Region, Ethiopia." J Fisheries Livest Prod 2(126).
Cornman RS, Tarpy DR, Chen Y, Jeffreys L, Lopez D, Pettis JS, et al. Pathogen webs in collapsing honey bee colonies. PLoS One. 2012; 7(8):e43562.
De Graaf, D., A. Alippi, M. Brown, J. Evans, M. Feldlaufer, A. Gregorc, M. Hornitzky, S. Pernal, D. Schuch and D. Titĕra (2006). "Diagnosis of American foulbrood in honey bees: a synthesis and proposed analytical protocols." Letters in applied microbiology 43(6): 583-590.
Delaplane KS, Mayer DR, Mayer DF. Crop pollination by bees: Cabi; 2000. Dessalegn Begna. 2006. The occurrence of chalk brood (Ascosphaera apis): a new honeybee (A.
mellifera L.) diseases in West Shoa, Ethiopia. Ethiopian journal of animal production 6 (1): 1-8.
Dietemann, V., C. W. W. Pirk and R. Crewe (2009). "Is there a need for conservation of honeybees in Africa?" Apidologie 40(3): 285-295.
EVANS, J.D., ARONSTEIN, K., CHEN, Y.P., HETRU, C., IMLER, J.L., JIANG, H., ANOST, M., THOMPSON, G.J., ZOU, Z. & HULTMARK, D. 2006. Immune pathways and defence mechanisms in honey bees Apis mellifera. Insect Molecular Biology 15: 645–656.
Forsgren, E., G. E. Budge, J.-D. Charrière and M. A. Hornitzky (2013). "Standard methods for European foulbrood research." Journal of Apicultural Research 52(1): 1-14.
Forsgren, E. (2010). "European foulbrood in honey bees." Journal of invertebrate pathology 103: S5-S9.
Fries, I. and S. Raina (2003). "American foulbrood and African honey bees (Hymenoptera: Apidae)." Journal of economic entomology 96(6): 1641-1646.
GENERSCH, E., FORSGREN, E., PENTIKÄINEN, J., ASHIRALIEVA, A., RAUCH, S., KILWINSKI, J. & FRIES, I. 2006. Reclassification of Paenibacillus larvae subsp. pulvifaciens and Paenibacillus larvae subsp. larvae as Paenibacillus larvae without subspecies differentiation. International Journal of Systematic and Evolutionary Microbiology 56: 501–511.
Gezehagn Tedesse and Amsalu Bezabeh (1991). Identifying and diagnosing honeybee diseases at Holeta Research Center. Proceedings of the fourth Annual National Livestock Improvement conference, Addis Ababa, Ethiopia. pp. 263-265.

Livestock Research Proceeding
136
Henry, M., M. Beguin, F. Requier, O. Rollin, J.-F. Odoux, P. Aupinel, J. Aptel, S. Tchamitchian and A. Decourtye (2012). "A common pesticide decreases foraging success and survival in honey bees." Science 336(6079): 348-350.
Hornitzky M.A.Z. & Wilson S.C. (1989). A system for the diagnosis of the major bacterial brood diseases of honeybees. J. Apicult. Res., 28, 191–195.
Matheson, A. and Reid, M. (1992). Strategies for the prevention and control of AFB. Parts I, II and III. Amer. Bee. J., 132(6): 399-402; 133(7): 471-475; 134(8): 534-547
National bee unit, 2015. Foulbrood Disease of Honey Bees and other common brood disorders. www.nationalbeeunit.com
Nazzi F, Brown SP, Annoscia D, Del Piccolo F, Di Prisco G, Varricchio P, et al. Synergistic parasitepathogen interactions mediated by host immunity can drive the collapse of honeybee colonies. PLoS Pathog. 2012; 8(6)
Otten, C. (2003). "A general overview on AFB and EFB pathogen, way of infection, multiplication, clinical symptoms and outbreak." Apiacta 38: 106-113.
Potts, S. G., J. C. Biesmeijer, C. Kremen, P. Neumann, O. Schweiger and W. E. Kunin (2010). "Global pollinator declines: trends, impacts and drivers." Trends in ecology & evolution 25(6): 345-353.
Roetschi, A., Berthoud, H., Kuhn, R., Imdorf, A. (2008). Infection rate based on quantitative real-time PCR of Melissococcus plutonius, the causal agent of European foulbrood, in honeybee colonies before and after apiary sanitation. Apidologie 39: 362-371.
SPIVAK, M. & REUTER, G.S. 2001. Resistance to American foulbrood disease by honey bee colonies Apis mellifera bred for hygienic behavior. Apidologie 32:555–565.
Van der Zee, R., L. Pisa, S. Andonov, R. Brodschneider, J.-D. Charrière, R. Chlebo, M. F. Coffey, K. Crailsheim, B. Dahle and A. Gajda (2012). "Managed honey bee colony losses in Canada, China, Europe, Israel and Turkey, for the winters of 2008–9 and 2009–10." Journal of Apicultural Research 51(1): 100-114.
Van Engelsdorp D, Meixner MD. A historical review of managed honey bee populations in Europe and the United States and the factors that may affect them. J Invertebr Pathol. 2010; 103 S80–95.
WEINSTOCK, G.M., ROBINSON, G.E., GIBBS, R.A., WORLEY, K.C., EVANS, J.D., MALESZKA, R., ROBERTSON, H.M., WEAVER, D.B., BEYE, M., BORK, P., et al. 2006. Insights into social insects from the genome of the honeybee Apis mellifera. Nature 443: 931–949.

Livestock Research Proceeding
137
Investigating the effect and control of small hive beetle, Aethina tumida (Murray) on honeybees
*Alemayehu Gela, Amssalu Bezabeh & Taye Negara
Oromia Agriculturalral Research Institute Holeta Bee Research Center
E-mail = [email protected] /[email protected] Abstract The study was conducted to investigate the effects of small hive beetle on honeybees and testing the effectiveness of different control methods. A total of 32 honeybee colonies were assigned into four treatment groups: seasonal colony management, hive entrance modification, trapping of small hive beetle larvae and control groups. Data on bee population, brood areas, and infested comb and pollen and nectar store areas were recorded using Liebefeld method (frame unit area, 10 x10 cm2) at every 21 days. Also, records on small hive beetle infestation rate, average honey yield and absconded tendency of bee colonies were taken. The result indicates that there is statistically significant difference (P<0.05) between treated and untreated colonies with high infestation rate and absconding tendency of the untreated colonies reaching about 80% and 7.33+2.6, respectively. Highest mean honey yield (25.5 kg/hive), and lowest (6.3kg/hive) was recorded in seasonal colony management and in control groups, respectively. Significantly greatest bee population, brood area and pollen and nectar stores were also registered in seasonal colony management groups followed by hive entrance modification. Hence, providing bee colonies with proper seasonal management strategies is seen as to be the best option for the minimization and control of small hive beetles. Key words:, infestation, honeybees,Smal hive beetles, contro Introduction Beekeeping is one of the major incomes generating agricultural activity for rural households and other smallholder communities. It provides substantial benefits to address household’s food security and poverty alleviation through income diversification for beekeepers in potential areas. Bees are important pollinators of crops and about one third of plant products eaten by humans depend directly or indirectly on bees for their pollination (FAO, 2009). However, the current bee colony decline and losses due to some of identified and unidentified pests and diseases are reported from different corners of the world (Potts, et al., 2010; Neumann, P. and N. Carreck, 2010; Higes, et al., 2008; Martin, S. 2001). The diseases and pests of honeybees are known to cause the deaths and decline of colonies and subsequent reduction of honeybee products and have negative impact on honeybee pollinated crop yield. Small hive beetle ‘SHB’, Aethina tumida (Murray) is a pest and scavenger of honeybees and other bee colonies (Neumann and Ellis, 2008; Neumann and Elzen, 2004; Hepburn and Radloff, 1998). It is a major threat to the long-term sustainability and economic prosperity of beekeeping and as a consequence, to agriculture and the environment through disruption of pollination services. The beetle is indigenous to Africa, where it is considered as a minor pest of honeybees (Mike. B & James .M, 2003), and until recently was thought to be restricted to the continent. The distribution of this pest in the same continent is primarily in Sub Sahara, which includes wide range of climatic zones (Aphis, 1998; Taber, 1999b). However, in 1998 it was detected in Florida and is now widespread in the different states of USA (Michael, 1998). In Ethiopia, the beetle was detected for the first time in southern and south eastern parts including; Teltele, Konso, Moyale, Segen, Moga and KeyAfer districts in 2000 (Dessalegn & Amssalu, 2001). Eight years later the

Livestock Research Proceeding
138
pest was found with high distribution and prevalence rates in most beekeeping potential areas of the country (Amssalu B. et al 2009). The general SHB’s biology is fairly well understood. Female beetles deposit clusters of eggs in cracks and crevices along the edges of frames and in capped brood. Eggs hatch in 24-48 hours and the larvae feed for the first 7 days on honey, pollen and bee brood and eggs. Larvae moult their exoskeletons as they grow, reaching maturity in about 10 days. At this time they become attracted to light and migrate out of the hive and into the surrounding soil. They typically burrow into the ground, or to where the moisture level is suitable for pupation (Zawislak, J. 2010). Upon eclosion from the ground, adult beetles search for honey bee colonies, probably identifying the host colony by a suite of olfactory cues (Zawislak, J. 2010; Elzen et al. 1999). Studies have shown that beetles fly before or just after dusk and odor from various hive products (honey, pollen) and particular pheromone from adult bees (isoamyl acetate) are very attractive to flying beetles (Schmolke 1974; Elzen et al. 2000). They are strong fliers from hive to hive, and between apiaries in search of suitable places to get food and to reproduce. The larvae and adult small hive beetle are considered as destructive pest of honeybee colonies, causing damage to comb, stored honey and pollen. As the larvae make tunnels through the combs it feeds and defecates on honey and consequently causes discoloration and fermentation of the honey (Fletcher and Cook 2002, Fell, 1999). Research shows that in highly infested colonies where larval feeding is extensive, the bees are generally forced to leave their hive (Suazo and et al, 2003, Fell, 1999). For example, in the US, it has attended to cause a considerable damage to honeybee colonies and depressingly affecting the beekeeping industry (Sanford, 1998, Morse and Calderone, 2000, Elzen et al., 1999; Hood, 2000, Fell, 1999, Caron, 1999). Small hive beetle didn't get attention in general in Africa and considered as a minor pest for a long period of time. As a result, little progress has been done to determine its effect on beekeeping industry in most places where it is widely exists. This condition gave the pest sufficient time to widely spread in the continent and cause severe reduction of beekeeping production. To this fact, the realistic effect of small hive beetle on our honeybees’ has not been yet investigated, beyond its existence and distribution has been reported in different regions of Ethiopia. Moreover, no attempts have been made to develop control/preventive mechanisms of the pest to minimize its effect on beekeeping production in the country. Therefore, the purpose of this study is to investigate the economic importance of this pest on honeybees and bee products and hence to generate a pragmatic prevention and/or control measure at our country situation. Material and method The study was conducted at Bakko apiary site to determining the effect of small hive beetle on honeybee populations and bee products and to generate effective control/preventive method. A total of 32 honeybee colonies having the same population & free of small hive beetle were randomly assigned in to four groups (each with eight colonies): Seasonal colony management, Trapping small hive beetle larvae, Regular entrance modification and Control groups. The effectiveness of each treatment to prevent the SHB infestation was evaluated under uniform environmental conditions and compared with the control group (colonies left untreated). Data on bee population estimate, measurements on brood areas, infested combs and, pollen and nectar store areas were recorded using Liebefeld method (frame unit area, 10 x10 cm2) at every 21 days. Data on average honey yield per harvest/colony and colony absconding tendency was also recorded for each treatment during the study period.

Livestock Research Proceeding
139
Seasonal colony management (T1) Seasonal colony management was manipulated to strengthen the colonies via supplementary feeding, timely suppering and suppers reducing, removing the unoccupied frames, regular hive cleaning to remove comb debris. Each colony was given a 1 kg of sugar solution (1sugar: 1 H2O) once every 7-10 days of the dearth period, followed by regular colony inspection and follow up. Moreover, extra suppers’ reducing (when the colonies became dwindled), regular hive cleaning, removing and changing old combs and removing unoccupied frames were performed to maintain bee colonies healthy and strong. Small hive beetle larvae trapping (T2) This treatment was applied to trap the wandering and crawling of SHB larvae intended to fall in the soil for the pupation process. Eight strong and uniform colonies were selected for this treatment and dead brood traps were fitted at the entrance of each hive under the landing boards. Each trap was made from wooden boxes with upper side fitted by mesh wire to let bees fly and perform regular activities without any hindrances. Wandering beetle larvae were expected to fall into the trap as they attempt to exit the hive to pupate. This was designed to cease the life cycle of small hive beetle by hindering the larvae from pupation stage and inhibit the developmental process of small hive beetle. Every 21 days, accumulated larvae of SHB (dead and alive) in the trap were collected and removed including other debris and dead bee broods removed by bees from the hives. Modifying the regular hive entrance (T3) Eight SHB free honeybee colonies, consisting of single deep hive bodies was set up for this experiment. After colony set-up, the regular entrance of hives were blocked and sealed tightly with a piece of woods and new entrances consisting of ¾ inch (2-cm, ID) bamboo pipe were installed 3-4 inches (7.6 -10.2cm) above the bottom board. All cracks or holes in the hives were sealed to hinder the entrance of small hive beetle from these cracks. Every 21 days, number of adult beetles were counted and removed from the hive. Control group (T4) Eight uniform colonies were exposed to small hive beetle infestation and used as control group. In this case the colonies were left unmanaged, unfed and exposed to invading beetles until end of the experiment. This group was used to compare the results of other treatments with regard to small hive beetle infestation, colony absconding tendency and average honey yield. Every 21 days after colony set up, data was collected to determine the magnitude of SHB effect on bees and bee products. For all treatments, pieces of corrugated cardboard (45 cm × 45 cm), with one surface peeled to expose the ridges were place on the bottom board of each bee hive with the ridged side down. Underneath of the frames on the bottom board were covered with mesh wires which allow SHB to enter and hide in the corrugations, but exclude honey bees to fit the bottom board. The inserts were removed and replaced every 21 days to examine small hive population measure. All the collected data was organized by Microsoft excel and analyzed using descriptive statistical analysis of variance ANOVA of SAS version 9.0. Tukey’s honest significant difference (HSD) at 5% level of significance was used for mean separation. Result and discussions The result of the study indicated that there is statistically significant difference (P<0.05) between treated and untreated colonies with regard to small hive beetle infestation rate and hive product production. Significantly higher mean bee population, brood area, pollen and nectar stores 722+6.51, 136+7.4, 55.3+3.72 and 213+8.4, respectively were recorded in seasonal colony management groups (Table.1). However, the amount of brood area, pollen and nectar stores did

Livestock Research Proceeding
140
not significantly differ (P > 0.05) between colonies treated by hive entrance modification and small hive beetle larvae trapping, but significantly higher than control groups (Table1). The study indicates that, as the highest number of adult beetles found in the hive, less amount of bee brood, pollen and nectar stores were recorded indicating that SHB has caused substantial reduction in bee products (probably by feeding and ovipositing on brood, pollen and nectar) which in turn lead the queen to cease egg laying and eventually decrease bee population (Fletcher and Cook 2002, Fell, 1999). To this fact, the highest SHB population rate (79.67%+7.6) with greater comb damage (36.67+1.56) was recorded in colonies left untreated (T4) which most likely indicates the strong correlation between SHB population and infested combs (Table. 1). In contrast, less damaged combs were recorded in seasonally managed colonies, and not significantly differ when compared to small hive beetle larvae trapping and hive entrance modification. This agrees with the study of Zawislak, J. 2010 that showed that good beekeeping management practices both in the apiary and in the bee hives are sufficient to tackle the effect of small hive beetle. Table1. Mean + SE of bee population and bee product area measures (with frame unit area, 10 x10 cm2) Treatments
Honey bee Population
Brood area
Pollen area
Nectar area
Adult SHB beetles
Infested Combs
T1 722+6.51a 136.00+7.4a 55.33+3.72a 213+ 8.41a 14+3.21a 1.30+ 0.33a T2 284+7.00b 98.67+3.33a 49.00+7.37b 122+ 8.88b 16.33+2.6a 2.33+0.88a T3 350.6+4.8b 122.67+17.6a 40.33+1.85b 113+ 9.86b 16.0+4.58a 3.00+ 0.57a
T4 53.0+22.6c 17.67+3.93b 12.67+0.88c 28.33+ 9.5c 79.67+6.7b 36.67+1.56b
* Values are mean ± standard error. In columns total means followed by the same letters are not significantly different at p≤0.05 using Turkey’s Standardized Test (HSD). T1: Seasonal colony management, T2: Small Hive beetle larvae trapping, T3: Modifying regular entrance, T4: control group. To determine the effect of small hivebeetle on honey yield, honey was harvested from each treatment during active seasons and compared with control group. Acordingly, the highest mean honey yield was recorded in seasonal colony management with mean value 25.5 kg/hive, and the lowest yield was recorded in untreated colonies (6.3kg/hive) (Fig.1). Colonies exposed to the infestation of SHB clearly reduced the amount of honey stores by three folds and in turn decreased other hive products. This difference could be due to the feeding habits of both adult and larvae beetles on honey and nectar (Lundie 1940; Schmolke 1974). Moreover, colony stress conditions due to small hive beetles or other pest infections might also generally contribute for the honey yield reduction in untreated colonies. Colonies treated by trapping of SHB larvae and hive entrance modification showed almost similar amount of honey yield per hive/ harvest time (Fig. 1). This similarity might be due to the obstruct of SHB larvae from pupation in the soil which in turn blocks the life cycle of the pest.

Livestock Research Proceeding
141
Fig .1 In ordlevel, duringin mopromiperiodal. 19active
Fig 2. In addthe nua few1.67+Or 7.3infestof par
0
5
10
15
20
25
1 Comparisio
der to investigdata on adult
g the study peonths from Juinently affectd and less like73). In line w
e periods, in m
. Seasonal eff
dition, absconumber of colower number o+1.3), while th33+2.6 %) attation of pestsrticular intere
SHB larvaeTrapping
on of honey yi
gate the seasot beetle populeriods. Accorly-August anted by SHB fely defend the
with this, highmonths betwe
ffect of SHB o
nding tendencyonies used for of bee colon
he highest pert the end of ts, including smest because m
e Seasonal cmanagem
Avarage ho
ield between
onal dynamiclation and comrdingly, highed February-Afollowing theemselves aga
her bee populaeen Septembe
on honeybees
y of bee coloneach treatmen
nies were absrcentage of cothe study permall hive bee
most African h
colonyment
Entmodi
oney yield (K
the treatmen
ity of small hmb infestationer SHB popul
April (Figure 2 dearth perio
ainst pests andation and broor-November (
s and bee pro
nies was evalunt under unifosconded in solonies were ariod (Fig. 3).etle are forcedhoney bee su
tranceification
Kg) per harve
nts during hon
hive beetle pon were taken lation and inf2.) This sugg
ods as bee cold diseases (Scod area measu(Figure 1).
oducts
uated by the raorm environmseasonal coloabsconded in This suggest
d to leave theubspecies read
Control
est time
ney harvest ti
opulation andevery 21 day
fected combs gests that honelonies are wechmolke, 197ure was recor
atio of coloniemental conditioony managem
the untreatedts that, coloneir nest and abdily abscond
Series1
ime
d its infestatioys of the mont
were recordeeybee colonieeak during th4; Anderson rded during th
es evacuated ton. In this cas
ment (20%, Od groups (92%nies exposed tbscond. This in response t
on th ed es
his et he
to se Or %, to is to

Livestock Research Proceeding
142
nest predation (Hepburn and Radloff, 1998). However, other factors (colony disturbance, nectar dearth, etc.) might be also causes honeybee colonies to abscond and not merely the presence of large numbers of adult beetles.
Fig 3. Comparison of colony absconding tendency due to SHB under treatments *Absconding tendency was evaluated by the ratio of colonies evacuated to the number of colonies used for the experiment in three years. Conclusion and recommendations Even though small hive beetle (Aethina tumida, Murray) is thought to be a minor pest in Africa, our study reveals that the pest can potentially affect honeybees and bee products of colonies that lack proper management. Under poor beekeeping management, the beetle can cause significant damage to comb, pollen and nectar stores which in turn lead to higher reduction in honey yield. The beetles can also promote structural collapse of the nest and colonies to abscond under sever infestation. Our data shows that the extent of beetle-associated damage most likely depends on the type of colony management practices, among other factors. Colonies with poor management in general are more vulnerable to small hive beetle infestation than colonies provided with regular treatments. In general, higher infestation of small hive beetle appears more successful in weak and stressed colonies which adversely affect all aspects of beekeeping, including honey production and pollination services. This mainly occurred in months from July-August and February-April following the dearth period, so that honeybees less likely defend themselves against pests and diseases during this season. Therefore, the result of this study indicates that maintaining colonies healthy and strong via proper seasonal colony management is the most effective way to minimize the threat of SHB. In addition to this, trapping the beetles’ larvae by dead brood trap might also slow down beetle population, as this can cease the pupation of larvae in the soil and then obsolete its life cycle. Hive entrance modification by sealing and replacing the regular hive entrance with bamboo pipe can also reduce colony invasion by adult beetles. Future research should look in to investigation of botanical pesticides and biological controls (such as; soil-dwelling entomopathogenic nematodes) against SHB control.
0123456789
SeasonalManagement
Trapping Entrance Modification Control
Colony absconding tendency in three years*

Livestock Research Proceeding
143
Acknowledgments The authors are indebted to Oromia Agricultural Research Institute, for financial support of this project. Moreover, we thank Holeta Bee Research Centre for all the logistic support and approval of the activity. Our special thanks also go to Mis. Inani B/Wored and Mis. Gete Daba for their technical assistance during experimental setup and data collection. References Anderson R.H., Buys B., Johannsmeier M.F. 1973. Beekeeping in South Africa. South African
Department of Agriculture, Bulletin No. 394, Pretoria, South Africa. 207 pp. Elzen P.J., Westervelt D., Causey D., Ellis J., Hepburn H.R., Neumann P. 2002. Method of
application of Tylosin, an antibiotic for American Foulbrood control, with effects on small hive beetle (Coleoptera: Nitidulidae) populations. Journal of Economic Entomology, 95(6): 1119-1122.
Elzen P.J., Baxter J.R., Neumann P., Solbrig A., Pirk C.W.W., Hepburn R., Westervelt D. Randall C. 2001. Behavior of African and European subspecies of Apis mellifera toward the small hive beetle, Aethina tumida. Journal of Apicultural Research, 40: 40-41.
Elzen P.J., Baxter J.R., Westervelt D., Randall C., Wilson W.T. 2000. A scientific note on observations of the small hive beetle, Aethina tumida Murray (Coleoptera: Nitidulidae), in Florida, USA. Apidologie, 31: 593-594.
Elzen P.J., Baxter J.R., Westervelt D., Randall C., Delaplane K.S., Cutts L., Wilson W.T. 1999. Field control and biology studies of a new pest species, Aethina tumida Murray (Coleoptera, Nitidulidae), attacking European honey bees in the Western Hemisphere. Apidologie, 30: 361-366.
Elzen P.J., Baxter J.R., Westervelt D., Rivera R., Cutts L., Randall C., Wilson W.T. 1998. Small hive beetle control, USDA initial lab study results. Bee Culture, October: 19-20.
FAO. 2009. Bees and their role in forest livelihoods. A guide to the services provided by bees and the sustainable harvesting, processing and marketing of their products. Rome.
Hepburn, H.R. and S.E. Radloff, 1998. Honeybees of Africa. Springer, Berlin, Germany. Higes, M., R. Martín‐Hernández, et al., 2008. How natural infection by Nosema ceranae auses
honeybee colony collapse. Environmental microbiology 10(10): 2659-2669. Martin, S. J., 2001. "The role of Varroa and viral pathogens in the collapse of honeybee colonies:
a modelling approach." Journal of Applied Ecology 38(5): 1082-1093. Neumann, P. and N. L. Carreck, 2010. Honey bee colony losses. Journal of Apicultural Research
(49).Potts, S. G., J. C. Biesmeijer, et al., 2010. Global pollinator declines: trends, impacts and drivers. Trends in ecology & evolution 25(6): 345-353
Schmolke M.D. 1974. A Study of Aethina tumida: The Small Hive Beetle. University of Rhodesia (Zimbabwe), Certificate in Field Ecology Project Report, Salisbury (Harare). 178 pp.
Zawislak, J., 2010. Managing small hive beetles, Cooperative Extension Service, University of Arkansas, US Department of Agriculture, and county governments cooperating.

Livestock Research Proceeding
144
Managemental practices to prevent the effect of wax moth, a pest of honeybees (Apis mellifera bandasii)
*Alemayehu Gela, Amssalu Bezabeh and Taye Negera
Oromia Agricultural Research Institute Holeta Bee Research Centre
Email: [email protected] & [email protected] Abstracts The study was designed to identify effective wax moth preventive and/ or control management practice(s) to minimize the damage inflected by this pest. The management preventive practices: strengthening honeybee colonies via feeding, reducing the suppers and un occupied combs, the combination of these practices and trapping wax moths that are intended to enter beehives were evaluated for their effectiveness to prevent wax moth infestation for three years and compared with control (group of colonies that did not receive treatment). Statistical significant variation was observed among the treatments (p< 0.05). Significantly low wax moth infestation level and high honey yield were recorded when all management packages (feeding, reducing super and unoccupied frames) were applied compared to control (P<0.05). Wax moth infestation level was reduced by 82.3% using this package. The prevalence of wax moth is higher during dearth period (Dec to March) in the study period. . Keyword: Wax moth, Honeybee Pest, management practices, infestation, prevalence 1. Introduction Wax moth is an insect in the order Lepidoptera that can eat and destroy the honeybee combs where the bees can store pollen, honey and lay eggs for their normal activity. It is the wax moth larvae (Caterpillar) that are very destructive and can quickly destroy bees wax combs. Wax moth is widely distributed throughout the country and is reported the most troublesome pest of honeybees. The study on the economical importance of this insect in Southwest, East and west show zones revealed that the wax moth causes the losses of 460.9 tones of honey, 8 tones of beeswax and absconding of 39,546 honey bee colonies in a year which worth about over 10 million Ethiopian Birr (Amssalu B; unpublished). The incidence and severity of the pest increased from time to time dramatically and causing great economical loss on beekeeping industry in different parts of the countries. Hence, developing various wax moth preventive methods that enables the beekeepers to protect his colonies from wax moth attack is a paramount important. Though different chemotrapuetical, biological and managemental practices were exercised in different parts of the world to control the effect of wax moth, the former is not recommended to apply due to some chemicals its residues in the wax, which can kill bees or contaminate honey stores (Jon L., 1990). Russell G., (2006) stated that it is the bees themselves that are the most effective to control natural enemies, such as wax moths. The strong, health & populous colony of honeybees carry the moths out of the hive and prevent any damage by the larvae. It is only when the colony has been weakened by disease, starvation, or other means that the wax moth succeeds in seriously damaging inhabited combs (James E., 2002). But no specific strategy has been universally adopted by beekeepers around the world. Therefore this is to test some of managemental practices and select effective and that can be easily applied to our farmer's condition to minimize the damage.

Livestock Research Proceeding
145
2. Materials and Methods The study was conducted at Bakko apiary site from July 2009 to June 2011, where the infestation of wax moth is high. The management preventive practices (strengthening honeybee colonies via feeding, reducing the suppers and placing the frames and boxes in well aerated areas, removing the unoccupied frames and all the above management together and trapping wax moths were evaluated for their effectiveness to prevent wax moth infestation. These management practices were selected as they were easily practiced under farmer's condition. The efficiency of these treatments was compared with the control ones (colonies left untreated). Five honey bee colonies that are free from wax moth were assigned to each aforementioned treatment at random. Reducing the suppers was applied for those honeybee colonies having one or more suppers. Suppers was reduced on time when the colonies dwindled and the removed frames and boxes were placed in well-aerated place and reused when necessary. Removing the unoccupied frames applied to colonies in the base hive. When colonies were dwindled and move to one side of the hive, the frames that was not occupied by honeybees were removed and placed in well-aerated place and was reused when necessary. 1kg of light sugar syrup (1 sugar: 1 H2O) was given once every month in the dry season for group of colonies in feeding treatment. Honeybee colonies under all treatment receive all necessary management practices (feeding, reducing supper at right time, and removing unoccupied frames). Wax moth trapping was conducted in separate site 500m away from the other treatments. 1 cup of H2O, 1 cup of sugar, 1 banana peel and ½ cup vinegar was added in to 2-liter plastic coke bottle that has 1-inch hole just below its neck and waited a few days till it starts to ferment. The fermented solution was hanged on to a tree close (2m) to the experimental honeybee colonies to attract adult wax moth that intend to enter the hives and number of adult wax moths drawn in the solution was recorded. The control groups were received no any manage mental practices mentioned in above treatments and were used to compare the results of the treatments in both sites. Data on wax moth infestation, honeybee population, number of broods, nectar and pollen were collected every other 21 days throughout the study year using liebefield method (Gerig, 1983) and analyzed using ANOVA procedures. To detect where statistically significant mean differences occurred, the post hoc Tukey mean comparisons test (HDS) was used at level of 0.05. The reduced wax moth infestation level by the treatment was calculated using the following formula: Mean wax moth infestations in all treatments – Mean wax moth infestation in control X 100
Mean wax moth infestation in control groups Result and discussion The results indicates that there was statistically significant difference among the treatments in minimizing wax moth infestation level (P<0.05). Significantly low wax moth infestation level and high honey yield were recorded when all management packages (feeding, reducing super and unoccupied frames) were used compared to control (P<0.05). There was no significant difference in reducing wax moth infestation among the individual treatments and between each treatment and control (P>0.05). More over significantly higher brood and honeybee populations were recorded in treatment received all management packages compared to all the rest treatments and control (table 1).

Livestock Research Proceeding
146
Table1. Mean comparison of wax moth control methods in prevention of wax moth infestation
Treatment Brood Pollen Nectar Infected comb Bee pop Honey yield Feeding 23.72 ± 2.28 b 11.02 ±1.40 b 56.63±4.87ab 2.73±0.24ab 71.01 ± 3.84 b 9.88 ± 2.35. b Reducing un occupied frame
24.41 ± 1.93 b 12.33 ± 1.61 b 50.29±3.25ab 3.1± 0.21ab 68.95 ± 3.28 b 5.50 ±0.87 b
Reducing super 30.80±2.82ab 15.5 ± 1.99ab 56.47±4.23ab 2.9± 0.20ab 68.40 ± 3.64 b 10.1 ± 1.33 a
All management 34.38 ± 2.86 a 13.84 ± 1.87 b 65.01 ±5.21a 1.3± 0.11 b 90.54 ± 5.43 a 13.8 ± 2.6 a Trapping 23.84 ± 2.1 b 20.39 ± 2.4a 58.26± 5.4ab 5.78± 0.34a 78.68 ± 4.72ab 9.8 ±2.23 b Control 23.73 ± 2.80 b 13.75 ± 1.95 b 43.55 ± 4.5 b 7.34± 0.48 a 65.87 ± 5.2 b 5.25 ± 1.25 b
***Means with the same letters are not significantly different at (P≤0.05) using Turkey’s Standardized Test (HSD).Figures in the left are unit area; 1unit area = 10cmX10 cm) except honey yield which is in kg, while figures in the right represents standard errors). In general the wax moth infestation level was reduced by 82.3% using all management packages. This implies that the combined actions: timely reducing the supers, reducing unoccupied combs and feeding while honeybee colonies dwindle, significantly reduce wax moth infestation and subsequently yielded better honey production compared to each of this measure but reducing super. This is attributed to the fact that honeybees could prevent the combs from infestation of wax moth as all combs in the hive are under their supervision and combs out of honeybee control have been removed on time. More over feeding light sugar syrup strengthen honeybee colonies to defend their hives from intruders. This is in agreement with the finding of Russell G. (2006) who indicated that, it is the bees themselves that are the most effective natural enemies of wax moths. James E. (2002) also indicated that the strong, health & populous colony of honeybees carry the moths out of the hive and prevent any damage by the larvae. Wax moth infestation level significantly varies over the months of the year and it was higher during Dec to March and a more evident elevation during February to March (Fig.1). This was a time when the honey bee population gets lower due to inadequate feed resources, in the study area. On other hand wax moth infestation was lower during July to November (Fig.1) when population of honey bee increased as the result of availability of bee forage. This implies that wax moth causes damage on honeybee colony when it gets dwindle and is less important pest for strong honeybee colonies. This concord the findings of James E. (2002) who showed that it is only when the colony has been weakened that the wax moth succeeds in seriously damaging inhabited combs.

Livestock Research Proceeding
147
Fig 1. Mean honey bee and brood population, nectar and pollen store, and wax moth infestation in months of study period (figures on Y axis are unit area; 1unit area = 10cmX10 cm) 4. Conclusion and Recommendation Wax moth is pest to beekeeping industry causing extensive losses to beeswax, absconding and dwindling of honeybee colonies and subsequent honey yield reduction. Wax moth prevalence is higher in dearth period when there is shortage of forage and colony dwindles. Though, chemotrapuetical and biological practices were used in different parts of the world to control wax moth infestation, they are not safe, available and cheap to use it in our country. Management package: feeding, reducing supers and removing unoccupied combs effectively minimized the wax moth pest when applied on time, during dearth period. Though, feeding, reducing supers and removing unoccupied combs contributed to the reduction of wax moth infestation when applied separetly, they are not as effective as their cumulative effect when applied in their respective time. Thus instead of using each treatment mentioned above alone it is important to combine and apply them when deem necessary to effectively reduce infestation. Strengthening honeybee colonies via feeding light sugar syrup during shortage of store, reducing the supper(s) from one or two stores of hives when honeybee colonies weakened and occupy only small portion of the hive and remove unoccupied frames or combs from the base and placing frames or combs and boxes in well aerated areas during the dearth period were highly recommended to prevent and/ or minimize wax moth infestation. These managemental practices are the cheapest and friendly to prevent and /or minimize wax moth infestation and obtain optimal hive products Acknowledgments The authors are indebted to Oromia Agricultural Research Institute, for financial support of this project. Moreover, we thank Holeta Bee Research Centre for all the logistic support and approval of the activity. Our special thanks go to Mis. Inani B/Wored and Mr. Hiwot Berhanu for their technical support during the data collection.
0
20
40
60
80
100
120
140
July
Augus tSep Oct
NovDec Jan
FebMarch
AprilMay
June
Mea
n va
lue
BroodPollenNectarInfected combsBeepopulation

Livestock Research Proceeding
148
References 1. Gerig L, (1983) Lehrgang zur Erfassung der volksstarke, Schweiz. Bienen-Ztg. 106: 199-204. 2. James E., (2002).Wax moth control in Bee hives. Department of Horticulture and Crop science,
OARDC/ .The Ohio state University. (http:waxmoth control in Bee hives, HYG-2165-97.htm), accessed Oct,10/10/2007.
3. Jon L. Williams (1990) Insect: Lepidoptera (moths). In: Honeybee Pests, Predators, and Diseases (Eds. Roger A. Morse and Richard Nowogrodzki): pp96-119, second edition, Cornell University press, USA
4. Russell. G. K (2006).Wax moth-a pest of combs and honey bee products. An information notes of department of primary industries (dpi).The state of Victoria. http://wax moth, a pest combs.htm, accessed 10 Oct 2007

Livestock Research Proceeding
149
Testing the Toxicity effect of Euphorbia Contifolia on honey bees (Apis mellifera) at field condition
*Alemayehu Gela, Taye Negara and Dessalegn Begna
Oromia Agriculturalral Research Institute Holeta Bee Research Center
E-mail = [email protected]
Abstract The recent decline of honey bee population raises speculations from different angles. Exposure to poisoning substances is proposed as prime factor for honeybee deaths and colony reduction. Euphorbia contifolia, commonly known as “key abeba” is suspected as poisonous plant to honeybees and other animals in different regions of Ethiopia. An attempt was made to test the phytotoxic effect of this plant on honeybees in Illubabora and Jimma zones of Oromia region. Questioner survey and controlled experiment were used to assess the effect of E.contifolia on honeybees during its flowering season. In the controlled experiment, 10 honeybee colonies (5 treatments and 5 controls) were used. The 5 experimental colonies were exposed to forage on the plant, and the rest 5 control colonies were placed in Euphorbia free areas to hinder foraging on the plant. Data on number of dead adult bees and dead broods were counted at every 3hr, 4hr, 5hr, 6hr and 12hr of the day for five consecutive days. The result indicates that on average, about 52 % of the respondents of the two zones suspected that E. contifolia causes death and narcosis of foraging bees. In contrast, the mean mortality rate of adult and brood bees between the treatment and control group did not significantly differ (P > 0.05), and no any narcosis symptom observed. Furthermore, good performance and wellbeing of bee colonies were observed during the abundantly blooming of E.Contifolia in all the suspected areas. This demonstrates the absence of distinct toxic effect of the plant on honeybees. However, further study on the plant’s nectar and pollen active compound is recommended to reach into full understanding. Moreover; rapid investigation and understanding of other potential drivers of bee colony decline is recommended. Key words: Honeybees, E. Contifolia, toxicity, nectar, pollen, narcosis Introduction Apart from pollination service, honeybees are well known for their commercial products playing increasing roles in income generation, healthy food and alternative medicinal values. However, the recent decline of bee population raises speculations from different angles and therefore, of great concern for global food security and environmental stability. It is multifaceted factors that lead to the decline of bee population worldwide. Outbreak of pathogens and pests, exposure to pesticides, shortage of forage and global climate change are the known factors commonly responsible for the loss and death of honeybee colonies ( Henry et al., 2012; Potts et al., 2010; Desneux et al., Potts et al., 20092007, Adler 2000). Exposure to poisoning substances (natural and chemical) is considered as prime causes for honeybee deaths and colony reduction. Though it is difficult to differentiate between plant and pesticide poisoning, some reports describe bee deaths or narcosis following visits to some plant species (Jaeger, 1961, Bell, 1971, Crane,1978). This can be supposed to be the biochemical effects of some active compounds in their pollens, nectars and honeydew that may be toxic to bees and other animals. Accordingly, recommended plant species such as Aesculus californica, Clematis hirsutar, Clematis simensis, Croton macrostachyus, Datura stramonium, Euphorbia abyssinica and Justicia schimperiana are reported poisonings plants ( Nuru and Hepburn 2001; Adler 2000; Majak et al. 1980; Mussen, 1979). Honeybees occasionally encounter sources of such toxic nectar, but the predominating nectar sources provide great dilution of any toxic nectar collected. Although such toxic nectar-
Livestock Research Proceeding
150
bearing plants are reported, the incidence of human poisoning by honey is extremely low. For example, Nuru (1996) reported as honey from Justicia schimperiana is known to cause vomiting and diarrhea when sipped by children, but its toxic effect on bees was not known. Euphorbia genus belongs to the family Euphorbiaceae comprises about 300 genus and 5000 species distributed mainly in America and tropical Africa (Webster, 1994). Euphorbace families in general contains latex secretions in their sap which commonly known to cause skin irritation and tumour-promoting diterpenoids (Evans & Taylor, 1983), inflammatory (Abo K, 1994) and antioxidant effect (Barla A, 2007). Some species of these plants are used in folk medicine to treat skin diseases, gonorrhoea, migraines, intestinal parasites and warts (Singla & Pathak, 1990). Moreover, several species of the genus Euphorbia were tested for their efficiency against antiviral and antibacterial activities (Rojas et al., 2008; Abubakar, 2009). In Ethiopia, a few species of Euphorbia are known distributed in arid and semi-arid agro-ecologies and are used for various purposes: live fencing, as hedges, fire wood, check for soil conservation strategies and as ornamental plant around homestead. Euphorbia Contifolia commonly known as “Key-abeba” (red leafed) is one of Euphorbia spps widely distributed in west and south west parts of Oromia and in some parts of SNNP regions. It is assumed as introduced species through Kenya to Moyale semi-arid agro-ecologies in not more than 20 years ago (personal communication). As easily and rapidly growing through stem propagation, it has been covered wide ranges of areas in the country with in short period of time. According to the Agricultural and rural development office of illubabora zone, this plant occupied approximately over 15 hectares of land in a single peasant association. People around cities and towns propagate this for the ornament due to its attractive red leaves. Despite its numerous advantages in these regions, speculations and oral reports have been raised in the country that E. Contifolia is toxic for honeybees and other animals, and its honey is poisonous to human. Several beekeepers from Illubabora and Jimma zones of Oromia region and some parts of SNNP have complained on the poisoning effect of this plant on foraging bees (OTV September, 2010). As a result, the Agricultural and rural development office of Metu district, Illubabor zone was reported the deaths of bee colonies to Holeta Bee Research Center disputably considering the poisons effect of E. Contifolia. However, no scientific data has recognized the relationship between honeybee deaths and poisons effect of E. Contifolia on honeybees and other animals. Therefore, this study was planned to test the toxicity effect of E. Contifolia on honeybees particularly during its flowering period. This is the first preliminary work to observe and generate baseline data for the understanding of honeybee deaths due to the flowering of the suspected plant in the study areas. Materials and Methods Study areas The study was conducted in Illubabora and Jimma zones of Oromia region based on the abundant distribution of E. contifolia and their potential for beekeeping. Mettu and Alle districts of Illubabora zone and Gera district of Jimma zone were selected as specific study areas. Two main study approaches were used to evaluate the toxicity effect of E. Contifolia on honeybees: Preliminary survey and control experiment test.

Livestock Research Proceeding
151
Preliminary survey Preliminary survey was conducted in the selected potential districts based on the abundance of E. contifolia. Befor the study discussion was made with zonal and Woreda livestock agencies of respective areas to explore the general information. From each district three potential peasant associations (PAs) were randomly selected. Accordingly, a total of nine PAs were selected for the study purpose. Then five model beekeepers from each PA were randomly selected and a total of 45 beekeepers were interviewed relating to the risks of E. contifolia on honeybees and other animals using pre-structured questionnaire. All the necessary information related to this plant such as its propagation method, its importance in the local area, its poisoning effect, flowering season, duration and parts of the plant exhibited toxicity, means of distribution and total abundance in the area were collected through face-face interview. In addition, agro-ecology and soil type of the areas were recorded during the interview period. Experimental Test Following the questionnaire survey, a control experiment tests was done at Boto site, Metu district of Illubabor zone during the peak blooming seasons of E. Contifolia (May-June). Site selection was made based on the potential distribution of E. Contifolia at distinct suspected area. A total of 10 strong and uniform bee colonies were selected and randomly assigned in to two groups (5 experimental and 5 control groups). The 5 experimental colonies were purposively introduced to the flowering area of E. Contifolia at a vicinity of 2-3 m to induce foraging (Fig.1). The rest 5 bee colonies (control group) were placed in area free of E. Contifolia, which is about 5km from the plant location area. Plastic sheet covers were placed beneath and in front of each hives to undoubtedly observe and count dead and crawling forager bees, dead broods and other abnormal symptoms of individual bees. After colony introduction, data on number of dead adult bees and dead broods were counted at every 3hr, 4hr, 5hr, 6hr and 12hr of the day for five consecutive days. Furthermore, each colony was inspected every night of the study period to record cumulative number of dead adult bees and broods inside the hive. Moreover, observational evaluation was conducted at the beekeepers site to recognize the general foraging behavior of bees on this plant and its poisoning clinical symptoms after foraging (Fig. 2). All the collected data was organized by Microsoft excel and the mean mortality of adult bees and broods were compared using descriptive statistical analysis of variance ANOVA of SAS version 9.0. To detect the statistically significant mean differences, the post hoc Tukey’s mean comparisons test (HDS) was used at P< 0.05 significance level.

Livestock Research Proceeding
152
Figure.1. Colony set up and exposure for foraging to test the toxicity effect of E .Contifolia on honeybees, Boto site of Metu district
Figure. 2. Field observation made to understand the risk factor of E. Contifolia around the beekeepers homestead, Metu district Results and discussions A preliminary survey reveals that on average about 52% (57% in Illubabor and 45% in Jimma zones) of the interviewed beekeepers were suspected the positive toxicity effect of E. Contifolia on honeybees and other animals. Some beekeepers stated their opinion towards death and narcosis of honeybees following the blooming season of E. Contifolia when they visit to forage. About 25% of the interviewed beekeepers were also assumed the honey from this plant might be poisonous to human. Moreover, communities in Illubabor zone in general were remarked the latex (milky secretion) from E. Contifolia causing eye burning and skin irritation effect on humans and other animals. This might be agree with the fact that various Euphorbia species have milky latex that causes the same effect on different animals including human being (Upadhyay et al., 1980; Jassbi, 2006). However, the result of experimental tests entirely contradicts with the response of beekeepers. Despite the flowering abundance of the plant in the study area, there was no significant narcosis or deaths of bees recorded in the experimental colonies as compared to control groups. To this fact, the mean mortality of both adult bees and broods between the treated and control colonies were not significantly differ (p > 0.05) at every hour of data collection (Table1 & 2). Relatively higher deaths of adult bees were observed at the beginning of data collection (3 hrs after colony set up), and then reduced for the rest hours. This indicates the normal bee deaths occurred due to colony disturbance when they moved from their original apiary to the experimental sites. As a result, greater mean mortality of adult bees was recorded even in the control groups (0.72+0.21) than the treated colonies (0.61+0.14) at the beginning of data collection (Table.1), which attest normal honeybee deaths.

Livestock Research Proceeding
153
Table.1. Mean mortality rate and SE of adult bees after experimental set up
Dead adult bees % ( Mean +SE) Treatments N 3 hr 4 hr 5 hr 6 hr 12 hr
Exp. colonies 25 0.61+0.14 0.38+0.08 0.16+1.25 0.08+0.18 0.44+0.34
Cont. colonies 25 0.72+0.21 0.32+0.21 0.08+0.08 0.12+0.12 0.20+0.16
P-Value 0.77 0.3 0.29 0.46 0.52 Similarly, the mean mortality rate of broods due to exposure to E. Contifolia was not significantly different between control and experimental colonies at every hour of data collection (Table 2). Exactly similar to adult bees, relatively higher mortality brood was recorded at the beginning of data collection (3 hr) for both experimental (0.80+0.16) and control (0.05+0.12) groups. At 4 and 12 hrs, there were no dead broods counted for both treatments (Table. 2). This suggests the non toxic effect of E. Contifolia on bee broods when they are exposed to its peak flowering period. This agrees with the study indicating the remarkable ability of honeybees to dilute the amount of toxic substance in the nectar or pollen to a level below the threshold toxic response (Atkins et al., 1981). In this way nurse bees supposed to balance the toxic substances by diluting the nectar or pollen while rearing the brood. Table.1. Mean mortality rate and SE of bee broods after experimental set up
Dead broods % (Mean +SE) Treatments N 3hr 4hr 5hr 6hr 12hr Exp. colonies 25 0.80+0.16 0.00+0.00 0.24+0.22 0.04+0.02 0.00+0.00 Cont. colonies 25 0.05+0.12 0.00+0.00 0.12+0.02 0.00+0.00 0.00+0.00
P-Value 0.29 _ 0.32 0.31 _ Beside the experimental test, both internal and external colony inspection also indicated the negative mortality of honeybees during the study period demonstrating the non distinct effect of E. Contifolia. Moreover, our field observation has confirmed good performance and wellbeing activity of bee colonies in spite of the peak blooming period of E. Contifolia in all the suspected areas. Only very few worker bees were observed foraging on this plant with in the presence of forage preference. This is concord with the study representing poisoning plants have deterring behavior of their pollinators when they secret toxic substances (Detzel and Wink 1993; Adler and Irwin 2005). Wright (2013) also indicated that honeybees are forced to forage on such poisoning plants only when they are vulnerable and under certain specific stress conditions such as food shortage and dearth of nectar. This suggests the negative correlation between E. Contifolia flowering and massive death of honeybees, which might be caused due other factors such as intensive pesticides applications, pests and diseases (Henry et al., 2012; Potts et al., 2010). Likewise, evidences revealed that honeybees have learning behavior to avoid toxic nectar or pollen and less likely vulnerable. To this fact toxic plants are less likely visited by honeybees due to their deterring behavior of their pollinators when they secret toxic substances.

Livestock Research Proceeding
154
Conclusion and recommendations In conclusion, our results provide evidence against the oral report that E. Contifolia is toxic to honeybees and responsible for the massive death of colonies in the study area. Despite the preliminary survey result, both experimental and observational test demonstrated the non distinct effect of E. Contifolia on honeybees in the study area. Insignificant mortality of both adult and brood bees was recorded in the experimental colonies as compared to the control groups. Moreover, good performing and wellbeing activity of bee colonies were observed in all the suspected areas in spite of the peak blooming period of E. Contifolia. As a result, our data indicates the presence of E.Contifolia in the study area would not be the cause for honeybee deaths reported suggesting the negative correlation between E. Contifolia flowering and massive death of honeybees. It seems that beekeepers have been wrongly correlate the fact that milky latex from some Euphorbia species has burning and skin irritation effect on other animals, including humans, with honeybee deaths due to other factors. This indicates with the sense that actual forage plants may not to poison their pollinators. Honeybees might be occasionally dead due to unidentified factors such as outbreak of diseases and pesticide applications. Therefore, beekeepers should attempt to identify the causes for occasional bee deaths and otherwise report as early as possible for diagnosis. Further study on analysis of active compounds in the nectar or pollen of E.Contifolia is also recommended for confirmation and better understanding. Acknowledgments The authors are indebted to Oromia Agricultural Research Institute, for financial support of this project. Moreover, we thank Holeta Bee Research Centre for all the logistic support and approval of the activity. Our special thanks also go to Mr. Fedesa Terefe and Mr. Kutafo Gonta for their technical assistance during experimental setup and data collection. References Abubakar, E. (2009). "Antibacterial activity of crude extracts of Euphorbia hirta against some
bacteria associated with enteric infections." Journal Medicine Plant Research 3(7): 498-505.
Abo KA. Characterisation of ingenol: an inflammatory diterpene from some Nigerian Euphorbia and Elaeophorbia species. Afr J Med Med Sci 1994; 23(2):161-163.
Adler, L. S. and R. E. Irwin (2005). "Ecological costs and benefits of defenses in nectar." Ecology 86(11): 2968-2978.
Adler, L. S. (2000). "The ecological significance of toxic nectar." Oikos 91(3): 409-420. Aizen, M. A. and L. D. Harder (2009). "The global stock of domesticated honey bees is growing
slower than agricultural demand for pollination." Curr Biol 19(11): 915-918. Barla A, Öztürk M, Kültür S, Öksüz S (2007). Screening of antioxidant activity of three
Euphorbia species from Turkey. Fitoterapia 78(6):423-425. Bell, C. R. (1971). Breeding systems and floral biology of the Umbelliferae, or evidence for
pecialization in unspecialized flowers Crane, E. (1978). "Dead bees under lime trees. Sugars poisonous to bees." Bee world 58. Desneux, N., A. Decourtye, et al. (2007). "The sublethal effects of pesticides on beneficial
arthropods." Annu. Rev. Entomol. 52: 81-106. Detzel, A. and M. Wink (1993). "Attraction, deterrence or intoxication of bees (Apis mellifera)
by plant allelochemicals." Chemoecology 4(1): 8-18. Henry, M., M. Beguin, et al. (2012). "A common pesticide decreases foraging success and
survival in honey bees." Science 336(6079): 348-350. Isaac K., Javad Y. and Ali G. (2010). “ Ocular Toxicity caused by Euphorbia sap”. Iranian J.of
pharmacology and therapeutics. 9: 37-39.

Livestock Research Proceeding
155
Jassbi, A. R. (2006). "Chemistry and biological activity of secondary metabolites in< i> Euphorbia</i> from Iran." Phytochemistry 67(18): 1977-1984.
Johnson, R. (2011). Honey bee colony collapse disorder, DIANE Publishing. Lovell, J. H. (1926). "Honey plants of North America." AI Root Co., Medina, OH. Majak, W., R. Neufeld, et al. (1980). "Toxicity of Astragalus miser v. serotinus to the honeybee."
Journal of Apicultural Research 19(3): 196-199. Mussen, E. C. 1979. Buckeye poisoning. U.C. Apiaries: Univ. of California Cooperative
Extension: 1–4. Nuru A. (1996). Poisonous honey source plant (Justicia shimperiana) in Agew Mider area in
Northwest part of Ethiopia (case study report). Holetta Bee Research Centre, Holetta, Ethiopia.
Nuru, A. and H. Hepburn (2001). "Pollen grains of some poisonous bee plants of Ethiopia." Proc. 37th Int. Apic. Congr 28.
Potts, S. G., J. C. Biesmeijer, et al. (2010). "Global pollinator declines: trends, impacts and drivers." Trends in ecology & evolution 25(6): 345-353.
Potts, S. G., S. P. Roberts, et al. (2009). "Declines of managed honey bees and beekeepers in Europe." Journal of Apicultural Research 49(1): 15-22.
Rojas, J., J. Velasco, et al. (2008). "Evaluation of antibacterial activity on different solvent extracts of Euphorbia caracasana Boiss and Euphorbia Contifolia L.(Euphorbiaceae) collected in Venezuela." Boletín Latinoamericano y del Caribe de Plantas Medicinales y Aromáticas 7(4): 198-201.
Upadhyay, R., F. Bakhtavar, et al. (1980). "Screening of Euphorbia from Azarbaijan for skin irritant activity and for diterpenes." Planta Medica 38(02): 151-154.

Livestock Research Proceeding
156
Identifying the Species, effects and seasonal dynamics of honeybee varroa mites: a newly emerging parasite to Ethiopian honeybee
Desalegn Begna1b, Alemayehu Gela1, Taye Negera1, Amssalu Bezabeh1
1Oromia Agricultural Research Institute, Holeta bee research center
Abstract The loss of bee colonies in recent years is a global phenomenon and Ethiopia is not exceptional. No single cause has been identified for the lose interactions of biotic and abiotic factors are speculated for the global bee colony decline. Following global warming and human population fast growth, natural forests which are used to be habitat and sources bee feed has been destroyed at fast rate. Also the contribution of bee pests and diseases is thought considerable for bee colony diminishing. Recently (2010), globally identify as causing bee colony dames bee mite varroa destructor has been reported in most beekeeping regions of Ethiopia. However, the effects of mite oh bee colonies and their products, the mite strain type and its seasonal dynamics under local incident remain uncertain. Therefore, this study has designed controlled experiment to unveil the basic questions with regards to the nature and the effects of the parasite under local conditions. Ten bee colonies were set up at Bako area which is 250 km west of Addis Ababa. Data collections were done for three years on monthly bases and collections of information were done on the parameters like the number of varroa mites on adults and brood bees and brood, pollen and nectar areas. Besides, morpho-size of the collected varroa mites were measured and compared with the morpho-sizes varroa mites collected from different localities. The study investigated negative correlation (P<-0. 0.513) between the number of mite and number of adult bees as well as brood, pollen and nectar areas. However, the number of mites on adult and brood bees as well as the mite’s pessimistic effect varied between the colonies and the seasons. Based on morpho-size measurement, the mites were grouped into five mopho-clusters, but generally confirming all the strains belong to varroa destructor type. In spite of the presence of the parasitic varroa mite in all the bee colonies year round, all the colonies appeared to be healthy. The result from this study has enlightened local understanding on the seasonal dynamics, effects and species of varroa mite. However, further study that entails investigations on biological/ behavior of both the parasite and the host is suggested to avail better understanding on how local bees were not affected following the number of parasailing varroa mite. Keywords: Varroa, Ethiopia, morpho-size, species, brood Introduction Beekeeping is an opportunity to harvest and add value to a local resource (floral nectar) to generate wealth and employment. Products from beekeeping contribute to the income and livelihood improvement of the rural people. In addition, beekeeping plays an important role in providing export commodities and environmental conservation (Krell, 1996). However, the benefits from beekeeping can be affected by many biotic and abiotic factors (Strauss et al., 2013, Desalegn 2014 and 2015). Recently, the issue of honeybee health has been becoming a global research topic (Genersch, 2010, Strauss et al., 2013). The recent emergence of high honeybee colony losses in many parts of the world has initiated many researches in different parts of the world (Strauss et al. (2013). Bee pathogens and parasites are identified as the most affecting honeybee health being distributed almost worldwide (Bailey and Ball, 1991; Allen and Ball, 1996; Ellis and Munn, 2005). When, rigorous researches have been conducted on honeybee health aspects in the other parts of the world, the health status of honeybees in Africa remain less characterized (Hepburn and Radloff, 1998; Dietemann et al., 2009, Desalegn B., 2015). In b Corresponding Author: [email protected] and [email protected]

Livestock Research Proceeding
157
particular, the health condition of Ethiopia honeybees is poorly described as systematically reviewed by Desalegn B. (2015). Presence of ecto-parasitic mite Varroa destructor is one of the factor globally reported effecting honeybee health (Rosenkranz et al, 2010; Dietemann et al., 2012). This mite was previously known as Varroa jacobsoni Oudemans, 1904 and was recorded as eastern honeybees (Apis cerana Fab) ecto-parasite (Boudagga et al., 2003). It was identified as Varroa destructor by a morphological study of many females collected throughout the world including Asia (Rahmani H., 2006). The parasite was first reported in South Africa in 1997 (Allsopp, 1997; Martin and Kryger, 2002) and later in 2009 in Kenya, Tanzania, Uganda and Ghana (Fazier et al., 2009) and in Ethiopia in 2010 (Desalegn B., 2014). However, understanding on the varroa mite strain, its seasonal dynamics and effects on local bees and their products in Ethiopia remain blurred. Therefore, given the wide spread of the varroa mite in most beekeeping areas of the country, it is paramount importance to investigate the plausible effects of this mites have both on the life and products of local honeybees. Material and methods Experimental places, animals and setups All field experimental bee colony setup was done at Bako sub-site of Holeta bee Research centre using honeybee race called A.m.bandassi. However, all laboratory works and data analysis were done at Holeta Bee research centre (HBRC). For the purpose, 10 bee colonies in traditional beehives were obtained from beekeepers through purchasing and transferred to moveable frame beehives (Langstroth). All bee colonies were standardized to have equal condition and then monitored for having varroa mites. Subsequently, data collections on the number of adult varroa mites, brood, pollen and nectar areas were done at every 21 days for three years (2011-2013). About 200-250 live adult bee samples were collected from each bee colony using a wide mouth plastic jars, killed in hot water and washed in detergent-water to dislodge varroa mite (Macedo et al., 2002). The mites were separated from dead bees using a ladle (8-12mm mesh sizes) that passes the mite together with the solution but hold the bees. Subsequently, the mites were separated from the solution using wire gauze (less than 8 mm mesh sizes) that pass the solution only but hold the mite. The wire gauze that is expected holding the mite was turned down and collided on the white paper and the dislodged mites was counted. Also the adult bees from which the varroa mites were recovered were counted to calculate the ration of the mite to the adult bees. In addition, a brood comb sections of 5 cm×5 cm drone and/or worker pupae areas were cut from each experimental bee colony and examined for varroa mites. A minimum of 100-200 pupae were uncapped and pulled out of their cells and examined for varroa mites. Both the number of larvae examined and the number of varroa mites recovered were recorded. Likewise, bees' collected resources (nectar and pollen) as well as brood areas measurement and estimations of adult bee population were done using standard method of Liebefelder method (Gerig, 1983). Statistical computations were done based on three years mean value for each of the parameters. For the varroa mite strain classification, morpho-metric measurements on the width and length of adult varroa mites were done using stereomicroscope (40x magnifications fitted with micrometers). Accordingly, body measurements of 10 varroa mites from each site were taken and their mean values were considered representing the varroa strain of the site. Results Currently, beekeeping in the country is challenged by multiple factors like reduction of habitat, destructions of bee forage sources vegetation and indiscriminate agrochemical application. However, the recent investigation of varroa mites being distributed in most parts of the country (Desalegn B., 2015 and HBRC, 2015) has raised great anxiety. Certainly, an investigation that

Livestock Research Proceeding
158
0
50
100
150
200
250
300# of mite on bee
Months
Are
a unit
establishes the type(s) of varroa mite strain, seasonal dynamics and magnitude of the parasite’s effect on bees and their product is vital. Accordingly, this study presents the research finding that addresses the aforementioned issues. Seasonal dynamics of varroa mite The mean value of monthly collected three years data indicated that adult varroa mites are present in all the experimental bee colonies throughout the years. However, the adult varroa mite population is slightly high during dry seasons of December-January and April-June (Figure-1). This is in line with the finding that states the varroa mite population dynamics is influenced by its host population dynamics as well as by internal and external factors (Fries et al., 1994 and Darabus et al., 2011). The results from the brood bee analysis also indicated presence of varroa mites in bee colonies throughout the year. However, in the months of January, March and July the population of varroa mites recovered were low and this might be attributed to low brood rearing in these dry months. In dry season, there is low brooding tendency and this hider the growth and reproduction of the mites, which in most cases depends on the availability of bee brood (Rosenkranz et al. 2010 and Darabus et al. 2011).
Figure 2: Seasonal dynamics of varroa mite over the months Effects of varroa mites on bees and bee collected resources Determining the level of inflicts caused by the varroa mite on bees and bee product is one of the objectives of this study. For the purpose, the monthly mean values of the data collected for three years over the nectar and pollen areas, bee colony population were correlated against the number of varroa mites recovered through adult and brood bee sampling. The, bee colony strength and nectar storage areas were analysis against or the number of varroa mite recovered through adult and brood bees (Figure-2).

Livestock Research Proceeding
159
Figure 3: Effects of varroa mites on bees and their products as evaluated over the months The result showed that the level of varroa mite is positively correlated and seasonally fluctuated along with bee occupied areas and nectar stored areas (Figure-2), suggesting bee population and bee's activities in nectar collections were not affected by the varroa mite. This result agrees with the finding that state significant positively correlation between level of varroa mites and colony size (Muli et al. 2014). Reproduction of varroa mites is closely synchronized with the brood development of the host and hence the colony strength (Rosen kranz et al. 2010) as well as brood less period reduces mite population growth and bee colonies during honey flow season are more likely to be infested by varroa mites (Darabus et al. 2011). In fact, this is despite the killing nature and historical records the mite in causing be colony collapse on European honeybees if not chemically treated (Webster and Delaplane 2001). On the other hand, there are report indicating African and Africanized honeybees did not succumbed to varroa mite attacks (Camazine, 1986, 1988, Vandam et al., 1995, De Jong, 1997; De Jong and Gonçalves, 1998, Medina et al., 2002; Mondragon et al., 2006; Allsopp, 2006, Fries and Raina, 2003). Several mechanisms that may be responsible for this tolerance have been investigated, including reduced reproduction by the mites (Ritter and De Jong, 1984), greater fficiency in removing infested brood (Corrêa-Marques and De Jong, 1998; Guerra et al., 2000), and increased grooming behavior (Moretto et al., 1991, 1993). Varroa strain classification Ten morpho-sizes (widths and lengths) of varroa mites collected for each 17 different localities were measured and compared using one way ANOVA (Duncan) to see if there are significant differences in their body sizes as a clue for different varroa mite strains. The mean results of 10 varroa body measurement revealed slight differences both in lengths and widths classifying the mites into five morpho-clusters (Table-1). However, the differences in body size measurements of varroa mites collected from different localities is not statistically significant (P>0.05). This suggests varroa mites that are distributed to different localities belong to similar strain and the slight body size differences can be phenotype alter due to environment.
0
100
200
300
400
500
600
700
800
900
1000 nectar area
bee area
# of varroa mites
pollen area
Num
ber o
fvar
roa
mite
s with
bee
&
nect
ar a
reas
Months

160
Livestock Research Proceeding
Table 2: Mean body width and length measurements of varroa mites collected from 17 localities Width (µm), Duncan Length (µm), Duncan Sample places N Cluster categories Cluster categories
1 2 3 4 5 1 2 3 4 5 w/Arsi 10 1712.50 1070 Tefki 10 1757.50 1757.50 1107.50 1107.50 Holeta 10 1767.50 1767.50 1767.50 1119.45 1119.45 Asela 10 1769.45 1769.45 1769.45 1150.00 1150.00 Muger 10 1777.50 1777.50 1777.50 1155.00 1155.00 Adama 10 1787.50 1787.50 1155.00 1155.00 Jijiga 10 1790.00 1790.00 1157.50 1157.50 Sebeta 10 1812.50 1812.50 1165.00 1165.00 A/alem 10 1813.89 1813.89 1165.00 1165.00 Mojo 10 1820.00 1820.00 1167.50 1167.50 Jima 10 1825.00 1825.00 1172.50 1172.50 Wolliso 10 1835.00 1197.22 1197.22 Gedo 10 1837.50 1202.50 1202.50 Machew 10 1912.50 1202.50 1202.50 Adewa and Aksum 10 1943.33 1943.33 1247.50 1247.50 Mekele 10 1950.00 1950.00 1263.33 1263.33 Moyale 10 1997.50 1295.00 Mean 1756.89 1792.08 1803.26 1935.28 1963.61 1098.98 1151.44 1171.79 1222.61 1268.61

Livestock Research Proceeding
161
Table 3: Comparative analysis of local varroa mite morpho-sizes with literature established sizes
S/N Study sources Length (mm) Width (mm)
1 V. jacobsoni (Anderson &Trueman 2000) 1063.0 1506.8
2 V. destructor (Anderson &Trueman 2000) 1167.3 1708.9
3 V. destructor (Rahmani et al 2006, Iran) 1197.2 - 1200.1 1775.6 - 1789.9
4 Ethiopia 1098.98- 1268.61 1756.89- 1963.61
5 Average (Ethiopia) 1182.69 1850.22 Conclusion and recommendation Based on this study, Varroa mite existed the whole season with local bees with minor differences in number across the study months. Moreover, this study identified the strain of Varroa mite that is associated with local bees is varroa destructor. The correlation between the number of varroa load with adult bee population, measured brood, nectar and pollen areas indicated less effects of the mite. Although further research investigation is required, from this study, it can be concluded that the effects of varroa mite is not significant. Further research that focus on developing and implementing honeybees with genetic-based resistance to Varroa mites is recommended References Allen, M.F., Ball, B.V., 1996. The incidence and world distribution of the honey bee viruses. Bee World
77, 141-162. Allsopp, M., 2006, Analysis of Varroa destructor infestationof southern African honey bee populations.
MS Thesis, University of Pretoria, Pretoria, South Africa Allsopp, M., Govan, V., Davison, S., 1997, Bee health report: Varroa in South Africa. Bee Wld. 78, 171-
174 Anderson DL, Trueman JWH. 2000. Varroa jacobsoni (Acari: Varroidae) is more than one species.
Experimental and Applied Acarology 24: 165-189. Anderson, D L (2000) Variation in the parasitic bee mite Varroa jacobsoni Oud. Apidologie, 31:281-292 Bailey, L., Ball, B.V., 1991. Honey Bee Pathology, Academic Press, London. Camazine, S., 1986, Differential reproduction of the mite Varroa jacobsoni (Mesostigmata, Varroidae),
on Africanized and European honeybees (Hymenoptera, Apidae). Annales of the Entomological Society of America 79, 801-803
Camazine, S., 1988, Factors affecting the severity of Varroa jacobsoni infestations on European and Africanized bees, In: Needham, G.R., Page, R.E, Jr. (Ed.) Africanized honeybees and bee mites. Ellis Horwood Ltd., Chichester, pp. 444-451
Corrêa-Marques, M.H. and De Jong, D. (1998). Uncapping of worker bee brood, a component of the hygienic behavior of Africanized honeybees against the mite Varroa jacobsoni Oudemans. Apidologie 29: 283-289
De Jong, D. (1997). Varroa and other parasites of brood. In: Pests, Predators and Diseases of Honeybees (Morse, R.A., ed.). 3rd edn. A.I. Root Co., Medina, OH, USA, pp. 231-279
De Jong, D. and Gonçalves, L.S. (1998). The Africanized bees of Brazil have become tolerant to Varroa. Desalegn Begna (2014). Assessment of Pesticides Use and its Economic Impact on the Apiculture
Subsector in Selected Districts of Amhara Region, Ethiopia. Environ Anal Toxicol 2014, 5:2 http://dx.doi.org/10.4172/2161-0525.1000267

Livestock Research Proceeding
162
Desalegn Begna (2014). Occurrences and Distributions of Honeybee (Apis mellifera Jemenetica) Varroa Mite (Varroa destructor) in Tigray Region, Ethiopia. J Fisheries Livest Prod http://dx.doi.org/10.4172/2332-2608.1000126
Desalegn Begna (2015): Honeybee diseases and Pests research progress in Ethiopia: A review Dietemann, V., Pflugfelder, J., Anderson, D., Charrière, J.D., Chejanovsky, N., Dainat, B., de Miranda,
J.R., Delaplane, K., Dillier, F.X., Fuchs, S., Gallmann, P., Gauthier, L., Imdorf, A., Koeniger, N., Kralj, J., Meikle, W., Pettis, J., Rosenkranz, P., Sammataro, D., Smith, D., Yañez, O., Neumann, P., 2012. Varroa destructor: research avenues towards sustainable control. J. Apic. Res. 51, 125- 132
Dietemann, V., Pirk, C.W.W., Crewe, R.M., 2009. Is there a need for conservation of honeybees in Africa? Apidologie 40, 285-295
Ellis, J.D., Munn, P.A., 2005. The worldwide health status of honey bees. Bee World 86, 88-101. Fazier M, Eliud M, Tracy C, Daniel S, Baldwyn T, et al. (2009) A scientific note on Varroa destructor
found in East Africa; threat or opportunity? Apidologie 41: 463-465 Fries, I., Raina, S., 2003, American foulbrood and African honeybees (Hymenoptera: Apidae). J. Econ.
Entomol. 96, 1641-1646 Gerig L, (1983) Lehrgang zur Erfassung der volksstarke, Schweiz. Bienen-Ztg. 106: 199-204 Guerra, J.C.V., Gonçalves, L.S. and De Jong, D. (2000). Africanized bees (Apis mellifera L.) are more
efficient at removing worker brood artificially infested with the parasitic mite Varroa jacobsoni Oudemans than are Italian bees or Italian/Africanized hybrids. Genet. Mol. Biol. 23: 89-92
Hepburn, H.R., Radloff, S.E., 1998. Honeybees of Africa. Springer, Berlin Holeta Bee Research center (HBRC) (2010). Report Krell R (196). value-added products from beekeeping, food and agriculture organization of the United
Nations Rome 1996, FAO, AGRICULTURAL SERVICES BULLETIN No. 124 Martin, S.J., Kryger, P., 2002. Reproduction of Varroa destructor in South African honey bees: does cell
space influence Varroa male survivorship? Apidologie 33, 51-61. Medina, L.M., Martin, S.J., Espinosa-Montano, L., Ratnieks, F.L.W., (2002). Reproduction of Varroa
destructor in worker brood of Africanized honeybees (Apis mellifera). Exp. Appl. Acarol. 27, 79-88
Mondragon, L., Martin, S., Vandame, R., (2006). Mortality of mite offspring: a major component of Varroa destructor resistance in a population of Africanized bees. Apidologie 37, 67- 74
Moretto, G., Gonçalves, L.S. and De Jong, D. (1991). Africanized bees are more efficient at removing Varroa jacobsoni - Preliminary data. Am. Bee J. 131: 434
Moretto, G., Gonçalves, L.S. and De Jong, D. (1993). Heritability of Africanized and European honey bee defensive behavior against the mite Varroa jacobsoni. Rev. Bras. Genet. 16: 71-77
Moretto, G; Gonçalves, L S; DE Jong, D; Bichuette, M Z (1991) The effects of climate and bee race on Varroa jacobsoni Oud infestations in Brazil. Apidologie 22: 197-203
Rahmani H., K. Kamali, A. Saboori and J. Nowzari (2006). Report and Survey of Morphometric Characteristics of Varroa destructor (Acari:Varroidae) Collected from Honeybees in Tehran Province, Iran, Research Note
Ritter, W. and De Jong, D. (1984). Reproduction of Varroa jacobsoni O. in Europe, the Middle East and tropical South America. Z. Angew. Entomol. 98: 55-57
Rosenkranz P., Aumeier P. and Ziegelmann B. 2010. Biology and control of Varroa destructor. J. Invertebr. Pathol, 103: 96-119
Strauss Ursula, Hannelie Human, Laurent Gauthier, Robin M. Crewe, Vincent Dietemann, Christian W.W. Pirk (2013). Seasonal prevalence of pathogens and parasites in the savannah honeybee (Apis mellifera scutellata). Social Insect Research Group, Department of Zoology and Entomology, University of Pretoria, South Africa
Webster TC, Delaplane KS. 2001. Mites of the Honey Bee. Dadant and Sons, Inc., Hamilton,Illinois. 280 pp

Livestock Research Proceeding
163
Assessing the optimum prolific age of queen honeybee (Apis mellifera bandasii)
*Zewdu Ararso, Tadele Alemu and Gemechis Legese
Holeta Bee Research Center.Oromia Agricultural Institute
*Corresponding: E-mail: [email protected] Abstract The study was conducted to determine the effects of queen age on brood pattern, brood population, swarming behavior and colony’s honey yield under Holeta Bee Research Center Apiary conditions from 2011 – 2013. The queens were reared; nuclei colonies formed and then transferred to standard Langstroth hives during the active season (September 2011). Performances of the colonies at first, second and third year compared. The average brood area, number of empty cells/100 cells, number of queen cell cups and swarm cells constructed, and honey yield were determined as performance criteria. The average brood areas throughout the experiment in one, two and three year queens were 4721.43±511.85cm2, 5523.08±490.07 cm2, 3433.82±413.83 cm2; the average number of empty cells/100 cells was 1.86±0.38, 2.40±1.65, 8.85±2.52; number of queen cell cups and swarm cells constructed was 0.07±0.07, 2.23±0.52, 9.90±1.89; and the average of honey yields was 13.34± 1.11, not harvested, 10.50 ±2.04 kg per colony, respectively. A weak positive correlation (r = 0.21; P= 0.09) between the number of queen cups and swarm queen cells constructed and the brood area was observed. The colonies headed by young queens had more brood areas, better brood pattern, less swarming tendency and better honey yield (by 27%) compared to colonies headed by old queens. These results, suggest that the queen’s age affects the overall colony strengths and the honey yields. Key words: Queen, Queen Age, Requeening, Swarm and Queen cells Introduction It is generally accepted that the longevity of a queen bee in various climates varies between 1 and 4 years (Seeley, 1968). However, the queen maintains its productivity only for the limited time of her lifetime. As the queen bee gets older and older she starts to produce insufficient queen pheromones that could be one of the major causes for supersdure (Crane, 1990). The ageing of queen bee affects both her attractiveness to workers (De Hazan et al., 1989) and her power to inhibit building of playing queen cells and swarm queen cells (Lensky and Slabezki, 1981). The queen’s mandibular gland structure and its pheromone’s chemical compositions, and tarsal gland secretion are also age dependent. Different studies conducted in temperate climates of England (Simpson, 1959), New Zealand (Forster, 1969) and Poland (Woyke, 1981), colonies headed by 1 year old queens performed better than those headed by 2 year old queens (Hauser and Lensky, 1994). Conversely, the work of Szabo and Lefkovitch (1991) in Canada indicated that there was no difference in performance between 2 year old queens and 1year old queens. However, according to the latest study conducted in subtropics (Israel) by Hauser and Lensky (1994), colonies headed by 7 to 10 month old queens had higher brood areas, honey yields and constructed less swarm queen cells than in those headed by up to 20-month-old queens during the nectar flow season. As a result annual requeening of bee colonies in commercial bee yards has been implemented as routine practice in Israel (Hauser and Lensky, 1994). Interestingly, in the Far East tropics (Thailand, and Taiwan) many commercial beekeepers who use A. mellifera bees for the production of honey or royal jelly, requeen the colonies every 6 months. In addition to climate the longevity of queen bees could be affected by the flow and resource fullness of the area. Furgala and McCutcheon (1992) indicated that those queens with constantly flow of resource and with a high constant rate of egg laying can get exhausted after a year. Similarly, Crane (1990) indicated that in resource rich areas where the environmental conditions allow full activities of the colonies for a longer period of a year, a queen lays eggs rapidly through almost the whole season. Under

Livestock Research Proceeding
164
this situation the queens get exhausted soon and become less efficient in heading the large colonies in short period of their life time as opposed to those queens in longer dearth period areas. Maximizing honey production depends on bee management that prepares a strong colony at the beginning of honey flow since the queen’s age and the season affect honey yields through the population level of workers. One component of successful bee management is to have prolific young queen that lead the colony for high honey yield. As the queen honeybee became aged she started to lay fewer eggs, and the proportion of these may give rise to drones. For beekeepers aiming to get large colonies and a high honey yield, it is therefore important to requeen a queen before it becomes old. Young queens, regardless of genetic origin, can lay more eggs than old queens. Laying more eggs means higher brood production and this therefore increases the colony's bee population. In turn, more bees contribute to increased honey production as well as higher standards for pollination. Colonies with younger queens are less likely to swarm, which is advantageous as swarming weakens the colony, which also greatly reduces its honey production. Though different queen rearing techniques have been tested and positive response was gained (Nuru and Dereje, 1999; Zewdu et al., 2013; Tadele et al., under review) there is no quantitative data about the effect of the queen’s age on the performance of honey bee colonies in Ethiopia. Therefore, this experiment was intiated to determine the effects of queen’s age on some biological characteristics (brood population, brood solidness, swarming behaviour and honey yields) of the honeybee colonies under central highland conditions (Holeta). Materials and methods Bee colonies The expewriment was conducted using central highland honeybee (Apis mellifera bandasii) colonies at the Apiary of the Holeta Bee Research Center, , from 2011 to 2013. The colonies were hived in Langstroth box hives. Queen rearing All queens were reared in May 2010 from a stock obtained during the preceding active season (September to November 2010) from local beekeepers around Holeta. The queens were reared using splitting and grafting methods. For each nucleus formation two full combs of bees were used. One comb with store was given to each nucleus. Then the nuclei were moved to an area 1 km away from their mother colonies. The hatched queens in the cage were given to the newly formed nuclei and they were released from the cages 24 hrs latter and left for open mating; and supplementary feed was given to the nuclei colonies. After confirming of egg laying, each queen was marked on her thorax with queen marking glue and numbered. Nuclei colonies were transferred to standard Langstroth hives during the next active season (September 2011). Colony management Feeding During the dearth period (dry and wet seasons) all colonies were fed with 50% (w/v) sugar syrup (4 litres per season per colony). Swarming prevention and control At the beginning of active seasons (September to November and April to June) prior to main nectar flow, inspection was carried out and supper was given to each of the experimental colony when adult workers occupied almost all the existed combs. . Once every twenty one days during the active seasons (spring and autumn) queen cups and swarm queen cells were counted and removed.

Livestock Research Proceeding
165
Brood area Once a month, from September to the end of November, all surfaces of the combs containing open and sealed broods were measured with a wire grid (5cmx5cm). The brood area was calculated based on the total numbers of the 25cm2 area. Brood solidity The brood pattern was rated as follows: excellent , a solid appearance with very few empty cells among the sealed broods (0 to 3 empty cells per 100 cells); very good ( 4 to 7 empty cells per 100 cells); good (8-11 per 100 cells) and compact appearing brood; fair (12-20 empty cells per 100 cells); poor many empty cells among sealed cells (over 20 empty cells per 100 cells) (Laidlaw, 1979). Construction of queen cups and swarm queen cells Queen cups and swarm queen cells in brood chambers of each colony were counted and destroyed once a month during active seasons of the study period. The total number of queen cups and swarm queens cells per colony per season were determined. Of the total number of colonies, the percentage of those that constructed queen cups and swarm queen cells were calculated. Honey yields Honey was extracted only from supers at the end of nectar flow (November and June). Frames from each super was marked and weighed separately. The weight of the frames from which honey was extracted was subtracted and net honey yield (kg/colony) was calculated. Statistical analyses Data were analysed by SAS GLM and correlation analyzed using SPSS version 20). Tukey’s studentized test (HSD) at 5% level of significance was used to make mean separation whenever necessary. Results and discussion The effect of the age of the queen on brood area The average brood area of two years old queen was 57% higher than that of three years old queen (p < 0.05). However, there was no significant difference between the average brood area of 1 year and two years old queens. One year old queen produced 33% higher brood areas compared to that of three old queens (P<0.05). This result indicates that brood rearing activity of a queen decreased as the age of queen increased. The colonies with young queens were found to be more prolific than those headed by older queens. This result was in agreement with the findings of different authors (Woyke, 1984; Hauser and Lensky, 1994; Akyol et al., 2007; Akyol et al., 2008; Hatjina et al., 2014). The effects of the age of the queen on queen cups and swarm queen cells The number of queen cups and swarm queen cells constructed in colonies headed by 3 years queens was 4.46 times higher than the 2 years old queens and even more times of queen cells compared to those younger queens (1 year old queens) (table 1). The queen’s age had a highly significant (P< 0.01) effect on the construction of queen cups and swarm queen cells. The construction of the queen cups and swarm queen cells in uncongested colonies was weakly affected by brood population. There was only a slightly (weak) significant correlation (r = 0.21; P= 0.09) between the number of queen cups and swarm queen cells constructed by a colony and the amount of brood area during the study period. The fact that there was weak correlation between the brood area and the construction of queen cups and swarm queen cells ought to have a comment. By on time supering to increase the volume of the experimental hives was done to prevent conditions of congestion and high density of workers in the brood chamber which could induce swarming. Yet in these uncongested conditions, the results of this study show that the intensity of the constructions of queen cups and swarm queen cells considerably increased with the queen’s age. It is well known that colonies with older queens

Livestock Research Proceeding
166
have a higher swarming tendency (Winston, 1987; Uzunov et al. (2014). This could be attributed to the less efficiently inhibited the construction of swarm queen cells than young queens. A similar trend had been reported from subtropical climate (Hauser and Lensky, 1994). The age of a queen bee affects both her attractiveness to workers (De Hazan et al., 1989) and her power to inhibit building of queen cups and swarm queen cells (Lensky and Slabezki, 1981). Table 1. The effect of queen’s age on brood surface, construction of queen cups and swarm queens cells, brood solidness and honey yield Queen’s age Brood area
(cm2/colony) No. queen cups and swarm cells/ colony/season
No. of empty cells/100cells
Honey yields (kg/colony)
1 year old 4721.43±511.85AB 0.07±0.07B 1.86±0.38B 13.34± 1.11A 2 years old 5523.08±490.07A 2.23±0.52B 2.40±1.65B . 3 years old 3433.82±413.83B 9.90±1.89A 8.85±2.52A 10.50 ±2.04A Averages assigned the same letters do not significantly differ at P< 0.05. Brood solidity Brood solidness is expressed by the percentage of empty worker cells in a brood patch of a given area. The brood solidness in colonies headed by 1 year and 2 years old queens were significantly (p < 0.01) higher (1.86 and 2.40 empty cells among the sealed brood per 100 cells , respectively) than those headed by 3 years old queens (8.85 empty cells per 100 cells) (table 1). The value obtained from three years old queens was below the value for very good brood pattern (4% - 7% empty cells per 100 cells). The higher the percent of empty cells, suggests the reduced potential of a queen. At this age the queens displayed brood with relatively less solid as stated by Laidlaw (1979). Furthermore, this value is very closer to the rejection percent of empty cells which is 10% (Delaplane et al., 2013). The effect of queen’s age on honey yields Even though , colonies headed by young queens (1year old queens) yielded 2.85 kg/colony more honey than those with 3 years old queens, the the mean honey yield difference is not statically significant(P>0.05).Honey yield was not recorded during the second year due to adverse weather conditions happened at a time of honey harvesting. It has been noted that in adverse weather conditions, the activity of foragers drop, leading to lower honey store (Mattila and Otis, 2006). In opposite to our current results, colonies headed by 1 year old queens in temperate zones and colonies headed by 6-7 month old queens in sub tropics produced more honey than colonies headed by 2 years old and 10-12 moth old queens, respectively (Woyke, 1981; Hauser and Lensky, 1994). Colonies headed by younger queens showed higher fecundity, good brood patterns and, less queen cups and swarm queen cells than those headed by older queens. Although the honey harvested from colonies led with older queens was none significant, the colonies became weaker in older queens, having less bees and brood population(Hatjina et al., 2014). The larger size of brood area with good pattern and less swarm queen cells positively affect the amount of collected nectar and honey yield. Moreover, the honey yields also get started to declining during the third. These results, suggest that the queen’s age affects the overall colony strength and the honey yields. Therefore, under Holeta (highland) conditions, it better to re-queen colonies headed by older queens more than two years. Conclusion and recommendation The results of this study support the previous data that the queen’s age is one of the most important factors affecting the performance of colonies (Woyke, 1971; Hauser and Lensky, 1994; Akyol et al., 2007; Akyol et al., 2008). The best results were obtained from colonies lead by one and two year queens, which had younger queens than the three years old queens. Colonies headed by young queens performed

Livestock Research Proceeding
167
well more than the three years old ones. This suggests that possibly the use of old queens is one of the reasons for low performance of local honeybees. Thus old queens should be replaced, for better results after the third year. . Acknowledgements We would like to express our deep appreciation to Oromia Agricultural Research Institute (OARI) who supported this experiment. A special thanks to the technical staff, in particular Mr. Terefe Chimdi. References Akyol, E., Yeninar, H., Karatepe, M., Karatepe, B., Özkök, D., (2007). Effects of queen ages on Varroa
(Varroa destructor) infestation level in honey bee (Apis mellifera caucasica) colonies and colony performance. Ital. J. Anim. Sci. 6,pp143-149.
Akyol, E., Yeninar, H., Korkmaz, A.and Cakmak, I. (2008). An observation study on the effects of queen age on some characteristics of honey bee colonies. Ital. J. Anim. Sci. 7:19-25.
Crane E. (1990). Bees and Beekeeping. Heinemann Newnes, Oxford, UK. pp.611. De Hazan, M., Lensky, Y. and Cassier, P. (1989). Effects of queen honeybees (Apis mellifera L) ageing
on her attractiveness to workers. Comp. Biochem. Physiol. 93App 777-783. Delaplane, K. S., Van Der Steen, J. and Guzman, E. (2013). Standard methods for estimating strength
parameters of Apis mellifera colonies. In V Dietemann, J D Ellis, P Neumann (Eds). The Coloss bee book, Volume I: standard methods for Apis mellifera research. Journal of Apicultural Research 52(1). pp--
Forster, W.I. (1969). Swarm control in honeybee colonies. N. Z. J. Agric. Res. 12 pp 605-610. Furgala, B., McCutcheon D. M. (1992). Wintering productive colonies. In: The hive and the honey bee.
(Graham J. M., Ed.). Dadant & Sons, Hamilton, Illinois. pp 829-868. Hatjina, F., Costa, C., Büchler, R., Uzunov, A., Drazic, M., Filipi, J., Charistos, L., Ruottinen, L.,
Andonov, S., Meixner, M.D., Bienkowska, M., Dariusz, G., Panasiuk, B., Le Conte, Y., Wilde, J., Berg, S., Bouga, M., Dyrba, W., Kiprijanovska, H., Korpela, S., Kryger, P., Lodesani , M., Pechhacker, H., Petrov, P and Kezic, N. (2014). Population dynamics of European honey bee genotypes under different environmental conditions. Journal of Apicultural Research 53, pp 233-247.
Hauser, H. and Lensky, Y. (1994). The effect of the age of the honey bee (Apis mellifera L) queen on worker population, swarming and honey yields in a subtropical climate. Apidiologie 25, pp 566-578.
Laidlaw, H.H. (1979). Cotemporary Queen rearing. Dadant and Sons Inc., Hamilton, Illinois. pp. 199. Lensky, Y. and Slabezki, Y. (1981). The inhibiting effect of the queen bee (Apis mellifera L) foot-print
pheromone on the construction of swarming queen cups. J. Insect Physiol. 27, pp 313-323. Mattila, H. R. and Otis, G. W. (2006). Influence of pollen diet in spring on development of honey bee
(Hymenoptera: Apidea) colonies. Journal of Economic Entomology 99(3), pp 604-613. Nuru, A. and Dereje W. (1999). (thematic) Proceeding of the 7th annual conference of Ethiopian Society
of Animal Production (ESAP), 26-27 May 1999. Addis Ababa, Ethiopia. Seeley, T. D. (1968). Life history strategy of the honey bee Apis mellifera. Oecologia 32,pp 109-118. Simpson, J. (1959). Variation in the incidence of swarming among colonies of Apis mellifera throughout
the summer. Insectes Soc. 6, pp 85-99. Szabo, T. I. and Lefkovitch L. P. (1991). Development of overwintered honey bee colonies with one- and
two-year-old queens. Bee Sci.1, pp 144-150. Uzunov, A., Costa, C., Panasiuk, B., Meixner, M., Kryger, P., Hatjina, F., Bouga, M., Andonov, S.,
Bienkowska,M., Le Conte, Y., Wilde, J., Gerula, D., Kiprijanovska, H., Filipi, K., Petrov, P., Ruottinen, L., Pechhacker, H., Berg, S., Dyrba, W., Ivanova, E. and Büchler, R. (2014).

Livestock Research Proceeding
168
Swarming, defensive and hygienic behaviour in honey bee colonies of different genetic origin in a pan-European experiment. Journal of Apicultural Research 53.pp 248-260.
Woyke, J. (1981). Effect of sex allele homo-heterozygosity on honeybee colony populations and on their honey production. 2. Unfavourable development conditions and restricted queens. J. Apic. Res. 20,pp 148-155.
Winston, M. L. (1987). The biology of the honey bee. Harvard University Press, USA. pp. 281.

Livestock Research Proceeding
169
Insecticidal action of honeybees propolis extract against larvae of wax moth (Achroia grisella)
*Zewdu Ararso and Gemechis Legesse Holeta Bee Research Center,Oromia Agricultural Research Institute
*Corresponding: E-mail: [email protected] Abstract This study was conducted to evaluate the insecticidal action of honeybee propolis (bee glue) extract against lesser wax moth, Achroia grisella, as a possible way of integrated pest management. Contact toxicity assay was conducted in the laboratory using 70% ethanol extracted propolis that dissolved in 55% ethanol at the concentrations of 2%, 4%, 6%, 8% and 10% (w/v), and distilled water and 55% ethanol as controls. The percent mortality due to the treatments of the extract showed a significant result at 24hrs and 48 hrs after dipping the young larvae for 30 second. It was found that 8% and 10% (w/v) of propolis caused 90% and 80% mortality of wax moth larvae respectively. From these results, it can be concluded that ethanol extract of propolis at higher concentrations is a powerful contact toxicant against young wax moth larvae. Key words: Propolis, wax moth, Achroia grisella, ethanol extract, toxicity Introduction Colonies of the honeybee, Apis mellifera L., are susceptible to a number of pests and diseases whose damage has serious negative economic implications for both the beekeeping industry and agriculture worldwide. The pests and diseases have severely reduced the number of healthy colonies available for beekeeping as well as the hive products harvested from the colonies. Wax moth is one of such honeybee pests known to cause a great damage, unless controlled at early stage, because it feeds on wax, pollen and cocoons of the bee larvae. This leads to the destruction of honeycombs and subsequently weakens colonies. In Ethiopia, wax moth is widely distributed throughout the country and was reported the most troublesome pest of honeybees. Amssalu (unpublished data) estimated that wax moth causes the loss of 2.5, 2.9 and 2.5 tons of pure bees wax in West Shoa, South West Shoa and East Shoa Zones, respectively every year. In Ethiopia, there are no chemotherapeutic agents registered and used against wax moth. However, there are a number of techniques that can be used to minimize the effects of wax moth and a range of chemicals both synthetic and natural that were reported to have activity against wax moth ( Hornitzky, 2001). But dependence on the use of pesticides to combat bee pests is leading to several problems:increased treatment and labor costs, toxicological hazards to beekeepers and bees, risks of contaminating hive products and vulnerability to the evolution of pesticide resistance are some of the problems caused by use of pesticides against honeybee pests (Hornitzky, 2001). The problems associated with the use of pesticides provide considerable incentive to develop new treatment strategies and screening for potential bio-pesticides that minimize these problems. Natural products having components with various modes of action might provide effective solution to the problem of honeybee pests and diseases (Mutinelli et al., 1997; Imdorf et al., 1999). One of such natural products is propolis (bee glue), a complex mixture of several compounds collected by honeybees from plants, mixed with wax and used in the construction and protection of the beehives (Ghisalberti, 1979 cited in Garedew et al., 2002a). Much of the background on biological activity of propolis involves using propolis or components of propolis as treatments of disease (antibiotics). However, literature on the insecticidal action of propolis in honeybee colonies is very limited. Currently, there has been a logical transition into studying propolis as a

Livestock Research Proceeding
170
treatment to use in honeybee colonies. In this regards few studies examined the insecticidal and insectstatic (inhibition of larval development) properties of propolis against honeybee pests like Varoa destructor and greater wax moth, Galleria mellonella (Garedew et al., 2002a; Garedew et al., 2004). Therefore, this information and the prevalence of the most important honeybee pest, wax moth, encouraged to initiate this study to evaluate the contact toxicity effects of propolis extract against lesser wax moth as a possible way of integrated pest management. Materials and methods Propolis extraction and preparation Propolis samples used in these experiments was collected from scrapings of honeybee hives (movable frame hives) from Holeta and Bako apiaries of Holeta Bee Research Center in West Showa and East Wollega Zones. Collected propolis samples were weighed and placed in refrigerator until extraction. Pre weighed and frozen samples were mixed, pulverized and homogenized using a mortar and pestle. Before extraction 97% ethanol was diluted to 70% in distilled water. The homogenate powder was extracted in 70% ethanol. For effective extraction, 50g propolis powder was added and suspended in 450ml ethanol (70%) solution in a ratio of 1:9 (w/v) in a flask of 500ml volume following the procedure used by Garedew et al. (2002a). Three flasks of volume 500ml were used to extract 150g propolis powder in 1350ml ethanol (70%). The solution was left at room temperature in dark condition for 20 days and shaken once a day. Then the suspension was filtered using Wetman No.1 filter paper, after filtration, the solvent was totally evaporated in a water bath, at temperatures below 50°C following the procedure used by Farnesi (2009). The yield of extracted (pure) propolis was weighed. From the extracted propolis,10g dried propolis was weighed and dissolved in 27ml ethanol (55% v/v) to prepare a stock solution of 10% (w/v). Accordingly each treatment concentration (10%, 8%, 6%, 4%, and 2% (w/v)) was prepared from the stock solution by diluting it in 55% ethanol (v/v). Wax moth rearing and larval bioassay The wax moth larvae (lesser wax moth, Achroia grisella) were collected from the abandoned combs from f the apiaries of Holete Bee Research Center. Then larvae were cultured in a plastic cage (25x25x10 cm) at room temperature, in dark area (covered with towel). The rearing medium (larval food) was prepared from old and darker combs. 10g wax (broken wax) from the same wax used for rearing was weighed and placed in Petri Dish and assigned to each of 5 treatments and 2 controls with 3 replications and place in CRD. 10 young larvae of similar size and age were introduced into each Petri Dish. One day later, a contact bioassay was conducted by dipping 10 larvae in each concentrate for 30 seconds. After contact bioassay, larvae were returned back to their original feed in the Petri Dishes. An individual was considered dead if it showed no movement when gently prodded with a probe. If it showed movement it was counted as alive, irrespective of whether it was partially paralysed or normal. After 24hrs and 48hrs number of dead larvae was counted and removed. Moreover, observations were also made on the feeding condition, amount of debris and cocoon formation. Data on number of pupated and adult emerged were recorded. Data management and statistical analysis Data was analyzed using a one-way ANOVA of completely randomized design using (SPSS system for windows version 20, 2011). Tukey honest significance difference (HSD) at 5% level of significance was used for mean separations whenever significant results were encountered. Result and discussion The extracted yield using 70% ethanol was 2.4% (w/w).This yield is more lower compared to the yield of extraction reported by Garedew et al. (2002a). This could be attributed to a method of extraction and equipment (rotary evaporator) used for extraction. From the observation made during dipping the larvae in propolis extracts for 30 second resulted in 100% necrosis immediately after treatment regardless of the

Livestock Research Proceeding
171
concentration. The larvae treated with ethanol and 2% propolis recovered earlier, compared to the higher concentrations. Moreover, the control groups and those which treated with lower concentrations consumed relatively more of the broken wax and accumulated more debris. The one-way ANOVA computed on the percent contact mortality data from the 5 levels of concentrations and the controls showed difference in larvacidal action of propolis extract on wax moth. Mean percent mortality record of larvae at 24 hrs and 48 hrs after treatment, percent pupae failed to hatch, total mortality (at larvae and pupae stages) due to contact toxicity of the propolis extract and adult emerged, is shown in Table 1. The treatment with 55% ethanol did not show a significant killing effect (P>0.05) larvae exposed to it compared to distilled water, confirming that the ethanol does not have a considerable effect on the experimental waxmoth larva. This result is in agreement with the microcalorimetric toxicity results obtained on larvae, pupae and adults of the yellow meal worm Tenebrio molitor L. (Coleoptera: Tenebrionidae) (Garedew et al., 2002b). Table 1. Percent mortality of larvae of wax moth due to contact toxicity of propolis extract under different treatment with different concentrations (% w/v) dissolved in 55% ethanol.
Concentration of propolis (%w/v)
Mean ± SE % dead larvae at each observation time
Mean ± SE % mortality at pupa stage
Mean ± SE % total mortality at larval & pupal stages
Mean ± SE % of adults emerged
24hrs 48hr 10 80.00 ±0.00ab 83.33 ± 3.33a 10.00 ± 5.77a 93.33 ±3.33a 3.33 ± 3.33c 8 90.00 ± 5.77a 90.00 ± 5.77a 3.33 ± 3.33a 93.33 ±3.33a 6.67 ± 3.33c 6 53.33 ± 26.03abc 66.67 ± 16.67a 10.00 ± 5.77a 76.67 ±12.02ab 16.67 ± 12.02bc 4 46.67 ± 8.82abc 46.67 ± 8.82ab 16.67 ± 3.33a 63.33 ±8.82ab 36.67 ± 8.82bc 2 26.67 ± 14.53bc 40.00 ± 20.82ab 0.00 ± 0.00a 40.00 ±20.82bc 60.00 ± 20.82ab 55% ethanol 3.33 ±3.33c 6.67 ± 3.33b 3.33 ± 3.33a 10.00 ±0.00c 90.00 ± 0.00a Distilled water
0.00 ±0.00c 3.33 ± 3.33b 6.67 ± 6.67a 10.00 ±5.77c 90.00 ± 5.77a
Means followed by different letters within a column are significantly different at the 5% level of probability using Tukey Student Test (HSD). Propolis extract dissolved in 55% ethanol at higher concentrations caused significantly (p<0.05) higher mortality to wax moth larvae than the lower concentrations and untreated controls 24 hrs after treatment. As indicate Table 1, the larvacidal action of propolis increases with the concentrations. However, the larvae of wax moth responded similarly to all concentrations (P > 0.05) 48 hrs but significantly (P < 0.05) more larvae up to 90% were killed in propolis treated than the controls. On the other hand, adult emergence was observed in treatments of higher concentrations. This may suggest propolis extract at higher concentration accelerated larva and/or pupa development stage/stages. The abnormally higher rate of development may lead to malformed and immature individuals (Garedew et al., 2004). From different concentration of propolis, 8 and 10 % w/v were the most toxic causing 90% and 80% mortality, but not sginificantly different from 4 and 6 % concentrations. This result is inconsistent with the findings of Garedew et al. (2002a; 2002c) in which treatment of 10% (w/v) propolis extract resulted in 100% of moth mortality regardless of a treatment time. The sixth and seventh larval instars were reported to be more sensitive to treatments with propolis concentrations of 10% propolis that was resulted in 100% mortality of seventh larval instars (Garedew et al., 2004). On the other hand, earlier adult emergence was observed in treatments of higher concentrations. This may suggest propolis extract at higher concentration accelerated larva and/or pupa development stage/stages. The abnormally higher rate of development may lead to malformed and immature individuals (Garedew et al., 2004). In general, the use of propolis as an insecticide may help us to minimize the problem of environmental pollutions as result of synthetic insecticide applications. It also help to reduce the constantly increasing

Livestock Research Proceeding
172
insecticide resistance development. Since propolis is a complex natural product, having different components with various modes of action is unlikely or very slow (Imdorf et al., 1999). This study reveals that the ethanol extract of propolis at higher concentration has high toxic action. This sensitivity of the larvae of wax moth towards the ethanol extracts of propolis at higher concentration demonstrates that ethanol extract of propolis contains toxic compounds, which are natural insecticides that act by contact. Therefore, based on the results obtained, ethanol extract of propolis can be used as an insecticide against wax moth, if applied during larval developmental stage of the insect. However, further studies should be conducted on the way of application and practical suitability. Reference Assegid Garedew, Lamprecht, I., Schmolz, E. and Schricker, B. (2002a). The varroacidal action of
propolis: a laboratory assay. Apidologie 33pp 41–50. Assegid Garedew, A; Schmolz,E; Schricker, B; and Lamprecht, I. (2002b). Microcalorimetric toxicity
investigation of propolis on Tenebrio molitor L. (Coleoptera: Tenebrionidae). Thermochimica Acta 7124 pp: 1–7.
Assegid Garedew, A; Schmolz,E; Schricker, B; and Lamprecht, I. (2002c). Microcalorimetric toxicity investigation of propolis on Varroa destructor mites. Thermochimica Acta 382pp 211–220.
Assegid Garedew, Schmolz, E. and Lamprecht, I. (2004). Effect of the bee glue (propolis) on the calorimetrically measured metabolic rate and metamorphosis of the greater wax moth Galleria mellonella. Thermochimica Acta 413pp 63-72.
Farnesi, A.P., Aquino-Ferreira, R., De Jong, D Bastos, J.K., and Soares, A.E.E. (2009). Effects of stingless bee and honey bee propolis on four species of bacteria. Genet. Mol. Res. 8 pp 635-640
Hornitzky, M. (2001). Literature review of chalk brood – a fungal disease of honeybees RIRDC Publication No. 01/150.pp----
Imdorf, A., Bogdanov, S., Ochoa, R.I. and Calderone, N.W. (1999). Use of essential oils for control of Varroa jacobsoni Oud. in honeybee colonies. Apidologie 30pp 209–228.
Mutinelli, F., Baggio, A., Capolongo, F., Piro, R., and Prandin, L. (1997). A scientific note on oxalic acid by topical application for the control of varroosis. Apidologie 28pp 461–462
.

Livestock Research Proceeding
173
Performance evaluation of Apis mellifera bandasii ecotypes
*Zewdu Arorso and Tadele Alemu
Holeta Bee Research Center,Oromia Agricultural Research Institute *Corresponding : E-mail: [email protected]
Abstract Honeybee colonies exhibit a wide range of variation in their performance, depending on their genetic and environmental factors. Thus this study was conducted to evaluate the performance of honeybee colonies from different ecotypes. For this purpose 50 honeybee colonies per site and a total of 150 colonies were established at three different locations: Bako (representing mid highland), Gedo and Holeta (representing highland). The colonies were evaluated using brood rearing activities, resource collecting, brood solidness, swarming, defensive and hygienic behaviours, survival rates and honey yields parameters. Location (apiary) factor was considered in statistical analyses to estimate its effect on the performance. The results indicated that different ecotypes showed significant differences at their respective agro-ecologies. For most of the parameters assessed, variability was observed among apiaries at different locations while the variations in area of stored pollen, brood solidness and honey yield were not impressive. It was observed significant variability within the colonies of the same ecotype of the same subspecies. Thus, this study demonstrates that there is great performance variation among and within honeybee ecotype /strains of A.m. bandasii. Thus, sustainable selection and breeding strategy is important to make use of variations of native stocks. Key words: Ecotype, A.m. bandasii, honeybee, brood rearing, behaviour Introduction In recent decades knowledge about honeybee geographic and genetic diversity has greatly increased worldwide (Meixner et al., 2013). Likewise, identification of geographical honeybee races of Ethiopia had been conducted and the results revealed five geographical races. Apis mellifera bandasii is among these races. This geographical race is widely distributed in the central highland, covering more than 90% of the highlands of Ethiopia (Amsalu Bezabeh, 2002; Nuru Adgaba, 2002). Apis mellifera bandasii is relatively gentle, with less swarming and migratory tendency (Amsalu Bezabeh, 2002). Nevertheless, a honeybee strain that performs well in one region may not perform well in an area with different conditions, or indeed in another area with apparently similar conditions (Meixner et al., 2014). Because honeybee colonies display considerable geographical variation, resulting in agro-ecologically varying factors of climate, vegetation and also the prevailing pests and predators (Meixner et al., 2013). From this, it is apparent as the physical environment (altitude, vegetation, climate, etc) greatly affects the behavioural and the productivity of colonies. Honeybee colonies exhibit a wide range of variation in their performance, depending on their genetic and environmental factors. The variations include all the desired and undesired traits in terms of production, productivity and behaviour. Ruttner (1988) indicated that honeybee colonies do not perform equally even under the same environmental conditions and managerial practices. Thus beekeepers are currently looking for a high economic performance of honeybee colonies with desirable behavioural traits. In other countries, this has been achieved via mass importations and an increasing practice of queen trade and colony movement. In our case, these trends are impossible for two reasons: first importation of live bee is forbidden; second the processes contribute to changing the natural diversity of honeybee fauna. Consequently, evaluating, selecting and improving of local populations at various locations is paramount in our condition. For this to happen good quality stocks have to be established in apiaries; then

Livestock Research Proceeding
174
multiplied and maintained. Therefore, evaluation of better performing colonies of different ecotypes is very critical, at least to start with A. m. bandasii to lay foundation for future selection and improvement of this race. Materials and methods The performance evaluation of ecotyps of A. mellifera bandasii was conducted: at Holeta and Gedo (representing highland agro-ecology) and Bako (midlandAgro-ecology). 50 honeybee colonies collected from forest and back yard of respective areas were assigned at each study area. All experimental colonies were hived in zandar hive and received similar seasonal managements. Brood, nectar and pollen data collection To assess brooding performance, the comb areas occupied with capped and uncapped brood was measured using a frame consisting of a5 x 5 cm grid. The total brood population was calculated from the total area occupied by the brood. In similar ways comb area occupied by pollen and nectar stores were measured and the hoarding capacity was estimated. Brood solidness Brood solidness was determined by overlaying card board grid that delimits 100 cells over a section of sealed brood and subtracting empty cells to estimate percentage brood solidness. Determining behavioural parameters The evaluation of swarming, defensive and hygienic behaviour was carried out during the active seasons for two years. The behavioral traits were evaluated every time the colonies in the apiary were visited. The swarming tendency was assessed at the interval of 9 days during the active period. queen cells constructed in each colony was counted and culled to avoid swarming and double count. Queen cells for a natural supersedure of the queen are not considered while counting swarm cells. Calmness of bees on the comb was judged according to the four-point system: Bees to their combs without noticeable reaction = 4, bees are moving on the combs but do not leave their combs during inspectiont= 3, when bees partly leave combs and cluster on the edges of frames = 2, bees became nervous, left the combs and runt out and cluster out of the hive = 1. Intermediate scores (0.5) was used to better describe slight differences within population (Buchler eat al., 2013). For evaluation of the colonies’ hygienic behaviour the pin-killed test was used, where 100 cells containing pupae were pierced through the cell capping with an entomological pin size number 1. The removal of the pin-killed pupae by the adult bees was estimated after 24 hours. The test was repeatedly performed through the entire active season. Colony survival rates were calculated as survival rate = Number of colonies after the experiment divided by /Number of colonies at the beginning x 100 (Akyol et al., 2008), provided that all the colonies were kept under similar management condition. Honey yield Honey was extracted only from supers at the end of nectar flow (November and/or June). Frames from each super was marked and weighed separately. The weight of the frames from which honey was extracted was subtracted and net honey yield (kg/colony) calculated. All data was analyzed using GLM statics

Livestock Research Proceeding
175
Results and discussions The results of brood rearing, nectar and pollen storing, brood solidness, running behavior during hive inspection, hygienic behavior, queen cell construction (swarming tendency) and honey yield of colonies were presented in table 1&2. Brood rearing activity The brood area was significantly different among different apiaries. The ecotype and/or the environmental conditions at each particular apiary significantly affected the brood development of the honey bee colonies. The lowest overall brood area was displayed in the colonies placed relatively at lower altitude (1600m). This is may be due to shorter active season. Similarly the individual colony trait within the colonies of an apiary significantly different in brood production with an average brood areas ranging from 1125.00±1125.00 to 8100.00±4725.00 at Bako, 1181.25±797 to 6075.00±2025.00 Gedo and 5062.50 to 15187.50 at Holeta. The lower brood rearing activity at mid highland is inconsistent with the results reported by Hatjina et al. (2014). According to these authors, colonies at warmer areas tend to rear more broods than those at colder areas. On the contrast, Tadele et al. (2014) reported higher brood area during the best brood rearing season for Apis mellifera scutellata at Guji highland. From this we can deduce that brood rearing activity of a given trait of honeybee colonies is not affected only by temperature gradient of that particular area rather, there must be other factors to be considered. The stored area of pollen grains of different apiaries/ecotypes of A. m. bandasii was none significantly different, while a significant variation was observed in area of nectar stored (Table 1). Significantly higher nectar storage was recorded in Holeta apiary. In general, it was observed that the general trend of nectar storing coincided with the slight differences of the apiaries in their honey yield. On the other hands, the variation of colonies within same apiary for pollen grain storage was more pronounced. Pollen storage levels may have a direct effect on colony fitness as they are related to immediate colony growth rates via brood production (Odoux et al., 2014). However, in this study there was no clear trend of overlapping of pollen storage of specific colonies with their brood production trends. Brood solidness Brood solidness is expressed by the percentage of empty worker cells in a brood patch of a given area. The results showed that brood solidness, was not significantly (p>0.05) affected by the location/ecotype (table 1). This trait did not also differently expressed within the colonies of same apiaries. The mean values of number of empty cells per 100 cells for the three localities/ecotypes were below the maximum acceptable level of empty cells which is 10% (Delaplane et al., 2013). According to this results, brood solidness as a selection trait is less important. Table 1. Mean ± SE brood, nectar, pollen area, and brood solidness of honeybee populations of different ecotypes Locations Brood area
(cm2) Nectar area (cm2)
Pollen area (cm2) Brood pattern (no. of empty cells/100 cells)
Bako 2521.23±244.67b 1883.09±232.57b 357.83±62.70a 7.00±1.48a Gedo 3298.30±365.92b 1238.78±228.96b 487.07±110.57a 4.34±0.76a Holeta 6114.13±500.36a 3399.46±738.88a 374.67±102.56a 5.56±0.84a Means followed by similar letters in the column do not significantly different at alpha 0.05. Swarming behavior The analysis showed that swarming behaviour was highly significantly affected (p < 0.05) by location (table 2) and ecotyps. The variability among locations was much lower than among the colonies within the same apiary. The mean values of swarming behaviour (scores of swarm queen cells in the different

Livestock Research Proceeding
176
apiaries) ranged from 0.00 ± 0.00 to 5.67 ± 4.70 in Holeta, 12.00 ±4.76 in Gedo and to 24 ± 12.16 in Bako. Accordingly, higher variation of the swarming trait within colonies of the same apiary was observed. Since honeybee colonies were collected from forests and backyards local beekeepers around the apiaries in local basket hives, the age of the queens were not considered. However, the age of the queen used for the test can affect the expression of swarming behaviour of a colony (Uzunov et al., 2014). Overall, the ecotype of Bako was most prone to swarm, while the expression of the trait in ecotype of Holeta was very low (table 2). The results obtained at highland apiaries (Holeta and Gendo) are less than the average value of queen cells (2 queen cells/colony) reported for A. m. scutellata honeybees in Guji highlands (Tadele et al., 2014) while that of Bako is higher. The study by Uzunov et al. (2014) has shown that swarming trait may express at different levels in different honeybee populations. In modern beekeeping, beekeepers have for a long time recognised this behaviour, swarming (Crane, 1990), and performed breeding strategies to reduce their expression, in opposition to natural selection. In contrast to nature, beekeepers favour colonies that never swarm. Thus, the lower swarming tendency in some population of local honeybee colonies can be used as an advantage since swarming tendency can be considered as a selective trait that can be improved through a long-term breeding programme (Petrov, 2010). Defensive behaviour Location had a significant effect (p < 0.05) on defensive behavior of A. m. bandasii colonies of different ecotypes (table 2). The lowest scores (corresponding to the highest expression of defensive behavior) were found in colonies of Gedo and Bako. Moreover, colonies at Bako apiary observed to fight at a distance if inspected a previous evening during active season (September to October) (subjective observation). In contrast, the highest mean values, corresponding to the calmest ecotype was found at Holeta apiary. The defensive characteristic of honeybees appears to vary between regions, counties, locations and even within the same apiary, due to genetic and environmental factors (Garcia et al., 2013). According to Uzunov et al. (2014), the interaction between location and ecotype can affect the defensive behavior either negatively or positively. However, environmental conditions like higher or lower temperatures or the presence of predators intensify the defensive behavior. The lower defensiveness behavior of a local honeybee could also be a consequence of the management adaptation to the local bees (Southwick and Moritz, 1987; Breed et al., 2004 cited in Uzunov et al., 2014). In this regard, the weather condition, relatively more exposure to management and the behavioral trait at Holeta might have caused the ecotype to be relatively calm than those at the two apiaries. Table 2. Mean ± SE running behavior scores, swarming, hygienic, honey yield and percentages of absconding Locations Temperament Queen cells
constructed Hygienic Behaviour (% removed in 24 hrs)
Honey yield (kg)
Percent absconded
Bako 0.92±0.06b 2.19±0.49a 80.09±7.86b 10.89±1.61a 46 Gedo 1.11±0.0.09b 1.20±0.39ab 96.42±1.86a 10.18±1.54a 54 Holeta 1.67±0.12a 0.62±0.30b 93.78±1.74a 11.79±1.18a 36 Means followed by similar letters in the column do not significantly different at alpha 0.05. Hygienic behaviour Regarding hygiene behaviour, colonies from two apiaries (Gedo and Holeta) were more efficient in removing dead brood than the colonies at apiary of Bako (Table 2). As for the swarming behaviour trait,

Livestock Research Proceeding
177
the variability among the colonies within the same apiary was much higher than among the locations/ecotypes. The mean values of removal rates within the apiary ranged from 52.38% to 100% in Bako, 73.81% to 100% in Holeta and 85.71% to 100%in Gedo. Gramacho and Gonçalves (2009) consider honeybees to be hygienic when 80–100 % of the killed pupae are removed within 24 hours of the test. The variation within the colonies in same apiary, could be hygienic behaviour is genetically determined but is not expressed all the time, being highly variable, maternal effect as well as colony conditions such as population factors (Garcia et al., 2013). The difference in the cleaning rate among the locations is not surprising, as the trait is governed by genotypes and strong influence of environmental factors (location and season) (Uzunov et al., 2014). The expression of hygienic behaviour is reported to be affected by seasonal differences. It is likely that season and location interact to yield unique combinations of floral availability and nectar flow, which are known to influence the expression of hygienic behaviour (Uzunov et al., 2014). A careful attention should be made during conducting colony selection for its hygienic behaviour since this trait correlated with honey production (Garcia et al., 2013; Uzunov et al., 2014). Honey yields The performance of a honey bee colony can also be described by its ability to collect honey and become productive. Regarding honey production, there were no significant differences (p > 0.05) between apiaries, even though they were in different localities. This is most probably the colonies might be exposed to areas with similar resource access and because the honeybees were not selected for any traits. The values were much more close to the mean honey yield per harvest per hive of Apis mellifera scutellata of Guji Zone (Tadele et al., 2014) and below the most recent national mean, estimated by SCA (2015), an average of about 23kg per colony in movable frame hive per year. The reason for lower yield might be due to most of the colonies was wild, that was captured as swarms and was previously unmanaged. Moreover, the management of the colonies during this experiment did not allow normal practice for honey production, and it was not specifically orientated to honey production, rather it was to collect most biological data in order to see the effect of the ecotypes on their overall performance at their respective agro-ecologies. Hatjina, et al. (2015) suggested that colonies kept under intensive experimental inspection and frequent data collection tend to store less honey. The current result indicated that there is no yield variation among ecotypes considered which was not evaluated over generations. Nevertheless, honey production generally has heritability values varying from low to medium with its low genetic gain over generations due to environmental variations (Garcia et al., 2013). Furthermore, Rinderer (1986) suggested that, selection based on this characteristic can yield a good genetic gain, especially if they are used to aid selection. Thus, honey production shall not be over looked as a selection criterion. Absconding behavior Absconding is abandoning of a nest by a colony which forms a swarm and presumably re-establishes itself elsewhere (Winston, 1987). Shortage of resources and other factors could cause the absconding of African honeybees (Schneider, 1990). The highest absconding rate (54%) was recorded at Gedo followed by Bako (46%) while the least was recorded at Holeta (36%). These figures of absconding at three localities were higher than what was reported by Tadele et al. (2014) for A.m. scutellata at Guji highland. Though most of the colonies abandoned their nest during the dearth periods (dry and wet seasons), the exact underlying responsible causes for these absconding of local honeybees of different locations were not fully understood and needs further investigations.

Livestock Research Proceeding
178
Conclusion Honeybee colonies at the three different locations were evaluated for biologically most relevant factors like brood rearing, nectar and pollen storing, brood solidness, running behavior during hive inspection, hygienic behavior, queen cell construction (swarming tendency) and honey yield. The factor location (ecotype) was considered in statistical analyses to estimate its effect on the performance. The results indicated that different ecotypes showed significant variations at their respective agro-ecologies. The variations in area of stored pollen and brood solidness were less impressive. Though honey yield was not significant it should not ignored as selection parameter, as a honey yield of a given line has varying heritability values gain. Taken as a whole, the ecotype of Bako was most prone to swarming, while the expression of the behavior at Holeta was very low. Colonies at Bako were found more defensive followed by Gedo. Those at Holeta were found to be the least defensive of the three sites. Regarding the hygienic behavior, highland (Holeta and Gedo) colonies displayed high rate of killed brood removal. The difference in the cleaning rate among the locations is not surprising, as the trait is governed by genotypes and strong influence of environmental factors. In general the current results suggest the variations within the apiary and among the ecotypes are good potential opportunities for further stock improvement and selections of Apis mellifera bandasii colonies. Therefore, while carrying out selection of better performance lines within an apiary as well as among ecotypes of native stocks, due attention should be given to the varying variables. Thus,it is important to make use of variations of native stocks. References Akyol, E., Yeninar, H., Korkmaz, A.and Cakmak, I. (2008). An observation study on the effects of queen
age on some characteristics of honey bee colonies. Ital. J. Anim. Sci. 7:19-25. Amssalu Bezabih (2002). Multivariate Morphometric Analysis and Behaviour of honeybees (Apis
mellifera L.) in the Southern Regions of Ethiopia. PhD Thesis, Rhodes University, South Africa. Pp.109-214.
Büchler, R., Andonov, S., Bienefeld, K., Costa, C., Hatjina, F., Kezic, N., Kryger, P., Spivak, M., Uzunov, A. and Wilde, J. (2013). The influence of genetic origin and its interaction with environmental effects on the survival of Apis mellifera L. colonies in Europe. Journal of Apicultural Research 53(2)pp 205-214.
Crane, E. (1990). Bees and beekeeping: science, practice and world resources. Cornell University Press, Ithaca, New York, USA.
CSA (2015). Federal Democratic Republic of Ethiopia Central Statistical Agency, Agricultural sample survey 2014/15 [2007 E.C.], Report on livestock and livestock characteristics (private peasant holdings). Volume II, statistical bulletin 578, March 2015, Addis Ababa, Ethiopia.
Garcia, R.C., Escocard de Oliveira, N.T., Camargo, S.C., Pires, B.G., Lopes de Oliveira, C.A., Teixeira,R.A. and Pickler, M.A. (2013). Honey and propolis production, hygiene and defense behaviors of two generations of Africanized honey bees. Sci. Agric. 70 (2)pp 74-81.
Gramacho, K.P. and Gonçalves, L.S. (2009). Sequential hygienic behavior in Carniolan honey bees (Apis mellifera carnica). Genetics and Molecular Research 8 pp 655–663.
Hatjina, F., Costa, C., Büchler, R., Uzunov, A., Drazic, M., Filipi, J., Charistos, L., Ruottinen, L., Andonov, S., Meixner, M.D., Bienkowska, M., Dariusz, G., Panasiuk, B., Le Conte, Y., Wilde, J., Berg, S., Bouga, M., Dyrba, W., Kiprijanovska, H., Korpela, S., Kryger, P., Lodesani , M., Pechhacker, H., Petrov, P and Kezic, N. (2014). Population dynamics of European honey bee genotypes under different environmental conditions. Journal of Apicultural Research 53pp 233-247.
Meixner , M.D; Büchler1, R.; Costa, C.; Francis, R.M.; Hatjina, F.; Kryger, P.; Uzunov, A. and Carreck, N.L. (2014). Honey bee genotypes and the environment. Journal of Apicultural Research 53 pp 183-187.

Livestock Research Proceeding
179
Meixner, M.D; Pinto, M.A; Bouga, M; Kryger, P; Iivanova, E and Fuchs, S. (2013). Standard methods for characterising subspecies and ecotypes of Apis mellifera. In V Dietemann; J D Ellis and P Neumann (Eds). The COLOSS BEEBOOK, Volume I: Standard methods for Apis mellifera research. Journal of Apicultural Research 52(4).pp-----
Nuru Adgaba ( 2002). Geographical Races of the Honeybees (Apis mellifera L.) of the Northern Regions of Ethiopia. PhD Thesis, Rhodes University, South Africa. pp----
Odoux, J. F., Aupinel, P., Gateff, S., Requier, F., Henry, M. and Bretagnolle, V. (2014). ECOBEE: a tool for long-term bee colony monitoring at landscape scale in west European intensive agro-systems. Journal of Apicultural Research 53(1)pp 57-66.
Petrov, P. (2010). Organization and principles of queen selection and rearing in Bulgaria. Second Balkan conference on biology,pp21-23 May 2010, Plovdiv, Bulgaria.
Rinderer, T.E. (1986). Bee Genetics and Breeding. Academic Press, Orlando, FL, USA. Schneider, S.S (1990). Nest characteristics and recruitment behavior of absconding colonies of the
African honeybee, Apis mellifera scutellata, in Africa.” Journal of Insect Behavior, 3pp 225-240. Tadele Alemu, Gemechis Legesse, and Zewdu Ararso (2014). Performance Evaluation of Honeybee (Apis
mellifera scutellata) in Guji Zone. International Journal of Innovation and Applied Studies 9:pp1987-1993.
Uzunov, A.; Costa, C.; Panasiuk, B.; Meixner, M.; Kryger, P.; Hatjina, F.; Bouga, M.; Andonov, S.; Bienkowska,M.; Le Conte, Y.; Wilde, J.; Gerula, D.; Kiprijanovska, H.; Filipi, K.; Petrov, P.; Ruottinen, L.; Pechhacker, H.; Berg, S.; Dyrba, W.; Ivanova, E. and Büchler, R. (2014). Swarming, defensive and hygienic behaviour in honey bee colonies of different genetic origin in a pan-European experiment. Journal of Apicultural Research 53 pp 248-260.

Livestock Research Proceeding
180
On-farm Honeybee Forage Evaluation and Demonstration in the Highland of Bale
*Bekele Tesfaye, Temaro Gelgelu and Genet Dadi Sinana Agriculture Research Center, P.O. Box: 208, Bales-Robe, OARI, Ethiopia
*Corresponding E-mail: [email protected] or [email protected]
Abstract To respond to the demands of beekeepers for honeybee forages, on farm adaptation and evaluation trial of improved bee forages was carried out at the high lands of Bale. Eight different forage species: Lenorus, Sweet Clover, Trifolium repanse, Trifolium quartinarium, Phacelia, Synaps, Coriander, and Blackumin were planted and tested for their adaptability for three year (2011 to 2013) using single plot observation. Data on germination date, flowering date, blooming (100%), number of flowers per plant, number of branches, and shading time were collected and statistically analyzed. The flower intensity and bee attraction of the forages were evaluated at a field by the researchers and farmers. Based on botanical and field evaluation four bee forages: Phacelea, Synaps, Coriander and black cumin were selected for the high lands of Bale. Thus all responsible organizations in general and experts in particular, must join hands in promoting these forages in the areas. Keywords: Bee forages, Honeybee, Evaluation, Demonstrations, and Bale Introduction Apiculture is floral based industry and bees wholly depend on plants for their food (Crane, 1990). Bee colony performance as well as production of honey, wax and other hive products depends on forage plants from which honeybees obtain nectar and pollen as main food. These food sources provide the nutritional requirements of the bee colonies. Nectar provides heat and energy for honey bees and pollen provides protein, vitamins, fatty substance, and other nutrients (Amsalu, 2000). However, not all plants are important for honeybees. Plants that supply either/or both nectar and pollen abundantly are often called honeybee plants (Akratanakul, 1990). Although, honeybees play an important role in the economy of our country in general, and that of farmers’ in particular, the production and productivity of beekeeping in Bale highlands is low. This may be attributed to many factors of which the major one is shortages of bee forages as the results of expansion of cereals crop cultivation. . To minimize the extent of these problems and there by improve the production and productivity of bee keeping in highlands of Bale areas introduction of adaptable improved bee forages to such areas is of paramount importance. Therefore, the objective of this study was to evaluate and demonstrate different adaptable bee forage species which could be good sources of feed for apiculture production in the area. Materials and method Description of study area and materials used The study was conducted in three districts, namely Sinana, Agarfa, & Goba of highlands of Bale zone from 2011 to 2013 in main cropping season. From each district one potential beekeepers’ site was selected and used for evaluation and demonstration of the bee forages. Single plot observation was used to taste the adaptability of the forage species. Eight honeybees’ forage species: Lenorus, Sweet Clover, Trifolium repanse, Trifolium quartinarium, Coriander and Blackmun were planted on plot size of 12m2
that is a total of the 8 plots were used. Seed rates used were 10kg/hector for Lenorus, Sweet Clover, Trifolium repanse, Trifolium quartinarium, Phacelia tancetifolia and synaps and 15kg/hector for Coriander and Blackumin. Row spacing of 20 centimeter for Lenorus, Sweet Clover, Trifolium repanse, Trifolium quartinarium, Phacelia tancetifolia and synaps and 30 centimeter for Coriander and Blackumin were used; while 1 meter spacing between plots was used for all other species. Data on planting date, date of germination, date of flowering, number of flower per plant, date of blooming, number of branch per plant and shading time were collected. All necessary agronomic practices were applied. At the time of

Livestock Research Proceeding
181
50% flowering (Peak flowering), field day was organized and the performance of the honeybee forage species was evaluated by participants of field day. The data was organized and analyzed using SAS version 9.1.3 Software Results Average performances of the forage species evaluated are given in Table1. The result indicated that lenorus, sweet clover, Trifolium repanse, Trifolium quartinarium, coriander and Blackmun took longer time to germinate compared to phacelea and Synaps. On average, they took 13.89, 12.22, 14.78, 13 & 12.67 days, respectively, whereas phacelea, synaps and sweet clover took short time, 8.22, 7.56 & 10.44 days, respectively. Concerning days to flowering, Trifolium-repanse, phacelea, sweet clover and Trifolium-quartinarium took longer days with mean values of 81.5, 76.33, 79.00, & 70.78 days, respectively. On the other hand, synaps, blackcumin, & coriander, with respective values of 63.22, 66.78 & 67.78 took shorter days. The average date of blooming (100% flowering) for Trifolium-repanse, phacelea, sweet clover, Trifolium-quartinarium, blackumin, coriander and synaps were 91, 88.11, 88.67, 77.67, 82.56, 78.67, 73.89 days, respectively (Table 1). Coriander had many number of flowers per plant (81.11) than other species of honeybees forages. Blackumin, Phacelea and synaps produced on average 10.44, 22.22, and 39.11 flowers per plant, respectively. The number of branches per plant for the forages was 12.11, 7.89, 14.00, and 8.22 for phacelea, blackumin, coriander, and synaps respectively. Flower shading times for the forages were, were 112.2, 123.78, 109.89, 101.33, 103.33, 107.22, and 94.44 days for Trifolium-repanse, Phacelea, Sweet clover, Blackumin, Trifolium-quartinarium, Coriander, and Synaps, respectively.The beekeepers suggested that during demonstration of honeybee forages at 50% flowering times four bee forage species (phacelea, synaps, coriander and black cumin) were selected based on honeybee visiting, flowering color and stand performance of the plants. Table1. Average performances and flower color of bee forages species No.
Honeybees forage species DG DF DB No. F No. B ST LFS FC
1 Trifolium Repanse 12.22 81.56 91.00 * * 112.22 30.66 white
2 Phacelea 8.22 76.33 88.11 22.22 12.11 123.78 47.45 Pink
3 Sweet clover 10.44 79.00 88.67 * * 109.89 30.89 Yellow/white
4 Blackumin 12.67 66.78 77.67 10.44 7.89 101.33 34.55 white
5 Trifolium Quartinium 14.78 70.78 82.56 * * 103.33 32.55 Pink
6 Lenorus 13.89 * * * * * * * 7 Coriander 13.00 67.78 78.67 81.11 14.00 107.22 39.44 White 8 Synaps 7.56 63.22 73.89 39.11 8.22 94.44 31.22 Yellow *= Not available, DG= Date of germination, DF= Date of flower, DB= Date of blooming (100%), No. F=Number of flowers, No. B= Number of branch, ST= Shading time, LFS= Length of flower to stay, FC= Flower color

Livestock Research Proceeding
182
Discussions The germination rate of lenorus, Trifolium repanse, Trifolium quartinarium, coriander, blackumin, and sweet clover were low as compare to that of phacelea and synaps. Phacelea and synaps geminated rapidly to due to adaptation and recurrent selection of the plant (Debissa, 2006). In the current study, Trifolium-repanse, phacelea, sweet clover and Trifolium quartinarium showed long days from flower opening till shading flower due to different factors such as growing habit, temperature and photo period (Evans, 1957). The flowers of plant species are indeterminate (opening one after another) which result in longer period of flowering (Debissa, 2006). In addition, moisture in the soil also increases the duration of flowering. With regard to the date of blooming (100% flowering) per plot area, Trifolium- repanse showed long days on flower compared to the rest species of forages evaluated. This is due to the varietal difference of the plant and its growing habit. Regardless of the number of flower head per plant, Phacelea, similarly these plants (Coriander, Synaps and Blackumin) produced higher number of flower heads due to their growing habit & headband size. Phacelea, Blackumin, Coriander, and Synaps produced also higher number of branches per plant. The fact that more r branching plants producing more flower heads per plant. is similar with the report of Debissa (2006). Phacelea, Trifolium Repanse, sweet clover and Coriander stayed longer days (123.78, 112.22, 109.89 and 107.22), respectively before shading compared with Synaps, Black cumin and Trifolium quartinium which stayed shorter days (94.44,101.33,103.33), respectively. In general, from beekeeping point of view it is cost-effective to evaluate honeybee forages species based on their number of flower per heads, number of branch per plant, length of flowers to stay, intensity of bee visitors, stand performance, presence of pollen and nectar which provide continuous food sources for the honey bee colonies. Accordingly, Phacelea, Synaps, Coriander and Black cumin were selected to be the best adaptable bee forages. From on-farm demonstration carried out at 50% flowering time during day time when the sun was shine and the bees were active on acting the plant, experienced beekeepers, experts and Development Agents (DAs) selected phacelea, synaps, coriander, & black cumin as good type of honeybees’ forages. Based on number of honeybee visitors on the plant, plant stand performance, number of flowers on plant and number of branches on the plant. Generally, out of the total eight bee forages species evaluated for their adaptability, four forages species were selected based on the overall individual performance of the species. This is because each species showed different biological characters of adaptation. Comparison among these forages showed that phacelea, synaps, coriander and blackcumin were more attractive to worker honeybees than the rest species (Trifolium-repanse, Trifolium quartinarium, sweet clover and lenorus). Comparatively, the numbers of bee visitors, intensity of bee visitors, no of set flowers per plant, number of branches per plant, stand performance and presence of pollen and nectar depending on bee visiting were also higher in phacelea, synaps, coriander and black cumin. Therefore, these plants are very important for honeybees as they are early sources of pollen and hence being useful for the colonies to build up their strength. Conclusion and Recommendation Based on their demonstrated performances phacelea, synaps, coriander & blackgumin were found to be the major adaptable honeybee forages in highland of Bale, being preferred by the forager’s honeybees. Additionally, these four species showed good potential for pollen and nectar depending on honeybee visiting time, intensity of bee visitors, number of bee visitors, flower numbers, number of branches and stand performance. Therefore, these forages are recommended as the major honeybee forages in the highlands of Bale and similar agro-ecologies. Beekeepers should get awareness about these improved forages and start planting them around their apiary sites in order to avail feed for their bees and save the

Livestock Research Proceeding
183
bees from wasting their time in searching food from far away. By so doing, the productivity of beekeeping activity will be increased tremendously. Reference Akratanakul P, 1990. Beekeeping in Asia. FAO (Food and Agriculture Organisation of the United
Nations), Agricultural Services. Bulletin 68/4. Rome, Italy. Amsalu, B, 2000. Identification of major pollen sources of honey plants around Holleta Bee Research
Centre. May 26 – 27, 1999. Proceedings of the 7th Annual Conference of the Ethiopian Society of Animal production (ESAP): held in Addis Ababa, Ethiopia. pp 169- 178.
Crane, E, 1990. Bees and Beekeeping: science practice and world resource. Henemann News, Hally court Jordan Hill OX28Ej.
Debissa Lameesssa, 2006. Assessment of potentiality of common herbaceous honey plants and determination of honeybees foraging intensity EBA 5th annual conference proceedings,
Evans, L.T, 1957 The Broad bean in experimental control of plant growing. P.P 124-128 Acknowledgements: We would like to appreciate and thank our field Assistance namely Alemayo Dinqu, Usman Mohammed & Shelem Tufa who helped us in collecting the data during the study time. We are also indebted to Sinana Agriculture Research Center (SARC) for its support in providing the necessary materials such as vehicle during the study period. The financial support given by Oromia Agriculture Research Institute (OARI) is also gratefully acknowledged. Lastly, we are thankful to beekeepers, experts and DAs of the study areas for their willingness to give their opinion and suggestion.

Livestock Research Proceeding
184
*Temaro Gelgelu1, * On-farm participatory Evaluation and demonstration of Splitting Technique of Queen Rearing (STQR) at Ginnir district, Bale Zone, South-eastern Ethiopia
Bekele Tesfaye1 and Genet Dadi1
Sinana Agriculture Research Center (SARC), P.O. Box: 208, Bale-Robe, OARI, Ethiopia Corresponding E-mail: [email protected] or [email protected]
Abstract Participatory evaluation and demonstration of Queen Rearing using splitting technique (SQRT) at Ginnir district of Bale Zone, South-eastern Ethiopia was conducted from2013 to 2014. Two Beekeeper Research Group (BRGs) each having 10 beekeepers were established at two sites (Ebisa and Kebena). Beekeepers were purposively selected based on their willingness, having bee colonies, indigenous knowledge of handling honeybee and trained on colony selection, honeybee biology, management, health, procedure of queen rearing in the first phase and on spot practical queen rearing in the second training phase. Two Development Agents and three livestock experts were participated on training. Demonstration of queen rearing was carried out at back yard of seven volunteer beekeepers (four at Ebisa and three at Kebena. sites). About 85.71% of the multiplied colonies established them selves and performed well. Average honey yield of 14.29 kg and 16.99 kg was obtained from daughter (new) and maternal colonies respectively. The beekeepers expressed that the technology is simple to operate, assist to generate additional income. This indicates that the technology got acceptance by farmers. Thus scaling up of this technology is paramount important. Keywords/Phrases: Participatory, Honeybee Colony, splitting, Demonstration, queen rearing Introduction Apiculture is one of the major incomes generating agricultural activity for the poorest and other beekeepers dwelling in areas where other livestock cannot exist and other income generating activity options are very limited. Ethiopia has a longstanding beekeeping practices and is also endowed with huge apicultural resources and it has been an integral part of other agricultural activities, where about one million households keep honeybees (Nuru Adgaba, 2007). Today, honeybee colony population is in the state of continuous decline due to various reasons and also it is difficult to get new colony easily because of different factors among which population pressure, declining of forest, indiscriminate applications of agrochemicals, pests and predators, honeybee diseases are worth mentioning. Number of honeybee colonies in the country has been declining (C.S.A, 2012) and consequently the honey and beeswax production as well as export earnings fell down (Gezahegne, 2001). Honeybee colonies have their own breeding strategies which are very dependent on the potential of the queen and the general activeness of the worker bees in a colony (Laidlaw H. and Eckert J., 1962; Dan, 2006). Man can also stimulate honeybee colonies to multiply themselves. Different queen rearing technologies that fit to local condition and honeybee races were developed By Holeta Bee Research Center. Of these technologies Splitting techniques is simple and can be easily practiced by farmers and 5 to ten queens can be reared from a colony. However this technique was not introduced to Bale, where shortage of honeybee colony is major problem either to increase stocks or to start beekeeping. Therefore, the objective of this study was to demonstrate and evaluate the Splitting techniques under Bale condition. Materials and methods Descriptions of study area The study was conducted in Ginnir district, Bale Zone, Oromia Regional State South-eastern part of Ethiopia, from 2013 to 2014 G.C. For the study two rural kebeles (Kebena and Ebisa) were selected

Livestock Research Proceeding
185
purposively based on their accessibility and potential for beekeeping. From each kebele 10 beekeepers were purposively selected based on their willingness, having bee colonies, indigenous knowledge of handling honeybee and organized in a group (Beekeeper Research Group (BRGs)). The area is characterized by bimodal rainfall with the mean annual rainfall ranging from 750-1000 mm. The two seasons are locally known as the first ‘Ganna’ or ‘Belg’ which extends from March to July while the second ‘Bona’ or ‘Meher’ season extends from July to December. The area has diversified flora, including natural trees, shrubs and agricultural crops like spices and pulse crops. Sites, beekeepers and honeybee colony selection Based on agro-ecology two representative sites (RK) were selected and ten beekeepers were selected from each site. Then farmer research group was established considering beekeepers that had honeybee colony in frame hives with better experience were purposively selected. The groups were briefed with the objectives and outcomes of colony splitting activities including all the activities expected from them and the research group. Based on beekeepers information and simple observations colonies in a frame hive were assigned to the experiment from each of the selected beekeepers. Experimental Procedures Two Beekeepers Research Group (BRG) each having ten members or beekeepers were established in selected kebeles and briefed on the objective of the study. All members, Two Development Agents and three Experts of the districts were trained on maternal colony selection, honeybee biology, and management, health, in the first phase and on spot practical queen rearing in the second training phase. At each site strong colonies were selected an d fed with sugar syrup A day before the splitting inspection was conducted to verify, the presence of adequate eggs, brood, store and, drones which are very important for success of the works. The existing resources were equally shared for both boxes (base and super). A day after arrangement of the resources the splitting of the colonies was conducted using recommended procedures (Spivak, M. and G. S. Reuter, 1997) Queen less colonies kept in the original apiary site while maternal colonies were moved 500m away from its place to minimize risk of reuniting. On the 3rd day after splitting, the queens less colonies were inspected to check queen cell construction. On the ninth day of splitting, less matured and deformed queen cells were culled while leaving good ones. On the 16th day the colony checked for, the emerged queen and all necessary management carried out. Queen rearing and all colony management rendered during the course of demonstration and evaluation were under taken with farmers and professionals of the district participation. Data collection Data on number of beekeeper participated, time/season of splitting, number of queens reared honeybee colony established at each site, honey yield harvested from daughter and maternal colonies and fed back of beekeepers (opinion) were recorded and analyzed using SPSS version 20 Software. Results and discussion The study was conducted in the participatory approach with beekeepers at two sites (Kebena and Ebisa) in Ginnir district of Bale Zone. Theoretical training was given at the beginning of the study for the BRG on honeybee’s colony selection, honeybee biology, management, health, procedure of Queen Rearing techniques and cares to be given while conducting the study process. In addition the beekeepers were advised to keep their apiary site clean and in well managed way.

Livestock Research Proceeding
186
Table1. Number of Participant Beekeepers, Development Agents and Experts on participatory evaluation and demonstration of Queen Rearing Technique (Splitting). Site Participants
Development agents
Experts Grouped Beekeepers (BRG)
Kebena 1 2 * 10 Ebisa 1 10 Total 2 2 20 * Experts participated were from Ginnir district Livestock development and marketing office. Likewise, practical training was also given on Splitting Queen Rearing Technique for 2 experts, 2 Development agents and 20 beekeepers of BRG members established (Figure 1) during active season. The training was supported by a demonstration exercise of Splitting Queen rearing. After practical training, the groups were followed the procedure of Splitting Queen rearing technique like checking on the third day the progress of constructing queen cell, on the ninth day observing less strong and deformed queen and aborted it by leaving the best queen cell and lastly, on the 16th day, they checked emergence of the queen and returned to the original apiary site. The participatory demonstration beekeepers, development agents and experts evaluated the practice of splitting mother colony and discussed and shared their views and opinions. At each time every data, views and opinions of beekeepers, development agents and experts were taken and recorded by the researcher. The overall activity was done during active season of the study area from November to December (first active season) and June to July (second active season) in two consecutive years. For the study, seven honeybee colonies were divided by the BRG at backyard in active season during flowering time. During colonies splitting time, the groups were also recorded the time taken to finalize the process by following correct procedure and the average time taken was 36 minute. However, out of the total honeybee colonies splitted, about 85.71% were successful and only 14.29% colonies (Table 2) were absconded. This was due to pests attack as reported by the group (BRG). Moreover, the individual beekeeper was also started to split their own honeybee colonies after they could get awareness and knowledge with the BRG to increase the number of colonies at their own backyard. Table 2. Number of honeybee colonies splitted at Kebena and Ebisa sites Sites Mother
colonies Daughter colonies
No. of daughter colonies successful
% of daughter colonies successful
Kebena 3 3 2 66.67 Ebisa 4 4 4 100 Total 7 7 6 85.71 The beekeepers Research Groups (BRG) were also evaluated honey yield obtained from the daughter (new) and mother (old) colonies and they harvested on average 14.29 kg and 16.99 kg from daughter and mother colonies, respectively. External factors like feeding during dearth periods and managing (cleaning apiary, keeping from pests and diseases) for the colonies were equally treated to avoid any confusion on colony strength which attributed to yield gained. However, the researcher assumed that the more honey yields obtained from the daughter colonies were because of its younger than mother in order to produce more eggs. During the study time any abnormality of the colonies were checked.

Livestock Research Proceeding
187
Table 3. Average honey yields harvested from mother and Daughter colonies Sites Honey yield from colonies in kg
Mother colonies Daughter colonies Kebena 15.57 17.58 Ebisa 13.00 16.40 Average honey yield 14.29 16.99 At the end of study period, check lists were prepared to collect back feed and opinions of the beekeepers. Table: 4 Suggestions of beekeepers on SQRT Evaluation and Demonstrations No. Opinion of beekeepers regarding to SQRT % of beekeepers from
BGR Yes No
1 Lack of honeybee colony in area 80 20 2 Could you split your own colony 90 10 3 Have you succeeded in splitting honey bee colony 90 10 4 Not Labor and time consumer 90 10 5 It could increase number of colony 90 10 6 Not difficult to split 85 15 7 It could reduce risk of catch swarm 75 25 8 Could you continue this method in future 80 20
According to the perception of the beekeepers, Splitting Queen Rearing technique is not comparable with baiting hive to catch swarm in order to increase the number of honeybee colonies. Beekeepers also obtained good awareness from the participatory practical approach of splitting queen rearing technique. The majority of beekeepers were showed their interest to the technology (Splitting Queen Rearing technique) and have willing to carry out at their backyard and popularize to nearby beekeepers. Generally, the Splitting Queen Rearing technique found to be a cost-effective, feasible, time saver and the beekeepers were satisfied with the results as long as the researchers were involved in the procedure of the study from the begging up to the final periods. In addition, the groups suggested that as they were enabled to obtain additional colonies Conclusion and recommendation Today, honeybee colony population is in the state of continuous decline due to various reasons and also it is difficult to get new colony easily. On the other hand the price of honeybee products becoming expense for small holder farmers. It is believed and proven that SQRT could be increases the number of honeybees colony existing stock on the beekeepers hand. Out of the total honeybee colonies splitted by BRGs about 85.71% of the colonies were successful and only 14.29% colonies were absconded because of pests attack. Honey yield harvested from the daughter (new) and mother (old) colonies were on average 14.29 kg and 16.99 kg from daughter and mother colonies respectively. Accordingly, beekeepers that involved on the demonstration noticed that SQRT will improve the number of honeybee’s colony under local condition and beekeepers situation. At the end of demonstration, beekeepers have shown interest on SQRT and have willing to succeed at their home and to popularize the technology to nearby beekeepers. The SQRT is accepted as a beneficial practice by most beekeepers and it will be successful and adopted in such areas where there are favorable honeybee forage resources available. Therefore, based on this conclusion it is forwarded that to capacitate or building the knowledge of beekeepers on honeybee colony splitting techniques and could be scaled up in potential beekeeping area where there are favorable honeybee forage resources available.

Livestock Research Proceeding
188
Reference CSA, 2012. Statistical Abstracts. Central Statistical Agency. Addis Ababa, Ethiopia Dan C., 2006. Queen Management Notes, New Hampshire Bee Meeting, South Deerfield, Massachusetts,
USA Gezahegne Tadesse. 2001b. Marketing of honey and beeswax in Ethiopia: past, present and perspective
features: Proceedings of the third National Annual Conference of the Ethiopian Beekeepers Association (EBA), September 3-4, 2001, Addis Ababa, Ethiopia, pp. 78-88.
Laidlaw H. and Eckert J., 1962. Queen Rearing, University Press, Berkly, California, USA Nuru Adigaba, 2007. Atlas of pollen grains of major bee flora of Ethiopia, ESAP. Addis Ababa,
Ethiopia. Acknowledgement We would like to acknowledge the Oromia Agriculture research institute who sponsored this study. We are also grateful to Alemeheyu Dinku, Usman Mohammed and Shelema Tufa for their support in data collection and field implementation of the activity.

Livestock Research Proceeding
189
Adaptation trial of promising honey bee forage in Fadis districts of eastern Hararghe zone
*Gemechis Waktole1
Fedis Agricultural Research Center, P.O.Box. 904 Oromia Agricultural Research Institute.
Corresponding E.mail: [email protected]
Abstract The study was conducted to introduce promising honey bee forages in eastern Hararghe zone of oromiya regional state. Where the availability of adequate perennial and annual sources of nectar and pollen is the most limiting factor in the survival, abundance and distribution of honeybees. Adaptation study of promising honey bee forage was, therefore, conducted at Fadis Agricultural Research Center during the year 2010 to 2012. The study was designed to evaluate the best performing plant species for honey production around Eastern Hararghe. Fagophyrum esculentum, Melilotus officinalis, and Phacelea tancetifolia were evaluated based on emergency date, number of flower heads per plants, foraging intensity of honeybees and duration of flowering. There was significant difference (P<0.01) in germination date, blooming duration and bee visit among different bee forages. Accordingly pagopyrum esculentun and Mellotus officinalis were found to be more adaptable to the area than Phacelea tancetifolia in terms of number of flower heads per plant, higher number of bee visit and longer flowering episode and thus need to be promoted in area. Key words: Bee forage, Evaluation, Adaptation, East hararghe. Introduction Bees and flowering plants are mutually dependent as bees need flowering plants for food in the form of pollen and nectar, and plants need bees for pollination. The scarcity of bee forage is becoming serious problem due to rapid population growth, expansion of Agriculture and shrinking of forest land.. This problem is even serious in East Hararghe. Due to this and other several reasons the production and productivity of beekeeping in the area is low. Herbaceous plants are largely replacing the natural forests (Admassu, 1996 and are significantly contributing to large proportion of honey production in the country. Common buckwheat (Fagopyrum esculentum Moench), Yellow sweet clover (Melilotus officinalis), and Phacelia tanacetifolia are herbaceous bee flora which are Europian in origin, have been introduced to Ethiopia and found well adapted to wide range of Ethiopian agro-ecologies .They are now considered as high quality bee forage. Therefore, in this study an attempt was made to introduce and evaluate the performance of these herbaceous honey plants to narrow bee forage gaps and improve production and productivity of beekeeping in East Hararghe zone Materials and methods Description of Experimental Site The study was conducted at Fadis Agricultural Research Center during the years 2010 to 2012. The site is located at 22 Km south of Harer city. It is located at 42º12'32'' E and 09º 02'57'' longitude. The altitude of an area is between 1400-1800 masl. The area receives an annual rain fall of 670-804mm. Rain fall of the area is bimodal. The first rain is from February to April and the second is from June to September. The plants were selected based on the agro ecology and their importance for honey bee forage. The seeds of Pagopyrum esculentum (buck wheat), Melilotus officinalis (sweet clover), and Phacilia tancetifolia (phacilia) were collected from Holeta Bee Research center and sown in normal planting season. The plant

Livestock Research Proceeding
190
species were planted at 12m2 plot sizes and a total of 9 plots were used. Rcommended seed rate, plant spacing & weeding were applied. Planting was done without fertilizer. Date of germination and date at 50% flowering were also recorded. Number of flower heads was counted for each species by taking the data from a plot of 1m2 area. Moreover the average times of flower opening, peak flowering and flower shedding were recorded. Honey bee foraging intensity on flowers was counted on a single plant starting from 6 am to 6 pm for fifteen minutes at every hour intervals. The data analysis was carried out using GenStat discovery 15th edition software (GenStat, 2012) for the parameters studied (Payne et al., 2008), following the standard procedures outlined by Gomez and Gomez (1984). Result and discussion The mean values for the selected traits were indicated in Table 1. The result indicated that, Fagopyrum esculentum,Melilotus officinalis and Phacilia tancetifolia took short time to germinate with mean of 8.33,13.0 &13.33 days, respectively. However, Fagophyrum esculentum germinated significantly (P< 0.01) earlier than other species. Even though, it was observed that seeds of Pagophyrum esculentum are rough, it did not take long time to break seed coat. (table 1). The germination time of Fagophyrum esculentum (buckwheat) was short due to its high tolerance to moisture stress and adaptability to a wide range of soil types. Plants often wilt during hot and dry conditions but will quickly recover during cool temperatures and over-night (Ohnishi, 1995). The number of honeybees visited Fagophyrum esculentum was significantly higher compared to that of Melilotus officinalis and Phacilia tancetifolia. This might be related to nectar and pollen potentiality and floral preference of honeybees. Variation in the number of bee visit to bee forage may be associated with different factors such as attractiveness of the flower, number of flower heads per plants, nectar and pollen yields of plants and weather condition. Pagopyrum esculentum and Melilotus officinalis produced significantly higher number of flower heads than Phacelea. This may be attributed to their growing habit and round off size. More branching plants produceds more flower heads. Melilotus officinalis and Phacilia tancetifolia significantly stayed longer time in flower compared to Pagopyrum esculentum. Bee forages that flower for longer period may provide continues food source for honeybees for longer time. Thus such be forages are very important for the development of beekeeping. Table 1. The mean value of selected traits of different bee forages SN.
Forage crop ED (50%)
FD (50%) NBPP NFPP HBV/P DM (90%)
1 Pagopyrum esculentum
8.33b 21.3c 36.33a 106.33a 90.83a 105.3b
2 Phacilia tancetifolia
13.00a 63.47b 11.83c 27.67b 70.67b 130.0a
3 Melilotus officinalis
13.33a 71.77a 34.17b 90.17a 55.0c 139.3a
LSD (5%) 3.16 8.15 2.06 33.82 5.59 13.93 CV 12.1 6.9 3.3 20 3.4 4.9 Mans followed by the same letter(s) with in column are not significantly different at P=0.05 ED= Days to 50% Emergence FD=Days to 50% Flowering, NBPP=Number of Branch Per Plant, NFPP=Number of Flowers Per Plant HBV/P=Honey Bee Visit Per Plant, DM=Days to 90% Maturity

Livestock Research Proceeding
191
Conclusion and recommendations From beekeeping point of view, it is economical to select plant species that provide more flower heads that flower for longer time that is attractive to be honeybees and have wider adaptive trait. In this regard as all the three evaluated honeybee forages have the aforementioned merits, they are recommended to be used as bee forages in the area. Hence, they have to be multiplied, promoted and distributed to beekeepers of the study areas. More over further study is necessary to determine the quantity and quality of pollen and nectar provided by each of these bee forages and to repeat the evaluation over multi locations. References Admassu Addi. 1996. Preliminary identification of honey bee flora of Ethiopia. In: Proceedings of Fourth
National Conference of Ethiopian society of Animal production. Evans, L.T. (1957). The broad bean in experimental control of plant growth. PP 124- 128. Evans, L.T. (1959). Environmental control of flowering in Vicia faba L. Annual Botany.23 pp 521-546. Gomez, K.A. and Gomez, A.A. (1984). Statistical Procedures for Agricultural Research, 2nd edition, John
Wiley and Sons, New York, p.680. Krotov, A.S. (1975). Fagopyrum Mill. Flora of cultivated plants III. Groat crops [in Russian] Kolos,
Leningrad, pp. 7-118. Lee-Mader, E., J. Hopwood, L. Morandin, M. Vaughan,and S. H. Black. (2014). Farming with Native
Beneficial Insects. Storey Publishing, North Adams,MA. Nuru Adigaba,Admassu Addi & Dereje Woltedgi (2001). Pollen spectrum and honey floral calander in west shoa zone. Addis Ababa. In: Second annual conference of Ethiopian beekeepers Association
Payne RW, Murray DA, Harding SA, Baird DB, Soutar DM (2008). Genstat for Windows, 11th Edition, VSN International,Hemel Hempstead.
USDA (United States Department of Agriculture), NRCS (Natural Resource Conservation Service). 2002. The PLANTS Database, Version 3.5 .National Plant Data Center, Baton Rouge, LA 70874-4490 USA.

Livestock Research Proceeding
192
Adaptation of Improved Bee Forages at Haro Sabu Districts of Kelem Wollega Zone, Ethiopia.
Ofijan Tesfaye 1
1 Haro Sabu Agricultural Research Center, OARI Abstract The study was conducted to evaluate the adaptability and performance of improved bee forages so as to recommend the best performing species for honey production at Haro sabu districts. The evaluated plant species were Medicago sativa, Phocilia indicum, Melilotus officinalis, Trifolium ruppellianum, Fagophyrum japonicum, Fagophyrum esculentum, Coriandrum sativum and Synups alba which were sown on the station with Randomized complete block design & replicated three times with 2m x 2m (4m2) plot sizes. Germination, duration on flowering, number of flower heads per m2 & honey bee foraging intensity on flowers per m2 are parameters used to evaluate the adaptation of the introduced improved bee forages. The longer (68 days) and shorter (27 days) on flowering was observed for Medicago sativa and Coriandrum sativum, respectively. Fagophyrum japonicum and Fagophyrum esculentum produced statistically higher number of flower heads per m2 area. While Phocilia indicum, Synups Alba and Medicago sativa produced statistically similar number of flower heads per m2 with values of 153, 196 and 202, respectively. Regarding the mean number of bee visits on plants Trifolium ruppellianum was visited significantly many times (579) by bee foragers while Coriandrum sativum was visited fewer times (162). The data revealed that Melilotus officinalis,Trifolium ruppellianum, Fagophyrum japonicum, Fagophyrum esculentum, Synups alba,Phocilia indicum and Medicago sativa performed well in terms of flower head per plant, number of bee visits and duration on flowering for honey production. Keywords: Melilotus officinalis, Trifolium ruppellianum, Fagophyrum japonicum, Fagophyrum esculentum, Synups alba, Phocilia indicum, Medicago sativa and Coriandrum sativum. Introduction Ethiopia is an agrarian country whose economy is based largely on renewable natural resources. Between six to seven thousand species of flowering plants, wide areas of natural forest and two rainy seasons to provide honey flow, the country has immense resources for apiculture (Edwards, 1976). The current honeybee population is estimated to consist of some seven million colonies which produce 43,000 tons of honey and 3000 tons of beeswax every year (MOARD, 2008). Availability of adequate annual and perennial source of nectar and pollen is the most limiting factor for the survival, abundance and distribution of honeybee colonies. Herbaceous plants that grow as weed on cultivated field, neglected open lands, wastelands and marginalized areas, are important source of bee forage (Edward 1976). Over 50% of the identified plant species in Ethiopia are herbaceous bee flora (Reinhard and Admassu 1994). These herbaceous floras are significantly contributing to large proportion of honey production in the country and beekeepers produce considerable amount of honey from these plants. Among these, Bidens prestinaria, Guizotia scabra, Trifolium rupplianum, oil crops, & pulses have been reported as the major sources of honey in central highlands (Admassu 1996; Nuru et al. 2002 Amssalu 2004). Moreover Guizotia scabra, Trifolium rupplianum, Bidens prestinaria & Caylusea abyssinica are the most common weeds in wide range of Ethiopian condition and they are important source of honey (Stroud & Parker 1989). Some introduced plants species like Melilotus alba and buckwheat (Fagophyrum esculentum and Fagophyrum japonicum) are also major source of golden honey in other parts of the world. Beekeepers use buckwheat to produce honey because its flowers produce a large volume of rich and flavorful nectar. The flour of this plant is used as fodder for livestock and to make traditional buckwheat bread in Japan.

Livestock Research Proceeding
193
Most of these plant species are annuals and they grow & flourish fast after summer rain. Moreover their seeds can be collected easily and sown for the next growing season. Currently beekeepers are complaining that the scarcity of bee forage is becoming a serious problem due to rapid population growth, expansion of agriculture and deforestation. To keep and maintain the bee colony strong by availing major bee floras on sustainable basis, beekeeper, researcher and farmers have a responsibility to cultivate and/or grow bee forages of pollen and/or nectar sources at the nearby of their apiaries. Therefore introduction and evaluation of the adaptability of improved bee forages are of paramount importance for sustainable production of beekeeping. The objectives of this study is to the adaptability and performance of improved bee forage at Haro sabu districts and recommend the best performing species for honey production. Materials and Methods. Eight species of honeybee forages: Medicago sativa, Phocilia indicum, Melilotus officinalis, Trifolium ruppellianum, Fagophyrum japonicum, Fagophyrum esculentum, Coriandrum sativum and synups alba were introduced to Haro Sabu agro ecological condition and evaluated for their performance at Haro Sabu Agricultural Research center. Each bee forage was sown on 2m x 2m (4m2) plot sizes with three replications in randomized completed block design. The distance between rows, plots and blocks were 20cm, 1m and 1.5m, respectively. Seed rate of 25kg/ha was used for each of the evaluated species. Data on day to germination, blooming time, peak time of flowering, flower shedding time were recorded. Moreover, number of flower heads was counted for each species by taking 1m2 plot area. At peak flowering time, honey bee foraging intensity on flowers was counted on 1m2 plot area starting from 9h– 14hrs for ten minutes at every hour intervals. All collected data were subjected to statistical analysis using SAS 9.1 Computer software and mean differences were analyzed by using least square significant test. Results and Discussion. Germination Date. Table 1 shows values for different parameters taken for the evaluated bee forages. There was no statistical difference (p>0.05) in germination rate among Coriandrum sativum, Trifolium ruppellianum, Phocilia indicum and Melilotus officinalis. All species took more than two weeks to germinate, but they vary statistically (p<0.05) from the rest of the species. Synaps alba, Fagophyrum esculentum and Fagophyrum japonicum germinated faster than all the rest of the bee forages. They germinated at less than a week time. Medicago sativa was statistically significant (p<0.05) from rest of the evaluated bee forages by taking 11 days to germinate. The germination data indicated that all the introduced improved bee forages germinated at different time length. This might be due to the germination character of their seeds as well as their variation in moisture requirement to germinate. For instance the seeds of Coriandrum sativum, Trifolium ruppellianum, phocilia indicum and Melilotus officinalis are hard and took long days to break their seed as compare with other evaluated materials. Flowering Duration. Days on flowering was calculated by counting the days from blooming to shedding of their flowers during the study. Medicago sativa stayed statistically longer (68 days) in flower than all the other bee forages evaluated followed by Trifolium ruppellianum, Melilotus officinalis and Synaps alba in decreasing order. The remaining bee forages such as Coriandrum sativum, Fagophyrum esculentum Fagophyrum japonicum and Phocilia indicum stayed in flower from 27 to 36 days. The variation from flower opening until shedding might be due to different factors such as growing temperature, photoperiod and availability of moisture in the soil (Evans 1957). As it was observed during the flowering time, the flowering character of Trifolium ruppellianum, Melilotus officinalis and Synaps alba was indeterminate, which means opening one after another, that resulted in long duration on flowering.

Livestock Research Proceeding
194
Flower Heads per M2
Concerning the number of flower head per m2 plot area, Fagophyrum esculentum produced higher number (451). However, this was statistically similar with that of Fagophyrum japonicum, Melilotus officinalis and Coriandrum sativum in decreasing order. Phocilia indicum produced the least number of flower head per m2 which is statistically different (P<0.05) from that of the other evaluated materials. The difference in number of flower heads per m2 might be due to the growing characteristics of the plants. More branching plants such as Fagophyrum esculentum produced more number of flower heads per plant. Excessive irrigation during the vegetative growth induces more flower production (Stolp, 1955). From beekeeping point view it is economical to select plant species with more flower heads which produces sufficient resources, as well as invites more bee foragers than bee forages that produced less branches. Longer time of flowering period is also preferred as it provides continuous food source for the honeybee colonies. Bee Visits Trifolium Ruppellianum, followed by Synaps alba were visited by significantly (p<0.05) higher number of bees with respective values of 579 and 337 compared to compared to other bee forages. Coriandrum sativum was a bee forage that was least visited by bees during its flowering period (table 1). During flowering time of Coriandrum sativum, flies of order Diptera were found to compte with bees and this might have brought small number of bee foragers. Similar bee foragers were counted on Fagophyrum japonicum Fagophyrum esculentum and Phocilia indicum during their peak flowering time. Nectar and pollen foragers sometimes prefer one food source over another as well as the specific position of one flower over another (Abou-Shaara 2014). Debisa Lamessa found that the variation of number of bee count is associated with different factors such as attractiveness of the flower, number of flower heads per plants, nectar and pollen yield of plants and weather condition. This is also in agreement with Crane (1990) who found the intensity of bee visits to be a measure of potentiality of plants for nectar and pollen production. Pictures of the adaptable forages at their flowering stage is given in fig.1 Table 1: Mean values for different parameters to evaluate the adaptability and performance of the forages.
* Means followed with the same superscript letters in a column are not significantly different.
Plant species Days to germination
Days on flowering
Number of flower head per m2
Number of bee visits per m2
Coriandrum sativum 18.16a 26.50f 321.42bc 161.60e Trifolium ruppellianum 17.83a 57.00b 239.63dc 579.00a
Phocilia indicum 17.50a 30.33e 153.03e 235.55d
Melilotus officinalis 16.66a 45.83c 361.77b 296.63c
Medicago sativa 11.00b 68.33a 201.70de 293.00c Synaps alba 6.16c 35.83d 196.25de 337.33b Fagophyrum esculentum 5.83c 29.50ef 450.70a 223.47d Fagophyrum japonicum 6.16c 30.66e 380.32ab 240.53d Cv(%) 20.7 7.7 24.4 11.0 Lsd(0.05%) 33..0011 33..6688 8822..2277 3388..3344

Livestock Research Proceeding
195
Coriandrum sativum Trifolium ruppellianum
Phocilia indicum Melilotus officinalis
Medicago sativa Sinapis alba
Fagophyrum esculentum Fagophyrum japonicum Figure 1: Adaptable bee forages at their flowering stage . Conclusion and Recommendation In general, the present work showed that there were differences among the evaluated bees forage species in values of the parameters considered. Depending on bee visits on forage flowers, duration on flowering and flower head production by the plants Melilotus officinalis, Trifolium ruppellianum, Fagophyrum

Livestock Research Proceeding
196
Fisheries Research Results
japonicum, Fagophyrum esculentum, Synups alba, Phocilia indicum & Medicago Sativa species are found to be the most adaptable and major herbaceous bee forages in the study area as compared with Coriandrum sativum. Therefore, demonstration and dissemination of these adapted bee forages around apiary site of beekeepers is necessary to alleviate feed problems which will in turn enables in maintaining bee colonies as well as increasing honey production in the area. Acknowledgment. Great thanks to Oromia Agricultural Research Institute who allocates the budget for this activity. I also thankful Haro Sabu Agricultural Research Center and my teams particularly Mrs Tariku Lema and Temesgen Terefe who assists me for this work. References Abou-Shaara.2014, the foraging behavior of honey bees, Apis mellifera, a review. Faculty of Agriculture,
amanhur University, Damanhur, Egypt. Admassu Addi. 1996. Preliminary identification honey bee flora of Ethiopia. In: Proceedings of Fourth
National Conference of Ethiopian society of Animal production. Amssalu Bezabeih.2004. Nature and phenology of bee plants in central highlands of Ethiopia. In:
Proceeding of 12th of Ethiopian Society of Animal production, Addis Ababa, Ethiopia.
Crane, E., 1990. Bees and Beekeeping, science, practice and world resource Heinemann Newness, London.
Debissa Lamessa et al. Assessment of potentiality of common herbaceous honey plants and determination of honeybees foraging intensity Holota Bee Research Centre, Environmental Protection Authority, Addis Ababa.
Edward, S.1976. Some wild flowering plants of Ethiopia. Addis Ababa University press, Addis Ababa, Ethiopia.
Evans, L.T.1957. The broad bean in experimental control of plant growth. PP 124- 128. Fichtl Reinhard & Admassu Addi. 1994. Honeybee Flora of Ethiopia. Margraf Verlage. P 3-13. German. Ministry of agriculture and rural development (MOARD), Government of Ethiopia, December 2008,
Addis Ababa, Ethiopia. Nuru Adigaba, Admassu Addi & Dereje Woltedgi .2001. Pollen spectrum and honey floral calander in
West shoa zone. In: Second annual conference of Ethiopian beekeepers Association. Addis Ababa.
Stolp, P.W. 1955. Introduction to the discussion on symposium papers. Rep, 4th International Horticultural Congress Scheveningen 1955: 118.
Stroud A, Parker C (1989) A weed identification guide for Ethiopia. Food and Agricultural Organization of the United Nations (FAO), Rome

Livestock Research Proceeding
197
Fisheries Research Results

Livestock Research Proceeding
198
Biomass and population characteristics of the unexploited strait fin barb, Barbus paludinosus in Lake Ziway, Ethiopia
MathewosHailuWorku
Ziway Fisheries Resources Research Center, P.O.Box 229, Ziway,, OARI Corresponding author: Mathewos HailuWorku., E-mail:[email protected], And Fax:
+251464412942
Abstract Biomass and population characteristics of the unexploited strait fin barb was studied by collecting specimen of Barbus paludinosus from Lake Ziway between December 2013 and February 2015, using Nordic survey multi-mesh monofilament nylon gillnets consisted of randomly distributed panels of the mesh-sizes 10, 19.5 and 29 mm bar mesh to analyze their biomass and growth pattern. A total of 5506 specimen of Barbus paludinosus were capturedusing gill nets, the total length of the specimen ranged from 3.8 to 11.3 cm with a mean±SD of 5.96±1.4 cm. CPUE varied between 325 and 762 fish per setting. Based on the analyses of length–frequency distributions,the estimated growth parameters of Barbus paludinosus gave an asymptotic length (L∞) of 11.6 cm TL; weight infinity (W∞) of 27.7 g; growth curvature (K) of 1.8 years–1and the total mortality (Z) was estimated to be 2.99 year–1.The MSY(Maximum Sustainable Yield) of Barbus paludinosus in Lake Ziway was estimated between 0.60-0.83 tons per km2. With the observed substantial biomass, high productivity, high growth rate and short generation of Barbus paludinosus fishery could be started at pelagic habitats. Therefore, starting small-meshed fishery might enhance the productivity of B. paludinosus as evidenced from other East African lakes small pelagic fishery. Keywords: Barbus paludinosus,CPUE, Fish production, Lake Ziway Introduction The fishery of Lake Ziway has supported the livelihoods of the surrounding communities through fishing for decades. The fishing activity of the lake was intensified from the funding acquired from Lake Fisheries Development Project (FelegeselamYohanes, 2003). The annual sustainable yield of the lake was estimated to be 2000 tons year-1 (Schroder, 1984), despite the previous intensified fishing of 3200 tons year-1 (FelegeselamYohanes, 2003). The fisheries of Lake Ziway production contribute the second largest annual fish of the rift valley lakes next to Lake Chamo that produces 4500 tons year-1. There are six indigenous fish species in the lake comprisingBarbusethiopicus, Barbuspaludinosus, Labeobarbusintermedius, Garramakiensis, Garradembechaand Oreochromisniloticus (Golubtsovet al., 2002; Eshete et al., 2010). The lake also harbors five exotic fish species (Tilapia zillii, Carassiuscarassius, Carassiusauratus and Cyprinouscarpio) which were introduced to enhance its production and Clariasgariepinusthatslipped into the lake accidentally (Golubtsovet al., 2002). Despite their small size, Barbus paludinosus,is economically important having significant contribution in the commercial landings in Eastern and central Africa. Njaya (2001) estimated the maximum economic yield of B. paludinosus in Lake Chilwa (Malawi) to be USD 3.4 million/year. Moreover, the fish serves as a prey for other commercially important fish species and fish-eating birds. Barbus paludinosus is not of any commercial importance in the fisheries production of Ethiopia, but it is ecologically important because it is used as a prey fish by some commercially important fish species such as the African big barb and the African catfish (Zerihunet al., 2008; Zerihunet al., 2007; Demeke and Elias, 1997). The aim of the present study was, therefore, to provide basic information on the abundance and fishery potential of this species in Lake Ziway.

Livestock Research Proceeding
199
Materials and methods Lake Ziway (Latitude: 7 ° 52′ to 8 ° 8′ N and Longitude: 38 ° 40′ to 38 ° 56′ E) is the most northerly of the lakes in the Ziway-Shala basin. The lake is situated at an altitude of 1636 m above sea level with a surface area of 434 km2 and mean depth of 2.5 m. The Lake is fed by rivers, Meki from the North-West and Katar from the East and it has an outflow through Bulbula River, draining into Lake Abijata. In addition to supporting commercial fishery of the country, the lake water is also used for irrigation and drinking water.Barbus paludinosus was captured monthly from December 2013 to February 2015, using Nordic survey multi-mesh monofilament nylon gillnets consisted of randomly distributed panels of the mesh-sizes 10, 19.5 and 29 mm bar mesh. Fishes were removed from gillnets shortly after landing. Total length and body mass (M) was measured to the nearest mm and g respectively. Sex and reproductive stages were determined by visual examination of the gonads, using a five-level maturity scale described by (Admassu, 1996). The abundance of Barbus paludinosussampled in the multi-mesh gillnets was calculated using a catch per unit effort index (CPUE).Data on CPUE was measured as numbers of fish per 10 m2 gillnet per two hour setting were analyzed using one-way ANOVA procedures in R package.Biomass of Barbus paludinosus was estimated by hauling a known area along the shore line at different locations of the lake. Twenty five meter long beach seine with a height of four meter was used for hauling. The average catch per net (in terms of weight) was calculated for each site and sampling occasion. Finally the data for all sites and hauling occasion were combined to give an average catch per net. This value was converted into wet weights of biomass km-2 in tons. Growth parameters of Barbus paludinosuswas from the monthly length frequency data were analyzed using the FiSAT computer program. The parameters of von Bertalanffy growth function (VBGF), asymptotic length (L∞) and growth coefficient (K) were estimated using ELEFAN routing incorporated into the FiSAT software (Gayaniloet al., 2005). K Scan routine was conducted to assess a reliable estimate of the K value. The VBGF was fitted to estimate the length- at -age curve using nonlinear squares estimation procedures. Since Barbus paludinosus is currently unexploited in Lake Ziway, maximum sustainable yield is estimated from virgin stock biomass. According to Sparre and Venema (1998) MSY for virgin stock can be estimated as MSY = x MBv where M = natural mortality, Bv = virgin stock biomass, and x is a constant, a value of 0.2 was used for x as it result in a more realistic estimate of MSY (SparreandVenema, 1998) despite its original value of 0.5 Gulland (1971) which over estimates MSY by a factor of 3 fold (Beddington and Cooke, 1983). Results and discussion A total of 5506 specimen of Barbus paludinosus were capturedusing gill nets with a mean±SDof 5.96±1.4 cm. The Total length of the specimens ranged from 3.8 to 11.3 cm (Fig 1. A).The length-weight relationships was curvilinear (Fig 1. B) and statistically significant with W= 0.0149LT
3.076351 (R² = 0.997, P < 0.001).Catch per unit effort (CPUE), measured as numbers of fish per 10 m2 gillnet per two hour setting.

Livestock Research Proceeding
200
Fig 1. Length frequency distribution (A) and Length weight relationship (B) of Barbus paludinosuscaptured in Lake Ziway. CPUE of B. paludinosus varied significantly between months (ANOVA, d.f. =10, P < 0 05). CPUE varied between 325 and 762 fish per setting; with a peak value during January to February.A peak value in CPUE for B. paludinosus was during September to October in Lake Hawassa (Zerihunet al., 2008). This might be due to the spawning aggregation of B. paludinosus after rainy season for reproduction. B. paludinosus breed on more than one occasion during a year, with peak breeding activity taking place between Januarys to February. Kirk (1979) reported that B.paludinosus spawn during the rainy season in Lake Chilwa (Malawi). Our study agrees with the findings of Furse (1979) who observed that Barbus spp. spawn several times in a year, with breeding fish making several spawning runs throughout the year into vegetation along the margin of Lake Chilwa (Msiska 2001), breeding on more than one occasion will contribute to reproductive success of Barbus. Recruitment has been described as a year-round phenomenon for tropical fish species. Barbus paludinosus populations studied here exhibited two recruitment peaks, which conforms to Pauly s (1982) assertion of a double recruitment pulse per year for tropical fish species and for short lived species. Due to the inability to calculate the parameter (to) of the von Bertalanffy growth model using length frequency data alone (Pauly, 1987), the absolute position of the recruitment peak (period of high juvenile-specimen preponderance) within the year could not be calculated. However, the major peak of recruitment for most studied species was in the earlier part of the year, which coincides with the rainy season. This was reported by many authors who have investigated the spawning periods for tropical fish populations in Africa (Welcomme and De Merona, 1988). Based on the analyses of length–frequency distributions (Fig 2.), the estimated growth parameters of Barbus paludinosus gave an asymptotic length (L∞) of 11.6 cm TL; weight infinity (W∞) of 27.7 g; growth curvature (K) of 1.8 years–1and the production/biomass ratio of the Barbus paludinosus, which is equal to total mortality (Z) as indicated by Allen (1971) was estimated to be 2.99 year–1. The maximum total length of 116 mm for Barbus paludinosus recorded in this study are less than 120–130 mm reported for Lake Chilwa and the Mnembo River (Njaya 2001; Delaney etal., 2007).

Livestock Research Proceeding
201
Fig.2 Restructured length–frequency distributions of Barbus paludinosus in Lake Ziway The estimated biomass of Barbus paludinosus in Lake Ziway was 1.2±0.2 tons per km2. Since Barbus paludinosus is not currently targeted by the fishery natural mortality is equivalent to total mortality. The natural mortality 2.99 year–1was used to estimate the MSY.The MSY of Barbus paludinosus in Lake Ziway was estimated between 0.60-0.83 tons per km2. Considering the total area of the lake (434 km 2) an annual production of 260.4 to 360.2 tons of Barbus paludinosus can be harvested from Lake Ziway.Considering the annual production of 1127 tons per year (2008–2010) of total commercial fish production (Mathewos, 2013),the mean 312 tons per annum of Barbus paludinosus production can have a significant contribution in the fishery. The current fisheries management plan for Lake Ziway focuses community based fisheries management to control recruitment overfishing in order to conserve the remnant fish populations. This scheme can be enhanced if the fishermen are willing to participate on harvest/ production of Barbus paludinosus for human and animal feed. Conclusions and recommendation The present study has shown the potential of having a fishery for small Barbus paludinosus in Lake Ziway. The main requirement for the development of a new fishery is the existence of adequate quantities of fish that can be harvested. With the observed substantial biomass, high productivity, high growth rate and short generation, of Barbus paludinosus fishery could be started at pelagic habitats. Therefore, starting subsidiary small-meshed fishery might enhance the productivity of B. paludinosus as evidenced from other East African lakes small pelagic fishery. The harvest of Barbus paludinosus should be regulated in the littoral zone as the intended gear can damage the fry of Oreochromis niloticus which breeds in the area. References Admassu, D. (1996). The breeding season of tilapia, Oreochromis niloticus L in Lake Awassa (Ethiopian
rift valley). Hydrobiologia 337: 77–83. Allen, K.R. (1971). Relation between production and biomass. J. Fish. Res. Board Can. 28:1573-1581. Beddington, J. R.,&Cooke, J.G.(1983). On the Potential Yield of Fish Stocks. FAO Fish. Technical Paper
242.

Livestock Research Proceeding
202
Delaney, L.M.,Jamu, D.M.,& Campbell, C.E. (2007). Abundance and distribution of fish in the lower Mnembo River, Malawi. African Journal of Ecology 3: 390–397
Demeke, A., & Elias, D. (1997). Diet composition, length-weight relationship and condition factor of Barbusspecies (Rüppell, 1836) (Pisces: Cyprinidae) in Lake Awassa, Ethiopia. SINET: Ethiop. J. Sci. 20: 13-30.
Eshete, D., Vijverberg, J., &Abebe, G. (2010). The biodiversities of nine Ethiopian lakes along a north south gradient: threats and possible solutions.In: Management of shallow water bodies for improved productivity and peoples livelihoods in Ethiopia, pp.155-160 (SeyoumMengistou and Brook Lemma eds), EFASA, Addis Ababa.
Felegeselam, Y. (2003). Management of Lake Ziway fisheries in Ethiopia. M.Sc Thesis, University of Toromso, 60 pp.
Furse, M.T. (1979). Reproduction and growth in the three open water species of fishes. MonographiaeBioliologicae35: 188–193.
Gayanilo, F.C., Sparre, P., &Pauly, D. (2005). The FAO-ICLARM Stock Assessment Tools II (FiSAT II Ver. 2.0), FAO.
Golubstov, A.S., Dgebuadze, Y Y., & Mina, M.V. (2002). Fishes of the Ethiopian rift valley. In: Ethiopian rift valley Lakes. pp. 167-256 (Tudorance, C. and Taylor, W.D. eds). Backhuys publishers, Leiden.
Gulland, J. A. (1971). The Fish Resources of the Ocean. Fishing News Books Ltd., West Byfleet, Surrey, England
Kirk,R.G. (1979). The fishes of Lake Chilwa. Society of MalawiJournal 20: 35–48. Mathewos, H. (2014). Lake Ziway Fisheries: trends in exploitation and implication for management.
Proceeding of the fifth national conference of the Ethiopian fisheries and Aquatic Sciences Association
Msiska, O.V. (2001). A review of limnology of Malawi. In: Wetzel RG, Gopal B (eds), Limnology in developing countries, Vol. 3. New Delhi: International Science Publications, and SocietasInternationalisLimnologiae. pp 121–189
Njaya, F.J. (2001). Review of management measures for Lake Chilwa, Malawi, UNUTraining Program, 50 pp.
Pauly, D. (1982). Studying single-species dynamics in a tropical multispecies context. In: Theory and Management of Tropical Fisheries. D. Pauly, G. I. Murphy (Eds), ICLARM Conf. Proc. 9: 33–70.
Pauly, D. (1987) A review of the ELEFAN system for analysis of length-frequency data in fish and aquatic invertebrates. In: Length-Based Methods in Fisheries Research. D. Pauly, G. R. Morgan (Eds). ICLARM Conf. Proc. 13, 7–34.
Schroder, R. (1984). An attempt to estimate the fish stock and the sustainable yield of Lake Ziway and Lake Abaya, Ethiopian Rift Valley. Arch. Hydrobiol. 3:411-441.
Sparre, P. &Venema, S.C.(1998). Introduction to tropical fish stock assessment. Part 1. Manual. FAO Fisheries Technical Paper 306.1, Rev. 2. FAO, Rome.
Welcomme, R. I.& De Merona, B. (1988) Fish communities of rivers. In: Biology and ecology of African freshwater fishes. C. Le´ veˆque, M. N. Bruton, G. W. Ssentongo (Eds), ORSTOM, Paris, pp. 251–272
Zerihun, D., Børgstrom, R., &Zinabu,G.. (2008). Habitat use and trophic position determine mercury concentration in the straight fin barb Barbuspaludinosus, a small fish species in Lake Awassa, Ethiopia. J. Fish Biol. 73: 477- 497.
ZerihunDesta, Børgstrøm, R., Rosseland, B.O. and Elias D. (2007). Lower than expected mercury concentration in piscivorous African sharptooth catfish, Clariasgariepinus(Burchell). Sci. Total Environ. 371: 134-142
Livestock Research Proceeding
203
Development of all-male tilapia fingerlings through sex reversal by heat treatment: strain evaluation
Megerssa Endebu, Derribew Hailu and DabaTugie
Zeway Fisheries Resources Research Center, P.O.Box 229 Zeway,OARI Corresponding author: Megersa Endebu Angessa., e-mail: [email protected], Mobile
+251911044974, Fax +251464412942,
Abstract This experiment was aimed to evaluate the response in sex proportion of two local tilapia populations to heat treatment at Zeway. Hatched embryos at yolk sac stage were collected from mouth of brood females of Hora and Zeway tilapia populations, pooled into one lot and incubated at 270C for fry production. At age of 10 days post yolk sack absorption, 150 fries from each population were transferred to heating unitand treated at 36±10C for 10 days. The fries were then transferred to outdoor ponds after heat treatment. Sex ratio was determined after four months by observation of their gonads after dissecting the fish. The heat treatment resulted in 77.6% (n=67) and 80.3% (n=61) male in Hora and Zeway populations respectively while the male proportion were 47.4% (n=135) and 50.3% (197) in control groups of Hora and Zeway respectively. The observed sex ratio in treated groups were significantly different (p<0.01) from male and female to occur with probabilities of 0.5 each. Tilapia fingerlings with higher male ratio can be produced by heat treatment. However, the results obtained in this experiment were still below the minimum 90% male required in commercial tilapia farms. As the sex-reversal response to heat treatment is affected by genetic factor, the diversified local tilapia populations have to be screened for their response in order to commercialize the technique. Key words: heat treatment, sex reversal, Nile tilapia Introduction Nile Tilapia (Oreochromisniloticus) is a widely cultured freshwater fish species because of its adaptation to wide range of environmental conditions, rapid growth rate, easy and rapid propagation, and tolerance to stress in handling (Tsadik and Bart, 2007). The fish is currently ranked second only to carps in global production (Ridha, 2006). The efficiency of reproduction in tilapia has paradoxical consequences. This aptitude allows easy and rapid propagation of the fish in various environmental conditions, but can as well be a source of problem. Within a limited environment, uncontrolled multiplication of the fish not only reduces the faunal diversity of the system but also produces dwarf fish population of poor market value (Hepher and Pruginin, 1981; Coleman, 2001). Moreover, male tilapia grows about twice as fast as its female correspondence in mixed sex of pond culture grown in central Rift Valley (Megerssaet al., 2013). Control of the unwanted multiplication of tilapia in a pond by introducing predatory fish such as C.gariepinus has been used in our country. However, the efficiency of predatory control, the availability of predator fish and the slower growth rate of female tilapia are some of the problems related to predatory control of unwanted population in mixed sex culture. Mono-sex culture of male tilapia has been popular for population control and is postulated to solve these problems. Tilapia mono sex culture can be achieved in different mechanisms. Hybrid male: Cross-breeding between O.niloticus Female and O.aurea (blue tilapia) male or O.mossambicus (Mozambique tilapia) gives all male population. The problem associated with this technology is introduction of exotic species, and maintaining different brood stocks. YY-super male technology: is another method to produce all-male tilapia population. This technology takes longer time to develop the YY-male tilapia.

Livestock Research Proceeding
204
Sex reversal: Hormone treatment is commonly used in some countries. This can be achieved through dietary supplementation of synthetic androgens which is a potent method for production of all-male tilapia population(Galeet al., 1999; Beardmoreet al., 2001; Smith and Phelps, 2001). However the consumption of hormone treated organisms is forbidden in some countries. Heat treatment of tilapia fry can result in male biased sex ratio. This heat treatment as means of producing mono sex Tilapia has been tried in several laboratories (Abucayet al., 1999; Baroiller and D’Cotta, 2001). Sexual differentiation of gonads in Nile tilapia is triggered by temperature during the critical developmental period. Exposure to elevated temperature for 10 or more days between post fertilization days 9–13 increases the proportion of male individuals (Baroilleret al., 1995; Hendry et al., 2002).Angiendaet al., (2010) indicated that the sex reversal efficiency of heat treatment in tilapia is affected by gene; whereby they achieved 86% male in general and 95% male for tilapia with a genetic marker called Abur36. The authors recommended the use of marker assisted selection of tilapia to select genotypes that give a higher percentage of males for commercial production. In Ethiopian case, tilapias collected from isolated water bodies are expected to show wider genetic diversity. Hence, the aim of this experiment was to evaluate the sex reversal efficiency of heat shock treatment in two tilapia populations collected from different water bodies. Materials and methods Study area This study was conducted at Zeway Fisheries Resources Research Center located at Central Ethiopian Rift Valley, during January 2014 to November 2015. The area is a low land with an altitude of about 1640m.a.s.l. where pond water temperature ranges from 210C early in the morning to 250C after midday. Water source used in fish ponds was ground with pH range of 8.5 to 9.0. Source of fish Brood stocks of Nile tilapia was collected from two different lakes namely Lake Hora(H) andLake Zeway(Z). Generations of similar age were produced in ponds from each of the populations. Male and female fish weighing 180 gmeach were kept in separate ponds before commencing this experiment. They were fed on pellet supplemented with 25-30% crude protein. Out-door concrete water ponds of approximately 35 m2 sizes, were used for breeding and brooding. The tanks wereaerated by continuously falling water from pipe at inlet and replenished from the ground in the flow through system. Sexually mature males and femaleswas transferred into the brood ponds at two females to one male ratio, and let to brood and hatch freely. The hatched embryos at yolk sac stage were collected from the buccal cavity of females and from bottom of fish capturing buckets, pooled into one lot and transferred into indoor separate (by populations) incubating containersset under recirculating system in lab. They were observed daily for yolk absorption. One day after yolk absorption constituted day one post yolk sac stage of development. Feeding on juveniles was also commenced at this timewith filtered zoo planktons consisted of copepods and rotifers from fish ponds. After 10 days post yolk sac absorption, 150 fries from each of the two groups (Hora population =H and Zeway population = Z) were counted and transferred to heat treatment unit. Heat treatment Heating unit within recirculation systemwas fitted with constant temperature thermostat water heaters, aerator pumps, sand-fine gravel filters systems and mercury thermometers. The optimal temperature for sex shift towards males and higher fry survival was identified to be 36±0.5°C (Angiendaet al., 2010) and the heating unit was adjusted to 360C in this experiment.Perforated but screen covered basket containers of 10 litre capacity werebathed in to the heating unit set at temperatures of 36±1°C. The heating unit was

Livestock Research Proceeding
205
used for each of the two groups in batches. The temperatures were allowed to stabilize for several days before introducing the fry into the containers in heating unit. One hundred and fifty fry at 10 days post yolk sac were introduced into the container from each of the two tilapiagroups. The fries were kept in the basket container protected by screen net, bathed in the common thermostat heating unit for 10 days receiving the heat treatment after which the thermostats switched off and the unit allowed cooling down to room temperature of 220C; this normally took about one day. During heat treatments the fry were observed daily and any death recorded. The final numbers of the fry in each container were taken and recorded for at least 24 hrs post heat treatment. These were used to calculate survival rates. For further observations and experimental procedures, the fry at about 15 days post heat treatment were transferred to outdoor ponds where they continue to receive feed portions based on theirbody weight. In the outdoor concrete ponds of size 7m x 5m x 1m, fries are let to feed in fertilized water having phyto and zooplanktons (copepods, rotifers and few daphnia). The tilapias were also supplemented with a feed prepared from mixture of wheat bran (50%) and noug cake (50%) at an estimate of 40 % their body weight daily and gradually decreased to 5% body weight daily from the 2nd month onwards. Finally, the fish were collected from the ponds at 4 months age when it is easy to identify their sex either by visual observation to their genital papilla or to their gonads after dissection. Data collection Survival rates Survival rates for the heat treatment werecalculated based on the numbers of fry that survived the heat treatment up to 24 hours post heat treatment and expressed as percentages of the initial numbers stocked. Similarly, survival rates in the outdoor ponds were calculated based on the number of fish survived in the ponds during the growth period of four months and expressed as percentage of the initial number stocked in to the ponds. Weight measurements All the fish werecollected from the ponds at 4 months post heat treatments and their weight in grams and length in cmmeasured, the fish were then dissected for sexing. Sex ratio The genital papilla of fish was observed then dissection was made to expose gonads for sex identification and under simple microscope in case of uncertainty. The numbers of males and females were recorded for each tilapia population obtained temperature treatment.Sex ratiowas calculated as percentages of the numbers of male or female fry sexed as such. Results and discussion Survival rate Among the 150 fries entered the heat treatment,108 (72%) of Hora group and 102 (68%)of Zeway group survived during the 10 days of heat treatment period. Higher mortality during this 10 days period was also recorded (Angiendaet al., 2010). Length and weight Even though the number of fish kept incontrol groups and treated groups of each of the two populations in separate ponds of similar size, were not equal. The growth of fish in the heat treated group was relatively higher than their untreated groups (Table 1). This could be due to the contribution of sex shift towards the male, which grows faster than their female corresponding.The faster growth rate of male mono sex tilapia than their corresponding mixed-sex tilapia was also reported by (Chakraborty and Banerjee, 2010).

Livestock Research Proceeding
206
Table1.Average total length (TL) and weight (TW) of tilapia populations at age of fourmonths (Mean ± Standard Error of mean) Population N Total Length (TL) in cm Total weight (TW) in g Hora Heat treated 67 12.067 ± 0.1228 32.107 ± 1.0475
Control 135 11.904 ± 0.3336 30.108 ± 0.9884 Zeway Heat treated 61 16.970 ± 0.1410 77.584 ± 1.8798
Control 197 12.437 ± 0.3354 35.682 ± 1.2495
Narrowing the comparison of the growth rate to the heat treated groups (having nearly similar densities in the ponds) during the four months of growing period, differences can be observed between the populations and the sex within the population (table 2). Their numbers were, however, not proportional within the heat treated groups because of the heat treatment effect (table 2). Table 2. Average weight (gm) of heat treated fish at four months of age in population and sex
Fish population with their sex N Mean weight (gm) ± Std. Error
Zeway Male 49 82.573a ± 1.5922
Hora Male 52 66.598b ± 0.8351 Zeway Female 12 57.208c ± 2.4129 Hora Female 15 37.813d ± 1.9956
Means in rows followed by different letters are statistically significant at significance level of 0.05 Though the fish were not reached at their sexual maturity, size differences were observed between the sexes. The difference in average weight was also observed among the populations. The differences in average weight of the heat treated fish between sex and population at four months of age was statistically significant (p<0.05). This difference in size between male and female will definitely widen when the fish are allowed to grow to market sizeby the time females start to produce egg and incubate larvae, care for their young (Megerssaet al., 2013). The multiple comparison of size in weight between sexes in each population showed the differences were significant (p<0.05). Male were generally grown faster than females, similar observation was reported earlier in mixed-sex tilapias grown in pond in mid Ethiopian Rift Valley (Megerssaet al., 2013). As it can be seen the growth performance of Zeway population was higher than that of Hora in both male and female sexes. The difference in growth performance observed between Zeway and Hora could be due to their difference in genetic potential to adapt in pond culture at Zeway condition (Daba T et al., 2014). Sex ratio As the sex identification made by visual observation to the genital papilla of the fish followed by observation of their gonad shape and content (females with eggs, males with milt) by dissecting their abdomen showed, different sex ratios (Fig 1.) were obtained among the treatments.

Livestock Research Proceeding
207
Fig 1. Sex In control(52.6%) wdifferent (of 197 tilaprobabilit0.5. However80.3% (n=in the twoin binary probabilittreatment Oreochroprevious s Sex reverpopulationno better study (Anto achieveamong diamong the ConclusioThe sex rrate in tilother meawas still bdepends oScreeningDesigninghelp solvi
0102030405060708090
Sex ratio
(%)
x ratio in % o
l group of Howere female, w(p>0.05) fromapias of Zewty of male and
r, among the h=61) were fouo groups are n
probability ties of 0.5 ea
(higher temisniloticus. studies (Abuc
rsal efficiencn ishighly prooption of ma
ngiendaet al. 2e more malefferent tilapiae tilapia popu
on and recomatio in the heapia pond cu
ans to producbelow the reqon the constag of potential g simple teching the curren
control
47.452.6
H
Male Fem
of tilapia in H
ora populatiowhere statisti
m 0.5 and 0.5aypopulationd female to o
heat treated pund to be manot significantest were sig
ach, unlike themperature o
The higher mcayet al. 1999
cy of heat treomising in prale tilapia pro2010), the cur proportion. a populations ulations.
mmendationseat treated groulture. Heat trce all male tilquired 90% mant power sup
tilapia populhnique ofheatnt problem.
Treate
77.6
6
2
ora
male
Hora and Zew
on, out of 135cally the prob
5. Similarly, i, 99 (50.3%) ccur in this g
populations, 7ale in Zeway gntly different gnificantly (phat of the unof 36 degrmale ratio in
9, Baroiller an
eatment in throduction of moduction . Howrrent result neMoreover, thalso perhaps
s oup was highreatment is thlapia in pond
male in tilapia pply, which dlations for tht treatment fo
ed
22.4
way populatio
5 fish grown bability of man control growere male an
group was not
77.6% (n=67)group; testing(p>0.05). In
p<0.01) diffentreated grouprees centigran tilapia was nd D’Cotta, 2
he current stumale dominatwever compaeeds improvehe difference s attributed to
ly skewed towherefore, gooculture. Howpond culture.determines th
heir response or commercia
0102030405060708090
c
5
Sex ratio
(%)
Ma
ons under tre
in a pond, 6ale and femal
oup grown unnd 98 (49.7%t significantly
) were found g differences both cases h
erent from, mps. Result inade) favoursalso obtained001, Angiend
tudy, 77.6% ted tilapias toared to the 86ment in the st in sex rever
o the genetic v
wards male, wod option for wever, the res. The reliancehe sex reversto heat treatm
al purpose in
control
50.3 49.7
Zeway
le Female
eated and con
64 (47.4%) wle to occur wa
nder normal p%) were femaly different (P=
to be male inbetween prop
however, the vmale and femn the current s tendency d under highda et al. 2010
in Hora ando be used in p6.3% male obtability of hearsal responsevariation (An
which favourr sex reversalsult obtained e on the heat al efficiency ment in sex rn supply of a
Treated
80.3
19.7
ntrol groups
were male whas not signific
pond conditiole; statisticall=1.0) from 0.
n Hora group portions, the values when
male to occurstudy showsto be mal
her temperatu).
d 80.3% in Zpond culture wbtained in preat and lab fac
e to heat treangiendaet al.
rs the rapid gl in the absenin this expertreatment howof heat treat
reverse is reqll male tilapi
ile 71 cantly n, out ly, the .5 and
while ratios tested r with , heat le in
ures in
Zeway where evious cilities atment 2010)
growth nce of riment wever tment.
quired. ia can

Livestock Research Proceeding
208
References Abucay, J.S., Mair.G.C.,Skibinski, D.O.F., &Beardmor, J.A. (1999). “Environmental sex determination:
the effect of temperature and salinity on sex ratio in Oreochromisniloticus L.” Aquaculture, 173: 219–234.Aquaculture, 173: 219–234
Angienda, P.O., Aketch, B.O.,&Waindi, E.N. (2010).Development of All-male Fingerlings by Heat Treatment and the Genetic Mechanism of Heat Induced Sex Determination in Nile Tilapia (OreochromisniloticusL.).International Journal of Biological and Life Sciences 6:1
Baroiller, J.F., and H. D’Cotta.(2001). Environment and sex determination in farmed fish.CompBiochemPhysiol, 130,399–409.
Baroiller, J.F.,Chourrout, D.,Fostier, A., &Jalabert, B. (1995). Temperature and sex chromosomes govern sex ratios of the mouthbrooding cichlid fish Oreochromisniloticus. J. Exp Zool., 273, 216–223.
Beardmore, J.A., Mair, G.C., Lewis, R.I., 2001.Monosex male production in finfish asexemplified by tilapia: applications, problems, and prospects. Aquaculture 197,283–301.
Chakraborty, S. B., &Banerjee, S. (2010). Comparative Growth Performance of Mixed-Sex and Monosex Nile Tilapia Population in Freshwater Cage Culture System under Indian Perspective.International Journal of biology, 2
Coleman, R. (2001). Cichlids and Science: Bad Cichlids.Cichlid News Magazine,32-34. Daba, T., Megerssa, E., and Tokuma, N. (2014).Comparative study of growth performance of three
Oreochromicniloticus populations under culture condition in concrete tanks, Zeway, Ethiopia.In: Water reservoirs in Ethiopia: Ecology and their benefits. Paper presented at the 6th annual conference of the Ethiopian Fisheries and Aquatic Science Association, Mekelle, Editors: Brook Lemma and SeyoumMengistou. 161-178pp
Gale, W. L., M. S. Fitzpatrick, M. Lucero, W. M. Contreras-Sanchez and C. B. Schreck1999.Masculinization of Nile tilapia (Oreochromisniloticus) by immersion inandrogen. Aquaculture, 178: 349-357.
Hendry, C.I.,Martin-Robichaud, D.J&Benfey, T.J. (2002). Gonadal sex differentiation in Atlantic halibut.J. Fish Biol. 60,1431-1442.
Hepher.&Pruginin.(1981). Commercial Fish Farming. John Wiley and Sons, New York. pp. 291. MegerssaEndebu, DabaTugie and TokumaNegisho (2013). Evaluation of fish growth performance under
fish-poultry integrated farming system at Gidara, East Showa, Ethiopia. In: Trends in the conservation and utilization of Aquatic resources of the Ethiopian Rift Valley, paper presented at the 5th annual conference of Ethiopian Fisheries and Aquatic Science, (2013): Hawassa, Ridha, M. T. (2006). Comparative study of growth performance of three strains of Nile tilapia, Oreochromisniloticus, L. at two stocking densities.Aquaculture Research, 37, 172-179.
Smith, E. S. & Phelps, R. P. 2001.Impact of feed storage conditions on growth and efficacy of sex reversal of Nile tilapia.North American Journal of Aquaculture, 63(3), 242-245.
Tsadik, G. G.,& Bart, A. N. (2007). Effects of feeding, stocking density and water-flow rate on fecundity, spawning frequency and egg quality of Nile tilapia, Oreochromisniloticus(L.). Aquaculture, 272, 380-388.

Livestock Research Proceeding
209
Fish stock assessment in GilgelGibe Reservoir
Mathewos Hailu Worku Zeway Fishery Resources Research Center, P.O.Box229 Zeway, OARI
Corresponding author: Mathewos Hailu Worku, email: [email protected], Fax: +251464412942
Abstract Aspects of the population dynamics of the fisheries in Gilgel gibe reservoir were described based on catch per unit effort (CPUE) collected monthly between October 2008 and June 2013 from three fish landing sites. The fisheries output were, 14, 16.7, 17.6, 13.2 and 9 kg/ha/year respectively for the five consecutive years. The average annual output of the fisheries varied between 45.7- 87.9 tonnes per annum, while CPUE 3.1±0.3 kg Net-1 day-1. The fishing intensity was 4.8 Net-days ha –1 year –1. The maximum sustainable yield is estimated at 84 tonnes per annum which can be achieved by using 20497 gillnet days per annum and the current effort level of 37499 gillnet days per annum is affecting the sustainability of the resource. Keywords: CPUE, Gillnet fishery, Nile tilapia, hydroelectric reservoir Introduction After a river is impounded and a reservoir is created, there are changes in fish communities resulting from the strong alterations of physical and chemical properties, as well as a changed ecosystem biological productivity characteristics (Kolding & van Zwieten, 2006). These eventually affect the variability of individual species abundance and yield (Buijseetal., 1994; Ahmed etal., 2001). Moreover, high fishing intensities will contribute to a decreased biological diversity that might lead to more unstable, and possibly lower, catches over the long term (Kolding & van Zwieten, 2006). The differences in annual fish yield within andor between reservoirs cannot be easily understood, likely being due to a complex interaction of several variables that influence biological productivity (De Silva &Amarasinghe, 2009). Several ecologists and fishery managers have attempted to determine the yield and abundance of fish stocks in aquatic ecosystems using physical, chemical and biological characteristics (surface area of the river drainage basin; surface area of lakes; floodplain areas; morphoedaphic index; depth, shoreline development; primary production; etc.) (Lae et al., 1999). The utilization of one or more variables as a management tool, however, largely depends on the nature of the fisheries as well as the available database (De Silva etal. 2001). Moreover, the variability in fish yield also may be caused by fluctuations in recruitment, and growth and survival rates of the available target species, as well as the fishing effort (Bayley, 1988; Buijseetal., 1991). Many studies had shown that changes in fish landings could serve as a suitable ‘indicator’ for monitoring community level responses to both fishing pressures and environmental factors (e.g. Paulyet. al., 1998; Darwall, 2001; Hyun et.al., 2005; Moratoetal., 2006). Variations in species composition of fish in reservoirs and lakes would also reflect the variation in fish yields (i.e. individual large-sized species contribute more weight than a small sized species), although declines in overall fish yield may not be apparent until the complete collapse of the fishery (Welcomme, 2001). Thus, temporal patterns of variation in fish species composition are one of the most important topics for fish stock assessment of lake and reservoir fisheries (Kubeckaetal., 2009), with long-term studies of reservoir fish communities and yields being necessary to establish a baseline for management recommendations

Livestock Research Proceeding
210
Materials and Methods Gilgel Gibe I reservoir (7°42'50"- 07°53'50"N; 37°11'22"E - 37°20'36"E) is created by impounding GilgelGibe river, a tributary of the Omo river, located at 260 km South West of Addis Ababa, Ethiopia (Fig. 1). The reservoir is characterized by a rock fill dam with asphalt concrete, situated on a plateau approximately 1650 m a.s.l. (EELPA, 1997). The Dam was commissioned in 2004 to generate hydroelectric power with an installed capacity of 180 MW. The main physical characteristics of the reservoir are summarized in Table 1. Table 1. Physical characteristics of the Gilgel Gibe I Reservoir and its basin
Physical characteristics Value Maximum normal water level (m a.s.l.) 1671 Minimum normal water level (m a.s.l.) 1651 Live Storage (m3) 711 x 106 Maximum depth (m) 40 Catchment area (km2) 5,125 Annual rainfall (mm) 1,550
The annual commercial fish catch of the Gilgel Gibe I Reservoir, for the period 2009 –2013 was estimated from annual frame survey and a weekly catch assessment survey (CAS) conducted on each landing site throughout the study period. The CAS parameters consisted of fishing days, landings (kg) for each species and effort (number of gillnet, of fifty meter length). The catch per unit effort (CPUE, kg per gillnet night) from CAS was raised by a function of the total gillnet (the only fishing gear in the reservoir) and active fishing days in a month, in order to obtain monthly estimates (Stamatopoulos, 2002). The data from the landing sites were then summed on a monthly basis, to compute annual fish landing. The variation in mean annual CPUE was computed using the non-parametric Kruskal-Wallis test on ranks. Annual fish landing landings for each species and effort (number of gillnet, of fifty meter length) were used to analyze the historical trends of the fishery applying the holistic models of Schaefer (1954) according to Sparre and Venema (1995). A lineal adjustment between catch per unit effort and the effort was used in the model. The optimum fishing effort and the maximum sustainable yield (MSY) which assures the stock’s long term sustainability were obtained from those relationships. Fisheries independent gillnet selectivity and length at first maturity were estimated from a monthly gillnet setting between July 2012 and March 2013 by using multifilament gillnet fleets comprising 60, 80, 100 and 120 mm stretched mesh size. The panel length of each mesh size was 25 m and 3 m depth. Immediately after capture, fishes were separated by species and mesh size and the total length (TL) and total weight (TW) of each fish specimen was measured and weighted to the nearest mm and 0.1 g respectively. Fish were then dissected, sexed and the gonads were visually assigned a stage of maturity according to the criteria outlined in (Bagenal and Braum ,1987). The relative abundance of fishes from gillnets was expressed using the index of relative importance (IRI) (Kolding, 1998) such that:
IRI = (%N + %W) × %F……….……………………………………………. (1) Where %N and %M are the percent number and mass of each species of total catch, and %F is the percent frequency of occurrence per gillnet per night (% of all net nights containing a given species)

Livestock Research Proceeding
211
Results and discussion Commercial fishing on Gilgel Gibe I Reservoir started in 2004 immediately after the impoundment. Fishing is carried out in five areas landing sites by fishermen organized in cooperative, using gillnets. The commercial fishery of the Gilgel gibe I reservoir is composed of Oreochromis niloticus (Linnaeus, 1758) and Labeobarbus intermidus (Ruppell, 1835), while Labeocylindricus (Peters, 1852) was only caught during the experimental fishing. The annual fisheries catch varied between 45.7- 87.9 tonne per annum (Fig.1). The commercial catch is dominated by O. niloticus. The proportion of L. intermidus decreased significantly (Kruskal–Wallis tests, χ2 (4) =24.1; P< 0.001).
Fig. 1. the annual fisheries catch of Gilgel Gibe reservoir Fishermen in Gilgel Gibe I reservoir mostly use gillnets with mesh size between 8-12 cm. The mean annual CPUE for the reservoir varied significantly (P< 0.001), ranging between 6.1 ± 1.9 and 1.2 ± 0.8 kg per gillnet night (Fig 2). Despite the similarity in decrement of CPUE for O. niloticus and L intermidus, the difference in mean annual CPUE was more apparent for L. intermidus. Mean annual CPUE of Oreochromis niloticus commercial gillnet fishery was significantly lower (P< 0.001) in 2010 (4.5±0.7) than 2013 (1.1±0.4).
Livestock Research Proceeding
212
Fig. 2 The mean annual CPUE in kg per gillnet day The MSY and the corresponding effort levels for each fishing effort unit are 84 tonnes and 20497 gillnet days respectively. According to the Shafer model the current the current effort level of 37499 gillnet days per annum exceeded the maximum sustainable effort and it is affecting the sustainability of the resource. Several predictive models, based on a variety of morphological physicochemical and biological parameters, have been developed to provide a general indication of potential fish yields from lakes and reservoirs (MRAG, 1995). Despite their limitations, their use can nevertheless provide a preliminary estimate of potential fish production.The MSY from Shafer model was compared with morph edaphic MIE fish yield predictors for African reservoirs (Henderson &welcome, 1974; MRAG, 1995) Table 2. Table 2.Different empirical models and estimated annual fish yields (Y) and Yield per hectare (Y/H) of Gilgel gibe I reservoir
Yield prediction Models for African reservoir Y Y/H
ln(Catch) = -10.502 + 0.484 * ln(Area) +0.45* ln(Catchment) + 1.57 * ln(Rainfall) a
219 43
ln(Catch) = 3.844 + 0.891 * ln(Area) + -0.342 * ln(Altitude) a 120 24 ln(Catch) = 2.625 + 0.879 * ln(Area) + -0.121 * ln(Zmax) a 267 53.4
Y=16.31*MIE^0.4681b 200 40 Shafer Surplus production Model 84 16.8 a (MRAG, 1995); b(Henderson &welcome, 1974)
The fish yield predicted through the empirical models predicted higher fish yield per annum for Gilgel gibe I reservoir. These models use catchment area and characteristics, which positively affects the trophic status of a reservoir (Nissanka et al., 2000). From the fishery independent gillnet survey, 609 fish composed of 326 O. niloticus, 271 L. intermidus and 12 L. Cylindricus were captured. This represented a %IRI of 63.3, 36.2 and 0.2 for O. niloticus, L. intermidus and L. Cylindricus respectively. The Total length of the specimens ranged from 12.0 to 28.5 cm, 11.0 to 34.0 cm and 13.0 to 26.4 cmfor O. niloticus, L. intermidus and L. Cylindricus respectively.Labeo cylindricusis missing from the commercial catch data. The species is rarely caught by fishermen, as it is too small to be retained by the gillnet fishery which only uses gillnet with a mesh size between 8 and 12 cm. Conclusions and recommendation From the annual catch result, the abundance of Labeobarbus intermidus and Oreochromis niloticus in Gilgel gibe reservoir are highly exploited. To maintain this valuable resource, the present level of exploitation should be reduced and the spawning stock and recruits should be safeguarded. To stabilize the fishery of Gilge gibe reservoir, the fishery can be assisted with auto stocking by protecting the spawning ground and artificial stocking once in a while. The management for reduction of gillnet fishing days can be accommodated by reducing the duration of the fishing season if the fishing efforts ( reducing the number of fishermen/gillnet) seems to be impossible for socio-economic reasons.

Livestock Research Proceeding
213
References Bagenal, T.B., & Braum, E. (1987). Eggs and early life history. Methods for assessment of fish
production in freshwaters. Blackwell Scientific Publications, London.Pages 165-201. EELPA (Ethiopian Electric Light and Power Authority). (1997). Gilgel Gibe hydroelectric project
environmental impact assessment, Addis Ababa, Ethiopia.100. Henderson H. F. &Welcomme R. L. (1974).The relationship of yield to morphoedaphic index and number
of fishermen in African inland fisheries.CIFA Occas. Pap.1, 19. Kolding, J. (1998). PASGEAR: A Database Package for Experimental Fishery Data from Passive Gears:
An Introductory Manual. Department of Fisheries and Marine Biology, University of Bergen High Technology Centre.
MRAG (1995).A synthesis of simple empirical models to predict fish yields in tropical lakes and reservoirs. Final Report, Fisheries Management Science Programme, Overseas Development Administration. MRAG Ltd, London, UK
Nissanka C., Amarasinghe U. S. & De Silva S. S. (2000). Yield predictive models for Sri Lankan reservoir fisheries. Fish. Manage. Ecol. 7, 425–36.
Schaefer, M. (1954). Some aspects of the dynamics of populations important to the management of the commercial marine fisheries. Bulletin I-ATTC/Bol. CIAT, 1:27-56.
Spare, P. & Venema S. (1995). Introduction to tropical fish stock assessment. Part. I. Manual FAO Fisheries Technical Paper 306: 337.
Stamatopoulos, C. (2002). Sample-based fishery survey: A technical handbook. FAO, Rome.

Livestock Research Proceeding
214
Gear selectivity and abundance of fish in Lake Chercher West Hararge Zone Oromia
Mathewos Hailu Worku Ziway Fisheries Resources Research Center, P.O.Box 229, Zeway, OARI
Corresponding author: Mathewos Hailu Worku, Zeway, E-mial: [email protected], Fax: +251464412942
Abstract The abundance of Fish in relation to season and gillnet selectivity was studied from November 2013 to June 2014 in Lake Charchar, West Hararge Zone. Four sets of gill net with stretched mesh sizes of 60, 80, 100 and 120 mm respectively were used each measuring 50 m in length and 3 m in depth. The lake is comprised of two fish species (Oreochromis niloticus and Tilapia zilli). There was no significant variation (P > 0.05) in abundance of Oreochromis niloticus among fishing season. The catch per unit effort for Oreochromis niloticus was 7.8±0.13 kg Net-1 day-1 higher than any other lakes in the country. The size at first sexual maturity was 20.3 cm. The estimated gillnet selectivity for 80 mm mesh size was 21.8 cm, and gillnet with mesh size 80 mm and above should be adopted for sustainable harvest of fish in the lake. Keywords: CPUE, Gillnet, Mesh selectivity, Nile Tilapia Introduction Fishes are important renewable natural resources in Ethiopian rift valley that have been exploited for both subsistence and commercial purposes. The importance of fisheries as an economic activity in providing food, income and employment in Ethiopia has been growing with increasing population and access to market. Lake Chercher is located in west Harergae between the towns of Bedesa and Gelemso. The lake has a surface area of about 352 ha at an altitude of 1680 m asl. The lake has experienced a frequent and drastic lake level fluctuation (Pers. Com.). Fishing has not been practiced in the area. There is no study on the ecology and biology of any of the lake Chercher fish species hence basic knowledge on fish population distribution, abundance, size classes and condition factor as well as reproductive biology is deficient, yet such knowledge is necessary to guide proper management of the fisher (Reyntjens and Wudneh 1988, Schaefer 1991). Materials and Methods The abundance of Fish in relation to season and gillnet selectivity was studied from November 2013 to June 2014 in Lake Chercher by using multifilament gillnet fleets comprising 60, 80, 100 and 120 mm stretched mesh size. The panel length of each mesh size was 50 m and 3 m depth. Immediately after capture, fishes were separated by species and mesh size and the total length (TL) and total weight (TW) of each fish specimen was measured and weighted to the nearest mm and 0.1 g respectively. Fish were then dissected, sexed and the gonads were visually assigned a stage of maturity according to the criteria outlined in (Bagenal & Braum, 1987). The mean length of O. niloticus at first maturity (L50), was determined using the method described by (Echeverria, 1987). The method fittest the percentages of mature fish that was grouped in 1 cm length classes to the logistic equation (1).
PL= (exp (α + βL)) / (1+exp (α + βL)) …………………………………….1 Where PL is proportion of mature fish at length (L) and L, is total length (cm), and α (the intercept) and β (the slope) of least-squares estimates.

Livestock Research Proceeding
215
The length frequency from gillnet fleets was corrected to provide an unbiased estimate of the length structure by determining the gillnet selectivity by using SELECT (Share Each LEngth’s Catch Total) method. The SELECT method applies maximum likelihood, which estimates selectivity parameters from a general log-linear model (Millar, 2003). Catch data were pooled by mesh size into 1 cm length classes, and the midpoint of each size class was used to estimate a selectivity curve for each mesh size. The four gillnet selectivity models (normal location, normal scale, gamma and log-normal) were fitted to the data by using the “gillnetfunctions” package in R statistical software (R Development Core Team, 2013). For each model, the data were fitted under the assumptions of equal effort and proportional effort to the size of the mesh. Goodness of fit statistics in the form of model deviance was used to choose the best model. Results and Discussion The fishery of Lake Chercher was comprised of Oreochromis niloticus and Tilapia zilli. A total of 382 Oreochromis niloticus specimens and 49 Tilapia zilli, were captured during the sampling period. The total lengthof Oreochromis niloticus specimens ranged from 10.2 cm to 29.4 cm with a corresponding weight of 18.1- 435.1 g. The length-weight relationships were curvilinear and statistically significant with W = 0.0202LT
2.9473, R² = 0.99. In this study the smallest mature male had a total length of 15.0 cm while the smallest mature female had a total length of 16.0 cm. The length at first sexual maturity (L50) was 20.3 cm TL (Fig. 1) and it is not significant between sex ANCOVA (P=0.436).
Fig 1. Length at first maturity of Oreochromisniloticus in Lake Chercher. The size at first maturity for Oreochromis niloticus is variable and broad in range in several Ethiopian lakes and reservoirs, ranging from 13 cm, Lake Ziway to 42 cm, Lake Chamo(Teferi, Admaasu, & Mengistou, 2001). Size at maturity in Oreochromis niloticus is inversely related to growth, and thereby is influenced by ecological habitat (Lowe-McConnell, 1982) and fishing pressure (Chervinski, 1982; Njiru et al., 2006; Ojuok, Njiru, Ntiba, & Mavuti, 2007). The latter could be ruled out for Lake Chercher as the fishery activity has been started recently.

Livestock Research Proceeding
216
Despite itstrategy aprobably the speciespawning The sampcould therthe abund7.8±0.13 Stations (K Various fitheir distrcommonlywithin thefishes in reconstrucselectivity Estimates121.7 62.criteria ofselectivityand 120 m
Fig 2. Gfor the 60 ConclusioIn generaland the seOreochromanagemwhich depwhich can
ts resent inunas in many trcontributed t
es is a multiplperiod (Adm
pling design irefore be assudance of thekg Net-1 day
Kruskal-Wall
fishing methodribution and y used sample mesh webbia certain optict the populaty of the nets u
of relative g.4 and 63.9 ff lower modey for Oreochrmm mesh size
Gillnet selectiv0-120 mm me
ons and Recol, the gillnet welection has amis niloticus
ment than closupend only in fn be achieved
ndation of lakropical aquatio its success le spawner (T
massu, 1996).
in this study umed to be co different spy-1There waslis, F = 0.976
ds are employrelative abun
ling techniqueing. Gillnets imal length intion size distrused, the bias
gillnet selectifor normal, nel deviance, gromis niloticues, respectivel
vity curves anesh sizes
ommendationwith mesh siza sharp peak is in this studure in small sfisheries. Thu
d if the minim
ke Chercher Oic ecosystemin the lake. T
Teferi, et al., 2
remained cononstant througpecies. The Cs no signific6, df= 3, p = 0
yed to estimandance. Withe. Gillnets arare, howevernterval. This ribution fromis reduced co
ivity are presnormal scale,gamma modelus was foundly.
nd residuals
ns ze 80 mm mosin about 22 cmdy was 20.3 scale artisanalus, the legal m
mum mesh size
Oreochromis m (Rinne & W
The species h2001), and pro
nstant over thghout the samCPUE of Orant differenc.46).
ate the numbehin reservoirse passive fishr, extremely sselectivity in
m experimentaonsiderably.
sented in Fig , gamma andl was selecte at 17.5, 23.6
estimated fo
st efficiently m length clascm TL. Fishl fisheries as minimum sizee is establishe
niloticus shoWanjala, 1982has a protractobably able to
he sampling pmpling period reochromis nce in seasona
er of fish specs and lakes, hing gear andselective in thntroduces a bal gillnet catc
2. The moded lognormal d for estimat
6, 29.6 and 35
or Oreochrom
selects indiviss. The estimahing gear restit does not the for Oreochred at 80 mm.
ows a well-de2; Trewavas, ted spawning o rear several
period and suand likely to
niloticus in laal CPUE bet
cies present wgillnets are
d entangle fishat a specific bias when atteches. By takin
el deviance vmodels. Base
tion of gill ne5.2 Cm TL, f
mis niloticus
iduals about 1ated lengths atriction is a
hreaten the livromis niloticu
efined reprodu1983), whicperiod confir
l broods in an
ubsequently Co be proportioake Cherchertween the va
within a waterpossibly the
sh by holdingmesh size ca
empts are mang into accou
values were 1ed on theseleet selectivity.for the 60, 80
in Lake Che
17-31 cm in leat first maturipreferable w
velihoods of fus should be 2
uctive ch has rming
ny one
CPUE onal to r was arious
rbody, most
g them atches ade to
unt the
114.9, ection Peak
0, 100
ercher
ength, ity for
way of fishers 21 cm

Livestock Research Proceeding
217
References Admassu, D. (1996). Maturity, fecundity, brood-size and sex ratio of Tilapia (Oreochromis niloticus) in
Lake Awassa (Ethiopian Rift Valley). Hydrobiologia 337, 77-83. Bagenal, T. B., & Braum, E. (1987). Eggs and early life history. In T. B. Bagenal (Ed.), Methods for
assessment of fish production in freshwaters (pp. 165-201). London: Blackwell Scientific Publications.
Chervinski, J. (1982). Environmental physiology of tilapias. In R. Pullin & R. Lowe-McConnell (Eds.), The Biology and Culture of Tilapias (pp. 119–128). Manila: ICLARM Conference Proceedings.
Echeverria, T. W. (1987). Thirty-four species of California rockfishes: maturity and seasonality of reproduction. U.S. Fish. Bull., 85, 229-250.
Lowe-McConnell, R. (1982). Tilapias in fish communities. In R. Pullin & R. Lowe-McConnell (Eds.), The biology and culture of Tilapias (pp. 309-316). Manila, Philippines: ICLARM conference proceedings.
Millar, R. B. (2003). R CODE for fitting SELECT models to gillnet data Retrieved August 10, 2013, from http://www.stat.auckland.ac.nz/~millar/selectware/R/gillnets/
Njiru, M., Ojuok, J., Okeyo-Owuor, J., Muchiri, M., Ntiba, M. J., & Cowx, I. (2006). Some biological aspects and life history strategies of Nile tilapia Oreochromis niloticus (L.) in Lake Victoria, Kenya. African Journal of Ecology, 44, 30–37.
Ojuok, J., Njiru, M., Ntiba, M., & Mavuti, K. (2007). The effect of overfishing on the life-history strategies of Nile tilapia, Oreochromis niloticus (L.) in the Nyanza Gulf of Lake Victoria, Kenya. Aquatic Ecosystem Health & Management, 10, 443–448.
R Development Core Team. (2013). A Programming Environment for Data Analysis and Graphics Retrieved August 10, 2013, from http://www.R-project.org
Rinne, J. N., & Wanjala, B. (1982). Observations on movement patterns of Tilapia spp. in Nyanza Gulf, Lake Victoria, East Africa. Journal of Fish Biology, 20(3), 317-322. doi: 10.1111/j.1095-8649.1982.tb04713.x
Teferi, Y., Admaasu, D., & Mengistou, S. (2001). Breeding season Maturation and fecundity of Oreochromis niloticus L. (Pisces:Cichilidae) in Lake Chamo, Ethiopia SINET: Ethiopian Journal of Science, 24, 255-264.
Trewavas, E. (1983). Tilapiine Fishes of the Genera Sarotherodon, Oreochromis and Danakilia. . London: British Natural History Museum.

Livestock Research Proceeding
218
Hazard analysis of different fish products provided for consumers in Zeway
Demeke Teklu Senbetu Zeway fishery resources research center, P.O. Box 229, Zeway, OARI
Corresponding author: Demeke Teklu Senbetu, e-mail:[email protected], Fax +251464412942, Mobile:+251913038068
Abstract Hazard analysis of different fish products in Zeway was initiated with the objective to analyze microbial load of four different fish products. 8 samples of Fish Gulash (GS), 8 sample of Cutlet (CS), 2 sample of fish fillet (FS) and 2 samples of fried fish (FFS)were collected in triplicate and packed in pre-sterilized glass jars from hotels, fish shops and lake side recreation areas of Zeway town. The result indicated that aerobic bacterial counts for 14 samples were categorized as highest microbiological risk, while 6 samples were categorized as moderate risk. Regarding Staphylococcus, 7 samples were categorized as highest microbiological risk however 8 samples didn’t show any growth while the rest of samples were at moderate risk. 9 samples were shown Salmonella species and Shigella species count beyond the acceptable limit. Only 6 samples were shown the highest risk of all total coliform, E-coli and fecal coliform counts. The highest microbial load observed from many of the collected fish product could be due to human contact through air particles breathed, coughed or sneezed out during the course of work or from food handlers or from other sources in the air within the processing area. It also could be due to processing water and equipment, unfavorable storage temperature and/or long period of storage time. Finally, further research work covering wider area and large sample size should be done to identify problems and determine appropriate processing and handling of fish. Key words: Fish products, biological hazard, health risk Introduction Fish is the rich source of protein with an amino acid composition very well suited to human dietary requirements, comparing favorably with eggs, milk and meat in the nutritional value of its protein (Tanikawa, 1971). Fish contains some vitamins, minerals and is a minor calorie source, in addition to its very considerable nutritional significance as a supply of protein. Unfortunately, as it is the important and significant sources of essential nutrients for human being, fish flesh also contains the nutrients necessary to support the growth of a wide range of micro-organisms. Although, the flesh of newly caught fish is sterile, the skin, gills and intestines tend to carry considerable microbial loads depending on the environment of the fish at the time of capture. At the death these micro-organisms starts to invade the tissues and this is favored by the struggle of the fish when caught and use up virtually all of the glycogen in their muscles, so little glycogen is left to be converted to lactic acid after death, thus, the preservative effect of muscle lactic acid to slow down bacterial, mold and yeast growth is limited (Shewan, 1977). The characteristics and the technology of traditional fish processing are made in general under primitive condition which results in low yield and poor quality of the product since fish is very perishable food stuff (Kagan, 1970). Fish being an extremely perishable foodstuff needs careful treatment in handling and processing both from public health aspects and improvement of the well fare of fishing (Demeke,2013). In addition to fish’s higher water activity (Aw), the poor sanitary practices in local fish processing results in public/consumer health hazards due to the presence of pathogenic bacteria like Moraxella, Staphylococcus species, Halo-bacterium and Coli-forms, moulds like Aspergillus restrictus, Aspergillus glaucus, Aspergillus candidus, Aspergillus flavus and Penicilium Spp., yeasts like Saccharomyces rouxii, Debaryo myceshansenii and Pichiaohmeri (Kagan, 1970). Therefore, the microbial count in locally fried fish is the most reliable indication we have of its sanitary/ microbial quality. Even though those human pathogens may not be present in high count, it may indicate unsanitary processing and handling and/or

Livestock Research Proceeding
219
unfavorable temperature while the high count indicates that there is a greater likelihood of disease transmission.Therefore, this research activity was initiated with the objective to analyze microbial load of four different fish products. Materials and methods Study area Zeway is situated in East Showa Zone, Oromia region 163 km from Addis Ababa to the South. Eight hotels, two fish shops and two lake side recreation areas were selected for samples collection in the town. Sample collection Fish Gulash (GF) and Fish Cutlet (CF) samples from eight hotels, fish fillet samples (FS) from two fish shops, and Fried fish samples (FFS) from two lake side recreation areas were collected three timesusing a sterile aseptic glass jar and cool transported using ice box to Hawassa University, Department of Applied Biology laboratory. APC analysis Immediately after arrival, 1 gram of fish sample was added to 9 ml peptone water and homogenized in stomacher bag. Then appropriate serial dilutions (10-1, 10-2, 10-3, 10-4& 10-5) of all samples were prepared and then 0.1 ml of the odd power dilutions were taken and plated using spread plate technique in a duplicate by using a Standard Plate Count Agar (PCA). Finally, it was incubated at 350 c for 48 hr. and then number of colony was counted and colony forming units was calculated by multiplying number of colony by its serial dilution factors. Mold and yeast analysis 0.1 ml of the odd power dilutions were taken and plated using spread plate technique in a duplicate by using standard Yeast Extract Glucose Chloramphenicol Agar (YGC). Finally, it was incubated at 250c for 5 days then after the result were recorded E.coli analysis Suspected colonies of the fecal coliform were confirmed in E.C Broth at 44°C for 24 hours with the production of gas, after which one loop of the positive tube were transferred into Tryptone water and incubated at 44°C for 48 hours 3 drops of Kovac’s reagent was added to the test culture and observed for any reaction. Formation of red colour indicated a positive reaction, thereby confirms the presence of Escherichia coli, and recorded those organisms producing red ring as indole positive. Total coliform analysis 0.1 ml of the odd power dilutions will be taken and plated using spread plate technique in a duplicate by using a standard Volatile Red Bile Lactose Agar (VRBLA).Finally, it will be incubated at 300c for 24 hr. then after the result will be recorded. Staphylococcus species analysis 1 ml of odd power dilutions was taken and plated using spread plate technique in a duplicate by using a standard Baird-parker agar plates. Finally, it was incubated at 37°C for 24 hours and at 37 °C for 48 hours. Typical colonies of Staphylococcus species was tested for coagulase positive as a confirmatory test and finally recorded. Salmonella species and Shigella species analysis Immediately after arrival, 25 gram of fish was added to 225 ml buffered peptone water into an Erlenmeyer flask and Incubate at 36°C (+/- 1°C) overnight for 20 hours. On the next day selective enrichment (I) and (II) were prepared and 1 ml of the pre-enrichment broth transferred to 10 ml Tetrathionate broth and Labeled as Tube I. 0.1 ml (100 uL) of the pre-enrichment broth was transfer to 10 ml Rappaport-Vassiliadis soy peptone (RVS) broth and Labeled as Tube II. Then Tube I Incubated at 36.0°C ± 1°C and Tube II Incubated at 41.5°C± 0.5°C overnight for 20 hours. On day three 10 µL from the inoculated and incubated Tetrathionate broth (I) and Rappaport-Vassiliadis Soy Peptone (RVS) broth (II) Spread on Xylose lysine desoxycholate (XLD) and on Brilliant Green Agar (BGA) agar plates and incubated at 36.0°C ± 1°C overnight for 24 hours. Day 4: Salmonella colonies from XLD plates were selected and Sub cultured: A typical Salmonella colony has a slightly transparent red halo and a black centre, a pink-red zone seen in the media surrounding the colonies. Typical Salmonella colonies on a

Livestock Research Proceeding
220
BGA agar plate appear red and impart a red/pink colour to the surrounding agar. Day five to seven: biochemical identification according to World Health Organization GFN Procedures was done to identify Salmonella and Shigella. Statistical analysis Average colony forming units of microbial load was calculated using descriptive statistics using spread sheet of Microsoft excel. Results and discussion This study explored the quality of different fish products provided for consumers in different hotels, restaurants, recreation areas and shops. The microorganisms tested were of food safety concern that included Aerobic Plate Count (APC), Mold, Yeast, Escherichia coli (E. coli), Fecal coliform, Total coliform, Staphylococcus aureus (S. aureus), Salmonella and shigella (Table 1). Table 1 Average cfu/gram of twenty different fish product samples
The total aerobic bacterial counts for 14 samples were categorized as highest microbiological risk (> 105), while 6 samples were categorized as moderate risk. The highest aerobic plate count (> 10 5cfu/g) recorded from fish samples could be due to the existence of predominant microorganism (Health Protection Agency, 2009) which could be favored at the specific storage conditions like time and temperature(Ibrahim and El-Sherif, 2008; Alemu, 2013). Regarding Staphylococcus count, 7 samples were categorized as highest microbiological risk however 8 samples didn’t show any growth while the rest left under moderate riskcategory. The highest S.auruescfu/g observed from fish samples could be due to human contact through air particles breathed, coughed or sneezed out during the course of work or from food handlers or from other sources in the air within the processing area (Beganiet al.,2012).Concerning the total coliform, E-coli and fecal coliform, 6 samples were shown the highest risk, whereas 14 samples for E-coli, 12 samples for fecal coliform and 12 samples for total coliform shown the count beyond the acceptable limits and 4 samples for E-coli left under the moderate risk category while the rest are under the acceptable microbial load limit.In spite of
No APC Mold Yeast E.coli Coliform Fecal Coliform
Staphylococcus Spp*
Salmonella Spp*
ShigellaSpp*
GSH1 2.5x10⁷ <1x101 <1x101 2.5x10⁴ 6.3 x10³ 2.0x10² 8.1x10⁴ Not isolated Isolated GSH2 6.4x10⁵ 3.3x10³ 3.3x10⁴ 5.0x10² 2.0 x10⁴ <1x101 6.3x10³ Isolated Isolated GSH3 7.0x10⁸ 1.2x10³ 4.1x10⁶ <1x101 1.4 x10² 4.1x10³ 4.1x10⁴ Isolated Not isolated GSH4 3.3x10⁶ <1x101 2.6x10⁵ 2.3x10⁴ <1x101 <1x101 4.2x10⁵ Isolated Isolated GSH5 4.3x10⁸ 6.1x10² 9.1x10⁴ 3.2x10³ 4.0 x10⁴ 3.2x10² <1x101 Isolated Isolated GSH6 4.8x10⁷ 2.4x10³ 2.0x10⁵ 1.6x10² <1x101 <1x101 2.5x10⁵ Not isolated Not isolated GSH7 2.1x10⁷ 4.1x10³ 1.3x10⁴ 1.1x10³ <1x101 2.0x10² 6.4x10³ Isolated Isolated GSH8 8.2x10⁷ <1x101 <1x101 1.6x10² 5.6x10³ <1x101 2.1x10⁵ Not isolated Not isolated CSH1 1.9x10⁶ <1x101 <1x101 <1x101 <1x101 <1x101 4.7x10³ Not isolated Not isolated CSH2 8.6x10⁴ 3.4x10² 8.1x10³ 3.1x10² 1.0x10² 2.5x10³ 3.1x10⁴ Isolated Not isolated CSH3 4.9x10⁵ <1x101 <1x101 <1x101 <1x101 1.2x10² 9.3x10² Not isolated Not isolated CSH4 6.3x10⁶ 4.4x10³ 7.0x10² 6.3x10³ 8.5 x10⁴ 8.3x10² <1x101 Isolated Isolated CSH5 9.4x10³ <1x101 <1x101 <1x101 4.1x10² 1.1x10³ <1x101 Isolated Isolated CSH6 4.0x10⁴ <1x101 8.4x10⁴ 3.6x10³ <1x101 <1x101 <1x101 Not isolated Not isolated CSH7 7.5x10⁶ <1x101 7.8x10³ 6.7x10² 1.0 x10³ <1x101 6.1x10² Isolated Isolated CSH8 4.8x10⁷ <1x101 3.9x10⁴ <1x101 <1x101 6.1x10³ <1x101 Isolated Not isolated FSS1 5.3x10⁵ <1x101 <1x101 1.4x10² <1x101 2.2x10² <1x101 Isolated Isolated FSS2 4.1x10⁴ <1x101 6.2x10⁴ <1x101 2.5 x10³ <1x101 <1x101 Isolated Not isolated FFS1 7.6x10⁴ <1x101 1.1x10² 2.1x10⁴ 2.0x10² 5.3x10² 1.6x10³ Isolated Isolated FFS2 4.3x10³ <1x101 <1x101 1.7x10³ 1.0x10³ 3.0x10² <1x101 Not isolated Not isolated

Livestock Research Proceeding
221
the other bacteria’s growth Salmonella species and Shigella species didn’t shown any growth for 6 samples while 10 samples for Shigella species and 13 samples for Salmonella species exceeds the acceptable microbial load for ready to eat foods. The highest E.coli in fish samples may attributed to fish will hence become contaminated with Enterobacteriaceae like E.colimainly during or after processing, e.g. by contaminated fish skin. However, the main source must be the direct contact of food with contaminated surfaces, tools or hands (Van den Broek et al., 1984). The Enterobacteriaceae, (Salmonella, Shigella, E. coli) are all occurring on fish products as a result of contamination from the animal/human reservoir. This contamination has normally been associated with fecal contamination or pollution of natural waters or water environments, where these organisms may survive for a long timeor through direct contamination of products during processing (Huss, 1995). The presence of human enteric organisms on fish products is clear evidence of contamination from a terrigenous source (ICMSF, 1986). The highest feacal coliform observed on fish product could be due to feacal contamination of the processing area where as most of the fishes are filleted on the ground (Demeke, 2013). The present study is in contrast with many scholars as they reported the absence of pathogenic bacteria like Salmonella in fish products; these could be the concrete evidence for the environmental contamination as seafood is a much less common vehicle for Salmonella than other foods, and fish and shellfish are responsible for only a small proportion of total number of Salmonella cases (Van den Broeketal., 1984; Boariet al., 2008). For mold count only 5 samples shown highest microbiological risk beyond the acceptable limit which could potentially injurious to health and/ or unfit for human consumption while 2 samples left under moderate risk.Nine samples which shown the highest count of yeast, 7 samples left under the acceptable limit which fits for human consumption while the rest left under moderate microbiological risk category.The appearance of mold on fish samples can explained as yeast and molds are widely distributed in the environment and can enter food through inadequately sanitized equipment or as air borne contaminants (IOM, 1985). The occurrence of Yeast and mold in fish samples has been reported by Begum et al., 2010 during the investigation of microbial assessment of five types of selected fish collected from four local markets and four super shops. The reason for highest yeast and mold counts in present study could be due to long period of storage and / or storage at high temperature of sample (Van den Broek et al., 1984). Conclusion and Recommendation Fish product of good quality should have bacterial counts less than 10 per gram fecal coliforms and total coliforms should not exceed 100 per gram. Total coliform and fecal coliform count of twelve samples and E. coli count of fourteen samples in this study exceeded the acceptable limit recommended. It was concluded that different fish products (Goulash, Cutlet, Fried fish and fillet) can be bad source of bacterial, yeast and molds. Therefore, great precautions should be taken to prevent contamination during post-harvest handling and processing of fish. It is recommended to implement regulatory measures like Good Processing practices as well as distribution and retail storage practices for ensuring microbiological safety offish provided for Zeway. Finally, further research work covering wider area and large sample size should be done to identify problems and determine appropriate processing and set standards for processing of fish. The need of training and capacity building program for fish processors and fish vending communities has been suggested.

Livestock Research Proceeding
222
References AlemuLemaAbelti. (2013). Microbiological and chemical changes of Nile Tilapia
(OreochromisniloticusL.) cillet during ice storage: Effect of age and sex.Advance Journal of Food Science and Technology 5(10): 1260-1265.
Begani, R.K., Tombe, B., &Polong, T. (2012). Effectiveness of cleaning and sanitation of food contact surfaces in the PNG fish canning industry. Contemporary PNG Studies: DWU Research Journal Volume 16.
Begum, M., Abu A.A., Das, M., &Parveen .(2010). A Comparative microbiological assessment of five types of selected fishes collected from two different markets. Advances in Biological Research 4 (5): 259-265.
Demeke,Teklu. (2013). Evaluation of different fish processing kits for better qualitypreservation.International Journal of Agricultural Innovation and Research 2(1): pp.62-67.
HPA (Health Protection Agency). (2009). Guidelines for assessing the microbiological safety of ready-to-eat foods. London: Health Protection Agency, November 2009.
Huss, H.H. (1995). Quality and quality changes in fresh fish. FAO FISHERIES TECHNICAL PAPER p 348.
Ibrahim, S.M., &El-Sherif, S.A. (2008). Effects of some plants extracts on quality aspects of frozen Tilapia (OreochrmisniloticusL.) fillet. Global Vet., 2: pp 62-68.
ICMSF (International Commission on Microbiological Specification for Foods). (1986)..MICROORGANISMS IN FOODS 2 Sampling for microbiological analysis: Principles and specific applications. Blackwell Scientific Publications.
IOM (Institute of Medicine). (1985). An evaluation of the role of microbiological criteria for foods and food ingredients.
Kagan, B. (1970). Fish processing in Ghana.Possibilities of improving traditional processing.Food research and Developing Unit. Rome, FAO, ASG:SF/GHA 7 Working paper 3.`
Shewan, J.M. (1977). The biological stability of captured fish. In: world fisheries year book 1949. London, British Continental Trade Press Ltd.,
Tanikawa, E. (1971). Marin products in Japan: size, technology and research. Tokyo, Koseikaku Co., p507.
Van den Broek, M.J.M., Mossel, D.A.A., &Mol, H. (1984). Microbiological quality of retail fresh fish fillets in The Netherlands. International Journal of Food Microbiology, 1 pp53-61.

Livestock Research Proceeding
223
Post-harvest and nutritional loss assessment of fish at different handling stage from Genale River, Southeastern Oromia
Alemu Lema Abelti
Zeway Fisheries Resources Research Center, P. O. Box 229, Zeway, OARI, Corresponding author: Alemu Lema Abelti, e-mail: [email protected], Mobile +251913189100, Fax +251464412942,
Abstract Post-harvest and nutritional loss assessment of fish was conducted to assess quality and nutritional loss of fish along the distribution chain of Genale river. The investigation was carried out between July 2014 and June 2015. A post-harvest loss was recorded from hotel when the fishermen came to hotel to sell fish. The nutritional loss between landing site and hotel was compared using independent samples t-test. Chemical analysis was done for fish whichwidely available in secondary market.From a total of 1581 kg of fish harvested , 1130 kg was Bagrus docmak, 259 kg was Labeobarbus intermidus and 192 kg was Eel (Anguilla bengalensis labiata). Regarding post-harvest loss, from 176 kg of Bagrus fish harvested, 60 kg (34.09 %) of quality deteriorated fish was discarded which amounts to 2700.00 ETB.Nutritional loss assessment indicated that crude protein has significantly decreased from 86.32 % to 63.25 % from landing site to hotel.The decrement of protein content is may be due to long distance transportation and high temperature have favored microbial growth which resulted in proteolysis induced by enzymatic activities of microorganism and denaturation of protein by heat.It was concluded that the long distances during the transportation and the high ambient temperature in combination with the poor packing materials could be the main reason for losses. Post-harvest fish losses could be reduced if fresh fish are sold shortly within 1 to 2 hours after harvestandunsold fresh fish should be processed to dry fish. Keywords: Bagrus, Post-harvest loss,Protein loss Introduction Fish is one of the most important food staples on the planet. Its flesh is a source of top quality protein and for many in the less developed parts of the world it represents a significant proportion of the animal protein in their diet. However, fish is one of the most perishable of all staple commodities, and in the tropical climates of most developing countries it will become unfit for human consumption within about one day of capture, unless it is subjected to some form of processing(Clucas and Ward, 1996). Even after the fish has been processed, particularly if traditional methods have been used, the fish is still subject to many forms of loss and spoilage. Because of influence of chemical composition on keeping quality, proximate composition like moisture, lipid, and protein and ash/mineral contents of fish from the time of harvest to different transportation and storage periods decreased with increased drip loss due to quality deterioration (Clucas and Ward, 1996). Post-harvest losses occur at different points from capture to marketing and in some fishery; the level of losses could be considerable. FAO (1981) has estimated post-harvest losses in developing countries to be up to 50% of domestic fish production. Substantial amount of fish can be lost after harvest in tropical countries. Due to high temperature in the tropics fish can spoil while still in the boat, at landing, during storage or processing, on the way to market and while waiting to be sold. In Africa, some estimates put post-harvest losses at 20 to 25 percent, and sometimes as much as 50 percent. Post-harvest losses in small-scale fisheries can be among the highest for all the commodities in the entire food production system.

Livestock Research Proceeding
224
It is known that substantial losses of fish occur at all stages in the chain from capture to marketing of fresh and cured fish. The instigation of an elaborate and lengthy loss assessment survey will not of itself increase the income of all fishermen or improve the protein content of the diets of all! Then there will the need for information on what losses actually occur and when, in order to identify improvements needed in existing processing systems. Fish losses are expressed in economic, physical and nutritional terms. The first of these (economic losses) implies a net reduction in potential revenue from a given lot of fish; the second (physical losses) means a direct loss of nutrient material, and is taken in this case to imply a loss in water-free solids (FAO, 1981); the third (nutritional losses) implies a reduction in nutritional value or increase in toxicity of the product. There are very few documented studies in our country. So, it is imperative to quantify the kind and level of fish post harvest losses and to determine nutritional losses during post-harvest losses of fish at different handling stage from Genaleriver. Materials and methods Post-harvest loss assessment The annual catch data from Genale River was recorded daily using standard format at Genale kebele. Post-harvest loss assessment was recorded from hotel when the fishermen came to hotel to sell fish. The nutritional loss between landing site and hotel was compared using independent samples t-test. Chemical analysis was done for three different fish species. Sample collection and preparation Fish for chemical analysis were harvested long lines and gill nets. The most commercially important fish species like B. docmak and L.intermidus and Mormyrus in Genale River were considered for the chemical analysis. Fish specimen was cleaned, descaled, eviscerated and filleted manually using plastic knife. Immediately after filleting, it was semi-dried under shade finally dried using oven. The dried sample was ground with mortar and pestle into fine powder and stored in polythene bag for analysis. Proximate composition was analyzed using the standard procedure (AOAC, 1998). Moisture content The moisture content was determined using oven drying method. For the purpose 5 g of dried powdered fish fillet was in the oven and determined as follows:
Determination of crude protein Crude Protein was determined by Kjeldahl methods. 0.5 g of dried powdered was weighed into Kjeldahl flask and digested by heating at 370 0c for four hours in the presence of 6 mL sulfuric acid (H2SO4), 3.5 mL Hydrogen peroxide (H2O2) and 3 g of catalyst copper sulfate (CuSO4) and potassium sulfate (K2SO4). After digestion was completed, formed clear solution was cooled for 30 minutes and neutralized by addition of 25 mL of NaOH (40 %) and diluted using 25 mL distilled water. Then 25 mL of distilled water, 25 mL of boric acid and 3 drops of methyl blue was added into receiving flask of 250 mL capacity connected to the distiller by tube. The distillation process was terminated when the volume of receiving flask reached between 200 to 250 mL. Eventually the nitrogen content was estimated by titration of the borate anion with 0.1 N HCl using the following formula.
Note: all reagents were added to blank except the sample.

Livestock Research Proceeding
225
Determination of crude fat Crude fat was determined by semi-continuous solvent extraction methods (Soxhlet method). Accordingly 2 g of fine powder fillet was placed in porous cellulose extraction thimble and covered with fat free cotton. The thimble was placed in extraction chamber which is suspended above a flask containing 50 mL diethyl ether. The flask was heated at 55 0c and the solvent evaporates and moves up into the condenser where it converted into a liquid that trickles into the extraction containing the sample. At the end of extraction process, which typically lasts for 3 hours, the flask containing the solvent and lipid was removed, the solvent evaporated at 70 0c and the weight of lipid remaining was quantified gravimetrically.
Determination of total ash Total ash content was determined using dry ashing method. For the purpose, 2 g of powdered fish fillet was weighed into ashing crucibles, placed on a hot plate under a fume hood and the temperature was slowly increased and awaited until smoking ceases and the samples become thoroughly charred. The crucibles was placed inside muffle furnace set at 550oc for 4 hours and removed from the muffle furnace and then placed in desiccators for 1 hour to cool. The amount of ash in the sample was measured from difference in weights and expressed as
Calculation of gross energy Gross energy value (Kcal/ 100g) was calculated according to Atwater’s conversion factors; by overall addition of the protein content multiplied by 4 and total fat content by 9. Method of data analysis All data of proximate composition (moisture, protein, fat and ash) in g/100g dry matter (DM). Mean of three fish species was compared using one analysis of variance (ANOVA) of Statistical Package for Social Sciences (SPSS). All data was presented as Mean ± standard deviation. Differences were considered statistically significant at p < 0.05. Data was subjected to Dunkan Multiple Range Test (DMLT) where differences detected. Results and discussion Fish butcher sale gutted B. docmak (Fig 1.) during fasting season. Fishing is seasonal and the supply of fish is largely available during drier period from December to May, however, occasional fishers catch fish during the wet season (Alemu etal., 2014).

Livestock Research Proceeding
226
Fig 1. Gutted Bagrus docmakready for sale Fish quality and economic loss From a total 1581 kg of different fish harvested from Genale river through wadara districts (Genale kebele), 1130 kg was B. docmak, 259 kg was L. intermidus and 192 kg was Eel(A. bengalensis labiata) (Fig 2.). Fish production was intense during dry season when the river volume decrease. The production was highest in February (565 Kg) followed by March (534 Kg) and became decreased in April (134 Kg) due to the onset of fall rainy season. A surveillance made at a hotel located at Negelle Borana, out of 176 kg of Bagrus fish harvested from Genale river through Somalia region, 60 kg (34.09 %) of quality deteriorated fish was discarded by fish trader. Interms of financial loss, it amounts to 2700.00 ETB (two thousands and seven hundreds birr). For all species there are no physical losses.
Fig. 2 Weight of fish harvested from GenaleRiver The types of losses experinced by fishermen fish quality loss. The major contributor of economic loss in fresh fish loss is quality loss. Given the high volume of globally traded fresh fish produce, quality loss is a major contributor to total economic loss in the fresh fish and sea food industry (Shafiur, 2007). The prevailing of quality loss percentage (34.09) is in the range for global level of fish losses as estimated to be 20 %-40 % (Shafiur, 2007). Quality loss is the difference between the potential value of fish or fish

Livestock Research Proceeding
227
prodcut if no deterioriation had taken places and the actual value of fish after it had undergone change due to spoilage and was sold for a low price (Ward and Jeffries, 2000). The perseverance of quality loss is owning to spoilagedue to fish was gutted at 10:00 hour local time and presented the next day for butcher at 8:00 hour local time the from Somalia region. Gutted fish is trasnported by human being for long distance then by motorcycle. The long distances involved in the transportation of fresh fish e.g. Somalia region to Negelle, over 24 hours on foot and the high ambient temperature, in combination with the poor quality packing materials would be the main reason for losses occurring. However, there are a number of general factors (variables) that can increase the likelihood of post-harvest losses occuring and the level at which they occur. These includes; inadequate preservation techniques, adverse weather conditions, diligence and skills of worker, species of fish, type of fish processing (Ward and Jeffries, 2000). Proximate composition The proximate composition of three different fish species was compared using one way ANOVA. The result indicated there is statistically siginificant difference (p< 0.05) between three fish species in regard to crude protein, fat and ash (Table 1). The crude protein content of Bagrus docmak (86.32 ±.67882 g/100g) is higher than that of Labeobarbus and Mormyru. The crude fat content of Mormyrus (8 g/100g) is higher than Labeobarbus and Bagrus. The ash content of Labeobarbus (6 g/100g) is higher than Bagrus and Mormyrus. The finding can be supplemented study conducted by (Sutharshiny and Sivashanthini, 2011) indicated there is siginificant difference in proximate comsposition between three different species of Scomberoides fish. Table 1 Proximate composition of some fish species in dry basis (g/100g)- Mean ± standard deviation
Fish species Moisture content Protein Fat Ash Gross energy value (Kcal/g)
Labeobarbus 10.50 ±.14142a 72.45 ±.24749c 1.00 ±.00000 6.40 ± .0000a 298.8 Bagrus docmak 8.40 ± .0000c 86.32 ±.67882a 1.00 ±.00000 3.800±.2000b 354.28 Mormyrus 9.30 ±.14142b 83.83 ±.49497b 8.00 ± .0000 2.40 ± .0000c 407.32 p-value 0.001 (Sig.) 0.000 (Sig.) - 0.000 (Sig.)
The composition of a particular species often appears to vary from one fishing ground to another, and from season to season, but the basic causes of change in composition are usually variation in the amount and quality of food that the fish eats and the amount of movement it makes (Huss, 1995). Protein loss The amount of protein lost in (%) is presented in Table 2 and pattern of protein changes is illustrated. Nutritional analysis indicated that the protein content of fresh B.docmak at landing site was 86.32 g/ 100 g whereas the protein content has significantly decreased (p<0.05) to 63.25 g/ 100 g at retailing shop. The amount of protein varied significantly (p<0.05) at two different distribution chains. In this study on average basis, 23.07 % protein loss was observed during time period from landing site to hotel (fish retailing shop). Table 2: Protein loss of B.docmak (g/100g)- Mean ± standard deviation Handling stage Moisture content Protein Fat Ash Fresh fish from landing site 8.4000 ± .0000 86.32 ±.67882 1.00 ±.00000 3.800±.2000 Fish from retailing shop immediately after delivered by fishermen
9.2756 ±0.1250 63.25 ± .2800 4.75 ± 0.3535 5.600 ±.0000
NS Sig. NS NS

Livestock Research Proceeding
228
Fresh fish is extremely perishable, and is subject to bacterial spoilage. As the fish spoils, the bacteria causing the spoilage degrade the protein which is intended for human consumption (Clucas and Ward, 1996).The lower protein content ofB.docmak at hotel (retailing shop) is may be due to long distance transportation and high temperature have favored microbial growth whichresulted in proteolysis induced by enzymatic activities of microorganism and denaturation of protein by heat.Nutritional loss is specific biochemical changes within fish flesh, as a result of spoilage or processing (Ward and Jeffries, 2000). The other possible reason for protein loss could bedue to gradual degradation of the initial crude protein to more volatile products such as total volatile bases, hydrogen sulphide and ammonia (Shafiur, 2007).Reduction of crude protein is therefore, a great nutritional concern (Makawaet al., 2014). Conclusions and recommendation A Post-harvest and nutritional losses of fish from Genale River was observed. The root cause for post-harvest quality loss was spoilage due to the long distances involved in the transportation of fresh fish, high ambient temperature in combination with the poor quality packing materials would be the main reason for losses. Post-harvest and nutritional loss can be controlled by improving the fishing activity, packaging, and transportation method, and storage condition, proper organization of the marketing and distribution channels to avoid unnecessary delays. Post-harvest fish losses would be highly reduced if freshly harvested fish are sold readily within 1 to 2 hours after harvest for immediate transportation to hotel and restaurant in urban areas. Unsold fresh fish should be processed to dry fish. Reducing spoilage requires improved fish handling on board, processing, preservation, and transportation, all of which are particularly deficient in small-scale fisheries. Acknowledgement I am grateful to Oromia Agricultural Research Institute for financial support of the project. Special thank goes to Addis Ababa University which help me for proximate composition analysis. The technical staff of Zeway Fishery Resources Research Center (Kasim, Abraham, Bedane, Mitiku, Dawit and Kedir) who involved during specimen collection deserves special acknowledgement. Lissan Hussien and Dawit Hirpho deserve special appreciation for their safe driving during the field work. References Alemu, L.A.,Assefa, M.J.,&Tilahun, G.A. (2014).Fishery production system assessment in different
water bodies of Guji and Borana zones of Oromia,Ethiopia.International Journal of Fisheries and Aquatic Studies 2(2): 238-242.
AOAC (Association of Official Analytical chemists).(1998). Official methods of Analysis of AOAC international.(16thed.)...
Clucas, I.J., & Ward, A.R. (1996).Post-harvest Fisheries Development: A guide to handling, preservation, processing and Quality. Natural Resources Institute.
FAO (Food and Agricultural Organization).(1981). Food Loss Prevention in Perishable Crops (FAO Agricultural Services Bulletin).
Golubtsov, A.S., Fekadu, T.,&Darkov, A.A. (2012).Marine elements in fish fauna of southeastern Ethiopia.Journal of Ichthyology. Vol.52. No.11pp813-816.
Huss, H.H. (1995). Quality and Quality changes in fresh fish. FAO Fisheries Technical paper No.348, Food and Agriculture Organization (FAO) of the United Nations, Rome, Italy.
Makawa, Z.,Kapute, F.,&Valeta, J. (2014). Effect of delayed processing on nutrient composition, pH and Organoleptic quality of pond raised Tilapia (Oreochromisshiranu) stored at ambient temperature. African journal of Food, Agriculture, Nutrition and Development.Volume 14 No.3.
Shafiur, R. (2007). Hand book of food preservation. (2nded.). CRC press Taylor and Francis Group, LLC.

Livestock Research Proceeding
229
Sutharshiny.S., &Sivashanthini.K. (2011).Proximate composition of three species of Scomberoides fish from Sri Lankan waters.Asian Journal of Clinical Nutrition.Asian Network for Scientific Information.
Suzanne, S.N. (2010). Food analysis.(4thed.). Springer Science+Business Media. Ward, A.R., & Jefferies, D.J. (2000).A manual for assessing post-harvest fisheries losses.Natural
Resources Inistitute, Chatham, UK.Vii+140pp. English.

Livestock Research Proceeding
230
Preliminary study of fish parasite in Lake Abaya
Gebawo Tibesso Bedasso Zeway Fisheries Research Center, P.O.Box 229, Zeway, OARI
Corresponding author: Gebawo Tibesso Bedasso, e-mail: [email protected], Mobile:+251912152764, Fax: +251464412942
Abstract A preliminary study of fish parasite in Lake Abaya was carried out from September 2012 to June 2013 by collecting different fish species using gillnets of various mesh sizes and hooks. A total of 216 fish samples were collected from randomly selected site of water bodies. These included 36(16.7%) African Catfish (Clarias gariepinus), 39(18.1%) Nile Tilapia (Oreochromis niloticus), 111(51.4%) Synodontis schall, 11(5.1%) Bagrus docmak, 7(3.2%) Lates niloticus, 8(3.7%) Mormyrus kannume and 4(1.9%) Labeobarbus intermidus. The fish was examined thoroughly both external and internally and the major parasites identified during the investigation include adult Contracaecum (Nematoda), Eustrongylides(Nematoda), Metacercariae of Clinostomumspp. (Digenea) and Diplostomum spp. (Digenea) from the cranial cavity of C. gariepinus. Among the parasites recorded in the present study, the Clinostomatid digeneans and Contracaecum nematodes could be medically important from public health point of view since the parasites can be transmitted to humans by eating raw or smoked fish. Key words: Fish parasites, Lake Abaya, prevalence Introduction Despite the huge amount of water bodies, little is known about the status of fish disease in Ethiopia. The fishery sector makes a vital contribution to the food and nutritional security of 200 million Africans and it provides income for over 10 million people engaged in fish production, processing and trade. Moreover, fish has become a leading export commodity for Africa, with an annual export value of US$ 2.7 billion (FAO, 2003). Africa hosts a great diversity of freshwater fish of which more than 3,000 species have been identified (Skelton, 2001). Ethiopian water bodies have an estimated surface area of 7334 km2 of major lakes & reservoirs and 275 km of small water bodies with 7185 km of rivers within the country (FAO, 2003). The annual fish production potential of Ethiopia based on empirical methods on individual lake surface area and mean depth of major water bodies was estimated to be 30,000 to 51,000 tones (Breuil, 1995; FAO, 2003; ADF, 2004). However, very few knowledge exists on the fish parasites especially in water bodies of Oromia. Freshwater fish can serve as definitive, intermediate or paratenic (transport) hosts in the life cycles of many species of protozoan, helminthes and crustacean parasites. The parasites usually exist in equilibrium with their hosts as a survival strategy (Bush et. al., 2001). However, in instances where the hosts are overcrowded, such as in fish farms, parasitic diseases can spread very rapidly and cause gross mortalities (Paperna, 1996), losses in productivity in different water bodies and human diseases (Paperna, 1980; Balarin, 1986; Lester, 1988; Roberts, 1989) all cited in (EshetuYimer and MulualemEneyew, 2003). They can also spoil the appearance of fish and usually affect the marketability of commercially produced fish, thus raising public health concerns especially in areas where raw or smoked fish is eaten (Paperna, 1996). Endoparasitic infections often give an indication of the quality of the water since they increase in abundance and diversity in more polluted waters (Poulin, 1992). The relative abundance of endo- and ectoparasites of fish in a particular aquatic system can also be used as an indicator of environmental stress. Ectoparasites, for instance, are more in contact with water; if they are

Livestock Research Proceeding
231
sensitive to a pollutant, there will be less ectoparasite than endoparasites in a polluted system (Avenant-Oldewage, 2001).Metacercaria of the trematode Clinostomum marginatum are known to cause considerable damage to the viscera and musculature of many fish species both wild and cultivated (Hoffman & Bauer, 1971). One of the main emphases in Ethiopia is to develop capture fisheries and aquaculture to its full potential making a big contribution to national food availability, food security, economic growth, and trade and improved living standards.Few studies were done on fish parasites of natural water bodies in Ethiopia. Those few studies were not include the prevalence of major parasite of Lake Abaya. The habit of raw fish eating is common among fishermen and people in Ethiopia, especially people near to water bodies. Lake Abaya is the contributor of fish source for the country. But potential fish parasites that can easily be disseminated to these water bodies are not sufficiently known. Therefore, this study; was undertaken to gather baseline information on fish parasites that can also be extrapolated to predict potential human health and risks, to identify the most common economically important parasite of fish and to assess the prevalence of the parasites in the selected water bodies. Materials and methods Description of the study area Lake Abaya is located in the Central Rift Valley of Ethiopia bordered by Oromia regional state and South Nations Nationalities and Peoples Region. The lake is found at an altitude of 1285 m.a.s.l with maximum depth of 13.1 m and mean depth of 7.1m. Lake Abaya is the second largest lake in Ethiopia with surface area of about 1162 Km2. The lake has catchment area of 17300 km2. Collection of fish species Samples of fish were collected monthly from September 2012 to June 2013 using different mesh size of gill nets and hooks from the selected sites. The gears were set in the afternoon and lifted in the following morning. In addition, fish caught by fishermen was included to provide a wide range of fish and to supplement the data on certain aspects of parasite infestation of the fish. Collection of fish parasites Immediately after fish were harvested, Coelom was opened by making a ventral surface cut from the anus forward to an imaginary line at the posterior portion of the operculum. Then cut out the entire side of the coelom by cutting a rectangle of skin from behind the operculum, anterior to the anus, and ventral to the backbone. Then, Following the digestive system from the esophagus to the anus and listing the number of parasite found on different organ. Eventually, small and large intestines were cut out and a wash bottle was used to flush out the inside so that parasite like, tapeworms will come out the back end.The parasite that was getting each fish was kept in a plastic bag containing 4% formaldehyde solution. Samples were transported to Addis Ababa University, College of Veterinary Medicine and Agriculture for further identification. Fixation, preservation and identification of parasites With regard to the technique and method used in fixing, preserving and identification of each parasite specimens guideline was used (Paperna, 1980). Larva of nematodes were fixed in 4 % formalin and later stored in the saline solution. Encapsulated larvae were carefully dissected before the tissue was fixed. Preserved larvae was cleared in lactophenol and then observed under low power magnification. Adult nematodes were fixed in hot formalin to insure their relaxation and preserved in 4 % formalin mixed in 1 % glycerine to avoid accidental drying. Parasite of trematodes and cestodes were fixed in AFA (Alcohol Formalin Acetic acid).Crustacean parasites were fixed in 70% alcohol or 4% formaldehyde. Each parasite was collected in labeled flat bottom tubes containing the specific preservative or fixative agent. Nematodes were cleared in rectophenol for 24 hours and examined under lower magnification

Livestock Research Proceeding
232
microscopy. In the case of Trematodes and Cestodes, diagnosis was made after being carmine stained and cleared in absolute alcohol followed by 70% alcohol. Results and discussion Out of 216 fishexamined during the study period, 26(12.03%) were infected with parasites of which 5(19.23%) Synodontis schall, 15(57.69%)is Clarias gariepinus and 6(23.07%) were Oreochromis niloticus. The common parasites recorded were Contracaecum, Clinostomum,Diplostomum and Eustrongylides(Table 1). Table 1. Major parasite isolated and identified from fish of Lake Abaya
Species of fish Fish sampled Parasite identified Total Infected Parasite type No. (+)
Synodontisschall
111
5
Contracaecum 2 Clinostomum 2 Eustrongylides 1
Bagrusdocmak 11 0 - 0 Oreochromisniloticus 39 6 Contracaecum 6 Clariasgariepinus 21 15 Diplostomum 15 Latesniloticus 7 0 - - Mormyruskannume 8 0 - - Labeobarbusintermidus 4 0 - - Total 216 26 26
In this study the prevalence of metacercariae of Diplostomum sp. from cranial cavity of C.gariepinuswas 71.4% which is lower than the finding ofZhokhovetal. (2007) unpublished work from Lake Tana, Ethiopia and the authors identified the species as Diplostomum tregenna. This group of researchers identified adult Diplostomum spp. from small intestine of piscivorous birds, such as kite. Mukama (2008) in Tanzania indicated that D. mashonensewas recovered from cranial cavity of the same fish species with prevalence of 83.3%.There is no study on the histopathology of this parasitic digenean in Africa. The most prevalent larval nematodes were Contracaecum spp.recovered from pericardial cavity of Nile Tilapia and Synodontisschall. Prevalence of Contracaecum spp. in Nile Tilapia from Lake Abaya was 15.4% which is again lower than the works of EshetuYimer (2003) in Lake Tana (59.8%) and higher than the findings of EshetuYimeretal. (1999) which was 2.09% from Lake Chamo. This study was in agreement with the findings of AmareTadesse (1986) in which the prevalence of Contracaecum spp. from Nile Tilapia in Lakes Awassa and Chamo was 10.6%. Identification of these larval nematodes to species level is difficult unless it is supported by DNA sequencing technique linked with their adult identification from the definitive bird hosts. Encapsulated larval nematodes are known to cause fibrous capsule (Paperna, 1980) and the non-encapsulated larvae cause extensive tissue damage by migration. Apart from this, the larval stages of Contracaecummultipapillatumwere reported as potentially zoonotic parasite in Mexico (Vidal-Martinez et al., 1994). This study also revealed, the nematode Eustrongylides spp. was prevalent nematode and Eustrongylide signotuswas also reported to be infectious to humans (Guerin etal., 1982; Eberhard etal., 1989;Wittneretal., 1989) all cited in (Barros etal., 2004) and the presence of the genus Eustrongylides in mesentery of African catfish from Lake Chamo was indicated by the work of (EshetuYimeretal., 1999). The findings of EshetuYimer and MulualemEneyewu (2003) on Lake Tana shows the most prevalent digenean parasites of Nile Tilapia in Lakes were Clinostomum spp. which is totallyin contrast with my

Livestock Research Proceeding
233
finding which shows no digenean parasites on Nile Tilapia. According to this study Clinostomum spp. was most prevalent on Synodontis schall. Conclusions and recommendations The prevalence rate of parasite in those fish was very low except for C.gariepinus. The Lake could be good source of fish fingerlings for aquaculture pond stocking. Clinostomatiddigeneans and Contracaecum nematodes could represent potential human health risks of eating uncooked or slightly cooked/smoked fish. It is recommended that identification of the genera Clinostomum and Contracaecum to species level is important, Capacity building in fish parasitology and pathology, and consumers should not eat uncooked or slightly cooked fish and health education should be given for them on the risk of eating raw and partly cooked fish. References ADF (African Development Fund).(2004). Fisheries Resources Development Plan Study.Agriculture and
Rural Development Department; North, East and Southern regions. 83 Pp AmareTadesse.(1986). Parasites of fish from Lake Awassa and Chamo.DVM thesis: Addis Ababa
University, Faculty of veterinary medicine, Ethiopia. Avenant-Oldewage, A. (2001). Protocol for the assessment of fish health based on the Health
Index.Report and manual for training of field workers to the Rand Water Board Report No. 2001/03/31. BIOM.GEN. (H1). Rand Water, Vereeniging.
Barros, L.A., Tortelly.R., Pint, R.M.,&Gomes, D.C. (2004).Effects of experimentalinfections with larvae of Eustrongylidesignotus (Jäegerskiold, 1909) andContracaecummultipapillatum(Drasche, 1882) Baylis, 1920 in rabbits.Arq.Bras.Med. Vet. Zootec, 56(3):325-332.
Breuil, C. (1995). Review on the fisheries and aquaculture sector: Ethiopia. FAO, Fisheries Circular No.890.Rome, FAO.29p.
Bush, A.O., Fernandez, J.C., Esch, G.W.,& Seed, J.R. (2001). Parasitism: The diversity and ecology of animal parasites.Cambridge University Press.
EshetuYimer, Kebede, A., &Biruk.(1999). Preliminary survey of parasites of fish at Lake Chamo.In: Proceedings of 7th annual conference of the ESAP (Ethiopian Society of Animal Production); Addis Ababa, Ethiopia.
Eshetu, Yimer and Mulualem,Eneyew.(2003). Parasites of fish at Lake Tana, Ethiopia. In SINET ETHIOP.J.SCI,26(1):31-36, 2003. Faculty of science, Addis Ababa University, Ethiopia
FAO (Food and Agricultural Organization).(2003).Fishery country profile, Ethiopia. Retrieved from FAO website, http://www.fao.org/fi/oldsite/FCP/en/ETH/profile.htm
Hoffman, G.L.,& Bauer, O.N. (1971). Fish parasitology in water reservoirs: A review. In: G.E. Hall (ed.) Reservoir fisheries and limnology. American Fisheries Society, Washington, D.C.
Mukama, S. (2008).Variations in abundance and diversity of parasites infecting catfish, Clariasgariepinus(Burchell, 1822) and Tilapia, Oreochromisurolepis(Norman, 1922) in the Mindu dam-Morogoro municipality, Tanzania.MSc thesis; UNESCO-IHE, The Netherlands. P: 47
Paperna, I. (1980). Parasites, infections and diseases of fish in Africa.CIFA Tech. Pap.7:216. Paperna, I. (1996). Parasites, infections and diseases of fishes in Africa - An update CIFA Technical Paper.
No.31. Rome, FAO. 220p. Poulin, R. (1992). Toxic pollution and parasitism in freshwater fish.Parasitology Today8: 51-61. Skelton, P.H. (2001). A complete guide to the freshwater fishes of Southern Africa Halfway House, Cape
Town Vidal-Martinez, V.M., Osorio-Sarabia, V.M., &Overstreet, R.M. (1994). Experimental infection of
Contracaecummultipapillatum(Nematoda: Anisakinae) from Mexico in the domestic cat. J. Parasitol., 80:576-579.
Zhokhov, A. E., Mironovsky, A.N., &Miretskaya, D.A. (2007). Methods of the complete parasitological dissection of fish.Unpublished paper.
Study on reproductive biology of fish in Gilgel gibe reservoir and Lake Elen

Livestock Research Proceeding
234
Mathewos Hailu Worku
Zeway Fishery Resources Research Center, P.O.Box 229 Zeway, OARI Corresponding authors: Mathewos Hailu Worku. Email: [email protected], Fax: +251464412942 Abstract Reproductive aspects of fish in Gilgelgibe reservoir and Lake Elen, were studied between July 2012 and June2014. The commercial fishery of the Gilgel gibe I reservoir is composed of Oreochromis niloticus (Linnaeus, 1758) and Labeobarbus intermidus (Ruppell, 1835), while Labeo cylindricus(Peters, 1852) was only caught during the experimental fishing in Gilgel gibe reservoir. The maturity–length relationship for O. niloticus and L. intermidus was explained by the logistic function; while the analysis could not be conducted for L. cylindricus as the sample size (n =12) was inadequate. There was no significance difference between the length at first sexual maturity (L50) (ANCOVA, p =0.145) of male and female O. niloticusL50 = 20.2.cm. A likelihood ratio test showed that L50 differed significantly between sexes (P<0·05), for L. intermidus, Males maturing at a smaller size (L50=282 mm) than females (L50=337 mm). Cyprinus carpioin Lake Elen (35.6 cm) was not significant (P>0.05) between sexes. Keywords: Breading season, Common Carp, Length at first maturity, Tropical lakes Introduction Knowledge of several components of a stock’s reproductive biology, such as spawning season and maturity size, are essential for fisheries management. These data form the basis of the biological reference points on the maximum fishing mortality that a population could sustain and the minimum biomass required for average recruitment. A review of reproductive characteristics relies on the accurate estimation of gonadal development and determination of maturity stages in individual fish. Determination is based either on a macroscopic (visual) examination of the gonad. Macroscopic examination is a quick and inexpensive method of estimating the reproductive state of many species in situ (Tomkiewicz et al., 2003). Several studies on the reproductive biology of fish were carried out in the rift valley lakes. It was found that Oreochromis niloticus are annual spawners that begin to reach sexual maturity in late spring, and that spawning is generally limited to the warm summer months. The Nile Tilapia (Oreochromis niloticus, L. 1758) is common throughout the Omo-Gibe and the Awash basin, including the Gilgel gibe I Reservoir. This fish has a high commercial value and is an important resource for the Commercial fisheries. Because the fish stocks are considered as heavily exploited, appropriate management schemes are needed (Tserpes et al., 2002). Cyprinus carpio was introduced in Ethiopia in 1936 for aquaculture it has been stoked in various reservoirs and natural lakes to enhance fish yield by filling the available niche. Even though C. carpiois wide spread in Ethiopia little is known about its reproductive biology. The aim of this study was to assess the adaptability status and reproductive pattern of O. niloticus, L.intermidus, Clarias gariepinus and C.carpioin a tropical Lake, including its size at sexual maturation and seasons of spawning to enable sustainable fishery exploitation. Materials and methods Study area Gilgelgibe reservoir (7°42'50"- 07°53'50"N; 37°11'22"E - 37°20'36"E) was formed by the construction of a concrete dam on the Gilgel gibe river located at 260 km South West of Addis Ababa, Ethiopia. The reservoir is characterized by a rock fill dam with asphalt concrete, situated on a plateau approximately 1650 m a.s.l.. The Dam was commissioned in 2004 to generate hydroelectric power with an installed capacity of 180 MW.

Livestock Research Proceeding
235
Lake Elen (8°221 N, 38°56.6"E) is located 117 km South East of Addis Ababa. The lake has an area of area of 250 ha and a mean depth of 2 m. The lake is formed by the overflow of Awash River through Gogesa River, which only connects to the river during wet season. Samples collection Fish samples were collected monthly between September 2012 and July 2013 at Gilgelgibe reservoir and between November 2013 and April 2014 at Lake Elen,using multifilament gill net having (60, 80, 100 and 120 mm) stretched mesh size. Immediately after capture the total length (TL) and total weight (TW) were measured and weighted to the nearest 1mm and 0.1g respectively. Sex was determined from gonads of the specimens. Data analysis Length at which 50% of both sexes reach maturity (L50) was determined from the percentages of mature fish that were grouped in 1 cm length classes and fitted to logistic equation (1) described by (Echeverria 1987).
PL= (exp (α + βL)) / (1+exp (α + βL))………. (1) Where PL is proportion of mature fish at length (L) and L is total length (cm), and α (the intercept) and β (the slope) of least-squares estimates. The breeding season was determined from the percentages of fish with ripe gonads taken each month. Results and discussion The fish catch of the Gilgel gibe I reservoir is composed of Oreochromis niloticus (Linnaeus, 1758), Labeobarbus intermidus (Ruppell, 1835) and Labeo cylindricus(Peters, 1852). From the fishery independent gillnet survey, 609 fish composed of 326 O. niloticus, 271 L. intermidus and 12 L. cylindricus were captured. The Total length (Fig. 1) of the specimens ranged from 12.0 to 28.5 cm, 11.0
to 34.0 cm and 13.0 to 26.4 cm for O. niloticus, L. intermidus and L. cylindricusrespectively. Fig.1 Length distribution of O. niloticus (A) and L. intermidus (B)caught inGilgel gibe I reservoir

Livestock Research Proceeding
236
Four species of fish were captured in Lake Elen, comprising Oreochromis niloticus (Linnaeus, 1758), Labeobarbus intermidus (Ruppell, 1835), Cyprinus carpio(Linnaeus, 1758) and Clarias gariepinus (Burchell, 1822). The length distribution (Fig 2) ranged from 15.0-33.5 cm, 19.2-41.2 cm, 12.0- 56.4 cm and 13.0- 56.0 cm for Oreochromis niloticus, Labeobarbus intermidus, Clariasgariepinus and Cyprinuscarpio respectively.
Fig 2 Length distribution of O. niloticus (A), L. intermidus (B), Clarias gariepinus (C) and Cyprinus carpio (D) in Lake Elen The maturity–length relationship for O. niloticus and L. intermidus was explained by the logistic function (Fig. 3); while the analysis could not be conducted for L. cylindricus as the sample size (n =12) was inadequate. There was no significance difference between the length at first sexual maturity (L50) (ANCOVA, p =0.145) of male and female O. niloticus which mature at L50 of 21 cm (Fig 4). A likelihood ratio test showed that L50 differed significantly between sexes L.intermidus (P<0·05), with males maturing at a smaller size (L50=282 mm) than females (L50=337 mm).
Fig.3 The size at first sexual maturity (L50) for O. niloticus (A) and L. intermidus (B)in Gilge gibe I reservoir

Livestock Research Proceeding
237
Fig 4 The size at first sexual maturity (L50) of Cyprinuscarpio(A), L. intermidus (B), O. niloticus (C)and Clarias gariepinus (D) in Lake Elen The size at first sexual maturity of Cyprinus carpio in Lake Elen (35.6 cm) was not significant (P>0.05) between sexes. The size at first sexual maturity were 20.4 cm, 30.7 cm and 42.5 cm for Oreochromis niloticus, Labeobarbus intermidus and Clarias gariepinus respectively in Lake Elen (Fig 4). The breeding season of O niloticus was determined from percentages of fish with ripe gonads taken monthly from September 2013 to June 2014. Accordingly, O niloticus with ripe gonads were caught throughout the years; however breeding activity was less intense only between December and February (Fig 5). High frequency of L. intermidus however was observed in the months of November and May (Fig 6).
Fig.5 The breeding season of O niloticusGilgel gibe I reservoir as indicated by the frequency of ripe gonads.

Livestock Research Proceeding
238
Fig 6 The breeding season of L intermidusin Gilgel gibe I reservoir The length at first maturity of fishvary considerably between species, and even within strains of same species underfavorable natural conditions, Nile Tilapia reaches their sexual maturity at a size of 20–30 cm (150–250 g) (Lowe-McConnell, 1958; Trewavas, 1983). However, Tilapia may mature at small sizes in many parts of the world, a phenomenon indicating that these fish are under stressful environmental conditions and/or over-exploitation (Duponchelle etal, 2000). References Duponchelle, F., Cecchi, P., Corbin, D., Nunez, J., & Legendre, M. (2000).Variations in fecundity and
eggs size of female Nile Tilapia, Oreochromisniloticus from man-made lakes of Cote d’Ivoire.Environ.Biol.Fish.57:155-170.
Echeverria, T.W. (1987). Thirty-four species of California rockfishes: maturity and seasonality of reproduction. U.S. Fish. Bull. 85:229-250.
Lowe-McConnell, R.H. (1958) Observations on the biology of Tilapia nilotica in East Africa waters.Rev. Zool. Bot. Afr. 57,130–172.
Tomkiewicz, J.,Tybjerg, L., & Jespersen, A. (2003) Micro- and macroscopic characteristics to stage gonadal maturation of female Baltic cod.J. Fish Biol. 62, 253–275.
Trewavas, E. (1983).Tilapiine Species of the Genera Sarotherodon, Oreochromis and Danakila.London British Museum (Natural History) Publication No. 583.Unecia Ltd., Jinja Uganda.

Livestock Research Proceeding
239
Study on major bacterial pathogen of fish at Lake Ziway
Gebawo Tibesso Bedasso Zeway Fisheries Resources Research Center, P.O.Box 229, Zeway, OARI
Corresponding author: GebawoTibessoBedasso, Oromia Agricultural Research Institute, Zeway Fisheries Resources Research Center, P.O.Box 229, e-mail: [email protected] ,
Mobile:+251912152764, Fax: +251464412942 Abstract A study on major bacterial pathogen of fish was carried out from October 2012 to June 2013 at Lake Ziway by collecting different fish species by using gillnets of various mesh sizes and hooks. A total of 155 fish samples were collected from randomly selected site of water bodies. These included 44 AfricanCatfish (Clariasgariepinus), 77 Nile Tilapia (Oreochromisniloticus), 10 (Tilapia zillii), 21 Carp species and 3 Barbus species. The fish was examined thoroughly both external and internally following the procedure for necropsy. Then sample was inoculated on different media and kept in incubator for 24-48hrs. Edwardsiellatarda, Shigella species, Escherichia coli, Citrobacter, Yersinia species and Aeromonasspecies were the major bacteria identified. It was found that Kidney, Liver and Spleen were found to be the predilection site for most of identified bacterial species. From a total of 155 fish samples 23(14.8%) were found to be infected, of which 4(17.39%) were C.gariepunus, 10(43.47%) were O.niloticus, 4(17.39%) were Tilapia zilli, 1(4.3%) was Barbus species and 4(17.39%) was Carp species. The presence of microorganisms in internal fish organs could indicate the breakdown of immunological defense mechanisms of fish. Studies emphasizing on identification ofzoonotically important bacteria could be done to prevent public hazard. Key words: Bacteria, Fish disease, Lake Ziway Introduction Fish are the most diverse group of vertebrate occupying a variety of marine and fresh water habitat. They are cold-blooded or poikilothermic animals. Their body temperature varies passively in accordance with the temperature of the surrounding water. Although fish as a group are tolerant of a wide range of temperatures, from just below 00C up to 450C individual species generally have a preferred optimum, as well as a more restricted temperature range. Each species of fish has preferred ranges for the various parameters of water quality, such as temperature, dissolved oxygen and salinity..One of the problems of fishery sector in the wild population is parasite and disease condition of fish parasitic diseases reduce fish production by affecting the normal physiology of fish and if left uncontrolled, it can result in mass mortality, or in some cases can be serve as source of infection for human and other vertebrates that consume fish.Understanding the etiology of the disease is of crucial importance as it determines the choice of potential treatment. Hence, identification of bacteria is generally sufficient to implement an effective therapeutic or prophylactic strategy (Ayotundeet al., 2007). Fish are susceptible to a wide variety of bacterial pathogens. Many of these bacteria capable of causing disease are considered to be saprophytic in nature. These bacteria become pathogens only when fishes are physiologically unbalanced, nutritionally deficient or there are other stressors i.e., poor water quality, overstocking, which allow opportunistic bacterial infections to proceed. Selecting the wrong treatment because of misdiagnosis is a waste of time and money and may be more detrimental to the fish than no treatment at all. In addition it enhances development of drug resistance to already available limited number of antimicrobial and other chemical agent that used to treat fish. Very few bacterial diseases of fish have been described from fish of Ethiopian waters so far (Eshetu, 2000). Along with the growing interest in the development of fish culture, there is an increasing awareness of the importance of disease as one of the major detrimental factors in culturing fish. At

Livestock Research Proceeding
240
present, prediction of potential health hazards is largely extrapolated from data available on fish disease and infections in natural and semi-natural habitat (Paperna, 1980). In Ethiopian water bodies including lakes the only group of pathogens of fish that have been relatively well-studied are helminthes, however less attention have been given to bacterial pathogens of fish including those which have zoonotic importance.The present study was undertaken at Lake Ziway with the objectives of identifying the most common economically important bacterial pathogen of fish and to contribute to fish bacterial pathogen information and complement the works in other water bodies of Ethiopia. Materials and methods Description of the study area Lake Ziway is located between 7 510N to 8 070N and 38 430E to 38 570E, in Oromia region of the country. Lake Ziway has open water area of 434km2 and shoreline length of 137km. The lake is fed by two major rivers, i’eKetar and Meki Rivers and has one outflow in the South, the Bulbula River which flows into Lake Abijata. Five bigger islands are situated in the lake. TulluGudo (4.8 km2), Tsedecha (2.1 km2), Funduro (0.4 km2), Debra Sina (0.3 km2) and Galila (0.2 km2). The latter two have only a few inhabitants, while the three bigger ones are populated with several hundreds of people (Anon, 1999). The lake is rich in Catfish (Clariasgariepinus), Nile Tilapia (Oreochromisniloticus), Tilapia zilli, Carp species and Barbus species. Collection of fish species and bacterial pathogen Samples of fish were collected monthly for nine month using different mesh size of gill nets from the selected sites. The gears were set in the afternoon and lifted in the following morning. Immediately after capture fish was examined externally for visible signs of lesion thenbody wall was opened, the viscera were exposed aseptically without damaging any part of intestinal tract and the sample were taken from kidney, spleen and liver after searing the surface of the organ. Then loop was hold in the burner flame until red hot and was inserted into the anterior region of the kidney and other organ, then hold it still for a few seconds to allow it to cool then the loop was finally pushed forward and backward on the organ from which the samples was taken. Bacterial Isolation and Identification Aseptically taken swabs from different organs were inoculated onto different media (blood agar and brain heart infusion agar) and incubated for 24-48hrs at 37oC. Thenafter, the media were examined for bacterial growth. If the bacteria grow on the media, it further sub-cultured on other petri-dish by taking single colony to get pure colony and finally colonies were Gram stained, morphology recorded and subjected to biochemical tests for further identification. Results and discussion A total of 155 fish were sampled. These included 44 African Catfish (Clariasgariepinus), 77 Nile Tilapia (Oreochromisniloticus), 10 Tilapia zilli, 21 Carp species and 3 Barbus species. From the total of 155 swab samples analyzed bacteriologically, the major bacteria identified included; Edwardsiellatarda, Shigellaspecies, Escherichia coli, Citrobacter, Yersinia species and Aeromonasspecies.

Livestock Research Proceeding
241
Table 1. Major bacteria isolated and identified from fish in Lake Ziway Species of fish Organs sampled Bacteria identified O. niloticus (n=77) C. gariepinus (n=44) T. zilli (n=10) Barbus spp. (n=3) Carp spp. (n=21)
Organ Kidney Spleen Liver Fecal sample Kidney Spleen Liver Kidney Spleen Liver Gut contents Kidney Kidney Spleen Liver Faecal sample Blood
No. 67 4 3 3 32 4 10 7 1 1 1 3 9 4 3 2 3
Bacteria spp. Edwardsiellatarda Yersinia species Aeromonas species Aeromonas species Citrobacter None Escherichia coli Shigella species Yersinia species Aeromonas species None None Edwardsiellatarda Edwardsiellatarda Yersinia species Escherichia coli Edwardsiellatarda Edwardsiellatarda Aeromonas species None Escherichia coli Yersinia species
No.organs (+) 4 1 2 1 1 None 1 1 1 3 None None 1 1 1 1 1 1 1 None 1 1
In this study some bacteria species were isolated from the kidney, liver and spleen, although the internal organs of healthy fish should be sterile (Sutineet al., 2007). The isolation of bacteria species from the kidney, liver and spleen of apparently healthy fish have frequently been reported (Cahill, 1990; Apunet al., 1999; Sousa and Silva-souza, 2001; Eshetu, 2000; Gebeyehu, 2003). Although Cahill (1990) and Magnadottir (2006) described the presence of microorganisms in internal fish organs could indicate the breakdown of immunological defense mechanisms.McVicar (1997) have pointed out that the occurrence of an infection in a fish could not be necessarily an abnormal event or it will lead to a disease situation. Moreover McVicar (1997) emphasized that under natural conditions; most infectious agents coexist with their host without causing significant disease. However, stress factors are frequently blamed for the incidence of many disease outbreaks and dissemination of infections. Conclusions and recommendation The findings have shown that the presence of opportunistic fish pathogens in kidney and the other organ indicates the risk of the occurrence of disease outbreak any time when the fish are succumbed under stress. The recovery of organisms, which are potentially pathogenic to humans in the fish suggest that if they are improperly handled, undercooked or consumed raw may cause diseases to susceptible individuals. The detection of similar bacterial species in different fish species has some implications on the relationship between the fish and their aquatic environment.Further study should be done to identify the pathogens that are hazardous to the public.

Livestock Research Proceeding
242
References Anon (1999).Regional Government of Oromia, Oromia Economic Study Project Office, Agricultural
Sector Study draft final report. Addis Ababa. Apun, K., Yusof, A. M.,&Jugang, K.(1999). Distribution of bacteria in tropical freshwater fish and
ponds.International Journal of Environmental Health Research 9:285-292. Ayotunde, E. O., Change, S. T.,&Okey, I. R. (2007).Parasitological examination and food composition in
the gut of feral African carp, lebeocoubie in the cross River, south eastern, Nigeria.Afr.J. Biotechnology. 6:625-630.
Cahill, M. M.(1990). Bacterial flora of fishes: a review. Microbial Ecology 19:21-41. Eshetu, Y.(2000). Preliminary survey of parasites and bacterial pathogens of fish at Lake Zeway.Sinet:
Ethiopian Journal of Science 23:25-32. Gebeyehu, D.(2003). Study on parasitic and bacterial pathogens of fish at Lake Tana. DVM Thesis,
Faculty of Veterinary Medicine, Addis Ababa University, Debre-Zeit, Ethiopia. Magnadottir, B.(2006). Innate immunity of fish: overview. Fish and Shellfish Immunology 20:137-151. McVicar, A. H.(1997). Interactions of pathogens in aquaculture with wild fish populations.Bulletin of the
European Association of Fish Pathologist 17:197-200. Paperna, I. (1980).Parasites infection and diseases of fish in Africa.CLFA.Tech. paper. 7:216-250 Sousa, J. A.,& Silva-Souza, A. T.(2001). Bacterial community associated with fish and water from
Congonhas River, Sertaneja, Paraná, Brazil. Brazilian Archives of Biology and Technology 14:373–381.
Sutine, S., Jaroensutasinee, M., &Jaroensutasinee, K.(2007). Water Quality and Freshwater Fish Diversity at KhaoLuang National Park, Thailand.Transactions on Engineering, Computing and Technology 19:373-376.