Maize and livestock: - CGSpace
104
Maize and livestock: Their inter-linked roles in meeting human needs in Ethiopia ILRI International Livestock Research Institute Research Report 6 slp C G I A R S y s t e m w i d e L i v e s t o c k P r o g r a m m e EIAR
-
Upload
khangminh22 -
Category
Documents
-
view
4 -
download
0
Transcript of Maize and livestock: - CGSpace

Maize and livestock:Their inter-linked roles in meetinghuman needs in Ethiopia
ILRIInternational Livestock Research Institute
Research Report 6
slpCGIAR Systemwide
Livestock Programme
EIAR
ISBN 92–9146–214–4

i
Maize and livestock: Their inter-linked roles in meeting human needs in Ethiopia
Berhanu Gebremedhin, S Fernandez-Rivera, Mohammed Hassena, W Mwangi and Seid Ahmed
International Livestock Research Institute
P.O. Box 5689, Addis Ababa, Ethiopia
Oromia Agricultural Research Institute
P.O. Box 81265, Addis Ababa, Ethiopia
International Maize and Wheat Improvement Center
P.O. Box 1041 Village Market-00621, Nairobi, Kenya
Ethiopian Institute of Agricultural Institute
P.O. Box 2003, Addis Ababa, Ethiopia
CGIAR Systemwide Livestock Programme
P.O. Box 5689, Addis Ababa, Ethiopia
Improving Productivity & Market Success (IPMS) of Ethiopian Farmers
P.O. Box 5689, Addis Ababa, Ethiopia
EIAR
ILRIINTERNATIONALLIVESTOCK RESEARCH
I N S T I T U T E
slpCGIAR Systemwide
Livestock Program
me

ii
Authors’ affiliations
Berhanu Gebremedhin, International Livestock Research Institute (ILRI), Addis Ababa, Ethiopia
Salvador Fernandez-Rivera, CGIAR Systemwide Livestock Programme (SLP), International
Livestock Research Institute, Addis Ababa, Ethiopia
Mohammed Hassena, Oromia Agricultural Research Institute (OARI), Addis Ababa, Ethiopia
Wilfred Mwangi, International Maize and Wheat Improvement Center (CIMMYT), Nairobi,
Kenya
Seid Ahmed, Ethiopian Institute of Agricultural Research (EIAR), Addis Ababa, Ethiopia
© 2007 ILRI (International Livestock Research Institute).
All rights reserved. Parts of this publication may be reproduced for non-commercial use provided
that such reproduction shall be subject to acknowledgement of ILRI as holder of copyright.
ISBN 92–9146–214–4
Correct citation: Berhanu Gebremedhin, Fernandez-Rivera S, Mohammed Hassena, Mwangi W and Seid Ahmed. 2007. Maize and livestock: Their inter-linked roles in meeting human needs in Ethiopia. Research Report 6. ILRI (International Livestock Research Institute), Nairobi, Kenya. 103 pp.

iii
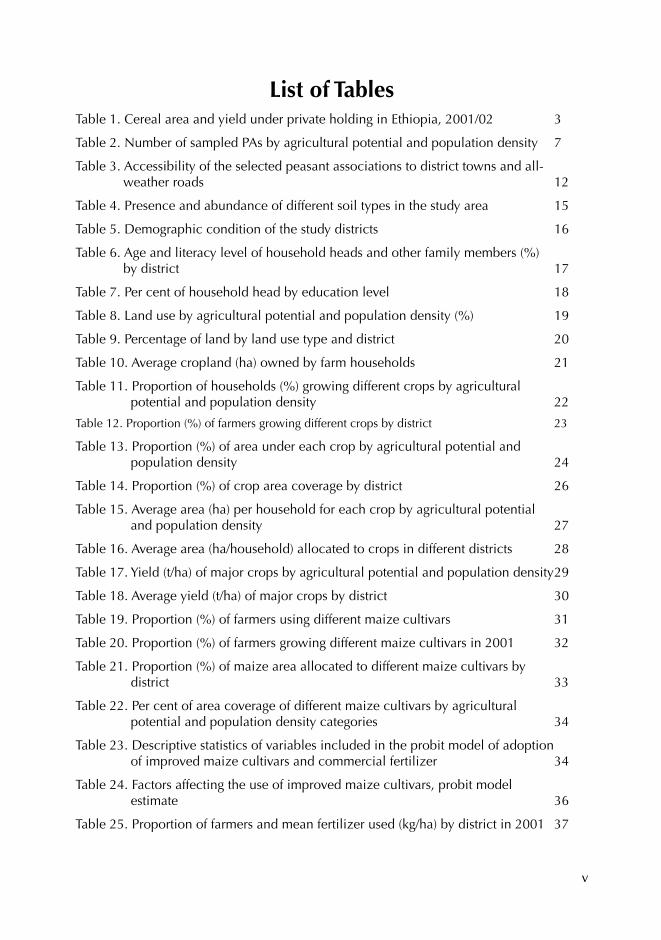
Table of ContentsList of Tables v
List of Figures viii
Acknowledgments ix
Executive summary x
1 Introduction 1
1.1. Background 1
1.2 Objectives 4
2 Methodology 6
2.1 Sampling method and data collection 6
2.2 Data analysis 7
3 Description of the study area 11
3.1 Physical features 11
3.2 Demographic characteristics 15
3.3 Land use pattern 19
4 Crop production in the maize belt of Ethiopia 22
4.1 Crops grown 22
4.2 Area coverage 24
4.3 Grain yield 27
5 Maize production 31
5.1 Cultivars grown 31
5.2 Use of fertilizer 36
5.3 Grain harvesting 39
6 Livestock production in the maize belt of Ethiopia 44
6.1 Livestock ownership 44
6.2 Purpose of keeping livestock 47
6.3 Livestock production services 50
6.4 Livestock production inputs 51
6.5 Livestock feeds and feeding 54
6.6 Constraints to livestock production 65
7 The multiple roles of maize 67
7.1 Use of maize as food 67

iv
7.2 Use of maize as livestock feed 69
7.3 Production of maize stover 70
7.4 Use of maize residues 72
8 Feed marketing in the maize belt of Ethiopia 77
8.1 Demand for livestock feed 77
8.2 Supply of livestock feed 79
8.3 Storage of crop residues 80
9 Conclusion and implications 82
References 86
v
List of TablesTable 1. Cereal area and yield under private holding in Ethiopia, 2001/02 3
Table 2. Number of sampled PAs by agricultural potential and population density 7
Table 3. Accessibility of the selected peasant associations to district towns and all- weather roads 12
Table 4. Presence and abundance of different soil types in the study area 15
Table 5. Demographic condition of the study districts 16
Table 6. Age and literacy level of household heads and other family members (%) by district 17
Table 7. Per cent of household head by education level 18
Table 8. Land use by agricultural potential and population density (%) 19
Table 9. Percentage of land by land use type and district 20
Table 10. Average cropland (ha) owned by farm households 21
Table 11. Proportion of households (%) growing different crops by agricultural potential and population density 22
Table 12. Proportion (%) of farmers growing different crops by district 23
Table 13. Proportion (%) of area under each crop by agricultural potential and population density 24
Table 14. Proportion (%) of crop area coverage by district 26
Table 15. Average area (ha) per household for each crop by agricultural potential and population density 27
Table 16. Average area (ha/household) allocated to crops in different districts 28
Table 17. Yield (t/ha) of major crops by agricultural potential and population density 29
Table 18. Average yield (t/ha) of major crops by district 30
Table 19. Proportion (%) of farmers using different maize cultivars 31
Table 20. Proportion (%) of farmers growing different maize cultivars in 2001 32
Table 21. Proportion (%) of maize area allocated to different maize cultivars by district 33
Table 22. Per cent of area coverage of different maize cultivars by agricultural potential and population density categories 34
Table 23. Descriptive statistics of variables included in the probit model of adoption of improved maize cultivars and commercial fertilizer 34
Table 24. Factors affecting the use of improved maize cultivars, probit model estimate 36
Table 25. Proportion of farmers and mean fertilizer used (kg/ha) by district in 2001 37
vi
Table 26. Use of fertilizer for maize in different agricultural potential and population density areas 37
Table 27. Factors that affect the use of chemical fertilizer, probit estimates 38
Table 28. Proportion (%) of farmers harvesting maize by months and districts 39
Table 29. Average maize yield (t/ha) by agricultural potential and population density 40
Table 30. Mean maize grain (fresh and dry) yield, t/ha, by district in 2001 41
Table 31. Location difference of green maize harvest in the maize belt of Ethiopia 41
Table 32. Descriptives of variables used in the determinants of grain yield model 42
Table 33. Determinants of maize yield in the maize belt of Ethiopia, OLS estimates 43
Table 34. Trends in livestock population (TLU) by location and species, (average per PA) during 1999–2001 45
Table 35. Average livestock holding (TLU/household) (proportion of owners) among sample households 46
Table 36. Purpose of keeping livestock 47
Table 37. Purpose of keeping oxen (1 = most important) 48
Table 38. Purpose of keeping cows 48
Table 39. Purpose of keeping sheep 49
Table 40. Purpose of keeping goats 49
Table 41. Average annual amount of livestock products produced and sold 49
Table 42. Average walking time (hours) to the veterinary services in the study areas 51
Table 43. Average amount (t) of on-farm produced crop residues used by farmers in different seasons 53
Table 44. Use of various feeds to feed different livestock species by season, per cent of farmers 58
Table 45. Farmers ranking of crop residue quality as feed (1 = best quality) 59
Table 46. Average grazing days on communal grazing land in different seasons 60
Table 47. Average grazing days on private grazing land in different seasons 60
Table 48. Average value (ETB/farmer) of feeds for different animal groups in different seasons 61
Table 49. Proportion (%) of farmers recognizing impact of feed shortage 64
Table 50. Ranking of impacts of feed shortage on different livestock group (1 = most important) 64
Table 51. Importance of feed shortage mitigation strategies 65
Table 52. Major problems of livestock management in the maize belt of Ethiopia (per cent of farmers reporting the problem) 66
vii
Table 53. Use of cereals in Ethiopia, (per cent of production), 2001/02 67
Table 54. Contribution of cereals to different uses in the study area (per cent of total production) 68
Table 55. Use of cereals for different purposes in the study area, per cent of production 68
Table 56. Types of food prepared from maize and their ranks 68
Table 57. Per cent of household producing maize stover and average annual maize stover production per household by districts (2001) 70
Table 58. Maize stover production per household by agricultural potential and population density 72
Table 59. The contribution of maize in crop residue utilization 73
Table 60. Proportion (%) of farmers using maize residue for different purposes 73
Table 61. Average production and proportion of maize stover used as livestock feed by district 74
Table 62. Description of sample statistics of variables used in the estimation of maize stover model 75
Table 63. Factors affecting the use of proportion of maize stover for livestock feed (OLS estimate) 76
Table 64. Per cent of farmers demanding to buy different feed types by year 78
Table 65. Sources and availability (quantity and quality) of the feed in the market, per cent of farmers 78
Table 66. Major marketing problems for different feed types as reported by purchasers, per cent of farmers 79
Table 67. Storage methods used for different types of residue (per cent of farmers using) 80
Table 68. Farmers’ perceptions of feed loss due to storage and level of loss for major crops 81

viii
List of FiguresFigure 1. Location of the study area and accessibility to road network 12
Figure 2. Location of the study districts and the topography 13
Figure 3. Duration of seasons in the study area 14
Figure 4. Feed availability by type and months 56
Figure 5. Level of feed availability throughout the year (all types of feed considered) 57
Figure 6. Level of feed security for livestock species in different seasons 62
Figure 7. Storage of maize stover around Shashemene 71
Figure 8. Stubble grazing of a maize field in western Oromia 71
Figure 9. Use of green and dry maize stover for livestock feed 74
Figure 10. Transporting green maize stover to market in Awassa 77
Figure 11. Marketing of different crop residues in Shashemene market 79
ix
Acknowledgments The authors gratefully acknowledge the contribution of the local communities in the study
area for their time in responding to our numerous questions, as well as Mr Kahsay Berhe
and Mr Solomon Gebreselassie who supervised data collection and entry. We appreciate
the contribution of Mr Abebe Misgina in cleaning and organizing the data. Especial thanks
are expressed to the Sasakawa Africa Association (SG-2000), in particular to Dr Marco
Quiñones and the late Mr Takele Gebre for the support provided to conduct this study as part
of a broader effort to assess options for improving the value of maize residues and forage
as livestock feed. We are thankful to Dr Aberra Debelo (SG-2000) and Dr Adugna Tolera
(Hawasa University) for reviewing this publication and for their comments and suggestions.
Appreciation is expressed to the sponsors of the Consultative Group on International
Agricultural Research (CGIAR) for the funding provided through ILRI, CIMMYT and the
CGIAR Systemwide Livestock Programme (SLP).

x
Executive summary1. Objective
The major objective of this study is to understand the roles and interactions of maize and
livestock in meeting the livelihoods requirements of Ethiopian households in the maize belt.
Emphasis is given to the factors that determine the use patterns of maize in order to identify
options for improving the use of maize as livestock feed.
2. Methodology
Based on their importance as maize growing areas, 56 peasant associations (PAs) were
purposively selected from the maize belt areas of northwestern Ethiopia in the Amhara
region (East Gojam and West Gojam); western, southwestern and southern Ethiopia in the
Oromia region (East Shewa, West Shewa, East Wellega and Jimma); and southern Ethiopia
in the Southern Nations, Nationalities and Peoples region (SNNPR) (Hadiya and Sidama).
The communities in each woreda (district) were then stratified by agricultural potential
and population density and grouped into four classes: high agricultural potential and high
population density (HaHp); high agricultural potential and low population density (HaLp); low
agricultural potential and high population density (LaHp); and low agricultural potential and
low population density (LaLp). In each community, 4 households were randomly selected,
thus generating a sample of 224 households. Data were collected at both the community
(PA) and individual farm household levels. Household interviews were preceded by
community interviews. Data were collected on household characteristics, maize production
and use, livestock holdings and husbandry, feeds and feed management, and constraints to
livestock production. Data were also collected on other crop production. Most of the data
were collected for three consecutive years by recall. Analysis of descriptive information and
multivariate econometric methods were used for data analysis.
3. Description of the study area
The study districts are located between 1591 and 2343 metres above sea level (masl).
Sample PAs in the high agricultural potential areas are relatively closer to their district towns
compared to PAs in the low agricultural potential areas. The PAs in the low agricultural
potential areas are farther from all weather roads compared with PAs in the high agricultural
potential areas.
The average population of a PA increased from about 8264 in 1999 to 9014 in 2001 with
annual average growth rate of 4.4%. The population density (persons/km2) also increased
from an average of 563 in 1999 to 628 in 2001. The average household size in the study

xi
districts is about 8, while the average age of the household heads is 47 years. The proportion
of males and females in the population is 49.5 to 50.5, which is similar to the national
statistics. On the contrary, the proportion of female-headed households in the sample is only
5.4%. About 44% of household heads are literate. Of the total sampled households about
40% are Muslims, 34% are Orthodox Christians and about 25% are Protestants.
The land under cultivation, which is mainly rain fed, accounts for 69% of the total land area.
Grazing land accounts for only 10% of the total land, followed by forest/wood lots (9%) and
home stead (7%). The proportion of cultivated land is very high in HaLp accounting for 80%
of the available land. This is followed by HaHp where cultivated land accounts for 71% of the
total land. The average land cultivated per household is 1.68 ha.
4. Crop production
Maize is the most widely grown crop in the study area and is produced by almost all
households (97%), followed by teff, which is grown by about 48% of the households and in
all districts but two. Sorghum is produced by less than one-quarter of the households. Noug,
finger millet and hot pepper are produced by about one-fifth of the farmers each. Maize
accounts for 47% of the area cultivated, followed by teff (16%). All other crops individually
occupy less than 6% of the cropped land. The average area allocated to different crops ranges
from 0.04 ha for tomato to 0.8 ha for maize.
The average maize yield is about 2.11 t/ha, which is higher than the national average of
1.80 t/ha. After maize, wheat has the highest yield in the study area, at about 1.84 t/ha, (also
higher than the national average of 1.36 t/ha in 2001/02). Maize and wheat are among the
few crops that have wider adoption of improved technologies compared with other crops.
The average yield of teff is about 0.72 t/ha, which is similar to the national average yield
of 0.87 t/ha in 2001/02. The average yield of other major crops is lower than the national
averages, particularly for sorghum (0.62 t/ha) and Noug (0.45 t/ha). The variability of yield
across agricultural potential and population density is significant for dry maize, where maize
yield was significantly higher in HaHp and HaLp and lower in LaHp.
5. Maize production
The average area planted with maize per household is about 0.8 ha. Maize production also
shows an expansion during the study period. Maize has relatively more suitable technologies
released compared to other crops. The use of improved technologies particularly hybrids and
open pollinated varieties (OPVs) is higher for maize than other crops.
xii
There is a tendency of increased use of improved varieties over the study period. The
proportion of farmers using improved varieties increased from about 63% in 1999 to 69%
in 2001. In terms of individual varieties, the proportion of farmers using the local variety
decreased from 37% in 1999 to 31% in 2001. In the high agricultural potential and high
population density areas, the local varieties and BH-660 are the most dominant varieties
covering about 35 and 31% of the maize area, respectively. The two varieties cover almost
similar proportion of maize area in the LaLp areas. In the HaLp areas, the hybrid BH-660 alone
covers about 41% of maize area followed by the local varieties, which covers about 18%.
In the high agricultural potential areas, BH-660 is very important covering more than 34%
of maize area. The local varieties dominate in LaLp areas covering about 35% of the maize
area and are second in the LaHp and HaHp areas. In the HaLp and LaHp areas, the variety
Katumani covers more than 21% of maize area. Oxen ownership, household labour supply
and dependency ratio are statistically significantly and positively associated with the use of
improved maize cultivars.
Sixty per cent of maize growers used di-ammonium phosphate (DAP) and about 56%
used urea in 2001. The number of livestock sold, education level of the household head,
oxen ownership and distance to input supply shops explain fertilizer use on maize fields
statistically significantly, all with expected signs. Education level of the household head
increases the probability of fertilizer use. Distance to input supply shops is found to affect
adoption of fertilizer negatively. Farmers who own oxen have higher probability of using
fertilizer than those who do not own oxen.
Maize harvesting starts in September and ends in January. The peak harvesting time, however,
is in November when about 62% of the producers harvest their maize. Yield of maize in the
low agricultural potential areas is 22% lower compared to the high agricultural potential
areas. The majority of farmers (more than 85%) harvest maize both as green and dry; while
about 7.7 and 6.7% of the farmers harvest maize only as dry and green, respectively. The
major variables affecting maize yield that are statistically significant (P<0.05) include maize
area owned, total crop area and amount of fertilizer used on maize fields. As maize area
increases, yield decreases. Total crop area and use of fertilizer are positively associated with
maize yield.
6. Livestock production
Cattle are the dominant livestock species in the study area accounting for about 75% of the
tropical livestock units (TLU, 1 TLU = 250 kg live weight) and owned by about 88% of the
households. The average number of cattle heads owned by a household was 4.5. Only 15
and 16% of the households own at least a sheep and a goat, respectively. Donkey ownership
xiii
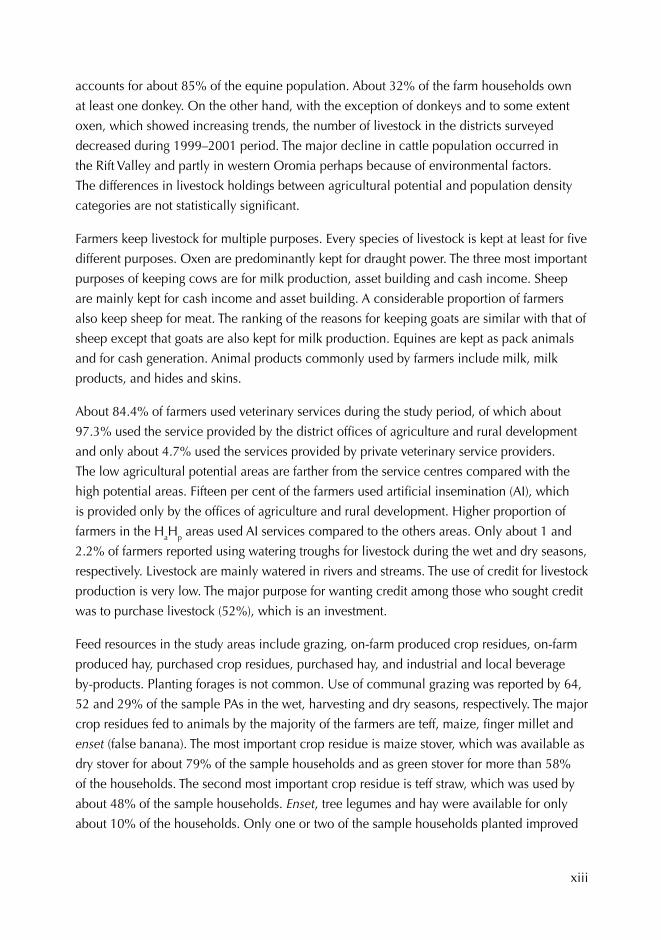
accounts for about 85% of the equine population. About 32% of the farm households own
at least one donkey. On the other hand, with the exception of donkeys and to some extent
oxen, which showed increasing trends, the number of livestock in the districts surveyed
decreased during 1999–2001 period. The major decline in cattle population occurred in
the Rift Valley and partly in western Oromia perhaps because of environmental factors.
The differences in livestock holdings between agricultural potential and population density
categories are not statistically significant.
Farmers keep livestock for multiple purposes. Every species of livestock is kept at least for five
different purposes. Oxen are predominantly kept for draught power. The three most important
purposes of keeping cows are for milk production, asset building and cash income. Sheep
are mainly kept for cash income and asset building. A considerable proportion of farmers
also keep sheep for meat. The ranking of the reasons for keeping goats are similar with that of
sheep except that goats are also kept for milk production. Equines are kept as pack animals
and for cash generation. Animal products commonly used by farmers include milk, milk
products, and hides and skins.
About 84.4% of farmers used veterinary services during the study period, of which about
97.3% used the service provided by the district offices of agriculture and rural development
and only about 4.7% used the services provided by private veterinary service providers.
The low agricultural potential areas are farther from the service centres compared with the
high potential areas. Fifteen per cent of the farmers used artificial insemination (AI), which
is provided only by the offices of agriculture and rural development. Higher proportion of
farmers in the HaHp areas used AI services compared to the others areas. Only about 1 and
2.2% of farmers reported using watering troughs for livestock during the wet and dry seasons,
respectively. Livestock are mainly watered in rivers and streams. The use of credit for livestock
production is very low. The major purpose for wanting credit among those who sought credit
was to purchase livestock (52%), which is an investment.
Feed resources in the study areas include grazing, on-farm produced crop residues, on-farm
produced hay, purchased crop residues, purchased hay, and industrial and local beverage
by-products. Planting forages is not common. Use of communal grazing was reported by 64,
52 and 29% of the sample PAs in the wet, harvesting and dry seasons, respectively. The major
crop residues fed to animals by the majority of the farmers are teff, maize, finger millet and
enset (false banana). The most important crop residue is maize stover, which was available as
dry stover for about 79% of the sample households and as green stover for more than 58%
of the households. The second most important crop residue is teff straw, which was used by
about 48% of the sample households. Enset, tree legumes and hay were available for only
about 10% of the households. Only one or two of the sample households planted improved

xiv
forage during the 1999–2001 period. The important reasons for not planting improved forage
were lack of awareness as reported by about 76%, and shortage of land as indicated by about
13% of the respondents.
Because of the dependency on natural rainfall, the availability of feed for livestock follows
seasonal pattern both in type and in quantity. Certain types of feeds are available at specific
periods only while others are stored for dry period use. Maize residues are fed to animals at
green stage, during harvest and after harvest in the dry season. Use of purchased feed is not
common. About 4% of farmers in dry season and 2% of farmers in wet season purchased hay.
In general less than 12% of the livestock owners bought livestock feed of any type in any one
season. About 27% of the farmers supplement livestock feed with salt and only during the
wet season. Although some farmers sold crop residue, sales usually were not made to other
farmers.
In general, the maximum level of feed security (60–80% of farmers reporting) occurs during
the grain harvest season. This is followed by the wet season. During the first quarter of the
year (January–March), there is a severe feed shortage. In the second quarter (April–June),
the level of feed scarcity eases, as a result of the short rains. Because of the main rains, feed
is reportedly relatively abundant in the third quarter (July–September). However, feed is
reported to be scarce during the early wet season when access to grazing lands is limited
and most land is under cultivation. Different types of livestock have different access levels to
feed. Crop residues are stored for the dry and wet periods, particularly for draught oxen and
milking cows.
The most important consequence of feed shortage, as prioritized by farmers, is weight loss
of animals, followed by weakness, increased mortality, low milk yield and extended calving
period. Farmers employ several strategies to overcome the problem of feed shortages. One
strategy, used by about 68% of livestock owners, is de-stocking. Other options include
moving the animals to other places, renting pastureland, storing hay and straw. Transferring
the stock to other households was practised by less than one-third of the livestock owners.
The majority of farmers reported feed shortage as the most important problem of livestock
production, followed by diseases.
7. The multiple roles of maize
Maize is the most important crop for households both for household consumption,
(accounting for 62% of all household cereal consumption), and as source of cash income
(accounting for about 54% of cash income). About 65% of maize produce is used for
household consumption. Wheat is the most marketed produce (44% of produce sold),
xv
followed by teff (about 37% of the produce marketed). About one-third of barley produce is
also sold.
Farmers consume maize by preparing different dishes. These include bread, injera, thick
porridge, boiled maize, roasted maize and local beer. About 93 and 92% of the maize
growers make bread and injera from maize, respectively. About 83% of the farmers consume
boiled maize, 72% make thick porridge and about 64% use maize to make the local beer,
tella. Hence, in order of importance, maize is used for making bread, followed by injera,
boiled maize, thick porridge and local beer.
Maize forage is derived from green stover (obtained from thinning, leaf stripping, plant tops
and the entire green plant after removal of the ear) and dry stover. The use of maize grain as
feed is very low, although few farmers reported its use. On average, farmers produce about
1 t and 1.51 t of green and dry maize stover per year, respectively. Of the produced maize
stover about 69% is used as livestock feed. About 25% of the residue is used as fuel. Sale and
construction account for very small proportion of the crop residue.
Maize accounts for about 77% of the total residue fed to the animals and about 99% of the
total crop residues used for fuel. The majority of farmers use maize residue to feed milking
cows and oxen. Regression results showed that the proportion of maize stover used for
livestock feed is statistically significantly determined by the amount of teff residue produced,
amount of maize residue produced, distance to livestock market, distance to input supply
shop, population density and oxen ownership.
Distance to livestock market and input supply shop are negatively associated with maize
stover use, as expected. Teff straw, as a substitute feed for livestock, decreases the proportion
of maize stover used as feed. Amount of maize stover produced is positively associated. In
areas of high population density, the use of maize stover for livestock feed increases.
8. Feed marketing
The number of farmers participating in feed marketing (buying and selling) in the study
area is very low. Farmer participation in the feed market is geared more towards selling to
generate income than buying. Those farmers who buy feed prefer grasses (pasture and hay)
to residues. The few farmers who wanted to buy reported that they could not get the required
amount. Interestingly, although many farmers did not buy livestock feed, they reported
having information on feed prices. The major marketing problem reported by farmers who
could potentially become feed buyers (reported by about 44% of respondents) is high prices
particularly for natural pasture, bran and hay.

xvi
Not all farmers store crop residues and thus high feed availability fluctuation is observed
widely. About 57 and 43% of farmers reported that they did not store sorghum stover and
barley straws for future use during the study period. More than 20% of the farmers also did
not store finger millet, barley and maize residues. Teff straw is the most stored residue (stored
by about 98% of the producers). Only a few farmers store crop residues under shade. The
average loss for major crops residues due to storage, as reported by farmers, ranges from 12%
for sorghum to 23% for maize.
9. Conclusion and implications
This study examines the interactions and roles of maize and livestock in the livelihoods of
people in the maize belt areas of Ethiopia. Maize is grown by about 97% of households
in the study area, followed by teff and sorghum. Maize accounts for 47% of the cultivated
area. The average area allocated to maize is 0.8 ha/household. About 69% of maize
residue produced is used for livestock feed. The importance of maize in the crop choice of
households in the study areas is increasing because of both its food and feed value. These
results imply that interventions to improve maize as food and feed crop could contribute
significantly to the livelihood of rural households and the alleviation of feed shortage.
Improving the availability and feed value of maize stover could enhance the contribution of
cattle production to the welfare of farmers and their families.
In spite of the multiple roles of maize, research and development efforts have focused on
the importance of maize grain for food security and have neglected the importance of maize
stover as livestock feed. Although farmers use all maize cultivars as animal feed, in general,
they showed preference for local maize varieties in terms of stover feed quality. Hence,
maize breeders need to study the traits of local maize varieties in order to incorporate them
in the maize improvement breeding programs. Agricultural research aimed at developing
improved maize cultivars needs to make explicit consideration of the value of the stover as
feed and other uses. Quantitative assessments of the economic loss due to under nutrition
of livestock and the trade-offs among the competing uses of maize stover should inform this
effort. In addition, attention needs to be given to improved storage of maize stover and its
management as feed. Overall, the contributions of maize to the welfare of farmers in the
maize–cattle belt could be enhanced if policy, research and extension interventions place
maize in a broader agricultural development context.

1
1 Introduction1.1. Background
Ethiopia has the largest livestock population in Africa. In 2001/02 the country was estimated
to have about 36.4 million tropical livestock units (TLU, 1 TLU = 250 kg body weight).
Cattle are the dominant species accounting for about 80% of the TLU mass, whereas equines
and small ruminants account for 11 and 7.8%, respectively. The regional states of Oromia,
Amhara and South Nations, Nationalities and Peoples Region (SNNPR) account for 43, 26
and 20% of the national livestock population, respectively (CSA 2003).
The two major livestock production systems in Ethiopia are the mixed crop–livestock and
pastoral/agro-pastoral systems. Mixed crop–livestock production is practised in the highlands
(above 1500 masl) and in the crop producing lowland areas. Pastoral and agro-pastoral
production is practised in the dry lowlands where crop production is not common. In the
highlands and lowland areas, where both crop and livestock productions have important
roles in the household economy, the interaction between the two subsystems is complex. In
this system, crops and livestock compete for resources but they also complement each other
(Gryseels and Anderson 1983).
In the mixed crop–livestock farming systems, the most important feed sources are crop
residues and natural herbage. Livestock have access to crop stubbles and weedy fallows. The
conversion of grazing land into cropland is likely to boost the importance of crop residues
as livestock feed, especially in the highlands. Because of high population growth and
farming, fallows have all but disappeared and private and communal pastures have become
a small fraction of the total land. Consequently, the livestock industry in Ethiopia is highly
constrained by the shortage of feed both in quantity and quality.
Maize was originated in Central America and introduced to West Africa in the early 16th
century (FAO 1992) and to Ethiopia between the 16th and the 17th century (McCann 2005).
Africa produces 6% of the total world maize production, most of which is used for human
consumption (Reynolds 1999). Maize is the staple food crop for over 24 million households
in East and Southern Africa (ESA) and is planted annually on over 15.5 million hectares of
land. The crop is grown in nearly all countries of ESA even under suboptimal conditions. In
southern Africa, only a single crop is possible per year, but in Kenya, Uganda and parts of
Tanzania two cropping seasons are possible due to the bimodal rainfall. Governments in ESA
have given top priority to maize production, because maize in this subregion is as important
as rice and wheat in Asia (Byerlee and Eicher 1997).
2
At the end of the last decade, ESA produced over twice as much maize (23.4 million tonnes)
as western and central Africa (11 million tonnes). Excluding the Republic of South Africa,
the largest maize producers in ESA are Ethiopia, Kenya, Malawi, Mozambique, Tanzania,
Zimbabwe and Zambia (Smale and Jayne 2002). The average yield in West and Central
Africa (WCA) is about 1 t/ha, compared to 1.5–2 t/ha in East Africa, Asia and Latin America
(FAO 1993; Reynolds 1999). Despite the importance of maize, African maize production is
characterized by lower and more variable yield. In countries such as Mozambique, Angola,
Zimbabwe, Malawi, Tanzania, Zambia, and Ethiopia the coefficient of variation (CV) in
maize yield is over 15%, while for Uganda and Kenya the CV was 10–15% (Byerlee and
Eicher 1997). Climatic factors are largely responsible for this variation, but price variability
also plays a vital role.
In 1997–99, maize accounted for 41% of total cereal area in ESA and 21% in WCA (Smale
and Jayne 2002). Maize is planted in 75% or more of the cereal growing area of Kenya,
Malawi, Zambia and Zimbabwe (Smale and Jayne 2002). In Ethiopia, maize stands first in
total annual grain production and second in terms of area coverage (CSA 2003). The grain is
mainly used for human consumption (Diriba et al. 2001). The contribution of maize as food
in total calorie intake in Africa is high. For instance, in Malawi its contribution is as high as
67%, whereas in Ethiopia it has a share of 19% of the total calorie intake (Reynolds 1999).
In Ethiopia, crop production is dominated by cereals. In 2001/02, cereals accounted for
73% of the cropping area. The major cereal crops grown in order of area coverage were teff,
maize, sorghum, wheat, and barley covering between 13.4 and 26.4% of the cereal area.
Maize is cultivated in a wide range of altitudes, moisture regimes, soil types and terrains,
mainly by smallholder crop producers. Three of the nine administrative regions account
for the bulk of maize production. According to FAO (2002) estimates, Oromia, Amhara
and SNNPR regions account for 56.5, 21.1 and 16.4% of the total maize production of the
country, respectively, together generating 94% of national maize production. Of all food
crops covered under the extension program, maize has received the highest attention owing
to its wider cultivation, significance in its share of food crops and availability of productivity
enhancing technologies. This can be seen from the fact that with a mean annual growth rate
of 1.62%, the total area of land under maize cultivation increased significantly from 75,500
ha in 1961 to about 1.5 million hectares in 1998 and 1.7 million hectares in 2001/02. It
constituted 12.8% of the total area under cereal crop in 1961, 23% in 1998 and 26.4% in
2001/02 (Tesfaye et al. 2001; CSA 2003). This trend reflects not only how important maize
has remained in the cereal production of the country’s agriculture, but also the shift of many
farmers towards cultivation of maize, such as in the Amhara region.

3
In terms of grain production, maize stood first mainly because of the higher productivity over
teff. The average smallholders’ yield of major cereals ranges from 0.87 t/ha for teff to 1.81
t/ha for maize (Table 1). Maize productivity in large farms can be much higher due to the use
of hybrids and fertilizer. Recently, rice was introduced in some areas in the country and the
yield is comparable to maize. Maize accounted for 23.7% of cereal area and 33.7% of cereal
grain production in the country in 2001/02. Over the last four decades, the yield of maize
has doubled, from 0.96 t/ha in 1961 to 1.81 t/ha in 2001/02 (Tesfaye et al. 2001; CSA 2003).
However, compared to other African countries that on average produce more than 2.5 t/ha,
productivity of maize in Ethiopia is still very low.
Table 1. Cereal area and yield under private holding in Ethiopia, 2001/02
Crop Area (× 103 ha) % of cereal Output
(× 103 t)Yield (t/ha)
Teff 1896 26 1657 0.9 Barley* 966 13 987 1.0Wheat** 1090 15 1484 1.4Maize 1702 24 3086 1.8Sorghum 1195 17 1583 1.3Finger millet 286 4 309 1.1Oat 44 0.6 39 0.9Rice 8 0.1 16 1.8
* Food and malt barley. ** Bread and durum wheat. Source: CSA (2003).
In Ethiopia, maize grain is mainly used for human consumption as a variety of food products
and also for local beverages. The use of maize for industrial processing is low but increasing.
Maize is mainly processed at the household level with 76% used for home consumption, 9%
for seed, about 10% marketed and the remaining 4% being used for different purposes (CSA
2003). Green cobs are also sold in big cities and towns.
Smallholders in Africa produce maize mainly for human consumption. Silage making is not
practised because of technical difficulties and the priority given for household food (Reynolds
1999). Ruminant feed from maize is derived almost entirely from the residues. Ruminant feed
from green stover is obtained from thinning, leaf stripping, plant tops or the entire green plant
after picking the ear. It is also obtained from dry stover after grain harvest and this is used
most widely for livestock feed. During crop failure at tasseling, farmers feed the entire maize
stand to their animals.
The contribution of maize stover to the diet of ruminant livestock varies widely depending
upon human population density, type of livestock, management system, market access
and climate (Thorne et al. 2001). Under severe human population pressure such as in the

4
highlands of Ethiopia, cereal straws and stover may also be used for bedding, fuel and as
construction materials (Zinash and Seyum 1989). There are indications that maize crop will
become increasingly important as a source of fodder (Staal et al. 1998).
Maize research in Ethiopia has mainly focused on grain yield improvement without concern
of the yield and feed quality of the stover (Tolera et al. 1999). This is explained mainly
because of the poor research linkages between crop breeders and animal nutritionists.
Exceptions are the efforts that have been made to quantify the quantity of maize residue
and its components and develop alternative interventions for the efficient use of the residue.
Positive results were obtained from the under sowing of forages with maize and intercropping
of forages with maize in different maize growing areas (Diriba et al. 2001). Integrating the
feed value of the stover into the development and release system of improved cultivars1 is at
an infancy stage. Research on the use of maize stover by smallholders is one step towards
bringing its importance to the attention of researchers.
As compared to other cereals, the contribution of maize as feed in Ethiopia is estimated to be
substantial. For example, of the 13.7 million tonnes of crop residues produced as dry matter
(DM), wheat, barley and teff, the typical highland crops, accounted for 6, 10 and 17% of
the total, respectively (de Leeuw 1997). The residues from maize and sorghum/pearl millet
growing in the mid- to low-altitude zones account for 39 and 36% of the total, respectively
(de Leeuw 1997) probably because of an assumed high residue:grain ratios (3 for maize and
5 for sorghum) (Kossila 1988; Nordblom and Shomo 1995). The high importance of maize as
livestock feed will have influence on the adoption of conservation tillage in Ethiopia.
Data and information on the actual level of use of maize residue for livestock feed and how
livestock rearing affects the adoption of maize-based technologies in Ethiopia is scarce. There
is little information on use pattern of maize residues by smallholders in the maize–livestock
production system in the country. The relevance of socio-economic factors on use of maize
stover for livestock feed has not been established. This research was undertaken primarily to
fill these existing gaps in knowledge.
1.2 Objectives
The general objective of this study was to understand the roles and interactions of maize
and livestock in meeting livelihoods requirement of Ethiopian households in the maize belt.
Emphasis was given to the factors that determine the use patterns of maize in order to identify
options for improving the use of maize as livestock feed. The specific objectives were to:
1. In this report, the term ‘cultivar’ is used to refer jointly to both hybrids and open pollinated varieties (OPV) whereas the term ‘variety’ is used only to refer to OPV.

5
1. characterize the maize–livestock production system
2. assess the availability and use of livestock feed in the system
3. analyse the role of maize as food and feed and
4. analyse the factors that affect the use of maize as livestock feed.
The report is organized as follows. The following section presents methods of study. Section
three describes the study area. Section four presents crop production in the maize belt
area. Sections five and six deal with maize and livestock production in the maize belt,
respectively. Section seven presents the multiple roles of maize, while section eight describes
the feed marketing situation in the study area. Section nine concludes the paper and draws
implications.

6
2 Methodology2.1 Sampling method and data collection
Data were collected from the maize belt areas of northwestern Ethiopia in the Amhara
region; western, southwestern and southern Ethiopia in the Oromia region; and southern
Ethiopia in the Southern Nations, Nationalities and Peoples Region (SNNPR). Using
secondary information, districts where maize is the major crop in the farming system were
identified. The communities in each woreda (district) were then stratified by agricultural
potential and population density. Communities/peasant associations (PAs) were classified
into high and low agricultural potential based on opinions of woreda level experts and key
informants. Factors like drought, access to market and all weather roads were considered
in this classification. Similarly, communities were classified into high and low population
density. Communities with population density of 160 persons per km2 or above were
classified as high population density, and those below that as low population density areas.
Hence, communities were grouped into the following four classes: high agricultural potential
and high population density (HaHp); high agricultural potential and low population density
(HaLp); low agricultural potential and high population density (LaHp); and low agricultural
potential and low population density (LaLp). One community was randomly selected from
each of the four agricultural potential and population density classes. In woredas where there
were empty cells1 of the combinations of agricultural potential and population density, four
communities were randomly selected from the available cells. A total of 56 communities
were selected. In each community, four households were randomly selected, thus having a
sample population of 224 households.
The distribution of PAs by district, administrative zone, agricultural potential and population
density is presented in Table 2. The majority of the PAs (71%) were in high agricultural
potential (Ha) areas and only 29% were in low agricultural potential (La) areas. Moreover,
68% of the high agricultural potential PAs were in the densely populated areas, showing
that the study villages are more in HaHp (52%) areas. Only 12.5% of the PAs were in the LaLp
areas.
Data were collected at both the community/PA level and individual farm/household level.
For the community/PA level survey, interviews were conducted with groups of farmers
representing age groups, gender, and administrative responsibility within the communities
and villages. Community interviews were followed by household interviews. In the
household interview, a wide range of information was collected. This included data on
livestock holdings and husbandry, infrastructure, feeds and feed management and constraints
1. Some woredas had communities of high population density (Hp) only.

7
to livestock production. Data were also collected on crop production and crop residues.
Scales were used to measure the equivalence of local measures used to weigh crop residues.
Detailed information was collected on maize production and use, in particular on the role
of maize as livestock feed and for human consumption. Most of the data were collected
for three years using recall system. For primary data collection, enumerators were hired to
administer the questionnaire.
Table 2. Number of sampled PAs by agricultural potential and population density
Region Zone District (woreda)
Agricultural potential–population densityTotal
HaHp HaLp LaHp LaLp
SNNPR
Hadiya Badawacho 4 4Alaba 1 1 1 1 4
Sidama
Awasa Zuria 2 2 4Boricha 2 2 4
Oromia
East Shewa Siraro 1 1 1 1 4Shashemene 1 1 1 1 4
West Shewa Bako Tibe 1 1 1 1 4
East Wellega Gobu Seyo 1 1 2 4Jimma
Kersa 3 1 4Omo Nada 3 1 4
Amhara
West Gojam
Bure 3 1 4Mecha 3 1 4
East Gojam
Baso Liben 3 1 4Debre Elias 1 1 1 1 4
Total 29 11 9 7 56
2.2 Data analysis
Data were analysed using both descriptive and multivariate methods. Descriptive statistics
were used to present the general overview of the farmers’ practices. These included
description of crop production in general and that of maize in particular, livestock
management, the role of maize as livestock feed and for human consumption, and feed
marketing. The General Linear Model (GLM) procedure of SAS was used to determine the
effect of agricultural potential and population density on key response variables (SAS Institute
Inc. 1999). The General Linear Model was specified as:
(1)
where:
Yijk = a dependent variable (the key variable to be analysed);
α OR υ = the population mean;
Ai = the fixed effect of agricultural potential for i = low or high;

8
Pj = the fixed effect of population density for j = low or high;
(AP)ij = the effect of the interaction between agricultural potential and population
density; and
εij = random error with a normal distribution, mean = 0 and variance = σ2.
Econometric methods were used to determine the relationships between outcome variables
of interest and explanatory variables. Factors affecting the use of improved maize cultivars
as well as chemical fertilizer were identified using the probit model. According to Greene
(2003) the probit model could be presented in the latent model framework as:
(2)
where
Y* is an unobservable magnitude which can be considered as the net benefit to
individual i of taking a particular course of action (in our case using improved
cultivar of maize (both open pollinated and hybrid)). We cannot observe that net
benefit, but can observe the outcome of the individual having followed the decision
rule.
Yi = 0 if Yi* < 0
Yi = 1 if Yi* ≥ 0 (3)
Y* as a latent variable, linearly related to a set of factors X and a disturbance process u. In
the latent model framework, the probability of an individual making each choice is modelled
using equations (2) and (3). We have:
(4)
The function ψ(.) is a cumulative distribution function (CDF) which maps points on the real
line into the probability measure {0, 1}. The explanatory variables in X are modelled
in a linear relationship to the latent variable Y*. The CDF of the normal distribution function
is given by:
(5)
where
j(.) is the probability density function of the normal distribution.
}{ ∞−∞

9
The parameters of probit models may be estimated by maximum likelihood techniques. For
each observation, the density of yi given Xi may be written as:
(6)
This implies that the log-likelihood for observation i may be written as:
(7)
and the log-likelihood of the sample is:
(8)
to be numerically maximized with respect to the k elements of β.
One of the major challenges in working with limited dependent variable models is the
complexity of explanatory factors’ marginal effects on the result of interest. That complexity
arises from the nonlinearity of the relationship. In equation (4), the latent measure is
translated by ψ( *iY .) to a probability that Yi = 1. While equation (2) is a linear relationship in
the β parameters, equation (4) is not. Therefore, although Xi has a linear effect on Yi, it will
not have a linear effect on the resulting probability that y = 1. The marginal effect is given by:
(9)
The probability that Yi = 1 is not constant over the data. Via the chain rule, we see that the
effect of an increase in Xj on the probability is the product of two factors: the effect of Xj on
the latent variable and the derivative of the CDF evaluated at *iY . The latter term, ψ(.), is the
probability density function (PDF) of the distribution.
Multiple linear regression using OLS procedure was used to identify factors that affect maize
yield. The OLS equation used to estimate the parameters is given as:
(10)
where
Yi is yield of maize in natural logarithmic form
Xi are dependent variables, in their natural logarithmic form for continuous variables
and 0/1 for dummy variables

10
βi are parameters to be estimated
α is constant term
υi is error term.
A similar model was used to identify the factors that affect the use of maize stover for
livestock feed. The dependent variable in this model was the proportion of maize stover
used for livestock feed. Data on proportion of maize used as livestock feed was missing for
households where stover was not harvested or where cattle were not owned. The regression
analysis used data from all households where stover was harvested and cattle were owned.
Therefore, there was no need for using a two-stage estimation procedure.

11
3 Description of the study area3.1 Physical features Location and accessibility
The study districts are located in the northwestern, western, southern and south-central parts
of Ethiopia. Those in the south (six districts in Oromia and SNNPR) are mainly located in the
Rift Valley. Those in the west stretched from northwest in the Amhara region to southwest in
Oromia.
Access to services is important particularly in areas where infrastructure is poorly developed
as it hinders performance of the agricultural sector through its impact on information and
marketing. The road networks radiate from the centre of the country and asphalt roads cross
most of the study districts in the south and west direction (Figure 1). In the northwest, two
districts are crossed by gravel all-weather road while the other two districts are not crossed
by all-weather road. Distances from the main towns (where services are usually available)
and all-weather roads to access services were measured in terms of both kilometre and
time (walking hours) that it takes to reach the town and all-weather road. Since accessing
these services and infrastructures is usually on foot and pack animals, these values were
compared across districts and levels of agricultural potential. On average, villages are located
10 km far from their respective district towns and this distance ranges from 2 km in Bure
and Shashemene to 17 km in Awassa Zuria (Table 3). PAs in the high agricultural potential
areas are relatively closer (9.7 km) to the district town compared to PAs in low agricultural
potential areas (11.5 km), but the difference is not significant. With an average speed of 5.4
km/hour on foot and 11.3 km/hour for pack animal (calculated from survey data), on average
it takes farmers about 2 hour on foot and 1 hour by pack animal to reach the district town.
On average, a PA is about 5.25 km away from the nearest all-weather road.
Table 3. Accessibility of the selected peasant associations to district towns and all-weather roads
DistrictsWalking dis-tance to district town (km)
Walking time to district town (hours)
Walking distance to the nearest all weather road (km)
Walking time to the nearest all weather road (hours)
Awassa Zuria 17.0 2:38 0.6 0:06
Boricha 15.0 3:08 6.5 1:05
Alaba 6.5 1:28 5.3 1:14
Badawacho 12.3 2:49 8.3 1:41
Siraro 12.0 2:45 9.9 3:15
Shashemene 5.8 1:13 3.1 0:39
Gobu Sayo 12.0 2:05 9.3 1:38

12
DistrictsWalking dis-tance to district town (km)
Walking time to district town (hours)
Walking distance to the nearest all weather road (km)
Walking time to the nearest all weather road (hours)
Omo Nada 8.5 1:34 5.5 0:49
Kersa 8.5 1:32 2.8 2:30
Bako Tibe 10.8 1:45 1.4 0:10
Debre Elias 7.0 1:16 7.5 1:21
Baso Liben 8.1 1:15 8.1 1:15
Bure 9.3 1:50 3.0 1:10
Mecha 6.0 1:13 1.3 0:35
Mean 9.9 1:56 5.2 1:10
Figure 1. Location of the study area and accessibility to road network.
Relief
The study districts are stretched from West Gojam zone in the north to Sidama zone in the
south following the major maize producing areas of the country. The altitude of the study
villages ranges from 1591 masl in Siraro in the Rift Valley to 2343 masl in Baso Liben in the
Omo Nada and Kersa
(Jimma)
Bako Tibe and Gobu Sayo(Wellega)
Awassa, Boricha, Alaba, Badawacho, ShashemeneSiraro (Rift Valley)
Debre Elias, Baso
Liben, Bure and Mecha
(Gojam)

13
northwestern part of the country. The districts in West Gojam are on the highlands with an
average altitude of more than 2100 masl. All other PAs are in the mid altitude zone below
2000 masl. The study districts could be clustered into four as indicated in Figure 2 with
relatively different topography.
Figure 2. Location of the study districts and the topography.
Seasonality
One-year cycle was divided into three seasons: dry, wet and harvest. Group interviewees
were asked in which of the three seasons a month falls. The results indicate that except July
and August where in all PAs it is considered as wet season, in all other months there are
differences in season among the PAs. For instance, 96% of the PAs reported that February is
dry month and only in the remaining 4% of the PAs was February reported as wet. Similarly,
January is reported to have different seasons in different PAs. Eighty-nine per cent of the PAs
reported that January is a dry month, while the remaining nine and two per cent of the PAs
reported that January is harvesting and wet month, respectively (Figure 3). The duration of
the seasons varies due to geographical location and altitude. Following the rainy season,
harvesting starts as early as September and extends to January. The peak harvesting months
are November and December where about 89 and 70% of the PAs are on harvesting,
respectively. Dry season covers longer period between January and March. Similarly,
between April and September more than 70% of the PAs reported rain in their area. For more
Bako Tibe and Gobu Sayo (Wellega)
Debre Elias, Baso Liben, Bure and Mecha (Gojam)
Awassa, Boricha, Alaba,Bandawacho, Shashemeneand Siraro (Rift Valley)
Omo Nada and Kersa (Jimma)

14
than 70% of the PAs, the dry season is between January and March; wet season is between
April and September; and harvest season is between October and December.
Figure 3. Duration of seasons in the study area.
Soil
Soils were classified into four types (clay, clay loamy, loam and sandy). Sandy soil is more
common in the southern part of the study sites (Shashemene, Siraro, Alaba and Awasa). This
soil type is with high sand content, low water holding capacity and low inherent fertility.
Clay soil is more common in the districts found in the northwestern and western parts of
the country. This soil is black in colour and mostly found in flat areas having water logging
problems and poor aeration for crop production. Maize usually does not tolerate water
logging and is not commonly grown in clay soils. Overall, the dominant soil types are clay
loamy and loamy soils found in 63% of the PAs each. Clay loamy soils are red in colour and
are usually well drained and suitable for crop production in gentle slope areas. Loam soils
have a favourable proportion of sand, silt and clay with good fertility and are suitable for crop
production.
January February March April May June July August September October November0
10
20
30
40
50
60
70
80
90
100
% of PAs who reported the month as:
December
Dry season
Wet season
Harvest season
15
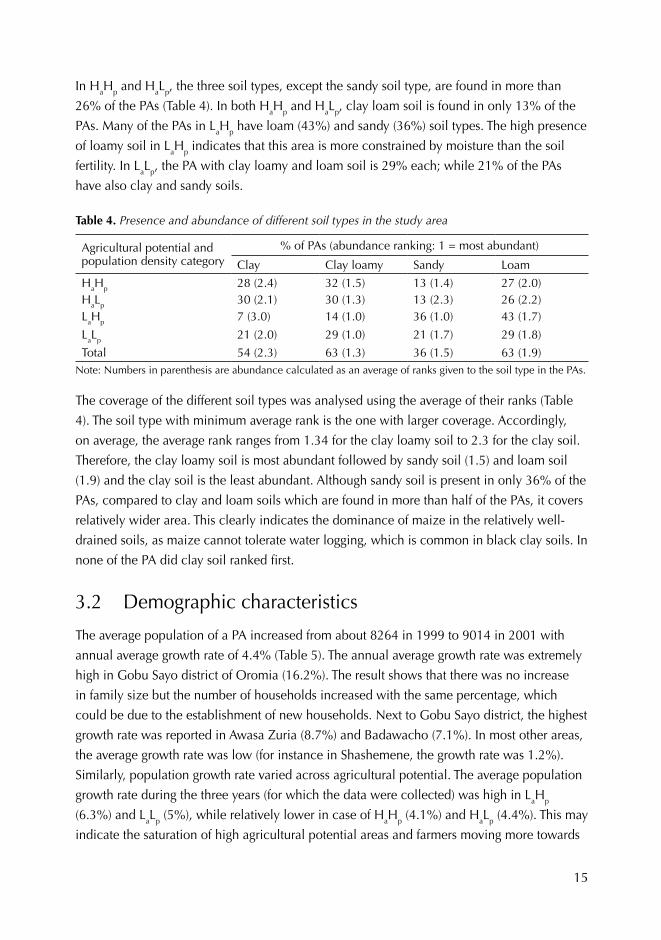
In HaHp and HaLp, the three soil types, except the sandy soil type, are found in more than
26% of the PAs (Table 4). In both HaHp and HaLp, clay loam soil is found in only 13% of the
PAs. Many of the PAs in LaHp have loam (43%) and sandy (36%) soil types. The high presence
of loamy soil in LaHp indicates that this area is more constrained by moisture than the soil
fertility. In LaLp, the PA with clay loamy and loam soil is 29% each; while 21% of the PAs
have also clay and sandy soils.
Table 4. Presence and abundance of different soil types in the study area
Agricultural potential and population density category
% of PAs (abundance ranking: 1 = most abundant)
Clay Clay loamy Sandy Loam
HaHp 28 (2.4) 32 (1.5) 13 (1.4) 27 (2.0)HaLp 30 (2.1) 30 (1.3) 13 (2.3) 26 (2.2)LaHp 7 (3.0) 14 (1.0) 36 (1.0) 43 (1.7)
LaLp 21 (2.0) 29 (1.0) 21 (1.7) 29 (1.8)
Total 54 (2.3) 63 (1.3) 36 (1.5) 63 (1.9)Note: Numbers in parenthesis are abundance calculated as an average of ranks given to the soil type in the PAs.
The coverage of the different soil types was analysed using the average of their ranks (Table
4). The soil type with minimum average rank is the one with larger coverage. Accordingly,
on average, the average rank ranges from 1.34 for the clay loamy soil to 2.3 for the clay soil.
Therefore, the clay loamy soil is most abundant followed by sandy soil (1.5) and loam soil
(1.9) and the clay soil is the least abundant. Although sandy soil is present in only 36% of the
PAs, compared to clay and loam soils which are found in more than half of the PAs, it covers
relatively wider area. This clearly indicates the dominance of maize in the relatively well-
drained soils, as maize cannot tolerate water logging, which is common in black clay soils. In
none of the PA did clay soil ranked first.
3.2 Demographic characteristics
The average population of a PA increased from about 8264 in 1999 to 9014 in 2001 with
annual average growth rate of 4.4% (Table 5). The annual average growth rate was extremely
high in Gobu Sayo district of Oromia (16.2%). The result shows that there was no increase
in family size but the number of households increased with the same percentage, which
could be due to the establishment of new households. Next to Gobu Sayo district, the highest
growth rate was reported in Awasa Zuria (8.7%) and Badawacho (7.1%). In most other areas,
the average growth rate was low (for instance in Shashemene, the growth rate was 1.2%).
Similarly, population growth rate varied across agricultural potential. The average population
growth rate during the three years (for which the data were collected) was high in LaHp
(6.3%) and LaLp (5%), while relatively lower in case of HaHp (4.1%) and HaLp (4.4%). This may
indicate the saturation of high agricultural potential areas and farmers moving more towards

16
low agricultural potential areas, which may lead to environmental degradation as most of
these low potential areas are fragile environments.
Table 5. Demographic condition of the study districts
DistrictAverage annual population growth rate (1999–01)
Average family size (1999–01)
Population density (persons/km2)
1999 2000 2001Awassa Zuria 8.7 6.9 1166 1111 1381Boricha 5.0 7.1 1016 1002 1113Alaba 2.3 7.3 463 455 489Badawacho 7.1 10.0 978 1009 1206Siraro 3.6 11.0 544 538 583Shashemene 1.2 6.5 1160 1090 1197Gobu Sayo 16.2 9.8 236 263 338Omo Nada 3.2 10.5 322 309 343Kersa 4.2 7.8 320 303 352Bako Tibe 4.3 8.0 279 264 301Debre Elias 4.0 6.8 342 322 372Baso Liben 2.1 6.8 403 382 417Bure 5.2 7.5 304 305 330Mecha 2.4 6.8 352 331 374
Average 4.4 8.0 563 549 628
The population density increased from an average of 563 in 1999 to 628 persons/km2 in
2001. In 2001, the four districts of Awassa Zuria, Badawacho, Shashemene and Boricha had
the highest population density of 1380, 1206, 1200 and 1110 persons/km2, respectively. All
other districts are by far less populated ranging from 301 persons/km2 in Bako Tibe and 583
persons/km2 in Siraro.
The average household size in the study districts is about eight. Family sizes in Badawacho
(10), Siraro (11) and Omo Nada (10) were relatively higher than in other districts. In terms
of adult equivalent, the average was 6.6, ranging from five in Baso Liben to 9.1 in Siraro.
The female and male proportion of the households was 3.8 for males and 3.9 for females.
The average household size did not change over the three years’ period. Thus, the change
in population over the three years was due to an increase expressed through the increase
in number of household units from 1119 in 1999 to 1270 households in 2001 per PA. The
family size among the agricultural potential and population density categories ranged from
7.64 in the LaHp to 8.14 in LaLp.
The gender structure in the sample population was similar to that of the country. The
proportion of males and females in the population was 49.5 and 50.5%, respectively, similar
to the national statistics. On the contrary, the proportion of female-headed households in the
sample is only 5.4%.

17
The average age of the household heads was 47 years, ranging from 38 in Alaba to 59 in
Omo Nada (Table 6). In terms of agricultural potential and population density, household
heads in LaLp areas were relatively younger (40 years) compared to other areas (47–48 years).
This may reflect the difficulty of living in LaLp and hence low population density. The average
population density in LaLp is only 358 persons per km2, while it is about 667 in the other
areas.
Table 6. Age and literacy level of household heads and other family members (%) by district
DistrictAverage age of household head (years)
Literate (%) Under school age* (%)
Household head
Other family Male Female Total
Awasa Zuria 56 37 59 36 22 58 20Boricha 45 31 40 23 14 38 29
Alaba 37 25 28 29 4 33 27
Badawacho 46 31 40 26 14 40 24
Siraro 45 50 46 32 14 46 30
Shashemene 53 50 63 33 28 61 20
Gobu Sayo 43 69 61 34 31 65 18
Omo Nada 59 31 52 29 20 49 14
Kersa 52 37 51 26 22 49 21
Bako Tibe 43 50 72 43 25 68 23
Debre Elias 40 62 51 31 26 57 23
Baso Liben 45 56 61 40 20 60 20
Bure 45 50 46 28 19 47 23
Mecha 45 56 33 21 18 39 21
Mean 47 44 51 31 20 51 22 * Under school age is children less than 6 years old.
Of the total population in the surveyed households, about 77% were more than 6 years old,
which are assumed to be enrolled in school, and the remaining 23% is under school age
(Table 6). The level of literacy was 51% across all districts and it ranged from 33% in Alaba
to 68% in Bako Tibe. Literacy level was relatively low in the south including Alaba (33%),
Boricha (38%), Badawacho (40%) with the exception of Awasa Zuria (58%) which is higher
presumably because of its proximity to the regional town, Awassa.
About 44% of household heads are literate, showing somehow an improvement over time
with the new generation (since 51% of other family members are literate). However, in
some districts such as Siraro and Gobu Sayo in Oromia, and Debre Elias, Bure and Mecha
in Amhara, the literacy level dropped probably showing higher population growth rate
compared to schooling rate. Given the gender biased cultural system in Ethiopia, it is not

18
surprising to see an average of 11% more literate male than female in the survey area.
The difference ranged from 3% in Gobu Sayo to 25% in Alaba. Literacy did not vary with
the agricultural potential and population density. The proportion of illiterate and literate
population was almost equal in HaHp, LaHp and LaLp. In HaLp as well the difference is not
high, hence literate population is only 54%.
A large variability was found among the literate household heads in terms of their level of
education. The majority (67%) of the literate household heads in the Amhara region did not
have formal schooling and this varied from 56% in Mecha to 80% in Debre Elias (Table 7). In
Alaba, the proportion of household heads that did not have formal school among the literate
is 50%. In districts like Badawacho (60%), Bako Tibe (50%), Gobu Sayo (36%) and Awassa
Zuria (33%), the proportion of literate farmers who completed elementary school was higher
than in the other districts.
Table 7. Per cent of household head by education level
Districts IlliterateEducation
Read and write only Grade 1–6 Grade 7–12
Awassa Zuria 63 0 25 12
Boricha 69 0 31 0
Alaba 75 12 13 0
Badawacho 69 0 12 19
Siraro 50 0 44 6
Shashemene 50 0 44 6
Gobu Sayo 31 6 37 25
Omo Nada 94 0 6 0
Kersa 63 6 31 0
Bako Tibe 50 6 19 25
Debre Elias 38 50 6 6
Baso Liben 44 38 12 6
Bure 50 31 19 0
Mecha 44 31 19 6
Average 56 13 23 8
Of the total sample households about 40% are Muslims, 34% are Orthodox Christians and
about 25% are Protestants. The spatial distribution of the main religions across the district
was very distinct with Orthodox Christians being prevalent in Amhara; Protestant in Sidama
and East Wellega zones and Badawacho district, and Muslim in East Shewa and Jimma in the
Oromia region and Alaba district in SNNPR. Almost all farmers in the four districts of Amhara
are Orthodox Christians and almost all farmers in Alaba and Siraro are Muslims.

19
Religion has a direct relation with the number of working days in a month. In Amhara region
where Orthodox Christian is the only religion in the surveyed PAs, the number of non-
working days in a month, including weekends, is three times higher (11–13 days per month)
compared to Muslim and Protestant dominated societies (4 days per month). This shows only
one non-working day per week in the south but three non-working days per week on average
in the north. The heavy dependency of agriculture on rainfall and lack of labour saving
technologies forces farmers to put more labour in specific period to complete the agricultural
operation on time. Having nearly 40% of the working days out of agricultural activity may
have serious repercussion on productivity and production.
3.3 Land use pattern
The land under cultivation, mainly rain fed, accounted for 69% of the total land area (Table
8). Grazing land accounted only for 10% of the total land, followed by forest/woodlots
(9%) and homestead (7%). In the high population density areas, the proportion of cultivated
land was higher than in the low population density areas. Irrigation accounts for only 1%
of the land and it is mainly found in the HaHp and LaLp areas. In Awassa Zuria irrigated land
accounts for 19.4%, while in many of the districts irrigation is minimal.
Table 8. Land use by agricultural potential and population density (%)
Land use pattern Agricultural potential and population density category
TotalHaHp HaLp LaHp LaLp
Cultivated rain fed 71 66 80 61 69
Grazing land 10 10 5 14 10
Forest/woodlot 6 18 1 8 9
Homestead 8 4 8 9 7
Waste land* 2 1 6 5 3
Cultivated irrigated 2 <1 0 2 1
Settlements 2 <1 0 <1 1
Area enclosure <1 <1 0 2 <1
Others <1 <1 0 0 <1* Waste lands are lands that could not be put into any use.
The proportion of cultivated land is very high in HaLp accounting for 80% of the available
land. This is followed by HaHp where cultivated land account for 71%. In LaLp the proportion
of cultivated land is about 61%. The proportion of grazing land is only 10% ranging from
5.4% in LaHp to 14% in LaLp. The proportion of grazing land is relatively high in some of the
districts like Badawacho and Bako Tibe, accounting for more than 17% of the land (Table
9). For most of the districts the proportion of grazing land ranges from 8–13%. A very small

20
proportion of grazing land was found in Shashemene (2.4%), Omo Nada (5.7%) and Boricha
(6.6%).
The proportion of cultivated land varied across districts ranging from 52 to 89% with an
average of 70% (Table 9). In three of the districts, the proportion of cultivated land was more
than three-quarter. Moreover, in some of the districts particularly those in Sidama and Jimma,
homesteads tend to cover higher proportion of land relative to other areas. Homesteads in
Sidama and Jimma are mainly covered with garden crops including enset.
The average land under cultivation depends on the spatial distribution of the population.
The average land cropped per household was about 1.68 ha ranging from 0.64 in Awassa
Zuria to about 2.38 ha in Omo Nada (Table 10). In the Oromia region, the average was 1.96
ha and it ranged from 1.09 ha in Shashemene to 2.38 ha in Omo Nada; while in Amhara,
the average was 1.82 ha and it ranges from 1.60 ha in Bure to 2.27 ha in Debre Elias. In the
SNNPR where population pressure is high, average land holding was 0.79, 1.5 and 1.43 ha
in Sidama, Alaba and Badawacho, respectively.
Table 9. Percentage of land by land use type and district
District
Land use
Cultivated rain fed
Cultivated irrigated
Home stead
Grazing land
Forest/ woodlot
Area enclo-sure
Settle-ments
Waste land Others
Awasa Zuria 45 19 13 8 8 0 0 6 0
Boricha 71 0 7 7 4 0 0 12 0
Alaba 69 0 5 9 6 7 0 4 1Bada- wacho 52 0 8 17 15 0 0 7 1
Siraro 65 0 7 12 8 0 0 8 0
Shashe- mene 89 0 8 2 1 0 0 0 <1
Gobu Sayo 65 4 6 13 5 0 1 6 0
Omo Nada 72 1 8 6 13 0 0 1 0
Kersa 77 0 12 9 0 0 0 <1 2Bako Tibe 63 <1 7 18 4 0 0 8 0
Debre Elias 73 1 8 11 7 0 0 1 0
Baso Liben 83 0 8 7 2 0 0 1 0
Bure 58 0 3 9 24 0 5 1 0
Mecha 72 1 8 12 5 1 0 <1 0
Average 69 1 7 10 9 0 1 3 <1

21
Table 10. Average cropland (ha) owned by farm households
Location Average crop land (ha)
Region Districts District Zone Region average
SNNPR
Awasa Zuria 0.640.79
1.24Boricha 0.94
Alaba 1.50 1.50
Badawacho 1.43 1.43
Oromia
Siraro 1.891.49
1.96
Shashemene 1.09
Gobu Sayo 2.282.04
Bako Tibe 1.80
Omo Nada 2.382.34
Kersa 2.29
Amhara
Debre Elias 2.272.02
1.82Baso Liben 1.77
Bure 1.601.62
Mecha 1.64
Average 1.68

22
4 Crop production in the maize belt of Ethiopia 4.1 Crops grown
The proportion of farmers growing different crops is shown in Tables 11 and 12. Maize is the most
widely grown crop and it is produced by almost all households (97%) followed by teff which
is grown by about 48% of the households. Sorghum is produced by less than a quarter of the
households. Noug, finger millet and hot pepper are produced by about one-fifth of the farmers
and most other food crops are grown by less than one-fifth of the households. This variability was
analysed in terms of agricultural potential and population density as well as geographical location.
Table 11. Proportion of households (%) growing different crops by agricultural potential and popu-lation density
Crop HaHp HaLp LaHp LaLp Total
Maize 96 100 97 100 97Teff 49 54 28 61 48Sorghum 23 25 14 32 23Noug 17 25 11 39 20Finger millet 22 27 6 21 20Hot pepper 15 20 19 36 19Enset 16 4 42 0 16Wheat 16 23 3 11 15Horse/faba bean 12 14 3 11 11Barley 10 14 3 14 10Coffee 12 7 8 0 9Chat 11 2 11 4 8Haricot bean 9 2 11 7 8Potato 5 4 17 0 6Linseed 7 11 3 7 7Others 34 20 11 4 23
The proportion of farmers producing maize ranged from 96 to 100% across agricultural
potential and population density (Table 11. ). On the other hand, teff, hot pepper, and noug
were more commonly produced by farmers in LaLp. The proportion of farmers that produce
teff was about 61% in LaLp, 55% in HaLp, 49% in HaHp and 28% in LaHp. Similarly hot pepper
is commonly grown by farmers in LaLp (35.7%) compared to 14.5, 20.5 and 19.5% in HaHp,
HaLp and LaHp, respectively.
Noug is grown on average by 21% of the households. Noug production is more important in
LaLp (39%) than in HaHp, HaLp and LaHp, where it is grown by 17, 25 and 11%, respectively.
Many crops including barley, wheat, sorghum, finger millet, linseed and faba bean are less
frequently grown by farmers in LaHp. These crops are either more commonly grown in HaLp
(wheat, barley, finger millet, linseed and faba bean) or in LaLp (sorghum).

23
Tabl
e 12
. Pro
port
ion
(%)
of fa
rmer
s gr
owin
g di
ffere
nt c
rops
by
dist
rict
Cro
psD
istr
icts
Bad
awac
hoO
mo
Nad
aB
ako
Tibe
Kers
aD
ebre
El
ias
Bas
o Li
ben
Ala
baSh
ashe
men
eA
was
sa
Zur
iaB
oric
haB
ure
Mec
haG
obu
Sayo
Sira
ro
Mai
ze88
8194
9494
8810
081
6394
9488
9410
0Te
ff31
6325
5694
9469
196
094
5656
13So
rghu
m13
810
810
050
440
00
050
6H
aric
ot b
ean
310
06
00
613
044
00
06
Ense
t13
130
130
06
00
630
00
0H
ot p
eppe
r6
669
00
050
60
025
00
0C
offe
e19
136
310
00
038
00
60
0C
hat
019
60
00
190
5019
00
00
Bar
ley
00
00
3819
025
00
2538
00
Ban
ana
613
66
00
00
00
00
00
Pota
to6
00
06
00
130
250
00
0W
heat
00
00
6388
044
00
130
00
Nou
g0
013
069
00
00
00
8144
0Fi
nger
mill
et0
00
00
013
00
094
9431
0Fa
ba b
ean
00
60
3819
00
00
500
00
Suga
r ca
ne6
60
00
00
013
60
00
0Li
nsee
d0
00
031
130
00
00
130
0Pa
paya
66
60
00
00
00
00
00
God
are
66
050
00
00
00
00
00
Chi
ck p
ea6
00
00
130
00
013
00
0Fi
eld
pea
00
00
631
00
00
00
00
Swee
t pot
ato
190
00
00
00
06
00
00
Tom
ato
00
00
00
00
130
00
00
Fenu
gree
k0
00
00
06
00
00
00
0H
opes
00
00
06
00
00
00
00
Man
go0
06
00
00
00
00
00
0Ta
ro0
00
130
00
00
00
00
0

24
Except in Awassa Zuria, where the proportion of farmers growing maize is lower, possibly due
to the higher importance of enset in the highlands than in other districts, more than 80% of
the farmers grow maize (Table 12). The second most commonly grown crop is teff, which is
grown in all districts except Boricha in Sidama. About 57% of the farmers grow teff, ranging
from 6% in Awassa Zuria districts to 94% in Amhara except Mecha where only 56% of the
sampled farmers grow teff. Teff production is usually low in the south including some districts
in Oromia (Siraro, Shashemene and Bako Tibe). Sorghum is also important as it is grown by
30% of farmers. Important areas where sorghum is widely grown are Jimma (59%), Gobu Sayo
(50%), Shashemene (44%) and Alaba (50%). Other important crops commonly grown are
wheat (20%), hot pepper (15%), enset (13%), finger millet (17%), noug (15%), haricot bean
(14%) and barley (12%). Some crops are location specific, such as taro in Kersa (50%), enset in
Sidama (72%) and field pea in Baso Liben (31%). In areas where enset is grown, the proportion
of farmers growing enset is very high (81 and 62% in Awassa Zuria and Boricha, respectively).
On average there are about eight different crop types grown per district showing how complex
the farming system is. This ranges from 4 in Siraro to 14 in Badawacho.
4.2 Area coverage
The area coverage of crops may not necessarily correspond to the proportion of producers that
grow them. Crops produced by many farmers could have smaller area coverage and vice versa.
For instance, sorghum was third in terms of the proportion of farmers producing it, but fifth in
terms of area coverage (Tables 11 and 13). Similarly, wheat was eighth in terms of proportion of
farmers growing the crop but fourth in terms of area coverage. Thus, how widely a crop is grown
should take into account both the proportion of farmers growing it and the area it covers.
Table 13. Proportion (%) of area under each crop by agricultural potential and population density
Crops HaHp HaLp LaHp LaLp Total
Maize 43 51 53 49 47Teff 14 19 12 19 16Noug 3 5 15 7 5Wheat 6 5 < 1 5 5Sorghum 5 5 2 8 5Finger millet 5 4 < 1 4 4Others 24 11 17 9 18
Maize accounted for 47% of the area cultivated followed by teff (16%). All other crops
individually occupied less than 6% of the cropped land. However, how much widely the crops
are grown varies from location to location. Sorghum is more widely grown in LaLp. In the case
of teff, the second crop in the study area, there is a tendency for being grown more in low
densely populated areas as it covers about 19% of the cropped land in this area and only about
12 and 14% in LaHp and HaHp areas, respectively which is statistically significant (F = 2.34).
Noug is more widely grown in LaHp (15.5%) compared to 2.7–6.6% in other areas.

25
The area coverage of maize ranges from about 14% in Debre Elias and 15% in Baso Liben
to 95% in Siraro (Table 14). The area planted with maize in Siraro is extremely high and the
small area left is covered by teff, haricot bean and sorghum. The other districts where maize
covers the highest cropped area are Bako Tibe (67%) and Kersa (64%). Generally, the area
coverage of maize is high in the Oromia region followed by SNNPR and lower in Amhara.
Teff is the second crop in terms of area coverage and it covers about 16% of the cropped
land. In the Amhara region, except in Mecha where it is only 11%, the coverage of teff is
high (29% in Bure and 35% in West Gojam). In Oromia, relatively high (13–16%) area
coverage of teff is observed in the western part of the region (Jimma and Gobu Sayo); while
in the south-central Oromia and Bako Tibe, area coverage of teff is not more than 6%. In
SNNPR, the area coverage of teff is high in Alaba (22%); while in other districts its coverage
is low (below 6%). Most other crops including wheat, haricot bean, noug, enset, finger
millet, coffee and chat are limited to specific areas in terms of their area coverage.
The average area allocated to different crops ranges from 0.04 ha for tomato to 0.8 ha for maize.
Larger areas are usually allocated to staple food crops (maize, wheat and teff) and cash crops (noug
and coffee). General Linear Model (model 1 in methodology) was used to see if area allocated to
crop is affected by agricultural potential, population densities and the interaction between these
categories. We find that only area of wheat is affected by these parameters. In LaLp, because of low
population density and relative abundance of land, farmers grow wheat extensively. In HaHp wheat
is an important crop and it is grown on relatively wider area (Table 15).
Relatively high variability exists across geographical locations; as the area allocated to different
crops depends on land availability as well as the importance of the crop in that particular farming
system. Except in Badawacho, Debre Elias and Baso Liben, in all other districts farmers allocate
more land to maize compared to other crops. The average area allocated to maize ranges from
0.29 ha in Baso Liben to 1.8 ha in Siraro. Except in Shashemene, where average land allocated to
maize is 0.55 ha, in all other districts in Oromia, the average area allocated to maize is more than
0.98 ha. On the other hand, in SNNPR, the area allocated to maize is low ranging from 0.45 ha
in Awassa to 0.81 ha in Alaba mainly because of land shortage. In the Amhara region, the area of
maize is usually low particularly in West Gojam where the average maize area is 0.35 and 0.29 in
Debre Elias and Baso Liben, respectively. In East Gojam, it is higher with an average of 0.51 ha in
Bure and 0.56 ha in Mecha. Although teff is second to maize in terms of area coverage, it is third
in terms of average area allocated by individual farmers (Tables 11 and 15). Area of teff is high in
the Amhara region particularly in West Gojam with an average area of 0.84 ha in Debre Elias and
0.66 ha in Baso Liben. In the Oromia region, teff area is high in the west particularly in Omo Nada
(0.61 ha) and Gobu Sayo (0.57 ha); while it is low in southern Oromia (0.37 ha in Siraro and 0.33
ha in Shashemene). The average area planted with sorghum is about 0.34 ha. A larger plot size
is allocated to sorghum in Omo Nada (0.44 ha) and Gobu Sayo (0.56 ha). In most districts, the
average area allocated to sorghum is less than the area allocated to the other major cereals.

26
Tabl
e 14
. Pro
port
ion
(%)
of c
rop
area
cov
erag
e by
dis
tric
t
Cro
psA
was
a Z
uria
Bor
icha
Ala
baB
adaw
acho
Sira
roSh
ashe
men
eG
obu
Sa
yoO
mo
Nad
aKe
rsa
Bak
o Ti
beD
ebre
El
ias
Bas
o Li
ben
Bur
eM
echa
Tota
l
Mai
ze44
5554
3995
4753
4464
6714
1532
3247
Teff
20
226
26
1416
136
3535
2911
16W
heat
00
00
019
00
00
1234
30
5So
rghu
m0
08
2<
17
1215
130
00
00
5B
arle
y0
00
00
00
00
00
00
02
Chi
ck p
ea0
00
20
00
00
00
32
0<
1H
aric
ot b
ean
019
16
26
00
10
00
00
2N
oug
00
00
00
90
05
280
021
6En
set
2717
42
00
01
< 1
00
00
02
Swee
t pot
ato
02
03
00
00
00
00
00
< 1
Pota
to0
40
20
60
00
0<
10
00
1Fi
nger
mill
et0
01
00
06
00
00
020
284
Lins
eed
00
00
00
00
00
32
03
1C
offe
e8
00
250
00
14
< 1
00
0<
12
Cha
t14
22
00
00
10
< 1
00
00
1Fa
ba b
ean
00
00
00
00
03
28
01
Suga
r ca
ne4
10
10
00
10
00
00
0<
1To
mat
o1
00
00
00
00
00
00
0<
1H
ot p
eppe
r0
07
20
15
< 1
012
00
30
2Pa
paya
00
07
00
07
02
00
00
1Fe
nugr
eek
00
00
00
00
00
00
00
< 1
Ban
ana
00
01
00
014
03
00
00
2Ta
ro0
00
10
00
16
00
00
01
Hop
es0
00
00
00
00
00
20
0<
1A
voca
do0
00
00
00
00
00
00
0<
1m
ango
00
00
00
00
03
00
00
< 1
Fiel
d pe
a0
00
00
00
00
01
60
0<
1

27
Table 15. Average area (ha) per household for each crop by agricultural potential and population density
Crops HaHp HaLp LaHp LaLp Average Range
Maize 0.72 0.94 0.83 0.85 0.80 0.13–6.00Teff 0.48 0.64 0.65 0.56 0.54 0.13–1.75Sorghum 0.34 0.35 0.20 0.42 0.34 0.13–1.00Barley 0.24 0.30 0.25 0.22 0.25 0.06–0.75Wheat 0.62 0.38 0.25 0.83 0.55 0.25–1.25Chick pea 0.35 0 0 0 0.35 0.25–0.50Haricot bean 0.31 0.25 0.56 0.38 0.37 0.13–0.75Noug 0.38 0.47 0.33 0.41 0.41 0.13–7.50Enset 0.20 0.03 0.23 0 0.20 0.06–1.00Sweet potato 0.21 0 0.25 0 0.22 0.13–0.25Potato 0.11 0.50 0.05 0 0.14 0.06–0.50Finger millet 0.38 0.30 0.06 0.31 0.34 0.13–1.00Linseed 0.08 0.21 0.38 0.13 0.14 0.06–0.05Coffee 0.54 0.21 0.10 0 0.43 0.06–5.00Chat 0.13 0 0.16 0.25 0.13 0.06–0.25Horse/faba bean 0.18 0.09 0.25 0.17 0.16 0.06–0.50Sugar cane 0.19 0 0.25 0 0.17 0.13–0.25Tomato 0.03 0 0.06 0 0.06 0.06Hot pepper 0.20 0.29 0.07 0.18 0.19 0.06–0.75Papaya 2.00 0 0.50 0 1.50 0.50–2.50Fenugreek 0 0.25 0 0 0.25 0.25Banana 1.25 0 0 0 1.25 0.25–5.00Taro 0.23 0.25 0 0 0.24 0.13–0.38Hopes 0.50 0 0 0 0.50 0.50Mango 0.75 0 0 0 0.75 0.75Field peas 0.27 0.00 0 0 0.21 0.13–0.50
4.3 Grain yield
To analyse the grain yield only major crops (crops with more than 4% area coverage and
grown by at least 20% of the households) were considered. Accordingly, six crops were
identified: maize, teff, sorghum, finger millet, noug and wheat (Table 17). The average maize
yield is about 2.05 t/ha, which is higher than the national average, 1.80 t/ha, in 2001/02
(CSA 2003). This is probably because the average yield found in this study is only from major
maize producing areas, which exclude marginal and low yield areas for maize (see the detail
of maize yield in chapter 5). Next to maize, wheat is second in terms of yield per hectare,
which is about 1.84 t/ha, also higher than the national average of 1.36 t/ha in 2001/02. These
two crops are among the few that have better seed technologies compared to others.

28
Tabl
e 16
. Ave
rage
are
a (h
a/ho
useh
old)
allo
cate
d to
cro
ps in
diff
eren
t dis
tric
ts
Cro
psA
was
a Z
uria
Bor
icha
Ala
baB
adaw
acho
Sira
roSh
ashe
men
eG
obu
Sayo
Om
o N
ada
Kers
aB
ako
Tibe
Deb
re
Elia
sB
aso
Libe
nB
ure
Mec
haTo
tal
Mai
ze
0.35
0.52
0.81
0.56
1.80
0.55
1.22
0.98
1.3
1.21
0.35
0.29
0.51
0.56
0.80
*Te
ff0.
250
0.48
0.27
0.37
0.33
0.57
0.61
0.46
0.44
0.84
0.66
0.50
0.32
0.54
*So
rghu
m0
00.
230.
250.
120.
160.
560.
440.
300
00
00
0.34
*B
arle
y0
00
00
0.37
00
00
0.24
0.21
0.22
0.23
0.25
Whe
at0
00
00
0.48
00
00
0.45
0.69
0.37
00.
55C
hick
pea
00
00.
500
00
00
00
0.37
0.25
00.
35H
aric
ot b
ean
00.
420.
250.
270.
500.
500
00.
250
00
00
0.37
Nou
g0
00
00
00.
480
00.
750.
260
00.
430.
41En
set
0.20
0.18
1.00
0.28
00
00.
190.
060
00
00
0.20
Swee
t pot
ato
00.
250
0.21
00
00
00
00
00.
22Po
tato
00.
140
0.37
00.
140
00
00.
060
00
0.14
Fing
er m
illet
00
0.05
00
00.
250
00
00
0.35
0.46
0.34
**Li
nsee
d0
00
00
00
00
00.
20.
070
0.21
0.14
Cof
fee
0.12
00
0.42
00
00.
120.
270.
120
00
0.12
0.43
Cha
t0.
180.
100.
150
00
0.06
0.12
00
00
0.13
Faba
bea
n0
0.0
00
00
00
00.
500.
160.
100.
180
0.16
Suga
r ca
ne0.
190.
120
0.25
00
00.
120
00
00
00.
17To
mat
o0.
040
00
00
00
00
00
00
0.04
Hot
pep
per
00
0.13
0.50
00.
120.
190.
120
0.27
00
0.14
00.
19Pa
paya
00
01.
500
00
2.50
00.
500
00
01.
50Fe
nugr
eek
00
0.25
00
00
00
00
00
00.
25B
anan
a0
00
0.25
00
02.
620
0.75
00
00
1.25
Taro
00
00.
250
00
0.25
0.23
00
00
0.24
Hop
es0
00
00
00
00
00
0.50
00
0.25
Avo
cado
00
00
00
00
00
00
00
0.00
Man
go0
00
00
00
00
0.75
00
00
0.37
Fiel
d pe
a0
00
00
00
00
00.
120.
270
00.
21N
ote:
*, *
* f-
valu
e fo
r m
eans
am
ong
dist
rict
s is
sig
nific
ant a
t 1 a
nd 1
0%, r
espe
ctiv
ely.

29
Table 17. Yield (t/ha) of major crops by agricultural potential and population density
CropsAgricultural potential and population density
AverageHaHp HaLp LaHp LaLp
Wheat 1.79 1.96 1.00 2.00 1.84Teff 0.75 0.73 0.75 0.62 0.72Sorghum 0.65 0.59 0.56 0.57 0.62Maize (total)a,b 2.12 2.38 1.49 1.97 2.05Maize (dry)a,b 0.56 0.51 0.47 0.46 0.52Nougc 0.41 0.60 0.60 0.29 0.45Finger millet 1.44 1.16 0.80 0.58 1.28
Notes: a. Ha vs. La, P < 0.01. b. Hp vs. Lp, P < 0.08. c. Agricultural potential * Population density, P < 0.05.
The average yield of teff is about 0.72 t/ha which is not much different from the national
average yield (0.87 t/ha) in 2001/02. The average yield of other major crops is low
particularly for sorghum (0.62 t/ha), and noug (0.45 t/ha). As expected, dry maize yield
was significantly higher in areas with high agricultural potential than in those with low
agricultural potential.
The difference in yield was significant among the geographical location for teff, maize and
noug (Table 18). On the other hand, there is little difference for wheat, sorghum and finger
millet among the districts. The yield of maize ranges from about 0.8 t/ha in Boricha to 3.18 t/ha
in Kersa. Yield of maize is high in western and northwestern parts of the country compared to
the southern part that extends from Shashemene to Boricha. Similarly, teff yield is higher in
Amhara where it is grown as a major crop and the yield ranges from 0.30 t/ha in Bako Tibe to
1.13 t/ha in Debre Elias. Except in Siraro, where the average teff yield is 0.80 t/ha, in all other
districts of Oromia and SNNPR, the yield of teff is less than 0.60 t/ha. Noug is grown in only
few districts and the yield in the two districts in Oromia where noug is grown (Bako Tibe and
Gobu Sayo) is significantly lower compared to the two districts in the Amhara region.

30
Table 18. Average yield (t/ha) of major crops by district
District Wheat Teff Sorghum Maize Noug Finger millet
Awassa Zuria – – – 1.28 abc – –
Boricha – – – 0.8a – –
Alaba – 0.46 ab* 0.67 1.52 abc – –
Badawacho – 0.52 ab 0.30 1.42 abc – –
Siraro – 0.80bc – 1.14 ab – –
Shashemene 1.26 0.57 ab 0.73 1.42 abc – –
Gobu Sayo – 0.32 a 0.45 2.89 de 0.21 0.60
Omo Nada – 0.47 ab 0.50 2.08 cd – –
Kersa – 0.44 ab 0.59 3.18 e – –
Bako Tibe – 0.30 a – 2.05 bcd 0.26 –
Debre Elias 1.83 1.13c – 3.02 e 0.61 –
Baso Liben 2.17 1.00c – 2.51 de – –
Bure 1.60 0.85bc – 2.54 de – 1.41
Mecha – 0.86bc – 2.86 de 0.47 1.36
Average 1.84 0.72 0.62 2.05 0.45 1.28Notes: * Numbers followed with the same letter across districts are not significantly different at 5%. – indicates that the crop is not produced in the district.

31
5 Maize production 5.1 Cultivars grown
As indicated in Chapter 4, maize is the dominant crop in the maize belt of Ethiopia covering
on average about 47% of the cropland. It ranges from 14% in Baso Liben to 95% in Siraro.
None of the sampled household reported the use of irrigation for maize production. The
average area planted with maize per household in the study area is about 0.8 ha. Maize
has relatively more suitable technologies released compared to other crops. Access to
international research on maize has been important to develop more technologies than other
crops, such as teff, where international experience is almost non-existent. Thus, the use of
improved technologies particularly hybrids and open pollinated varieties (OPVs) is higher
for maize than other crops.1 There is also a tendency of increased use of improved cultivars
over the period the data were collected. The proportion of farmers using improved cultivars
increased from about 63% in 1999 to 69% in 2001 (Table 19).
Table 19. Proportion (%) of farmers using different maize cultivars
Cultivar Years
1999 2000 2001Local1 36.8 32.9 30.8BH-1402 10.5 12.9 13.7Katumani1 8.1 6.7 7.6BH-6602 28.7 30.0 30.8PHB-32532 10.5 9.5 8.1A5111 0.5 1.0 1.9BH-5402 1.4 3.3 3.8Other (improved) 3.3 3.8 3.3N 209 210 211
1. OPV. 2. Hybrid.
In terms of individual cultivars, the proportion of farmers using the local variety decreased
from 37% in 1999 to 31% in 2001. The decrease in use of local varieties corresponds to an
increase in the use of improved cultivars including BH-140, BH-660, A511 and BH-540.
The proportion of farmers using the most popular hybrid BH-660 was equal to those using
the local variety in 2001. The hybrids BH-140 and PHB-3253 are also commonly used by
farmers. The number of farmers using BH-140 has an increasing trend while that of PHB-
3253 appears to be decreasing. There is a geographical distribution pattern where each
cultivar has a niche to dominate (Table 20). The major improved hybrid BH-660 dominates
1. Wheat is the other crop, which has better improved seed technologies due to national and international efforts.
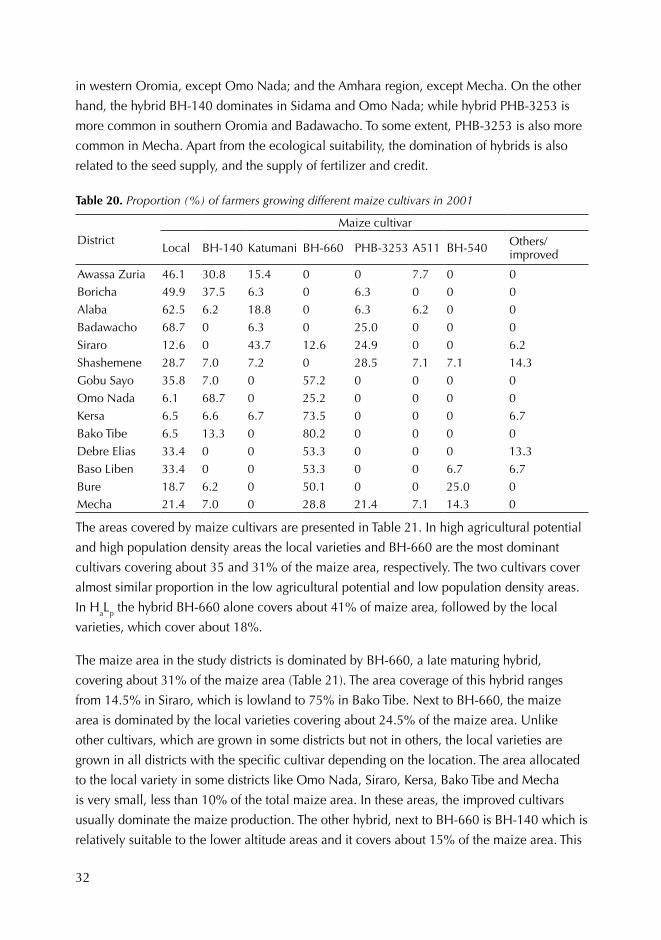
32
in western Oromia, except Omo Nada; and the Amhara region, except Mecha. On the other
hand, the hybrid BH-140 dominates in Sidama and Omo Nada; while hybrid PHB-3253 is
more common in southern Oromia and Badawacho. To some extent, PHB-3253 is also more
common in Mecha. Apart from the ecological suitability, the domination of hybrids is also
related to the seed supply, and the supply of fertilizer and credit.
Table 20. Proportion (%) of farmers growing different maize cultivars in 2001
DistrictMaize cultivar
Local BH-140 Katumani BH-660 PHB-3253 A511 BH-540 Others/ improved
Awassa Zuria 46.1 30.8 15.4 0 0 7.7 0 0Boricha 49.9 37.5 6.3 0 6.3 0 0 0Alaba 62.5 6.2 18.8 0 6.3 6.2 0 0Badawacho 68.7 0 6.3 0 25.0 0 0 0Siraro 12.6 0 43.7 12.6 24.9 0 0 6.2Shashemene 28.7 7.0 7.2 0 28.5 7.1 7.1 14.3Gobu Sayo 35.8 7.0 0 57.2 0 0 0 0Omo Nada 6.1 68.7 0 25.2 0 0 0 0Kersa 6.5 6.6 6.7 73.5 0 0 0 6.7Bako Tibe 6.5 13.3 0 80.2 0 0 0 0Debre Elias 33.4 0 0 53.3 0 0 0 13.3Baso Liben 33.4 0 0 53.3 0 0 6.7 6.7Bure 18.7 6.2 0 50.1 0 0 25.0 0Mecha 21.4 7.0 0 28.8 21.4 7.1 14.3 0
The areas covered by maize cultivars are presented in Table 21. In high agricultural potential
and high population density areas the local varieties and BH-660 are the most dominant
cultivars covering about 35 and 31% of the maize area, respectively. The two cultivars cover
almost similar proportion in the low agricultural potential and low population density areas.
In HaLp the hybrid BH-660 alone covers about 41% of maize area, followed by the local
varieties, which cover about 18%.
The maize area in the study districts is dominated by BH-660, a late maturing hybrid,
covering about 31% of the maize area (Table 21). The area coverage of this hybrid ranges
from 14.5% in Siraro, which is lowland to 75% in Bako Tibe. Next to BH-660, the maize
area is dominated by the local varieties covering about 24.5% of the maize area. Unlike
other cultivars, which are grown in some districts but not in others, the local varieties are
grown in all districts with the specific cultivar depending on the location. The area allocated
to the local variety in some districts like Omo Nada, Siraro, Kersa, Bako Tibe and Mecha
is very small, less than 10% of the total maize area. In these areas, the improved cultivars
usually dominate the maize production. The other hybrid, next to BH-660 is BH-140 which is
relatively suitable to the lower altitude areas and it covers about 15% of the maize area. This

33
hybrid covers about 74% of the maize area in Omo Nada and its coverage in Sidama zone
is also considerable (33% in Boricha and 29% in Awassa Zuria). Katumani variety, which
covers about 12% of the maize area, is more common in Siraro covering about 54% of the
maize area in the district. In the adjacent district, Alaba, it also covers a relatively large area
(15%). Other hybrids, PHB-3253 and BH-540 and the OPV A511 in total cover about 12.3%
while the remaining 5.6% is covered by improved cultivars, which could not be identified by
name.
Table 21. Proportion (%) of maize area allocated to different maize cultivars by district
DistrictsMaize cultivars
Local BH-140 Katumani BH-660 PHB-3253 A511 BH-540 OtherAwassa Zuria 43.9 29.3 12.2 0 0 14.6 0 0Boricha 54.1 33.1 5.1 0 7.6 0 0 0Alaba 59.6 13.5 15.4 0 3.8 7.7 0 0Badawacho 65.9 0 4.5 0 29.5 0 0 0Siraro 4.7 0 54.5 14.5 19.6 0 0 6.8Shashemene 30.1 16.4 8.2 0 15.1 5.5 11.0 13.7Gobu Sayo 50.7 4.0 0 45.3 0 0 0 0Omo Nada 2.9 73.7 0 23.4 0 0 0 0Kersa 4.8 3.6 3.6 59.0 0 0 0 28.9Bako Tibe 7.5 17.6 0 74.8 0 0 0 0Debre Elias 28.4 0 0 61.7 0 0 0 9.9Baso Liben 30.0 0 0 57.5 0 0 7.5 5.0Bure 15.9 6.3 0 55.6 0 0 22.2 0Mecha 7.9 6.3 0 20.6 23.8 9.5 31.7 0Average 24.5 14.8 11.8 31.1 7.5 1.7 3.1 5.6
Comparing the proportion of farmers growing different maize cultivars and the areas in which
they are grown, some differences could be observed particularly for the local, Katumani and
an identified improved cultivars (Table 21). In 2001, the proportion of area allocated to local
varieties was less than the proportion of farmers growing improved cultivars by about 6.3%.
This is related to the average maize area in the districts where improved cultivars are more
common. In Badawacho and Boricha, where the local varieties dominate, the average maize
area and the coverage of improved cultivars are generally low.
The area coverage of different maize cultivars also varies by agricultural potential and
population density (Table 22). The domination of BH-660 and the local variety is high
throughout. In the high agricultural potential area, BH-660 is very important covering more
than 34% of maize area. The local varieties dominate more in LaLp covering about 35% of the
maize area and they also are second in LaHp and HaHp. In HaLp and LaHp, Katumani variety
covers more than 21% of maize area.

34
Table 22. Per cent of area coverage of different maize cultivars by agricultural potential and popula-tion density categories
CultivarsAgricultural potential and population density
HaHp HaLp LaHp LaLp
Local 29 12 23 35
BH-140 22 6 11 14Katumani 4 22 26 1BH-660 34 36 19 27A510 2 2 0 0PHB-3253 4 4 12 18A511 1 0 0 0BH-540 4 2 0 4Other improved 0 16 9 1Total 100 100 100 100
A probit regression model was estimated in order to identify factors that influence the use of
improved maize cultivars. The variables included in the probit model are given in Table 23.
The same explanatory variables were used in models that predict use of fertilizer.
Table 23. Descriptive statistics of variables included in the probit model of adoption of improved maize cultivars and commercial fertilizer
Variables Mean Std. dev. Min Max
Age of household head (years) 46 15.42 25 102
Age square of household head (years) 2387 1691 625 10404
Education level of household head (years) 1.65 2.65 0 12
Active family member (15–60 years old) 3.51 1.73 1 10Dependency ratio (number of dependents/ total family size)** 0.5 0.5 0 0.9
Walking distance to input shop (hours) 1.39 1.14 0 5
Walking distance to crop market (hours) 1.69 1.09 0.05 5
Per capita maize area (ha) 0.12 0.11 0.01 0.88
Per capita other crop area (ha) 0.26 0.21 0.02 1.54
Value of livestock sold (Ethiopian birr* × 102) 262 519.87 0 4020
If the household does not have ox (0/1) 0.25 0.43 0 1
If the household has only one ox (0/1) 0.21 0.41 0 1
If the household has more than 1 oxen (0/1) 0.55 0.5 0 1
If household is in HaHp (0/1) 0.50 0.50 0 1
If household is in HaLp (0/1) 0.21 0.41 0 1
If household is in LaHp (0/1) 0.16 0.37 0 1
If household is in LaLp (0/1) 0.13 0.34 0 1
* In May 2007, USD 1 = Ethiopian birr (ETB) 8.86. ** Dependents were those family members below 15 years or above 60 years of age.

35
The result of the model (Table 24) showed that variables including oxen ownership, active
labour force and dependency ratio are statistically significantly associated with the use of
improved maize cultivars. We find that the three variables affect the use of improved maize
cultivars positively. The probability of using improved cultivars for those farmers who own
a pair of oxen increase by about 25% over those who do not have oxen. This may show
the importance of oxen in determining the capacity of farmer to adopt crop technologies.
However, we find no difference between farmers who own no ox and those who own one
ox. However, if the size of working labour force increases by one, the probability of using
improved maize cultivars increase by about 4.6%. As the number of work forces increase,
there is possibility to look for more intensive production to increase productivity. Improved
cultivars usually require more labour inputs to accommodate management practices
recommended for the use of improved cultivars. The other important variable that affects the
use of improved cultivars is dependency ratio and as the level of dependency ratio increases
by a unit, the probability of using improved cultivars of maize increases by about 22%.
High dependency ratio could mean higher household consumption requirements and such
households may have higher incentives for more intensive production.
5.2 Use of fertilizer
Sixty per cent of maize growers in 2001 used di-ammonium phosphate (DAP) and about
56% used urea (Table 25). In some districts (Omo Nada, Kersa, Bako Tibe) all maize growers
use DAP. In Jimma zone, all maize growers used urea. In general, the use of DAP is more
common in the districts found in western Oromia and Amhara as more than 60% of the
farmers have used it. A few farmers (12.5–19%) use DAP in southern Oromia and Hadiya
areas. The proportion of farmers using DAP in Sidama zone is also low (37.5% in Boricha and
46.2% in Awassa Zuria). Similar trend is also found for urea since as low as 6.3% of farmers
in Siraro use urea, while in Amhara and western Oromia, more than 53% of the farmers used
urea. In 1998, about 90% of maize growers in Ethiopia used commercial fertilizer (Tesfaye
et al. 2001). Despite extension efforts to increase fertilizer use in the country there is still a
considerable proportion of farmers who are not using it for several crops. Farmers in drought
prone areas, such as Shashemene, are less likely to use fertilizer due to risk.
The use of fertilizer could also be related to the moisture availability as the response to
fertilizer is very much related to the rainfall especially for urea. Areas in the Rift Valley
usually receive low amount of rain compared to the western part of the country affecting the
use of fertilizer besides other factors.

36
Table 24. Factors affecting the use of improved maize cultivars, probit model estimate
Variables Coefficient dF/dx Z
Constant –0.655 –0.78
Age of household head (years) –0.011 –0.004 –0.29
Age square of household head (years) 0.00009 0.00003 0.27Education level of household head (years of schooling) 0.007 0.002 0.18
Dependency ratio (dependent/total family size) 0.657 0.224 1.72*
Active labour size (15–60 years old) 0.135 0.046 1.83*
Walking distance to input supply shops (hours) 0.08 0.027 0.71
Walking distance to crop market (hours) –0.148 –0.05 –1.28
Per capita maize area (ha) 0.225 0.077 0.20
Per capita other crop area (ha) 0.519 0.177 0.72
Value of livestock sold (ETB* × 102) 0.0003 0.0001 1.12
Oxen dummya
Farmers with one ox§ 0.458 0.143 1.60
Farmers with two or more oxen§ 0.715 0.245 2.82***Agricultural potential and population density dummy compared to LaLp
HaHp§ –0.061 –0.021 –0.20
HaLp§ 0.515 0.159 1.37
LaHp§ 0.254 0.082 0.67
Regression diagnosis
No. 209 Obs. P = 0.69
LR x2 27.07** Pred. P = 0.71
Log likelihood –116.024
Pseudo R2 0.1045
Per cent of positive values 69Notes: a. It is conceivable that oxen ownership may be dependant on adoption of improved cultivars, thus en-dogenous in this model. However, since farmers usually grow a number of crops, decision to acquire oxen may not necessarily be endogenous in a model of one particular crop. * In May 2007, USD 1 = Ethiopian birr (ETB) 8.86. § dF/dx is for discrete change of dummy variable from 0 to 1. *, **, *** are significant at 10, 5 and 1%, respectively.
There is a difference in the rate of fertilizer application through the different agricultural
potential and population density (Table 26). The average rate of DAP use rate in the high
agricultural potential areas is about 96 kg/ha, while it is 70 kg/ha for low agricultural
potential areas. Similarly, the amount of urea fertilizer used per hectare was 91 kg/ha for high
agricultural potential areas while it is 80 kg/ha for low agricultural potential areas.

37
Table 25. Proportion of farmers and mean fertilizer used (kg/ha) by district in 2001
District
DAP Urea
% of farmers using Mean amount of fertilizer (kg/ha)
% of farmers using
Mean amount of fertilizer (kg/ha)
Awassa Zuria 46 67.2 38 70.7
Boricha 37 71.1 189 73.9
Alaba 19 59.5 12 39.3
Badawacho 12 83.3 31 62.0
Siraro 19 63.3 6 40.0
Shashemene 14 66.7 21 41.1
Gobu Sayo 93 62.7 79 127.0
Omo Nada 100 70.3 100 66.4
Kersa 100 77.5 100 61.9
Bako Tibe 100 59.2 93 80.0
Debre Elias 93 157.1 80 141.7
Baso Liben 60 128.4 53 110.7
Bure 75 95.8 75 84.4
Mecha 79 111.4 79 100.0
Total 60 88.5 56 87.7
F-values 3.457*** 3.464***
Note: *** Means are significantly different at 1%.
Table 26. Use of fertilizer for maize in different agricultural potential and population density areas
Agricultural potential and population density
DAP Urea
% of users Average kg/ha % of users Average kg/ha
HaHp 59 96 59 81HaLp 64 95 59 114LaHp 49 70 37 77LaLp 73 69 61 82Average 60 88.5 56 87.7
Factors that were hypothesized to affect the use of fertilizer in maize production were used
in the analysis to identify which factors are important in determining the use of fertilizer. The
descriptive statistics for those variables included in the probit model are given in Table 27.
Probit model results indicated that among the variables included, some of the variables
were statistically significant in affecting the use of fertilizer (Table 27). These include value
of livestock sold, education level of the household head, oxen ownership and distance
to input supply shops. All these variables have the expected sign. Education level of the
household head affects adoption of fertilizer positively, as expected. As year of schooling
increases by one year, the probability of using fertilizer increases by about 5.6% confirming
the importance of education in technology adoption. Distance to input supply shop was also

38
found to affect adoption of fertilizer negatively. As walking time to reach the input supply
shops increase by an hour, the probability of using fertilizer decrease by about 9%.
Table 27. Factors that affect the use of chemical fertilizer, probit estimates
Variables Coefficient dF/dx Z
Constant –1.139 –1.09
Age of household head (years) 0.059 0.02 1.47
Age square of household head (years) –0.0006 –0.0002 –1.54
Active labour (15–60 years) –0.015 –0.005 –0.21
Education level of household head (years of schooling) 0.161 0.056 3.29***
Dependency ratio (dependent/total family size) –0.156 –0.054 –0.5
Walking distance to input supply shops (hours) –0.266 –0.092 –2.22**
Walking distance to crop market (hours) –0.088 –031 0.74
Per capita maize area (ha) –1.41 –0.487 –1.12
Per capita total crop area (ha) 1.062 0.367 1.25
Value of livestock sold (ETB* × 102) 0.072 0.025 2.16**
Oxen dummy compared to no ox
Farmers with one ox§ 0.573 0.177 1.92*
Farmers with two or more oxen§ 1.199 0.407 4.4***Agricultural potential and population density dummy compared to LaLp
HaHp§ –0.42 –0.144 –1.18
HaLp§ –0.60 –0.22 –1.45
LaHp§ –0.257 0.092 –0.6
Regression diagnosis
N 209 Obs. P = 0.66
LR chi2 (16) 64.25*** Pred. P = 0.70
Log likelihood –102.46
Pseudo R2 0.2387
Notes: * In May 2007, USD 1 = Ethiopian birr (ETB) 8.86. (§) dF/dx is for discrete change of dummy variable from 0 to 1. *,**,*** are significant at 10, 5 and 1% respectively.
Farmers who own oxen have higher probability of using fertilizer than those who do not own
oxen. The marginal effect indicate that those farmers who own an ox have about 18% more
probability to use fertilizer compared with those who do not own oxen. Moreover, as the
number of oxen increases the probability of using fertilizer also increases. Those farmers who
own a pair of oxen or more have about 41% more probability to use fertilizer compared with
those who do not own an ox. Similarly, revenue from sale of livestock in the year positively
influences the use of fertilizer. As cash income from livestock sale increase by ETB2 100,
2. In May 2007, USD 1 = Ethiopian birr (ETB) 8.86.
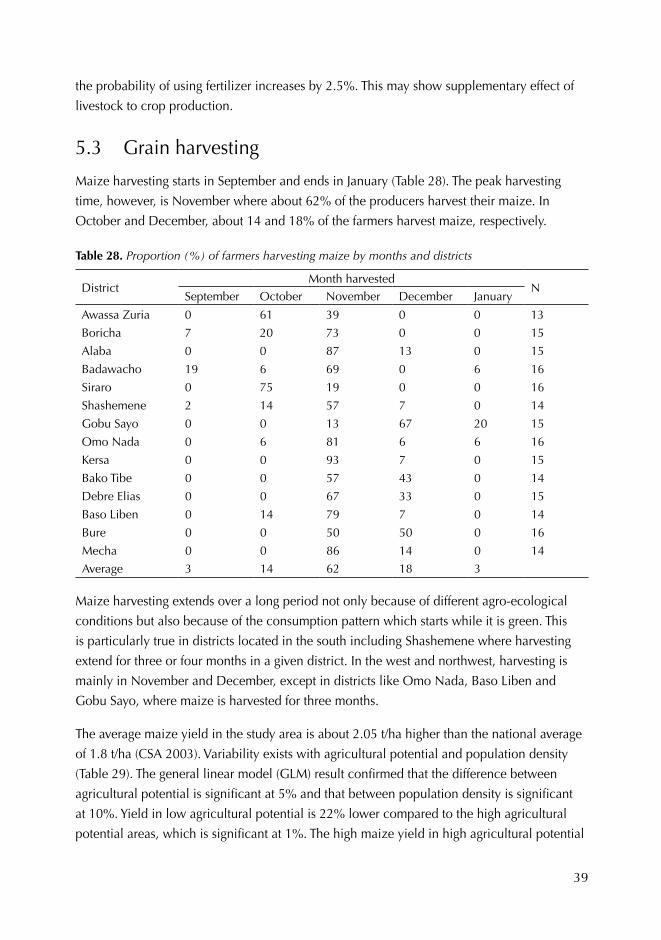
39
the probability of using fertilizer increases by 2.5%. This may show supplementary effect of
livestock to crop production.
5.3 Grain harvesting
Maize harvesting starts in September and ends in January (Table 28). The peak harvesting
time, however, is November where about 62% of the producers harvest their maize. In
October and December, about 14 and 18% of the farmers harvest maize, respectively.
Table 28. Proportion (%) of farmers harvesting maize by months and districts
DistrictMonth harvested
NSeptember October November December January
Awassa Zuria 0 61 39 0 0 13
Boricha 7 20 73 0 0 15
Alaba 0 0 87 13 0 15
Badawacho 19 6 69 0 6 16
Siraro 0 75 19 0 0 16
Shashemene 2 14 57 7 0 14
Gobu Sayo 0 0 13 67 20 15
Omo Nada 0 6 81 6 6 16
Kersa 0 0 93 7 0 15
Bako Tibe 0 0 57 43 0 14
Debre Elias 0 0 67 33 0 15
Baso Liben 0 14 79 7 0 14
Bure 0 0 50 50 0 16
Mecha 0 0 86 14 0 14
Average 3 14 62 18 3
Maize harvesting extends over a long period not only because of different agro-ecological
conditions but also because of the consumption pattern which starts while it is green. This
is particularly true in districts located in the south including Shashemene where harvesting
extend for three or four months in a given district. In the west and northwest, harvesting is
mainly in November and December, except in districts like Omo Nada, Baso Liben and
Gobu Sayo, where maize is harvested for three months.
The average maize yield in the study area is about 2.05 t/ha higher than the national average
of 1.8 t/ha (CSA 2003). Variability exists with agricultural potential and population density
(Table 29). The general linear model (GLM) result confirmed that the difference between
agricultural potential is significant at 5% and that between population density is significant
at 10%. Yield in low agricultural potential is 22% lower compared to the high agricultural
potential areas, which is significant at 1%. The high maize yield in high agricultural potential
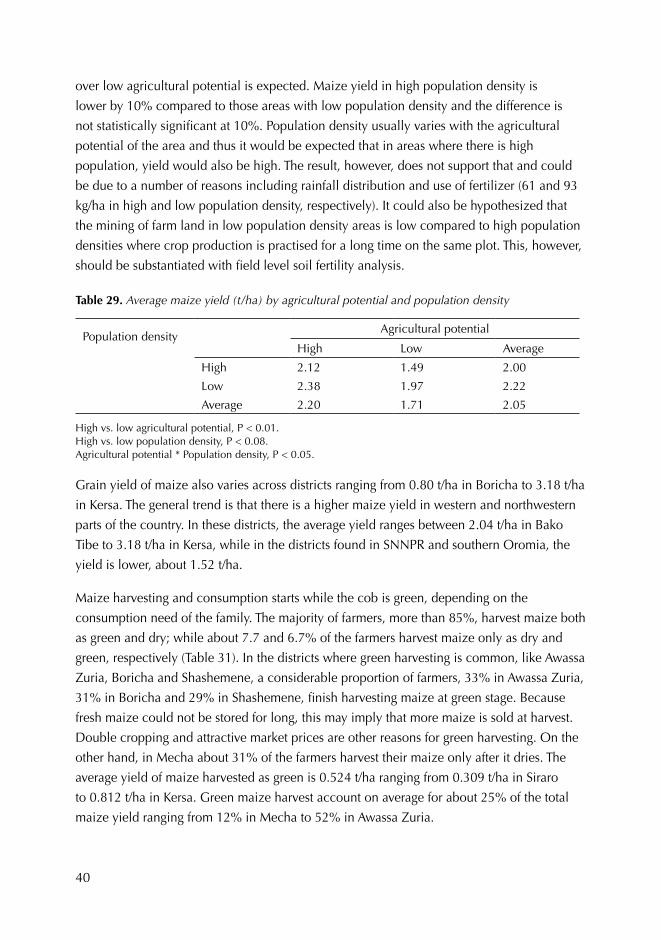
40
over low agricultural potential is expected. Maize yield in high population density is
lower by 10% compared to those areas with low population density and the difference is
not statistically significant at 10%. Population density usually varies with the agricultural
potential of the area and thus it would be expected that in areas where there is high
population, yield would also be high. The result, however, does not support that and could
be due to a number of reasons including rainfall distribution and use of fertilizer (61 and 93
kg/ha in high and low population density, respectively). It could also be hypothesized that
the mining of farm land in low population density areas is low compared to high population
densities where crop production is practised for a long time on the same plot. This, however,
should be substantiated with field level soil fertility analysis.
Table 29. Average maize yield (t/ha) by agricultural potential and population density
Population density
Agricultural potential
High Low Average
High 2.12 1.49 2.00
Low 2.38 1.97 2.22
Average 2.20 1.71 2.05
High vs. low agricultural potential, P < 0.01. High vs. low population density, P < 0.08. Agricultural potential * Population density, P < 0.05.
Grain yield of maize also varies across districts ranging from 0.80 t/ha in Boricha to 3.18 t/ha
in Kersa. The general trend is that there is a higher maize yield in western and northwestern
parts of the country. In these districts, the average yield ranges between 2.04 t/ha in Bako
Tibe to 3.18 t/ha in Kersa, while in the districts found in SNNPR and southern Oromia, the
yield is lower, about 1.52 t/ha.
Maize harvesting and consumption starts while the cob is green, depending on the
consumption need of the family. The majority of farmers, more than 85%, harvest maize both
as green and dry; while about 7.7 and 6.7% of the farmers harvest maize only as dry and
green, respectively (Table 31). In the districts where green harvesting is common, like Awassa
Zuria, Boricha and Shashemene, a considerable proportion of farmers, 33% in Awassa Zuria,
31% in Boricha and 29% in Shashemene, finish harvesting maize at green stage. Because
fresh maize could not be stored for long, this may imply that more maize is sold at harvest.
Double cropping and attractive market prices are other reasons for green harvesting. On the
other hand, in Mecha about 31% of the farmers harvest their maize only after it dries. The
average yield of maize harvested as green is 0.524 t/ha ranging from 0.309 t/ha in Siraro
to 0.812 t/ha in Kersa. Green maize harvest account on average for about 25% of the total
maize yield ranging from 12% in Mecha to 52% in Awassa Zuria.

41
Table 30. Mean maize grain (fresh and dry) yield, t/ha, by district in 2001
District Yield t/haDry grain yield, t/ha Fresh grain yield, t/ha
N Mean N Mean % of total
Awassa Zuria 1.28 8 1 11 0.67 52
Boricha 0.80 11 0.55 13 0.40 49
Alaba 1.52 16 0.95 16 0.57 38
Badawacho 1.42 15 0.77 14 0.70 49
Siraro 1.14 16 0.83 16 0.31 27
Shashemene 1.42 10 1.12 14 0.62 44
Gobu Sayo 2.89 15 2.51 14 0.41 14
Omo Nada 2.09 16 1.75 14 0.39 19
Kersa 3.18 15 2.37 15 0.81 26
Bako Tibe 2.05 15 1.62 15 0.42 21
Debre Elias 3.02 14 3.29 14 0.51 13
Baso Liben 2.51 15 1.83 14 0.73 29
Bure 2.54 15 2.14 14 0.42 17
Mecha 2.86 13 2.62 9 0.35 12
Average 2.05 194 1.71 193 0.52 25
F-values 7.36*** 5.95** 1.83*Note: *, ** means are significantly different at 5 and 1%, respectively across district.
Table 31. Location difference of green maize harvest in the maize belt of Ethiopia
Location Total green maize harvested (t)
% of total harvest
Southern Ethiopia Alaba, Badawacho, Awassa, Boricha, Siraro, Shashemene 0.369 36
Western EthiopiaOmo Nada, Kersa, 0.511 16Bako Tibe, Gobu Sayo, 0.433 17
Northwestern Ethiopia
Debre Elias, Baso Liben, Bure, Mecha 0.158 13
Average 0.341 21
There is clear geographical difference regarding the per cent of maize harvested while green.
Farmers in the southern Ethiopia including those in SNNPR and southern part of Oromia
harvest higher proportion of their maize (on average 36%) while green (Table 28). On the
other hand, farmers in western Oromia and northwest Ethiopia harvest 17% or less of their
maize at green stage. This variability is important as it affects the time of harvesting and thus
availability of quality maize stover for the animals.
The correlation coefficient between previous year per-capita major food crop production
and the level of green maize harvested is negative (–0.427, significant at 1%). Those farmers
who harvested more grain per capita the previous year harvest relatively smaller proportion
of their maize output as green indicating the relative availability of food grain in this period.
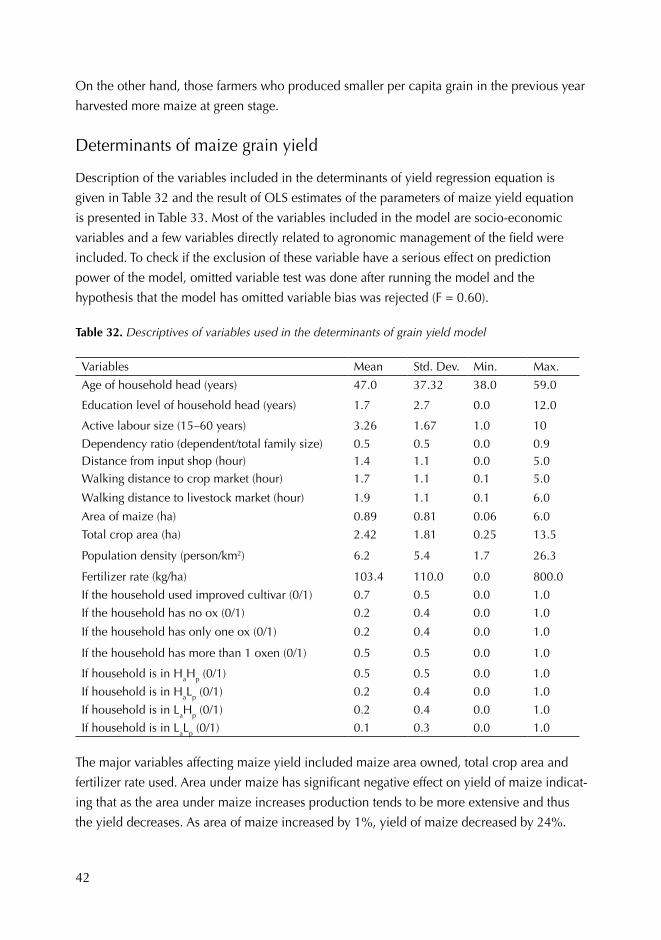
42
On the other hand, those farmers who produced smaller per capita grain in the previous year
harvested more maize at green stage.
Determinants of maize grain yield
Description of the variables included in the determinants of yield regression equation is
given in Table 32 and the result of OLS estimates of the parameters of maize yield equation
is presented in Table 33. Most of the variables included in the model are socio-economic
variables and a few variables directly related to agronomic management of the field were
included. To check if the exclusion of these variable have a serious effect on prediction
power of the model, omitted variable test was done after running the model and the
hypothesis that the model has omitted variable bias was rejected (F = 0.60).
Table 32. Descriptives of variables used in the determinants of grain yield model
Variables Mean Std. Dev. Min. Max.
Age of household head (years) 47.0 37.32 38.0 59.0
Education level of household head (years) 1.7 2.7 0.0 12.0
Active labour size (15–60 years) 3.26 1.67 1.0 10
Dependency ratio (dependent/total family size) 0.5 0.5 0.0 0.9Distance from input shop (hour) 1.4 1.1 0.0 5.0Walking distance to crop market (hour) 1.7 1.1 0.1 5.0
Walking distance to livestock market (hour) 1.9 1.1 0.1 6.0
Area of maize (ha) 0.89 0.81 0.06 6.0
Total crop area (ha) 2.42 1.81 0.25 13.5
Population density (person/km2) 6.2 5.4 1.7 26.3
Fertilizer rate (kg/ha) 103.4 110.0 0.0 800.0
If the household used improved cultivar (0/1) 0.7 0.5 0.0 1.0
If the household has no ox (0/1) 0.2 0.4 0.0 1.0
If the household has only one ox (0/1) 0.2 0.4 0.0 1.0
If the household has more than 1 oxen (0/1) 0.5 0.5 0.0 1.0
If household is in HaHp (0/1) 0.5 0.5 0.0 1.0
If household is in HaLp (0/1) 0.2 0.4 0.0 1.0
If household is in LaHp (0/1) 0.2 0.4 0.0 1.0
If household is in LaLp (0/1) 0.1 0.3 0.0 1.0
The major variables affecting maize yield included maize area owned, total crop area and
fertilizer rate used. Area under maize has significant negative effect on yield of maize indicat-
ing that as the area under maize increases production tends to be more extensive and thus
the yield decreases. As area of maize increased by 1%, yield of maize decreased by 24%.

43
On the other hand, the total area of crop has positive elasticity which may probably indicate
the impact of diversification on the productivity of maize. As the total crop area increased by
1% the yield of maize increase by 26%. As expected, the rate of fertilizer use on maize has
significant and positive effect on the yield. For 1% increase of fertilizer use per hectare on
maize, yield increases by 6%.
Table 33. Determinants of maize yield in the maize belt of Ethiopia, OLS estimates
Variables Coefficient t-value
Constant 3.53 5.06***
Age of household head (years)1 –0.276 –1.53
Education level of household head (years) 0.017 0.90
Dependency ratio (dependent/total family size) –0.002 –0.06
Active labour size (15–60 years) –0.06 –0.54
Distance from input shop (hours) 0.01 0.33
Walking distance to crop market (hours) –0.011 –0.12
Walking distance to livestock market (hours) 0.051 0.54
Maize area (ha) –0.239 –3.5***
Total crop area (ha) 0.257 2.3**
Population density (person/km2) –0.093 –0.95
Fertilizer rate (qt/ha)a 0.061 4.53***
If the household used improved cultivar (0/1)a 0.058 0.48
Oxen dummy compared to no ox
If the household has only one ox (0/1) –0.097 –0.60
If the household has more than 1 oxen (0/1) 0.041 0.26
Agricultural potential and population dummy compared to LaLp
If household is in HaHp (0/1) 0.061 0.39
If household is in HaLp (0/1) 0.196 1.12
If household is in LaHp (0/1) –0.041 –0.21
Regression diagnosis
N 191
F( 17, 173) 5.33***
R-squared 0.34
Adj R-squared 0.28
Root MSE 0.66
Note: 1. Both the dependent and continuous independent variables are in natural log. a. Use of fertilizer and adoption of improved cultivars could be endogenous in this model. However, endogene-ity test failed to reject the null hypothesis of no endogeneity. ***,* indicate statistical significance at 1 and 10%, respectively

44
6 Livestock production in the maize belt of Ethiopia6.1 Livestock ownership
Livestock are an important component in the livelihood of the farming communities
that grow maize in Ethiopia. Data at community level indicate that with the exception
of donkeys and to some extent oxen, which have shown some increasing trends, the
number of livestock in the communities decreased from 1999 to 2001 (Table 34). On
average, the population of livestock per peasant association decreased from about 5589
TLU in 1999 to 4594 (by about 995 TLU) in 2001 while the average human population
per peasant association increased from 1119 to 1217 during the same period. This
reduces the average livestock holding of the household from about 5 TLU in 1999 to
3.8 TLU in 2001. The major decline in cattle population in the Rift Valley and partly
in western Oromia is perhaps due to environmental factors such as drought and feed
shortage.
Cattle are the dominant livestock type in the study area accounting for about 75% of
TLU and owned by about 88% of the households (Table 35). The average number of
cattle owned by households is 4.5 heads ranging from 2.3 in Awassa Zuria to 8.7 in Omo
Nada. About 72% of the households have at least one ox and similarly about 75% of
the households have one cow, pointing to the importance of both oxen and cows in the
household economy. For those households who own oxen, on average oxen constitute
about 42% of the cattle ranging from 25% in Siraro to 63% in Bure. The average number of
oxen and cows owned by households is 1.6 and 1.7, respectively. In terms of animal value
per household, the average is ETB 2268 ranging from ETB 1004 in Awassa, to 3531 ETB in
Debre Elias indicating the low value per animal probably due to the domination of young
animals in districts like Omo Nada, Kersa and Siraro. The variation in average number
of cattle owned by households among the districts is significant (5% level) ranging from
2.3 in Awassa Zuria to 8.7 in Omo Nada. On the other hand, the difference in livestock
ownership did not show significant difference by the agricultural potential and population
density categories, (the average number of livestock owned by households in HaHp is 7,
LaLp is 6.6, HaLp is 6 and LaHp is 4.7).
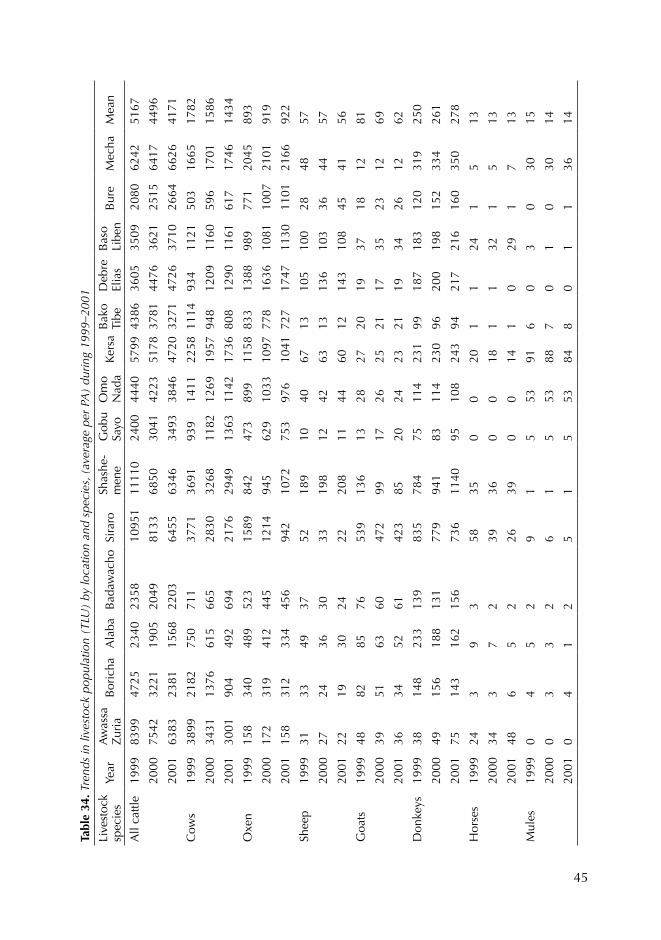
45
Tabl
e 34
. Tre
nds
in li
vest
ock
popu
latio
n (T
LU)
by lo
catio
n an
d sp
ecie
s, (
aver
age
per
PA)
durin
g 19
99–2
001
Live
stoc
k
spec
ies
Year
Aw
assa
Z
uria
Bor
icha
Ala
baB
adaw
acho
Sira
roSh
ashe
- m
ene
Gob
u Sa
yoO
mo
Nad
aKe
rsa
Bak
o
Tibe
Deb
re
Elia
sB
aso
Libe
nB
ure
Mec
haM
ean
All
cattl
e19
9983
9947
2523
4023
5810
951
1111
024
0044
4057
9943
8636
0535
0920
8062
4251
67
2000
7542
3221
1905
2049
8133
6850
3041
4223
5178
3781
4476
3621
2515
6417
4496
2001
6383
2381
1568
2203
6455
6346
3493
3846
4720
3271
4726
3710
2664
6626
4171
Cow
s19
9938
9921
8275
071
137
7136
9193
914
1122
5811
1493
411
2150
316
6517
82
2000
3431
1376
615
665
2830
3268
1182
1269
1957
948
1209
1160
596
1701
1586
2001
3001
904
492
694
2176
2949
1363
1142
1736
808
1290
1161
617
1746
1434
Oxe
n19
9915
834
048
952
315
8984
247
389
911
5883
313
8898
977
120
4589
3
2000
172
319
412
445
1214
945
629
1033
1097
778
1636
1081
1007
2101
919
2001
158
312
334
456
942
1072
753
976
1041
727
1747
1130
1101
2166
922
Shee
p19
9931
3349
3752
189
1040
6713
105
100
2848
57
2000
2724
3630
3319
812
4263
1313
610
336
4457
2001
2219
3024
2220
811
4460
1214
310
845
4156
Goa
ts19
9948
8285
7653
913
613
2827
2019
3718
1281
2000
3951
6360
472
9917
2625
2117
3523
1269
2001
3634
5261
423
8520
2423
2119
3426
1262
Don
keys
1999
3814
823
313
983
578
475
114
231
9918
718
312
031
925
0
2000
4915
618
813
177
994
183
114
230
9620
019
815
233
426
1
2001
7514
316
215
673
611
4095
108
243
9421
721
616
035
027
8
Hor
ses
1999
243
93
5835
00
201
124
15
13
2000
343
72
3936
00
181
132
15
13
2001
486
52
2639
00
141
029
17
13
Mul
es19
990
45
29
15
5391
60
30
3015
2000
03
32
61
553
887
01
030
14
2001
04
12
51
553
848
01
136
14

46
Table 35. Average livestock holding (TLU/household) (proportion of owners) among sample house-holds
District All cattle§ Oxen Cows Sheep Goats Horses Donkeys MulesAwasa Zuria 2.3 (81) 0.7# 0.8 (88) 0.4 (6) 0.4 (13) 0 0 0Boricha 3.5 (94) 1.0 (56) 2.0 (75) 0.4 (13) 0.5 (38) 0 0.7 (19) 0Alaba 2.9 (88) 1.3 (56) 1.2 (69) 0.5 (13) 0.3 (25) 0 0.7 (19) 0Badawacho 3.9 (62) 1.4 (38) 1.6 (56) 0.7 (6) 0.4 (25) 4.8 (6) 1.2(38) 1.4 (6)Siraro 5.8 (81) 1.3 (81) 2.2 (88) 0.5 (13) 0.6 (69) 2.4 (6) 1.0 (69) 0.7 (12)Shashemene 3.2 (81) 1.2 (56) 1.3 (63) 0.3 (13) 0.3 (13) 0 1.1 (25) 0Gobu Sayo 3.9 (94) 1.4 (88) 1.2 (88) 0.3 (13) 0.5 (6) 0 0.6 (38) 0Omo Nada 8.7 (94) 1.7 (94) 3.0 (94) 0.3 (6) 0.3 (6) 0 0.7(44) 0.7 (13)Kersa 6.2 (94) 2.2 (94) 2.0 (81) 0.3 (13) 0.8 (6) 0 0.9 (25) 0.7 (19)Bako Tibe 5.6 (81) 1.7 (75) 2.1 (75) 0 0.3 (6) 0 0.8 (19) 0.7 (6)Debre Elias 5.4 (100) 2.3 (100) 2.0( 63) 0.4 (56) 0.6 (6) 0 0.9 (25) 0Baso Liben 4.8 (100) 1.9 (81) 1.6 (88) 0.4 (50) 0 1.6 (6) 0.7 (50) 0Bure 2.8 (100) 1.5 (100) 1.0 (50) 0 0 0 0.6 (31) 0Mecha 4.3 (87) 1.6 (88) 1.3 (69) 0.3 (13) 0.7 (6) 0 0.7 (50) 0.7 (6)Average 4.5** (88) 1.6** (72) 1.7 (75) 0.4 (15) 0.5 (16) 3.0 (1) 0.8 (32) 0.8 (4)Note: **means are significantly different among the districts at 5%. ( ) numbers in parentheses are per cent of owners. § Cattle include oxen and cow, among others. # Only one respondent owned oxen in Awassa Zuria.
Only 15 and 16% of the households own at least one sheep and one goat, respectively.
The average number owned by households is about 0.4 TLU for sheep and 0.5 for goat.
Relatively more farmers in Debre Elias (56%) and Baso Liben (50%) owned sheep, and in
all other districts, the proportion of owners was very low, 6 to 13%. In Siraro, 69% of the
farmers owned six goats on average. In many of the districts of SNNPR, except Awassa, at
least more than one-quarter own goats. But in all other districts, not more than 6% of the
households own goats. The average number of sheep owned ranges from 0.3 TLU in many
districts to 0.7 TLU in Badawacho. Similarly, the average holding of goat ranges from 0.3 TLU
in four districts to 0.8 TLU in Kersa. The difference among the districts as well as among the
agricultural potential and population density categories for ownership of small ruminants is
not statistically significant, unlike for cattle.
Population of equines is very low particularly for horses, which are owned only by 1% of the
households. The average number of horses for the owners is about 3 TLU and the difference
among the district as well as the agricultural potential and population density categories is
not significantly high. Among the equines, donkey ownership accounts for about 85% of the
equine population. In 6 of the 14 studied districts, the equines reported are only donkeys.
This indicates the dominance of donkeys as pack animals. Moreover, shortage of grazing land
may be forcing farmers to keep donkeys rather than other pack animals as donkeys withstand
hardship better. About 32% of the households own at least one donkey. None of the sample

47
households own donkeys in Awassa Zuria; while in Siraro the majority of farmers (69%)
own donkeys, which may be due to the unavailability of water and in this area, where often
farmers use donkeys to transport water from distant places. The average number of donkeys
owned ranged from 0.6 TLU in Bure to 1.2 in Badawacho with an overall average of 0.8 TLU.
About 61% of the households own one donkey and about 30% have two donkeys and the
remaining 9% of the households own more than two donkeys.
6.2 Purpose of keeping livestock
Livestock kept by farmers have multiple purposes. Every categories of livestock are kept at
least for five purposes (Table 36). This may partly reflect the subsistent nature of agriculture in
the area. However, some animal species are more important for certain purposes than others.
Keeping livestock for cash generation is more common across different groups.
Table 36. Purpose of keeping livestock*
Purpose% of users for each livestock group
Sheep Goats Donkeys Cows Oxen
Draught power* – – 89 7 99
Milk – 37 – 96 –
Meat 56 63 0 8 51
Cash 79 89 92 97 97
Manure 6 9 8 69 67
Savings 32 37 25 57 52
Prestige – 3 3 32 38
Reproduction 76 80 31 97 –Note: *Transport for donkey. * Mules and horses are omitted because of their small number.
Some specific purposes are associated with specific animals, such as oxen for draught power,
cows for milk and equines as pack animals. Keeping small ruminants for prestige and manure
production is not common in the maize producing areas. In addition to the proportion of
farmers that keep certain animals for different purposes, the way they rank the purposes is
also important. The multiple purposes were ranked for the different groups of animals in
Tables 37–40.
Oxen are predominantly kept for draught power with 99% of the farmers ranking draught
power as most important (Table 37). The second major purpose of keeping oxen is for cash
generation indicating that after some years of traction services, farmers sell their oxen. About
96% of the farmers ranked cash generation to be the second and the remaining 4% ranked
cash generation to be the third. The third major purpose of keeping oxen is for meat which is

48
ranked 3rd and 4th by 59 and 26% of the farmers, respectively, which is in fact related to cash
generation.
Table 37. Purpose of keeping oxen (1 = most important)
Purpose% of farmers for the ranks Total farmers
responded1 2 3 4 5 6
Draught power 99 1 0 0 0 0 170
Cash 0 96 4 0 0 0 168
Prestige 0 5 25 34 30 7 61
Saving 0 4 59 19 15 3 95
Meat 0 1 59 26 9 5 92
Manure 0 1 25 59 13 3 117
The three most important purposes of keeping cows, in order of importance, are milk,
breeding and cash income (Table 38). About 55 and 42% of the farmers who keep cows
ranked milk as the first and second most important purpose respectively. Similarly, about 40
and 35% of the farmers who keep cows ranked breeding as first and second respectively.
Among those farmers who keep cows 65 and 21% ranked cash as the third and second
purpose respectively.
Table 38. Purpose of keeping cows
Purpose% of farmers for the ranks
Total farmers responded1 2 3 4 5 6 7 8
Draught power 16 16 53 11 5 0 0 0 19
Milk 55 42 3 0 0 0 0 0 192
Meat 0 1 19 46 22 7 3 1 69Cash 5 21 65 9 0 1 0 0 188
Manure 0 1 4 34 50 8 3 0 150
Saving 1 1 3 56 26 11 3 0 110
Prestige 0 0 9 16 35 33 9 0 58
Reproduction 40 35 16 5 2 <1 1 189
Sheep are mainly kept for cash and breeding purpose and a considerable proportion of
farmers also keep sheep for meat (Table 39). About 80 and 10% of the farmers ranked
breeding as the first and second purpose respectively. Similarly, 25 and 59% of the farmers
ranked keeping sheep for cash as the first and second priority, respectively.
The ranking of purpose of keeping goats is also similar with that of sheep with the exception
of milk (Table 40). Breeding purpose was ranked first by majority of the farmers (57%), and
cash generation was ranked as first and second by 29 and 50% of the farmers, respectively.
The third purpose of keeping goats was milk production, although by few farmers.

49
Table 39. Purpose of keeping sheep
Purpose% of farmers for the ranks
Total farmers responded1 2 3 4 5
Meat 9 39 42 9 0 33
Cash 25 59 16 0 0 44
Manure 0 0 0 0 100 5
Saving 0 4 61 35 0 23
Breeding 80 10 5 5 41
Table 40. Purpose of keeping goats
Purpose% of farmers for the ranks
Total farmers responded1 2 3 4 5 6
Milk 47 29 12 12 0 0 17
Meat 4 30 30 26 11 0 27
Cash 29 50 19 2 0 0 42
Manure 0 0 33 33 33 0 3
Saving 0 5 68 16 5 5 19
Reproduction 57 16 11 14 3 0 37
Equines are kept for two purposes (as pack animals and for cash generation). About 95% of
the farmers ranked the use of equine as a pack animal as the most important purpose.
Table 41. Average annual amount of livestock products produced and sold
Livestock product Production Sale
N Quantity Value (ETB) N Quantity Value (ETB)
% of production
Cattle whole milk (litre) 93 307 457 4 156 207 9
Butter (kg) 92 17 245 35 9 132 74
Cheese (kg) 39 18 33 6 15 42 18
Hide (number) 18 2 16 6 1 10 43
Dung cake (number) 40 399 45 1 180 18 6
Goat milk (litre) 8 23 23 1 10 20 29
Skin (goats/sheep) (number) 26 2 46 23 2 41 95
Animal products commonly used by farmers include milk and milk products, and hides/skins.
For cattle, milk is the major product produced by 56% of the cow owners and almost the
same proportion makes butter (Table 41). Hides/skins are a by-product of meat consumption
and/or if the animal dies as a result of disease or accident. The average value of livestock
products ranged from ETB 16.47 for hides to 457.5 for cattle milk. The proportion of
farmers selling the animal products varies from 6% for milk to 88% for skins. Milk is mainly

50
consumed in the household but 38% of the farmers sell butter. The proportion of farmers
selling cheese and hides is 15 and 33%, respectively. The average proportional sale of animal
products ranges from 6% for dung cake to 95% of skin. The most sold products are thus skins
followed by butter (74%) and hides (43%).
6.3 Livestock production services Availability and access to livestock services and infrastructure
Some of the infrastructure and services for livestock management include veterinary services,
artificial insemination (AI) and access to water in different seasons. A large majority of the
farmers (84.4%) use veterinary services. The majority of the farmers use veterinary services
provided by the district offices of agriculture (97.3%) and only very few (4.7%) used private
veterinary services. The districts where the private veterinary services providers are found
include Shashemene, Boricha and Awassa Zuria.
Veterinary services are usually found only in district towns and farmers are expected to go to
town from their respective villages to get the services. The time it takes to reach the veterinary
services centres on average is about one and half walking hour ranging from 0.38 in Omo
Nada to 2.45 in Siraro (Table 42). Besides the significant variation in the distance the farmers
have to travel in the districts, there are also differences among the agricultural potentials
and population density categories. The low agricultural potential areas are usually far from
the service centres. As a result, it took 60% more time to reach LaLp areas compared to HaHp
areas. Such a difference will increase the disparity in terms of development if attention is not
given to those areas with low agricultural potential.
Fifteen per cent of farmers used artificial insemination (AI), which is only provided by the
district offices of agriculture. Badawacho, Siraro and Shashemene are some of the districts
where AI service is relatively more common. In some districts like Omo Nada and Baso
Liben, not a single household used AI and in many others (Boricha, Gobu Sayo, Kersa and
Mecha) only about 6% use AI. It also appears that more farmers in high agricultural potential
and high population density areas use AI services compared to the other categories. About
20% of households in HaHp used AI services compared to 13.6% in HaLp and less in the
others. Those few farmers who look for the AI services on the average walk almost 2 hours to
get the services. This ranges from about 30 min. in Awassa Zuria to more than 3:25 hours in
Siraro.
Only about 1 and 2.2% of farmers reported using watering trough for livestock during the wet
and dry seasons, respectively. Livestock are mainly watered in rivers and streams.

51
Table 42. Average walking time (hours) to the veterinary services in the study areas
DistrictAgricultural potential and population density Average
HaHp HaLp LaHp LaLp
Awassa Zuria 1.19 1.50 1.35
Boricha 1.02 1.37 1.48
Alaba 0.25 1.30 1.33 2.15 1.25
Badawacho 1.54 1.54
Siraro 2.20 2.30 2.08 4.20 2.45
Shashemene 1.20 0.40 0.53 1.55 1.10
Gobu Sayo 1.55 1.00 2.30 1.59
Omo Nada 0.44 0.21 0.38
Kersa 2.02 0.56 1.44
Bako Tibe 0.32 1.16 0.41 1.23 0.58
Debre Elias 2.00 2.23 1.45 1.26 1.53
Baso Liben 1.11 0.59 1.08
Bure 1.57 1.30 1.35
Mecha 1.00 1.15 1.04
Average 1.26 1.18 1.33 2.16 1.32*
Note: F-value for the districts (4.96) and for agricultural potential and population density (5.85) are significant at 1%.
Credit
The use of credit for livestock production is very low and this is not different from the rest of
the country. Not more than 25% of the sampled households perceive the need for credit in
any of the three years showing that credit for livestock management is not common in the
study areas. Most of those who did not show an interest in taking credit lacked awareness
about the availability of credit services for livestock (54%). About 31% of them fear risk of
not being able to repay the credit. Moreover, only less than half of those farmers who actually
want credit applied (21% to formal sources and 24% to informal sources) showing lack of
interest by farmers to make use of the available opportunities. This may be related to the
low level of success as only 30 and 43% of the applicants to formal and informal sources,
respectively, in 2001 obtained the credit, mainly in cash. The major purpose for wanting
credit among those who sought credit was to purchase livestock (52%), which is usually an
investment.
6.4 Livestock production inputs
Livestock production inputs include mainly feeds, health care and labour for management
(herding, watering, feeding, milking and cleaning). In subsistence oriented crop–livestock
production, where open grazing is more common and stall feeding is almost non-existent,

52
actual input use for livestock is difficult to measure accurately. Only in some cases, farmers
attempt to consider the various inputs as real inputs. The majority of the farmers were not
able to estimate the amounts of residue they have used.
Feeds
Livestock feeds in the study area could be categorized into grazing, on-farm produced crop
residues, on-farm produced hay, purchased crop residue, purchased hay, industrial/local
beverage by-product and minerals/salt. Weeds are also used as feed. Planting forages is not
common. Only three sample households planted improved forage crops in 1999 and only one
planted in 2000. Only 4.5% of the sample households have been trained on forage production
and less than 1% has been trained on improved livestock and poultry management.
Natural pasture
The increased population pressure in the country, which has brought more and more land
under crop production has greatly reduced area left for grazing. Use of communal grazing
was reported in 64, 52 and 29% of the sample PAs in the wet, harvest and dry seasons,
respectively. It was indicated above that grazing land account for 10% of the land mass in
the survey area. Such grazing lands usually do not go beyond concentrating the livestock on
small areas to prevent damage to crops during the cropping season.
Districts where communal grazing was reported in dry season include Gobu Sayo and Omo
Nada in Oromia and all districts in Amhara region. During the harvest season the same
districts in Amhara, and districts in Jimma zone and Badawacho reported to have communal
grazing. The average grazing hours in the reporting villages is 9 hours/day in the wet season
and 7 hours during harvesting when livestock also feed on stubble. During dry season, when
there is no pasture, the time of grazing on communal fields is increased to 9 hours/day. This
turns the communal grazing fields into resting places.
On-farm produced crop residues
Residues of almost all crops are fed to animals and the use depends on the location and
farming system. The major crop residues fed to the animals by the majority of farmers are teff,
maize, finger millet and enset. Maize residue is fed to the animals both at green stage, during
harvest and in dry season after harvest. Dry and green maize stover was used as feed by 79
and 58% of sample households. Similarly, all teff producers used teff straw for animal feed.
However, the amount used was difficult to estimate particularly for maize. While 55 and
67% of teff straw users were able to estimate the amount of teff straw used for livestock in the
wet and dry seasons, respectively, only about 8.7 and 6.4% of maize growers were able to

53
estimate the amount of green and dry maize stover they fed to their animals in the wet and
dry seasons, respectively.
The households that were able to estimate the total amount of stover used as a feed in a
season are shown in Table 43. On average they have used 0.86 t of green maize stover and
0.8 t of dry maize stover as feed in the wet and dry seasons, respectively. A higher proportion
of teff growers reported using about 1.39 and 1.1 t of teff straw as feed in the wet and dry
seasons per household, respectively. About 33% of enset growers have used enset as feed
for animals in the dry season, although there are few farmers using enset for animal feed in
other seasons. In the dry season, where feeding enset is more common, farmers have used
on average about 1.35 t of enset as feed per household. The other crop residue which is
commonly used by growers is finger millet residue which is used by about 22 and 15.6%
of finger millet growers in the wet and dry season, respectively. On average, they have used
about 0.46 and 0.27 t, in the wet and dry seasons, respectively.
Table 43. Average amount (t) of on-farm produced crop residues used by farmers in different sea-sons
Residue typeWet Harvest Dry
N Mean N Mean N Mean
Maize dry 1 1.90 14 0.80
Maize green 19 0.864 0 0 0 0
Barley* 6 1.30 3 1.32 4 3.16
Wheat 6 0.27 4 1.20 6 3.19
Teff 59 1.39 2 1.10 72 1.96
Haricot bean 2 0.025 4 2.10 7 .46
Enset 5 0.58 5 1.94 22 1.35
Finger millet 10 0.46 0 0 7 0.27Note: * Cartload of barley straw.
Purchased feed
Besides on-farm produced feed, which is common to all farmers, some farmers also buy
feeds. The most common purchased supplementary feed is salt which was used by about
27% of the farmers, only during wet season. The number of farmers supplementing with salt
in the other seasons is low. This also indicates the need of supplementing with minerals.
Only about 4% of farmers in dry season and 2% of farmers in wet season purchased hay. In
general, less than 12% of the livestock owners bought livestock feed of any type in any one
season. Although there is some practice of selling crop residues, farmers usually do not sell to
other farmers. Most of the sale is for town dwellers mostly for dairy and equines. During the
wet season when farmers have natural pasture, they only purchase supplementary feeds and

54
also rent pasture field. In the harvest season, farmers do not purchase any feed except salt. It
is in the dry season that a range of feeds are purchased, although by a few farmers.
Health services
Despite unavailability of animal health services in rural areas, some farmers travel the
required distance to get treatment for their animals. The proportion of farmers using animal
health services is more in the wet season (31%), with an average expense of ETB 21.48 per
household. In the dry season, only about 17% of the households received health services
with average cost of about ETB 18.91 per household. In the harvest season, only about 9%
of farmers used health services. In general, about 45% of the farmers who own livestock
received animal health service in 2001.
Labour
Herding and watering are the major activities that require labour in livestock management. About
93–95% of the livestock owners used family labour for herding and watering while only 3–4%
used hired labour. Farmers rely heavily on family labour for milking and barn cleaning. Almost all
households having livestock (93–96%) used family members for barn cleaning and milking. The
other activity where labour is important is feeding of crop residue, hay, and supplements.
6.5 Livestock feeds and feeding Sources
Livestock feeds mainly include natural pasture, crop stubble, crop residue and hay. Natural
pasture and stubble are the most widely used feed resources as these resources were used by
97 and 93% of the farmers, respectively. Most farmers use crop residues as stubble as they
do not collect and feed their animals. Crop residues (collected and fed to the livestock) are
usually used when there is shortage of natural pasture and stubble. With the expansion of
cropland, which has reduced the availability of natural pasture, crop residues are becoming
increasingly important. As a result, more than 62% of the crop residue produced by
smallholders is used for livestock feed.
The most common crop residue is maize stover, which is available as dry stover in about
79% of the sample households and as green stover in more than 58% of the households.
The second most common crop residue next to maize is teff, which was used by about 48%
of the sample households in the study area. Enset, tree legumes and hay are available for
about 10% of the households. There are other feed sources, which are available to some
55
farmers during the year including the sown pasture, which is available only for 3.1% of the
households and commercial feed, which is available for about 1% of the sample households.
Only one or two of the sample households planted improved forages during 1999–2001.
The major reason for not planting improved forage is lack of awareness as reported by about
76% of the respondents indicating the low promotion activity for this technology. Some 13%
of the respondents also indicate shortage of land to plant forage as a reason for not planting
improved forage.
Seasonality of feed availability
Because of the heavy dependency of the agricultural system on rainfall, the availability of
feed for livestock follows a seasonal pattern both in type and quantity. In terms of type, some
feeds are available at specific period and some could also be stored temporally. In order to
know the relation between the type of feed and seasonality, the five most common sources
of feed were considered. For each feed, farmers’ responses on its availability was analysed
(Figure 4). The pattern of availability is directly related to rainfall. During May–October,
natural pasture constitutes the larger portion of feed available compared to other feed sources
for many farmers, but contributes the smallest share during the dry period, i.e. November
to March. During this period the larger proportion of the feed available are stubble and
crop residues. The availability of stubble extends from September to March depending on
the type of crop and harvest time. However, during the months of November to January,
stubble provides most of the feed for the livestock. This role is taken up by crop residue in the
three months that follow (February–April). Dry maize residue is available for many farmers
between January and March, although its availability is almost throughout the year. Teff straw
is available mainly in the dry season, January–May, being highest in March and gradually
decreasing.
Availability in terms of percentage of farmers using specific feed and the length of the
period in which that feed is available does not necessarily indicate the sufficiency of the
feed, i.e. the amount available in relation to the livestock owned. To highlight how much
the available feed is sufficient, farmers’ responses are presented in Figure 5. Seasonal
trend in the level of availability of the feed could be clearly seen. The year is divided into
quarters of almost equal period. The first quarter, January–March, is the period of severe
feed shortage. For most part of this season more than 50% of the farmers reported the
severity of feed shortage. In the second quarter, April–June, the level of severity reduces
as there is some grass as a result of the short rains. The proportion of farmers reporting
severe shortage drops in this period while those farmers reporting moderate shortage of
feed increases. Because of the main rains, feed is relatively abundant in the third quarter,

56
July–September. At least 50% of the farmers reported excess feed indicating availability of
better amount of feeds compared to other periods. As the rains stop, feed availability also
decreases but it is sufficient to sustain the animals. The cyclical trend directly follows the
rainfall, although there could be lags.
By overlapping Figures 4 and 5 (availability and level of availability) it is possible to elucidate
the importance of each of the major feed sources. Year-round feeding of animals is based
on a dynamic integration of feed resources at the farm level. In the first quarter, where there
is severe shortage of feed, the major component of the feed is crop residues. On the other
hand, in the third quarter, where feed is reported to be in excess, natural pasture dominates
the feed available in the period. In the fourth quarter too, where feed is sufficient, natural
pasture dominates in October and stubble dominates in the other two months. This may show
the importance of natural pasture in the feed supply system. Stubble grazing is also important
as it still supplies partly green feed for the animal. Thus, crop residue is mainly used during
the period where natural pasture is unavailable.
Dry maize N. Pasture Stubble Green maize Green maize
% of farmers
0% 20% 40% 60% 80% 100%
September
October
November
December
January
February
March
April
May
June
July
August
Months
Figure 4. Feed availability by type and months.

57
Use of available feeds
Almost all farmers who have livestock use free grazing mainly on herding throughout the
year. However, grazing as such is less common in the wet and harvest seasons mainly
because of shortage of grazing land and animals graze on roadsides, pathways and around
the home stead. Although these types of grazing are becoming more common because of
land shortage, most farmers did not report such system as a pasture grazing. Stubble grazing
after grain harvest is used by the majority of the farmers particularly for draught oxen and
milking cows.
Use of feeds for different livestock groups
Different livestock groups have different level of access to different sources of feed. Moreover,
there is seasonal variability within the same group. In the dry and wet seasons, all cattle
Excess Sufficient Moderate shortage Severe shortage
January
FebruaryMarch
April May JuneJuly
Septem
berAugust
October
November
Decem
ber0
10
20
30
40
50
60
70
80
% of respondents
Severeshortage
Moderateshortage Excess Sufficient
Months
Figure 5. Level of feed availability throughout the year (all types of feed considered)

58
groups except calves have better access to private grazing land, which in most cases fallowed
from cropland, communal grazing and crop residue (Table 44). They have less access to
other sources of feed. The availability of crop residue after grain harvest is low for most of the
cattle groups. This is because of the availability of stubble, which will be lost if not used soon
after grain harvest. Crop residues are stored for dry and wet period, particularly for draught
oxen and milking cows. In the wet season, calves do have better access to private grazing
land and weeds. Calves are not usually taken to communal grazing fields and are not also
given crop residue. Equines and small ruminants depend more on communal grazing and
private grazing land than other sources of feed in both the dry and wet seasons. During the
grain harvest season, the majority of the livestock groups have access to stubble and private
grazing land except small ruminants, which concentrate more on the stubble grazing. Dry
season is similar to wet season for almost all livestock group.
Table 44. Use of various feeds to feed different livestock species by season, per cent of farmers
Livestock group Season
Cro
p re
sidu
es
Com
mun
al g
razi
ng
Priv
ate
graz
ing
Stub
ble
graz
ing
Hay
Thin
ning
(mai
ze &
so
rghu
m)
Gra
ss &
Wee
ds
Tree
leav
es
Draught oxen
Wet 68.4 69.6 74.9 4.7 3.5 31.0 21.6
Harvest 28.1 35.1 48.0 97.1 – – 3.5 –
Dry 56.7 72.5 55.0 19.3 2.9 1.8 – 2.3
Milking cows
Wet 65.8 65.2 76.1 4.2 3.0 38.3 22.1 5.4
Harvest 32.4 43.7 79.0 67.7 0.0 0.0 2.4 0.0
Dry 54.5 69.1 57.6 17.6 4.9 1.2 1.2 4.2
Calves
Wet 37.3 16.2 63.6 1.0 1.0 24.2 61.7 0.0
Harvest 31.0 12.0 59.0 55.1 1.0 2.1 29.9 1.0
Dry 58.7 17.5 72.1 9.3 4.1 2.1 16.6 1.1
Other cattle
Wet 60.0 67.7 76.8 2.6 – 21.3 14.8 0.6
Harvest 38.5 34.0 50.0 94.2 – – 1.3 –
Dry 58.8 75.2 57.5 21.6 2.6 0.7 0.7 0.7
Small ruminants
Wet 20.0 63.6 56.4 – – 1.8 5.5 30.9
Harvest 15.1 26.4 37.7 83.0 – – 1.9 24.5
Dry 13.5 65.4 50.0 9.6 – 1.9 – 32.7
Equines
Wet 30.1 68.5 74.0 1.4 – 5.5 2.7 –
Harvest 31.1 39.2 54.1 85.1 – 1.4 – –
Dry 40.8 71.8 50.7 19.7 – – – –

59
Farmers’ perception on feed quality of different residues
The most important crop residues in terms of feed quality as perceived by farmers are maize
stover and teff straw (Table 45). The majority of the farmers ranked maize first (67%) and
about 52% ranked teff second and 50% also ranked enset leaves as second in terms of
quality. Maize stover and teff straw in that order are better in terms of quality, while crop
residues such as wheat and haricot bean are not considered as high quality feed by farmers.
Table 45. Farmers ranking of crop residue quality as feed (1 = best quality)
Residue types% of farmers for each rank
Overall rank*1 2 3 4 5
Maize (green and dry) 67 26 5 2 0
1Teff 38 52 9 1 0 2Enset 19 50 27 4 0 3Sorghum 4 46 50 0 0 4Haricot bean 0 41 50 5 5 6Wheat 0 29 38 29 5 7Finger millet 33 29 29 10 0 5
* Cumulative figures were used to estimate the overall rank.
Priority of feeding
Feed resources are not abundant throughout the year and thus all animals do not have equal
access to the limited feed available. Thus, farmers give priority depending upon the purpose
and contribution of the livestock group to the livelihood of the family. The priority for the
different animal species is almost uniform throughout the seasons.
Cattle are generally given high priority and oxen get the first priority followed by milking
cows. This may be related to the high contribution of oxen for crop production to sustain the
household. Even during non-working time, oxen get priority as it is felt that it influences their
performance during ploughing. Milking cows are also important both as breeding animal
and for their milk. Third feeding priority is given to other cattle, followed by calves. Small
ruminants and equines (mainly donkey in this case) are usually given low priority for feed. In
general, equines get priority compared to small ruminants.
Level of consumption
As indicated in Tables 46 and 47, grazing is the most widely used feeding system. Average
grazing day varies more among seasons than either among animal groups or between the
private and communal grazing areas, but draught oxen have significantly lower grazing day
during the wet season. While other animals except equine (91 days) graze for more than 110

60
days, oxen graze for 74 days during this season. In general oxen grazing duration is lower,
followed by equines, perhaps because of the work load on these two animal groups. The
trend is similar on the private grazing land. In the wet season, small ruminants have more
grazing days in both communal and private grazing land. Stubble grazing is usually for short
period and average grazing days range from about 35 days for equines to 42 days for small
ruminants. It is more widely used for cattle than for equines and small ruminants.
Table 46. Average grazing days on communal grazing land in different seasons*
Livestock group Wet Harvest Dry
Draught oxen 74 (68) 31 (32) 82 (76)
Milking cows 113 (61) 35 (26) 101 (67)
Other cattle 110 (57) 35 (27) 100 (63)
Small ruminants 118 (62) 33 (27) 96 (67)
Equines 91 (67) 31 (29) 83 (74)Note: *numbers in parentheses are number of farmers/users.
Table 47. Average grazing days on private grazing land in different seasons*
Livestock group Wet Harvest Dry
Draught oxen 74 (80) 32 (55) 77 (64)
Milking cows 114 (74) 31 (51) 92 (60)
Other cattle 113 (168) 33 (47) 88 (56)
Small ruminants 128 (75) 37 (52) 90 (65)
Equines 102 (85) 29 (63) 75 (78)Note: *numbers in parentheses are number of farmers/users.
The most common crop residues fed to animals are those of maize, teff and wheat (Table
48). Maize residues are fed to livestock almost throughout the year and are used by a
large number of farmers and in larger quantities than other feeds. Green maize stover is
used during wet season and dry maize stover is used after grain harvest and during the dry
seasons. Relatively few households, not more than 7%, use the green maize stover that is
only available during wet season. The green maize forage is only used for feeding oxen and
milking cows. The average value of green maize stover provided to the animals range from
ETB 7.5 to 22.1 per household during the wet season.
Dry maize stover is used starting from harvest. During grain harvest, the number of
households using dry maize stover is relatively low, not more than 11% for a given type of
animal. Yet the amount fed is relatively higher with the average value of ETB 11.8 for oxen,
ETB 11.5 for equines and ETB 9.8 for milking cows. The number of users is low mainly
because there is stubble to be grazed in this period. In the dry season the proportion of
farmers using dry maize stover was 37% for oxen, 33% for other cattle and 32% for cows.

61
The value of the residue used also increased to ETB 19.8 for oxen, ETB 12 for milking cows
and ETB 10.6 for other cattle. The use increases because of the declining availability of other
feeds (stubble and grass). In this period, relatively other animal types, goats and equines are
also included, for it is critical for the animal to reach the wet season where they can have
relatively enough grass. In the wet season, the proportion of farmers feeding maize was
35% for other cattle, 38% for milking cows and 42% for oxen. During the rainy season, the
average value of the dry maize feed was ETB 18.2, 22.1 and 25.4 for other cattle, milking
cows and oxen, respectively.
Table 48. Average value (ETB/farmer) of feeds for different animal groups in different seasons
Feed Livestock typeWet Harvest Dry
N* Mean N Mean N Mean
Green maizeOxen 14 22 – – – –Milking cows 13 11 – – – –Other cattle 14 8 – – – –
Dry maize
Other cattle 78 18 – 72 11Oxen 93 25 23 12 83 20Small ruminants –§ – 1 2 1 2Equines – – 9 12 4 3Milking cows 86 22 24 10 72 12
TeffOxen – – – – 63 42Equines – – – – 2 8Milking cows – – – – 33 22
WheatOxen – – 3 1 – –Milking cows – – 1 9 – –
EnsetMilking cows – – 1 16 – –Oxen – – 1 24 – –
SaltOxen 34 6 – – – –Milking cows 29 3 – – – –Small ruminants 3 2 – – – –
Note: * Number of farmers. § – not used.
The other residue used by many farmers (28% for oxen and 15% for milking cows) is teff
straw, which is used during the dry season only. The average value used is about ETB 42.4 for
oxen and ETB 22.4 for milking cows. Very few farmers feed equines a small amount of teff
straw. Enset leaves and wheat straw are rarely used by farmers. Moreover, these two crops
are limited in their geographical distribution within the maize producing areas. Additional/
supplementary feed that farmers commonly use is salt, especially during the wet season.
The level of ‘feed security’ varies across livestock types and seasons (Figure 6). In most cases,
relatively a higher proportion of farmers reported enough feed for cattle compared to small
ruminants and equines.

62
Smallruminant
EquinesCow
OxenOthercattle
Crop residue
Natural pasture
Stubble grazing0
10
20
30
40
50
60
70
80
90
Livestock type
Feed
type
Harvest season% of farmers
Smallruminant Equines
Cow Oxen Othercattle
Stubble grazing
Natural pasture
Crop residue0
2
4
6
8
10
12
14
16
18
Livestock type
% of farmers
Feed
type
Dry season
Figure 6. Level of feed security for livestock species in different seasons.
Smallruminant Equines Cow Oxen
Othercattle
Stubble grazing
Crop residueNatural pasture
0
10
20
30
40
50
60
70
80
Livestock type
Wet season
Feed
type
% of farmers

63
The amount of feed resources available varies by season and the feed type. Crop residues
are normally available in the dry season. However, in this season, not more than 18% of the
farmers reported sufficient feed from various sources for any livestock group. The maximum
proportion of farmers who reported sufficient feed in the dry season were referring to crop
residues used for oxen (17%). The contribution of other feed sources is low during the dry
season. Even for oxen, which usually get priority, less than 10% of the owners reported
sufficient natural pasture. Natural pasture is the second major source of feed in the dry
season.
In the wet season the majority of farmers (more than 60%) reported that available natural
pasture is enough for their livestock. The contribution of crop residues is also high, as
20–40% of the farmers reported enough crop residues for different livestock groups in the
season. This shows that farmers store crop residue to be used during the wet season. The
maximum level of feed security is reported during the grain harvest season. The majority
of farmers (60–80%) reported that stubble grazing is sufficient for different livestock groups
in this season. The contribution of both natural pasture and crop residue is also high in this
period. About 25–40% of the farmers reported sufficient natural pasture in the harvest season
for different livestock group. Moreover, 20–30% of the farmers have also reported that crop
residue is sufficient for different livestock groups in the harvest period.
In general, the maximum level of feed security (60–80% of farmers reporting) occurs during
the grain harvest season. This is followed by the wet season (reported by about 55% for
milking cows and slightly more than 70% for oxen). In the dry season, very few farmers
reported that crop residues are enough for livestock (9–16%) and less than 10% reported that
natural pasture is sufficient for livestock. This shows the seasonality in the amount of feed
available for the livestock in the study area.
Consequences of feed shortage and mitigation strategies
The consequence of feed shortage is well recognized by farmers (Table 49). The most
common effect is weight loss and weakness, which are recognized by more than 80%
of the farmers for all livestock groups. Weight loss is more serious for small ruminants
and equines, probably due to less attention given to them by farmers compared to cattle.
Similarly, the incidence of weakening of the animal is reported more for small ruminants and
equine than cattle. Most farmers (more than 70%) also reported that feed shortage increases
mortality. The decrease in milk yield by cows and extended calving for cows and equines
were also mentioned by 86 and 85% of the respondents, respectively. For equines, the most
important impact of feed shortages was reported to be weight loss, weakness and mortality.
Reproductive effects were not reported for equines possibly, at least in part, due to the fact

64
that the equines were not disaggregated into males and females. The effect of feed shortage
on the incidence of diseases was reported by less than 10% of the sampled households for
the different groups of animals.
Table 49. Proportion (%) of farmers recognizing impact of feed shortage
Consequence Oxen Milking cows Other cattle Small ruminants EquinesWeight loss 83 87 90 99 100Low milk – 86 – – –Increased mortality 74 75 78 – 88Weakness 82 85 88 99 100Delayed calving – 85 – – 31Predisposition to disease 8 6 5 – 2
The effect of feed shortage in order of importance is given in Table 50 for the different groups
of animals. The most important effect across animal groups is weight loss. Weakening, except
in case of milking cows and equines, is the second most important. In the case of milking
cows, less milk is more common than weakening. Similarly, mortality is more important
compared to weakening in the case of equines. Mortality is the third most important effect of
feed shortage for oxen and other cattle.
Table 50. Ranking of impacts of feed shortage on different livestock group (1 = most important)
Rank Oxen Milking cows Other cattle Small ruminants Equines
1 Weight loss Weight loss Weight loss Weight loss Weight loss2 Weakening Less milk Weakening Weakening Mortality3 Mortality Weakening Mortality Weakening
4 Susceptibility to disease Delayed calving Susceptibility to
disease Delayed calving
5 Mortality Susceptibility to disease
6 Susceptibility to disease
The order of priority of the different effects of feed shortage, therefore, is weight loss followed
by weakness, mortality, low milk and extended calving. This shows that farmers easily
recognize the visual effects like weight loss and weakness while the second level effects,
such as reduction in milk yield, reproductive wastage and exposure of the animals to the
diseases are less perceptible.
Farmers employ several strategies to overcome the problem of feed shortages. Table 51 shows
the different mitigation strategies followed by livestock owners and their preference whenever
there is a problem. One strategy that is used by about 68% of livestock owners is de-stocking.
Among those farmers who opt for de-stocking, 48% ranked it as the first option; 28% ranked
it as second and the remaining 24% ranked de-stocking as the third option. The second

65
strategy used by about 62% of the household is purchase of feed, which is ranked second by
majority of the farmers (57%) and ranked as first option by about 20% of the farmers. Other
options include moving the animals to other places, renting pastureland, storing hay and
straw. As feed is not widely available in the market in times of feed shortage and hence the
purchase strategy is rarely realized. Whenever there is shortage of feed, farmers usually rent
grazing plots in other areas. Transferring the stock to another person is practised by less than
a third of the livestock owners. However, the majority of those farmers who opted for moving
the animals to other places and those who opted to store hay and straw ranked these as their
first options.
Table 51. Importance of feed shortage mitigation strategies
Mitigation strategy% of farmers for each rank % of livestock
owner1 2 3 4De-stocking 48 28 23 0 68Purchase feed 20 57 19 5 62Moving the stock to other places 66 15 19 0 30Renting grass land 6 33 57 4 26Store hay and straw 53 25 22 0 24Transferring stock to other people 41 39 21 0 19Others* 40 40 20 0 3
*Planting forage and asking relatives feed for free.
6.6 Constraints to livestock production
The major constraints to livestock production, according to farmers, are listed in Table 52 for
the different districts. The majority of farmers reported problems of feed availability as the
most important constraint. On average, about 62% of the farmers reported feed shortage as
the most important problem, ranging from 38% of farmers in Bure and Bako Tibe to 94% in
Baso Liben. Some of the districts where feed problem is serious include Baso Liben, Debre
Elias, Kersa and Awasa Zuria where more than 75% of the farmers reported feed shortage. In
districts like Bure, Bako Tibe and Siraro, feed shortage is less important since only less than
45% of the farmers reported it. In other districts, the problem is moderate and 50–69% of the
households reported the problem.
The second important constraint is disease, which on average was reported by about 12% of
the households. However, the problem is more serious in Wellega zone where many farmers,
38% in Bako Tibe and 44% in Gobu Sayo reported the problem. About 19% of the farmers
in Alaba and Badawacho also reported the problem of livestock disease. The next problem in
order of importance is cash shortage. This is true as there is no credit for purchasing livestock
input unlike for crop inputs where credit is usually available for fertilizer and seed. Water is a

66
problem in only two districts particularly in Siraro where about 19% of the farmers reported
the problem. Siraro is the driest districts among the districts included in this study.
Table 52. Major problems of livestock management in the maize belt of Ethiopia (per cent of farm-ers reporting the problem)
District Feed shortage Disease Labour
shortageWater shortage
Cash shortage
Land shortage Others
Awassa Zuria 75 6 0 0 13 0 0
Boricha 69 0 0 0 13 0 0
Alaba 56 19 0 0 13 0 0
Badawacho 50 19 0 0 19 0 0
Siraro 44 6 0 19 0 6 0
Shashemene 50 0 6 0 13 0 0
Gobu Sayo 50 44 0 0 0 0 0
Omo Nada 69 6 0 0 6 0 0
Kersa 81 6 0 0 0 0 0
Bako Tibe 38 38 0 0 13 0 0
Debre Elias 88 0 0 0 6 0 0
Baso Liben 94 0 0 0 6 0 6
Bure 38 13 0 6 25 0 0
Mecha 63 13 0 0 0 6 0
Average 62 12 0 2 9 1 0
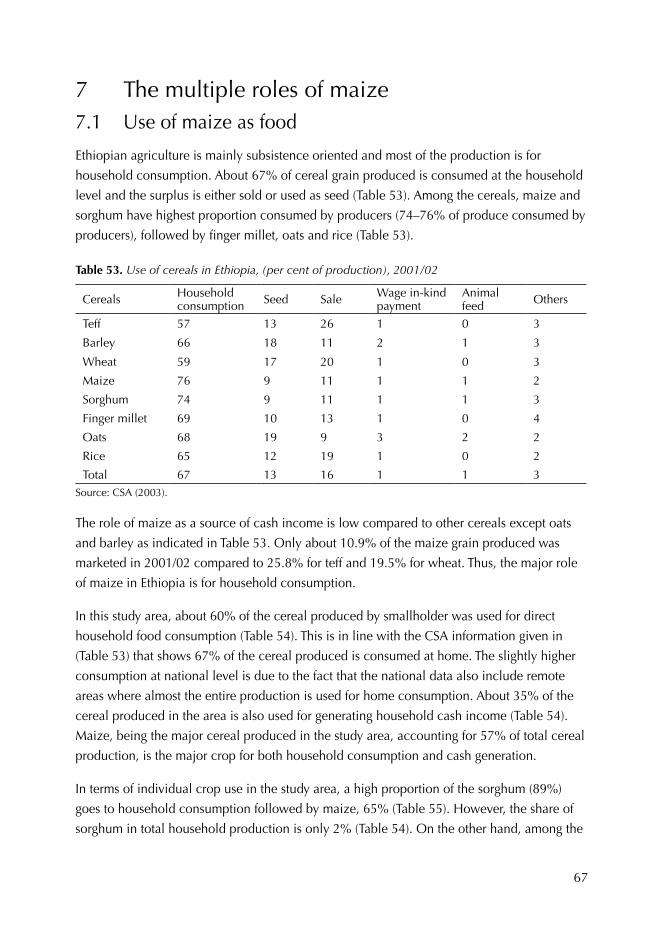
67
7 The multiple roles of maize7.1 Use of maize as food
Ethiopian agriculture is mainly subsistence oriented and most of the production is for
household consumption. About 67% of cereal grain produced is consumed at the household
level and the surplus is either sold or used as seed (Table 53). Among the cereals, maize and
sorghum have highest proportion consumed by producers (74–76% of produce consumed by
producers), followed by finger millet, oats and rice (Table 53).
Table 53. Use of cereals in Ethiopia, (per cent of production), 2001/02
Cereals Household consumption Seed Sale Wage in-kind
paymentAnimal feed Others
Teff 57 13 26 1 0 3
Barley 66 18 11 2 1 3
Wheat 59 17 20 1 0 3
Maize 76 9 11 1 1 2
Sorghum 74 9 11 1 1 3
Finger millet 69 10 13 1 0 4
Oats 68 19 9 3 2 2
Rice 65 12 19 1 0 2
Total 67 13 16 1 1 3Source: CSA (2003).
The role of maize as a source of cash income is low compared to other cereals except oats
and barley as indicated in Table 53. Only about 10.9% of the maize grain produced was
marketed in 2001/02 compared to 25.8% for teff and 19.5% for wheat. Thus, the major role
of maize in Ethiopia is for household consumption.
In this study area, about 60% of the cereal produced by smallholder was used for direct
household food consumption (Table 54). This is in line with the CSA information given in
(Table 53) that shows 67% of the cereal produced is consumed at home. The slightly higher
consumption at national level is due to the fact that the national data also include remote
areas where almost the entire production is used for home consumption. About 35% of the
cereal produced in the area is also used for generating household cash income (Table 54).
Maize, being the major cereal produced in the study area, accounting for 57% of total cereal
production, is the major crop for both household consumption and cash generation.
In terms of individual crop use in the study area, a high proportion of the sorghum (89%)
goes to household consumption followed by maize, 65% (Table 55). However, the share of
sorghum in total household production is only 2% (Table 54). On the other hand, among the
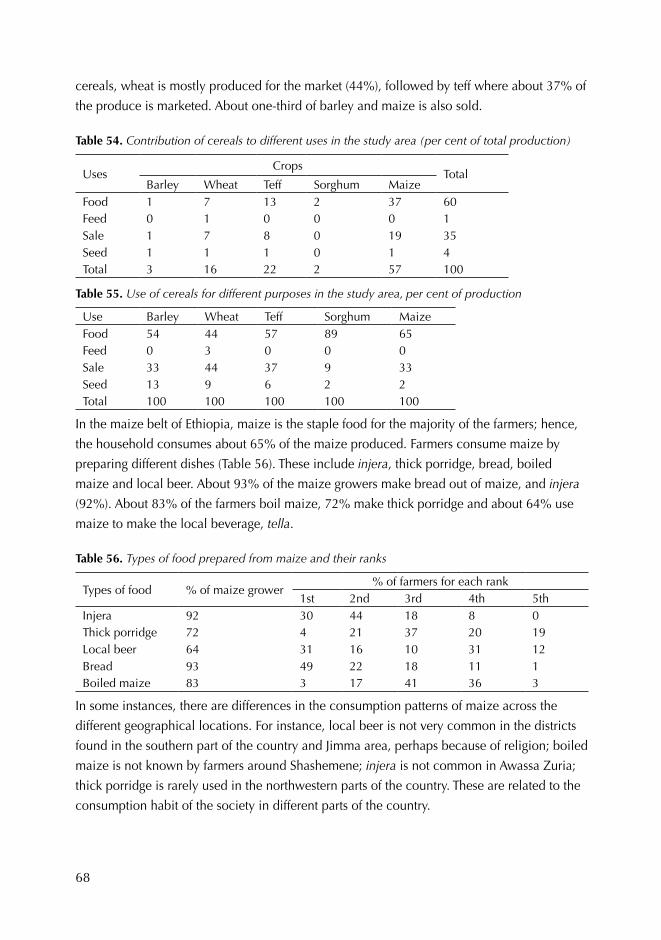
68
cereals, wheat is mostly produced for the market (44%), followed by teff where about 37% of
the produce is marketed. About one-third of barley and maize is also sold.
Table 54. Contribution of cereals to different uses in the study area (per cent of total production)
UsesCrops
TotalBarley Wheat Teff Sorghum Maize
Food 1 7 13 2 37 60Feed 0 1 0 0 0 1Sale 1 7 8 0 19 35Seed 1 1 1 0 1 4Total 3 16 22 2 57 100
Table 55. Use of cereals for different purposes in the study area, per cent of production
Use Barley Wheat Teff Sorghum MaizeFood 54 44 57 89 65Feed 0 3 0 0 0Sale 33 44 37 9 33Seed 13 9 6 2 2Total 100 100 100 100 100
In the maize belt of Ethiopia, maize is the staple food for the majority of the farmers; hence,
the household consumes about 65% of the maize produced. Farmers consume maize by
preparing different dishes (Table 56). These include injera, thick porridge, bread, boiled
maize and local beer. About 93% of the maize growers make bread out of maize, and injera
(92%). About 83% of the farmers boil maize, 72% make thick porridge and about 64% use
maize to make the local beverage, tella.
Table 56. Types of food prepared from maize and their ranks
Types of food % of maize grower% of farmers for each rank
1st 2nd 3rd 4th 5thInjera 92 30 44 18 8 0Thick porridge 72 4 21 37 20 19Local beer 64 31 16 10 31 12Bread 93 49 22 18 11 1Boiled maize 83 3 17 41 36 3
In some instances, there are differences in the consumption patterns of maize across the
different geographical locations. For instance, local beer is not very common in the districts
found in the southern part of the country and Jimma area, perhaps because of religion; boiled
maize is not known by farmers around Shashemene; injera is not common in Awassa Zuria;
thick porridge is rarely used in the northwestern parts of the country. These are related to the
consumption habit of the society in different parts of the country.

69
From the proportion of farmers using maize for different purposes and the ranks they have
given, it could be seen that the major use of maize is for bread and injera (Table 56). They
have both comparable number of users as well as similar ranking pattern. In general, maize
is used more for bread followed by injera. Among the remaining food types, the majority of
households (82.5%) consume boiled maize and a considerable proportion ranked it third.
Hence, boiled maize grain (nifro) is the third most important use of maize, followed by local
beer and thick porridge.
7.2 Use of maize as livestock feed
Maize forage is derived from green stover (obtained from thinning, leaf stripping, plant tops
and entire green plant) and dry stover (Reynolds 1999). Thinning does indeed introduce a
significant benefit in terms of fodder availability and quality, during the rainy season, thereby
promoting an increase in milk production. The immature plant thinning contains up to six
times the crude protein content of dry stover, and it has been reported that it can produce up
to 4 t DM/ha of high quality feed without significantly affecting the final grain yield (Onim
et al. 1991; Methu 1998). Thinning is practised in Western Kenya by a dual-purpose goat
project in the highlands of Kenya, the Kilimanjaro region of Tanzania and in the Ethiopian
highlands on smallholder dairy farms (Franzel and van Houten 1992; Getz and Onim 1993;
Shirima 1994). Early thinning (8 weeks) has been recorded to contain a crude protein of 17%
DM compared to late thinning (14 weeks) of 10–11% DM.
Dry maize stover available after grain harvest is the most widely used (Reynolds 1999). The
major limitation to the use of dry maize is its high lignification and low protein content,
which varies from 55 to 66 g/kg DM (Methu 1998). Dry maize stover accounts for 15%
of the annual ruminant diet in the low veldts of Zimbabwe, to 40% in the cut and carry
dairy systems in the Tanzanian highlands (Shirima 1994). In West Africa, overall annual
contribution is as low as 16% and during the peak of dry season it could go up as high as
80% in other areas (Sandford 1989). Part of the difference between West and East Africa can
be explained by rainfall pattern; two growing seasons per year in the east African highlands,
produce more stover than a single growing season in South Africa (Reynolds 1999).
Methu (1998) reported that yields of up to five t/ha of dry maize stover are common in the
Kenyan highlands. Abate (1990) reported maize stover yields of 2.2–3.8 t/ha (DM basis) on
station. Despite the large volume, dry and mature maize stover with low N and digestible
organic matter contents is at best maintenance feed. Dry matter digestibility of maize forage
decreases from 65 to 55% in four weeks and protein content from 19 to 10% in 10 weeks
(Abate and Lukuyu 1985). Nevertheless, dry stover is of considerable importance during dry
seasons when forage of any kind may be in short supply.

70
7.3 Production of maize stover
The use of maize grain for feed is insignificant in the study area, although few farmers
reported its use. The major part of maize used for feed is its stover both as green and dry.
Maize stover production for different purposes depends on the farmers’ circumstances. About
66% of maize growers produced green maize stover and 89% produced dry maize stover
(Table 57).
Table 57. Per cent of household producing maize stover and average annual maize stover produc-tion per household by districts (2001)
District Green Dry Total
Amount (t)
% of producers
Amount (t)
% of producers
Amount (t)
% of producers
Awassa Zuria 0.53 92 0.83 67 1.04 100
Boricha 0.50 88 0.43 75 0.81 94
Alaba 1.82 94 1.15 94 2.98 94
Badawacho 0.90 88 0.84 88 1.74 88
Siraro 2.34 94 4.21 88 5.87 100
Shashemene 1.44 93 2.70 79 3.46 100
Gobu Sayo 0.40 7 1.82 67 1.69 73
Omo Nada 0.80 69 1.56 94 2.15 94
Kersa 0.72 73 1.83 100 2.36 100
Bako Tibe 1.03 33 1.82 100 2.16 100
Debre Elias 2.46 47 0.67 100 0.78 100
Baso Liben 2.98 93 0.75 100 1.03 100
Bure 0.53 27 1.18 87 1.25 93
Mecha 0.19 23 1.27 100 1.31 100
Mean 1.00 66 1.51 89 2.09 95
Ninety five per cent of maize growers produced either of the two stover types or both. On
average, farmers produced about 1 t and 1.51 t of green and dry maize stover per year,
respectively and this varied among districts. In some districts like Gobu Sayo, Bure, Mecha
and Bako Tibe, very few farmers produce green maize stover, which may also be related to
the level of green maize harvest. The differences were also observed in terms of green stover
harvest between the agricultural potentials. The amount of green maize stover harvested in
high agricultural potential area (0.83 t) is significantly lower compared to what is harvested
in low agricultural potential (13.1 t). The difference is not high for dry maize stover, which is
1.4 t for high agricultural potential and 1.6 t for low agricultural potential.
On the other hand, in districts like Alaba, Siraro, Shashemene, Badawacho, Boricha and Baso
Liben the majority of the farmers produce green maize stover. Average production of green

71
maize stover per household per year ranged from 0.19 t in Mecha to 2.34 t in Siraro. The
majority of farmers (>67%) in all districts produced dry maize stover.
Figure 7. Storage of maize stover around Shashemene.
Figure 8. Stubble grazing of a maize field in western Oromia.
Average dry maize collected and stored by a household is 1508 kg per annum ranging from
0.43 t in Boricha to 4.21 t in Siraro. The total maize stover collected and stored for different
purposes is on average 2092 kg per household per year ranging from 0.78 t in Debre Elias
to 5.87 t in Siraro. In terms of total maize stover production, southern Oromia and Alaba
take the lead, collecting more than 2.9 t/year per household. This is followed by districts

72
in western Oromia, which collect between 1.69 t to 2.36 t/household per year. Districts in
Amhara region and Sidama zone produce smaller amount ranging between 0.78 t to 1.31 t,
which could also be due to the smaller average land under maize in these areas.
Differences among locations in terms of amount of maize stover produced were significant
(P<0.05) as indicated in Table 57. If the districts are grouped into some homogenous groups
then the difference is pronounced. Southern Oromia produced the highest maize stover (4.75
t), while West Gojam and Sidama produced on average 0.91 t and 0.89 t, respectively. East
Gojam produced about 1.25 t which is more than West Gojam (0.91 t), West Oromia (2.12 t)
and Hadiya (2.38 t). The analysis shows in general, the existence of high spatial variability in
maize stover production.
On the other hand, the variability that exists among agricultural potential and population
density is relatively low (Table 58). Green maize stover production ranged from 0.79 t in
HaHp to 1.53 t in LaLp. Similarly dry maize stover harvest ranged from 1.27 in HaHp to 2.09
in LaLp, leading to the total maize stover production that range from 1.82 t in HaHp to 3 t in
LaLp. The increasing trend from HaHp to LaLp shows the relative scarcity of feed in LaLp forcing
farmers to harvest and store all available stover unlike in the high potential areas where there
could be other sources of feeds.
Table 58. Maize stover production per household by agricultural potential and population density
Agricultural potential and population density
Green Dry Total
N Amount (t) N Amount (t) N Amount (t)HaHp 70 0.79 94 1.36 101 1.82
HaLp 24 0.96 37 1.69 40 2.14
LaHp 28 1.24 30 1.27 33 2.20
LaLp 16 1.53 24 2.09 25 2.99
Average* 138 1.00 185 1.51 199 2.09
* Means are different at 5%.
7.4 Use of maize residues
Not all produced/collected stover is used for livestock feed as there are also other uses of
crop residue. The major ones, however, are animal feed and fuel. About 69% of the residue
produced is used for livestock feed followed by fuel which consumes about 25% of the
residue (Table 59). Sale and construction account for very small amount of crop residue. In
the case of animal feed, maize account for about 77% of the total residue fed to the animals
and about 99% of the total crop residue used for fuel. Thus, the two major uses of maize
stover, animal feed and fuel, account for about 59 and 40% of the maize stover produced by
smallholders, respectively. The amount used for sale and construction is less than 1%.
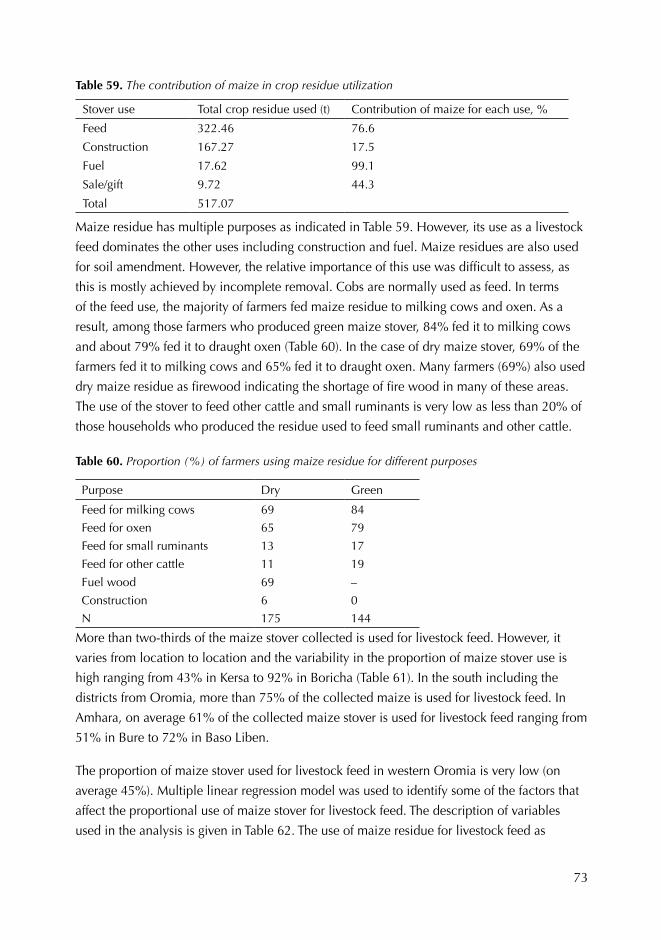
73
Table 59. The contribution of maize in crop residue utilization
Stover use Total crop residue used (t) Contribution of maize for each use, %
Feed 322.46 76.6
Construction 167.27 17.5
Fuel 17.62 99.1
Sale/gift 9.72 44.3
Total 517.07
Maize residue has multiple purposes as indicated in Table 59. However, its use as a livestock
feed dominates the other uses including construction and fuel. Maize residues are also used
for soil amendment. However, the relative importance of this use was difficult to assess, as
this is mostly achieved by incomplete removal. Cobs are normally used as feed. In terms
of the feed use, the majority of farmers fed maize residue to milking cows and oxen. As a
result, among those farmers who produced green maize stover, 84% fed it to milking cows
and about 79% fed it to draught oxen (Table 60). In the case of dry maize stover, 69% of the
farmers fed it to milking cows and 65% fed it to draught oxen. Many farmers (69%) also used
dry maize residue as firewood indicating the shortage of fire wood in many of these areas.
The use of the stover to feed other cattle and small ruminants is very low as less than 20% of
those households who produced the residue used to feed small ruminants and other cattle.
Table 60. Proportion (%) of farmers using maize residue for different purposes
Purpose Dry Green
Feed for milking cows 69 84
Feed for oxen 65 79
Feed for small ruminants 13 17
Feed for other cattle 11 19
Fuel wood 69 –
Construction 6 0
N 175 144
More than two-thirds of the maize stover collected is used for livestock feed. However, it
varies from location to location and the variability in the proportion of maize stover use is
high ranging from 43% in Kersa to 92% in Boricha (Table 61). In the south including the
districts from Oromia, more than 75% of the collected maize is used for livestock feed. In
Amhara, on average 61% of the collected maize stover is used for livestock feed ranging from
51% in Bure to 72% in Baso Liben.
The proportion of maize stover used for livestock feed in western Oromia is very low (on
average 45%). Multiple linear regression model was used to identify some of the factors that
affect the proportional use of maize stover for livestock feed. The description of variables
used in the analysis is given in Table 62. The use of maize residue for livestock feed as

74
indicated in Table 63 is influenced by the amount of teff residue produced, amount of maize
residue produced, distance to livestock market, distance to input supply shop, population
density and oxen ownership.
Figure 9. Use of green and dry maize stover for livestock feed.
Table 61. Average production and proportion of maize stover used as livestock feed by district
District Average production (t) per household
Number of farmers
% of stover used for feed
Awassa Zuria 0.938 13 88Boricha 0.809 15 92Alaba 4.518 16 79Badawacho 1.791 13 75Siraro 5.056 13 90Shashemene 3.396 14 80Gobu Sayo 0.675 11 44Omo Nada 1.231 16 48Kersa 1.722 15 43Bako Tibe 1.543 15 44Debre Elias 0.769 15 55Baso Liben 1.020 15 72Bure 1.179 15 51Mecha 1.160 13 67Average 1.854 199 68
Distance to livestock market has negative elasticity as expected. As the farmer is nearer to
the livestock market by one hour (walking time), the proportion of maize stover used for
livestock increases by 3.3%, probably indicating the market value of well-fed animals. On
the other hand, distance to input supply shops affect the proportion of maize stover used as
livestock feed negatively. As walking distance to input supply shop increase by an hour, the
proportion of maize stover used for livestock increases by about 4%. Similarly, the effect of
using improved cultivars is negative. The proportion of maize stover used by those farmers

75
who used improved maize cultivars is 6.5% less than those who do not use improved maize
cultivars. The effect of these two variables may show that those who have access to input
and use improved maize cultivars concentrate more on crop production than livestock
management. As a result, they may have more cropland and less livestock, which could
lead them to less proportional use of stover. It may also be possible that this effect of using
improved cultivars on the proportion of stover used as feed is related to the perception that
stover of improved cultivars is less nutritious compared to local varieties. Participatory rural
appraisal (PRA) studies in western Oromia and in Sidama and Wolayita found that farmers
preferred maize stover for their cattle from their local maize varieties, Burre and Asemera,
respectively to that of their improved maize cultivars (Degu et al. 2006; Hassena et al. 2006).
Oxen ownership also affected the proportion of maize stover used for livestock feed, where
those farmers who have more oxen tends to use lower proportion of maize stover for feed. As
farmers concentrate more on crop production, they may have more oxen than other animals,
which will lead to lower number of total livestock. As a result they may use proportionally
less maize stover for livestock feed.
Table 62. Description of sample statistics of variables used in the estimation of maize stover model
Variables Mean Std. Dev. Min MaxProportion of maize stover used for feed (%) 68 22 16 100Age of household head (years) 47.26 15.45 25 102Age square of household head (years) 2471 1714 625 10404Education level of household heads (years of schooling) 1.48 2.46 0 12Active labour size (15–60 years) 3.46 1.69 1 10Dependency ratio (dependent/total family size) 0.49 0.52 –5 0.93Walking distance to input supply shops (hours) 1.35 1.08 0.01 5Walking distance to livestock market (hours) 1.77 1.06 0.05 5Per capita maize area (ha) 0.11 0.10 0.01 0.75Livestock owned (TLU) 5.16 5.43 0.7 50.3Total maize residue produced (qt) 14.96 22.63 0.44 170.5Total teff residue produced (qt) 7.84 9.73 0 47.81Population density (person/km2) 6.52 5.62 1.66 26.29If the farmer used improved cultivars (0/1) 0.70 0.46 0 1If the farmer does not have an ox (0/1) 0.20 0.40 0 1If the farmer owns one ox (0/1) 0.23 0.42 0 1If the farmer owns a pair or more oxen (0/1) 0.57 0.50 0 1If household is in HaHp (0/1) 0.52 0.50 0 1If household is in HaLp (0/1) 0.20 0.40 0 1If household is in LaHp (0/1) 0.17 0.38 0 1If household is in LaLp (0/1) 0.10 0.31 0 1
Teff straw is the substitute feed for livestock and the model correctly showed that those
farmers who produced more teff residue used less proportion of maize residue for livestock
feed. As production of teff stover increased by one quintal (100 kg), the proportion of maize
stover used for livestock feed decreased by about 0.5%. On the other hand, the elasticity

76
of the amount of maize residue produced is positive showing that those farmers who
produce more maize residue use more of it for livestock feed compared to those farmers
who produces less maize stover. As the production of maize stover increased by one quintal
(100 kg), the proportion of maize stover used for livestock increased by about 0.3%. In
areas where population density is high, the use of maize stover for livestock feed increases.
As population density increase by one person per km2, proportion of maize stover used for
livestock also increased by 1.1% indicating more intensification of livestock management
compared to low population density areas.
Table 63. Factors affecting the use of proportion of maize stover for livestock feed (OLS estimate)
Variables Coefficient t-value
Constant 98.382 6.37**Age of household head (years) –0.752 –1.32Age square of household head (years) 0.006 1.1Education level of household heads (years of schooling) –0.641 –1.0Dependency ratio (dependent/total family size) 2.819 0.62Active family size –0.718 –0.66Walking distance to input supply shops (hours) –4.108 2.42**Walking distance to livestock market (hours) –3.261 –1.82*Per capita maize area (ha) –29.749 –1.58Livestock owned (TLU) 0.430 1.38Total maize residue produced (qt) 0.256 3.58***Total teff residue produced (qt) –0.475 –2.73***Population density (person/km2) 1.143 3.85***If the farmer used improved cultivars (0/1) –6.486 –1.95*Oxen dummy compared to no oxIf the farmer owns one ox (0/1) –7.445 –1.54If the farmer owns a pair or more oxen (0/1) –9.030 –1.91*Agricultural potential and population density dummy compared to LLIf household is in HaHp (0/1) –1.463 –0.28If household is in HaLp (0/1) –5.039 –0.85If household is in LaHp (0/1) 1.956 0.32Regression diagnosisN 162a
F(20, 141) 5.69***R-squared 0.42Adj R-squared 0.34Root MSE 18.08
Note: ***,**,* are significant at 1, 5 and 10%, respectively. a. In the sample, 25 households did not harvest maize stover and 26 households did not own cattle. Data on use of maize stover as livestock feed are missing for these households.
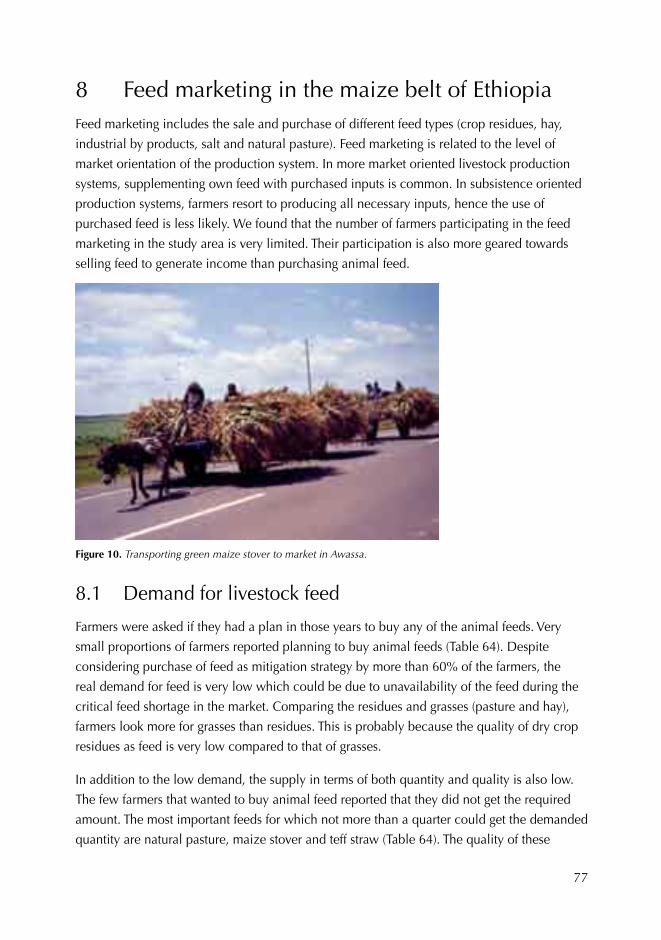
77
8 Feed marketing in the maize belt of EthiopiaFeed marketing includes the sale and purchase of different feed types (crop residues, hay,
industrial by products, salt and natural pasture). Feed marketing is related to the level of
market orientation of the production system. In more market oriented livestock production
systems, supplementing own feed with purchased inputs is common. In subsistence oriented
production systems, farmers resort to producing all necessary inputs, hence the use of
purchased feed is less likely. We found that the number of farmers participating in the feed
marketing in the study area is very limited. Their participation is also more geared towards
selling feed to generate income than purchasing animal feed.
Figure 10. Transporting green maize stover to market in Awassa.
8.1 Demand for livestock feed
Farmers were asked if they had a plan in those years to buy any of the animal feeds. Very
small proportions of farmers reported planning to buy animal feeds (Table 64). Despite
considering purchase of feed as mitigation strategy by more than 60% of the farmers, the
real demand for feed is very low which could be due to unavailability of the feed during the
critical feed shortage in the market. Comparing the residues and grasses (pasture and hay),
farmers look more for grasses than residues. This is probably because the quality of dry crop
residues as feed is very low compared to that of grasses.
In addition to the low demand, the supply in terms of both quantity and quality is also low.
The few farmers that wanted to buy animal feed reported that they did not get the required
amount. The most important feeds for which not more than a quarter could get the demanded
quantity are natural pasture, maize stover and teff straw (Table 64). The quality of these

78
residues are, however, better as more than 50% of the farmers reported to have the required
quality. While the industrial by-products are found from markets, the residues are mainly
obtained from other farmers. Most of the farmers know the sources of these feeds and the
remaining farmers also get information mainly from neighbours (Table 65).
Table 64. Per cent of farmers demanding to buy different feed types by year
Type of feed Year
1999 2000 2001
Maize residue 1.8 1.3 1.8
Teff residue 1.3 1.8 3.6
Sorghum residue 0.4
Finger millet residue 0.4
Hay 4.5 4.0 6.3
Bran 3.1 2.7 2.2
Oilseed cake 2.2 1.8 2.7
Pasture* 2.2 1.8 4.0
Note: * Purchase of pasture is renting grass land for limited months.
Table 65. Sources and availability (quantity and quality) of the feed in the market, per cent of farmers
Feed typeObtained Source
Quality demanded
Quantity demanded
Other farmers
District market
Nearest market
Maize residue 50 25 100 – –
Teff residue 57 25 100 – –
Sorghum residue 100 – – – 100
Finger millet residue 100 100 100 – –
Hay 77 46 86 7 7
Bran 100 – 40 – 60
Oilseed cake 100 20 33 – 67
Natural pasture 67 22 75 12.5 12.5
There are generally three sources of feed: traders, input supply shops, and other farmers.
Traders and input supply shops are sources of industrial by-products and farmers are sources
of farm products. The traders are the main source of bran and oilseed cake.
Although many farmers do not buy livestock feed, they have information on prices. The role
of development agents and traders as sources of feed price information is low. Farmers might
have not participated in the feed market because of a number of reasons. However, the
availability of information about the market and prices could be used as an opportunity to
strengthen feed marketing.

79
Figure 11. Marketing of different crop residues in Shashemene market.
The major marketing problem cited by farmers (44%) was high prices particularly for natural
pasture, bran and hay (Table 66). This could be the reason behind the very low number
of farmers purchasing livestock feed. The second factor, also related to the price, is the
fluctuation of price particularly for salt and hay and to some extent also for teff residue.
Unavailability of the sellers and shortage of supply were cited as problems by about 24% of
the farmers.
Table 66. Major marketing problems for different feed types as reported by purchasers, per cent of farmers
Feed types
% of purchasers reporting
High price
Supply shortage/feed seller unavailability
Price variation
Lack of transport No problem
Maize residue 6 3 – – –
Teff residue 3 2 3 – –
Finger millet residue – 2 – 2 –
Hay 10 8 5 – –
Bran 10 – – – –
Salt 2 – 6 – 14
Oilseed cake 5 – – – –
Natural pasture 10 10 2 – –
Total 44 24 16 2 14
8.2 Supply of livestock feed
Only three respondents reported having supplied crop residue to the market in 2001. This
confirms the shortage of supply reported by buyers. Moreover, only very small proportion

80
of farmers confirmed the availability of maize stover in the market in different seasons.
In the wet season, when it is only green maize stover, about 29% of the farmers reported
the availability of maize stover in the market. The figure is very low for harvest (14%) and
dry (16%) seasons. This may confirm the sale of green maize stover most commonly than
the dry maize stover. Teff straw could be sold throughout the year as it is also used for
construction.
8.3 Storage of crop residues
Storage of crop residues is important to utilize the available residue efficiently over the
seasons. However, not all farmers store the residue and thus increased feed fluctuation
is observed widely. Sorghum stover and wheat straw are some of the residues, which the
majority of the farmers (57% for sorghum and 43% for wheat) do not collect for future use.
This could be related to the low use of the stovers for animal feed. More than 20% of the
farmers also do not collect finger millet, barley and maize residue. Teff is the most stored
residue as about 98% of the producers stored it using different storage methods. Both stalking
and piling are used for many of the residues stored by farmers. However, stalking is more
commonly used for maize, barley and finger millet; and piling is most commonly used for
wheat, sorghum and teff residue. Other residues are also piled. Only very few farmers store
crop residue under shade (Table 67).
Table 67. Storage methods used for different types of residue (per cent of farmers using)
Feed typeStorage methods by importance
NStacking/piling Under shade
Maize 80 0 159
Teff 97 2 111
Finger millet 62 14 21
Barley 64 7 14
Wheat 57 0 14
Sorghum 43 0 14
Others 30 10 30
Farmers recognized the loss of residue due to improper storage (Table 68). This is more
prevalent for maize, barley and wheat. The average loss for major crops residue ranged
from 12% for sorghum to 23% for maize. The perceived loss of enset as feed due to storage
is 25%. About 40% of the farmers reported storage loss of teff residue of about 14%. For
many other crops, the proportion of growers that have recognized storage loss of stover is
low.

81
Table 68. Farmers’ perceptions of feed loss due to storage and level of loss for major crops
Feed typeFeed loss due to storage
Per cent of lossYes (%) N
Maize 80 140 23
Barley 60 10 17
Teff 40 110 14
Sorghum 75 10 12
Enset (false banana) 75 6 25
82
9 Conclusion and implicationsThe cultivated area in the maize belt of Ethiopia accounts for 69% of the total land area
and grazing land accounts for 10% of the total land, followed by forest/wood lots (9%) and
homestead (7%). The proportion of cultivated land is higher in the HaLp areas (accounting for
80% of the available land), followed by HaHp (accounting for 71%). The average land holding
in the study area is about 1.68 ha.
Maize is grown by about 97% of households in the study area, followed by teff (grown by
48%), and sorghum (grown by about 25%). Maize accounts for 47% of the cultivated area,
followed by teff (16%). All other crops individually occupied less than 6% of the cropped
land. The average area allocated to maize is 0.8 ha/household.
The average maize yield is about 2.11 t/ha. Because of international and national research
efforts, there is a wide variety of technological options for maize and maize has received
high attention by the extension service. The use of improved technologies particularly hybrids
and open pollinated varieties (OPVs) is higher for maize than other crops. The proportion
of farmers using improved cultivars increased from about 63% in 1999 to 69% in 2001.
The importance of maize in the crop choices of households in the study areas is increasing,
perhaps because of both its food and feed value. This implies that the attention given to
maize in research and development needs to be strengthened.
In the HaHp areas, the local varieties and BH-660 are the most dominant cultivars covering
about 35 and 31% of the maize area, respectively. These two cultivars cover almost similar
proportion in the LaLp areas. In the HaLp areas, the hybrid BH-660 alone covers about 41%
of maize area followed by the local varieties, which covers about 18%. The local varieties
dominate more in the LaLp areas covering about 35% of the maize area. In HaLp and LaHp,
Katumani variety covers more than 21% of the maize area.
We find that oxen ownership, active labour force and dependency ratio are statistically
significantly and positively associated with the use of improved maize cultivars. In 2001,
60% of maize growers used DAP and about 56% used urea. Amount of livestock sold,
education level of the household head, oxen ownership and distance to input supply shops
explained commercial fertilizer use on maize statistically significantly. Education level of
the household head increases probability of fertilizer use positively. Distance to input supply
shop affect adoption of fertilizer negatively. Farmers who own oxen have higher probability
of using fertilizer more than those who do not own oxen. Household traction capacity is
clearly an important factor for more intensive maize production, as is labour supply. These
results suggest that interventions to improve oxen ownership, such as through credit services,
could improve maize productivity. Our results also imply that developing input supply

83
centres could reduce transaction cost in procuring fertilizer, thus enhancing adoption of
commercial fertilizers for maize production.
Maize yield is explained significantly by maize area, total crop area and fertilizer rate
used. While maize area is inversely related with yield, total crop area and use of fertilizer
are positively associated with maize yield. These results imply that maize is responsive to
fertilizer at the current average rate farmers are applying it, reinforcing the need for more
efforts to promote fertilizer for maize production.
Cattle account for about 75% of livestock population in the study area and are owned by
about 88% of the households, with an average holding of 4.5 per household. Households
reported that every categories of livestock are kept at least for five different purposes. Oxen
are predominantly kept for draught power. The major purposes of keeping cows are milk,
saving and cash income. Sheep are mainly kept for cash and saving purposes.
About 84.4% of the farmers reported using veterinary services, mostly from the district offices
of agriculture (97.3%) but also from private sources (4.7%). Only 15% of farmers used AI,
which is provided only by the district offices of agriculture. There was a tendency that more
farmers in the HaHp areas use AI services compared to the other categories. Only about 1
and 2.2% of farmers reported using watering trough for livestock during the wet and dry
seasons, respectively. Livestock are mainly watered in rivers and streams. The use of credit
for livestock production is very low. The major purpose of wanting credit among those who
sought credit was to purchase livestock (52%), which is an investment. These results imply
that the extension service needs to accord better attention to the livestock sector. The demand
for credit for livestock is high, implying that credit services with appropriate terms and
repayment arrangements could contribute to welfare of livestock keepers.
The major livestock feeds in the study area are natural grazing, own produced crop residues,
stubble grazing, and own produced hay. Residues of almost all crops are fed to animals and
the use depends on the location and farming system. The most common crop residue used
as feed in the study area is maize stover, followed by teff, finger millet and enset. Maize
residue is fed as green and dry stover, during the growing season, harvest and the dry season.
Majority of the farmers use maize residue as feed for milking cows and oxen.
Green maize stover is derived from thinning, leaf stripping, plant tops and entire green plant.
Dry maize stover is available after harvest. The use of maize grain for feed is insignificant in
the study area, although few farmers reported its use. On average, farmers produced about 1
and 1.51 t of green and dry maize stover per year, respectively. Maize stover is used as feed,
fuel and for construction purposes. About 69% of the residue produced is used for livestock
feed followed by fuel which accounts for about 25% of the residue. Sale and construction

84
account for very small amount of the crop residue. Cobs are used as fuel. Our results imply
that interventions to improve maize as food and feed crop could contribute significantly to
the alleviation of feed shortage.
Purchased crop residue and hay, and industrial by-products are rarely used. About 4 and
2% of farmers purchased hay, in the dry and wet seasons, respectively. In general, less than
12% of the livestock owners bought livestock feed of any type in any one season. Farmers
participate in the feed market more as sellers than as buyers. Farmers are more likely to buy
grasses (pasture and hay) than crop residues. In addition to the low demand, the supply
in terms of both quantity and quality is also low. The few farmers that wanted to buy feed
reported that they could not get the required amount.
Only one or two of the sample households reported planting improved forage during
1999–2001 period. The major reason for not planting improved forage is lack of awareness
as reported by about 76% of the respondents indicating the low promotion activity of this
technology. These results imply the need for interventions to develop feed markets and
promote improved forage technologies to alleviate the feed shortage problem.
According to farmers, the first quarter, January–March, is the period of severe feed shortage.
In the second quarter, April–June, the level of severity reduces slightly because of the short
rains. The highest level of feed security (60–80% of farmers reporting) occurs during the grain
harvest season, followed by the wet season. Different livestock groups have different level of
access to different sources of feed. Cattle are generally given high priority and oxen get the
first priority followed by milking cows.
This study points to the multiple roles of maize in the livelihoods of people in the Ethiopian
highlands. In spite of these multiple roles, research and development efforts have focused on
the importance of grain for food security and have neglected the importance of crop residues
as livestock feed, and soil amendments. Since maize accounts for over 50% of the feed
supply in the area, improving the availability and feed value of maize stover can enhance
the contribution of maize–cattle production to the well-being of farmers and their families.
Although farmers use all maize cultivars as animal feed, in general they prefer local maize
varieties in terms of feed quality of the stover. Hence, there is need for maize breeders to
study the traits of local varieties in order to incorporate them in their breeding programs.
Agricultural research aimed at developing improved maize cultivars needs to make explicit
consideration for the stover value. Quantitative assessments of the economic loss due to
under nutrition of livestock and the trade-offs among the competitive use of maize stover
should inform this effort. In addition, attention needs to be given to improved storage of
maize stover and its utilization.

85
Research also needs to investigate the link between maize stover, livestock productivity and
farm income. Although initial results indicate that performance of animals is influenced by
the feed quality of the stover as determined by cultivar (Fernandez-Rivera and Twumasi-
Afriyie 2005) this is a question that requires further investigation, in particular in terms of
the potential tradeoffs between use of stover as feed, grain yield and availability of residues
for soil amendment. These studies should ultimately address the question on whether grain
yield and feed quality of the stover are related to higher incomes per unit of land and how
increased maize stover can lead to poverty reduction.
Planting of improved forages can alleviate the problem of feed shortage but only about
24% of the sample farmers were aware of this technology. Extension services need to focus
on promoting improved forages as well as on efficient management and utilization of crop
residues.
Our results imply that the contributions of maize to the welfare of farmers in the maize–cattle
belt could be enhanced if policy, research and extension interventions place maize in a
broader agricultural development context.

86
ReferencesAbate AN. 1990. Nutritive value of maize forage silage fed to cows for an integrated system of grain
and milk production in Kenya. PhD thesis, Aberdeen University, UK.
Abate AN and Lukuyu B. 1985. Digestibility of maize leaves defoliated at different stages of growth. In: The Annual Animal Production Research Department Report. pp. 96–100.
Byerlee D and Eicher CK. 1997. Africa’s emerging maize revolution. World Bank, Washington, DC, USA. 301 pp.
CSA (Central Statistical Authority). 2003. Ethiopian agricultural sample enumeration, 2001/02. Statistical report on socio-economic characteristics of the population in agricultural households, land use, and area and production of crops. Results at country level. Part I. CSA, Addis Ababa, Ethiopia.
Diriba G, Tessema Z, Shimalis A, Demekash A and Senait Y. 2001. Enhancing the utilization of maize as food and feed in Ethiopia: Availability, limitations and opportunities for improvement. 2nd national maize workshop of Ethiopia, November 2001. pp. 12–16.
Degu Getahun, Mwangi W, Jemal Abdurahman, Getachew Kassaye, Mergia Aberra and Mwabu D. 2006. Participatory rural appraisal (PRA) on the use of maize as food and feed in Sidama and Wolayita mixed farming system, Ethiopia. Research Report. OARI/EARI and CIMMYT.
FAO (Food and Agriculture Organization of the United Nations). 1992. Maize in human nutrition. FAO, Rome, Italy.
FAO (Food and Agriculture Organization of the United Nations). 1993. Production yearbook 1992. FAO, Rome, Italy.
FAO (Food and Agriculture Organization of the United Nations). 2002. Special report FAO/WFP crop and food supply assessment.
Fernandez-Rivera S and Twumasi-Afriyie S. 2005. Meat production using maize stover from eight cultivars as feed for sheep. Journal of Animal Science 83(Supp 1):82.
Franzel S and van Houten H. (eds). 1992. Research with farmers. Lessons from Ethiopia. IAR (Institute of Agricultural Research), Addis Ababa, Ethiopia, CABI (Commonwealth Agricultural Bureau International), Wallingford, UK. 303 pp.
Getz W and Onim M. 1993. Systems approach in developing feed resources and feeding strategies. In: Keane M (ed), Small ruminants workshop. University of California, Davis, USA. pp. 235–247.
Greene WH. 2003. Econometric analysis. 5th edition. Prentica Hall, Engelwood Cliffs, New Jersey, USA.
Gryseels G and Anderson FM. 1983. Research on farm and livestock productivity in the central Ethiopian highlands: Initial result, 1977–1980. ILCA Research Report 4. ILCA (International Livestock Centre for Africa), Addis Ababa, Ethiopia.
Hassena Mohammed, Mwangi W, Temesgen Jambare, Milkessa Temesgen, Brihanu Tadesse, Bayisa Gedefa and Mwabu D. 2006. Participatory rural appraisal (PRA) on use of maize as food and livestock feed in western Oromia: The case of Ambo and Sibu-Sire districts, Ethiopia. Research Report, OARI/EARI and CIMMYT.
Kossila V. 1988. The availability of crop residues in developing countries in relation to livestock populations. In: Reed JD, Capper BS and Neate PJH (eds), Plant breeding and the nutritive value of crop residues. Proceedings of a workshop, 7–10 December 1987. ILCA (International Livestock Centre for Africa), Addis Ababa, Ethiopia. pp. 29–39.
de Leeuw PW. 1997. Crop residues in tropical Africa: Trends in supply, demand and use. In: Crop residues in sustainable mixed crop/livestock farming systems. Proceedings of an international workshop. CAB (Commonwealth Agricultural Bureau) International, Wallingford, UK, ICRISAT (International Crops Research Institute for the Semi-Arid Tropics), Patancheru, India, and ILRI (International Livestock Research Institute), Nairobi, Kenya. pp. 41–77.
87
McCann JC. 2005. Maize and grace: Africa’s encounter with a new world crop, 1500–2000. Harvard University Press, USA.
Methu JN. 1998. Strategies for the utilization of maize stover and thinning as a dry season feed for dairy cows in Kenya. Unpublished PhD thesis. University of Reading, Reading, UK. 298 pp.
Nordblom JL and Shomo F. 1995. Food and feed prospects to 2020 in the West Asia–North Africa region. ICARDA Social Science Paper 2. ICARDA (International Centre for Agricultural Research in the Dry Areas), Aleppo, Syria.
Onim JFM, Otieno K and Getz W. 1991. Development of Maseno double cobber maize variety for high forage and grain yield. In: Proceedings of the ninth SR-CRSP scientific workshop. SR-CRSP (Small ruminants Collaborative Research Support Program), Nairobi, Kenya, and KARI (Kenya Agricultural Research Institute), Nairobi, Kenya.
Reynolds N. 1999. Maize for food, feed and fertilizer: A literature review on multiple uses of maize in mixed farming systems in East and southern Africa. ILRI (International Livestock Research Institute), Nairobi, Kenya.
Sandford SG. 1989. Crop residue/livestock relationships. In: Soil, crop and water management systems for rain fed agriculture in the Sudano-Sahelian zone: Proceedings of a workshop. ICRISAT (International Crops Research Institute for the Semi-Arid Tropics), Patancheru, Andhra Pradesh, India. pp. 169–182.
SAS Institute Inc. 1999. SAS Language Reference, Version 8. SAS Institute INC., Cary, NC, USA. 1256 pp.
Shirima EJM. 1994. Quality and quantity of maize and sorghum vegetative parts harvested at different stages of plant growth as fodder of livestock. Unpublished MSc thesis. Swedish University of Agricultural Science, Uppsala, Sweden.
Smale M and Jayne TS. 2002. Maize in eastern and southern Africa: The ‘Seeds’ of success in an historical perspective. A paper prepared for IFPRI workshop on success in African agriculture, June 10–12, 2002, Lusaka, Tanzania.
Staal SJ, Chege L, Kenyanjui M, Kimari A, Lukuyu B, Njubi D, Owango M, Tanner J, Thorpe W and Wambugu M. 1998. Characterization of dairy systems supplying the Nairobi milk market: A pilot survey in Kiambu district for the identification of target producers. Collaborative Research Project Report. KARI (Kenya Agricultural Research Institute)/MOA (Ministry of Agriculture)/ILRI (International Livestock Research Institute), Nairobi, Kenya. pp. 85.
Tesfaye Zegeye, Bedassa Tadese and Shiferaw Tesfaye. 2001. Adoption of high yielding maize technologies in major maize growing regions of Ethiopia. EARO (Ethiopian Agricultural Research Organization) Research Report 41. EARO, Addis Ababa, Ethiopia.
Thorne PJ, Thornton PK, Kruska RL, Rutherford AS and Odero AN. 2001. Maize as food, fodder and fertilizer in intensifying crop–livestock systems in East and Southern Africa: An ex ante impact assessment of technology interventions to improve smallholder welfare. Impact Assessment Series 9. ILRI (International Livestock Research Institute), Nairobi, Kenya.
Tolera A, Berg T and Sundstol F. 1999. The effect of variety on maize grain and crop residue yield and nutritive value of stover. Animal Feed Science and Technology 79:165–177.
Zinash Sileshi and Seyoum Bediye. 1989. Feeding value of some Ethiopian feedstuffs. In: Proceedings of the second national livestock improvement conference. IAR (Institute of Agricultural Research), Addis Ababa, Ethiopia. pp. 179–185.