Annual Report - CGSpace
387
¡ T/- , Working Dhcument No. 95 / co NISfORICA Annual Report 1990 Cassava Program
-
Upload
khangminh22 -
Category
Documents
-
view
2 -
download
0
Transcript of Annual Report - CGSpace

~._-~¡ I--~-·~--"~-
¡ (.-.---~ "~~' ,~;~-- T/- , i--~\Lj
Working Dhcument No. 95 / co ~Lu0N NISfORICA
Annual Report 1990
Cassava Program

TABLE OF CONTENTS
CASSAVA PROGRAM HIGHLIGHTS
1.
2.
3.
4.
CASSAVA GERMPLASM RESOURCE DEVELOPMENT
1.1. Introduction
1.2. Latin America
1.3. Africa
1.4. Asia
BIOTECHNOLOGY RESEARCH
1
1
2
40
48
63
2.1. Germplasm Conservation 63
2.2. Pollen CUlture: Toward a Haploid Methodology
in Cassava
2.3. Genetic Transformation of Cassava
2.4. Genetics of Esterase Isozymes in Cassava
2.5. DNA Fingerprinting of Cassava
68
71
73
75
2.6. Biochemistry of Cassava Fermentation 78
2.7. The Pilot In vitro Active Genebank (P-IVAG)
Project
2.8. The Cassava Biotechnology Network
2.9. References
CASSAVA PATHOLOGY ANO VIROLOGY
3.1. Research in Pathology
3.2. Cassava Viruses
CASSAVA ENTOMOLOGY ANO ACAROLOGY
4.1. Cassava Mealybug
4.2. The Cassava Hornworm, Erinnyis ello
80
81
84
87
87
107
119
119
128

5.
6.
7.
4.3. The Cassava Whitef1y 131
4.4. Cyrtomenus bergi: The Cassava Burrowing Bug 132
4.5. The Black Lacebug: Amblystira macha lana 136
4.6. Cassava Pest Complexes 137
4.7. Cassava Acaro1ogy 145
4.8. References 170
CASSAVA PHYSIOLOGY AND CROP MANAGEMENT
5.1. Physiology, Soil Ferti1ity and Erosion
Research
5.2. Cassava Varietal Response te Phosphorus
5.3. Sink-Source Relationships in Cassava
5.4. Soi1 Fertility Maintenance and Erosion
Research in Asia
5.5. Cassava Intercrepping Systems
CASSAVA ECONOMICS
6.1. Past Emphasis
6.2. Current Priorities
6.3. Research Results
6.4. References
CASSAVA UTILIZATION
173
173
197
215
221
238
283
283
284
286
298
299
7.1. Cassava Quality 299
7.2. Fresh Cassava Conservation 307
7.3. Cassava Flour 312
7.4. Production and Uti1ization of Cassava Starch 319
7.5. References 331

8.
9.
INTEGRATED CASSAVA DEVELOPMENT PROJECTS 333
8.1. Brazil: Cassava Development Project, Ceará 333
8.2. Ecuador: Cassava Development Project, Manabi 354
8.3. ColOmbia
8.4. Collaboration with Paraguay, Panama and
Bolivia
REGIONAL NETWORKS AND TRAINING
364
366
369
9.1. 11 Latin American Cassava Breeders' Workshop 369
9.2. 111 Asian Cassava Research Workshop 371
9.3. Meeting on Cassava Cooperation in the Latin 373
American subtropics
9.4. Headquarters-Based Training 374
10. PROGRAM PUBLICATIONS 377
11. PROGRAM PERSONNEL 385

CASSAVA PROGRAM ANNUAL REPORT 1990 HIGHLIGHTS
An in-depth analysis of the potential of 18 agricul tural crops as alternatives for research at CIAT--which were evaluated on the basis of growth, equity, natural resource conservation and institutional criteria--indicated that cassava can contribute substantially to achieving the overall CIAT goal of sustainable agricultural growth with equity. It has therefore been proposed that cassava remain part of the CIAT commodity portfolio in the 1990s.
The current value of cassava production in Latin America and Asia is US$1.46 and 1. 76 billion, respectively. The Net Present Value (NPV) of research benefits from improved technology could amount to U5$738 milI ion and 1.978 billion, respectively, in Latin America and Asia, with poor consumere accruing benefits to the value of US$460 and 280 million. In addition, cassava development activities can generate 60,000 and 111,000 man-yeare of labor, respectively, on these continents.
Research Highlights
A first lot of 87,615 botanical seeds obtained at CIAT HQ by controlled hybridization and open pollination was introduced to the International Institute of Tropical Agriculture (lITA) as part of these two institutions' collaboration on cassava germplasm improvement in Africa. Half of these seeds were sown in three different ecologies of Nigeria, representing humid, subhumid and semiar id areas of Afr ica. The materials will be evaluated and selected on the basis of yield, growth habit and reaction to biotic constraints, particularly African cassava mosaic disease (ACMD) and cassava bacterial blight (CBB).
CIAT-generated technology reaches farmers and consumers largely through the efforts of national research programs. CIAT has made a major effort to adjust its mode of collaboration to suit individual needs and capabilities. In Asia, for example, these programs are highly diverse. The establishment of CIAT' s regional office in Asia in 1983 has allowed a close working relationship to develop with many programs. This in turn has contributed to an evident progression of programs through developmental stages. In more advanced programs such as those of Thailand and Indonesia, this has reached the level of socioeconomic impact through adoption of new varieties. The Philippines, China, Thailand, Malaysia and Indonesia have all released varieties based on CIAT germplasm. Countries with recently established breeding programs, such as those of China and Vietnam, are systematically establishing the foundations for similar future impacto
i

Over the past four years, the Cassava Program has cOllaborated with the Colombian Agricultural Institute (ICA) and local institutions in Cauca, Meta and six states ("Departamentos" on the North Coast of Colombia on the development of a methodology for farmers' participation in variety selection. This has directly resulted in the release of two clones, ICA Catumare and ICA Cebucán, in 1990, and the preparation of two more for release in 1991. The implementation of the methodology has led to a clearer definition of farmers' criteria for adoption and institutional strengthening via extensive interaction within the framework of the project. This methodology is now beginning to be used in other Latin American countries.
Root rots constitute a major source of yield loss in cassava, and their incidence appears to be increasing in Latin America. In the "várzea" (holm) of the Amazon, more than 80,000 ha are affected by Phytophthora drechsleri and Fusarium solani. Following nine years of research conducted with the Center for Agricultural Research in the Amazon (CPAA), two resistant clones (Mae Joana and Zolhudinha) were released this year.
For the Pivijay area of Colombia, where Diplodia manihotis is endemic, a technology package has been deve~oped. Cassava growers obtained yield increases of 208% for the resistant clone and 300% for the susceptible clone. The resistant clone yielded more than the susceptible clone with or without the associated improved cultural practices. Very high host plant resistance has been identified to Phytophthora nicotianae varo nic9tíanae, one of the most ímportant causal agents of cassava root rot in poorly drained plantations. Thís will make it possible to initiate a genetíc program to control this pathogen.
The development of integrated pest management for the cassava mealybug remains a high-príority research area because of the seriousness of this pest in Africa. Further important natural enemies of the mealybug have been identified, including the parasitoids Aenasius vexans and Acerophagus coccois collected in Venezuela. In addition, three varieties resistant to Phenacoccus herreni have be en identified.
Cassava whiteflies, apart from feeding on the crop, are known to be vectors that transmit a number of viruses that cause extensive yield reduction in certain cassava-growing regions. This year four clones with good resistance to cassava whiteflies were developed.
The Cassava Green Mite (CGM) is a serious cassava pest in NE Brazil as well as in Africa. Based on taxonomic analysis, electrophoresis, differences in distribution and abundance
ii

patterns, the 10w diversity of parasitoid natural enemies and the re1ative1y high frequency of CGM outbreaks in Bra?il compared to northern South America, its area of origin is probably Colombia or Venezuela. The introduction of CGM into Brazil is not recent, but it appears that the Brazilian population of CGM has remained relative1y isolated. There is evidence for physio10gica1, roorpho10gica1 and ecological divergence froro the parent population, suggesting the presence of a distinct strain or biotype in Brazil.
Differences in survival and fecundity on different acarine prey types have been demonstrated between geographical subpopulations of parasitoid predators of CGM. These findings corroborate ear1ier work which showed that reproductive incompatibility exists between geographical subpopu1ations of certain parasitoid species. Both types of evidence suggest strain differences between geographica1 subpopulations. Electrophoretic methods for distinguishing strains were successfu11y deve1oped. Se1ection of effective strains wi11 be essential for successful biological control in Africa and NE Brazi1.
The feasibi1ity of deploying the fungal pathogen Neozygites sp. against CGM was investigated. No evidence was found for the pathogenicity of this fungus in phytoseiids. Although high re1ative humidity (> 65% RH) favor s development of the fungus on CGM, it inhibits the formation of the anadhesive conidia, responsib1e for its dissemination.
New fundamental information on the mechanisms responsible for cassava's tolerance to prolonged water stress was obtained, strengthening the views that cassava has a greater comparative advantage than other food crops in semiarid regions such as sub-Sahelian Africa and NE Brazil. Varietal differences in response to water stress were found. Yield reductions due to stress were minimal in some clones with low hydrocyanic acid (HCN) levels.
Severa1 germplasm accessions and new advanced breeding lines were identified for their high to1erance to acid soils with low phosphorus. Tolerance to low-P soils is roainly related to phosphorus use efficiency in terros of yield and bioroass production, not to phosphorus acquisition.
The Program is dedicating increased attention to soi1 fertility maintenance and erosion control through research at two sites in Colombia (Santander de Quilichao and Pivijay) and through a series of trials set up in severa1 Asian countries in collaboration with national programs. In Colombia, the long-terro response of cassava to fertilizer application indicated that reasonable sustainable yields could be obtained on infertile soil with moderate levels of K fertilizer but no N and P applications, provided that
iii

organic matter (OM) is high. In sandy soils with low OM, sustainable casaava production requires application of NPK fertilizer.
These results are being corroborated in Asia, where soils are low in organic matter and nutrients. In short-term trials, cassava has shown a marked response to N application but little or no response to either K or P.
Research on bóth continents has shown that soil erosion in cassava-based cropping systems on hilly lands can be greatly minimized by cultivating cassava in contour ridges, with grass barriers, or by using mulch and live ground cover of forage legumes. Agronomic practices that resul t in rapid canopy closure, such as fertilizer application in poor soils and closer spacing, also reduce soil 106161.
In smallholder agriculture cassava is frequently intercropped with other species, especially ma1ze. On-farm research (OFR) on the Atlantic Coast region of Colombia, carried out in cooperation with ICA, continues to increase our knowledge on the interaction of cassava with maize. Results this year show that cassava responds positively to fertilizer applications designed for and applied to the maize intercrop. Furthermore, nutrient balances reveal that cassava is more efficient than maize in the use of nutrients, especially P and K, per unit of dry matter (OM) produced.
The trials also illustrate the important role that cassava plays in reducing risk and sustaining a minimum level of production for the small-scale farmer. In monocropping, the stability of cassava production over time is much greater than for maize. Finally, under the biotic and abiotic conditions prevailing in the region under study over a four-year period, no yield reduction was observed when planting material was selected from plants that had always been intercropped with maize as compared with planting material taken from monocrop plantations. This suggests that intercropping cassava with maize has no effect on the quality of the planting material produced.
In the area of cassava utilization research, the highlights include the construction and initial operation of the first pilot plant for producing high-quality cassava flour. This plant is operated and managed by a small farmer cooperative in Córdoba, Colombia with funding from the International Oevelopment Research centre, IORC. A recently completed national market survey for cassava flour has identified a potential of 30,000 t/yr for the meat processing and biscuit industries.
iv
Improvements in the traditional starch extraction and fermentation industry processes in Colombia have been designed, and studies relating sour starch functional properties to physicochemical characteristics, initiated. Initial results showed the "expansion power" on baking, a characteristic of the starch. Improvement of small-scale indigenous starch (unfermented) processing is being Hcarried out by national programs in Ecuador and Paraguay with CIAT's assistance.
Experiments have shown that the chemical treatment of the fresh roots to prevent microbial deterioration can be delayed for 24 h after harvest, provided the roots are immediately packed into polyethylene or polypropylene sacks. This permits centralized treatment and repacking of the roots, which has improved product quality contro,l in the Barranquilla pilot project.
with respect to quality research, improved methodologies for starch and cyanide analysis were instituted during 1990. Results from soil fertility and water stress experiments of the Physiology Section clearly show the importance of the preharvest environment in determining root qua 1 i ty. Adequate levels of K are essential for obtaining roots with good eating quality while excessive application of P may have an adverse effect.
During the second year of the Kellogg Foundation-financed project in the state of Ceará, Brazil, 20 new farmer groups were organized, and there are 35 cassava agroindustries functioning. The total output for this second year is approximately 1200 t of dry cassava chips.
Institution strengthening has been actively maintained through the consolidation of the Ceará State Cassava Committee and the formation of five Regional Cassava Committees in each of the main areas covered by the project. These committees have started to play important roles in implementing the project, especially in areas such as training, selection and organization of new farmer groups, technical assistance for farmers, commercialization, and monitoring and evaluation of the project.
CIAT HQ staff have been providing backup support for the state research and extension agencies in establishing technology validation trials (pre-production plots) and in developing methods for controlling the mycoplasmlike witches' broom disease, which is causing serious yield losses.
After a difficul t year in 1989, the cassava development project in Manab1 Province, Ecuador has consolidated; and with the reactivation of the shrimp industry, it should have
v

a record year in terms of cassava flour and starch production. The 18 farmers associations have projected a total of 1800 t of cassava products, principally flour (8S%) for balanced shrimp feed and starch (12%) for the cardboard box industry. A high DM clone introduced from Colombia has proved to be well adapted to the prevailing edaphoclimatic conditions, and its widespread adoption could result in considerable benefits for cassava producers and processors.
Research Networks and Workshops
Existing regional research networks in Latin America and Asia were consolidated, and the first steps were taken toward the formation of a network for the subtropical region of Latin America. The II Latin American Cassava Breeders Network Meeting was held in Cruz das Almas, Brazil from 21-24 May with representatives from 9 countries. Impartant decisions were taken regarding future collaborative activities: (1) the systematic study of cassava ecosystems according to varietal performance; (2) the exchange of elite clones among countries; (3) the preparation of a uniform list of characteristics for evaluation in breeding and for communicating results; and (4) the establishment of informal communication mechanisms among members of the network.
The III Asian Cassava Research Workshop was held in Malang, Indonesia froro 22 to 27 October. Researchers from 12 Asian countries presented 30 papers on varietal improvement, crop manageroent, processing and utilization of cassava. It was agreed that the scope of the regional network should be extended to include socioeconomic and utilization aspects of cassava, with emphasis being put on technology transfer and improved information exchange.
A two-day meeting (15-16 October) was he Id in Asunción, Paraguay with representatives from southern Brazil, Paraguay and Northern Argentina to discuss the convenience of promoting horizontal cooperation among these countries with respect to cassava research and development for subtropical environments. Support for this initiative was unanimous: areas of cooperation were outlined, research priorities delineated, and a plan of action drawn up.
Training
1990 saw a radical change in the type of course offered by the Cassava Program at CIAT HQ. The traditional 5-week intensive roultidisciplinary course for new cassava researchers and extension leaders was dropped in favor of a two-week introductory course organized around the productionj processingjmarketingjutilization cycle of the crop in which the interdisciplinary nature of cassava research and development was stressed. participants then either pursued a
vi

period of disciplinary specialization or participated in a three-week course on integrated cassava development projects. This arrat)gement appears to meet better the actual needs of Latin American cassava workers.
Members of the Program participated in a very successful course organized by the Seed unit on cassava stake production and distribution systems held from 27 to 31 August for participants from Panama, Colombia and Ecuador. It is envisaged that the demand for this type of training will increase as further integrated cassava proj ects get under way.
Proqram Developments
Rupert Best, formerly Head of the Cassava utilization Section, was appointed Leader of the Program as of 1 May 1990. He replaced Anthony Bellotti, who accepted the additional responsibility of Acting Leader during the interim period between the departure of James Cock in July 1989 and the appointment of Rupert Best. Christopher Wheatley was subsequently appointed Head of the utilization Section. Guy Henry, Economist, joined the Program on 1 January 1990; and Susan Poats, Anthropologist, replaced Stephen Romanoff in the cassava development project, Manabí, Ecuador as of 1 April.
vii
1. CASSAVA GERMPLASM RESOURCES DEVELOPMENT
1.1 Introduction
1.1.1 objectives of cassava germplasm development
Genotype-based technology is one of the principal components of CIAT's strategy aimed at improving cassava's contribution to human welfare in the tropics. Through a range of activities in germplasm resources management and development, the CIAT Cassava Program supports national and international institutions by providing components for improving cassava varieties and for promoting these varieties to farmers. Within this mandate, the central activities are stewardship of the world germplasm collection, building the knowledge base upon which genetic improvement depends, genetic improvement for national program needs, and institutional support and strengthening. These activities necessarily involve a multidisciplinary effort within the Program and with other units in CIAT, and close linkages with collaborating national and international institutions.
specific objectives of germplasm development are to:
Play a leading role worldwide for cassava and wild Manihot germplasm management activities, especially conservation and characterization
Build upon the knowledge base necessary for sustained genetic improvement, in areas of genetics, physiology, pest and disease management, crop and soil management, and quality
Develop improved germplasm through genetic manipulation in the form of broad-based gene pools, from which national programs can directly select superior new clones, or alternatively, use selected clones as parental material in further breeding
Provide training to national program personnel
Create mechanisms for networking among national programs
Develop a production technology based on true cassava seed
1.1.2 Regional priorities
The Cassava Program has a world mandate. Priorities and modus operandi among regions are determined by a combination of factors including importance of cassava production, characteristics of national programs, available genetic
1

diversity, presence of lITA with regional responsibility in Africa, and funding opportunities.
The Program divides responsibilities for germplasm development into three sections: the HQ program, which responds to regional program needs and has principal responsibility for Latin America; an Asia regional program based in Bangkok; and an Africa regional program based at lITA HQ in Nigeria.
Germplasm cOllection, conservation and evaluation, as well as gene pool development, are given emphasis in Latin America--center of diversity for cassava, its wild relatives and the pests and diseases affecting the crop. For Asia and Africa, the emphasis is on increasing genetic diversity and on introducing genes for resolving specific problems. A CIAT breeder is posted in each of these last two regions. In the case of Asia, the breeder coordinates activities directly with national programs; and considerable emphasis is given to institutional strengthening and networking activities. In Africa the breeder works within IITA's ongoing cassava improvernent efforts to assure the effective two-way flow of information and germplasm between the two centers.
The following sections surnmarize the rnain activities and results of cassava breeding in the three regions.
1.2 HQ Research/Latin America
1.2.1 Germplasm management
1.2.1.1 Management objectives and strategies. Germplasm management includes the activities of collection, conservation, characterization and documentation of cassava and wild Manihot species. CIAT has assumed world responsibility for conservation of cultivated cassava, but no formal arrangements have yet been made at the international level to coordinate the management of the wild species. Nevertheless, CIAT intends to begin a major effort in wild species conservation, evaluation and utilization as part of a long-term strategy for exploiting these potentially valuable genetic resources. The main responsibility tor managing the wild species will reside with the Genetic Resources unit (GRU), working closely with the Cassava Program, especially with respect to evaluation and utilization.
CIAT works toward management strategies that are costeffective yet provide high assurance of long-terro germplasm coneervation at low levels of risk of loss, contamination by peste or pathogens, or genetic modification. These strategiee at present include the conservation of the collection both in vitro and in the field. The latter is a working collection for providing planting material for experimental
2

purposes and for direct evaluations. The in vitro col lection, while not technically a base collection, serves as a more se cure means of conservation and as a forro for international gerroplasm exchange.
1.2.1.2 In vitro management of cassava (Manihot spp.) gerroplasm. In February a new tissue culture laboratory was established in the Gerroplasm Resources unit (GRU). SUbsequently, the responsibility of in vitro cassava gerroplasm management was transferred from the Biotechnology Research unit (BRU) to the GRU. This responsibility includes three aspects of in vitro gerroplasm management:
Gerroplasm conservation Gerroplasm exchange Production of disease-free clones in collaboration with the Virology Research unit (VRU)
Germplasm conservation. As a valuable complementary method to back up cassava gerroplasm conservation in the field, in vitro conservation provides a means for maintaining large collections in small spaces, free of pests and diseases, and without risk of loss to climatic changes or soil problems. Cassava pathogen-tested clones are maintained in vitro to allow the propagation of new disease-free plants at any time.
Cassava clones in the in vitro active genebank are maintained under the following slow growth conditions:
23-24 ·C, constant throughout day (12 h) and night (12 h) 1000-1500 Ix illumination In a slightly modified culture medium Test tubes (20 x 150 mm) capped with aluminum foil Five test tubes per clone
Materials need to be subcultured every 12 to 18 months, depending on the genotype. The nurober of in vitromaintained clones this year was 4354 from 23 countries (Table 1.1); thus, 94% of clones of the field genebank is already conserved.
Gerroplasm exchange. Up to 1980 the principal forro of gerroplasm transfer was via lignified stem pieces (stakes). with the development of in vitro techniques, shipment of vegetative material has been almost exclusively by this method. Recently there has be en renewed interest in introducing vegetative material--either elite hybrids or basic gerroplasm. As many programs have developed a capability for producing their own hybrids, they are looking for specific traits from CIAT to incorporate into their breeding populations. In 1988
3
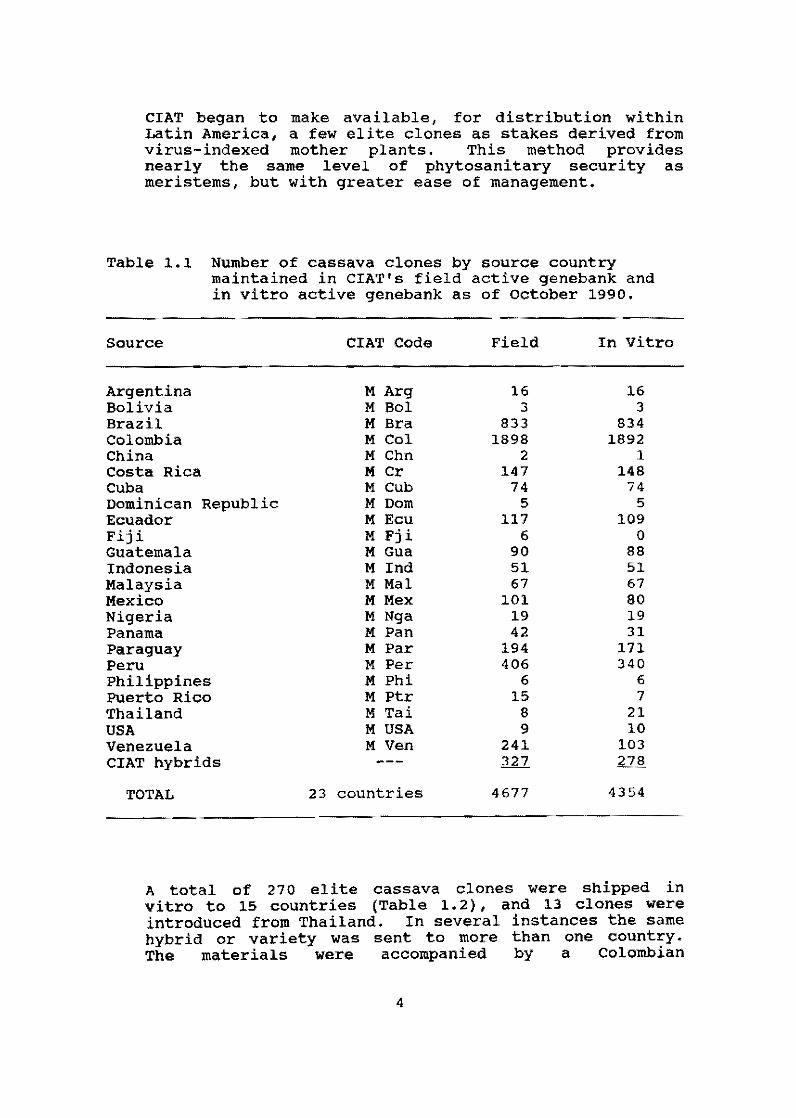
CIAT began to make available, for distribution within Latin America, a few elite clones as stakes derived from virus-indexed mother plants. This method provides nearly the same level of phytosanitary security as meristems, but with greater ease of management.
Table 1.1 Number of cassava clones by source country maintained in CIAT's field active genebank and in vitro active genebank as of October 1990.
Source CIAT Code Field In vitro
Argentina M Arg 16 16 Bolivia M Bol 3 3 Brazil M Bra 833 834 Colombia M Col 1898 1892 China M Chn 2 1 Costa Rica M Cr 147 148 Cuba M Cub 74 74 Dominican Republic M Dom 5 5 Ecuador M Ecu 117 109 Fiji M Fji 6 O Guatemala M Gua 90 88 Indonesia M Ind 51 51 Malaysia M Mal 67 67 Mexico M Mex 101 80 Nigeria M Nga 19 19 Panama M Pan 42 31 Paraguay M Par 194 171 Peru M Per 406 340 Philippines M Phi 6 6 Puerto Rico M Ptr 15 7 Thailand M Tai 8 21 USA M USA 9 10 Venezuela M Ven 241 103 CIAT hybrids 327 278
TOTAL 23 countries 4677 4354
A total of 270 elite cassava clones were shipped in vitro to 15 countries (Table 1.2), and 13 clones were introduced froro Thailand. In several instances the same hybrid or variety was sent to more than one country. The materials were accompanied by a Colombian
4

Phytosanitary certificate and a CIAT Phytosanitary Statement, which describes the procedures, treatments and pathogen testing carried out on the material in preparation for shipment, together with a list of clones being sent and a recommended handling procedure.
Table 1.2 CIATts international exchange of caSS8va clones. involving in vitro techniques, by COU'ltry and institution, 1990.
Country
Austria Bolivia Brazil Costa Rica Ecuador flii france Guatemala England
Japan
Phi l i~ines
Peru
Thalland
Tonga
USA
TOTAL
Institution
lAEA-Laboratories [BTA CEIlAAGEN (EMPASC)
Univ. of Costa Rica [NIAI' Plant heal th 01 SPC/UNOP
ORSTOH
Mayacrops S.A.
uni wrs i ty of 8ath
Cell biologYI Unilever Research The John Iones lnstitute Japan Association of the Intem.
Garden & Greenery Exposition Phi lippines Root Crop Research
& Trainjng Center (PRCRTC) [NIIA
Field Cropsf Research Institute Taufaia hau-Road Nultu's lofa Washington State Unlversity USOA Plant GerJll)lasm Qusranthle tenter
University 01 Georgia/USAIO
20
1 Clenes (No.)
Distril>.lted
fr"'" CIAT
7
140 11
2 10 2
13 5 5
8
18
19 3
15
2
270
Introduced
to CIAT
13
13
Five to ten test tli:>es per clone were shipped; often the sane clone was distrH:uted to several cOU"Itries.
Under the agreement of collaborative project,
the IFAD-supported CIAT-EMPASC shipments to EMPASC (Santa
5

Catarina, Brazil) were begun of 434 clones that or1g1-nate from subtropical environments as pathogen-tested, in vitre clones.
In vitro techniques, associated with extensive pathogen testing, have been used for distributing and introducing cassava germplasm in the last ten years. During this period, 2292 clones were distributed te 46 countries and 2010 clones were introduced to CIAT froro 15 countries (Table 1.3). Those figures demonstrate the scale and efficiency of the world in vitro germplasm exchange systero, which has been developed in collaboration with national and international agencies.
Table 1. 3 Number of cassava clones distributed from or introduced to CIAT, using in vitro techniques, 1980-90.
Distributed from CIAT Introduced to CIAT
Countries Clones1 Countries Clones1
Region (No. ) (No. ) (Ne. ) (No. )
America North 1 20 1 10 South 8 967 4 1,540 Central 15 787 3 267 Caribbean 2 27
Asia 8 324 5 168 Africa 1 51 1 19 Europe 3 14 Oceania 4 84 1 6 Other (Far East) ~ 18
TOTAL 46 2,292 15 2,010
1 Usually 5 to 10 test tubes per clone were shipped; eften the same clones were distributed to several countries.
Table 1. 4 summarizes seed shipments by regien over the last five years (1986-90). In the late 19705, CIAT began te give relatively more emphasis te sending segregating populations rather than finished varieties
6

as national programs developed increasing capabilities for managing the full range of breeding activities.
Disease elimination. Whenever possible only cassava plants that show no evidence of viral diseases are selected for the in vitro collection. To ensure disease-free in vitro plantlets, a disease elimination technique was developed in the BRU for cleaning pathogens from clones. Small (0.2-0.3 mm) meristem tips are cultured from apical buds of newly sprouted shoots at 40·C day and 35·C night temp for 3 to 4 weeks. In cases where no stakes are available--Le., the germplasm was introduced to CIAT as in vitro plantlets--then in vitro thermotherapy is applied. Rates of virus elimination depend, to a large extent, on the size of the explant used for culture and on whether thermotherapy was applied or not, as well as on the virus strain.
Table 1.4 Summary of cassava seed shipments, 1986-90.
No. of No. of No. of No. of Region Shipments Crosses Seeds Clones
Africa 11 722 108372
Asia 37 1978 125586 189
Middle East 1 6
Caribbean 8 325 20259 136
Meso-America 15 709 39045 146
South America 11 656 35665 863
North America 7 39 5700 20
Europe 13 70 37450 34
TOTAL: 102 4499 372077
7

The disease-free status of the plants is validated through indexing. Viruses and viruslike diseases oi major concern for elimination at CIAT are cassava common mosaic virus (CCMV), cassava Colombian symptomless virus (CCSPV), cassava X virus (CsXV), Caribbean mosaic disease (CMD), frog-skin disease (FSD) and some latent agents. Thermotherapy before or during meristem tip culture has been applied at CIAT to some 4300 cassava clones in the last ten years.
The development of sensitive virus diagnostic techniques by the VRU has facilitated producing pathogen-tested cassava clones. Tests to detect viruses are carried out on in vitro plantlets and on plants that have been moved to the greenhouse. A total of 1377 clones have been cleaned and indexed by using diagnostic techniques (ELISA) for at least CCMV and CsXV: and 140 clones have been indexed for the frogskin disease by grafting onto an indicator clone.
The disease elimination technique continued to provide healthy material for:
Distribution of elite clones to national programs Recovery of pest-infested, diseased or damaged clones from the field collection Provision of clean seed stocks for regional variety trials and eventual cleanup of the whole collection
1. 2.1. 4 wild Manihot species. The wild relatives of !:L.. esculenta are receiving increasing attention for their potential as sources of useful traits for improving cassava. Genes for characters such as apomixis (form of asexual reproduction by seed), virus resistance and low HCN are thought to be present in wild Manihot germplasm. Table 1.5 shows the present status of wild Manihot germplasm conserved in the in vitro genebank. In vitro micropropagation techniques of cultivated cassava are not readily extrapolated to wild species. The BRU developed in vitro culture techniques for wild Manihot spp., whereby embryos from seeds are extracted and cultured in sterile media. A student thesis was initiated to study further improvement of the in vitro management of wild germplasm.
1.2.1.5 Isozyme characterization. In 1988 the GRU began characterizing the entire cassava collection for banding patterns resulting from electrophoresis on polyacrylimide gels of alpha-beta esterase extracts of root tip tissue. Thls system was the one that demonstrated the highest degree of polymorphlsm (22 bands tentatively defined). The objectlves of thls analysls are to:
8

Table 1.5 wild Manihot speeies maintained in vitro at elAT.
Manihot Speeies
aeseulifolia alutaeea anomala brachiloba caerulescens carthaginensis chlorostiea cecropiaefolia epruinosa filamentosa flabellifolia frutieulosa glandulifolia glaziovii guaranitiea hastatiloba irwinii jaeobinensis longipetiolata orbicularis peltata pentaphylla pilosa purpureo-costata sparsifolia triphylla tristis rubrieaulis violacea violacea
spp. reeurvata
Abbreviation
aes alt anoro bra cae cth ehl cee epr fmt fla fru gld gla gua has irw jae Ion orb pel pnt pil pur spr tph tst rub vio vio
Others (taxonoroieally undefined) 6047-75663 167-71323 666.10-470.80 595-075698
TOTAL: 34 species
9
No. Genotypes
3 9 2 1
35 185
9 6 1 5
41 2 1 4
48 4 2
29 7 9 1 2 3 1 3
24 41 21
4 2
1 1 1 J.
509

Characterize the cassava germplasro with environmentally stable descriptors
Apply these descriptors to the identification of duplicates in the collection, thereby strearolining both field and in vitro conservation
utilize these co-doroinant roarkers in better elucidating the genetics of cassava
Apply results to study of genetic diversity in cassava
In the last two years, 3238 cassava clones froro 20 countries, as well as hybrid material s froro ICA-Colombia and CIAT, have been fingerprinted. This represents about 75% of the entire collection assembled at CIAT (Table 1.6). Every
Table 1.6 status of cassava germplasm collection at end of 1990.
Country of Origin
Argentina Bolivia Brazil China Colombia Costa Rica Cuba Dominican Republic Ecuador Fiji Guatemala Indonesia Malaysia Mexico Nigeria Pan ama Paraguay Peru Philippines Puerto Rico Thailand United States Venezuela CIAT Hybrids
TOTAL
10
No. Clones Analyzed for a!3-Esterase
o O
785 1
912 137
74 5
114 6
85 51 66 81 16 40
130 240
6 15
8 ~
236 223
3239

electrophoretic isozyme pattern is analyzed quantitatively by means of a laser densitometer and qualitatively by codifying the presence/absence of each of the 22 bands. Thus far, 1719 different electrophoretic patterns have been identified, with about two-thirds (1167) being represented by a single clone in the collection. The highest number of identical patterns was 39 (Table 1.7).
Table 1.7 Description of banding patterns resulting from electrophoretic analysis of alpha-beta esterase in 3288 germplasm accessions.
No. of Distinct No. of Clones for Total No. Esterase Patterns Each Pattern Clones
1167 1 1167 291 2 582
96 3 288 55 4 220 29 5 145 19 6 114 13 7 91
8 8 64 9 9 81 8 10 80 2 11 22 5 12 60 2 13 26 3 14 42 2 15 30 2 17 34 1 19 19 1 20 20 2 23 46 1 24 24 1 26 26 1 29 29 2 39 78
1719 3288
11

Preliminary studies were carried out on the genetics of esterase isozymes. Understanding the inheritance is es sential for interpreting genetic variability in cassava properly; aiding in the definition of gene pools; determining relationships between cultivated and wild relatives; and constructing linkage maps. Ideally, the study of isozyme inheritance in cassava would involve selecting polymorphic parental material and characterizing F
1, F2 , reciprocal and
backcross populations. Because of the aif!Lculty of obtaining seed in cassava, it is often not possible to meet the normal requirements for complete genetic studies. Nevertheless, some useful preliminary information was obtained.
Four crosses were analyzed using both a hypothetical diploid and a tetraploid modelo The esterase 1 locus (EST-l) comprises 4 active alleles (A , A , A and A4), thus presenting a possible total of 1! ph~not~pes and 15 genotypes for the locus. EST-l presents a maximum of four bands (alleles) for the locus and two for each individual. EST-l was defined as monomeric, with a disomic inheritance.
1.2.1.6 Methodology for duplicate identification. Germplasm conservation for vegetatively propagated species is generally costly compared to seed conservation. Thus it is critical to continue seeking ways of making the process more efficient. One obvious contribution would be to eliminate duplicate accessions in the collection. While there have been no studies to date to quantify potential levels of duplication, simple observation indicates this to be on the order of 20%. Most of the collection has be en classified for the basic morphological descriptors defined by the International Board for Plant Genetic Resources (IBPGR). However, these alone do not provide a high enough level of confidence to make a definitive identification of duplicates. The additional b1ochem1cal descriptor, alpha-beta esterase, whose analysis has nearly be en completed for the germplasm collection, provides an additional powerful tool to raise the level of confidence in clonal characterization.
During 1990, alternative procedures ware studiad for identifying duplicates. To develop a modal that could be applied to the entire collection, a group of 175 clones from the North Coast of Colombia, in which a high dagree of duplication was suspected, were studied. Grouping of clones was based individually on morphological and¡or b10chemical traits (alpha-beta esterase banding). The final criteria to select the best procedure included empir1cal analysis of which descriptors should be given greater¡lesser weight, depending upon the degree of environmental influence on their expression.
The procedure consisted of
that appeared to work most satisfactorily two stages: The first stage involved the
12
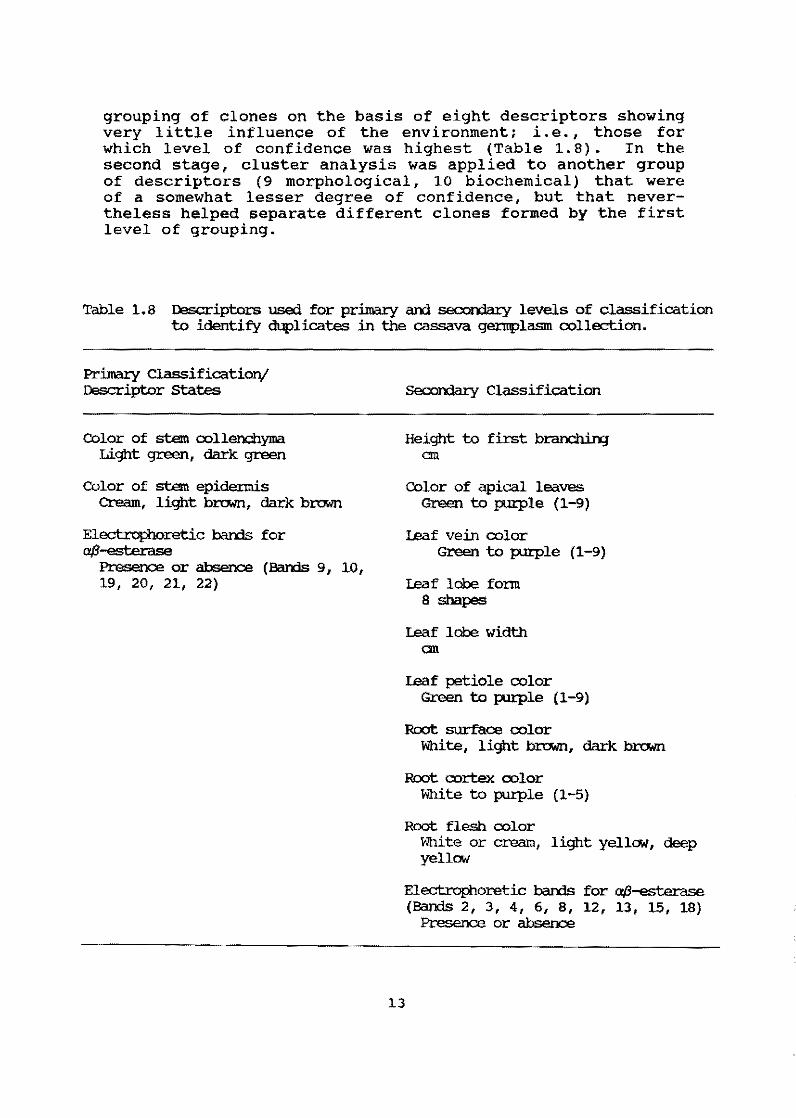
grouping of clones on the basis of eight descriptors showing very little influence of the environment; Le., those for which level of confidence was highest (Table 1.8). In the second stage, cluster analysis was applied to another group of descriptors (9 morphological, 10 biochemical) that were of a somewhat lesser degree of confidence, but that nevertheless helped separate different clones formed by the first level of grouping.
Table 1. 8 lRscriptors used for primary and secon:lary levels of classification te identify duplicates in the cassava gernplasm oollection.
Primary Classificationj lRscriptor states
Color of stem oollenchyma Light green, dark green
Color of stem epidermis cream, light brcMn, dark brovm
Elect.ro¡:iloretic bands for aj3-esterase
Presence or absence (Bands 9, lO, 19, 20, 21, 22)
SecoI'l:lal:y Classification
Height te first branching cm
Color of apical leaves Green to purple (1-9)
Leaf vein oolor Green te purple (1-9)
Leaf labe forro 8 shapes
Leaf labe width cm
Leaf petiole oolor Green to purple (1-9)
Root surface oolor White, light brovm, dark brovm
Root oortex oolor White te purple (1-5)
Root flesh oolor White or creatn, light yellow, deep yellow
ElectJ:"oI:horetic bands for aj3-esterase (Bands 2, 3, 4, 6, 8, 12, 13, 15, 18)
Presence or absence
13

The model will now be applied to the entire collection. After defining potential duplicates via statistical analysis, these groups will be planted together in the field for a further comparison of morphological traits. If no differences are observed in these two stages of comparison, they will be assumed to be genetically identical (Le., duplicates). These duplicates will be eliminated from the field collection but will be maintained in the in vitro collection until a further level of testing can be applied to confirm genetic identity, such as other isozyme systems or restriction fragment length polymorphisms (RFLPs).
1.2.2 Gene pool development
1.2.2.1 General objectives and strategy. Definition of gene pools on the basis of adaptation to climate and soil conditions, and biological constraints, has been a core concept of cassava varietal improvement at CIAT over the past decade (see past annual reports). During 1990, two basic modifications were made to the gene pool descriptions. First, based on the recognition of the growing importance of semiarid regions for expanding cassava production--especially in Africa and NE Brazil--this edaphoclimatic zone (ECZ) was added as a new objective for gene pool development.
Secondly, the growing concern about effects of HCN on human heal th--especially in Africa but also in other regions-motivated the subdivision of each gene pool into a low HCN pool and one for which HCN was not considered. As high HCN is preferred for certain industrial processes, the generalized selection for low HCN cannot be justified. Two exceptions are the mid-altitude areas (ECZ IV) and the highlands (ECZ V), corresponding to the Andean zone and the mid- and high-altitude areas of Africa, where only low HCN clones are required. A summary of the new classification is presented in Table 1. 9 .
To date, the strategy with regard to root sur'face color has been to maintain variability within gene pools, so that national programs can select according to their own preferences. This strategy may result in some instances of a high proportion of unsuitable root color and therefore a narrower than desirable genetic diversity available for selecting. Nevertheless, it is not felt that separating gene pools by root color is justified. As program emphasis shifts toward providing parental genotypes rather than germplasm for direct variety selection and with increased emphasis on Africa, a reassessment of the strategy for selecting for root sur fa ce color may be necessary. The proportion of white-rooted materials appears to be highest in the gene pool for ECZ I, due in large part to the extensive use of white-rooted materials as parents in the past decade. For
14

Table 1.9 Revised ~iption of gene pools for defini.rxJ cassava gentplasm developnent.
No. Description
1 SuJ::humid tropics
lIC SuJ::humid tropics; lCM HCN
:2 Acid-soil savannas
:2IC Acid-soil savannas; lCM HCN
3 Humid tropical lCMlands
3IC Humid tropical lCMlands¡ lCM HCN
4IC Mid-altitu::le tropics; lCM HCN
5IC High altitu::le tropics; lCM HCN
6 SUbtropics
6IC SUbtropics¡ lCM HCN
7 Semiarid
7IC Semiarid¡ lCM HCN
:Representativa eountriesjRegions
Mexico (Yucatan Peninsula); NE Brazil¡ NE 'lbailaro; I:Xlminican:Rep. ¡ N. Venezuela
Colombia (N. Coast & Santanderes); Panama (Cocle) ¡ suJ::t¡umid belt of Africa (N Nigeria, Benin, Tanzania), Ecuador (NW Coast)
Mexico (Tabasco) ¡ llanos of Colanbia & Venezuela; Brazil (Cerrado)
0Jba¡ W. Africa savannas; RliliWines; Panama (Ocú)
Amazon Basin (Brazil, Colombia, Peru); West Java & SUmatra¡ Malaysia; S. Vietnam
Equatorial West Africa
Al:rlean zone; central arazilian highlands; midaltitude areas of Nigeria, camercon, E. Africa
S. Brazil; N. Argentina; Orina; N. vietnam
CUba; Paraguay; S. Africa
NE Brazil
NE Colombia; (Guajira) semiarid belt of West Africa: Tanzania: Mozambique; :RwanJa, FlU:rurxii
1 I1::M HCN gene pools can also lOOVe to equivalent ECZs indicated for lCMjhigh HCN pools, but not vice versa.
For the Íl:t'IJr¿rljate futura the follCMing gene pools or gene pool cambinations are cont:en¡llated, with possible disaggregation in the futura: lIC aro 4IC; 1: :2 aro 3; :2le aro 3IC; 5IC; 6; 6le; 7: 7IC.
15

example, M Col 22, M Col 1684 and M Bra 12 participated as parents in 27.9, 21.0 and 7.7%, resp., of elite clones.
1.2.2.2 studies on efficiency of selection. Each harvest season a breeder faces the challenge of selecting genotypes within each gene pool that will be kept for next season and that can be used as new parents. Those rejected (the large majority) are generally lost permanently. Selection usually takes into account information about the performance of a particular genotype in previous years, other locations and early stages of development (especially with respect to disease and pest reactions). For optimal genetic progress, selection criteria need to be based on solid, well-analyzed data.
Data from yield trials involving different sets of genotypes at four environments (2 locations, 2 seasons) were used to estimate the expected response to selection (% improvement over the experimental mean when selecting the top 30%). Four characters were considered: root yield (RY) (tjha), harvest index (HI), dry matter (% DM), and DM yield (tjha). Direct and indirect response to selection was estimated considering selection for each individual trait; simple index selection [(1= H P + H P + ••. + H P j, where H = broad sense heritabilitJY l¡,f tr~ii n, and P n= Ithe phenoty\hc value of trait n]¡ and rank summation indeº.
For this particular set of data (Table 1.10), using DM yield as the main selection criterion seems to be the most effective in terms of improving crop productivity. In two cases, using DM yield gave no expected improvement in % DM, but in those cases % DM is already high (> 32%). Using simple selection indices do es not seem to improve the efficiency of selection.
Considerable emphasis has be en given in the past to MI as one of the principal selection criteria because of its high positive correlation with yield and its high heritability. At the levels observed in this experiment, however, other traits--possibly including duration of leaf area index (LAI), photosynthetic efficiency, and the capacity of a clone to take full advantage of the whole growing cycle-seem to contribute more to final yield.
Even though the aboye yield components constitute high priority for selection, many other traits need to be considered as well, including MCN content and cooking quality, which seem to have little or no relation to yield.
1.2.2.3 Heritability estimates. since the beginning of the 80s, cassava breeding at CIAT has been oriented toward specific ECZ adaptation. In order to compare estimated and realized genetic progress in cassava breeding during this
16

rabIe 1.10 Efficiency of selection in cassava using indlVidual trait selection, simple selectfon index, and rank summation indexo
Trial: GY8918 - EeZ I·S ... oo A GY8958 - ECZ ¡-S •• son B GY8925 • Eez II-Sea.en A GY8962 - EeZ II-Sea.on B
Response j n: RY HI % DM DMY RY MI X OM DMY RY HI % DM DMY RY MI XOM DMY
Selection tor fndiv1<:tu~l TreHs
RY 0.22 0.07 0.02 0.26 0.13 0.12 -0.01 0.14 0.12 0.15 0.00 0.11 0.22 0.12 -0.03 0.22 HI 0.11 0.13 0.00 0.12 0.10 0.13 -0.01 0.11 0.25 0.10 -0_02 0.21 0.17 0.14 -0.02 0.17 XDM 0.07 0.00 0.06 0.14 -0.02 '0.01 0.05 0.01 -0.09 '0.04 0.06 '0.02 -0.02 -0.04 0.07 0.04 DMY 0.20 0.07 0.04 0.27 0.12 0.12 0.00 0.14 0.23 0.10 0.00 0.22 0.20 0.011 0.02 0.25
.... Simple Selection Index
..,¡
RY + MI 0.21 0.11 0.01 0.24 0.12 0.13 -0.01 0.13 0.24 0.11 '0.02 0.20 0.21 0.13 '0.03 0.21 RY+XDM 0.21 0.07 0.03 0.26 0.12 0.11 0.00 0.14 0.24 0.01 0.00 0.21 0.20 0.08 0.02 0.25 MI + X DM 0.13 0.11 0.02 0.16 0.08 0.12 0.01 0.11 0.10 0.14 0.02 0.10 0.16 0.14 -0.01 0.18
Rank Sunnation Irdex
RY + HI 0.21 0.11 0.01 0.24 0.12 0.13 -0.01 0.13 0.23 0.12 '0.02 0.19 0.21 0.13 '0.03 0.21 RY + % OH 0.19 0.06 0.04 0.26 0.06 0.05 0.03 0.09 0.15 0.05 0.03 0.17 0.11 0.02 0.04 0.17 MI + X DM 0.12 0.09 0.04 0.17 0.04 0.08 0.04 0.07 0.04 0.10 0.04 0.08 0.07 0.08 0.03 0.12
Mean fer the Trait 17.0 0.55 28.6 4.90 23.7 0.50 36.0 8.53 23.7 0.57 32.0 7.56 19.1 0.50 30.8 5.80
Heritability 0.64 0.76 0.69 0.72 0.46 0.82 0.84 0.54 0.83 0.79 0.65 0.76 0.56 0.74 0.75 0.65

period, as well as to assess present and future breeding strategies, a systematic evaluation of genetic variability was undertaken. Broad sense heritability estimates (H) were obtained by regression analysis using information from the performance of sets of clones in consecutive years from 1981 to 1989. Estimates were obtained for the two main selection sites (Media Luna - ECZ 1 and Carimagua or La Libertad - ECZ 11); two growing seasons (A and B); and two stages of selection (Ca, single-row, nonreplicated observation trials; and EPR, mul tiple-row, nonrepl icated yield trials) (Table 1. 11) •
Pooled estimates showed high H values (0.40-0.60) for HI, % root DM, HCN content, and reaction to superelongation disease (SED); intermediate values (0.20-0.40) for RY, and visual evaluation of foliage; and low values «0.20) for visual evaluation of roots and reaction to CBB.
Estimates based on EPR tended to be higher for those traits with low and intermediate pooled-H estimates as compared to those from ca. Higher values were obtained for ECZ 1 and season B, for RY and % DM. A negative association between overall performance for a trait and H estimate was observed.
1.2.2.4 Progress in gene pool development
ECZ 1 (Lowland tropics with low to intermediate rainfall and long dry season). Media Luna (Magdalena) and ICA-El Carmen (Bolívar) are the principal and secondary selection sites, resp., for this zone. They are characterized by poor soils (especially low P), and severe water deficits during the latter part of the growing season. In 1990 there was a low incidence of the most relevant pests for the region (thrips and mites) in both seasons. Selection was based primarily on productivity, plant type and quality.
During Season A, the pre-released clones (CG 1141-1 and CM 3306-4), together with clone CM 4777-2 had excellent % DM (Table 1.12). There were many clones with higher productivity (DM yield) than the checks and the prereleased clones; however, few of those had cooking quality as good as the local checks. These are of potential interest for industry. Four introductions from Brazil have demonstrated good adaptation and productivity under Media Luna conditions; and they will broaden the genetic base available for ECZ l.
18

Table 1.11 Pooled heritability ~imates for different locations, seasons and selection stages.
Root Yield Harvest In:iex % Dry Matter HCN
ECZ Season oofEPR EPIVER oofEPR EPIVER oofEPR EPIVER OOfEPR EPIVER
I A 0.29 0.26 0.59 0.52 0.68 0.47 0.61 0.44
I B 0.29 0.48 0.71 0.68 0.67 0.31 0.48 0.52
II A 0.08 0.51 0.35 0.44 0.08 0.51 0.18 0.63
II B 0.59 0.37 0.63 0.57 0.59 0.37 0.62 0.60
0Vera11 0.28 0.56 0.46 0.50
Table 1.11 canto
Foliage Eval. Root Eval. CBB SED
ECZ Season oofEPR EPIVER oofEPR EPIVER COfEPR EPIVER oofEPR EPIVER
I A 0.22 0.30 0.13 0.08
I B 0.24 0.55 0.10 0.31
II A 0.17 0.28 0.36 0.26 0.00 0.33 0.57 0.30
II B 0.15 0.19 0.00 0.14 0.15 0.17 0.35 0.48
OVerall 0.26 0.17 0.15 0.42
1 00 = single-row, nonreplicated observation trials; EPR = multiple-row, nonreplicated yield trials; ER = advanced yield trials.
19

Table 1.12 Means for selected entries for the yield trial (GY8925) at Media lllna (ECZ 1), Season A.
Ha; Female Mala RY rM Yield Clone Parent Parent (tjha) HI %rM (tjha) (1-9)
M Era 191 21.5 0.46 33.4 7.2 4.5 M Era 383 27.1 0.62 31.7 8.6 7.5 M Era 390 21.8 0.53 35.8 7.8 9.0 M Era 589 26.3 0.51 33.3 8.8 8.5 o:; 915-1 M Era 12 M Col 1643 25.8 0.58 32.2 8.3 7.0 o:; 1141-1 M Mex 1 M Col 65 21.6 0.56 36.9 8.0 7.0 o:; 1320-10 M Mex 1 M Pan 51 21.4 0.57 32.5 7.0 6.0 o:; 1355-2 CM 922-2 M Mal 3 34.5 0.61 32.8 11.3 7.5 o:; 1372-5 M Era 12 M Mal 3 25.5 0.60 31.6 8.0 7.0 CM 3299-4 CM 849-1 M Col 22 17.9 0.55 33.0 5.9 5.0 CM 3306-4 M Col 22 CM 523-7 17.9 0.55 37.1 6.6 6.0 CM 3306-9 M Col 22 CM 523-7 27.0 0.67 35.7 9.6 6.0 CM 3372-4 CM 517-1 CM 840-31 24.0 0.58 30.9 7.4 7.0 CM 3555-6 CM 841-106 M Col 22 22.4 0.52 31.4 7.0 6.0 CM 3992-9 CM 681-2 M Col 1468 25.5 0.63 33.9 8.6 6.5 CM 4365-1 CM 976-15 M Col 2207 24.4 0.58 35.4 8.6 5.5 CM 4542-4 CM 681-2 M Col 1916 25.8 0.60 31.6 8.1 7.0 CM 4733-2 M Era 12 M Col 72 25.2 0.57 33.5 8.4 7.5 CM 4772-4 M Col 22 M Mal 3 23.3 0.52 32.7 7.6 5.5 CM 4777-2 M Col 72 CM 523-7 24.1 0.63 38.5 9.3 6.5 CM 4793-1 M Col 72 M Ven 77 26.6 0.54 35.1 9.3 5.5 CM 4843-1 M Col 1468 M Ven 25 26.6 0.60 32.9 8.7 9.0 CM 4919-1 M Col 2207 SM 303-3 29.2 0.75 31.5 9.2 9.0 CM 5461-5 M Col 72 M Pan 12B 21.1 0.52 33.1 7.0 7.0 CM 5577-1 a:; 22-7 M Q.¡b 74 25.0 0.57 31.8 7.9 8.5 CM 5586-1 CM 681-2 M Col 2215 20.1 0.57 34.8 7.0 6.5 CM 5644-2 CM 976-15 M Col 2215 21.1 0.69 35.0 7.4 8.0 CM 5830-4 M Mal 2 a:; 1-37 25.6 0.50 32.9 8.4 8.5
Avg 24.2 0.58 33.6 8.1 6.9 ISO (0.05) 5.66 0.06 3.73 2.0
M Col 1505 (ICA P-13) 17.8 0.50 33.1 5.9 7.0 M Col 2215 (Venezolana) 13.4 0.61 36.4 4.9 6.0
20

ouring Season B, selected entries presented similar percentages of superiority with respect to the checks as in Season A (Table 1.13). Changes in weed control resulted in better cooking quality than previous seasons. Weeds were controlled early in the season with a machete and left as mulch in the plots. No weed control was performed during the last part of the crop cycle. It is suspected that high soil temperatures negatively affect root quality. No clear relationship between % DM and cooking quality was found. Clones such as CG 959-1 and CM 4042-4, with less than 30% DM, were among the best for quality.
Given the difficulty of testing a large number of entries, the cooking of samples is left for the final stages of selection (yield trials) when only preselected materials are tested. There is usually a low frequency of good-quality clones; for that reason clones that do not seem exceptional for other trai ts may be selected when showing excellent cooking quality. Many mediumproductivity, high-quality clones may be lost at intermediate stages of selection, highlighting the importance of improved rapid methods for evaluating root quality.
ECZ II (Lowland tropics with acid-soil savannas and high rainfall). Previous years showed a steady increment in the incidence of CBB and SED at ICA-La Libertad near Villavicencio, Meta--the main selection site for ECZ II. It seemed that disease pressure conditions similar to Carimagua could be developed. This year, however, the level of disease incidence was low, especially for SED.
It will probably be necessary to enhance disease pressure, possibly through artificial inoculation, in order to have adequate selection pressure. Otherwise "elite" clones that were never checked under heavy disease pressure will be accumulated, or conversely, clones of average productivity that could be valuable for their high disease resistance might be eliminated.
During the last two months oi growing Season A, there was asevere mealybug attack, leaving little foliar area. Subsequent heavy regrowth prior to harvest resulted in low % DM. ICA-Catumare showed medium RY and high % DM, while ICA-Cebucán had low % DM. All tested entries had glassy roots when cooked, as a consequence of the regrowth (Table 1.14). Two introductions from subtropical Argentina (ECZ VI) performed well in the Llanos Orientales. This provides some support for the utilization of ECZ 11 materials in crossing blocks aimed at ECZ VI.
21

'rabIe 1.13 Means for selecta::l entries for the yield trial (GY8962) at Media Luna (ECZ 1), Season B.
Female Male Yield r:M Yield HCN Clone Parent Parent (tjha) HI %r:M (tjha) (1-9)
M Bra 99 21.9 0.52 32.1 7.0 7.5 ex:; 959-1 M Col 948C M Col 1643 29.7 0.64 29.2 8.6 4.0 ex:; 1457-2 M Col 1740 CM 507-37 20.0 0.58 29.7 5.9 8.5 CM 1442-204 M Col 1684 M Bra 12 25.2 0.62 30.4 7.7 7.5 CM 1785-6 CM 507-13 CM 326-407 27.3 0.68 29.2 8.0 5.5 CM 2976-1 CM 1252-12 CM 840-31 26.0 0.62 26.3 6.8 7.5 CM 3997-1 CM 681-2 CM 849-1 18.4 0.48 32.1 5.9 5.5 CM 4013-1 CM 922-2 CM 728-2 28.1 0.64 32.7 9.2 7.0 CM 4042-4 CM 1015-13 CM 180-5 24.8 0.65 29.6 7.3 6.5 CM 4063-6 CM 1015-42 CM 849-1 33.0 0.68 30.4 10.0 7.5 SG 536-1 M Col 948C 17.7 0.48 33.3 5.9 4.0 SG 555-10 M Col 1807 11.7 0.31 37.2 4.3 3.0 SG 756-7 M Col 71 17.6 0.60 32.2 5.7 6.5 SG 761-4 M Col 976 21.1 0.50 30.0 6.3 7.0 SG 787-10 CM 681-2 25.1 0.46 32.9 8.2 8.0 3M 328-1 M Ven 45A 21.6 0.53 33.8 7.3 7.5
Avg 23.1 0.56 31.3 7.1 6.4 ISD (0.05) 7.12 0.07 2.11 2.0
M Col 1505 (1 CA P-13) 13.4 0.42 31.3 4.2 6.0 M Col 2215 (V enezolana) 14.7 0.53 32.9 4.8 5.0
22

Tabla 1.14 Means for selected entries for the yield tria! (G'i8918) at la Libertad (EX::Z II) I season A.
Fernala Mala Yield rM Yield H<N Clone Parent Parent (tjha) HI %CM (t¡ha) (1-9
MArg 7 29.7 0.71 27.1 8.0 6.5 MArg 13 23.0 0.64 31.6 7.2 6.0 o:; 165-7 MOJl1495 M Pan 90 20.6 0.57 29.4 6.1 9.0 o:; 1139-2 M Era 5 M Fcu 82 22.0 0.71 28.9 6.4 6.0 o:; 1450-4 MOJI 1505 MOJI 1940 19.3 0.64 31.6 6.1 6.0 CM 523-7 MOJI 655A MOJI 1515 18.3 0.52 33.6 6.1 7.0 CM 2166-6 CM 430-37 M Ven 218 23.3 0.66 29.8 6.9 3.5 CM 2177-2 CM 430-37 CM 840-138 21.8 0.64 26.3 5.7 4.5 CM 2600-2 CM 523-7 M Ven 77 17.1 0.44 29.6 5.1 6.0 CM 2766-5 CM 723-3 CM 523-7 18.6 0.56 27.1 5.0 3.0 CM 2772-3 CM 727-14 M Pan 12B 12.5 0.51 25.2 3.1 5.5 CM 2952-3 CM 1145-1 M Pan 12B 16.5 0.50 27.1 4.5 5.5 CM 3311-3 MOJI 1468 CM 523-7 26.0 0.57 31.4 8.1 8.0 CM 3380-7 CM 586-1 CM 523-7 20.6 0.55 30.5 6.2 7.5 CM 4402-4 CM 1335-4 M Ven 77 23.2 0.56 30.3 7.0 5.0 CM 4574-7 CM 976-15 SM 301-3 21.0 0.41 33.0 6.9 8.5 CM 4729-4 M Era 5 M CUb 31 11.1 0.52 32.3 3.6 6.0 CM 4793-1 MOJI 72 M Ven 77 13.2 0.58 31.0 4.0 5.5 CM 5286-3 CM 1335-4 CM 1223-1 20.5 0.60 29.8 6.1 6.5 SG 104-264 VAR 2 20.7 0.56 29.9 6.1 9.0 SG 804-5 CM 523-7 17.6 0.52 31.5 5.5 9.0
Avg 19.8 0.57 29.9 5.9 6.4 ISO (0.05) 6.89 0.06 3.16 2.2
• Orlroza Morada 7.4 0.35 24.3 1.8 5.5 Orlroza Blanca 18.1 0.50 29.5 5.3 4.0 M Ven 77 18.7 0.56 28.3 5.3 6.0
23

Contrary to Season A, Season B was almost ideal, with excellent % DM and productivity (Table 1.15). Most of the tested entries had good to excellent cooking quality. Clone CM 4793-1 was simultaneously selected at ECZ 1 and 11, showing broad adaptation.
ECZ IV (Mid-al ti tude tropics). CIAT HQ serves as the selection site for ECZ IV. Although a relatively less important ecosystem than others, it provides a generally consistent possibility of selecting for thrips resistance and for ability of clones to respond favorably to fertile soil conditions. For these reasons, all materials selected in other ECZs are also evaluated at the Palmira station. There is not a particular genetic base built each season for the mid-altitude tropios. The genetic variability generated for ECZs 1 and 11 is used as the starting point (Tables 1.16 & 1.17). The high potential for thrips damage in this environment was again confirmed by high levels of damage in susceptible spreader rows. In recent years virtually all clones that arrive at the advanced yield trial stage of selection for any ecosystem are resistant to thrips. Mite resistance, however, still needs to be inoreased.
HMC 1, used as the local check, seems to set a high standard for comparison. Just a few clones could significantly outyield HMC 1 this year in terms of DM yield. When cooking quality is considered HMC 1 is hardly equalled. In most years, however, many clones will outyield HMC 1.
ECZ V (High-altitude tropics). The high-altitude tropics (1600-2200 masl) are mainly important in the Andean zone of Latin America and in East Africa. In Colombia, CIAT's Santa Rosa experiment station near Popayán, Cauca (1800 masl) , has been the main site for selecting highland-adapted materials.
Two major changes are being introduced to the selection methodology for the highlands. First, in view of the potential importance of CBB in this ecosystem, greater efforts are being given to incorporating resistance. After outbreaks of CBB in Popayán over the last two years, attempts are being made to eradicate the pathogen from the experiment station, which implied a break in selection activities this past year. Whether or not the station can be kept CBB-free is still uncertain; in any case a major effort is under way to incorporate resistance from the ECZ 11 gene pool. In the East Africa highlands, CSB can also be of moderate importance. Two existing elite clones for ECZ V (M Col 262 and CG 402-11) have shown good CBB resistance. These are being
24

Table 1.15 Means for select:ecl entries for the yield trial (GY8958) at La Libertad (ECZ II) 1 Season B.
Female Male Yield J:M yield HCN Clone Pa:rent Pa:rent (tjha) HI %J:M (tjha) (1-9)
M Sra 97 27.7 0.51 35.1 9.7 6.0 o:; 165-7 M Col 1495 M Pan 90 31.9 0.55 35.2 11.2 8.5 o:; 1139-2 M Ecu 82 M Sra 5 32.4 0.61 33.6 10.9 5.5 o:; 1367-1 M Sra 5 M Pan 90 29.9 0.53 33.6 10.0 6.5 o:; 1450-4 M Col 1505 M Col 1940 28.1 0.62 40.1 11.2 6.0 CM 523-7 M Col 655A M Col 1515 20.3 0.50 40.5 8.2 5.0 CM 2166-6 CM 430-37 M Ven 218 35.3 0.64 34.2 12.1 4.0 CM 2177-2 CM 430-37 CM 840-138 21.0 0.50 37.8 7.9 3.5 CM 2766-3 CM 723-3 CM 523-7 33.2 0.60 37.2 12.3 5.5 CM 2766-5 CM 723-3 CM 523-7 18.1 0.46 36.9 6.7 6.0 CM 3320-8 M Sra 12 CM 523-7 24.7 0.47 34.7 8.6 6.5 CM 4484-2 M Col 1468 M Cub 74 25.0 0.50 35.3 8.8 6.0 CM 5253-1 CM 1223-11 CM 523-7 29.2 0.58 38.5 11.2 5.0 CM 5620-3 CM 955-2 CM 523-7 30.3 0.64 36.6 11.1 7.5 CM 5667-1 CM 2087-101 M Sra 12 24.9 0.51 32.6 8.1 6.0 CM 5789-1 M Col 1823 CM 2175-1 26.2 0.49 36.6 9.6 3.0 CM 5847-1 a; 1-3 CM 1335-4 23.7 0.54 36.2 8.6 6.5 CM 5898-1 o:; 32-22 CM 430-37 30.7 0.54 33.9 10.4 3.5 CM 5898-2 o:; 32-22 CM 430-37 29.4 0.53 37.0 10.9 5.5 CM 5902-2 o:; )2-22 M Col 638 26.3 0.46 37.7 9.9 4.0 CM 5948-1 CM 1335-4 SG 107-35 25.2 0.55 36.5 9.2 5.0 CM 5958-1 CM 1585-13 SG 625-18 31.9 0.64 32.2 10.3 4.0 CM 5962-3 CM 1851-4 CM 1335-4 23.7 0.56 36.3 8.6 7.0 CM 5990-1 CM 2087-101 CM 2298-3 28.0 0.59 35.6 10.0 6.0 CM 5995-2 CM 2088-1 SG 107-35 23.0 0.47 35.8 8.3 6.5 CM 6009-1 CM 2144-1 M Pan 51 30.2 0.59 34.0 10.3 6.0 CM 6031-2 CM 2882-1 a; 32-22 25.4 0.50 36.1 9.2 5.0 CM 6049-1 CM 2882-1 M Ven 77 24.4 0.46 34.1 8.3 5.5 CM 6061-1 SG 105-11 CM 91-3 21.4 0.45 37.8 8.1 6.0 CM 6068-3 SG 591-3 CM 2174-7 29.5 0.57 37.3 11.0 6.0 CM 6070-1 SG 591-3 SG 618-3 30.8 0.52 35.9 11.0 4.0 CM 6082-1 M Sra 5 o:; 32-22 30.1 0.57 36.5 11.0 4.5 CM 6094-5 M Sra 12 SG 625-18 26.6 0.61 37.8 10.0 6.0 CM 6103-1 M Sra 35 SG 107-35 19.6 0.48 37.1 7.3 4.5 SG 104-74 VAR 2 28.3 0.49 37.3 10.5 7.5 SM 344-8 CM 523-7 23.3 0.57 38.6 9.0 7.5 SM 494-2 M Per 245 30.6 0.63 34.3 10.5 6.0 SM 667-1 CM 723-3 24.9 0.47 36.1 9.0 6.0 SM 673-1 CM 2448-201 22.1 0.48 36.8 8.2 3.5 SM 673-) CM 2448-201 25.8 0.52 38.4 9.9 4.5
Avg 26.8 0.54 36.2 9.7 5.5 lSD (0.05) 5.3 0.04 1.2 1.6
Oriroza Morada 15.3 0.42 32.6 5.0 3.5 Oriroza Blanca 13.1 0.32 35.1 4.6 4.5 M Ven 77 21.5 0.41 35.0 7.5 6.5
25

Table 1.16
Clone
M Olb 32 m 996-6 o:; 1320-14 o:; 1374-2 at 305-41 at 3750-5 at 4169-1 at 4344-1 at 5307-1 at 5458-4 CM 5541-1 CM 5655-2 CM 5655-4 CM 5656-1 CM 5656-2 at 5729-1 SM 394-2 SM 414-1
Avg ISD (0.05)
IH:! 1
Means fer select:ed entries fer the yield trial (ECZ IV) I seasém A.
(GY8914) at Palmira
Female Male Parent Parent
M Col 1413 M Ptr 19 M Mex 1 M Pan 51 M Bra 12 M Ven 156 M Col 113 M Col 22 at 1117-3 M Col 22 at 845-91 M Bra 12 at 922-2 CM 1191-12 at 1559-5 M Pan 51 M Col 22 M Pan 12B o:; 1-37 M Col 2215 at 1203-13 at 91-3 at 1203-13 CM 91-3 CM 1203-13 M Bra 12 CM 1203-13 M Bra 12 M Bra 12 M Col 1818 CM 955-2 M Par 245
yield (tjha)
39.3 37.5 32.9 45.6 31.8 32.3 36.9 38.0 30.8 32.4 34.3 45.6 42.6 41.4 37.3 39.1 36.2 34.7
37.0 9.05
38.0
26
HI
0.59 0.67 0.52 0.56 0.64 0.60 0.52 0.63 0.57 0.59 0.65 0.57 0.64 0.68 0.69 0.54 0.56 0.66
0.61 0.10
0.58
%rM
38.8 36.9 39.0 33.3 35.7 37.3 34.5 39.9 35.0 35.3 40.0 38.0 36.6 33.6 36.2 39.3 38.8 34.1
36.7 2.86
35.8
rM Yield (tjha)
15.2 13.8 12.8 15.2 11.3 12.0 12.7 15.2 10.8 11.4 13.7 17.3 15.6 13.9 13.5 15.4 14.0 11.8
13.6 3.4
13.6
H<N (1-9)
4.0 2.5 3.0 5.5 4.5 6.0 4.0 4.5 4.0 6.0 4.0 5.5 5.5 6.5 6.5 6.0 2.5 5.0
4.8
5.0

Table 1.17 :!oimls for selected entries for the yie1d tria! (GY8955) at Palnúra (ECZ IV) I season B.
Ferrale Male Yie1d [M Yie1d ROl" Clone Parent Parent (tjha) HI %[M (tjha) (1-9)
ex; 1-37 M Sra 12 M Col 22 22.6 0.55 35.3 8.0 6.0 ex; 913-4 M Sra 12 M Col lll2A 19.4 0.65 29.8 5.8 8.5 ex; 1286-3 M Col 2207 M Sra 12 20.8 0.48 34.2 7.1 7.0 ex; 1287-5 M Sra 12 M Ven 185 33.6 0.51 36.0 12.1 8.0 ex; 1370-5 M Sra 12 M Col 1505 35.6 0.56 33.5 11.9 6.5 ex; 1403-6 M Col 948C M Col 1505 15.7 0.57 34.6 5.4 4.0 ex; 1413-3 M Col 976 CM 507-37 18.4 0.64 31.2 5.7 7.0 CM 523-7 M Col 655A M Col 1515 20.4 0.48 35.3 7.2 5.5 CM 1203-13 CM 321-252 CM 477-3 21.8 0.67 32.6 7.1 5.0 CM 1286-7 CM 409-2 CM 477-3 18.9 0.65 36.4 6.9 3.0 CM 3306-19 M Col 22 CM 523-7 15.1 0.55 34.0 5.1 5.5 CM 3997-1 CM 681-2 CM 849-1 19.1 0.57 34.4 6.6 6.0 CM 4063-6 CM 1015-42 CM 849-1 21.3 0.70 32.7 7.0 9.0 CM 4157-34 CM 849-1 CM 723-3 25.0 0.50 34.3 S.6 4.0 CM 4313-2 CM 342-170 M Ven 25 17.7 0.47 35.8 6.3 9.0 CM 4388-1 CM 1195-2 M Col 1828A 15.0 0.64 32.8 4.9 5.0 CM 4420-1 CM 1559-5 M Sra 12 26.7 0.43 35.2 9.4 6.0 CM 4744-7 M Sra 12 M Ven 25 19.5 0.57 31.8 6.1 5.5 CM 5071-1 CM 942-14 CM 723-3 17.0 0.58 34.8 5.9 7.5 CM 5431-2 M Sra 12 CM 1014-2 22.S 0.57 35.2 S.O 5.0 CM 5854-2 ex; 1-3 M Col 1818 20.0 0.56 33.9 6.S S.5 CM 5935-2 CM 922-2 CM 91-3 22.0 0.46 35.6 7.8 4.5 CM 5940-1 CM 1015-6 M Sra 12 22.0 0.55 34.8 7.6 5.0 CM 6068-3 SG 591-3 CM 2174-7 25.7 0.55 32.8 S.4 4.0 CM 6129-2 M Col 72 M Ven 185 20.S 0.53 35.8 7.4 5.0 SG 731-4 CM 922-2 lS.l 0.67 39.2 7.1 3.0 SM 540-5 M Sra 12 lS.9 0.37 37.2 7.0 4.0 SM 554-S CM 681-2 20.3 0.58 32.0 6.5 S.5
Avg 21.2 0.56 34.31 7.3 5.9 ISO (0.05) 9.67 0.08 3.93 3.2
}k: 1 20.2 0.44 34.3 6.9 2.5
27

multiplied for commercial use in the Popayán region and are al so being used extensively in crossing.
The second modification in selection was introduced in an attempt to broaden the range of adaptation of this gene pool. As selection over the past years has been in a single region, there is some evidence of a fairly narrow range of adaptation of the resulting advanced lines. For example, in trials at altitudes of about 1550 masl, neither the ECZ IV nor the ECZ V materials performed very well. As of 1990, all materials beginning with F ~_1 are being planted and evaluated at both Popayán and~IAT HQ (1000 masIlo In order to be selected for the ECZ V gene pool, a clone most show good performance in Popayán and at last reasonable adaptation to Palmira. In the first across-site selection this year, it has been shown that this type of broader adaptation is feaslble. In the medlum term, this strategy should result in the ECZ V gene pool having a much broader relevance than at presento
1.2.3 Project for developing semlarid- and subtropicaladapted germplasm
1.2.3.1 General objectives and strategy. The International Fund for Agricultural Development (IFAD) agreed in mid-1990 to fund a five-year project to develop cassava germplasm for semiarid and subtropical regions. The overall objective of this project is to enhance food security in the drier tropical and subtropical areas of the world, with emphasls on Africa, through the introduction of preselected cassava germplasm from Brazil. This project will provide the means for the Brazilian National Cassava Research Center (CNPMFj EMBRAPA) and other institutions ln Brazil, under agreement with CIAT, to expand and accelerate the collection, evaluation and selection of cassava germplasm adapted to the drier and subtropical conditions of Africa, Asia and Latin America. Brazil has special comparative advantages in that it has a wide diversity of cassava-growing environments (including the subtropical and semiarid zones); a broad germplasm base; and an institutional base and experienced personnel for managing cassava breeding activities.
Although external fundlng will not be available until 1991, several project-related activities were begun ln 1990. The subprojects for the subtropics and semlarid regions are essentially independent, except for certain administrative aspects. Some of the activities for each ecosystem are reported, as well as additional related activities for the subtropics, undertaken at CIAT and in Paraguay.
1.2.3.2 Semiarid region. A planning meeting was held at CNPMF in May 1990, with the participation of representatives
28

from several state and regional programs, CNPMF and CIAT. The main objective was to introduce the project idea and establish a preliminary basis for interinstitutional collaboration.
Based on suitability of climate and soil conditions (including similarity to target regions in Africa), and institutional interest and capability, four sites were selected for preliminary germplasm evaluation (Fig. 1.1). The first year 500 accessions from the CNPMF germplasm col1ection (about 1200) will be evaluated at all sites as a basis for selecting parents, the seed of which will be sent to lITA for incorporation into their breeding program for Africa.
1.2.3.3 Subtropical region
Southern Brazil. In order to plan activities for the first year of the IFAD project (subtropics), a meeting was held in July involving representatives from the four southern states (RS, SC, PR, and SP) (Fig. 1.1). The main activities for 1990/91 are in vitro introduction from CIAT of all relevant accessions (particularly those from Paraguay); introduction to EMPASC-SC of germplasm collections from neighboring states; germplasm collection in the sta te of SC; establishment of regional trials with the most cornmonly grown clones in the region; establishment of crossing blocks with parental clones selected among the most cornmon varieties and elite genotypes from regional programs; and evaluation of an F1 nursery under high CBB pressure (inoculation) with seeas introduced from CIAT.
Paraguay. For the first time the national cassava collection (235 clones) was agronomically evaluated at IAN in Caacupe. Table 1.18 presents results from clones preselected for plant type. There is a high proportion of good clones (approx. 40%) that were selected to be advanced to preliminary tria1s. The Paraguayan collection represents an excellent germplasm source for cassava breeding in the subtropics.
Introduction of sexual seed to southern Paraguay has resulted in few genotypes being selected at early stages (4 out of about 300), reflecting a need for better defining parental genotypes for this ecosystem. Three local clones are being multiplied and have be en distributed to regional cooperatives for promotion in a field day early next year.
Genotype-by-photoperiod interaction. The main breeding support activity developed at CIAT for the subtropics has been recombination among accessions originating from areas in the subtropics, or between them and clones
29

contributing resistance to CBB and SED (from ECZ 11). As a result of work done in the Colombian Llanos, there are a wide range of genotypes that may contribute resistance or toleranee to those diseases. Their use represents the introduction of valuable exotie germplasm to subtropieal regions.
The reaetion of a set of 25 genotypes to photoperiod is being studied to determine the possibility of identifying characteristics as indicators for potential adaptation to the subtropics. The genotypes were planted under two photoperiod regimes: normal photoperiod at CIAT (NPP) (12 h 20')¡ and an extended photoperiod (EPP) (15 h of light). An early harvest was done at 5 mo and a normal harvest at 10 mo. Preliminary analysis of data showed that EPP resulted in an overall reduction of RY and HI, and an inereased production of aerial part (Table 1.19). Sensitivity to EPP [(Yield .NPP - Yield
)/Yield J, for RY at 10 mo was consi~eYed as the &i~fn referJWJe trait. Nonsensitive clones will have values around O; those stimulated by EPP, negative values; and those whose yield is reduced by EPP, positive values. Correlation of sensitivity with RY invol ves certain autocorrelation and must therefore be interpreted cautiously. Clones wíth profuse development of the aeríal part tend to be the most affected. EPP tended to stimulate foliage production, transloeating fewer carbohydrates to the roots than under NPP. That is also reflected in a elose negative eorrelation with HI under EPP. Clones wíth the highest HI were less affected or even stimulated by EPP eompared to those with a lower HI.
1.2.4 Participatory research with farmers for variety selection
1.2.4.1 Objectives and strategy. Sinee 1986 the Germplasm Development Seetion has been engaged in developing methodologies to involve farmers in the process of defining and refining selection eriteria. This work has eoneentrated in the Atlantic Coast region of colombia, to take advantage of several key factor s present there: (a) Cassava is a basíc traditional crop of the region, and farmers generally have well-formed opiníons eoncerning cassava production technology, including varieties; (b) with the expanding cassava drying industry of the regíon, an increased demand for improved production technology has been noted, thereby making farmers more reeeptive to reeeiving and evaluating new genetic material ¡ and (e) a well-established eassava working group exists in the region, with capability for managing trials in a network fashion.

Table 1.19 Avg sensitivity to extended photoperiod treatment for the main agronomic traits and correlation coefficients between RY (at 10 mol, sensitivity and other traits.
Treatment
Harvest 1 (5 mol Harvest II (10 mol
Normal Photoperiod
Harvest 1 Harvest 11
Extended Photoperiod
Harvest 1 Harvest 11
% DM
0.04 0.03
0.30 0.14
0.26 0.22
Foliage % RY Yield
Average Sensitivityl
0.32 0.19
Correlation
0.49* 0.76 **
0.04 0.37
-0.44 -0.42
Coefficient
0.63** 0.64**
0.35 0.31
Hl
0.40 0.26
0.09 0.04
0.03 0.47*
1 (Normal photoperiod - Extended photoperiodl/Normal photoperiodo
Based on successes and failures over the past four years, a strategy has evolved for participatory research, involving the following basic stages
Preselection of a set of about ten experimental clones, based on breeder evaluations over several sites and growing seasons
Selection of regions for on-farm trials
Selection of farmers and explanation to them of trial objectives and methodology
planting by farmers with their own management practices
Researcher-farmer interaotion during various phases of the crop cycle, especially at harvest
Data analysis
33

Feedback of results to breeders to refine selection criteria
In 1989-90, experimental clones were planted on 22 farms in five states of the Atlantic Coast region. At harvest, 138 farmers participated, giving their opinions about a wide range of traits of these clones, as well as the local ones.
1.2.4.2 Analysis and interpretation of results. Overall, the experimental clones received an acceptance rating aboye that of the local clones (Tables 1.20 & 1.21). In a multipIe regression analysis, three characters stand out as apparently key to acceptance by farmers: number of commercial-sized roots; root thickness; and reot surface color (Table 1.22). lt is significant that all these characters are closely tied to requirements for the fresh market. This indicates that even theugh farmers in the region may have access to the drying plants to sell their cassava, they want to maintain dual-purpose varieties that can also enter the higher priced fresh market.
These traits should not necessarily be seen as the only important enes for farmer acceptance of a new variety. Within this group of clones, many traits had already been highly selected such as root flesh color and starch content; therefore, there was little discrimination by farmers among clones for these traits.
Of several experimental clones evaluated on-farm for three years, CG 1141-1 and CM 3306-4 stood out for their superiority in nearly all traits and generalized acceptance by farmers in the region--both being rated considerably higher than the local checks. lCA is in the process of multiplying these clones and preparing one or both for release.
1. 2.5 True cassava seed
The Cassava Program will study the feasibility of developing a true-seed alternative for commercial-scale production. vegetative propagation entails several constraints including virus accumulation, inefficient photosynthate partitioning, and difficulties in storage and management of planting material. Two well-recognized constraints to developing a trua-saed technology are seed production and germination. Preliminary studies of these two areas are reportad here.
1.2.5.1 Seed production enhancement. Assuming there is an internal competition for available photosynthates between the aerial part and the roots, and between seeds and the rest of the foliage, girdling (1. e., removal of a band of phloem near the base of the stem) was proposed as a means of enhancing seed production. Two clones were observad for flowering and seed production, with and without girdling,
34

Table 1..20 Ra'tin:Js of acceptability by fanrers for ten clones evaluated at 16 sites of the Atlantic Coast region of COlombia, 1990.
Ievel of 1Iooeptability (%)1 Total No. of
eriteria High Intermediate IJ:N Observations
Preharvest
st.ake production 61 26 13 92 Brandúng habit 59 27 15 82 General foliage eval. 69 21 10 89
F\::lsthal:vest
Fase of harvest 62 24 14 80 No. ~ial roots 78 17 5 77 Starch content 62 23 15 84 Rlx:lt fonu 70 20 10 87 Rlx:lt flesh color 58 26 16 119 Rlx:lt surface color 63 24 13 95 Rlx:lt thickness 83 14 3 64 Maturity 67 23 10 88
1 l?Em::ent evaluations of all experimental clones in given categories of acceptability .
Table 1..21 P.egression analysis to define the IIOSt i.np::lrtant criteria for félL11:Ver aooeptanoe of new cassava varieties.
Source of Variation
Model Error Total
2 r = O.64i C'l = 37.2%
Variable
No. of ~ial roots Rlx:lt thickness Rlx:lt surface color Rlx:lt size Rlx:lt flesh color Preharvest foliage evaluation
DF
10 110 120
ss
555.0 309.7 864.2
SD
0.14 0.20 0.23 0.39 0.52 0.58
35
MS
55.5 2.8
F Prcb >F
19.7 0.0001
Probability > T
0.0001** 0.0001** 0.0001** 0.0218* 0.0695 0.0687

Table 1. 22 Comparison among exper:inental arrl local clones fer fanner acceptance in trials at 16 sitas on the Atlantic Ooast region ef Colombia, 1990.
Fanrer Evaluation cri~ia¡ Researcher OVerall Evaluation Evalúations
No. O::m!erc. Root Root SUrt. Root sta.J:l:h stake General Yield Clone Roots/plant 'Ihickness Color Size Content Production 1\coeptabili~ %[M (t¡ha)
ex; 1141-1 G G G G G G 1.1 37 23 CM 3306-4 G G G G G G 1.1 38 21 CM 3306-19 G 1 G 1 1 G 1.4 33 25 ex; 1355-2 G 1 G 1 1 G 1.6 33 24 CM 3555-6 G G 1 G G G 1.7 35 22 CM 3372-4 G 1 G G G G 1.7 35 24 CM 523-7 1 1 G 1 G 1 1.8 37 21 CM 3306-9 G 1 P 1 G G 1.9 36 20
II::lcal clones
M Col 1505· 1 1 G 1 G G 1.8 36 17 M Col 2215 1 1 G G G G 2.0 36 16
1 G = good; 1 = i.ntentaliate; p = peor.
2 Mean of all sitas, where. 1 = good; 2 = inter.mediate¡ 3 = peor.

and with and without removal of flowers. The girdled plants looked stressed one month after the treatment as a result of restricted carbohydrate flow to the roots, limiting active absorption of nutrients. This nutrient stress resulted in increased flowering and seed production for one of the varieties (Table 1. 23): and the increased availability of carbohydrates in the aerial part seems to have increased seed production.
Table 1.23 Means for nain traits evaluated in the study of girdli.n;J effects on two cassava clones.
Seeds/ 100-Seed R<x>t wt Foliage Clone Treatlrent Plant wt (g) (tjha) wt (tjha) HI
ex; 915-1 Girdled 44 13.8 11.1 15.2 0.42 100% flawerl 32 12.0 35.7 24.3 0.60
0% flawer 34.2 19.6 0.64
CM 3372-4 Girdled 390 12.6 8.1 13.4 0.38 100% flawer 125 11.9 27.7 24.0 0.54
0% flawer 28.9 16.1 0.64
1 Flawers nanually re=ved.
1.2.5.2 Pregermination seed treatment. Cassava seeds germinate well under favorable soil conditions (good moisture and temp around 35"C). Field conditions are usually far from optimal, however, resulting in low percentages of establishment when seed is planted directly in the field. Treating the seed before planting seemed a logical technique for enhancing germination. As many factors can potentially be included in pretreatment studies, combining them in one factorial experiment is difficult. Thus two separate factorial experiments were designed: (a) variety, temp and soaking effects: and (b) variety and red-light effects.
open-pollinated seeds from two clones previously detected to have different germination rates were subjected to a high temp (45"C) for different periods (O, 24, 48 and
37

72 h), and soaking using osmotic pressure), for the factorial of 16 treatments. two temp: optimal (35'C) and
a solution with PEG (0.5% same periods, resulting in a
Seeds were germinated under suboptimal (25·C).
From the ANOVA (Table ;¡-.24) it could be observed that except for a slight 1ncrease in germination at the intermediate period of temp pretreatment (Table 1.25), there were no differential effects due to other pretreatments. The significant effects of variety and variety-by-germination temp were a result of seeds from clone 2 having lower percentage germination under optimal conditions than clone 1. Thus varietal or pregermination treatment effects did not resul t in much improvement of germination at suboptimal temp.
Table 1.24 MVJA for maxi:mum germination (%) and germination rate for study involving two varieties and sixteen pregermination treatments (te:np. x soaking) •
Max. Germination Germination Rate
Source of Variation DF MB PR>F MB PR>F
Reps 1 309.72 0.1200 63.39 0.0040 Treatments 63 1844.83 0.0001 34.56 0.0001
Germination te:np (Gl') 1 95141.23 0.0001 974.79 0.0001 Variety (V) 1 4085.06 0.0001 322.95 0.0001 Gl' x V 1 6819.51 0.0001 353.38 0.0001 Soaking (S) 3 244.99 0.1290 0.44 0.9800 Gl' x S 3 327.41 0.0580 3.11 0.7290 VxS 3 355.38 0.0450 8.13 0.3430 Gl'xVxS 3 181. 70 0.2350 9.92 0.2570 Prege:rm. te:np (PI') 3 359.24 0.0430 27.30 0.0140 Gl'xPI' 3 46.15 0.7750 10.76 0.2230 V x PI' 3 5.31 0.9880 3.84 0.6590 Gl'xVxPI' 3 171.50 0.2590 13.28 0.1470 S x PI' 9 175.57 0.2050 5.95 0.5920 Gl'xSXPI' 9 111.26 0.5380 8.73 0.3020 VxSxPI' 9 111.84 0.5340 5.50 0.6470 Gl'xVxSxPI' 9 133.93 0.3950 5.67 0.6530
Error 63 126.73 9.44
38

Table 1.25 Means for cambination varieties aro pregermination trea1::nvant tenp urner two germination tenperatures.
Germination Pregerm. ~ Varietal Max. Varietal
TeIIp ('C) variety TeIIp ('C) Mean Genn. Mean
25 1 O 3.4 15.5 25 1 24 2.5 2.9 18.2 14.9 25 1 48 3.6 15.5 25 1 72 2.0 10.2
25 2 O 2.5 13.9 25 2 24 3.7 3.0 20.6 18.2 25 2 48 3.4 20.1 25 2 72 2.5 18.0
35 1 O 10.4 80.2 35 1 24 14.8 11.7 88.0 84.0 35 1 48 11.5 86.7 35 1 72 10.1 81.0
35 2 O 4.3 61.4 35 2 24 5.6 5.2 62.1 58.1 35 2 48 6.7 59.8 35 2 72 4.3 49.1
1 .Percent par day until 1I1aXÍ!11I.Illl germination achieved.
In the second experlment, normal visible and red light were applied to seeds from other varieties for 72 h. The seeds were germinated under the same temp conditions as the previous experiment (3S' and 2S'C). No effect on germination was observed due to variety or red light (Table 1.26).
Low soil temperatures represent a common stressful condition for germination of cassava seeds. The treatments studied seem to offer 1ittle advantage for increasing poor levels of germination at 2S·C. other pretreatments need to be studled, as well as screening of the available genetic diversity for seed germination under suboptimal conditions.
39

Table 1.26 AtKNA for roaximum gennination (%) arrl gennination rate fer study involvin;¡ two varieties arrl red light pretreatment.
-~-----
Max. Germination Germination Rate
Source of Variation DF MS ffi>F MS ffi>F
M::ldel 9 37.73 0.050 3122.25 0.0001 Germination temp (Gr) 1 290.11 0.001** 27722.25 0.0001 Re¡:> (Gr) 2 0.64 0.930 21.25 0.6800 Variety (V) 1 0.01 0.980 42.25 0.4000 Light (L) 1 31.18 0.110 42.25 0.4000 VxL 1 10.23 0.330 12.25 0.5400 Gr X V 1 0.01 0.980 110.25 0.1900 Gr X L 1 5.84 0.450 56.25 0.3400 GrxVxL 1 0.94 0.760 72.26 0.2800
Error 6 9.07 51.25
1.3 Germplasm: Africa
For many years the CIAT Cassava Program has co1laborated with lITA in germplasm and information exchange in 1ine with CIAT I s world mandate for cassava research. The effectiveness of this interchange was limited, however, by the difficulties inherent in long-distance communication and coordination. Thus in 1989 CIAT placed a physiologistjbreeder at lITA headguarters in Ibadan, Nigeria, in order to:
Facilitate inforrnation exchange between CIAT and lITA, especially with regard to areas lOhere the activities and expertise of the two centers are complernentary, particularly the area of utilization research.
Transfer germplasm betlOeen Africa and Latin Arnerica, and follow through lOith evaluation and seIectíon of promising materíals prírnaríly for the dríer and the highIand areas, considering the relatively narrolOer germplasrn base for these ecologies ín Africa.
Contribute to a better understanding of the cassava production systerns in use or lOith .potential to be deveIoped, in the drier areas of Africa, lOhere food deficits are especíally acute.
40

1.3.1 Germplasm exehange
Three basie sourees of germplasm were identified for emphasis in the early stages of the new eollaborative arrangement between CIAT and lITA, with a view toward complementing the existing germplasm base in Afriea.
1. 3 . 1.1 Brazilian germplasm. The IFAD-funded proj ect for developing germplasm adapted to semiarid and subtropica1 ecosystems (see 1.2) has as a major objeetive the introduetion into Africa of improved, drought-tolerant and pestresistant materials. This project got under way in late 1990, and the first seed shipments are expected during 1991.
1.3.1.2 CIAT elite germplasm. The edaphoclimatically oriented gene pools developed by CIAT will be a principal source of germplasm to be introduced into Africa for eva1uation under similar ecologies. lITA has requested that special emphasis be given to materíals showing the following charaeteristies: high RY and hígh DM; 10w HCN and 9000 cookíng qua1ity; high earotene eontent (ye110w root f1esh); resistance to CGM and cassava mealybug; adaptation to dry eonditions; and adaptation to low temp. A shipment of seeds was sent from CIAT to lITA in ear1y 1990. Their management and evaluation are deseribed in detail in the following sections.
1.3.1.3 lITA elite germplasm. CIAT has established 19 of IITA's elite, Afriean Cassava Mosaie Disease (ACMD)resistant clones within its germplasm colleetion. These are being used to combine resistance with the specific traits outlined aboye. Preliminary resu1ts in Nigeria indicate the efficacy of this strategy, especially in the more humid regions where ACMD is severest. Therefore, more emphasis will be given in the future to these Africa X Latin American crosses.
1.3.2 Evaluation of introduced germplasm in Nigeria
A total of 87,615 botanica1 seeds obtained by contro1led hybridization and open po1lination at CIAT-Pa1mira were sent to lITA in 1990. This was the first seed lot introduced as part of the IITA-CIAT collaboration on cassava germplasm improvement in Africa.
Seeds were collected from crossing blocks and open po11ination fields established at CIAT on the basis of adaptation of parents to specific agroecological zones. Prior to shipment, seeds were tested for Cassava American Latent Virus by the CIAT Virology Unit and inspected for general phytosanitary status by ICA quarantine authorities. Seeds sown in Nigeria in 1990 (40,000) were processed according to recommendations of IITA's Phytosanitary Committee. This
41

included treatment in hot water before sowing in screenhouses. Samples of each eros s were tested for presence of bacterial and fungal diseases. The resulting seedlings were inspected by lITA virologists and pathologists to ensure that the introduced material was free of viruses and other pathogens.
The seeds were sown in three different areas of Nigeria representing the humid, subhumid and semiarid ecologies of Africa. Locations were chosen on the basis of similarity to the different target agroecologies, availability of infrastructure, and similarity to zones of adaptation in Latin America where the parents had been selected. Seeds potentially adapted to mid-altitude areas were not sown for lack of basic infrastructure.
Progenies being evaluated at Ibadan (subhumid) and Onne (humid) represent 149 and 78 families, resp. The genetic base of the materials planted at both locations is similar as 94% of the families being evaluated at Onne are also planted at Ibadan. The 62 families at Rano (semiarid) are of different origin as the seeds were obtained from parents adapted to CIAT's ECZ I (lowland tropics with low to intermediate rainfall and long dry season).
Evaluations are being done on both an individual and family basis. Data on plant height, branching height and leaf retention, as well as scoring for the main pests and di seases, are being taken at monthly intervals. Plants will be harvested at 12 mo from planting and selected on the basis of yield, growth habit and reaction to biotic constraints.
Data presented on the reaction to ACMD and CBB refer to the first 5 and 4 mo of the growth cycle at Ibadan and Onne, resp.
1. 3.2.1 Reaction to ACMD. As this viral disease is not found in South America, the progenies introduced from CIAT were expected to show a high degree of susceptibility at Ibadan, a hot spot of the disease in Nigeria. On the other hand, as some of the introduced families were hybrids between lITA elite clones existing at CIAT and South American materials, a higher level of tolerance was expectéQ for those cases. Table 1.27 gives the results of monthly evaluations being done at Ibadan and Onne since June 1990. Individuals that fall into classes 1 and 2 of the standard evaluation scale (1 = no symptoms to 5) were considered tolerant. The number of individuals classified as tolerant sharply decreased at Ibadan after the first evaluation. As expected, a low average level of tolerance is being observed at that location as a result of the high ACMD pressure.
42

Table 1.27 Reactíon of Latín American germplasm to ACMD at Ibadan and onne, Nigeria {values are in % of the total seedlings evaluated at each location.
DAT
Total Seedlings Evaluated
Reaction to ACMDl
Tolerant Susceptible
Ibadan
1
30 60 90
120 150
30 60 90
120
4187 3164 3014 3066 3049
3512 3249 3151 3133
60.64 4.92 5.29 2.79 3.39
99.04 94.82 89.79 80.81
Tolerant = plants within cIasses 1 and evaluation scale (1-5); Susceptible classes 3-5 of the same scale.
39.36 95.18 94.71 92.21 96.63
0.56 5.18
10.03 19.19
2 of the standard = plants within
ACMD pressure has been much lower at Onne, the humid ecology (Table 1. 27) • The percentage of individual s with no or light disease symptoms was always higher than in Ibadan, as was the vector (Bemisia tabaci) population (data not shown). However, symptom expression is still increasing over time at Onne although not so fast as was observed at Ibadan.
These preliminary results confirm the usefulness of Ibadan as the best site for selecting for ACMD resistance in Nigeria as already recognized by lITA' s cassava breeding program in its long-term improvement research.
Progenies planted at Ibadan and onne are also being compared on the basis of the origin of progenitors. Progenies obtained by controlled hybridization at CIAT were divided into three different groups: thosa that have M Nga 1 (TMS 30001) as one of the parents; those that haya M Nga 2 (TMS 30572) as one of the parents, and; those of pure Latin American origin, usually originated from crosses involving CIAT's elite germplasm. TMS 30001 and TMS 30572 are among
43

llTA's most ACMD-resistant elite clones and were introduced to ClAT in 1986 as sources of ACMD resistance.
Figure 1.2 shows that progenies derived from crosses between lITA clones and ClATjLatin American materia1s have a higher percentage of tolerant individual s compared with those of pure Latin American origino These observations, although preliminary, suggest that resistance to ACMD was incorporated in the crosses with Latin American germplasm and opens up the possibility of combining the beneficial traits present in South America and resistance to ACMD.
In the first 4 mo of the cycle, a few individual s of pure Latin American origin also showed no symptoms of ACMD in the fie1d at lbadan despite the high incidence of the disease (Table 1.28). Although the possibility of escape cannot be ruled out, this suggests that some Latin American material s may have the potential to express certain levels of tolerance, at least during part of their growth cycle. Five months from transplanting, light symptoms of ACMD deve10ped in those seedlings, but they are still maintaining a low level of symptom expression when compared with the great majority of the germplasm under evaluation.
% Seedlíngs (withín classes 1-2; scale 1-5) 80
June
60
40
20
o 1 2 3 4 5
Mo After Planting
Africa: _ TMS 30001 _ TMS 30572 I , Latín Amerioa
Figure 1.2 Tolerance to ACMD in cassava progenies African and Latin American origino
44
of

Table 1.28 Reaction of progenies frOID CIAT and CIAT x lITA sources to ACMD at Ibadan, Nigeria (values represent total numbers of individuals in c1asses 1 and 2 (toleranr) and 3-5 (susceptible) on each evaluation date.
1
2
Origin of Parents No.
seedlings2 CIAT lITA DAT Evaluated T S T S
30 1244 261 113 623 247 60 842 7 245 34 614 90 858 7 149 63 609
120 893 3 194 46 650 150 879 2 192 88 597
Evaluation scale: 1-5 (1 = no symptoms).
IncreaseB in no. of seedlingB froID 60 to 120 DAP are due to sprouting of seedlings previously wilted as a result of CSS infection.
Among the familias obtained from open pollination, those originated from M Nga 1 and M Nga 2 also Bhow a higher percentage of individuals with no or light symptoms of ACMD, confirming the tendency observed in the families obtained by controlled hybridization. Families SM 1275 and SM 1276, which have as respective female parents lITA clones TMS 30001 (M Nga 1) and TMS 30572 (M Nga 2), were the ones with the highest percent tolerant individual s (38 and 18%, resp.) at Ibadan between the second and fifth months after transplanting. When all the families under avaluation are considered, 4.1% of the individuals were classifiad as tolerant in tha same pariod.
Three months after transplanting, no symptoms of ACMD were observed at Kano (semiarid zone). Although no information exists on the degree of ACMD severity at Kano, it seems it is not a serious constraint in semiarid areas. Previous studies show that population buildup of ~ tabaci iB favored by high rainfall (150-2802mmjmo), temp of 27-32"C, and Bolar radiation of 400 9 cal/cm. Climatic conditions at Kano are characterized by a unimodal pattern of rainfall distribution with a dry sea son of 6-8 mo. The seedlings being evaluated were planted late and received only 423 mm of rainfall (mid-Aug.-Sept.). However, further data are needed to
45

confirm the potential pressure of ACMD at Kano, especially in plants established at the onset of the rainy season.
1.3.2.2 Reactien te CBB. A major objective of both CIAT's and lITA' s cassava breeding programs is resistance to CBB. Both Centers now have elite clones that combine resistance to the disease with high RY and other desirable traits.
Selection pressure for CBB resistance was increased by CIAT in the mid-seventies when evaluation of germplasm started in the Colombian Llanos (CIAT's ECZ 2, representing the lowland tropics with acid-soil savannas and high rainfall), where environmental conditions are ideal for the expression of CBB. The recent release of varo Catumare and Cebucán by ICA reflects the work done by the two institutions in the Llanos to combine resistance to CBS and high yield.
IITA's efforts to select cassava germplasm for resistance to CBB in the past two decades have al SO been successful. Highly resistant, high-yielding clones have been obtained and are now being used as sources of resistance to that disease by the Root Tuber and Plantain lmprovement Program (TRIPP) at rITA. The combination of both CIAT and lITA sources is expected to improve resistance to CBB in the progenies derived from crosses involving African and Latin American germplasm.
A high percentage of ClAT' s families under evaluation at lbadan and Onne were obtained from parents adapted to ECZ 2. The crosses involving both lITA and CIAT materials also have a considerable potential for CBB resistance as the lITA sources used as parents (M Nga 1 and M Nga 2) are al SO
resistant to CBB under the conditions of Nigeria.
Results obtained after 5 and 4 mo of field evaluations at lbadan and Onne, resp., cannot be considered conclusive. A higher incidence of caa was observad at lbadan compared to that at Onne, even causing the death of several young seedlings at 50 and 90 days after transplanting (DAT).
The reaction of the germplasm to caa at the two locations is shown in Table 1.29 and Figure 1.3. Symptom express ion at lbadan was high at 50 days froro transplanting and then decreased. It should be noted that the reduction in the proportion of susceptible material (classes 3-5) after the second month was partially due to the death of susceptible individuals. CBB incidence at Onne was low in 1990 although the environmental conditions (high rainfall, temp and RH) were highly suitable for pathogen development. Further evaluation of the resul ting clones and new seed introductions are needed in order to assess the potential of CIAT germplasm for resistance to CBB at that location.
46
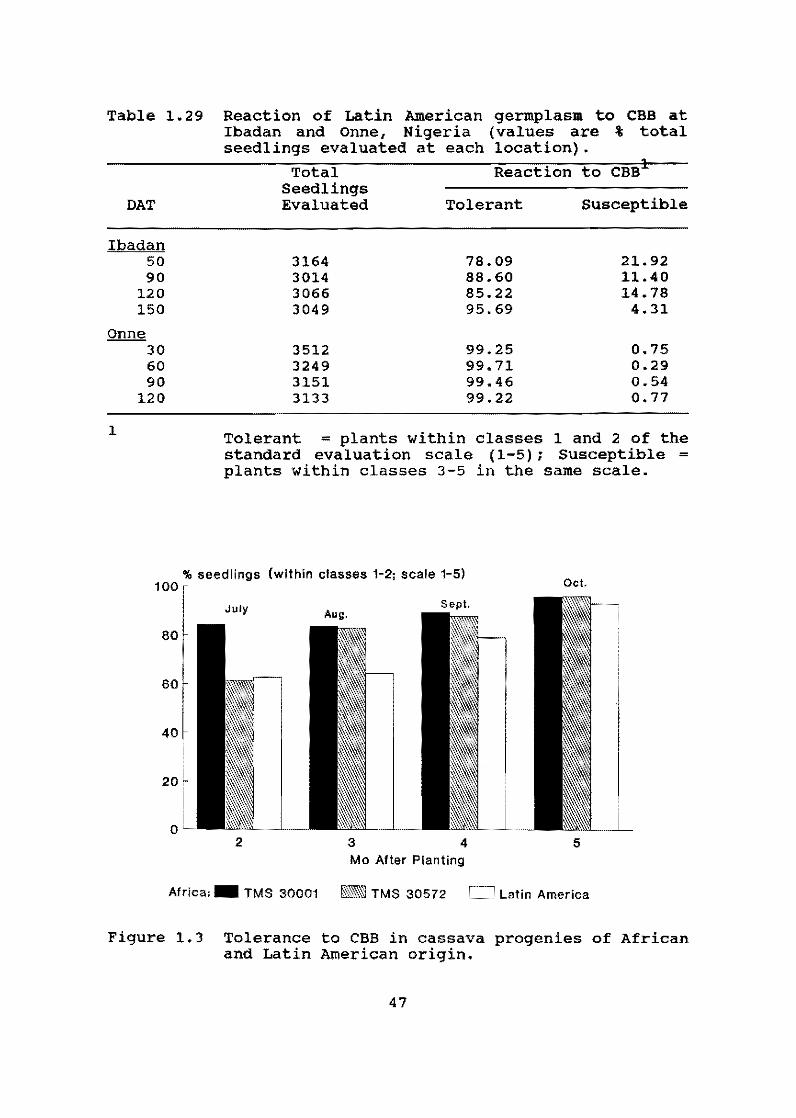
Table 1.29 Reaction of Latin American germplasm to CBS at Ibadan and Onne, Nigeria (values are % total seedlings evaluated at each location).
DAT
Ibadan 50 90
120 150
Onne 30 60 90
120
1
Total Seedlings Evaluated
3164 3014 3066 3049
3512 3249 31S1 3133
Reaction to CSSi
Tolerant Susceptible
78.09 21.92 88.60 11.40 8S.22 14.78 95.69 4.31
99.25 0.7S 99.71 0.29 99.46 0.54 99.22 0.77
Tolerant = plants within classes 1 and 2 of the standard evaluation scale (l-S) ; Susceptible = plants within classes 3-S in the same scale.
% seedlíngs (wilhin classes 1-2; scale 1-5) 100 Ocl.
2 3 4 5 Mo Alter Planting
Afrioa: _ TMS 30001 I&'i'ilt~ TMS 30572 Latin America
Figure 1.3 Tolerance to CBB in cassava progenies of African and Latin American origino
47

Comparison oi progenies originated from crosses involving pure Latin American and IITA/CIAT parents shows that the latter present a higher percentage of tolerant individuals (Table 1. 30) • These preliminary results may reflect not only the degree oi resistance of both materials to the disease, but also the adaptation of lITA material s to the conditions prevalent at Onne.
1.4. Asia
Some of the world's strongest national programs in cassava varietal development, as well as institutions that are just beginning to develop their research capacity, are found in Asia. Through its regional office in Bangkok, CIAT tailors its collaboration according to individual program needs and requests. The principal areas oi input are institutional strengthening through training and network activities; technical input through extensive consulting throughout the region; and facilitating germplasm exchange between CIAT HQ and national programs, and among national programs. Highlights of these areas are presented for 1990.
Table 1.30 Reaction to CBB of progenies oi CIAT and CIAT x lITA origin at Ibadan, Nigeria (values represent total no. of individuals in classes 1 and 2 (tolerant) ind 3-5 (susceptible) on each evaluation date.
Origin oi Parents Total
seedlings2 CIAT rITA DAT Evaluated T S T
50 1281 62.70 37.30 72.81 90 808 64.28 35.72 83.31
120 886 78.92 21. 08 88.50 150 875 92.82 7.18 95.80
1 Evaluation scale: 1-5 (1 = no symptoms).
2 Increase in no. of seedlings froro 50 to 90 DAP due to sprouting oi seedlings previously wilted froro CBB.
48
S
27.19 16.69 11.50 4.20

1.4.1 National program development
A eertain strueture is neeessary for the effieient operation of varietal improvement. The most important is the strueture of ea eh national program, whieh varies greatly from one country to another. Past cooperation had been limited largely to strengthening each national breeding program; however, activities have gradually shifted toward helping national programs as a whole through the formation of a research network, of which CIAT is an important, but one of many, eomponents.
It is useful to eonsider five phases of national eassava breeding program development in order to assess the present situation, aehievements and future directions (Fig. 1.4). CIAT has been highly instrumental in Phase 1, "Identifieation of research needs and establishment of a researeh program"; and many of the cassava research programs in Asia have been established through the Center's support in this area.
CIAT has acquired considerable expertise in cooperating in Phase II, "Researeh capability building of national programs." CIAT eooperation during this phase emphasizes training, contribution of genetie materials, and working together in actual varietal selection with the national program personnel.
Phase 111, "Selection of superior genotypes, 11 is where maximum progre ss is currently being made and is dealt with in depth in the next section.
The strength of national programs in Phase IV, "Varietal release and extension," is highly variable. Building on good cooperation in Phase 11 and 111 will help national programs gain momentum in varietal release and dissemination. Numerous new varieties have been released by the national programs in the past few years (see later discussion).
Phase V, "Socioeconomic returns of new varieties," is usually the ultimate objective of a breeding programo Given the increasing emphasis on environmental viability and social equity, the assessment of socioeconomic returns becomes ever more complexo Nevertheless, improved production efficiency by new varieties will rema in one important facet of new technology to provide additional flexibility for producers and consumers. At last I some 18 years after starting from point zero at CIAT HQ, CIAT-related varieties can be seen planted on ten s of thousands of hectares (see later discussion).
49

01 O
,--I n nI IV V
Establishment Di Research Capabili ty Selection ol Socioeconomic
Breeding Program Building Superior GenotJpes Varietal Releasc Returns --------Thailand
Indonesia --------- ------1>
Malaysia
Philippines
Oliaa
Vietnam
Sr! Lanka
Laos lo
Myanmar .. India ----------1----------- ---------- --------- ----Jo
--------
1 The do~tedlline for Iodones;~ cQrresuoods tQ th" orogre" ... de witb Mira 4, for whch most of. the cr.dit .ces to nat:lOlla organ:tzat:tons; the dotted tille tor 1.nO:t4 corresponda to the progresa made mostly mdependent trom CIAT cooperation.
"l ..... IQ ¡: '1 ro ... "..
ti
~ 1-'
.... ·0 ::111 >oro m ::1 ..... <1' flI
o ..... ,." ::1
::1 '1 flI ro <1' 1-' ..... flI O <1'::1 .... ·flI 01-' ::1
(') <1'flI O m
m ()flI H<:
~~ (')'1 oro .g~ ro ..... '1 :l flIlQ rt ..... 'tj 0'1 ::so .IQ ~
~

1.4.2 Technical progress
Cassava varietal research in a national program typically starts with the collection and evaluation of local germplasm; proceeds to selection from local1y produced or introduced hybrid populations; and then to selection from the hybrids among local1y selected cross parents, which are often best adapted local varieties and best locally selected introduced genotypes. Selection from local landraces has produced several excellent varieties such as Rayong 1 in Thailand, South China 205 in China, and Black Twig in Malaysia, which are currently supporting the successful cassava industry in Asia. Selection from hybrids among local germplasm also produced an excellent variety (Adira 4)'. in Indonesia. However, initial selection progress seems to exhaust the chance of further selection with local germplasm rather quickly. Thus virtually all cassava breeding programs in Asia now largely depend on introduced germplasm from CIAT HQ or the Thai -CIAT program as the source of immediate varietal selection and use fuI cross parents. Many of the cross parents for the CIAT HQ cassava breeding materials distributed to Asia are selections from the original germplasm collection and the hybrids among them identified at CIAT HQ during the 1970s. These breeding materials are characterized by high HI, resistance to some of the major diseases and pests, and tolerance to acid soils. However, they do not necessarily possess vigorous vegetative growth, high root DM content, good plant type, adaptation to drier lowland climate, low root HCN content, or good eating quality. While efforts to further improve in these areas continue at CIAT HQ, the Thai-CIAT breeding program concentrates on improving these traits based on crosses between local varieties and CIAT parents.
During the past eight years, steady progre ss has been made in mean dry RY of the breeding populations in Thailand (Fig. l.Sa). This progress is even more appreciable when the data are expressed in relative values to the yield of Rayong 1, the highly successful local variety (Fig. 1.Sb). The major part of this yield improvement was attributable to improved fresh root yield (Fig. 1. 6a); yet improvement in root DM content (Fig. 1.6b) was also significant. As great emphasis had been given during the 1970s to improving HI at the CIAT HQ breeding program and at the Rayong Field Crop Research Center (RFCRC) in Thailand, the breeding population had a high HI at the start of this analysis, and no further improvement took place in HI thereafter (Fig. 1.7a). On the other hand, significant progress occurred in total plant weight of the breeding population (Fig. 1. 7b). In recent years the majority of the breeding materials at the RFCRC and the Kasetsart University Sriracha Experiment Station (KU-SRC) breeding centers in Thailand are of good plant type, which is closely related to ease of field management,
51

12
10
~ ., ,.c; ........ 8 ... .
Q) := .... ., > 6 ,... <!I := '" ~ 4 ....,
~ 2
o
120
110
~ 80
70
60
(A)
/ /
'\ / I
11/ / , '\ .... .,JI,,<,, I
I ~ /..,/ / / .. , " , ..... '-'" / ..... ....
/ ........ /
/ .. _ __ 1Ii.
(B)
Rayong 1
I
RT - ... AT \ \ \ \ \ \ \
"PT
JI AT
/
, RT
"APT
1982/83 83/84 84/85 85/86 86/87 87/88 88/89 89/90
Crop Year
Figure 1.5 Change in mean DMY of breeding population (all-entry mean of yield trials) for 8 years in Thailand (PT = preliminary trial at Rayong, AT = advanced trials at 3 locations, RT = regional trials at 7 locations).
52

,.... ,..;
00 c: o .., tO
i!l<:
!Ni '-'
;... ~
..c rJl !!) ... ...
'" ~
00 c: o .., tO ~
!Ni "-"
'"' c: !!)
"" e o t.>
:E ~
.., o o
i!l<:
120 (A) ,. AT
110 /
Rayong 1 /~ PT RT 100
/'-90 /' Jr
/ /
/
80 -...t.- __ Jt
70
60
(B)
HO
RT Rayong 1 /~ ...... AT
100 ,/ " ¡.--7-..... --.... PT
::;~ I
..- , , I , /
I I 90 I ,
11. ''Ii. /
i i
1982/83 83/84 84/85 85/86 86/87 87/88 88/89 89/90
Figure 1.6 Crop Year
Chnn~e in menn fresh RY nnd root DM content (all-entry mean of y1eld tria1s) for 8 years in Thailnnd (PT = preliminary tríal at Rayong, AT = advanced trials at 3 locations, RT = regional trials at 7 locations).
53

,..... ..... btl § '" ~
t<! '-'
H
==
,..... .....
120
110
Rayong 1 100 O O
90
80
110
Rayong 1
..--~ RT
/J-~ AT
...... -- PT ...¿.;:: I ,
'w------I O ,
O O , O O O /
Ji
00 100 O O~----~O~--~O~----~O~---<O~ __ ~O~~;~~~O AT
! ///,¡A PT
90 RT
70
i
1982/83 83/84 84/85 85/86 86/87 87/88 88/89 89/90
Crop Year
Figure 1.7 Change in mean HI and total plant w1: (all-entry mean of yield trials) for 8 years in Thailand (PT = pre1iminary trial at Rayong, AT = advanced tria1s at 3 locations, RT = regional trials at 7 locations).
54

rabie 1~31 Result of regional yietd triaLs in Thailand¡ 1969-90.
DMY (t/h.) .t (1) Fresh
Yield Total Plant Root Plant Clone ParE!f'lts SPB SRC RAY RET BMS MSK Mean (t/ha) Wt (t/ha) MI DM(X) Type<2¡
DMR 25·105·112 27·77·10 x Rayong 3 4.2 7.1 8.9 10.5 11.2 27.1 11.5 35.' 57.3 .617 32.4 4 M KUC 28·77·3 Rayong 1 x 21·1 4.9 7.4 6.2 14.1 16.6 18.7 11.3 35.4 59.5 .595 31.9 5 M KUC 28·71'67 Rayong 1 x OMR 23·29·15 4.2 5.6 5.0 13.7 16.6 20.5 10.9 35.4 64.0 .553 30.8 4 CMR 25·27·3 VI x Rayong 1 4.9 5.4 5.5 10.3 15.6 21.$ 10.5 35.7 58.8 .607 29.4 4
U1 Rayong 60 M Col 1684 x Rayong 1 3.8 4.8 5.0 8.8 15.4 23.6 10.2 34.9 60.0 .582 29.2 5 U1
CMR 25·33·105 Rayong 3 x Rayong 1 4.1 7.0 5.7 11.0 14.0 18.7 10.2 31.7 52.2 .607 32.2 4 CMR 28·67·76 Ksset x 21-1 3.8 5.0 6.7 8.6 14.5 20.0 9.8 32.1 57.8 .555 30.5 4 Rayong 1 3.3 4.5 3.4 11.7 13.3 20.3 9.4 32.6 63.1 .517 28.8 5 Rayong 3 M Mex 55 x M Ven 307 2.4 4.4 3.6 10.4 14.8 18.3 9.0 27.1 49.7 .545 33.2 2 CM 4054·40 CM 1015·34 x CM 849·1 3.0 3.3 5.3 7.7 10.4 17.2 7.8 29.5 49.6 .595 26.4 5
Mean 3.9 5.4 5.5 10.7 14.2 20.6 10.1 33.0 57.2 .577 30.5 4.2
(1) Location ! SPB ~ Suphanburi; SRC = Srlracha; RAY = Rayong; REt = Ro; et; BMS = Banmai Smarong¡ MSK = Mahasarakanm.
(2) Ptant type (1 = poor f 5 = excellent); mean of 6 locations.

ea se of handling planting stakes and good-quality planting material. Thus the significant improvement in total biological yield, root DM and plant type was the major breeding achievement in the Thai-CIAT and cassava breeding program during the 1980s.
One good example that demonstrates the present status of cassava varietal improvement in Thailand is the result of regional yield trials in 1989/90 (Table 1. 31) . Rayong 1, the world's most successful cassava variety, is basically a high-yielding variety capable of producing 20.3 t/ha dry roots or 61.4 t/ha fresh roots under the high-yielding environment of Mahasarakarm. Yet, in the overall average, virtually all the varietal entries gave higher dry root yield and root DM content than Rayong 1. CMR25-105-112 was outstanding, with an extraordinarily high yield (27.1 t/ha dry or 72. O t/ha fresh roots) in 11 mo without irrigation and with 4 mo of no rain) at Mahasarakarm. M KUC28-77-3, a selection from the Kasetsart University breeding program, was also outstanding in its ability to give high yields throughout low- to high-yielding environments.
The Thai-CIAT cooperative breeding program--established in 1983 as a cooperative effort among the Dept. of Agriculture, Kasetsart University and CIAT--now has dual functions of varietal development for Thailand and generation of breeding materials for other Asian cassava improvement programs. Encouraging results came from a replicated yield trial conducted at Hong Loe Field Research Center in South vietnam, in which three recommended varieties from Thailand were compared with a local industrial variety (Table 1.32). Rayong 60 and Rayong 1 outyielded the best local industrial var. Hong Loe 24, both in fresh RY and root DM content, suggesting that the Thai materials can do well under edaphoclimatic conditions similar to those of Thailand.
In the wetter climate of Umas Jaya Farm (UJF), Lampung, Sumatra, Indonesia, selections both from CIAT HQ and ThaiCIAT hybrid populations gave encouraging results compared with the performance of a traditional local variety (Table 1.33). The selections of CIAT HQ origin appeared to be slightly superior to those of Thai-CIAT origin, at least in this particular trial. Thus the recent hybrid materials from CIAT HQ offer good opportunities for immediate varietal selection in the wet low1and tropics, while they are a good source of selecting use fuI cross parents in the seasonally dry low1and tropics of Asia.
1.4.3 Germplasm distribution
Three types of germplasm--i.e., germplasm accessions including recommended varieties, hybrid clones and hybrid seeds-are available from CIAT in the form of stakes, meristem
56

Table 1.32 Result of a replicated yield trial at Hong Loe Research Center, South vietnam, 1989-90.
Root DH DHY Fresh RY Content
Clone (tjha) (tjha) (%)
Rayong 60 10.6 27.2 39.0 Rayong 1 9.9 26.1 37.9 Hong Loe 24 (local) 8.1 23.2 35.1 Rayong 3 7.9 20.9 38.4
Table 1.33 Result of an advanced yield trial at UJF. Lampung. Indonesia 1989-90.
Total Root
Fresh Plant OM Root Root
DMV Vietd Wt Content Plant Skin Flesh Clone Parents (t/ha) (t/ha) (t/ha) HI (X) Type(1) Color(2) Color(3
$M 566·IlJJ M Bra 35 16.0 42.9 60.2 .71 37.2 5 B W
CM 4049·2UJ DI 101·19 x DI 849-1 14.3 38.4 64.3 .60 37.2 5 W WV CM 4031·1ruJ DI 922·2 x CM 507·37 14.2 36.6 68.4 .54 38.9 3 B V $M 445·2!JJ M Col 1468 13.2 37.6 64.9 .58 35.1 3 B W
OIIR 28'32'7UJ DlR 23'102·198 12.9 34.7 69.4 .50 37.1 4 S W
5M 554-3I)J DI 681·2 12.8 35.3 58.7 .60 36.2 3 W W Mira 4 Bogor 528 12.3 33.1 74.9 .44 37.1 4 S W $M 564·15UJ M Bra 5 11.9 32.3 54.3 .59 37.3 5 B W
$M 483·23UJ M Br. 5 10.8 29.9 56.0 .53 36.1 3 W WV OIIR 28-47-1ruJ Ravors 60 10.4 29.0 45.8 .63 35.8 5 W W
CMR 28'97 '4UJ Ravors 3 x 21·1 9.5 24.0 44.4 .54 39.5 3 W W
CMR 28·42·3uJ CMR 23·149·35 9.4 34.6 77.5 .45 36.8 4 8 W $M 566·15UJ M 8ra 35 7.8 30.4 53.2 .57 35.8 5 B W OIIR 28·42·1UJ DlR 23·149·35 6.8 24.3 68.6 .35 35.7 4 W W Kretelc (local) 5.9 17.8 54.7 .33 33.3 5 8 W
(1) Plant type, 1 = poor. 5 = desirable.
(2) aoot slcin color. 8 = brown~ W ~ white.
(3) Root flesh color. W = white, WY = slightly yellow f y: yellow_
57

cul ture or true seeds. The breeding materíals from the Thaí-CIAT program are beíng transferred to natíonal programs ín each of these forms, dependíng upon the capacity of the recipíent program and the likelihood of accidentally íntroducing díseases or pests. From CIAT HQ, true seed ís the major mean s of transfer, occasionally supplemented by meristem culture.
During the past 15 years, sorne 235,000 hybrid seeds from some 4000 eros ses have been distributed to the eassava breeding programs in Asia from CIAT HQ (Table 1.34). From this source, various varieties have been seleeted in several Asian eountries and numerous cross parents seleeted in Thailand. Encouraged by the favorable results of Thaí hybríds, first ín Indonesía and more recently in South Vietnam, a systematic distribution of Rayong hybrid seeds to Asian national programs started in 1989 (Table 1.35). More than 40,000 seeds had been distríbuted to 17 institutions in 11 countries by 1990.
A systematic transfer of selected clones, mostly in meristem culture occasionally supplemented by stakes, also started this year (Table 1.36). Recommended varieties in Thailand and the most promising clones from the RFCRC and KU-SRC are included in the list of clones transferred to the eleven countries (Table 1.37).
1.4.4 Varietal release
Varietal selection and multiplication take a long time with cassava. Dissemination of varieties takes still longer. Moreover, official release of recommended varieties has not been the principal means of disseminating new eassava varieties, at least in the pasto Thus it will take a mueh longer time to be able to assess the socioeconomic benefits varietal improvement work brings about for cassava than for major cereal crops. Nevertheless, official release of varieties is one measure of the Program's eommitment.
Several new names have been added to the list of reeently released CIAT-related cassava varieties (Table 1.34). From now on, the number of varieties selected from local X introduced parents and from Thai-CIAT clonal introductions is expected to become more ímportant.
58

Tab{e 1~34 cassava F1 hybrid seeds from CIAT HQ dlstributed to Astan programs.
Year
Country 1975 1977 1978 1980 1981 1982 1983 1984 1985 1966 1987 1988 1989 1990 Total
Th.iland 900 6170 mo 3050 1400 7450 7900 8000 9300 8000 11800 14200 9400 14121 109411 U1 Indonesia 900 700 4600 3050 4950 8600 22800 \O
Phi l i ppines 900 950 5100 4700 5500 2350 5000 3850 2386 30736 China 2300 6100 3500 1800 2100 4400 8399 7400 35999 Malaysia 900 1500 2050 1250 4050 200 1490 11440 lrdia 900 850 1050 7900 10700 Vietnam 1900 4250 4500 10650 Sri Lanka 1500 1500 laiwan 500 1200 1700
Total 5000 7670 10220 5100 7750 19700 27050 18250 22350 14950 13900 32540 24435 26021 234936

Table 1. 35 Cassava hybrid seeds fraro the 'lbai -CIAT program distriruted Asian national programs aro CIAT HQ.
No. of Seeds Per Year
Country 1985 1986 1987 1989 1990 Total
Irrlonesia 2950 3130 4893 2840 13813 China 2621 3250 5871 vietnam 1950 2750 4700 Ihllippines 3334 2300 4634 Malaysia 1400 1100 2500 Irrlia 1350 1350 2700 Iaos Myanmar 950 950 sri I.anka 750 750 Israel 750 750
CIAT HQ 1300 2860 2561 6721
Total 2950 1300 5990 14548 18601 43389
Table 1.36 cassava clones transfered from the 'lbai -cIAT pn:XJralll te Asian national programs and CIAT HQ.
No. of Clones Per Year
Country 1987 1988 1989 1990
Indonesia 3 China 13 vietnam 13 13 H1ili¡;pines 3 13 Malaysia 3 13 Irrlia 13 laos 4 13 Myanmar 13 sri I.anka 13 Israel 13
CIAT HQ 8 13
60

Tabte 1~37 Description of promising clones distributed by the Thai-CIAT program to Asian nat;onaL programs.
Location of Location Yield OH Root Potential Maln Clone Parents Hybridizat.(l) of selection Potential Content HCN U •• (2) Characteristic
Rayong 1 (Thai local) ? RFCRC + O ++ AF,ST Provon industrial va ••
Rayong 3 M Mex 55 x M Ven 307 CIAT RfCRC O ++ O ST,AF,FC High starch
'" ,.... Rayong 60 M Col 1684 x Rayong 1 RFCRC RfCRC + O ++ Af early nturing CMR 25·105'112 27-77·10 x Rayong 3 RFCRC RFCRD ++ + + AF,ST High OMY CMR 26-65·13 Rayong 3 x M Col 22 RfCRC RFCRC + O O FC,AF ,.Sl O .... l purpose CMR 29-56·101 CMR 23-149-128 x R1 RFCRC RfCRC ++ O ++ AF High yield M KUC 28-77·3 Rayong 1 x 21-1 K1.I-SRC I(lJ-SRC ++ + + AF,ST Hígh OMY CM 4231'32 CM 982-20 x CM 681-2 CIAr RFCRC ++ o AF High yield
(1) CIAl: CtAT. HO¡ RFCRC, Rayong Field Crop Research Center; KU-SRC: Kasetsart University Sriracha Experiment Stetion_
(2) AF = animal feed f SI = starch production, Fe : fresh for human consumption~

Q\ !<.>
rabie 1.38 CIAr~related clones released as recommended varieties by Asian national programs.
Category/Name
CIAT Clone VC 1
Nan:::i 188 VC 2
M Col 1684
Selected from CIAI Séed Introduction
Rayong 3 Rayong 2
Perintis
CM 3590
Country
PhH ippines
China
Ph il ippi nes
Ph il i ppi nes
Tha; land Thai lard
Malaysia
Phi l ippines
Selected fran Local x CIAT Cross
Ravong 60 Thai land
Rayong 5 Thallaro
Selected 1rom LocaL Crosses
Adlra 4 Indonesia
Year of Decision to Release(1)
1966 1987 1988
1989
1984 1985 1988
1990
1987
1990
1966
Clonal Cnde
CM323-52 0021-188 M Col 14l\8
M Col 1684
CM 407-7 CM 305-21 CM 982-7
CM 3590-1
CMR 24-63-43 (CMe 76 x V 43)21-
M-31
LocatiOt'l of Hybridi.ation(2)
CIAT CIAl Brazil
CIAT CIAT CIAl
CIAT
RfCRC RFCRC
BORlf
Location of Selection
CIAT/PRCRTC CIAT/SCIS Bra/CIAT/PRCRlC
RfCRC RFCRC MAROl
PRCRTC
RfeRC RfCRC
BORIF/UJF
Adaptation Potential '0(3) Use(4)
\lLT ST ,AF
ST ST,AF WLT FC,M
\lLT sr
OLT ST"AF,FC Oll Fe \llT AF,ST
IIL' Fe,Sr
Olr AF,Sr
Ol' Si,Af
WLT ST ,AF
(1) Given slow multiplication rute of cassaV8 planting stakes, there is usually a 3~yr time Lag between th~ year of decision to releáse and the actual planting in sizable acreage.
Main Characteristics
HlgII Vi.ld HlgII Vi.ld Teble use and
higll yl.ld Hlgh vield
High starch content Snack fooc::j
Higll Vi.ld on peat soils
Dual purpose
High early yteld
High starch content
Higll .tareh Vl.ld
(2) BORIF = Bogor Research Jnstitute of Food Crops¡ e[Al = CIAT ~; MARDJ • Malaysian Agrjcultural R&D Institute¡ PRCRTC ::: Philippine Root crap Research and Training Center; SCIB ;:; South China IhStitute 01 Botany; ~J ::: !.mas Jaya Farm.
(3) WLT ;:; wet lowland tropics, OLr = dry lowland troplcs# ST = subtropics.
(4) ST : starch productjon. AF ::: animal feed, FC = Fresh for human consumpt¡on.

2. CASSAVA BIOTECHNOLOGY
The Biotechnology Research unit (BRU) continued its research and informationjtechnology transfer activities in support of cassava in the areas of germplasm conservation, cryopreservation of cassava shoot tips, pollen culture, genetic transformation of cassava, biochemistry of cassava fermentation, and a cassava biotechnology network.
2.1 Germplasm Conservation
2.1.1 Storage under minimal growth conditions and the effect of acetyl salicylic acid (ASA)
With the aim of increasing the transfer time to fresh medium of the in vi tro cassava clones, the effect of ASA on the growth and viability of 15 different cassava varieties maintained under in vitro storage conditions for 15 mo was evaluated. This treatment has been reported to improve shoot growth in Sol.anum cardiophyllum (López, 1985) and other species (Dougall 1987).
Two time points (5 and 10 mol were evaluated, the latter being due in December 1990. Response levels were dependent on the variety; qualitatively, however, all behaved similarly, with the control showing higher levels of defoliation.
-5 : 10 M ASA gave the highest number of green nodes and shoots, as well as highest leaf retention. Thus far this concentration of ASA results in the hiq~est viability, making it ideal for long-term storage. 10 M ASA, on the contrary, had a drastic effect on the plants, most of them dying soon after the onset of the experimento
The varieties tested were chosen either for their field characteristics or their in vitro storage behavior. The life span of two of them--which show rapid deterioration under normal storage conditions in the pilot In vitro Active Genebank (P-IVAG) y!.oject--could be expanded from 9-10 mo up to 14 mo with 10 M_~SA. In general most varieties g~1ie best results with 10 M ASA; in only a few cases did 10 M seem to give better results.
2.1.2 Cryopreseryation of cassava shoot tips
After defining the conditions for the cryopreservation of seeds and zygotic embryos (BRU Annual Report 1989; Marin et al. 1990; Roca et al. 1989), the cryopreservation project concentrated its efforts on the difficult task of developing cryopreservation protocols for cassava shoot tips in liquid nitrogen. The methodology developed thus far tor M Col 22 is simple and reproducible, yielding a high percentage of survi val and plant recovery. The next step will be to
63

verify whether this methodology can be applied without modifications to other cassava accessions. Experiments are presently under way invol ving 12 different cassava accessions, representative of Latin American germplasm, as a first step to test the methodology with a large germplasm collection.
To solve the problems encountered in the cryopreservation of cassava shoot tips required the study of every single factor involved. In 1988 the project was far from finding a solution to the problem: few shoot tips survived the storage in liquid N, and those that did lost their morphogenic capability completely. In 1989 it was possible to push the 1 imi t down to -25' e and grow plants from frozen shoot tips. The protocols for the best results obtained were the starting point for the work done during 1990, when it became possible to achieve a survival rate of 10-95% (avg 68%), while plant recovery ranged from 0-44% (avg 19%).
Discussion of the results follows.
2.1.2.1 Tbe preculture medium. Previous studies had shown the favorable effects of cryoprotection over a long period of preculture before going into the liquid phase of cryoprotection, which is stronger and shorter in duration. Results of the preculture experimenta in osmotic media are shown in Table 2.1. As can be observed, the first shoot tips frozen in liquid N suffered severe damage because only callus was formed by the surviving specimens.
Doubling of the dimethyl sulfoxide (DMSO) concentration with respect to the original protocol slightly increased the survival rate of the frozen tisaue, but decreased the no. of plants recovered. Doubling of the sucrose concentration had an overall positive effect, but the contrary was true for the agar concentration.
2.1.2.2 Cryoprotection. Table 2.2 shows survival in several experiments and, for the first time, the recovery of plants from in vitro shoot tips frozen in liquid N. The main characteristic of this successful experiment is that the shoot tips were dehydrated after the liquid cryoprotection procedure. Drying the shoot tips for 1 h on sterile filter paper after liquid cryoprotection markedly increased the rate of recovery. Drying at room temp gave better results than drying on ice (35 vs 7% plant recovery).
2.1. 2.3 Shoot tip size. Shoot tip size ia a logistical factor, more labor being involved in isolating smaller specimens « 1mm) than in large ones (2mm). Large shoot tips had a low survival rate (only 8%) and produced only calli; while for small shoot tips, tissue survival rate rose to 72%, with a plant recovery of 20%. In more recent
64

Table 2.1 Results obtained with different cryoprotectors in ~ vation experiments with in vit= cassava (M Col 22) Shoot tipa.
N
N
A B C D E F N D E F N N
:2 :2
2+1(3)
2 3 4 2 2 2 2 2 2 3 3 3 3 3 3
+
+
+ + + + + + + + +
SUrVival U::Mest RecoIre:!:y
Tel1Ip ('C) (%)
- 25 10 P -196 25 CA -196 30 CA
14 P - 30 20 CA - 25 90 P - 25 40 P - 40 20 CA - 35 20 CA -196 20 CA -196 60 CA -196 20 CA -196 20 CA -196 32 CA - 40 33 CA -196 40 CA -196 20 CA -196 50 CA -196 30CA
1 N = (MS salts + suerosa 2%) = (C) + sorbito1 1M + J:MSO 10% A = (C) + so:t:bito1 1M + J:MSO 1M + sucrose 0.1M
2
B = (C) + sorbito1 1M + J:MSO 0.5M + sucrose 0.5M C = (C) + suerosa 1M + J:MSO 0.5M + g1yoero1 0.5M O = (C) + sortlitol 2M + J:MSO 1M + suerosa 0.1M E = (C) + sortlitol 2M + J:MSO 0.5M + sucrose 0.5M F = (C) + sucrose 2M + J:MSO 0.5M + glycerol 0.5M CA = Calli P = Plants
eryoprotective solution was :renx:wed (+ = yes; - = no) fran the cryotube befon! the cooIÍl'XJ-freezÍl'XJ process.
3 Shoot-tipa were dehydrated on dry filter papar for one h after two h of crycprotective action befon! coo1Íl'XJ.
65

Table 2.2 Results obtained in ~i.narts with different preclliture treatllents (C'l. M Col 22).
- ._-----------
22 23 24 25 26 27 28
IM30 0.1 3 SUcrose 0.25 7 IM30 O:.S 5 ABI\. 10_5 5 ABI\. 10_
7 10
ABI\. 10_7 10 ABI\. 10 5
Reculture Tiloo (ravs)
MediumZ
1 2
3 2 2 2 2 3 2
4 5 5 5 5 4 5
1 Semital 1M is included in all precllitured media.
SUrvival I.owest Reoovery
-196 - 30 -196 - 25 - 20 - 25 -196
30 CA 29 CA 60 CA 10 P 50 CA 60 CA 20 CA"3
2 Reculture medium: 1= sucrose 0.75 M + activated charcoal 0.2% = MS salts (1/2) + sucrose 0.3 M arrl inosital 1 nq/lt.
3 'Ihis survivirg shaot tip was not treated with cryop:rotective liquid before coolil'q.
experiments, plant recovery rates have been averaging 50% (Fig. 2.1).
2.1. 2.4 Recultivation conditions. Washing the DMSO away with medium after thawing had no influence on survival rate, but had a detrimental effect on plant recovery. Several combinations of medium, duration of cultivation, photoperiod and temp were studied for recultivation (Table 2.2).
66

B
Figure 2.1 Cryopreservatien ef cassava sheet apica1 meristems: (a) meristem grewth after retrieval frem liquid nitregen and (b) plant growth from cryopreserved meristems.
67

2.2 Pollen Culture: Toward a Haploid Methodology in Cassava
2.2.1 Cassava pollen
Morphologic variants of pollen are found in some plants at anthesis (P-grains), starting at very early stages of pollen development and reflectéd finally as sterile pollen grains. Such abnormal pOllen grains have been considered as potentially embryogenic pollen grains as found in research done on tobacco, barley and peonies. To identify dimorphic pollen from cassava (normal and abnormal) growing in the field, an examination was made of mature flowers excised at anthesis.
At anthesis a dimorphism was evident in cassava pollen grains (Fig. 2.2). Normal pollen grains were 140-160 ~m in diameter and contained abundant starch and densely stained cytoplasm. The smaller grains were 80-100 ~m in diameter, contained little starch and were characterized by weakly staining cytoplasm (putative p-grains). In view of this, it seemed pertinent to study whether these P-grains represented a particular form of male sterility originating from a deviation from normal male development at the sporophyticgametophytic transition in the microspore mother cell (Fig. 2. 3A) .
Pollen fertility (capacity for in vitro germination) was evaluated using a special in vitro culture medium optimized to reach a high percentage of germination (Fig. 2.3B). Germination was evaluated after 2 h at 40'C under light and high RH conditions. A strong correlation exists between pollen dimorphism and fertility. Normal grains showed a fertility level of 23-75%, while abnormal pollen ranged from 0-16% (Table 2.3). The next step was to elucidate whether normal and abnormal pollen grains would exhibit differential behavior in anther and isolated microspore culture.
2.2.2 Anther and microspore culture
Once having hypothetically defined abnormal pollen grains as embryogenic and having characterized cassava microsporogenesis and gametogenesis, the appropriate stage for anther and microspore in vitro culture seemed to be around the tetrad to the uninucleated stage of development; that is, when the flower bud is around 0.8-1.5 mm in size.
The methodology for microspore isolation was modified and optimized. The new method (Fig. 2.4) not only reduces labor time but also reduces sources of contamination. It starts from whole flower buds, which are subsequently macerated and filtered to yield very pure microspore preparations after washing and decantation steps.
68
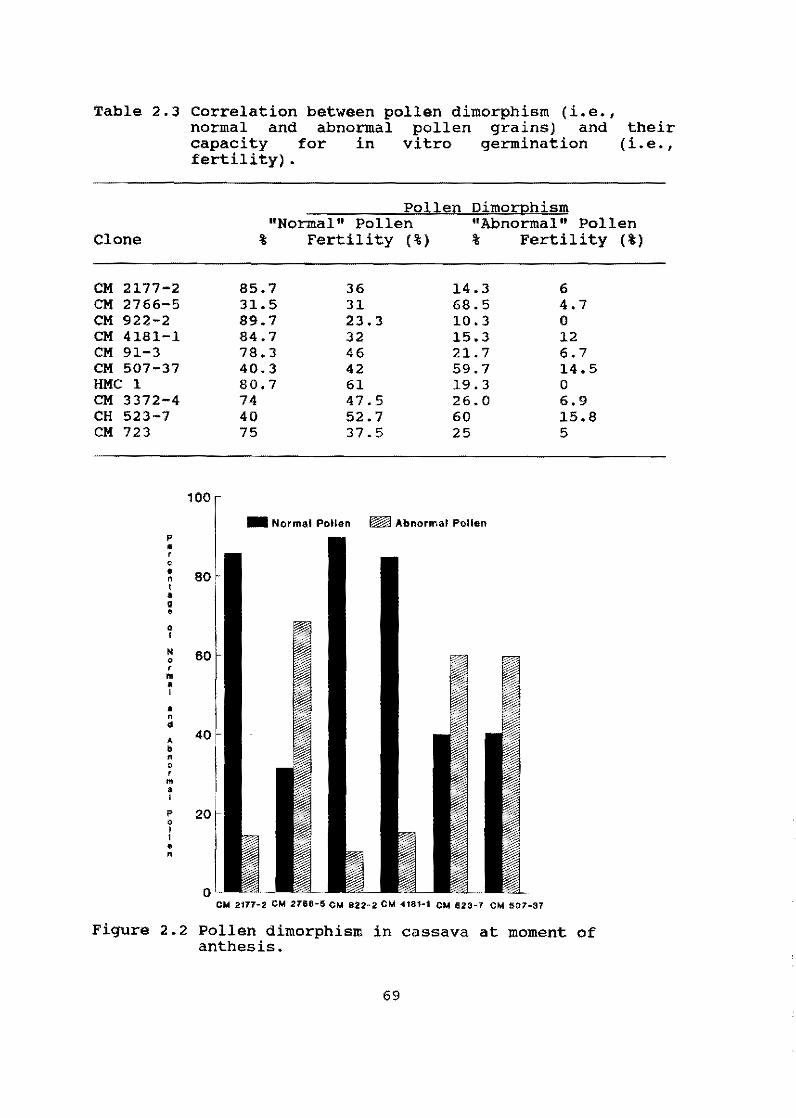
Table 2.3
Clone
CM 2177-2 CM 2766-5 CM 922-2 CM 4181-1 CM 91-3 CM 507-37 HMC 1 CM 3372-4 CH 523-7 CM 723
p
• , o • n
• • • • o , N o , In
• I
• n • , • n o , m
• , p
• I 1
• n
Correlation between pollen dimorphism (i.e., normal and abnormal pollen grains) and capacity for in vitro germination fertility) •
Pollen Dimorphism
their (Le.,
"Normal" Pollen "Abnormal" Pollen % Fertility (%) % Fertility (%)
85.7 36 14.3 6 31.5 31 68.5 4.7 89.7 23.3 10.3 O 84.7 32 15.3 12 78.3 46 21.7 6.7 40.3 42 59.7 14.5 80.7 61 19.3 O 74 47.5 26.0 6.9 40 52.7 60 15.8 75 37.5 25 5
100
_ Normal Ponen Abnormat Pollen
80
60
40'
201
Figure 2.2 Pollen dimorphism in cassava at moment of anthesis.
69

Figure 2.3 (a) Normal and abnormal eassava pollen grains at anthesis; (b) eapaeity of in vitro germination fertility in normal pollen grains; and (e) isolated mierospore showing first mitotie divisions.
, "
1 ,- -! \ -, ••• --+ -,
':1í!
Figure 2.4 MOdified, highly effieient methodology for isolating mierospore cultures using complete flowers: (a) flower bud, (b) maeeration of complete flowers, (e) filtration (750 ~), (d) filtration (double filter 150 ~), (e-f) decanted pollen, (g-h) washing twice with resuspension and deeantation, and (i-j) isolated mierospore culture in droplets.
70

Potential embryogenic pollen grains are determined early during pollen ontogenesis. As it has been reported that stressed plants give rise to abnormal polI en grains due to changes in general metabolism, work is being done with cassava plants stressed in the field in cooperation with the Cassava Program Breeding Section.
A total of )00 six-month-old plants representing 55 different clones were stressed in the field using stem girdling. Figure 2.5 shows their response to in vitro anther culture. Among the factors tested were temp, light and different basal media at different pH values modified with various levels of sucrose, vitamins, amino acids, organi~ add!tives (coconut water), and the N supplement ratio (NH 4 ¡NO) l.
Stem girdling increased the frequency of abnormal pollen grains. High temp pretreatment and a specific hormonal balance induced microspores to undergo first mitotic divislons in vitro (CM91-3, CM2766-5), the first step toward androgenesis.
Producing stress by grafting did not work beca use of incompatibilities between the genera used (Jatrofa, Ricinus). Grafting onto wild species should be tried as the stress produced by the expected hormonal imbalance could lead to higher yields in abnormal pollen grains.
Work is under way to do single-cell culture with isolated microspores, trying to induce sporophytic microspore development. The utilization of conditioned medium for this purpose seems to be one of the relevant factors.
2.3 Genetic Transformation of Cassava
The development of a transformation and regeneration protocol for cassava is of central importance for breeding programs as a means of introducing use fuI agronomic traits asexually. Infection of cassava by Agrobacterium tumefaclens and the associated expression of foreign genes has already been demonstrated (Calderón, 1989), the next step being the production of transformed, regenerated plants.
As a model for developing the transformation¡regeneration protecol, the pGV1040 plasmid (PGS, Gent-Belgium) ls belng used (de Block et al. 1987, de Creef et al. 1989). This plasmid shows the universal appllcability of such approaches as lt ls belng used also fer developing transformation¡ regeneratlon pretocols in common beans and Stylosanthes. This plasmid contains two selectable markers: the nptII gene conferring resistance to the antibioticum kanamycin and the bar gene conferring resistance to the herbicide Basta (phosphinotricin), as well as a scorable marker I the uidA gene (Jefferson 1987), coding for p-glucuronidase (GUS),
71
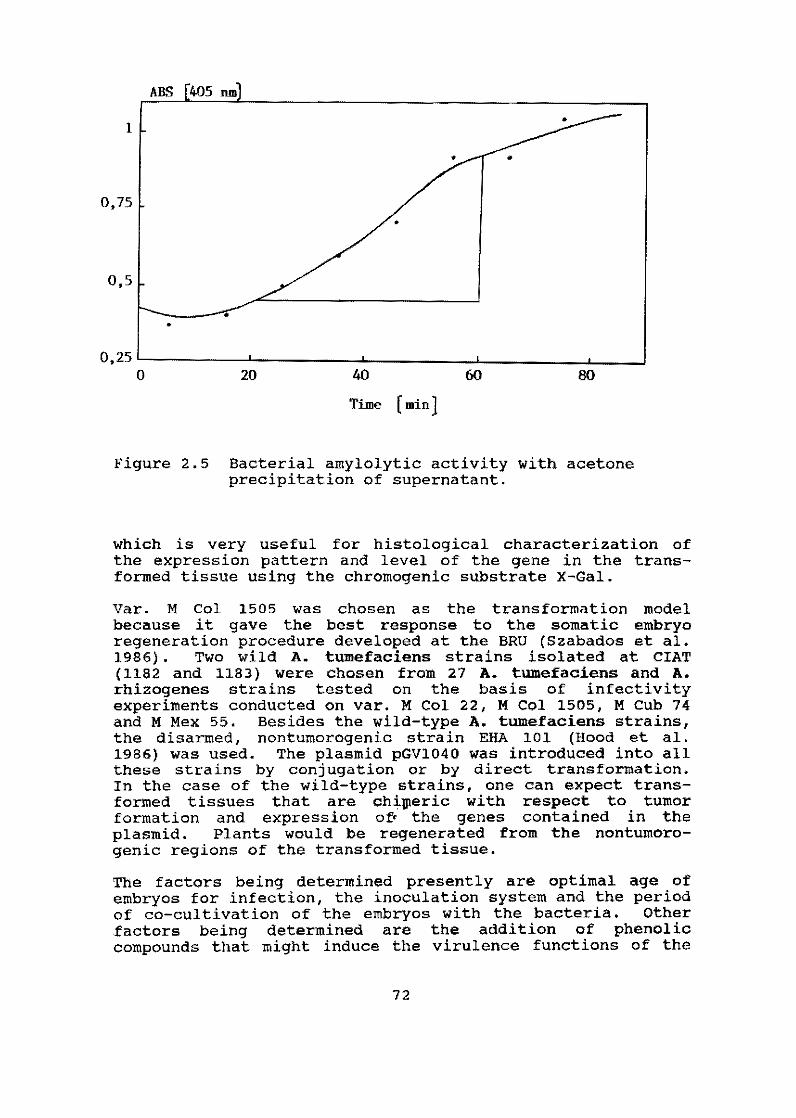
ABS
1
0,75 •
0,5
•
O,25L-________ -L __________ ~ ________ ~ __________ ~ __ ~
O 20 40 60 80
Time [min 1
Figure 2.5 Baoterial amylolytic activity with aoetone precipitation of supernatant.
whioh is very useful for histological characterization of the express ion pattern and level of the gene in the transformed tissue using the ohromogenio substrate X-Galo
Var. M Col 1505 was chosen as the transformation model because it gave the best response to the somatic embryo regeneration procedure developed at the BRU (Szabados et al. 1986) . Two wild A. tumefaciens strains isolated at CIAT (1182 and 1183) were chosen from 27 A. tumefaciens and A. rhizogenes strains tested on the basis of infectivity experiments conducted on varo M Col 22, M Col 1505, M Cub 74 and M Mex 55. Besides the wild-type A. tumefaciens strains, the disarmed, nontumorogenic strain EHA 101 (Hood et al. 1986) was used. The plasmid pGV1040 was introduced into all these strains by conjugation or by diract transformation. In the case of the wild-type strains, one can expect transformad tissues that are chi~erio with respect to tumor formation and express ion OP the genes contained in the plasmid. Plants would be regenerated from the nontumorogenic regions of the transformed tissue.
The faotors being determined presently are optimal age of embryos for infection, the inoculation system and the period of co-oultivation of the embryos with the bacteria. Other factors being determined are the addition of phenolic compounds that might induce the virulence functions of the
72

Ti-plasmid, the role of pH, and the influence of stress on bacterial virulence. Following three different protocols, embryos expressing GUS activity have already been obtained, but transformation efficiency has yet to be optimized.
Protocols are being developed for using the particle gun for transformation purposes. The gun accelerates DNA-ceated metallic microprojectiles (1 ~m in diameter) to high speed so that they can penetrate cell walls without killing the penetrated cell in many cases, thus being a useful vehicle fer plant transformation with foreign DNA. Some preliminary bombardments were carried out on roets and embryes, showing GUS transient gene express ion from 3 to 20 days latero A high level of transient gene express ion usually correlates well with efficient stable transformation. This is one more advantage of the GUS system, which allows a quick assay at any stage of development.
2.4 Genetics of Esterase Isozymes in Cassava
There are only a few existing reports on cassava genetics and cytogenetics, for a number of reasons:
Cassava is traditionally prepagated by means of stem cuttings from mature plants.
About 20% of CIAT's germplasm collection flowers only rarely or never (Hershey, pers. comm.).
Seed set through controlled pollination in cassava tends to be low; an avg of 0.8 seeds are formed per female flower (CIAT, 1980).
Cassava is probably an allotetraploid with a basic chromosome number, n = 9 (Magoon et al. 1969).
Cassava is generally heterozygous; self-pollination occur naturally. among genotypes, selfing produces depression.
both cross- and Although variable strong inbreeding
The fact that male and female flowers of an inflorescence mature at different times tends to reduce selfing during open pollination.
The amount of variation found in cassava, both among and within plants (as heterozygosity), is great, hence the difficulty in finding useful heterozygotic lines for genetic studies.
The electrophoretic characterization of isozymes provides data that differ fundamentally from those derived from morphological characterization or the chemistry of secondary
73

metabolites. The colored band patterns of isozymes on gels represent areas of enzymatic activity catalyzing a particular reaction. Differences in the electrophoretic mObility of enzymes usually reflect changes in the structural genes cOding for the corresponding polypeptides, thus being the direct result of genetic differences (Crawford 1983).
Isozyme patterns are simple as compared with those of total proteins, which are very complex; however, sorne enzymes with nonspecific substrates su eh as phosphatases and esterases still provide large number of bands. Esterases have often been used for genetic studies given their high degree of polymorphism. Esterases have been reported as monomers and dimers depending on the plant species studied. In potato even a tetramer with three types of subunits has been postulated.
Chavez et al. (1988) reported 16 esterase bands among a population of 100 selected cassava accessions displaying a wide range of the variability present in CIAT I s cassava collection. Hershey & Oc ampo (pers. comm.) have already found 22 bands in 3288 accessions screened thus faro Based on knowledge from other crops, cassava esterase activities could be codified by 7-11 loci. Like in other crops, the fas test anodical esterase from cassava root tips shows the highest enzymatic activity. This region of the pattern, called EST-1, is codified by one single locus. In an analysis of 100 accessions, Sarria (1989) found the presence of 11 phenotypes in the locus EST-1, some of them displaying a one- or two-band pattern, as well as a null phenotype, suggesting a null allele at this locus. These 11 phenotypes were confirmed in 257 progenies from 7 additional crosses to the 4 (76 progenies) reported last year. The phenotypes observed exhibited 0-, 1- or 2-band patterns, but never a 3-band pattern, suggesting that the esterase at this locus behaves as a monomer. The data were analyzed under hypothetical diploid and tetraploid models, the result being more compatible with a diploid modelo
In conclusion, the 11 phenotypes found for the locus EST-1 suggest the presence of 5 multiple alleles including a null allele (A to A4 ). These 5 alleles should yield 15 different PhenOeypes; the 4 invisible phenotypes corresponding to the null allele-carrying heterozygotes.
Preliminary study of the EST-2 locus (intermediate running group of modera te active bands) suggests that EST-2 is a single locus cOding for a dimeric enzyme; however, this requires further substantiation.
74

2.5 DNA Fingerprinting of Cassava
The development of RFLP technology has opened a door to detecting, monitoring and manipulating genetic variation in plants in a previously not possible manner (Tanksley et al. 1989). One of the immediate applications of this technology is for assessing genetic variation in natural populations and in phylogenetic studies (Song et al. 1988).
DNA fingerprinting techniques are currently displacing other techniques used to characterize the genome because of their extensive covera~e of the genome and their insensitivity to environmental and plant developmental factors--problems often encountered with morphological and even protein markers. DNA-based technology can also detect variation in coding as well as noncoding regions of the genome.
The work presented here involves producing a cassava genomic library and searching for clones that exhibit polymorphisms on 3 cassava varieties included in the P-IVAG project (BRU Annual Report 1989). The primary goal consists of obtaining an intermediate repetitive DNA probe. Such probes give more or 1ess complex hybridization patterns (ca. 20 bands), which may detect differences between closely related accessions. The degree of variation in the P-IVAG, as well as genetic stability after long storage, will be evaluated.
A cDNA library of cassava is currently being prepared. Besides being the source of further clones for genome mapping, this library will be used to isolate genes involved in CO fixation, as the pep-carboxylase, the pepcarboxikinase and the malate dehydrogenase genes. The aim is to e1ucidate the putative C3-C4 hybrid character of cassava at the molecular level.
2.5.1 Extraction of genomic DNA
The extraction protocol used was similar to that described by De1laporta et al. (1983). Tissue from M Col 22 was frozen in 1iquid nitrogen and ground to a fine powder in a mortar. This powder was further extracted with a detergent-containing buffer at 65'C. Proteins and polysaccharides were removed by potassium acetate precipitation. DNA was precipitated from the supernatant with isopropanol and after resuspension, RNase treated, phenol extracted and reprecipitated with ethanol. After resuspension DNA was quantified spectrophot.ometrically and stored at 4'C.
2.5.2 Cloning of genomic DNA into pUC19
Aliquots of the genomic DNA were digested with one of the following restriction enzymes: Pst 1, Eco RI, Bam HI, Xba I
75

or Hind 111. Digested DNA was ligated into pUC19 (Vieira & Messing 1982). The constructs were then transformed inte Endamoeba coli DH5, plated out on ampicillin-selective medium and checked for loss of p-galactosidase activity due te insertion into the plasmid's lacZ region with the help of the specific chromogenic substrate X-galo Plasmids were reisolated from individual colonies, excised with the corresponding restriction enzyme, and their size determined with the aid of \-DNA mol wt standards. The sizes of the inserts obtained ranged from 0.2 to 7 kb.
2.5.3 Search for polymorphisms
The cassava varieties used in this study were M Col 22, M Col 1505 and CM 507-35 from the P-IVAG project. After isolation, DNA from each variety was digested with the following 13 restriction enzymes: Apa 1 , Bam HI, Dra 1, Eco RI, Eco RV, Rae 111, Hind 111, Hinf 1, Rpa 11, Msp 1, Pst 1, Taq 1 and Xba 1 (Fig. 2.6). Methylation-sensitive enzymes such as Apa 1, Msp 1 and Pst 1 cut the DNA ineffecti vely, suggesting a high degree of methylation of the genomic cassava DNA. There is some evidence that methylation of DNA plays a role in regulating gene express ion. By cloning only the fragments cut by Pst 1, for example I one can enrich a library for expressed genomic regions as Pst 1 will not cut highly methylated regions, which are supposedly inactive.
The digested DNA was run on an agarose gel and transferred to a nylon membrane by capillary force (Southern 1975). Whole plasmids containing inserts ranging3~rom 0.2 to 3 kb were labeled by random prim\pg with a P-dATP to high specific activities (1-10 x 10 cpm/,ug) (Feinberg & Vogelstein 1983) and hybridized to the nylon membranes containing the blotted restricted cassava DNA.
polymorphisms were detected with several clones, but usttaIIy two clones were necessary to discriminate among the three varieties (Fig. 2.6). Only one Hind 111 clone has been found that was able to discriminate among the three varieties analyzed. Of 40 clones tested to date, about 10% were intermediate repetitive clones, but none showed polymorphisms among the accessions tested. These clones could still be useful to discriminate among other accessions.
Recently a Pst 1 clone (P12, 0.7 kb) was found that hybridizes only to M Col 22. Two additional varieties tested (M Ven 82 and M Bra 191 from Venezuela and Brazil, resp.) did not cross-hybridize with P12 either. This sequence might be use fuI as an RFLP marker or for gene tagging. P12 has be en partially sequenced, and homology searches are being run in the Genbank and EMBL databases to identify its function.
76

kb
kb
.... ttt ABe
---).,EcoRI,EcoRV ,Haelll~
t t t ABe
kb
_4,5
_',0
Figure 2.6 Variation at DNA level detected with probes P21 and X14. Restriction endocnucleases Eco RI, Hind 111 (1) and Pst 1 (11) detected DMA variation in CM 507-37 (1) and M Col 22 (11), resp. Southern blots were exposed by 2 days at -70°C with intensifier screens.
77
Sour cassava starch is a typical product obtained through natural fermentation of native cassava starch in Latin America. This product has many applications in the bakery and cookie industry, as well as in the production of some traditional specialties such as cheese bread ("pan de bono"), where its use is irreplaceable because of its specific functional properties. Nevertheless, the product presents many quality fluctuations that make it impossible to guarantee the satisfaction of national and international markets. The Cassava Utilization Section (see 7.4), in cooperation with the BRU, is studying the sour cassava starch production process to improve and standardize its qua lit y and thereby facilitate its industrial utilization (Cereda 1986).
The fermentation process occurs naturally in the tanks of the traditiona1 starch-extraction operations ("rallanderías") over a 25- to 30-day period, under anaerobic conditions without movement, this being one of the main stages responsible for the quality of the producto During this process the starch granules are structurally modified, their water absorption capacity increases, and organic acids and alcohols are produced (Cereda et al. 1985; Zapata & Parada 1988).
Some research has been carried out to understand the fermentation mechanisms and the role of the different microorganisms involved (Cárdenas & Buckle 1989; Ducrocq 1990; Gallego 1990; Nwankwo et al. 1988;). Initial results showed that the fermentation process is mainly homolactic and strictly anaerobic--different bacteria, yeasts and molds being involved (see Utilization section). Taking into account that the principal substrate is starch, amylolytic activities must play the central role in the metabolic processes involved. This led to a search for a methodology to determine and differentiate the amylolytic activities along the process, to characterize the enzymatic systems of the microorganism and to measure the production of excreted enzymes. Results were as follows:
The fermented starch samples were extracted with water at different times of the fermentation process in order to detect amylolytic activities using an enzymatic assay for aamylase, as well as iodine staining of starch-containing acrylamide gels. A new technique was adopted that involved running the samples in acrylamide gels and then electrotransferring the proteins to a second gel containing starch, where the iodine staining takes place (Kakefuda 1984).
To increase the sensitivity of the method, starch concentration in the gels was reduced froro 0.52% as described, to
78
0.02% to detect better the amylolytic activities on the iOdine-stained, otherwise dark, background. This modification improved detection considerably. Dilutions of the commercial a-amylase were made (1:5 to 1:3125) to determine the sensitivity of the method. The starting concentration was 6 u/~l. It was possible to detect the activity down to a dilution factor of 625, which is equivalent to 0.0096 u/141.
Besides showing amylolytic activity, the iOdíne-staining procedure yields different colors for each amylolytic enzyme: orange and blue for p-amylase, purple for pullulanase, and transparent for a-amylase.
To fínd out whether this procedure was adequate for detecting excreted amylolytic activities, an amylolyt~u bacterium isolated from cassava starch fermentation was used. The bacterium was grown in starch-containing medium; pelleted by centrifugation; and the supernatant was either directly used for activity measurements or the proteins were acetone precipitated. Additionally, cassava extract was obtained (squeezed and centrifuged juice) to detect amylase activity on acrylamide gels (Fig. 2.5).
The transfer step has been simplified in that the electrophoretically separated proteins are directly blotted by capillary forces onto the starch containing gel. This process has been optimized, the entire procedure taking just 1 h at 2S"C in a moist atmosphere. The amylolytic activitíes are detected with iodine as highly resolved, colored bands on the starch-containing gels. The control enzymes used were commercial preparations of a-amylase, p-amylase, amyloglucosidase, isoamylase, pullulanase and maltase.
A balance of the mineral salts was made to define better the fermentation conditions that will preferentially lead to homolactic and more efficient fermentation. Thus far samples of day O and 15 have been analyzed. Results indicate that P might be a limiting factor during the fermentation process. (Phosphorylation of the reducing sugars is one of the first metabolic steps in starch degradation.) Elemental analysis will also be done in fractions following the profile of the fermenting starch mass to determine whether the process is homogeneous.
This electrophoretic methodology will be used to select and classify isolated amylolytic microorganisms through their respective patterns. These patterns will make it possible to monitor the presence and development of the amylolytic activities throughout the fermentation process.
79

2.7 The pilot In vitro Active Genebank (P-IVAG) Project
During the three-year period of the P-IVAG project, important components of the establishment and operation of an in vitro active genebank were assessed (see the BRU 1989 report). This year the project concentrated on two objectives: monitoring the effect of (a) sub culture frequency during in vitro storage on genetic stability of three cassava genotypes with striking morphological and isozyme pattern differences (M Col 22, M Col 2264 and M Pan 127) ¡ and (b) storage time on stability using 10 clones maintained under slow growth conditions for 9 to 10 years in the world cassava in vitro collection at CIAT. These clones have been micropropagated 8 times on the average.
2.7.1 Subculturing frequency
Polyacrylamide gel electrophoresis (PAGE) for two isozyme systems a P, EST and a, P ACP and morphological evaluation of the in vitro material were carried out. The morphological descriptors were: no. of shoots, presence or absence of callus, roots, aerial roots and etiolation.
The first micropropagation yielded four cultures, the second gave rise to eight, the third to 16, and so on. Of the four morphological evaluations performed to date, no differences from the patterns of the controls have been found. As for the electrophoretic patterns, the major bands also remained unchanged.
2.7.2 storage time
Genetic stability was evaluated on the basis of changes in EST, ACP, GOT and DIAP electrophoretic patterns. The electrophoretic patterns of the control and the material from storage showed stability in every isozyme tested for 7 of the 10 varieties. Fourteen isozymes, in two running systems, were done wi th the P- IVAG material. No changes were found after storage. Results are summarized in Table 2.4",
The database developed for the P-IVAG has been updated systematically. The raw data collected during the four years of the project related to passport, field characterization, disease indexing, electrophoresis, storage location details, in vitro viability evaluation, and all the technical and logistical aspects of the project have already be en classified and fed into the database.
80

Table 2.4 Results obtained with 14 isozyrne systems using rWo buffer systems for root tips of 11 cassava varieties.
Isozyrne System
Peroxidase Malic enzyrne Glucose 6 phosphate dehydrogenase Phospho-gluco dehydrogenase Glutamate dehydrogenase 6 phospho-gluco dehydrogenase Malate dehydrogenase Shikimic dehydrogenase Diaphorase Isocitric dehydrogenase Phospho glucomutase Sulfoxide dismutase Hexokinase
Buffer Lithium
Borate (pH 8.1)
HA-LP* HA-LP* HA-LP* HA-LP* LA-LP HA-LP* LA-LP LA-LP LA-HP LA-LP LA-LP
NA NA
system2
Histidinecitrate
(pH 6.5)
LA-LP HA-LP LA-LP LA-LP HA-LP* LA-LP HA-HP* LA-HP* HA-HP* HA-LP* HA-HP*
NA NA
1 M Bra 12, M Bra 132, M Col 304, M Col 1684, M Col 2131, M Col 2264, M Ecu 72, M Mex 8, M Per 328, M Ven 82 and M Mex 55 as control.
2 HA = high degree of activity; LA = low degree of activity; HI = high degree of polyrnorphism; LP = low degree of polyrnorphism; NA = nonactivity.
* Suggested system.
2.8 The Cassava Biotechnology Network
Through the collaboration of CIAT, lITA and many other national and international agricultural research institutions interested in cassava, the Cassava Biotechnology Network (CBN) was organized in a workshop held at CIAT in September 1988. Feedback from individual scientists and research institutions has allowed prioritization of cassava constraints for advanced research. The approach through a network of cooperating researchers has been received with a wide level of general acceptance by the agricultural scientific community and national and international funding agencies. This is evidenced by the number of research projects under way in just two years. Table 2.5 shows the existing 20 research projects in developed and developing
81

eountries as of September 1990 in eomparison with 4 projeets in September 1988.
Table 2.5 Research projects un:ler way in the CBN (Sept. 1990).
Subject
Cyanagenesis
Institutions
U. of Newcastle upon Tyne Royal Veto & Agrie. U., Dernnark Mahidol U., 'Ihailarx:l. Chio state U., Columbus, OH, USA Free U., Amsterdam, Netherlands
virus n!Sistance washington U., sto louis, ID, USA
Insect n!Sistance Washington state U., Pulllnan, WA, USA
Photosynthesis
Plant regeneration techo
Genetie transformation techo
Gene e:Kpn!SSion & regulation
Australian National U., Canberra U. of Georgia, Athens, GA, USA
U. de Paris, Orsay, France U. of Bath, UK U. of z:iJnbab..¡e U. de San Marcos I Lima I Pe:ru
CENAI<GEN, Brazil CIAT, Colombia
U. of Singapore
Radiation-:i.rrluced IAEC, Vienna, Austria variability
Gerlc:me structure RFLP mawinJlmA firgetprintirg"
other
CIAT, Colombia/IBffiR Washington U., St. I.ouis, ID, USA
CIAT, Colombia lITA, Nigeria
82
RFjEEC RFjEEC RFjEEC USAID
~I USAID RE'
AImB USAID
EEC 0D1\. OOIS CAF
lroEB Core
RF
Core Core

countries as of September 1990 in comparison with 4 projects in September 1988.
Table 2.5 Research projects urrler way in the CBN (Sept. 1990).
Subject
Cyanogenesis
Institutions
U. of Newcastle upon Tyne Royal Veto & J\gric. U. I Denmark Mahidol U. I Tbailarrl Ohio state U., Columbus, OH, USA Fn!e U., Amsterdarn, Netherlarrls
virus resistance washin:Jton U., sto lDuis, 00, USA
Insect resistance washington state U., Pullman, VIA, USA
Rlotosynthesis Australian National U., Canberra U. of Georgia, Athens, GA, USA
Plant regenera- U. de Paris, Orsay, France tion techo U. of llath, UK
U. of zilnbabwe U. de San Marcos, Lima, Peru
Ge.netic trans- c:ENARGEN, Brazil fonnation techo CIAT, Colombia
Gene express ion & regulation
Radiation-:in:luC'ed variability
Genome structure RFll' mapping/t:». firqerprintir:g
other
U. of Sirqapore
IAEC, Vienna, Austria
CIAT, Colombia/IBPGR Washirqton U., St. LouÍ8, 00, USA
CIAT, Colombia IrfiI., Nigería
82
RF/EEC RFfEEC RFfEEC USAID
0RS'lQ>f,IRF / USAID RF
AIIW3 USAID
EEC 0I:li'\. o:;rs CAF
Ia:;EB Coro
Core Coro

A proposal was presented to the Netherlands Agency for International Cooperation (DGIS) in order to seek financial support for the activities of the CBN in the next 5 years including coor~ínatíon of the network, network meetíngs, training of developing countries scientists, bridging funds for critical research areas and research projects in developing countries. The proposed activities for which funding has been requested include two major interrelated components:
Bridging support of critical research initiatives and support for training of developing country scientists
Operation and coordination of the network activities
2.8.1 Research and training actiyities
Catalyzing and facilitating specific atives including short-term bridging particular research initiatives
research initiin support of
In-service training of laboratories
training: short-term technique-oriented developing country scientists in advanced
2.8.2 Network operation and coordination
Scientific meetings every second year to promote information exchange and discussion, encourage new ideas and new participation. (first meeting scheduled for August in Cartagena.)
steering Committee meetings: 'learly meetings are proposed to guarantee continuous interaction among the constituting members, their role being to advise on the functioning of the network including periodic reviews of research projects under way and new proposals, planning of scientific meetings, training needs, communication media and funding possibilities.
Communications: Preparation of an introductory brochure on the Network; publication of a network newsletter twice ayear; other network pUblications such as reports and proceedings on an ad-hoc basis.
Coordination: CIAT has been providing initial coordination sinee 1988; but as the network evo1ves, the increasing work load calls for the appointment of a full-time coordinatorjscientist at eIAT.
83

2.9 References
Calderon, A. 1988. Transformation of Manihot esculenta (cassava) using Agrobacterium tumefaciens and express ion of the introduced foreign genes in transformed cell lines. MSc thesis, vrije Universiteit Brussels, Belgium.
Cárdenas, O.S. and Buckle, T.S. 1989. Preliminary studies of the reaction mechanisms involved in sour cassava starch production. Document lIT, Bogotá, Colombia.
Cereda, M.P. 1986. Tecnologia e qualidade do polvilho azedo. Reporte interno.
____ ~--_; Bonassi, I.A.; Brasil, O.G.; Matsui, E. 1985. Ensaios de fermentacao da fecula de mandioca em diferentes condicoes de cultivo, RBM Cruz das Almas (BA) V, 111, 2, pp. 69-81.
Chavez, R.; Roca, W.M.: Arias, D.I.; Withers, L.A.: and Williams I T. 1988. Cooperati ve IBPGR and CIAT pilot project test feasibility of in vitro conservation. Diversity 16:8-10.
Crawford 1983.
de Block, M.J.; Bottermann, J.; Vandewiele, M.; Dockx, J.; Thoen, C.; Gossele, V.; Rao Movva, N.; Thompson, C.: Van Montagu, M. and Leemans, J. 1987. Engineering herbicide resistance in plants by express ion of a detoxifying enzyme. EMBO J 6:2513-2518.
de Greef, W.; Delon, R.; de Block, M.; Leemans, J. and Bottermann, J. 1989. Evaluation of herbicide resistance transgenic crops under field conditions. Bio/Technology 7:61-64.
Dellaporta, S.L.; Wood, J.; and Hicks, J.B. 1983. A plant DNA minipreparation: version II. Plant Mol Biol Rep 1: 19-21.
Dougall, D.K. 1987. Primary metabolism and its regulation in plant tissue and cell culture. Proceedings of the Vlth Internation1 Congress of Plant Tissue and Cell culture. Alan R. Liss Inc., NY, pp.97-117.
Ducrocq, S. 1990. Etude de la fermentation lactique de l' amidon de manioc. These Ingenieur Agricole ESITPA, Angers.
Feinberg, A. and Vogelstein, B. 1983. A technique for radiolabeling DNA restriction endonuclease fragments to high specific activity. Anal Biochem 132:6-13.
84
Gallego, V. 1990. Perfeccionamiento de los métodos de estudio de la fermentación de almidón agrio. Reporte de trabajo CEEMAT/ClRAD.
Hood et al. 1986. The hypervirulence of Agrobacterium tumefasciens A281 is encoded in a region of pTiB0542 outside of t-DNA. J. Bacteriol. 168:1291-1301.
Jefferson, R.A. 1987. Assaying chimeric genes in plants: the GUS gene fusion system. Plant Molec Biol ~
Kakefuda, G.; Duke, S. 1984. Electrophoretic transfer as a technique for the detection and identification of plant amylolytic enzymes in p01yacrylamide gels. Plant Physiol 75:278-280.
López, H.A. 1985. Efecto del ácido acetil salicílico en el crecimiento de yemas de Solanum cardiophyllum (Lindl.) cultivados en vitro. Tesis de Maestría, Colegio de Postgraduados, México.
Magoon, M.L.; Krishnan, R.; and Vijoyabai, K. 1969. Morphology of pachytene chromosomes and meiosis in Manihot esculenta Crantz. Cytologia 24:612-626.
Marin M.L.; MafIa, G.; Roca W.M.; and Withers, L.A. 1990. Cryopreservation of cassava zygotic embryos and whole seeds in liquid nitrogen. cryo-Letters 11:257-264.
Nwankwo, D.; Anadu, E.; Usoro, R. 1988. Cassava fermenting organisms. MIRCEN Journal 5:169-179.
acampo, C.H. 1988. yuca (Manihot Valle.
Identificación de genes marcadores en esculenta, Crantz). Tesis, Univ. del
Roca W.M.; Chavez R.; Marin, M.L.; Arias D.I.; and Reyes, R. 1989. In vitro methods conservation. Genome 31:813-817.
MafIa, G.; of germplasm
sarria, R. 1989. Estudios de la herencia y variabilidad genética de isoenzimas en poblaciones Fl de yuca (Manihot esculenta, Crantz). Tesis, Univ. del Valle.
Song, K.M.; asborn, T.C.; and William, P.R. 1988. Brassica taxonomy based on nuclear restriction fragment length polymorphism (RFLP). Theor Appl Genet 75:784-794.
Southern, E. 1975. Detection of specific sequences among DNA fragments separated by gel electrophoresis. J Mol Biol 98:503.
85

Szabados, L.; Hoyos, R. and Roca, W.M. 1987. In vitro somatic embryogenesis and plant regeneration of cassava. Plant Cell Rep 6:248-251.
and Roca, W.M. 1986. Regeneration of isolated mesophyll and cell suspension protoplasts to plants in Stylosanthes guianensis, a tropical forage legume. Plant Cell Rep 3:174-177.
Tanksley, S.D.; Young, N.O.; Paterson, A.H.; and Bonierbale, M.W. 1989. RFLP mapping in plant breeding: New tools for an old science. Biotechnology 7:257-264.
vieira, J. and Messing, J. 1982. M13mp7-derived system for sequencing with synthetic 19:259-263.
The pUC plasmids, an insertion mutagenesis universal primers.
and ~
Zapata, L.E. and Parada, J.L. 1988. Almidón agrio de yuca: Aspectos tecnológicos y microbiológicos, Documento lIT, Bogotá, Colombia.
86

3. CASSAVA PATHOLOGY AND VIROLOGY
3.1 Research in pathology
Special emphasis was given in 1990 to research on the mycoplasmlike disease witches' broom and root rots present in different ecological regions. Research on biocontrol of cassava diseases, cassava endophytes and storage of planting material was also carried out.
3.1.1 Witches' broom
Resul ts are reported here of three years' research (CIAT Annual Reports 1987-1989) conducted in cooperation with the Cassava Integrated Development Project in Ceará, the Dept. of Agriculture of the State of Ceará, and the National Center For Research on Cassava and Fruits (CNPMF-EMBRAPA).
Data on plots of ll-month-old healthy and diseased plants of the traditional clone Cruvela Rastreira, derived from stakes collected from symptomless plants in plantations with different percentages of infection, show the following (Table 3.1):
Root weight and aboveground plant weight (AGPW), as well as HI, of healthy and di sea sed plants did not show any statistical difference among plots whose stakes were taken from plantations with different percentages of infection. This indicates the relatively stable sanitary condition of most plants during the growing cycle.
The root weight of healthy plants was 57.9% greater than that of diseased plants, indicating that disease losses induced by witches' broom can be of great magnitude in this traditional clone.
The ABPW of healthy plants was diseased plants as a result induced by the pathogen.
28.6% less than that of of shoot proliferation
As a consequence of the two foregoing findings, the HI of diseased plants was lower than that of healthy plants. Most carbohydrates produced by diseased plants are utilized to produce shoot tissue.
When stakes were taken from a 25%-affected plantation, the losses induced by wi tches' broom averaged 51% i but losses can range from 23.5 to 87.1%, depending on the level of infection of the mother plants (Table 3.2). This indicates that los ses induced by this disease are related to the infection status of the mother plants.
87

Table 3.1 1
Root weight {RWl and AGPW (k9lplant), and HI 01 healthy and witches1vbroOll"i diseased plants
of 11~month-old Cruvela Rastreira after plantíng selected stakes from symptomtess plants taken from plots with different percent8ges of infection~
H •• l thy Planto Oiseased Plants % lnfection
of Source Plots keplications R\I AGP\I HI RII AGP\I MI
95 1 2.1 2.0 0.51 1.4 3.0 0.32 2 2.4 2.8 0.46 2.2 3.6 0.38 3 2.3 2.8 0.45 1.,1 3.4 0.31
K 2.3 2.5 0.47 1.7 3.3 0.34
50 1 2.3 2.6 0.47 1.3 3.2 0.29 2 2.2 2.1 0.51 1.9 3.6 0.35 3 1.8 2.1 0.46 2.4 3.1 0.44 4 2.2 2.3 0.49 1.8 ;L.l! 0.38
X 2.1 3.0 0.48 1.9 3.2 0.28
25 2.8 2.1 0.57 1.8 3.7 0.33 2 2.9 2.3 0.56 1.1 2.9 0.28 3 2.7 2.5 0.52 2.1 3.3 0.39 4 U U 0.54 2.5 3.9 0.39
X 3.0 2.5 0.55 1.9 3.5 0.35
1 Avg data taken fraro 5 plants each.
Table 3.2 LOSSéS induced by the mycoplasmlike witches' broom of cassava in the regional clone Cruvela Rastreira 11 mo after planting unselected stakes froM a 25%~affected plantation.
---------------------------~---~----------------------------------------
Ruat Vield (t/hal
Repllcate Unselected Stakes Healthy Controls Vi el d
Reduction(%)
--------------------------------~---------------------------------------
1 13.2 ,
16.3 23.5
2 , O. O 15.6 56.0
3 12.0 16.5 37.5
4 9.3 17.4 87.1
X 11 .3 16. S 51.0 ------------------------------------------------------------------------1 Oata taken from 15 plants/rep/treatment.
88

The incidence of witches' broom disease of cassava was reduced drastieally by planting stakes seleeted from symptomless plants;, but percent disease reduction was related to the percent infection in plots from where mother plants were taken (Table 3.3). This indieates that the disease ean be controlled by selecting symptomless plants from the least affected plantation in the endemic area.
The percent of symptom remission induced by the witches' broom pathogen was drastically reduced after planting stakes from infected plantations in a neighboring nonendemlc area (Table 3.4). This indlcates that the disease can also be controlled by producing planting material in areas where ecological conditions restrict pathogen multiplication and invasion into the host.
Thus witches' broom disease can be redueed both by planting stakes from symptomless plants and by producing stakes in locations where environmental conditions reduce pathogen infection. Commercial implementation of these control mea sures has commenced in the Ibiapaba region of Ceará state, Brazil.
3.1.2 Biological control of cassava diseases
3.1.2.1 Control of root rot causal agents by fungal specles. A straln of Trichoderma sp., isolated from the root rhizosphere of a cassava plantation, showed promising results in vitro for eontrolling root rot causal agents. The strain inhibited growth of Diplodia manihotis, Fusarium solani and ~ oxysporum; however, it was unable to inhibit the growth of Phytophthora dreschleri or E. nicotianae varo nieotianae. Nevertheless, these two species of Phytophthora were rapidly colonized only 5 days after infection (Table 3.5). Trials to determine the effectiveness of this strain in controlling root rots under field conditons, as well as attempts to isolate more efficient strains of this species from different ecological areas, are under way.
3.1.2.2 Control of root rot pathogens by beneficial bacterial species. Two strains of Pseudomonas fluorescens (Pf F-259 and Pf F-44) signlficantly increased the root weight of two cassava clones (M Col 1468 and CM 342-170) after root inoculation in the early stages (1 mo after germination) with P. nicotianae varo nicotianae under greenhouse conditions (Table 3.6).
These results are similar to those reported in 1988 for controlling other root rot pathogens under greenhouse conditions (CIAT Annual Report 1988), suggesting likelihood of success under field conditions. Commercial plots of M Col 2215 (susceptible) and M Col 1505 (resistant) were planted in a D. manihotis-endemic area (La Colorada, North
89

Table 3.3 Reduction of symptoms of witches' broom disease of cassava over two cycles by planting setected stakes from vlsuatly symptomless plants.
Disease Symptom Reductl0n (%)
Fi rst Cyele
% Infection of Source Plots
95.0 5 O. O 25.0
O
Total N'o. 1 Plants Evaluated
52 400
600 500
6 IDO
51.9 94. , 97.9
100.0
12 mo
22.0 75.5 87.5
100. O
2nd Cycle
87.7 88.0 92.9
100.0
1 Evaluation was at the peak of the epidemic for each cyele.
Table 3.4 Remission of symptoms 01 witches l broom disease by ptanting infected stakes in a location with unfavorabte environmentat conditions for disease development.
% Symptom Expression X Symptom Expression at favorable Site st Unfavorable Site
Clone <First Cycle) (2nd Cyole)
Cruvela Rastreirá 95.3 1
O
Cruvela Vicosae 27.4 O
1 Avg data taken from more than 120 pl/treatment~
90
X S~tan Expression Back at Favorable Site
(3rd Cycle)
4.5 10.0

Table 3.5 F'Urgal inhibition arxl colonization of a Trichoderma sp. strain on 5 cassava root pathogens.
Pathogen Species
Dipladia manihotis FUsarium oxysporum F. solani ij¡yt.oootilora drechsleri P. nicotianae varo nicotianae
l . t< 1 Co oruza :ton
++ + +
+++ +++
1 Inhibition = :fungal growth inhibition; Colonization = mycoparasitism on :fungal host colony.
2 -,+,++,+++ = Absent, low, inte:nnedi.ate, severe inhibition or colonization.
Table 3. 6 Biocontrol of Phytophtilora nicotianae var. nicotianae (P. n. var n.) witil PseudOlOClllas fluoresceos (P.f. C-259 arxl P.f. F-44) on two cassava clones under greenhouse conditions.
Treatment
P.n. varo P.n. varo Control
+ P f C-2592 n. •. n.+ P.f. F-44
P.n. varo n.
Root Weight (g) 1
M Col 1468
1.49a 1.44a 1.96a 0.44b
CM 342-170
3.35a 2.85a 2.83a 1.07b
1 Avg root wt of 20 plantletsjtreatment 2 roo after treatment; plantlets grown under greenhouse conditions (26'C ± lO'C, 80% RH) .
2 Plantlets inoculated by pourirY;J 30 ml of a suspens!on of 1.1 x lt9
ctbjmljpot of tile P.f. strain; arxl 30 ml of 1 x 10 zoosporejmljpot of tile pathogen 5 days before plantirY;J.
91

Coast of Colombia), where CBB and anthracnose normally occur at low levels of severity. Stakes were dip-treated and plants sprayed monthly with a bacterial suspension (strain P.f. C5a). Results showed a yield increase of 28 and 123% for the susceptible clone M Col 2215 when planted with stakes taken from commercial plantations or from meristem cUlture-derived plants, resp. (Table 3.7). The lowest yield was obtained on plots planted with untreated stakes of the same susceptible clone obtained from meristem culturederived plants (Table 3.7). The highest disease rating was also shown on untreated plants from stakes taken from meristem culture-derived plants, indicating the efficiency of the protective effect exerted by the native microflora living on stakes taken from commercial plantations. This micro flora is probably acquired after many growing cycles. Finally, the bacterial treatments did not increase yield levels significantly on the resistant clone M Col 1505 because the intrinsic genetic resistance of this clone overcame the possible stresses caused by the pathogens.
These results open up the possibility of using strains of fluorescent pseudomonads commercially to prevent root and foliar diseases on susceptible cassava clones; their commercial deployment in various production systems is being investigated.
3.1.2.3 Effect of native microflora on disease protection. The effect of native microflora on disease protection was reported in 1988 froro data taken on experimental plots planted with stakes taken from commercial plantations and froro meristem cul ture-der i ved plants, coroparing untrea ted and treated in a suspension of Pseudomonas putida (F-44) (CIAT Annual Report 1988). Results obtained in commercial plantations this year confirmed these data (Table 3.8). Disease severity and field infection (%) for CBB, SED and Choanephora leaf blight were higher on plantations from stakes taken froro meristem-derived plants than from stakes taken from comroercial fields (Table 3.8). Native roicroflora provide effective protection against cassava pathogens when they are living epiphytically on the plant epidermis. These results suggest that it is advisable to reestablish beneficial flora on the epidermis of meristem-derived stakes before their use for propagation; they can be dip-treated with the respective beneficial bacterial strain (i.e., efficient strains of P. putida or P. fluorescens) a few hours befo re planting.
3.1.3 Phytophthora root rot
For lack of a dependable field methodology for evaluating germplasm for resistance to Phytophthora spp. on cassava, the following root-bore inoculation method was developed: healthy swollen roots froro 10-12 mo old are bored to a depth
92

Table 3.7 Effect of P. fluorescens (strain P. f. CSa) 1 on carroercia! yield (tjha of fresh roots) of two clones (M Col 2215 = susceptible; arxi M Col 1505 = resistant) planted in a D.
____ --'manUE;.!;'ih!}!ot""""i..,s-en:lemic area, with !roderate CBB blight arxi anthrac:nose infection during their g:t."CMing cycle.
Swrce of Stakes
Comrnercial plantations-bacterized Meristem-derived plants-bacterized Comrnercial plantations-untreated Meristem-deri ved plants-untreated
Yield (tjha)jClone
M Col 2215
23a2
29a 18ab 13b
M Col 1505
20a 20a 17a 18a
1 Bacteriza~ion: stakes were dip treated in a bacteria! suspension of 1 x 10 cfbjml; arxi plots ~ spray-treated ronthly with a bacterial suspension of 5 x 10 cfbjml.
2 Plots were harvested 10 mo after planting; results followed by the sama letter were not statistically different.
Table 3.8 Oisease severity arxi percent field infection caused by 3 foliar pathogens in ~ial plantations of M Col 2215 planted with stakes taken from ~ial plantations (C) arxi reristem-culture derived plants (M).
oisease severi ty1
Field Infection oisease Stake Swrce Mx Mn X (%)
CBB C 2.5 1.0 2.2 89.8 M 4.0 2.0 2.8 100.0
SED e 1.5 1.0 1.1 3.6 M 3.5 1.0 1.6 18.3
Oloanephora leaf blight e 2.0 1.0 1.3 28.6 M 4.0 2.0 2.9 100.0
l oisease severity: 1 = No symptoms; 5 = '!he highest infection; Mx = Maxbnum rating recorded; Mn = Mininurn rating recorded. Avg values taken from more than l-ha plantation for stake source; data taken at peak of epidemic.
93

of 3-4 cm, using a disinfested O.l-cm diameter borer. The holes are filled with agar-mycelium taken from a 15-day-old PDA-growth culture and sealed with the peeled root cortex. Roots are then incubated in sealed plastic bags for 5 days. Resistance is related to the percentage of pathogen invasion through the root tissues from the inoculation point; clones with less than 15% invaded root tissue are considered resistant. This method makes rapid evaluation possible (i.e., 1 mo vs. 1 yr for field evaluation).
From among 46 elite clones evaluated for resistance to .e.... nicotianae var. nicotianae using the root-bore inoculation method, clones M Col 2302, M Col 2265 and SG 799-9 showed the highest grade of resistance.
As a result of nine years of cooperative research with the Center for Agricultural Research in the Amazon (CPAA) and CNPMF-EMBRAPA, two clones (Mae Joana and Zolhudinha) resistant to E. drechsleri and 1':. solani and adapted to the flooded Amazonian Basin zone ("várzea"l were released in Manaos this year. In commercial trials the avg RY of these two clones in a 6- to 7-month period was 20 t/ha, which is 80% higher than the yield of traditional clones in noninfected plantations. Planting material of these two clones was delivered to more than 100 cassava growers who expressed a strong preference for these clones over the others for their yellowish colored cortex, which is highly valued for producing roasted cassava flour ("farinha").
3.1.4 Unrepor:ted steI!l and root rot cassava pathogens
Two unreported stem and root rot pathogens of cassava were isolated from several affected cassava plantations in the eastern and northern coastal areas of Colombia.
3.1. 4.1 verticillium dahliae. V. gahliae affects young plants, inducing light brown root deterioration. Stems are striated showing black microsclerotia at the base; stems of adult plants (> 6 mol are al so striated. Plants suddenly wilt and die. Swollen roots show necrotic spots very similar to those of the "smallpox" disease, but without signs of insect or wound damage on the epidermis surrounding the spots. The pathogen penetrates the root tissues through the root peduncle from affected stems. These symptoms are commonly found at the onset of the dry season. It appears that the fungus penetrates the stem or root peduncles through wounds induced by environmental stress es or any type of physical or mechanical damage.
It was found that the fungus grows well with abundant production of spores on PDA (potato-dextrose-agar) and LBA (lima bean-agar). The optimum temp for growth and spore production is 26°C. The hyphae are hyaline, whitish to
94

cream after 1 wk, later becoming black with the formation of microsclerotia. Conidiophores are abundant, erect, hyaline, verticillately branched; phialides are variable in size; conidia arise singly at the apices of the phialides, ellipsoidal to irregularly subcylindrical, hyaline, mainly simple but occasionally l-septate. Dark brown resting mycelia are formed only in association with microsclerotia. Each microsclerotium arises from a single hypha by repeated budding. They are highly variable in size and shape, from elongate to irregularly spherical.
3.1.4.2 Scytalidium sp. was found affecting stems and roots of 10-mo or older plants. Affected stems showed black necrosis of vascular strands, very similar to those symptoms induced by º. manihotis. However, the epidermis of affected stems swells and breaks longitudinally, releasing a mass of charcoal-like blackish conidia, which are easily disseminated. These symptoms differ from those of D. manihotis in the absence of pycniocarp formation on the bark of stems or roots (Fig. 3.1).
Colonies on PDA are effuse, dark blackish brown with immersed and superficial mycelia; hyphae are smooth with dark brown septae. They do not produce stroma (Fig. 3.1); their conidiophores are micro- or mononematous and branched. Conidiogenous cells fragment and form arthroconidia. Conidia are catenate, simple, smooth. There are two kinds: colorless, thin-walled; and medium or dark brown, thickwalled.
Damage induced by this pathogen is commoner at the end of the rainy season; it usually appears in association with ~ manihotis, where they are hard to differentiate.
3.1.5 Diplodia stem and root rot
After four years of evaluating 90 clones for resistance to D. manihotis under field conditions in a Diplodia-endemic area (La Colorada, Atlantic Coast of Colombia), only seven clones survived (Table 3.9). Five had been previously rated as resistant or of intermediate resistance by the stake inoculation method under greenhouse conditions (CIAT Annual Report 1986). The other two clones were susceptible but had acquired resistance (bioprotection given by acquired epidermal microflora). These results stress the reliability of the method for identifying resistance to º. manihotis under greenhouse conditions; show the importance of Diplodia root rot when susceptible clones are planted in endemic areas; and partially explain the progressive decline of susceptible clones planted in soil-borne infested plots.
RY of these resistant and intermediate-resistant clones planted on a Diplodia-infested plot, with and without
95

Figure 3.1 Difference between D. manihotis and Scytalidium on (a) cassava stems and (b) PDA medium: .!h manihotis produces protuberant pycniocarpes.
96

rable 3.9 four years of lield evaluations of 90 clones where resístance/susceptiblity to ~. manihotis was determined previously by the stáke inoculation method (StH) (eJAT Annual Report 1986).
1 Field Survival/Year of Evaluatlon
Resistance level Determined by SIM
Resistant lntermedlate Susceptible
1987
3(100) 6(100)
81 (100)
1 . f Mean of 5 pl/clone ln each o 4 reps.
1988
3(100)
5(83.;)
47(58)
1989
3(100)
3(50)
3<3.7>
1990
3(100)
2( 33)
0(0)
Table 3.10 Yield (tjha) 1 of 5 resistant or i.ntennediate-resistance clones that survived for 4 consecutive years of evaluation on a Diplcdia stem and root rot-infested plot.
Fresh Roclt yield
Level of Fertilized2 Clone Resistance Ul1fertilized
M Mal 2 R 41.0a 44.6a3
M Ven 185 R 30.2a 27.8a M Col 1505 R 24.8a 29.8b
SG 104-57 1 18.4a 28.lb SG 104-284 I 17.6a 25.6b
1 Avg RY taken from 4 reps/clone with 30 plants each.
2 Each fertilized plot received 100 kgfha NPK applied at 1, 2 and 3 !OC) after planting.
% Yield Increase
+ 8.8 - 7.9 +20.2
+52.7 +45.5
3 Similar letters across fertilization treatments indicate no significant effect for this treatment.
97

fertilization, is shown in Table 3.10. There was a moderate or even negative effect of the fertilizer treatment on RY of resistant clones in contrast with the highly significant effect of the fertilizer on RY of the intermediateresistance clones. These data also show the importance of the disease in the area, which can decrease RY by more than 45.5% on even intermediate-resistance clones. Additionally, these data stress the importance of genetic control as a means of partially overcoming the problem. This is supported by the data presented in Table 3.11 regarding the RY of a resistant (M Col 1505) and a susceptible (M Col 2215) clone obtained on plots by alternating different cropping systems over a 4-yr periodo Percent RY increase by the fertilizer application was lower on plots planted with the resistant clone than on plots planted with the susceptible one, independent of the cropping systern used. Similarly, the best cropping system for ~ rnanihotis-endemic areas was ayear rotation with rnaize and sesame; the worst was continuous cassava planting. By far the largest effect was variety, indicating the possibility of selecting varieties suited across a range of cropping systems and disease pressures (Table 3.11).
These results will be used to rnodify the production package promoted in 1987 (CIAT Annual Report 1989) and validated during 1988-1989. More than 30 cassava growers are now successfully growing cassava following this technological package. For example, data collected among 12 cassava growers who followed this production package showed a RY increase of 208% when they planted a resistant clone and 300% when the clone was susceptible (Table 3.12). It is expected that the new genotypes incorporating resistance to this pathogen and to other important constraints will greatly increase production in the area.
3.1.6 Superelongation Disease (SED)
Studies on genetic control of SED of cassava (caused by EIsinoe brasiliensis) covered the following subjects:
3.1.6.1 Morphological resistance. This type of resistance was suspected after finding that pee1ed stems of resistant clones showed susceptible reaction (CIAT Annual Report 1983). Histological studies carried out this year showed that the cuticles of three-mo-old shoots of resistant clones (CM 523-7 and M Ven 77) were 3.7 times thicker than those of susceptible clones (M Col 22 and M Col 113) when the plantlets were incubated at 24,000 Ix. This stem-cuticle thickness ratio decreases at low light intensities; e.g., at 920 Ix or lower the cuticle-thickness decreased dramatically and differences between resistant and susceptible clones disappeared (Table 3.13). Temp and RH had no effect on these parameters. Similarly, measurements on other stem tissues
98

Table 3.11 Yietd (t/ha)' of a resistant CM Col 150$) and a susceptible CM Co\ 2215) clone planted for 4 consecutive cycles, after a yearts fallow, or after a yearls rotation with maizal sesame and cowpeas in a º~ manihotis~endemic area.
Fresh Root Vield
Clone
M Col 1;05 (Roes i s tant)
M Col 221; (Susceptible)
Cropping System
Majze~sesame
Fallow
Maize-cowpeas Cassava~ cassava
X
Maize-sesame fallow
Maize-cowpeas Cassava-cassava
X
Unfert i lized
17.8 16.8 16.3 14.1
16.3
10.7 11.7 7.4 7.5
Yield of 4 reps/clone/treatment of 30 ptants each.
T ed2
Fertl lZ
18.9 20.1 20.8 18.7
19.6
11.8 15.7 13.7 13.2
Yield lncrease (Xl
5.3 23.5 27.7 32.4
22.2
10.3 34.2 85.6 76.8
9.3
2 Each fertitized plot received 100 kg/ha of NPK applied at 11 2 and 3 IDO after planting.
did not show significant differences between the susceptible and resistant clones used.
This finding apens up the possibility af devising a rapid screening system for resistance to E. brasiliensis, which can replace the field screening evaluation system that is currently being used for identifying genotypes resistant to this disease.
3.1.6.2 Field evaluation. To determine the most apprapriate location for field evaluation of genotypes for resistance to SED, genotypes belonging to 17 families were planted at three locations where the disease is endemic: Carimagua and Villavicencio (Llanos Orientales of Colombia) and Huimanguillo (Tabasco, Mexico). Disease levels were recorded at the height of the epidemic in each location, and the probability af finding resistant clones among genotypes of each family per site was calculated accarding to Grizzle, Starmer & Koch (1969). Disease severity was highest at Carimagua,
99

1 Table 3.12 Avg yield (t/ha) obtained by 12 cassava growers who planted
reSlstant ctone M Col 1505 and susceptible clone M Col 2215, us;ng the cassava production system designed for Media luna (CIAr Annual Report 1989)s a tt5plodia~endemic area~
Clone
Cassava Grower M Col 1505 M Col 2215
--~---------------------------------------------------------------------
Leandro P-érez Miguel Pacheco Enrique Herrera Marcos Hernández Francisco Yepez Tomás lara Alejandro Gamero Ebolo Escorcia Miguel Pereyra
Antonio Cnarry Juan Pertus Tomás Hernández
X
Avg yieLd by tradítlonal system % avg yield increase
. 2 Avg Yleld of sn area of 5000 m /clone/grower.
21 . O
19.2 18.8 17. O 15 • 5
14.9 14.9 14.9 14 .8 12.2 11.6 10. 1
15.4 5.0 208
15. O
12.3 14.6
14. O 3.5 300
Table 3.13 Effect of light intensity on thickness of the stem cu:ticle of plantlets fraro two clones resistant or susceptible to Elsinoe brasiliensis, causal agent of SED of cassava.
Average 'lhickness of stem euticle (¡.t)/Clone
Resistant Clones Susceptible Clones Light Intensity
(Ix) CM 523-7 M Ven 77 M Col 22 M Col 113
24,000 1.371 1.37 0.37 0.37 20,600 0.37 0.37 0.12 0.12 7,200 0.75 0.25 0.12 0.12
920 0.06 0.24 0.12 0.03 6 0.03 0.04 0.03 0.02
1 stem samp1e data taken at 2 cm fraro the growing point of each plantlet¡ avg of 10-15 samples/light intensity/clone with CV no higher than 12%.
100

where disease stress reduced the probability of finding plants of low disease damage in each family (Fig. 3.2); similarly, the avg disease scores were highest. Consequently, this location appears to be the most appropriate for field evaluations of resistance to SED among the three locations investigated. As expected, the families that showed the highest proportion of resistant progenies in Carimagua were those obtained from crosses with high parental resistance.
3.1.6.3 stability analysis. Stability of resistanee to SED and caB was investigated by planting clones belonging to three families over a 5-yr periodo stability analysis of these data, aeeording to the modified joint regression method of Digby, showed the following (Fig. 3.3):
The general response of the evaluated clones to SED and CBB during the five growing eyeles was unstable.
Despite this resistanee to families and family.
instability, differences in levels of these two diseases were identified among among genotypes belonging to the same
Disease pressure for both SED and CBB was different eaeh year, whieh justifies clonal evaluation for several growing cycles.
The families that showed the best stability for resistance to SED and CBB were CG 890 (CM 723-3 x M Col 638) and CM 3581 (CM 849-1 x CM 523-7). AII these parents have intermediate to high resistanee to both SED and CBB.
3.1.7 Cassava endophytes
Thus far 20 speeies of fungal endophytes have been isolated from stem samples of native clones growing in different plots. The effeet of 9 of these endophytes on 3 eassava clones (M Col 2215, M Bra 191 and M Col 1468) after inoeulation by spray, immersion and puncturing methods was determined by comparing the root weights of inoculated and noninoculated control s (Figs. 3.4 & 3.5). It was found that:
Most endophytes had a detrimental effeet on M Col 1468 (a root-rot susceptible clone), especially when plants were immersed in the fungal inoeulum.
The detrimentaljbeneficial effect depended on the inoculation method; c:::urvularia sp. was detrimental when
101
of some endophytes e.g., on M Col 2215,

1-' O N
O.9r
O.S!
0.7
:-: 0,6
~ 0.5 ~ ~
~
~ o
" o " O-
0.4
0.3
0.2
0.1
.1.1 I I I I I I I I I I I 111111111111111 1:2345678911'11111123456789"111111 1Z345678911111111
01234567
Figure 3.2
01234567 01234567
Carimagua I I Vil1avic:encio - f------ Mexico ------i
f amil y ILoca ti on
Probability for SED resistance amonq genotypes belonging to 17 families plantad at 3 SED-endemia locations.

120
5 ':: ~ ~
~ ~
6O~ " o ~ -, ,~ " '"
e .+ S • a. ¡:g
" o "
iO I w v ro lli
'" • O w 2 120 w
'" ~ 'co~ "" 1-' • " '
O w ~ I i':: en
W ~
:~ o w u o o
'~
;, CJ >
w u m
'" m > ro m
2:L m
:3
·'0
Figure 3.3
----~~ .~- ~
////
/'/
~6, S-:-~ ~- - -~=-- :::;::::;=--
-= -
// / ¿;/:;::.
-----/v~
~~ ~ ~~ =$Y ·5 o
CM 35.\2 5 10 -10 ·5 o
CG 890 5 10 ·10 ·5
Environmental effect/genolype/family ovcr a 5-year period
o 5
CM 3581
Stability of genotypes beloqing to 3 families planted over a five-year period (5 growing cycles) planted at a CBB- and SED-endem1c location (carimagua); stability analysis according to the modified joint regression method (Digby).
,o

Figure 3.4 Hyphae of an enodphyte growing inter- and intracellularly in the vascular strands of stem tissues of M Col 1478.
," s P S I P S P
~ 1(10 ;-
r n o o
" ¡ c,
:, 801-
e o
o
~ 60
Fe H. P, e r C'u e " ~ 40 eh ~ F, rl
, P, • P, F, r :u t
3
¡H' ~ 2D E " o CI C,
~ "" , el Cu
4 H, : el h .
eh " t': o eh Ch p. e, H. CI
H& Fu tf:~. Rh P ~ r H. Hf!! Fu " Rh
" Rh Rh Ch H, 20 ;.. Hu
~:1 CI H' " .. H, " Ch F, Ch
Rh Hu leh Ch
" CI.I~ " Rh el u Hu Fe
40 :-Rh , "
CI e o Hu e " .,
Ch
~ "" , P, ... E
u
o 80 L. ~
~1 ü)L 2215 ti ERA 1S1 X COL 1¿.i:::8
ln0culdt :Gn meth()ú/o:lone flllwtr:
Figure 3.5 Effect of 9 cassava endophytes (inoculated by spray = S; immersion = I; and puncturing = P) on 3 cassava clones in relation to percent root wt of uninoculated controls. Inoculated endophyte species: eh = Choanephora; el = eladosporium; Cu = curvularia; Fu = Fusarium; He = Hendersonula; Hu = Humicola; Rh = Rhizoctonia; PI = Penicillium; P2 = PeniciL).ium.
104

spray-inoculated and beneficial when inoculated by immersion or puncturing.
Rhizoctonia sp. did not induce symptoms in leaf and stem tissues, but was detrimental to root production in the three inoculated clones (all three inoculation methods); however, when the roots were mechanically wounded, the fungus induced root necrosis.
There were varietal differences in relation to the behavior of the endophytes on cassava, as well as in relation to the inoculation method used. similarly, i t appears that sorne fungal species can behave as endophytes on a given plant part (living as epiphytes on stems or leaves) or as pathogens on others (affecting the root tissues). Similarly, sorne endophytes appear to be beneficial when affecting the epidermis (epiphytic stage), but detrimental when infecting the host tissues (parasite stage). Further research is under way in relation to these interactions.
3.1.8 Storageof vegetative planting material
A summary of research on the storage of vegetative planting material of cassava was previous1y reported (CIAT Annua1 Reports 1987 & 1988). The storage method was improved in 1988 by watering the stem bundles during the first 2 wk of storage under open field conditions (full exposure to sunlight) in order to promote rooting and sprouting at the onset of storage. Additionally, it was found that all storage practices led to RY reduction after 2 mo, suggesting that this practice should be avoided or implemented only when necessary. This year, however, it was found that RY on plots planted with stakes stored for 4 mo under the very dry conditions of the Pivijay area (28"C avg; 60% RH) were similar to RY obtained on plots planted with unstored control s if there was adequate fertilization (Table 3.14). Fertilized plots also showed significant improvement in establishment, plant vigor and RY in relation to both control plots or plots planted with stakes stored in shade.
Based on these and previous findings, the following storage system is advisable in tropical environments:
Stakes should be selected from visually heal thy plants of clones showing satisfactory levels of resistance to storage (more than 80% establishment after 60 days I storage of long-stem stakes). Mother plants should be those with the highest RY at harvest.
105

Table 3.14 Effect of fertillzer applic~tion en yield (t/ha of iresh roots) of plots planted with stored and nonstored stakes of two clones planted in Media luna.
Fresh Root Yield (t/ha}/Clone
M Col 22162 2
M Col 2215
2 Treatment Nonfertítized Fertil ízed Nonfert ¡ l i zoo Ferti~ized
Nonstored control Storage in open ficld Storage under shade
16.3
15.2 11.2
20.2
17.9 15.2
14.5 15.6 12.8
20.8 20.8
20.4
2
Stakes token from the f1r8t half of the stem of 11-mo~old ptants of each clone; long C1.2Om) stem stakes stored for 4 me (Jsn.~Harch, the dricst perlod of the region) after a S-min dip treatment with benomyl (3 g), maneb (3 g) and malathion (2 cc)~
Stems stored ln the open fjeld were posltioned vertlcally and rooted; those stored under $hade were not rooted.
stakes should be more than 1.20 ro long, taken froro the bottom half of 8- to ll-mo-old mother plants. They should be arranged in bundles (no more than 10 stakes each) and treated prior to storage with a fungicidepesticide mixture (benomyl, 3 gjlt; maneb, 3 gjlt; and malathion, 1-2 ccjlt).
Bundles should be stored vertically under opan field conditions by burying the first 5-10 cm of the stakes in the soil and watering during the first 2 wk of storage.
At planting time, 10 cm of both ends of each stake should be removed, as well as any shoots produced during the storage periodo stakes for planting should be 15-20 cm long and treated again with the fungicide-pesticide mixture before planting. Fertilization (based on soil or plant-tissue analysis) should be done within the first 45 days after planting.
3.1.9 Geographic .distribution and potential risk for six cassava. diseases
Based on epidemiological studies, surveys on disease severity, and climatological data extrapolations done with the Agroecological studies Unit, it was possible to determine
106

the geographic distribution in Latin America and the potential risks of CBB, SED, the mycoplasm-induced witches' broom, Phytophthora root rot, and Fusarium and Diplodia stem and root rots (Figs. 3.6a-f). These data show that:
The highest potential risks for foliar and stem pathogens (CBB and SED, Figs. 3.6a & b) exist in areas with moderate temp (18-25'C) and more than 1200 mI rainfallj yr, where prolonged periods of high RH occur (in the case of SED, Fig. 3.6b) andjor where dayjnight temp fluctuate more than 10'C (in the case of CBB, Fig. 3. 6a) .
The highest risks for stem and root rot pathogens (Fusarium and Diplodia) exist in areas where high temp (> 25°C) and heavy rainfalls for short periods of the wet seasons are frequent (Figs. 3.6c & d). If the temp of the area is more than 20·C and the land is periodically flooded during the rainy season or badly drained, Phytophthora root rot can be of great importance (Fig. 3 • 6e) •
The mycoplasm-induced witches' broom is characteristically found in areas where the temp ranges from 15-20'C for a period of more than 3 mojyr (Fig. 3.6f). symptoms of this mycoplasmlike disease are moderate to mild, or might disappear as temp increases. Consequently, witches' broom can be a threat in areas where cool temp occur during the year or for more than a 3-mo periodo
3.1.10 References cited
Grizzle, J.E., Starmer, C.F. & Koch, G.G. categorical data by linear models. 504.
3.2 Cassava Viruses
1969. Analysis of Biometries 25:489-
Progress was made over a broad range of eassava viruses and viruslike diseases. Cassava Colombian Symptomless (CCSpV) and Cassava American Latent viruses (CALV) were added to the cassava viruses that can be routinely identified using ELISA. The molecular characterization of Cassava Common Mosaie virus (CCMV) is progressing, and the sequencing of over half of the virus is complete. The area that has progressed most is the characterization of the agents of Caribbean mosaic (CMD) and frogskin diseases (FSD). The causal agent of CMD is a member of a new subgroup of the phyto-reoviruses. A similar but distinct virus is the causal agent of the mosaic symptoms associated with FSD.
107

Figure 3.6
---,~~
""~i '~-, ,
"
B
~~l..tl~~'A 1 r/'''\ ( _o.."f>~ .'~.~.~.".l 't'-"~_'"
WA!)~"~. ! ,.- \; . ' /"-
!a e o • • •
r(lll.l \_ t .-\ ""Alft
r " , ',-,Cfl~ I ."tI?¡A "-. ~ \
\ .---{;~~~\ ::>l~~ ','...
,/ '":1' ;(~
\ ~Á'.IO\.I' __ A'U(NlIlf;(
: ! ,
"
• •
Geographic distribution and potential risks of si>! (a)
important cassava CBB and (b) SED.
108
diseases in Latin America:

Figure 3.6 Geographic distribution and potential risks of six important eassava diseases in Latin Ameriea: (el Fusarium and (d) Diplodia stem and root rots.
109

Figure 3.6 Geographic distribution and potential risks of six important cassava disseases in Latin America: (e) Phytophthora root rot and (f) witches' broom.
110

3.2.1 FSD and CMD
Both these diseases are viruslike disorders of unknown etiology that are present in Colombia. These two diseases were reported as distinct because the root symptoms associated with FSD are either absent or very mild in plants with CMD. Although CMD can cause significant RY loss in susceptible clones, there are many tolerant clones. There are few reports of clones that are resistant or tolerant to FSD, however. Secundina is the cassava clone used for detecting both CMD and FSD as both diseases produce mosaic symptoms on its leaves. CrAT has disease-free, in vitro culture clones and greenhouse-grown stakes of Secundina available for indexing programs.
Viruslike particles were found in the leaves, petioles and stems of cassava plants infected with either FSD or CMD (Fig. 3.7). These partieles, whieh are approx. 80 nm in diameter, are similar in size and morphology to reovirus partieles. Viruslike inelusion bodies were found only in the roots of the eassava varo M Col 113, which develops root but no leaf symptoms.
Double-stranded RNAs were purified from cassava plants infected with either CMD or FSD and run on both agarose and polyaerylamide gels. On agarose gels, there appear to be 3 or 4 bands; but on polyacrylamide gels there are 10 bands for FSD and 9 for CMD (Fig. 3.8). The no. and size of the ds-RNA bands differ between FSD and CMD. The relative molecular weights (M )--the number of the ds-RNAs found in CMD- and FSD-infected plants--are similar to genomes of the Fiji subgroup of phyto-reoviruses (Table 3.15). Reoviruses have unique genomes that consist of either lOor 12 segments of ds-RNA. Table 3.15 gives the sizes of the ds-RNA segments of selected phyto-reoviruses and the ds-RNA segments found in CMD- and FSD-infeeted plants. The genomie segments are often of similar or equal size in the characterized phyto-reoviruses. As several of the bands in both FSD and CMD are similar in size, only 3 or 4 are deteeted by agarose gels; and 9 or 10 bands are resolved using polyacrylamide gels, which have greater resolving power. It is predicted that there are 10 segments of ds-RNA, but only 9 bands found in polyacrylamide gels of CMD. There are probably two genomic segments of egual Mr •
The whitefly Bemisia tuberculata has been suspected as the vector of FSD based on experiments using field-collected whiteflies. until this year, the only viruslike disease that had been transmitted by whiteflies was the WF isolate, which originates from whiteflies collected in the field. Healthy eassava plants infected with the WF isolate showed mosaic symptoms on the indieator clone Secundina but did not show root symptoms typical of FSD.
111

Figure 3.7 Viruslike particles found in a thin section of cassava leaves. They were sometimes found in groups as shown in the photograph, but were more frequently scattered through the cytoplasm.
Figure 3.8 A polyacrylamide gel showing the ds-RNA segments associated with infected FSD and CMD. Lane A is a molecular weight marker of ds-RNAS, lane B is CMD isolate 5, lane C is FSD isolate 29, lane D is FSD isolate 80, lane E is CMD isolate 86, and lane F is ds-DNA markers.
112

Table 3.15 Molecular weights of dsRNA segments of phyto-reoviruses and Fijiviruses compared with ds-RNA segments of selected isolates of frogskin diseasI (FSD) and Caribbean mosaic disease (CMD) •
Genomic Segment WTV RDV FDV RBSDV FSD CMD
1 2 3 4 5 6 7 8 9 10 11 12
1
2.90 3.10 2.90 2.75 2.70 2.75 2.40 2.50 2.50 2.24 2.60 2.60 2.20 2.20 2.48 2.19 1.80 2.30 1.80 1.80 2.48 2.14 1. 75 1.80 1. 78 1.76 2.12 2.00 1.35 1.30 1.10 1.05 1.80 1.82 1. 30 1.25 1.05 1.02 1.45 1.37 1.25 1.20 0.83 0.78 1.21 1.17 1.20 0.71 0.57 0.70 1.12 1.11 1.15 0.67 0.55 0.67 1.08 1.06 0.68 0.54 0.48 0.32 0.48
Size estimates for the phyto-reoviruses and the Fijiviruses (WTV, RDV, FDV, MRDV) are from Plant Viruses, vol. 1: Structure and Replication, C.L. Mandahar, ed., pp. 220-221. The estímate for FSD ís from isolate 29; for CMD, isolate 5. These were compared with ds-RNA markers, which were isolated from mycoviruses provided by Dr. R.L. Bozarth, Indiana State university.
Manipulating the acquisition times of the vector increased efficiency of transmission. Isolate 29 of FSD was consistently transmitted although the rate of transmission varied from 10-60% (Table 3.16). An acquisition period of one day gave the highest rates of transmission. According to these results, the disease agent does not need to replicate in the vector I but the whiteflies do need a minimum acquisition period of one day before they are able to transmit the virus. Table 3.17 lists the viruslike diseases transmitted by B. tuberculata.
The plants that developed the mosaic symptoms in the transmission tests were analyzed for the presence of ds-RNA species. Both the mother plants used as the source of
113
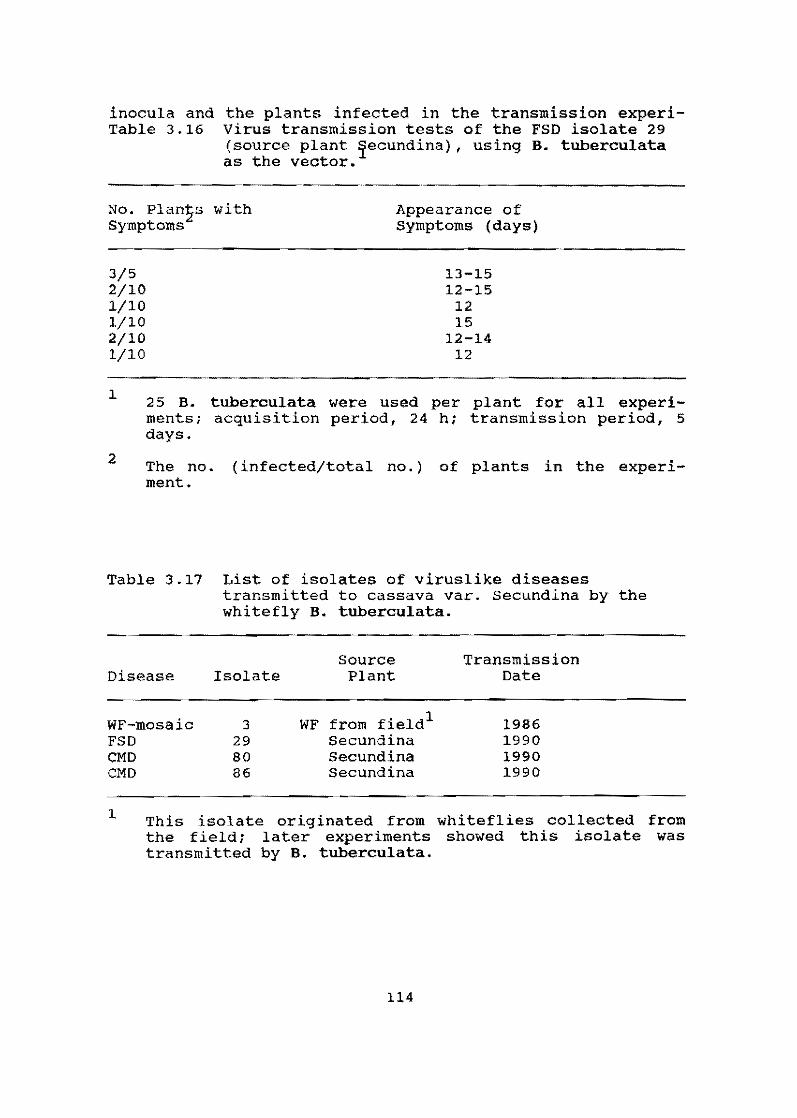
inocula and Table 3.16
the plants infected in the transmission experivirus transmission tests of the FSD isolate 29 (source plant lecundina), using B. tuberculata as the vector.
No. Plan~s with Syrnptoms
Appearance of syrnptoms (days)
3/5 2/10 l/lO l/lO 2/10 l/lO
1
2
13-15 12-15
12 15
12-14 12
25 B. tuberculata were used per plant for all experiments; acquisition period, 24 h; transmission period, 5 days.
The no. (infected/total no.) of plants in the experimento
Table 3.17 List of isolates of viruslike diseases transmitted to cassava varo Secundina by the whitefly B. tuberculata.
Source Transmission Disease rsolate Plant Date
WF-mosaic 3 WF from field1 1986 FSD CMD CMD
1
29 Secundina 1990 80 Secundina 1990 86 Secundina 1990
This isolate originated from whiteflies co11ected froro the field; later experiments showed this isolate was transmitted by B. tuberculata.
114

ments had similar ds-RNA patterns. Also leaf dips of the infected plants contained viruslike partieles with diameters of 80 nm. There were no viruslike partieles or ds-RNAs in the healthy control plants.
B. tubereulata were fed on plants infected with either CMD or FSD and examined using inseet dip preparations for viruslike partieles. Partieles 80 nm in diameter, similar in size and morphology to the viruslike partieles found in plants infeeted with CMD or FSD, were found in these sampIes. The strueture of the viruslike partieles extraeted from B. tuberculata is more distinet than that of the partieles found in the plants (Fig. 3.9). Whiteflies that fed on healthy plants contained no viruslike partieles. In blind tests, the whiteflies that had fed on the infeeted plants were eonsistently identified.
Figure 3.9 Viruslike partieles found in B. tubereulata that were fed on plants infeeted with isolate 29 of FSD. Similar partieles were found in B. tubereulata fed on CMD-infeeted plants. No viruslike partieles were found in whiteflies that fed on healthy plants.
115

In conclusion, viruses similar in morphology and genomic structure to the phyto-reoviruses are associated with CMD and FSD. Both viruses are transmitted by the whitefly B. tuberculata. Additional experiments are needed to determine that all symptoms associated with CMD and FSD are present in the plants infected by the whiteflies. Currently some of the plants infected in the transmission experiments are being grown in a small field plot in a se re en house to determine the type of root symptoms caused by the virus transmitted by B. tuberculata. Additional experiments will be conducted in field trials.
Based on the ds-RNA patterns, the virus associated with CMD appears to be distinct from the one associated with FSD. Based on their morphology and genomic structure, these viruses appear to be members of a new subgroup of phytoreoviruses. The main difference between the Fij i subgroup of the phyto-reoviruses and those associated with CMD and FSD is the type of vector. The vectors of phyto-reoviruses are leaf- or planthoppers; and all, except wound tumor virus (WTV) , infect only monocotyledons. The vector of viruses associated with CMD and FSD is B. tuberculata, and the only known host for these viruses is cassava, a dicotyledon.
Most of the phyto-reoviruses are unstable and difficult to purify; yet knowing the type of virus usually makes the task easier. The development of a rapid assay method for these viruses will be a priority this coming year.
3.2.2 Potexviruses in cassava
Cassava Colombian Symptomless Virus (CCSpV) was originally isolated from cassava infected with CMD. There are no symptoms produced in cassava infected only with CCSpV, which is only present in some of the characterized isolates of CMD or FSD. An antiserum to ccspV (provided by Dr. Harrison at SCRI) is being used to screen germplasm for the presence of this virus. ccspV is serologically related to Cassava X virus (CsXV) but distinct from it. Although neither virus causes any apparent disease in cassava, CIAT germplasm is being screened for both of them by ELISA to assure virus free germplasm.
The molecular characterization of CCMV is continuing, and the sequence of approx. half the genome is complete. Figure 3.10 is a diagram of the predicted molecular organization of the virus. Based on homology at the RNA and protein sequences, CCMV is most closely related to potato virus X (PVX). The Cassava Trans proj ect (Dr. R. Beachy, Washington Universi ty, has successfully demonstrated that coat proteinmediated cross protection of CCMV is effective in Nicotiana benthamiana. The major technical limitation of its deployment as a resistance gene in cassava is the transformation of cassava.
116

Cassava Common Mosaie Virus Genome Organization
166 kD Polymerase 14kD 25kDCP
5 ...... ---------.,~_:~...J.a.f2j~+--..L1 25kD 11 kD
I
A(60)3'
o 2000 4000 60006400
Figure 3.10 The size (kD) of the four putative proteins and their position on the genomic map are shown in the diagram. The 166-kD protein shares homology with other polymerase genes; the 25-kD CP is the coat protein.
3.2.3 Cassava Vein Mosaic virus (CVMVl
A survey was conducted of viruses infecting cassava in NE Brazil (states included parts of Bahia, Perambuco and Ceará) • Much of this semiarid are a is usad for salecting and producing the germplasm for the IFAD project (emphasis on Africa). Basad on the observations of symptoms, CVMV is widespread throughout these areas of BraziL Typical infaction rates were 20-30%, but some fields had 100% infection. Exact losses in cassava infected with CVMV are unknown, but the plant does produce good RY even though the virus is prevalent. This viral disease is probably similar to CCMV, which causes 20-30% RY losses in infected plants. More information on the losses caused by this virus is needed to determine its importance. The development of rapid diagnostic techniques for detecting CVMV is al so needed to facilitate the exchange of clean germplasm.
117

3.2.4 Cassava American Latent Virus (CALVl
A new nepovirus of cassava was reported (Dr. B. Walter, ClRAD, Colmar, France), isolated from samples infected with CCMV that had been collected in humid lowland areas around Manaus, Brazil and in French Guyana. CALV does not produce syrnptoms or apparent disease in cassava. It is not known whether the virus causes RY losses or if it is seed transmitted.
As nepoviruses are frequently seed transmitted, the seeds being sent to lITA in Nigeria were studied using an antiserum to the virus (provided by Dr. Walter, CIRAD). Both seed lots and mother plants of seed lots to be sent to lITA in 1991 were tested for the virus. Results were negative, and it appears that this virus is not present at CIAT. CALV (like CCSpV and CsXV) is a minor problem that causes no obvious disease. More work needs to be done to determine its distribution, seed transmission and effect on RY.
118

4. CASSAVA ENTOMOLOGY AND ACAROLOGY
Research in cassava entomology and acarology stresses the need to develop effective, cost-efficient, environmentally sound crop protection methologies that will assist in stabilizing production and eliminate the need for pesticide use. Host plant resistance, biological control and agronomic practices are emphasized.
Recent research results in entomology are as follows:
4.1 Cassava Mealybug
Two species of cassava mealybugs--Phenacoccus manihoti and P, herreni--can cause serious yield los ses in cassava. ~ manihoti, native to Paraguay and limited areas of SW Brazil (Mato Grosso do Sur), appears to be under control because of the presence of two natural enemies. In Africa, on the other hand, this pest caused severe damage until key natural enemies were introduced from the neotropics to bring ~ manihoti under control. The CIAT Cassava Entomology section continues to collect, evaluate and send natural enemies to lITA for evaluation and possible release for P. manihoti control on that continent. Two predators recently sent were Cleothera onerata and Hyperaspis sp. Life table and consumption studies with ~. onerata are presented here.
E. ,herreni has caused severe damage in NE Brazil and the Colombian Llanos. Research at CIAT has concentrated on biological control and host plant resistance.
4.1.1 Biological control
The sudden appearance of 1'. herreni in NE Brazil in the mid-1970's suggested that it was introduced into that area. Possible areas of origin are being explored in order to study the natural enemies associated with this mealybug. In order to define the geographic distribution of P. herreni, a survey of cassava-growing regions of Venezuela (Fig 4.1) was initiated in 1989 and continued during 1990.
Of 47 farms visited, 14 had 1'. herreni infestations. Nine of the 14 infested fields were planted to bitter cassava from 6-12 mo of age, three were planted to sweet cassava of 9-12 mo, and two fields had a mix of 10-mo-old sweet and bitter varieties. The altitude and weather conditions were recorded for each site. The mealybug-infested cassava fields occurred from 25-275 masl, with temp between 28-35'C and RH from 40-70%. This information supports previous observations and studies that show that 1'. herreni is primarily a pest of the lowland tropics with high temp and prolonged dry seasons.
119

CARIBBeAN SEA
L
E F
Figure 4.1 Exploration of cassava-growing zones in Venezuela surveyed during 1990 (A-L); shaded area indicates distribution of E. herreni and letters indicate sites where parasitoids A. vexans (G-K) and A. coqcois (B) were found.
Parasites and predators found during this year's survey added valuable information to 1989 observations. The most frequently found predators were Nephus sp. (Coccinellidae) and Ocyptamus sp. (Syrphidae) (Table 4.1). Three other coccinellids of the Hyperaspini tribe were present in a few fields.
The two wasp (Hymenoptera) species found parasitizing R.... herreni were subsequently identified as Aenasius v~xans (Encyrtidae) and Acerophagus coccois (Encyrtidae) by R. Noyes of the British Museum. A. vexans was found in nearly
120

Table 4.1 Important natural enemies associated with populations of P. herreni in Venezuela, 1990.
No. Parasitoids (%)
fu vexans fu coccois
104 (45.6) 124 (54.4)
No. Predators (%)
Nephus sp. Ocvptamus sp. Hyperaspini sp.
57 (40.7) 55 (39.3) 28 (20)
all mealybug-infested fields, while large numbers of ~ coccois were found in El Jaquito and Trujillo. Colonies of Nephus sp., A. vexans and A. coccois were established in the CIAT lab. Approximately one generation per month of Aephus sp. and two generations per month of the two encyrtid parasites can be reared under lab conditions.
Lab studies were conducted of the two parasitoid species on two mealybug species: P. herreni and P. madeirensis (= ~ gossypii) . The latter will feed on cassava but is not considered an important pest of this crop and is usually observed only at low populations. (For details on rearing techniques utilized for mealybug and parasitoid species, see previous Annual Reports).
Whereas A. vexans preferred to parasitize P. herreni over ~ madeirensis under free-choice lab conditions, host preference was found when these two mealybug species were offered to A. coccois (Table 4.2). These data indicate that ~ vexans may be more specific for P. herreni--a hypothesis that will require further evaluation. No evidence was found for host stage preference in A. vexans (Table 4.3). Second and third instar nymphs and adult females of ~. herreni were parasitized with equal frequency; whereas first instar nymphs were not preferred although occasional parasitism did occur (Table 4.3). li. coccois showed a strong preference for second instar nymphs of both P. herreni and ~. madeirensis (Tables 4.3 & 4.4). Whereas A. coccois oviposited in adult females of P. madeirensis, parasitism of this stage was insignificant in P. herreni. Neither li. coccois nor ~ vexans appears to parasitize eggs of P. herreni (Table 4.3).
A. coccois was previously found parasitizing ~. herreni in COlombia and has been studied at CIAT (Annual Report 1985). The Colombian species showed a marked preference for ~ madeirensis. Although the second instar of P. herreni was preferred (as with the Venezuelan species), the Colombian species had equal preference for the adult female stage, as
121

Table 4.2 Preference of two parasitoids, A. coccois and ~ vexans, in a choice test for adults of two cassava mealybug species, P. herreni and R. madeirensis.
Mealybug Spp.
P. berreni
No. of Hosts Subjected
P. madeirensis 250 250
No. of Eggs of A. vexans
92+ 5
No. of Eggs of A. coccois
+ = Significantly different; Student "t" test P<0.05.
ns = No significant difference.
Table 4.3 Preference of two parasitoids in a choice test for life stages of the cassava mealybug P. berreni.
Life No. Eggs of No. Eggs of Stage No. A. vexans A. coccois
r 125 4+ 5 II 125 40 38+
III 125 40 16 Adult female 125 30 1
+ Significantly different; Student "t" test P < 0.05.
Table 4.4 Preference of two parasitoids in a choice test for life stages of the cassava mealybug R. madeirensis.
Lite stage No.
r 125 II 125 !Ir 125 Adult female 125
No. Eggs of A. vexans
9ns
10 4 o
No. Eggs of A. coccois
7 32 + 11 14
+ = Significantly different; Student "t" test P < 0.05.
ns = No significant difference.
122

well as parasitizing all other ~. herreni stages including the male cocoon. This apparent difference in behavior indicates the possibility of biotypes and should be further investigated.
P. herreni predator studies concentrated on two species (Col: Coccinellidae): Cleothera onerata and Hyperaspis sp. Data on the former are presented. Methodologies for rearing coccinellids, life table and predation¡consumption studies have been described elsewhere (Annual Report 1989). Development time for~. onerata was studied at four temp (17', 20', 25' and 30'C). Development time was most rapid at 30'C (26.1 days) and progressively longer at lower temp (39.1 days at 25'; 64.3 at 20', and 106.8 at 17'C) (Table 4.5). Rate of development increased with higher temp (0.9, 1.5, 2.5 and 3.8 at 17', 20', 25' and 30'C, resp.) (Fig. 4.2), indicating that this predator would be more successful in the warmer climates where P. herreni dominates.
Life stages of C. onerata include egg, four larval stages, prepupa, pupa, preadult and adult (Fig. 4.3). Higher mortality occurs during the early instars and at lower temp. Overall mortality was 93% at 17', but only 33% at 30'C. Percent mortality decreased as development stages progressed. The minimum temp developmental threshold for ~ onerata is 12.9'C, with the physiological time equivalent to 452.9 degree-days. The net reproductive rate (Ro) is greater at 2S'C, while the intrinsic rate of increase (Rro) is higher at 30'C (Table 4.6). Generation time and population doubling time are lowest at the higher (3Q'C) temp. Highest fecundity occurred at 2S'C, with 19S eggs¡female.
Tabte 4~5 Oevelopment times (days) at four constant t~ for ~. ~ feed,ng on f.. her-reni.
1~ Larval Sta~es Tftal
E99 Il ItI IV Pre~ Pupa Preaclllt De., opnent
"".
17 21.7 13.2 8.3 9.2 23.9 6.2 18.7 5.6 lD6.8 20 13.7 8.4 4.4 4.8 12.1 4.0 12.8 4.2 64.3 25 8.1 3.8 2.3 2.6 7.7 2.3 9.0 3.1 39.1 30 5.9 2.3 1.8 2.1 4.7 1.5 5.9 1.9 26.1
123

Temp (OC)
Figure 4.2 Effect of temp on the time and velocity of development of C. notata.
4.7
2.1 1 .5
-
Life cycle of 5.9
1 • B
Figure 4.3 Life stages and developmegt time (days) of g. onerata at constant 30 e and 70 ± 5% RH.
124

Table 4.6 Effect of temp on life table parameters of ~. onerata.
Parameters 200e 250e 300e
Egg-to-egg development 119.3 63.4 52.6 OViposition period (days) 60.8 108.8 26.5 Fecundity (total eggs) 60.3 195.2 33.4 Net reproductive rate, R 24.5 74.4 20.3 Generation time o 140.4 115. O 74.8 Intrinsic rate of increase, R 0.023 0.037 0.040
Finite rate ~f increase ( ) 1.02 1.04 1.04 Doubling time 30.4 18.5 17.2
Predation studies show that 5;;.. onerata prefers feeding on the egg stage, followed by the P. herreni instars and adult stages. It is most voracious dur1ng its fourth instar when it can consume over 1300 eggs at an avg rate of 182 eggs/day (Table 4.7). During oviposition, one pair of adults can consume about 120 eggs daily, tor a total of more than 6500 eggs during an avg adult lite span of 70 days.
Table 4.7 Total consumption of ~. herreni eggs by different development stages of e. onerata.
Deve10pment stage
1 instar 11 instar 111 instar IV instar Adult female Adult male
Avg Total consumption Direction
34.3 111.4 270.4
1338.8 875.2 722.9
F1
E D A B e
standard
10.8 54.1 128.7 280.9 81.6 167.6
1 Avg followed by the same letter are not signiticantly different at the 5% level (DMRT).
125

4.1.2 Resistance to P. herreni
Screening ef cassava germplasm fer mealybug resistance has been ongoing for several years. Selected clones were evaluated first at CIAT and ultimately at Carimagua, where there are high natural mealybuq pepulations. In addition to natural populations, artificial infestatiens are used te ensure the uniform, adequate infestation needed for effective screeninq. Nearly 3000 cassava varieties have now been evaluated over several screeninq cycles.
One hundred clones were screened for resistance to ~ herreni in Carimaqua. They were planted in 4 blocks in plots of 5 plants/clone. Each plant was infested with 1-2 ovisacs of P. herreni. Highly branched clones were infested with two ovisacs/plant. Three months afterward, damaqe was evaluated using a scale of 1 (no damage) to 9 (necrosis of branches and plant death). Three clones were selected: CM 6069-3, CM 5263-1 and SM 540-8 (Table 4.8) for continued evaluation. These clones are also reported as tolerant to Cercospora, CBB and SED, which severely limit production in the savannas of Colombia. RY ranged from 13.6 t/ha for SM 540-8 to 24.8 t/ha for CM 6068-3. Damage levels for CM 6068-3 and CM 5263-1 were at 4, but only at 1 for SM 540-8. The selected clones will be evaluated further in an experiment with a larger plot size to determine resistance levels.
Three clones selected durinq 1989 (SG 250-3, SG 106-54 and CM 2177-2) were sown in 36-plant plots, using a split plot design with four replications. Some plots were protected with aldicarb, while nonprotected plots were infested with mealybug ovisacs to ensure adequate populations. Yield depression due to mealybug attack is an indication of
Table 4.8 Yield and damaqe level of 3 selected clones for mealybug (P. herreni) resistance in Carimagua.
Yield No. stakes/ Clone t/ha
Damagi Level Plant % DM
CM CM SM
1
6068-3 24.8 4 10 30.62 5263-1 16.3 4 6.5 33.36 540-8 13.6 1 10 31.95
Based on a damage scale of 1 (no mealybuqs) to 9 (necrosis and plant mortality).
126

resistance levels in protected clones. Results showed only a 10.1 and 9.3% reduction in yield between the protected and nonprotected plots of clones SG 250-3 and CM 2177; while SG 106-54 had a 34.2% reduction in yield (Fig. 4.4). These results indicate that there exist adequate levels of resistance or tolerance in clones SG 250-3 and CM 2177-2, which are suitable for use in a resistance breeding programo Additional greenhouse and lab studies are required to determine whether this resistance is due to an antibiosis mechanism or tolerance due to high plant vigor.
4.1.3 Yield loss studies
To obtain more information on RY loss potential in cassava due to mealybug attack, an experiment using M Col 77 was conducted in Carimagua. A random plot design with three reps and treatments of dimethoate 48% (0.720 kg a.L/ha), monocrotophos 50% (0/5 kg a.i./ha), and dimethoate + monocrotophos. The control received no pesticide; but at 30 days, each plant was infested with 2 mealybug evisacs. Pesticides were applied at 30 and 75 days after germination.
Yielcl (l/ha)
50
40
80
20
10
O SG 250-8 Crv12177-2 SG 106-54
_ W¡lh Pesticida _ WithOut Past'cide
Figure 4.4 Yield comparisons, with and without pesticide treatment, of 3 cassava clones selected fer mealybug (P. herreni) resistance.
127

RY (8.6 tjha) in the control plots was reduced by an avg of 28%; there was no significant difference among the three insecticide treatments (avg RY 11. 9 tjha). When aldicarb 10% (3 kg a.i.¡ha) was applied, RY increased 47.3% over the control (16.4 t¡ha); however, aldicarb is prohibi ti vely expensive (one application costs US$297¡ha vs. US$9. 52¡ha for monocrotophos) and its high toxicity makes it unacceptable for mealybug control on cassava.
4.1.4 Pseudococcus mandio: the cassava root mealybug
P. mandio was first reported attacking both bitter and sweet cassava varieties in Sombrio (SC, Brazil) in 1986. This mealybug has since been observed attacking cassava roots in the subtropical cassava-growing areas of South America; that is, Paraguay, Argentina and southern Brazil (especially in Santa Catarina). Additional hosts are Cyperus rotundus and Ergeron bonairensis. The mealybug is normally found feeding on underground plant parts including the underground portion of the stem. Root damage is manifested by darkened spots, possibly caused by fungal pathogens introduced through mealybug feeding. This damage not only reduces the commercial value of the root but also its culinary quality (roots becoroe harder when cooked). Highly infested plants display chlorosis and defoliation of lower leaves.
A collaborative project, using contract research funds, was set up with the EMPASC Experiment station at Itajai, SC to study the occurrance, behavior and damage caused by ~ roandio. Preliminary data indicate that mealybugs appear during warmer temp which, under subtropical conditions, corresponds to about 3- to 4-mo-old plants. The number of plants attacked and ~ mandio populations increase as plants roature and warmer temp occur. The female life span froro egg to adult is about 45 days. Observations and studies of this pest will continue.
4.2 The Cassava Hornworm, Erinnyis ello
The cassava hornworm--a major pest of cassava throughout the Americas--can cause severe defoliation resulting in considerable yield losses, especially when repeated attacks occur. Over 40 natural enemies including parasites, predators and pathogens have been identified. It is speculated that due to the highly migratory habits of the sphingid moth adult, stable biological control is difficult to achieve and maintain in cassava fields.
Recent research at CIAT has concentrated on using a naturally occurring baculovirus, which has been shown to be effective in controlling hornworm populations. The advantage of this virus is that it is storable (under refrigeration) by farmers; and when hornworm attacks occur, it can be applied
128

similar to a pesticide. This technique is being used by farmers in Brazil and certain areas of Colombia.
The pathogenicity of the baculovirus on hornworm larvae was evaluated using seven concentrations prepared in distilled water. The number of inclusion bodies par liter water was estimated by electron microscopy. A standard curve was prepared from these data (Fig. 4.5). An objective of the study was to determine the mean lethal concentration (LDso) for each instar and the incubation period required to obtaln this mortality level. Evaluations for each instar were run until 90% mortality was obtained.
The effect of virus concentration and larval instar on mortality was tested. After 72, 96, 120 and 144 h for instars 1, 11, 111 and IV, resp., 90% mortality was obtained with the highest virus concentration (0.9 mI virus/lt H20 = to 1.5 x 10⁶ inclusion bodies) (Fig. 4.6). A sigmo1.dal relationship between concentration and mortality was found for instars 1, 11 and IV. In the third instar, the relationship was asymptotic, with high mortality at a much lower concentration than in the other instars (Table 4.9). In the control larvae, mortality was never higher than 10%.
2.8 o
2.1 o
o 1.6
o 1.1
o 0.6
o ~1+--------+--------r-------~-------i--------+-------~
0.00
Figure 4.5
0.15 0.30 0.45 0.60 0.75 0.90
Virus ml/I
No. of virus inclusion concentrations of solution.
129
bodies at each of 7 ~ ello baculovirus

100,------------------------------------------------,
BO
60
40 0-01 .-.11
20
O+-------_+------~r_------+_------_+--------r_------4
0.00 0.15 0.30 0.45 0.60 0.75 0.90
Virus ml/I
Figure 4.6 Percent mortality of four instars of ~. ello at 7 virus concentrations.
Tabie 4~9 Percent mortality of four ~. ello fnstars at seven virus concentr8tions~
Conceotration lnctusion
Bodi •• /lt H2
0
4 1.65 x 12
7.4 x 11005 2.2 x 6.8 x 10
5
1.9 x 10⁶
3.3 x 10⁶
4.5 x 10⁶
Controt
1 1st Instar
(X)
33
37 38 44 45
66 95 10
2 2nd Instar
(X)
33 36 41
47
60 7S 94 10
3 3rd instar
(% )
43 47.5
63 75 83 90 95 10
4 4th Instar
(% )
45 53 55
68 70 75
90 10
------------------------------------------------------------------------1 = 72 h; 2 3
= 96 h; 4
= 120 h; = 144 h.
130

Preliminary tests with fifth instar larvae resulted, even at the highest concentration, in most larvae reaching the prepupal stage: but 22.5% and 40% of these died within 144 h after virus application for the lowest (185 x 104 inclusion bodies/lt H,O) and the highest (4.5 x 10⁶ inclusion bodies/ lt H20) concentrations, resp. Of those that reached the prepupal stage, 80% also reached adult stage. Of the remaining 20%, some mummification was observed, and no adult emergence occurred for some pupae. Determination of LD O and a detailed study of the interaction of virus concentr~tion and time of mortality is in progress.
4.3 The Cassava Whitefly
Whiteflies, which can cause severe yield losses in cassava as a result of direct feeding, are also major vectors of cassava virus diseases. High whitefly populations have been reported from certain areas of colombia (Tolima, Valle del Cauca), Paraguay and NE Brazil. Several species have been reported, and no single species appears to predominate. Bemisia tabaci transmits ACMD in Africa. Although present in the Americas, it had not been reported feeding on cassava until recently, suggesting the existance of a distinct biotype in the Americas. In recent years, however, ~ tabaci has been reported feeding on cassava in Florida, Puerto Rico and the Dominican Republic, indicating the possible introduction of a new biotype in these areas. If this biotype is capable of transmitting ACMD and the disease enters the Americas, it could have devastating effects on cassava production; therefore, continued research on whitefly dynamics is a priority.
Recent research at CIAT has concentrated on identifying resistant clones. The predominant whitefly species present is Aleutotrachellus socialis although field populations usually contain Trialeurodes variabilis and B. tuberculata as well. Screening cassava germplasm in the presence of this species complex has been in progress for several years. Four clones (CG 489-34, CG 489-4, CG 489-23 and CG 489-31) have been selected and evaluated in the field (ICA-Nataima, TOlima, Colombia).
Whitefly population estimates, damage scores and yield in the clones were compared to the regional varo Quindiana and to CMC 76 and CMC 40 in an area ol high whitefly population pressure. Four reps of 36-plant plots of each clone and variety were treated with a pesticide and compared to untreated plots.
The lowest damage seo res and highest yields were obtained from the clones. Clone yi.elds in the unprotected plots were higher than the check s (CMC 76 and CMC 40) and regional variety in the protected plots (Table 4.10). There was no
131

Table 4.10 Evaluation of four selected whitely·resistant cassava clones, compared to varo CMC 76 and CMe 40 and the regional varo Quindiana in ICA-Nataima, Tolima, Colombia.
Variety
CK 489·34 CK 489·4 CK 489·23 CK 489·31 CM·76 CM·40 Regional
Quindiana
With Insecticide
Yield t¡ha
30.3 32.9 39.1 27.9 22.8 25.0
25.1
B
B
A
C E
O
O
X OM
28.6 32.4 33.1 33.2 34.6 27.1
35.5
Difference y i e l d
3 17
9 10 31 38
31
Without Insecticide
y; e l d
t¡ha
29.3 27.1 35.4 24.9 15.8 15.6
17.3
% OM
27.1 30.8 31.9 32.7 32.1 25.0
34.5
significant difference in clone yields between protected and nonprotected plots (9% avg reduction), indicating that effective levels of resistance exist in these clones. Yield depression for the two checks and the regional variety averaged 33%.
The high DM content and cUlinary quality of the regional varo Quindiana are primary criteria for farmer selection and probably account for this variety' s success in the Tolima region. Crosses between whitefly-resistant clones and the regional varo Quindiana have already been made in collaboration with the Breeding Program; and progeny will be evaluated in future trials.
4.4 cyrtomenus bergi: The Cassava Burrowing Bug
The feeding of Q.. bergi, a soil-borne hemipteran, causes severe deterioration to the roots and the loss of their commercial value. This polyphagous insect feeds on numerous other hosts (CIAT Annual Report 1989), thereby complicating control efforts. Although previous studies have shown that C. bergi can complete its development stages feeding only on cassava, it appears that cassava is not its preferred host. Bitter cassava is detrimental to its development and causes marked mortality; but even sweet cassava does not permit optimal population growth.
132

4.4.1 Development studies
Twenty pairs of C. bergi adults were placed in soH-filled plastic boxes with onions, cassava or maize as feeding media. Fresh roots were provided every 4 days. The no. of surviving adults was counted every 7 days, and oviposited eggs were separated from the soil by washing and filtering. Egg and adult counts continued until all adults had died.
oviposition was highest when maize was provided and lowest on the cassava dieto A peak in oviposition on maize occurred in the first half of the adult stage1 thereafter, egg production was sustained at a constant level until death. Egg production was appreciably lower on both the bitter (M Col 1684) and sweet (CMC 40) cassava varieties. On onions and cassava, eggs were produced in the latter part of the adult stage, suggesting that essential nutrients for egg production are lacking in these hosts (Fig. 4.7).
The death rate on all food types was constant (Fig. 4.8); the principal effect of food type on survivorship was lifespan. The LD50 on maize was 95 days, compared with 68.5 on onions and 66 and 64 days, resp., on cassava clones CMC 40 and M Col 1684. Maize is clearly the superior host in terms of survival and fecundity. The major difference between cassava and onions is that the latter is a better host for reproduction. Although survival and fecundity of C. bergi were similar on CMC 40 (a sweet variety) and M Col 1684 (a bitter variety), the sweet variety is the preferred host when a choice is offered. Root damage levels were always severer on sweet varieties.
These fecundity data help explain two observations on C. berqi behavior. Difficulties in maintaining ~ bergi colonies in the lab had be en experienced when sweet cassava was the medium provided for fecundity and reproduction. Since maize has been introduced as the feeding substrate, reproduction and subsequent colony maintainance has improved dramatically. During 1990 an avg of more than 10,000 nymphs and adults was provided each month, thereby facilitating numerous ongoing lab studies.
In addition, it has been observed in field trials (especially in Santander de Quilichao) that after several cycles, C. bergi populations and subsequent root damage decrease, resulting in disappointing experimental results. As cassava is such a poor medium for oviposition, C. bergi populations may be decreasing over time for lack of a suitable host for maximum oviposition. Cassava and onions appear to be alternate hosts, which represent a viable means for survival but are not suitable for reproduction and population increases.
133

NO I've~ 400r-----~···········-------~-~--~~------------------------_,
300
100
20 4C 60 80 100 "2C 14C 160 "","ti€! (DayS)
-4.~ Malze .. +- Onlon -é- Cassava Ctv1C 40 -B- Cassava M COi 1684
Figure 4.7 C. bergi oviposition on three hosts.
NO.LiVé~
5C-~····· --------------- --------------------- ------,
40
20
10
CJ--------O 50 100 150
-- !\"'1aize _ ... ¡ ... Or'icn ~ C335;:1",/3 8VC 40 ----B- Cassava tv" Cel "584
200
Figure 4.8 c. bergi survival when feeding on 3 hosts: maize, onions and cassava (CMC 40 and M Col 1884) •
134

4.4.2 Field trials
Recent observatiQns have indicated that k.. bergi damage is increasing in cassava-growing regions on the Atlantic Coast of Colombia. Data on ~. bergi attack were recorded from three experiments in pivijay (Magdalena) and Ciénaga de Oro (Córdoba).
Five cassava clones CM Bra 12, M Ven 1, M Ven 11, M Col 1505 = P12) were evaluated for ~. bergi damage at Pivijay. The clones and Sardina were planted in rows of 6 plants with three reps. The vegetative period was from May 1989-May 1990, and damage evaluations were made at harvest. Avg damage levels (grades 2-4 on a 0-5 damage scale) for commercial and noncommercial roots were 26.6% and 36.8%, resp. (Table 4.11). However, damage to roots (especially commercial roots) of M Bra 12, M Ven 11 and M Ven 1 was considerably higher than to roots of M Col 1505 and Sardina. These results are confusing in that M Bra 12, a high-HCN variety, should be the least attacked and show less damage than the sweet varieties. In this trial M Bra 12 had the greatest damage of the 5 varieties. The "susceptibility" of M Bra 12 indicates a possible "behavior" change; it may have a greatly reduced HCN content when grown under the edaphic and climatic conditions of pivijay.
laMe 4.11 k,.. bergi oanw:.ge to five cassava varietfes in La Colorada (Pivijay .. Magdalena) during the May 1989 cropping eyel ••
% Commerciat Roots X Noncommercial foots
Total Total D_ Grade Root D_9" Grade Root
Variety 1I 111- IV 0_ II 11I-IV O_
H 8ra 12 40.0 10.0 SO.O 30.0 10.0 40.0 M V .... II 33.0 6.6 39.0 17.0 37.0 54.0 M Ven I 30.0 0.0 30.0 43.0 3.0 46.0 M Col 1505 (PI2) 7.0 0.0 7.0 23.0 14.0 37.0 Sardina 7.0 0.0 7.0 0.0 0.0 7.0
Avg 23.4 3.3 26.6 22.6 12.8 36.8
135

Tabte 4.12 Effect of planting data erd local jty c:n ~ bergl damege to CBssava roots on the Colarbian Horth toast.
Vegetative !:ycl.
05/89·05/90 10/89·10/90 05/89·05/90 05/89·05/90
Local ity
Pivi jay
Pi.; iay
Plvijay Ci~aga
de Oro
:Ii: Comercial Roots
II 111 IV
20.4 3.9 0.58 0.0
23 •• 3.3 38.4 22.0
% Noncanercial Roots
Total 11 111 IV Totol
24.3 18.3 10.3 28.6 0.58 0.58 0.0 0.18
26.6 22.6 12.8 36.8 60.4 24.0 34.0 58.0
In a separate trial, 7 varieties were sown at 2 distinct vegetative cycles (May-May and Oct.-Oct.) and evaluated for insect and mite populations and damage. ~. bergi damage averaged 24.3% for the 7 varieties during the May-to-May vegetative cycle, but only 0.6% during the Oct.-to-Oct. planting (Table 4.12). These results indicate that environment and/or edaphic conditions are more favorable to 'º-'bergi activity during the May-to-May cycle when high precipitation and subsequent greater soil moisture (combined with lower soil temp) may alter C. bergi behavior, resulting in less root damage. This hypothesis will be evaluated further.
In ciénaga de Oro, damage reached 60% root damage in 'º-'bergi control experiments. It can be seen that C. bergi is becoming an important pest in cassava fields on the Colombian North Coast and requires monitoring in the future. Varieties that expressed little or no damage symptoms in other cassava-growing regions (i.e., Valle del Cauca) display severe damage symptoms on the North Coast. This phenomenon needs further investigation.
4.5 The Black Lacebug: Amblystira machalana
The black lacebug, A. macha lana (Hemiptera: Tingidae), was first reported on cassava in COlombia, Venezuela and Ecuador in 1987. A closely related species, A. opaca Champion, which has also be en identified, is indistinguishable from A. macha lana in field infestations. Damage, which is primarily to the lower plant leaves, is manifested by considerable speckling, which in severe infestations whitens the leaves.
136

4.5.1 Xield loss studies
To evaluate the potential economic importance of this pest on cassava, a field trial was conducted at CIAT from Oct. 1989 to Sept. 1990 using var. M Col 22 in a random plot design, with and without pesticide application (2 cc dimethoatejlt water). In naturally infested fields, a damage grade of 3 (O to 5 scale) was recorded from the 4th to the 9th mo after planting, while damage level reached 0.8 in the control plots. There was a 39% reduction in RX compared to the control (pesticide-applied plots) (Fig. 4.9).
The within-plant distribution of ~. machalana was evaluated in four clones (M Sra 12, M Ven 77, M Bra 677 and HCM 1). Within-plant distribution was similar for all clones: The lower and intermediate leaves supported 83% of the adults and immatures (Fig. 4.10).
4.5.2 Resistance eyaluations
The relationships among damage, population density and duration, and yield loss 1S unknown; thus preliminary screening for sources of resistance was based on the se lection of clones from yield trials. Under natural field infestation, 278 clones were evaluated during high lacebug populations using a damage scale of O (no damage) to 5 (necrosis and defoliation). Low damage scores (Grade 0-1.5) were found on 94 clones (Fig. 4.11). As screening was done with natural populations of A. machalana, escapes are probably included in this group; thus continued evaluation of selected clones as well as additional material from the germplasm bank is planned.
4.5.3 Siology studies
preliminary studies on the life cycle of A. macha lana were done in the lab on excised leaves of the varo CMC 40 in petri dishes at a constant temp of 28<C and 50-60% RH. Mean egg-to-adult development time was 42.5 days (Table 4.13). The life stages consist of the egg, 5 nymphal stages and the adult stage. Adult males and females lived a mean of 22 and 18 days, resp.; and a mean of 36 eggsjfemale were oviposited.
4.6 Cassava Pest Complexes
Pest complex studies provide a view of the fluctuations in insect and mite populations and their effect on the stability of cassava yields over several cropping cycles. A long-range study of pest complexes at CIAT is into its tenth year. More recently these studies were initiated in pivijay (Magdalena) and Villavícencio (Meta).
137
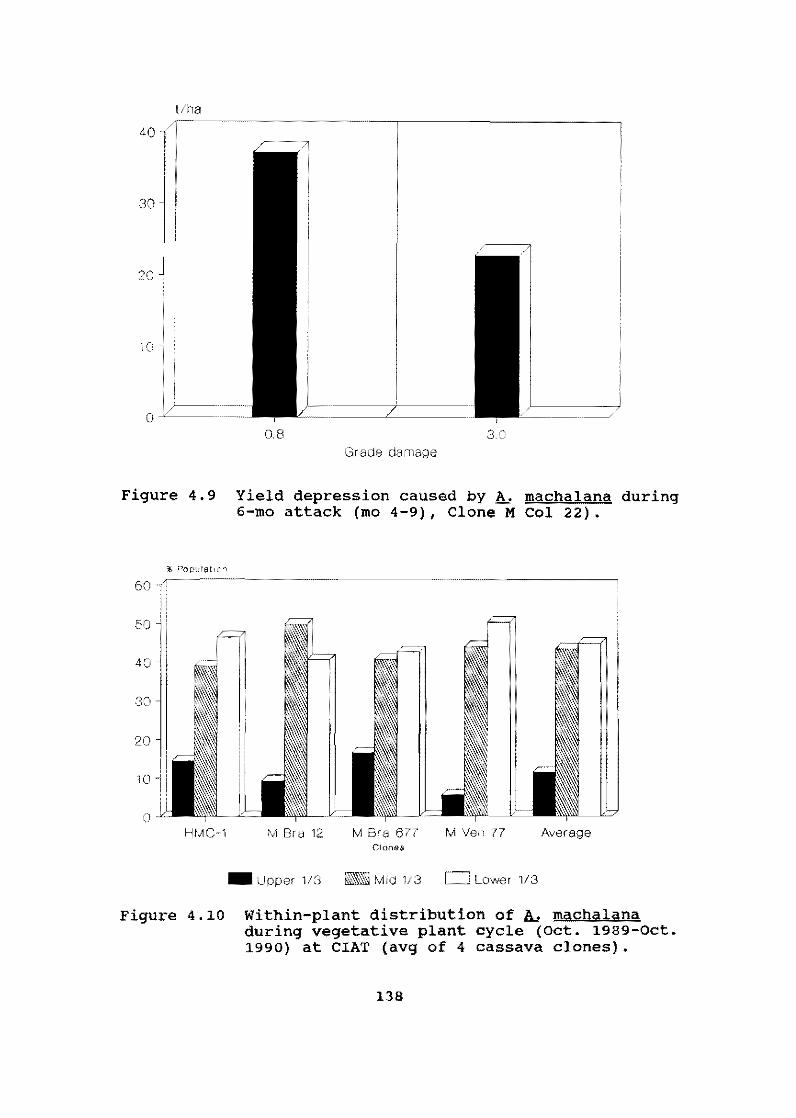
t/ha
40
30
20
iO
0-'"'----········· ...... .
0.8 Grade da>1age
Figure 4.9 Yield depression caused by A. macha lana during 6-mo attack (mo 4-9), Clone M Col 22).
60
50
40
3;)
20
10
()
H~:::;-l M 8ra 12 M Bra 677 M Ven 77 ¡l.verage Clones
_ Upper 1/3 _ Mid 1/3 Lower 1/3
Figure 4.10 Within-plant distribution of A. machalana during vegetative plant cycle (oct. 1989-0ct. 1990) at CIAT (avg of 4 cassava clones).
138

0,0"05
80
70
60
50
40
30
20 .
10
O O 5 15 2 25 3 3.5 4 45
GRADE DAMAGE
Figure 4.11 Field evaluation of 272 cassava clones for A. macha lana damage at CIAT.
Table 4.13 Life cycle of A. macha lana (Hemiptera:Tingidae) under lab conditions (2S"C, 50-60% RH) on cassava varo eMC 40.
Life No. Avg Duration CV stage Observations (days) %
Egg 22 S.2 11 _
Nynphal Instar
I 27 2.5 26 II 26 2.2 18
III 24 2.4 24 IV 22 3.0 17
V 19 4.0 4
Adults
Ma1e lS 22.0 3S Female 18 lS.3
1 Ovipos'i tion: Avg 36 eggsjfemale.
139

Seven cassava varieties (P12, M Bra 12, M Ven I, CMC 40, M Col 22, M Col 1684 and M Col 113) were planted in May (May 1989-Hay 1990 cropping cycle) and October (Oct. 1989-0ct. 1990 cropping cycle). Three 36-plant plots of each variety were treated with dimethoate (2 ccjlt water) and omite (1 cc propargitejlt water); and four plots of each variety were left untreated. Honthly evaluations of insect and mite populations were recorded. Major pests encountered were mites (Mononychellus and Oliqonychus spp.), thrips, whiteflies and termites. An evaluation of C. berqi damage to roots was recorded at harvest.
By comparing results between treated and nontreated plots for each variety, the stability of the variety in relation to pest attack can be evaluated. Results indicate that planting time al so has an influence on varietal reaction. Overall yields were higher for the May-to-May cropping cycle, with the avg RY (for the 7 var.) in the treated plots 24.4 tjha--a 20% reduction over the Oct. planting (19.4 tjha). In the nontreated plots, yield differences were greater. For the Hay planting, avg RY was 24.1 tjha; for the Oct. planting, only 11.8--a 51% reduction (Tables 4.14 & 4.15) .
There was no RY reduction during the May-to-May cycle in either the treated or nontreated plots; however, RY from the Oct.-to-Oct. cycle were reduced by 39% in the nontreated vs. treated plots (Tables 4.14 & 4.15). These results indicate that insect and mi te pressure is only one factor in RY reductions during the Oct.-to-Oct. cycle. The two planting cycles differ in that the Hay planting is at the beginning of the rainy season, thereby allowing for rapid plant growth (no stress for lack of moisture) when foliar insect and mite populations are greatly suppressed (Figs. 4.12 & 4.13) due to heavy precipitation. The Oct. planting is at the end of the rainy season so initial plant growth occurs during the drier months when insect and mite pressures and damage are greatest (Figs. 4.14 & 4.15) and plants are subjected to drought stress. Previous studies have shown that it is during the first 5 mo of growth that the plant is most susceptible to yield reductions due to arthropod attack. This combinatien of factors probably contributes to the differences in cassava RY recorded from this experimento
Varietal preference also differed considerably. RY of varo P 12 and M Col 22 were reduced by 45 and 53%, resp., between the treated vS. nontreated plots during the Oct. cycle, but shewed no yield reductien during the May cycle (Tables 4.14 & 4.15). M Ven I was stablest, with almost identical yield reductiens ef 14 and 16% in the treated and nontreated plota fer the Oct. and May planting cycles, resp.
140

)JN J01 AI.lG I
'00
OCT NO... D":C JAN "El MAl< ,;pp MAV I Oü I
JUN JUI, A!JO SE? l'e1 NO" ore JAN FfB "'AI1 I\P;; ~~A'-, 80 ' g: I
~''"''''I"'~'-500 ---~ .. ~~---------~----,----~-------
,roer ,I~~.~,
I
l"l 1]1 _ r:il i. , LJL .i ¡ile _J"'''1 'EB /-AA;; i'.PR VA. _"J~~ sr Afj SlP oc"!"
, 6& ¡ ?C I
Figure 4.12 Population fluctuations of insect and mite complexes on cassava varo P12 (M Col 1505) during two planting cycles in Pivijay (Magdalena) .
.,. •• ~~O "","' .. 4""'''''''' ICO •• ~~-'.--~~ •• -_._--'-' ,
140 - \ '" \ '00 \
" \
""
JUN .IU~ AlJG $Cf' Qt:T NVI DEe ,iNi FES ~IAq APR MAY es I 90 I
Figure 4.13 Population fluctuations of insect and mite complexes on cassava varo M Ven I during two planting cycles in pivijay (Magdalena).
141

,. , " , .. , M,
O -, •• J(Ji'1 JUl "'UO llEP OCT 1<(4 OEe JAN fEO .... MI APfI In,'f I 6. loo!
_ "G~""9<HH)5
CJ Ot.1OOH>'C"\i5
"",
o Thrips
m l/hite! Hes
""~---'~~~~ .... -----··1 !
Jl<'" .oUt A!J(l TIfr OC¡ NOV CEe 1<1'1 rE? >.tIA "P<l .... "Y I Ci'I I gO I
úfC JAN Pf9: ... "" ",ro MM JU'< -.IlJ( AW $tP ocr j el< I ,,0 j
_ ... ("Hm'WltuI,lS
::::J Q\.!OO>l'C><\lS
!'2;JThrips mWllÍlefli("s
:: Ih-----n"" f- -=-, ,
'N~. ""~' Q"" "~ h~-' , ' '
200 .... - ¡ .... :
100 r ~_.... i .: ¡
o • t~-r--, ni J JUL A~'G SU'
Figure 4.14 Mean damage af insect and mite camplexes on cassava varo M Ven 1 during two planting cycles in Pivijay (Magdalena).
,1\}" .J--Jl AV" ~k" OC! NO>' OEe JAN fES MAR '"YR ...... r I "" I 110 I
_ ....... ".<".,"'. t:i3' .. "" SIl T.¡,.,,>:<"" &;;;:) ",.11.", ...
,<oi-'; ~~--
,00;,,1-----
_ ... ~ .... ""'".,'". m h,·' •• IIIIl.',."'<..... D",~".,,, ..
-----._----~_ .... _----
I
1 1-
1 ¡-.-[L
"
...... -
.-~ I •
11 I
Figure 4.15 Mean damage oi insect and mite camplexes on cassava varo P 12 (M Col 1505) during two planting cycles in Pivijay (Magdalena).
142
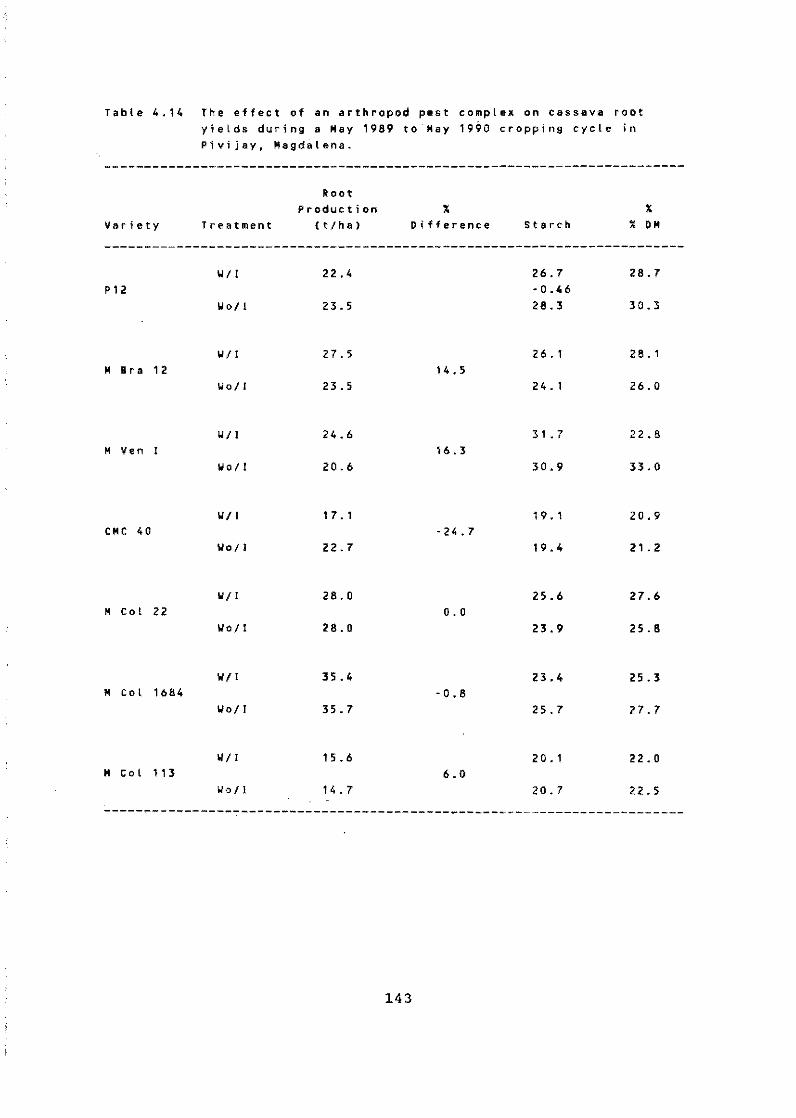
Table 4.14 The effect of sn arthropod pest complex on cassava root yields during a May 1989 to'May 1990 cropping cycle ~n Pivijay. Magdalena.
Variety Treatment
I/t! P12
1/011
lit! H Bra 12
11011
I/I! M Veo 1
I/ol!
I/I! CMC 40
1/011
1111
M Col 22 1/011
I/I! M Col 1684
1/011
WI! M Col 113
l/o!!
Root Production
(t/ha)
22.4
23.5
27.5
23. 5
24.6
20.6
1 7 . 1
22.7
28.0
28.0
35.'
35.7
15.6
14.7
" Difference
14.5
16.3
- 24 _ 7
0.0
- 0.8
6.0
Staren
26.7 - 0.46 28.3
26.1
24.1
31.7
30.9
19.1
19.4
25.6
23.9
23.4
25.7
20.1
20.7
" " DH
28.7
30.3
28.1
26.0
22.8
33. O
20.9
21.2
27.6
25.8
25.3
27.7
22.0
22.5
------------------------------------------------------------------------
143

Table 4.15 The effect of an arthropod pest complex on cassava RY during an Oct. 1989 to Oct. 1990 cropping cycle in Pivijay, Magdalena.
Variety Treatment1
P12
MBra 12
MVen 1
CMC-40
MCol 22
MCol 1684
MCol 113
WjI
WojI
W/I
WojI
WjI
WojI
WjI
WojI
WjI
WojI
WjI
WojI
WjI
WojI
Root
Production
(tjha)
21.5
11. 7
19.8
14.7
16.8
14.5
25.1
15.7
23.8
11.1
24.0
15.1
4.5
0.0
% %
Difference starch % DM
29.5 31.6 45.6
29.8 31.9
27.5 29.6 25.8
27.6 28.6
32.0 34.2 13.4
29.4 31. 5
27.3 29.3 37.5
26.1 28.1
27.4 29.4 53.4
27.1 29.1
26.5 28.5 37. O
26.4 28.4
19.5 21.3 100.0
1 (WI = with insecticide treatment; WoI = without insecticide treatment) .
144

Although the Hay-to-Hay planting cycle was most favorable for RY and foliar arthropod pressure was reduced, the reverse was found for ~. bergi activity. Damage due to this soil-borne hemipteran was 24% of roots damaged during the Hay planting cycle vs. only 0.6% during the Oct. cycle.
Termite activity was slightly higher during the Oct. planting cycle. Damage to the original planted stakes was high during both cycles; whereas root damage--although quite low overall--increased during the May planting cycle (Table 4.16). Insect and mite foliar damage was higher during the Oct. planting, which corresponds to those months of low precipitation (Figs. 4.14 & 4.15).
4.7 Cassava Acarology
Research has focused on biological control of the cassava green mite (CGH) , Mononychellus tanajoa, which was accidentally introduced to Africa from the Neotropics in the 1970s. From its initial foothold in Uganda, CGM spread throughout most of the African cassava belt. Control of CGH in Africa is considered to be one of the most important challenges facing crop protection today.
Shipments of natural enemies from CIAT to IITA have been made regularly since 1984. Eight species of phytoseiid predators of CGM have be en shipped; but up until 1989, establishment for longer than one growing season in Africa
Table 4.16 Effect of planting cycles on termite damage on seven cassava varieties in Pivijay, Magdalena.
_______________ E12~!!~g_~y~1~ __________________ Hay 1989 to Hay 1990 Oct. 1989 to Oct. 1990 -----------------------------------------------Termite Damage (%) Termite Damage (%)
Variety Stakes Roots Stakes Roots
P12 80 2.8 98 0.6 MBra 12 93 0.9 98 O MVen I 83 2.2 94 O CMC-40 99 6.4 100 3.6 MCol 22 74 0.4 98 O MCol 1684 81 0.6 87 O Meol 113 95 5.8 95 O
145

had not been reported for any species. The initial introduction strategy involving release of multiple species was modified once difficulties in establishment became apparent. Typhlodromalus limonicus, the most geographically widespread and numerically abundant species throughout most of the the northern Neotropics, was highly recommended for release; and an intensive effort to establish it in Africa commenced in 1989. Neoseiulus idaeus, the most widespread and abundant CGM predator in Brazil, was also included in the release programo
Difficulties in establishing .L limonicus in Africa have persisted; thus recent research has focused on identifying possible causes for this. strain differences between distinct geographical subpopulations have been found for several species of cassava-inhabiting phytoseiids, including T. limonicus and N. idaeus. The introduction of poorly adapted strains was hypothesized to be involved iñ' the failure of establishment, and shipments of T. limonicus populations from inter-Andean valleys were suspended in favor of '. populations from· the caribbean coast of Colombia and NE Brazil. After shipments of an H.. idaeus strain from the Colombian Guajiran Peninsula were suspended in favor of a Brazilian strain, regular recoveries of progeny from released populations were made in several sites; however, several phenomena were noted. H. idaeus appeared to be feeding on oligonychus gOSSyp11, a tetranychid mite of negligible economic importance on cassava, rather than on CGM. T. limonicus attained peak populations during the wet season when CGM density is low, corroborating observations of similar behavior in Colombia (Fig. 4.16) and Brazil (Moraes et al. 1991). This pattern of occurrence has not been observed for other species of phytoseiids. The objective of the research presented here is to explain these and other phenomema related to the process of establishing phytoseiids in Africa.
4.7.1 CGM and natural enemies in Braz il and Northern S. America
4.7.1.1 OGM. Exp1orations for natural enemies of CGM were conducted from 1985-90 in most cassava-growing countries of the Neotropics. The area explored by CIAT included Colombia, Venezuela, Ecuador, Trinidad, Mexico, and severa1 Central American and Caribbean countries. This area will be referred to as Northern S. America (NSA). In NE Brazil, a parallel effort was conducted by EMBRAPA frem 1988-90. The explorations involved qualitative and quantitative evaluation of CGM, other tetranychid mites, and natural enemy popu1ations on cassava and on neighboring vegetation and weeds. Over 1000 cassava fields were eva1uated. Comparative analyses of the phytoseiid mi te complex in different ecological zones showed that species tended to
146

.... " ~
":-" z c::
" 4> :::E
300
200
100 o
• -. T. limonicus (x 100)
O-O CmA
/ /-"", 0[----->""'_4 i-. .-. 0'0-0-0 o ............
O+-~------~---------+------~~----------r---~----+-~
1600 1900 2200 2500 2800 3100
Degree-doys ofter Plonting
Figure 4.16 population dynamics of CGM and T. limonicus in cassava.
separate out along ecological gradients such as the number of dry months per year (CIAT 1989), and that well-defined species complexes occur. The composition of these complexes varies with ecological zone; however, species composition also varies within ecologicaly similar areas (Tables 4.17-4.19).
Comparative analysis of CGM and natural enemy distribution and abundance in Brazil and NSA has important implications for classical biological control of CGM. A number of species of the genus Mononychellus occur on cassava in NSA, with the greatest number reported in Colombia. Colombia and Venezuela are the only countries outside Brazil, where M.... tana;oa is widespread. Throughout most of NSA, Mononychellus caribbeanae is éither the only species of Mononychellus reported (Cuba, Mexico, Nicaragua), or the predominant species (Panama, Ecuador) (Table 4.20).
In Brazil, only one Mononychellus spp., M. tana;oa (CGM) , occurs on cassava (Table 4.20). Taxonomic analysis of CGM specimens collected throughout the Neotropics revealed that the length of the dorsocentral setae used in classifying
147

Table 4.17 Cassava tetranychid and phytosefid ccxrplexes on the Colonbian Horth CoasL
Phytosei idee Tetranychidae
Ecologiiol No. Fields No. $"""I.~ No. Fields S"""ling 3 S_ling 3 State Zone Salq:Jled ldentified ¡$pecies $pecios FreqJency Species Frequency
San Andrés NL 5 7 0.7 A. Laraoensis 0.60 M. caribbeanae 0.40 ! . !!f1OfM!!Js 0.40 ~ • Sl!!l!.i.2l! 0.20 É· !.W.Y! 0.20 l· .Y!li.s.!! 0.20 Q. alveolaris 0.20 Q. helveolus 0.20 f. neotrQE!icus 0.20 g. sp. near ~ 0.20
Atlántico SIlL 8 9 0.9 1. 1 imcnicus 1.00 !l. t""" joa 0.62 !.~ 0.38 2- e!!;uviarllS 0.62 1. denti lis 0.38 Q. psypii 0.25 a. serial is 0.25 H. caribbeanae 0.13 §. arnectens 0.25 l. arillO 0.25 l. bellottil 0.13 §. hel veolus 0.13 S. alatus 0.13
Sucre SIll 94 18 5.2 r. Umonicus 0.71 g. Q!ruviaoos 0.56 ,a. aeria{ ls 0.34 Q. sossypi i 0.40 l. dentitis 0.33 !l. tanajoa 0.35 !.~ 0.21 l·~ 0.09 E:. cannaens i S 0.20 t!. mc:gresori 0.02 l. bellottii 0.11 l. canadensis 0.02 !. zuluaga; 0.10 !!. caribbeanae 0.01
!l . .e!!ot! 0.01 !. luden! 0.01

Table 4.17 cont.
Phytosei idae Tetranychidae
Ecologi~al No. Fields No. Speci.~ No. Fields S'"'1'l i ng 3 S'"'1'l ing 3 State Zon. Sa""led Identified /Species Species FreqJency Species FreqJency
C6rdoba SOL 181 18 10.2 l. limonicus 0.70 Q. esl:ruvi anJs 0.76 l. dentilis 0.15 !!. tanajoa 0.54 !. aerialis 0.13 Q. gOSSYD; i 0.34
l·~ 0.12 !!. caribbeanae 0.11 tI. anonyrrus 0.10 l. tunidls 0.03
l. canadensis 0.02 !t. mcgreSS!ri 0.01 ~. pla""; 0.01 l. cimabarinJs 0.01 l. tn.n:::atus 0.01
Magdalena SOL 33 11 3.0 l. l imonicus 0.81 ~. tanajoa 0.30
l· !tiBQ 0.12 Q. esl:ruvi 8rus 0.27 !!. s:aribbeanae 0.15 Q. AOSSYD;; 0.12 l. tunidus 0.06
Bol ¡var SOL 29 13 2.6 l. l imonicus 0.68 !!. caribbeanae 0.03
l· !!.iBQ 0.21 !t. tanajoa 0.31 l. dentil is 0.14 Q. gossyei i 0.24
l· .!:!!11!! 0.10 Q. peruvianJs 0.31 Si. helveolus 0.10

Teble 4.17 cont.
State
Cesar-
la Guajira
ECOlogi~.1
Zene
SOL
SDL,SAL
No. fíelds No. specie~
Sarrpled IdentifiOO
15 12
38 12
Phytosei idee
No. Fields ISpecies
1.3
3.1
Species
r. limonjeus ! . ttnonyt!!Js
a. chiapensis g. concof"dis
~. helveolus
ti·~ g. sibelius
!l. idaeu5
1. limonicus §.. amectens
§. he' m' os g. concordis
Tetranychidae
S_ling 3 FreqJency Spoeles
S_ling 3 FreqJency
O.SO Q. e!r!:C!lll'lUS 0.33 0.20 !!. caribbean!$it 0.20 0.13 Q. gosiypi i 0.20 0.13 !l. tanajoa 0.13 0.13 !!. 1nC9regori 0.07 0.13 !. t\!!!idus 0.07 o.n
0.55 !!. caribbeanae 0.71 0.45 !!. tana j 011 0.53 0.42 Q. ~~i Brus 0.37 0.24 -. Q. Aossvpi i 0.03 0.11 !. t\!!!ldus 0.03
1 Ecological ZOf"'IeS: Hl :::: htltlid lowland¡ SOL :: seasonalty dry lowland; SAL := semiarid lowland.
2 Phytoseiid ."ocie. fOU"ld in less than 10l: of flelds __ loo are not tisted.
3 S~ling frequeney is the proportion of fields conteinfng a given Spec::iH~

Table 4.18 Cassava tetranychid and ,:ilytosei id c~lexes in the Coloobian intervAndean zone.
Phytoseiídae .' retranyehidae
Eeologí1at No. Fieldo No. Specíe~ No. Fíeldo S,"",l íng 3 ·S,"",l íng 3 State Zene s,"",led Identified Ispecies Specie. Fr~ Species Frequeney
Valle HH 186 27 6.9 !~ ~ hnonicus 0.57 !l. tanajos 0.49
!. anorwtYUS 0.37 2. QS;ruv i arus 0.24
.É. concordi~ 0.30 I·~ 0.16
§. h!I!!!l21us 0.25 !!. mcgregori 0.05
Q. 8mec~ens 0.22 !!. el!!!!!! 0.01
!~ e!rsrinus 0.19 !. cinnebarirus 0.01 l. ar;po 0.17
Cauca HH 56 13 4.1 !. Limonicus 0.50 !l. tanajoa 0.45
~. cS!!lS2a1is 0.16 2- I2$rwi arus 0.21
H. anorwmJS 0.11 !!. IIICgresori 0.14
l. urticM 0.09 ! . el I'lrI8beri r&J$ 0.02
Huila HH 49 14 3.5 l. 1 imonicus 0.33 ti. mcaregorf 0.64
.s. ho 0.31 ., g. m!:l!:!anJS 0.27
!l. l!!l!la 0.24
l·~ 0.02
Toli ... HH 23 5 4.6 l. 1 i!!!!i!!i!ii!al 0.22 !!. tanajos 0.52
11· !!!lOfM!!Js 0.13 !l. !!CSregpri 0.22 Q. _uvia ...... 0.04
Eeologieal Zones: HH = hunid highland; HL • hunid lowland.
2 PI1ytoseiid _íes fOU'ld in les. th.., 10% of fí.ldo are not Usted.
3 S~ling frequency '$ the proportion of fjelds containing a given- species.

Table 4.19 Cassava tetrsnychid and phytoseiid complexes in Central Colombia.
Phytose; idae Tetranychidae
EcolOgi~al No. Fields No. spec, No. Fields S...,l in¡¡ 3 5...,1 in¡¡ 3 State Zone S.""lec Identifi ISpecies Species frequency Species frequency
Santander HHfHL 23 12 1.9 l. l imonicus 0.52 H. tanajoa 0.39 l. rapax 0.22 !!. caritBanae 0.30
g. h~I~2I!1t! 0.22 2. ~Cl.Ni arus 0.26 Q. Qossvpii 0.04
Meta Hl 93 7 13.3 !. llrncf)icus 0.24 !!. tanajoa 0.66 Q. ~rwiarus 0.11 !!. greoori 0.01 ~. planld 0.01 Q. gosSVDii 0.01
Ecologicat Zones: HH = humid highland; Hl = hunid lowland.
2 Phytoseiid species found in less than 1~ of fields sampled are not listed.
3 S~l ing frequency is the proportion of fields containing a given species.

Table 4.20 Relative abundance of Tetranychid species on cassava in Brazil and the northern Neotropics.
Country
Brazil
Cuba
Colombia
Ecuador
Mexico
Nicaragua Panama
Venezuela
No. Fields Sampled
49
43
838
132
27
2 17
43
Species Reported
M. tanajoa T. neocalidonicus M. caribbeanae T. tumidus T. urticae M. tanajoa Q. peruvianus Q. gossypii M. caribbeanae M. rncgregori T. urticae T. tumidus M. planki T. canadensis Q. mcgregori M. caribbeanae Q. peruvianus M. mcgregori M. tanajoa T. urticae Q. gossypii M. caribbeanae Q. mcgregori T. marianae T. rnexicanus T. turnidus Q. peruvianus T. turkestani M. caribbeanae M. caribbeanae M. tanajoa M. rncgregori
Q. peruvianu5 M. tanajoa M. caribbeanae Q. peruvianus T. tumidus Q. gossypii
samplinQl Frequency
0.53 0.06 0.09 0.27 0.02 0.49 0.37 0.11 0.08 0.07 0.05 0.02 0.01 0.01 0.01 0.49 0.27 0.10 0.02 0.01 0.01 0.44 0.19 0.07 0.07 0.04 0.04 0.04 0.50 0.76 0.18 0.12 Q.12 0.84 0.72 0.14 0.05 0.02
1 Sampling frequency i5 the proportion of fields containing a given species.
153

tetranychids, varies greatly, particularly in Colombia. CGM from Brazil vary little in setal length; however, the measurements fall within the range found in NSA. Cluster analysis showed that Brazilian material is confined to the short extreme of the range of morphological variability (Fig. 4.17). CGM with short setae--whether from NSA or Brazil-have higher esterase activities than mites with long setae, suggesting the existence of physiological differences between morphs.
CLUSTER SETAL LENGTlI
1 • --......... Very Shorf 2 o -~~ Slmrt J • - !1\lUlIll'(liH.e
4 ti LOIlIl 5 • - Very Lon¡:: .. • •
• • • • • . , • •
• •
29
D3 lS
21
[7 27
19 U2
Figure 4.17 Graphic representation of cluster analysis of lengths of dorsocentral setae, 01, 02 and 03 of M. tanajoa (Bondar) from six SA countries. Geographic membership by cluster: l-Colombia, Brazil, Paraguay, Panama, Venezuela; ¿colombia, Venezuela; 3-Colombia; 4-Colombia, Trinidad, Venezuela; 5-Colombia, Ecuador, Panama, Paraguay, Venezuela, Trinidad.
154

The phytoseiid natural enemy complex associated with CGM in NSA attains maximum species diversity in Colombia, where 40 species have been identified and 18 are common (CIAT 1989). In NSA, up to 12 phytoseiid species were found per cassava field, and 29% of the fields contained three or more species (Fig. 4.18). In Brazil 22 phytoseiid species were recorded on cassava (Moraes et al. 1991); but only two were common. Only 3% of the fields contained three or more species, 56% contained only one, and 28% were devoid of phytoseiids (Fig. 4.18). In quantative eva1uations of CGM population density in 486 cassava fields, intermediate to high levels of CGM were found in 23% of the Brazilian fields. Of the fields surveyed in NSA, 93% had low populations or were devoid of CGM (Fig. 4.19). Fig. 4.20, which is a geographical representation of the CGM incidence data, shows the greater prevalence of heavy infestations in Brazil.
CGM is a dry season pesto Rainfall is a direct mortality factor, and populations are rapid1y decimated at the onset of the rainy season. During the dry ssason, actively growing mite popu1ations are sustained only as long as soil moisture is adequate to support production of new cassava foliage (Yaninek et al. 1989). In Africa, where CGM is an introduced pest, seasonally dry areas (4-6 dry mo/yr) run the greatest risk of severe CGM infestations (Yaninek & Be llotti 1987). Of the Brazilian cassava fieIds sampled, 14% were in areas with 365-700 mm annual precipitation.
60
CJ 8rozil (n = 337) _ NSA (n - 1002)
45
-u ti íi E o
(/) JO " ." -¡¡ ti: ¡o¡
"
Lq ~ .- .-• o
o 2 J ,. No. Phytoaeííd .pp./F1eld
Figure 4.18 Phytoseiid species diversity in Colombia and Brazil.
155

-o .J!! o.. E o Ul
Ul -o 'ií ;¡:
lII!
50
0+----..1--4 o
CJ 8razil (n = 325) _ Colombia (n - 224)
um
No. CGM/leaf
Figure 4.19 CGM incidence in Colombia and Brazil.
i No. CGM I Leal
• > 25
Figure 4.20 Infestation foci of CGM in NSA and Brazil. Each point represents the mean no. of CGMjleaf I averaged over 4 and 2 cassava fields in NSA and Brazil, resp.
156

..... o ID
--J
"-:::?! t:I Ü
These areas are semiarid with more than 6 dry mo during the year. Surprisingly, the severest outbreaks of CGM were found in these, rather than in the seasonally dry areas of NE Brazil (Fig. 4.21). In NSA, intermediate to heavy infestations of CGM were not found in semiarid areas (Colombian Guajiran Peninsula, Coastal Venezuela, Coastal Ecuador); however, moderate to heavy infestations of a sibling species, ~ caribbeanae were frequently recorded in these areas.
100~----------------------------------------------------~
n = 56 ea
60
4tl n = 84
20
0-1-----365-700 701-1300 )1300
Mean Annual Precipitation (mm)
Figure 4.21 Effect of rainfall on mean CGM population levels in NE Brazil (Rainfall Zones: 365-700 mm/yr - semiarid; 701-1300 - seasonally dry; > 1300 - humid. n = no. cassava fields averaged to obtain a mean CGM population density-leaf for each rainfall zone); effect of rainfall on CGM density is significant (Kruskal-Wallis test statistic = 8.93 P = 0.01]. (Source: Moraes et al. 1991).
157

The largest, most effective complex of natural enemies of an herbviorous arthropod has often been found in its area of origino The diversity of Mononychellus spp. and their natural enemies in NSA suggests that this region is the area of origin of the genus Mononychellus and, therefore, of the CGM. The occurrence of only a single species of Mononychellus (CGM) on cassava in Brazil, which frequently reaches interroediate-to-high densities--together with the absence of the diverse complex of natural enemies associated with this species in NSA--suggests that CGM may have been introduced to Brazil. The morphological differentiation and low variability of Brazilian CGM compared to other neotropical populations suggest that the introduction is not recent and that the Brazilian population has remained relatively isolated.
The striking ability of Brazilian CGM to colonize semiarid areas may represent ecological adaptation to dry conditions. Alternatively, the success of the mite in the Brazilian semiarid zone may be related to the absence of competing species of other tetranychid mites, including sibling species such as N. caribbeanae, and¡or to the lack of effective predators that are themsel ves adapted to dry conditions. The morphological differentiation of Brazilian CGM, its related difference in esterase activity, and its adaptation to semiarid areas suggest that the population of COM in NE Brazil may be a distinct strain or biotype.
The possibility that CGN is an introduced pest suggests that classical biological control could contribute to its management; however, the semiarid areas may require the introduction of strains that have been genetically manipulated in order to improve their tolerance to low RHs. Under Brazilian conditions, classical biological control should forro part of an integrated pest management strategy, which would also include augmentation and conservation of natural enemies, appropriate cultural practices, and the deployment of resistant varieties.
The NSA origin of CGN implies that natural enemies from this region should receive higher priority for introduction and release in Africa than has been the case recently. This does not necessarily imply, however, that the priority given to Brazilian natural enemies should be lowered. As discussed in a subsequent section, the behavior of phytoseiid species¡strains associated with cassava cannot always be predicted reliably from predator/prey association patterns in the field. Although 1:.. limonicus and N. idaeus do not appear to be effective in NE Brazil( it is conceivable that Brazilian strains of these species could be more effective against African than Brazilian CGM. It is therefore recommended that the introduction, release and evaluation of Brazilian strains of these species in Africa be continued.
158
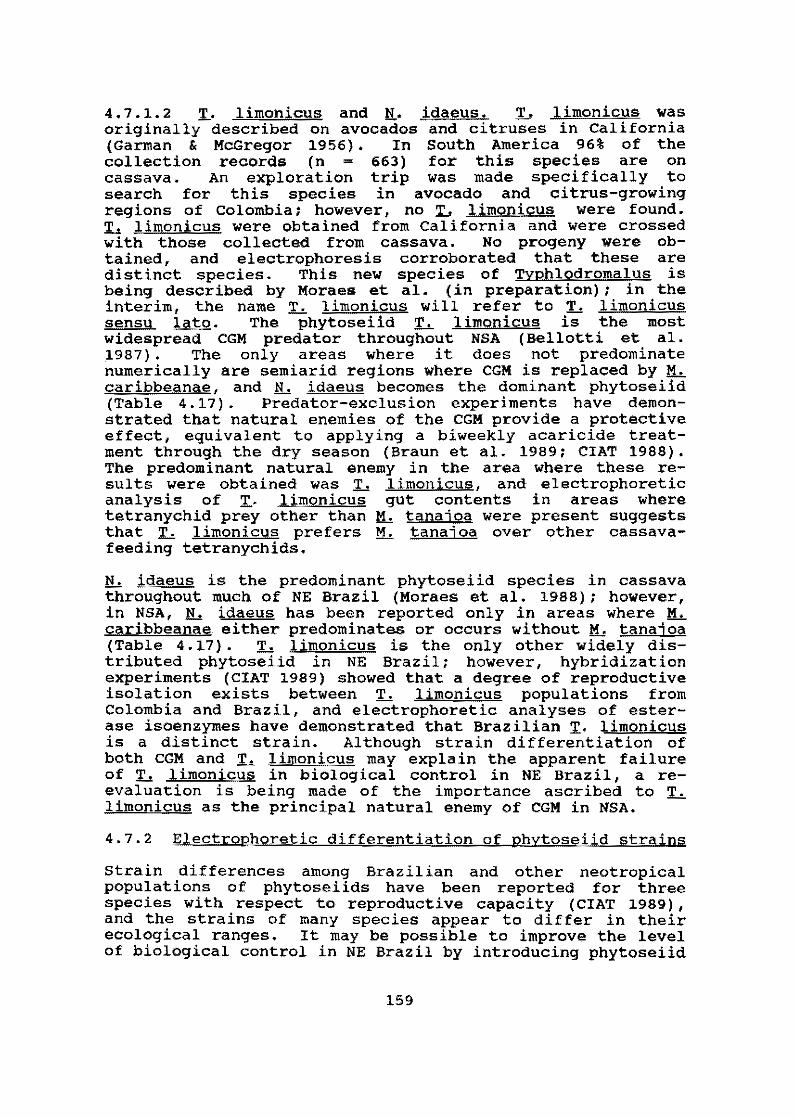
4.7.1.2 ~. limonicus and K. idaeus. T. limonicus was originally described on avocados and citruses in California (Garman & McGregor 1956). In South America 96% of the collection records (n = 663) for this species are on cassava. An explorat~on trip was made specifically to search for this spec~es in avocado and citrus-growing regions of Colombial however, no T. limonicus were found. ~ limonicus were obtained from California and were crossed with those collected from cassava. No progeny were obtained, and electrophoresis corroborated that these are distinct species. This new species of Typhlodromalus is being described by Moraes et al. (in preparation); in the interim, the name :L. limonicus will refer to T. limonicus sensu lato. The phytoseiid ~ limoniqus is the most widespread CGM predator throughout NSA (Bellotti et al. 1987). The only areas where it does not predominate numerically are semiarid regions where CGM is replaced by M. caribbeanae, and N. idaeus becomes the dominant phytoseiid (Table 4.17). Predator-exclusion experiments ha ve demonstrated that natural enemies of the CGM provide a protective effect, equivalent to applying a biweekly acaricide treatment through the dry season (Braun et al. 1989; CIAT 1988). The predominant natural enemy in the area where these results were obtained was T. limoniqus, and electrophoretic analysis of ~. limonicus gut contents in areas where tetranychid prey other than M. tana;oa were present suggests that ~ limonicus prefers M. tana;oa over other cassavafeeding tetranychids.
N. idaeus is the predoroinant phytoseiid species in cassava throughout much of NE Brazil (Moraes et al. 1988); however, in NSA, ~ idaeus has been reported only in areas where M. qaribbeanae either predominates or occurs without M. tanajoa (Table 4.17). T. limonicus is the only other widely distributed phytoseiid in NE Brazil; however, hybridization experiments (CIAT 1989) showed that a degree of reproductive isolation exists between T. limonicus populations froro Colombia and Brazil, and electrophoretic analyses of esterase isoenzymes have demonstrated that Brazilian T. limonicus is a distinct strain. Al though strain differentiation of both CGM and :L. limonicus may explain the apparent failure of ~ limonicus in biological control in NE Brazil, a reevaluation is being made of the importance ascribed to :L. limonicus as the principal natural enemy of CGM in NSA.
4.7.2 Electrophoretic differentiation of phytoseiid strains
strain differences among Brazilian and other neotropical populations of phytoseiids have been reported for three species with respect to reproductive capacity (CIAT 1989), and the strains of many species appear to differ in their ecological ranges. It may be possible to improve the level of biological control in NE Brazil by introducing phytoseiid
159

strains with higher consumption or oviposition rates, or better adaptation to ecological conditions. To determine whether introduced strains establish, it must be possible to distinguish them from their local counterparts. Morphological differentiation of strains is not possible: however, electrophoresis has been used successfully.
~ limonicus was used to study the feasibility of electrophoretic differentiation of strains using polyacrylamide gels. After testing several isoenzymes, the esterase system was chosen for its superior polymorphormism. Five strains of ~ límonicus have been identified. The first strain encompasses eight populations from the North Coast of Colombia. Two strains were identified from the state of Valle (Colombia) • T. limonicus from Cruz das Almas, Brazil and Puerto España, Trinidad comprises a fourth strain: and a Venezuelan population collected in Carora, a fifth. statistical analyses of esterase banding patterns are in progress to elucidate the phylogenetic relationships among strains.
4.7.3 Geographical associations among cassava mites
The tetranychid and phytoseiid complexes on cassava reach their maximum species richness in Colombia; however, different species associations occur in different cassava-growing areas. For phytoseiids this phenomenon holds for both common and rare species (Table 4.21). Phytoseiid and tetranychid species diversity is positive1y correlated (n = 14, r = 0.65; P = 0.01).
On the North Coast, the most frequently reported species was T. limonicus (Table 4.17). The island of San Andrés was the only area sampled where T. limonicus has not been reported, and where ~ caribbeanae occurs in the absence of N. idaeus. Several of the phytoseiids species reported on San Andrés (Amblyseius largoensis, Proprioseiopsis neotropicus, Galendrominus alveolaris) are extremely rare in other regions of Colombia. This site could be appropriate for experimental releases of phytoseiids. Although a number of species such as T. limonicus, ~ anonyrnus, Galendromus annectens, G. helveolus (Tables 4.17-4.18) are geographically ubiquitous, the distribution of others is restricted. ~ rapax, Typhlodromips dentilis and ~ bellottii occur only on the North Coast. Comparison of an indicator of the profitability of exploration in a given region (no. fields sampled per species encountered, Tables 4.17-4.19) suggests that San Andrés, Atlántico, and Cesar may be underexplored. Magdalena, Bolívar and Guajira should also receive some additional attention.
160

Table 4.21 Rare cassava phytoseiids in Colombia.
Species
A. ehiapensis A. herbicolus -f. macropilis H. californicus -f. mexicanus Typhlodromips n. sp. -f. pursglovei :ro tenuiseutus )1;. h.Q :ro neotunus )1;. naindaimei ~. transvaalensis A. aerialis J:;. alatus :ro rapax :ro mangleae :ro tropica J:;. sibelius -f. ealiensis -f. neotropieus ];.. zuluagai ~. sp. near ovalis :ro aripo H. anonymus liZ. helveolus liZ. anneetens -f. cannaensis ~. eoncordis H. idaeus
North Coast Inter-Andean
C2 X X X X C X X X X X NF X NF X X X C X X X X X X e x e X e X
NF X NF X e X
NF X e x C X e X C e C e C C C C C X C e e X
Central
X NF NF NF NF NF NF NF
X NF NF NF
X X
NF NF NF
X NF
X X X X X X X X X X
1 North Coast = the states of San Andrés, Atlántico, Suere,
2
Córdoba, Magdalena, Bolívar, Cesar and Guajira: InterAndean = the states of Valle, Cauea, Huila and Tolima: Central = the states of Meta and Santander.
X = Found in less than 10% of fields sampled; NF = Not found; C = Found in more than 10% of fields sampled.
161

4.7.4 Phytoseiid diet analysis
4.7.4.1 Acarine food types. In NSA a number of species of tetranychid mites other than CGM are common in cassava and may occur together on the same plant, even on the same leaf. The most important of these species in terms of numerical abundance and widespread geographical distribution are H... caribbeanae, Oligonychus gossyppi, O. peruvianus and Tetranychus urticae. T. urticae and O. gossyppi also occur on cassava in Africa. In order to identify species that might prefer prey species other than CGM, survival and reproductive rates of 11 species and strains of phytoseiids were compared for CGM and the aforementioned tetranychid prey. The possible importance of inter- and intraspecific cannibalism as a survival mechanism during periods of prey shortage was also evaluated.
AIl species of phytoseiids tested were able to compl~te development from egg to adult on all the prey speC1es tested; however, survival was strongly affected by prey type (Table 4.22) • Neoseiulus spp. had high egg-to-adult survival rates on all prey types except O. peruyianus. The Typhlodromalus spp. had high survival rates with M.. caribhe ana e and M. tanajoa as prey with significant differences hetween strains (ANOVA, P .s 0.05). Surviva1 rates were generally low on the other prey species.
Because of low survivorship from egg to adu1t, reproduction with O. peruvianus as prey was observed on1y in N. idaeus (Brazilian strain) (Table 4.23). Fewer eggs were 1aid per female with O. peruvianus as prey than with any of the other species tested. The capacity of N. idaeus from Brazi1 to survive and reproduce with O. peruvianus as prey was unexpected since ~ peruvianus does not occur in Brazil. Survival of Typhlodromalus spp. from egg to adult was low when O. gossyppi was the prey (Table 4.22). T. rapax and ~ tenuiscutus (Colombian strain) were the only species that reproduced when fed O. 90ssyppi (Table 4.23).
None of the T. limonicus strains tested achieved oviposition when T. urticae was the prey although survival from egg-toadult was as high as 31.2% in the Guajiran strain. Reproduction was observed only when ~ caribbeanae or M. tanaioa were provided, and there was a significant effect of strain on fecundity (P $ 0.001). When fed M. caribbeanae, fecundity was similar or superior to when M.. tanajoa was the prey for all T. limonicus strains except a population collected at CIAT (Table 4.23). Two strains (Guajira and Trinidad) come from areas where M. caribbeanae is the predominant species. The third strain, which had a higher oviposition rate when M. caribbeanae was the prey, was collected from an area where on1y M. tanajoa occurs (Pivijay).
162

Table 4.22 Effect of prey on su:rvival from egg to adult of cassava-inhabitin:.J ¡;ilytoseiid mitas.
% SUrvival2
Prey Species Fhytoseiid
Strain1 Spp. 1. urticae M. tanajoa M. cari.bbeanae Q. peruyianus Q. qossvoii
N. califomicus roL, Bogotá 98.0 99.0 94.0 37.0 100.0 N. anony:mus roL, ClAT 93.7 93.0 86.0 61.0 72.0 N. idaeus roL, Fonseca 90.7 86.7 91.8 35.7 73.0 N. idaeus SRA, Pet:rolina 93.0 99.0 89.0 70.1 95.0 tl. idaeus VEN, C'arora 86.0 99.0 89.0 42.8 81.0 1'. ~ roL, I.as Oórdobas 72.0 50.0 83.0 39.8 27.0 l' . limonicus COL, Pivijay 11.3 96.0 88.0 38.0 12.0 1'. limolJi= COL, CIAT 6.0 79.0 64.6 36.0 16.0 1'. limon~= COL, I.as Flores 31.2 83.7 88.0 61.0 8.0 1'. limoni= TRI, ruerto España 10.0 73.0 68.0 14.0 20.0 1'. tenuiscutus EaJ, Quevedo 32.0 90.0 72.0 :21.8 1.0 1'. tenuiscutus COL, I.as Oórdobas 10.0 81.0 84.7 36.7 18.0
1 COL = Colombia; SRA = Brazil; VEN = Venezuela; TRI = Trinidad; EaJ = Ecuador.
2 '!he effect of prey species on % su:rvival was significant (il test of inc'Ieperrlenoe; P :'>.001) for all ¡;ilytoseiid species, 50 :'> n :'> 202.

Table 4.23 Effect of prey species on fecundity of cassava-inhabiting phytoseiid mites.
Ibytoseiid Spp.
B. califomicus N· anonymus N. idaeus N. idaeus N. idaeus :ro ~ :ro limonicus 1'. lirocmicus :ro limonicus :ro limonicus :r. tenuiscutus 1'. tenuiscutus
strain1
COL, Bogota COL, CIAT COL, Fonseca ERA, Petrolina VEN, carora COL, ras Córdobas COL, Pivijay COL, CIAT COL, ras Flores TRI, Puerto España E<lJ, Quevedo COL, ras Córdobas
:ro urticae
43.7 a 34.4 abe 32.3 abe 28.5 bo:i 23.4 cdefgh 12.0 jklm 0.0 0.0 0.0 0.0 2.5 op 0.0
Mean No. of Eggs/Female2
!'rey 8peCies
j1. tanajoa M. caríbbeanae Q. oeruvianus
34/8 ah 23.4 bcrle 0.0 14.5 ghijkl 27.7 bo:ief 0.0 13.8 lrnn 12.5 mn 0.0 22.2 crlefg 19.9 defghi 3.6 op 22.4 crlefgh 16.2 jklm 0.0 6.0 o 19.4 fghijk 0.0
10.3 n 15.8 ghijk 0.0 14.2 ijklm 3.5 P 0.0 15.5 hijkl 13.1 lrnn 0.0 12.7 klmn 18.2 efghij 0.0 32.0 abe 16.1 ghij 0.0 14.6 ijklm 18.6 efghi 0.0
1 COL = Colombia; BRA = Brazil; VEN = Venezuela; TRI - Trinidad; E<lJ - Ecuador.
Q. QOSSVPii
15/1 ijklm 16.9 hijkl 10.2 n 17.7 efghij 20.0 defghi 1.3q 0.0 0.0 0.0 0.0 0.0 0.6 qr
2 Predator/prey combinations follawed by the sane letter are not significantly different (fl1RT; P = 0.05). 7 ::; n ::; 100.

T. tenuiscutus, collected from Quevedo, Ecuador, occurs in an area where only M. caribbeanae has been reported; however, this species laid significantly more eggs per female when M. tana;oa was the prey (Table 4.23); whereas oviposition by T. tenuiscutus from Las Córdobas (Colombia) was similar on the two prey types. The foregoing· data demonstrate that behavior of species and strains with different prey types can not be predicted from predatorjprey association patterns in the field and that strains react differently to the same prey type.
oviposition was highest for all Neoseiulus spp. tested when T. urticae was the prey. If optimization of fecundity is a significant factor in the evolution of prey preference, then the Neoseiulus spp. may be less likely te succeed as biological control agents of M. tanajoa in Africa than Typhlodromalus spp., particularly as more profitable prey types such as T. urticae and O. qossyppi inhabit cassava in Africa.
The superior fecundity of Neoseiulus spp. as predators of ~ urticae, O. peruvianus and O. gossyppi is probably related to their ability to move and hunt prey in webbing. Of the three web-forming species in the assay, o. peruvianus forms the densest web. Although egg-to-adult survival was as high as 61%, N. idaeus (venezuela), N. californicus and ~ anonvmus were not able to reproduce when O. peruvianus was the prey, suggesting that adult females were not able to consume enough to provide for egg production.
The Typhlodromalus spp. tested performed poorly when webforming species were the prey, with the exception of ~ rapax on ~ urticae. The webbing of ~ urticae is the least dense of the three web-forming species. The ability of ~ rapax to oviposit when T. urticae was the prey suggests that this species has some ability to forage in tetranychid webbing.
4.7.4.2 Nonacarine foad types. The ability of T. limonicus not only to survive periods of low CGM density but also to reach relatively high population densities when CGM is rare has raised doubts as to the capacity of this predator for regulating CGM populations. In an example of this phenomenon from the untreated plots of a predator exclusion experiment, T. limonicus density increases were correlated with increases in CGM numbers; however, a second peak in ~ limonicus numbers occurred and was sustained over a long period of low CGM density (Fig. 4.16). These data suggest that doubts about the effectiveness of ~ limonicus and questions concerning the mode of survival of this species in the absence of prey are related issues.
165

In an assay of L limonicus survival and reproduction on nonacarine foods, mycelia and conidia of the fungus Oidium manihotis, first and second instars of the thrips Frankliniella williamsi, cassava exudate, and pollen of the castor bean Ricinus communis were compared with diets of T. urticae and M. tanajoa (all stages). Egg-to-adult survival occurred on all diets tested, being highest for the H.... tana; oa diet and lowest for the L urticae diet (Table 4.24). Food type had a significant effect on egg-to-adult development time (ANOVA, P $ 0.05). oviposition occurred on all food types, but was extremely limited when O. manihotis, pollen, T. urticae or cassava exudate were supplied (Table 4.24). Furthermore, it should be noted that the oviposition studies employed virgin adult females collected from colonies. Less oviposition would be expected froID survivors of the development portion of the study.
4.7.4.3 Cannibalism. Defined as consumption of phytoseiids of the same or other species, cannibalisID was also examined as a possible survival mechanism during periods of prey scarcity. Well-fed and starved (24 h) female T. limonicus and ~ anonymus were presented with eggs of other females of
Table 4.24 Effect of acarine and nonacarine foods on eggto-adult survival and development time, and on fecundity of T. limonicus.
Food Type % 1
Survival Developme2t
Time (h) No. Egg21
Female
I· urticae 18 150 a 2.0 b M. tanajoa 86 130 c 25.4 a E. willll,lmsi 44 128 c 22.9 a B· communis 76 132 bc 2.6 b Q. manihotis 56 138 b 2.6 b Cassava exudate 56 144 a 2.0 b
1 Effect of food type on % survival was significant (X2 test of independence; P $ O .01). % survival and development time: n = 100 (I. urticae, M. tanajoa, Q. manihotjs); n = 50 (E. williamsi, B. communis, exudate). No. eggsl female: n = 50 (T. urticae, M. tana;oa, Q. manihotis): 30 $ n $ 39 (E. williamsi, B. communis, exudate).
2 Means followed by different letters are signifcantly different (DMRT: P = 0.05).
166

the same species and of several others. ~ anonyrnus females were also presented with their own eggs.
More cannibalism occurred in T. limonicus than in ~ anonyrnus (CMH statistic; P ::; 0.001). Cannibalism on aH prey types occurred, regardless of hunger state in ~ limonicus, and well-fed females cons21med more eggs of 1:... cannaensis than of other species (X; P ::; 0.001) (Table 4.25); however, after 48 h no significant differences in consumption were found between prey types. With ~ anonymus, however, well-fed predators did not begin to consume their own eggs or eggs of other ~ anonyrnus until 48 h had passed (Table 4.26). Less cons~ption of conspecific than eggs of other species occurred (X ; P ::; 0.001). These data suggest that ~ anonyrnus is cannibalistic under conditions of food shortage; whereas T. limonicus will consume phytoseiid eggs regardless of hunger state. This may explain why it, and not other species of phytoseiids, is frequently found under conditions of low CGM density.
Although their own progeny were not offerred as food to ~. limonicus females, these were observed to consume their own eggs. Fewer eggs were oviposited by starved than by wellfed T •. limonicus, suggesting that oviposition depended on nutrients acquired prior to the experimento
Table 4.25 Effect of ¡;ilytoseiid prey species en eg:¡ cannibalism in T. 1imonicus.
% Rlytoseiid Fqgs Consumed1
T· limonicus F. cannaensis P. persimilis
Hurger state 24 h 48 h 24 h 48 h 24 h 48 h
Well-fed 36.0 94.0 58.3 90.0 30.0 50.0
starved 78.0 82.0 42.0 60.0 60.0 86.0
1 10-12 T. limonicus females were used par test; eaeh was supplied with 5 eg:¡s. Observations were made after 24 and 48 h (~ 24 h effects of hunger state and prey type were significant, ; P ::; 0.001; after 48 h, effect of prey type was significant, ¡::; P 0.001).
167

Table 4.26 Effect of phytoseiid prey species on egg cannibalism in N. anonyrnus.
% Phytoseiid Eggs consumedl
Progeny N. anonymus ,E.. cannaensis ,E.. persimilis 1:. limonicus
Hunger state 24 h 48 h 24 h 48 h 24 h 48 h 24h 48h 24h 48h
1
Well-fed 0.0 9.7 0.0 8.0 0.0 16.0 36.0 70.0 16.0 42.0
starved 44.0 70.0 32. O 64.0 44.0 66.0
10 N. anonyrnus females were used per test; each was supplied with 5 eggs. When eggs were the progeny of test females, 31 eggs were available to 10 females. Observations were made a2ter 24 and 48 h (After 24 and 48 h, effect of hunger state and prey type were significant, X ; P ~ 0.001).

Neither cannibalism nor exudate, pollen, or Q... manihotis permit ~ limonicus oviposition levels comparable to that of acarine prey. Although the nonacarine foods tested may contribute to survival during periods of prey scarcity, they cannot account for the population levels of ~ limonicus observed in the field during periods of low CGM density (Fig. 4.16). Other ~ limonicus diet components are the primary focus of research by Bakker & Klein (1989).
4.7.5 Hypotheses about T. limonicus
A number of different lines of evidence (predator exclusion studies, feeding assays, geographical data, electrophoretic analysis of gut contents) suggest that L limonicus is an effective predator and perhaps the key natural enemy of CGM. This conclusion appears to be contradicted by the observation that CGM is not under effective biological control in Brazil even though ~ limonicus is widespread and numerically abundant. The strain differentiation of both CGM and L limonicus in Brazil could account for this discrepancy. When confronted with the data supporting an important role for T. limonicus in biological control of CGM and with field data showing peak populations of T. limonicus in the virtual absence of CGM (Fig. 4.16), two hypotheses emerge: One possibility is that T. limonicus is an effective predator of CGM, but equally successful on nonacarine foods under low CGM densities or in its absence. An alternative hypothesis is that although T. limonicus appears to be regulating CGM, another agentes) is responsible. Although sufficient data are not yet available for deciding between these hypotheses, a possible alternative biological control agent has been identi fied •
4.7.6 Alternative biological control agents
The predator exclusion experiments which demonstrated an impact of T. limonicus on CGM (Braun et aL 1989) did not take into account the possiblity of CGM pathogens. Sub sequently, Neozygites sp. (Entomopthorales: Entomopthoraceae) were reported attacking CGM in Brazil (Delalibera et al. 1990) and Colombia (Alvarez et al. 1990).
Although attempts to culture Neogygites sp. in artificial media have been unsuccessful, a number of research advances can nevertheless be reported. Neozygites sp. is pathogenic to all mobile stages of CGM. No evidence was found for pathogenicity of this fungus to phytoseiids; however, these may aid in the dissemination of the anadhesive conidia responsible for propagation of Neozygites sp. Conidiogenesis does not occur when the RH is less than 65%; however, the formation of anadhesive conidia is inhibited by high RH. Epizootics of Neozygites sp. have been detected on the North Coast of Colombia; however, in order to evaluate
169

the potential importance of this fungus in the biological control of CGM, field impact assessments which can separate the contribution of phytoseiids in requlation of CGM from that of Neogygites sp. are needed. The importance of rare species of phytoseiids (Table 4.21) also requires more research attention.
4.8 References
Alvarez, J.M. 1990. Estudios de patogenicidad de un hongo asociado a Mononychellus tanaíoa (Sondar) y Tetranychus urticae (Koch) ácaros plaga de la yuca. Unpublished undergraduate thesis. Universidad Nacional, Facultad de Agronomía, Bogotá, Colombia.
Bakker, F.M. & M.E. Klein. 1989. The significance of cassava exudate for predacious mites. Proceedings 7th International Symposium on Insect-Plant relationships; Budapest Hungary. May 1989.
Bellotti, A.C.; N.C. Mesa; M.S. Serrano; J.M. Guerrero & C.J. Herrera. 1987. Taxonomic inventory and survey activity for natural enemies of Cassava Green Mite in the Americas. Insect Science and its Application 8:845-849.
Braun A.R.; J.M. Guerrero; A.C. Bellotti & L.T. Wilson. 1989. Effect of predator exclusion on cassava infested with tetranychid mites (Acari:Tetranychidae). Environmental Entomology 18:711-714.
CIAT. 1988. Annual Report. Centro Internacional de Agricultura Tropical, Cali. Colombia.
--------o 1989. Annual Report. Centro Internacional de Agricultura Tropical, Cali. Colombia.
Delalibera, l.; G. de Moraes; D. Sosa & J.A. Alencar. 1990. Distribution of Neozygites sp. pathogens of Cassava Green Mites in northeastern Brazil. (submitted)
Garman, P. & E.A McGregor. 1956. Four new predaceous mites (Acarina: Phytoseiidae). Bulletin oi the Society of the California Academy of Science 55:7-13.
Guerrero, J.M.; C.H.W. Flechtmann; M.C. Duque; A.R. Braun & A.C. Bellotti. 1991. An hypothesis on the evolution of Mononychellus species on Manihot esculenta in the Neotropics. (in preparation)
170

Moraes, G. de; J.A. de Alencar; F.W. Neto « S.M.R. Mergulhao. 1988. Exploration for natural enemies of Cassava Green Mite in Brazil. Proceedings 8th Symposium Internationai Society for Tropical Root Crops. Bangkok, Thailand. pp. 351-353.
--------¡ A.R. Braun; J.S. Yaninek « J.A. de Alencar. 1991. Distribution and abundance of phytoseiid predators of the Cassava Green Mite in Brazil. Proceedings 8th Internationa1 Congress of Acarology. Ceske Budejovice, Czechoslovakia. (in press)
Yaninek, J.S. « A.C. Sellotti. 1987. Exploration for natural enemies of Cassava Green Mite based on agrometeorolocal criteria in Rijks, D. « Mathys, G. (Eds.) Proceedings of the Seminar on Agrometeorology and Crop Protection in the Lowland Humid and Subhumid Tropics. Cotonou, Senin 7-11 July, pp. 69-75.
« H.R. Herren. 1988. Introduction and spread of the cassava green mite, Mononychellus tanaioa (Bondar) (Acari: Tetranychidae), an exotic pest in Africa and the search far appropriate control methods: a review. Bulletin of Entomological Research 78:1-13.
--------; H.R. Herren & A.P. Gutierrez. 1989. Dynamics of Mononychellus tanajoa (Acari: Tetranychidae) in Africa: seasonal factors affecting phenology and abundance. Environmental EntomolQgy 18: 625-632.
171

5. CASSAVA PHYSIDLQGY ANO CRDP MANAGEMENT
5.1 Physiology, Soil Fertility and Erosion Research
5. l. 1 Performance of cassava under prolonged mid-season water stress
Previous research at CIAT (Annual Reports 1982-89) has shown that cassava can tolerate long periods of water shortage without large reductions in RY. Varietal differences in response to water stress were detected and found to be related to the plant's vegetative vigor, particularly its LA! throughout the growth cycle (Fig. 5.1). Vigorous varieties such as M Mex 59 usually yield more under midseason stress than less vigorous ones such as M Col 22. which yield better under wet condi tions. However, yield stability requires selecting varieties that yield well under both wet and stress conditions. Varieties such as CM 507-37, which maintain relatively higher than optimal LAI under wet conditions, were found to produce well under both wet and stress conditions. This performance was found to be associated with better leaf retention, a higher leaf area ratio (partitioning DM between leaf and stem), and a more extensive fine root system.
Because most cassava varieties show increased HCN content under stress and become less suitable for human consumption in fresh form, research was continued to find out whether some genotypes can maintain low levels of HCN under stress. Dnly a few clones tended to keep their HCN at reasonably low levels (CIAT Annual Report 1989). These clones were grown for the third year at the Quilichao station to determine, beside yield performance, some physiological parameters related to photosynthesic efficiency as affected by prolonged drought. The clones were grown in the field drainage lysimeter¡ and commencing ~o days after planting, half the experimental area (~ 2000 m ) was subjected to three months' water stress by covering the soil surface with white plastic sheeting. The second half of the experimental area received natural precipitation as well as supplementary irrigation in periods with rainfall less than the potential evapotranspiration of that station (~ 4.4 mm/day). Data were collected on leaf water potential (indicator of stress), canopy light interception (indicator of leaf area) and leaf gas exchanges (indicators of leaf photosynthetic capacity) during the entire stress periodo These data are illustrated by Figures 5.2-5.9.
Predawn leaf water potentials (Fig. 5. 2a) were found to remain stable around -5 bars throughout the 3-mo stress period for all four genotypes, with virtually no differences between the stressed and unstressed crops. The morning leaf water potential remained unaffected by stress during the
173

! 100 o • 6 o ,..,
o ., '" 80 c:
.~ • f.¡
60 GJ
! § .~
40
i 20 N
0.5 1.0 1.5 2.0 2.5 3.0 3.5 4.0 4.5
Growth Cycle Avg LAI
Figure 5.1 DMY as function of mean LAI under nonstress and mid-season water stress conditions for 4 varieties with different vigor: (1) M Col 22; (2) M Mex 59 , maximum yield 11.2 t/ha for M Col 22 over 306 days, 1980 season; (3) M Col 1684; (4) CM 507-37, maximum yield 19 t/ha for CM 507-37 over 345 days; 1984 season; (5) M Col 1684; (6) CM 507-37, maximum yield 18.5 t/ha for CM 507-37 over 364 days; 1987 season. Arrows indicate changes from nonstress (closed symbols) to stress (open symb01s).
first half of the stress period; whereas in the second half of the stress periad, it showed significant reduction (Fig. 5.2b). The mid-day leaf water potential (Fig. 5.2c) was 1 to 2 bars less in the stressed crops, except for clone CM 1335-4. The values of mid-day leaf water potential oscillated between -8 to -15 bars for both stressed and unstressed crops, depending on measurement dates. These values, which are strikingly high compared to the much 10wer values usually encountered for other field crops under stress, indicate the abi1ity of cassava to regulate its stomata, preventing water loss. This characteristic is of a paramount importance for the tolerance of cassava to prolonged drought. Such a "stress-avoidance mechanism"
174

Figure 5.2
6 a. rn.
~ ...... ~¡Rl5S .~ ...• c:m¡~"l
" ••. <> SrRns I • -. CCtlT~Ol.
, 1" • Q ~mr~$
II/--;:~ '''912-1 ,
.- Q SlIIrS$ ·-·~II1:J...-
.-, •• " Sl'fIt1;S ,
.~. t~JlW!. :
10 o. m.
2 p. m.
." " DAYS ArTER PL.ANTINC '"
.- _-o STRess
.-. CilrIflI(h •
~- ~" n"CM .-. {Q'IIPQ,
9· ••• S"t,s'S .-.;;oar~
'"
Leaf water potential of 4 eassava clones as affected by prolonged mid-season water stress at (a) predawn, (b) in the morning and (e) at mid-day¡ bars indicate SE; data points are means of 8 leaves.
175

underlies the crop's ability to endure months of little or no rainfall in seasonally dry and semiarid regions. Coupled with this mechanism is the ability of the cassava crop to reduce levels of light interception dramatically--a factor of great importance in water loss--through reduction in its leaf canopy under stress (Fig. 5.3). Although reduction in leaf area would lead to water conservation, it would also lead to reduced total biomass and RY. Nevertheless, the cassava crop can recover rapidly, once released from stress, by forming a whole new leaf canopy that can be effective in light interception and hence in compensating for yield losses during stress (Fig. 5.3).
0--0-0
o/ 0-
,
CM 489-1
/. ------.--... '--0/
0,
, 0,
, " /
'" CM 922-2
, ,o o'
.0
IU:COVDn
o· --o STRESS .-. CONTROL
0- _. o STRESS .-. CONTROL
0,
CM 1335-4
,
0···0 STRESS . o-o CONTROL :
100.------------------~
60 0, ,
40 \ \
20
o Cí.l213S-2
95 14S
o
0- -- o STRESS .-. CONTROL
DA YS AFTER PLANTING LYSIMETER 89
Figure 5.3 Light interception of 4 cassava clones as affected by prolonged mid-season water stress.
176

Cassava leaves also remain fairly active during the prolonged water stress (Figs. 5.4-5.9). The stressed leaves are capable of maintaining photosynthetic rates around 40-60% of the nonstressed leaves during the entire stress period of 3 months. Upon recovery from stress, the old leaves can approach the efficiency of the nonstressed leaves. Furthermore, the new leaves of the previously stressed crop showed even higher photosynthetic rates than those of the nonstressed crop (F igs. 5.4 & 5. 5) • This characteristic is associated with both higher mesophy11 conductance (more active enzyme systems) (Fig. 5.6) and higher stomatal conductance (Fiqs. 5.7 & 5.8), hence more CO supp1y. The instantaneous leaf water-use efficlency (c62 uptake/H20 loss) of the new leaves was hlgher than that of ~he nonstr~ssed crop (Fig. 5.9). Durinq stress the plant closes its stomata partially, thus restrictinq transpiration [Flgs. 5.7 & 5.8). Although the partial closure of stomata also restricts CO2 supply to the leaf (Fiq. 5.5), it leads to a stable leaf water potential (Fig. 5.2), which partly explains the ability of cassava leaves to remain photosynthetically active during stress (Fig. 5.4).
There are apparent genotypic dlfferences in stress tolerance as indicated by the magnitude of reduction in photosynthesiso Clone CM 489-1, which appears to maintain hiqher photosynthesis during the entire stress' period than other clones, is known to have high yield potentlal under both 1010 and adequate soll P and ls also capable of forming large numbers of storage roots, hence greater sink capacity (see section 5.2).
Yield, top and total biomass, Hl and percent starch in storage roots at final harvest (11 mo after planting) are presented in Table 5.1. Across all varieties, reductions due to water stress were 10% in dry roots, 46% in top growth and 21% In total biomass. On the other hand, water stress lncreased Hl by 16% and starch content by 7%. In general the greatest reduction in biomass occurred in the top portion (stems + leaves); the least, in the roots. This resulted in better partitioning of assimilates toward the storage root as indicated by the improved Hl and starch content (fresh wt basis). These data suggest that prolonged mid-season water deficit does not seriously limi t cassava productivity and clearly confirm that cassava is a highly productive crop where a long dry sea son occurs.
Genotypic differences in response to water stress also existo CM 489-1 produced the highest yields under both wet (19.3 t DMY/ha) and stress (18.5 t DMYjha) conditions. This clone also maintained the highest leaf photosynthetic rates during the entire stress period (Fig. 5.4), suggesting that high photosynthetic capacity during stress cou1d be used as a selection criterion for high yields. Previous findings
177

STRESS PHASE ANO R[COy~RY Ol.O LEAVES
CI.I 922-2
CI.I 1335-4
1- -. ,--2 1 - ""'o-
1 a I RECOVE,IN
0--·-0 STRESS .-. CONTROL
"'o- _.- 2 . .. I f!(COVERY
O~~-~_-~_-_~ ____ ~ N IHI171.1.lml61 lnlUI9'2~
LYSIMETER 89
Ció 489-1
el\! 1335-4
0-· o STR'SS o-o CONTROL
o· ---o STRESS 0-. CONTROL
30r----------------~
20
lO
0·--0 STRESS CM 2136-2 .-. CONTROL
O~~~~~--~--~--~~ 200 210 210 230 2.0 250 260
Figure 5.4 Leaf photosynthetic rates of 4 cassava clones as affected by prolonged mid-season water stress.
178

STRESS PI-!ASE AND RECOYERY. OlD lEAVES C~ .89-1
CM 922-2
0-"---0 STRESS .-. CONTROL
o~--_··o STRESS .-. CONTROL
0-'-0 STRESS 0-. CONTROL
300r------------------~
2~O
200
C~ 2135-2. 0"--0 STRESS .-. CONTROL
IS0+---~~--~--r_~--__ --,_--__ ~--~ 9S 106 117 128 139 ISO 161 172 183 194 205
LYSIMETER 89
RECDVERV NEW u:AVES
Ct.!'S9-1
Ci.4 922-2
CM 1335-4
o~,,_··o STRESS .-. CONTROL
Q. ·--0 STRESS .-. CONTROL
0"·0 STRESS .-. CONTROL
~o.-------------------------------~
250
200 0----··0 STRESS .-. CONTROL
Ci.4 2136-2 150,+-~~~~ __ ----._--__ ----__ --~
200 210 220 230 UO 250 260
Figure 5.5 Intercellular CO2 concentration clones as affected by prolonged stress.
of 4 cassava mid-season water
179

STRESS PHASE AND RECQVERY OLD LEAVES
CM 922-2
o. 1 '
CM 1335-4
a I RrcovrRY
0·---0 STRESS .-. CONTROL
a I RECOvt:RY
o·-~-o STRESS .-. CONTROL
''( -- 9 a I IIteovtRY
0.15.,.------.,.-----------, CM 21..56-2 0- --o STRESS
D.l0
,
0.05
~ " '1 , " ' Y",? j'2~
a I RU':OV(!f't
0.00"'· -~~-~-~~~~-~~~~-~ 95 10. 117 12a 139 150 161 172 183 194 205
LYSIMETER 89
RECOVERY NEW LEAVES
CIO 922-2
;1; 1 }>'" ,ó.
0'- o STRESS .-. CONTROl
0·"--0 STRESS .-0 CONTROL
\~/)~ .. <r-!~6. " t/l"t t~ ... ·- .. -· ......... -,T
~o !
0···_··0 STRESS 0-. CONTROL
0---"0 STRESS
CM 2136-2 o-o CONTROL 0.00 ~:..;;..~.:.....:=-~--,--~--~-__J
200 210 22ó 230 240 250 260
Figure 5.6 Mesophyll conductance of 4 cassava clones as affected by prolonged mid-season water stress.
180

~
.,.-
(1)
N I E -1 o 2 E
'-.../
W 1-<t: O::::
z o 1-<t: D:::
D... (f)
Z <t: D::: 1-
15
12
8
4,
!
O:
STRESS PHASE ANO RECOVERY OLD LEAVES
CM 489-1
CM 922-2
CM 1335-~
0'··_··0 STRESS 0-. CONTROL
0-"-"0 STRESS 0-. -. CONTROL
_ 1 , r ; __ 0 ____ 1_;..--- ~\ I
..... -". ,.0 A 1 }'t1i'Y "'. "-,",, 1- I
2-··_ .. _,,_ .. 0_ .. - ..... --,.. .. -2· R(covtRY
CM 2136-2
0·····0 STRESS
0-' CONTROL
0-··_··0 STRESS 0-. CONTROL
4'
RECOVERY NEW LEAVES
Cioi 489-1
CI.4 922-2
CM 1335-4
0",-,,0 STRESS
.-. CONTROL
o·"~"O STRESS 0-. CONTROL
0'·'·0 STRESS 0-. COIUROL
O"'_"(} STRESS 0-. CONTROL
CM 2136-2 O+-~~~~~--_-__ -~-~
95 106 117 128 139 150 161 172 183 194 205 200 210 220 230 250 260 DAYS AFTER PLANTING
Figure 5.7 Transpiration rate of 4 cassava clones as affected by prolonged mid-season water stress.
181

STRESS PHASE AND RECOVERY OLO LEAVES
CM 1335-4
0",-,0 STRESS o-o CONTROL
0----0 STRESS .-. CONTROL
0 .. --0 STRESS 0-. CONTROL
1.5,----------------,
1.0
o.~
CM 2136-2 0---0 STRESS o-o CONTROL
~-.... 2"""",_ A 2"00.9
.... " .- .. ---0,,,-,-- Q ~ECOvtRr o.o-l---_-__ - ______ -_~
OS 106 117 128 139 ISO 161 172 183 194 205
LYSIMETER 89
RECOVERY Ntw LEA vES
CM 922-2
0--·0 STRESS .-. CONTROL
1.5,---------------,
1.0
o· ---o STRESS 0-. CONTROL
CM 2136-2 O.O~=..::...;:.::....::.~--_-~-__ __l
2M 210 220 240 250 2&0
Figure 5.8 stomatal conductance of 4 cassava clones as affacted by prolonged mid-season water stress.
182

STRESS PHASE At!I) RECOVERY OLD LEAVES
CM 922-2
0·'-,0 STRESS .-. CONTROL
O' -,0 STRfSS .-. CONTROL
T
I,í, ~ ~¡~~ 'r 1\ o' , •
. '''".
CM 1335-4
"o--.--itl. , l l
R~CO';'ERY
o'· o STRESS .-. CONTROL
;r---------------,
2
1 :
l' CM 2136·2 O +...:...~, __ --~~
o· - o STRESS .-. CONTROL
95 106 117 128 139 150 161 l72 183 194205
LYSIMETER 89
CM 922-2
RECOVERY NEW LEA\lES
ó- - o STRESS .-. CONTROL
0"'-,,0 STRESS .-. CONTROL
0·,,-,,0 STRESS .-. CONTROL
3,---------------------------, C;'¡ 2136-2
0"'0 STRESS .-. CONTROL
2
210 220 230 240 250
Figure 5.9 Water-use efficiency of 4 cassava clones as affected by prolonged mid-season water stress.
183

Table 5.1 Yjeld, biomass; MI &nd percent starch of four clones of cassava as affected by 3·8'10 stres:s periad cOI'I1Tlef'íCing 100 days after planting; final harvest at 11 100 after planting; stressed plots allowed
to recover for rest ~f cycte (1989).
Unstressed Stressed
Dry Dry 1 Total 1 Ory DrY1 Total
Roots T~ Bianass Roots Tops Biomass1
2 Clone t¡ha HI X Starch HI X Starch
CI4 489·1 19.3 6.8 26.1 0.74 23.0 18.5 4.8 23.3 0.79 25.0 CM 922-2 12.7 7.2 19.9 0.64 33.3 12.9 2.9 15.8 0.82 35.0 CM 1335-4 16.2 6.1 22.3 0.73 31.< 13.9 2.6 16.5 0.84 33.4 CI4 2136-2 17.6 7.6 25.2 0.70 25.3 13.7 4.2 17.9 0.77 27.2
A\I!I all clones 16.5 6.9 23.4 0.70 26.2 14.8 3.6 18.4 0.81 30.2
% change die to stress -lO -48 -21 +16 +7.1
1 Excluding fallen leaves.
2: en fresh wt basis.
(CIAT Annual Reports 1988-1989) have shown signifieant positive eorrelations between leaf photsynthesis and both yield and total biomass for a wide range of eassava varieties when grown under stress in the Pat1a Va1ley (Cauea State), Colombia.
The highest reduetion in RY among this group of genotypes was 22% (CM 2136-2); whereas CM 922-2 showed no ehange in yield due to stress. CM 1335-4 and CM 489-1 showed 14% and 4% reduetion, resp. HCN content remained at low leve1s (140-220 ppm DM basis) under stress for the two clones, CM 1335-4 and CM 922-2; whereas they were elevated (ca. 330-440 ppm DM basis) in CM 2136-2 and CM 489-1. Maintaining low HCN under stress is of paramount importance when cassava is used for human eonsumption in drought-prone regions sueh as NE Brazil and Sub-Sahelian Afriea.
5.1.2 Screening eassava germplasm tor toleranee to 1ow ... P soila at Santander de Quiliehao
In the effort to eharaeterize cassava germplasm for to1eranee to low-P soils, a new group of advaneed breeding lines
184
2

and clones were screened during 1989-90 at the Quilichao station. The screened accessions were planted (10,000 pI/ha) in plots with low available P «4 ppm) , which had received no P for S yr. Half the plots received 75 kg P/ha annually for S yr (4 reps). Adequate levels of N and K were applied at planting to the whole experimental area; P fertilizer in the form of triple superphosphate was banded around the stakes at planting. Table 5.2 shows DMY at 10 mo after planting along with the calculated P adaptation indices. At both levels of P, there were significant differences in yield among genotypes. The overall avg yield of all genotypes at low P (S.8/t ha) was significantly lower than with adequate P (12.5 t/ha). These yields are compa~able to those obtained on these plots over the last few years (CIAT Annual Reports 1986-89). Reasonable yields without P application may indicate that native P uptake by cassava was effective. Cassava is highly dependent on mycorrhizal associations for P uptake; thus it is possible that cassava roots were effectively colonized by efficient VAM strains.
Based on the low-P adaptation indices, this group of cassava genotypes varied widely in their tolerance to low-P soils (ranging from 0.35 for M Col 2215 to 2.05 for the CIAT advanced line CG 996-6). The highly adapted genotypes, with low-P adaptation indices greater than 1. 65 included 3 new CIAT lines (CG 996-6, CM 305-41, CM 1374-2) and two traditional clones from Brazil (M Bra 383 and M Bra 191). There were 3 very low adapted genotypes, with low-P adaptation indices under 0.5, which included 2 CIAT clones (CM 2774-11 and SG 250-3) and a traditional variety from the North Coast of Colombia (M Col 2215). The remaining accessions showed either intermediate (indices from 1.49 to 1.06) or low adaptation levels (indices from 0.99 to 0.56). Considering that cassava was cultivated continuously at this site for the last 10 years, the moderate level of productivity maintained without P application suggests that acid soils with low available P, but with high OM, can support sustainable yields. Nevertheless, the significant response to a moderate level of P fertilizer, observed in these trials as well as in previous ones, indicates that cassava still benefits from applied fertilizer. The genotypes highly adapted to low-P soils should be considered as genetic resources for breeding new materials adaptive to low-P soils.
5.1.3 Relationships among leaf gas exchange. total biomass. RY and tolerance to low-P soils
Leaf gas exchange (C02 uptake and H2? loss) was measured on upper canopy-exposed, fully expa~ed leaves of the 33 genotypes screened for low-P tolerance using portable infrared CO2 analyzers. Measurements were conducted six times between 3 and 6 mo after planting with a total of 24 leaves measured/genotype/P treatment when incident sunlight
185

Table 5.2 DMY and low-P adaptation index of 33 cassava clones at Santander de Quilichao (1989-90); values are means of 4 reps.
Clone
CG 996-6 CM 305-41 CM 1374-2 M Bra 383 M Bra 191
CM 2718-1 CM 4864-1 CM 3750-5 CM 4711-2 CM 3401-2 CM 4830-3 CM 3654-3 SG 455-1 M Pan 51 CM 3456-3
SG 106-59 CM 3667-1 CM 4701-1 SM 414-1 CM 3285-7 SG 104-284 SG 545-7
CM 4793-1 CM 4617-1 CM 4575-1 SG 104-264 CM 4716-1 CM 4145-4 SG 302-1 CG 927-12
CM 2774-11 SG 250-3 M Col 2215
Avg all clones
LSD 5%
DMY (t/ha) Zero P 75 kg P/ha
13.1 13.9 11.9 10.9 12.6
10.1 11.4 11.5 9.6 9.0 9.4
11. 3 9.8 9.1 8.5
9.3 9.4 7.6 7.7 9.8 6.5 8.1
7.6 7.5 7.0 6.6 6.4 6.4 5.1 6.6
5.0 6.7 4.8
8.8
1.9
16.9 14.6 16.2 16.9 14.1
16.5 14.1 12.8 14.0 15.4 13.9 11.9
12.7 13.1 13.4
11.6 11.4 13.6 13.1 10.0 13.5 10.5
10.3 10.6 11. O 10.9 11. 2 10.0 11.9 9.3
10.1 7.4 7.9
12.5
2.1
Low-P Adaplation lndex
2.05 1.86 1. 78 1.67 1.65
1.49 1.45 1. 35 1. 27 1.27 1.24 1. 23 1.16 1. 08 1. 06
0.99 0.98 0.95 0.92 0.91 0.84 0.79
0.75 0.73 0.71 0.66 0.66 0.59 0.56 0.56
0.47 0.45 0.35
0.43
1 Low-P adaptation index was calculated for each clone using the ratio: IYield at Zero PI IYield at 75 kg P/hal
(Avg yield at zero P) (Avg yield at 75 kg P/ha)
2 HA = High adaptation; lA = lntermediate adaptation; LA = Low adaptation; VLA = very low adaptation.
186

-2 -1 was greater than 1000 /J. mol m s in the photosynthetic active range. Gas exchange data (avg for measurement period) were correlated with RY and total biomass at 10 mo after planting. Low-P adaptation index and other growth parameters were also included in calculating simple correlations. Among this group of genotypes, leaf photosynthesis was significantly correlated with RY, total biomass, top weight, storage root no. and low-P tolerance index (Table 5.3). Mesophyll conductance, but not stomatal conductance, was also significantly correlated with these yield and growth parameters. These correlation patterns confirm earlier findings at CIAT that a direct, positive relation exists between single-leaf photosynthesis and cassava yield (CIAT Annual Reports 1988-89). This relation is related more to variations in mesophyll characteristics (i.e., enzyme systems and leaf anatomy) than stomatal conductance. Another important finding is the significant positive relation between RY and both top wt and storage root no. It appears that when HI i5 high (in this group of genotypes, HIs were > 0.6), improvement in yield could be achieved by improving the crop photsynthetic capacity through higher leaf area and higher leaf photosynthetic rate (carbon assimilation source) and by increasing storage root no. (sink strength). Tolerance to low-P soils also appears to be directly related to both assimilation capacity and storage root no. High assimilation capacity and high sink strength would probably lead to higher Puse efficiency, particularly in soils low in P (see section 5.2).
5.1.4 Long-term response of cassava to NPK fertil izer in acid soils
For the last 7 years cassava was grown at two experimental sites in the acid soil at Santander de Quilichao to assess the effect of this permanent production system on cassava productivity and its response to applied fertilizer.
One site was initially fertile (fertile plot) while the second was very low in fertility (exhausted plot). Two cassava clones (M Col 1684 and CM 91-3) were planted at the two sites annually. Fertilizer treatments consisted of three levels of NPK (O, 50, 100 kgjha each of NPK). Each oí the three elements was also varied independently at three levels (O, 50, 100 kgjha) while the other two elements were kept constant at 100 kgjha. The treatmentsH (4 reps) were allocated in a complete randomized block design within each site. AlI fertilizer treatments were applied at planting. Harvesting was at 11 mo after planting.
Figures 5.10 and 5.11 illustrate cassava yield response to the combined fertilizer applications at the two sites for 6 yr. For both varieties, first-year yields in the fertile plot were higher than in the exhausted plot, indicating the
187

1-' 00 00
lable 5.3 COrrelation coefficients among leaf gas exchange characteristics~
lesf pnotosynthesls le8f conducta"". (H
20)
Mesopñyll _tone. (COz) OMY
Top dry wt Total biomass No. storege root&
Low-P tolerance index
1 Mean of th. two P t.vels.
leaf Mesophyll Conducta",,_
("2°)
0.81**
Corduc:tance
(COZ)
0.97** 0.69**
DMY
0.48** 0.29 ns 0.53**
na = Not s;gnifieant at 5%; * = Significant at 5%; •• = Significant at 1%.
RY f bianass and Low-P tolerance index of 33 clmes'.
low·P Top Dry total No. Stor_ Tolersnc:e
Wt 8ianass Roots lnde. Kl
0.39* 0.49** 0.37* 0.51- 0.12 ns 0.25 ns 0.31 ns 0.11 ns 0.30 ns 0.03 ns 0.40- 0.56- 0.49** 0.57** 0.08 ns 0.58** 0.96- 0.62*· O.99*" 0.33 ns
0.76« 0.50*" 0.58** ·0.52** 0.65** 0.96** 0.09 no
0.67** 0.07 ns 0.31 no

Annual application
>0
~ .c '"-"C -¡¡ O o;:.
15 so e .c ~
" ~ 40
20
Year
Residual effect
Ne" 000
NeK 000
NPK Response M Col 1684
N P K
o O O 50 50 50
tOO 100 100
Fentle plot
ElIIhausted plot
Figure 5.10 Long-term responses to NPK fertilizer application in acid soils, Santander de Quilichao, Clone M Col 1684.
" .c '"-"C
'" o;:.
<5 e .c ~ e u.
Annual apptication
60
40
>~L~ 60
40
Residual effect
NeK 000
Ne • 000
NPK _ Responsv CM91-3
N e K
o o o o .505050 A 100 100 100
Fertile plQt
t~ ~ o._~¡_~l -L.-_~ L--l ~ !----L-.J .---1
123456123456
Year
Figure 5.11 Long-term responses to NPK fertilizer application in acid soi1s, Santander de Quilichao, Clone CM 91-3.
189

extremely low fertility in the latter. This enhancement in yield was apparent despite the level of applied fertilizer.
In absence of applied NPK, yields in the fertile plot decreased from initial levels of about 38 tjha to around 15-20 tjha by the sixth yr. The rate of yield reduction was greater in CM 91-3 than in M Col 1684. On the other hand, the level of productivity in the exhausted plot without NPK fertilizer remained almost stable (ca. 15-18 tjha) for both varieties, which was equivalent to the lowest yields achieved in the fertile plot by Yr 6 of cassava production. This mimimun level of productivity clearly illustrates that sustainable yields could be obtained in infertile soils without fertilizer application, provided that the soil OM is adequate to release available nutrients. Furthermore, annual application of fertilizer can ensure higher levels of productivity when cassava is continuously cultivated in the same site without fallow or crop rotation. These data contradict the long-held views that cassava cultivation causes soil depletion and degradation in the tropics. It has been documented that cassava produces more biomass per unit nutrients removed from the soil or from applied fertilizer than most other annual grain and root crops. Nevertheless, the long-term concern of soil fertility dictates that reasonable levels of fertilizer application be practiced irrespective of the kind of crop produced. Cassava should not be considered an exception in this case. For resource-poor farroers, who are the main growers of cassava, alternative means for improving soil fertility should be sought. Perhaps by seeking better patterns of land uses and crop production systems, soil fartility could be maintained to levals capable of sustaining reasonable productivity.
In soils similar to those at Quilichao, long-terro cassava production appears to be more limited by the level of K than of N and, to certain extent, of P. Figures 5.12-5.17 illustrate the long-terro response of cassava to NPK. It is clear that cassava is highly responsive to K, particularly when the soil is poor in this element (Figs. 5.12 & 5.15); 50 kg Kjha almost doubled the yield of cassava. Moreover, in the absence of adequate K levals, no benefit in productivity i5 achieved by 5upplying the crop with high levels of N and P. This conclusion is further substantiated by the lack of 1arge responses to N and P when K levels were high (Figs. 5.13-5.17). In cassava a large portion of absorbed K (>60%) is removed with the harvested roots; whereas significant amounts of absorbed N and Pare recycled to the soil through fallen leaves and crop residues. It is known that a crop of cassava can return to the soil from 3 to 6 t of dry leaves during its growth cycle of 10-12 mo. In addition to the native OM in the soil, this relatively large amount of crop residue can serve as a source for nutrients.
190

60~
40
20
~ re
'" -o -¡¡ O ¡;. 15 60 ~ .r; ~
~ u.
40
20;"'"
01
Figure 5.12
60,
~f 20 L
m .ce
'" 'O -¡¡ O ¡;. 15
60 e .c ~
l' u.
AO ~
J
Annual app!ication
~L I ..
I I I I 2 3 4 5
I 6
Year
Residual sffeet
NPK 000
NPK 000
K Response M Cal l6S4
N P K
O 100 100 O
• 100 lOO 50
" lOO lOO 100
F<lftHe plol
Exhaosted plOl
Long-term responses to K application in acid soils, Santander de Quilichao, Clone M Col 1684.
AnnuaJ applieation Residual effect N - Respof\se
NPK M Col 1684
000 N P K
O ° lOO 100
• 50 lOO 100
" lOO 100 100
Fertile plol
---'- .......l
NPK 000
Exhausted plot
4 6 L ... -.-.L _!;-' _* ~---1.~---I
1 2 3 4 5 6
Year
Figure 5.13 Long-term responses to N application in acid soils, Santander de Quilichao, Clone M Col 1684.
191

60
40
20
ao
40
Figure 5.14
60
40
20
m
'" '" v
Annual application
. I
I I 4 5
J
r
~
l 6
Year
Residual eftect
2
NPK 000
3 4
p ~ Response MCul1684
N P K
O 100 O 100
• 100 50 lOO t:. 100 100 100
Fertlle plol
E~t>aus\e('J plot
Long-term responses to P app1ication in acid soils, Santander de Quilichao, Clone M Col 1684.
Ánnual appllcatíon Residual effect
1( - F1espo()se
l NeK CM91·3
000 N P K
o 100 100 O
• 100 100 50
l t:. 100 100 100
Fertlle plot
" 0'------'--- ..... I I .... .......l. '¡:'
¡¡ e 60-r; m ~ ~
40
I 6
Year
NPK 000
E;¡hausted plot
Figure 5.15 Long-term responses to K application in acid soils, Santander de Quilichao, Clone CM 91-3.
192

Anoual applic8!IUf)
BO
40
20
ro
"' "" " -¡; O~. >-
" e
:r "' ~ ~ ~
':L I I , 1 2 3 4 5
Res:dual eitect
NP. 000
NPK 000
~ ~ ... I I I I
6 1 2 3 • 5
Year
N - Response CM 91-3
N P K
O O 100 100
• 50 100 100
" 100 100 100
Fertile plot.
Exhausled plot
I 6
Figure 5.16 Long-terro responses to N application in acid soils, Santander de Quilichao, Clone CM 91-3.
ro
"' !e-
:2 .~ ,.
" f .c 0
!! ~
Annual application
6l 40:~
:L 60
40
20
QLi -+-c!'--!,'--;I--;I .. -----l 2 3 4 5 6
Year
Res¡dual effeet
NPK 000
NPK 000
3 4
P - Response CM91·3
N P K
O 100 O 100
• 100 50 100
" 100 100 100
Fertile plot
ExnauslOO plot
5 6
Figure 5.17 Long-terro responses to P application in acid soils, Santander de Quilichao, Clone CM 91-3.
193

In conclusion, it can be stated that long-term cassava productivity can be maintained at a reasonable level in acid soils high in OM provided that moderate levels of K fertilizer are applied to compensate partially for the removed soil K in the harvested roots. However, when soils are poor in OM or sandy, other nutrients such as N and P would limit productivity.
5.1.4 Response of cassava to NPK fertilizer in sandy soils
In contrast to the Quilichao soils, the Media Luna soils (Magdalena state, Colombia) are sandy with extreme1y low OM and nutrient contents (CIAT Annual Report 1988). Yields of cassava in that region have declined rapidly in the last few years. One of the more obvious reasons (see Pathology section, Chapo 4) is the disappearance of the traditiona1 "fallow system" due to pressure on the limited land available to local farmers. In addition, the resource-poor farmers rarely apply fertilizer. Field trials were initiated in the last two years to assess the value of applying a moderate level of NPK fertilizer (50 kg/ha NPK or 330 kg of 15-15-15 compound fertilizer), which is equivalent in cost to the frice of one ton of fresh cassava (ca. Col. Ps. 28,000). Tria1s were conducted on a private farm using 15 cassava clones including local varieties as well as sorne CIAT advanced lines. Split applications of the fertilizer were made at 30 and 60 days after planting.
Table 5.4 contains data on DMY and biomass production for the 1989-90 season. The experimental site was the same for the 1988-89 trials, but with a new group of cassava clones. Average increases for all clones due to fertilizer application were 103%, 136% and 116% for DMY, top growth and total biomass, resp. These differences in yield and biomass due to fertilizer application are more than twice the increases in the 1988-89 trial (ca. 47% increases, CIAT Annual Report 1989). This indicates that by continuously growing cassava in this poor sandy soil, productivity decreases and the need to fertilize the soil becomes more crucial.
Among this group of genotypes, the increase in RY ranged from 38% for M Ven 25 to 275% for CG 1411-1 (a CIAT clone). As a result of the fertilizer, the three local varo (M Col 1505, M Col 2215 and M Col 2216) showed yield increases of 124%, 81% and 171%, resp. Beside these substantial increases in RY, top growth was also greatly increased. This is of paramount importance to cassava growers as production of sufficient good-quality stakes is critical in that
1 Avg exchange rate for 1989-1990 season, Col. Ps. 433.73 ~ US$1.00.
194

Table 5.4 Response of cassava to JOOderate levels of NPK fertilizer application in sarrly soils at Media luna (Magdalena, COlanbia), 1989-90 season; values are means of 4 reps (ll'1Y, tjha) anl % increase due to fertilizer in parentheses.
50 kq NPK/ha tlnfertilized
ClonE? Roots Tops2 Total Roots Tops2 Total
M ara 191 7.8 4.9 12.7 3.5 2.6 6.0 M ara 383 7.9 4.6 12.5 5.0 2.5 7.5 M COI 15Q:¡ 4.7 (124%) 5.6 10.3 2.1 3.0 5.1 M COl ¡¡215 5.8 (81%) 4.1 9.9 3.2 1.9 5.1 M COI 2216 6.5 (171%) 6.9 13.5 2.4 2.5 4.9 M CUb 18 3.8 5.0 8.7 1.8 1.4 3.2 ex; 912-8 7.1 5.8 12.9 3.0 2.4 5.4 ex; 1220-2 5.9 6.6 12.5 2.5 1.8 4.3 ex; 1355-2 8.9 4.3 13.2 4.9 3.5 8.4 ex; 1372-5 7.6 4.7 12.3 2.5 2.4 4.9 ex; 1411-1 4.5 (275%) 3.5 7.9 1.2 1.0 2.2 CM 507-37 5.7 7.3 12.9 3.3 1.7 5.0 CM 3320-4 7.5 3.0 10.4 3.3 1.5 4.8 CM 4181-1 5.0 4.0 9.0 2.3 1.6 3.9 M Ven 25 9.1 (38%) 7.0 16.1 6.6 3.0 9.6
Avg all clones 6.5 5.2 11.7 3.2 2.2 5.4
% increase due to fertilizer 103 136 116
1 Underlined entries are local varieties.
2 Fallen leaves not included.
region. The cost of added fertilizer is insignificant compared to the large gains in yield and the supply of planting materials. There was also a reduction in labor costs for weeding as ferti1izer enhances cassava growth and results in reduced weed populations.
5.1.6 Soil erosion in cassava-based croppinq systems
The Cassava Program has be en conducting research on production management practices effective in minimizing soil eros ion in erosion-prone hilly lands, both in Latin America
195

and Asia (see section 5.3). Resul ts of these research efforts indicated some useful practices that can sustain cassava productivity and also help in soil conservation. Table 5.5 summarizes data on soil 10ss as affected by various production practices along with cassava yield at Quilichao station. Similar results were obtained on private farms with steeper slopes (20-30%) at Mondomo (Cauca state). Annual soil loss from bare soils ranged from 50 to 200 tjha at Quilichao (~ 12% slope) and from 50 to 300 t/ha at Mondomo (~ 25% slope). A major portion of this loss can occur in a very short time because of water runoff during high-intensity rains (CIAT Annual Report 1989). This suggests that in less than a decade, the thin top soi1 of those regions can completely disappear and the land will become unproductive. The findings also point to the high risk in growing cassava on vertical ridges where soi1 loss is very high as compared to other more effective practices. Growing cassava in association with annual grain legumes (e.g., common beans, cowpeas, peanuts) also resu1ts in more soi1 loss than growing cassava alone. Some of the most effective practices in minimizing soil erosion are growing cassava on contour ridges with live barriers of native grasses or with elephant grass. Cassava in association with some forage legumes (as live ground covers) also appears to be effective; nevertheless, the feasibility of the latter practice has to be determined because of the difficulties inherent in establishing and managing the legumes in association.
Table 5.5 Son loss at Sa:ntarrler de Quilidlao (10-15% slope) ard cassava RY as affected by productien systems ard cultural practic:es; clone eN 507-37 planted in 1 x 1 m arrangement (10,000 pljha).
CUmulative Fresh Soil !J:lsS Soil !J:lsS RY
1989/90 (1987/90) 1989/90 Treatment tjha
clean-tilled fallow (COI1trol) 165 cassava planted en flat 4 cassava plantad en contour ridges 4 Cassavajkudzu + mulch 3.5 Cassava,lzornia + mulch 4.3 Cassava,lgrain legu¡res 5.0 cassava/grass barriera 5.6
Cassava (eN 523 7) plantad en vertical ridges (1987-1989)
196
411 26 17
42 26
98
28.5 28.4 23.4 30.5 22.1 24.4
27

Research on soil erosion control has been strengthened by a joint project with the University of Hohenheim, funded by the Federal Republic of Germany.
5.2 Cassava Varietal Response to P
Generally in the tropics, particularly in Latin America, the cassava-growing areas are characterized by a strong acid, P-deficient soil. Low P levels can limit cassava yield. CIAT germplasm is currently being characterized for tolerance and adaptation to low-P soils at Santander de Quilichao. Since 1980, more than 1500 clones have been evaluated, several of which have been found to be tolerant to low-P soils (CIAT Annual Reports 1982-87).
A collaborative research project between CIAT and the Swiss Federal Institute of Technology and funded by the Swiss Development Cooperation (SDC) was initiated in 1988 to study varietal response to P and to elucidate possible mechanisms underlyinq this response.
Two crop cycles (1988-89 and 1989-90) have been conducted on a private tarm near CIAT's Quilichao station. The experimental site was under tropical pasture grass tor several years, and soil-P was about 2.5 ppm--lower than the critical level required tor optimum cassava growth. The experiment was laid out in a split-plot design with three reps: and the following fertilizer treatments (P as triple superphosphate, K as KCl, N as urea) were assigned to the main plots: (1) unfertilized: (2) 100 O 100 kg NPK/ha; (3) 100 50 100 NPK/ha; and (4) 100 100 100 kg NPK/ha.
The same treatments in the same plots were maintained in the second crop cycle. Before planting the second crop, 500 kg/ha of dolomitic lime were incorporated in all plots. Cassava varo CM 523-7 (released in 1989 under the name ICA-Catumare for the Llanos Orientales de Colombia), CM 489-1, M Col 1684 and CMC 40 were planted as sUbplots at a population density of 10,000 pI/ha. Sequential harvests of 8 protected pl/plot were made every 2 mo (up to 10 mol to determine the pattern of qrowth over time. The plants were separated into 7 "parts": younqest leaf blades (nonfully expanded leaves), mature 1eaves, petioles, stems, storaqe roots, original stakes and new formed tissues at this level (which is neither root nor stem), fallen leaves (with fallen petioles), collected between two harvests. In the second crop cycle, flowers and fruits were collected separately.
P content was determined for each plant part, and total P uptake was estimated as the sum of P accumulated in the different plant parts. This was obtained by multiplying P concentration in each plant part by its dry weight.
197

Soil samples (taken to a depth of 20 cm at 2-mo intervals) were analyzed for available P and exchangeable K (Bray 11 extraction method). For fine root density determination, 12 soil samples per plot were taken at the mid-distance between two plants by hand auger (433 cm3) in the 0-20 cm soil layer. Rootlets were separated from soil by flotation, and length was estimated using the grid line method. Vesiculararbuscular mycorrhiza (VAM) infection of fine roots was determined under stereoscopic microscope after Trypan blue staining.
Single-leaf gas exchanges (C02 uptake and H20 loss) were measured on the 5-7th upper canopy leaves 2, 3, 4 and 5 mo after planting, using a portable infrared gas analyzer. Measurements were always made from 0800 to 1300 h with a solar irradiance over 1000 ~ mol m-2s-1 in the active photosynthetic range.
5.2.1 Soil analysis
P and K fertilizer application increased soil nutrient availability (Fig. 5.18). N application had no effect (data not shown). In the first crop cycle, at 2 mo after planting and app1ying NK fertilizer, there was very 10w availability of P in the control treatment (O kg P/ha)--the only one under the critical level (6 ppm).
During the second cycle (1989-1990), soil P in the control treatment ranged from 2.5 to 5.3 ppm. Comparing these levels with that at the beginning of the experiments in 1988 (2.5 ppm), cassava caused no apparent P depletion after two crops. Two consecutive applications of 100 kg P/ha/yr induced a dramatic buildup of P to 25 ppm in the second ayale. With intermediate P applications (50 kg p/ha/yr), P availability reached an optimal level for cassava growth.
The yearly application of 100 kg K/ha maintained exchangeable K aboye the critical level (0.15-0.17 meqf100 9 soil) after two cycles (Fig. 5.18). In plots without fertilizer application, soil K contents fe11 from 0.15 meq K at the beginning of the first cycle to 0.10 meq K 6 mo after p1anting during the second cycle, stressing the importance of K fertilization to sustain cassava production (see Sectien 5.1).
5.2.2 Root yield. leaf canopy. sink-source relationship and photosynthesis
Figure 5.19 i11ustrates fresh RY and its evolution over time after planting for each of the two crop cycles. Clone CM 489-1, which had the highest yield at any given P level, showed a significant response te P in both years. M Col 1684 did not show any significant response to P at final
198

'0 VI
~ el Q>
o o ~
""-cr <1> E
P Soil Availobility (Bray 11) 30~----------~~~~--------------.
25
20
CL 15 E o. 0.10
5
"'-A. 100 P + NK
D.-D. 50 P + NK
e·- e O P + NK
o' ··0 O NPK
T
/~1 T T .... --"" T
.... " ...
Exchangeable K 0.35..,.---------=---------------------,
T
0.30 Crop Cycle 1 Crop Cycle 11
0.25 1988-89 1989-90
0.20 l.:
l
0.15
0.10 '0'·' O.' ,··0
0.05
o 2 4 6 8 10 2 4 6 8 10 Months After Planting
Figure 5.18 Evolution of P and K soil availability over time according to fertilizer treatments, during a 2-yr field trial ¡vertical bars represent SE of the mean (n=3) if greater than symbols.
199

55.,-------------, T------..,.------~
50 CM 523 7 CM 489-1 45
~40 oC ,35 ~
'--'
>- 30 O:: 25 oC
~ 20 L...
l!...15
10
T
5 Oa-.-~~~~~~~_+_+~.~_+_+_4~~~~~~~ 55,------------------------,-----------------------~
50 45 40 35 30 25 20 15
10
5
M Col 1684 eMe 40
O a-.-~-+-~_i9":Z\:II_~~_+_+~ 11--411'---1-1--+----119" ~'---1I--~~-i---l
2 4 6 8 102 4 6 8 10 Months After Planting
Figure 5.19 Response of fresh RY to P application: filled symbols for first crop cycle (1988-89), open symbols for second cycle (1989-90); vertical bars represent SE of the mean (n=3).
200
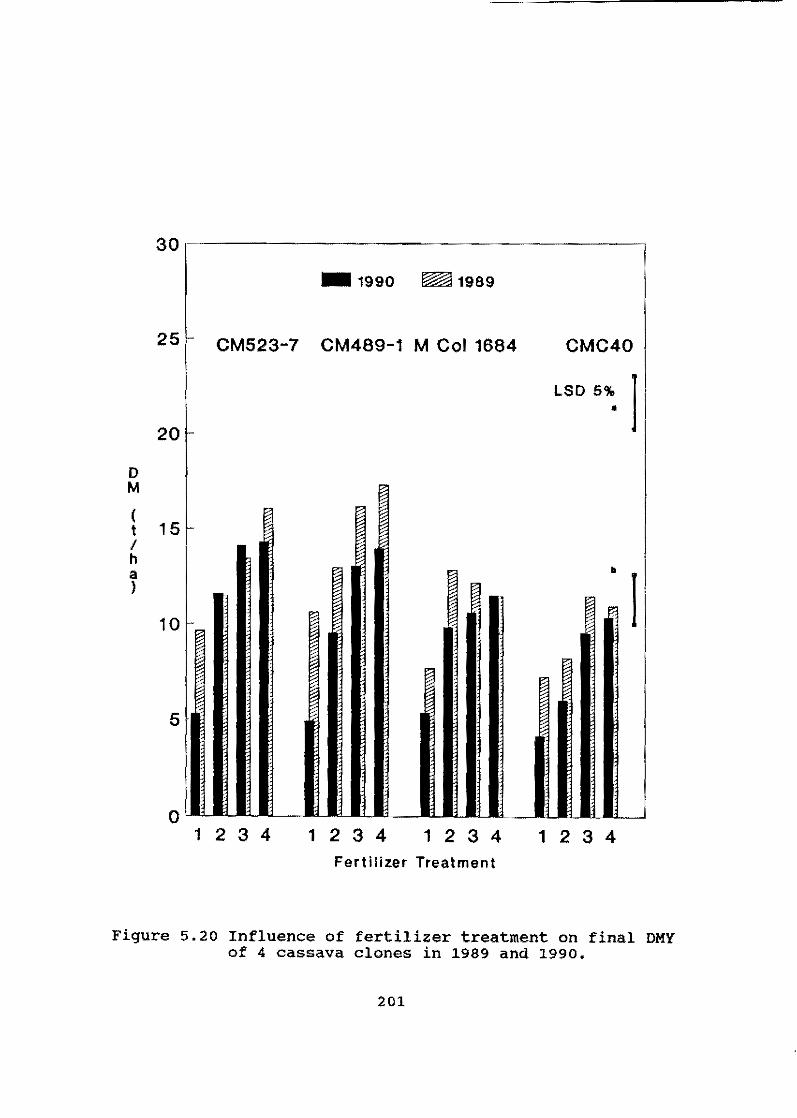
30,~----------------------------------,
_1990 ~1989
25 C M523-7 CM489-1 M Col 1684 CMC40
20
LSD 5~ 1
o M
( 15 t
I h a
b 1 )
10
5
o 1 234 1 234 1 234 1 234
Fertilizar Treatment
Figure 5.20 Influence of fertilizer treatment on final DMY of 4 cassava clones in 1989 and 1990.
201

harvest either year. CM 523-7 and CMC 40 showed intermediate response to P. In the second year, yield of unfertilized plants decreased compared to the first crop cycle, partly bécause of K stress.
Figure 5.20 shows DMY at final harvest for both crop cycles. Generally, yields were higher ln 1989 than in 1990, partlcularly in the zero fertilizer treatment. In the second cycle no significant difference was noted between 50 and 100 kg P/ha for any clone despite large differences ln 5011 P availability, confirming the optimal fertilizer rate of 50 kg P/ha/yr. Differences between the two cycles could be due to changes in climatic factors (storm with some plant lodging in 1990) and canopy development (see below); however I the dlfferential clonal response to P was consistent across both years. The two most contrasting clones (CM 489-1 and M Col 1684) maintained different behaviors over the years; i.e., a significant response to P application in CM 489-1 but not in M Col 1684. Under P stress, however, these two clones had similar yields both years.
Figure 5.21 illustrates the effect of fertilizer treatment on LAI evolution over time during the two crop cycles. In 1990 LAI reached higher values in all clones than in 1989. The rapid leaf area development was already evident at 2 mo a!ter planting, reaching its maximum at 4 mo. At that point, M Col 1684 showed the highest response to P; CM 523-7, the least. The LAIs in CM 489-1 and CMC 40 were significantly increased by P application. In 1989, LAI reached its maximum from 4 to 6 mo after planting, but with lower values and less response to P than in the 1990 crop. In 1990, leaf fall was very marked just after reaching maximum values. Excessive shading due to large canopy enhanced rapid senescence and subsequent leaf fallo The apparently large leaf regrowth in CM 523-7 and CM 489-1 might partly explain the decrease in RY as compared to 1989.
It is known that cassava response to soil fertility is markedly expressed in lea! canopy changes (confirmed by the present data, Fig. 5.22); however, the varieties differed in their response to P level with respect to leaf canopy. CM 523-7 had the highest avg LAI values with no significant response to p¡ whereas CMC 40 had the lowest avg LAI values and significant response to P. The two contrasting clones CM 489-1 and M Col 1684 had very similar LAI values and response to P. M Col 1684 could not transform its leaf canopy increase into economic yield increases because of a poor HI at high P rates (HI = 0.65 at high P and 0.77 at o P) ¡ while the HI of CM 489-1 did not change much with P rates (HI ~ 0.68 at high P and 0.7 at O P). M Col 1684 is known to have a high HI (HI = 0.71 avg for all treatments), higher than CM 489-1 (HI = 0.68 avg for all treatments). As varieties with comparable HI may respond differently to
202

LEAF AREA INDEX
4.5~----------------------~
4.0
3.5
3.0
2.5
2.0
1.5
1.0
CM 523-7 T CM 489-1
1
0.5 /' :
0.0
1 o
4.5
4.0 MCOL 1684 CMC 40
3.5
3.0
;~ i:~t . 1. O ¡, -1 \ .T ,ti o \. ,.-,A[J~T I '1 1, Y ¿.\" 05 /, J¿* /9 \/0 "[5l . V: -,: ~ o 0.0. 1 1 1 1 111 I I 1 1 I ,
2 4 6 8 10 :: 4 6 8 10 2 4 6
i'11'JTI-lS AfTER PLJl¡\IT I í'.(;
V lO I
T
~~~é'j €l'é
---If--+-+ 8 10 2 :. 6 8 10
Figure 5.21 Response of LAI to P application: filled symbols for first crop cycle (1988-89), open symbols for second cycle (1989-90): response of LAI to fertilizer application: vertical bars represent SE of the mean (n~3).
203
increased soil fertili ty, HI is not a good parameter for predicting cassava reactions in this regard.
Figure 5.22 also shows the influence of fertilizer treatments on no. of storage roots. All varieties showed a significant response to P. As in 1989, Clone CM 489-1 reached the highest values. No. of storage roots was significantly correlated with final DMY (r=0.70, P<O.OOl). This confirms results of the first year, suggesting that no. of storage roots could be an indicator of "sink" capacity of cassava. Moreover, recent findings showed the additive effect of leaf area duration and leaf photosynthesis on RY. These facts suggest that cassava yield depends on both "source" and "sink" capacity. Figure 5.22 presents the avg value of "sink-source" ratio for each variety (taken as root no./avg LAI). M Col 1684 had the lowest sink-source ratio (8.1 and 6.6 for O P and high P, resp.) and the lowest DMY increase due to Pi CM 489-1 with high sink-source ratio (18.6 and 16.4 for O P and high P, resp.) gave the highest DMY increase. This suggests that sink/source relationship may be a better indicator than HI alone to characterize varietal response to soil fertility.
Figure 5.23 illustrates single-leaf photosynthesis over time according to P treatment for four genotypes in 1990. Maximum photosynthetic rates were reached 3-4 mo after planting, with enhanced rates at high P compared to O P by CM 489-1 and CM 523-7 (Figs. 5.23 & 5.24). Across al! measurements and treatments, clone CM 489-1 had the highest avg rate; M Col 1684, the lowest (32.13 ± 0.6 and 29.74 ± 0.6 umol C02.m-2s-1, resp.). Leaf photosynthesis might be influenced by sink-source ratio (feedback effect). Enhancement of leaf photsynthesis by P application was consistently related to nonstomatal factors (biochemical or anatomical) as indicated by the level of internal C02 concentration. Internal C02 tended to decrease with increases in photosynthesis (e.g., compare net photosynthesis with internal C02 of CM 489-1 at different treatments).
5.2.3 P uptake. p~ant reaction to P. P-use efficiency
Figure 5.25 represents total P uptake or total P accumulation over time by four different varieties as affected by fertilizer levels (crop cycle 1988-89). From these data (see Table 5.6), it is obvious that all varieties accumulated more P at high P fertilizer levels (50 and 100 kg P/ha) compared to the control (O kg Pjha). This response was apparent from 4 to 6 mo up until 10 mo after planting (8 mo for M Col 1684). The observed decrease in uptake between 8 and 10 mo for varo 523-7 and M Col 1684 was due to dieback and senescence of aerial parts. The lack of RY response of M Col 1684 to P is thus not related to limitation in P uptake or acquisition.
204

3 30
CM 523-7 CM489-1 M Col 1684 CMC 40
2.5 25 100 +-1.2 19.1+-1- 7.9+-0.6 11.0+-0.5
I S t
2 • 20 O r
LSD 5% a 9
L e A 1.5 15
R I o o t
1 10 s I M 2
0.5 5
o 1 234 1 234 1 234 1 234
Fertilizer Treatment
_ Avg LAI ~ Storage Roots
Figure 5.22 Influence of fertilizer treatment on LAI and storage root no. in 1990 (a '" LSO 0.05 for storage root no.; b'" for avg LAI).
205

50
CM 523-7 CM 489-1
e:. 40 ~T e:.:::>-<~
t/L "\ ~ ~~¡ ;~.~, --1 " ,
30 e:. / ' .... ,... T
~/ !---- : ' 1 1
r--. ~ ~ 20 ~-~ 100 P + NK I A-e:. 50 P + NK (J)
N .----. O P + NK I
~ 10 2:150 ü CMC 40 o M Col 1684 E
2-40- T
(J)
~t~t? ___ T )t~T t <f)
v ..c fY ' " t---:i e 30 t "j~ >-, ... ' •. -",,'" 1 • 1 <f) ~ A +' o 1 J::
:: 20 QJ
Z
10 ,
1 2 3 4 5 6 1 2 3 4 5
Figure 5.23 Influence of P application on single-leaf CO2 uptake over time by 4 cassava genotypes in 1990; vertical bars represent SE of the mean (n=3 repe x 2 readings).
206
6
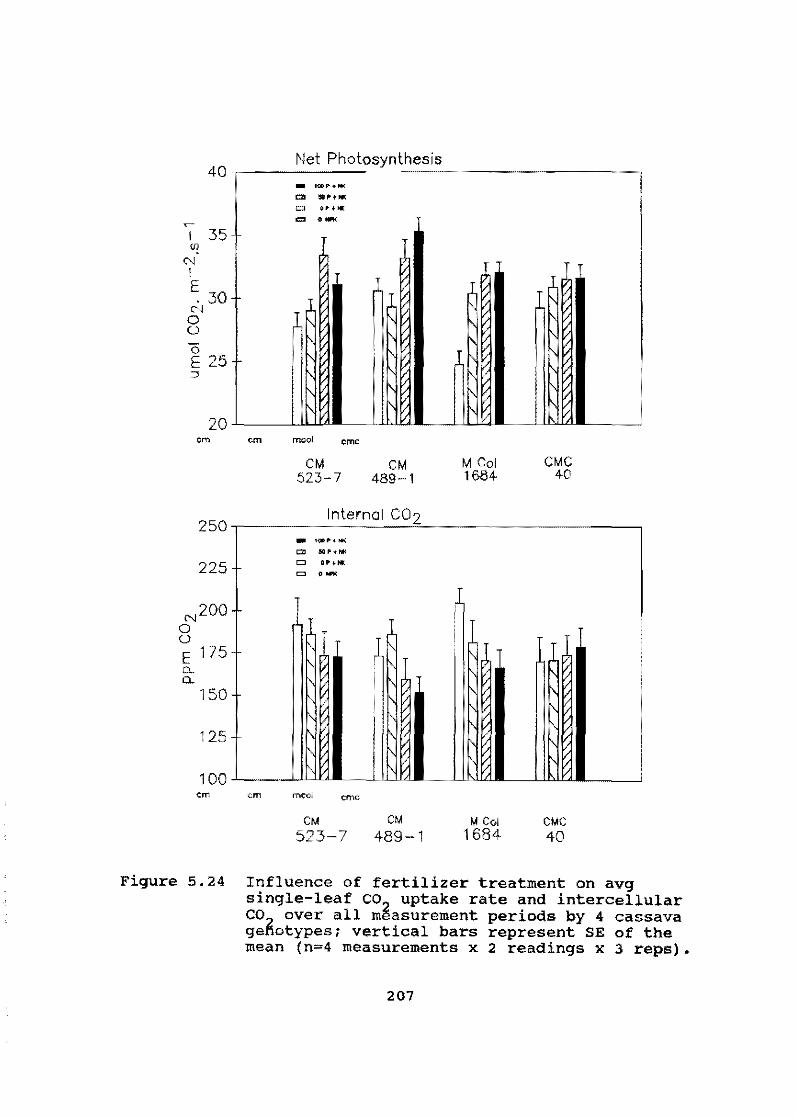
40
I 35 fj)
('>J
I
~ 30 ('>J
o ü
o E 25 :::J
20 Cm
250
225
N200
O ü E 175 Do..
150
125
100 cm
cm
-
-
cm
Net Photosynthesis
- _"'+1« O> SOP'H«
<::> o .. + 11[
'" .-
meol eme
CM 523-7
!
CM 489-1
Internal C02
-1.f;IIl .... "'"
'" 5lI PO ... NI!
e O"H. = .-,
meol eme
CM
c'
CM 489-1
T
1'1
M Col 1684
M Col 1684
CMC 40
T
CMC 40
Figure 5.24 Influence of fertilizer treatment on avg single-leaf CO2 uptake rate and intercellular CO over all measurement periods by 4 cassava ge~otypes; vertical bars represent SE of the mean (n=4 measurements x 2 readings x 3 reps).
207

CM 523-7 CM 489-1
35 35
30 ¡( 30
25 25 I¡ 'l
20 20
/;=-+ ...---- 15 -10
5
6 8 10 12 o 4 6 12
M Col 1684 CMC 40 ..... 2 35--------------------- 35
~
30~ 25r
,
20 ~
30
25
20 ~-~~ ,. //
j/' 10
//
5 ;Í-/
o o 2 4 6 8 10 12
Months After Planting
o 2 4 8 10 12 --000 -op 4-50r -B- 100 P
Figure 5.25 Influence of fertilizer treatment on total P uptake and its evolution over time by 4 cassava varieties in the first crop cycle; vertical bars represent SE of the mean (n=3).
208

Tal::lle 5.6 varietal ard fertilízatíon effect on total P uptake an:l t:heír evolutíon CN& tiloo (durin;¡ first crcp cycle 1988-89).
cassava varietl Total Uptake P (kg Pfha)
or !Ihnths after Plarrt:l.rq Fertilizar Treatn~n:t? 2 4 6 8 10
Varieti..s
Qf 523-7 1.37 9.64 16.69 22.60 22.19 Qf 489-1 1.65 10.48 16.10 20.27 22.82 M Col 1684 1.24 8.18 13.10 17.39 16.83 <»::: 40 1.32 8.39 12.33 15.72 15.00
ISD (0.05) 0.25 1.36 1.80 2.27 1.80
Fertilizer 'l'rea!:nent
ONK 1.08 7.29 10.04 12.33 11.97 O P + 100 NK 1.21 7.60 11.11 14.10 15.59
50 P + 100 NK 1.52 10.50 17.61 23.77 22.54 100 P + 100 NK 1.79 11.31 19.46 25.78 26.76
LSD (0.05) ns 1.97 4.26 5.30 4.24
1 Each value ís the avg CN& al! treatnents.
2 Each value ís the avg aver al! varieties.
This is confirmed by data on absolute P uptake rates, calculated over the entire growth period in the first crop cycle (Fig. 5.26, Table 5.7). Across all clones, there were higher uptake rates at adequate P supply (50 and 100 kgjha) as compared to the control (O PI. At O P, uptake rates of the different clones were very similar, indicating that VAM efficiency was similar in the four genotypes, even in the presence of slight differences in VAM root infection (data not shown).
Figure 5.27 shows the influence of fertilizer treatments on apex no.jplant, dry storage RY, total biomass, and total P uptake 6 mo after planting in the first crop cycle. As mentioned, all varieties showed marked responses in P accumulation to P fertilization (compare treatments 1-3).
209

A • • • I
" t • • u ~ • • • • • t • 1 m
• p
2.5 •
:t 523-7 CM 489-1 M Col 1684 CMC 40
i CM 523-7 CM 489- M Col 1684 CMC 40
1.5
1
o, o 1 2 3 O 123 O 123 O 123 o 123 O 123 O 123 O 1 23,
Fertilizer Treatment
Figure 5.26 P uptake rates related to (a) VAM-infected root length and (b) total root length. Values calculated from 2 and B mo after planting of the first crop cycle; vertical bars represent SE of the mean (n=3).
CM 523-7 and M Col 1684 had more apices and showed a marked increase in apice no.¡plant due to P application, but showed no or low increases in dry root and biomass (higher P concentrations were observed in the stems of these two varieties; data not shown). On the other hand, CM 489-1 and CMC 40 had a low no. of apices, which did not change with P fertilization, but showed high DMY and total biomass responses to P. Varietal response to P was not related to absolute P uptake; CMC 40 accumulated less P than CM 523-7 at 6 mo (Table 5.6 and Fig. 5.25) but had a greater absolute yie1d increase than CM 523-7 at that stage (Fig. 5.27).
210

N .... ...
Table 5.7 Varietal and fertilization effect en mean fibrous root length, VAM infected mean fibrous root length, mean absolute P ""t.ke rate, reloted to fibreos root length end VAM infe<:ted fibroLlS root length (during first orop oyele 1988-1989).
Cassava variety'
Fertilf::~ rreatment2
Varieties
CM 523-7 CM 489-1 M Col 1684 eMe 40
lOO (0.05)
(0.01)
Fertilizer lreatment
ONPlC O P • 100 NK
50 P • 100 NK 100 P • 100 NK
lOO (0.05)
(0.01)
Meen
Root lo~th (m.m-Z)
189.9 139.3 110.6 101.5
19.0 25.8
122.8 139.9 143.3 135.4
ns
1 Each value is the avg over all treatments.
2 Each value is the BVD over aH varieties.
VAIHnfe<:ted Mean
Root lengl~ (m .... Z)
71.8 52.8 43.1 44.5
11.1 15.5
41.5 57.4 55.2 58.1
ns
3 """sured In the O'ZO cm soll l ..... r; 8V11 of ..... ur ... 4 to 8 me aft .. phmting.
4 Calcul.ted for time period 2 to 8 me aftor planling.
4 Mean Absoluto P Upt~. R.te
Root length VAN-lnf.Oled ROO\ l.ngth (RQ P .m·l root.Wk·ll (RQ P ..... l.wk·l)
0.444 1.194 0.539 1.450 0.605 1.S41 0.595 1.369
0.101 ns no
0.393 1.152 0.378 0.923 0.647 1.728 0.166 1.751
0.189 0.509 0.281 ns

P-use efficiency 6 mo after planting (first crop cycle) in terms of biomass and dry root production (kg DM/kg P concentrated in total biomass), differed significantly among clones; CM 489-1 and CMC 40 had higher P-use efficiency than CM 523-7 and M Col 1684 (Table 5.8). The latter clones produced more apices and tissues high in P concentration but low in biomass. It is suggested that formation of large no. of apices might be related to lower P-use efficiency. The same patterns of apex formation were observed in the second year at 4 mo after planting (Fig. 5.28). CM 523-7 and M Col 1684 had more apices and high response to P as compared to CM 489-1 and CMC 40. Flower production al so varied among clones, with M Col 1684 showing the strongest response to P and the highest production of flowers (note the high production of flowers and fruits in treatments without fertilizer) . These data indicate the importance of K for translocation of assimilates. Fruit production was not closely related to P fertilization. It is interesting to note that M Col 1684, with the smallest sink-source ratio and least RY response to P, used more assimilates to produce flowers--organs high in P (0.5 to 0.6 % P) and very low in biomass.
5.2.4 Conclusions
The present study supports the following conclusions:
Oifferential varietal response to P was observed in two consecutive crop cycles.
One clone (M Col 1684) with the lowest DMY response to P was characterized by a low sink-source ratio and a marked response in apices and flowers production.
The clone with the highest sink-source ratio (CM 489-1) had high DMY response to P, the highest C02 uptake rates and response to P fertilization. It is a late-branchinq variety with a low no. of apices and few reproductive organs.
Yield response to P was not related to P uptake, and no specific mechanism of P acquisition was identified to explain differences in P response between genotypes.
Genotypic differences in response to Pare related to P-use efficiency in terms of yield and total biomass production.
P-use efficiency differed significantly among this group of 4 clones, with CMC 40 and CM 489-1 showing the highest rateo
212

CM 523-7
25r----------------------------,170
60
20
50
15 40
10 ~ 30
20
5
10
o • o
O 1 2 3 O 1 2 3 o 1 2 3 o 1 2 3
M Col 1684
70
60
20
50
15 40
CM 489-1
25,-------------------------,-70
20
15
10
5
, ,
o O 1 2 3 o 1 2 3 (> 123
CMC 40
60
50
·40
·30
20
10
O o 1 2 3
A p I e E s I p L
" N T
25,---------------------------.60
'5
l 10
5
50
" 40 ~ e E
30 S I P l
20 A N T
10
¡ ~ OiLiLU-~~U&~LUiU~~UL~O
o 1 2 3 O 1 2 3 o 1 2 3 o 1 2 3
Fertilizer Treatment
;:::::] P Tot.1 Upt .....
o Total aloma ..
~ OM Ptodu(¡lion
~ Api"eetPlanl
Figure 5.27 Influence ef fertilizer treatment en different yield and phenelegical parameters of 4 cassava varieties, 6 mo after planting (1989), vertical bars represent SE of the mean (n=3).
213

260 240 220 200 180 160
i? 140 "'- 120 ~ 100 O> 80 -'"
60 40 20
Fruits
100 P + NK 50 p + NK
O P + NK
ONPK
-rn;¡
UJ
c:::J
260 240 220 200 180 160
Flowers
100 P + NK -50 p + NK V7J,1 O PI W< !....'.J
ONPKc::J
O ..L....---LIal1!JL-..Jl:,J.UlL-JJllI.t
0140 ~120 ~100 O> 80 -'" 60 CM CM M Col CMe
523-Jl.89-11684 40 40 20
O
" 11
III In~1
CM CM t-.A Col CMe 523-Jl.89-11684 40
55 Aerial A ices 4 Monlhs Afler Plantin
50 45 40 35
o 30 .r: "'- 25 :z o 20 O>
-'<- 15
10
5 O
- lOOl'+HK
llZJ ~II' .. NI(
I:S:J o P .. NI(
c::J tllH' 1(
CM CM 52)-7 489-1
M Col lSR4
eMe 40
Figure 5.28 Influence of fertilizer treatment on fruits, flowers and aerial apices production in the second crop cycle (1989-1990); vertical bars represent SE of the mean (n=3).
214

Table 5.8 Varietal ard fertilization effect on P-use efficiency far total bianass ard bu1.kf:rl root production, 6 lID after plant.i.n3 (dur.i.n3 the first <::rql cycle, 1988-89).
cassava Varietyl or
Fertilizer Treatment2
varieties
CM 523-7 CM 489-1 M 0:>1 1684 <::M: 40
ISD (0.05) (0.01)
Fertilizer Tteatment
o NPK O P + 100 NK
50P+l00NK 100 P + 100 Nk
1SD (0.05) (0.01)
P-Use Efficiency for
Total Bianass Producto kq r.tVkg ~
821.8 975.9 895.1
1083.2
61.6 83.4
1012.1 1131.6 858.9 773.2
246.3 ns
1 Ead:l. value 15 the avg OIler aH treatments.
2 Eadl value 15 the avg OIler aH varieties.
465.1 598.9 491.7 645.6
46.7 63.3
612.0 643.2 492.5 453.5
ns
3 Kq of total bianass (inc1udirg fallen leaves) produce::l by kq of P absoJ:tled in total bianass.
4 DI:y bu1.kf:rl roots.
5.3 Sink-Source Relationships in Cassava
Previous findings (see aboye and CIAT Annual Report 1989) showed that cassava yield was highly correlated with total no. of storage roots and, to a lesser extent, with individual storage root wt. It was suggested that no. of storage roots could be a reliable indicator of sink capacity or sink
215

strength in cassava. In the same trials, varietal ranking on the basis of both leaf photosynthesis and sink-source ratio (as root no./LAI) were similar. Thus leaf photosynthesis might be influenced by the sink-source relation (i.e., feedback effect), warranting further research to test this possibility. Two contrasting clones--M Col 1684 with a low no. oi storage roots and early-branching, and CM 489-1 with many roots and late branching--were reciprocally grafted and planted in the fields in Palmira, along with control plants and self-graftings. Woody stems were used for grafting by cutting both the scions and stocks at 45' and then tying them with plastic tape. AII planting materials were treated with fungicide-insecticide solution prior to planting. The field experiment was laid out in a randomized block design with four reps at a population density of 10,000 pI/ha. Three sequential harvests of 6 protected plants each were made 3, 5 and 9 mo after planting. There were six treatments:
1 - M Col 1684 (control) MCO 2 - M Col 1684/M Col 1684 (self-grafting) MCO/MCO 3 - M Col 1684/CM 489-1 (reciprocal grafting) MCO/CM 4 - CM 489-1 (control) CM 5 - CM 489-1/CM 489-1 (self-grafting) CM/CM 6 - CM 489-1/M Col 1684 (reciprocal grafting) CM/MCO
M Col 1684 produced flowers intensively while CM 489-1 produced very few flowers; thus flowers were eliminated as they appeared to avoid forming alternative sinks.
5.3.1 No. of storage roots
Figure 5.29 illustrates the evolution of storage root no. (roots thicker than l cm in diameter). Plants with M Col 1684 as root stock had fewer storage roots than the reciprocal graftings with CM 489-1 as stock. storage root no. was nearly constant from 5 mo until final harvest. Although self-graftings had fewer storage roots than the controls, the effect of the clones was more evident than that of self-grafting. It appears that grafting was effective in manipulating root no.; hence the sink strength of the combined clones.
5.3.2 Fresh and dry RY
Fresh RY as a function of harvest time and treatments are presented in Figure 5.30 and the final DMY in Figure 5.31. The effect of self-grafting was not significant (compare control and self-graftings). RY was significantly increased when CM 489-1 was used as stock for M Col 1684; whereas when M Col 1684 was used as stock for CM 489-1, RY decreased significantly. These data suggest that sink capaci ty is limiting yield in cassava, and storage root no. might be a
216

Rootl/PlsI'lt 16r---------------------------------,
!
14 _-
12 ~
- CM
~ hlCO
-- CM/CM
-<0'- MeO/CM
CM/Meo
-€<- MCO/MCO
Figure 5.29 Evolution of no. storage rootsjplant according to clone and reciprocal graftinga.
ti . __ h~. ____________________________________ _, 40r
30
20
CM
~ MCO
f
Months AHer PJanting
CM/CM
-+ MCO/CM
CM/MCO
4- MeO/Meo
Figure 5.30 Influence of grafting treatment on fresh RY and ita evolution over time.
217

8 LSD 5%
4
2
o CM CM/CM CM/MCO MCO MCO/CM MCOMCO
Treatments
Figure 5.31 Influence of grafting treatments on DMY at final harvest 9 mo after planting.
useful criterion for evaluating progenies with better sink capacity and hence higher RY. In Figure 5.31, the souree effect can be observed comparing grafts with the same root stock and different scions. In boths eases the effect of scion on final RY was much greater than that of stock. This indicates, as already known, that leaf area duration and photosynthesis are of paramount importance in cassava and should be considered as selection criteria for high yield potential.
5.3.3 Sink-source ratio. 51
Sink capacity in terms of root no. was used to determine the sink-source ratio (no. storage roots/LAI). This ratio as well as 51 (root wt/total biomass) are indicators of assimilate partitioning between top and root growth. At 5 mo after planting, sink-source ratio and HI showed similar trends in biomass partitioning (Fig. 5.32). Grafts and control p1ants with M Col 1684 as stock had signifieant1y
218

(A) HI 5 MO After Planting
% O,6r----~·····~···-------,
0,5
0.2\
0.1 r
LSD 5%
o C • .<.- ~ '-'- '--'-CM CM/CM CM/MCO Meo MCO/CIIfICO/MCO
(B) Sink-Source Ratio 5 MO After Planting
6~N~O~,O~f~R~O~o~t=S~/M~2~l=e=af~A~re~a~ ____ -,
5
4' LSD 5%
3
2 .
J CM CM/CM CM/Meo MCO UCO/C~CO/MCO
Treatments
Figure 5.32 Influence of grafting treatments on HI and sink-source ratio (LAI/no. storage roots) 5 mo after planting.
lower HIs and sink-source ratio than plants with CM 489-1 as stock. This suggests that sink capacity is important in biomass partitioning. This also means that the distribution of assimilates in this trial was controlled mainly by the stock.
5.3.4 Photosynthesis
Table 5.9 presents data on leaf gas exchange as measured at 3 and 4 mo after planting. Higher rates of net photosynthesis were observed in CM 489-1 leaves (avg of scions and control s of CM 489-1) than in M Col 1684. Differences were due more to mesophyll characteristics of clones than to stomatal differences.
Grafts of CM 489-1/M Col 1684 did not show any decrease in photosynthetic rates compared to the self-graft of CM 489-1, despite reduction of sink capacity (root no.). In the
219

Table 5.9 Influence of scions and reciprocal grafting on gas exchange characteristics.
Net PhotOSY2thesis Internet ce Stomatal CTt"""" OVerall Avg ca 2 _11m l. -2 """,11m 'o
CM 459,' 26.85 a 197.19 b 713.27 M Col 1684 23.46 b 212.31 • 709.70 ns
Graft Treatments
D4 489-1 control 26.58 b 199.4 d 721.15 CM 489'I/CM 489·1 selt'gratr 26.99 • 195.93 • 720.37 CM 489~1/M Col 1684 recipprocal graft 26.97. 196.22 e 693.30 M Col 1684 control 23.30 d 212.4 b 705.5 H Col 1684/" Col 1684 self'gra,t 22.60 • 216.33 • 716.37 " Col 1684/CM459·1 reciprocal grafr 24.50 e 208.19 e 707.23 na
AH vatUM até avg 01 5 ~asurements between 92 and 134 f)AP.
2 OMRT, P : 0.05.
grafts with M Col 1684 as stock, a significant increase in aerial biomass compared to self-graft (data not shown) offered an alternative sink in the absence of large root no. On the other hand, leaf photosynthesis was enhanced in the graft of M Col 1684/CM 489-1, compared to self-grafting of M Col 1684 and M Col 1684 control, suggesting a possible effect of large root no. on leaf photosynthesis. In this case, the enhancement in CO uptake was associated with lower internal CO:;>. concentr~tion, suggesting nonstomatal regulating mechanisms.
The hypothesis of a "feedback" effect of sink-capacity on photosynthesis appears to be confirmed partia11y. Final DMY was significantly correlated with avg leaf photosynthetic rate (r=O.65, P<O.001), with avg LAI (r=O.75, P<O.001) and with final no. ef sterage reets (r=0.77, P<O.OOl). On the ether hand, no significant cerrelations were observed between RY and avg wt of individual storage reets or with DH content at final harvest.
5.3.5 Conclusions
Number of capacity. different
storage roots seems to be a good indicator Yield was affected by sink capacity
root stocks. Root sink capacity affected
220
of sink of the biemass

partitioning between top growth and roots. A feedback effect of no. of storage roots on photosynthesis was detected. To determine in greater detail tile sink strength of cassava clones, sink capacity should be complemented with parameters describing sink activity.
5.4 Soil Fertility Kaintenance and Erosion Research in Asia.
From October 22 to 27, the Third Asian Cassava Workshop was held in Malang, Indonesia, at which researchers from national programs presented results of the agronomy trials conducted from 1987-90. Most of this research was conducted in collaboration with, and with small financial contributions from, ClAT. An across-country overview of this research, highlighting the most important results, was also presented. Thus this report will be limited to the principal results obtained during 1990 in the area of soil fertility maintenance and eros ion control in Asia.
5.4.1 Soil fertility maintenance
5.4.1.1 Fertilizer response. Short-term fertilizer trials conducted with cassava in many Asian countries have usually shown a marked response to N and an occasional response to K, but seldom a significant response to P. This is in sharp contrast to similar trials conducted in Latin America, where cassava often responds principally to P, especially in the low-fertility Oxisols, Ultisols and Inceptisols, where cassava is principally grown. In Asia, however, it is estimated that 55% of the cassava is grown on Ultisols, 18% on Inceptisols, 11% on Alfisols, 9% on Entisols and only 7% on Oxisols, Mollisols, Histosols and Vertisols combined. Although Ultisols have relatively low levels of OM, P, K, Ca and Mg, they are not nearly as infertile as many of the Oxisols and Inceptisols on which cassava is often grown in Latin America. For that reason, fertilizer responses in Asia tend to be less pronounced than those obtained in Latin America, and the responses tend to be limited to NPK, very seldom to the secondary or minor nutrients.
While short-term trials in Asia have usually shown a major response to N, several long-term fertility trials have invariably shown a major response to K. As cassava extracts large amounts of K in the root harvest, it is expected that continuous cassava cultivation on the same soil will eventually lead to K exhaustion and a significant response to K. To determine both the short-term fertilizer response and the long-term nutrient requirements for cassava, simple longterm fertilizer trials were initiated at 13 locations in 7 countries. Most of these trials had a standard design of 12 treatments, in which 4 levels of NPK were combined in an incomplete factorial designo The levels and sources of the
221

nutrients varied among locations, depending on the native soil fertility.and the type of fertilizers available.
Table 5.10 shows the soil characteristics and the relative response to the application of NPK at the various locations. As expected, the major first year response was to the application of N, while only in two locations in E. Java was there al so a significant response to P or P and K. The soil analyses data in Table 5.10 indicate that at most locations soils are intermediately acid (pH 5-6) and relatively low in OM, P and K. But even at very low soil P and K levels, there was seldom a response to the applied nutrients. Only in the trial at Thai Nguyen in vietnam, was it possible to observe (not yet harvested) a marked first-year response to K because of the very low level of exchangeable K in these soils. It is expected that after several years of continuous cropping in the same plots, cassava will start to respond mainly to the application of K.
Figure 5.33 shows the response to NPK in Guangzhou, China and in Tarokan, Kediri district oí E. Java. In Guangzhou there was a significant response only to the application of N; while in Tarokan there was also a significant response to P. In both locations there was a very marked response to the application of NPK combined, which nearly doubled yields in Guangzhou and tripled yields in Tarokan. Figure 5.34 shows the response of a similar trial conducted in Jatikerto of Malang district in E. Java, in which cassava was intercropped with maize, as this is the standard practice in E. Java. Although in tllis case there was a significant response to alJ. three nutrients, it is also clear that there was a marked negative response oí cassava to the highest level of application. This is because the intercropped maize responded markedly to the highest level of application of N, thereby creating an increasing level oí competition for light and water with cassava, which resulted in decreased cassava yields at the highest level of fertilizer application. These examples illustrate that fertilizer recommendations obtained in monoculture are not always correct when the crops are grown in intercropping systems.
5.4.1.2 Effect of green manures. A trial on the effect of green manures on cassava yield and soil fertility was initiated in Pluak Daeng, Thailand in 1988 and replanted in 1989. In 1989 the green manures were p1anted in the early rainy season (June) and cut after two months. The tops were left as a mulch on the soil surface and cassava was planted without further soil preparation.
Table 5.11 shows the dry weight and nutrient content of the green manures at time of cutting. Canavalia ensiformis and Crotalaria iuncea--the two most productive legumes--absorbed the greatest amounts of N and K. They also resulted in the
222

fable 5.1Q Soit characteristic$ and the first-year relativ. response of cassaVI to application of NPK fertilizers in varlous loe.tiana in Asia.
highest cassava yields. Unlike the previous year, when incorporation of nearly all green .manures increased cassava yields, the application of green manure mulch this year increased cassava yields only in the case of three species. Q.,. juncea was among the most effective species in both years I increasing cassava yields even above those obtained with chemical fertilizers. Sesbaniarostrata, which was the most effective species last year, had no significant effect this year.
223

'" '" .1>
'" <11 .c: ......
301 (A) Guangzhou
Guanuzhou
.. e -/ J
10
o'" ...1-...... 1..-...1.. __ .....1
~ ~ -
I..~ ¡
A se 201
• se 205
~ 30, (B) Tarokan Tarokan
tll
j 21)
10 1"
60 Pz"s
•• Faroka
~
100 N
100 ILO
-....-.. .
200 O 25 60 100
100 K20
o' b sO 100 o
100 N
60 P205
50 100 200 0·0-0 100-60100 200100'200 kll NoP20,·KzO/h. kg N/ha kll ~06/ha kg KzOlha
Figure 5.33 Response of cassava to NPK application in the first year of cropping in Guangzhou, China (A) and Tarokan, Indonesia (B) in 1988-89.

o J I I
050100 ... NIhe
1 UlDI.06l
:t eSO tosl
200
4.0
! tO :;;
Ll,a--,~ao"--200-LlNa o 50 100 P:zOs O 100 200 ":p
... Ihe
Figure 5.34 Response of intercropped cassava (Faroka) and maize to the application of various levels of NPK in the first year of cropping in Jatikerto, Malang, Indonesia in 1988-89.
It can be seen (Table 5.11) that cassava yields were low even when fertilizers were applied because cassava could only be planted in August (i.e., toward the end of the wet season) and had to be harvested at 9 mo, 5-6 mo of which were very dry. Thus the growing of a green mahure crop before planting cassava may not be feasible in areas with only one relatively short wet season because much of the wet season will be used for growing the green manure and little is left for cassava. Green manuring may be a more attractive alternative in areas with a bimodal rainfall distribution or in those that have a longer wet season. In Thailand it may be useful only if cassava can be left in the ground for 15-18 mo and grown in a 2-yr cropping cycle.
225

Table 5.11 Effect of green marure crops on yield of cassava at Rayong, Thai 18m in 19894
Green Kanu •• Crops(l)
------------------------------------------ eassava Dry Wt N P K RY
Treatment (t/ha) ··········kg/h.·········· (t/ha)
Ne fertil izer 5.75 bcd Sesbenia speciosa 2.15 b 61.31 e 2.54 abe 40.38 b 4.46 cd
Sesbania rostrata 3.46 b 57.11 • 4.56 a 55.29 b 5.37 bcd sesbania aculeata 2.54 b 56.94 e 3.67 ab 40.96 b 4.42 cd Indlgo 3.21 b 101.73 be 2.25 ab 41.06 b 5.08 bcd Canavalia ensiformis 6.96 a 183.54 a 2.36 be 93.58 a 7.00 abe
Mue...... fospeada Z.ro b 74.33 e 3.25 ab 39.77 b 6.08 abcd Crotalaria mucronata 7790 2.86 b 65.81 e 0.67 e 37.14 b 5.17 bcd Crotalaria spectabilis 2.98 b 153.83 ab 1.61 be 51.36 b 3.96 d Crotalaria juncea 6.88 a 209.08 a 3.38 ab 97.14 • 8.83 • Plgeon pea (ICR1SAT) 3.46 b 86.Z3be 1.81 be 45.48 b 4.5D ab Fertilizer (94~O-50 Kg/ha) 7.71 ab
F-test .. •• ~ . .. •
(1) Dry wt ard rutrient eontent of green ma~re crops at time of c:utting.
*,*" - Means within a colurn, followed by the same letters are not significantly different at 5X and 1X levels t resp., OMRT.
5.4.1.3 Effect of cover crops. One al ternati ve manuring is to grow a legume crop together with with the purpose of protecting the soil from controlling weeds and contributing N to the cassava
to green cassava, eros ion, crop.
Thus in 1988 and 1989 several legume species were grown as cover crops under cassava in Pluak Daeng, Thailand. In 1988 the cover crops were seeded in rows at the time of planting cassava. AIl cover crops competed with cassava, causing a reduction in cassava yields (1989 Annual Report). In 1989 each legume plot was split in two; in one half, 30-cm wide strips for planting cassava were prepared mechanically with a hand tractor, whila in the other half the strips wera prepared by spraying an herbicide (Gramoxone = paraquat) to kilI the cover crops. Cassava was planted at 110 x 90 cm distance in the preparad strips. Table 5.12 shows the number of plants harvested and the cassava RYs obtained for both methods of plant bed preparation. The cover crops had no significant effect on cassava establishment, but significantly decreased cassava yields due to competition for
226

Table 5.12 Effect of cover cropo on stand and yi.ld of cassava at Pluak 0"09, Thailand in 1989.
Ho. Planto at Harvest CHova RY
Treatment ('OOO/ha) (t1ha)
land preparation CM) . Mechanic.l land preparation (A) 9.85 a 6.44. ~ Herbicide spray (8) 9.59 b 5.46 b
F·test • •• A 8 8 X
Cavor cropo (S): Monoculture cassava 10.10 10.10 7.79 7.19 7.49 ¡ndigo 9.119 10.10 6.36 6.56 6.46 Centrosema p.bescens 10.10 8.84 5.60 2.99 4.29 CentfOSem8 acut; fal hin 9.68 9.26 6.69 3.41 5.05 Macropti II iun atropurpureun 9.47 9.05 7.70 4.46 6.08 Mifl'OSB envise 9.89 10.10 6.48 8.04 7.26 Stylosanthes hameta 9.47 10.10 3.91 4.71 4.31 Stylosanthes guianensis 9.119 9.45 6.56 5.26 5.91 Ar-achis pintoi 10.10 9.68 6.56 6.06 6.31 Desmodiun oval i fol it.an 9.119 9.26 6.78 5.85 6.31
F·test HS •
lSO(O.OS) for interaction (MxS) 2.13
*,** - Meaos wfthin a column, followed by the same letters are not significantly diffenent at 5% and 1% tevels_ resp.f DMRT~
1 ight , water and nutrients. As the cover crops were cut at a 3D-cm height at regular intervals to prevent excessive light competition, cassava yield reduction was less pronounced in the second year than in the first when the growth of cover crops was not controlled. Nevertheless, cassava yields were significantly reduced by the oover crops of Centrosema pubesoense and C. acutifolium, as well as by siratro (Macroptillium atropurpureum) and Stylosanthes hamata when the strips were prepared by herbicide spraying (there was much less yield reduction when a hand tractor was used). Given its relatively slow establishment, S. hamata was the least competitive cover crop in the first year; however, in the second year it was among the most oompetitive cover orops, causing a significant reduction in cassava yield with both methods of plant bed preparation. Mimosa envisa, Arachis pintoi and Desmodium ovalifolium were among the less competitive cover crops. Soil analyses after every
227

cassava harvest indicate that the cover crops had no significant effect on soil fertility and could not prevent a significant reduction of the level of OM, from 0.93% before planting the first cassava crop to 0.57% at harvest of the second. Thus, while cover crops may be effective in reducing eros ion, they seem to contribute little to the maintenance of soil fertility and can cause severe competition for cassava, especially during periods of drought. For that reason, it is unlikely that farroers will find this a useful practice.
Table 5.13 shows the results of a similar trial conducted at the South China Academy of Tropical Crops (SCATC) on Hainan Island. Four rows of cassava were alternated with one row of pasture species, four grasses and four legumes, with the objective of establishing apasture after the cassava harvest. Brachiaria dictyoneura and ~ humidicola were the most competitive grasses; setaria anceps, the least competitive. Among the legumes, stylosanthes guianensis and Q.... hamata were less competitive than the two Desmodium spp., mainly because of their slower rate of establishment. Brachiaria decumbens was most productive in terros of DM production. The strip cropping of pasture species within a cassava stand seems to be a promising way of establishing pastures without seriously affecting cassava yields.
Tabte 5.'3 Effect 01 intercropping cassava(1) with varlOU$ pasture legumes ano grasses en cassava RY and pasture production at SCATC,
Hainan. China l 1989~
Cassava RY Pasture Yleld Itlna) It OMIna)
1. Cassava + Brachiaria decumbens 20.5 8.53
2. Csssava + Brachiaria dictyonuera 16.5 5.53 3. Cassava + 8rachiaria humidicola 19.4 5.33
4. Cassava + Setaria anceps 21.5 3.47 5~ Cassava + Stylosanthes guianensis 22.1 0.72 6. Cassava + Stylosanthes hamata 22.0 0.63 7. Cassava + Desmodium ovalifolium 20.9 3.33 8. Cassava + DesllotHun gyroides 19.8 0.85
(1) 4 rows of cassava var. se 205, alternated with 1 row of pasture spp.
228

5.4.1.4 Effect of intercropping. Intercropping cassava with grain legumes will establish a rapid soil cover and reduce erosion; and the crop residues of the intercrops, if left in the field, can contribute nutrients to cassava and help maintain soil fertility.
During 1988-89 a trial was conducted in Rayong, Thailand to determine the best spacing of peanuts, mung beans and soybeans intercropped between cassava rows. Cassava was planted at 180 x 55 cm at a population of 10,100 plants/ha. Table 5.14 shows that cassava RY was not significantly reduced by the mung bean intercrop, but was reduced by intercropping with 3 rows of peanuts or with 2-3 rows of soybeans. Cassava RY was always higher when the intercrops were planted at 60 rather than at 45 cm from the cassava row, but the intercrop yields were generally slightly higher at 45 cm. Although intercropping always increased the land equivalent ratio (LER), the various spacing treatments had no significant effect on the LER. Gross income was significantly increased only by intercropping with peanuts, while soybeans or mung beans had no positive effect on income.
Another intercropping trial was conducted in Hung Loc centre, South Vietnam, where cassava was intercropped with seven grain legumes and maize. Table 5.15 shows that cassava RY was slightly increased by intercropping with soybeans and mung beans, which produced very low grain yields, but decreased by intercropping with winged beans, peanuts, cowpeas and maize. Net income was greatest for cassava monoculture or when intercropped with peanuts. All other crop combinations were less profitable.
5.4.2 Soil erosion control
Because of its slow rate of early growth, cassava normally takes several months for complete canopy closure. For that reason cassava cultivation can cause serious problems of soil erosiono However, once the crop is well established, the foliage is quite effective in protecting the soil from the direct impact of rain drops. To be effective in reducing soil erosion, cultural practices should therefore aim at rapid canopy closure I minimum disturbance of the soil, or provision of barriers to slow down water runoff. To determine the most effective soil and crop management practices that reduce erosion and increase cassava yields, simple eros ion control trials were conducted at 10 locations in 5 countries. Different management practices were established on relatively large plots with a uniform slope; a contour channel was built below each plot to catch the eroded soil sediments, which were weighed at month1y intervals. In most locations the channels were lined with plastic sheet s that had little holes to let the runoff water seep out; but at a few locations the channels were lined with a tightly woven
229
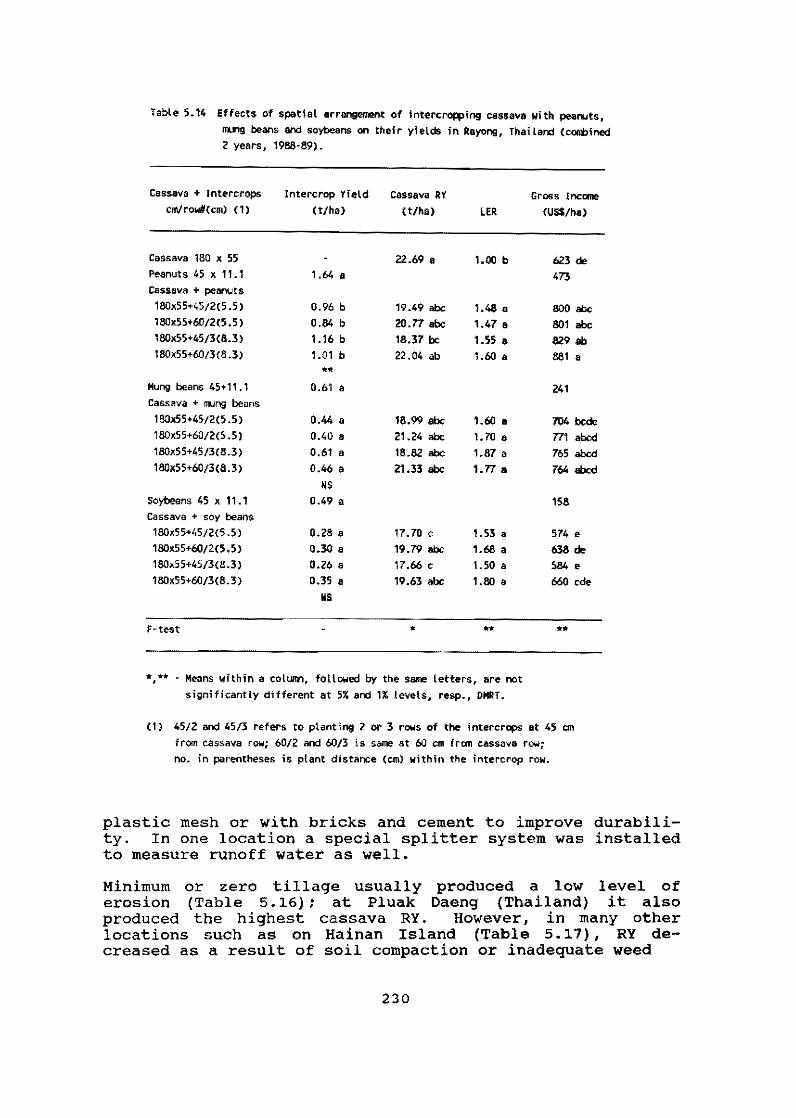
Table 5.14 Effects of spatial arrangement 01 interc~ing cassaYa with peanuts, l1U'l9 beans and soybeans on th.fr yi.ldo in Rayong, ThaBa"" (cooQ:)ined 2 yea .. , 1988·89).
Cassava + Intercrops Intercrop Yield Cssssva RY cl1\lroW#(cm) (1) (t/ha) (t/ha) lER
Cassava 180 x 55 22.69 • 1.00 b Peenuts 45 • 11.1 1.64 a Cassava + peanuts 180.55+45/2(5.5) 0.96 b 19.49 abe 1.48 • 180x55*6O/2(5.5) 0.84 b 20.77 abe 1.47 a 180x55+45/3(8.3) 1.16 b 18.37 be 1.55 • 180.55+60/3(8.3) 1.01 b 22.04 ab 1.60 a
•• Hung beans 45+11.1 0.61 • Cassava .. I1l1ng beans
180x55+45/2(5.5) 0.44 • 18.99 abe 1.60 a 180.55+60/2(5.5) 0.40. 21.24 abe 1.70 • 180.55+45/3(8.3) 0.61 a 18.82 abe 1.87 a 180.55+6013<8.3) 0.46 • 21.33 abe 1.77 •
NS Soybeans 45 x 11.1 0.49 a Cassava + soy beans 180.55+45/2(5.5) 0.28 a 17.70 c 1.53 • 18Ox55+6O/2(5.5) 0.30 a 19.79 abe 1.68 a 180.55+45/3(8.3) 0.26 • 17.66 c 1.50 • 180xS5+6O/3{8.3) 0.35 a 19.63 abe 1.80 a
NS
F-test •
• •• , ~ Means within a column, followed by the same letters, are not significantly different st 5% and 1% levels, resp~, DMRT.
Gross Incorne
(USS/ha)
623 de
473
800 abe 801 abe
829 ab 881 a
241
704 bede 771 abcd
765 abcd
764 abcd
158
574 e 638 de
584. 660 cde
••
(1) 45/2 and 45/3 refers to planting 2 ot 3 rows 01 the intercrops at 45 cm from cassava row; 60/2 and 60/3 i& same at 60 cm frctn cassava row; no. in pa~theses 15 plant distance (cm) within the intercrop row.
plastic mesh or with bricks and cement to improve durability. In one location a special splitter system was installed to measure runoff water as well.
Minimum or zero tillage usually produced a low level of erosion (Table 5.16); at Pluak Daeng (Thailand) it also produced the highest cassava RY. However I in many other locations such as on Hainan Island (Table 5.17) I RY decrea sed as a result of soil compaction or inadequate weed
230

Table 5.15 Economic evaluation of intercropping cassava with grain legumes and malle at HlSlg loe Centre, South Vietnam, 1989~90.
Y¡eld (t/hal Grosa Net Cost Inc_ Inc ....
Treatments CSSsaV8 Intercr-ops (USS/ha)
1. Cassava .. winged bean 17.97 0.58 345.9 346.8 0.9 2. Cassava + peal'lJts 22.57 0.86 363.9 496.9 133.0 3~ Cassava + soybeans 25.92 0.00 313.4 388.8 75.4
4. Cassava + lab·lab 21.98 0.00 313.4 329.7 16.3 5. Cassava + lIUlg beans 23.34 0.27 378.5 440.1 61.6 6. Cassava + Canaval i 8 21.17 0.00 313.4 317.5 4.1 7~ Cassava + cowpeas 21.02 0.31 378.5 413.5 35.0 8. CaS$áva + maize 20.02 2.23 345.9 430.4 84.5 9~ Cassava monocutture 21.95 0.00 190.5 329.2 138.7
Table 5.16 Effect of soH and crop management on cassava RY and losses due to erosion in Pluak nl.en;¡, 'lhaHand, 1989.
3 d1sc plow + 7 disc har:row¡ no r1dgin;¡ 3 disc + 7 disc; contour ridgin;¡ 3 disc + 7 disc; up-and-down ridgin;¡ cassava harvester No tillage 3 disc + 7 disc; no fertilizers 3 disc + 7 disc; closer spacin;¡ (0.8XO.8m) 3 disc + 7 disc; cassava (lxlm) + peanut intercrop
ISO (0.05)
Root yield (tjha)
10.8 12.4 12.7 11.8 14.3 11.2 11.3 9.5
3.18
control. The localized preparation of planting holes with a hoe (Table 5.17) further reduced erosion and gave better RY. contour-prepared strips alternated with unpreparad strips, was not affactive in reducing eros ion in either Thailand or Hainan (Table 5.17); it also resulted in low yields.
Normal plowing followed by harrowing always resulted in high so11 losses in Thailand, Indonesia, China and the
231

Table 5.17 Elfeet of ... thod of lord preporation en dry soH l .. ses We to erosion ard '" fresh RY of cassa.a (1) planted on 25% slope at $CATe, Hainan, China. '989.
SOil Loss (t/ha)
1. cooplete preparation:2 plowing, 2 discfng, contour ridging 71 2. 2 plowing, 2 disdng, no ridgíng 141
3. 1 plowing, no ridging 91
4. 4 m wide plowed strip olterneted with 1 m strip without prep. 145 5. 2 m wide plowed strip alterneted wlth 0.5 m strip wíthout prep 82 6. preparation of plant;ng hote with noe 38 7. no preparat i on 60
• cultivar se 205
CaSS8V8 RY
(t/ha)
26.3 26.0 21.3
23.5 22.6 25.5 22.6
Philippines unless this practice was followed by contour ridging. Contour ridging was consistently effective in reducing erosion and usually resulted in high yields (Figs. 5.35 & 5.36; Table 5.17).
Planting intercrops or live barriers of grasses, legumes or hedgerow trees generally reduced erosion, but tended to reduce cassava RY because land was occupied by the barrier species or there was direct competition for light, water and nutrients. In Thailand (Table 5.16) intercropping with peanuts reduced erosion but also seriously reduced cassava RY. In Lampung Province of Indonesia, intercropping cassava with maize, rice or peanuts also reduced eros ion (Fig. 5.37) but seriously reduced cassava yields (Table 5.18). Gross income was highest when cassava was first intercropped with peanuts, followed by mung beans.
In E. Java it was found that live barriers of elephant grass (Pennisetum purpureum) or setaria grass (Setaria anceps) were more effective in reducing erOS1on than those of peanuts or hedgerows of Leucaena or Gliricidia (Fig. 5.3a). Elephant grass, when regularly cut, is a highly promising live barrier. On Mainan Island of China, a live barrier of Brachiaria decumbens was generally more effective in reducing eros ion than one of Stylosanthes guianensis.
Application of dry grass as a mulch was found to be highly effective in the Philippines, reducing erosion and increasing cassava RY, probably through the release of some nutrients. Althouth application of chemical fertilizers reduced eros ion consistently in various trials in China, the
232

o 2 4 6
..... _ .... _ .... _ .. no ridge. peanuts
,..JIr_ ...... - ...... - ...... no ridge. setaria
_--'--�--- contour ridgas. no live barrier
r-_o---o---.Q contour ridges. Leucaena ::::::=::::=: contour .idges. Gliricidía , _ contour rillgas. peanuts ,_ ...... ~--t_-..:. contour ridges. setaria gr8SS
8 10 12 Months after plantíng
Figure 5.35 Effect of various agronomic practices on accumulated dry soil loss due to eros ion in a farmer's cassava field with 8% slope in Sri Racha, Thailand in 1988-89.
Philippines and Thailand (Figs. 5.35 & 5.36; Table 5.16), it increased eros ion at some locations in China, probably due to the loosening of soil during application; moreover, the fertilizers had no significant effect on growth and yield. It i9 mainly on very poor 90ils that fertilizer application will increase yields and reduce erosion through a mora rapid canopy closure. The latter can also be achieved by closer plant spacing, which was very effectiva in Thailand in reducing erosion and increasing yield (Table 5.16). A spacing of 80 le 80 cm could be recommended. In Lampung, Indonesia, square planting (100 x 100 cm) reduced erosion markedly when compared with single (200 x 50 cm) or double (273 x 60 x 60 cm) row planting even when these rows were grown along the contour (Fig. 5.37; Table 5.18).
233

160
120
80
2
160 (e)
2
Ce) 400
]
I 200
O A M J J
• Stylooanthe. no f"'tlllzer
wlth '.<tUlzer
cIoMr lpeclng
como... rldgM .8rachlarl.
4 8 8 10 monIlla after plantIng
4 month.
A
,,;::::t;::=~ 1 plow In .tr!pe oI4m ~ 2plow. 2 dilO
6 8
, plow
, plow In It,lpa 01 2m 2 plow • 2 dilO' 'Id; .. no Pl"'Pl'atlon
plantlng hole
10 aft.. plantlng
S o N
Figure 5.36 Effect of various cultural practices on accumulated soi1 10ss due to erosion in cassava planted at SCATC, Hainan, China, 1989.
234

80
60
¿ 40 ...
'12D ., ~ .. O ., O 2 .Ji!
'o (B) lO 60
al ... ~ 40 E :¡ o o «
20
O
O 2
E (e)
..5400
i ~
>200 ::;: ... e o :E
O O J
• • • • • • •
.... cassava2.73x60x60 O. peanut •• cassava 200x 50 0- rice • a cassava 100xloo 6- maize
4 6 8 10
... cassava monoculture 100 X 100 cm o,. cassava + peanut - mungbeans o ~ cassava + rice- peanuts 6 _ cassava +maize-peanuts '7 _ cassava +maiZ8+rice-peanuts
4 6 8 10 Months after planting
F M A M J J A S O
12
12
Figure 5.37 Accumu1ated dry soi1 10ss by erosion in various monocrop (A) and intercropping (B) systems during an 11-mo cropping cyc1e in Tamanbogo, Lampung, Indonesia in 1988-89; rainfa11 distribution is shown in (e).
235

Table 5.1a Effect of planting arrangement en soil losses by erosion as well as en the yield and gross jncome from cassava, rice, malze, peanuts and fTIJng beans grown in various intercro¡:ping systems in Tamanbogo,
LarrpISl9. Indonesia, in 1988-89.
Cassava Yfeld (tIlla) Gross Dry $oH Cropping Spacing Cassava Rice Maize PearLJts Mu1g 8eans IncOfOO(1) lo .. System (cm) ('OooRp/ha) (t/ha)
A-l C+M+R-P lOOxloo 21.73 1.19 0.83 0.232 1596.3 31.52 -2 C+M-P .. 30.91 2.18 0.226 1766.8 34.22 -3 C+R-P u 31.95 1.94 0.177 1664.1 36.30 ·4 C+P-Mu u 32.53 0.009* 0.078 2091.7 40.86
8·5 e_R'? 200x50 21.41 2.21 0.49 0.21,7 1638.4 41.25
'6 C+M'P .. 23.54 1.97 0.349 1551.2 41.88 ·7 C+R~P .. 28.30 2.59 0.232 1910.6 32.81 ·9 C+P-Mu .. 31.73 0.816' 0.065 2003.6 41.97
C·9 C+M+R-P 273x60x6O 22.44 2.04 1.11 0.173 1668.6 4055 ·10 C+M-P " 22.79 2.21 0.349 1557.2 34.07 -11 C+R'P " 29.90 1.88 0.325 1902.1 33.27
'12 C+P-Mu " 36.08 0.553' 0.095 2016.9 38.40
0-13 R-e 100xl00 18.83 3.63 1551.8 39.28
-14 M·e " 22.31 1.77 1157.9 35.34 -15 p-e .. 16.89 1.055" 1625.1 44.56
E-16 e monocutt 100xl00 43.57 1742.8 49.58
·17 e " 200.50 42.54 1701.6 60.66 ·18 e .. 273x60x6O 44.05 1762.0 70.95
(1) Crap prices: Cassava (C) Rp 40/kg fresh roots Ríce (R) 220/k9 paddy Mai ze (M) 150/l<g dry grain
Pea...,t. (P) 900/k9 dry pods
Mung 8eans (Mu)000/k9 dry grain Avg exchange rate for 1988-89~ US$ = Rp1800
* first intercrop of peanuts. others second intéte~.
236

~~'--4~~nori~.~~
! ~ ____ .. no ridgo ••• terla sr'"
_ ........... __ .. contour ridges. no live bar,ier
;~:::::~~=~ contour ridges, Leucaena oontour ridg8S, GlirickUa Pé.:::;;-'':,...- contOur ,uiges. ~t.
~-"'"___ contour ridges ... tena 9""'"
__ -"---0--....... :>--0--0--0 contour rídges. elephent graos
B 10 12 Months efte, plantinll
Figure 5.38 Effect of contour ridging and various live barriers on accumulated soil loss due to erosion during a lO-mo cropping cycle (2nd yr) of cassava in Jatikerto, Malang, Indonesia in 1988-89.
From these experiments it may be concluded that soil erosion can be greatly reduced by (a) simple agronomic practices that result in a rapid canopy closure, such as fertilizer application, closer spacing and square planting arrangements; (b) establishing a soil cover such as applieation of mulch, intercropping, and minimum tillage with crop residues left on the soil surface; or (e) by barriers that slow down the runoff water, such as contour ridges or banks, live barriers of elosely spaeed tillering grasses and even rock barriers along the contour. Fertilizer application, mulching and closer spaeing will often also increase cassava RY, which make these practices most attractive to farmers.
237

5.5. Cassava Intercropping Systems
During 1990 the Agronomy section of the Cassava Program conducted outreach activities, mostly OFR in several countries of Latin America. Support research, mostly in intercrop systems with cassava, was conducted both at HQ and on the North Coast of Colombia, the results of which are presented here.
5.5.1 Performance of the cassava/maize intercrop across different environments on the North Coast of Colombia
In most countries where maize and cassava are intercropped, the number of new maize varieties released by national institutions is larger than the number of new cassava varieties. Improvements in the coverage of extension services and the efforts of private seed companies are al so contributing to better availability of new maize varieties te farmers.
Adoption of improved varieties depends mainly on their availability on the local market and on the farmers' economic conditions. Most of the recently released maize varieties have be en developed ·for intensive production in monoculture, with improved Hl as the main breeding objective; however, small farmers cultivate maize using traditional management practices, treating impreved varieties exactly like traditional ones: intercropped with other species, planted at similar densities and stored in the same facilities. Such production practices modernize slowly as the new varieties become more and more familiar te farmers.
The inclusion of new maize varieties in the cassavajmaize intercrop represents a technological innovation with several management implications. National research and extension teams of Colomb ia, Ecuador, Paraguay, Ecuador and, more recently, Brazil are conducting OFR to adapt this new technology better te their specific production conditions.
Several diagnostic studies conducted by ClAT and lCA on the North Coast of Colombia since 1985 indicate that farmers intercrop cassava mainly with traditional maize varieties. The low market availability of seed was given as the main reason for not using new maize varieties more frequently. At the time, two new varieties (V-156 and V-109) were released on the North Coast, based on their performance as a monocrop in farmers' fields. lt was expected that as more seed became available, new maize varieties would replace the traditional ones in the intercrop with cassava. similar situations were developing in other countries where the cassava/maize intercrop is commonly cultivated.
238

since 1985 a series of studies of the agronomic implications of new maize varieties for the maize/cassava intercrop have been conducted jointly by CIAT and ICA-Regional Ir. This ICA unit is responsible for the Colombian North Coast sta tes of Córdoba, BOlívar, Sucre and Atlántico. Several diagnostic studies were conducted, and different experimental procedures were tested in the field. Training in field evaluation methods and data analysis was provided to improve the ability of the national team to conduct OFR on intercrop systems. Similarly linked research and training efforts have been pursued with national institutions of other countries. The fOllowing summary of findings is based on 4 years' research.
Venezolana, the most commonly grown cassava variety on the North Coast, was used in all on-farm trials. Three to five new maize varieties were tested during the experimental phase reported here; however, ICA varo V-156 and V-lOS and the local maize variety were always included. Maize and cassava were intercropped in alternate rows at 1.2 x 1.2 m in a split-plot design with cropping system (maize and cassava in monoculture and the maize/cassava intercrop) as the main plot and maize variety as the subplot. Selection of planting material, protective stake treatment, application of preemergence herbicida and planting wara done jointly by researchers and farmersi however, crop management was the responsibility of each farmer.
Statistical analyses were based on 479 plots grown on 19 farms with at least two reps per farm. Half the plots were planted te maize or to maize associated with cassava, and the other half to cassava as asole crop or associated with maize. Cassava was intercropped with improved maize varieties on 189 plots and with the traditional maize variety on 51 plots.
Intercropping with improved maize varieties increased cassava y ield by ca. l. O t/ha over the association wi th traditional varieties (Table 5.19). Cassava yield reduction, when intercropped with either traditional or improved maize varieties, was small (2-3 t/ha) compared to the cassava monocrop, and was compensated by the additional yield from the maize component (Table 5.20). This may explain why Nerth Coast farmers rarely plant cassava in moneculture. The avg yield of 13 t/ha for cassava as asole crop was very close to the avg yield fer the area, as reported in surveys conducted by ICA and CIAT; but lower than expected gi ven the consistent usa of stake selection and treatment, and preemergence herbicides.
Significant differences in yields of all cropping systems were found between years (P ~ 0.05), which is a characteristic of rainfed, small-scale agricultural systems and is an
239

Table 5.19 Avg yields of cassava as sole crop and intercropped with improved and traditional maize varieties on the North Coast of Colombia, 1985-88.
Cropping Systems
Cassava sole crop Cassava + improved maize Cassava + traditional maize
llield (t/ha)
13.15 a 1 11. 07 b 10.07 e
No. of Plots
239 189
51
1 Means followed by different letters are significantly different (P ~ 0.05, DMRT).
Table 5.20 llields of improved and traditional maize varieties in sol e crop and intercropped with cassava var. Venezolana: avg. of four years (1985-88) of on-farm trials.
Cropping Systems
Improved variety as sole crop Improved variety + cassava Traditional variety + cassava Traditional variety as sol e crop
llield (t/ha)
2.57 a 1 2.40 a 2.01 b 1.93 b
No. of Plots
189 189
51 50
1 Means followed by different letters are statistically different (P ~ 0.05, DMRT).
important factor in farmers' decisions to plant intercrops rather than sol e crops as part of their risk-aversion strategy.
Significant differences in all cropping systems (P ~ 0.05) were found among farms. This variability is related to physicobiological characteristics of the farm itself, as well as to differences in management. In addition to the variability in rainfall distribution froro year to year-which is probably the main cause of differences in yields between years--the environment changes continuously as the farmer rotates from one plot to another within the farm. A progressive decrease in soil fertility from one cropping
240

season to the next occurs if a crop is cultivated on the same piece of land. variations in management were expected even though several activities including planting were standardized through the participation of the researcher; and several cultural practices were common among the farmers included in the study.
No differences in yield were found among cropping systems for improved or traditional maize varieties; however, improved varieties were always superior in yield to traditional ones (Table 5.20). Yield of improved maize was calculated as the average of at least three varieties and was compared with only one traditional variety. The traditional variety is similar in origin and general agronomic performance throughout the North Coast although some variation in performance between farms occurred, as is characteristic of landraces. This variability was not studied.
Comparing yields of cassava and maize in monoculture and in association, the LERs were 1. 77 with traditional varieties and 1.72 with improved maize. These high LER values, in an area where access to land is very limited, clearly explain the farmers' preference for intercropping.
Although both interactions were significant, the level of significance of the interaction between year and cropping system was greater than for the interaction between farmer and cropping system. This could be interpreted as an indication that variations in environmental conditions (e.g., rainfall distribution) affect yields of maize and cassava in all cropping systems tested, more than the variability between farms as production units (e.g., soil fertility, water hOlding capacity, crop management).
When cassava' s reaction to intercropping with improved and traditional maize varieties is evaluated without including the cassava monocrop as a check, cassava yields when intercropped with traditional or improved maize varieties are not statistically different. As the improved maize varo V-109 was included in the field experiments from 1986 onward, comparisons between the yields of cassava intercropped with traditional and improved maize varieties were based on data from 1986-88 (Table 5.21).
A one tjha difference between the yields of cassava intercropped with traditional and with improved varieties of maize would not be detected by an analysis with a 26% coefficient of variance; however, for intercropped maize varieties, the sensitivity of the analysis was 0.38 tjha.
Neither traditional nor improved significant yield reductions as cropping with cassava. These data
241
maize varieties suffered a consequence of interfor maize corroborate

Table 5.21 Yields of cassava varo Venezolana and maize varieties in intercrop; avg of on-farm trials from 1986-88.
Crop Association Cassava Maize No. Plots
Cassava + maize V - 156 10.9 a 1 2.49 a 44 Cassava + maize V - 109 10.9 a 2.35 a 44 Cassava + traditional maize 9.9 a 1.97 b 44
1 Means followed by different letters are statistically different (P $ 0.05, DMRT).
earlier results from other sites in Colombia, but are quite different from what is generally reported in the literature. Based on analyses of three consecutive cropping seasons, the main effects of year and farm on yield of the cassava¡maize association were highly significant. The interactions of year x farm, and among year x farm x cropping system were also highly significant, suggesting that the cassava¡maize association will perform similarly regardless of the maize variety planted; but it will vary as a whole depending upon the environmental conditions prevailing in a given cropping season, the specific conditions of the farm or locality and¡or farmers' management.
Differences due to year and farm were the main sources of variability for the improved maize (V-156, V-I09)¡cassava (var. Venezolana) intercrop (bivariate analysis; P $ 0.01). Cassava¡maize V-156 was the best combination in terms of yield across the localities tested (DMRT, P $ 0.05). No interaction was found for year and cropping system, indicating that the same results should be expected over time despite yearly variation in factors such as weather.
Given the yield increases that can be attained with improved maize varieties with no negative consequences for cassava production, adoption of improved maize varieties would be expected to proceed more rapidly if there were an increase in the relative price of maize. A survey of 360 farms on the North Coast showed that 37% of the farmers were already planting new maize varieties. In Córdoba, where maize monocropping is more common than in the other North Coast states, the proportion of farmers' planting improved varieties was even higher.
242

The stability of different cropping systems across different environments was tested, and the sensitivity of cropping systems to various environments was estimated. For purposes of this analysis, environments refer to a series of farms with characteristic physical, biological and management properties. The environmental favorability oi farms was based on relative comparisons within the range of farms selected as experimental sites. At present, the available regional information on the spatial variability in physicobiological characteristics is inadequate; therefore, the analyses of environmental sensitivity provided in this report should be considered as preliminary.
As asole crop, cassava is less sensitive (Fig. 5.39a) to different environments than any of the maize varieties tested (Fig. 5.39b). Cassava yield estimates varied between 10 and 14 tjha across the environments tested. From this analysis cassava would be expected to yield over 10 tjha even in the least favorable environment although it does not respond very positively to more favorable environments.
The reaction of maize to different environments is very unlike that of cassava. The improved and traditional varieties respond positively to better environments but do not perform very well in the less favorable ones. Contrary to what was expected, the traditional maize variety did not perform better than the improved varieties in the les s favorable environments; but as expected, its performance in the most favorable environments was inferior to that of improved varieties (Fig. 5.39b). V-I09 is claimed to be more drought resistant than V-156. This observation is consistent with the superior yields obtained with V-l09 in less favorable environments; however, the performance of V-156 was superior in more favorable environments.
The general performance of maize as sol e crop and in association wi th cassava is similar in terms of environmenta1 sensitivity. The behavior of each variety under intercropping can be predicted from its behavior in monoculture; however, the expected yields in intercrops are lower than in sole crop (Figs. 5.39a & c).
From the standpoint of cassava, association with maize increases its sensitivity to different environments as the cassavajmaize performance is inferior to that of cassava as sole crop in less favorable environments and much better than cassava monoculture in more favorable environments.
5.5.2 Effect of fertilization on the cassava/maize intercrop
Deciding upon fertilizer recommendations for intercrops is difficult because the components generally differ in their requirements for nutrients and in the manner and timing of
243

4.5 (a)
2.5
1.5
-1700 -1100 -500 o 400
20.0 (b)
t , ... ".# . ,,"
1000 1600
Maize V-·~l56 Maize V-I09 Local Maize
;:: 10.0 _,f ~ ~,,# : Cassava + Maize V-156 ~ - Cassava + Matze V-l09
5 :;o' ..,,,,'!Ie I il . l' ,.","" ,,,'*' I •••• ",."" Cassava + Local Haize t ,. ., I (J ",,'/ ,<1 I Cassava sole c.rop
¡ ~--~"~~~r--.o --+I--~o---.--__ ~--~o __ ---1!XW -iffil ~ O:ro:¡ (ID) 1!XW
l'JIVIROllllEllToIl. EFFECT
(e)
3.
2. --- Maize V-l56 + Cassava
1. ----- Maize V-I09 + Cassava
-1700 -1100 -500 o 400 1000 1600
EIIV lRO!OOlIITAL EFFECT
Figure 5.39 Sensitivity analysis for (a) eassava sol e erop and intercropped with a regional and two improved maize varieties¡ (b) three maize varieties as sole erop¡ and (e) three maize varieties intereropped with eassava. Environments to the left and right sides of the perpendicular divisory lines are less and more favorable, resp. (analysis of ineomplete data from experiments on the North Coast of Colombia, 1985-88.)
244

application. Furthermore, the relative ability of a given species to take up a specific nutrient while competing with the root systems of other species is not well understood. When cassava is intercropped with maize, the latter will probably respond positively to increases in N applications up to a level that depends on variety and soil type. Cassava, on the other hand, will increase its HI at N levels that are still adequate for increased maize yield. Similar relationships occur with other nutrients and other crop combinations. In practice, farmers will decide whether to fertilize a given intercrop based mainly on the probable return on investment in fertilizers by either or both crops.
Improved maize varieties have outperformed traditional varieties in association with cassava at several experimental sites, without negatively affecting cassava yields. New maize varieties perform even better in an intercrop with cassava if small amounts of fertilizers are applied.
If the tendency to replace traditional with improved maize varieties continues, farmers will eventually be faced with the decision of whether to fertilize the maize planted in association with cassava in order to benefit fully from the use of improved maize varieties, which allocate more photosynthates to the grain than traditional varieties. Consequently, soil nutrient depletion will proceed at a faster rate as new varieties replace the traditional landraces. In most regions where the cassava/maize association is found, production systems rely on fallow periods for the restoration of soil fertility. As improved maize replaces traditional varieties, the duration of the fallow phase will have to be increased, or fertilization of the new maize varieties will be required if soil fertility is to be maintained. possible benefits of fertilization to the cassava/maize intercrop include higher maize yields in the short term and greater sustainability of production in the long runo
Few recommendations for fertilization of the cassava/maize association are available in the literature; however, positive responses to small amounts of fertilizers were obtained with new maize varieties intercropped with cassava in preliminary experiments at a few sites on the Colombian North Coast. Direct application of fertilizer (in bands) to maize, approx. 10 days postemergence, rather than to the two crops simultaneously at planting gave the best results in small-scale trials. As the improved maize varieties were developed for cultivation in monoculture but performed better than traditional ones in association, the existing technical recommendations for fertilizing maize as sole crop could presumably be used for intercropped maize.
On-farm trials were planted in order to verify these preliminary results and test the performance of intercropped
245

maize when fertilized according to the recommendations for maize as a monocrop. Based on soil analyses, three farms were selected with high, medium and low soil fertility levels (Table 5.22). Farms were chosen from a single state in order to minimize differences in rainfall, planting dates and management practices. A completely random block design of three blocks and four fertilizer levels (low, medium, high and no fertilizer; see Table 5.23) was used (3 reps within each farm). Except for the fertilizer treatments, management decisions were taken by the farmer.
The effects of fertilizer treatment (Table 5.24) and farm fertility level on yield were highly significant, and the interaction between these factor s was also highly significanto The low level of fertilization resulted in an increase in maize yields of ca. 1. O t/ha. Yields obtained with the medium and high fertilization rates were not statistically different.
Cassava plant height was significantly higher at high levels of fertilization; however, the total weight of the aerial part was not significantly affected by the fertilization treatments. Yield of marketable cassava roots was not affected by the level of fertilization applied to the maize. Cassava HI was not affected by the fertilization treatments; however, there was a significant interaction between 10C81ities and fertilization level for this variable.
Given that cassava yield was not affected by fertilization level, a cost/benefit analysis of fertilization was made based on maize yields only (Table 5.25). The low application rate resulted in the largest marginal net return (5.68) per unit of money invested in fertilization (cost ef the fertilizers plus cost of the labor used). The maximum marginal benefit, however, was realized with the medium level of fertilization.
Yields of maize intercropped with cassava were increased significantly using relatively low levels of fertilization. The results demonstrate that the fertilization recommendations for maize in monoculture are appropriate for intercropped maize. The application of fertilizer in bands, directly to the maize rows of the intercrop, 10 days postemergence, appears to be an effective practice.
The statistical significance of the interaction between localities and levels of fertilization suggests that better characterization of agricultural environments (soils in this case) can improve the relevance of technical recommendations for specific cassava-producing regions.
246

Table 5.22 Soil characteristics of three farms on the North Coast of Colombia with low, medium and high fertility conditions.
Locality According P ppm K to Soil Fertility % OM (BrayII) meqfl00 9
Low 1.2 4.1 0.21 Medium 3.4 4.0 0.47 High 4.6 3.1 0.57
Table 5.23 Rates of NPK appliad to maize intercropped with cassava at three localities on the North Coast of Colombia.
Low-Fertility Locality
Low rata Medium rata High rata
Medium-Fertility Locality
Low rate Medium rate High rate
High-Fartility Locality
Low rate Medium rate High rata
247
N
50 75
100
25 50 75
O 25 50
P205
50 75
100
50 75
100
50 75 100
K20
15 25 35
O 15 25
O 15 25

Table 5.24 Effect of fertilization on maize yields.
Fertilization Level
Low Medium High No fertilization (check)
Maize Yields (tjha)
3.03 b 1
3.68 a 3.65 a 1.89 c
1 Means followed by the same letter are not statistically different (P.$ 0.05, DMRT).
Table 5.25 Total cost (x 100) of fertilizer application, maize yields (tjha), total value of productionj ha (x 1000), marginal net benefit (x 100) due to fertilizer applied and marginal net return per unit of money invested in fertilizers applied at different rates on the North Coast of Colombia.
Fertilization Total Maize Total Marg.Net Marg.Net Level Cost Yield Value Benefit Return
Low 23.5 1 3.03 354.0 330.5 5.68 Medium 37.9 3.68 429.3 391. 4 5.50 High 51.5 3.65 426.1 374.5 3.98 No Fert. O 1. 89 220.4 220.4 O
1 The costjkg of the fertilizers applied (in Colombian pesos) were: urea = $93.8; triple phosphate = $130.4 and potassium chloride = $89.8. The price of one kg of maize was $116.5 (U5$1 = 463.42 Col. 15 Mar. 1990).
5.5.3 Biomass partitioning and nutrient uptake by the cassava/rnaize intercrop
The replacernent of traditional rnaize varieties will accelerate the depletion of nutrients from soils in areas where the maizejcassava association is commonly cultivated. Improved varieties allocate more photosynthates to the grain than traditional ones; therefore, more nutrients will be exportad
248

from production units as grains. Consequently, the recirculation of nutrients within farms will be modified.
To gain more knowledge about biomass partitioning in traditional and improved maize varieties intercropped with cassava, nutrient uptake and recirculation were studied at at Palmira. Maize clone H-211 and ICA varo V-258 were used as improved varieties and the regional materials, Limeño and Clavo represented traditional varieties. These varieties were planted in association with the cassava clone CMC 40 at a density of 20,000 pI/ha. As asole crop, maize was planted at 20 and 50,000 pI/ha, the densities used in crop association (AO) and the commercial density (CO), resp. Cassava was also planted as sole crop at densities of 8300 and 10,000 pI/ha. The first planting density was also used in the intercrop (AD) with maize, and 10,000 pI/ha is the recommended planting density (CO) for the region. As differences in the performance of the cassava/maize association due to spatial arrangement had been reported previously, two spatial arrangements were used: intercrop of maize and cassava in alternate rows (AR) and intercrop on the same row (OR). A split-plot design was used with spatial arrangement as the main plots; cropping system, the subplot; and maize varieties, the sub-subplots.
The total biomass produced by cassava was not affected by the association with maize or the maize variety with which it was associated (Table 5.26). CV values for cassava biomass were relatively high (ca. 30%); consequently, the analysis could not detect a 4. O t/ha difference between total biomass values.
Uptake of nutrients by cassava was not affected by the type of maize with which it was associated (Table 5.27). As the sole crop cassava data (Tables 5.26-27) are an avg of AD and CO planting densities, in general terms the biomass accumulation and nutrient uptake of cassava are similar, whether monocropped or associated with different maize varieties" Total biomass and nutrient uptake by cassava as asole crop (10,000 pI/ha) was higher than in the other treatments, but this difference was not statistically significant.
The total biomass accumulation of the two improved and two traditional maize varieties was similar, but a significant difference between variety types was observed in the al location of photosynthates to product (grains) biomass. Traditional varieties allocated more biomass to vegetative parts of the plant than improved ones (Table 5.28). Allocation of photosynthates to grains was different in the two traditional maize varieties (Table 5.29); however I no difference between the two improved ones was found as to total biomass or biomass allocated to grains. In the traditional varieties, the difference in biomass allocated to grains was
249

Table 5.26 Biomass production by cassava varo CMC 40 in monoculture and in association with different types of maize.
Biomass (t/hal Intercropped Maize Total Leaves stems Roota
H-211 18.90 0.68 8.63 9.68 V-258 17.48 0.44 7.19 9.85 Clavo 17.54 0.64 6.90 9.99 Limeño 20.48 0.55 7.75 12.18 Cassava monoculture 22.07 0.72 9.12 12.23
Tab1e 5.27 Uptake of nutrients by cassava in monoculture and in association with different maize varieties.
Nutrhlnts (kg¿hal Varieties N P K Ca Mg S
H-211 111.9 19.6 118.6 82.2 63.7 14.6 V-258 101.8 17.3 94.0 72.6 58.1 13.7 Clavo 102.6 17.5 104.0 72.2 57.2 13.4 Limeño 124.4 20.3 121.6 80.8 66.0 15.2 Cassava monoculture 130.9 21.1 128.6 98.8 83.0 18.5
Table 5.28 Total biomass and biomass allocated to grains by traditional and improved maize varietiesl avg of sol e crop and intercropped with cassava.
Maize Variety
Improv;ad Traditional
Total
10083 9662
Biomass (kg/hal Grains % to Grains
4312 2113
250
42 21

Table 5.29 Total bíomass and bíomass allocated to graíns by tradítional maíze varieties; avg of sole crop and intercrop with cassava.
Maize Variety
Clavo Límeño
Total
10364 8959
Biomass (kg/ha) Grains % to Grains
1963 2261
18 25
.
statistically significant (Table 5.29), suggesting that they have dístinct origins and, consequently, differ substantially in agrononlÍc performance. The exaet origins of Limeño and Clavo were not known to farmers, but both are considered local varieties in the Valle del Cauea.
Maize intercropped with cassava yielded less biomass than maize as sol e crop (Fig. 5.40a). There was interaction between total bíomass and spatíal arrangement of the intererop (Fig 5.40b). As expected, more total biomass and more leaves plus stems were produced at 50,000 plants regardless of maize variety, cropping system or spatial arrangement (Fig. 5.41). In terms of total biomass, traditional maize varieties yielded more than the improved ones at the 50,000 density, but this difference was not statistica1ly signíficanto At 33,000 densíty the improved varíeties yielded sígnifieantly more total biomass than the traditional ones (Fig. 5.42) ¡ however, most of the total biomass was alloeated to vegetative parts ín the latter.
There was an interaetion between the improved maíze varieties and spatíal arrangement. H-211 yíelded consíderably more total biomass in association with cassava in the AR than in the OR spatíal arrangement. In monoculture there was no ínteraction between maíze type and spatíal arrangement (Table S.30). A larger proportion of photosynthates was alloeated to grains by H-211 regardless of spatíal arrangement. It is not known íf hígher yíelds ín alternate rows is a general characteristic of hybrids or specific to H-211. The higher yields of maíze hybrids ín ARs have been mentioned in the literature, but no systematic research has be en conducted to test this hypothesis.
In either spatial arrangement, association wíth eassava (CMC 40) did not affeet the ability of improved maize varíeties to allocate a large proportion of bíomass to the grains.
251

Crójlping System.
Cropping System.
~ Inttln:rop CJ SOl. Crop
Figure 5.40 Biomass yield of maize in sole crop and associated with cassava.
The efficiency characteristics of improved maize varieties are particularly evident in H-211.
Nutrient uptake by cassava was not affected by spatial arrangement or maize type. The traditional maize varietias usad more nutrients than improved ones (Tabla 5.31). More nutrients were allocated to leaves and stems in traditional
252

Ory Biomass (l/ha) 141-------------------------------~-------------------------_.
12
4
2
o j"
Total leaves+Stems
Biomass
Planting Oensity
_ 33,333 pi/ha 50,000 pI/ha
Figure 5.41 Biomass yields of maize as sole crop at two planting densities.
Dry Biomass (l/ha) 14-----------------------------------------------------------,
12
10
8
6
4
2
O Improved Tradilional
Types of Maize
Plant Densities
_ 33,333 pi/ha O 50,000 pI/ha
Figure 5.42 Total biomass yields of two types of maize at two planting densities.
253

Table 5.30 Total biomass and % biomass allocated to the grain by improved maize varieties in sole crop and associate~ with cassava in two spatial arrangements.
Total Cropping Spatial Biomass % to System Varo Arrangementl (tjha) Grain
ARl 9.64 50.3 H-211 OR 7.51 46.8
Intercrop AR 7.73 36.1 V-258 OR 8.70 38.0
AR 10.23 50.5 Sole crop H-211 OR 12.99 43.4
AR 11.19 39.8 V-258 OR 9.26 36.5
1 AR and on correspond to maize interplanted with cassava in alternate rows and in the same row, resp.
Table 5.31 Nutrient uptake by traditiona1 and improved maize varieties; avg of intercrop with cassava and sole crop.
NlItrients [kg¿ha) Type of Maize N P K Ca
Improved 72 a 1 14 a 101 a 21 a 10 Traditional 195 b 21 b 124 b 27 b 13
S
a b
1 Figures followed by the same letter are not statistically different (DMRT, P = 0.05).
varieties and to the grains in the case of improved varieties. If leaves and stalks of traditional varieties are 1eft standing in the fie1d after harvesting the cobs, more efficient recirculation of nutrients is expected than if the residues are removed to feed animals.
254

Association with cassava affected the amount of nutrients used by maize. Intercropped maize always extracted fewer nutrients than maize alone, not on1y because it yielded 1ess total biomass in the intercrop, but because the percent of each nutrient in the tissues, except Mg, was always 1ess in the intercrop than in the monocrop (Table 5.32).
Uptake of K, Ca and Mg in intercropped maize varies significant1y between spatia1 arrangements (Fig. 5.43). Regard-1ess of maize type, cropping system or spatial arrangement, heavier nutrient use by maize occurred only as the no. of pI/ha was increased (Table 5.33) from 33,000 to 55,000 (CO).
In monoculture, improved maize varieties used more N than traditional varieties, but this difference was not statistica1ly significant. Monocultures of traditiona1 maize varieties extracted significantly more P, K and Ca than improved varieties (Table 5.34). It appears that traditional varieties cul tivated at relatively high densities tend to use nutrients, particularly P, K and Ca rather inefficiently I at least in favorable environments such as Palmira.
Clone H-211 extracted significant1y more nutrients (particularly N) than the improved variety. The two traditional maize varieties also differed in nutrient uptake (Table 5.35) •
5.5.3.1 Efficiency in nutrient use. Two indices were used to compare the efficiency of nutrient use by maize, cassava and in the intercrop of these. Biomass Efficiency Index (SI) is the quantity (kg) of a given nutrient required to produce 1000 units of dry total biomass of either maize or cassava. Production Index (PI) is the amount (kg) of a given nutrient necessary to produce 1000 units of either dry maize grain or dry cassava roots. The smaller the value of the index, the more efficient the biomass production. Table 5.36 gives values for the SI and PI indices for the cassava monocrop (mean of two plant densities), the cassava/maize intercrop and maize as asole crop at two plant densities.
Cassava is more efficient than maize in production of both total biomass and per unit of nutrient extracted. The data for cassava in Table 5.36 were averaged over 8300 and 10,000 pI/ha as no significant difference was found between the nutrient uptake efficiency at these densities. With maize there was a difference in nutrient use efficiency between 33,000 and 50,000 densities; therefore, the results for these densities are presented separately.
Cassava was a more efficient user of NPK and S than maize at any plant density. Maize was more efficient than cassava in production of stems and leaf biomass per unit of Ca and Mg.
255

Table 5.32 Nutrient uptake by maize in association with cassava and as asole crop; avg of two improved and two traditional maize varieties.
____ -"'N~u_"'t~rients (kg/ha) Cropping System N P K Ca s
Intercropped Sale crop
1 117 a 158 b
22 a 32 b
102 a 142 b
21 a 27 b
14 a 19 b
1 Figures followed by the same letter are not statistically different (DMRT, P = 0.05).
"N"~u"t~:r~ie:"n~t_U~p."t:=a~k~e"~(:k~g~/":h"~a~) _____ " ____ " _________ ~ ____ " _______ "_. 180,
160
140
120
100
80
60
40
20
o
K
~nteréropped Sale Crop lntercropped SoJe Crop Intercropped Sole Crop
Cropping Sys tems
Cropping Patterns
.OR L.JAR
Figure 5.43 K, Ca and Mg uptake in maize as sole crop and intercropped with cassava in two cropping patterns.
256
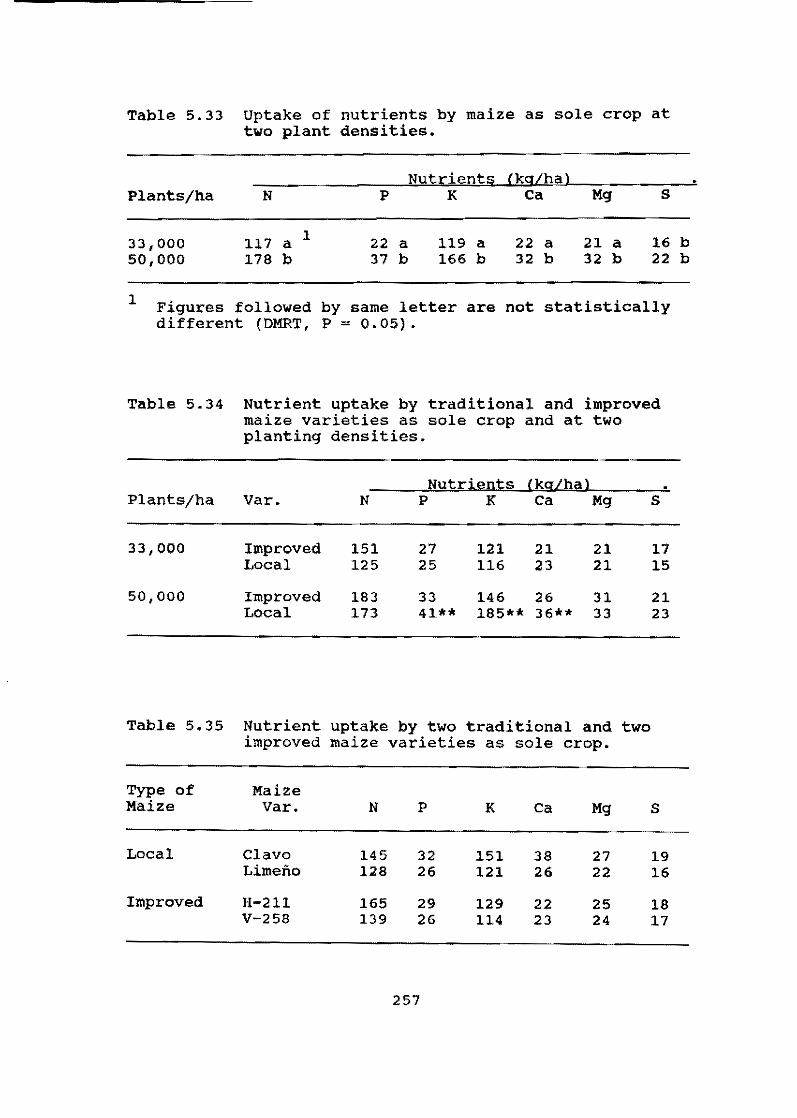
Table 5.33 Uptake of nutrients by maize as sol e crop at two plant densities.
Nut¡;;:ient§ (~g¿hal Plants/ha N P K Ca Mg S
33,000 117 a 1 22 a 119 a 22 a 21 a 16 50,000 178 b 37 b 166 b 32 b 32 b 22
1 Figures followed by same letter are not statistically different (DMRT, P = 0.05).
Table 5.34 Nutrient uptake by traditional and improved maize varieties as sol e crop and at two planting densities.
Hutri~Dts (~g¿l:lªl Plants/ha Varo N P K Ca Mg S
33,000 Improved 151 27 121 21 21 17 Local 125 25 116 23 21 15
50,000 Improved 183 33 146 26 31 21 Local 173 41** 185** 36** 33 23
Table 5.35 Nutrient uptake by two traditional and two improved maize varieties as sole crop.
Type of Maize Maize Varo N P K Ca Mg S
Local Clavo 145 32 151 38 27 19 Limeño 128 26 121 26 22 16
Improved H-211 165 29 129 22 25 18 V-258 139 26 114 23 24 17
257
b b
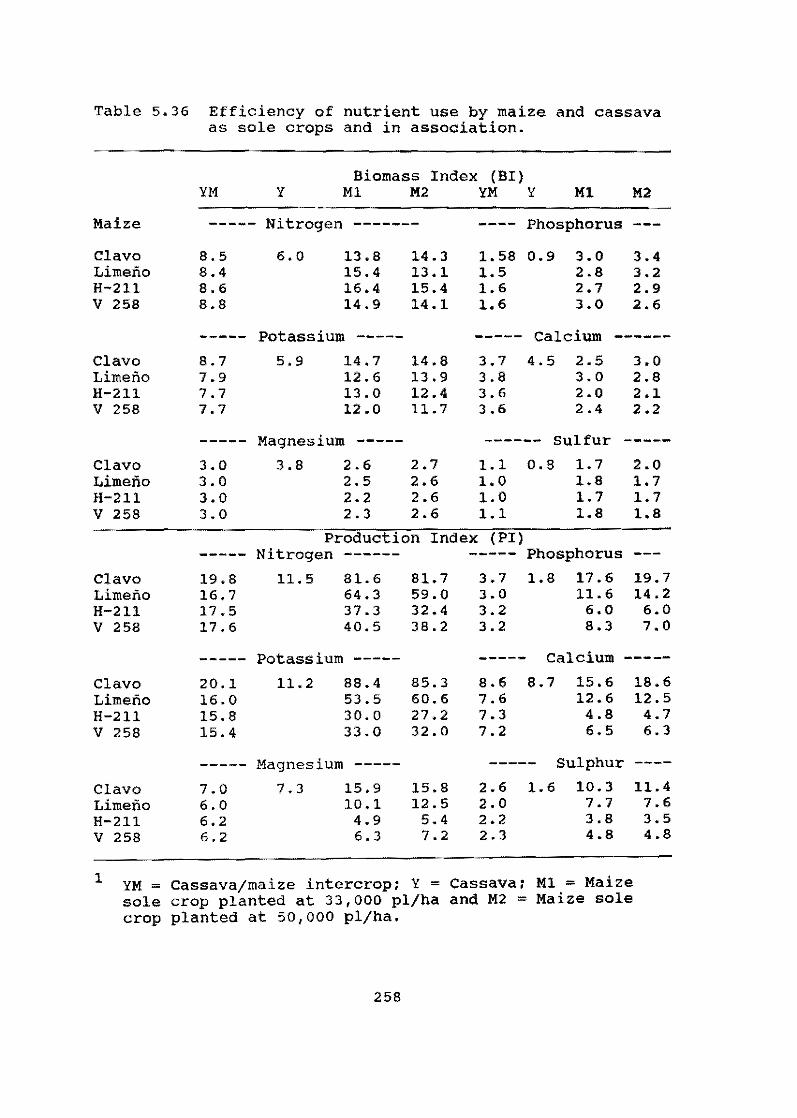
Table 5.36 Efficiency of nutrient use by maize and cassava as sale crops and in association.
Biomass Index (BI) YM Y M1 M2 YM Y MI M2
Maize ----- Nitrogen ------- Phosphorus
Clavo 8.5 6.0 13.8 14.3 1.58 0.9 3.0 3.4 Limeño 8.4 15.4 13.1 1.5 2.8 3.2 H-211 8.6 16.4 15.4 1.6 2.7 2.9 V 258 8.8 14.9 14.1 1.6 3.0 2.6
----- Potassium ----- ----- Calcium ------Clavo 8.7 5.9 14.7 14.8 3.7 4.5 2.5 3.0 Limeño 7.9 12.6 13.9 3.8 3.0 2.8 H-211 7.7 13 .0 12.4 3.6 2.0 2.1 V 258 7.7 12.0 11.7 3.6 2.4 2.2
----- Magnesium ----- ------ su1fur -----Clavo 3.0 3.8 2.6 2.7 1.1 0.8 1.7 2.0 Limeño 3.0 2.5 2.6 1.0 1.8 1.7 H-211 3.0 2.2 2.6 1.0 1.7 1.7 V 258 3.0 2.3 2.6 1.1 1.8 1.8
Production Index (PI) ----- Nitrogen ------ ----- Phosphorus
Clavo 19.8 11.5 81.6 81.7 3.7 1.8 17.6 19.7 Limeño 16.7 64.3 59.0 3.0 11.6 14.2 H-211 17 .5 37.3 32.4 3.2 6.0 6.0 V 258 17.6 40.5 38.2 3.2 8.3 7.0
----- Potassium ----- ----- CaIcium -----
Clavo 20.1 11.2 88.4 85.3 8.6 8.7 15.6 18.6 Limeño 16.0 53.5 60.6 7.6 12.6 12.5 H-211 15.8 30.0 27.2 7.3 4.8 4.7 V 258 15.4 33.0 32. O 7.2 6.5 6.3
----- Magnesium ----- ----- Sulphur
Clavo 7.0 7.3 15.9 15.8 2.6 1.6 10.3 11.4 Limeño 6.0 10.1 12.5 2.0 7.7 7.6 H-21l 6.2 4.9 5.4 2.2 3.8 3.5 V 258 6.2 6.3 7.2 2.3 4.8 4.8
1 YM = Cassava/maize intercrop; Y. = Cassava; MI = Maize sale crop planted at 33,000 pI/ha and M2 = Maize sale crop planted at 50,000 pI/ha.
258

The efficiency of biomass production in maíze is improved by intercropping with cassava.
BI was similar in improved and traditional maize varieties; but improved varieties were significantly more efficient in nutrient use and allocation of resources to the grain instead of the leaves and stems. H-211 was by far the most efficient user of N for grain production in association with cassava (Table 5.37). Intercropping cassava and maize resulted in efficiency values slightly aboye those of the cassava as asole crop, but significantly different from maize as asole crop.
No significant differences were found between the indices in maize or cassava as sole crops or in association for most of the nutrients studied. This means that maize and cassava will be equally efficient in nutrient uptake whether monocropped or in association. Phosphorous was an exception, used more efficiently for biomass production when maize was planted in association with cassava. The BI index was 2.71 tor associated maize and 2.93 for maize as sole crop. Significant differences in PI were found between the traditional maize varieties. Limeño was more efficient than Clavo for most of the nutrients tested.
TO compare the production efficiency (PI) of a crop combination (cassava/maize) vs. the sum ot its components (cassava + maize), Table 5.38 was constructed. only K, Ca, Mg and S are shown as no difference were found in PI values for N or P.
A difference in favor of the crop association in comparison with the sum of the components can be observed for the selected nutrients included in this table.
5.5.3.2 NutrÍent content and export by a cassava/maize system. A model of nutrient content that includes the percentage of each nutrient in different plant parts is presented in Figure 5.44. Maize roots were not included although they constitute ca. 5% of total maize biomass. The model does not include soil, which is the main source of nutrients.
The export of nutrients from the crop system is representad by maize grains and cassava roots. In reality, the export of nutrients by maize could be greater if the leaves and stems leave the farro system. If the leaves are consumed by the animal subsystem on the farro, recirculation may take place in other plots within the farro. Cassava roots are always taken out of the plots, but most of the aboveground biomass returns to the soil in the forro of planting material or is left in the borders of the fields to decompose. The model is based on management practices coromon on the North
259

Table 5.37 Values of Biomass Index (BI) and Production Index (PI) for nutrient use by improved and traditional maize varieties. Avg of intercrop with cassava and maize as asole crop.
Maize Index1 Nutrients (kg/hal
Varo N P K Ca Mg S
Local BI 14.2 3.0 13.8 2.9 1.8 PI 74.1 15.7 73.9 15.7 14.0 9.5
Improved BI 15.0 2.7 12. O 2.3 1.7 PI 36.8 6.7 30.2 5.7 6.1 4.3
1 BI = Biomass Index; PI Production Index. =
Table 5.38 Production Index (PI) for nutrient use by cassava associated with maize and avg for cassava and maize as sol e crops.
Nutrient crops Clavo Limeño H-211 V-258
N YM 19.8 16.7 17.5 17.6 Y+M 20.0 19.3 19.2 17.8
K YM 20.1 16.0 15.8 15.5 Y+M 20.2 17.3 16.8 16.0
Ca YM 8.6 7.6 7.3 7.2 Y+M 9.1 9.0 7.4 8.1
Mg YM 7.0 6.0 6.2 6.2 Y+M 8.0 7.6 6.5 7.0
S YM 2.6 2.0 2.2 2.3 Y+M 2.6 2.5 2.3 2.3
1 YM = Cassava and maize intercropped; Y+M = avg va1ue of PI for cassava and maize as sale crops.
260

MAIZE
I P K Ca Mgi
I
kg/h. .. '-- ..
N
Root.
p
CASSAVA
l K Ca Mgl
!
L· ~NlpIKfa~g! LL . ... ~~ .. _-~~~--'
Figure 5.44 Nutrient distribution model of a cassavajmaize intercrop.
Coast of Colombia, where maize leaves and stems are not consumed by the animal component of the system, but are left in the field until decomposition. Recirculation in the model assumes decomposition and mineralization at similar rates for all biomass components and for each nutrient.
In Figures 5.45a-d, the amounts and percentages of each nutrient in different plant organs are represented for the four maize varieties under study. The amounts of NPK vary between the organs and the maize varieties. Cassava contains approx. 73% of the total Ca and 72% of the total Mg of the crop system. As only 10 and 20% of Ca and Hg, resp., are exported by the system, cassava i5 the component that recircula tes most of these elements to the environment (ca. 87 and 80% for Ca and Mg, resp.). Recirculation in the model assumes the composition and mineralization at a similar rate for all the biomass and each nutrient in particular (Figs. 5.46-5.48). The cropping system with maize (H-2ll) exports ca. 45% of the NPK out of the system, while an intercrop that includes a traditional maize varo such as Clavo exports only 35% of the same nutrients. This
261

(A) MAIZE
Graina
3&.4 U '.1 •. 0 '.1 34.0 U .• l.' ...
U.O i
L •• vea L •• v ••
~ ... ... 24.' 1.1,0 le., kg/ha • •• 33. j 24,0 u,a u.a : 31.0 , •••
St.ma Sl.me
34.3 ••• n .• ••• t.O '.,4
1'" .u,O ••.• I ••.• U.O &1.1
A:ooh
101
•
! 41.5
(8) MAlze e
Gr.h'll
kg/h. u., M 10,0 ... '"' L :n.7 2tL4 .., O •• 10.4
l. •• ~. t. •• v ••
l···· t.' aL. '3.' • •• kg/he IL4
•••• U,a U,O u .• 40 .• , ".,
Stema Stema
u .• 10.8 n,3 ••• tu. ' •. 1
i UJt H.1 'G," 3'.1 ••. e U .•
Root.
, U .•
32 .•
----
Figure 5.45 Nutrient distribution in a eMC 40) intercrop with (a) and (b) varo Clavo.
262
CASSAVA
I
l .•
I
'.1 17.7 ••• o •• U JU 1O,'
. .L ••
O. , ,u.a U.O U.O
·40.1 U.2 U .• 111.1
¡
.... ~ i
ti.! U .• 10,2 u,al
U,a 7 ••• n .• 21..
CASSAVA
.., ... n,a l.' t.1 l. H,O '4,1
T.T U.O .... 37.3
.u .• 23.1 13.' u,a
.., H.' o .• 11.4
.O,S rLa 12.'" 20.0
I
cassava (var. maize varo Limeño

(C) MAIZE
(ir.¡ ....
I 11.1 O., O.,
, . ".~ kG/ha¡ 06.,( .,. " •• ,. .".a
.... _-_ ... "--
(O)
Ste-m.
! 20.4
17.1
Graln ..
... ".1
20.0
MAIZE
I ".2 ... ; CI'IL7 fa.' ! ~
.. , ...1 21.'
I
,--·EE·-,----·~ I i kg/h_
E' 77.5 12.e 18,1 O.l 4.7,
• e 1.1 64.0 1~.' 4.0 2$.2;
_1 ... ___ .. _-1_--'
••• 4r.1 '.1
H.'
=-~'n
CASSA\lA , ... _-------,
I ti .• I 41.3
... !
~ .. _"----Roob
t4.t
%I.t
60.41
I.~: I.·:~ .. ·1 •.. l~I_~'¡ ....
CASSA\lA
;:: I
J
'g/ha .'U "'1'''' " .. la., · ~ .. ~ •. '~:J~j
Slema
10.1 u.a .... .... 2
'8'"
\
:31.4 tl .• 'tI.O 1.& 11 .. ! 28.1 '12.7 '''.f 10.6 HI.O
,
Figure 5.45 Nutrient distribution in a CMC 40) intercrop with (e) (d) maize varo H-211.
cassava (var. maize varo V258
263
and

MAIZE ~-- --_··················--200
~/I--~ ..... ~--_ .............. -:: ~
~~ :i ~ ~ ~rrtt~II~1!l
u
CASSAVA
REMOVAL
/·k-·····················----~
"-211 ~-_ CUMl
¡"""""~""'¡~c..,', ......
! 1
Figure 5.46 Nutrient uptake and removal from a cassava/ maize intercrop.
264

MAIZE - 33,333 pI/ha
/~-1i--- ................ ~--~IOC~
REMOVAL
100 i 1'5 ~ 00 ~ 25
o
. .,----~~~~~--__,ro:J // 175
/ 100 ~ // / 125 ~
~//// :f %§/ , oo¡ /' 25
/
~/:: L:=7 L:=7 :::::::=;;; :::::::=;;; ~ // ~~Z:::7 ..
"'?"
MAIZE - 50,000 pi/ha
9
REMOVAL r------~~--~ .~~~~~~~~--I7S
/ /.LJ.-..--....... --_-_-_-_-~~.:~ / /%,--/r~~~~~~--j100
71-------175
I-r-,,----I,oo
b::::=:7I-l'" o
Figure 5.47 Nutrient uptake and removal from a maize sole crop at two plant densities.
265

CASSAVA
)------ .................. --1 1'" ~
i ¡ ¡
REMOVAL
-----1171;
Figure 5.48 Nutrient uptake and removal from cassava sol e crop at two plant densities.
difference ls due to the heavy allocation of biomass te the grain in the impreved maize varieties.
Improved maize varieties in monoculture recirculate ca. 50% of N and P, while traditional varieties recirculate 70%. The inclusion of improved maize varieties in a cassava/maize intercrop will slightly increase the percent of N that is recirculated, but it will decrease the percent recirculation of other nutrients. Cassava as a sale crap recirculates ca. 70% af N, 55% of P, 39% of K, 87% of Ca and 80% of Mg.
When cassava was associated with maize, recirculatian af K was decreased by ca. 30% campared with each component as a sole crop. A similar pattern was observed with P although the decrease in recirculation was aprox. 13%.
As a result of the dynamics of K in the soil, a decrease in recirculation due to intercropping should not affect the performance of the system in the long runo A similar situation is anticipated for the P in soils that are deficient in this elemento
266

Improved maize varieties in association with cassava increased the recirculation of N by 7% in comparison with traditional varieties, while maintaining tne same level of recirculation for P.
In general terms, considering cassava and maize as sole crops as well as in association, the recirculation of nutrients was always aboye 50%. These amounts are sufficient to replace the quantities exported outside the system in the form of maize grains and cassava roots. The nutrient 1055 by percolation and surface runoff should probably be replaced by fertilizers or other soil management practices. A summary of the dynamics of nutrient recirculation is presented in Table 5.39.
5.5.4 Performance of di fferent cassava varieties intercropped with maize, cowpeas. yams and sweet potatoes
Worldwide, most cassava is grown in association with other species; therefore, the characterization of cassava germplasm for its ability to grow as an intercrop component is important for both cassava breeding and agronomy.
Several studies carrried out at CIAT HQ have indicated that not all cassava varieties perform similarly when intercropped with other species, particularly maize. Cultivars with less foliage and high HI tend to yield less in inter-
Table 5.39 Percent nutrients recirculated to the farm in a cassava/maize intercrop and in maize as sole crop.
Cropping Maize System Varo N P K Ca Mg
Intercrop H-211 54.2 51.2 56.0 90.4 80.8 Sole crop 49.8 52.0 80.2 97.2 77.9
Intercrop V 258 60.5 53.0 58.5 90.0 80.3 Sole crop 51.1 57.8 80.3 93.9 79.6
Intercrop Clavo 69.6 63.7 65.2 90.6 90.6 Sole crop 67.3 77 .0 92. O 98.5 90.1
Intercrop Limeño 62.0 56.3 54.9 90.0 80.4 Sole crop 63.3 70.0 91.0 98.6 88.0
267

crop with maize than tall varieties. It has also been suggested that more erect and late-branching cassava types tend to yield more when intercropped with other species, particularly maize.
To continue with the study of the reaction of different cassava varieties to intercropping, an experiment was conducted at HQ with seven representative cassava varieties in association with maíze, cowpeas, sweet patatoes and yams. The cassava clones selected for this experiment and their plant characteristics are presented in Table 5.40.
Maíze (H-211), the new yam varo CDC-18, the sweet patato varo S-2 (El Carmen de Bolívar collectian), and the S-5 cowpea (ICAls collection in Palmira) were each intercropped wíth cassava. These crops were planted simultaneously as monocrops and in alternate rows with cassava at 33,000; 100,000; 8300 and 40,000 pI/ha, resp. Cassava was planted at 8300 pI/ha both as asole crop and in association with other species. Treatments were arranged in a split-plot design where the main plots were the species intercropped with cassava and the cassava clones were the subplots. Four reps were planted.
The performance of the maize clone H-211 intercropped with different cassava varieties is presented in Figure 5. 49a. Maize yielded significantly more when intercropped wíth medium-height cassava clones, but the differences in the yield of maize intercropped with short and tall cassava varieties of cassava were not significant (Table 5.41).
Table 5.40 Growth characteristics of cassava varieties selected for intercropping with other specíes.
Cassava Clone Plant Height Branching Habit
CMC 40 Medium Erect CM 1223-11 Low Erect CM 523-7 Tal! Erect CM 849-1 Medium Branched SG 107-35 Tal! Erect CM 1918-3 Low Branched M Ven 218 Medium Branched
268

(A) Mal .. Ylelds (l/ha)
Ces.ave Clones O 1 2 3 4 5 6
CM 1223-11
CM 1918-3
CMC 40
CM 849-1
MVEN 218
CM 523-7
SG 107-35
Sole Maize
(B) Cowpea Ylelds (l/ha)
Caasava Clones O 0.5 1 1.5 2 2.5 3 3.5 !!.. I .. ~ .~. __
CM 1223-11 ~"'\~a CM 1918-3 a
CMC 40 a
CM 849-1 a
MVEN 218 a
CM 523-7 a
SG 107-35 a
Sol e Crop
Figure 5.49 Yields of (a) maize (H-211) as sole crop and (b) cowpea varo S-5 intercropped with different cassava varieties; bar s followed by the same letter are not significantly different (DMRT, P = 0.05).
269

Table 5.41 Relative yields (% of sole crop) of maize, cowpeas, sweet potatoes and yams with selected cassava varieties.
intercropped
Clone Maize cowpeas Sweet Poto Yams
CMC 40 109 84 52 95 CM 1223 110 98 43 109 CM 523-7 103 96 40 129 CM 849-1 108 98 41 113 SG 107-35 95 92 46 76 CM 1918-3 99 94 46 79 M Ven 218 109 95 52 80
Cassava branching habit did not significantly affect the performance of maize; however, there was a tendency for higher maize yie1ds in intercrops with erect types of cassava. This tendency was more evident as the size of the cassava plants decreased. Apart from dry (14% MC) grain yield, other variables such as total biomass, no. of cobsj plant and no. p1jha were not affected by the cassava clone. Maize as a sale crop registered one of the lowest yields, corroborating results from previous studies.
Cowpea yields were not affected by cassava clone (Fig. 5.4 9b); moreover, there were no differences between the yields of cowpeas intercropped with cassava and as asole crop. Other variables recorded for cowpeas such as no. of podsjplant; no. of grainsjpod¡ no. of grainsj100 9 and total cowpea biomass, were not affected either by cassava type or by cropping system. The S-5 cowpea variety performed similarly with all cassava varieties tested; this may be due to its relatively short growing cycle (80 days).
As shown in Figure 5.49c, sweet potato yields were significantly lower in the intercrop than in the monocrop. The no. of rootsjplant (2.14 vs 1.21), mean weight of marketab1e roots (0.5 vs 0.4 kg); aerial biomass (4.0 vs 2.7 tjha) and HI (0.4 vs 0.3) were a11 higher when sweet potatoes were grown as a sale crop than in association with cassava. The cassava clones tested did not affect sweet potato yields differently. There was no significant effect of cassava clone on the other sweet potato variables that were evaluated.
The new yam var. cnC-18 was severely affected by foliar pathogens, and some plots were negatively affected by root
270
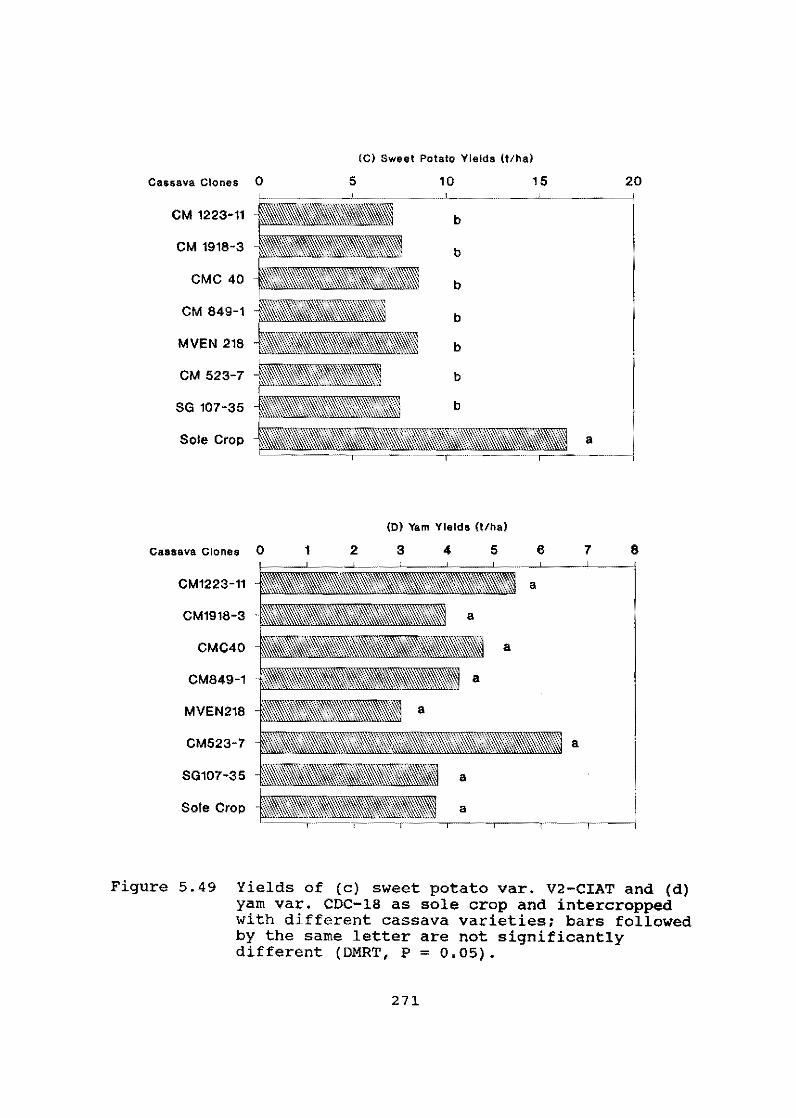
(e) Sw •• t Pot.to YI.lda (tIha¡
Ca$sava Clones O 5 10 15 20
CM 1223-11 b
CM 1918-3 b
CMC 40 b
CM 849-1
MVEN 218
CM 523-7
SG 107-35
Sole Crop a
(O) Yam Vleld. (l/ha)
Cassava Clones O 1 2 3 4 5 6 7 8
CM1223-11
CM1918-3
CMC40
CM849-1
MVEN218
CM523-7 a
SG107-35
Sote Crop
Figure 5.49 Yields of (e) sweet potato varo V2-CIAT and (d) yam varo CDC-18 as sole erop and intereropped with different eassava varieties: bars followed by the same letter are not signifieantly different (DMRT, P = 0.05).
271

rot pathogens. As a result of this highly variable yam growth, the CV values for yields were very high (46%); and the avg yield (6 tjha) (Fig. 5.49d) was much lower than obtained in previous experiments (ca. 30 tjha) with other yams varieties in Palmira. Under these experimental conditions, differences as large as 2.6 tjha between treatments were not registered as significant. A summary of the yield reductions in cassava due to intercropping with maize, cowpeas, sweet potatoes and yams is presented in Table 5.42.
The medium-height, moderately branched cassava varo CM 849-1 outyielded other varieties in monoculture, but this was an exceptional case. Generally the highest yields were obtained in the short cassava varieties (Fig. 5. 50a) • CM 849-1 also yielded more than the other clones in association with cowpeas, sweet potatoes and yams, and performed relatively well in association with maize (Fig. 5.50b-e). Cassava clone CM 523-7 performed relatively well as an intercrop component. Only CM 849-1 performed better in association with cowpeas, sweet potatoes and yams, and CM 523-7 outperformed CM 849-1 in the intercrop with maize. Shorter cassava clones suffered greater yield reductions as a consequence of intercropping than the other varieties. M Ven 218 yielded poorly both as an intercrop and as asole crop. Fresh yield in tall, erect cassava types was less affected by intercropping than medium and short types (Table 5.42) .
In an analysis of correlations between plant height, stem diameter, no. of stemsjplant, no. of leavesjpl, stem diameter mul tipl ied by stem height and fresh RY, only no. of leavesjpl, plant height and stem diameter were correlated with fresh RY (Table 5.43).
The largest number of significant correlations were found between variables evaluated 141 days after planting. The number of positive correlations diminished significantly for the subsequent sampling dates. The number of significant correlations between the aboye variables and yield did not vary with sampling date. No significant correlations were obtained for any sampling date for some clones such as CM 849-1 and SG 107-35 (Table 5.44). In general, the correlations between the aboye variables and the yield of marketable fresh roots were lower and less frequent than in the case of total fresh roots.
5.5.5 Effect of cropping systems on the guality of cassava planting material
A number of surveys indicate that the majority of small farmers use their own cassava stakes as planting material year after year. since cassava is primarily grown in association with other crops, the stakes that are used as
272

(A) Solo Crop
Fr.ah Root Ylelda (tlha)
Cassava e'onea O 5 10 15 20 25
CM 1223-11
CM 1918-3
CMC 40
CM 849-1
MVEN 218
CM 523-7
SG 107-35
r ~ '2,a. J:lll~~\I\\:&\\l,,~~~-~.JLl.L.
! " :J 21.47
30 35
~"-_.¡-.. ----,---. __ .. ¡---._~.-" _.~. -_ .. __ ._~.
_ Markelable Root. D Tolal Root. IsÓ-2,31 tlha Isd-2,35 tlha
(B) Into,o,opped wlth malle H-211
F, •• h Roo! Ylold. (tlha)
Cassava Clones O 5 10
CM 1918-3
eMC 40
CM 849-1
MVEN 218
CM 523-7
SG 107-35
_ Marke!able Roo!. msd-2,31 tlha
15 20 25
D Total Rool. msd-2,35 tlha
30 35
Figure 5.50 Total and marketable fresh root weights of different cassava clones (a) as sale crop and (h) intercropped with maize (H-Zll).
273

(C) Intercropped with cowpea
Cassava Clones
CM 1223-11
CM 1918-3
CMC 40
CM 849-1
MVEN 218
CM 523-7
SG 107-35
Fr.oh Roo! VI.ld. (l/ha)
\ ,\ 8.U ~ ____ ._ .. _ .. __ 1.&8
\ ,,\, \ - , \ '" " . '. 16.18 ______ ~._____ _ _____ ~_-.-J 17.72
!'iIl,~""",,*\\\'\ii¡.\\\,,,\\,,,'\§ii:il 1 •.•• , 16.36
-1 1-----.,-
_ Marketable Roots D Total Roots msd-2.31 l/ha msd-2.35 l/ha
(O) Intercopped wlth sweet potatoes
Fr.oh RoOI Yi.lda (l/ha)
Ca$sava Clonas O 5 10 15 20 25 30
CM 1223-11 \ \~\"''''\",\''\%\\,(\\ll\~ 11.S1 ___ .. _ .. ____ . _______ ._~J 20.1
CM 1918-3 . \" ~$\\\'í\\\~ ~.28 ____ . ____ .:=1 U.96
CMe 40 17.01
CM 849-1
MVEN 218 7.46 10.26
CM 523-7 ,'o
20.i
SG 107-35 18.68
_ Marketable Rools ,': Total Roots mSd-2.31 l/ha msd-2.35 l/ha
35
Figure 5.50 Total and roarketable fresh root weight of different eassava clones intereropped with (e) eowpeas (S-S) and (d) sweet potatoes (V-2 CIAT).
274

(E) Intercropped wlth y.m>.
Freoh Root Ylelds (tlha)
Cassava Clones O 5 10 15 20 25
CM 1223-11
CM 1918-3
CMC 40
MVEN 218
CM 523-7
SG 107-35
b\",,,,,\'(,.\'(,.\,,,,~,,,,\\\,,,,,,,,\'(,.~\,,,,,,,,,,,,~~'l ' ,4&, : t 19.99
~~\"""'\'(,.\\"'*''''\'''\\'''\'''\''''''''~~~~~'íR>~~'''~ 18.87 ~_ I 20.8ti
~íí*}\""""""~'(,.\§$Y,\",\",\""",,""\,,,,*,~'l&%W)m 17.8' , I 20.87
\ \ :; 2'0.99 23.&7
23,63
B;¡¡ Marketable Roots dm.·Z.31 t/ha
• Total Roots dm.·Z.35 tlha
30 35
Figure 5.50 Total and marketable fresh root weight of different cassava clones intercropped with (e) yams (CDC-18).
Table 5.42 Yield reduction in cassava clones intercropped with maize, yams, sweet potatoes and cowpeas.
Cassava Yield Yield Reduction m , Mean Clone (t¡ha) Maize Yams Sweet Poto Cowpeas Avg
CM 1223 25 63 20 20 65 42 CM 1918-3 26 67 18 41 76 47 CMC 40 23 61 8 25 32 31 CM 849-1 28 56 14 10 31 28 M Ven 218 16 55 22 37 41 39 CM 523-7 23 43 3 8 22 18 SG 107-35 21 52 9 13 24 20
275

Table 5.43 Correlation coefficients for total fresh RY, no. leaves/pl (leaves). plant height (helght) and stern diameter (diurn.) for seven cassava varieties.
------------------------------------------------------------------------
77
106
141
169
198
230
Varo CMe 40
CM
1223 CM
523- 7 CM
849 - 1
SG
107-35 CM
1918-3 M Ven
218
-------------------------------------------------------------------leaves height diam.
leaves heíght diam.
leaves height diam.
leaves height
di am.
leaves height
diarn.
leaves height
diam.
~79'11'11
.82**
.87**
.8S**
.79**
.88**
.82**
.81 **
.84**
.83**
.77**
.87**
.83**
.76**
.83*·
.84**
.79*· .7ó·*
.91** ~84*'11
.79**
.80·* .82**
.84** .79··
.75·* .77**
.S7*·
.85** .77* *
.82**
.79**
.76*·
.81··
.83**
.84** .81**
.78**
.79*· .16* *
.77··
.. 8S**
.80··
.93**
.89**
.89** ,
.88**
.75 * '"
.86**
.85**
.75··
.81**
.76**
.86**
.83**
.80··
.83**
.76**
.83**
.82**
~80**
---~-------------------------------------~------------------------------
DAP = Days after planting~
planting material come from mother plants that were intercropped with one or more species. Competition with other species usually reduces the aerial biomass of cassava plants. As a result, planting material coming from intercropped p1ants tends to be 1ess vigorous than the p1anting material from plants grown in monocu1ture. If stakes obtained from intercropped cassava are planted year after year, a progressive decline in quality coupled with 10wer yie1ds is to be expected.
A study of the effect of the origin of cassava planting material was conducted over a period of three years. Stakes originating from intercropped cassava grown in a1ternate rows, from mother plants grown continuous1y in monoculture,
276

Table 5.44 Correlation coefflcients for welght of marketable roots, no. of leaves/pl (leaves), plant height (neight) end stem diameter
(diam.) for seven cassava varieties.
------------------------------------------------------------------------
DAP Varo CMC
40 CM
1223 eH
523·7 CM
849-1 SS CM M Ven
107-35 1918-3 218
------------------------------------------------------------------------77 leaves .79** .86*·
height diam. .76** .80**
106 leaves .51*- .86** .72" .91**
height .83*· diam. .85·* .SS**
, 4 1 leave-s .82** .78** .85** .8S** .78**
heigh. .77** .77**
diam. .85** .80** .87**
169 leaves .82** height .78*· .. 78··
dism. ,81*· .83*· .86*·
198 leaves .84** height .76·· ~79**
diam. ~86*111. .82** .89**
230 leaves .80** .81· * neignt diam. .82** .76** ~77*·
------------------------------------------------------------------------
and from cassava grown in association with other crops in alternate years, were included in the experimento The eight treatments are summarized in Table 5.45.
Cassava (CMC 40); yams (CDC-lB) and maize (H-211) were used in the experimento Cassava mother plants were randomly selected from the center plots of either cassava grown in association or as asole crop. Immediately before planting, a random se1ection of cuttings was made.
There was a significant difference between the yields of cassava grown in monoculture and in association with maize and yams; but within cropping systems, no differences in yield due to stake origin were registered. Cassava yie1ds corresponding to the different treatments are presented in Figure 5.51. Maize tended to yield more when it was inter-
277

Table 5.45 origin of planting stakes.
Treatment No.
1 2 3 4 5 6 7 8
4
3
2
1
o
Cycle 1987-88 1988-89
Sol e crop Sole crop Sol e crop Sole crop Sole crop Maizejyams Sol e crop Maizejyams Maizejyams Sole crop Maize/yams Sol e crop Maize/yams Maize/yams Maizejyams Maize/yams
" "
SCCY CYCY SCSC P-tevIOU8 Cropplng Sy.tema of 0888ava
Mother Plant.
1989-90
Sol e crop Maizejyams Sol e crop Maize/yams Sole crop Maize/yams Sole crop Maize/yams
CY • C •• sava ., Yaml
CYSC
Figure 5.51 Yields of maize (H-211) intercropped with cassava and yams; planting stakes of the cassava plants were obtained from mother plants cultivated in different cropping systems during the two previous cropping seasons; bars with equal letters are not statistically different (DMRT, P = 0.05).
278

cropped with cassava grown from stakes of mother plants intercropped continuously (Fig. 5.52)~ however, this difference was not statistically significant with a 10% value for CV. Maize intercropped with cassava plants from continuously intercropped mother plants produced more cobsjplant than maize intercropped with cassava from stakes of plants grown continuously in monoculture.
Cassava grown froro stakes from mother plants continuously intercropped probably has a slower initial growth than when grown from stakes of other origins and therefore competes less strongly with the intercropped maizel however, initial growth rates of cassava and maize were not recorded.
Fresh Roo! Yields (l/ha) 40 ~.~_.~_. __ . __ ._~._--se .. Sol. trop
_ Tol.I Root. Marketable Roots MY .. M.lzo '* Yem.
30 A A A • A A A
20
B B
e 10 B • B • •
o MYMY MYSe ses e SeMY MYMY MYSe SeMY sese
Previoua Cropplng Sy.tema of Caatava tdQther Planla
1--·- Staf(e$ Planted u Sale Crop _.--; I_Slai<u: Planted wjt~ Malze .. 'mm. -1
Figure 5.52 Total and marketable fresh root weight of cassava (CMe 40) obtained using planting stakes froro roother plants cultivated in different cropping systems during the two previous cropping seasons~ bars with equal letters are (DMRT, P = 0.05).
279

No significant differences were found between the yields (fresh root weight) of yams intercropped with cassava planted from stakes of mother plants previously intercropped or grown in pure culture (Fig. 5.53). Yams intercropped with cassava from stakes in continuous monoculture yielded significantly more rootsjplant than than yams from other treatments (Table 5.46). Cassava plants from stakes grown continuously as asole crop had vigorous initial growth, which provided yam vines with good physical support, resulting in more yam roets/plant.
Treatments 1 and a are considered the twe extremes for this experimento In Table 5.47 differences in no. of leavasj plant and plant height ara presented fer thesa two extreme treatments.
Yam Yields (t¡ha) 10,-----------------------------------------------,
• se • Sole Crop • A
MY' • Mall1l ..... m.
SCMY MYMY SCSC MYSC
MolheH Plant.
_ Total Roots Marketable Roots
Figure 5.53 Yields of yams (CDC-la) intarcropped with maize and cassava; planting stakes of the cassava plants were obtained from mother plants cultivated in different cropping systems during the two previous cropping saasons; bars with egual letters are not statistically different (DMRT, P = 0.05).
280

Table 5.46 Effect of origin of cassava planting stakes on no. of roots/plant of yams intercropped with cassava.
1
Treatment No.
2 4 8 6
Roots/Plants
2.27 a 1 1. 77 b 1. 77 b 1. 73 b
Amounts followed by the same letter are not statistically different (DMRT, P = 0.05).
Table 5.47 Plant height and no. of leaves/pl of cassava grown as asole crop from stakes of mother plants continuously intercropped for three consecutive years and continuously grown in sole crop for three consecutive years.
Plant Height No. of Leaves¿Plant S ampling From From From From
DAP Intercrop Sol e Crop Intercrop Sole Crop
79 91a1 88a 62a 53a 126 128a 125a 82a 68b 159 172a 164a ISla l29b 186 188a 185a 194a 166b 216 210a 201a 202a 160b 247 228a 215a 212a 160b
1 Means followed by the same letter in the same sampling period are not significantly different (P $ 0.05, DMRT).
Plant height and no. of leaves/pl were higher for cassava monocultures planted from stakes originating from continuously intercropped plants. The no. of leaves/pl in plants grown from stakes that were always intercropped increased until the last sampling date while the no. of leaves/pl remains constant after 181 days for cassava grown from stakes originating from continuous monoculture.
281

Heights of intercropped cassava p1ants from stakes of mother plants continuous1y intercropped and plants from stakes continuous1y grown as asole crop were not statistically different (Tab1e 5.47); but the no. of leavesjpl in cassava plants from stakes of continuous1y intercropped mother p1ants was significantly higher than in cassava plants grown from stakes continuous1y grown as asole crop (Table 5.48).
In other experiments with cassava associated with maize, with yams, and with roaize and yams simu1taneously, a higher no. of 1eavesjp1 and, consequent1y, a higher leaf area were recorded immediate1y after harvesting the associated crops than in cassava of the same age but grown as asole crop.
Table 5.48 P1ant height and no. of leavesjp1 of cassava grown in intercrop with maize and yams froro stakes of mother p1ants continuously intercropped for three consecutive years and continuously grown in sole crop for three consecutive years.
Samp1ing DAP
79 126 159 186 216 247
Plant Height From
Intercrop
lO9al
l23a l39a l50a l62a la3a
From Sole Crop
lO8a l23a l27a uaa l65a la3a
No. of Leaves/Plant • From From
Intercrop Sole Crop
3aa 30a 32a 29a 46a 33b 57a 4lb 65a 43b
lO3a 57a
1 Means followed by the same letter in the same sampling period are not significantly different (P ~ 0.05, DMRT).
282

6. CASSAVA ECONOMICS
The Economics section of the Cassava Progra,n at HQ has the responsibility for conducting research within a threedimensional framework. As such, it has to work in an integrated fashion across disciplines within the Programo The section also identifies and analyzes issues within its own discipline. Not only does the section work in Latin America but al so in Asia and Africa. Given the presence of lITA in Africa, the section plays a minor role there. In Asia, on the other hand, cassava production and consumption developments have been dynamic, thus requiring an increasing amount of economics resources given the absence of a CIAT cassava economist stationed in the region.
To assist in optimizing the efficient development and diffusion of improved cassava technologies, the Economics section allocates its resources among five major work areas (within the aboye framework):
Collection of regional and country data to monitor production and consumption of cassava (products) and related commodities
Generation of identify and marketing and
primary farm- and household-level data to analyze cassava production, processing,
consumption problems and opportunities
Ex-ante analyses of potential technologies in order to assess priorities, feasibility and probability of success
Collaboration in evaluating and diffusing improved technologies
Ex-post analyses of technology diffusion and impact
6.1 Past Emphasis
In 1984 the External Program Review recommended that CIAT undertake studies to assess the future demand for cassava and cassava products. Since then the Cassava Economics Section has focused its efforts almost entirely on cassava demand studies in Latin America and Asia. With support from the Rockefeller Foundation (RF), lITA, CIAT, NRI and severa1 other institutions initiated a baseline survey on cassava production, processing, marketing and consumption in Africa under the name of COSCA (Collaborative study of Cassava in Africa) in 1988.
The studies for Latin America and Asia were completed in 1987. The results clearly demonstrated that cassava products have a significant potential for the developing world,
283

depending on the area; that for various processed cassava products there exists a strong and growing demand; that these praducts will continue to serve as an important source of relatively inexpensive calories for the very poor; and that on-farm or rural processing of cassava intermediate praducts (e.g., chips, starch, flour) can significantly improve incomes of the resource-poor, small farmer in the developing world.
Besides this major effort on the cassava demand studies, the Economics Section has allocated limited resources over the last 5 years, to supportive research on technology development and diffusion, as well as the ex-post measurement of technology adoption and impact, almost exclusively in Latin America.
6.2 Current Priorities
Given the adjustment of CIAT's research goals and objectives to meet the ever-evolving demands in a developing world, the section's current research agenda includes the following major activities:
Adoption and impact studies of already diffused technologies, both in Latin America and Asia
Assessment and analysis of alternative cassava-based praducts markets in Latin America and Asia
Updating and expansion cassava products and America and Asia
of the socioeconomic database for related commodities for Latin
Readjustment of activities for America
the methodology and use of moni toring Cassava Integrated Projects in Latin
Caordination of the setting up of benchmark studies on cassava in Asia
Provision of economics input in technology development.
The Economics section warks on these topics together with a wide range of partners and under different institutional, organizational and financial conditions; e.g., networking, thesis work, contract research and training. In additian, a majar emphasis for the next two years will be placed on adoption and impact studies. Table 6.1 lists the Economics section's majar projects and activities during 1990.
284

Table 6.1 Cassava Economics Section's major projects and activities in 1990.
-------------------------~----------------------------------------------------------------------------------------
Title/Objeetive Topie Collaborators Country lime Table
---~---------------------------------------------------------------------------------------------------------------
Organization/analysi. of UAPPY's monltoring database
CIAT's commodíty portfolio revlsited; indicators of present and future importance
The agroindustrial development of cassava on the Colombia Atlantic Coast
History, current status and potent1al of Cassava use ln Asia
Ex-post impact of cassava technologies in Colombia
Cassava study in Vietnam
Adoptlon of Rayong-3: Beneficiaries
Regional impact
Ex-ante potential
Thesis
Market potential
Ex-post impact
Benchmark survey
Ex-post adopti on
UAPPY. FUHOAGRO
CIAT economists
Cornell University. USA
CGPRT Centre Sogor. Indonesi a
1 e A, ANPPY. o R !
MF ¡ • lAS. USA
Oept. of Extenslon. MAE
Ecuador Jan.-Hay
HQ April-Oec.
Colombia June-Nov.
Asia June-Aug.
Colombia July onwaró (ongoin9)
Vietnam Feb. onward (ongoi ng)
Thai 1 and Cee. onward (ongoing)

6.3 Research Results
Of this year's activities, two sets of research results will be discussed: a reevaluation by CIAT's economists of the Center's commodity portfolio and a study of the rapid development of Integrated Cassava Projects in Latin America and how monitoring activities can be a strategic device to refocus project strategies, while at the same time measure regional impact of an improved technology.
6.3.1 Quantifying the relative importance of cassava
The criteria used to assess the current importance or future potential of a crop reflect the user's objectives and goals. International agricultural research centers may have criteria that differ from those of developing country decision makers (in the short run); and the relative weights of criteria shift over time. In addition, especially in the case of cassava, the crop production system, production area, intensity of cropping, methods of processing, cassavabased product range and consumption patterns, change. These dynamics can, to a large extent, change the outlook of a crop.
In order to reexamine CIAT's commodity portfolio, a range of commodities (including CIAT's mandate crops) were evaluated on the basis of four sets of criteria: economic growth, equity, conservation of the natural resource base, and institutional considerations. The methodology developed for the analysis combines several different approaches. An initial hierarchical screening process was followed by a multiple-criteria model, based on a cost-benefit analysis using estimates derived from consultations with commodity experts. To establish the relative importance of cassava, this analysis focuses on only a small sample of the initial set of 18 commodities--cassava, beans, rice and sorghum--in Latin America. In the case of cassava, Asia is also included (for the original study, see Janssen et al. 1990).
6.3.1.1 Economic growth, as the principal aim of technology development, is by far the most widely used criterion. It is generally interpreted as the direct effect of increased production per unit of land or labor. Nevertheless, as the increased supply of a commodity can indirectly influence demand for other commodities (or goods and services) in nonrelated sectors, a linkage effect was introduced in the model to capture this indirect effect. other economic growth criteria included present value of production, expected demand growth and potential foreign export earnings including import substitution.
The direct effect of potential technological impact on a commodity's supply and demand from 1990-2025 was estimated
286

in a partial equilibrium framework. Estimates on commodity productivity increase, cost reduction, lag time and adoption rate were obtained through an expert-opinion survey. Benefits from research were calculated at net present value (NPV) , applying a 10% discount rate (for model specifications, see Janssen et al. 1990). The indirect effect was estimated in a general equilibrium framework, and a distinction was made between tradeable and nontradeable commoditieso
When commodities are evaluated (Table 6.2) for the criterion of monetary benefits from research only, rice technology can generate (direct and indirect) research benefits of well over US$5 billion. Cassava benefits at US$738 million are comparable to the other cropsl however, it should be noted that cassava benefits are considerably higher when Asia is included.
When looking at the criteria of potential foreign export earnings and future demand growth, it becomes clear that cassava benefits in Asia and sorghum benefits are the
Table 6.2 Economic growth parameters for selected commodities in Latín America.
Cassava Cass8v8
Parameter LA Asia Be",," Rice Sor gil ...
NPV 01 research benefits at 419 1,076 594 2,957 619 10% (mllllor. 0$$).
NPV of muttiplier effect 319 902 241 2,319 454 (mil 11 ons US$).
Potential foreign exchange • .- • • ••• , 1 eamml}
2 Future ~ growth ~ ~ = : >
Current value of productioo 1,461 1,767 2,459 4,070 1,237 (mili Ion. US$)
.*. = high; ** = medium; • : low (includes import substitution).
2 ~, =. > than population gfowth.
287

winners. The last criterion--current value of production-to a large extent reflects a similar relative importance of rice. Thus, if the commodity's importance is measured by the toregoing economic growth criteria alone, rice technology presents the best picture. Nevertheless, cassava technology generates a relatively better pay-off than either beans or sorghum.
6.3.1.2 Equity criteria, as re1ated to income improvement, have become increasingly important as the primary mechanism for reducing poverty and malnutrition. Agricultural commodities playa dual role: as food crops for small farmers and as generators of economic development. Development in Latin America has been characterized by intensive use of capital, with low labor absorption and labor displacement. Large producers benefit more than small ones from public policies, farm mechanization and input subsidies, resulting in increased urbanization, landless labor and increased poverty. Moreover, small farmers have often been pushed to 1ess fertile or marginal lands. Therefore, equity criteria need to include benefits for small farmers and poor consumers, generation of labor and direct nutritiona1 contributions.
For purposes of this analysis, measurement of the benefits to poor consumers was based on the resul ts of the partial equilibrium model tor the NPV of research benefits. The second criterion of benefits to small farmers was captured by using the share (%) for small farmers (Le., earning a family income of < U8$3000) among total farmers. The criterion of labor generation was introduced in the form of a technology-derived employment effect, which was measured using the general equilibrium model. The employment effect is comprised of (a) the direct effect, which measures employment changes within the commodity sector as influenced by technological changes: and (b) the indirect effect, which captures employment changes outside the subsector and is calculated through the linkage effect of the model. Total calories and proteins make up the last two equity criteria.
The results for the equity criteria are shown in Table 6.3. When considering benefits to poor consumers, rice technology can generate more than U8$ 2.5 billion to this group: while cassava and beans can contribute US$ 461 and 415 million, resp. The contribution of sorghum to poor consumers is rather low. The picture changes dramatically, however, when inspecting the share of small farmers who benefit from technology. It can be seen that benefits are targeted to more than half the cassava and bean farmers: whereas for rice and sorghulll f only 18 and 13%, resp., of the small farmers will profit frolll improved technology. Hence the largest proportion of rice and sorghulll technology benefits will make intermediate and large farmers better off. In the
288

case of cassava and beans, a relatively larger group of small farrners will benefit. Moreover, when considering derived benefits to Asian cassava producers, improved cassava technology automatically translates into improved incomes for the rural poor as 90% are small farmers.
The effect of employment shows relatively higher values for rice and cassava in Asia. This is in line with the knowledge that cassava products in Asia and rice employ a considerable labor force during the processing stage. Total ca 1 ories and proteins are high for rice and beans; but it should be noted that these values are expressed for direct human consumption. If the amount of cassava used in animal feed to produce animal protein (direct human consumption) were calculated, the calorie and protein values for cassava would be significantly higher. The same reasoning applies for cassava starch used in human food products.
6.3.1.3 In the past little consideration was given to natural resource preservation in assessing the relative importance of agricultural commodities research. Economic growth, equity and natural resource management interact and
Table 6.3 Equity parameters for selected commodities in latin America.
Cass8v8 Cassava
Pafatreter LA Asia Beans Rice Sorgh\Jl1
Technology-derived benefits 461 280 415 2,595 62 tor ror coosl.llTlers (mi II 10115 US$)
Small fanners benefi~ing from 58 90 55 18 13 new technology (%)
Technolo9y~derived employment 60 111 ·63 98 59 effect (tOOO person-yr)
Total calarles fer human 229.8 56.7 38.8 106 2.3 nutrition Cmillions kcal/day)
Total proteins tor hunan consumption ('000 kg/doy) 187 355 2,393 2,100 60
For const...mers of two towest incClI're quinti les (lowest 40%).
2 Fanners with incomes 01 less than US$3000/family.
289
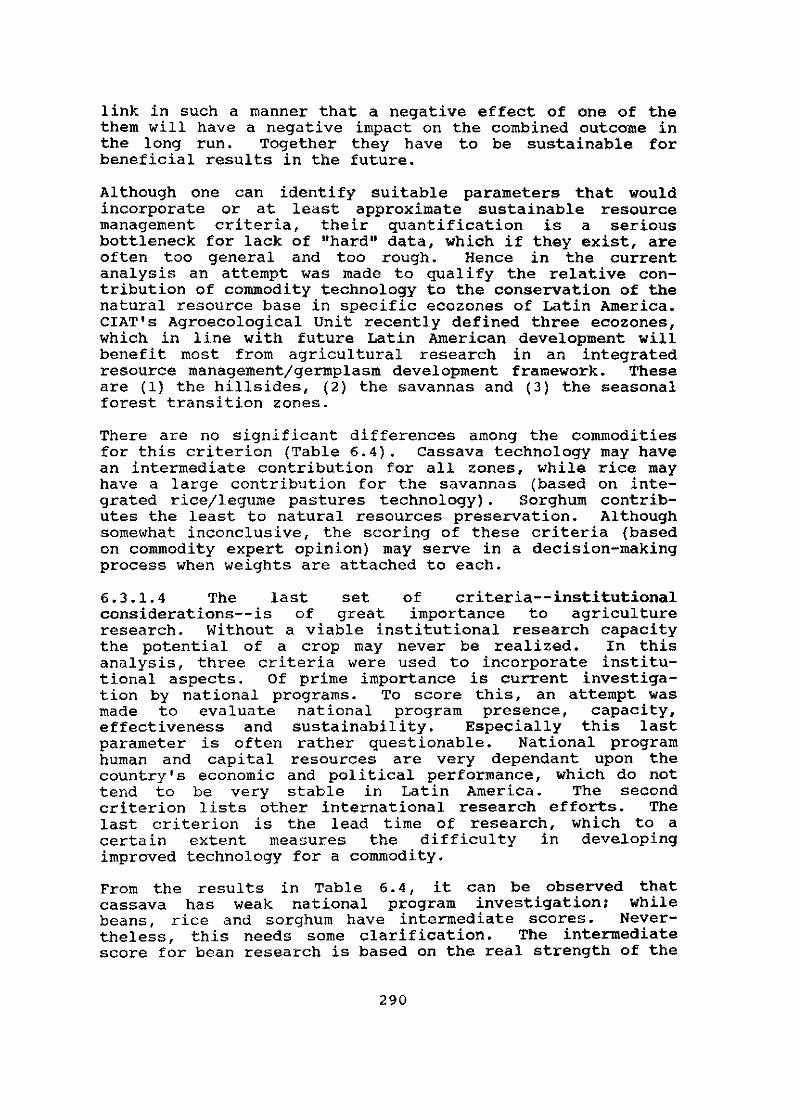
link in such a manner that a negative effect of one of the them will have a negative impact on the combined outcome in the long runo Together they have to be sustainable for beneficial results in the future.
Although one can identify suitable parameters that would incorporate or at least approximate sustainable resource management criteria, their quantification is a serious bottleneck for lack of "hard" data, which if they exist, are often too general and too rough. Hence in the current analysis an attempt was made to qualify the relative contribution of commodity technology to the conservation of the natural resource base in specific ecozones of Latin America. CIAT's Agroecological unit recently defined three ecozones, which in line with future Latin American development will benefit most from agricultural research in an integrated resource managementjgermplasm development framework. These are (1) the hillsides, (2) the savannas and (3) the seasonal forest transition zones.
There are no significant differences among the commodities for this criterion (Table 6.4). Cassava techno1ogy may have an intermediate contribution for all zones, while rice may have a large contribution for the savannas (based on integrated ricejlegume pastures technology). Sorghum contributes the least to natural resources preservation. Although somewhat inconclusive, the scoring of these criteria (based on commodity expert opinion) may serve in a decision-making process when weights are attached to each.
6.3.1.4 The last set of criteria--institutional considerations--is of great importan ce to agriculture research. without a viable institutional research capacity the potential of a crop may never be realized. In this analysis, three criteria were used to incorporate institutional aspects. Of prime importance is current investigation by national programs. To score this, an attempt was made to evaluate national program presence, capacity, effectiveness and sustainability. Especially this last parameter is often rather questionable. National program human and capital resources are very dependant upon the country's economic and political performance, which do not tend to be very stable in Latin America. The second criterion lists other international research efforts. The last criterion is the lead time of research, which to a certain extent measures the difficulty in developing improved technology for a commodity.
From the results in Table 6.4, it can be observed that cassava has weak national program investigation: while beans, rice and sorghum have intermediate scores. Nevertheless, this needs sorne clarification. The intermediate score for bean research is based on the real strength of the
290
Teble 6~4 Conservation of natural resources and fnstitutional parameters tor selected commodities in Latin Anerica.
C8ssava Cassava Parameter LA Asia Seans Rice Sorghun
Conservation of natural 1
resources
Mil tolde tones •• •• • • SavarY\a zones •• •• ••• -Seasonal forest transltlOtl zones •• • •• •
tnstitutional
Current re~earch of netional • • •• •• •• programs
Current researeh international UTA llTA CRSP lRRt# tNTSOI!MIL, centers WARDA ItRlSAT
Lead time of research (yr) 8 6 4 4 7
1 Retative contribution of commodity technology to the conservation of the natural resource base in specific Latin American ecozones.
2 Weak and strong: • ; intermediate: **
national programs. In the case of rice and sorghum, the intermediate score is more a reflection of relatively strong producer organizations and commercial companies. with regard to other international research efforts, work is being done on all commodities; in most cases, however, this research is conducted under different agroclimatic conditions. The last criterion shows that both cassava and sorghum have long lead times for research, implying that research benefits will accrue at a longer horizon than that for rice and beans.
6.3.1.5 What major conclusions can be drawn from this analysis? Basically two. First of al1, the importance of cassava has been demonstrated, both quantitatively and qualitatively, for several sets of criteria. Current value of cassava production is US$1.46 and 1.76 billion in Latin America and Asia, resp. The NPV of research benefits from improved technology (including the multiplier effect) amount to U8$738 and $1.978 million for LA and Asia, resp. It has also been shown that cassava in Asia enjoys streng growth in future demand and a high potential for fereign exchange earnings. Frem the standpoint ef equity, it has been
291

demenstrated that technelegy-derived benefits te consumers in the lowest 40% income groups amount to U8$460 and $280 million in Latin America and Asia, resp. Because of improved cassava technology, 60,000 and 111,000 person-years of labor can be generated on these two continents. Moreover, it is primarily the small, resource-poor farmer who is the ultimate beneficiary.
From a natural resources preservation perspective, it was noted that cassava research can have an intermediate contribution te the conservation of the natural resource base in several Latin American ecozones. From an institutional standpoint, it was shown that cassava research at the natienal level is weak in general. Benefits from improved technology ha ve a 6- to 7-year research lag time.
The second major conclusion that can be drawn from this analysis is that the relative importance of a commodity vis-a-vis others can significantly change depending on the criteria that are used. Table 6.5 gives a summary of the four sets of criteria used in the analysis. If the decision maker uses only the criterion of economic growth to assess the importance of a crop for research investment, rice would
Tabte 6.S SUffimary of scores for four sets of criteria for evaluatfng the relative importance 01 COIlI'IlOdities.
Cassava Cassava
Criteria LA Asia 8eans Rice Sorgh\l1l
Economi e growth • •• • ... • e",ity •• • •• •• ••• Natural resources preservation • •• • .. .. lnst;tutional consideratlons • • ... ** ***
be the obvious choice. However, if the decision is based on equity alone, cas~ava research (in Asia) would be the clear winner. Similar contradictory conclusions can be drawn when reviewing the other two sets of criteria. Hence, if decision makers have clearly defined their goals and objectives, they are able to place weights on each criterion, covering all the different aspects that need to be considered. Depending on the objectives, the outcome would probably be a portfolio of commodities whose potential technology would
292

influence a broad range of essential criteria positively, within the decision maker's mUlti-objective decision framework.
6.3.2 Growth and monitoring of integrated cassava projects
The following short analysis not only quantifies the dynamic adoption of a cassava technology but also demonstrates the value of monitoring. The integrated cassava project concept was initially developed in the Atlantic Coast region of Colombia in the early 1980s. Small cassava farmers' associations using small-scale processing methods started to produce chips for the animal feed industry as an alternative to selling for the fresh market. Over the last 9 years this methodology has been rapidly adopted throughout Central and Latin America (Fig. 6.1). By 1990, there were four other major cassava-producing countries, besides Colombia, with integrated cassava projects. While the no. of cassava drying plants on the Colombia North Coast increased by 11% annually, in Ecuador the rate was almost twice that (20%). In Brazil (state of Ceará) the no. of plants remained constant until the start-up of a special project funded by the W.K. Kellogg Foundation, after which the no. of plants increased by 23%. It must be noted here that in Colombia and southern Brazil, additional plants have sprung up (for which no official data exist), so the total no. of drying plants in these countries exceeds the figures presented.
NCl 01 Plan:s
55, 501 45 40 35
_ PARAGUAY
_ BRAZI~-C-eara
_ PANAMA
_ COLOMB!,.'\-North Coast
Figure 6.1 Expansion of cassava drying plants in selected countries of Latin America (1981-90).
293

other information from Brazil (Fig. 6.5) shows that most of the cassava grown for the drying plants is produced by smallholders. This information can, over time, shed light on technology impact on landholding systems. At the same time, it serves to verify the goals of the project with respect to what type of farmer the technology is benefiting.
A similar issue is demonstrated in Figure 6.6, where cassava sales according to membershipjnonmembership in the farmers' drying cooperativejassociation are compared between Colombia and Ecuador. In 1987 member sales to the drying plants in Ecuador, were greater than nonmember sales; after that year, however, there was a gradual proportional (%) decrease; and by 1990 members supplied only two-thirds of the drying plant' s raw material requirements. This may prove that insufficient incentives exist for small farmers to become members. As such, membership growth may decrease further, ceteris paribus. In the case of Colombia, the situation is similar. The reason why the no. of members as percent of total suppliers is so low and has remained low over time needs to be investigated.
ha
1000 .,. 800
600
400
200
O Sharecroppera Smallholders Rentera
1988 - 92.6 717.49 152.3 ·1989 - 109.4 771.99 169.2
Figure 6.5 Hectares of cassava by land tenure in Brazil (Ceará project).
296

'000 t
COLOMBIA
ECUADOR
11 Member ~Nonmember
Figure 6.6 Cassava sales to drying plants by membership in Ecuador and Colombia.
Information of a different nature is shown in Figure 6.7, which compares the use of different cassava varieties over time, by suppliers to the drying plants in Manabí, Ecuador. The variety "Taurino", which in 1985 accounted for the largest share (41%) fell to only 11% in 1990. A similar trend was shown by "Chola." However, the reverse was true for "Tres Meses," whose share increased from 37% in 1985 to 88% in 1990. This very strong evidence of a variety that becomes dominant within 5 years and other varieties that virtually disappear needs to be studied by cassava breeders, processing specialists and economists to see whether it was caused by abiotic stresses, changing quality demand, starch content, etc.
This sample analysis of monitoring data demonstrates that if collected timely, analyzed properly and fed back to the right audience of project coordinators, supporting institutions and researchers, the information is of great value in helping cassava integrated projects become more efficient and effective in increasing employment and incomes of the rural poor.
297

100%
80%
60%
40%
20%
0% 85-86 88-89 89-90
,"¡""¡I"Ta~'8na" _ "-:-res Meses' _ "Che'a'
Figure 6.7 Cassava variety changes in drying plants in Manabí, Ecuador (Napoleón Chávez, lNlAP).
6.4 References
Janssen, W., sanint, L., Rivas, L. & Henry, G. 1990. Trends in ClAT COllllllodities (Working Document No. 74). Cali, ClAT.
298

7. CASSAVA UTILIZATION
During 1990 the Utilization section contim.:ed research on cassava starch and flour for human consumption and on cassava quality for all end uses. In addition some research was conducted on improving the practicality of the fresh cassava storage technology based on the experiences of the pilot project on the Atlantic Coast of Colombia. The Section also devoted significant human and material resources to training and support of integrated cassava projects in Colombia, Ecuador, Paraguay and Brazil.
The Section actively pursues collaboration with relevant institutions in the developed and developing world in the areas of process and product development as a mechanism for allowing a greater proportion of core resources to be devoted to research on cassava quality issues. During this past year, collaboration was received from CEEMATjCIRAD of France on research on fermented cassava starch; NRI of the UK on research on cassava flour and quality (especially HCN); and the financial support of IDRC, Canada for the pilot phase of the cassava flour project. Research collaboration with the Universidad del Valle (UNIVALLE) Cali on cassava flour and starch process and product development was intensified. An agreement with the University of the State of Sao Faulo (UNESF, Botucatu) will strengthen collaboration in the areas of cassava starch, eating quality and HCN research.
7.1 Cassava Quality
7.1.1 Cyanide analysis. The Utilization Section has used Cooke's (1978) enzymatic method for analyzing root cyanide content for the last 10 years. This method requires extracting free cyanide and cyanogenic glucosides into a stable medium (orthophosphoric acid) . The subsequent enzymic hydrolysis of the cyanogenic glucosides uses exogenous linamarase and the determination of total cyanide is based on color reaction with piridinejpirizolone. This method was recently modified by the NRI. A different initial medium increases the time permitted between extraction and hydrolysis from 4 to 30 days. The amount of piridine used is also greatly decreased, reducing costs and the risks involved in handling this toxic chemical. This modified method also permi ts the quantification of cyanhydrin intermediaries in addition to the free and bound cyanide already possible. Cyanohydrins are an intermediary step in the breakdown of cyanoglucosides to free cyanide. Although unstable in fresh roots, cyanohydrins may be found in some processed products.
A third variation of the enzymatic method (Monroy, 1990) was al so tested. The color reaction is carried out using
299

For the second step, the glucose resulting from the acid hydrolysis method was quantified using a copper reagent, whereas for the enzymatic method glucose oxidase was used to determine glucose contento
Table 7.3 shows the percent starch found in each of the four varieties of cassava analyzed using the two methods. Values were lower for acid hydrolysis than for the enzymatic method, which also had smaller standard deviation values. Acid hydrolysis was probably less efficient at hydrolyzing all the starch than the enzymatic method, which is now standard in the Utilization section. Another advantage is a 50% reduction in cost compared with the acid hydrolysis method.
7.1.3 Effect of preharvest variables on root quality
continuing collaboration between the Physiology and utilization sections has provided a wealth of information on the effects of the preharvest environment, especially fertilizer application and water stress, on root quality factors such as DM and cyanide contents and eating quality. Experiments were managed by the Physiology section in Santander de Quilichao (Cauea) and Pivijay (Magdalena) Colombia (see section 5.1 for production-related results).
The utilization seetion took root samples from relevant experiments for DM, starch, cyanide and eating quality evaluations. These show that many of the treatments used in the experiments do affect root quality. Cyanide centent has preved especially variable in this respecto
Table 7.3 Comparison of two methods of starch cont¡nt determination from cassava root tissues.
Clone Acid Hydrolysis Enzymatie Hydrolysis
1 72.8 + 4.0 80.2 ± 0.4 2 73.3 + 2.6 80.8 ± 0.4 3 82.0 ± 3.8 87.0 ± 0.0 4 77.0 ± 9.1 86.3 ± 0.3
-_ .. 1 Values represent means of 6 reps/clone ± SO.
302

Two experiments were carried out studying the effect of different levels of NPK applieation and annual vs. residual effect (Tables 7.4 & 7.5). Identical results were obtained in both experiments, in that those treatments with zero K produced roots with the highest eyanide and lowest DM contents. DM content was inereased by annual applications, but cyanide eontent increased in one experiment and deereased in another. This may be a varietal effect.
Considering each element separately, N application (Table 7.6) increased root DM content and decreased cyanide contento There was al so an effect on eating quality of roots from plants treated with progressively increasing levels of N, which improved in taste and texture. The source of N was also important in affeeting DM content and eating quality.
Table 7.4 The effect of NPK applications on root DM and total cyanide contents of M Col 1684 and CM 91-3, harvested at Santander de Quilichao.
Treatment
Fertilizer Application
Annual Residual Significance
NPK levels (kgjha)l
0-0-0 50-50-50 0-100-100 50-100-100 100-100-100 100-0-100 100-50-100 100-100-0 100-100-50 Significance
Root Quality Factor Total HCN
%DM (ppm, DM Basis)
34.1 33.8
NS
33.7 abc 33.8 abc 34.0 ab 33.5 be 34.7 ab 34.1 ab 34.7 a 32.8 c 34.1 ab
1%
519 335
0.01%
449 ab 427 b 376 c 407 be 422 b 412 be 422 b 475 a 450 ab
1%
1 Values followed by different letters are significantly (5%) different, DMRT.
303

Table 7.5 Effeet of applying NPK on root OM and total cyanide eontent of M Col 1505 at pivijay.
Treatment
Fertilizer Applieation
Annual Residual
Signifieanee
NPK level (kg/ha)l
0-0-0 50-50-50 0-100-100 50-100-100 100-100-100 100-0-100 100-50-100 100-100-0 100-100-50
Significanee
% OM
41.5 39.5
0.1%
39.5 b 40.6 a 40.9 a 40.6 a 40.9 a 40.6 a 40.8 a 39.9 ab 40.6 a
5%
Total HCN (ppm, OH Basia)
303 376
0.1%
352 abe 345 abe 316 e 339 abe 323 be 333 abe 328 abe 363 a 357 ab
5%
1 Values followed by different lettera are signifieantly (5%) different, OMRT.
P application at 75 t/ha deereased root DH content and inereased HCN content significantly (Table 7.7). Conaidering individual varieties, there were some differenees; for example, SM 414-1 signifieantly inereased in DH with P applieation against the general trend. From the standpoint of root quality, varieties adapted to low P would appear to be valuable.
Applications of K, even at moderate levels, decreased root cyanide eontent significantly and tended to inerease OM eontent although this wae not aignificant (Table 7.8). This agrees with the resulte of the NPK tri al s (Tables 7.4 & 7.5) •
304

Table 7.6 Effect of N source and level on root OM and total cyanide content, and eating quality of M Col 1505 at Pivijay.
Treatment % OM Total HCN
(ppm, OM Basis) Eating Qua1ity1 Texture Taste
Source
NH4S04 Urea
Significance
Level (kgjha)2
O 50 100 200
Significance
33.3 33.9
1%
33.1 b 33.9 a 33.7 a 33.8 a
5%
179 172
NS
187 189 a 176 ab 149 b
5%
2.1 1.9
5%
2.5 a 2.1 a 2.1 a 1.5 b
0.1%
1 Taste and texture evaluated on scale: O = excellent to 3 '" bad.
2.4 2.1
5%
2.6a 2.3ab 2.3ab 1.8b
5%
2 Values followed by different letters are sígnífícantly (5%) different, OMRT.
Considering all these NPK trials together, it is clear that root quality is greatly affected by the levels of applícation of each element, and that although K and N appear to improve quality and P to decrease it, considerable varietal differences exist that could be exploited to achieve highquality roots at low levels of fertilizer application.
Table 7.9 reports an experiment combining fertilizer application treatments with water stress (irrigated vs. rainfed or stressed plots), in which fertilizer application decreased root cyanide content and water stress increased both DM and cyanide contents. Plants were harvested at 5, 7 and 12 mo of age. OM increased with age, and eating quality improved. Cyanide content showed great variation, being significantly lower at 7 mo than at 5 or 10 mo. Table 7.10 shows how cyanide content varies with age for both stressed and irrigated treatments. Cyanide content was higher in
305

Table 7.7 Effect of P application on root DM and total cyanide content of 33 clones harvested at Santander.
Treatment
P Application (kg/ha) O 75 Significance
Clone x P
CG 927-12 CG 996-6 CG 1374-2 CM 305-41 CM 2718-1 CM 2774-11 CM 3285-7 CM 3401-2 CM 3456-3 CM 3654-3 CM 3667-1 CM 3750-5 CM 4145-4 CM 4575-1 CM 4617-1 CM 4701-1 CM 4711-2 CM 4716-1 CM 4793-1 CM 4830-3 CM 4864-1 M Bra 191 M Bra 383 M Col 2215 M Pan 51 SG 104-264 SG 104-284 SG 106-59 SG 250-3 SG 302-1 SG 455-1 SG 545-7 SM 414-1
(% DM)
o
36.1* 38.8* 40.0 32.0 35.9* 37.3 37.8* 37.7* 36.4* 40.1* 37.1 37.6 37.1 37.1 35.8 38.5 37.6 40.2 38.7* 35.0* 38.3* 35.6 37.4 38.5* 36.6* 37.0* 35.3 33.6 37.5* 36.1* 39.5* 33.9 33.7
37.0 35.8
1%
LSD = 0.8
75
33.8 34.3 39.3 31.8 35.1 36.7 35.3 36.3 34.7 37.7 37.2 37.6 36.9 36.9 35.5 38.2 37.2 39.7 36.7 31.0 35.3 35.9 37.2 34.9 33.7 35.7 34.7 35.8* 33.3 35.2 38.2 33.5 37.0*
Total HCN Content (ppm DM Basis)
o
187 131 128 286 286 96 139 172 158 138
200 241
5%
251* 278*
124 234 424 102
418* 123 257 184 152 168
350* 291 148 193 125 168 145 232 166 207 132
LSD = 29
75
206 163*
154 411* 360*
119 192* 208* 219*
154 220 249
177* 285* 477* 132*
262 154* 354* 343* 189* 227*
305 382* 293* 260* 253*
150 181* 270* 214*
198 204*
* Denotes significant (5%) difference between means, placed next to the highest value of the pairo
306

Table 7.8 Effect of K application on root DM and total cyanide content (mean of 8 clones harvested at Pivijay).
Treatment
Level of K (kg/ha)l
o 50 100 200
Significance
(% OM)
34.5 34.2 35.0 35.3
NS
Total HCN (ppm, OM Basia)
350 a 286 b 277 b 256 b
0.01%
1 Values followed by different letters are significantly (5%) different, OMRT.
atressed plants at 5 and 7 mo, but lower at 10 mo than in the irrigated plots.
In a final water stress experiment, stress greatly increased root total cyanide content of each of four varieties although some showed greater percent increases than others (Table 7.11). Harvests were carried out at 6 and 11 mo of age. Root OM content increased between 6 and 11 mo in stressed plants (1. e., following the removal of the water stress regime) whereas OM content in control plants decreased over the same periodo
Considering varietal effects on root starch content (Table 7.12), CM 489-1 produced lower values in control plants at 6 mo, but by 11 mo this had reversed. On the qther hand, CM 2136 had higher starch content in stressed plants at 6 mo, with the position reversed at 11 mo. The response of plants to water stress is thus highly dependent on genetic factors as regards DM and starch contento This leaves considerable scope for varietal development to obtain high-quality roots under adverse environmental conditions.
7.2 Fresh Cassava Conservation
since 1987 the Colombian Integrated Rural Development (ORI)-CIAT pilot project has been functioning in Barrranquilla, using the fresh cassava conservation technology developed by CIATjNRI and first field tested in Bucaramanga, Colombia (see Annual Reports 1983-1984 for experimental
307

Table 7.9 Effect of fertilizer application an:i water stress 00. root IX, total cyanide content and eating quality f:t:a\l plants of M Col 1684 an:i CM 507-37 harvested at three aqes at santan;ler.
Total HCN Eating ~itl Treatment (% I:M) (p¡;!Il, IX Basis) Texb.lre
Fertilizer Application
500 kg!ha 10-20-20 28.1 745 2.5 Control 28.1 891 2.8
Significance NS 0.1% 5%
Irrigation 26.9 747 2.7 water stress 29.3 890 2.7
Significance 30.1% 0.1% NS
Age at Harvest (=l2
5 24.5 e 945 a 2.8 a 7 28.9 b 576 b 2.7 ab 10 31.0 a 934 a 2.5 b
Significance 0.1% 0.1% 5%
1 Texture and fiber evaluated on scale: O = excellent te 3 = bad.
2 Values followed by different letters are significantly (5%) different, DMRT.
Fiber
1.7 1.6
NS
1.9 1.4
1%
2.1 a 1.6b 1.2 e
0.1 %
Table 7.10 Effect of water stress on total root cyanide content at different plant ages.
Total HCN (ppm, DM Basis) Plant Age (mo) Irrigation Water stress
5 779 1110 7 492 660
10 968 900 LSD = 59
308

Table 7.11 Effect of water stress on root DM and total cyanide contents of four clones harvested at two ages.
Total HCN Treatrnent (% DM) (pprn, DM Basis)
Water stress 32.3 326.5 Control 32.3 186.5
Significance NS 1%
Total HCN (pprn • DM Basis)
(% DM) Mean Drought Control
Variety
CM 489-1 27.5 d 350 a 432 268 CM 922-2 36.3 a 210 e 259 161 CM 1335-4 35.0 b 179 c 218 127 CM 2136-6 30.4 e 294 b 398 191
significance 0.1% 0.1%
Total HCN (% DMl (ppm, DM
Mean Drought Control Basis)
Age at harvest (mo)
6 32.3 31.3 33.1 290 11 32.3 33.2 31. 4 226 Significance NS LSD = 0.IL01%
phase, 1985-1987 for Bucararnanga project and 1987-1989 for Barranquil1a reports). The process was technologically satisfactory, and good acceptance of the stored product was obtained by retai1ers and consumers, which led to the placing of orders for storable cassava from rnany superrnarkets and shops in Barranqui11a and other markets. Scale-up of the vo1umes of fresh cassava treated and packed beyond the 10 tjwk maximurn achieved to date has been frustrated by two bott1enecks--one in the area of the
309

Table 7.12 Effect of water stress on root starch content in four clones harvested at 6 and 11 mo of age.
Root Starch Content (%, DM Basis)
6 mo 11 mo
Clone Water stress Control Water stress Control
CM 489-1 70.5 79.3 81.0 77.5 CM 922-2 79.3 77. o 85.3 86.5 CM 1335-4 78.3 79.5 84.8 86.5 CM 2136-6 77. O 73.8 82.5 86.3
Note: Differences significant at 1% level, LSD = 1.9.
organization of fresh cassava supply and the other in the area of product distribution and promotion.
Cassava reaches the Barranquilla market from several production areas--all in the Atlantic Coast region but with differing planting and harvesting times. Thus a constant, reliable provision of good-quality fresh cassava is difficult to achieve. Numerous farmer groups had to be trained in the use of the technology (treatment and packing must be carried out at the farm level immediately after harvest). Cassava quality is highly variable; and at times it is necessary to move to new production areas for quality rather than availability considerations. The constant changing of farmer groups carrying out selection, treatment and packing operations has made quality control difficult. Consequently, experiments were carried out to develop a more flexible supply approach.
If the treatment could be delayed by 24 h, greatly simplifying the operations to be carried out in the field, greater flexibility could be achieved in changing production areas and hence in assuring good-quality cassava. An experiment using three cassava clones carried out at CIAT (Fig. 7.1) showed that treating the roots with thiabendazole could be delayed for 24 h after harvest with no negative results as regards the amount of physiological or microbial deterioration 12 days after storage. An additional delay between harvest and treating (2 days) did, however, cause elevated levels of both types of deterioration. Although thiabendazole treatment can be delayed 24 h, the roots must still be packed at harvest in bags that retain moisture if physiological deterioration is to be prevented.
310

% LOSS 100,-------------------------------------.--.--~
ao~----------·········· ---------.. -------- ........... ----
60~-- _____________________ ~L_ __________ __
40~------------~---------
20 ~------__b_-
e e o L .... _~:;wL"__
Mlcroblological Det. Ph)'Síological Det. Total Deterioration
_ TREATEO IN THE FIELO
TREATEO AFTER 2 OAVS
_ TREATEO AFTER 1 DAY
R NO TREATMENT
Figure 7.1 Fresh cassava conservation: mean of three varieties stored for 12 days after harvest.
When field treatment of the roots was practiced, roots were immediately packed into the 5- or 12-kg polyethylene bags in which they were to be commercialized. If treatment is delayed 24 h, roots can be selected, treated and packed in a central location, provided that they have been packed in the field into bags. These bags can be larger, and an experiment was conducted to see if reusable polypropylene sacks could replace polyethylene bags for this initial 24 h period only. Resul ts (Table 7.13) suggest that al though not as effective as polyethylene bags over a 3-day period, the polyethylene sacks were a significant improvement over the traditional sisal sacks used for cassava marketing in Colombia. The experiment shown in Figure 7.1 was carried out using root storage in polypropylene sacks for the 24-h period between harvest and treatment, with good results.
The economics of the process was improved by developing a means of using roots with high levels of mechanical damage. Such roots are cut cleanly to present a smooth surface and then a dessicant (e.g., caCO) is applied to prevent the buildup of excessive moisture ~t the cut surface, effectively reducing the incidence of bacterial rotting (which thia-
311

Table 7.13 The effect of fresh root package material on physiological deterioration (%) after storage for 3 days after harvest.
Sisal sack Polypropylene sack Polyethylene bag
43 a 20 b
O c
M Col 22
58 31
O
CMC 40
25 6 O
CMC 76
44 22
O
1 Values followed by different letters are significantly (5%) different, DMRT.
bendazole cannot control). This novel treatment means that all previously discarded damaged roots (10-20% of total roots harvested) can now be stored for two weeks.
Figure 7.2 compares the original and new fresh cassava storage processes. One major consequence of the new process is the transfer of treatment and packing operations froID rural to urban areas. In practice, the process has be en carried out as a small business in one of the marginal areas of Barranquilla, thus providing employment for the urban poor. The change has, however, resulted in a much greater flexibility in cassava root supply I with roots coming from cassava coops andjor individual farmers who need no training in treatment or root selection, only in the provision of high-quality fresh roots.
7.3 Cassava Flour
Previous reports (1984-88) detailed the experimental phase of the project to develop a high-quality cassava flour for human consumption. In 1989 IDRC funded the second phase, which contemplated the construction and operation of a pilot plant for producing the flour; the execution of in-depth market surveys to assess the demand for a cassava flour in the food industry; and the use of cassava production technology package s at pilot level to ensure sufficient cassava production to supply the planto During the first year of the project (mid-1990), the following activities were carried out in collaboration with DRI and UNIVALLE.
312

TRADITIONAL
Harvest
I Select roots
I P~ck ínto polyethylene bags (5, 12 kg rootsjbag)
I Treat with Thiabendazo1e
(Spray, 0.4%)
I Drain excess liquid
Seal bags
I Transport to urban
dístríbutíon center
Distribute to retail outlets
Farm
Urban Center
l!'EW SYSTEM
Harvest
Select initially
I Pack into polypropylene
(sacks (50 kgjsack)
I Transport to treatment
center
Receive, store «24 h)
Wash
Select
Treat by ímmersion (thíabendazole 0.4%)
I Dry
I Pack into 5, 12 kg bags
I Distribute to retail
outlets
Figure 7.2 Traditional and new processes for fresh cassava root storage.
313

7.3.1 Establishment of the pilot plant
The following criteria were used to select the site for the pilot plant: land availability, potential to increase cassava yield, availability of cassava, potential to harvest cassava throughout the year, infrastructure (electrici ty , water), proximity to final markets and wheat milIs, institutional supportjpresence, socioeconomic importance of cassaya. The region was the major cassava production area of Colombia--the Atlantic Coast--where farmer and institutional support for these activities is strong.
six possible sites were selected by screeninq the entire region based on these criteria. The National Association of Cassava Farmers and Processors (ANPPY) was also involved in the planning process for site selection and in pilot plant operation. A detailed survey of each site was conducted to determine the best option. A site at Chinu (state of Córdoba) was selected, and the farmer organization of COOPROALGA (Cooperative of Farmers from Algarrobos) was chosen to participate.
A preliminary design for the pilot plant was given to architects to produce a final design (blueprints, electricity and water supply, quantities of material required and budget) . However, the estimate for the initial design totaled US$80,000 (approved budget, US$35,OOO). Thus the capacity of the plant was reduced by 50% to 150 tjyr and other savings were identified for a final cost of US$52,000. Future capacity increases (e.g., increase in artificial drying bed capacity), following the economic feasibility of the pilot operation, will have a relatively low costo
From among three bids for constructing the pllot plant, a local civil englneerlng firm was selected. The pilot plant was bullt between January and April 1990: and the followlng 3 mo were spent testing and adapting the equipment, organizing and training the coop members who are responsib1e for operating the planto Personnel required are a plant head, a production chief and 3 workers.
The equipment was designed, adapted and lmproved in collaboration with UNIVALLE-Cali. The heat generation and transmission system (coke burner, fan, motor and ducts) were purchased from a firm in Bogota. Processing equlpment was modified slightly on arriva1 at the p1ant as follows:
root washer: sealed to prevent water leaks
• carts for chip transport: re-enforced
drying chamber: improvement of finish to increase useful life
314

pre-miller: re-enforced by soldering between screens and roller milIs
• coke burner: additional grate to improve fuel-use efficiency
Equipment modification will continue during the trial operation of the plant as required.
A serious bottleneck developed with regard to the supply of water to the pilot planto Although an aqueduct with sufficient supply passes close to the plant and an agreement had been reached with the local community for the plant to take its full requirement from this aqueduct, at a later date said agreement was anulled as a result of internal community conflicts. The efforts of DRI and other national agencies failed to persuade the local inhabitants to resume supply so a new source of water for the plant had to be found and additional funding sought to take advantage of this supply. This has resulted in the provision of an independant water supply for the pilot plant financed by a loan obtained by ANPPY. The delays encountered prevented operating the pilot plant until November 1990.
Despite this setback, the plant has been operating from June 1990 onward, producing cassava chips suitable for the animal feed market. These chips have been produced using the process for cassava flour production (i.e., strict root selection, artificial or mixed drying systems) and hence have suffered from higher costs than is usual for chips sun-dried for the animal feed market. Nevertheless, with careful cost control ( good fuel-use efficiency and a reasonable price paid for the raw material, losses have been kept to a minimum. An unexpected result of this operation has been the tentative justification of mixed or artificial drying systems to produce a product for the animal feed market in Colombia. Conversion rates of fresh roots:dried chips as low as 2.42 were obtained. Coke requirements varied from 1600 to 670 kg per ton of chips produced, showing that as the workers become more practiced in plant operation, cost reductions can occur.
Although the cassava production component of this project is contained within the Agronomy section (see 5.5), it 1S interesting to note that no problems were experienced in obtaining a supply of raw material for the plant in the off season and that the local Venezolana variety had a higher root DM content than the introduced P-12 variety, which has significant implications for process economics. Future production trials will emphasize Venezolana rather than P-12.
315

7.3.2 Market development
Initial studies were carried out to detect potential markets for cassava flour in the food industry.
Market studies were carried out with food industries that use flours in their product formulations, in the following geographical regions of Colombia:
• National: Bogotá Medellín, Cali
• Atlantic Coast: Barranquilla, Cartagena, Santa Marta
• Area close to pilot plant: Montería, Sincelejo, Corozal, Chinu, etc.
AII industries received samples of cassava flour in sufficient quantities for conducting their own product formulation trials, and they were interviewed on the results of these trials. The main conclusions were:
Preliminary estimate of potential demand ín the food industry for cassava flour of 30,000 tjyr, for the substitution of other raw materials, principally wheat flour
The wide variety of both products and impressive. Products most suitable with cassava flour are:
processed meats
• biscuitsjcookies (all types)
• pastas
• cakes, bakery goods in general
food industries is for substitution
• mixtures for starch-based drinks ("coladas")
• mixtures for soups
for breading chickens, etc.
• ice cream eones
sauce bases, spices, etc.
In sorne products cassava flour has clear functional and product quality advantages over other flours regardless of price; e.g., processed meats, biscuitsjcookies, ice crea m canes and mixtures for breading.
316

The main flour substituted by cassava flour is wheat (80%); others include rice, maize starch and cassava starch.
The industry requires 50-kg sacks of flour.
At a price 15-20% below that of wheat flour, cassava flour would be very attracti ve to the food industry. This price should be achievable by the pilot planto
Of the major cities close to the pilot plant, Barranquilla and Medellin, the latter has a larger potential demand for the flour.
Subseque~t actions will be to promote the use of cassava flours 1n those markets with greatest potential. This implies the development of market channels for the new producto Two possible rnarket channels exist:
pilot plant
Pilot plant client.
wheat milI
wheat mill
industrial client
wholesaler -- small volume
A third option--that of milling the chips to flour at the plant itself--will become available at a later date if a viable small-scale, efficient milI can be developed.
Wheat milIs in Medellin and Barranquilla have milled 1-ton lots of cassava chips, with conversion rates of 70-95%. Both expressed great interest in milling the chips as a commercial proposition. Few modifications are necessary to achieve a consistent 90-95% conversion rateo
Product promotion activities will be concentrated in Medellin once the pilot plant is producing flour of an adequate quality.
7.3.3 Support research
In collaboration with UNIVALLE, research has continued in tha following areas:
Product devalopment using cassava flour for starch-based drinks ("coladas"), pastasjnoodles for soups and "manjar blanco" (a typical Colombian milk-based dessert). Sorne changes in the process for producing the items are required to maintain product quality using cassava flour, but these are relati vely easy to achieve wi th practica.
317
Processing equipment coupling of washer to machine itself.
improvement: root washer, the chipping machine, and the chipping
Development of milling and gradinq equipment for inplant production of cassava flour. A small-scale roller milI with a siftingjgrading system that can function to milI pre-milled cassava chips is beinq evaluated. This system has a 200-300 kgjh capacity.
Storage studies. 900 kg samples of chips and flour were placed in 3 warehouses of IDEMA (Colombian state agricultural marketing organization) in Montería (Atlantic Coast), Bogotá and Cali. From February 1990 onward, monthly samples were taken; and the microbiological quality and physicochemical characteristics, evaluated. Initial results (Feb. -July) show that moisture content has remained stable (11.0-12.2%) as have protein, reducing sugar and fiber contents. The microbiological status of the samples has also been stable, with apparent reductions in fungal and yeast counts over this periodo No Salmonella or E. coli bacteria have been found in those samples destined for human consumption.
Cyanide elimination studies. Cassava flour for human consumption must meet standards of 50 ppm HCN, yet the artificial dryinq system used to obtain flour with an acceptable microbioloqical quality a1so reduces the cyanide los s as compared to the sun-dried producto Flour samples from the pilot plant will be monitored for HCN contento Preliminary experiments at CIAT suqqest that breakinq the artificial dryinq time into two 4-6 h periods (with an overnight break) allows more time for enzymic release of free HCN, and has the potential to reduce the final level of HeN. This is also a practical operational procedure for the pilot planto
7.3.4 Economíc analysis
An economic feasibility study will be completed during 1991, using data and costs obtained from pilot plant operations. A model for calculating financial profitability (Financial Rate of Return, FRR) has been developed, which will be used for this analysis. Using the best information available at present, the costs of producing cassava chips for the food industry market are Col. $12 o, OOOjt: $ 7 4,000 for raw material, Col.$12,OOO for transport and Col.$9,OOO for
318

coke. 1 The reroaining costs relate -mainly to labor and financial costs. A roargin of Col. $28,000 is envisaged to produce a sale price in Medellin of Col. $140, OOO/t. This compares with a price for wheat in Medellin of Col. $159, OOO/t; i. e., cassava is 12 % cheaper than wheat. Given these prices the FRR is highly positive (30%, twice the 15% needed to justify the project). Nevertheless the pilot plant operation will permit substitution of assumed prices/costs etc. by real commercially obtained data, thereby providing a true picture of the commercial viability of the process.
7.4 Production and utilization of Cassava Starch
7.4.1 Background
In Latin America, many sroall-scale cassava starch industries exist where the product has specific food uses, typically for the production of "sour" starch (Brazil, Colombia). "Sour" starch is a naturally fermented starch whose characteristic functional properties are necessary for making traditional cheese breads: "pandeyuca", "pandebono" in Colombia or Ecuador, "biscoito", "pan de queijo" in Brazil. This traditional industry has a real socioeconomic importance for the local economy and for adding value to cassava production. Nevertheless, this sector presents many probleros in terros of production, processing and comercialization, which limit its development. A collaborative CIATCEEMAT/ClRAD project on "Production and utilization of cassava starch" was initiated in 1989 to improve new technologies for this industry (see Annual Report 1989). For defining research priorities compatible with local needs, the following methodologies were used:
Analysis and diagnosis of the Colombian traditional process technology (see also biotechnology section)
Identification of the "bottlenecks" of the technioeconomic system
Organization of workshops on this theme with the participation of researchers, producers and users
Constitution of multidisciplinary interinstitutional teams.
The following priority areas of research and development on cassava starch were established in 1989:
1 Exchange rate averaged Col. Ps.$50l.10 to US$l for the perlod June-July 1990.
319

• Standardization oE analytical assays Characterization of sour starch
• Equipment technology Influences of raw material on product quality Mechanisms involved in natural fermentation
These themes have been developed in collaboration with national institutions: lIT, the Institute of Technological Research in Bogotá, SEDECOM, UNIVALLE (Section of Foods, Chemistry Dept., Dept. of Mechanical Engineering) and the Universidad Autónoma del Occidente (Depts. of Mechanical and Industrial Engineering) in Cali. Other national agencies are supporting this project in Colombia by providing technical assistance for cassava production through to commercialization, and farmer and starch producer organization.
7.4.2 Standardization of analytical methods
The analytical methods used by different institutions working on cassava products were compiled: NRI (England) I
ClRAD and ORSTOM (France), UNESP Botucatu (Brazil), ITNN (Paraguay), lIT and UNIVALLE (Colombia). Sorne of them have been evaluated; others adapted for cassava starch and used for research:
Biochemical analysis (water content, starch determination by enzymatic assay, organic acids by gas chromatography, organic acids, ethanol, starch and glucose by high pressure chromatography)
• Physical parameters (color, granulometry)
Functional properties of starch (amylograms, water absorption)
starch structure (degree oE polymerization by gel permeation chromatography)
7.4.3 Characterization of sour starch
7.4.3.1 Evaluation of sour starch quali ty. Tradi tionally , only empirical tests are used (e.g., acidity, taste and rough sensation of starch granule in the mouth between the tongue and the palate, the color of a flame in the presence of starch dust, or the form and expansion of a starch hall made of sour starch and saliva put on the extremity of a lighted cigarette). No quality test with a scientific basis exists. The establishment of a simple method for evaluating sour starch quality has been a research priority. The main quality characteristic that seur starch users (small-scale bakeries or large companies) require is "expansion power." This is "the ability of a fermented starch to increase the volume of a dough containing that starch and suhmitted te a
320

proces:: of baking. ," The simplest parameter for determining expans~on power ~s the specific volume of bread after baking. Nevertheless, this expansion power depends not only on the starch quality but also on the cheese quality (which is also very variable), product forroulation, dough texture and consistency, bread forro and baking conditions. For designing a reproducible and sensitive baking test, several assays using good- and bad-quality samples were carried out under different baking conditions and forroulations (cheese, fat, salt, yeast, etc.) using a domestic electric oven.
The following protocol was standardized:
Manual preparation of a dough made of sour starch (1 part) , commercial white ("campesino") cheese (1 part) and cold water (0.5 part) at ambient temperatures
• Baking oi 6 or 8 small round breads of 15 9 at 450°F for 7 mino
• Determination of the average specific volume of the cheese breads by the method of seed displacement
This protocol has the advantages of using or having:
• A formulation similar to that of traditional products
A sweet consistency of the dough
• A stable and homogeneous structure of the final product
No variability with cheese quality
The best differentiation between good and bad starch quality (Fig. 7.3)
Good reproducibility (Table 7.14) ; the results obtained with this manual breading test (assay BTMan) were not significantly different (p<O.OOl, Student's test) from those assays carried out under stricter conditions: (dough prepared in a farinograph Brabender until a consistency of 200 BU and baking in a convection rotatory oven, assay BTFar).
This test can be used at the level of the lab to determine the influences of raw material or process steps on starch quality as well as in the extraction plants for process control and in product price negotiations.
321

R e 1 a t 1.6
: 14
E 1.2 X
P a n s i 0,8 o n 0.6
R a 0,4 t e
( R € )
0,2
o Cheese Fat (6%)
Re "" (Ehq - Ebq}/Ebq
chq = E:lf .. ao8ion foí' .. Righ QuaHty ebq '" Exp.nslon tor " p,;,or Quaiity
Salt(3%) Yeast (f%)
Figure 7.3 Relative expansion rate in function of different formulations with sour starch.
Table 7.14 Repeatibility of the breading test (10 reps) for two starch qualities.
Specific Volume (g/mI)
Sour Starch N' 1 Saur Starch N· 2
Assay BTMan Assay BTFar Assay BTMan Assay BTFar
Mean 3.81 3.88 3.39 3.31 SD 0.264 0.221 0.235 0.166 SE 0.084 0.070 0.075 0.053 CV 6.9 % 5.7 % 6.9 % 5.1 %
322

7.4.3.2 Evaluation of different sour starches. A series of 35 samples were collected and ranked with em~irical criteria by users, into 3 groups: good, regular and poor quality. Another classification into 3 classes was made by clustering the values of the specific volumes determined by the breading test (Tabla 7.15). When the two classifications were compared, a correlation was observed between the qualitative one (empirical) and the quantitative one (specific volume value) :
Very good (R = 1, P < 0.001) for good-quality starches
Not significant (R = 0.79, P = 035) for regular and poor-quality starches
Thus the traditional knowledge of the product permits identification of only the good-quality products.
Correlations between specific volume and starch character parameters (biochemical, physical and functional properties) were also studied. The following correlations were significant (p < 0.05):
• Total organic acids
• Lactic (+) and acetic (-) acids
Color (brightness)
• Swelling power at 90'C
• Water absorption at 40 and 500 BU
Thesa results show that acid lactic production and the modification of the functional properties of native starch during fermentation are important.
Table 7.15 Classes of a sour starch samples cluster (values with same letter are significantly different, p < 0.05).
Class Starch Quality
1 2 3
Good Regular Poor
Specific Volume Mean (SD)
4.89 (0.05) a,b 4.21 (0.17) a,c 3.38 (0.15) b,c
323
7.4.4 Equipment technology
One of the main conclusions of the technological diagnosis made in 1989 was the very low efficiency of the traditional process, with starch los ses of about 25%. To improve the extraction rate and the "sour" or/and "sweet" starch quality, some equipment modifications were proposed, looking at the possibilities of scale reduction of those used in advanced technology. The improved equipment was designed, built and is now belng evaluated with the producers in some traditional starch-extracting operations (flrallanderiasfl ).
7.4.4.1 Washing/peeling. The presence of external peel affects the product color and increases the quantity of "mancha"; so, the modifications have been:
Addition of 2 or 4 abrasive rollers
Distribution of washing water from the central axle
• Direct power transmission by a moto-reductor
7.4.4.2 Extraction. The low efficiency of the process is due to a poor liberation of starch granules during rasping and a limited extraction of starch as shown by the values of the "rasping efficiency" (Re) and the "rasping effect" (R) of 83.6% (SO = 3.0) and 81.1 % (SO = 8.6) compared to those obtained in advanced technology of more than 95 and 90%, resp.
Re = 100 * (Sr - Swp)/Sr R = 100 * (1 - Swp*Fr/(Sr*Fwp»
with Sr, Swp, Fr, Fwp (starch and fiber contents in the roots and the waste pulp, resp.).
The other problem is excessive fiber content in the final producto This can be overcome by:
Grating with a system of root disintegration by cutting blades fixed on a plastic drum with a higher rotation velocity
Extracting with water in a traditional cylindrical extractor equipped with four mixing screws to get better contact between water and cassava mash
Refining of starch milk in a vibratory sifter with two sieves (80 and 120 mesh)
7.4.4.3 Starch separation. Natural decantation of starch milk in the settling tanks takes one day. To avoid removing starch on a daily basis, several successive sedimentations
324

are carried out during one week. The natural fermentation that occurs modifies the functional properties of native starch; under these conditions, the final product does not respond to the general requirements for industrial uses of "sweet starch." Also, some starch is lost when the supernatant is removed. An improved system--sedimentation in settling tables--which is already used in India and Brazil, reduces starch los ses and allows starch classification by purity and granule size.
7.4.5 Influence of raw material
A survey of starch producers was carried out in the municipalities of Santander and Caldono (97 rallanderias in Cauca, Colombia), to learn their opinion about the influence of cassava varieties en starch extraction yields and en sour starch quality. Ranking of the varieties using Friedman's test (Fig. 7.4) shows differences between quality and yield for the two main varieties used (Fig. 7.5). M Col 8 (Blanquita) gives the best yield but the worst qualitYi M Col 1522 (Algodona) the best quality but the worst yield.
A study of the suitability of cassava varieties for sour and sweet starch production was undertaken. Varieties were planted at CIAT and the starch production area in order to:
Monitor the evolution of the raw material as a function of plant age and the preharvest environment
Obtain precise data on extraction rate and on the sour starch quality for each variety
Understand varietal differences in yield and quality by characterizing the native starch
7.4.6 study of natural fermentation
7.4.6.1 Physicochemical parameters. The physicochemical parameters and functional properties of sour starch are highly variable from one processing plant to another and from one fermentation to another in the same planto Factors such as ambient conditions, variety, water quality and traditional knowledge may be involved in this variability.
A study of several fermentations showed that natural fermentation is homolactic; that is, lactic acid explains 99% of the variation of total organic acids, but is in itself extremely variable (20-800 mg/lOO 9 of starch DM basis). Nevertheless, a tendency can be shown for the evolution of pH and lactic acid production (Fig. 7.6). The process can be divided into three stages:
325

M e a n
R 5~---------'~--------------------~--------~ a n k 4
( D e 3 e r
e 2 a s í n 1 g
o r d e r )
O M Col 1522 M Col 6 M Col 2260 CMC-40 CM 523-7 M Col 1684 M Col 113
_ Extraclion Rate _ Quality
Figure 7.4 Mean arder rank af sorne cassava varieties for extraction rate and quality parameters; values with same letters are significantly different (Friedman's multiple test, P<O.OOl or P<O.Ol or P<O.05).
% of Producers
1
40 ! I
I
/ .
i .
I --- ,
f ' ' , , , ,
! t :
I ! ) , í
>' /1 r! ,
20
o M Col 1522 M Col 8 M Col 22GO CMC-40 CM 523-7 M Col 1684 M Col 113
Figure 7.5 Main varieties used in sour starch process.
326

L a e t 500 i e
A 400 e i d 300
( m 200
7 1 O 100 O
g O
d m )
pH ~~~~~~~··~~~~~················~~~~~--~~-,7
O
40Q lo 800 mg/l O 9 dm * 6
5
FnnTt da:!} '2 t 15
4
~~~~~~~~~~~~~~-L3
10 15
Time (days)
- Lactlc ACld c=~~~. .
20 25
Figure 7.6 Evolution of pH and lactic acid during fermentation (case of good-quality sour starch).
Development of lactic fermentation during the first 3 to 5 days (pH 4-4.3) and production of organic acid (20-50 mgj100 mg of starch DM basis)
A stationary stage until day 15-20 when the microorganisms adapt to the difficult conditions of the medium, becoming anaerobic after day 3-4, with a temp of about 18-20'C, and a substrate composed only of starch
A renewed homolactic fermentation with great production of lactic acid (1000 mgj100 9 starch DM basis) from day 20 onward; process does not always have time to develop fully before the starch is removed and dried, in which case final product quality is poor
7.4.6.2 Functional properties. During fermentation (increasing acidification of medium) and the subsequent modifications in starch structure, functional properties change (Fig. 7.7):
• Increased gelatinization temp (60 to 63j65'C)
Lower viscosity values: maximum viscosity during heating (Vm), viscosity after 30 min at 90'C (Vr) and on cooling to 50'C (Ve)
327

600 Heating from 25 to 90 e Const. Temp. to 50 e Const, temp,
B r 500 a b e 400 n d e 300 r
U 2()O n í t 100. s
O O 20 40 60 80 100
Time (min)
_." .. "Sweet" starch - "Sour" starch I Figure 7.7 Effect of fermentation on starch paste (4%)
quality.
Different behavior of the starch paste: greater ease of cooking; i.e, time to reach the maximum viscosity starting from the beginning of the gelatinization phenomenon, a lower gelatinization index (Ve-Vr) and a greater setback value (Ve-Vm).
Screening the starch structure by SEM microscopy showed a selective decrease in the size of some starch granules, mainly during the last stage of fermentation. The evolution of the degree of polymerization using gel permeation chromatography wi11 be studied to obtain more information on the changes in starch structure during fermentation.
7.4.6.3 Microbia1 popu1ation. Screening of the microorganisms invo1ved in natural fermentation of cassava starch showed the following characteristics (Fig. 7.8):
• A 10-fold increase in the anaerobic popu1ation between the extraction step and the beginning of fermentation
• A con~tant anaerobic microbial population of ca. 107
to 10 ce11s/g starch DM basis, (main1y bacteria)
328

L o
f 10
e e 8 1 1
n 6 u m b 4 e r
" i 2 *,,~* *"".~( n " " ¡¡ " " " d O m O 5 10 15 20 25 ) Time ( days)
[- - Anaerobie PopuL -+- Yeasts "m MOUld~]
Figure 7.8 Evolution of the microbial population during fermentation (day O = extraetion step; day 4 = beginning of fermentation).
A small population of yeast and rool2s, roorelor less c?nstant after the 5th day, about 10 and 10 , resp.
A progressive inerease in the proportion of Lactobacillus (froro 5% to 20% of the total population) during the entire fermentation
The roieroorganisms present in the mediuro have starch as their only earbon souree. Oxygenation conditions change rapidly froro aerobic to strictly anaerobic; thus seleetion of anaerobic amylolytie flora is important. For this, media progressively less rieh in nutitive elements were used until one was obtained whose only carbon source is starch. It was found that in all the steps of the process, there are amylolitic microorganisms, some of whieh are producing a great quantity of gas, identified by mass spectrophotometry as CO
2•
Lactic bacteria (in MRS medium) with amylelytic activity, which play an important role in the process, were selected. Taxonomic characterization, metabolism and enzymatie system are being studied for the 20 isolates. Research en the amylolytic activity of the enzymes involved in microbial fermentation of cassava starch is reported in seetion 2.6.
329

7.4 .6. 4 Fermentation influences on sour starch baking power. Based on previous results, the following hypothesis is presented to explain the baking power property of sour starch:
Fermentation step. The amylolitic microorganisms (sorne are lactic bacteria) produce reducing sugars that are immediately consumed by lactic bacteria (the reducing sugar content in the medium has a zero value for the entire fermentation) to produce organic acids (mainly lactic acid) and carbonic gas. These may be absorbed by the starch¡ the attack by amylolitic enzymes and the acidification of the medium modify the functional properties of native starch.
Baking step. During the heat treatment of baking, the dough moisture is volatilized (initial and final water contents are about 50 and 8-12%, resp.). Lactic acid and CO produce the expansion power of the dough and the de~reased gelling tendency, which together give the characteristic texture of the final producto
7.4.7 International cooperation
Contacts have be en maintained in basic research with Brazil and Argentina, and technical assistance has been provided to national starch programs in the following countries:
Paraguay (SEAG)
Technical diagnosis of the 3 technological levels (manual, semimechanized and mechanized) identified in the traditional process of strarch extraction
• Socioeconomical survey of this rural agroindustry
• Research for evaluating new technologies
Ecuador (FUNDAGRO, UAPPY)
• Technico-economic survey of cassava starch production in Manabi Province
Determination of the biochemical, physical and functional properties of cassava-derived products cornmercialized by UAPPY (starches and flours)
Definition of the requirements of products for sorne industrial uses in collaboration with these users
330

7.5 References
Bate & Ryde. 1982. Starch 34(4):125-128.
Cooke, R.O. 1978. An enzymatic assay for the total cyanide content of cassava. J. Sci. Food Agrie. 29:345-352.
Monroy, J.A, Lebert, A, Marty, C; Bimbenet, J.J. and Muchnik J. 199Q (In preparation).
331

8. INTEGRATED CASSAVA DEVELOPMENT PROJECTS
8.1 Brazil: Cassava Development Project, Ceará
Through the establishment of a cassava-based agroindustrial development model, the CIAT Cassava Program will be in a position te formulate and implement a strategy aimed at supporting poverty alleviation and institution-building objectives. The project is expected to contribute to the development of a general methodology, technologies and expertise for implementing small farmer integrated rural development projects based on the specific characteristics of the cassava crop in other regions of Brazil and other countries of Latin America. CIAT is promoting the formation of a network of national agencies interested in cassavabased integrated rural development projects1 and Brazil, as the largest cassava producer in Latin America, could be one of the principal actors.
Since 1979, Brazilian agricultural institutions have been trying te implement activities to promote the production of dry cassava chips for animal feed as an alternative cornmercial activity for the cassava farmers in NE Brazil. During the period 1980-86, efforts included the installation of the first dry cassava agro industries in the state of Ceará (1981). These units were not very successful for various reasons, among these severe drought (1979-83), which substantially reduced crop production; and the agroindustrial model chosen relied on large farmer coops (400-500 members), which greatly diminished farmers' interest in participating in the administration of the agro industries.
In 1986 the CIAT Cassava Program initiated closer collaboration with agricultural research and rural extension agencies of Ceará; and in 1987, during a training event held at CIAT, a group of technicians from NE Brazil did a diagnosis of the principal problems of the cassava crop in 7 states of the region. Production of dry cassava for animal feed was identified as a marketing alternative for the cassava farmers in the region. In 1988 the agricultural institutions of the State of Ceará formed a State Cornmittee for Cassava (Cee) with the purpose of coordinating the work being implemented with this crop in the state. CIAT collaborated actively with the cce in the formulation of this integrated development project, funded by the W. K. Kellogg Foundation as of May 1989.
8.1.1 The setting
The region of NE Braz il, considered to have the highest levels of poverty and underemployment in the country, ::LS comprised of 9 states (Maranhao, Piaui, Ceará, Rio Grande do Norte, Para iba , Pernambuco, Alagoas, Sergipe and Bahia) with
333

a total area of ca. 1.5 million km2 (18% of the country's total area). Negative national recards are held in aspects su eh as absolute poverty, infant mortality rates, unemplayment and underemployment, illiteracy and access t:o basic services. In 1990 the population of NE Brazil wa. approx. 43 millian (28% of the country's population), 42' ol whom live in rural areas. More than 50% of the work force is engaged in agriculture-related activities (IBGE, 1980).
More than 70% of the families live below the poverty line (Le., cannot fulfill their own basie needs of food and basie services). Land distribution is greatly skewed; the no. of farros with· fewer than 10 ha represent 70% of the total but account for less than 6% of the tatal farro area; whereas the no. of farros over 100 ha represent 6% of the total but oceupy more than 40% of the total farro area (Fig. 8.1) .
The NE's contribution to total Brazilian agricultural production represents about one fifth of the total value, and sOme of the most important agricultural commodities produced in the region (sugarcane, cotton, cassava) represent a significant share of national production.
80
70
60
50 1
40
30
20 3.9
10 Ceara
O~~~···.--L~_~~_L-r-2-. ....... ~~~~~ Farms < 10 Ha. Total Area Farm. >100 Ha. Total Area
Figure 8.1 Land distribution in NE Brazil and the state of Ceará.
334

The state o~Ceará is the fourth largest state in NE Brazil (148,000 km). Population projections indicate that by 1990, the total population of Ceará was about 6.4 million, 36% of whom will be living in rural areas. Agriculture is the main economic acti vi ty , employing 56% of the sta te , s labor force (IBGE 1989).
Average per capita income in the rural areas is one of the lowest in the NE. Income distribution patterns are extremely skewed, with 50% of the population earning less than the minimum salary (US$75 in Oct. 1990), accounting for only 15% of the total income in the Sta te. High rates of infant mortality (25/1000), malnutrition and illiteracy are major socioeconomic problems (IBGE 1989).
Land distribution in Ceará, as in the rest of NE Brazil, presents a highly skewed pattern, where farros with under 10 ha represent 48% of all farros but account for only 3.9% of the total farro area. Conversely, the no. of farros with areas over 1000 ha represents only 0.44% of the total no. of farros (20.5% of the total area available). Some 60% of the rural producers are classified as nonowners: and of those considered as owners, 40% have no legal title (IBGE, 1989) (Fig. 8.1). Cotton, beef, fruit, beans, maize, sugarcane and cassava are some of the State's most important agricultural products.
8.1.2 Importance of cassava production
Cassava is grown throughout Brazil. According to FAO, the area planted in 1989 was 1.9 million ha with a total production of 23.2 million t and an avg productivity of 12.5 t/ha. Brazil used to be the most important producer in the world, but recently this position was lost to Thailand. On a countrywide basis, cassava holds eighth place as regards total area planted and seventh place in monetary value (FAO, 199?) •
Cassava, which is a major caloric source in Brazil, is consumed in two principal forros: "farinha" (toasted flour) and fresh. Per cap ita consumption of farinha (17,6 kg/year) is much more important than consumption of cassava in fresh forro (6.1 kg/yr) (IBGE, 1989).
In the NE, cassava is produced mainly by small farroers. The climatic conditions in this area are much harsher than those of other cassava-growing areas of the country; consequently, yields are Iower. In 1989 a total of 1. 09 million ha of cassava were planted for a total production of 11.7 million t and an avg productivity of 10.7 t/ha.
335

Most of the cassava harvested in the region is used for making farinha, with smaller amounts sold fresh for human consumption and minimal quantities used for animal feed.
In the State of Ceará, cassava production is one of the main agricultural activities. From 1985-87, avg annual production was on 113,035 ha with avg productivity at 9.6 tjha. This production ranked fifth statewide in terms of total crop area planted and second in terms of total monetary value. Cassava is mainly used in the form of farinha (64%), for animal feed at the farm level (25%), and minimal quantities are used in fresh form for human consumption (ISGE, 1989).
8.1.3 Proiect objectives and expected outcomes
The project is intended to lmprove the welfare of the rural poor invo1ved in cassava production in communities throughout the State of Ceará, NE Brazil. This objective i8 to be achieved through the introduction and adoption of improved cassava production, processing and marketing technology.
Expected outcomes of the project are:
Generation and testing of a small-scale cassava-based agro-industrial development model
Institution building through a participatory management approach for implementing the project at the various levels and stages; development and strengthening of community-based organizations
Improved welfare through the simulation of economic development and generation of employment opportunities in the rural communities in the project area
8.1.4 Proiect activities
The work plan has involved the following activities:
Selection of site for developing a pilot project
Identification of local implement the project, as financial support
institutiona1 capacity well as local sources
to of
Design and establishment of the pilot project: production technology 1 processing technology I commercialization, organization and training
Monitoring of operations and in situ modification of the modus operandum in accordance with local conditions
336

Monitoring of project performance and modification of project design
Expansion phase to semicommercial- and commercial-scale production
8.1.5 Progress toward project outcomes
8.1.5.1 Selection of pilot project site. The selection of the State of Ceará as the site for the pilot project was strongly influenced by prior involvement of some agricultural institutions in Ceará--especially the State Rural Extension Agency (EMATERCE)--in the promotion of activities related to small-scale cassava farming and processing. The concept of small-scale cassava-based agroindustries for producing dry cassava chips for animal feed, which had remained practically frozen in Ceará from 1981-86, was reactivated; and in 1987, five cassava agro industries were installed across the state. However, the farmers' groups performed poorly once again as a result of the poor selection of areas and farmers' groups, the lack of credit for planting, and scarcity of planting material.
The formation of the CCC in 1988 facilitated the coordination of support activities in the state. with other sources of funding, nine new farmer groups were organized around dry cassava processing facilities that year. In May 1989 the coordinating activities of the CCC were strengthened; and during this reporting period (May 1989-0ct. 1990) 24 new producer groups were organized to install and operate dry cassava processing agroindustries. By December 1990 38 agroindustries will be installed (Table 8.1).
8.1.5.2 Identification of local institutional capacity and financia! support. This objective is being pursued at four levels: State, regional, municipal and community. Identification of financial support at national and local level has been more difficult because of the prevailing economic situation in Brazil although the cce has been able te obtain access to some development programa (PAPP-Support Program for Small Farmers; SUDENE-Superintendency for Oevelopment of the NE; BNB-Bank of NE Brazil), which are supporting farmer groups to install cassava processing agroindustries.
8.1.5.3 Production technology. Minimal adoption of improved agricultural technology and lack of good-quality planting material were identified as two of the main constraints in implementing the production technology component of the pilot project. Actions taken to overcome these constraints have included the setting up of (a) demonstration/preproduction trials and (h) seed production plots.
337

Table 8.1 Cassava drying plants in Ceará, 1981-90.
No. of Agro- Drying PI~nts Period industries Area (m ) Funding
1980-81 4 4,200 1 1986-89 5 2,070 1 1988-89 9 5,010 1-4 1989-90 24 22,179 1,2,3,5
TOTAL 42 33,459
1. International Bank for Reconstruction and Development (IBRD) /EMBRATER
2. BNB/ETENE - Technical and Economic Studies for the NE 3. PAPP/FADA - Support Fund for Agriculture Development 4. Sao Vicente Rural Development Program 5. PAPP/ATER - Technical Assistance and Rural Extension
Demonstration/pre-production trials. In order to test and demonstrate improved cassava production technology generate feedback for the research and extension agencies, trials (0.25 ha) have been set up in the vicinity of each processing planto During the first planting sea son (Jan-March 90), 16 of these trials were established; for the next planting season, a total of 35 preproduction plots will be installed.
The strategy for these trials is twofold: (a) Apply all the components of available improved technoloqy in combination with those components of traditional technology for whieh no improvements have been developed in an area bigger than that used in elassieal experimental work; and (b) faeilitate the integration of research and
"extension workers at field level through their active involvement and evaluation of the trials. If sueeessfuI, these trials will form the basis for preparing local, regional and national produetion plans.
Cassava seed produetion plots. The expected impact of the projeet on the cassava produetion and commercialization systems in the State of Ceará, is likely to increase farmers' demand for improved, good-quality planting material. To meet this demand, seed production plots are being set up in collaboration with the farmers' groups.
338

During the first year 16 seed plots (1.0 ha) were installed¡ for the second year the goal is to establish 35. This work is being undertaken as communal enterprises so as to promote group cohesiveness and facilitate farmer participation and control of the production and distribution of the planting material.
8.1.5.4 Processing technology. Implementation of a dry cassava processing technology among small-scale farmers so that they can function as supp1iers of raw material to the animal feeding industry, is faced with the problem of meeting large-scale demand on a continuous basis. The sma11 farmers generally have difficulties maintaining consistency of price, quantity and quality.
The following parameters have been established to facilitate evaluation of farmers' groups performance in the adoption of the new processing technology and the new marketing alternative: efficiency of plant use and of processing, global efficiency, yields and conversion ratios. Some results obtained in assessing progress in this activity are as follows:
Efficiency of plant use. This parameter gives an idea of the availability of cassava in the area of influence of each agroindustry. In Ceará sun-drying can be carried out between August and December (24 wk). The climatic conditions prevailing during this period permit the drying of a lot of chips in two days (60 lotsjyr). Where sun-drying is practiced on a day-to-day basis using only half the drying area each day, the no. of lots processed rises to l20jyr. Table 8.2 shows the efficiency of use of the drying plant for some of the groups that produced dry cassava the first year (1989). The values obtained were generally low, which is considered standard for the first year of operation. Data for the second year of processing are not yet available.
Efficiency of processing. This parameter gives an idea of the assimilation of the processing technology by the farmers. It compares the amount of cassava chips processe~per unit of drying area with an optimum amount (10 kgjm ). Values below 75-80% are considered low (Table 8.3).
Global efficiency. This parameter combines efficiency of plant use with that of processing. Values below 50% are considered low. Table 8.4 shows some rates obtained by farmers groups during the first two years of operation. Complete data for the second year are not yet available.
339
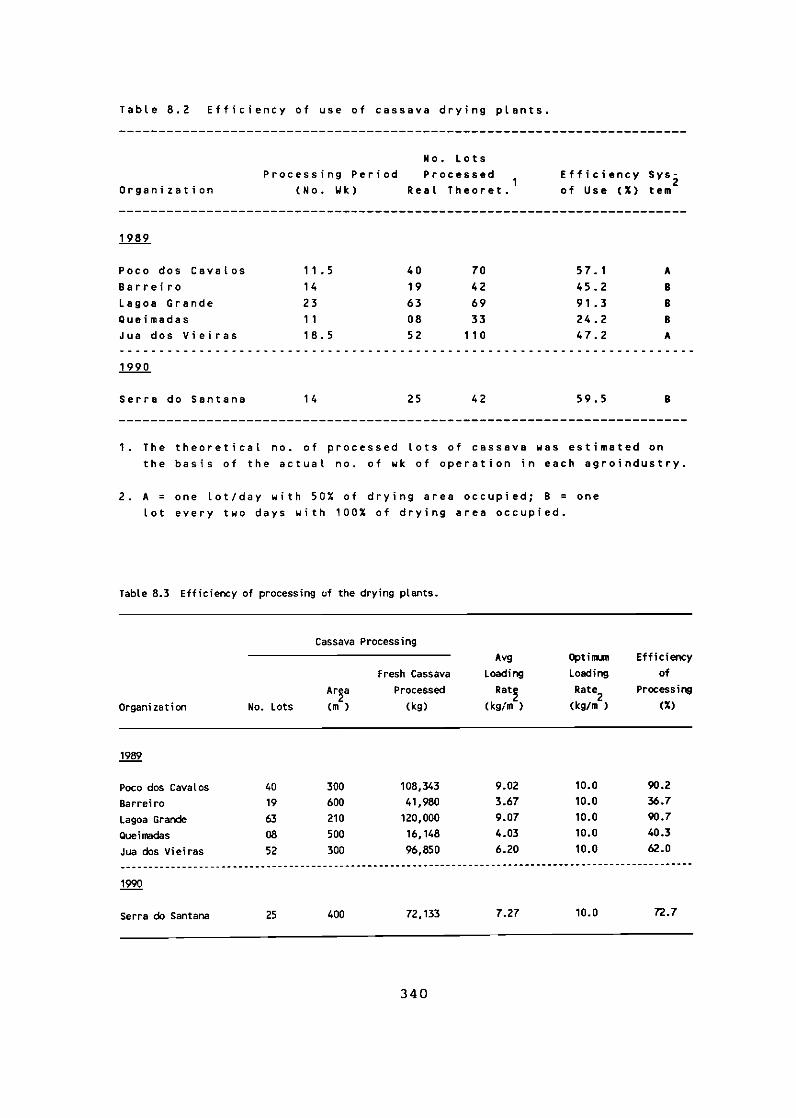
Table 8.2 Efficiency of use of cassava drying plants.
Organization
1989
Poco dos Cavalos Barrei ro Lagoa Grande Queimadas JUB dos Vieiras
Serra do Santana
Processing Period (No. Wk)
11 • 5 14 23 1 1 18. 5
14
No. Lots Processed 1
Real Theoret.
40 70 19 42 63 69 08 33 52 1 1 O
25 42
Efficiency SYSi of Use (X) tem
57. 1 A
45.2 B
91.3 B
24.2 B
47.2 A
59.5 B
1. The theoretical no. of processed lots of cassava was estimated on the basis of the actual no. of wk of operation in each agroindustry.
2. A = one lot/day with 50% of drying area occupied¡ B = one lot every two days with 100X of drying area occupied.
Table 8.3 Efficiency of processing uf the drying plants.
Organization
Poco dos Cava l os Barreiro lagoa Grande Queimadas Jua dos Vieiras
No. Lots
40 19 63 08
52
Cassava Processing
F resh Cassava
Ar!!a Processed (m ) (kg)
300 108,343 600 41,980 210 120,000 500 16,148 300 96,850
Avg OptiRLm loading Loading
Rat!! (kgfm )
Rate2
(kgfm )
9.02 10.0 3.67 10.0 9.07 10.0 4.03 10.0 6.20 10.0
Efficiency of
Processing (X)
90.2 36.7 90.7 40.3 62.0
oooooooooo.oo. ________________________________________ ------------------------------------------------
Serra do Santana 25 400 72,133 7.27 10.0 72.7
340

Table 8.4 Global efficiency of eassava drying plants.
------------------------------------------------------------------------
Organization
Eff;ciency of Use 01 Orying Planto
no
Effieieney of Processing
(Xl
Global Effieiency
(Xl
------------------------------------------------------------------------1969
Poco dos Cavalos 57. 1 90.2 51.5
Barreiros 45.2 36.7 16.6
Lagoa Grande 91.3 90.7 82.6 Queimadas 24.2 40.3 9.8 Ju. dos Vieiras 47.2 62.0 29.2
Serra do Santana 59.2 72.7 43.0
Yields and conyersion ratios. Table 8.5 presents the yields obtained during 1989-90 by the 12 farmer groups that participated in cassava processing activities. In 1989 the total output was 265 t of dry chips (702 t of cassava roots). During 1990 (23 groups and only 4 mo of processing activities, July-Oct.), total output was 932 t of dry chips (2438 t of cassava roots). This production represents an increase of 247% in relation to the first year. The conversion rates obtained in the two processing seasons--2. 64 and 2.61 resp. --are considered acceptable.
8.1.5.5 Commercialization. This project activity operates under the basic assumption that as a result of the project's activities a new alternative market will be developed for the cassava crop through the cassava processing agroindustries, allowing small-scale farmers to sell dry chips to animal feed manufacturers for use as a partial substitute for cereals in feed rations. This assumption, which had proved to be valid in similar projects in Colombia and Ecuador, has not been fully realized in the Ceará Project thus faro
Most of the dried cassava produced in Ceará has been sold directly to dairy farmers in the vicinity of the drying plants. Of the 115 users for the dry cassava processed in 1989, only three were commercial manufacturers of animal feed although they purchased 30% of total output. Although only partial data are available for the 1990 processing
341

Table 8.5 Yields and conversion rates 01 eassava drying plants t
1989-90.
Organization
folha Larga Poco do. Cavalos Ju. dos vieiras Sol ideo lagoa Grande Barreito Lagoa do Mato Serra do Mondeu Queimadas Cacho. 801 Morto Dourado Serra do Santana Pau da Sandeira Sao Vitente Carqueijo Lagoa Mineiro Corrego do Brao Iboassu Vel"o Macajetuba 1
Patos/Aruaru Aroeiras Gameleira Marinheiros Catanduba Gurguri
Cassava Roots(t) 1989 1990
92. S 17\. 8 108.3 230.7 96.8 152.6
118. O 144.0 120.0 182.0 4\.9 74.2 47.5 67.2 35. O 90.9 16.1 36.0 17.3 77.1 3.9 56.0 5.0 72.7
239.2 135.9 138.2 161 .8 135 • 5 49.2 54.5 64.0 70.7
18.3 15.9
Dry C •••• v.(O
1989 1990
34.0 71.5 45.0 85.0 38.9 59.8 38.1 5\.0 44.4 67. O
16.7 31.1 17.4 24.0 13 .8 38.1 6.9 14.4 6.8 31.4 1.3 20.0 1.9 27.9
84.9 55.6 50.4 67.8 47.6 20.8 22.0 23. 7 26 .4
6.9 4.7
Conversion 1989 1990
2.72 2.41 2.40 2.71 2.48 2.55 3.09 2.82 2.70 2.72 2.50 2.38 2.72 2.80 2.53 2.38 2.33 2.50 2.54 2.45 3.00 2.80 2.63 2.60 2.81 2.81 2.44 2.44 2.74 2.74 2.38 2.38 2.84 2.84 2.37 2.36 2.48 2.47
2.70 2.67
2.65 3.38
__ ~"~~.~.",, __ ,._,,.~~~~~_~. _____ ~~ ____ ~A ____ ~ _______________ ~ ______ ~ ____ ..
TOTAL (25) 702.6 2,438.4 265.4 932.0
------------------------------------------------------------------------Avg 2.ó4 2.61
------------------------------------------------------------------------
season¡ the tendency appeare to be the same with a large number of low-volume consumers. This situation may be due to the fact that animal faed manufacturers are usually high-volume consumere throughout the year and the project is not yet eufficiently developed to stimulate their interest. Those who purchased more than 10 t accounted for 68% of the total production (Table 8.6).
342

Teble 8.6 Commerctalization of dry cassava in ceará, 1989-90.
--------------~---------------------------------------------------------
No. Year Organizations
Total Output ( t)
Total No. Coosumers
No. Consumersl Ton Purchased
<1 1·10 >10
--~---------------------------------------------------------------------
1989 1990
12 23
265.4 932.0
115 151
68 86
41 55
6 10
8.1.5.6 Organization
Institutions. The the institutions Project is being following results
organizational structure proposed for participating in the Ceará Cassava implemented at various levels. The
were obtained during the first 18 mo:
State level: The Ceará State Cassava Committee (CCC) has been reinforced. It is composed of technical and administrative representatives from state agencies working with the cassava crop. Among these are EMATERCE, EPACE (State Agricultural Research Agency), CEPA (State Agricultural Planning Commission) and COOCENTRAL (Central Coop of Cotton Growers). The CCC is responsible for ensuring day-to-day planning and coordination of project activities and maintaining permanent communication with the offices of agricultural research and extension services located in the project's zones of influence. The C~C has an executive leader chosen from one of the participating institutions •
• Regional level: The implementation strategy of the project at this level is pursued through the establishment of Regional Cassava Committees in each of the main areas of project influence. The purpose of these regional committees is to decentralize project administration and facilitate participation of local technicians and farmer groups in the decision-making process at state and regional levels. These Regional Committees function in close coordination with the CCC and have started to play important roles in project implementation in areas such as training, selection of new groups and technical assistance. During the first year only one Regional Committee was organized; in 1990 similar committees were formed in the other four areas of project influence.
343

• Local level: In each municipality where there are cassava processing groups, the goal has been to promote the formation of technical teams composed of agricultural extension agents, social extension personnel and sUbject-matter specialists drawn from EPACE, EMATERCE and other agricultural agencies. These teams are coordinated by the respective Regional Cassava Committee and are responsible for giving technical assistance to rural communities in the organization and administration of community-based groups around integrated cassava production and processing activities.
Farmers. Organization building among farmers participating in the proj ect is been pursued through the establishment of small-scale farmers organizations who are responsible for the installation, operation and administration of the cassava-based processing agroindustries. Achievements in this area during the reporting period have been as follows:
• In 1989 twelve farmers' groups were reorganized andjor reactivated for cassava processing activities. Although the majority of these groups were established before the initiation of the project, they had no experience in operating cassava agroindustries under a commercial farmer-owned scheme, and most of their cassava-processing experiences had be en under the community-owned scherne, which characterizes most of the coromunal cassava flour ("casas de farinha") production units existing in rural NE Brazil.
• During 1990 another 24 cassava farmers' groups were organized, and it is expected that by the end of 1990 a total of 36 groups will be engaged in producing dry cassava for animal feeding.
The project is fomenting the organization of second-. order groups at the regional level (Associations of Farmers' Groups) in order to improve their bargaining power and thei~ participation in central project planning and implementation. This type of organization could play an increasing role in areas such as marketing, channeling of funding, farmer-to-farmer traíning and could al so facilitate institutional work in the adaptatíon of cassava production and processing technology, as well as the implernentation of agronomíc, agroíndustrial and social research activities.
In 1990, in two of the regions where the project operates initial steps were taken toward forming Assocíations of Cassava Farmers' Groups (Ubajara and
344

, •
CEARA INTEGRATED CASSAVA DEVELOPMENT PROJECT
OAGANIZATIONAL STAUCTURE
FARMEAS ORGANIZATIONS
Federation 01 Ca8sava Farmara 01 the Stat& 01 Ceara
1 Aaaociationl of Caeaava Farmera O,grlZallOna
1 Cas.ava Farmera
Of'ganlutlona .........
LEVEL INSTlTUTIONS
+--+ Ceara Casaava Siate CommIU ••
REGION 1
~Cassava Regional Commlttee
1 Technl.al T •• m
MUNICIPALlTY
I Techniclane
RURAL COMMUNITIES
Figure 8.2 Orga~izational structure of the project.
Itapipoca). The organizational structure of the project is shown in Figure 8.2.
8.1.5.7 Training. During the first two years of the project, several important events related to training of technicians and farmers were accomplished (Table 8.7). In addition, excursions and special days are being utilized for training and information purposes (Table 8.8).
8.1.6 Monitoring and evaluation
Tracking progress toward achieving the project' s specific objectives is being done through an evaluation strategy that includes the following monitoring activities:
Daily project functioning in the area of cassava processing
Project impact in relation to cassava production and productivity in Ceará
345

Table 8.7 Training events, 1989~90.
Training Events Participants Event Type No. Tech~ Farmers
Planing Meeting Course on Ceatá
Processíng Semminar on Community
Organization Course on Cass8v8
Production t Annual Meeting of
Farmers l Groups Mgers
Courses on CassaVá Production
Course on Organization of Farmers Groups
Co~rses on CaSS8V8 Processing
Semminars on CaSSáv8 Comercializatlon
11 Annual1Meetin g of
Farmers
lntroduction Processing
Organization
Production
Evaluatjon
Production
Organization
Processing
Commercialitatíon
Evaluation
Wi t t b. held in January 1991.
Table 8.8 Excursions and special days.
26 16
30
35
38
14 17
2 30
20
6 36 46
5 35
25
Participants Type of Training Event
No. of Events Community Farmers
Excursions Special Field Days
15 2
15 5
123 20
------------------------------------------------------------
Excursions Special Field Days
11 1
346
11 10
82 150

Distribution of project benefits among intended beneficiaries.
After the two cassava processing seasons, some preliminary information has been collected in the following areas:
8.1.6.1 Characteristics of project participants
Land tenure. Currently there are 3 S active farmers I groups in the project. Members operate their holdings under three types of land tenure systems: owners, sharecroppers and renters (Table S.9). The main difference between sharecroppers and renters is the land rental agreement, which in the case of the latter is often arranged for periods of more than one year.
Age of participants. The maj ori ty of the farmers are between the ages of 30 and 60, with fewer than 20% below 30 and 12% above 60 (Fig. S.3).
Size of farmers I organizations. Most of the farmers' groups participating in the project have undergone a transition from community groups originally organized around communal activities such as farinha production units and communal wells. The dry cassava processing groups being formed within the Ceará Project are different in nature and organization, and their functioning has been initiated on the basis of farmerowned and operated cassava agro industries (Table 8.10).
Table S.9 Land tenure of cassava farmers, 1990.
Type of Land Cumulative Tenure Frequency % %
Owners 694 73.4 73.4 Sharecroppers 64 6.8 80.2 Renters 188 19.8 100.0 ------------------------------------------------------------
TOTAL
Valid Cases Missing Cases
946
946 O
100.0
347

18-30 21%
Figure 8.3 Age of members, 1990.
> 60 12%
8.1.6.2 Cassava production. A basic assumption of the project is that small-scale cassava farmers will increase their production if there are alternative markets. Two production factors are being monitored to test this assumption: (1) size of cassava plots planted by project beneficiaries, and (2) the relationship between cassava plot size and land tenure system.
size of cassava plots (1988-89). Preliminary analysis of baseline data collected on size of cassava plots planted by project beneficiaries indicates that 80% of the plots are from l. O to 2. O ha and that fewer than 15% exceed 3.0 ha in size (Table 8.11).
Cassava plot size and land tenure system (1988-89). Initial data suggest a similarity in size of plots planted by sharecroppers and renters and a significant difference between these two groups and smallholders, whose plantings are generally larger (Table 8.12).
8.1.6.3 Results of the first two processing seasons (1989-90). The following information was collected during the first two seasons of processing activities:
Cassava sales. During the first processing season (July-Dec. 1989), 53% of the cassava roots processed were from nonmembers near the processing units and 47%
348

Table 8.10 Size of cassava farmers' groups, 1990.
Region Community
ITAPlPOCA Marinheiros MaceiojCoqueiro Poco dos Cava los Gurguri Solidao Lagoa Grande Catanduba Lagoa do Mato Lagoa do Mineiro Gameleira Lagoa Mineiro 11
LIMOEIRO PatosjAruaru Dourado Fradinho Aroeira Siriema
CARIRI Sao vicente Serra de Monde Serra do Santana Cajueiro Pau da Bandeira
CRATEUS Cabea de Ona UBAJARA Jua dos Vieiras
Queimadas Macajetuba 1 Barreiros Cachoeira B. Morto Nova Venez a Araticum
SOBRAL Folha Larga Ibuassu Velho Ange1im Carqueijo Pedra do Fogo Corrego do Brao Tamboriu AlvacajGoiabeira Barroquinha
Municipa1ity No.Members
Itapipoca 19 36
Trairi 21 27
Cruz 16 Acarau 20
34 Bela Cruz 19 Itarema 12
22 45
Morada Nova 49 31
Russas 12 Aracati 19 Quixada 19 Araripe 11 Araripe 07 Assare 16 Santana do Cariri 28 Salitre 17 Crateus 31 Viosa do Ceará 21
15 38
Sbo Benedito 22 Ubajara 21
122 48
Granja 34 41 18
Mucambo 18 17
Camocim 21 29
SantanajAcarau 10 Lagoa do Mato 58
------------------------------------------------------------TOTAL 38 24 1024
349

Table 8.11 Cassava plot size (1988-89).
Cassava Area Planted (ha)
0.0 - 1.0 1.1 - 2.0 2.1 - 3.0 3.1 - 5.0
> 5.0
Valid Cases:
Frequency
1988 1989
217 304 145 270
39 73 43 55 25 36
469 738
Percentage
1988 1989
46.3 41.0 30.9 36.6 8.3 9.9 9.2 7.5 5.3 4.9
100.0 100.0
Table 8.12 Land tenure vs. cassava plot size, 1988-89.
Mean Cassava Area Planted (ha) Land Tenure 1988 1989
Owners 2.31 2.33 Sharecroppers 1.45 1. 70 Renters 1.65 1.48 Entire population 2.09 2.08 ----------------------------------------------------------Valid cases:
froro members. indicates that froro nomnembers
477 738
Partial information available on 1990 56%- of the raw material processed was and 44% from members (Fig. 8.4).
In relation to land tenure status of the farmers, during the first year 69% of the cassava sold to the processing units was from smallholders, 22% from renters and 9%froro sharecroppers. Information on the 1990 processing sea son indicates that 66% of the raw material sold to the drying plants was coming from smallholders, 30% from renters and only 4% from sharecroppers (Fig. 8.5).
350

,'v1embers 44%
Members 47%
NonMembers 53% 1989
(701 tn Ncr¡-Members 56%
1990 (1705 tn
Figure 8.4 Cassava root sales by membership, 1989-90.
1969 ( 343 I ) 1990 ( 4891 )
Figure 8.5 Cassava sales by land tenure, 1989-90.
351

Cassava Drocessina wages. Besides selling the roots, another form of benefits gained by the farmer members of the cassava agroindu~~ries is in the form of wages paid at the drying plants during the processing activities. During the first drying season (1989), the wages benefiting the farmers were distributed as follows: 52% to smallholders, 35% to renters and 13% to sharecroppers. Preliminary data for the second drying season (1990) show that 26% of the wages paid at the processing plants went to smallholders, 53% to renters and 21% to sharecroppers. (Fig. 8.6).
Total incomes. Benefits accruing to farmers' groups who participate in cassava processing activities include cassava sales, wages and the sharing of annual profits among members. During the first processing season, 58% of the total income earned by the processing groups went to smallholders, 32% to renters and 10% to sharecroppers. (Fig. 8.7). Total information about the second processing season is not yet available beca use sorne of the agro industries will be processing dry cassava until December 1990. Preliminary data from 5 agroindustries indicate that 53% of the total incomes went to renters, 25% to smallholders and 22% to sharecroppers (Fig. 8.8).
1989 í 701 • )
I',,,¡'<\óvt "'. '990 í 6.2 t j
Figure 8.6 Wages (%) by land tenure, 1989-90.
352

1989
Figure 8.7 Total incomes (%) by land tenure, 1989-90.
7 U S 6 $
5 • O
" O O
3
1- 2 1990 ( 603 In ) '. 1 1989 ( 701 tn )
O
1990 ( 603 tn ) 3.84 6.213 1989 ( 701 In ) 3.271 6.618. 0.231. 1.109
Figure 8.8 Total incomes (1989-90) by cassava plot size (1990).
353

Additionally, the distribution of this total income according to the size of cassava plots planted in 1989, shows that more than 70% of the total income went to the farmers who planted between 1. O and 2. O ha of cassava and that farmers with more than 3. O ha received less than 10% of total income. In 1990 the results of 5 agro industries show that 94% of the total income went to farmers with cassava areas of up to 2. O ha and that those farmers with more than 2.0 ha of cassava received less than 10% of total income (Fig. 8.8).
8.1.7 References cited
FAO.
IBGE. 1980. Agricultural Census.
IBGE. 1989. Anuario Estatístico do Brasil.
8.2 Ecuador: Cassava Development Project, Hanabí
8.2.1 1985-89
The Ecuador Cassava' Program was initiated in 1985. During the first phase of this project, the following achievements were accomplished:
Creation of a well-organized and effective farmer organization, the Union of of Cassava Producers and Processors Associations, UAPPY, with assured operational funding through the US Government PL-480 Program
Training of an experienced and qualified project coordinator supported by the National Foundation for Agricultural Development, FUNDAGRO
Development of an interinstitutionally supported cassava research and extension project with secure funding from USAID via FUNDAGRO for four more years.
8.2.2 June 1989-April 90
CIAT support for the project was then intermittent until April 1990 when the second project technical advisor arrived. This report summarizes activities until Hay 1989, the processing year from June 1989 to April 1990, and the current project situation.
with a good rainy season at the end of 1988-89 and greatly expanded drying space, UAPPY-Manabi and the collaborating sections in the Cassava Program fully expected an excellent production and process ing season; nevertheless, the year fell short of expectations. No one factor or problem can be
354

singled out ¡ rather a constellation of related occurrences resulted in much lower processing and decreased benefits for UAPPY-Manabi members. However, experiencing a "bad" year may well have served good purposes for the long-terro sustainability of both the UAPPY and the larger cassava programo
As a result of the good rains, cassava production in the region was good, and association members prepared for harvest. The cassava producer and processing associations (APPYs) began to demand operating funds fer precessing from the UAPPY. These were depleted, however, because of the investments made in drying patios; and the UAPPY was awaiting new PL-480 funds, which did not arrive. The only income was from the sale of flour to shrimp feed producers. As available UAPPY funds ran out, the APPYs turned to private lenders and borrowed operating capital at high rates of interest (8-10%/mo). The UAPPY moved quickly to turn around the milled flour to the feed factories to generate sufficient operating capital. As the year progressed, conditions for drying were optimal, but money became tighter.
In September Ecuador suffered a drop in the demand for exported shrimp due to strong competition from Asia. At the same time, national producers were faced with a growing shortage of larvae to stock their ponds. As their production declined, feed factories immediately stopped buying UAPPY cassava flour, traditionally usad not only as a source of carbohydrate but as the natural agglutinant for the pellets used to feed the shrimp. UAPPY was faced with sto res full of dried chips, no market, and still no funds from PL-480. APPYs with access to their own or privately borrowed resources continued to process; however, the majority simply stopped all work.
There were also problems of support from other participating institutions. The National Argicultural Research Institute, INIAP, continued with its program of varietal and agronomic work, but with reduced collaboration from CIAT HQ and decreasing attention to pestharvest issues. An exception to this was a thesis en drying technology cenducted by a university student whe was subsequently hired by INIAP. The secioeconomics team conducted its fifth round of the farrolevel production systems survey but did not complete the interviews. Funding frem IDRC was somehow misplaced in ministerial circuits; and problems were compounded by a move of the IDRe regional office from Bogotá to Montevideo, leading to a halt in INIAP collaboration in the monitoring of the processing plants and preventing the final round of the farro-level production systems survey. This si tuation was further aggravated by the absence of direct socioeconomic support and participation from CIAT, as well as by delay in the analysis of the survey information. The end
355

result was a growing gap between the work of the roota and tubers program at the local INIAP research station and the needs of the farmers associated with the UAPPY.
In the case of the Ministry of Agriculture, MAG, the person in charge of the cassava extension activities and activity involved with the UAPPY was transferred to another post in 1988. As his replacement did not have the same interests, collaboration was reduced, except in the area of accounting. Another problem directly affecting UAPPY was a virtual stalemate in the procedures within the MAG to legalize the APPYs. Uncertainty over legal status affects the APPYs I ability to obtain access to government resources that could be put to use in processing activities. It also affects APPY participation in UAPPY I s electoral acti vi ties. UAPPY voted to revise its statues in order to ease the entry of rural workers' associations without legal ownership of land; however, MAG approval is still pending.
FUNDAGRO also underwent staffing changes that affected the Cassava Programo The position of Director of Programs was vacant for the entire year, and the Director of Research who resigned in late 1989 was not replaced until March 1990. The FUNDAGRO cassava coordinator was fully occupied with the problems of funding, commercialization and legalization of the UAPPY; and a shortage of professional staff reduced FUNDAGRO I s capaci ty to monitor and support all programs, including cassava research.
Given the lack of money and market, as well as the decline in support from institutional cOllaborators, UAPPY could have virtually collapsed; but they resorted to several survival strategies. ~n order to conserve funds, half the administrative staff returned to their respective APPYs, and activities including training were put on hold. The jeep was stored to save on gasoline. Remaining UAPPY staff went on half salary, meetings of members were reduced, and the annual November get-together among members was cancelled. The UAPPY administrator and marketing committee--made up of older, experienced members--began an intense search for new markets for UAPPY products.
Problems with the UAPPY-Manabi also contributed to increasing organizational and operational problems in Esmeraldas. The coordinator, an expatriate volunteer, went on an extended funding trip and did not return for seven months. Given a certain lack of leadership and a lack of funding, the farmer groups were unable to sustain their processing activities. For lack of a local collaborating institutional environment and sustained contact with CIAT, the project is still in a state of reorganization and recovery.
356

When part (S./30,000,000) of the promised PL-480 funds finally arrived at the end of December, it was too late to process so this money was used to pay oEf debts and to complete the last of the processing. A study on the potential of cassava starch for industrial markets, commissioned by FUNDAGRO, pointed out the potential of the cardboard box industry. Samples of starch produced by the two women' s groups were sent to a major box factory. As a result of the strong potential for this market, one of the larger APPYs invested money in the construction of starch processing facilities. Other explorations of potential markets began to yield tentative results, and further samples were sent for industrial experimentation. More importantly, the shrimp feed factories began to huy again. Slowly t UAPPY began to sell off its stored production, and funds were available again for operating at full capacity.
In the meantime new human resources were added to the project. FUNDAGRO made an agreement with the local technical uni versi ty for agronomy students to do their required year of rural work wi th UAPPY in conj unction wi th INIAP' s supporting research, training and extension activities. In October a doctoral student in nutrition from the Univsity of Arizona arrived to do research on the nutritional and consumption impact of the Cassava Programo She initiated a series of surveys that increased contact between the Cassava program as a whole and the cassava farmer community. The CIAT socioeconomics input to the Ecuador project was revived, and the final step of the farm survey was initiated.
Although things were finally looking up, several hard lessons were learned. First and foremost was the recognition of the need to expand markets. This meant not only new markets for existing products but also for new products, implying new processing techniques and different marketing strategies. Second, UAPPY learned that it could no longer depend on one sole source of external funds but must make a concerted effort to locate more reliable sources of external funding in order to create sustained internal revolving funds for organizational growth.
8.2.3 The current situation
By the time the new project technical advisor had arrived (April 1990), UAPPY's situation had greatly improved. The remaining stores of cassava chips had been milled and soldo A new market was taking hold with a major plywood factory in Quito. UAPPY began sifting the unpeeled cassava meal to obtain a finer product equivalent to wheat flour for use by the plywood factory as a filler for the resins used to glue the sheets of wood together. Industrial experiments revealed that up to 40% cassava flour could be used to replace the wheat flour. In March 1990 the plywood factory began
357

buying cassaVa flour at arate of 6 timo, in August, their demand doubled to 12 timo, and they anticipate doubling production and thus their demand for cassava flour in 1991. UAPPY, which has al so explored other buyers in the wood industry, just received a new order for 7.5 t from another plywood factory, which intends to substitute 50% of its wheat flour filler.
UAPPY also continued to explore the market for selling starch to the cardboard box industry. After several tests, one company began buying at arate of 25 timo in July¡ the following month, it was doubled. The type of starch demanded by the industry, which is referred to as common starch ("corriente"), requires less labor to produce than higher quality starch and can be dried directly on a cement patio. As this demand is far greater than UAPPY's current capacity for starch production, they are buying starch from selected private producers. Although UAPPY plans to increase starch production capacity during the coming year, management is considering how these small starch producers might be organized into an association and join UAPPY.
UAPPY has started producing cassava flour for human consumption on a somewhat smaller scale. The flour is produced at the Demonstration Center using an artificial dryer, as well as at one or the associations which dries all the chips on trays raised aboye the ground. The flour (3 timo) is sold to a noodle factory in Ambato. Although the market is small, UAPPY intends to maintain it while it explores other potential buyers in the food industry.
With these new markets, UAPPY has moved into a cornmercial phase of production. Rather than being 95% dependent on the shrimp feed industry, 40% of the production this year is going to the new markets. New products are being produced requiring different processing technology (e.g., sifting the cassava meal)¡ and some associations are beginning to look at specialized production (e. g., flour for human consumption). Both efforts will require a different research focus.
Despite the growth in the commercial sector, cassava production was poor in the Manabi region this year. Rainfall was lower than normal during the rainy season, which was al so shorter. Some private starch producers never stopped production¡ they simply continued making starch through the scant rainy season and drying when it was sunny. Some made a product called "bagazo y todo," where the cassava is grated and dried without removing the starch. Middlemen, taking advantage of the market for shrimp feed opened up by the UAPPY, buy this product for sale to the feed factories.
358

The low rainfall had another important impacto Unless farmers irrigated their crop, much of it was too poor to harvest this year. This created a shortage of fresh roots for both UAPPY associations as well as private starch producers. In addition, the short rainy season allowed for processing to begin much sooner than normal, before the local harvest would begin even in a good rainfall year. To meet the demand, UAPPY and the APPYs themselves traveled to the humid zone (4-5 h to the east of Manabi) and made contracts with cassava growers to buy their production. Located in a zone with year-round rainfall, these producers, normally supply much of the large urban fresh market demand; however, production has increased and prices have fallen, making it attractive for both producers and processors to bring the cassava to Manabi for processing.
The roots from this region are usually larger and of better starch quality than those produced locally. APPY processors have noted that the conversion rate is better than local cassava during a normal year and that the roots are much easier to peel by hand. Large quantities of cassava were brought in during the June-September period until the better local areas began to be harvested. It is likely that the comparison for this year between fresh supply from UAPPY members vs nonmembers will be on the order of 25 to 75%.
The móve to purchase cassava outside the region is indicative of the overall maturation of the UAPPY and its members as a whole. The experience of the past year has taught them that they must be quick and flexible to take advantage of the entire period of sun-drying. The farmers are discontent with the qua lit y of their own production and are' making quite vocal their demands for better, early-maturing (7-9 mo) varieties that are more drought tolerant and maintain a consistent DM content despite fluctuations in rainfall over the growing season. These demands were presented by farmer representatives at the interinstitutional committee meeting in October to develop the next work plan for FUNDAGRO support. Changes in the plans by INIAP agronomists for on-farm trials reflect these demands.
UAPPY maturity is also demonstrated in the management and administration of the commercialization and the distribution of credit to the APPYs. As a result of last year's experience, UAPPY did not invest all its profits in construction; instead, funds went into strategic activities to support the development of new markets. Although supporting institutions are collaborating in the search for new funds, UAPPY pursued the remaining PL-480 funds that had be en promised the previous year. This sum (S./20,000,000) was now worth less than half its value in dollars the previous year; however, it was still a sizable amount for operating expenses. PL-480 administrators decided to make this a donation
359

to UAPPY, with the restriction that it be used as a revolvlng fund with near-commercial rates of interest so as not to lose its remalning value. Once again, there were multiple changes in the bureaucracy, and the money again arrived quite late in the season (early Nov.). This time, however, UAPPY used reserve funds and its own credit at the bank to tide over the demands for operating capital from the associations. A broader range of products and markets al so kept UAPPY funds circulating until the PL-480 funds arrived. Nonetheless, UAPPY has stepped up its efforts to locate other funding sources; and even some of the associations are beginning to conslder seeking independent grants for their specific construction needs. As such funds are captured, UAPPY will push ahead with plans to bring all the APPYs up to full processing capacity with adequate drying space and ultimately with the infrastructure to process elther flour or starch ln order to have greater flexibility in responding to market demands or variations in price.
After a fairly long hiatus in the building of new associations, several new groups are entering UAPPY. One group of women worked with a Peace Corps volunteer to se cure a donation of US$500U for constructing their processing planto UAPPY assisted them in developing the proposal and i5 now focusing promoter activities on assisting and training the new members in operating and managing their processing activities and association. UAPPY assisted a second group of woman, organizad last year, in securing funds to purchase a plot of land; and with a small operating fund from UAPPY, they will process using borrowed equipment in order to earn funds for construction next year. A third group of women has recently ini tiated discussions with UAPPY to consider starch making as an economic activity for their community organization. In Esmeraldas, two woroen I s groups recently received externa 1 funding froro the UK and will begin processing shortly.
The growing involveroent of women in both UAPPYs is quite interesting and appears to demonstrate some practical lessons regarding women's participation in agricultural development projects in the coastal region of the country. Nomen and men are considered as individua1s rather than household representatives in the UAPPY associatlons. A 1imit of 3 related persons in any APPY is genera11y the rule; however, both men and women from the same household can be members of the same APPY or members from one household can belong to different APPYs as ls the case in both of the older all-woroen APPYs. This makes calculating the benefits on a per-member or per-household basis more complicated, but it serves to encourage female participation in the organization. Women are also part of mixed associations; and in several, they hold the senior elected offices. Nomen participate fully in the UAPPY general
360

assembly, hold office on the directorate, and hold the administrative positions of secretary, office manager and accountant. Although the women have not been active as promotors, they have been involved in farmer-to-farmer technology transfer, hosting new women members and teaching them how to process starch.
While it appears that women in mixed associations have earned more than those in all-female APPYs, this is due more to the limited production areas of the two older womens' groups rather than to their production ability. This issue will be tested as the new Las Piedras women's group starts to work in its plant, which was designed to be the same in size as the best of the all men' s groups. The prevalent gender-based division of processing activities in the UAPPY (men produce flour and women do starch) has likely contributed to the presence of women in the organization. The validity of the division will be tested as more groups begin to process starch. However, the experience of the one all-male group processing starch shows that the roen may build the structure, but they hire women as the processors. This increases the job opportunities for women in the cornmunity, which has probably been the most important gender impact of the project. External observers of the UAPPY have noted in several reports that the income generated by the women in UAPPY has served to enhance their socioeconomic status as well as their economic independence, which in turn appears to be affecting their social status with respect to meno This observation requires further careful analysis, however.
While UAPPY opera tes on a July-to-June calendar, research operates on an annual calendar funding and planning basis. Research results for this year are mixed. Three years of agronomic testing show that the varo M Col 22-15, introduced from ClAT because it is widely used in drier areas of Venezuela and Colombia, is appropriate to the region; and it will be released next year as INlAP Porto Uno. Plans for wider scale mul tiplication of planting material are under way and will invol ve considerable UAPPY participation in managing five multiplication plots with association members. A collaborative project among UAPPY, INlAP and thesis students will be in charge of this effort.
The socioeconomic farm-level production systems survey was finally completed in August, and analysis is under way iR collaboration with ClAT. Collection of the processing plant monitoring information from 1989-90 was also completed. A major initiative in this area for next year will be the merging of the various data bases on cassava production and socioeconomics and the comparative analysis and interpretation of results. The methods for conducting the monitoring of production and processing activities will be modified to
361

allow for a more focused data collection procedure, greater involvement of APPY members in the data collection, and a more agile analysis system to permit more immediate use of the information by UAPPY.
Unfortunately, a large part of the research planned by INIAP was not implemented. Less than half the research budget was spent, and a large part of the training funds (> U8$30,000 allocated by FUNDAGRO) were not touched. UAPPY, on the other hand, normally uses all of its FUNDAGRO budget for its planned activities in institutional support, development and training of farmer members. consequently, FUNDAGRO has changed its procedure for allocating research funds. Explicit attention will be paid to INIAP's actual capacity for implementing the planned activities; and budget al locations will be made only for those where sufficient human resources are available. All training funds will be placed in a central fund for access by all project participants rather than being explicitly allocated to INIAP's research programo Finally, a separate research fund will be created to meet project demands that INIAP is unable to meet. These funds will focus on postharvest issues, quality control, environmental impact, marketing, and new product research. Collaborative research projects between private and public sector research entities will be encouraged. The intent is to bring a larger community of R&D institutions together in support of the Cassava Program's needs.
Research activities undertaken by the CIAT technical advisor for the Cassava Program are only just getting under way. In addition to synthesizing the project's history and development, considerable time has been allocated to assisting in the reorientation of the research program and to facilitating greater interinstitutional participation in the project planning process. Egual time has be en spent in providing direct assistance to the farmer groups in Manabi and Esmeraldas in identifying R&D needs and directions, as well as arbitrating a reorganization of the Esmeraldas project. Greater FUNDAGRO support for this group will decrease this role and allow for some more focused research activities to get under way in support of the farmer groups.
The major focus of CIAT-supported research activities this year has be en on cassava starch. In direct support of UAPPY's need to open new markets, a diagnostic survey of the traditional and potential starch industry was initiated in July. First an inventory of all industrial users in the country was made using secondary sources at bank and ministerial levels. This information was used to select industries from the wood, textile, bOK, food processing and glue sectors for informal interviews. This information was analyzed by the economist hired to conduct the study in collaboration with CIAT and FUNDAGRO specialists. The
362

report, which has stimulated further exploration of additional markets, will be the basis for dAsigning a more formal study of the potential starch market next year.
An important finding of the starch users survey was that virtually none of the potential users outside of the box and shrimp feed factories had had any previous experience with cassava starch and had very little information about its potential. To address this knowledge gap, the Cassava Program is planning to hold an industrial users seminar in order to provide information on how to use cassava starch and experiences in using the starch at industrial levels in other countries. The FUNDAGRO-supported seminar will receive collaboration from CIAT and other national programa.
'The second part of the starch diagnostic study focuses on the local marketing system of the well-known middlemen in the region. Because of difficulty in using formal or even informal research methods and the lack of researchers to obtain this information, a group of UAPPY members with long-term involvement in the traditional starch productiv areas are COllecting this information on their own via their personal relationships in the communities. This information will be assembled in December, and a strategy designed for further research in this area.
The final and lengthier part of the diagnosis consists of a survey of all starch processors in the region. The survey instrument, which was adapted from one designed by CIAT for Colombia, is applied in interviews (30-60 min) of all the private, largely family-based processors in three zones covering nearly all of the known starch-production areas in the country. The survey team consists of two uni versity students and one farmer member from an association in the major starch-producing zona. To date 154 have been interviewed, and an estimated 100 remain in part of one zone and all of the third. The survey will be completed in December.
Preliminary findings indicate that two processing systems are in operation: one is semimechanized with the grating done by machine; the other, entirely by hand. There is a total absence of machinery for peeling, washing or straining starch. Products include three types of starch ("corriente," "chillón industrial" and "consumo humano") and two by-products ("cachaza," the proteins, fats and phenols with the starch, known as "mancha" in Colombia; and "bagazo," the fibrous mash left after straining). As variations have been observed in product quality at different processing sites, a study of quality of production will be initiated at the end of November in collaboration with a specialist from Colombia. There is also some product adulteration among processors; but this practice is more widespread among middlemen. As a result UAPPY is faced with a major constraint in
363

opening up new markets among the box factories because they have had bad experiences in the past with the quality of starch supplied by the local middlemen. All these products have markets, but the by-products tend to be sto red for sale during the rainy season when starch ls scarce. Prices fluctuate greatly over the processlng season and very few formal credit systems are used. A small group of middlemen in each locality control the commercialization of the products, advancing credit or buying on credit with different producers.
8.3 Colombia
8.3.1 DRItICA Atlantic Coast
An ongoing agreement (since 1981) between CIAT and the Integrated Rural Development Fund (DRI) of the Colombian government has provided the institutional framework within which the Cassava Program can conduct research at a pilot level in Colombia. Initially, research concentrated on the technology for producing dried cassava for the animal feed market; but sinee 1988 CIAT has had no role in this now successfu1 small-scale rural agroindustry. Upon request, CIAT does provide some support to the National Association of Cassava Producers and Processors (ANPPY) in the form of technical advice and assistance in project formulation.
Research activities within the DRIjCIAT framework in 1990 were fresh eassava storage, cassava flour for human eonsumption, and cassava production (especially the preproduction plots destined to supply the pilot plant for high-quality cassava flour). For details of these areas of research, see the utilization and Agronomy sections. This institutional arrangement is valuable in providing (a) a means for the Program to generate technologies in el ose contaet with farmers, processors and consumers; and (b) a highly efficient interface between research, extension and development--something that has been amply demonstrated in previous years.
In January 1990 another meeting of the GRUYA (Group of Cassava and Associated Crops t Research) was held on the Atlantic Coast of Colombia. This group, which has been meeting for five years, consists of people from ICA, the caja Agraria (Agrarian Bank) , the universities of Sucre and Córdoba, and the Agricultural Secretariats of Bolivar and Córdoba in addition to CIAT. GRUYA planned all experiments to be planted in the Atlantic Coast sta tes of Suere, Córdoba, Bolívar and Atlántico during 1990. In Atlántico the emphasis was on associations with sorghum and early-maturing maize. In Córdoba, experiments with yuca, maize and yam associations were planted; while in Bolívar and Sucre the yuca/maize association was of most interest. Experiments
364

were conducted ei ther in farmers I fields or at the lCA experiment station in Carmen de Bolívar.
In July a group of GRUYA members received training at ClAT in experimental techniques and statistical designo Results of their field experiments were used for the statistical exercises. Many of the experiments planted by the GRUYA involved the new cassava varieties due for release by lCA in 1991, and planting material of these varieties is being multiplied. Moreover, all field experiments that resulted in the acceptance of these varieties had been carried out by this group.
Over and aboye the traditional research activities in farmers I fields, GRUYA maintains 10 pre-production plots distributed throughout the region which, together with those carried out in collaboration with ClAT, total 30 plots in which the most advanced cassava production technology components are tested as a package. Finally, GRUYA published another volume of research results, covering 1988-89.
8.3.2 National Rehabilitation Program (PNR)
In 1989 a joint project was initiated between CIAT and the PNR of the Popular lntegration Secretariat attached to the Office of the President. The PNR is a government program designed to bring development to those areas of the country ignored by the public sector (henee suffering from public order and rural poverty problems). The small-scale eassava processing eoops were viewed as one of few viable alternatives available to the small farmers in these areas.
Under the auspiees of the agreement, the Cassava Program is working in a multi-institutional environrnent in three regions of the country (Suere, Córdoba and Cesar on the Atlantic Coast; Meta; North and south Santander) where cassava is a traditional erop but laeks alternative markets. During 1990 drying plants were built in Suere, Córdoba, Santander and Meta, and another is under construction in Cesar. In Meta, where there is high precipitation during the harvest season, a rnixed natural-artificial drying plant was built.
In order to test prornising CIAT clones in the region, trials have been established in eollaboration with ICA in Cesar, North and South Santander, and a program for the mUltiplication of two recently released varieties is under way in Meta (PNRjICAjCIAT Seed Unit). This two-year project will end in mid-1991, when responsibility for those activities currently undertaken by CIAT will be assumed by Colombian national institutions.
365

8.4.1 Paraguay
The agricultural research and extension team that works with cassava in Paraguay was trained at CIAT and has gradually increased in capacity to the point where it now receives greater in-country support for its activities. A study of fresh cassava commercialization in the country was published this year. Team members have participated in international meetings and courses, and two members will obtain masters degrees in 1991.
Four years of field research have resulted in the characterization of at least seven local varieties of good yield and eating quality. In addition, improved production technology now exists, and appropriate crop management recommendations can be made. Current field research ~s focusing on soíl management and conservation and on germplasm improvement.
Research on cassava utilizatíon is becoming increasingly important. Oiagnostic studies have been completed, with the termination of surveys on starch processing industries and markets during 1990. The cassava storage technology developed at CIAT is now being used at a pilot commercial level in Asunción, with excellent results. The first cassava drying plant is under construction in collaboration with a farmers' coop. Equipment improvements for small-scale starch extraction will be tested, based on solving the problems identified in the surveys. Animal feed trials using fresh, ensiled and dried cassava are also planned.
8.4.2 Panama
CIAT reduced its activities over the last two years in light of the financial problems of local institutions. Oespite these difficulties, farmers participating in the Integrated Cassava Project have continued drying cassava for sale to private industry. The agricultural policy of the new government appears favorable for small farmers in cassavaproducing areas, and renewed government interest in cassava is anticipated.
The Ministry of Agriculture recently named a coordinator of a National Cassava Program, who works closely with the national agricultural research institute, IDIAP, in all cassava-related activites. The national research team recently compiled a document summarizing the experiences of the Integrated Cassava Project since its inception. This document will be useful in planning future activities.
366

The private sector has responded efficiently to the opportunity for using cassava in animal feed rations (especially for chickens), and at least one business has planted considerable areas of cassava close to Panama City in order to cut transport costs.
8.4.3 Bolivia
Contact was resumed with Bolivia after an interim of B years. Two development proj ects (UN and USAID funding) working on coca substitution in the Chapare region contacted CIAT with respect to developing cassava processing for the local animal feed industry. In addition, the University of Santa Cruz is carrying out cassava production research and is also interested in processing.
Although the difficulties caused by working toward substitution of coca by other crops are enormous, they are not insurmountable. Cassava is one of the most attractive alternative options if small-scale processing can be introduced for small farmers. One advantage is that most farmers already have drying patios. Nevertheless, the economics of cassava processing are not clear: the price offered to farmers for the fresh root must be attractive to compete with coca, but the cost of the dried cassava must be low enough to compete as a carbohydrate source with local maize. As prices of coca and maize fluctuate in a relatively free market, eCOnomic feasibility is not easy to estimate. ,
The UN project in Chapare has funded a pilot plant for producing dried cassava, based on the Colombian modal with sorne innovations. Project personnel were trained at CIAT in processing and cassava integrated projects. CIAT will monitor the operation of the pilot plant during 1991 and collaborate in feasibility studies for project expansiono An in-country course on cassava, organized by IBTA-Chapare, is planned for June 1991.
367

9. REGIONAL NETWORKS AND TAAINING
9. 1 11 Latin American Cassava Breeders' Workshop (cruz das Almas, Brazil, 21-25 Hay 1990)
As a resu1 t of a meeting held at CIAT in 1988, a PanAmerican Cassava Network was created with representatives from eight countries. The network's original objectives were to promote the integration of and communication among Cassava programs in the hemisphere through meetings, training, pub1ications and other network activities. A set of priority areas was established in order to organize workshops (marketing, transfer oE techno10gy, breeding, etc.). This breeders' workshop was the second to be. organized at the Pan-American leve1 and the first within the framework of a cassava network.
The objectives of the meeting were to:
Interchange information about cassava breeding activities, the status of the crop, and its main limitations
Discuss breeding re1ated aspects that were mentioned as re1evant in a previous1y conducted "Delphi" survey
Analyze and propose specific breeding activities to be conducted within the network.
Discussion was organized around the country presentations, and roundtables were organized on specific topics. The most important points arising from these discussions were:
9.1.1 Characterization of the main environments for cassava
Some ten years ago CIAT proposed a classification based on edaphic, c1imatic and bio1egica1 factors, intended te provide a bread framework fer the different cassava regions to be classified. The discussien raised the issues of how wel1 the different growing regions in Latin America fit lnto that c1assification and the importance of considering other aspects of the crop such as product utilization for future subdivisions of the present classification.
Determining the homology among cassava-growing areas of the continent wi11 facilitate the movement of elite germp1asm among regions. C1assification into different agroecosystems (ECZs) reduces the variability within a particular ECZ, but does not e1iminate it. There is stil1 variation in soi1 type, incidence of pathogens, differences in pathotypes, uti1ization aspects, etc., representing what is referred to as microenvironments or intra-ECZ variation.
369
The working group concluded that environmental variation at the regional (micro) level could be studied using regional trials with the main varieties for the area. The network will develop a project for uniformity trials, including the most common varieties for the principal predefined ECZs (I, 11, 111 and IV). Participants from the different countries are to provide detailed information about their main cassava regions. This activity will generate a continuous flow of improved genetic material (basically centralized at CIAT) and information among countries.
9.1.2 Germplasm movement
Germplasm movement among countries has to be accomplished with minimum guarantees of being pathogen- and pest-free. It was generally agreed that in-vitro transfer represents the safest mean s for germplasm movement lo'ithin the continent. Indexed stakes were also regarded as a safe procedure by most countries (except for Brazil), and the one that permits the availability of enough planting material for yield trials in the shortest time.
Germplasm movement as sexual seeds raised some doubts about phytosanitary safety as the list of seed-transmitted pathogens is constantly growing. Close observation of introduced progenies at the experiment station level will help prevent introducing diseases to areas that are presently free of them. Sorne participants regarded the risk of disease transference by seeds to be minimal as they considered the continent already colonized by the main diseases.
9.1.3 Multiplication of promising genotypes
Felo' countries have institutionalized or commercial stakemultiplication enterprises, and there was a general consensus that this can restrict the rapid spread of improved genotypes and the express ion of the potential of local varieties through quality seed production. As this area requires further attention, it was recommended that it be a topic for further discussion on a regional level.
9.1.4 Agronomic evaluation of breedinq material
One of the most important desicions taken at the meeting was to establish a basic list of characteristics to be reported when germplasm is interchanged or when advanced yield trial results are reported. A list of passport data, qualitative descriptors and agronomic traits will accompany each clone that is distributed. When data from yield trials are reported, information about the experiment site, crop management and mean RY plus an indication of experimental variation for agronomic traits for each clone (RY, % DM, HCN, starch, HI, branching height and quality) must be
370

submitted. included as continent.
Mantequeira (eMC 40, M Col 1468) will be a common check for advanced yield trials on the
9.1.5 Communication within the Cassaya Breeder's Network
Reactivation of the Cassava Network Bulletin was recommended. It was also decided to include in it two annual reports from the participating programs, describing the main activities conducted and results. Given its comparative advantage, CIAT will centralize the information and dissemina te it.
The next meeting of the 1992, to be hosted by (second).
Breeders' Network was proposed for CUba (first priority) or Mexico
9.2 111 Asian Cassava Research Workshop (Malang, Indonesia, 22-27 Oct. 1990)
One of the functions of CIAT's Regional Cassava Program is to promote collaborative research among national programs by forming networks through which information exchange and utilization of technical expertise can be enhanced. One of the mechanisms for achieving this goal has be en the organization of periodic (every 3 yr) regional research workshops.
The first workshop, co-sponsored by the ESCAP-CGPRT Centre, Bogor was held in Bangkok in 1984, the primary emphasis of which was on cassava in Asia, its potential and research development needs. The second workshop was held in 1987 in Rayong, Thailand in cooperation with the RFCRC, Dept. of Agriculture. Each national program reported on its major research accomplishments in varietal improvement and cultural management, and priority research areas were discussed.
In this year 1 s workshop, the main emphasis was on cassava processing and utilization, with seven countries presenting papers on the markets, products and processes for cassava, together with a description of the research being undertaken and future areas of priori ty. Progress made in varietal improvement and agronomic research during the past three years was also discussed.
Regional-level achievements in varietal improvement and agronomic research have been reported herein (sections 1.4 and 5.5) and in previous annual reports. with respect to modifications in regional research priorities that will have a bearing on future CIAT collaborative activities, it is interesting to note that quality factors are now an important criterion for selecting improved genetic materials. There was also a felt need for further economic analysis of the data being generated on soil fertility and erosion
371

control measures, coupled with on-farm testing of those technologies that appear both technically and economically viable.
The presentations on cassava processing and utilization highlighted the diverse end uses 1n Asia (Table 9.1), particularly the import role of starch production. In terms of common research priorities, two major areas were apparent. Indonesia, India, the Philippines and vietnam are interested in small-scale rural processing, especially for producing dry cassava products or intermediate products for further processing. On the other hand, Thailand, China, Malaysia, India and, to a lesser extent, Indonesia, are focusing on industrial-scale production of derived or modified products principally from starch. In both areas the link between the physicochemical properties of the raw material and the quality of the end product was recognized.
The workshop was the first opportunity for integrating breeders, agronomists and processing specialists at the regional level. It was proposed that this integration be strengthened at the next workshop through country presentations that cover the three areas, rather than treating the disciplines separately. Finally, a recommendation was made that communication among countries be improved, and the Asian Insti tute of Technology, Bangkok agreed to act as a clearinghouse for collecting and disseminating information, possibly through a regional newsletter, if funds could be found.
Table 9.1 Current cassava-based products and their relative importance in Asian countries.
Country
Philippines Thailand vietnam India Indonesia China Malaysia
Dry cassaya
(AF)
X XX
x
Cassava Flour (HC)
X X X X
XX
Fresh Cassava starch
(HC) (IU)
XX
X XXX XX
x
xx xx xx xxx xxx xxx xxx
starch-Derived Products (IU)
x X X X X
XX X
1 AF = animal feed, HC = human consumption, IU = industrial use.
2 X = relative importance; those in bold denote products for export
372

9.3 Meeting on Cassava Cooperation in the Latin American Subtropics (Asunción, Paraguay, 15-16 Oct.)
Since its inception in 1972, the Cassava Program has been unable to cover the research needs and potential opportunities of the subtropical cassava-growing regions adequately. On a world basis the importance of this ECZ in terms of cassava production may not be that significant; however, 22% of the total area planted to cassava in Tropical America is located in the subtropics, making it the single most important cassava ecosystem on that continent. Other important subtropical cassava-growing regions are found in southern China and North Vietnam. Although CIAT has provided training and research support for national programs in southern Brazil, Paraguay and more recently northern Argentina, little systematic attempt has be en made to promote horizontal cooperation among these countries or to define the principal research areas that might be dealt with on a regional basis.
The objectives of this meeting were therefore threefold:
Analyze the convenience of improving communication among professionals working on cassava in the countries.
Identify technical areas of specific interest to the institutions in each country and about which it would be useful to interchange more information.
Prepare tutions needs.
an agenda on future activities among the instithat will satisfy their common information
Interestingly, while supporting enthusiastica11y the idea of improving subregional communication among the countries, participants also recognized that there is deficient communication among institutions within the same country. steps wi11 be taken to improve this situation. With respect to mechanisms for improving communication among countries, it was recommended that:
A country coordinator be designated who wou1d meet periodically with counterparts in the other countries
An information network be formed with the interchange of annual reports in the first instance
A study be carried out on the feasibility of creating a regional cassava society
A regional cassava workers directory be prepared
373

The technical areas in which It was felt there was insufficient expertise within the subregion were soil microbiology, soil conservation, root rots, postharvest physiology and genetic tolerance of low temp. To support these research needs, it was proposed that agreements be sought with both national and international institutions.
Four areas of expertise that could present opportunities for horizontal cooperation were identified: breeding, production, postharvest aspects and socioeconomics. The resulting information will be used to formulate a project to obtain funding for these regional activities. The project will be formulated jointly at a meeting of country coordinators, together with a representative from CIAT in mid-199l.
9.4 HQ-based training
The training activities of the Cassava Program, carried out in collaboration with the Training and Communications Support Program, have be en progressively changing their focus and contento In common with other commodity programs, there is now a reduced need for the intensive type of multidisciplinary course usually targeted at young research workers and extension leaders with little or no previous experience with the crop in question. In the case of researchers, a period of in-service training in their particular discipline is now seen as the most effective way of preparing them for carrying out their jobs. On the other hand, extensionjdevelopment personnel and on-farm researchers, many of whom have several years' experience with cassava, often require greater skills in problem and opportunity identification so as to respond to the changing needs of their client farmers. Problem areas may arise from production, processing or marketing limitations. The Program's experience in executing integrated cassava development projects in collaboration with national cassava research and development organizations in Colombia, Ecuador, Paraguay and Brazil has provided the basis for structuring a course that meets the needs of on-farm researchers and development personnel more directly. The first course was held this year (see 9.4.1).
To complement both in-service specialization and training in integrated projects, a two-week introductory course on cassava production and utilization was offered, mainly for those country professionals who had not previously attended a CIAT cassava course.
9.4.1 Introductory course on cassava production and utilization rCIAT), 3-14 Sept. 1990)
This two-week course gave the 16 participants (8 Latin American countries) a general overview of cassava production
374

and utilization research within the context of the development of the crop, after which they either continued on for a period of disciplinary specialization or took the integrated cassava projects course. For this reason, it was structured in a modular form, following the sequence of events in the cassava production, processing, marketing, utilization cycle. This was a departure from previous courses which have been presented more on a disciplinary rather than on an interdisciplinary basis. The course consisted of seven modules: Introduction, Cultural practices, Planting Material, Plant/Environment Interactions, Biological Environment, Socioeconomics, Processing and utilization. While this organization does not allow certain subjects to be dealt with in the accustomed depth (e.g., soils and fertilization), it was quite adequate for highlighting the type of disciplinary interaction needed to approach the resolution of farmers' problems. This is of particular importance as many national cassava programs cannot afford to have specialists in every discipline. The modular organization was appreciated by the participants, and a similar form of organization has been adopted for a national course in at least one country.
9.4.2 Integrated proj acts Course (CIAT , 17 sept. -4 Oct .. 1990)
The Cassava Program recognizas that a high priority must be given to developing in-country expertise in the conceptualization, design, axecution and evaluation of integrated cassava production, processing and marketing projects. This will require the training of personnel from national research, extension and development programs/projects in technical aspects of cassava research, as well as in the subjects of project management, farmer and institutional organization, and farmer-, market- and consumer-oriented research methods, etc.
A first attempt at organizing a course on integrated cassava projects was made during 1990, with the participation of personnel from cassava projects in Colombia, Ecuador, Brazil, Paraguay, BOlivia, Panama and Argentina. The course consisted of country project presentations, conceptual/ methodological information based on the CIAT experience, the analysis of case studies, a field visit to projects in Colombia and the development of future action plans by all participants. A manual on integrated projects will be produced as a result of the information collected.
The course was highly successful in motivating participants to use an integrated, multi-institutional approach to cassava research and development. This clearly demonstrates the importance of areas such as farmer organization, relevant technology selection and scale of operation to project
375

success. An informal information exchange network was established, and a second meeting tentatively arranged for 1991 in Ecuador.
376

10. PROGRAM PUBLICATIONS
Bellotti, A.C.; Arias, B.; Reyes, J.A. 1990. Biological control of the cassava hornworm, Erinnyis ello (Lepidoptera: sphingidae) with emphasis on the hornworm virus. In Howeler, H., ed. Symposium of the International society for Tropical Root Crops, 8, Bangkok, Thailand, 1988. Tropical root and tuber crops changing role in a modern world: proceedings. Bangkok, Thailand, Department of Agriculture. International Society for Tropical Root Crop. pp.354-363.
Bellotti, A.C.; Braun, A.R.; Yaninek, J.S.; Newenschwander, P. i Herren, H. 1990. Cassava agroecosystems and the evolution of pest complexes. Paper presented at the International congress of Plant protection, 11, Manila, Philippines. (in press).
Bellotti, A.C.; Cardona, C.; Lapointe, S.L. 1990. Trends in pesticide use in Colombia and Brazil. Journal of Agricultural Entomology 7(3):191-201.
Best, R.; Menéndez, L. 1990. Cassava utilization in feed. Supplement 1989. Cali, Colombia, Internacional de Agricultura Tropical. 147p.
animal Centro
Best, R.; Menéndez, L. 1990. El uso de la yuca en alimentación animal. Suplemento 1989. Cali, Centro Internacional de Agricultura Tropical. 958-9183-20-4.
la Colombia,
155p. ISBN
Best, R. 1990. The role of the International Agricultural Research Centers in generating and transferring root and tuber crop post-harvest technology: CIAT' s experience. In Howeler, R.H., ed. Symposium of the International Society for Tropical Root Crops, 8, Bangkok, Thailand, 1988. Tropical root and tuber crops changing role in a modern world: proceedings. Bangkok, Thailand, International Society for Tropical Root crops. Department of Agriculture of Thailand. pp.76-91.
Best, R.; Wheatley, C.C.; Chuzel, G. 1990. Cassava process and product development at CIAT. Paper presented at Asian Cassava Research Workshop, 3, Malang, Indonesia, Brawijaya University, Oct. 1990. 17p.
Bottema T., J.W.; Henry, G. 1990. History, current status and potential of cassava use in Asia. Trabajo presentado al Asian Cassava Research Workshop, 3, Malang, Indonesia, Brawijaya university, Oct. 1990. 17p.
377

Buitrago A., J.A. 1990. La yuca en la alimentación animal. Ca1i, Colombia. Centro Internacional de Agricultura Tropical. 450p.
carter, S.E. 1990. A survey method to characterise spatial variation for rural development proj ects. Agricul tural Systems 34:237-257.
Carter, S.E.; Jones, P.G. 1990. A model of cassava distribution in Africa. Trends in CIAT commodities. Economics Document 1.15 (Nov):39-59.
Carter, S.E.; Jones, P.G. 1990. A model of cassava distribution in Africa. Economic Geography (in press).
Castaño, J.; Correa, C.; Echeverry, A.; Franco, M.A.; Monsalve, A. Rivas, L. 1990. Trends highlights FAO data: cassava. Trends in CIAT commodities. Economics Document 1.15 (Nov):195-203.
Chavez, R. 1990. Especies silvestres de Manihot: un recurso valioso. Yuca Boletin Informativo 14(1):2-5.
Chuzel, G. 1990. Diagnóstico tecnológico de las plantas de producción de almidón agrio de yuca. Trabajo presentado al Seminario Latinoamericano y del Caribe de Ciencia y Tecnología de Alimentos, San José, Costa Rica, Abr. 1990. Alimentos para la paz. 20p.
Cock, J.R.; Lynam, J.K.; Wheatley, C.C.; Correa, C.; Izquierdo, D. 1990. Benefits to cassava consumers and producers: new market options in Colombia. Food PoI icy 15(3) :255-257.
Cock, J.R.; Lynam, J.K. 1990. Research for development. In Roweler, R.R., ed. Symposium of the International Society for Tropical Root Crops, 8, Bangkok, Thailand, 1988. Tropical root and tuber crops changing role in a modern world: proceedings. Bangkok, Thailand, Department of Agriculture, International Society for Tropical Root Crops. pp.109-119.
De Llamas, P.A.; Moreno, R.A.; Izquierdo, D.A. 1990. Comercialización de la mandioca en Paraguay. Cali, Colombia, Centro Internacional de Agricultura Tropical. Documento de Trabajo no. 71. 87p.
378

El-Sharkawy, M.A.; Cock, J.H.; Lynam, J.K.; Hernandez, A. del P. 1990. Relationship between biomass, root yield and single leaf photosynthesis in field grown cassava. Field Crops Research 25:183-201.
El-Sharkawy, M.A.; Cock, J.H. 1990. Photosynthesis of cassava (Manihot esculenta). Experimental Agriculture 26(3) :325-340.
El-Sharkawy, M.A. 1990. Effect of humidity and wind on leaf conductance of field grown cassava. Revista Brasileira de Fisiología Vegetal 2(2):17-22.
Empresa Brasileira de Pesquisa Agropecuaria. 1990. Cultivares de mandioca recomendadas para Varzea do Estado do Amazonas. Cali, Colombia. Centro Internacional de Agricultura Tropical. Plegable. 2p.
Estrada, R.D.; Seré, C.; Ferguson, J.E.; Best, R. 1990. Vinculos entre la investigación en fincas, la extensión y desarrollo agropecuário. Estudio de caso: El establecimiento de la industria de yuca seca en la Costa Atlántica de Colombia. Trabajo presentado a la Reunión del Comité Asesor de la RIEPT, Lima, Perú, Ago. 1990. IIp.
Gold, C.S.; Altieri, M.A.; Bellotti, A.C. 1990. Direct and residual effects of short duration intercrops on the cassava whiteflies Aleurotrachelus socialis and Trialeurodes variabilis (Homoptera: Aleyrodidae) in Colombia. Agriculture, Ecosystems and Environment 32(1-2):57-67.
Gold, C.S.; Altieri, M.A.; Bellotti, A.C. 1990. Effects of intercropping and varietal mixtures on the cassava hornworm, Erinnyis ello L. (Lepidoptera: Sphingidae), and the stemborer, Chilomima clarkei (Amsel) (Lepidoptera: Pyralidae), in Colombia. Tropical Pest Management 36(4):362-367.
Gold, C.S.; Altieri, M.A.; Bellotti, A.C. 1990. Response of the cassava whitefly, trialeurodes variabilis (Quaintance), (Homoptera: Alyerodidae) to host plant size: Implications for cropping system management. Acta Ecológica 11(1):35-41.
Hernández, J.; Lozano, J.C. 1990. Efecto de la cepa c-5a pseudomonas fluorescens en la producción de yuca (Manihot esculenta Crantz). Trabajo presentado al Congreso de ASCOLFI, Ibagué, Colombia, Jun. 1990. (in press)
379
Hernández, J.; Lozano, J.C. 1990. Evaluación sobre resistencia a Phytophtora spp. en yuca. presentado al Congreso de ASCOLFI, Ibagué, Jun. 1990. (in press)
Trabajo Colombia,
Henry, G.; Janssen, W. 1990. Snap Beans in the Developing World: potential Benefits of Research. In Trends in CIAT Commodities 1990. Working. Document No. 74, Nov. 1990. (Economics Document No. 1.15). CIAT. Cali, Colombia. pp. 89-115.
Hershey, C. 1990. Nuevo impulso al mejoramiento de yuca en América Latina. Yuca Boletin Informativo 14(1):8-9.
Howeler, R.H., ed. 1990. Symposium of the International Society for Tropical Root Crops, Bangkok, Thailand, Nov. 1988. Tropical root and tuber crops changing role in a modern world: proceedings. Bangkok, Thailand, Department of Agriculture. International Society for Tropical Root Crop. 724p.
Howeler, R.H.; cadavid, L.F. 1990. Short and long-term fertility trials in Colombia to determine the nutrient reguirements of cassava. Fertilizer Research 26:6-80.
Howeler, R.H. 1990. Long-term effect of cassava cultivation on soil productivity. In Howeler, R.H., ed. Symposium of the International Society for Tropical Root crops, 8, Bangkok, Thailand, Nov. 1988. Tropical root and tuber crops changing role in a modern world: proceedings. Bangkok, Thailand, Department of Agriculture. International Society for Tropical Root Crops. pp.269-270.
Howeler, R.H. 1990. Phosphorus requirements and management of tropical root and tuber crops. In Symposium on Phosphorus Requirements for Sustainable Agricul ture in Asia and Oceania, Manila, Philippines, 1989. Proceedings. Manila, Philippines, International Rice Research Institute. pp.427-444.
Improving cassava quality for new products and markets. 1990. CIAT International 9(2):6-8.
Izquierdo, D.; Wheatley, C.W.; Henry, G. 1990. Metodología para ampliar la demanda tradicional de yuca Cali, Colombia. Centro Internacional de Agricultura Tropical. Trabajo presentado al Taller Latinoamericano sobre Métodos para Estudiar la Comercialización agrícola, Lima, Peru, 1990. 27p.
380
Janssen, A.; Hofker, C.D.; Braun, A.R.; Mesa, N.; Sabelis, M.W. ; Bellotti, A.C. 1990. preselecting predatory mites for biological control: the use of an olfactometer. Bulletin oE Entomological Research 80(2):177-181.
Janssen, W.G.; Lynam, J.K. 1990. Integrated ex ante and ex post impact assessment in the generation of agricultural technology: cassava in the Atlantic Coast of Colombia. In ECheverria, R.G., ed. Methods for diagnosing research system constraints and assessing the impact of agricultural research. 2. Assessing the impact of agricultural research. The Hague, Netherlands, International Service for National Agricultural Research. pp.215-250.
Janssen, W.;Sanint, L.;Rivas, L.;Henry, G. 1990 CIAT'S Commodity Portfolio Reexamined: Indicators of Present and Future Importance. In Trends in CIAT Commodities 1990. Working Document No. 74, Nov. 1990. (Economics Document No. 1.15). CIAT. Cali¡ Colombia. pp. 1-38.
Jantawat, S.; Vichukit, V.; Putthacharden, S.; Howeler, R.H. 1990. Cassava cultivation practices for eros ion control in Thailand. (Abstract). In HOIo¡eler, R.H., ed. Symposium of the International Society for Tropical Root Crops, 8, Bangkok, Thailand, 1988. Tropical root and tuber crops changing role in a modern world: proceedings. Bangkok, Thailand, Department of Agriculture. International Society for Tropical Root Crop. pp.242-243.
Rawano, K. 1990. Harvest index and evolution of major food crop cultivars in the tropics. Euphytica 46:195-202.
Kawano, R.; Sarakarn, S.; Limsila, A.; Tongglum, A.; Supaharn, D. 1990. Cassava cultivar evolution viewed through harvest index and biomass production. Howeler, R.H., ed. Symposium of the International Society for Tropical Root Crops, 8, Bangkok, Thailand, 1988. Tropical root and tuber crops changing role in a modern world: proceedings. Bangkok, Thailand, Department of Agriculture. International Society for Tropical Root Crops. pp. 202-210.
Laberry, R.; Lozano, J.C. 1990. Efecto del origen del material de siembra y el sistema de cultivo en la severidad e incidencia del añublo bacterial, el añublo fungoso y el superalargamiento de la yuca. ASCOLFI Informa 16(5):39-42.
Lopez, J. 1990. Almacenamiento del material de siembra de yuca en la Costa Atlántica. In Yuca y cultivos asociados. Cali, Colombia, Centro Internacional de Agricultura Tropical. Documento de Trabaj o No. 02. pp.35-50.
381

Lopez, J. 1990. Producción comercial de semilla Cali, Colombia, Centro Internacional de Tropical. Unidad de Semillas. 33p.
de yuca. Agricultura
Lopez, C. 1990. Evaluación sobre la resistencia a Phytophthora spp. en yuca. Proceedings XI Congreso ASCOLFI (Ibagué, Junio 6-8, 1990) (in press).
Lozano, J.C.; Laberry, R 1990. Problemas patológicos que afectan la calidad sanitaria del material de siembra (estacas) de la yuca en Colombia. Trabajo presentado al Congreso de ASCOLFI, Ibagué, Colombia, Jun. 1990. (in press)
Lozano, J.c.; Zeigler, R. 1990. Methods to screen for resistance against foliar bacterial pathogens. In methods in Phytobacteriology. Edited by Z. Clement, K. Rudolf. D.C. Sands. Akademiai Kiadó, Budapest 1990. Chapter lI.8. p.334-338.
Marin, M.L.; MafIa, G.; Roca, W.M.; withers, L.A. 1990. Cryopreservation of cassava zygotic embryos and whole seeds in liquid nitrogen. Cryo-Letters 11:257-264.
Menendez F., L.; Lopez S., J. 1990. Cassava in Asia: East and Southeast Asia. Cali, Colombia. Centro Internacional de Agricultura Tropical. National Bibliographies. 486p.
Menendez F., L.; Lopez S., J. 1990. Cassava in Asia: South Asia. Cali, Colombia. Centro Internacional de Agricultura Tropical. National bibliographies. 305p.
Mesa, N.C.; Braun,A.R.; Bellotti, A.C. 1990. Comparison of Mononychellus progresivus and Tetranychus urticae as prey for five species of phytoseiid mites. Experimental and Applied Acarology 9:159-168.
Moraes, G.J. de; Braun, A.R.; Yaninek, J.S.; Alencar, J.A. 1990. Distribution and abundance of phytoseiid predators of the cassava green mites in Brazil. Paper presented at the International congress of Acarology, 8, Ceske Budejovice, Czechoslovakia. (in press)
Moreno B., A. 1990. Resultados preliminares de ensayos realizados en el CIAT con la asociación maiz-ñame-yuca. In Yuca y cultivos asociados. Cali, Colombia, Centro Internacional de Agricultura Tropical. Documento de Trabajo No. 02. pp.51-59.
382

Moreno B., A. 1990. Uso del analisis bivariado para presentar, analizar e interpretar datos provenientes de cultivos asociados •. In Yuca y cultivos asociados. cali, Colombia, Centro Internacional de Agricultura Tropical. Documento de Trabajo No. 02. pp.127-137.
Moreno, R.A.; Moreno B., A.; Muñoz, F. 1990. Cassava-yam intercrop in the North Coast of Colombia (Abstract). In Howeler, R.H., ed. Symposium of the International Society for Tropical Root Crops, 8, Bangkok, Thailand, 1988. Tropical root and tuber crops changing role in a modern world: proceedings. Bangkok, Thai1and, Department of Agriculture. International Society for Tropical Root Crops. p.31!.
Moreno, R.A.; Tobón, R., eds. 1990. Yuca y cultivos asociados. Cali, Colombia, Centro Internacional de Agricultura Tropical. Documento de Trabajo No. 02. 183p.
Muñoz, F.; Lopez, J.; Moreno, R.A. 1990. Protección química del material de siembra de la yuca: Validación de tecnología de la Costa Atlántica de Colombia. In Yuca y cultivos asociados. cali, Colombia, Centro Internacional de AgricUltura Tropical. Documento de Trabajo No. 02. pp.109-116.
Orozco, J.; Duque, M.C.; Mesa, N.C. 1990. Efecto de la temperatura sobre la tabla de vida de Oligonychus yothersi en Coffea arabica. Cenicafé 41(1):5-18.
Porto, M.C.M. 1990. Growth of cassava intercropped with maize and cowpea. In Howeler, R.H., ed. Symposium of the International Society for Tropical Root Crops, 8, Bangkok, Thalland, 1988. Tropical root and tuber crops changing role in a modern world: proceedings. Bangkok, Thailand, Department of Agriculture, International society for Tropical Root Crops. pp.300-310.
Roca, W.M. 1990. Cassava production and utilization problem~ and their biotechnological solutions. In Sasson, A.; costarini, V., eds. International Symposiurn on Plant Biotechnologies for Developing Countries, Luxembourg, 1989. Proceedings. Wageningen, The Netherlands, Technical Centre for Agricultural and Rural Co-operation. Food and Agriculture Organization of the united Nations. pp.215-219.
Rodriguez, H.; Nubia, S.; Hershey, C. 1990. Dos nuevas variedades de yuca de alta producción para los Llanos Orientales. Bogotá, Colombia, Instituto Colombiano Agropecuario. Plegable Divulgativo No. 220. 6p.
383

Thingstrup, l.; Laberry, R.; Lozano, J.C. 1990. Efecto de algunos hongos micorrizógenos en la ocurrencia de pudriciones radicales. Trabajo presentado al Congreso de ASCOLFl, 11, Ibagué, Colombia, Jun. 1990. (in press)
Urias l., M.A.; Reyes, Q.J.A. 1990. Fluctuación poblacional y ciclo biológico de Erinnyis ello (L), gusano de cuerno de la yuca (Manihot esculenta Crantz) Rivista di Agricoltura Subtropicale e Tropicale 84(2) :265-271.
Velasco, A.C.; Nolt, B.L.; Pineda, B. 1990. Comparacion de tres métodos de la técnica irnnunoenzimática ELISA para el diagnóstico del virus del mosaico común de la yuca. Fitopatologia Colombiana 14(1):3-9.
Wheatley, C.C.: Best, R.; Chuzel, G. 1990. A product development approach to cassava utilization. Paper presented at National Symposium on Recent Advances in Production and Utilization of Tropical Tuber Crops, Nov. 1990. Indian Society for Root Crops. 20p.
Wheatley, C.C. 1990. Cassava quality research at ClAT. Paper presented at Asian Cassava Research Workshop, 3, Malang, Indonesia, Oct. 1990. 20p.
Wheatley, e.c.; Izquierdo, D.A.; Lynam, J.K. 1990. lncreasing fresh cassava consumption in urban Latin America: the introduction of storage technology. In Howeler, R.H., ed. Symposium of the lnternational Society tor Tropical Root crops, 8, Bangkok, Thailand, 1988. Tropical root and tuber crops changing role in a modern world: proceedings. Bangkok, Thailand, Department of Agriculture. lnternational Society tor Tropical Root Crops. pp.364-373.
384