EADD Project – PRA Report (KENYA) - CGSpace
106
EAST AFRICAN DAIRY DEVELOPMENT PROJECT REPORT OF PARTICIPATORY RURAL APPRAISAL BASELINE SURVEY OF SMALLHOLDER DAIRY FARMERS IN BOMET, NANDI NORTH AND KEIYO DISTRICTS OF KENYA Consultant Dr Washington O. Ochola Egerton University, Njoro PRA Team Members Anjela Wokabi Liston Njoroge Mary W. Kanyi Steve Gikonyo Stanley Muli Daniel Keter Charles Ombui Francis Rop International Livestock Research Institute (ILRI) DECEMBER , 2008
-
Upload
khangminh22 -
Category
Documents
-
view
1 -
download
0
Transcript of EADD Project – PRA Report (KENYA) - CGSpace

EAST AFRICAN
DAIRY
DEVELOPMENT
PROJECT
REPORT OF
PARTICIPATORY RURAL
APPRAISAL BASELINE
SURVEY OF
SMALLHOLDER DAIRY
FARMERS IN BOMET,
NANDI NORTH AND KEIYO
DISTRICTS OF KENYA
Consultant
Dr Washington O. Ochola
Egerton University, Njoro
PRA Team Members
Anjela Wokabi
Liston Njoroge
Mary W. Kanyi
Steve Gikonyo
Stanley Muli
Daniel Keter
Charles Ombui
Francis Rop
International Livestock
Research Institute (ILRI)
DECEMBER , 2008

1
Executive Summary
Kenya, whose economy is heavily dependent on agriculture, has one of the largest dairy industries in sub-Saharan Africa. About 600,000 smallholders produce some 70% of the country’s marketed milk. In recognition of the role that the private sector plays in spear heading industrialization, the Government of Kenya (GoK) has put in place a policy framework to foster the creation of a conducive environment for private sector participation in economic development. The East African Dairy Development project has been made possible through grant from the Gates & Melinda Foundation to Heifer International and aims to help the estimated 179,000 dairy farmers in East Africa double their dairy-related incomes by increasing their ownership of cross-bred cows, increasing the amount of milk their cows produce, and strengthening the farmers’ relationship to formal markets so they can sell more milk. The project seeks to enhance production by: increasing the volume of milk produced; improving milk quality and reducing loss through spoilage; providing access to production inputs through business delivery services; improving market-access by developing local hubs of business development services and chilling plants that facilitate market access; linking producers to formal markets through processors; and increasing producers’ benefit from traditional markets. This will only be achieved through coordinated, farmer-focused interventions that develop smallholder profit-participation in the dairy value chain. Participatory surveys of farmer-circumstance would inform this process.
The study used participatory and consultative approaches to gather data presented in this report. A host of Participatory Rural Appraisal (PRA) tools were used to carry out a situation analysis among the small holder dairy farmers. The goal was to identify constraints and suggest interventions geared towards promoting the sustainable development of dairy production of study sites. The studies were conducted in three villages, namely, Siongiroi (Bomet district), Metkei (Keiyo district) and Kabiyet (Nandi North district). The specific villages involved are Kiproroget (Bomet), Chepkosom (Keiyo) and Kuriot (Nandi North). The studies were conducted between 6th and 30th October 2008. A multidisciplinary research team was constituted with Ministry of Livestock Development (MoLD) staff from headquarters, Rift Valley province and the study districts. Before the field work, the team was introduced to the PRA approach, techniques and tools that were to be used in the baseline investigation. The team invited at least 30 dairy farmers from each village to participate, where PRA tools were used to generate community sketch map, wealth ranking, livelihood analysis, constraints and opportunities in dairy farming, innovation actor analysis, and livestock feeds and breeding analysis. An analysis of the field results from each village indicated a growing need for continued use of the consultative approaches to implementation of the project. The field data relates to dairy farming resource endowment and their spatial distribution in each village, challenges and opportunities in the sector, existing innovations and actors in the sector, feeding and breeding options and challenges. From the wealth ranking exercise, it was noted that farmers have diverse criteria for classifying households by wealth. The households in the various wealth categories have varying challenges of engagement in dairying but also have differential opportunities and drive to invest in dairy farming. A number of alternative livelihood activities support farmers in the study villages. In all villages, dairy farming is the most important source of livelihood. There is, however, a positive synergy between dairying and the other livelihood activities. Although prioritized differently by the villagers, the other livelihood activities include maize farming, horticulture, sheep and goat rearing, poultry keeping, trade in milk and livestock, small-scale businesses, wage employment and farming of other crops like beans.

2
The three villages are at different levels of preparedness and readiness for the EADD project and will thus require different approaches and pathways to EADD implementation. In Siongiroi there is already an operational chilling plant run through a cooperative society and management with a capacity of 30,000 kg of milk per but currently handling only 14,000Kg. It is even serving one major milk processor (Brookside Dairy LTD) by chilling its collected milk from the area. Dairy farmers in the other two villages are already part of preparations to establish similar plants for milk collection and chilling. Farmers are already registering as members and have contributed their share of the 10% funding. The innovations and actors analysis revealed critical policy issues that should be addressed in order for dairy development objectives of EADD to be met. The study also reviewed the criteria used by farmers in selecting dairy breeds. The farmers’ preference for dairy breeds in the village is guided by a number of choices: udder size, coat colour, body size, body shape, posture, milk yield, age and ancestry, including resistance to diseases. The various breeds are preferred for differed reasons. In all the villages Ayrshire is the most preferred for its colour, milk yield, disease resistance and lower feed requirement compared to Friesian In all the villages livestock feeding systems, forage preferences and constraints to livestock feeding as well as forage seasonality are critical to dairy development. The selected PRA tools revealed that natural pastures are most dominant but are complemented variously by Napier grass, other fodder plants and limited commercial supplementation. There is a general low level of feed conservation due to inadequacies of skills for cost-effective fodder conservation. Most of the times, farmers rely on natural pasture. Napier grass is mostly used during the dry season. Forage availability remains a major constraint to dairy development. The studies have also revealed that dairying remains the single most important livelihood activity albeit with a number of constraints. The main problems constraining dairying in the villages include low quality breeds, water shortage, inadequate dairy management skills, poor markets, poor rural infrastructure, livestock diseases, inadequate feeds, expensive feeds and dairy production inputs. The constraints need redress for the farmers to realize the potential of doubling their income from milk and other dairy products. Top on the list of interventions is an enabling environment which must involve: Milk handling regulation that is not restrictive for farmers of different socio-economic status Capacity building for farmers on emerging, appropriate and profitable dairy technologies Support for farmers’ competitive edge in the milk marketing sector Control of livestock movement outside and within the village to reduce disease outbreak Redress of the breeding policy and capacity development to access appropriate breeding
services The development and maintenance of infrastructure in the area should be in tune with dairy
development needs to facilitate transport of milk, inputs and promote marketing. Other developments that would promote dairy development include improving telecommunications network, electrification and water resources.
A technology dissemination enabling environment with adequate extension staff and useful links with research institutions like ILRI and KARI are also required.
The dairy farmers have negative attitudes towards some actors especially KCC owing to past bad experiences and loaning institutions particularly AFC. Government policy on dairy/livestock sector should be restructured to promote community managed dips, subsidize on cost of drugs particularly for treating ECF, improved resources allocation to the department of livestock production to enhance their reach to farmers, and improvement of roads to enhance movement of dairy products, people and farm inputs.
3
The studies all show that continued use of various participatory approaches for dairy technology dissemination and farmer training will greatly improve the sustainability of the initiatives under EADD. There is need for a full fledged gender analysis to improve the mainstreaming of gender issues and concerns that might undermine the project. Some of these issues are less understood but crucial. There is also need to use this study and the subsequent household survey for benchmarking the project performance for later use in monitoring continued project relevance, effectiveness, efficiency, quality and impact. Specifically the skills of participatory monitoring and evaluation should be inculcated into the farmers and other implementing partners to build capacity for endogenous learning and correction/redesign. The study also revealed that a chilling plant is very vital in enhancing farmers’ capacity for milk marketing. There is need for more popularization of the project and clarification of the roles of various partners including the farmers. There is need for more consultation and empowerment of local dairy farmers to manage the cooperatives and affairs of the chilling plant. Plans should be made for the plants to expand operation into other value addition businesses. The report presents a consolidated documentation of the three studies. It is structured in such a way as to report the basis of the PRAs and EADD, methodology used, findings from separate village and key lessons and recommendations. The findings from these three studies, it is hoped will, allow an efficient, relevant, result-oriented and quality design, implementation and monitoring and evaluation of the activities of the EADD project to improve dairy productivity. The findings will also enhance informed participation by all the actors including the dairy farmers.

4
Acknowledgment
The consultant greatly acknowledges the support given to him during the execution of the village level PRAs. Many people, groups and organizations contributed separately or collectively to the success of this undertaking. I acknowledge the opportunity accorded to me by the International Livestock Research Institute (ILRI) to lead the PRAs. Special thanks go to Isabelle Baltenweck, RoseKellen Njiru, Liston Njoroge and Nelson Mango all of ILRI for the preparatory and administrative work they did. The Ministry of Livestock Development (MoLD) not only sanctioned the exercise but also offered its staff at all levels to organize the activities, mobilize the farmers and coordinate the whole process. Other partners of EADDP, including WAC (ICRAF), ABS and HPI are also acknowledged for the role they played in the process. At individual level I thank most sincerely the members of the PRA team drawn from the MoLD: Angela Wokabi (HDBB – Nairobi), Stanley Muli (PMED – Nairobi), Mary Kanyi (Rift Valley Province), Steven Gikonyo (Animal Production Department Headquarters, Nairobi), Daniel Keter (Bomet district), Charles Ombui (Keiyo district) and Francis Rop (Nandi North district). The divisional and district livestock extension staff who accompanied the PRA team to the field made useful preparations and offered to interpret the discussions. They are greatly acknowledged. Our driver, Mr Mustafa contributed immensely to the successful completion of the PRAs. Special thanks go to the many dairy farmers who participated in the PRA sessions. Their insights, information, experiences shared, great wealth of knowledge and valuable time shared with us form the basis of this report that is hoped to underpin subsequent EADD activities. While I appreciate the contribution of all the above, I however, remain responsible for the content, accuracy, unavoidable omissions and any unintended misrepresentation of facts. Dr Washington O. Ochola Egerton University, Njoro

5
Table of Contents
EXECUTIVE SUMMARY ..................................................................................................................................... 1
ACKNOWLEDGMENT ........................................................................................................................................ 4
TABLE OF CONTENTS ........................................................................................................................................ 5
LIST OF TABLES ................................................................................................................................................ 7
LIST OF FIGURES ............................................................................................................................................... 8
LIST OF PLATES................................................................................................................................................. 9
ACRONYMS AND ABBREVIATIONS ................................................................................................................. 10
INTRODUCTION ............................................................................................................................................. 11
THE DAIRY INDUSTRY IN KENYA ............................................................................................................................... 11 ABOUT THE EAST AFRICAN DAIRY DEVELOPMENT PROJECT (EADDP) ............................................................................ 11
METHODOLOGY ............................................................................................................................................. 14
OVERALL APPROACH AND METHODS ........................................................................................................................ 14 CHOICE OF VILLAGES ............................................................................................................................................. 14 RESEARCH TEAM AND PRA METHOD ........................................................................................................................ 15 TRAINING OF PRA TEAM ........................................................................................................................................ 15 PRELIMINARY ACTIVITIES ........................................................................................................................................ 16 THE PRA TOOLS ................................................................................................................................................... 16
Introductory Session .................................................................................................................................... 17 Community Sketch Mapping ....................................................................................................................... 17 Wealth Ranking ........................................................................................................................................... 17 Livelihood Analysis ...................................................................................................................................... 18 Innovations Actors Analysis ......................................................................................................................... 18 Livestock Feeds and Breeds Analysis ........................................................................................................... 18 Constraints and Opportunities .................................................................................................................... 19 Final plenary session ................................................................................................................................... 19
DATA ANALYSIS AND SYNTHESIS............................................................................................................................... 20
FIELD FINDINGS ............................................................................................................................................. 20
KIPROROGET VILLAGE, SIONGIROI, BOMET DISTRICT ...................................................................................... 20 INTRODUCTION ..................................................................................................................................................... 20 THE PRA FINDINGS ............................................................................................................................................... 23
Village Profile .............................................................................................................................................. 23 Village Resource Map .................................................................................................................................. 23 Wealth Ranking ........................................................................................................................................... 24 Problems and Opportunities Analysis.......................................................................................................... 27 Livelihoods Analysis ..................................................................................................................................... 29
Gender Issues in Dairying ......................................................................................................................................... 31 Innovation Systems and Actor Analysis ....................................................................................................... 31
Review of Farmers’ Attitudes ................................................................................................................................... 36 Policy Issues ............................................................................................................................................................. 36
Breeding Services ........................................................................................................................................ 36 Livestock Feeding and Feed Types ............................................................................................................... 37
Emerging Issues on Feeding ..................................................................................................................................... 39 Enabling Environment for Dairy Development ............................................................................................ 39
CHEPKOSOM VILLAGE, METKEI, KEIYO DISTRICT .............................................................................................. 41 INTRODUCTION ..................................................................................................................................................... 41 PRA FINDINGS ..................................................................................................................................................... 42
Village Profile .............................................................................................................................................. 42 Village Resource Mapping ........................................................................................................................... 42

6
Wealth Ranking ........................................................................................................................................... 44 Livelihood Analysis ...................................................................................................................................... 46
Emerging Issues ....................................................................................................................................................... 47 Gender Issues in Livelihoods .................................................................................................................................... 48 Interrelationships between Livelihood Activities ..................................................................................................... 48
Innovation Actor Analysis ............................................................................................................................ 48 Actors in the Dairy Industry ..................................................................................................................................... 49 Emerging Issues and Government Policy ................................................................................................................. 53 Local Vision in Dairy Sector ...................................................................................................................................... 53
Livestock Feeds and Breeding Analysis........................................................................................................ 53 Preferred Livestock Breeds ...................................................................................................................................... 53 Breeding Services ..................................................................................................................................................... 54 Forage Seasonality ................................................................................................................................................... 54
Constraints and Opportunities in Dairy Farming ......................................................................................... 57 KURIOT VILLAGE, KABIYET, NANDI NORTH DISTRICT ........................................................................................ 60 INTRODUCTION ..................................................................................................................................................... 60 MAIN FIELD FINDINGS ........................................................................................................................................... 61
Village Profile .............................................................................................................................................. 61 Village Resource Mapping ........................................................................................................................... 61 Wealth Ranking ........................................................................................................................................... 64 Livelihood Analysis ...................................................................................................................................... 68 Innovations Actor Analysis .......................................................................................................................... 70 Livestock Feeds and Breeding Systems Analysis .......................................................................................... 74
Breed and Breeding Services.................................................................................................................................... 74 Feeds and Feeding Systems ..................................................................................................................................... 76
Constraints and Opportunities in Dairy Farming ......................................................................................... 76 Emerging Issues ....................................................................................................................................................... 79
LESSONS AND WAY FORWARD ...................................................................................................................... 80
LESSONS LEARNT .................................................................................................................................................. 80 WAY FORWARD FOR EADD .................................................................................................................................... 81
BIBLIOGRAPHY ............................................................................................................................................... 83
ANNEXES ....................................................................................................................................................... 84
ANNEX A: MEMBERS OF THE PRA TEAM .......................................................................................................... 84 ANNEX B: TEMPLATE FOR ANALYSIS OF THE QUALITATIVE SURVEY RESULTS .................................................. 85 ANNEX C: CHECKLIST FOR COMMUNITY SURVEY ............................................................................................. 89

7
List of Tables
Table 1: Objectives, narrative and illustrative targets of EADD................................................. 12 Table 2: Siongiroi village profile ................................................................................................ 23 Table 3: Analysis template for Kiproroget Village resource map............................................... 23 Table 4: Wealth ranking analysis results for Kiproroget ............................................................ 25 Table 5: Attributes, challenges and opportunities for households in different wealth categories26 Table 6: Problems and opportunities analysis matrix ................................................................ 28 Table 7: Livelihood activities ranking and analysis matrix ......................................................... 30 Table 8: Dairy Innovation in Kiproroget ..................................................................................... 31 Table 9: Dairy Innovations Actor Analysis ............................................................................... 33 Table 10: Ranking of dairy breeds by preference of farmers in Kiproroget ............................... 37 Table 11: Mapping of breeding services ................................................................................... 37 Table 12: Livestock feed types in Kiproroget village ................................................................. 37 Table 13: Analysis template- for capturing forage constraints .................................................. 38 Table 14: Seasonal feed/forage availability and estimation of feed in Kaproroget .................... 39 Table 14: Chepkosom village resource map analysis summary ............................................... 43 Table 15: Summary Table for Wealth Ranking in Chepkosom Village ...................................... 45 Table 16: Opportunities for investment in dairying by different wealth categories in Chepkosom Village ................................................................................................................................................. 46 Table 17: Template for analysis – livelihood analysis ............................................................... 47 Table 18: Dairy Innovations in Chepkosom .............................................................................. 48 Table 19: Summary analysis of the activities of main actors in dairy development in Chepkosom Village ................................................................................................................................................. 51 Table 20: Ranking of dairy cattle breeds in Chepkosom Village ............................................... 54 Table 21: Breeding services in Chepkosom Village .................................................................. 54 Table 22: Seasonality of dairy cattle feed/forage availability and estimation of feed sufficiency56 Table 23: Problem analysis matrix for Chepkosom Village ....................................................... 58 Table 24: Kuriot village resource map analysis summary ......................................................... 63 Table 25: Attributes of households in various wealth categories in Kuriot ................................ 65 Table 26: Livelihoods Analysis Matrix ....................................................................................... 68 Table 27: Kuriot Innovation Actor Analysis Matrix..................................................................... 70 Table 28: Kabiyet dairy breed preference ranking matrix ......................................................... 75 Table 30: Kabiyet Breeding Services Ownershio and Access .................................................. 75 Table 31: Seasonal availability of forage in Kuriot .................................................................... 76 Table 32: Problem Analysis Chart - Kabiyet ............................................................................. 77

8
List of Figures
Figure 1: The countries covered by the EADDP ....................................................................... 13
Figure 2: Location of study villages in Kenya and in the three districts ..................................... 14
Figure 3: Location of Siongiroi .................................................................................................. 21
Figure 4: Kiprorget Village resource map (Inset photo of map on ground) ............................... 23
Figure 5: Problem pair-wise ranking matrix. ............................................................................. 27
Figure 6: Mapping of dairy actor linkages in Kiproroget Village ................................................ 36
Figure 7: Location of Chepkosom sub-location in Metkei division............................................. 41
Figure 8: Chepkosom Village Resource Map ........................................................................... 43
Figure 9: The linkages between dairy actors in Chepkosom Village ......................................... 50
Figure 10: Problem pair-wise ranking matrix for Chepkosom ................................................... 57
Figure 11: Location of Kuriot Village in Kabiyet ........................................................................ 60
Figure 12: Kuriot Village resource map ..................................................................................... 62
Figure 13: Dairy Actor Linkages Network Diagram ................................................................... 74
Figure 14: Problem pair-wise ranking matrix for Kuriot village .................................................. 77

9
List of Plates
Plate 1: A series of photos showing the activities during PRA team members training ......... 16
Plate 2: A village elder thanking the PRA team while women participants prepare to entertain
the group during the final plenary in Chepkosom Village in Metkei ...................................... 20
Plate 3: Photos of Siongiroi Dairy Plant .................................................................................. 22
Plate 4: Wealth ranking process and output ............................................................................. 45
Plate 5: A field of maize and fodder crops planted for cattle feeding ..................................... 56
Plate 7: Kuriot Farmers drawing their village resource map ................................................... 61
Plate 8: Farmers going through the paces of livelihoods ranking ............................................ 69
Plate 9: Generating the actor linkages map.............................................................................. 74

10
Acronyms and Abbreviations
ABS African Breeders Society AFC Agricultural Finance Cooperation AI Artificial Insemination BBS Broad-Baseline Survey BF Butter Fat Content CDF Constituency Development Fund DLEO Divisional Livestock Extension Officer DLPO District Livestock Production Officer EADDP East African Dairy Development Project ECF East Coast Fever FMD Foot and Mouth Disease GA Gender Analysis GoK Government of Kenya HPI Heifer Project International ICRAF International Centre for Research in Agroforestry ICT Information and Communication Technologies ILRI International Livestock Research Institute ITK Indigenous Technical Knowledge KARI Kenya Agricultural Research Institute KCC Kenya Creameries Cooperative KWFT Kenya Women Finance Trust MCC Milk Collection Centres MFI Micro-Finance Institutions MoLD Ministry of Livestock Development MPT Multi-Purpose Trees PLA Participatory Learning and Action PM&E Participatory Monitoring and Evaluation PRA Participatory Rural Appraisal WAC World Agrofestry Centre

11
Introduction
The Dairy Industry in Kenya
Kenya's economy is heavily dependent on agriculture, with over 75% of Kenyans earning their living from farming either directly or indirectly. The country has one of the largest dairy industries in sub-Saharan Africa. Up to 1992, the dairy industry in Kenya was under government control, which gave the policy guidelines, set prices, determined the players in the industry and set the market rules, among other roles. Kenya Co-operative Creameries (KCC) enjoyed a protected monopoly in the marketing of the milk and dairy products. The Kenya Dairy Board currently regulates the industry. Although the country is largely self sufficient in milk production, there is potential for increased production which could be used for the export market. Smallholder farmers are the backbone of the countries dairy industry. About 600,000 smallholders produce some 70% of the country’s marketed milk. Approximately 56% of this milk is sold raw in the unregulated informal market. In recognition of the role of private sector in spear heading industrialization, the Government of Kenya has put in place a policy framework to foster the creation of a conducive environment for private sector participation in economic development, the dairy industry included. The dairy industry in Kenya has potential for spurring substantial growth in the economy. Some of the investment opportunities available include artificial insemination services, dipping services, clinical services, rearing of livestock for dairy products, as well as milk processing for local and regional markets. The smallholder dairy farmers hold the key to the sector fulfilling this goal. The East African Dairy Development Project (EADD-P) has come at the time when capacity of dairy farmers must be developed to remain afloat in a pluralistic and privatized system.
About The East African Dairy Development Project (EADDP1)
The East African Diary Development project has been made possible through grant from the Gates & Melinda Foundation to Heifer International. Its aim is to help the estimated 179,000 dairy farmers in East Africa to double their dairy-related incomes by increasing their ownership of cross-bred cows, increasing the amount of milk the cows produce, and selling more milk through increased access to formal markets. The demand for dairy products in developing countries is projected to double by the year 2020. East African dairy farmers who wish to tap into this growth face several constraints, which include access to the latest livestock production methods, low dairy cattle pedigree, and milk perishability, among others. To prevent their milk from spoiling, they must sell it within a few hours, and within a finite area. It has been established that crossbred dairy breeds can produce up to 17 times more milk than local breeds, and with better management including fodder and breeding, even the local breeds can produce almost twice their current milk production. In addition, if farmers have access to chilling plants where their milk can be preserved, they can sell more of their product in the growing formal market. These chilling plants can also become hubs of business activities where farmers can get training and services for their cows, including artificial insemination and veterinary health care. The grant to Heifer International is designed to double the dairy incomes of smallholder dairy farmers in the region in 10 years time. The grant amount is $42.8 million and runs from December 2007 – December 2011. The project covers smallholder dairy farmers in Kenya, Rwanda and Uganda (Figure 1). The partners are
1 Based on progress report on EADD grant by Gates and Melinda Foundation
(http://www.gatesfoundation.org/learning/Pages/africa-dairy-development-progress-report.aspx)

12
TechnoServe, International Livestock Research Institute (ILRI), African Breeders Services (ABS) and World Agroforestry Center (ICRAF). The project has the specific objectives presented in Table 1. Table 1: Objectives, narrative and illustrative targets of EADD
OBJECTIVE TARGET ILLUSTRATION
Help farmers organize themselves into business associations that can establish chilling plants and manage the dairy hubs where various livestock services will be available.
35 dairy business associations registered by December 2009.
Working with the business associations, establish 27 new and strengthen 10 existing chilling plants and train the farmers to run them efficiently.
400,000 liters of milk a day sold through chilling plants by December 2011.
Establish an investment fund to help farmers participate in chilling plant businesses, and work with banking institutions to help business associations with related financing needs.
27 chilling plants with secured financing by September 2010.
Provide farmers with animal health, nutrition, and breeding supplies and services and business training through dairy hubs.
338,400 inseminations completed by June 2011.
According to Heifer International (2008), the EADD objectives aim to help move 179,000 smallholder farm families out of poverty by improving production and market-access drivers of farmer income. The project seeks to enhance production by Increasing the volume of milk produced Improving milk quality and reducing loss through spoilage Providing access to production inputs through business delivery services Market-access will be improved by developing local hubs of business development services
and chilling plants that facilitate market access Linking producers to formal markets through processors Increasing producers’ benefit from traditional markets
The objectives will be achieved through coordinated, farmer-focused interventions that develop smallholder profit-participation in the dairy value chains. The project takes care to extend benefits to women and to minimize additional burden that dairy activities could impose on women. Bringing women and youth into production and business activities, and supporting their leadership in the community and dairy farmer associations is key to its success. This will be supported in part by engaging women staff in the project implementation.

13
Figure 1: The countries covered by the EADDP (Source: Heifer International, 2008)
The PRA exercise reported in this document were design to gather confirmatory evidence of existing smallholder dairy farmer circumstances, resources based, challenges and opportunities to investment in dairy production.

14
METHODOLOGY
Overall Approach and Methods
The study used participatory and consultative approaches to gather data presented in this report. A host of Participatory Rural Appraisal (PRA) tools were used to carry out a situation analysis among the smallholder dairy farmers and identify constraints and suggest interventions geared towards promoting the sustainable development of dairy production in study sites. Annex B presents the checklist and guidelines of tools used in the baseline study. In the past two decades, PRA techniques have become ubiquitous and are almost an obligatory element in project design and implementation.
Choice of Villages
The study was conducted in three villages, one each in Siongiroi (Bomet district), Metkei (Keiyo district) and Kabiyet (Nandi North district. The actual villages were Kiproroget (Siongiroi), Chepkosom (Metkei) and Kuriot (Kabiyet). The three villages were chosen as the most appropriate environment for learning about dairy improvement in the country. Figure 2 shows the location of the study sites in Kenya and in the respective districts.
Figure 2: Location of study villages in Kenya and in the three districts

15
Research Team and PRA method
A multidisciplinary research team was constituted made up of Ministry of Livestock Development (MoLD) staff from headquarters, Rift Valley province and the study districts. Appendix A presents the details of the PRA team. The team had a wide background with expertise in animal production, dairy development, veterinary sciences, social sciences, agricultural extension and agricultural economics, Staff from the study districts were also co-opted in the study team to help establish links with local smallholder farmers and other local dairy stakeholders. The team included two female officers. The team spent one week going through a participatory training session on selected PRA tools, bonding and making preparations for the field work. In every PRA focus group discussion session, the teams performed the following roles. Facilitator: Explaining and guiding the discussion, cross-checking the analysis templates and
key notes on flipchart for all participants to see.
Observer: Cross-checking the analysis templates, reminding the facilitator about missing issues Note taker: Detailed documentation of the discussions; noting observations during the
discussions; cross-checking the analysis templates, reminding the facilitator about missing issues
Training of PRA Team
Before the field work, the PRA team was introduced to the PRA approach, techniques and tools to be used in the baseline investigation. The training took one week and included intensive introduction to the rationale and theories of participatory approaches, the PRA tools, role plays with PRA facilitation, familiarization with the checklist and templates for analysis of field data, pretest of selected tools and a review of the pre-test experiences as a way of planning for the actual field work. The teams were also introduced to the roles to be played by the teams.

16
The breed ranking and scoring matrix
The PRA process demystified Practicing to facilitate a tool
Practicing how to draw a community sketch map
Facilitating mapping at the pre-test village
A review meeting after pre-test
Innovation actor network analysis Planting trees after pre-test The final plenary during the
pre-test Plate 1: A series of photos showing the activities during PRA team members training
Preliminary Activities
Before the PRA exercise in each village appropriate preparatory arrangements were made. These included awareness creation about the EADD project, its objectives and activities to the selected community members. Appropriate mobilization of participants for the PRA meetings was done in good time. Secondary data about the PRA site was done including reviewing the previous PRA reports from other projects such as the National Agriculture and Livestock Extension Program (NALEP) Broad Based Survey (BBS) reports. This period was also used for setting the dates for each village and requesting representation of all representative socio-economic groups and dairy sector actors from the village. The team invited at least 30 participants in each village. Since the study was targeting dairy farmers, it was decided that the selection of participants be conducted in a way that provided an audience that consisted of people with interest in dairying. Attempts were made to have equal representation by gender and age, with specific attention given to adults of age range 18-65 years.
The PRA Tools
The study used an array of PRA tools, selected on the basis of their utility in harnessing the dairy development issues and constraints and promoting triangulation through data collection involving different people, time and place. The study used a selection of social (people-related), temporal (time-related) and spatial (space-related) PRA tools. The following tools were used with adaptations to suit the specific contexts in each study site. Community Sketch Mapping Wealth Ranking Livelihood analysis

17
Constraints and opportunities in dairy farming Innovation actor analysis Livestock feeds and breeding analysis
Introductory Session Prior to the use of the specific PRA tools, an introductory session was held with the participating dairy farmers. The sessions were designed for personal introductions, administrative endorsement by local chiefs, and explanation of the EADD project and mission of the PRA team. The project was introduced to community members by the lead facilitator and the team leaders from ILRI and MoLD. It was explained that the PRA sessions would help all involved including the community to characterize the context, and complement the further studies (e.g. the household survey) and future implementation and evaluation of the project. The facilitators also explained basic objectives of the PRA village meetings, introduced the team, explained their roles (facilitators, note takers, observers), set communication rules, and the agenda of the days. The introductory sessions lasted an average of 30 minutes and dwelt largely on clarification of the objectives of the PRA and how it fits in the overall EADD project objectives. Community Sketch Mapping The main objective of village mapping exercise was to develop spatial profiles by mapping the natural resources, infrastructures, social services and land use systems within the village with respect to dairying opportunities and challenges. It was carried out in a village resource map and focus group discussion plenary and lasted about 1 – 2 hours. In addition to indicating the village boundary and neighbourhood, the session also investigated and mapped:
1. The locations of the most important area landmarks surrounding the community 2. Resources that are available in the village and are considered to have an impact on people’s
livelihoods such as crop fields, rangelands, grazing reserves, and rivers. 3. Village infrastructure (e. g., settlement patterns, roads, power supply, network access, different
types of water points/sources, community buildings, shops, commodity markets, livestock markets/milk collection points, dip tanks, livestock crush, veterinary posts/clinic, sources of stock feeds)
4. Social services (e.g., health clinics, schools, dwelling places of village authorities, community meeting place, or other important facilities) that exist in the area
5. The main land use and resource management systems in the area (e. g., allocation of cropping, communal rangelands, grazing reserves (browse and fodder plant species, seasonal herd movement, areas that herders associate with diseases)
Wealth Ranking This was done to determine the distribution of wealth within the community based on assets owned and income and the links between livestock ownership and wellbeing, including the critical herd size. The tool also helped to establish the link between wealth standards by social category and capture farmers’ interests and motivations to invest in dairy farming. Using the participants and available secondary data, a comprehensive list of households was

18
developed and used for the exercise. The participants discussed the local criteria for wealth classification. Being a sensitive issue among many Kenyan communities, the wealth ranking tool was explained clearly and the importance of understanding the different types of wealth categories and the particular types of opportunities and challenges they face in dairying. The process involved identifying (and ranking) local criteria for wealth, defining thresholds for wealth categories and checking how many households (%) fall in each category. The sessions also discussed the status of female-headed households, and households headed by older people and children. The farmers’ tendency to invest in various aspects of dairy production across the categories was also discussed and recorded. Livelihood Analysis Livelihood analysis was done in each village to identify important livelihood activities and income sources (on farm, off-farm, and non-farm) and their recent trends. The tool also captured differences in key livelihood sources by gender and related them to opportunities in dairy development. Farmers were asked to list and rank main sources of livelihoods and cash income both from within and outside the area. A ranking matrix was used to facilitate the sessions. Emphasis was placed on the role of dairy related activities, with discussions cognisant of the situation faced by households head by women and those headed by older people, as well as special groups identified in the wealth ranking. The tool yielded a matrix showing key sources of livelihoods and cash income, as well as the changes in importance, by gender. Innovations Actors Analysis The PRA sessions used this tool to gather data through actor linkage mapping as well as actor analysis matrix. The innovation systems and actor analysis sessions were aimed at identifying and documenting the status of innovations in dairy industry; identifying major actors in the dairy innovation systems, the roles they play, and activities in which they are involved; assessing attitudes and practices of main actors; understanding patterns and effects of interactions; and assessing the enabling environment (policies and infrastructure) for dairy innovations. An innovation was considered as new ideas, technologies or ways of doing things, in a place where or by people whom they have not been used before. It includes not only new knowledge and technologies but also new practices, organisational and institutional arrangements introduced into and used in an economic and social process. Innovation systems were referred as the set of interrelated actors, their interactions, and institutions that condition their behaviour with respect to bringing new products, new processes, and new form of organization or institution into social and economic use. Actors were considered to be those individuals and institutions that introduce and use innovations – including individuals like smallholder dairy farmers, government and non-governmental organizations, research organizations and the private sector. The sessions yielded actor linkage maps showing key actors and their links with farmers, within the village, outside the village, and in relation to main milk markets, as well as innovative farmers and missing actors and their expected linkages. The tool also produced a matrix summarizing dairy farmers’ opinion of the inputs and services provided by the actors, particularities of innovators and expectations towards missing input and service providers. Livestock Feeds and Breeds Analysis

19
The PRA process also investigated, using a variety of matrix ranking and scoring tools the breeding preferences, strategies and livestock feeding systems in the sampled villages. The objective was to identify important traits of dairy cattle preferred at the community level and assess breeding services and strategies linked to them. The farmers listed the trait or characteristic they considered important in judging an animal they prefer and the reasons for keeping or preferring a certain animal. The exercise considered both the breeds that are currently kept by the farmers and any other breeds the farmers wanted to consider. The criteria used for breed ranking included milk production, feed requirement, disease resistance, calving Interval, and docility. A mapping of available and preferred breeding services was also done on the ground. The tool generated a general description of existing and desired breeds in the region and the general level of demand for certain breeding services The livestock feeding systems and their seasonality was also investigated. The objective was to capture the general problems associated with forage production in areas studied. The sessions listed, discussed and ranked the general forage production constraints. The farmers were also facilitated to discuss their ranking criteria as well as how the problems affect forage production. A seasonal feed calendar that show importance of different forages at different times of the year and the seasonal shortages and coping mechanism applied was generated for each village. Constraints and Opportunities The main challenges (constraints) and salient opportunities in dairy farming were investigated through problem ranking and opportunities assessment. The goal was to identify major constraints and problems in dairy farming and to broaden the discussion about their causes and effects. The tool also highlighted current coping or response strategies and to indicate whether efforts to address a particular problem have already been tried and failed or have not addressed the problem adequately. The specific tools used were the pair-wise ranking matrix and problem analysis chart. A mixed group of men and women was organized and ask them to think about their problems. The most important problems afflicting dairy farming was made. After a comprehensive but less overlapping list of problems was generated, the group ranked the problems according to importance using the pair-wise ranking matrix. The farmers then discussed the causes and effects of these problems by drawing a problem analysis chart that lists the priority problems, the causes and effects, the coping or response strategies, and the opportunities or proposed solutions for change. Final plenary session To conclude the PRA meetings in each village a final plenary was organized with the objective of sharing the findings of the sessions. The whole group of farmers participating in the PRA was allowed to benefit from the exercises and build ownership of the process. The participants reflected on the activities of the 2 – 3 days of PRA work. A reflection was also made on the link between the findings of the exercises and forthcoming EADD activities, the survey and implementation. The importance of the data gathered as benchmark for any future monitoring and evaluation was clarified. The sessions finished with the group facilitators thanking participants and giving them information about what will happen next.

20
Plate 2: A village elder thanking the PRA team while women participants prepare to entertain the group
during the final plenary in Chepkosom Village in Metkei
Data Analysis and Synthesis
Both traditional participatory qualitative data analysis protocols and generic templates (See Annex B and C) were used to analyse the data generated from the above tools. The qualitative data obtained from secondary data sources and PRA sessions were summarized by identifying items of data with similarities in themes and certainty according to PRA tool objectives and emerging themes. This was done through content analysis, a procedure for the categorization of textual, verbal or behavioural data, for purposes of classification, summarization and tabulation. The PRA outputs and dairy farmers’ comments were captured verbatim for reporting and collation with other data items. The content analysis was done at two levels: descriptive account of the data (what was actually said with nothing read into it and nothing assumed about it) and interpretative or latent level (what is meant by the response, inferred or implied). The basic objective was to identify from the PRA outputs and processes extracts of data that are informative on the situation, trends, constraints and sustainability of dairy development interventions in the sampled villages. Relevant quotations and photographs have been captured and digitally processed for presentation to complement the textual explanations of the field findings, Observations made during the PRA processes have also been used to complement the synthesis of information to illustrate the strength of opinion or belief; similarities and differences between PRA participants and gender groups. A careful selection of quotes was done to demonstrate the reliability and validity of the information presented. The unique feature of PRA of facilitating on-the-spot analysis has also been adopted to have qualitative representation of facts as they were analysed and consensus reached during the PRA sessions. Both the PRA procedures and outputs were captured during the recording and in the qualitative analysis.
FIELD FINDINGS
KIPROROGET VILLAGE, SIONGIROI, BOMET DISTRICT
Introduction

21
Kiproroget Village is in Kiproroget sub-location, Siongiroi division of Bomet district. Siongiroi division covers an area of 330 km² with 7 locations (Chebunyo, Siongiroi, Mogor, Kamaget, Bingwa, Makimany and Kong’asis). It has 32 sub-locations and approximately 4,500 households. The average farm size and family size are 5 acres and 5-6 respectively. Kiproroget Village covers an area of 3 km² with 198 households with an average farm holding of 3 acres. Figure 3 shows the location of Siongiroi in the division.
Figure 3: Location of Siongiroi
The PRA exercise lasted 3 days and it begun with an introduction of the team and participating dairy farmers. The local Divisional Livestock Extension Officer (DLEO) introduced the team. The team leader for the day briefed the farmers on the EADD project mentioning its history, mission, objectives and partners. An emphasis was made on the role of farmers as the main partners. The exercise was conducted at the Siongiroi Dairy Plant. The team made a courtesy call to the Plant office before beginning the PRA exercise. The Chairman of Siongiroi Dairy Farmers’ Society, which is a co-owner of the Dairy Plant, welcomed the PRA team and gave a brief history of the plant.

22
Box 1: Siongiroi Dairy Plant The plant was started in 1998 at the height of the dairy crisis in Kenya, when the only national dairy processor, Kenya Creameries Cooperative (KCC2), collapsed and was not paying farmers promptly. The Society was started to improve the marketing of milk in the area. In 2000, the community in partnership with Heifer International (on a 60:40 basis). The plant cost KSh. 15 million (farmers contributed KSh 9 million). The society has 2149 members out of which 772 are fully paid. The plant has a capacity of 30,000 Kg per day but currently is operating under capacity with daily milk delivery standing at 14,000 Kg per day from the community. Brookside, a private milk processing company also uses the plant for milk chilling. The plant currently has an agreement with Brookside to sell its milk at Ksh 23 per litre. The farmers are in turn paid Ks 20 – 21 per litre. The plant now is collaborating with other actors like HPI, ABS, WAC, ILRI and MoLD each with strategic roles. The plant has plans to carry out value addition in 3 years time. The main challenges include price fluctuations and poor road networks. The society also offers other services to its members including running an Agrovet shop, serving farmers on cash and credit basis.
A truck waiting to load milk for transport
Milk delivery Milk being received for chilling
The milk cooling tanks A farmer delivering milk on donkey
PRA session starting with prayers
Plate 3: Photos of Siongiroi Dairy Plant
2 KCC has since then been revitalized and has been renamed New KCC operating in a pseudo-private capacity
23
The PRA Findings
Village Profile Table 2: Siongiroi village profile
Country: KENYA
District Bomet
Other administrative unit Siongiroi Division, Chebunyo Location, Kiproroget
Name of Village Kiproroget
Date of village workshop 14th – 16th October, 2008
Duration of workshop 3 days
Venue for the workshop Siongiroi Dairy Plant Language of workshop Kiswahili, Kalenjin
Number of participants (Female)
14 Number of participants (Male)
27
Names of facilitators Group 1: Mr Stanley Muli Group 2: Mrs Mary Gaithuma
Names of note takers Group 1: Mr Steven Gikonyo Group 2: Mr Daniel Keter
Names of observers Group 1: Mr Francis Rop Group 2: Mr Charles Ombui
Special conditions (weather, local activities, etc)
Fine but sunny, Milk Delivery in process, a meeting of a farmers group at the dairy plant took place during the PRA with separate farmers
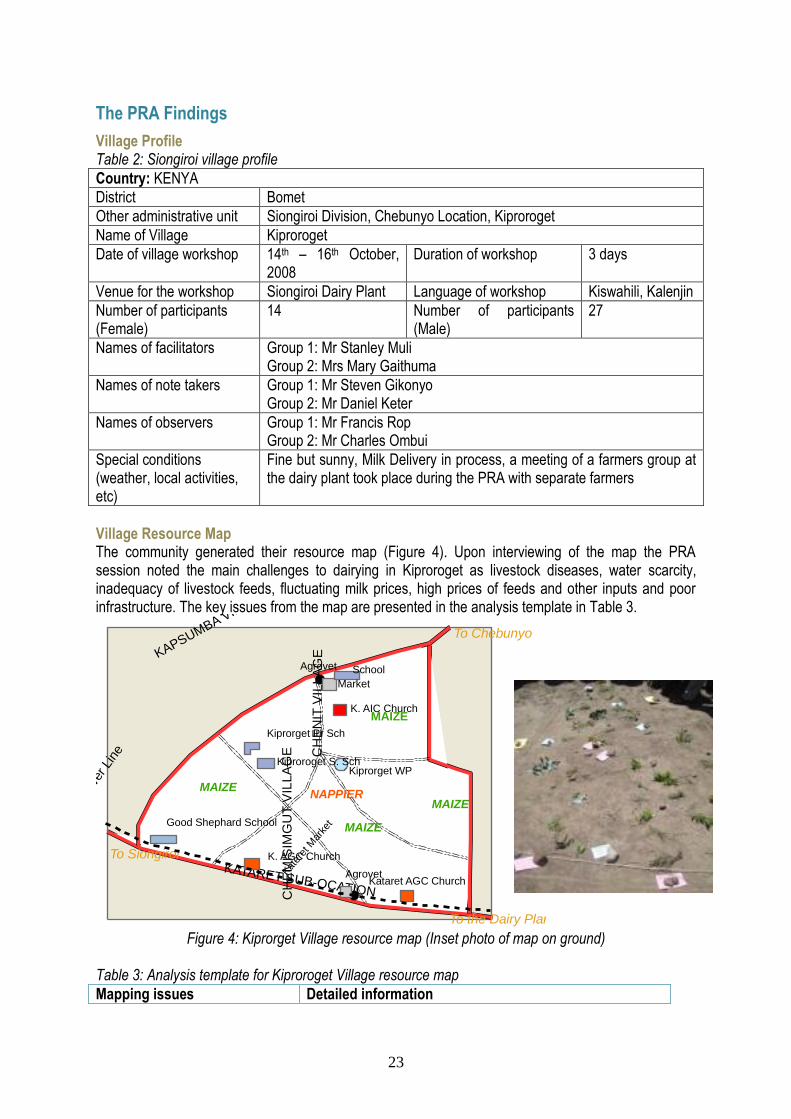
Village Resource Map The community generated their resource map (Figure 4). Upon interviewing of the map the PRA session noted the main challenges to dairying in Kiproroget as livestock diseases, water scarcity, inadequacy of livestock feeds, fluctuating milk prices, high prices of feeds and other inputs and poor infrastructure. The key issues from the map are presented in the analysis template in Table 3.
To Siongiroi
KAPSUMBA VILLAGE
KATARET SUB-OCATIONCH
EM
ISIM
GU
T V
ILLA
GE C
HE
NIT
VIL
LA
GE
Kiprorget WP
K. AIC Church
K. AGC Church
Kataret AGC Church
Good Shephard School
School
AgrovetKat
eret
Mar
ket
Market
Agrovet
Kiprorget Pr Sch
Kiproroget S. Sch
MAIZE
MAIZE
MAIZE
MAIZE
To Chebunyo
Pow
er L
ine
NAPPIER
To the Dairy Plant Figure 4: Kiprorget Village resource map (Inset photo of map on ground)
Table 3: Analysis template for Kiproroget Village resource map
Mapping issues Detailed information

24
Natural resources
Water 1 proposed water project. Majority of households have shallow wells
Crop fields Major crop is maize grown by almost all the households throughout the village
Rangelands None
Gardens
Irrigation schemes Only small scale bucket irrigation
Mines None
Others (specify)
Infrastructure
Roads Two major murrum roads and numerous feeder roads
Settlements Individual land ownership and formal settlements
Commodity markets Two small shopping centres Sach Angwan and Kataret
Milk sale point (informal or cooperative/ self-help group)
Formal cooperative milk marketing system
Milk cooler/ processor Siongiroi milk cooling plant run by Siongiroi Dairy Farmers Cooperative society and HPI
Dip tank/cattle crush One cattle crush but no dip tank
Vet Clinic
Stock feed sources One agrovet at Kateret market and also agrovet services offered by the Milk cooling Plant
Others (specify)- Electricity power line
I power line passing through the village serving the cooling plant but the community has not benefited
Mobile AI service Offered by a private AI doing outreach from outside the village. Breeds offered Ayrshire and Friesian
Social services
Health
Schools 1 secondary school Kiproroget Day Secondary school and two primary schools. Kiproroget Primary and Good shepherd
Church 2 African Gospel Churches and 1 African Inland Church
Local administration
Traditional Authorities
Extension offices No offices in the village but the community accesses extension services from the Divisional Livestock office
NGO offices HPI operates in the area
Others (specify)
Land use system
Croplands and use of crop residues
Maize extensively cropped throughout the village. Residue used as standing hay
Communal rangelands
Grazing reserves
No grazing reserves in the village but dairy farmers graze on individual plots. There are Napier grass plots across the village
Seasonal herd movements
Wealth Ranking The five main wealth categories in Kiproroget were identified as:

25
1. Mogoriot (wealthy) 2. Labwab Orop (Well-off) 3. Kolongei (Slightly well-off) 4. Ne-terter (Poor) 5. Kibananiat (very poor, destitute)
The main criteria (in ranked order) used by the community rank households according to the wealth categories include:
1. Education of children 2. Size of land holding 3. Number of livestock owned 4. Amount of milk produced 5. Type of housing 6. Fencing 7. Has planted trees 8. Has a water tank 9. Keeps quality dairy breeds
The main attributes, challenges and opportunities in dairying of the households in the wealth categories are presented in Table 4 Table 4: Wealth ranking analysis results for Kiproroget
Criteria for wealth
Wealth category
Mogoriot (Wealthy)
Lakwab Orob (Well-off)
Kolongei (Slightly well off)
Ne Terter (Poor)
Kibananiat (Destitutes – Very Poor)
Education of Children
Children go to boarding schools from primary to college
Up to university level
Children attend public primary and secondary schools, some to tertiary colleges
A lot of children attend only public primary schools. Do not proceed to secondary school
Has no children, family broken
Land Size 30 acres and above
About 20 acres
0.5-1 acre Less than 0.2 acres
No land
Livestock numbers, by species. For cattle, differentiate by breed
About 30 cows About 20 cows
1-2 cows No cows None
Improved breeds
Crosses Crosses None None
Has many small stock
Few small stock
Very few small stock and 5-30 chicken
No small stock
Type of House Permanent house
Semi permanent house
Iron sheet roof, mud walls
Grass thatched, small, leaking roof
Has no shelter
Amount of milk produced
Delivering 15-20 litres per day
Delivers 10-15 Litres per day
0 0 0

26
Other farm structures Fencing, water tank
Barbed wire fencing and water tanks
Fenced land
None None 0
% of households in each category (to be done with key informants)*
2% 8% 67% 33% 0
Differences by gender, female headed HH/Orphans
none None 7.5% of the group
20% of the group None
Differences by milk marketing orientation
None
Table 5: Attributes, challenges and opportunities for households in different wealth categories
Wealth Category
Attributes Challenges Opportunities
Kibananiet Has no shelter Has no food – borrows or begs for food No proper clothing No livestock No family, sometimes separated
Lack resources for any investment in dairying Food insecure
Employed for wage income Revolving fund for heifer supply
Ne Terter Has small grass thatched house
Leaking roof Owns less than 0.2 acres of land Does not plan farming Lacks resources Has many children Children go to public primary schools but do not proceed to secondary school
Lack of skills Inadequate finances Low education level Water scarcity
Farm exchange visits (training) Breed improvement Credit facilities
Kolongei Iron-roofed mud-walled house
Has a kitchen Has little food Hard working Owns 0.5 – 1 acre Has many children (3 – 8) who go to public schools and some even proceed to secondary schools, and tertiary colleges Has 1 -2 cows, 5 – 30 chicken, very few small stock Has improved pastures and can source from elsewhere Has cross-bred animals Aspires to be rich
Livestock diseases Larger share of income goes to education Poor marketing Poor skills Water scarcity
Training Credit facilities to improve breed
Labwab Has iron-sheet roofed house Lack f enough Provision of

27
Wealth Category
Attributes Challenges Opportunities
Orop Inherited property from parents Can succeed or fail Has more than 20 acres of land Owns about 20 cows Has cross-bred animals Children go to private schools and up to university Can sell land to do anything Land is fenced Produces 10 – 15 litres of milk per day
water Milk marketing, cattle and maize marketing Poor breeds Rural-urban migration of children
permanent water supply Artificial Insemination (AI) Training fro livestock and crop husbandry Credit facilities Hire of labour Construction of dips
Mogoriot Permanent housing
Has vehicle Owns about 30 cross-bred or pedigree animals Delivers 15 – 20 litres of milk per day Has few children all going to private schools Has good development plan
Inadequate water Livestock diseases Managerial skills Poor marketing Poor road network during rains Lack of electric power
Marketing Permanent water source Marketing improvement Improvement of roads Credit facilities Employment of a farm manager Electricity supply for mechanized dairying
Problems and Opportunities Analysis The farmers listed and discussed the main problems afflicting dairying and used the pair-wise ranking matrix in Figure 5 to rank them.
PROBLEM PR SF LPM HCF LD LQB SW LS Tally Rank
Poor Roads (PR) SF LMP HCF LD LQB SW LS 0 8
Shortage of Feeds (SF) SF HCF LD LQB SF LS 3 5
Low Milk Prices (LMP) LMP LMP LQB SW LS 3 4
High Cost of Feeds (HCF) LD LQB HCF LS 3 7
Livestock Diseases (LD LQB SW LS 3 6
Low Quality Breeds (LQB) LQB LS 6 2
Shortage of Water (SW) LS 3 3
Lack Skills (LS) 7 1
Figure 5: Problem pair-wise ranking matrix.

28
The farmers agreed by consensus on the order of problems that had tied in tallying. The ranked list of problems facing dairy farmers in Kiproroget village is, therefore, as follows.
1. Lack of skills 2. Low quality breeds 3. Shortage of water 4. Low milk prices 5. Shortage of feeds 6. Livestock diseases 7. High cost of feeds 8. Poor roads
On analysis of the top 6 ranked problems to establish their causes and current coping strategies as well as opportunities for solution, the PRA session generated the analysis matrix in Table 6. The poor condition of roads and frequent breakdown in infrastructure such as bridges also complicates dairying in the village and division as a whole. Table 6: Problems and opportunities analysis matrix
Problem Causes Coping Strategies Opportunities
1. Lack of skills
- Lack of exposure - Inadequate extension
services - Women not allowed to
attend field days hence gender imbalance in training
- Women tied up by domestic chores
- Attending field days - FM radio lessons
(KASS FM) - Visit to extension
offices - Visiting other
progressive farmers
- Tours to progressive farmers
- Increase of staffing for extensions officers
- Strategic livestock skills enhancement (capacity building)
2. Low quality breeds
- Use of low quality bulls - High cost of AI services - Inexperienced
inseminators leading to repeats
- Few inseminators - Lack of knowledge in
breeding
- Looking for high genetic bulls from developed farms
- Use of AI - Introduction of grade
cows from elsewhere
- Use of AI services - Training in breeding - Tours to breeder farms for
more knowledge
3. Shortage of water
- Inadequate boreholes - Drought - Long distance from
rivers - Lack of machinery to
reach water table - Lack of skills for piped
water - Deforestation
- Digging of shallow wells
- Roof catchment/plastic tanks
- Waking to the water with small water cans
- Afforestation
- Proposed water project (Chepalungu Water Project)
- Write a new project proposal on piped water from River Chepkulo
- Drill boreholes - Plant more trees in the
forest - Buy plastic Kentanks or
masonry tanks - Roof catchment
enhancement

29
4. Low milk prices
- High milk supplies - Poor transportation - Lack of value addition
and packaging
- Competition (Spinknit, New KCC, Brookside)
- Direct sales to hotels
- Community mobilising themselves to maintain roads
- Improving roads in the village
- Strengthening existing cooperatives
- Dairy cottage industries - Promote culture of drinking
milk e.g. through road shows
5. Shortage of feeds
- Drought due to environmental destruction
- Shortage skills – lots of feeds during wet season but no conservation
- Overstocking - Communal grazing - Reduced land sizes - Grazing various species
of livestock together - High cost of commercial
feeds - Low income
- Agroforestry (Gravellea, cypress, pine, indigenous trees
- Water pans development
- Road side grazing - Diversifying sources
of income - Use of crop residues
to feed livestock
- Feed conservation training - Homemade rations - Catchment protection - Grazing management - Cooperative to purpose
feeds on behalf of farmers
6. Livestock diseases
- Lack of regular tick control measures
- Poor hygiene measures - Tick resistance to
acaricides - Lack of regular dips - Lack of regular
vaccination - Poor animal nutrition - Communal use of bulls - Many stray dogs
- Hand spraying - Use of various
acaricides - Milking cows in
open paddocks without restraining
- Animal vaccination when there is disease outbreak
- A few use AI as it is expensive
- Construction of cattle dip with good management
- Veterinary department to recommend an effective acaricides
- Practice farm hygiene and clear weed from pastures
- Proper fencing and paddocking of fields
- Control of stray dogs - Regular deworming - Introduce AI service either
public or private - On-farm feed formulation
and utilization - Water development for
livestock use and irrigation
Livelihoods Analysis The PRA participants were guided through a livelihoods analysis session by listing the main livelihood sources. The mail livelihood activities in Kiproroget include: Maize farming Dairy farming Local poultry keeping Livestock and livestock products trade
(animals, eggs, chicken)

30
Horticulture crop farming (onions, tomatoes, etc) Agroforestry Crop farming (beans, sugar cane, potatoes) Wage employment Milk trade Kiosk business Trading in maize and beans Goat keeping
The group then discussed the importance of each livelihood activity and its relationship with dairy farming. The activities were then ranked using a matrix scoring approach, the output of which is presented in Table 7. Table 7: Livelihood activities ranking and analysis matrix
Current sources of livelihoods
Contribution to livelihoods
(Rank in order of importance)
Total
Trends
Differences in terms of Gender Food Cash Environment Energy
1. Dairy Farming 9 2. Maize Farming 6 3. Horticulture 6 4. Local Poultry Farming 4 5. Crop Farming (Beans,
Sugarcane, Potatoes)
4
6. Milk Trade 3 7. Livestock Trade 3 8. Kiosk Business 3
9. Wage Employment 2 KEY: TREND
Becoming more important
Becoming less important
Becoming important at low rate
New /Emerging Livelihood activity
GENDER Female Male Youth
Becoming more important
Becoming less important
Becoming important at low rate
New /Emerging Livelihood activity
Dairy farming is perceived to be the most important livelihood strategy with almost every household keeping at least one dairy animal. The milk plant and services offered by the cooperative society have elevated farmers’ confidence in dairying. Although they have not yet achieved their milk production potential, there is scope for improvement with the coming of EADD. The dairy sector contributes a lot to the other sectors. It contributes directly through food and cash from milk sales. It also offers routine jobs to people of different walks of life in the entire dairy production chain from forage provision, rearing, herding, transport of milk and farm inputs, and wage employment for skilled and unskilled labour force at the plant. The farmers also recognize that income from dairy is used to support other farm activities and off-farm as well as non-farm commitment. The sector also provides manure for crop farming from
31
the paddocks and through rotational grazing leaving behind manure that improves soil fertility. Cow dung is also used by many households to control mosquitoes by burning to produce smoke. Other livelihood activities like maize production, poultry, milk trade and horticulture were also found to have relationships with dairying in the village. Maize farming is a direct source of feed through stovers. Maize is easily and quickly converted to cash that is used for purchase of livestock and livestock production inputs like drugs, feeds and to pay for AI services. Though farmers appreciated the high quality manure from poultry, the quantities produced are not cost-effective for such activities like Napier and fodder farming. Poultry manure is mainly used in kitchen gardening. Poultry keeping (sales of eggs and chicken) provide steady income especially for the women. Milk trade, on the other hand, provides good and regular income to the youth and women who hawk. There are however challenges of transportation and perishability as milk collection routes are prone to erosion. Sugar tops and husks are used by the farmers to feed cattle. Livestock trading provides cash to those involved while farmers have outlets for getting rid of culled stock as well as getting access to new heifers, steers and bulls through the middlemen in livestock trade. It is a good source of cash but the activity is only undertaken by men.
Gender Issues in Dairying There was a rich debate on the key gender issues in dairying by the group. It was noted that management of dairy is only in the hands of men as they make major decisions while women do the routine dairying operations such as milking, feeding and calf rearing. Men own the livestock and control decisions to buy and sell animals. There emerged a need for a detailed gender analysis (GA) during or before implementation of the EADD project as there are still some unclear gender issues and concerns which may hinder effective implementation and direction of training targets. In dairy it was clarified that farmers of different gender (youth, mean and women) have different extension needs, face different challenges and can invest and be more effective in different aspects of dairy value chains. The GA will reveal critical uncertainties and aspects that would improve sustainability and avoid social exclusion of the disadvantaged gender as well as clarify the gender roles and relations important in dairy development for improved milk yields and incomes for all. Innovation Systems and Actor Analysis The farmers discussed key innovations under selected aspects of livestock production including breeding, feeds and fodder, animal health, milk value addition. The results are shown in Tables 8 and 9 while Figure 6 illustrates the linkages between the actors as perceived by the dairy farmers in the PRA meeting. Table 8: Dairy Innovation in Kiproroget
Conventional activities Innovations Innovating farmers
1. Natural breeding by use of bulls of unknown quality/origin
- use of AI - use of proven bulls
- by the slightly well of to the moderately rich
- AI innovators are fewer than those using proven bulls.
2. Feeds and fodder natural pastures -Napier grass and boma
Rhodes -maize stovers -un poddocked land
paddocked grazing fields tumbukiza Napier grass
establishment hay making feeding on mixed fodder
(different types) more farmers setting
aside grazing fields feed conservation
- majority are from slightly well off to the rich farmers.
- Tumbukiza Napier grass established mostly by youths

32
on farm feed formulation
3.Animal Health services hand spraying and dipping free vaccination
- Privatised community dips - Vaccination now closer to
the people but not free
- done by all the groups. NB sometimes after spraying for so long ticks become many and they have to dip animals
4. Value addition fermentation of milk takes a
lot of time and is done in Kibuyus (traditional gourds)
there was communal transportation of milk
milk transported in plastic cans
colostrum milk is retained at home for a week
- shortened period of fermented milk
- transportation of milk is done individually
- milk carried in aluminium containers
- colostrums milk delivered to cooling plant after five days
- all groups
5. Community organisations A long ago there were KCC
organised groups
- presently there are NALEP organised groups 50% are men and 50% are women
-
6.Milk transportation hand delivery
- now use bicycles, hand carts, donkey carts or vehicles
- mostly done by the youth and Kolongei

33
Table 9: Dairy Innovations Actor Analysis
Key Actors Activities and services
Achievements Challenges Status3 Linkages4 Satisfaction5
Village based actors (e.g., traditional authorities, healers)
Dairy input providers -Kapkatet agrovets
Provision of farm inputs, clinical services
employment creation
Lack of capital poor roads
1
2
2
Siongiroi dairy plant Agrovet Offers Clinical service, supply of farm inputs
employment
Poor roads fluctuations in milk supply
2 3 3
Rugaa Animal Feed grinder/miller
grinding of maize cobs and stovers for livestock feeds
employment access to livestock feeds
Mill has low capacity, lack of capital, competition from commercial feeds
1 1 1
Milk buyers (e.g. small scale traders, transporters, cooperative/SHG, processor etc)
New KCC Buys milk from farmers
Pays cash at every end of month, employment has created competition
Poor roads, poor past history, faces stiff competition form other milk buyers
1 1 1
Kabyanga Premier dairy Buys milk from farmers
Pays cash on delivery Poor roads, poor past history, faces stiff competition form other milk buyers
1 1 1
Siongiroi dairy plant buys milk provides bursaries, pays bonus , Poor roads, fluctuations in milk 2 3 3
3 0 = Not active in the village; 1 = Present in the village but less active; 2 = Present in the village and fully active
4 0 = No link; 1 = Link not functioning; 2 = Link is weak; 3 = Link is strong
5 3 = Good; 2 = Satisfactory; 1 = Poor

34
Key Actors Activities and services
Achievements Challenges Status3 Linkages4 Satisfaction5
gives loans offers extension service, supply of farm in puts
started an agro-vet, improved income, has procured a milk tanker
supply
Middlemen Buys milk, milk transport service, offer advance payment
improved income employment
poor roads, insufficient capital, lack of milk containers, dishonesty by some farmers who fail deliver milk after advance payments
2 2 2
Brookeside buys milk in large quantities
Employment, provides milk cans extension services
Poor roads, faces stiff competition form other milk buyers
2 3 3
Siongiroi dairy farmers Cooperative
buys milk and milk from farmers supplies farm inputs
farmers access quality seeds employment
lack of adequate finance, poor management, poor past history of none payment to farmers.
1 1 1
Transporters transports milk transports farm in puts
improved income employment some have bought vehicles for transporting milk
Poor roads (rainy periods), delayed payment, inadequate transport equipments, milk spillage/spoilage
2 3 3
Community Based organizations (CBOs) (e.g., farmers groups, women groups, livestock clubs)
Modern political organization (e.g., community chairmen, councillor)
Gov. dept. (e.g., veterinary, livestock extension, livestock
extension service Disease control
many farmers trained and capacity building
Inadequate staff, inadequate transport/extension,
1 2 2

35
Key Actors Activities and services
Achievements Challenges Status3 Linkages4 Satisfaction5
marketing, crop extension, police, state cooperatives) MoLD
linking farmers with relevant service providers
improved livestock production
equipments, poor roads
Non-governmental organizations (e.g., World Vision, Heifer International)
HPI Partnering with farmers in development – (chilling plant)
Assisted in procurement of the cooler and milk tanker.
Poor roads 2 3 3
ABS Breed improvement A.I service Extension service
improvement of dairy breeds, improved milk production, good prices of dairy cows
Poor conception rates, lack of skills by farmers, high cost of AI service, inadequate staff/transport, inadequate insemination skills
1 1 1
Financial (banks, micro-savings organizations etc)
AFC training on entrepreneurship Loans/credit to farmers
farmers capacity built on business skills, farmers have been able to procure improved dairy cows & home equipment improvements (gas cookers, solar), new business started, School fees loans
high interest rates, poor management within groups, terms and conditions not very sensitive to farming enterprises, takes long time to get the loan.
1 0 1
EQUITY BANK, KREP, KWFT, Kenya ECLOF
1 1 1
Farmer innovators: Mr Chesoton – provides breeding bulls to neighbours
providing private A.I service
Selling breeding stock improved breeds
Poor communication, inseminator not always available, poor roads
1 1 1

36
Figure 6: Mapping of dairy actor linkages in Kiproroget Village6 Review of Farmers’ Attitudes The farmers’ level of satisfaction with transporters is very high due to good services offered. The payment for the transporters’ services is done by the Milk plant on behalf of the farmers. The farmers also rated the cooperative society low due to previous non-payment of farmers’ dues particularly for maize and milk. This has now improved due to change of management. Other actors rated low included ABS due to high charges for semen and there is not yet trust on inseminators’ performance. According to the farmers, the government offers better services compared to ABS. It was noted that to iron out the misconceptions, mistrust and perceived low satisfaction, there is need for a stakeholders’ forum in the area. Policy Issues The innovations and actors analysis revealed critical policy issues that should be addressed in order for dairy development objectives to be met with ease. The farmers articulated the following issues: Costs for water, disease control, and for extension and AI services should be reduced through
appropriate local and national policy strategies including declaring them public goods The government was implored upon to take up dip management or give subsidy on farm inputs More research to be carried out with the farmers’ involvement on the management of East
Coast Fever (ECF) AI services to be subsidized by the government The number of livestock extension officers to be increased in the area to address the
skills/capacity shortages in the village with an enhanced budget for the department for improved mobility and training of dairy farmers
There should be permanent crushes built in strategic places for easy access to AI and other livestock health services
The partners in the EADD project to consider setting up cheap ICT facilities at the plant for farmers to access dairy development information and other technologies
Breeding Services The group reviewed the criteria used by farmers in selecting dairy breeds. The farmers’ preference for dairy breeds in the village is guided by the following choices. Udder size: good udder placement for high milk yield. The udder should also be well-placed
and not sagging
6 Note the different line thickness type (dotted or continuous) show the degree of strength of linkage and
benefits to the Dairy Farmer (DF). The abbreviations/acronyms in the illustration: BS is BrookSide;

37
Coat colour: not pure white to avoid vulnerability to “sun burns and skin diseases”. A combination of black and white is preferred
Body size: medium size as big animals have heavy feed demand Body shape: “triangular” (wedge-shaped) Posture: strong, straight legs Milk yield: more than 15 litres per day Age: medium (first calvers or 2nd calving up to 4) Resistance to diseases
The various breeds are preferred for different reasons. Friesian is high milk yielder and fast maturing while Ayrshire is preferred for its colours, disease resistance and lower feed requirement. Jersey has higher butter fat (BF) content, requires lower feeding and is more disease resistant. Other breeds also investigated include Guernsey, redpoll, cross breeds and local zebu. To rank the breeds by farmer preference the matrix in Table 10 was used. Table 10: Ranking of dairy breeds by preference of farmers in Kiproroget
Breed Criteria Score Rank
Milk Production
Feed Requirement
Disease Resistance
Caving Interval
Docility
Friesian 9 3
Ayrshire 10 1
Jersey 10 2
Guernsey 7 6
Red Poll 9 4
Cross-breeds 8 5
Zebu 7 7
Sahiwal 6 8 The existence of various breeding services was discussed in the group and Table 11 illustrates the current status of breeding services, their ownership, distances of reach and preference. On average 5 households share one bull. The farmers also practice some selection within the local herd to minimize in-breeding and optimise their preference. Some farmers have individual bulls that are not shared. Only about 10% of the farmers access AI services. Private AI costs about KSh. 800 – 2,500. Subsidized services from ABS through the plant cost almost the same. Farmers prefer AI over use of bulls but availability and cost hinders their access to the services Table 11: Mapping of breeding services
Breeding Service Ownership Distance to service (Km) Preference
Bull Communal/ Individual 0.5 Selection within herd
A.I. Private GoK
5.0 35.0
A.I. preferred over bull but availability low and cost high
Livestock Feeding and Feed Types The group also discussed existing livestock feeding systems, forage preferences and constraints to livestock feeding as well forage seasonality. Table 12 presents the summary of key feed types in Kiproroget villages that were revealed from the PRA discussions. Table 12: Livestock feed types in Kiproroget village
Feed Type Locality Preference

38
Natural pasture On-farm Cheap, regeneration and palatable
Napier grass On-farm Nutritious, fast growing, drought resistant, farmers can conserve easily
Boma Rhodes On-farm and purchased
Increase milk yield, nutritious, palatable, does not require frequent weeding, can be conserved
Hay Purchase from Leles (20 km away
Useful in times of scarcity
Maize stover Own maize fields For maintenance feeding during drought. Does not contribute to milk
Maize cobs Own shelled maize cobs
Ground with spoilt maize and grains for supplementation
Sweet potatoes Own farms Good for supplementation
Banana stover and leaves Own farms Used during times of drought and any time banana is harvested
Sugar cane tops and stems Own farms Used mainly during drought
Bran (wheat, maize) From shops For lactating cows
Dairy meal Purchased from shops/stockists
For lactating cows
Molasses Purchased For lactating cows and during drought The main constraints to forage production in the village were ranked and are presented in Table 13 while Table 14 shows the seasonality of the different types of fodder in relation to wet and dry seasons. Table 13: Analysis template- for capturing forage constraints
Constraint Rank Affecting Numbers (production)
Shortage of Forage 1 Serious effect Lack of forage conservation 3 Moderate Low skills in pasture management 2 Moderate Forage wastage at times of abundance 5 Moderate Lack of Equipment 6 Moderate Water Shortage 4 Serious effect
High Transport Costs 7 Moderate

39
Table 14: Seasonal feed/forage availability and estimation of feed in Kaproroget
Season Month Forage sources & Availability How sufficient are feed supplies?
A B C D E F G H I
Dry January 0 1 1 2 0 1 0 1 1 Very Scarce
Dry February 1 1 1 2 0 1 0 1 1 Very Scarce
Dry March 2 1 2 1 0 0 0 0 0 Scarce
Wet April 3 3 3 0 0 0 1 0 0 Sufficient
Wet May 3 3 2 0 0 0 0 0 0 Sufficient
Wet June 3 3 2 0 3 0 0 0 0 Sufficient
Wet July 3 3 2 0 2 0 0 0 0 Sufficient
Dry August 2 3 2 0 2 0 0 0 0 Scarce
Dry September 1 2 1 0 1 0 0 0 0 Scarce
Wet October 1 1 1 0 0 0 2 0 0 Scarce
Wet November 0 1 1 1 0 0 2 0 0 Very Scarce
Dry December 0 1 1 1 0 1 0 1 1 Very Scarce
Note: - A =Natural pasture, B=Napier grass, C=Boma Rhodes, D=Hay, E=Maize stover, F=Maize cobs, G=sweet potatoes, H=Banana stover and leaves, I=Sugar cane tops and stems.
- Numbers 0-3 refer to the relative contribution of each forage to the animal diet i.e. 0= Not Available, 1= Scarce, 2= Moderately Available, 3= Available
Emerging Issues on Feeding It was clear from the exercises that most of the times, farmers rely on natural pasture. Napier grass is mostly used during the dry season. There is low utilization of Boma Rhodes because few farmers have planted it or heard about it. Hay is used during drought by few farmers (moderately well-off farmers). Forage availability remains a major constraint to dairy development. All forages are scarce during the dry season and no conservation action is done during the periods of planting. During pasture abundance, milk production is high, prices are low, a lot of wastage is experienced and farmer incomes are low. This makes it difficult to use extra income for forage conservation. The cooler cannot absorb all the milk produced in seasons of plenty. Farmers reported a generally low rating of their skills in pasture management hence there is need to bolster training on fodder and pasture management. Other constraints mentioned include inadequate water for fodder production. The high cost of transport also leads to high costs of feeds. Enabling Environment for Dairy Development From the presented findings of the PRA meetings in Kiproroget, it is clear that dairying remains the single most important livelihood activity albeit with a number of constraints. The constraints need redress for the farmers to realize the potential of doubling their income from milk and milk production. Top in the list of intervention is an enabling environment which must involve: Milk handling regulation that recognises the current practise of using plastic cans with the
objective of widespread adoption of metallic containers through training and incentives Capacity building for farmers on improved dairy and fodder management “Control of livestock movement outside and within the village should be maintained to reduce
disease outbreak Breeding policy is still wanting due to inbreeding problems and ethical standards that should be
observed. Currently the breeding bill is yet be passed into law to support policy The development and maintenance of infrastructure in the area should be in tune with dairy
development needs to facilitate transport of milk, inputs and promote marketing. Other developments that would promote dairy farming include telecommunications network, electrification and water development.

40
A technology dissemination enabling environment is also required with adequate extension staff and useful links with research institutions like ILRI and KARI.

41
CHEPKOSOM VILLAGE, METKEI, KEIYO DISTRICT
Introduction
The dairy farmers who participated in the PRA were drawn from Chepkosom and Siliboi villages. The villages were sampled purposively because of their dairy potential and past experience with EADD. The farmers in the division had already organized themselves into a cooperative and have started contribution towards the construction of a Milk Cooling Plant in the division. The two villages are located in Chepkosom sub-location (Fgure 7), Tumeiyo location in Metkei division of Keiyo district.
Figure 7: Location of Chepkosom sub-location in Metkei division The PRA exercise took three days. At the onset preliminary launching speeches were made with introduction of the PRA team to the farmers. The District Livestock Production Officer (DLPO), Mr Omolo welcomed the PRA team to the village and invited a woman farmers’ representative and local assistant Chief to welcome the team. It was noted that the farmers are eager to improve their dairy breeds with the recent introduction of 22 dairy cattle from Kitale being a strong indication. In a previous farmers’ dairy field day, the choice of site for the plant was made. The farmers noted that the main problem of dairying in the areas was milk marketing occasioned by poor road network, fluctuating prices and lack of organized marketing. The farmers are well aware that they will partner with EADD-P to establish a cooler. Hitherto, about 1900 farmers have registered and have collected about KSh 1.4 million which is approximately 10% of the total cost of the cooler. The mission of the exercise was explained to the participants as appraising the existing dairy development situation, the farmers’ resources, challenges and opportunities in order to design how the partners will work together to bring about development in the dairy sector in the division. The farmers were made aware that the villages were only selected to be representative of the entire division that will form the dairy hub.

42
PRA Findings
Village Profile
Country: KENYA
District Keiyo
Other administrative unit
Division – Metkei; Location –Tumeiyo; sub-location – Chepkosom
Name of Village Chepkosom and Siliboi
Date of village workshop
21 – 10 – 2008 to 23 – 10 – 2008
Duration of workshop 3 days
Venue for the workshop
Day 1: Open ground at the proposed community centre, Days 2 & 3 AIC church
Language of workshop Kiswahili, Kalenjin
Number of participants (Female)
26 Number of participants (Male)
32
Names of facilitators Group 1: Daniel Keter Group 2: Stanley Muli
Names of note takers Group 1: Charles Ombui Group 2: Francis Rop
Names of observers Group 1: Mary Kanyi Group 2: Steven Gikonyo
Special conditions (weather, local activities, etc)
The day was very cold, windy, rainy and foggy. There was an ongoing school committee meeting in the local school, the chief of the location was therefore not present but sent his apologies and granted permission for the PRA to be held
Village Resource Mapping Figure 8 presents the village map drawn by the participating dairy farmers. This was done only for Chepkosom village. The village has several roads including the Eldoret – Ravine tarmac road which is currently in bad condition. The other roads within the village are also impassable during rainy seasons. The mapping exercise revealed that there is no cattle dip in the village and farmers mainly use hand spray at home in temporary crushes. Almost all homes have dug shallow wells for water supply. Animal feeds are obtained from Eldoret. Milk collection centres consist of kiosks at Chepkosom centre and other kiosks along the road. The main cattle feeds/fodder are natural pastures, napier grass, oats, maize, sunflower, lipins and other stocks. The main constraints to dairying identified during the mapping exercise include inadequate grazing especially in January to April dry spell, ticks, poor livestock markets, poor milk prices and poor transportation of milk to market.

43
Figure 8: Chepkosom Village Resource Map
Table 14: Chepkosom village resource map analysis summary
Mapping issues Detailed information
Natural resources
Water River Chepksom cuts across the village from Kipkabus forest. Almost all homes have dug shallow wells
Crop fields Major crop is maize grown by most of the farmers. A few households also grow vegetables like tomatoes, kales, potatoes
Rangelands
Gardens
Irrigation schemes
Mines
Others (specify)
Infrastructure
Roads The village is surrounded by earth roads which feed into the Eldoret – ravine tarmac road. To the North, neighbouring Kipkabus forest, a short stretch of tarmac road marks the village boundary. The earth roads are impassable in wet weather.
Settlements Land is individually owned and settlements are formal
Commodity markets There are no formal commodity markets in the village. There is a livestock market at Metkei divisional headquarters. Several (3) village kiosks serve the simple household supplies.
Milk sale point (informal or cooperative/ self-help group)
There is no formal milk marketing system. However, they deliver their milk to collection centres strategically located along the village roads
Milk cooler/ processor There is no milk cooler in the village or nearby
Dip tank/cattle crush There is no dip-tank in the village, so farmers practice hand-spraying at home. There is a proposed dip and crush in the village
Vet Clinic No vet clinic
Stock feed sources A small agrovet which is at its infancy at HZ centre near the village.
Others (specify) Proposed community centre
There is a proposed Chepkosom community centre where the village borders with Siliboi village

44
Social services
Health
Schools 1 Chepkosom primary school.
Church 1 AIC church
Local administration Office of the Asst. chief with a team of village elders working under her. The Administrator is a unity figure in the village
Traditional Authorities
Extension offices No offices in the village but the community accesses extension services at the Divisional Livestock office
NGO offices HPI is partnering with villagers to put up a milk cooler
Others (specify)
Land use system
Croplands and use of crop residues
Maize is grown throughout the village. Pruned maize stalks and maize stovers are fed to cattle
Communal rangelands None
Grazing reserves
No grazing reserves in the village but dairy farmers have set aside grazing plots for livestock within their farms. Some farmers grow fodder crops e.g. maize, oats, sunflower etc small stock (sheep) are tethered on the roadsides
Seasonal herd movements
Others (specify)
Wealth Ranking The various wealth categories in the village identified were:
1. Kibananiat (Very Poor) 2. Chi Ne Miyoo (Slightly Well-Off) 3. Chi Ne Mayaa (Well-Off) 4. Mogoriot (Wealthy) 5. Mogoriot Kindo (Very Wealthy
The wealth ranking exercise was conducted by first explaining to the participants the purpose of the PRA tool. The participants then identified and ranked their local criteria for wealth categorization of the households. The criteria used included:
Education of children Land size Family size (number of children) Livestock numbers Types of livestock breeds kept Type of house Level of dairy management Amount of milk produced Ownership of other farm structures like fencing and water tank
It was noted that this was only for the purpose of the identification of dairy opportunities for households with different socio-economic status and to monitor progress in wealth creation through dairy development. Small cards were cut to represent each household without showing its identity. For every household, a card was dropped by a community member into to the appropriate wealth class on the ground (Plate 4). The criteria were used by the participant groups to place the card in appropriate

45
wealth classes. Special households (female headed) were identified with a mark on the card without revealing its identity.
Plate 4: Wealth ranking process and output Table 15: Summary Table for Wealth Ranking in Chepkosom Village
Criteria for Wealth Mogoriot kindo (Very Wealthy)
Mogoriot (Wealthy)
Chi Ne Miya (Well-
Off)
Chi Ne Miyoo (Slightly Well-
Off)
Kibananiat (Very Poor)
Education of Children Children go to high cost private schools, University and even abroad
Children go to boarding schools from primary to college
Up to university level
Children attend public primary and secondary schools, some to tertiary colleges
A lot of children attend only public primary schools. Do not proceed to secondary school
Land Size Has many farms ranging 100 – 200 kms
30 acres and above
About 20 acres
0.5-1 acre Less than 0.5 acres
Livestock numbers, by species. For cattle, differentiate by breed
Over 50 pedigree cows Has own bull and private veterinary doctor and AI provider
About 30 cows
About 20 cows
1-2 cows No cows
Pedigree cows Improved breeds
Crosses Crosses None
May have small stock
Has many small stock
Few small stock
Very few small stock and 5-30 chicken
No small stock
Type of House Permanent storey building
Permanent house
Semi permanent house
Iron sheet roof, mud walls
Grass thatched, small, leaking roof
Amount of milk produced
Delivers over 20 litres
Delivering 15-20 litres
Delivers 10-15 Litres per day
0 0
Other farm structures Fencing, water tank
Electric fencing, permanent water tank. Piped water in house
Barbed wire fencing and water tanks
Fenced land
none None

46
% of households in each category (to be done with key informants)*
0% 2% 8% 67% 33%
Differences by gender, female headed households/Orphans
Mainly male headed
none None 7.5% of the group
20% of the group
Differences by milk marketing orientation
Has own transport and milk marketing channel
The group also discussed and recoded the challenges and opportunities in dairy investment for each of the wealth groups. Female-headed households, for instance face a myriad of challenges in investing in dairy farming: Cows they keep are “only for keeping and not really their own” Access to farm inputs Difficulty in raising and educating children Inadequate labour for dairy farming Access to dairy farming technology and training, they rarely attending extension fora Most of their land is leased off
Table 16: Opportunities for investment in dairying by different wealth categories in Chepkosom Village
Wealth Category
Opportunities
Kibananiat Can provide labour Training through extension can improve their dairying skills Provision and investment in local transportation of milk and farm inputs NB: The poorest cannot be employed by the rich because of poor quality service they render due to lack of skills and illiteracy
Chi-Ne Miyoo Has a lot of knowledge but needs credit facilities to invest in different aspects of dairying (forage production, transportation, value addition Can be improved if trained
Chi-Ne Mayaa A lot of enterprises but can specialize in dairy to realize full potential of income and milk production Can exploit the use of AI for improved breeds They can benefit from training to improve productivity Can obtain “maziwa loan” from the cooperative bank and other credit institutions to improve milk production Can buy shares in the proposed plant
Mogoriot Can invest in milk transportation Can invest in agrovet and dairy farming input service provision Can get involved in value addition Can buy shares in the proposed plant
Livelihood Analysis The main livelihood sources for the village include: Potato farming Dairy farming Maize farming

47
Horticulture *cabbages, tomatoes, carrots, onions) Wage employment Sheep rearing Local poultry farming
The contribution of each livelihood activity was assessed by the group in order to establish their relative importance and link with dairy faming. The ranking matrix in Table 17 was used to prioritize the activities. Locally available materials like sticks, cards and bottle tops were used in the exercise. The criteria used include contribution to cash, food, environmental protection and social value. The group also established the recent trends in the activities (whether it is increasing, decreasing, constant or is an emerging new activity). Table 17: Template for analysis – livelihood analysis
Current sources of livelihoods
Contribution to livelihoods
(Rank in order of importance)
Total
Trends
Differences in terms of Gender
Food Cash Environment
Social Value
Dairy Farming 11
Sheep Production
9
Maize Farming 7
Local Poultry Farming
7
Horticulture 6
Potato Farming 5
Wage Employment
2
KEY: TREND
- Becoming more important
- Becoming less important
- Becoming important at low rate - constant in importance - New /Emerging Livelihood activity with increasing prospects
GENDER Female Male Youth
Emerging Issues Potato farming has been on the decline due to high cost of fertilizer, unreliable sources of quality seed and unreliable market outlets for produce. Dairy farming is on the increase due to improving market conditions, better prices than before and capacity building of producers by MoLD. The farmers have also been able to reduce the cost of production by using locally available resources such as feeds to increase their profit margins. The acquisition of improved breeds by some farmers and increased use of AI have also contributed to the increase in dairying in the area.
Maize production has remained constant due to high cost of inputs hence farmers only produce for home consumption while concentrating on dairy farming for income. Horticulture is a new enterprise but likely to increase in production with improved marketing and awareness. Local poultry farming has not improved much in production but is mainly used for domestic needs. The system of production is free range leading to damage of crops. Sheep production is declining due to declining farm sizes and the animals are less popular with farmers as they are considered as destructive grazers.

48
Gender Issues in Livelihoods The ownership of large livestock especially cattle is in the hands of men. Poultry and horticulture are controlled by women and youth. Men receive proceeds from dairy and decide with family on how to utilize. Majority of the households have consultative decision making between men and women although in some, the men have total control and access to dairy farming resources and benefits. The level of education was mentioned as being critical to gender empowerment which the participants agreed was important to be understood for a sustained dairy farming. There is need for a fully-fledged gender analysis to not only empower the community to address the underlying issues and concerns but also inform the EADD-P implementation process.
Interrelationships between Livelihood Activities The various livelihood activities have beneficial relationships with dairy farming. Potato farming generates income that farmers invest in dairy while potato residues are also used as livestock feeds. Maize is occasionally used to make silage and maize stovers are fed to livestock during the dry spells. Proceeds from horticulture farming are also ploughed back as investment in various aspects of dairy farming. Farmers and their relatives engaged in wage employment also use their earnings to improve dairy farming through purchase of inputs and payment for hired labour especially for herding and hand spraying. Poultry farming generates small amounts of manure used in Napier fields as well as in supplementing feed sources for dairy cows.
Innovation Actor Analysis The group of farmers discussed key innovations under selected topic of dairy farming including breeding, feeds and fodder, animal health, and milk value addition. The results are shown in Tables 18 and 19 while Figure 9 illustrates the linkages between the actors as perceived by the dairy farmers in the PRA meeting.
Table 18: Dairy Innovations in Chepkosom
Dairy Issue Conventional activities Innovations Innovating farmers
Breeds & Breeding
- Natural breeding by use of bulls
- Use of AI for Friesian and Ayrshire from CAIS Kabete
Jersey preferred breed
AI but only by few farmers AI from private AI providers Sourcing of breeding bulls from outside the district particularly ADC Kitale Currently Friesian and Ayrshire preferred
Expose farmers, progressive farmers, “Mayaa” group and wealthy farmers
Feeds - Free grazing using natural pastures and roadside grazing
- Napier grass, oats and few with Rhodes grass also few grow sunflower
- Few grow maize for feed - Use of crop residues - NB: there is a mobile grinder in
the village - Few have done paddocking and a
few feed lactating cows on dairy meal. The cooperative is used to get access to dairy meal
- Well-Off and wealthy feed continuously with dairy meal and also do grinding of maize stovers
Animal Health Services
- Had herbs for medicine, use of traditional brews for treating FMD, by-
- Going for private veterinary services
- Buying drugs and doing treatment
- Well off and above
- Only the rich buy

49
product of “chang’aa” brewing
- Hand spraying dipping bathing using clothes
- Use of private veterinary services
by self - GoK vaccination services in case
of disease outbreaks - Use of public crushes
drugs for animal treatment
- Literate farmers
Milk Marketing
- No formal milk marketing previously
- Only sold to KCC and brokers
- Making of local “mala” for home consumption
- Few sell evening milk to brokers
- Both plastic and aluminium cans used
- Sell through cooperatives to Brookside or New KCC for processing
- Brokers are ignored in formal milk marketing
- NB: organized agreements with processors through cooperatives
- Sour milk (“Murzik”) for home consumption and sale
- All dairy farmers sell through co-operative society
Milk Transport
- Individual farmers take to milk collection points
- Transport cost deducted from sales
- Private transporters - Strictly aluminium cans
- Deliver milk to collection points collectively
- Transport costs deducted from sales
- Cooperative transport
- All dairy farmers
Livestock Sales
- Direct sale to buyer - Use of brokers - All dairy farmers
Actors in the Dairy Industry Table 19 presents an analysis of the main actors in the dairy sector in Chepkosom. Of interest is the list of missing actors that the participants felt should feature in their dairy development innovation system including The Kenya Power and Lighting Company, WAC, Ministry of Water, Ministry of Roads and the Local authority. The activities, achievements, challenges and farmer perceptions of the status and satisfaction with the actors were also discussed. Figure 9 illustrates the linkages between dairy industry actors in the village

50
Figure 9: The linkages between dairy actors in Chepkosom Village7
7 The arrows, their thickness and color indicate the direction of linkages, strengths and perceived benefit to dairy
development in the village. The thicker the line the stronger the linkages. Red color indicates most beneficial
linkage for dairy development as perceived by the farmers

51
Table 19: Summary analysis of the activities of main actors in dairy development in Chepkosom Village
Actor Activities Achievements Challenges Status8
Linkages9
Satisfaction10
Co-operative
Buying of milk, transportation of milk , look for good markets, farm inputs, advance payment
Employment, high milk outputs, -access of goods cow and sources of aluminium cans, improve milk prices
Poor roads, inadequate transport, milk spoilage competition from middlemen and other direct buyers
1 3 3
New KCC Buy milk from cooperative market
Buy milk from cooperative, markets Stabilization of milk prices by offering competition
Competition Mistrust due to past experiences with unpaid milk deliveries
1 1 2
Middlemen Collude or buy milk directly from the farmer on cash payment
High income by the middle man, no delayed payments addresses immediate needs
Inadequate capital milk price fluctuation, poor roads sometimes leading to losses
0 1 1
Brookside Buys milk, farmers training Stabilize milk prices Alternative milk market
Competition, milk spoilage leading o farmer losses
1 2 2
Local Transporter
Transportation of milk directly from the farmer cash payment
Reaches inaccessible places, employment for staff, increases volume of milk to market
Poor roads, delay of milk reaching processors, spoilage
1 2 1
Agro-vet Avails animal drugs, animal feeds and fertilizers
Access to farm inputs locally. Can negotiate on credit
Inadequate business premises have no cooling facilities for drugs 9refrigiration). Bad debts.
2 2 3
MoLD Extension services, mass vaccination in outbreaks, avail drugs at cost linkages with other actors
Capacity building of farmers Mortality due to diseases
Prompt response control measures
2 3 3
8 0 = Not active in the village; 1 = Present in the village but less active; 2 = Present in the village and fully active
9 0 = No link; 1 = Link not functioning; 2 = Link is weak; 3 = Link is strong
10 3 = Good; 2 = Satisfactory; 1 = Poor

52
Actor Activities Achievements Challenges Status8
Linkages9
Satisfaction10
Private Vet Provision of clinical services, Reports on notifiable diseases, vaccination, quarantine and control of livestock movement
Improved animal health, accessibility to services increased, faster response
Insufficient transport, poor roads, mistrust, competition from the private practitioners or own treatment
2 2 3
Office of the President
Mobilization and unity, security, identification and registration of residence, coordination of government extension through barazas
Solves disputes, access to services, unity and security in the village is maintained, Facilitates some MFIs
Insecurity threats, drug abuse, large administrative units to cover, alcoholism
1 3 3
CDF School fees bursaries provision, construction of various infrastructure e.g. dips, schools, roads, dispensaries, transport
Provided vehicle for milk transportation, improved education standards, school levies taken over by CDF to improve self-help development, improved milk delivery
Inadequate funding capacity against numerous proposals, delayed funds disbursement, lack of adequate facilitation for sub-location and locational levels,
2 2 2
AFC Dormant 0 0 0
MFI Training on entrepreneurship, provision of loans, teach farmers on loans management and how to save
Financial empowerment of farmers, opening of businesses
Bad debts, credit management, high rates of defaulters, risk averse behaviour of farmers
2 2 1
HPI Community mobilization, proposed participation in a chilling plant, partnering in dairy development
Resources have been mobilized for a cooling plant, Farmers are aware of their role in the EADD-P
Poor roads, some farmers are still apprehensive to buy shares
1 3 3

53
Emerging Issues and Government Policy The dairy farmers have negative attitude towards loaning institutions particularly AFC. They have positive attitude towards cooperative loans and prefer repaying at intervals of 3 months. Government policy on dairy/livestock sector affects the following aspects of dairying: Community managed dips need government assistance in the initial stages especially for
capacity building on management and technical maintenance The farmers feel the government should subsidize cost of drugs particularly for treating ECF FMD is a serious problem and prompt government action is needed in case of outbreak Dosages for FMD vaccines be in small quantities to cater for all wealth categories of farmers Resources allocation to the department of livestock production to be improved to enhance their
reach to farmers e.g. well equipped staff in appropriate numbers Improvement of roads to enhance movement of dairy products, people and farm inputs Issuance of land title deeds to be completed to enable farmers access loans A chilling plant is very vital for the farmers as they have shown interest and this would enhance
their marketing capacity
Local Vision in Dairy Sector The farmers indicated the following as attributes of the kind of dairy sector they wish to have in future: To be breeders in future To practice profitable value addition of milk and other dairy products In 10 years time the community will be having dairy cows producing up to 40kg of milk per cow
per day To be involved in exchange visits to learn and be used as learning centre for other dairy
farmers in Kenya and beyond EADD-P will work within the village for 10 years and be a fruitful partner of the dairy farmers
with achievement of its objectives. Livestock Feeds and Breeding Analysis
Preferred Livestock Breeds The discussion on breeding and breeding systems was started by asking farmers why they select different breeds. The farmers indicated that they look for the following traits in order of priority:
Milk production (high yield) Shape of animals Well built, strong legs, straight and able to give strength to udder Feed requirements Body size Disease resistance Udder size and shape Ancestors (parental history) Growth rate Short calving intervals
After careful scrutiny, they agreed to use only six of the traits for ranking their preferences of selected dairy cattle breed: milk yield; feed requirement; body size; disease resistance; growth rate and calving interval. Table 20 summarizes the output of the participatory ranking exercise.

54
Table 20: Ranking of dairy cattle breeds in Chepkosom Village
Breed Type CRITERIA Score
Rank
Milk Yield
Feed Requirement
Body Size
Resistance to
Diseases
Growth rate
Calving Interval
Friesian ●●● ●●● ●●● ● ●●● ●●● 16 2 Jersey ●● ●● ● ●●● ● ●● 11 4 Ayrshire ●●● ●● ●●● ●● ●●● ●●● 16 1 Guernsey ●● ●● ●● ●●● ●● ●● 13 3 Cross breeds/Zebu
● ● ●● ●●● ● ● 9 5
Zebu ● ● ●●● ● ● 7 6
Ayrshire is the most preferred due to its superior attributes that include: high butterfat content; feed requirement is lower for a small size of land and it is more resistant to diseases compared to Friesian. Ayrshire is the predominant breed in the area. They learnt of it from Ainabkoi and Chesire Farms. In the area, it began spreading with an imported bull from the two farms. The requisite skills are accessed from extension and fellow farmers. The farmers indicated that they have no other preference for another breed but would like to improve the existing ones. Many farmers do not keep records making it difficult to tell the kind of breed they are buying from fellow farmers.
Breeding Services The community uses both bulls and AI for livestock breeding. Table 21 presents the summary of the ownership, access and preference of these two methods of breeding. Table 21: Breeding services in Chepkosom Village
Breeding Method/Service
Ownership Distance to service (Km)
Preference Rank
Communal/Individual Bull
Communal
Individual
1 1 3
A.I. Private
Cooperative
15 15
1 3
2 1
Note: Preference 1 = Least Preferred, 2 = Moderately Preferred, 3 = Highly preferred
The farmers are aware that private AI is expensive and accessed over a distance and it is often needed to use mobile phones for communication. The farmers’ cooperative is about to launch a communal AI service. This is preferred because it is reliable and the society will advance loans to farmers. Individual and communal bulls are not preferred although common. The method exposes the cows to diseases and is not always available.
Forage Seasonality The PRA group noted that Friesian breed consumes most and Zebu least feed. Feeding was noted to be important as it determines milk output and the overall body condition of the animal. The feed resources available in the village include: Napier grass Oats Maize Kikuyu grass Sunflower – a little

55
Dairy meal mentioned though not forage Nandi setaria (but not in village) Star grass, Boma Rhodes – a few farmers Lucern (1 farmer) Lupins Sesbania calliandra, Lucaena – known one farmer said his dried up in the last dry season.
The main constraints in forage production were given as: Storage facilities Low skills Lack of quality seeds Lack of equipment Unreliable rainfall; some farmers wanted to change this to water shortage Water shortage They have enough feeds but lack skills for conservation.
After ranking, the following constraints were documented
1. lack of skills 2. storage facilities 3. lack of quality seeds – oats 4. water shortage 5. lack of equipment for harvesting and
conservation
On further probing on Napier grass management, the women indicated that they are the ones who act. The availability of oats depends on farmers’ preparedness.
January – maize stover There are very few farmers that grow maize for fodder. Therefore it was changed to maize
stover Training required in utilization of maize stover (treatment).
In response to a farmer’s question: “Based on the above are we as farmers on the right track?”. The group discussed milk production potential of the area and recorded levels at different scales. Responses from participants and PRA team members indicated that the highest production per cow in the village is 15 litres per day per cow. At the division and national levels, it is 28 litres and 40 -60 litres
“mambo ya oats inategemea
vile mkulima anajipanga”.
Farmers “harvest oats but due to shortage of
equipment some rot in the field before grinding.
They have been taught to make hay using hay
box but only “on paper”.
Female Farmer
“In this community, we have
enough rainfall. The problem is its
use. A lot of the rain waters goes to
waste due to inappropriate
technology and attitude of farmers
towards rainwater harvesting. If we
conserve rainwater and fodder, our
cattle will produce wonders”
A farmer in response to whether
rainfall is a problem or not

56
per day per cow, respectively. The challenge for the community is to acquire the right skills to achieve the potential. Table 22 shows the seasonal availability of various fodder and feeds in the village. Table 22: Seasonality of dairy cattle feed/forage availability and estimation of feed sufficiency
Season Month Forage sources & Availability How sufficient are feed supplies?
A B C D E F G H I* J* Scarce
Dry January 2 2 3 3 1 1 1 1 0 0 Scarce
Dry February 1 2 2 2 1 1 1 1 0 0 Scarce
Dry March 1 1 1 0 1 0 0 1 0 0 Scarce
Wet April 1 0 0 0 0 0 0 0 0 0 Very Scarce
Wet May 2 0 0 0 0 0 0 0 0 0 Very Scarce
Wet June 3 1 0 1 0 0 0 0 0 0 Scarce
Wet July 3 2 0 2 0 1 1 0 0 0 Scarce
Wet August 3 3 0 3 0 2 2 0 0 0 Sufficient
Wet September 3 3 0 3 0 3 3 0 0 0 Sufficient
Wet October 3 3 0 3 0 3 3 0 0 0 Sufficient
Wet November 3 3 0 3 0 3 3 0 0 0 Sufficient
Wet December 3 3 0 3 0 3 3 0 0 0 Sufficient
A = Napier grass; B = Oats; C = Maize Stover; D= Kikuyu Grass; E = Sunflower; F = Nandi Setaria; G = Boma Rhodes; H = Lupins; I = Lucern; J = Mullti-Purpose Trees (MPT) Numbers 1-3 refer to the relative contribution of each forage to the animal diet 0= Not Available 1= Scarce 2= Moderately Available 3= Available
* = New/emerging forage
Plate 5: A field of maize and fodder crops

57
Constraints and Opportunities in Dairy Farming All the previous PRA tools had given an emerging list of problems facing the dairy industry. These problems were reflected on by the farmers and the following list generated.
Livestock diseases Breeds – low quality (ya zamani) Feeds – some farmers cannot afford due to lack of capital. High cost of feeds High cost of labour Shortage of water Inadequate skills Overstocking Markets for milk Poor infrastructure (roads) Extreme weather
After consolidated and detailed discussion the final list of problems emerged as:
Livestock diseases Inadequate feeds Poor markets High cost of inputs Inadequate skills Low quality breeds Water shortage
These were then ranked using the pair-wise ranking matrix in Figure 10.
Problem/Constraint IF PM HCI IS LD WS LQB Score Rank
Inadequate Feeds (IF) IF HCI IS LD WS LQB 1 6
Poor Markets (PM) HCI IS LD WS LBQ 0 7
High Cost of Inputs (HCI) IS LD WS LQB 2 5
Inadequate Skills (IS) LD WS LQB 3 4
Livestock Diseases (LD) LD LD 6 1
Water Shortage (WS) LQB 4 3
Low Quality Breeds (LQB) 5 2
Figure 10: Problem pair-wise ranking matrix for Chepkosom The final list of ranked problems was therefore as follows:
1. Livestock diseases 2. Low quality breeds 3. Water shortage 4. Inadequate skills 5. High cost of inputs 6. Inadequate feeds 7. Poor markets
The ranked problems were then analysed using the matrix presented in Table 23.

58
Table 23: Problem analysis matrix for Chepkosom Village
Problem/Constraint Causes Effects Coping strategies Opportunities 1. Livestock
Diseases
Poor Tick control Lack of regular deworming Drought Tsetse fly menace Extreme cold Unscreened breeding bulls Lack of skills Inadequate vet services Lack of strict vaccination programme
Livestock deaths Low milk production calf mortality Poor animal condition Low income Zoonotic diseases High cost of production
Treatment by private vets and quacks Vaccinations conducted following disease outbreaks Resort to traditional treatment (ITK) Isolation of sick animals from the herd Culling sick animals Hand spraying against ticks and tsetse flies
Have well managed cattle dips Have qualified vet personnel to render clinical services Training on routine disease control measures Research on ITK Strict routine vaccination programme and screening of breeding herd for breeding diseases
2. Low quality breeds
Inbreeding Unavailability/limited access to A.I service High cost of quality breeds Attitude of resistance to change lack of skills
Low milk production Low quality replacement stock Low income from sale of stock and products High cost of production due to low output
Upgrading using locally selected bulls Use of cheap feeds Use of Napier grass with low supplementation Reliance on natural pasture (low input)
Efficient A.I service Destocking Introduction of high quality breeds Feed conservation Develop reliable source of water Adopt Zero grazing system Proper farm business plan Legume fodder production
3. Water shortage
Lack of water projects Inadequate water storage facilities Long dry spells Lack of water conservation measures expensive water harvesting & storage equipment
low milk production increased disease prevalence encounter with unwanted bulls serving cows (all cattle using the same water point) poor body condition poor growth reduced forage intake abortion due to walking long distances to water
digging shallow wells roof catchment use of animal drawn carts to collect water use of tanks (plastic) to store rain water
a piped water project construct a dam sinking of bore holes initiate an irrigation project train farmers on water harvesting techniques

59
Problem/Constraint Causes Effects Coping strategies Opportunities 4. Inadequ
ate Skills
inadequate extension services illiteracy few stakeholders In dairy
poor yield from cows livestock losses thro’ deaths low income low standard of living hunger insecurity
attend farmers’ training activities Copying from advanced farmers farmer to farmer extension
Demand for training from service providers dairy management skills information & equipment for home made rations forage conservation
5. High cost of Inputs
inadequate machinery for mixing feeds not using locally available feed resources high taxation poor roads hence high transport cost low skills
low milk production low income low forage production
use of available local resources recycling of old planting materials community repair of roads use of hand tools
improve roads thro’ CDF & other donors provision of electricity provision of mobile feed milling services (privately owned by community)
6. Inadequate Feeds
Unreliable rainfall overstocking High input costs low skills on forage conservation lack of implements to grind/mix feeds poor quality forage seeds No storage facilities
Low milk production discouraging dairy farmers low quality milk slow growth rate keeping poor quality breeds infertility repeat inseminations abortions and long calving interval vulnerability to disease
supplementation with commercial feeds road side grazing use of crop residues e.g. maize stover planting napier grass, oats giving out extra livestock to relatives/friends for care. borrowing feeds from neighbours
increase skills thro’ training exemption of tax on farm inputs formation of community groups provision of credit streamline milk marketing ICRAF to provide quality seeds.
7. Poor Markets lack of milk cooling facilities poor roads Fluctuation of milk prices Limited markets, hence lack of competition low quality of milk due to poor handling long distance to markets
milk rejection loss of income failure to sell milk low returns high cost of production
trekking long distances to milk collection centres escorting milk vans during rainy season sell all milk thro’ cooperatives
milk cooling plant encourage more players to increase competition hence higher prices improve roads

60
KURIOT VILLAGE, KABIYET, NANDI NORTH DISTRICT
Introduction
In Kabiyet division, the selected village was Kuriot in Cheptuyot sub-location. The village has 55 households with approximately 500 people. Its location on the division is shown in Figure 11.
Figure 11: Location of Kuriot Village in Kabiyet
The launching meeting was attended by the local area Assistant Chief, the DLPO and area livestock officer. Some 35 farmers were in attendance at the beginning of the exercise. Mr Francis Rop, the DLEO introduced the PRA team and gave a brief background of the mission of the team. The exercise was being carried out on behalf of EADD-P which has 5 other players (HI, ABS, MoLD, ILRI, ICRAF and TechnoServe). The objective of EADD-P, that is, to improve income from dairy and thereby raise household standard of living, was explained. The PRA exercise was explained to be the beginning of many planning activities for the project, whose goal was to appraise the village, and inform the various entry points during the implementation. The 35 farmers present at the meeting represented the 55 households in the village during the meeting. The approach would be to use various tools and methods of mapping, ranking, scoring and consensus building to finally arrive at the key constraints and opportunities in the dairy sector in the village.

61
Main Field Findings
Village Profile
Country: Kenya
District Nandi North
Other administrative unit Kabiyet Division, Kabiyet Location, Cheptunyo sub-location
Name of Village Kiproroget
Date of village workshop 27th – 29th October, 2008
Duration of workshop 3 days
Venue for the workshop Kuriot Language of workshop
Kiswahili, Kalenjin
Number of participants (Female)
15 Number of participants (Male)
20
Names of facilitators Group 1: Mr Francis Rop Group 2: Mr Daniel Keter
Names of note takers Group 1: Mr Stanley Muli Group 2: Mr Charles Ombui
Names of observers Group 1: Mr Steven Gikonyo Group 2: Ms Mary Kanyi
Special conditions (weather, local activities, etc)
Rainy, cold and windy
Village Resource Mapping The first activity of the Kuriot PRA exercise was to draw a village resource map (See Plate 7 and Figure 12). This was done to capture the spatial arrangement of key features, utilities and resources of significance to dairy farming. The villagers mapped out the location of main infrastructure, rivers, springs, social services, milk collection centres and land use patterns.
Plate 7: Kuriot Farmers drawing their village resource map
The mapping revealed the widespread existence of individual shallow wells. The village is well traversed by 5 existing earth roads which are not passable during wet seasons. The farmers have individual land plots but there is 1 acre plot owned by the cooperative society. Men have full access and control of land, unlike women. In response to this, a farmer reckoned:

62
Gender is, therefore, a major consideration for food security in the village. From the exercise it was also revealed that there is no dip in the village. Farmers use a dip in Mumet village about 2kms away. AI (private) services are available from Mosoriot and there is one about 3 kms away. The village also lacks a feeds store. The cooperative society has 1 acre plot that is not developed. A youth group office and an adult education centre are located within the cooperative society plot.
Figure 12: Kuriot Village resource map All farmers practice open grazing and free access to water points for their animals. The only river, Tabiriri) is about 2 kms away from most farmers in the upper part of the village. The village is
“Kiamtoi Asis – ma – Kiamtoi Korin, we share the
sun – not the household” i.e. each household has
its own issues and approaches to handle the issues

63
characterized by low milk production, 75% of farmers use bull service for breeding (own bulls or share with neighbours). No fodder conservation is currently practiced. During dry spells, cattle body conditions deteriorate greatly. Other livestock in the village include goats (very few and are not popular because they are browsers and destroy vegetation), sheep and chicken. There is no veterinary clinic. Farmers depend on veterinary services from outside the village. There are few traditional herbalists as well as traditional birth attendants. Table 24: Kuriot village resource map analysis summary
Mapping issues Detailed information
Natural resources
Water River Tabarin forms the eastern border with Cheborus Village. Most homes have dug shallow wells. The upper parts have springs that are not protected
Crop fields Major crop is maize grown by most of the farmers. They also grow beans and vegetables like tomatoes, kales, potatoes in a few households
Rangelands
Gardens
Irrigation schemes
Mines
Others (specify)
Infrastructure
Roads The village is surrounded by earth roads that form its boundary and minor roads traversing it. The earth roads are impassable in wet conditions
Settlements Land is individually owned and settlements are formal
Commodity markets There are no formal commodity markets in the village. A number of village kiosks serve the simple household supplies.
Milk sale point (informal or cooperative/ self-help group)
There is no formal milk marketing system. However, they deliver their milk to road-side collection points along the village roads where milk trucks collect it
Milk cooler/ processor There is no milk cooler in the village or nearby. Plans are under way to collect funds for the same
Dip tank/cattle crush No cattle dip exists in the village and farmers practice hand spraying at home or use a dip in Mumet village 2km away. No public crushes are available.
Vet Clinic No vet clinic, depend on services from outside the village
Stock feed sources None in the village.
Others (specify) Proposed community centre
The cooperative society has a communal plot for possible use
Social services
Health None in the village.
Schools 2 in Kapng’etuny and Shiners Academy (private).
Church 1 Catholic Church
Local administration Office of the Asst. chief with a team of village elders

64
working under him outside the village. The village elder’s home is strategic and serves as a unifying figure in the village
Traditional Authorities
Extension offices No offices in the village but the community accesses extension services from the Divisional Livestock office
NGO offices HPI is partnering with villagers to put up a milk cooler
Others (specify)
Land use system
Croplands and use of crop residues Maize is grown throughout the village. Pruned maize stalks and stovers are fed to cattle. Napier grass planted close to the river
Communal rangelands None
Grazing reserves
No grazing reserves in the village but dairy farmers have set aside grazing plots for livestock within their farms. Some farmers grow fodder crops e.g. maize, oats, sunflower etc small stock (sheep) are tethered on the roadsides
Seasonal herd movements
Others (specify)
Wealth Ranking The group first identified the key local criteria for wealth ranking in order of priority as follows
1. type of house 2. land size 3. livestock quality and numbers 4. fencing 5. education of the children
Based on these criteria the following wealth categories were identified to exist in the village
1. Kibananiat (destitute – very poor) 2. Ne wisis (Poor) 3. Ne terter (Average) 4. Ne maya (Well off) 5. Mogoriot (Wealthy) 6. Moriot ne o (Very Wealthy)
The characteristics of the households in each group are presented in Table 25.

65
Table 25: Attributes of households in various wealth categories in Kuriot
Criteria for wealth
Wealth category
Mogoriot ne o (Wealthy)
Mogoriot
Ne maya Ne terter Ne Wisis
Kibananiat (Destitutes – Very Poor)
Education of Children
Family size up to 3 Children with one wife Children go abroad for studies Sometimes get married overseas
Few Children i.e. 2 -3 children per mother – polygamous Children go to private schools and sometimes do not go beyond form 4. most of their children do not go to school and sometimes drive vehicles
Have 4 – 5 children Children go to private and secondary boarding They go beyond secondary schools i.e. colleges and universities
6 -7 children Children go to school, secondary schools and most of the go to public schools. Children can go up to tertiary colleges
Has a family of 5 -6 children Children go to school up to standard eight but can continue with assistance
Has many children, from 6 – 8 children Children do not go to school
Land Size Land 100 acres and above Has several pieces of land
15 – 30 acres land size They hire or own farms from outside
Average of 5 acres Leases land-farming land
Land size 2 – 3 acres
Has about .5 – 2 acres
Has small farm up to .2 acres
Livestock numbers, by species. For cattle, differentiate by breed
Cattle – has more than 100 cows and the animals sometimes imported of quality
Have 10 -20 cows – Ayrshire or Friesians.
Has 3 – 4 cows (Ayrshire and Friesian Has chicken which boost income of the owner
Has livestock up to 2 cows and
Has poultry but has no cows, if he has a cow he borrows from friends
Has no livestock
Can be having a ranch of many animals including beef animals Many goats and sheep
20 sheep and some goats Chicken- Has both local and commercial layers: 30 – 40 locals and about 40 - 50 commercial layers
2 – 3 small livestock and chicken 10 – 15
Has a dog, cats

66
Criteria for wealth
Wealth category
Mogoriot ne o (Wealthy)
Mogoriot
Ne maya Ne terter Ne Wisis
Kibananiat (Destitutes – Very Poor)
Type of House
Big stoned house Roofed with tiles
Bricked walled and gal sheet house Big house
Plastered iron roofed house Furnished house 3 -4 rooms Separate kitchen
Iron roofed house, mud walled and about 2 rooms –
One or 2 small rooms Can be iron roofed house made of mud walls Gabled house
Has no house (may have a house of poor quality, leaking roof No beddings No furniture Small house (one roomed)
Amount of milk produced
Can be selling above 1000 kgs
Produces up to 10 litres per cow Sells around 50 litres 50 litres per day
Sells about 10 litres of milk
Able to produce about 5 litres of milk for sale and sell 3 litres
Other farm structures Fencing, water tank
Electricity Lorries Tractors with implements Have reasonable shares and many rental houses, have companies Dairy, other farm structures like stores, Private dip Can be having milking machines Live fence, and has security in house
4 – 6 barbed wire lines Have business and farm implements e.g. tractors Have farm implements for hire and own use Has a small wood lot Fenced land with droppers Piped water for livestock Can be having private dip Fenced compound Kitchen garden almost one acre
Has a good farm plan with Napier Can be having farm structures e.g. dairy Has maize store Has a fenced land – has two lines of barbed wire
Has line fence - Don not maintain the fence Uses manure during planting of maize Has a granary for grains or cereals

67
Criteria for wealth
Wealth category
Mogoriot ne o (Wealthy)
Mogoriot
Ne maya Ne terter Ne Wisis
Kibananiat (Destitutes – Very Poor)
Other descriptions
One spouse working i.e. income from a family members Produces enough food and sells surplus to National Cereals and Produce Board (NCPB)
Has no off farm income Has vision i.e. Can be able to plan
Produces inadequate food s Has no vision (plan) Gets income from casual labour
Lives on borrowed food and seeks employment from other people Moves from house to house looking for employment
% of households in each category (to be done with key informants)*
0% 5% 25% 45% 20% 5%
Differences by gender, female headed HH/Orphans
0% Mainly male headed 2.5% female headed 5% female headed None is female headed
None is female headed
Differences by milk marketing orientation

68
Livelihood Analysis The main livelihood sources for the farmers in Kuriot include Maize farming Dairy farming Bean farming Local poultry keeping Sheep farming Horticulture (cabbages, local
vegetables, tomatoes onions) Bee-keeping Trade (kiosks, shops) Milk trade Livestock trade Wage employment
Table 26 shows the chart used to generate the ranking of these livelihood activities. Table 26: Livelihoods Analysis Matrix
Current sources of livelihoods
Contribution to livelihoods (Rank in order of importance)
Total
Trends
Gender Differences Food Cash Environ-ment
Social Value
Rank
Dairy Farming
9 1
Maize Farming
7 2
Horticulture 6 3 Beekeeping 6 4 Bean Farming
5 5
Trade (Kiosk) 4 8 Local Poultry Farming
4 7
Sheep Production
4 6
Milk Trade 2 9 Wage Employment
2 11
Livestock Trade
2 10
KEY: TREND
Becoming more important(Increasing)
Becoming less important(Decreasing)
Stagnant
Increasing less rapidly
GENDER
Female
Male
Youth
GENDER
Female
Male
Youth

69
Maize production is on the downward trend due to high cost of inputs including fertilizer and ploughing costs. Dairy farming is the main activity and its trend is increasing due to improvement in milk marketing and reduction in disease prevalence especially ECF due to regular tick control. Bean farming is increasing due to its increased utilization as food (githeri) – change in eating habits and better seed varieties that are early maturing. Local poultry production has remained stagnant due to prevalent diseases and predators. Sheep farming has also remained stagnant due to unfavourable system of production and competition for scarce forage resource largely meant for dairy cattle. Horticulture is increasing mainly due to better market and marketing channels while bee keeping is stagnant due to inadequate skills and lack of exposure to modern bee-keeping methods. Engagement of the farmers in off-farm activities like small-scale business (kiosk trade) is declining due to high cost of goods requiring a higher capital to maintain the business. Milk trade is increasing due to increase in milk prices and improvement in marketing channels (competition). Livestock trade has remained stagnant/ declining due to decreasing volume of off take. There has been a slight increase in local employment due to creation of new district but compared to the turnover of graduates from colleges and schools the trend is still stagnant. The main actors in dairy are women who carry out most routine activities (feeding, milking/herding).The income from dairy mainly goes to the head of the family (man/husband). Bean farming is also mainly a women’s activity as a source of food – kitchen garden and intercropped with maize. Bee keeping is entirely a men’s activity because it is still based on traditional bee keeping method that is gender insensitive. Kiosks businesses are run by youth and men. Dairy farming is related to almost all activities with crop residues – bean straws, maize straws and leftovers given to dairy animals. The proceeds from other livelihood activities such as sale of horticulture and maize are normally be ploughed back/invested in dairy. The key challenges to dairy farming emanating from the livelihood analysis include water shortage especially during dry seasons; shortage of/inadequate forage; disease prevalence; and poor breeding services with the use of local bulls dominating.
Plate 8: Farmers going through the paces of livelihoods ranking

70
Innovations Actor Analysis Table 27: Kuriot Innovation Actor Analysis Matrix
Key actors Activities and services Achievements Challenges Status11
Linkages12
Satisfaction13
Dairy input providers Agrovets
Provision of animal feeds and farm inputs like pasture feeds, vitamins
Access to animal feeds and drugs improved Improved milk
production
Poor roads High cost of
transportation leading to cost of inputs
2
3
3
Kipkaren Cooling plant Agrovet shop
Supply of farm in puts Employment creation Farmers accessing
inputs at affordable prices
Poor roads Farmers’ low purchasing
power
1
2
3
Milk buyers (e.g. small scale traders, transporters, cooperative/SHG, processor etc)
Kipkaren Cooling plant Buys milk from farmers Guarantees loans for farmers
Stabilized milk prices Created a reliable
market for milk Chilling the milk
adds value.
Cooler is far away from the village Poor roads Competition from other
dairy cooperative societies
2 2 3
New KCC No activities in the village No achievement
Mistrust due to past poor record of non-payment.
0 1 1
Kuriot Cooperative society dairy
Currently dormant None Lack of cooperation of the farmers Lack of transparency from
past committees
1 3 2
Middlemen Buys milk directly from Employment Milk losses due to poor 1 3 2
11
0 = Not active in the village; 1 = Present in the village but less active; 2 = Present in the village and fully active 12
0 = No link; 1 = Link not functioning; 2 = Link is weak; 3 = Link is strong 13
3 = Good; 2 = Satisfactory; 1 = Poor

71
Key actors Activities and services Achievements Challenges Status11
Linkages12
Satisfaction13
farmers Sometimes advance payment
to assist farmers meet immediate financial needs
creation Prompt payments ,
farmers immediate needs addressed
roads Fluctuation of milk supply
causing flooding of milk in the market and sometimes deficiency
Brookside Buys milk from the cooler ( bulk milk market) Offers farmers training
Improved milk prices Employment Improved production
through training of farmers
Poor roads Faces stiff competition
form other milk processors
1 3 3
Ol Donyo Lessos creameries
No service or activity at the moment
None Plant far away from the village
0 1 1
Local milk Transporters Transports milk from farmers to chilling plant and other markets
Transports farm in puts
Farmers spared time to perform other duties Reduced cost of
transport of milk to chilling plant
Milk losses due poor roads (rainy periods) Delayed in milk reaching
processors especially when bicycle breaks down Spillage/spoilage
2 3 3
Community Based organizations (CBOs) (e.g., farmers groups, women groups, livestock clubs)
Modern political organization (e.g., community chairmen, councillor) Administration ( Office of the President Chief, Assistant Chief)
Mobilization of community and government services Security Conflict resolution
Improved security has fostered development Unification of the
community
Administration area very large Inadequate support staff Pressure of work
2 3 3
Gov. dept. (e.g., veterinary, livestock extension, livestock marketing, crop
Extension service Disease control Linkage with other service
Capacity building for farmers Improved livestock
Inadequate personnel Lack enough
transport/extension
2 3 2

72
Key actors Activities and services Achievements Challenges Status11
Linkages12
Satisfaction13
extension, police, state cooperatives) MoLD
providers
production Farmers linked with
EADDP
equipments
County Council 0 1 1
Nongovernmental organizations (e.g., World Vision, Heifer International)
Private vet Treatment of livestock Sometimes offers extension
service
Improved animal health Accessibility of
services enhanced
Poor roads High transport cost due to
high fuel cost High cost of drugs
1 2 2
Private AI service provider Provision of AI service to dairy farmers
Improved cattle breeds Improved access to
AI service in the village
Poor roads Many repeats causing
mistrust Lack of professionalism
among the AI service providers High cost of AI
1 2 2
EADDP Community mobilization Partnering with farmers and
other players in development dairy sector
Resources have mobilized for installing a cooling plant.
Poor roads Majority of farmers
apprehensive about buying shares
2 3 3
Financial (banks, micro-finance institutions – MFI, etc)
AFC
Offers loans for seasonal crops and other development e.g. machinery and livestock
Improved farm production, farmers able to pay school fees. Development of
farm structures in the farms
High interest rates Farmers attitude of being
risk averse Men taking loans without
consultation with spouses Bad debts
1 2 2

73
Key actors Activities and services Achievements Challenges Status11
Linkages12
Satisfaction13
EQUITY/FAMILY BANK
Provide loans Saving accounts for the
farmers Training farmers on Entrepreneurship/skills Offers loans/credit to farmers
particularly women
Farmers have started the culture of saving Some have
purchased land, improved dairy cow
Farmers capacity
built on business skills Farmers have been
able to start small enterprises like local poultry rearing
High interest rates Low awareness on loan
facilities Farmers attitude of being
risk averse Farmers are risk averse
hence not using the opportunity to take loans Lack of business skills
2
2 2
MFIs 2
2
3
Mobile Phone Services Communication Farmers able to get information on prices Fast means of
accessing animal health services Cash remittances
made fast and convenient
Cost of communication is limiting wider usage of mobile phones
2 3 2

74
Farmers were not able to identify missing actors in this village. AFC loans are popular with men since they are the custodians of the collateral required (title deeds) while women prefer MFIs. Farmers in this village are “very risk averse” as they claimed that the memories of the 1980s where many lost farms and livestock to AFC in loan defaulting has led many to fear to apply for loans. Local administration presence was strong and with many positive attributes. The assistant chief was among the farmers in the PRA exercise both as leaders and dairy farmers.
Figure 13: Dairy Actor Linkages Network Diagram
Plate 9: Generating the actor linkages map
Livestock Feeds and Breeding Systems Analysis
Breed and Breeding Services The PRA session started by facilitators asking farmers to identify the traits they consider important in dairy cattle. The following traits were mentioned in order priority.
1. feed requirement 2. milk production 3. fertility (calving interval)

75
4. body size 5. resistance (hardiness)
The known breeds (Ayrshire, Friesian, Guernsey, Jersey, Red poll and Zebu (Kipkaa)) were then classified and ranked based on the identified traits and presented on matrix form. The ranking exercise used the criteria set and stones were used for scoring. Table 28 presents the findings of the ranking exercise. Table 28: Kabiyet dairy breed preference ranking matrix
Breed Type Milk Yield
Feed Requirement
Body Size
Hardiness Calving Interval
Score Rank
Friesian ●●● ● ●●● ● ●●● 11 2
Jersey (New breed)
● ●●● ●● ●● ●● 10 6
Ayrshire ●● ●● ●● ●● ●●● 11 1
Guernsey (New breed)
Cross breeds/Zebu
● ● ●● ●● ●● ●● 10 4
Zebu ● ●●● ● ●●● ● 9 5
Red poll (Not Common)
●● ●● ●● ●● ●● 10 3
Ayrshire is the most common and preferred dairy breed in the village. The farmers gave a number of reasons including being better in feeding, butterfat content and hardiness compared to Friesian. Jersey is not widely known in the area. “Was bought by one farmer but it was during ECF outbreak and the cow perished”. Friesian is popular but feared by farmers due to its heavy feeding requirement. “Can eat even at night”. Guernsey breed is not in the area but was owned by former MP a long time ago. Farmers get to know of the breeds through farmer-to-farmer dissemination process. Farmers use bulls to maintain the breeds. AI services are rare, inaccessible and expensive. Only private services are accessible some 5 kms away. The bulls are individually owned or borrowed and used for free. However, they are not sustainable and are also prone to diseases. Table 30 presents the summary of key breeding services. Table 30: Kabiyet Breeding Services Ownershio and Access
Breeding Service Ownership Distance to service (Km)
Preference Rank
Communal/Individual Bull Individual 1 1 2
A.I Private
5 2
1
N/B Bull service is predominant in the area over AI service though least preferred.

76
Feeds and Feeding Systems There is a limitation of forage alternatives and farmers mainly rely on natural pasture. No fodder legume is maintained though wild sesbania (Sesbania sesban) is available but rarely utilized due to lack of awareness and knowledge of preparation and conservation. The bulk of the feeds is from natural pasture. Forage conservation is also rare with a little of maize stover being stored and used in the dry season (March). Napier grass is left standing between June and October when natural pasture is in plenty. However, only a few farmers have small acreages under Napier. Table 31: Seasonal availability of forage in Kuriot
Season Month Forage sources & Availability How sufficient are feed supplies?
A B C D E F
Dry January 2 2 0 0 0 1 Insufficient
Dry February 1 1 0 0 0 1 Insufficient
Dry March 1 1 0 1 0 1 Insufficient
Wet April 1 1 0 0 0 0 Sufficient
Wet May 2 2 0 0 0 0 Sufficient
Wet June 3 3 0 0 1 0 Sufficient
Wet July 3 3 0 1 2 0 Sufficient
Wet August 3 3 0 2 3 0 Sufficient
Wet/ Dry September 3 3 0 3 0 0 Sufficient
Dry October 3 3 0 2 0 0 Sufficient
Dry November 2 2 0 1 0 0 Insufficient
Dry December 2 2 0 1 0 0 Insufficient
KEY: D= Dry, W= Wet 0 Not available, 1 Scarce, 2 Available but inadequate, 3 Plenty N/B Natural pasture form bulk of feed. A=Napier, B=Natural Pasture, C=Boma Rhodes (new), D=Maize Stover, E=Bean Straw, F=Banana Stem/Leaves Constraints and Opportunities in Dairy Farming The PRA group listed the following as the main problems afflicting dairy farming Low quality breeds Feed shortages Poor roads Poor markets Livestock diseases Inadequate skills High cost of inputs Inadequate water
Using the pair-wise ranking matrix in Figure 14, the farmers ranked these constraints before analysing them to determine their respective causes, coping strategies and opportunities (Table 32).
Problem/Constraint LQB FS IW PR PM LD LS HCI Score Rank

77
Low quality breeds (LQB) FS IW LQB LQB LQB LS LQB 4 3
Feed shortages (FS) FS FS PM FS LS HCI 4 4
Inadequate water (IW) IW IW IW LS IW 5 2
Poor roads (PR) PM PR LS HCI 1 7
Poor markets (PM) PM LS PM 4 5
Livestock diseases (LD) LS HCI 0 8
Low skills (LS) HCI 6 1
High cost of inputs (HCI) 4 6
Figure 14: Problem pair-wise ranking matrix for Kuriot village Table 32: Problem Analysis Chart - Kabiyet
Problem/ Constraint
Causes Effects Coping strategies Opportunities
1. Low skills (LS)
Lack of training Lack of attitude
change Lack of exposure Inadequate extension
service
Low production Low Income Human diseases
due to nutritional imbalance Idleness Increased in
school dropout
Awareness barazas to sensitize farmers Engaging youth in
piece meal jobs and short courses Efforts geared to
meet basic needs only Borrowing from
neighbours.
Training on dairy husbandry and provision of start-up capital Group formation Gender
empowerment through training and group formation.
2. Inadequate water (IW)
Lack of community participation in pooling resources High cost of piped
water projects Lack of water
harvesting skills High cost of water
storage facilities
Poor sanitation Human disease &
livestock diseases due to poor hygiene A lot of time spent
in fetching water Not able to have
kitchen gardens Low milk
production
Trekking long distance and waking up early to reach the source Dig shallow wells
but need to fetch the water very early buying small
water storage tanks
Community empowered through group formation, hence proposal for support
3. Low quality breeds (LQB)
Inadequate A.I service Use of local bulls
(unproven sires) Low management
standards High cost of quality
breeding stock Low skills
Low milk production Low income
(returns) Low productivity
Use of AI by a few Use of local bulls Skipping of
service
Formation of groups Use of A.I Castration of Local
bulls Destocking to
acquire quality breed. Strengthen & revive
one cooperative( Kuriot) Training & Capacity
building.
4.Feed Lack of feed Low milk Leasing of Pasture & fodder
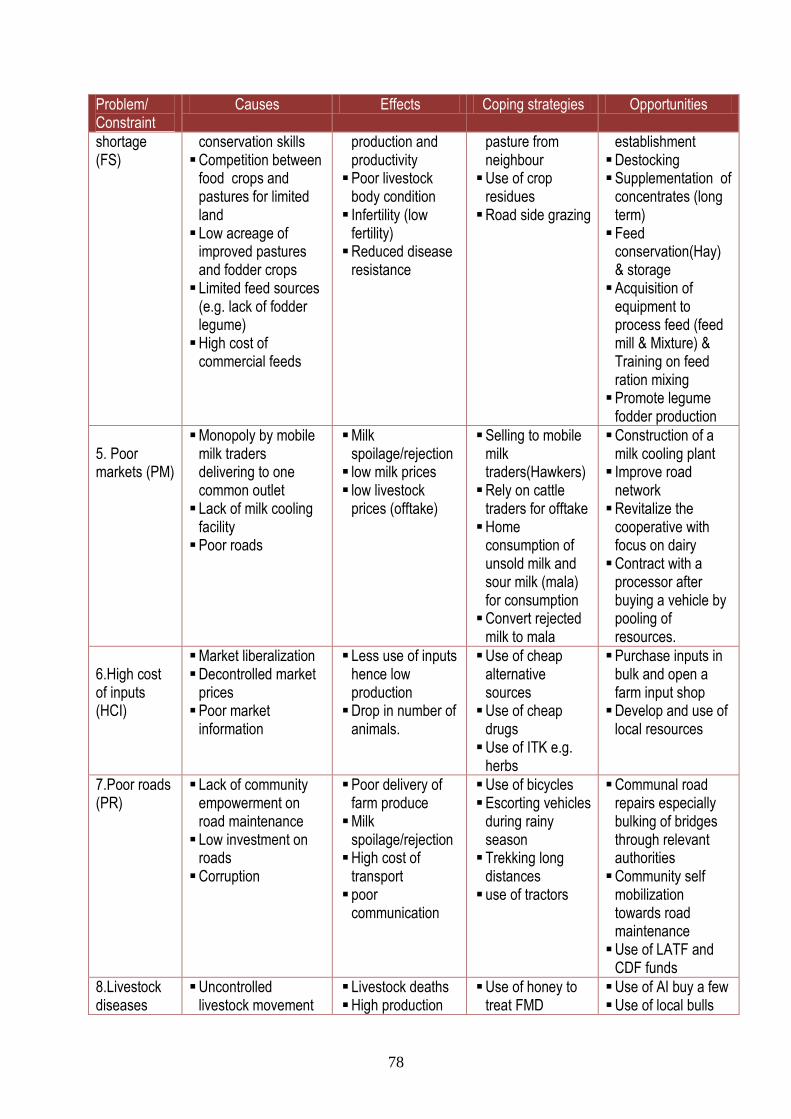
78
Problem/ Constraint
Causes Effects Coping strategies Opportunities
shortage (FS)
conservation skills Competition between
food crops and pastures for limited land Low acreage of
improved pastures and fodder crops Limited feed sources
(e.g. lack of fodder legume) High cost of
commercial feeds
production and productivity Poor livestock
body condition Infertility (low
fertility) Reduced disease
resistance
pasture from neighbour Use of crop
residues Road side grazing
establishment Destocking Supplementation of
concentrates (long term) Feed
conservation(Hay) & storage Acquisition of
equipment to process feed (feed mill & Mixture) & Training on feed ration mixing Promote legume
fodder production
5. Poor markets (PM)
Monopoly by mobile milk traders delivering to one common outlet Lack of milk cooling
facility Poor roads
Milk spoilage/rejection low milk prices low livestock
prices (offtake)
Selling to mobile milk traders(Hawkers) Rely on cattle
traders for offtake Home
consumption of unsold milk and sour milk (mala) for consumption Convert rejected
milk to mala
Construction of a milk cooling plant Improve road
network Revitalize the
cooperative with focus on dairy Contract with a
processor after buying a vehicle by pooling of resources.
6.High cost of inputs (HCI)
Market liberalization Decontrolled market
prices Poor market
information
Less use of inputs hence low production Drop in number of
animals.
Use of cheap alternative sources Use of cheap
drugs Use of ITK e.g.
herbs
Purchase inputs in bulk and open a farm input shop Develop and use of
local resources
7.Poor roads (PR)
Lack of community empowerment on road maintenance Low investment on
roads Corruption
Poor delivery of farm produce Milk
spoilage/rejection High cost of
transport poor
communication
Use of bicycles Escorting vehicles
during rainy season Trekking long
distances use of tractors
Communal road repairs especially bulking of bridges through relevant authorities Community self
mobilization towards road maintenance Use of LATF and
CDF funds
8.Livestock diseases
Uncontrolled livestock movement
Livestock deaths High production
Use of honey to treat FMD
Use of AI buy a few Use of local bulls

79
Problem/ Constraint
Causes Effects Coping strategies Opportunities
(LD) Mismanagement of dips and lack of proper tick control No strict vaccination
programme Use of unscreened
bulls Inadequate
veterinary services.
cost Low production Zoonotic diseases
e.g. brucellosis
Vaccination following outbreak Boiling of milk to
prevent Brucellosis Isolation of sick
animals Hand spraying Quarantines
Skipping of service Formation of
groups Use of A.I. Castration of Local
bulls Destocking to
acquire quality breed. Strengthen & revive
one cooperative (Kuriot) Training & Capacity
building
Emerging Issues Critical to policy and a good enabling environment for dairy development are some issues that came out of the PRA process in Kuriot. There is gross understaffing of the livestock department – the farmers would wish to have more extension staff posted to the area. Dairy technology services should be more accessible for the goals of the project to be met as farmers require more training. Farmers also noted that the government and other actors can work with them to improve water supply. The farmers need to be informed clearly of the development projects in livestock and all the actors to be coordinated. Farmers should be trained on safe use of herbicides and acaricides. Farmers are also recommending subsidized or lower prices of dairy farming inputs. Modalities should be found to have prices of milk to be benchmarked through contracts to avoid fluctuation. The farmers noted that the scanty activities by the Ministry of Livestock are an indication that the funding level is low. This needs to be up-scaled and more staff employed or better ways of reaching more dairy farmers designed. The main infrastructural and other requirements to be addressed include expansion of rural electrification, water project to use the river which is about 2 kms away, credit facility for the vulnerable households or initiate special programmes for these vulnerable groups, enhancement of training farmers on business skills and adult education centre in the village need to be enhanced and men to be encouraged to attend. It is mostly women who attend. Men normally borrow money (loans) from AFC since they own collateral (title deeds) while women go for loans from MFs. Most of the farmers are very risk averse and they fear to take loans [“they will sell my shamba (piece of land) and cows”]. The memory of the 80s when a few farmers lost land as a result of defaulting AFC loans is still alive in the farmers’ minds. KCC is not a preferred choice of selling milk, the past history of non-payment has compounded a great deal of mistrusts. The farmers and the old KCC have a history of collaboration, in creating a reliable market of milk. This collaboration collapsed when the KCC failed to pay farmers and has culminated into mistrust. The village does not have coordinating mechanisms to bring all the actors together. EADD-P may in some way start these coordinating networks through a dairy stakeholders’ forum.

80
Lessons and Way Forward
Lessons Learnt
This baseline study has shown the rationale and importance of the approaches, methodologies and tools of Participatory Rural Appraisal (PRA) to enable constraint analysis, to understand the complexities of dairy farming systems and to improve integrated dairy productivity. Implicit in this regard was the focus on dairy development as an economic hub for improved dairy farmer incomes and milk production. The report has detailed the processes and outputs of site selection, site description and characterization (diagnosis), PRA exercise documentation and dairy development priorities, challenges and opportunities in each village. This, it is hoped, will allow an efficient, relevant, result-oriented and quality design, implementation and evaluation of the activities of the EADD project to improve dairy productivity. It will also enhance informed participation by all the actors including the dairy farmers. To do this, the report hereby documents some key lessons:
1. Farmers have diverse criteria used to classify households by wealth. The households in the various wealth categories have varying challenges of engagement in dairying but also have differential opportunities and drive to invest in dairy farming. A number of alternative livelihood activities support farmers in the study villages. In all villages, dairy farming is the most important source of livelihood. There is however a positive synergy between dairying and the other livelihood activities. Although prioritized differently by the villagers, the other livelihood activities include maize farming, horticulture, sheep and goat rearing, poultry keeping, trade in milk and livestock, small-scale businesses, wage employment and farming of other crops like beans.
2. The three villages are at different stages of preparedness and readiness for the EADD project
and will thus require different approaches and pathways to EADD implementation. In Siongiroi there is already an operational chilling plant run through a cooperative with a capacity of 30,000 kg of milk per but currently handling only 14,000 kg. It is even serving one major milk processor by chilling its collected milk from the area. The other two villages are already part of preparations to establish similar plants for milk collection and chilling. Farmers are already registering as members and have contributed their share of the 10% funding.
3. The farmers use different criteria in selecting dairy breeds. The farmers’ preference for dairy breeds in the village is guided by the following choices. Udder size, coat colour, body size, body shape, posture, milk yield, age and history as well as resistance to diseases. The various breeds are preferred for differed reasons. In all the villages Ayrshire is most preferred for its colour, milk yield, disease resistance and lower feed requirement compared to Friesian
4. In all the villages livestock feeding systems, forage preferences and constraints to livestock
feeding as well as forage seasonality were revealed by the selected PRA tools. Natural pastures are most dominant but are complemented variously by Napier grass, other fodder plants and limited commercial supplementation. There is a general low level of feed conservation due to inadequacies of skills for cost-effective fodder conservation. Most of the times, farmers rely on natural pasture. Napier grass, alongside natural pasture, is mostly used during the dry season. Forage availability remains a major constraint to dairy development.
5. Dairying remains the single most important livelihood activity albeit with a number of constraints. The main problems constraining dairying in the villages include low quality breeds, water shortage, inadequate dairy management skills, poor markets, poor rural infrastructure,

81
livestock diseases, inadequate feeds, expensive feeds and dairy production inputs. The constraints need redress for the farmers to realize the potential of doubling their income from milk and milk production.
6. There are many critical policy issues that should be addressed in order for dairy development objectives of EADD to be met. Top in the list of intervention is an enabling environment which must involve:
a. Milk handling regulation that is not restrictive to farmers of different socio-economic status
b. Capacity building for farmers on emerging, appropriate but profitable dairy technologies including management of chilling plant
c. Support of farmers’ competitive edge in the milk marketing sector d. Control of livestock movement outside and within the village should be maintained to
reduce disease outbreak e. Redress of the breeding policy f. The infrastructure development and maintenance in the area should be in tune with
dairy development needs to facilitate transport of milk, inputs and promote marketing. Other developments that would promote dairy development include telecommunications network, electrification and water development.
g. A technology dissemination enabling environment is also required with adequate extension staff and useful links with research institutions like ILRI and KARI.
7. Participatory approaches for dairy technology dissemination and farmer training will greatly
improve the sustainability of the initiatives under EADD.
Way Forward for EADD
Although, chilling plant is very vital for dairy farming and farmers have shown interest and this would enhance their marketing capacity, there is need for more popularization of the project and clarification of the roles of various partners including the farmers. There is also need for more consultation and empowerment of local dairy farmers to manage the cooperatives and affairs of the chilling plant. Plans should be made for the plants to expand operation into other value addition businesses. There is need for a full fledged gender analysis to improve the mainstreaming of gender issues and concerns that might undermine the project. Some of these issues are less understood but crucial. There is also need to use this study and the subsequent household survey for benchmarking the project performance for use later to monitor continued project relevance, effectiveness, efficiency, quality and impact. Specifically the skills of participatory monitoring and evaluation should be inculcated into the farmers and other implementing partners to build capacity for endogenous learning and correction/redesign. Farmers’ capacity for dairy development must be continuously improved through training and other extension exposure methods. The training should target the requisite skills identified from the PRAs to be severely lacking. These include: Dairy record keeping Breeding and breeding services management Feeding and feed conservation especially the formulation of ‘home made’ rations Clean milk handling Management of dairy cooperatives

82
The training should target the gender/farming groups responsible for each dairying activity. Efforts should be made to facilitate easy access to dairy input services like AI, veterinary supplies and cattle feed at manageable costs. Modalities for farmer involvement in acquisition of the services should be organized through the existing cooperatives or other appropriate means. Infrastructural development must be part and parcel of the EADD capacity building portfolio including engaging the private sector, farmers and the government and local authorities to invest in roads, water supply, ICT for technology dissemination, processing installation dips and crushes. A functional stakeholders platform should be established in each division that would bring together all the actors in the EADD for regular briefing, PM&E and resolution of any conflicts. Farmers, as the primary stakeholders must be kept informed at all stages of the development of the project.

83
Bibliography
Heifer International (2008). Fact Sheet: East Africa Dairy Development Project. Heifer International. Accessed from http://www.heifer.org. [Accessed on 30th October, 2008].
OCHOLA, W.O. 2002. Gender Integration in Agricultural Extension: A Training Guidebook. Eds. L.I. Mwarasomba & G. Mitoko. National Agriculture and Livestock Extension Programme (NALEP), Ministry of Agriculture and Rural Development, Nairobi – Kenya.
Egerton University. 1995. PRA field handbook for participatory rural appraisal practitioners. Egerton University, Njoro, Kenya. (PRA Programme, Egerton University, PO Box 536, Njoro, Kenya)
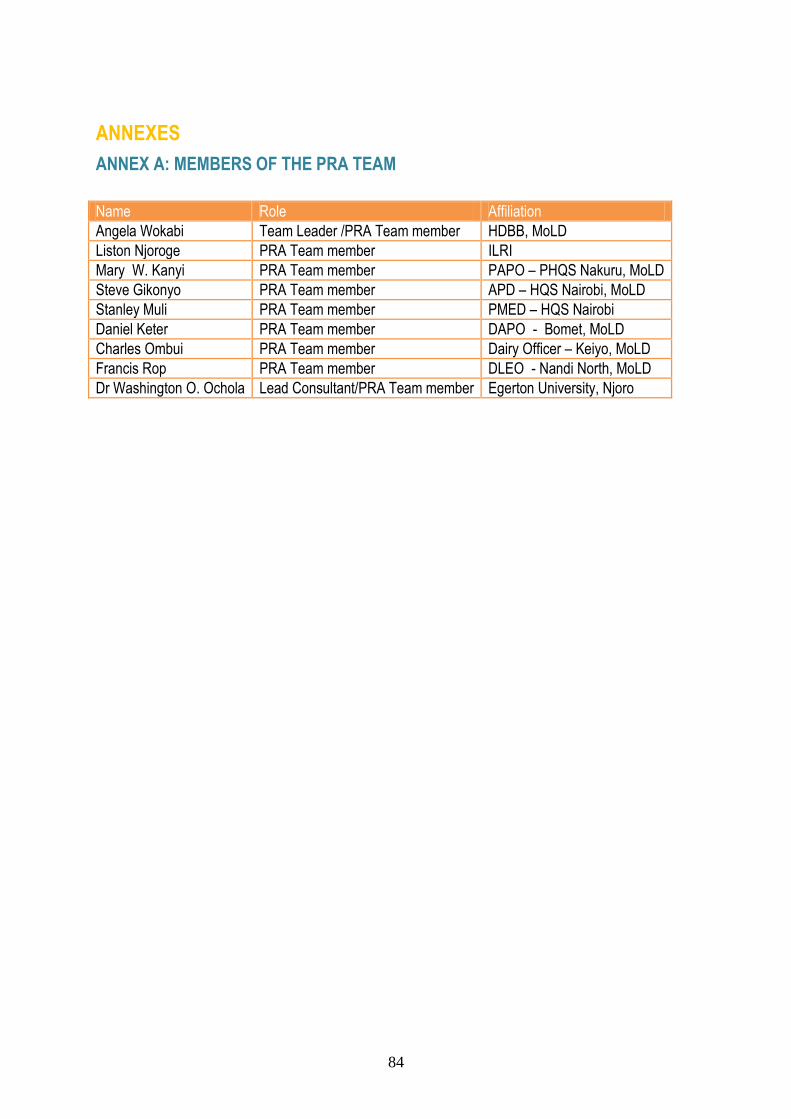
84
ANNEXES
ANNEX A: MEMBERS OF THE PRA TEAM
Name Role Affiliation
Angela Wokabi Team Leader /PRA Team member HDBB, MoLD
Liston Njoroge PRA Team member ILRI
Mary W. Kanyi PRA Team member PAPO – PHQS Nakuru, MoLD
Steve Gikonyo PRA Team member APD – HQS Nairobi, MoLD
Stanley Muli PRA Team member PMED – HQS Nairobi
Daniel Keter PRA Team member DAPO - Bomet, MoLD
Charles Ombui PRA Team member Dairy Officer – Keiyo, MoLD
Francis Rop PRA Team member DLEO - Nandi North, MoLD
Dr Washington O. Ochola Lead Consultant/PRA Team member Egerton University, Njoro

85
ANNEX B: TEMPLATE FOR ANALYSIS OF THE QUALITATIVE SURVEY RESULTS
The team prepares a PRA village workshop report on the following day of each workshop. These village reports provide detailed information about the experiences and findings at each PRA site, and build the base for condensed site reports. The following guideline helps the team to write the field reports in a structured and comparable format. The report is attached to photos and tables taken during the workshops. Cover page Please attach the table below to the documentation of each PRA village workshop. Table 1: PRA village workshop profile information
Country
District Site/hub
Village (PRA site) Date of interview
Venue for the workshop
Duration of workshop
Language of workshop Number of participants Female = Male = Total =
Names of facilitators
Names of note takers
Names of observers
Special conditions (weather, local activities, etc)
Introduction (1 page max) Attach a short description of
1. The project and its objectives 2. The sampling strategy, and why this village was selected.
Give a brief overview on the research process 1. Who participated?
a. e.g. farmers, local leaders; b. e.g. share of wealth groups, gender, age
2. How was the applicability of the PRA tools? 3. How was the communication between the participants and the PRA team? 4. What were special challenges that could have affected the outcomes? 5. Any other relevant observations? 6. Recommendations for future exercises?
PRA results 1. Findings on community sketch map (attach a photo of the map and Table 3)
1. Describe the allocation of local natural resources, infrastructures, social services and their statuses.

86
2. What is the most important economic activity of the community as revealed by the map? 3. Describe the overall land use system. 4. Discuss the relationships between the map items, challenges and opportunities. 5. What are the gender and other crosscutting issues? 6. Comment about the process and discussion around this exercise.
2. Findings on wealth ranking (attach Table 4)
1. Describe criteria for wealth according to the order of importance. 2. Describe the wealth categories. 3. Discuss the importance of livestock regarding the other wealth criteria. 4. Explore farmers’ interest for dairying across the wealth categories. 5. What are the gender and other crosscutting issues? 6. Comment about the process and discussion around this exercise.
3. Findings on community livelihoods analysis (attach Table 5)
1. What are the main livelihoods in order of importance? 2. What are the main sources for cash income and how do they relate to the livelihoods identified
above? 3. What role does dairying play in terms of livelihoods and cash income? 4. What trends did farmers observe in the relative importance of livelihoods and cash income? 5. What are gender and other crosscutting issues? 6. Comment about the process and discussion around this exercise.
4. Findings on constraints and opportunities in dairy farming (insert Table 6)
1. What are the major constraints and problems in dairy farming in the study area? What are the causes and effects of these constraints and problems?
2. What are the current coping/response strategies for each problem? 3. What solutions can be implemented locally? Which ones require outside assistance? 4. What are the gender and other crosscutting issues? 5. What are farmers future aspirations related to dairy farming and marketing? 6. Comment about the process and discussion around this exercise.
5. Findings on innovation actor analysis (attach a photo of the actor linkage map and Table 7)
1. What were the key innovations and who were the actors involved? 2. Describe the actors, their activities (including technologies), achievements and challenges. 3. How do farmers assess their services/inputs (levels of satisfaction) 4. What actors and linkages are considered as important but are weak or missing in the dairy
sector? What are the reasons? 5. What farmer innovators were identified? What were their special activities, linkages, challenges
and limitations? 6. What are the missing actors for improved dairy production and marketing? 7. What institutional and policy changes did farmers observe 8. What differences in linkages occur between actors? Do some resource groups have better
connections than others? 9. Comment about the process and discussion around this exercise
6. Findings on livestock breeding and feeds a) Breeding (attach table)
1. What are the important traits of dairy cattle preferred by community members?

87
2. Which dairy breeds posses these traits? 3. What are the breeding services and strategies linked to the above traits? 4. What are the common breeds of cattle kept across the community? 5. What are the main ways of acquiring animals in the area? 6. Why are certain breeding services preferred and not others? 7. Factors considered in choosing a breeding service? 8. Major constraints faced in accessing preferred breeding services in the research area 9. Existing opportunities for availing other breeding services 10. Comment about the process and discussion around this exercise
b) Feeds and feed sources (attach table) 1. What are the different feeds (including forage) that exist in the community? Which ones come
from outside? Fodder trade? 2. Which forages are preferred by farmers and why? 3. What are the forage production constraints in order of importance? 4. Map forages sources in the community by season 5. What are other feed sources for the community? 6. What are the coping strategies during times of forage scarcity? 7. What types of feed supplements are used by farmers? Sources and cost? 8. Comment about the process and discussion around this exercise
An example of capturing forage constraints
Constraint Rank Affecting
Numbers (production) Productivity
A 1 x x
B 3 x
C 2 x x
D 4 x
Table 1: An example of a simple feed/forage calendar
Season Month Forage sources
A B C D E F G H I J
Dry January 2 1 3 1 1 2
Dry February
Dry March
Wet April 5 3 1 1
Wet May 3 3 2 1 1
Wet June 6 3 1
Wet July 6 3 1
Dry August
Dry September
Wet October 7 1 1 1
Wet November 8 1 1
Wet December 3 5 3 A = Napier grass; B = Maize stover; C = Road side grazing etc Numbers 1-10 refer to the relative contribution of each forage to the animal diet
OR
Feed type J F M A M J J A S O N D
Season D D W W W W W D D W W D
Napier x x x x x x x

88
Stover x x x x x
Hay x x x x x
etc
D= Dry W= Wet etc This will make the results much clearer and easy to follow. Discuss the tables where possible. 7. Discussion and conclusion
1. Highlight the key findings! 2. Did the analysis yield insights in accordance with results that we expected before hand? 3. Did the analysis yield any unexpected insights? If the answer is yes, what types of insights did
it help to generate? 4. What conclusions can we draw from these findings?
a) On the livelihoods in general b) On the role of dairying in people’s livelihoods c) On challenges and opportunities to improve dairy farming and marketing d) On requirements for input supply and service delivery to dairy farmers e) On chances to support farmers’ innovative activities. f) On livestock breeds and breeding services g) On livestock feeds and feeding practices
5. What were the intervention gaps identified and possible recommendations? 6. What were the lessons learnt from the process as well as technical issues?

89
ANNEX C: CHECKLIST FOR COMMUNITY SURVEY
Please fill in the table below, and attach it to the documentation of each PRA workshop. Table 1: PRA village workshop profile information
Country
District
Other administrative unit
Name of Village
Date of village workshop
Duration of workshop
Venue for the workshop
Language of workshop
Number of participants (Female)
Number of participants (Male)
Names of facilitators
Names of note takers
Names of observers
Special conditions (weather, local activities, etc)
OVERVIEW OF SURVEY PROCESS Preparation before PRA workshop Preliminary activities before the workshop will include: Awareness creation about the EADD project: Objectives, activities to the selected community
members. Mobilization for the PRA workshops, setting the dates for each village and requesting
representation of all wealth groups. The team should invite at least 30 participants. Since the study is targeting dairy farmers, it’s important that the selection of participants be conducted in a way that provides an audience that consists of people with interest in dairying. The 30 participants should have equal representation by gender and should be adults of age range 18-65 years. The project team should avoid inviting very young people as they can not make decisions for themselves while very old people will have hearing problems. The project team should invite the maximum number to allow for people dropping out. Each group will be manned by two facilitators.
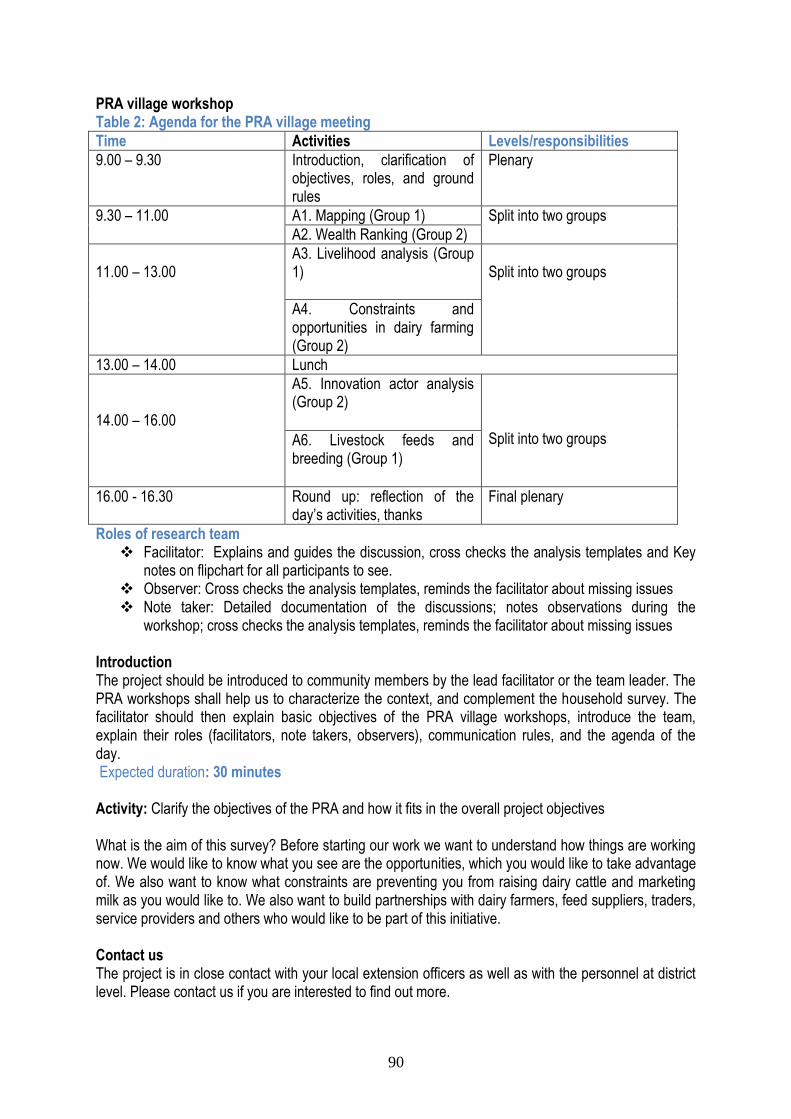
90
PRA village workshop Table 2: Agenda for the PRA village meeting
Time Activities Levels/responsibilities
9.00 – 9.30 Introduction, clarification of objectives, roles, and ground rules
Plenary
9.30 – 11.00 A1. Mapping (Group 1) Split into two groups A2. Wealth Ranking (Group 2)
11.00 – 13.00
A3. Livelihood analysis (Group 1)
Split into two groups
A4. Constraints and opportunities in dairy farming (Group 2)
13.00 – 14.00 Lunch
14.00 – 16.00
A5. Innovation actor analysis (Group 2)
Split into two groups
A6. Livestock feeds and breeding (Group 1)
16.00 - 16.30 Round up: reflection of the day’s activities, thanks
Final plenary
Roles of research team Facilitator: Explains and guides the discussion, cross checks the analysis templates and Key
notes on flipchart for all participants to see. Observer: Cross checks the analysis templates, reminds the facilitator about missing issues Note taker: Detailed documentation of the discussions; notes observations during the
workshop; cross checks the analysis templates, reminds the facilitator about missing issues Introduction The project should be introduced to community members by the lead facilitator or the team leader. The PRA workshops shall help us to characterize the context, and complement the household survey. The facilitator should then explain basic objectives of the PRA village workshops, introduce the team, explain their roles (facilitators, note takers, observers), communication rules, and the agenda of the day. Expected duration: 30 minutes Activity: Clarify the objectives of the PRA and how it fits in the overall project objectives What is the aim of this survey? Before starting our work we want to understand how things are working now. We would like to know what you see are the opportunities, which you would like to take advantage of. We also want to know what constraints are preventing you from raising dairy cattle and marketing milk as you would like to. We also want to build partnerships with dairy farmers, feed suppliers, traders, service providers and others who would like to be part of this initiative. Contact us The project is in close contact with your local extension officers as well as with the personnel at district level. Please contact us if you are interested to find out more.

91
NB/ Insert contact names and addresses of the key actors in this country. You may want to choose one actor to be the key contact person. A1. Mapping (Group 1) Objective: The main objective of this exercise is to develop area profile by mapping the natural resources, infrastructures, social services and land use system within the village. Tools: Village resource map and focus group discussion, in plenary. Expected duration: 1 ½ hours Activities: Ask group members to map out their village/region and its key natural resources, infrastructures, social services and land use system. The checklist below should guide the discussion with community members.
1. Where are the locations of the most important area landmarks surrounding your community (give example of landmarks – external boundaries)?
2. Which resources are available in the village, which are considered to have an impact on people’s livelihoods (e. g., crop fields, rangelands, grazing reserves, rivers, degraded areas)?
3. Map the village infrastructure (e. g., settlement patterns, roads, power supply, network access, different types of water points/sources, community buildings, shops, commodity markets, livestock markets/milk collection points, dip tanks, livestock crush, veterinary posts/clinic, sources of stock feeds)
4. What social services (e. g., health clinics, schools, dwelling places of village authorities, community meeting place, or other important facilities) exist in the area?
5. What are the main land use and resource management systems in the area (e. g., allocation of cropping, communal rangelands, grazing reserves (browse and fodder plant species), seasonal herd movement, areas that herders associate with diseases)?
Interviewing the diagram (Questions to ask or observations to make during the Mapping process) 1. Which resources are plentiful? Which are scarce or lacking? 2. Does the community have land that is held in common? Who makes decisions about how
common resources are used? 3. Where are different livestock kept? Where do they graze? (Specifically cattle) 4. Which resources are used-particularly in terms of raising and caring for livestock? By whom?
Which resources are unused? Which of the resources indicated are the most problematic in relation to raising livestock? (Specifically cattle)
5. Do women and men have different access rights to resources for livestock and related agricultural production? If yes, what are they and how do they affect women and men’s capacity to undertake animal husbandry activities? Other agricultural activities?
6. In the household, who makes decisions on the use of land? Water? Livestock/livestock products? Fodder species planted? Species and breeds of livestock raised?
7. What are some of the challenges to raising livestock in the area (e.g. seasonal migration to grazing areas, seasonal migration for labour, and other challenges)?
8. Where are the markets for livestock/livestock products? The input and outlet markets? What are the distances? How are they accessed? By whom?
Expected outputs:

92
- Allocation, opportunities and constraints in natural resources, infrastructure and social services - Identify significant land use and resource management issues in relation to dairy farming
Table 3: Template for analysis – Mapping
Mapping issues Detailed information
Natural resources
Water
Crop fields
Rangelands
Gardens
Irrigation schemes
Mines
Others (specify)
Infrastructure
Roads
Settlements
Commodity markets
Milk sale point (informal or cooperative/ self-help group)
Milk cooler/ processor
Dip tank/cattle crush
Vet Clinic
Stock feed sources
Others (specify)
Social services
Health
Schools
Church
Local administration
Traditional Authorities
Extension offices
NGO offices
Others (specify)
Land use system
Croplands and use of crop residues
Communal rangelands
Grazing reserves
Seasonal herd movements
Others (specify)

93
A2: Wealth Ranking (Group 2) Objective: To determine the distribution of wealth within a community based on assets owned and income and the links between livestock ownership and well being (critical herd sizes). To establish the link between wealth standards by social category and capture farmers’ interests and motivations to invest in dairy farming. Tools: Review of secondary material (earlier PRA reports for the area), Group discussion of local criteria for wealth (triangulation tool), Piling, and card/bean ranking can assist in categorising the community. Participants for wealth ranking: A mixed group of men and women from the community should do the wealth ranking in each village at an appropriate place. Tools: Review of secondary material (earlier PRA reports for the area); group discussion of local criteria for wealth (triangulation tool) and its distribution; ranking with key informants can assist in categorising the community. Expected duration: 1 ½ hours Activity:
1. Explain clearly the aim of the project and why it is important for us to understand the different types of wealth categories and the particular types of opportunities and challenges they face. Stress the confidentiality of any personal information that is collected.
2. Identify (and rank) local criteria for wealth, checking for aspects such as number of livestock owned, size of land owned, education, housing type.
3. Define thresholds for wealth categories and check how many households (%) fall in each category.
4. Discuss status of female-headed households, and households headed by older people and ethnic minorities by each category.
5. Identify farmers’ trends to invest in dairy production by each category.
Expected Outputs - Local criteria for wealth categories and the critical herd size for the different wealth categories - Percentage of households by wealth categories - Differences by gender, age and ethnic minorities between wealth categories - Differences by farmers’ interests/motivation to commercialize livestock production by wealth
categories (e.g., distress sales, livestock as business, investment options)
Table 4: Template for analysis – Wealth ranking
Criteria for wealth
Wealth category
Better-off Moderately poor Very poor
Livestock numbers, by species. For cattle, differentiate by breed
Land size
External income (off-farm)

94
Education for children
Housing standard
Others (specify)
% of households in each category (to be done with key informants)*
Differences by gender, age, ethnic minority
Differences by milk marketing orientation
*This table should be completed on the second day with key informants A3: Livelihoods analysis (Group 2) Objectives: To identify important livelihood activities and income sources (on farm, off-farm, and non-farm) and trends. To capture differences in key livelihood sources by gender. Tools: Livelihoods matrix supplemented by focused group discussion with a mixed group. Expected duration: 2 hours Activity: Ask group members to list and rank main sources of livelihoods and cash income both from within and outside the area. Emphasise the role of dairy related activities compared to the other activities. Discuss if the importance of livelihood activities has changed in the past ten years. Discuss the situation faced by women headed households and households headed by older people and other particular groups identified in the wealth ranking.
1. What are the main sources of livelihoods and cash income in the area? 2. Rank the sources of livelihoods in order of importance. What is the importance of dairy farming
compared to other activities? 3. What livelihood activities are important sources of cash income? Is dairy an important
component? 4. What activities are new and what other changes did farmers observe in the relative importance
of the livelihoods? 5. What differences do you observe for women and men (e.g., access to land and livestock,
control over production and sale) Expected Outputs
Matrix showing key sources of livelihoods and cash income, as well as the changes in importance, by gender
Table 5: Template for analysis – livelihood analysis
Current sources of livelihoods
Contribution to livelihoods (Rank in order of importance)
Contribution to cash income (1=very important, 2=somehow important, 3=not important)
Trends (1=becoming more important 2=less important, 3=new activity)
Differences in terms of gender, age, ethnic minorities
1.

95
2.
3.
4.
5.
A4: Problem/Constraints and opportunities in dairy farming (Group 1) Objective: To identify major constraints and problems in dairy farming and to broaden the discussion about their causes and effects. Highlight current coping or response strategies and to indicate whether efforts to address a particular problem have already been tried and failed or have incompletely addressed the problem. Tool: Problem ranking and Problem Analysis Chart Expected duration: 2 hours Activity: Organise a mixed group of men and women and ask them to think about their problems. Ask them to list at least six problems that are most important to them in dairy farming. The group should then rank the problems according to importance and use different amount of stones to represent the ranking - the greater number of stones, the greater emphasis they place on the problem. Ask the group to discuss the causes and effects of these problems. Draw a problem analysis chart that lists the priority problems, the causes and effects, the coping or response strategies, and the opportunities or proposed solutions for change. Questions to ask during the process:
1. Which problems/constraints are related? 2. Which groups (social categories) share which problems? 3. What are the current coping/response strategies for each problem? 4. Do men and women cope differently? Why these solutions were not already
implemented? What solutions can be implemented locally? Which ones require outside assistance?
Table 6: Problem analysis chart
Problem/Constraint Causes/effects Coping strategies Opportunities
1.
2.
3.

96
4.
A5: Innovation systems and actor analysis14 (Group 2) Tools: Focused group discussion, actor linkage map, actor analysis matrix. Expected duration: 2 hours Objectives: This session is aimed at:
Identifying and documenting the status of innovations in dairy industry (as these relate to the EADD),
Identifying major actors in the dairy innovation systems, the roles they play, and activities in which they are involved,
Assess attitudes and practices of main actors (focusing on the way they work, particularly their history of collaborations, pattern of trust, culture of innovation, etc.)
Understand patterns and effects of interactions (particularly risk taking behaviours, informal/formal networks, partnerships, actor coordination mechanisms, etc.)
Assess the enabling environment (policies and infrastructure) Activities:
1 Identify and document status of innovations in dairy industry as these relate to the EADD
(a) What are the major innovations in the dairy industry? (Suggestion: first, ask group members to list prevailing conventional inputs, products and process or practices in the diary industry. Then ask them to identify (and for you to document) new and emerging innovations. Structure the discussion around:
(new) breeds and feed/fodder selected and adopted
(new) animal services received or bought
(new) products being implemented; new processes applied (for example, do farmers convert milk into other products and how?)
packaging and other innovations
(new) organizational innovations at the household level and community levels (for example, cooperatives societies being established).
Other relevant innovations (b) Who are the innovative farmers? (Identify innovative farmers in the dairy innovation system, and give some characteristics of these farmers – are they rich, poor farmers; are they women farmers, educated farmers, etc. Also give some indications of their numbers).
14
Key Definitions: Innovation: often refers to the use of new ideas, technologies or ways of doing things, in a place
where or by people whom they have not been used before. It includes not only new knowledge and technologies but also
new practices, organisational and institutional arrangements introduced into and used in an economic and social process.
Innovation systems: set of interrelated actors, their interactions, and institutions that condition their behaviour with respect
to bringing new products, new processes, and new form of organization or institution into social and economic use.
Actors: are those who introduce and use innovations – including individuals like smallholder dairy farmers, government and
non-governmental organizations, research organizations, the private sector, etc.

97
Table 7: Status of Innovations analysis chart
Conventional activities Innovations Innovating farmers
1.
1. 1.
2.
2. 2.
3.
3. 3.
4.
4. 4.
5.
5. 5.
6.
6. 6.
7.
7. 7.
8.
8. 8.
9.
9. 9.
10.
10. 10.
2 Identify actors in the dairy innovation systems, the roles they play, and activities
in which they are involved a. Who are the important actors in dairy production, processing, marketing and
use? b. What are the core activities that major actors perform? What did they basically
achieve in your village? c. Are the actors still active in the village? d. What are their main constraints? Do they vary by season? e. Do different actors in the community link with different people, or have different
types of links, for example, richer households, migrants, minority ethnic groups?
Summarize the discussion around the actors by an actor matrix. Characterize the actors by their activities, achievements, constraints, linkages, status, and satisfaction. Think of the major actors like research organizations, various input suppliers, regulators, providers of animal health services, providers of relevant information including about market, buyers of milk, etc.
3 Understand patterns and strengths of interactions a. How important are these actors to you? b. With whom are they interacting? How strong/effective are those links?
(Categorize actors according to their importance. As you do this think about the quality of interaction you make with them; the frequency and speed of interaction, physical distance between actors, etc. Also think about if interactions vary by season. Indicate with arrows on the actor linkage map (0 = have no link, dotted line = link exists but not functioning, thin line = link exists but weak, thick line = strong and effective; arrows denote direction of information or service flows).

98
c. Where and how frequently do you interact with these actors (media used, location)? Arrange the actors on a manila/flip chart according to their distance from the community/village, clarify if they are inside or outside the community/village, and in relation to the final consumers
d. Are interactions two or one way flows? e. What new actors and/or new links would you like to create, or strengthen to
help you with your dairy production? Identify missing actors and linkages, using different colours than previously.
f. What actors are missing for improved dairy production and marketing in your area? What activities and achievements would you expect from the missing actors? How should they be linked to the existing actors?
4 Assess attitudes and practices of main actors (collaborations, trust, culture of
innovation, etc.)
(a) If any which actors have histories of collaboration? In which innovation areas were these collaborations?
(b) Are there some formal/informal networks in the dairy innovation systems? (c) Are there mechanisms for coordinating actors in the dairy innovation systems? Identify
these mechanisms. (d) Do actors trust each other in what jointly do? (e) Give more indicators of attitudes and practices
(Provide a comprehensive list of attitudes and practices)
5 Assess the enabling environment (policies and infrastructure) (a) What are the (current) enabling (or constraining) policies, regulations, guidelines
relevant to the dairy industry? (b) If any, what resources (personnel, budgetary, etc.) are allocated to the industry? (c) What are the relevant and available (or missing) infrastructures to the dairy industry?
(These may include ICTs and credit facilities). (Produce a list of policies at all levels that have impact on dairy production and use: identify current policies, regulations, guidelines, resource allocations to the dairy sector…. Also list infrastructure relevant to the dairy sector, including ICT, roads, etc.) Expected outputs:
Actor Linkage map showing key actors and their links with farmers, within the village, outside the village, and in relation to main milk markets, as well as innovative farmers and missing actors and their expected linkages.
Matrix summarizing participants opinion of the inputs and services provided by the actors, particularities of innovators and expectations towards missing input and service providers.

99
TABLE 8: TEMPLATE FOR ANALYSIS – INNOVATION ACTOR MATRIX
Key actors Activities and services
Achievements Challenges Status 0= Not active in the village 1= present in the village but less active 2= Present in the village and fully active
Linkages 0=no link 1= link not functioning 2= link is weak 3= link is strong
Satisfaction 1=good, 2=satisfactory 3= poor
Village based actors (e.g., traditional authorities, healers)
Dairy input providers (e.g., feeds, health, breeding, water)
Milk buyers (e.g. small scale traders, transporters, cooperative/SHG, processor etc)
Community Based organizations (CBOs) (e.g., farmers groups, women groups, livestock clubs)
Modern political organization (e.g., community chairmen,

100
councillor)
Gov. dept. (e.g., veterinary, livestock extension, livestock marketing, crop extension, police, state cooperatives)
Non-governmental organizations (e.g., World Vision, Heifer International)
Financial (banks, micro-savings organizations etc)
Farmer innovators
Missing actors
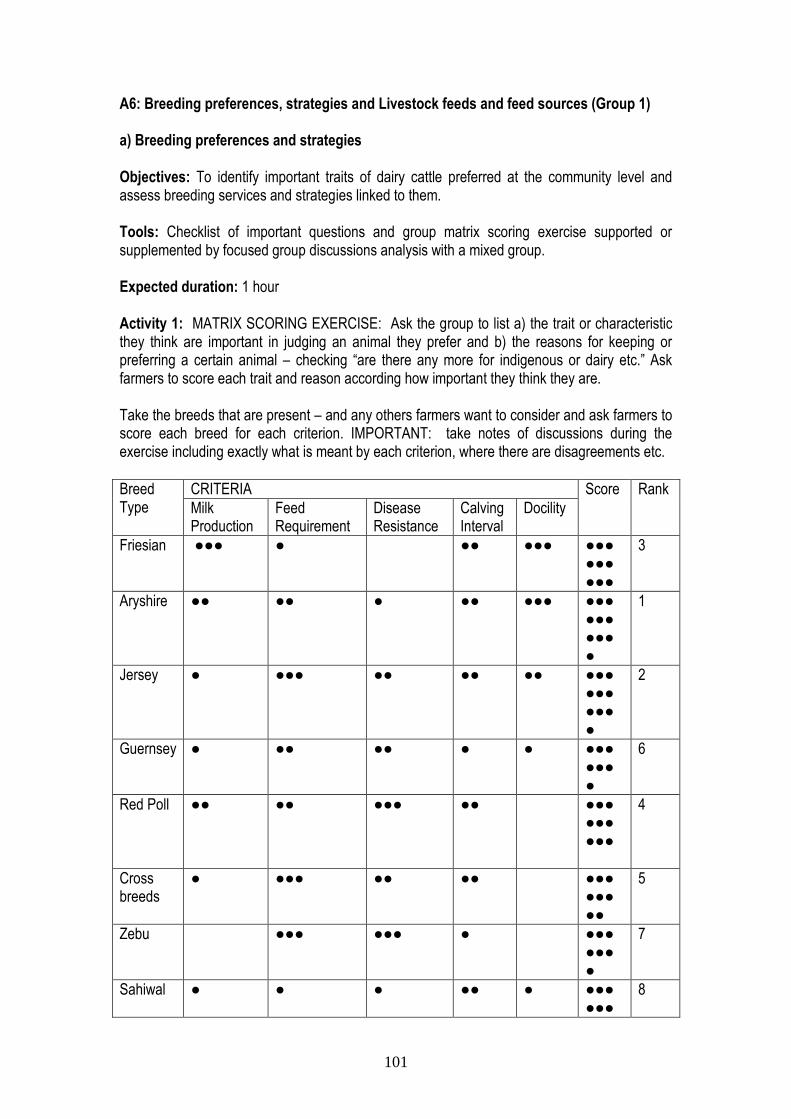
101
A6: Breeding preferences, strategies and Livestock feeds and feed sources (Group 1) a) Breeding preferences and strategies Objectives: To identify important traits of dairy cattle preferred at the community level and assess breeding services and strategies linked to them. Tools: Checklist of important questions and group matrix scoring exercise supported or supplemented by focused group discussions analysis with a mixed group. Expected duration: 1 hour Activity 1: MATRIX SCORING EXERCISE: Ask the group to list a) the trait or characteristic they think are important in judging an animal they prefer and b) the reasons for keeping or preferring a certain animal – checking “are there any more for indigenous or dairy etc.” Ask farmers to score each trait and reason according how important they think they are. Take the breeds that are present – and any others farmers want to consider and ask farmers to score each breed for each criterion. IMPORTANT: take notes of discussions during the exercise including exactly what is meant by each criterion, where there are disagreements etc.
Breed Type
CRITERIA Score Rank
Milk Production
Feed Requirement
Disease Resistance
Calving Interval
Docility
Friesian ●●● ● ●● ●●● ●●● ●●● ●●●
3
Aryshire ●● ●● ● ●● ●●● ●●● ●●● ●●● ●
1
Jersey ● ●●● ●● ●● ●● ●●● ●●● ●●● ●
2
Guernsey ● ●● ●● ● ● ●●● ●●● ●
6
Red Poll ●● ●● ●●● ●● ●●● ●●● ●●●
4
Cross breeds
● ●●● ●● ●● ●●● ●●● ●●
5
Zebu ●●● ●●● ● ●●● ●●● ●
7
Sahiwal ● ● ● ●● ● ●●● ●●●
8

102
The following check list questions will be used for activity 1:
How did you learn about and end up with the breeds you currently keep? (historical reasons, availability, extensionists’ advice, due to lack of information on available breeds)
What is the most common breed of cattle kept across the group?
Are there other breeds that you would choose – if so why do you not keep these breeds? E.g. if keep Jersey, why not keeping Friesian?
What is the main way of acquiring animals in the area (purchase/gift/calf etc)
If they purchase why do they not rear their own?
If they purchase how do they decide which animal to buy o What information do they request from the seller o What characteristics do they look for o If parentage not mentioned – ask if this is important etc. etc. o Where do they get the animals from
If they reared their own – why did they not purchase? Activity 2: MAPPING EXERCISE: Map breeding services (i) available and (ii) preferred in the area. This can be done on the ground or on large pieces of paper. It should include all bulls the farmers know of in the area as well as all other source of breeding services (different AI providers) and the distances from them. Sources of hired and purchased animals could also be included if wished. IMPORTANT:- Take good notes of discussion/disagreements etc. MAPPING OF BREEDING SERVICES
Breeding Service Ownership Distance to service (Km)
Preference
Bull Communal
Individual
0.5 Selection within herd
A.I Private
GoK
5 35
A.I preferred over bull but availability low and cost high
Some of the checklist questions to be covered during activity 2 include:
Why are certain breeding services preferred and not others?
Which factors are considered in choosing a breeding service?
What are major constraints faced in accessing preferred breeding services in the research area?
If there is no choice – what choices are taken and why? Expected outputs:
A general description of existing and desired breeds in the region. Information on why certain traits and breeds are important will be important and will later be correlated to available breeding services and baseline survey.
General level of demand for certain breeding services will be captured. Moreover information on advantages and constraints associated with different breeding services as well as scope for availing more services will be gathered.

103
b) Livestock Feeding systems and seasonality Objectives: We are interested in capturing the general problems (Physical e.g. limited access to water; disease, quality, quantity of feed etc; Economic e.g. limited access to cash, credit, land etc; Policy and so on) on forage production in areas visited Tools: Focus Group Discussion, Ranking, seasonal calendar and village map Time 1 hour Forage production constraints Probes for forage production constraints
i. Ask for list of general forage production constraints (list and rank) ii. What are their ranking criteria? iii. Discuss how they affect forage production. [It is important to have detailed discussion
here since the nature of the problem (e.g. water scarcity) may be different from group to group. Another example here is making a distinction between overall feed scarcity (i.e. insufficient quantity) and a shortage of high quality feeds.]
Table 9:- Analysis template- for capturing forage constraints
Constraint Rank Affecting
Numbers (production)
Shortage of Forage 1 treffe sriireS
Lack of forage conservation 3 Moderate
Low skills in pasture management 2 Moderate
Forage wastage at times of abundance 5 Moderate
Lack of Equipment 6 Moderate
Water Shortage 4 Serious effect
High Transport Costs 7 Moderate
Forage resource maps
These are already covered under the mapping exercise A1 activity 5. However I suggest that the probing be extended beyond browses and fodder trees to all types of forages. Forage resources could be linked to seasons/seasonal movement of herds or herd routines Seasonal feed calendars We are interested in:
Importance of different forages at different times of the year
Seasonal shortages and solutions applied Seasonal feed calendars shows feed types by month and /or by source The purpose of these is to show (a) general types of all feed or (b) sources of feed, and the proportion of each that are used in each month; and estimation of feed sufficiency of supplies in each month. Probes for seasonal calendars:
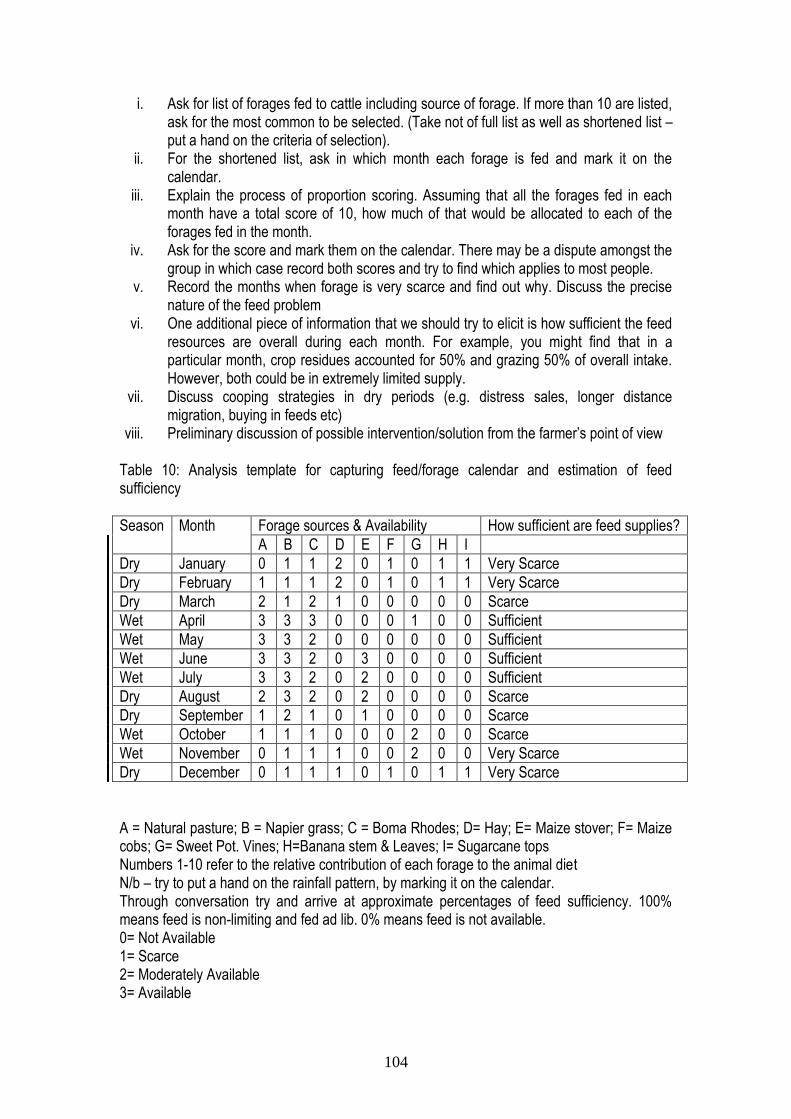
104
i. Ask for list of forages fed to cattle including source of forage. If more than 10 are listed, ask for the most common to be selected. (Take not of full list as well as shortened list – put a hand on the criteria of selection).
ii. For the shortened list, ask in which month each forage is fed and mark it on the calendar.
iii. Explain the process of proportion scoring. Assuming that all the forages fed in each month have a total score of 10, how much of that would be allocated to each of the forages fed in the month.
iv. Ask for the score and mark them on the calendar. There may be a dispute amongst the group in which case record both scores and try to find which applies to most people.
v. Record the months when forage is very scarce and find out why. Discuss the precise nature of the feed problem
vi. One additional piece of information that we should try to elicit is how sufficient the feed resources are overall during each month. For example, you might find that in a particular month, crop residues accounted for 50% and grazing 50% of overall intake. However, both could be in extremely limited supply.
vii. Discuss cooping strategies in dry periods (e.g. distress sales, longer distance migration, buying in feeds etc)
viii. Preliminary discussion of possible intervention/solution from the farmer’s point of view Table 10: Analysis template for capturing feed/forage calendar and estimation of feed sufficiency
Season Month Forage sources & Availability How sufficient are feed supplies?
A B C D E F G H I
Dry January 0 1 1 2 0 1 0 1 1 Very Scarce
Dry February 1 1 1 2 0 1 0 1 1 Very Scarce
Dry March 2 1 2 1 0 0 0 0 0 Scarce
Wet April 3 3 3 0 0 0 1 0 0 Sufficient
Wet May 3 3 2 0 0 0 0 0 0 Sufficient
Wet June 3 3 2 0 3 0 0 0 0 Sufficient
Wet July 3 3 2 0 2 0 0 0 0 Sufficient
Dry August 2 3 2 0 2 0 0 0 0 Scarce
Dry September 1 2 1 0 1 0 0 0 0 Scarce
Wet October 1 1 1 0 0 0 2 0 0 Scarce
Wet November 0 1 1 1 0 0 2 0 0 Very Scarce
Dry December 0 1 1 1 0 1 0 1 1 Very Scarce
A = Natural pasture; B = Napier grass; C = Boma Rhodes; D= Hay; E= Maize stover; F= Maize cobs; G= Sweet Pot. Vines; H=Banana stem & Leaves; I= Sugarcane tops Numbers 1-10 refer to the relative contribution of each forage to the animal diet N/b – try to put a hand on the rainfall pattern, by marking it on the calendar. Through conversation try and arrive at approximate percentages of feed sufficiency. 100% means feed is non-limiting and fed ad lib. 0% means feed is not available. 0= Not Available 1= Scarce 2= Moderately Available 3= Available

105
Final plenary session Objective To share the day’s experience. Allow the whole group to benefit from the exercises and build ownership of the process. Activity Ask the group to reflect on the day’s activities. Expected duration: 15 minutes Closing the Session The session should finish with the group facilitators thanking participants and giving them information about what will happen next.