PROJECT SBA-2 - CGSpace
299
PROJECT SBA-2 IMPROVED CASSAVA FOR THE DEVELOPING WORLD
-
Upload
khangminh22 -
Category
Documents
-
view
1 -
download
0
Transcript of PROJECT SBA-2 - CGSpace

PROJECT SBA-2IMPROVED CASSAVA FOR THE DEVELOPING WORLD

INDEX
CHAPTER 1 Genetic base of cassava and related Manihot species evaluated and available for cassava improvement (320 kb)
Page
Developing source cassava germplasm for the high-carotenoid trait 1-1 Biofertilization trials 1-21 Inter-laboratory study 1-22 genetic transformation work 1-24 Variation of quantifications when extracted carotenoids are stored 1-27 Molecular markers involved in carotene synthesis and accumulation in
cassava 1-29
The effect of the environment in Fe and Zn in cassava roots 1-32 Translocation studies 1-37 Other activities 1-37 CHAPTER 2 Genetic base of cassava and related Manihot species evaluated and made available for cassava improvement: higher commercial value (679 kb)
2-1
Field evaluation of accessions from the germplasm collection 2-1 Induction and identification of a small-granule, high-amylose mutant in
cassava 2-2
CHAPTER 3 Development of new genetic stocks and improved gene pools for their evaluation in key target environments (106 kb)
3-1
Selection of progenitors based on previous cycle results and information from other outputs (I.E., resistance/tolerance, root quality traits, etc).
3-1
Establishment of crossing and production of recombinant seed from previously established blocks.
3-4
Generation and distribution of advanced breeding materials for national programs.
3-6
Selection of recombinant progenies for broad and specific adaptation within major agro-ecosystems
3-8
The use of selection index 3-10 References 3-11
CHAPTER 4 Development of genetic stocks and improved gene pools adapted to the sub-humid environments (269 kb)
4-1
Evaluations and selections in the sub-humid environment 4-1 DIALLEL TRIALS 4-3 Diallel Trials 4-22 Special trials 4-22 References 4-28 CHAPTER 5 Development of genetic stocks and improved gene pools adapted to the acid-soil savannas environments (221 kb)
5-1
Evaluations and selections in the Acid Soils Environment 5-1
Index-I 2007 Annual Report
CIAT
This report has been divided into sections to facilitate downloading. Please click on the links in blue to access each output.
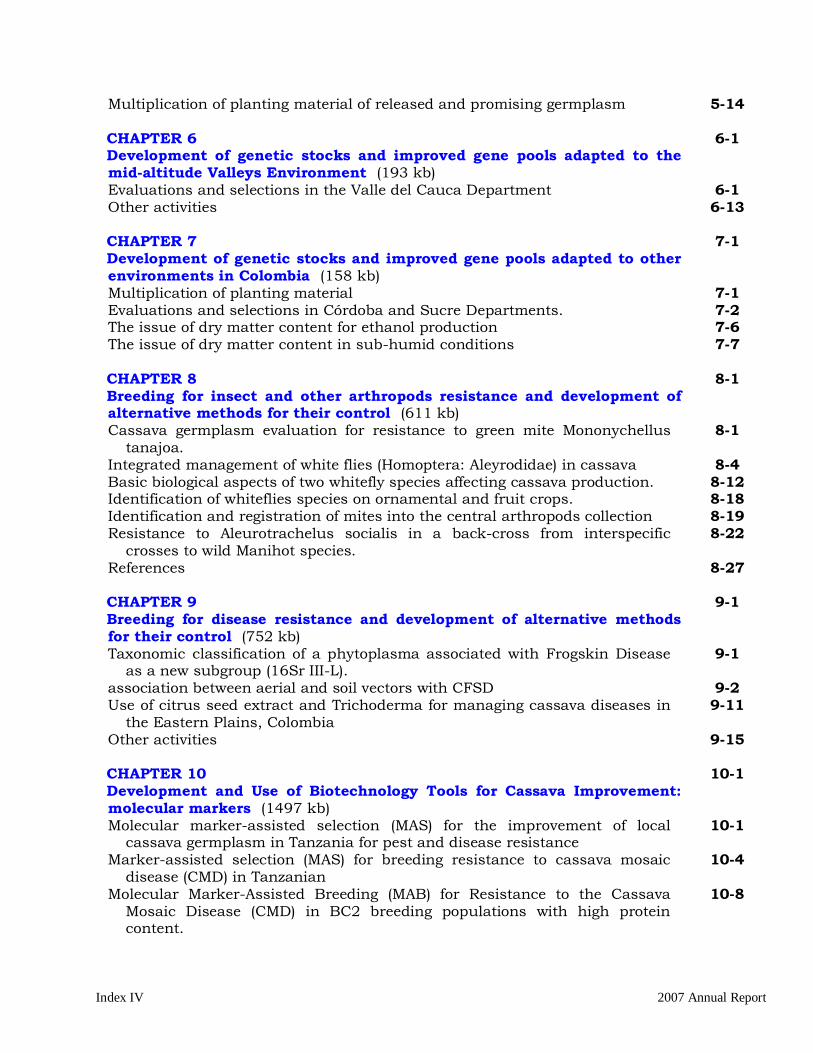
Multiplication of planting material of released and promising germplasm 5-14 CHAPTER 6 Development of genetic stocks and improved gene pools adapted to the mid-altitude Valleys Environment (193 kb)
6-1
Evaluations and selections in the Valle del Cauca Department 6-1 Other activities 6-13 CHAPTER 7 Development of genetic stocks and improved gene pools adapted to other environments in Colombia (158 kb)
7-1
Multiplication of planting material 7-1 Evaluations and selections in Córdoba and Sucre Departments. 7-2 The issue of dry matter content for ethanol production 7-6 The issue of dry matter content in sub-humid conditions 7-7 CHAPTER 8 Breeding for insect and other arthropods resistance and development of alternative methods for their control (611 kb)
8-1
Cassava germplasm evaluation for resistance to green mite Mononychellus tanajoa.
8-1
Integrated management of white flies (Homoptera: Aleyrodidae) in cassava 8-4 Basic biological aspects of two whitefly species affecting cassava production. 8-12 Identification of whiteflies species on ornamental and fruit crops. 8-18 Identification and registration of mites into the central arthropods collection 8-19 Resistance to Aleurotrachelus socialis in a back-cross from interspecific
crosses to wild Manihot species. 8-22
References 8-27 CHAPTER 9 Breeding for disease resistance and development of alternative methods for their control (752 kb)
9-1
Taxonomic classification of a phytoplasma associated with Frogskin Disease as a new subgroup (16Sr III-L).
9-1
association between aerial and soil vectors with CFSD 9-2 Use of citrus seed extract and Trichoderma for managing cassava diseases in
the Eastern Plains, Colombia 9-11
Other activities 9-15 CHAPTER 10 Development and Use of Biotechnology Tools for Cassava Improvement: molecular markers (1497 kb)
10-1
Molecular marker-assisted selection (MAS) for the improvement of local cassava germplasm in Tanzania for pest and disease resistance
10-1
Marker-assisted selection (MAS) for breeding resistance to cassava mosaic disease (CMD) in Tanzanian
10-4
Molecular Marker-Assisted Breeding (MAB) for Resistance to the Cassava Mosaic Disease (CMD) in BC2 breeding populations with high protein content.
10-8
Index IV 2007 Annual Report

Molecular Marker-Assisted Breeding for Resistance to the Cassava Mosaic Disease in populations with high beta carotenes content (yellow fleshed root
10-11
Molecular Marker-Assisted Breeding for Resistance to the Cassava Mosaic Disease in populations with delayed PPD
10-13
Estimation of genetic diversity in parental lines from the Ugandan national program and MAS for CMD resistance in open pollinated pollinations from these parents
10-16
Genetic mapping of multiple sources of resistance to the Cassava Mosaic Disease (CMD)
10-19
Evaluation of Cassava Mosaic Disease (CMD) resistant Latin American Germplasm in Nigeria
10-22
MAS for improvement of traits associated with high and early productivity in cassava
10-26
Controlling Delayed post harvest physiological deterioration in cassava 10-29 Genetic Mapping of Quantitative Trait Loci (QTL) Controlling High Protein
Content in the Primary Gene Pool of Cassava (Manihot esculenta Crantz) and its transfer into Cassava Gene Pools
10-32
Genetic changes as a result of cassava domestication: a study of genes controlling selected traits important for cassava improvement
10-35
Genetic mapping of beta-carotene content from multiple sources in cassava 10-36 Development of populations for genetic mapping of drought tolerance in
cassava 10-42
The Cassava Genetic Information System (CGIS) 10-43 Fingerprinting and Assessment of Genetic Diversity of Cassava Varieties
Cultivated by Small Holder Farmers in the Colombian Atlantic Coast 10-44
Simple Sequence Repeat (SSR) Characterization of Cassava Germplasm in Ghana and Predictability of Heterosis
10-48
Progress in Chromosome walking towards the CMD2 Gene 10-55 Development of a TILLING (Targeting Induced Local Lesions in Genomes)
Protocol for Cassava 10-56
Modification of flowering in cassava by genetic transformation 10-60 Over-expression of the yeast-derived invertase gene in cassava for increasing
dry matter content 10-66
Sharing results of 30 years of cassava breeding: shipments of improved germplasm to Africa, Europe, Asia and Latin America
10-68
Training in 2007 10-69 Proposals funded and under review in 2007 10-70 CHAPTER 11 Development and Use of Biotechnology Tools for Cassava Improvement: doubled haploids and anther culture (290 kb)
11-1
Development of an in vitro protocol for the production of doubled-haploids of cassava
11-1
Other relevant information about this activity 11-11 CHAPTER 12 Increasing the productivity and utilization of cassava in Asia, using farmer participatory approaches (280 kb)
12-1
Index-III 2007 Annual Report

Index IV 2007 Annual Report
Institutional Collaboration 12-3 Collaborative On-Station Research 12-3 On-farm and Farmer Participatory Research (FPR) 12-20 Other activities in the region 12-27 Publications 12-28

Chapter 1-1 2007 Annual Report
CHAPTER 1
GENETIC BASE OF CASSAVA AND RELATED MANIHOT SPECIES EVALUATED AND MADE AVAILABLE FOR CASSAVA IMPROVEMENT: NUTRITIOANL QUALITY
The overall objective of this output is to generate genetic stocks and knowledge about genetic variability for root quality traits in cassava, with a particular emphasis of nutritional quality and special traits to make processing cassava more competitive. The main activities focus in developing and identifying cassava germplasm whose roots have higher carotene contents. Protein, Zn and Fe contents are also important targets. The scope of research does focus on nutrients concentrations, related agronomic characteristics and the effect of processing. In addition, there is a need for a better understanding of the biochemical and genetic basis of these high nutritional quality traits. Because of the nature of the research described in this output, it is one of the many collaborative activities between projects SB2 and IP3, as well as the HarvestPlus Challenge Program, which also involves EMBRAPA from Brazil and IITA. To maintain some coherence through this report some of the activities reported herein may also be reported by SB2 and/or HarvestPlus. 1.1 DEVELOPING SOURCE CASSAVA GERMPLASM FOR THE HIGH-CAROTENOID TRAIT In May 2005 a clearly defined goal of 15 �g of �-carotene per gram of fresh root was established from the nutritional point of view. CIAT cassava breeding project reacted to the establishment of these goals by initiating a rapid cycling recurrent selection scheme” in which crosses among high-carotenoids content genotypes are crossed, the botanical seed produced germinated and the resulting seedlings transplanted to the field for evaluation at the proper age (9-11 months of age). The best genotypes are then immediately incorporated into the crossing blocks and within two years progenies from these elite genotypes (which would be a new cycle of recurrent selection) can be harvested and screened. Traditional recurrent selection in cassava normally requires about 6-8 years for completion. The main objectives of the cassava-breeding project at CIAT therefore are:
a. Obtain cassava germplasm that meets the nutritional objective of �g of �-carotene per gram of fresh root (through the rapid cycling process described above).
b. High-carotenoids genotypes are evaluated for their per se agronomic performance and join the mainstream breeding process.
c High-carotenoids genotypes are routinely crossed with elite germplasm cassava that is then evaluated for their agronomic performance.
d. High-carotenoids genotypes are also crossed with sources of resistance to ACMD to combine the two traits.

Project IP3: improving cassava for the developing world Chapter 1-2
e. In vitro plants of the high-carotenoids genotypes are produced for their shipment to Africa (IITA) so they can be used in the crossing blocks with locally adapted high-carotenoids clones.
f. Contribute to the introduction of high-carotenoids, drought-tolerant germplasm developed or identified by EMBRAPA-Brazil.
1.1.1 NEW CROSSING BLOCKS TO PRODUCE RECOMBINANT SEED (MAY 2007-DECEMBER 2008). Every year the best group of genotypes, based on nutritional quality and other desirable traits is planted to make crosses among them (or in special cases, make self-pollinations) and obtain botanical seed. In May 2007 the following genotypes were included in the crossing blocks to increase one or more nutritional traits and/or combine them with good agronomic performance, including crosses with sources of resistance to Cassava Mosaic Disease.
CROSSES TO INCREASE CAROTENOIDS CONTENT IN THE ROOTS: � A total of 52 clones from the germplasm collection or improved hybrids from the
breeding project. AM 262-12 CM 9961-6 GM 893-16 MBRA 463 MBRA 1251 MCOL 2279 MCOL 2489 AM 320-133 GM 708-42 SM 1859-26 MBRA 467 MBRA 1303 MCOL 2295 MCOL 2547 AM 320-136 GM 708-50 MARG 6 MBRA 496 MBRA 1321 MCOL 2318 MCR 87 AM 320-140 GM 708-63 MBRA 1A MBRA 502 MBRA 1445 MCOL 2330 MPER 297 CM 1015-34 GM 734-57 MBRA 253 MBRA 507 MCOL 2070 MCOL 2354 CM 2452-5 GM 849-33 MBRA 337 MBRA 517 MCOL 2141 MCOL 2401 CM 9816-2 GM 893-4 MBRA 443 MBRA 928 MCOL 2175 MCOL 2436 CM 9961-4 GM 893-5 MBRA 461 MBRA 1107 MCOL 2199 MCOL 2459
� 18 clones selected from the botanical seed introduced from Brazil (F1-2005B), and
evaluated during the harvests of the second semester of year 2006. CB 4-4 CB 4-28 CB 5-9 CB 12-10 CB 46- 3 SB 325-35 SB 326-24 CB 4-10 CB 5-5 CB 5-14 CB 19-10 SB 325-32 SB 325-38 SB 326-31 CB 4-25 CB 5-6 CB 7-9 CB 44-15
� 11 clones selected from botanical seed produced at CIAT (F1-2005B) and evaluated during the harvests of the second semester of year 2006.
SM 3306-1 SM 3306-5 SM 3306-13 SM 3308-24 SM 3308-45 SM 3308-49 SM 3309- 46
SM 3306-4 SM 3306-7 SM 3308-16 SM 3308-27
� 15 clones selected from botanical seed produced at CIAT (F1-2006) and evaluated during the harvests of the first semester of year 2007.
GM 905-3 GM 905-43 GM 905-56 GM 905-60 GM 905-68 SM 3308-48 SM 3308-150 GM 905-21 GM 905-52 GM 905-57 GM 905-66 GM 905-69 SM 3308-63 SM 3308-156 GM 905-37 � 30 clones in poly-crosses.

Chapter 1-3 2007 Annual Report
CROSSES TO INCREASE PROTEIN CONTENT IN CASSAVA ROOTS: � 31 clones reported to have high-protein content (CIAT Annual Report, 2002).
CM 696-1 SM 629-6 MBRA 101 MCOL 689B MCOL 2694 MGUA 76 MMEX 108 CM 3199-1 SM 673-1 MBRA 300 MCOL 1563 MCR 38 MGUA 79 CM 3236-3 SM 734-5 MBRA 1384 MCOL 2436 MCR 136 MGUA 86 CM 5620-3 SM 1406- 1 MCOL 219 MCOL 2459 MCR 142 MGUA 91 CM 7310-1 MBRA 26 MCOL 678 MCOL 2532 MGUA 33 MMEX 95
� 16 additional clones for high-protein identified by the cassava-breeding Project from
evaluations of genotypes from the germplasm collection. MBRA 158 MBRA 890 MCOL 1734 MCR 61 MPAN 7 MPER 286 MVEN 134 MBRA 162 MBRA 900 MCOL 2199 MMAL13 MPER 243 MPTR 49 MBRA 435 MCOL 226B MCOL 2493 � 3 clones that may offer higher-than-normal Fe content in the roots: MBRA 517; MBRA
1400 and MCOL 2489. � 3 clones that may offer higher-than-normal Zn content in the roots: CG 354-2; CM
4919-1 and MPER 496. � 30 clones in poly-crosses.
LOW CYANOGENIC POTENTIAL: � 10 clones for low-cyanogenic potential identified by the cassava-breeding project from
screenings of genotypes from the germplasm collection. MBRA 924 MCOL 304 MCOL 1132 MCOL 1458 MCOL 1516 MECU 141A MPAN 100 MCOL 112 MCOL 1030 MCOL 1185 1.1.2 NEW RECOMBINANT SEED PRODUCED UNTIL DECEMBER 2007. During the year thousands of directed crosses and pollinations in poly-cross nurseries took place. As a result thousands of botanical seed containing new recombinant genotypes were produced and harvested. The process is a continuum that is not interrupted until the crossing blocks are finally harvested to renew the field. The list of new genotypes produced in search of improved nutritional quality (high-carotenoids and/or high protein) is provided in Table 1.1 The amount of new germplasm produced in 2007 (the figure also includes estimations of seed that is expected to be harvested by the end of 2008) doubles the amount produced in 2005. For the first time sources of high carotenoid content and resistance to CMD have been combined in 2007 (112 genotypes).

Project IP3: improving cassava for the developing world Chapter 1-4
In addition, high carotenoid content is also combined with elite germplasm adapted to Zones 1, 2 and 4 (Acid soils, sub-humid environments and mid-altitude valleys). Table 1.1. Seed obtained from crosses targeting increased carotenoids content in cassava roots produced at the crossing blocas in CIAT, Colombia. Type of cross 2005 2006 2007* TOTAL High Carotenoids Between yellow-rooted clones 1096 1291 775 3162 S1 (one self-pollination) 505 688 139 1332 S2 (two consecutive self-pollinations) 132 140 1010 1282 Crosses to clones adapted to Zone1 422 422 Crosses to clones adapted to Zone2 80 80 Crosses to clones adapted to Zone 4 494 494 Combining resistance to ACMD 112 112 Polycrosses 13815 15687 18659 48161 High protein Between high-protein cassava 112 78 1148 1338 S1(one self-pollination) 111 93 1196 1400 Polycrosses 7642 7642 High carotene x high protein 201 12 442 655 TOTAL 15972 17989 32119 66080
1.1.3 RECOMBINANT GENOTYPES PLANTED IN F1 NURSERIES. In March 2007 a total of 3838 botanical seeds obtained previously from crosses among high-carotenoids clones were germinated. In May, a total of 3025 of the resulting seedlings were vigorous enough to be transplanted to the field (78.8% success, which is considered high). These plants will be grown in the field until March-April 2008, when they will be harvested in search of genotypes that have reached the nutritional target of 15 �g �–carotene /g fresh root. Table 2 presents a summary of the 112 families made up of these segregating genotypes. In addition to the nutritional quality related to carotenoids content in the roots of cassava crosses are also made in search of increasing protein content in the roots and, hopefully, to combine the two traits. Because of the current limitation in the number of clones that can be evaluated a reduced number of genotypes for high-protein are planted each season. A total of 183 seeds were put to germinate (March 16, 2007) and, of those, 132 produced seedlings that were vigorous enough to be transplanted to the field (May 11, 2007). At the bottom of Table 1.2 there is a summary of the 24 different families from high-protein progenitors.

Chapter 1-5 2007 Annual Report
F1 – 2006 Nursery (Planted in May 2006). This trial included about 1500 new genotypes. They are the result of germination of new recombinant germplasm. Botanical seeds were germinated (March-April 2006) and transplanted to the field in May 2006. Only one plant represented each genotype. Plants were harvested in March 2007 and screened for high-carotenoids content following the normal step-wise process of selecting first based on color intensity of the root, followed by total carotenoids content (TCC) based on the spectrophotometer quantification of selected intense-yellow rooted clones. The genotypes with highest values for TTC are then selected and their roots evaluated for �-carotene content (BCC) using the HPLC methodology. A total of 1354 genotypes with yellow roots from 38 families were grown (Table 3) and 171 of them were selected because of the intense yellow coloration of their root (Table 4). Of those only 12 had high values of TTC and were evaluated through HPLC. Table 1.2. List of the F1 nursery involving new recombinant genotypes obtained from crosses among high-carotenoids and high-protein cassava clones. The material was transplanted to the field in May 2007.
Family Size Family Size Family Size Family Size Family Size AM 318 3 GM 1380 42 GM 1472 3 GM 1521 33 SM 3360 100 AM 324 87 GM 1381 0 GM 1494 5 GM 1524 4 SM 3361 85 AM 379 21 GM 1382 1 GM 1495 26 GM 1525 4 SM 3362 104 AM 381 30 GM 1383 4 GM 1496 39 GM 1526 3 SM 3363 7 AM 383 11 GM 1384 0 GM 1497 54 GM 1527 5 SM 3364 78 AM 585 16 GM 1385 6 GM 1498 128 GM 1528 6 SM 3365 12 AM 587 13 GM 1386 2 GM 1505 6 GM 1529 6 SM 3366 81 AM 592 76 GM 1387 0 GM 1506 17 GM 1530 12 SM 3367 3 AM 596 6 GM 1388 2 GM 1507 32 GM 1531 9 SM 3368 1 AM 597 33 GM 1389 2 GM 1508 15 GM 1532 5 SM 3369 12 AM 600 5 GM 1390 44 GM 1509 16 GM 1533 7 SM 3370 0 AM 601 18 GM 1391 4 GM 1510 109 GM 1534 22 SM 3371 30 AM 610 85 GM 1392 3 GM 1510 12 GM 1535 27 SM 3372 59 AM 621 10 GM 1392 4 GM 1511 10 GM 1540 3 SM 3373 8 AM 623 162 GM 1393 5 GM 1512 2 GM 1542 0 SM 3374 130 AM 625 98 GM 1394 1 GM 1513 17 GM 1543 5 A1 5 GM 1357 2 GM 1395 1 GM 1514 28 GM 1544 7 C1 3 GM 1359 5 GM 1436 3 GM 1515 24 GM 1545 13 C1 8 GM 1361 5 GM 1449 3 GM 1516 3 SM 3355 103 C2 6 GM 1376 5 GM 1453 1 GM 1517 95 SM 3356 53 GM 1377 6 GM 1469 32 GM 1518 22 SM 3357 109 Total of GM 1378 5 GM 1470 4 GM 1519 72 SM 3358 99 transplanted 3025 GM 1379 3 GM 1471 79 GM 1520 32 SM 3359 43 plants
Crosses for high-protein content AM 423 43 GM 905 10 GM 1399 5 GM 1503 1 GM 1537 0 AM 426 2 GM 1328 2 GM 1417 0 GM 1504 1 GM 1538 2 AM 588 1 GM 1396 2 GM 1499 2 GM 1522 2 GM 1539 0 AM 590 5 GM 1398 0 GM 1501 2 GM 1523 7 GM 1541 5 AM 624 22 GM 1399 15 GM 1502 3 GM 1536 0 Total 132

Project IP3: improving cassava for the developing world Chapter 1-6
Table 1.3. List of the 38 full-sib families among yellow-rooted clones evaluated in March 2007. The genotypes with the most intense yellow coloration were selected and subsequently evaluated for TCC and the best for BCC. Family Size Family Size Family Size AM 318 44 GM 1354 2 SM 3298 108 AM 585 2 GM 1355 4 SM 3299 97 GM 1375 11 GM 1356 2 SM 3300 35 AM 587 18 GM 1357 2 SM 3301 1 AM 592 157 GM 1358 5 SM 3302 2 AM 594 2 GM 1359 1 SM 3303 10 CM 9365 16 GM 1361 62 SM 3304 51 GM 709 6 GM 1362 21 SM 3305 77 GM 905 97 GM 1363 77 SM 3306 91 GM 1324 2 GM 1373 28 SM 3307 27 GM 1346 10 GM 1374 12 SM 3308 102 GM 1352 1 SM 3296 1 SM 3309 155 GM 1352 11 SM 3297 4 TOTAL 1354
Figure 1 illustrates the relationship between the TCC values and cyanogenic potential of the sample of roots from the 171 clones selected for further analyses in the March 2007 harvest of the F1 nursery. The association is very weak (R2 value = 0.0046) and if it means anything it would be to suggest that high carotenoids content genotypes would tend to have lower values for cyanogenic potential, which is a desirable association.
y = -0.0004x + 7.0968R2 = 0.0046
0
4
8
12
16
0 400 800 1200 1600 2000
Cyanogenic potential (ppm)
Tota
l car
oten
oids
con
tent
Figure 1.1. Relationship between cyanogenic potential and total carotenoid contents (�g/ g fresh root weight) in root sample from 171 genotypes selected (because their root color intensity) from 1354 entries in the F1 nursery harvested in March of 2007.

Chapter 1-7 2007 Annual Report
Table 1.4. Results of the evaluation of 1354 genotypes in the high-carotenoids F1 nursery harvested in March 2007. Genotypes with intense yellow root coloration were selected and TCC) quantified through the spectrophotometer. Only those genotypes that had high TCC values were then screened for �–carotene content with the HPLC.
TCC (�g/g fresh root) Family Genotypes evaluated
DMC (%)
HCN (ppm) Average Lowest Highest
�–carotene (�g/g fresh root)
AM 318 6 32.26 305.1 5.93 5.54 6.97 6.05 GM 1375 2 36.55 133.4 3.91 2.61 5.20 -.- AM 587 2 35.76 361.2 4.16 3.72 4.59 -.- AM 592 4 35.10 196.7 5.06 4.46 5.32 -.- AM 594 1 38.37 344.0 9.39 9.39 9.39 -.- CM 9365 3 41.75 130.0 6.89 4.17 8.47 -.- CM 9365 4 41.69 199.8 5.78 4.12 6.52 -.- GM 905 23 38.44 423.4 9.04 5.90 13.79 6.12 to 12.13 GM 1355 2 27.71 1303.4 6.73 5.78 7.68 -.- GM 13581 1 42.07 314.0 7.69 7.69 7.69 -.- GM 1361 10 37.48 311.8 5.75 4.17 7.86 -.- GM 1362 3 36.27 498.3 6.14 4.93 8.22 -.- GM 1363 13 37.90 801.1 6.58 4.84 8.19 -.- SM 3298 9 33.46 724.4 5.87 3.67 7.94 -.- SM 3299 5 33.72 462.9 5.37 4.47 6.43 -.- SM 3300 1 36.28 739 4.97 4.97 4.97 -.- SM 3302 1 31.49 366 5.42 5.42 5.42 -.- SM 3304 6 33.12 711.78 5.73 5.04 6.52 -.- SM 3305 5 35.23 1209.7 6.63 4.97 7.91 -.- SM 3306 10 33.54 986.9 5.90 3.50 8.92 -.- SM 3308 52 37.91 354.8 7.47 4.03 11.61 7.31 to 9.23 SM 3309 8 34.42 766.6 7.63 5.62 9.50 -.-
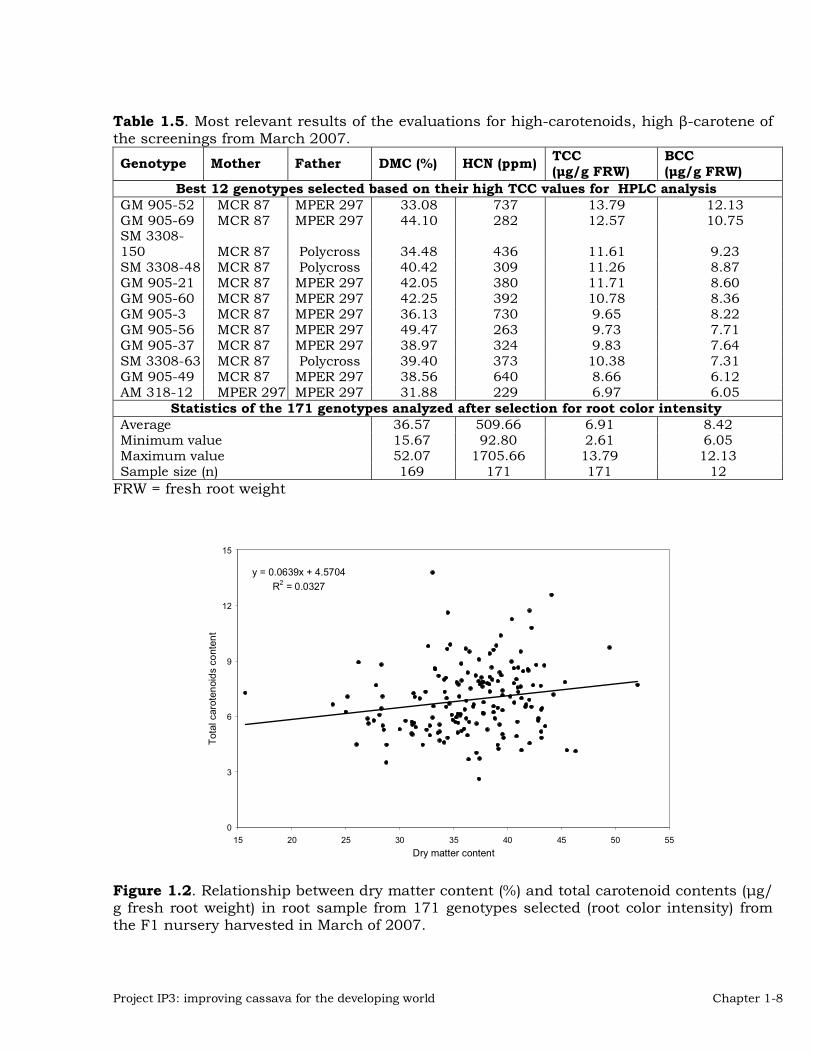
Figure 2 illustrates a similar association between TCC and dry matter content in the roots of the same sample of 171 selected clones. As in the previous case, the correlation between the two variables was very weak (R2 value = 0.0327). However, even if the association were present it would indicate a positive relationship between TCC and dry matter content, which is also a desirable situation.The relationship between TTC and �–carotene content (BCC) is illustrated in Figure 3. As is has been found in previous analyses there is a very strong association between the two variables (R2 value = 0.8757) and a positive regression coefficient (0.9005). About 80% of total carotenoids content quantified in these 12 genotypes was �–carotene (Table 5). An interesting observation from the harvest of the F1 nursery in March 2007 was that families involving two progenitors (MCR 87 and MPER 297) yielded the highest TCC and BCC found in the entire evaluation. Crosses between clones with high carotenoid and high protein content have been made during the previous years. The resulting botanical seed was germinated and the plants evaluated. A total of 143 genotypes from 25 different families were evaluated (Table 6). Based on the results of the harvest, roots from 85 genotypes were further analyzed and the results of these analyses are presented in Table 7.
Project IP3: improving cassava for the developing world Chapter 1-8
Table 1.5. Most relevant results of the evaluations for high-carotenoids, high �-carotene of the screenings from March 2007. Genotype Mother Father DMC (%) HCN (ppm) TCC
(�g/g FRW) BCC (�g/g FRW)
Best 12 genotypes selected based on their high TCC values for HPLC analysis GM 905-52 MCR 87 MPER 297 33.08 737 13.79 12.13 GM 905-69 MCR 87 MPER 297 44.10 282 12.57 10.75 SM 3308-150 MCR 87 Polycross 34.48 436 11.61 9.23 SM 3308-48 MCR 87 Polycross 40.42 309 11.26 8.87 GM 905-21 MCR 87 MPER 297 42.05 380 11.71 8.60 GM 905-60 MCR 87 MPER 297 42.25 392 10.78 8.36 GM 905-3 MCR 87 MPER 297 36.13 730 9.65 8.22 GM 905-56 MCR 87 MPER 297 49.47 263 9.73 7.71 GM 905-37 MCR 87 MPER 297 38.97 324 9.83 7.64 SM 3308-63 MCR 87 Polycross 39.40 373 10.38 7.31 GM 905-49 MCR 87 MPER 297 38.56 640 8.66 6.12 AM 318-12 MPER 297 MPER 297 31.88 229 6.97 6.05
Statistics of the 171 genotypes analyzed after selection for root color intensity Average 36.57 509.66 6.91 8.42 Minimum value 15.67 92.80 2.61 6.05 Maximum value 52.07 1705.66 13.79 12.13 Sample size (n) 169 171 171 12
FRW = fresh root weight
y = 0.0639x + 4.5704R2 = 0.0327
0
3
6
9
12
15
15 20 25 30 35 40 45 50 55Dry matter content
Tota
l car
oten
oids
con
tent
Figure 1.2. Relationship between dry matter content (%) and total carotenoid contents (�g/ g fresh root weight) in root sample from 171 genotypes selected (root color intensity) from the F1 nursery harvested in March of 2007.

Chapter 1-9 2007 Annual Report
y = 0.9005x - 1.1098R2 = 0.8757
5.0
7.5
10.0
12.5
15.0
5.0 7.5 10.0 12.5 15.0
Total carotenoids content
Bet
a ca
rote
ne c
onte
nt
Figure 1.3. Relationship between total carotenoid contents and �–carotene content in a sample of roots from 12 genotypes harvested in March of 2007 and selected because of their high TCC values for analysis through HPLC. Table 1.6. List of the 25 full-sib families between yellow-rooted and high-protein clones evaluated in March 2007. The genotypes with the most intense yellow coloration were selected and subsequently evaluated for TCC and, the best, for BCC.
Family Size Family Size Family Size Family Size GM 1042 5 GM 1332 2 GM 1342 1 GM 1351 1 GM 1044 13 GM 1333 2 GM 1344 7 GM 1360 4 GM 1049 8 GM 1334 5 GM 1345 1 GM 1371 6 GM 1325 2 GM 1336 2 GM 1347 13 GM 1372 11 GM 1327 5 GM 1337 1 GM 1348 7 GM 1330 6 GM 1338 7 GM 1349 25 GM 1331 6 GM 1339 2 GM 1350 1 There were interesting materials with high proteins (for cassava standards) of more than 6%. This is a three-fold increase in the normal (root) levels for the crop. The relationship between protein and TCC from data presented in Table 7 is further illustrated in Figure 4. There is a very weak (R2 value = 0.0251) and negative association between the two parameters suggesting that increasing simultaneously for the two variables may be difficult. However the weakness of the association and the low value for the regression coefficient (b= -0.1531) suggest that this limitation would not be difficult to overcome. High protein clones were self-pollinated following the same criteria than for high TCC. At the bottom of table 7 the result of key genotypes from six self-pollinated families, which ere evaluated for protein content are also presented. A total of 37 plants were grown and 25 of them were selected for analysis based on the performance of the F1 plants at harvest time.

Project IP3: improving cassava for the developing world Chapter 1-10
Table 1.7. Results of the evaluation of F1 genotypes from crosses between high-carotenoids and high protein contents harvested in March 2007. Genotypes with intense yellow root coloration were selected and total carotenoid contents (TCC) quantified through the spectrophotometer. Only those genotypes that had high TCC values were then screened for �–carotene content with the HPLC.
Family Genotypes evaluated
DMC (%)
HCN (ppm)
Crude protein (%)
TCC (�g/g fresh root)
GM 1042 4 40.07 731.55 3.89 2.89 GM 1044 8 41.14 782.07 4.38 2.47 GM 1049 7 42.44 607.36 3.89 -.- GM 1325 1 41.06 833 3.37 5.09 GM 1327 2 41.68 306.26 4.02 2.04 GM 1330 5 41.27 226.24 3.70 2.44 GM 1332 6 39.63 503.01 4.34 2.10 GM 1334 4 37.61 320.44 4.67 -.- GM 1336 1 43.49 243 4.15 -.- GM 1337 1 41.39 596 3.31 -.- GM 1338 4 40.22 588.00 2.84 -.- GM 1339 1 34.01 395 3.40 GM 1344 4 36.86 460.09 4.72 2.29 GM 1345 1 35.01 921 3.33 -.- GM 1347 8 39.89 400.28 3.13 2.62 GM 1348 5 39.69 415.38 3.01 GM 1349 11 37.71 381.45 3.99 2.00 GM 1351 1 39.14 579 3.08 2.81 GM 1360 4 39.35 160.86 4.37 4.05 GM 1371 2 39.60 417.42 2.86 2.35 GM 1372 5 37.03 505.92 4.01 2.47
Results of the evaluation of F1 genotypes for high-protein content harvested in March 2007 AM 310-1 1 36.99 266 4.74 -.- AM 423-1 1 41.57 190 4.57 -.- AM 424-1 10 37.83 811.39 3.95 -.- AM 426 7 39.41 306.55 4.30 -.- AM 588 3 33.07 405.02 4.98 -.- AM 589 3 38.24 594.34 5.52 -.-
A highlight for the research conducted during the first semester of the year was the identification of a cassava genotype with 13.79 �g TCC/g fresh root of which about 88% was �-carotene yielding as much as 12.13 �g �-carotene/g fresh root (Tables 4 and 5). Another interesting observation is the relationship between carotenoids content in roots obtained from plants grown from botanical seed and roots from the same genotype but cloned (plants grown from vegetative cuttings). Preliminary results suggest that TCC and BCC tend to be slightly higher in plants obtained from vegetative cuttings. If that is the case, then when the genotype GM 905-52 (Table 5) is evaluated after its asexual reproduction the TTC and BCC values it yielded in the March 2007 harvest may be up to 1 ug/g higher. F1 – 2006 B Nursery (Planted in October-November 2006) This F1 nursery involves mainly the Ph.D thesis of Yecenia Morillo Coronado. From population of more than 50 full-sib families a group of individuals from five selected families was chosen for self-pollinations, which were made through the first semester of

Chapter 1-11 2007 Annual Report
2006. Seed was then germinated and the resulting seedlings transplanted to the field in two batches during October and November 2006. Plants were grown and started to be harvested / analyzed in September through October 2007 (some genotypes have therefore not been harvested at the time this report was written). Table 8 describes the materials transplanted in October 2006. Table 9 lists those transplanted in November 2006. There were eight S1 (result of one self-pollination and expected to carry 50% or more homozygosity) families in the first planting described in Table 8. The first four S1 families were derived from four contrasting individuals from the same full-sib family (CM9816). The last four S1 families were also derived from four contrasting F1 genotypes from the full-sib family GM893.
y = -0.1531x + 3.1784R2 = 0.0251
0
1
2
3
4
5
6
2 3 4 5 6 7
Crude protein content (%)
Tota
l car
oten
oids
con
tent
Figure 1.4. Relationship between crude protein (%) content and TCC (�g/g fresh weight) in a sample of roots from 24 genotypes harvested in March of 2007 and selected because of their high root color. Concluding remarks for progress to increase carotenoids content. Figure 5 summarizes the most relevant results from the last three years of breeding to increase carotenoids content in cassava roots at CIAT and the most recent data from current year. In 2005 and 2006 we stopped quantifying TTC and �-carotene contents in light colored roots, once it was proven that the strong linkage between color and carotenoids content could not be broken. Therefore the absence of low-carotenoid genotypes after 2004 is not a reflection of the progress achieved from the genetic point of view but rather an unavoidable consequence of the screening strategies implemented that year. It is important to emphasize the higher levels of TTC and �-carotene contents observed successively during this period of time. There has been a gain of about 2 �g/g of �-carotene per year and therefore, if progress continues at the same rate by the main harvest in 2008 the project should be able to identify materials with values close to the nutritional target of 15 �g/g of �-carotene (fresh weight basis). The availability and use of NIRS would greatly facilitate this process. Although the most promising genotypes are still to be harvested during October, an

Project IP3: improving cassava for the developing world Chapter 1-12
additional increase from 10.9 to 12.1 �g/g of �-carotene has already been observed from the harvest that took place in March. Table 1.8. First planting of self-pollinations from selected F1 genotypes to study inheritance of carotenoids content in cassava roots and to identify high-carotenoids clones to be used as parental source for the trait (Planted in October 2006 – Harvested in September 2007)
S1 family Progenitor Seed germinated Seed transplanted
AM 689 CM 9816-1 74 72 AM 690 CM 9816-2 101 94 AM 691 CM 9816-5 76 73 AM 692 CM 9816-6 78 48 AM 710 GM 893-5 46 38 AM 712 GM 893-8 87 86 AM 718 GM 893-16 56 47 AM 720 GM 893-18 75 53
593 511 Table 1.9. Second planting of self pollinations or crosses among selected F1 genotypes to study inheritance of carotenoids content in cassava roots and to identify high-carotenoids clones to be used as parental source for the trait (Planted in November 2006 – To be harvested in October 2007).
Family Mother Father Seed germinated Seed transplanted AM 697 GM 708 - 20 GM 708 - 20 83 50 AM 698 GM 708 - 27 GM 708 - 27 71 52 AM 700 GM 708 - 47 GM 708 - 47 3 2 AM 702 GM 708 - 63 GM 708 - 63 52 46 GM 1546 CM 9816 - 2 GM 893 - 4 13 10 GM 1547 CM 9816 - 2 GM 893 - 5 34 20 GM 1548 GM 705 - 5 CM 9816 - 2 89 66 GM 1549 GM 705 - 5 GM 708 - 63 23 15 GM 1550 GM 705 - 5 GM 893 - 4 59 49 GM 1551 GM 705 - 5 GM 893 - 5 79 59 GM 1552 GM 705 - 5 GM 893 - 16 55 40 GM 1553 GM 708 - 37 CM 9816 - 2 9 4 GM 1556 GM 708 - 63 GM 893 - 5 33 6 GM 1547 GM 893 - 5 CM 9816 - 2 37 35 GM 1556 GM 893 - 5 GM 708 - 63 7 6 GM 1559 GM 893 - 8 CM 9816 - 2 3 3 GM 1560 GM 893 - 16 CM 9816 - 2 41 28 GM 1561 GM 893 - 16 GM 708 - 63 19 18
710 509

Chapter 1-13 2007 Annual Report
2004(150)
2005(550)
2006(500)
2007(695)
Year(# samples)
0
3
6
9
12
15
18
21
Car
oten
oid
cont
ent (
�g/ g
FW
)
19.1
12.8BCC target(15 �g/g FW)
TCC
BCC
12.1
S1 genotypes
2004(150)
2005(550)
2006(500)
2007(695)
Year(# samples)
0
3
6
9
12
15
18
21
Car
oten
oid
cont
ent (
�g/ g
FW
)
2004(150)
2005(550)
2006(500)
2007(695)
Year(# samples)
2004(150)
2005(550)
2006(500)
2007(695)
Year(# samples)
0
3
6
9
12
15
18
21
Car
oten
oid
cont
ent (
�g/ g
FW
)
0
3
6
9
12
15
18
21
Car
oten
oid
cont
ent (
�g/ g
FW
)
19.1
12.8BCC target(15 �g/g FW)
TCC
BCC
12.1
S1 genotypes
Figure 1.5. Progress over the last three years in increasing total carotenoids content (TTC) and �-carotene content (BCC) in the cassava project at CIAT. Data presented illustrates the maximum levels measured in non-replicated quantifications in full-vigor materials and partially inbred (S1) genotypes Table 9 describes the genotypes that will be harvested during October 2007. It includes four S1 families derived from four contrasting F1 genotypes from full-sib family GM 708-2. In many cases self-pollinations could not be made because of the randomness of cassava flowering in some genotypes. Therefore, several crosses among selected genotypes were also made. As a result, in addition to the S1 families mentioned already, a total of 14 full sib additional families was produced and will be evaluated at the end of 2007. 1.1.4. SEGREGATION FOR CAROTENOIDS CONTENT IN SELF-POLLINATED PROGENIES In the previous section results from several activities whose main objective is to increase carotenoids content in cassava roots have been reported. A second objective of some of the activities and results already reported is to elucidate the inheritance of carotenoids content in the roots. In this section data that have been already presented will be reorganized to illustrate the kind of information being generated. The S1 families described in Table 8 were developed and evaluated not only to identify high-carotenoids genotypes that could be used as source germplasm. They were also part of a Ph.D. thesis to elucidate the inheritance of carotenoids content in cassava roots. Therefore, data from Table 8 has been re-organized and presented in Table 10 so the way segregation from heterozygous progenitors occurred in the resulting S1 families they produced. The data has also been consolidated in the Figures 6 to 13 presented below.

Project IP3: improving cassava for the developing world Chapter 1-14
Table 1.10. Segregations observed in the eight S1 families already harvested. These are the same families described in Table 8. However, results are now presented to illustrate the way carotenoids content segregate in the inheritance studies.
Progenitor Data from the S1 family S1 Family Name
TCC (�g/g FW)
Size (#)
Average TCC (�g/g FW)
TCC range (�g/g FW)
AM 689 CM 9816-1 6.67 (intermediate) 4.74 71 0.46-11.31 AM 690 CM 9816-2 9.99 (high) 6.51 90 2.55-13.10 AM 691 CM 9816-5 1.87 (low) 2.32 73 0.40-5.89 AM 692 CM 9816-6 5.04 (intermediate) 5.29 48 2.02-9.13 AM 710 GM 893-5 8.77 (high) 29 6.38 4.85-8.95 AM 712 GM 893-8 6.06 (intermediate) 57 3.32 0.44-8.66 AM 718 GM 893-16 8.14 (high) 38 5.88 3.75-8.98 AM 720 GM 893-18 2.04 (low) 40 2.08 0.14-9.72
Figure 1.6. Segregation of TCC in the 71 S1 genotypes from family AM 689. The TCC of the progenitor of this family (CM 9816-1) is also presented.
0
3
6
9
12
0-1 1-2 2-3 3-4 4-5 5-6 6-7 7-8 8-9 9-10 10-11 11-12 12-13
TCC (ug/g FW )
Freq
uenc
ies
Progenitor of familyAM 689 (CM 9816-1)
0
3
6
9
12
0-1 1-2 2-3 3-4 4-5 5-6 6-7 7-8 8-9 9-10 10-11 11-12 12-13
TCC (ug/g FW )
Freq
uenc
ies
Progenitor of familyAM 689 (CM 9816-1)

Chapter 1-15 2007 Annual Report
Figure 1.7. Segregation of TCC in the 48 S1 genotypes from family AM 690. The TCC of the progenitor of this family (CM 9816-2) is also presented.
Figure 1.8. Segregation of TCC in the 73 S1 genotypes from family AM 691. The TCC of the progenitor of this family (CM 9816-5) is also presented.
0
4
8
12
16
20
0-1 1-2 2-3 3-4 4-5 5-6 6-7 7-8 8-9 9-10 10-11 11-12 12-13
TC C (ug/g FW )
Freq
uenc
ies
Progenitor of familyAM 690 (CM 9816-2)
0
4
8
12
16
20
0-1 1-2 2-3 3-4 4-5 5-6 6-7 7-8 8-9 9-10 10-11 11-12 12-13
TC C (ug/g FW )
Freq
uenc
ies
Progenitor of familyAM 690 (CM 9816-2)
0
5
10
15
20
25
30
0-1 1-2 2-3 3-4 4-5 5-6 6-7 7-8 8-9 9-10 10-11 11-12 12-13
TCC (ug/g FW)
Freq
uenc
ies
Progenitor of familyAM 691 (CM 9816-5)
0
5
10
15
20
25
30
0-1 1-2 2-3 3-4 4-5 5-6 6-7 7-8 8-9 9-10 10-11 11-12 12-13
TCC (ug/g FW)
Freq
uenc
ies
Progenitor of familyAM 691 (CM 9816-5)

Project IP3: improving cassava for the developing world Chapter 1-16
Figure 1.9. Segregation of TCC in the 73 S1 genotypes from family AM 692. The TCC of the progenitor of this family (CM 9816-6) is also presented.
Figure 1.10. Segregation of TCC in the 29 S1 genotypes from family AM 710. The TCC of the progenitor of this family (CM 893-5) is also presented.
0
2
4
6
8
10
12
14
0-1 1-2 2-3 3-4 4-5 5-6 6-7 7-8 8-9 9-10 10-11 11-12 12-13
TCC (ug/g FW)
Freq
uenc
ies
Progenitor of familyAM 692 (CM 9816-6)
0
2
4
6
8
10
12
14
0-1 1-2 2-3 3-4 4-5 5-6 6-7 7-8 8-9 9-10 10-11 11-12 12-13
TCC (ug/g FW)
Freq
uenc
ies
Progenitor of familyAM 692 (CM 9816-6)
0
3
6
9
12
15
18
0-1 1-2 2-3 3-4 4-5 5-6 6-7 7-8 8-9 9-10 10-11 11-12 12-13
TCC (ug/g FW)
Freq
uenc
ies
Progenitor of familyAM 710 (GM 893-5)
0
3
6
9
12
15
18
0-1 1-2 2-3 3-4 4-5 5-6 6-7 7-8 8-9 9-10 10-11 11-12 12-13
TCC (ug/g FW)
Freq
uenc
ies
Progenitor of familyAM 710 (GM 893-5)

Chapter 1-17 2007 Annual Report
Figure 1.11. Segregation of TCC in the 57 S1 genotypes from family AM 712. The TCC of the progenitor of this family (CM 893-8) is also presented.
Figure 1.12. Segregation of TCC in the 38 S1 genotypes from family AM 718. The TCC of the progenitor of this family (CM 893-16) is also presented.
0
3
6
9
12
15
18
0-1 1-2 2-3 3-4 4-5 5-6 6-7 7-8 8-9 9-10 10-11 11-12 12-13
TCC (ug/g FW)
Freq
uenc
ies
Progenitor of familyAM 712 (GM 893-8)
0
3
6
9
12
15
18
0-1 1-2 2-3 3-4 4-5 5-6 6-7 7-8 8-9 9-10 10-11 11-12 12-13
TCC (ug/g FW)
Freq
uenc
ies
Progenitor of familyAM 712 (GM 893-8)
0
3
6
9
12
0-1 1-2 2-3 3-4 4-5 5-6 6-7 7-8 8-9 9-10 10-11 11-12 12-13
TCC (ug/g FW)
Freq
uenc
ies
Progenitor of familyAM 718 (GM 893-16)
0
3
6
9
12
0-1 1-2 2-3 3-4 4-5 5-6 6-7 7-8 8-9 9-10 10-11 11-12 12-13
TCC (ug/g FW)
Freq
uenc
ies
Progenitor of familyAM 718 (GM 893-16)

Project IP3: improving cassava for the developing world Chapter 1-18
0
4
8
12
16
0-1 1-2 2-3 3-4 4-5 5-6 6-7 7-8 8-9 9-10 10-11 11-12 12-13
TCC (ug/g FW)
Freq
uenc
ies
Progenitor of familyAM 720 (GM 893-18)
0
4
8
12
16
0-1 1-2 2-3 3-4 4-5 5-6 6-7 7-8 8-9 9-10 10-11 11-12 12-13
TCC (ug/g FW)
Freq
uenc
ies
Progenitor of familyAM 720 (GM 893-18)
Figure 1.13. Segregation of TCC in the 40 S1 genotypes from family AM 720. The TCC of the progenitor of this family (CM 893-18) is also presented. In every case (Figures 6-13) there were always progenies with higher TCC levels than their respective progenitors. Even in the case of progenies from high carotenoids progenitors (families AM 690, AM710 and AM 718) few genotypes had TCC values higher than the progenitors. Results would suggest that inheritance is not due to one or two genes alone but, most probably, to several genes. 1.1.5. EVALUATION OF YELLOW-ROOTED CASSAVA GERMPLASM IN AGRONOMIC TRIALS. Clones identified because of their intense root color were immediately included in the crossing blocks for “general purpose” cassava breeding. This was the standard approach until the HarvestPlus initiative allowed for a more quantitative approach for identifying high TCC and BCC. Currently the process is based on the quantification through spectrophotometry and HPLC approaches. As segregating progenies are selected (purely on their agronomic merits) they are moved to the standard step-wise approach followed by the cassava-breeding project. From the F1-nurseries (one plant per genotype) selected genotypes are then evaluated successively in clonal evaluation trials (7-8 plants/genotype); preliminary yield trials (10-plant plots and three replications); advanced yield trials (20-plant plots, three replications and 1-2 locations) and regional trials (25-plant plots, three replications and 3-5 locations). Table 11 presents a list of the germplasm that was included in the clonal evaluation trials that included materials that were selected because of their high TCC in the evaluation of materials introduced from Brazil. In addition to the germplasm from Brazil several segregating genotypes have been included in the past few years in the standard breeding process. Table 12 summarizes the number of genotypes present in different stages of the breeding evaluation and selection process targeting different relevant cassava growing environments (acid soil savannas, sub-humid conditions, and mid-altitude valleys).

Chapter 1-19 2007 Annual Report
Table 1.11. Germplasm in Clonal Evaluation Trials from selections in F1-2005B (botanical seed from EBRAPA - Brasil and CIAT Planted in Corpoica-Palmira in January 2007 – to be harvested in November, 2007).
CB 4-4 CB 19-10 SM 3306-5 CB 4-10 CB 44-15 SM 3306-7 CB 4-25 CB 46-3 SM 3306-13 CB 4-28 SB 325-32 SM 3308-16 CB 5-5 SB 325-35 SM 3308-24 CB 5-6 SB 325-38 SM 3308-27 CB 5-9 SB 326-24 SM 3308-45 CB 5-14 SB 326-31 SM 3308-49 CB 7-9 SM 3306-1 SM 3309-46
CB 12-10 SM 3306- 4 Table 1.12. Number of clones with yellow roots included in clonal evaluation trials (CET) and advanced yield trials (PYT) for the most relevant cassava-growing environments.
Location Trial Root Color Number of Clones
1 Mid-altitude valleys AYT 2-3 16
2 Mid-altitude valleys AYT 4 2
3 Acid Soil Savannas AYT 2-3 6
4 Sub-humid Environment CET 2 15
5 Sub-humid Environment CET 3 4
6 Mid-altitude valleys CET 2 27
7 Mid-altitude valleys CET 3 6
8 Acid Soil Savannas CET 2 170
9 Acid Soil Savannas CET 3 60

Project IP3: improving cassava for the developing world Chapter 1-20
Table 1.13. Selected genotypes from the PYT harvested in May 2007 in the Sub-humid environment. These materials that come from crosses made in 2003-2004 and were in a CET during 2005-2006.
Genotype Plant Type (1-5)
Fresh root yield (t/ha)
Harvest Index (0-1)
Dry matter content (%)
Dry matter yield (t/ha)
Root color (1-9)
CM 9912-136 3 39.3 0.49 32.0 11.8 3 CM 9912-128 3 47.4 0.43 32.2 11.5 2 SM 3112-70 2 26.4 0.55 30.5 9.7 2 GM 250-62 2 34.9 0.50 29.7 10.8 3 GM 250-64 3 46.5 0.38 32.0 9.2 2 CM 9955-12 3 38.0 0.47 29.1 9.8 3 CM 9955-16 2 53.7 0.39 29.5 10.0 2 SM 3154-17 2 37.0 0.46 28.7 9.1 3 SM 3155-11 3 41.2 0.46 28.5 9.9 3 GM 495-2 4 56.4 0.36 31.9 10.0 2 SM 3154-15 1 47.4 0.44 26.3 9.7 1 CM 9912-138 3 49.4 0.40 29.6 9.7 2 SM 3060-34 3 48.2 0.42 29.4 14.1 2 CM 9955-34 3 54.8 0.54 26.1 14.3 3 SM 3158-26 1 24.9 0.48 30.4 7.6 3 GM 215-96 2 44.0 0.55 26.6 11.7 2 CM 9912-150 3 30.3 0.40 30.2 9.1 3 CM 9912-143 3 32.1 0.46 28.7 9.2 3 CM 9912-154 3 22.0 0.39 31.0 6.8 2 SM 3158-32 3 29.6 0.41 28.5 8.4 3 CM 9955-35 2 23.9 0.39 29.4 7.0 3 CM 9912-166 3 59.4 0.46 33.1 19.6 3 CM 9912-167 3 33.7 0.37 32.0 10.8 2 CM 9912-160 3 29.3 0.37 33.3 9.8 3 SM 3149-25 2 31.9 0.61 28.4 9.0 2 CM 9910-46 4 23.9 0.48 33.0 7.9 2 CM 9955-38 2 34.9 0.44 28.8 10.1 2 CM 9912-170 3 39.5 0.43 28.7 11.4 3 GM 437-26 4 24.3 0.43 30.5 7.4 2 CM 9924-32 2 27.5 0.30 29.5 8.1 3 SM 3158-48 2 31.0 0.42 26.9 8.3 2 SM 3150-31 3 25.1 0.43 28.8 7.3 2
Table 1.14. Selected genotypes from the AYT harvested in May 2007 in the Sub-humid environment. These materials that come from crosses made in 2002-2003 and were in a CET during 2004-2005.
Genotype Plant Type (1-5)
Fresh root yield (t/ha)
Harvest Index (0-1)
Dry matter content (%)
Dry matter yield (t/ha)
TCC (�g/g FW)
CM 6119-5 1 20.1 0.42 34.5 7.0 3.43 GM 451-31 3 25.2 0.47 32.3 8.1 3.00 CM 9960-16 3 29.0 0.43 31.2 9.1 3.31 CM 9947-2 2 20.4 0.33 34.0 7.0 2.63 Check 1 15.0 0.33 32.4 4.9 3.99 GM 519-7 2 15.1 0.51 30.1 4.6 3.73 GM 447-21 3 15.8 0.29 32.4 5.1 3.43
Chapter 1-21 2007 Annual Report
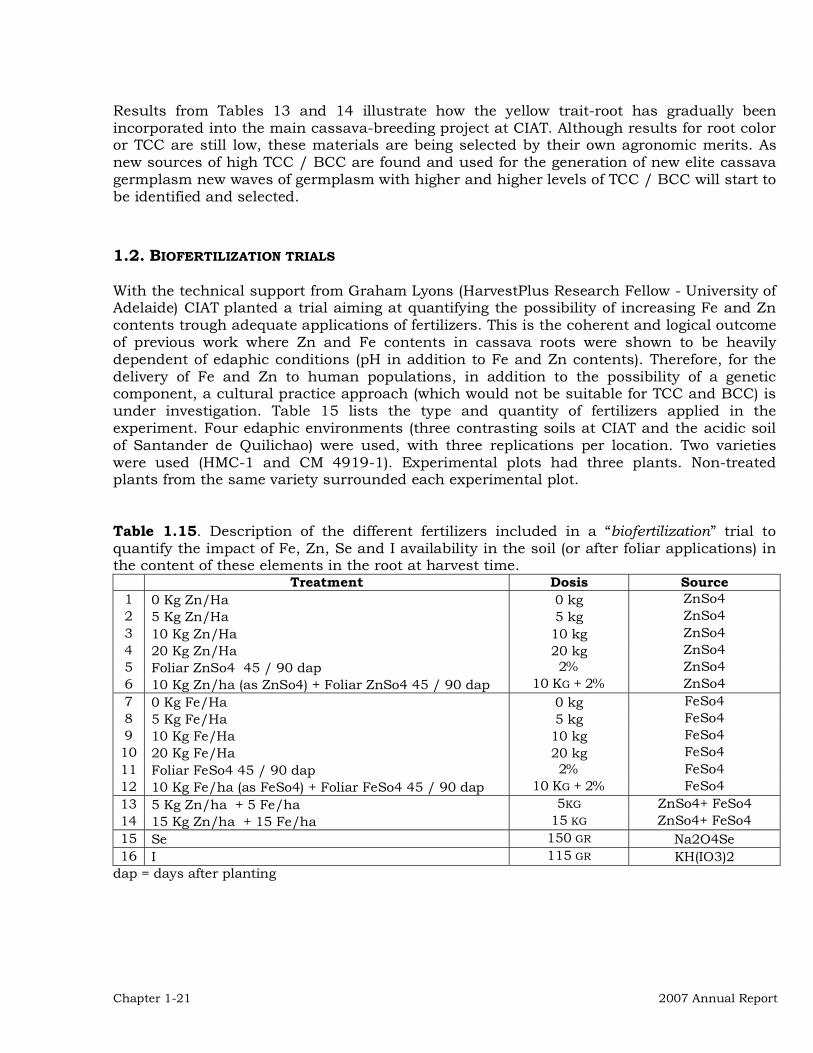
Results from Tables 13 and 14 illustrate how the yellow trait-root has gradually been incorporated into the main cassava-breeding project at CIAT. Although results for root color or TCC are still low, these materials are being selected by their own agronomic merits. As new sources of high TCC / BCC are found and used for the generation of new elite cassava germplasm new waves of germplasm with higher and higher levels of TCC / BCC will start to be identified and selected. 1.2. BIOFERTILIZATION TRIALS With the technical support from Graham Lyons (HarvestPlus Research Fellow - University of Adelaide) CIAT planted a trial aiming at quantifying the possibility of increasing Fe and Zn contents trough adequate applications of fertilizers. This is the coherent and logical outcome of previous work where Zn and Fe contents in cassava roots were shown to be heavily dependent of edaphic conditions (pH in addition to Fe and Zn contents). Therefore, for the delivery of Fe and Zn to human populations, in addition to the possibility of a genetic component, a cultural practice approach (which would not be suitable for TCC and BCC) is under investigation. Table 15 lists the type and quantity of fertilizers applied in the experiment. Four edaphic environments (three contrasting soils at CIAT and the acidic soil of Santander de Quilichao) were used, with three replications per location. Two varieties were used (HMC-1 and CM 4919-1). Experimental plots had three plants. Non-treated plants from the same variety surrounded each experimental plot. Table 1.15. Description of the different fertilizers included in a “biofertilization” trial to quantify the impact of Fe, Zn, Se and I availability in the soil (or after foliar applications) in the content of these elements in the root at harvest time.
Treatment Dosis Source 1 0 Kg Zn/Ha 0 kg ZnSo4 2 5 Kg Zn/Ha 5 kg ZnSo4 3 10 Kg Zn/Ha 10 kg ZnSo4 4 20 Kg Zn/Ha 20 kg ZnSo4 5 Foliar ZnSo4 45 / 90 dap 2% ZnSo4 6 10 Kg Zn/ha (as ZnSo4) + Foliar ZnSo4 45 / 90 dap 10 KG + 2% ZnSo4 7 0 Kg Fe/Ha 0 kg FeSo4 8 5 Kg Fe/Ha 5 kg FeSo4 9 10 Kg Fe/Ha 10 kg FeSo4 10 20 Kg Fe/Ha 20 kg FeSo4 11 Foliar FeSo4 45 / 90 dap 2% FeSo4 12 10 Kg Fe/ha (as FeSo4) + Foliar FeSo4 45 / 90 dap 10 KG + 2% FeSo4 13 5 Kg Zn/ha + 5 Fe/ha 5KG ZnSo4+ FeSo4 14 15 Kg Zn/ha + 15 Fe/ha 15 KG ZnSo4+ FeSo4 15 Se 150 GR Na2O4Se 16 I 115 GR KH(IO3)2
dap = days after planting

Project IP3: improving cassava for the developing world Chapter 1-22
1.3. INTER-LABORATORY STUDY Test materials preparation: Orange fleshed sweetpotato tubers and yellow cassava roots, purchased directly from the producers, were peeled and sliced (3-4 mm thickness) manually. The slices were put in a stainless steel basket and immediately blanched at 98�C for 1 min using a steam-jacketed kettle. After draining, the slices were spread in perforated trays and dried at 70oC. The dried slices were ground and sieved (0.35 mm). The powder was vacuum packed in a small PET/Aluminum/PP bag using a vacuum sealer Selovac 200B. A more rigid (PET/Aluminum/PP) second packaging bag was used to avoid damage during the transport and handling. Test materials distribution: Test materials were sent to 20 laboratories. Only seven had participated of the First Inter-laboratory Proficiency Study in 2004. Test materials were sent by fast airmail on May 21, 2007. Most of the labs received test materials within 15 days. Because not all laboratories work on the two crops, they decided which test material to analyze and the method to be used. Seventeen labs chose to analyze sweetpotato sample and 13 cassava samples. Fourteen labs used HarvestPlus extraction procedures. Ten performed HPLC analysis, 5 used HarvestPlus chromatographic conditions. One ampoule containing 1 mg of commercial beta-carotene standard (Carotenature) was sent to labs performing HPLC analysis. Table 1.16. Comparison between quantifications of total carotenoids, �-carotene and Trans-�-carotene made at CIAT from of sweet potato and cassava samples and the average across 19 laboratories.
Sweet Potato Cassava Parameter Average CIAT Laboratory Average CIAT Laboratory
Total carotenoids content Average 751 732 4.82 3.88 Standard Deviation 1 15 0.07 0.01
CV 0 2 1 0 Total �-carotene
Average 680 661 3.85 2.96 Standard Deviation 13 14 0.02 0.02
CV 2 2 0 1 % total �/ total 91 90 80 76
Trans-�-carotene Average 636 636 1.88 1.34 Standard Deviation 11 14 0.02 0.02
CV 2 2 1 1 % trans�/total� 94 96 49 45 %trans-�/ total 85 87 39 34

Chapter 1-23 2007 Annual Report
Homogeneity and stability of the samples: Before the distribution of the test materials, five bags took randomly were analyzed in triplicate to evaluate the homogeneity. To evaluate the stability during the study period, bags were storage in two conditions: 1- bags were maintained at room temperature for 15 days to simulate the most drastic conditions during the transport, followed of the storage in deep freezer (< -18�C), 2- bags were maintained in deep freezer over period. Three packages stored in each condition were took randomly and analyzed weekly until July 30. Eighteen labs reported analytical results. Averages from the 18 laboratories for total carotenoid, total �-carotene and trans-�-carotene contents of sweet potato and cassava test materials are presented in Table 16 as well as the results from the quantifications made at CIAT. All data were submitted to statistically analysis and interpreted considering the used procedures, chromatograms, comparison of the results for both samples, proportion of total carotenoid, total-�-carotene and trans-�-carotene contents. Sweet potato: Results showed good agreement (inter-lab CV 8%) considering the variations on the used methods, lab conditions and experience. Most of labs presented good results and repeatability (within lab CV 0-3%) for total carotenoids content. It indicates that extraction was not a problem, although some labs need to assess their procedures. Evaluation of the HPLC results indicates that some labs need some adjustments on their procedure or practice on this analysis. Cassava: As the carotenoid content of cassava was much lower than sweet potato sample, higher inter-lab (15%) and intra-lab (0-8%) variation was expected. The results of total and trans-�-carotene by HPLC for cassava agree with the conclusions extracted from analysis of sweet potato. z-score � 2 (satisfactory results) were found for TCC, TBC and trans-�-carotene for samples from sweet potato and cassava samples estimated at CIAT, indicating the high quality and reliability of the quantifications made at CIAT. 1.4. GENETIC TRANSFORMATION WORK CIAT and the University of Freiburg (Germany) are inserting into cassava a series of combinations of promoters and bacterial genes to increase the content of �-carotene in roots. This effort is part of a HarvestPlus strategy to augment the level of micronutrients in staple foods to improve human nutrition. Three cassava clones (60444, MCol2215 and CM3306-4) were transformed using friable embryogenic callus and cotyledons from somatic embryos and two Agrobacterium strains (Agl1 and LBA4404). Constructs in pCAMBIA1305.2-based vectors were:

Project IP3: improving cassava for the developing world Chapter 1-24
a) pCAS-Phyt with promoter from cassava roots 2x35S hpt II CasP’ CrtB
b) pPat-Erwinia II with promoters from potato (Patatin) provide a mini-pathway for carotene synthesis 35S npt II pat CrtY pat-1 CrtB pat CrtI
Table 1.17. Summary of all the transgenic events that have taken place on the three model varieties using different plasmid constructions. Many of these transgenic genotypes are already represented by plants growing in the green-house.
Variety Plasmid Transgenic
lines (number)
Replicates per line (number)
Transfer to GH (Date)
Molecular (RealTime)
confirmation CM 6740-7 4 27-Feb-07 Not available MCol 2215 4 27-Feb-07 Not available 60444 4 27-Feb-07 Not available 60444 CP 2(-) 8 3 27-Feb-07 Not available 60444 pCas Phyt 20 2.95* 20-Feb-07 (+) CM3306-4 pPat ERW II 1 7 8-Jun-07 (-) MCol 2215 pPat ERW II 10 1.5* 8-Jun-07 6 (-) + 4 n.a. 60444 pPat ERW II 8 in vitro Nov-07 Not available MCol 2215 pPat ERW II 99 in vitro Nov-07 Not available CM3306-4 pPat ERW II 4 in vitro Nov-07 Not available MCol 2215 pPat ERW II pending in vitro Jun-08 Not available CM3306-4 pPat ERW II pending in vitro Jun-08 Not available MCol 2215 pCa Ext Gus pending in vitro Jun-08 Not available MCol 2215 pCa Ext Phyt pending in vitro Jun-08 Not available MCol 2215 pCa Yam Phyt pending in vitro Jun-08 Not available MCol 2215 pCa New Pr Phyt pending in vitro Jun-08 Not available CM3306-4 pCa Ext Gus pending in vitro Jun-08 Not available CM3306-4 pCa Ext Phyt pending in vitro Jun-08 Not available CM3306-4 pCa Yam Phyt pending in vitro Jun-08 Not available CM3306-4 pCa New Pr Phyt pending in vitro Jun-08 Not available MCol 2215 pCa Ext Gus pending in vitro Jun-08 Not available MCol 2215 pCa Ext Phyt pending in vitro Jun-08 Not available
Table 17 provides a summary of the transgenic material available in the laboratory or green-house stages. Some of the constructs being tested are combination of root-specific promotors from potato, cassava, sugar beet or yams, which drive the expression of one or more genes of the carotenoids pathway. The most recent experiments (those listed as pending in the transgenic line number column in Table 16) are still at the in vitro – regeneration stage. Figure14 illustrates some examples of transgenic calli, which express high levels of phytoene synthase and will hopefully accumulate high levels of carotenoids in the roots. However, the plants have not yet started to develop storage roots as seen in the photograph in that figure, and final results are still pending. A promising finding is the information

Chapter 1-25 2007 Annual Report
provided in Figure 15 where it is clear that some lines do express the trans-gene (crtB) at high levels in the roots. Moreover, Figure 16 illustrates cases (line 6) where the expression of the gene is much higher in the roots compared with leaves. This would suggest that indeed the promotor is indeed favoring the expression of the gene in the target tissue, at least for some of the lines.
Figure 1.14. Yellow calli and roots of transgenic cassava lines transformed with pCas-Phyt. Fifteen lines are growing in the green house.
Figure 1.15. Real-time PCR quantification of expression of the crtB gene in roots of cassava lines transformed with pCas-Phyt relative to the least expresser
Transgene Expression in Roots
0
3
6
9
12
15
487 509 60 122
Cassava transgenic lines
Rea
ltive
mR
NA le
vel
CrtBcrtB
Transgene Expression in Roots
0
3
6
9
12
15
487 509 60 122
Cassava transgenic lines
Rea
ltive
mR
NA le
vel
CrtBcrtB

Project IP3: improving cassava for the developing world Chapter 1-26
Lines
2. 487
4. 509
6. 60
8. 122
10. NT
Lines
2. 487
4. 509
6. 60
8. 122
10. NT Figure 1.16. Real-time PCR amplificaction of expressed crtB in roots and leaves of transgenic lines transformed with pCas-Phyt. Table 1.18. HPLC estimation of carotenoids in roots from in vitro transgenic cassava plants transformed with pCAS-Phyt.
Line Phytoene (�g/g FW) Total carotenes (�g/g FW) 487 6.21 4.55 509 not available not available 60 0.00 – 2.89 0.29 – 1.27 122 17.4 4.29 NT Undetectable 1.27
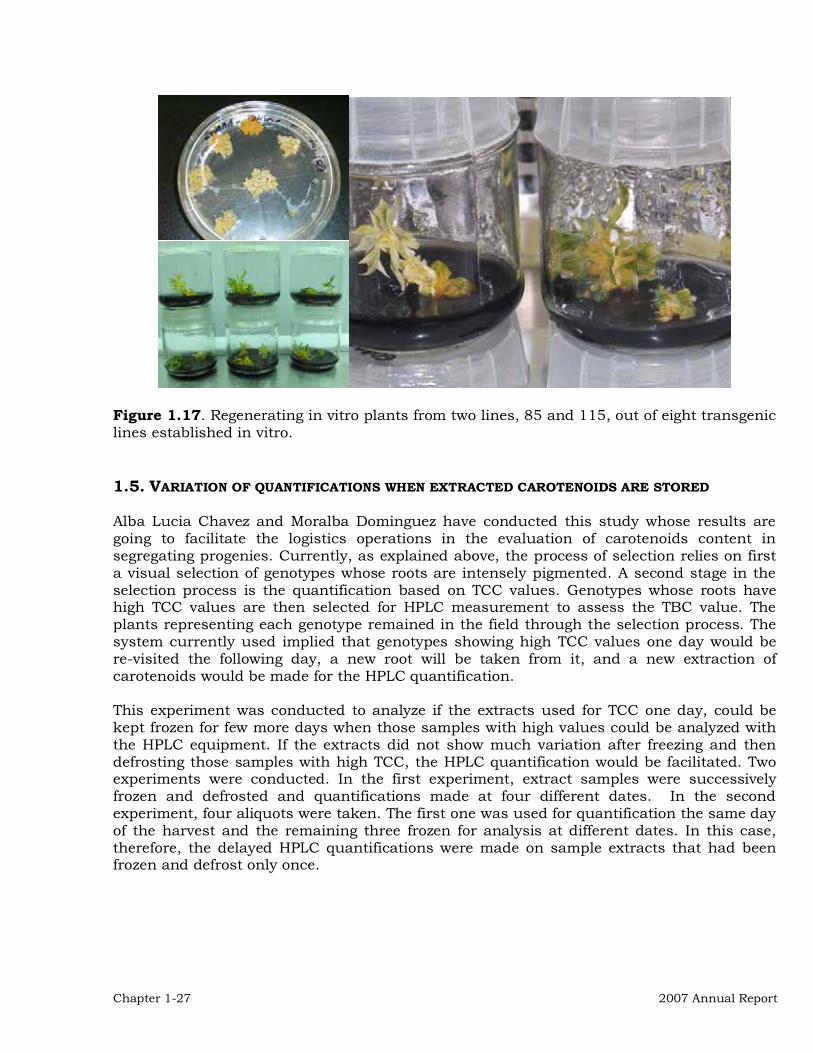
The estimation of phytoene and total carotenoids in the roots of the transformed in vitro plants (pCAS-Phyt) indicate that some of the transformed lines do indeed produce very high levels of phytoene (Table 18). This is promising because this molecule is central in the carotenoids pathway. Table 2222 presents results from a different experiment using the p-Pat-Erwinia II plasmid. As in the previous case notoriously high expression of the carotenoids gene(s) was observed even at calli stage as intense yellow-orange pigmentation. Carotenoids contents of two of the cell lines mentioned in Table 19 demonstrate high levels of pro-vitamin A carotenoids. Currently, plants are being regenerated (Figure 17) from several of the transgenic lines and will be transferred to the green-house. The process to obtain authorization for field evaluation is also underway. Table 1.19. regenerating in vitro plants from two lines (85 and 115) out of eight transgenic lines established in vitro. HPLC estimation of carotenoids in these two transgenic lines transformed with p-Pat-Erwinia II is provided.
Line �-carotene (�g/g FW) �-carotene (�g/g FW) Lutein (�g/g FW) 115 2.44 1.92 2.19 85 7.04 6.14 3.05 NT Undetectable Undetectable Undetectable
Chapter 1-27 2007 Annual Report
Figure 1.17. Regenerating in vitro plants from two lines, 85 and 115, out of eight transgenic lines established in vitro. 1.5. VARIATION OF QUANTIFICATIONS WHEN EXTRACTED CAROTENOIDS ARE STORED Alba Lucia Chavez and Moralba Dominguez have conducted this study whose results are going to facilitate the logistics operations in the evaluation of carotenoids content in segregating progenies. Currently, as explained above, the process of selection relies on first a visual selection of genotypes whose roots are intensely pigmented. A second stage in the selection process is the quantification based on TCC values. Genotypes whose roots have high TCC values are then selected for HPLC measurement to assess the TBC value. The plants representing each genotype remained in the field through the selection process. The system currently used implied that genotypes showing high TCC values one day would be re-visited the following day, a new root will be taken from it, and a new extraction of carotenoids would be made for the HPLC quantification. This experiment was conducted to analyze if the extracts used for TCC one day, could be kept frozen for few more days when those samples with high values could be analyzed with the HPLC equipment. If the extracts did not show much variation after freezing and then defrosting those samples with high TCC, the HPLC quantification would be facilitated. Two experiments were conducted. In the first experiment, extract samples were successively frozen and defrosted and quantifications made at four different dates. In the second experiment, four aliquots were taken. The first one was used for quantification the same day of the harvest and the remaining three frozen for analysis at different dates. In this case, therefore, the delayed HPLC quantifications were made on sample extracts that had been frozen and defrost only once.

Project IP3: improving cassava for the developing world Chapter 1-28
Table 1.20. First experiment to measure stability of carotenoids in the extracts. Results for each date of quantification are averages of two replications (except for TCC which was taken only once). In this experiment the extracts were frozen at the starting of the experiment and defrosted every successive date. Therefore, the quantifications made on August 31 were made on an extract that had been frozen and defrost three times.
Genotype Date quantification TCC TBC / TCC
(%) Total Trans �-carotene
(�g/g FW) Total �-carotene
(�g/g FW)
Ago 28-07 79.16 1.98 3.49 Ago 29-07 81.26 2.02 3.58 Ago 30-07 81.55 2.02 3.59
CM 9816-1
Ago 31-07
4.41
80.66 1.98 3.55 Ago 28-07 91.56 9.05 10.06 Ago 29-07 91.65 8.86 10.07 Ago 30-07 91.59 8.77 10.06
CM 9816-2
Ago 31-07
10.99
91.70 8.62 10.07 Ago 28-07 82.19 3.71 5.45 Ago 29-07 81.15 3.66 5.38 Ago 30-07 81.93 3.58 5.44
CM 9816-6
Ago 31-07
6.64
80.80 3.57 5.36 Table 1.21. Second experiment to measure stability of carotenoids in the extracts. Results for each date of quantification are averages of two replications (except for TCC which was taken only once). In this experiment four different aliquots were taken the first day for each of the four quantification dates. For the first date extracts were not frozen, but for the three remaining dates of evaluation for each genotype extracts have been frozen and defrost only once.
Genotype Date quantification TCC TBC / TCC
(%) Total Trans �-carotene
(�g/g FW) Total �-carotene
(�g/g FW)
Sep-21-07 83.84 3.25 4.04 Sep-23-07 83.49 3.23 4.02 Sep-25-07 83.77 3.23 4.04
7
Sep-28-07
4.82
83.64 3.15 4.03 Sep-11-07 72.00 5.64 7.46 Sep-13-07 71.38 5.49 7.40 Sep-15-07 71.56 5.54 7.42
29
Sep-18-07
10.37
71.49 5.59 7.41 Sep-19-07 82.33 5.22 6.36 Sep-21-07 81.16 5.21 6.27 Sep-23-07 83.02 5.19 6.42
72
Sep-26-07
7.73
82.08 5.22 6.35 Sep-11-07 88.58 10.79 11.55 Sep-13-07 88.16 10.65 11.50 Sep-15-07 87.61 10.60 11.43
76
Sep-18-07
13.05
86.69 10.46 11.31
Chapter 1-29 2007 Annual Report
Results for the two experiments are presented in Tables 20 and 21. Even when samples were successively frozen and defrost up to three times (Table 20) the quantifications of TBC remained constant. Results from Table 21 suggest that duration of the storage period does not seem to have any influence. In the last measurement (September 18) on sample # 76 there was, perhaps, a reduction of the total trans �-carotene and total �-carotene. This reduction however, is not significant from the practical point of view and is the result of about a week of storage, something that is not necessary to happen. 1.6 MOLECULAR MARKERS INVOLVED IN CAROTENE SYNTHESIS AND ACCUMULATION IN CASSAVA Knowledge of the inheritance and gene action of beta-carotene accumulation in cassava can be used to guide the breeding process and also to combine favorable alleles at multiple loci that control beta-carotene content in cassava. The objective of this study was to identify simple sequence repeat (SSR) markers associated with beta carotene content in cassava through the bulked segregant analysis (BSA) of families segregating for beta-carotene content. To select the best families for the marker-aided analysis of the inheritance of beta-carotene content in cassava, TCC and BCC were evaluated in 800 individuals from 46 families having white, cream, and yellow colored root parenchyma. A frequency distribution for the trait was generated for each family to draw conclusion on the possible genetic control of the beta-carotene accumulation in each family. Three families, namely GM708, GM 734, and CM 9816 were selected for further study. The extraction and quantification of total carotenes in fresh cassava roots was conducted following the established procedures, which produce very reliable results as described in the section 1.3 of this chapter. Two or three plants are harvested per genotype and 5 of the best roots selected. The roots are cleaned, chopped up into small cubes, mixed, and a sample of 5g drawn. DNA extraction was using the standard protocols as modified for cassava; the quality of the DNA was verified using agarose gel (0.8%) electrophoresis stained with ethidium bromide (0.5ug/ml) and quantified using a DNA flourometer (DYNA Quant, Hoefer). Dilutions of each DNA sample were made to a final concentration of 10ng/ul. For bulked segregant analysis (BSA), bulks of high and low beta-carotene content were constituted for each family. Between 10 and 20 individuals with high beta-carotene content, 7-11�g/g, were selected as the high bulk and, 10-20 genotypes with beta-carotene content lower than 2�g /g were selected as low bulks. The bulks and parents were evaluated with 140 SSR markers that have earlier been mapped onto the genetic map of cassava distributed all over the cassava genome at a distance of 10-20cM per marker. PCR analysis and polyacrylamide gele analysis (PAGE) was as already described by Mba et al. in 2001 (Theoretical and Applied Genetics 102: 21-31). Markers polymorphic in the high and low bulks were evaluated in individuals of the bulks and those that markers that continue to differentiate between high and low beta-carotene genpotypes were evaluated in the entire population.

Project IP3: improving cassava for the developing world Chapter 1-30
Using the data of total carotenes, simple statistical parameters for example average, median, standard deviation, maximum, minimum was calculated. A frequency distribution of total carotenes in each family was also drawn as a preliminary assessment of gene control of beta-carotene content in cassava. To identify association between molecular markers associated with total carotene content after the BSA, a correlation and simple regression analysis was conducted considering the marker genotypic classes as independent variable and content of total carotenes as dependent variable.
Based on the frequency distribution and standard deviations of total carotenes in 46 families, there families, namely GM708, GM734 and CM9816, with the widest segregation were selected for BSA. Family GM 708 has 62 progenies, GM734 64, and CM9816 37. Table 1.22 shows simple statistics of total carotenes in the three selected families. Total carotene content ranged from 0.45 to 11.1�g/g in progenies from crosses between parents with cream-colored roots and between yellow and white colored roots. Frequency distribution of TCC in the three families tends to follow normal distribution, suggesting that several genes control TTC (Figure 1.18).
Table 1.22. Simple statistics of TTC and CCC in 3 families obtained from genetic crosses between parents with cream-colored roots or yellow root parenchyma.
Parameter TCC (�g/g) BCC (�g/g) CM9816 (MCOL 2295 x SM980-4)
Average 5.38 4.83 Sd. Deviation 1.69 2.96 Minimum 4.00 1.45 Maximum 8.00 9.99
GM 708 (MBRA 1A x MMAL 66) Average 3.68 3.14 Sd. Deviation 2.30 2.65 Minimum 1.00 0.16 Maximum 8.50 11.16
GM734 (MTAI 2 x CM 3750-7) Average 3.60 3.62 Sd. Deviation 1.61 1.74 Minimum 1.00 0.44 Maximum 8.00 8.45
Single marker analysis, by simple regression, of association between the polymorphic markers and total carotene content revealed a number of major quantitative trait loci (QTL) controlled beta-carotene content in cassava (Table 1.23). The QTLs explained up to 26% of phenotypic variation.

Chapter 1-31 2007 Annual Report
Figure 1.18. Distribution frequencies of TCC values (�g/g) in the three families evaluated. Five QTLs were identified on linkage group D for all of the 3 families, suggesting major QTLs that go across different sources of enhanced beta-carotene content reside on this linkage group (Table 10.2). In a previous study of the mode of inheritance and the number of genes involved in determination of yellow root color in a S1 family (AM320) derived from the Thai variety MTAI8, 3 polymorphic markers were found to be associated with root color and controlled between 30 and 40% of phenotypic variance (CIAT 2005). All of the markers - SSRY 313, NS251, and NS717 - are located on linkage group D and are similar to those found in these studies. Families GM708 and CM9816 also had QTLs on linkage group G (Table 10.2). Six other QTLs were unique amongst the 3 families. These results reveal that regions of the cassava genome controlling beta-carotene content are common for different sources of increased beta-carotene content but also unique with respect to source. Gene action for all aforementioned QTLs are thought to be additive in nature but confirmation will come from subsequent marker-validation studies already being conducted.
MCOL 2295 x SM 980- 4
0
2
4
1-2 3-4 5-6 7-8 9-10TCC (microgram / gram FW)
Num
bero
fgen
otyp
es
MTAI 2 x CM 3750- 7
0
2
4
6
8
10
12
14
16
18
0-1 2-3 4-5 6-7 8-9
TCC (microgram / gram FW)
Num
berg
enot
ypes
MBRA 1A x MMAL 66
02468
1012141618
0-1 2-3 4-5 6-7 8-9 >10TCC (microgram /gram FW)
Num
bero
fgen
otyp
es
A B
C
MCOL 2295 x SM 980- 4
0
2
4
1-2 3-4 5-6 7-8 9-10TCC (microgram / gram FW)
Num
bero
fgen
otyp
es
MCOL 2295 x SM 980- 4
0
2
4
1-2 3-4 5-6 7-8 9-10TCC (microgram / gram FW)
Num
bero
fgen
otyp
es
MTAI 2 x CM 3750- 7
0
2
4
6
8
10
12
14
16
18
0-1 2-3 4-5 6-7 8-9
TCC (microgram / gram FW)
Num
berg
enot
ypes
MTAI 2 x CM 3750- 7
0
2
4
6
8
10
12
14
16
18
0-1 2-3 4-5 6-7 8-9
TCC (microgram / gram FW)
Num
berg
enot
ypes
MBRA 1A x MMAL 66
02468
1012141618
0-1 2-3 4-5 6-7 8-9 >10TCC (microgram /gram FW)
Num
bero
fgen
otyp
es
MBRA 1A x MMAL 66
02468
1012141618
0-1 2-3 4-5 6-7 8-9 >10TCC (microgram /gram FW)
Num
bero
fgen
otyp
es
A B
C

Project IP3: improving cassava for the developing world Chapter 1-32
LOW BULK HIGH BULK Figure 1.19. Evaluation of SSR marker SSRY-313 in high and low bulks of GM708. Table 1.23. Association between SSR markers and beta-carotene content in the families GM708, GM734 and CM9816 as revealed by single marker analysis (simple regression).
Family Microsatellite Correlation Rregression Linkage Group SSRY-178 0.31 0.10 H NS-267 0.26 0.07 R SSRY-313 0.44 0.19 D SSRY-226 0.23 0.05 G
GM708
SSRY-88 0.31 0.10 K SSRY-250 0.51 0.26 L SSRY-242 0.31 0.10 A SSRY-21 0.28 0.08 D GM734
NS-717 0.41 0.17 D SSRY-49 0.42 0.18 C SSRY-195 0.42 0.18 F SSRY-330 0.37 0.14 N/A SSRY-324 0.23 0.05 D NS-158 0.43 0.18 G SSRY-172 0.33 0.11 J
CM9816
SSRY-313 0.47 0.22 D Association of molecular markers and beta-carotene content was initially conducted with regression analysis, there is a need to conduct the analysis with other more powerful forms of analysis including interval and composite interval analysis. Validation of markers identified to explain large amounts of phenotypic variation will be conducted in S1 families developed from some selected genotypes. 1.7 THE EFFECT OF THE ENVIRONMENT IN FE AND ZN IN CASSAVA ROOTS A large trial for assessing the relative importance of the environment and the interaction between genotype and environment in Fe and Zn content in cassava roots was planted. Originally four contrasting environments were considered but one had to be eliminated because of flooding. A total of 30 clones were planted. Roots were harvested at 9 months after planting. Remnant plants allowed a second harvest (10 months after planting) but including only 20 of the original genotypes.

Chapter 1-33 2007 Annual Report
Results came recently from the University of Adelaide and the analysis of data is still preliminary. Few conclusions can be drawn. There was a clear association between Fe and Al data, which prompted the elimination of two data points from the original data set as contamination on the samples was suspected. Samples were prepared following the most updated protocol and using adequate tools and procedures. Nevertheless, the possibility of contamination remains a major problem. Tables 1.24 through 1.27 presents the analyses of variance for Fe and Zn quantifications at nine and ten months after planting. Figures 1.20 and 1.21 present the distribution of the actual data. This preliminary analysis allows for few conclusions:
� In all analyses genetic differences in Fe and Zn contents were found suggesting the possibility of success to improve the nutritional quality of cassava roots for these traits. Although there was data supporting this hypothesis, this is the first case where replicated, multi-location trials involving contrasting set of genotypes have been conducted.
� Environment clearly plays an important role for Zn content in cassava roots and may affect Fe content through significant genotype by environment interaction effects.
� Coefficients of variation were very high, particularly for Fe content. This may be the result of sample contamination even after the suspect data points were eliminated.
Table 1.24. Analysis of variance for Fe content from the evaluation of 28 clones at three different locations. Roots harvested 9 months after planting.
Source df SS MS Probability Location 2 134.9 67.5 0.017 Cultivar 27 1448.4 53.6 0.000 Location x Genotype 54 1779.4 33.0 0.000 Error 157 2532.9 16.1 TOTAL 240 Grand Mean 11.585; CV 34.67 Table 1.25. Analysis of variance for Zn content from the evaluation of 28 clones at three different locations. Roots harvested 9 months after planting.
Source df SS MS Probability Location 2 7100.3 3550.1 0.000 Cultivar 27 363.5 13.46 0.000 Location x Genotype 54 745.2 13.8 0.000 Error 157 606.1 3.86 TOTAL 240 Grand Mean 10.021; CV 19.61

Project IP3: improving cassava for the developing world Chapter 1-34
Figure 1.20. Average Fe content (from three replications) in cassava roots from 30 clones grown in three environments and harvested nine months after planting (A), and ten months after planting (B). Table 1.26. Analysis of variance for Fe content from the evaluation of 20 clones at three different locations. Roots harvested 10 months after planting.
Source df SS MS Probability Location 2 21.7 10.8 0.405 Cultivar 19 1026.4 54.0 0.000 Location x Genotype 38 501.2 13.2 0.329 Error 111 1317.8 11.9 TOTAL 170
Grand Mean 9.7614; CV 35.30
0
5
10
15
20
25
30
1 2 3 4 5 6 7 8 9 10 11 12 13 14 15 16 17 18 19 20 21 22 23 24 25 26 27 28 29 300
5
10
15
20
25
30
1 2 3 4 5 6 7 8 9 10 11 12 13 14 15 16 17 18 19 20 21 22 23 24 25 26 27 28 29 30
0
5
10
15
20
25
1 2 3 4 5 6 7 8 9 1011 12 13 14 15 16 17 18 19 2021 22 23 24 25 26 27 28 29 30
Cultivar
Fe (m
g/kg
)
S. de Quilichao Villavicencio Sub-humid
0
5
10
15
20
25
1 2 3 4 5 6 7 8 9 1011 12 13 14 15 16 17 18 19 2021 22 23 24 25 26 27 28 29 30
Cultivar
S. de Quilichao Villavicencio Sub-humidS. de Quilichao Villavicencio Sub-humid
Fe (m
g/kg
)
A
B
0
5
10
15
20
25
30
1 20
5
10
15
20
25
30
1 2 3 4 5 6 7 8 9 10 11 12 13 14 15 16 17 18 19 20 21 22 23 24 25 26 27 28 29 300
5
10
15
20
25
30
1 2 3 4 5 6 7 8 9 10 11 12 13 14 15 16 17 18 19 20 21 22 23 24 25 26 27 28 29 30
0
5
10
15
20
25
1 2 3 4 5 6 7 8 9 1011 12 13 14 15 16 17 18 19 2021 22 23 24 25 26 270
5
10
15
20
25
1 2 3 4 5 6 7 8 9 1011 12 13 14 15 16 17 18 19 2021 22 23 24 25 26 27 28 29 30
Cultivar
Fe (m
g/kg
)
S. de Quilichao Villavicencio Sub-humid
0
5
10
15
20
25
1 2 3 4 5 6 7 8 9 1011 12 13 14 15 16 17 18 19 2021 22 23 24 25 26 27 28 29 30
Cultivar
S. de Quilichao Villavicencio Sub-humidS. de Quilichao Villavicencio Sub-humid
Fe (m
g/kg
)
A
B

Chapter 1-35 2007 Annual Report
Table 1.27. Analysis of variance for Zn content from the evaluation of 20 clones at three different locations. Roots harvested 10 months after planting.
Source df SS MS Probability Location 2 2184.7 1092.4 0.000 Cultivar 19 351.0 18.5 0.000 Location x Genotype 38 564.9 14.9 0.000 Error 111 297.1 2.7 TOTAL 170
Grand Mean 8.2097; CV 19.93
Figure 1.21. Average Zn content (from three replications) in cassava roots from 30 clones grown in three environments and harvested nine months after planting (A), and ten months after planting (B). Table 1.28 presents the averages for each of the thirty clones. Averages are based on three replications per location and per age of harvest. They are, therefore, based on a maximum of
0
5
10
15
20
25
1 2 3 4 5 6 7 8 9 1011121314151617181920212223242526272829300
5
10
15
20
25
1 2 3 4 5 6 7 8 9 101112131415161718192021222324252627282930
02468
101214161820
1 2 3 4 5 6 7 8 9 101112131415161718192021222324252627282930Cultivar
Zn(m
g/kg
)
S. de Quilichao Villavicencio Sub-humid
0
4
8
12
16
20
1 2 3 4 5 6 7 8 9 101112131415161718192021222324252627282930Cultivar
Zn(m
g/kg
)
S. de Quilichao Villavicencio Sub-humidS. de Quilichao Villavicencio Sub-humid
Zn(m
g/kg
)Zn
(mg/
kg)
A
B
0
5
10
15
20
25
1 2 3 4 5 6 7 80
5
10
15
20
25
1 2 3 4 5 6 7 8 9 1011121314151617181920212223242526272829300
5
10
15
20
25
1 2 3 4 5 6 7 8 9 101112131415161718192021222324252627282930
02468
101214161820
1 2 3 4 5 6 7 8 9 101112131415161718192021222324252627282930Cultivar
Zn(m
g/kg
)
S. de Quilichao Villavicencio Sub-humid
0
4
8
12
16
20
1 2 3 4 5 6 7 8 9 101112131415161718192021222324252627282930Cultivar
Zn(m
g/kg
)
S. de Quilichao Villavicencio Sub-humidS. de Quilichao Villavicencio Sub-humid
Zn(m
g/kg
)Zn
(mg/
kg)
A
B

Project IP3: improving cassava for the developing world Chapter 1-36
18 single independent measurements. In some cases (particularly for the harvest at ten month) roots of commercial size were not available. This is a partially a result of the diversity of the genotypes evaluated and the differences of the environments employed which meant that some genotypes lack adaptation to certain environments. Although there were statistically significant differences among averages, the range of variation for Fe and Zn was disappointingly narrow. The highest values for the relevant columns have been highlighted with bold face characters. Table 1.28. Averages for Fe, Zn and Al content from the evaluation of 30 clones at three different locations and two ages. Each Environment x Age data point is the average of three replications.
Count Fe Zn Al Genotype Env X Age Average St. Dev. Average St. Dev. Average CG 354-2 3 12.53 3.25 8.24 2.77 10.87 CM 523-7 5 9.82 3.32 7.30 3.72 7.51 CM 2177-2 4 9.16 2.34 10.59 7.63 8.71 CM 3236-3 5 10.21 1.35 6.57 5.14 6.56 CM 4919-1 4 14.46 5.80 10.76 3.49 12.36 CM 6740-7 6 9.34 1.78 8.14 5.42 4.01 SM 629-6 5 11.36 2.27 10.30 7.08 8.81 SM 734-5 6 7.63 1.22 6.76 4.12 4.79 SM 805-15 5 7.55 2.51 6.60 4.06 6.07 SM 1438-2 6 8.30 2.15 8.00 6.05 6.48 HMC-1 6 10.61 1.46 9.78 5.47 6.46 MBRA 101 6 10.03 2.71 9.18 5.81 7.43 MBRA 502 5 9.85 2.97 9.11 4.86 7.25 MBRA 517 4 12.21 5.29 9.99 8.34 9.43 MBRA 1251 6 7.96 1.95 8.10 4.15 8.13 MBRA 1400 6 13.10 3.16 10.30 4.91 10.82 MCOL 1505 6 11.57 2.50 9.51 7.42 6.86 MCOL 1508 6 9.40 3.47 9.58 7.26 9.36 MCOL 1793 6 11.99 1.40 8.99 6.98 9.56 MCOL 2199 6 10.04 2.38 7.97 4.13 7.87 MCOL 2279 6 11.76 0.65 8.76 5.22 9.04 MCOL 2436 6 14.91 4.51 11.26 6.06 11.34 MCOL 2489 5 10.00 1.44 8.26 4.37 8.61 MGUA 86 6 16.01 4.50 9.35 6.07 11.63 MMAL 42 6 11.32 2.08 10.14 4.73 6.54 MMEX 53 3 14.52 1.71 11.96 5.96 16.99 MPAR 119 6 9.58 1.53 10.92 7.45 9.58 MPER 183 6 8.18 1.54 10.11 4.60 5.56 MPER 297 6 9.19 1.72 10.01 5.38 7.06 MPER 496 6 8.54 1.46 8.18 3.57 5.99
Minimum 7.55 0.65 6.57 2.77 4.01 Maximum 16.01 5.80 11.96 8.34 16.99 Average 10.70 2.48 9.16 5.41 8.39
St. Deviation 2.25 1.24 1.40 1.42 2.62 Al values are presented because they can be useful for detecting contamination of samples. Two data points were eliminated from the data set presented in Table 1.28 because of their suspiciously high levels of Al (51 and 30 mg/kg). Nonetheless, two of the genotypes with the

Chapter 1-37 2007 Annual Report
highest levels of Fe and Zn are associated with the two highest levels of Al and, therefore, casting doubts about the accuracy of these Fe and Zn values. In general, however, the levels of Al observed are acceptable and indicate that measures taken have been effective in reducing the possibilities of contamination but, unfortunately, it is not possible to be sure that to negligible levels. 1.8. TRANSLOCATION STUDIES Tissue from leaves, stems and roots of seven clones were harvested at four different ages (October 25, December 5, January 16 and March 6). The interest was to learn about the relative relationship between the three different type of tissue and follow up in the patterns of accumulation. Correlation between leaf and stem tissue was 0.267. Correlation between stem and root tissue was 0.567. Correlation between leaf and root tissue was 0.019. �-carotene content oscillated significantly for leaves (Table 3), with lower values in Dec. 5 and Jan.16. An opposite trend could be observed in the stems with the highest values during these two dates. In general, �-carotene content tended to be higher as the roots aged, with a slight decrease in the last quantification of March 06. This, reduction, however may be due to the typical reduction in dry matter content at this time of the year. �-carotene levels were much higher in leaves, than in stems than in roots.
Tissue/Date Oct.25 Dec.05 Jan.16 Mar.06 Leaves 73.72 66.72 69.77 95.62 Stems 6.02 12.58 14.77 10.74 Roots 1.51 2.14 2.58 2.28 1.9. OTHER ACTIVITIES A group of cassava genotypes has been selected to provide a sample of roots large enough to conduct initial bioavailability studies in the USA under the supervision of the nutrition coordinator (Christine Hotz). These studies are planned for November 2007. In addition to the ongoing phenotyping work to elucidate the inheritance of carotenoids content in cassava roots there is a parallel work at the molecular level. Considerable progress has been made but results are not presented in this report because some of the results needed to be re-evaluated and re-analyzed.

CHAPTER 2
GENETIC BASE OF CASSAVA AND RELATED MANIHOT SPECIES EVALUATED AND MADE AVAILABLE FOR CASSAVA IMPROVEMENT: HIGHER COMMERCIAL VALUE
2.1. FIELD EVALUATION OF ACCESSIONS FROM THE GERMPLASM COLLECTION Because of problems related to the accumulation of diseases the germplasm collection is no longer routinely grown in the field. The collection had become a focus of diseases, particularly frog skin disease (FSD), because given its importance no genotype could be eliminated if found to have symptoms of the disease. However, the phenotypic characterization of the collection has not been completed. Therefore, during a considerable part of 2006 plantlets from the in vitro collection were obtained, hardened and transplanted to the field where they were grown during 2007. The nursery was planted in an isolated field at CENICAÑA to prevent, as much as possible, contamination with FSD. In February 2008, evaluation of this material was initiated in search of high TCC values. Planting material will be obtained and trials will be planted in the mid-altitude valleys (Palmira); sub-humid (Barranquilla) and acid-soil (Villavicencio – Puerto López) environments. Data for completion of the collection will be obtained for the morphological descriptors. In addition, a set of these accessions will be planted in the crossing nurseries to obtain self-pollinated seed in search of useful recessive traits that may be carried by some of these accessions. Table 2.1 presents a summary of the material recovered from the in vitro collection. Table 2.1. Country of origin, number of accessions and number of plants grown in the field from the recoveries of in vitro germplasm collection of cassava.
Country # accessions # plants Country # accessions # plants Argentina 40 133 Paraguay 41 139 Brazil 568 2060 Perú 109 309 Colombia 580 1757 Philippines 1 3 Costa Rica 43 154 Puerto Rico 1 3 Cuba 32 107 Tailandia 2 5 Ecuador 24 71 USA 3 7 Fiji 3 12 Venezuela 45 129 Guatemala 20 57 Total 1586 5170 Indonesia 12 40 CG 10 21 Malaysia 26 81 CM 38 80 Mexico 28 80 SG 1 2 Nigeria 2 7 SM 4 9 Panama 6 16 Total 53 112
Chapter 2-1 2007 Annual Report

2.2 INDUCTION AND IDENTIFICATION OF A SMALL-GRANULE, HIGH-AMYLOSE MUTANT IN CASSAVA This is a manuscript submitted to the Journal of Agricultural and Food Chemistry and has already undergone one round of revisions. The authors are (not in the same order as in the submitted manuscript) Hernán Ceballos, Teresa Sánchez, Nelson Morante, Juan C. Pérez and Martin Fregene from CIAT; Adriana P. Tofiño from CORPOICA; Elvia A. Rosero from National University of Colombia; Dominique Dufour from CIRAD-CIAT and Kay Denyer, Alison Smith, and Brendan Fahy and from the John Innes Centre (U.K.). The most important sources of starch include cereals, tree, fruit and vegetable crops and, very relevant for tropical environments, the root and tuber crops (1). Starch extraction, however, is carried out from a limited number of crops. Among the non-cereal sources, the most important are the sago palm, potato, cassava and sweet potato. Comprehensive reviews of cassava starch properties have been published (1, 2). The starch is easily extractable from the roots because they contain low levels of protein and fat (3, 4). The starch granules are generally round (oval), with a flat surface on one side (truncated) and range from 5 to about 40 �m in size. Sriroth and co-workers found starch granule size from four different varieties ranging from 8 to 22, with an average of 15 �m (3). Several studies have reported differences in starch granule structure and chemical composition, which depend on the botanical origin of the starches (5, 6, 7). CIAT has conducted quantification of thousands of starch samples from improved clones as well as from clones of the germplasm collection. The average amylose content from 110 different genotypes was 19,8% with a standard deviation of + 1.58 (CIAT, unpublished data). However, data based on smaller samples reported the amylose content varying from 18.6 to 23.6% (5). Recently an amylose-free natural mutation has been identified and reported (8). Viscosity of cassava starch has been well studied and tends to be high compared with that of starch from other tubers and the cereals (1, 5). There are clear genetic differences in viscosity. CIAT is currently screening the starch quality traits from the entire cassava germplasm collection (more than 6000 accessions). In most cases, pastes analyzed with the rapid-viscoanalyzer, show a single high-viscosity peak as a result of the high degree of swelling, which then generally breaks down sharply. In other cases two adjacent peaks can be observed. In other cases, the peak is low and wide (CIAT, unpublished data). Cassava starch is one of the least resistant to enzymatic breakdown, among the non-cereal starches, with hydrolysis curves similar to those of normal maize starch (2). In spite of the considerable variation in the physico-chemical properties of cassava starch, there is little natural qualitative variation reported (8, 9, 10). Compared with the several mutations reported for starches from other crops like maize, rice, barley and potato, cassava offers comparatively very little variation. CIAT has, therefore, implemented several strategies to develop high-value cassava clones (8, 10, 11). The main objective is to develop not only clones with high and stable productivity, but also with root characteristics that better fit the needs of the different industries. For the feed industry high-protein clones have been identified (12). For the starch and bio-ethanol industries different approaches to develop and identify clones with novel starch properties have been gradually introduced in the cassava-breeding project, already with positive results (8, 11).
Project IP3: improving cassava for the developing world Chapter 2-2

In spite of their low frequency and the unpredictability of results, the induction of mutations has been a successful approach to generate new variability in other crops where natural genetic variation was limited and insufficient. As a result, several varieties have been developed after the induction of mutations (13, 14). CIAT and National University of Colombia have, therefore, implemented a joint mutation-breeding project in search of genetic modifications for useful traits, including starch quality. This article reports on two cassava genotypes identified in a mutagenized population that showed distinctive starch characteristics. They were initially discovered in March 2006, and further confirmed in September 2007. 2.2.1Materials and methods A project to induce mutations in botanical seed from five different families was initiated in 2003 (11). About 1400 botanical seeds from five different full- or half-sib families (Table 2.2) were irradiated with 200 Gy Gamma Rays (from Cobalt 60). Dosage was based on previous experience at International Atomic Energy Agency (IAEA) with cassava as well as with other crops whose seeds have similar size as those of cassava. After transplanting the seedlings, normal cultural practices were used to maintain the crop in good growing conditions. By August 2004 the plants from the M1 generation (M1 = first stage of mutagenesis) started to flower. Whenever possible (cassava plants do not always flower) the M1 plants were self-pollinated to generate M2 seed (M2 = second stage in the mutation breeding process). This action is important to eliminate chimeras (typical in mutagenesis) and to allow recessive traits to express themselves. M2 seeds were germinated, seedlings transplanted to the field in May 2005 and plants harvested in March 2006. Only one plant per genotype was available because evaluations were made on individual plants obtained from botanical seed. At least one commercial-size root was harvested per genotype. Whenever possible, up to five roots per plant and genotype were harvested. Immediately after harvest starch granule morphology was analyzed with an optical microscope. Roots were then washed and peeled before samples were prepared for the different analyses performed.
Table 2.2. Cassava germplasm irradiated with gamma rays (from Cobalt 60). In full-sib families (CM 9331, GM 155, and C-4) both the female and male progenitors are known. In half-sib families (SM 3015 and SM 3045) only the female progenitor is known because the pollination in crossing nurseries is made by insects.
Family Mother Father No. Seed
1 CM 9331 SM 1210-10 MNGA 1 150
2 SM 3015 MCOL 1505 Unknown 150
3 SM 3045 HMC 1 Unknown 150
4 GM 155 MTAI 1 SM 2102-34 158
5 C-4 TME3 TMS30555 787
Chapter 2-3 2007 Annual Report
Optical microscopy. A microscope slide was rubbed against the freshly-cut section of the roots and stained with a drop of iodine solution 0.2 %. The slide was observed through a light microscope (Olympus CX41) using a 40X magnification lens. If any analysis resulted in unusual starch phenotypes (i.e. starch granule morphology that was different from those typical of cassava), vegetative cuttings were taken from the mother plant to clone the respective genotypes. Other tests, following the standard procedures of the root quality laboratory at CIAT (15) were conducted in the “seedling plants” (plants derived from botanical seed, not vegetative cuttings). Starch isolation. Freshly cut pieces from the harvested root(s) were lyophilized for 24 hours at –30°C. Cut pieces were then suspended in tap water and crushed in an Osterizer blender. The slurry was filtered through a 100μm sieve. The starch was allowed to settle and the supernatant decanted off and dried (at room temperature). Scanning electron microscopy (SEM). Dehydrated starch granules were sprinkled on double sided sticky tape, mounted on circular aluminum stubs, coated with 35 nm of gold-aluminum, and then photographed in a Scanning Electron Microscope (JSM 820 Jeol, Tokyo, Japan) at an accelerating voltage of 20 kV. Granule size was measured. Granule size and distribution. Starch granule size and distribution was determined with a laser diffraction particle size analyzer (SALD -3001-Shimadzu Jp). Starch samples were mixed with distilled water and one drop of sodium hexametaphosphate (0.2%) was added. Suspension was mixed using a mechanical stirrer and sonicated to obtain a laser light obscuration level of ~ 30 %. Refractive index of 1.600 ± 0.101 was set for the starch. Measurements were run in triplicate on two different starch samples per genotype at room temperature. Paste clarity. A 1% dry basis aqueous dispersion of starch was boiled at 97ºC (1000 m above sea level) and shaken thoroughly every 5 min for 30 min. Transmittance was measured after cooling to room temperature at 650 nm (16). Colorimetric amylose determination. Amylose content in the starch was measured following standard procedures (17). Starch granules were first dispersed with ethanol and then gelatinized with sodium hydroxide. An aliquot was then neutralized with acid and treated with an iodine solution, which produces blue-black stain coloration. The color intensity, which is related to amylose content, was then measured with a spectrophotometer and compared with a standard curve obtained using purified amylose and amylopectin extracted from potato tubers. Five different quantifications per starch sample were made and mean values were then calculated. The use of amylose and amylopectin from potato has proven to be also useful for a crop like cassava, even though it belongs to a different family (8). Pasting Properties. Hot starch dispersion viscosity profiles were obtained with a Rapid Visco Analyzer model RVA-4 Series (Newport Scientific, Australia). Starch (1.25 g db) was dispersed in distilled water (near 23cm3) to 5% suspension. Viscosity was recorded using the temperature profile holding at 50°C for 1 min, heating from 50°C to 90°C at 6°C min-1, holding at 90°C for 5 min, and then cooling down to 50°C at 6°C min-1 with continuous stirring at 160 rpm. Pasting formation characteristics were: Pasting temperature (PT), peak viscosity (Vpeak), peak temperature (Tpeak), Viscosity at start of 90°C plateau (V90°C/7.667
Project IP3: improving cassava for the developing world Chapter 2-4

min), Viscosity at the end of the plateau at 90°C (V90°C/12.667 min) and the viscosity at 50°C (V50°C/19.334 min). Swelling power, solubility and dispersed volume fraction measurements. Swelling power and solubility patterns were determined using 2.5% starch dispersions (w/w) (0.70 g starch dry basis dispersed in 27.3 g of distilled water). Paste was prepared in Rapid Visco Analyzer (RVA) holding at 35°C for 1 min, heating to 75°C at 6°C min-1 rate, holding at 75°C for 2.5 min. The paste was immediately transferred to 50cm3 centrifuge tube. The supernatant and sediment after centrifugation for 5 min at 6000g at 25°C were collected and weighed (Wsu and Wse, respectively) then dried at 100°C for 24 h and 48 h respectively and weighed (Dsu and Dse, respectively). Three parameters were calculated (18): concentration of soluble material in the supernatant (solubility), the swelling power and the volume fraction of the dispersed phase (�).
Solubility (%db) = 100 * Dsu /0.70 Swelling Power = (Wse – Dse )/Dse (�) = (27.77 – (Wsu – Dsu ))/27.77
Factor 27.77 is calculated as total volume (cm3) of the paste. Starch specific density is 1.5 g/cm3. And, 27.77 = 27.30+(0.70/1.5) cm3. Native gel electrophoresis: Roots from the small-granule mutant (clone 5G160-13) harvested in September 2007 were used for these experiments. To preserve enzyme activity, immediately after harvest in the field, the roots were sliced into 1-cm thick slices, each slice was cut into quarters and wrapped in aluminum foil and these samples were frozen in liquid nitrogen and then stored at -80oC. Samples of control roots with normal granules were prepared and stored in the same way. Two or three samples per root from five separate plants of each line were prepared. Enzyme activities were characterized using native (non-denaturing) polyacrylamide gels (PAG) as follows. Isoamylase. Samples of the frozen roots (~0.5 g) were defrosted and homogenized in a mortar at 4oC with ~50 mg PVPP in 1cm3 extraction buffer containing 50 mM MOPS (pH 7.0), 1 mM EDTA, 5% (v/v) ethanediol and 5 mM DTT. Extracts were centrifuged at 10 000g for 10 min at 4oC and the supernatants were mixed with 0.25 volumes of native gel sample buffer (300 mM Tris HCl (pH 6.8), 50% (v/v) glycerol, 0.05% (w/v) bromophenol blue). Samples were loaded onto discontinuous gels (80 x 60 x 1mm). The main gel contained 7.5% polyacrylamide, 375 mM Tris HCL (pH 8.8), 0.2% potato amylopectin and 0.1% (w/v) acarbose (Glucobay 100 Tablets: Bayer plc, Newbury, Berlshire, UK), 0.04 % (w/v) ammonium persulphate and 0.1% (v/v) TEMED. Gels were subjected to electrophoresis at 150 V and 4oC in 25 mM Tris, 192 mM glycine. After electrophoresis, gels were rinsed twice in incubation buffer containing 100mM MES (pH 6.0), 10 mM EDTA, 5 % ethanediol and 5mM DTT and then incubated in this buffer for 3.5 h at 37oC. Gels were rinsed briefly with water and then stained with Lugol’s solution. Starch branching enzyme. Samples of frozen roots (each ~ 0.3 g) were defrosted and homogenized in a mortar at 4oC with ~30 mg PVPP in 1.5 cm3 extraction buffer containing 50 mM HEPES (pH 7.4), 2 mM MgCl2, 12.5 % (v/v) glycerol and 50 mM 2-mercaptoethanol. Extracts were centrifuged at 20 000g for 30 min at 4oC and the supernatants were mixed with 0.05 volumes of native gel sample buffer (50 % (v/v) glycerol, 0.2 % (w/v) bromophenol blue).
Chapter 2-5 2007 Annual Report

Samples were loaded onto discontinuous gels (80 x 60 x 1mm). The main gel contained 7.0 % polyacrylamide, 375 mM Tris HCL (pH 8.8), 0.01 % (w/v) phosphorylase a (rabbit muscle, 25 U per mg; Sigma, Dorset, UK), 0.2 % (w/v) maltoheptaose, 0.1 % (w/v) acarbose (Glucobay 100 Tablets: Bayer plc, Newbury, Berlshire, UK), 0.04 % (w/v) ammonium persulphate and 0.1% (v/v) TEMED. Gels were subjected to electrophoresis at 150 V and 4oC in 25 mM Tris, 192 mM glycine. After electrophoresis, gels were rinsed twice in 20 mM MES (pH 6.6), 100 mM Na citrate and then incubated for 2 hours at 30�C in 20 mM MES (pH 6.6), 100 mM Na citrate, 45 mM glucose 1-phosphate, 2.5 mM AMP, 1 mM EDTA, 1 mM DTT. Gels were rinsed briefly with water and then stained with Lugol’s solution. 2.2.2 Results During the harvest of approximately 1500 M2 plants in March 2006, only about 800 genotypes produced commercial-size roots (M2 plants were weak because natural inbreeding depression and the negative effects of the mutations) and 38 of them were selected because they were suspected to carry special characteristics (variation in starch granule morphology, capacity of the roots to withstand storage for up to three weeks, and roots that seemed to store compounds different from starch). Vegetative cuttings of these 38 genotypes were used to clone them. Cloned plants were then harvested in September 2007. One of the special characteristics observed was a starch whose granules were considerably smaller than those typical in cassava (Figure 2.1). This article describes the characteristics of this small-granule mutation, exclusively. This type of mutation was observed in self-pollinated progenies from two different M1 plants (3G43 and 5G160) coming respectively from families SM 3015 and C-4 (Table 2.2). 3G43-1 was the only M2 genotype from 3G43 that expressed the small-granule phenotype. On the other hand, there were three M2 sister genotypes (5G160-13, 5G160-16, and 5G160-18) that trace back to a common M1 progenitor plant (5G160) expressing this phenotype. The finding of three sister M2 genotypes derived from the same M1 mother was a strong indication that the special characteristic observed in these genotypes was, indeed, genetic in origin.
Figure 2.1. Photographs from light microscope (40X) of wild type cassava starch (A) and the small-granule mutation (B).
1 mm
B BA
50 �m
Project IP3: improving cassava for the developing world Chapter 2-6

The first indication that the four M 2 genotypes mentioned above had a mutation that affected the starch-granule morphology was the visual observation of their small size through light microscopy (Figure 2.1). Although optical microscopy is a limited technique to determine granule size distribution, it proved to be adequate for detecting abnormal starch granule morphologies during the screening of a large number of genotypes (800) conducted during this study. This observation prompted a more careful analysis using scanning electron microscopy. Figure 2.2 presents photographs at different magnifications of the small-granule phenotype compared with normal-sized cassava starch granules. In both figures, “wild type” (WT = normal) starch granules showing the typical morphology and size (around 15 μm) for cassava is provided. The small-granule mutation (MUT), however, showed a large proportion of granules ranging mostly from 5 to 8 μm and failing to show the truncated shape typical of cassava.
A
B
A
B
Figure 2.2 Photographs from scanning electron microscope at different magnifications of typical cassava starch-granules (A) and the small-granule mutant (B). The relative sizes of photographs on the right have been modified so that the 10 �m bars are of equal lengths. The observation of the MUT phenotype during the harvest of March 2006 (on plants derived from botanical seed) was confirmed again for all the four M2 genotypes on the cloned plants whose roots were harvested in September 2007. This observation demonstrated that the mutation was stable and transmitted through vegetative multiplication. Further analyses were made on starches from five plants derived from 5G160-13, which was the most vigorous
Chapter 2-7 2007 Annual Report

of the four MUT genotypes. For the other genotypes plants were not harvested because they have been used to make crosses to start the transfer of the MUT trait into elite cassava germplasm (a root was taken without harvesting the plant to confirm the MUT phenotype) or because they failed to produce enough starch for complete analyses (3G43-1). Table 2.3 presents results of the granule size, proximal and reological analyses of the two MUT genotypes from which enough starch was available. Data from three WT genotypes of African (MNGA11), Asian (MTAI8 = Rayong 60) or Latin American (MCOL 1505) origin is also provided to facilitate comparison. Five plants from 5G160-13 were harvest and the starch from each individual plant was extracted and analyzed separately. Table 2.3. Analyses of the starches from MUT and three WT genotypes (all from cloned plants) from Africa, Asia, and Latin America. Data from one MUT came from a seedling plant (March 2006 harvest) and five cloned plants (September 2007 harvest). Analyses for these five plants were made individually so standard deviations (within parenthesis) values could be provided. For the second MUT, only data from the seedling plant is available.
Seedling Cloned Genotype Parameter 5G 160-16 5G 160-13 5G 160-13 MTAI 8 MCOL 1505 MNGA 11
Average granule size (�m) (St. Deviation) n.a. n.a. 8.51
(0.270) 16.45 (0.214)
18.81 (0.222)
14.69 (0.225)
Paste clarity (%) 17 26 13 (1.18)
63 (1.76)
63.5 (0.14)
58.7 (1.06)
Amylose (%) 36.23
28.49
28.24 (1.40)
20.67 (1.62)
22.18 (0.76)
22.6 (0.60)
Pasting temperature (PT) in °C 67.4 67.15 67.50
(0.35) 64.23 (0.53)
61.60 (0.49)
63.55 (0.07)
Peak viscosity (PV) in cP 44 76 19
(3.2) 976
(2.82) 1052 (6.36)
1080 (4.94)
Solubility (% db) 33.83 37.17 36.84 (0.67)
10.15 (0.03)
12.20 (0.73)
8.34 (0.55)
Swelling Index (g g-1) 16.45 14.19 9.25 (0.26)
21.77 (0.44)
27.92 (0.57)
26.55 (0.66)
Volume fraction of dispersed phase (�) 0.32 0.28 0.22
(0.008) 0.70
(0.002) 0.72
(0.002) 0.68
(0.009) Granule size: Average granule size (independent starch samples from three 5G160-13 plants) was 8.51 + 0.270 �m compared with typical cassava granule sizes ranging from 14.69 + 0.225 (MNGA 11); 16.45 + 0.214 (MTAI 8) to 18.81 + 0.222 �m (MCOL1505). Paste clarity. Paste clarity was 3-4 times lower in MUT compared with WT cassava genotypes (Table 2.3). The differences can also be appreciated in Figure 2.3.
Project IP3: improving cassava for the developing world Chapter 2-8

A BA B
Figure 2.3. Paste clarity from a typical cassava starch (A) and from the small granule mutation (B). Colorimetric amylose determination. Average amylose content using the colorimetric method ranged in MUT from 28 to 36%, a considerably higher value compared with the 20-22% values observed in the WT genotypes presented in Table 2.3 or the average of 19.8% obtained after the analysis of 110 cassava genotypes (CIAT unpublished data). Differential scanning calorimeter (DSC) determination of amylose, conducted at CIRAD’s laboratories in Montpellier, France corroborated the values obtained by the colorimetric method on starches from the seedling plants (data not presented). Starch Functional properties. Table 2.3 presents the most relevant results from the pasting behavior of MUT and WT cassava starch obtained from the amylograms presented in Figure 2.4. Pasting temperature (PT) was higher in MUT, particularly in the cloned version of 5G 160-13 (67.5°C), than in WT cassava (ranging from 61-64 °C). The most outstanding difference in the amylograms relates to the very low viscosity of MUT with viscosity peaks ranging only from 19 to 76 cP compared with the 976 to 1080 cP in WT cassava. This striking difference is clearly illustrated in Figure 2.4. Hot and cool paste viscosities, breakdown, setback and consistency were very low and difficult to quantify in the almost flat amylograms of MUT (Figure 2.4). These parameters, therefore, were not included in Table 2.3. Solubility and swelling properties. These properties were also distinctive for MUT. Solubility was about three times higher in those genotypes (34 to 37 % db) compared with WT cassava (8-12 % db). Swelling index was, on the other hand, lower in MUT (9-17g g-1) than in WT starches (22 to 28g g-1). Finally, volume fraction of dispersed phase was significantly lower in MUT (0.22 to 0.32 �) compared with WT cassava (0.68-0.72 �).
Chapter 2-9 2007 Annual Report

0
200
400
600
800
1000
1200
0 5 10 15 20
Time (minutes)
Visc
osity
(cP)
0
10
20
30
40
50
60
70
80
90
100
Tem
pera
ture
(oC
)
MUT-1 MUT-2 MUT-3 MUT- 4 MUT-5
MTAI 8 MCOL 1505 MNGA 11 Profile temperature
0
200
400
600
800
1000
1200
0 5 10 15 20
Time (minutes)
Visc
osity
(cP)
0
10
20
30
40
50
60
70
80
90
100
Tem
pera
ture
(oC
)
MUT-1 MUT-2 MUT-3 MUT- 4 MUT-5
MTAI 8 MCOL 1505 MNGA 11 Profile temperature
Figure 2.4. Amylograms from starch samples of the five cloned plants from genotype 5G160-13 (MUT-1 to MUT-5) and three wild-type cassava clones from Africa (MNGA11), Asia (MTAI 8) and Latin America (MCOL 1505) using a rapid viscoanalyzer (RVA). The amylograms from 5G160-13 are drastically different, with no increase in viscosity. Native gel electrophoresis: From common knowledge on starch mutants from other species, it was hypothesized that the MUT were likely to be due to mutations in either starch branching enzymes (SBE) or isoamylase (ISA). Therefore, the activities of these enzymes using native gels were assayed. In addition, limit dextrinase (LD) and �-glucan phosphorylase (PHO) activity was also analyzed. Respective bands were identified based on previous knowledge of these enzymes on native gels from extracts of other crops like maize and rice. Their color and position were typical of these enzymes (Figure 2.5). Results are based on the analysis of genotype 160-13 only, which provided roots from five cloned plants. Roots from five and four plants were used for ISA and SBE, respectively. Not all of these are shown on Figure 2.5 but the same results were obtained from each plant. There were no qualitative differences between MUT and WT samples with respect to the SBE activity. Since MUT roots had lower dry matter content than WT cassava, two types of analyses were made using dilutions with either equal total fresh weight or equal total protein content. MUT tended to have less total SBE activity than WT on both analyses (Figure 2.5A). There were also no consistent differences between MUT and WT in LD and PHO activities (Figure 2.5B and A, respectively). With ISA, however, consistent differences in the pattern of bands could be observed (Figure 2.5B). In the WT, two ISA bands could be observed, above and below the SBE band. In MUT, on the other hand, one ISA band in a different position from either of those in the WT was seen.
Project IP3: improving cassava for the developing world Chapter 2-10

A. Starch - branching
Equal Equal protein
PHO
SBSB
Figure 2.5. Native PAGs (zymograms) of starch metabolising enzymes. Crude extracts of the roots of the 5G 160-13 MUT and WT cassava were subjected to native gel electrophoresis, incubated to allow enzyme activity and then stained with Lugol’s solution to reveal starch-branching enzyme (SBE), isoamylase (ISA), limit dextrinase (LD) and �-glucan phosphorylase (PHO) activity. Each track contains an extract from a different plant. FWT = fresh weight. A) The gel was incubated in the presence of glucose 1-phosphate and �-glucan phosphorylase. Tracks were loaded with volumes of extract containing equal amounts of protein (8 �g/track) or equal amounts of root (2 mg fresh weight/track). B) The gel contains potato amylopectin. Tracks were loaded with volumes of extract containing equal amounts of protein (20 �g/track) or equal amounts of root (10 mg fresh weight/track). Note that the ISA bands in the wild type cassava (WT ISA) and in the mutant (MUT ISA) differ in position and number.
MUT ISA
B. Starch - degrading
Equal Equal FWT
MUT MUT WT WT MUT MUT WT WT
SBSB
SBWT ISA MUT ISA WT ISA
LD
MUT MUT WT WT MUT MUT WT WT
Chapter 2-11 2007 Annual Report

2.2.3 Discussion Only one starch mutant has been reported so far in cassava (8). A second mutation (9) completes all the variation so far reported in the literature on root quality traits for this crop. Because of the extremely limited variation on cassava root quality traits in general, and starch quality in particular, the mutation-breeding project described in this article was initiated. Although frequencies of mutation are very low and results unpredictable, two mutant genotypes with the same starch phenotype have been identified in a M2 population. The most relevant characteristics of this starch mutation are the small granule size (about half the normal size), higher-than-normal amylose content, and very low paste clarity and viscosity peaks. Pasting properties showed higher solubility and lower swelling index and volume fraction of dispersed phase. Several of these characteristics offer potential commercial advantages. The addition of a third mutation that is clearly distinctive and different from those already reported (8, 9) and from WT cassava is a significant contribution, which has already generated interest of the starch industry. In addition to these natural mutants, transgenic cassava has been already produced for different traits (19, 20), but so far they have not been exploited commercially. It is surprising to observe so many changes in biochemistry, granule morphology and functional properties arising from just a single mutation. However a similar situation has already been observed using transgenic sweet potato where SBE II activity was suppressed (21). Complicated structural changes including increased amylose content, increases in phosphate content, alteration in the crystalline structure, and in the length of chains have been reported elsewhere (21, 22). Information from the zymograms presented in Figure 2.5 is preliminary, but strongly suggests that a difference in the isoform composition of isoamylase in MUT is likely the genetic basis of the mutation. There are likely to be three types of the isoamylase gene in cassava: Isa1, Isa2 and Isa3. Of these, Isa1 and Isa2 are thought to be required for normal starch synthesis in several plant species, including potato (23) whereas Isa3 is thought to be involved in starch degradation (24). Whether the changes in Isa bands presented in Figure 2.5 are due to a lesion in a gene encoding one of the isoforms of isoamylase (probably Isa1 or Isa2), or due to a secondary effect remains to be determined. It should be emphasized that the mutant is not devoid of isoamylase activity but then, neither are the sugary1 mutants of maize (25). Cereal mutants lacking isoamylase accumulate large amounts of soluble starch (phytoglycogen), as well as having small starch granules (26). However, transgenic potato, with low isoamylase activity had small granules but little phytoglycogen (23). It is not possible, therefore, to predict whether phytoglycogens are characteristic of isoamylase mutants or not, and this MUT may help to answer this question. Results of enzymatic activity were obtained when all root tissue had been used and, therefore, quantification of phytoglycogens in MUT can only be made after the next harvest of roots. In addition to isoamylase, other enzymes (pullulanase, disproportionating enzyme, and �-glucan water dikinase) have also been related to amylopectin biosynthesis in different crop species (27) and are also potential site(s) of the observed mutation. Although on native gels we could not observe any effect of the mutant on SBE activity, this enzyme cannot be entirely ruled out at this stage. TILLING (28, 29) using primers from as many as 16 different enzymes known to be related to starch biosynthesis is also underway. Most likely, therefore, the genetic origin of these mutations will be confirmed during 2008.
Project IP3: improving cassava for the developing world Chapter 2-12

The factors affecting starch granule morphology and size within and between crops are not clearly understood (22, 27). These new small-granule mutations in cassava may contribute for a better understanding of these factors since they are clearly affecting simultaneously granule morphology and chemistry. According to Lindeboom and co-worlkers (30) the size of MUT granules should be classified as small (5-10 �m) compared with those of WT cassava, which should be classified as medium (10-25 �m). The higher-than-normal level of amylose in MUT has important commercial implications. Increased amylose levels leads to slowly digestible and resistant starches (22, 27, 31, 32), which have distinctive advantage in health, particularly in diabetes management. In addition, high-amylose starches in different crops offer advantages for the production of sweets, adhesives, corrugated boards and in the paper industry, and reduces the uptake of fat in certain fried products (22, 27). Very high levels of amylose result in “resistant” starches (maize starches with more than 50% and up to 90% can be produced commercially). Resistant starches cannot be digested but they are rather fermented in the large intestine resulting in the production of butyrate that has been found to be beneficial to colon health (27). Crosses between the two different MUT genotypes will be made. Since they are genetically unrelated, the resulting F1 crosses will not have the negative effects of inbreeding observed in the M2 cloned genoytpes currently available. Moreover, the F1 crosses will be segregating for many loci, including those causing the small-granule phenotype (in case the mutations in 5G160 and 3G43 affected different loci). This segregation could allow for breeding for amylose content levels above the maximum level of 36% already observed in one of the quantifications made in this study. Alternatively, the starch granule characteristics of these mutants may have other commercial applications. The reduced granule size and the obvious irregularities in their surface (Figure 2.2) would lead to a facilitated hydrolysis (31). If that were the case, these starches would offer important advantages for the bio-ethanol industries by requiring reduced quantities of enzymes or resulting in faster starch-degradation processes. It is acknowledged, however, that while the starch granule appearance would facilitate bio-ethanol production, the higher proportion of amylose would tend to make it less efficient. Only when proper fermentation studies are conducted the relative importance of these contrasting and opposed trends would be clarified. Similar problem has already been analyzed for starches from other crops (31). For the commercial exploitation of the special starch characteristics observed in MUT, it is necessary to combine the trait with a competitive yield of fresh roots with acceptable levels of dry matter content. It is not possible to assess in the M2 plants were MUT was identified the yield penalty (if any) of this special characteristic. A penalty in yield has bee observed in high-amylose varieties from other crops (27). In addition, small granules may have problems for commercial exploitation related to the difficulties in purifications at the commercial level (22, 30). In spite of these problems, commercial exploitation of small-granule or high-amylose starch from other crops is a reality today. In addition to crosses between the sources of MUT and elite WT germplasm with good agronomic performance, crosses between MUT and the amylose-free genotype already reported (8) and other unusual starch types (still in the process of characterization) have already been made. The resulting hybrids will be heterozygous for the two mutations they carry. Therefore, neither mutation will express in these hybrids, which need to be self-pollinated in order to obtain the double homozygotes. Hopefully, the simultaneous expression of two of these mutations combined will lead to different and new starch phenotypes. In
Chapter 2-13 2007 Annual Report

addition, crosses between the two sources of MUT (originally derived from 3G43 and 5G160 M1 plants) would help understanding if these two mutations are allelic or not. Differences in the results from the seedling plant (March 2006 harvest) and the cloned plants (September 2007 harvest) of genotype 5G 160-13 are not surprising (Table 2.3). The root system of plants derived from germinating botanical seed (seedling plant) and those from cloned plants are different (seminal and adventicious tissue, respectively). Therefore, it is expected to find differences in the starch extracted from the two different types of plants. A similar situation was observed through the discovery of the amylose-free mutation (8). Important to emphasize is the fact that the main characteristics of MUT are preserved in the cloned plants, therefore, demonstrating that the mutation is stable. The effect of irradiation overlaps and confounds with the normal genetic segregation that made each botanical seed unique and different from each other. Several (but not all) of these progenitors have already been self-pollinated and their progenies evaluated. In no case has the MUT phenotype been observed. Therefore, based on the available information, our current working hypothesis is that two independent mutation events, with similar phenotypes, took place in four genotypes (belonging to two lineages from 3G43 and 5G160) out of about 800 evaluated. This is a high mutation frequency (whether or not the two mutations are allelic) and would suggest that mutations at the locus (or loci) controlling this characteristics are either easy to attain, or else, that the repairing mechanisms to revert the mutations are less efficient in this region of the genome. This information, in turn, is relevant for future mutation breeding work. In conclusion, two different genotypes with the same MUT phenotype have been identified. Results conclusively demonstrate that these are, indeed, genetic mutations that are stable and, therefore, commercially exploitable. The biochemical and functional characteristics in these mutations have commercial relevance. Ongoing activities include further characterization of the small-granule starch; crosses with elite WT germplasm to place the mutation in a better genetic background which in turn will result in a better agronomic performance required for commercial exploitation; and crosses with other starch mutants to produce double-mutants and, hopefully, new starch phenotypes.
2.3.4 References 1. Moorthy, S.N. Tropical sources of starch. In Starch in food; Eliasson A.C. Ed. CRC Press,
Boca Ratón, Fl., 2004; pp. 321-359. 2. Rickard, J.E.; Asaoke, M.; Blanshard, J.M.V. The physico-chemical properties of cassava
starch. Trop. Sci. 1991, 31,189-207. 3. Sriroth, K.; Santisopasri, V.; Pechalanuwat, C.; Kurotjanawong, K.; Piyachomkwan, K.;
Oates, C.G. Cassava starch granule structure-function properties: influence of time and conditions at harvest of four cultivars cassava starch. Carbohydrate Polymers, 1999, 38, 161-170.
4. Munyikwa, T.R.I.; Lageveld, S.; Salehuzzaman, S.N.I.M.; Jacobsen, E.; Visser, R.G.F. Cassava starch biosynthesis: new avenues for modifying starch quantity and quality. Euphytica 1997, 96, 65-75.
5. Hoover, R. Composition, molecular structure, and physicochemical properties of tuber and root starches: a review. Carbohydrate Polymers 2001, 45, 253-267.
6. Jane, J. Current understanding on starch granule structures. 2006, J. Appl. Glycosci. 53, 205-213.
Project IP3: improving cassava for the developing world Chapter 2-14

7. Hung, P.V.; Maeda, T.; Morita, N. Waxy and high-amylose wheat starches and flours-characteristics, functionality and application. Trends in Food Science & Technology 2006, 17, 448-456.
8. Ceballos, H., Sánchez, T.; Morante, N.; Fregene, M.; Dufour, D.; Smith, A.M.; Denyer, K.; Pérez, J.C.; Calle, F.; Mestres, C. Discovery of an amylose-free starch mutant in cassava (Manihot esculenta Crantz). Journal of Agricultural and Food Chemistry 2007, 87(3), 388-393.
9. Carvalho, L.J.C.B.; de Souza, C.R.B.; Cascardo, J.C.M.; Junior, C.B.; Campos, L. Identification and characterization of a novel cassava (Manihot esculenta Crantz) clone with high free sugar content and novel starch. Plant Molecular Biology 2004, 56, 643-659.
10. Ceballos, H.; Iglesias, C. A.; Pérez, J.C.; Dixon, A.G.O. Cassava breeding: opportunities and challenges. Plant Molecular Biology 2004, 56, 503-515.
11. Ceballos, H.; Fregene, M.; Lentini, Z.; Sánchez, T.; Puentes, Y.I.; Pérez, J.C.; Rosero, A.; Tofiño, A.P. Development and Identification of High-Value Cassava Clones. Acta Horticulturae 2006, 703, 63-70.
12. Ceballos, H.; Sánchez, T.; Chávez, A.L.; Iglesias, C.; Debouck, D.; Mafla, G.; Tohme, J. Variation in crude protein content in cassava (Manihot esculenta Crantz) roots. Journal of Food Composition and Analysis 2006, 19:589-593.
13. Ahloowalia, B.S.; Maluszynski, M.; Nichterlein, K. Global impact of mutation-derived varieties. Euphytica 2004, 135,187-204.
14. Maluszynski, M.; Szarejko, I.; Barriga, P.; Balcerzyk, A. Heterosis in crop mutant crosses and production of high yielding lines using double haploid systems. Euphytica 2001, 120, 387-398.
15. Aristizábal, J.; T. Sánchez, T. Guia técnica para producción y análisis de almidón de yuca. 2007, Boletín de Servicios Agrícolas de la FAO. Roma, Food and Agriculture Organization of the United Nations.
16. Craig, S.A.S.; Maningat, C.C.; Seib, P.A.; Hoseney, R. C. Starch paste clarity, Cereal Chem, 1989, 66(3), 173-182.
17. ISO 6647 (F). Riz: Détermination de la teneur en amylose, 1987. 18. Mestres, C.; Nago, M.; Akissië, N.; Matencio, F. End use quality of some African corn
kernels. Cooking behavior of whole dry-milled maize flours; incidence of storage. J Agric Food Chem 1997, 45, 565-571.
19. Raemakers, K.; Schreuder, M.; Suurs, L.; Furrer-Verhorst, H.; Vincken, J.P.; de Vetten, N.; Jacobsen, E.; R.G.F. Visser. Improved cassava starch by antinsense inhibition of granule-bound starch synthase I. Molecular Breeding 2005, 16, 163-172.
20. Taylor, N.; Chavarriaga, P.; Raemakers, K.; Siritunga, D.; Zhang, P. Development and Application of transgenic technologies in cassava. Plant Molecular Biology 2004, 56, 671-688.
21. Kitahara, K.,; Hamasuna, K.; Nozuma, K.; Otani, M.; Hamada, T.; Shimada, T.; Fujita, K.; Suganuma, T. Physicochemical properties of amylose-free and high-amylose starches from transgenic sweetpotatoes modified by RNA interference. Carbohydrate Polymers 2007, 69, 233-240.
22. Davis, J. P.; Supatcharee, N.; Khandelwal, R. L.; Chibbar, R.N. Synthesis of novel starches in planta: opportunities and challenges. Starch/Stärke 2003, 55, 107-120.
23. Bustos, R.; Fahy B.; Hylton, C.M.; Seale, R.; Nebane N.M.; Edwards A.; Martin C.; Smith, A.M. Starch granule initiation is controlled by a heteromultimeric isoamylase in potato tubers. PNAS 2004, 101, 2215-2220.
24. Wattebled, F.; Dong, Y.; Dumez, S.; Delvallé, D.; Planchot, V.; Berbezy, P.; Vyas, D.; Colonna, P.; Chatterjee, M.; Ball, S.; D'Hulst, C. Mutants of Arabidopsis lacking a
Chapter 2-15 2007 Annual Report

Project IP3: improving cassava for the developing world Chapter 2-16
chloroplastic isoamylase accumulate phytoglycogen and an abnormal form of amylopectin. Plant Physiol. 2005, 138, 184-195.
25. Dinges, J.R.; Colleoni, C.; Myers, A.M.; James, M.G. Molecular structure of three mutations at the maize sugary1 locus and their allele-specific phenotypic effects. Plant Physiol. 2001, 125, 1406-1418.
26 Burton, R.A.; Jenner, H.; Carrangis, L.; Fahy, B.; Fincher, G.B.; Hylton, C.; Laurie, D.A.; Parker, M.; Waite, D.; Wegen van, S.; Verhoeven, T.; Denyer, K. Starch granule initiation and growth are altered in barley mutants that lack icoamylase activity. The Plant Journal 2002, 31(1), 97-112.
27. Jobling, S. Improving starch for food and industrial applications. Current Opinion in Plant Biology 2004, 7, 210-218.
28. McCallum, C.M.; Comai, L.; Greene, E.A.; Henikoff, S. Targeting induced local lesions in genomes (TILLING) for plant functional genomics. Plant Physiol. 2000, 123, 439–442.
29. Till, B.J.; Reynolds, S.H.; Greene, E.A.; Codomo, C.A.; Enns, L.C.; Johnson, J.E.; Burtner, C.; Odden, A.R.; Young, K.; Taylor, N.E.; Henikoff, J.G.; Comai, L.; Henikoff, S. Large-scale discovery of induced point mutations with high-throughput TILLING. Genome Res. 2003, 13, 524–530.
30. Lindeboom, N.; Chang, P.R.; Tyler, R.T. Analytical, biochemical and physicochemical aspects of starch granule size, with emphasis on small granule starches: a review. Starch/Stärke 2004, 56, 89-99.
31. Lehman, U.; Robin, F. Slowly disgestible starch – its structure and health implications: a review. Trends in Food Sci. & Technology 2007, 18, 346-355.
32. Stevnebø, A.; Sahlström, S.; Svihus, B. Starch structure and degree of starch hydrolisis of small and large granules from barles varieties with varying amylose content. Animal Feed Science and Technology 2006, 130, 23-38.
CHAPTER 3
DEVELOPMENT OF NEW GENETIC STOCKS AND IMPROVED GENE POOLS FOR THEIR EVALUATION IN KEY TARGET ENVIRONMENTS
The overall objective of the output described in this chapter is to produce genetically improved cassava germplasm, by recombining selected parental genotypes and then evaluating the segregating progenies under adequate environmental conditions. Recombinant seed and/or vegetative propagules from elite clones are then shipped to our collaborators in Africa, Asia and Latin America. The activities described below may not follow the exact order used to describe them in the respective work plan. This change has been made for being more logical and, hopefully, to make it easier to understand the description of the research carried out. In addition to germplasm we are also producing knowledge and developing technologies that will make the breeding process more efficient. 3.1 SELECTION OF PROGENITORS BASED ON PREVIOUS CYCLE RESULTS AND INFORMATION FROM OTHER OUTPUTS (I.E., RESISTANCE/TOLERANCE, ROOT QUALITY TRAITS, ETC.) The selection of parents to build populations for future breeding work represents the core of our improvement efforts, since it will be the source of the genetic progress we will achieve in the future. There are two types of populations developed: open pollinated and controlled crosses. We generally employ open pollination (polycrosses) to develop populations for target ecosystems. We have consistently developed polycrosses for the sub-humid tropics, acid soil savannas, semi-arid tropics, mid-altitude and highland tropics, and sub-tropics. In the case of controlled crosses, they are to develop progenies for specific traits, special studies or the combination of elite experimental material with local landraces that need to be improved, but they can also be used for adaptation to target ecosystems as well. The main objectives of this activity are: 1) To identify, a set of elite clones, based on information from evaluation trials at several locations, and new objectives defined for the project. These clones are recombined to start a new cycle of selection. 2) To include as progenitor, for each agro-ecological zone, at least one genotype with high-carotene, yellow roots; and 3) To base the selection of parental lines increasingly on information from the performance of their progenies (� general combining ability or breeding value).
Only genotypes that have been selected over 2 consecutive years in Advanced Yield Trials are selected to participate as parents for the following generation. Among those genotypes, clones with outstanding performance for the most important agronomic traits are selected. After the analysis of results is conducted with data across two years, those genotypes exceeding at least one standard deviation from the overall mean are considered as parents for the next generation. Sometimes, landraces or already released cultivars that can contribute special features to the progenies generated are also included. Lately, thanks to the modifications introduced to the evaluation process selection of parents is greatly affected by data of the
Chapter 3-1 2007 Annual Report

progenies they produce (� general combining ability). It is envisioned that about 15-20% of the parental lines will be changed, eliminating those with poor general combining ability and introducing new clones that have had outstanding performance per se in Advanced Yield Trials to assess their breeding value. The information provided by pathologists, entomologists and quality specialists in relation to sources of resistance or special traits is used to select genotypes for controlled crosses. These controlled crosses are developed upon specific requests from National Programs that want their main landrace, or released varieties, crossed to genotypes with specific traits; or requests from CIAT scientists that want to pyramid genes, or develop segregating progenies for gene tagging. As will be described below, one of the major changes introduced in the cassava breeding scheme at CIAT has been to take and record data on all progenies starting at the first evaluation stage (Clonal Evaluation Trials). The kind of information obtained allows a gross estimation of general combining ability (simply defined, it is the capacity of an individual to produce a good progeny) of parental lines employed in generating the clones included in those trials. This information is increasingly influencing the decisions of materials that will continue to be used as parents and those that will not. Significant changes were introduced during the 2002-2003 growing season by blocking the Clonal Evaluation Trials to reduce the large effects that the environmental variation within these large trials had on the average performance of each family. Basically these changes follow the ideas described by Gardner in 1961 for stratified phenotypic mass selection. The parents selected for the development of gene pools targeted to specific ecosystems is presented in Table 3.1. The agronomic performance of these materials is described further down in this document. Seed will be harvested from July, 2007 through December, 2007. F1 plants will grow until the planting of the trials early in 2008. A major decision to take in the genetic improvement of crops is how to choose materials for use as parents that will produce new varieties with increased production potential and adequate adaptation to the environmental conditions under which they will be cultivated. The principal criterion for selecting parents to date has been their performance per se. Unfortunately, however, good clones do not necessarily give rise to good progeny, hence the need to precisely estimate the traits that the progeny of each individual will produce. Until now, data was recorded starting at the Preliminary Yield Trials, which meant that no balanced information was available on all progeny produced by a given individual, but only on those that had passed the first stages of selection. The new modality implies taking data for all and each clone evaluated, whether or not it will be eventually selected. This permits the development of a solid database for selecting parents in terms of the progeny they produce (which, from the genetic viewpoint, is what really matters) and not merely based on their innate traits, as was done in the past. Tables 3.1 and 3.2 list the clones selected as progenitors. These materials had stood out for their excellent performance per se, and for demonstrating good levels of general combining ability in relation to the results observed in the respective Clonal Evaluation Trials. The agronomic performance of some of these materials per se is also described. These tables also mention the parental lines for special purpose crosses. The seed produced from the current crossings will be harvested until December 2008.
Project IP3: improving cassava for the developing world Chapter 3-2

Table 3.1. Parental lines to be used in crosses for different ecosystems, relevant for cassava production in the world.
Parental progenies selected for the sub-humid tropics CM 8209-61 GM 213-56 SM 2081-34 SM 2619-12 SM 2773-32 SM 2783-12 CM 9067-2 GM 214-62 SM 2545-22 SM 2620-1 SM 2775-2 SM 2834-31 CM 9456-12 GM 273-57 SM 2546-32 SM 2621-29 SM 2775-4 SMB 2446-2 CM 9560-1 GM 290-50 SM 2546-40 SM 2629-36 SM 2779-56 MTAI 16 CM 9912-11 SM 1511-6 SM 2615-25 SM 2769-11 SM 2780-17 MVEN 25 CM 9957-35 SM 1759-29 SM 2619-4 SM 2772-5 SM 2782-4 -.-
Parental progenies selected for the acid-soil savannas CM 9460-12 CM 9463-19 CM 9953-76 SM 2601-44 SM 2642-35 SM 2852-5 CM 9460-13 CM 9464-29 SM 1812-69 SM 2610-43 SM 2727-12 SM 2855-13 CM 9460-15 CM 9464-33 SM 1821-7 SM 2632-47 SM 2730-1 SM 2965-29 CM 9461-1 CM 9464-36 SM 1859-26 SM 2636-6 SM 2739-4 SM 2977- 6 CM 9461-5 CM 9474-42 SM 2219-11 SM 2638-13 SM 2786-10 MCOL 638 CM 9462-17 CM 9903-56 SM 2452-13 SM 2640-21 SM 2792-31 -.-
Parental progenies selected for the mid-altitude valleys CM 7951-5 GM 254-89 GM 374-32 SM 2052-4 SM 2860-10 SM 3047-19 CM 8370-11 GM 297-54 GM 555-3 SM 2058-2 SM 2864-17 SM 3087-3 CM 9903-107 GM 297-67 SM 1642-22 SM 2211-3 SM 2869-9 SM 3090-8 CM 9953-121 GM 297-89 SM 1855-15 SM 2858-2 SM 2871-23 INIVIT - Cuba CM 9953-159 GM 297-93 SM 1965-1 SM 2858-31 SM 2913-4 MBRA 12
Parental progenies selected for their yellow roots AM 262-12 GM 708-42 MARG 6 MBRA 502 MCOL 2070 MCOL 2354 AM 320-133 GM 708-50 MBRA 1A MBRA 507 MCOL 2141 MCOL 2401 AM 320- 136 GM 708-63 MBRA 253 MBRA 517 MCOL 2175 MCOL 2436 AM 320-140 GM 734-57 MBRA 337 MBRA 928 MCOL 2199 MCOL 2459 CM 1015-34 GM 849-33 MBRA 443 MBRA 1107 MCOL 2279 MCOL 2489 CM 2452-5 GM 893-4 MBRA 461 MBRA 1251 MCOL 2295 MCOL 2547 CM 9816-2 GM 893-5 MBRA 463 MBRA 1303 MCOL 2318 MCR 87 CM 9961-4 GM 893-16 MBRA 467 MBRA 1321 MCOL 2330 MPER 297 CM 9961-6 SM 1859-26 MBRA 496 MBRA 1445 -.- -.-
Parental progenies selected for their yellow roots (BRAZIL x CIAT) CB 4-4 CB 7-9 SB 325-38 SM 3308-16 GM 905-21 GM 905-66 CB 4-10 CB 12-10 SB 326-24 SM 3308-24 GM 905-37 GM 905-68 CB 4-25 CB 19-10 SB 326-31 SM 3308-27 GM 905-43 GM 905-69 CB 4-28 CB 44-15 SM 3306-1 SM 3308-45 GM 905-52 SM 3308-48 CB 5-5 CB 46-3 SM 3306-4 SM 3308-49 GM 905-56 SM 3308-63 CB 5-6 SB 325-32 SM 3306-5 SM 3309-46 GM 905-57 SM 3308-150 CB 5-9 SB 325-35 SM 3306-7 GM 905-3 GM 905-60 SM 3308-156 CB 5-14 CB 7-9 SM 3306-13 -.- -.- -.-
Parental progenies selected for their high-protein (nitrogen) content in their roots CM 696-1 SM 629-6 MBRA 101 MCOL 689B MCOL 2694 MGUA 76 CM 3199-1 SM 673-1 MBRA 300 MCOL 1563 MCR 38 MGUA 79 CM 3236-3 SM 734-5 MBRA 1384 MCOL 2436 MCR 136 MGUA 86 CM 5620-3 SM 1406-1 MCOL 219 MCOL 2459 MCR 142 MGUA 91 CM 7310-1 MBRA 26 MCOL 678 MCOL 2532 MGUA 33 MMEX 95/108 MBRA 158 MBRA 890 MCOL 1734 MCR 61 MPER 243 MPTR 49 MBRA 162 MBRA 900 MCOL 2199 MMAL 13 MPER 286 M VEN 134 MBRA 435 MCOL 226B MCOL 2493 MPAN 7 -.- -.- Parental progenies selected for their high-protein (nitrogen) and low-HCN content in their roots MBRA 924 MCOL 304 MCOL 1132 MCOL 1458 M ECU 141A M PAN 100 MCOL 112 MCOL 1030 MCOL 1185 MCOL 1516
Chapter 3-3 2007 Annual Report

Table 3.2. Parental lines to be used in special crosses for different purposes. Parental progenies selected for the high-amylose starch
SM 722-13 MBRA 739 MCOL 355 MCOL 1508 MECU 3 MVEN 211 MBRA 46 MBRA 1396 MCOL 764 MCOL 1943 MECU 6 MVEN 284B MBRA 273 MCOL 133 MCOL 838 MCOL 2456 MMAL 42 MVEN 309 MBRA 503 MCOL 352 -.- -.- -.- -.-
Parental progenies selected for the low-amylose starch MBRA 107 MBRA 1230 MCOL 2269 MCUB 2 MMEX 53 MPAR 119 MBRA 369 MBRA 1378 MCOL 2474 MCUB 3 MMEX 54 MPER 473 MBRA 393 MCOL 216 MCUB 1 MGUA 10 MPAN 139 MVEN 311 MBRA 432 MCOL 1667 -.- -.- -.- -.-
Parental progenies selected for their resistance to white flies CG 489-31 MECU 72 MPER 331 MPER 459 MPER 497 MPER 564 MECU 64 MPER 321 MPER 390 MPER 461 MPER 504 MPER 545
Parental progenies selected for their resistance to CMD C 4 C 6 C 18 C 19 C 243 C 413 Planting materials were also selected from these parents to seed the F1 in July 2007. In addition to crossing, some of these clones were also self-pollinated to begin an S2 recurrent selection scheme to improve each of them for tolerance to inbreeding. The justification for this approach is given later when the description of a cassava-breeding scheme based on the production of doubled-haploids or partially inbred materials such as the activities described in the chapter “Cassava Genetic Improvement” by H. Ceballos, M. Fregene, J. C. Pérez, N. Morante and F. Calle.. In: Breeding Major Food Staples (M.S. Kang and P.M. Priyadarshan Eds.). 2007. p. 365-391, Blackwell Publishing. Ames, IA. USA. 3.2 ESTABLISHMENT OF CROSSING BLOCKS AND PRODUCTION OF RECOMBINANT SEED FROM PREVIOUSLY ESTABLISHED BLOCKS Populations developed for specific ecosystems represent the basis for our cooperation with National Programs and IITA (International Institute of Tropical Agriculture, Ibadan, Nigeria). The development of genetic stocks is gaining importance through the years. Genetic stocks are produced based on the recombination of a set of genotypes that excel for a particular trait, and we would like to upgrade that trait beyond its natural range of variation (i.e. look for transgressive segregation in broader adaptation). Stocks developed for inheritance studies or to support molecular mapping of specific traits are constructed by the recombination of contrasting genotypes (i.e. resistance to CMV, African Cassava Mosaic Virus). Often times our aim is to pyramid genes responsible for different sources of resistance (i.e. bacterial blight). As we shift our emphasis from applied breeding to more basic research supporting breeding (i.e. molecular marker assisted selection or MAS) genetic stocks will become even more important. Parental population development in the future will concentrate more in targeting specific crosses between genotypes selected by NARS and complementary sources of genetic information from our genetic enhancement program or our global germplasm collection. The specific objective of this activity is to produce large number of seed by sexual crosses (either polycrosses or controlled) recombining desirable traits from selected parental materials, and deliver them to NARS in Africa, Asia and Latin America.
Project IP3: improving cassava for the developing world Chapter 3-4

Table 3.3. Production of recombinant cassava seed at CIAT, Palmira, Valle del Cauca, Colombia, between October 2006 and December 2007.
Purpose of the cross 2005 2006 2007 Between high-carotene cassava 1096 1291 775 Self-pollinations to obtain S1 from high-carotene cassava 505 688 139 Self-pollinations to obtain S2 from high-carotene cassava 132 140 1010 High-carotene cassava adapted to sub-humid conditions -.- -.- 329 High-carotene cassava adapted to acid-soils conditions -.- -.- 119 High-carotene cassava adapted to mid-altitude valleys -.- -.- 379 Polycrosses for high carotenoids. 13815 15687 18659 Between high-protein cassava 112 78 1148 Self-pollinations to obtain S1 from high-protein cassava 111 93 1196 Polycrosses for high protein -.- -.- 7642 High-protein and high-carotenoids 201 12 442 High-protein and low-HCN content in the roots -.- -.- 263 Self-pollinations to obtain S1from elite germplasm -.- -.- 975 Self-pollinations from landraces of core collection -.- -.- 3894 Self-pollinations to obtain S2 -.- -.- 65 Self-pollinations to obtain S3 -.- -.- 1412 Crosses between S2 lines -.- -.- 569 Tolerance to post-harvest physiological deterioration (PPD) -.- -.- 1458
CMD resistance and adaptation to sub-humid conditions -.- -.- 480 CMD resistance and adaptation to acid-soils conditions -.- -.- 230 CMD resistance and adaptation to mid-altitude valleys -.- -.- 115 CMD resistance and high-carotenoids content -.- -.- 80 Self-pollination of sources of resistance to CMD -.- -.- 136 Crosses involving different starch mutants -.- -.- 4968 Total: 15972 17989 54025 For polycrosses we use the design developed by Wright 1965 for polycrosses in forage species. For this type of design there is a need to have a number of clones equal to a prime number minus one (i.e. 12, 16, 18, etc.). The design allows for each genotype to have the same probability of being surrounded by any other genotype of the selected group. Knowledge on flowering capacity is important in order to select a group of materials with synchronized flowering. When there are considerable differences we have to implement delayed planting and/or pruning of the earliest flowering genotypes. At harvest the seed from different plants of the same genotype are combined together and named as a half-sib family (SM). For controlled crosses, we plant 10 to 20 plants depending on the flowering capacity of the genotype in question. The fruit developed from each flower has the potential to produce 3 seeds, but in average we obtain no more than 1 seed per pollination. This is due to the sensitivity of the stigma to the manipulation during pollination. Seeds from the same cross are mixed together and name as a full-sib family (CM). Because the number of CM families produced in the last few years has reached 10,000, we began utilizing a new code for full-sib families (GM).
Chapter 3-5 2007 Annual Report

More than 87,000 recombinant cassava seeds were produced at CIAT’s Experiment Station, Palmira, between October 2006 and December 2007 (Table 3.3). Although the recombinant seed was produced at CIAT, the generated seedlings used to be transplanted to fields outside the Experiment Station and under conditions of isolation from other cassava crops. Thus, the generated F1 plants grew and were maintained under conditions where possibilities of contamination from frogskin disease were minimized. This strategy, as can be seen in the description of results from different Clonal Evaluation Trials, has been highly successful in virtually eliminating the incidence of this disease from the nurseries for cassava improvement at CIAT. The production of botanical seed within the CIAT Experiment Station did not represent high risk because this disease, which is probably induced by a virus or phytoplasm, is not likely to be transmitted through botanical seed.
3.3 GENERATION AND DISTRIBUTION OF ADVANCED BREEDING MATERIALS FOR NATIONAL PROGRAMS Breeding for Asia has mainly centered on the issue of increased productivity of dry matter per hectare. Yield and root dry matter concentration have been the primary traits for selection, with almost no emphasis given to pests and diseases, or cooking quality. The results obtained in Asia for 15 years, has revealed the possibility to select for broader adaptation of genotypes. We have the case of Rayong 60 and Kasetsart 50 with good performance in a range of Asian countries. The production of germplasm for Asia has been moved from Thailand to Colombia due to budget constraints. However, because of the development attained by several NARS in Asia, the provision of recombinant material from Colombia can satisfy their needs. A CIAT soil scientist based in Thailand still coordinates the cassava network for Asia, but covering a broader spectrum of activities. For Africa, our breeding efforts have been traditionally channeled through our collaboration with the International Institute of Tropical Agriculture (IITA) in Nigeria. As a result extensive germplasm with Latin American “blood” has been introduced to Africa in a long introgression project financed by the International Fund for Agriculture Development (IFAD). The purpose of this special project was, among several others, to introgress Latin American cassava germplasm into Africa, in order to increase the genetic base of the crop in that continent, particularly for drought tolerance. This introgression process requires crosses to combine the desirable traits of Latin American germplasm, with resistance to the African Cassava Mosaic Virus (ACMV) disease. More recently, with resources provided by the Rockefeller Foundation the introgression of new genetic variability for cassava breeding in Africa has focused in Eastern Africa (particularly in Tanzania) The same approaches as the ones implemented for other regions of the word (polycrosses and controlled crosses) have been implemented, but a greater proportion of segregating progenies from controlled crosses is usually produced. Elite germplasm identified from the evaluations across the Asian region is periodically sent back to Colombia, to be used as a parental material in new cycles of selection. We have benefited from the availability of molecular markers to select “embryo-rescued” tissue cultured germplasm that had been already been selected for the presence of the marker related to CMD. This is only for the materials developed for their shipment, introduction and evaluation in Africa in collaboration with IITA and/or NARs. In this process we have also benefited from the valuable contribution of IITA
Project IP3: improving cassava for the developing world Chapter 3-6
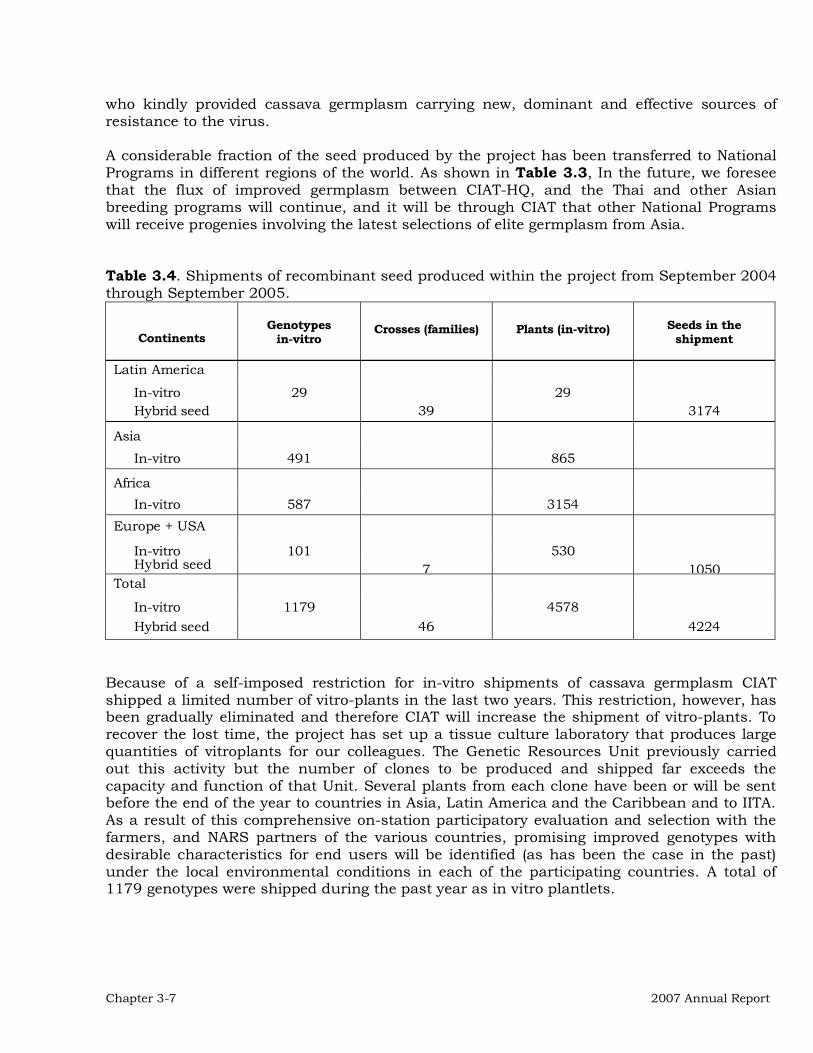
who kindly provided cassava germplasm carrying new, dominant and effective sources of resistance to the virus. A considerable fraction of the seed produced by the project has been transferred to National Programs in different regions of the world. As shown in Table 3.3, In the future, we foresee that the flux of improved germplasm between CIAT-HQ, and the Thai and other Asian breeding programs will continue, and it will be through CIAT that other National Programs will receive progenies involving the latest selections of elite germplasm from Asia. Table 3.4. Shipments of recombinant seed produced within the project from September 2004 through September 2005.
Continents
Genotypes in-vitro
Crosses (families) Plants (in-vitro) Seeds in the shipment
Latin America
In-vitro 29 29 Hybrid seed 39 3174
Asia
In-vitro 491 865
Africa In-vitro 587 3154
Europe + USA
In-vitro 101 530 Hybrid seed 7 1050
Total In-vitro 1179 4578 Hybrid seed 46 4224
Because of a self-imposed restriction for in-vitro shipments of cassava germplasm CIAT shipped a limited number of vitro-plants in the last two years. This restriction, however, has been gradually eliminated and therefore CIAT will increase the shipment of vitro-plants. To recover the lost time, the project has set up a tissue culture laboratory that produces large quantities of vitroplants for our colleagues. The Genetic Resources Unit previously carried out this activity but the number of clones to be produced and shipped far exceeds the capacity and function of that Unit. Several plants from each clone have been or will be sent before the end of the year to countries in Asia, Latin America and the Caribbean and to IITA. As a result of this comprehensive on-station participatory evaluation and selection with the farmers, and NARS partners of the various countries, promising improved genotypes with desirable characteristics for end users will be identified (as has been the case in the past) under the local environmental conditions in each of the participating countries. A total of 1179 genotypes were shipped during the past year as in vitro plantlets.
Chapter 3-7 2007 Annual Report
3.4. SELECTION OF RECOMBINANT PROGENIES FOR BROAD AND SPECIFIC ADAPTATION WITHIN MAJOR AGRO-ECOSYSTEMS Our strategy for cassava germplasm development is centered on the development of improved gene pools for specific edapho-climatic zones with importance for cassava production, as defined in Table 3.5. The most relevant ecosystems are the semi-arid and sub-humid tropics, for which we devote the majority of our efforts. The main selection activity is conducted in sites selected to represent the conditions of the target ecosystem. For every genotype that was tested in those sites, a copy was maintained at CIAT-HQ. This location is considered to be free of bacterial blight and some important viruses, and to maintain that condition, the introduction of vegetative material from other areas is restricted. In case vegetative material has to be brought to HQ, then it has to pass through quarantine, which usually takes more than a year. The specific objective of this activity is to develop and evaluate superior germplasm adapted to particular ecosystems and develop genetic stocks useful for other CIAT projects as well as for our collaborators in Asia, Africa and Latin America and the Caribbean Regions. For each of the zones we conduct a recurrent selection program, with a progressive set of stages as described in Figure 3.1. As the stages progress, we give more emphasis to traits of lower heritability, because we have more planting material for each genotype, and the evaluation can be conducted in bigger plots with replications. Certain selection criteria are of general importance across ecosystem (i.e. yield potential, dry matter content), while others are specific for each ecosystem (i.e. pest and diseases). The current evaluation system is described in Figure 3.1. This scheme has incorporated several modifications implemented and tested over the years. The main objective of such modifications were to reduce the selection of materials based on single-plant and/or non-replicated evaluations and to obtain data in the first selection stage as an approximation to the general combining ability of the parents used in the crossing nurseries. This information, in turn is used to decide what parents can continue for another cycle in the breeding nurseries as elite parents or dropped because of the poor performance of the progeny it produces. A description of the advantages of such a method has been published (Ceballos et al., 2004).
One important modification introduced at the clonal evaluation trials or CETs follows the idea of stratification suggested by Gardner in the 1960s. The field for the CET (usually a large field 1-2 ha) is divided in three “blocks” of about equal size. All the clones from a given family are then randomly allocated to one of these “blocks”. This modification allows for a replicated presence for each family. The individual clones, of course, cannot be replicated. On the other hand, the family means are based on three replications and therefore, more precisely estimated. Selection of individual clones was done within each “block”, following the ideas behind stratified mass selection proposed by Gardner in the 1960s.Therefore, to a certain extent selection of individual clones is more precise. The increase in precision is inversely proportional to the variation between the conditions in each of the three “blocks”.
Project IP3: improving cassava for the developing world Chapter 3-8
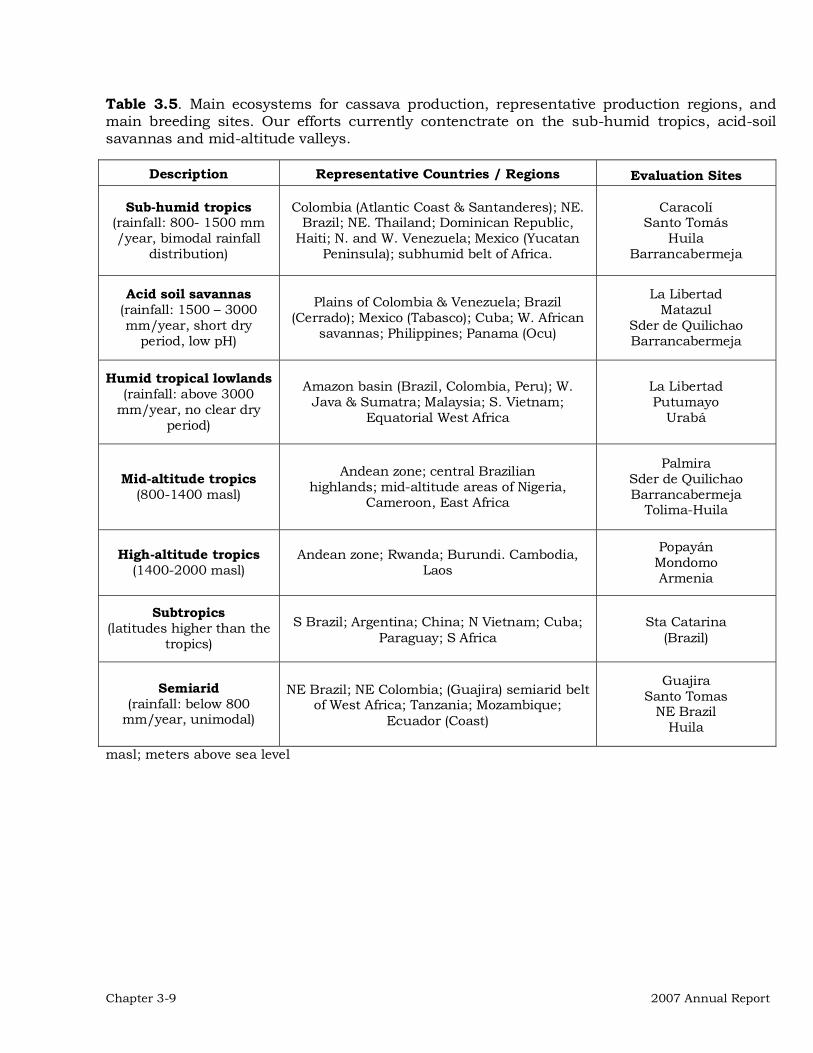
Table 3.5. Main ecosystems for cassava production, representative production regions, and main breeding sites. Our efforts currently contenctrate on the sub-humid tropics, acid-soil savannas and mid-altitude valleys.
Description Representative Countries / Regions Evaluation Sites
Sub-humid tropics (rainfall: 800- 1500 mm /year, bimodal rainfall
distribution)
Colombia (Atlantic Coast & Santanderes); NE. Brazil; NE. Thailand; Dominican Republic,
Haiti; N. and W. Venezuela; Mexico (Yucatan Peninsula); subhumid belt of Africa.
Caracolí Santo Tomás
Huila Barrancabermeja
Acid soil savannas (rainfall: 1500 – 3000 mm/year, short dry
period, low pH)
Plains of Colombia & Venezuela; Brazil (Cerrado); Mexico (Tabasco); Cuba; W. African
savannas; Philippines; Panama (Ocu)
La Libertad Matazul
Sder de Quilichao Barrancabermeja
Humid tropical lowlands (rainfall: above 3000
mm/year, no clear dry period)
Amazon basin (Brazil, Colombia, Peru); W. Java & Sumatra; Malaysia; S. Vietnam;
Equatorial West Africa
La Libertad Putumayo
Urabá
Mid-altitude tropics (800-1400 masl)
Andean zone; central Brazilian highlands; mid-altitude areas of Nigeria,
Cameroon, East Africa
Palmira Sder de Quilichao Barrancabermeja
Tolima-Huila
High-altitude tropics (1400-2000 masl)
Andean zone; Rwanda; Burundi. Cambodia, Laos
Popayán Mondomo Armenia
Subtropics (latitudes higher than the
tropics)
S Brazil; Argentina; China; N Vietnam; Cuba; Paraguay; S Africa
Sta Catarina (Brazil)
Semiarid (rainfall: below 800
mm/year, unimodal)
NE Brazil; NE Colombia; (Guajira) semiarid belt of West Africa; Tanzania; Mozambique;
Ecuador (Coast)
Guajira Santo Tomas
NE Brazil Huila
masl; meters above sea level
Chapter 3-9 2007 Annual Report

Time Number of
genotypes Plot size
(# of plants) Number of
Replications Number of Locations
Crossing of selected parental genotypes Around 80 elite clones (see Table 3.1)
10 F1 3000-5000 1 1 1
22 Clonal evaluation trial (CET) 1000-2000 7-8 1§ 1
34 Preliminary yield trial (PYT) 100-300 10 3 1
46-58 Advanced yield trial (AYT) 40-100 20-25 3 2-3
ELITE GERMPLASM
Crossing nurseries
(new parents as in Table 3.1)
Collaborators in different countries
Germplasm Collection (in vitro)
Regional Trials
(2-3 years)
Participatory research
and evaluation
¶ Time in months after germination of botanical seed. § One replication for clones within each “block” but three replications for families. Figure 3.1. Basic scheme used for the evaluation and selection of segregating progenies. The number of genotypes varies according to year, general performance of germplasm, quality of data and experiments. Each year similar schemes are used for different environments. Preparing new F1 field About 17591 recombinant, botanical seeds were germinated early in 2006, and approximately 11321 of the resulting plantlets were transplanted at CIAT Experimental Station in Palmira (Table 3.6). This material represents the F1 stage described in Figure 3.1. 3.5 THE USE OF SELECTION INDEX A Selection Index integrating the most relevant variables is used to facilitate selection in different trials. To avoid the problems related to the magnitudes used to measure different variables, the index is constructed using standardized deviation units (Steel and Torrie, 1960). As an example the typical selection index used for the Acid Soil Savannas environment of Colombia is presented below:
SI = (FRY * 10) + (DMC*8) + (HI*5) - (PT 3) - (SED3)
where SI is the selection index; FRY = fresh root yield; DMC = dry matter content; HI = harvest index; PT = rating for plant type or architecture; and SED = rating for super elongation disease. The relative importance of each trait is weighted, as shown in the formula
Project IP3: improving cassava for the developing world Chapter 3-10

Chapter 3-11 2007 Annual Report
above, by a subjective assessment by the breeder. Negative signs are used for those variables where lower values represent most desirable phenotypes. Harvest index has been consistently favored as one relevant variable to be included in early stages of selection such as CET trials (Kawano et al., 1998). Plant architecture also plays an important role in early stages of selection (Hahn et al, 1979). Since the SI is estimated using the standardized values, a positive SI means a performance better than the average, while a negative one means a poor performance. Table 3.6. Cassava seed processed for producing F1 plants for various purposes at CIAT, Palmira, Valle del Cauca, Colombia. F1 nursery was transplanted in June 2007.
Purpose of cross Germinated seed Transplanted Seed
For sub-humid tropics 3360 2123
Acid-soil savannas 3739 1408
Mid-altitude valleys 3837 2629
Yellow Roots 3938 3062
High-protein content 183 132
Low or high amylose 120 101
Parentals of mutagenized families 160 91
Partially inbred elite germplasm 2254 1775
Total 17591 11321
3.6 REFERENCES Ceballos, H., Iglesias, C. A., Pérez, J. C. and Dixon, A.G.O. 2004. Cassava breeding:
opportunities and challenges. Plant Mol. Biol. 56:503-515. Ceballos, H., M. Fregene, J. C. Pérez, N. Morante and F. Calle. 2007. Cassava Genetic
Improvement. In: Breeding Major Food Staples (M.S. Kang and P.M. Priyadarshan Eds.). p. 365-391, Blackwell Publishing. Ames, IA. USA.
Gardner, C.O. 1961. An evaluation of effects of mass selection and seed irradiation with thermal neutrons on yields of corn. Crop Sci. 1:241-245.
Hahn, S.K., Terry, E.R., Leuschner, K., Akobundu, I.O., Okali, C. and Lal, R. 1979. Cassava improvement in Africa. Field Crops Research 2: 193-226.
Kawano, K., Narintaraporn, K., Narintaraporn, P., Sarakarn, S., Limsila, A., Limsila, J., Suparhan, D., Sarawat, V. and Watananonta, W. 1998. Yield improvement in a multistage breeding program for cassava. Crop Sci 38 (2): 325-332.
Steel, R.G.D. and Torrie, J.H. 1960. Principles and procedures of statisitics. McGraw-Hill Book Company. New York. USA., pp 39-40.
Wright, C.E. 1965. Field plans for a systematically designed polycross. Record of Agricultural Research 14: 31-41.

Chapter 4-1 2007 Annual Report
CHAPTER 4
DEVELOPMENT OF GENETIC STOCKS AND IMPROVED GENE POOLS
ADAPTED TO THE SUB-HUMID ENVIRONMENTS.
This output relates to the efforts directed to the creation and identification of germplasm adapted to the sub-humid environment found in Colombia’s Caribbean coast. The environment is characterized by a long dry spell without rains (January through May), low fertility soils and the common severe problems of pests (particularly thrips and different mite species). There are no major problems with diseases although super-elongation disease may because some occasional damage. 4.1. EVALUATIONS AND SELECTIONS IN THE SUB-HUMID ENVIRONMENT. For logistic reasons, improvement activities developed for several regions of the Northern Coast of Colombia were centralized initially in Barranquilla. Many of the materials evaluated there can then be transferred to the more humid region in the Departments of Córdoba and Sucre, Table 4.1 lists the most relevant trials, whereas the other tables show results specific to each one. Table 4.1. Trials conducted in the sub-humid ecosystem (North Coast of Colombia) in the 2006-2007 cycle. Trial Location Genotypes
(# plants/rep) Reps
F1 CIAT-Palmira 1302 1 Clonal Evaluation Trial (CET-1) Santo Tomas 587 (8) 1 Clonal Evaluation Trial (CET-2) Santo Tomas 468 (4) 2 Clonal Evaluation Trial (CET-3) Barrancas (Guajira) 540 (8) 1 Preliminary yield trial 1 (PYT-1) Santo Tomás 100 (10) 3 Preliminary yield trial 2 (PYT-2) Santo Tomás 100 (10) 3 Preliminary yield trial 3 (PYT-3) Santo Tomás 100 (10) 3 Advanced yield trial-1st cycle (AYT-I) Three locations 72 (25) 3 Advanced yield trial-2nd cycle (AYT-II) Santo Tomas & Malambo 30 (25) 3 Regional trial (RT-I) – First cycle Three locations 30 (25) 3 Regional trial (RT-II) – Second cycle Five locations 30 (25) 3 Preliminary yield trial yellow roots (PYT-4) Santo Tomás 47 (10) 3 Advanced yield trial yellow roots Santo Tomás 7 (25) 3 Preliminary yield trial for high DMC (PYT) Santo Tomás 259 (10) 3 Advanced yield trial for high DMC Santo Tomás 30 (25) 3 Advanced yield trial: diallel and leaf retention Santo Tomas Atlántico 16 (25) 3 Special evaluation trial for 8 clones Santo Tomás & Malambo 8 (25) 3 Multiplication plots Santo Tomás 32 (500) 1 Multiplication plots Santo Tomás 200 (100) 1

Project IP3: improving cassava for the developing world Chapter 4-2
As mentioned in the previous Chapter (Table 3.6) a total of 3360 seeds were germinated and 2123 seedlings from these botanical seeds (targeting this particular environment) were transplanted at CIAT-Palmira in an isolated field. The planting of the current F1 stage is isolated to reduce as much as possible infection by diseases that can be found at later stages of the evaluation process. Seedlings from botanical seed are considered to be disease-free and efforts are made to maintain this condition for as long as it can possibly be done. The germinated seedlings were then transplanted to the field were a total of 2105 plants survived. In April 2008 these plants will be harvested and selections made for those genotypes capable of producing at least 8 vegetative cuttings to plant the Clonal Evaluation Trial, which will be grown from April-May 2008 through March 2009 (see Figure 3.1). This CET will be planted in the Atlántico Department. In June 2007 a new Clonal Evaluation Trial (CET) was planted in the Atlántico Department with a total of 1302 genotypes. CETs are large experiments around one hectare in size. A major constraint in their evaluation is the experimental error associated with the unavoidable variation in environmental conditions in such a large experimental plot. Because this is the first evaluation and selection stage (See Chapter 3) only 8 stakes are available from each genotype. Replication of each clone, therefore, is difficult to implement. On the other hand clones are grouped in either full- or half-sib families. Since many clones are generally available from each family they are randomly allocated in one of three blocks in which the field is divided. In other words instead of planting all the clones from a given family together one after the other, they are split in three groups, which are planted in the three blocks the entire evaluation is divided into (Figure 4.1). This approach allows for two interesting advantages: a) There is a replication effect for the families because all the clones from a given family are
scattered in three “repetitions” in the field. The averages from all these clones are less affected by the environmental variation in such a large experiment.
b) Selection is made within each block. This is similar to the stratified mass selection suggested by Gardner (See Activity 3.1, page 3.2). This approach effectively overcomes the environmental variation that can be measured by comparing the means of each block.
A B Block 1 Block 2 Block 3 Figure 4.1. Advantage of splitting each family of clones in three groups that were randomly assigned to each of three blocks in the CET. (A= current procedure; B= previous situation).

Chapter 4-3 2007 Annual Report
Because all the clones from the CET were divided, the average performance of each family were more precisely estimated, since each family was scattered in three different parts of the field, whereas before it was concentrated in just one sector (Figure 4.1). As a consequence, the estimates of GCA for each family are much more precise. During this cycle two different types of CET were conducted. CET-1 followed the traditional design of one replication, in which each genotype was planted in a single-row plot with eight plants. This trial was made up of 587 genotypes. Because of the concerns of lack of replication and the size of these trials it is relevant to have an idea of the convenience of introducing replicated evaluation even at this early stage of the evaluation process. Therefore, CET-2 was planted using a different design in which the eight plants traditionally planted in a single row were split in two replications with four plants each. Tables 4.2 and 4.3 describe the most relevant results of CET-1 from which the analysis of progenitors described in Tables 4.4 and 4.5 were made. Tables 4.6 and 4.7 describe the most important results of CET-2. Table 4.2 presents the results of the three blocks in which CET-1 was divided. Maximum, minimum, average and standard deviation values for all clones evaluated and for the selected group are provided. Differences in the average performance of all the clones in each block give an idea of the variation in the field that has been controlled by splitting the CET into the three blocks. Average fresh root yield were 18.4, 19.8 and19.2 t/ha respectively for Blocks 1, 2 and 3. If stratification of the CET were not made the tendency would have been not to select clones located in the first block, and favor those in the second block. The stratification, however, eliminated this tendency. The average fresh root yield (FRY) of selected clones in Block 1 was 31.5, with an average dry matter content (DMC) of 30.3%, which yielded an average of 9.4 t/ha of dry matter (DMY). The average FRY of selected clones in Block 2 was 32.6, with an average DMC of 30.4%, which yielded an average of 9.8 t/ha of DMY. For Block 3 the average FRY was 31.1, with an average dry matter content of 29.6%, which yielded an average of 9.2 t/ha of dry matter. Figure 4.2 illustrates the variation for FRY and DMC observed individually in each of the three blocks. The shape of distributions is contrasting with long tails to the right for FRY and the opposite for DMC. Table 4.3 presents the performance of the best ten clones of each of the three blocks in CET-1. There were families that had several clones among the best ten mentioned in Table 4.3. Families CM 9962 and GM 955 were represented by three clones scattered in Blocks 1, 2 or 3. Two clones represented families GM 279; GM 924; GM 954 and SM 3191. In general the performances of these outstanding genotypes is excellent with average dry matter yields frequently above 10 t/ha. A matter of concern in these trials is the relatively low dry matter content observed in these progenies. Because of our interest in rapid multiplication of planting material to reach replicated stages in the evaluation process quickly, harvest takes place at the end of the dry season, just prior to the initiation of the rains. This strategy, unfortunately and unavoidably, exposes the trials to some early rains and most likely the low DMC observed in these trials is the result of plants starting to re-initiate their growth taking advantage of these early rains. In the future trials will be harvested two week earlier.

Project IP3: improving cassava for the developing world Chapter 4-4
Table 4.2. Results from the Clonal Evaluation Trial (CET-1) divided into three blocks and conducted in Santo Tomás (Atlántico Department). Statistics of the 60 clones selected and all the clones evaluated in each block are presented. Evaluation was conducted using single-row plots with eight plants per genotype.
Plant type Fresh Root Yield (t/ha)
Harvest Index
Dry matter content Selection Index
Parameter
(1-5) Root Foliage (0-1) % t/ha (%)
Block 1: Parameters of 30 selected clones (15.00%) Maximum 5 52.7 75.0 0.58 32.6 15.1 51.59 Minimum 1 21.4 17.9 0.34 25.8 6.9 22.29 Average 2 31.5 37.8 0.46 30.3 9.4 30.22 St. Deviation 1 7.7 11.8 0.06 1.8 1.9 6.71 Block 1: Parameters of 200 clones evaluated Maximum 5 52.7 77.1 0.59 32.7 15.1 51.59 Minimum 1 1.2 3.3 0.06 17.4 0.3 -52.72 Average 3 18.4 36.7 0.33 27.5 5.2 0.00 St. Deviation 1 10.1 15.4 0.12 3.2 3.0 21.44 Block 2: Parameters of 30 selected clones (15.00%) Maximum 4 54.2 70.9 0.65 34.5 15.0 45.48 Minimum 1 17.3 18.2 0.37 25.5 5.8 17.72 Average 3 32.6 38.2 0.47 30.4 9.8 28.31 St. Deviation 1 8.9 13.1 0.07 2.2 2.4 7.77 Block 2: Parameters of 200 clones evaluated Maximum 5 54.2 72.8 0.67 34.5 15.0 45.48 Minimum 1 1.2 3.8 0.09 20.1 0.2 -53.90 Average 3 19.8 33.9 0.37 28.0 5.6 0.00 St. Deviation 1 9.8 14.0 0.11 2.9 2.9 20.67 Block 3: Parameters of 30 selected clones (15.00%) Maximum 5 43.0 60.4 0.86 32.8 12.6 39.57 Minimum 2 20.5 4.7 0.36 26.6 6.0 18.06 Average 3 31.1 34.0 0.49 29.6 9.2 26.22 St. Deviation 1 6.1 10.8 0.09 1.5 1.7 6.60 Block 3: Parameters of 200 clones evaluated Maximum 5 43.0 78.2 0.86 33.3 12.6 39.57 Minimum 1 0.2 1.0 0.02 16.3 0.0 -72.09 Average 3 19.2 31.6 0.37 27.5 5.4 0.00 St. Deviation 1 9.6 14.0 0.12 3.1 2.8 20.73
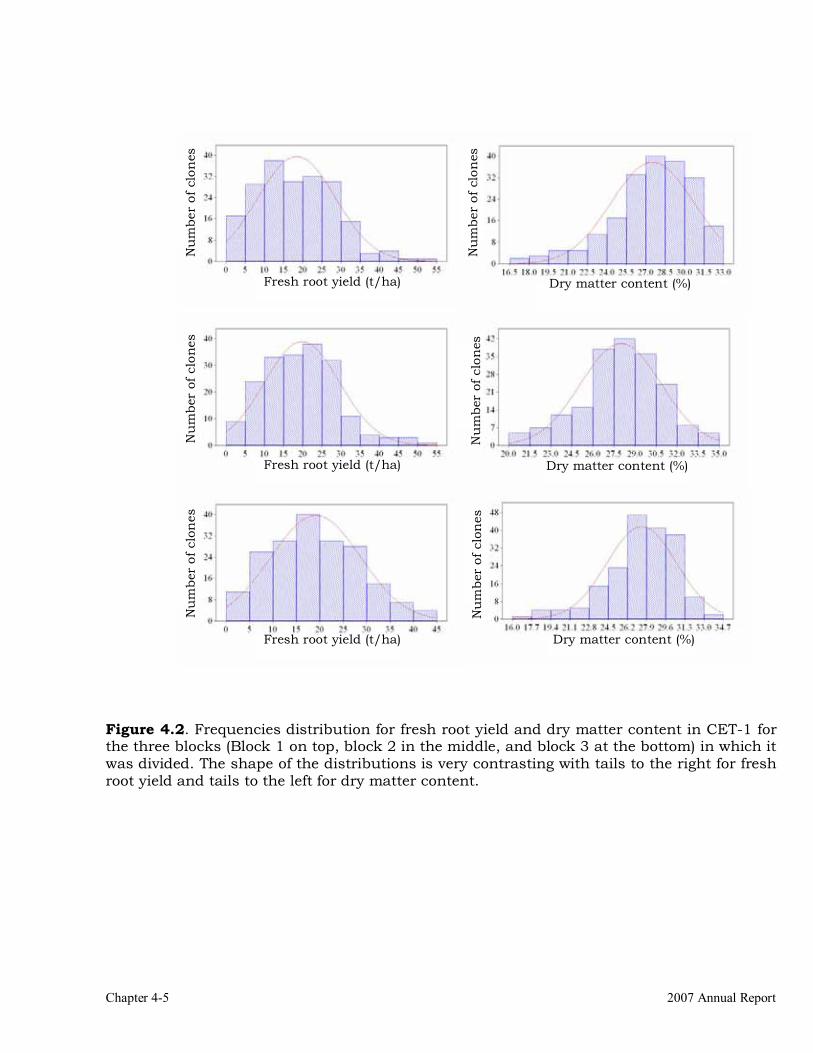
Chapter 4-5 2007 Annual Report
Figure 4.2. Frequencies distribution for fresh root yield and dry matter content in CET-1 for the three blocks (Block 1 on top, block 2 in the middle, and block 3 at the bottom) in which it was divided. The shape of the distributions is very contrasting with tails to the right for fresh root yield and tails to the left for dry matter content.
Nu
mbe
r of
clo
nes
Fresh root yield (t/ha)
Nu
mbe
r of
clo
nes
Dry matter content (%)
Nu
mbe
r of
clo
nes
Fresh root yield (t/ha)
Nu
mbe
r of
clo
nes
Fresh root yield (t/ha)
Nu
mbe
r of
clo
nes
Dry matter content (%)N
um
ber
of c
lon
es
Dry matter content (%)
Nu
mbe
r of
clo
nes
Fresh root yield (t/ha)
Nu
mbe
r of
clo
nes
Fresh root yield (t/ha)
Nu
mbe
r of
clo
nes
Dry matter content (%)
Nu
mbe
r of
clo
nes
Dry matter content (%)
Nu
mbe
r of
clo
nes
Fresh root yield (t/ha)
Nu
mbe
r of
clo
nes
Fresh root yield (t/ha)
Nu
mbe
r of
clo
nes
Fresh root yield (t/ha)
Nu
mbe
r of
clo
nes
Fresh root yield (t/ha)
Nu
mbe
r of
clo
nes
Dry matter content (%)N
um
ber
of c
lon
esDry matter content (%)
Nu
mbe
r of
clo
nes
Dry matter content (%)
Nu
mbe
r of
clo
nes
Dry matter content (%)

Project IP3: improving cassava for the developing world Chapter 4-6
Table 4.3. Results from the best ten clones per block in the Clonal Evaluation Trial (CET-1) ranked according to their selection index values, Santo Tomás (Atlántico). Harvested in March, 2007. Evaluation was conducted using single-row plots with eight plants per genotype.
Clon Mother Father Plant Type
Yield (t/ha) Harvest
Dry matter Selection
(1-5) Root Foliage Index % t/ha Index Block 1 GM 898-49 SM 1665-2 SM 1565-15 2 52.7 41.4 0.56 28.6 15.1 51.59 SM 3185-2 CM 7514-8 2 38.8 32.8 0.54 30.7 11.9 43.45 GM 279-59 SM 1565-15 MTAI 8 1 31.9 25.4 0.56 30.3 9.7 39.19 SM 3189-5 SM 1438-2 1 34.4 46.0 0.43 30.8 10.6 37.75 SM 3128-3 SM 1438-2 2 31.4 36.3 0.46 32.0 10.0 36.73 GM 955-2 CM 8475-4 MTAI 8 3 34.8 38.2 0.48 31.4 10.9 35.92 SM 3196-1 SM 1778-45 2 32.0 54.7 0.37 32.1 10.3 33.69 SM 3188-2 SM 1411-5 2 23.1 20.3 0.53 32.6 7.5 33.63 SM 3193-3 SM 1669-5 2 30.9 38.1 0.45 30.8 9.5 32.03
CM 9962-27 SM 1565-17 SM 1438-2 2 26.6 25.2 0.51 31.1 8.3 31.30 Block 2 GM 955-5 CM 8475-4 MTAI 8 2 43.9 45.3 0.49 31.2 13.7 45.48 SM 3191-9 SM 1521-10 1 33.5 18.2 0.65 30.5 10.2 42.82 CM 9962-31 SM 1565-17 SM 1438-2 3 54.2 51.3 0.51 27.6 15.0 41.25 GM 954-4 CM 8475-4 SM 1637-22 3 46.7 56.3 0.45 30.3 14.2 40.26 GM 955-7 CM 8475-4 MTAI 8 3 45.4 51.1 0.47 30.4 13.8 39.93 GM 954-3 CM 8475-4 SM 1637-22 4 37.6 58.6 0.39 33.6 12.7 36.58 GM 942-3 CM 8027-3 CM 8475-4 2 25.9 30.1 0.46 33.6 8.7 34.18 CM 9685-6 CT 20-2 CM 4365-3 2 26.2 37.2 0.41 33.3 8.7 31.27 GM 924-2 CM 6754-8 SM 1973-25 2 33.9 46.3 0.42 30.9 10.5 31.18 CM 9962-34 SM 1565-17 SM 1438-2 2 37.3 27.0 0.58 27.7 10.3 30.45 Block 3 GM 279-64 SM 1565-15 MTAI 8 3 38.5 60.4 0.39 32.8 12.6 39.57 SM 3182-20 CM 4365-3 3 43.0 41.9 0.51 29.2 12.5 37.23 SM 3191-11 SM 1521-10 2 30.1 30.4 0.50 32.2 9.7 36.52 CM 9464-51 CM 4574-7 SM 1411-5 4 30.0 4.7 0.86 29.7 8.9 36.44 SM 3181-5 CM 3306-4 3 36.5 31.5 0.54 30.4 11.1 35.72 GM 226-75 MTAI 8 CM 4574-7 2 37.6 32.9 0.53 28.9 10.9 34.91 GM 961-9 SGB 765-2 MTAI 8 3 41.0 41.4 0.50 28.9 11.9 33.91
SM 3112–110 MTAI 16 2 35.4 37.1 0.49 29.3 10.4 32.12 SM 3192-13 SM 1565-17 3 40.4 26.2 0.61 26.6 10.7 30.14 SM 319- 7 MTAI 8 2 41.3 43.1 0.49 26.7 11.0 29.98
Tables 4.4 and 4.5 provide valuable information that consolidates all the performances of genotypes evaluated in blocks 1, 2 and 3 from CET-1. Table 4.4 presents all the families involved in CET-1. Each family, as explained above, is divided in three groups of genotypes of about equal size. Each group is then randomly allocated to blocks 1, 2 or 3 in the field. After

Chapter 4-7 2007 Annual Report
harvest data of the three groups of each family is combined together for the information presented in Table 4.4. For instance the first family (CM 7985) was represented by 19 clones. These 19 clones were divided in a group of 7 clones that went to Block 1. Another group of six clones went to Block 2 and the third group of six clones went to Block 3. As it can be seen, only one of these 19 clones was selected. A simple way of assessing the value of each family is the average selection index. An index of around cero means that the family had an average performance. Positive selection indexes mean above average performance, the higher the more outstanding. Negative selection indexes (as in the case of this first family) imply a below average performance. Families CM 9421, CM 9962, GM 279, GM 872, GM 876, GM 924, GM 954, GM 955, SM 3191 and SM 3196 had excellent average selection indexes. However few of them (CM 9421, GM 876, GM 924 and SM 3196) were represented by few clones (three or two) so the assessment for their overall performance should be taken with caution. Table 4.4. Family size, number of selected clones in each family and average selection index values for the progenies evaluated in CET-1. Data combines results from the three blocks in which the trial was divided. Family Size Selected Sel. Index Family Size Selected Sel. Index CM 7985 19 1 -9.8 GM 963 9 0 -10.9 CM 9421 3 1 14.5 GM 966 11 0 -13.8 CM 9464 10 1 6.4 GM 976 7 0 -1.8 CM 9554 2 0 4.1 GM 1034 2 0 -18.6 CM 9685 13 1 -0.3 SM 3107 18 2 -1.2 CM 9748 11 1 -6.0 SM 3109 10 3 5.6 CM 9958 5 1 -0.8 SM 3112 8 1 8.2 CM 9962 18 8 15.4 SM 3128 11 1 -5.8 CM 9998 9 1 -7.2 SM 3146 17 0 -27.0 GM 226 7 1 5.5 GM 961 13 5 9.9 CM 7985 19 1 -9.8 SM 3180 20 1 -2.6 GM 279 9 2 12.9 SM 3181 7 3 10.8 GM 671 7 1 2.0 SM 3182 26 5 2.8 GM 866 12 0 -5.8 SM 3183 19 1 -16.6 GM 869 15 0 -12.2 SM 3184 14 1 -6.9 GM 870 14 1 -9.9 SM 3185 11 2 4.0 GM 872 6 1 12.9 SM 3186 11 2 2.9 GM 876 3 1 20.4 SM 3187 19 0 -8.7 GM 898 9 1 8.1 SM 3188 3 1 11.5 GM 924 2 1 22.3 SM 3189 21 1 0.6 GM 942 7 1 10.9 SM 3190 21 0 1.7 GM 950 5 1 11.5 SM 3191 14 8 20.1 GM 951 8 2 9.6 SM 3192 19 4 0.3 GM 953 4 0 -6.8 SM 3193 17 7 5.8 GM 954 6 2 18.1 SM 3194 6 0 -11.4 GM 955 11 6 20.8 SM 3195 10 1 -5.0 GM 958 9 1 7.3 SM 3196 3 2 13.5 GM 959 9 1 -4.7 SM 3197 7 1 0.2 GM 961 13 5 9.9 Total/Mean 587 90 1.94

Project IP3: improving cassava for the developing world Chapter 4-8
Table 4.5. Relative performance of progenitors involved in generating the progenies evaluated in CET-1. The performance of the progenitors is assesses through the average performance of all the progenies each progenitor produced. Progenitor #
fam. Selec.
(%) Pl.Type (1-5)
FRY (t/ha)
H.I. (0-1)
DMC (%)
DMY (t/ha)
Sel. Ind.
CM 6758-8 1 33.3 3 24.4 0.38 31.3 5.1 20.4 SM 1521-10 1 57.1 3 25.4 0.50 29.4 7.6 20.1 CM 1223-11 1 33.3 3 26.7 0.46 28.1 7.5 14.5 SM 1778-45 1 66.7 3 22.9 0.35 29.5 7.0 13.5 CM 8027-3 1 14.3 3 23.0 0.41 28.6 6.7 10.9 CM 3306-4 1 42.9 3 20.0 0.38 30.1 6.1 10.8 CM 8475-4 7 26.9 3 22.9 0.39 29.3 6.7 10.6 SM 1565-15 2 16.7 3 24.2 0.40 28.3 7.0 10.5 MTAI 16 1 12.5 4 21.5 0.36 29.7 6.4 8.2 CM 4574-7 2 11.8 3 22.6 0.43 27.2 6.1 6.0 SGB 765-2 4 22.2 4 20.2 0.37 29.0 5.6 5.5 SM 1411-5 4 15.0 3 21.0 0.39 28.0 5.9 5.2 SM 1669-5 3 29.4 4 19.9 0.38 29.0 5.9 4.2 SM 1406-1 1 0.0 4 29.1 0.33 26.7 7.8 4.1 CM 7514-8 1 18.2 3 19.5 0.43 27.3 5.5 4.0 MTAI 8 8 23.3 3 22.0 0.37 27.4 6.1 3.8 SM 1438-2 4 17.5 3 21.6 0.35 28.2 6.1 3.7 SM 1565-17 3 24.0 3 23.4 0.40 26.8 6.3 3.2 CM 4365-3 3 15.2 3 17.6 0.34 28.8 5.1 1.8 SM 163722 3 11.5 4 20.9 0.34 28.1 6.1 0.9 SM 1511-6 3 6.5 3 19.7 0.37 27.5 5.5 0.6 SM 1665-2 3 10.3 3 19.0 0.37 27.6 5.4 0.4 CT 20-2 1 7.7 3 16.4 0.32 28.8 4.8 -0.3 SGB 765-4 2 11.8 4 18.1 0.29 29.0 5.3 -1.3 CG 1141-1 2 14.3 3 16.6 0.35 27.9 4.7 -1.6 CM 2772-3 1 5.0 3 21.4 0.37 25.6 5.5 -2.6 SM 1973-25 3 15.4 3 16.0 0.33 28.3 4.6 -2.7 CM 6758-1 2 11.8 3 16.7 0.32 27.8 4.2 -3.3 SM 1759-29 1 10.0 4 12.5 0.35 28.6 3.6 -5.0 CM 6756-15 3 3.0 4 13.8 0.31 28.6 4.0 -5.3 CM 6756-8 1 0.0 4 12.2 0.31 28.9 3.6 -5.8 SM 653-16 1 9.1 3 13.9 0.32 27.8 3.9 -6.0 MBRA 781 1 11.1 4 25.0 0.38 24.0 6.1 -7.2 CM 9067-2 1 0.0 4 17.1 0.32 26.4 4.6 -8.7 MTAI 1 2 7.1 4 19.9 0.36 24.9 5.1 -9.0 CM 6756-13 2 3.4 4 12.4 0.28 27.7 3.5 -11.1 SM 1669-7 1 0.0 4 14.2 0.37 26.4 3.9 -11.4 CM 6754-8 2 9.5 3 15.3 0.33 25.0 4.0 -12.9 SM 805-15 1 0.0 4 14.9 0.28 26.2 4.0 -13.8 SM 2772-2 1 0.0 4 8.5 0.17 25.5 2.4 -27.0 The information provided in Table 4.4 can be further consolidated in Table 4.5. This table presents the average performance of all the progenies generated from a given progenitor. In some cases, a given genotype is used as progenitor in just one family. In other cases genotypes are involved in generating more than one family. This is the case, for example, of genotypes CM 8475-4 and MTAI 8, which have been used in 7 and 8 crosses, respectively. Progenitors CM 6758-8, SM 1521-10, CM 1223-11, SM 1778-45, CM 3306-4, CM 8475-4,
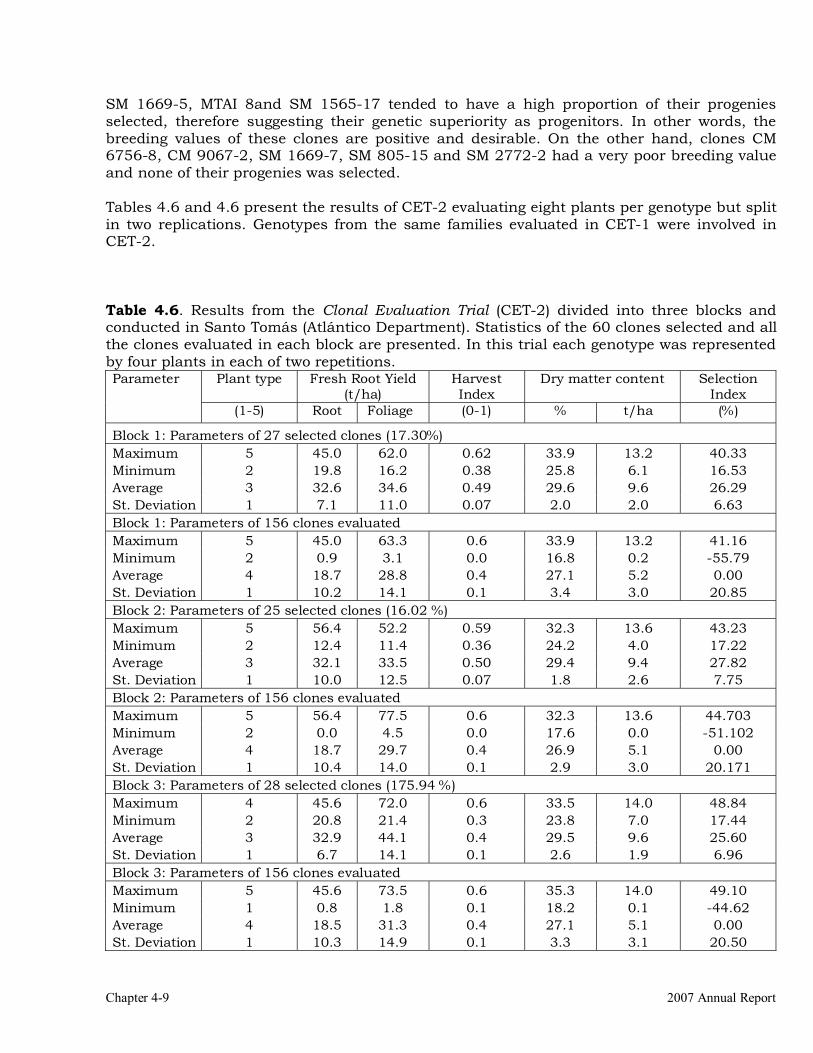
Chapter 4-9 2007 Annual Report
SM 1669-5, MTAI 8and SM 1565-17 tended to have a high proportion of their progenies selected, therefore suggesting their genetic superiority as progenitors. In other words, the breeding values of these clones are positive and desirable. On the other hand, clones CM 6756-8, CM 9067-2, SM 1669-7, SM 805-15 and SM 2772-2 had a very poor breeding value and none of their progenies was selected. Tables 4.6 and 4.6 present the results of CET-2 evaluating eight plants per genotype but split in two replications. Genotypes from the same families evaluated in CET-1 were involved in CET-2. Table 4.6. Results from the Clonal Evaluation Trial (CET-2) divided into three blocks and conducted in Santo Tomás (Atlántico Department). Statistics of the 60 clones selected and all the clones evaluated in each block are presented. In this trial each genotype was represented by four plants in each of two repetitions.
Plant type Fresh Root Yield (t/ha)
Harvest Index
Dry matter content Selection Index
Parameter
(1-5) Root Foliage (0-1) % t/ha (%)
Block 1: Parameters of 27 selected clones (17.30%) Maximum 5 45.0 62.0 0.62 33.9 13.2 40.33 Minimum 2 19.8 16.2 0.38 25.8 6.1 16.53 Average 3 32.6 34.6 0.49 29.6 9.6 26.29 St. Deviation 1 7.1 11.0 0.07 2.0 2.0 6.63 Block 1: Parameters of 156 clones evaluated Maximum 5 45.0 63.3 0.6 33.9 13.2 41.16 Minimum 2 0.9 3.1 0.0 16.8 0.2 -55.79 Average 4 18.7 28.8 0.4 27.1 5.2 0.00 St. Deviation 1 10.2 14.1 0.1 3.4 3.0 20.85 Block 2: Parameters of 25 selected clones (16.02 %) Maximum 5 56.4 52.2 0.59 32.3 13.6 43.23 Minimum 2 12.4 11.4 0.36 24.2 4.0 17.22 Average 3 32.1 33.5 0.50 29.4 9.4 27.82 St. Deviation 1 10.0 12.5 0.07 1.8 2.6 7.75 Block 2: Parameters of 156 clones evaluated Maximum 5 56.4 77.5 0.6 32.3 13.6 44.703 Minimum 2 0.0 4.5 0.0 17.6 0.0 -51.102 Average 4 18.7 29.7 0.4 26.9 5.1 0.00 St. Deviation 1 10.4 14.0 0.1 2.9 3.0 20.171 Block 3: Parameters of 28 selected clones (175.94 %) Maximum 4 45.6 72.0 0.6 33.5 14.0 48.84 Minimum 2 20.8 21.4 0.3 23.8 7.0 17.44 Average 3 32.9 44.1 0.4 29.5 9.6 25.60 St. Deviation 1 6.7 14.1 0.1 2.6 1.9 6.96 Block 3: Parameters of 156 clones evaluated Maximum 5 45.6 73.5 0.6 35.3 14.0 49.10 Minimum 1 0.8 1.8 0.1 18.2 0.1 -44.62 Average 4 18.5 31.3 0.4 27.1 5.1 0.00 St. Deviation 1 10.3 14.9 0.1 3.3 3.1 20.50

Project IP3: improving cassava for the developing world Chapter 4-10
Table 4.7. Results from the best ten clones per block in the Clonal Evaluation Trial (CET-2) ranked according to their selection index values, Santo Tomás (Atlántico). Harvested in March, 2007. In this trial each genotype was represented by four plants in each of two repetitions.
Clon Mother Father Plant Type
Yield (t/ha) Harvest
Dry matter Selection
(1-5) Root Foliage Index % t/ha Index Block 1: Result of the best 10 clones from 27 selected GM 976–8 SM 1669-5 SM 1438-2 3 38.0 27.6 0.58 30.6 11.6 40.33 SM 3191-19 SM 1521-10 3 41.2 35.7 0.53 29.9 12.4 39.41 SM 3182-27 CM 4365-3 4 45.0 47.1 0.49 29.4 13.2 36.43 SM 3109-27 SM 1669-5 3 41.4 62.0 0.40 31.4 12.9 36.05 GM 942-10 CM 8027-3 CM 8475-4 3 41.6 33.1 0.56 27.0 11.3 33.78 SM 3194-8 SM 1669-7 3 33.8 36.7 0.48 30.9 10.4 32.36 CM 9962-41 SM 1565-17 SM 1438-2 4 39.6 32.5 0.55 28.2 11.1 30.67 CM 9962-45 SM 1565-17 SM 1438-2 4 43.8 46.8 0.48 27.1 11.9 29.18 SM 3183-25 CM 6754-8 3 28.1 22.5 0.56 31.0 8.7 28.90 SM 3182-30 CM 4365-3 3 28.3 40.4 0.41 32.8 9.3 27.41 Block 2: Result of the best 10 clones from 25 selected SM 3185-17 CM 7514-8 3 45.6 44.8 0.51 29.7 13.6 43.23 GM 958-15 SGB 765-2 SM 1637-22 3 44.2 35.5 0.56 29.3 13.0 42.84 SM 3192-31 SM 1565-17 3 56.4 45.8 0.56 24.2 13.6 40.16 SM 3190-33 SM 1511-6 3 47.8 32.1 0.59 26.8 12.7 38.95 GM 279-69 SM 1565-15 MTAI 8 2 38.9 38.2 0.51 27.5 10.7 34.14 CM 9962-52 SM 1565-17 SM 1438-2 2 35.3 27.0 0.57 28.4 10.0 33.84 SM 3181-12 CM 3306-4 4 32.8 28.8 0.54 31.2 10.2 32.81 SM 3109-29 SM 1669-5 4 38.2 47.2 0.44 31.2 11.9 32.13 SM 3190-34 SM 1511-6 4 31.1 22.9 0.59 29.6 9.3 28.85 GM 942-13 CM 8027-3 CM 8475-4 3 33.4 48.0 0.42 30.7 10.3 28.74 Block 3: Result of the best 10 clones from 28 selected SM 3193-33 SM 1669-5 4 44.5 33.5 0.64 31.5 14.0 48.84 SM 3194-11 SM 1669-7 4 45.6 72.0 0.39 30.6 13.9 36.32 GM 961-25 SGB 765-2 MTAI 8 4 38.9 67.6 0.37 32.6 12.7 34.35 SM 3193-30 SM 1669-5 4 31.9 25.7 0.55 30.7 9.8 32.38 SM 3187-35 CM 9067-2 4 31.9 60.0 0.35 33.5 10.7 31.27 GM 961-26 SGB 765-2 MTAI 8 3 31.3 43.2 0.42 31.4 9.8 29.88 SM 3192-35 SM 1565-17 2 44.3 41.2 0.52 23.8 10.6 28.64 SM 3182-43 CM 4365-3 3 34.3 47.9 0.42 29.9 10.3 28.62 SM 3183-37 CM 6754-8 3 30.9 23.4 0.57 28.0 8.7 28.22 SM 3182-49 CM 4365-3 2 24.4 32.3 0.43 31.6 7.7 27.66
Comparison of results from CET-1 and CET-2 are irrelevant at this stage because they were physically planted in different plots. However, we are very much interested in learning the relative efficiency of each method of analysis later when we can compare in the same trial the relative performance of progenies from CET-1 and CET-2. If splitting the eight plants into two replications is useful overcoming a significant fraction of the environmental effect in this kind of trials, then the selection process is expected to be more efficient identifying the best clones. If that is the case, overall, the average performance of all genotypes selected from CET-2 may be better that that of all the genotypes selected from CET-1.

Chapter 4-11 2007 Annual Report
Table 4.8 presents the result of a third type of Clonal Evaluation Trial (CET-3). The genotypes included in this trial are all coming from the cassava germplasm collection, specifically the core collection (although about 60 clones from the core collection were not included in this evaluation because of lack of adequate amount/quality of planting material).This trial is part of an important effort to finalize the screening of the germplasm collection in search of useful genotypes (such as this evaluation) or traits (such as those efforts that lead to the identification of a natural waxy starch mutation). Relative performance of the 540 clones evaluated in CET-3 was not outstanding. This is not a surprise since many of these clones are not adapted to the sub-humid conditions (i.e. long dry period and mites pressure) of this region of Colombia. The same set of clones has now been shipped to the acid-soils savannas to be evaluated under the conditions in that region (acid soils, bacterial blight and super-elongation disease). Less than 10% of the clones evaluated in CET-3 were selected for further evaluation. Information of this trial will be shared with the Genetic Resources Unit at CIAT to improve and complete the data files of accessions in the collection. Performance of clones from the core collection is also going to be produced at Rayong Field Crops Research Station in Thailand. Table 4.8. Results from the Clonal Evaluation Trial (CET-3) evaluated in Barrancas (Guajira Department). A total of 540 clones (all from CIAT’s Core Collection) were evaluated, from which 50 were selected. Performance of the best 10 clones is presented. Evaluation was conducted using single-row plots with eight plants per genotype.
Plant type Fresh Root Yield (t/ha)
Harvest Index
Dry matter content Selection Index
Parameter
(1-5) Root Foliage (0-1) % t/ha (%)
Parameters of the best 10 selected clones BRA 191 2 70.6 84.4 0.46 31.7 22.3 55.4 BRA 916 1 62.4 24.9 0.71 28.5 17.8 53.6 BRA 674 2 70.4 52.9 0.57 28.8 20.3 51.1 BRA 829 4 93.0 111.5 0.45 27.5 25.6 50.5 ARG 7 1 42.3 24.5 0.63 31.8 13.4 48.3 BRA 658 4 78.0 78.4 0.50 29.3 22.9 48.2 ARG 6 1 39.1. 32.6 0.55 33.3 13.0 47.7 CM 5286-3 2 63.4 73.3 0.46 30.2 19.1 47.4 COL 1098 2 27.9 28.3 0.50 36.0 10.0 47.1 ARG 9 2 52.5 73.4 0.42 31.0 16.3 41.8 Parameters of 50 clones selected Maximum 4 93.0 153.0 0.71 36.0 25.6 55.42 Minimum 1 24.7 12.0 0.28 23.4 7.4 25.44 Average 2 50.7 54.8 0.50 29.1 14.6 36.48 St. Deviation 1 15.2 28.7 0.09 2.3 4.0 8.03 Parameters of 540 clones evaluated Maximum 5 93.0 164.1 0.71 36.9 25.6 55.42 Minimum 1 0.5 3.0 0.02 0.0 0.0 -97.45 Average 3 20.2 40.7 0.30 25.8 5.4 0.0 St. Deviation 1 17.1 23.3 0.15 3.6 4.8 20.5

Project IP3: improving cassava for the developing world Chapter 4-12
Genotypes selected in clonal evaluation trials are then evaluated in preliminary yield trials or PYTs (see Figure 3.1). Typically these PYTs are based on three replications and two-row plots with 10 plants per plot. Figure 4.3 illustrates how PYT are planted in the field. Figure 4.3. Illustration of the way Preliminary Yield Trials are planted. Each plot has two rows (0.8m apart) with five plants each. Distance between plots is increased to 1.6m to favor within-family plant competition and reduce between-family competition. This strategy aims at reducing the competitive advantage of plants that are very vigorous and tall. An example of such competition is provided in the photograph on the left of this figure. As explained above, each genotype in a PYT is planted in three replications. Experimental unit (plots) have two rows each with five plants for a total of ten plants per plot. As illustrated in figure 4.3, separation between rows within a plot is only 80 cm. On the other hand, a row is left empty to separate rows belonging to different plots. Therefore, plots are separated by 160cm space. This strategy is followed to favor within-family competition and not as much between-family competition. One of the concerns that breeders have when evaluating cassava genotypes in this kind of trial is that tall, vigorous genotypes (not necessarily the best and preferable ones) tend to compete more favorably against smaller short plant types. This competition is not desirable. Tables 4.9, 4.10 and 4.11 present the results of PYT-1, PYT-2 and PYT-3 respectively. The genotypes evaluated in these trials were in the clonal evaluation trial stage that was harvested in March-April 2006. Each trial had 100 clones selected at that time. Since they are still large in number PYT are made up of the clones selected in each of the block of the CET. PYTs also include a group of four commercial checks for comparison. PYT-1 (Table 4.9). Based on their selection index the best commercial check (Corpoica- Verónica) occupied the ninth rank. The other checks were ranked 19th, 29th, 30th and 31st. This information is very useful to highlight the relative merits of the new germplasm under development. Several of these selected clones showed dry matter yields above 10 t/ha, as well as Commercial check Corpoica Ginés (with an excellent DMY of 11.5 t/ha, but which was achieved with a low dry matter content below 30%).
1.60 mts 0.80 m0.80 m 1.60 mts 0.80 m0.80 m

Chapter 4-13 2007 Annual Report
Table 4.9. Results from the Preliminary Yield Trial (PYT-1) evaluated in Santo Tomás (Atlántico Department). A total of 100 clones were evaluated, from which 25 were selected. Performance of the best 10 clones is presented. Each genotype was planted in three replications with 10 plant-plots.
Plant type Fresh Root Yield (t/ha)
Harvest Index
Dry matter content Selection Index
Parameter
(1-5) Root Foliage (0-1) % t/ha (%) Parameters of the best 10 selected clones CM 9912-136 3 36.8 39.3 0.49 32.0 11.8 36.11 SM 3112–60 3 37.0 45.4 0.45 31.7 11.7 35.04 CM 9912-128 3 35.6 47.4 0.43 32.2 11.5 34.28 CM 9955–21 3 36.5 43.0 0.46 30.9 11.4 31.33 SM 3112–70 2 31.7 26.4 0.55 30.5 9.7 30.15 GM 848–13 3 39.1 25.5 0.61 27.6 10.8 29.62 GM 250–62 2 35.8 34.9 0.50 29.7 10.8 29.37 SM 3060–20 2 34.9 54.3 0.39 31.5 11.1 28.95 SM 3060–1 3 31.3 34.8 0.47 30.5 9.5 23.23 GM 250–64 3 28.7 46.5 0.38 32.0 9.2 20.93
Commercial checks C. VERONICA 1 30.9 32.9 0.49 30.2 9.3 27.73 C. GINÉS 5 38.5 48.7 0.44 29.8 11.5 18.81 CM 3306–4 4 22.5 38.1 0.38 32.8 7.4 11.11 C. TAI 2 29.2 41.5 0.41 27.2 7.8 6.18 MVEN 25 4 30.7 45.7 0.40 28.2 9.1 4.29 Parameters of 25 clones selected Maximum 4 39.1 56.4 0.6 32.2 11.8 36.11 Minimum 1 25.6 25.5 0.4 26.3 7.9 13.93 Average 3 33.3 42.2 0.4 29.9 10.0 22.48 St. Deviation 1 3.5 8.7 0.1 1.5 1.0 6.81 Parameters of 100 clones evaluated Maximum 5 39.1 74.5 0.61 33.1 11.8 36.11 Minimum 1 8.4 16.4 0.20 21.2 2.1 -48.22 Average 3 25.6 41.6 0.38 28.6 7.4 0.00 St. Deviation 1 7.5 9.7 0.08 2.3 2.3 19.61
Commercial checks included In PYT-2 (Table 4.10) ranged in the 10th and 11th place (Corpoica-Ginés and Verónica, respectively), followed by MTAI in the 23rd place, and MVEN 25 and Costeña (CM 3306–4) in the 29th and last place. In this trial again, the excellence in the performance of new experimental clones is highlighted. Very high dry matter yields could be observed, and in several cases they were above 17 t/ha. However, these high yields were related to lower-than-desirable levels of dry matter content (they were all below 30%).

Project IP3: improving cassava for the developing world Chapter 4-14
Table 4.10. Results from the Preliminary Yield Trial (PYT-2) evaluated in Santo Tomás (Atlántico Department). A total of 100 clones were evaluated, from which 25 were selected. Performance of the best 10 clones is presented. Each genotype was planted in three replications with 10 plant-plots.
Plant type Fresh Root Yield (t/ha)
Harvest Index
Dry matter content Selection Index
Parameter
(1-5) Root Foliage (0-1) % t/ha (%) Parameters of the best 10 selected clones CM 9955-27 2 42.2 32.4 0.57 28.8 12.1 36.95 CM 9912-157 3 45.4 53.1 0.46 28.9 13.1 32.80 SM 3060-34 3 48.2 61.6 0.42 29.4 14.1 32.64 CM 9955-34 3 54.8 47.7 0.54 26.1 14.3 32.06 CM 9924-24 2 35.5 44.4 0.46 29.9 10.6 30.90 GM 466-62 3 48.3 50.9 0.48 27.3 13.2 28.88 CM 9955-26 2 43.6 45.7 0.49 27.7 12.1 28.31 SM 3158-26 1 24.9 27.0 0.48 30.4 7.6 27.93 GM 215-96 2 44.0 36.6 0.55 26.6 11.7 26.08 CM 9955-31 3 36.2 43.6 0.46 29.1 10.5 24.64
Commercial checks C. GINÉS 4 49.9 61.0 0.45 28.0 13.9 25.69 C. VERONICA 1 28.4 41.4 0.42 29.9 8.5 25.30 C. TAI 2 36.4 51.0 0.42 26.9 9.8 14.60 MVEN 25 4 30.6 46.3 0.40 28.0 8.6 6.23 CM 3306-4 4 11.2 25.3 0.29 30.2 3.2 -9.14 Parameters of 25 clones selected Maximum 4 54.8 63.8 0.6 31.0 14.3 36.95 Minimum 1 22.0 24.5 0.4 26.1 6.8 11.75 Average 3 34.8 42.2 0.5 29.0 10.0 22.11 St. Deviation 1 8.9 9.3 0.1 1.2 2.3 7.69 Parameters of 100 clones evaluated Maximum 4 54.8 82.9 0.57 31.0 14.3 36.95 Minimum 1 2.6 7.7 0.11 22.1 0.6 -53.89 Average 3 24.9 40.5 0.38 27.5 6.9 0.00 St. Deviation 1 10.6 16.0 0.1 2.0 3.0 19.21
Commercial checks in PYT-3 described in Table 4.11 were ranked depending on their selection index as follows: MVEN 25 (12th); C. VERONICA (14th); C. TAI (17th); Negrita (24th) and C. GINÉS (30th). The best experimental clone was CM 9912–166 with a dry matter yield above 19 t/ha, and a relatively high dry matter content of 33.1%. This clone was derived from the cross between CM 7514-8 and SM 1433-4. The later progenitor itself has proven to be outstanding fresh root yielder (in one commercial plot it yielded more than 80 t/ha FRY) but had low dry matter content. This progeny, fortunately, has combined high fresh root productivity and adequate dry matter content.

Chapter 4-15 2007 Annual Report
These PYTs are useful to illustrate the impact of genotype-by-environment interaction in cassava. MVEN25 was 31st in PYT-1, 29th in PYT-2 but was the best check in PYT occupying the 12th rank Table 4.11. Results from the Preliminary Yield Trial (PYT-3) evaluated in Santo Tomás (Atlántico Department). A total of 100 clones were evaluated, from which 25 were selected. Performance of the best 10 clones is presented. Each genotype was planted in three replications with 10 plant-plots.
Plant type Fresh Root Yield ( /h )
Harvest d
Dry matter content Selection d
Parameter (1-5) Root Foliage (0-1) % t/ha (%)
Parameters of the best 10 selected clones CM 9912–166 3 59.4 69.3 0.46 33.1 19.6 68.14 SM 3060–59 3 46.9 44.5 0.51 27.8 13.1 32.82 CM 9912–167 3 33.7 58.1 0.37 32.0 10.8 32.50 CM 9912–160 3 29.3 49.6 0.37 33.3 9.8 31.21 SM 3149–25 2 31.9 20.1 0.61 28.4 9.0 30.86 CM 9912–173 3 38.9 51.6 0.43 30.3 11.8 30.10 CM 9954-74 2 39.2 28.2 0.58 26.9 10.6 28.71 SM 3060–54 3 40.4 46.7 0.46 28.3 11.3 27.32 CM 9910–46 4 23.9 26.8 0.48 33.0 7.9 26.44 CM 9955–38 2 34.9 44.7 0.44 28.8 10.1 25.30
Commercial checks MVEN 25 3 35.8 52.3 0.41 29.8 10.6 24.63 C. VERONICA 1 24.2 41.5 0.37 30.7 7.5 22.11 C. TAI 2 30.6 56.8 0.34 29.2 9.0 19.25 CM 3306-4 4 23.3 41.1 0.36 31.8 7.4 14.22 C. GINÉS 4 34.7 50.7 0.41 27.8 9.6 9.60 Parameters of 25 clones selected Maximum 4 59.4 69.3 0.6 33.3 19.6 68.14 Minimum 2 23.9 20.1 0.3 25.1 7.3 10.19 Average 3 34.3 45.7 0.4 29.4 10.1 23.07 St. Deviation 1 8.2 12.9 0.1 2.1 2.5 12.03 Parameters of 100 clones evaluated Maximum 4 59.4 76.6 0.61 33.3 19.6 68.14 Minimum 1 6.3 15.5 0.12 22.1 1.9 -41.73 Average 3 23.7 43.4 0.35 28.0 6.7 0.00 St. Deviation 1 9.4 12.9 0.10 2.1 2.9 19.60
Gentoypes that were selected from PYTs harvested in April 2006 were combined in a single advanced yield trial which was planted as first cycle (AYT-I) in three locations (Ingenio Central Sicarare in Codazzi, Cesar Department; Santo Tomás and Malambo in the Atlántico

Project IP3: improving cassava for the developing world Chapter 4-16
Department). A total of 72 clones were evaluated. Table 4.12 presents the result of the evaluation in the Cesar Department (Codazzi) and Table 4.13 those in the Atlantic Department. Results of the evaluation conducted in Ingenio Central Sicarare (Table 4.12) were disappointing. There may have been some management problems with this trial and as a result performance of experimental material was and commercial checks were not as good as expected. However, the same trial was conducted also in two locations in the Atlántico Department (Santo Tomás and Malambo). Combined results from these two trials are summarized in Table 4.13). The best commercial check was CM 4919-1 which, according to its selection index ranked 25th. This information highlights the relative performance of the experimental clones. Clone CM 9946-108 (derived from the cross between SM 805-15 and SM 1411-5) showed an excellent performance with DMY above 14 t/ha and, also very relevant, an outstanding dry matter content (above 36%). It is interesting to note that based on data presented in Table 4.5, SM 805-15 had a very poor breeding value, whereas SM 1411-5 presented an acceptable (if not outstanding) one. The experimental clone CM 9946-108, therefore shows high levels of heterosis, since the expectations based on the breeding values of its progenitors would have predicted just an average performance. Table 4.12. Results from the Advanced Yield Trial (AYT-I) evaluated in Ingenio Central Sicarare in Codazzi (Cesar Department). A total of 72 clones were evaluated. Performance of the best 10 clones is presented.
Plant type Fresh Root Yield (t/h )
Harvest I d
Dry matter content Selection I d
Parameter (1-5) Root Foliage (0-1) % t/ha (%)
Parameters of the best 10 selected clones GM 521-26 2 36.1 16.8 0.69 27.3 10.0 45.59 GM 273-61 4 27.8 14.4 0.66 28.8 8.0 27.57 SM 3103-2 2 26.7 17.7 0.61 28.1 7.5 26.93 GM 451-36 2 21.2 17.1 0.56 30.7 6.5 26.51 CM 9924-19 3 21.5 12.1 0.64 29.2 6.4 22.43 CM 9913-10 3 16.5 11.9 0.58 31.9 5.3 21.90 GM 273-89 3 22.9 16.3 0.59 29.3 6.8 20.07 SM 3104-34 4 26.6 17.1 0.62 28.2 7.6 19.95 CM 9955-15 3 18.6 10.1 0.64 29.3 5.4 17.55 SM 3107-14 4 16.2 7.9 0.67 30.1 4.9 16.37 Parameters of 72 clones evaluated Maximum 5 36.1 21.0 0.69 32.8 10.0 45.59 Minimum 2 1.8 2.0 0.37 22.4 0.5 -39.85 Average 4 14.8 10.7 0.58 28.3 4.2 0.00 St. Deviation 1 6.0 3.9 0.07 2.1 1.7 15.46

Chapter 4-17 2007 Annual Report
Table 4.13. Results from the Advanced Yield Trial (AYT-I) evaluated in Malambo and Santo Tomás (Atlántico Department). A total of 72 clones were evaluated. Performance of the 14 clones selected is presented.
Plant type Fresh Root Yield (t/ha)
Harvest Index
Dry matter content Selection Index
Parameter
(1-5) Root Foliage (0-1) % t/ha (%)
Parameters of the best 10 selected clones CM 9946-108 2 40.8 27.9 0.60 36.2 14.8 40.8 GM 273-60 1 34.4 26.0 0.57 34.5 11.8 22.9 CM 9955-14 2 38.5 21.6 0.64 33.2 12.8 21.3 GM 248-71 3 39.9 17.5 0.70 32.7 13.1 21.2 CM 9924-19 3 34.4 16.7 0.67 33.8 11.6 19.2 SM 3061-31 3 28.7 23.4 0.56 36.3 10.4 16.5 GM 273-82 3 37.1 29.7 0.56 34.0 12.6 16.3 CM 9912-112 3 41.1 35.3 0.53 33.5 13.8 16.0 SM 3106-14 2 35.3 21.6 0.63 33.1 11.7 15.5 CM 9912-107 2 40.3 28.0 0.59 32.1 12.9 13.3 SM 3106-11 2 30.3 24.6 0.56 34.7 10.5 13.1 GM 273-83 2 40.7 31.6 0.56 31.8 13.0 12.6 CM 9960-1 3 35.4 23.0 0.61 33.1 11.7 12.1 CM 9955-15 2 33.1 25.6 0.56 33.8 11.2 11.7 Commercial checks MTAI 8 2 28.4 26.6 0.53 30.8 8.7 -15.16 CM 4843-1 4 33.4 26.8 0.54 32.2 10.8 -8.62 CM 4919-1 1 24.7 18.1 0.59 34.0 8.4 6.84 MVEN 25 2 29.4 29.4 0.50 31.9 9.4 -9.85 Parameters of 72 clones evaluated Maximum 4 46.5 39.7 0.70 37.5 14.8 40.75 Minimum 1 15.4 11.6 0.35 28.5 5.6 -43.96 Average 2 30.5 26.4 0.54 33.0 10.0 0.00 St. Deviation 1 6.8 5.3 0.08 1.6 2.1 14.24
In March-April 2006 a group of clones was selected from an AYT-I trial that had gone through its first cycle of selection, from those materials the best 30 clones were selected for a second cycle of evaluations (AYT-II). These clones were evaluated in Ingenio Central Sicarare in Codazzi, (Cesar Department); and in Santo Tomás and Malambo (Atlántico Department). As in the case of the trials mentioned above, results in Codazzi were not very satisfactory with pest and diseases problems as can be deducted from the low yields observed in Table 4.14. Corpoica Verónica (CM 4919-1) was the best performing genotype in this trial. The other commercial checks MTAI 8, Corpoica Ginés (CM 4843-1) and CM 3306-4 (Negrita) had all negative selection index values, suggesting a very poor performance. These results, however, are not very reliable. CM 9946-97, GM 259-110 and SM 3061-7 however, were among the best eight clones in the evaluations conducted in the Cesar (Table 4.14) and the Atlántico Departments (Table 4.15). Results from the trials in the Atlántico Department were much better (Table 4.15) with average dry matter yields around 8.5 t/ha. The best commercial check was Verónica which ranked 11th in the entire experiment.

Project IP3: improving cassava for the developing world Chapter 4-18
Table 4.14. Results from the Advanced Yield Trial (AYT-II) evaluated Ingenio Central Sicarare in Codazzi (Cesar Department). A total of 30 clones were evaluated.
Plant type Fresh Root Yield (t/ha)
Harvest Index
Dry matter content Selection Index
Parameter
(1-5) Root Foliage (0-1) % t/ha (%) Performance of the best 8 clones evaluated GM 462-6 3 15.1 14.5 0.51 30.2 4.6 33.13 SM 3067-16 3 18.2 12.8 0.58 26.7 4.8 32.94 GM 259-108 4 17.7 13.8 0.56 27.4 4.9 29.23 SM 3063-20 4 12.0 9.0 0.58 29.9 3.6 23.64 CM 9946-97 4 14.7 11.6 0.54 27.4 4.2 18.43 SM 3067-24 4 14.8 11.9 0.54 26.8 4.1 18.05 GM 259-100 5 12.2 10.7 0.54 27.7 3.4 9.22 SM 3061-7 4 8.3 9.9 0.46 29.4 2.5 5.21 Commercial checks Costeña 5 4.9 4.9 0.48 26.5 1.3 -18.12 CM 4919-1 2 13.3 11.2 0.54 30.5 4.0 35.37 CM 4843-1 5 10.1 10.3 0.47 24.9 2.5 -11.49 MTAI 8 5 11.4 10.8 0.52 23.9 2.7 -8.41 Parameters of all clones evaluated Maximum 5 18.2 14.5 0.58 30.5 4.9 35.37 Minimum 2 4.7 4.3 0.31 21.5 1.3 -31.90 Average 4 9.9 9.6 0.50 26.8 2.7 0.00 St. Deviation 1 3.9 2.5 0.07 2.3 1.1 18.67
Table 4.15. Results from the Advanced Yield Trial (AYT-II) evaluated in Malambo and Santo Tomás (Atlántico Department). A total of 30 clones were evaluated. Performance of the 14 clones selected is presented.
Plant type Fresh Root Yield (t/ha)
Harvest Index
Dry matter content Selection Index
Parameter
(1-5) Root Foliage (0-1) % t/ha (%) Parameters of the best 8 selected clones CM 9924-6 2 36.4 33.4 0.52 33.4 12.2 28.2 SM 3061-7 3 35.6 26.6 0.57 33.3 11.9 26.6 GM 259-110 3 33.4 17.8 0.66 31.1 10.4 15.3 GM 466-36 1 26.8 20.4 0.57 33.3 9.0 14.3 CM 9904-7 3 30.7 26.9 0.55 33.1 10.2 13.9 CM 9946-97 2 32.5 24.7 0.57 31.7 10.3 13.5 GM 579-13 2 23.8 26.4 0.48 35.2 8.4 13.3 SM 3058-29 2 33.7 23.3 0.62 30.9 10.4 12.9 Commercial checks Costeña 2 17.0 28.6 0.38 33.5 5.7 -18.6 CM 4919-1 1 22.1 22.9 0.50 33.8 7.5 4.2 CM 4843-1 4 25.3 30.6 0.46 33.5 8.5 -5.6 MTAI 8 1 24.0 29.5 0.44 32.8 7.9 -3.4 Parameters of 30 clones evaluated Maximum 4 36.4 37.5 0.66 35.5 12.2 28.2 Minimum 1 17.0 17.8 0.38 29.8 5.7 -40.5 Average 2 26.1 27.2 0.49 32.8 8.5 0.00 St. Deviation 1 5.0 4.9 0.07 1.6 1.5 14.5
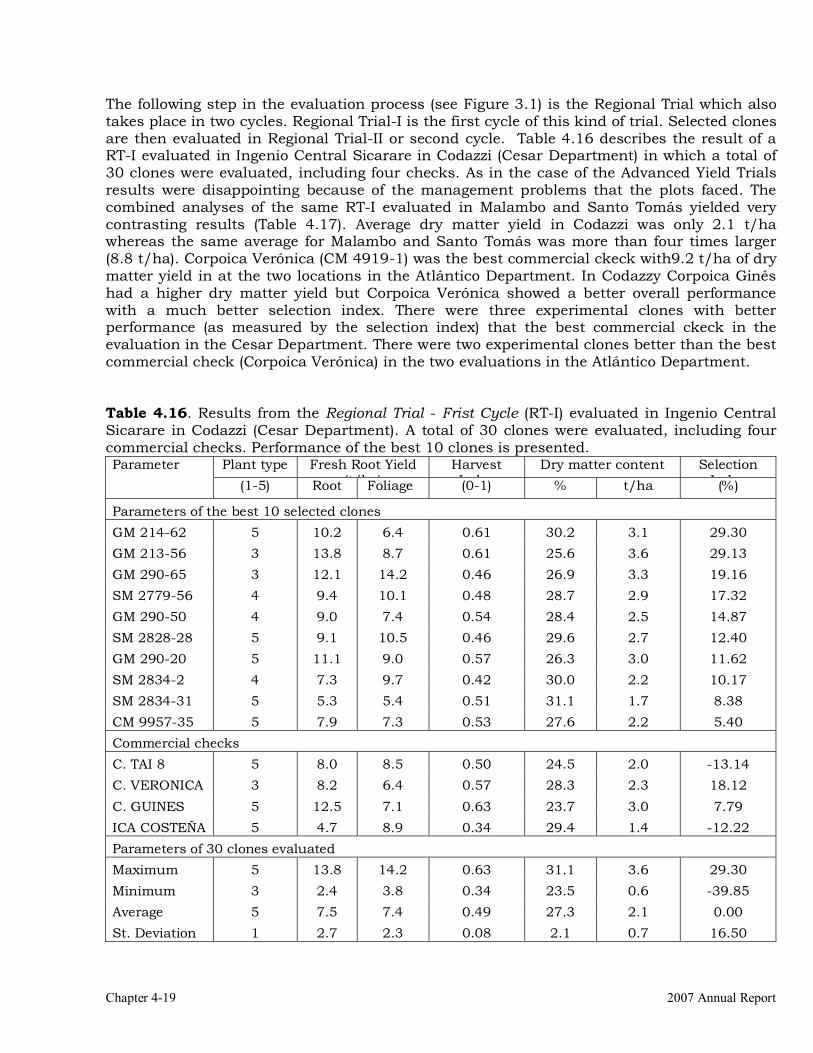
Chapter 4-19 2007 Annual Report
The following step in the evaluation process (see Figure 3.1) is the Regional Trial which also takes place in two cycles. Regional Trial-I is the first cycle of this kind of trial. Selected clones are then evaluated in Regional Trial-II or second cycle. Table 4.16 describes the result of a RT-I evaluated in Ingenio Central Sicarare in Codazzi (Cesar Department) in which a total of 30 clones were evaluated, including four checks. As in the case of the Advanced Yield Trials results were disappointing because of the management problems that the plots faced. The combined analyses of the same RT-I evaluated in Malambo and Santo Tomás yielded very contrasting results (Table 4.17). Average dry matter yield in Codazzi was only 2.1 t/ha whereas the same average for Malambo and Santo Tomás was more than four times larger (8.8 t/ha). Corpoica Verónica (CM 4919-1) was the best commercial ckeck with9.2 t/ha of dry matter yield in at the two locations in the Atlántico Department. In Codazzy Corpoica Ginés had a higher dry matter yield but Corpoica Verónica showed a better overall performance with a much better selection index. There were three experimental clones with better performance (as measured by the selection index) that the best commercial ckeck in the evaluation in the Cesar Department. There were two experimental clones better than the best commercial check (Corpoica Verónica) in the two evaluations in the Atlántico Department. Table 4.16. Results from the Regional Trial - Frist Cycle (RT-I) evaluated in Ingenio Central Sicarare in Codazzi (Cesar Department). A total of 30 clones were evaluated, including four commercial checks. Performance of the best 10 clones is presented.
Plant type Fresh Root Yield (t/h )
Harvest I d
Dry matter content Selection I d
Parameter (1-5) Root Foliage (0-1) % t/ha (%)
Parameters of the best 10 selected clones GM 214-62 5 10.2 6.4 0.61 30.2 3.1 29.30 GM 213-56 3 13.8 8.7 0.61 25.6 3.6 29.13 GM 290-65 3 12.1 14.2 0.46 26.9 3.3 19.16 SM 2779-56 4 9.4 10.1 0.48 28.7 2.9 17.32 GM 290-50 4 9.0 7.4 0.54 28.4 2.5 14.87 SM 2828-28 5 9.1 10.5 0.46 29.6 2.7 12.40 GM 290-20 5 11.1 9.0 0.57 26.3 3.0 11.62 SM 2834-2 4 7.3 9.7 0.42 30.0 2.2 10.17 SM 2834-31 5 5.3 5.4 0.51 31.1 1.7 8.38 CM 9957-35 5 7.9 7.3 0.53 27.6 2.2 5.40 Commercial checks C. TAI 8 5 8.0 8.5 0.50 24.5 2.0 -13.14 C. VERONICA 3 8.2 6.4 0.57 28.3 2.3 18.12 C. GUINES 5 12.5 7.1 0.63 23.7 3.0 7.79 ICA COSTEÑA 5 4.7 8.9 0.34 29.4 1.4 -12.22 Parameters of 30 clones evaluated Maximum 5 13.8 14.2 0.63 31.1 3.6 29.30 Minimum 3 2.4 3.8 0.34 23.5 0.6 -39.85 Average 5 7.5 7.4 0.49 27.3 2.1 0.00 St. Deviation 1 2.7 2.3 0.08 2.1 0.7 16.50

Project IP3: improving cassava for the developing world Chapter 4-20
Table 4.17. Results from the Regional Trial - First Cycle (RT-I) evaluated in Malambo and Santo Tomás (Atlántico Department). A total of 30 clones were evaluated, including four commercial checks. Performance of the best 10 clones is presented.
Plant type Fresh Root Yield (t/h )
Harvest I d
Dry matter content Selection I d
Parameter (1-5) Root Foliage (0-1) % t/ha (%)
Parameters of the best 10 selected clones GM 290-50 1 27.5 19.8 0.58 34.9 9.6 23.87 GM 214-62 2 32.0 28.0 0.53 34.5 11.0 22.05 GM 213-56 2 34.3 23.4 0.59 32.5 11.2 20.66 CM 9912-11 2 30.4 26.2 0.54 34.6 10.5 20.17 SM 2834-31 2 23.9 21.9 0.53 36.0 8.6 15.25 GM 273-57 3 37.0 34.2 0.52 32.2 11.9 14.25 SM 2779-56 3 30.4 27.6 0.54 34.0 10.3 13.56 CM 9957-35 2 27.2 18.3 0.60 32.8 8.9 7.38 CM 9957-76 2 31.1 25.0 0.56 32.2 10.0 7.09 SM 2834-2 3 24.4 30.1 0.44 35.8 8.7 6.20 Commercial checks C. TAI 8 2 18.6 27.9 0.40 33.6 6.3 -19.56 C. VERONICA 1 26.6 18.6 0.58 34.7 9.2 21.54 C. GUINES 4 22.2 18.1 0.56 32.0 7.1 -20.02 ICA COSTEÑA 2 29.9 30.0 0.50 33.2 9.8 9.62 Parameters of 30 clones evaluated Maximum 4 37.0 38.2 0.61 36.0 11.9 23.87 Minimum 1 16.4 17.9 0.38 29.7 5.6 -26.29 Average 2 26.7 26.4 0.50 33.2 8.8 0.00 St. Deviation 1 4.7 5.4 0.07 1.5 1.5 15.04
GM 290-50 was ranked first in the Atlántico Department (Table 4.17) and sixth in the Cesar Department (Table 4.16). GM 214-62 was ranked second in the Atlántico Department and first in the Cesar Department. GM 213-56 was ranked third and second in the evaluations in the Atlántico and Cesar Departments. The consistent outstanding performances of these three experimental clones provide strong evidence of their genetic superiority. In Tables 4.18 and 4.19 the results of a Regional Trial – second cycle (TR-II) are summarized. This is a group of 25 experimental clones and five commercial checks. The experimental clones were evaluated the previous season in a RT-I evaluation. This season the RT-II was planted in two locations in the Cesar Department (Central Sicarare and Motilonia in Codazzi) an one location in the Guajira Department (Barrancas). Combined results of these three evaluations are presented in Table 4.18. In addition this RT-II was also evaluated in two locations in the Atlántico Department (Santo Tomás and Malambo).

Chapter 4-21 2007 Annual Report
SM 2773-32 was the best-ranked material in the three locations in the Guajira and Cesar Departments (Table 4.18) and ranked third in the combined analysis of the two trials in the Atlántico Department. SM 2619-4 was ranked 3rd and 7th according to data presented in Tables 4.18 and 4.19, respectively. The combined outstanding performance of these two genotypes in five different locations strongly suggests that they are indeed genetically superior and point them as new releases as official varieties. The same materials are also tested in other Departments in the northern coast of Colombia (Sucre and Córdoba Departments). The best check in Tables 4.18 and 4.19 was Corpoica Caiseli ranked 5th and 4th, respectively. Table 4.18. Results from the Regional Trial - Second Cycle (RT-II) evaluated in Ingenio Central Sicarare and Motilonia in Codazzi (Cesar Department) and in Barrancas (Guajira Department). A total of 30 clones were evaluated, including five commercial checks. Performance of the best 10 clones is presented.
Plant type Fresh Root Yield (t/h )
Harvest I d
Dry matter content Selection I d
Parameter (1-5) Root Foliage (0-1) % t/ha (%)
Parameters of the best 10 selected clones SM 2773-32 3 26.5 21.1 0.56 33.4 8.6 19.01 SM 2775-4 3 25.9 33.5 0.45 34.6 9.2 16.40 SM 2619-4 4 17.8 25.4 0.38 33.8 6.2 14.97 SM 2620-1 3 29.4 23.7 0.53 34.0 10.1 13.98 CM 9560-1 4 38.8 29.9 0.53 32.3 12.7 11.22 SM 1438-2 4 28.1 32.8 0.47 32.1 9.2 10.04 SM 2548-22 4 25.1 24.0 0.48 32.4 8.5 7.35 SM 2783-12 4 32.6 26.7 0.52 31.4 10.2 6.97 SM 2621-29 4 27.5 27.5 0.48 32.0 9.1 6.96 SM 2615-25 4 21.6 26.9 0.42 31.9 6.9 4.50 Commercial checks C.CAISELI 2 26.2 17.4 0.58 34.0 9.2 13.23 C.GINES 4 36.8 27.1 0.58 30.7 11.6 11.51 ICA Costeña 3 27.5 24.8 0.50 31.6 8.9 -1.28 C. TAI 3 33.0 28.6 0.51 32.0 10.8 -1.66 C.VERONICA 2 28.5 20.5 0.58 30.9 9.1 -7.91 Parameters of 30 clones evaluated Maximum 4 41.0 38.5 0.65 34.6 12.8 19.01 Minimum 2 14.7 17.3 0.37 29.3 4.6 -34.58 Average 3 28.4 25.8 0.50 31.6 9.1 0.00 St. Deviation 1 6.3 5.0 0.06 1.4 1.9 12.48
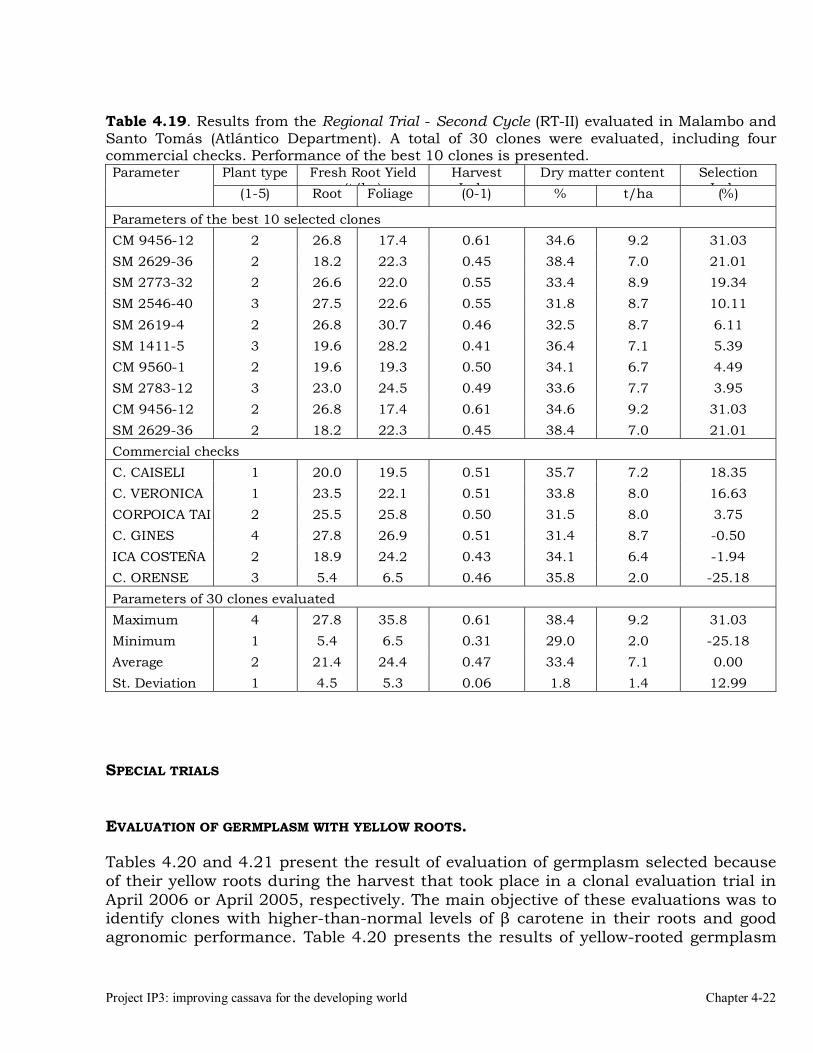
Project IP3: improving cassava for the developing world Chapter 4-22
Table 4.19. Results from the Regional Trial - Second Cycle (RT-II) evaluated in Malambo and Santo Tomás (Atlántico Department). A total of 30 clones were evaluated, including four commercial checks. Performance of the best 10 clones is presented.
Plant type Fresh Root Yield (t/h )
Harvest I d
Dry matter content Selection I d
Parameter (1-5) Root Foliage (0-1) % t/ha (%)
Parameters of the best 10 selected clones CM 9456-12 2 26.8 17.4 0.61 34.6 9.2 31.03 SM 2629-36 2 18.2 22.3 0.45 38.4 7.0 21.01 SM 2773-32 2 26.6 22.0 0.55 33.4 8.9 19.34 SM 2546-40 3 27.5 22.6 0.55 31.8 8.7 10.11 SM 2619-4 2 26.8 30.7 0.46 32.5 8.7 6.11 SM 1411-5 3 19.6 28.2 0.41 36.4 7.1 5.39 CM 9560-1 2 19.6 19.3 0.50 34.1 6.7 4.49 SM 2783-12 3 23.0 24.5 0.49 33.6 7.7 3.95 CM 9456-12 2 26.8 17.4 0.61 34.6 9.2 31.03 SM 2629-36 2 18.2 22.3 0.45 38.4 7.0 21.01 Commercial checks C. CAISELI 1 20.0 19.5 0.51 35.7 7.2 18.35 C. VERONICA 1 23.5 22.1 0.51 33.8 8.0 16.63 CORPOICA TAI 2 25.5 25.8 0.50 31.5 8.0 3.75 C. GINES 4 27.8 26.9 0.51 31.4 8.7 -0.50 ICA COSTEÑA 2 18.9 24.2 0.43 34.1 6.4 -1.94 C. ORENSE 3 5.4 6.5 0.46 35.8 2.0 -25.18 Parameters of 30 clones evaluated Maximum 4 27.8 35.8 0.61 38.4 9.2 31.03 Minimum 1 5.4 6.5 0.31 29.0 2.0 -25.18 Average 2 21.4 24.4 0.47 33.4 7.1 0.00 St. Deviation 1 4.5 5.3 0.06 1.8 1.4 12.99
SPECIAL TRIALS EVALUATION OF GERMPLASM WITH YELLOW ROOTS. Tables 4.20 and 4.21 present the result of evaluation of germplasm selected because of their yellow roots during the harvest that took place in a clonal evaluation trial in April 2006 or April 2005, respectively. The main objective of these evaluations was to identify clones with higher-than-normal levels of � carotene in their roots and good agronomic performance. Table 4.20 presents the results of yellow-rooted germplasm

Chapter 4-23 2007 Annual Report
that was first evaluated in the clonal evaluation trials harvested in April 2006. This is a Preliminary Yield Trial based on three replications and 10-plant plots. A single location was used to evaluate a total of 47 genotypes. Clones SM 3152–34 and CM 9912–140 were outstanding with dry matter yields above 10 t/ha. However, in the case of CM 9912–140, its dry matter content was very low (26.6%), whereas SM 3152–34 had a much better dry matter content (32.5%). In this trial a group of 12 clones was selected for a second evaluation where dry matter and � carotene contents will be the main traits for selection. The Advanced Yield Trial described in Table 4.20 was based on a three replication, 25-plant plots design. Evaluation was conducted in a single location and involved seven genotypes. Clones CM 9960-16 and GM 451-31 presented the best results regarding dry matter yields, which were above 8 t/ha. The commercial check Corpoica Verónica (CM 4919-1) is a released variety with colored roots. However, in this evaluation this check did not produce well. Table 4.20. Results of a Preliminary Yield Trial for yellow-rooted cassava germplasm originally selected in the clonal evaluation trial harvested in April 2006. Clon Plant
tYield (t/h )
Harvest I d
Dry matter Selection I d (1-5) Roots Foliage (0-1) % t/ha
CM 9912-140 3 32.5 41.4 0.43 32.5 10.4 40.61 SM 3152-34 3 44.7 53.5 0.46 26.6 11.9 36.24 CM 9955-36 3 31.4 35.7 0.47 29.0 9.1 27.99 CM 9912-164 3 31.2 52.2 0.37 30.0 9.4 23.14 SM 3157-9 2 30.6 40.4 0.44 26.4 8.1 22.15 SM 3155-24 2 22.3 30.6 0.42 29.6 6.7 21.96 CM 9924-32 3 29.9 59.6 0.33 29.7 9.0 21.50 CM 9924-18 2 28.8 45.4 0.39 28.4 8.2 20.46 GM 664-4 3 38.6 46.3 0.47 24.3 9.4 20.28 CM 9912-165 3 26.5 43.0 0.38 29.6 7.9 19.92 Parameters of the 12 selected clones Maximum 3 44.7 59.6 0.5 32.5 11.9 40.61 Minimum 1 22.3 30.6 0.3 24.3 6.7 15.68 Average 2 30.6 43.8 0.4 28.5 8.7 24.03 St. Deviation 1 6.2 8.2 0.0 2.1 1.5 7.39 Parameters of the 47 selected clones Maximum 4 44.66 63.63 0.47 32.5 11.9 40.61 Minimum 1 4.08 12.41 0.08 18.6 1.0 -50.32 Average 3 20.57 40.42 0.33 27.2 5.7 0.00 St. Deviation 1 8.26 11.57 0.08 2.9 2.4 20.33

Project IP3: improving cassava for the developing world Chapter 4-24
Table 4.21. Results of an Advanced Yield Trial for yellow-rooted cassava germplasm originally selected in the clonal evaluation trial harvested in April 2005. Clon Plant
tYield (t/h )
Harvest I d
Dry matter Selection I d (1-5) Roots Foliage (0-1) % t/ha
GM 451-31 3 25.2 29.0 0.47 32.3 8.1 10.09 CM 9960-16 3 29.0 38.6 0.43 31.2 9.1 7.90 CM 9947-2 2 20.4 41.2 0.33 34.0 7.0 6.61 GM 519–7 2 15.1 14.5 0.51 30.1 4.6 -17.08 GM 447-21 3 15.8 35.5 0.29 32.4 5.1 -17.08 C. Verónica 1 15.0 30.4 0.33 32.4 4.9 -9.63 CM 6119-5 1 20.1 26.5 0.42 34.5 7.0 19.19 Maximum 3 29.0 41.2 0.51 34.5 9.1 19.19 Minimum 1 15.0 14.5 0.29 30.1 4.6 -17.08 Average 2 20.1 30.8 0.40 32.4 6.5 0.00 St. Deviation 1 5.4 8.9 0.08 1.5 1.7 14.45
Special selections for high and stable dry matter content. In the sub-humid environment there is a long period without rains, extending from December to May. Farmers typically plant their cassava May through July of each year (that is after the arrival of the rains). Harvest typically takes place in the middle of the dry season, in February and March of each year. This is when dry matter content is at the highest levels. However, harvesting at this time of the year, implies that planting material would have to be stored for up to two months which, under the farmers’ conditions, renders its almost useless. A major concern for the starch industry located in the region is that dry matter content drops drastically with the arrival of the rains. CIAT has therefore started to pay attention to this subject and try to develop cassava germplasm that has high fresh root productivity, high dry matter content (both standard selection criteria) but also materials whose dry matter content will not drop so drastically upon the arrival of the rains, or else, that will be able to recover their DMC after re-growth has been initiated. Recognizing the importance for this environment to have germplasm with high and stable dry matter content crosses among progenitors with good performance for these traits were made during the year 2003. The resulting seed was germinated and transplanted early in 2004. The resulting progenies were then evaluated in a Clonal Evaluation Trial, which included 999 clones. This trial was harvested in three different dates during the first semester of 2005 (March 1-3; April 25-27 and May 30-June 1st). In that CET a total 259 clones were selected. A Preliminary Yield Trial was planted in June 2006 with these 259 genotypes. Harvest took place, also at three different dates in March 19, May 11 and June 9 2007. Based on those harvests a selection was made following different criteria:
� High selection index � High average dry matter content � High superiority index � Low dry matter content � High drop in dry matter content.

Chapter 4-25 2007 Annual Report
The last two criteria (low dry matter content and high drop in dry matter content) were included to identify susceptible checks that can later on be used for genetic studies that may help elucidate the inheritance of dry matter content in cassava roots, as well as identify molecular markers for this trait. Table 4.22 presents a summary of the 71 clones selected based on the criteria described above. For each of the selection criteria in the 2006 harvest the results of the clones harvested in 2007 are presented. A total of 50 clones out of the 71 selected belonged to the group originally selected for high selection index. These clones present a higher average selection index (24.6) compared with an average for selection index (across the 71 selected clones) of 0.00. Similarly, a total of 45 clones came from selections for their high dry matter content. This group presented an average of 33.4% dry matter content, whereas the average of the 71 selected clones was 30.8%. There were 7 clones selected in 2006 because of their low dry matter content. These clones had an average of 25.2% compared with the average across the 71 selected clones of 30.8%. These comparisons are very useful because it shows that the selections made on the 999 clones evaluated in 2006 and the 71 clones selected in 2007 show a clear agreement. Table 4.22. Performances of clones derived from crosses where the main objective was dry matter content. Different selection criteria were used in after the harvests that took place during the first semester of 2006. Clone or Fresh Root Yield Dry matter content Selection Parameter (t/ha) March 19 May 11 June 9 Average Index Parameters (2007) of 50 clones selected in 2006 because of their high selection indexes Maximum 32.1 38.4 34.0 36.2 35.9 44.9 Minimum 6.4 31.0 25.0 26.2 27.7 2.9 Average 19.4 34.7 30.8 33.2 32.9 24.6 St. Deviation 4.6 1.8 2.1 1.9 1.6 9.6 Parameters (2007) of 45 clones selected in 2006 because of their high average dry matter content Maximum 32.1 38.4 34.0 36.2 37.4 44.9 Minimum 6.4 31.1 26.8 29.3 29.7 -2.2 Average 18.2 35.1 31.4 33.5 33.4 23.1 St. Deviation 5.0 1.9 1.8 1.6 1.6 9.9 Parameters (2007) of 42 clones selected in 2006 because of their high superiority index Maximum 32.1 38.4 34.0 36.2 35.9 44.9 Minimum 6.4 31.8 27.8 30.3 30.2 -2.2 Average 18.3 35.1 31.6 33.7 33.5 23.3 St. Deviation 5.1 1.8 1.7 1.4 1.3 10.0 Parameters (2007) of 7 clones selected in 2006 because of their low average dry matter content Maximum 17.7 32.0 25.0 27.5 32.0 24.6 Minimum 5.8 25.1 18.0 19.1 22.3 -41.0 Average 12.3 28.6 20.9 23.4 25.2 -9.8 St. Deviation 3.9 3.0 2.4 2.8 3.7 21.4 Clones (2007) selected in 2006 because of their drastic drop in dry matter content SM 3146-27 29.8 32.5 30.5 32.0 31.7 37.34 SM 3137-7 16.8 33.9 n.a. 33.9 33.9 25.19 SM 3134-74 10.5 27.5 22.8 24.9 25.0 -19.05 SM 3134-44 10.2 28.5 25.3 23.5 25.8 -24.25 Average 10.7 33.0 28.4 30.9 30.8 0.0

Project IP3: improving cassava for the developing world Chapter 4-26
Table 4.23. Performances of clones derived from crosses where the main objective was dry matter content. Here the best and worst materials regarding different selection criteria are listed. There is an excellent segregation for outstanding and poor performances which is the main interest of this work.
Fresh Root Yield Dry matter content Selection Clone (t/ha) March 19 May 11 June 9 Average Index
Best 5 clones for selection index based on 2007 data
SM 3137-40 28.3 35.7 32.1 34.9 34.2 44.93 SM 3137-61 32.1 32.5 31.4 30.5 31.5 43.89 SM 3137-30 25.4 36.5 31.6 35.2 34.5 42.12 SM 3135-14 21.8 34.2 30.3 32.7 32.4 40.38 SM 3140-23 18.9 37.0 34.0 33.6 34.8 39.12 Best 5 clones for average dry matter content based on 2007 data
SM 3135-43 16.0 38.4 33.8 35.5 35.9 38.24 SM 3143-76 14.3 37.3 33.4 35.9 35.5 17.44 SM 3144-20 16.4 37.5 33.4 35.1 35.3 25.24 SM 3136-16 6.4 36.5 33.3 36.0 35.3 2.86 SM 3144-40 9.2 37.2 33.3 35.1 35.2 7.88 Best 5 clones for the capacity to maintain dry matter content based on 2007 data SM 3135-30 19.1 33.4 32.3 35.7 33.8 30.20 SM 3134-10 20.0 31.0 28.6 33.3 30.9 14.02 SM 3135-60 21.0 33.6 32.7 34.1 33.5 26.72 SM 3137-64 20.3 31.1 28.5 33.2 30.9 16.86 SM 3137-47 21.5 31.8 29.7 33.0 31.5 18.34 Characteristics of worst 5 clones for dry matter content based on 2007 data
SM 3134-26 9.9 27.2 20.6 19.1 22.3 -25.40 SM 3146 -2 13.4 25.1 18.0 24.0 22.4 -17.28 SM 3134-37 5.8 26.1 19.4 22.7 22.7 -40.98 SM 3139-10 17.7 26.8 21.5 22.5 23.6 -1.55 SM 3134-74 10.5 27.5 22.8 24.9 25.0 -19.05 Worst 5 clones for drop in matter content based on 2007 data
SM 3139-13 13.9 32.0 25.0 27.5 28.2 5.12 SM 3140-20 17.1 32.0 25.0 26.2 27.7 10.55 SM 3134-63 21.4 33.9 26.0 27.8 29.2 14.64 SM 3134-26 9.9 27.2 20.6 19.1 22.3 -25.40 SM 3143-101 10.6 31.2 20.6 24.4 25.4 -12.99 Table 4.23 presents the result of an evaluation of 30 clones selected during the clonal evaluation trial harvested in April 2006, which includes selections paying particular attention to the issue of dry matter content. The trial described in Table 4.22 was an Advanced Yield Trial based on three replications and 25-plants plot. The main objective of this evaluation is to identify high and stable dry matter content germplasm that, although it may not have a perfect agronomic performance, could be used as source to make new crosses adapted to this environment. A total of 15 clones were selected.

Chapter 4-27 2007 Annual Report
Table 4.24. Results of a Advanced Yield Trial including selections for high dry matter content from a Clonal Evaluation Trial harvested in April 2006.
Clon Plant type
Yield (t/ha)
Harvest Index Dry matter Selection
Index (1-5) Roots Foliage (0-1) % t/ha GM 842–26 3 13.4 19.7 0.38 40.7 5.8 24.34 CM 9912–159 2 27.3 44.8 0.37 35.7 9.7 23.46 SM 3154–32 3 22.9 22.0 0.51 35.5 8.2 20.04 SM 3154–51 3 22.4 37.5 0.37 36.5 8.2 17.53 GM 842-3 3 16.8 28.6 0.37 37.8 6.3 15.81 GM 732-9 2 27.5 39.0 0.41 33.4 9.2 13.50 SM 3148-5 4 28.3 41.2 0.40 34.2 9.7 11.73 SM 3148-18 3 9.4 14.8 0.37 38.8 3.7 9.37 GM 842-29 3 20.9 37.9 0.35 36.0 7.5 9.20 GM 437-18 3 19.7 34.7 0.36 36.0 7.1 9.12 SM 3151-45 3 14.2 22.1 0.41 36.9 5.3 8.76 GM 839-4 3 14.2 34.9 0.29 37.9 5.4 6.54 CM 9910-32 3 18.3 39.0 0.32 36.2 6.6 4.63 SM 3149-18 2 18.4 35.4 0.34 34.5 6.3 3.42 GM 840-4 3 17.5 33.8 0.34 35.4 6.2 0.70 Commercial checks C. Verónica 1 26.1 29.7 0.47 33.8 8.8 21.19 C. TAI 2 27.7 36.2 0.44 33.6 9.3 19.39 C. GINÉS 4 26.7 37.7 0.41 33.2 8.9 4.18 ICA Costeña 2 19.5 38.2 0.33 33.9 6.6 3.42 Parameters of 15 clones selected Maximum 4 28.3 44.8 0.5 40.7 9.7 24.34 Minimum 2 9.4 14.8 0.3 33.4 3.7 0.70 Average 3 19.4 32.4 0.4 36.4 7.0 11.88 St. Deviation 0 5.6 8.9 0.1 1.9 1.7 7.14 Parameters of 30 clones evaluated Maximum 4 28.3 49.3 0.51 40.7 9.7 24.34 Minimum 1 4.9 14.3 0.13 29.9 1.6 -44.83 Average 3 16.6 31.3 0.34 35.2 5.9 0.00 St. Deviation 1 7.2 8.9 0.09 2.1 2.5 18.66
PRUEBAS DE LOS DIALÉLICOS In May 2002 a diallel set was harvested in the sub-humid environment. That study was equivalent to a CET with the difference that the cloned plants from a given genotype were planted in two locations with three replications and one plant per replication, rather than in a single row at one location as it is usually done. In addition to the standard information from the diallel study, which resulted in two scientific articles in the peer-reviewed journals (Catch et al, 2005; 2006) selections were made on the best genotypes. In addition an earlier observation, which lead to the publication of another scientific article (Lenis et al., 2006) in relation to the value of foliar retention, also lead to the selection of a few genotypes for further evaluation. Selections from these studies were combined in a trial with three replications and 25-plant plots grown in Atlántico Department. The same trial was harvested in two consecutive years. Results in Table 4.25 are those from the second year of such study.

Project IP3: improving cassava for the developing world Chapter 4-28
In the first evaluation harvested in April 2006 the best five clones were GM 258-3, SM 2783-73; CM 6119-5; GM 258-2 and GM 280-15. Three of these five clones were among the best in the evaluation harvested in the first semester of 2007 (GM 280-15; GM 258-3 and CM 6119-5). Therefore suggesting their stability of outstanding performance. Table 4.25. Results of an Advanced Yield Trial for materials selected from the diallel studies and genotypes with good foliar retention. A total of sixteen clones were evaluated in three replications, with 25 plants per plot in the Atlántico Department. This is the second time this trial was conducted. The same materials had been evaluated during the 2005-2006 season. Clon Plant Yield
( /h )Harvest
dDry matter Selection
d (1-5) Roots Foliage (0-1) % t/ha GM 280-15 1 28.1 26.4 0.52 35.2 9.9 23.51 GM 258-3 2 34.0 30.5 0.53 32.9 11.2 22.00 CM 6119-5 1 24.6 23.9 0.51 34.9 8.6 13.32 CM 9794-21 2 31.5 29.5 0.52 31.9 10.0 12.50 CM 9954-23 2 27.0 35.9 0.43 34.3 9.2 8.42 Commercial checks C. VERONICA 1 25.9 25.1 0.50 33.9 8.8 11.94 C. GINÉS 4 26.2 41.4 0.39 32.9 8.6 -10.21 C. TAI 2 21.3 34.6 0.38 32.3 7.0 -16.05 M VEN 25 3 23.7 31.6 0.43 30.9 7.3 -19.23 Parameters of 5 clones selected Maximum 2 34.0 35.9 0.5 35.2 11.2 23.51 Minimum 1 24.6 23.9 0.4 31.9 8.6 8.42 Average 2 29.0 29.2 0.5 33.8 9.8 15.95 St. Deviation 0 3.7 4.5 0.0 1.4 1.0 6.51 Parameters of 16 clones evaluated Maximum 4 34 41 1 37 11 23.51 Minimum 1 15 23 0 29 6 -19.23 Average 2 25 31 0 33 8 0.00 St. Deviation 1 5 6 0 2 1 14.17
References Cach, N.T., J.C. Perez, J.I. Lenis, F. Calle, N.Morante, and H. Ceballos. 2005. Epistasis in the
expression of relevant traits in cassava (Manihot esculenta Crantz) for subhumid conditions. Journal of Heredity 96(5):586-592.
Lenis, J.I., F. Calle, G. Jaramillo, J.C. Pérez, H. Ceballos and J. Cock. 2006. Leaf retention and cassava productivity. Field Crops Res. 95(2-3):126-134.
Cach T.N., J.I. Lenis, J.C. Perez, N. Morante, F. Calle and H. Ceballos (2006). Inheritance of relevant traits in cassava (Manihot esculenta Crantz) for sub-humid conditions. Plant Breeding 125(2):177-182
CHAPTER 5
DEVELOPMENT OF GENETIC STOCKS AND IMPROVED GENE POOLS ADAPTED TO THE ACID-SOIL SAVANNAS ENVIRONMENT
This output relates to the efforts directed to the creation and identification of germplasm adapted to the acid-soil savannas environment found in Colombia’s eastern plains. The environment is characterized by acid soils with toxic levels of Al and Mn and severe deficiency of P and Ca. In addition, bacterial blight (CBB) and super-elongation disease (SED) are very common, inducing severe disease levels in materials that lack resistance or tolerance to them. Disease pressure is natural but in the nurseries, particularly at CETs stakes from diseased plants are taken and planted to serve as spreader of the diseases. 5.1. EVALUATIONS AND SELECTIONS IN THE ACID SOILS ENVIRONMENT Activities developed for the acid-soil savannas environment were centralized initially in CORPOICA – La Libertad in Villavicencio and in the experimental farm Cantaclaro, property of Sumprocol (a member of the Petrotestig Group) in Puerto López, both in Meta Department. The latter has become a strong supporter of cassava research and production, aiming at the processing of cassava roots into bio-ethanol. The company is currently leading a project to develop an adequate cultural practices package for the competitive production of cassava in the acid soil savannas. The farm has a good fleet of machinery to assure the proposed goal of establishing up to 1,200 ha of cassava during the 2007-2008 period. Table 5.1 lists the most relevant trials, whereas the other tables show results specific to each one. As mentioned in Table 3.5 a total of 3739 seeds were germinated and 1408 seedlings from these botanical seeds (targeting this particular environment) were transplanted at CIAT-Palmira in an isolated field. The planting of the current F1 stage is isolated to reduce as much as possible infection by diseases that can be found at later stages of the evaluation process. Seedlings from botanical seed are considered to be disease-free and efforts are made to maintain this condition for as long as it can possibly be done. Clonal Evaluation Trials (CET) are very large experiments around one hectare in size. A major constraint in their evaluation is the experimental error associated with the unavoidable variation in environmental conditions in such a large experimental plot. Because this is the first evaluation and selection stage (See Chapter 3) only 8 stakes are available from each genotype. Replication of each clone, therefore, is difficult to implement. On the other hand clones are grouped in either full- or half-sib families. Since many clones are generally available from each family they are randomly allocated in one of three blocks in which the field is divided. In other words instead of planting all the clones from a given family together one after the other, they are split in three groups, which are planted in the three blocks the entire evaluation is divided into (Figure 4.1). The CET planted this year was a special case. Half of the new germplasm (545 genotypes) to be evaluated in CET was planted following the typical arrangement of single-row plots with 8 plants/plot and no replication. The other half (516 genotypes), however, was planted following a new approach in which the eight plants of each genotype were split into two replications. This second CET was therefore planted using
Chaptert 5-1 2007 Annual Report

a two replications design in which each plot had four plants. Table 5.1. Trials conducted in the acid-soil savannas environment during the 2004-2005 cycle.
Type of Trial Location Genotypes (# plants) Reps Observations F1 Palmira 1213 (1) 1 -.- Clonal evaluation trial-1 La Libertad 545(8) 1 Tables 5.2-5.3 Clonal evaluation trial-2 La Libertad 516(4) 2 Tables 5.4-5.5 Preliminary yield trial PYT-1 La Libertad 80(10) 3 Table 5.6 Preliminary yield trial PYT-2 La Libertad 80(10) 3 Table 5.7 Preliminary yield trial PYT-3 La Libertad 80(10) 3 Table 5.8 Advanced yield trial – 1st cycle La Libertad 55(25) 3 Table 5.9 Advanced yield trial – 2nd cycle La Libertad 33(25) 3 Table 5.10 Regional Trials – First cycle Three locations 25(25) 3 Table 5.11 Regional Trials – Second cycle Three locations 32(25) 3 Table 5.12
Table 5.2. Results from the first Clonal Evaluation Trial divided into three blocks and conducted in CORPOICA La Libertad (Meta Department). Statistics of the 30 clones selected and all the clones evaluated in each block are presented.
Plant type (1-5)
Fresh root yield (t/ha)
Foliage Yield (t/ha)
Harvest Index (0-1)
Dry matter Content (%)
Dry root yield (t/ha)
Selection Index
Statistics of the 30 selected clones from Block-1 Maximum 4 39.6 32.6 0.67 37.6 14.9 63.99 Minimum 1 16.1 10.2 0.43 26.3 5.4 18.71 Average 3 23.4 19.1 0.55 32.7 7.6 27.61 St. Deviation 1 5.9 5.0 0.06 2.4 2.0 10.34 Performance of the 184 clones evaluated in Block -1 Maximum 5 39.6 32.6 0.7 37.6 14.9 63.99 Minimum 1 0.5 3.6 0.1 17.0 0.1 -73.84 Average 4 15.0 15.8 0.5 29.8 4.6 0.00 St. Deviation 1 7.1 6.1 0.1 3.5 2.3 20.98 Statistics of the 30 selected clones from Block-2 Maximum 4 44.3 39.1 0.73 38.2 11.9 49.44 Minimum 1 16.1 6.0 0.45 25.9 5.4 20.52 Average 3 26.9 20.3 0.58 32.6 8.7 28.33 St. Deviation 1 5.4 7.2 0.06 3.0 1.5 6.28 Performance of the 180 clones evaluated in Block -2 Maximum 5 44.3 39.1 0.7 38.8 11.9 49.44 Minimum 1 2.3 5.2 0.1 18.7 0.5 -54.14 Average 4 16.6 16.8 0.5 30.2 5.1 0.00 St. Deviation 1 7.8 6.3 0.1 3.6 2.5 20.34 Statistics of the 30 selected clones from Block-3 Maximum 4 31.3 32.0 0.7 37.1 11.3 42.91 Minimum 1 15.6 10.4 0.5 28.9 5.8 17.84 Average 3 24.5 19.4 0.6 33.5 8.2 26.99 St. Deviation 1 4.3 5.7 0.1 2.0 1.4 7.55 Performance of the 181 clones evaluated in Block -3 Maximum 5 31.3 39.6 0.7 37.7 11.3 42.91 Minimum 1 1.0 1.2 0.1 18.0 0.2 -70.35 Average 4 16.3 16.2 0.5 30.6 5.1 0.00 St. Deviation 1 7.0 6.7 0.1 3.4 2.3 20.49
Project IP3: improving cassava for the developing world Chapter 5-2

Results from the first CET evaluation (single row plots with eight plants) are presented in Table 5.2. The 545 clones included in the CET were planted in three blocks with 184, 180 and 181 clones each one, respectively. Checks were also included in each block. Table 5.2 provides information on the averages for each of the three blocks. The variation among these three blocks is an error that eventually affects the selection process. By selecting within each block, however, this environmental effect could be effectively eliminated. Since selection indexes were calculated within each block there is no major variation for this variable across blocks. On the other hand the average fresh root yields were 15.0, 16.6, and 16.3 t/ha respectively for Blocks 1, 2 and 3. This highlights the large environmental variation that is overcome by stratifying the selection within each block. Average productivity of this year CETs was higher than in the last year (which ranged from 11 to 13 t/ha). Average dry matter yields in the selected fractions were excellent ranging from 7.6 to 8.7 t/ha. This CET at the acid-soil savannas environment allowed a drastic selection within each block. This is illustrated by the average superiority of the selected fraction mentioned above and highlighted by the very high selection indexes of the best clones in the evaluation. In general a selected material will have selection indexes whose highest value will be around 26-28. However, as can be seen in Table 5.3, the best clones in this year CET had selection indexes as high as 64. Table 5.3. Description of the best five clones at each of the three blocks in the first CET harvested in April 2007 (based on single row plots with eight plants/plot).
Clone Plant type (1-5)
Fresh root yield (t/ha)
Foliage Yield (t/ha)
Harvest Index (0-1)
Dry matter Content (%)
Dry root yield (t/ha)
Selection Index
Performance of the best five clones from Block-1 SM 3209-5 2 39.6 32.6 0.55 37.6 14.9 64.0 SM 3213-7 3 34.4 25.5 0.57 34.4 11.8 45.7 SM 3199-2 3 35.4 20.6 0.63 32.2 11.4 44.7 SM 3210-1 1 26.0 15.1 0.63 33.7 8.8 44.1 GM 688-4 1 33.3 16.4 0.67 27.7 9.2 42.1 Performance of the best five clones from Block-2 SM 3212-3 1 29.2 21.1 0.58 37.3 10.9 49.44 GM 971-2 3 31.8 18.8 0.63 34.4 10.9 39.61 SM 3200-6 3 44.3 26.0 0.63 26.8 11.9 39.08 GM 935-2 3 25.0 23.4 0.52 38.2 9.5 34.06 SM 3199-6 3 34.4 36.5 0.49 33.0 11.4 33.50 Performance of the best five clones from Block-3 SM 3207-42 3 31.0 22.4 0.58 36.3 11.3 42.91 GM 934-14 1 27.9 20.8 0.57 34.0 9.5 42.48 SM 3209-31 2 30.2 14.3 0.68 31.9 9.6 40.96 SM 3210-3 1 24.5 15.4 0.61 34.3 8.4 40.06 SM 3212-7 1 26.6 29.4 0.47 33.8 9.0 35.49
There were 516 entries in the second CET evaluated also in the 2006-2007 season, but based on two replications per genotype with four plants each replication. Table 5.4 presents the most relevant results of this CET. Since the data from this CET is based on two replications results are expected to be more reliable. However, the replications imply considerable more work and only time will tell if the additional effort is justified or not.
Chaptert 5-3 2007 Annual Report

Table 5.4. Results from the second Clonal Evaluation Trial divided into three blocks and conducted in CORPOICA La Libertad (Meta Department). Statistics of the 30 clones selected and all the clones evaluated in each block are presented.
Plant type (1-5)
Fresh root yield (t/ha)
Foliage Yield (t/ha)
Harvest Index (0-1)
Dry matter Content (%)
Dry root yield (t/ha)
Selection Index
Statistics of the 30 selected clones from Block-1 Maximum 4.0 37.8 51.4 0.6 36.2 12.8 32.4 Minimum 1.5 19.1 13.0 0.4 26.9 6.8 21.3 Average 3.0 28.1 24.4 0.5 32.1 8.9 25.7 St. Deviation 0.7 5.5 8.5 0.1 2.9 1.4 3.2 Performance of the 163 clones evaluated in Block -1 Maximum 5.0 37.8 51.4 0.7 36.2 12.8 32.4 Minimum 1.5 0.7 3.3 0.1 19.2 0.1 -63.2 Average 4.0 17.8 17.3 0.5 29.2 5.4 0.0 St. Deviation 0.9 8.7 7.9 0.1 4.0 2.8 21.8 Statistics of the 30 selected clones from Block-2 Maximum 5.0 38.9 37.7 0.7 35.9 11.8 46.7 Minimum 2.0 14.6 8.2 0.4 26.0 4.9 19.1 Average 3.2 26.1 21.1 0.6 31.5 8.1 28.6 St. Deviation 0.7 6.1 6.8 0.1 2.3 1.6 5.8 Performance of the 163 clones evaluated in Block -2 Maximum 5.0 38.9 50.0 0.7 35.9 11.8 46.7 Minimum 2.0 0.3 2.1 0.1 17.4 0.1 -61.9 Average 4.3 16.1 15.7 0.5 28.1 4.7 0.0 St. Deviation 0.9 7.9 7.7 0.1 3.9 2.5 22.0 Statistics of the 30 selected clones from Block-3 Maximum 4.0 41.3 38.9 0.7 35.8 13.7 71.9 Minimum 2.0 13.9 7.5 0.4 23.2 4.3 16.3 Average 3.4 22.3 18.0 0.6 30.7 6.8 29.8 St. Deviation 0.7 6.6 7.4 0.1 2.8 2.0 12.9 Performance of the 190 clones evaluated in Block -3 Maximum 5.0 41.3 38.9 0.8 35.8 13.7 71.9 Minimum 2.0 0.3 2.1 0.1 16.5 0.1 -60.5 Average 4.5 13.6 11.6 0.5 26.4 3.8 0.0 St. Deviation 0.8 6.6 6.0 0.1 4.0 2.1 21.4
Variation between blocks was somewhat higher in the second CET (average FRY of 17.8; 16.1 and 13.6 t/ha for blocks 1, 2 and 3 respectively), compared with the first one (average FRY of 15.0; 16.6 and 16.3 t/ha for blocks 1, 2 and 3 respectively). The average FRY of the third block in the second CET was considerably lower than in the other two blocks. The
Project IP3: improving cassava for the developing world Chapter 5-4

performance of the best five clones (out of the 30 clones selected within each block). Several genotypes had excellent performances with average dry matter yields above 10 t/ha. Table 5.5. Description of the best five clones at each of the three blocks in the second CET harvested in April 2007 (two replications per genotype and four plants per replication).
Clone Plant type (1-5)
Fresh root yield (t/ha)
Foliage yield (t/ha)
Harvest Index (0-1)
Dry matter Content (%)
Dry root yield (t/ha)
Selection Index
Performance of the best five clones from Block-1
GM 956-29 1.5 24.1 22.0 0.52 34.1 8.2 32.37
SM 3207-51 3.0 32.5 25.7 0.56 32.1 10.4 31.48
SM 3213-35 4.0 36.5 51.4 0.42 35.0 12.8 30.11
GM 956-28 2.5 32.5 39.1 0.45 32.3 10.5 30.05
GM 971-3 2.0 25.7 18.1 0.59 31.6 8.1 29.46
Performance of the best five clones from Block-2
SM 3200-13 3.0 37.5 22.9 0.62 31.6 11.8 46.70 SM 3205-7 2.0 33.0 22.9 0.59 31.9 10.5 46.15 SM 3207-61 3.0 28.5 13.7 0.67 32.5 9.3 39.24 SM 3212-10 4.0 37.3 18.8 0.67 28.9 10.8 37.02 GM 956-33 3.0 31.1 28.6 0.52 31.9 9.9 35.31
Performance of the best five clones from Block-3
SM 3212-12 2.0 41.3 35.6 0.54 33.1 13.7 71.92
SM 3198-40 2.0 28.1 14.1 0.67 30.5 8.6 51.96 GM 956-46 3.0 28.5 28.5 0.50 33.6 9.6 45.50 SM 3211-16 2.0 22.4 16.5 0.56 32.8 7.4 43.84
SM 3209-58 4.0 25.9 18.8 0.56 35.8 9.2 41.88
As explained in Chapter 3 (Figure 3.1) the step after CET in the selection process is the Preliminary Yield Trial or PYT. Clones evaluated in these trials are those selected during the CET conducted the previous year. The eight plants from the CET produce more than 30 stakes. Therefore, the PYT are planted with three replications of 10-plant plots. Each experimental plot consists of two rows with five plants each. Since selections at the CET stage are conducted in three different blocks selections within each block generate a respective PYT. The clones allocated to each block at the CET (and selected) are therefore, competing among themselves also at the PYT phase. The reasons for this are: a) This approach maximized the genetic variability within each PYT by maximizing the number of families present in it; b) The performance of the cassava plant depends heavily on the quality of the stake from which it grew, and the quality of the stakes, in turn, depends on the environmental conditions in which the mother plant grew. By keeping together in the same PYT trial the clones that grew together at the CET a better uniformity of the quality of the stakes is achieved and, therefore, the experimental error at the PYT is somewhat reduced.
Chaptert 5-5 2007 Annual Report

Plots are made up of two rows with five plants each. Row spacing is 80cm within plots and 160cm between plots to favor within-family competition and discourage between-family competition. Three different PYTs were planted this year. Each had a total of 80 genotypes of which only 20 were selected. Results from these trials are presented in Tables5.6, 5.7 and 5.8. Table 5.6. Results from the Preliminary Yield Trial (PYT-1) divided into three blocks and conducted in CORPOICA La Libertad (Meta Department).
Plant type (1-5)
Fresh root yield (t/ha)
Foliage Yield (t/ha)
Harvest Index (0-1)
Dry matter Content (%)
Dry root yield (t/ha)
Selection Index
Statistics of the best 10 clones from the 20 selected
SM 3176–3 3 35.8 27.6 0.56 34.8 12.4 49.69 SM 3171-10 2 28.0 24.5 0.54 30.0 8.4 35.47 SM 3171-13 3 25.9 10.9 0.70 32.2 8.3 34.70 SM 3176–4 4 43.9 36.6 0.55 28.2 12.6 33.30 SM 3176–5 3 33.3 19.8 0.63 27.2 9.1 30.99 SM 2785–6 3 24.3 18.4 0.57 30.8 7.5 30.71 SM 3171–8 3 16.4 12.2 0.64 32.8 5.4 30.27 SM 2847-37 3 23.7 20.7 0.53 35.1 8.3 30.27 SM 2857-14 4 23.0 14.2 0.61 36.1 8.3 27.74 SM 3169–9 4 29.9 18.5 0.61 30.5 9.2 26.07 Performance of six commercial checks CM 523–7 4 5.2 6.5 0.45 27.6 1.4 -28.59 CM 2177-2 4 5.2 7.2 0.42 23.4 1.2 -40.69 CM 4574-7 3 26.4 21.1 0.56 33.8 8.9 39.86 CM 6438-14 3 11.8 10.3 0.51 30.5 3.8 7.48 CM 6740-7 4 35.8 20.2 0.64 34.2 12.3 39.75 BRASILERA 3 26.4 20.4 0.56 31.8 8.4 35.15 Statistics of the 20 selected clones Maximum 4.0 43.9 36.6 0.70 36.1 12.6 49.69 Minimum 2.3 15.1 9.9 0.36 27.2 4.9 11.75 Average 3.3 25.3 19.4 0.58 31.7 7.9 25.65 St. Deviation 0.5 7.1 7.0 0.08 2.5 2.0 9.35 Performance of the 80 clones evaluated Maximum 4.7 43.9 36.6 0.70 36.1 12.6 49.69 Minimum 2.3 5.2 6.1 0.24 22.1 1.2 -40.69 Average 3.7 15.9 15.5 0.50 29.4 4.8 0.00 St. Deviation 0.5 8.4 7.2 0.09 3.1 2.7 21.71
Project IP3: improving cassava for the developing world Chapter 5-6

Two commercial checks in PYT-1 (CM 4574-7 and CM 6740-7) were ranked second and third, based on their selection indexes (Table 5.6). Only the experimental clone SM 3176–3 had an overall performance better than these two clones. The commercial check Brasilera (MCOL 2737) also had an excellent performance but had a selection index lower than two sister genotypes SM 3171-10 and SM 3171-13. A third genotype from the same family (SM 3171-8) was also among the best 10 experimental clones in PYT-1. The best genotype (SM 3176–3) also had sister genotypes among the best ten of PYT-1 (SM 3176–4; and SM 3176–5). Results of PYT-2 and PYT-3 are presented in Tables 5.7 and 5.8, respectively. Table 5.7. Results from the Preliminary Yield Trial (PYT-2) divided into three blocks and conducted in CORPOICA La Libertad (Meta Department).
Plant type (1-5)
Fresh root yield (t/ha)
Foliage yield (t/ha)
Harvest Index (0-1)
Dry matter Content (%)
Dry root yield (t/ha)
Selection Index
Statistics of the best 10 clones from the 20 selected GM 543-53 3 26.2 16.3 0.62 31.2 8.2 43.26 GM 517-36 3 30.6 25.3 0.55 31.1 9.5 42.00 GM 507-19 3 22.0 14.8 0.59 32.6 7.3 35.98 SM 3177-16 3 20.6 13.5 0.60 33.1 6.8 32.25 GM 517-37 3 24.6 22.4 0.53 31.3 7.7 31.73 GM 456-105 3 27.1 17.4 0.60 29.2 7.8 30.34 SM 2847-44 4 22.3 19.4 0.53 33.0 7.4 26.72 GM 537-28 3 18.5 17.7 0.51 32.8 6.1 26.05 SM 3169-16 3 18.5 15.8 0.54 32.2 5.9 26.03 SM 3171-31 4 21.7 12.8 0.63 32.3 7.0 22.44 Performance of six commercial checks CM 4574-7 3 32.9 27.7 0.54 33.1 10.9 54.75 BRASILERA 4 27.1 18.8 0.59 32.4 8.8 35.71 CM 6438-14 4 19.7 15.4 0.56 33.0 6.5 24.30 CM 523-7 4 15.9 18.0 0.46 33.7 5.4 14.15 CM 6740-7 4 5.2 5.5 0.49 24.3 1.3 -32.31 CM 2177-2 5 5.2 6.0 0.47 24.6 1.3 -43.53 Statistics of the 20 selected clones Maximum 4 30.6 32.0 0.63 33.3 9.5 43.26 Minimum 2 12.9 12.8 0.37 29.2 4.1 12.52 Average 3 20.6 18.0 0.54 31.7 6.5 24.51 St. Deviation 0 4.3 4.8 0.07 1.1 1.3 9.09 Performance of the 80 clones evaluated Maximum 5 32.9 32.0 0.63 33.9 10.9 54.75 Minimum 2 5.2 5.3 0.28 23.5 1.2 -44.72 Average 4 13.9 13.5 0.50 29.4 4.2 0.00 St. Deviation 1 6.5 5.5 0.08 2.7 2.2 21.79
Chaptert 5-7 2007 Annual Report

Table 5.8. Results from the Preliminary Yield Trial (PYT-3) divided into three blocks and conducted in CORPOICA La Libertad (Meta Department).
Plant type (1-5)
Fresh root yield (t/ha)
Foliage yield (t/ha)
Harvest Index (0-1)
Dry matter content (%)
Dry root yield (t/ha)
Selection Index
Statistics of the best 10 clones from the 20 selected SM 3077-75 3 32.0 17.1 0.65 32.4 10.4 65.80 SM 2857-44 4 23.0 12.1 0.65 36.7 8.7 59.11 GM 541-25 3 22.1 16.7 0.57 32.0 7.2 50.68 SM 3169-30 4 27.0 15.9 0.63 30.8 8.3 46.21 GM 542-31 4 18.1 13.4 0.57 33.1 6.0 30.00 GM 898-44 4 15.4 9.2 0.62 31.7 4.8 23.61 GM 543-78 3 15.5 14.6 0.52 29.9 4.6 20.47 SM 3177-27 3 12.9 14.6 0.48 31.7 4.1 18.91 SM 3076-67 4 15.4 13.9 0.52 31.9 4.8 18.16 SM 3074-55 3 15.6 12.4 0.54 28.5 4.6 17.92 Performance of six commercial checks CM 4574-7 3 28.6 18.8 0.60 33.7 9.7 69.55 CM 6740-7 4 14.5 9.9 0.59 33.3 4.8 29.56 BRASILERA 3 13.9 10.7 0.57 28.8 4.0 17.53 CM 523-7 5 17.4 21.1 0.45 32.5 5.7 10.51 CM 6438-14 4 6.6 10.0 0.40 30.6 2.0 -8.65 CM 2177-2 5 4.3 15.9 0.32 27.0 1.2 -42.27 Statistics of the 20 selected clones Maximum 5 32.0 17.7 0.7 36.7 10.4 65.80 Minimum 3 7.2 5.9 0.4 28.5 2.3 6.98 Average 4 16.2 12.4 0.6 31.4 5.2 23.71 St. Deviation 0 5.9 3.4 0.1 2.2 2.0 17.53 Performance of the 80 clones evaluated Maximum 5 32.0 21.1 0.66 36.7 10.4 69.55 Minimum 3 4.3 4.2 0.32 24.6 1.2 -42.27 Average 4 10.7 10.1 0.51 29.6 3.3 0.00 St. Deviation 1 5.7 4.3 0.08 2.6 2.0 22.64
The best genotype in PYT-2 (Table 5.7) was the check CM 4574-7 with an outstanding selection index value of 54.75. The second best genotype was the experimental clone GM 543-53 whose selection index was more than ten-points lower (43.26). The third best genotype was GM 517-36 and the fourth was GM 507-19. Another commercial check (Brasilera) ranked fifth. The performance of CM 6740-7 which was excellent in PYT-1 was very deficient in PYT-2 with a very negative selection index (-32.31). This kind of situation, which is not unusual points out the strong genotype-by-environment interactions in cassava.
Project IP3: improving cassava for the developing world Chapter 5-8

The best genotype in PYT-3 was the outstanding commercial check CM 4574-7 with a very high selection index of 69.55 (Table 5.8). Experimental clones SM 3077-75; SM 2857-44; GM 541-25; SM 3169-30 and GM 542-31 followed in performance. The second best commercial check was again CM 6470-7 which showed a good performance in PYT-1 but a very poor one in PYT-2. Results combined across the three PYT trials show family SM 3171 with four representatives among the best ten clones. It is followed by families SM 3169 and SM 3176 with three representatives. Families SM 2847, SM 2857 and SM 3177 had two representatives among the best ten clones in the three PYTs. Clones selected at the PYTs are grouped together in an Advanced Yield Trial or AYT, which can be planted in more than one location and in 20-plant or 25-plant plots (Figure 3.1). When plots have 20 plants, the six central plants are harvested for evaluation and the remaining 14 plants of the periphery are left as source of planting material. Harvested plants, therefore, grow surrounded by plants of the same genotype and, therefore, harvest data is taken only from plants that have competed with sister plants. In the case of 25-plant plots the nine central plants are harvested and the surrounding 16 are left as source of planting material In this particular environment AYTs are conducted for two consecutive years with some selection exerted in the first year. Therefore there are two types of AYTs. First year (AYT-I) evaluates the best performing clones emerging from the PYTs conducted the previous year. Second year (AYT-II) evaluates the best performing clones emerging from the PYTs conducted two years before and after a mild selection at the First year AYT-I. The clones selected in the PYTs planted in May 2005 were then planted in May 2006 in the AYT-I (1st cycle) trial whose results are presented in Table 5.9. A total of 55 clones were evaluated in this trial and the best 25 genotypes were selected to move on as AYT (2nd cycle). The trial was conducted in CORPOICA – La Libertad. The average fresh root yield of the 55 clones was 19.4 t/ha with values ranging from 31.6 down to 2.3 t/ha. Dry matter content ranged from 23.2% to 37.2%, with an average of 32.6%. Average dry matter yield was 6.4 t/ha ranging from 10.8 down to 0.5 t/ha. There were up to eight commercial checks planted in AYT-I. As it was the case of previous trials CM 4574-7 was still the best genotype under the mild acid-soil conditions of CORPOICA LA Libertad. Average dry matter yield of this clone was above 10 t/ha. Among the experimental clones SM 3070-20, SM 3033-4, GM 665-3, GM 536-64 and SM 3114-36 had an excellent performance with several dry matter yields above 10 t/ha. From this AYT a group of 25 clones (whose statistical parameters are also provided in Table 5.9) was selected for a second cycle AYT currently in the field. Table 5.10 presents AYT-II evaluated in two contrasting edaphic conditions in CORPOICA La Libertad. Porcinos is a much better soil with higher organic matter and lower levels of the typical problems of acid soils (low-P availability, Al-toxicity, Mn-toxicity, Ca and Mg deficiencies). The second environment was in Loma that has more typical savanna soil an d presents much higher disease (bacterial blight and super elongation disease) pressure. Consequently average fresh root yields were 38.7 and 20.6 t/ha, in Porcinos and Loma, respectively. Across the two environments average fresh root yield was 29.6 t/ha (ranging from 45.6 to 16.1 t/ha). Average dry matter content was 31.9% and ranged from 35.8 to 25.8%. Average dry matter yield was 9.4, ranging from 13.9 to 4.3 t/ha.
Chaptert 5-9 2007 Annual Report

Table 5.9. Results from the Advanced Yield Trial-First Cycle (AYT-I) divided into three blocks and conducted in CORPOICA La Libertad (Meta Department).
Clone or parameter
Plant type (1-5)
Fresh root yield (t/ha)
Foliage yield (t/ha)
Harvest Index (0-1)
Dry matter Content (%)
Dry root yield (t/ha)
Selection Index
Statistics of the best 10 clones from the 20 selected SM 3070-20 3 28.4 15.2 0.65 34.9 10.0 31.79 SM 3033-4 3 29.7 15.4 0.66 34.8 10.3 31.25 GM 665-3 4 29.4 13.2 0.69 36.7 10.8 30.47 GM 536-64 2 27.7 20.8 0.57 32.9 9.2 25.53 SM 3114-36 2 26.7 18.8 0.59 33.4 8.9 23.61 GM 665-16 3 31.6 16.3 0.66 32.2 10.2 23.55 SM 2965-68 4 26.2 16.9 0.61 35.4 9.2 16.36 GM 677-8 3 23.0 11.3 0.66 32.8 7.6 15.03 GM 263-112 4 27.0 17.8 0.61 34.5 9.3 14.93 GM 536-70 3 19.9 14.8 0.57 34.3 6.9 12.22 Performance of six commercial checks CM 4574-7 2 30.2 20.1 0.59 34.4 10.4 32.16 CM 6438-14 3 20.1 18.5 0.52 34.3 6.9 9.30 CM 6740-7 4 18.9 13.2 0.59 33.5 6.3 0.70 CM 2772-3 3 26.6 19.7 0.57 27.5 7.3 -4.02 BRASILERA 5 20.8 14.5 0.60 31.0 6.4 -11.93 CM 507-37 4 20.3 17.6 0.53 29.7 6.3 -15.28 CM 523-7 4 7.3 15.5 0.30 29.0 2.2 -50.86 CM 2177-2 4 2.3 4.6 0.34 23.2 0.5 -77.30 Statistics of the 25 selected clones Maximum 4 31.6 23.2 0.69 37.2 10.8 31.79 Minimum 2 14.1 10.7 0.47 29.6 5.2 3.00 Average 3 22.6 15.8 0.58 33.6 7.6 12.99 St. Deviation 1 5.1 3.2 0.07 1.8 1.8 9.33 Performance of the 55 clones evaluated Maximum 5 31.6 23.2 0.69 37.2 10.8 32.16 Minimum 2 2.3 4.6 0.30 23.2 0.5 -77.30 Average 3 19.4 14.9 0.56 32.6 6.4 0.00 St. Deviation 1 6.4 4.0 0.08 2.6 2.2 20.37
CM 6740-7 and CM2772-3 were the best commercial checks across the two environments in which AYT-II were evaluated (Table 5.10). They had dry matter yields of 11.5tha and 12.3 t/ha, respectively. The best experimental clone was GM 220-67 with an average dry matter yield of 13.9t/ha. Other clones with dry matter yields above 11 t/ha were SM 3077-21 (11.2t/ha), GM 233-84 and GM 223-89 with 12.8 t/ha. From this trial a group of16 clones was selected and were moved to Regional Trials currently in the field.
Project IP3: improving cassava for the developing world Chapter 5-10

Table 5.10. Results from the Advanced Yield Trial-Second Cycle (AYT-II) divided into three blocks and conducted in two contrasting edaphic conditions (Porcinos and Loma) in CORPOICA La Libertad (Meta Department).
Clone or parameter
Plant type (1-5)
Fresh root yield (t/ha)
Foliage Yield (t/ha)
Harvest Index (0-1)
Dry matter Content (%)
Dry root yield (t/ha)
Selection Index
Statistics of the 16 clones selected GM 233-84 3 39.8 23.9 0.62 32.2 12.8 24.84 SM 3068-19 3 30.1 18.5 0.62 35.2 10.6 22.72 SM 3077-21 3 32.4 19.5 0.62 34.8 11.2 22.57 GM 223-89 4 40.6 20.3 0.66 31.8 12.8 21.15 GM 220-67 4 40.9 28.9 0.58 34.1 13.9 20.82 GM 536-44 1 27.3 24.3 0.52 34.2 9.4 18.12 GM 536-20 2 26.3 21.0 0.56 35.7 9.4 15.30 GM 371-8 3 34.5 21.2 0.60 29.6 10.1 8.86 GM 223-85 3 29.2 19.4 0.59 32.4 9.2 8.15 GM 220-79 3 35.0 19.7 0.63 30.0 10.5 7.22 GM 536-13 4 28.0 17.4 0.62 34.1 9.6 7.04 GM 517-3 4 34.0 22.9 0.58 33.3 11.3 6.32 SM 3022-27 3 35.3 20.2 0.62 29.1 10.3 5.87 GM 536-49 3 28.0 26.0 0.52 34.7 9.7 4.63 SM 3075-10 3 23.4 19.3 0.53 35.8 8.5 3.16 GM 517-18 3 30.6 26.2 0.54 33.4 10.3 0.07 Performance of six commercial checks CM 6740-7 3 33.6 22.2 0.59 34.2 11.5 15.48 CM 2772-3 4 45.6 25.7 0.64 27.2 12.3 12.68 BRASILERA 4 29.4 17.4 0.62 33.0 9.8 1.42 CM 6438-14 3 26.8 19.9 0.57 32.2 8.7 -0.64 CM 4574-7 3 25.6 21.1 0.52 31.1 8.0 -7.71 CM 523-7 4 29.8 25.5 0.54 33.3 9.9 -8.40 CM 507-37 4 23.9 19.5 0.55 28.2 6.7 -31.87 CM 2177-2 4 16.1 14.2 0.53 26.8 4.3 -52.77 Statistics of the 33 clones evaluated Maximum 4 45.6 28.9 0.66 35.8 13.9 24.84 Minimum 1 16.1 14.2 0.51 25.7 4.3 -52.77 Average 3 29.6 20.6 0.58 31.9 9.4 0.00 St. Deviation 1 6.8 3.3 0.04 2.6 2.1 17.52
Regional Trials (RT) are experiments in which a group of varieties is evaluated using a common and uniform technology in a wide range of representative environments (including soil characteristics and prevalent diseases and pests). The ultimate objective is to identify genotypes that are genetically superior to available local commercial checks. Regional trials identify germplasm that will be officially released as new varieties. Clones that are selected in AYT-II are combined in RT that are evaluated for 2-4 years. In the 2006-2007 season two
Chaptert 5-11 2007 Annual Report

types of RT were established. RT-I originates in the selected clones in AYT-II from the 2003-2004 season and the summary of this trial is presented in Table 5.11. Table 5.11. Results from the Regional Trial (RT-I) conducted in three environments in the acid-soil savannas of the Meta Department.
Clone or parameter
Plant type (1-5)
Fresh root yield (t/ha)
Foliage yield (t/ha)
Harvest Index (0-1)
Dry matter Content (%)
Dry root yield (t/ha)
Selection Index
Statistics of the 13 clones selected
SM 2642-5 3 32.1 21.5 0.60 31.6 10.21 41.04 SM 2977-6 3 26.7 18.9 0.58 29.6 7.84 21.17 SM 2632-47 3 25.4 15.8 0.61 29.3 7.46 18.37 SM 2965-29 3 21.8 16.0 0.58 27.6 6.00 14.04 CM 9953-76 3 22.4 16.7 0.56 30.2 6.68 11.99 CM 9903-78 3 19.2 16.8 0.53 28.7 5.80 9.42 SM 2610-43 3 22.1 17.5 0.52 27.8 6.55 5.03 CM 9903-56 3 20.7 14.9 0.59 27.5 5.85 2.69 SM 2852-5 3 16.7 12.5 0.57 26.8 4.51 2.36 CM 9940-2 3 20.2 13.6 0.58 27.0 5.33 -0.83 SM 2658-26 2 13.4 19.4 0.42 29.5 4.01 -0.99 SM 2640-21 3 19.5 20.3 0.49 27.7 5.56 -6.97 SM 2610-57 3 15.4 14.5 0.50 30.0 5.01 -8.41 Performance of six commercial checks
BRASILERA 3 25.7 17.2 0.61 32.4 8.38 28.26 CM 2772-3 3 30.3 19.2 0.61 26.4 8.17 21.98 CM 523-7 3 19.5 20.0 0.49 33.6 6.60 15.21 CM 6438-14 3 21.6 18.8 0.53 31.6 6.81 15.07 CM 6740-7 3 20.5 17.3 0.53 28.7 6.05 -3.97 CM 4574-7 3 12.8 15.4 0.42 24.9 3.20 -35.73 CM 2177-2 4 9.6 9.9 0.49 23.4 2.32 -47.95 Statistics of the 25 evaluated clones
Maximum 4 32.1 21.5 0.61 33.6 10.2 41.04 Minimum 2 7.7 7.1 0.42 23.4 2.1 -53.25 Average 3 19.3 15.9 0.53 28.5 5.6 0.00 St. Deviation 0 6.1 3.5 0.06 2.4 2.0 22.21
Data presented in Table 5.11 combines results from three individual experiments (planted at Loma, Porcinos and Pozo, Villavicencio County, Meta Department). The best environment was Porcinos with an average fresh root yield of 29.6 t/ha, followed by Pozo with 18.4 t/ha and then Loma with only 11.2 t/ha. Average dry matter yields were 8.9; 5.2 and 3.3 t/ha, respectively (data on individual locations is not presented).
Project IP3: improving cassava for the developing world Chapter 5-12

Combining the three evaluations, average fresh root yield was 19.3 t/ha, ranging from 32.1 t/ha (SM 2642-35) down to 7.7 t/ha (GM 276-99). Average dry matter content combined across experiments was 28.5%, ranging from 33.6% (CM 523-7), down to 23.4 (CM 2771-2). Experimental clones presented dry matter contents below 31.6% which is considered undesirable. Average dry matter yield was 5.6 t/ha, ranging from 10.2 t/ha (SM 2642-35) down to 2.1 t/ha (GM 276-99). The best commercial check (Brasilera) yielded 8.4 t/ha of dry matter, followed by CM 2772-3 (8.2 t/ha); CM 6438-14 (6.8 t/ha); CM 523-7 (6.6 t/ha); CM 6740-7 (6.1 t/ha); CM 4574-7 (3.2 t/ha) and CM 2177-2 (2.3 t/ha). It was surprising to see the poor performance, in these trials, of CM 4574-7 which was in most cases one of the best commercial checks. It is also interesting to note the good performance of CM 2772-3 which has yellow roots. Results of RT-II are presented in Table 5.12. The same evaluation was planted during the previous season (in seven locations) and the results of these evaluations were presented in the Annual Report for 2006. With these three additional experiment a total of ten sites have been used for the evaluation and selection of the genotypes included in this trial. CM 4574-7 was the best commercial check and the best clone in the evaluation conducted this year, but that was not the case for the evaluations during the 2005-2006 season, which took place in seven locations and in two different Departments in Colombia. One interesting feature in this RT-II is the frequency of individuals from family CM 9460, since five of the sixteen selected clones belong to this family. Family CM 9460 was derived from two outstanding progenitors: CM 4574-7 x CM 6740-7, therefore these results are not really surprising. Below the ranking of CM 9460-12 and CM 4574-7 in the ten RT where they were evaluated is presented.
Experiment Average Clone 1 2 3 4 5 6 7 8 9 10 Ranking CM 9460-12 1 1 6 2 12 1 2 11 2 1 3.9 CM 4574-7 3 2 3 2 5 3 3 1 4 4 3.0 In general, CM 9460-12 can be seen as a better genotype because it was the best in four of the ten trials. CM 4574-7 was the best only once. However CM 9460-12 had an average performance in two trials (rankings 12 and 11), while CM 4574-7 was always among the best ten clones. Only with additional trials the relative merits of this experimental clone CM 9460-12 will be defined. Overall it is clear that CM 4574-7 is an excellent material and although it has not been yet officially released it should certainly be among the next clones to be released.
Chaptert 5-13 2007 Annual Report

Table 5.12. Results from the Regional Trial-Second Cycle (RT-II) conducted in three environments in the acid-soil savannas of the Meta Department.
Clone or parameter
Plant type (1-5)
Fresh root yield (t/ha)
Foliage yield (t/ha)
Harvest Index (0-1)
Dry matter Content (%)
Dry root yield (t/ha)
Selection Index
Statistics of the 16 clones selected
CM 9460-15 2 23.0 16.4 0.58 32.9 7.52 41.11 CM 9460-12 2 23.2 17.3 0.57 33.3 7.62 34.21 CM 9464-33 3 24.8 17.6 0.60 32.5 8.06 25.77 SM 2792-31 3 25.9 17.8 0.59 33.2 8.62 25.76 CM 9460-40 3 24.5 16.6 0.60 30.7 7.55 21.82 CM 9460-13 3 23.7 13.7 0.61 30.5 7.51 17.97 CM 9461-1 3 20.2 11.5 0.65 32.9 6.66 17.45 CM 9464-29 3 24.1 18.8 0.54 29.4 7.55 11.41 CM 9460-9 3 24.9 14.1 0.63 26.4 6.56 9.67 CM 9464-36 3 19.2 13.0 0.60 31.0 5.95 7.90 SM 2739-4 3 18.2 14.4 0.53 32.3 6.05 7.34 CM 9461-5 3 18.8 16.4 0.52 27.7 5.57 1.34 CM 9462-17 3 19.8 16.6 0.53 28.2 5.77 -1.46 SM 2636-6 3 15.1 11.0 0.58 29.1 4.54 -2.29 SM 2730-1 3 16.1 14.9 0.52 31.3 5.16 -3.31 SM 2601-44 4 18.2 12.3 0.60 27.3 4.95 -6.54 Performance of six commercial checks
CM 4574-7 2 32.3 19.9 0.62 30.9 9.93 46.87 CM 6740-7 3 24.1 15.0 0.62 32.0 7.78 28.01 BRASILERA 3 19.2 14.3 0.57 32.5 6.26 14.56 CM 523-7 4 13.2 14.6 0.44 30.4 4.29 -21.48 CM 6438-14 3 10.4 12.5 0.44 28.2 3.08 -25.67 CM 2177-2 4 7.4 9.5 0.45 22.5 1.67 -53.31 Statistics of the 32 evaluated clones
Maximum 4 32.3 19.9 0.65 33.3 9.9 46.87 Minimum 2 6.6 6.5 0.44 22.5 1.7 -53.31 Average 3 17.8 13.9 0.55 29.2 5.4 0.00 St. Deviation 1 6.1 3.3 0.06 3.0 2.1 23.80
5.2 MULTIPLICATION OF PLANTING MATERIAL OF RELEASED AND PROMISING GERMPLASM During the 2006-2007 growing season multiplication plots for a group of 225 clones were planted in CORPOICA- La Libertad. The plots were around the Porcinos area which is a better environment for cassava and offer conditions that are not the best for diseases to affect the plants. This, in turn, allows the production of planting material of better quality and cleaner of pathogens. Most of the germplasm multiplied, however, are resistant to the two most important diseases in the region (Bacterial Blight and Super Elongation Disease). The
Project IP3: improving cassava for the developing world Chapter 5-14

objective of these multiplications is to produce planting material for future evaluations and selections and for the establishment of multi-location trials in 2007-2008 season. Between 150 and 300 plants per genotype were planted in these plots. Because of the strong interest and commitment of Sumprocol (from the Petrotesting Group) to cassava research for the Acid Soil Savannas, a multiplication plot for the best 12 cassava varieties was also planted at the Cantaclaro farm in Puerto López. These elite clones were selected from RT in the 2005-2006 season. The objective of this planting is to produce enough planting material of good quality for this germplasm to reach semi-commercial plantings. In our experience these semi-commercial plantings are extremely useful for a final selection of germplasm to be released. Table 5.13 presents a summary of the results of these semi-commercial trials and illustrate a new approach for cassava research and development in Colombia. While the results of these evaluations are very relevant for Petrotesting allowing this company to have a ready access to the elite germplasm generated by the project, the costs of these large evaluations could not be covered by the project, which nonetheless has access to the information which is very relevant for defining new progenitors to be included for the region, and the official release of the next generation of varieties. CM 9460-13 CM 9464-19, CM 9464-29 and SM 2792-31 had an outstanding performance with dry matter yields above 9.9 t/ha. In addition Petrotesting has planted its own collection of elite germplasm and multiplication plots. CIAT is very happy with this kind of arrangements that allow a very dynamic and natural flow from research to exploitation to development based on cassava germplasm. There is a natural complementation between the capacities that Petrotesting and CIAT have to offer for the development of cassava in the Acid Soils Environment of Colombia (and similar environments worldwide). Table 5.13. Results of semi-commercial evaluations of experimental clones. Contaclaro Farm – Petrotesting. Puerto López. 2006-2007 season.
Dry matter Clon Plant type
(1-5) SED (1-5)
Fresh Root Yield (t/ha) (%) (t/ha)
SM 2636-42 3 2.0 15.2 33.4 5.5 SM 2452-13 3 2.5 17.7 40.9 7.2 CM 9464-36 4 2.5 18.2 40.5 7.3 CM 9463-19 3 2.0 22.4 39.2 8.8 CM 9460-40 1 1.0 23.5 38.0 8.9 CM 9464-33 3 2.0 26.2 36.3 9.5 CM 9460-13 2 1.5 27.2 36.2 9.9 CM 9464-19 3 1.5 27.0 37.8 10.2 SM 2792-31 1 1.0 31.3 38.5 12.0 CM 9464-29 3 1.5 33.9 38.9 13.2 CM 523-7 3 1.0 21.1 39.5 8.3
SED= Super elongation disease
Chaptert 5-15 2007 Annual Report

Figure 5.1 presents photographs of these plots for the multiplication of planting material at the Cantaclaro Farm.
Figure 5.1. Multiplication plots and preparation of planting material at the Cantaclaro Farm of Petrotesting in Puerto López, Meta Department.
As part of the activities conducted in the region on November 24, 2006 a field day was prepared to address the issue of agro-industrial cassava for the Acid Soils environment. This was a join event between CIAT, CLAYUCA, Petrotesting and the Colombian Ministry of Agriculture and Rural Development and took place in the Cantaclaro Farm in Puerto López. Producers, processing industries and technicians from different institutions participated. Among the issues addressed were soil management, varieties, and handling of planting material. In addition a pilot plant for the production of ethanol from cassava roots was installed as a demonstration (Figure 5.2).
Figure 5.2. Photographs of the field day at Cantaclaro Farm in Puerto López, Meta Department. A pilot plant for the production of ethanol was set up as demonstration. Brochures were printed (central photograph) as well as demonstrations on the handling of planting material.
Project IP3: improving cassava for the developing world Chapter 5-16
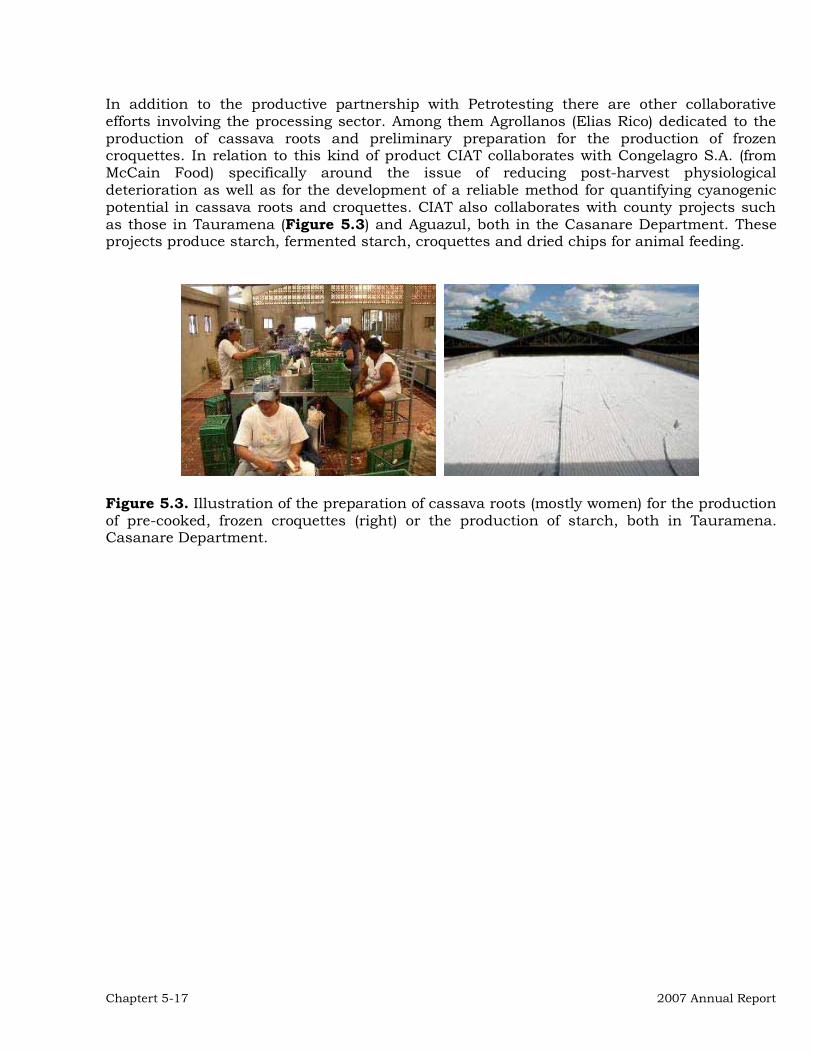
Chaptert 5-17 2007 Annual Report
In addition to the productive partnership with Petrotesting there are other collaborative efforts involving the processing sector. Among them Agrollanos (Elias Rico) dedicated to the production of cassava roots and preliminary preparation for the production of frozen croquettes. In relation to this kind of product CIAT collaborates with Congelagro S.A. (from McCain Food) specifically around the issue of reducing post-harvest physiological deterioration as well as for the development of a reliable method for quantifying cyanogenic potential in cassava roots and croquettes. CIAT also collaborates with county projects such as those in Tauramena (Figure 5.3) and Aguazul, both in the Casanare Department. These projects produce starch, fermented starch, croquettes and dried chips for animal feeding.
Figure 5.3. Illustration of the preparation of cassava roots (mostly women) for the production of pre-cooked, frozen croquettes (right) or the production of starch, both in Tauramena. Casanare Department.

CHAPTER 6
DEVELOPMENT OF GENETIC STOCKS AND IMPROVED GENE POOLS ADAPTED TO THE MID-ALTITUDE VALLEYS ENVIRONMENT
Activities developed for the Mid-altitude Valleys environment were centralized initially in CIAT Experimental Station, in Palmira Valle del Cauca Department. Because of the problems of Frog Skin Disease (FSD) that CIAT has failed to overcome a decision has been taken to move the evaluations of materials outside the Experimental Station. Therefore germplasm targeting this environment is now evaluated not only in CIAT experimental station but, preferably in other farms isolated from other cassava fields. It is in CIAT Experimental Station where crossing blocks are planted to produce the botanical seed of segregating families targeting not only mid-altitude valleys but all the other environments as well (See Table 3.3). Therefore it is at Palmira that all botanical seed is produced. In addition it is in Palmira where that seed is germinated and F1 nurseries (See Figure 1) are planted. The plants in the F1 nurseries are used as source of vegetative cuttings for the Clonal Evaluation Trials that are then shipped to the target environments. Finally it is also in Palmira where the root quality laboratory conducts all the screening of quality traits that has been so productive in recent years. 6.1. EVALUATIONS AND SELECTIONS IN THE VALLE DEL CAUCA DEPARTMENT Table 6.1 lists the most relevant trials, whereas the other tables show results specific to each one. As mentioned in Chapter 3 (Table 3.5) a total of 3837 seeds were germinated and 2629 seedlings from these botanical seeds (targeting this particular environment) were transplanted at CIAT-Palmira in an isolated field in June 2007. The planting of the F1 stage is isolated to reduce as much as possible infection by diseases that can be found at later stages of the evaluation process. Seedlings from botanical seed are considered to be disease-free and efforts are made to maintain this condition for as long as it can possibly be done. Table 6.1. Trials conducted in the Mid-altitude Valleys environment during the 2005-2006 cycle. Type of Trial Location Genotypes (# plants) Reps Observations F1 Palmira 1184 1 Clonal evaluation trial Palmira 533 (8) 1 Table 6.2 and 6.3 Clonal evaluation trial Palmira 452 (4) 2 Table 6.4 and 6.5 Preliminary yield trial 1 Palmira 66 (10) 3 Table 6.8 Preliminary yield trial 2 Palmira 66 (10) 3 Table 6.9Preliminary yield trial 3 Palmira 66 (10) 3 Table 6.10Advanced yield trial (AYT-I-1) Palmira 44 (25) 3 Table 6.11Advanced yield trial (AYT-I-2) Palmira 24 (25) 3 Table 6.12
Chapter 6-1 2007 Annual Report

The F1 nursery planted in June 2006 was harvested in April 2007. Enough vegetative cuttings from 1184, 10-months old plants, from that nursery could be obtained and planted in the CET for the mid-altitude valleys (Valle del Cauca Department) on May, 2007. The trial will be harvested in April 2008. Clonal Evaluation Trials are very large experiments around one hectare in size. A major constraint in their evaluation is the experimental error associated with the unavoidable variation in environmental conditions in such a large experimental plot. Because this is the first evaluation and selection stage (See Chapter 3) only 7-8 stakes are available from each genotype. Replication of each clone, therefore, is difficult to implement. On the other hand clones are grouped in either full- or half-sib families. Since many clones are generally available from each family they are randomly allocated in one of three blocks in which the field is divided. In other words instead of planting all the clones from a given family together one after the other, they are split in three groups, which are planted in the three blocks the entire evaluation is divided into (Figure 4.1). During this cycle two different types of CET were conducted. CET-1 followed the traditional design of one replication, in which each genotype was planted in a single-row plot with eight plants. This trial was made up of 533 genotypes. Because of the concerns of lack of replication and the size of these trials it is relevant to have an idea of the convenience of introducing replicated evaluation even at this early stage of the evaluation process. Therefore, CET-2 was planted using a different design in which the eight plants traditionally planted in a single row were split in two replications with four plants each. A total of 452 clones were evaluated in CET-2.Tables 6.2 through 6.5 describe the most relevant results of CET-1 and CET-2, respectively. The highest fresh root yield was observed in the third block in CET-1 with 68.9 t/ha, and the lower yield in a clone from block 2 with as little as 0.6 t/ha (Table 6.2). Average fresh root yield was 18.1 t/ha. Average dry matter content was 34.2%, with a range of variation going from 41.6% in a clone from block 1 down to 21.6% in an entry located in block 2. These values for dry matter content are considered adequate ranging from intermediate to high. Average fresh root yield was significantly lower in block 1 (14.4 t/ha) than in blocks 2 and 3 (21.0 and 21.9 t/ha, respectively). Since selection is made within each block this kind of environmental variation does not influence selection. This is precisely the advantage of stratified selection as indicated in Chapter 4. For each block a group of 30 clones was selected. Parameters of all the clones evaluated in each of the three blocks, as well as for those 30 clones selected are provided in Table 6.2. Dry matter yield was very high illustrating the high yield potential of cassava for this kind of environment. Average dry matter yield of the selected fractions were 9.8; 12.4; 14.0 for blocks 1, 2 and 3, respectively. Overall the selected population presented fresh root yields around 27.7 t/ha, average dry matter content of 35.8% and dry matter yield of about 9.8 t/ha. The performance of the best six clones out of the 30 selected from each block in CET-1 is presented in Table 6.3. In general the most important traits showed excellent levels in genotypes presented in that table. Fresh root yield, dry matter content and their combination (dry matter yield) are very high as to be expected for non-replicated data such as this one. Clones SM 3232-2, SM 3224-10, SM 3232-20, SM 3226-23, SM 3226-25, SM 3233-13, SM 3232-31, y SM 3235-61 showed an outstanding performance with dry matter yield above
Project IP3: improving cassava for the developing world Output 6-2

18.0 t/ha in some cases. Selected clones from each block were combined together in a PYT which will be harvested in April 2008. Table 6.2. Results from the Clonal Evaluation Trial (CET-1) divided into three blocks and conducted in CIAT Experimental Station (Valle del Cauca Department). In this trial each genotype was planted in a single row with eight plants (no replications).
Parameters Plant type (1-5)
Fresh root yield (t/ha)
Foliage yield (t/ha)
Harvest Index (0-1)
Dry matter content (%)
Dry root yield (t/ha)
Selection Index
Statistics of the 30 selected clones from Block-1 Maximum 5 52.3 26.6 0.76 39.2 18.7 43.23 Minimum 2 13.3 5.5 0.55 29.6 5.0 17.11 Average 3 27.7 15.3 0.65 35.8 9.8 23.46 St. Deviation 1 8.8 5.7 0.06 2.4 2.8 6.05 Performance of the 182 clones evaluated in Block -1 Maximum 5 52.3 26.6 0.86 41.6 18.7 43.2 Minimum 2 0.6 0.3 0.17 25.3 0.2 -50.9 Average 4 14.4 8.9 0.62 34.6 5.0 0.0 St. Deviation 1 9.3 6.0 0.12 2.9 3.2 16.7 Statistics of the 30 selected clones from Block-2 Maximum 5 58.6 52.5 0.79 40.3 20.6 43.34 Minimum 2 20.6 8.8 0.46 31.9 7.6 16.92 Average 3 34.4 19.7 0.65 36.3 12.4 24.96 St. Deviation 1 8.9 8.9 0.07 2.3 3.0 7.00 Performance of the 177 clones evaluated in Block -2 Maximum 5 58.6 52.5 0.79 40.7 20.6 43.34 Minimum 0 0.6 1.3 0.15 21.6 0.2 -54.19 Average 4 21.0 14.9 0.59 34.0 7.2 0.00 St. Deviation 1 11.3 9.6 0.11 2.9 3.9 18.10 Statistics of the 30 selected clones from Block-3 Maximum 5 68.9 48.4 0.81 39.4 22.9 38.65 Minimum 2 20.6 5.3 0.41 32.3 7.6 5.96 Average 3 39.4 26.3 0.60 35.9 14.0 24.01 St. Deviation 1 11.6 9.5 0.08 1.8 3.7 7.08 Performance of the 174 clones evaluated in Block -3 Maximum 5 68.9 82.0 0.90 39.4 22.9 38.65 Minimum 2 0.8 1.1 0.08 24.5 0.3 -57.67 Average 4 21.9 20.5 0.51 34.0 7.5 0.00 St. Deviation 1 14.1 14.0 0.16 3.0 4.9 18.51
The results from the second Clonal Evaluation Trial (CET-2), based on two replications of 4-plant plots are presented in Tables 6.4 and 6.5. The range of variation for fresh root yield in CET-2 was not as wide as for CET-1 with a maximum yield of 57.0 t/ha and a minimum of 0.8 t/ha and an average fresh root yield of 20.0 t/ha (Table 6.4). Perhaps this is a result of the replication of genotypes that would have the expected result of narrowing the range of
Chapter 6-3 2007 Annual Report
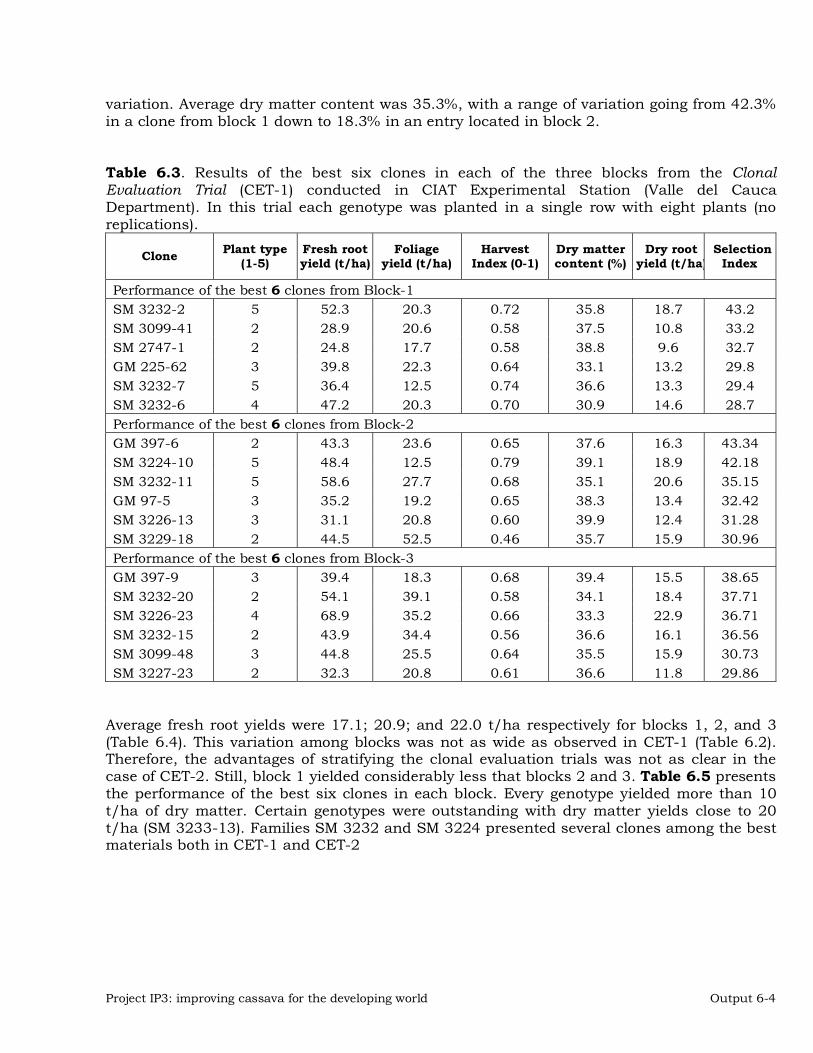
variation. Average dry matter content was 35.3%, with a range of variation going from 42.3% in a clone from block 1 down to 18.3% in an entry located in block 2. Table 6.3. Results of the best six clones in each of the three blocks from the Clonal Evaluation Trial (CET-1) conducted in CIAT Experimental Station (Valle del Cauca Department). In this trial each genotype was planted in a single row with eight plants (no replications).
Clone Plant type (1-5)
Fresh root yield (t/ha)
Foliage yield (t/ha)
Harvest Index (0-1)
Dry matter content (%)
Dry root yield (t/ha)
Selection Index
Performance of the best 6 clones from Block-1 SM 3232-2 5 52.3 20.3 0.72 35.8 18.7 43.2 SM 3099-41 2 28.9 20.6 0.58 37.5 10.8 33.2 SM 2747-1 2 24.8 17.7 0.58 38.8 9.6 32.7 GM 225-62 3 39.8 22.3 0.64 33.1 13.2 29.8 SM 3232-7 5 36.4 12.5 0.74 36.6 13.3 29.4 SM 3232-6 4 47.2 20.3 0.70 30.9 14.6 28.7 Performance of the best 6 clones from Block-2 GM 397-6 2 43.3 23.6 0.65 37.6 16.3 43.34 SM 3224-10 5 48.4 12.5 0.79 39.1 18.9 42.18 SM 3232-11 5 58.6 27.7 0.68 35.1 20.6 35.15 GM 97-5 3 35.2 19.2 0.65 38.3 13.4 32.42 SM 3226-13 3 31.1 20.8 0.60 39.9 12.4 31.28 SM 3229-18 2 44.5 52.5 0.46 35.7 15.9 30.96 Performance of the best 6 clones from Block-3 GM 397-9 3 39.4 18.3 0.68 39.4 15.5 38.65 SM 3232-20 2 54.1 39.1 0.58 34.1 18.4 37.71 SM 3226-23 4 68.9 35.2 0.66 33.3 22.9 36.71 SM 3232-15 2 43.9 34.4 0.56 36.6 16.1 36.56 SM 3099-48 3 44.8 25.5 0.64 35.5 15.9 30.73 SM 3227-23 2 32.3 20.8 0.61 36.6 11.8 29.86
Average fresh root yields were 17.1; 20.9; and 22.0 t/ha respectively for blocks 1, 2, and 3 (Table 6.4). This variation among blocks was not as wide as observed in CET-1 (Table 6.2). Therefore, the advantages of stratifying the clonal evaluation trials was not as clear in the case of CET-2. Still, block 1 yielded considerably less that blocks 2 and 3. Table 6.5 presents the performance of the best six clones in each block. Every genotype yielded more than 10 t/ha of dry matter. Certain genotypes were outstanding with dry matter yields close to 20 t/ha (SM 3233-13). Families SM 3232 and SM 3224 presented several clones among the best materials both in CET-1 and CET-2
Project IP3: improving cassava for the developing world Output 6-4

Table 6.4. Results from the Clonal Evaluation Trial (CET-2) divided into three blocks and conducted in CIAT Experimental Station (Valle del Cauca Department). In this trial each genotype was planted in a two replications of four-plant plots.
Parameters Plant type (1-5)
Fresh root yield (t/ha)
Foliage yield (t/ha)
Harvest Index (0-1)
Dry matter content (%)
Dry root yield (t/ha)
Selection Index
Statistics of the 30 selected clones from Block-1 Maximum 5 54.0 35.4 0.81 42.3 18.5 47.04 Minimum 2 16.7 4.2 0.60 34.2 6.8 13.31 Average 4 28.2 13.1 0.69 37.9 10.6 23.78 St. Deviation 1 7.9 6.5 0.06 2.1 2.7 9.36 Performance of the 151 clones evaluated in Block -1 Maximum 5 54.0 35.4 0.81 42.3 18.5 47.04 Minimum 2 0.8 0.8 0.31 27.6 0.3 -48.27 Average 4 17.1 9.3 0.65 36.4 6.3 0.00 St. Deviation 1 8.5 5.5 0.09 2.7 3.2 17.90 Statistics of the 30 selected clones from Block-2 Maximum 3 57.0 41.7 0.79 41.5 19.9 38.54 Minimum 2 13.8 4.7 0.47 34.4 5.5 15.75 Average 3 33.8 18.5 0.66 37.4 12.5 25.30 St. Deviation 0 10.4 8.7 0.07 2.0 3.5 6.64 Performance of the 153 clones evaluated in Block -2 Maximum 3 57.0 41.7 0.83 41.5 19.9 38.54 Minimum 1 1.6 1.3 0.22 29.1 0.5 -53.75 Average 3 20.9 13.1 0.61 35.0 7.4 0.00 St. Deviation 0 11.6 7.8 0.11 2.6 4.2 18.24 Statistics of the 30 selected clones from Block-3 Maximum 3 56.9 53.5 0.77 39.6 20.2 41.76 Minimum 3 23.4 7.8 0.43 33.5 8.5 14.50 Average 3 36.7 24.3 0.62 36.6 13.4 22.03 St. Deviation 0 7.9 11.2 0.08 1.7 2.8 7.06 Performance of the 148 clones evaluated in Block -3 Maximum 3 56.9 65.1 0.86 39.9 20.2 41.76 Minimum 1 0.8 0.4 0.17 18.3 0.3 -44.18 Average 3 22.0 17.7 0.56 34.6 7.7 0.00 St. Deviation 1 12.9 12.4 0.14 3.0 4.6 17.19
Chapter 6-5 2007 Annual Report

Table 6.5. Results of the best six clones in each of the three blocks from the Clonal Evaluation Trial (CET-2) conducted in CIAT Experimental Station (Valle del Cauca Department). In this trial each genotype was planted in a two replications of four-plant plots.
Clone Plant type (1-5)
Fresh root yield (t/ha)
Foliage yield (t/ha)
Harvest Index (0-1)
Dry matter content (%)
Dry root yield (t/ha)
Selection Index
Performance of the best 6 clones from Block-1 SM 3225-10 3 35.7 7.8 0.81 38.4 13.8 47.0 SM 3232-21 3 44.5 24.9 0.63 37.2 16.5 41.6 GM 936-31 2 28.3 16.8 0.63 39.4 11.1 38.4 SM 3232-25 3 36.8 19.3 0.65 37.0 13.7 36.0 SM 3226-25 4 54.0 35.4 0.60 34.2 18.5 35.5 SM 3221-26 3 26.8 7.8 0.77 39.1 10.5 33.8 Performance of the best 6 clones from Block-2 SM 3233-13 3 57.0 25.7 0.68 34.4 19.9 38.5 SM 3225-13 3 41.5 31.3 0.57 40.1 16.7 37.8 SM 3232-31 3 49.1 41.7 0.55 37.2 18.3 34.5 SM 3224-45 3 27.9 16.5 0.63 41.5 11.5 33.4 GM 264-170 3 49.5 22.3 0.69 34.5 17.0 32.7 SM 3224-43 3 43.6 30.6 0.60 35.0 15.4 32.0 Performance of the best 6 clones from Block-3 SM 3099-57 3 36.5 19.4 0.66 38.7 14.2 41.8 SM 3231-63 3 37.4 25.4 0.59 39.2 14.5 41.4 SM 3231-65 3 51.3 33.9 0.60 36.1 18.5 33.4 SM 3221-46 3 34.8 32.3 0.52 37.5 13.0 29.3 SM 3225-16 3 33.9 24.5 0.59 39.4 13.3 27.9 SM 3221-40 3 40.9 16.7 0.72 35.0 14.3 26.4
Table 6.6. Family size, number of selected clones in each family for the progenies evaluated in CET-1. Data combines results from the three blocks in which the trial was divided. Family Size Selected Sel./size Family Size Selected Sel./size CM 8996 1 0 0.00 SM 3046 5 0 0.00 CM 9247 6 0 0.00 SM 3049 1 0 0.00 CM 9872 13 1 0.08 SM 3087 11 4 0.36 CM 9884 6 1 0.17 SM 3091 21 5 0.24 CM 9887 6 0 0.00 SM 3093 14 2 0.14 CM 9888 1 0 0.00 SM 3099 8 3 0.38 CM 9984 5 0 0.00 SM 3129 2 0 0.00 GM 56 4 1 0.25 SM 3217 10 4 0.40 GM 193 2 0 0.00 SM 3218 6 2 0.33 GM 225 2 1 0.50 SM 3219 10 0 0.00 GM 234 8 0 0.00 SM 3220 23 5 0.22 GM 264 10 1 0.10 SM 3221 23 3 0.13 GM 278 8 1 0.13 SM 3223 5 1 0.20 GM 307 6 0 0.00 SM 3224 28 7 0.25 GM 397 9 4 0.44 SM 3225 8 3 0.38 GM 509 1 0 0.00 SM 3226 24 3 0.13 GM 936 26 3 0.12 SM 3227 29 4 0.14 GM 968 5 2 0.40 SM 3228 22 2 0.09 GM 970 7 1 0.14 SM 3229 38 6 0.16 GM 975 7 3 0.43 SM 3230 14 1 0.07 GM 981 4 1 0.25 SM 3231 35 0 0.00 GM 982 19 4 0.21 SM 3232 20 9 0.45 GM 986 6 0 0.00 SM 3233 7 1 0.14 SM 2747 6 1 0.17 SM 3045 1 0 0.00 Total/Mean 533 90 0.16
Project IP3: improving cassava for the developing world Output 6-6

Table 6.7. Relative performance of progenitors involved in generating the progenies evaluated in CET-1. The performance of the progenitors is assesses through the average performance of all the progenies each progenitor produced.
Progenitor # fam.
Selec. (%)
Pl.Type (1-5)
FRY (t/ha)
H.I. (0-1)
DMC (%)
DMY (t/ha)
Sel. Ind.
SM 643-17 1 0.0 16.4 12.8 0.56 36.3 6.0 19.89 CM 8370-11 1 33.3 20.3 11.8 0.62 34.0 6.7 17.11 SM 1741-1 1 44.4 28.6 14.4 0.67 35.9 10.4 16.70 MCOL 2246 1 0.0 12.7 7.8 0.62 34.3 4.3 15.14 CM 8887-60 1 25.0 21.2 15.3 0.58 35.9 7.7 12.00 MECU 72 4 32.1 28.0 20.4 0.57 34.9 9.7 11.73 CM 4574-7 2 45.5 27.8 14.4 0.66 35.6 10.0 10.28 SM 1855-15 1 37.5 22.4 13.0 0.65 34.4 7.6 8.78 SM 1660-4 2 33.3 26.1 15.0 0.66 34.6 9.1 8.13 CM 5336-3 1 16.7 15.5 15.3 0.42 33.3 5.3 4.33 SM 1779-7 4 24.6 20.8 14.8 0.59 34.8 7.3 3.31 MCOL 1505 2 12.5 25.0 16.2 0.60 33.1 8.3 1.39 MCUB 74 1 0.0 4.7 2.3 0.67 29.9 1.4 1.05 CM 975-1 1 0.0 19.7 14.7 0.60 34.4 6.6 0.25 MNGA 2 1 0.0 19.7 14.7 0.60 34.4 6.6 0.25 MPER 183 5 13.8 22.6 17.9 0.56 32.9 7.4 0.13 SM 1460-1 3 17.1 19.1 14.0 0.59 32.3 6.4 -0.24 SM 2085-7 1 15.8 19.9 21.8 0.49 34.0 6.9 -0.31 CM 7951-5 2 19.4 18.7 10.6 0.64 35.8 6.6 -0.67 MCOL 1468 2 11.1 14.4 9.4 0.63 33.6 5.0 -0.89 SM 1219-9 5 19.3 18.4 11.0 0.64 34.6 6.4 -1.21 SM 1557-17 2 13.3 18.8 12.4 0.59 33.2 6.3 -1.38 SM 2058-2 1 9.1 19.0 21.8 0.49 33.1 6.3 -2.44 SM 1871-33 3 17.0 17.3 14.0 0.54 35.2 6.1 -2.69 HMC 1 3 5.3 15.0 7.2 0.67 32.1 4.8 -3.58 SM 1565-15 1 12.5 22.0 17.8 0.55 33.5 7.4 -3.83 CM 6740-7 2 21.1 19.1 13.6 0.60 33.7 6.5 -4.19 CM 8370-10 4 14.6 15.8 10.9 0.59 35.8 5.6 -4.67 MTAI 8 2 21.4 17.8 12.6 0.59 34.5 6.3 -4.86 MECU 64 1 0.0 21.1 12.7 0.62 31.8 6.8 -6.09 SM 2052-4 2 11.4 15.9 12.2 0.55 33.1 5.2 -6.65 SM 909-25 1 0.0 11.4 5.8 0.68 33.7 3.9 -7.75 SM 2211-3 1 7.1 15.1 11.6 0.61 35.2 5.3 -8.80 SM 2179-13 1 7.7 13.4 9.5 0.58 33.1 4.4 -9.15 MCOL 2737 1 0.0 14.5 16.7 0.46 34.8 5.1 -10.43 CM 6070-1 1 0.0 16.9 13.0 0.58 35.8 6.2 -10.66 SM 2072-24 2 5.6 13.3 10.7 0.57 33.6 4.4 -13.86 SM 2102-23 1 0.0 12.9 13.8 0.56 35.1 4.4 -26.12 In Table 6.6 the size (number of clones) and the number of selected clones from each progenitor has been consolidated. This data has been obtained by combining information of
Chapter 6-7 2007 Annual Report

the three blocks in which the CET was divided into. The use of selection index has been already described in Chapter 3. Some families were very deficient and none of their representatives were selected. This is, for instance, the case of family SM 3231 with 35 clones, none of which was selected. Family SM 3219 had ten clones and no one was selected either. On the other hand, there were several families that had a higher proportion of its members selected. This is clearly the case of family SM 3232, which had 20 clones and nine of them were selected (45% success). Similarly, four of the ten clones from family SM 3217 were selected (40% success). Table 6.7 groups all the progenies derived from a given progenitor. In some cases the same clone has been used as progenitor in more than one cross. For example MPER 183 SM and 1219-9 were used as progenitor of five different families. SM 1779-7, MECU 72 and CM 8370-10 were used in four different families. SM 1741-1 was the progenitor of family SM 3232 (Table 6.6). Progenitor CM4574-7 was used in two families and a remarkable 45.5% of its progenies were selected. A 32.1% of the progenies from MECU 72 (four families) were selected. On the other hand, there were several progenitors where none of their progenies were selected. Results from the CET are also very useful to illustrate the huge potential of cassava as reliable and competitive source of starch for the tropics. On average about 6-8 t/ha of dry matter could be harvested. Moreover, the selected clones yielded an average between 12 and 16 t/ha of dry matter and the highest single-clone fresh root yield was observed in the third block (68.9t/ha) in CET-1. It is not expected that in larger evaluation this level of productivity will be maintained, however. Dry matter content, a key trait for the industry, was also outstanding with averages in the selected fractions above 35%. Results from the Clonal Evaluation Trials, as good and promising as they are, should be taken with caution. These materials have been grown in the field for only two years (one season in the F1 nurseries and the second season in the CET). Cassava vegetative propagation inevitably involves the gradual “contamination” by mild-pathogenic and other organisms that may reduce yield potential through successive vegetative multiplications. In addition, the optimum physiological and nutritional status of the F1 plant cannot be reproduced thereafter in the subsequent evaluations. As explained in Chapter 3 (Figure 3.1) the step in the selection process after the CET is the Preliminary Yield Trial or PYT. Clones evaluated in these trials are those selected during the CET conducted the previous year. The seven or eight plants from the CET produce more than 30 stakes. Therefore, they are planted with three replications of 10-plant plots. Each experimental plot consists of two rows with five plants each. Since selections at the CET stage are conducted in three different blocks selections within each block generate a respective PYT. The clones allocated to each block at the CET (and selected) are therefore, competing among themselves also at the PYT stage. The reasons for this are: a) This approach maximized the genetic variability within each by maximizing the number of families present in it; b) The performance of the cassava plant depends heavily on the quality of the stake from which it grew, and the quality of the stakes, in turn, depends on the environmental conditions in which the mother plant grew. By keeping together in the same trial the clones that grew together at the CET a better uniformity of the quality of the stakes is achieved and, therefore, the experimental error at the PYT is somewhat reduced.
Project IP3: improving cassava for the developing world Output 6-8

Table 6.8. Results from the Preliminary Yield Trial (PYT-1) evaluated in Palmira (Valle del Cauca Department). A total of 84 clones were evaluated, from which 17 were selected. Performance of the best 10 clones is presented. Each genotype was planted in three replications with 10 plant-plots.
Clone Plant type (1-5)
Fresh root yield (t/ha)
Foliage yield (t/ha)
Harvest Index (0-1)
Dry matter content (%)
Dry root yield (t/ha)
Selection Index
Performance of the best 10 clones CM 9953–252 3 30.4 13.2 0.70 39.6 12.0 37.76 SM 3094-20 2 34.9 20.5 0.63 36.7 12.7 36.95 SM 3126-20 4 33.1 13.2 0.72 39.0 12.9 35.25 GM 425-2 2 26.1 14.3 0.65 39.3 10.2 30.41 SM 3126-23 4 26.3 9.0 0.74 40.7 10.7 27.94 SM 3096-41 2 21.3 11.8 0.65 40.9 8.7 26.11 SM 2727-111 2 29.7 17.4 0.64 36.5 10.8 26.10 GM 473-22 2 23.0 11.0 0.68 39.2 9.0 25.29 CM 9953–254 3 27.3 12.8 0.68 38.1 10.4 24.50 SM 2911-3 3 27.3 15.8 0.63 37.8 10.3 22.37 Performance of the four commercial checks HMC 1 4 27.0 12.8 0.68 35.2 9.6 5.48 M PER 183 4 35.4 19.9 0.64 31.4 11.3 3.66 M COL 1505 3 16.1 8.2 0.66 35.8 5.9 -4.52 CM 2772-3 3 20.8 10.5 0.66 30.7 6.4 -9.96 Performance of the 17 clones from selected Maximum 4 34.9 20.5 0.7 42.0 12.9 37.76 Minimum 2 17.8 7.4 0.5 35.8 7.3 14.10 Average 3 26.0 13.0 0.7 38.6 10.0 24.07 St. Deviation 1 4.6 3.4 0.1 1.9 1.6 7.77 Performance of the 84 clones evaluated Maximum 5 35.4 24.6 0.81 42.0 12.9 37.76 Minimum 2 6.4 3.5 0.48 30.7 2.3 -32.68 Average 3 19.2 10.3 0.65 36.2 7.0 0.00 St. Deviation 1 6.2 4.4 0.07 2.4 2.3 15.98
Clones that were selected during the CET for the Mid Altitude Valleys in May 2006 were planted in PYTs in June 2006 and harvested in May 2007. Tables 6.8 to 6.10 provide the most relevant information for PYTs 1, 2 and 3, respectively. Comparison of the mean performance of each trial across Tables 6.8 through 6.10 reveals the kinds of environmental variation that can be found, which is effectively controlled by growing three separate trials. Average fresh root yields were 19.2, 18.9, and 22.1t/ha respectively for PYT 1, 2 and 3. Results from the first PYT are summarized in Table 6.8. A total of 84 experimental clones had been evaluated, including four commercial checks had been planted for comparison purposes. Three replications were used and plot size was the standard for this kind of trial based on ten plants (two rows with five plants each). The best commercial check was HMC-1. Most of selected clones were superior to the best commercial check and several of them
Chapter 6-9 2007 Annual Report

produced more than 10 t/ha of dry matter. Average dry matter yield of the selected clones was, in fact, 10 t/ha. Average dry matter content of the selected fraction was 38.6%, which is an excellent value. Seventeen of the experimental clones included in PYT1 were selected for evaluation in AYT-I. Table 6.9. Results from the Preliminary Yield Trial (PYT-2) evaluated in Palmira (Valle del Cauca Department). A total of 84 clones were evaluated, from which 17 were selected. Performance of the best 10 clones is presented. Each genotype was planted in three replications with 10 plant-plots.
Clone Plant type (1-5)
Fresh root yield (t/ha)
Foliage yield (t/ha)
Harvest Index (0-1)
Dry matter content (%)
Dry root yield (t/ha)
Selection Index
Performance of the best 10 clones GM 510-15 3 37.0 21.2 0.64 39.6 14.6 42.67 GM 425-19 1 29.7 24.8 0.54 39.0 11.6 37.38 GM 297-136 3 30.0 12.8 0.70 37.9 11.4 31.05 SM 2733–158 1 24.6 18.0 0.58 38.4 9.5 28.87 SM 3096-53 3 25.5 12.5 0.68 38.6 9.8 25.37 SM 3042-15 3 22.8 9.1 0.71 39.1 8.9 23.21 GM 568-18 2 23.8 18.4 0.57 37.9 9.0 21.67 SM 3097-48 3 29.1 25.6 0.54 37.7 11.0 21.09 CM 8885-36 3 29.4 24.8 0.55 37.4 11.0 20.92 SM 3039-19 1 28.4 12.4 0.70 33.0 9.6 20.59 Performance of the four commercial checks CM 7951-5 4 19.7 8.7 0.69 36.8 7.2 6.38 HMC 1 5 26.5 17.7 0.60 35.5 9.4 0.67 M COL 1505 4 13.1 8.5 0.60 37.0 4.9 -8.42 M PER 183 5 20.2 19.3 0.50 32.6 6.6 -28.67 Performance of the 17 clones from selected Maximum 4 37.0 25.6 0.7 39.6 14.6 42.67 Minimum 1 18.7 6.4 0.5 33.0 7.0 13.31 Average 3 26.9 15.9 0.6 37.4 10.1 22.64 St. Deviation 1 4.1 5.6 0.1 1.7 1.6 8.22 Performance of the 84 clones evaluated Maximum 5 37.0 25.6 0.75 41.4 14.6 42.67 Minimum 1 5.3 3.6 0.39 30.8 1.7 -53.19 Average 3 18.9 12.5 0.61 36.4 6.9 0.00 St. Deviation 1 6.6 5.8 0.09 2.0 2.4 16.68
Table 6.9 presents the result of PYT-2. As in the previous experiment a total of 84 clones were evaluated and 17 of them were selected. This table presents the performance of ten of the selected clones. There was a clear superiority of experimental clones over the four commercial checks, of which the best one was CM 7951-5. Average selection index of the selected fraction was 22.64 whereas the selection index of the best commercial check was only 6.38. Dry matter yield of the selected fraction was higher than 10 t/ha.
Project IP3: improving cassava for the developing world Output 6-10

Table 6.10. Results from the Preliminary Yield Trial (PYT-3) evaluated in Palmira (Valle del Cauca Department). A total of 84 clones were evaluated, from which 17 were selected. Performance of the best 10 clones is presented. Each genotype was planted in three replications with 10 plant-plots.
Clone Plant type (1-5)
Fresh root yield (t/ha)
Foliage yield (t/ha)
Harvest Index (0-1)
Dry matter content (%)
Dry root yield (t/ha)
Selection Index
Performance of the best 10 clones GM 568-30 3 24.3 11.9 0.67 44.6 10.9 33.54 CM 9953–303 2 35.5 16.6 0.68 38.3 13.6 32.65 SM 3097-72 3 41.6 27.7 0.60 38.0 15.9 29.77 GM 568-28 2 33.6 26.2 0.57 38.9 13.1 27.41 SM 3094-63 4 46.1 27.8 0.63 35.9 16.5 26.02 GM 570-54 2 33.3 18.5 0.64 37.6 12.6 25.51 SM 3094-62 2 28.8 22.6 0.56 38.8 11.1 22.69 GM 309-128 2 31.8 19.4 0.63 37.5 11.8 22.47 GM 306-144 4 39.9 20.3 0.67 36.7 14.7 21.61 SM 3096-83 3 31.4 14.4 0.68 36.6 11.5 20.52 Performance of the four commercial checks M COL 1505 4 9.4 8.9 0.51 35.8 3.4 -27.14 M PER 183 4 24.1 25.4 0.49 33.0 7.9 -21.93 CM 7951-5 4 8.9 5.8 0.62 37.3 3.3 -18.60 HMC 1 4 27.1 18.4 0.60 39.2 10.7 7.24 Performance of the 17 clones from selected Maximum 4 46.1 27.8 0.68 44.6 16.5 33.54 Minimum 2 23.4 11.9 0.56 35.9 8.9 15.95 Average 3 31.3 19.4 0.62 38.8 12.1 22.65 St. Deviation 1 6.6 5.0 0.04 2.3 2.1 5.65 Performance of the 84 clones evaluated Maximum 5 46.1 37.7 0.78 44.6 16.5 33.54 Minimum 2 6.8 2.9 0.32 29.8 2.4 -45.17 Average 3 22.1 15.9 0.59 37.0 8.2 0.00 St. Deviation 1 8.4 7.3 0.08 2.6 3.2 17.59
Table 6.10 presents the result of PYT-3. Again this trial involved 84 clones and four commercial checks. Seventeen experimental clones were selected and included in Advanced Yield Trials to be harvested in April 2008. Table 6.10 presents the performance of the best ten of the selected clones. There was a clear superiority of experimental clones over the four commercial checks, of which the best one was again HMC-1. Average selection index of the selected fraction was 22.65 whereas the selection index of the best commercial check was only 7.24. The other three commercial checks had negative selection indexes. Dry matter yield of the selected fraction was the highest of the three PYT trials 12.1 t/ha. The advanced yield trial (ATY-I-1) described in Table 6.11 combines the best 20 clones identified in PYT1, PYT2 and PYT3 harvested in May 2006. There were, therefore, sixty experimental clones and four commercial checks for a total of 64 clones evaluated. A group of
Chapter 6-11 2007 Annual Report
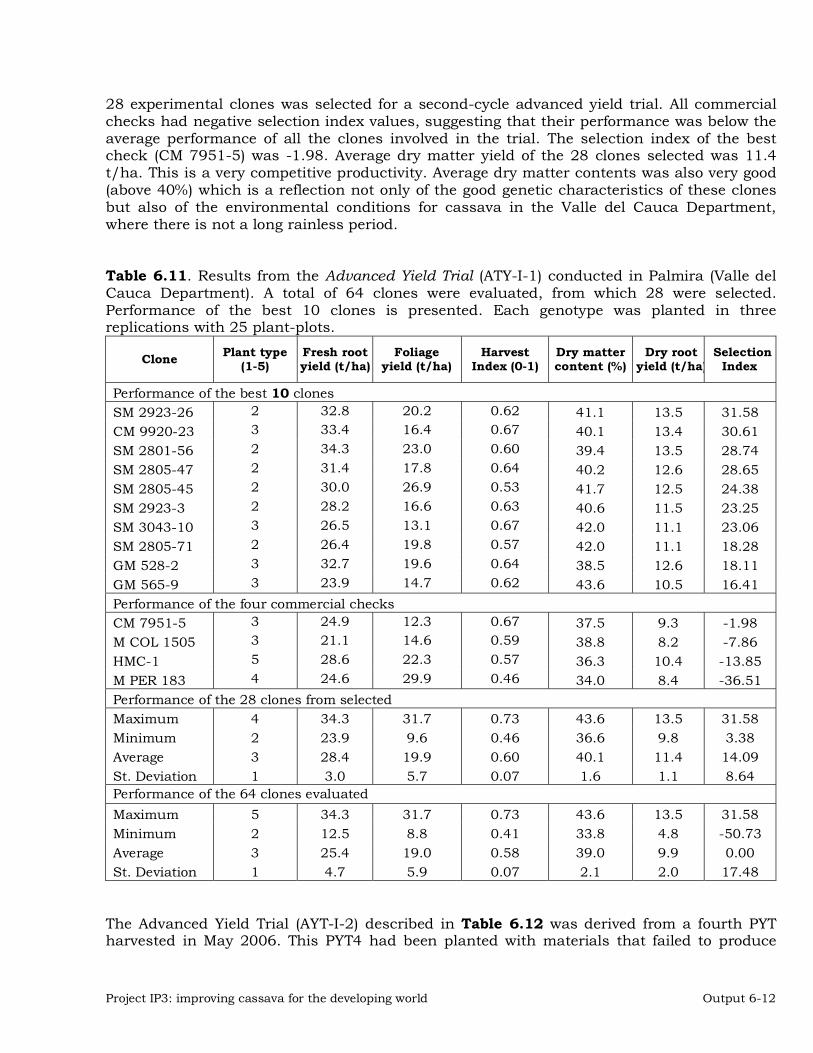
28 experimental clones was selected for a second-cycle advanced yield trial. All commercial checks had negative selection index values, suggesting that their performance was below the average performance of all the clones involved in the trial. The selection index of the best check (CM 7951-5) was -1.98. Average dry matter yield of the 28 clones selected was 11.4 t/ha. This is a very competitive productivity. Average dry matter contents was also very good (above 40%) which is a reflection not only of the good genetic characteristics of these clones but also of the environmental conditions for cassava in the Valle del Cauca Department, where there is not a long rainless period. Table 6.11. Results from the Advanced Yield Trial (ATY-I-1) conducted in Palmira (Valle del Cauca Department). A total of 64 clones were evaluated, from which 28 were selected. Performance of the best 10 clones is presented. Each genotype was planted in three replications with 25 plant-plots.
Clone Plant type (1-5)
Fresh root yield (t/ha)
Foliage yield (t/ha)
Harvest Index (0-1)
Dry matter content (%)
Dry root yield (t/ha)
Selection Index
Performance of the best 10 clones SM 2923-26 2 32.8 20.2 0.62 41.1 13.5 31.58 CM 9920-23 3 33.4 16.4 0.67 40.1 13.4 30.61 SM 2801-56 2 34.3 23.0 0.60 39.4 13.5 28.74 SM 2805-47 2 31.4 17.8 0.64 40.2 12.6 28.65 SM 2805-45 2 30.0 26.9 0.53 41.7 12.5 24.38 SM 2923-3 2 28.2 16.6 0.63 40.6 11.5 23.25 SM 3043-10 3 26.5 13.1 0.67 42.0 11.1 23.06 SM 2805-71 2 26.4 19.8 0.57 42.0 11.1 18.28 GM 528-2 3 32.7 19.6 0.64 38.5 12.6 18.11 GM 565-9 3 23.9 14.7 0.62 43.6 10.5 16.41 Performance of the four commercial checks CM 7951-5 3 24.9 12.3 0.67 37.5 9.3 -1.98 M COL 1505 3 21.1 14.6 0.59 38.8 8.2 -7.86 HMC-1 5 28.6 22.3 0.57 36.3 10.4 -13.85 M PER 183 4 24.6 29.9 0.46 34.0 8.4 -36.51 Performance of the 28 clones from selected Maximum 4 34.3 31.7 0.73 43.6 13.5 31.58 Minimum 2 23.9 9.6 0.46 36.6 9.8 3.38 Average 3 28.4 19.9 0.60 40.1 11.4 14.09 St. Deviation 1 3.0 5.7 0.07 1.6 1.1 8.64 Performance of the 64 clones evaluated Maximum 5 34.3 31.7 0.73 43.6 13.5 31.58 Minimum 2 12.5 8.8 0.41 33.8 4.8 -50.73 Average 3 25.4 19.0 0.58 39.0 9.9 0.00 St. Deviation 1 4.7 5.9 0.07 2.1 2.0 17.48
The Advanced Yield Trial (AYT-I-2) described in Table 6.12 was derived from a fourth PYT harvested in May 2006. This PYT4 had been planted with materials that failed to produce
Project IP3: improving cassava for the developing world Output 6-12

enough vegetative cuttings at the F1 stage. They were multiplied and put together in a clonal evaluation trial a year later than their sister genotypes. A total of 19 clones were selected in PYT4 in May 2006 and this trial was immediately planted with the addition of five commercial checks for a total of 24 genotypes. Table 6.12. Results from the Advanced Yield Trial (ATY-I-2) conducted in Palmira (Valle del Cauca Department). A total of 24 clones were evaluated, from which 10 were selected. Performance of selected clones is presented. Each genotype was planted in three replications with 25 plant-plots.
Clone Plant Type (1-5)
Fresh root yield (t/ha)
Foliage Yield (t/ha)
Harvest Index (0-1)
Dry matter content (%)
Dry root yield (t/ha)
Selection Index
Performance of the best 10 clones CM 9911-7 2 25.8 18.2 0.59 44.2 11.4 28.09 CM 9902-35 3 39.4 31.9 0.57 38.0 15.0 21.62 CM 9907-110 3 38.0 18.5 0.67 36.5 13.9 20.59 CM 9901-193 3 32.6 11.9 0.73 37.2 12.1 19.53 GM 373-33 1 32.6 25.4 0.56 37.4 12.2 19.23 SM 3055-9 3 33.0 23.3 0.59 37.0 12.2 11.87 CM 9911-13 2 19.4 15.0 0.56 43.4 8.4 10.84 SM 3055-11 3 28.6 20.1 0.58 38.1 10.9 7.42 CM 9912-117 3 25.2 17.1 0.60 39.7 10.0 6.82 SM 2830-33 2 24.2 16.5 0.60 38.3 9.3 5.26 Performance of the five commercial checks CM 7951-5 4 29.4 16.3 0.66 37.5 11.0 6.81 CM 523-7 3 19.2 20.0 0.50 41.9 8.0 -6.22 MCOL 1505 4 17.3 12.2 0.57 38.4 6.6 -16.79 HMC1 4 28.1 31.3 0.48 35.6 9.9 -20.58 MPER 183 4 26.2 32.0 0.45 33.1 8.7 -31.46 Performance of the 10 clones from selected Maximum 3 39.4 31.9 0.7 44.2 15.0 28.09 Minimum 1 19.4 11.9 0.6 36.5 8.4 5.26 Average 3 29.9 19.8 0.6 39.0 11.5 15.13 St. Deviation 1 6.3 5.8 0.1 2.7 2.0 7.68 Performance of the 24 clones evaluated Maximum 4 39.4 32.0 0.73 44.2 15.0 28.09 Minimum 1 16.2 11.3 0.45 33.1 6.2 -31.46 Average 3 25.8 19.5 0.58 38.3 9.8 0.00 St. Deviation 1 6.3 6.0 0.06 2.5 2.3 16.09
6.2 OTHER ACTIVITIES During the reported period there were many additional activities related to training and extension. Many visitors come to CIAT to learn about cassava, obtain information, planting material and other products. An important activity coordinated from Palmira was the “First
Chapter 6-13 2007 Annual Report

Technological Exhibition of Cassava and its Products” that took place in the Experimental Farm of CORPOICA in Nataima, in the neighboring Department of Tolima. The event was jointly organized by CORPOICA, CLAYUCA, CIAT, Ministerio de Agricultura y Desarrollo Rural de Colombia, Universidad del Tolima, SENA, FEDEGAN, the Government of Tolima Department, Espinal County, and the Cattle Growers Committee from the Tolima Department. Farmers, agriculture students and processors from different regions of Colombia attended to the Exhibition. Many different subjects were addressed during the Exhibition: cassava breeding and processing; uses of cassava in human nutrition and for animal feed; potential of cassava as source of biomass with particular emphasis in ethanol production. The event was considered to be a success given the number and diversity of people attending. Figure 6.1 provides an illustration of the promotion brochure of the event.
Figure 6.1. Brochure used for the promotion of the First Technological Exhibition of Cassava and its Products that took place in the Experimental Farm of CORPOICA in Nataima (Tolima Department, Colombia) Another activity that was recently initiated was the setting of a system to analyze the “fermentability” of cassava roots or flour. The system is under development and aims at the possibility of producing ethanol from either fresh roots or cassava flour. There is a huge potential and need for knowledge in this regard. CIAT has a large availability of genetic resources that one way or another affect root quality traits. These traits, in turn, affect in ways that are not yet clearly understood the amount or speed in which the starch in the roots is first degraded and then fermented. In addition to the variation in the quality of raw material there is a very dynamic evolution in the technologies for the production of
Project IP3: improving cassava for the developing world Output 6-14

bioethanol. There is a constant improvement of starch degrading enzymes and modifications in the whole process to make it more efficient. CIAT and CLAYUCA are aggressively addressing this issue because at the end the competitiveness of bio-ethanol industry will depend on two factors:
a. Cost of raw material b. Cost of turning cassava roots into ethanol
The combination of root quality traits as raw material, the increasing diversity of processing technologies and the recognition that there will be an ideal combination of specific characteristics of the raw material (cassava roots) and the processing technologies justify this initiative. Figure 6.2 illustrates the system that we have so far developed. Initially fresh roots were placed in closed plastic bottles with the starch degrading enzymes and the yeasts. Quickly there is production of CO2 which needed to be released every four hours, otherwise bottles may explode. The first trial lasted five days which was extenuating because of the need to visit the lab every four hours. This was an important requirement particularly during the first three days of the experiment. The CO2 released implied that there was a reduction in the weight of each bottle which is directly proportional to the production of ethanol. To avoid the need to visit the lab every four hours (particularly during the first few days of the experiment) we developed a closed system where the bottles are connected to a hose whose other end is inside a tray with water. The CO2 is released into the in a water but oxygen cannot get back into the system, which is an important requirement.
Figure 6.2. Illustration of the system to evaluate “fermentability” in cassava roots. A) Original closed system. B) Detail of the open system with hoses for the release of the CO2 produced inside the bottles. C) Tray with a central collecting copper tube with valve. D) Shaker where bottles are maintained under controlled temperature and collecting hose submerged in water for the release of CO2 without entrance of oxygen to the system.
Chapter 6-15 2007 Annual Report

Project IP3: improving cassava for the developing world Output 6-16
The system has already been applied to certain varieties. Figure 6.3 illustrates an example of four varieties whose roots were processed with and without starch degrading enzymes. As expected, the roots from the waxy mutation recently reported (Ceballos et al., 2007) produced the highest amount of ethanol, particularly in the absence of enzymes. This is to be expected because the absence of amylose (a difficult molecule to degrade) in the starch from that mutation makes waxy roots particularly suitable for ethanol production.
CM 523-7Rayong 60
NEPWAXY
Without enzyme
With enzyme0
50
100
150
200
250
300
350
400
Clone
Total ethanol(ml ethanol /
kg starch)
Clone-3Clone-2
Clone-1
WAXY
CM 523-7Rayong 60
NEPWAXY
Without enzyme
With enzyme0
50
100
150
200
250
300
350
400
Clone
Total ethanol(ml ethanol /
kg starch)
Clone-3Clone-2
Clone-1
WAXY
Figure 6.3. Total ethanol production from roots of four different cassava clones with and without the addition of starch degrading enzymes. The information provided in Figure 6.3 illustrates the importance of variation in root quality traits (waxy clone producing more ethanol), the importance of adding enzymes, and some indication of the potential interaction between these two factors.

CHAPTER 7
DEVELOPMENT OF GENETIC STOCKS AND IMPROVED GENE POOLS ADAPTED TO OTHER ENVIRONMENTS IN COLOMBIA
Cassava genetic improvement at CIAT has three main target environments: in the sub-humid (Chapter 4), acid-soil savannas (Chapter 5) and mid-altitude valleys (Chapter 6). Additional activities are conduced in other regions of Colombia, which are not necessarily related to the selection and evaluation processes described in previous chapters. In the present chapter a brief description of the most important activities are described. 7.1. MULTIPLICATION OF PLANTING MATERIAL As the selection process advances there is an increasing need for large number of good-quality vegetative cuttings. Therefore, parallel to the evaluation of segregating progenies there is a continuous multiplication of materials that increases in intensity as the materials reach the Regional Trial stage. In the Atlántico Department a total of 264 genotypes were planted in multiplication plots. In Farm Los Manguitos (of Mr. Alvaro Barros) 232 genotypes were planted. The remaining 32 clones were multiplied in Farm La Unión (Juan B. de la Hoz). Table 7.1 provides an idea of the amount of planting material produced and shared with farmers and producers of the region. Table 7.1. Amount of vegetative cuttings produced and shared with different collaborators in the Northern Coast of Colombia. Cycle 2006-2007.
Beneficiary/Proyect Location (Department) Farm # cuttings José Altamar. Ganadero Campeche (Atlántico) Buenos Aires 25.000 Agricultores Caracolí (Atlántico) 30.000 Siembras CIAT Santo Tomas (Atlántico) 100.000 José Marulanda Fonseca (Guajira) 50.000 Roberto Gallo Calamar (Bolívar) 25.000 Juan Ángel Hernández Pivijay (Magdalena) 50.000 Dr. Antonio López CORPOICA Cereté (Córdoba) C.I. Turipaná 10.000 Alfredo Alcieri Marchese Baranoa (Atlántico) Hda Don Blas 25.000 Fabian Gómez Pitalito (Atlántico) Finca Cachubana 80.000 Industrias el Maíz Malambo (Atlántico) 5.000 DISTRAVES – Elías Espindola B/bermeja (Santander) 100.000 Alejandro Chadid Tolú Viejo (Sucre) 70.000 Omar de la Rosa Pitalito (Atlántico) 60.000 Miguel Valverde - ASOGANORTE Sabana Grande (Atlántico) 30.000 Total 655.000
Chapter 7-1 2007 Annual Report

Similar activities were developed in Córdoba and Sucre Departments. A multiplication nursery involving 23 promising materials or commercial checks was planted in Farm El Litoral (Angel Osorio). From each clone as many as 200 plants were planted (Table 7.2).
Table 7.2. Seed multiplication of 23 experimental clones and commercial checks in Farm El Litoral (property of Mr. Angel Osorio), in Sucre Department.
Code (Popular name) No semillas Code (Popular name) No semillas
SM2775-2 200 CG 1411 (ICA Costeña) 200
SM2619-4 200 CM 3306-4 (ICA Negrita) 200
SM2620-1 200 Mcol 1505 (P12 or Verdecita) 200
CM9456-12 200 SGB 765-4 (C. Rojita) 200
SM1411-5 200 SGB 765-2 (C. Caribeña) 200
SM2771-5 200 CM 3555-6 (C. Sucreña) 200
SM2629-36 200 Rayong 60 (C. Tai) 200
SM2546-40 200 CM 4919-1 (C. Verónica ) 200
CM9560-1 200 CM 4843-1 (C. Ginés) 200
SM2769-11 200 SM 3306-19 (C. Colombiana) 200
SM2772-5 200 CM 6754-8 (Enanita ) 200
SM1127-8 (Cubana) 200
7.2. EVALUATIONS AND SELECTIONS IN CÓRDOBA AND SUCRE DEPARTMENTS Córdoba and Sucre Departments represent an important cassava-growing region in Colombia. Several of the trials grown in the Atlántico and Cesar Departments already described in Chapter 4 were also planted in Córdoba and/or Sucre Departments. Table 7.3 presents a summary of the most relevant results from an Advanced Yield Trial evaluated in Chinú, Córdoba Department. The same trial was also planted in Atlántico Department and the results presented in Table 4.11. There were a total of 72 clones evaluated in this trial, including four commercial checks. Fifteen of these clones were selected. Table 7.3 also provides the ranking of each genotype in the group of trials in the Atlántico Department, as well as that for the Córdoba trial. The two regions share common characteristics but are not identical. For instance, in Córdoba and Sucre there is some pressure from bacterial blight and super-elongation disease which is absent in the drier environment of Atlántico Department. In spite of the differences there was an interesting agreement for some clones. CM 9946-108 was ranked second in Córdoba and was the best in Atlántico. Clone CM 9924-5 was the best in Córdoba and ranked fifth in Atlántico. Clones GM 273-82, GM 248-71, SM 3106-14 and CM 9955-14 were among the best ten clones in both environments.
Project IP3: improving cassava for the developing world Chapter 7-2

Table 7.3. Results from the Advanced Yield Trial (AYT-I) evaluated in Chinú (Córdoba Department). A total of 72 clones were evaluated. Performance of the 14 clones selected is presented. The same clones were also evaluated in the Atlántico Department in Table 4.11.
Yield (t/ha) Harvest Index Dry matter Ranking Clon or
Parameter Roots Foliage (0-1) % t/ha Córdoba Atlántico
CM 9924-19 40.1 16.1 0.71 32.8 13.2 1 5 CM 9946-108 36.7 26.0 0.59 34.7 12.7 2 1 CM 9913-11 35.4 25.3 0.58 35.4 12.5 3 29 SM 3106-29 36.4 29.2 0.56 34.7 12.6 4 37 GM 273-82 39.2 19.4 0.67 32.1 12.6 5 7 CM 9955-12 40.6 22.8 0.64 31.4 12.7 6 68 GM 248-71 42.6 15.6 0.73 29.6 12.7 7 4 SM 3106-14 34.9 17.9 0.66 32.1 11.2 8 9 CM 9955-14 35.3 16.7 0.68 31.2 11.0 9 3 SM 3061-31 34.0 20.0 0.63 33.1 11.3 10 6 GM 273-59 31.6 19.7 0.62 32.0 10.1 11 26 GM 273-60 31.9 17.8 0.64 32.5 10.4 12 2 GM 273-85 27.9 18.5 0.60 33.3 9.4 13 71 CM 9912-112 39.1 29.1 0.58 30.7 12.1 14 8 Performance of four commercial checks C. TAI 30.8 16.9 0.64 31.5 9.7 19 61 C. Ginés 24.5 14.3 0.63 29.8 7.3 58 52 C. Verónica 31.2 16.5 0.65 33.5 10.5 4 25 MVEN 25 31.0 30.1 0.51 31.2 9.7 49 54 Statistics of the 15 clones selected Maximum 42.6 33.7 0.7 35.4 13.2 Minimum 27.9 15.6 0.5 29.6 9.4 Average 36.4 21.9 0.6 32.5 11.8 St. Deviation 4.0 5.5 0.1 1.6 1.2 Statistics of the 72 clones evaluated Maximum 42.6 33.7 0.74 35.4 13.2 Minimum 13.3 9.1 0.44 25.5 4.2 Average 29.5 19.6 0.60 30.7 9.1 St. Deviation 6.7 5.3 0.07 1.7 2.2
Figure 7.1 presents a relationship between the ranks in the two types of environments for this ATY-I. It can be seen that a group of clones ranked above 60th in Atlántico and were among the best 20-30 in Chinú. The R2 value was in the regression analysis, which showed a positive trend, was 0.23. A more appropriate parameter to quantify the relationship is Spearman’s coefficient of rank correlation (Steel, R.G.D. and J. H. Torrie. 1960. Principles and procedures of statistics. McGraw-Hill Book Company. New York, Toronto, London),
Chapter 7-3 2007 Annual Report
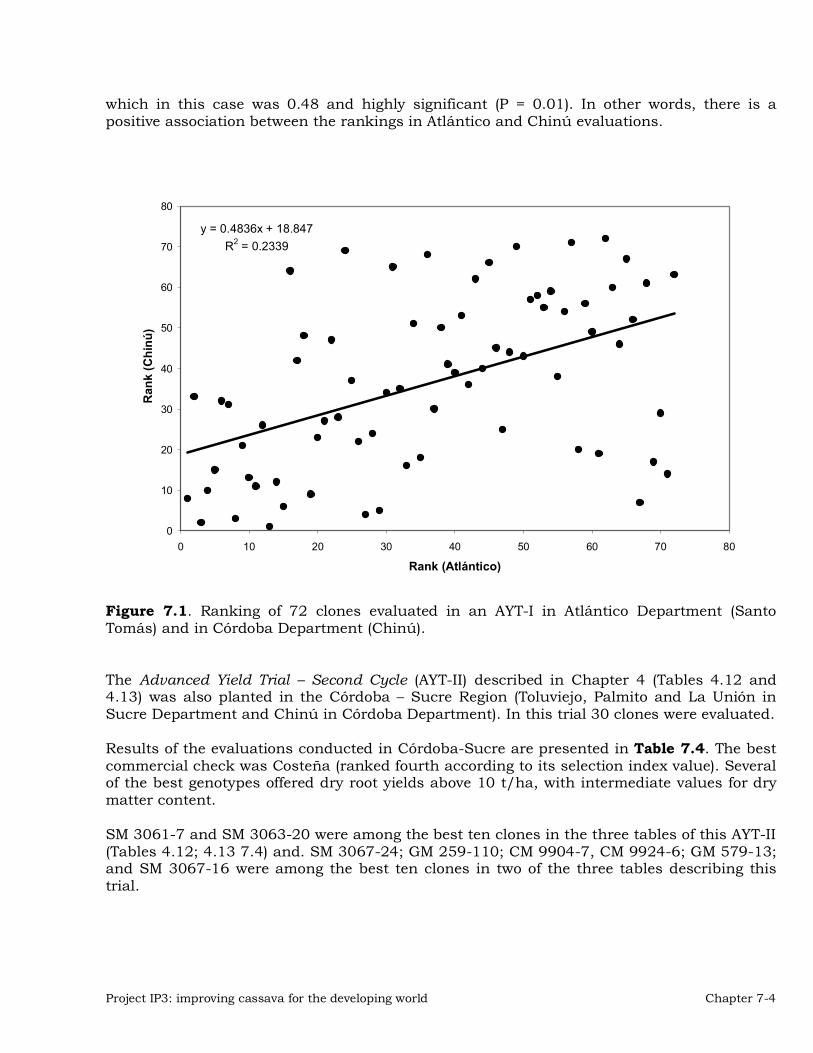
which in this case was 0.48 and highly significant (P = 0.01). In other words, there is a positive association between the rankings in Atlántico and Chinú evaluations.
y = 0.4836x + 18.847R2 = 0.2339
0
10
20
30
40
50
60
70
80
0 10 20 30 40 50 60 70 8
Rank (Atlántico)
Ran
k (C
hinú
)
0
Figure 7.1. Ranking of 72 clones evaluated in an AYT-I in Atlántico Department (Santo Tomás) and in Córdoba Department (Chinú). The Advanced Yield Trial – Second Cycle (AYT-II) described in Chapter 4 (Tables 4.12 and 4.13) was also planted in the Córdoba – Sucre Region (Toluviejo, Palmito and La Unión in Sucre Department and Chinú in Córdoba Department). In this trial 30 clones were evaluated. Results of the evaluations conducted in Córdoba-Sucre are presented in Table 7.4. The best commercial check was Costeña (ranked fourth according to its selection index value). Several of the best genotypes offered dry root yields above 10 t/ha, with intermediate values for dry matter content. SM 3061-7 and SM 3063-20 were among the best ten clones in the three tables of this AYT-II (Tables 4.12; 4.13 7.4) and. SM 3067-24; GM 259-110; CM 9904-7, CM 9924-6; GM 579-13; and SM 3067-16 were among the best ten clones in two of the three tables describing this trial.
Project IP3: improving cassava for the developing world Chapter 7-4
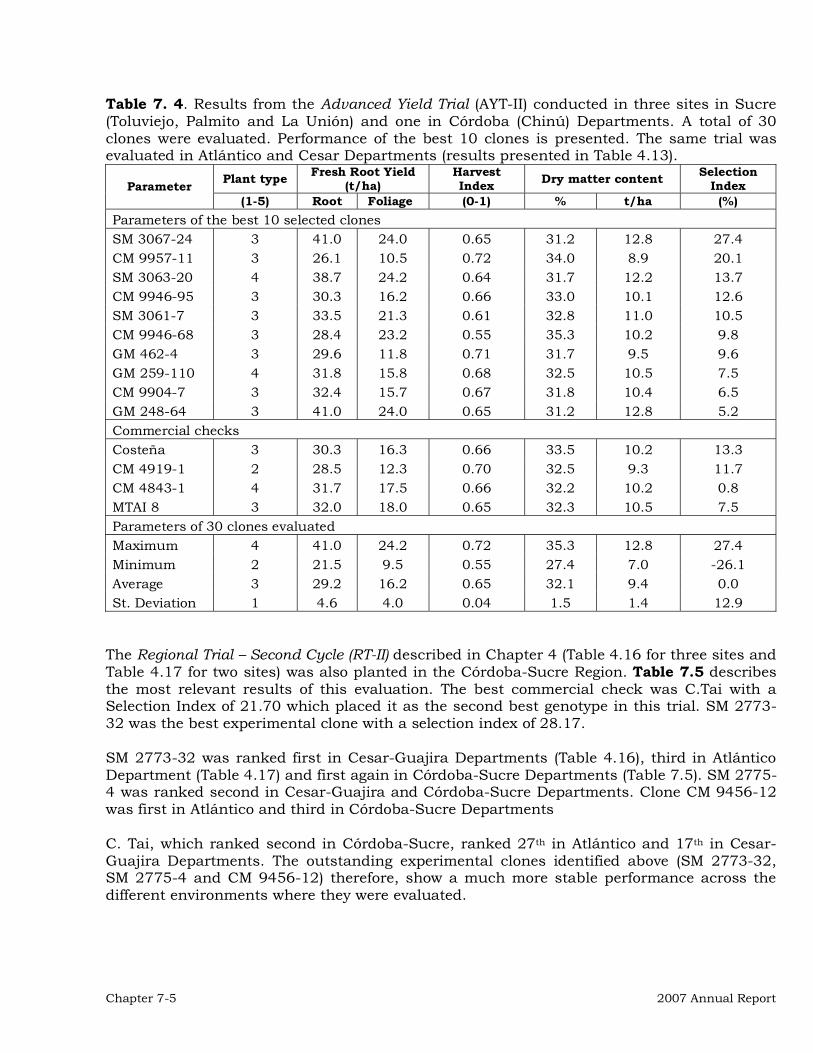
Table 7. 4. Results from the Advanced Yield Trial (AYT-II) conducted in three sites in Sucre (Toluviejo, Palmito and La Unión) and one in Córdoba (Chinú) Departments. A total of 30 clones were evaluated. Performance of the best 10 clones is presented. The same trial was evaluated in Atlántico and Cesar Departments (results presented in Table 4.13).
Plant type Fresh Root Yield (t/ha)
Harvest Index Dry matter content Selection
Index Parameter (1-5) Root Foliage (0-1) % t/ha (%)
Parameters of the best 10 selected clones SM 3067-24 3 41.0 24.0 0.65 31.2 12.8 27.4 CM 9957-11 3 26.1 10.5 0.72 34.0 8.9 20.1 SM 3063-20 4 38.7 24.2 0.64 31.7 12.2 13.7 CM 9946-95 3 30.3 16.2 0.66 33.0 10.1 12.6 SM 3061-7 3 33.5 21.3 0.61 32.8 11.0 10.5 CM 9946-68 3 28.4 23.2 0.55 35.3 10.2 9.8 GM 462-4 3 29.6 11.8 0.71 31.7 9.5 9.6 GM 259-110 4 31.8 15.8 0.68 32.5 10.5 7.5 CM 9904-7 3 32.4 15.7 0.67 31.8 10.4 6.5 GM 248-64 3 41.0 24.0 0.65 31.2 12.8 5.2 Commercial checks Costeña 3 30.3 16.3 0.66 33.5 10.2 13.3 CM 4919-1 2 28.5 12.3 0.70 32.5 9.3 11.7 CM 4843-1 4 31.7 17.5 0.66 32.2 10.2 0.8 MTAI 8 3 32.0 18.0 0.65 32.3 10.5 7.5 Parameters of 30 clones evaluated Maximum 4 41.0 24.2 0.72 35.3 12.8 27.4 Minimum 2 21.5 9.5 0.55 27.4 7.0 -26.1 Average 3 29.2 16.2 0.65 32.1 9.4 0.0 St. Deviation 1 4.6 4.0 0.04 1.5 1.4 12.9
The Regional Trial – Second Cycle (RT-II) described in Chapter 4 (Table 4.16 for three sites and Table 4.17 for two sites) was also planted in the Córdoba-Sucre Region. Table 7.5 describes the most relevant results of this evaluation. The best commercial check was C.Tai with a Selection Index of 21.70 which placed it as the second best genotype in this trial. SM 2773-32 was the best experimental clone with a selection index of 28.17. SM 2773-32 was ranked first in Cesar-Guajira Departments (Table 4.16), third in Atlántico Department (Table 4.17) and first again in Córdoba-Sucre Departments (Table 7.5). SM 2775-4 was ranked second in Cesar-Guajira and Córdoba-Sucre Departments. Clone CM 9456-12 was first in Atlántico and third in Córdoba-Sucre Departments C. Tai, which ranked second in Córdoba-Sucre, ranked 27th in Atlántico and 17th in Cesar-Guajira Departments. The outstanding experimental clones identified above (SM 2773-32, SM 2775-4 and CM 9456-12) therefore, show a much more stable performance across the different environments where they were evaluated.
Chapter 7-5 2007 Annual Report

Table 7.5. Results from the Regional Trial Second Cycle (RT-II) conducted in two sites in Sucre (Palmito and La Unión) and two in Córdoba (Montería and Chinú) Departments. A total of 30 clones were evaluated. Performance of the best 10 clones is presented. The same trial was evaluated in Atlántico, Guajira and Cesar Departments (results presented in Tables 4.16 and 4.17).
Plant type Fresh Root Yield (t/ha)
Harvest Index Dry matter content Selection
Index Parameter (1-5) Root Foliage (0-1) % t/ha (%)
Parameters of the best 8 selected clones SM 2773-32 3 26.0 17.9 0.61 37.3 9.8 28.17 SM 2775-4 3 31.5 19.6 0.61 34.1 10.8 20.84 CM 9456-12 2 27.4 11.8 0.69 32.1 8.9 15.49 SM 2775-2 3 44.5 18.1 0.71 26.7 11.9 12.91 SM 2780-17 2 31.7 19.9 0.60 31.5 10.2 9.90 SM 2621-29 3 28.9 18.8 0.60 33.2 9.7 9.51 SM 2619- 4 3 28.3 22.7 0.55 34.1 9.7 8.45 SM 2629-36 2 26.1 13.8 0.64 32.6 8.5 7.08 SM 1411-5 3 31.3 19.0 0.61 31.6 10.0 3.80 SM 2620-1 2 25.6 14.7 0.63 31.9 8.1 2.25 Commercial checks C.TAI 2 33.4 17.2 0.66 32.0 10.8 21.70 C.VERONICA 2 27.7 12.7 0.68 31.8 8.9 15.10 C.CAISELI 2 24.2 16.7 0.59 33.5 8.2 9.12 C.INES 4 30.2 16.5 0.63 31.7 9.8 3.23 C.ORENSE 3 21.1 18.3 0.5 32.6 6.9 -12.68 Parameters of 30 clones evaluated Maximum 4 42.7 34.4 0.71 37.3 11.5 28.17 Minimum 2 11.1 9.7 0.53 26.7 3.9 -23.05 Average 3 25.7 17.4 0.60 32.1 8.3 0.00 St. Deviation 1 5.2 4.3 0.05 1.8 1.5 13.22
7.3. THE ISSUE OF DRY MATTER CONTENT FOR ETHANOL PRODUCTION There has been an interesting contrast observed in the RT-II studies. Two sister genotypes (SM 2775-4 and SM 2775-2) showed drastic differences in dry matter content (Table 7.6). In general, SM 2775-4 has much higher dry matter content than its sister clone SM 2775-2 (with the exception of a two-locations evaluation in Atlántico Department). Because the selection index favors high-dry matter content, SM 2775-4 consistently has better values for selection index. Also with the exception of the two trials in Atlántico, however, SM 2775-2 has much higher fresh root yields than SM 2775-4. In several cases the high fresh root yield of SM 2775-2, in spite of its lower dry matter yield, resulted in an overall dry matter yield higher than that of SM 2775-4. As confusing as these ideas are, they are very relevant for the future of cassava. In general high dry matter content was a requirement for processing cassava because for the main uses (starch or dried chips), lower dry matter contents implied higher processing costs. In the case of starch it also implied an environmental cost because more effluents are produced per amount of starch produced. However, there is a new player in processing cassava: bio-ethanol. For this new market for cassava, dry matter content may not be relevant because when fresh roots are grinded to start the process, water is even
Project IP3: improving cassava for the developing world Chapter 7-6

added to the system. When fresh roots are used to produce ethanol, the main selection criteria should be dry matter productivity per hectare. If that were the case, then clones such as SM 2775-2, which would have been discarded in the past, are now back into the picture. Table 7.6. Comparison of two sister lines from the Regional Trial Second Cycle (RT-II) conducted in two sites in Sucre (Palmito and La Unión in 2006 and Toluviejo and Mandioca in 2007), Córdoba (Montería and Chinú), Atlántico (Santo Tomás and Malambo), Cesar (Codazzi and Motilonia) and Guajira (Barrancas) Departments. They contrast for dry matter content.
Plant type Fresh Root Yield (t/ha)
Harvest Index Dry matter content Selection
Index Parameter (1-5) Root Foliage (0-1) % t/ha (%)
Córdoba - Sucre SM 2775-4 3 31.5 19.6 0.61 34.1 10.8 20.84 SM 2775-2 3 41 27 0.60 31.1 12.8 2.31 Atlántico SM 2775-4 2 27 31 0.46 32.5 8.7 8.72 SM 2775-2 1 22 26 0.45 33.0 7.1 1.80 Cesar - Guajira SM 2775-4 3 26 33 0.45 34.6 9.2 16.40 SM 2775-2 3 41 27 0.60 31.1 12.8 2.31 Sucre 2007-2008 SM 2775-4 3 36.5 19.5 0.65 37.6 13.7 27.20 SM 2775-2 2 44.6 16.9 0.73 29.6 13.2 14.67
7.4. THE ISSUE OF DRY MATTER CONTENT IN SUB-HUMID CONDITIONS A major concern that cassava production has in the coast is the drop of dry matter content values with the starting of the rains. Stability of dry matter content is, therefore, a major objective for the sub-humid conditions in Atlántico, Guajira and Cesar Departments (Chapter 4) and Córdoba and Sucre Departments (this Chapter). Contrary to what happens in the ethanol industry, cassava for the starch and dried chips (animal feeding) requires a minimum of dry matter content, otherwise processing becomes too expensive. Several steps have been taken to answer the needs of the processing sector of these regions. First approach: The selection index described in Chapter 3 has been changed so dry matter content has the same weight than fresh root yield (a weight of 10, which is the maximum). Therefore, since 2007 harvests the selection index formula for the sub-humid conditions has been changed to be as follows:
SI = (FRY * 10) + (DMC*10) + (HI*5) - (PT 3) - (SED3) Second approach As described in Chapter 4 a group of clones was generated using a set of “high-dry matter”
Chapter 7-7 2007 Annual Report

progenitors. Materials were selected in the Clonal Evaluation Trial stage for different criteria (high dry matter, low dry matter, drastic drop in dry matter content, etc.). This is an interesting study case because it widens the range of variation for dry matter contents. Figure 7.2 presents the relationship between different variables (fresh root yield; dry matter yield; harvest index; dry matter content) at the CET and PYT stages. Regression analysis has been made on that data. R2 values are equivalent to broad sense heritability. As expected fresh root yield show low “heritability” values. Dry matter content, on the other hand show the highest R2 values, suggesting high heritability values on one hand but also good quality of data on the other. In fact to have good heritability values good quality data is a requisite. This is a group of genotypes specifically selected for high and low dry matter content. It also has material that having high dry matter content at the optimum harvest time (during the dry season), show a drastic drop in dry matter content with the advent of the rains. For the later variable, three different quantifications at three different times before and after the beginning of the rains were obtained but cannot be shown clearly in the graphs presented in Figure 7.2.
y = 0.5908x + 10.705
R2
= 0.5248
15
20
25
30
35
40
15 20 25 30 35 40Dry matter content CET 2005-2006 (%)
Dry
mat
ter c
onte
nt P
YT 2
006-
2007
(%)
y = 0.3751x + 0.4736R2 = 0.2918
0.0
2.0
4.0
6.0
8.0
10.0
12.0
0.0 2.0 4.0 6.0 8.0 10.0 12.0 14.0 16.0Dry matter yield CET 2005-2005 (t/ha)
Dry
mat
ter y
ield
200
6-20
07 (t
/ha)
y = 0.4882x + 0.095R2 = 0.4157
0
0.1
0.2
0.3
0.4
0.5
0.6
0.7
0 0.1 0.2 0.3 0.4 0.5 0.6 0.7 0.8Harvest index CET 2005-2006
Har
vest
Inde
x PY
T 20
06-2
007
y = 0.3895x + 1.8737R2 = 0.2506
0
5
10
15
20
25
30
0 10 20 30 40 50
Fresh root yield (t/ha) in CET 2005-2006
Fres
h ro
ot y
ield
(t/h
a) in
PYT
200
6-20
07
y = 0.5908x + 10.705
R2
= 0.5248
15
20
25
30
35
40
15 20 25 30 35 40Dry matter content CET 2005-2006 (%)
Dry
mat
ter c
onte
nt P
YT 2
006-
2007
(%)
y = 0.5908x + 10.705
R2
= 0.5248
15
20
25
30
35
40
15 20 25 30 35 40Dry matter content CET 2005-2006 (%)
Dry
mat
ter c
onte
nt P
YT 2
006-
2007
(%)
y = 0.3751x + 0.4736R2 = 0.2918
0.0
2.0
4.0
6.0
8.0
10.0
12.0
0.0 2.0 4.0 6.0 8.0 10.0 12.0 14.0 16.0Dry matter yield CET 2005-2005 (t/ha)
Dry
mat
ter y
ield
200
6-20
07 (t
/ha) y = 0.3751x + 0.4736
R2 = 0.2918
0.0
2.0
4.0
6.0
8.0
10.0
12.0
0.0 2.0 4.0 6.0 8.0 10.0 12.0 14.0 16.0Dry matter yield CET 2005-2005 (t/ha)
Dry
mat
ter y
ield
200
6-20
07 (t
/ha)
y = 0.4882x + 0.095R2 = 0.4157
0
0.1
0.2
0.3
0.4
0.5
0.6
0.7
0 0.1 0.2 0.3 0.4 0.5 0.6 0.7 0.8Harvest index CET 2005-2006
Har
vest
Inde
x PY
T 20
06-2
007 y = 0.4882x + 0.095
R2 = 0.4157
0
0.1
0.2
0.3
0.4
0.5
0.6
0.7
0 0.1 0.2 0.3 0.4 0.5 0.6 0.7 0.8Harvest index CET 2005-2006
Har
vest
Inde
x PY
T 20
06-2
007
y = 0.3895x + 1.8737R2 = 0.2506
0
5
10
15
20
25
30
0 10 20 30 40 50
Fresh root yield (t/ha) in CET 2005-2006
Fres
h ro
ot y
ield
(t/h
a) in
PYT
200
6-20
07 y = 0.3895x + 1.8737R2 = 0.2506
0
5
10
15
20
25
30
0 10 20 30 40 50
Fresh root yield (t/ha) in CET 2005-2006
Fres
h ro
ot y
ield
(t/h
a) in
PYT
200
6-20
07
Figure 7.2. Relationship between performance at the CET and PYT stages of selection for
high-dry matter content. The germplasm of these evaluations has been described in Chapter 4 (Tables 4.20 and 4.21).
Project IP3: improving cassava for the developing world Chapter 7-8

It is important to emphasize the high R2 values for dry matter content clearly indicating the reliability of these evaluations (based on averages of three harvesting dates for each genotype). Faster progress can, therefore, be expected because of the changes in weight for the selection index and because the additional efforts to quantify dry matter content at three different stages of the growth of the plants. Third approach Most of nurseries and trials in the sub-humid environment in Atlántico Department are based either in collaboration with a starch company (Industrias del Maíz – INYUCAL) or in a cattle production farm where the issue of dry matter content of the roots is nor a relevant one because cassava is fed to the cattle fresh (chopped and let “breathe” few hours to release cyanide before offered to the animals). This cattle farm turned out to be an ideal arrangement because there is no pressure to harvest cassava at a given time, neither to release the land for a new crop. Remnant plants from the experiments can be left in the field long after the main harvest season has taken place. Cassava should be harvested in the middle of the dry seasons (ideally in February, no later than March). April and May are months with occasional rains, and May-July is the main planting season with excellent rains. The third approach has been to take advantage of the remnant plants in the field to quantify dry matter content before the plants are harvested to feed the cattle. This additional activity, although time consuming, provides an ideal avenue for identifying clones that have the capacity to maintain (or recover) dry matter content after the initiation of the rainy season. One important advantage that it has the only additional cost of measuring dry matter content at a time when personnel is mostly occupied in the planting of new trials and taking care of weeds and applying fertilizers early on in the new season. Table 7.7 presents a summary of results obtained from 42 clones that were identified because they had a good agronomic performance (had been selected through the standard selection process) or else because having been discarded through the standard selection process they showed the capacity to maintain or recover dry matter content in their roots (they are identified with an asterisk in Table 7.7). Data from three harvesting dates is presented: the first in March (the ideal harvest time at the end of the dry season); the second harvest data was from early July (about two months after plants re-initiated growth with the advent of the rains); and the third harvesting date was in August (six months after the initiation of the rains which is enough time to identify clones that have the capacity to recover dry matter contents some time after the coming of the rains). This trial involves materials from different origins. Group (1) identifies genotypes from PYTs; Group (2) include clones that had been in AYT-II; materials in Group (3) were in Regional Trials - First Cycle; Group (4) includes Regional Trials – Second Cycle; and the fifth group includes several clones for high dry matter content from PYTs. It should be emphasized that the group of 14 clones identified with asterisks would have been lost in the normal selection process, but were recovered because of their high and/or stable dry matter contents. As expected fresh root yields keep going up with the re-initiation of the growth. Similar situation is observed and has been exploited in southern Brazil where farmers harvest cassava 16-18 months after harvest. Rather than drought, it is cold weather that slows down the growth of the plants for 3-4 months. The relevance of the high yields at 18 months of age is that, if results are maintained, these high fresh root yields combined with high dry matter contents provides alternatives for the availability of cassava during a period when there is very little production of cassava and factories just have to stop operating.
Chapter 7-9 2007 Annual Report

Table 7.7. Data from remnant plants from different trials re-visited two times (in July and September) after the normal harvesting in March. Several of these materials offer great performances.
Fresh root yield (t/ha) Dry matter content (%) (Origin) Clone 1st 2nd 3rd Mean 1st 2nd 3rd Mean
(1) CM 9912-128 35.6 26.2 37.3 33.0 32.2 32.6 31.4 32.1 SM 3060-20 34.9 66.3 45.8 49.0 31.5 30.1 28.5 30.0 SM 3150-17 27.2 53.0 49.5 43.2 30.6 34.6 31.4 32.2 SM 3151-30 * 22.1 14.3 73.0 36.5 29.6 34.2 32.9 32.2 SM 3154-35 34.5 82.0 116.3 77.6 28.8 32.2 33.8 31.6 SM 3158-26 24.9 56.0 61.3 47.4 30.4 36.8 34.9 34.1
(2) GM 462-6 19.7 35.0 52.8 35.8 33.8 35.3 35.0 34.7 CM 9924-6 37.4 46.5 42.5 42.1 34.3 32.5 34.2 33.6 GM 410-7 19.4 33.8 30.5 27.9 34.7 34.6 35.3 34.9 GM 579-13 20.6 29.2 44.5 31.4 35.7 35.2 35.0 35.3 GM 259-108 22.3 37.0 47.0 35.4 31.3 35.6 34.1 33.6
(3) CM 8209-61 * 21.6 49.5 51.3 40.8 34.8 34.2 35.2 34.7 GM 214-62 26.0 32.2 35.5 31.2 34.9 33.7 33.3 34.0 SM 2834-2 * 16.7 38.7 42.3 32.5 36.7 36.7 35.9 36.4 CM 9912-28 * 22.4 35.3 22.5 26.7 33.0 32.4 34.2 33.2 SM 2828-28 16.3 35.3 44.0 31.9 35.3 36.0 34.5 35.3 SM 2834-31 22.7 38.0 47.0 35.9 36.3 35.9 34.2 35.5 CM 9912-54 25.3 50.7 59.0 45.0 34.3 34.4 34.3 34.3 CM 9912-11 26.6 39.7 20.0 28.8 35.5 32.8 33.8 34.0
(4) SM 2619-4 22.8 32.2 46.3 33.7 37.0 37.1 37.4 37.2 SM 2629-36 27.3 41.8 76.0 48.4 34.7 34.8 33.1 34.2 SM 2773-32 14.2 45.2 35.5 31.6 39.2 39.7 39.9 39.6 CM 9560-1 19.6 32.7 58.8 37.0 34.2 33.7 38.9 35.6 SM 2548-22 24.3 23.3 49.0 32.2 34.1 32.4 35.8 34.1 SM 2621-29 20.6 28.5 40.0 29.7 34.0 35.9 36.8 35.5 SM 2775-4 18.4 22.3 37.3 26.0 34.1 34.7 35.1 34.7 SM 2780-17 23.1 32.2 37.8 31.0 33.8 31.8 34.2 33.2
(5) GM 236-78 * 25.6 30.7 31.5 29.3 34.1 35.0 33.7 34.3 GM 273-72 * 23.3 27.8 57.5 36.2 34.4 35.5 34.0 34.6 GM 438-7 * 8.3 39.0 41.3 29.5 34.6 34.5 36.0 35.1 GM 410-22 29.3 36.8 34.3 33.5 33.6 37.1 35.9 35.6 GM 410-24 32.3 31.5 56.3 40.0 33.5 35.8 33.2 34.2 GM 410-28 * 27.5 29.8 40.8 32.7 32.2 34.3 33.7 33.4 SM 2831-17 * 14.7 24.5 32.8 24.0 35.8 35.9 31.7 34.5 SM 3061-29 30.1 17.2 29.3 25.5 34.6 36.3 36.7 35.9 SM 3100-3 8.2 4.5 5.3 6.0 34.2 30.9 26.8 30.6 SM 3102-2 * 9.6 n.a. n.a. 9.6 34.9 n.a. n.a. 34.9 SM 3103-27 * 6.3 n.a. n.a. 6.3 36.6 n.a. n.a. 36.6 SM 3110-15 * 18.4 27.7 59.0 35.0 35.8 34.6 37.2 35.8 SM 3110-30 * 17.6 24.0 27.3 22.9 34.7 37.1 32.0 34.6 SM 3111-13 * 8.6 22.0 35.5 22.0 32.9 32.8 37.3 34.3 SM 3112-48 25.0 25.5 26.3 25.6 34.2 31.9 29.7 32.0 Average 22.2 34.9 44.5 32.9 34.1 34.5 34.3 34.3
Project IP3: improving cassava for the developing world Chapter 7-10

Chapter 7-11 2007 Annual Report
Some clones that have been highlighted presented outstanding dry matter contents. Very remarkable is clone SM 2773-32, which had already been mentioned in Table 7.5 as one of the best and most promising clones from Regional Trial – Second Cycle. Clones SM 2619-4 also had very high and stable levels of dry matter content. Also another clone that has been mentioned before (SM 2775-4) showed a stable dry matter content. It should be acknowledged that fresh root productivity for the second (July) and third (August) harvest dates presented in Table 7.7 is preliminary. Data was taken from plants that had been left in the field without competing plants in the surrounding environment. The emphasis was on dry matter content, which as shown in Figure 7.2, is a more reliable characteristic. So, fresh root productivity is and should be considered as reference points rather that actual productivity quantification.
CHAPTER 8
BREEDING FOR INSECT AND OTHER ARTHROPODS RESISTANCE AND DEVELOPMENT OF ALTERNATIVE METHODS FOR THEIR CONTROL
The entomology section of the cassava-breeding project at CIAT is going through a transition phase after the retirement of the cassava entomologist (A.C. Bellotti). Although Dr. Bellotti remains connected with CIAT in an Emeritus status providing advice to the team, day to day activities lack the leadership that he provided exceptionally well for about thirty years. This situation is indeed a major problem that needs to be addressed. As cassava moves from subsistence farming into commercial endeavors to produce raw material for the different processing activities, there will be a tendency to concentrate cassava production around these processing facilities. Large areas, with high cassava density, are an ideal condition for pests and diseases to become bottlenecks in cassava production. It is under these conditions, where the leadership of a qualified and experienced entomologist is urgently required. 8.1 CASSAVA GERMPLASM EVALUATION FOR RESISTANCE TO GREEN MITE Mononychellus
tanajoa.
This is a join activity between the entomology and breeding teams lead by José María Guerrero and Fernando Calle. Cassava green mite (CGM), Mononychellus tanajoa is one of the most serious pest problems of this crop, causing serious damage and inducing considerable reduction in yield in those regions affected by long and pronounced dry periods. Since cassava is particularly appreciated because of its tolerance to drought and adaptation to such environments, the CGM and other mites are very relevant in Africa, Asian and LAC. It has been estimated that root yield losses caused or induced by CGM in Africa and the Neotropics range between 20 and 80%. In addition, there is a considerable reduction in the production of planting materials (good quality stems), which can be as high as 82% in several susceptible genotypes. The cassava project at CIAT produces every year a large number of new segregating germplasm, which need to be evaluated and screened for different traits, in particular their reaction to the relevant pests prevalent in their target environments. In the case of cassava germplasm bred for its adaptation to sub-humid conditions, characterized by long and dry rainless period where CGM is the most important pest, the breeding and entomology teams work together for the identification of resistant genotypes. CGM is also a problem, even in CIAT-Palmira where the dry period can last only for a couple of months instead of the typical four months in the northern Coast. . In CIAT-Palmira, up to 1378 genotypes at different stages in the selection process were evaluated in search of good agronomic characteristics combined with resistance to the CGM. During the 2006-2007 growing season, the different trials described in Table 8.1 were evaluated between January and February (the dry period where damage by M. tanajoa can be effectively assessed, as can be illustrated in the photograph presented in Figure 8.1).
Chapter 8-1 2007 Annual Report

Damage level were established using a 1.0 to 6.0 scoring scale, where 1.0 is used to identify healthy plants with no observable damage and 6.0 represents severe damage, considerable reduction in apical growth, defoliation and yellowing in leaves at the middle and lower sections of the plant. Table 8.1. Trials evaluated at CIAT-Palmira, during the period 2006-2007 for the reaction against CGM. Trial Nº of genotypes Cycles evaluated Nº of plants/genotypes and replications CET-1 533 1 6 plants/genotype/2 reps CET-2 468 1 3 plants/ genotype /3 reps PYT-1 84 2 10 plants/ genotype /3 reps PYT-2 84 2 10 plants/ genotype /3 reps PYT-3 84 2 10 plants/ genotype /3 reps EAR-1 24 3 20 plants/ genotype /3 reps EAR-1 64 3 25 plants/ genotype /3 reps EAR-2 20 4 25 plants/ genotype /3 reps RT-1 17 5 25 plants/ genotype /3 reps
Figure 8.1. Illustration of the severity of damage by CGM that can be observed during the dry period at CIAT-Palmira.
Project IP3: improving cassava for the developing world Chapter 8-2
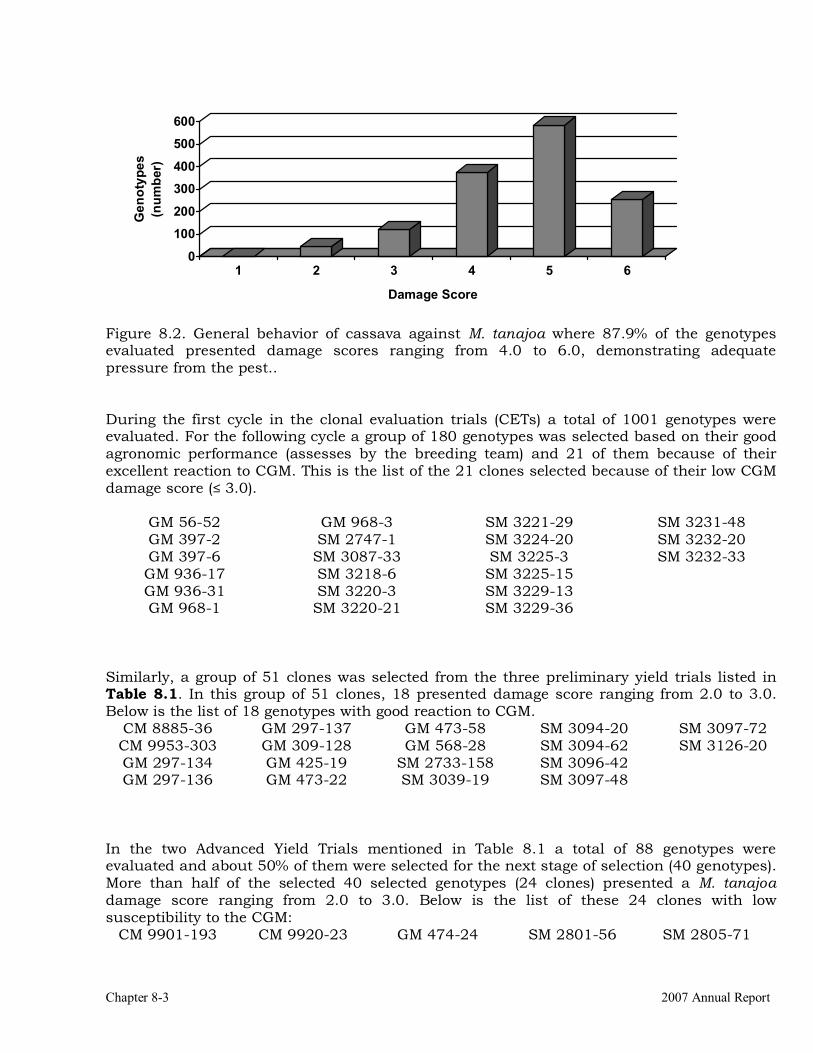
0
100
200
300
400
500
600G
enot
ypes
(num
ber)
1 2 3 4 5 6
Damage Score
Figure 8.2. General behavior of cassava against M. tanajoa where 87.9% of the genotypes evaluated presented damage scores ranging from 4.0 to 6.0, demonstrating adequate pressure from the pest.. During the first cycle in the clonal evaluation trials (CETs) a total of 1001 genotypes were evaluated. For the following cycle a group of 180 genotypes was selected based on their good agronomic performance (assesses by the breeding team) and 21 of them because of their excellent reaction to CGM. This is the list of the 21 clones selected because of their low CGM damage score (� 3.0).
GM 56-52 GM 968-3 SM 3221-29 SM 3231-48 GM 397-2 SM 2747-1 SM 3224-20 SM 3232-20 GM 397-6 SM 3087-33 SM 3225-3 SM 3232-33 GM 936-17 SM 3218-6 SM 3225-15 GM 936-31 SM 3220-3 SM 3229-13 GM 968-1 SM 3220-21 SM 3229-36
Similarly, a group of 51 clones was selected from the three preliminary yield trials listed in Table 8.1. In this group of 51 clones, 18 presented damage score ranging from 2.0 to 3.0. Below is the list of 18 genotypes with good reaction to CGM.
CM 8885-36 GM 297-137 GM 473-58 SM 3094-20 SM 3097-72 CM 9953-303 GM 309-128 GM 568-28 SM 3094-62 SM 3126-20 GM 297-134 GM 425-19 SM 2733-158 SM 3096-42 GM 297-136 GM 473-22 SM 3039-19 SM 3097-48
In the two Advanced Yield Trials mentioned in Table 8.1 a total of 88 genotypes were evaluated and about 50% of them were selected for the next stage of selection (40 genotypes). More than half of the selected 40 selected genotypes (24 clones) presented a M. tanajoa damage score ranging from 2.0 to 3.0. Below is the list of these 24 clones with low susceptibility to the CGM:
CM 9901-193 CM 9920-23 GM 474-24 SM 2801-56 SM 2805-71
Chapter 8-3 2007 Annual Report

CM 9902-35 GM 373-33 GM 474-27 SM 2801-62 SM 3043-10 CM 9911-7 GM 474-4 GM 479-19 SM 2803-79 SM 3055-9
CM 9911-13 GM 474-8 SM 2799-67 SM 2805-45 SM 3086-5 CM 9912-117 GM 474-10 SM 2799-84 SM 2805-65
A total of 37 genotypes were evaluated in the Advanced Yield Trial (second cycle) and in the Regional Trial. Eighteen of these clones presented good agronomic characteristics and eight will be further evaluated in future trials leading to the identification of potential germplasm to be officially released as new varieties by Colombian authorities, and to become elite germplasm in the cassava project. These eight clones had low damage scores by CGM:
CM 9903-107 GM 555-3 GM 297-67 SM 2858-2 GM 374-22 SM 2858-31 GM 374-32 SM 2864-17
In summary, from the 1378 genotypes evaluated in different trials during the 2006-2007 growing season, 289 were selected and will be evaluated in their respective following stage of selection. These genotypes were selected because their outstanding selection index score. A total of 71 clones, among the selected germplasm, presented low CGM damage levels Genotypes GM 374-22, GM 474-8 and CM 9911-7, were particularly interesting because they consistently presented low damage levels in during the successive years in which they were evaluated. 88..22 IINNTTEEGGRRAATTEEDD MMAANNAAGGEEMMEENNTT OOFF WWHHIITTEE FFLLIIEESS ((HHOOMMOOPPTTEERRAA:: AALLEEYYRROODDIIDDAAEE)) IINN CCAASSSSAAVVAA This activity was lead by Carlos Julio Herrera Fernández under the coordination of A.C. Bellotti and F. Morales, and was supported by the collaboration of Adriano Muñoz, Bernardo Arias, and Claudia Holguín (currently a graduate student in NCU, USA). This activity had the financial support of DFID. During the past few years cassava fields in the coffee growing area of Colombia (Quindío and Risaralda Departments) have seen and increasing population density of whiteflies (Aleurotrachelus socialis Bondar and Trialeurodes variabilis Quaintance). Lately, population sizes have been high (Figures 8.3 and 8.4) and the levels of damage reaching economic impact. This situation applies to the varieties and management practices commonly used in the coffee growing region for cassava. When infestation and attack starts early on during the first four months of the cassava growing cycle, direct yield losses have been estimated to be as high as 40%. This level of losses justifies the intervention of the entomology team at CIAT in order to develop technological packages that will allow a rational and efficient management of the whitefly problem in cassava. Early work had demonstrated that whiteflies in cassava have to be managed and monitored for the first seven months of the crop’s growth; thereafter no control measure is justifiable. During the period reported in this chapter additional work to identify alternative control tools (both chemical and biological) were evaluated.
Project IP3: improving cassava for the developing world Chapter 8-4

Figure 8.3. Illustration of level of damage and pressure from white flies observed in cassava fields in the coffee growing area of Colombia.
Figure 8.4. Pupae and nymphs from the two predominant whitefly species affecting cassava in the coffee growing region of Colombia (Left: Aleurotrachelus socialis; Right: Trialeurodes variabilis). The main objectives of this activity were: i) To determine the best chemical alternative for an efficient management of the whitefly problem in cassava; ii) To better define the best
Chapter 8-5 2007 Annual Report

approach and frequency of chemical application or release of biological control agents so that production costs are minimized at the end of the cycle; and iii) Publish a divulgation brochure on the integrated whitefly management of cassava. 8.2.1 MATERIAL AND METHODS. Two different types of trials were conducted. One aimed at identifying the most efficient biological tools available for the control of whiteflies that could be incorporated in a technology package for its control. The second type of trial had the broader objective of integrating different control tools to develop a properly integrated technology package. Research was conducted in a high whitefly (Trialeurodes variabilis) pressure area located in the Calarcá County (Quindío Department). Although considerably variable, average altitude was about 1400 meters above sea level, average temperature was 23-240C, relative humidity ranged from 70-85% and adequate rainfall. The typical planting pattern (1.0 by 1.2 m) was used for a final density of about 8,333 plants/hectare. Whitefly infestation occurs naturally in the region, and pressure is moderate to high. This is an optimal cassava growing area, with fertile soils and different economic alternatives, including growing coffee. Farmers in this region are, therefore, not resource-limited and are willing to adopt new technologies.
Table 8.2. Whitefly (Aleurotrachelus socialis Bondar) scale to estimate population levels in cassava.
Score Adults-Eggs Nymphs-Pupae
1 NO NO
2 1 – 50 1 – 200
3 51 – 200 201 - 500
4 201 – 500 501 – 2000
5 501 – 1000 2001 – 4000
6 > 1000 > 4000
Evaluations were made since the development of the first leaves and every other week until the age of 12 months after planting when the crop was harvested. During the evaluations, the action criteria described in Table 8.2 were followed. Chemical treatment alternatives were initiated when whitefly populations reached a score of 3 (see Table 8.2). For biological control measures, treatments were initiated earlier when whitefly population levels reached a score of 2. Treatments were followed through until the crop reached six months of age. In each plot six plants were randomly selected and the whitefly population score was taken considering the different stages of the insect cycle on the leaves of the selected plants. Trials were visited every other week until harvest, when 20 central plants of each plot were evaluated for all
Project IP3: improving cassava for the developing world Chapter 8-6

parameters in order to measure the impact of each treatment, yield and cost/benefits. Ultimately this information would help identifying the best approach to manage the whitefly problem in cassava for this region of Colombia. Evaluation of different biological alternatives.
A completely randomized blocks design was used with cassava variety HMC-1, the seven treatments described in Table 8.3 and four replications. Treatments included two types of checks: the traditional approach used by farmers and an absolute check (no control). For every treatment (except the absolute check) planting material was treated using a commercial product whose active ingredient is Thiamethoxam (1 g/l water). Stakes were immersed for 7-10 minutes and then let dry and immediately planted. Population levels were estimated using the scale described in Table 8.2. After each evaluation, and depending on the results, it was decided if application of a treatment was or not required. If score was higher than two and lower that three the corresponding biological product (as described in Table 3) was applied. When score went above the level of three, then a chemical treatment was applied to lower the population levels of the whitefly and then (hopefully) continue with biological control agents in later evaluations. This strategy is based on a well known and sufficiently proven principle that biological control agents are useful and effective in maintaining population density of the pest at a low level, whereas chemical treatments are best used to reduce population density of the pest down to a manageable level where it does not cause economic losses. Also at these low levels the biological control agents can again take over and maintain the low population levels.
Table 8.3. Description of treatments used in the process to identify the best biological alternative for the management of whiteflies in cassava. Treatment Commercial product Dosage “Seed” treatment
1 Mycotrol® (B. bassiana)
2.5 cc/l water
Thiamethoxan (1 g/l)
2 BioCanni® (L. lecanni)
1.5 g/l water
Thiamethoxan (1 g/l)
3 Vektor® (Entomophthora virulenta)
1 cc/l water Thiamethoxan (1 g/l)
4 Bioneem® (Extracto Neem)
2.5 cc/l water
Thiamethoxan (1 g/l)
5 L’ecomix® (Repelente natural para plagas)
4 cc/l water Thiamethoxan (1 g/l)
6 C. Químico: Probado Combi® + Oportune® (Imidacropid-ß-cyflutrina+ Buprofizin )
4 cc/lt +1 cc/lt water
Thiamethoxan (1 g/l)
7 Absolute check ( no control)
-.- -.-
Applications until four months of age were made using a standard pump (backpack type). Applications at later stages were made using a pump with a motor for a more efficient deployment of the product.
Chapter 8-7 2007 Annual Report

Evaluation of best technology packaged for an integrated management of whiteflies. A completely randomized blocks design was used also with the variety HMC-1 and six treatments described in Table 8.4, with four replications. In addition, the same types of check as described above, were used (farmers’ practice and the absolute check with no control whatsoever). Table 8.4. Different alternatives for the integrated management of whiteflies in cassava grown in the coffee growing region of Colombia. Treatment “Seed” treatment Foliar application of comercial product
1 Thiamethoxan (1 g/l)
Imidacropid-B-cyflutrina (4 cc/l) + Buprofizin (1 cc/l) >>> (Y/N Evaluation) >>> Etofenprox (5 cc/l)
2 Thiamethoxan (1 g/l)
Etofenprox (5cc/l) >>> (Y/N Evaluation) B. Bassiana (2.5 cc/l) / Etofenprox (5 cc/l)
3 Thiamethoxan (1 g/l)
B. bassiana (2.5 cc/l) >>> (Y/N Evaluation) B. bassiana (2.5 cc/l)
4
No
Imidacropid-B-cyflutrina (4 cc/l) + Buprofizin (1 cc/l) >>> (Y/N Evaluation) B. Bassiana (2.5 cc/l) / Imidacropid-B-cyflutrina (4 cc/l) + Buprofizin (1 cc/l)
5 No Etofenprox (5cc/l) >>> (Y/N Evaluation) B. bassiana (2.5 cc/l) / Etofenprox (5cc/l)
6 No Thiamethoxan (35 dds) >>> Carbofuram (2.5 cc/l) >>> Metomil (0.3 g/l) >>> Carbofuram (2.5 cc/l)
7 No No Control (Absolute check)
Tested: Combi ® =(Imidacropid-B-cyflutrina) ;Oportune ® = (Buprofizin) ;Trebon ® = (Etofenprox) ;Mycotrol ® = (Beauveria bassiana) ; Actara ® = (Thiamethoxan); Furadan ® = (Carbofuram); Metavin ® = (Metomil). As indicated in the previous section, evaluations were conducted every other week, starting the development of the first leaves. Decisions were taken according to the population levels indicated in Table 8.2. Treatments were applied until the seventh month of age, taking advantage of the information previously developed that it is not economically justifiable to continue with control after the 7th month of age. After that time only standard care of cassava (no control of the whitefly) was followed and population density of the insect continued to be monitored.
Applications until four months of age were made using a standard pump (backpack type). Applications at later stages were made using a pump with a motor for a more efficient deployment of the product. 8.2.2 RESULTS. The environmental conditions of this area are different from others in Colombia and, therefore, conclusions from this study need to be validated in other regions.
Project IP3: improving cassava for the developing world Chapter 8-8

Evaluation of different biological alternatives.
Results provided cannot include yield data because harvest has not yet taken place. Only results related to the efficiency of the different products tested on the population of whiteflies and number of applications required (up to the seventh month of age) will be presented. As previously reported, the control based solely on biological agents (such as entomopathogens and/or vegetal extracts) is not rentable or efficient. In the current study it was observed that up to four applications of biological control agents were necessary (Table 8.5). In certain cases, two additional applications of chemical products were required to lower the population levels back to acceptable levels for management through the use of biological control agents. This information indicates the high insect pressure in this area. Table 8.5. Costs (Colombian peso per hectare) of each product for the control of whiteflies in cassava evaluated in this study. Active
Ingredient
CP** /
pump (12 l)
CP / pump
($/12 l)
Cost Applic
($/ha)
Cost CP
/ ha
# Biol.
applic
# Chem.
applic
Cost /ha
/cycle
B.
bassiana
30 cc 4.320 8.000 213.714 4 2 1.497.142
L.
lecanni
18 g 1.680 8.000 88.000 4 2 994.286
E.
virulenta 12 cc 6.48 8.000 38.857 4 2 797.714
Neem
extract
30 cc 9.60 8.000 53.714 4 2 857.143
Repellents
48 cc 1.560 8.000 82.286 7 2 1.218.286
Various
chemicals* 48 cc
+ 12 cc
6.570 8.000 321.143 2 642.286
Plant density 8,333 plants/hectare; Volume of application per hectare= 714 l; plot area 42 m2; Volume of application per plot= 3 l. * Probado Combi + Oportune (Imidacropid-ß-cyflutrina + Buprofizin); ** CP = Commercial product.
Data presented in Table 8.5 indicates that control of whitefly is expensive. The cheapest treatment (Neem extract) treatment cost was $857.143/ha whereas the most expensive one was that based on the entomopathogen B. bassiana, which cost $1,497.142/ha. These figures need to be contrasted with just two applications of chemical products Imidacropid-ß-cyflutrina + Buprofizin,), which cost $642.286/ha. Figure 8.5 provides a comparison of the costs of different treatment alternatives. It is clear that just two applications of chemical agents were enough for an adequate control of the whiteflies.
Chapter 8-9 2007 Annual Report

Project IP3: improving cassava for the developing world Chapter 8-10
Figure 8.5. Comparative cost (millions of Colombian $ per ha) for the application of different treatments evaluated for the control of whiteflies in cassava.
It is also clear that relying only in the use of biological control agents is not economically advantageous in areas where insect pressure is high. These agents were not capable of maintaining population of the insect below a manageable level.
Evaluation of best technology packaged for an integrated management of whiteflies. This part of the study aimed at identifying the best combination of biological control agents (entomopahtogen fungi) and chemical products for their foliar application for the most efficient control of the whiteflies. Plan of action depended on the evolution of the population of the insect. In addition most treatments relied also in the chemical treatment of the planting material. Results clearly demonstrate the need to control whiteflies and the economic advantages of doing that. Table 8.6 provides information of the different technology packages evaluated and the results, in economic terms, of their implementation. The benefit/cost dilemma for farmers is always an important decision making tool. Root yields (based on previous year experience) are high, averaging about 40 t/ha, if investment in the appropriate control of whiteflies is made. The cost/benefit ratio in many cases was above 3.0. The worst alternatives, from the farmers’ economic point of view, were the traditional control measures with a cost/benefit ratio of only 1.73 and the absolute check (no control) with a cost/benefit ratio of 1.48. Traditional practices result in a productivity of 25.2 t/ha (a 40.8% reduction) and the absolute check results in further decrease in root yield down to 19.8 t/ha. Table 8.6. Yield and profit (based on sales of cassava roots at 400 Col. $ / kg) depending on different technology packages for the control of whiteflies in cassava.
0
0,5
1,0
1,5C
olom
bian
$/h
a
B.b L. l E. v Neem Repellent Chemical
Treatments
0
0,5
1,0
1,5C
olom
bian
$/h
a
B.b L. l E. v Neem Repellent Chemical
Treatments

Annual
Cost (C)
Benefit
Net
Benefit (B)
Trmt # of
foliar
applications
Fresh root
yield
(t/ha)
Yield
Reduction
(%) (Million Col. $)
B/C
1 3 42,42 0 3,500 16,968 13,468 3,85
2 4 37,38 11,88 3,520 14,952 11,432 3,24
3 5 35,90 15,37 3,600 14,358 10,758 2,98
4 5 38,29 9,74 3,600 15,315 11,715 3.25
5 5 40,73 3,99 3,600 16,291 12,691 3,52
6 6 25,13 40,76 3,680 10,052 6,372 1,73
7 0 19,80 53,32 3,200 7,920 4,720 1,48
See Table 8.4 where each treatment is described.
The best alternative was the first one where the planting material was treated with Thiamethoxam and then, there were a total of three foliar applications were made. The treatment started with Imidacropid-�-cyflutrina mixed with Buprofizin and then, after scoring population levels, applications followed with Etofenprox. The three foliar applications were made, as stated above, within the first seven months of the growth of cassava. Treatment number 5 was the second best, from the economic point of view. Planting material was also treated with Thiamethoxam and then there were foliar applications first with Etofenprox and then with Beauveria bassiana. There were a total of five alternating applications, again during the first seven month of the crop. Fresh root yields for these two treatments were 42.4 and 40.7 t/ha, respectively. The benefit/cost ratio was above 3.5.
8.2.2 CONCLUSIONS In regions where whitefly pressure is high, management based solely on biological products (vegetal extracts or entomophatogenic fungi) is not effective. This option results in high costs derived from the need of frequent applications and the ultimate need to rely anyway on few applications of chemical agents. Results of this study support previous findings that biological control strategies are useful to maintain low population levels of the pest, but once the population of the insect goes beyond a certain level, biological agents cannot keep it under control. It is convenient to treat planting material with Thiamethoxam (1g/l de water) immersing it in the solution and keeping it immersed for 7-10 minutes. The best practice, from the economic point of view of the farmer and using the benefit/cost ratio as a guiding criterion is Probado Combi® (Imidacropid-B-cyflutrina (4 cc/l) + Buprofizin (1 cc/l), mixed with Oportune® alternating with applications of Trebon®( Etofenprox (5cc/l). An adequate selection of the planting material (in good nutritional and sanitary conditions and free of mechanical damage) also proved to be beneficial. This package required of three foliar applications during the first seven month of the crop which cost Col. $ 3.500.500 for an ultimate fresh root yield of 42.4 t/ha and a benefit / cost ration above 3.5. Alternating chemical and biological products was also feasible. Trebon® (Etofenprox) could be applied first, followed by Beauveria bassiana (Mycotrol®) with satisfactory results. Production
Chapter 8-11 2007 Annual Report

Project IP3: improving cassava for the developing world Chapter 8-12
costs were higher than relying only in chemical applications ($ 3.500.500 / ha) and fresh root yield was slightly lower (40.7 t/ha) with a benefit/cost ratio also above 3.5. Any of these two treatments offer a viable and economically advisable alternative for competitive production of cassava and effective control of whiteflies.
t technology
packages for the efficient control of whiteflies in cassava.
8.3 BASIC BIOLOGICAL ASPECTS OF TWO WHITEFLY SPECIES AFFECTING CASSAVA PRODUCTION. This work was conducted mainly by María del Pilar Hernández, with the technical assistance of Adriano Muñoz. During the last three years there has been a steady increase in populations of Trialeurodes variabilis (Quaintance), particularly in the coffee-growing region of Colombia, as well as Cauca and Valle del Cauca Departments. This reflects the dynamic nature of plant-arthropods, which is constantly evolving and always ready to react to environmental changes or else changes in human activities and the way farmers grow their crops. For the 2004-2005 growing period the frequency of this species reached 51% (CIAT, 2005). The following year this species represented 85% of all whiteflies and for the 2006-2007
Figure 8.6. Fresh root yield reduction and benefit/cost ratio using differen
0
10
20
30
40
50
60%
Red
uctio
nin
root
yie
ld
1 2 3 4 5 6 7
00.5
11.5
22.5
33.5
B/C
ratio
1 2 3 4 5 6 7Treatments
0
10
20
30
40
50
60%
Red
uctio
nin
root
yie
ld
1 2 3 4 5 6 7
00.5
11.5
22.5
33.5
B/C
ratio
1 2 3 4 5 6 7Treatments

the proportion went slightly down to 79%. It is assumed that this species is more aggressive and, based on field and laboratory observations, its degree of parasitism is very low at least in Cauca and Valle del Cauca Departments. This section presents results on biological and morphological issues related to the two prevalent whitefly species feeding on cassava in the mid-altitude valleys environments of Colombia. Colonies from both species were established in greenhouse conditions (25 ± 4.5°C and 75.9 ± 20 % relative humidity), on the host cassava clone MCOL1468. The biological studies on T. variabilis y B. tuberculata were conducted under controlled laboratory conditions at a temperature of 25.5 °C ±.3 and relative humidity of 73% ± 27. 8.3.1 BIOLOGY OF T. variabilis Taxonomy.
Order: Hemiptera Suborder: Sternorrhyncha Family: Aleyrodidae Subfamily: Aleyrodinae Genus : Trialeurodes Species: Trialeurodes variabilis (Quaintance)
Host range. Manihot esculenta, Carica papaya, Acer sp., Citrus sp., Coccoloba sp., and Gardenia sp. (Mound & Halsey 1978). Distribution. This species is widely distributed in the Americas from the United Status in the north down to Brazil in the south. It has been reported in Colombia, Ecuador, Venezuela, Mesoamerica, countries in the Caribbean basin, Mexico and in Florida State in the USA). Life cycle and morphology of immature stages. Eggs: Eggs are deposited in groups forming a semicircle. Sometimes, eggs are deposited isolated on the underside of the leaf. Eggs are elongated, with anterior pole slightly narrower and adhere to the surface of the leaf through a short pedicel, which keeps it firmly united to the leaf tissue. Just after oviposition, the eggs are colored cream and covered with a waxy powder. As embryo develops inside the egg, a yellow spot can be observed in the superior half of the egg (Figure 8.7 a). When the egg is close to hatch they turn brownish. Embryo development lasts on average 7.7 days (Table 8.7). Egg size, on average is about 0.21 mm long and 0.07 mm wide in its widest section (Table 8.8). First nymphal stage: It is mobile, white-cream in color, elongated in shape, with red eyes, and conspicuous legs without claws. In mounted specimens a crenulated margin (mcr) is apparent. Subdorsum is smooth, and abdominal segments are well differentiated. Vasiform orifice (ov) is subcordated with a short lingula with five lobules (ln) and a pair of microsetae. Caudal setae are as long
Chapter 8-13 2007 Annual Report

Project IP3: improving cassava for the developing world Chapter 8-14
as the vasiform orifice. Average length of first stage nymphs is 0.26mm and their width is around 0.16 mm. On average this stage lasts 5.1 days. Table 8.7. Average duration of different development stages of T. variabilis.
Stage Number of observations
Duration range (days)
Average (days)
Egg 61 7,0 - 9,0 7.7 Nymph 1 51 4,0 - 6,0 5,1 Nymph 2 58 3,0 - 5,0 4,3 Nymph 3 56 5,0 - 7,0 5,3
Nymph 4 or pupa 52 9,0- 11,0 9,9 Adult 55 7,0- 24,0 15,0
Second nymphal stage: Second instar numphs are very similar to those in the first instar, but remain almost immobile on the substrate. Average length of nymphs II is 0.35mm and their width is around 0.21 mm. On average this stage lasts 4.3 days. Third nymphal stage: Third instar nymphs are yellowish slightly translucent, oval shaped with a small constriction between the first and second pair of legs. Margin with narrow crenulatus. Marginal setae are not apparent. Submargin with a line of conic-shaped papillae (23-34 pairs), which produce lengthy waxy filaments (Figure 8.7 b). Coxas of middle and posterior legs have one pair of spine-shaped setae. Caudal setae are shorter than the vasiform orifice. Abdominal segments are easily observable. Lingula presents seven lobules. Average length of nymphs III is 0.45mm and their width is around 0.36 mm. On average this stage lasts 5.3 days.
Figure 8.7. Trialeurodes variabilis. Eggs (a), nymph (b), “pupa” (c) and adult (d). Fourth nymphal stage or “pupa”: Fourth instar nymphs are pale yellow. A clear pair of reddish ocular spots is apparent. They are elongated in shape, visibly elevated above the substrate. Marginal crenulatus are narrow. Submarginal papillae are not continuous (15 to 17 pairs), produce long waxy filaments (Figure 8.7 c). Coxas of middle and posterior legs with a line (from two to five). of spine-shaped setae(Figure 8.8 a). Operculum is subcordate (opc) Lingula presents seven lobules.
a b c da b c d

Chapter 8-15 2007 Annual Report
Caudal setae are at least as long as the vasiform orifice (Figure 8.8 b). Average length of nymphs IV is 0.80 mm and their width is around 0.49 mm. On average this stage lasts 9.9 days
Figure 8.8. (a) Ventral view of pupa: mid- and posterior coxas with spines; (b).Caudal section of pupa: vasiform orifice (ov), operculum (opc), lingula (ln) Adults: They are small insects with yellowish body and white wings which do not rest fully over the abdomen. The difference between female and male, size wise, is significant. They live, on average, 15 days. Natural enemies: The following species have been found among T. variabilis parasitoids: Encarsia nigricephala, E. pergandiella, E.hispida, E. bellotti, Eretmocerus sp. and Amitus macgowni. In addition, Delphastus sp., Leis comformis and Chrysopidae are predators of this whitefly. Table 8.8. Average sizes of each of the developmental stages of Trialeurodes variabilis.
Stage Number of observations
Length (L) (mm)
Width (W) (mm)
Average L / W (mm)
a ba b
Egg 41 0.14 - 0.25 0.07 - 0.13 0.21 - 0.07 Nymph 1 40 0.23 - 0.31 0.13 - 0.20 0,26 - 0.16 Nymph 2 40 0.41 - 0.47 0.26 - 0.31 0.35 - 0.21 Nymph 3 40 0.61 - 0.81 0.43 - 0.52 0.64 - 0.36
Nymph 4 or pupa 40 0.86 - 1.29 0.60 - 1.26 0.80 - 0.49 In addition to the main work described above, a Eretmocerus species native of Calarcá (Quindío Department) was identified (Figure 8.9). During the second semester of 2007 the parasitism of this species on T. variabilis was quantified reaching values as high as 68%. This species was also found to parasite B. tuberculata and B. tabaci at least under greenhouse conditions. Since it has been found to be a useful agent for the biological control

Project IP3: improving cassava for the developing world Chapter 8-16
of white flies this species is currently reared in the greenhouse. Eretmocerus was also found in Valle del Cauca and Cauca Departments, but parasitism levels are below 22%.
Figure 8.9. Adult of Eretmocerus sp (Quindio): female (a) and male (b). 8.3.2 BIOLOGY OF Bemisia tuberculata BONDAR Taxonomy:
Order: Hemiptera Suborder: Sternorrhyncha Family: Aleyrodidae Subfamily: Aleyrodinae Genus : Bemisia Species Bemisia tuberculata Bondar
Host range. Manihot esculenta, M. Aipi, Chamaescyce hypericifolia, Gossypium hirsutum and Eritrina sp. Distribution. Colombia, Venezuela, Ecuador, Brasil, Nicaragua and Puerto Rico (Evans, 2007). Life cycle and morphology of immature stages. Eggs: Eggs are deposited in groups and some times isolated on the underside of the leaves. They are elongated with a wider base. Soon after oviposition they are cream colored, as and the embryo develops inside the eggs turn brown. Embryo development takes an average of 11.8 days (Table 8.9). Egg size, on average is about 0.22 mm long and 0.10 mm wide in its widest section (Table 8.10).
a ba b
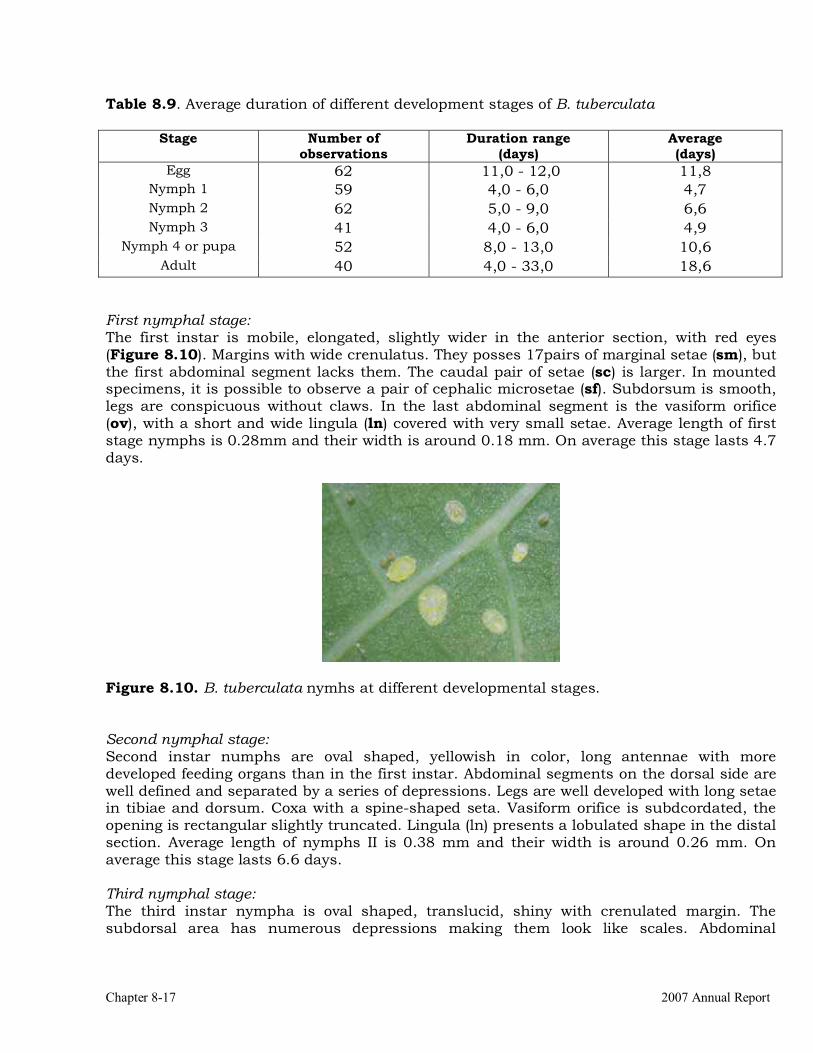
Table 8.9. Average duration of different development stages of B. tuberculata
Stage Number of observations
Duration range (days)
Average (days)
Egg 62 11,0 - 12,0 11,8 Nymph 1 59 4,0 - 6,0 4,7 Nymph 2 62 5,0 - 9,0 6,6 Nymph 3 41 4,0 - 6,0 4,9
Nymph 4 or pupa 52 8,0 - 13,0 10,6 Adult 40 4,0 - 33,0 18,6
First nymphal stage: The first instar is mobile, elongated, slightly wider in the anterior section, with red eyes (Figure 8.10). Margins with wide crenulatus. They posses 17pairs of marginal setae (sm), but the first abdominal segment lacks them. The caudal pair of setae (sc) is larger. In mounted specimens, it is possible to observe a pair of cephalic microsetae (sf). Subdorsum is smooth, legs are conspicuous without claws. In the last abdominal segment is the vasiform orifice (ov), with a short and wide lingula (ln) covered with very small setae. Average length of first stage nymphs is 0.28mm and their width is around 0.18 mm. On average this stage lasts 4.7 days.
Figure 8.10. B. tuberculata nymhs at different developmental stages. Second nymphal stage: Second instar numphs are oval shaped, yellowish in color, long antennae with more developed feeding organs than in the first instar. Abdominal segments on the dorsal side are well defined and separated by a series of depressions. Legs are well developed with long setae in tibiae and dorsum. Coxa with a spine-shaped seta. Vasiform orifice is subdcordated, the opening is rectangular slightly truncated. Lingula (ln) presents a lobulated shape in the distal section. Average length of nymphs II is 0.38 mm and their width is around 0.26 mm. On average this stage lasts 6.6 days. Third nymphal stage: The third instar nympha is oval shaped, translucid, shiny with crenulated margin. The subdorsal area has numerous depressions making them look like scales. Abdominal
Chapter 8-17 2007 Annual Report

Project IP3: improving cassava for the developing world Chapter 8-18
segments are clearly visible. Average length of nymphs II is 0.76 mm and their width is around 0.43 mm. On average this stage lasts 4.9 days. Table 8.10. Average sizes of each of the developmental stages of B. tuberculata.
Stage Number of Length (L) Width (W) Average L / W b i ( ) ( ) ( )Egg 40 0.18 - 0.29 0.07 - 0.13 0.22 - 0.1
Nymph 1 40 0.21 - 0.31 0.13 - 0.22 0,28 - 0.18 Nymph 2 40 0.32 - 0.44 0.17 - 0.30 0.38 - 0.26 Nymph 3 40 0.49 - 0.65 0.32 - 0.49 0.76- 0.43
Nymph 4 or pupa 40 0.83 - 1.26 0.60 – 0.95 1.10 - 0.78
Fourth nymphal stage or “pupa”: Fourth instar nymphs are yellow 1.10 mm long and 0.78 mm wide. This stage lasts for an average of 10.6 days. As development occurs the central region is elevated, has crenulated margin, tracheal folds are visible. The dorsal area has an irregular surface scale-shaped. There are six pairs of subdorsal setae of about similar size. In the central section of segments 1 to 5 a depression in a circular shape can be appreciated. There are no visible cephalic setae. The caudal ones are very small. Legs are strong. Vasiform orifice is triangular in shape and truncated on the apical side. Around the vasiform orifice a very characteristic set of folds that continue through the caudal surcal can be seen. Lingula is elongated ending in a setae shape. Caudal surcal (sc) is about the same length than the vasiform orifice (Figure 8.11).
Figure 8.11. Pupa (photograph on the left) and adult (photograph on the right) of B. tuberculata Adult: Adults are light yellow with white wings. Females are larger than males. Average duration of adult stage is about 18.6 days. Natural enemies: The following species: Encarsia sophia , E. hispida, E. cubensis and Eretmocerus sp are parasitoids, and Chrysopidae sp. is a predator of this whitefly.

8.4 IDENTIFICATION OF WHITEFLIES SPECIES ON ORNAMENTAL AND FRUIT CROPS. Because of their relevance, even for cassava, whiteflies from different crops in Colombia and Brazil were collected. A total of 17 different species collected from 21 hosts, including ornamental and fruit crops were identified. This work could only be made through the collaboration with NARs who collected and shipped a large quantity of samples, which were then processed and mounted for their evaluation and identification. Currently this material is mounted in permanent settings, organized and classified according to their taxonomic relationships in the reference collection at CIAT. Samples were processed at the Cassava Entomology Laboratory. First the genus was identified which was then confirmed by Dr. Gregory Evans (USDA) who confirmed initial classifications and went further to define the species. Table 8.11 presents the list of species identified until the writing of this report. There are few other samples, which are still undergoing taxonomic classification. This activity was also conducted by María del Pilar Hernández. Table 8.11. Whitefly species and their hosts in Valle del Cauca Department, Colombia. Species Host Parasitoids Aleurodicus sp Ficus sp. Brunfelsia pausiflora Heliconia rostrata Aleuronudus bondari (Costa-Lima) Citrus sp. Aleurotrachelus trachoides (Back) Capsicum sp. Solanum lycopersicum Aleurotrachelus sp. Elaeis guinensis Anthurium sp. Aleurothrixus sp. Oryctamus sp. Crescentaleyrodes sp. o nr. Guadua angustifolia Crenidorsum aroidephagus Asplenium nidus-avis Lecanoideus floccisimus Martin, H-S &C Tabebuia guayacán Cananga odorata Minutaleyrodes minuta (Singh) Ixora coccinea Parabemisia myricae (Kuwana) Citrus sp. Paraleyrodes bondari Peracchi Citrus sp. Pealius rhodendri (Takahashi) Rhododendron indicum Octaleurodicus n. sp.* Simaruba glauca Amitus sp. Tetraleurodes sp.* Persea americana Encarsia strenua Trialeurodes sp. Rhododendron indicum
Whiteflies from Petrolina (EMBRAPA), Brazil Bemisia sp. pos. afer Manihot sp. Paraleyrodes sp. Manihot sp. Other species (not whiteflies) identified for Universidad Estadual do Oeste do Paraná. (Brasil).
Phenacoccus manihoti Matile-Ferrero Manihot esculenta Aonydomitilus sp. pos. albus Manihot esculenta Anagyrus lopezi (De Santis) Phenacoccus manihoti Encarsia sp. Aonydomitilus sp.
Chapter 8-19 2007 Annual Report
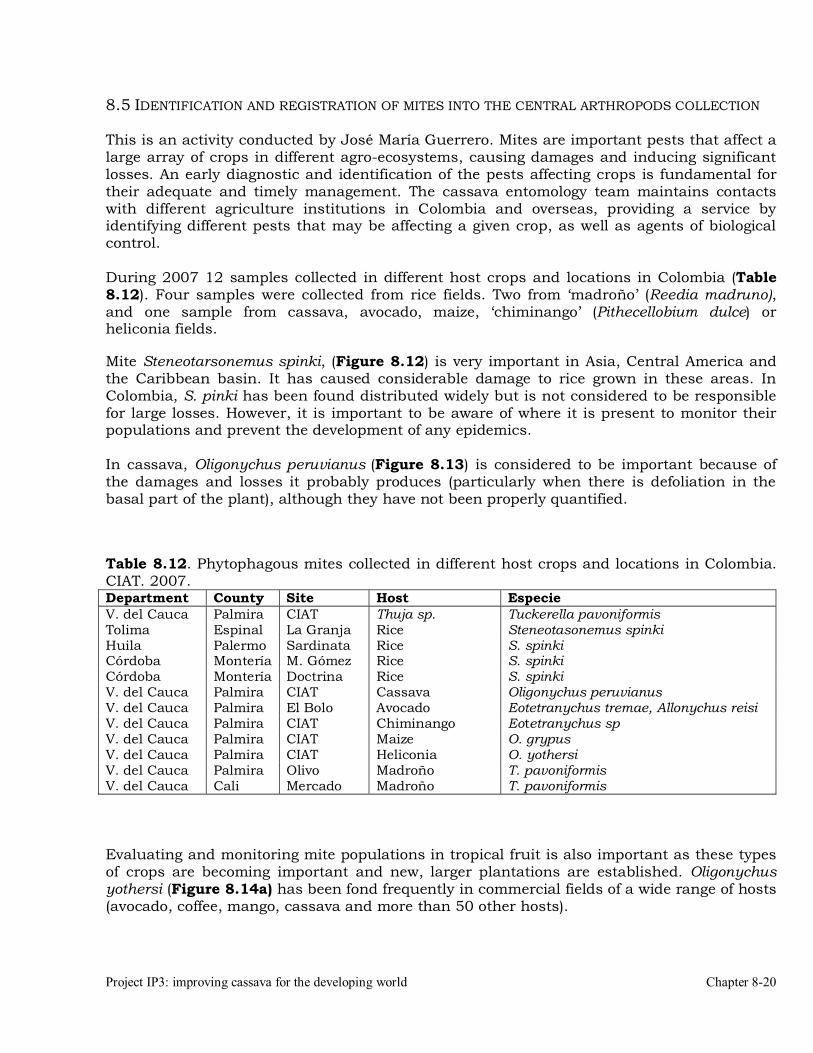
8.5 IDENTIFICATION AND REGISTRATION OF MITES INTO THE CENTRAL ARTHROPODS COLLECTION This is an activity conducted by José María Guerrero. Mites are important pests that affect a large array of crops in different agro-ecosystems, causing damages and inducing significant losses. An early diagnostic and identification of the pests affecting crops is fundamental for their adequate and timely management. The cassava entomology team maintains contacts with different agriculture institutions in Colombia and overseas, providing a service by identifying different pests that may be affecting a given crop, as well as agents of biological control. During 2007 12 samples collected in different host crops and locations in Colombia (Table 8.12). Four samples were collected from rice fields. Two from ‘madroño’ (Reedia madruno), and one sample from cassava, avocado, maize, ‘chiminango’ (Pithecellobium dulce) or heliconia fields.
Mite Steneotarsonemus spinki, (Figure 8.12) is very important in Asia, Central America and the Caribbean basin. It has caused considerable damage to rice grown in these areas. In Colombia, S. pinki has been found distributed widely but is not considered to be responsible for large losses. However, it is important to be aware of where it is present to monitor their populations and prevent the development of any epidemics. In cassava, Oligonychus peruvianus (Figure 8.13) is considered to be important because of the damages and losses it probably produces (particularly when there is defoliation in the basal part of the plant), although they have not been properly quantified.
Table 8.12. Phytophagous mites collected in different host crops and locations in Colombia. CIAT. 2007. Department County Site Host Especie V. del Cauca Palmira CIAT Thuja sp. Tuckerella pavoniformis Tolima Espinal La Granja Rice Steneotasonemus spinki Huila Palermo Sardinata Rice S. spinki Córdoba Montería M. Gómez Rice S. spinki Córdoba Montería Doctrina Rice S. spinki V. del Cauca Palmira CIAT Cassava Oligonychus peruvianus V. del Cauca Palmira El Bolo Avocado Eotetranychus tremae, Allonychus reisi V. del Cauca Palmira CIAT Chiminango Eotetranychus sp V. del Cauca Palmira CIAT Maize O. grypus V. del Cauca Palmira CIAT Heliconia O. yothersi V. del Cauca Palmira Olivo Madroño T. pavoniformis V. del Cauca Cali Mercado Madroño T. pavoniformis Evaluating and monitoring mite populations in tropical fruit is also important as these types of crops are becoming important and new, larger plantations are established. Oligonychus yothersi (Figure 8.14a) has been fond frequently in commercial fields of a wide range of hosts (avocado, coffee, mango, cassava and more than 50 other hosts).
Project IP3: improving cassava for the developing world Chapter 8-20

Chapter 8-21 2007 Annual Report
Figure 8.12. Female and male of Steneotarsonemus spinki
Figure 8.13. (a) Damage on the upper and under side of the leaves caused by Oligonychus peruvianus. (b) Detail of the male, female and eggs under a web.
Figure 8.14. Aedeagus from (a) O. yothersi and (b)Eotetranychus tremae
Female
Male
a b
a b
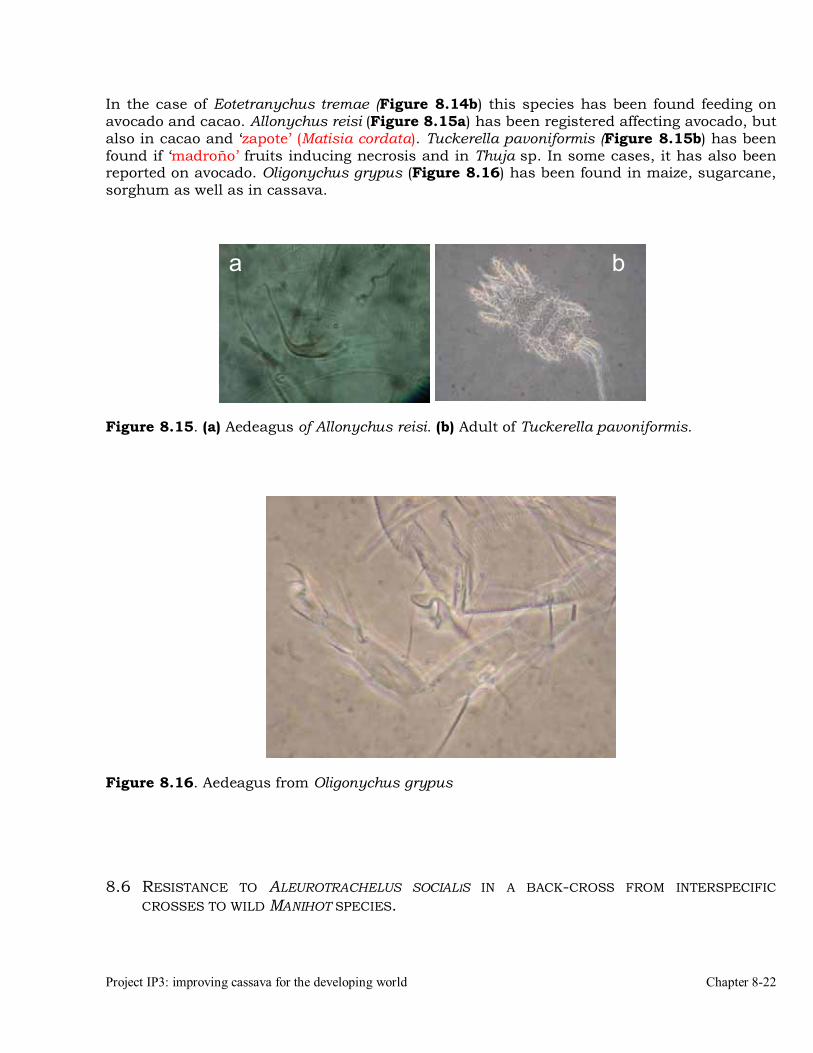
Project IP3: improving cassava for the developing world Chapter 8-22
In the case of Eotetranychus tremae (Figure 8.14b) this species has been found feeding on avocado and cacao. Allonychus reisi (Figure 8.15a) has been registered affecting avocado, but also in cacao and ‘zapote’ (Matisia cordata). Tuckerella pavoniformis (Figure 8.15b) has been found if ‘madroño’ fruits inducing necrosis and in Thuja sp. In some cases, it has also been reported on avocado. Oligonychus grypus (Figure 8.16) has been found in maize, sugarcane, sorghum as well as in cassava.
Figure 8.15. (a) Aedeagus of Allonychus reisi. (b) Adult of Tuckerella pavoniformis.
a b
Figure 8.16. Aedeagus from Oligonychus grypus 8.6 RESISTANCE TO ALEUROTRACHELUS SOCIALIS IN A BACK-CROSS FROM INTERSPECIFIC
CROSSES TO WILD MANIHOT SPECIES.

Chapter 8-23 2007 Annual Report
This work was coordinated by Bernardo Arias with the technical support of Gerardino Pérez, Adriano Muñoz and Carlos Núñez. The main objective of this work was to evaluate whitefly (Aleurotrachelus socialis) incidence in three back-cross families (B1P2, B1P5 and B1P6) derived from the inter-specific cross between cultivated cassava and wild Manihot species. The initial inter-specific hybrids were back-crossed to cultivar MTAI 8 (used as female progenitor). The ultimate objective of the inter-specific crosses followed by back-crossing to cassava was the introgression of the high-protein trait (from the wild Manihot species) into cassava. During the growing of the segregating progenies, there was a strong infestation of the whitefly. This circumstance was taken as an opportunity to further characterize the individual genotypes of each of these three families. This information will be useful for the genetics section of the project. Therefore, in addition to the main target (high-protein), other traits such as resistance to mites and/or whiteflies and prevalent diseases are also addressed.
8.6.1 MATERIALS AND METHODS Scoring for the reaction to whiteflies was conducted at CIAT, taking advantage of excellent levels of natural infestation with high population densities of eggs, nymphs and pupae to the point that fumagin was also widespread as early as at five months after planting. At this age symptoms and reaction to the insect are very distinctive. A damage score ranging from 1 (absence of damage and little or no population of the insect) to 6 (maximum damage, profuse leaf curling, drastic reduction in leaf size in the top third of the plant, mosaic-like chlorosis, presence of fumagin in the entire plant or parts of it, and high population density) was used. Scoring was made on several individual plants (ranging between 3 and 8 plants) from each genotype. There were four replications in the trials analyzed. Information taken included an assessment of population levels (adults, eggs, nymphs and pupae) and damage stratified in the three thirds (superior, medium and lower) of the plant. A descriptive analysis was made and the maximum score (population and damage) at any of the plants from a given genotype either at the lower, medium or top third of the plant, and considering that there were four replications. This information was used to construct graphs that facilitated the analysis of data and detect trends in the behavior of the insect on these cassava families. Ultimately information on their resistance/susceptibility to the pest was produced and this information was added to the selection process, although the priority objective remained the high-protein trait. In addition, taking into consideration that there has been a huge introduction of “foreign” genes into the Manihot esculenta gene pool, through these inter-specific crosses, it was envisioned that these segregating families were ideal to screen for new sources of resistance to the whiteflies, as well as other insects and arthropods. 8.6.2 RESULTS Family B1P2 This family had 223 individuals. Insect pressure in this family was relatively uniform in the field and populations were high in the top and mid thirds of the plants both for nymphs and pupae (Figure 8.17). Most clones were scored between 4 and 6 and only few (six out of 223 or 2.7%) genotypes did not present pupae in the mid sections of their plants. A group of 17 clones (6.3% of the population) presented very low score (below 2.5). The vast majority (203 genotypes representing 91.0 % of the entire family) showed high to very high scores (from 4 to 6). These scores imply populations larger than 3000 whiteflies per leaf.

Project IP3: improving cassava for the developing world Chapter 8-24
the
ted damage with of the plant. A d damage scores
esented the same 3, Table 8.13) or e B1P2-115 and
eration in future
Figure 8.18. Damage scores of A. socialis in family B1P2 derived from the back-cross between inter-specific hybrids and the cassava cultivar MTAI 8.
Figure 8.17. Behavior of white fly populations of A. socialis in family B1P2 derived from
06
0 2
176
18
4127
71 6274
8977 86
43
20 30
0102030405060708090
No.
of c
lone
s
1.0 1.1 - 2.5 2.6 - 3.0 3.1 - 4.0 4.1 - 5.0 5.1 - 6.0
Population scores
Nymph superior Pupa superior Pupa Middle
06
0 2
176
18
4127
71 6274
8977 86
43
20 30
0102030405060708090
No.
of c
lone
s
1.0 1.1 - 2.5 2.6 - 3.0 3.1 - 4.0 4.1 - 5.0 5.1 - 6.0
Population scores
Nymph superior Pupa superior Pupa Middle
back-cross between inter-specific hybrids and the cassava cultivar MTAI 8. Damage scores are presented in Figure 8.18. In general all genotypes presenonly 10 clones (4.5%) with little or no damage in the superior and mid thirdsgroup of 114 clones (out of 233 family which represents the 51.1%) presentebetween 4 and 6 in the top third of the plant; and 70 clones (31.4%) also prdamage scores for the mid third of their plants. Only one genotype (B1P2-220.45% of the family, did not present any damage. In addition to this genotypB1P2-116 presented damage scores of two and should be taken into considworks, as potential source of resistance (Table 8.13).
0
20
40
60
80
100
No.
of c
lone
s
1 9
4763 61
81 77
37 3225
5 8
1 1.1 - 2.5 2.6 - 3.0 3.1 - 4.0 4.1 - 5.0 5.1 - 6.0
Damage score
Damage score in top third Damage score in mid third
0
20
40
60
80
100
No.
of c
lone
s
1 9
4763 61
81 77
37 3225
5 8
1 1.1 - 2.5 2.6 - 3.0 3.1 - 4.0 4.1 - 5.0 5.1 - 6.0
Damage score
Damage score in top thirdDamage score in top third Damage score in mid thirdDamage score in mid third
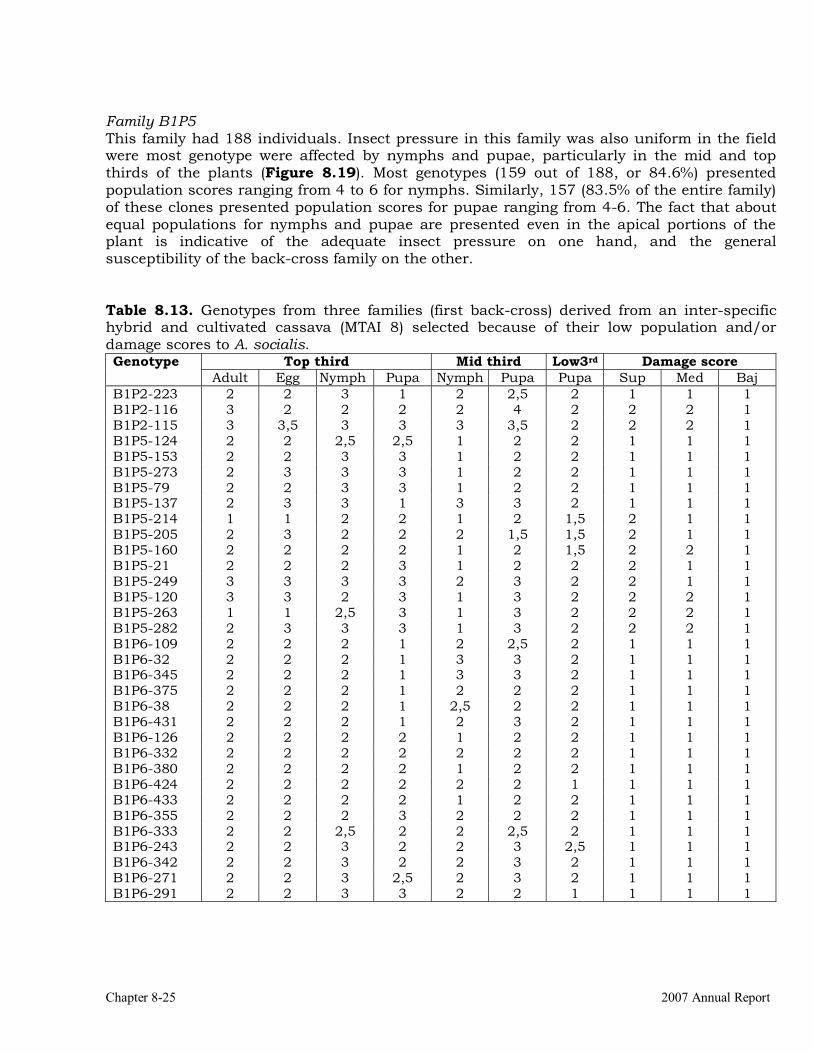
Family B1P5 This family had 188 individuals. Insect pressure in this family was also uniform in the field were most genotype were affected by nymphs and pupae, particularly in the mid and top thirds of the plants (Figure 8.19). Most genotypes (159 out of 188, or 84.6%) presented population scores ranging from 4 to 6 for nymphs. Similarly, 157 (83.5% of the entire family) of these clones presented population scores for pupae ranging from 4-6. The fact that about equal populations for nymphs and pupae are presented even in the apical portions of the plant is indicative of the adequate insect pressure on one hand, and the general susceptibility of the back-cross family on the other. Table 8.13. Genotypes from three families (first back-cross) derived from an inter-specific hybrid and cultivated cassava (MTAI 8) selected because of their low population and/or damage scores to A. socialis.
Top third Mid third Low3rd Damage score Genotype Adult Egg Nymph Pupa Nymph Pupa Pupa Sup Med Baj
B1P2-223 2 2 3 1 2 2,5 2 1 1 1 B1P2-116 3 2 2 2 2 4 2 2 2 1 B1P2-115 3 3,5 3 3 3 3,5 2 2 2 1 B1P5-124 2 2 2,5 2,5 1 2 2 1 1 1 B1P5-153 2 2 3 3 1 2 2 1 1 1 B1P5-273 2 3 3 3 1 2 2 1 1 1 B1P5-79 2 2 3 3 1 2 2 1 1 1 B1P5-137 2 3 3 1 3 3 2 1 1 1 B1P5-214 1 1 2 2 1 2 1,5 2 1 1 B1P5-205 2 3 2 2 2 1,5 1,5 2 1 1 B1P5-160 2 2 2 2 1 2 1,5 2 2 1 B1P5-21 2 2 2 3 1 2 2 2 1 1 B1P5-249 3 3 3 3 2 3 2 2 1 1 B1P5-120 3 3 2 3 1 3 2 2 2 1 B1P5-263 1 1 2,5 3 1 3 2 2 2 1 B1P5-282 2 3 3 3 1 3 2 2 2 1 B1P6-109 2 2 2 1 2 2,5 2 1 1 1 B1P6-32 2 2 2 1 3 3 2 1 1 1 B1P6-345 2 2 2 1 3 3 2 1 1 1 B1P6-375 2 2 2 1 2 2 2 1 1 1 B1P6-38 2 2 2 1 2,5 2 2 1 1 1 B1P6-431 2 2 2 1 2 3 2 1 1 1 B1P6-126 2 2 2 2 1 2 2 1 1 1 B1P6-332 2 2 2 2 2 2 2 1 1 1 B1P6-380 2 2 2 2 1 2 2 1 1 1 B1P6-424 2 2 2 2 2 2 1 1 1 1 B1P6-433 2 2 2 2 1 2 2 1 1 1 B1P6-355 2 2 2 3 2 2 2 1 1 1 B1P6-333 2 2 2,5 2 2 2,5 2 1 1 1 B1P6-243 2 2 3 2 2 3 2,5 1 1 1 B1P6-342 2 2 3 2 2 3 2 1 1 1 B1P6-271 2 2 3 2,5 2 3 2 1 1 1 B1P6-291 2 2 3 3 2 2 1 1 1 1
Chapter 8-25 2007 Annual Report

Project IP3: improving cassava for the developing world Chapter 8-26
A group of 66 genotypes (35.1% of the family) presented damage scores ranging from 4 to 6 in the top third, also indicating severe susceptibility to the insect (Figure 8.19). Of these a group of 50 clones also showed this level of damage in the mid section of the plant. Only seven genotypes (3.7%) presented low damage scores in the mid-third of the plant. Thirty three clones did not present major damage in the top and middle sections of the plant. Damage was not serious in the lower third of the plant in any family. Table 8.13 lists 13 genotypes from this family (B1P5–124, -153, 273, -79, -137, -214, -205, -160, -21, -249, -120, -263 and
Figure 8.19. Scores of damage and populations of A. socialis in family B1P5 back-crossed to MTAI 8.
Family B1P6 Results from this family are summarized in Figure 8.20. Compared with the other two families there were lower levels of population scores, with many values below four. This would suggest that levels of resistance in this family may be acceptable, and at least, higher than in the other two families. A total of 101 out of 221 genotypes making up this family (45.7%) presented nymph scores in the top third between 4 and 5, of those 73 (33% of the family) genotypes also presented pupae in the top of the plant. Damage score in the top third was considerably lower than for the other two families. Almost all (216 out of 221) genotypes in the family, or 97.7% presented damage scores 3 or lower. The same was true for the mid-third of the plant, since 100 genotypes also presented score values � 3. In 49.3% of the family, there was no major damage in the mid-third of the plant, and in 28.5% (15 clones) damage was not observable in the top third either. Table 8.13 presents the list of 17 genotypes from this family selected for further evaluation.
-282), whose reaction to the white flies was promising.
07
08
25
10 7
2942
73
19 1726
64
40
66
5042
54
31
8592
72
1815
815
19
2 4
0102030405060708090
100
No.
of C
lone
s
1 1.1 - 2.5 2.6 - 3.0 3.1 - 4.0 4.1 - 5.0 5.1 - 6.0
Damage and population scores
Nymphs top third Pupae top third Pupae mid-third
Damage superior third Damage mid-third
07
08
25
10 7
2942
73
19 1726
64
40
66
5042
54
31
8592
72
1815
815
19
2 4
0102030405060708090
100
No.
of C
lone
s
1 1.1 - 2.5 2.6 - 3.0 3.1 - 4.0 4.1 - 5.0 5.1 - 6.0
Damage and population scores
Nymphs top third Pupae top third Pupae mid-third
Damage superior third Damage mid-third

Chapter 8-27 2007 Annual Report
Figure 8.20. Population and damage scores in family B1P6 evaluated against A. socialis. 8.7 REFERENCES CIAT 2005. Annual Report IP3. Improved cassava for the developing world. Evans Gregory. 2007. The Whiteflies (Hemiptera Aleyrodidae) of the World and their Host
Plantas and Natural Enemies. http://www.sel.barc.usda.gov:591/1WF/World-Whitefly-Catalog.pdf Mound, L.A., S.H. Halsey. 1978. Whitefly of the world. A systematic Catalog of the Aleyrodidae (Homoptera) with host plant and Natural enema data. British Museum (Natural History). John Wiley & Sons, Chichester. 340 pp.
015
63
109
22
42
133
104 9891
20
8
85
60
4 01513
0 0 1 0 0 00
20
40
60
80
100
120
140N
o. o
f Clo
nes
1 1.1 - 2.5 2.6 - 3.0 3.1 - 4.0 4.1 - 5.0 5.1 - 6.0
Population and damage scores
Nymph top third
Pupa top third
Damage top third
Damage mid third
015
63
109
22
42
133
104 9891
20
8
85
60
4 01513
0 0 1 0 0 00
20
40
60
80
100
120
140N
o. o
f Clo
nes
1 1.1 - 2.5 2.6 - 3.0 3.1 - 4.0 4.1 - 5.0 5.1 - 6.0
Population and damage scores
Nymph top thirdNymph top third
Pupa top thirdPupa top third
Damage top third Damage top third
Damage mid thirdDamage mid third
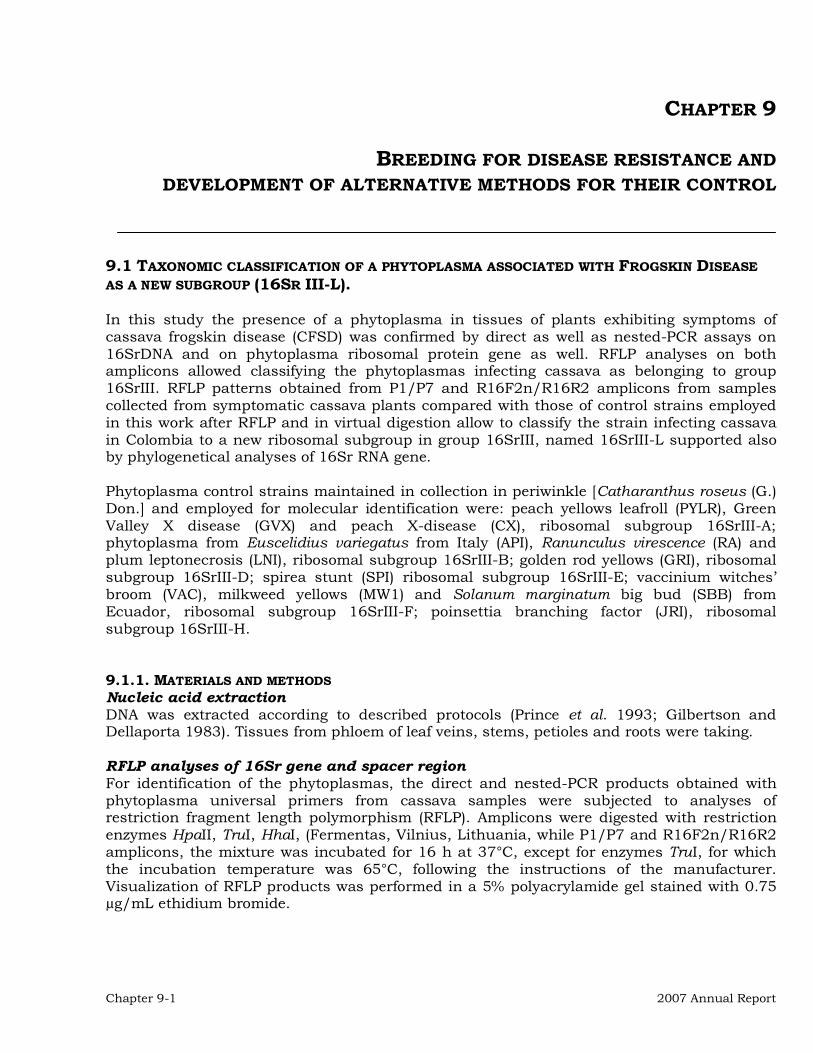
Chapter 9-1 2007 Annual Report
CHAPTER 9
BREEDING FOR DISEASE RESISTANCE AND DEVELOPMENT OF ALTERNATIVE METHODS FOR THEIR CONTROL
9.1 TAXONOMIC CLASSIFICATION OF A PHYTOPLASMA ASSOCIATED WITH FROGSKIN DISEASE AS A NEW SUBGROUP (16SR III-L). In this study the presence of a phytoplasma in tissues of plants exhibiting symptoms of cassava frogskin disease (CFSD) was confirmed by direct as well as nested-PCR assays on 16SrDNA and on phytoplasma ribosomal protein gene as well. RFLP analyses on both amplicons allowed classifying the phytoplasmas infecting cassava as belonging to group 16SrIII. RFLP patterns obtained from P1/P7 and R16F2n/R16R2 amplicons from samples collected from symptomatic cassava plants compared with those of control strains employed in this work after RFLP and in virtual digestion allow to classify the strain infecting cassava in Colombia to a new ribosomal subgroup in group 16SrIII, named 16SrIII-L supported also by phylogenetical analyses of 16Sr RNA gene. Phytoplasma control strains maintained in collection in periwinkle [Catharanthus roseus (G.) Don.] and employed for molecular identification were: peach yellows leafroll (PYLR), Green Valley X disease (GVX) and peach X-disease (CX), ribosomal subgroup 16SrIII-A; phytoplasma from Euscelidius variegatus from Italy (API), Ranunculus virescence (RA) and plum leptonecrosis (LNI), ribosomal subgroup 16SrIII-B; golden rod yellows (GRI), ribosomal subgroup 16SrIII-D; spirea stunt (SPI) ribosomal subgroup 16SrIII-E; vaccinium witches’ broom (VAC), milkweed yellows (MW1) and Solanum marginatum big bud (SBB) from Ecuador, ribosomal subgroup 16SrIII-F; poinsettia branching factor (JRI), ribosomal subgroup 16SrIII-H. 9.1.1. MATERIALS AND METHODS Nucleic acid extraction DNA was extracted according to described protocols (Prince et al. 1993; Gilbertson and Dellaporta 1983). Tissues from phloem of leaf veins, stems, petioles and roots were taking. RFLP analyses of 16Sr gene and spacer region For identification of the phytoplasmas, the direct and nested-PCR products obtained with phytoplasma universal primers from cassava samples were subjected to analyses of restriction fragment length polymorphism (RFLP). Amplicons were digested with restriction enzymes HpaII, TruI, HhaI, (Fermentas, Vilnius, Lithuania, while P1/P7 and R16F2n/R16R2 amplicons, the mixture was incubated for 16 h at 37°C, except for enzymes TruI, for which the incubation temperature was 65°C, following the instructions of the manufacturer. Visualization of RFLP products was performed in a 5% polyacrylamide gel stained with 0.75 μg/mL ethidium bromide.

Project IP3: improving cassava for the developing world Chapter 9-2
In silico RFLP were performed using the public available 16S rDNA sequences of representative strains of 16SrIII subgroups were retrieved from GenBank, and alignments of sequences were generated and sequence similarities evaluated using CLUSTALX (Thompson et al., 1997) and BioEdit (Hall, 1999). Further in silico RFLP were performed using the public available 16S rDNA sequences of representative strains of 16SrIII subgroups were retrieved from GenBank,Putative restriction site maps of the 16S rRNA gene sequences of these phytoplasmas were generated by using the DNASTAR program MapDraw option (DNASTAR Inc.).
PCR/RFLP analyses on ribosomal protein Molecular identification was performed by direct and nested-PCR using primers rpL2F3/rp(I)R1A (Martini et al., 2007) followed by rpIIIF1/rpIIIR1 primer pair, that specifically amplify part of 16SrIII group rp operon (about 300 bp) (Davis et al., 1998). Six μl of PCR products were separated in 1% agarose gel, stained with ethidium bromide and visualized with UV transilluminator. To further characterize the nested-PCR amplicons obtained with phytoplasma rpIIIF1/rpIIIR1 primers from cassava samples were subjected to RFLP analyses with restriction enzymes TruI, Tsp509I and AluI (Fermentas, Vilnius, Lithuania); visualization of RFLP products in a 5% polyacrylamide gel was carried out.
Cloning of PCR products and sequencing Direct sequencing was performed from P1/P7 amplicon of sample SM909-25 (CFSDY15) after cleaning with QIAquick PCR Purification Kit (Qiagen GmbH, Hilden, Germany); both directions sequencing with primers P1, F1 (Davis et al., 1993), and P7 was obtained using the BIG DYE sequencing terminator kit (PE Biosystems, Warrington, UK) in the Centro Ricerche Interdipartimentale Biotecnologie Innovative (C.R.I.B.I. Padua, Italy). The nucleotide sequences determined in this study were deposited in the GenBank data library.
Phylogenetic analyses The public available 16S rDNA sequences of 40 representative strains of the genus ‘Candidatus Phytoplasma’ (IRPCM, 2004) and some additional strains (belonging to 16SrIII group) were retrieved from GenBank and were aligned using CLUSTALX (Thompson et al., 1997) and BioEdit (Hall, 1999). A phylogenetic trees was then constructed using MEGA version 4 (Tamura et al., 2007) for aligning samples CFSDY15, CFSDY17, CFSDY29 16S ribosomal sequences with similar sequences from those phytoplasma strains; bootstrap analysis was also performed and replicated 100 times. Acholeplasma laidlawii a cultivable Mollicute phylogenetically related to phytoplasmas, was designated as the out-group to root the tree.
9.1.2 RESULTSPCR amplification and RFLP analyses of phytoplasma 16S gene and spacer region Direct PCR from symptomatic samples with P1/P7 primers and nested-PCRs with R16F2n/R16R2 primers resulted in the amplification of 1.7 and 1.2 kb DNA fragments respectively. RFLP patterns obtained with the enzymes described above from P1/P7 (data no shown) and R16F2n/R16R2 amplicons from samples collected from symptomatic cassava plants were compared with control phytoplasmas (Figure 9.1). Collective profiles distinguished the CFSD phytoplasma strains from other employed phytoplasmas classified in group 16SrIII; HpaII,
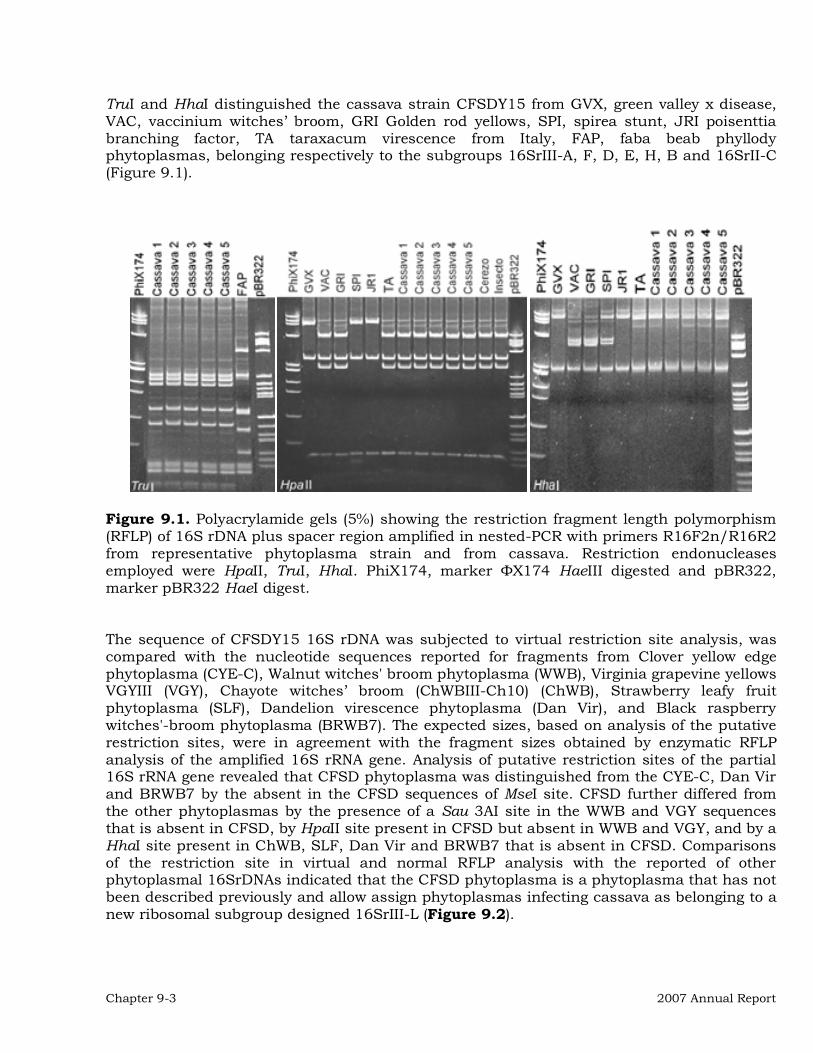
Chapter 9-3 2007 Annual Report
TruI and HhaI distinguished the cassava strain CFSDY15 from GVX, green valley x disease, VAC, vaccinium witches’ broom, GRI Golden rod yellows, SPI, spirea stunt, JRI poisenttia branching factor, TA taraxacum virescence from Italy, FAP, faba beab phyllody phytoplasmas, belonging respectively to the subgroups 16SrIII-A, F, D, E, H, B and 16SrII-C (Figure 9.1).
Figure 9.1. Polyacrylamide gels (5%) showing the restriction fragment length polymorphism (RFLP) of 16S rDNA plus spacer region amplified in nested-PCR with primers R16F2n/R16R2 from representative phytoplasma strain and from cassava. Restriction endonucleases employed were HpaII, TruI, HhaI. PhiX174, marker �X174 HaeIII digested and pBR322, marker pBR322 HaeI digest. The sequence of CFSDY15 16S rDNA was subjected to virtual restriction site analysis, was compared with the nucleotide sequences reported for fragments from Clover yellow edge phytoplasma (CYE-C), Walnut witches' broom phytoplasma (WWB), Virginia grapevine yellows VGYIII (VGY), Chayote witches’ broom (ChWBIII-Ch10) (ChWB), Strawberry leafy fruit phytoplasma (SLF), Dandelion virescence phytoplasma (Dan Vir), and Black raspberry witches'-broom phytoplasma (BRWB7). The expected sizes, based on analysis of the putative restriction sites, were in agreement with the fragment sizes obtained by enzymatic RFLP analysis of the amplified 16S rRNA gene. Analysis of putative restriction sites of the partial 16S rRNA gene revealed that CFSD phytoplasma was distinguished from the CYE-C, Dan Vir and BRWB7 by the absent in the CFSD sequences of MseI site. CFSD further differed from the other phytoplasmas by the presence of a Sau 3AI site in the WWB and VGY sequences that is absent in CFSD, by HpaII site present in CFSD but absent in WWB and VGY, and by a HhaI site present in ChWB, SLF, Dan Vir and BRWB7 that is absent in CFSD. Comparisons of the restriction site in virtual and normal RFLP analysis with the reported of other phytoplasmal 16SrDNAs indicated that the CFSD phytoplasma is a phytoplasma that has not been described previously and allow assign phytoplasmas infecting cassava as belonging to a new ribosomal subgroup designed 16SrIII-L (Figure 9.2).

Project IP3: improving cassava for the developing world Chapter 9-4
Figure 9.2. Analysis of putative restriction sites of 16S rRNA gene sequence of cassava was compared with other phytoplasmas of subgroup 16SrIII, using the MapDraw option of the DNASTAR program. Arrows indicate restriction sites that differentiate CFSD phytoplasma from the reference phytoplasmas. Phylogenetic analyses P1/P7 amplicon from CFSDY15 were selected as representative for sequencing. Sequence of 1,679 bp was obtained from the phytoplasma infecting cassava, which was deposited in GenBank with the accession numbers EU346761 respectively. Phylogenetic comparison of the 16S rRNA gene of CFSD phytoplasma sample CFSDY15 with 40 representative strains of the genus ‘Candidatus Phytoplasma’ confirmed that the CFSD phytoplasmas are very closely related to the phytoplasmas belonging to 16SrIII group (Figure 9.3).

Chapter 9-5 2007 Annual Report
Figure 9.3. Legend in next page.

Project IP3: improving cassava for the developing world Chapter 9-6
Figure 9.3 (previous page). Phylogenetic tree constructed by parsimony analyses or near full lenght 16SrDNA sequences from CFSD phytoplasma strain from Colombia, 40 reference strains of phytoplasma and some additional strains from 16SrIII group, reporting the placement of the CFSD phytoplasma within the genus ‘Candidatus Phytoplasma’, employing Acholeplasma laidlawii as the outgroup. M30790 ‘Ca. Phytoplasma asteris’ (16SrI-B); U15442 ‘Ca. P. aurantifolia’ (16SrII-B); L04682‘Ca. P. pruni’ (16SrIII-A); U18747 ‘Ca. P. palmae’ (16SrIV); X80117 ‘Ca. P. cocostanzianae’ (16SrIV); Y14175 ‘Ca. P. cocosnigerianae’ (16SrIV); AF122910 ‘Ca. P. ulmi’ (16SrV-A); AF305240 ‘Ca. P. ziziphi’ (16SrV-B); X76560 ‘Ca. P. vitis’ (16SrV-C); AY390261 ‘Ca. P. trifolii’ (16SrVI-A); AF092209 ‘Ca. P. fraxini’ (16SrVII-A); AF086621 ‘Ca. P. luffae’ (16SrVIII-A); AF515637 ‘Ca. P. phoenicium’(16SrIX-B); AJ542541 ‘Ca. P. mali’(16SrX-A); AJ542544 ‘Ca. P. prunorum’ (16SrX-B); AJ542543 ‘Ca. P. pyri’ (16SrX-C); X92869 ‘Ca. P. spartii’ (16SrX-D); D12581 ‘Ca. P. oryzae’ (16SrXI-A); AF248959 ‘Ca. P. solani’ (16SrXII-A); L76865 ‘Ca. P. australiense’ (16SrXII-B); AF248960 Mexican periwinkle virescence (MPV)(16SrXIII); AJ550984 ‘Ca. P. cynodontis’ (16SrXIV-A); AF147708 ‘Ca. P. brasiliense’ (16SrXV-A); AY725228 ‘Ca. P. graminis’ (16SrXVI); AY725234 ‘Ca. P. caricae’ (16SrXVII); DQ174122 ‘Ca. P. americanum’ (16SrXVIII-A); DQ086423 ‘Ca. P. fragariae’ Lithuania Strawberry; AJ310849 ‘Ca. P. pini’ Germany Pinus; AB010425 ‘Ca. P. japonicum’ Japan Hydrangea; X76431 ‘Ca. P. rhamni’ Germany Rhamnus frangula; AY135523 ‘Ca. P. allocasuarinae’ Australia Allocasuarina muelleriana; AB054986 ‘Ca. P. castaneae’ South Korea Chestnut; EU346761 Cassava frogskin disease strain (CFSDY15) (16SrIII-L); AY737646 Cassava frogskin disease strain (CFSDY17) (16SrIII-L); AY737647 Cassava frogskin disease strain (CFSDY29)(16SrIII-L); AF147706 Chayote witches’ broom (ChWB) (16SrIII-J); AF274876 Strawberry leafy fruit phytoplasma (SFL) (16SrIII-K); AF373106 Cirsium white leaf phytoplasma (CWL) (16SrIII-U); AF189288 Clover yellow edge (CYE) (16SrIII-B); AF175304 Clover yellow edge (CYE-C)(16SrIII-B); AF302841 Black raspberry witches- broom (BRWB7)(16SrIII-Q); AF060875 Virginia grapevine yellows VGYIII (VGY) (16SrIII-I); AF510724 Milkweed yellows phytoplasma (MW1)(16SrIII-F); AF190227 Walnut witches' broom phytoplasma (WWB) (16SrIII-G); AF190223 Poinsettia branch-inducing phytoplasma (PoiBI) (16SrIII-H); AF370119 Dandelion virescence phytoplasma (DanVir) (16SrIII-P); M23932 Acholeplasma laidlawii. PCR/RFLP analyses on ribosomal protein The use of ribosomal protein group III specific primers produced the expected length amplicons from several symptomatic cassava samples in nested-PCR and from selected phytoplasma reference strains belonging to 16SrIII group (data not shown). RFLP analyses with Tsp509I and AluI restriction enzymes showed no differences among cassava strains and most of the reference strains employed, however profiles obtained with TruI clearly indicates that phytoplasmas infecting cassava differ from all reference strains employed (Figure 9.4). 9.1.3 CONCLUSIONSThe wide presence of phytoplasmas belonging to 16SrIII group suggest the presence of prokaryotes deriving from a common ancestor in South America: phytoplasmas in the same clade were reported in Bolivia in Chinaberry (Melia azedarach); in Brazil in chayote witches’ broom disease and in tomato big bud; in Agentina in garlic (Allium sativum L.) and in chinaberry (Melia azedarach) (Arneodo et al 2007; Galdeano et al 2004; Harrison et al 2003), and finally in Brazil in several diseases including cassava witches’ broom (Barros et al 1998). The adherence of phytoplasmas to the host’s cellular membranes is necessary for successful colonization, which may then interfere with membrane function and alter transportation

Chapter 9-7 2007 Annual Report
mechanisms as shown for human mycoplasmas (Rottem and Naot 1998), restricting, in the case of cassava, sugar transfer from leaves to roots. This results in the accumulation of carbohydrates in leaves, and probably explains the increase of aerial part growth observed in infected cassava plants; the consequent low starch concentrations in roots lead to reduced tuberization (Maust et al 2003). Increased carbohydrate accumulation in leaves also occurs in periwinkle (Catharanthus roseus) (Lepka et al 1999) and pears (Catlin et al 1975) infected by phytoplasmas. Low starch concentrations in roots are also found in palms suffering from lethal yellowing (Montano et al 2000) and in pears infected by pear decline (Catlin et al 1975).
Figure 9.4. Polyacrylamide gels 5% showing RFLP patterns of phytoplasmas from cassava and selected control strains amplified in nested-PCR with rpIIIF1/rpIIIR1 primer pair. CFSDY15 M, P and L, Cassava frogskin diseases phytoplasma strain CFSDY15 from Midrib, Petioles and Leaves; CX, X-disease; GVX, Green Valley X-disease; SBB, Solanum marginatum big bud from Equador, VAC, vaccinium witches’ broom; LNI, Plum leptonecrosis; API, from Euscelidius variegatus from Italy; GRI, golden rod yellows; SPI, spirea stunt; JRI, poinsettia branching factor. PhiX174, marker �X174 HaeIII digested. The reduced transfer of sugars could be caused by the physical blockade of phloem tubes by phytoplasmas and/or by the deposition of calluses or other material in response to phytoplasma infection (Maust et al 2003). In sweet potato infected by phytoplasmas (sweet potato little leaf), the whole plant, including the root system, becomes stunted with a pronounced proliferation of axillary shoots; latex production in vines and roots is also noticeably reduced. Depending on the time of infection, yields of harvestable tubers can be severely reduced, to the extent that plants infected in early growing stages may not produce harvestable tubers (Crossley and Clark 1996). In carrot phytoplasma presence induce among other symptoms the reduction in the size and quality of taproots (Orenstein et al., 1999; Lee et al., 2006; Duduk et al., 2007). 9.1.4 REFERENCES Arneodo, J. D., Marini, D. C., Galdeano, E., Meneguzzi, N., Bacci J.R., Domecq, C., Nome, S.
F., and Conci, L. R. 2007. Diversity and Geographical Distribution of Phytoplasmas infecting China-tree in Argentina. J. Phytopathology 155: 70-75.
Barros, T., Kitajima, E.W., and Resende, R. O. 1998. Diversidade de isolados brasileiro de fitoplasmas através da análise do 16S rDNA. Fitopatol. Bras. 23(4): 459 – 465.
Project IP3: improving cassava for the developing world Chapter 9-8
Catlin, P. B., Olsson, E. A., and Beutel, J. A. 1975. Reduced translocation of carbon and nitrogen from leaves with symptoms of pear curl. J. Am. Soc. Hortic. Sci. 100:184-187.
Davis, R.E., and Lee, I.-M. 1993. Cluster-specific polymerase chain reaction amplification of 16S rDNA sequences for detection and identification of mycoplasmalike organisms. Phytopathology 83, 1008-1001.
Duduk, B., Bulaji�, A., Duduk, N., Calari, A., Paltrinieri, S., Krsti�, B., and Bertaccini, A. 2007. Identification of phytoplasmas belonging to aster yellows ribosomal group (16SrI) in vegetables in Serbia. Bullettin of Insectology 60: 341-342.
Gilbertson, L., and Dellaporta, S. L. 1983. Molecular extraction DNA protocols. In: Molecular biology of plants. Cold Spring Harbor Laboratory, Cold Spring Harbor, NY. pp 395–397.
Galdeano, E., Torres, L. E., Meneguzzi, N., Guzmán, F., Gomez, G. G., Docampo, D. M., and Conci, L. R. 2004. Molecular characterization of 16S ribosomal DNA and phylogenetic analysis of two X-diseases group phytoplasma affecting China-tree (Melia azedarach L.) and Garlic (Allium sativum L.) in Argentina. J. Phytopathology 152:174-181.
Hall, T. A. 1999. Bio Edit: a user-friendly biological sequence alignment editor and analysis program for Windows 95/98/NT. Nucleic Acids Symposium Series, 41: 95-98.
Harrison, N. A., Boa, E., and Carpio, M. L. 2003. Characterization of phytoplasmas detected in Chinaberry trees with symptoms of leaf yellowing and decline in Bolivia. Plant Pathology 52: 147–157.
Lee, I.-M., Bottner, K. D., Munyaneza, J. E., Davis, R. E., Crosslin, J. M. du Toit, L. J., and Crosby, Z. 2006. Carrot purple leaf: A new spiroplasmal disease associated with carrots in Washington State. Plant Disease 90: 989-993.
Lepka, P., Stitt, M., Moll, E., and Seemuller, E. 1999. Effect of phytoplasmal infection on concentration and translocation of carbohydrates and amino acids in periwinkle and tobacco. Physiol. Mol. Plant Pathol. 55:59-68.
Martini, M., Lee, I.-M., Bottner, K. D., Zhao, Y., Botti, S., Bertaccini, A., Harrison, N. A., Carraro, L., Marcone, C., Khan, A. J., and Osler, R. 2007. Ribosomal protein gene-based phylogeny for finer differentiation and classification of phytoplasmas. Int. J. Syst. Bacteriol., 57: 2037-2051.
Maust, B. E., Espadas, F., Talavaera, C., Aguilar, M., Santamaría, J.M., and Oropeza, C. 2003. Changes in carbohydrate metabolism in coconut palms infected with the Lethal Yellowing Phytoplasma. Phytopathology 93: 976-981.
Orenstein, S., Franck, A., Kuznetzova, L., Sela, I., Tanne, E. 1999. Association of phytoplasmas with a yellows disease of carrot in Israel. Journal of Plant Pathology 81(3): 193-199.
Prince, J. P., Davis, R. E., Wolf, T. K., Lee, I-M., Mogen, B., Dally, E., Bertaccini, A., Credi, R., and Barba, M. 1993. Molecular detection of diverse mycoplasmalike organisms (MLOs) associated with grapevine yellows and their classification with aster yellows, X - disease, and elm yellows MLOs. Phytopathology, 83(10):1130–1137.
Rottem, S., and Naot, Y. 1998. Subversion and exploitation of host cells by mycoplasmas. Trends Microbiol. 6:436-440.
Tamura, K., Dudley, J., Nei. M., and Kumar, S. 2007. MEGA4: Molecular Evolutionary Genetics Analysis (MEGA) software version 4.0. Molecular Biology and Evolution, 24: 1596-1599.
Thompson, J. D., Gibson, T. J., Plewniak, F., Jeanmougin, F., and Higgins, D.G. 1997. The Clustal X windows interface: flexible strategies for multiple sequence alignment aided by quality analysis tools. Nucleic Acids Research, 24, 4876-4882.

Chapter 9-9 2007 Annual Report
9.1.5 ACKNOWLEDGEMENTS AND HIGHLIGHTS Juan Fernando Mejia, Elizabeth Álvarez, Assunta Bertaccini (University of Bologna, Italy), Alberto Calari (University of Bologna, Italy) and Bojan Duduk (Institute of Pesticide and Environmental Protection, Belgrade-Zemun, Serbia) were responsible for this work. The following outcomes can be highlighted: i) Report of a new phytoplasma X-diseases subgroup (16SrIII-L) associated with cassava frogskin disease; ii) Through PCR/RFLP analyses on “rp” (ribosomal protein gene) we were able to confirm the classification of cassava frogskin disease phytoplasma as a group 16Sr III. Also differences were detected in the “rp” gen between cassava and control of 16Sr III group; and iii) New report of GenBank sequence (Genbank accession EU346761) of a phytoplasma associated with Cassava frogskin diseases in Colombia and phylogenetic analyses to classify as a new subgroup 16Sr III. 9.2. ASSOCIATION BETWEEN AERIAL AND SOIL VECTORS WITH CFSD Phytoplasmas can survive in the soil; they are also found in certain soilborne insect stages and in living roots, but are unlikely to survive in pure (mineral) soils and dead plant material. Our study aimed to evaluate the soil as a possible source of microorganism vectors of cassava frogskin disease (CFSD), and whether the presence of aerial vectors is related to the dissemination of this important disease. 9.2.1 MATERIALS AND METHODSIn Santander of Quilichao (Cauca, Colombia), a field trial was with cassava variety HMC-1, using stakes from infected plants (Jamundí, Valle del Cauca, Colombia) and healthy plants (Montenegro, Quindío, Colombia). To cut the stakes, a machete was disinfected in a solution of 1% sodium hypochlorite. The plants were planted inside and outside a screen house. The outside plants were separated into two blocks, one receiving a weekly application of insecticides to control aerial vectors and the other no applications. Plots of 12 plants were established in a randomized split-plot design with 3 replications, where the main plots were with insecticides, without insecticides, with screen and without screen, and subplots were healthy and affected plant cuttings. Two crop cycles were realized. The plants inside the screen house received weekly applications of insecticides, rotating two products: either Sistemin® (dimethoate, 3 cc/L of commercial product) or Malathion® (malathion, 1 cc/L of commercial product). The subplots, both inside and outside the screen house, were plants from healthy seed and plants from seed infected with CFSD. At 12 months, all the plants were harvested, and disease severity symptoms were evaluated on roots, using the scale presented at Table 9.1. Samples of roots and leaves were collected for detecting phytoplasmas through nested-PCR. Three crop cycles were realized through of three years (2004 – 2007, see Table 9.2).

Project IP3: improving cassava for the developing world Chapter 9-10
Table 9.1. Scale of symptom severity currently used to evaluate cassava frogskin disease. Grade(
a) Category of infection Observed symptoms
0 Healthy plant Roots have filled, no symptoms; peel is thin and flexible
10 Very light
Roots have filled; few fissures or lip-like splits in some roots; peel slightly opaque and not very flexible
35 Light Roots have filled, with few fissures or lip-like splits in many roots; peel opaque and brittle
65 Moderate Greater number of fissures or lip-like splits in any part of the root (basal, inter-mediate, and distal zones); some reduction of root filling; peel opaque and brittle
90 Severe Presence of reticulation or honeycomb in some or many roots; moderate reduction of root filling; peel is thick, cork-like, and brittle
100 Very severe
Presence of reticulation or honeycomb in many roots; severe reduction of root filling; roots appear woody or fibrous; peel is thick, cork-like, and brittle
(a) Scale of severity (0-5) previously transformed according to Little and Hills, 1989. 9.2.2 RESULTS On harvesting the first-cycle crop, no symptoms were observed in plants from healthy stakes. Plants from infected stakes showed various levels of symptom severity, scoring, respectively, 3.78, 3.22, and 2.67 for outside the screenhouse and no fumigation, outside the screenhouse and fumigation, and inside the screenhouse. However, phytoplasmas were detected through nested-PCR, even in asymptomatic plants, highlighting the sensitivity of this test. The results of the study to detect phytoplasmas through nested-PCR were as follows:
� In the plots with plants from healthy stakes, the frequency of positive samples was 55%, outside screen and not fumigated; 22% outside screen and fumigated.
� In the plots with plants from diseased stakes, the frequency of positive samples was
77%, outside screen and not fumigated; 77% outside screen and fumigated and 44% inside screen.
The low detection of phytoplasmas through amplification of DNA obtained from plants with healthy stakes outside screen and with application of insecticides indicates that insect vectors of phytoplasmas may exist. On harvesting the second-cycle crop, symptom severity in plants from healthy stakes, was greatest in plants outside the screen house and receiving no fumigation (34.3%), followed by plants outside the screen house and fumigated weekly (9.0%), while plants inside the screen house showed no symptoms. On harvesting the third-cycle crop, symptom severity was greatest in plants outside the screenhouse and receiving no fumigation (2.60 (38.2%)), followed by plants outside the screenhouse and fumigated weekly (1.70 (15%)), while plants inside the screenhouse showed no symptoms. These findings corroborated the hypothesis of a possible presence of an aerial vector. Plants from infected stakes presented symptoms of CFSD, whereas plants from healthy seed did not show symptoms.

Chapter 9-11 2007 Annual Report
A four cropping cycle using new seed from different variety, is currently being trialed to confirm the results obtained so far, and to elucidate the possible role of the vector in spreading the disease. Table 9.2. Evaluation of different treatments in the field in terms of severity of disease, for cassava frogskin disease through two crop cycles of the variety HMC-1.
Source of PCR Severity per plant at harvest inTreatment Cuttings
(a) Detection
(%) 1st cycle
(2004-2005)b 2nd cycle
(2005-2006)b 3rd cycle
(2006-2007)bOutside screen, not fumigated D 77 3.78 (77.3%) 3.72 (75.2%) 3.90 (79.3%)
Outside screen, not fumigated H 55 1.00 (0.0%) 2.55 (34.3%) 2.60 (38.2%)
Inside screen, fumigated H 11 1.00 (0.0%) 1.00 (0.0%) 1.00 (0.0%)
Inside screen, fumigated D 44 2.67 (38.5%) 2.93 (47.6%) 2.20 (33.3%)
Outside screen, fumigated D 77 3.22 (57.7%) 3.77 (77.0%) 3.90 (81.0%)
Outside screen, fumigated H 22 1.00 (0.0%) 1.60 (9.0%) 1.70 (15%)
LSD 5% 20.7 9.5 11.4 a Cuttings source: D = diseased cuttings; H = healthy cuttings b Average of three plants and three replications evaluated for diseased roots at harvest according to a disease severity scale, where 1 = no symptoms; 2 = mild; 3 = moderate; 4 = moderate to high; 5 = severe symptoms. 9.2.3 ACKNOWLEDGEMENTS AND HIGHLIGHTS Juan Fernando Mejía, German Llano and Elizabeth Álvarez conducted this research. A highlight is the suggestion that the soil may be a possible source of microorganism vectors of cassava frogskin disease (CFSD), and the need to evaluate whether the presence of aerial vectors is related to the disease’s dissemination. 9.3 USE OF CITRUS SEED EXTRACT AND TRICHODERMA FOR MANAGING CASSAVA DISEASES IN THE EASTERN PLAINS, COLOMBIA Bacterial blight, Phytophthora root rots, and superelongation disease are widespread and cause high losses in important cassava-producing regions in Colombia. Several ecological control practices, like the use of biocontrol agents, have been evaluated recently for managing root rots in cassava. In this report, we discuss the progress made towards the objective: with farmer participation, to adjust and validate strategies of integrated management of the constraining diseases found in each region. 9.3.1. EXPERIMENTS IN PUERTO LÓPEZ (META DEPARTMENT) Two semicommercial plots were established on farms in Tauramena (Casanare) and Puerto López (Meta), to evaluate the performance of four promising cassava varieties and the effect of

Project IP3: improving cassava for the developing world Chapter 9-12
treating stakes with Lonlife and of inoculating them with T. viride and T. harzianum, with and without organic matter. We planted 0.5 ha with the varieties La Reina, Vergara, and CM 4574-7, and treated the stakes and soil as described below. A check without Trichoderma spp. was planted. Good quality stakes were selected from productive healthy plants. They were treated as follows:
a. Stakes were immersed for 10 min in a solution with Lonlife and the insecticide Roxion® (dimethoate), each at 2 cc/L.
b. Stakes were immersed for 10 min in a solution of Trichoderma harzianum strain
AgroGuard (Live Systems Technology S.A.) or of Trichoderma viride strain CIAT (0.5 g/L, equivalent to 2.5 × 10⁸ spores/L). These Trichoderma spp. strains antagonists and plant growth stimulators, were also applied directly to the soil around planted cassava stakes, after planting, at 0.5 g/L, equivalent of 2.5 × 10⁸ spores/L.
c. Farmers immersed stakes for 10 min in a solution of copper oxychloride (at
3 g/L) and Roxion (at 2 cc/L). This treatment was used as check. Germination was similar in both stake treatments. Evaluations of incidence of disease were conducted by the technicians handling the crop. These evaluations will serve to define crop management practices, which are urgently needed as the area planted to the crop expands in response to demand for fuel-bioethanol production from cassava. Variety CM 4574-7 showed no symptoms of either superelongation disease (SED) or cassava bacterial blight (CBB), while La Reina was the most affected by both diseases. The technicians regard CM 4574-7 as the variety that so far shows the best performance. At harvest, significant differences were observed between yields of varieties, with Vergara and CM 4574-7 being the best. However, the latter variety was the most affected by rots at 20% when the AgroGuard strain of T. harzianum was used. Except for variety Vergara, no significant differences were observed among yields after strains of the antagonistic Trichoderma fungus were applied. For Vergara, yields were highest after treatment with the strains CIAT-14PDA-4 and AgroGuard. In terms of dry matter content, both Trichoderma species were better than check in 2.6 to 3.6%, depending on variety. The difference was higher in CM 4574-7. Figure 9.5 shows the effect of the two Trichoderma strains evaluated for yield. Yield with the CIAT strain was more than 7.5 t/ha higher than Agroguard in variety La Reina, whereas in varieties Vergara and CM 4574-7, the Agroguard surpassed CIAT strain by 5 t/ha and 2 t/ha, respectively. The Least significant difference (LSD �10%) was 7.3 t/ha. La Reina surpassed varieties Vergara and CM 4574-7, by 6 t/ha (LSD �5% = 3 t/ha).

Chapter 9-13 2007 Annual Report
0
5
10
15
20
25
30
35
Agroguard CIAT 14PDA-4 Control
Treatment and variety
Yie
ld (t
/ha) Vergara
La ReinaCM4574-7
Figure 9.5. Effect of three Trichoderma strains on the yield of three cassava varieties, Cantaclaro Farm, Puerto López, Meta. Trichoderma harzianum (Agroguard®) y Trichoderma viride (CIAT 14PDA-4) 9.3.2. EXPERIMENTS IN TAURAMENA (CASANARE DEPARTMENT) Two cassava varieties, La Reina and ICA Catumare, were planted on 0.5 ha and the following stake and soil treatments were carried out: Treatments. Two fungal strain was used to inoculate two organic products (Abimgra®=organic matter with chemical fertilizer and Ecoterra®=biological inoculant), which were incorporated into the soil at planting. The inoculum was either the fungus T. viride strain CIAT-14PDA-4 or the product Agroguard (T. harzianum), each at 0.5 g/L, which was equivalent to 2.5 × 10⁸ spores/L. As Figure 9.6 illustrates, Trichoderma viride (CIAT) and T. harzianum (Agroguard) strains performed better when Ecoterra® was applied to the soil. Apparently, the inoculant enhances the absorption of nutrients and the effects of growth regulators, particularly in cv. La Reina, for which yields were 23.9 t/ha with the T. viride strain and 16.2 t/ha with T. harzianum (LSD at 5% = 7 t/ha). Where no Ecoterra® was applied, yields for both varieties La Reina and Catumare dropped to 15 t/ha (T. viride) and 13 t/ha (T. harzianum).

Project IP3: improving cassava for the developing world Chapter 9-14
0
5
10
15
20
25
30
CIAT-Ecoterra
CIAT AgroguardEcoterra
Agroguard Control
Treatment and variety
Yie
ld (t
/ha)
La ReinaCatumare
Figure 9.6. Yields of cassava varieties La Reina and Catumare when the soil was treated with strains of Trichoderma harzianum (Agroguard) and T. viride (CIAT), and the inoculant Ecoterra® on a farm in Tauramena, Casanare. When an organic fertilizer was used together with a chemical fertilizer, cv. Catumare yielded 22.1 t/ha. Yields dropped to 10.3 t/ha when only the chemical fertilizer was applied (LSD at 5% = 5.3 t/ha). When both the organic and chemical fertilizers were applied, yields of both cultivars La Reina and Catumare were 15 t/ha and 13 t/ha for T. viride and T. harzianum, respectively. Differences were not significant (Figure 9.7). For both varieties, when inoculated with Trichoderma spp., dry matter increased, on average, from 26.8% to 29.7%, with cv. La Reina having the higher dry matter content. We conclude that the effect of Trichoderma spp. increased when Ecoterra® was used, and that cassava yields are higher when organic and chemical fertilizers are used together than when the chemical fertilizer is used alone. 9.3.3 ACKNOWLEDGEMENTS AND HIGHLIGHTS The following scientists were involved in this work: Elizabeth Álvarez, Germán Llano, Juan Fernando Mejía, Víctor Montaña, and Jaime Jaramillo (Petrotesting Colombia S.A.). The highlight of this work was that cassava yields were successfully increased by using Trichoderma viride and Trichoderma harzianum.

Chapter 9-15 2007 Annual Report
0
5
10
15
20
25
Fertilizer +Abingra
CIAT Agroguard Fertilizer
Treatment and variety
Yie
ld (t
/ha)
La ReinaCatumare
Figure 9.7. Yields of two cassava varieties when the soil was treated with a chemical fertilizer, the organic fertilizer Abimgra®, and strains of Trichoderma harzianum (Agroguard) and T. viride (CIAT) on a farm in Tauramena, Casanare. 9.4 OTHER ACTIVITIES 9.4.1 FIELD DAYS AND TRAINING Two field days were organizad by the cassava pathology team. The subjects were integrated cassava management and disease control with biological inputs. The events took place in Tauramena and Aguazul (both locations in the Casanare Department). April 23, 2007. Alvaro José Guzmán (Colegio Bolívar). Diagnostics, disease resistance, pathogenicity tests in cassava, berries, lulo and guanábana.. Cassava Diseases. IPRA Workshop and Training course. August 2, 2007. Trainining to 25 farmers from Tauramena (Casanare Department). Augst 15, 2007. Trainining to 35 students from 6th semester of Agronomy from Universidad UDCA (Bogotá). October 10, 2007. Training of Fanny Puard and Adrien Brusson, de ENIHP (Ecole Nationale d'Ingénieurs de l'Horticulture et du Paysage Monpellier, France. May to July, 2007. Training on Cassava Frog Skin Disease to personnel from Instituto Colombiano de Agricultura (ICA). November 6-7, 2007 Workshop “Diseases Induced by Phtoplasmas and Diagnostic Methods”. October 1-2, 2007. 25 participants attended this meeting. George W. Norton. Virginia Tech. Project Evaluator. Fritolay Company. Evaluation of feasibility of research projects in cassava and plantain.

Project IP3: improving cassava for the developing world Chapter 9-16
9.4.2 CONFERENCES Alcohol a partir de yuca. I Seminario Nacional del Sector Agropecuario. Colombia Agrícola 2019. Armenia, August 17, 2007. El cultivo de la yuca en la era de los biocombustibles. Riesgos fitosanitarios. XXVIII Congreso Nacional de Fitopatología. Cali, Octubre 3 – 5 de 2007. 9.4.3 CONFERENCES, WORKSHOPS ATENDED BY PERSONNEL FOR THE CASSAVA PATHOLOGY TEAM: I Seminario Nacional del Sector Agropecuario. Colombia Agrícola 2019. Armenia, Agosto 17 de 2007. ASCOLFI. XXVIII Congreso Nacional de Fitopatología. Cali, 3 a 5 de octubre de 2007. Taller Innovación tecnológica para el sector agrícola: un sistema de agricultura específica por sitio que aprovecha y comparte las experiencias de los mismos productores. CIAT, Cali, Octubre 18 – 19 de 2007 First International Phytoplasmologist Working Group Meeting November 12-15, 2007, Bologna - Italia Curso en Buenas Prácticas de Laboratorio. Cali, noviembre 23 de 2007. 9.4.4 PUBLISHED SCIENTIFIC ARTICLES Alvarez, E., Mejía, J.F., Loke, J.B. Llano, G.A. 2005. Detection and characterization of a phytoplasma associated with cassava frogskin disease. Fitopatología Colombiana 29 (2): 69-76. Alvarez, E., Mejía, J.F., Llano, G.A, Loke, J.B. 2007. Detection and characterization of a phytoplasma associated with frogskin disease in cassava. Bulletin of Insectology 60 (2): 273 – 274. Published by Department of Agroenvironmental Sciences and Technologuies Alma Mater Studiorum University of Bologna, Italy Divulgation Brochure: Prevenga y Controle el Cuero de Sapo de la Yuca (Manihot esculenta Crantz). ICA Quindío, CIAT Divulgation Brochure: Enfermedades limitantes del cultivo de la yuca. ICA Quindío Alvarez, E., Llano, G.A, Loke J.B., González A. 2007. Nuevas Alternativas para el Manejo de Moko de Plátano. Revista ASIAVA 78: 12-15. Alvarez, E., Mejía, J.F., Llano, G.A., Loke, J.B.2007. Detection and characterization of a phytoplasma associated with frog skin disease in cassava Bologna 12-15 November, 2007. 9.4.5 APPROVED RESEARCH PROPOSALS Development of low-cost technologies to pyramiding useful genes from wild relatives of cassava into Elite progenitors, The Generation Challenge Programme, US$ 894,906

Chapter 9-17 2007 Annual Report
Combating Hidden Hunger in Latin America: Biofortified crops with improved Vitamin A, Essential Minerals and Quality Protein, CIDA, US$ 122.880 Mejoramiento del manejo nutricional para el control preventivo del mildeo velloso del rosal, Peronospora sparsa. Ministerio de Agricultura y Desarrollo Rural de Colombia.-COLCIENCIAS, US$105.000 Estrategia de Manejo sanitario y fitosanitario para mejorar la productividad en la cadena de yuca y su industria: Desarrollo y evaluación de un programa de manejo integrado de microorganismos asociados con la enfermedad de cuero de sapo en yuca en la zona caribe Colombiana, Ministerio de Agricultura y Desarrollo Rural de Colombia, US$860.000. 9.4.6 CONCEPT NOTES SUBMITTED Determinación y manejo del daño y muerte de los aguacates de la Sierra Nevada y de los Montes de María. Ministerio de Agricultura y Desarrollo Rural de Colombia. Tools for Cassava Breeding, Improvement, and Germplasm Exchange, Bill & Melinda Gates Foundation Innovaciones Tecnologicas Para El Manejo De Pudrición de Raíces de Yuca con la Participación De Comunidades Indigenas de la Amazonia, Concurso Fundación Aurelio Llano, 50.000.0000 Manejo sostenible y competitivo de plantaciones de mango de pequeños agricultores en Colombia y Venezuela. FONTAGRO, US1.105.769, 15 Agricultura específica por sitio para mejorar la competitividad de las cadenas productivas de lulo y mora en Ecuador y Colombia, FONTAGRO, US 910.000. Global Phytophthora Network (GPN): A cyberinfrastructure gluing together data, “e-tools” and human resources to support the monitoring and management of Phytophthora.
Chapter 10-1 2007 Annual Report
CHAPTER 10
DEVELOPMENT AND USE OF BIOTECHNOLOGY TOOLS FOR CASSAVA IMPROVEMENT: MOLECULAR MARKERS
Many of the activities related to biotechnology tools have been described elsewhere in this report. Therefore, biotechnology research for cassava goes well beyond the activities described in this chapter. Of particular relevance are the activities describes in Chapter 1 (in relation to nutritional quality); Chapter 0 (in relation to high-value traits); Chapter 8 (collaboration with other institutions, training and publications); Chapter 9 (germplasm collection and wild Manihot relatives) and in relation with pests and disease resistances described in Chapters 10 and 11.Biotechnology tools, therefore, have been incorporated in many different activities and for a wide array of purposes in the cassava research conducted at CIAT. This chapter provides further information on biotechnology tools that was not mentioned elsewhere but, nonetheless, represents the hopes for a better and more efficient genetic enhancement of cassava. 10.1 MOLECULAR MARKER-ASSISTED SELECTION (MAS) FOR THE IMPROVEMENT OF LOCAL CASSAVA GERMPLASM IN TANZANIA FOR PEST AND DISEASE RESISTANCE The Tanzanian cassava Molecular Marker Assisted Selection (MAS) and Participatory Plant Breeding (PPB) project has completed a first phase of three years, 2003-2006. In the first phase, 2003-2006, High dry matter elite lines bred at CIAT for resistance to CMD using molecular markers were introduced into Tanzania, evaluated in a single year, and crossed to CBSD resistant local Tanzanian varieties to combine resistance to both diseases in farmer-preferred varieties. A second phase, 2007-2009 was awarded by the donor, the Rockefeller foundation, and it entails a single year of clonal evaluation trials (CET), followed by two years of participatory evaluation of preliminary yield trials (PYT), and recommendation for release of selected varieties. In April 2007, the F1s, planted in a seedling trial, were evaluated for resistance to CMD and CBSD, dry matter content, harvest index, and fresh root yield. A selection 1611 genotypes were established in a clonal evaluation trial in May 2007. The F1 seedling nursery was harvested in March 2007 and evaluated for root necrosis, due to susceptibility to CBSD, resistance to CMD, dry matter content, harvest index, and fresh root yield. A clonal evaluation trial was planted in May 1, 2007, in a complete randomized block design, with 1611 F1 genotypes selected from the seedling nursery and control varieties planted every 40 genotypes. A well adapted farmer-preferred local variety Mfaransa and an officially released variety Kiroba were used as controls. A plot size of one row of five plants per genotype spaced at 1 x 1 meters was used. In addition to these control varieties, spreader rows of highly susceptible CBSD and CMD varieties were included in the trial to increase disease pressure on the field. At three and six months foliar symptoms of CBSD, CMD, and CGM were evaluated in the clonal trial. Harvest of the CET is planned for April 2008.

Project IP3: improving cassava for the developing world Chapter 10-2
A total of Table 10.1 lists the best 34 genotypes from over 2,000 genotypes evaluated in the seedling trial with respect to fresh root yield. Simple statistics for the entire F1 seedling trial are also provided. Results reveal successful combination of resistance to CMD and high dry matter yield from elite CIAT CMD resistant introductions and local farmer-preferred CBSD resistant germplasm. The healthy clonal evaluation trial (Figure 10.1) also reiterates this result. The CIAT introductions A30-3 and AR42-4 and the local variety Namikonga were parental lines for 23-25% of the top yielding genotypes (Table 10.1). A total of 80 parents were used for the crosses and the high level of excellent genotypes coming from these 3 lines suggests they are good general combiners for fresh root yield.
Figure 10.1. Healthy F1 cassava genotypes obtained from crossing CMD resistant elite CIAT lines and CBSD local farmer-preferred varieties in the field in Chambezi, Tanzania. Data on the evaluation of response to pest and diseases in the F1s at 3 and 6 months in the CET are still being compiled and will be reported in the following year. Perspectives Selection of F1s from the CET based on resistance to CMD, CBSD, harvest index, and high dry matter yield will be transferred to a plant participatory breeding (PPB) preliminary yield trials in 14 villages each from the Southern and Eastern region of Tanzania

Chapter 10-3 2007 Annual Report
Table 10.1. Top 34 F1 genotypes, with respect to fresh root yield, and simple statistics for the entire breeding population from a seedling trial of a F1 genotypes obtained from crossing CIAT introductions and local cassava varieties
Genotype Mother Father Rootwt (ton/ha)
Harvest Index
%Dry matter
CMD at 12 MAP
CBSD at 12MAP
O3-2 Kiroba 80.00 0.30 34.0 1 2 O1-1 Mkiwa 75.00 0.63 28.7 2 1 C47-10 Kifumulo AR30-3 73.00 0.62 36.6 1 1 C9-110 Kalolo CR52A-19 70.00 0.78 35.4 1 2 C96-13 AR17-25 Namikonga 60.00 0.55 33.5 1 3 O42-2 CR52A-40 53.33 0.70 28.5 2 2 C130-10 AR16-1 Muzege 49.00 0.52 29.1 1 1 O4-15 CR45-9 46.00 0.63 38.2 1 2 C36-30 Mfaransa AR30-3 38.00 0.52 35.8 1 2 C57-1 Amani AR30-3 37.00 0.51 36.0 1 2 C1-8 Kalolo AR42-4 35.00 0.70 34.0 1 2 O16-89 AR42-4 35.00 0.54 27.1 1 2 C36-30 Mfaransa AR30-3 35.00 0.58 33.9 1 1 C232-1 Kiroba AR42-2 32.00 0.62 36.0 1 1 C165-2 AR9-18 Kifumulo 32.00 0.52 34.6 1 1 C111-7 AR42-4 Namikonga 32.00 0.53 39.8 1 1 C41-1 Mfaransa CR20B-2 30.00 0.27 32.7 1 2 C67-11 Albert AR30-3 30.00 0.51 31.1 1 2 C218-14 albert AR42-4 30.00 0.38 33.3 1 2 C1-33 Kalolo AR42-4 30.00 0.58 37.8 1 1 C57-1 Amani AR30-3 30.00 0.31 35.5 C154-33 AR42-4 Muzege 30.00 0.50 36.5 1 1 C130-52 AR16-1 Muzege 28.67 0.46 35.8 1 2 C20-11 Namikonga AR42-2 28.00 0.54 37.1 3 1 C154-84 AR42-4 Muzege 27.50 0.51 27.2 2 2 C4-18 Kalolo AR30-3 26.67 0.57 34.5 1 2 C154-134 AR42-4 Muzege 26.00 0.66 35.4 1 1 C111-25 AR42-4 Namikonga 26.00 0.63 28.5 1 3 C110-38 CR20A-6 Namikonga 26.00 0.43 37.3 1 1 C11-56 Nanchinyaya AR42-2 26.00 0.55 31.9 2 3 C21-81 Namikonga AR30-3 25.00 0.45 37.1 1 1 C110-2 CR20A-6 Namikonga 25.00 0.52 44.5 2 1 C233-61 AR32-2 kalolo 25.00 0.55 35.6 1 1 C81-24 AR12-11 Namikonga 25.00 0.38 28.7 1 2
Average 2.51 0.38 35.45 1.32 1.55 Std Deviation 2.66 0.13 5.53 0.72 0.70 Maximum 20.50 1.00 76.26 5.00 5.00 Minimum 0.00 0.06 16.30 1.00 1.00
This activity was conducted with the financial support of the Rockefeller Foundation and core resources from CIAT. Among the collaborators the following people were closely involved in the research: Kullaya A.(ARI-Mikocheni) ; K. Mtunda; Masumba E., (SRI-Kibaha) H. Kulembeka (ARI-Ukiriguru); M. Ferguson (IITA-Nairobi); Ospina Cesar, Hurtado Paula, Gutierrez Janneth, Barrera Edgar, Marin Jaime, Castro Ana Maria, Morillo Ana Cruz, Alzate

Project IP3: improving cassava for the developing world Chapter 10-4
Adriana; N. Morante under the supervision of M. Fregene (CIAT). As relevant outputs we can mention the identification of 1611 CMD and CBSD resistant F1 genotypes with high dry matter yield in crosses between CMD resistant CIAT introductions and cassava brown streak disease (CBSD) resistant local farmer-preferred germplasm and the establishment of the afore-mentioned genotypes in a clonal evaluation trial to select a sub-set for participatory preliminary yield trials (PYT) 10.2 MARKER-ASSISTED SELECTION (MAS) FOR BREEDING RESISTANCE TO CASSAVA MOSAIC DISEASE (CMD) IN TANZANIAN Supplementary to field evaluation of populations designed to improve local varieties for resistance to CMD and CBSD, a MAS program was also conducted to compare the effect of MAS and phenotypic evaluation. The Genotyping Support Service project (GSS) of the Generation Challenge Programme (GCP) provided funds to CIAT to conduct marker genotyping of the afore-mentioned populations. The genotyping activities included the molecular evaluation of parental lines of the breeding populations from Tanzania using four marker pairs that flank the CMD2 gene (RME1-NS158, RME1-RME4, RME1-NS169) Families that were polymorphic for the afore-mentioned marker pairs were subjected to marker genotyping. The results of the Genotyping Services were made available to the Mikocheni Agricultural Research Institute (MARI), lead institution of the Tanzanian MAS project and also compared with results of phenotypic evaluation. Dried leaves tissue was sent from the MARI, Tanzania, and DNA extraction was conducted at CIAT following the Dellaporta protocol. Seventy-nine parents and two PCR controls were evaluated for polymorphism with markers associated with CMD2-mediated resistance namely RME1, RME4, NS158, and NS169. From results of the parental survey of polymorphism families were selected for MAS using the appropriate polymorphic markers associated with resistance to CMD. Genotypes having the allele markers associated with CMD2 were scored as R (CMD resistant genotype), while S depicts CMD susceptible genotypes. Conditions for marker evaluation have been reported earlier (CIAT 2003). Results of the marker evaluation of the parental lines are presented in Table 10.2 and Figure 10.2. From results of the parental survey, 159 families could be evaluated with markers associated with resistance to CMD2. Individual progenies from selected families were evaluated with the appropriate markers and the summary of CMD resistant and susceptible individuals identified with the four markers in the crosses are presented in Table 10.3 Genotypes having the allele markers associated with CMD2 were scored as R (CMD resistant genotype), while S depicts CMD susceptible genotypes. The 4 markers linked to CMD2 were selected in such a way to flank the gene. RME1 and NS158 flank the gene at a distance of 4 and 7cM respectively. RME4 and NS169 are on the same side with NS158 but are at 10 and 12cM from the gene respectively. Percentage of individuals having marker alleles associated with CMD2 for 2 markers ranged between 69.8 and 89.5% in the controlled crosses and 69.1 and 83.8 in the open pollinated crosses (Table 10.4). Determination of CMD resistance with flanking markers is more accurate compared to single markers because double recombination between flanking markers at less than 20cm is a relatively rare event.

Chapter 10-5 2007 Annual Report
The families selected above by MAS were planted in a clonal evaluation trial (CET) in the field at the Chambezi sub-station of the Mikocheni Agricultural Research Institute (ARI), Dar es Salaam, Tanzania, in April 2007 and evaluated for CMD resistance at 3 and 6 months after planting. Table 10.2. Evaluation of 79 progenitors of breeding populations with four markers associated with CMD2 (R: allele associated with CMD resistance, S: other alleles)
555657585960616263646566676869707172737475767778798081
42434445464748495051525354
CR52A-19CR54B-44AlbertAmaniBwana MrefuKabindaKaloloKibahaKibandamenoKifumuloKigoma MtotoKigoma RedKilokoteKirobaLimbangaLipukalyeneMfaransaMkiwaMuzegeMzunguNanchinyayaNamikongaNDL90/34UKG93/44AmaniTMENGA
AR40-12AR41-2AR42-4CR11A-20CR11A-25CR20B-2CR20A-6CR25-4CR27-24CR27-99CR43-13CR44-6CR45-9
RRRRRSSRRSRSRRSRRRRRRRRSRRR
SRRSSR-SSSRRR
RRRRRRRRRRRRRRSRSRRRRRRSRRS
RRRRRRRRRRRRR
RRRRRSSRRSRSRRSSSRRRSRRRR--
RRRRRRRRRRRRR
RRRRRRRRRRRRRRSSSRRRSRRSRRS
RRRRRRRRRRRRR
Seri
al N
o
Pare
nt
RM
E-4
NS1
58
RM
E-1
NS1
69
1234567891011121314151617181920212223242526272829303132333435363738394041
AR9-2AR9-22AR9-6AR9-18AR9-44AR11-12AR12-11AR12-14AR14-1AR14-2AR14-5AR14-14AR15-2AR15-9AR15-10AR16-1AR16-3AR16-8AR16-16AR17-5AR17-8AR17-16AR17-18AR17-23AR17-25AR17-27AR30-3AR30-4AR50-5AR50-5AR32-1AR35-1AR37-1AR37-38AR37-48AR37-54AR37-73AR37-81AR37-96AR38-3AR38-6
RRRRRRRRRRRRRRRRRRRRRRRRRRRRRRRRRRRRRRRRR
RRRRRRRRRRRRRRRRRRRRSRRRRRRRRRRRRRRRRRRRR
RRRRRSRRRRRRRRRRRRRRSRRRRRRRRRRRRRRRRRRRR
RRRRRRRRRRRRRRRRRRRSSSSRRRR R RRRRRRRRRRRRR
Seri
al N
o
Pare
nt
RM
E-4
NS1
58
RM
E-1
NS1
69
555657585960616263646566676869707172737475767778798081
42434445464748495051525354
CR52A-19CR54B-44AlbertAmaniBwana MrefuKabindaKaloloKibahaKibandamenoKifumuloKigoma MtotoKigoma RedKilokoteKirobaLimbangaLipukalyeneMfaransaMkiwaMuzegeMzunguNanchinyayaNamikongaNDL90/34UKG93/44AmaniTMENGA
AR40-12AR41-2AR42-4CR11A-20CR11A-25CR20B-2CR20A-6CR25-4CR27-24CR27-99CR43-13CR44-6CR45-9
RRRRRSSRRSRSRRSRRRRRRRRSRRR
SRRSSR-SSSRRR
RRRRRRRRRRRRRRSRSRRRRRRSRRS
RRRRRRRRRRRRR
RRRRRSSRRSRSRRSSSRRRSRRRR--
RRRRRRRRRRRRR
RRRRRRRRRRRRRRSSSRRRSRRSRRS
RRRRRRRRRRRRR
Seri
al N
o
Pare
nt
RM
E-4
NS1
58
RM
E-1
NS1
69
555657585960616263646566676869707172737475767778798081
42434445464748495051525354555657585960616263646566676869707172737475767778798081
42434445464748495051525354
CR52A-19CR54B-44AlbertAmaniBwana MrefuKabindaKaloloKibahaKibandamenoKifumuloKigoma MtotoKigoma RedKilokoteKirobaLimbangaLipukalyeneMfaransaMkiwaMuzegeMzunguNanchinyayaNamikongaNDL90/34UKG93/44AmaniTMENGA
AR40-12AR41-2AR42-4CR11A-20CR11A-25CR20B-2CR20A-6CR25-4CR27-24CR27-99CR43-13CR44-6CR45-9CR52A-19CR54B-44AlbertAmaniBwana MrefuKabindaKaloloKibahaKibandamenoKifumuloKigoma MtotoKigoma RedKilokoteKirobaLimbangaLipukalyeneMfaransaMkiwaMuzegeMzunguNanchinyayaNamikongaNDL90/34UKG93/44AmaniTMENGA
AR40-12AR41-2AR42-4CR11A-20CR11A-25CR20B-2CR20A-6CR25-4CR27-24CR27-99CR43-13CR44-6CR45-9
RRRRRSSRRSRSRRSRRRRRRRRSRRR
SRRSSR-SSSRRRRRRRRSSRRSRSRRSRRRRRRRRSRRR
SRRSSR-SSSRRR
RRRRRRRRRRRRRRSRSRRRRRRSRRS
RRRRRRRRRRRRRRRRRRRRRRRRRRRSRSRRRRRRSRRS
RRRRRRRRRRRRR
RRRRRSSRRSRSRRSSSRRRSRRRR--
RRRRRRRRRRRRRRRRRRSSRRSRSRRSSSRRRSRRRR--
RRRRRRRRRRRRR
RRRRRRRRRRRRRRSSSRRRSRRSRRS
RRRRRRRRRRRRRRRRRRRRRRRRRRRSSSRRRSRRSRRS
RRRRRRRRRRRRR
Seri
al N
o
Pare
nt
RM
E-4
NS1
58
RM
E-1
NS1
69
Seri
al N
o
Pare
nt
RM
E-4
NS1
58
RM
E-1
NS1
69
1234567891011121314151617181920212223242526272829303132333435363738394041
AR9-2AR9-22AR9-6AR9-18AR9-44AR11-12AR12-11AR12-14AR14-1AR14-2AR14-5AR14-14AR15-2AR15-9AR15-10AR16-1AR16-3AR16-8AR16-16AR17-5AR17-8AR17-16AR17-18AR17-23AR17-25AR17-27AR30-3AR30-4AR50-5AR50-5AR32-1AR35-1AR37-1AR37-38AR37-48AR37-54AR37-73AR37-81AR37-96AR38-3AR38-6
RRRRRRRRRRRRRRRRRRRRRRRRRRRRRRRRRRRRRRRRR
RRRRRRRRRRRRRRRRRRRRSRRRRRRRRRRRRRRRRRRRR
RRRRRSRRRRRRRRRRRRRRSRRRRRRRRRRRRRRRRRRRR
RRRRRRRRRRRRRRRRRRRSSSSRRRR R RRRRRRRRRRRRR
Seri
al N
o
Pare
nt
RM
E-4
NS1
58
RM
E-1
NS1
69
1234567891011121314151617181920212223242526272829303132333435363738394041
1234567891011121314151617181920212223242526272829303132333435363738394041
AR9-2AR9-22AR9-6AR9-18AR9-44AR11-12AR12-11AR12-14AR14-1AR14-2AR14-5AR14-14AR15-2AR15-9AR15-10AR16-1AR16-3AR16-8AR16-16AR17-5AR17-8AR17-16AR17-18AR17-23AR17-25AR17-27AR30-3AR30-4AR50-5AR50-5AR32-1AR35-1AR37-1AR37-38AR37-48AR37-54AR37-73AR37-81AR37-96AR38-3AR38-6
AR9-2AR9-22AR9-6AR9-18AR9-44AR11-12AR12-11AR12-14AR14-1AR14-2AR14-5AR14-14AR15-2AR15-9AR15-10AR16-1AR16-3AR16-8AR16-16AR17-5AR17-8AR17-16AR17-18AR17-23AR17-25AR17-27AR30-3AR30-4AR50-5AR50-5AR32-1AR35-1AR37-1AR37-38AR37-48AR37-54AR37-73AR37-81AR37-96AR38-3AR38-6
RRRRRRRRRRRRRRRRRRRRRRRRRRRRRRRRRRRRRRRRR
RRRRRRRRRRRRRRRRRRRRRRRRRRRRRRRRRRRRRRRRR
RRRRRRRRRRRRRRRRRRRRSRRRRRRRRRRRRRRRRRRRR
RRRRRRRRRRRRRRRRRRRRSRRRRRRRRRRRRRRRRRRRR
RRRRRSRRRRRRRRRRRRRRSRRRRRRRRRRRRRRRRRRRR
RRRRRSRRRRRRRRRRRRRRSRRRRRRRRRRRRRRRRRRRR
RRRRRRRRRRRRRRRRRRRSSSSRRRR R RRRRRRRRRRRRR
RRRRRRRRRRRRRRRRRRRSSSSRRRR R RRRRRRRRRRRRR
Seri
al N
o
Pare
nt
RM
E-4
NS1
58
RM
E-1
NS1
69

Project IP3: improving cassava for the developing world Chapter 10-6
1 2 3 4 5 6 7 8 9 10 11 12 13 14 15 16 17 18 19 20 21 22 23 24 25 26 27 28 29 30 31 32 33 34 35 36 37 38 39 40 41 42 43 44
AR9-
2
AR9-
22
AR9-
6
AR9-
18
AR9-
44
AR11
-12
AR12
-11
AR12
-14
AR14
-1
AR14
-2
AR14
-5
AR14
-14
AR15
-2
AR15
-9
AR15
-10
AR16
-1
AR16
-3
AR16
-8
AR16
-16
AR17
-5
AR17
-8
AR17
-16
AR17
-18
CONT
ROL-
AR17
-23
AR17
-25
AR17
-27
AR30
-3
AR30
-4
AR50
-5
AR50
-5
AR32
-1
AR35
-1
AR37
-1
AR37
-38
AR37
-48
AR37
-54
AR37
-73
AR37
-81
AR37
-96
AR38
-3
AR38
-6
AR40
-12
AR41
-2
AR42
-4
R R R R R S R R R R R R R R R R R R R R S R R R R R R R R R R R R R R R R R R R R R R R
47 48 49 50 51 52 53 54 55 56 57 58 59 60 61 62 63 64 65 66 67 68 69 C+ 70 71 72 73 74 75 76 77 78 79 80 81 82 83
CR20
B-2
CR20
A-6
CR25
-4
CR27
-24
CR27
-99
CR43
-13
CR44
-6
CR45
-9
CR52
A-19
CR54
B-44
ALBE
RT
AMAN
I
BWAN
AMRE
FU
KABI
NDA
KALO
LO
KIBA
HA
KIBA
NDAM
ENO
KIFU
MUL
O
KIG
MOT
O
KIG
OM
ARED
KILO
KOTE
KIRO
BA
LIM
BANG
A
CONT
ROL
+
LIPU
KAYE
NE
MFA
RANS
A
MKI
WA
MUZ
EGE
MZU
NGU
NANC
HINY
AYA
NAM
IKON
GA
NDL9
0/34
UKG
93/4
4
AMAN
I
CONT
ROL+
CONT
ROL+
CONT
ROL+
R R R R R R R R R R R R R S S R R S R S R R S S S R R R S R R R R Figure 10.2. Ethidium bromide stained agarose stained gel of PCR amplifications of Tanzanian cassava parents using a SCAR marker associated with resistance to CMD2 resistance namely RME-1

Chapter 10-7 2007 Annual Report
Table 10.3 Summary of resistant and susceptible individuals identified by MAS in the control and open-pollinated crosses.
Table 10.4. Summary of coincidence/difference between results obtained using the four markers associated with CMD2.
Controlled Crosses RME1-NS158 RME1-RME4 RME1-N169 Number of comparisons 124 729 124
Percentage of genotypes with resistant alleles from both markers
89.5 69.8 88.7
Open-pollinated crosses RME1-NS158 RME1-RME4 Number of comparisons 1397 1360
Percentage of genotypes with resistant alleles from both markers
83.8 69.1
The phenotypic data from the CET was compared with the MAS data. Results revealed that results revealed that 80% of all individuals selected as resistant using phenotypic evaluation were found to be resistant by MAS. This suggests that broad sense heritability for CMD resistance at the Chambezi Station during the first year evaluation was about 0.8. Although Chambezi is a very high CMD intensity site, MAS could still increase selection efficiency for CMD resistance by 20%. There was also a coincidence of 90% between results of MAS and second year phenotypic evaluation suggesting that the process of sample collection, shipment to Colombia, PCR amplification, electrophoresis, and data collection on the one hand and harvesting, selection, and re-planting of the families on the other was conducted in a satisfactory manner. A problem encountered in MAS in Ugandan CMD resistance breeding population was the lack of marker polymorphism between parental combinations using currently identified markers linked to CMD2. A program of sequencing BAC ends of BAC clones in a contig constructed around CMD2, screening for low copy sequences, and re-sequencing of these genomic
Controlled crosses Molecular Marker Genotype RME-1 RME-4 NS158 NS169
Number of Resistant genotypes 585 453 85 160 Percentage (%) of genotypes resistant 61,6 58,8 60,3 70,4 Number of Susceptible genotypes 365 317 56 61 Percentage (%) of genotypes susceptible 38,4 41,2 39,7 27,6 TOTAL 950 770 141 221
Open-pollinated crosses Molecular Marker Genotype
RME-1 RME-4 NS158 Number of Resistant genotypes 1170 1081 1208 Percentage (%) of Resistant genotypes 81,8 77,4 84,6 Number of Susceptible genotypes 261 315 220 Percentage (%) of Susceptible genotypes 18,2 22,6 15,4 TOTAL 1431 1396 1428

Project IP3: improving cassava for the developing world Chapter 10 8
fragments in a panel of 8 cassava genotypes to identify useful SNP markers has been instituted to identify additional useful markers. This activity involved the collaboration between the following people: Ospina Cesar, Hurtado Paula, Gutierrez Janneth, Morillo Ana C., Ovalle Tatiana, Macea Eliana, Castro Ana M., Marin Jaime, Barrera Edgar, Fregene Martin (CIAT). Heneriko Kulembeka, Geofferey Mkamilo, Esther Masumba (ARI-Tanzania). : Genotyping Support Service (GSS) of the Generation Challenge Program (GCP) provided important financial support for the work.. Major outputs were the implementation of Marker Assisted Selection (MAS) for resistance to CMD in cassava breeding populations by crossing CIAT introductions and local farmer-preferred varieties. A comparison of MAS and phenotypic selection for breeding resistance to CMD 10.3 MOLECULAR MARKER-ASSISTED BREEDING (MAB) FOR RESISTANCE TO THE CASSAVA MOSAIC DISEASE (CMD) IN BC2 BREEDING POPULATIONS WITH HIGH PROTEIN CONTENT Molecular marker-assisted breeding (MAB) to combine CMD resistance and high protein content into elite cassava lines for small holder cassava farmers in Mozambique is in its third year at CIAT. First backcross derivatives (BC1) developed last year and confirmed by field and biochemical evaluations to have high protein content were crossed this year to CMD resistance that have been bred earlier at CIAT using MAB. CMD is the principal production constraint in Africa and any cassava introductions must have resistance to CMD otherwise cannot be evaluated in the field. The resulting BC2 families were transferred via embryo rescue in vitro and molecular marker-assisted selection for CMD resistance carried out. CMD resistant lines are ready for shipment to Mozambique but are being delayed by the late arrival of an import permit. Once received in Mozambique, they will be hardened in the screen house and transferred to crossing blocks for genetic crosses to farmer-preferred varieties that carry resistance to the cassava brown streak disease (CBSD) a prominent disease of cassava in Mozambique. Progenies from these crosses are BC3 and will be evaluated with markers linked to CMD resistance as well as phenotypic evaluation for CBSD resistance in field seedling trials. Selections from the BC3 will evaluated at the Clonal trial and a sub-set sent to farmer participatory variety testing (PVT) trials in the Nampula and Zambezi district of the country. Parallel to this are nutritional evaluations to assess the nutritional value of the protein in human diet. Over 1700 sexual seeds were obtained from crosses of high protein BC1 derivatives of M. esculenta sub spp flabellifolia, having protein content between 8 – 15% (dry weight basis), with CMD resistant parental lines, a total of 11 parents were used for crosses. The seeds were tested for viability and 1555 mature seeds, corresponding to 32 families, were established in vitro from embryo axes according to standard protocols at CIAT (CIAT 2003). The above represents BC2 breeding populations with high protein content and CMD resistance.
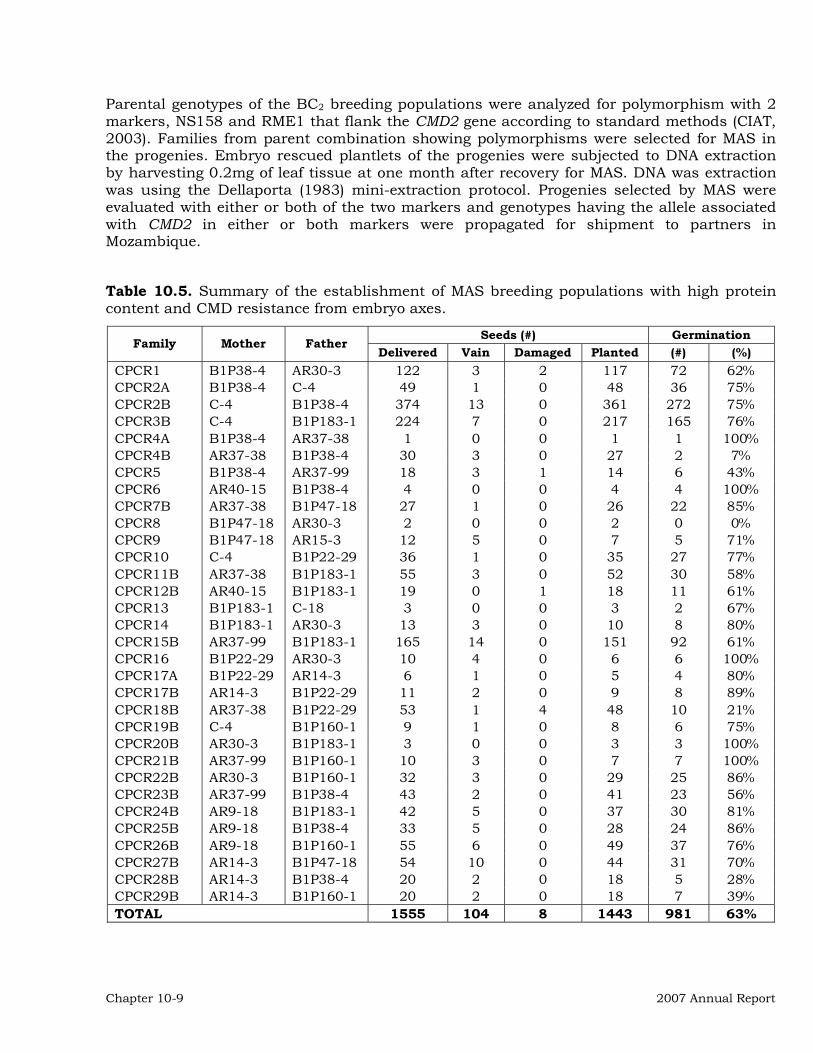
Chapter 10-9 2007 Annual Report
Parental genotypes of the BC2 breeding populations were analyzed for polymorphism with 2 markers, NS158 and RME1 that flank the CMD2 gene according to standard methods (CIAT, 2003). Families from parent combination showing polymorphisms were selected for MAS in the progenies. Embryo rescued plantlets of the progenies were subjected to DNA extraction by harvesting 0.2mg of leaf tissue at one month after recovery for MAS. DNA was extraction was using the Dellaporta (1983) mini-extraction protocol. Progenies selected by MAS were evaluated with either or both of the two markers and genotypes having the allele associated with CMD2 in either or both markers were propagated for shipment to partners in Mozambique. Table 10.5. Summary of the establishment of MAS breeding populations with high protein content and CMD resistance from embryo axes.
Seeds (#) Germination Family Mother Father
Delivered Vain Damaged Planted (#) (%) CPCR1 B1P38-4 AR30-3 122 3 2 117 72 62% CPCR2A B1P38-4 C-4 49 1 0 48 36 75% CPCR2B C-4 B1P38-4 374 13 0 361 272 75% CPCR3B C-4 B1P183-1 224 7 0 217 165 76% CPCR4A B1P38-4 AR37-38 1 0 0 1 1 100% CPCR4B AR37-38 B1P38-4 30 3 0 27 2 7% CPCR5 B1P38-4 AR37-99 18 3 1 14 6 43% CPCR6 AR40-15 B1P38-4 4 0 0 4 4 100% CPCR7B AR37-38 B1P47-18 27 1 0 26 22 85% CPCR8 B1P47-18 AR30-3 2 0 0 2 0 0% CPCR9 B1P47-18 AR15-3 12 5 0 7 5 71% CPCR10 C-4 B1P22-29 36 1 0 35 27 77% CPCR11B AR37-38 B1P183-1 55 3 0 52 30 58% CPCR12B AR40-15 B1P183-1 19 0 1 18 11 61% CPCR13 B1P183-1 C-18 3 0 0 3 2 67% CPCR14 B1P183-1 AR30-3 13 3 0 10 8 80% CPCR15B AR37-99 B1P183-1 165 14 0 151 92 61% CPCR16 B1P22-29 AR30-3 10 4 0 6 6 100% CPCR17A B1P22-29 AR14-3 6 1 0 5 4 80% CPCR17B AR14-3 B1P22-29 11 2 0 9 8 89% CPCR18B AR37-38 B1P22-29 53 1 4 48 10 21% CPCR19B C-4 B1P160-1 9 1 0 8 6 75% CPCR20B AR30-3 B1P183-1 3 0 0 3 3 100% CPCR21B AR37-99 B1P160-1 10 3 0 7 7 100% CPCR22B AR30-3 B1P160-1 32 3 0 29 25 86% CPCR23B AR37-99 B1P38-4 43 2 0 41 23 56% CPCR24B AR9-18 B1P183-1 42 5 0 37 30 81% CPCR25B AR9-18 B1P38-4 33 5 0 28 24 86% CPCR26B AR9-18 B1P160-1 55 6 0 49 37 76% CPCR27B AR14-3 B1P47-18 54 10 0 44 31 70% CPCR28B AR14-3 B1P38-4 20 2 0 18 5 28% CPCR29B AR14-3 B1P160-1 20 2 0 18 7 39% TOTAL 1555 104 8 1443 981 63%

Project IP3: improving cassava for the developing world Chapter 10 10
A total of BC2 1555 seeds were established in vitro from embryo axes and 981 plantlets or 63% of the seeds were successfully recovered into plantlets (Table 10.5). Leaf tissue was obtained from all 981 plantlets for MAS. Parental genotypes of the 32 BC2 families were analyzed with NS158 and RME1 (Figure 10.3). A total of 26 families showing polymorphism between their parents were selected to for MAS in their progenies in the first instance (Table 10.6). Additional markers are being surveyed in the parents of the other families for MAS. A total of 475 genotypes from 26 families selected for MAS were evaluated with NS158 and RME1 and 138 genotypes showed the allele associated with resistance to CMD with the two markers and 49 with the marker RME1, all of these were selected for shipment to partners Once CMD resistant genotypes were identified by MAS, the plantlets were micro- propagated in preparation for shipment to partners in Mozambique. Once received in Mozambique, the BC2 will be hardened in the screen house and transferred to the field for genetic crosses to farmer-preferred varieties that carry resistance to the cassava brown streak disease (CBSD) a prominent disease of cassava in Mozambique. BC3 progenies from the crosses made in Mozambique will be evaluated for CBSD and CMD resistance and high protein content in seedling trials. The progenies will also be evaluated with markers linked to CMD resistance. Selections from the BC3 will evaluated a in a clonal trial and transferred to farmer participatory variety testing (PVT) trials in the Nampula and Zambezi district of the country.
Figure 10.3. Ethidium bromide stained gel off PCR amplification of parental lines of MAS breeding populations using the molecular marker RME1 located at less than 4cM from a CMD resistance gene (CMD2). The larger weight allele is associated with resistance.
NG
-2
TME
3A
M32
0-14
5
AR
14-3
AR
15-3
AR
30-3
AR
37-3
8
AR
37-9
9
AR
40-1
5
AR
9-18
B1P
160-
1
B1P
183-
1
B1P
22-2
9
B1P
38-4
NG
-2
TME
3
B1P
47-1
8
B1P
D28
0-11
B1P
D28
0-11
2
B1P
D28
0-13
B1P
D28
0-14
2
B1P
D28
0-15
B1P
D28
0-18
B1P
D28
0-19
B1P
D28
0-20
4
B1P
D28
0-21
NG
-2
TME
3
λ
S R S R R R R R R R S S S S S R R R R R R R R R S S S R M
NG
-2
TME
3B
1PD
280-
229
B1P
D28
0-29
B1P
D28
0-32
B1P
D28
0-38
B1P
D28
0-40
B1P
D28
0-61
B1P
D28
0-8
B1P
D28
0-85
B1P
D28
9-2
B1P
D28
9-51
C-1
8
C-1
9
NG
-2
TME
3
C-2
43
C-3
3
C-4
C-4
13
C-5
4
C-6
CM
2772
-3
CM
523-
7
K15
0-30
9
TME
3B
ulkR
Bul
k S
λ
S R R R S R R R R R S R R R S R R R S R R S S R S R R S M

Chapter 10-11 2007 Annual Report
Table 10.6. Families selected for MAS based on polymorphism in the parents with markers NS158 and RME1.
Family Mother RME1 NS158 Father RME1 NS158 Progenie CPCR1 B1P38-4 S AR30-3 R 72 CPCR4A B1P38-4 S AR37-38 R 1 CPCR4B AR37-38 R B1P38-4 S 2 CPCR5 B1P38-4 S AR37-99 R 6 CPCR6 AR40-15 R B1P38-4 S 4 CPCR7B AR37-38 R R B1P47-18 S S 22 CPCR9 B1P47-18 S S AR15-3 R R 5 CPCR11B AR37-38 R R B1P183-1 S S 30 CPCR12B AR40-15 R R B1P183-1 S S 11 CPCR13 B1P183-1 S S C-18 R R 2 CPCR14 B1P183-1 S R AR30-3 R S 8 CPCR15B AR37-99 R R B1P183-1 S S 92 CPCR16 B1P22-29 S S AR30-3 R R 6 CPCR17A B1P22-29 S S AR14-3 R R 4 CPCR17B AR14-3 R R B1P22-29 S S 8 CPCR18B AR37-38 R R B1P22-29 S S 10 CPCR20B AR30-3 R R B1P183-1 S S 3 CPCR21B AR37-99 R R B1P160-1 S S 7 CPCR22B AR30-3 R R B1P160-1 S S 25 CPCR23B AR37-99 R B1P38-4 S 23 CPCR24B AR9-18 R R B1P183-1 S S 30 CPCR25B AR9-18 R B1P38-4 S 24 CPCR26B AR9-18 R R B1P160-1 S S 37 CPCR27B AR14-3 R R B1P47-18 S S 31 CPCR28B AR14-3 R B1P38-4 S 5 CPCR29B AR14-3 R R B1P160-1 S S 7
Janneth Gutierrez, Luis G. Santos, Cesar Ospina, Paula Hurtado, Adriana Alzate, Adriana Núñez, and Martin Fregene worked in this activity with the financial support of DANIDA and core resources from CIAT. Important outcomes are i) the crosses of high protein BC1 derivatives of M. esculenta sub spp flabellifolia with CMD resistant parental lines to yield BC2 high protein and CMD resistant lines; ii) embryo rescue of 1555 BC2 sexual seeds (32 breeding populations) having high protein content and CMD resistance and the recovery of 981 plantlets for micro-propagation; and iii) Marker Assisted Selection (MAS) of 981 plantlets and identification of genotypes with resistance to CMD. 10.4 MOLECULAR MARKER-ASSISTED BREEDING FOR RESISTANCE TO THE CASSAVA MOSAIC DISEASE IN POPULATIONS WITH HIGH BETA CAROTENES CONTENT (YELLOW FLESHED ROOT) As a major staple food crop across the tropics, cassava can serve as a cheap means of deploying adequate Vitamin A requirement amongst the poor. But more importantly, high Vitamin A cassava has its greatest uses in the animal feed industry. Cassava varieties rich in beta-carotene (pro-vitamin A) content, used in animal feed gives egg yolk and poultry flesh a desirable golden color.

Project IP3: improving cassava for the developing world Chapter 10 12
Cassava varieties with up to 10ug/g of fresh root and high dry matter content have been identified. Breeding to combine the high beta-carotene with other desirable ones such as resistance to the cassava mosaic disease (CMD), and adaptation to other biotic and abiotic stresses, was initiated at CIAT in 2005. More than 1000 breeding lines have been developed and processed via embryo rescue; we report here progress in the effort to combine increased beta-carotene content and CMD resistance. Two yellow fleshed root varieties, CM2772-3 and AM320-145, were crossed to 5 CMD resistant parents for development of germplasm with high beta-carotene content. CM2772-3 is a very popular yellow fleshed root variety with excellent cooking quality and some tolerance to CMD. A total of 747 F1 seeds corresponding to 9 families were obtained and embryo axes from seeds that passed a viability test (of soaking in water) were cultured in vitro following a protocol developed earlier at CIAT (CIAT 2003). Parental genotypes of the F1breeding populations were analyzed for polymorphism with 3 markers, NS158, RME1, and NS169 that flank the CMD2 gene according to standard methods (CIAT, 2003). Families from parent combination showing polymorphisms were selected for MAS in the progenies. Embryo rescued plantlets of the progenies were subjected to DNA extraction by harvesting 0.2mg of leaf tissue at one month after recovery for MAS. DNA was extraction was using the Dellaporta (1983) mini-extraction protocol. Progenies selected by MAS were evaluated with either or both of the two markers and genotypes having the allele associated with CMD2 in either or both markers were propagated for shipment to partners in Mozambique. A total of 747 F1 seeds harvested from crosses of yellow fleshed roots and CMD resistant genotypes were established in vitro from embryo axes. A total of 427 seeds were successfully recovered as plantlets or 69% of all seeds cultured (Table 10.7). Table 10.7. Summary of the establishment of MAS breeding populations (2005 and 2006) with CMD resistance and high beta carotenes content, yellow root and early bulking.
(a) Objectives: (1) β-carotene + CMD; (2) CMD; (3) Yellow Root+CMD; (4) Early bulking+CMD.
Seeds (#) Germination Family (a) Mother Father Delivered Vain Damaged Planted (#) (%) CBC1 (1) C-243 AM320-145 329 43 284 243 86% 329 CR 85 (2) C-18 CM523-7 168 24 144 62 43% 168 CRA1 (3) C-4 CM2772-3 113 27 86 60 70% 113 CRA2 (3) C-243 CM2772-3 62 14 48 34 71% 62 CRA3 (3) C-18 CM2772-3 9 0 9 2 22% 9 CRA5 (3) C-413 CM2772-3 6 0 6 3 50% 6 CRA7 (3) C-6 CM2772-3 7 0 7 2 29% 7 CPC1 (4) C-413 K150-309 26 4 22 16 73% 26 CPC2 (4) C-6 K150-309 27 15 12 5 42% 27
TOTAL 747 127 618 427 69% 747

Chapter 10-13 2007 Annual Report
Six families could be evaluated MAS with markers NS158, RME1, and NS169 of which 140 genotypes showed the allele associated with resistance to CMD with one or two markers and these were selected for shipment to partners. Once CMD resistant genotypes were identified by MAS, the plantlets were micro- propagated in preparation for shipment to African partners. In the first stage, the parents of the 9 families were analyzed with NS158/NS169 and RME1. The families showing polymorphism between their parents were selected to do MAS in their progenies (Table 10.8). Table 10.8. Families selected for MAS according to the molecular evaluation of the parents using NS158/NS169 and RME1.
Family Mother RME1 NS158 NS169 Father RME1 NS158 NS169 Progeny CBC1 C-243 R R AM320-145 S S 243 CR 85 C-18 R CM523-7 S 62 CRA2 C-243 R CM2772-3 S 34 CRA3 C-18 R CM2772-3 S 2 CRA5 C-413 R CM2772-3 S 3 CPC1 C-413 R R K150-309 S S 16
Selected genotypes with resistance to CMD have been shipped sent to partners in Africa, and also transferred to the screen house here at CIAT subsequently to the field for use in additional crosses to increase the content of beta-carotene content. The participating researchers were Gutierrez Janneth, Santos Luis G., Hurtado Paula, Ospina Cesar, Alzate Adriana, Núñez Adriana, and Martin Fregene. 10.5 MOLECULAR MARKER-ASSISTED BREEDING FOR RESISTANCE TO THE CASSAVA MOSAIC DISEASE IN POPULATIONS WITH DELAYED PPD The Generation Challenge Programme (GCP) competitive grant ‘Development of Low-Cost Technologies for Pyramiding Useful Genes from Wild Relatives of Cassava into Elite Progenitors’ has as one of its activities development of elite cassava gene pools with delayed post harvest physiological deterioration (PPD). Tolerance to PPD had earlier been identified in an inter-specific hybrid with M. walkerae and recovered in BC1 derivates from the inter-specific hybrid. Gene pool development emphasized not just delayed PPD but also resistance to CMD and cassava green mite (CGM). Figure 10.4 shows the breeding scheme that was employed for the development of elite cassava gene pools that combine delayed PPD, resistance to CMD and CGM. Molecular markers associated with CMD were used to screen the BC2 generations for resistance to CMD and selected plants will be shipped to partners in Nigeria, Ghana, Uganda, Tanzania and the USA (partners in the Biocassava Plus project). BC1 derivatives of M. walkerae showing delayed PPD were crossed to cassava genotypes bred for resistance to cassava mosaic disease (CMD) and cassava green mite (CGM) using molecular markers. Embryo rescue techniques were applied to these seeds and resultant plants were micro-propagated.

Project IP3: improving cassava for the developing world Chapter 10 14
Parental genotypes of the BC2 breeding populations were analyzed for polymorphism with 2 markers, NS158 and RME1 that flank the CMD2 gene according to standard methods (CIAT, 2003). Families from parent combination showing polymorphisms were selected for MAS in the progenies. Embryo rescued plantlets of the progenies were subjected to DNA extraction by harvesting 0.2mg of leaf tissue at one month after recovery for MAS. DNA was extraction was using the Dellaporta (1983) mini-extraction protocol. Progenies selected by MAS were evaluated with either or both of the two markers and genotypes having the allele associated with CMD2 in either or both markers were propagated for shipment to partners in Mozambique Embryo rescue of 1267 BC2 seeds from 31 breeding populations segregating for delayed PPD and CMD resistance from which 972 plantlets were obtained (Table 10.9). Molecular markers associated with CMD were used to screen the BC2 progenies for selection of plants resistant to CMD. Marker-assisted selection for CMD resistance will be completed in early 2008. In vitro plants of selected genotypes will micro-propagated and shipped to Nigeria, Ghana, Uganda and Tanzania.
Figure 10.4. Breeding scheme for combining Delayed PPD and CMD resistance into Cassava germplasm adapted to countries of participating NARs. BC2 progenies revealed to be resistant to CMD will be shipped to partners in Nigeria, Ghana, Uganda, Tanzania, and USA for evaluation for delayed PPD. Molecular markers are being developed for delayed PPD in the BC1 generation and the BC2 population, provide appropriate genetic stocks for validation of the molecular markers. In this work Gutierrez Janneth, Santos Luis G, Hurtado Paula, Ospina Cesar, Alzate Adriana, Núñez Adriana, Fregene Martin participated actively. Important outputs are that i) genetic crosses between BC1 derivatives of M. walkerae with delayed PPD and CMD resistant lines have been
M.Walkerae(Wae 001)
SM909-25 XX
BCBC13 familiesXX
CMD ResistantParental Lines…C4, AR30-3,C33, C14A-1…
FF1CW429-
1
XX
XXSM909-25MTAI8
BCBC218 families
BCBC340 families
CIAT and NARsElite Lines
Three cycles of evaluation of delayed PPD confirmed transfer of the trait from the wild parent
Evaluation, genotyping and QTL mapping of delayed PPD to developmarkers for MAS
Shipment of BC2 families to NARs partners and selection of best lines forcrosses to elite line for variety development
Evaluation of BC3 families at NARs and CIAT and selection of best lines that combine delayed PPD, resistance to CMD, and other end-user preferred traits

Chapter 10-15 2007 Annual Report
produced, and ii) the embryo rescue of 1267 cassava sexual seeds from 31 breeding populations segregating for delayed PPD and CMD resistance from which 972 plantlets were obtained and will be micro propagated. Table 10.9. Family name, parents and number of second backcross generation progenies for development of improved gene pools with delayed PPD and cassava mosaic disease resistance
Seeds (#) Germination Family Mother Father
Delivered Vain Damaged Planted (#) (%) CPDCR1B C-4 B1PD280-8 141 18 0 123 87 71 CPDCR2A B1PD280-13 C-4 3 0 0 3 3 100 CPDCR2B C-4 B1PD280-13 335 18 1 316 269 85 CPDCR3B C-4 B1PD280-15 3 0 0 3 2 67 CPDCR4A B1PD280-21 C-4 8 0 0 8 5 63 CPDCR4B C-4 B1PD280-21 133 9 0 124 91 73 CPDCR5A B1PD280-40 C-4 21 4 0 17 17 100 CPDCR5B C-4 B1PD280-40 137 1 0 136 111 82 CPDCR6A B1PD280-85 C-4 2 2 0 0 0 0 CPDCR6B C-4 B1PD280-85 37 5 0 32 28 88 CPDCR7B C-19 B1PD280-13 3 0 0 3 0 0 CPDCR8B C-33 B1PD280-13 12 1 0 11 4 36 CPDCR9A B1PD280-21 C-18 17 3 0 14 12 86 CPDCR10B AR37-99 B1PD280-13 49 2 0 47 46 98 CPDCR11B C-6 B1PD280-13 8 8 0 0 0 0 CPDCR12A B1PD280-18 C-4 36 13 0 23 7 30 CPDCR12B C-4 B1PD280-18 78 1 0 77 62 81 CPDCR32 B1PD280-19 C-18 16 10 0 6 5 83 CPDCR13B C-4 B1PD280-19 21 0 0 21 13 62 CPDCR14 B1PD280-13 C-18 8 3 0 5 5 100 CPDCR15 B1PD280-229 C-4 5 0 0 5 4 80 CPDCR16 B1PD280-29 C-4 6 0 0 6 5 83 CPDCR17 B1PD280-40 C-19 9 1 0 8 5 63 CPDCR18 B1PD280-18 C-18 31 17 0 14 14 100 CPDCR19B C-4 B1PD289-2 60 3 0 57 40 70 CPDCR20B C-4 B1PD280-61 11 0 0 11 7 64 CPDCR21 B1PD280-40 C-18 13 2 0 11 8 73 CPDCR22 B1PD280-40 C-245 2 1 0 1 0 0 CPDCR23B C-4 B1PD280-11 89 0 1 88 66 75 CPDCR24B C-4 B1PD280-142 52 2 1 49 28 57 CPDCR25B C-4 B1PD280-229 11 0 0 11 2 18 CPDCR26B C-4 B1PD280-32 1 0 0 1 0 0 CPDCR27B C-4 B1PD280-112 2 1 0 1 1 100 CPDCR28B C-4 B1PD280-204 9 2 0 7 6 86 CPDCR29B C-4 B1PD289-51 1 0 0 1 0 0 CPDCR30B C-18 B1PD280-13 16 0 0 16 13 81 CPDCR31 B1PD280-38 C-4 14 3 0 11 6 55 TOTALS 1400 130 3 1267 972 62%

Project IP3: improving cassava for the developing world Chapter 10 16
10.6 ESTIMATION OF GENETIC DIVERSITY IN PARENTAL LINES FROM THE UGANDAN NATIONAL PROGRAM AND MAS FOR CMD RESISTANCE IN OPEN POLLINATED POLLINATIONS FROM THESE PARENTS Breeders often wish to know the extent of genetic diversity in the parental genotypes of their breeding populations. The Genotyping Support Service project (GSS) of the Generation Challenge Programme (GCP) provided funds to CIAT to estimate genetic diversity of progenitors of 9 open-pollinated (half-sib) breeding populations for improvement of CMD resistance at the National Crops Resources Research Institute (NCRRI), Namulonge, Uganda using 36 SSR markers from the cassava SSR-kit. In addition the GSS also provided funds for genotyping of the progenitors and half sib families using molecular markers flanking the CMD2 gene. Results of the Ugandan study will enable national program breeders determine if they have sufficient genetic variation, and by extension additive genetic variance, in the parental lines being used in breeding. Furthermore, the MAS effort will help determine if resistance to CMD in some of the progenitors is mediated by the CMD2 gene and to compare MAS with field-based selection. Data obtained from the genotyping effort was made available to cassava breeders at NCRRI, Namulonge, Uganda for use in their plant breeding activities. Dried leaves tissue was sent from NCRRI to CIAT and DNA extraction was conducted at CIAT following the Dellaporta (1983) protocol. Samples included nine cassava parents namely: Bamunanika, Kakwale, Nyaraboke, Bao, TME 14, TME5, NASE 10, NASE 12, 95/SE-00036. The parents TME14, TME5, NASE10, NASE12, and TMS95/SE-00036 are resistant to CMD. The nine progenitors and two PCR controls were evaluated with 36 SSR markers from the cassava SSR-Kit (Hurtado et al. 2008). Genetic similarity in the parental genotypes was assessed by the UPGMA cluster method based on Euclidian similarity distance matrix derived from the raw SSR data. The 9 parents and 2 PCR controls, NGA2 and TME2, were also evaluated with four markers associated with CMD2 namely NS158, NS169, RME-1 and RME-4. Parental lines that reveal the putative allele associated with CMD2 could be tested in a subset of the progeny and if confirmed to segregate with resistance could be used for marker assisted selection (MAS) in the entire progenies. The half-sib families whose progenitors possessed CMD2 were subjected to MAS. Each individual was genotyped with markers associated with the CMD2 gene that were also polymorphic in the parents. DNA extraction, PCR amplification, and gel electrophoresis were as described earlier (CIAT 2003). Evaluation of the nine parental lines with 36 SSR markers revealed considerable allelic diversity (Figure 10.5). This result was also confirmed SSR by UPGMA cluster analysis of genetic similarity (Figure 10.6). The parents clustered into 4 groups at genetic similarity of 75%.The first group is composed of local varieties all susceptible to CMD. Cluster 2 is made up of improved cassava varieties bred in Uganda, Cluster 3 are exclusively CMD resistant local varieties from Nigeria that are the source of the CMD2 gene. Cluster 4 consists of two IITA improved varieties, TMS30572 (NG2) and TMS 95/SE-00036, a yet to be characterized source of resistance. The clustering of the parents also closely mirrors the different source of CMD resistance. Cluster 2 and 4 have the older source of resistance, while cluster 3 has the newer CMD2 gene, genotypes in cluster 1 are all susceptible to CMD.

Chapter 10-17 2007 Annual Report
Figure 10.5. Silver-stained PAGE gels of 3 SSR markers evaluated in 9 progenitors used or breeding in the Ugandan National breeding program.
Figure 10.6. UPGMA of Euclidian distances of genetic similarity in 9 Ugandan varieties and two PCR controls (NGA2 and TME3). Evaluations of the parental genotypes with four markers associated with CMD2 revealed that alleles associated with CMD2 in these markers have a high frequency in the Ugandan cassava germplasm, 8 out of 9 parental genotypes showed the presence of an allele associated with CMD resistance for at least one of four markers (Table 10.10). This lack of polymorphism in almost all progenitors using available markers linked to CMD2 precluded MAS for families derived from these progenitors with the exception of TME5, that has the CMD2 gene.
Coefficient0.00 0.25 0.50 0.75 1.00
5/SE-00036MW
BAMUNANIKA
KAKWALE
NYARABOKE
BAO
NASE10
NASE12
TME14
TME5
TME3
95/SE-00036
NGA2
1
2
3
4
SSRY 12 SSRY 103 SSRY151

Project IP3: improving cassava for the developing world Chapter 10 18
Table 10.10. Summary of evaluation of 9 progenitors with 4 markers associated with CMD2 (R: allele associated with CMD resistance, S: other alleles, NA: No amplification)
No Serie Progenitor Family
CMD Resistance NS158 NS169 RME-4 RME-1
1 Bamunanika Bamunanika Susceptible R R R NA 2 Kakwale Kakwale Susceptible R R R R 3 Nyaraboke Nyaraboke Susceptible R R R NA 4 Bao Bao Susceptible R R R R 5 TME 14 CMD2 R R R R 6 TME 5 TME 5 CMD2 R R R NA 7 NASE 10 NASE 10 CMD1 R R R R 8 NASE 12 CMD1 R R R R 9 95/SE-00036 Unknown S S S NA 10 NGA2 Tolerant S S S S 11 TME3 CMD2 R R R R
The only family for which MAS could be conducted was TME5, a parent with the CMD2. A total of 125 half-sib progenies derived from open pollination were available for this progenitor. The half-sib population was subjected to marker genotyping with all 4 markers associated with resistance to CMD. A total of 123 genotypes were genotyped with the 4 markers linked to CMD2. Results of MAS in the TME5 derived population revealed that only 8 genotypes (6%) failed to show resistant alleles associated with CMD2. Since this half-sib population had been selected in one season for resistance to CMD, results revealed that MAS increased selection efficiency for CMD resistance by 6%.Compared to a similar MAS effort in Tanzania, where MAS increased selection efficiency by up to 20%, this reduced effect of MAS could be due to the very high CMD disease pressure in Uganda. However, since this breeding population is a half-sib population and the other potential parents have been shown earlier to have a high frequency of alleles associated with CMD2 in the 4 marker used, the results could have been confounded by this problem. Similar to the Tanzania MAS project, a problem encountered in MAS in Ugandan CMD resistance breeding population was the lack of marker polymorphism between parental combinations using currently identified markers linked to CMD2. A program of sequencing BAC ends of BAC clones in a contig constructed around CMD2, screening for low copy sequences, and re-sequencing of these genomic fragments in a panel of 8 cassava genotypes to identify useful SNP markers has been instituted to identify additional useful markers. Genotyping Support Service (GSS) from the Generation Challenge Program provided financial support for this work that was conducted by Paula Hurtado, Janneth Gutierrez, Cesar Ospina, Ana C. Morillo, Tatiana Ovalle, Eliana Macea, Ana M. Castro, Jaime Marin, Edgar Barrera, and Martin Fregene. The most important outputs were i) Genetic diversity estimates of 9 Ugandan varieties used as progenitors in cassava breeding; and ii) Marker Assisted Selection (MAS) for CMD resistance in Ugandan breeding populations.

Chapter 10-19 2007 Annual Report
10.7 GENETIC MAPPING OF MULTIPLE SOURCES OF RESISTANCE TO THE CASSAVA MOSAIC DISEASE (CMD) Cassava mosaic disease (CMD) is the most important constraint to cassava production in Africa. Cyclic epidemics of the disease caused by new recombinants of the virus have wrecked havoc with food security in many African countries and led to low intensity famines in others. The primary goal of cassava improvement for CMD resistance therefore is to continue to search for new sources of resistance and pyramid multiple genes for durable resistance to CMD in commercial cultivars to check the ravages of the disease in sub-Saharan Africa. Until date breeding programs in Africa have exploited two major sources, a recessive gene (CMD1) and a dominant gene (CMD2) to combat the disease. However, 5 other putative additional sources have been identified by IITA in local African cassava varieties and genetic mapping is being used to identify these new CMD genes, pyramid genes, to build durable disease resistance. This study was undertaken to determine new additional sources of resistance to the cassava mosaic disease (CMD) in the elite germplasm of IITA and at the National Root Crops Research Institute (NRCRI) in Nigeria. Crosses between resistant and susceptible parents were done to generate four F1 populations segregating for CMD resistance (Table 10.11). The mapping populations were scored in the 2006 and 2007 growing seasons for resistance to CMD at 6 and 9 months after planting. Phenotypic data scores for CMD resistance in 2006 and 2007 were correlated using Pearson correlation test in Microsoft Excel. The mapping populations are COB4 (TMS97/2005 x TMS30555), COB5 (TMS97/2205 x NR8212), COB6 (TMS97/2205 x NR8083), and COB7 (TMS0505 x TMS30555). The populations were evaluated for CMD on scale of 1 (resistance) to 5 (high susceptibility) in 2006 and 2007 at Umudike, Nigeria where CMD pressure is high. Table 10.11 List of parental genotypes used for survey of polymorphism in markers linked to CMD2
Serial # Genotype Response to CMD 1 TMS2205 Resistant 2 NR8212 Susceptible 3 NR8083 Susceptible 4 TMS0505 Resistant 5 TMS30555 Susceptible
Control TME3 Resistant To determine if CMD2 is the gene mediating resistance in the parents of the mapping populations, all parental genotypes were evaluated with markers linked to CMD2 namely NS 158, NS169, RME1, RME4 for polymorphism. A sub set of progenies were then evaluated with polymorphic markers. Parental genotypes and their mapping population whose segregation for CMD resistance were not consistent with CMD2 gene were then were screened with 530 SSR markers by bulked segregant analysis (BSA)(Michelmore et al. 1991) for polymorphism. Polymorphic markers

Project IP3: improving cassava for the developing world Chapter 10 20
were then evaluated in bulks of resistant and susceptible genotypes of the mapping populations. Markers polymorphic in the bulks were then evaluated in individuals and subsequently in the entire mapping populations. PCR and PAGE gel analysis were as described earlier (CIAT 2003). Polymorphic markers selected after screening of contrasting bulks and evaluation of individuals in each family were analyzed further by correlating the phenotypic and genotypic data of each selected marker. The selected candidate markers from correlation analysis were further subjected to t-test analysis to identify markers significantly associated to new sources of CMD resistances. T-test analysis was done by comparing the phenotypic data of the individuals with presence of band and those with absence of bands. Statistical significance was declared at P ≤ 0.05. A high correlation ranging from r =0.70 – 075 was obtained for CMD results between 2006 and 2007 effective disease segregation and expression was achieved in the first year. There was mild increase in disease severity score (SS) from 2006 to 2007. The disease SS changed from 2.14 to 2.42 for COB4, 2.01 - 2.20 in COB5 and 2.08-2.11 in COB6. The slight change in disease severity score was mainly due to increased SS in the susceptible individuals in 2007 likely caused by increased virus load expected in the plants since cassava is vegetatively propagated. TMS0505, the resistant parent of mapping population COB7, shows the presence of the allele associated with CMD2 with all four markers (Table 10.12); evaluation of the progeny confirmed that CMD2 is the principal sources of resistance. Families COB4, COB5, COB6, share a common resistant parent, TMS2205, which although had the resistant allele for 3 of the four markers (Table 12.12) had segregation in the progeny that was not consistent with the presence of CMD2. Table 10.12. Presence (+) and absence (-) of marker allele associated with CMD2 in the parents and breeding populations.
COB4 COB5 COB6 COB7 TMS
2205 TMS
30555 TMS 2205
NR 8212
TMS 2205
NR 8083
TMS 0505
TMS 30555
RME-1 - - - - - + + -
RME-4 + - + - + + + -
NS158 + - + - + + + -
NS169 + - + - + + + - Evaluation of contrasting bulks from the 3 families, individuals of the bulks, and the entire progenies revealed that five markers, SSRY319, NS119 in COB4, NS955 in COB5, and NS198, EST-SSRY88 in COB6) showed significant correlation with resistance genes (Table 10.13).

Chapter 10-21 2007 Annual Report
Table 10.13. Candidate markers selected from the three rounds of selection in the BSA scheme.
COB4 COB5 COB6
First selection from screening of parents 150 154 169
Second selection from screening of contrasting bulks 11 12 5
Third selection from evaluation of constrasting individuals in each bulk 2 2 1
Further analysis based on T-test and analysis of variance indicate significant association of two markers NS 119 in COB4 (P = 0.49) and NS 198 in COB6 (P = 0.15) with new sources of CMD resistance (Table 10.14). The alleles for CMD resistance in both families were from the male parent TMS2205. The phenotypic variance explained for CMD resistance in family COB4 by NS198 is 11%. In family COB6, the phenotypic variance explained for CMD resistance by NS119 is 3%. The low levels of phenotypic variation explained suggest the markers found are a long distance from the putative CMD resistance genes or there are other undetected parts of the genome with other genes. Table 10.14. T-test analysis for significant association to CMD resistance.
Mean (CMD scores) Family Markers Band presence Band absence
T-test (P level)
COB4 NS119 2.096 2.745 0.049* SSRY319 2.277 2.519 0.474 (ns) COB5 EST-SSRY88 2.157 2.305 0.614 (ns) NS915 2.322 2.180 0.645 (ns) COB6 NS198 1.591 2.611 0.015** Additional markers in the vicinity of the two markers that show good association with CMD resistance are being evaluated in the parents of the COB4, 5, and 6 families towards identifying markers that are more tightly linked to CMD resistance in TMS2205. Genotyping Support Service (GSS) from the Generation Challenge Program provided financial support for this work that was conducted by Okogbenin, C. Egesi, J. Marin, C. Ospina, P. Hurtado, Martin Fregene (CIAT) B. Olasanmi, S. Kahya (NRCRI), H. Gomez, C. de Vicente (GCP) Ivan Ingelbrecht, and Alfred Dixon (IITA). As a result of this activity two markers associated with a new source of CMD resistance were identified and two varieties with the two sources of CMD resistance started to be used for pyramiding genes for resistance to this disease in the breeding program.

Project IP3: improving cassava for the developing world Chapter 10 22
10.8 EVALUATION OF CASSAVA MOSAIC DISEASE (CMD) RESISTANT LATIN AMERICAN GERMPLASM IN NIGERIA
Cassava is native to tropical America, and the diverse germplasm held at CIAT has is essential to the success of breeding program world-wide. In the last 3 years and through a collaborative project funded by the GCP, NRCRI has successfully introduced useful germplasm bred for CMD resistance from CIAT for evaluation and use in its breeding program. The main objective of this project is to broaden the genetic base of cassava in Nigeria and to develop improved varieties of cassava with novel traits. We report here the performance of top selected CIAT clones being evaluated at various stages of breeding scheme in Nigeria. NRCRI-CIAT collaborative research activities consist primarily of the evaluation of top CIAT lines from seedling nursery stages to uniform yield trials and multi-locational pre-release on-farm trials. One of the leading CIAT clones (CR4A-1) identified for good yield and disease resistance was selected for on-farm pre-release testing on farmer’s field in the 2007 season. Three clones were also evaluated under the national coordinated research project (NCRP) across 8 locations (Umudike, Zaria, Ibadan, Ikenne, Otobi, Minna, and Abakaliki. Additional eleven clones have also been selected in readiness for NCRP multi-locational testing. Introgression of Latin American germplasm with African elite varieties continued in the year. All trials except for early bulking trials were harvested at 12 MAP. Fertilizers were applied to all field trials at NRCRI, Umudike at 450 Kg per ha of NPK fertilizer. Diseases and pests were assessed based on the highest severity score in the season, as well as the mean severity scores at the peak of the disease and pest. Nationally coordinated research project (NCRP) The major achievement of activities in 2007 was the nomination of three entries, CR 14A-1, AR 38-3 and CR 41-10 for the NCRP trial which is a multi-location evaluation of top genotypes for their adaptation response and general performance across Nigeria as first step towards their release. These clones were initially evaluated in 2006 and they are presently in the second year of evaluation. The CMD severity scores of CIAT entries in Ibadan and Umudike, two high CMD disease pressure zones, were low confirming their resistance status (Table 10.15). The yield obtained at three sites showed marked variation between environments for each genotype (Table 10.15). Performance in yield was best at Umudike where fertilizers were applied in relation to other sites. CR 14A-1 and AR 38-3 were among the best three clones in the NCRP at Umudike. CR14A-1 was among the best clones at Otobi. This year, CR 14A-1 is being evaluated for earliness in the NCRP. These genotypes will be assessed at 8 and 12 MAP in the current trial. Early bulking is top priority trait in NRCRI breeding program and is highly desired by farmers. Table 10.15 Yield and disease scores of CIAT lines in NCRP trials.
Location Clone *MCMD SS
MCBB SS
MCAD SS
MCGM SS
Fesh root yield (t/ha) Havest index
AR38-3 1 2 1.5 4.25 8.8 0.38 CR14A-1 2.08 2 2.25 3.88 13.03 0.33 Ibadan CR41-10 1 1.75 1 3.5 10 0.47 AR38-3 2 2.25 2.75 27.15 0.6 CR14A-1 1.75 2 2.25 27.3 0.55 Umudike CR41-10 1.75 2.5 3 23.92 57
Otobi CR14A-1 1.67 1.5 2 17.78 0.76 * MCMD = mean seveity score for CMD; MCBB = mean severity score CBB, MCAD = mean severity score for CAD; and MCGM = mean severity score for CGM

Chapter 10-23 2007 Annual Report
On farm adaptation pre-release trial The On-farm pre-release trial is the next step after the NCRP and represents the final step towards recommendation of clones to the Nigerian release committee. Due to the abundant availability of planting materials for CR 14A-1, this genotypes is being tested simultaneously at the NCRP for the second year and at the On –farm pre-release trial stages. This clone has been distributed to 12 states and the Federal capital territory through their respective ADPs as at August 2007. The states are Kaduna, Nasarawa, Osun, Ogun, Rivers, Cross Rivers, Imo, Kogi, Delta, Oyo, Benue, and Enugu. Each state was given a bundle of 150 1metre stakes for evaluation. Uniform yield trial Ten GCP clones, which could not be immediately absorbed into NCRP trials were evaluated at the UYT stage. Mean severity score and yield of the clones were evaluated at NRCRI experimental field at Umudike based on a 6 x 6 plot at a spacing of 1 x 1 m using RCBD and replicated three times. The clones were also evaluated along with CR 14A-1 as control. CMD reactions of these clones showed the genotypes showed good resistance based on their mean severity score (MSS) (Table 10.16). A good number of the genotypes had highest severity score of class 3 at the peak of the disease, but however showed good recovery mechanism against CMD and had low mean CMD score for the whole season. At harvest the CMD severity score was between 1 and 2 for the three clones (Table 10.17). Diseases scores for other diseases are presented in Table.10.18. The UYT were harvested in August 2007, which coincided with the peak period of CMD in the forest savanna transition zone where Umudike is located. With the exception of AR15-5, which had low yield due to poor establishment, all the clones in the UYT had good yields ranging from 28 –54 tons/ha (Table 12.17). The two leading clones in fresh root yield were CR12-45 (54 t/ha) and CR 14A-1 (47.4 tons/ha). Seven of the clones had yields above 35 tons/ha. NRCRI is currently seeking improved varieties with root yield in the range of 35-40 tons /ha which is a top criteria being emphasized by the release committee in Nigeria as part of measures to double yield output. These values obtained are comparable to the IITA clones in the NRCRI elite collection. Root samples of these clones are being evaluated for gari, and starch, which are other priority traits desired by the release committee. Table 10.16 Highest and mean CMD score over an 8-month period.
Accession Mean CMD score Highest CMD AR15-5 1.11 2 AR1-82 2.06 3 AR37-108 1.72 3 CR12-45 2.11 3 CR14A-1 1.72 3 CR26-1 1.33 3 CR36-2 1.17 2 CR36-5 1.17 2 CR42-4 1.61 3 CR52A-25 1.44 3 CR52A-41 1.33 2

Project IP3: improving cassava for the developing world Chapter 10 24
Table 10.17 Yield and disease result of 11 CIAT clones in the UYT.
Accession Fresh root weight(t/ha)
Fresh shoot weight (t/ha)
Harvest index
Pulp Color.
CMD (at harvest)
Gari dry weight output from 20g
root fresh wt AR1-82 43.43 28.74 0.60 2 1 4.27 AR37-108 39.24 77.62 0.34 2 1 4.20 CR12-45 54.29 41.02 0.57 2 2 4.07 CR14A-1 47.43 40.07 0.54 2 2 3.47 CR26-1 37.111 21.44 0.63 2 2 4.03 CR36-2 28.15 17.38 0.62 2 2 4.13 CR36-5 39.82 26.37 0.60 2 1 4.27 CR42-4 39.41 20.50 0.66 2 1 4.03 CR52A-25 35.26 12.54 0.74 2 1 4.43 CR52A-41 29.90 9.78 0.75 2 1 4.9 AR15-5 - - - 2 1 -
Table 10.18. Average CMD severity scores over 6 months.
Diseases Accession CBB CAD CGM CM AR15-5 1.0 1.4 1.9 1.0 AR1-82 1.5 1.9 2.3 1.0 AR37-108 1.0 1.8 2.3 1.0 CR12-45 1.3 1.7 2.6 1.0 CR14A-1 1.0 1.7 2.5 1.0 CR26-1 1.0 2.1 2.2 1.0 CR36-2 1.0 1.9 2.0 1.0 CR36-5 1.0 2.0 2.2 1.0 CR42-4 1.0 1.5 2.5 1.0 CR52A-25 1.0 1.5 2.3 1.0 CR52A-41 1.0 1.7 2.1 1.0
Period: Aug, Sept, Nov. Jan. March, May Advanced yield trial A total of 50 CMD resistant clones from CIAT are being evaluated for yield trials. They have been planted out in a 40 x 40 plot replicated four times in a Randomized complete block (RCBD) design. The clones will be harvested at 12 MAP later in 2008. Disease scores indicate that about 84% of these clones have remained consistently and highly resistant to CMD with highest severity scores of 2 or less (Table 10.19). However, the highest severity scores in the remaining 16% was not more than 3 and the average disease scores in this group was therefore less than three for over a period of 8 months indicating that all the CIAT clones in the yield trials are showing good resistance. The disease response of CIAT clones were also generally better than the check varieties (local best and improved varieties) usually grown in Nigeria. Selected materials from this trial will be considered for inclusion in the NCRP and UYT stages of the NRCRI breeding and multi-location trials.

Chapter 10-25 2007 Annual Report
Table 10.19. Disease scores of advanced lines in yield trials. Accession CMD CBB CAD CGM CM Accession CMD CBB CAD CGM CM
SET 1 SET 2 AR12-45 3 2 4 4 1 AR12-4 2 2 3 4 1 AR14-4 1 2 3 3 1 AR12-57 1 2 3 4 AR15-5 1 3 3 3 1 AR14-10 2 2 3 4 1 AR26-1 2 2 3 4 1 AR38-89 1 2 3 4 AR38-8 3 2 2 3 1 AR6-1 1 2 3 4 1 AR9-2 3 2 3 3 1 AR9-12 2 2 3 3 1 AR9-45 2 2 2 3 1 AR9-19 1 2 3 3 1 AR9-46 2 2 2 4 1 AR9-48 1 2 3 4 1 AR9-5 1 2 3 3 1 AR9-63 2 2 3 4 CR13-1 2 2 2 3 1 CR11A-20 3 2 3 3 1 CR20A-2 2 2 3 3 1 CR20A-6 2 3 3 4 CR24-9 1 2 3 3 1 CR24-7 1 2 3 3 1 CR25-4 1 2 2 4 1 CR34-6 1 2 3 4 1 CR35-10 1 2 4 4 1 CR36-2 1 2 3 3 1 CR35-14 1 2 3 4 1 CR41-8 - - - - - CR41-10 1 2 3 3 1 CR44-6 1 2 3 4 1 CR41-7 1 2 3 4 1 CR49-2 2 2 3 3 1 CR45-10 1 2 3 3 1 CR52A-2 1 2 3 4 1 CR52A-1 1 2 3 3 1 CR52A-22 1 2 3 3 1 CR52A-26 3 2 3 3 1 CR52A-31 1 2 3 4 1 CR52A-37 1 2 3 3 1 CR52A-40 3 2 3 3 1 CR52A-4 2 2 3 3 1 CR52A-9 1 1 3 4 4 CR52A-6 2 2 3 4 1 CR53-3 3 3 3 3 1 CR8A-22 1 2 3 4 1 CR59-4 1 2 3 4 1 CR59A-3 1 2 3 3 1 Local 4 2 3 3 1 Local 3 3 3 3 1 NR8082 3 2 3 4 1 NR8082 4 2 3 3 1 TMS30572 3 2 3 3 1 TMS30572 3 2 3 4 1
Clonal Evaluation trial A total of 57 clones with good response to CMD are presently being evaluated at this stage. Clonal evaluation was done using a row plot of 5 – 10 plants in at least two replications. The clones are being evaluated for the major pests and disease of cassava. Seedling Nursery About 11,000 seeds representing 203 families were generated from crosses between CIAT introduced germplasm and local varieties from NRCR and CIAT. These seeds have been planted out on the field this year and will be evaluated primarily for pests and diseases this year including selection for CMD resistance using markers linked to CMD. Selected CMD resistant genotypes from GCP activity In summary, From all GCP trials being conducted at NRCRI Umudike a total of 146 genotypes with CMD resistance and good vigor have so far been identified and are at various stages of yield evaluation. They represent 65 families and 10 of the families have no less than 4 genotypes. The 10 families tend to suggest good genetic combining ability in the development of useful elite genotypes and additional crosses for these families are therefore suggested to enhance the objectives of this project. The 146 genotypes identified will be transferred to the NRCRI GRU for in vitro and in vivo conservation.

Project IP3: improving cassava for the developing world Chapter 10 26
Crossing block A new crossing block has been established to further generate crosses involving Latin American and African germplasm as part of efforts to introgress useful genes into NRCRI breeding program. CIAT genotypes in the UYT are mainly been used for the cross. Backcrosses will be done to improve some of the LA germplasm with good vigor yield with moderate CMD resistance. The materials will be crossed with more resistant germplasm. Multiplication The best genotype coming out of GCP activities have been shared with the NARs of Ghana and a big NGO in Benin Republic. Because of imminent demands for planting materials of the top genotypes and to ensure successful delivery of the project’s outcomes to farmers, a 2 ha multiplication field of the 11 clones currently in UYT, NCRP, or on-farm trials was planted in August 2007. This activity is important for the rapid dissemination of these genotypes to farmers. The successful development of F1 hybrids of Lain American and African cassava germplasm has resulted in the successful transfer and introgression of useful germplasm into Africa thereby broadening the genetic base of cassava in Africa. The increased number of CIAT genotypes selected for on farm trials and NCRP provides high opportunity to release a number of CIAT genotypes in Africa as varieties to African farmers. CR14A-1 is being considered for release in 2008. This work benefited from the financial support of NRCRI, GCP, and CIAT. E. Okogbenin, C. Egesi, K. Ogundapo, C. Nwadili, S. Shuaibu and M. Fregene were involved in this research. The following relevant outputs can be listed: i) One clone, CR14A-1, from CIAT introductions is presently undergoing on-farm pre-release trials in ten states in Nigeria; ii) CR14A-1 has been disseminated to Ghana and Republic of Benin; iii) Eleven clones have been identified inclusion in the Nationally coordinated research project (multi-location trials) in Nigeria: and iv) A total of 146 CIAT introductions with CMD resistance are being currently used in the NRCRI breeding program and have been conserved in NRCRI germplasm unit. 10.9 MAS FOR IMPROVEMENT OF TRAITS ASSOCIATED WITH HIGH AND EARLY PRODUCTIVITY IN CASSAVA The storage roots of cassava are the economic part of cassava and they develop simultaneously with aerial parts during the crop growth cycle. Early bulking has been identified as one of the important traits of interest to farmers in cassava growing regions. Late bulking has been attributed as the major factor responsible for the rejection of improved cassava genotypes (Nweke et al. 1994). One way of improving the efficiency of cassava production in terms of yield per unit time is by shortening the period over which the plant grows to give a reasonable yield through the identification of early yielding cultivars. Early yield will also solve a lot of problems especially in drought prone marginal areas and dry savannas where the rainy season is short. This will help to improve the role of cassava as a food security crop. Molecular markers have been earlier identified associated with traits, namely harvest index, shoot weight and root number, found to control early bulking (Okogbenin and Fregene). Additional markers for these traits can be identified via bulked segregant analysis (BSA) in

Chapter 10-27 2007 Annual Report
other crosses and can provide an effective means, via marker assisted selection, to accelerate genetic gain for these traits and stimulate rapid production of early improved cultivars trait. The simplicity and low cost of BSA have made this approach more appropriate for identifying markers associated with traits of interest in breeding programs. This study seeks to use BSA to screen for markers or genes linked to component traits of early productivity in African cassava germplasm. Six parental genotypes were employed different crosses to generate nine early bulking breeding populations (Table 10.20 and 10.21). The early bulking varieties were used as female parents to capture any cytoplasmic factors associated with early bulking. The seeds generated from each population were planted in a nursery and later transplanted to the field after three months. The seedlings were scored for pests and diseases and then harvested at 7 MAP. All surviving seedlings (952) were again replanted as clonal evaluation trials with stem cuttings and evaluated. Depending on the vigor of each genotype, the number of plant per genotype varied from 6 – 10 in each population. The clonal trial was planted in two replicates (3-5 plants per replication). Table 10.20 Parents sused in genrating F1 populations.
Early bulking Late bulking
TMS 30572 TMS30555 TMS97/2055 NR8212 TMS98/0505 NR8083
The clonal trial was harvested at 8MAP. At harvest yield data was taken and results used to select extreme phenotypes with respect to early bulking to be used for BSA to identify markers linked to early productivity. The parents used in generating the F1 populations were also evaluated for yield in a randomized complete block design (RCBD) of three replications. The parents were planted in 6 x 6 plot at spacing of 1 x 1 m. The yield results of the parents were analyzed using analysis of variance. Table 10.21 Selected clones from each early bulking population.
Cross Number of genotypes No. of selected genotypes TMS 30572 x TMS 30555 144 19 TMS 30572 x NR 8212 87 3 TMS 30572 x NR 8083 89 5 TMS 97/2205 x TMS 30555 93 14 TMS 97/2205 x NR 8212 92 26 TMS 97/2205 x NR 8083 41 7 TMS 98/0505 x TMS 30555 160 23 TMS 98/0505 x NR 8212 100 3 TMS 98/0505 x NR 8083 146 5 Total 952 105 Results indicate that there were significant differences between the yield of the early bulking parents and those that are late bulking at 7 months after planting (Table 10.22). All the early bulking parents were higher in yield than those of the late bulking parents; yield of

Project IP3: improving cassava for the developing world Chapter 10 28
genotypes in the nine early bulking breeding populations ranged from 18 -78 tons of fresh root weight. The phenotypic evaluation permitted the identification of extreme phenotypes (late and early bulking) to be used for BSA towards identifying markers linked to early bulking and associated traits for application in MAS activities in breeding program for this complex trait (Table 10.23). Table 10.22 Yield results of parents of F1 populations at 7MAP.
Variety *Yield (t/ha) TMS30572 14.55a TMS97/2205 13.38bc TMS98/0505 18.63c TMS30555 8.34d NR8212 8.50cd NR8083 5.21d *Values followed by the sme letter are not significantly different at 5% level of probability Table 10.23 Number of genotypes selected for BSA in each population.
Crosses Early bulking genotypes Late bulking genotypes
TMS 30572 x TMS 30555 21 20
TMS 30572 x NR 8212 17 15
TMS 30572 x NR 8083 16 18
TMS 97/2205 x TMS 30555 21 20
TMS 97/2205 x NR 8212 20 20
TMS 97/2205 x NR 8083 13 13
TMS 98/0505 x TMS 30555 20 20
TMS 98/0505 x NR 8212 15 12
TMS 98/0505 x NR 8083 15 15
A sub-set of 530 SSR markers from all 800 SSR markers currently available for cassava are being evaluated in the parental genotypes and bulks of the nine populations. Polymorphic markers will next be evaluated in individuals of the bulks and finally in the entire population to identify associations with traits implicated in early bulking. The associated traits to be analyzed in this study includes harvest index, shoot weight and root number. The selected clones in each population to be used in BSA will be evaluated in three locations this year. Markers identified to be associated with this trait will be combined with phenotypic data (marker assisted selection) to select the best genotypes with early productivity. This work was conducted by B. Olasanmi, M. Akoroda, E. Okogbenin, C. Egesi and M. Fregene with the financial support from Kirkhouse Trust, NRCRI, GCP, and CIAT. Relevant outputs were the identification of genotypes with high productivity and the selection of genotypes for bulked segregant analysis based on phenotypic characterization.

Chapter 10-29 2007 Annual Report
10.10 CONTROLLING DELAYED POST HARVEST PHYSIOLOGICAL DETERIORATION IN CASSAVA Dramatically delayed PPD was earlier identified in an inter-specific hybrid (CW429-1) between cassava and Manihot walkerae. The discovery of delayed PPD in cassava from crosses with a wild relative further underlines the usefulness of genes from wild species for use in cassava. A major step towards enhancement of commercialization cassava has been achieved as resource-poor farmers, processors and other end-users can keep their roots longer without fear of economic losses. Multi-location evaluation for delayed PPD in CW 429-1 and 8 other elite genotypes, that have the widest known range of response to PPD, was conducted at 2 sites namely, CORPOICA, Palmira and CIAT, Quilichao, to assess the effect of the environment (GXE) on the trait. A randomized complete block design of 4 replicates per site was used for the trials at each site. At 8 months after planting, the trials were harvested and evaluated for delayed PPD at 5, 10, and 14 Days after harvest (DAH). Results of mean PPD values at 5 DAH ranged from 0% in CW 429-1 and MBRA 337 to 44.85% in CM 523-7. At 10 DAH, mean values ranged from 0% in CW429-1 to 58% in CM 523-7, respectively. The same trend was observed 14 DAH with CW 429-1 still displaying no visible sign of deterioration. Previous evaluation of delayed PPD shows nothing higher than of 7 DAH has been observed. Evaluation of the inter-specific hybrid CW 429-1 and other 8 elite genotypes across the 2 sites showed that the effect of genotype accounted for 66% of the total variation observed while the environment contributed just 3%. In this report we describe efforts to identify QTLs controlling delayed PPD using 2 BC1
backcross mapping populations derived from CW429-1, the inter-specific hybrid with M. walkerae. Two backcross mapping populations (BC1 generation) were developed using CW 429-1 as the donor parent and two elite PPD susceptible lines, MTAI8 (B1PD284) and SM909-25 (B1PD289) as recurrent parents in an attempt to identify molecular markers associated with delayed PPD. The BC1 populations, numbering 122 individuals (66 from MTAI 8 and 56 from SM 909-25), was established in vitro from embryo axes, micro-propagated and 4-10 plants per genotype were established in the field. The low number of progenies was due to the high rate of abortion of crosses obtained from crossing CW429-1 to cassava. Progenies from the mapping population were evaluated at 10months after planting for delayed PPD as described earlier (Fregene et al. 2006). The parents of the 2 mapping populations were surveyed for polymorphism using 450 SSR markers of which 70% are already anchored on the cassava genetic map. Molecular analysis was as described by Mba et al. 2001. A total of 151 markers (36%) were polymorphic between CW 429-1 and MTAI 8 or SM 909-25. Of these, a sub-set of 82 polymorphic SSR markers have been evaluated to date in each of the mapping populations. A genetic map was constructed for each population using the MAPMAKER version 2.0 statistical program (Lander et al. 1987) using a maximum recombination 0.4 and a LOD score 3.0. Markers in each group were ordered using the command order with LOD>2.0 and recombination to centimorgans (cM) using the Kosambi function (Kosambi 1944). Variation for delayed PPD in the BC1 mapping populations ranged from 0 to 100% (Figure 10.7). Up to 33% of the individuals in the population studied showed low PPD values (<35%) with about 6% of them exhibiting very low deterioration (<2%) and indication that the trait was successfully transferred from the inter-specific hybrid to the BC1 populations. A greater

Project IP3: improving cassava for the developing world Chapter 10 30
number of genotypes with reduced PPD were observed in the B1PD 284 family (43% of genotypes) compared to B1PD 289 (23%). Genotypes which showed high resistance to PPD at 14 days after harvest were used for further breeding to combine resistance to CMD and other traits for distribution to participating NARs. Linkage analysis yielded 22 known linkage groups, described previously by Fregene et al. (1997) and by Okogbenin et al. (2006). The linkage groups formed in population B1P284 have between 2 – 6 markers with a mean distance of 11.6 cM and interval between various loci of 3.8 to 19.6 cM (Appendix 1). The map covers 400cM in total indicating that it still needs further saturation. Preliminary QTL analysis was based on single marker analysis using simple regression and the QGENE program (Nelson 1997). A QTL was declared significant when P<0.05. Three linkage groups with putative markers for delayed PPD were identified. These QTLs were found on groups E, F and G (Figure 10.8). It was observed that all alleles associated with putative QTLs controlling delayed PPD were derived from the donor parent CW 429-1. Eight markers were significantly associated with a putative QTL for delayed PPD accounting for 6.2 to 12.8% of phenotypic variance (Table 10.24). Linkage group E has 2 markers explaining 8% (SSRY330) and 10.2% (EST41) of phenotypic variance. Group F has 3 markers (SSRY68, EST93 and NS53) linked with a putative QTL explaining 6.6%, 9.4% and 9.6% of phenotypic variation, respectively. Group G has 3 markers EST271, NS158 and SSRY106 linked with a QTL accounting for 5.2%, 8.6% and 12.6% of phenotypic variance respectively. The BC1 population was re-established in single-row replicated trial (3 reps) at CIAT Palmira. Each plot consisted of 6 plants and replication was thrice. The trial will be harvested for evaluation at 10 months after planting, in March 2008. Data from this second harvest will be used to refine the afore-mentioned QTL studies of delayed PPD. Funds from GCP; Bio Cassava Plus, and CIAT supported this activity which involved C. Egesi, C. Cuambe, A. Rosero, T. Sanchez, N. Morante, H. Ceballos, M. Fregene. Important outputs were the establishment and evaluation of 3 mapping populations for delayed PPD in cassava; the identification of QTLs associated with delayed PPD in a BC1 mapping population; and the development of BC2 families from genetic crosses of PPD resistant BC1 derivates from M. walkerae to CMD resistant parental genotypes Table 10.24. Details of Marker loci associated with PPD in the single marker regression analysis
Marker Linkage group Source R2 Probability Additivity SSRY106 G CW429-1 0.1277 0.0068 17.15 EST41 E' CW429-1 0.102 0.0129 15.48 NS53 F CW429-1 0.0959 0.0160 15.09 EST93 F CW429-1 0.0939 0.0192 14.86 EST271 G CW429-1 0.0869 0.0222 14.36 SSRY330 E' CW429-1 0.0802 0.0270 13.64 SSRY68 F CW429-1 0.0664 0.0448 12.91 NS158 G CW429-1 0.0626 0.0517 12.11

Chapter 10-31 2007 Annual Report
(a) (b)
Figure 10.7. Frequency distribution of genotypes evaluated for post-harvest physiological deterioration at the 7th and 14th days after harvest in (a) family B1PD284 (n=47) and (b) family B1PD289 (n=49). Means for parental genotypes are shown by arrows.
Figure 10.8. Putative QTLs for PPD in linkage groups E, F and G of the mapping population B1PD 284. Colours denote the probability of association of marker with a QTL
μ = 45.5 ± 23.9Min = 0 Max = 100 Kurtosis = -0.52 Skewness = 0.15
Cw429-1 DFP= 0%
MTAI8 DFP= 41%
μ = 23.8 ± 16.2Min = 0 Max = 56.5 Kurtosis = -0.64 Skewness = 0.47
Cw429-1 DFP= 0%
MTAI8 DFP= 34.7%
μ = 31.3 ± 21.0Min = 0 Max = 94.5 Kurtosis = 0.60 Skewness = 0.71
Cw429-1DFP= 0%
SM909-25 DFP= 76%
μ = 49.2 ± 24.3Min = 0 Max = 100 Kurtosis = -0.22 Skewness = 0.35
Cw429-1DFP= 0%
SM909-25 DFP= 77%

Project IP3: improving cassava for the developing world Chapter 10 32
10.11 GENETIC MAPPING OF QUANTITATIVE TRAIT LOCI (QTL) CONTROLLING HIGH PROTEIN CONTENT IN THE PRIMARY GENE POOL OF CASSAVA (MANIHOT ESCULENTA CRANTZ) AND ITS TRANSFER INTO CASSAVA GENE POOLS Cassava (Manihot esculenta Crantz) has a long history of attempts to introgress protein content into its root from the wild progenitors with the earlier breeders (Bolhuis, 1953). The importance of protein in the root of cassava is becoming more pronounced because of the role of the crop in food security in the developing world and its importance in the animal feed industry. Wild progenitor of cassava possess high protein in there roots (Nassar and Dorea, 1982), but earlier attempt to introgress the trait into cassava wild relatives led to it being lost during backcrosses to cassava (Asiedu et al. 1992). In 2000, CIAT initiated again the introgression via the advanced backcross QTL (ABC-QTL) mapping method that uses molecular markers to tag and follow introgressions from wild Manihot species in the breeding program (CIAT 2002). We describe here progress made in 2007. Genetic crosses were made in 2005 between a high protein inter-specific line , CW 198 – 11, and an elite variety, MTAI8, to obtain a BC1 population of 227 genotypes, the B1P2 family. The population was established in vitro and transferred to the screen house and then the field at CORPOICA in 2006. Stem cuttings from the seedling nursery in CORPOICA were used to establish an experiment at CIAT using a random complete block design (RCBD), with three replicates of 12 blocks, involving 227 genotypes. Plots comprised of single rows of eight plants per genotype at a spacing of 0.7 m x 1.4 m. Yield and quality traits were evaluated in the seven middle plants and means were calculated. Harvest of the BC1 population was carried out at 10 months after planting (10 MAP). Seven plants were harvested and measured for fresh root yield, dry matter content, foliage weight, harvest index, and root colour. Dry roots from each genotype in the family were sent for total protein determination at the CIAT analytical service laboratory. Out of the 817 SSR markers screened in parents of the BC1 population in the previous year, 220 polymorphic markers were selected for genotyping of the progenies. Marker data was used to construct genetic map using the MAPMAKER version 2.0 Statistical Software (Lander et al., 1987). Simple statistic traits measured in the BC1 population are shown in Table 10.25 was replicated three times and there was consistency across the replication. Root protein content (%) ranged from 0.77 to 9.61 with an average of 2.71 (Table 10.25). High heritability estimates were obtained for protein content in the analysis of variance (Table 10.26). This is the first year evaluation of the BC1 mapping population for high protein and dry matter content and the experiment has been re-planted again at Palmira and Quilichao for a second year evaluation. Figure 10.9 shows a silver stained PAGE gel of PCR amplification of SSR marker SSRY 70 in the BC1 population. A total of 220 SSR markers have been evaluated in the population and the markers were scored as single dose restriction fragments (Wu et al., 1992) with respect to the high protein parental genotype, CW 198 – 11, for linkage analysis. Table 10.27 shows a summary of linkage analysis conducted so far.

Chapter 10-33 2007 Annual Report
Table 10.25. Simple statistics of agronomic variables evaluated on 227 genotypes of a BC1 population in CIAT, Palmira in May, 2007
Variables Minimum Maximum Average SDa LSDb Skewness
Rtpltc 0.16 16.5 5.53 2.47 2.47 0.66
comRtd 0 9 1.2 1.44 11.94 2.21
Rtwte 0.03 1.2 0.2 0.08 0.09 3.27
FRYf 0.26 58.59 8.97 5.91 5.42 1.98
DRYg 0.09 22.31 3.5 2.27 2.08 1.85
HIh 0.008 0.88 0.33 0.13 0.11 0.15
DMCi 10.83 50.51 39.34 4.14 5.29 -0.82
PCj 0.77 9.61 2.71 1.06 11.44 0.87
RtColk 1 7 1.74 1.31 1.28 1.57 aStandard deviation; bLeast square deviation; cRoot per plant; dCommercial root; eRoot weight; fFresh root yield (t/ha); gDry root yield (t/ha); hHarvest index; iDry matter content; jProtein content (%); kRoot colour (1-8) Table 10.26. Analysis of variance (ANOVA) of yield parameters and quality traits in the B1P2 population evaluated at harvest at CIAT, Colombia.
Source of
variation dfa CoRtb Rtpltc HId Rtwte FRYf DRYg DMCh PCj
Rep 2 91.1** 15.9** 0.04** 0.11** 442.05** 69.76** 481.66** 116.24**
Genotype 213 188.2** 11.6** 0.04** 0.01** 69.31** 10.28** 30.74** 185.86**
Error 426 78.7 3.4 0.006 0.005 16.24 2.39 15.46 72.31
Hk 0.58 0.71 0.86 0.55 0.76 0.76 0.49 0.61 aDegree of freedom; bCommercial root; cRoot per plant; dHarvest index; eRoot weight (kg); fFresh root yield (t/ha); gDry root yield (t/ha); hDry matter content (%); iProtein content (%);jCoefficient of variation; kBroad-sense heritability; **p<0.0001
Figure 10.9. Silver-stained polyacrylamide gel showing PCR amplification using marker SSRY 70 on parents and individuals constituting the genotyping BC1 mapping population, F=female; M=male.
F M
M
BC1

Project IP3: improving cassava for the developing world Chapter 10 34
Table 10.27. Linkage group size, number of markers, and the average marker interval per linkage group of the BC1 linkage map.
Linkage group Size (cM) No. of markers Average marker Interval (cM)
I 44.8 3 22.4 II 32.0 2 32.0 III 7.4 2 7.4 IV 80.0 6 13.3 V 43.8 4 10.9 VI 10.9 2 10.9 VII 62.6 6 10.4 VIII 29.4 2 29.4 IX 23.8 2 11.9 X 63 7 9 XI 51 7 7.3 XII 83.1 7 11.8 XIII 81.8 5 16.4 XIV 28.8 4 7.2 XV 17.0 2 17.0 XVI 22.8 2 22.8 XVII 20.8 4 5.2 XVIII 20.2 2 20.2 XIX 119.5 6 19.9 XX 19.7 2 19.7 XXI 64.7 4 16.2 XXII 25.2 2 25.2 XXIII 109.9 6 18.3 XXIV 62.6 6 10.4 XXV 13.3 3 4.4 XXVI 63.7 4 15.9 XXVII 15.4 2 15.4 XXVIII 23.8 3 7.9 XXIX 30.1 2 30.1 XXX 33.5 2 33.5 XXXI 26.9 2 26.9 XXXII 15.4 2 15.4 ∑/mean 1346.8 115 17.17 For the genetic map is the basis for QTL mapping but we are waiting for the second year evaluation of the BC1 populations before embarking on QTL mapping. The population will be harvested and evaluated in early 2008 and QTL analysis will commence then. Olalekan Akinbo, Jaime Marin, Javier Lopez, Cesar Ospina, Jairo Valencia, Janeth Gutierrez and Martin Fregene conducted this research whose main outputs were: i) First year evaluation of BC1 protein population; and ii) Genotyping of the BC1 protein population with 220 SSR map for identification of QTLs associated with protein content

Chapter 10-35 2007 Annual Report
10.12 GENETIC CHANGES AS A RESULT OF CASSAVA DOMESTICATION: A STUDY OF GENES CONTROLLING SELECTED TRAITS IMPORTANT FOR CASSAVA IMPROVEMENT QTL mapping of traits associated with domestication of crop plants has been employed as a tool to understand the genetic basis of adaptation and the genetic changes involved in domestication (Zeng et al, 2005; Westerbergh and Doebley, 2002). Previous work started at CIAT on the use of accessions of M. esculenta sub spp flabellifolia, the wild progenitor of cassava, in breeding has been extended to understanding the genetic basis of domestication of cassava from its wild ancestor. QTL mapping of key traits, for example, plant morphology, fibrous root morphology, starch, protein, β-carotene, etc, in a S1 population derived of a cross between the cassava cultivar MCOL1734 and an accession of M. esculenta sub spp flabellifolia, OW181-2, was initiated in 2005. The main goal of this project is to study the genetic and phenotypic changes that have occurred during cassava domestication, especially to identify the genes/QTLs, and linked molecular markers, that control differences in selected traits between cassava and its wild ancestor. A second objective is to compare the genetic variation in cassava and its wild ancestor and some wild relatives of the genera Manihot. This knowledge is of great importance for the use of wild relatives as genetic sources in breeding programs based on marker-assisted selection as well as a preliminary knowledge about the evolution of the crop. The QTL mapping population is a S1 population obtained from a cross between a cassava variety, MCOL1734 and an accession of M. esculenta sub spp. flabellifolia with approximately 200 individuals. The population was established in vitro from embryo axes and transferred to the screen house and later the field at CORPOICA, between 2 and 5 plants per genotype was transplanted to the field. Planting material from the S1 population in CORPOICA was used to establish a replicated trial at CIAT in July 2007, 8 replicates and a single plant per genotype per replicated, using a distance of 1 x 1m. Two other environments had been selected for phenotypic evaluation of the mapping population, they include SLU (green house) and Hanoi, Vietnam (field). SSR and EST-SSR markers polymorphic in the parents are being analyzed in the mapping population following standard PCR and PAGE protocols for cassava (Mba et al. 2001). Candidate genes for target traits (adaptive traits) will be selected and located in the linkage map as SNP-SSCP markers variation (Castelblanco and Fregene, 2006). New statistical approaches are also being reviewed for QTL analysis (Shizhong Xun, statistical genomics course, 2006, Umea, Sweden). Large phenotypic variations were found in genotypes of the S1 mapping population in the field in CORPOICA. The replicated field trial established at CIAT had to be re-established again in February 2008 due to problems with poor establishment of the S1 plants from stems. A major problem of working with wild relatives of cassava is that they are not easily established from stems. Stems from each genotype of the S1 population were first of all planted in the screen house under intensive care before transfer to the field. The population was successfully established in the green house in Sweden and biochemical analysis of root traits have been initiated in genotypes of the mapping population. The scoring of polymorphic SSR markers is also on going in the S1 mapping population.

Project IP3: improving cassava for the developing world Chapter 10 36
The mapping population is being analyzed at both at the genetic as well as the phenotypic level in different environments. We expect to conclude genotyping in 2008 and obtain a linkage map at the end of 2008. We also expect to saturate the map with a new set 1500 SNPs markers being developed for cassava. The genotypic information will then be combined with the phenotypic data and QTLs for the various traits identified. This work involved Wilson Castelblanco, Anna Westerbergh, Christer Jansson, Sun Chuanxin, Ulf Lagercrantz (SLU) and Martin Fregene (CIAT) and had the financial support of SIDA-SAREC; SIDA-FORMAS; Swedish Institute (SI); Centro Internacional de Agricultura Tropical (CIAT); Department of Plant Biology and Forest Genetics, Swedish University of Agricultural Science (SLU) As relevant output we can list: i) A F2 population derived from an accession of the wild progenitor of cassava was established in the field at CIAT and a replicate of it was sent to SLU as in vitro culture plants for phenotyping of traits that differentiate cassava and its wild progenitor; ii) The F2 population at SLU has been evaluated for target biochemical and morphological traits. A third environment in Vietnam is being considered for phenotypic analysis; and iii) 127 polymorphic PCR-based markers from a previous parental survey carried out at CIAT (SSR and EST-SSR) are being scoring on the F2 population at SLU. Additional SSRs and new markers such SNPs will be added. Biochemical analysis of roots for target traits such starch and protein content are been evaluated 10.13 GENETIC MAPPING OF BETA-CAROTENE CONTENT FROM MULTIPLE SOURCES IN CASSAVA A project to fortify cassava varieties grown by small holder farmers with high beta carotene content has been launched as means to combat micronutrient deficiencies in areas where cassava is widely grown and consumed. Knowledge of the inheritance and gene action of beta-carotene accumulation in cassava can be used to guide the breeding process and also to combine favorable alleles at multiple loci that control beta-carotene content in cassava. The objective of this study was to identify simple sequence repeat (SSR) markers associated with beta carotene content in cassava through the bulked segregant analysis (BSA) of F1 and S1 families segregating for beta-carotene content. To select the best families for the marker-aided analysis of the inheritance of beta-carotene content in cassava, total carotenoids content (TCC) and β-carotene content (BCC)/g were evaluated in 800 individuals from 46 F1 families having white, cream, and yellow colored root parenchyma. Three families, namely GM708, GM 734, and CM 9816 were selected for further study. In addition, eleven S1 families, obtained from selfing high, medium, and low genotypes from the three selected F1 families, were also chosen for validation of associations between SSR markers and high beta carotene content. (Table 10.28) The extraction and quantification of total carotenes in fresh cassava roots was conducted following the established procedures (Safo-Katanka et al. 1984). Two or three plants are harvested per genotype and 5 of the best roots selected. The roots are cleaned, chopped up into small cubes, mixed, and a sample of 5g drawn. Simple statistics, for example average, median, standard deviation, maximum, minimum, was calculated for total and beta carotenes. A frequency distribution of total carotenes in each family was also drawn as a preliminary assessment of gene control of beta-carotene content in cassava.

Chapter 10-37 2007 Annual Report
Table 10.28. S1 families obtained from F1 genotypes with high, medium, and low beta carotene content to validate SSR marker association with beta carotene content in cassava roots.
Father Mother Cross No. of genotypes
CM9816-1 CM9816-1 AM-689 70
CM9816-2 CM9816-2 AM-690 68
CM9816-5 CM9816-5 AM-691 68
CM9816-6 CM9816-6 AM-692 46
GM893-5 GM893-5 AM-710 26
GM893-8 GM893-8 AM-712 49
GM893-16 GM893-16 AM-718 32
GM893-18 GM893-18 AM-720 34
GM708-63 GM708-63 AM-702 20
GM708-20 GM708-20 AM-697 35
GM708-27 GM708-27 AM-698 30 DNA extraction was using the Dellaporta (1983) protocol as modified for cassava; the quality of the DNA was verified using agarose gel (0.8%) electrophoresis stained with ethidium bromide (0.5ug/ml) and quantified using a DNA flourometer (DYNA Quant, Hoefer). Dilutions of each DNA sample were made to a final concentration of 10ng/ul. For bulked segregant analysis (BSA), bulks of high and low beta-carotene content were constituted for each family. Between 10 and 20 individuals with high beta-carotene content, 7-11μg/g, were selected as the high bulk and, 10-20 genotypes with beta-carotene content lower than 2μg /g were selected as low bulks. The bulks and parents were evaluated with 140 SSR markers that have earlier been selected from the genetic map of cassava to cover the entire cassava genome at a marker density of one marker every 10-20cM. To identify association between molecular markers associated with total or beta carotene content after the BSA, a correlation and simple regression analysis was conducted, considering the marker genotypic classes as independent variable and content of total carotenes as dependent variable. Markers that explain large amounts of phenotypic variation for total carotenes were evaluated in the S1 families for further marker validations. Table 10.29 shows simple statistics of total carotenes in the three selected families. Total carotene content (TCC) and beta-carotene content (BCC) ranged from 0.16 to 11.1μg/g in progenies from crosses between parents with cream-colored roots and between yellow and white colored roots. Frequency distribution of TCC in the three families tends to follow normal distribution, suggesting that several genes control TTC (Figure 12.9). Markers polymorphic were evaluated in the individuals of the bulks (Figure 12.9) and those that showed consistency with results from analysis of the bulks were analyzed in all progenies.

Project IP3: improving cassava for the developing world Chapter 10 38
Table10.29. Simple statistics of TCC and BCC in 3 families obtained from genetic crosses between parents with cream-colored roots or yellow root parenchyma
Parameter BCC (μg/g) TCC (μg/g) CM9816 (MCOL 2295 x SM980-4)
Average 5.38 4.83 Sd. Deviation 1.69 2.96 Minimum 4.00 1.45 Maximum 8.00 9.99
GM 708 (MBRA 1A X MMAL 66) Average 3.68 3.14 Sd. Deviation 2.30 2.65 Minimum 1.00 0.16 Maximum 8.50 11.16
GM734 (MTAI 2 x CM 3750-7) Average 3.60 3.62 Sd. Deviation 1.61 1.74 Minimum 1.00 0.44 Maximum 8.00 8.45
Figure 10.9. Distribution frequencies of TCC values (μg/g) in the three families evaluated. A. CM9816, B. GM-734 y C. GM708.

Chapter 10-39 2007 Annual Report
Figure 10.10 Evaluation of SSR marker SSRY-313 in high and low bulks of GM708. Single marker analysis, by simple regression, of association between the polymorphic markers and total carotene content revealed a number of major quantitative trait loci (QTL) controlled beta-carotene content in cassava (Table 10.30). The QTLs explained up to 26% of phenotypic variation. Five QTLs were identified on linkage group D for all of the 3 families, suggesting major QTLs that go across different sources of enhanced beta-carotene content reside on this linkage group (Table 10.30). Families GM708 and CM9816 also had QTLs on linkage group G (Table 10.30). Six other QTLs were unique amongst the 3 families. Table 10.30. Association between SSR markers and beta-carotene content in the families GM708, GM734 and CM9816 as revealed by single marker analysis (simple regression).
Family SSR Marker Correlation Regression Linkage Group
GM708 SSRY 178 0.31 0.1 H NS267 0.26 0.07 R SSRY313 0.44 0.19 D SSRY226 0.23 0.05 G SSRY88 0.31 0.1 K GM734 SSRY250 0.51 0.26 L SSRY242 0.31 0.1 A SSRY21 0.28 0.08 D NS717 0.41 0.17 D CM9816 SSRY49 0.42 0.18 C SSRY195 0.42 0.18 F SSRY330 0.37 0.14 N/A SSRY324 0.23 0.05 D NS158 0.43 0.18 G SSRY172 0.33 0.11 J SSRY313 0.47 0.22 D
Single marker analysis, by simple regression, of association between the polymorphic markers and total carotene content in families S1 confirmed the existence of major quantitative trait loci (QTL) controlled beta-carotene content in cassava. The QTLs explained up to 32% of phenotypic variation. (See Table 10.31).

Project IP3: improving cassava for the developing world Chapter 10 40
Table 10.31. Association between SSR markers and beta-carotene content in the families S1 revealed by single marker analysis (simple regression).
Family SSR Marker Correlation Regression Linkage Group NS-158 0.44 0.19 G NS-717 0.48 0.23 D
SSRY-172 0.41 0.17 J SSRY-195 0.34 0.12 F SSRY-21 0.49 0.24 D SSRY-324 0.47 0.22 D SSRY-330 0.44 0.19 D
AM-689
SSRY-49 0.46 0.21 C NS-158 0.39 0.15 G NS-717 0.47 0.22 D
SSRY-172 0.36 0.13 J SSRY-195 0.34 0.12 F SSRY-21 0.44 0.19 D SSRY-313 0.38 0.14 D SSRY-324 0.38 0.15 D SSRY-330 0.43 0.18 D
AM-690
SSRY-49 0.39 0.15 C NS-717 0.32 0.1 D NS-158 0.33 0.11 G
SSRY-195 0.45 0.2 F SSRY-21 0.36 0.13 D SSRY-324 0.34 0.12 D SSRY-330 0.36 0.13 D
AM-691
SSRY-49 0.33 0.11 C SSRY-172 0.39 0.15 J SSRY-324 0.44 0.19 D SSRY-330 0.47 0.22 D
NS-158 0.46 0.21 G NS-717 0.44 0.19 D
SSRY-195 0.32 0.1 F
AM-692
SSRY-21 0.46 0.21 D SSRY-178 0.45 0.2 H
NS-158 0.34 0.11 G SSRY-49 0.36 0.2 F SSRY-226 0.37 0.13 G
AM-697
SSRY-88 0.32 0.1 K NS-158 0.32 0.1 G
SSRY-178 0.34 0.11 H SSRY-49 0.39 0.15 F SSRY-226 0.33 0.11 G
AM-698
SSRY-88 0.32 0.1 K

Chapter 10-41 2007 Annual Report
cont. Table 10.31 Family SSR Marker Correlation Regression Linkage Group
SSRY-178 0.48 0.23 H NS-158 0.46 0.21 G AM-702
SSRY-49 0.47 0.22 F NS-158 0.42 0.18 G
SSRY-195 0.33 0.11 F SSRY-21 0.48 0.23 D SSRY-330 0.46 0.22 D SSRY-31 0.32 0.11 F
AM-710
SSRY-226 0.4 0.16 G NS-158 0.49 0.24 G
SSRY-195 0.35 0.12 F SSRY-21 0.48 0.23 D SSRY-313 0.49 0.24 D
NS-717 0.54 0.29 D SSRY-226 0.45 0.2 G
AM-712
SSRY-31 0.35 0.13 F NS-158 0.48 23 G
SSRY-195 0.33 11 F SSRY-21 0.57 32 D SSRY-313 0.51 26 D
NS-717 0.51 26 D
AM-718
SSRY-226 0.49 24 G NS-717 0.36 0.13 D
SSRY-21 0.36 0.13 D SSRY-226 0.34 0.11 G
NS-158 0.36 0.13 G AM-720
SSRY-178 0.36 0.13 H In a previous study of the mode of inheritance and the number of genes involved in determination of yellow root color in a S1 family (AM320) derived from the Thai variety MTAI8, 3 polymorphic markers were found to be associated with root color and controlled between 30 and 40% of phenotypic variance (CIAT 2005). All of the markers - SSRY 313, NS251, and NS717 - are located on linkage group D and are similar to those found in these studies. These results reveal that regions of the cassava genome controlling beta-carotene content are common for different sources of increased beta-carotene content but also unique with respect to source. Gene action for all aforementioned QTLs are thought to be additive in nature but confirmation will come from subsequent marker-validation studies already being conducted. Association of molecular markers and beta-carotene content was initially conducted with regression analysis, there is a need to conduct the analysis with other more powerful forms of analysis including interval and composite interval analysis. Markers that explain large amounts of phenotypic variation identified in this study will be validated in additional families having genetic backgrounds different from those used in this study

Project IP3: improving cassava for the developing world Chapter 10 42
Ana Cruz Morillo Coronado, Yacenia Morillo Coronado, Nelson Morante, Teresa Sánchez, Alba Lucía Chavez, Martin Fregene, Hernán Ceballos Lascano have been involved in this work, with the support of the HarvestPlus Challenge Program. Relevant outputs were the determination of total carotene content in 3 populations of Cassava (Manihot esculenta Crantz) segregating for beta carotene content and the dentification of SSR markers associated with high beta-carotene content in the 3 segregating populations. 10.14 DEVELOPMENT OF POPULATIONS FOR GENETIC MAPPING OF DROUGHT TOLERANCE IN CASSAVA Improving cassava’s tolerance to drought is important to help increase yields in the semi-arid Sub Saharan African regions where cassava as an essential crop. Cassava’s natural stress tolerance can be substantially improved by breeding, especially by marker-assisted selection of key physiological traits associated with drought tolerance. In recognition of the importance of cassava improvement for dry areas in the developing world, the Generation Challenge Program (GCP) awarded a grant to study drought tolerance traits and develop molecular markers to improve cassava breeding for drought tolerance. Partners in the project are NARs of Brazil, Ghana, Kenya, and Tanzania. We describe development of mapping populations and shipment to partners. A set of elite drought tolerant varieties were identified in cassava germplasm from North East Brazil and the Northern coast of Colombia, based on evaluation for fresh root yield under water stress conditions, in the late 1990s under the auspices of an IFAD project. Three genotypes, BRA 255, BRA534, and MCOL1734 were selected for development of F1 and S1 mapping populations. Genetic crosses were made, with drought susceptible genotypes in the F1s, as follows:
1. BRA255 x MCOL1468 2. BRA534 x MCOL1468 3. MCOL1734 x MVEN77 4. BRA255 (selfed) 5. BRA534 (selfed) 6. MCOL1734 (selfed)
Additional crossed of the drought tolerant lines were also made to CMD and CBB resistant parental lines. Sexual seeds were obtained from the afore-mentioned F1 and S1 crosses were tested for viability and good seeds were established in vitro from embryo axes according to standard protocols at CIAT (CIAT 2003). The above represents the drought tolerant mapping populations. A total of 1451 seeds were harvested from the controlled crosses and 1091 were established in vitro from embryo axes, of which 599 genotypes (55%) formed plantlets (Table 10.32). Families with highest number of genotypes in the progeny, namely CTS1A, CTS2A, CTS2B and S1TS1 were selected for micro-propagation and shipment to partners. Five plants of these genotypes have been shipped to Brazil, Ghana, Kenya and Tanzania for hardening in the screen house and establishment in the field at a water stress site for evaluation off drought tolerance. A copy of the 3 mapping populations will also be hardened in the screen house at CIAT and transferred to the field in the Colombian North Coast for drought tolerance evaluation.

Chapter 10-43 2007 Annual Report
Table 10.32 Summary of the establishment of mapping breeding populations with drought tolerance from embryo axes.
Luis G. Santos M., Adriana M. Alzate, Adriana Núñez, Diana L. Falla, Janeth P. Gutiérrez and Martin Fregene participated in this work with core fundings from CIAT. Relevant outputs were the development of two F1 and one S1 mapping populations for drought tolerance and establishment in vitro through embryo rescue; and the shipment of the mapping populations to GCP project partners in Brazil, Ghana, Tanzania, and Kenya 10.15 THE CASSAVA GENETIC INFORMATION SYSTEM (CGIS) The Cassava Genetics program generates large amount of data from its tissue culture, MAS, shipments of germplasm, screen house, and field activities. Data is usually stored as spreadsheets in the Excel format but this process is disjointed and does not permit easy access to information across activities producing a delay in the extraction of information and generation of reports. On the other hand the nature in which information is collected has a high risk of mistakes related creating problems that might lead to grave consequences, especially as it related to germplasm shipment. The main objective of this project was therefore to design and develop a web-based information system that automates the processes of capture, processing and storing of the information in activities of the Cassava Genetics program. The information system selected integrates modern advances in information science technology tools such as Bar Code, PDA, Databases, and Web applications. An information system can be defined as a set of functions or interrelated components that form a whole. It serves to capture, process, store, and distribute information to support the process of control and decision making of an organization. It also facilitates the coordination and analysis of a set of complex and inter-related activities. The technologies used to set up the Cassava Genetics information systems have been previously described. (CIAT 2006).
Seeds (#) Germination Family Mother Father
Delivered Vain Damaged Planted (#) (%) CTS1A COL1734 VEN77 495 36 5 454 312 69% CTS1B VEN77 COL1734 91 15 1 75 38 51% CTS2A COL1468 BRA255 124 48 0 76 41 54% CTS2B BRA255 COL1468 368 135 0 233 76 33% CTS3 COL1468 COL1734 5 1 0 4 2 50% CTS4A COL1468 BRA534 26 7 1 18 15 83% CTS4B BRA534 COL1468 41 7 2 32 0 0% CTS5 C-4 BRA534 18 1 0 17 11 65% CTS6 NGA19 BRA534 21 2 0 19 10 53% CTS7 NGA11 BRA534 21 3 0 18 0 0% CTS8 BRA969 BRA534 3 1 0 2 1 50% S1TS1 COL1734 COL1734 238 95 0 143 93 65%
TOTAL 1451 351 9 1091 599 55%

Project IP3: improving cassava for the developing world Chapter 10 44
Currently, the tissue culture module of CGIS is fully developed and quality test has been done. PDA software and code bar technology have also been developed, implemented and tested. In addition, an initial upload of data, including germplasm processed from 2002 until 2007 - a total of 443 families, 6640 genotypes, 17000 propagations, 35 shipments, and 22 objectives – have been carried out. The tissue culture module is composed of input files on seeds, generation of genotypes, plant losses control, micro propagation, input control of the external material in vitro, MAS evaluations. A Beta version of this module (http://198.93.225.66:8080/sigyweb) is being tested now by end users. Necessary interfaces with subsequent modules (screen houses, field, shipments and molecular markers) have also been built into the tissue culture module. Perspectives for CGIS include: a) adding functionality to the administrative sub module, b) Final test and generation of a user manual for the tissue culture module c) Deployment of CGIS on GENE3 server, d) continue with development of other modules beginning with the screen houses and shipments modules. The work described in this section was conducted by Luis G. Santos M., Fernando Rojas, Janeth P. Gutiérrez, Martin Fregene, USI, software Developer team (CIAT). As a result, the Cassava Genetic information System (CGIS) for the systematization of data collection from tissue culture, MAS, shipments of germplasm, screen house, and field activities was developed. In addition, the tissue culture module was completed. 10.16 FINGERPRINTING AND ASSESSMENT OF GENETIC DIVERSITY OF CASSAVA VARIETIES CULTIVATED BY SMALL HOLDER FARMERS IN THE COLOMBIAN ATLANTIC COAST In many countries of Africa, Asia and Latin America, cassava is an important staple and food security crop. It is the fourth most important staple after rice, the wheat and the maize. Both the root and leaves are used as a source of calories and protein for human and animals; the roots are an important raw material for the starch, animal feed, and ethanol Industries. Africa is the largest producer of cassava world-wide level with 50% of the production, followed by Asia with 30%, and Latin America and the Caribbean with 19%. Cassava production takes place principally in small holder farmers’ field and in marginal environments (Ceballos, 2002). In Latin America and the Caribbean, Colombia is the third largest producer after Brazil and Paraguay, producing 2.1 million tons of cassava in 2005 (FAO 2006). The main production area is the Atlantic Coast region with 50.5% of national production. In this region, 70% of cassava producers are small holder farmers with farm sizes ranging from 0.5 to 2Ha, although there are producers with 2 to 5 Ha of cassava and occasionally more than 5Ha (Gottret et al. 2002). Cassava varieties grown by these farmers are made up of local and improved varieties, a result of breeding at CIAT and dissemination activities of ICA-CORPOICA. It is not known however the extent of adoption of improved varieties, neither is the genetic diversity of the composition of these varieties known. This study attempted fingerprinting of cassava varieties in the departments of Cordoba, Sucre, Atlantic and Magdalena, in the Colombian Atlantic coast using SSR markers as a means of determining the genetic diversity of varieties grown by farmers and to estimate the

Chapter 10-45 2007 Annual Report
degree of adoption of improved cassava varieties. Another objective was determination of the geographical distribution of improved varieties in the region. A collection of woody stakes of cassava varieties grown by small holders and an oral interview-aided survey about farmer knowledge of improved varieties was conducted in four departments of the Colombian Atlantic coast. A total of 392 farms distributed in departments of Cordoba, Sucre, Atlantico, and Magdalena were visited during the study. A total of 1048 genotypes were collected broken down into 234 accessions from Córdoba, 192 from Sucre, 330 from Atlántico (330), and 283 from Magdalena. Simple Sequence Repeat (SSR) markers were used for DNA fingerprinting and assessment genetic variability. DNA extraction was using the method of Dellaporta (1983) as modified by the cassava genetics laboratory of CIAT. Nine SSR markers with the highest polymorphism information content (PIC), as determined from an evaluation of 30 genotypes from the collection and analysis using the CERVUS program, were selected from a set of 36 molecular markers routinely used for cassava genetic diversity studies at CIAT. The selected markers are: SSRY12, SSRY51, SSRY82, SSRY100, SSRY151, SSRY155, SSRY69, SSRY179 and SSRY63. Genetic relationships of the accessions was determined by principal coordinate analysis (PCoA) clustering of a Euclidean genetic distance matrix and by the UPGMA cluster analysis method using NTSYS-PC computer software package. For the analysis of the surveys, a data base was created in Microsoft Office Access 2003 where the information was validated and output tables generated for analysis in Excel. In 2007, 563 accessions of the 1048 genotypes of cassava collected from the Colombian Atlantic coast were analyzed using 8 of 9 SSR markers. Figure 10.11 shows a PAGE gel of 20 accessions evaluated with SSR marker SSRY63.
S6-1
S6-
2-1
S6-3
S6-
4-1
S6-
4-2
S6-
5-1
S6-6
S6-
6-2
S6-
6-3
S6-7
S6-
7-1
S6-
7-2
S6-8
S6-
8-1
S6-
8-2
S6-
8-3
S6-
8-4
S6-
8-5
S6-
8-6
S6-
8-7
Figure 10.11. A silver-stained PAGE gel of PCR amplification produce with the SSR marker SSRY63 from 20 cassava genotypes collected in the North Coast of Colombia. Cluster analysis of the raw SSR data using UPGMA resulted in 7 groups with each group corresponding to a genotype with the highest frequency in the group (Figure 10.12). In Group A, the genotype P-12 is present 60.3% of the time; in group B, MTAI 8 has a frequency of 21.9%; in group C ICA Negrita is present 16.7% pf the time; Group D, has ICA Costeña 89.6% of the time; Group F, has Blanca Mona with a frequency of 78.6% and group in G, Venezolana is present 87.23% of the time (Figure 10.13). Group E has the largest number of accessions but none of the varieties is predominant in this group; the genetic variability in this group is also the largest.

Project IP3: improving cassava for the developing world Chapter 10 46
Figure 10.12. UPGMA cluster analysis of Euclidean genetic distances of varieties from the Colombian Atlantic Coast based on 8 SSR markers
Figure 10.13. Frequency distribution of 563 cassava varieties from the Colombian Atlantic coast in 7 groups obtained by UPGMA cluster analysis based on SSR marker data In farmer interviews conducted during the collection of varieties, 31% farmers of farmers preferred the variety Venezolana, followed by Blanca Mona (8.5%), ICA Costeña (8.2%), P-12 (4.3%), Cubana (3.2%), MTAI 8 (3.1%), and Secundina (3%). The remainder 48.5% is made up of other genotype that includes improved varieties such as Corpoica Verónica, Ica Negrita, Corpoica Sucreña, Corpoica and Rojita. Other varieties included in this group include Sofa, Santanera, Maria prieta, Lengua de venado, etc. Some varieties were of unknown origin and farmers had given them names such as Ruíz, Rodeo, Polo, Lomita, etc.). The SSR marker analysis confirmed the preference of farmers for Venezolana, P-12, Mtai-8, Ica Negrita, Ica Costeña and Blanca Mona (Figure 10.14).
G
F
E
D C B
A

Chapter 10-47 2007 Annual Report
Figure 10.14. Genotypes identified with the high frequencies amongst varieties held by small holder farmers in Colombian Atlantic Coast from farmer interviews conducted during the collection of varieties. The SSR fingerprint of the collection also revealed that the CIAT varieties adopted by farmers are P-12, MTAI-8, ICA Negrita and ICA Costeña. These varieties are grown in the Department of Cordoba and Atlántico, but ICA Negrita was not reported in Magdalena and Sucre departments. The geographic distribution of CIAT varieties are: MTAI 8 was collected 43.8% of the time in Sucre department; ICA Negrita and P-12 are the most popular varieties in Cordoba, found 66.7% and 65.8% of the time respectively; ICA Costeña and MTAI8 was collected 48.8% y 25.6% of the time respectively and in Atlántico and Magdalena, (Figure 10.15). Perspectives for this work include completing the evaluation of SSR marker analysis of the collection with all 6 SSR markers; completing the analysis of the data; and the preparation and submission of final report. Adriana Mercedes Alzate G., Martín Fregene, Hernán Ceballos, Juan Carlos Pérez, Yaneth P. Gutierrez, Paula Hurtado, Eusebio Ortega, Jorge Iván Lenis were involved in this work which had the financial support of CIAT and CBN. Important outcomes were: i) SSR marker fingerprinting and genetic diversity analysis of a sample of 1048 genotypes held by small holder farmers in the Colombian Atlantic coast; ii) Estimation of the degree of adoption on the part of small cassava holders of improved cassava varieties from CIAT; and iii) Identification of areas with higher adoption of improved cassava varieties developed by CIAT.

Project IP3: improving cassava for the developing world Chapter 10 48
Figure 10.15. Distribution by department of the adoption of CIAT improved varieties in the Colombian Atlantic coast. 10.17 SIMPLE SEQUENCE REPEAT (SSR) CHARACTERIZATION OF CASSAVA GERMPLASM IN GHANA AND PREDICTABILITY OF HETEROSIS Cassava is the most important staple crop in Ghana with respect to area cultivated, number of calories supplied, and contribution of the Agricultural Gross Domestic Product in Ghana (22% in 1989) (Al-Hassan, 1989). Cassava improvement in Ghana until recently used to be introduction and evaluation of elite materials from IITA. But materials released from this activity had problem with the adoption since the varieties did not suit the culinary requirements for which cassava was grown for in Ghana. Farmers continued to grow their land races that they had selected over hundreds of years. The Crops Research Institute (CRI) in collaboration with CIAT took up the challenge to assess the genetic diversity that exist in Ghanaian land races as a first step towards cassava improvement based on local land races. Farmers’ varieties or land races that represent a wide genetic diversity could be selected and entered into genetic crossing schemes to generate hybrids that can later be tested together with farmers to select superior improved varieties. In 2003, a collection of 320 land races from cassava growing areas, all ten regions of Ghana (Figure 10.16) was made. DNA isolation from young leaves was analyzed using 36 SSR markers to determine the structure of genetic diversity of Ghanaian cassava land races as well as to select land races that maximize additive genetic variance. Based on the results from the diversity studies and the clusters obtained as well as on their agronomic performance, diversity and agro-ecological distribution, parents were selected and established in 2004. Crosses between the local varieties were conducted during the flowering season of 2005. Some crosses were also made to Latin American and IITA improved introductions. Seeds were germinated and transplanted to the field in 2006. The F1 seedlings were established in a clonal evaluation trial in 2007. Cassava germplasm collection Cassava germplasm collection was done following the COSCA selected sites with some additional areas in all the ten regions of Ghana Figure 10.16. A total of 320 cassava land races were collected including four IITA improved genotypes released for farmers use.

Chapter 10-49 2007 Annual Report
Germplasm was established in the field in Ghana and a copy sent to IITA, as stem cuttings, for DNA isolation. Genotyping using SSR markers A total of 36 SSR markers were used to define and assess the genetic diversity that existed in the collections made. Results have been submitted in previous reports, and gel profiles documented at the MOLCAS website (www.ciat.cgiar.org/molcas). Crossing Block Initial crosses done for land races and Latin American genotypes did not work out well, due to severe disease susceptibility as indicated in previous reports. A crossing block of selected land races was used for generation of the diallel crosses. Selection was based on the yield, dry matter content, disease resistance, position in clustering based on SSR marker data that may represent heterotic pools and adaptation to certain agro-ecologies. Two diallel crosses were set up for the forest and coastal savannah agro-ecologies respectively.
Figure 10.16. The Map of Ghana showing all the 10 regions where cassava land races were collected from. Diallel Crosses The good flowering land races used as parents were put in two sets of diallel crosses, namely 8 parents for the forest ecological zone and 7 for the coastal savannah zone. Over 15,000 botanical seeds were generated for the 2 ecological zones. The seeds collected were tested for viability by soaking in water. Viable seeds, those that sink, were germinated in seed trays and bowls in families. Seedlings were transplanted at 2 months after planting (MAP) into the field. Seedling trial was established at Fumesua and Pokuase in a RCBD trial; Planting was done on ridges at 1 x 1m spacing, routine agronomic practices were followed. Crosses of land races and CIAT improved materials In 2006/2007 further crosses were done between CIAT introductions having the CMD2 gene that confers resistance to CMD and land races to introgress useful genes into the land races
0 80K
UPPER EAST REGIONUPPER WEST
REGION
NORTHERN REGION
BRONG AHAFO REGION
ASANTE REGION
GREATER ACCRA
REGION
CENTRAL REGIONWESTERN
REGION
VOLTA REGION
EASTERN REGION
Accra
Kumasi
Wenchi

Project IP3: improving cassava for the developing world Chapter 10 50
(Akano et al. 2002). Figure 10.17 shows F1 seeds generated from successful crosses between CIAT inter specific hybrids and Ghanaian land races. Table 10.33 shows the number of seeds generated from the crosses. Clonal evaluation trial Clonal evaluation for the two sets of diallel was established in two locations each, in each of the two agro ecological zones. Planting was done in March, 2007 at 1 x1m spacing with 4 and 5 replications for the forest and savannah ecologies respectively. Plant establishment, disease reaction and plant vigor data were collected. Yield and its yield component data would be collected at harvest in March 2008. The 28 families for the forest zone and the 21 families for the savannah zone had between 7-30 genotypes. Families with less than 30 genotypes had local checks added to give uniform plot size. At harvest statistical analysis would be done to find the General Combining Ability (GCA) and Specific Combining Ability effects for traits of interest; harvest index, fresh root yield, and dry matter, plant type and CMD reaction scores. Table 10.33. Botanical seeds obtained from Crosses CIAT Inter-specific hybrids and Ghanaian land races.
Father Mother Dabudabu Afe Bankye Tuaka TME II AR 15-5 126 32 158 39 CR 52A–4 477 79 122 0 CR 52A–25 374 250 299 332 CR 52A–31 144 24 75 128 CR 42–4 0 0 0 0 CR 59–4 0 0 0 0 AR 14–10 75 2 6 0 CR 41–10 116 38 41 0 AR 12–50 5 3 0 0 CR 12 – 7 0 0 0 0
Figure 10.17. F1 seeds from crosses between CIAT genotypes and Ghanaian land races.

Chapter 10-51 2007 Annual Report
Table 10.34 shows all the crosses done from 2005 and 2006 with the land races. Over 31,000 seeds generated have been used for various experiments including establishment of the diallel seedling nursery, mutation breeding and for other breeding activities. The seedling nursery established in 2006 was harvested in 2007, and in March 2007 selections were re-established in a clonal evaluation trial. Some ½ sib seeds from land races and Latin American materials were collected for evaluation. Results from the cassava starch screening exercise as shown in Table 10.35 revealed land races with percent starch content of up to 25-28.5 (w/w of fresh roots), the highest recorded in this experiment. The yields obtained for some genotypes were remarkably high as seen in Table 12.35. Some of the high starch materials were included in the diallel crosses. Clonal evaluation A clonal evaluation trial of the F1s from the two sets of diallel crosses was carried out at two locations in each of the target agro-ecologies, the forest and savanna zones, using a Randomized Complete Block (RCB) field design. The forest zone trial had 28 families with 8 parents. The two locations for the forest diallel were the Crops Research out stations at Fumesua and Ejura. The savanna diallel experiment also had 21families and 7 parents planted at Pokuase and Ohawu CRI out-stations, in the coastal savanna agro-ecological zone. Some genotypes in the Debor, Lagos, TME11 and Sisipe 290 families, showed resistance to CMD. Molecular analysis is being employed to confirm whether the land races possess the CMD2 gene. Preliminary results of disease reaction showed that crosses with Debor and Lagos in the forest zone and Sisipe 290 and TME11 in the savannah showed resistance for CMD, and could be a potential source for the CMD2 gene. Further molecular work is being carried out to confirm this. The F1 seedling nursery for crosses between CIAT inter-specific hybrids and some land races has some resistant genotypes for further studies. The Clonal evaluation of the diallel will be harvested in March 2008 and will then be analyzed for general and specific combining ability (GCA and SCA) to assess the value of selecting parents from cassava breeding based on phenotypic and molecular information from marker assessment of genetic diversity. Many collaborators participated in this activity: Elizabeth Parkes, Dr John Otoo (Crop Research Institute, CR1, Kumasi, Ghana) Dr. Martin Fregene (CIAT,Cali) Dr Alfred Dixon (11TA) Prof. Osei Sarfo Kantanka (KNUST, Kumasi Ghana), Dr. Elizabeth Acheampong (Dept.of Botany, Legon Ghana),Prof S.K.Offei , Prof. Kwadwo Ofori (Dept. of Crops Science, Legon) and Prof. Maryke Labuschagne ( UFS,Bloemfontein S.A). Funding was provided by the International Program for the Chemical Sciences (IPICs), University of Uppsala, Uppsala, Sweden. Important outputs were: i) Genotyping of 320 cassava land races from all ten regions of Ghana (nation wide collection) using 36 SSR markers; ii) Establishment of two sets of diallel crosses, for the forest and savanna agro- ecological zones, based on SSR marker-based clustering for prediction of Heterosis; iii) Clonal evalution of F1s from the diallel crosses in 4 locations (2 in each agro-ecological zone); and iv) Selection of F1s genotypes from certain families for participatory variety testing (PVT) with farmers in preparation for variety release.

Project IP3: improving cassava for the developing world Chapter 10 52
Table 10.34. Cassava crosses and seeds obtained from crosses in 2005 and 2006. The number of seed from direct (Dir.) and reciprocal (Rec.) crosses is indicated.
Female Male Dir. Rec. Female Male Dir. Rec. Agric 149 B' nsia 104 321 3 Agric 149 Sisipe 166 172 1 Agric 149 Abasafitaa 207 - Agric 149 Lagos 183 - Agric 149 Kwaseabediawu 125 39 Agric 149 TME 104 - Agric 149 Sisipe 290 60 Agric 149 Dabudabu 287 157 44 Agric 149 SN 909-25 45 Agric 149 Akatawia 249 49 - Agric 149 Afisiafi 117 Agric 149 Cedi Bankye 114 Agric 149 Debor 10 Agric 149 Giplelowo 60 Agric 149 Wodze 025 13 Agric 149 Wch009 109 B' nsia Abasafitaa 135 3 B' nsia Lagos 250 34 B' nsia Kwaseabediawu 276 33 B' nsia Agric 130 11 B' nsia Sisipe 166 243 173 B' nsia Dabudadu 287 138 12 B' nsia Giplelowo 175 B' nsia Akatawia 249 40 8 B' nsia Sisipe 290 22 B' nsia TME ii 140 - B' nsia TME ii 2 B' nsia Ahyengyanka 68 B' nsia Wodze 025 45 B' nsia Afisiafi 142 B' nsia Sisipe 281 12 B' nsia Debor 289 B' nsia SN 909-25 2 B' nsia Cedi Bankye 301 Sisipe 166 B' nsia 104 349 42 Sisipe 166 Afisiafi 188 Sisipe 166 Abasafitaa 282 - Sisipe 166 Lagos 430 - Sisipe 166 Kwaseabediawu 264 6 Sisipe 166 Agric 108 72 Sisipe 166 Dabudabu 287 196 - Sisipe 166 Ahyengyanka 85 Sisipe 166 Akatawia 249 234 1 Sisipe 166 Giplelowo 104 Sisipe 166 TME i 230 - Sisipe 166 Wch 009 171 Sisipe 166 TME 11 221 Sisipe 166 Debor 189 Sisipe 166 Cedi Bankye 99 Sisipe 166 Wodze 025 130 Kwaseabediawu B' nsia 104 108 304 Kwaseabediawu Lagos 273 77 Kwaseabediawu Abasafitaa 336 3 Kwaseabediawu Agric 341 114 Kwaseabediawu Sisipe 166 288 63 Kwaseabediawu Dabudabu 287 113 83 Kwaseabediawu Akatawia 214 - Kwaseabediawu Debor 137 Kwaseabediawu TME ii 244 20 Kwaseabediawu Giplelowo 125 Kwaseabediawu Wch 009 241 Abasafitaa B' nsia 110 294 Abasafitaa TME ii 216 90 Abasafitaa Kwaseabediawu 241 236 Abasafitaa Cedi Bankye 134 Abasafitaa Sisipe 166 98 280 Abasafitaa Wodze 025 127 Abasafitaa Lagos 142 271 Abasafitaa Debor 001 143 Abasafitaa Agric 118 266 Abasafitaa Sisipe 290 178 Abasafitaa Dabudabu 287 229 97 Abasafitaa TME 11 123 Abasafitaa Akatawia 145 115 Abasafitaa Afisiafi 201 Lagos B' Nsia 291 141 Lagos Abasafitaa 281 - Lagos Kwaseabediawu 198 77 Lagos Agric 264 75 Lagos Sisipe 166 89 265 Lagos Dabudabu 287 215 - Lagos Afisiafi 217 Lagos Akatawia 217 - Lagos Debor 209 Lagos TME ii 197 - Lagos Wch 009 235 Dabudabu 287 B' Nsia 59 282 Dabudabu 287 Afisiafi 207 Dabudabu 287 Abasafitaa 199 39 Dabudabu 287 Sisipe 290 129 Dabudabu 287 Kwaseabediawu 169 93 Dabudabu 287 Ahyengyanka 208 Dabudabu 287 Sisipe 166 156 106 Dabudabu 287 Gilpelowo 224 Dabudabu 287 Lagos 108 112 Dabudabu 287 Wodze 025 92 Dabudabu 287 Agric 244 102 Dabudabu 287 Debor 272

Chapter 10-53 2007 Annual Report
cont. Table 10.34 Female Male Dir. Rec. Female Male Dir. Rec.
Dabudabu 287 Akatawia 137 14 Dabudabu 287 Cedi Bankye 108 Dabudabu 287 TME ii 145 - Dabudabu 287 Sisipe 281 264 Dabudabu 287 Wch 009 108 Akatawia B' Nsia 8 143 Akatawia Sisipe 166 1 96 Akatawia Abasafitaa 115 4 Akatawia Lagos - 78 Akatawia Kwaseabediawu - 97 Akatawia Agric 108 97 Akatawia Dabudabu 287 114 32 Akatawia WCH 009 89 Akatawia TME II 93 4 Akatawia Afisiafi 92 TME B' Nsia - 140 TME Akatawia 69 9 TME Abasafitaa 138 9 TME Wch 009 42 TME Kwaseabediawu 98 108 TME Sisipe 290 174 TME Sisipe 166 107 30 TME Debor 96 TME Lagos 128 - TME Giplelowo 103 TME Agric 203 42 TME Afisiafi 142 TME Dabudabu 287 63 89 TME Cedi Bankye - Cedi Bankye b' nsia 1 Cedi Bankye WCH 009 70 Cedi Bankye Abasafitaa 0 Cedi Bankye Sisipe 290 83 Cedi Bankye Kwaseabediawu 23 Cedi Bankye Wodze 025 13 Cedi Bankye Sisipe 166 4 Cedi Bankye TME 11 30 Cedi Bankye Lagos 0 Cedi Bankye Afisiafi 13 Cedi Bankye Agric 4 Cedi Bankye Debor 44 Cedi Bankye Dabudabu 287 2 Cedi Bankye Sisipe 281 8 Cedi Bankye Akatawia 6 Debor B' Nsia 126 Debor Cedi Bankye 69 Debor Abasafitaa 100 Debor Wodze 025 109 Debor Kwaseabediawu 83 Debor Ahyengyanka 78 Debor Sisipe 166 71 Debor Sisipe 290 108 Debor Lagos 104 Debor Wch 009 141 Debor Agric 75 Debor Afisiafi 109 Debor Dabudabu 287 86 Debor Giplelowo 58 Debor Akatawia 94 Debor Sisipe 281 56 Debor TME ii 92 WCH 009 B' Nsia 102 WCH 009 Dabudabu 287 92 WCH 009 Abasafitaa 98 WCH 009 Wodze 025 87 WCH 009 Kwaseabediawu 76 WCH 009 Sn 909-25 50 WCH 009 Sisipe 166 162 WCH 009 Cedi Bankye 82 WCH 009 Lagos 113 WCH 009 Debor 78 WCH 009 Agric 109 Afisiafi B' Nsia 109 Afisiafi Akatawia 85 Afisiafi Abasafitaa 124 Afisiafi TME ii 88 Afisiafi Kwaseabediawu 216 Afisiafi Cedi Bankye 84 Afisiafi Sisipe 166 103 Afisiafi Wodze 025 79 Afisiafi Lagos 180 Afisiafi Sisipe 281 90 Afisiafi Agric 89 Afisiafi Ahyengyanka 93 Afisiafi Dabudabu 287 93 WODZE 025 Giplelowo 56 Wodze 025 Cedi Bankye 92 WODZE 025 Agric 149 84 Wodze 025 TME 70 WODZE 025 Sisipe 287 75 Giplelowo 216 Agric 149 97 Giplelowo 216 Afisiafi 81 Giplelowo 216 Cedi bankye 95 Giplelowo 216 Bosomnsia 90 Giplelowo 216 Akatawia 249 76 Giplelowo 216 Ahyengyanka 85 Giplelowo 216 Abass 84

Project IP3: improving cassava for the developing world Chapter 10 54
cont. Table 10.34 Female Male Dir. Rec. Female Male Dir. Rec.
SISIPE 290 Cedi Bankye 112 Sisipe 290 TME 11 132 74 SISIPE 290 Abass 99 Sisipe 290 Wch 009 85 SISIPE 290 Afisiafi 152 Sisipe 290 Lagos 90 SISIPE 290 Debor 81 53 Sisipe 290 Sn 909-25 40 Akosua tumtum Kwaseadediawu 97 Akosua tumtum 96/1569 85 SN 909 25 242 Dabudabu 85 Table 10.35. Yield and percentage starch content of land races.
Clone FRY1 FRY2 % Starch Clone FRY1 FRY2 % Starch Bosomnsia 9 45 23.2 Bosomnsia 195 24 120 24 Esaabaayaa 8.2 41 22 Sisipe 281 37 185 22.4 Afebankye 18.2 91 27 Cedi Bankye 260 8.2 41 23.4 Ahyengyaka 247 12.7 63.5 26.5 Nyame B. 270 38.8 194 27.7 Sisipe 290 26.8 134 26.5 Nyame B. 273 13 65 27.2 Sisipe 116 20.6 103 17.1 96 / 0603 26.2 131 19.8 Dagarti 017 14.8 74 25.2 94 / 0111 21.6 108 18.9 Debor 001 18.6 93 18.9 TME II 39.2 196 25.9 Akos. Tumtum 263 6 30 23.8 97 / 3982 31.4 157 23.5 Dabudabu 287 8 40 26.4 Agric 081 12.4 62 28.5 96 / 1569 13.8 69 25.5 Lagos 128 8.4 42 26.8 Abasafitaa 12.2 61 22.9 Bosomnsia 237 11 55 18.2 97 / 4414 20.6 103 18.3 Grace 140 15.9 79.5 16.4 Afisiafi 14 70 19.8 7951-5 8 40 20 IFAD 20.4 102 26.2 B/Pieligu 1.8 9 Nkabom 17.8 89 24.7 Kalabar 6.2 31 14.3 WCH Alata 9.6 48 20.5 Essabaya 235 13.8 69 20.2 279 16.8 84 22.6 Warilobe 5.2 26 10.4 674 Debor 262 9 45 21.7 Buyaado 7 35 12.1 455 Tuaka 230 13.8 69 26.8 Akosuatumtum 8 40 22 Giplelowo 8.8 44 18.7 Duapong 14 70 19.6 Santum 11 55 24.5 Dagariti 14 70 21.7 Wch oo9 8.2 41 18.9 Tuaka 12.2 61 20.2 Kwaseabediawu 6.2 31 22.5 Uncle 12.8 64 20.4 Agege 073 12.5 62.5 23.6 Nyamebekyere 270 20.2 101 20.3 Cedi Bankye 13.5 67.5 19.2 Afe Bankye 194 33.6 168 20.2 Agric 081 16.5 82.5 23.2 Agric 137 23.2 116 22.5 Sisipe 281 12.2 61 17.2 Akatamanso 232 9 45 13.7 Ahyengyanka 12.4 62 20.8 Afisifia 27 135 18.9 Sisipe 290 12.2 61 27.2 Agric 149 23.8 119 X Koleudor 24 120 23.2 Sisipe 4 166 11.8 59 15.9 Duafra 24.2 121 22.5 Wodze 025 21.4 107 19.5 Essabaya 240 11.8 59 22.5 B' Nsia 195 20 100 16.8 Debor 262 11 55 21 Wch o37 18 90 20.9 Lagos short 043 22 110 24.7 Nyamebekyere 273 24.6 123 22.5 Debor 001 18 90 17.4 Ankrah 11.4 57 26.9 B' Broni 23.2 116 22.4 Akatawia 10.4 52 20.3 Dabudabu 287 9 45 28.3 FRY1 =Fresh root yield (kg/two plants); FRY2 = Fresh root yield (t/ha).

Chapter 10-55 2007 Annual Report
10.18 PROGRESS IN CHROMOSOME WALKING TOWARDS THE CMD2 GENE New molecular markers were developed from BAC-end sequences of BAC clones obtained from screening a TME3 BAC library with two markers that flank CMD2, a major gene for CMD resistance (CIAT 2006). These new molecular markers, namely BAC33a, BAC33b, BAC36a, BAC 36b and SBAC33c, were used to screen the TME-3 BAC library in order to obtain additional BAC clones that will permit closing the gap in the contig around the CMD2 gene. TME-3 BAC library was organized into plate pool, consisting of 11 96-well plates referred to as Pool Plate, Row Plate and Column Plate (CIAT 2005). These plate pools were used as template for PCR amplification using primers from the following markers: BAC33a, BAC33b, BAC36a, BAC 36b and SBAC33c, and the SSR primer NS169. For PCR amplification, 2ul of the bacteria culture was transferred using a multi-pipette to a clean 96 well plate. PCR conditions for amplification with the primers were 1X of Buffer, 2 mM of MgCl2, 0.2 mM of DNTPs, 0.2 uM of each primer, 1 U of taq-polimerase, in a final volume of 25ul. Thermal cycle profile was an initial denaturation step at 95ºC 2 min, 30 cycles 94º 30s, 55ºC 1 min, 72ºC 1 min, and a final extension step of 72ºC for 5 min. For the SSR NS169 marker, PCR condition was 1X of Buffer, 2.5 mM of MgCl2, 0.2 mM of DNTPs, 0.2 uM of each primer, 1 U of taq-polimerase, in a final volume of 25ul. PCR cycling conditions were: 95ºC 2 min, 30 cycles: 94ºC 30 seg, 55ºC 1 min, 72ºC 1 min; and a final extension of 72ºC for 5 min. PCR products were visualized in a 1.0% agarose gel stained with ethidium bromide. The positive clones were identified and located in the library based on amplification in the plate pools. Fingerprinting of the BAC clones, BACs-end sequencing, and contig construction were conducted in either Cornell University or the University of California at Davis. SNP or SNP-SSCP markers were developed from low copy BAC-end sequences and mapped in the CMD2 fine-map population. We identified 7, 4 and 2 BAC clones following screening of the BAC library with the markers BAC33a, SBAC33c and NS169 respectively (Figure 10.18). The rest of markers produced multiple amplification associated with sequences of multiple copies. A BAC contig was constructed that spans the markers RME1, BAC33a, BAC33b, and SBAC33c. This contig goes across the CMD2 region as RME1 and Bac33b flank the CMD2 gene.
1 2
3 4
Figure 10.18. Etidium stained agarose gel showing PCR amplification of a Plate pool us primers from the SBAC33c marker.

Project IP3: improving cassava for the developing world Chapter 10 56
Three BAC clones that go across the region of CMD2 have been selected for whole BAC clone sequencing and identification of candidate CMD resistance genes. I. Moreno and M. Fregene (CIAT); Bunmi Olasanmi; Sharon Mitchell (Cornell University) Ming Cheng Luo; Yanquin Ma (University of California at Davis) were involved in this work with funding from CIAT. Relevant outputs were: i) Screening of the TME-3 BAC library with new molecular markers linked to the CMD2 gene; ii) Fingerprinting and BAC-end sequencing of positive BAC clones; and iii) Construction of a contig that goes across the CMD2 region 10.19 DEVELOPMENT OF A TILLING (TARGETING INDUCED LOCAL LESIONS IN GENOMES) PROTOCOL FOR CASSAVA Last year the TILLING (Targeting Induced Local Lesions in Genomes) protocol was employed to assay natural variation in gene regions associated with starch synthesis pathway in a panel of cassava accessions establishing differences between wild and cultivar accessions using a homemade CELI enzyme. Results were revealed using ethidium bromide stained gels which detected a limited amount of SNP and Indel polymorphism (CIAT 2006). To continue application of the TILLING technique to unraveling natural and irradiation-induced mutation in cassava, a collaborative project was initiated with IAEA (Drs Brad Till and Chikelu Mba). The first objective of the collaboration with IAEA was to conduct TILLING of a set of starch biosynthesis in the cassava irradiation-induced mutants with novel starch types as a means of identifying genes involved in the starch mutants. Thirty genomic DNA samples extracted from cassava starch mutants were sent to IAEA and arrived there on September 4th, 2007. DNA was electrophoresed on an agarose gel and stained with ethidium bromide to assay for concentration and intactness. Conditions were: 1.5% agarose gel, 45minutes @ 5V/cm, 3 µl/ sample plus 2 µl load dye. Sample organization was 15 samples in each tier followed by [DNA] references Tier 1 samples: 881, TAI-8, 5G28M1, 579, 5G20M1, 648, 2G89M1, 847, 214, 5N34M1, 5G102M1, 38, 90, 5N124M1, 854. Tier2: 323, 5G76M1, 582, 5G160M1, 2G28M1, WAXY, C4, 5N85M1, 5G127M1, 5G185M1, 438, 30, 868, 5G90M1, 145. Samples were given TILLING #s cc_0001 through cc_0030 (cc = CIAT cassava). DNA samples were diluted to ~3ng/ul and concentrations determined using ethidium bromide staining and ImageJ image analysis software. DNA concentrations were estimated by visually comparing the intensity of ethidium staining of the sample versus the standards of known concentration. Concentrations were entered into the TILLING/Ecotilling DNA concentration workbook. Normalized samples were further diluted to 0.25ng/ul, the optimal screening concentration determined using cassava DNAs prepared at IAEA. A 96 well plate containing the test samples and quality control samples for PCR amplification and the TILLING assay prepared at IAEA was prepared. Test and control samples are replicated and intermixed on the array to reduce evaluation biases. To validate that the test DNAs were of suitable quality for the TILLING assay, we screened the test plate described in section III, with primers for a control gene target.

Chapter 10-57 2007 Annual Report
CIAT supplied EST or cDNA sequence data for 12 unique target biosynthesic genes (Table10.36). Primers were designed using Primer3 with settings optimized for TILLING (Table 10.36). Multiple primer pairs were designed for targets with two sequence entries or for targets with greater than 1500 bp of available sequence. Table 10.36. Primers designed for CIAT target genes.
Primer testing was carried out in three phases: Amplicon analysis by agarose gel, sequence analysis of amplicons, and Li-Cor validation. A primer pair that passes the agarose gel phase produces a single amplicon between ~750 and 1600 bp at a concentration of >= 5 ng/ul. Primer pairs passing phase two produce moderate to good quality sequence trace data showing the amplification of only one gene product with ~<= 5% “heterozygous” polymorphisms as observed by overlapping ABI sequence trace peaks. Fluorescently labeled primers are ordered for those passing phases I and II. Li-Cor validation is performed with

Project IP3: improving cassava for the developing world Chapter 10 58
fluorescently labeled primers following the standard high-throughput TILLING protocol with positive control samples.
Figure 10.19. Ethidium bromide stained gel assay of Genomic DNA samples from CIAT; see methodology for arrangement of samples.
Figure 10.20. Li-Cor validation assay of DNA quality of 30 samples from CIAT. GelBuddy screen capture of a 96 lane TILLING assay using primers for a control gene target with control plate containing DNAs from 17 unique cassava accessions. Gel quality is evaluated for amplification consistency and signal to noise ratio. The example shown is of the highest quality (rated “A”). Ethidium bromide stained agarose gels of DNA from the 30 samples sent from CIAT revealed that 5 out of 30 (17%) samples were degraded or partially degraded (Figure 10.19). It is likely that samples were degraded during shipment, as pictures of the same samples sent from CIAT showed good quality DNA. Several samples are partially degraded and one is completely degraded. TILLING data quality from the test samples is reduced when compared to DNAs

Chapter 10-59 2007 Annual Report
prepared by IAEA (observed in Figure 10.20 as weaker signal, amplification failure in some lanes). However, bands representing putative nucleotide polymorphisms can be observed in both test and control samples, suggesting that the quality of at least a subset of test samples is sufficient for TILLING.
Figure 10.21. Example of agarose gel validation assay. DNA from four different cassava accessions are tested with a primer pair (labeled above lanes). Samples are flanked by a quantitative ladder (Low DNA mass ladder, Invitrogen. From top to bottom: 2000 bp = 200ng, 1200 bp = 120 ng, 800 bp =80ng, 400 bp=40 ng, 200 bp=20ng, 100bp =10ng). 4 µl of PCR product is loaded per lane, and bands with signals stronger than the 400bp marker show a suitable yield for TILLING. Amplicon analysis by agarose gel of all primers in the 25 good DNA samples revealed that 3 out of 12 primers failed the first phase test (Figure 10.01 and Table 10.37). These primers will need to be re-designed. The first primer pair (77012 control) in Figure 10.21 is rejected because the amplicon size (>2000bp) exceeds the allowable limit. The second primer pair is rejected because multiple products are amplified and the yield falls below 5ng/ul. The third and fourth primer pairs pass the agarose gel assay. In summary:
1. 7/28 (25%) primer pairs passed all testing phases. 2. 12/28 (43%) primer pairs failed due to likely amplification of multiple products 3. 9/28 (32%) primer failure due to unusable amplicon size
While the ability to design robust primers for TILLING is hindered by incomplete knowledge of genome sequence, success with 25% of the primers shows promise for Cassava TILLING and Ecotilling projects. The next step will be to array a screening plate and to screen the test samples with more primer pairs. From this we will determine if a subset of DNA samples are unsuitable for TILLING (consistently failing with all primers). The inclusion of replicates will allow an estimation of false positive and false negative error rates. Because heteroduplexes are the substrate for the mutation discovery assay, it will be crucial to obtain a reference sample of the unmutagenized parental genotype to mix with the test samples to allow the discovery of mutations that are homozygous in the plant. Brad Till, Chikelu Mba, Souleymane Bado, Joy Nakitandwe (IAEA); Adriana Tofiñio, Hernan Ceballos, Martin Fregene (CIAT) are involved in this research whose most important outcome

Project IP3: improving cassava for the developing world Chapter 10 60
is the standardization of the TILLING protocol for 9 starch biosynthesis genes and 25 samples from mutant and non-mutant cassava samples. Table 10.37. Results of Cassava primer testing 1. Target Name
Primer pair
2Amp length Results3 Recommendations
DBE F/R - Fail phase 1. Multiple amplification products (R)
INV. F/R 966 Pass phase 1. Status of phase 2 uncertain due to low sequence data quality
Design new forward primer
HET F/R 998 Pass phase 1. Status of phase 2 uncertain due to low sequence data quality
Re-sequence with available reverse primer / design new reverse primer
RCP1 F/R - Fail phase 1. Multiple amplification products (R) SBII F/R 526 Fail phase 1. Amplicon too short. (R) SPS 1F/1R 861 Pass all three phases. (P) 2F/2R 420 Fail phase 1. Amplicon too short. (R)
SSII 1F/1R >2000 Fail phase 1. Amplicon too long. (R) Optional: redesign new primers if more gene coverage desired.
2F/2R 581 Fail phase 1. Amplicon too short. (R)
3F/3R >2000 Fail phase 1. Amplicon too long. (R) Optional: redesign new primers if more gene coverage desired.
4F/1R 1,101 Pass all three phases. (P) SSIII F/R 880 Pass all three phases. (P) SUSY 1F/1R 876 Pass all three phases. (P) 2F/2R 1,350 Pass all three phases. (P)
3F/3R 988 Pass phase 1. Forward primer failed phase 2. Re-sequence OR Design new 3F primer
4F/4R 970 Pass phase 1, failed phase 2. Re-sequence OR Design new primers
SUT1 F/R 431 Fail phase 1. Amplicon too short. (R)
X74160 F/R ~2000 Fail phase 1. Amplicon too long. (R) Optional: redesign new primers if more gene coverage desired.
5F/4R 1,349 Fail phase 2, 98% homology with MEGBSS (R) 5F/7R 1,072 Fail phase 2 (R) 6F/4R 1,245 Fail phase 2 (R) 6F/7R 970 Fail phase 2 (R) F/7R <2000 Pass all three phases (P)
X77012 F/R >2000 Fail phase 1. Amplicon too long. (R) Optional: redesign new primers if more gene coverage desired.
4F/5R 1,868 Fail phase 1. Amplicon too long. Reject
4F/8R 1,572 Possible failure at phase 2. 99% homology to MESB 97% homology to MEBENRI
(R) Optional: Further sequence analysis
6F/5R 1,672 Possible failure at phase 2. 97% homology to MESB and MEBENRI
(R) Optional: Further sequence analysis
6F/8R 1,422 Passing all three phases. High homology to MESBE and MEBENRI.
Li-Cor evaluation of the level of heterozygosity required before mutation screening.
1Genes identified as (R) are permanently rejected until genomic or longer CDNA sequences become available, since the available sequences were too short Genes and primers identified as (P) have been passed for TILLING based on the sequencing results. 2 Estimated Amp length (bp) 10.20 MODIFICATION OF FLOWERING IN CASSAVA BY GENETIC TRANSFORMATION Flowering in is an important trait for cassava improvement and recalcitrant flowering limits the use of some varieties. Induction of flowering through hormone application, or photoperiodic manipulation is difficult, cumbersome and expensive. Development of a low-
Chapter 10-61 2007 Annual Report
cost alternative means of inducing flowering at will in cassava would greatly overcome the problems of synchronization of flowering being faced by breeders and enhance the genetic improvement of the crop. This will make many excellent cassava genotypes with desirable traits that have been otherwise inaccessible due to poor or non flowering readily available for conventional breeding. Beginning in 2005, transformation experiments were conducted in cassava with the following flowering genes: flowering Locus T(FT) and Constans (CO) under the control of an ethanol inducible system. A total of 48 putative transgenic lines were obtained for CO and 25 plants for FT. We present results of the evaluation of transformation events of cassava Real Time PCRs DNA was extracted using 300mg leaf tissues from the putative cassava lines according to Dellaporta (1983) with some modifications made at CIAT. The quality was checked on 1% agarose gel and quantified with the DyNA Quant 200 Hoefer fluorometer. The concentrations were diluted to 25ng/ul, 2ul of which was used in the real-time PCR reaction plus 10ul of the ready to use Master mix (Finnenzyme, Helsinki), 2ul of 1uM pat forward and reverse primers and 4ul HPLC –grade water for a 20ul total reaction volume. The PCR conditions used were 94oC denaturation for 10minutes, 94oC for 10seconds,annealing at 60 oC for 20seconds, extension at 72 oC for 30secs, and this cycle from the second denaturation step to the extension at 72 oC is repeated 34 more times, melting curve from 65 oC to 95 oC and incubated at 72 oC for 10mins in a Real Time PCR DNA engine opticon 2 MJ machine.All the sample were used with a positive gus control DNA, TMS 60444 non-transgenic as negative control and plasmid was used as a second positive control. Southern Blot Southern Blot Hybridization was used to confirm results of the real-time PCR experiments. DNA was extracted from 15g of leaf tissues of each of 48 putative transgenic plants from CO constructs and the 25 putative transgenic plants from the API constructs using the Dellaporta (1983) DNA extraction protocol. After a quantity and quality check of the extracted DNA on a 0.8% agarose gel, 20ug DNA from each sample was digested completely by 2ul of EcoR1 restriction enzyme (15U/ul) overnight at 37 oC. The restriction digest product was precipitated with equal volume of ice-cold isopropanol and 3M Sodium acetate and digested products separated in a 1% 0.5 TBE gel at 90volts for 15mins and 35volts overnight. The gel was stained for 5mins in water with 5ul of 0.5ug/ml Ethidium bromide to visualize the DNA. The gel was depurinated with 0.25N HCL and denatured in 0.5N NaOH / 0.5M NaCl for an hour. A Southern blot was set up and the gel transferred onto the filter overnight in the transfer solution (NaOH 0.5N and NaCl 0.5M).The filter was removed, labelled and washed for 1-2 mins in 2x SSC , dried and fixed with a stratagene UV stratalinker 2400 for 5min (120mJoules). The filter was pre-hybridized for four hours in the hybraid oven at 63 oC. The probe was a PCR product of phosphinothricin(ppt) primers of 444bp size amplified from the plasmid DNA and purified by ethanol precipitation with 10M ammonium acetate. The hybridization was done using the Megaprime labeling protocol (Amersham, UK). The filter was washed as follows:
1. 2 x SSC/ 0.1% SDS at 65 oC for one hour 2. 1 x SSC/ 0.1% SDS at 65 oC for one hour 3. 0.5 x SSC/ 0.1% SDS at 65 oC for one hour.
Project IP3: improving cassava for the developing world Chapter 10 62
The filter was dried at room temperature and transferred to a transparent nylon sheet and placed in the film cassette protected away from light and exposed for 4days in -80 oC.The films were developed. Herbicide Selection The Murashige and Skoog’s maturation medium containing 1uM alpha-naphthalenic acid (NAA) medium was prepared with increasing concentrations of ppt,0mg/l, 1mg/l,10mg/l,50mg/l,100mg/l and 200mg/l respectively in duplicates.100mg of non-transgenic FECs were distributed in clusters on the medium and left for 15 days. The FECs were observed for development of green tissues. Cotyledon Transformation The Somatic Embryo Cotyledons Transformation protocol of Sarria, 2000 and Siritunga and Sayre 2003 was also attempted for transformation of cassava FEC wish the flowering genes CO and FT used. The advantage of this method is that it is faster and less prone to produce somaclonal variation in the lines regenerated. In this method the initial explant for transformation is 15-30 day old somatic embryos from the cassava varieties CM3306-4 and MCol 2215 that have been induced on MS medium containing the growth regulator 2,4-D. The elongated somatic embryos and cotyledons were carefully cut under sterile conditions and infected with agrobacterium suspension already containing the flowering constructs API, FT, CO and SOC1. Bacteria were pelleted and resuspended in GD2-50uMPicloram with 10ul acetosyringone the vir gene inducer of the T-DNA region. This suspension is added to the explants and left for 2-3 days at 21 oC. The explants were dried on sterile filter papers and placed on maturation medium MS2-1uMANA including cefotaxin(0.5mg/ml) for the control of the agrobacteria. The medium was changed after a week but this time including the 20mg/l ppt selection. The plates are kept in the 28 oC incubator and checked from time to time, replacing the medium. New transformation experiments Additional transformation experiments using the FT and CO flowering genes was also conducted using a more stringent herbicide selection condition (20mg/l compared to 1mg/l used earlier). Friable Embryogenic Callus (FEC) used for this transformation was obtained from the cassava variety TMS 60444 or CM 3306-4. Detailed methodology of genetic transformation has been described elsewhere (Li et al. 1996; CIAT 2005). Results Real time PCR for first set of transformation Figure 10.22 shows amplification of the plasmid control (red) between the 10th and 15th cycle and the gus positive control (green) at the 23rd cycle in the real-time PCR. The yellow line shows amplification for the putative transgenic line CO-6. The quantification curve (Figure 10.23) showed peaks for only the plasmid (red) and the gus controls (blue). The putative transgenic plants CO-6 (yellow) and CO-5 (light blue) including the TMS control showed no similar peaks compared to the plasmid control.

Chapter 10-63 2007 Annual Report
Figure 10.22.Melting curve of control and transgenic samples in the RT-PCR.
Figure 10.23. Quantifiation curve of the DNA samples in the RT-PCR.

Project IP3: improving cassava for the developing world Chapter 10 64
Results of the Southern blot also revealed no evidence of incorporation of the flowering genes in the putative transgenic plants (Figure 10.24).
Figure 10.24. Southern Blot resulted in positive signal only from the control, none from the sample. Real time PCR results from the current putative lines generated from FT constructs using 20mg/l ppt selection Real time PCR of additional transgenic lines generated last year indicated the presence of the 444bp fragment from the selectable marker phosphinothricin (Figure 10.25 and 10.26). The peak signified by the arrow shows the presence of the transgene.(Figure 10.25). The red peak shows the plasmid positive control, while others represent those from the putative transgenic cassava lines and the negative controls have no peaks. Herbicide Selection There was growth and development of FECs placed on 0 and 1mg/l ppt selection but not on 10mg/l and higher concentrations (Figure 10.27). But when 10mg/l plate was left for more than 21days on the same medium, green tissues developed, while the others showed no emerging green somatic tissues. Cotyledon Transformation The Somatic Embryo Cotyledons Transformation protocol tested did not work as agrobacterium infection killed the explants. The ABI strain containing the FT and CO constructs of interest is very aggressive. Additional efforts were made to introduce the flowering constructs into a less aggressive agrobacteria LBA4404 were futile due to incompatibility of the plasmid and LBA4404. The strain LBA4404 is very sensitive to minute doses of Carbenicillin which is used to select for positive transformed clones after the plasmid is introduced to the agrobacterium. The first set of transformation events selected on 1mg/l ppt was unsuccessful as confirmed by real-time PCR and Southern blot results. However, the current putative lines regenerated from the transformation events selected on 20mg/l PPT showed the presence of the insert genes. We will spray the green house plants with 150mg/l ppt to test their tolerance to confirm the insert genes by Southern hybridization. Induction of flowering will also be conducted by spraying the plants with 1-5% of ethanol.

Chapter 10-65 2007 Annual Report
Figure 10.25.Quantification curve of the DNA from putative transgenic plants by RT-PCR.
Figure 10.26. Melting curve of putative transgenic lines by RT-PCR; the positive control is rep. by turquoise blue, the negative controls have no peaks and the nine curves are for the nine samples.

Project IP3: improving cassava for the developing world Chapter 10 66
Figure 10.27. FECs in varying concentration of PPT. O.S Adeyemo, S.J Davis, P. Chavarriaga, J.Tohme, and M. Fregene were involved in this work, funded by Rockefeller Foundation. Relevant outputs were: i) 48 putative transgenic plants with the flowering gene Constans (CO) and 25 plants for the flowering gene Apetala 1 (AP1) were confirmed to be non-transgenics; ii) The lethal dosage of the selectable marker phosphinothricin was confirmed to be 20mg/l not 1mg/l as used earlier to select the afore-mentioned false positive transgenic lines; and iii) The current transformation event with FT constructs showed the presence of insert genes by Real Time –PCRs. 10.21 OVER-EXPRESSION OF THE YEAST-DERIVED INVERTASE GENE IN CASSAVA FOR INCREASING DRY MATTER CONTENT Invertases play an important role in supplying carbohydrates to sink tissues via the apoplastic pathway by catalyzing the conversion of sucrose to glucose + fructose. When apoplastic invertase is over-expressed in tomato and potato plants it leads to an increased export to the sink tissues, with subsequent conversion into and from sucrose and after that to starch. The objective of this work was to over-express the invertase gene in cassava to increase starch and therefore starch content. The construct used in this work was obtained as a gift from by Annette Klocke and Babette Regierer of the Max Planck Institute in Germany. This construct have as selection marker, for use in bacteria as well as plants, the Kanamycin antibiotic gene (Figure 10.28).
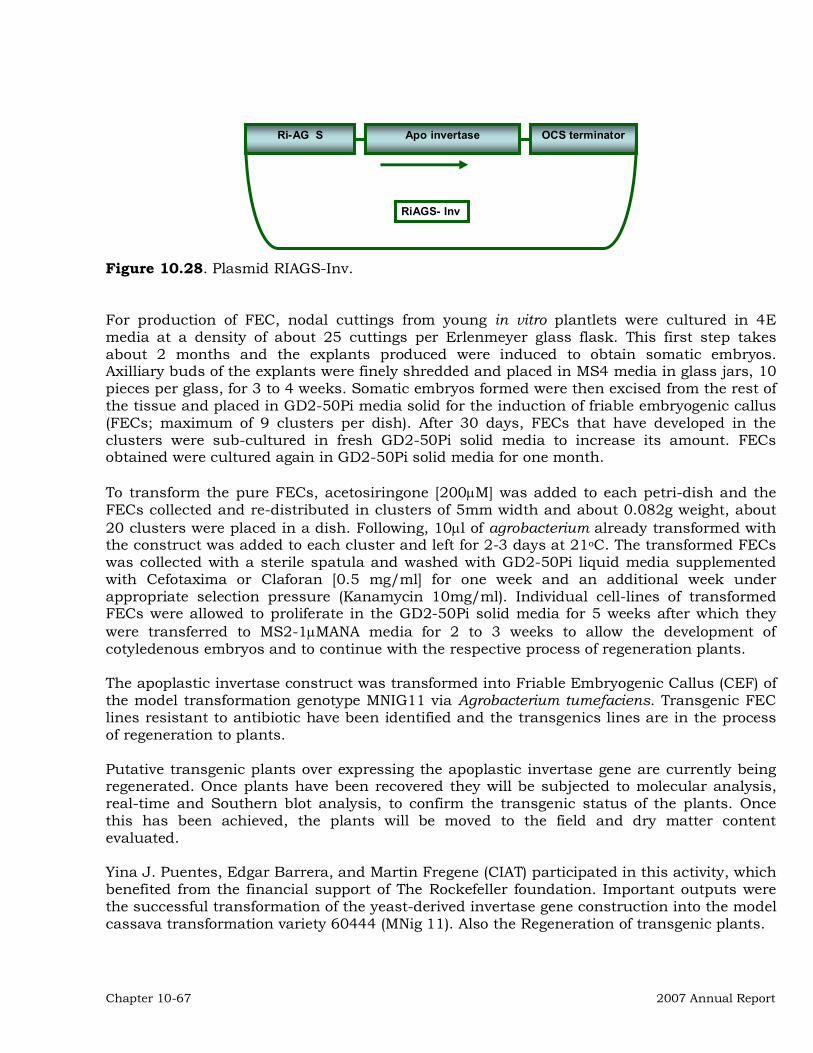
Chapter 10-67 2007 Annual Report
Figure 10.28. Plasmid RIAGS-Inv. For production of FEC, nodal cuttings from young in vitro plantlets were cultured in 4E media at a density of about 25 cuttings per Erlenmeyer glass flask. This first step takes about 2 months and the explants produced were induced to obtain somatic embryos. Axilliary buds of the explants were finely shredded and placed in MS4 media in glass jars, 10 pieces per glass, for 3 to 4 weeks. Somatic embryos formed were then excised from the rest of the tissue and placed in GD2-50Pi media solid for the induction of friable embryogenic callus (FECs; maximum of 9 clusters per dish). After 30 days, FECs that have developed in the clusters were sub-cultured in fresh GD2-50Pi solid media to increase its amount. FECs obtained were cultured again in GD2-50Pi solid media for one month. To transform the pure FECs, acetosiringone [200μM] was added to each petri-dish and the FECs collected and re-distributed in clusters of 5mm width and about 0.082g weight, about 20 clusters were placed in a dish. Following, 10μl of agrobacterium already transformed with the construct was added to each cluster and left for 2-3 days at 21oC. The transformed FECs was collected with a sterile spatula and washed with GD2-50Pi liquid media supplemented with Cefotaxima or Claforan [0.5 mg/ml] for one week and an additional week under appropriate selection pressure (Kanamycin 10mg/ml). Individual cell-lines of transformed FECs were allowed to proliferate in the GD2-50Pi solid media for 5 weeks after which they were transferred to MS2-1μMANA media for 2 to 3 weeks to allow the development of cotyledenous embryos and to continue with the respective process of regeneration plants. The apoplastic invertase construct was transformed into Friable Embryogenic Callus (CEF) of the model transformation genotype MNIG11 via Agrobacterium tumefaciens. Transgenic FEC lines resistant to antibiotic have been identified and the transgenics lines are in the process of regeneration to plants. Putative transgenic plants over expressing the apoplastic invertase gene are currently being regenerated. Once plants have been recovered they will be subjected to molecular analysis, real-time and Southern blot analysis, to confirm the transgenic status of the plants. Once this has been achieved, the plants will be moved to the field and dry matter content evaluated. Yina J. Puentes, Edgar Barrera, and Martin Fregene (CIAT) participated in this activity, which benefited from the financial support of The Rockefeller foundation. Important outputs were the successful transformation of the yeast-derived invertase gene construction into the model cassava transformation variety 60444 (MNig 11). Also the Regeneration of transgenic plants.
Apo invertase OCS terminator Ri-AG S
RiAGS- Inv

Project IP3: improving cassava for the developing world Chapter 10 68
10.22 SHARING RESULTS OF 30 YEARS OF CASSAVA BREEDING: SHIPMENTS OF IMPROVED GERMPLASM TO AFRICA, EUROPE, ASIA AND LATIN AMERICA The cassava tissue culture facility was set up to facilitate easy and rapid sharing of improved varieties and advanced breeding lines from the genetic resources unit (GRU) and the cassava project to collaborators in Africa and USA. This year improved varieties at CIAT were shipped to 4 countries; we describe below germplasm shipment activities undertaken by the cassava tissue culture laboratory. Germplasm shipped were genotypes from the GRU collection, breeding lines from Cassava Genetics or embryo rescued plants from sexual seeds of a mapping population from Tanzania. About 5-10 plants per genotype were shipped; micro-propagation of genotypes was using nodes as described by Roca et al. (1984) in 17N (only apexes) for screen house hardening or 4E for conservation or screen house hardening. A total of 562 genotypes consisting of improved varieties, advanced breeding lines, and mapping populations from CIAT and Tanzania were shipped to 3 African countries, and USA. A list of the number of genotypes, countries, and date of shipments are shown in Table 10.38. Table 10.38. List of shipments and destination of improved varieties and advanced breeding lines shipped from the cassava tissue culture facility between June and December 2007
Other activities related to these are the maintenance of genotypes being shipped in vitro. They include including genotypes of the CR and AR families (resistance to CMD), the mapping population for cyanogenic potential and dry matter content (AM320), the core collection, a group of 38 elite CIAT varieties, 60444 (the model cassava regeneration genotype being used to produce FECs for genetic transformation, and TME-3 (source of CMD resistance). Others include a number high protein content varieties, inter-specific F1 having delayed PPD, White fly resistant germplasm, drought tolerance genotypes, CBSD resistant embryo-rescued plants materials of Tanzania, irradiated materials, and 33 accessions of wild Manihot genotypes requested by the cassava tissue culture facility from the GRU for GCP project activities. The above materials were renewed during the year. The cassava tissue culture laboratory has continued to provide invaluable services of micro-propagation, embryo rescue and shipment of elite materials to partners, propagation of germplasm required by CIAT projects as well as conservation of a large group of materials being held for cassava breeding and genetics. Members of the laboratory have also trained a large number of people this year. Future perspectives include micro-propagation and
Country Date Family No. Genotypes Tanzania June 20, 2007 CBH1, CBH2 85 USA July 31, 2007 B1PD 29 Nigeria September 17, 2007 B1P 5 Tanzania October 12, 2007 CBH1, CBH2 72 Ghana December 14, 2007 TS 371
TOTAL 562
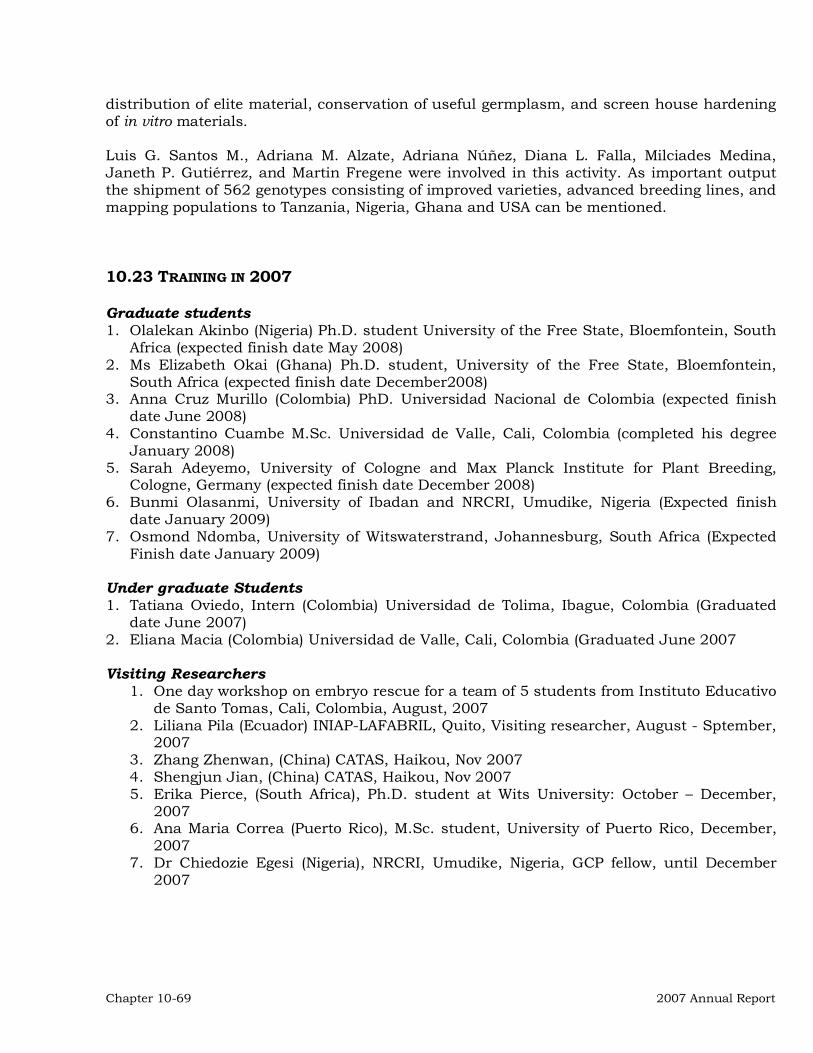
Chapter 10-69 2007 Annual Report
distribution of elite material, conservation of useful germplasm, and screen house hardening of in vitro materials. Luis G. Santos M., Adriana M. Alzate, Adriana Núñez, Diana L. Falla, Milciades Medina, Janeth P. Gutiérrez, and Martin Fregene were involved in this activity. As important output the shipment of 562 genotypes consisting of improved varieties, advanced breeding lines, and mapping populations to Tanzania, Nigeria, Ghana and USA can be mentioned. 10.23 TRAINING IN 2007 Graduate students 1. Olalekan Akinbo (Nigeria) Ph.D. student University of the Free State, Bloemfontein, South
Africa (expected finish date May 2008) 2. Ms Elizabeth Okai (Ghana) Ph.D. student, University of the Free State, Bloemfontein,
South Africa (expected finish date December2008) 3. Anna Cruz Murillo (Colombia) PhD. Universidad Nacional de Colombia (expected finish
date June 2008) 4. Constantino Cuambe M.Sc. Universidad de Valle, Cali, Colombia (completed his degree
January 2008) 5. Sarah Adeyemo, University of Cologne and Max Planck Institute for Plant Breeding,
Cologne, Germany (expected finish date December 2008) 6. Bunmi Olasanmi, University of Ibadan and NRCRI, Umudike, Nigeria (Expected finish
date January 2009) 7. Osmond Ndomba, University of Witswaterstrand, Johannesburg, South Africa (Expected
Finish date January 2009) Under graduate Students 1. Tatiana Oviedo, Intern (Colombia) Universidad de Tolima, Ibague, Colombia (Graduated
date June 2007) 2. Eliana Macia (Colombia) Universidad de Valle, Cali, Colombia (Graduated June 2007 Visiting Researchers
1. One day workshop on embryo rescue for a team of 5 students from Instituto Educativo de Santo Tomas, Cali, Colombia, August, 2007
2. Liliana Pila (Ecuador) INIAP-LAFABRIL, Quito, Visiting researcher, August - Sptember, 2007
3. Zhang Zhenwan, (China) CATAS, Haikou, Nov 2007 4. Shengjun Jian, (China) CATAS, Haikou, Nov 2007 5. Erika Pierce, (South Africa), Ph.D. student at Wits University: October – December,
2007 6. Ana Maria Correa (Puerto Rico), M.Sc. student, University of Puerto Rico, December,
2007 7. Dr Chiedozie Egesi (Nigeria), NRCRI, Umudike, Nigeria, GCP fellow, until December
2007
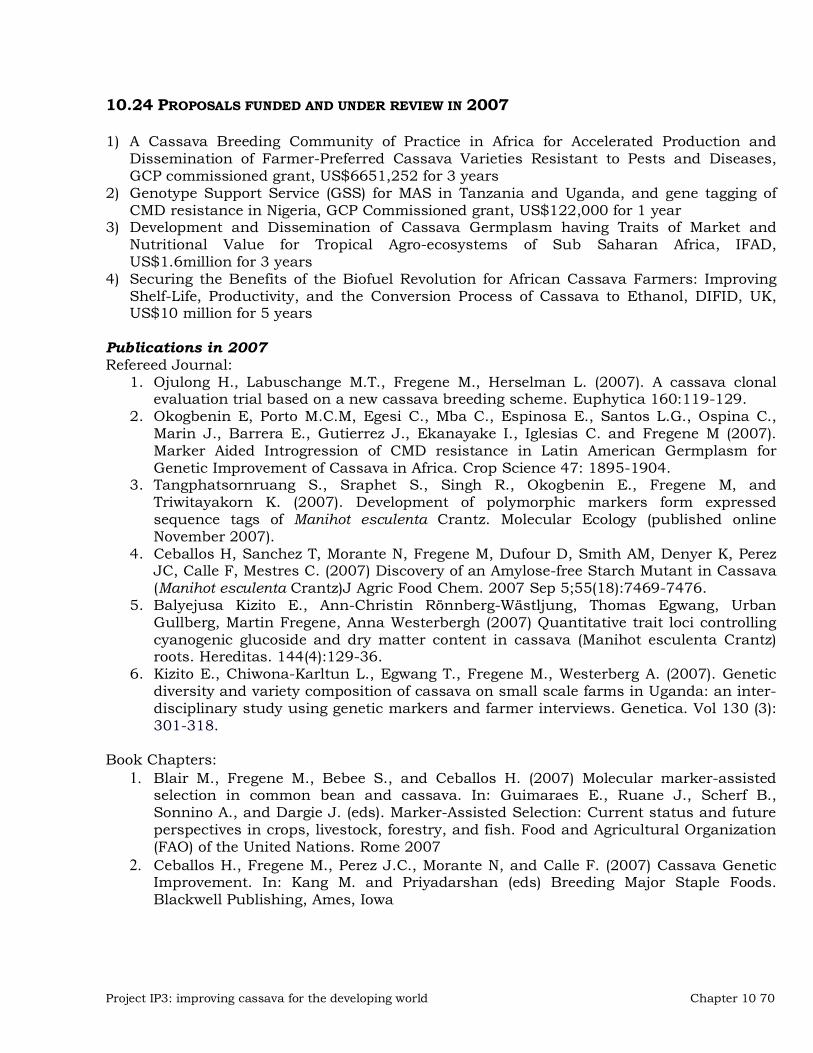
Project IP3: improving cassava for the developing world Chapter 10 70
10.24 PROPOSALS FUNDED AND UNDER REVIEW IN 2007 1) A Cassava Breeding Community of Practice in Africa for Accelerated Production and
Dissemination of Farmer-Preferred Cassava Varieties Resistant to Pests and Diseases, GCP commissioned grant, US$6651,252 for 3 years
2) Genotype Support Service (GSS) for MAS in Tanzania and Uganda, and gene tagging of CMD resistance in Nigeria, GCP Commissioned grant, US$122,000 for 1 year
3) Development and Dissemination of Cassava Germplasm having Traits of Market and Nutritional Value for Tropical Agro-ecosystems of Sub Saharan Africa, IFAD, US$1.6million for 3 years
4) Securing the Benefits of the Biofuel Revolution for African Cassava Farmers: Improving Shelf-Life, Productivity, and the Conversion Process of Cassava to Ethanol, DIFID, UK, US$10 million for 5 years
Publications in 2007 Refereed Journal:
1. Ojulong H., Labuschange M.T., Fregene M., Herselman L. (2007). A cassava clonal evaluation trial based on a new cassava breeding scheme. Euphytica 160:119-129.
2. Okogbenin E, Porto M.C.M, Egesi C., Mba C., Espinosa E., Santos L.G., Ospina C., Marin J., Barrera E., Gutierrez J., Ekanayake I., Iglesias C. and Fregene M (2007). Marker Aided Introgression of CMD resistance in Latin American Germplasm for Genetic Improvement of Cassava in Africa. Crop Science 47: 1895-1904.
3. Tangphatsornruang S., Sraphet S., Singh R., Okogbenin E., Fregene M, and Triwitayakorn K. (2007). Development of polymorphic markers form expressed sequence tags of Manihot esculenta Crantz. Molecular Ecology (published online November 2007).
4. Ceballos H, Sanchez T, Morante N, Fregene M, Dufour D, Smith AM, Denyer K, Perez JC, Calle F, Mestres C. (2007) Discovery of an Amylose-free Starch Mutant in Cassava (Manihot esculenta Crantz)J Agric Food Chem. 2007 Sep 5;55(18):7469-7476.
5. Balyejusa Kizito E., Ann-Christin Rönnberg-Wästljung, Thomas Egwang, Urban Gullberg, Martin Fregene, Anna Westerbergh (2007) Quantitative trait loci controlling cyanogenic glucoside and dry matter content in cassava (Manihot esculenta Crantz) roots. Hereditas. 144(4):129-36.
6. Kizito E., Chiwona-Karltun L., Egwang T., Fregene M., Westerberg A. (2007). Genetic diversity and variety composition of cassava on small scale farms in Uganda: an inter-disciplinary study using genetic markers and farmer interviews. Genetica. Vol 130 (3): 301-318.
Book Chapters:
1. Blair M., Fregene M., Bebee S., and Ceballos H. (2007) Molecular marker-assisted selection in common bean and cassava. In: Guimaraes E., Ruane J., Scherf B., Sonnino A., and Dargie J. (eds). Marker-Assisted Selection: Current status and future perspectives in crops, livestock, forestry, and fish. Food and Agricultural Organization (FAO) of the United Nations. Rome 2007
2. Ceballos H., Fregene M., Perez J.C., Morante N, and Calle F. (2007) Cassava Genetic Improvement. In: Kang M. and Priyadarshan (eds) Breeding Major Staple Foods. Blackwell Publishing, Ames, Iowa

Chapter 10-71 2007 Annual Report
3. Setter T. and Fregene M. (2007). Cassava In: Matthew A. Jenks, Paul M. Hasegawa, and S. Mohan Jain (eds). Advances in Molecular-breeding toward Drought and Salt Tolerant Crops. Springer, Berlin
Trips made in 2007:
1. Participation in two meetings, one in Tanzania and the other in Kenya, with IITA and NARs colleagues on development of cassava proposals for the Gates Foundation.
2. Participation in the Third General Meeting on Biotechnology, Breeding & Seed Systems for African Crops in Maputo, Mozambique, 26-29 March, 2007.
3. Participation in the Second Annual Meeting of the Bio-Cassava Plus project, St Louis, May 7-9, 2007.
4. GCP Workshop on Development of Delivery Plan for Competitive Grants, August 6-5, Mexico City, Mexico.
5. Participation in the China-Nigerian Meeting on Cassava Development, Haikou, Hainan, August 27-31, 2007.
6. Participation in the Second meeting of the Cassava Breeders Network in Zanzibar, Tanzania, October 3-5, 2007.
References Akano, A., E. Barera, C. Mba, A.G.O. Dixon, and M.A. Fregene. 2002. Genetic mapping of a
dominant gene conferring resistance to cassava mosaic disease. Theor. Appl. Genet. 105:521–525.
Al-Hassan, R. 1989. Cassava in the Economy of Ghana. In : Status of Cassava research in Africa, COSCA working paper No. 3, Eds, F. I. Nweke, J. Lynam and C. Y. Prudencio, International Institute of Tropical Agriculture, Ibadan, Nigeria.
Asiedu, R., K.V. Bai, R. Terauchi, A.G.O. Dixon and S.K. Hahn, 1992. Status of wide crosses in Cassava and Yam. In: Thotttapily, G. (ed.). Biotechnology; enhancing research on tropical crops in Africa: Proceedings of an international conference held at the International Institute of Tropical Agriculture, 26-30 November 1990, IITA, Ibadan, Nigeria.
Bolhuis GG. 1953. A survey of some attempts to breed cassava varieties with a high content of protein in the root. Euphytica 2: 107-112.
Cassava’s Genetic Information System (CGIS) (2006) Juan G. Rozo(1), Luís G. Santos M., Edgar Barrera, Fernando Rojas & Martín Fregene (CIAT) (2) (1)Universidad Libre (2) CIAT.
Castelblanco W. and M. Fregene (2006) SSCP-SNPs based Conserved Ortholog Set (COS) Markers for Comparative Genomics in Cassava (Manihot esculenta Crantz). Plant Molecular Biology Reporter 24: 229-236
Ceballos et. al. 2002. Mejoramiento genético de la yuca. En: La yuca en el tercer milenio: Sistemas modernos de producción, procesamiento, utilización y comercialización. Publicación CIAT.
CIAT, 2002. Annual Report IP3. Improved cassava for the developing world. CIAT 2003. Annual Report IP3. Improved cassava for the developing world. Pp8-85 to 8-90 CIAT 2005. Annual Report IP3. Improved cassava for the developing world. Construction of a
TME-3 Bacterial Artificial Chromosome (BAC) Library and Development of a BAC contig around a CMD Resistance Gene. Annual Report. CIAT, Cali, Colombia.
CIAT 2006. Annual Report IP3. Improved cassava for the developing world. Progress in chromosome walking toward to the CMD2 gene using comparative genomics with Castor bean (Ricinus communis). Annual Report. CIAT, Cali, Colombia.
CIAT 2007. Annual Report IP3. Improved cassava for the developing world.

Project IP3: improving cassava for the developing world Chapter 10 72
Dellaporta SL, Wood J, Hicks JR (1983) A plant DNA mini preparation: version II. Plant Mol Biol Rep 1: 19-21.
Dieter Heineke, et al. 1992 Apoplastic expresión of Yeast-Derived Invertase in Potato Plant physiol. 100, 301-308
ECLIPSE IDE(Integrated Development Environment): http://www.eclipse.org/ FAO 2006. Producción mundial de yuca. FAO, Roma Fregene, M.A., F. Angel, R. Gómez, F. Rodríguez, W. Roca, J. Tohme, and M. Bonierbale
(1997). A molecular genetic map of cassava (Manihot esculenta Crantz). Theor. and Appl. Genet. TAG 95 (3) 431-441.
Fregene, M., F. Angel, R. Gomez, F. Rodriguez, P. Chavarriaga, W. Roca, J. Tohme, M. Bonierbale (1997) A molecular genetic map of cassava (Manihot esculenta Crantz). Theor Appl Genet 95:431-441
Fregene M. Morante N., Sanchez T., Marin J., Ospina C., Barrera E., Gutierrez J., Guerrero J., Bellotti A., Santos L., Alzate A., Moreno S., and Ceballos H (2006). Molecular Markers for the Introgression of Useful Traits from Wild Manihot Relatives of Cassava; Marker-Assisted Selection of Disease and Root Quality Traits. Journal of Root Crops, Vol 32, No.1, pp 1-31.
Gottret, M. V.; Escobar, Z.; Perez S., Salomón. 2002. El sector yuquero en Colombia: Desarrollo y competitividad. En: La yuca en el tercer milenio. Publicación CIAT.
HSQLDB (Database for PDA): http://hsqldb.org/ Lander, E.S., P. Green, J. Abrahamson, A. Barlow, M.J. Dal, S.E. Lincoln and L. Newberg.
1987. MAPMAKER: an interactive computer package for constructing primary genetic linkage maps of experimental and natural populations. Genomics 1:174-181.
Marin J., C. Ospina, N. Morante, T. Sanchez, H. Ceballos, M. Fregene.2001. Mapeo Genético y Análisis de QTLs para el Contenido de Beta Carotenos en una Población S1 en Yuca (Manihot esculenta Cranz). Annual Report. Centro Internacional de Agricultura Tropical (CIAT) AA 6713, Cali, Colombia.
Mba REC, Stephenson P, Edwards K, Melzer S, Mkumbira J, Gullberg U, Apel K, Gale M, Tohme J, Fregene MA (2001) Simple Sequence Repeat (SSR) markers survey of the cassava (Manihot esculenta Crantz) genome: towards an SSR-based molecular genetic map of cassava. Theor Appl Genet: 21-31
Michelmore RW, Paran I, Kesseli RV (1991). Identification of markers linked to disease-resistance genes by bulked segregant analysis:a rapid method to detect markers in specific genomic regions by using segregating populations. Proc Natl Acad Sci USA. 1991 Nov 1;88(21):9828-32.
Murashige T. and Skoog F. (1962) A revised medium for rapid growth and bioassays with tobacco tissue cultures. Plant Physiol. 15: 437-497.
MySQL(Database Server): http://www.mysql.org/ Nassar, N.M.A. and G. Dorea, 1982. Protein content in some cassava cultivars and its hybrid
with wild Mannihot species. Turrialba 32: 429-432. Nweke F.I., A.G.O. Dixon, R. Asiedu, and S.A. Folayan. 1994. Cassava variety needs of
farmers and potential for production growth in Africa. Collaborative study of cassava in Africa (COSCA). Working paper No. 10:40-41.
Okogbenin E. and Fregene M (2002) Genetic Analysis and QTL Mapping of Early Bulking in an F1 Segregating Population from Non-inbred Parents in Cassava (Manihot esculenta Crantz) Theor Appl Genet 106:58-66
Okogbenin E., Jaime Alberto Marin, and Fregene M. (2006). A SSR marker based Genetic Map of Cassava Euphytica 147:433-440.
Okogbenin E, Porto M.C.M, Egesi C., Mba C., Ospinosa E., Santos L.G., Ospina C., Marin J., Barrera E., Gutierrez J., Ekanayake I., Iglesias C. and Fregene M (2007). Marker Aided

Chapter 10-73 2007 Annual Report
Introgression of CMD resistance in Latin American Germplasm for Genetic Improvement of Cassava in Africa. Crop Science 2007 47: 1895-1904.
P.D.A: http://www.psionteklogix.com/public.aspx?s=com&p=Products&pID=3965 Roca, W.M., Rodfriguez, J.A., Mafla, G. Y Roa, J. (1984) Procedures forrecovering cassava
clones distributed in vitro. Centro Internacional de Agricultura Tropical (CIAT). Pp 8. Safo-Katanga, O., Aboaagye, P., y Amartey, S.A. 1984. Studies on the content of yellow-
pigmented Cassava. Terry, E.R, (Eds), Tropical roots crops production and uses in Africa. p. 103-104.
Sarria R, Torres E, Angel F, Chavarriaga P & Roca WM (2000) Transgenic plants of cassava (Manihot esculenta) with resistance to Basta obtained by Agrobacterium-mediated
transformation. Plant Cell Rep. 19: 339-344. Till, B.J., C. Burtner, L. Comai, and S. Henikoff. 2004. Mismatch cleavage by single-strand
specific nucleases. Nucleic Acids Res. 32:2632-2641. Westerbergh A. and John Doebley (2002) Morphological traits defining species differences in
wild relatives of maize are controlled by multiple quantitative trait loci. Evolution 56(2): 273-283
Wu, K.K., W. Burnquist, M.E. Sorrells, T.L. Tew, P.H. Moore and S.D. Tanksley. 1992. The detection and estimation of linkage in polyploids using single-dose restriction fragments. Theoretical and Applied Genetics 83: 294 – 300.
ZEBRA DESIGNER PRO (Code Bar technology): http://www.zebra.com/id/zebra/na/en/index/products/software/label_design_software/zebradesignerpro.html
Zhao-Bang Zeng (2005) QTL mapping and the genetic basis of adaptation: recent developments. Genetica 123: 25-37.

CHAPTER 11
DEVELOPMENT AND USE OF BIOTECHNOLOGY TOOLS FOR CASSAVA IMPROVEMENT: DOUBLED HAPLOIDS AND ANTHER CULTURE
11.1 DEVELOPMENT OF AN IN VITRO PROTOCOL FOR THE PRODUCTION OF DOUBLED-HAPLOIDS OF CASSAVA 11.1.1 INTRODUCTION Cassava has served as one of the most important staple food in the tropics and drawn significant attention from starch industries recently worldwide. Since years of vegetatively propagated by stem cut in farmers’ practices, it has been established in many elite clones a highly heterozygous genome, which subsequently delays the advanced breeding progress. The true breeding, homogenous line, is always expected for a breed program. However, it is time-consuming job get the true breeding by self-pollinating for several consecutive generations, takes about 10 years generally. Scientists are increasingly resorting to another method---in vitro microspore culture that can produce doubled haploids (DHs). This method has been applied in plant breeding since 1964 (Guha and Maheshwari). However, the success of in vitro production of DH lines by androgenesis is subject to the constraints from many factors, including the physiological status of donor plants, special developmental stage of microspore, proper pretreatment on the microspores (stress), and microspore culture condition (the medium species and its composition, the cell density, the temperature regime, the application of plant growth regulators, and the conditioned media). In general, a typical androgenesis protocol (based on the barley androgenesis, reviewed by Wang et al., 2000) can be divided into the following major steps: a) plant material: harvesting inflorescences from vigorously growing donor plants. Any infection or stress to the donor plant will lead to less success or complete failure for induction of androgenesis and further regeneration (Wang et al., 2000); b) Pre-treatments on the plant material: cold pretreatment (Gaillard et al., 1991; Kasha et al., 2001), high osmolarity (Touraev et al., 1997), nitrogen starvation (Kyo and Harada, 1986), heat shock (Custers et al., 1994) and chemical inducer (Liu et al., 2002) can be used alone or combined on the right developmental stage of microspores. This is the step to switch the microspores from the gametophytic pathway to a sporophytic development. Successfully induced microspores (embryogenic microspores) will experience a rapid growth (2-3 weeks after pretreatment) and can be recognized by their
Chaptert 11-1 2007 Annual Report
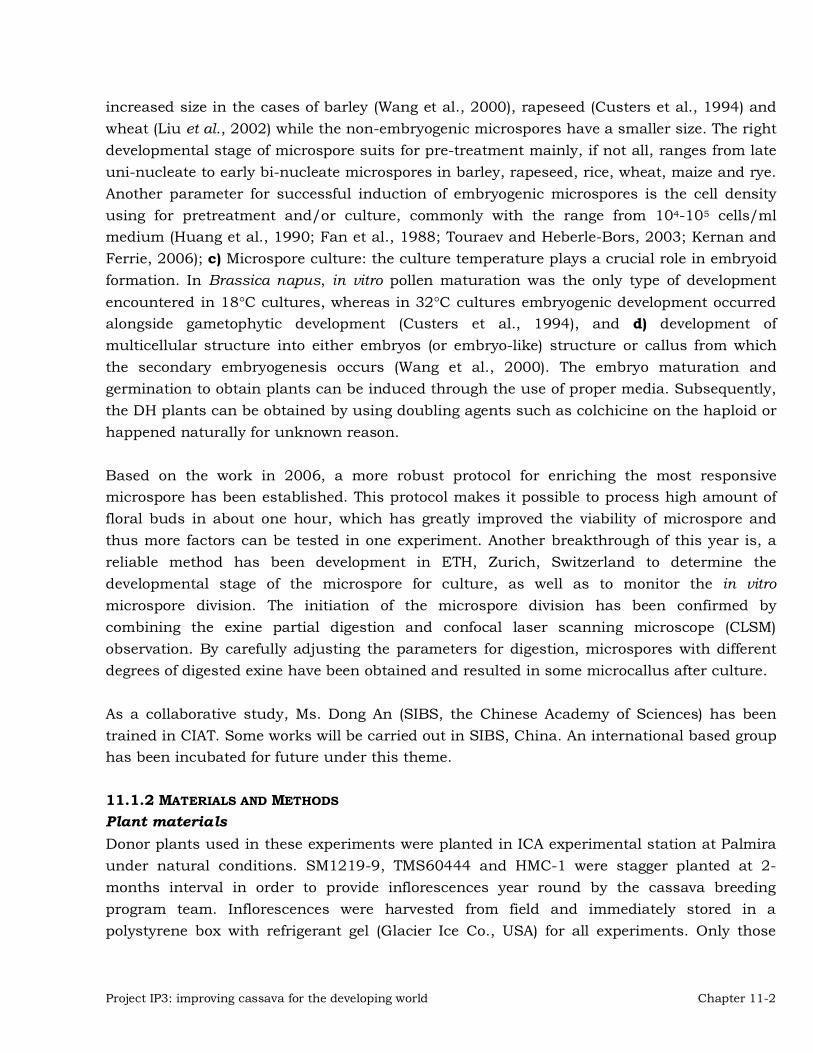
increased size in the cases of barley (Wang et al., 2000), rapeseed (Custers et al., 1994) and wheat (Liu et al., 2002) while the non-embryogenic microspores have a smaller size. The right developmental stage of microspore suits for pre-treatment mainly, if not all, ranges from late uni-nucleate to early bi-nucleate microspores in barley, rapeseed, rice, wheat, maize and rye. Another parameter for successful induction of embryogenic microspores is the cell density using for pretreatment and/or culture, commonly with the range from 104-105 cells/ml medium (Huang et al., 1990; Fan et al., 1988; Touraev and Heberle-Bors, 2003; Kernan and Ferrie, 2006); c) Microspore culture: the culture temperature plays a crucial role in embryoid formation. In Brassica napus, in vitro pollen maturation was the only type of development encountered in 18�C cultures, whereas in 32�C cultures embryogenic development occurred alongside gametophytic development (Custers et al., 1994), and d) development of multicellular structure into either embryos (or embryo-like) structure or callus from which the secondary embryogenesis occurs (Wang et al., 2000). The embryo maturation and germination to obtain plants can be induced through the use of proper media. Subsequently, the DH plants can be obtained by using doubling agents such as colchicine on the haploid or happened naturally for unknown reason. Based on the work in 2006, a more robust protocol for enriching the most responsive microspore has been established. This protocol makes it possible to process high amount of floral buds in about one hour, which has greatly improved the viability of microspore and thus more factors can be tested in one experiment. Another breakthrough of this year is, a reliable method has been development in ETH, Zurich, Switzerland to determine the developmental stage of the microspore for culture, as well as to monitor the in vitro microspore division. The initiation of the microspore division has been confirmed by combining the exine partial digestion and confocal laser scanning microscope (CLSM) observation. By carefully adjusting the parameters for digestion, microspores with different degrees of digested exine have been obtained and resulted in some microcallus after culture. As a collaborative study, Ms. Dong An (SIBS, the Chinese Academy of Sciences) has been trained in CIAT. Some works will be carried out in SIBS, China. An international based group has been incubated for future under this theme. 11.1.2 MATERIALS AND METHODS
Plant materials Donor plants used in these experiments were planted in ICA experimental station at Palmira under natural conditions. SM1219-9, TMS60444 and HMC-1 were stagger planted at 2-months interval in order to provide inflorescences year round by the cassava breeding program team. Inflorescences were harvested from field and immediately stored in a polystyrene box with refrigerant gel (Glacier Ice Co., USA) for all experiments. Only those
Project IP3: improving cassava for the developing world Chapter 11-2

plants with healthy growth and profuse flowering and of similar morphology and developmental stage were used. If available, depending on the genotype, 1-3 young leaves were kept attached to the excised inflorescences to prevent deterioration of microspores. Light microscopy analysis The anthers were dissected from the floral buds and fixed in 2.5% glutaraldehyde (in 0.1 mol/l phosphate buffer, pH 7.2) for 24 h at 4ºC and then dehydrated in a series of ethanol (25%, 50% and 75%). Specimens were immersed in 2% uranyl acetate (in 75% ethanol) for 12 h at room temperature followed by a series of ethanol (washing in 90% and 100%, three times each), a pure acetone rinses for 20 min and then gradually infiltrated and embedded in Spurr epoxy resin. Embedded anthers were sectioned on an ultramicrotome for semi-thin or ultra-thin sections following Reynolds (1963). The ultrastructure of microspore was observed and imaged under transmission microscope (JEOL TM1010). Confocal laser scanning microscope (CLSM) analysis Complimentary to the light and electronic microscopic analysis, samples were analyzed under a fluorescence confocal scanner microscope (Leica TCS SP2 Confocal, Leica Microsystems, Heidelberg, Germany). The anthers from a series of sorted floral buds were fixed in a FAA solution for more than 24 h and digested in 10% sodium hypochlorite for 2 min. Then partially digested microspores were washed in ddH2O for three times and stained in 0.05 mg.ml-1 of Acridine Orange (AO) solution. The images were captured by a Leica Confocal Software and processed using Imaris 3D software version 4.2.0 (Bitplane AG, Zurich, Switzerland). Microspore isolation and culture The clone SM1219-9 was chosen as a model for experiment design because of its high yielding of homogenous microspores at the same time comparing to other clones (personal observation), which makes it a suitable material for a relative large scale of experiments. Unless otherwise indicated, results are from SM1219-9 clone. Parameters optimized with SM1219-9 have been expanded to clone TMS60444. Unless specified, flower buds were selected and treated, and micropore isolated following the same protocol as reported Annual Report 2006. The slurry was filtered through a series of nylon meshes (218,150, 102 and 88 �m pore size in turn). The cells blocked on the filters of 102 and 88 were recovered separately by mannitol washing and pelleted by centrifugation at 100g for 1min. The composition of the pellets was determined under light microscope. The pellets were purified by percoll gradient centrifugation (50% and/or 75% percoll gradient) at 150g for 3min. Resultant cell suspension was washed with medium for 3 times. The cell concentration was determined by means of series dilution. The suspension, with the concentration of 104 cells/ml, was cultured in 30×15mm Petri dishes at different temperature regimes in the dark. All the media were
Chapter 11-3 2007 Annual Report

refreshed every 2 or 4 weeks depending on different experiments and cultured for at least two months. Each experiment was repeated between 3 to 10 times. Ovary dissection Different sizes of female flowers prior to opening for pollination were excised and cultured jointly with the microspores as described in Annual Report 2006. Exine digestion and microspore culture In order to remove the exine from the microspores, the isolation of the microspores was subjected to sodium hypochlorite (NaClO) with different concentrations and duration. The partially digested microspores were culture in medium at 26ºC. The media included liquid medium or a feeder layer in which a filter of 0.8 �m in pore size (Millipore Corp.) was placed on a semisolid media containing actively growing embryogenic callus. 11.1.3 RESULTS AND DISCUSSION
Improvement on the microspore isolation protocol Based on the work in 2006, only the floral buds ranging from 2.0-2.6 4 mm in the diameter were selected for microspore isolation. A new, reproducible protocol was developed this year to obtain microspores with higher viability and yields comparing to last year. The steps of floral bud selection and the Percoll gradient centrifugation are simplified as follow. The flower bud size categories covered 0.2 mm-intervals and ranges from 2.0mm to 2.6 mm were analyzed. Categories of 2.0-2.2mm, 2.2-2.4mm and 2.4-2.6mm of bud sizes were evaluated at the beginning of the rainy or dry season. The effect of bud size was similar in both seasons (Table 11.1). Microspore yield from buds of 2.0-2.2 mm is very low and there is not formation of embryogenic microspore (EM). Microspores from 2.2-2.4 mm buds showed the highest yield isolation and induced EM. Buds of 2.4-2.6 mm although release high yield of microspores, the EM induction is 3 times lower respect to that with 2.2-2.4 mm buds. Buds of 2.2-2.4 mm were selected as the size of choice for all experiments thereafter. The efficiency of bud selection was increased more than twice. Percoll gradient centrifugation was also improved allowing a further enrichment in obtaining homogeneous microspore isolation. This step is critical to get rid of those microspores that are at different developmental stages and brought in when a larger range of different bud size is used. The microspores recovered from the 50% and 75% Percoll bands are cultured separately. In general, microspores of 102-150 �m in size recovered from 50% Percoll bands account for more than 93% of EM. By implementing these changes the isolation and culture process can be finished in one and half hours. The shorter time used for isolation, the higher the microspore viability because the isolation process is a stress to the microspores.
Project IP3: improving cassava for the developing world Chapter 11-4

The isolation protocol has been standardized as follows: 1) Flower buds within 2.2-2.4mm in diameter are carefully selected on ice and then disinfected in 5.25% NaClO for 15min followed by 3 times of washing with sterile water. 2) Buds are blended in a pre-cold 0.4 M mannitol solution in a blender (Warings, USA) for 20s at low speed. 3) The slurry is filtered in step-wise sequence through 213 �m, 150 �m, 102 �m and 88 �m (the first two filters are used to eliminate large debris). 4) The microspores retained above the 102 �m and 88 �m filters are recovered separately, and pellet down by centrifugation at 100g for 1 min. 5) The pellet is re-suspended and layered onto 50% Percoll solution and centrifuged at 150g for 3min. 6) The microspores at the interface band are transferred to a new tube and washed with medium. After adjustment of the concentration at 104 cells/ml, the microspores are ready for use. Confirmation of the key stage of microspore development by TEM (Transmission electron microscopy) and Confocal laser scanning microscope (CLSM) In previous work, we had identified easily most of the microsporogenesis stages from the very early stages of mother pollen cell to mature pollen stage using standard light microscopy. However, it was impossible to distinguish the late uninucleate from early and advanced binucleate stages, the critical stages for microspore induction in vitro, because the thick microspore exine appears as soon as the cells are released from cassava tetrads. Therefore, this year we used both TEM and CLSM as complementary techniques. TEM analysis of serial sections from flower buds of 2.6-2.7 mm suggests the presence of a bi-nucleate microspore. In this section it is clearly identified a nucleolus enclosed in an envelop suggesting a vegetative cell nucleus (Figure 11.1), next to another envelop where the nucleus is not visible either because it is located in a different plane section or because the expanded chromatin status of the generative cell nucleus. CLSM complements the TEM analysis revealing the binucleate stage of the microspore (Figure 11.2A). CLSM analysis was essential to confirm the developmental stages of these microspores. In order to be able to use CLSM technology, it was necessary to digest about 90% of the exine with Na-hypochlorite prior the CLSM test because of the thickness and auto fluorescence of the cassava microspore exine. After this treatment, it was possible to detect the fluorescent emission of specific DNA-fluorescent staining from inside the microspore confirming that microspores from 2.6 mm size flower buds are at binucleate stage. One large (vegetative) and one small (generative) nucleus are clearly identified with the CLSM. Flower buds < 2.5 mm in size, contained microspores at uninucleate stage (Figure 11.2B). Thus, it appears that mitotic division may occur in flower buds from 2.5 to 2.6 mm in clone HMC-1. Results also indicate that the most responsive microspores to in vitro induction are usually from buds of 2.2-2.4 mm. We suggest that these buds may contain microspores at earlier stages most likely from early to mid-
Chapter 11-5 2007 Annual Report

uninucleate. The results obtained with TEM and CLSM this year corroborate the results using standard light microscopy-staining analysis presented last year.
Figure 11.1 TEM (Transmission electron microscopy) of a binucleate microspore. Insert (left upper corner) show the schematic view of two linked sets of envelops.
Confirmation of pre-embryo induced in cassava androgenesis Results from last year indicated the presence of four clearly identified structures/ stages during microspore in vitro culture: (a) Type I --- Embryogenic microspores (EM); (b) Type II --- Multi-cellular structure (MCS); (c) Type III --- Embryoid-like structure (ELS), and (d) Type IV --- Micro-callus. In model species such as barley, EM is a marker stage for acquisition of embryogenic potential, MCS a marker for initiation of cell division, and ELS a marker for the initiation of the final stage of androgenetic response (Maraschin et al., 2005). Isolated microspore cultured for 72 h and treated with Na-hypochlorite to digest the exine revealed multi-nucleoli with CLSM in (Figure 11.3). These cells show at least 4 cycles of mitotic division (Figure 11.3). Bayliss et al., 2004, also call pro-embryo this type of multi-cellular structure. This result suggests corroborates that these microspores switched from a normal gametophytic development pathway to the commencement of embryogenesis by the low temperature pretreatment and the following in vitro culture. To our knowledge, this is first report providing evidence of pro-embryo structure formation in cassava from androgenetic
Project IP3: improving cassava for the developing world Chapter 11-6

response. Based on this observation the term EM used herein above and in earlier reports actually represents a MCS (multi-cellular structure).
Figure 11.2. CLSM images of (A) binucleate and (B) uninucleate microspore.
Figure 11.3. CLSM image of a multicultural structure from cultured microspore after 72h. Factors affecting MCS formation in cassava microspores cultures in vitro Large emphasis was placed to revise in the detail the different components of medium composition, culture procedures and conditions. Of the factors evaluated, the use of spermidine, high concentration of CuSO4 and hormone combinantions (ABA 3 mg/l, PAA 8 mg/l and picloram 7 mg/l) (data not shown) had either no or a negative effect on MCS induction (Table 11.1). Below we summarized factors increasing MCS induction.
Chapter 11-7 2007 Annual Report

Three culture temperature regimes were evaluated: 26�C, 28�C and 32�C. Microspores recovered from 50% and 75% Percoll gradient were tested. When testing microspores from the 50% Percoll, a 6-fold increase in MCS was observed at 26�C in contrast to 3-fold at 28�C and 1-fold at 32�C. Microspores from 75% Percoll were less responsive and MCS induction at 26�C was 4-times less respect to 50% Percoll, and the response decreases as the temperature increases. This optimal temperature is similar to the one reported for cassava somatic cell culture by Szabados et al. (1987). The addition of 2,4-D to the culture medium in general increased MCS induction with an optimal effect at 6 mg/l. (20% increase in response). Higher concentrations have an inhibitory effect. The addition of gum Arabic or Larcoll (a glycoprotein) increased MCS in microspores of 102-150 �m. Concentrations from 0 to 200 mg/l Larcoll were tested. The highest MCS response (about 30% induction) was obtained when using 100 mg/l Larcoll and co-cultured with ovary. Similarly, the effect of adding 0 to 125 mg/l gum Arabic was evaluated. MCS was significantly increased (26%) when 10 mg/l gum Arabic was added to the medium. In this case the co-culture with ovary did not increase the response. These results agree with those by Letarte et al. (2006) indicating that Larcoll and gum arabic increased androgenesis response in wheat but these compounds seem to have different mode of actions on the MCS induction since the addition of Larcoll and ovary appeared to have a synergistic effect.
Figure 11.4. Exine digestion of cassava microspore with NaClO treatments and the release of pre-embryo structures. (A-C) Different degrees of exine digestion. (D) A pre-embryo released from the partially digested microspore after 10 days of culture (yellow arrow), the putative remnant of exine ghost is left behind (black arrow). Another partially digested microspore.
Project IP3: improving cassava for the developing world Chapter 11-8

In general, the addition of ovary to the culture medium increases MCS induction independently of the treatment. It seems that the ovary may provide a “buffer” environment for CMS growth. Although this nourishment effect of the ovary has been known for decades (Zheng et al., 2002), the mechanism is still poorly understood. The ARP (arabinogalactan-protein) such Larcoll and gum arabic have been postulated to play a function similar to the ovary nourishment (Letarte et al., 2006). In our study, the pistil-free ovary does not induce CMS (reported in 2006), suggesting a signal transduction and a cascade effect followed from the release of some substances that induces CMS formation. In relation to the carbon source, CMS induction was nearly doubled when sucrose was increased from 13% to 20%. Maltose at the same concentration (20%) had an inhibitory effect suggesting that the carbon source in this case seems to be not due to osmolarity effect. Reproducible development of multi-celluar structures and micro-callus formation The thick exine wall of cassava microspore has not only been a major bottleneck for standard analysis of microsporogenesis and microspore progress during in vitro culture, but also to allow the spontaneous released of MCS structures. Cassava exine wall is highly resistant to enzymatic digestion commonly used for the release of protoplast from plant cell (reported in 2005). During the course of the project, MCS, ELS and microcallus were observed with certain treatments. Although in a non-reproducible manner, these structures are signs of a possible continuous embryogenesis development of cassava microspore (reported in 2006). Observations led to the conclusions that these sporadic signs of development were the results of involuntary physical damage of the microspores during the isolation process that weaken the exine. Based on these observations, various treatments were tested (i.e. ultrasonic shocks, blending, etc.) trying to remove or weaken the exine of the isolated microspore prior culture. Ultrasonic treatment generated too much heat and killed most of the cells even when ice bath was used. The blender speed could not be regulated to desirable levels thus it was difficult to standardize a protocol. Based on these chemical approaches were examined as potential alternative. Microspores were incubated with high concentrations of strong acid or basic solutions (i.e. HCl, KOH) but the exine remained intact. Of the treatment tested, incubation with NaClO was the only one dissolving the exine. NaClO concentration and incubation time were adjusted to obtain partial or complete digestion of the exine, including the release of viable protoplasts (Figure 11.4 A-C). By culturing microspore with digested exine it has been possible to induced MCS, micro-callus and pre-embryogenic structures in a reproducible manner (Figure 11.4D). The objective of current work is to increase the androgenesis response. 11.1.4 CONCLUSIONS By using TEM and CLSM methods, the binucleate microspore stage was clearly identified. Based on results obtained with light microscopy, TEM and CLSM in the case of clone HMC-1
Chapter 11-9 2007 Annual Report

we can concluded that: 1) flower buds of 2.0 to 2.2 mm contained mainly tetrad stage; 2) Early uninucleate to mid-uninucleate stage in buds of 2.2. to 2.4mm in diameter; 3) it appears that mitotic division may occur in flower buds from 2.5 to 2.7 mm containing microspores from early to late binucleate; 4) Flower buds > 2.7 mm contain mature pollen grain in various stages of development. Results also indicate that the most responsive microspores to in vitro induction are usually from buds of 2.2-2.4 mm. We suggest that these buds may contain microspores at earlier stages most likely from early to mid-uninucleate. A robust protocol for microspore isolation and culture was established and optimized. MCS has been revealed as a pre-embryo by CLSM method. This is solid evidence for the proper pretreatment has been adapted. Pre-embryo strucutre induction rate is further improved to as high as 26.6%. Partially digested microspore has been obtained with certain viability and cultured. Pre-embryo with a little remnant of exine has been reproducibly found. Acknowledgements This work has been conducted by Changhu Wang1, Eddie Tabares1, G.Delgado1, M. Quintero2, and Zaida Lentini1, 2 (1SB2 Project, 2IP4 Project). The Rockefeller Foundation and ZIL (Switzerland) supported financially the execution of this project. Core resources from CIAT and contributions from IP3 projects were also provided. 11.1.5 REFERENCES
Bayliss KL, Wroth Jm, and Cowling WA, 2004. Pro-embryos of Lupinus spp. produced from isolated microspore culture. Austrilian Journal od Agricultural Research 55:589-593.
Custers, JBM, Cordewener, JHG, Nollen, Y, Dons, JJM, and van Lookeren Campagne MM, 1994. Temperature controls both gametophytic and sporophytic development in microspore cultures of Brassica napus. Plant Cell Report 13:267-271.
Fan Z, Armstrong KC and Keller WA 1988 Development of microspores in vivo and in vitro in Brassica napus L. Protoplasma 147: 191-199.
Gaillard A, Vergne P, Beekert M, 1991. Optimization of maize microspore isolation and culture conditions for reliable plant regeneration. Plant cell rep. 10:55-58.
Guha, S and SC maheshwari, 1964. In vitro production of embryos from anthers of Datura. Nature 204:497.
Huang B, Bird S, Kemble R, Simmonds D, Keller WA, and Miki B, 1990. Effects of culture density, conditioned medium and feeder cultures on microspore embryogenesis in Brassica napus L. cv. Topas. Plant Cell Rep 8:594–597.
Kernan Z and Ferrie AMR, 2006. Microspore embryogenesis and the development of a double haploidy protocol for cow cockle (Saponaria vaccaria). Plant Cell Rep. 25(4):274-280.
Project IP3: improving cassava for the developing world Chapter 11-10

Kyo M and Harada H, 1986. Studies on conditions for cell division and embryogenesis in isolated pollen culture of Nicotiana rustica. Plant physiol. 79:70-94.
Letarte J, Simon E, Miner M, Kasha KJ, 2006. Arabinogalactans and arabinogalactan-proteins induced embryogenesis in wheat (Triticum aestivum L.) microspora cultura. Plant cell rep. 24: 691-698.
Liu W, Zheng MY, Polle E, and Konzak CF, 2002. Highly efficient doubled-haploid production in wheat (Triticum aestivum L.) via induced microspore embryogenesis. Crop Sci 42: 686-692.
Maraschin SF, W de Priester, Spaink HP and Wang M, 2005. Androgenic switch: an example of plant embryogenesis from the male gametophyte perspective. Journal of Experimental Botany 56(417):1711-1726.
Shain EA, Shepard JF, 1980. Cassava mesophyll protoplast : isolation, proliferation, and shoot formation. Plant science letters 17: 459-465.
Szabado L, Hoyos R, Roca W, 1987. In vitro somatic embryogenesis and plant regeneration of cassava. 6: 248-251.
Touraev A, Vicente O, and Heberle-Bors E, 1997. Initiation of microspore embryogenesis by stress. Trends in Plant Sciences 2:297-302.
Touraev A and Heberle-Bors E, 2003. Anther and microspore culturein tobacco. In: Maluszynski M, Kasha KJ, Forster BP, Szarejko I (eds) Doubled haploid production in crop plants. Kluwer, Dordrecht, pp 223–228.
Wang M, Sandra van Bergen, and Bert van Duijn, 2000. Insights into a key developmental switch and its importance for efficient plant breeding. Plant Physiology 124:523-530
Zheng Y, Konzak CF, Weng Y, and Sahibazada R, 2002. Methods for generation doubled haploid maize plants. US. Patent application.
11.2 OTHER RELEVANT INFORMATION ABOUT THIS ACTIVITY
11.2.1 SCIENTIFIC PRESENTATIONS
Pérez, J.C., H. Ceballos, Z. Lentini, J. López, and N. Morante (2007). Introduction of inbreeding and analysis of inbreeding depression in eight S1 cassava families. Biotechnology, Breeding and Seed Systems for African Crops. The Rockefeller Foundation-IIAM. Maputo, Mozambique 26-29 March.
Changhu Wang, E. Tabares, H. Ceballos, Z. Peng, and Z. Lentini (2007). Development of an
in vitro protocol for the production of cassava doubled-haploids and its use in breeding. Biotechnology, Breeding and Seed Systems for African Crops. The Rockefeller Foundation-IIAM. Maputo, Mozambique 26-29 March.
Chapter 11-11 2007 Annual Report

Project IP3: improving cassava for the developing world Chapter 11-12
Changhu Wang, Eddie Tabares, Hernán Ceballos, and Zaida Lentini. (2007). Development of
an in vitro protocol for the production of cassava doubled-haploids and its use in breeding. VI Encuentro Latinoamericano y del Caribe de Biotecnología Agropecuaria REDBIO 2007. Viña del Mar, Chile. October 22-26, 2007.
11.2.2 RESOURCE MOBILIZATION LIST List of proposals funded in 2006, dollar value of contract and donor:
� Development and use of inbred lines in cassava breeding. Donor: The Rockefeller Foundation. USD 1,008,800 (2003-2006)
� Development of an In Vitro Protocol for the Production of Cassava Doubled-Haploids and its Use in Breeding. CIAT – ETH (Switzerland) - SCIB (China). Donor: ZIL, Switzerland. CHF 229,258 (2004-2008).
� Introduction of inbreeding in cassava genetic improvement. USD 600,000 Donor: The Rockefeller Foundation. Approved November 2006. January 2007-December 2009.
11.2.3 LIST OF PARTNERS
� South China Institute of Botany (SCIB), Academia Sinica. Guangzhou, China � Institute of Plant Physiology & Ecology, Shanghai Institutes for Biological Sciences,
Chinese Academy of Sciences. Shanghai, China � ETH, Switzerland � PRI, University of Wageningen, The Netherlands

Chapter 12-1 2007 Annual Report
CHAPTER 12
INCREASING THE PRODUCTIVITY AND UTILIZATION OF CASSAVA IN ASIA, USING FARMER PARTICIPATORY APPROACHES
The overall objective of this output is to increase the income and agricultural sustainability in less favored upland areas by developing, together with farmers, efficient and effective integrated cassava-based cropping and livestock production systems that optimize total farm productivity, improve livelihoods and contribute to the long-term sustainability of cassava-based cropping systems in Asia. Highlights 2007 � The Nippon Foundation-funded project entitled “Improving the Livelihoods of Small-holder.
Upland Farmers in Lao PDR and Cambodia through Improved and Integrated Cropping and Livestock Systems” completed its 4th year in Lao PDR and 3rd year in Cambodia.
� The ACIAR-funded project entitled “Enhancing the Adoption of Improved Cassava Production and Utilization Systems in Indonesia and East Timor” completed its third and final year. In East Timor this project is closely linked with the 2nd phase of the Seeds-of-Life project funded by AUSAID and ACIAR.
� In Lao PDR two on-station variety evaluation trials were harvested in early 2007. In both experiments the recently introduced Thai industrial varieties had 2-3 times higher yields than the local eating varieties; in addition, they have much higher starch contents resulting in starch yields that were 5-10 times higher than those of the local varieties.
� In an on-station NPK trial conducted on extremely infertile soils of the Plain of Jars in Xieng Khouang province of Lao PDR, the Thai variety KU 50 produced 12.4 t/ha even without fertilizers while the local variety produced only 3.0 t/ha. With high levels of NPK KU 50 produced 31.7 t/ha versus 18.6 t/ha for the local variety.
� Many on-farm and FPR variety trials conducted in Lao PDR showed similarly large yield differences between the Thai industrial varieties, particularly KU 50, Rayong 72, Rayong 90 and Rayong 5, and the local varieties. Farmers are now multiplying the planting material of these new varieties to obtain higher cassava yields for feeding their animals or for export of dry chips to China and Vietnam.

Project IP3: improving cassava for the developing world Chapter 12-2
� It was found that delaying the harvest of cassava to 18-24 months after planting (MAP) produced very high yields, sometimes 2-3 times higher than that of roots harvested at 11 MAP, at very little additional cost. Root starch contents also remained high. This practice could well reduce production costs per ton of roots, reduce the need for land preparation and weeding, and reduce erosion on sloping land. This needs further investigation.
� On-farm trials conducted in three provinces of Cambodia also showed that the industrial varieties from Thailand produced considerably higher root and starch yields than the local or introduced eating varieties. The widespread use of these varieties, introduced by farmers and traders several years ago from Thailand and Vietnam, is currently fueling a cassava “boom” in the eastern province of Kampong Cham with the establishment of many new cassava starch factories and chipping/drying operations. The price of fresh roots has reached $ 60-70/tonne as compared to $ 20 only 2-3 years ago.
� A 3-year experiment in Indonesia has shown that highest yields of cassava and intercropped maize were obtained with the use of a combination of 5 t/ha of manure or compost with 135 kg N/ha, either with or without P. A similar long-term experiment in Vietnam indicates that planting contour hedgerows of Leucaena or Gliricidia trees and incorporating the leaf prunings into the soil, when combined with well-balanced chemical fertilizers, produced the highest yields and significantly improved soil fertility after 15 years of continuous cassava cropping. These hedgerows also reduced erosion.
� A cassava leaf production experiment conducted in Indonesia indicate that regular cutting of plant tops (5 times/year) markedly reduced the final root yields, but that application of high levels of N (>250 kg N/ha) can increase both leaf and root yields to 9 t/ha of dry leaves (about 2 t/ha of CP) and 20 t/ha of roots, in addition to 3.4 t/ha of intercropped maize.
� On-farm and FPR variety trials conducted in five provinces of Indonesia indicate that on average UJ-5 (=KU 50), Adira 4 and UB 477-2 produced the highest root yields, but several new breeding lines may still outperform those varieties. This needs further testing in more locations.
� On-station variety evaluation experiments conducted over the past few years in four sites in East Timor indicate that the Thai industrial varieties Rayong 5, Rayong 72 and KU 50 out- yielded the local and introduced Indonesian varieties. However, most farmers prefer planting the better-tasting local varieties as cassava is still predominantly used for direct human consumption.
� On station and on-farm pig and cattle feeding trials have shown that supplementing the diet with ensiled cassava leaves increased the live weight gain of pigs and the milk yield of dairy cows.

Chapter 12-3 2007 Annual Report
� An End-of-Project Workshop was held in Malang, Indonesia, on Nov 16-17 to present and discuss the results and the impact of this project. While many very promising results were obtained, the impact of the project was limited due to severe constraints of time (only 3 years) and money, as well as limited personnel involved in cassava research and extension. This is unfortunate as Indonesia is the second largest cassava producer in Asia, and cassava demand currently far outstrips supply due to increasing use of cassava chips for export to China, and fresh roots for production of animal feed, starch, biodegradable plastics, sorbitol and fuel-ethanol. 12.1 INSTITUTIONAL COLLABORATION Table 12.1 shows the institutions and persons collaborating in the Nippon Foundation-funded cassava project in Lao PDR and Cambodia; similar information for the ACIAR-funded cassava project in Indonesia and East Timor is shown in Table 12.2. The ACIAR-funded project officially terminated on Aug 31, 2007 but was extended without additional funding to March 31, 2008. The results of the project were presented and discussed during the End-of-Project Workshop held in Malang, East Java, on Nov 16 and 17, 2007.In Lao PDR the project is now rapidly expanding into new districts and two new provinces, i.e. in Houa Phan in the northeast, and in Saravanh in the far south; the latter in response to the need for more cassava in that province to supply the first cassava starch factory in the country. 12.2 COLLABORATIVE ON-STATION RESEARCH The relative importance of cassava root pellets, widely used in Europe for animal feeding, started to decrease as a market during the 1990s. In Thailand this is not yet widely practiced due to the availability of other cheap raw materials for the production of animal feed, such as broken rice and maize. But this is also changing rapidly with the increased prices of these commodities. Starch for domestic consumption within Asia (with China becoming a major consumer) and bio-ethanol have become important markets for cassava and its products. In addition there is a growing interest in cassava leaves, which are known to contain high levels of crude protein with a good amino acid spectrum. Finding alternative sources of proteins for the formulation of animal diets is relevant to promote the use of cassava roots for that purpose, because their use requires additional protein (compared with maize). Recent research indicates that the low-medium tannin content of cassava leaves actually improves protein digestibility. Thus, intensive research was initiated half a decade ago to identify the best varieties for leaf production and to determine the most economic way of producing high yields of leaves as well as roots.

Project IP3: improving cassava for the developing world Chapter 12-4
Table 12.1. Institutions and principal individuals that are collaborating in the Nippon Foundation Cassava Project in Lao PDR and Cambodia.
Institution Location Person Specialty Lao PDR
Mr. Phimphachanhvongsod Animal Nutrition Mr. Soukanh Keonouchanh Director Nam Xuang Mr. Sopha Xaipha Animal Nutrition Mr. Sitone Kongvongxay Cassava Mr. Phoumi Inthapanya Director Naphok Mrs. Sengkham Lakmaitry Cassava Mr. Phanthasin Khanthavong Cassava
National Agriculture and Forestry Research Institute (NAFRI)
Vientiane
Mr. Saythong Udthachit Cassava Oudomxay Mr. Somsamouth Phongsavath PAFO Crops Oudomxay Mr. Moua Yang PAFO Livestock La Mr. Odon DAFO Director La Mr. Bounpheng Thanthonbai DAFO Crops Namor Mr. Bounson Duangphasith DAFO Director Phonesavan Mr. Amphone Phommavong PAFO Crops Phonesavan Mr. Sonthavath Vanthala PAFO Livestock Phonesavan Mr. Khamphai Phommavong PAFO Livestock Phonesavan Mr. Hongthong Phimmasau Director Cattle Bank Phonesavan Mr. Kamla Thammachack Crops Nong Het Mr. Vong Philavong DAFO Livestock Nong Het Mr. Neuakhom Thepphanit DAFO Crops Luang Prabang Mr Sengpasith Thongsavath PAFO Livestock Luang Prabang Mr. Soulideth Phaphonxay PAFO Livestock Xamneua Mr. Satian Vannasouk PAFO Livestock Huoa Phan Mr. Mayphuot Ban Vi Done PAFO Crops Huoa Phan Mr. Lee Cha PAFO Livestock
Huoa Phan Mr. Siviengxam Phengphomma PAFO Agric. Extension Savavanh Mr. Somkit Senthay PAFO Livestock Savavanh Mr. Sysomphone Fangkham PAFO Crops Savavanh Mr. Thongdy Chanthavong PAFO Agriculture
Provincial Agriculture and Forestry Offices
Xaythany Mr. Banelom Siakkhasone DAFO Director Mr. Phosy Chanhming Agric. Ecom Mr. Boonheng Silakoon Agric. Ecom Dr. Silinthone Sacklokham Agric. Ecom
National University of Laos Vientiane
Mr. Sitthisack Phoulivonk Agric. Ecom Mr. Khamphoul Phonexay Director Mr. Chanphone Keoboualapheth Dep. Dir Mr. Aphaivanh Souksanti Livestock Mr. Outhai Soukkhy Agriculture Mr.Thonsamouth Phoummasone Dep. Dir. Education
Luang Prabang Agriculture and Forestry College
Luang Prabang
Mr. Bounxou Xaysana Agriculture Cambodia
Mr. Ung Sopheap Agronomy Mr. Pith Khon Hel Varietal Impr.
Cambodia Agric. Res. and Development Institute (CARDI)
Phnom Penh Dr. Nget Sivutha Soil/Water Cons.
Kampong Cham Mr. Lorn Sophal Livestock Kampong Cham Mr. Katam Sonavon Agronomy Kampong Speu Mr. Leng Thary Agronomy Battambang Mr. Nou Praneth Agronomy
Provincial Dept. Agriculture, Forestry and Fish.
Battambang Mr. Chhem Chantha Agronomy Kandal Stung Dr. Khieu Borin Animal Nutrition 3. CelAgrid Mr. Chhay Ty Animal Nutrition

Chapter 12-5 2007 Annual Report
Table 12.2. Institutions and individuals that have been or may be collaborating in the ACIAR Cassava Project in Indonesia and East Timor in 2005/06 and 2006/07.
Institution Location Person Specialty
Indonesia
Dr. Wani Hadi Utomo Soils, Project Coord. for Indonesia Brawijaya University
(UNIBRAW) Dr. Marjuki Animal Nutrition
Research Inst. Legumes and Tuber Crops (RILET) Dr. Koeshartojo Cassava Breeding
Assessment Inst. Agric. Technologies (BPTP), East Java
Malang, E. Java
Dr. Suhardjo Mrs. Endah Retnaningtyas
Post-harvest Processing Socio-economics
Central Research Inst. for Food Crops (CRIFC) Mr. J. Wargiono Cassava Agronomy
Soils Research Institute (SRI) Bogor, W. Java
Dr. Djoko Santoso Mrs. Enggis Tuherkih Soils
Budi Mixed Farming (BMF-NGO) Pati,Central Java Mr. Adi Widjaja General Agriculture
Lambung Mangkurat University
Banjarbaru, S. Kalimantan Mr. Anis Wahdi Animal Nutrition
East Timor
Mr. Lourenco Fontes Director
Mr. Manuel Xavier Researcher Research and Extension Center (REC) under MAFF
Mr. Telio Muniz Researcher
Food Crops Department under MAFF
Mr. Deolindo Da Silva Mr. Joao Rodrigues
Director Crops Assistant
National University of Timor Leste (NUTL)
Mr. Marcal Gusmao Mr. Antonio Joao da Costa
Head, Agronomy Vice-Dean, Soils
Mr. Rob Williams ACIAR Advisor
Mr. Brian Monaghan ACIAR Advisor Seeds-of-Life (SOL-2)
Dili
Mr. Alex Dalley ACIAR Advisor
12.2.1 VARIETY EVALUATION EXPERIMENTS Table 12.3 shows the results of a variety evaluation experiment conducted in Naphok Agric. Research Center (ARC) in Vientiane Municipality of Lao PDR. Very high yields were obtained with some of the Thai varieties, especially KU 50; this remains the most popular variety, now grown all over SE Asia, due to its high yield, high starch content, and good germination of stakes even after a long period of stem storage.

Project IP3: improving cassava for the developing world Chapter 12-6
Table 12.4 shows similar results for a cassava variety evaluation experiment conducted at the Luang Prabang College of Agric. and Forestry in Laos. Again, the Thai industrial varieties, KU 50, Rayong 72 and Rayong 90, produced the highest root and starch yields, closely followed by the local germplasm accession NARC 114; this accession was introduced from Thailand and seems to be genetically close to Rayong 72. In East Timor a large range of cassava varieties, both local and introduced from Indonesia and Thailand, have been evaluated by MAFF and the Seeds-of-Life Project in four experimental sites since 2001. Table 12.5 summarizes the yields and characteristics of the best 28 varieties (out of about 50) tested over the years. Presently cassava is used almost exclusively for human consumption, after boiling, so sweetness and good taste are the most important selection criteria. However, in the future it is likely that cassava will also be used for animal feeding, starch extraction and ethanol production, as well as for export as dry chips; in that case yield and starch contents will become increasingly important. Although based on limited data, it is likely that the Thai varieties KU 50, Rayong 72 and Rayong 5, the Indonesian variety Sulawesi and the local variety Autohanh will become the most promising varieties once cassava becomes an industrial crop in East Timor. Table 12.3. Results of a cassava variety experiment conducted at Agriculture Research Center (ARC) in Vientiane Municipality of Lao PDR in 2006/07 (11months after planting.
Cassava variety Origin Fresh root yield (t/ha)
Starch content (%)
Starch yield (t/ha) Usage
KU 50 Thailand 41.4 27.8 11.5 Starch, feed Rayong 1 Thailand 32.0 21.3 6.8 Starch, feed Rayong 5 Thailand 28.6 21.9 6.3 Starch, feed Rayong 90 Thailand 27.9 25.4 7.1 Starch, feed Rayong 72 Thailand 27.7 24.2 6.7 Starch, feed, food HL 23 Vietnam 27.7 16.1 4.5 Seed, food KM 98-1 Vietnam 27.1 23.4 6.3 Feed, food KM 140 Vietnam 25.9 21.9 5.7 Starch, feed Rayong 60 Thailand 24.1 21.0 5.1 Starch, feed Rayong 2 Thailand 20.9 17.6 3.7 Food NARC 48 Laos 19.4 19.9 3.9 Food Ba Trang Vietnam 18.8 16.6 3.1 Food, feed Hanatee Thailand 17.2 19.4 3.3 Food NARC 61 Laos 15.5 23.3 3.6 Food NARC 115 Laos 14.9 20.5 3.0 Food NARC 50 Laos 14.1 19.8 2.8 Food Vinh Phu Vietnam 14.0 15.4 2.2 Food, feed NARC 96 Laos 13.3 18.4 2.4 Food NARC 114 Laos 13.3 20.8 2.8 Starch, feed Nep Vietnam 13.1 28.3 3.7 Food Xieng Khoung 1 (C1) Laos 11.6 21.9 2.5 Food Xieng Khoung 2 (C2) Laos 10.5 20.1 2.1 Food Green Oudomxay Laos 9.9 17.2 1.7 Food NARC 101 Laos 8.4 17.4 1.5 Food
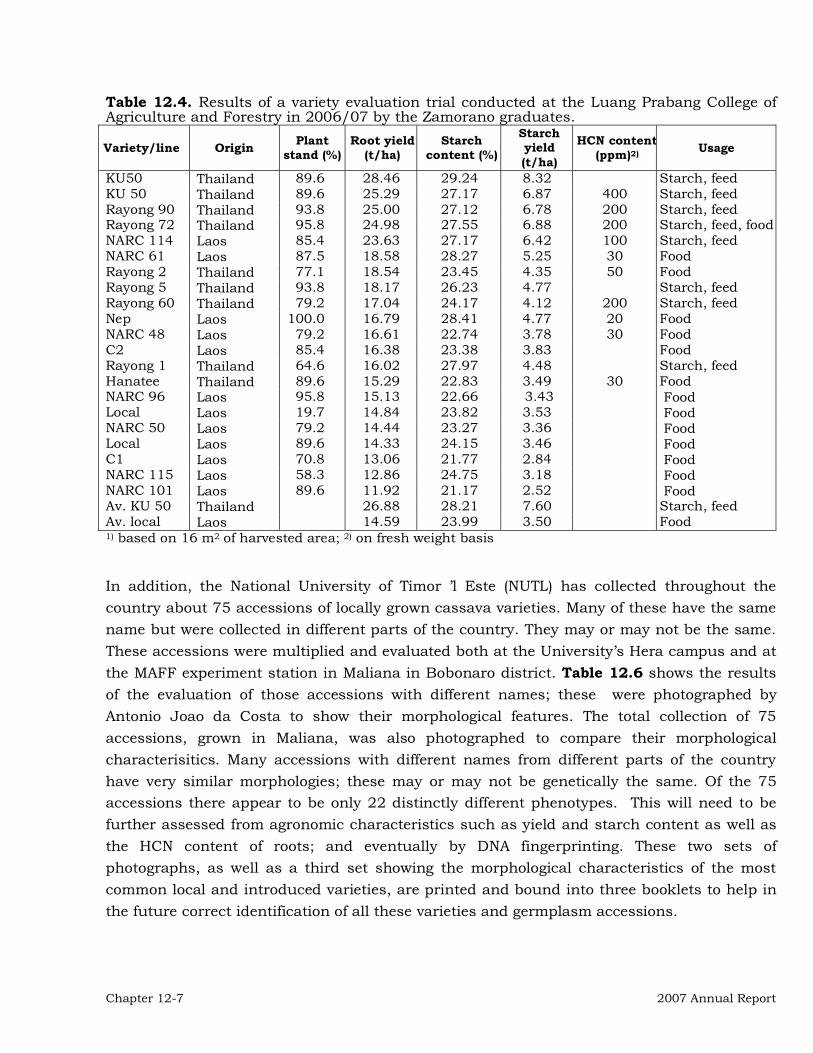
Chapter 12-7 2007 Annual Report
Table 12.4. Results of a variety evaluation trial conducted at the Luang Prabang College of Agriculture and Forestry in 2006/07 by the Zamorano graduates.
Variety/line Origin Plant stand (%)
Root yield (t/ha)
Starch content (%)
Starch yield (t/ha)
HCN content(ppm)2) Usage
KU50 Thailand 89.6 28.46 29.24 8.32 Starch, feed KU 50 Thailand 89.6 25.29 27.17 6.87 400 Starch, feed Rayong 90 Thailand 93.8 25.00 27.12 6.78 200 Starch, feed Rayong 72 Thailand 95.8 24.98 27.55 6.88 200 Starch, feed, food NARC 114 Laos 85.4 23.63 27.17 6.42 100 Starch, feed NARC 61 Laos 87.5 18.58 28.27 5.25 30 Food Rayong 2 Thailand 77.1 18.54 23.45 4.35 50 Food Rayong 5 Thailand 93.8 18.17 26.23 4.77 Starch, feed Rayong 60 Thailand 79.2 17.04 24.17 4.12 200 Starch, feed Nep Laos 100.0 16.79 28.41 4.77 20 Food NARC 48 Laos 79.2 16.61 22.74 3.78 30 Food C2 Laos 85.4 16.38 23.38 3.83 Food Rayong 1 Thailand 64.6 16.02 27.97 4.48 Starch, feed Hanatee Thailand 89.6 15.29 22.83 3.49 30 Food NARC 96 Laos 95.8 15.13 22.66 3.43 Food Local Laos 19.7 14.84 23.82 3.53 Food NARC 50 Laos 79.2 14.44 23.27 3.36 Food Local Laos 89.6 14.33 24.15 3.46 Food C1 Laos 70.8 13.06 21.77 2.84 Food NARC 115 Laos 58.3 12.86 24.75 3.18 Food NARC 101 Laos 89.6 11.92 21.17 2.52 Food Av. KU 50 Thailand 26.88 28.21 7.60 Starch, feed Av. local Laos 14.59 23.99 3.50 Food 1) based on 16 m2 of harvested area; 2) on fresh weight basis In addition, the National University of Timor ’l Este (NUTL) has collected throughout the country about 75 accessions of locally grown cassava varieties. Many of these have the same name but were collected in different parts of the country. They may or may not be the same. These accessions were multiplied and evaluated both at the University’s Hera campus and at the MAFF experiment station in Maliana in Bobonaro district. Table 12.6 shows the results of the evaluation of those accessions with different names; these were photographed by Antonio Joao da Costa to show their morphological features. The total collection of 75 accessions, grown in Maliana, was also photographed to compare their morphological characterisitics. Many accessions with different names from different parts of the country have very similar morphologies; these may or may not be genetically the same. Of the 75 accessions there appear to be only 22 distinctly different phenotypes. This will need to be further assessed from agronomic characteristics such as yield and starch content as well as the HCN content of roots; and eventually by DNA fingerprinting. These two sets of photographs, as well as a third set showing the morphological characteristics of the most common local and introduced varieties, are printed and bound into three booklets to help in the future correct identification of all these varieties and germplasm accessions.

Project IP3: improving cassava for the developing world Chapter 12-8
Table 12.5. Summary of the best cassava varieties in East Timor based on varietal evaluation experiments conducted in four locations in East Timor from 2002 to 2006/07.
Average Variety name No. of
trials Root yield (t/ha)
Standar- dized yield1)
Starch content
(%)
Starch yield (t/ha)
HCN (2) Observations
SM 2361-1 3 31.47 1.009 25.3 6.72 2 Tested only in Baucau & Aileu CMM 96-08-19 8 32.53 0.626 18.8 6.55 2 Quite high yield everywhere CMM 96-36-224 7 31.88 0.316 11.7 3.61 4 Good only in Betano CMM 96-36-269 10 33.31 0.572 17.8 5.75 3 Mainly good in Betano OMM 96-01-69 7 28.48 -0.114 23.8 7.59 4 Rather good only in Betano CMM 95-42-3 13 32.07 0.350 19.7 6.72 2 Mainly good in Aileu CMM 96-25-25 13 34.30 0.563 19.0 5.60 5 High yield everywhere OMM 96-01-93 5 24.39 -0.095 20.0 5.51 3 Only a Aileu ? 6 41.22 0.798 18.0 6.43 3 Only tested in Betano & Maliana OMM 90-03-100 12 39.27 0.960 22.4 7.98 4 Very good everywhere Mantega-Aileu 7 24.94 -0.353 26.1 6.91 5 Tested only in Aileu & Maliana Putih-Aileu 5 23.98 0.097 23.7 6.64 5 Rather good only in Aileu Sulawesi 5 34.05 1.202 24.0 8.61 3 Tested only in Aileu & Betano Bogor 1 3 28.70 0.358 25.1 7.36 4 Tested only in Aileu CMM 97-01-158 4 22.03 0.044 26.2 6.27 5 Mainly good in Aileu CMM 97-11-155 3 29.44 0.703 28.2 8.29 4 Tested only in Aileu CMM 97-02-36 5 31.38 0.615 25.1 7.59 4 Quite high yield everywhere CMM 97-06-48 3 30.36 0.579 19.2 7.12 3 Tested only in Aileu & Betano CMM 97-11-157 3 26.76 0.325 25.3 6.80 5 Tested only in Aileu CMM 97-07-145 4 32.70 0.416 22.5 7.37 5 Tested only in Aileu & Betano CMM 97-02-181 5 30.23 0.741 19.7 6.93 4 Mainly good in Aileu CMM 97-02-59 1 30.90 0.802 25.8 7.97 2 Tested only in Aileu Rayong 3 1 30.72 0.790 - - 4 Tested only in Maliana Rayong 5 1 39.85 1.871 28.8 11.48 3 Tested only in Maliana Rayong 72 1 38.40 1.699 25.5 9.79 5 Tested only in Maliana Kasetsart 50 1 38.95 1.765 29.6 11.53 2 Tested only in Maliana Autohanh 1 36.00 0.740 24.7 8.89 - Tested only in Betano Lesu Metan 1 27.60 0.009 27.5 7.59 - Tested only in Betano 1) yields standardized on mean and standard deviation of each trial (see Table 2d) 2)1 = very bitter, 2 = bitter, 3 = bitter/sweet, 4 = sweet, 5 = very sweet(see Table 2e) 12.2.2 LONG-TERM NPK EXPERIMENTS Three long-term NPK experiments are being continued, one in South Vietnam, one in Hainan island of China, and one in Lampung province of Indonesia, all in their 16th year of continuous cropping. In addition, a similar experiment was started in 2005 at the Cattle Bank in Xieng Khouang province of Lao PDR. Because of the cold temperature at high elevation (>1000 masl), especially during winter, as well as the extreme infertility of the soil, cassava plants grew very poorly. For that reason the experiment was harvested only after 21 months.

Chapter 12-9 2007 Annual Report
Table 12.6. Characterization of 22 cassava varieties, collected in East Timor in 2005/06, and evaluated at 3 and 7½ months after planting at the UNTL Hera Campus in 2007.
A 3 months after planting A time of root harvest at 7½ months after planting Outer peel
——————— Variety name Plant stand (%)
Plant height (cm)
No. of branches
Leaf shape1)
Leaf color2)
Petiole color3)
Shoot color4)
No. roots/ plant
Plant height (cm)
Root weight
(kg/plant) texture5) color6)
Inner peel color7)
Mentega 10 145 3 2 2 2 2 7.0 210 2.24 1 1 1 Naran laiha? 100 151 1 3 1 2 1 9.5 256 3.20 1 2 2 Atematu asarinik8) - - - - - - - - - - - - - Aifarina malae8) - - - - - - - - - - - - - Aifarina butilai 90 132 1 2 2 2 1 6.1 312 1.44 2 2 1 Aifarina fuik 30 145 1 1 3 2 4 14.3 252 7.52 2 2 1 Dara atisia 20 78 1 2 2.5 2.5 1.5 4.5 176 1.58 2 2 1 Tolontoka 20 130 1 2 2 2 1 8.0 274 6.37 1 2 2 Lesu 30 81 1 2 2 4 2 3.3 234 1.21 1 2 2 Aifarina mutin 30 120 1 2.3 2.3 2 1.7 - 276 0.32 - - - Aifarina kangkung 100 117 1 1 2.4 4 3 4.0 255 1.97 1 2 1 Etuhare 70 112 1 2 1.8 4 2 7.0 220 4.36 1 2 1 Kaimalae 90 142 1 1 3 4 4 4.0 232 1.51 1 2 2 Unknown 50 125 1 2 2.4 2.2 1.4 2.3 240 1.34 1 2 2 Silva 50 156 2.4 2 2.8 4 2 7.8 295 4.24 1 2 2 Esmera 35 (Tolontoka) 80 158 2.6 2 3 4 2 8.4 289 4.66 1 2 2 Marungi 30 143 1 2 2 1 1 9.0 285 4.57 1 2 2 Kasarubi 50 116 1.4 2 2.6 4 2 3.7 245 2.02 1 2 2 Olokai 50 121 1 2 2 1 1 8.4 220 4.41 1 2 2 Nona metan 30 117 1.7 2 3 4 2 5.7 248 3.17 1 2 2 Atisia lesibua 10 90 1 2 3 4 2 10.0 230 3.62 1 2 2 Kulu atisia 10 60 1 2 3 2 3 4.0 222 1.18 1 2 1 1) leaf shape: 1 = narrow, 2 = normal, 3 = broad 2) leaf color: 1 = light green, 2 = green, 3 = dark green 3) petiole color: 1 = green, 2 = green/red, 3 = red, 4 = purple 4) shoot color: 1 = green, 2 = green/purple, 3 = purple, 4 = dark purple 5) 1 = rough, 2 = smooth 6) 1 = yellow, 2 = creamy 7) 1 = white, 2 = pink 8) Atematu asarinik and Aifarina malae died Source: Antonio Joao da Costa, 2007

Project IP3: improving cassava for the developing world Chapter 12-10
Figure 12.1 shows that the Thai variety KU 50 produced 2-3 times the yield of the local variety from Xieng Khouang; KU 50 produced a reasonably good yield of 12.4 t/ha without any fertilizers, while the local variety produced only 3.0 t/ha. Both varieties responded very markedly to the lowest levels of application of P and K, but with little or no response to N. However, the combined application of high levels of all three nutrients resulted in the highest yields of 18.6 and 31.7 t/ha for the local and KU 50 variety, respectively.
Figure 12.1. Effect of the application of various levels of N, P and K on the root yield of two cassava varieties grown at the Cattle Bank in Paek district, Xieng Khouang province of Lao PDR in 2005/07 (two year crop). Similar data for the 16th consecutive cropping cycle in a long-term NPK trial in Tamanbogo, Indonesia can be observed in Figure 12.2. In this experiment subplots had either cassava planted in monoculture or intercropped with upland rice. Cassava yields were not significantly affected by intercropping. Cassava responded markedly to high applications of K, and to low rates of application of N and P, with a negative response to high rates of N and P when intercropped with rice. The negative response to high levels of P may be due to increased competition from intercropped rice, which showed a very marked positive response to P. On the other hand, as in previous years, rice showed a negative response to high levels of N, as continuous applications of high levels of urea resulted in a significant reduction in soil pH and a corresponding increase in exchangeable Al. Both cassava and rice produced very low yields without fertilizers but continued to produce reasonably high yields of 15 and 1.8 t/ha, respectively, when high rates of NPK were applied. The very marked response of rice to increasing rates of P application may actually be a response to Ca as well as to P. Increasing levels of P increased the exchangeable Ca and decreased the exchangeable Al of the soil. The bottom part of Figure 12.3 shows how the exchangeable Al saturation of the soil increased over time, except during the 15th and 16th crop cycles after 2 t/ha of dolomitic lime had been applied in one of the three replications in 2005/06, and again in two replications in 2006/07. The top part of Figure 12.3 shows how the yields of intercropped maize started to
0
10
20
30
40
0 25 50 100 0 50 100 200 0 50 100 200
kg N/ha kg P2O5/ha kg K2O/ha
= KU 50 = local from Xieng Khouang
0
10
20
30
40
0-0-0 50 -100 -100 100 -200-200
kg N-P2O5-K2O/ha
100 P2O5100 K2O
50 N100 K2O
50 N100 P2O5
0
10
20
30
40
0 25 50 100 0 50 100 200 0 50 100 200
kg N/ha kg P2O5/ha kg K2O/ha
= KU 50 = local from Xieng Khouang
0
10
20
30
40
0-0-0 50 -100 -100 100 -200-200
kg N-P2O5-K2O/ha
100 P2O5100 K2O
50 N100 K2O
50 N100 P2O5

Chapter 12-11 2007 Annual Report
decrease when the percent Al-saturation increased above 55%, and maize yields were zero when the Al saturation had reached 60-65% in the 6th year. Similarly, yields of intercropped upland rice started to decrease when the percent Al saturation reached about 70%. Cassava yields were much less affected by increasing soil acidification as its tolerance to soil acidity and Al-toxicity is generally much higher than those of maize and rice. Rice yields improved markedly again in the 16th year after lime had been applied in two of the three replications.
Figure 12.2. Effect of annual applications of various levels of N, P and K on the yields of cassava and intercropped rice, during the 16th consecutive cropping cycle in Tamanbogo, Lampung, Indonesia in 2006/07. 12.2.3 USE OF ORGANIC AND INORGANIC FERTILIZERS An experiment was conducted at Brawijaya University’s Jatikerto Experiment Station in Malang district of East Java, Indonesia, on the combined use of organic and inorganic fertilizers for cassava. Table 12.7 shows the effect of annual applications of various combinations of N, P and K in chemical fertilizers with different rates and types of organic fertilizers on the yields of cassava and intercropped maize during three years of consecutive cropping. Both crops responded mainly to the application of N, followed by P, but without a response to K. The soil in this station is high in K and relatively low in P and organic matter (OM). Application of 10 t/ha of cattle manure or compost increased yields but not to the
0
5
10
15
20
0
1.0
1.5
2.0
2.5
0.5Rice yield (t/ha)
Cassava root yield (t/ha)
= cassava monoculture= cassava+rice
0 25 50 100 0 45 90 1800 45 90 180
kg N/ha kg P2O5/ha kg K2O/ha kg N-P2O5- K2O/ha
0-0-0 90-50-90 180-100-180
0 25 50 100 0 45 90 180 0-0-0 90-50-90 180-100-1800 45 90 1800
5
10
15
20
50 P2O5
90 K2O90 N
90 K2O
90 N
50 P2O5
0
1.0
1.5
2.0
2.5
0.5
0
5
10
15
20
0
1.0
1.5
2.0
2.5
0.5Rice yield (t/ha)
Cassava root yield (t/ha)
= cassava monoculture= cassava+rice
0 25 50 100 0 45 90 1800 45 90 180
kg N/ha kg P2
0
5
10
15
20
0
1.0
1.5
2.0
2.5
0.5Rice yield (t/ha)
Cassava root yield (t/ha)
= cassava monoculture= cassava+rice
0 25 50 100 0 45 90 1800 45 90 180
kg N/ha kg P2O5/ha kg K2O/ha kg N-P2O5- K2O/ha
0-0-0 90-50-90 180-100-180
0 25 50 100 0 45 90 180 0-0-0 90-50-90 180-100-1800 45 90 1800
5
10
15
20
50 P2O5
90 K2O90 N
90 K2O
90 N
50 P2O5
0
1.0
1.5
2.0
2.5
0.5

Project IP3: improving cassava for the developing world Chapter 12-12
same level as that obtained with urea. Highest yields were obtained with the combination of 5 t/ha of cattle manure or compost combined with 135 kg/ha of N as urea, with or without P. The use of sugar mud (blotong), a by-product of the sugar industry, was less effective than farm-yard manure (FYM) or compost. The use of N and P as chemical fertilizers, alone or in combination with 5 t/ha of compost produced the highest net income (see Table 5 in the 2006 Annual Report).
Figure 12.3. Change in the yields of cassava and intercropped maize and rice during 16 consecutive years growing cassava, Adira 4, with intercropped rice and maize. Data are average values of 12 NPK trials conducted in Tamanbogo East Lampung, Indonesia from 1991 to 2007. Below: the change in the average percent Al-toxicity of the three crops. Note: 2 t/ha of lime were applied in Rep III before the 15th crop cycle and another 2 t/ha in Reps I and III before the 16th crop cycle.
Years of cropping
80
100
1 2 3 4 5 6 7 8 9 10 11 12 13 14 15 161991/92
90
70
critical level cassava
critical level rice
critical level maize
2.5
1 2 3 4 5 6 7 8 9 10 11 12 13 14 15 16
2.0
1.5
1.0
0.5
0
25
20
15
10
5
0
= maize= rice= cassava
60
50
40
2006/07
80
100
90
70
60
50
40
Years of cropping
80
100
1 2 3 4 5 6 7 8 9 10 11 12 13 14 15 161991/92
90
70
critical level cassava
critical level rice
critical level maize
2.5
1 2 3 4 5 6 7 8 9 10 11 12 13 14 15 16
2.0
1.5
1.0
0.5
0
25
20
15
10
5
0
= maize= rice= cassava
60
50
40
2006/07
80
100
90
70
60
50
40

Chapter 12-13 2007 Annual Report
Table 12.7. Effect of various fertilization alternatives on the intercropped maize yields and cassava root yields when grown for three consecutive years in Jatikerto Station in Malang, East Java from 2004/05 to 2006/07.
Treatments Maize grain yield (t/ha) Cassava root yield (t/ha) N-P2O-K2O
(kg/ha) Organic (t/ha)
1st year
2nd year
3rd year Average 1st
year 2nd
year 3rd
year Average
1: 0-0-0 0 2.40 1.10 1.06 1.52 26.00 10.96 9.83 15.60 2: 135-0-0 0 3.80 1.93 3.37 3.03 32.50 35.60 29.90 32.67 3: 135-50-0 0 3.74 2.07 3.33 3.05 43.88 36.80 28.40 36.36 4: 135-50-100 0 3.76 2.10 3.43 3.10 42.05 37.47 28.17 35.90 5: 0-0-0 10 FYM 2.83 1.66 3.00 2.50 35.50 26.53 24.10 28.71 6: 0-0-0 10 Compost 2.69 1.63 2.55 2.29 33.00 22.67 20.63 25.43 7: 135-0-0 5 FYM 3.86 2.26 3.71 3.28 48.61 35.63 30.50 38.25 8: 135-0-0 5 Compost 3.36 1.97 3.51 2.95 46.66 39.33 33.60 39.86 9: 135-50-0 5 Compost 3.72 1.87 3.79 3.13 46.11 39.07 36.27 40.48 10: 135-0-0 5 Sugar mud 3.78 1.67 3.21 2.89 36.67 33.73 29.57 33.32 Source: Wani Hadi Utomo, 2007 12.2.4 USE OF GREEN MANURES, INTERCROPS AND ALLEY CROPS TO IMPROVE SOIL FERTILITY When chemical fertilizers are too expensive or not available farmers often try to maintain or improve soil fertility and crop yields by the planting of green manures and intercrops; few farmers have ever adopted alley cropping systems even though the benefits of this practice are documented well in the scientific literature. On the contrary, many cassava farmers in Thailand are now interested in the use of green manures to reduce the need for chemical fertilizers even though there is little published data on their effectiveness. Green manures can be planted at the beginning of the wet season, slashed and incorporated into the soil after 3-4 months, after which cassava is planted towards the end of the wet season. This system increased yields over that obtained when cassava was planted without green manures in Sept, at the end of the rainy season, either with or without chemical fertilizers. However, yields were lower than when cassava was planted without green manures in the early wet season, even without fertilizers. No farmer would be interested in this, as the planting of green manures increases costs while it reduced yields (Howeler, 1995). This system may increase yields and income if cassava is harvested at 18 months after planting (MAP), i.e. a cassava harvest every two years (Howeler, 2001). Alternatively, farmers can plant short-season green manures as an intercrop between cassava rows and pull out and mulch the green manures 1½-2 months later, before they seriously compete with the slower growing cassava. An experiment conducted from 1994 to 1999 at Rayong Field Crop Research Center in Thailand indicate that intercropping with Canavalia ensiformis or Crotalaria juncea slightly increased cassava yields over that obtained with 156 kg/ha of 13-13-26, but not nearly as much as with the application of 469 kg/ha of 13-13-26; the latter would give a much higher net income (Howeler, 2001). A new trial was initiated in Kasetsart University’s Khaw Hin Sorn station in Chachoengsao province in 2002 in order to determine the potential benefits of green manures planted as intercrops between cassava rows. In this case, the green manures were planted one month after the planting of cassava (to give cassava a competitive edge) and were pulled out and mulched 1½-2 months later. Table 12.8 shows the effect of annual planting of green manures on cassava yields during five consecutive cropping cycles. While the planting of

Project IP3: improving cassava for the developing world Chapter 12-14
some green manures produced slightly higher cassava yields in some years, on average none had a beneficial effect on yield. It was expected that green manures would improve both the physical and chemical characteristics of the soil, resulting in higher cassava yields, especially in these very light-textured soils that have very little organic matter (1-2%). However, the data indicate that even after five years there was still no beneficial effect of green manuring (as an intercrop) on cassava yields. Canavalia ensiformis and mungbean were less competitive than Mucuna sp. and Crotalaria juncea. Highest yields and net income were obtained with the application of the high rate of 469 kg/ha of 15-7-18. Table 12.8. Effect of green manures and/or chemical fertilizers on the root yield and average starch content of cassava, KU 50, when cassava was planted for five consecutive years at Khaw Hin Sorn Research Station in Khaw Hin Sorn, Chachoengsao, Thailand from 2002/03 to 2006/07.
Cassava yield (t/ha) Starch 1st 2nd 3rd 4th 5th content Treatments1)
year year year year year Average
(%) 1. Check without GM; 25 kg/rai 15-7-18 46.45 26.28 32.48 36.08 18.86 32.03 24.22. Crotalaria juncea; 25 kg/rai 15-7-18 36.58 20.83 29.26 31.19 19.03 27.38 23.73. Canavalia ensiformis; 25 kg/rai 15-7-18 40.35 27.07 31.16 29.79 19.00 29.47 24.24. Pigeon pea ICPL 304; 25 kg/rai 15-7-18 38.23 24.18 31.86 30.79 19.64 28.94 23.65. Cowpea CP 4-2-3-1; 25 kg/rai 15-7-18 38.54 21.66 32.12 32.06 20.76 29.03 23.26. Mucuna; 25 kg/rai 15-7-18 36.73 21.17 28.58 32.09 16.45 27.00 24.37. Mungbean; 25 kg/rai 15-7-18 40.07 25.08 33.49 36.38 16.51 30.31 23.98. Check without GM; 75 kg/rai 15-7-18 43.44 32.16 37.78 34.51 27.56 35.29 24.41) GM = green manures; 1 ha = 6.25 rai Results of a rather similar experiment conducted at Hung Loc Agric. Research Center in south Vietnam for 15 consecutive years, either with or without chemical fertilizers (Table 12.9), indicate that in the 15th crop cycle intercropping with peanut slightly increased cassava yields and net income, while intercropping with cowpea, pigeon pea, Crotalaria juncea and Mucuna sp. all decreased cassava yields. On the other hand, alley cropping with Leucaena leucocephala or Gliricidia sepium markedly increased cassava yields and net income. Incorporation of the foliage of these tree legumes also resulted in a clear improvement in soil fertility (Table 12.10) by increasing the contents of soil OM, P, Ca, Mg and K. This technology, which does not require yearly replanting of the green manure, seems much more beneficial than the planting of traditional annual green manures. Moreover, if planted along contours, the hedgerows of Leucaena and Gliricidia can markedly reduce soil losses by erosion (Table 12.11). 12.2.5 CASSAVA LEAF PRODUCTION FOR ANIMAL FEEDING Cassava leaves have 20-25% crude protein on can be effectively used, after drying, cooking or either ensiling, as a good protein source for animal feeding. However, the regular harvests of cassava top growth (pruning) at 2-3 month intervals, can markedly reduce root production, especially if not enough N is applied to compensate for the large removal of N in the leaf harvests. Table 12.12 shows the results of a cassava-maize intercropping trial conducted in Jatikerto Experiment Station in East Java, Indonesia, in which cassava tops were cut at 20 cm from the soil at 2½, 4½, 6½, 8½ and 11 months after planting (MAP). The last pruning at 11 MAP corresponded with the root harvest. Cassava was planted at a spacing of either 1.0 x 0.8 or 1.0 x 0.4 m and urea was applied at levels of 300, 400, 500 and 600 kg/ha. The
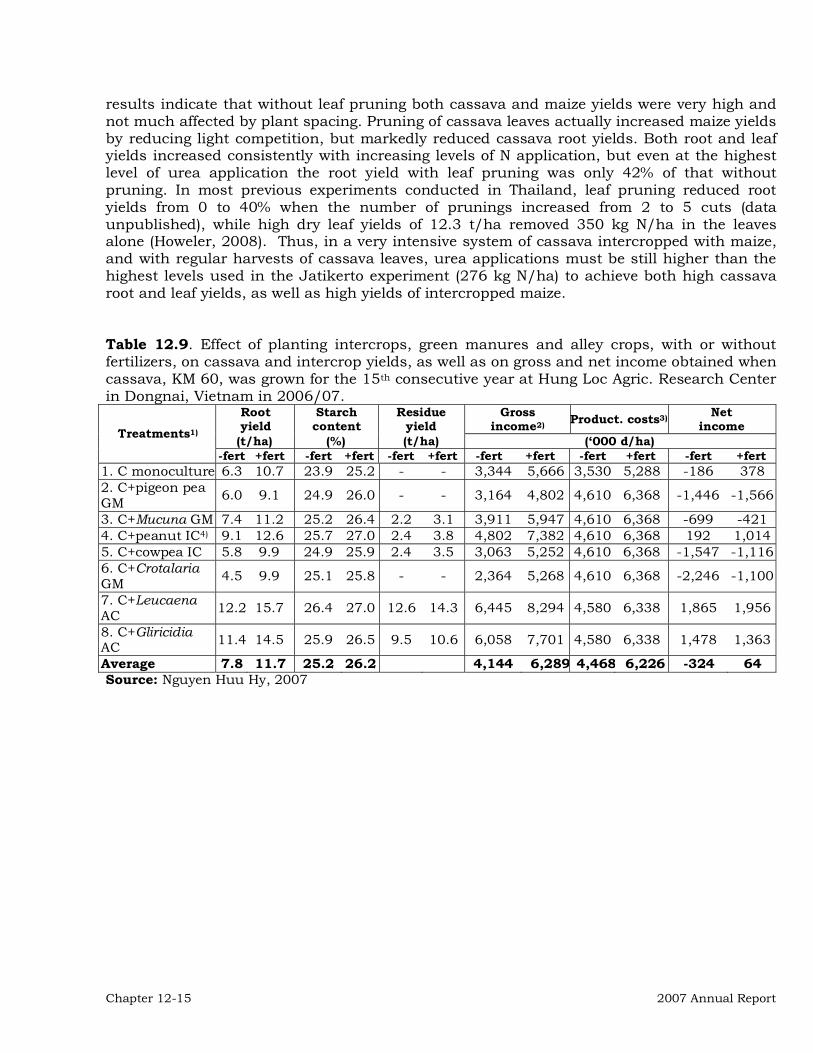
Chapter 12-15 2007 Annual Report
results indicate that without leaf pruning both cassava and maize yields were very high and not much affected by plant spacing. Pruning of cassava leaves actually increased maize yields by reducing light competition, but markedly reduced cassava root yields. Both root and leaf yields increased consistently with increasing levels of N application, but even at the highest level of urea application the root yield with leaf pruning was only 42% of that without pruning. In most previous experiments conducted in Thailand, leaf pruning reduced root yields from 0 to 40% when the number of prunings increased from 2 to 5 cuts (data unpublished), while high dry leaf yields of 12.3 t/ha removed 350 kg N/ha in the leaves alone (Howeler, 2008). Thus, in a very intensive system of cassava intercropped with maize, and with regular harvests of cassava leaves, urea applications must be still higher than the highest levels used in the Jatikerto experiment (276 kg N/ha) to achieve both high cassava root and leaf yields, as well as high yields of intercropped maize. Table 12.9. Effect of planting intercrops, green manures and alley crops, with or without fertilizers, on cassava and intercrop yields, as well as on gross and net income obtained when cassava, KM 60, was grown for the 15th consecutive year at Hung Loc Agric. Research Center in Dongnai, Vietnam in 2006/07.
Root yield
Starch content
Residue yield
Gross income2) Product. costs3) Net
income (t/ha) (%) (t/ha) (‘000 d/ha) Treatments1)
-fert +fert -fert +fert -fert +fert -fert +fert -fert +fert -fert +fert
1. C monoculture 6.3 10.7 23.9 25.2 - - 3,344 5,666 3,530 5,288 -186 378 2. C+pigeon pea GM 6.0 9.1 24.9 26.0 - - 3,164 4,802 4,610 6,368 -1,446 -1,566
3. C+Mucuna GM 7.4 11.2 25.2 26.4 2.2 3.1 3,911 5,947 4,610 6,368 -699 -421 4. C+peanut IC4) 9.1 12.6 25.7 27.0 2.4 3.8 4,802 7,382 4,610 6,368 192 1,014 5. C+cowpea IC 5.8 9.9 24.9 25.9 2.4 3.5 3,063 5,252 4,610 6,368 -1,547 -1,116 6. C+Crotalaria GM 4.5 9.9 25.1 25.8 - - 2,364 5,268 4,610 6,368 -2,246 -1,100
7. C+Leucaena AC 12.2 15.7 26.4 27.0 12.6 14.3 6,445 8,294 4,580 6,338 1,865 1,956
8. C+Gliricidia AC 11.4 14.5 25.9 26.5 9.5 10.6 6,058 7,701 4,580 6,338 1,478 1,363
Average 7.8 11.7 25.2 26.2 4,144 6,289 4,468 6,226 -324 64 Source: Nguyen Huu Hy, 2007

Project IP3: improving cassava for the developing world Chapter 12-16
Table 12.10. Effect of intercropping, green manure and alley cropping systems, as well as annual application of chemical fertilizers on soil fertility in the 15th consecutive crop cycle of a cassava experiment conducted in Hung Loc Agric. Research Center in Dong Nai, Vietnam in 2006/07.
pH OM (%)
P (ppm)
Al (me/100g)
Ca (me/100g)
Mg (me/100g)
K (me/100g)
Al Sat (%) Treatments1)
-fert +fert -fert +fert -fert +fert -fert +fert -fert +fert -fert +fert -fert +fert -fert +fert
1. C monoculture 3.98 3.90 2.3 2.4 12.0 18.3 2.8 3.2 0.48 0.70 0.17 0.16 0.20 0.13 76 76
2. C+pigeon pea GM 3.88 3.93 2.3 2.4 12.8 16.1 3.2 3.1 0.51 0.77 0.16 0.20 0.09 0.15 81 74
3. C+Mucuna GM 3.90 3.91 2.4 2.4 11.7 14.3 2.9 3.0 0.74 0.77 0.29 0.18 0.13 0.11 71 74
4. C+peanut IC 3.82 3.86 2.4 2.6 14.3 19.0 3.1 3.3 0.52 0.76 0.19 0.18 0.11 0.15 79 75 5. C+cowpea IC 3.87 3.90 2.3 2.5 14.1 17.0 3.1 3.0 0.51 0.73 0.18 0.18 0.26 0.16 77 74 6. C+Crotalaria GM 3.93 4.07 2.3 2.2 11.9 18.8 3.0 3.0 0.52 0.76 0.18 0.19 0.14 0.14 78 73
7. C+Leucaena AC 3.80 3.90 2.8 2.7 17.6 20.6 3.0 3.1 0.77 0.83 0.25 0.26 0.24 0.17 70 71
8. C+Gliricidia AC 3.87 3.93 2.7 1.2 14.0 15.7 2.8 3.1 0.95 0.70 0.31 0.19 0.27 0.13 65 75
Average 3.88 3.92 2.43 2.30 14.4 17.5 2.98 3.12 0.62 0.75 0.22 0.19 0.18 0.14 75 74 1) C= cassava; GM = green manure; IC = intercrop; AC = alley crop; + fertilizers = 80 kg N + 40 P2O5 + 80 K2O/ha Table 12.11. Effect of cropping systems and contour hedgerows on the yield of cassava and intercrops, on dry soil loss by erosion, and on gross and net income during the 10th consecutive yearof cropping on 12% slope at Hung Loc Agric. Research Center in Thong Nhat district,Dongnai, Vietnam in 2006/07.
Root yield
Starch content
IC or hedgerow yield1)
Dry soil loss
Gross income3)
Product. cost
Net income
Treatments1)
(t/ha) (%) (t/ha) (t/ha) (‘000d/ha) 1. C monoculture, no hedgerows 21.42 25.6 - 37.8 11,353 5,677 5,676
2. C+mungbean intercrop 25.20 26.6 2.26 30.1 13,356 6,757 6,599 3. C+peanut intercrop2) 28.68 27.4 3.82 23.3 15,948 6,757 9,191 4. C+vetiver hedgerows 24.60 27.8 13.64 12.5 13,038 6,727 6,311 5. C+Leucaena hedgerows 23.39 28.4 10.33 15.1 12,397 6,727 5,670 6. C+Gliricidia hedgerows 23.24 27.0 8.28 17.7 12,317 6,727 5,590 Source: Nguyen Huu Hy, 2007. 1) C = cassava; IC = intercrop residue 2) Peanut intercrop produced 136 kg/ha of dry pods 2) Prices (Dong):
Cassava 530 dong /kg fresh roots (harvest by middleman)
Peanut 5,500 dong /kg dry pods
3) Costs (Dong) Land preparation 650,000/ha
Planting (12 mdays/ha) 480,000/ha
Weeding (60 mdays/ha) 2,400,000/ha for monoculture and alley cropping
Weeding (40 mdays/ha) 1,600,000/ha for intercropping and green manuring
Intercrop planting (12 mdays/ha) 480,000/ha
Intercrop harvest and cutting 1,050,000/ha
Fertilizer application (5 mdays/ha) 200,000/ha
Fertilizers 1,947,000/ha
Seed of intercrops or GM 350,000/ha
Labor 40,000/manday

Chapter 12-17 2007 Annual Report
Table 12.12. Effect of leaf pruning, plant spacing and rate of N application on the leaf and rootyields of cassava and the yield of intercropped maize, as well as on the gross and net income when cassava, UBI 477-2, was grown in Jatikerto, Malang, E. Java, in 2005/06.
Maize yield
Dry leaf yield
Fresh root yield
Gross income
maize grain2)
Gross income cassava leaves2)
Gross income cassava roots2)
Pro- duction costs3)
Net income
Pruning/ spacing/urea
rate 1) (t/ha) (t/ha) (t/ha) (‘000 Rp/ha
Nopruning/ 1.0x0.8/300
3.27 1.341) 46.76 5,232 2,010 18,704 5,237 20,709
No pruning/ 1.0x0.4/300
2.64 1.681) 48.68 4,224 2,520 19,472 5,516 20,700
Leaf pruning/ 1.0x0.8/300
3.68 3.14 10.11 5,888 4,710 4,044 5,782 8,860
Leaf pruning/ 1.0x0.8/400
3.97 4.32 13.62 6,352 6,480 5,448 6,820 11,460
Leaf pruning/ 1.0x0.8/500
4.04 6.27 15.82 6,464 9,405 6,328 8,378 13,819
Leaf pruning/ 1.0x0.8/600
3.97 7.73 18.09 6,352 11,595 7,236 9,590 15,893
Leaf pruning/ 1.0x0.4/300
2.97 4.18 12.27 4,752 6,270 4,908 6,563 9,367
Leaf pruning/ 1.0x0.4/400
3.17 5.19 15.81 5,072 7,785 6,324 7,481 11,700
Leaf pruning/ 1.0x0.4/500
3.05 6.32 19.02 4,880 9,480 7,608 8,478 13,490
Leaf pruning/ 1.0x0.4/600
3.43 9.07 20.57 5,488 13,605 8,228 10,591 16,730
Source: Wani Hadi Utomo, 2007 1) Cassava leaves at time of root harvest only 2) Prices (Rp):
Maize 1,600/kg dry grain
Cassava roots 400/kg fresh roots
Cassava leaves 1,500/kg dry leaves
3) Costs (Rp) Cassava monoculture Cassava + maize
Land preparation (40 md/ha) 700,000/ha 700,000/ha
Planting 225,000/ha 285,000/ha
Weeding+hilling up (21 md/ha) 375,000/ha 375,000/ha
Fertilizer+manure application 180,000/ha 270,000/ha
Harvesting+loading cassava 17,000/t fresh roots 20,000/t fresh roots
Harvesting maize -.- 75,000/ha
Maize seed -.- 250,000/ha
Fertilizers -urea (1,300/kg) 390,000 (300 kg/ha) 520,000 (400 kg/ha)
-SP 36 (1,600/kg) 160,000 (100 kg/ha) 160,000 (100 kg/ha)
-KCl (3,000/kg) 345,000 (115 kg/ha) 345,000 (115 kg/ha)
-manure (100/kg) 500,000 (5 t/ha) 500,000 (5 t/ha)
Leaf harvesting+transport 300,000/t dry leaves 300,000/t dry leaves
Leaf chopping + drying 410,000/t dry leaves 410,000/t dry leaves

Project IP3: improving cassava for the developing world Chapter 12-18
12.2.6 USE OF CASSAVA LEAVES FOR PIG FEEDING A pig feeding experiment was conducted at the Luang Prabang College of Agric. and Forestry in Lao PDR on the use of cassava leaf meal or leaf silage as a protein source to substitute for expensive feed concentrate, in a diet based on maize, rice bran, soybean and cassava root meal. Table 12.13 indicates that pigs gained weight rapidly with all three rations, but daily weight gain was lower with either cassava leaf meal or silage as compared to feed concentrate. Among the two cassava leaf diets, daily weight gain, feed intake and the feed conversion ratios were very similar, but the feed cost per kg weight gain was significantly lower for the leaf silage than the leaf meal treatment. The feed cost of the cassava leaf meal treatment was actually higher than that of the concentrate treatment due to the unusually high cost of the cassava leaves purchased for this experiment. To be competitive with soybean, cassava leaf meal should cost no more than 45-55% of the cost of soybean (Table 12.14). In this case, however, the leaf meal was actually more expensive than soybean. Table 12.13. Effect of using cassava leaf meal or cassava leaf silage on performance of crossbred female pigs at Luang Prabang College of Agriculture and Forestry in Luang Prabang, Lao PDR in 2007.
Parameter Treatment 1 Cassava leaf meal
Treatment 2 Cassava leaf silage
Treatment 3 Concentrate
No. of pigs 4 4 4
Initial live weight (kg) 45.85 48.25 47.2
Final live weight (kg) 81.63 83.63 96.3
Weight gain in 84 days (kg) 35.78 35.38 49.10
Daily weight gain (g/day) 425.82 421.13 582.44
Feed intake (kg fresh/day) 1.95 2.19 2.12
Feed intake (kg DM/day) 1.71 1.66 1.86
Feed conversion ratio (kg DM feed/kg gain) 4.02 3.94 3.19
Feed cost per kg gain
(Kip/kg gain) 13,551 7,035 8,296
Source: Ivan Garcia, 2007

Chapter 12-19 2007 Annual Report
Table 12.14. Approximate prices of various feed ingredients and the final cost and protein content of various feed mixes in Indonesia in 2005.
Protein (%)
Price (‘000Rp/t)
Price (US$/t)
Ingredients -Maize 8.5 1,338 138 -Cassava chips or pellets 2.5 807 83 -Soybean 44.0 3,894 402 -Cassava chips (85.5%) + soybean meal (14.5%) 8.5 1,255 129 -Cassava leaf meal-1 20.0 1,551 160 -Cassava leaf meal-2 25.0 1,939 200 Feed mixes -Milk cows:
Maize (82%) + soya (18%) 14.9 1,798 186 Cassava chips (70%) + soya (30%) 15.0 1,733 179 Cassava chips (56%) + leaf meal-1 (24%) + soya (20%) 15.0 1,603 165 Cassava chips (59%) + leaf meal-2 (24%) + soya (17%) 15.0 1,603 165
-Pigs: Maize (76%) + soya (24%) 17.0 1,951 201
Cassava chips (65%) + soya (35%) 17.0 1,887 195 Cassava chips (61%) + leaf meal-1 (7%) + soya (32%) 17.0 1,847 190 Cassava chips (62%) + leaf meal-2 (7%) + soya (31%) 16.9 1,843 190
-Chickens: Maize (73%) + soya (27%) 18.1 2,028 209
Cassava chips (63%) + soya (37%) 17.9 1,949 201 Cassava chips (60%) + leaf meal-1 (5%) + soya (35%) 17.9 1,925 198 Cassava chips (60%) + leaf meal-2 (6%) + soya (34%) 18.0 1,924 198
1 US$ is Rp 9,694 in 2005 Source: commodity prices from FAOSTAT, Aug 2007; calculations by R. Howeler. Another pig feeding trial using cassava leaf silage was conducted at Nam Xuang Livestock Research Center near Vientiane, Lao PDR, in order to determine the efficiency of feed utilization of the local (black) breed as compared with three types of cross-bred pigs. The results, shown in Table 12.15, indicates that most pigs grew rather well on the diet of 80% rice bran-maize and 20% (of DM) as cassava leaf silage. The basal diet of rice bran and maize had 87% DM and 11% CP, while the cassava leaf silage had 35% DM and 28% CP (of DM), for a mixed feed with 14.4% CP on a DM basis. The live weight gain, as well as the total feed and protein intake were highest for the cross breed of Landrace x Large White. While the local breed gained weight slightly slower, it was actually more efficient in feed utilization. Least efficient in feed conversion was the cross-bred Landrace x the local Vietnamese breed Moncay. Unfortunately, the cross-bred of Moncay x Large White, widely used in Vietnam, was not included in this experiment.

Project IP3: improving cassava for the developing world Chapter 12-20
Table 12.15. Effect of using local and various cross-bred pig breeds1) on the efficiency of feed utilization when 20% of the basal diet of maize and rice bran was replaced with cassava leaf silage at Nam Xuang Livestock Research Center in Vientiane, Lao PDR in 2006/07.
Pig breeds2) Parameter LRMC LRLW DRLW LCLC
No. of pigs 4 4 4 4 Live weight (kg) -initial 19.75 23.37 21.87 19.62 -final 36.37 50.55 43.52 45.02 Weight gain in 84 days (kg) 16.62 27.18 21.65 25.40 Daily weight gain (g/day) 197.90 323.50 256.30 302.40 Feed intake (g DM/day) 1,292 1,750 1,524 1,403 Crude protein intake (g/day) 191 266 222 203 Feed concersion ratio (kg DM/kg gain) 6.53 5.41 5.95 4.64 Source: Sopha Xaypha et al., 2007
1) castrated male pigs. 2) LRMC = Land race x Moncay
LRLW = Land race x Large White DRLW = Duroc x Large White LCLC = local breed
12.3 ON-FARM AND FARMER PARTICIPATORY RESEARCH (FPR) The objectives and methodologies used in these trials have been described in the 2004 and 2005 Annual Reports of IP-3. Both on-farm and FPR trials are conducted on farmers’ fields, but in on-farm trials the experiment is designed and managed mainly by researchers, while in FPR trials farmers decide on the types of trials to be conducted and the treatments to be tested; in this case the farmers are the “owners” of the trials and they discuss and select the best treatments. In both cases, researchers or extension workers, help the farmers set out and plant the trials and measure the yields obtained in each treatment. 12.3.1 ON-FARM AND FPR TRIALS IN LAO PDR In 2006/07 nearly 150 FPR trials were conducted in three provinces of northern Laos, i.e. Oudomxay, Luang Prabang and Xieng Khouang. However, many of these were informal trials conducted by farmers themselves with small amounts of planting material of the new high-yielding varieties. In some cases they harvested without informing the project staff, so yields could not be determined; in many other cases trials were damaged or completely destroyed by roaming cattle, buffaloes, pigs or goats, or occasionally chickens or rats damaged bthe roots. Since cassava plants are often the only green vegetation in the field during the dry season, these trials are a favorite target for hungry animals, including people. Tables 12.16-12.19 show some examples of FPR variety trials harvested in 2007 in Lao PDR. Tables 12.16 and 12.17 indicate that in Pak Baeng and Houn districts of Oudomxay province cassava yields were very high when plants were left to grow (with little or no additional management) until two years after planting. In both locations highest yields were obtained with Rayong 72, followed by either KU 50 or Rayong 60. The starch contents of Rayong 72 and KU 50 were still very high even after two years; those of Rayong 60, Hanatee, Rayong 2 and the local variety were much lower. However, for eating purposes farmers clearly prefer the local variety or Rayong 72, which is similar to results of taste tests conducted previously in Hue province in Vietnam, and in Kampong Speu province of Cambodia.
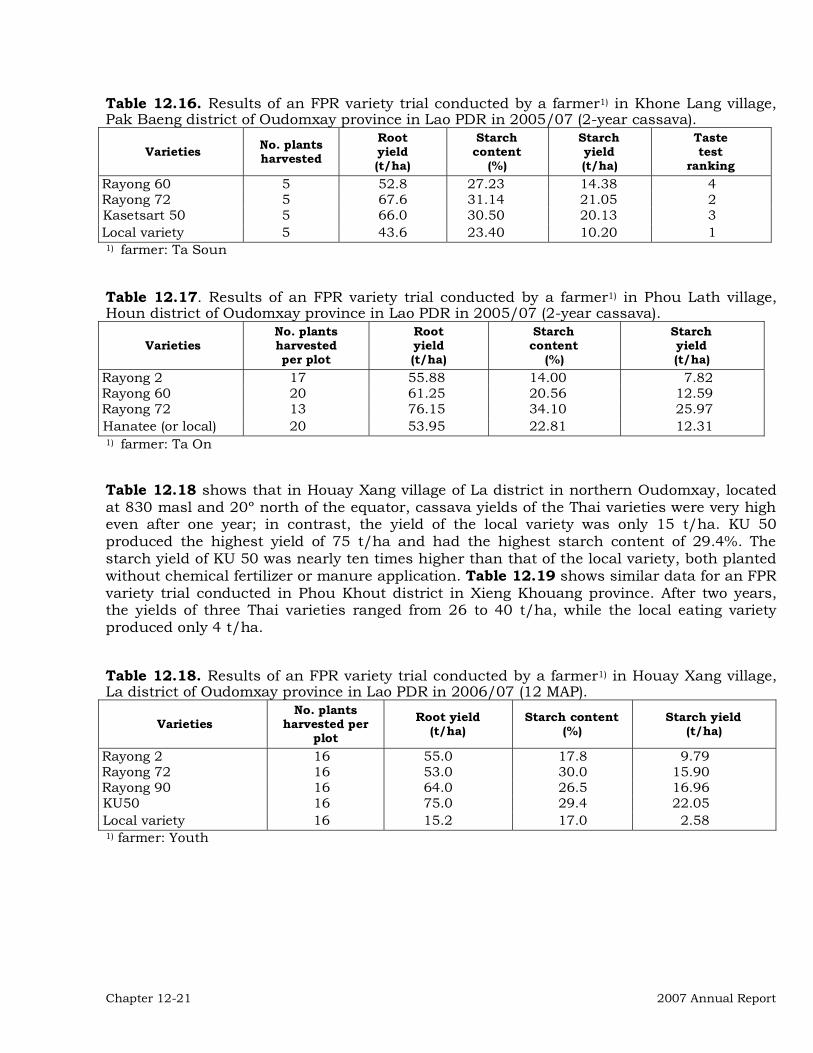
Chapter 12-21 2007 Annual Report
Table 12.16. Results of an FPR variety trial conducted by a farmer1) in Khone Lang village, Pak Baeng district of Oudomxay province in Lao PDR in 2005/07 (2-year cassava).
Varieties No. plants harvested
Root
yield (t/ha)
Starch content
(%)
Starch yield (t/ha)
Taste test
ranking Rayong 60 5 52.8 27.23 14.38 4 Rayong 72 5 67.6 31.14 21.05 2 Kasetsart 50 5 66.0 30.50 20.13 3 Local variety 5 43.6 23.40 10.20 1 1) farmer: Ta Soun Table 12.17. Results of an FPR variety trial conducted by a farmer1) in Phou Lath village, Houn district of Oudomxay province in Lao PDR in 2005/07 (2-year cassava).
Varieties No. plants harvested per plot
Root
yield (t/ha)
Starch content
(%)
Starch yield (t/ha)
Rayong 2 17 55.88 14.00 7.82 Rayong 60 20 61.25 20.56 12.59 Rayong 72 13 76.15 34.10 25.97 Hanatee (or local) 20 53.95 22.81 12.31 1) farmer: Ta On Table 12.18 shows that in Houay Xang village of La district in northern Oudomxay, located at 830 masl and 20º north of the equator, cassava yields of the Thai varieties were very high even after one year; in contrast, the yield of the local variety was only 15 t/ha. KU 50 produced the highest yield of 75 t/ha and had the highest starch content of 29.4%. The starch yield of KU 50 was nearly ten times higher than that of the local variety, both planted without chemical fertilizer or manure application. Table 12.19 shows similar data for an FPR variety trial conducted in Phou Khout district in Xieng Khouang province. After two years, the yields of three Thai varieties ranged from 26 to 40 t/ha, while the local eating variety produced only 4 t/ha. Table 12.18. Results of an FPR variety trial conducted by a farmer1) in Houay Xang village, La district of Oudomxay province in Lao PDR in 2006/07 (12 MAP).
Varieties No. plants
harvested per plot
Root yield (t/ha)
Starch content (%)
Starch yield (t/ha)
Rayong 2 16 55.0 17.8 9.79 Rayong 72 16 53.0 30.0 15.90 Rayong 90 16 64.0 26.5 16.96 KU50 16 75.0 29.4 22.05 Local variety 16 15.2 17.0 2.58 1) farmer: Youth

Project IP3: improving cassava for the developing world Chapter 12-22
Table 12.19. Results of an FPR variety trial conducted by a farmer in Phou Khout district, Xieng Khouang province (2005/07).
Variety Fresh root yield (t/ha)
Starch content (%)
Starch yield (t/ha)
Rayong 72 40.0 28.1 11.2 Rayong 90 39.6 27.2 10.7 Kasetsart 50 26.4 29.5 7.8 Local variety 4.0 18.0 0.7 12.3.2 ON-FARM AND FPR TRIALS IN CAMBODIA In Cambodia 24 on-farm and FPR trials were conducted in 2006/07, mostly on varietal evaluation, fertilization, planting method (plant distance x stake position), and intercropping. Results shown in Tables 12.20 and 12.21 indicate that in four FPR variety trials conducted in Battambang and Kampong Cham provinces, Rayong 5 and Rayong 72 produced the highest root yields, followed by KU 50. The variety locally known as “Malaysia” is actually the same as KU 50 as it was introduced from across the border of Vietnam as KM 94, which is the Vietnamese name for KU 50. While most soils in Battambang and Kampong Cham provinces are quite fertile clay soils, in some sites in Battambang soils are low in P, while in Kampong Cham many soils are low K. Results of two NPK trials conducted in Battambang (Table 12.22) indicate that cassava responded mainly to P, with no response to N or K, while in two trials conducted in Kampong Cham the crop responded mainly to K with some additional response to N, P and farm yard manure (FYM) (Table 12.23). In a different experiment, however, in Kampong Cham, the main response was to P followed by K, and no response to N. Table 12.20. Results of an FPR variety trial conducted by two farmers1) in Rattanak Mondoul district of Battambang province in Cambodia in 2006/07.
No. plants /30m2
Plant stand
Root yield (t/ha)
Starch content (%)
Starch yield
Varieties
A B (%) A B Average A B Average (t/ha) 1. Rayong 2 29 25 90 17.50 31.67 24.59 19.7 26.1 22.9 5.63 2. Hanatee 30 29 98 16.67 20.83 18.75 25.3 29.0 27.2 5.10 3. Rayong 5 30 30 100 32.50 27.50 30.00 27.8 33.0 30.4 9.12 4. Rayong 72 30 25 79 33.75 30.83 32.29 30.0 30.9 30.5 9.85 5. KU 50 29 29 97 29.17 22.08 25.63 27.1 30.6 28.9 7.41 1) A = Mr. Pich Pros in Teuk Sab village, Plav Meas commune
B = Mr. Ung Sareoun in Thmor Phrous village, Andeuk Heap commune

Chapter 12-23 2007 Annual Report
Table 12.21. Results of an FPR variety trial conducted by two farmers in Thmor Pich village,Vihear Loung commune, Thbong Khmon district of Kampong Cham province inCambodia in 2006/07.
No. plants/ 30m2
Plant stand
Root yield (t/ha)
Variety
A1) B Average (%) A B Average 1. Rayong 72 18 0 2) 18.0 60 35.83 - 35.83 2. Rayong 5 22 0 2) 22.0 73 38.33 - 38.33 3. KU 50 29 20 24.5 82 31.67 33.33 32.50 4. Rayong 90 16 13 14.5 48 35.42 21.25 28.34 5. Malaysia 30 21 25.5 85 32.92 32.50 32.71 1) A = Mr. Yim Channa; B = Mr. Ek Noul 2) plants missing due to stealing of edible varieties Table 12.22. Results of an FPR fertilizer trial conducted by two farmers in Rattanak Mondoul district of Battambang province in Cambodia in 2006/07.
No. plants/ 30m2
Plant stand
Root yield ( t/ha) Treatment
A1) B1) (%) A B Average 1. N0P0K0 30 28 97 24.17 29.17 26.67 2. N0P40K0 30 29 98 33.33 35.00 34.17 3. N60P0K60 30 30 100 26.67 32.50 29.59 4. N60P40K60 30 30 100 30.00 33.33 31.67 5. N60P40K60 +5 t/ha FYM 29 30 98 30.83 31.67 31.25 1) A = Mr. Pich Pros in Teuk Sab village, Plav Meas commune using KM 94
B = Mr. Ung Sareoun in Thmor Phrous village, Andeuk Heap commune using Rayong 5 In the planting method trials, planting either vertical or inclined generally produced the highest yields, while planting inclined with two stakes per hill usually produced the lowest yields. In the intercropping trial conducted in Battambang, there were no significant differences in cassava yields from intercropping with mungbean, soybean and pumpkin, which were slightly higher than intercropping with peanut or sweet corn (Table 12.24). Table 12.23. Results of an FPR fertilizer trial conducted by two farmers in Thmor Pich village, Vihear Loung commune, Thbong Khmon district of Kampong Cham province in Cambodia in 2006/07.
No. plants/ 30m2
Root yield (t/ha)1) Treatment
A1) B Average
Plant stand
(%) A B Average 1. N0P0K0 24 26 25.0 83 35.83 30.00 32.92 2. N0P0K60 22 28 25.0 83 43.33 33.33 38.33 3. N60P0K60 26 28 27.0 90 30.42 39.17 34.80 4. N60P20K60 28 26 27.0 90 38.50 33.33 35.92 5. N60P20K60 +5 t/ha FYM 27 25 26.0 87 39.58 39.17 39.38 1) A = Mr. Yim Channa using Rayong 5; B = Mr. EK Noul using KU 50 variety

Project IP3: improving cassava for the developing world Chapter 12-24
Table 12.24. Results of an on-farm intercropping trial conducted by CARDI in Teuk Sab village, Plav Meas commune, Rattanak Mondoul district of Battambang province in 2006/07.
No. plants/30m2 Plant stand
Cassava root yield (t/ha)1)
Cropping systems
I II III (%) I II III Average 1. C + sweet corn 29 29 29 97 28.75 35.00 35.00 32.92 2. C + mungbean 29 28 18 83 39.58 36.67 34.58 36.94 3. C + soybean 29 29 29 97 36.67 35.00 40.00 37.22 4. C + peanut 29 28 29 96 29.17 37.50 34.17 33.61 5. C + pumpkin 28 30 29 97 31.67 38.75 39.17 36.53 1) farmer: Mr. Try Mong; variety: KU 50 12.3.3 ON-FARM AND FPR TRIALS IN INDONESIA In Indonesia many on-farm and FPR trials were conducted in 2006/07 as part of the ACIAR-funded cassava project in Indonesia and East Timor. Most of these trials evaluated a number of promising cassava varieties or breeding lines. Table 12.25 summarizes the results of 13 varieties trials conducted in five locations. After standardizing the yields on the mean and standard deviation it can be concluded that in general highest yields were obtained with UJ 5 (= KU 50 = Kasetsart), followed by UB 477-2 and Adira 4, while the two breeding lines CMM 99-23-12 and CMM 96-36-255 also appear very promising. Table 12.26 shows the results of an FPR fertilizer and manure trial conducted by a farmer in Gunung Kidul district of Yogyakarta, using cassava intercropped with maize and rice followed by peanut. The yields of all crops increased when medium to high levels of urea were combined with high to medium levels of cattle manure. There appeared to be no need for application of P or K. The highest net income was obtained with the application of either 100 kg/ha of urea combined with 4 t/ha of manure, or 200 kg/ha of urea with 2 t/ha of manure. Table 12.27 shows the results of an FPR feeding trial of lactating dairy cows using ensiled cassava leaves as a supplement of a traditional diet based on elephant grass and concentrate, conducted in Batu district of East Java. Supplementation with ensiled cassava leaves increased daily milk yield by 6.2% and slightly increased the protein and fat content of the milk. But if all the costs of cassava leaf collection and silage making were included the extra income obtained from feeding leaf silage only barely compensated for the cost of the silage. Farmers who conducted the trial are still enthusiastic about the use of cassva leaf silage, but may find it difficult to obtain an adequate supply of cassava leaves, as cassava growth is slow at the high elevation (about 1000 masl) where dairy production is normally practiced.

Chapter 12-25 2007 Annual Report
Table 12.25. Results of 13 on-farm cassava variety evaluation trials conducted by farmers in five provinces of Indonesia in 2006/07.
Locations
Variety/line E. LampungLampung
(3)1)
Sukabumi W. Java
(5)
Pati C. Java (1)
G. Kidul Yogyakarta
(1)
Malang E. Java
(3)
Yields standardized on mean and
STDV
No. of locs
tested
Adira 1 26.07 23.70 14.15 -0.77 3 Adira 4 29.45 18.36 0.21 2 Malang 6 25.90 19.40 16.88 39.18 -0.65 4 UB ½ 16.69 25.41 22.03 39.85 0.05 4 UB 477-2 16.21 24.09 36.63 17.62 44.14 0.11 5 UJ-3=Rayong 60 23.38 16.89 -0.48 2 UJ-5=KU 50 29.77 26.56 32.93 21.46 36.54 0.29 5 Markonah 35.50 19.06 35.62 -0.27 3 Manggu 24.42 0.03 1 Bandung 26.90 1.05 1 Dorowati 24.67 0.13 1 Roti 21.62 -1.12 1 Kaspro 38.80 -0.15 1 Faroka 40.39 0.42 1 Gatotkoco 21.29 0.59 1 CMM 99-23-12 32.45 1.19 1 CMM 96-36-255 25.70 1.92 1 Average 24.84 24.35 32.19 19.34 39.22 St. Dev. 6.424 2.439 5.868 3.316 2.778 1) Number in parenthesis indicates the number of FPR trials conducted in each location. Table 12.26. Results of an FPR fertilizer and manure trial with cassava intercropped with maize and upland rice followed by peanut, and conducted by a farmer in Jambu village, Tangungsari, Gunung Kidul, Yogyakarta in 2006/07.
Treatments (kg/ha)
Urea SP-36 KCl FYM
Cassava yield (t/ha)
Rice yield (t/ha)
Maize yield (t/ha)
Peanut yield (t/ha)
Net income (mil. Rp/ha)
1 200 100 50 0 17.15 1.16 1.15 0.45 7.11 2 100 100 0 2,000 17.64 1.59 1.48 0.58 8.92 3 200 0 2,000 18.45 1.73 1.51 0.54 9.41 4 100 0 4,000 19.89 1.67 1.44 0.60 9.55 Table 12.27. Effect of supplementing dairy cattle ration of elephant grass and concentrate with cassava leaf silage on milk yield and quality in six FPR feeding trials conducted by farmers in Tlekung village of Junrego subdistrict in Batu district of E. Java, in 2006/07.
Daily milk yield (liters/cow) Farm Before1) During1) Significance
Farm #1 11.25 11.71 0.042 Farm #2 15.33 16.28 0.116 Farm #3 11.41 11.03 0.038 Farm #4 10.86 11.65 0.003 Farm #5 12.86 15.21 0.000 Farm #6 9.23 10.28 0.000 Average 12.40 13.17 0.000 Protein content (%) 3.15 3.58 - Fat content (%) 3.62 3.71 -

Project IP3: improving cassava for the developing world Chapter 12-26
1) Before and during the feeding of cassava leaf silage at about 6 kg/head/day in addition to the normal ration of 30-40 kg elephant grass plus 5-8 kg concentrate feed.
12.3.4 ON-FARM AND FPR TRIALS IN EAST TIMOR In 2006/07 about 50 FPR variety trials were conducted in East Timor. Some were very well managed, while others suffered greatly from excessive competition from intercropped maize and weeds, were damaged by free roaming pigs and goats, or were harvested prematurely by the farmers. Table 12.28 shows some of the results obtained and farmers’ preferences. Yields varied widely, but were generally quite high for Ca 03, Ca 13, Ca 15 and Ca 109 (= KU 50); of these Ca 13 and Ca 109 are quite bitter while Ca 15 is considered sweet and Ca 03 bitter/sweet. Most farmers were interested in planting these new varieties, while they will also continue to plant their traditional eating varieties such as Mentega, Nonametan and Etuhare. Table 12.28. Results of four FPR cassava variety trials conducted by farmers in Maliana subdistrict in Bobonaro district of East Timor in 2006/07.
Cassava root yield (t/ha) Average Want to Variety name/code A1) B B C D taste2) plant3)
Ca 03 - 26.4 - - 16.4 1.5 2.0 Ca 13 - 13.6 - 11.2 15.6 1.0 2.0 Ca 15 - 9.6 27.2 10.0 16.4 2.0 2.0 Ca 30 - 14.0 - - - 1.0 2.0 Ca 36 - - - 6.0 - 2.0 2.0 Ca 109 = KU 50 - 24.0 20.0 2.0 20.0 1.0 1.8 Etuhare 12.0 - - 22.4 - 2.0 2.0 Tolantoka 22.0 - - - - 2.0 1.0 Mentega 12.0 - - - - 2.0 2.0 Nonametan 14.0 19.2 - - - 2.0 2.0 Mutin - - - 18.8 1.0 1.0 1) A = Jeremias Lasi; B = Marcelino Pereira; C = Francisco Kaiero; D = Miguel Pereira 2) bitter = 1; sweet = 2 3) no = 1; yes = 2 Table 12.29 shows similar results of three FPR trials conducted by farmers in Manufahi district. In most trials cassava was well managed and yields were very high. Starch contents, however, were rather low especially for some of the eating varieties like Ca 26, which is the Indonesian variety Gading. On average, Ca 14b (= OMM 96-01-93) had the highest starch yield, followed by Ca 10.
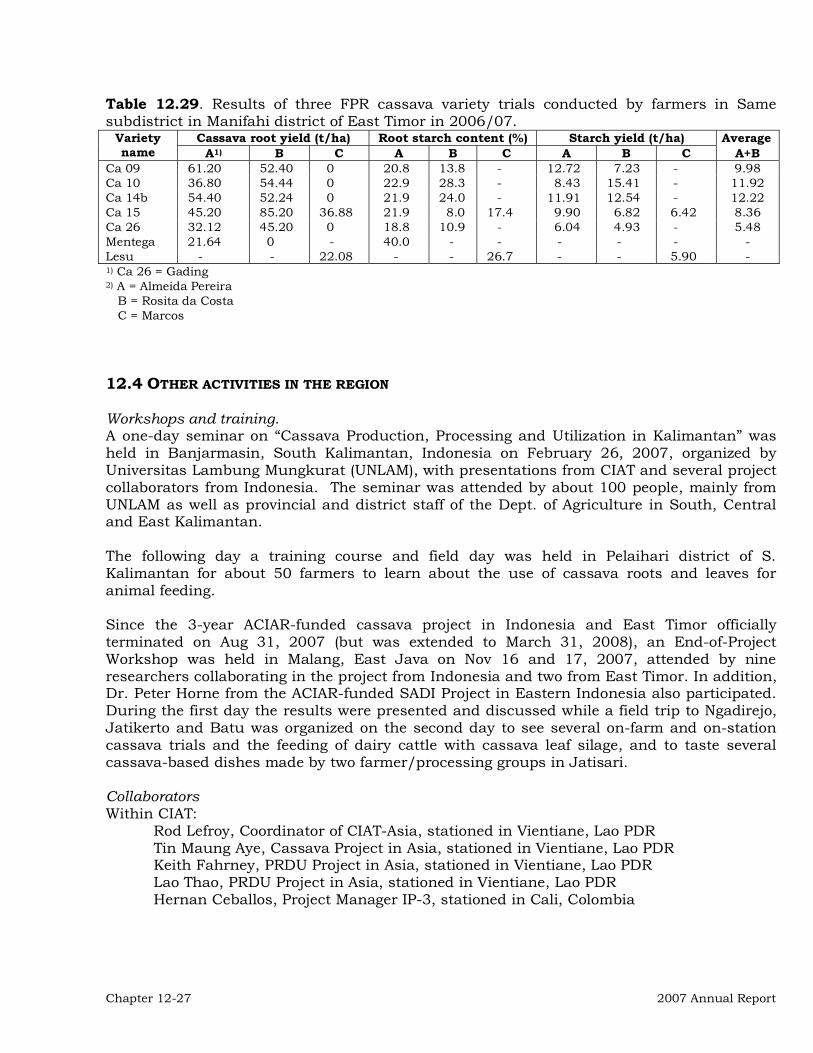
Chapter 12-27 2007 Annual Report
Table 12.29. Results of three FPR cassava variety trials conducted by farmers in Same subdistrict in Manifahi district of East Timor in 2006/07.
Cassava root yield (t/ha) Root starch content (%) Starch yield (t/ha) Average Variety name A1) B C A B C A B C A+B
Ca 09 61.20 52.40 0 20.8 13.8 - 12.72 7.23 - 9.98 Ca 10 36.80 54.44 0 22.9 28.3 - 8.43 15.41 - 11.92 Ca 14b 54.40 52.24 0 21.9 24.0 - 11.91 12.54 - 12.22 Ca 15 45.20 85.20 36.88 21.9 8.0 17.4 9.90 6.82 6.42 8.36 Ca 26 32.12 45.20 0 18.8 10.9 - 6.04 4.93 - 5.48 Mentega 21.64 0 - 40.0 - - - - - - Lesu - - 22.08 - - 26.7 - - 5.90 - 1) Ca 26 = Gading 2) A = Almeida Pereira
B = Rosita da Costa C = Marcos
12.4 OTHER ACTIVITIES IN THE REGION Workshops and training. A one-day seminar on “Cassava Production, Processing and Utilization in Kalimantan” was held in Banjarmasin, South Kalimantan, Indonesia on February 26, 2007, organized by Universitas Lambung Mungkurat (UNLAM), with presentations from CIAT and several project collaborators from Indonesia. The seminar was attended by about 100 people, mainly from UNLAM as well as provincial and district staff of the Dept. of Agriculture in South, Central and East Kalimantan. The following day a training course and field day was held in Pelaihari district of S. Kalimantan for about 50 farmers to learn about the use of cassava roots and leaves for animal feeding. Since the 3-year ACIAR-funded cassava project in Indonesia and East Timor officially terminated on Aug 31, 2007 (but was extended to March 31, 2008), an End-of-Project Workshop was held in Malang, East Java on Nov 16 and 17, 2007, attended by nine researchers collaborating in the project from Indonesia and two from East Timor. In addition, Dr. Peter Horne from the ACIAR-funded SADI Project in Eastern Indonesia also participated. During the first day the results were presented and discussed while a field trip to Ngadirejo, Jatikerto and Batu was organized on the second day to see several on-farm and on-station cassava trials and the feeding of dairy cattle with cassava leaf silage, and to taste several cassava-based dishes made by two farmer/processing groups in Jatisari. Collaborators Within CIAT:
Rod Lefroy, Coordinator of CIAT-Asia, stationed in Vientiane, Lao PDR Tin Maung Aye, Cassava Project in Asia, stationed in Vientiane, Lao PDR Keith Fahrney, PRDU Project in Asia, stationed in Vientiane, Lao PDR Lao Thao, PRDU Project in Asia, stationed in Vientiane, Lao PDR Hernan Ceballos, Project Manager IP-3, stationed in Cali, Colombia

Project IP3: improving cassava for the developing world Chapter 12-28
The institutions and principal individuals collaborating in the Nippon Foundation and the ACIAR funded projects in Laos, Cambodia, Indonesia and East Timor are shown in Tables 12.1 and 12.2. 12.5 PUBLICATIONS Book Chapters. Howeler, R.H., Watana Watananonta and Tran Ngoc Ngoan. 2007. Farmer participation in
research and extension: The key to achieving adoption of more sustainable production practices on sloping land in Asia and their impact on farmers’ income. In: J. de Graaff, J. Cameron, S. Sombatpanit, Ch. P�eri and J. Woodhill (Eds.). Monitoring and Evaluation of Soil Conservation and Watershed Development Projects. Science Publishers, Enfield, NH., USA. Chapter 24. pp. 435-476.
Dalton, T., N. Lilja, N. Johnson and R.H. Howeler. 2007. CIAT. Impact of Participatory NRMR in Cassava Based Cropping Systems in Vietnam and Thailand. In: H. Waibel and D. Zilberman (Eds.). International Research on Natural Resource Management: Advances in Impact Assessment. Oxford Univ. Press. USA. 320 p.
Other Publications. Howeler, R.H. 2007a. Agronomic practices for sustainable cassava production in Asia. In:
R.H. Howeler (Ed.). Cassava Research and Development in Asia: Exploring New Opportunities for an Ancient Crop. Proc. 7th Regional Workshop, held in Bangkok, Thailand. Oct 28-Nov 1, 2002. pp. 288-314.
Howeler, R.H. 2007b. Sustaining cassava farmers and our earth: Background of the Nippon Foundation project in Asia. In: R.H. Howeler (Ed.). Cassava Research and Development in Asia: Exploring New Opportunities for an Ancient Crop. Proc. 7th Regional Workshop, held in Bangkok, Thailand. Oct 28-Nov 1, 2002. pp. 315-332.
Howeler, R.H. 2007c. Achievements and lessons learned in the Nippon Foundation project in Asia. In: R.H. Howeler (Ed.). Cassava Research and Development in Asia: Exploring New Opportunities for an Ancient Crop. Proc. 7th Regional Workshop, held in Bangkok, Thailand. Oct 28-Nov 1, 2002. pp. 412-421.
Howeler, R.H. 2007d. Results of soil analysis in Asia. 2000-2006. In: R.H. Howeler (Ed.). Cassava Research and Development in Asia: Exploring New Opportunities for an Ancient Crop. Proc. 7th Regional Workshop, held in Bangkok, Thailand. Oct 28-Nov 1, 2002. pp. 615-663.
Jongruaysub, S., P. Namwong, A. Tiensiriroek, C. Laochaikarm, A. Joodkong, S. Katong, W. Watananonta and R.H. Howeler. 2007. Minimum tillage for cassava in Thailand. In: R.H. Howeler (Ed.). Cassava Research and Development in Asia: Exploring New Opportunities for an Ancient Crop. Proc. 7th Regional Workshop, held in Bangkok, Thailand. Oct 28-Nov 1, 2002. pp. 251-263.
Li Kaimian, Ye Jianqiu, Huang Jie and R.H. Howeler. 2007. Farmer participatory research (FPR) in Hainan province of China. In: R.H. Howeler (Ed.). Cassava Research and Development in Asia: Exploring New Opportunities for an Ancient Crop. Proc. 7th Regional Workshop, held in Bangkok, Thailand. Oct 28-Nov 1, 2002. pp. 400-407.
Limsila, A., S. Tungsukul, P. Sarawat, W. Watananonta, A. Boonsing, S. Pichitporn and R.H. Howeler. Cassava leaf production research in Thailand. In: R.H. Howeler (Ed.). Cassava Research and Development in Asia: Exploring New Opportunities for an Ancient Crop. Proc. 7th Regional Workshop, held in Bangkok, Thailand. Oct 28-Nov 1, 2002. pp. 472-480.

Chapter 12-29 2007 Annual Report
Pham Van Bien, Hoang Kim, Tran Ngoc Ngoan, R.H. Howeler and J.J. Wang. 2007. New developments in the cassava sector of Vietnam. In: R.H. Howeler (Ed.). Cassava Research and Development in Asia: Exploring New Opportunities for an Ancient Crop. Proc. 7th Regional Workshop, held in Bangkok, Thailand. Oct 28-Nov 1, 2002. pp. 25-32.
Tran Ngoc Ngoan and R.H. Howeler. 2007. The adoption of new technologies and the socio-economic impact of the Nippon Foundation cassava project in Vietnam. In: R.H. Howeler (Ed.). Cassava Research and Development in Asia: Exploring New Opportunities for an Ancient Crop. Proc. 7th Regional Workshop, held in Bangkok, Thailand. Oct 28-Nov 1, 2002. pp. 387-399.
Vongkasem, W., K. Klakhaeng, K. Srakaew, R. Sevatasai, W. Watananonta and R.H. Howeler. 2007. Farmer participatory extension (FPE) methodologies used in the cassava project in Thailand. In: R.H. Howeler (Ed.). Cassava Research and Development in Asia: Exploring New Opportunities for an Ancient Crop. Proc. 7th Regional Workshop, held in Bangkok, Thailand. Oct 28-Nov 1, 2002. pp. 344-351.
Watananonta, W., W. Vongkasem, K. Klakhaeng and R.H. Howeler. 2007. Farmer participatory research activities in the Nippon Foundation project in Thailand. In: R.H. Howeler (Ed.). Cassava Research and Development in Asia: Exploring New Opportunities for an Ancient Crop. Proc. 7th Regional Workshop, held in Bangkok, Thailand. Oct 28-Nov 1, 2002. pp. 333-343.
Posters and workshop papers presented. Aye, T.M. and R.H. Howeler. 2007. Improving the production and on-farm utilization of
cassava by farmers in Laos and Cambodia. Knowledge Sharing Weeks at CIAT Headquarters, Cali, Colombia. May 18-25, 2007.
Aye, T.M. and V. Phimphachanhvongsod. 2007. Cassava in Laos: current production and potential market development and doubling subsistence production with potential development as a new commodity crop. In: Workshop on “Poverty Reduction through Market Oriented Production: Action on Research to Achieve Impacts”, held in Vientiane. Lao PDR. Oct 4, 2007. NAFRI/CIAT. pp. 27-31.