The Bihar Livestock Sector Analysis - CGSpace
172
The Bihar Livestock Sector Analysis Animal & Fisheries Resources Department, Government of Bihar Technical support: International Livestock Research Institute (ILRI) Program support: Bill & Melinda Gates Foundation Govt. of Bihar
-
Upload
khangminh22 -
Category
Documents
-
view
4 -
download
0
Transcript of The Bihar Livestock Sector Analysis - CGSpace

The Bihar Livestock Sector Analysis
Animal & Fisheries Resources Department, Government of BiharTechnical support: International Livestock Research Institute (ILRI) Program support: Bill & Melinda Gates Foundation
Govt. of Bihar

Govt. of Bihar
The Bihar Livestock Sector Analysis

Contents
Tables III
Figures VII
Abbreviations/Acronyms IX
Acknowledgements XI
1 Introduction 1
2 Livestock in Bihar—overview 5
3 Livestock systems and production zones in Bihar state 10
3.1 Livestock systems classication in Bihar 10
3.2 Livestock systems in Bihar 12
3.3 Livestock output distribution over the main production zones 15
3.4 Livestock species distribution over the different production zones 16
3.5 Technical parameters for livestock productivity 17
3.6 Gender and social inclusion considerations in livestock production systems 22
4 Livestock contribution to Bihar state 26
4.1 Past livestock trends—population and production 26
4.2 Current (2017–18) livestock population, production and GSDP 30
4.3 Projection of livestock populations, production and GSDP to 2031–32 under
business as usual (BAU)) 37
4.4 Projected consumption and consumption preferences 42
5 Livestock sector improvement strategies 50
5.1 Cattle value chain improvement strategies 50
5.2 Buffalo value chain improvement strategies 55
5.3 Goat value chain improvement strategies 56
5.4 Chicken value chain improvement strategies 60
5.5 Pig and pork meat value chains improvement strategies 63
5.6 Post-production improvement strategies 66
6 Priority institutions and policy constraints and opportunities 73
6.1 Animal health 73
6.2 Animal breeding 73
The Bihar Livestock Sector Analysis I

6.3 Animal nutrition 74
6.4 Dairy 74
6.5 Poultry 75
6.6 Buffalo 75
6.7 Goats 75
6.8 Pigs 76
6.9 Hides and skins 76
6.1 Livestock and livestock products marketing and processing 76
6.11 Policy requirements for social and gender inclusion 77
6.12 Livestock research 79
6.13 Livestock extension services 80
7 Foresight assessment of intervention options 81
7.1 Cow dairy improvement 81
7.2 Buffalo milk and meat improvement 99
7.3 Goat meat improvement 105
7.4 Chicken meat and egg improvement 114
7.5 Pig improvement 122
7.6 Lessons for gender and social inclusion 128
8 Summary and conclusions 133
9 Annexes 142
10 References 168
The Bihar Livestock Sector Analysis II

Tables
Tables
Table 1: Livestock population (lakhs) in 2012, with 2017 projections and 5-year growth rates 6
Table 2: Indicators for classication of traditional ruminant production systems in Bihar
by production zone 11
Table 3: List of districts by production zone 12
Table 4: Red meat production in metric tonnes (MT) by production zone (2017–18) 15
Table 5: Annual milk production (in lakh MT) by production zone (2017–18) 15
Table 6: National livestock numbers (in lakhs) and distribution over livestock
production zones in 2017/18 16
Table 7: Average productivity parameters in cow dairy production systems by zones 18
Table 8: Average productivity parameters in commercial cow dairy production systems 18
Table 9: Buffalo production system average productivity parameters 19
Table 10: Goats average productivity parameters 20
Table 11: Chicken production average productivity parameters 21
Table 12: Swine production average productivity parameters 22
Table 13: Distribution of livestock according to land-size category in Bihar
(number per 1,000 households) 24
Table 14: Composition and distribution of livestock across social groups (%) across India 24
Table 15: The distribution of Bihar livestock population over the three production
zones and in specialized commercial systems (not zone specic) 31
Table 16: Livestock production during the baseline year (2017–18) 33
Table 17: Trends in state, agriculture and livestock GSDP 2011–12 to
2016–17 in INR crore at constant 2011–12 prices 34
Table 18: Summary of the composition of the subsector gross VA at the production stage 2017–18 35
Table 19: Share of livestock GSDP by livestock production zones and species 2017–18 36
Table 20: Comparison of baseline current and projected livestock populations
2017–18 to 2032–33 under the BAU scenario 37
Table 21: Comparison of the baseline 2017–18 and projected 2032–33 BAU
livestock production in Bihar 39
The Bihar Livestock Sector Analysis III

Table 22: Red meat production in MT by production zones, 2032–33 BAU 40
Table 23: Milk production by production zones and species, 2032–33 under BAU 40
Table 24: Livestock GSDP in 2032–33 under BAU 41
Table 25: Share of livestock GSDP by zone and species, in 2032–33 under BAU 42
Table 26: Per capita consumption of livestock products in the state of Bihar during the year 2011 43
Table 27: Trends in annual population and GSDP growth rates
for Bihar state (2011–2012 to 2015–2016) 44
Table 28: Income elasticities of livestock products 44
Table 29: Projected total population size (in lakhs) in Bihar state (2017 and 2032)
used in obtaining the projected total consumption gures for different livestock products 45
Table 30: Current and projected future annual per capita consumption of livestock products in Bihar 2017–18 to 2032–33 45
Table 31: Current and projected production and consumption of livestock products
BAU 2017–18 to 2032–33 46
Table 32: Consumption expenditures by land holding and social class in Bihar (INR) 49
Table 33: Challenges of cattle production by production zones 52
Table 34: Challenges to commercial dairy in Bihar state 53
Table 35: Opportunities for cattle dairying in Bihar state 53
Table 36: Key strategies to address challenges: cattle (by zone) 53
Table 37: Challenges to buffalo production in Bihar state 55
Table 38: Opportunities for buffalo production in Bihar state 55
Table 39: Key strategies to address buffalo production challenges 56
Table 40: Challenges to small-size goat production in Bihar state 56
Table 41: Challenges to medium-size goat production in Bihar state 57
Table 42: Opportunities for goat production in Bihar state 59
Table 43: Key strategies to address challenges in goat production 59
Table 44: Complementary success requirements for production of goats 60
Table 45: Challenges to backyard chicken production in Bihar state 60
Table 46: Opportunities for backyard chicken production in Bihar state 60
Table 47: Key strategies to address challenges in backyard chicken production in Bihar state 61
Table 48: Challenges to broiler production in Bihar state 61
Table 49: Opportunities for broiler production in Bihar state 61
Table 50: Key strategies to address challenges to broiler and layer production in Bihar state 62
Table 51: Complementary success requirements for broiler and layer production 62
Table 52: Challenges to layer production in Bihar state 62
Table 53: Opportunities for production of layers in Bihar State 63
Table 54: Key strategies to address challenges to broiler and layer production in Bihar state 63
The Bihar Livestock Sector Analysis IV

Table 55: Challenges to pig production in Bihar State 65
Table 56: Opportunities for pig production in Bihar state 65
Table 57: Key strategies to address challenges in pig production in Bihar state 65
Table 58: Post-production opportunities, challenges and intervention strategies for dairying 66
Table 59: Post-production opportunities, challenges and intervention strategies for buffalo
meat and skins 67
Table 60: Post-production opportunities, challenges and intervention strategies for goat meat 69
Table 61: Post-production opportunities, challenges and intervention strategies
for chicken meat and eggs 70
Table 62: Post-production opportunities, challenges and intervention strategies for pork 72
Table 63: Cattle population of Bihar over different periods of years 83
Table 64: Cattle population growth rate and trends of Bihar over periods of years 83
Table 65: Targets for 15-years and 5-years breakdown of milk processing facilities 86
Table 66: Cow dairy population at production subsystem level for
baseline, BAU and WI scenarios (in lakhs and percentages) 87
Table 67: Production in the base year, and BAU and WI-1 scenarios 89
Table 68: Results of nancial analysis for both breed and livestock interventions
in family and commercial cow dairy production in
Bihar, 2017–18 to 2032–33 (at cow dairy production unit/thousand herd) 91
Table 69: GSDP contribution for baseline, BAU and WI-1 scenarios (INR crores) 93
Table 70: Cattle population growth rates for the two scenarios (WI-1 and WI-2) 95
Table 71: Projected cattle population change and per cent change
from baseline for WI-1 and WI-2 scenarios 96
Table 72: Production change and per cent change from baseline, for WI-1 and WI-2 scenarios 97
Table 73: GSDP contribution change and per cent change from baseline,
for WI-1 and WI-2 scenarios (INR lakhs) 97
Table 74: Buffalo population at production zone level for
baseline, and under BAU and WI scenarios (in lakhs) 101
Table 75: Production for baseline, and BAU and WI scenarios 101
Table 76: Results of nancial analysis for the combined livestock interventions in small
buffalo production units in Bihar production zones, 2017–18 to 2032–33
(at buffalo production unit/herd level) 103
Table 77: GSDP contribution for baseline, BAU and WI scenarios (INR crores) 104
Table 78: Goat population at production subsystem level for baseline,
BAU and WI scenarios (in lakhs) 108
Table 79: Production at baseline, and under the BAU and WI scenarios 108
Table 80: Offtake and population growth rates and average live weight of goats when sold 109
The Bihar Livestock Sector Analysis V

Table 81: Results of nancial analysis for the combined livestock interventions (WI)
in goat production in Bihar, 2017–18 to 2032–33 (at herd level) 111
Table 82: GSDP contribution for baseline, BAU and WI scenarios (INR crores) 112
Table 83: Processed/commercial feed targets and number of chicken feed processing plants 115
Table 84: Commercial layer and broiler chicken population (in lakhs) 2017–18 to 2032–33 116
Table 85: Annual population growth rate of commercial layers and broilers 116
Table 86: Number of hatcheries targeted by 2022–23, 2027–28 and 2032–33 116
Table 87: Chicken population at production subsystem level for baseline,
BAU and WI scenarios (in lakhs) 117
Table 88: Production for baseline, and in the BAU and WI scenarios 117
Table 89: Results of nancial analysis for WI in poultry production in Bihar,
2017–18 to 2032–33 (ock level) 118
Table 90: GSDP contributions for baseline, and BAU and WI scenarios (INR crores) 119
Table 91: Population projection in traditional and semi-intensive pig productions 124
Table 92: Population projection in intensive pig production systems 124
Table 93: Pig population at production subsystem level for baseline, BAU and WI scenarios (in lakhs) 125
Table 94: Production for baseline, and BAU and WI scenarios in 2032-33 125
Table 95: Results of nancial analysis for the combined livestock interventions in
pig production in Bihar, 2017–18 to 2032–33 (pig production size/herd level) 126
Table 96: Contributions for baseline, BAU and WI scenarios (INR crores) 127
Table 97: Summary of protability and GSDP impacts by 2032–33 of investments in
the livestock sector 137
Table 98: Review of current policy constraints and proposed actions in animal health services 145
Table 99: Review of current policy constraints and proposed actions in animal breeding 147
Table 100: Review of current policy constraints and proposed actions in animal nutrition 148
Table 101: Review of current policy constraints and proposed actions in dairy sector 150
Table 102: Review of current policy constraints and proposed actions in the poultry sector 151
Table 103: Review of current policy constraints and proposed actions in the buffalo sector 153
Table 104: Review of current policy constraints and proposed actions in the goat sector 153
Table 105: Review of current policy constraints and proposed actions in the pig sector 154
Table 106: Review of current policy constraints and proposed actions in the hide and skin sector 156
Table 107: Review of current policy constraints and proposed actions in
livestock and livestock products marketing and processing 157
Table 108: Review of current policy constraints and proposed actions in livestock research 158
Table 109: Review of current policy constraints and proposed actions in livestock extension services 159
Table 110: Feed balance analysis for base year (2017/18) of Bihar state by production zones 160
Table 111: Feed balance analysis for projected (2031/32) of Bihar state by production zones 160
The Bihar Livestock Sector Analysis VI

Table 112: Competition of chicken and pig with human for cereals 161
Table 113: Production of maize, sorghum and millet in Bihar (2016/17) 161
Table 114: Results of nancial analysis for the combined livestock interventions in
cow dairy production in Bihar 2017–18 to 2032–33 (livestock production zone level) 161
Table 115: Results of nancial analysis for the combined livestock interventions
in buffalo production in Bihar 2017–18 to 2032–33 (livestock production zones level) 163
Table 116: Results of nancial analysis for the combined livestock interventions in small
and medium goat farms in Bihar 2017–18 to 2032–33 (goat production subsystem level) 163
Table 117: Results of nancial analysis for the combined livestock interventions in goat production
in Bihar 2017–18 to 2032–33 (livestock production zones level) 164
Table 118: Results of nancial analysis for the combined livestock interventions in pig production
in Bihar 2017–18 to 2032–33 (production subsystem level) 164
Table 119: Gender and social inclusion possible strategies, cow/buffalo dairy
improvement interventions 165
Table 120: Gender and social inclusion possible strategies, goat improvement interventions 166
Table 121: Gender and social inclusion possible strategies, BYP improvement interventions 166
Table 122: Gender and social inclusion possible strategies, pig improvement interventions 167
The Bihar Livestock Sector Analysis VII

Figures
Figure 1: Livestock numbers for selected species in 2012 (in lakhs) 5
Figure 2: Per cent share of resources for livestock research and development (R&D)
in the districts of Bihar 7
Figure 3: Proposed allocation (%) of resources across livestock species in Bihar 8
Figure 4: Current allocation of budget in Bihar state
(compiled from the Bihar Agricultural Road Map 2017–22). 8
Figure 5: Bihar livestock production zones. 11
Figure 6. Species and size categorization of the livestock production zones
and the commercial production system. 14
Figure 7: Buffalos, cattle and goats per cent distribution over the different production zones. 17
Figure 8: Cattle, buffalo, goat and chicken population trends in Bihar (2007–17). 26
Figure 9: Sheep and pig population trends in Bihar (2007–17). 27
Figure 10: Milk production from 2008–09 to 2016–17 27
Figure 11: Average per capita milk consumption and availability in
Bihar and the national average per capita milk availability (gm per day). 28
Figure 12: Annual egg production in Bihar state (2010–2011 to 2016–2017). 29
Figure 13: Per capita egg availability in selected Indian states during
2016–2017 (Source: DAFR 2016). 29
Figure 14: Population of cattle, buffalos, sheep and goats across the three
Bihar state livestock production zones in the base year 2017–18. 31
Figure 15: Annual income per animal for BAU and WI-1 scenarios in 15 years (by 2032-33). 90
Figure 16: Impact of interventions: 15-years IRR for WI-1 scenario by
production subsystems (at cow dairy production unit or herd level). 91
Figure 17: Impacts of interventions: BCR and 15-years IRR for
WI-1 scenario (at cow dairy production subsystem level). 92
Figure 18: Impacts of interventions: 15-years IRR for WI-1 scenario
(at livestock production zone level). 92
Figure 19: Future production-consumption balance in milk and
milk products under BAU and WI-1 scenarios 94
The Bihar Livestock Sector Analysis VIII

Figure 20: Future projected production-consumption balance in milk and
milk products under BAU, WI-1 and WI-2 scenarios 98
Figure 21: Income per animal for BAU and WI scenarios. 103
Figure 22: Investment impacts of the WI interventions: 15-years IRR
(at zonal livestock production level). 104
Figure 23: Future production-consumption balance in buffalo meat under BAU and WI scenarios. 105
Figure 24: Annual incremental income per goat for the BAU and WI scenarios. 109
Figure 25: Impacts of interventions: 15-years IRR for WI for small and
medium goat farms in different production zones (herd level). 111
Figure 26: Impacts of interventions: 15-years IRR for WI at production zone level. 112
Figure 27: Future production-consumption balance in goat meat under BAU and WI. 113
Figure 28: Annual income per animal in the BAU and WI scenarios. 118
Figure 29: Future production-consumption balance for eggs under BAU and WI. 121
Figure 30: Future production-consumption balance in chicken meat under BAU and WI. 122
Figure 31: Annual income per animal for the BAU and WI scenarios. 126
Figure 32: Future production-consumption balance in pig meat under BAU and WI. 127
Figure 33: Changes in cow milk revenues controlled by women, by production
systems, under different scenarios. 129
Figure 34: Changes in goat revenues controlled by women, by farm size, under different scenarios. 130
Figure 35: Changes in BYP revenues controlled by women, by product, under different scenarios. 131
Figure 36: Changes in pig revenues controlled by women, under different scenarios. 132
Figure 37: Production-consumption balance by 2032–33 comparing the BAU and WI scenarios. 138
Figure 38: Diagram showing the different modules and sub-modules of LSIPT 144
Figure 39: Impacts of interventions: 15-years IRR for WI scenario in small and
medium goat farms (goat production subsystem/farm level). 163
The Bihar Livestock Sector Analysis IX

The Bihar Livestock Sector Analysis X
Abbreviations/Acronyms
AGSP agriculture gross state product
AH Department of Animal Husbandry
AI articial insemination
ASF animal-source foods
ATMA Agricultural Technology Management Agency
AU-IBAR African Union Inter-African Bureau for Animal Resources (AU-IBAR)
BAU business as usual
BCR benet-cost ratio
BMCU bulk milk chilling units
BPL below poverty line
BQ black quarter
BYP backyard poultry
COMFED Bihar State Milk Co-Operative Federation Ltd.
CPR common property resource
DOC day-old chicks
DAFR Department of Animal and Fisheries Resources
DCS dairy co-operative societies
EANPV equivalent annual net present value
e.g. for example
etc. additional items
FAO Food and Agriculture Organization of the United Nations
FFS farmer eld schools
FMD foot-and-mouth disease
GDP gross domestic product
gm gram
GMP Good Management Practices
GoB government of Bihar
GSDP gross state domestic product
ha hectare
HESM herd and economic sector model
HH household
HS haemorrhagic septicaemia
ICAR Indian Council of Agricultural Research
i.e. that is
ILRI International Livestock Research Institute

INR Indian rupee
IRR internal rate of return
kg kilogram
L litre
LMP Livestock Master Plan
LSA Livestock Sector Analysis
LSIPT Livestock Sector Investment and Policy Toolkit
MAFW Ministry of Agriculture and Farmers Welfare
MCC milk collection capacity
MPCS milk producer co-operative societies
MT metric tonne or 1,000 Kg
MSP minimum support price
N/A not available
NGO nongovernmental organization
NPV net present value
NSS National Sample Survey
OBC other economically backward classes
POPt projected population for a given time
PPP public-private partnership
PPR peste des petits ruminants
R&D research and development
SC Scheduled Castes
SHG self-help group
SNF solids not fat
ST Scheduled Tribes
t metric tonne
UHT ultra-high temperature pasteurization
UK United Kingdom
USD United States dollar
WI with investment intervention
The Bihar Livestock Sector Analysis XI

Acknowledgements
The Bihar livestock sector analysis (LSA) and the master plan (LMP) were undertaken by a joint team of Bihar and
ILRI livestock and planning experts. The analytical work was carried out under the guidance of Dr N
Vijayalakshmi, the Secretary, Department of Animal and Fisheries Resources. This effort was generously funded
and supported by the Bill & Melinda Gates Foundation, South Asia Agriculture Program.
A Technical Advisory Committee chaired by the Secretary periodically reviewed and made recommendations
related to ensuring progress in achieving the outputs of the LMP project. It was comprised of the heads of key
livestock departments and other relevant government agencies of Bihar, as well as representatives from civil
society organizations and development agencies. Once completed, the commodity value chain roadmaps of
the LMP were reviewed by eminent livestock scientists of ICAR, the Indian Council of Agricultural Research. They
were found credible and defensible.
Many capable individuals and supportive institutions and agencies contributed to the genesis and realization of
the Bihar LSA and LMP. Without the hard work and good-will of all of them the LSA and LMP would not have
been completed.
Dr N Vijayalakshmi, the Secretary, Department of Animal and Fisheries Resources was the champion of this
effort and deserves the highest appreciation for her sincere support for the work. Without her support, useful
input and constant encouragement, the work would not have been successfully completed. Dr Vijayalakshmi
saw the value of carrying out this exercise to help DAFR in its efforts to support the further development of the
sector under the Bihar Agricultural Road Map or ARM and helped to ensure it complements and supports the
ARM.
Moreover, Dr Srivalli Krishnan, Senior Program Ofcer for Agriculture, of the Bill & Melinda Gates Foundation
(BMGF) saw the value of DAFR having a livestock development roadmap or LMP to assist it in implementing the
ARM. She also deserves the highest appreciation for her sincere support for the work. Dr Srivalli supported the
project wholeheartedly, with much appreciated perseverance and facilitation.
Special mention also has to be made of Mr Amitabh Singh, Nodal Ofcer DAFR for LMP, Bihar DAFR, without
whose administrative expertise and energy, accomplishing this complex task would have been impossible.
Despite the considerable burden of his many tasks, he always made time to work his magic and facilitate the
work of the team.
Special mention also has to be made of Dr BP Bhatt, Director, ICAR-RCER and Dr Amitava Dey, ICAR-RCER
Representative, for agreeing to and providing excellent meeting facilities and cafeteria privileges to the DAFR
and ILRI team, as well as sector experts. Their kind and professional help greatly facilitated the LMP work.
We had great luck in nding very competent and hard-working professionals to be members of the Livestock
Master Plan (LMP) team, from DAFR and ILRI, which included:
Dr. Jagriti Prasad Singh, DAFR
Dr. L.N. Mandal, DAFR
The Bihar Livestock Sector Analysis 01

Dr. Sanjay Kr. Sinha, DAFR
Dr. Surendra Narayan Mishra, Team coordinator, DAFR
Dr. Asmita Kumari, DAFR
Dr. Shambhu Kumar, DAFR
Dr. Abdhesh Kr. Jha, DAFR
Dr. Getachew Gebru, Animal Scientist
Mr Kidus Negussie, Animal Scientist
Dr Sirak Bahta, Agricultural Economist, ILRI
Mr Vijay Baskha Reddy, Dairy Processing Engineer and Marketing Specialist
Dr Thanammal Ravichandran, Gender Expert, ILRI
Dr Nicoline de Haan, Core Theme leader– Gender, poverty and institutions, ILRI
The work of the LMP/LSA team was aided by many livestock experts who sacricially contributed to the
numerous expert consultations held to get technical advice and validate the livestock sector analysis results.
The institutions they represented are listed on the page of Contributors.
The LMP team was gratefully guided by a Technical Advisory Committee (TAC), led and chaired by Dr
Vijayalakshmi and co-chaired by Dr. Purvi Mehta, Agriculture Director, South Asia, Bill & Melinda Gates
Foundation. The TAC provided technical oversight and good counsel. The institutions represented on the TAC
included:
1. Secretary, DAFR, Govt. of Bihar, Chair person
2. BMGF Asia Agriculture Director, Co-Chair person
3. Under-Secretary, DAFR, Govt. of Bihar
4. Director, AHD, Govt. of Bihar
5. Director, Fisheries Department, Govt. of Bihar
6. Director, Dairy Department, Govt. of Bihar
7. Assistant Internal Financial Advisor, DAFR, Govt. of Bihar
8. General Manager, NABARD, Patna, Bihar
9. Managing Director, COMFED, Patna, Bihar
10. CEO, Aga Khan Foundation, India
11. Representative of farmers from the Kaushalya Foundation, Bihar
12. Director, ICAR-RCER, Patna
13. Senior Program Ofcer, BMGF – ex ofcio
14. ILRI Project Leader – ex ofcio
The team would also like to express its appreciation to members of ILRI Management, Dr Habibar Rahman,
Regional Representative, South Asia, Dr Steven Staal, Program Leader, Policies, Innovations and Livelihoods,
and Dr Iain Wright, Deputy Director General, General – Research and Development – Integrated Sciences. The
team gained greatly from the constant and exemplary support of these colleagues. As well, we would like to
make mention of the kind and competent support beyond the call of duty provided to the team by Ms. Roma Oli
and Ms. Tiruwork Melaku.
The team had the good fortune to use the Livestock Sector Investment and Policy Toolkit (LSIPT) to develop the
Bihar herd and economic sector model applied in the analytical effort. We are grateful to CIRAD, World Bank,
FAO and ILRI, and especially Cees de Haan, retired World Bank chief livestock ofcer, for the great and long
efforts taken to help develop this useful toolkit, and related tools used by the team in its herd and sector analysis.
Finally, on behalf of the DAFR and ILRI team, I sincerely thank all these dear friends and colleagues for their
invaluable contributions to the success of this critically important work! The team hopes the resulting LMP will
prove useful to Bihar DAFR in its efforts to support the implementation of the Agricultural Road Map and will
result in improved livelihoods for the livestock farmers of Bihar.
Barry I. Shapiro, PhD
Senior Livestock Development Advisor, ILRI - retired
Project Leader, Bihar Livestock Master Plan (B-LMP)
International Livestock Research Institute (ILRI)
The Bihar Livestock Sector Analysis 02
1 Introduction
Bihar is the third most populous state in India and the most densely populated, while per capita income is the
fth lowest across the states of India. Thirty-six per cent of the population was below the poverty line in 2012
(World Bank, 2016). About 89% of the population live in rural areas, the highest per cent in India after
Himachal Pradesh (ORGI, 2011). Moreover, around 60% of the rural workforce is engaged in agriculture
(NSSO, 2011), but agriculture contributed only 18% to total gross state domestic product (GSDP) in Bihar in
2012. Meanwhile, Bihar's economy has been growing rapidly since 2005, driven by the services sector, and
poverty has been declining. According to the World Bank, agriculture adds greatly to GSDP volatility (World
Bank 2016).
For all of India, the livestock sector contributes around 4% of national gross domestic product (GDP) and
around 25% of total agricultural GDP. In comparison, the livestock sector of Bihar contributes 5% to total state
GDP or GSDP, but this is lower than other mainly agricultural states such as West Bengal the sector contributes
about 11% (Data.gov.in, 2016). The percentage of households which possess ruminant livestock (cattle and
buffalo) is lower in Bihar (according to the last national livestock census) in comparison to comparable states,
such as Madhya Pradesh, Haryana, West Bengal and Punjab. The low share of livestock production in total
GSDP and the high poverty rate in Bihar compared to other Indian states can be related to the low livestock
ownership rate (MOSPI, 2017). Meanwhile, Bihar has a large goat population (ranked fth in India) and most
goats are held by marginal castes and women, so goats are particularly important in poverty-reduction
strategies.
At the same time, Bihar is particularly recognized for its high milk production from cows, buffalo and goats
(ninth highest state in India), making the livestock sector one of the principle sectors with potential to help
achieve the development goals of the state. The growth and performance of the dairy subsector in Bihar has
been better than in many other Indian states (DAHDF, 2017). The Bihar State Milk Co-Operative Federation Ltd.
(COMFED), which is supported by the government, has played a very successful role in developing the dairy
subsector, and in raising dairy cow productivity and milk production, as well as in raising dairy farmer incomes.
Thus, increasing livestock productivity and production further is seen by the government of Bihar (GoB) and its
Department of Animal and Fisheries Resources (DAFR) as a key means of improving per capita incomes and
reducing poverty.
To help raise more investment resources to achieve even greater livestock and overall economic development in
Bihar, the GoB through DAFR asked the International Livestock Research Institute (ILRI) to provide technical
assistance to carry out a Livestock Sector Analysis (LSA) to develop a long-term sector strategy, as a rst step in
developing a livestock master plan (LMP) or ve-year livestock sector investment plan for Bihar. This effort was
generously funded by the Bill & Melinda Gates Foundation, South Asia Agriculture Program. This initiative is
meant to help increase and target public and private investment to further modernize the livestock sector and
enable it to make an even more substantial contribution to achieving state development goals.
The Bihar Livestock Sector Analysis 03

Ongoing efforts to help develop the Bihar livestock sector
At the same time, Bihar is implementing its third agriculture roadmap (ARM) or agriculture sector investment
plan. These ARMs are meant to help modernize and transform the whole agriculture sector of the state. The
ARM includes the following agriculture sub-sectors: livestock, crops, sheries, cooperatives, water resources,
minor water resources, land reforms, etc. The past ARMs have been successful in helping the livestock sub-
sector of Bihar achieve signicant modernization, especially in the dairy value chain, and more recenty in the
poultry industry.
Each sub-sector roadmap of the ARM outlines a broad vision for the sub-sector, key strategies and activities,
ve-year targets for the output quantities to be produced, and the nancial or investment costs required to
achieve the targets for the sub-sector. Besides output targets, the ARM does not include targets for achieving
other state development objectives. Moreover, the choice of the ARM investment interventions is not based on
analysis of the impacts of proposed alternative investment interventions on state development indicators to
prioritize the investments.
DAFR has decided to increase its support for the implementation of the current Bihar ARM specically for 1livestock (for 2017-18 to 2021-22 ), through the elaboration of a Bihar livestock sector analysis (LSA) and
livestock master plan (LMP), in order to provide a more detailed and complete set of 5-year livestock commodity
value chain investment plans to help achieve the targets of the livestock roadmap of the ARM.
In section 8 of the Bihar LMP, the the livestock segment of the Bihar ARM and the LMP roadmaps are analyzed to
highlight the complementarities of each and the added value of the LMP, as well as overlaps between ARM and
LMP strategies and activities, to help DAFR rationalize the ARM and LMP where necessary to improve
implementation of the ARM livestock sub-sector plan.
The added value of the livestock sector analysis (LSA)
The main objective of the Bihar LSA is to provide quantitative and evidence-based justication for public and
private investments in recommended and prioritized commodity value chains (VCs) of the Bihar livestock sector
chosen based on analysis of the returns on investment (ROIs) from investments in new and/or additional
combined technology and policy interventions. The LSA is thus meant to inform the development planning of
DAFR, together with other Bihar government agencies working on livestock sector development in the state. It is
also meant to provide direction for the investment planning of development partners or donors,
nongovernmental organizations (NGOs), civil society organizations, private sector actors and development
banks.
Investment in each commodity value chain in the 15-year LSA is analyzed based on the projected impacts of
livestock improvement strategies and interventions chosen based on past research and recommended by
senior livestock sector experts of Bihar. The LSA then complements the ARM by including ROI analysis, and also
the projected investment impacts on both 5-year commodity production quantity and income targets, as well as
an analysis of the challenges and opportunities facing each commodity value chain, and most importantly the
impacts of the investments on indicators for achieving state development objectives.
1 The ARM and LSA/LMP do not match in years since the LSA/LMP were carried out in 2018. The15-year time period of the LSA is from 2017-18 to 2032-33 and the LMP from 2017-18 to 2022-23. The nancial or budget year of the government of Bihar runs from April of one year to March of the next year. The base year for the LSA was designated as 2017-18 or April 2017 to March 2018, and subsequent one-year periods in this report are listed in the same way, from April of one year to March of the next year.
The Bihar Livestock Sector Analysis 04

In carrying out the LSA, in order to choose the investment and policy interventions to be recommended in the 5-
year LMP or sector investment plan for Bihar, the alternative investments in new technologies or innovations
combined with changes in policy are tested to compare their impacts or contributions to the following specic
development objectives (through measurable indicators) chosen by the Bihar sector experts and conrmed by
DAFR:
• Poverty reduction (improvement in household incomes)
• Economic growth (contribution of livestock sector to Agricultural State Domestic Product (ASDP) and State
Gross Domestic Product (GSDP)
• Improvements in food and nutritional security of rural people (more animal source foods (ASFs), including
more protein and carbohydrate)
• Potential for surplus trade with the rest of India and surrounding countries (value of potential marketing to
other states and exports to surrounding countries)
• Contribution to industrialization and employment (pre and post-production investment and employment
increases)
• Contribution to social equity (household and post-production income, employment and investment
increases for women, youth and scheduled minority groups)
The livestock sector analysis or LSA methodology
The livestock sector analysis or LSA presented in this document has been done for the 15-years period from
2017–18 to 2032–33 and leads to a long-term strategy which then informs the development of the 5-years
investment plan of the LMP, which is described in the Bihar LMP report. The analysis done to develop the LSA
entailed rst creating a livestock herd and economic sector model (HESM) using quantitative tools from the
Livestock Sector Investment and Policy Toolkit (LSIPT). This toolkit was developed by a group of international 2agencies under the aegis of the African Union Inter-African Bureau for Animal Resources (AU-IBAR). The
methodology for the LMP was developed by ILRI by modifying the LSIPT and other tools to perform a ve-years
analysis for investment planning.
Once the model or HESM was developed it was used to evaluate current productivity and production, and carry
out investment returns analysis based on the present technical and economic performance of the sector, given
current investments in technologies and policies. Then, it was used to analyze changes in of the future potential
of the sector to produce positive economic impacts on households, venture capital, the livestock subsector, the
agricultural sector and the national economy given the economic contribution of potential interventions that
entail new and additional investments over the 15-years period.
Meanwhile, qualitative survey and analytical tools were used to lter and interpret the outputs of the analytical
results of the HESM analysis of proposed technology-policy interventions for their potential impacts on gender
and disadvantaged groups in Bihar. Based on these results the investments and policies with the most positive
potential impacts on gender and disadvantaged groups have been identied in the LSA and LMP
recommendations.
2LSIPT was developed by a team of livestock experts from the World Bank, the Agricultural Research Centre for International Development of France and the Food and Agriculture Organization of the United Nations (FAO), working under the auspices of AU-IBAR.
The Bihar Livestock Sector Analysis 05

The LSA and LMP development process
To accomplish its mission, the ILRI LMP team engaged with senior technical staff of the Bihar DAFR and formed a
joint Bihar and ILRI LMP team. This joint team then engaged with other Bihar livestock experts to understand the
existing development priorities of the Bihar government, to agree upon the relevant framework of key species,
production systems and a typology of agro-ecological zones to be analysed, as well as the commodity value
chains to be included in the LMP diagnostic process, to agree upon the relevant investment options to be tested
and compared, to collect relevant and reliable livestock data and parameters to build the HESM, and nally to
carry out the sector analysis to understand the current situation and future potential of the sector.
The full explanation of the Livestock Sector Investment and Policy Toolkit or LSIPT methodology and the process
for developing the herd and economic sector model or HESM which was followed to carry out the Bihar sector
analysis or LSA is given in Annex 1.
The Bihar Livestock Sector Analysis 06

2 Livestock in Bihar—overview
The development of the agricultural sector has great signicance for the overall growth of Bihar's economy.
Bihar is divided into two distinct agricultural regions, north and south of the Ganges river. The economy of both
regions is based mainly on crop agriculture. Bihar has good soil, as well as abundant water resources,
particularly ground water. The portion north of the Ganges river has rich alluvial soils which are very fertile. The
proportion of total land used for agriculture is high compared to other states of India. This is because of Bihar's
topography, as it falls in the riverine plains of the Ganga basin.
Bihar is thus predominantly an agricultural state and there is also a large scope for improving animal
husbandry. Apart from agriculture, animal husbandry is one of the key sectors which plays an important role in
employment and income opportunities for the rural population of Bihar. This sector contributes about one-fth
total rural income and provides large scale employment to women and workers belonging to the marginalized
sections of society. Livestock contributes 38% to the gross value of agricultural output in Bihar. Furthermore,
since many households are either landless or land poor in rural Bihar, this sector supplements the income they
generate from their other agricultural enterprises and farm labor.
The livestock herd of Bihar is very large and the species makeup diverse. According to the livestock census of
2012, the total livestock population was 329.39 lakhs. Figure 1 below presents the comparative numbers of
selected species predominant in the livestock sector of Bihar in 2012.
Figure 1: Livestock numbers for selected species in 2012 (in lakhs)
The Bihar Livestock Sector Analysis 07

The livestock herd of Bihar has also been growing fairly rapidly. In Table 1 below, the livestock population for
selected species is projected for the 5 years from 2012 to 2017, based on Bihar census data. The projection
shows that the goat and buffalo populations have grown most rapidly, at 17.9% amd 16% over 5 years,
respectively. Cattle (both dairy cows (exotics and exotic crosses and indigenous cattle)) also grew at an 3impressive rate of 8.5% over this 5 year period, while pigs grew little at 3%. No projections were available for
chickens.
Table 1: Livestock population (lakhs) in 2012, with 2017 projections and 5-year growth rates
4 Livestock species 2012 2017 Percent increase (2012-2017)
Cattle 122.3 132.7 8.5%
Buffalos 75.7 87.8 16.0%
Goats 121.5 145.5 17.9%
Pigs 6.5 6.7 3.0%
(Department of Animal Husbandry, Gov't of Bihar, 2017)
Factors constraining livestock productivity and production
As was stated earlier in the introduction, an increase in livestock productivity and production is viewed by the
GoB and DAFR as a way to improve per capita incomes and reduce poverty in the rural areas of Bihar. This
belief is based in part on the past performance of the milk subsector (with the milk coming mainly from cows
and buffalos). This performance has been better in comparison to the livestock subsectors in many other Indian
states ( DAHDF 2017). As well, goats and chickens have signicant importance of to women, and pigs to
marginalized groups. Yet, milk productivity from cows, buffalos and goats is still low in Bihar compared to the
all-India average or that of many similar states (DAHDF 2017), and pig production and its value chain is in its
infancy. In addition, more attention has also been proposed to raise chicken and egg production in Bihar
(DAHDF 2017). Smallscale farm household poultry productivity and production also needs serious attention,
and even the poultry industry, baed on broilers and layers, needs to be expanded greatly to meet rapidly
growing demand.
5There is signicant evidence that livestock production in Bihar is constrained by the main factors determining
livestock productivity and production, the breeding, health, nutrition and management of animals (Singh
2013). Bihar faces major challenges from animal diseases due in part to limitations in health services, as well as
insufcient animal feed for all species (Rahman 2017). Problems related to animal health account for over one-
third of the losses, followed by breeding and reproduction (31%) and feed and nutrition (28%). The constraints
and challenges tare related to achieving better genetic potential for higher yields are due to lack of progeny-
tested bulls, and infertility, while those related to better feeding include mineral deciency and lack of
availability of green fodder. Moreover, a further challenge is how to convert the prevalent food grain-based
agriculture n Bihar into a food-fodder based crop-livestock sector (Rahman 2017). The constraints related to
achieving better health include rst and foremest require addressing foot-and-mouth disease (FMD). Notably,
the challenges identied at the Bihar LMP stakeholders' consultation workshops held during the LMP project in
Patna are in line with those outlined above.
3 The annual rates of population growth will be presented, analyzed and discussed in Section 34 Projection from the 18th and 19th Livestock Census data5 Singh, R. K. 2013. Livestock Research and Development Priorities for Bihar and Odisha. Available at the Social Science Research Network (SSRN): https://ssrn.com/abstract=2391607 or http://dx.doi.org/10.2139/ssrn.2391607
The Bihar Livestock Sector Analysis 08

Meanwhile, a study led by RK Singh (Singh, 2013) was done to recommend R&D investment priorities, taking
into consideration the developmental goals of increasing production efciency, improving per capita income
equity and enhancing the sustainability of the production systems in Bihar. It considered 'value of production of
a species' as a proxy for efciency, 'number of poor' as an indicator of equity and 'land available for livestock
production' as a proxy for sustainability. Assigning equal weights for these 3 developmental goals/objectives
and their associated intensity parameters, district and species priorities were developed.
The analysis to prioritize resource allocation showed that livestock R&D resources could be streamlined and
prioritized by district and species (Singh, 2013). As resented in Figure 2 below, the geographic prioritization led
to a recommendation that some of the more densely populated and developed disctricts should be prioritized:
Gaya followed by Patna, Muzaffarpur, Jamui, East Champaran, Banka, Madhubani, Bhagalpur and Saran
should receive higher resources than other districts in the state.
Figure 2: Per cent share of resources for livestock research and development (R&D) in the districts of Bihar
In terms of allocation of R&D resources across species (see Figure 3 below), the study proposes that R&D for
buffalos receives the most resources (48%), followed by cattle (40%), while other species, i.e. goats, pigs and
poultry receive lower allocations. Sheep are the lowest priority in terms of the proposed resource allocation
(0.1%). This proposed allocation of R&D resources is meant to help guide relative geographic and species
priorities to enhance livestock productivity and production in the state of Bihar, yet it has not been related to the
potential returns from investment in new technologies and complementary policies which would be the
outcomes of potential investments in livestock R&D.
The Bihar Livestock Sector Analysis 09

Figure 3: Proposed allocation (%) of resources across livestock species in Bihar
Recent budgetary investments to improve livestock production in Bihar
From 2012-17, the state of Bihar had been following its second agricultural road map or ARM. This road map
to 2017 included a vision for the agriculture sector as a whole, as well as strategy, production targets and
investment program. Another ARM was then developed for the period 2017–22 which identied the challenges
of achieving the targets of the 2012–17 road map and outlined new measures to increase investment impact in
the agriculture sector. In both instances, a detailed road map for the livestock sub-sector was lacking. These
road maps did not capture the details of the varied livestock production systems of the state or measure their
potential for future development and modernization. This may have led to a limited budget allocation to the
livestock sector during the 2017-22 ARM (Figure 4).
Figure 4: Current allocation of budget in Bihar state (compiled from the Bihar Agricultural Road Map 2017–22).
The ARM is relatively general and the allocated budget is not based on quantitative analysis of returns to
alternative investments. The budget requested for the livestock sector is only 3.7% of the total agricultural
budget. The contribution of livestock to the agriculture state gross product (ASGP) is about 20%. Proposed
targets for livestock production need to be based on detailed quantitative analysis of the potential of the
livestock sector o contribute to economic development in the state of Bihar, to increase ivestment in the sector.
This is the main purpose of the livestock sector analysis (LSA) and livestock master plan (LMP).
The Bihar Livestock Sector Analysis 10

The Bihar Livestock Sector Analysis 11
3 Livestock systems and production zones in Bihar
state
This section summarizes the distinguishing characteristics of the livestock systems in each of the three
production zones in Bihar which include livestock population and the geographic distribution for major species,
livestock product and output contribution of each species, and their major characteristics of productive and
reproductive performance. It also elucidates the major gender and social inclusion considerations in these
livestock production systems since this is critical to further modernizing these systems in Bihar.
The development of the LSA was supported by the continual involvement of state livestock experts and
consultation with a wide range of key sector stakeholders. The systems and zones presented here were
identied and their classication discussed and agreed upon in a series of meetings and workshops with the
livestock experts of Bihar and other key sector stakeholders involved in trying to further modernize the livestock
sector of Bihar. These consultations included: Gov't of Bihar technical staff and policy makers, including those
from the new livestock university and government institiutes, as well as veterinary clinic staff, NGO staff and
livestock project staff from donor-supported development projects, private sector investors and technical staff,
etc.
3.1 Livestock systems classification in Bihar
Livestock production systems can be classied using many criteria. In this study, the Bihar livestock production
systems are classied based on the Seré and Steinfeld (1996) approach, which uses a combination of criteria
and the concept of the farming system. It classies livestock systems into four types: 1) landless livestock
production systems (LL, which may be monogastric or ruminant), 2) grassland or grazingbased systems (LG, in
which crop-based agriculture is minimal), 3) mixed-rainfed systems (MR, mostly rainfed cropping combined
with livestock keeping), and 4) mixed irrigated systems (MI, in which a signicant proportion of cropping uses
irrigation and is interspersed with livestock). According to the Dixon et al (2001), a farming system is dened as
a group of farms with a similar structure, such that individual farms are likely to share similar production
functions. Studying and classifying similar livestock production systems into production zones based on
agroecological criteria and farming systems characteristics provides the opportunity to group production
systems with similar challenges and opportunities and can thus simplify the planning of development
options/interventions.
The Bihar livestock production system has been classied into three livestock production zones, namely,
Northern, Central and Southern (Table 2 and Figure 5). In addition to the three production zones, there is a
commercial/specialized livestock production system which extends across the production zones. The
commercial/specialized production systems include urban and peri-urban dairy, piggeries, and chicken layer
and broiler systems.

The Bihar Livestock Sector Analysis 12
Criteria Northern Central Southern
Livestock species · Buffalos, cattle, goats
and poultry · Cattle, buffalos, goats,
poultry and sheep · Cattle, buffalos, goats,
sheep and poultry
Livestock feeding pattern
· Semi-intensive (grazing and stall feeding)
· Semi-intensive (grazing and stall feeding)
· Extensive (sheep and goat)
· Semi-intensive (grazing and stall feeding)
· Extensive (sheep and goat)
Challenges · Flood prone · Densely populated · Drought prone
Opportunities
· Suitable for indigenous and 50% Jersey
· Signicant population of goats
· Sutiable for chicken and piggery
· More suitable for higher grade Holstein-Friesian and Jersey crossbreeds
· Sutiable for chicken and piggery
· Suitable for indigenous and 50% Jersey
· Sutiable for chicken and piggery
Table 2 : Indicators for classication of traditional ruminant production systems in Bihar by production zone
Figure 5: Bihar livestock production zones.
3.2 Livestock systems in Bihar
The three livestock production zones and the commercial production systems are each subdivided into different
species and ock/herd size groups (Figure 6). The species are cattle, buffalos, sheep and goats while the
ock/herd size categories are small and medium. For backyard chicken and pigs, a uniform production system
is assumed to exist throughout the country.

4 Crossbreeding of cattle was analyzed following the Bihar Breeding Policy recommendation.
The Bihar Livestock Sector Analysis 13
Table 3: List of districts by production zone
Northern Central Southern
W. Champaran Siwan Aurangabad
E. Champaran Kaimur Arwal
Gopalganj Saran Gaya
Sitamarhi Rohtas Nawada
Sheohar Muzaffarpur Sheikhpura
Madhubani Bhojpur Lakhisarai
Supaul Vaishali Jamui
Saharsa Jehanabad Banka
Madhepura Samastipur
Araria Nalanda
Kishanganj Begusarai
Purnia Munger
Katihar Bhagalpur
Darbhanga Buxar
Khagaria Patna

The Bihar Livestock Sector Analysis 14
Liv
esto
ck p
rod
uct
ion
sys
tem
s of
Bih
ar
No
rth
ern
C (a
cc. t
o
avai
lab
ility
of
Bre
ed)
G (a
cc. t
o h
erd
Size
)
MF
(6
-20)
SF
(1
-5)
Ce
ntr
al
Sou
the
rn
Ch
(Acc
. to
Her
d
Size
)
Cro
ssb
red
(1
-5)
In
dig
en
ou
s (1
-5)
CD
(16
-10
0)
Br
(1,5
00
)
Ly (
5,0
00
)
Ind
ige
no
us
(1-7
)
SF
(1
-5)
P
g(A
cc. t
o
Her
d S
ize)
MF
(25
)
E
x (1
-10)
SI
(1-1
0)
B
Sh
(Acc
. to
Her
d S
ize)
Ind
ige
no
us(
1-5
)
Cro
ssb
red
(1-
5)
Ind
igen
ous
(1-7
)
S
F (
1-5
)
MF
(6
-20)
SF
(1
-5)
MF
(25
)
Ex
(1-1
0)
SI
(1-1
0)
SF
(1
-25)
Ind
ige
no
us
(1-1
0)
Cro
ssb
red
(1-
5)
Ind
igen
ous
(1-7
)
S
F (
1-5
)
MF
(6
-20)
SF
(1
-5)
MF
(25
)
Ex
(1-1
0)
SI
(1-1
0)
SF
(1
-15)
MF
(16
-65)
SP
(sp
eci
aliz
ed
)
MF
(26
-75)
SF
(1
-15)
MF
(16
-65)
Key:
SF:
Sm
all
farm
MF:
Mediu
m farm
C:
Cattle
B:
Buffalo
G:
Goat
Pg:
Pig
sSh:
Sheep
SP:
Speci
aliz
ed
CD
: C
om
merc
ial dair
yBr:
Bro
iler
Ly:
Laye
r
Valu
es
in b
rack
et:
herd
/ock
siz
es
Figure
6.
Speci
es
and
size
cate
gori
zation o
f th
e liv
est
ock
pro
duct
ion
zones
and the
com
merc
ial pro
duct
ion
syst
em
.

Livestock production zones
Buffalos Sheep Goats Total meat production % red meat
Northern 32,850 92 16,199 49,141 46%
Central 33,770 321 9,633 43,724 41%
Southern 9,682 186 4,086 13,954 13%
Total red meat 76,302 599 29,918 106,819
The Bihar Livestock Sector Analysis 15
3.3 Livestock output distribution over the main production zones
Table 4: Red meat production in metric tonnes (MT) by production zone (2017–18)
(LSA results)
The Northern and Central production zone contributes 87% of the total ruminant meat; sheep make very little
contribution in all zones. Buffalos contribute 71% of the total meat red coming from the three relevant red meat
producing species in Bihar (buffalos, sheep and goats).
Table 5: Annual milk production (in lakh MT) by production zone (2017–18)
Livestock production zones Cattle Buffalo Goat Total % of milk production
Northern 12.8 14.8 1.0 28.5 32%
Central 35.9 15.6 0.6 52.0 58%
Southern 5.0 3.7 0.2 9.0 10%
Commercial dairy 0.1 0.0 0.0 0.1 0%
Total milk 53.7 34.1 1.9 89.6 100%
(LSA results)
Annual milk production at present amounts to 89.6 lakh MT. While one-third of this is produced in the Northern
production zone, the Central zone contributes 58% of the milk produced. The Southern livestock production
zone contribution to the total milk output is very low (10%) at present. Bihar is one of India's largest milk-
producing states, and according to a study by Kumar (2010), Bihar accounts for 8.9% of national milk
production. However, milk availability and milk productivity (3.7 kilograms (kg)/day/milking animal) in Bihar
was reported in the same study to be one of the lowest in India.
3.4 Livestock species distribution over the different production zones
The common livestock species in Bihar are cattle, buffalo, sheep, goat, pig and chicken. According to
projections for 2017–18, Bihar has 132.7 lakh cattle, 87.8 lakh buffalos, 145.3 lakh goats, 111.7 lakh
chickens; and 6.9 lakh pigs. (Table 6). Of the 132.7 lakh cattle, 38% are found in the Northern zone while 44%
and 18% are in the Central and Southern zones, respectively. The buffalo population is mostly in the Northern
(46%) and Central (41%) zones, with 13% in the Southern production zone. Goats are concentrated in the
Northern zone (54%), with 30% in the Central and 26% in the Southern zones (Figure 7). The Northern and
Central zones thus contribute the largest share of the Bihar state livestock population.

Livestock production
zones Cattle Buffalos Goats
Indigenous breed Crossbred Indigenous Small size Medium size
Northern 39.02 11.60 40.69 63.12 15.78
Central 14.08 43.69 35.37 31.30 13.41
Southern 18.30 5.95 11.75 17.31 4.33
Commercial
0.08
Total 71.40 61.32 87.81 111.73 33.52
Chicken Pig
In all three production
zones
Traditional Broilers Layers Traditional and
semi-intensive Commercial
30.07 68.76 12.90 6.63 0.22
13.4
40.346.3
Buffalo
Northern Central Southern
The Bihar Livestock Sector Analysis 16
Table 6: National livestock numbers (in lakhs) and distribution over livestock production zones in 2017/18
(LSA results)
Figure 7: Buffalos, cattle and goats per cent distribution over the different production zones.
3.5 Technical parameters for livestock productivity
The different livestock production and reproduction parameters are summarized for different species under
each livestock production zone. The values of these parameters were obtained through review of the literature

The Bihar Livestock Sector Analysis 17
Parameters
(Northern zone)
Indigenous breed family
dairy
(Northern zone)
Crossbred family dairy
(Central zone)
Indigenous breed family
dairy
(Central Zone)
Crossbred family dairy
(Southern zone)
Indigenous breed family dairy
(Southern zone)
Crossbred family dairy
Herd size 2.0 2.0 2.0 2.5 4.0 2.0
Parturition rate 0.40 0.45 0.45 0.55 0.40 0.45
Mortality rate (female juveniles)
10 7 9 7 6 10
Mortality rate (male juveniles)
25 35 28 35 18 35
Mortality rate (female subadults)
8 6 8 5 5 8
Mortality rate (male subadults)
20 35 30 35 25 35
Mortality rate (female adult)
5 5 5 4 5 8
Mortality rate (male adult)
15 20 15 20 5 20
Lactation length (days)
225 300 230 300 220 300
Daily milk production
3.0 6.2 3.5 7.0 2.5 5.0
(research and national survey reports) and a panel of experts. Using the parameters listed here and in the
Annex, the baseline situation of the Bihar livestock system is established.
Cow dairy production parameters in the different production zones
The production parameters of cow dairy in the different production zones is listed in Table 7. Parameters like
parturition rate in cow dairy in the three production zones ranges from 40-45% Northern, 45-55% Central and
40%-45% Southern. Mortality gures show 6-10% for juvenile male, as opposed to 18-35% for juvenile female.
Subadult males and females show mortality of 20-35% and 5-8%, respectively. The annual mortality for adults
ranged between 5-20% for males and 4-8% for females. Daily milk production of indigenous cattle ranges
between 2.5-3.5 litres per day with a lactation length ranging between 220-230 days. For crossbred cows, the
daily milk production ranges between 5-7 litres per day with a lactation length of 300 days.
Table 7: Average productivity parameters in cow dairy production systems by zones

6 Herd size ranges between 16-100
The Bihar Livestock Sector Analysis 18
Parameters (Northern zone)
Indigenous breed small (Central zone)
Indigenous breed small (Southern zone)
Indigenous breed small
Herd size 2 2 2
Parturition rate 0.40 0.45 0.40
Mortality rate (female juveniles)
10 8 3
Mortality rate (male juveniles)
40 35 35
Mortality rate (female subadults)
8 5 5
Mortality rate (male subadults)
30 30 30
Mortality rate (female adult)
3 3 3
Table 8: Average productivity parameters in commercial cow dairy production systems
6 Parameters Commercial cow dairy
Herd size 30
Parturition rate 0.60
Mortality rate (female juveniles) 8
Mortality rate (male juveniles) 35
Mortality rate (female subadults) 4
Mortality rate (male subadults) 35
Mortality rate (female adult) 4
Mortality rate (male adult) 18
Daily milk production (litres) 12
Lactation length (days) 300
Buffalo production and productive parameters
The buffalo breeds widely available in Bihar state are indigenous to India. Despite the development of the
livestock breeding policy for the state of Bihar, little attention is given to improving the existing breeds. There are
opportunities for improving the indigenous breed using other breeds of Indian buffalo. Currently, milk
production from buffalo indigenous breeds is higher than from the indigenous cow dairy. In addition, the
relatively high fat content in buffalo milk, compared to cow, fetches a good price for buffalo milk.
Table 9. Buffalo production system average productivity parameters

The Bihar Livestock Sector Analysis 19
Parameters (Northern zone)
Indigenous breed small (Central zone)
Indigenous breed small (Southern zone)
Indigenous breed small
Mortality rate (male adult)
25 25 25
Off-take rate 35 35 35
Dressing percentage 54 54 54
Lactation length (days) 300 300 290
Daily milk production 5.0 5.5 4.5
Parameters (Northern
zone) small- size ock
(Northern zone)
medium- size ock
(Central zone)
small- size ock
(Central zone)
medium- size ock
(Southern zone)
small-size ock
(Southern zone)
medium- size ock
Flock size 3 13 3 13 3 13
Parturition rate 1.25 1.25 1.25 1.25 1.25 1.25
Mortality (%) (female juveniles)
30 25 30 25 25 25
Mortality (%) (male juveniles)
35 25 35 25 30 25
Mortality (%) (female subadults)
20 20 20 18 20 18
Mortality (%) (male subadults)
25
20
25
18
25
18
Mortality (%) (female adult)
20
12
15
12
15
12
Mortality (%) (male adult)
20
10
15
12
15
12
Dressing percentage
50
50
50
50
50
50
Live weight, kg (female juvenile)
4
5
4
5
4
4
Live weight, kg (male juvenile)
5
6
5
5
4
5
Goat production and productivity parameters
Like traditional cattle, production parameters of indigenous goats show the potential for further improvement
of the system. In the indigenous goats traditional production system, the parturition rate is 1.3 and the mortality
rate of juveniles is 25-30% (Table 10).
Table 10: Goats average productivity parameters

The Bihar Livestock Sector Analysis 20
Parameters (Northern
zone) small- size ock
(Northern zone)
medium- size ock
(Central zone)
small- size ock
(Central zone)
medium- size ock
(Southern zone)
small-size ock
(Southern zone)
medium- size ock
Live weight, kg (female subadult)
8
9
7
8
7
7
Live weight, kg (male subadult)
9
10
8
9
8
9
Live weight, kg (female adult)
15
18
14
17
13
16
Live weight, kg (male adult)
17
20
16
19
15
18
Parameters Backyard village
chicken Crossbred backyard
chicken Layers Broilers
Average number of chicks and hens (for village system)
1.5 12 5,000 1,500
Age of hens at the start of the laying period (months)
6 5 5 N/A
Duration of the laying period (months)
12 12 12 N/A
Adult mortality (% per year) 10 10 10 5
Number of eggs laid (hen per year) 70 127 327 N/A
Age of males when sold (months) 6 missing N/A 35 days
Proportion of commercial feed for layers (%)
NA 20 100 100
Chicken production and productivity parameters
The chicken production system is mainly divided into traditional (village chicken) and commercial. The
commercial chicken production encompasses layer and broiler systems. The average number of eggs
laid/hen/year in the village chicken production is 70 with a laying period of 12 months. The average slaughter
weight is 1 kg and dressing weight is 65% of village chicken.
Village chickens produce low total income per hen compared to total income per bird produced by commercial
chickens (Table 11). Due to the brooding behaviour of hens, the ock size in village chicken is counted by using
the number of hens. A hen in a village chicken system has around eight followers (chicks, cockerels and pullets).
The high number of followers per hen and the very small input cost in the village chickens produces an
unexpectedly high net income per hen compared to commercial chicken. Layers and broilers, on the other
hand, have high productivity but also high input cost. Layers produce 327 eggs per year and start laying when
they reach ve months old. Broilers also have a very high growth rate and usually reach a slaughter weight of
1.3 kg by 35 days.
Table 11: Chicken production average productivity parameters

The Bihar Livestock Sector Analysis 21
Parameters Backyard village
chicken Crossbred backyard
chicken Layers Broilers
Average live weight of chickens (growers) sold (kg)
1 1.5 1.4 1.3
Average dressing percentage (%) 65 65 65 65
Net income per bird or per hen (for village chicken) in rupees
77 611 130 49
N/A - not available
Pig production parameters
The main pig production system in Bihar state is village based. The village piggery is divided further into two
types of management systems, extensive and semi-intensive, resulting in differences in productivity. The
number of sows in both systems is the same. The extensive village piggery has the lower productivity
performance. The litter size per sow in the extensive village piggery is about ve while the litter size per sow is
about seven for semi-intensive village piggeries. The mortality rate of young pigs is 20% in the extensive and
12.5 % in the semi-intensive village system (Table 12).
Table 12: Swine production average productivity parameters
Village pig (extensive)
Village pig (semi-intensive)
Number of sows 1 1
Parameters of reproduction
Age at rst service (days) 260 250
Litter size (live births) per sow 5 7.2
Delay weaning-successful service (days) 60 14
Mortality and culling
Mortality rate of young animals before weaning (%) 20 12.5
Mortality rate weaning—marketing 5 4
Adult mortality rate 3 3
Feeding parameters
Proportion of purchased feed included in the ration (%) 0 20
Production parameters
Age at weaning (days) 56 60
Weight at weaning (kg) 4.5 10
Weight at marketing (kg) 5.0 10
Dressing percentage (%) 70 70

The Bihar Livestock Sector Analysis 22
3.6 Gender and social inclusion considerations in livestock production systems
Across the world, agriculture is undertaken by men and women. Time studies show that 32% of agricultural
labour is provided by women in India (FAO 2011). In Bihar, as elsewhere, women are intrinsically involved in
livestock management; women's activities range widely from care of animals, grazing, fodder collection,
cleaning of animal sheds, processing milk and livestock products (ILRI FDGs 2018). Indoor jobs like milking,
feeding and cleaning are dominated by women. Due to the recent out migration of men from Bihar (18%)
(Rodgers et al. 2013), the burden of women is increasing. Despite women's considerable involvement and
contribution in livestock, there are signicant gender differences when accessing technologies, credit,
information, inputs and services. This has resulted in a gender gap, contributing to inefciencies in the livestock
sector. Concomitantly, when women do not benet or engage in increased productivity and income from
livestock, they may disengage, which has a negative effect on livestock productivity.
Similar issues arise with Scheduled Tribes (ST) and Scheduled Castes (SC) who are not able to exploit the
opportunities offered by livestock or able to engage effectively to improve livestock production. Bihar has
approximately 12 lakh tribal people and 160 lakh SC people (Directorate of Economics and Statistics 2016)
whose voice is unheard due to limited bargaining power (Nathan and Xaxa 2012). Many do not have land for
their housing and farming, forcing them to live in forest or communal land areas. SC and especially ST main
livelihoods are livestock keeping (Mazumder et al. 2014), especially indigenous dairy animals, small
ruminants, pigs and chicken.
Dairy production systems
Data from Bihar indicate that women play an important role, with women providing 71% of labour in the dairy
sector (ILRI 2014). Women in rural areas contribute four to ve hours of labour for activities including collecting
fodder, grazing, feeding, watering, cleaning sheds, dung collection for fuel, milking, bathing animals and
taking care of sick animals (ILRI FDGs 2018). Control of dairy income by women in Bihar is different among out
migrated (60-70%) and nonmigrating (20-30%) households. Women also control more income when there is
informal marketing (80%) than formal co-operatives (30%) (ILRI FDGs 2018). The benet from dairy income is
multifaceted and includes nutrition for household, education of children, care of sick persons, social status for
women and as a store of wealth.
In Bihar, 91% of marginal farmers live on less than 2 hectares (ha) of land; both ST and SC are the poorest within
these communities (Rodgers et al. 2013) . In these categories of households, dependence on crop cultivation is
decreasing whereas off-farm income and dairy income share have increased (Singh and Datta 2013). Dairy
farming is more common with SC than ST that have very small pieces of land, with an average of 0.08 ha of
land in Bihar (Rodgers et al. 2013; ILRI FD Gs 2018). Involvement of youth in dairy farming is limited as they
migrate to cities for nonfarm income (ILRI FDGs 2018).
Goat farming/small ruminants
In terms of small ruminants, goat farming provides a signicant contribution to the livelihoods of women, SC
and ST. Women's labour contribution in goat production is two to four hours daily for grazing, cleaning sheds,
care of kids and feeding (ILRI FDGs 2018) and control of income from goat is 50% (nonmigrating) and 80%
(out-migrated households) (ILRI FDGs 2018). Goat is preferred by the poorest and women because of low
investment, ease to handle, highly prolic in nature and low religious taboos. The goat population in Bihar has
increased in the last decade due to increased land fragmentation. Goats are an asset that can be easily
converted to cash by women for household emergencies, health services, paying school fees and for household

The Bihar Livestock Sector Analysis 23
food security (ILRI FDGs 2018). Due to lack of capital, feed scarcity, lack of veterinary services and technical
knowledge available to women, goat herd size is not increasing even though the number of goat farmers is
increasing.
Backyard poultry (BYP)
Most BYP in Bihar are kept traditionally by landless, marginal communities and women; they are often reared
by Muslim and tribal communities. BYP is considered important for household nutrition and as a good source of
income with low input and high return (ILRI FDGs 2018). Women use household leftovers and agricultural by-
products to decrease the feed costs. Women contribute 20-30 minutes of labour for feeding, cleaning and
taking care of these birds. Women control 40-70% of the income produced by BYP (ILRI FDGs 2018). Women
and marginalized communities are unable to access veterinary care and input supply due to mobility issues and
social barriers. Women sell poultry within their village and in nearby local markets.
Pig production
Pigs are being reared in tribal belts of Bihar, especially south and north Bihar, by ST communities. Pig rearing is
done on a small scale in backyards and pigs are fed with household waste and agricultural crop residues. Pig
rearing is considered a low-input and high-return activity and does not require a lot of skill. Most of the
management practices and labour for pig rearing is done by women in tribal regions; one to two hours are
spent on care of pigs by women and women control 50-100% of the income generated by pigs, dependent
upon whether the household is non-migrated or out-migrating (ILRI FDGs 2018).
The average herd size in these tribal communities is two to three pigs per household. There is high demand in
the local market and a common practice in tribal regions is community sharing of pig meat within the village
(ILRI FDGs 2018). Women sell pigs when cash is needed for emergencies. Due to the lower political bargaining
power of the tribal communities, they are unable to access veterinary services and input supply for better pig
production.
Broiler and layer production
There are very few commercial broiler and layer farms with 3,000-10,000 birds in all regions of Bihar except
around urban areas. Due to high demand for egg and meat because of increased income in urban areas,
government programs and the National Bank for Agriculture and Rural Development have promoted
commercial farms. The poorest, marginalized people and women are not involved in commercial farming due
to lack of capital for investment and lack of management skills. It was observed that in a few farms that keep
86% of the poultry population of the state (Table 13), there is a high-labour contribution from women for
cleaning sheds, feeding, watering and caring for chicks, about one to two hours, but the income is mostly
controlled by men.

The Bihar Livestock Sector Analysis 24
Table 13: Distribution of livestock according to land-size category in Bihar (number per 1,000 households)
Number per thousand households %
Land size category
Adult cattle
Adult buffalo
Sheep Goat Pig Poultry Adult cattle
Adult buffalo
Sheep Goat Pig poultry
Marginal/ landless
2,224 913 12 908 59 1,407 31 15 6 35 100 7
Small 714 543 1 229 0 420 10 9 1 9 0 2
Small-medium
1,487 888 3 256 0 838 21 15 2 10 0 4
Medium 2,260 1,600 174 186 0 412 32 27 91 7 0 2
Large
409
2,002
0
1000
0
1,8377
6
34
0
39
0
85
Total
7,094
5,946
190
2579
59
2,1454
100
100
100
100
100
Source: calculated from unit data of National Sample Survey (NSS) report 572, Livestock ownership in India
Table 14: Composition and distribution of livestock across social groups (%) across India
Social group
Composition of livestock in each social group
Cattle Buffalos Small ruminants Pigs Poultry Total
ST
22
5
15
4
55
100
SC
28
9
18
1
46
100
OBC
23
15
19
0
42
100
Others
30
17
17
0
35
100
Distribution of livestock across social groups
ST
17
8
13
73
26
SC
15
10
12
10
15
OBC
43
54
53
11
43
Others 25 28 22 6 16
Total 100 100 100 100 100
Source: calculated from unit data of NSS report 572, Livestock ownership in India
OBC – other economically backward classes

The Bihar Livestock Sector Analysis 25
4 Livestock contribution to Bihar state
4.1 Past livestock trends—population and production
The state of Bihar has a huge population of different livestock species. Figures 8 and 9 present the livestock
population recorded during the livestock census years 2007 and 2012 and projected for the year 2017. The
projected population for the year 2017–18 shows that there are about 132.7 lakh cattle, 87.8 lakh buffalos,
2.5 lakh sheep, 145.3 lakh goats, 6.9 lakh pigs and 111.7 lakh chickens.
Figure 8: Cattle, buffalo, goat and chicken population trends in Bihar (2007–17).
Source: 2007 and 2012 population data from the 18th and 19th Livestock Census; 2017 population based on
own projection
During the last 10 years, the population of buffalos, goats and chickens has increased steadily while the
population of cattle, sheep and pigs has only increased marginally. Bihar is one of the states with higher
proportion of buffalos and goats than in the total livestock population of India (Singh et al. 2010). The increase
in buffalo population was greater (16%) than the corresponding increase in cattle population (8%) during
2012–17. This indicates the growing importance of buffalo for milk production. According to Singh et al.
(2010), Bihar farmers' preference towards buffalo for milk production is increasing because it efciently
converts coarse fodder to milk. In addition, buffalos are more disease resistant and survive well under adverse
water-logged conditions and can more easly be sold for the meat market.
Poultry has grown at the fastest rate compared to other livestock in Bihar, due to the robust expansion of poultry
farms and hatcheries. As shown in Figure 8, the chicken population increased by 102% during 2012–17, from
55.3 lakh to 111.7 lakh.

The Bihar Livestock Sector Analysis 26
Figure 9: Sheep and pig population trends in Bihar (2007–17).
Source: 2007 and 2012 population data from 18th and 19th Livestock Census; 2017 population based on
own projection
The goat population in Bihar grew by 20% from 120 lakh in 2012 to 145.3 lakh in 2017-18 (Figure 8). The
sheep population in Bihar has marginally grown by 7% from 2.3 lakh in 2012 to 2.5 lakh in 2017-18 (Figure 9).
The slow growth in the sheep population in Bihar is attributed to the lack of institutional efforts to promote wool
production, among other reasons.
The total milk production in Bihar has increased steadily in the last decade, from 2008–09 to 2016–17. Most of
the increase in milk production is attributed to the signicant increase of crossbreed cows, which has increased
by 78% in the last ve years, from 2012–13 to 2016–17. Likewise, the share of milk produced from crossbreed
cows has increased from 17% in 2008–09 to 32% in 2016–17. The share of buffalo milk as a part of total milk
production, however, gradually decreased in the last 10 years from 46% in 2008–09 to 39% in 2016–17.
Figure 10: Milk production from 2008–09 to 2016–17
Source: Department of Animal and Fisheries Resources (DAFR) (2016)
The state of Bihar was ranked the ninth-top milk producer in India during the year 2016–17 (DAFR 2016).
During the same year, the top ve milk-producing states were Uttar Pradesh, Rajasthan, Gujarat, Madhya

The Bihar Livestock Sector Analysis 27
Pradesh and Andhra Pradesh.
Figure 11 shows the average per capita milk consumption and availability in Bihar and the national average
per capita milk availability from 2011–12 to 2016–17. During this period, the per capita milk availability in
Bihar was lower than that of the national average. However, it steadily increased from 175 grams (gm) per day
in 2011–12 to 228 gm per day in 2016–17. The per capita consumption of milk and milk products was lower
than the per capita milk availability during the whole period of 2011–12 to 2016–17.
Figure 11: Average per capita milk consumption and availability in Bihar and the national average per capita
milk availability (gm per day).
Source: DAFR 2016 and own calculation
Annual egg production in the state of Bihar from 2010–2011 to 2016–2017 is shown in Figure 12. In line with
the drastic poultry population increase in Bihar, egg production in the state has steadily grown in the last seven
years. The production of eggs has increased from 745 crore eggs in 2010–11 to 1,112 crore eggs in 2016–17,
a growth of about 33% (Figure 12).
Figure 12: Annual egg production in Bihar state (2010–2011 to 2016–2017).
Source: DAFR 2016

The Bihar Livestock Sector Analysis 28
Figure 13 shows the 2016–17 per capita egg availability in selected Indian states. Despite the steady increase of
egg production in Bihar during the last seven years, per capita egg availability in the state is only 11 eggs per
annum, which is far lower than the Indian average per capita egg availability of 69 eggs per annum. The state
has a long way to reach the production level of major egg producing states such Tamil Nadu, Andhra Pradesh,
Telangana, West Bengal and Maharashtra.
Figure 13: Per capita egg availability in selected Indian states during 2016–2017 (Source: DAFR 2016).
4.2 Current (2017–18) livestock population, production and GSDP
Current livestock population
7The Bihar LMP team used the 2007 and 2012 India Livestock Census data to project the 2017–18 Bihar state
livestock population. Using the ve-years growth rate (2007–2012), rst, the team calculated an annual growth
rate for each livestock species. The annual growth rates were then used to project and establish the baseline
livestock population values for the targeted species for baseline year 2017–18.
The 2017 and 2012 livestock population (from India Livestock Census) and LMP projected values for 2017–18
are given in Table 14 below. The 2017–18 LMP projected gures are used as baseline livestock population
values in the whole Bihar livestock sector analysis. The baseline year or 2017–18 cattle population in Bihar
includes about 61 lakh or 46% crosses or exotic breeds and 71 lakh or 54% local/indigenous breeds. The total
population of buffalos, sheep and goat have been increasing since 2007, reaching 87.8, 2.5, 145.3 lakhs in
the baseline year, 2017–18. The populations of pig and chicken is projected to grow to 6.9 lakh and 1,117
lakhs by 2017-18.
As shown in Table 15, the population of layers and broilers continuously increased since 2007 and it is
projected to constitute 73% of the chicken population in the baseline year 2017–18. The local/indigenous and
crossbred chicken which are managed under the family/village backyard system has been decreasing steadily
since 2007 and it only constitutes about 23% and 4%, respectively, of the total chicken population in 2017–18.
For pig farming, the traditional backyard family system is predominant. Despite the huge potential in rural
areas, commercial piggery and specialized pig fattening are almost non-existent in the baseline year 2017–18.
In the last decade, the total pig population has grown by only 8%.
7 A livestock census in India is generally conducted once every ve years; the in the series is the 19th Livestock Census with reference date of 15th October 2012, released June 2014.

The Bihar Livestock Sector Analysis 29
Table 15: The distribution of Bihar livestock population over the three production zones and in specialized
commercial systems (not zone specic)
Livestock population (lakhs)
2007
Census
2012 Census
LMP projected gures
2017–18
Indigenous breeds
1,05,827.6
87,564.0
71,397.3
Crossbreds 19,762.8 34,751.2 61,318.5
Total cattle 1,25,590.4 1,22,315.2 1,32,715.8
Buffalos 66,904.2 75,672.3 87,812.5
Sheep 2,182.4 2,324.7 2,480.4
Goats 1,01,670.1 1,21,535.2 1,45,254.5
Indigenous backyard (hens) 19,913.1 22,538.0 25,508.9
Crossbred backyard 3,135.2 3,782.2 4,562.7
Commercial chickens (layer and broiler) 32,248.6 50,116.7 81,661.8
Total chickens
55,296.9
76,436.9
1,11,733.3
Pigs
6,320.6
6,497.1
6,847.0
Source: DAFR (2016) and based on LSA simulation results
Figure 14 below shows the current population of cattle, buffalos, sheep and goats across the three Bihar state
livestock production zones. There is a considerable number of cattle in all three production zones. The Northern
and Central livestock production zones together support about 81.6% of the total cattle population, whereas
the Southern production zone supports about 18.3 % of the total cattle population. The rest, about 0.17% of the
cattle population, belongs to the commercial cattle system, which is at its initial development stage.
Most of the sheep, about 55%, are found in the Central livestock production zone. Overall, sheep production is
less important in the other livestock production zones. The largest proportion of goats (54%) are found in the
Northern livestock production zone followed by the Central (31%) and Southern (15%) production zones. Unlike
sheep, goats remain important in all livestock production zones of Bihar. When the total distribution of ruminant
livestock (cattle, buffalos, sheep and goats) population is considered, a less signicant difference was observed
across Central and Northern production zones, 46% in the Central and 38% in the Northern production zones.
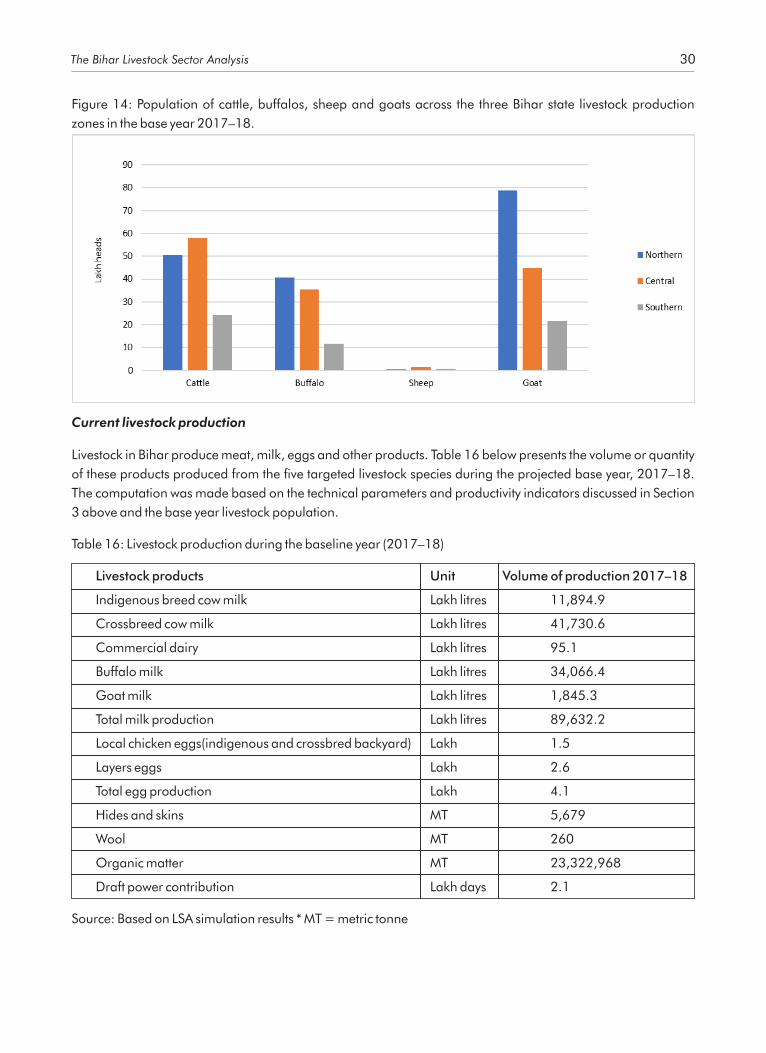
Figure 14: Population of cattle, buffalos, sheep and goats across the three Bihar state livestock production
zones in the base year 2017–18.
Current livestock production
Livestock in Bihar produce meat, milk, eggs and other products. Table 16 below presents the volume or quantity
of these products produced from the ve targeted livestock species during the projected base year, 2017–18.
The computation was made based on the technical parameters and productivity indicators discussed in Section
3 above and the base year livestock population.
Table 16: Livestock production during the baseline year (2017–18)
Livestock products Unit Volume of production 2017–18
Indigenous breed cow milk Lakh litres 11,894.9
Crossbreed cow milk Lakh litres 41,730.6
Commercial dairy Lakh litres 95.1
Buffalo milk Lakh litres 34,066.4
Goat milk Lakh litres 1,845.3
Total milk production Lakh litres 89,632.2
Local chicken eggs(indigenous and crossbred backyard) Lakh 1.5
Layers eggs Lakh 2.6
Total egg production Lakh 4.1
Hides and skins MT 5,679
Wool MT 260
Organic matter MT 23,322,968
Draft power contribution Lakh days 2.1
Source: Based on LSA simulation results * MT = metric tonne
The Bihar Livestock Sector Analysis 30

As shown in Table 16, about 32% of the chicken meat and 37% of the eggs are coming from the local
(indigenous and crossbred backyard) or village chicken system. Similarly, 66% of the chicken meat comes from
broilers and layers and 63% of the eggs from specialized layers. The contribution of the local cattle breeds to the
total milk production is only 13% (Table 16), although they represent 54% of the cattle population in Bihar (Table
15). The indigenous cattle breeds do not seem to have a future for milk production in land-scarce Bihar, as the 8yield per cow is too low. However, recently, the demand for organic milk and milk products (A2 milk) is
increasing. Thus, further improvement of the indigenous cattle through genomic selection needs to be
encouraged.
Current livestock GSDP
Policy decisions on resource allocation to a sector are often based on the relative importance of that sector in the
national or state economy. One of the most commonly used measures of importance of an economic sector or
industry is the magnitude of its contribution to the GDP or GSDP. The contribution of livestock to GSDP is
therefore the best way to measure the economic performance of the subsector and its relative importance in the
state economy. Accordingly, the contribution of livestock to the Bihar GSDP or the livestock GSDP is dened as a
monetary measure of the market value of all livestock nal goods and services (milk, meat, eggs, manure and
energy) produced annually, generated at the production stage and includes values added from the value chains
by aggregating the margins from the various subchains.
Table 17 shows the trends in agriculture and livestock GSDP and GDP during 2011–12 to 2016–17. The GSDP
estimates for that income from livestock and livestock products for the year 2016–17 is INR 17,400 crores
which is approximately 2,700 crore United States dollars (USD) (India Central Statistics Ofce 2017).
The absolute value of the livestock GSDP has increased from INR 12,000 crore in 2011–12 to INR 17,400 crore
in 2016–17. The 7.7% annual growth of livestock GSDP has led to a gradual increase of the contribution of
livestock in the agricultural GSDP and state GSDP. The share of livestock and livestock products in the
agricultural GSDP of Bihar has increased from 19.4% in 2011–12 to about 26.7 % in the year 2016–17,
whereas nationally the share of livestock and livestock products in the agricultural GDP has decreased from
25% in 2011–12 to about 24% in the year 2016–17. As shown in Table 17, the livestock sector grew
substantially more than the rest of the Bihar agriculture sector, which only grew 1.3%.
Similarly, the contribution of livestock and livestock products in the state economy (GSDP) has steadily increased
from 4.9% in 2011–12 to 5.2% in 2016–17. The contribution of livestock and livestock products in the national
economy (GDP) has increased only marginally from 9% in 2011–12 to 10% in 2016–17.
8 A2 milk is the milk that contains only the A2 type of beta-casein protein whereas A1 milk contains only A1 beta casein or A1 type variant. A1 protein variant is commonly found in milk from crossbred and European breeds of cattle. A2 milk is found in the indigenous cows and buffalos of India (and Asia as a whole) (Prasanta B. et.al. 2016).
The Bihar Livestock Sector Analysis 31

The Bihar Livestock Sector Analysis 32
Table 17: Trends in state, agriculture and livestock GSDP 2011–12 to 2016–17 in INR crore at constant
2011–12
2011–12 2012–13 2013–14 2014–15 2015–16 2016–17
Average
growth rate
GSDP 247,100 256,900 269,600 279,500 300,600 331,600 6.08%
Agriculture, forestry and shing
62,100 68,000 59,500 59,300 60,900 65,100 1.3%
Livestock 12,000 12,500 14,000 15,400 16,300 17,400 7.7%
Livestock/agriculture GSDP 19.4% 18.4% 23.5% 25.9% 26.7% 26.7%
Livestock/GSDP 4.9% 4.9% 5.2% 5.5% 5.4% 5.2%
Livestock/national agriculture GDP
25% 26% 27% 24% 24% 24%
Livestock/national GDP 4.1% 4.1% 4.3% 4.1% 4.0% 3.9%
Source: India Central Statistics Ofce and LSA results
GSDP estimate of livestock at the production stage
In the sector model used for the Bihar LSA, the livestock GSDP is computed at the production stage by 9aggregating the gross value of the livestock output (milk, meat, eggs and manure ) and subtracting the
intermediate consumption or costs to obtain the total value added (VA).
GSDP or total VA = gross value of output – value of intermediate consumption/costs.
The added value from each livestock species in each system and production zone is calculated and aggregated
to generate the GSDP for the state herd. In the GSDP formula below, Q is total production of all livestock
products generated by each livestock systems (S), p is the average producer price of each product and %CI is the
percentage of the intermediate costs.
Table 18 provides the VA at the production stage of the various livestock commodities. The total VA from the
livestock sector during the base year, 2017–18, amounts to INR 20,318 crore or about USD 317 crore. This is,
about 17% higher than the 2016–17 estimate reported by the India Central Statistics Ofce (Table 17 above).
9 The average weight of manure produced per animal and per day is calculated and used to estimate the value of manure, which only takes into account the quantity used at the farm and sold, if any.

The Bihar Livestock Sector Analysis 33
Table 18: Summary of the composition of the subsector gross VA at the production stage 2017–18
Commodity VA (in INR crores) Share of VA
Meat
Buffalo meat 1,676 8%
Sheep meat 14 0.07%
Goat meat 857
4%
Pork meat 193
1%
Poultry meat
340
2%
Milk 0
Cattle 7,112 35%
Buffalo 6,541
32%
Eggs 97
0%
Hides and skins
85
0.4%
Wool 3 0.01%
Organic matter 3,484 17%
Energy 2 0.01%
Total 20,318 100%
Source: Based on LSA simulation results
Table 18 further shows that about 81% of the livestock GSDP comes from milk, followed by organic matter and
meat which accounts for about 17% and 15%, respectively. Overall, cattle and buffalo account for about 91% of
the current livestock VA or GSDP of Bihar, showing the importance of the cattle and buffalo production systems
in the state. This includes organic matter VA which is predominantly cattle and buffalo output (about 99.7% of
the organic matter VA). VA from buffalo meat amounts to about 8% and the remaining 7% comes from goat
meat (4%), sheep meat (0.07%), chicken (2%) and pigs (1%).
Table 19 below shows the contribution of each production zone to the total livestock GSDP of the year 2017–18.
The production performance of the specialized dairy farming system and monogastric animals (pigs and
chickens) is assumed to be not zone specic, hence were not modelled by production zones. The results show

The Bihar Livestock Sector Analysis 34
that more than half of the livestock GSDP (about 55.8%) comes from the Central livestock production zone
followed by Northern which contributes about 31.8% of the livestock GSDP. The rest, 12.4% of the livestock
GSDP, comes from the Southern livestock production system (about 9.5%), specialized dairy farming system
(0.1%) and monogastric livestock (chickens 1.8% and pigs 1%).
Table 19: Share of livestock GSDP by livestock production zones and species 2017–18
Cattle Buffalos Sheep Goats Chickens Pigs
Northern 8.5% 20.7% 0.02% 2.6% 1.3% 0.9%
Central 34.4% 19.9% 0.1% 1.5%
Southern 3.9% 4.8% 0.04% 0.8%
Commercial 0.1% 0.5% 0.1%
Total 46.8% 45.4% 0.1% 4.9% 1.8% 1.0%
Source: Based on LSA results
More than 90% of the cattle and buffalo VA during the base year originated from the Central and Northern
livestock production systems whereas the goat VA is predominantly from the Northern production system (54%).
The latter nding is in line with the fact that most of the goats in Bihar are reared by the marginal communities in
the Northern part of the state. The Northern production system is home to about 54% of the goat population in
Bihar.
4.3 Projection of livestock populations, production and GSDP to 2031–32 under business as usual
(BAU))
Projected livestock population (to 2032–33 BAU)
The herd and sector model were used to project the livestock population, livestock products and livestock GSDP
for 15 years. The 2032–33 projected livestock population gures for different livestock species are given in
Table 20. These values are based on the BAU scenario, i.e. with no additional investment beyond that already
occurring to improve the productivity of the sector for the coming 15 years. This scenario assumes that private
and public investment continue at current rates.
Under the BAU scenario, in 2032–33 there is projected to be signicant growth in the populations of all
livestock, especially of chickens, goats and buffalos, at 374%, 71% and 45%, respectively. The numbers of
chickens in all system typres is projected to grow very signicantly. Meanwhile, the number of local cattle is
projected to decrease by 43%. Pigs across all systems (extensive, semi-intensive and intensive or commercial)
will increase by only 13% under BAU, and mostly due to the larger numbers and growth (16%) in the traditional
extensive. While cattle overall in total are projected to increase only 5%, the growth rate for crossbred cows is
projected to be higher (60%) than for local cattle which are projected to decrease by 43%. This trend of relative
increase in the numbers and propostions of crossbred cattle to increase milk production has been an ongoing
strategy in India, which has gradually replaced a sizeable number of local breed animals.

The Bihar Livestock Sector Analysis 35
Table 20: Comparison of baseline current and projected livestock populations 2017–18 to 2032–33 under the
BAU scenario
Livestock speciesLivestock population (in lakh)
% change2017–18 2032–33
Cattle
132.7
138.8
5%
Local
71.4
40.4
-43%
Cross
61.3
98.3
60%
Buffalos
87.8
127.0
45%
Sheep
2.5
3.0
21%
Small
2.2
2.7
21%
Medium
0.3
0.3
20%
Goats
145.3
248.0
71%
Small
111.7
191.0
71%
Medium 33.5 57.0 70%
Chickens 176.2 834.7 374%
Local/indigenous backyard
90.0
130.5
45%
Crossbred backyard
4.6
8.0
75%
Layer subsystem
12.9
469.8
3540%
Broiler subsystem
68.8
226.4
229%
Pigs
6.8
7.8
13%
Extensive
backyard
6.6
7.7
16%
Semi-intensive
backyard
0.02
0.01
-73%
Commercial piggery 0.2 0.1 -73%
Pig fattening 0.005 0.001 -80%
Source: Based on LSA results

The Bihar Livestock Sector Analysis 36
The percentage of growth of goats and sheep populations in the year 2032–33 is almost the same across small
and medium farms, however most of the goats and sheep are within the context of small farm systems. Under
the BAU scenario, in 2032–33, the pig population in the state of Bihar is projected to decrease by about 34%
overall. While taking into account the very small pig populations in all the pig systems, the populations of pigs
under the semi-intensive, commercial and intensive pig fattening systems are projected to decrease by about
73%, 73%, and 80%, respectively, due to a lack of incentives and marketing opportunities faced by intensive
and commercial pig farmers.
Overall as shown in Table 20, under the BAU situation in 2032–33, crossbreeds of cattle, all types of species of
chicken, and buffalos and goats would be projected to dominate the livestock systems of Bihar state.
Projected livestock production (to 2032–33 under BAU)
To estimate the quantities of future productionof livestock products to 2031-32 under BAU, the baseline
livestock productivity parameters were applied to the projected livestock population. The volume of the main
livestock products, meat, milk, eggs, manure and skin and hides, are estimated and valued to approximate
their contributions to the state economy or GSDP of Bihar.
The results of the production projection (BAU 2032–33) are presented in Table 21 below and compared with the
2017–18 baseline situation. Under the BAU scenario, milk production increases from 89,632 lakh litres to
1,26,228 lakh litres, a 41% increase.
Table 21: Comparison of the baseline 2017–18 and projected 2032–33 BAU livestock production in Bihar
Livestock products
Unit
Volume of production2017–18
Volume of production 2032–33
Change
Milk (total)
Lakh litres
89,632.2
126,228.2
41%
Local cows
Lakh litres
11,894.9
6,736.0
-43%
Crossbreed cows
Lakh litres
41,730.6
66,934.5
60%
Specialized
Lakh litres
95.1
141.0
48%
Buffalos
Lakh litres
34,066.4
49,266.1
45%
Goats
Lakh litres
1,845.3
3,150.6
71%
Buffalo meat
MT
76,302.0
110,347.0
45%
Sheep meat (total)
MT
599.0
723.0
21%
Small farms
MT
533.0
644.0
21%
Medium farms MT 66.0 79.0 20%
Goat meat (total) MT 29,918.0 51,062.0 71%
Small farms MT 21,041.0 35,973.0 71%

The Bihar Livestock Sector Analysis 37
Livestock products
Unit
Volume of production2017–18
Volume of production 2032–33
Change
Medium farms MT 8,877.0 15,089.0 70%
Pork meat MT 44,473.0 27,529.0 -38%
Poultry meat (total) MT 61,975.0 190,228.0 207%
Local chickens MT 20,136.0 29,438.0 46%
Layers MT 695.0 25,291.0 3540%
Broilers MT 41,145.0 135,499.0 229%
Eggs (total) Lakh 4.1 95.8 2,234%
Local chickens Lakh 1.5 2.3 52%
Layers Lakh 2.6 93.4 3,540%
Hides and skins MT 5,679.0 9,686.0 71%
Wool MT 260.0 314.0 21%
Organic matter MT 23,322,968.0 29,672,790.0 27%
Draft power contribution
Lakh days 2.1 0.2 -92%
Source: Based on LSA results
The additional milk production in 2032–33, about 69%, predominantly comes from the crossbreed cattle
followed by buffalo which contribute about 42% of the additional milk. The milk production from local cattle
breeds is projected to be about 43% lower in 2032–33 and contributes only about 5% of the total milk
production in 2032–33.
The major red meat products are buffalo and goat meat. The production of the dressed buffalo carcass
increases from 76.3 thousand MT in 2017–18 to 110.35 thousand MT in 2032–33, a 45% increase, whereas
goat meat increases from 29.9 thousand MT in 2017–18 to 51.1 thousand MT in 2032–33, a 71% growth.
Overall, sheep and pork meat production are very low in Bihar state. While the sheep meat production
increases from 599 MT in 2017–18 to 723 MT in 2032–33, pig meat production is projected to decrease by
38% in the nal year, 2032–33. Over the period of 2017–18 to 2032–33, poultry meat production increases by
207%, which is predominantly due to an increase in the population of layers as well as broilers. Similarly, egg
production increases by 2,234% over the same period, largely due to a signicant increase in the population of
layers.

The Bihar Livestock Sector Analysis 38
Table 22: Red meat production in MT by production zones, 2032–33 BAU
Livestock production zones Buffalo Sheep Goat Total % red meat
Northern 47,507 111 27,651 75,269 46.4%
Central 48,837 387 16,436 65,661 40.5%
Southern 14,002 225 6,975 21,202 13.1%
Total red meat 1,10,347 723 51,062 1,62,132
Source: Based on LSA results
Overall, based on the gures shown in Table 21, under BAU, livestock products from improved livestock species
become dominant in 2032–33.
Table 22 shows the red meat contribution of each zone to the state red meat production in 2032–33 BAU.
Central and Northern livestock production zones are almost equally important in terms of red meat production.
Despite ample forage feed availability, the Southern livestock production zone contributes only about 13% of
the total red meat production in the year 2032–33.
Table 23: Milk production by production zones and species, 2032–33 under BAU
Livestock production zones Species Milk in crore litres % of total
Northern
Cow
138.1
10.9%
Buffalo
213.3
16.8%
Goat
17.7
1.4%
Subtotal
369.0
29.2%
Central
Cow
543.3
43.0%
Buffalo 225.4 17.9%
Goat 10.0 0.8%
Subtotal 778.7 61.7%
Southern
Cow
55.3
4.4%
Buffalo
54.0
4.3%
Goat
3.8
0.30%
Subtotal
113.1
8.9%
Commercial
1.4
0.11%
Total 1262.3 100%
Source: Based on LSA results

The Bihar Livestock Sector Analysis 39
Similarly, the Central and Northern livestock production zones are projected to lead in milk production in
2032–33 BAU. Table 23 shows milk production by production zones and species. Under the BAU scenario,
about 91% of the total milk production in 2032–33 comes from the Northern and Central livestock production
zones.
Projected livestock GSDP (in 2032–33 under BAU)
The total livestock VA or livestock GSDP at production stage in 2032–33 is projected to reach 28,000 crore,
which is a 46% growth over the 2017–18 value. Table 24 shows the distribution of the livestock GSDP across the
2different livestock commodities.
Like the 2017–18 situation, livestock wealth in Bihar state in 2032–33 BAU is accumulated in milk (both cow
and buffalo). Cow and buffalo milk production contributes about 70% of the total livestock GSDP. If VA from
organic matter are included, the contribution of cattle and buffalo to the livestock GSDP increases to about 86%
of the total.
Table 24: Livestock GSDP in 2032–33 under BAU
Commodity VA (in INR crore) Per cent of total
Cow milk 10,229 36.4%
Buffalo milk 9,459 33.7%
Buffalo meat 722 2.6%
Sheep meat 17 0.1%
Goat meat 1,464 5.2%
Pork meat 122 0.4%
Poultry meat 915 3.3%
Eggs 557 2.0%
Hides and skins 145 0.5%
Wool 3 0.01%
Organic matter 4,437 15.8%
Draft power 1 0.004%
Total 28,071 100%
Source: Based on LSA results
The distribution of the gross VA or GSDP of the commodities that are generated from the different livestock
species over the three main livestock production zones and specialized sector is provided in Table 25 below. For
example, cattle and buffalo in the Central and Northern livestock production zones contribute to more than
80% of the value addition.
Compared to the 2017–18 baseline situation, the total contribution of goats and chicken increases 71% and
172%, respectively, while the contribution of pigs decreases by 37%. Overall, under the BAU scenario, the cattle
and buffalo production systems remain dominant and important in the state of Bihar.

The Bihar Livestock Sector Analysis 40
Table 25: Share of livestock GSDP by zone and species, in 2032–33 under BAU
Livestock production zones Cattle Buffalos Sheep Goats Chickens Pigs
Northern 5.9% 20.8% 0.01% 3.1% 1.4% 0.4%
Central 36% 20% 0.05% 1.7%
Southern 2.6% 4.8% 0.03% 1.0%
Commercial 0.1% 2.1% 0.01%
Total 44.5% 45.6% 0.1% 5.8% 3.5% 0.4%
Source: Based on LSA results
4.4 Projected consumption and consumption preferences
Projected consumption of livestock products
Projections of future production and consumption gaps for the major livestock products (meat and milk) without
any additional policy or technology interventions beyond current trends (the BAU scenario) were made to assess
the size of the future supply and demand gaps. This projection is critical to anticipate the magnitude of required
future investment in livestock R&D interventions (policies and technologies), which will be required to close any
production-consumption gaps.
The estimation of current and projected consumption requirements of livestock products requires the base year
information on quantities of livestock products consumed by households, income elasticity of demand for
different livestock products, the growth rates of real per capita GDP and human population.
Accordingly, given the income elasticity of demand (η) for a given livestock product, trend annual growth rates
(γ) of real per capita GSDP, and baseline per capita consumption (LC0) of a given livestock product, the
projected per capita livestock product consumption (LCt) for a given year t is based on the following formula:
The projected total consumption (TLCt) of a given livestock product in time t is obtained by multiplying the
projected per capita consumption with the projected population (POPt) for a given time t:
The following sections provide brief discussion of the steps used in the derivation of important variables used in
estimating the current and the projected future consumption of livestock products in the state of Bihar.
First, the baseline per capita annual consumption (LC0) data for livestock products in the state of Bihar was not
available for the base year 2017–18. The most recently available per capita annual consumption data are from
the NSS 68th round conducted during 2011–12 and the results are summarized in Table 26. As shown in Table
26, during 2011-12, the average state per capita liquid milk and total milk and milk product consumption was 10about 48 and 58 litres/annum, respectivelly. The per capita milk and milk product consumption was slightly
higher for the urban areas than the rural areas of the state of Bihar. Similarly, the per capita consumption of
10 Total milk and milk products include liquid milk and other milk products such as ghee and curd.

The Bihar Livestock Sector Analysis 41
eggs in urban areas, about 15 eggs/annum, was slightly higher than in rural areas, about 12 eggs/annum. The
average state per capita goat meat/mutton and buffalo meat consumption was 0.6 kg/annum and 0.4 11kg/annum, respectively; as such there was no clear difference between urban and rural areas. The per capita
consumption of pork in rural areas was 0.04 kg/annum and, in contrast to other livestock products, the per
capita annual consumption of pork was higher for rural areas than urban areas.
Table 26: Per capita consumption of livestock products in the state of Bihar during the year 2011
Livestock products Rural Urban Average
Liquid milk (litres) 47 49 48
Egg (numbers) 12 15 13
Goat meat/mutton (kg) 0.6 0.70 0.6
Buffalo meat (kg) 0.3 0.4 0.4
Pork (kg) 0.04 0.01 0.02
Chicken (kg) 2 2 2
12 Milk and milk products (litres) 63 54 59
Source: NSS Report No. 562 (2015)
Second, the average per capita income computed by the Bihar directorate of economics and statistics (Table 27)
is used as state average per capita income. Accordingly, the computed trend in annual growth rate in real per
capita GSDP over the period from 2012–13 to 2015–16 is used; the computed annual growth rate in real per
capita GSDP (γ) was 3.4% for this period (Table 27).
Third, the income elasticity (η) parameters used in the projections of consumptions of different livestock
products are based on previously estimated national or state level income elasticities. There are several studies
that estimated elasticities for livestock products to project the demand for livestock products at national or state
levels. Most of the recent studies have used the household consumer expenditure data from NSS 67th round
and NSS 68th round conducted during 2004–05 and 2011–12, respectively. The income elasticities used to
project the consumption of livestock products in the state of Bihar were identied from studies that used the most
recent data (NSS 68th round) and studies that derive elasticities that closely reect the consumption patterns of
livestock products in the state of Bihar. Among the many studies that estimated the income elasticities of
livestock products in India, the study by Chengapa et al. (2016) is the only study that used the most recent
household consumer expenditure data, NSS 68th round. Thus, the income elasticity estimates for milk, chicken,
eggs and pork are based on the study by Chengapa et al. (2016). The income elasticities for beef/buffalo and
goat/mutton from the same study, however, do not reect the livestock product consumption pattern of the
households in the state of Bihar. Hence income elasticities from the study by Gandhi and Zhou (2010), which
used household consumer expenditure data from 2004–05 NSS 67th round, were used instead.
11 The available data for buffalo meat consumption did not distinguish local vesrsus export demand, while the majority of this product is likely to be exported. Thus the per capita consumption gures provided for urban and rural demand cannot be considered reliable.12 Milk and milk product include liquid milk, curd and ghee. The amount of curd and ghee was converted to liquid milk equivalent based on sources available at https://www.quora.com/How-much-milk-is-required-to-produce-1-kg-of-ghee.

The Bihar Livestock Sector Analysis 42
Table 27: Trends in annual population and GSDP growth rates for Bihar state (2011–2012 to 2015–2016)
Year Total
population (in lakh)
Annual population growth rate (%)
GSDP (INR crore)
Per capita GSDP (INR)
Growth rate in per capita GSDP (%)
2011–12 1,050 2,471 23,525
2012–13 1,070 1.58% 2,569 24,068 2.3%
2013–14 1,080 1.58% 2,696 24,874 3.3%
2014–15 1,100 1.58% 2,795 25,379 2.0%
2015–16 1,120 1.58% 3,006 26,868 5.9%
Average 1,084 1.58% 2,707 24,943 3.4%
Source: Bihar directorate of economics and statistics (2016)
Accordingly, the rural and urban per capita consumption of the respective livestock products for the year
2011–2012 (Table 26), the average growth rate in per capita GSDP (%) (Table 27) and respective income
elasticity (Table 28) were used in equation (1) to project the rural and urban per capita consumption of livestock
products for the base year 2017–18. The total rural and urban consumption of each livestock product was
calculated separately using equation (2). Finally, to arrive at the state level or aggregated per capita
consumption of each livestock product, for the base year, the sum of total rural and total urban consumptions of
each livestock product was divided by the 2017–18 total state population.
Table 28 shows the income elasticities of livestock products used in projecting the consumption of livestock
products. For all livestock products except pig meat, the signs of income elasticities of demand are positive
indicating that all the livestock products considered are normal goods—the demand for these products
increase as income increases. In contrast, the sign of the income elasticity of demand for pig meat is negative,
indicating pig meat is considered as inferior meat. Pig meat is mostly consumed by low-income communities in
rural areas; its consumption in urban areas is very low (Table 26).
Table 28: Income elasticities of livestock products
Livestock products Rural Urban All
Milk and milk products 1.2 1.3 1.3
Eggs 2.6 2.1 1.5
Goat meat/mutton 1.3 1.3 1.3
Buffalo meat 1.0 1.0 0.9
Pork -0.3 -2.6 -1.1
Chicken 2.0 1.2 2.2
Source: Chengapa et al. (2016) for milk, chicken, eggs and pork; Gandhi and Zhou (2010) for beef/buffalo
and goat/mutton
Second, the population of Bihar for the baseline year was not available. The last census in India was conducted
in 2011. Therefore, the projected human population was based on the state level population data estimated for

The Bihar Livestock Sector Analysis 43
the years 2011–2012 to 2015–2016 by the Bihar directorate of economics and statistics (Directorate of
Economics and Statistics 2016). Table 27 shows the population data published by the Bihar directorate of
economics and statistics for the years 2011–2012 to 2015–2016.
The total human population for the year 2011–2012 was about 1,050 lakh and is expected to grow annually by
1.58% to reach 1,150 lakh in 2017–2018 base year, and 1,460 lakh in the year 2032–2033 (Table 29). A
separate urban and rural population was used to arrive at aggregated per capita consumption of livestock
products for the baseline year 2017–2018. To do so, an annual urbanization rate, the proportion of total 13human population living in the urban areas, of 11.3% was used to compute urban and rural populations from
the aggregate population estimated by the Bihar directorate of economics and statistics (Table 27).
Table 29: Projected total population size (in lakhs) in Bihar state (2017 and 2032) used in obtaining the
projected total consumption gures for different livestock products
Year Rural population (lakhs) Urban population (lakhs) Total population (POPt) (lakhs)
2017 930 220 1,150
2032 370 1,090 1,460
Source: Bihar directorate of economics and statistics
Table 30 presents the baseline and projected per capita consumption of livestock products in Bihar state,
2017–2018 to 2032–33. Except for pork, signicant increase in per capita consumption is expected for all
livestock products between 2017–2018 and 2032–33. However, it is important to note that the percentage
change in per capita consumption between 2017–18 and 2032–33 is greater than 100% for eggs and chicken.
At the state level, the highest growth per capita consumption of livestock products is projected for chicken,
followed by eggs and goat meat/mutton. For milk and milk products and buffalo meat, the per capita
consumption is projected to grow by 86% and 58%, respectively, between 2017–18 and 2032–33. To the
contrary, the consumption of pig meat is expected to decrease by 42% between 2017–18 and 2032–33.
Table 30: Current and projected future annual per capita consumption of livestock products in Bihar 2017–18
to 2032–33
Livestock products Annual per capita consumption Growth in per capita consumption
2017–18 2032–33 (%), 2017–18 to 2032–33
Milk and milk products
(litres) 78 146 86%
Egg (numbers) 20 42 107%
Goat meat/mutton (kg) 0.8 1.6 95%
Buffalo meat (kg) 0.4 0.6 58%
Pork (kg) 0.03 0.02 -42%
Chicken (kg) 3 9 200%
Source: LSA calculations
13 In the absence of a strong nonagricultural sector, despite a large population, the urbanization rate in Bihar is just 11.3% as of 2011, vis-à-vis 31.2% for all-India (Kumar and Punia, 2014; International Growth Centre 2014).

Current and projected production and consumption of livestock products under business as usual
(BAU)
Table 31 shows the current and projected state-level total production and total consumption of livestock
products at current investment rates (BAU) for the base year 2017–18, and nal year 2032–33. The estimation
of the current and projected future livestock production was made using an Excel-based deterministic
herd/ock growth model built in the LSIPT. The main data required in the herd/ock model are the size of
livestock population for the reference (base) year and the herd/ock survival rates are derived based on
technical parameters relating to births, deaths and offtake rates. In turn, the baseline technical parameters for
different production systems by herd/ock size classes are based on the review of grey literature and expert
opinions.
The results for projections of the production and consumption of meat and milk over the coming 15 years BAU
are presented in Table 31. Over the next 15 years, the total consumption of goat meat/mutton is projected to
grow by 147% from 93,000 to 2,31,000 MT. While this projected change in consumption seems high, by
2032–33, the estimated population will have increased to 1,460 lakh. This accounts for an average annual
meat consumption of 1.6 kg per year. Similarly, despite very low per capita consumption of buffalo meat, 0.6 kg
per annum, the total buffalo meat consumption is projected to grow by 100% from 44,000 to 88,000 MT.
Considering differential growth rates from the different production systems, the production of goat
meat/mutton and buffalo meat is projected to grow by about 71% and 45%, respectively. Thus, in 2032,
domestic production of goat meat/mutton is expected to cover only 22% of the required consumption. It is
estimated that there will be about an 1,80,000 t goat meat/mutton gap between production and consumer
demand. The low consumption in buffalo meat allows the domestic production to cover 125% of the total
demand in 2032–33, an excess of 22,000 MT which could be exported to international markets. The buffalo
meat exports from Bihar (22,000 t) is approximately 2% of the total 2017-18 Indian buffalo meat export,
which is 13.50 lakh MT (DGCIS, 2018). According to the 2017-18 report of the Indian Directorate General of
Commercial Intelligence and Statistics (DGCIS), the top ve Indian buffalo meat export destinations are
Vietnam, Malaysia, Egypt, Iraq and Saudi Arabia.
Table 31: Current and projected production and consumption of livestock products BAU 2017–18 to 2032–33
Livestock product
Production Consumption Per cent (%) change (2011
to 2016)
Production as a percentage (%) of
consumption
2017 2032 2017 2032 Production Consumption 2017 2032
Milk and milk products (lakh litres)
89,630 126,230 90,480 213,920 41% 136% 99% 59%
Egg (lakhs) 4,100 95,760 23,640 62,200 2,234% 163% 17% 154%
Goat and mutton (thousand MT)
30 51 93 231 71% 147% 32% 22%
Buffalo (thousand MT)
76 110 44 88 45% 100% 173% 125%
The Bihar Livestock Sector Analysis 44

The Bihar Livestock Sector Analysis 45
Livestock product
Production Consumption Per cent (%) change (2011
to 2016)
Production as a percentage (%) of
consumption
2017 2032 2017 2032 Production Consumption 2017 2032
Pork (thousand MT)
44 28 3 2 -38% -26% 1,334% 1,120%
Chicken (thousand MT)
62 190 353 1,340 207% 280% 18% 14%
Source: Own calculation
A similar pattern is also observed for the projected future consumption of milk. The consumption of milk and
milk products is projected to grow by 136% from about 905 crore litres in 2017–18 to 2,139 crore litres in
2032–33. Similarly, the domestic production is projected to grow by 41% from 896 crore litres in 2017–18 to
1,262 crore litres in 2032–33. The domestic milk production is thus expected to cover only about 59% of the
total consumption requirements representing a milk production-consumption gap of 877 crore litres.
While the total consumption of eggs is projected to grow by 163% from 236 crore eggs in 2017–18 to 622 crore
eggs in 2032–33, the total domestic production of eggs in Bihar is projected to increase by 2,234% from 41
crore eggs in 2017–18 to 958 crore eggs in 2032–33, which is projected to cover 154% of the domestic
requirement. The egg production excess is expected to be 3,36 crore eggs in the year 2032–33.
Chicken consumption is projected to grow rapidly in the state of Bihar. The total consumption of chicken in the
state is projected to reach 13 lakh MT in the year 2032–33, an increase of 280% from the year 2017–18.
Although the domestic production increased in a similar pattern, by 207%, the total quantity of chicken meat
production projected in the year 2032–33, 1.9 lakh MT, is expected to meet only about 14% of total
consumption requirements of the state, 13 lakh MT. Thus, it is expected that there will be a gap of about 12 lakh
MT of chicken meat in the year 2032–33.
Total pig meat consumption and production is projected to decrease by 26% and 38%, respectively, in the year
2032–33. Despite the decline in total pig production in the year 2032–33, total pig meat production is expected
to exceed the total consumption requirement by 1,119%. There may be opportunites for exports to other states,
such as in the Northeast.
In general, the 15-years production and consumption projections under BAU indicate signicant production
gaps in milk, goat meat/mutton and chicken meat.
Effects of gender and cultural patterns on consumption behaviour
Traditionally, people in India, including in Bihar, have a diet based on grains and vegetables, and consume
limited amounts of meats and meat products (Devi et al. 2014). The recent economic growth and introduction
of western culture have changed the food consumption habits. There are wide variations in the consumption of
different livestock products. Cultural differences and religious belief are mainly responsible for variation in
meat consumption patterns in Bihar. Dietary habits of Indians are signicantly inuenced and controlled by
traditions, customs and taboos. This is a strong factor of inuence especially in rural societies.
Regarding consumption of milk and milk products, almost one-third of Indians especially in the northern states
follow lacto-vegetarianism where milk and milk products are an important source of protein. Increased

The Bihar Livestock Sector Analysis 46
production of milk through the White Revolution facilitated this consumption pattern. There are no taboos
attached to milk consumption and it is accepted by all classes of people.
There are variations in the consumption of meat products which include beef, chicken, goat meat, mutton and
buffalo. This is due to cultural and religious differences within society. In Bihar, 82.7% of the population are
Hindu and 16.8% belong to the Muslim community. Hinduism bars beef consumption and Islam bars pork
consumption. The Hindu community considers the cow a sacred animal so killing of cow is banned in Bihar.
Buffalo meat is only consumed by the lower caste communities, specically the SC and ST.
Chicken meat is consumed at a higher level than other meat products because it is accepted by both Hindu and
Muslim communities. Presently, poultry production is growing rapidly in India, making it a cheap source of
protei. Chicken meat is considered an important dish during festivals for all classes of people.
Pork is considered an important source of protein among tribal communities. There is a traditional practice of
cooking pork during festivals and marriages in these communities. They have a system of distributing pork
among the villagers. This meat is considered the cheapest among tribal communities. Pork is not preferred by
Muslims and the majority of most Hindu communities, except the lower caste such as ST and SC within these
communities.
Even though goat meat is acceptable by some members of both Hindu and Muslim communities, the
consumption of goat meat is low in Bihar due to high cost. Goat meat is consumed by the better-off households
or those who rear these animals. Lower caste SC and ST households rear goat to sell in the market rather than
for their own consumption (ILRI FGDs 2018).
About 48% of children under the age of ve are stunted or too short for their age, which indicates that they have
been undernourished for some time. Undernutrition is particularly common in the younger age groups, in rural
areas and among scheduled caste women (Government of India 2016). The malnutrition in Bihar is higher than
in any country in the world (von Grebmer et al. 2011). Poor growth and anaemic conditions are very common
given that the diet is decient in micronutrients of vitamin A, vitamin B-12, riboavin, calcium, iron and zinc.
ASFs are rich in these micronutrients; small amounts in a daily diet would provide adequate nutrition (Murphy
and Allen 2013).
Women's role in livestock care and animal husbandry affects household food security. A recent study by Jumrani
and Birthal (2015) indicates that livestock ownership by household does not automatically improve household
nutrition. There is need for intrahousehold distribution of income. This study also reports that income control by
women from livestock production signicantly reduces malnutrition among children. Households where
women oversee animal production, especially dairy animals, have better household nutrition (Jumrani and
Birthal 2015). There is strong evidence that the consumption of dairy products has a strong marginal effect on
child nutrition. These effects are particularly stronger for children between 6 and 24 months of age who are no
longer exclusively breastfed and have high physical growth potential (Bhutta et al. 2013). Traditionally in Bihar,
women and female children eat last after the male members have nished the meal (Desai and Vanneman
2012). This leads to undernutrition for female children and women. This is practised among the higher caste
households even more than in ST/SC households.
Gender and social implications of the projected production and consumption of livestock products
When we see the projection of milk and milk products, only 59% of consumption requirements will be met
through state production in 2032 under the BAU scenario (Table 31). This may have negative implications for
the poorest, as products will have to be imported with a possible increase in consumer price. Therefore, the

The Bihar Livestock Sector Analysis 47
poorest, especially lower caste communities, SC and ST communities are likely to be most affected.
There may also be negative social implications as chicken and goat meat demand will also be higher than the
production, with only 14% and 22% of consumption requirements met by state production under the BAU
scenario. On the other hand, the other livestock products may be more available and affordable, as the
production from Bihar of buffalo meat (125%) and pork (1,120%) is expected to be higher than projected
consumption requirements. This is of relevance to the poorest and lower caste communities like SC/ST who
consume more of such meats, compared to other communities. Eggs are also projected to be more available,
given the large increase in supply compared to the expected demand.
In each case where there is higher demand than projected supply, i.e. as projected for milk, goat meat/mutton
and chicken meat, communities will have an opportunity to full the supply through increased production. In
these cases, because women often perform much of the labour in livestock production, it will be important to
understand the demands on labour for women and to ensure that women will benet from the labour they are
providing. However, this could also open opportunities for women to start up small to medium businesses to
supply the medium-sized towns and markets with products such as eggs and chicken meat.
Even though there is an increased trend of diversication among the poorest due to increased income, levels of
nutrition deciency remain high in India (Kumar et al. 2016). This is obvious with households living below the
poverty line where protein deciency is 53%. Inequitable distribution of food among different segments of the
population and lower income levels are the major factors for undernourishment in the poorest households. The
consumption expenditure data from the NSS (Table 32) by land-holding size in Bihar show that consumption
expenditures among the marginal households, especially lower caste households like SC and ST, are lower than
the other caste groups. Moreover, the smallholders in the SC/ST communities have lower consumption
expenditures compared to marginal farmers of other caste groups.
Table 32: Consumption expenditures by land holding and social class in Bihar (INR)
Size class of land SC/ST OBC Others
Landless<0.02 4,287 4,412 4,569
Marginal<1 ha 3,832 5,127 5,837
Small 1-2 ha 4,291 6,098 6,753
Medium 2-4 ha 6,938 8,111 7,750
Large>4 ha 9,578 12,281 12,287
Source: NSS Report No. 576: Income, Expenditure, Productive Assets and Indebtedness of Agricultural
Households in India 2012-13

5 Livestock sector improvement strategies
The animal husbandry sector plays an important role in the economic development of the state of Bihar.
Livestock production, however, confronts several constraints including poor quality of animal germplasm,
frequent occurrence of diseases and acute feed and fodder scarcity. Moreover, many socio-economic and
institutional factors such as underdeveloped veterinary and breeding infrastructure, shrinking common lands
and lack of farmers' access to markets, credit and information, restrict farmers from realizing the production
potential of their animals. Overcoming these challenges requires evolving suitable development strategies and
targeting thereof to the regions and species that have potential to generate signicant economic and social 14gains without causing any damage to the environment and natural resources (Singh 2013).
In the second animal and sheries sector of the agricultural road map (2017–22), efforts were made to identify
problems faced in achieving the targets set for the period 2012–17, as well as the type of measures that need to
be taken. In the following section prior to addressing the measures/interventions by production zone, the
challenges and opportunities as well as the complementary success requirements are presented by a) major
commodity value chains, b) species of livestock and c) category: feed, animal health and genetics.
Section 5 consists of ve sections on commodity value chains: dairy (5.1), buffalos (5.2), goats (5.3), chickens
(5.4) and pigs/pork (5.5). Section 5.6 is specically focused on the post-production investment strategies for
each of the commodities i.e. dairy, buffalos, goats and chickens. Section 5.7 addresses some of the strategies
and challenges from the perspective of gender and social inclusion in Bihar. Under each commodity value
chain, the challenges, opportunities and strategies are outlined. Where appropriate, the challenges and
opportunities as well as complementary success requirements are contextualized to the livestock production
zones, i.e. Northern, Central and Southern.
The contents of this chapter, particularly the strategies/interventions proposed to address the challenges are
further detailed in Section 6 of this report. The interventions are quantied and incorporated to develop
intervention scenarios for the quantitative analysis. The interventions identied were also aligned with the
outlined measures for livestock improvement in the agricultural road map of 2017–2022.
5.1 Cattle value chain improvement strategies
The development of the livestock and the dairy sector is important to enhance the rural economy and to further
decrease poverty (Hardenberg 2016). The low animal productivity in Bihar is due to several different factors,
including poor animal health and insufcient feed and fodder (Singh 2013). Research and improvement of
these constraints are crucial to obtain better productivity in the dairy sector (Hardenberg 2016).
The Bihar Livestock Sector Analysis 48
14 Singh, R. K. 2013. Livestock Research and Development Priorities for Bihar and Odisha. Available at SSRN: https://ssrn.com/abstract=2391607 or http://dx.doi.org/10.2139/ssrn.2391607

The state has made signicant strides in milk production, however, the milk productivity level in the state is still
very low. This may be attributed to the low percentage of crossbred and other improved varieties within the
bovine population even with increased introduction of more crossbred varieties for increasing milk production
as demand within the state is increasing rapidly with growing urbanization and increase in per capita income.
Moreover, increased milk production generates additional income to the marginal and landless households,
besides dairy farming providing additional employment to rural women (Government of India 2008).
Challenges: cattle
Challenges to cattle production exhibit differences by production zones and systems (Table 33). The challenges
of cattle production from specialized farms, i.e. those more commercially oriented with improved breeds and
higher blood level of exotics, especially in terms of feed and animal health, are linked to concentrate
availability, and mastitis and protozoal diseases (Tables 33 and 34).
Table 33: Challenges of cattle production by production zones
The Bihar Livestock Sector Analysis 49
Category Northern zone Central zone Southern zone
Feed
Scarcity of feed and fodder during two to three months of ood time
March to June lack of availability of green fodder, lack of quality fodder seeds
High density of cattle
population and limited
grazing land, lack of
availability of quality
feed
Fluctuating prices of dry
fodder (INR 4-12/kg).
Low milk production
Scarcity of green 15
fodder
Insufcient rainfall
impacting feed and
low-quality feed
Animal health
Mortality, high parasite infestation, alkali disease due to toxicity of selenium e.g. paddy straw, low mineral contents in feed and fodder
Insufcient animal health
services (disease control,
treatment), high
incidence of protozoan
disease, no timely
deworming and
vaccination
Young mortality,
disease affecting
cows, villages are
scattered and low
veterinary services
coverage
Genetics/
breeding
Low productivity, repeat
breeding and anoestrusLow productivity
Lack of improved
types of cattle
Challenges: cattle in specialized commercial dairy
The herd size of the commercial dairy operations in Bihar ranges between 16-100. The average herd size is
about 30 heads. Although smallholder dairy farms is the dominant source of milk in Bihar, the increasing
growth in bigger dairy operations is a welcome trend in dairy development from the perspective of productivity
gains. The increase in milk production is mainly from the increase in the number of crossbred cattle, and there is
a steady increase in articial insemination (AI) service delivery over the years. The major challenge for
commercial dairy is access to credit. Other challenges are covered in Table 34 and opportunities are included in
table 35:
15 South and southwest Bihar are more vulnerable and often experience severe drought situations (source. http://bsdma.org/Know-Your-Risk.aspx?id=4).

The Bihar Livestock Sector Analysis 50
Table 34: Challenges to commercial dairy in Bihar state
Category Challenges: cattle specialised
Feed Low quality of the concentrate feed (>100 feed plants, but feed produced does not meet
requirement of cows)
Animal health Mastitis (clinical and subclinical), heavy protozoan infestation (trypanosomiasis,
Babesios, theileriosis, anaplasmosis etc.)
Genetics/ Lack of quality animals for herd replacement and establishing new farms, anoestrous
breeding and repeat breeding are key reproductive performance problems
Table 35: Opportunities for cattle dairying in Bihar state
Species Northern zone Central zone Southern zone
Cattle dairy
Due to availability of water and hedge areas there is potential for
growing green fodder, labour is
available, milk bulk chilling infrastructure development in progress in certain places
Availability of green and dry fodder (paddy and wheat straw), good milk yield from cows, good market for milk and products, well-developed infrastructure of COMFED, farmers more commercially
oriented
Large area of land available for grazing, labour is available, high demand for milk and milk products
Key strategies to address cattle production challenges
The strategies to address the key challenges (Table 36) vary from the ood-prone north Bihar villagesto the
drought-prone south Bihar villages. Although conservation of forages is key in the Northern and Southern
production zones, there is a need to improve the quality of existing feed resources. Availability of veterinary
services and timely vaccination as well as calf management are areas needing attention. Addressing calf
mortality remains a vital step forward.
Table 36: Key strategies to address challenges: cattle (by zone)
Category Northern zone Central zone Southern zone
Feed
Conservation of forage to address feed shortage during the 2-3 months of ooding,
establishment of fodder banks, complete feed block development (green fodder, concentrate, dry fodder and mineral mixture), cultivate perennial grasses–Napier cross, import fodder seed from other states e.g. Berseem, sorghum etc., improve productivity/ha of land, where possible increase land area under fodder, supply of improved seeds
Availability of green fodder
during lean period (April–
June), conservation of
green fodder in form of hay
and silage, buffer stock of
feed for scarcity period,
ensure availability of
concentrates in market
year-round, improve the
nutritional value (treatment
using chemicals) of less
utilizable dry fodders e.g.
maize Stover, Kadbi etc.
Production of fodder
(Napier, sugarcane grass,
hybrid Napier, sorghum,
Moringa Olerifera),
establish cattle feed plants
for provision of
concentrates and rations
for milking cows required,
develop complete feed
block (brick) total mixed
ration, improve the poor-
quality forages through
treatments

The Bihar Livestock Sector Analysis 51
Category Northern zone Central zone Southern zone
Animal health
Improve management at farmers’ level (all), sufcient quantity of colostrum feeding at the right time (calf), control of roundworm
infestation (calf), control of all worm infestation (all), vaccination against highly infectious disease (haemorrhagic septicaemia (HS), black quarter (BQ), FMD etc.) at proper age and time, equipment for proper drainage of water from paddy elds and less use of paddy straw from water logged elds, supplementation of area specic minerals
Increase availability of vet services through seasonal health camp at village level, strengthen and operationalize the existing sub-divisional level diagnostic facilities, establishment of referral diagnostic lab at district level, make round the year calendar on deworming, vaccination (HS, BQ, FMD and Brucellosis) activities
Improve calf management (see Northern),
more veterinary services required (see Northern)
Genetics/
breeding
Grading up of local breeds, crossbreeding-AI facility with good quality semen, increase the number of semen production centres and AI centres, reproductive management interventions
Selection among the local breeds, crossbreeding
Up grading by using better-milk producing Indian cattle breeds, crossbreeding program
5.2 Buffalo value chain improvement strategies
Although the local cattle population in the state of Bihar has been declining, the buffalo population has been
growing but only marginally; this is attributed to slow increase in productivity, and inadequate attention to
making the bulls and semen available (National Dairy Development Board 2008).
Table 37: Challenges to buffalo production in Bihar state
Category Northern zone Central zone Southern zone
Feed/fodder Diet not nutritionally balanced
Feed shortage due to
reduced access to
grazing because of
rise in water level
during rainy season
Diet nutritionally low
Animal health
High calf mortality due to high
roundworm infestation, negligence
by owners, lack of awareness of
veterinary services available, lack of
adequate information/knowledge on
buffalo diseases by producers
Mortality in juveniles Like Northern
Genetics/
breeding
Occurrence of silent heat and
inability to detect heat cases,
buffalos are majorly nondescript
breeds, high dependence on natural
service, little knowledge on AI
Milk yield is low,
local breeds need
improvement,
farmers sticking to
natural
service/mating
Local breeds of buffalo with low milk yield, population is also low, infertility is high
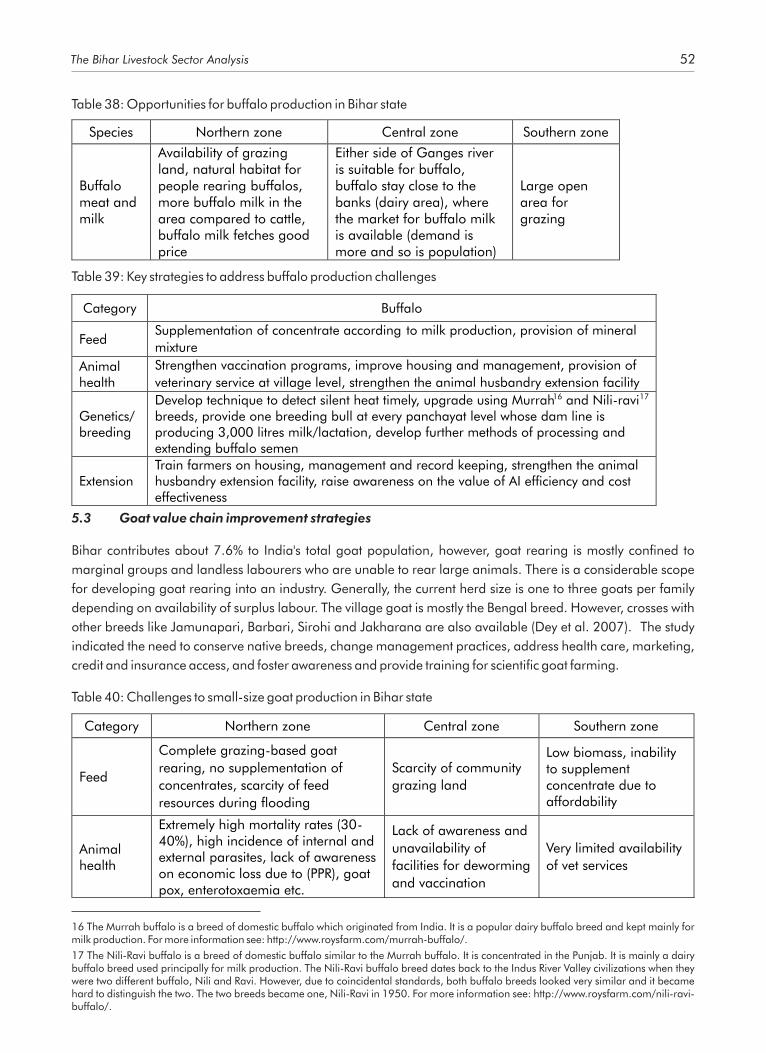
The Bihar Livestock Sector Analysis 52
Table 38: Opportunities for buffalo production in Bihar state
Species Northern zone Central zone Southern zone
Buffalo meat and milk
Availability of grazing land, natural habitat for people rearing buffalos, more buffalo milk in the area compared to cattle, buffalo milk fetches good price
Either side of Ganges river is suitable for buffalo, buffalo stay close to the banks (dairy area), where the market for buffalo milk is available (demand is more and so is population)
Large open area for grazing
Table 39: Key strategies to address buffalo production challenges
Category Buffalo
Feed Supplementation of concentrate according to milk production, provision of mineral
mixture
Animal health
Strengthen vaccination programs, improve housing and management, provision of
veterinary service at village level, strengthen the animal husbandry extension facility
Genetics/ breeding
Develop technique to detect silent heat timely, upgrade using Murrah16 and Nili-ravi17 breeds, provide one breeding bull at every panchayat level whose dam line is producing 3,000 litres milk/lactation, develop further methods of processing and extending buffalo semen
Extension Train farmers on housing, management and record keeping, strengthen the animal husbandry extension facility, raise awareness on the value of AI efciency and cost effectiveness
5.3 Goat value chain improvement strategies
Bihar contributes about 7.6% to India's total goat population, however, goat rearing is mostly conned to
marginal groups and landless labourers who are unable to rear large animals. There is a considerable scope
for developing goat rearing into an industry. Generally, the current herd size is one to three goats per family
depending on availability of surplus labour. The village goat is mostly the Bengal breed. However, crosses with
other breeds like Jamunapari, Barbari, Sirohi and Jakharana are also available (Dey et al. 2007). The study
indicated the need to conserve native breeds, change management practices, address health care, marketing,
credit and insurance access, and foster awareness and provide training for scientic goat farming.
Table 40: Challenges to small-size goat production in Bihar state
Category Northern zone Central zone Southern zone
Feed
Complete grazing-based goat
rearing, no supplementation of
concentrates, scarcity of feed
resources during ooding
Scarcity of community
grazing land
Low biomass, inability to supplement concentrate due to affordability
Animal health
Extremely high mortality rates (30-40%), high incidence of internal and external parasites, lack of awareness on economic loss due to (PPR), goat pox, enterotoxaemia etc.
Lack of awareness and
unavailability of
facilities for deworming
and vaccination
Very limited availability
of vet services
16 The Murrah buffalo is a breed of domestic buffalo which originated from India. It is a popular dairy buffalo breed and kept mainly for milk production. For more information see: http://www.roysfarm.com/murrah-buffalo/.
17 The Nili-Ravi buffalo is a breed of domestic buffalo similar to the Murrah buffalo. It is concentrated in the Punjab. It is mainly a dairy buffalo breed used principally for milk production. The Nili-Ravi buffalo breed dates back to the Indus River Valley civilizations when they were two different buffalo, Nili and Ravi. However, due to coincidental standards, both buffalo breeds looked very similar and it became hard to distinguish the two. The two breeds became one, Nili-Ravi in 1950. For more information see: http://www.roysfarm.com/nili-ravi-buffalo/.

The Bihar Livestock Sector Analysis 53
Category Northern zone Central zone Southern zone
Absence of timely/adequate
veterinary services (access to
preventive health care), diagnostic
facility not fully functional, goat
rearers either landless or small
landholders (~0.38 ha)
Genetics/
breeding
Small size and body weight of the
nondescript local breeds, limited
research on local breeds
improvement, Black Bengal has
good quality meat but size is small,
lack of quality bucks
Small size and body
weight of the
nondescript local
breeds, limited
research on local
breeds improvement,
Black Bengal has good
quality meat but size is
small, lack of quality
bucks
Population of
unimproved local
nondescript goats is
higher in this zone
Table 41: Challenges to medium-size goat production in Bihar state
Category Northern zone Central zone Southern zone
Feed
No scientic feeding
practices are followed,
little concentrate is
given to goats
Feed shortage, scarcity of community grazing land
Low biomass and limitation on
access to land, inability to
supplement concentrate due to
affordability and goat rearing
is a zero input
Animal health
Lack of awareness
about preventive goat
health care and its
management, lack of
timely deworming and
vaccination which
increase the risk of
mortality
High load of parasites/,
lack of awareness on
economic loss due to
PPR, goat pox,
enterotoxaemia etc., lack
of timely and complete
vaccination, diagnostic
facility not fully functional
Very limited availability of vet
services
Genetics/ breeding
Lack of good quality Black Bengal bucks, indiscriminate breeding leading to inbreeding, natural breeding is followed with available bucks in most villages
Like Northern zone Population of local nondescript
goats is higher in this zone

The Bihar Livestock Sector Analysis 54
Table 42: Opportunities for goat production in Bihar state
Species
Northern zone
Central zone
Southern zone
Goat meat (small)
Abundant grazing resources,
growing demand for goat meat
likely to outstrip supply, availability of labour, need to diversify incomes, income generation potential for scheduled castes, northwestern Bihar people are engaged in goat marketing including bulk sales to other states and Nepal
More urbanization and literacy, more awareness on the value of concentrate as supplement, availability of market, higher population of improved goats, low incidence of external and internal parasites
Favourable topography and conducive environment, a high proportion of landless wanting to keep goats, more open land is available
Goat meat
(medium)
Women play a major role in goat rearing and management, medium and large producers have the capacity to contribute more to
production of goats and
possess the potential to become entrepreneurs in goat rearing Demand will outstrip supply, thus creating new opportunities
for productivity
increasing technologies and increasing incomes
Table 43: Key strategies to address challenges in goat production
Category Goats medium size
Feed
Grow good green biomass-producing trees on a small portion of land, practicestall feeding, follow scientic lopping practices, increase amount of concentrate in goat feed, explore use of nonconventional feeds e.g. Azolla
Animal health
Awareness generation on vaccination, deworming and other preventive care of goat
diseases through Pashu Sakhi, timely deworming and vaccination of goats,
use og
right solution for deworming goats i.e. faecal sample testing, development of separate, simple and scientic goat house/Machan
Genetics/ breeding
Black Bengal breed of goat needs to be conserved, selection of Black Bengal type bucks from within the herd from same area, inbreeding needs to be checked (discourage service with unwanted available bucks), castration of scrub bucks to discourage inbreeding
Table 44: Complementary success requirements for production of goats
Category Complementary success requirements
Feed Educating farmers about scientic ration (feed) formation
Animal health Maintenance of health record
Extension Organizing eld level training program cum demonstration of modern technology
Genetics Emphasize dual purpose breed of goat since goat milk has immense medicinal value
5.4 Chicken value chain improvement strategies
The chicken value chain focuses on the backyard chicken, and the specialized broilers and layers. In the
following section, the major challenges across the value chain are specied along with the opportunities and
suggested strategies to overcome the challenges.

The Bihar Livestock Sector Analysis 55
Table 45: Challenges to backyard chicken production in Bihar state
Category Northern zone Central zone Southern zone
Feed No serious challenge on feed for backyard units
Less availability of maize
Unavailability of minimum balanced feed
Animal health
High mortality rate (20%) (including predators), lack of awareness of
proper management, unavailability of veterinary expertise
Mortality rate (20%) Poor health care and management
Genetics/
breeding
Lack of good quality breeds, limited research in improving local breeds of chicken
Like Northern zone Egg laying capacity is low (60-80/year)
Table 46: Opportunities for backyard chicken production in Bihar state
Species Northern zone Central zone Southern zone
Chicken backyard
Availability of maize, disease- resistant local birds, people are natural rearers (northeast), large number of landless farmers with the potential to rear chickens, readiness of women to diversify income
Availability of feed plants, suitable climatic condition as compared to Northern and Southern, easily available market (demand is growing), large area for open feeding/scavenging
The tribal community is more adaptable to BYP compared to Northern and Central zones, coloured birds preferred for ceremonial and cultural purposes of tribal families
Table 47: Key strategies to address challenges in backyard chicken production in Bihar state
Category Northern zone Central zone Southern zone
Feed and breeds
Increase availability of veterinary expertise, encourage landless farmers and women with training, increase access to better breeds
Increase the availability of maize from Northern zone, land availability for maize and soybean production, increase access to better breeds
Increase availability of different
vegetable oil cakes, explore the
use of nonconventional feeds
such as Azolla as a protein
supplement in semi-scavenging
feeding
Animal health
Timely vaccination, immediate response to diseases, proper housing system, strengthening of poultry, diagnostic lab at district level, training facility at district level, weekly visit by poultry expert at block level
Like Northern zone Awareness raising on animal
health and management
Table 48: Challenges to broiler production in Bihar state
Category
Feed
High and uctuating price of chicken feed, inadequate feed
processing plants, unregistered feed processing plants, quality control
of processed feeds lacking at processing plants, land access limited
for producing feed ingredients like maize and soybeans
Animal health
Hygiene and sanitary codes not adhered to, poor management (light, ventilation etc.), chicken diseases e.g. avian inuenza, chronic respiratory disease, inammatory bowel disease etc.
Genetics Limited choice of broiler breeds
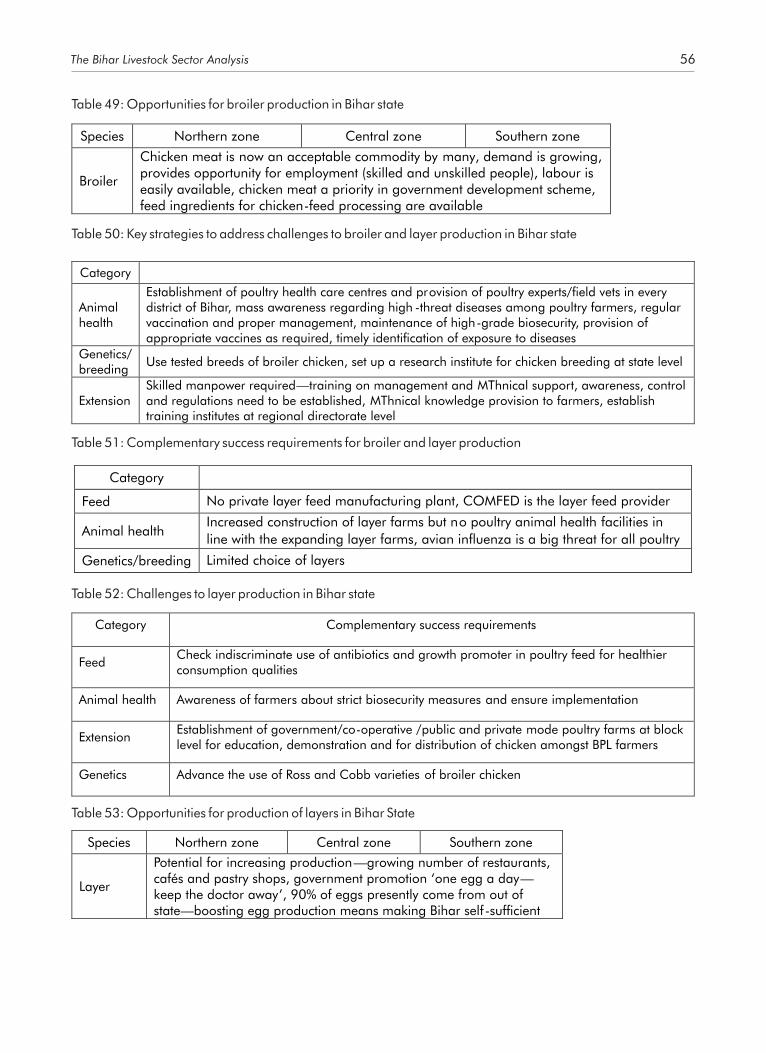
The Bihar Livestock Sector Analysis 56
Table 49: Opportunities for broiler production in Bihar state
Species Northern zone Central zone Southern zone
Broiler
Chicken meat is now an acceptable commodity by many, demand is growing, provides opportunity for employment (skilled and unskilled people), labour is easily available, chicken meat a priority in government development scheme, feed ingredients for chicken-feed processing are available
Table 50: Key strategies to address challenges to broiler and layer production in Bihar state
Category
Animal health
Establishment of poultry health care centres and provision of poultry experts/eld vets in every district of Bihar, mass awareness regarding high -threat diseases among poultry farmers, regular vaccination and proper management, maintenance of high-grade biosecurity, provision of appropriate vaccines as required, timely identication of exposure to diseases
Genetics/ breeding
Use tested breeds of broiler chicken, set up a research institute for chicken breeding at state level
Extension
Skilled manpower required—training on management and MThnical support, awareness, control and regulations need to be established, MThnical knowledge provision to farmers, establish training institutes at regional directorate level
Table 51: Complementary success requirements for broiler and layer production
Category Complementary success requirements
Feed Check indiscriminate use of antibiotics and growth promoter in poultry feed for healthier consumption qualities
Animal health Awareness of farmers about strict biosecurity measures and ensure implementation
Extension
Establishment of government/co-operative /public and private mode poultry farms at block level for education, demonstration and for distribution of chicken amongst BPL farmers
Genetics
Advance the use of Ross and Cobb varieties of broiler chicken
Table 52: Challenges to layer production in Bihar state
Category
Feed No private layer feed manufacturing plant, COMFED is the layer feed provider
Animal health Increased construction of layer farms but no poultry animal health facilities in
line with the expanding layer farms, avian inuenza is a big threat for all poultry
Genetics/breeding Limited choice of layers
Table 53: Opportunities for production of layers in Bihar State
Species Northern zone Central zone Southern zone
Layer
Potential for increasing production—growing number of restaurants, cafés and pastry shops, government promotion ‘one egg a day—keep the doctor away’, 90% of eggs presently come from out of state—boosting egg production means making Bihar self-sufcient

The Bihar Livestock Sector Analysis 57
Table 54: Key strategies to address challenges to broiler and layer production in Bihar state
Category
Animal health
Establishment of poultry health care centres and provision of poultry experts/eld vets in every district of Bihar, mass awareness of high-threat diseases among poultry farmers, regular vaccination and proper management, maintenance of high grade biosecurity, provision of appropriate vaccines as required, timely identication of exposure to diseases
Genetics/ breeding
Use tested breeds of broiler chicken, set up a research institute for chicken breeding at state
level
5.5 Pig and pork meat value chains improvement strategies
In India, the eastern and northeastern regions of the country comprise around 63% of the pig population 18(Pig330.com, 2016). According to the same study, the highest pig population is in the state of Assam (16.3
lakh) followed by Uttar Pradesh (13.3 lakh), Jharkhand (9.6 lakh), Bihar (6.5 lakh) and West Bengal (6.5 lakh).
Pork production is concentrated mainly in the states of Uttar Pradesh (30%), followed by northeastern states
(25%), Bihar (15%), West Bengal (6%), Karnataka (4%), Jharkhand (4%) and Kerala (3%).
19According to an all India study by the Global Agricultural Information Network (USDA, FAS, 2016), the sector 20is also constrained as most of the pig farmers belong to the lower socio-economic strata (Seth et al, 2014)
and undertake pig farming as a livelihood rather than scientic pig farming with improved foundation stock,
proper housing, feeding and management. Pig husbandry in India is an occupation for ST and OBC; status
regarding livestock ownership at the national level suggests that pig production is an economic activity 21dominated by marginal and smallholders (NSSO 2003)
Table 55: Challenges to pig production in Bihar State
18 https://www.pig333.com/latest_swine_news/pork-production-in-india_11587
19 https://gain.fas.usda.gov/Recent%20GAIN%20Publications/Pork%20-%202016_New%20Delhi_India_7-21-2016.pdf
20 See also http://www.rseeudaipur.org/wp-content/uploads/2014/08/14-Pankaj_Se.pdf
21 The National Sample Survey Organization (NSSO), since its inception in 1950, has played a major role in providing the socio-economic data needed—from all spheres of life—to formulate a vibrant plan for social and economic development.
Category
Feed
The corn feed needed to raise quality pork is not grown cost efciently to sustain domestic pig herds
Animal health
The health status of pigs is poor;
disease outbreaks often devastate local pig populations
Genetics/
breedingLow productivity of local breed, lack of suitable pig breeds for commercial meat production according to the Bihar weather and climate
Table 56: Opportunities for pig production in Bihar state
Species
Northern zone
Central zone
Southern zone
Pig/pork
-Prolic breeders, income opportunities
for small and landless farmers, unemployed educated or uneducated young people and for rural women -Growing level of awareness about the economic value of pigs like other domestic livestock animals
-Livestock keeping—especially pig keeping is integral to the majority of tribal people’s way of life -Increasing per capita income, urbanization and changes in lifestyle and food habits might contribute to demand for pork

The Bihar Livestock Sector Analysis 58
Table 57: Key strategies to address challenges in pig production in Bihar state
Category
Feed Raise awareness of proper feeding and management, establish feeding methods
Animal health Establish state level department on piggery, technical support, awareness, and training directed at producers and vet service providers, strengthen the preparedness of relevant government health institutions
Genetics/ breeding
Upgrade the current breed of pigs and pursue crossbreeding, import suitable breeds and encourage commercial piggeries
Marketing and processing
Promote preparation and consumption of pork, establish abattoirs and processing plants
Extension Establish a model farm with training facility
5.6 Post-production improvement strategies
Table 58: Post-production opportunities, challenges and intervention strategies for dairying
Northern zone Central zone Southern zone
Opportunities
Condensing plants for ease of transport of milk to Central zone, explore food ingredient business for baking and confectionary, access to markets of Bangladesh, Nepal and northeast India which are milk decit and are in close proximity to Bihar
More urbanization and educational hub
Use of the tourism circuit to promote ultra-high temperature pasteurization
(UHT)/cheese/yoghurt through specialized retail stores
New trends in food for the younger generation, cheese, UHT milk, yoghurt, introduction of new and consumer-friendly retail packs and probiotics
Challenges
Low urbanization Monopoly of COMFED Low productivity, poor milk collection system
Access to nance, availability of uninterrupted power supply, chilling at source to improve the quality of milk, lack of cold chain infrastructure
Intervention strategies
Collection system
Bulk milk chilling units (BMCU) and automation of milk collection at the village level with SMS- based mobile payment system Creation of new milk- producer societies and district unions
Separate collection of milk by species to convert to VA products—additional costs only for separate transportation to dairy plants
Improve the milk transportation from collection points through refrigerated/insulated tankers
Processing
Establish milk condensing plants for ease of transport and cheese plants for production of mozzarella and feta cheese
Establish
processed cheese plant
Additional processing facilities to improve procurement and processing, 100,000 Litres per day plant and additionally enhance capacity
Sales and retailing
Establish customs and formalities agents for milk products in northeast states and seek export permissions from the National Dairy Development Board to access Nepal and Bangladesh markets
Creation of seamless cold chain for product movement
Improvement of quality standards of products
Promotion of local products helps local farmers and adds to state GSDP
Introduction of new packs and products

The Bihar Livestock Sector Analysis 59
Table 59: Post-production opportunities, challenges and intervention strategies for buffalo meat and skins
Northern zone Central zone Southern zone
Opportunities
Natural habitat for people rearing buffalo hence high buffalo population, farmers more commercially oriented due to green fodder, dry fodder and labour availability
Market for buffalo meat exists in Middle East and Far East and buffalo hides are in demand due to its hard surface texture for use in upholstery and footwear
Challenges
Lack of awareness on alternative feed resources and hence limited organized system for animal pooling and block-level model for fattening
Limited market access due to lack of transportation and market information from village to abattoirs
Lack of advisory services at local level
No organized local market for buffalo due to religious beliefs
Lack of collection and pre-processing facility for hides and skins
Intervention strategies
Collection system
Formation of feedlot co-operative societies and work in partnership with COMFED for awareness regarding better upkeep of animals
Establish transport system for large ruminant movement to avoid middlepersons in the value chain of the supply chain
Establish a market information system to provide timely price/market information and implement a live weight meat pricing system with minimum support price (MSP)
Strengthen private sector engagement in the buffalo value chain and in boosting export of buffalo meat
Revitalize the livestock extension centres in Bihar to train producers on small-scale technology in value addition for hides and skins
Processing
Invite private investments into small and medium abattoirs to support already established large meat processing plants in the Forbesganj area
Additional hide and skin processing tanneries to be established
Sales and retailing
Participate in the Agricultural and Processed Food Products Export Development Authority sponsored food trade shows to create interest
Departments of Industry and DAFR to develop/establish export market for buffalo meat
Create optional retail/catering system for consuming buffalo meat or carabeef especially in the tourist circuits in association with the Department of Tourism
Complementary success factors
Modernization of existing abattoirs
Strengthening of livestock markets and market information systems
Incentivise private investments that work on value chain development on the supply side
Develop a state-wide market intelligence system for the livestock sector to assist in realistic planning at the micro and macro levels going forward without disturbing the current scenario
Table 60: Post-production opportunities, challenges and intervention strategies for goat meat
Northern zone Central zone Southern zone
Opportunities
Big demand for goat meat, northwestern Bihar people engage in goat trade including bulk purchase from other states and Nepal, need to diversify for income generation, labour availability
More urbanization and literacy, more awareness on the value of concentrate as supplement, availability of market
Favourable topography and conducive environment, a high
proportion of landless interested in goat rearing
Opportunities
Women play a major role in goat rearing and management, medium and large producers can contribute more in production of goats and they can become entrepreneurs in the eld of goat rearing

The Bihar Livestock Sector Analysis 60
Northern zone Central zone Southern zone
Challenges
Unorganized goat market (inappropriate engagement by middleperson), lack of timely price/demand information, price of goat on visual determination rather than weight
Lack of modern abattoir facilities
Poor funding and insurance facilities
Lack of package of practices for goat rearing
Limited access to animal health centres and vets due to longer distance
Lack of strategic planning to produce large number of marketable goats in peak season
Lack of infrastructure for processed meat market
Intervention strategies
Collection system
Create live animal market infrastructure at each block level and encourage goat co-operative/self-help group (SHG) models at the village level
Existing infrastructure of agricultural markets could be used by allotting space on rental basis
Development of community animal extension workers (Pashu Sakhi) and
working with JEEViKA to create SHGs for market linkage of producers with processors
Link farmers with big buyers and reduce engagement of middlepersons
Introduce weighing system in pricing
Processing
Modern abattoirs for export of meat
Farmer entrepreneurship development for processing of goat meat
Use of by-products of goats (milk and manure) which give better income to the goat rearers
Develop community owned processing unit or cluster approach of processing units to support the export houses
Sales and retailing
Organized marketing facilities, digital marketing platform
Cold chain
Halal certication to full religious beliefs
Meat cuts/product packs and promotion
Ready to eat meats and sausages/shawarma concepts
Complementary success factors
Support of goat-rearing groups and provide support to strengthen the community institutions through public-private partnership (PPP) as well as NGOs
Development of short-term training programs on goat entrepreneurship development and scientic goat rearing practices
Promotion of goat meat in trade shows
Increase the coverage of goat animal health and management related services 24/7 via use of community-based animal health workers
Government support in infrastructure development
Encourage community institutions
Private sector to play key role in the goat processing value chain
Table 61: Post-production opportunities, challenges and intervention strategies for chicken meat and eggs
Northern zone Central zone Southern zone
Opportunities
Backyard
Not much commercial farming
Access to markets
Labour availability
Availability of maize for feed, disease resistant local birds, natural rearers (northeast), large number of landless farmers with potential to rear chickens, readiness of women to diversify for additional income
More urbanized Some commercial operations in both multiplication and out growing
Availability of feed plants, suitable climatic conditions as compared to Northern and Southern, easily available market (demand is growing)
Suitable for commercial farming Feed plants available
Tourist destination
The tribal community people in the south are more adaptable to BYP compared to Northern and Central, coloured birds preferred for ceremonial and cultural purposes of tribal families

The Bihar Livestock Sector Analysis 61
Northern zone Central zone Southern zone
Broiler
Chicken meat is an acceptable commodity by all, considerable demand exists, provides opportunity for employment (skilled and unskilled people), labour easily available, chicken meat a priority in government development scheme, feed ingredients for chicken feed processing are available
Layer
Potential for increasing production—growing number of restaurants, cafés and pastry shops, government promotion ‘one egg a day—keep the doctor away’, 90% of eggs come from out of state—boosting egg production means making Bihar self-sufcient
Challenges
Flood prone
Unorganized marketing system
MSP not xed
Lack of processing facilities
Limited number of training centres at district level (only 3 out of 38), lack of adequate knowledge of housing to prevent ood damage
Interference by middlepersons, lack of processing facilities
Limited number of training centres at district level (only 3 out of 38), lack of adequate knowledge of housing
Drought prone
Unorganized marketing system
MSP not xed
Lack of processing facilities
Unavailability of training centres at district level (only 3 out of 38), lack of adequate knowledge of housing
Broiler/layer
commercial model
Unorganized market and dominance of middlepersons, demand uctuation by season (wedding and festival), very poor commercial poultry production, unorganized market and dominance of middlepersons, demand uctuation by season (wedding and festival), few training institutions in Bihar (Patna, Bhagalpur and Muzaffarpur), lack of skilled labour and management force
Intervention strategies
Organized marketing system, organizing producers into co-operatives, establish market information system, establishment of poultry processing plants (three in each zone), farmers work in SHGs and form a co-operative for proper marketing
Training facility at district level, weekly visit by poultry expert at block level, establish training centre at district level, awareness about appropriate housing during ood period
Collection system
Establish a government-regulated chicken marketing system for the entire supply chain for eggs as well as chicken
Provide necessary support on Day Old Chicks (DOC)
as well as feed and feed ingredients
Coordinate with National Egg Coordination Committee
Processing
Establish modern abattoirs with processing facilities for VA chicken products
Advance hygienic meat processing practices in the retail trade with cold chain facilities
Explore option of egg processing to ensure availability for food processing industry development as well as meet the needs in times of shortages (oods/drought etc.)
Sales and retailing
Promotion of processed chicken meat, promotion for awareness, control and regulations to prohibit unhygienic practices in chicken shops
Complementary success factors
Skilled manpower required—training on management and technical support
Create training institutes at zonal/district level for providing technical knowledge to farmers
Encourage private participation by allotting lands and ensuring access to nance
Feed and feed additive availability

The Bihar Livestock Sector Analysis 62
Table 62: Post-production opportunities, challenges and intervention strategies for pork
Northern zone Central zone Southern zone
Opportunities
Prolic breeders Income opportunities for the small and landless farmers, unemployed educated or uneducated young people and for rural women Growing level of awareness about the economic value of pigs like other domestic livestock animals Majority tribal population, livestock keeping—especially pig keeping—is integral to their way of life. Increasing per capita income, urbanization and changes in lifestyle and food habits might contribute to demand for pork
Challenges
Limited information on national investment on pig production, limited availability, poor quality and high price, low consumption of pork because of religious prohibitions, the movement of frozen, chilled swine meat is limited by poor infrastructure, transportation and cold storage
Intervention strategies
Collection system
Create live animal market infrastructure at each block level and develop swine co-operative/SHG models at the village level Existing infrastructure of agricultural markets could be used by allotting space on rental basis
Sales and retailing
Create cold chain facilities for transport and retailing, promote pork products such as ham, bacon and sausage among the hotel/restaurant/café chain
Complementary success factors
Investment attractions to go into commercial pig production Boosting the consumption of pork and other processed products Ensure remunerative price to pig producers by establishing bacon and pork processing plants through private- and public-sector investment Support private small-scale meat processing plants which are mainly processing pork and pork products like sausage, bacon and ham Establish pig producers co-operative Develop infrastructure, transportation and cold storage in the state of Bihar for moving frozen, chilled swine meat to states in the northeast and Nepal in addition to urban markets in Bihar

The Bihar Livestock Sector Analysis 63
6 Priority institutions and policy constraints and
opportunities
This section provides a review of current major policy and institutional constraints, evidence and recommended
actions for selected areas of livestock production in Bihar. The review covers: animal health, animal breeding,
animal nutrition, milk (dairy), poultry (chicken), buffalos, goats, pigs, hides and skins, livestock and livestock
product marketing and processing, policy requirement for social and gender inclusion, livestock research and
livestock extension services. Many studies including major policy documents, government directives,
regulations, acts, laws, strategies and road maps and research papers have been reviewed, and the salient
issues are summarized in the subsequent paragraphs and presented in tabular form in the Annex.
6.1 Animal health
Growth in livestock production depends upon livestock protection against diseases. Despite the considerable
progress in animal health service delivery during the last two decades, there exists a high incidence of livestock
diseases, such as mastitis, vector-borne diseases, infectious diseases and emerging diseases (such as FMD, BQ,
Hidradenitis suppurativa, theileriosis and surra etc.). Inadequate doorstep services and insufcient medicines
at veterinary institutions present a big challenge to the development of the livestock industry.
Animal health service delivery is constrained by inadequate infrastructure such as diagnostic facilities in the
veterinary dispensaries and manpower, inadequate PPPs, low adoption of technologies and Good
Management Practices (GMP) and prevalence of uncertied practitioners, lack of adherence to the prevention
of contagious diseases act and lack of proper compliance with vaccination protocols. Additional constraints
include lack of a system of quality control and regulation of services and an inadequate disease reporting
system. The National Animal Disease Reporting System that links the state headquarters to the Central Disease
Reporting and Monitoring Unit at New Delhi is currently operating but it needs improvement and proper
monitoring.
The main approaches to the further development of the commercial livestock sector include providing an
enabling environment to encourage the private sector to operate in rural areas through provision of incentive
packages, preparation of a policy statement providing for cost sharing for prevention and control of diseases of
economic importance, support and strengthen PPP in delivery of animal health services, resolve the
administrative constraints that inhibit the launch of mobile clinics, establish a system that ensures quality control
and regulation of services and properly train and equip the eld staff to directly communicate livestock disease
data to a central (state headquarters) monitoring unit.

The Bihar Livestock Sector Analysis 64
6.2 Animal breeding
Much like the animal health services, breeding services are predominantly a public service provided through
the Bihar Livestock Development Agency and COMFED. Apart from the government, some NGOs and private
service providers also provide limited breeding services. More engagement of the NGOs in breeding services is
restricted due to stringent government guidelines and privatization of AI services lacks proper monitoring and
assessment.
The state has a breeding policy that covers all geographic regions, focuses on specic breeding issues,
recognizes the importance of research institutes and includes a uniform curriculum on AI training. However, the
policy doesn't encompass a regulatory authority to govern the use of germplasm and an institutional framework
for implementation of a regulatory framework, including a strategy on monitoring AI, nor does it establish an
animal identication authority or mention climate change adaptation strategies.
Key breeding concerns include a lack of adherance to breeding policies as well as inbreeding due to
inappropriate semen allocation and monitoring. Poor heat detection and insemination skills as well as poor
infrastructure are other constraints that lead to a high incidence of repeat breeding, an irregular supply of liquid
nitrogen and ultimately poor semen quality.
The recommended policy action includes revisiting the breeding policy, privatization of AI services, reinforcing
the genetic improvement, encourage PPPs, develop a breed standard and initiate herd/ock books for existing
local breeds, provide extension services and training to farmers, establish an identication, registration and
performance testing system for purebred animals, and ensure adequate expertise and infrastructure and
establishment of livestock breeders' associations and societies.
6.3 Animal nutrition
Adequate and balanced availability of feed and fodder is a prerequisite for increasing livestock production in
Bihar. Crop residue and by-product of crops are the main sources of fodder for most livestock, however goats
are generally maintained on tree leaves and grazing. There exists a huge gap between demand and supply of
both dry and green fodder. Although the feed constraints in terms of quantity and quality are critical constraints,
there is also insufcient land to produce the required quantity of cultivated feeds. Additional constraints include
inadequate technical support services, inadequate fodder storage facilities, unorganized and informal fodder
markets and an inefcient fodder transport system.
The government has an active role to play in making land available for feed production, establishing feed
quality standards and monitoring, regulating forage seed markets and supplying high yielding multi-cut forage
varieties, and establishing policies, regulations and incentives to support private-sector investment in animal
feeding. The government's role also includes the improvement of feed marketing and supply channels by
strengthening animal feed factories and distribution selling points, the support of community fodder banks and
technologies, and the provision of training, extension and professional education to farmers.
6.4 Dairy
The dairy industry in Bihar has been growing and steady growth in milk production has been registered in the
past years. However, to meet the growing milk demand for the growing population of the state, the dairy
industry needs to enlarge considerably and produce more milk. The development of the dairy industry still
requires strong support services, providing better breeding, improving animal health and feeding inputs to milk
producers. This necessitates encouraging investment by private sector dairy processors and strengthening of
institutions that provide necessary support; PPPs also need to be strengthened.

The Bihar Livestock Sector Analysis 65
Efforts also need to be geared towards ensuring quality and monitoring of AI operations, building skills of milk
producers, expanding the co-operative networks and conducting milk production and demand surveys. Better
organization of the milk collection, distribution and processing facilities, and input into building the
organizational and institutional capacity of dairy co-operative societies (DCS) remain priorities.
The policy actions will consist of strict enforcement of the breeding policy, enhanced capacities for policy
implementation, strengthen monitoring of the AI operations, improve the capacity of the AI service delivery
through capacity building programs and PPP, strengthen quality control and carry out education campaigns for
all intervening parties on improvement of the quality of milk and dairy products, increase the capacity to
process milk and reinforce the marketing chain for the output and, lastly, reinforce and strengthen DCS.
6.5 Poultry
The poultry development program envisages to strengthen poultry, meat and egg production in the state. It is
imperative to establish more layer and broiler poultry farms to enhance the availability of eggs and meat in the
state. The poultry industry in Bihar has a promising future, but currently it is constrained by inadequate
availability of feed resources, poor quality of feeds, limited research in improving local breeds of chicken,
inefcient marketing system, inadequate processing facilities, inadequate technical support services, lack of
basic infrastructure such as storage and transportation, lack of proper assessment of investment options and
inadequate access to credit.
Recommended policy measures include strengthen quality audit and compliance of commercial feeds,
encourage private investments, reinforce the strategic plan for developing commercial chicken, strengthen the
capacity of research scientists (chicken nutrition and health) and support staff, and improve credit access to
farmers and other actors in the value chain. Additional policy actions include strengthen facilities for hygienic
meat processing and preservation of eggs, develop reliable and stable market chains year-round for marketing
of poultry products and support formation of producer co-operatives/associations and rural market yards.
6.6 Buffalo
The buffalo industry is one of the fastest-growing livestock industries in Bihar. It contributes to about 38% of the
milk and 36% of the meat production of the state. The development of the buffalo industry is constrained by
insufcient supply of dairy buffalo stock, inadequate buffalo breeding services, inadequate feed supply and
inadequate support services. Other constraints include inadequate nancial and credit facilities, inadequate
milk collection and distribution centres and inadequate abattoir and processing plants. The poor sanitary and
phyto-sanitary conditions are also considered to be one of the major constrains in realizing the export potential.
The policy recommendations consist of strengthening support services, providing better breeding, health and
feeding services, encouraging the private sector, building skills of milk producers and expanding the co-
operative networks. In addition, enhancing the organization of the milk collection, distribution and processing
facilities and building the organizational and institutional capacity of DCS and improving credit access by
farmers is crucial.
6.7 Goats
In Bihar, goats are mainly reared by women, and landless and marginal farmers (in smaller ocks). The goat
sector is largely neglected in policy terms. There is no formal institutional mechanism for providing services to
this sector. Currently, the sector is constrained by poor health service coverage, lack of effective common

The Bihar Livestock Sector Analysis 66
property resource (CPR) policies, lack of regulation for vaccine quality control, inadequate extension, no formal
mechanism for credit and inadequate marketing of goats at farmer level, village level and urban areas.
Proposed policy actions include develop a policy for the small ruminant sector focusing on critical issues such as
health services, breeding issues, common property resources, and producer associations for marketing
linkages. Additionally, establish institutional mechanisms for providing services and regulating quality control
and improve access to credit by goat farmers.
6.8 Pigs
Despite Bihar's potential in pork production, pigs are managed by small and marginal livestock keepers with
very low inputs. The development of the pig industry is limited by low genetic potential of existing stock,
inadequate breeding services, prevalence of animal diseases, poor nutrition and inadequate support services.
Other constraints include low sanitary inspection at all stages of the value chain, inadequate infrastructure,
poor marketing system, low consumption of pig meat, lack of extension and lack of information materials.
The policy response will need to consist of establishment of a breeding improvement program to improve the
genetic potential of local pigs, enhancing health care and nutritional management, strengthening livestock
market price and related information, strengthening sanitary inspection regulations, encouraging farmer
organizations, increasing extension services delivery through farmers associations and supporting existing
farmer organizations in the establishment of farmer eld schools (FFS), farmer to farmer extension and study
tours.
6.9 Hides and skins
Hides and skins are important by-products of livestock that provide major input to the industrial sector and can
contribute signicantly to farmer incomes and foreign exchange earnings. Despite the large population of
Black Bengal goats and other livestock species in Bihar, hide and skin production is very low. Few private
tanneries are presently operational in Bihar. These tanneries suffer from lack of modern efuent treatment
plants and irregular power supply. Additionally, the quality of hides and skins retrieved from abattoirs is usually
poor due to improper skinning, preservation and skin processing.
The recommendation, therefore, is to encourage the private sector to build leather processing plants to take
advantage of the large population of Black Bengal goats in the state, give necessary attention to updating and
reinforcing the processing regulations on hides and skins, encourage proper branding, aying, preservation
and storage of hides and skins, encourage trading of hides and skins according to grades, strengthen
marketing information and support services, boost investment in processing facilities, provide credit facilities,
set standards for upgrading abattoir facilities and strengthen guidelines for skin processing, efuent treatment,
and environmental standards.
6.10 Livestock and livestock products marketing and processing
Demand for livestock products, both in terms of quantity and quality, is expected to increase in the future.
However, the marketing and processing systems of the livestock sector remain relatively unorganized, possibly
leading to high transaction costs for the smaller players. Investment in gaining access to growing urban markets
and processing of dairy and meat products will be critical. Given the very small marketable surplus of individual
households, it is necessary to build institutions that vertically integrate small and scattered producers with dairy
and other product processors. Co-operatives, self-help groups and other forms of collective action need
considerable support to improve efciency and facilitate commercialization of smallholder dairy.

The Bihar Livestock Sector Analysis 67
Public sector encouragement of private investments in meat processing and marketing will support and ensure
fair competition in the market. Subsequently, standards need to be established to improve the quality of
livestock products and hygienic practices that meet the sanitary and phytosanitary specications for export.
It is also imperative to increase farmer awareness about the importance of quality and hygiene standards
through extension and communication campaigns. Identication of real marketing bottlenecks and critical
areas of market development through a good livestock market information and research system would be very
helpful in encouraging market competition. Finally, setting, monitoring and certication of standards by a
competent authority will become increasingly important as retailing of poultry and other meat products starts to
consolidate and modernize into managed outlets and retail chains.
6.11 Policy requirements for social and gender inclusion
To achieve a livestock sector in Bihar, to which both men and women, and ST and SC, contribute and benet an
equitably will require a more thorough policy review, analysis and documentation. As has been mentioned in
Section 3, both women and ST/SC are integral players in the livestock sector and will be for some time to come.
This makes it paramount that policies align to ensure effective opportunities and rewards for both women and
men, including from ST/SC, their households, communities and the state.
22An initial and important policy entry point will be to ensure the access and control by women and ST/SC of
resources for livestock production. This includes appropriate policies to give access to credit to utilize animal
health care, feed and good genetic stock, information to support more modern production, land tenure policies
to be able to expand production, and markets for attractive returns. These issues are often within a wider context
and will affect the livestock sector for most producers; however, if we are to engage women and ST/SC more,
these issues will need to be addressed.
At the public institution level, general recommendations on gender inclusion include ensuring that gender and
social inclusion are mainstreamed in all departments related to animal husbandry and production. To support
this there are four main areas of work: 1) developing a gender and inclusion strategy to guide the departments
and partners to address gender and inclusion issues, 2) raising awareness and training eld staff on gender-
inclusive interventions based on evidence, 3) developing the capacity to perform gender and social inclusion
research to provide an evidence base and 4) developing the appropriate interventions and setting up a
monitoring system to understand how proposed interventions differentially impact women and men, ST/SC and
others, in terms of labour, income and livelihoods options.
To realize this will require institutional support in the form of dedicated approaches and resources from a variety
of partners (government, NGOs, women's groups, research and private sector) to be developed in a
gender/social inclusion action plan. Areas that need to be considered include: 1) a dedicated gender budget
for staff, research and activities, 2) leadership and engagement at state level to support this type of work
through policy and public support, 3) recruitment of capable gender experts to support the development of the
strategy and the action plan, 4) development of the appropriate gender indicators to ensure accountability and
progress, and 5) grants to pilot and showcase innovation for gender-appropriate approaches.
Linking the development of the livestock sector with gender-policy tools already available in Bihar, specically
the women's development co-operation, would also be a good entry point. This would require a dedicated
22 Information for this section was based on secondary literature and key informant interviews with the following organizations: Professional Assistance for Development Action, Aga Khan Development Network, BAIF, National Bank For Agriculture And Rural Development (NABARD), and Bihar Agriculture & Extension Training Institute.

The Bihar Livestock Sector Analysis 68
effort as they are now in different sectors. Bihar already supports certain reservation policies, including 35%
women for public distribution system food shops, 35% for women-only dairy co-operatives (although only 22%
of women are registered as members from both mixed- and women-only dairy co-operatives), 50% for women
in Panchayat Raj institutions and 35% reservation for women in state government jobs.
Policies are also needed to support nutrition sensitive agriculture, along with nutritional or health institutions
and the livestock development department to work together for nutrition improvement of marginal
communities. Introduction of a mid-day milk and egg program will boost protein consumption for
marginalized community children, which will reduce malnutrition.
Dairy (cows and buffalos)
Within the dairy sector, pursuing policies and entry points to ensure increased engagement of women in co-
operatives, preferably women only co-operatives, could provide women with better control of the income from
milk sales. Overall, women need to be supported to become more effective leaders of farmers' groups, besides
village-level groups. This could be achieved by supporting training for women on handling accounts and milk
quality standards, supporting gender inclusive by-laws, and members' education. Setting targets will facilitate
progress assessment, for example: an increase from 22% to 60% women members and a goal of 50% women
leaders.
Other activities to support gender and socially inclusive development are for more women extension workers to
be employed in COMFED co-operatives and other programs for enhanced communication to women farmers,
as there are communication barriers between men and women due to cultural and gender norms. Special
training or extension work for marginal or SC/ST communities are also required as there are social and cultural
barriers preventing women from all castes working together. Credit systems for women and SC/ST without
collateral assets could be made available, including a group-based credit system for women-producer groups.
Small animals (goats/BYP/pigs)
Like small ruminants, poultry and pigs are important assets for developing social inclusion, which therefore
require different policy support mechanisms. Women and marginal communities lack capital for investment
and feed purchases as well as political capital for policy lobbying. Establishment of a feed security bill could
enable land owners to sell feed to landless livestock keepers for intensive production where labour is abundant
enough.
Other aspects to focus on include support of women producer groups and federations for inputs and service for
goats, BYP and pigs for marginal communities. Training and extension work in marginal or SC/ST communities
to address social and cultural barriers could encourage women of all castes to work together. Credit systems for
women and SC/ST without collateral assets could be made available (for example, a group-based credit system
for women producer groups). Given that most small animals are cared for by women at least partially due to
high migration by men, women could be supported as community-based animal health workers, especially for
small animals. Weather-based small animal insurance in ood-prone areas is needed, targeting women. Small
animal development (pro-poor) policies especially for goats, BYP and pigs could encourage gender and social
inclusion. A forum for sharing of knowledge between NGOs and government agencies could also aid in
fostering inclusionary policy development.

The Bihar Livestock Sector Analysis 69
6.12 Livestock Research
The development of the livestock sector requires adequate investment in research, education and training to
generate and disseminate new technology, inputs, services and institutional options. Presently, there is
inadequate operational resources and the share of animal sciences in total agricultural research staff and
expenditure remains low. Most of the livestock research is skewed towards milk production and is disciplinary
oriented, while most problems are multidimensional. The research-extension link has rarely absorbed
feedback from farmers and extension staff and the link between research and extension remains weak which
results in inadequate packaging and dissemination of research outputs. Moreover, there is a lack of adequate
coordination among various agencies collecting statistics, which creates unnecessary overlaps and gaps.
Some of the policy actions required are development of multidisciplinary systems-oriented livestock research
that must include all stakeholders, encourage research, training and extension linkage and platforms, capacity
building for research scientists including animal scientists and promote PPP for infrastructure investments.
6.13 Livestock extension services
Most of the livestock extension is conducted by the Bihar Animal Husbandry Department, which has neither the
resources or the expertise to adequately conceive and operate technology transfer packages. There are
attempts to provide livestock extension services through co-operatives, NGOs and research institution-
afliated programs like Krishi Vigyan Kendra, however the coverage of, and access to, these agencies is limited,
both in area and content. The Agricultural Technology Management Agency (ATMA) approach has attempted to
coordinate agricultural extension, yet very few of the ATMAs have embraced livestock extension activity. Within
livestock extension, services are primarily focused on milk production, neglecting other roles of livestock, and
concentrated in higher potential areas.
The main constraints in extension service delivery include low allocation of public or private funding to livestock
extension services, low private sector involvement, lack of appropriate livestock extension systems and
inadequate access to information on animal husbandry, weak research-extension linkages and insufcient
extension expertise.
To improve livestock extension, service delivery needs to be expanded to include all livestock species and
support utilization of the fund allocated to Bihar under the centrally sponsored program, including Rashtriya
Krishi Vikas Yojana. There is also a need for strong partnerships between the public sector, private sector, local
and international NGOs, farmer organizations and research and education agricultural institutions. Besides
sufcient expertise both in quantity and quality, research-training-extension-farmer linkages and adequate
infrastructure and facilities are important for efcient livestock extension service delivery.

The Bihar Livestock Sector Analysis 70
7 Foresight assessment of intervention options
7.1 Cow dairy improvement
The investment context
Cow dairy is the most important commodity value chain of the livestock sector of Bihar. It contributes 35% of the
GSDP and 11% of the agricultural GSDP (LSIPT results and Bihar, Directorate of Economics and Statistics,
2016). Fifty-seven lakh households own cattle and directly depend on the dairy sector for their livelihoods
(MAFW, 2017) and many more households make their leaving along the dairy value chain. Cow dairy
production (including both indigenous and crossbred cattle) is found in all areas of the state. As such, the
proposed cow dairy improvement interventions will target the whole state for both indigenous and crossbred
cattle. The cow dairy improvement interventions include improvements in the genetics and feeding of animals,
health and extension service delivery, marketing and processing of milk and milk products and research. The
foresight assessment for these improvement interventions is done in three scenarios.
• Business as Usual (BAU) scenario - Represents the base case scenario (no additional investment or any
change in the types of investment) with the analysis showing the impacts of continuing the current type and
level of investment and recurrent spending on milk production and contribution to GSDP throughout the
LSA analysis period of 15 years.
• With Intervention-1 (WI-1) scenario – Crossbreeding of cattle and buffalos are both emphasized, but cattle
given priority, along with improving the productivity of all cattle and buffalos (including indigenous ones).
Crossing of local cows increases the number of crossbred cattle, thus enabling the population of crossbred
cattle to increase while the number of indigenous cattle decreases. The population of buffalos, both locals
and crosses also increases. This scenario is aimed at meeting the milk consumption requirements of the
state in the 15-year LSA period.
• With Intervention-2 (WI-2) scenario – Crossbreeding of cattle with exotics is de-emphasized, while
crossbreeding of local cows with improved local cows (i.e., Sahiwal and Gyr) is given priority and
improving the productivity of both through complementary feed and health interventions. Crossbreeding
with improved local cows enables the local cattle population to increase while the number of crossbreds
remains constant. This scenario is aimed at exploiting the resistance traits of indigenous cattle breeds to 23disease, inadequalte feed and heat stress and satisfying growing demand for A2 milk.
23 A2 milk is the milk that contains only the A2 type of beta-casein protein whereas A1 milk contains only A1 beta casein or A1 type variant. A1 protein variant is commonly found in milk from crossbreds and European breeds of cattle. A2 milk is found in the indigenous cows and buffalos of India (and Asia as a whole) (Prasanta B. et. al., 2016).

The Bihar Livestock Sector Analysis 71
WI-1 scenario
Cow dairy improvement interventions and targets
Genetics
• The number of AI performed during 2017–18 (27.96 lakh) is targeted to increase to 50 lakh per annum by 242022–23, 85 lakh by 2027–28 and 110 lakh by 2032–33. The AI will use semen of both crossbred and
improved indigenous cattle breeds.
25• Currently, Bihar has one semen production centre (under the Department of Animal Husbandry (AH)). The
target is to add three new semen production centres with a capacity of about 50 lakh straws per year every
ve years until 2032–33, providing four semen production centres at the end of 15 years.
• Nine liquid nitrogen cryovessel storage plants are found in Bihar out of which four are currently functional.
In the coming ve years, it is targeted to rehabilitate the existing plants by 2022–23 and then build three
additional cryovessel storage plants by 2032–33.
• There are three liquid nitrogen production plants in Bihar of which none are functional. In the coming ve
years, the targeted goal is to rehabilitate the existing plants and by 2032–33 build three additional new 26liquid nitrogen production plants, each with a capacity of 1,000 litre/hour.
• Currently, two cattle breeding farms exist (managed by AH; of which one is not functional). The goal is to
strengthen the existing farms and establish two new ones by 2022–23 and four more new facilities by
2032–33.
• In Bihar, there are 1,476 AI centres which are managed by AH of which 800 are functional and another
3,280 private/NGO AI centres. The goal is to restore existing centres and establish 500 new ones by
2022–23, another 1,000 or more by 2027–28 and an additional 1,000 by 2032–33. These AI centres will 27cater to both cattle and buffalo and serve as 'aid' and extension service delivery centres.
• Currently, there are three frozen semen banks of which two are not functional. The targeted goal is to make
the inoperative semen banks functional and increase the banks to ve (two additional by 2032–33).
• The per cent of sexed semen/sex xer use compared to total insemination in Bihar will reach 20% by
2022–23, 30% by 2027–28 and 35% by 2032–33.
• To speed up genetic gains, the use of embryo transfer will be supported.
• Due to the improvement in the AI service, the population of crossbred cattle is expected to increase while the
indigenous cattle population is expected to decrease.
• The annual population growth rate of crossbred cattle for the coming 15 years of the LSA (2018–19 to
2032–33) is expected to be lower than the growth trend observed between the 2007 (18th) and 2012
24 Assumptions include: per cent of adult females=58% for cattle and 48% for buffalo; the parturition rate=50% for cattle and 45% for buffalo; and number of repetitions=2.25 This semen production centre is already under construction.26 Liquid nitrogen tank with capacity of 21 litres handles 1,000 straws, used for 100 days, with an evaporation rate of liquid nitrogen=100 millilitres per day27 Assumptions include: one AI centre serves 1,500 breedable cattle
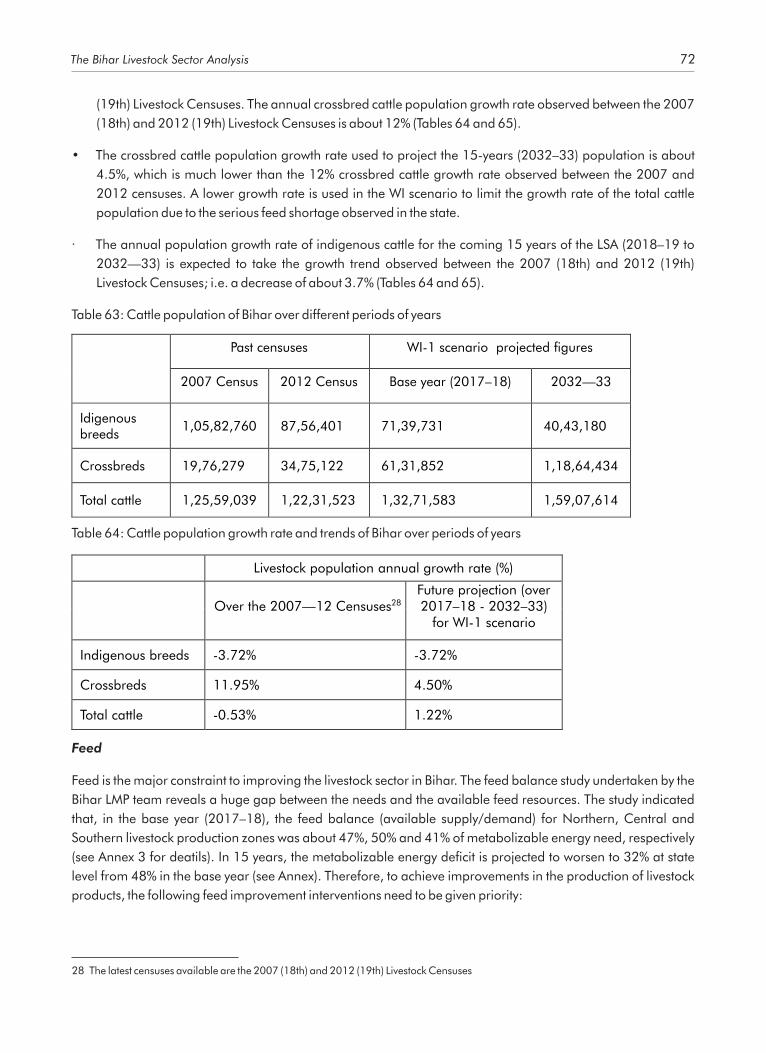
The Bihar Livestock Sector Analysis 72
(19th) Livestock Censuses. The annual crossbred cattle population growth rate observed between the 2007
(18th) and 2012 (19th) Livestock Censuses is about 12% (Tables 64 and 65).
• The crossbred cattle population growth rate used to project the 15-years (2032–33) population is about
4.5%, which is much lower than the 12% crossbred cattle growth rate observed between the 2007 and
2012 censuses. A lower growth rate is used in the WI scenario to limit the growth rate of the total cattle
population due to the serious feed shortage observed in the state.
· The annual population growth rate of indigenous cattle for the coming 15 years of the LSA (2018–19 to
2032—33) is expected to take the growth trend observed between the 2007 (18th) and 2012 (19th)
Livestock Censuses; i.e. a decrease of about 3.7% (Tables 64 and 65).
Table 63: Cattle population of Bihar over different periods of years
Past censuses
WI-1 scenario
projected gures
2007 Census 2012 Census Base year (2017–18) 2032—33
Idigenous breeds
1,05,82,760 87,56,401 71,39,731 40,43,180
Crossbreds 19,76,279 34,75,122 61,31,852 1,18,64,434
Total cattle 1,25,59,039 1,22,31,523 1,32,71,583 1,59,07,614
Table 64: Cattle population growth rate and trends of Bihar over periods of years
Livestock population annual growth rate (%)
Over the 2007—12 Censuses28
Future projection (over 2017–18 - 2032–33)
for WI-1 scenario
Indigenous breeds
-3.72%
-3.72%
Crossbreds
11.95%
4.50%
Total cattle -0.53% 1.22%
28 The latest censuses available are the 2007 (18th) and 2012 (19th) Livestock Censuses
Feed
Feed is the major constraint to improving the livestock sector in Bihar. The feed balance study undertaken by the
Bihar LMP team reveals a huge gap between the needs and the available feed resources. The study indicated
that, in the base year (2017–18), the feed balance (available supply/demand) for Northern, Central and
Southern livestock production zones was about 47%, 50% and 41% of metabolizable energy need, respectively
(see Annex 3 for deatils). In 15 years, the metabolizable energy decit is projected to worsen to 32% at state
level from 48% in the base year (see Annex). Therefore, to achieve improvements in the production of livestock
products, the following feed improvement interventions need to be given priority:

The Bihar Livestock Sector Analysis 73
• In the higher irrigated areas, implementing year-round forage production through the combination of
perennial and annual forages by overlapping perennial and annual forage crops in the different seasons.
This has been found to result in up to a threefold increase from the current productivity of forages (ICAR
2011).
• Mixed cropping of graminaceous and leguminous forages, when managed properly using modern soil
and crop management techniques, are able to yield 180-300 t of green fodder (30-55 MT of dry fodder)
per ha/year.
• Strengthening research related to grasslands/grazing lands/rangelands improvement and identication
of improved forage types that suit each of the agro-ecological zones.
• Including forage crops in crop sequences. Cropping leguminous forages after harvest of the main
crops/cereals will improve soil nitrogen and cereal and forage yields.
• Introducing short-duration forages in gap periods of main season crops, grown on residual moisture.
• Introducing intercrops in widely spaced row crops. Cotton, sugarcane and grain crops like maize and
sorghum offer scope for adding short-statured forage crops. Inclusion of these forage crops does not affect
row-crop production and will benet the main crop in several ways.
• Dual-purpose crops give fodder as a by-product. Farmers growing these crops (vegetables, maize,
sugarcane, etc.) get substantial amounts of fodder along with the main product.
• Cultivar releasing criteria of maize, rice, wheat, coarse grains, cereals and pulses need to give due
emphasis to the improvement of the crop residue biomass and nutritive value for animals.
• Mixed intercropping system with forage production consists of growing two or more plant species together
with different growth habits, canopy structures and rooting patterns while offering little competition.
Common mixes of crops are cereals/grasses and cereals/legumes.
• Mixed cropping of cereals/grasses with leguminous forages also have signicant impact on increasing
crude protein content of forages.
• Introducing the integration of perennial forages on bunds and boundaries. Bunds around elds are a
common feature on cultivated lands and occupy 2-10% of the cultivated area. Perennial forages like
Sesbania, hybrid Napier + Stylo, fruit trees like amla (Indian gooseberry), ber (Ziziphus spp.) and karonda
growing on the bunds and boundaries recorded maximum forage yields (ICAR 2011).
29• Improving management of communal grazing land.
• Replacing low-yielding annual grasses with high-yielding perennial grasses that are adaptable to the
prevailing conditions of each of the production zones.
• Careful preservation of the surplus production from rangelands during the rainy season will contribute to
meeting the forage requirements of the lean periods.
29 Marginal farmers—accounting for 92.35% of the total in Bihar state—on average possess approximately 0.25 ha (0–1), while small farmers—accounting for 5.48% of the total—on average possess 1.25 ha (http://agcensus.nic.in/document/agcensus2010/completereport.pdf, Ministry of Agriculture 2014).

The Bihar Livestock Sector Analysis 74
• The adoption of targeted fodder production area is planned to be 50% by 2022–23 and 80% by 2027–28
and remain at 80% in 2032–33.27,28
• The area of land under permanent pasture/grazing during 2013–14 was about 15,000 ha. The plan to
improve productivity is to oversow with improved grass and leguminous forage seeds and use of fertilizer,
where applicable. The targeted goal is to increase rehabilitated permanent pasture/grazing land to be
50% of the total permanent pasture land by 2022–23, 80% by 2027–28 and remain at 80% by 2032–33.
• Improving production, marketing and quality control of forage seeds, forages and concentrates through
strengthening existing regulatory bodies.
• The number of fodder seed production farms (now zero under AH and zero under private) is targeted to
grow from the current zero enterprises to three private enterprises in ve years.
Animal health
• Currently, there are 39 veterinary hospitals and polyclinics in Bihar. In the rst ve years, it is proposed to
strengthen the existing hospitals with various clinical experts and with diagnostic laboratories. By 2027–28,
the targeted goal is to put one veterinary hospital in each subdivision and by 2032–33 one hospital in each
block.
• The number of veterinary dispensaries is proposed to increase from the current 1,083 (MAFW, 2017) to 301,400 by 2022–23, 1,700 by 2027–28 and 2,000 by 2032–33.
31• The number of veterinary aid centres (livestock centres/mobile dispensaries) is currently about 1,595.
Veterinary aid centres will also serve as AI centres.
• Cattle currently receive vaccinations for critical diseases at the following percentages: FMD 80% (started
from 2015), brucellosis 90% (from 2017), HS and BQ 80% (historically implemented). The targeted goal is
to maintain a vaccination rate of 80% by 2022–23. The major intervention thus is to make the vaccination
campaigns more timely and improve deworming, sanitation, housing, and controlooding and drought.
• The percent of farmers who adopt the recommended rate of external and internal parasite control
treatments will reach 80% in the coming 15 years.
• Support for private veterinary service providers.
• Implementation of mastitis control and prevention technologies.
Extension
Current livestock development training centres include three: one functional in the veterinary college, one non-
functional under the training school Buxar (Bihar AH), one functional under COMFED in Patna. Training centres
with different levels of capacity will be established at different administrative levels. Regional directorate and
district level training centres may focus on training of trainers while block-level training centres will provide
education to farmers and other input suppliers.
30 Calculated based on the livestock number and assumption of one veterinary dispensary serving 5,000 animals.31 Veterinary aid centres will also serve as extension (education, input and marketing service) and AI centres and vice-versa.

The Bihar Livestock Sector Analysis 75
• Increasing the number of training centres to eight (8 or one training centre in each regional directorate) by
2022–23, 20 by 2027–28 and 38 by 2032–33. These training centres will be engines for the production of
livestock extension agents (Pashu Sakhi, agri-clinics and agro-business operators, para-vets/community
animal health workers, input suppliers, other private extension service providers and extension service
providers at co-operatives, farmer-based organizations, farmer self-help groups, telecommunication
extension service providers/operators etc.).
• By 2032–33, all of the AI centres/veterinary aid centres will also serve as extension service centres (training,
input and marketing).
• Extension service providers need to be supported through improved oversight, regulation and incentives
(input, advisory and marketing services) provided by extension departments at different levels.
• Necessary parliamentary acts, regulations, guidelines and manuals will be developed/improved in the rst
two years of this plan to help the extension services provide better outreach to farmers.
• Bureaucracy that hinders service providers' success will be identied and addressed while supporting the
ethical and responsible provision of services. Control of unregistered input, advisory and marketing service
providers is also critical for survival of the legal service providers.
32• Coverage of ongoing dairy improvement training will reach 15% by 2022–23, 40% by 2027–28 and 80%
by 2032–33. Farmers will receive more intensive and continuous training in dairy cattle management
(feeding, breeding, deworming, tick control, hygiene and milk handling and transport).
• Percentage of MCCs and milk producer associations providing dairy input supply, animal health, extension
and nancial services will increase to 80% by 2032–33.
Research
• In Bihar, the Indian Council of Agricultural Research Research Centre for Eastern Region (ICAR-RCER) is the
only central government research centre. It will be requested to increase and diversify research in the
livestock sector in Bihar.
• Three new state research centres (one in each production zone) will be established to perform research in
all of the livestock sub-sectors of Bihar.
Processing and marketing
Currently, 22,018 registered milk producer co-operative societies (MPCS) are found, of which 2,653 are
women's milk producer co-operative societies (WMPCS). The total membership of these MPCS is 11,39,000
and under WMPCS, the membership is 1,27,000. Milk collection capacity of the state for processing will 33increase from the current 13% of the total milk produced to 20% in 2022–23, 25% in 2027–28 and 32% in
2032–33.
• Increasing the functional capacity and utilization of existing MCC.
32 According to Glendenning et.al. 2010 (http://www.ifpri.org/publication/review-agricultural-extension-india) agri-clinic operators get two months training; out of the trainees, 47% did not succeed in the business in the past and served only about 500 households. We assume that a training centre will give two months training for 200 trainees/year and currently there are about 57 lakh households that own cattle.
33 Milk collection/processing capacity of COMFED and private processors is about 28.55 and 4 lakh litres/day, respectively; the total milk collection/processing capacity in Bihar is about 32.55 lakh litres/day or 3,255,000 *365=1,18,80,75,000 litres/year.

The Bihar Livestock Sector Analysis 76
• Currently, there is a capacity to process 13% of the total milk produced into various milk products
(pasteurized milk, UHT, powdered milk, ice cream, butter, ghee etc.). It is targeted that the per cent of milk 34processed will reach 20% by 2022–23, 25% by 2027–28 and 32% by 2032–33.
• Establish 21 new pasteurized milk and other milk products plants (ghee, yoghurt etc.), 11 UHT milk plants,
11 powdered milk plants and 3 ice cream production and processing plants in the next 15 years (Table 65).
• Establish new bulk milk chilling units with 5,000-litre capacity for areas more than 50 km away from milk
processing plants.
• Strengthen the capacity of milk quality and safety control laboratories.
• Provide incentives to the private sector to take part in the marketing and processing of milk.
• Strengthen existing dairy co-operative societies and establish 15,000 new MPCS in each of the rst, second
and third ve years.
• Enhance the capacity of MCCs to test milk quality (fat, protein, total solid non-fat and antibiotic residues).
• Create enabling environment to establish functional linkage between private milk traders, MCCs, co-
operatives and processing plants.
• Train farmers and cottage-scale processors on the use of small-scale technologies to create value addition
from raw milk (e.g. curd, ghee, paneer, khoa etc.).
Table 65: Targets for 15-years and 5-years breakdown of milk processing facilities
Milk processing facility
15-years targets
(# of plants)
Targets—breakdown for 5 years (# of plants)
2018–19 to 2022–23
2022–23 to 2027–28
2027–28 to 2032–33
Pasteurized milk and other milk products (ghee, yoghurt) processing plants
21 5 6 9
UHT milk processing plants 11 3 3 5
Powdered milk processing plants 11 3 3 5
Ice cream production plants 3 1 1 1
Animal and herd-level targets and assumptions for farmers adopting cow dairy improvement
interventions (to 2033)
• Parturition rate to increase from the current 45% to 50% annually.
• The sex ratio at birth of female to male will be around 80% annually for cows that receive sexed semen and
sex xer treatments (Mohteshamuddin, 2017).
• The mortality rate will decrease by 50% annually.
34 This includes milk processing plants currently under construction (ITC – 2 lakh litres/day, Mother Dairy – 2 lakh litres/day, four other private processors – 1.5 lakh litres/day and COMFED – 3.5 lakh litres/day milk processing capacity).

The Bihar Livestock Sector Analysis 77
• The current daily milk production of crossbred cattle is 6, 7, and 5.5 litres/day in the Northern, Central and
Southern zones, respectively. It will increase by an additional four litres/day in each of the production
zones. MAFW (2017) and Vaidya (2017) reported that for every litre of milk, 0.4 kg of concentrate is
required (keeping genetics in mind).
• The amount of land allocated for crossbred cattle farmers to produce forage will increase to 0.04 ha from
the current level of about 0.008 ha. The additional land allocated will be achieved through extension
education to encourage farmers' use of all available areas around houses, hedges, fences etc.
• The amount of purchased concentrate/processed feed is targeted to increase by 1.5 kg/day per lactating
cow (Vaidya 2017) over the 5 years to 2028.
• Cattle will be provided with 40-50 gm/day mineral supplement and 30 gm/day of common salt.
• Expenditure for veterinary service is targeted to increase by an additional INR 500 per animal/year.
• The cost of using sex xer/sexed semen will incur on average an additional INR 2,000 per cow/year.
Animal and herd-level interventions for indigenous cattle and productivity improvement targets for
farmers adopting the above cow dairy improvement interventions (to 2033)
• Parturition rate increases from the current 40 to 45% anually.
• Mortality rate will decrease by 50% annually.
• Lactation length (in days) of indigenous cattle increases from the current 225, 230 and 220 days in the
Northern, Central and Southern zones to 230, 240 and 230 days, respectively.
• Indigenous cattle milk production increases from the current 3, 3.5 and 2.5 litres/day in the Northern,
Central and Southern zones to 5, 5.5 and 4.5 litres/day, respectively (MAFW 2017; Vaidya 2017).
• The amount of purchased concentrate/processed feed increases by 0.8 kg/day/lactating cows (Vaidya
2017).
• Cattle will be provided with 40–50 gm/day mineral supplementation and 30 gm/day common salt.
• Expenditure for veterinary services is targeted to increase by an additional INR 500 per animal/year.
WI-1 Scenario—Impact of interventions
Projected population in 15 years
According to the 16th and 19th Livestock Census, at the national level, the indigenous cattle number decreased
by 15% over 15 years (during the period of 1997 to 2012) while the crossbred (indigenous X exotic dairy) cattle
population increased by 98%. Moreover, the rate of decrease in the number of indigenous and increase in the
crossbred cattle number became more pronounced during the period of 2007 to 2012. During this ve-years
period, the number of indigenous cattle in Bihar decreased by 17% while the number of crossbred cattle
increased by 76%. The table below (Table 66) conveys a similar future trend as in the past ve years. In the
coming 15 years (2018–19 to 2032–33), the indigenous cattle population is expected to decrease by 43% and
the crossbred population to increase by 93%. The total cattle population is projected to increase by 20%.

The Bihar Livestock Sector Analysis 78
Table 66: Cow dairy population at production subsystem level for baseline, BAU and WI scenarios (in lakhs and
percentages)
Production zone
Breed
Livestock population
Baseline 2017–18
BAU 2032–33
% change baseline to
BAU
WI-1 scenario 2032–33
% change baseline to WI-1
scenario
Northern
Indigenous breed
39.0 22.1 -43% 22.1 -43%
Crossbred 11.6 18.6 60% 22.5 94%
Total 50.6 40.7 -20% 44.6 -12%
Central
Indigenous breed 14.1 8.0 -43% 8.0 -43%
Crossbred 43.7 70.1 60% 84.6 94%
Total 57.8 78.1 35% 92.5 60%
Southern
Indigenous breed 18.3 10.4 -43% 10.4 -43%
Crossbred 6.0 9.6 60% 11.5 94%
Total 24.3 19.9 -18% 21.9 -10%
Commercial dairy
0.1 0.1 48% 0.1 60%
Total population
Indigenous breed 71.4 40.4 -43% 40.4 -43%
Crossbred 61.3 98.3 60% 118.6 93%
Grand total population 132.8 138.9 5% 159.2 20%
Source: LSA results
Projected production in 15 years
Compared to the base year (2017–18), under the “with intervention” scenario (WI-1) milk production from cow
dairy grows by 182% to 2032-33 (Table 67). This increase comes mainly from the milk production of the
crossbred family dairy system. The increase in milk production from crossbred family dairy is about 237% by
2032-33. This big increase in milk production is both due to the increase in the number and productivity of
crossbred cows. Meanwhile, milk production from indigenous cattle shows a 7% increase, although the
decrease in the indigenous cattle population is about 43%. The improvement in the productivity of indigenous
cattle in 2032–33 under the WI-1 scenario results in a positive percentage increase in milk production.
The decline in traction power is the other signicant nding. By 2032–33 under both the BAU and WI-1
scenarios, the use of cattle for traction power shows a 43% decrease. This is due to the fact that the dairy cattle
production system favours crossbreds more for milk production than indigenous which are commonly used for
traction power.

The Bihar Livestock Sector Analysis 79
Table 67: Production in the base year, and BAU and WI-1 scenarios
Products
Base year2017–18
Production in 2032–33
under BAU scenario
% change under BAU
Production in 2032–33
under WI-1 scenario
% change underWI-1
Milk in indigenous breed family dairy (crore
litres)
118.9
67.4
-43%
127.8
7%
Milk in crossbred family dairy (crore
litres)
417.3
669.3
60%
1,386.5
232%
Milk in commercial dairy (crore
litres)
1.0
1.4
48%
2.0
114%
Total milk ( crore litres)
537.2
738.1
37%
1,516.3
182%
Organic matter (lakh MT)
122.0
135.1
11%
156.2
28%
Traction power ( lakh
days)1.7 0.9 -43% 0.9 -43%
Source: LSA results
Projected income per animal in 15 years (2032-33)
Figure 15 shows the income per animal in the indigenous family dairy, crossbred family dairy and commercial
dairy under BAU and WI-1 scenarios. The results indicate that the increase in income per animal by 2032-33 is
signicantly higher for crossbred family dairy and commercial dairy. The highest income per animal under the
WI-1 scenario is achieved for crossbred family dairy in the Central production zone and commercial dairy
production, INR 24,043 and INR 25,321, respectively.
Figure 15: Annual income per animal for BAU and WI-1 scenarios in 15 years (by 2032-33).

The Bihar Livestock Sector Analysis 80
Returns on investment
As shown in Table 68 below, the net present value (NPV) and equivalent annual net present value (EANPV) for
dairy improvement in the indigenous breed family dairy in all livestock production zones are positive, which
indicate the potential of the investments. The investments result in 15-years NPVs of INR 2,700, INR 11,000 and
INR 4,700 per herd in the indigenous breed family dairy system of the Northern, Central and Southern livestock
production systems, respectively.
The results in Table 68 (and Figure 16) further show that the internal rate of return (IRR) in the indigenous breed
family dairy in the Northern and Southern production zones is equal to the acceptable social discount rate,
which is 10%, but much higher and more protable in the Central livestock production zone, about 25%.
Table 68 also shows that investments in crossbred family dairy and commercial dairy show higher measures of
NPV, IRR and BCR. The highest NPV and IRR for crossbred family dairy are observed in the Central livestock
production zone where feed availability is much better than in the other livestock production zones. Overall, the
crossbred family dairy system performs quite well in all production zones and its improvement promises to be
quite rewarding. The investment resulted in economically viable 15-years NPVs of INR 67,000, 1,80,000 and
58,000 per herd in the Northern, Central and Southern livestock production zones, respectively. Similarly, as
shown in Figure 16, the IRRs obtained for crossbred family dairy in all livestock production zones are greater
than the acceptable minimum investment return of 10%.
The highest NPV over the 15-years time horizon is observed in the commercial dairy (Table 68). This shows the
viability of the investment made in the sector and the potential of the commercial dairy business. However, it
requires the state government to implement appropriate policy measures to make land available for the private
sector to grow adequate forage to meet the feed requirements of the crossbreds. It also requires improvement in
the marketing system and infrastructure to absorb the additional milk for value addition and distribution.
Incentives to attract private sector investment in the industry include favourable loans.
Table 68: Results of nancial analysis for both breed and livestock interventions in family and commercial cow
dairy production in Bihar, 2017–18 to 2032–33 (at cow dairy production unit/thousand herd)
Production zone
Breed/size
Financial indictors based on 15-years
discounted incremental cash ow analysis
NPV
(INR Thousand)
IRR (%)
Benet-cost ratio (BCR)
EANPV
(INR Thousand)
Northern Indigenous breed family dairy 2.7 10% 1.0 0.4
Crossbred family dairy 67 32% 1.5 9
Central Indigenous breed family dairy 11 25% 1.3 1.5
Crossbred family dairy 180 58% 2.1 23.7
Southern
Indigenous breed family dairy 4.7 10% 1.0 0.6
Crossbred family dairy
58
30%
1.5
7.7
Commercial dairy
1,196
34%
1.8
157

The Bihar Livestock Sector Analysis 81
Figure 16: Impact of interventions: 15-years IRR for WI-1 scenario by production subsystems (at cow dairy
production unit or herd level).
Overall, as shown in Figure 17 below, the IRR is greater than the acceptable minimum investment return of 10%
and the BCR is greater or equal to one for all three systems: indigenous breed family dairy, crossbred family
dairy and commercial family dairy. However, it is more viable in the crossbred family dairy and commercial
family dairy systems.
Figure 17: Impacts of interventions: BCR and 15-years IRR for WI-1 scenario (at cow dairy production subsystem
level).
Figure 18 below shows the 15-years IRR for the three livestock production zones. Overall, the IRR is greater than
the acceptable minimum investment return of 10% in all livestock production zones, but it is more viable in the
Central livestock production zone.

The Bihar Livestock Sector Analysis 82
Figure 18: Impacts of interventions: 15-years IRR for WI-1 scenario (at livestock production zone level).
GSDP contribution for all cow dairy products
As shown in table 69 below, The GSDP contribution of cow dairy in the WI-1 scenario in 2032–33 is more than
twice (226%) the base year cow dairy GSDP contribution, while the increase is only 37% to the BAU scenario
2032–33. Milk provides the highest GSDP share in the cow dairy system. The GSDP contribution of milk under
the WI-1 scenario in 2032–33 changes by 252% when compared with the base year (2017–18), increasing
from INR 7,112 crores to INR 25,004 crores. In the BAU scenario, the GSDP contribution of milk increases by
only 44% in 2032–33from the base year (2017–18). Similarly, the per cent change in GSDP contribution of milk
under BAU (in 2032–33) from the base year for indigenous and crossbred dairy is 43% and 60%, respectively,
while the per cent change in the WI-1 scenario (in 2032–33) is 50% and 290%, respectively.
Table 69: GSDP contribution for baseline, BAU and WI-1 scenarios (INR crores)
Products Baseline
(2017–18) (INR crores)
GSDP for BAU in 2032–33 (INR crores)
% change, baseline to
BAU
GSDP for WI-1 in 2032–33 (INR
crores)
% change, baseline to
WI-1
Milk— family indigenous
1,134.7 642.6 -43% 1,697.9 50%
Milk—family crossbreds
5,966.7 9,570.3 60% 23,280.5 290%
Milk—commercial dairy
10.9 16.2 48% 26.1 138%
Total milk 7,112.3 10,229.1 44% 25,004.4 252%
Organic matter
1,830.5 2,026.1 11% 2,342.5 28%
Energy 1.3 0.8 -43% 0.8 -41%
Total 16,056.4 22,485.1 40% 52,352.2 226%

The Bihar Livestock Sector Analysis 83
Milk production-consumption balance in 15 years under the WI-1 scenario
Figure 19 shows the projection of future production-consumption balance in milk and milk products under the
BAU and WI-1 scenarios. Milk consumption is projected to grow linearly from 900 crore litres in 2017–18 to
21,300 crore litres in 2032–33 (a 136% increase), due to changes in human population, urbanization and
incomes. Meanwhile, milk production under the BAU scenario or with the current level and type of investment is
projected to increase by only 41%, from 896 crore litres in 2017–18 to 1,260 crore litres in 2032–33. With the
current investment (BAU), the production-consumption gap for milk remains large in 2032-33, indicating the
need for additional investment to close the gap. With additional investment (WI-1), milk production from cattle,
buffalo and goats is projected to increase by 141% over the 15-years horizon, from 896 crore litres in 2017–18
to 2,159 crore litres in 2032–33.
Milk and milk product consumption in Bihar state is projected to increase progressively in the coming 15 years,
hence the additional milk production from milk improvement interventions (WI-1) will only close the
production-consumption gap by the year 2026–27.
Figure 19: Future production-consumption balance in milk and milk products under BAU and WI-1 scenarios
WI-2 scenario
Compared to crossbred cattle, indigenous breeds of India are known for their resistance to existing constraints: 35disease, inadequate feed and heat stress. They also produce A2 milk, which has signicantly higher market
value than milk from crossbreds among urban consumers in India. Due to these potentially positive traits, an
additional dairy foresight scenario analysis (WI-2) focusing on improvement of indigenous cattle breeds was
conducted. In the WI-2 scenario, productivity of indigenous cattle is improved through crossbreeding with
improved locals, and their numbers increase while the number of crossbreds is held constant. Indigenous cattle
breeds are improved by crossing with semen from 'improved indigenous breeds' like Sahiwal and Gyr, while
semen from crossbreds is used only for improving crossbred cattle. Local buffalos are also improved by
crossing with improved buffalo breeds.
35 A2 milk is the milk that contains only the A2 type of beta casein protein, whereas A1 milk contains only A1 beta casein or A1 type variant. A1 protein variant is commonly found in milk from crossbreds and European breeds of cattle. A2 milk is found primarily in the indigenous breed cows and buffalos of India and Asia (Prasanta B. et.al. 2016).

The Bihar Livestock Sector Analysis 84
In this section, besides presenting the results of the analysis of the WI-2 scenario, the impacts of the two cow
dairy improvement scenarios, WI-1 and WI-2, are compared to see the advantages of each in order to
recommend the interventions which would most likely result in the greatest benets to Bihar, in terms of
achieving its own development objectives: increasing milk production and achieving projected production-
consumption balance, raising income per animal and returns on investment (IRR and BCR) in dairying, and in
contributing the most to GSDP.
Cow dairy improvement targets and interventions under the WI-2 scenario
*All of the interventions listed under the WI-1 scenario previously presented apply equally to the WI-2
scenario.
The difference between the WI-1 and WI-2 scenarios is the use of improved indigenous semen for crossing with
local cows and the resulting herd population changes for cows and buffalos. In WI-1, semen from crossbred
bulls is used with local cows to produce more crossbred cattle and the population of crossbred cows increases,
while indigenous cows not crossed and are allowed to decrease in number. In the WI-2 scenario, semen from
improved local cows is used to cross with unimproved cows thus raising their milk productivity, and the number
of cows crossed with exotics remains constant. Moreover, the population of buffalos, including locals and
crosses increase, as under WI-1.
Assumptions and targets for WI-2 cow dairy improvement interventions
*All of the animal and herd-level assumptions and targets included under the WI-1 scenario apply
equally to the WI-2 scenario.
WI-2 scenario intervention impacts
Projected cattle population in 15 years
The cattle population changes are based on the following growth rates:
Table 70: Cattle population growth rates for the two scenarios (WI-1 and WI-2)
Livestock population annual growth rate (%)
WI-1 scenario growth rates
WI-2 scenario growth
rates
Indigenous breeds
-3.72%
2.12%
Crossbreds 4.50% 0% Total cattle 1.22% 1.22%
Table 70, above, presents the population growth rates under the two scenarios (WI-1 and WI-2). The
projected population growth rates in the WI-1 and WI-2 scenarios are the fundamental differences
between the two scenarios. For WI-2:
• The annual population growth rate of indigenous cattle for the coming 15 years of the LSA (2017–18 to
2032–33) is expected to be 2.12% (Tables 71 and 72).
• The annual population growth rate of crossbred cattle for the coming 15 years of the LSA is projected to be
0%.

The Bihar Livestock Sector Analysis 85
As presented in Table 71, under both the WI-1and WI-2 scenarios, the total cattle population by 2032–33
grows by 20% from the baseline. However, breed-wise population growth rates have different trends under the
two scenarios. Under the WI-1 scenario, the population growth rate for indigenous cattle breeds is negative
while the growth rate for crossbreds is positive. In the WI-2 scenario, the indigenous cattle breeds over 15 years
grow by 37% while the population of crossbred cattle is assumed to remain constant.
Table 71: Projected cattle population change and per cent change from baseline for WI-1 and WI-2 scenarios
Production zone
Breeds
Livestock population (in lakhs) %
change WI-1
Livestock population
WI-2 2032–33
(lakhs)
% change WI-2
Baseline 2017–
18
WI-1 scenario 2032–33
Northern
Indigenous breeds
39.0 22.1 -43% 53.5 37%
Crossbreds 11.6 22.5 94% 11.6 0%
Total 50.6 44.6 -12% 65.1 29%
Central
Indigenous breeds
14.1 8.0 -43% 19.3 37%
Crossbreds 43.7 84.6 94% 43.7 0%
Total 57.8 92.5 60% 63.0 9%
Southern
Indigenous breeds
18.3 10.4 -43% 25.1 37%
Crossbreds 6.0 11.5 94% 6.0 0%
Total 24.3 21.9 -10% 31.0 28%
Commercial dairy
0.1 0.1 60% 0.1 51%
Total population
Indigenous breeds
71.4 40.4 -43% 97.8 37%
Crossbred 61.3 118.6 93% 61.4 0%
Grand total population
132.8 159.2 20% 159.2 20%
Source: LSA results
Projected production in 15 years
Compared to the base year (2017–18), in 2032–33, under the WI-2 scenario, milk production from cow dairy
grows by 91%, compared to 182% under WI-1. The increase in the milk production comes from both crossbreds
and indigenous cows. The increase in milk production from the indigenous breeds is about 160% and from
crossbreds 72%.

The Bihar Livestock Sector Analysis 86
Under the WI-2 scenario, the contribution of cattle to traction power in 2032–33 increases by 37% when
compared to the base year (Table 72). This is due to the increase in the number of indigenous cattle under this
scenario (WI-2). However, in both the BAU and WI-1 scenarios, the use of cattle for traction power shows a
decrease due to the decrease in indigenous cattle which are normally used to provide traction.
Table 72: Production change and per cent change from baseline, for WI-1 and WI-2 scenarios
Products Baseline 2017–18
Production in 2032–33 WI-1
% change under WI-1
Production in 2032–33 WI-2
% change under WI-2
Milk in indigenous breed family dairy (crore litres)
118.9 127.8 7% 309.1 160%
Milk in crossbred family dairy (crore litres)
417.3 1,386.5 232% 716.4 72%
Milk in commercial dairy (crore litres)
1.0 2.0 114% 2.0 114%
Total milk ( crore litres) 537.2 1,516.3 182% 1,027.6 91%
Organic matter (lakh MT) 122.0 156.2 28% 143.5 18%
Traction power ( lakh
days) 1.7 0.9 -43% 2.3 37%
Source: LSA results
GSDP contribution for all cow dairy products
As shown in Table 73 below, the GSDP contribution of cow dairy in the WI-1 and WI-2 scenarios 2032–33 is
about 226 and 115%, respectively, above the base year cow dairy GSDP contribution.
Table 73: GSDP contribution change and per cent change from baseline, for WI-1 and WI-2 scenarios (INR
lakhs)
Products Baseline 2017–18 (INR lakhs)
GSDP WI-1, 2032–33 (INR
lakhs)
% change, under WI-1
GSDP WI-2 scenario, 2032–33
(INR lakhs)
% change, under WI-2
Milk— family indigenous 1,134.7 1,697.9 50% 4,107.0 262%
Milk—family crossbreds 5,966.7 23,280.5 290% 12,029.5 102%
Milk—commercial dairy 10.9 26.1 138% 26.1 140%
Total milk 7,112.3 25,004.4 252% 16,162.6 127%
Organic matter 1,830.5 2,342.5 28% 2,152.0 18%
Energy 1.3 0.8 -41% 1.8 42%
Total 16,056.4 52,352.2 226% 34,478.9 115%
Source: LSA results; *N/C - no change

The Bihar Livestock Sector Analysis 87
Milk production-consumption balance in 15 years
Figure 20 presents the projected production-consumption balance in milk and milk products under the BAU,
WI-1 and WI-2 scenarios. Milk consumption is projected to grow from 900 crore litres in 2017–18 to 2,130
crore litres in 2032–33 (a 136% increase), due to changes in human population, urbanization and incomes.
As shown in Figure 20 under the WI-2 scenario, with additional investment that primarily focuses on improving
indigenous cattle production, overall milk production (from cattle, buffalos and goats) is projected to increase
by only 86% over the 15-years horizon, from 896 crore litres in 2017–18 to 1,670 crore litres in 2032–33.
Under such a scenario, the production-consumption gap continues to expand and will reach a decit of 460
crore litters by the year 2032–33.
Under the WI-1 scenario in which both indigenous and crossbreds are improved with exotic semen and
complementary interventions and less productive indigenous animals are replaced by crossbreds, milk
production from cattle, buffalos and goats is projected to increase by 141% over the 15-years horizon, from
896 crore litres in 2017–18 to 2,159 crore litres in 2032–33, closing the milk production-consumption gap by
the year 2032–33.
Lastly, it will be recalled that the WI-I scenario for cow dairy improvement interventions resulted in IRRs of 13%
and 50% and BCR of 1.1 and 1.9 for indigenous and crossbred cattle, respectively (see Table 97). The
investment analysis for WI-2 was not done since the investment costs would be almost the same as in WI-1 and
thus the ROIs (IRR and BCR) would certainly be lower than for the WI-1 crossbred cow scenario.
Figure 20: Future projected production-consumption balance in milk and milk products under BAU, WI-1 and
WI-2
scenarios

The Bihar Livestock Sector Analysis 88
7.1 Buffalo milk and meat improvement
Intervention areas (production zones)
All the livestock production zones (Northern, Central and Southern) are target areas for buffalo milk and meat
improvement interventions.
Buffalo milk and meat improvement interventions and targets
Feed
In addition to the feed interventions listed under the cow dairy improvement intervention options section, other
major feed improvement focus areas are listed below:
• Supporting backyard, hedge and live fence etc. fodder production.
• As stated before, the area of land under permanent pasture/grazing during 2013–14 was about 15,000
ha. The plan to increase land productivity would be to oversow with improved grass and leguminous forage
seeds and use of fertilizer, where feasible. The targeted goal is to increase rehabilitated permanent
pasture/grazing land to be 50% of the total permanent pasture land by 2022–23, 80% by 2027–28 and
remain at 80% by 2032–33.
• Improving production, marketing and quality control of forage seeds, forages and concentrates through
strengthening of existing regulatory bodies.
Health
• Veterinary hospitals/poly clinics, veterinary dispensaries and veterinary aid centres presented in the cow
dairy improvement intervention options section would cater to all species including buffalo.
• Buffalo receiving vaccinations for the important diseases (FMD (80% currently, started from 2015),
brucellosis (90% currently, from 2017), HS, BQ (80% currently, historically implemented) will remain 80%
by 2022–23. The major interventions are timely vaccination campaigns, improvement of deworming,
sanitation and housing, and control of ood and drought.
• Farmers that adopt the recommended rate of external and internal parasite control treatments will reach
80% in the coming 15 years.
• Private veterinary service providers would be supported with incentives in remote areas.
• Mastitis control and prevention technologies would be supported.
Genetics
• The number of AI services performed for buffalos is usually reported together with cattle inseminations. By
2017–18, total cattle and buffalo inseminations performed were 27.96 lakhs. The targeted goal is to 36increase inseminations to 50 lakhs by 2022–23, 85 lakhs by 2027–28 and 110 lakhs by 2032–33.
36 Assumptions include: per cent of adult females=58% for cattle, 48% for buffalo, parturition rate=50% for cattle and 45% for buffalo, number of repetitions=2.

The Bihar Livestock Sector Analysis 89
• The upgrades and establishment of semen production centres, frozen semen banks, liquid nitrogen
storage plants and AI centres targeted for cattle would also serve for buffalo.
• Currently, the number of buffalo breeding farms include only one under AH. The goal is to strengthen the
existing farm and establish one new farm by 2022–23 and one more by 2032–33. These breeding farms
could serve as breed improvement, breeding, nucleus and multiplication centres.
Extension
• Extension infrastructure listed under cattle would also cater to buffalo.
• By 2032–33, all of the AI/veterinary aid centres will provide extension services (training, input and
marketing) to farmers.
• Extension departments at different levels would be involved in public extension services and support,
control and regulate extension services (input, advisory and marketing services) provided by Pashu Sakhi,
agri-clinics and agro-business operators, para-vets/community animal health workers, input suppliers,
other private extension service providers and extension service providers at co-operatives/MCCs, farmer
based organizations, farmer self-help groups, and telecommunication extension service
providers/operators.
• Needed acts, regulations, guidelines and manuals would be developed/improved in the rst two years of
the plan to support the rapid growth of extension service providers. Bureaucratic procedures that hinder
service providers would be reviewed and revised to support the ethical and responsible provision of
services. Control of unregistered input, advisory and marketing service providers is also critical for survival
of the legal service providers.
• Coverage of regular buffalo management training will reach 15% by 2022–23, 40% by 2027–28 and 3780% by 2032–33. Farmers will receive more intensive and continual training in buffalo management
(feeding, breeding, deworming, tick control, hygiene and milk handling and transport).
• Strengthening the telecommunication extension service.
• The percent of MCCs and milk producer associations providing dairy input supplies, animal health,
extension and nancial services would increase to 80% by 2032–33.
Research
The interventions listed under the cow dairy improvement intervention options section will also serve for
buffalos.
Processing and marketing
• Encouraging establishment of buffalo milk producer co-operative societies.
• Infrastructure listed under the cattle dairy intervention like MCCs, milk processing plants and bulk milk
chilling units would also serve for milk produced by buffalos.
37 According to IFPRI (IFPRI, 2016), agri-clinic operators receive two months training; out of the trainees, 47% didn't succeed in the business in the past and served for about 500 households. Assume a training centre will provide two months training for 200 trainees/year. Currently, there are about 57 lakh households that own cattle.

The Bihar Livestock Sector Analysis 90
• Increasing the functional capacity and utilization of existing MCCs.
• Incentivizing the private sector to take part in the marketing and processing of buffalo milk, separate from
cow milk.
• Strengthening the capacity of milk quality and safety control laboratories.
• Creating an enabling environment to establish functional linkages between private milk traders, MCCs,
co-operatives and processing plants.
• Supporting small-scale technologies for value addition of raw milk e.g. curd, ghee, paneer, khoa, etc.
• Establishing integrated abattoir and processing plants, one by 2022–23, one by 2027–28 and one by
2032–33.
Animal and herd-level assumptions for farmers adopting buffalo milk and meat improvement
interventions
• Parturition rate to increase by 5% points.
• Mortality rate to decrease by 50%.
• Daily milk production of buffalo to increase from the current 5, 5.5 and 4.5 litres/day in the Northern,
Central and Southern zones to 6, 6.5 and 5.5 litres/day, respectively (MAFW 2017; Vaidya 2017).
• Average live weight of buffalos to increase by 50-10%.
• Amount of fodder purchased to increase by 10%.
• Amount of purchased concentrate/processed feed to increase by 0.5 kg/day/lactating buffalos (Vaidya
2017).
• Each buffalo to be provided with 40-50 gm/day mineral supplementation and 30 gm/day common salt.
• Expenditure for veterinary services to increase by an additional INR 500 per animal/year.
• The price of hides to increase by 10% due to external parasite treatment/controls.
Impact of interventions
Projected population in 15 years
The current and projected serious feed shortage in the state (see Annex 3— feed balance analysis) does not
support increased production through an increase in livestock population. Thus, the annual growth rate for the
buffalo population is maintained at 2.49% under both the BAU and WI scenarios and there is the same 45%
change in the buffalo population between BAU and WI in 2032–33. The major focus of the buffalo meat and
milk improvement interventions is to increase productivity of buffalos, not to increase population.

The Bihar Livestock Sector Analysis 91
Table 74: Buffalo population at production zone level for baseline, and under BAU and WI scenarios (in lakhs)
Production zone
Livestock population
Baseline
(2017–18) (in lakhs)
BAU in
2032–33 (in
lakhs)
% change
under BAU
WI in 2032–
33 (in lakhs)
% change
under WI
Northern
40.7
58.9
45%
58.9
45%
Central
35.4
51.2
45%
51.2
45%
Southern
11.8
17.0
45%
17.0
45%
Total 87.8 127.0 45% 127.0 45%
Source: LSA results; *N/C - no change
Projected production in 15 years
Under the BAU scenario for buffalos, the change in meat and milk production under BAU from the base year
(2017–18) to 2032–33 will be 45%, while the change in meat and milk production under WI scenario in
2032–33 from the base year (2017–18) will be 62% and 78%, respectively (Table 75). The results related to
traction power (or energy) and manure (or organic matter), on the other hand do not show any difference as
there is no change in the buffalo population between BAU (2032–33) and WI (2032–33).
Table 75: Production for baseline, and BAU and WI scenarios
Products Baseline
(2017–18) BAU Production
in 2032–33 % change under BAU
WI Production in 2032–33
% change under WI
Buffalo meat (MT) 76,302 1,10,347 45% 1,23,589 62%
Buffalo milk (crore litres) 340.7 492.7 45% 606.5 78%
Organic matter (lakh MT) 109.0 157.7 45% 157.7 45%
Energy (thousand days) 41 59 45% 59 45%
Source: LSA results
Projected income per animal in 15 years
The income per animal in buffalo production is presented in Figure 21 below. The results indicate that income
per animal under the WI scenario increases around 10% in the Northern and Southern livestock production
zones, whereas in the Central production zone, in absolute terms the income per animal increases by more
than INR 2,000 per animal due to the additional investment (WI).

The Bihar Livestock Sector Analysis 92
Figure 21: Income per animal for BAU and WI scenarios.
Returns on investment
Table 76 presents the results of the nancial analysis for investments in buffalo production units across the three
livestock production zones in Bihar. All the nancial indicators based on 15-years discounted incremental cash
ow analysis are viable.
Table 76: Results of nancial analysis for the combined livestock interventions in small buffalo production units
in Bihar production zones, 2017–18 to 2032–33 (at buffalo production unit/herd level)
Buffalo production unit level by zone
Financial indictors based on 15-years discounted incremental cash ow analysis
NPV (INR thousands) IRR (%) BCR EANPV (INR thousands)
Northern 8.6 13% 1.1 1.1
Central 18.5 25% 1.4 2.4
Southern 8.6 15% 1.1 1.1
Source: LSA results
However, investments in the Central livestock production zone are more than twice as rewarding. The NPV over
the 15-years horizon is about INR 18.5 thousand per herd. The IRR for the Central zone is 25%, higher than the
acceptable discount rate of 10%.
Figure 22: Investment impacts of the WI interventions: 15-years IRR (at zonal livestock production level).

The Bihar Livestock Sector Analysis 93
GSDP contribution for all buffalo products
The total GSDP contribution of all buffalo products by 2032–33 would increase by 67% from the base year
(2017–18) in the WI scenario, while the increase would be only 45% under the BAU scenario (Table 77). Milk
accounts for most of the share of the buffalo VC contribution to GSDP. Furthermore, the GSDP contribution of
milk increases by 76% under WI (by 2032–33) compared to the base year (2017–18), increasing from INR
6,540 to 11,520 crores. Under the BAU scenario, the GSDP contribution of milk increases by 2032–33 only
45% from the base year (2017–18). Similarly, the per cent change in GSDP contribution of meat under the BAU
scenario (in 2032–33) from the base year (2017–18) would be 45%, while the per cent change under WI would
be only 31%. The lower per cent change in GSDP contribution under WI (by 2032–33) compared with the BAU
change by 2032–33 would be due to the lower returns due to the additional post-production investment costs to
improve meat production and processing under WI.
Table 77: GSDP contribution for baseline, BAU and WI scenarios (INR crores)
Products Baseline GSDP in
2017–18 (INR crores)
BAU GSDP in
2032–33 (INR
crores)
% change
under BAU
WI GSDP in
2032–33 (INR
crores)
% change
under WI
Buffalo meat 498.9 721.5 45% 656.1 31%
Buffalo milk 6540.6 9458.9 45% 11,515.8 76%
Organic matter 1635.7 2365.5 45% 2,352.3 44%
Energy 0.3 0.5 45% 0.5 45%
Total 8,675.6 12,546.5 45% 14,524.6 67%
Source: LSA results
Projected buffalo meat production-consumption balance in 15 years
Figure 23 compares the future production-consumption balance in buffalo meat under the BAU and WI
scenarios. Buffalo meat consumption in Bihar state is projected to increase by more than 100% over the 15-
years LSA period to 2032-33, from the base year of 2017-18, but from only 0.4 lakh MT/year to 0.9 lakh
MT/year. Production in 2017-18 is already higher than consumption, indicating surplus production already
exists and it is being marketed to other states or exported.
Figure 23: Future production-consumption balance in buffalo meat under BAU and WI scenarios.

The Bihar Livestock Sector Analysis 94
As shown in Figure 23 above, surplus buffalo meat production presently exists and is projected with the current
level of investment or BAU. The increase in buffalo meat production which would result from additional
investment or the WI scenario over the BAU scenario is relatively small, ranging from a 1% increase in 2017–18
to a 12% increase in 2032–33. However, under the WI investment scenario, meat production in Bihar is
projected to increase by 45%, or from 0.76 lakh t/year in 2017–18 to 1.1 lakh t/year in 2032–33, in absolute
terms. Whether WI or BAU is chosen as the preferred investment scenario, these results indicate that there would
need to be ways developed to market this additional surplus to other states or to export it. Moreover, the
additional investments to increase buffalo production under WI compared to BAU would need to be
complemented with investments in buffalo meat processing, raising the cost per kg and lowering the meat
contribution to GSDP, as earlier alluded to. Thus, under both the BAU and WI scenarios, a projected surplus
over local demand would be generated, but a bigger one under WI. However, it would be worthwhile to invest
in and implement the WI scenario only if the buffalo meat markets outside Bihar can be exploited.
7.3 Goat meat improvement
The intervention context
Bihar is endowed with a large number of goats—1.2 crores. Bihar is the third largest state in goat population,
following Rajasthan and Uttar Pradesh (MoA, 2014b). Goats in Bihar are reared in a traditional and
subsistence manner by some sects of the society (marginal and landless labourers) who are unable to rear large
animals (Dey et al., 2007). This traditional way of keeping goats results in high mortality and low productivity.
Although the most commonly used breed, Black Bengal goat, is highly prolic and resistant to diseases, feed
shortages and inadequate health services result in high mortality. Thus, the goat meat improvement
intervention focuses on reducing mortality in addition to improving parturition and prolicacy rates through
feed improvement (feed availability and quality) and health services (primarily vaccination).
Goat meat improvement interventions and targets
Feed
• Supporting backyard, hedge and live fence etc. fodder productions.
• Educating farmers to feed dams/does with supplementary concentrate feeds a month before and after
parturition to increase their mothering ability, birth weight and survival of kids (Chowdhury et al. 2002).
• The area of land under permanent pasture/grazing during 2013–14 was about 15,000 ha. The plan is to
increase productivity by oversowing with improved grasses and leguminous forage seeds and use of
fertilizer, where applicable. The targeted goal is to increase rehabilitated permanent pasture/grazing land
to encompass 50% of the total permanent pasture land by 2022–23, 80% by 2027–28 and remain at 80%
by 2032–33.
• Improving production, marketing and quality control of forage seeds, forages and concentrates through
the strengthening of existing regulatory bodies.
• The number of fodder seed production farms targeted under cow dairy also serves for goats.
Health
• Veterinary hospitals/poly clinics, veterinary dispensaries and veterinary aid centres presented in the cow
dairy improvement intervention options section to cater to all species including goats.

The Bihar Livestock Sector Analysis 95
• Goats to receive vaccinations for critical diseases such as PPR, goat pox, enterotoxeamia, HS, FMD and BQ.
Currently, about 80% of goats are receiving vaccinations for PPR by public campaign programs and it is
assumed it will remain 80% by 2022–23. Adoption of vaccinations for other diseases is targeted to increase
to 50% by 2022–23 and 80% by 2027–28
• Farmers that adopt the recommended rate of external and internal parasite control treatments would reach
80% over the next 15 years.
• Private veterinary service providers to be supported.
Genetics
• Improving local breed goats through breed selection
• Making the existing goat breeding farm functional by 2022–23 and establishing one more new breeding
farm by 2032–33.
• Breeding farms to be used to develop and multiply improved local goat breeds.
• Community-based goat breed improvement programs to increase productivity of indigenous goats.
• Implementing AI on goats in collaboration with ICAR-Central Institute for Research on Goats, Mathura
(Uttar Pradesh).
Extension
• Extension infrastructures listed under cow dairy would also cater to goats.
• Extension departments at different levels to be involved in the public extension services, and support,
control and regulate extension services (input, advisory and marketing services) provided by Pashu Sakhis.
Similarly extension service provided by agri-clinics and agro-business operators, para-vets/community
animal health workers, input suppliers, and extension service providers at co-operatives/MCCs, farmer
based organizations, farmer self-help groups, telecommunication extension service providers/operators,
need to be controlled and regulated.
• Needed parliamentary acts, regulations, guidelines and manuals to be developed/improved in the rst two
years of the plan to support the rapid growth of extension service providers. Bureaucratic procedures that
hinder the service providers to be reviewed and revised while continuing to support the ethical and
responsible provision of services. Control of unregistered input, advisory and marketing service providers
carried out for survival of the legal service providers.
• Provision of consistent goat management training to reach 15% by 2022–23, 40% by 2027–28 and 80% of
farmers by 2032–33. Farmers to receive more intensive and continuous training in goat management
(feeding, breeding, deworming, tick control, hygiene and milk handling and transport).
Research
• The interventions listed under the cow dairy improvement intervention options section to also serve for
goats.

The Bihar Livestock Sector Analysis 96
Processing and marketing
• Establishing three abattoirs by 2032–33 to be used for exporting.
Animal and herd-level targets and assumptions for farmers adopting goat meat improvement
interventions
• Parturition rate to increase from 1.25 to 1.5 (Miah et al. 2016; Haque et al. 2013).
• Prolicacy rate will increase from 1.5 to 2.0 (Miah et al. 2016; Haque et al. 2013).
• Mortality rate to decrease by 50% (Kumar et al. (2003) and Chowdhury et al. (2002) reported mortality
reductions of up to 70% through implementation of the above listed interventions).
• Live weight of goats to increase by 2 kg.
• Does to be fed with 200 gm per day of concentrate for a month before and after parturition to increase their
milk production and mothering ability and improve survival of kids (Chowdhury et al. 2002).
• Each animal be be provided with 5 gm/day mineral supplementation and common salt.
• Expenditures for external and internal parasite treatment and control and vaccination for critical diseases to 38result in veterinary-related cost increases of INR 100 per animal/year.
• Price of skins increases by 10% due to external parasite treatment/controls.
Impact of interventions
Projected population in 15 years
The goat population is currently growing at an annual rate of about 3.63% (i.e., in the BAU scenario). In the WI
scenario, the annual growth rate remains at 3.63%. The major focus of the goat intervention is to increase
productivity of goats, rather than impacting production through population increase. This is due to the serious
current and projected feed shortage in the state (see Annex 3— feed balance analysis) which does not support
increasing production through an exaggerated increase in livestock population.
Table 78: Goat population at production subsystem level for baseline, BAU and WI scenarios (in lakhs)
38 Vaccination for important diseases (PPR, ET, FMD, goat pox, HS, BQ etc.) - (INR 50), external parasite treatment INR 10 per year/animal (three/year), internal parasite treatment INR 15 per year/animal (three/year), other disease treatments INR 25.
Production
zone
Production
subsystem
Livestock population
2017–18
baseline (lakhs)
BAU in
2032–33 (lakhs)
% change under WI
WI in
2032–33 (lakhs)
%
change
under WI
Northern
Small farms
63.1
107.9
71%
107.9
71%
Medium farms 15.8
26.8
70%
27.0
70%
Total 78.9 134.7 71% 134.9 71%

The Bihar Livestock Sector Analysis 97
Production
zone
Production
subsystem
Livestock population
2017–18
baseline (lakhs)
BAU in
2032–33 (lakhs)
% change under WI
WI in
2032–33 (lakhs)
%
change
under WI
Central
Small farms
31.3
53.5
71%
53.5
71%
Medium farms
13.4
22.8
70%
22.9
70%
Total
44.7
76.3
71%
76.4
70%
Southern
Small farms
17.3
29.6
71%
29.6
71%
Medium farms
4.3
7.4
70%
7.4
70%
Total
21.6
37.0
71%
37.0
71%
Total 145.3 248.0 71% 248.3 71%
Source: LSA results
Projected production in 15 years
Table 79: Production at baseline, and under the BAU and WI scenarios
Products Production
subsystem
Production
2017–18
baseline
Productio
n 2032–
33 BAU
% change
baseline
to BAU
Production
2032–33
WI
% change
baseline to
WI
Goat meat (MT)
Small farms
21,041
35,973
71%
63,689
203%
Medium
8,877
15,089
70%
23,132 161%
Total goat meat (MT)
29,918
51,062
71%
86,821 190%
Goat milk (lakh
litres)
Small farms
1,423.6
2,433.9
71%
2,827.1
99%
Medium
421.7
716.8
70%
837.16
99%
Total goat mi lk (lakh
litres)
1,845.3
3,150.6
71%
3,664.2
99%
Organic matter (MT)
188,352
320,503
70%
309448
64%
Skins (MT) 5,665 9,669 71% 28,161 397%
Source: LSA results
In the goat BAU 2032–33 scenario, the change in meat, milk and skin production from BAU in 2032–33 and
the base year (2017–18) will only be 70-71% while the change in meat, milk and skin production under the WI
scenario in 2032–33 and the base year (2017–18) will be about 190%, 99% and 397%, respectively (see Table
79, above). In the WI scenario, the state-level goat meat and skin production increases tremendously (about
twofold and fourfold). This increase in meat and skin production is due to the increase in average live weight of

The Bihar Livestock Sector Analysis 98
goats of 14% and the increase in offtake rate of 52%, which are a result of the decrease in mortality rate coupled
with an increase in parturition and prolicacy rates (Table 80 below and subsection 7.3).
Table 80: Offtake and population growth rates and average live weight of goats when sold
Parameters Base year (2017–18) WI in 2032–33 % change
Average live weight when sold (Kgs) 7 8 14%
Offtake rate (%) 58% 88% 52%
Population growth rate (%)
3.63%
3.63%
0%
Source: LSA results
Projected annual income per animal in 15 years
Figure 24 shows the annual incremental income per animal for both the BAU and WI scenarios in goat
production. The results indicate that under WI (with intervention), the annual income per animal increases on
average by only about INR 200 across all goat farm types and production zones. The highest income per
animal as the result of additional investment interventions, about INR 247, is observed for small indigenous
goat farms in the Northern livestock production zone. INR 200 is a very small amount of additional annual
incremental income. Given the low additional income increases per animal under WI compared to BAU, and
predominant small herd sizes, it becomes clear that the BAU scenario may be more attractive than WI for those
goat keepers who can add more goats to their herd (with the existing available technology interventions) and
those who are starting goat herding for the rst time.
Figure 24: Annual incremental income per goat for the BAU and WI scenarios.
Returns on investment
Table 81 presents the nancial analysis results for the combined livestock interventions (WI) for goat production
in Bihar. All of the nancial indicators based on 15-years discounted incremental cash ow analysis show that
the investments in both small and medium goat farms in all livestock production zones are nancially viable.

The Bihar Livestock Sector Analysis 99
Table 81: Results of nancial analysis for the combined livestock interventions (WI) in goat production in Bihar,
2017–18 to 2032–33 (at herd level)
Production
zone
Goat production
unit size
Financial return indictors based on 15-years discounted incremental cash ow
NPV IRR (%) BCR
EANPV
(INR thousands) (INR thousands)
Northern Small farms 1.2 25% 1.5 0.2
Medium farms 8.4 48% 1.9 1.1
Central Small farms 1.3 29% 1.5 0.2
Medium farms 7.4 40% 1.8 1.0
Southern Small farms 0.9 22% 1.4 0.12
Medium farms 4.9 21% 1.4 0.6
Source: LSA results
As shown in Table 81 and Figure 25, the results indicate that investments in medium goat farms in the northern
and central livestock production zones are more protable than investments in small goat farms.
Figure 25: Impacts of interventions: 15-years IRR for WI for small and medium goat farms in different
production zones (herd level).
Figure 26 presents the IRR over the 15-years horizon for goat production in the three livestock production zones.
Although the IRR is higher than the acceptable minimum discount rate of 10% in all livestock production zones,
investments in goat production are more protable in the Northern and Central livestock production zones.

The Bihar Livestock Sector Analysis 100
Figure 26: Impacts of interventions: 15-years IRR for WI at production zone level.
GSDP contribution
The total GSDP contribution of goats by 2032–33 will increase by 197% from the base year (2017–18) in the WI
scenario, while the increase will be only 71% in the BAU scenario (Table 82). Similarly, the change in GSDP
contribution of meat and skins under BAU in 2032–33 will only be 71% while the change in GSDP contribution
of meat and skins production under the WI scenario will be about 177% and 397%, respectively. The change in
GSDP contribution of goat skins in 2032–33 under the WI scenario is fourfold due to the coupled effects of
increases in number and price of skins produced. The number of goat skins increases due to the increased
offtake rate in the WI scenario while the price of skins increases by about 10% due to less external parasites due
to the treatments/controls. Goat milk is not valued in the GSDP contribution as the majority of the milk
produced is consumed at home.
Table 82: GSDP contribution for baseline, BAU and WI scenarios (INR crores)
Goat meat
Baseline GSDP in
2017–18 (INR
crores)
GSDP for BAU in
2032–33 (INR
crores)
% change in
GSDP due to
BAU
GSDP for WI in
2032–33 (INR
crores)
% change in
GSDP due
to WI
Small farms 664.2 1,135.6 71% 1,873.2 182%
Medium farms 193.2 328.3 70% 505.1 161%
Total goat meat 857.4 1,464.0 71% 2,378.3 177%
Skins 85.0 145.0 71% 422.4 397%
Total VA 942.4 1,609.0 71% 2,800.7 197%
Source: LSA results
Goat meat production-consumption balance in 15 years
The future production-consumption balance in goat meat is presented in Figure 27 below. As the result of an
increase in human population, urbanization and incomes, the quantity of goat meat demanded for

The Bihar Livestock Sector Analysis 101
consumption in Bihar state is projected to increase to 2.31 lakh MT equivalent by the year 2032–33 from the
baseline level of about 0.93 lakh MT in 2017–18, an increase of about 147%.
Meanwhile, during the same period, the quantity of goat meat produced is expected to increase by 67% without
additional investment (BAU) and by 185% with additional investment in goat improvement interventions (WI).
Although goat meat production is expected to increase signicantly with WI, due to the projected rapid increase
in expected demand for goat meat, the projected impact of the additional interventions (WI) on closing the gap
between the goat meat produced and consumed is not signicant over the 15-years investment period. It is
projected that the supply shortage will continue under either BAU or WI.
Moreover, given the technology options presently available and the low additional returns to investment in WI
compared to BAU, we conclude goat rearing is presently mainly a life-changing option for marginalized
farmers and especially women, who are either going into goat production for the rst time or can expand their
herd sizes— for these farmers adopting WI will not help them much. Besides additional income from expanding
herds, the benets goats provide under BAU include empowerment due to the income and asset generation
made possible, and help in achieving better household food security.
Figure 27: Future production-consumption balance in goat meat under BAU and WI.
7.4 Chicken meat and egg improvement
Chicken meat and egg improvement interventions and targets
Backyard family chicken (BYP) improvement interventions and targets
Intervention areas (production zones)
Improvement of traditional family backyard chicken farming system (BYP) is possible throughout the state— in
all of the livestock production zones (Northern, Central and Southern zones)

The Bihar Livestock Sector Analysis 102
Feed and feeding
• Supplementing scavenging chickens with locally available feeds with up to 25% of the nutritional
requirements.
• Supplementing feed for incubating hens with at least 55 gm/day.
Genetics and reproductive management
• Improving indigenous chicken productivity through improved breed selection.
• Reducing reproductive wastage through early weaning of chicks and facilities to protect chicks (Hossen
2010).
Health
• Chickens to be vaccinated against chicken priority diseases (Newcastle Disease (ND) and fowl pox etc.)
(GALVmed 2016).
• The percent of village chickens vaccinated for ND and fowl pox diseases to reach 50% by 2022–23 and
80% by 2027–28 (GALVmed 2016).
• Rationalize public and private veterinary services with privatization where feasible.
• Improve disease diagnostic and surveillance capacity of the Institute of Animal Health and Production.
Research and extension
• Research and extension improvement interventions listed in the cow dairy intervention improvement
options section will also benet chicken-related work.
Animal and herd-level targets and assumptions for farmers adopting backyard family chicken
improvement interventions
• Average number of hens per ock to increase from 1.5 to 3 hens.
• Average number of clutches per year to increase from the current three to ve (Hossen, 2010).
• Eggs laid per year to increase from 70 to 90 (Hossen, 2010).
• Chicken mortality before marketing to drop from 20% to 10%.
Scaling up commercial specialized chicken production
Intervention areas (production zones)
• Scaling up the commercial specialized chicken practice throughout the state and all of the livestock
production zones (Northern, Central and Southern zones)
Priority interventions and assumptions
Feed and feeding
• Supporting production of processed chicken feed.

The Bihar Livestock Sector Analysis 103
• Establishment of 69 medium and 5 large commercial feed producers over the next 15 years (Table 83).
Also, commercial chicken farm owners to have their own feed-processing plant to cost up to INR 5–6 lakhs.
• Improving quality assurance of chicken processed feeds.
• Improving the feed quality testing and regulation capacity of the Institute of Animal Health and Production.
Table 83: Processed/commercial feed targets and number of chicken feed processing plants
Item
Targets in the three ve-years LSA periods
(2018–19 to
2022–23)
(2022–23 to
2027–28)
(2027–28 to
2032–33)
Commercial feed needs (10^3 MT) 546.4 1,449.9 3,906.9
Chicken commercial feed processing plants (number)
Upgrade existing plant 3 2 -
Establish new medium size plant
4 13 52
Establish new large plant 0 2 3
Per cent of chicken feed expected to be produced by chicken farms themselves (%)
20% 30% 35%
With current maize, sorghum and millet production of around 38,45,700 MT and 12,508 MT, respectively,
chicken production in Bihar takes up to 4% of the total production of these cereals. However, by 2032–33, given
the current production of maize, sorghum and millet, the chicken sector will require 75% of the total production
of these cereals (see Annex).
***This represents a potentially alarming chicken feed shortage which could be averted by increasing cereal
production or purchasing cereal from other states. Currently, at the India state level, about 28% of the maize
produced is utilized for food consumption, 11% for livestock feed, 48% for poultry feed, 12% in the wet milling
industry (e.g. starch and oil production) and 1% as seed (Murdia et al. 2016).
• Support production and marketing of cereals to be used as row material for chicken feed production (maize
and soybean).
Increasing the number of chickens in the commercial chicken production system
• The number of layers and broilers is targeted to increase from 13 and 69 lakhs from the base year to 4.7
and 24.8 crore, respectively, by 2032–33 (Table 84).
Table 84: Commercial layer and broiler chicken population (in lakhs) 2017–18 to 2032–33
Breed type Base year (2017–18) By (2022–23) By (2027–28) By (2032–33)
Layer population 13 43 142 470
Broiler population/cycle 69 227 751 2,479

The Bihar Livestock Sector Analysis 104
Table 85: Annual population growth rate of commercial layers and broilers
Breed type First ve years (2017–
18 to 2022–23)
Second ve years (2022–
23 to 2027–28) Third ve years (2027–
28 to 2032–33)
Layer population 27% 27% 27%
Broiler population/cycle 27% 27% 27%
• Establish large and medium chicken multiplication centres and hatcheries to satisfy the increasing demand
for day-old chicks (DOC).
• With an average of seventy lakhs DOC production capacity, about 152 hatcheries are recommended for
the coming 15 years (Table 86).
Table 86: Number of hatcheries targeted by 2022–23, 2027–28 and 2032–33
Commodity
Number of hatcheries
until 2022–23
until 2027–28 until 2032–33
Hatcheries 10 33 109
Marketing and processing
• Support consumption of exotic chicken meat and eggs.
• Encourage construction of modern chicken slaughterhouses and cutting and processing plants.
Impact of interventions
Projected population in 15 years
Table 87: Chicken population at production subsystem level for baseline, BAU and WI scenarios (in lakhs)
Poultry production subsystem
Chicken population
Baseline, 2017–18 (lakhs)
BAU, 2032–33 (lakhs)
% change baseline to BAU
WI 2032–33 (lakhs)
% change baseline to WI
Indigenous backyard 204 296 45% 424 108%
Crossbred backyard 4.6 8.0 75% 8.2 80%
Layers 13 470 N/A* 470 N/A*
Broilers 6,9 226 229% 2480 N/A*
Total 290 1000 245% 3381 N/A*
Source: LSA results; N/A - not available; due to the baseline being a very small number
According to the 19th Livestock Census, Bihar ranked 16th in chicken population. Andhra Pradesh and Tamil
Nadu are the two leading states in India in chicken population with a total of 16 and 11.2 crore chickens,
respectively. The chicken population in Bihar is projected to grow by about threefold in the BAU scenario and by
tenfold in the WI scenario. In the WI scenario, the chicken population grows to 34 crore in 15 years from the
current 2.9 crore (Table 87 above).

The Bihar Livestock Sector Analysis 105
Projected production in 15 years
Chicken meat and egg production show a huge increase over 15 years. Chicken meat production increases
from the current 0.6 lakhs t to 15 lakhs t in 15 years (2032–33). Egg production also increases from 41 crore to
980 crore by 2032–33 (Table 88 below).
Table 88: Production for baseline, and in the BAU and WI scenarios
Products
Production in 2017–
18 (baseline)
Production in 2032–33 under
BAU
% change under BAU
Production in 2032–33 under
WI
% change under
WI
Chicken meat from indigenous backyard (MT)
19,371 28,096 45% 38,519 99%
Chicken meat from crossbred backyard (MT) 765 1,343 75% 1,378 80%
Chicken meat from layers (MT) 695 25,291 N/A* 25,291 N/A*
Chicken meat (MT) 41,145 1,35,499 229% 14,83,784 N/A*
Total chicken meat (MT) 61,975 1,90,228 207% 15,48,972 N/A*
Eggs from improved backyard (in crores) 12 17 45% 37 217%
Eggs from crossbred backyard (in crores) 3.8 66 75% 68 80%
Eggs from commercial layers (in crores) 26 934 N/A* 934 N/A*
Total eggs (in 000s) 41 958 N/A* 980 N/A*
Source: LSA results; N/A* - not available
Projected annual income per animal in 15 years
Figure 28 below presents the income per animal for the BAU and WI scenarios. The annual income per animal
in the village backyard poultry (BYP) system reects income per hen with eight chickens. The income per hen is
approximately INR 155 and INR 240 under BAU and WI, respectively, due to additional chicken interventions.
The income per animal in the village crossbred chicken system is relatively higher, about INR 611 per animal.
The crossbred investment interventions are already ongoing in the village subsector (under programs such as
the Bihar rural livelihoods project—'JEEViKA' project for India), as shown in Figure 28. Only small difference in
incomes per animal are thus observed under the BAU and WI scenarios.
Figure 28: Annual income per animal in the BAU and WI scenarios.
Source: LSA results

The Bihar Livestock Sector Analysis 106
Returns on investment in all poultry systems
The results of investments for chicken production under WI are summarized in Table 89. All nancial indicators
based on 15-years discounted incremental cash ow analysis indicate that the investments in both backyard
and commercial chicken production systems are nancially viable. However, it was found that the investments
in commercial chicken production (broilers and layers) are more protable than the investments in indigenous
family backyard chicken production.
Table 89: Results of nancial analysis for WI in poultry production in Bihar, 2017–18 to 2032–33 (ock level)
Poultry production size/ock
Financial indictors based on 15-years discounted incremental cash ow analysis
NPV (INR lakhs) IRR (%) BCR EANPV (INR lakhs)
Indigenous family backyard (BYP)
0.33 N/A* 28 0.04
Commercial
Broiler 17.8 178% 1.2 2.3
Layer 44.8 124% 1.1 5.9
Source: LSA results; N/A* - not available
GSDP contribution
The GSDP contribution of chickens by 2032–33 will increase by elevenfold from the base year (2017–18) with
the interventions (WI) scenario while the increase will be twofold in the BAU scenario (Table 90 below). Like the
ndings in chicken production, the change in GSDP contribution of meat and egg between BAU (in 2032–33)
and the base year (2017–18) will be about twofold and vefold, respectively. However, the change in GSDP
contribution of meat and eggs production between the WI scenario (in 2032–33) and the base year will be
about fourteenfold and sixfold, respectively (Table 90).
Table 90: GSDP contributions for baseline, and BAU and WI scenarios (INR crores)
Products
GSDP in base year (2017–18) (INR crores)
BAU GSDP in 2032–33
(INR crores)
% change baseline
to WI
WI GSDP in 2032–33
(INR crores)
% change baseline
to WI
Chicken meat from indigenous backyard
245 356 45% 799 225%
Chicken meat from crossbred backyard 9.7 17 75% 17 80%
Chicken meat from layers 8 290 N/A* 291 N/A*
Chicken meat from broilers 77 2,52 229% 2914 N/A*
Total chicken meat 340 915 169% 4022 N/A*
Eggs from improved backyard 70 101 45% 2,18 212%
Eggs from crossbred backyard 16 28 75% 29 80%
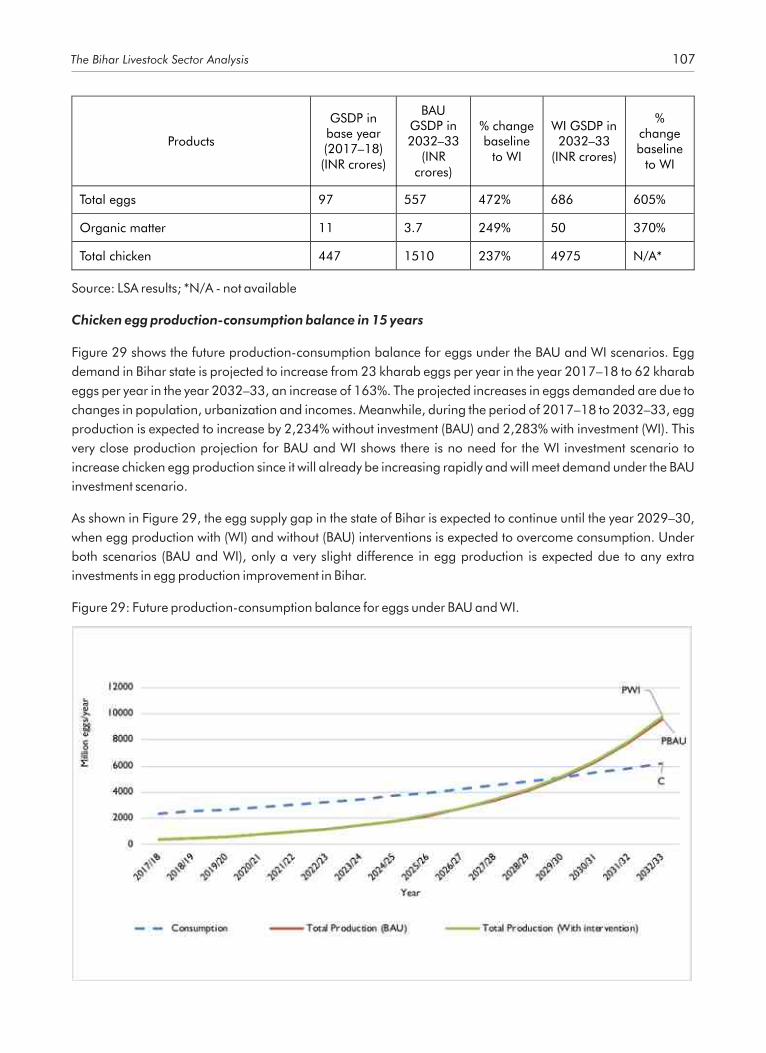
The Bihar Livestock Sector Analysis 107
Products
GSDP in base year (2017–18) (INR crores)
BAU GSDP in 2032–33
(INR crores)
% change baseline
to WI
WI GSDP in 2032–33
(INR crores)
% change baseline
to WI
Total eggs 97 557 472% 686 605%
Organic matter 11 3.7 249% 50 370%
Total chicken 447 1510 237% 4975 N/A*
Source: LSA results; *N/A - not available
Chicken egg production-consumption balance in 15 years
Figure 29 shows the future production-consumption balance for eggs under the BAU and WI scenarios. Egg
demand in Bihar state is projected to increase from 23 kharab eggs per year in the year 2017–18 to 62 kharab
eggs per year in the year 2032–33, an increase of 163%. The projected increases in eggs demanded are due to
changes in population, urbanization and incomes. Meanwhile, during the period of 2017–18 to 2032–33, egg
production is expected to increase by 2,234% without investment (BAU) and 2,283% with investment (WI). This
very close production projection for BAU and WI shows there is no need for the WI investment scenario to
increase chicken egg production since it will already be increasing rapidly and will meet demand under the BAU
investment scenario.
As shown in Figure 29, the egg supply gap in the state of Bihar is expected to continue until the year 2029–30,
when egg production with (WI) and without (BAU) interventions is expected to overcome consumption. Under
both scenarios (BAU and WI), only a very slight difference in egg production is expected due to any extra
investments in egg production improvement in Bihar.
Figure 29: Future production-consumption balance for eggs under BAU and WI.

The Bihar Livestock Sector Analysis 108
Chicken meat production-consumption balance in 15 years
The future production-consumption balance in chicken meat under the BAU and WI scenarios is presented in
Figure 30. Chicken meat consumption in Bihar is projected to increase by 280% over the 15-years horizon
(2017–18 to 2032–33).
Unlike in the case of the eggs, the LSA scenario analysis for chicken meat investment shows it will not be possible
to close the demand gap without additional investment in chicken meat production improvement interventions
(WI). With additional chicken production improvement interventions (WI) that are mostly targeted at increasing
the population of broilers and poultry feed, chicken meat production is projected to increase by about 2,400%
over the 15-years horizon, from 2017–18 to 2032–33. As shown in Figure 30, the chicken meat demand gap is
expected to close by the year 2030–31.
Figure 30: Future production-consumption balance in chicken meat under BAU and WI.
7.5 Pig improvement
The investment context
Pig production in Bihar is divided into three main categories. The rst and most predominant type of pig
production is the traditional scavenging piggery system followed by semi-intensive and intensive production
systems. The traditional piggery is characterized by very minimal/zero input; pigs obtain feed by scavenging
locally available feed resources/vegetation, crop residues and kitchen wastes (Chauhan et al. 2016). Housing
and management are very poor— pigs are exposed to extreme weather conditions and rain. The semi-intensive
pig production on the other hand has better management, shelter and feeding while the intensive system is a
commercial modern piggery. The intensive pig system is either specialized in fattening piglets or involved in
breeding and fattening pigs (Chauhan et al. 2016).
Pig improvement interventions

The Bihar Livestock Sector Analysis 109
Transforming the traditional backyard piggery production
Intervention areas (production zones)
· Transforming the traditional family pig to improved family pig throughout the state and all of the livestock
production zones (Northern, Central and Southern zones)
Priority interventions and assumptions
The main objective of the traditional family piggery improvement intervention (WI) is to replace it with semi-
intensive piggery interventions. In semi-intensive pig production, farmers provide better management, housing
and feeding to pigs and improve their genetics through selection and breeding with locally adapted pig breeds.
Feed and feeding
• Improve availability of feed (produced, agro-industrial by-products and processed feeds).
o Make land available for production of pig feed and raw material for processed feed production.
o Provide incentives and suitable investment to support agro-processing industries and feed processing
factories.
• Improve quality assurance of agro-industrial by-products and processed feeds.
Genetics
• Improve breed performance through crossing with improved breeds.
• Establish a breeding farm to ease breed improvement and multiplication of improved breeds.
• Establish improved breed piglet multiplication and distribution centres.
• Provide extension service to farmers on how to improve productivity of pig breeds through selection.
Health
• Advocate for periodic vaccination and treatments against internal and external parasites.
• Encourage private health service providers with incentives where necessary.
Extension
• Educate farmers to improve the piggery management in the traditional piggery system and to be able to
move to improved and semi-intensive production. It is expected that farmers will adopt improved and semi-
intensive production and move away from the traditional piggery.
• The number of pigs in the traditional piggery is expected to decrease annually by 5% while the pig
population in the semi-intensive piggery is targeted to increase from the current almost nil situation (Table
91 below).

Table 91: Population projection in traditional and semi-intensive pig productions
Production type Base year (2017–18)
End of rst ve years (2022–23)
End of second ve years (2027–28)
End of third ve years (2032–33)
Traditional piggery 1,32,188 1,02,285 79,146 61,242
Semi-intensive piggery 442 1,982 8,887 39,850
Source: LSA results
Processing and marketing
• Create market linkages between pig producers and pig abattoirs/pork processors.
• Establish pig producers' co-operatives to facilitate marketing of inputs and outputs.
• Establish pig abattoirs and pork processing factories.
• Assure the quality of live pig, pork and pork products marketed.
Priority targets and assumptions
Farmers moving away from the traditional piggery to improved piggery will realize the following
benefits and costs:
• Number of piglets at birth to increase from the current 5-7 litters/sow;
• Mortality rate of young animals before weaning to decrease from 20–12%;
• Average marketable live weight of pigs to increase from 80–85 kg;
• Veterinary service expense of the farmer to increase to INR 350; and
• Per cent of feed purchased to increase from the current 0% in traditional piggery to 20% in the improved
piggery.
Expanding the specialized commercial intensive piggery
• Intensive pig production system is planned to emerge and increase in size over the next 15 years.
• Intensive pig production has two forms: sow rearing and fattening of pigs (Table 92).
Table 92: Population projection in intensive pig production systems
Production type Base year
(2017–18)
1st 5 years (2022–23)
2nd 5 years
(2027–28)
3rd 5 years
(2032–33)
Intensive sow rearing 3,000 9,155 26,840 69,616
Intensive piglet fattening 500
1,244
2,557
4,507
Total
1,36,130 1,13,396
1,09,689
1,37,211
Source: LSA results
The Bihar Livestock Sector Analysis 110

The Bihar Livestock Sector Analysis 111
Impact of interventions
Projected population in 15 years
Table 93: Pig population at production subsystem level for baseline, BAU and WI scenarios (in lakhs)
Pig production
subsystem
Pig population
Baseline
(2017–18) (lakhs)
BAU in
2032–33
(lakhs)
% change
baseline
to WI
WI in
2032–33 (lakhs)
% change
baseline
to WI
Traditional backyard
6.6
7.7
16%
3.1
-54%
Improved backyard
0.22
0.06
-73% 1.9
NA*
Commercial
0.21
0.05
-73%
4.87
NA*
Fattening
0.01
0.001
-80%
0.05
NA*
Total 6.8 7.8 13% 9.9 46%
Source: LSA results; N/A - not available; * negative growth rate observed
According to the 19th Livestock Census, Bihar ranked fth in pig population with a total of 6,50,000 pigs.
Assam and Uttar Pradesh are the two leading states in India in pig population with a total of 16 and 12 lakhs
pigs, respectively. As shown in Table 87 above, the pig population in Bihar between 2017–18 and 2032–33 is
projected to grow by about 13% in the BAU scenario and 46% in the WI scenario. In the WI scenario, the pig
population is projected to grow from the current 6.8 to 9.9 lakhs in 15 years.
Projected production in 15 years
The production of pork shows similar increases to that of population. Table 94 shows that the total pork
production increases from 46,000 MT without intervention (BAU) to 1,62,000 MT with intervention (WI) in 15
years (2032–33).
Table 94: Production for baseline, and BAU and WI scenarios in 2032-33
Products
Production
2017–18
(baseline)
BAU
production
in 2032–33
% change
due to BAU
WI
production
in 2032–33
% change
due to WI
Traditional backyard (MT) 39,189 45,633 16% 18,156 -54%
Improved backyard (MT) 323 88** -73% 29,027 N/A*
Commercial (MT) 4,913 1,342** -73% 1,13,964 N/A*
Fattening (MT) 96 26** -73% 860 N/A*
Total 44,521 47,088 6% 1,62,013 264%
Source: LSA results; N/A - not available; **negative growth rate observed

The Bihar Livestock Sector Analysis 112
Projected annual income per animal in 15 years
Figure 31 presents the annual income per animal for BAU and WI scenarios in pig farms. The results show there
is very slight or no increase in income per animal due to the WI investment interventions in the traditional
backyard system, improved backyard piggery and pig fattening farm types. The income per animal in the
category of commercial piggery is signicantly higher under the BAU scenario and pig improvement
interventions (WI) result in additional income of only INR 1,008 per animal.
Figure 31: Annual income per animal for the BAU and WI scenarios.
Returns on investment
Table 95 shows the ex-ante impact assessment of improvements in pig production (due to WI). The results show
a positive NPV and high IRR and BCR for all pig production herds. For commercial piggery and pig fattening, the
investment resulted in a 15-years NPV of INR 19 lakhs for commercial piggeries and INR 12 lakhs for pig
fattening.
Table 95: Results of nancial analysis for the combined livestock interventions in pig production in Bihar,
2017–18 to 2032–33 (pig production size/herd level)
Pig production
size/herd
Financial indictors based on 15-years discounted incremental cash ow analysis
NPV
IRR (%) BCR EANPV
(INR lakhs) (INR lakhs)
Improved backyard 0.12 N/A 1.87 0.02
Commercial 19 63% 3.12 2.6
Fattening 12 60% 1.28 1.63
Source: LSA results

The Bihar Livestock Sector Analysis 113
GSDP contributions
Table 96: Contributions for baseline, BAU and WI scenarios (INR crores)
Products
GSDP at
baseline 2017–
18 (INR crore)
BAU GSDP in
2032–33 (INR
crore)
% change
due to
BAU
WI GSDP
in 2032–
33 (INR
crore)
%
change
due to
WI
Traditional backyard 175 204 16% 81 -54%
Improved backyard
0.7
0.2*
-73%
57
N/A
Commercial
17
4.6*
-73%
387
N/A
Fattening
0.3
0.1*
-72%
2
N/A
Total
193
209
8%
527
173%
Source: LSA results; N/A - not available; * negative growth rate observed
The GSDP contribution of pigs by 2032–33 will increase by 8% from the base year (2017–18) in the BAU
scenario while the increase will be 173% in the WI scenario (Table 96). Of the total pig GSDP contribution, meat
contributes 99%, while manure contributes the rest.
Pork production-consumption balance in 15 years
Figure 32 shows the projected production-consumption balance for pork under BAU and WI scenarios. During
the period of 2017–18 to 2032–33, both pork demand and production under the BAU scenario are expected to
decrease by 26% and 38%, respectively. Although pork production is steadily decreasing under the current
investment or the BAU scenario, a huge pork production surplus is expected during the 15 years of the WI
investment period, from 2017–18 to 2032–33.
Additional investments (WI) that target the commercial piggery sector and slaughter and marketing
infrastructures will be necessary to increase pork production to supply pork to hotels, restaurants and cafeterias
in Bihar and for marketing to neighbouring states and export to nearby countries.
Figure 32: Future production-consumption balance in pig meat under BAU and WI.

The Bihar Livestock Sector Analysis 114
7.6 Lessons for gender and social inclusion
Most of the technical and market interventions listed earlier have positive impacts on productivity and revenues
(GSDP contribution). This section complements the previous analysis by looking at the likely impact on gender
and social inclusion. In addition to supporting productivity-enhancing technologies and practices, following a
gender and social inclusion-sensitive approach will not only maximize impact of poverty reduction, but also
sustain gains of productivity increases, as both women and men, marginalized communities and others, will
benet in a more equitable manner. Indeed, the World Bank (2011) estimated that productivity could increase
in some countries (especially in Africa) by as much as 25% if the barriers that prevent women from entering the
workforce were eliminated. Ravichandran et al. (2018 forthcoming) arrived approximately at the same
percentage: there is about a 22% positive difference in income controlled by women for those in women-only
co-operatives, compared to those in mixed co-operatives. In the following section, we discuss the gender and
social inclusions implications of proposed interventions in each production system.
Cow/buffalo dairy improvement interventions
There is a strong imbalance between women's contribution to labour and their contribution in decision-making,
including control over income. In dairy production, even though women contribute more labour compared to
men (50-80%), amounting to four to ve hours of labour per day, their contribution in decision-making for
technical (breeding, feeding, health) and nancial aspects (credit, purchase and sale of animal) are very limited
(20-40%) (ILRI FDGs 2018). Such imbalances, due to social norms, are exacerbated by some government
programs that are gender neutral. Indeed, women are unable to access technical and nancial services due to
household work burden, weak bargaining power and mobility issues (Kaaria et al. 2016). This situation has a
negative impact on women's access to and control of milk income. It is worth noting that when the marketing of
milk is through informal channels (compared to more formal or structured channels), women usually have
greater access to and control of dairy income. As the proposed interventions include the support of co-
operatives, it will be crucial to pay attention to women's and marginal communities' ability to participate in, and
benet from, such new marketing outlets (Ravichandran et al. 2018 forthcoming). In cases like in Bihar where
there are deep gender inequalities within society, the support of women-centred activities (e.g. women only co-
operatives) may provide an opportunity for expressing voice and opinions (World Bank 2011). Annex 4 Table
119 lists, for the different types of interventions, possible gender and social implications as well as promising
strategies for more equitable inclusion of women and marginal communities in cattle and buffalo systems.
Figure 33 below illustrates the changes in cow milk revenues controlled by women compared to baseline, by
production system and under different scenarios. Assuming no change in control over milk revenues by women
for the BAU and WI gender-neutral interventions, the changes simply mimic the overall changes in milk GSDP
contributions presented in Table 67. The last scenario, WI following a gender-sensitive approach as described
in the last column of Table 119, assumes a 25% increase in women's control over milk revenues (from an
estimated 44% to 55%), translating into a more than fourfold increase in women revenues, compared to the
baseline.

The Bihar Livestock Sector Analysis 115
Figure 33: Changes in cow milk revenues controlled by women, by production systems, under different
scenarios.
Sources and assumptions: baseline percentage of revenues controlled by women, average across zones, 44%
(ILRI FDGs 2018). We assumed a 25% increase in women's control of revenues for the 'gender sensitive'
scenario (from World Bank 2011). The same applies to the other gures in this section.
Goat production interventions
As mentioned previously, goats are mainly owned by the poorest and marginalized communities and managed
by women. Women control about 63% of revenues from goats (ILRI FDGs 2018), and therefore any
interventions targeting goats will likely benet them. Households who do not keep cows due to feed and capital
constraints keep goats. Annex 4, Table 116. lists the different types of interventions, possible gender and social
implications as well as promising strategies for more equitable inclusion of women and marginal communities
in goat systems.
Figure 34 below illustrates the changes in goat revenues controlled by women compared to baseline, for small
and medium farms, under different scenarios. Assuming no relative change in control over goat revenues by
women for the BAU and WI gender-neutral interventions, the changes simply mimic the overall changes in goat
GSDP contributions on Table 76. The last scenario, WI following a gender-sensitive approach as described on
the last column of Annex 4, Table 120, assumes a 25% increase in women's control over goat revenues (from an
estimated 63% to 80%), translating into a more than threefold increase in women's revenues, compared to
baseline.
Figure 34: Changes in goat revenues controlled by women, by farm size, under different scenarios.

The Bihar Livestock Sector Analysis 116
Backyard poultry production production interventions
Backyard poultry production (BYP) production is mainly managed by women from marginalized and landless
community households. The major challenge is the high mortality during disease outbreaks, which not only
affects subsistence revenues but also household food diversity. BYP production is considered a pro-poor policy
which has more outreach for poor people and leads to improved food security than any other livestock
intervention (Dolberg 2003). Annex 4, Table 121 lists the different types of interventions, possible gender and
social implications as well as promising strategies for more equitable inclusion of women and marginal
communities in BYP systems.
Figure 35 below illustrates the changes in backyard chicken revenues controlled by women compared to
baseline for the different products and under different scenarios. Assuming no change in control over BYP
revenues by women for the BAU and WI gender-neutral interventions, the changes simply mimic the overall
changes in BYP GSDP contributions on Table 84. The last scenario, WI following a gender sensitive approach as
described on the last column of Annex 4, Table 121, assumes a 25% increase in women's control over BYP
revenues (from an estimated 66% to 69%), translating into a more than fourfold increase in women revenues
for chicken meat from indigenous backyard, compared to baseline.
Figure 35: Changes in BYP revenues controlled by women, by product, under different scenarios.
Pig production interventions
Approximately 8% of all animal-source protein in India is supplied through pig products, of which 15% is from
Bihar, mainly from indigenous breeds (USDA 2016). As mentioned earlier, pigs are mainly owned by tribal
communities. The major challenges faced by these communities are lack of access to health, feeding and
breeding services to increase productivity. Weak bargaining power and poor social status are some of the
barriers that existing government interventions are working to eliminate. More productive crossbred pigs are
available but marginalized communities are unable to acquire them. Hotels and restaurants import pig meat
products from other countries; indeed, marginal communities do not provide value addition due to lack of
slaughterhouses for pork. Annex 4, Table 122 lists the different types of interventions, possible gender and
social implications as well as promising strategies for more equitable inclusion of women and marginal
communities in pig systems.
Figure 36 below illustrates the changes in pig (traditional backyard) revenues controlled by women compared
to baseline, under different scenarios. Assuming no change in control over traditional backyard pig revenues by

The Bihar Livestock Sector Analysis 117
women for the BAU and WI gender-neutral interventions, the changes simply mimic the overall changes in pig
GSDP contributions in Table 96. Under the WI scenario, pig revenues experience a large decline, jeopardizing
an important source of livelihood for the marginal communities. The last scenario, WI following a gender-
sensitive approach as described in the last column of Annex 4, Table 122, assumes a 25% increase in women's
control over pig revenues (from an estimated 73% to 92%), which cushions a bit the decrease in revenues.
However, even if gender- sensitive interventions are followed, pig revenues controlled by women reduces by
42%, compared to baseline. It is crucial to re-examine these interventions to avoid a worsening of welfare
amongst marginal communities. It will also be important to nd mechanisms to support marginalized
communities in their transition from backyard to semi-intensive systems.
Figure 36: Changes in pig revenues controlled by women, under different scenarios.

The Bihar Livestock Sector Analysis 118
8 Summary and conclusions
Context
Bihar is predominantly an agricultural state and there is large scope for animal husbandry. Animal husbandry
plays a critically important role in employment and income generation for rural people. Livestock provide
signicant employment to women and also agricultural workers belonging to the marginal strata of society.
Moreover, the livestock sector contributes 26.7% to agricultural GSDP, but contributes only about 5.2% to state
income, or GSDP, indicating the low incomes and value addition generated in the sector.
Bihar is particularly recognized for its large goat population (ranked fth among states in India) and high milk
production (ranked ninth among states in India), making the livestock sector core within any potential plans to
help achieve the development goals of the state. Most goats are cared for by marginal castes and women, so
they can be particularly important in poverty reduction strategies and activities.
The growth and performance of the dairy subsector in Bihar, meanwhile, is better in comparison to many other
Indian states (DAHDF, 2017). The COMFED dairy co-op, which is supported by the government, has played a
very critical and successful role in developing the dairy subsector, and in raising dairy cow productivity and milk
production, as well as in raising dairy farmer incomes.
To help raise more investment resources to achieve even greater livestock development in Bihar, the DAFR of the
GoB asked ILRI to provide technical assistance to develop an LSA) as a rst step in developing an LMP or ve-
years livestock sector investment plan for Bihar. This effort was generously funded by the Bill & Melinda Gates
Foundation, South Asia Agriculture Program. This initiative is meant to help increase and target investments to
further modernize the livestock sector and enable it to make an even more substantial contribution to state
development goals.
The main objective of the Bihar LSA has been to provide quantitative and evidence-based justication for more
public and private investments in prioritized priority commodity value chains (VCs) of the Bihar livestock sector
chosen. The recommendations are based on analysis of scenarios where the returns on investment (ROIs) from
investments in new and/or additional combined technology and policy interventions were tested. The LSA is
also meant to inform the development planning of DAFR, together with other Bihar government agencies
working on livestock sector development in the state, as well as the investment planning of development
partners or donors, nongovernmental organizations (NGOs), civil society organizations, private sector actors
and development banks.
To accomplish its mission, the ILRI LMP team engaged with senior and technical staff of the Bihar DAFR, and
other livestock experts to understand the existing development priorities of the Bihar government, to agree upon
the relevant framework of key species, production systems and a typology of agroecological zones to be

The Bihar Livestock Sector Analysis 119
analyzed, as well as the commodity value chains to be included in the LMP diagnostic process, collect reliable
livestock data and parameters, build a state herd and economic sector model (HESM), and carry out the sector
analysis to understand the current situation and future potential of the sector.
In the investment scenarios carried out in the LSA on productivity-enhancing technology interventions,
combined with better policies, state development objectives of Bihar were identied by the sector stakeholders
and DAFR. The measurable indicators in parentheses were used as decision criteria for testing and comparing
the alternative investment interventions (combined technology and policy) to be considered for inclusion in the
LMP.
Bihar has adopted the following development objectives (and indicators):
• reduce poverty (improve household incomes)
• economic growth (contribution of livestock sector to Agriculture State Domestic Product and GSDP
• increase the food and nutritional security of all people—rural and urban ASFs, including more protein and
carbohydrates
• surplus trade with the rest of India (value of marketing to other states)
• contributing to industrialization and employment (especially employment for women, youth, and
scheduled minorities)
• contributing to social equity (household production income and investment increases for women, youth
and scheduled minorities)
The LSA results show that further investments in the development of the livestock sector could be a means of
improving incomes and greatly reducing poverty while meeting other state development goals.
Challenges and opportunities
Despite the successes of COMFED in building up the dairy subsector and raising the productivity of dairy cows
and buffalos, and DAFR and NGO efforts at raising the productivity of goats, dairy productivity is still lower in
Bihar than the all-India average. In addition, more attention is required to increase the production of chicken
meat and eggs, and wool and skins in Bihar (DAHDF 2017).
A lack of sufcient animal feed may be the greatest challenge hindering long-run development of the sector.
One specic feed challenge will be how the food grain-focused agriculture can be converted into a food-fodder
based agriculture-livestock sector (Rahman, 2017).
Besides scarcity of feed, other prominent challenges were identified by stakeholders in the livestock
sector, and are borne out by the sector analysis:
• poor feed quality regulation
• lack of organized and continuous livestock training on productivity-raising production practices
• loss of livestock due to ooding
• lack of private sector investment in input production and supply, and post-harvest value-addition
processing

The Bihar Livestock Sector Analysis 120
• inadequate government budget to help develop the sector
The livestock value chains chosen for sector analysis
Based on the input from the government of Bihar, sector experts and stakeholders, the commodity value chains
investigated and compared for impacts were: cow and buffalo dairy; red meat from buffalos and goats;
chicken meat and eggs from improved backyard semi-scavenging chickens; commercial chickens—broilers
and layers, and pigs and pork (improved traditional and commercial piggeries). Some of these VCs are
presently important for food production, household incomes and state income growth, as well as meeting
equity goals such as poverty reduction (especially cow and buffalo dairy and commercial chickens with broilers
and layers), while others (backyard dual-purpose chicken, and buffalo and pigs for meat) were analyzed for
their potential to grow to become of major economic and livelihood importance in future.
To tap the opportunities and cope with the challenges facing the livestock sector in Bihar, livestock improvement
interventions and investments in feed, extension, health, genetics and marketing and processing are critical.
The impact of these interventions on the incomes of farmers, productivity of animals and production of ASFs
and GSDP (or state income) contributions to the sector were measured and the impacts of priority interventions
analyzed in the LSA quantied in the 'with intervention (WI) scenario' as compared to the 'business as usual
(BAU)' scenarios.
These two types of projections of sector impacts were measured for the investment interventions
(combined technologies and policy) in the LSA:
• BAU or the current level and type of investment interventions (policy and technology)
• WI or with additional and/or new investment
Priority interventions to further modernize the sector were proposed to include:
• Improve the quantity and quality of livestock feed resources through training of farmers to use all available
areas to produce forage crops and upgrade feed quality testing and regulatory institutes to test quality of
feed in the market.
• Improve genetics through selection of local breeds and crossing them with improved indigenous and exotic
breeds across all species and improve semen production and AI delivery through more PPP and private
service providers where appropriate.
• Increase the quality and availability of animal health services and improve producers' access to these
services through private and/or PPP in order to decrease livestock mortality and morbidity.
• Introduce interventions to improve collection and marketing systems (creation of feedlots, increasing the
number and improving the management of dairy co-ops and strengthening co-op partnerships with
COMFED).
• Increase value-addition processing (establishment of slaughterhouses, sales and retail store chains (cold
chains and product packaging) etc.
• Design and implement policies and institutional interventions which encourage private and PPP investment
interventions in animal husbandry, input production, processing and delivery, as well as output processing
and marketing.

The Bihar Livestock Sector Analysis 121
Summary of investment impacts across livestock commodities
As shown in Table 97 below, the IRR and BCR values for investments in all the interventions are sufciently
attractive to warrant investment. As expected, the returns on investments (ROIs) are higher for crossbred cows
than indigenous cows, but the investment returns in indigenous cattle are marginally attractive, as well.
Meanwhile, the investments in indigenous buffalos and goats are nancially worthwhile, and there are added
societal benets since improving the value chains for these species can be targeted at women and socially
disadvantaged castes, . Meanwhile, the benets from investment to intensify family chicken and backyard pig
operations are higher than the returns from investing in commercial chicken or commercial piggeries or pig
fattening. Finally, the contributions to state income or GSDP by commodity value chain are positive in all cases.
Table 97: Summary of protability and GSDP impacts by 2032–33 of investments in the livestock sector
Value chain and production zone
IRR% BCR
Increase in GSDP in WI scenario by 2032–33 (%)
In comparison with the base year
(2017–18)
In comparison with the BAU in
2032–33
Family cow dairy -
indigenous 10% 1.00
191% 112% Family cow dairy -
crossbred 35% 1.60
Buffalos 15% 1.00 67% 16%
Goats 31% 1.60 197% 74%
Backyard chickens N/A (large number) 28.99
N/A (small base year value)
230% Broilers 178% 1.25
Layers 124% 1.21
Pigs - Improved Backyard N/A (large number) 1.87
173% 152% Commercial piggery 63% 3.12
Commercial Pig fattening 60% 1.28
Source: LSA results
Summary of investment impacts on future production and consumption balance
Projections of future production and consumption balance (production over consumption in percentages) for
the major livestock products (milk, eggs and meat) with and without policy and technology interventions (the
BAU scenario) and with additional investment in policy and technology interventions (the WI scenario) were
made to assess the potential for and size of potential future supply and demand gaps. This projection is critical
to anticipate the magnitude of required future investment in livestock production interventions which would be
required to close any production-consumption gaps.

The Bihar Livestock Sector Analysis 122
This projection of current and future consumption requirements for livestock products is needed and requires
base year information on quantities of livestock products consumed by households, income elasticities of
demand for the various livestock products, the growth rates of real per capita GDP, and the growth rates of
human population and urbanization. With the projected consumption requirements over time and the herd and
economic model results for projected production possible over time, the impact of the WI intervention scenarios
on the production-consumption balance of livestock products can be calculated and analyzed.
The impact of the BAU and WI intervention scenarios on the production-consumption balance for the major
livestock products relevant in Bihar are summarized in the Figure 37 below. The production-consumption
balance for milk and milk products by 2032 is projected to be -41% in the BAU scenario, while under the WI
investment scenario the consumption of milk could be satised by milk produced in Bihar state— or no
consumption gap is projected. Buffalo, pork and egg production-consumption balances are positive through
2032 under both the BAU and WI scenarios, but are higher under WI, suggesting these extra commodities
could be marketed to other states or exported to nearby countries. Meanwhile, the goat meat production-
consumption balance is projected to remain negative under both the BAU and WI scenarios, since demand is
growing very rapidly, but ways to increase animal productivity as rapidly over the next 15 years could not be
identied and tested with the HESM. The production-consumption balance for chicken meat is also negative
under the BAU scenario but is projected to be and about 16% in surplus under the WI scenarios for broilers and
improved backyard chicken production.
Figure 37: Production-consumption balance by 2032–33 comparing the BAU and WI scenarios.
Source: LSA results

The Bihar Livestock Sector Analysis 123
Bihar LSA conclusions and recommendations
Cow and buffalo dairy value chain
Dairy will continue to be a key commodity value chain which can increase contributions to the development
goals of the state: poverty reduction, economic growth, increasing food and nutritional security, contributing to
industrialization and employment, and contributing to social equity.
• The milk and dairy product-consumption balance (production over consumption in percentages) is
projected to be 59% and 101% in 15 years under the BAU and WI-1 scenarios, indicating that the WI-1
investment will be required to ensure no production-consumption gap.
• To take the dairy subsector to the next level, there is a need to open processing more to private investment,
especially in areas where COMFED is not already dominant
• The major interventions required to improve the dairy commodity value chain are improving feed
availability and quality, breeding/crossbreeding with exotic dairy and improved indigenous breeds
• Inclusion of women and marginalized communities in all investment interventions, included in increased
processing of milk and marketing of milk products
• The WI-1 scenario is the preferred dairy value chain improvement intervention scenario since it contributes
far more than WI-2 to improving milk production and other development impacts of the dairy value chain
• Yet, the positive investment returns to WI-2 showed it could be a complementary activity to dairying with
crossbred cows for farmers who could also manage the A2 milk producers.
Chicken meat and egg value chains
Chicken is the emerging subsector in Bihar with the most potential for further growth. It is critical to meeting the
development goals of the state and especially meeting growing meat consumption requirements. Investment
needs to focus mainly on broilers, not layers, but also backyard dual-purpose scavenging birds, as well, to raise
incomes of very poor farmers, including women and all people from scheduled castes. To realize the
developmental potential of chicken, there will be a requirement to dramatically increase production of the
cereals that go into chicken feed, particularly maize, and/or to purchase these cereals from other states.
• Egg production with layers does not need additional investment (WI) to produce surplus production— Bihar
can stay with BAU
• Chicken meat from broilers
o A decit in chicken meat is projected with BAU in 15 years
o Additional investment or WI is needed in broilers
• Backyard semi-scavenging crossbreds
o Additional PPPs or private investments, not only public efforts, would seem advantageous to be able to
signicantly scale up backyard poultry with crossbreds which are dual-purpose semi-scavenging,
including for women and scheduled castes

The Bihar Livestock Sector Analysis 124
Goats and goat meat value chains
Goats show much potential, mainly for aiding equitable achievement of development objectives, especially for
women and marginal ethnic groups.
• A decit in goat meat is projected with BAU; but additional investment (WI) does not close the supply gap
• Additional investment (WI) is thus not needed; the decit in goat meat with WI is still projected due to the
feed shortage and other technology and marketing factors
• Goat rearing presently is thus mainly a life-changing option for marginalized farmers and especially
women, who are either going into goat production for the rst time or can expand their herd sizes under
BAU technologies
• Decreasing mortality in goats would result in signicant improvement in goat production and productivity,
as well as incomes for farmers and higher GSDP contributions
• A state breeding policy for goats also needs to be developed and implemented
• A change of management practices (introduction of stall feeding, planting fodder trees, use of locally
available feed resources) could have signicant positive impacts on goat productivity and production, but
need to be combined with better breeds when they become available in future
• Credit and insurance for goat farming needs be scaled up since goats are mainly held by very poor women
from marginalized communities
• If further productivity-increasing interventions could be identied and introduced, especially addressing
better genetics and the severe feed constraint, increased marketing and sales to other Indian states and/or
exports to nearby countries could help to increase local goat prices and the incomes of women and
scheduled castes further
Buffalo milk and meat value chains
Buffalo production shows potential to grow in Bihar due to projected increasing demand in future. The benets
will increase most if more productive buffalo breeds are introduced and AI services are expanded.
• More buffalo milk is needed to help close the overall milk gap. It is combined with cow milk and it is highly
appreciated due to its high fat content
• Specialized buffalo milk and milk products collection, marketing and processing could help ensure a
premium price and higher incomes for buffalo milk producers, beneting scheduled castes
• Surplus buffalo meat could be produced with BAU and WI—WI is needed when investment in buffalo
slaughter is also increased.
• Not much preference exists for buffalo meat in Bihar so meat processing and marketing to other states or
exports need to be increased to raise prices and incomes to farmers, and state income
Pigs and pork value chains
Public support for investment in this emerging sector could particularly be instrumental in achieving tribal
community development, which would need to be supported in the transition towards more intensive systems.

The Bihar Livestock Sector Analysis 125
• With additional investment in production and marketing, surplus production of pig and pork production is
projected in 15 years
• The pig sub-sector has potential to provide development benets through better marketing and export of
pigs and pork. This could start with supporting marketing and export of live pigs, and later investments in
pork processing and marketing/exports
• Investments to improve pig production need to focus on improving both backyard and commercial scale
operations, as well as introducing pig fattening
• Pig producers from marginalized communities need to be supported to make the transition to semi-
intensive and later commercial pig operations
• Additional investment needs also to be focused on establishment and improvement of marketing coops for
pigs, with training for coops to help producers to market to hotels and other states
Policy recommendations
• Dairy processing needs to be made more attractive to private investment, especially in areas where
COMFED is not already dominant
• For the chicken value chain, the policy priority is on creating a more conducive environment for private and
private-public investment in feed production and inputs and services delivery, as well as chicken meat
processing and marketing
• Feed quality standards and regulation enforcement is urgently needed in all livestock value chains, and
feed quality testing and regulatory institutes need to be upgraded
• The quality and availability of animal health services and improved producers' access to these services need
to be improved through encouragement of private service providers and/or PPPs
• Greatly increased semen production and AI delivery through more PPP and private service providers where
appropriate need to be enabled, with incentives, if needed
• Gender mainstreaming and social inclusion strategies are required at all levels
Main entry points for improving gender mainstreaming and social inclusion
• Greater access to and control of resources for livestock production
• Greater access of women and marginalized communities to credit to be able to purchase animal health
care, feeds and good genetic stock
• Targeted information to support innovative production by individual women and women's self-hep groups
• Land tenure policies to expand production and access to markets for appropriate returns
Also needed:
• Research to develop evidence-based policies, including to promote gender and social inclusion
• Gender mainstreaming within government departments (budget, staff and expertise)

The Bihar Livestock Sector Analysis 126
• Building on knowledge gained from positive experiences
Key policy recommendations to mainstream gender and social inclusion
• In dairy, women could benet from increased milk production through membership in co-operatives, to
ensure they maintain control of this income
• Goats are already the domain of women, so investments in this sector will benet women, although greater
access to feeds and forages will need to be resolved, as well as reducing demands on women's labor
• Pig and pork production are mainly in the hands of tribal communities, so marketing access to reach
demand centers would benet these communities
• In poultry, as women are involved in backyard production and if there is a push for semi-intensive systems, it
will be important to ensure women included in this transition, both for better incomes and nutrition
Finally, the commodity value chains recommended for investment in the LMP, in order of priority are:
1. Cow and buffalo dairy
2. Chicken meat and eggs
a. Improving backyard chicken through dual-purpose crossbreds
b. Commercial chicken—broilers and layers
3. Goat meat, milk and skins (focusing on improving the traditional systems of women)
4. Meat from buffalos and goats
5. Pigs and pork (focusing on the traditional systems of marginalized castes)
a. Intensifying the traditional piggery system through stall production and better breeds
b. Improving and increasing commercial piggeries and pig fattening

The Bihar Livestock Sector Analysis 127
9 Annexes
Annex 1: The process and methodology used in the Bihar LSA and LMP
Process used to prepare the Bihar LSA and LMP
The joint Bihar DAFR and ILRI LMP team rst carried out stakeholder consultations and a study tour to better
understand the Bihar livestock sector.
A comprehensive data base on the state livestock herd and baseline (depicting the current state of development
in the livestock sector– livestock numbers, animal and herd productivity levels and herd production, and the
monetary value of animal products produced) was then collected. Data collection took place from existing
secondary-source data, and gaps were lled in by consulting Bihar livestock sector experts for reliable
productivity parameters.
The data and productivity parameters were used to specify a dynamic state-level herd model and economic
sector model, jointly referred to as the HESM. The herd model builds from animal level productivity to herd
productivity and production, and the impacts on herd population growth. The household herd types modeled
include those found in the production systems of the three (3) commonly used livestock production zones of
Bihar (north, central and south), as chosen and characterized by the Bihar livestock experts, as well as the
representative household (HH) and HH herd types. This is described in section 3 of the LSA.
The two models are linked together to form the HESM, or herd and economic sector model, to do the livestock
sector analysis or LSA to create a long-run 15-year sector strategy, which then forms the basis for preparing the
LMP or medium-term 5-year livestock investment plan or livestock master plan (LMP).
The Livestock Sector Investment and Policy Toolkit (LSIPT), developed under the auspices of AU-IBAR by the
World Bank, CIRAD, and FAO, was used to create the HESM and LSA for the Bihar livestock sector. Then, LMP
tools developed by ILRI were used to produce the LMP or 5-year investment plan to inform public and private
investment planning, as well as inuence the development support investments and programs of donors and
the private sector.
In the LSA stage, the HESM was used to carry out a unique, multi-faceted analysis of the Bihar livestock sector.
The relevant representative household and production system types were chosen by the livestock experts of the
country, based on their unique assets, including the household herd. Then, the key livestock commodity value
chains considered in the sector analysis were chosen with the sector livestock experts. They included: local cattle
for milk and dairy products; goats for goat meat and milk; dairy grade cows and water buffalo for milk and
dairy products; chickens for meat and eggs; pigs for pork meat; and buffalo for meat. The quantities and values
of intermediate products, including manure and traction, were also measured. Perhaps most importantly, the
sector experts also helped choose the candidate technologies and policy interventions to be tested in the sector

The Bihar Livestock Sector Analysis 128
analysis.
The impacts of the alternative candidate interventions were tested and compared based on their unique impacts
on key state development objectives identied with the pertinent government decision makers. Measurable
indicators for these development objectives provided the criteria for testing and comparing the proposed
individual and combined technology/policy interventions using the herd and economic livestock sector model
(HESM) for Bihar.
For Bihar, the HESM was used to provide quantitative measures of the potential future impacts of the
proposed alternative combined technology/policy interventions on the following state development
objectives (and measurable indicators):
• Poverty reduction (impact on household and/or enterprise income)
• Achievement of state-level food security (state-level consumption-production balance)
• Economic growth (contribution to state income or GSDP (Gross State Domestic Product)
• Decrease in input and livestock purchases from other states or excess production available for sale to other
states and surrounding countries
In addition, recognizing the known importance of the role of women and marginalized communities in
livestock production in Bihar, we added an additional development objective and analyzed:
• Employment and income impacts (increased employment, asset control, and income) for women and
marginalized groups
While LSIPT, and thus the HESM built using LSIPT, does not differentiate labor components and explicitly
consider intervention impacts on gender, youth and disadvantaged groups, we used qualitative survey tools to
lter and interpret the outputs of the analytical results of the HESM analysis of proposed technology-policy
interventions in the LSA and LMP value chains. Based on the results investments and policies with the most
positive impacts on gender and disadvantaged groups have been identied in the LSA and LMP
recommendations.
The LSA commodity value chain assessments also included an end market analysis of projected consumption
growth of livestock products over time (or demand with constant prices). The analysis also included
identication and analysis of priority policies (to go hand in hand with the proposed technologies, training, and
infrastructure investments) which could create incentives for improved primary production through adoption of
production technologies. The investment interventions (policies combined with investments in primary
production technologies, as well as in infrastructure) were tested with the LSIPT cost-benet analysis (CBA) sub-
module.
Lastly, the interventions (combined policies and interventions), and related prioritized species and commodity
value chains, which demonstrated the most promise to contribute to the achievement of the chosen Bihar state
development objectives formed the basis for the recommendations for public and private investment in the LMP.
LSIPT Methodology - Livestock Sector Investment and Policy Toolkit
The ILRI team used LSIPT, the Livestock Sector Investment and Policy Toolkit, to build the herd and sector model
(HESM) to then carry out the analysis to produce the LSA and LMP.

The Bihar Livestock Sector Analysis 129
Spearheaded by AU-IBAR, LSIPT was developed by livestock experts at CIRAD, FAO and the World Bank. It had
been tested in Mali and Zambia and is now operational and has been applied in Ethiopia, Tanzania and
Uzbekistan by the ILRI LMP team and national collaborators from the ministries of agriculture and/or livestock.
LSIPT integrates micro, meso, and macro analysis for quantitative and qualitative assessment of household
vulnerability, the role of livestock in strategy for poverty reduction, and the contribution of livestock to the overall
economy. It accounts for the multiple functions of livestock, including: those of cultural importance; the
contribution to food security and nutrition; and the supplier of draught power and manure for soil fertility.
LSIPT provides a systematic framework for organizing accessible quantitative data (mostly from secondary
sources) and includes tools to carry out analyses which help to understand the production potential of the sector,
and its contribution to agricultural and overall economic growth (GDP), as well as reduction in rural poverty and
food insecurity. Furthermore, LSIPT enables the running of alternative technology and policy scenarios to
gauge the supply response of potential government investments in research and extension (such as
technologies that impact on feed availability, animal health, etc.), as well as private sector investments over 5 to
15-year projection periods. The scenario analysis is transparent and readily understandable, and thus useful to
policy makers and development investors. Moreover, analysis of potential impacts from changes in key aspects
of policy, such as the enactment of food quality standards and regulations required to compete in formal
markets (including export markets) can also be evaluated with the toolkit. Further description of the LSIPT
methodology is given in the diagram (below).
The elements of LSIPT are described in the diagram below. The core modules of LSIPT are 3, 4 and 5. Module 3
assesses the productivity at household, production systems and value chain levels. These micro and mesa data
gures are then consolidated and extrapolated to the national level in module 4. Once this data base is
established, the participatory tools of module 5 can be used to identify, with all stakeholders, the priority sectors,
target groups, and the most promising technology and policy interventions, to ensure optimal use of scarce
human and nancial resources. Once the interventions are identied, nancial, economic, social and
environmental impacts can be rapidly assessed using the database established in modules 3 and 4. Finally
using the tools, implementation arrangements can also be established on a mutually agreed upon basis.

The Bihar Livestock Sector Analysis 130
Figure 38: Diagram showing the different modules and sub-modules of LSIPT
Key information and data needed for the quantitative analysis carried out in Module 3 and 4 include:
a. A typology of the main different production systems prevailing in the country, state or region, with the
respective number of households keeping livestock and livestock numbers
b. Main livestock performance data for each species of livestock in each production system in each typology
zone, with a breakdown by age group and sex, reproductive performance, mortality by age group and sex,
average production, live-weight, off-take rate, carcass weight, etc.
c. Feed requirements by species, age and sex of animals, as well as feed availability, as related to land and
water availability for forage production, and crop residues and industrial byproducts
d. Dry matter yields of grass and crop lands (for crop-residues estimates for animal feed) in each of the main
agro-ecological zones
Available data and parameters required for the herd models were collected from published papers and
consultancy reports, as well as other “grey” literature. Gaps were lled through consultations with Bihar state
livestock experts.

The Bihar Livestock Sector Analysis 131
Annex 2: Institutional and policy constraints and
opportunities supporting Section 6
Table 98: Review of current policy constraints and proposed actions in animal health services
Priority policy or institutional
constraint/gap
Evidence, group affected and rationale for change Required policy action
Weak private
sector and weak
PPP
Animal health care is heavily
dependent on public sector
Limited reach of animal health care
services to most of the rural farming
communities
Doorstep animal health services
which is in high demand by farmers
is only performed through a few
private health service providers and
most of them lack proper training
High cost of prevention and control
of diseases of economic importance
Persistence of incidences of some
animal diseases (e.g. FMD, BQ, HS
etc.) in some areas and high
mortality rates, especially among
young stock
Absence of formal coordination and
co-operation between public and
private sectors
Strengthen the use of private service
providers for vaccination campaigns
Encourage the private sector to operate
in rural areas through provision of
incentive packages such as xed
performance contracts with government
(e.g. mass vaccinations)
Prepare a policy statement providing for
cost sharing for prevention and control
of diseases of economic importance
Develop feasible and cost-effective
control and prevention strategies, with
greater emphasis on prophylactic control
measures rather than curative, for
specic priority diseases
Use of information, communication and
technology platforms for dissemination
of information on disease/vector control

The Bihar Livestock Sector Analysis 132
Priority policy or institutional
constraint/gap
Evidence, group affected and rationale for change Required policy action
Inadequate
infrastructure
Limited number of veterinary
hospitals
Limited facilities for animal health
service delivery (e.g. ambulances,
diagnostic facilities-laboratories) at
all levels
The number of livestock units served
per livestock institution in Bihar is 2.5
times more than the national
average
A serious concern is the cold chain
management due to irregular power
supply and lack of refrigerated vans
for bulk transport, deep
freezers/refrigerators/asks etc.
Lack of adequate infrastructure in
eld institutions
Lack of quarantine facilities at
designated border posts
Limited zoonosis sanitary
inspectorate facilities (e.g. at border
posts)
Lack of communication facilities at
all levels (e.g. inadequate computers
(operation facility) at all levels of the
National Animal Disease
Reporting System)
Improve budget allocation to facilitate
provision of essential public animal
health infrastructures
Resolve the administrative constraints
that inhibit the launch of mobile clinics
Strengthen the capacity of the laboratory
diagnostic network and improve
diagnostic services
Encourage community-level
infrastructure development
Strengthen cold chain management at
retailers

The Bihar Livestock Sector Analysis 133
Priority policy or institutional
constraint/gap
Evidence, group affected and rationale for change
Required policy action
Absence of clear
policy to ensure
quality of
veterinary
education
One veterinary college exists and the
intake of students is limited
The efforts of COMFED, BAIF, J.K.
Trust and some NGOs in providing
animal health services are
satisfactory but are mostly
concentrated around Patna and
other urban centres
Prevalence of quacks (cattle
vaidya)/uncertied practitioners
No adherence to the prevention of
contagious diseases act
Lack of proper compliance with
vaccination protocols
Indiscriminate usage of antibiotics
and hormones often administered by
poorly trained livestock service
providers
Inadequate computer literacy at all
levels of National Animal Disease
Reporting System
One more Veterinary college be added
and also increase the intake of students
Develop strict regulations and
enforcement that ensures quality of
veterinary education
Expand universities and colleges
providing higher level education to meet
the required skilled manpower
Organize training in animal health
services to rural educated youths,
especially to those who are performing
job of cattle vaidya in rural areas
Low adoption of
GMP and
technologies.
Adoption of GMP is inadequate and
results in spread of diseases like
mastitis
Unhygienic management practices.
Limited number of livestock farmers
using available technology such as
vaccines
Strengthen veterinary extension services
to transfer of technologies and relevant
information
Provide incentives/premium price for
quality livestock produce as adherence to
GMP
Boost and strengthen working
relationships between livestock farmers
and various service providers to foster
usage of technologies
Provide credit and extension services to
the livestock producers

The Bihar Livestock Sector Analysis 134
Priority policy or institutional
constraint/gap
Evidence, group affected and rationale for change
Required policy action
Inadequate
technical support
services
Low average number of qualied
animal health personnel compared
to the number of animals requiring
services
Low availability of various technical
support services at farm level
Absence of formal mechanism for
collecting information on veterinary
drugs and biologicals pertaining to
their failure or adverse effects
Promote and strengthen PPP in delivery
of animal health services
Establish a reporting system that will
facilitate collection of information on
veterinary drugs/vaccines performance
at all levels
Table 99: Review of current policy constraints and proposed actions in animal breeding
Priority policy or
institutional
constraint/gap
Evidence, group affected and rationale for
change Recommended policy action
Absence of clear policy
regarding ensuring
quality and monitoring
AI operations
No mention about regulatory authority to
regulate use of germplasm in the breeding
policy
Institutional framework for implementation
of regulatory framework is not mentioned in
the breeding policy
The breeding policy does not include
monitoring of AI works
Climate change is going to have an impact
on crossbred animals but there is no
mention about this issue in policy
No regulation for breeding of small
ruminants—small ruminants like goats
naturally mate with any available village
bucks
Revise the breeding policy to
address policy gaps
Develop regulation for
breeding of small ruminants
Supply male goats to
progressive farmers in rural
areas
Enhance capacities for
policy implementation

The Bihar Livestock Sector Analysis 135
Priority policy or
institutional
constraint/gap
Evidence, group affected and rationale for
change Recommended policy action
Privatization of AI
Breeding is largely conducted by public
breeding service providers
Revised government guidelines say it is the
responsibility of the breeding service
provider to follow up with the AI calf for two
months which discourages NGO operations
The government engaged NGOs (BAIF and
J.K. Trust) to provide AI services by allocating
villages to them to prevent overlapping of
services, but such delineation of
public/private roles has not yet taken
place—limited progress in privatization
Lack of awareness about the potential of Al
in the rural areas, along with initiative of
improving semen quality, especially, blood
level supply of different varieties of bull
semen
Lack of monitoring and coordination among
the public and private sectors
Encourage private
involvement in AI service
delivery
Use of ICT in service
delivery as promoted by the
National Dairy
Development Board
Encourage and provide
incentives to private AI
workers to provide doorstep
services
Provide training to rural
private Al workers
Increase coverage with
quality, efciency and cost-
effective services to the
small farmers
Insufcient improved
genetic resources
Poor animal identication system and no
performance testing
Lack of progeny-tested bulls
Large population of nondescript animals
Indiscriminate breeding is one of the major
problems
Farmers do not maintain breeding records
Blood levels very high
Establish and strengthen
bull stations and frozen
semen banks
Strict enforcement of
breeding protocols
Improvement of nondescript
buffalo through Murrah
Inadequate expertise
and infrastructure
Prevalence of quacks (cattle
vaidya)/uncertied practitioners
Poor heat detection and insemination skills
Unavailability of liquid nitrogen plant
Irregular supply of liquid nitrogen
Create awareness among
farmers
Educate AI service providers
and monitor AI services in
the state
Maintain the only non-
functional liquid nitrogen
plant

The Bihar Livestock Sector Analysis 136
Table 100: Review of current policy constraints and proposed actions in animal nutrition
Priority policy or
institutional
constraint/gap
Evidence, group affected
and rationale for change Recommended policy action
Localized and
seasonal scarcity
of fodder, both
in quantity and
quality
The state is heavily decient
in production of green
fodder (only 4.4%
requirement is met by the
produced fodder)
Persistent seasonal scarcity
of dry fodder in the
Northern production zone
Develop animal nutrition strategies
Strengthen animal feed factories and distribution
selling points
Develop policies/regulations and incentives to support
private-sector investment in animal feeding.
Support household-level improved grass and
leguminous feed production (such as backyard feed
production)
Encourage establishment of storage facilities of feed
ingredients in harvesting season
Increase awareness among farmers for the
conservation of fodders
Poor quality
control and
regulation of
animal feeds
Insufcient and uncontrolled
commercial feeds
Fodder seeds in markets
are unregulated
Low quality control of
manufactured feed
Strengthen quality audit and compliance of the
commercial feeds
Strengthen existing regulatory bodies to improve
quality control of forage and forage seeds
Research on improved forage seeds
Insufcient land
for forage
production and
grazing and
poor
management of
common
resources
Lack
of farming lands for
forage production
High competition for land
with crops
Lack of grazing lands
Presence of ‘zero grazing’
policy
Encourage backyard forage production
Support oversowing of grazing land with improved
grass and leguminous forage seeds
Encourage allocation of land for production of
improved pasture/forage
Inadequate
technical support
services
Lack of skilled capacity in
the areas of feed
production and formulation
Provide technical assistance for feed formulation
Strengthen capacity building for research scientists
and extensions agents
Research on improvement of forage seeds
Inadequate
infrastructure
and poor
marketing system
Poor fodder storage
facilities
Inadequate forage
compressing technologies
and transportation system
Unorganized fodder
markets
Strengthen and establish forage storage facilities
Improve forage transportation system
Develop cost-effective and efcient compressing
machines to make fodder blocks
Encourage community fodder banks
Strengthen animal feed factories and distribution
selling points

The Bihar Livestock Sector Analysis 137
Table 101: Review of current policy constraints and proposed actions in dairy sector
Priority policy or
institutional
constraint/gap
Evidence, group affected and rationale for
change Recommended policy action
Inadequate support
services and
insufcient supply
of dairy stocks.
Insufcient number of inseminators
Predominantly public and inadequate animal
health and breeding services
Quality veterinary treatment is limited by a lack
of medicines
Ineffective cold chain management
Inadequate access to quality vaccination services
No system of quality control and regulation of
services provided by private animal health
workers
High incidence of repeat breeding
An irregular supply of liquid nitrogen
Prevalence of FMD and mastitis in crossbred
animals
Strict enforcement of the
breeding policy
Enhance capacities for policy
implementation
Strengthen monitoring of the
AI operations
Improve the capacity of AI
service delivery through
capacity building programs
and PPP
Reinforce programs
combating all animal
diseases to improve
productivity
Poor availability of
animal feeds
Insufcient commercial feeds
Low quality of feed stuff
High feed prices and seasonal variation
Scarce and expensive feed ingredients and raw
materials
Feed for lactating animals is mostly low quality
Incidence of animals suffering from mineral
deciencies due to low-quality paddy straw and
local grasses that are low in minerals
Strengthen animal feed
factories and distribution
selling points
Develop policies/regulations
and incentives to support
private sector investment in
animal feeding
Encourage household level
improved grass and
leguminous feed production
(such as backyard feed
production)
Strengthen existing
regulatory bodies to improve
quality control of forage and
forage seeds
Research on improved
forage seeds varieties using
PPP model

The Bihar Livestock Sector Analysis 138
Priority policy or
institutional
constraint/gap
Evidence, group affected and rationale for
change Recommended policy action
Poor quality of milk
Quality control in terms of microbial load is
mostly not functional
Milk supplied to the consumers by farmers and
dairies rarely meet the required standards
Absence of quality assurance system at milk
procurement
High incidences of ood particularly in north
Bihar
Poor transport: lack of trucks with chilling
equipment, poor road infrastructure
Lack of power for cooling and cold storage
facilities
Establish more BMCU
Strengthen quality control at
all levels
Carry out education
campaigns for all intervening
parties on improvement of
the quality of milk and dairy
products.
Limited coverage of
DCS (6.8%)
Insufciency of milk for dairies
Dairies function below their capacities
Uneven distribution of DCS
High seasonal supply variation
Most of the milk produced is sold through
informal circuits
Encourage private sector
investment along the dairy
value chain
Encourage formation of DCS
in new areas
Provide incentive to milk co-
operative societies
Inadequate access
to credit and
insurance services
Poor access to credit
Low repayment rates for loans created reluctance
of banks and credit institutes to provide loans to
dairy farmers
Institutional mechanisms to protect animals
against risks are weak—only 6% of farm animals
(excluding poultry) are covered by insurance
Enhance credit access by
dairy farmers
Link credit for dairy animals
with a functional livestock
insurance system
Encourage private institutions
to enter into livestock
insurance markets

The Bihar Livestock Sector Analysis 139
Table 102: Review of current policy constraints and proposed actions in the poultry sector
Priority policy or
institutional
constraint/gap
Evidence, group affected and rationale
for change Recommended policy action
Inadequate availability of
feed resources, poor
quality of feeds
High variability in quality of feeds and
the formulation
High feed prices and seasonal variation
Scarce and expensive feed ingredients
and raw materials
Provide technical assistance for feed
formulation
Strengthen quality audit and compliance
of the commercial feeds
Increase feed processing plants through
PPP model
Prevalence of diseases
The poultry industry has suffered many
setbacks due to new or re-emergence of
diseases
Develop effective bio-security and
implementation of successful hygienic
procedures
Low productivity and
genetic quality
Dominance of BYP
Low productivity
Lack of proper nutritional management
Develop genetic improvement of the
national herd of poultry that considers
diseases prevention, feeding systems,
marketing, extension and training and
credit facilities
Strengthen/upgrade chicken multiplication
centres
Inadequate infrastructure
and poor marketing
structure and organization
Lack of basic infrastructure such as
storage and transportation
Absence of cutting and processing
facilities
Price of chicken meat is high
Inadequate mothering units and
distribution centres
Inadequate chicken multiplication
centres.
Marketing of eggs and broiler meat are
not fully organized except few in urban
sectors
Eggs are still transported in open
conditions and in unrefrigerated vehicles
Eggs are sold in open markets without
consideration for preservation of their
quality
Encourage private investments
Strengthen facilities for hygienic slaughter
and preservation of eggs
Establish more mothering units and
distribution centres
Support formation of producer co-
operatives/associations and rural market
yards
Develop reliable and stable market chain
year round for marketing of poultry
products
Inadequate access to
credit facility
Lack of operating capital to increase
production
Provide credit access to farmers and other
actors in the value chain
Inadequate MThnical
support services
Lack of skilled capacity in the areas of
poultry feed and health
Strengthen capacity building for research
scientists (poultry nutrition and health) and
support staffs

The Bihar Livestock Sector Analysis 140
Table 103: Review of current policy constraints and proposed actions in the buffalo sector
Priority policy or
institutional constraint/gap
Evidence, group affected and
rationale for change Recommended policy action
Poor quality and genetic
stock
Low productivity of local buffalo
Low growth rate that leads to long
period to reach marketing age
Improve the breeding services
Provide better health and feeding services
Establish genetic improvement program
Inadequate infrastructure
and marketing system
Inadequate abattoirs and
slaughterhouses
Insufcient meat processing plants
Inadequate milk collection and
distribution centres
Promote PPP policy for infrastructure
investments
Improve credit access throughout the
buffalo value chain
Expand the co-operative networks
Table 104: Review of current policy constraints and proposed actions in the goat sector
Priority policy or
institutional
constraint/gap
Evidence, group affected and rationale for
change Recommended policy action
Lack of clear policy
towards the sector
Sector largely neglected in policy focus
Develop a policy for small ruminant
sector focusing on critical issues such
as health services, breeding issues,
common property resources and
producer associations for marketing
linkages
Poor quality and
genetic stock
Low productivity of local goat
Low growth rate that leads to long period to
reach marketing age
Poor performance recording and communication
Develop breeding programs for
small ruminants that consider:
·
animal species involved
·
type of traits considered
·
availability and affordability of
different breeds
·
production environment
Inadequate
infrastructure and
marketing system
Inadequate transportation system
Inadequate abattoirs and slaughterhouses
Insufcient meat processing plants
No market regulations exist for marketing goats
and sheep
There is no proper marketing facility
Promote PPP policy for infrastructure
investments
Strengthen market price and related
information
Develop proper marketing systems
for goats and sheep, including
grading system Support
formation of
goat and sheep producer
associations

The Bihar Livestock Sector Analysis 141
Priority policy or
institutional
constraint/gap
Evidence, group affected and rationale for
change Recommended policy action
Inadequate feed
resources, lack of
effective CPR
policies
Poor management of forests and grazing lands
Insufcient and uncontrolled commercial feeds
Develop CPR policies
Develop animal nutrition based on
locally available and affordable feed
resources
Prevalence of
diseases and poor
quality control
Lack of regulation for vaccine quality control
Weak private sector involvement
High disease prevention and control costs
Predominance of backyard slaughterhouses
Low sanitary inspection at all stages of the value
chain
Reinforce the control and prevention
of strategies for specic priority
diseases
Encourage private sector to operate
in rural areas through incentive
packages and regulatory framework
Strengthen sanitary inspection
regulations
Inadequate
technical support
services
Many fragmented small producers without real
support from the government
No training strategy of the abattoir industry
No formal mechanism for credit access
Reinforce the extension services
Develop industry training strategy for
abattoirs that include hygiene and
safety standards, quality assurance,
meat inspection and qualication
regarding meat processing
Table 105: Review of current policy constraints and proposed actions in the pig sector
Priority policy or institutional
constraint/gap
Evidence, group affected and rationale for
change Recommended policy action
Poor animal nutrition
Shortage of farming lands
Insufcient and uncontrolled commercial
feeds
Limited use of agricultural by-products
Develop animal nutrition based
on locally available and
affordable feed resources.
Poor quality of genetic stock
Low productivity of indigenous breeds
Poor performing local breeds
Lack of productivity data regarding the local
breeds
Establish genetic improvement
program.
High prevalence of animal
diseases
Prevalence of diseases
Weak private sector involvement
Reinforce the control and
prevention of strategies for
specic priority diseases.
Encourage private sector to
operate in rural areas through
incentive packages and
regulatory framework

The Bihar Livestock Sector Analysis 142
Priority policy or institutional
constraint/gap
Evidence, group affected and rationale for
change Recommended policy action
Lack of farmers’
organizations
Low organizational capacity throughout the
value chain
Strengthen the organization of
the different stakeholders of the
supply chain
Develop a joint strategy,
together with representatives of
research, extension, NGOs and
private sectors to come up with
a widely-disseminated plan for
the development of the pig
industry in the country
Inadequate infrastructure,
marketing system and quality
control
Low level of meat processing (cutting and
transformation)
Inadequate slaughterhouses (delivers whole
or semi- and quarter carcasses)
Poor transport facilities
Low level of pork consumption
Taboos related to pork meat
Low sanitary inspection at all
stages of the
value chain
Predominance of backyard slaughterhouses
Encourage PPP for infrastructure
investments
Develop standards for:
Transportation of meat by cold
storage
Meat processing and
transformation (meat sausage
and meat cutting)
Promote consumption of pork
Strengthen sanitary inspection
regulations
Inadequate technical support
services
Many fragmented small producers without
real support from the government
Reinforce the extension services
Develop industry training strategy
throughout the pig value chain
Table106: Review of current policy constraints and proposed actions in the hide and skin sector
Priority policy or
institutional
constraint/gap
Evidence, group affected and
rationale for change Recommended policy action
Poor quality skins and
hides, Low recovery of
skins
Poor quality is attributed to
poor animal husbandry
practices
Lack of appropriate slaughter
facilities and tools, poor
storage and preservation
techniques
Lack of incentives to producers
to improve quality
Encourage proper branding, slaughtering,
aying, preservation and storage of hides
and skins
Boost trading of hides and skins
according to grades
Strengthen marketing information and
support services
Boost investment in processing facilities of
hides and skins;
Strengthen stakeholder organizations
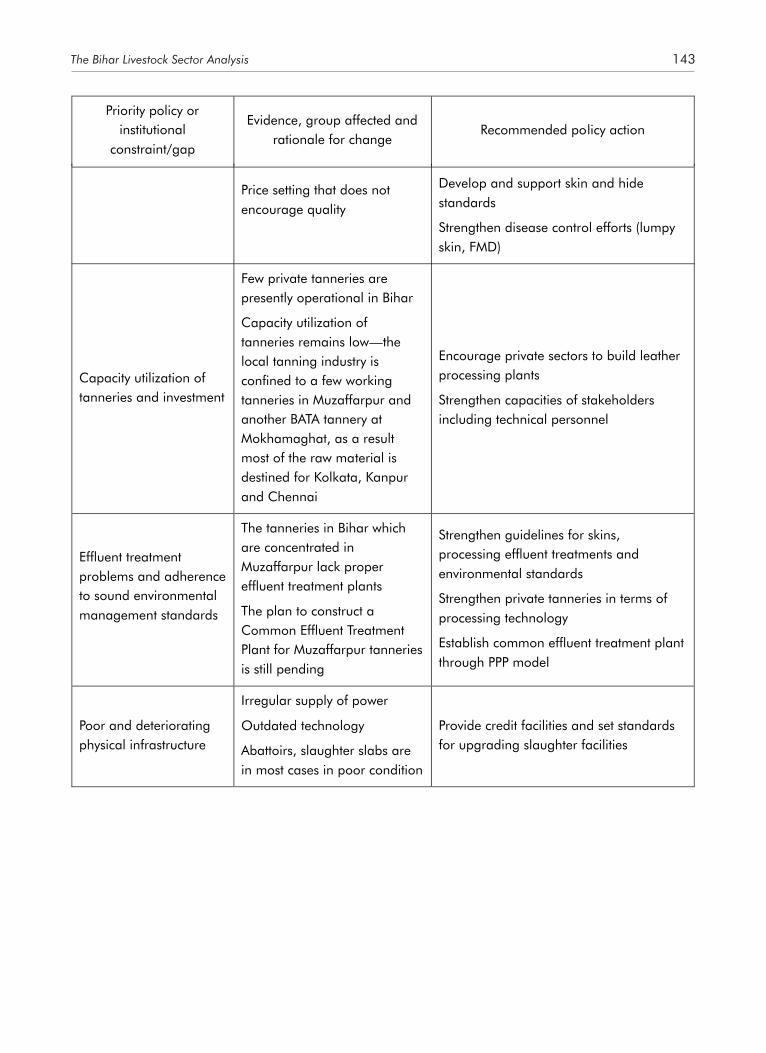
The Bihar Livestock Sector Analysis 143
Priority policy or
institutional
constraint/gap
Evidence, group affected and
rationale for change Recommended policy action
Price setting that does not
encourage quality
Develop and support skin and hide
standards
Strengthen disease control efforts (lumpy
skin, FMD)
Capacity utilization of
tanneries and investment
Few private tanneries are
presently operational in Bihar
Capacity utilization of
tanneries remains low—the
local tanning industry is
conned to a few working
tanneries in Muzaffarpur and
another BATA tannery at
Mokhamaghat, as a result
most of the raw material is
destined for Kolkata, Kanpur
and Chennai
Encourage private sectors to build leather
processing plants
Strengthen capacities of stakeholders
including technical personnel
Efuent treatment
problems and adherence
to sound environmental
management standards
The tanneries in Bihar which
are concentrated in
Muzaffarpur lack proper
efuent treatment plants
The plan to construct a
Common Efuent Treatment
Plant for Muzaffarpur tanneries
is still pending
Strengthen guidelines for skins,
processing efuent treatments and
environmental standards
Strengthen private tanneries in terms of
processing technology
Establish common efuent treatment plant
through PPP model
Poor and deteriorating
physical infrastructure
Irregular supply of power
Outdated technology
Abattoirs, slaughter slabs are
in most cases in poor condition
Provide credit facilities and set standards
for upgrading slaughter facilities

The Bihar Livestock Sector Analysis 144
Table107: Review of current policy constraints and proposed actions in livestock and livestockproducts marketing and processing
Priority policy or
institutional
constraint/gap
Evidence, group affected and rationale for
change Recommended policy action
Inadequate marketing
system
Inadequate livestock marketing regulation
Lack of regulation for transporting animals
Develop grading system for
all meat sectors
Strengthen livestock market
prices and related
information
Inadequate investment
in marketing and
processing facilities
Marketing of eggs and broiler meat is not
fully organized except in a few urban sectors
Inadequate marketing facility for small
ruminants
Inadequate abattoirs and slaughterhouses
Inadequate milk and meat processing plants
Encourage and support
private investments in
developing marketing and
processing infrastructure
Poor quality of
livestock products
Eggs are still transported in open conditions
and in unrefrigerated vehicles
Eggs are sold in open markets without
consideration for preservation of their quality
Poor quality control of meat s laughtering and
retailing
Set standards to improve the
quality of livestock products
and hygienic practices that
would meet the sanitary and
phytosanitary specications
for export
Strengthen extension and
communication campaigns
Insufcient number of
co-operatives and
other forms of
collective actions
Most co-operatives are related to dairy
production
The available farmers’ organizations involve
the small groups of farmers with a weak
platform
Support establishment of
various organizations
throughout the livestock
value chain

The Bihar Livestock Sector Analysis 145
Table 108: Review of current policy constraints and proposed actions in livestock research
Priority policy or institutional
constraint/gap
Evidence, group affected and
rationale for change Recommended policy action
Inadequate operational
resources and low private sector
participation
The share of animal sciences in
total expenditure remains low
More emphasis on crop
research than livestock research
Insufcient funds for operational
costs, training and capacity
development
Establish a livestock research
centre through a PPP model
Strengthen Research capacity for
quality and sustainable delivery
of research services
Promote PPP Inadequate facilities and
infrastructure
Poor networking due to lack of
means of transport, GPS,
veterinary, computers etc.
Insufcient laboratories
Inadequate capacity and
insufcient expertise
Most of the livestock research is
skewed towards milk production
and disciplinary oriented
The share of animal sciences in
total agricultural research staff is
low
Public staff are overburdened
with implementing state and
centralized schemes
Development of multidisciplinary
systems-oriented livestock
research
Capacity building for research
scientists including animal
scientists (nutrition, animal
health, genetics etc.)
Improve government scheme of
services
Enable environment for research
at institute level especially across
paths and availability of mentors
Weak linkages and rare
partnerships among research
collaborators with other
stakeholders
The link between research and
extension is very weak
Research–extension link has
rarely absorbed feedback from
farmers and extension staff
Outputs generated by the
research systems are not
adequately and properly
packaged and disseminated
Inadequate coordination among
various agencies collecting
statistics
Encourage experimentation in
farmers’ elds and establish a
network of farmer researchers
Facilitate coordination meetings
that involve stakeholders
Development of participatory
research agenda that must
include all stakeholders
Formulation of research,
extension and farmers platform

The Bihar Livestock Sector Analysis 146
Table 109: Review of current policy constraints and proposed actions in livestock extension services
Priority policy or
institutional
constraint/gap
Evidence, group affected and
rationale for change Recommended policy action
Inadequate
resources and weak
private sector
participation
Low allocation of public or private
funding to livestock extension
services
Most of the livestock extension is
conducted by the Bihar animal
husbandry department, which has
neither the resources nor the
expertise to conceive and operate
technology transfer packages
Allocate adequate resources for livestock
extension and training
Promote PPP
Harmonize institutional policies to ensure
full participation of private sector in
extension activities
Introduce progressive disengagement of
public sector from extension service delivery
in favour of private extension service delivery
Weak research-
training-extension-
farmer linkages
Low coverage of technology that
has maintained low adoptions
among stakeholders
Only few famers have access to
any kind of information on animal
husbandry from formal extension
services
A large segment of animal health
services is in hands of quacks/
uncertied service providers who
lack technical competencies
Support research, training and extension
linkages and platforms
Strengthen group formation, e.g. FFS
Establish bottom-up technology formulation
participatory approach
Inadequate
infrastructure and
facilities
Lack of means of work for
extension workers (means of
transport, GPS, veterinary kits,
computers etc.)
Encourage PPP
Facilitate extension staff in transport,
houses and other equipment
Insufcient
extension expertise
Lack of expertise to formulate and
implement technology transfer
packages services are mainly run
by veterinarians
Prevalence of quacks/uncertied
practitioners
Support voluntary farmers’ extension
services providers
Support rural innovation community centres
Facilitate in-service training
Establish support services to private
extension services (AI, animal health units
etc.)
Strengthen technical capacities of
male/female producers by means of
subcontracting with service providers
Organize technical and organizational
training needs assessment

The Bihar Livestock Sector Analysis 147
Annex 3: Results of LSIPT Analysis
Table 110: Feed balance analysis for base year (2017/18) of Bihar state by production zones
Feed available (crore MJ ME equivalent)
Current feed need (crore MJ ME equivalent)
Feed balance (crore MJ ME equivalent)
Percent of feed available over feed need (%)
Northern
5,566
11,757
-6,191
47%
Central
6,164.6
12,208.5
-6,043.9 50%
Southern
1,816
4,458.6
-2,642.6
41%
Bihar state 13,546.6 28,441.5 -14,894.9 48%
The feed analysis result shows that the feed balance gap in Bihar between what is required and available is
huge and depicts the need for strong interventions towards bridging these feed decit. As the table above
shows, the Central livestock production zone has relatively better feed resource compared to other zones.
However, by 2032/33 the decit will be much worse for the central than the other zones (Table 110). This is due
to the fact that majority (about 70%) of crossbred cattle are currently found in the Central zone and also targeted
in the WI-1 scenario to have more replacement of local breeds with crossbred cattle in the central than the other
zones. Crossbred cattle have higher feed need than local, due to their higher body weight and productivity.
Table 111: Feed balance analysis for projected (2031/32) of Bihar state by production zones
Feed available (crore MJ ME equivalent)
Projected (2031/32) feed need (crore MJ
ME equivalent)
Feed balance (crore MJ ME equivalent)
Percent of feed available over feed need (%)
Northern
5,566
14,820.4
-9,254.4
38%
Central
6,164.6
22,913.8
-16,749.2 27%
Southern
1,816
5,429.1
-3,613.1
33%
Bihar state 13,546.6 42,423.8 -28,877.3 32%
Level of competition of chicken and pig with human for cereals
The amount of feed consumed by chicken and pig is estimated using feed conversion ratio of the two species.
Based on this estimate, it is found that chicken and pork are consuming about 4% of major cereals (maize,
sorghum and millet) produced by 2016/17. However, due to the anticipated huge increase in the number of
chicken in the coming 15 years, their consumption requirement is also expected to increase. By 2032/33, it is

The Bihar Livestock Sector Analysis 148
expected that the share consumed by chicken and pig will reach 75% of the amount of currently produced
cereals (maize, sorghum and millet).
Currently, at India level, about 28% of maize produced is utilized for food purpose, 11% for livestock feed, 48%
for poultry feed, 12% in wet milling industry (for example starch and oil production) and 1% as seed goes
(Murdia L.K., 2016).
Table 112: Competition of chicken and pig with human for cereals
Chicken and pig products
Production (MT) Cereal equivalent of poultry meat, pork and egg productions (with 1.37 conversion ratio)
Base year (2017/18)
2032/33 Base year (2017/18) 2032/33
Chicken meat (MT)
61,975
15,48,972 84,906
21,22,091
Pork (MT)
44,473
1,62,013
60,928
2,21,958
Egg (MT)
16,409
3,91,061
22,480
5,35,754
1,68,315
28,79,803
Poultry meat, pork and egg cereal equivalent/ cereals produced (%)
4% 75%
Table 113: Production of maize, sorghum and millet in Bihar (2016/17)
Major cereals Production by 2016/17 (MT)
Maize 38,45,700
Sorghum & Millet 12,508
Total 38,58,208
Source: Govt of Bihar - Department of Agriculture
Table 114: Results of nancial analysis for the combined livestock interventions in cow dairy production in Bihar
2017–18 to 2032–33 (livestock production zone level)
Production zone
Financial indictors based on 15-years discounted incremental cash ow analysis
NPV IRR (%) BCR
EANPV
(INR lakhs) (INR lakhs)
Northern 2,25,060.60 15% 1.1 29,589.57
Central 24,47,512.15 40% 1.7 3,21,783.67
Southern 88,039.04 14% 1.2 11,574.83
All cow dairy 27,60,706.89 31% 1.5 3,62,960.56

The Bihar Livestock Sector Analysis 149
Table 115: Results of nancial analysis for the combined livestock interventions in buffalo production inBihar 2017–18 to 2032–33 (livestock production zones level)
Livestock
production zone
Financial indictors based on 15-years discounted incremental cash ow analysis
NPV
(INR lakhs) IRR (%) BCR
EANPV
(INR lakhs)
Northern 1,74,587.05 13% 1.1 22,953.62
Central 1,16,290.08 25% 1.4 15,289.10
Southern 1,61,495.82 15.3% 1.1 21,232.47
All buffalo 4,52,372.95 15% 1.0 59,475.18
Table 116: Results of nancial analysis for the combined livestock interventions in small and medium goatfarms in Bihar 2017–18 to 2032–33 (goat production subsystem level)
Goat production
subsystem
Financial indictors based on 15-years discounted incremental cash ow analysis
NPV (INR lakhs) IRR (%) BCR EANPV (INR lakhs)
Small farms 1,25,515.28 29% 1.6 16.501.96
Medium farms 44,628.30 40% 1.9 5,867.45
Figure 39: Impacts of interventions: 15-years IRR for WI scenario in small and medium goat farms(goat production subsystem/farm level).

The Bihar Livestock Sector Analysis 150
Table 117: Results of nancial analysis for the combined livestock interventions in goat productionin Bihar 2017–18 to 2032–33 (livestock production zones level)
Livestock
production zone
Financial indictors based on 15-years discounted incremental cash ow analysis
NPV IRR (%) BCR
EANPV
(INR lakhs) (INR lakhs)
Northern 1,01,680.42 31% 1.676 13,368.31
Central 50,442.30 34% 1.7 6,631.84
Southern 18,020.86 24% 1.4 2,369.27
All goat 1,70,143.59 31% 1.6 22,369.42
Table 118: Results of nancial analysis for the combined livestock interventions in pig productionin Bihar 2017–18 to 2032–33 (production subsystem level)
Flock size class/farm
type
Financial indictors based on 15-years discounted incremental cash ow
analysis
NPV (INR lakhs) IRR (%) BCR EANPV (INR lakhs)
Improved backyard 5,76,052.51 N/A 27.99 75,735.80
Commercial
Broiler 2,77,175.78 226% 1.25 41,432.94
Layer 54,693.46 172% 1.21 7,190.76

The Bihar Livestock Sector Analysis 151
Annex 4: Gender and Social Inclusion
Table 119: Gender and social inclusion possible strategies, cow/buffalo dairy improvement interventions
Intervention area/proposed/issue Gender and social implication Possible strategy for social equity
Dairy genetics: genetic improvement through AI, sexed semen and embryo transfer Crossbred dairy cows are given in subsidy for women, marginalized and poor communities (existing)
Women and marginalized communities have poor access to these services due to higher cost, mobility issues and additional requirement of feed for improved breeds Women, ST and SC prefer buffalo over cow for dairy production due to easy handling and scarcity of cow feed
Doorstep delivery of services through decentralized systems/co-operatives/SHGs and subsidy for poorest households
Decisions made by women and the poorest about species preference Apart from milk, buffalo meat is a good source of animal protein for scheduled caste people
Feed: Low productivity of dairy animals from marginalized households because of lack of balanced feed
Feed: land rental issue
Women and marginalized people have limited access to better feed/concentrate due to high cost and mobility issues
Marginalized communities have issues with renting land which is main source for feed production for dairy animals
Decentralized target-based feed distribution (encourage small-to-medium enterprises) through co-operatives/JEEViKA SHGs, boost surplus to demand area fodder transactions
Establish land rental regulations to reduce exploitation of marginalized communities
Extension: support training centre and extension agents and expansion areas (all species)
Women and marginalized communities are excluded in the centralized extension system due to distance, work burden and social status
Decentralized extension system
with at least 30-50% women extension agents
Support village-based digital extension systems which are good for illiterates and do not discriminate (applicable also for goat and other small animals)
Processing, marketing: support dairy co-operatives
Gender neutral co-operatives will not benet women as there are gender inequalities within households and communities which hinder participation and access to dairy income
Women-only dairy co-operatives and support of women leaders in union and federation level at least to 50% level

The Bihar Livestock Sector Analysis 152
Table 120: Gender and social inclusion possible strategies, goat improvement interventions
Intervention area/proposed/issue Gender and social implication Possible strategy for social equity
Feed: promotion of backyard fodder production Pasture land improvement
Will compete for land allocated to food production, with possible negative impact on household nutrition
No involvement of marginalized/women for common land management
Promotion of fodder banks/supplement feed—facilitate transactions of fodder from surplus to demand area (Like Gaya Nalanda fodder market) Community and women participation in committees of common land fodder management (e.g. UK)
Health: high mortality and vaccination and deworming goats
Services will not reach women and marginalized due to distances, weak bargaining and political power, governance issues
Training and promotion of decentralized women private health service providers would facilitate easy communication based on community selection and preferenceTarget based subsidy for marginalized communities to provide services from these providers to reduce governance challenges
Genetics: community-based goat improvement programs
Given that women are those managing goats, excluding women and marginalized will not bring any improvement
Include women from marginalized communities in feed improvement programs and award system for local improved breeds
Processing, marketing: strengthen existing market, abattoirs
Women from marginalized communities have access to local markets
Traders, abattoirs may discriminate against women as in other formal livestock markets
Facilitate linkages with women SHGs, trader or butcher associations and abattoir linkages; i.e. emphasis on strengthening existing systems based on local markets
Introduce micro insurance for women traders to cushion them against losses
Table 121 : Gender and social inclusion possible strategies, BYP improvement interventions
Intervention area/proposed/issue
Gender and social implication Possible strategy for social equity
Feed: feed supplementation
Women and marginalized have limited access to poultry feed due to high cost, lack of capital and knowledge
Support target-based subsidy feed to women SHGs of SC/STs (same as JEEViKA program)
Health: vaccination Women from marginalized and tribal communities have limited access to vaccination
Training and support of decentralized women private health service providers, in a similar way as goats (integrated service for poultry, goats and pig-PRADAN model impact is explained in Annex)

The Bihar Livestock Sector Analysis 153
Intervention area/proposed/issue
Gender and social implication Possible strategy for social equity
Genetics: improve productivity through selective breeding
Opinions and knowledge of women and marginalized communities for breed selection are usually not considered so promoted breed is not adopted
Community-based breed selection and development through entrepreneurship to supply chicks and breed saviour awards, to support farmers who maintain and improve indigenous breeds (as done by the Self Employed Women’s Associ ation)
Marketing: lack of collective marketing, high transaction
Women and poorest members have poor negotiation skills due to lack of market information, leading to lower return on labour
Support of collective marketing and integer system with private (for input and market support) collaboration through SHGs as done in JEEViKA
Table 122: Gender and social inclusion possible strategies, pig improvement interventions
Intervention area/proposed/issue Gender and social implication Possible strategy for social equity
Feed and system: transitioning from scavenging to semi-intensive system
Women from tribal communities don’t have access to feed and lack capital to invest in improved feed practices
Provide concentrate pig feed to SHGs in tribal communities in target-based subsidy to promote semi-intensive system; assess better use of communal resources
Marketing: formal channel through slaughterhouse
This will have positive implications for women in tribal communities, with possibility of employment
Collective marketing through SHG to slaughterhouse and link to northeastern states for value addition and supply A special project assigned under the Mahadalit program will develop slaughter and hygiene skills within tribes
Health: vaccination and deworming
Positive implication in terms of increased productivity and reduced mortality
Under the Mahadalit program, train women and men as community-based animal health workers to treat pigs, BYP and goats

The Bihar Livestock Sector Analysis 154
10 References
Bhutta, Z.A., Das, J.K., Rizvi, A., Gaffey, M.F., Walker, N., Horton, S., Webb, P., Lartey, A., and Black, R.E. 2013.
Evidence-based interventions for improvement of maternal and child nutrition: What can be done and at what
cost? Lancet 382(9890): 452–477.
https://www.sciencedirect.com/science/article/pii/S0140673613609964?via%3Dihub. (Accessed on 27 July
2018)
Bynner, J. 2018. Risks and Outcomes of Social Exclusion Insights from Longitudinal Data.
http://www.oecd.org/education/school/1855785.pdf. (Accessed on 22 June 2018).
Chauhan, A., Patel, B.H.M., Maurya, R., Kumar, S., Shukla, S. and Kumar, S. 2016. 2016. Pig production
system as a source of livelihood in Indian scenario: An Overview. International Journal of Science, Environment
and MThnology 5(4): 2089–2096.
Chengapa, P.G., Umanath, M., Vijaysarathy, K., and Manjunatha, A.V. 2016. Changing demand for livestock
food products: An evidence from Indian households. Indian Journal of Animal Sciences 86(9): 1055–1060.
Chowdhury, S. A., Bhuiyan, M. S. A. and Faruk, S. 2002. Rearing Black Bengal goat under semi-intensive
management: Physiological and reproductive performances. Asian-Aust. J. Anim. Sci. 15(4): 477–484.
Data.gov.in., 2016. Gov. of India, New Delhi.
https://data.gov.in/keywords/statewise-gdp
Department of Animal Husbandry, Dairying and Fisheries (DAHDF), 2017. Basic Animal Husbandry & Fisheries
Statistics: AHS Series-18. Ministry of Agriculture and Farmers Welfare, Government of India, New Delhi.
Desai, S. and Vanneman, R. 2012. India Human Development Survey-II (IHDS-II), 2011-12.
Devi, S.M., Balachandar, V., Lee, S.I. and Kim, I.H. 2014. An outline of meat consumption in the Indian
population - A pilot review. Korean Journal for Food Science of Animal Resources 34. The Korean Society for
Food Science of Animal Resources: 507–15. doi:10.5851/kosfa.2014.34.4.507.
Dey, A., Barari, S.K. and Yadav, B.P.S. 2007: Goat production scenario in Bihar, India. Livestock Research for
R u r a l D e v e l o p m e n t . V o l u m e 1 9 , A r t i c l e # 1 2 3 . R e t r i e v e d M a y 2 8 , 2 0 1 8 .
http://www.lrrd.org/lrrd19/9/dey19123.htm. (Accessed on 27 July 2018)
DGCIS annual export. 2018. Dirctorate general of commercial intelligence and statistics annual export report.
http://agriexchange.apeda.gov.in/product_prole/exp_f_india.aspx?categorycode=0401 (Accessed
October 26, 2018)

The Bihar Livestock Sector Analysis 155
Dixon, J. and A. Gulliver with D. Gibbon. 2001. Farming Systems and Poverty: Improving Farmers' Livelihoods
in a Changing World. FAO & World Bank, Rome, Italy & Washington, DC, USA.
Dolberg, F. 2003. A Living from Livestock Pro-Poor Livestock Policy Initiative Review of Household Poultry
Production as a Tool in Poverty Reduction with Focus on Bangladesh and India.
FAO. (Food and Agriculture Organization of the United Nations). 2011. The State of Food and Agriculture:
Women in Agriculture Closing the Gender gap for Development. Rome, Italy: FAO.
GALVmed. 2016. A report on the CARI-GALVmed workshop (02 December 2016) on Smallholder Poultry
Production -Opportunities and Challenges. New Delhi, India.
Gandhi, V. P., Zhou, Z.Y. 2010. Rising demand for livestock products in India: Nature, patterns and
implications. Australasian Agribusiness Review. 18: 103–135.
Glendenning, C.J., Babu, S., Asenso-Okyere, K. 2010. Review of Agricultural Extension in India: Are Farmers'
Information Needs Being Met? International Food Policy Research Institute Discussion Paper 01048. Eastern
and Southern Africa Regional Ofce .
Global Agricultural Information Network (GAIN). 2016. Report Number: IN6098. 7/21/2016.
https://gain.fas.usda.gov/Recent%20GAIN%20Publications/Pork%20-%202016_New%20Delhi_India_7-
21-2016.pdf
Government of Bihar, Department of Animal and Fisheries Resources (DAFR). 2012. Bihar basic animal
husbandry statistics,, Patna, Bihar.
Government of Bihar, Department of Animal and Fisheries Resources (DAFR). 2014. Bihar basic animal
husbandry statistics, Patna, Bihar.
Government of Bihar, Department of Animal and Fisheries Resources (DAFR). 2016. Bihar basic animal
husbandry statistics, Patna, Bihar.
Government of Bihar, Directorate of Economics and Statistics. 2016. Bihar Statistical Handbook.. (2016) Patna,
Bihar.
Government of Bihar. 2016. National Family Health Survey (NFHS-4), Bihar Family Health Survey, , Patna,
Bihar.
Government of Bihar - Department of Agriculture. 2018. Area coverage, production and yield.
http://krishi.bih.nic.in/Statistics/State%20Report%20of%20Area,%20Production%20&%20Yield.pdf
(Accessed on 24 May 2018.)
Haque, M.N., Husain, S.S., Khandoker, M.A.M.Y., Mia,1.M.M. and Apu, A.S. 2013. Selection of Black Bengal
buck based on some reproductive performance of their progeny at semi-intensive rearing system. Journal of
Agricultural Science 5(8) ISSN 1916-9752 E-ISSN 1916-9760.
Hardenberg, F. 2016. Clinical and subclinical mastitis in dairy cattle and buffalos in Bihar, India : prevalence,
major pathogens and risk factors. Second cycle, A2E. Uppsala: SLU, Dept. of Clinical Sciences.
Hossen, M. J. 2010. Effect of Management Intervention on the Productivity and Protability of Indigenous
Chickens Under Rural Condition in Bangladesh. Livestock Research for Rural Development 22 (10).

The Bihar Livestock Sector Analysis 156
http://lrrd.cipav.org.co/lrrd22/10/hoss22192.htm
IFPRI, 2016. Review of Agricultural Extension in India. IFPRI, Washingtn, DC.
http://www.ifpri.org/publication/review-agricultural-extension-india (IFPRI, 2016)
ILRI FDG. 2018. Focus Group discussion in South, North and Central zone villages of Bihar for gender analysis
of labour and dicision making in livestock production system, May 2018, Bihar, India.
Indian Council of Agricultural Research (ICAR). 2011. Hand book of Agriculture. PP 1353-1369. India. New
Delhi: ICAR
Jumrani, J. and Birthal, P.S., 2015. Livestock, Women, and Child Nutrition in Rural India. Agric. Econ. Res. Rev.
28, 223–246. https://doi.org/10.5958/0974-0279.2016.00003.3
Kaaria, S., Osorio, M., Wagner, S. and Gallina, A. 2016. Rural women's participation in producer
organizations: An analysis of the barriers that women face and strategies to foster equitable and effective
participation. Journal of Gender, Agriculture and Food Security 1: 148–167.
Kumar, Anjani 2010. Milk Marketing Chains in Bihar: Implications for Dairy Farmers and Traders. Agricultural
Economics Research Review Vol. 23, pp 469-477
Kumar, P., Joshi, P.K., Mittal, S. 2016. Demand vs supply of food in India - Futuristic projection, in: Proceedings
of the Indian National Science Academy.
https://doi.org/10.16943/ptinsa/2016/48889
Kumar, R. and Punia, M. 2014. Urbanisation in Bihar: Need to break stigma. Journal of Asian Network for GIS-
based Historical Studies (2): 32–42.
Kumar, S., Rao, C.A.R., Kareemulla, K. and Venkateswarlu, B. 2018. Role of goats in livelihood security of rural
poor in the less favoured environments. Ind. Jn. of Agri. Econ. 65(4).
Kumar S., Vihan, V.S., Deoghare, P.R. 2003. Economic implication of diseases in goats in India with reference to
implementation of a health plan calendar. Small Ruminant Research 47(2): 159–164.
Mazumder, D.K., Kalita, D.N., Kalita, S.C. 2014. Status and Constraints in Livestock Farming amongst Tribal
Farmers of Kamrup District in Assam. Econ. Aff. 59.
Miah, G., Das, A., Bilkis, T., Momin, M.M., Uddin, M.A. et al. 2016. Comparative study on productive and
reproductive traits of Black Bengal and Jamnapari goats under semi-intensive condition. Scientic Research
Journal (SCIRJ) IV(II): 2201–2796.
Ministry of Agriculture. 1997. 16th Livestock Census 1997, All India Report. Commissioner of Animal
Husbandry. Krishi Bhawan, New Delhi.
Ministry of Agriculture. 2005. 17th Livestock Census 2003, All India Report. Department of Animal Husbandry,
Dairying and Fisheries. Krishi Bhawan, New Delhi.
Ministry of Agriculture. 2010. 18th Livestock Census 2007, All India Report. Department of Animal Husbandry,
Dairying and Fisheries. Krishi Bhawan, New Delhi.

The Bihar Livestock Sector Analysis 157
Ministry of Agriculture. 2014a. Agriculture Census 2010-11: All India Report on Number and Area of
Operational Holdings. Agriculture Census Division Department of Agriculture & Co-operation, New Delhi.
India
Ministry of Agriculture. 2014b. 19th Livestock Census 2012, All India Report. Department of Animal
Husbandry, Dairying and Fisheries. Krishi Bhawan, New Delhi.
Ministry of Agriculture and Farmers Welfare (MAFW). 2017. Basic Animal Husbandry & Fisheries Statistics
2017. AHS SERIES-18. Department of Animal Husbandry, Dairy and Fisheries, Krishi Bhawan, New Delhi. India
Ministry of Statistics and Programme Implementation (MOSPI), 2017. National Accounts Statistics (NAS),
Ministry of Statistics and Programme Implementation, Government of India, New Delhi.
Mohteshamuddin, K. 2017. Sexed Semen Technique: A Revolution in Indian Dairy Industry. Agrotechnology
6(3).
Murdia, L. K., Wadhwani, R., Wadhawan, N., Bajpai, P., Shekhawat, S. 2016. Maize utilization in India: An
Overview. American Journal of Food and Nutrition. 4(6) 169–176.
Murphy, S.P., and Allen, L.H. 2003. Nutritional Importance of Animal Source Foods. The Journal of Nutrition
133. 3932S–3935S. doi:10.1093/jn/133.11.3932S.
Nathan, D. and Xaxa, V. 2012. Social exclusion and adverse inclusion: development and deprivation of
Adivasis in India. Oxford University Press.
National Sample Survey Ofce, (NSSO), 2011. Key Indicators of Employment and Unemployment in India
2009-10, NSS 66th Round Survey, Report 572, National Sample Survey Ofce, Government of India, New
Delhi.
National Dairy Development Board 2008. National Dairy Development Board Annual report.
https://www.nddb.coop/about/report
Ofce of the Registrar General & Census Commissioner (ORGI), 2011. Primary Census Data Highlights,
Government of India, New Delhi.
http://www.censusindia.gov.in/2011census/PCA/PCA_Highlights/pca_highlights_india.html
Pig330.com, 2016. Pig production in India (USDA). Professional Pig Community, India
https://www.pig333.com/latest_swine_news/pork-production-in-india_11587
Prasanta, B., Naha, B.C., Saikia, D.P. and Prakash, C. 2016. A1 and A2 milk and its impact on human health.
I n t e r n a t i o n a l J o u r n a l o f S c i e n c e a n d N a t u r e 7 ( 1 ) : 0 1 - 0 5 .
https://www.researchgate.net/prole/Prasanta_Boro2/publication/299334264_A1_AND_A2_MILK_ITS_IMP
ACT_ON_HUMAN_HEALTH/links/56f0d8da08ae70bdd6c9564c/A1-AND-A2-MILK-ITS-IMPACT-ON-
HUMAN-HEALTH.pdf?origin=publication_detail
Rahman, H., 2017. Personal communication, ILRI, Delhi, India.
Rodgers, G., Datta, A., Rodgers, J., Sharma, S.K.M., and Alakh, N. 2013. The challenge of inclusive
development in rural Bihar. Published by Institute of Human Development in association with Manak
Publications.

The Bihar Livestock Sector Analysis 158
Seré, C. and Steinfeld, H. 1996. World livestock production systems: Current status, issues and trends. Animal
production and health paper No. 127. Rome, FAO. 82 pp.
Seth, Pankaj et al. 2014. Sources of information in adoption process of livestock innovations: A case of T&D pig
breed in India. Ind. J. Extn. Educ. & R.D. 22 : 63-66, 2014
Singh, K.M. and Singh, R.K.P. and Jha, A.K. and Meena, M.S. 2010. Dynamics of livestock sector in Bihar: A
Temporal Analysis. ICAR-RCER, Patna, RAU, Pusa, SGIDT, Patna.
Singh, R. K. 2013. Livestock Research and Development Priorities for Bihar and Odisha.
https://ssrn.com/abstract=2391607 or http://dx.doi.org/10.2139/ssrn.2391607
Singh, S.R. and Datta, K.K. 2013. Future of Smallholders in the Indian Dairy Sector – Some Anecdotal Evidence.
Ind. Jn. Agri. Econ 68.
USDA. 2016. Pork-2016 India. USDA Gain reports. Washington, DC, USA
https://gain.fas.usda.gov/Recent%20GAIN%20Publications/Pork%20-%202016_New%20Delhi_India_7-
21-2016.pdf
Vaidya, S.V. 2017. Good feeding practices. In. Dairy India. 7th ed. Ed. Sharad Gupta. PP 307-312
von Grebmer, K., Maximo Torero, Tolulope Olonbiyi, Heidi Fritschel, Doris Wiesmann, Yisehac Yohannes, Lilly
Schoeld, and Constanze von Oppeln. 2011. Global Hunger Index: The Challenge of Hunger: Taming Price
Spikes and Excessive Food Price Volatility. Bonn, Washington, D.C., Dublin.
World Bank. 2011. World development report 2012: Gender Equality and Development. Washington D.C.,
USA: World Bank.
W o r l d B a n k , 2 0 1 6 . B i h a r P o v e r t y , G r o w t h & I n e q u a l i t y .
http://documents.worldbank.org/curated/en/781181467989480762/pdf/105842-BRI-P157572-PUBLIC-
Bihar-Poverty.pdf

Govt. of Bihar
Animal & Fisheries Resources Department, Government of Bihar2nd Floor, Vikash Bhawan, Patna - 800 015 (Bihar) India
www.ahd.bih.nic.in
The International Livestock Research Institute (ILRI) works to improve food and nutritional security and reduce poverty in developing countries through research for efficient, safe and sustainable use of livestock. Co-hosted by Kenya and Ethiopia, it has regional or country offices and projects in East, South and Southeast Asia as well as Central, East, Southern and West Africa. ilri.org
CGIAR is a global agricultural research partnership for a food-secure future. Its research is carried out by 15 research centres in collaboration with hundreds of partner organizations. cgiar.org
BILL& MELINDA GATES foundation
Guided by the belief that every life has equal value, the Bill & Melinda Gates Foundation works to help all people lead healthy, productive lives. In developing countries, it focuses on improving people's health and giving them the chance to lift themselves out of hunger and extreme poverty. In the United States, it seeks to ensure that all people—especially those with the fewest resources—have access to the opportunities they need to succeed in school and life. Based in Seattle, Washington, the foundation is led by CEO Sue Desmond-Hellmann and Co-chair William H. Gates Sr., under the direction of Bill and Melinda Gates and Warren Buffett.