August 2020 - NCERT
188
ISSN 0377-0435 (Print) 0972-5628 (Online) Volume XLVI Number 2 August 2020
-
Upload
khangminh22 -
Category
Documents
-
view
0 -
download
0
Transcript of August 2020 - NCERT

ISSN 0377-0435 (Print) 0972-5628 (Online)
Volume XLVI Number 2 August 2020

OFFICES OF THE PUBLICATION DIVISION, NCERT
NCERT CampusSri Aurobindo MargNew Delhi 110 016 Phone : 011-26562708
108, 100 Feet Road Hosdakere Halli ExtensionBanashankari III StageBengaluru 560 085 Phone : 080-26725740
Navjivan Trust BuildingP.O.Navjivan Ahmedabad 380 014 Phone : 079-27541446
CWC CampusOpp. Dhankal Bus StopPanihatiKolkata 700 114 Phone : 033-25530454
CWC ComplexMaligaon Guwahati 781 021 Phone : 0361-2674869
About the JournalThe Journal of Indian Education is a reviewed periodical published in May, August, November and February by the National Council of Educational Research and Training, New Delhi. The NCERT encourages original and critical thinking in education. The JIE provides a forum for teachers, teacher educators, educational administrators and researchers through presentation of novel ideas, critical appraisals of contemporary educational problems and views and experiences on improved educational practices. Its aims include thought-provoking articles, challenging discussions, analysis, challenges of educational issues, book reviews and other related features. The Journal reviews educational publications other than textbooks. Publishers are invited to send two copies of their latest publications for review. The views expressed by individual authors are their own. They do not necessarily reflect the views of the NCERT or the views of the Editors.© 2020. Copyright of the articles published in the Journal will vest with the NCERT and no matter may be reproduced in any form without the prior permission of the NCERT.
Single Copy: ` 45.00 Annual Subscription: ` 180.00
Advisory Board Director, NCERT : H.K. Senapaty Joint Director, NCERT : Sridhar Srivastava Head, DTE : Ranjana Arora Head, Publication Division : Anup Kumar Rajput
Editorial Board Academic Editor : Vijayan K. Chief Editor : Shveta Uppal
Raj Rani Ranjana Arora Anupam Ahuja Kiran WaliaM. V. Srinivasan Madhulika S. PatelB.P. Bhardwaj Kirti Kapur Meenakshi Ravivanshi
Publication TeamChief Business Manager (Incharge) : Vipin Dewan ChiefProductionOfficer : Arun Chitkara Production Assistant : Mukesh Gaur
CoverAmit Kumar Srivastava
CONTENTS
Editor’s NotE 3
Pedagogical Beliefs of Pre-service Teachers towards Teaching 7 Physical Science at the Secondary LevelAmlEsh KumAr ANd B. N. PANdA
A Study on Professional Commitment of Government 22 School Teachers of East District of SikkimAruP BhowmiK ANd BEd PrAsAd shArmA
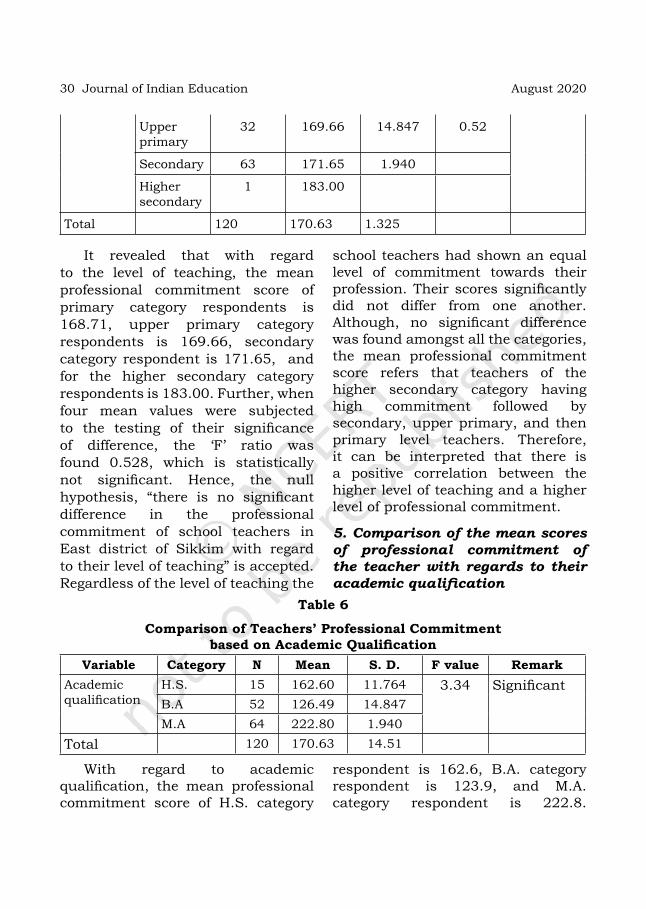
Empowering School Students through Developing Critical 36 Thinking SkillsBhArti dogrA
Use of Concept Mapping as an Innovative Teaching-learning 45 Strategy in Mathematicsroohi FAtimA
Teaching of Environmental Education through Infusion— 56 An Analysis with Reference to Science Teaching rAshmi shArmA
Green School Curriculum and Curricular Practices Quest 71 for Sustainable Developmentr. PushPA NAmdEo
JOURNAL OF
INDIANEDUCATION
Volume XLVI Number 2 August 2020
ISSN 0377-0435 (Print) 0972-5628 (Online)

Social Skill Training for the Social Problems among 81 Adolescents with Specific Learning Disabilitymolly Joy ANd ANN mAry AugustiNE
Introducing Privilege and Oppression in Classrooms 94diliP diwAKAr g ANd VisAKh ViswAmBArAN
Administrative Barriers to the Implementation of Inclusive Education 112sANdEEP BErwAl, rENu BAlA ANd PooNAm PuNiA
Reservation Policy of Government— Issues in Manipur University 127lEisANgthEm BiNitA dEVi
Private Tuition Industry in India— Students’ Perspective 141rAJENdrA PrAsAd ANd ANshu KumAri
On Students’ Well-being in the Indian Context— A Review 166ViNEEt gAirolA ANd PrABhAt KumAr mishrA
Kanyashree Prakalpa in West Bengal— Desirability and Promises 177soumi muKhErJEE ANd suBrAtA muKhErJEE
Editor’s NotE
The National Education Policy (NEP), 2020, envisions an education system rooted in Indian ethos that contributes directly to transforming India, that is Bharat, sustainably into an equitable and vibrant knowledge society, by providing high-quality education to all, and thereby making India a global knowledge superpower (NEP, 2020). The realisation of the vision of NEP 2020 requires sustained efforts from all the stake holders to ensure quality education to all our children, which will help them to think critically and face the world confidently. We need to prepare effective and committed teachers, who can facilitate the young learners with 21st century skills such as critical thinking, creativity, communication, problem solving, etc. In this context, the papers and articles in the present issue of the journals focuses on some of the themes, the NEP, 2020 has highlighted. It includes research papers, case studies and theoretical papers covering the areas such as themes such as teacher education, teaching-learning process, 21st century skills, education for sustainable development, inclusion etc.
Amlesh Kumar and B.N. Panda have studied the pedagogical beliefs of pre-service science teachers about the nature of teaching and learning physical science. It infers the importance of the professional experience and pedagogical expertise in influencing the reflections and learnings of students towards physical sciences education. The study acknowledges the centrality of pre-service teacher’s pedagogical beliefs in improving teacher’s professional experiences and indicates toward the need of pedagogical skills and high quality training to the physical sciences’ teachers. Total commitment towards the teaching profession is a requirement among all successful and ideal teachers; total commitment is total involvement, much more than merely working hard. The study titled ‘A Study on Professional Commitment of Government School Teachers of the East District of Sikkim’ conducted by Arup Bhowmik and Bed Prasad Sharma investigates the level of professional commitment of school teachers in the East district of Sikkim with regards to their gender, locality of the school, level of teaching, academic and professional qualifications, and teaching experience. The study has shown a significant difference in the professional commitment of teachers with respect to their academic qualifications.
An objective understanding of issues away from presuppositions and towards a more reflective process is the underlying basis of critical thinking. Bharti Dogra in the paper on ‘Empowering School Students through developing Critical Thinking Skills’ has dwelled into critical thinking for students. The paper establishes importance of critical thinking in different spheres of life

ranging from personal to political and discusses various strategies that can inculcate critical thinking in students.
In ‘Use of Concept Mapping as an Innovative Teaching-learning Strategy in Mathematics’, Roohi Fatima has examined whether concept mapping can be used to facilitate the teaching-learning process of mathematics or not. The article further puts emphasis on the effectiveness of concept mapping in the teaching-learning process of Mathematics by giving a practical based example of a unit from mathematics of Class VIII. The study concludes that concept map is not only helpful in teaching but also in assessing the learner’s understanding of concepts and the relationship among those concepts.
In today’s world, one of the crucial issues that need most of the attention is environmental consciousness. Rashmi Sharma tries to analyse the transactional strategies being used by science teachers at secondary stage for infusion of environmental education components with the science subject. The analysis reflects that infusion of environmental components with science teaching needs more attention in science classrooms as teachers are not well equipped with strategies for infusion. Sustainable development has occupied a central position in the policy circles as well as public paradigm in light of unprecedented environmental degradation. In light of this, the idea of green school curriculum emerged to enhance understanding of environment and increase awareness amongst youth. R. Pushpa Namdeo in her study titled ‘Green School Curriculum and Curricular Practices Quest for Sustainable Development’ establishes the potential of green school curriculum for holistic development of student. The study infers that education for sustainable development (ESD) has less awareness amongst teachers factually but is being practiced through curricular activities.
Disabled persons experience communicative and other social barriers as consequence of stigma and learning disabilities. In this context, the study titled ‘Social Skill Training for the Social Problems among Adolescents with Specific Learning Disability’ by Molly Joy and Ann Mary Augustine demonstrates the pivotal role social skills training play in improving social life of children with specific learning disability.
Education could provide the opportunity to recognise the systems of privilege and systematic oppression that is embedded in the society they live in. In the study ‘Introducing Privilege and Oppression in Classrooms’, Dilip Diwakar G and Visakh Viswambaran discuss the concept of privilege and oppression which further forms a base for discussions on other systemic oppressions. The study infers that participants agreed that seeing their own privilege is an arduous task.

In the road to inclusive education in India there are many barriers; one of them is administrative barrier. Sandeep Berwal, Renu Bala and Poonam Punia examined the administrative barriers that impede the implementation of inclusive education in primary schools of Haryana. It concludes that the heads of inclusive schools have posed a significant barrier to the implementation of inclusive education.
The policy of reservation was developed with an objective to improve welfare of socially and educationally backward classes in the country. Leisangthem Binita Devi gives a detailed analysis of change in reservation policies due to transition of status of Manipur University from a state university to a central university. The status of central university has impacted the adequate representation of the indigenous tribal population in the higher educational spaces and consequentially hampered equality of opportunity for tribal population of Manipur.
Rajendra Prasad and Anshu Kumari through the paper titled ‘Private Tuition Industry in India— Students’ Perspective’ seek to understand the forces behind private tuition industry in the country. There are multiple forces at play ranging from psychological to personal and academic that has contributed to significant growth of tuition industry in India. The paper highlights the inequitable impact of tuition industry on students from disenfranchised communities due to unsatisfactory level of quality of education in public education.
The well-being of the students is the most important concern of school education as well as of teacher education. Vineet Gairola and Prabhat Kumar Mishra through their study emphasised on how mental health and students’ well-being are connected. Also, how the social environment, gender roles, school climate, self esteem etc are interrelated in understanding the well-being of a student has been discussed.
In ‘Kanyashree Prakalpa in West Bengal— Desirability and Promises’ Soumi Mukherjee and Subrata Mukherjee attempt to understand the need for conditional cash transfer programmes in education for girl students in West Bengal. Also, the paper tries to understand the interplay between educational progress and conditional cash transfers. The paper finds that Kanyashree Prakalpa (KP) is similar, in terms of conditions and transfers, to its predecessors like the Ladli scheme. However, it concludes the KP targets girls’ dropout in a state where boys’ dropouts are higher.
This issue of JIE provides articles and research papers on a variety of themes and issues under School Education and Teacher Education. We hope that our readers will be able to relate their personal experiences with the issues and concerns discussed by the authors of these articles and research
papers. We also look forward to suggestions and comments on the articles published. We invite our readers to contribute to the journal by sharing their knowledge in the form of articles, research papers, case studies and book reviews.
Academic Editor
Pedagogical Beliefs of Pre-service Teachers towards Teaching
Physical Science at the Secondary Level
Amlesh KumAr* And B. n. PAndA**
*Research Scholar, RIE (NCERT), Bhubaneswar**Dean (Research) RIE (NCERT), Bhubaneswar
ConCeptualisation of the problem
Pedagogical beliefs are beliefs about teaching and learning. Pre-service teachers enter teacher education programmes with prior beliefs about teaching and ideas on pedagogical approaches. Different pedagogical beliefs may have significant influences
AbstractThe purpose of the study was to examine the pedagogical beliefs of pre-service science teachers about the nature of teaching and learning physical science, understanding how the physical science subject should be taught and characteristics of a good physical science teacher at the secondary level. Descriptive survey with mixed method approach was followed for data collection and analysis. 97 pre-service science teachers of RIE, Bhubaneswar were the participants of the study. The findings showed that pre-service science teachers had strong pedagogical beliefs towards the nature of teaching and learning physical science, were sensitive towards the effective use of pedagogy in teaching physical science and had knowledge about the characteristics of a good physical science teacher at the secondary level.
on different approaches to the planning and conduct of lessons. Pedagogical beliefs of pre-service teachers are closely related to their learning experiences. Their pedagogical beliefs, practices and attitudes are important for understanding and improving
8 Journal of Indian Education August 2020
educational processes. It’s a big challenge for teacher educators to shift pre-service teachers away from traditional pedagogical beliefs towards constructivist ones (Lim and Chan, 2007). The teacher education programme, especially at the pre-service stage, plays a crucial role in facilitating teachers’ transformation in their instructional practices by shifting their pedagogical beliefs. Many strategies have been recommended how to shift pre-service teachers away from traditional beliefs and guide them in adopting more constructivist instructional practices (Applefield, Huber and Moallem, 2001; Muijs and Reynolds, 2002). Pre-service teachers’ beliefs about teaching are well established throughout many years in their educational observation. It occurs over the years as students where they accumulate ideas about what it takes to be an effective teacher and how students have to behave. Pre-service teachers learning pedagogy as an integral part of their teaching learning process. Teaching opportunities can reinforce the pre-service teachers’ pedagogical beliefs, in this regard we need to provide ample opportunity for pre-service teachers to reconstruct their pedagogical beliefs.
Bandura (1986) has stated that beliefs represent the best indicator of why a person behaves, acts and makes decisions in a certain way. Pre-service teachers come to teacher education programmes with their own prior experiences, thoughts, values and beliefs which have an impact
on their professional development (Chan, 1999). Teacher education programmes play an important role in the development of pre-service teachers’ pedagogical beliefs about teaching and learning (Pajares, 1992; Hancock and Gallard, 2004). Their pedagogical belief about teaching and learning can be formed through the observations they make and the practices they perform over a long time period that begins the day a pre-service teacher starts their teacher education (Harwood et al., 2006). Several pedagogical research has indicated that pre-service teachers possess a vast array of complex beliefs about pedagogical issues. Accepting and appreciating the nature and role of these pedagogical beliefs is essential to understanding the choices and decisions these pre-service teachers will make. It has become widely accepted that the pre-service teachers’ pedagogical beliefs play a crucial role in their teaching-learning practices (Handal and Herrington, 2003, Salmon and MacCyvers, 2001), whereas these pedagogical beliefs are established during teaching-learning process by selecting appropriate teaching methods, by choosing the subjects/content, activities and learning experiences, by decision-making, and assessment in the classrooms (Borg, 2001). Hence, in order to change classroom teaching practices, pre-service teachers’ pedagogical beliefs should be considered and need to continuously improve. (Hart, 2002).
9Pedagogical Beliefs of Pre-service Teachers’ towards Teaching...
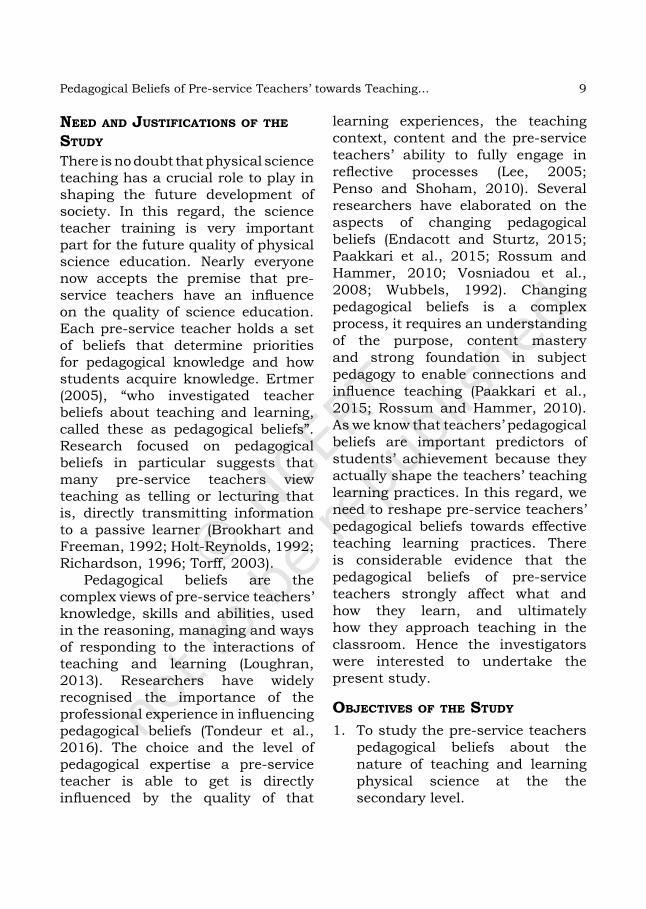
need and JustifiCations of the study
There is no doubt that physical science teaching has a crucial role to play in shaping the future development of society. In this regard, the science teacher training is very important part for the future quality of physical science education. Nearly everyone now accepts the premise that pre-service teachers have an influence on the quality of science education. Each pre-service teacher holds a set of beliefs that determine priorities for pedagogical knowledge and how students acquire knowledge. Ertmer (2005), “who investigated teacher beliefs about teaching and learning, called these as pedagogical beliefs”. Research focused on pedagogical beliefs in particular suggests that many pre-service teachers view teaching as telling or lecturing that is, directly transmitting information to a passive learner (Brookhart and Freeman, 1992; Holt-Reynolds, 1992; Richardson, 1996; Torff, 2003).
Pedagogical beliefs are the complex views of pre-service teachers’ knowledge, skills and abilities, used in the reasoning, managing and ways of responding to the interactions of teaching and learning (Loughran, 2013). Researchers have widely recognised the importance of the professional experience in influencing pedagogical beliefs (Tondeur et al., 2016). The choice and the level of pedagogical expertise a pre-service teacher is able to get is directly influenced by the quality of that
learning experiences, the teaching context, content and the pre-service teachers’ ability to fully engage in reflective processes (Lee, 2005; Penso and Shoham, 2010). Several researchers have elaborated on the aspects of changing pedagogical beliefs (Endacott and Sturtz, 2015; Paakkari et al., 2015; Rossum and Hammer, 2010; Vosniadou et al., 2008; Wubbels, 1992). Changing pedagogical beliefs is a complex process, it requires an understanding of the purpose, content mastery and strong foundation in subject pedagogy to enable connections and influence teaching (Paakkari et al., 2015; Rossum and Hammer, 2010). As we know that teachers’ pedagogical beliefs are important predictors of students’ achievement because they actually shape the teachers’ teaching learning practices. In this regard, we need to reshape pre-service teachers’ pedagogical beliefs towards effective teaching learning practices. There is considerable evidence that the pedagogical beliefs of pre-service teachers strongly affect what and how they learn, and ultimately how they approach teaching in the classroom. Hence the investigators were interested to undertake the present study.
obJeCtives of the study
1. To study the pre-service teachers pedagogical beliefs about the nature of teaching and learning physical science at the the secondary level.

10 Journal of Indian Education August 2020
2. To study the pre-service teacher’s pedagogical beliefs about the way physical science should be taught at the secondary level.
3. To examine the pre-service teachers’ beliefs about the characteristics of a good physical science teacher.
researCh Questions
1. What are the pedagogical beliefs of pre-service teachers about the nature of teaching and learning physical science at the secondary level?
2. What are the pre-service teachers’ pedagogical beliefs about the way physical science should be taught at the secondary level?
3. What are the beliefs of pre-service teachers about the characteristics of a good physical science teacher?
methods and proCedure
Research design: The study was a descriptive survey research and mixed method were followed.Participants: The present study was confined to science students studying in RIE, Bhubaneswar. There were 97 pre-service science teachers (B.Ed. and B.Sc.B.Ed.) of RIE, Bhubaneswar were the participants of the study.Tools: Self developed questionnaire and rating scale (5-point likert scale) were used for the present study.
Questionnaire consisted of a series of questions (short and long questions), and there were both open-ended and closed-ended questions were included.Procedure of data collection: The data were collected with the help of questionnaire and rating scale (5-point likert scale). Researcher had administered questionnaire and rating scale to participants’ respective class, and requested to fill them. During this period, the investigator was interacted with pre-service teachers.Statistical techniques used: The data gathered were analysed by using both quantitative and qualitative analysis technique.
delimitations of the study
The study was limited to 97 pre-service science teachers (B.Ed. and B.Sc.B.Ed.) of RIE, Bhubaneswar. This was a group of diverse (i.e. social, cultural, economic, linguistic etc.) pre-service teachers. The study was focused on pedagogical beliefs of pre-service teachers’ towards teaching physical science at the secondary level.
data analysis and interpretation
Pre-service Teachers’ pedagogical beliefs about the nature of teaching and learning physical science at the secondary level

11Pedagogical Beliefs of Pre-service Teachers’ towards Teaching...
Table 1
Pre-service teachers’ pedagogical beliefs about the nature of teaching and learning physical science at the secondary level
Sl. No.
Items PERCENTAGE (%)
SA A UD DA SDA
1. Engaging in repeated practice for mastery of skills is a critical part of physical science learning
24.7 50.5 19.6 4.1 1.0
2. Students learn physical science, when presented with problems, questions or situations
37.1 53.6 4.1 4.1 1.0
3. Learners can learn physical science by themselves 6.2 20.6 36.1 29.9 7.2
4. Students’ questions and ideas direct some of the learning in the classroom 37.1 52.6 9.3 1.0 00
5. Learning science is an orderly process; students learn by gradually accumulating more information about a topic over time
49.5 43.3 7.2 00 00
6. Teachers are more responsible for students learning than the students 5.2 30.9 13.4 46.4 4.1
7. Students know very little about science before they learn it in school 4.1 32.0 21.6 34.0 8.2
8. Learning physical science through use of ICT stimulates learners engagement 33.0 48.5 9.3 6.2 2.1
9. Effective use of Community resources nurtures learners creativity and curiosity 34.0 52.6 12.4 00 1.0
10. As classrooms became more diverse, I believe that teaching profession is more challenging now
30.9 46.4 12.4 8.2 2.1
12 Journal of Indian Education August 2020
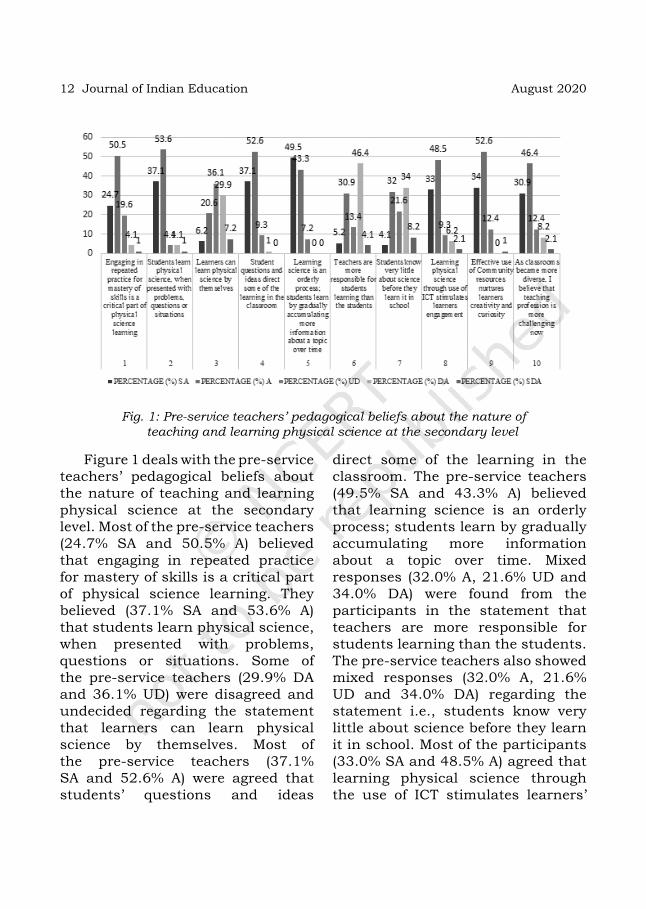
Figure 1 deals with the pre-service teachers’ pedagogical beliefs about the nature of teaching and learning physical science at the secondary level. Most of the pre-service teachers (24.7% SA and 50.5% A) believed that engaging in repeated practice for mastery of skills is a critical part of physical science learning. They believed (37.1% SA and 53.6% A) that students learn physical science, when presented with problems, questions or situations. Some of the pre-service teachers (29.9% DA and 36.1% UD) were disagreed and undecided regarding the statement that learners can learn physical science by themselves. Most of the pre-service teachers (37.1% SA and 52.6% A) were agreed that students’ questions and ideas
direct some of the learning in the classroom. The pre-service teachers (49.5% SA and 43.3% A) believed that learning science is an orderly process; students learn by gradually accumulating more information about a topic over time. Mixed responses (32.0% A, 21.6% UD and 34.0% DA) were found from the participants in the statement that teachers are more responsible for students learning than the students. The pre-service teachers also showed mixed responses (32.0% A, 21.6% UD and 34.0% DA) regarding the statement i.e., students know very little about science before they learn it in school. Most of the participants (33.0% SA and 48.5% A) agreed that learning physical science through the use of ICT stimulates learners’
Fig. 1: Pre-service teachers’ pedagogical beliefs about the nature of teaching and learning physical science at the secondary level

13Pedagogical Beliefs of Pre-service Teachers’ towards Teaching...
engagement. They had strong beliefs (34.0% SA and 52.6% A) that effective use of community resources can nurtures learners creativity and curiosity. Most of the pre-service teachers (30.9% SA and 46.4% A) believed that as classrooms became more diverse, the teaching profession is more challenging now.
From the study, it is noticed that participants had strong pedagogical beliefs about the nature of teaching
and learning physical science at the secondary level. They understood the importance of pedagogy in effective teaching learning process. Pre-service teachers had sound understanding regarding how a children learn physical science more effectively. Participants of this study also understand the role of physical science at the secondary level and how important is physical science compared to other subjects.
Table 2 Pre-service teachers’ pedagogical beliefs about the way physical science
should be taught at the the secondary levelSl. No.
Items PERCENTAGE (%)SA A UD DA SDA
1. Physical science learning is enhanced when Students work in groups 24.7 71.1 4.1 00 00
2. Learning is enhanced when students explain and demonstrate their ideas to others 70.1 28.9 1.0 00 00
3.
Students are more likely to understand a scientific concept if the teacher explain the concept in a way that is clear and easy to understand
60.8 37.1 2.1 00 00
4.Teacher must prepare lessons and activities where students from diverse backgrounds can work together
66.0 29.9 4.1 00 00
5. Active participation in learning enable students to learn physical science better 60.8 39.2 00 00 00
6.Teachers should provide students with problem solving situations to investigate in small groups.
37.1 55.7 6.2 1.0 00
7.There should be common assessment strategies for all students in physical science classrooms
15.5 30.9 15.5 28.9 9.3
8.
In physical science classrooms, students should be encouraged to ask questions, debate and challenge ideas while maintaining a climate of respect for what others have to say
62.9 24.7 8.2 2.1 1.0

14 Journal of Indian Education August 2020
9. Observation and Experimentation should be included in lessons as a way to reinforce the scientific concepts
48.5 39.2 2.1 5.2 5.2
10. Teachers should engage learners in situations that might bring about contradictions and then encourage discussions
24.7 60.8 5.2 8.2 1.0
Fig. 2: Pre-service teachers’ pedagogical beliefs about the way physical science should be taught at the secondary level
The Figure 2 deals with the pre-service teachers’ pedagogical beliefs about the way physical science should be taught at the secondary level. Most of the pre-service teachers (24.7% SA and 71.1% A) believed that physical science learning is enhanced when students will work in groups. They had strong belief (70.1% SA and 28.9% A) that learning is enhanced when students explain and
demonstrate their ideas to others. Pre-service teachers believed (60.8% SA and 37.1% A) that students are more likely to understand a scientific concept if the teacher explain the concept in a way that is clear and easy to understand. Most of the pre-service teachers (66.0% SA and 29.9% A) agreed the statement that teacher must prepare lessons and activities where students from diverse
Pre-service Teachers' Pedagogical Beliefs about the way Physical Science should be taught at the Secondary Level

15Pedagogical Beliefs of Pre-service Teachers’ towards Teaching...
backgrounds can work together. The participants of the study believed (60.8% SA and 39.2% A) that active participation in learning enable students to learn physical science better. They believed (37.1% SA and 55.7% A) that teachers should provide students with problem solving situations to investigate in small groups. There were mixed responses (15.5% SA, 30.9% A, 15.5% UD, 28.9% DA and 9.3% SDA) found from the participants regarding the statement, there should be common assessment strategies for all students in physical science classrooms. Most of the pre-service teachers (62.9% SA and 24.7% A) believed that in physical science classrooms, students should be encouraged to ask questions, debate and challenge ideas while maintaining a climate of respect for what others have to say. Most of the participants (48.5% SA and 39.2% A) agreed that observation and experimentation should be included in lessons as a way to reinforce the scientific concepts. They believed (24.7% SA and 60.8% A) that teachers should engage learners in situations that might bring about contradictions and then encourage discussions.
From the study, it is found that pre-service teachers had strong pedagogical beliefs about the way physical science should be taught at the secondary level. They had strong belief that teaching physical science through different activities, assignments, project work, field visit etc. had a considerable impact
on learners’ achievement. They had prior knowledge and understanding regarding the effective utilisation of learning resources as well as community resources and effective use of ICT in transacting physical science content. Participants of this study had strong beliefs regarding use of different approaches and strategies for effective teaching and learning physical science.
Pre-service teachers’ beliefs about the characteristics of a good physical science teacherFrom the responses, it is noticed that a good physical science teacher should have a sound understanding of the subject matter and knowledge of different pedagogical aspects. They must interact with learners in a friendly manner during teaching-learning process as well as outside the school environment to get the ideas of learners thinking process regarding physical science and try to optimise their level. They must encourage discussion and argumentation in physical science classrooms. They always help students to develop the habit of using different resources, i.e. textbook, reference books, class notes, periodicals, magazines, internet, etc. In the classroom process, they create joyful learning environment and always present learning tasks in a challenging way. They always actively involve every learner in teaching learning process. Apart from the personal characteristics of a good teacher, a physical science teacher

16 Journal of Indian Education August 2020
should be open-minded, free from prejudices and must be a creative person, who possessess scientific attitude, scientific temper and a keen aesthetic sense.
Best practices adopted in ideal physical science classroomsMost of the participants revealed that in an ideal physical science classroom teacher should try to connect physical science content/knowledge with learners’ prior learning experiences and their immediate learning environment. An ideal physical science classroom should be well equipped with scientific tools. The different learning needs of the learners must cater in the classroom process. The classroom management and transaction of content should be in such a way that every student will get the equal opportunity to clear their doubts. In the classroom process, teacher must use different approaches and strategies and utilise different learning resources to teach physical science content. In an ideal physical science classroom, teacher transact science knowledge in a joyful manner, where each and every learner take science learning without any kind of burden or hurdle. The relationship between teacher and student must be healthy in nature. Students should be given full freedom to express their ideas and creative thoughts. All above data showed that participants had strong pedagogical
beliefs regarding an ideal physical science classrooms.
maJor findings
Pre-service teachers’ pedagogical beliefs about the nature of teaching and learning physical science at the secondary level• Most of the pre-service teachers
(24.7% SA and 50.5% A) believed that engaging in repeated practice for mastery of skills is a critical part of physical science learning.
• They believed (37.1% SA and 53.6% A) that students learn physical science, when presented with problems, questions or situations.
• Most of the pre-service teachers (37.1% SA and 52.6% A) agreed that students’ questions and ideas direct some of the learning in the classroom.
• There were mixed responses (32.0% A, 21.6% UD and 34.0% DA) found from the participants in the statement that teachers are more responsible for students learning than the students.
• Most of the participants (33.0% SA and 48.5% A) were agreed that learning physical science through use of ICT stimulates learners’ engagement.
• They had strong beliefs (34.0% SA and 52.6% A) that effective use of community resources can nurture learners creativity and curiosity.

17Pedagogical Beliefs of Pre-service Teachers’ towards Teaching...
• Most of the pre-service teachers (30.9% SA and 46.4% A) believed that as classrooms became more diverse, the teaching profession is more challenging now.
Pre-service teachers’ pedagogical beliefs about the way physical science should be taught at the secondary level• Most of the pre-service teachers
(24.7% SA and 71.1% A) believed that physical science learning is enhanced when students work in groups.
• Pre-service teachers believed (60.8% SA and 37.1% A) that students are more likely to understand a scientific concept if the teacher explain the concept in a way that is clear and easy to understand.
• Most of the pre-service teachers (66.0% SA and 29.9% A) agreed with the statement that teacher must prepare lessons and activities where students from diverse backgrounds can work together.
• There were mixed responses (15.5% SA, 30.9% A, 15.5% UD, 28.9% DA and 9.3% SDA) found from the participants regarding the statement, there should be common assessment strategies for all students in physical science classrooms.
• Most of the pre-service teachers (62.9% SA and 24.7% A) believed that in physical science
classrooms, students should be encouraged to ask questions, debate and challenge ideas while maintaining a climate of respect for what others have to say.
• Most of the participants (48.5% SA and 39.2% A) were agreed that observation and experimentation should be included in lessons as a way to reinforce the scientific concepts.
Pre-service teachers’ beliefs about the characteristics of a good physical science teacher• A good physical science
teacher should have a sound understanding of the subject matter and knowledge of different pedagogical aspects.
• They must interact with learners in a friendly manner during teaching-learning process as well as outside the school environment to get the ideas of learners thinking process regarding physical science and try to optimise their level.
• They must encourage discussion and argumentation in physical science classrooms.
• They always help students to develop the habit of using different resources, i.e. textbook, reference books, class notes, periodicals, magazines, internet, etc.
• In the classroom process, they create joyful learning environment and always present learning tasks in a challenging way.

18 Journal of Indian Education August 2020
• They always actively involve every learner in teaching learning process.
• A physical science teacher should be open-minded, free from prejudices and must be a creative person, who possess scientific attitude, scientific temper and a keen aesthetic sense.
Best practices adopted in ideal physical science classrooms• Teacher should try to connect
physical science content/knowledge with learners’ prior learning experiences and their immediate learning environment.
• An ideal physical science classroom should be well equipped with scientific tools.
• The different learning needs of the learners must cater in the classroom process.
• The classroom management and transaction of content should be in such a way that every student will get the equal opportunity to clear their doubts.
• In the classroom process, teachers must use different approaches and strategies and utilise different learning resources to teaching the physical science content.
• In an ideal physical science classroom, teachers transact science knowledge in a joyful manner, where each and every learner takes science learning without any kind of burden or hurdle.
• The relationship between teacher and student must be healthy in nature.
• Students should give full freedom to express their ideas and creative thoughts.
disCussion of result
The major findings of the study have been presented above. The purpose of this research was to investigate pedagogical beliefs of pre-service teachers towards teaching physical science at the secondary level. The result of this study shows that pre-service teachers had strong pedagogical beliefs towards teaching physical science at the secondary level. They understood the importance of pedagogy and the role played by pedagogy in effective teaching learning process. Their pedagogical beliefs are important for understanding and improving educational processes. These pedagogical beliefs are closely linked to pre-service teachers’ strategies for coping with upcoming challenges in their daily professional life and to their general well-being, and they shape students’ learning environment and influence student motivation and achievement. The pre-service teachers’ pedagogical beliefs are closely related to their prior learning experience (Hong and Chai, 2017). Pre-service teachers' pedagogical belief is the conception about teaching physical science at the secondary level. It incorporates pre-service teachers' roles, actions, and classroom activities. The objective

19Pedagogical Beliefs of Pre-service Teachers’ towards Teaching...
behind understanding pedagogical belief is that how pre-service teachers learn to teach, their views about teaching and how these views are implemented in actual classroom situations. The study found that pre-service teachers were aware about the different pedagogical aspects in teaching learning process of physical science at the secondary stage.
eduCational impliCations
It is hoped that this study will provide the baseline data for understanding pedagogical beliefs of pre-service teachers towards teaching-learning process. Knowing the pedagogical beliefs of pre-service teachers could have a huge impact on the work of curriculum reformers, policy makers and other educational administrators and leaders. That knowledge could inform them about how to think of the best ways to effect changes in teachers’ pedagogical beliefs towards the goal of a successful curriculum reform. This study was intended to add to the body of knowledge on how pedagogical beliefs predict or contribute to the kinds of pedagogical instruction existing in an Indian context. The implication of this research is that pedagogical teaching in teacher education can be improved by a better understanding of how pedagogical beliefs evolve over the duration of the course. It is suggested that the professional experience will be helpful in building confidence and influencing possible changes in pedagogical beliefs of
pre-service teachers. It is assumed that the exposure to professional experience, particularly when linked with specific coursework i.e. CWSNs education, behaviour management and method courses, can influence the pre-service teacher’s pedagogical beliefs (Sheridan, 2016). This research signals the need for further exploration of pre-service teachers’ developing pedagogical beliefs and the views they bring to teacher education. It is crucial to develop a broader understanding of the factors that influence the pre-service teachers’ beliefs about pedagogy. This is particularly important in supporting reflection during and post the practicum experience and in reinforcing or challenging pre-conceived beliefs about teaching and learning. Future study is recommended to investigate individual belief systems so as to further enhance our understanding of how teacher education programmes contribute to pedagogical beliefs. Understanding how best to support the pre-service teachers’ pedagogical development in teacher education is central to producing quality teachers and improving student outcomes.
ConClusion
Pre-service teachers’ pedagogical beliefs about physical science teaching are highly personalised construct that are emerged by their prior learning experiences, interactions with colleagues, teachers, and their immediate environments. This
20 Journal of Indian Education August 2020
research was focused on pedagogical beliefs of pre-service teachers towards teaching physical science at the secondary level. According to key theorists, pedagogical beliefs are shaped by own experiences and align closely with beliefs about knowledge, how students learn and how teachers teach (Fajet, Bello, Leftwich, Mesler, and Shaver, 2005; Ryan, Carrington, Selva and Heally, 2009). Researchers have recognised the importance of the professional experience in influencing pedagogical beliefs. The choice and level of pedagogical expertise, a pre-service teacher is able to acquire is directly influenced by the quality of that experience, the teaching context and the pre-service teachers’ ability to fully engage in reflective processes. In contemporary, era an important task of physical science education
is making physical science more relevant to students, more easily learned and remembered, and more reflective of the actual practices of physical science. There is a strong belief emerged through researches that prospective physical science teachers need high quality training and pedagogical skills. The process of changing pedagogical beliefs and understanding how beliefs change, as the pre-service teachers progress through their degree, will assist teacher educators in supporting pre-service teachers’ learning. Pre-service teachers’ pedagogical beliefs is considered to be central to improving teachers’ professional practices. In this regard, there is a need to reconstruct pedagogical beliefs of pre-service teachers and provide them adequate pedagogical skills.
referenCes
APPlefield, m.J., r. huBer And m. moAllem. 2001. Constructivism in theory and practice — Toward a better understanding. The High School Journal. Vol. 84, No. 2. pp. 35–69.
BAndurA, A. 1986. Social foundations of thought and action — A social cognitive theory. Englewood Cliffs, Prentice Hall, New Ersey.
Borg, m. 2001. Teachers’ beliefs. ELT Journal. Vol. 55, No. 2. pp. 186–187.BrooKhArt, s.m. And d.J. freemAn. 1992. Characteristics of entering teacher candidates.
Review of Educational Research. Vol. 62, No. 1. pp. 37–60.ChAn, J.K.s. 1999. Student teachers’ beliefs. What have they brought to the initial teacher
training. ERIC Document Reproduction Service No. ED435607, Hong Kong.endACott, J.l. And J. sturtz. 2015. Historical empathy and pedagogical reasoning. The
Journal of Social Studies Research. Vol. 39, No. 1. pp. 1–16.ertmer, P.A. 2005. Teacher pedagogical beliefs — The final frontier in our quest for
technology integration? Educational Technology Research and Development. Vol. 53, No. 4. pp. 25–39.
fAJet, W., m. Bello, s.A. leftWiCh, J.l. mesler And A.n. shAver. 2005. Pre-service teachers’ perceptions in beginning education classes. Teaching and Teacher Education. Vol. 21, No. 6. pp. 717–727.

21Pedagogical Beliefs of Pre-service Teachers’ towards Teaching...
hAnCoCK, e. And A. gAllArd. 2004. Pre-service science teachers’ beliefs about teaching and learning — The influence of K-12 field experiences. Journal of Science Teacher Education. Vol. 15, No. 4. pp. 281–291.
hAndAl, B. And A. herrington. 2003. Mathematics teachers’ beliefs and curriculum reform. Mathematics Education Research Journal. Vol. 15, No. 1. pp. 59–69.
hArt, l.e. 2002. Pre-service teachers’ beliefs and practice after participating in an integrated content/methods course. School Science and Mathematics. Vol. 102, No. 1. pp. 4–15.
hArWood, s.W., J. hAnsen And C. lotter. 2006. Measuring teacher beliefs about inquiry — The development of a blended qualitative/quantitative instrument. Journal of Science Education and Technology. Vol. 15, No. 1. pp. 69–79.
holt-reynolds, d. 1992. Personal history-based beliefs as relevant prior knowledge in coursework — Can we practice what we teach? American Educational Research Journal. Vol. 29. pp 325–349.
hong, h.y. And C.s. ChAi. 2017. Principle-based design — Development of adaptive mathematics teaching practices and beliefs in a knowledge building environment. Computers and Education. Vol. 115, pp. 38–55.
lee, h. 2005. Understanding and assigning pre-service teachers’ reflective thinking. Teacher and Teacher Education. Vol. 21. pp. 699–715.
lim, C.P. And B.C. ChAn. 2007. ‘Micro lessons in teacher education — Examining pre-service teachers’ pedagogical beliefs’, Computers and Education. Vol. 48, No. 3. pp. 474–494.
loughrAn, J. 2013. Pedagogy— Making sense of the complex relationship between teaching and learning. Curriculum Inquiry. Vol. 43, No. 1. pp. 118–141.
muiJs, d. And d. reynolds. 2002. Teachers’ beliefs and behaviours — What really matters? Journal of Classroom Interaction. Vol. 37, No. 2. pp. 3–15.
PAJAres, m.f. 1992. Teachers’ beliefs and educational research — Cleaning up a messy construct. Review of Educational Research. Vol. 62 pp. 307–332.
Penso, s. And e. shohAm. 2010. Student Teachers’ Reasoning while Making Pedagogical decision. European Journal of Teacher Education. Vol. 26, No. 3. pp. 313–328.
riChArdson, v. 1996. The Role of Attitudes and Beliefs in Learning to Teach. In J. Sikula (Ed.), Handbook of research in teacher education (2nd ed., pp. 102–119). Macmillan, New York.
rossum, e. And r. hAmer. 2010. The Meaning of Learning and Knowing. Sense, The Netherlands.sheridAn, l. 2016. Examining Changes in Pre-service Teachers’ Beliefs of Pedagogy.
Australian Journal of Teacher Education. Vol. 41, No. 3. pp. 1–20.tondeur et Al. 2016. Understanding the Relationship between Teachers’ Pedagogical Beliefs
and Technology use in Education — A Systematic Review of Qualitative Evidence. Educational Technology Research and Development. DOI: 10.1007/s11423-016-9481-2.
torff, B. 2003. Developmental changes in teachers’ use of higher-order thinking and content knowledge. Journal of Educational Psychology. Vol. 95, No. 3. pp. 563–569.
vosniAdou, s., z. vAmvAKoussi And i. sKoPeliti. 2008. The Framework Theory Approach to the Problem of Conceptual Change. In S. Vosniadou (Ed.), International handbook on research on conceptual change (pp. 3–34). Routledge, New York.
WuBBels, t. 1992. Taking Account of Student Teachers’ Preconceptions. Teaching and Teacher Education. Vol. 8, No. 2. pp. 137–149.
A Study on Professional Commitment of Government
School Teachers of East District of Sikkim
Arup Bhowmik* And Bed prAsAd shArmA**
**Junior Research Fellow (Ph.D.), Department of Education, Mizoram University**M.A. in Education, Department of Education, Sikkim University
IntroductIon
A profession is regarded as a higher grade occupation, where a person requires the command of specialised knowledge and extended professional preparation. There is a conceptual distinction between the
AbstractTotal commitment toward the teaching profession is a common denominator among all successful and ideal teachers; total commitment is total involvement, much more than merely working hard. The present study aimed to investigate the level of professional commitment of school teachers in the East district of Sikkim with regards to their gender, locality of the school, level of teaching, academic and professional qualifications, and teaching experience. The study found a moderate level of professional commitment among the teachers. Further, no significant variations in professional commitment were found based on gender, locality, duration of teaching experience, professional qualification, level of teaching, and different factors of professional commitment. However, a significant difference was found among teachers based on their academic qualifications.
term occupation and profession; as the profession consists of rigorous training, education, and expertise (Basu, 2016). The concept of commitment is attitudinal, emotional, or psychological that reflects the closeness of an individual's feelings
23A Study on Professional Commitment of Government School...
towards the organisation. In general, professional commitment refers to the obligation, promise, responsiveness, or accountability of professionals towards their profession. It is greatly related to individuals’ socio-psychological bond, attitude, feelings, attachment, and passion for work. Practicing the goals and ethics, enthusiasm for professional progress, craving to maintain a sound relationship with other members, and readiness for work are some common determinants of professional commitment (Gill and Kaur, 2017). According to APJ Abdul Kalam (2002), “Total commitment is a crucial quality for those who want to reach the very top of their profession.”
In the teaching profession, commitment is one of the utmost important and obvious constituents (Sawhney, 2015). It is closely connected to teachers’ work performance, absenteeism, burnout, and turnover as well as having an important influence on student’s achievement in and attitude towards school (Louis, 1998). As a profession, teaching has acquired a noble place for laying the foundation for other professions. The destiny of any nation greatly depends upon the teaching profession as teachers are the yardstick that measures the achievements and aspirations of the nation (Bashir, 2017). The teaching profession is based on long specialised intellectual training, representing a high degree of creative thought, certification, engagement in research
work, innovations to the knowledge domain, and contributing to the development of society. Teachers are the nucleus of the education system and their impact on student's development is very crucial and long-lasting. Therefore, professional commitment and responsiveness is the core of the teaching profession. Dedication, promise, pledge towards work, following certain rules and norms, concerning students and society, seek to achieve excellence, and basic human values, are some salient features of the teaching profession. As the most responsive and dutiful profession of the society, teachers’ professional commitment can be divided into some important domains such as commitment to the learner, commitment to the society, commitment to the own profession, commitment to achieve excellence and commitment to basic human values.
revIew of related StudIeS
Numerous research studies have been conducted in the field of teacher’s profession and teacher’s professional commitment. Shann (1998) revealed a high level of dissatisfaction among teachers engaged in low-achieving schools those high-achieving school teachers. Shah and Abualrob (2012) showed that the teacher’s collegiality positively influenced professional commitment among Pakistani school teachers. Bala (2013) found an average level of professional commitment (56%)

24 Journal of Indian Education August 2020
among school teachers where gender variance existed. Shamina (2014) exposed a high level of professional commitment and job satisfaction among self-financed college teachers. Shukla (2014) revealed a very high positive correlation between commitment to profession and job satisfaction level of primary school teachers. Sawhney (2015) revealed no significant difference in professional commitment among teachers of rural and urban secondary schools. Marshall (2015) revealed significant variation in the level of professional commitment between new and old secondary school teachers in Barbados. Maiti (2015) revealed significant commitment variation between secondary and primary school teachers in West Bengal. Kaur and Sharma (2015) revealed that the teachers are satisfied up to a great extent in schools of Ludhiana and the quality of the student depends on the quality of teaching and teachers which is directly linked to the satisfaction. Swarnalatha (2016) reveals that the majority of teachers had average work commitment levels. The study also revealed that female teachers, experienced teachers, and science teachers have better commitment than their counterparts. Srinivasan, Beri and Beri (2016) revealed a slight correlation between work motivation and professional commitment overall and dimension-wise. However, the relationship between dimensions like basic values and workgroup relations revealed a
distinct result. Hussen, Awegichew and Teshome (2016) found a low level of teachers’ commitment towards learning, profession, and community at Eastern Ethiopian secondary schools. The reasons behind the results were such as low professional attitude, low salary, low respect, fewer incentives, and lastly less motivation. Sasikumar (2017) found that based on gender, location of the institution, major subjects, and marital status, there are no significant differences in the organisational commitment of teacher educators from self-financing colleges of Chennai and Thiruvallur district.
From the above-cited studies, it is clear that there is no similar degree of professional commitment among teachers. The level of professional commitment varies among teachers depending upon the place, type of school governance, gender, locality, and leadership style of the school. Moreover, studies revealed that there are many depending variables like work motivation, salary provided, attitude, job satisfaction, workgroup relation, and school's curriculum having a significant positive impact on teachers’ professional commitment.
need and SIgnIfIcance of the Study
After reviewing the related literature, the investigator found some research gaps. Firstly, no studies have been witnessed which dealt with the secondary school teachers’ professional commitment

25A Study on Professional Commitment of Government School...
in the state of Sikkim. Secondly, no comprehensive research has been witnessed which explored teachers’ professional commitment concerning gender, locality, level of teaching, teaching experience, academic qualification, and professional qualification. Therefore, the investigators had a keen interest to examine the professional commitment of government school teachers of Sikkim with consideration of research gaps. The process of education largely depends upon the teachers, who are known as the primary human resource of this process, and their commitment toward work matters a lot. In this regard, studying teachers’ professional commitment is having a large range of significance. First of all, by knowing their own level of commitment a teacher can improve themselves. Secondly, the headmaster of a school can take necessary measures for the improvement of professional commitment among subordinates. Thirdly, this may help the policymakers, school administrators, and the larger social endeavor. Nowadays, one of the major problems in the education system is the deterioration of the quality of teachers due to different social and personal factors. In this regard, teachers professional commitment plays a vital role. Therefore, the investigators are keenly interested to know about the professional commitment of teachers concerning factors like the learner, society,
profession, basic values, and many more emerging issues.
objectIveS of the Study
1. To examine the level of professional commitment of school teachers in East district of Sikkim.
2. To compare the professional commitment of teachers in East district of Sikkim with regard to their gender.
3. To compare the professional commitment of teachers in East district of Sikkim with regard to the locality of schools.
4. To examine the professional commitment of the teacher in Sikkim with regard to the level of teaching.
5. To examine the professional commitment of the teacher in Sikkim with regard to their academic qualification.
6. To find out the professional commitment of the teacher in Sikkim with regard to professional qualification.
7. To reveal the professional commitment of the teacher in Sikkim with regard to teaching experience.
8. To reveal the professional commitment of the teacher in Sikkim with regard to learner, society, profession, excellence and basic human values.

26 Journal of Indian Education August 2020
Hypotheses of the Study H1: There is a high level of professional commitment among the school teachers in East district of Sikkim.HO2: There is no significant difference in the professional commitment of school teachers in East district of Sikkim with regard to their gender.HO3: There is no significant difference in the professional commitment of school teachers in East district of Sikkim with regard to the locality of schools.HO4: There is no significant difference in the professional commitment of school teachers of Sikkim with regard to their level of teaching.HO5: There is no significant difference in the professional commitment of school teachers of East district of Sikkim with regard to their academic qualification.HO6: There is no significant difference in the professional commitment of school teachers of East district of Sikkim with regard to their professional qualification.HO7: There is no significant difference in the professional commitment of school teachers of Sikkim with regard to their teaching experience.HO8: There is no significant difference in the professional commitment of school teachers of Sikkim with regard to learners, society, profession, excellence and basic human values.
Methodology of the Study The descriptive survey method was employed in the present study. The
quantitative approach was used in the analysis of the collected data. The present study was delimited to East district of Sikkim only and data were collected from a total of eight schools of the district (4 from rural and 4 from urban area). The sample of the present study consisted of 120 school teachers (31 male and 89 female teachers) of East district of Sikkim. For the collection of the data, Professional Commitment Scale for Teachers 2013 (PCST-KRB), constructed and standardised by Dr. Ravinder Kaur, Dr. Sarbjit Kaur Ranu, Mrs. Sarvjeet Kaur Brar. The tool consisted of 45 items with five dimensions namely commitment to the learner, commitment to society, commitment to the profession, commitment to attain excellence, and commitment to basic human values. The reliability of the scale was computed with the test-retest method and the co-efficient of correlation score was found to be 0.76. The investigators personally visited the sample schools with permission, communicated with the teachers sitting in the common rooms, instructed them about the test, and questionnaires were distributed to the teacher to respond. Therefore, the sampling technique could be named as incidental technique, where without making any disturbance to the regular teaching-learning condition, the investigator collected data as per the convenience and availability of teachers. Collected
27A Study on Professional Commitment of Government School...
data were calculated and analysed with the help of SPSS.
Analysis, Results and Interpretations The investigator utilised both descriptive as well as inferential statistics for analysis and interpretation of the obtained data. As per the stated objectives, the investigator analysed the data as follows:
1. The overall level of professional commitment among school teachersTo interpret the overall level of professional commitment of teachers the raw scores of the professional commitment scale are converted into
z-scores and distributed in Table 2 and for the same purpose the mean scores and mean percentage are also calculated and tabulated in Table 3.
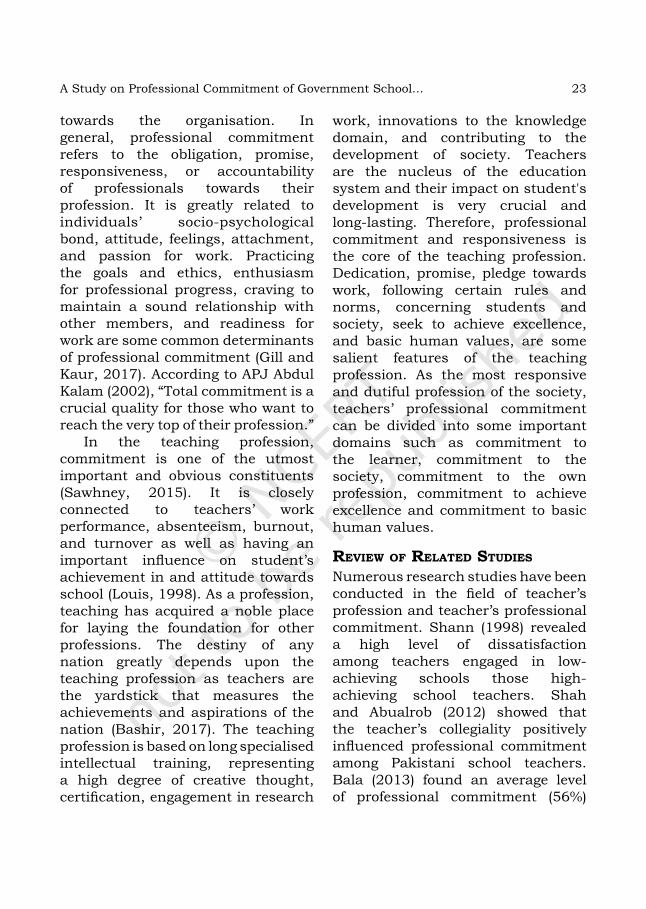
From Table 1, it is clear that the level of professional commitment among school teachers of East district of Sikkim is varied. 46.66% (56) teachers having average or moderate, 22.5% (27) teachers having above average, 11.66% (14) teachers having below average, 11.66% (14) teachers having low, 4.16% (5) teachers having high, 1.66% (2) teachers having extremely high, and 1.66% (2) teachers having an extremely low level of professional commitment. Here, the highest number (56) of teachers had shown an average or moderate level of professional commitment.
Table 1
Conversion of Raw Scores of Professional Commitment into z-ScoresSl. No.
Range of Raw Scores
Range of z-Scores
Frequency % Level of Professional commitment
1. 202 + +2.01 and above 2 1.66 Extremely high commitment
2. 189-201 +1.26 to +2.00 5 4.16 High commitment
3. 179-188 +0.51 to +1.25 27 22.5 Above-average commitment
4. 163-178 -0.50 to + 0.50 56 46.66 Average/ moderate
5. 153-162 -0.51 to -1.25 14 11.66 Below average commitment
6. 139-152 -1.26 to -2.00 14 11.66 Low commitment
7. 138 and below
-2.01 and below 2 1.66 Extremely low commitment

28 Journal of Indian Education August 2020
Table 2
Mean Score of Teachers’ Professional Commitment in Overall
Variable Category N Mean S.D. Mean %
Minimum Score
Maximum Score
Level of Professional Commitment
Government Schools Teacher
120 170.63 14.51 75.83 128 210
Table 2 shows that the mean score of the professional commitment test is 170.63 and the mean percentage is found 75.83. Further, the standard deviation is found 14.51. The maximum and minimum score of the test has been found to be 210 and 128 respectively. Since the mean score of professional commitment 170.63 comes under -0.5 to + 0.5 range of z-score, therefore it is evident that the overall level of professional commitment is average or moderate among the teachers of the government school. Hence, it can be stated that the professional commitment of the
teachers of East district of Sikkim is average. So, the stated hypothesis “There is a high level of professional commitment among the school teachers in East district of Sikkim” is not accepted. Only about 28% of teachers showed a higher and above-average level of commitment and 25% of teachers showed lower and below-average levels of satisfaction which is not much satisfactory for the state that having standard quality school education.
2. Comparison of the mean scores of professional commitment between male and female teachers
Table 3
Professional Commitment Score of Male vs. Female TeacherVariable Category n Mean S. D. ‘z’ value Remark
GenderMale 31 170.35 18.01
0.105Not
SignificantFemale 89 170.72 13.19
From Table 3, it is observed that with regard to gender, the mean professional commitment score of male category respondents is 170.35, whereas for the female category respondent is 170.72. The SD values are 18.01 and 13.19 respectively. Further, when both the mean values
were subjected to the testing of their significance of difference, the ‘z’ value was found 0.105. As the calculated z-value is smaller than the critical values at both levels of significance, the calculated value of ‘z’ is found not significant. Therefore the null hypothesis, “there is no significant

29A Study on Professional Commitment of Government School...
difference in the professional commitment of school teachers in the East district of Sikkim with regard to gender” is accepted. No gender variation was found with regard to the professional commitment of school teachers. It could be stated from this
finding that both male and female teachers are more or less equally empowered in their profession.
3. Comparison of the means of professional commitment between rural and urban teachers
Table 4
Professional Commitment Score of Rural vs. Urban School TeacherVariable Category n Mean S. D. ‘z' value Remark
LocalityRural 60 170.08 14.32
0.012 Not SignificantUrban 60 170.57 14.81
Total 120 170.63 14.51
From Table 4, it is observed that with regard to locality the mean professional commitment score of rural category respondents is 170.08, whereas it is for the urban category respondents is 170.57. The SD values are 14.32 and 14.81 respectively. Further, when both the mean values were subjected to the testing of their significance of difference, the ‘Z’ value was found 0.012. As the calculated Z-value is smaller than the critical values at both the levels of significance, the calculated value of ‘Z’ is found not significant with 118 degrees of freedom. Therefore the null hypothesis, “there is no significant
difference in the professional commitment of school teachers in East district of Sikkim with regard to their locality” is accepted. Despite their variance in the locality, the Govt. school teachers of East district of Sikkim showed an equal level of commitment. This could be due to their inclusive training, education in the heterogeneous group, sharing of the same institutional atmosphere, and other related factors.
4. Comparison of the means of professional commitment of the teacher with regards to the different level of teaching
Table 5
Comparison of Teachers’ Professional Commitment Based on Level of Teaching
Variable Category N Mean S. D. F value Remark
Level of teaching
Primary 24 168.71 11.764 Not significant
30 Journal of Indian Education August 2020
Upper primary
32 169.66 14.847 0.52
Secondary 63 171.65 1.940
Higher secondary
1 183.00
Total 120 170.63 1.325
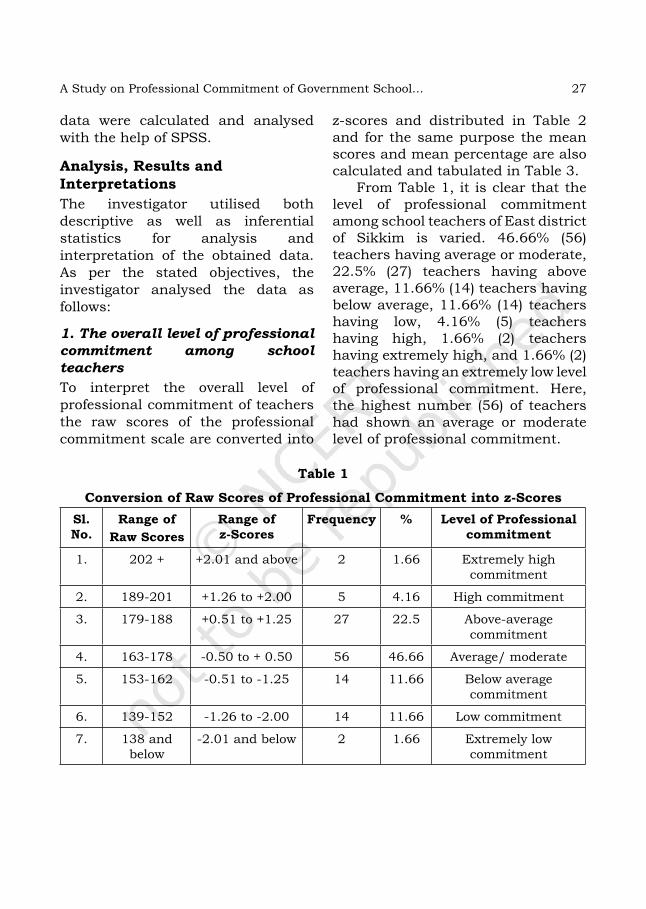
It revealed that with regard to the level of teaching, the mean professional commitment score of primary category respondents is 168.71, upper primary category respondents is 169.66, secondary category respondent is 171.65, and for the higher secondary category respondents is 183.00. Further, when four mean values were subjected to the testing of their significance of difference, the ‘F’ ratio was found 0.528, which is statistically not significant. Hence, the null hypothesis, “there is no significant difference in the professional commitment of school teachers in East district of Sikkim with regard to their level of teaching” is accepted. Regardless of the level of teaching the
school teachers had shown an equal level of commitment towards their profession. Their scores significantly did not differ from one another. Although, no significant difference was found amongst all the categories, the mean professional commitment score refers that teachers of the higher secondary category having high commitment followed by secondary, upper primary, and then primary level teachers. Therefore, it can be interpreted that there is a positive correlation between the higher level of teaching and a higher level of professional commitment.
5. Comparison of the mean scores of professional commitment of the teacher with regards to their academic qualification
Table 6
Comparison of Teachers’ Professional Commitment based on Academic Qualification
Variable Category N Mean S. D. F value RemarkAcademic qualification
H.S. 15 162.60 11.764 3.34 SignificantB.A 52 126.49 14.847M.A 64 222.80 1.940
Total 120 170.63 14.51
With regard to academic qualification, the mean professional commitment score of H.S. category
respondent is 162.6, B.A. category respondent is 123.9, and M.A. category respondent is 222.8.

31A Study on Professional Commitment of Government School...
Further, when three mean values were subjected to the testing of their significance of difference, the ‘F’ ratio was found 3.34, which is statistically significant. Hence, the null hypothesis, “there is no significant difference in the professional commitment of school teachers in East district of Sikkim with regard to their academic qualification” is not accepted. Based on the teachers' academic qualifications, there
exists a significant difference in their professional commitment. The result indicates that teacher those having M.A. degree are possessed a higher level of professional commitment followed by H.S. degree holder teachers and then B.A. degree holders.
6. Comparison of the means of professional commitment of the teacher with regards to professional qualification
Table 7
Comparison of Professional Commitment based on Professional Qualification
Variable Category N Mean S. D. F value RemarkProfessional qualification
B. Ed 39 171.54 17.15 .574 Not significantM. Ed 4 177.00 21.41
N. P.Q. 77 169.83 12.69Total 120 170.63 14.51
Note: N.P.Q. Non-professional Qualification.
With regard to the professional qualification, the mean professional commitment score of B.Ed. category respondent is 171.54, M.Ed. category respondent is 177, and the N.P.Q category respondent is 169.83. Further, when three mean values were subjected to the testing of their significance of difference, the ‘F’ ratio was found 0.574, which is statistically not significant. Hence, the null hypothesis, “there is no significant difference in the professional commitment of school teachers in East district of Sikkim with regard to their professional
qualification” is accepted. Although the differences are statistically not significant, the result showed that teachers those having M.Ed. degree are scored higher in professional commitment test, followed by the score obtained by teacher those having B.Ed. degree, and teacher those having no professional degree are obtained low score in comparison with counterparts.
7. Comparison of the means of professional commitment of teacher with regards to their teaching experience in years

32 Journal of Indian Education August 2020
Table 8
Comparison of Teachers’ Professional Commitment based on Teaching Experience
Variable Category (Years)
N Mean S. D. F value Remark
Teaching Experience
1-10 61 169.77 14.35
1.43 Not significant 11-20 32 173.75 15.4421-30 21 171.05 12.5831-40 6 161.17 15.66
Total 120 170.63 14.51
Concerning the duration of teaching experience, the mean professional commitment score of 1-10 category respondent is 169.77, 11-20 category respondent is 173.75, 21-30 category respondent is 171.05, and 31-40 category respondent is 161.17. Further, when four mean values were subjected to the testing of their significance of difference, the ‘F’ ratio was found 1.43, which is statistically not significant. Hence, the null hypothesis, “There is no significant
difference in the professional commitment of school teachers in East district of Sikkim with regard to their teaching experience” is accepted. It can be interpreted that the teaching experience of the teachers having very less effect on professional commitment.
8. Comparison of the mean scores of professional commitment of teachers towards learner (A), society (B), profession (C), excellence (D), and human value (E)
Table 9
Dimension-wise Comparison of Teachers’ Professional Commitment Variable Dimension n Mean S.D. F-value Remark
Teachers’Professional Commitment
A 120 35.72 5.23
1.08 Not Significant
B 120 34.93 3.57C 120 32.22 4.4D 120 33.78 3.6E 120 33.98 3.8
Total 120 170.63 14.51
With regards to different dimensions of the scale, the mean professional commitment score was found 35.72 for ‘A’ dimension, 34.93
for the ‘B’ dimension, 32.22 for ‘C’ dimension, 33.78 for ‘D’ dimension, and 33.98 for ‘E’ dimension. The SD values are 5.23, 3.57, 4.4, 3.6, and

33A Study on Professional Commitment of Government School...
3.8 respectively. Further, when all the mean values were subjected to the testing of their significance of difference, the ‘F’ ratio was found 1.08. Therefore, the calculated value of ‘F’ is found statistically not significant. Therefore the null hypothesis, “there is no significant difference in the professional commitment of school teachers in East district of Sikkim with regard to learner, society, profession, excellence, human value” is retained. Therefore, it can be concluded that professional commitment factors namely learner, society, profession, excellence, and human value are having an equal impact on professional commitment scores among teachers.
concluSIon and recommendatIonS Teachers with a high level of professional commitment can make the teaching-learning process fruitful and will lead to societal betterment. Only teachers with professional commitment are able to fulfill the need of the students and society. The schools which have good and committed teachers can succeed in developing students’ personality in all-round. Investigating the secondary school teachers’ professional commitment at the East District of Sikkim, the study found a moderate level of professional commitment among them. No significant variations in professional commitment were found based on their gender, locality, duration of teaching experience, professional qualification, level of
teaching, and different factors of professional commitment. However, a significant difference was found among teachers based on their academic qualifications. Hence, there is a need of implementing the practices for building a higher level of professional commitment among secondary school teachers of Sikkim.
Meaningful research always provides cause and paves for further investigation and recommendations for improving the situation. More systematic and comprehensive studies including more variables and levels of education should be conducted in this field. Better professional commitment is a prerequisite for sound teaching and ultimately for the student's all-round development. As the study found the moderate or average level of professional commitment among the govt. school teachers of East district of Sikkim, there is much more to do by the department of education for betterment. The government should make provision for organising capacity-building programmes, seminars, workshops, and training for government school teachers through which they can develop their selves for committed teaching. Heads of the schools can make an effort for uplifting the professional commitment among subordinates through good leadership behaviour. Individually, a teacher must respect their profession for the betterment of greater society. The investigators are hereby hopeful for the improvement of teachers’ professional commitment.

34 Journal of Indian Education August 2020
referenceS
BAlA, r. 2013. Professional Commitment of School Teachers in the State of Punjab. Scholarly Research Journals. Vol. 22, No. 4. pp. 5393–5398.
BAshir, l. 2017. Job Satisfaction of Teachers in Relation to Professional Commitment. International Journal of Advanced Education and Research. Vol. 4, No. 4. pp. 52–59.
BAsu, s. 2016. Professional Commitment and Job Satisfaction among Secondary School Teachers. Educational Quest — An Int. J. of Education and Applied Social Sciences. Vol. 7, No. 3. pp. 255–259.
Beri, n. And A. Beri. 2016. Professional Commitment of Teacher Educators in Relation to Work Motivation. International Journal of Research in Humanities, Arts and Literature. Vol. 4, No. 1. pp. 45–52.
Gill, s.p. And h. kAur. 2017. A Study of Professional Commitment among Senior Secondary School Teachers. International Journal of Advanced Education and Research. Vol. 2, No. 4. pp. 253–257.
hussen, A.A., s. AwGichew And T.Z. Teshome. 2016. Teachers Professional Commitment towards Students Learning, their Profession and the Community in Eastern Ethiopian Secondary Schools. Journal of Teacher Education and Educators. Vol. 5, No. 3. pp. 289–314.
kAur, s.p. And s. shArmA. 2015. A Study of Job Satisfaction and Commitment of Government School Teachers in Ludhiana. Global Journal of Management and Business Research. Vol. 15, No. 3. pp. 27–33.
louis, k.s. 1998. Effects of Teacher Quality of Work Life in Secondary Schools in Relation to Commitment and Sense of Efficacy. School Effectiveness and School Improvement. Vol. 9, No. 1. pp. 1–27.
mAiTi, G. 2015. A Study on Commitment of School Teachers in Teaching Profession. An International Peer Reviewed Referred Journal. Vol. 4, No. 7. pp. 133–139.
mArshAll, i.A. 2015. Principal Leadership Style and Teacher Commitment among a sample of Secondary School Teachers in Barbados. Journal of Art and Humanities. Vol. 4, No. 5. pp. 43–58.
sAsikumAr, s. 2017. Professional Commitment of Teacher Educators Working in B.Ed. Colleges. International Monthly Referred Journal of Research in Management and Technology. Vol. 6, No. 7. pp. 13–17.
sAwhney, n. 2015. Professional Commitment among Secondary School Teachers in Relation to Location of their School. Global Journal for Research Analysis. Vol. 4, No. 8. pp. 1–7.
shAh, m. And m.A. ABuAlroB. 2012. Teacher Collegiality and Teacher Professional Commitment in Public Secondary Schools in Islamabad, Pakistan. Procedia — Social and Behavioral Sciences. Vol. 46. pp. 950–954.
shAminA, h. 2014. Impact of Job Satisfaction on Professional Commitment in Higher Education. Galaxy International Interdisciplinary Research Journal. Vol. 2, No. 2. pp. 1–11.
shAnn, m.h. 1998. Professional Commitment and Satisfaction among Teachers in Urban Middle Schools. The Journal of Educational Research. Vol. 92, No. 2. pp. 67–73.

35A Study on Professional Commitment of Government School...
shuklA, s. 2014. Teaching Competency, Professional Commitment and Job Satisfaction. IOSR Journal of Research and Method in Education. Vol. 4, No. 3. pp. 44–64.
srinivAsAn, p. And k. selvi. 2016. Organisational Commitment of Higher Secondary School Teachers. American Journal of Educational Research. Vol. 4, No. 5. pp. 404–407.
swArnAlAThA, s.s. 2016. Work Commitment of Secondary School Teachers. The International Journal of Indian Psychology. Vol. 3, No. 4. pp. 99–156.
Empowering School Students through Developing Critical
Thinking SkillsBharti Dogra*
*Professor, School of Education (SOE), IGNOU, New Delhi
IntroductIon
Let us understand the conversation going on between student A and B in a classroom.A: If somebody commits an act which is considered ‘crime’ by the society, but the person shows his ignorance, then it should not be considered as an act of ‘crime’.B: But, why? What do you understand by the term ‘crime’?
AbstractDeveloping critical thinking has always remained one of the primary goals of school education. Critical thinking emphasises on thinking, challenging the validity of prior beliefs and assumptions. A person having critical thinking skills is expected to adopt an objective and questioning perspective. Can critical thinking be developed? Can students acquire critical thinking? What is the role of a teacher in developing critical thinking of the students? How can we as teachers initiate and sustain a classroom environment which is conducive for development of critical thinking of students? This paper tries to answer these questions through analysis of various strategies which can be used by teachers for developing critical thinking amongst students. Critical thinking is a skill and it can be acquired by students.
A: It is an action which constitutes an offence and is punishable by law.B: Then, in this case he has committed a crime.A: But, he was not aware of it.B: But, crime is a crime whether you are aware of it or not aware of it.
These two students are grappling with an issue that concerns them— whether a crime is a crime when you are not aware about it. These students

37Empowering School Students through Developing Critical Thinking Skills
were thinking critically about a significant matter— the concept of crime and questions of culpability. Critical thinking is also required for simple tasks such as critiquing a novel, deciding the hero of the book and planning a presentation. In this paper, the author discusses the meaning of critical thinking, rationale for teaching critical thinking, various strategies for promoting critical thinking.
What Is crItIcal thInkIng?The origin of critical thinking as a goal for education dates back at least as far as the ancient Greeks, when Socrates, Plato, and Aristotle encouraged their students to realise that things often are not what they seem to be on the surface (Burbach, Matkin, and Fritz, 2004). Many educators have continued to stress the importance of critical thinking, following John Dewey, who indicated in Democracy and Education (1916, p. 179) that “all which the school can or need to do for pupils … is to develop their ability to think.” As educators, we understand that learning does not result from mere memorisation of facts as by memorisation of facts we just become familiar with the knowledge and opinions of others. But, when we do our thinking about these facts then we develop understanding.
John McPeck has recently defined critical thinking as “a certain skepticism” about what to believe, think and do. The key thought here is that critical thinking reflects “certain
skepticism,” a willingness to withhold judgment, to doubt, and to ask good questions before we accept or believe what we’re told.
Critical thinking is about challenging the validity of presuppositions in prior learning; as Mezirow (1990) argues, premise reflection more accurately captures what critical reflection is. Critical reflection addresses the question of the justification for the very premises in which problems are posed or defined in the first place. We very commonly check our prior learning to confirm that we have correctly proceeded to solve problems, but becoming critically aware of our own presuppositions involves challenging our own established and habitual patterns of expectation: the meaning perspective with which we have made sense out of our encounters with the world, others, and ourselves.
Finlay (2008) in examining skills underpinning reflective practice advocated the use of an integrated theoretical framework to examine three interrelated areas impacting reflective practice— self-awareness, reflection and critical thinking. How do we develop self-awareness? This comes from our own experiences. Our experiences can improve our reasoning and analysing skills by exposing us to new ideas. We also experience feelings as a part of our everyday lives. We experience affect in the form of moods or emotions. Reflection draws on existential phenomenology and critical theory to
38 Journal of Indian Education August 2020
inform self and social awareness, and critical thinking draws on skepticism and critical theory focusing on identifying and challenging assumptions about oneself and about the context in order to imagine and explore alternatives.
“Critical thinking is skillful, fully responsible thinking that facilitates judgments because it (1) relies on criteria, (2) is self-correcting, and (3) is sensitive to context”. Here, we are talking for the criteria with which you made your judgment or drew your conclusions (Lipman, 1988).
The development of a critical perspective provides students with the skills to read any given text or content from an informed position. Critical thinking skills enable students to adopt an objective and questioning perspective. However, ‘critical thinking’ should not be reduced to simply a set of skills. Rather, it should be regarded as an ‘attitude, underpinned by curiosity…the motivation to understand at deeper levels’ (Bryan et al., 2010)
crItIcal thInkIng Is a skIll
Critical thinking is not the same as intelligence; it is a skill that can be improved in everyone (Walsh and Paul, 1988). Also, many educators differentiate between ordinary thinking and critical thinking. According to Lipman (1988b), ordinary thinking is usually simple and lacks standards, whereas critical thinking is more complex and is based upon standards of objectivity
and consistency. He suggests that students must be taught to change their thinking from• guessing to estimating;• preferring to evaluating;• grouping to classifying;• believing to assuming;• inferring to inferring logically;• associating concepts to grasping
principles;• noting relationships to
noting relationships among relationships;
• supposing to hypothesising;• offering opinions without reasons
to offering opinions with reasons; and
• making judgments without criteria to making judgments with criteria.Critical thinking tends to require
higher levels of thinking— that is, more evaluation and synthesis than application or analysis.
Rationale for Teaching Critical Thinking• As citizens, we have to make
decisions about who to vote for and what stance to take on issues. It is better to think about these responsibilities critically.
• Understanding any discipline or subject area requires that we understand and critique the claims made within that discipline or subject area. This requires critical thinking.
• We often confront conflicting claims, whether in science,
39Empowering School Students through Developing Critical Thinking Skills
history, or the media. Critical thinking can help us sort out which are most credible.
• Without critical thinking, there would be little human progress. Let us explain this with an example here. State Government wants to set up some industries in the state. Now, industries will provide employment to workers and finished products to people. But, before taking this decision, higher authorities need to critically think about its impact on the environment in terms of air pollution, disposal of wastes etc. These are the problems which may arise because of absence of critical thinking.
• Critical thinking is useful in making personal decisions.
• Many of the problems we face are moral. It is better to think critically about these than to appeal to emotions, self-interest, or the use of force.
• If we respect children and want them to become independent decision makers, then we should teach them how to think critically.
• The use of critical thinking helps empower people so they can reason well about problems and issues.
• Employers want people who can think critically.
• If you can think critically, you are more likely to think about your own thinking and evaluate it.
crItIcal thInkIng InstructIon
According to Stephen Brookfield (1987), there are two activities central to critical thinking—1. identifying and challenging
assumptions and2. exploring and imagining
alternativesBrookfield defined assumptions
as the unquestioned rules that individuals have assimilated into their value system as self-evident truths – “taken-for-granted” truths established by the culture that the individuals have accepted as their own. These assumptions influence how we interpret situations and how we perceive solutions to problems. Critical thinking helps us in developing open-mindedness and a willingness to explore other possibilities. In effect, we must teach students to examine old ideas in new ways and to consider alternatives to old ways of thinking.
One good way of providing opportunities for students to examine assumptions is by having them work in small groups with a list of “loaded” questions – statements about which the group must gather responses from each member and then report their areas of agreement and disagreement during a whole-class discussion. The following statements are examples of loaded questions:1. When we see a picture of a rock
star, what assumptions might we make about their lifestyle?
40 Journal of Indian Education August 2020
2. When we see somebody wearing shabby clothes, what assumptions might we make about them?
3. When we hear that someone has AIDS, what do we think?
4. When you come to know about a lady who is fighting parliamentary elections then what assumptions do you have about her abilities?
5. Anybody who is selected in IIT entrance exams, then what assumptions you must be having about their abilities?
strategIes for teachIng crItIcal thInkIng
All those approaches which require students to be actively engaged help in developing critical thinking. The interactive classrooms where communication between students-to-teachers, teachers-to-students and students-to-students, is encouraged motivate students to learn, explore, discover and inquire. A number of strategies can be used for creating interactive environment in the classrooms. These strategies include:1. Inquiry as a thinking skill:
According to Hester (1994), inquiry involves critical thinking processes such as methods of diagnosis, speculation and hypothesis testing. Inquiry helps in confronting the problems and then testing the news ideas. In inquiry method, information (such as events, facts, situations, behaviours) are examined and then explained. In inquiry learning,
students apply their knowledge in new problem situations and then on the basis of the findings they arrive at the usefulness of this knowledge. Inquiry learning helps the students in acquiring knowledge and skills with the help of which they can learn independently throughout their life. Inquiry learning starts with a question so role of a teacher here becomes very important. Teachers must ask thoughtful probing questions such as • What would happen if you…?• How are you going to do that?• Where would you get more
information? Questions must be well-thought
out to stimulate critical, higher-level thinking by the students. These questions are critical in that they provide students with their thinking task. These questions take time to develop if they are to be different from the typical, closed, low-level questions which are often used in classrooms and which do not stimulate student thinking. In addition to the critical initial questions, the teacher’s role throughout the lesson is one centered on questioning. Rather than answering students’ questions, the teacher’s job is to lead students to their own answers to their questions either through an open-ended response question or through refocusing the students on their observations of the objects. Today, we talk about multiple realities. There is
41Empowering School Students through Developing Critical Thinking Skills
no one correct answer. The problem can be approached in many ways and the student may arrive at an answer based on their experience. 2. Active learning: Critical thinking
requires students to be actively involved in their learning (Browne and Freeman, 2000) as they attempt to understand and apply the information to which they are exposed (Ahern-Rindell, 1999). For actively involving students, they must be given opportunities such as small group interaction, asking higher order questions, problem solving, planning and carrying out investigations and then preparing a report on findings using tables, graphs etc. and then discussion on results with other students, debates, discussions etc. Instructional techniques that encourage passivity in a learner are probably not going to support and may even impede critical thinking (Browne and Freeman, 2000). To develop students’ thinking skills in the science classroom, instruction should require students to hypothesise, speculate, generalise, create, and evaluate while providing opportunities for identifying and solving problems, especially problems that are real and of interest and concern to students (Pizzini, Abell, and Shepardson 1988).
3. Story telling in classrooms: The real world stories as cases can be presented in the class along
with discussion. Both case based teaching and PBL have been successful because they are based on stories that put learning in context and actively engage students in the learning process (Herreid, 2006). Open-ended activities can be conducted for developing critical thinking skills in which no single, correct answers are sought.
4. Brainstorming: The dictionary meaning of ‘Brainstroming’ is to have a group discussion to generate many ideas or to solve a problem. This means that we get a number of responses or ideas from a group and it is important to accept and appreciate all responses during the activity. Provide an accepting atmosphere throughout the activity. Brainstorming can also encourage flexible thinking.
5. Flexible thinking: As the name ‘flexible’ means able to easily modify as per the needs of the circumstances so flexible learning goes beyond the usual learning situations and offers opportunities beyond the usual responses.Students must be encouraged to put their five senses to work in thinking about how many ways a concept could be used. A teacher can ask questions that help them consider alternative possibilities— what if you are stuck up at a desert (with no water). They can ask themselves questions like—

42 Journal of Indian Education August 2020
What if________________________?Suppose that__________________?How is___________________________like___________________________?If you were____________________?Such questions and statements
help define new possibilities and produce flexible thinking.6. Problem solving: Complex thinking
processes often involve problem solving and decision making. Problem solving involves six steps— (1) defining the problem, (2) collecting data, (3) identifying obstacles to the goal, (4) identifying alternatives, (5) rating alternatives, and (6) choosing the best alternative. Problem-solving models can be developed and guide students through these important steps. Divergent questions can be developed for encouraging students to give all different types of answers.
7. Use of advance organisers: Let us consider few examples here such as:• a teacher makes students
bring in pictures that show the destruction caused by earthquakes before starting a lesson on earthquake waves, how they are caused and measured.
• a teacher constructs a concept map of transport system in man to familiarise students with structure and functions of human transport system and can refer back to visual aid to emphasise on interactive instruction on this topic.
In the above mentioned examples, advance organisers are being discussed. In order to form a connection between what students presently know or understand and what they need to learn, an advanced organiser comes into picture. Advance organisers involve some form of information that is presented prior to learning, allowing the learner to apply an organisational scheme while they construct new knowledge. Advance organisers help the students organise what they are to learn. The teacher can refer back to the organiser and use it to support the immediate instruction, as well as communicating connections to past and upcoming lessons.8. Using examples to help students
understand concepts: According to Webster Dictionary, the word ‘example’ comes from the word ‘sample’ which means a portion that shows the character of the whole. When a teacher cites examples of concepts or asks students to give examples of concepts, they acknowledge that learning must be based on students’ prior knowledge. By using examples, teaching is connected to the students’ world. Students can relate examples to concepts such as:• substances existing in
different states, solids, liquids and gases,
• plants and plant parts,• different types of animals,
43Empowering School Students through Developing Critical Thinking Skills
• liquids of different density, colour and viscosity,
• magnetic attraction of iron,• rusty iron,• sinking and floating of objects
in water,• conversion of different states of
matter,• different life stages of fishes,
butterflies, mosquitoes and frogs,
• germinating seeds and,• composition of soil.These examples can be used
deductively or inductively to help students understand concepts. But inductive approach, is closer to constructivist notion of how students learn concepts, students begin with an exploration of ideas and phenomena, followed by a teacher-directed activity to facilitate the invention of the concepts. Examples can also be thought of as metaphors and analogies of the concepts in the curriculum.
conclusIon
Critical thinking means not accepting any information without questioning it or analysing it objectively. We all require critical thinking at each and every stage of life. While studying at school, we need to comprehend, analyse and apply classroom information critically. Later, for choosing a stream and then a profession or vocation. Therefore, critical thinking is required by all during all the stages of life. While developing critical thinking instruction for students, it must be framed in such a manner that it must provide opportunities to students to (i) identify and challenge assumptions, and (ii) explore and imagine alternatives. Teachers can help students in developing critical thinking skills by actively engaging them in the classrooms, providing interactive and stimulating classroom environment and providing opportunities to inquire, explore and discover.
references
ahern-rinDell, a.J. 1998. Applying inquiry-based and Cooperative Group Learning Strategies to Promote Critical Thinking. Journal of College Science Teaching. Vol. 28, No. 3. pp. 203–207.
BrookfielD, S. 1987. Developing Critical Thinkers. Jossey Bass, San Francisco. Browne M.n. anD k. freeMan. 2000. Distinguishing features of critical thinking classrooms.
Teaching in Higher Education. Vol. 5, No. 3. pp. 301–309.Bryan, h., C. Carpenter anD S. hoult. 2010. Learning and Teaching at M-level — A Guide for
Student Teachers. Sage. London.

44 Journal of Indian Education August 2020
BurBaCh, M.e., g.S. Matkin anD S. M. fritz. 2004. Teaching Critical Thinking in an Introductory Leadership Course Utilising Active Learning Strategies: A Confirmatory Study. College Student Journal. Vol. 38, No. 3. pp. 482–493.
Dewey, J. 1916. Democracy and Education: An Introduction to the Philosophy of Education. Mcmillan. New York.
finlay, l. 2008. Reflecting on ‘reflective practice’. Open University Practice-based Professional Learning Centre. Retrieved from http://www.open.ac.uk/cetl-workspace/cetlcontent/documents/ 4bf2b48887459.pdf (accessed 18 December 2013).
herreiD, C.f. 2006. “Clicker” Cases: Introducing Case Study Teaching into Large Classrooms. Journal of College Science Teaching. Vol. 36, No. 2. pp. 43–48.
heSter, J.p. 1994. Teaching for Thinking: A Program for School Improvement Through Teaching Critical Thinking Across the Curriculum. Carolina Academic Press. Durham, N.C.
lipMan, M. 1988. Philosophy goes to School. Philadelphia: Temple University Press.MCpeCk, J. 1982. Reviewed Work: Critical Thinking and Education. Review by: William
Hare. Canadian Journal of Education/Revue canadienne de l'éducation. Vol. 7, No. 4. pp. 107–110.
Mezirow, J. 1990. How Critical Reflection Triggers Transformative Learning. pp. 1–20.pizzini, e. l., S. k. aBell anD D. p. SheparDSon. 1988. Rethinking thinking in the Science
classroom. The Science Teacher. Vol. 55. pp. 22–25.walSh, D. anD r, paul. 1988. The Goal of Critical Thinking: From Educational Ideal to
Educational Reality. American Federation of Teachers. Washington, D.C.

Use of Concept Mapping as an Innovative Teaching-learning
Strategy in MathematicsRoohi Fatima*
Abstract
*Assistant Professor, Department of TT and NFE (IASE), Faculty of Education, Jamia Milia Islamia
IntroductIon
I have a long experience in teaching Mathematics in a Middle School, I have found that some students had so much trouble in understanding
‘If I had to reduce all of educational psychology to just one principle, I would say this: The most important single factor influencing learning is what the learner already knows. Ascertain this and teach him accordingly’ are the famous words of Ausubel. For this, to help students in making conceptual connections, a technique called ‘Concept Mapping’ was evolved by Novak (1983).
In this article, the author attempts to find out whether concept mapping can be used to facilitate the teaching-learning process of mathematics or not? This article is research based. The author, who is a teacher educator, gave an assignment to her B.Ed. students (pedagogy of mathematics) to teach at least one topic or unit during their internship program with the help of technique of Concept Mapping. In this article, she discusses the effectiveness of concept mapping in the teaching-learning process of Mathematics by giving a practical based example of a unit of mathematics of class VIII by using Concept Mapping as a teaching-learning strategy. In the end of this article, she summarises the observation of her students under the heading of “Concept Map as an Evaluation Tool”.
some relatively simple ideas, while they might have been good at spelling and some other things, but they didn’t appear to understand why 2+2= 4 was the same as 2×2 = 4 or why 2 half or
46 Journal of Indian Education August 2020
4 quarter both equals to a one whole. They were just learning differently, the reasons for these differences may be understood by going through David Ausubel’s ‘Assimilation Theory of meaningful learning’. Ausubel made the sharp distinction between learning by rote, where the learner makes little or no effort to integrate new concepts and propositions with relevant concepts and propositions already known and the meaningful learning where the learner seeks to integrate new knowledge with relevant existing knowledge.
In contrast to the students who learn by rote, those who employ meaningful learning are expected to retain knowledge over an extensive time span and find new related learning progressively easier. As a teacher or teacher educator, I can arrange my instruction and assessment to encourage either learning by rote or learning meaningfully, the main responsibility for learning is the learner’s, and this responsibility cannot be shared. I wish to give this message to my pre-service as well as in- service teachers.
The changing views, higher expectations and enhanced responsibilities of teachers demand the use of practical and innovative methods of teaching which lay stress on building and clarifying the basic concepts underlie the content. These methods should be capable of linking various concepts to one another and also to the previously acquired concepts. These searches
of improvised instructional methods carried out in the classroom and improve student’s learning; “Concept Mapping” has been evolved as a useful strategy for leading students towards meaningful learning and a conceptual understanding of the subject. It has been associated with exploring learner understanding in terms of how they make links between concepts. There has been a growing interest in the use of concept mapping in teaching and research across various fields of education.
What are concept Maps?Concept Maps, developed by Professor Joseph D. Novak of Cornell University (1983), is a two-dimensional technique for visually representing the hierarchical arrangement of concepts as well as their relationships or it is a type of graphic organiser used to help students to organise and represent knowledge of a subject. Concept map begins with a main idea (or concept) and then branch out to show how that main idea can be broken down into specific topics.
Concept maps are also called mind maps. They can be defined as a way of representing relationship between ideas or images or words in the same way that a road map represents the locations of roads and houses in the colonies, a blue print represents an achievement test or a chemical equation represents the chemical process. It organises information like an outline but less linear and more spatial. In a concept

47Use of Concept Mapping as an Innovative Teaching-learning Strategy...
map, connections are made between pieces of information in different areas. Here, every word or concept is associated to another and linked back to the first idea, word or concept.
Concept maps are mirrors of how your brain actually makes connections. They can be used to develop logical thinking and study skills in the students; by displaying the connections between the individual ideas and helping them to observe that, how individual ideas form a larger whole. The concept map represents the hierarchical relationships among concepts within the structure or segment of a discipline. They help to improve understanding of a given subject and facilitate building student's own knowledge. We can say that, concept maps were developed to enhance meaningful learning.
use of concept MappIng as a teachIng-learnIng strategy In MatheMatIcs
Mathematics has been recognised as one of the pivotal strings of human intellectual activities. It has its roots in everyday activities and forms basic structure of our highly advanced technological developments. Mathematics is a complex system of concepts and its knowledge has the character of a network, as mathematical objects, e.g., concepts, definitions, theorems, proofs, algorithms, axioms are only interrelated but one can easily find its use in daily life.
Understanding is one of the most important traits associated with the teaching-learning process and with the attainment of educational goals. A significant concern in school mathematics is learning i.e., understanding of mathematical concepts. Kilpatrick, Swafford and Findell (2011) have described conceptual understanding as a critical concept of mathematical proficiency that is necessary for anyone to learn mathematics successfully.
Vygotsky (1962) makes the observation that: “Concepts don’t lie in the child's mind like peas in a bag, without any bonds between them. If that were the case, no intellectual operation requires, coordination of thoughts would be neither possible, nor any general conception of the world. Not even separate concepts could exist; their very nature presupposes a system.”
The teaching of mathematics is aimed at developing proper abilities and right attitude. But, it is very general to hear that mathematics is a tough subject. This is the perception of a student with which she comes in a class. It is because of abstract nature of the subject, that students find it difficult. It is observed that mathematical ideas and concepts build on one another to create a comprehensible structure and also, the teaching of mathematics is generally based on lectures. It aims at imparting the material to students without offering the opportunities to sharpen their intellectual skill. The

48 Journal of Indian Education August 2020
teaching and learning of mathematics is supposed to enable learning of mathematics by “developing a deep conceptual understanding in order to make a sense of mathematics”. Therefore, by finding out how learners have organised their knowledge of mathematical concepts might be a way of establishing how they understand those concepts. Thus, teaching of mathematics entails modification by some innovative and revolutionary change. One of the currently emerging new strategies that we are discussing so far is “concept mapping”.
As a mathematics teacher or teacher educator, the author strongly feels that, concept map could be used as an effective teaching strategy for Mathematics as it allows the teacher, to break the content into several parts and then link the parts with one another and creating a particular clarity of thought in the student's mind. The students will find a topic or a concept interesting if the teacher links the unknown with the known or if they could find it in resonance with the previous knowledge. They find relation among the previous and new knowledge. This helps them to see a topic or concept as a sum total of subtopics and not separate and isolated ones. At the end of the teaching process of the topic, the concept map will also be used for evaluation or revision. With the help of concept map, children are able to identify logical sequence and connection between subtopics and
hence learn with clarity and without confusion.
To justify her believes; the author first discusses the concept of concept mapping to her B.Ed. students and then she asked them to teach at least one topic of mathematics with the help of it during the practice teaching. The objective of this assignment is to explore the practical implication and the effective use of concept mapping in teaching, learning and evaluation of students in the subject of mathematics. Although, the success of class depends on many factors other than teaching methodology, the teaching methodology being prominent requires much attention and innovation as well. The following is a practical example of teaching the topic of ‘Mensuration’ to Class VIII students has been done during the teaching practice of B.Ed. course at the “Shafeeq Memorial School” by a student named Nasir Hassan. He planned his lesson in the following manner and then taught accordingly. Topic: MensurationSub Topics: The unit includes the following sub topics;
(i) Let us recall(ii) Area of Trapezium(iii) Area of general and special
quadrilateral(iv) Area of polygon(v) Solid shapes(vi) Surface Area of Cube, Cuboid
and Cylinder

49Use of Concept Mapping as an Innovative Teaching-learning Strategy...
(vii) Volume of Cube and Cuboid(viii) Volume and CapacityNumber of proposed Lesson: 09Time duration of each Lesson: 35 minutesPrevious knowledgeAfter going through the syllabus, it was found that the unit is based on the concepts taught in previous classes such as;Class VII:Chapter 8; Triangle and its propertiesChapter 11; Perimeter and AreaChapter 15; Visualising Solid ShapesClass VI: Chapter 5: Understanding Elementary ShapesChapter 10: Mensuration
Key Words of the TopicPlane figures, Solid shapes, Area, Perimeter, Volume, Surface Area, Triangle, Quadrilateral, Parallelogram, Rectangle, Square, Circle, Cylinder, Cuboids, Cube
teachIng-learnIng strategIes
We can teach the topic ‘Mensuration’ effectively with the help of concept mapping. This concept involves the above mentioned sub concepts. These sub concepts, if not all, by large are related to each other. By using this relationship, we can teach Mensuration to the Class VIII students with the help of concept mapping. The flow of the teaching can be in the following form—
We can divide the whole chapter Mensuration for Class VIII in three phases—
1. In the first phase, we will introduce the term Mensuration and what factor distinguishes plane figure and solid shapes etc?
2. In the second phase, we will discuss the various plane figures and their area.
3. In the third and the last phase, we will discuss about the solid shapes and relation between the parameters of solid shapes (such as volume) and plane figure (such as area).We can discuss all these three
phases in following manner.
lesson 1: IntroductIon to the topIc
• In the first lesson we will introduce the students with the name ‘Mensuration’, that, in our daily life, we come across many situations in which we need to ‘measure the spread’ of a given shape like wrapping a gift, carpeting the floor, painting the walls, putting up wall paper, making furniture, setting cloths in the cupboard, lace for chunnis or border for sarees, making a box for biscuits or sweets etc.
• In the next step, we will make the students make difference between the plane figure and the solid shape, that a solid shape must have a height. To clear this concept we will use the cut-outs of rectangles or circles (i.e., plane figures) and put them on each other to make cuboids or cylinder (i.e., solid shapes).

50 Journal of Indian Education August 2020
• Then, we will discuss the parameters with which we can specify the plane figure and a solid figure i.e., the concepts of area and volume, perimeter and total surface area and their relationship with plane figures and solids.
In the final step, we will link the concepts with the help of following concept map for the students so that they can have a foundation for the next lesson and basic layout of the concepts in the form of map.
Mensuration
is the study of
Plane figure
Area
Perimeter
Volume
Total Surface Area
Solid shapesThat hasThat has
lesson 2: let us recall
In this lesson, first of all we will discuss only the concept of basic plane figures leaving the solid shapes and will ask the students to recall the different plane figures that they have learned previously.• We will classify the plane figures
based on the sides they are made up of. Such as there are three sides in a triangle, four sides in a quadrilateral and we will place the figures that have more than four sides under a topic polygon and a separate section for circle as it has no side.
• Next, we will ask the students to recall the general area and perimeter of triangle and of circle and then we will add the blocks for the circle, triangle and area and perimeter of circle and triangles in the concept map.
• Thereafter, we will discuss the different quadrilateral such as parallelogram, rectangle and square, and the relationship between each other. We will again put this entire concept in the blocks and will link them with the previous concept map and it will look as follows—

51Use of Concept Mapping as an Innovative Teaching-learning Strategy...
Mensuration
is the study of
Plane figure
Circle
Area
Perimeter
Triangle
Parallelogram
Rectangle
Square
Quadrilateral
Volume
Total Surface Area
Solid shapesThat hasThat has
Area
Area
Perimeter
Perimeter
has
b*h
πr2
2πr
½(bxh)
(l1+l2 +l3)
l*b
a2
has
If opposite sides are parallel and equal
Area
Area
Area
lesson 3: area of trapezIuM
In the third lesson, we will discuss the area of a trapezium. As we know that, the trapezium is also a quadrilateral and we can find the area of a trapezium as the area of general quadrilateral as well. However, we will discuss the area of trapezium separately as sum of the area of triangle and rectangle and we will derive the formula for area of a trapezium as the sum of the area of its constituent rectangle and triangle.
lesson 4: area of general QuadrIlateral
As per the textbook, the area of general and special quadrilateral need to be discussed in detail we will assign one complete lesson each to the area of general and special quadrilateral.• First of all, the students are
encouraged to draw various quadrilateral and then we will ask them to visualise the quadrilateral as a sum of simpler plane figures such as rectangle and triangle as

52 Journal of Indian Education August 2020
students are supposed to know about the area of triangle and rectangle.
• Then, we will discuss the area of general quadrilateral in terms of two constituent triangle and with the help of students we will derive the formula to find out the area of general quadrilateral.
lesson 5: area of specIal QuadrIlateral
• The basic difference between the general and special quadrilateral (Rhombus) is that in special quadrilateral the opposite sides are equal as well as parallel and the interior angles are not at right angles but in the general quadrilateral the sides may or may not be same and they may or may not be parallel.
• We will make this distinction clear to the students and we will proceed to find out the area of special quadrilateral starting with the area of general quadrilateral.
lesson 6: area of polygon • In this lesson, the students
are encouraged to visualise the polygons as made of up quadrilaterals and triangles and to find out the area of same using the area of triangles and quadrilateral.
• We will put this entire concept in the blocks, during the course of each lesson, and will link them with the previous concept map
and it will look as shown in the next page.
lesson 7: solId shapes
• After completing the plane figures section, we will start the solid shapes section, before starting the solid shape section we will assign one lesson in which we will show how can we create solid (3D) out of the plane figure (2D shape)
• Which plane figure resembles a solid shape when we look at it from different sides, and
• Shape of different objects from day to day life, of which we may need to find the volume or the total surface area, such as pen, pencil, instrument box, briefcase, cakes etc…
lesson 8: cylInder
• After showing the student, how can we build a solid shape out of the plane figure, for example in this case,
(i) We can build a cylinder with circular discs, or
(ii) We can build the cylinder with two circular discs and a cylinder.
We will discuss to find the total surface area of cylinder in term of circular disc and rectangular sheet.• Finally, we will discuss the volume
of the cylinder.

53Use of Concept Mapping as an Innovative Teaching-learning Strategy...
Mensuration
is the study of
Plane figure
Circle
Area
Perimeter
Triangle
Parallelogram
Rectangle
Square
Quadrilateral
½ d(h1 + h2)
Polygons
Triangles Quadrilaterals’
Can be considered as made up of
Area of Trapezium = ½ (sum of parallel side x perpendicular
distance)
½*d2*d2
Volume
Total Surface Area
Solid shapesThat hasThat has
Area
Area
Perimeter
Perimeter
has
b*h
πr2
2πr
½(bxh)
(l1+l2 +l3)
l*b
a2
has
If opposite sides are parallel and equal
Area
Area
Area
General Special

54 Journal of Indian Education August 2020
lesson 9: cuboIds and cube
• In this lesson, we will discuss the total surface area of cuboids and cube. Students will be encouraged to visualise the cuboids and cube in term of plane shapes, in this case rectangles or squares, and to count the number of faces in each of the two solid shapes.
• Next, the student will derive the formula for the total surface area of cuboids and cube in terms of area of squares and rectangles.
• Finally, we will discuss the concept of volume of cube and cuboids.We will again put this entire
concept in the blocks, during the course of each lesson, and will link them with the previous concept map and it will look as follows.
(Note: For the section of solid shapes, we may make use of audio visual teaching aids as well)
concept Map as an evaluatIon tool
Concept map is not only an effective teaching strategy but it is also an effective evaluation tool for teachers, for measuring the growth of students. It gives an accurate way to evaluate the areas in which the student was not able to grasp the concept clearly. The objectivity in evaluation is also maintained. Students showed positive response in this regard, saying it works as a good aid to memory for revision. It is also good as a lot of things can be said in a few words. Thus, concept
map is not only helpful in teaching but also in assessing the learner's understanding of learning objectives, concepts and the relationship among those concepts.
We can make use of concept map as a testing tool as well in;
Formative assessment In classroom while teaching and drawing, we can use concept map for formative assessment purpose as well. Such as—• We can ask students to draw the
concept map of the lesson of the last day.
• During the mid of the lesson, we can ask the students to draw the concept map for whole of the thing we have learned.
• We can ask the student to draw the various possible concept map or the possibilities for the top we are yet to learn.
• We can ask the students to draw the relation between the different blocks and write the connecting words.
Summative assessment We can also use concept map effectively for summative assessment as well in the following ways—• drawing the concept map for a
given section;• fill up the vacant place of formulas;• linking the different segment of
the following map;• if the concept map is given in
the form of numerals instead of
55Use of Concept Mapping as an Innovative Teaching-learning Strategy...
variables, we can ask the students to find the given parameters based on the concept map. For example—
(i) If the area of circle, rectangle, triangle and of other such plane figure is given, we can ask the students to find out
the volume of cylinder if we use the given circle and rectangle.
(ii) How many circles and rectangles are required to get desired volume if we wish to make a cylinder of some given volume etc?
references
ausubel, D.P. 1963. The psychology of meaningful verbal learning. New York: Grune and Stratton.
———. 1968. Educational Psychology: A Cognitive View. Holt, Rinehart and Winston, New York.
CalDwell, w.h., F.a. RubaCe anD leonaRD liPkin. 2006. Developing a Concept Mapping Approach to Mathematics Achievement in Middle School. University of North Frorida. Jacksonvills, United States of America.
JosePh D. novak. 1983. Florida Institute for Human and Machine Cognition (IHMC).http:/www.inhmc.us/Technical Report IHMC Cmap Tools 2006-01 Rev 2008 01
JosePh D., novak anD J. albeRto Canas. 2006. “The Theory Underlying Concept Maps and How To Construct and Use them”, Institute for Human and Machine Cognition. Accessed 24 Nov 2008.
national CounCil oF eDuCational ReseaRCh anD tRaining. 2011. Pedagogy of Mathematics, NCERT, New Delhi.
novak, J.D. anD D.b. gowin. 1984. Learning how to learn. Cambridge University Press, New York.
woolFolk, a. 2016. Educational Psychology,13th Edition, Pearson, Edinburgh, England.

Teaching of Environmental Education through InfusionAn Analysis with Reference to
Science Teaching Rashmi shaRma*
*Associate Professor, Regional Institute of Education, Bhopal
IntroductIon Environmental consciousness is a major theme of almost all global and
AbstractIn the present era, environmental consciousness is a major concern which needs to be addressed by all future citizens. In India, this concern is addressed through formal school education. Environmental education is a compulsory subject in Indian schools. Some topics pertaining to environmental education are included in every discipline at school level such as in science subject. Science is a way to understand the surrounding in an effective manner. Local and global environmental concerns also can be taken care of properly by understanding scientific principles. The paper tries to analyse the transactional strategies being used by science teachers at secondary stage for infusion of environmental education components with the science subject. Analysis reflects that infusion of environmental components with science teaching needs more attention in science classrooms as teachers are not well equipped with strategies for infusion. Status of various other aspects related to infusion approach is found different in the study. Result suggests an urgent need to evolve well designed strategies for orientation of science teachers to use infusion approach in the classrooms. This paper also suggests some guidelines for infusion of environmental components with science teaching which can be helpful for teachers.
local deliberations and discussions in today’s time (Our common future, 1987 and Rickinson, 2001).
57Teaching of Environmental Education through Infusion...
Environmental education is also an integral part of education at all levels of schooling. As per the guidelines of Hon’ble Supreme Court of India, the environmental education is a compulsory subject in schools (Writ petition (civil) No 860 of 1991). Apart from this, some topics pertaining to environmental education are the part and parcel of every discipline at school level (Habitat and Learning, 2006). However, there are still some gaps reflected in the attitude of our student in regard to environmental awareness and sensitivity (Tesfai, Nagothu, Simek, Fucik 2016; Himmani et al, 2017). Preparation of the students to meet real life challenges is one of the important aims of formal school education programme (NCF, 2005). In the present context, the biggest challenge is to inculcate the environmental friendly practices and attitude amongst the school students. This is essential because students need to cope up with rapidly changing environmental conditions and to act in an environmental friendly manner (Environmental Education in Schools, NCERT, 2004). Therefore, it is essential to focus on environmental education components with the teaching of all subjects at school level.
need and sIgnIfIcance of the study
NCF, 2005 recommends that environmental education should be taught through infusion approach with other school subjects. (NCF 2005). For this purpose, text books of all subjects reflect the concern for environmental education
wherever is possible. Science text books also incorporate the chapters which generate the awareness and attitude towards the environment and environmental conservation. There are many other chapters in science books where the environmental concerns are reflected along with the scientific concepts (Science, Class IX and X, NCERT). In spite of this all, still there is a lot which needs to be reflected in the practices of our students for the healthy and happy life. School teachers are expected to take lead for this purpose. There are ample opportunities for a science teacher to talk about components related to environmental education during routine class-room science teaching at secondary stage of schooling. It is observed that some of science teachers try to infuse environmental education components with science teaching through different teaching-learning strategies. There is no study conducted so far in Madhya Pradesh with the objective to find out the details about transactional strategies used for infusion of environmental education components with science concepts. It is expected that the outcomes of this study would help the science teachers and other stake holders to put their focused efforts for inclusion of infusion of environmental education components with science concepts. The concerns related to environmental education needs to be addressed on priority basis through education as education is an unique investment for present and future (NPE, 1986).

58 Journal of Indian Education August 2020
MethodologyThe paper focuses on the identification of different transactional strategies being adopted by science teachers in routine class room transactions at secondary stage in the state of Madhya Pradesh. Data for the study was collected from randomly selected 50 science teachers of government schools of Madhya Pradesh using survey method through self made questionnaire.
objectIves
The main objective of this study was to find out the ways through which science teachers try to infuse environmental education components with science teaching. Another objective includes the analysis of transactional strategies (practiced routinely) in regard to infusion of environmental education with science.
SampleData was collected from randomly selected 50 science teachers(teaching at secondary level i.e. Class IX and X) of government schools of Madhya Pradesh.
ToolsA self made questionnaire (having 10 descriptive type questions)was used as tool to collect the responses of science teachers. (Annexure – 01)
result and analysIs
Item wise analysis of questionnaire reflects that infusion of environmental components with science teaching is in practice by some of the teachers. The
different aspects related to infusion have different status. A summary of the teacher's response in regard to each of question is presented herewith in the form of graphs. Item 1: Teaching strategies used for infusion of environment related issues and concerns
Responses of teachers in regard to Item no. 1 are presented in the Table 1.
Table 1
Teaching strategies used for infusion
S. No.
Name of Strategy
Frequency of responses
1. Discussion and group discussion
50
2. Project work 253. Field trip 204. Demonstrations 25. Quiz and games 56. Brain storming 007. Role play 008. Reflective diaries 009. Portfolios 00
10. Use of ICT 511. Discussion with
resource persons00
Table 1 reflects majority of teachers (100%) use discussion and group discussion method for teaching science at secondary level. Project work is also used by 50 per cent of teachers. Field trip as a way to incorporate environmental issues with science teaching is also used by 40 per cent teachers. Demonstrations made by the teacher hardly incorporate the issues of

59Teaching of Environmental Education through Infusion...
environment. Very less percentage of teachers (2%) mention that the brain-storming and role play is being used to incorporate the environmental issues. Quiz and games are also used by about 10 percent of teachers as pedagogy of infusion. None of the teachers mention that they use reflective diaries and portfolios as pedagogy for secondary stage science teaching. ICT is also used by some of the teachers (10%) for incorporating environmental issues with the
science teaching at secondary stage. Discussion with the resources person and use of any other material as teaching aid is also not mentioned by any of the respondent teacher.
In a nut shell, it is reflected from the responses of the teachers that in general, the traditional chalk and talk method is being used by the majority of the teachers for transaction of science concepts and to incorporate the environmental issues with science teaching.
120
100
80
60
40
20
0
Discus
sion
Proje
ct wor
k
Field
trip
Demon
strat
ions
Quiz an
d gam
es
Brain st
orming
Reflec
tive d
iaries
Portf
olios
Use of
ICT
Discuss
ion w
ith ro
urce p
erso
ns
Use o
f oth
er m
ater
ial
Fig. 1: Teaching strategies used for infusion of environment related issues and concerns

60 Journal of Indian Education August 2020
Table 2
Examples of environmental related topics taught through infusion approach
S. No.
Examples of environment related topics
Frequency (Total 100) Each respondent to mention two activities
1. Air pollution 102. Water pollution 303. Energy 204. Biodiversity 105. Not provided any examples 30
Item 2: Each of the respondent teachers were expected to provide at least name of two topics or concepts as examples of environmental related topics taught through infusion approach. The responses reflect that only 40 per cent of teachers give examples. Majority of the examples includes the concepts from the topics directly related to environment; air pollution (20%), water pollution
(15%), energy (10%), biodiversity (5%).
In second part of question, teachers were asked to provide reasons for not including infusion approach. 60 per cent of the teachers do not mention any of the examples. Majority of them also, does not give any reason and 40 per cent of them mention that they have not been given any training in this regard.
70
60
50
40
30
20
10
Not provided any examples
Air pollution Water pollution Energy Biodiversity0
Fig. 2: Examples of environmental related topics taught through infusion approach

61Teaching of Environmental Education through Infusion...
Table 3
Activities for students regarding environmental awareness and attitude development
S.No. Activities for awareness and attitude development
Frequency of responses (Total 50 respondent)
Each teacher to mention two activities
1. Plantation in school premise 402. Competitions on environment related
topics30
3. Nature club activities 104. Infusion with content 20
45
40
35
30
25
20
15
10
5
0Plantation in
school premiseCompititions Nature club
activitiesInfusion with
content
Fig. 3: Activities for students regarding environmental awareness and attitude development
Item 3: Activities for students regarding environmental awareness and attitude development revels that 40% teachers mention about tree plantation in the school premise.30% teachers mention about some competitions on the topics related to environment. About 10% teachers
mention about nature club activities also. Some 20% of them mention that they make them aware about some of the issues along with the content wherever is possible. In this question also each of the respondents were suppose to mention to activities at least.
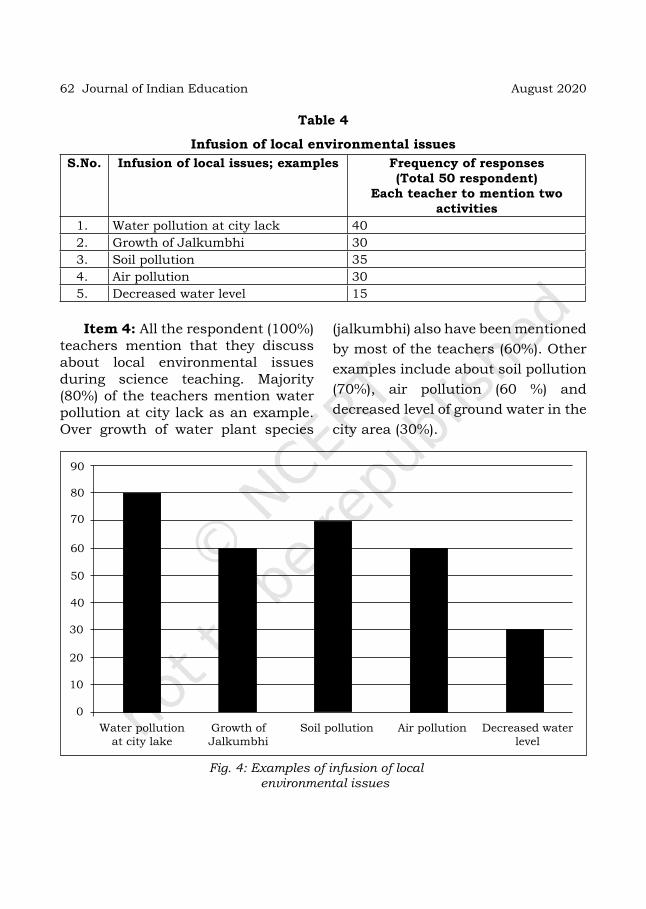
62 Journal of Indian Education August 2020
Table 4
Infusion of local environmental issuesS.No. Infusion of local issues; examples Frequency of responses
(Total 50 respondent)Each teacher to mention two
activities 1. Water pollution at city lack 402. Growth of Jalkumbhi 303. Soil pollution 354. Air pollution 305. Decreased water level 15
Item 4: All the respondent (100%) teachers mention that they discuss about local environmental issues during science teaching. Majority (80%) of the teachers mention water pollution at city lack as an example. Over growth of water plant species
(jalkumbhi) also have been mentioned by most of the teachers (60%). Other examples include about soil pollution (70%), air pollution (60 %) and decreased level of ground water in the city area (30%).
90
80
70
60
50
40
30
20
10
0Water pollution
at city lakeGrowth of Jalkumbhi
Soil pollution Air pollution Decreased water level
Fig. 4: Examples of infusion of local environmental issues

63Teaching of Environmental Education through Infusion...
Table 5
Examples of activities to enhance students’ participation for conservation of environment
S. No. Activities for students Frequency of responses (Total 50 respondent)
Each teacher to mention two activities
1. Tree plantation 502. Van Mahotsav celebration 403. Development of vermin compost
pit 20
4. School campus cleaning programme
90
Item 5: This question was asked to the teachers with the intention to know about classroom activities related to science concepts those can be helpful for conservation of environment as well. For example; teachers could mention the use of micro-scale apparatus, for example,
2 mL test tube, 10 mL beaker etc. for performing some activities during science teaching. Activities can be performed with the help of these apparatus to demonstrate the scientific concepts and are environmental friendly also. Teachers have not responded about the
120
100
80
60
40
20
0Tree
plantationVan Mahotsav
CelebrationDevelopment of
vermi-compost pitSchool campus
cleaning programme
Fig. 5: Examples of activities to enhance students’ participation for conservation of environment;

64 Journal of Indian Education August 2020
activities during science teaching but they have mentioned about other activities those are performed in the school for conservation of environment. The same is presented here in the graphical form.
All the respondent teachers (100%) mention about tree plantation as one of the major activity to increase student's participation for environmental conservation. Celebration of Van Mahotsav in the month of July is another activity which involves students at large. Around 80 per cent teachers mention about it. 40 per cent teachers mention that the development of vermi compost
plantin school campus is also one activity ensures the students’ participation. Apart from this, school campus cleaning programme involves students as mentioned by 90 per cent of the teachers.
In this question, teachers were expected to mention about content area which has scope to infuse legal provision for conservation of natural wealth. They were asked to mention at least one legal provision. Majority of the teachers (80%) mention that the content of science does not provide scope for infusion related to legal provisions for conservation of natural wealth and wild life. Only 20
45
40
35
30
25
20
15
10
5
0No legal provision Conservation of trees
and animalsPollution
Fig. 6: Examples of legal provisions for conservation of natural wealth
Conservation of forests
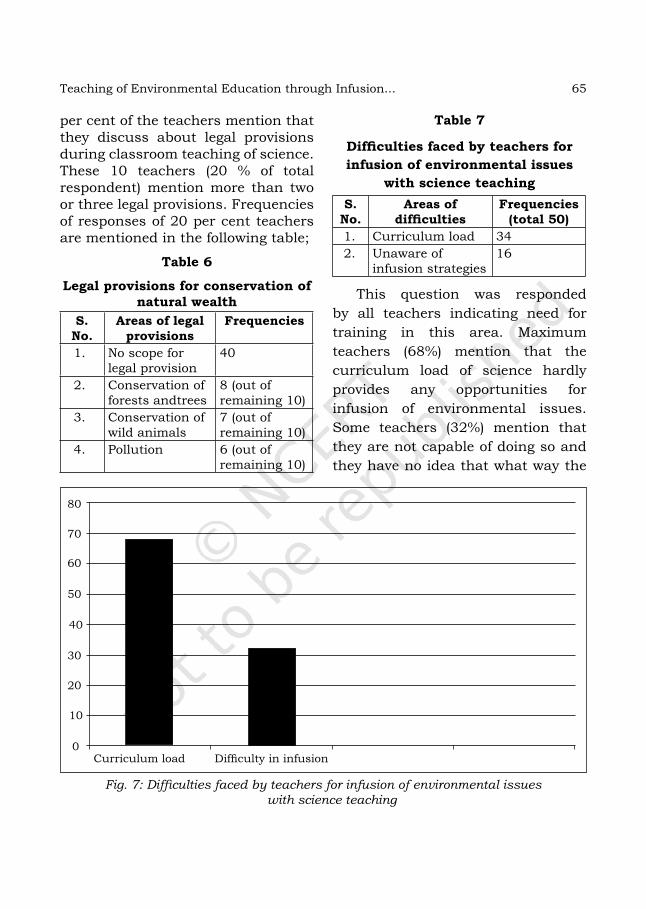
65Teaching of Environmental Education through Infusion...
per cent of the teachers mention that they discuss about legal provisions during classroom teaching of science. These 10 teachers (20 % of total respondent) mention more than two or three legal provisions. Frequencies of responses of 20 per cent teachers are mentioned in the following table;
Table 6
Legal provisions for conservation of natural wealth
S. No.
Areas of legal provisions
Frequencies
1. No scope for legal provision
40
2. Conservation of forests andtrees
8 (out of remaining 10)
3. Conservation of wild animals
7 (out of remaining 10)
4. Pollution 6 (out of remaining 10)
Table 7
Difficulties faced by teachers for infusion of environmental issues
with science teachingS.
No. Areas of
difficulties Frequencies
(total 50)1. Curriculum load 342. Unaware of
infusion strategies 16
This question was responded by all teachers indicating need for training in this area. Maximum teachers (68%) mention that the curriculum load of science hardly provides any opportunities for infusion of environmental issues. Some teachers (32%) mention that they are not capable of doing so and they have no idea that what way the
80
70
60
50
40
30
20
10
0Curriculum load Difficulty in infusion
Fig. 7: Difficulties faced by teachers for infusion of environmental issues with science teaching

66 Journal of Indian Education August 2020
infusion should be carried out in the class room while teaching of science.
Table 8
Suggestions to overcome difficulties regarding infusion— teachers’ viewS.
No. Suggestions to overcome difficulties
Frequencies (total 50)
1. Need training 452. Separate classes
for environment education
05
Out of total respondents, 90 per cent teachers mention that they need proper training for infusion of environmental concerns with science teaching. Some of the teachers (10%) mention that the idea of infusing environmental education with science is not good. They advocate for the separate classes for the environmental education as in their opinion infusion leads to the dilution of the science subject.
100
90
80
70
60
50
40
30
20
10
0Needs proper
trainingSeperate classes for
environmental concerns
Fig. 8: Suggestions to overcome difficulties regarding infusion— teachers’ view

67Teaching of Environmental Education through Infusion...
Table 9
Daily life examples used for infusionS. No. Examples used for infusion from
daily lifeFrequencies (Total 100)
Each respondent to mention two example
1. Global warming 702. Pollution 703. Climate change 304. Organic food and GM seeds 205. Vegetarian vs non-vegetarian food 10
30 per cent teachers mentioned about climate change and 20 per cent about organic food and GM seeds. 10 per cent of teachers also mentioned about vegetarian and non-vegetarian diet related environmental issues.
Teachers were asked to provide at least two examples from daily life those can be infused with the teaching of science at secondary level. Global warming (70%) and pollution (70%) are the two topics those are mentioned by most of the teachers.
80
70
60
50
40
30
20
10
0Global warming Pollution Climate change Organic food
and GM seedsVegetarian vs
non-vegetarian food
Fig. 9: Daily life examples used for infusionApart from the existing chapters
related to environmental issues or problems, the majority of the teachers are in the opinion that incorporating the environmental related issues with the existing content may dilute
the science in it. Still some of the teachers suggested that some of the places may have the possibility to incorporate the environmental issues related content with science teaching.

68 Journal of Indian Education August 2020
Table 10
Teachers’ view examples of science content and concepts best suitable for infusion
S. No. Science content / concepts Frequencies (total 150)Each respondent to mention three
concepts 1. Metals and non-metals 082. Sound 163. Life processes 124. Why do we fall ill 175. Natural resources 346. Our environment 277. Sources of energy 338. Human eye and colorful world 3
80
70
60
50
40
30
20
10
0
Metals
and n
on-m
etals
Why
do w
e fall
ill
Natura
l res
ourc
es
Our env
ironm
ent
Sourc
es of
ener
gy
Human ey
e and
colou
rful
world
Life p
roce
sses
Sound
Fig. 10: Examples of science content and concepts best suitable for infusion— teachers’ view
conclusIon An analysis of responses of the teachers reflect that about 50 per cent teachers try to incorporate
local and global environmental issues with the teaching of science. Further strengthening of this spirit can be done by opting well designed

69Teaching of Environmental Education through Infusion...
strategies for infusion. Orientation and training programmes also can be organised to sensitise science teachers about infusion.
Another important exercise can be carried out while writing text book for secondary stage. Care should be taken to avoid repetition of same environmental components in various subjects. In this way, different environmental education related concepts can be incorporated at secondary stage without increasing the curriculum load.
For infusing the environmental education with science, some of the important concerns may be addressed by the science teachers during routine classroom transactions. Whenever possible during routine classroom transactions the teachers should focus on current environmental concerns and should try to relate them with their immediate environment. The possible interaction between science, technology and environment should be focused. For example, while teaching energy, the different sources of energy, non-conventional energy sources, technology used for renewable energy, their cost effectiveness and their positive impacts on environment needs to be discussed. While discussing local specific environmental concern, learners should be given opportunities to clarify their personal
stand on the issue. Not only should one try to relate all environmental problems with science but for their solutions also science should be trusted. Learners should be trained to assess community needs, community resources and community problems. Also, they need to be exposed to problems solving situations. They should be made aware about environment through simulations, role playing and educational games.
Ecological principles are universal and having bearing on social, cultural, economical and political aspects of life. Every teacher must be aware of ecological principles and should be able to use them during routine science classes.
There is ample of possibility to incorporate the text related to environmental education in the science textbooks at secondary stage. But, at the same time there is a danger of dilution of some of the scientific concepts. The infusion has to be carried out in such a skilled manner that the spirit of the science teaching is not affected.
This is an important task, the present generation teachers are entrusted with. For this purpose the teachers need proper training. The task of imparting training has to carry out effectively by the teacher training institutions for better future of human kind.

70 Journal of Indian Education August 2020
references
habitat and leaRning. 2006. Focus Group Report on Environmental Education, NCERT, New Delhi.
hammami, mohammad bakRi alaa, et al. 2017. Survey on Awareness and Attitudes of Secondary School Students Regarding Plastic Pollution: Implications for Environmental Education and Public Health in Sharjah City, UAE., Environmental Science and Pollution Research International, U.S. National Library of Medicine, Sept. 2017, 2017 Sep;24(25):20626-20633. Retrived from www.ncbi.nlm.nih.gov/pubmed/28712081.
tesfai, m., U.s. nagothU., J. simek and P. fUcik. 2016. Perceptions of secondary school students towards environmental services: A case study from Czechia. International Journal of Environmental and Science education. Vol. 11, No. 12. pp 5533–5553
national coUncil of edUcation ReseaRch and tRaining. 2004. Environmental Education in schools, NCERT, New Delhi
———. 2006. Class IX Textbook, NCERT, New Delhi.———. 2006. Class X Textbook, NCERT, New Delhi.———. 2005. National Curriculum Framework, NCERT, New Delhi.national Policy of edUcation. 1986. MHRD, Govt of India, New Delhi.Rickinson, m. 2001. Learners and Learning in Environmental Education: A critical review of
the evidence. Environmental Education Research. Vol. 7, No. 3. pp. 207–320.teacheR’s handbook on enviRonmental edUcation. 2011. For Classes XI-XII, Department of
Education and Science and Mathematics, NCERT, New Delhi.WoRld commission on enviRonment and develoPment. 1987. Our Common Future. Oxford
University Press. New York.WRit Petition (civil) no 860 of 1991, m. c. mehta, hon’ble sUPReme coURt of india.

Green School Curriculum and Curricular Practices Quest for
Sustainable DevelopmentR. PushPa Namdeo*
*Assistant Professor, Department of Education, Mahatma Gandhi Antarrashtriya Hindi Vishwavidyalaya, Wardha
AbstractEducation is one of the most important tools for the progress of the nation. Environmental education has always been a priority area in curriculum development programmes. Environmental education is not just about learning. It is about understanding the environmental issues confronting our planet and changing our behaviours as well. Developments in science and technology have not only made human living more comfortable but created several problems to ecological balance and to the environment. Hence, environmental education should equip children to transform scientific knowledge into optimum utilisation without affecting the environment. This could be achieved when inter and intra disciplinary approaches are practiced. Progress and development have become synonymous with the introduction of new technologies and products, aimed at making life better, safer and more viable. But, there have been instances where apparently useful products and technologies have turned out to be capable of inflicting extremely detritus impact on environment and development in the long run. Realising the importance of preparing younger generations to protect environment and maintain ecological balance for sustainable development, school curriculum from time to time emphasises the need for promoting environmental awareness to develop environment friendly behaviour. Keeping this rationale as the base, the researcher conducted the research on awareness about green school curriculum and curricular practices for sustainable development among elementary school teachers. The sample of 50 elementary school teachers from Wardha were selected using random sampling method for this study. The collected data were subjected to qualitative analysis. The
72 Journal of Indian Education August 2020
results of the study inferred that elementary school teachers though not fully aware about green school curriculum but have an idea of integrating specific subject content to environmental issues.
Environmental concern is one of the important aspects of education. Integration of these environmental concerns in school curriculum and curricular practices has become inseparable in present education system for sustainable development. This issue at present is not only interdisciplinary in nature but a paradigm shift has taken place where it is considered as transdisciplinary. Not a single curricular area remains untouched with these issues. It is well known that this issue cuts across curriculum. At present, sustainable development is the main aim for the societal upliftment. The World Summit on Sustainable Development (WSSD) in Johannesburg in 2002 catalysed the efforts to bring about a shift from ‘educating about the environment’ to ‘educating for sustainability’. This shift reflected the international climate of thinking about sustainable development as, ‘development that meets the needs of the present without compromising the ability of future generations to meet their own needs’.
The Decade of Education for Sustainable Development (DESD) launched by the United Nations in 2005 aimed at integrating the principles, values and practices for nurturing sustainable development (UNESCO, 2005). This required infusing appropriate processes in
the school curricula. Article 51A of the Constitution has made it a ‘fundamental duty of every citizen to protect and improve the natural environment including forests, lakes, rivers and wildlife’. Various education commissions, besides the National Policy on Education, 1986 and Programme of Action, 1992, have reiterated the growing need to address the environmental concerns.
Keeping in view the wider perspective of the environment and recommendations of the UNESCO, 2005, the curriculum development at the national level took cognizance and Education for Sustainable Development (ESD) was the core of the curriculum for each subject area developed by NCERT (towards a green school resource book on ESD for elementary school).
Green School curriculum
It is a well known fact that the curriculum is the core to every school, it initiates directed and structured implementation of the curricular and co-curricular aspects promoting the holistic development of the students. Greening the school campus and making students aware about environment and its role in the sustainable development is the major objective of the green school curriculum. Thus, the green curriculum prepared for school is

73Green School Curriculum and Curricular Practices Quest...
called green school curriculum. Green curriculum enables students to learn from the nature and natural processes (The C.A.S School, Green Curriculum).
The major characteristic of green curriculum is to incorporate issues of environment and sustainable development in school. It encourages a greater understanding of the environment and ecological issues. The students are provided with the space in curriculum and its transactional practices to own their learning and understanding about the environment as well as nature. The ultimate goal of green curriculum is action, i.e., action to improve the environment, prevent its degradation and sustain its well-being.
Implementation of green school curriculum developed a proactive behaviour towards environment. It also affected school curriculum, its activities and the community where the curriculum was implemented. Thus, inclusion of green school program plays an important role in the development of eco-friendly behaviour among the students (Marcus, 2012).
curricular Practice
Curricular practices are the activities in which students are actively engaged and exposed to, during teaching learning practices. The school environment provides enormous teaching-learning opportunities. Students gain first-hand experience from their surroundings that go
beyond the classroom and as a teacher we need to think of strategies of engaging them with it. Green school practices will develop a new generation who will have greater awareness, positive feelings, understanding and appreciation for life and environment (Razak, Iksan and Zakaria).
The green school will promote students learning outside the periphery of the classroom and they will develop a sense of commitment and responsibility which will empower students with positive attitude towards environment and sustainable development (Ahmad et al., 2019).
For students, direct engagement with their surroundings can be a powerful way of learning about the environment because it helps them realise that their actions can make a difference. The sense of action and achievement will not only motivate children, but also create a sense of empowerment, a feeling that ‘we can make a difference’ will develop a positive attitude among students towards green environment.
ncert on Green School curriculum
Towards A Green School: Resource Book on Education for Sustainable Development for Elementary Schools was developed by NCERT in 2017 considering the role of ESD towards achieving MDGs.
This curriculum steps towards creating awareness about ESD among different stakeholders in

74 Journal of Indian Education August 2020
school education. It focuses on treating ESD as an integral, holistic part of school curriculum, teaching-learning practices and school and home environment of every learner. Considering it a joint responsibility of every individual, it aims to involve the entire school community (children, teachers, principal, support staff) and the neighbourhood to work together through participatory, practical and collaborative approaches. It will also help all stakeholders of school education to realise that it does not require additional physical or human resources to understand and practice the principles of sustainable development within the available resources.
The Resource Book suggests ways to transform the schools through practices of ESD in order to enable the children to grow in an environment that helps imbibe awareness, sensitivity and the necessary skills to be environmentally responsible citizens of earth. This resource book has four sections—• ‘A green school: An introduction’
develops an insight of ESD, ‘Greening’ and ‘whole school’ approach as per national and international outlook.
• ‘Understanding the green school curriculum’ helps to understand ESD in the context of curriculum.
• ‘Promoting green practices: Within and beyond the school’ gives different strategies to transact a Green Curriculum.
• ‘How green is my school’ includes various case studies with examples of schools in reality that have demonstrated practices for ESD.
rationale of the Study
Environmental concern has attracted the attention of all the countries globally. For sustainable development of any nation it is necessary that it takes into consideration the environmental issues. To save our environment so as to sustain it for future generation we need to relate it to our curriculum. Though environmental studies have become a compulsory subject of study at each level of education system, it is the duty of teachers and every functionaries of education system to integrate environmental issues in teaching learning process. For this, it is important for teachers to become aware of green school curriculum and the curricular practices.
objectiveS of the Study
In order to investigate, researchers decided the following objectives for the study. 1. To study elementary school
teacher’s awareness about factual knowledge in terms of green school curriculum for sustainable development.
2. To study elementary school teachers understanding about green school curriculum.
75Green School Curriculum and Curricular Practices Quest...
3. To study various curricular practices adopted by elementary school teachers to promote sustainable development.
methodoloGy
For the present study, descriptive research method was adopted.
SampleElementary school is the pivot area where most of the effective practices related to the environment can be inculcated among the students. To attain these objectives, it is important for the teachers to be aware as well as involve practices which are environment friendly which leads to sustainable development. Therefore, this study emphasised on the elementary teachers.
Random sampling procedure was adopted to draw out the sample for the study. Total 50 elementary school teachers from Wardha were taken as a sample. As green school curriculum emphasises that issues relating to the environment should not be limited to science or environmental studies only, it should also be made transdisciplinary. Therefore, the sample included not only science or environmental studies teachers but the sample included social science, language as well as mathematics teachers also.
ToolFor measuring the awareness about green school curriculum questionnaire was prepared based on
the resource book prepared by NCERT i.e. Towards a Green School: Resource Book on Education for Sustainable Development for Elementary Schools. The questionnaire consists of 10 questions related to factual knowledge about green school curriculum.
Semi structured interview was prepared to know the understanding of green school curriculum among elementary school teachers and curricular practices adopted by the teachers to transact green school curriculum.
Data analysis methodAfter collection of data, analysis was done qualitatively.
reSultS and diScuSSion
• The first objective of the study was to study elementary school teacher’s awareness about factual knowledge in terms of green school curriculum for sustainable development.
Table 1
Awareness about the Green school curriculum
Awareness No. of teachers
Percentage
Low 12 24Moderate 23 46High 15 30
On the basis of the data obtained through the questionnaire, the first objective of the study was analysed it was found that 30 per cent of teacher’s awareness was found to be high whereas 46 per cent of the teachers
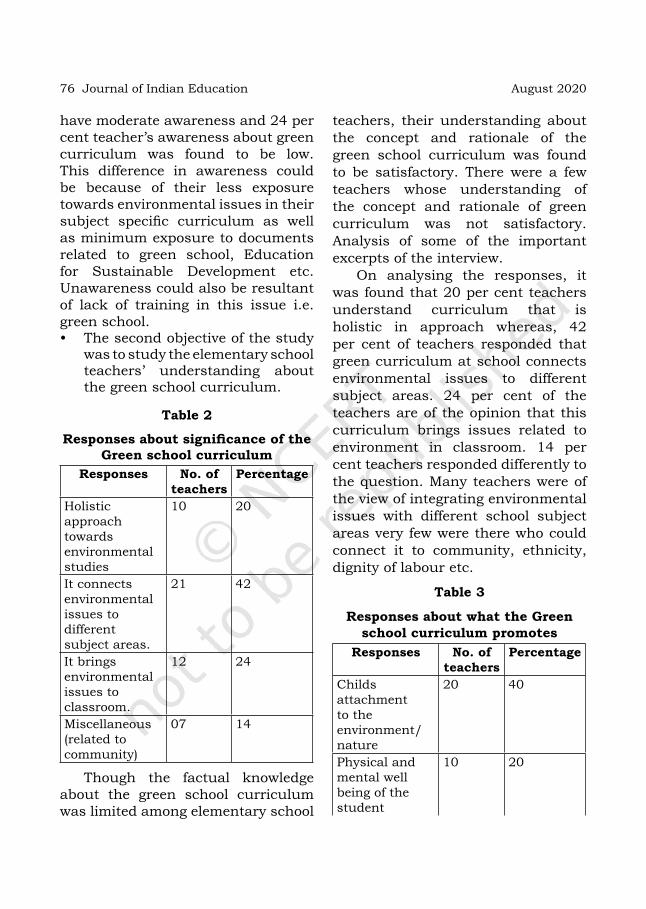
76 Journal of Indian Education August 2020
have moderate awareness and 24 per cent teacher’s awareness about green curriculum was found to be low. This difference in awareness could be because of their less exposure towards environmental issues in their subject specific curriculum as well as minimum exposure to documents related to green school, Education for Sustainable Development etc. Unawareness could also be resultant of lack of training in this issue i.e. green school.• The second objective of the study
was to study the elementary school teachers’ understanding about the green school curriculum.
Table 2
Responses about significance of the Green school curriculum
Responses No. of teachers
Percentage
Holistic approach towards environmental studies
10 20
It connects environmental issues to different subject areas.
21 42
It brings environmental issues to classroom.
12 24
Miscellaneous (related to community)
07 14
Though the factual knowledge about the green school curriculum was limited among elementary school
teachers, their understanding about the concept and rationale of the green school curriculum was found to be satisfactory. There were a few teachers whose understanding of the concept and rationale of green curriculum was not satisfactory. Analysis of some of the important excerpts of the interview.
On analysing the responses, it was found that 20 per cent teachers understand curriculum that is holistic in approach whereas, 42 per cent of teachers responded that green curriculum at school connects environmental issues to different subject areas. 24 per cent of the teachers are of the opinion that this curriculum brings issues related to environment in classroom. 14 per cent teachers responded differently to the question. Many teachers were of the view of integrating environmental issues with different school subject areas very few were there who could connect it to community, ethnicity, dignity of labour etc.
Table 3
Responses about what the Green school curriculum promotes
Responses No. of teachers
Percentage
Childs attachment to the environment/nature
20 40
Physical and mental well being of the student
10 20

77Green School Curriculum and Curricular Practices Quest...
Safe infrastructure in school
11 22
Miscellaneous (related to environment)
09 18
The above table shows that 40 per cent of the teachers think that green curriculum in school brings a feeling of attachment between student and nature. 20 per cent responded that this curriculum enhances physical and mental well being of the student, 22 per cent responded that it promotes safe and healthy infrastructure whereas 18 per cent of the teacher’s responded differently. The responses given by the teachers could be because of their preconceived concept related to green school or some exposure to this issue.
Table 4
Responses about effectiveness of the Green school curriculum in teaching and learning processResponses No. of
teachersPercentage
Highly effective 30 60Moderately effective
15 30
Less effective 05 10
Responses to this question reflect that 60 per cent teachers are of opinion that this curriculum will be highly effective in teaching learning process. The teachers are of the view that if this curriculum is implemented in the school the teaching learning
process as well as school environment will become effective whereas some teachers were of the opinion that it would be to incorporate it in each and every aspect in school due to infrastructural facilities as well as lack of human resources although it will provide effective opportunities to the students.
Table 5
Responses about the stances where the Green school curriculum could
be effectively usedResponses No. of
teachersPercentage
Curricular activities (Classroom teaching)
5 10
Co-curricular activities (Playground, cultural activities)
35 70
Both 10 20
Majority of the teachers responded that co-curricular activities are the stances when this curriculum can be effectively used. There are very few teachers near about 10 per cent of the total sample who responded that curricular activities are the stances where green curriculum can be used effectively as it takes time, energy and economic efforts to incorporate it in teaching learning process in the classroom. 20 per cent teachers are of the view that it depends entirely on the teachers will on how to integrate in curriculum.

78 Journal of Indian Education August 2020
• The third objective was to study various curricular practices adopted by elementary school teachers to promote sustainable development. Thinkers like Rabindranath
Tagore, Mahatma Gandhi commissions along with various policies like NPE, 1986 along with POA, 1962 emphasised on integration of environmental concerns at various school level.
Semi structured interview was conducted to know the curricular practices adopted during classroom processes. In this context, subject specific teachers were interviewed, where the majority of the language teachers responded that poetry, prose, grammar, discussion are the places where they try to incorporate sustainability issues i.e. society, environment and economy. Natures poetry or poetry related to nature, prose on environmental issues, sentences of the words etc. Although environmental consciousness is one of the major issues towards education for sustainable development.
Social science teachers responded that they can connect social issues to environment and sustainable development. Contents related to geography, civics, history, for example— natural resources, rocks, forest, battles, different periods like ancient, medieval, modern periods, civilisations, industrialisation, agriculture, community work, concept like Swachh Bharat Abhiyaan, etc.
are the content area where green school curriculum can be included in curricular practices and students can be made sensitive towards environment.
Maximum content area in science subject like pollution, pollination, food preservation, micro organism, diseases, health and hygiene etc. can be taught keeping green school curriculum in context. Maximum word problems in mathematics can be made making students sensitive towards environmental issues.
Along with these questions many questions related to sustainable development and green curriculum were asked to the teachers many teachers responded that sustainable development is the development in the present without compromising with the future. They also responded that this curriculum follows integrated approach to learning.
findinGS
Although, factual knowledge of the Green school curriculum is not known by the teacher but they are well aware about the environmental issues that can be incorporated during the classroom transaction. Knowingly or unknowingly they were able to link green curriculum in various curricular practices. Inter linkages of various subject areas to green curriculum was also made by the teachers. Although there were some problems in linking the curriculum but they try to develop a notion among students that various

79Green School Curriculum and Curricular Practices Quest...
subjects are linked to each other and all contributes towards sustainable development.
concluSion
Green school curriculum helps in holistic development of the student. It develops sensitivity as well as attachment of the students towards the nature. It directs towards inclusive development. Therefore, we can conclude that green school curriculum—• Enhances the environmental
sensitivity during teaching in class by maximum utilisation of senses by formal or informal method.
• Indigenous knowledge about the environment is utilised during teaching learning process.
• It inculcates the awareness towards various issues of environmental problems.
• Involve the participation of students in various activities for environmental protection.
• Provide emphasis on the recycling of waste products.
• Motivate the students by giving some better examples related to protection, conservation of environment or by organising campaign.
• Give opportunities to the students, to know the importance of nature.
educational imPlicationS
The findings of this research could be helpful for teachers, students as well as administrators for facilitating Education for Sustainable Development.• Green school curriculum is
important for teachers as well as students therefore efforts should be made through seminar, conferences and workshop to disseminate the concept of green school curriculum and curricular practices.
• The challenges and barriers in implementing this curriculum could be worked upon by government as well as administrators so as to pave the path for sustainable development.
• The teachers should be provided with proper training towards executing green school curriculum for sustainable development.
• Practicing environmental sensitive activities by teachers will help to inculcate the same among the students. In a nutshell, we can say that
green school curriculum is crucial for the reduction of environmental problems and for enhancing sustainable development.
80 Journal of Indian Education August 2020
referenceS
ahmad et al. 2019. Conceptualising Green School Awareness in Primary School to Promote Sustainability. Religacion Revista de Ciencias Sociales y Humanidades, Vol. 4, No. 17. pp 23-30, https://www.researchgate.net/publication/337337599
CeNtRe foR eNviRoNmeNtal eduCatioN. Towards a Green Future: A Trainer’s Manual on Education for Sustainable Development. CEE, Ahmedabad.
deCade of eduCatioN foR sustaiNable develoPmeNt. 2005-2014. http://www.desd.org/eduCatioN foR sustaiNable develoPmeNt. https://en.unesco.org/themes/education-
sustainable-developmentthe Cas sChool. Green curriculum. https://cas.edu.pk/green-curriculumJohaNNesbuRg deClaRatioN oN sustaiNable develoPmeNt. 2002. http://www.joburg.org.za/
pdfs/ johannesburgdeclaration.pdfmaRCus. 2012. Implementation of Environmental Education Case Study: Activating
“Green School” Program among elementary school students of Israel. Geographia Technica (2), pp. 52 -58. http://technicalgeography.org/pdf/2_2012/06_arny_marcus_implementation_of_environmental_education_case_study_activating_the_green_school_program_among_elementary.pdf
miNistRy of humaN ResouRCe aNd develoPmeNt. 1986. National Policy on Education, Govt. of India, New Delhi.
NatioNal CouNCil of eduCatioNal ReseaRCh aNd tRaiNiNg. 2017. Towards a Green School: Resource book on Education for sustainable development for elementary schools. NCERT, New Delhi.
Razak, Iksan, and Zakaria. Students’ Reflection on Green School. https://pdfs.semanticscholar.org/93be/058cb8bdbc2c0f7acd9323eea7054d69b5db.pdf
WoRld CommissioN oN eNviRoNmeNt aNd develoPmeNt. 1987. Our Common Future. Oxford University Press. New York. http://www.un-documents.net/wced-ocf.htm
uNesCo. 2004. Framework for the UNDESD International Implementation Scheme. http://unesdoc. unesco.org/images/0014/001486/148650E.pdf
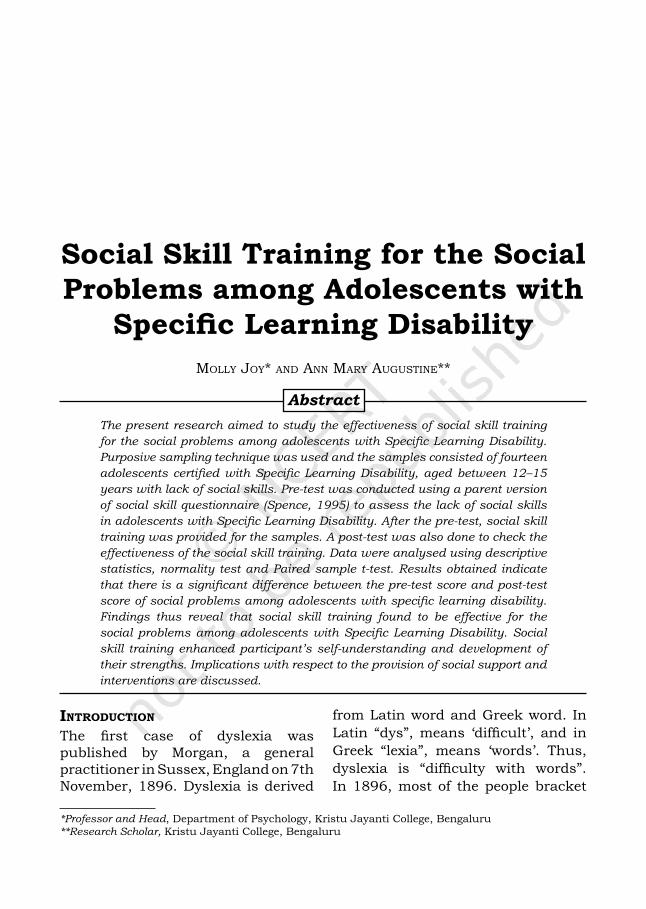
Social Skill Training for the Social Problems among Adolescents with
Specific Learning DisabilityMolly Joy* and ann Mary augustine**
*Professor and Head, Department of Psychology, Kristu Jayanti College, Bengaluru**Research Scholar, Kristu Jayanti College, Bengaluru
AbstractThe present research aimed to study the effectiveness of social skill training for the social problems among adolescents with Specific Learning Disability. Purposive sampling technique was used and the samples consisted of fourteen adolescents certified with Specific Learning Disability, aged between 12–15 years with lack of social skills. Pre-test was conducted using a parent version of social skill questionnaire (Spence, 1995) to assess the lack of social skills in adolescents with Specific Learning Disability. After the pre-test, social skill training was provided for the samples. A post-test was also done to check the effectiveness of the social skill training. Data were analysed using descriptive statistics, normality test and Paired sample t-test. Results obtained indicate that there is a significant difference between the pre-test score and post-test score of social problems among adolescents with specific learning disability. Findings thus reveal that social skill training found to be effective for the social problems among adolescents with Specific Learning Disability. Social skill training enhanced participant’s self-understanding and development of their strengths. Implications with respect to the provision of social support and interventions are discussed.
IntroductIon
The first case of dyslexia was published by Morgan, a general practitioner in Sussex, England on 7th November, 1896. Dyslexia is derived
from Latin word and Greek word. In Latin “dys”, means ‘difficult’, and in Greek “lexia”, means ‘words’. Thus, dyslexia is “difficulty with words”. In 1896, most of the people bracket
82 Journal of Indian Education August 2020
together intelligence with the ability to read. But, the case of Percy F, a 14-year-old child who was intelligent, bright, quick with learning games and the intellectual equal of his peers, but fell behind, in his inability to learn how to read breaks down the association between reading and intelligence.
Morgan and Hinshelwood, an ophthalmologist speculated that difficulties with reading and writing were due to “congenital word blindness”. After that for many years, the governing view of dyslexia was that it was caused by visual processing deficiencies. Later, it was widely accepted that dyslexia is a verbal deficit and can be considered as part of the range of language disorders.
After the first case of dyslexia different types of specific learning disabilities were defined such as dyslexia (difficulty in reading), dysgraphia (difficulty in writing), dyscalculia (difficulty in numbers and mathematical concepts).
SpecIfIc LearnIng dISabILIty (SLd)Specific learning disability (SLD) is a neuro-developmental disorder produced by the interaction of heritable and environmental factors that influence the brain’s ability to efficiently perceive or process verbal and nonverbal information. It is characterised by difficulty learning academic skills in reading, written expression or mathematics beginning
in early childhood that is consistent with the overall intellectual ability of a child. Children with specific learning disorder find it difficult to keep up with their peers in certain academic subjects whereas they may excel in others. Academic skills that may be compromised in specific learning disability include a) reading single words and sentences fluently, b) written expression and spelling, c) calculation and mathematical problems. Specific learning disorder results in underachievement that is unexpected based on the child’s potential as well as the opportunity to have learned.
Specific learning disability in the areas of reading, writing and mathematics were predominantly more found in families. While, increased the onset of four to eight times among the same relatives who were earlier diagnosed with specific learning disorder. Besides, it was found that children had more deficits in the area of mathematics compared to other specific disorders. (Moll, K., Kunze, S., Neuhoff, N., Bruder, J., and Schulte-Korne, G. 2014).
Specific learning disorder crops up two to three times more frequent in males than in females. Learning problems in a child or adolescent identified in this manner can establish eligibility for academic services through the public school system. (Thomas. F. and Joel T. 2015)
Specific learning disorder affects at least ten per cent of the population among youngsters. In the year 1975,

83Social Skill Training for the Social Problems among Adolescents...
Public Law 94–142 (the Education for All Handicapped Children Act, now known as the Individual with Disabilities Education Act [IDEA] mandated all the states... to provide free and suitable educational services to the needy children.
According to ICD- 10 (International Classification of Diseases), 1992 system of classification specific learning disability is categorised under disorders of psychological development and the diagnostic criteria of ICD-10 has to meet up for the diagnosis of specific learning disability.
deveLopmentaL perIod All children go through various stages of development and acquire skills based on their phase of development as part of their normative development. There is a particular phase at which certain milestone has to be achieved and it develops in a sequential manner, if there is any delayed milestone it will lead to developmental disabilities. So, it is important to enquire whether the child has gone through each milestone during their phase of development. Thus, developmental disabilities are neurobiological conditions that interfere with the acquisition, retention or application of specific skills or sets of abilities. It may involve dysfunction in areas such as attention, language, learning and social interaction.
Developmental disabilities are being categorised by ICD- 10
(International Classification of Diseases) as disorders of psychological development. The second system of classification that is DSM-5 (Diagnostic Statistic Manual) developmental disabilities is named as neurodevelopmental disorders. In ICD-10 (International Classification of Diseases), specific learning disability is under the disorders of psychological development and in DSM-5 (Diagnostic Statistic Manual) specific learning disability is under the neurodevelopmental disorders. Erik Erikson (1963) developed one of the most comprehensive theories of social development. Erikson viewed that there were eight stages through which people pass in terms of psychosocial development. Erikson categorised the phases as struggles between biological tendencies and sociocultural forces acting upon an individual. These stages span all the way from birth to death, and the way that they are completed dictates the way they process their own emotions, participate in relationships, and develop their identity. According to him, psychosocial development is an individual’s interactions and understanding of each other and of their knowledge and understanding of themselves as members of society.
According to Erik Erikson, fifth stage of psychosocial development spans from age 13 to 19, and is characterised by identity versus role confusion and the teenagers develop an identity towards the relationship outside the family. It was found that

84 Journal of Indian Education August 2020
there was a special importance for internal desire and thinking belonging to a specific social group.
If this stage is successful, then a teenager develops a sense of identity in this phase. If unsuccessful, then they develop a distinct confusion about who they are and where they belong.
Adolescent is the developmental period and is considered as the transition period from childhood to adulthood. There will be lot of developmental changes such as physical, intellectual, and personality during this period. During this period they tend to think on higher level than that of children. In this period of adolescents dealing with abstractions and testing hypothesis also by using infinite possibilities were found to be common characteristics. (As cited in https://my.clevelandclinic.org/)
Adolescents are also developing socially and emotionally during this period. They search for identity and struggle for independence. Thus, for an adolescent with specific learning disability it becomes hard-hitting to cope with the social world and develop social problems.
SocIaL probLemS
Social skills may be defined as socially acceptable learned behaviours that enable a person to interact with others in ways that elicit positive responses and assist in avoiding negative responses (Elliot and Gresham, 1993). The social skills include cooperation, assertion, responsibility, and self-control (Elliot and Gresham,
1993). McFall (1982) proposed that social skills include overt behaviour and cognitive skills that determine how we respond. Research has revealed that children with learning disabilities not only have academic difficulties but also exhibit deficits in social skills (Gresham and Elliot, 1984). Social problems are a reality for a significant number of LD youths (Hazel and Schumaker, 1988).
The major social problems faced include a) social competence (Gresham, 1988), b) social cognition (Maheady and Sainato, 1986), c) social behaviour (Thompson and Kronenberger, 1990), d) social relationships (Pearl, Donahue, and Bryan, 1986), e) peer status (Wiener, 1987), f) self-concept (Chapman, 1988), g) interpersonal skills (LaGreca, 1987), h) social adjustment (Bruck, 1986), i) classroom behaviour (Bender and Smith, 1990), j) communicative competence (Donahue, Pearl, and Bryan, 1983), k) motivation (Licht and Kistner, 1986), l) anxiety (Margalit and Zak, 1984), m) locus of control (Bryan and Pearl, 1979). As there were lots of social problems found among specific learning disability, social skill training become a major intervention for social skill deficits among specific learning disability population.
SocIaL SkILL traInIng (SSt)Social skill training programme typically include a comprehensive assortment of skills that cover areas such as social problem solving, friendship, conversation, planning,

85Social Skill Training for the Social Problems among Adolescents...
and dealing with feelings. The actual training procedures may include different forms and combinations of (a) direct instruction, (b) coaching, (c) modeling, (d) rehearsal, (e) shaping, (f) prompting, and (g) reinforcement (Cartledge and Millburn, 1986; Combs and Slaby, 1978; Gresham, 1981). In all cases, the goal of SST is to help develop effective social response patterns.
need and SIgnIfIcance of the Study
Children with learning disability encounter literacy difficulties and it persists during their adolescence and adult life (Nalavany, Carawan, and Brown, 2011). Pupils with dyslexia are dropping out from high school more than the general population (Price and Skinner, 2007). There are several coping strategies that were developed to help learning disability pupil.
Research findings had also suggested that pupil with learning disability is facing different social difficulties (Yari, Rad, Rahimi, and Fathi, 2013). Pupil with dyslexia experience feelings of inferiority and emotional insecurity due to labeling (McNulty, 2003). Children with learning disability have deficits in social perception, behaviour problems, problem solving ability and verbal communication (Celmak and Aberson, 1997). There were several attempts made to enhance social functioning in pupils with specific learning disability. Social skill intervention has become one of the most popular treatments for children
with specific learning disability. The parent- report measures of social skill questionnaire indicate that social skill training found to be effective in improving social skills of children with specific learning disability.
The above research findings indicated that the children with specific learning disability have deficit in social skills and therefore, social skill intervention was found to be effective in order to improve their skills. Adolescent period is considered as the transition period from childhood to adulthood. At this period, they face several social problems due to deficit in social skills. Thus, the present study attempts to provide social skill training for adolescents with specific learning disability to improve their social skills. During adolescence they face issues of independence and self- identity which would hinder their social life and personal life as it is the transition period. So, by improving the social skills of adolescents with specific learning disability having social deficits will help them to improve their social life.
method
The aim of the social skill training is to teach basic social skills and strategies in order to face the challenges in adolescents with specific learning disability. Interventional, with in-group research design is used to study the effectiveness of social skill training for social problems among adolescents with Specific Learning Disability.

86 Journal of Indian Education August 2020
HypothesisH1: There will be a significant difference between pre-test and post-test scores of social problems among adolescents with Specific Learning Disability.
operatIonaL defInItIonS
Specific learning disabilitySpecific Learning Disability is a neuro-developmental disorder resulting in impairment in scholastic skills as a result of impairment in development of reading skills, mathematical skills and writing skills.
AdolescentsAdolescents with Specific Learning Disability are the individuals of age group 12-15 pursuing high school education and are being certified with Specific learning disability.
Social problemsSocial problems are problems such as difficulty in describing situation or object, poor communication skill, poor interpersonal relationships, understanding others point of view, lack of social interaction, sharing skills and cooperation that affect an individual’s present and the future life.
Social skill trainingSocial skill training by Susan H Spence is an intervention used to bring about change in social problems such as describing situation or object, poor communication skill,
poor interpersonal relationships, understanding others point of view, lack of social interaction, sharing skills and cooperation of an individual.
Sample distributionThe population of the study is adolescents with Specific Learning Disability hence, purposive sampling was used in the current study. The samples were chosen after filling social skill questionnaire. The questionnaire yielded information regarding adolescents with Specific learning disability who lack social skills. The research sample consisted of fourteen adolescents certified with specific learning disability, age 12–15 and was collected from aided school at a particular district from South India. Informed consent was taken from school authority, participants and their parents.
meaSureS
Social Skill Questionnaire for ParentsThe present study used questionnaire to assess the social skills. The parent version of social skill questionnaire (Spence, 1995) was used to evaluate the adolescent’s social skills. Social skill questionnaire is a 30 item questionnaire for the age group 12-15 years. The internal consistency of SSQP is good with Guttman split-half reliability of 0.90 and coefficient alpha of 0.92. All items exceeded an item-total correlation
87Social Skill Training for the Social Problems among Adolescents...
of 0.40. Social skill questionnaire is having good construct validity.
procedure
The current study was conducted in two aided schools. Additionally, permission to conduct the study was approved and granted by the school authority. Informed consent was taken from parents and the samples before the study. School authority, parents and samples were given explanation about the study and techniques used.
A pre-test was done using social skill questionnaire to assess the social problems. Social skill training was conducted on the respective schools of adolescents certified with specific learning disability. As it was a group intervention a group of fourteen adolescents certified with having poor social skills was formed. Social skill training started with a two hour training session for twelve sessions. The structure of the intervention was explained to the parents and adolescents. Thus, the content in social skill training for social problems is from studies (Spence, 1995) and from Spence’s research with young people having autism spectrum disorder (Mitchell, 2008).
The social skill training programme for the study included—
Step 1: Instruction and discussionAccording to incentive theory of motivation, an external goal has capacity to motivate behaviour. Participants are given motivation through need for communication
skills, assertiveness and making them aware of their disability and how they can overcome it. Children in this session are taught to use eye contact during their conversations and also how to understand whether others are listening or interested in their conversation.
Step 2: ModelingModeling is done through films, videos. The participants will be observing the characters and role play is done to model the characters in the film.
Step 3: Reinforcing listening skillsParticipant read a selected text and is being asked to reflect on its content; meaning and questions are being asked from the text.
Step 4: Communication skillsIn order to develop communication skills, different topics were given and were asked to present it in group. Also, group discussion is done on a particular topic.
Step 5: RoleplayParticipants were given different life situations and were instructed to take decisions and solve the problem. They were also given situation for developing assertiveness.
After the group social skill training was completed, a post-test on social skill questionnaire was administered to check the effectiveness of the social skill training on social skills of adolescents with specific learning disability.

88 Journal of Indian Education August 2020
StatIStIcaL anaLySIS
Data were analysed using descriptive statistics, normality test and paired sample t-test. Descriptive statistics was used to describe the basic features of the data in the study such as summary about the sample and its measures. Normality test was being used to determine whether the sample data of the study has been drawn from a normally distributed population and to use the parametric tests to analyse the data. Normality can be tested using graphical method and statistical method. Thus, the current study uses statistical method, Shapiro-Wilks test. In Shapiro- Wilks test if the significance value is >0.05 the data is normal and <0.05 data is not normally distributed. In inferential statistics, paired sample t-test was used. Paired sample t-test is a parametric test and is used when there is only one group and data is collected from two different occasions or under two different conditions. In paired sample t-test if the p<0.05,
then we can conclude that there is significant difference between two scores. If the p>0.05, then we can conclude that there is no significant difference between two scores. The mean scores in paired sample t- test will help us to conclude whether there is significant decrease or increase in pre-test score and post-test score.
reSuLtS and dIScuSSIon
The aim of the study was to check the effectiveness of social skill training for social problems among adolescents with Specific Learning Disability. Descriptive statistics, normality test and paired sample t-test were used for the analysis in the current study. Following are the result findings after the analysis.
Preliminary data analysis was done in order to understand the mean differences and skewness in the pre-test and post-test scores of the social skill training. The following are the data obtained for the descriptive statistics.
Table 1
Mean differences and skewness value of pre-test and post-test scoresSocial Skill N Mean Skewness Standard
ErrorNormality
ValuePre – test 14 20.29 -0.024 .597 *-0.040Post – test 14 51.86 - 1.947 .597 -3.261
* ± 1.96 assumed normal
From Table 1, the mean obtained for pre-test was 20.29 and for the post-test were 51.86. This indicates that there is a significant difference
in the mean scores of the pre-test and post-test. Thus, the mean value of post-test indicate poorer social skills which proves that it is consistent with
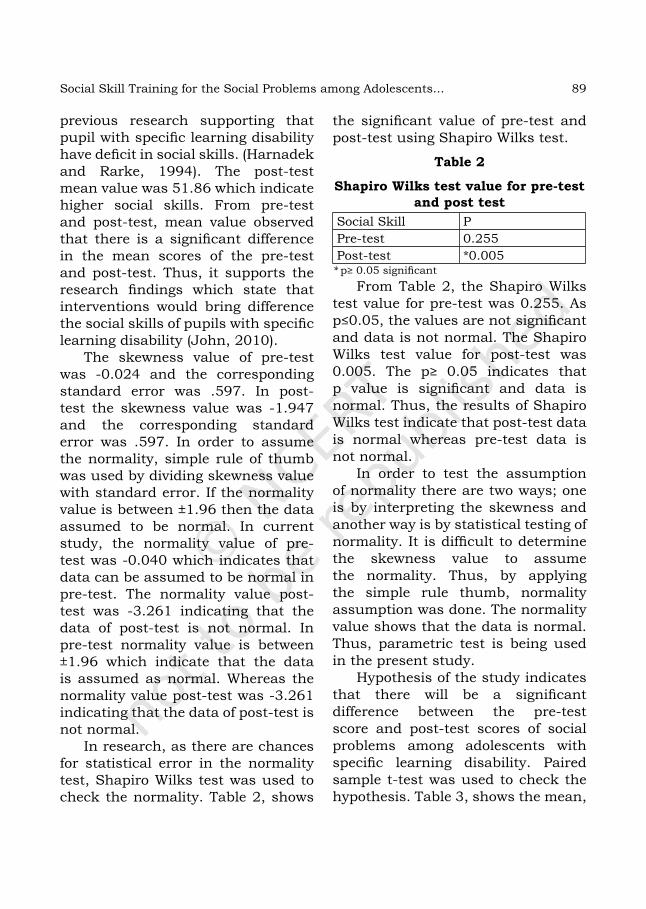
89Social Skill Training for the Social Problems among Adolescents...
previous research supporting that pupil with specific learning disability have deficit in social skills. (Harnadek and Rarke, 1994). The post-test mean value was 51.86 which indicate higher social skills. From pre-test and post-test, mean value observed that there is a significant difference in the mean scores of the pre-test and post-test. Thus, it supports the research findings which state that interventions would bring difference the social skills of pupils with specific learning disability (John, 2010).
The skewness value of pre-test was -0.024 and the corresponding standard error was .597. In post-test the skewness value was -1.947 and the corresponding standard error was .597. In order to assume the normality, simple rule of thumb was used by dividing skewness value with standard error. If the normality value is between ±1.96 then the data assumed to be normal. In current study, the normality value of pre- test was -0.040 which indicates that data can be assumed to be normal in pre-test. The normality value post-test was -3.261 indicating that the data of post-test is not normal. In pre-test normality value is between ±1.96 which indicate that the data is assumed as normal. Whereas the normality value post-test was -3.261 indicating that the data of post-test is not normal.
In research, as there are chances for statistical error in the normality test, Shapiro Wilks test was used to check the normality. Table 2, shows
the significant value of pre-test and post-test using Shapiro Wilks test.
Table 2
Shapiro Wilks test value for pre-test and post test
Social Skill PPre-test 0.255Post-test *0.005
* p≥ 0.05 significantFrom Table 2, the Shapiro Wilks
test value for pre-test was 0.255. As p≤0.05, the values are not significant and data is not normal. The Shapiro Wilks test value for post-test was 0.005. The p≥ 0.05 indicates that p value is significant and data is normal. Thus, the results of Shapiro Wilks test indicate that post-test data is normal whereas pre-test data is not normal.
In order to test the assumption of normality there are two ways; one is by interpreting the skewness and another way is by statistical testing of normality. It is difficult to determine the skewness value to assume the normality. Thus, by applying the simple rule thumb, normality assumption was done. The normality value shows that the data is normal. Thus, parametric test is being used in the present study.
Hypothesis of the study indicates that there will be a significant difference between the pre-test score and post-test scores of social problems among adolescents with specific learning disability. Paired sample t-test was used to check the hypothesis. Table 3, shows the mean,

90 Journal of Indian Education August 2020
standard deviation, standard error and p value f paired sample t-test.
Table 3
Mean, Standard Deviation, Standard Error and p value of paired sample
t- testMean SD SE P
Pre- test and Post- test
-31.57 5.1101.366 *0.000
* p≤ 0.05 significantFrom Table 3, the p value of
pre-test and post-test is 0.000 (p≤ 0.05) which indicates that there is significant difference between the pre-test score and post-test score. Thus, the alternative hypothesis states, there will be a significant difference between the pre-test score and post-test scores of social problems among adolescents with specific learning disability is accepted and null hypothesis is rejected.
The pre-test scores using social skill questionnaire (Spence, 1995) revealed that adolescents with Specific Learning Disability have social skill deficits. Concerning social relationships, more than half of the students mentioned that they were teased by some of their peers and felt rejected, a finding frequently reported in the literature (Ingesson, 2007). The students considered that teasing as well as their feelings of insecurity because of the learning disability and their poor social skills were the main factors that hindered the development of close friendships with their peers. These findings are
consistent with those of other studies (Goldberg et al., 2003; Hellendoorn and Ruijsenaars, 2000). On the other hand, the development of friendships of students with dyslexia with their peers depends on a variety of factors such as personal characteristics, opportunities to socialise and the presence of similar difficulties in learning (Wiener and Tardif, 2004).
The findings of the present study indicated that social skill training is effective in coping with the social problems among adolescents with specific learning disability. Social skill training produced more interaction, enhanced cooperation, and improved friendships (Kavale and Mostert, 2004). The results demonstrated that social skill training improves social interactions, communication skills of children with learning disabilities. Social skill training is a viable means for improving the social skills of children with learning disabilities.
concLuSIon
Social skill training was found to be effective for the social problems among adolescents with specific learning disability. Social skill training enhanced participants’ self-understanding and assisted in the development of their strengths. Social skill training produced more interaction, enhanced cooperation, and improved friendships (Kavale and Mostert, 2004). The results demonstrated that social skill training improved social interactions, communication skills of children with

91Social Skill Training for the Social Problems among Adolescents...
learning disabilities. Hence, social skill training is a viable means for improving the social skills of children with learning disabilities.
Since, studies have shown that a child’s difficulty in social skills may relate to problems reading non-verbal cues which are due to visual perceptual problems (Harnadek and Rourke, 1994), when perceptual problems are encountered, it is important for therapists to investigate the child’s social skills. If deficits are found, some of the training techniques described in this research may be used. However, approaches to the treatment of social skills often identify isolated impairments and
train isolated skills, and the child's ability to use these skills for everyday interactions has not always been examined. The child's capacity to generalise what is taught in treatment is an important consideration that must be monitored. The findings of the study would help to include social skill training in inclusive education. The children with specific learning disability should be included in inclusive education which would give them more opportunity to learn and come up in life. Improving the social skills of adolescents with specific learning disability having social deficits will help them to improve their social life.
referenceSassociation, a.P. 2013. Diagnostic and Statistical Manual of Mental Disorders. American
Psychiatric Association. Arlington.Baker, J.e. 2003. Social Skills Training: for Children and Adolescents with Asperger
Syndrome and Social-Communication Problems. AAPC Publishers. US.Bender, W.n. and J.k. sMith. (1990). Classroom Behavior of Children and Adolescents with
Learning Disabilities: A Meta-Analysis. Sage JournalsBruck, M. 1986. Adjustments of Learning. Handbook of cognitive, social, and
neuropsychological aspects of learning disabilities. Vol 1, pg. 361.Bryan, t. and r. Pearl. 1979. Learning Disabled Children’s Conversational Skills. Sage
Journals. cartledge, g. 1980. Teaching social skills to children: innovative approaches. USA.cartledge, g. and J.F. MilBurn. 1986. Teaching social skills to children. Pergamon Press.
New York.celMak, s.a. and J.r. aBerson. 1997. Social Skills in Children with Learning Disabilities.
Occupational Therapy in Mental Health. pp. 11–15.chaPMan, J.W. 1988. Learning Disabled Children’s Self-Concepts. Sage Journals .coMBs, t.P. and d. slaBy. 1978. Social skills training with children. In B. Lahey and A. Kazdin
(Eds.), Advances in clinical child psychology. Vol. 1, pp. 38-57. Plenum Press. New York.doikou-avlidou, M. 2015. The Educational, Social and Emotional Experiences of
Students with. International Journal Of Special Education. Education, Society and the
92 Journal of Indian Education August 2020
K-12 Learner. (n.d.). Retrieved from Lumen: https://courses.lumenlearning.com/teachereducationx92x1/chapter/individuals-with-disabilities-education-act/
erikson, e.h. 1963. Eight stages of man. Childhood and society. pp. 219-243.goldBerg, r.W., a.l. rollins and a.F. lehMan. 2003. Social network correlates among people
with psychiatric disabilities. Psychiatric Rehabilitation Journal. Vol. 26, No 4, pp. 393.greeshaM, F.M. and s.n. elliot. 1981. Social skills training with handicapped children: A
review. Review of educational research. Vol. 51, No. 1. pp. 139-176.greshaM, F.M., s. evans and s.n. elliott. 1988. Self-efficacy differences among mildly
handicapped, gifted, and nonhandicapped students. The Journal of Special Education. Vol. 22, No. 2. pp. 231–241.
harnadek, M.c. and B.P. rourke. 1994. Principal Identifying Features of the Syndrome of Nonverbal Learning Disabilities in Children. SAGE Journals .
hazel, s., J. schuMacher and a. Pederson. 1988. Social skills deficits. InKavanaugh, J., Truss, T. (Eds.), learning disabilities: Proceedings of the national conference. Parkton, MD: York Press. pp. 293–366.
hellendoorn, J. and W. ruiJssenaars. 2000. Personal experiences and adjustment of Dutch adults with dyslexia. Remedial and special education, Vol. 21, No. 4, pp. 227-239.
ingesson, s.g. 2007. Growing Up with Dyslexia: Interviews with Teenagers and Young Adults. Sage Journals .
John, M.W. 2010, June 8. Social Skills Training for Youth With Emotional and Behavioral Disorders and Learning Disabilities: Problems, Conclusions, and Suggestions. Retrieved February 6, 2019, from Taylor and Francis Online: https://doi.org/10.1207/s15327035ex1303_2
kavale, k.a. and M.P. Mostert. 2004. Social skill interventions for individuals with learning disabilities. Winter.
kristner, J.a., M. osBorne and l. leverrier. 1988. Causal attributions of learning-disabled children: Developmental patterns and relation to academic progress. Journal of Educational Psychology.
kuhne, M. and J. Wiener. 2007. Stability of Social Status of Children with and without Learning Disabilities. Learning Disability Quarterly.
la greca, a.M. 1987. Children with learning disabilities: Interpersonal skills and social competence. Journal of Reading, Writing, & Learning Disabilities International. Vol .3, No 2. pp. 167–185.
licht, B.g. and J.a. kistner. 1986. Motivational problems of learning-disabled children: Individual differences and their implications for treatment. In J. K. Torgesen and B.Y.L. Wong (Eds.), Psychological and educational perspectives on learning disabilities. pp. 225–255. Orlando, FL: Academic Press.
lloyd, W., e.J. kaMeenui and d.J. cha. 1997. Issues in Educating Students With Disabilities. Lawrence Erlbaum Associates. New York.
Maheady, l. and d. sainato. 1986. Learning disabled students; perceptions of social events. In S.J. Ceci (Ed.), Handbook of cognitive, social, and neuropsychological aspects of learning disabilities. pp. 381–402. Hillsdale, NJ: Erlbaum.
93Social Skill Training for the Social Problems among Adolescents...
Margalit, M. and i. zak. 1984. Anxiety and Self-Concept of Learning Disabled Children. SAGE Journals .
McFall, r.M. 1982. A review and reformulation of the concept of social skills. Behavioral assessment.
Mcnulty, M.a. 2003. Dyslexia and the life course. Journal of learning disabilities. Vol 36, No. 4. pp. 363–381.
Mitchell, P. and s. Parsons. 2002. The potential of virtual reality in social skills training for people with autistic spectrum disorders. Journal of intellectual disability research. Vol. 46, No. 5. pp. 430-443.
Moll, k., s. kunze, n. neuhoFF., J. Bruder and g. schulte-körne. 2014. Specific learning disorder: Prevalence and gender differences. PLoS one. Vol. 9, No. 7. e103537.
nalavany, B.a., l.W. caraWan and l.J. BroWn. 2011. Considering the role of traditional and specialist schools: do school experiences impact the emotional well-being and self-esteem of adults with dyslexia. British Journal of Special Education. Vol. 38, No. 4. pp. 191–200.
national center For health statistics. 1992. International Statistical Classification of Diseases and Related Health Problems. Geneva: WHO.
Price, g. and J. skinner. 2007. Dyslexia. Dyslexia and Learning Style: A Practitioner's Handbook. pp. 47–50. John Wiley and Sons. Germany.
Pearl, r., M. donahue and t. Bryan. 1986. Learning Disabilities: Theoretical and Research Issues. Routledge. London.
Pearl, r., t. Bryan., M. donahue., J. Bryan and s. PFlauM. 1983. The Chicago institute for the study of learning disabilities. Exceptional Education Quarterly. Vol. 4, No. 1. pp. 1–22.
sPence, s.h. 1995. Social Skills Training. In S. H. Spence, SST User's Guide Low (p. 46). Nfer Nelson Pulishing Company Ltd. UK.
sWanson, l., k.r. harris and s. grahaM. 1986. Handbook of Learning Disabilities, Second Edition. The Guilford Press. New York.
thoMPson, r.J. and W. kronenBerger. 1990. Behavior problems in children with learning problems. In H. L. Swanson and B.K. Keogh (Eds.), Learning disabilities: Theoretical and research issues. pp. 155–174. Hillsdale, NJ: Erlbaum.
Wiener, J. 1987. Peer status of learning disabled children and adolescents: A review of the literature. Learning Disabilities Research.
Wiener, J. and c.y. tardiF. 2004. Social and emotional functioning of children with learning disabilities: does special education placement make a difference. Learning disabilities research and practice. Vol. 19, No. 1. pp. 20–32.
yari, n.d., a.a. rad., a. rahiMi and a. Fathi. 2013. Investigating the Relationship between Learning Disabilities and Behavioral Disorders. European Online Journal of Natural and Social Sciences. Vol. 2, No. 2. pp. 292–295.
———. 1984. Assessment and classification of children's social skills: A review of methods and issues. APA PsycNet.
———. 1987. The adult outcomes of children with learning disabilities. Springer.———. 1993. Social Skills Interventions for Children. SAGE Journals.
Introducing Privilege and Oppression in Classrooms
Dilip Diwakar G* anD Visakh Viswambaran**
*Assistant Professor, Department of Social Work, Central University of Kerala, Kasaragod, Kerala**PhD Scholar, Department of Social Work, Central University of Kerala, Kasaragod, Kerala
IntroductIon
Horace Mann, an American educational reformer stated that education is the “great equaliser of the conditions of men” (Massachusetts, 1848). The education system could indeed make a level ground where individuals from different socio-economic strata could assemble
AbstractEducation is a powerful tool that can be used to deepen the understanding of systemic privileges and institutionalised oppression present in our society. This paper focuses on a classroom intervention module that seeks to provide an understanding of the concept of privilege and oppression and how it manifests in the Indian context. This module, titled “Privilege and Oppression” is part of a larger intervention addressing intersectional social inequalities arising out of hierarchies of gender, caste, religion and class. The module discusses the concept of privilege and oppression, it forms a base for further discussions on other systemic oppressions. The module uses constructive activities to create an understanding of the concept and uses discussions to build upon the foundation that the students have about privilege and oppression. The reflections of the students are analysed to understand the outcome of the intervention. The analysis of outcomes shows that the module is successful in imparting knowledge about privilege and oppression.
and have access to free and quality public education. Unfortunately, the inverse could also be true. The same education system could be used to invigorate the existing biases and prejudices thus normalise disequilibrium prevailing in the society. Education could provide the opportunity to recognise the systems

95Introducing Privilege and Oppression in Classrooms
of privilege and systematic oppression that is embedded in the society they live in.
This module of privilege and oppression is the first module of an intersectional pedagogy that addresses the intersectional nature of social inequalities in the Indian context. The intersectional pedagogy seeks to create a platform for discussing the intersectional nature of the oppressive structures in our society. The intervention opens with the concept of privilege and oppression since it is viewed as the best way to set up a base from which discussion on various other social systems can take place.
Privilege and oppression are passed down through a combination of several factors such as social capital, cultural capital, dominant myths, prejudices and bias. A classroom is a dwelling place of various types of privilege that comes along the lines of gender, caste, religion, class and disability. The intervention aims to examine the student’s level of understanding of the concept of privilege and oppression. Examining privilege is a tough task since the participants have varied responses to the concept of privilege. Participants who have the privilege could feel attacked or blamed for having the privilege. Those who don’t have the privilege could feel out of sorts due to lack of privilege. The objective of the intervention is to make the participants understand the concept of privilege, how it subsists in the society they exist. Understanding
of the issue better would aid the participants to move towards the dialogue, advocacy and acceptance.
theorIsIng oppressIon and prIvIlege
Social oppression is a situation in which a single group in the society is in a situation to exercise power over and take advantage of another group using dominance and subordination. The situation is created as a result of a complex interplay between power, inequality, multiple oppressions arising out the established order (Glasberg and Shannon, 2011). The situation enables a socially sanctioned exploitation and humiliation of the oppressed group by a group who holds relative power than the oppressed (Wormer and Besthorn, 2017).
Social oppression sorts people into hierarchies based on gender, caste, class, sexuality, and ability. The hierarchical system benefits a dominant group by oppressing the other. The dominant group has greater access to resources and power and gains this access and power at the expense of the oppressed. The oppressed also face systematic humiliation, exploitation, and abuse from the dominant groups. Social oppression is permeated through the societal values, assumptions, practices. It can be seen in societal interactions, social structures and ideologies. It is very difficult to perceive because its eternal presence makes it difficult to see.
The concept of privilege— that some people have unearned

96 Journal of Indian Education August 2020
special advantages that are mostly unacknowledged— has a long history. W. E. B. Du Bois, coined the term “psychological wage” to illustrate the difference in treatment that was dished out to poor whites and poor blacks. Psychological wage refers to special statuses granted exclusively to poor white people. They had unrestricted access to public functions and public places. Better schooling and job prospects were made available to them. Public officials, legislation and law enforcement cajoled them. The newspapers were empathetic to the causes behind their poverty. At the same time, poor blacks were ignored, ridiculed and treated with disgust (Du Bois, 1935). Noel Ignatin (1967) and Theodore W. Allen (1969) build on this foundation and analysed white skin privileges which manifest in forms such as the white monopoly over skilled jobs, better housing and standard of living, among others.
The concept came on to its own after in the 90s when Peggy McIntosh defined privilege as “an invisible package of unearned assets” (McIntosh, 1988). McIntosh identifies and illustrates how the unacknowledged privileges through a series of examples which describes how race and gender positions affect the feelings of belongingness, security and self-worth. Apart from this, privileges also favour some through better representation and provisions for access to social resources. McIntosh compares the white privilege to an “invisible weightless knapsack of special provisions, maps,
passports, codebooks, visas, clothes, tools and blank checks”. These privileges are an elusive and fugitive topic. These race privileges favour one group and enable them to be confident, comfortable, and oblivious at the cost of oppressing other groups by forcing them to be unconfident, uncomfortable, and alienated.
The understanding of oppression and privilege and its effects on the learning outcomes of those who were left behind gave rise to social justice education. Social justice education is aimed at creating awareness and perceptions about the systems of oppression, privilege and diversity. This awareness and perceptions are expected to create a more just, inclusive and democratic environment. (Bell, 1997) observed that social justice is, simultaneously, a process and a goal. It envisions a safe and secure society which is equitable to all the citizens. To achieve this goal, the actors of the society have to be aware of the injustices around them and work with all concerned parties— victims, bystanders and perpetrators— to dismantle the unjust conditions. Self-determination and interdependence are key terms in this process. The awareness about the inequalities of the society requires one to see the details that are hidden in the plain sight. This is where self-determination comes into the forefront. It requires effort from the part of an individual as it is easy to be blind about one’s own privileges. To accept their role (knowingly or unknowingly) in perpetuating the unjust hierarchical
97Introducing Privilege and Oppression in Classrooms
order is even more difficult. To change this unjust order, collective action is needed which is only possible through interdependence. It’s imperative that an educational intervention that pursues social justice would incorporate the self- determination and interdependence into its framework. The pedagogy then should be enlightening, inclusive and participatory if it is to create a change.
relevance In IndIan context
Indian society is inherently discriminative. Since an education system does not function in isolation from society, it’s only normal that the system is also suffering from the same inequalities prevailing in the society. The fact that hierarchies of caste, economic status and gender relations deeply influence the access to education and participation of children in school have been already recognised (NCERT, 2005) and attempts to abolish this had been also made. Since its inception, the Indian state has tried to dismantle the axis of stratification through various policies and programs. Despite these initiatives, substantial inequalities that manifests itself in education, employment, healthcare, and other socio-economic indices persists in our country. Since blocking access to education is one key component that aided in the persistence of these discriminations, the constitution has attempted to rectify this situation in particular. Ambedkar, the harbinger of hope to the oppressed sections, had
a huge role in shaping the educational philosophy of India. The constitution drafted under his supervision lays special emphasis on the promotion of educational interests of scheduled caste, scheduled tribe and other weaker sections. Various committees and commissions were constituted to address the issues of discrimination in the educational system. National Policy of Education, 1986, Programme of Action, 1992, District Primary Education Programme, Sarva Shiksha Abhiyan, Shiksha Karmi Yojana, Non-formal Education Programme, Education Guarantee Scheme, Kasturba Gandhi Balika Vidyalaya were all measures taken to address the above-mentioned hierarchies.
Despite the efforts to tackle caste discrimination, the Dalits of India continue to experience low enrolment rates and a lack of access to primary education. Poor infrastructural facilities, lack of effective pedagogic supports to acquire linguistic, numerical and cognitive competencies adversely affect the schooling of Dalit children. Other important spheres within the school where exclusionary practices continue to flourish are those that are concerned with water and food, which have been traditionally powerful sites of caste-based discrimination. Dalit students experience unfair treatment and are denied equal participation in programs, functions and ceremonies where food is cooked, served and eaten. Apart from this, there is also a tendency to restrict the Dalit children

98 Journal of Indian Education August 2020
from taking part in co-curricular activities (Nambissan, 2009). This caste-based discrimination persists in higher education also. Examples of caste prejudice and discrimination could be visible from practices such as asking Dalit students by asking their surnames to decode their caste affiliation, ignoring them and showing differential treatment towards them by faculty and peers (Maurya, 2018)
Inequalities related to gender plague all stages of education and can be seen in terms of gross enrollment ratio, differentiation in terms of educational literacy, the gender gap in enrollment of girls in higher education, dropout rates and gender bias in curriculum (Bordoloi, 2015). Findings of the Indian human development survey also substantiates that persistent learning gaps operating along social background lines despite improvements in educational access (White, Ruther, and Kahn, 2016).
This intervention attempts to address the issues related to privilege and oppression that remains invisible. The objective is to create awareness about the systems of privilege and oppression and the various dimensions through which it affects the lives of the people.
populatIon and sample sIzeA total of 103 students from four institutions from two districts of Kerala participated in the intervention. The rationale of the sample size selection is as follows. The classroom intervention module was carried out in two graduate-level institutions each from
Kottayam and Kasaragod, two districts with distinct characteristic features. Kerala is a high performing state in India when it comes to the human development index. These two districts from within Kerala were particularly selected due to their stark contrast in performance in Human Development Index. Kasaragod is a district which is considered to have a less developed educational system was ranked at 11th in Human Development Index, while Kottayam with a huge number of educational institutions was ranked 2nd. From each district two colleges were selected, one government college and one aided college, this has helped to capture the diverse experiences of participants from different socio-economic conditions. The universe of the study is the total students in the selected college and the population is the undergraduate students in their second year. Thirty-three students from Government college of Kottayam, twenty-one students from St Berchmans College from Kottayam and twenty-five students from Government college of Kasaragod and twenty-four from Nehru College from Kasaragod participated in the study.
methodology
Each activity of the module was followed with a focus group discussion to capture the thoughts of the participants during their engagement in that activity. These focus group discussions on specific research questions were useful on gathering collective views of the respondents and also the meanings

99Introducing Privilege and Oppression in Classrooms
attached to their views. These discussions served as the qualitative data that is used to analyse the impact of the intervention. These discussions were guided, monitored and recorded by the facilitator and transcribed into verbatim afterwards. These transcribed records were analysed using Atlas.ti, a software used for qualitative analysis of data. The analysis using Atlas.ti brought many patterns into the light which are discussed in the analysis part.
The participants are coded using abbreviations based on the educational institutions they are enrolled in. The acronym PSB stands for Participant SB college. Others are as follows. PNC stands for Participant Nehru College, PGK for Participant Government college Kottayam and PGQ for Participant Government college Kasaragod.
theoretIcal and conceptual framework
Throw to know your privilage
The Pencilsword: On a plate
Privilege walk
Throw to know your privilegeThe first activity is a microcosmic representation to shed light over the intricacies of social and personal exposure and experiences associated with the existence of privilege.
The Pencilsword: On a plateThe second activity involves the discussion around a comic book which portrays the lives of two individuals born into different family setups. The one born into a wealthier family goes on to get a better quality of education, work experience and social connections which helped the person to succeed in his life. The other, born into relative poverty, don’t have those opportunities. The comic shows how privileges that an individual is born into could affect the kind of life they lead throughout their lifetime.
Privilege walkPrivilege walk is an activity conducted to understand the various types and intricacies of privilege and how it works in society. The participants are asked to stand in a horizontal line and are asked to take a step forward or backwards based on their responses. Twenty questions that deals with privileges related to gender, class, caste and religion will be read aloud by the facilitator. The movement generated in the group as a result of a statement can make the participants aware of the privilege or oppression that is happening to them.
Analysis
1. Throw to know your privilegeThe first activity was titled ‘Throw to know your privilege’ and it introduces the concept of privilege to the participants. This activity is taken from empowering education model. The activity involves a recycle bin which
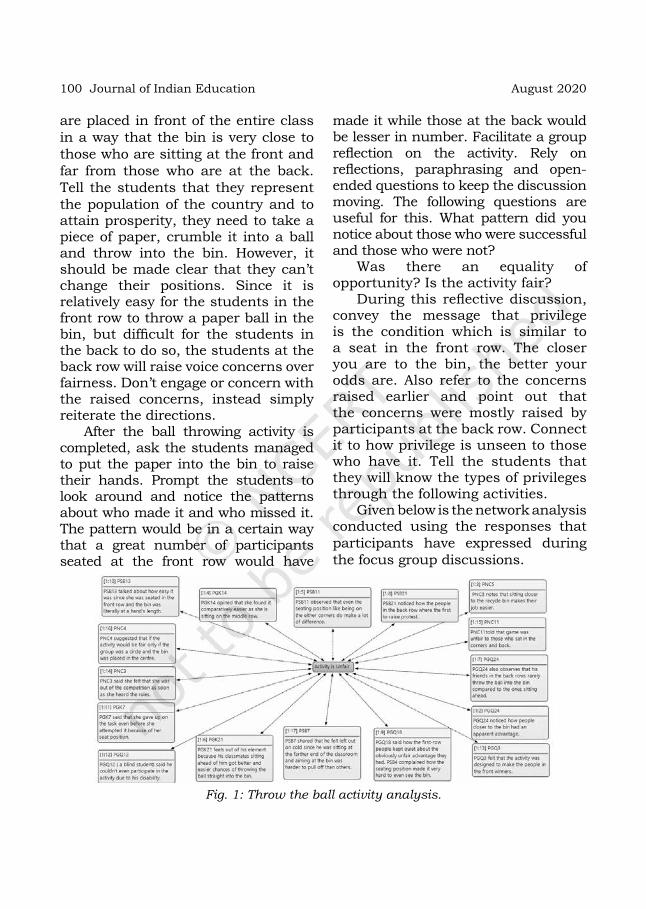
100 Journal of Indian Education August 2020
are placed in front of the entire class in a way that the bin is very close to those who are sitting at the front and far from those who are at the back. Tell the students that they represent the population of the country and to attain prosperity, they need to take a piece of paper, crumble it into a ball and throw into the bin. However, it should be made clear that they can’t change their positions. Since it is relatively easy for the students in the front row to throw a paper ball in the bin, but difficult for the students in the back to do so, the students at the back row will raise voice concerns over fairness. Don’t engage or concern with the raised concerns, instead simply reiterate the directions.
After the ball throwing activity is completed, ask the students managed to put the paper into the bin to raise their hands. Prompt the students to look around and notice the patterns about who made it and who missed it. The pattern would be in a certain way that a great number of participants seated at the front row would have
made it while those at the back would be lesser in number. Facilitate a group reflection on the activity. Rely on reflections, paraphrasing and open-ended questions to keep the discussion moving. The following questions are useful for this. What pattern did you notice about those who were successful and those who were not?
Was there an equality of opportunity? Is the activity fair?
During this reflective discussion, convey the message that privilege is the condition which is similar to a seat in the front row. The closer you are to the bin, the better your odds are. Also refer to the concerns raised earlier and point out that the concerns were mostly raised by participants at the back row. Connect it to how privilege is unseen to those who have it. Tell the students that they will know the types of privileges through the following activities.
Given below is the network analysis conducted using the responses that participants have expressed during the focus group discussions.
Fig. 1: Throw the ball activity analysis.

101Introducing Privilege and Oppression in Classrooms
As the analysis shows, the participants univocally noted that the success of ball throwing activity was depended on the individual’s seating position. The people who were sitting close to the recycle bin had a better aim which made their job easier. People in the back rows rarely threw the ball into the bin. The facilitator guided the discussion and introduced the concept of geographical privilege, i.e. how people close to the recycle bin where privileged in terms of were their seating positions. A discussion about privilege ensued and the facilitator informed that not only geographical privilege people also enjoy other privileges based on their individual identities such as their economic status, gender, religion, caste etc with this he was able to introduce the concept of privilege and its sociological history as mentioned in the review part.
2. The Pencilsword: On a plate ‘The Pencilsword: On a plate’ (Morris) is a comic strip about privilege and inequality. It is created by an illustrator named Toby Morris. In the
comic strip, he illustrates how people have unearned advantages over others for any number of reasons that are beyond individual control. The comic simultaneously follows two kids from their birth to middle age and portrays how privilege plays an important part in their lives. The comic compares the life of two individuals born into different households. Their life is depicted and compared side by side and it shows how financial security and the lack of it affect the kind of life they live. The life of the individuals is perpetually affected by their socio-economic conditions in which they grew up.
Participants across groups have connected the activity to the nepotism prevalent in India. They were all against this tendency to exploit the legacy of one’s parents and relatives in furthering one’s profession and career. Nepotism prevalent in the film industry and politics were widely discussed. The trend of connecting this activity to nepotism that was rife in politics and film industry was consistent in all intervention groups.
Fig. 2: Nepotism network analysis
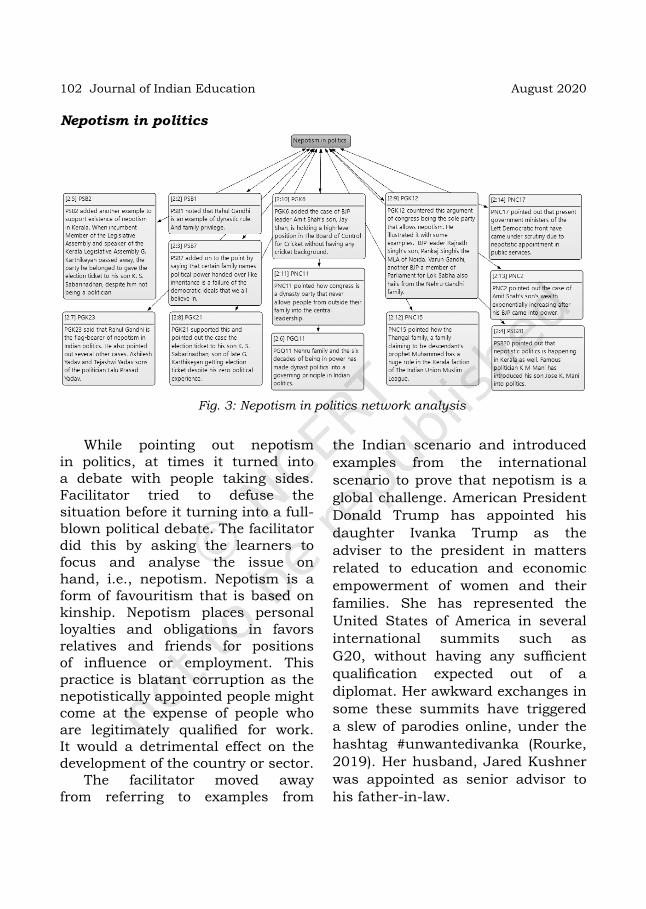
102 Journal of Indian Education August 2020
Nepotism in politics
Fig. 3: Nepotism in politics network analysis
While pointing out nepotism in politics, at times it turned into a debate with people taking sides. Facilitator tried to defuse the situation before it turning into a full-blown political debate. The facilitator did this by asking the learners to focus and analyse the issue on hand, i.e., nepotism. Nepotism is a form of favouritism that is based on kinship. Nepotism places personal loyalties and obligations in favors relatives and friends for positions of influence or employment. This practice is blatant corruption as the nepotistically appointed people might come at the expense of people who are legitimately qualified for work. It would a detrimental effect on the development of the country or sector.
The facilitator moved away from referring to examples from
the Indian scenario and introduced examples from the international scenario to prove that nepotism is a global challenge. American President Donald Trump has appointed his daughter Ivanka Trump as the adviser to the president in matters related to education and economic empowerment of women and their families. She has represented the United States of America in several international summits such as G20, without having any sufficient qualification expected out of a diplomat. Her awkward exchanges in some these summits have triggered a slew of parodies online, under the hashtag #unwantedivanka (Rourke, 2019). Her husband, Jared Kushner was appointed as senior advisor to his father-in-law.

103Introducing Privilege and Oppression in Classrooms
Benazir Bhutto, the Pakistani politician who served as Prime Minister of Pakistan from 1988 to 1990 and again from 1993 to 1996 was referred. She represented Pakistan People’s Party (PPP), which was founded by her father Zulfikar Ali Bhutto, who was also the 9th Prime Minister of Pakistan. Benazir Bhutto’s term in charge as prime minister was punctured by allegations of corruption, economic mismanagement, and a decline of law and order. She imposed a self-exile away from Pakistan to escape having to attend the trial for her alleged corruption cases. In 2007, she returned to Pakistan after being granted amnesty by dictatorial President Pervez Musharraf. The Supreme Court challenged Musharraf’s right to grant the amnesty, however,
criticising it as unconstitutional; nevertheless, in October 2007 she returned back with the intention to contest in elections. Bhutto was assassinated in December 2007 while campaigning for upcoming parliamentary elections (Britannica, 2007). After her assassination in 2007, her husband Asif Ali Zardari became the president of Pakistan.
The studies about nepotism in the industry show that by hindering competition and innovation, it results in bias in decision-making, unfair treatment and overall losses in the long term. Besides these, it makes people who are hardworking feel demotivated and alienated. Ultimately nepotism adversely affects organisational development and jeopardise the country’s social and economic development (Safina, 2015).
Nepotism in the film industry
Fig. 4: Nepotism in film industry
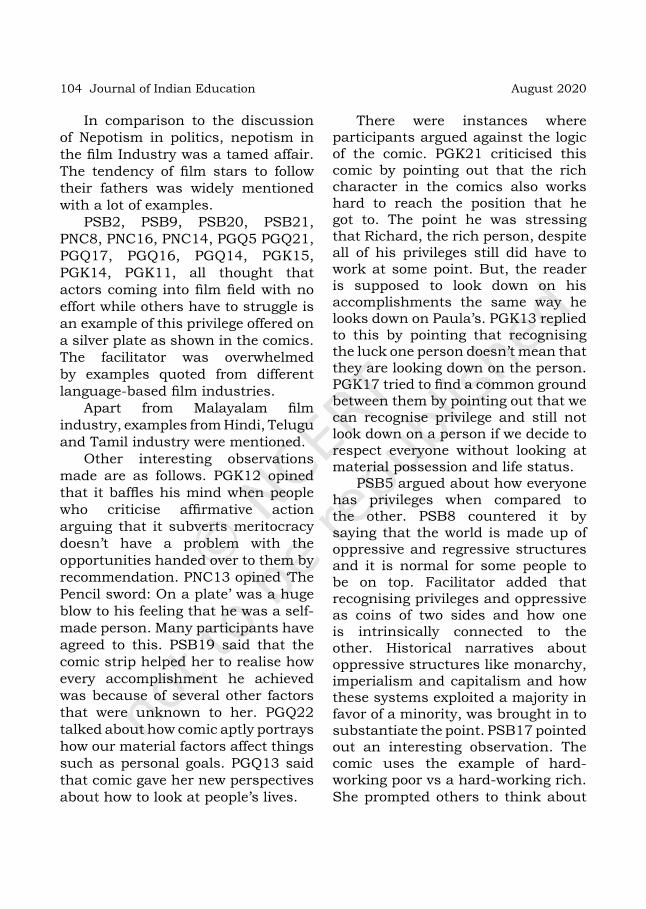
104 Journal of Indian Education August 2020
In comparison to the discussion of Nepotism in politics, nepotism in the film Industry was a tamed affair. The tendency of film stars to follow their fathers was widely mentioned with a lot of examples.
PSB2, PSB9, PSB20, PSB21, PNC8, PNC16, PNC14, PGQ5 PGQ21, PGQ17, PGQ16, PGQ14, PGK15, PGK14, PGK11, all thought that actors coming into film field with no effort while others have to struggle is an example of this privilege offered on a silver plate as shown in the comics. The facilitator was overwhelmed by examples quoted from different language-based film industries.
Apart from Malayalam film industry, examples from Hindi, Telugu and Tamil industry were mentioned.
Other interesting observations made are as follows. PGK12 opined that it baffles his mind when people who criticise affirmative action arguing that it subverts meritocracy doesn’t have a problem with the opportunities handed over to them by recommendation. PNC13 opined ‘The Pencil sword: On a plate’ was a huge blow to his feeling that he was a self-made person. Many participants have agreed to this. PSB19 said that the comic strip helped her to realise how every accomplishment he achieved was because of several other factors that were unknown to her. PGQ22 talked about how comic aptly portrays how our material factors affect things such as personal goals. PGQ13 said that comic gave her new perspectives about how to look at people’s lives.
There were instances where participants argued against the logic of the comic. PGK21 criticised this comic by pointing out that the rich character in the comics also works hard to reach the position that he got to. The point he was stressing that Richard, the rich person, despite all of his privileges still did have to work at some point. But, the reader is supposed to look down on his accomplishments the same way he looks down on Paula’s. PGK13 replied to this by pointing that recognising the luck one person doesn’t mean that they are looking down on the person. PGK17 tried to find a common ground between them by pointing out that we can recognise privilege and still not look down on a person if we decide to respect everyone without looking at material possession and life status.
PSB5 argued about how everyone has privileges when compared to the other. PSB8 countered it by saying that the world is made up of oppressive and regressive structures and it is normal for some people to be on top. Facilitator added that recognising privileges and oppressive as coins of two sides and how one is intrinsically connected to the other. Historical narratives about oppressive structures like monarchy, imperialism and capitalism and how these systems exploited a majority in favor of a minority, was brought in to substantiate the point. PSB17 pointed out an interesting observation. The comic uses the example of hard-working poor vs a hard-working rich. She prompted others to think about

105Introducing Privilege and Oppression in Classrooms
poor people who couldn’t even afford to be hard working due to the absence of basic resources. The reason she brought it up is that she believed that a poor person who does not seem to work hard is still deserving of help, they are still products of their environment. PSB11 agreed to this and added that prejudice that poor people stay poor is a prejudiced notion that is continuously reinforced in society. PSB20 talked about how she heard about the notions about how the poor remain poor because of their laziness.3. Privilege walkThe third activity is the privilege walk. This activity is modelled after the privilege walk activity used by Penn University. Privilege walk is conducted to confront the various types and intricacies of privileges and how it works in society. The participants are asked to stand in a horizontal line and are asked to take a step forward or backwards based on their responses. Twenty questions that deals with privileges related
to gender, class, caste and religion will be read aloud by the facilitator. Privilege Walk helps to promote understanding and acknowledgement of privileges and marginalisation.
Some examples of statements used for privilege walk is given below.• If you can move through the world
without fear of sexual assault, take one step forward.
• If you constantly feel unsafe walking alone at night, take one step back.
• If you were ever made fun of the color tone of your skin, take one step backwards.Privilege walk helped the
participants to realise that everyone experiences both privilege and marginalisation at different levels. The privilege walk started with an announcement about how this activity is about acknowledging the privileges and oppressions in front of the group. It was reiterated that the activity was completely discretional and that participants were free to call it a day.
Fig. 5: Privilege walk network analysis

106 Journal of Indian Education August 2020
The facilitator asked the intervention groups to give examples of such privilege in real life. Several students came up with examples of class, gender, caste, religious and color privilege. Class privilege was the most instantly recognisable. No one contended the existence of class privilege as it was seen all around them. PGK15,
PNC15, PSB8, PNC23, PSB14, PSB8, PSB14, PGQ18, PSB11, PGQ17, PSB6 have all noted class privilege is easily visible in the way they dress, the locality they live and the things they own.
The discussions revealed how other social privileges by pointing out how class advantages lead to better social and cultural capital.
Fig. 6: Privilege walk network analysis, sub domain— class
PNC19, PNC9, PGQ16, PGQ4, PSB7, PNC15, PGQ14, PGQ4, PGK13, PGK20, PSB8, PSB21, PSB17, PGK3 talked about gender privilege. PSB8 mentioned how gender directly affects her freedom of movement, the role she is expected to do and behaviour she is expected to exhibit. The discussions revolved around the differential treatment that occurred due to gender roles.
Many women participants commented that their entire
existence is defined by her gender identity as a woman. Families have, since early childhood, reminded women that they will someday, leave the house and be part of someone else’s household. Quoting the same reason, they were taught to cook, clean and do all the odd jobs in the household whereas their two brothers never had to do any household chores. Many participants resonated to this and said how the male members of their

107Introducing Privilege and Oppression in Classrooms
family are free from household burdens. Many male learners have agreed to this and pointed out how men are also bogged down by a
different set of gender expectations. Men are expected to be the default providers and decision-makers and it comes with its own problems.
Fig. 7: Privilege walk network analysis, sub domain— gender
Discussions also threw light on how women have no agency in their own life. The autonomy of women in making even the basic decisions about being in love and getting married are robbed from them. Facilitator, while conducting the discussion introduced the terms such as heteronormativity and toxic masculinity. It’s important to notice that the participants were giving out the examples of these concepts without knowing the terms, the facilitator merely had to inform them about the concepts at the appropriate time. Facilitator intervened at in the group discussions to make them
aware that even the discussion they are having is following the gender binary model by mentioning only the issues that affect either men or women. These discussions were taking no notice of transgender issues. Absence of LGBT issues was a clear indicator of how privilege is a difficult thing to see. Intervention groups were relatively unaware of the issues of LGBT communities. The human right violations that the community faces due to their sexual orientation and subsequent violation of human rights hurled upon them where new information for many of the participants.
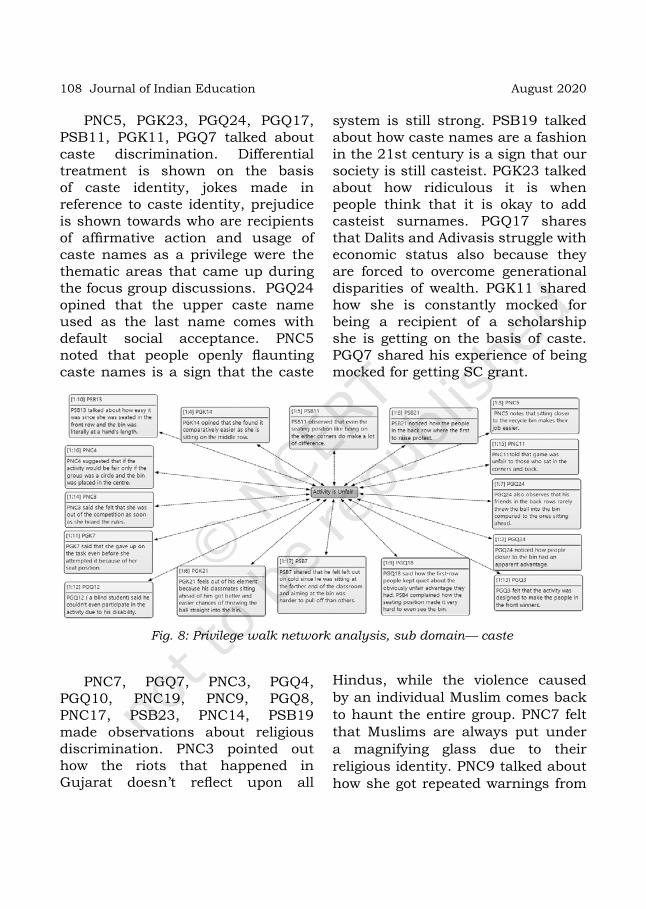
108 Journal of Indian Education August 2020
PNC5, PGK23, PGQ24, PGQ17, PSB11, PGK11, PGQ7 talked about caste discrimination. Differential treatment is shown on the basis of caste identity, jokes made in reference to caste identity, prejudice is shown towards who are recipients of affirmative action and usage of caste names as a privilege were the thematic areas that came up during the focus group discussions. PGQ24 opined that the upper caste name used as the last name comes with default social acceptance. PNC5 noted that people openly flaunting caste names is a sign that the caste
system is still strong. PSB19 talked about how caste names are a fashion in the 21st century is a sign that our society is still casteist. PGK23 talked about how ridiculous it is when people think that it is okay to add casteist surnames. PGQ17 shares that Dalits and Adivasis struggle with economic status also because they are forced to overcome generational disparities of wealth. PGK11 shared how she is constantly mocked for being a recipient of a scholarship she is getting on the basis of caste. PGQ7 shared his experience of being mocked for getting SC grant.
Fig. 8: Privilege walk network analysis, sub domain— caste
PNC7, PGQ7, PNC3, PGQ4, PGQ10, PNC19, PNC9, PGQ8, PNC17, PSB23, PNC14, PSB19 made observations about religious discrimination. PNC3 pointed out how the riots that happened in Gujarat doesn’t reflect upon all
Hindus, while the violence caused by an individual Muslim comes back to haunt the entire group. PNC7 felt that Muslims are always put under a magnifying glass due to their religious identity. PNC9 talked about how she got repeated warnings from

109Introducing Privilege and Oppression in Classrooms
her community about needing to be careful when being friendly with Muslim boys because they are the proponents of love jihad. PGQ7 also talked about how she was asked by her community members to be wary
of Muslim boys because they are the proponents of love jihad. Discussions about how mass media always propagate Islam religion as terrorists and a national threat by portraying them in negative light happened in all groups.
Fig. 9: Privilege walk network analysis, sub domain— religion
The fact that privilege is difficult to notice was brought up by many participants across intervention groups. PGK9 observed how she was aware of the gender privilege, due to her experiences of being a woman and but was largely unaware about privileges and oppression that arises out of factors such as age, socioeconomic status and sexual identity. PNC17 observed that the privileges have a taken for granted nature which makes it difficult to identify and acknowledge. PNC20 observed that this hidden nature
makes it more dangerous since it is easy for those who have privileges to ignore the plight of those who don’t have it. PGK14 observed said that those who are privileged try to normalise their privileges by saying that it how the world is supposed to be. PGQ11 observed how gender privileges and discrimination are rationalised under the pretext of the natural order. PSB8 made an excellent observation about how its easier to notice oppression than a privilege. “Oppression is noticed because those who oppressed are quarrelling

110 Journal of Indian Education August 2020
for equality, while the privileged are busy trying to find ways to normalise their privilege so they could be free from moral shame.” PGQ23 made a similar observation. “Privilege and oppression are opposite spectrums. The marginalised desperately tries to escape from their spectrum while privileged cling to theirs.”
It was intriguing to see participants in different groups making similar comments. Facilitator wrapped the privileged activity by recapitulating that having privilege or not having privilege is not a fault of the participants and that the activity intended to make them aware about the diversity of the world they live in.
conclusIon
Across intervention groups, participants agreed that seeing their own privilege is an arduous task. Acknowledging privilege is even more effortful. The biases and prejudices that participants had it in them form the crux of the social norms that govern the people in society. The concept of privilege is not a widely discussed topic. The process of making people acknowledge, understand and critique about privilege is a long and winding task. This is because privilege is so deeply rooted in one’s life and it is easy to normalise and look past it. On the other hand, the oppression is an easily observable and widely discussed topic since those who are oppressed by the system protest against the partisanship that they are being subjected to. It is easy to point out discrimination in a classroom, but
when the privileges corresponding to the same discrimination is not well received. For example, all the students agree on the existence of gender discrimination, largely due to the involvement of women participants, but the concept of male privilege is getting a mixed response. Many are highly defensive in accepting the male privilege. These privileges and oppressive structures are often normalised and viewed as a natural way of life. This natural way of life regards women as secondary citizens and fuels the graded inequality of caste. Discussions about privilege and oppression would allow for an increased understanding about the society they live in. Several participants have remarked that the module to analyse privilege and oppression was a humbling experience. Privilege groups resist introduces narratives that normalises their privilege. Some narratives paint men being the superior sex and goes as far as to say that women are natural caregivers. Pitching affirmative action against meritocracy is another popular dominant narrative. These narratives are part of the resistance by the privileged to make them believe that they deserve the advantages they have. Also, it is important to recognise that having privilege doesn’t mean that the life of the privileged is free from the absence of hardships. It simply means that some are getting an unearned advantage at the expense of some others due to the nature of their identity and the society they live in.
111Introducing Privilege and Oppression in Classrooms
references
allen, w.T. 1969. Can White Radicals Be Radicalized?bell, 1997. TheoreTical founDaTions for social jusTice eDucaTion. in m. aDams., l.a. bell anD
p. Griffin, Teaching for diversiTy and social jusTice: a sourcebook. new York: rouTleDGe.briTannica, The eDiTors of encYclopaeDia. 2019. “Benazir Bhutto.” Encyclopædia Britannica,
Inc. 2019. https://www.britannica.com/biography/Benazir-Bhutto.Du bois, w.e. 1935. Black Reconstruction in America: An Essay Toward a History of the Part
Which Black Folk Played in the Attempt to Reconstruct Democracy in America, 1860–1880. Simon and Schuster.
Du bois, w.e. anD e. burGharDT. 2014. Black Reconstruction in America. Oxford: Oxford University Press.
GlasberG, D.s. anD D. shannon. 2010. Political Sociology: Oppression, Resistance, and the State. SAGE Publications.
iGnaTin, n. 1967. White Blindspot. N Ignatin.massachuseTTs. 1848. Twelfth Annual Report of the Board of Education. Massachuetts:
Commonwealth of Massachusetts, Board of Education.maurYa, r. 2018. In their Own Voices: Experiences of Dalit Students in Higher Education
Institutions. International Journal of Multicultural Education.mcinTosh, p. 1988. White privilege: Unpacking the invisible knapsack. Philadelphia.
Freedom Magazine, Retrieved from https://psychology.umbc.edu/files/2016/10/White-Privilege_McIntosh-1989.pdf
morris, T. (n.d.). The Pencilsword: On a plate. Speaking for Ourselves. Auckland city mission, Auckland.
nambissan, G.b. 2009. Exclusion and Discrimination in Schools: Experiences of Dalit Children. Delhi: Indian Institute of Dalit Studies and UNICEF.
naTional council of eDucaTional research anD TraininG. 2005. National Curriculum Framework. New Delhi: National Council of Educational Research and Training.
rourke, alison. 2019. “#Unwantedivanka: Awkward Moment at G20 Prompts Slew of Trump Parodies.” The Guardian, July 1, 2019. https://www.theguardian.com/us-news/2019/jul/01/unwantedivanka-awkward-moment-at-g20-prompts-slew-of-trump-parodies.
safina, Dinara. 2015. “Favouritism and Nepotism in an Organization: Causes and Effects.” Procedia Economics and Finance. 23 (October 2014): 630–34. https://doi.org/10.1016/s2212-5671(15)00416-5.
whiTe, G., m. ruTher anD j. kahn. 2015. Educational Inequality in India: An Analysis of Gender Differences in Reading and Mathematics. India Human Development Survey.
wormer, k.V. anD f. besTh. 2017. Human Behavior and the Social Environment, Macro Level Groups, Communities, and Organizations. Oxford University Press. Oxford.

Administrative Barriers to the Implementation of Inclusive Education Sandeep Berwal* renu Bala** and poonam punia***
*Department of Education, Chaudhary Ranbir Singh University, Jind, Haryana**Special Education Teacher, Directorate of Education, NCT, Delhi*** Assistant Professor, ITTR, BPS Women University, Khanpur Kalan, Haryana
AbstractThis study was undertaken to identify certain administrative barriers that impede the implementation of inclusive education in primary schools of Haryana. The sample comprised 28 school heads selected from nine educational blocks of four districts through a multistage random sampling technique. An ‘Administrative Barriers Checklist,’ covering six broad areas of ‘school working’ and 25 standards on the ‘functions of school head’, given in the framework of Sarva Shiksha Abhiyan (SSA), was used to determine if any standard listed in the checklist was a barrier to inclusion. Each school head was contacted personally while filling up the checklist. The results show that only six standards out of 25 were met fully by head teachers whereas 19 unmet standards were counted as administrative barriers to the implementation of inclusive education. This would imply that school heads being local administrators have failed to comply with the standards given in Sarva Shiksha Abhiyan (SSA) framework for implementing inclusive education. In particular, the heads failed in their function to encourage the teachers to use technology in the classroom, prepare and use the Individual Educational Plan (IEP), etc. The study recommends the government to undertake intensive in-service orientation and training programmes for the school heads to understand and implement inclusive education strictly as per the guidelines of Sarva Shiksha Abhiyan (SSA). The study has its implications for policymakers, teachers, media personnel, children with disabilities, and their parents.
Chapter 9.indd 112 12-11-2021 12:29:44

113Administrative Barriers to the Implementation of Inclusive Education
IntroductIon According to Census 2011, India is the second most populous country in the world. There are 121 crore persons in the country out of which 2.68 crore have one or other kind of disability. It means, 2.21 per cent of the Indian population comprises of persons with disabilities (Census, 2011). The Census 2011 further indicates a dismal educational status of the persons with disabilities, since only 55 percent of them are reported literate. Therefore, making provisions to educate them in the least restrictive environment is a major concern for educators and policymakers. However, in spite of the concerted efforts by the government, the education of persons with disabilities still has limited coverage.
Educational status of persons with disabilities is not good because of lack of knowledge, skills, and attitudes among stakeholders about the implementation of educational policies for persons with disabilities (Hegarty and Alur, 2002; Pandey, 2009; Limaye, 2016). Inclusive education under SSA is one of such policy that aims to bring all children with disabilities in the ambit of mainstream education so that no child is left out of the education system. Experts have defined inclusive education in different ways and contexts (Singal, 2006). In the Indian context, it is described as a system of education where children with and without disabilities get education in the same physical,
social, and emotional environment with the help of special equipment and teachers (Singal, 2006; Thakur and Thakur, 2012). Every inclusive school setting is supposed to comply with certain provisions stipulated in the SSA framework viz. identifying or screening every disabled child at an early stage of development, enroling them in neighbourhood school and providing medical assessment, distributing aids and appliances to help counter disability, providing in-service training to teachers and school heads to know better and deeper about inclusion, organising counselling camps for parents and guardians to generate awareness about inclusion and related issues, making the school premises fully accessible, mobilising and utilising the funds appropriately, etc. However, studies on practices of inclusive education in India vis-à-vis role of school heads being local administrator shows that these provisions or standards are not being met fully and properly (Lohidhasan, Beegam and Basheer, 2012; UNESCO, 2019).
A few years ago, inclusion was considered a new venture in India (Thakur and Thakur, 2012), but, nowadays it is well established in government policies and amongst the stakeholders (Shruti Taneja Johansson, 2014). A variety of documents, including laws, policies, and regulations give a detailed note onits organisational framework. The Sarva Shiksha Abhiyan (SSA), launched in 2002, has an inbuilt
Chapter 9.indd 113 12-11-2021 12:29:44

114 Journal of Indian Education August 2020
mechanism for inclusion of children with disabilities in neighbourhood schools. The Right to Education Act (2009) has defined responsibilities and functions of local authorities to cater to the needs of disabled learners while the Rashtriya Madhyamik Shiksha Abhiyan (2009) outlined a formal procedure through which learning needs of secondary school students with disabilities are identified and addressed. The Rights of Persons with Disabilities Act, 2016 stipulates measures for full access of the disabled to inclusive education and strengthens the initiatives of government on wider educational coverage to the disabled. However, the law can only stipulate the provisions; the success depends upon the efforts of school heads being local authorities. In spite of the existence of so many laws and regulations, the low educational status of the disabled indicates a gap between the policy and its practices at the school level.
The analysis of literature indicates that there are barriers to the practices of inclusive education (Berwal, 2012). These barriers exist in the form of inaccessible buildings, negative attitudes, rigid, de-motivating and centrally designed curriculum, inadequately trained teachers, inappropriate policies, ignorant administrators, and scant funding (Pivik, McComas and Laflamme, 2002; Quinn and Ryba, 2002; UNESCO, 2005; Barriga, 2011; Sharma, Loreman and Simi, 2017). In order to overcome these barriers, it
is essential for the school to meet the needs of all students by creating the facilitators. In an inclusive setting, the teachers and administrators must own all students, support policies, and practices to ensure that individual student succeeds (Jacobs, Tonnsen, and Baker, 2004).The professionals interact and collaborate regularly to understand the requirements of the learners and work together as a team. The school heads being local administrators work as advocates to demand resources (essential and additional like special teachers needed at the school level and counsellors, therapists, etc.) from the district and state functionaries to support inclusion. It is one of the functions of school heads to gather useful resources for teachers to use in the class while differentiating instruction (Irvine et al., 2010).
In the process of inclusion, the role of school head is critical. They are organisers, collaborators, and executors of the school activities. They prepare and submit annual and prospective plans to get funds from the state machinery. They disburse and utilise funds for ensuring the best education for disabled learners. According to Smith and Leonard (2005), the school heads are facilitators of collaborative vision for inclusion. In inclusive settings, it is generally assumed that conflicts and tension occur occasionally where the general teacher only share the responsibility of teaching and learning while the special teachers
Chapter 9.indd 114 12-11-2021 12:29:44

115Administrative Barriers to the Implementation of Inclusive Education
own the students with disabilities. Therefore, it is vital that the school head knows the trouble spots and resolve them amicably. It is the duty of the head, being a collaborator of teaching-learning activities, to ensure continuous professional development of their colleagues. In the role of builders of society, the school heads must ensure that disabled children do not get isolated from a peer group or school culture while getting the education.The head can be a powerful facilitator in the process of inclusive education if their relations with all students are fair, frank, kind, and firm.
It is also important for school administrators to hold positive attitudes and beliefs about inclusion since it affects the extent to which the philosophy of inclusion is implemented in their schools. It is significant for them to convey and clarify to staff as what is expected of them to make inclusion effective. A good understanding of the purpose and rationale behind inclusion prepares the staff members to hold a favourable view and get ready to implement inclusion (Smith and Leonard, 2005). Furney et al. (2005), and Ross and Burger (2009) are of the view that school heads being transformational, distributive and democratic leaders are to facilitate teachers’ growth, teachers’ empowerment, and freedom to support inclusion. It is assumed that an effective school head uses knowledge and skills to ensure that expectations and requirements
are well received by teachers. The barriers to inclusion can be removed successfully if the school head gives equal opportunities to all teachers to participate in the decision making, assign them leadership roles, and deal with the problematic staff skilfully. A head with a minimum of bureaucracy facilitates the education of children with disabilities by arranging aids and appliances and developing classrooms, laboratories, and toilets for their optimal functioning. On the other hand, an ignorant and poorly equipped school head acts as a barrier to inclusion. Kalyanpur (2008) surveyed the school heads and found that they are ignorant and untrained to implement inclusive schooling. In a study by Stanley (2015), school heads found inclusion unsuitable for all children with disabilities. Booth and Aniscow (1998), discovered that “many pupils who had been included in a regular class wanted to go back to their special schools after suffering isolation and stigmatisation in the regular class”. According to Stevenson-Jacobson, Jacobson, Halinton (2006), training and experience in special education made heads more responsible for the implementation of education policies for children with disabilities. At times, when a teacher believes that the school head does not understand the inclusive practices, have limited knowledge of inclusion, and excludes staff in the decision-making, then implementation of inclusion becomes difficult. Teachers who are not
Chapter 9.indd 115 12-11-2021 12:29:44

116 Journal of Indian Education August 2020
aware of the purpose of inclusion tend to have a negative view and/or feel discomfort with its processes. Shepherd (2006) found that school heads are an important figure in supporting education to children with special needs and their presence on educational support team is crucial at different levels. Burch, Theoharis, and Rauscher (2010) are of the view that school administrators take a proactive approach to staff development and team teaching. The approach of school head to act merely an ‘administrator’ and ‘not contribute’ in ‘day to day functioning’ of school inclusion is harmful to the process since it may lead school heads to distance themselves from day to day work on inclusive practices and from the staff itself (Valeo, 2008). If a school administrator is not interested in developing outreach networks such as contacting the Health Department for health check-ups, liaison with the District Social Welfare Officer and the Red Cross Society for availing the benefits of scholarships, stipends and assistive devices for the disabled children, they are an obstacle to inclusion. It is due to the red-tapeism in the bureaucracy and indifferent attitudes of school heads that most of the time, the purchase of aids and appliances for the disabled children are delayed. The inability of the school heads to execute the policies and provisions with reference to inclusive education is a barrier to its implementation. However, in a study
by Stevenson-Jacobson, Jacobson, and Hilton (2006), it was found that if the principals devote between 36 percent and 58 percent of their time to special education matters then they can make it successful.
Taking into consideration all these factors, it was felt that the existing inclusive education practices need a fresh look and administrative barriers to implementing inclusion, if any, need identification first and thereafter removal. Providing effective and successful inclusive education is the need of the hour and demand of the day to enhance the educational opportunities for the disabled and to make India a leader in the 21st century world. While selecting the problem for research, it is assumed that inclusive education is a revolutionary change in the philosophy and practice of education and such a change is likely to face problems and barriers. It is assumed that the findings of the study willmake a significant contribution by identifying the administrative barriers to inclusion at the primary school level in Haryana and recommending the measures for removing the barriers.
objectIves The study was designed to achieve the following purposes—(i) To identify the administrative
barriers in the implementation of inclusive education at primary school level in Haryana.
Chapter 9.indd 116 12-11-2021 12:29:44

117Administrative Barriers to the Implementation of Inclusive Education
(ii) To suggest measures for overcoming the administrative barriers and strengthening the facilitators for successful implementation of inclusive education in primary schools of Haryana.
Method
A descriptive survey method was used to execute the study since it best suited the nature and objectives of the study.
SampleThe sample consisted of 28 government primary schools selected through a multistage random sampling technique. While drawing the sample, the State of Haryana was divided into four administrative divisions namely Hisar, Ambala, Gurugram, and Rohtak. At the first stage, 04 districts namely Sonipat, Hisar, Rewari, and Kaithal, out of 22 districts in Haryana, were randomly selected, each district representing the four different administrative divisions of the State. After that, nine educational blocks, out of 27 total educational blocks in the selected four districts, were drawn randomly. At the next stage, 28 schools out of all schools in 9 educational blocks, were selected on a random basis. It means an equal number of 7 schools were selected from each district. A chosen school had at least three Children with Special Needs (CWSNs) on its roll.
ToolA self-developed ‘Administrative Barriers Checklist’ covering 06 broad areas of ‘school world’ and 25 items on the 'functioning of the school head' was used to determine if an item listed in the checklist was a barrier. The items were constructed by considering the norms, guidelines, policies, Acts, and regulations of the Government of Haryana. The checklist had an in-built rating scale named ‘Discrepancy Scale’. There were four levels of ‘Discrepancy Scale’. The first level was assigned a score of 1 and a check (√) in this level indicates a ‘Major’ discrepancy on the part of school head in meeting the standards of inclusive schooling. The next level was designated as ‘Minor’ discrepancy. It carries a score value of 2. A check (√) in the second column means that the item related to the responsibility of school head to make the school inclusive has not met the standard fully, but it is close to meeting the standards. The third column was given a weighted score of 3. It was labelled as “No” discrepancy column. It means that the item being rated for efforts of the school head to make the school inclusive meets the full requirements of the standard given in guidelines, policies, and Acts. A check in the fourth column means that the item was ‘Not Applicable (NA)’ to the duties and responsibilities of school heads directly. The tool was handed over to language and subject experts to determine its face validity.
Chapter 9.indd 117 12-11-2021 12:29:44
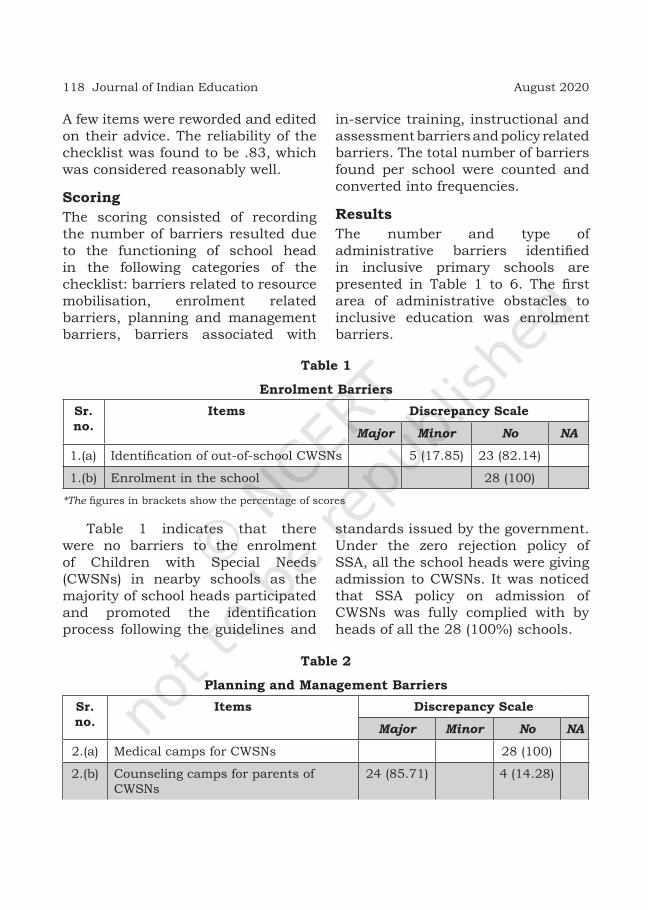
118 Journal of Indian Education August 2020
A few items were reworded and edited on their advice. The reliability of the checklist was found to be .83, which was considered reasonably well.
ScoringThe scoring consisted of recording the number of barriers resulted due to the functioning of school head in the following categories of the checklist: barriers related to resource mobilisation, enrolment related barriers, planning and management barriers, barriers associated with
in-service training, instructional and assessment barriers and policy related barriers. The total number of barriers found per school were counted and converted into frequencies.
ResultsThe number and type of administrative barriers identified in inclusive primary schools are presented in Table 1 to 6. The first area of administrative obstacles to inclusive education was enrolment barriers.
Table 1
Enrolment BarriersSr. no.
Items Discrepancy Scale
Major Minor No NA
1.(a) Identification of out-of-school CWSNs 5 (17.85) 23 (82.14)
1.(b) Enrolment in the school 28 (100)
*The figures in brackets show the percentage of scores
Table 1 indicates that there were no barriers to the enrolment of Children with Special Needs (CWSNs) in nearby schools as the majority of school heads participated and promoted the identification process following the guidelines and
standards issued by the government. Under the zero rejection policy of SSA, all the school heads were giving admission to CWSNs. It was noticed that SSA policy on admission of CWSNs was fully complied with by heads of all the 28 (100%) schools.
Table 2
Planning and Management BarriersSr. no.
Items Discrepancy Scale
Major Minor No NA
2.(a) Medical camps for CWSNs 28 (100)
2.(b) Counseling camps for parents of CWSNs
24 (85.71) 4 (14.28)
Chapter 9.indd 118 12-11-2021 12:29:44

119Administrative Barriers to the Implementation of Inclusive Education
2.(c) Participation of CWSNs in all curricular and co-curricular activities
18(64.28)
6(21.42)
4(14.28)
2.(d) Procurement & distribution of aids and appliances
20(71.42)
2(7.14)
6(21.42)
2.(e) Civil work proposals for modifications in existing infrastructure as per the needs of CWSNs
25(89.28)
3(10.71)
*The figures in brackets show the percentage of scores
Perusal of Table 2 reveals that there were administrative barriers to planning and management aspect of inclusive education. Although, all the 28 (100%) school heads were complying fully with the norms of organizing and supporting medical camps for CWSNs, yet they were found reluctant on holding counselling camps for parents through local resources and initiatives. The researchers pointed out it to be a policy barrier at planning, and management level as funds were not allocated to each school for organising counselling camps locally, on the contrary camps were organised at resource schools, thus, only 4 (14.28%) school heads,
where resource support was located and special teachers were posted, reported organising the counselling camps. The participation of CWSNs was required to be encouraged by all the heads since it was one of the norms under SSA, but 24 (85.71%) school heads were found discrepant to meet this standard. Inability of 24 (85.71%) school heads to procure aids and appliances and to prepare proposals for modifications in existing infrastructure as per the needs of CWSNs had emerged as an administrative barrier to the implementation of inclusive education.
Table 3
In-service Training BarriersSr. no.
Items Discrepancy Scale
Major Minor No NA
3.(a) In time relieving of teachers for training 28(100)
3.(b) Training of head teachers on inclusion 27(96.42)
01(3.57)
*The figures in brackets show the percentage of scores
Chapter 9.indd 119 12-11-2021 12:29:44
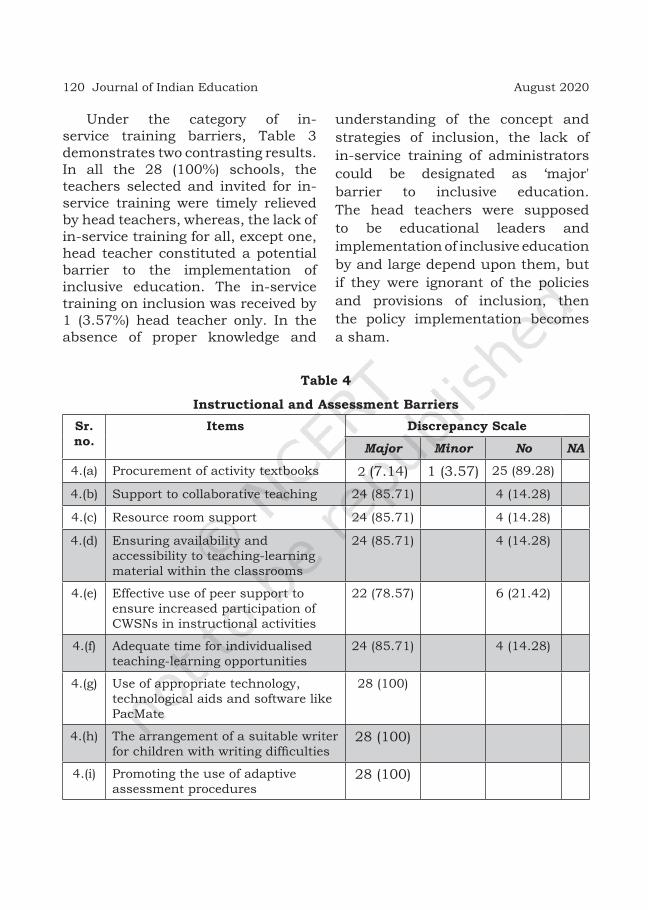
120 Journal of Indian Education August 2020
Under the category of in-service training barriers, Table 3 demonstrates two contrasting results. In all the 28 (100%) schools, the teachers selected and invited for in-service training were timely relieved by head teachers, whereas, the lack of in-service training for all, except one, head teacher constituted a potential barrier to the implementation of inclusive education. The in-service training on inclusion was received by 1 (3.57%) head teacher only. In the absence of proper knowledge and
understanding of the concept and strategies of inclusion, the lack of in-service training of administrators could be designated as ‘major' barrier to inclusive education. The head teachers were supposed to be educational leaders and implementation of inclusive education by and large depend upon them, but if they were ignorant of the policies and provisions of inclusion, then the policy implementation becomes a sham.
Table 4
Instructional and Assessment BarriersSr. no.
Items Discrepancy Scale
Major Minor No NA
4.(a) Procurement of activity textbooks 2 (7.14) 1 (3.57) 25 (89.28)
4.(b) Support to collaborative teaching 24 (85.71) 4 (14.28)
4.(c) Resource room support 24 (85.71) 4 (14.28)
4.(d) Ensuring availability and accessibility to teaching-learning material within the classrooms
24 (85.71) 4 (14.28)
4.(e) Effective use of peer support to ensure increased participation of CWSNs in instructional activities
22 (78.57) 6 (21.42)
4.(f) Adequate time for individualised teaching-learning opportunities
24 (85.71) 4 (14.28)
4.(g) Use of appropriate technology, technological aids and software like PacMate
28 (100)
4.(h) The arrangement of a suitable writer for children with writing difficulties
28 (100)
4.(i) Promoting the use of adaptive assessment procedures
28 (100)
Chapter 9.indd 120 12-11-2021 12:29:44

121Administrative Barriers to the Implementation of Inclusive Education
The most significant administrative barrier to inclusive education was reflected in the field of instructional and assessment areas. It is clear from Table 4 that the head teachers in 24 (85.71%) sample schools rated ‘major’ discrepant in the area of collaborative teaching, resource room support, ensuring availability and accessibility to teaching-learning material in the class and giving adequate time for individualised teaching-learning opportunities. The head teachers of 22 (78.57%) schools were using peer support to
ensure increased participation of CWSNs in instructional activities. All the 28 (100%) head teachers appeared 'major' discrepant in use of appropriate technology, technological aids, and software, arranging suitable writers for children with writing difficulties and in the promotion of adaptive assessment procedures. The only area where head teacher acted as a facilitator to inclusive education was the procurement of activity/textbooks since it had been procured by 25 (89.28%) out of 28 (100%) head teachers.
Table 5
Policy BarriersSr. no.
Items Discrepancy Scale
Major Minor No NA
5.(a) Appointment of special teachers 24 (85.71) 4 (14.28)
5.(b) Teacher salaries 28 (100)
5.(c) Inconvenient/forced placement of teachers
24 (85.71) 4 (14.28)
5.(d) Categorical funding 28 (100)
*The figures in brackets show the percentage of scores
Table 5 indicates the policy barriers to inclusive education. The four sub-barriers reported under this category were not directly related to the school heads, but during interaction with the researchers, the school heads revealed that these barriers were related to administrators and policymakers at the district, state, and national levels. The appointment
of a teacher at the block level and forced placement of a special teacher in certain pockets and clusters to meet the individual needs of disabled children was a straight departure from the policy documents and court judgments. All the 28 (100%) school heads described low salaries of special teachers as potential barriers to inclusive education.
Chapter 9.indd 121 12-11-2021 12:29:44
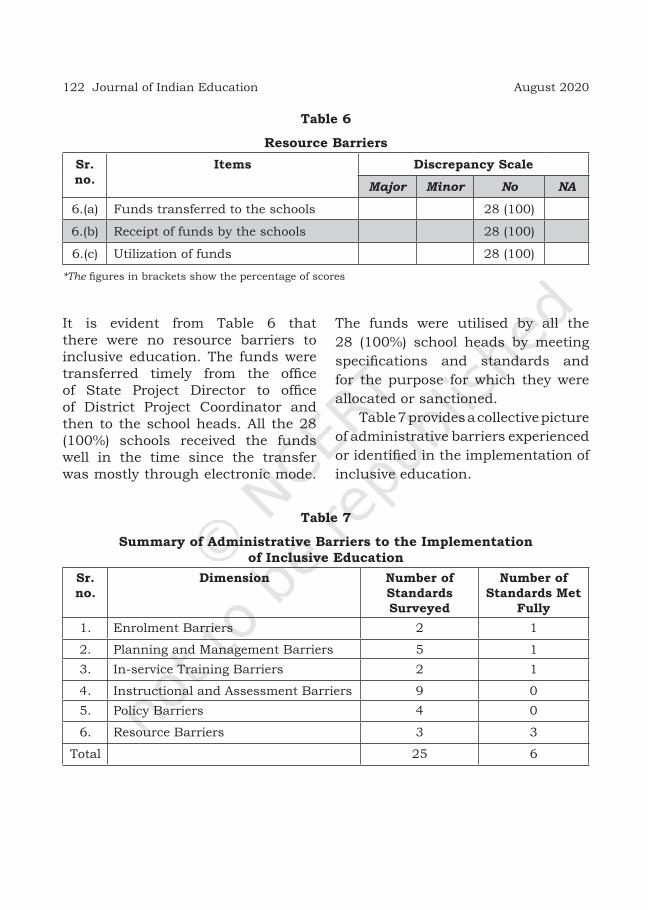
122 Journal of Indian Education August 2020
Table 6
Resource BarriersSr. no.
Items Discrepancy Scale
Major Minor No NA
6.(a) Funds transferred to the schools 28 (100)
6.(b) Receipt of funds by the schools 28 (100)
6.(c) Utilization of funds 28 (100)
*The figures in brackets show the percentage of scores
It is evident from Table 6 that there were no resource barriers to inclusive education. The funds were transferred timely from the office of State Project Director to office of District Project Coordinator and then to the school heads. All the 28 (100%) schools received the funds well in the time since the transfer was mostly through electronic mode.
The funds were utilised by all the 28 (100%) school heads by meeting specifications and standards and for the purpose for which they were allocated or sanctioned.
Table 7 provides a collective picture of administrative barriers experienced or identified in the implementation of inclusive education.
Table 7
Summary of Administrative Barriers to the Implementation of Inclusive Education
Sr. no.
Dimension Number of Standards Surveyed
Number of Standards Met
Fully1. Enrolment Barriers 2 1
2. Planning and Management Barriers 5 13. In-service Training Barriers 2 1
4. Instructional and Assessment Barriers 9 05. Policy Barriers 4 0
6. Resource Barriers 3 3
Total 25 6
Chapter 9.indd 122 12-11-2021 12:29:44
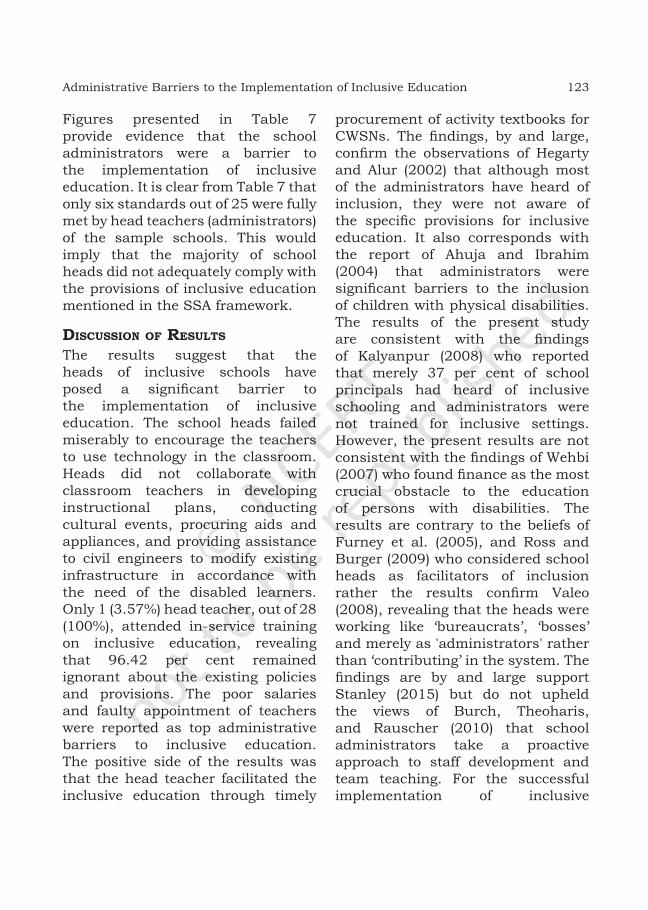
123Administrative Barriers to the Implementation of Inclusive Education
Figures presented in Table 7 provide evidence that the school administrators were a barrier to the implementation of inclusive education. It is clear from Table 7 that only six standards out of 25 were fully met by head teachers (administrators) of the sample schools. This would imply that the majority of school heads did not adequately comply with the provisions of inclusive education mentioned in the SSA framework.
dIscussIon of results
The results suggest that the heads of inclusive schools have posed a significant barrier to the implementation of inclusive education. The school heads failed miserably to encourage the teachers to use technology in the classroom. Heads did not collaborate with classroom teachers in developing instructional plans, conducting cultural events, procuring aids and appliances, and providing assistance to civil engineers to modify existing infrastructure in accordance with the need of the disabled learners. Only 1 (3.57%) head teacher, out of 28 (100%), attended in-service training on inclusive education, revealing that 96.42 per cent remained ignorant about the existing policies and provisions. The poor salaries and faulty appointment of teachers were reported as top administrative barriers to inclusive education. The positive side of the results was that the head teacher facilitated the inclusive education through timely
procurement of activity textbooks for CWSNs. The findings, by and large, confirm the observations of Hegarty and Alur (2002) that although most of the administrators have heard of inclusion, they were not aware of the specific provisions for inclusive education. It also corresponds with the report of Ahuja and Ibrahim (2004) that administrators were significant barriers to the inclusion of children with physical disabilities. The results of the present study are consistent with the findings of Kalyanpur (2008) who reported that merely 37 per cent of school principals had heard of inclusive schooling and administrators were not trained for inclusive settings. However, the present results are not consistent with the findings of Wehbi (2007) who found finance as the most crucial obstacle to the education of persons with disabilities. The results are contrary to the beliefs of Furney et al. (2005), and Ross and Burger (2009) who considered school heads as facilitators of inclusion rather the results confirm Valeo (2008), revealing that the heads were working like ‘bureaucrats’, ‘bosses’ and merely as 'administrators' rather than ‘contributing’ in the system. The findings are by and large support Stanley (2015) but do not upheld the views of Burch, Theoharis, and Rauscher (2010) that school administrators take a proactive approach to staff development and team teaching. For the successful implementation of inclusive
Chapter 9.indd 123 12-11-2021 12:29:44
124 Journal of Indian Education August 2020
education, the need of substantial administrative support and adequate human and material resources has been highlighted by many researchers like Scruggs and Mastropieri (1996), and Cook, Semmel and Gerber (1999). Therefore, school system needs to train the school heads on inclusive policies and philosophies, in particular about individualised education plans, collaborative teaching, inclusive technology, curriculum adaptations, and simplified assessment techniques. Inclusion is better facilitated when administrators are aware of their roles and responsibilities.
conclusIon
The findings indicate that the heads were ignorant about the policies and programmes on inclusive education. These findings are not surprising since they, except one, were yet to attend any training on inclusive education. Inclusion expects from heads to provide ample opportunities and motivation to staff for collaboration,
mobilise resources, and address school diversity but the study reveals the opposite trend. The utility of this study lies in eliminating the administrative barriers by generating awareness among the policymakers about the magnitude of the problem and inspiring them to allocate larger funds for conducting workshops, in-service training, and conferences for the school heads to understand and implement inclusive education strictly as per the guidelines of policy documents viz. SSA and RTE Act. The training of administrators is critical since action by an untrained person in the implementation process may prove a bane rather than a boon. The study also suggests inspiring the media to give maximum coverage to inclusive education activities viz. sports, cultural, tours, and excursion for CWSNs so that every member of the society may have an idea of the problems and prospects of inclusive education and can play a significant role in bonding and building an inclusive society.
references
ahuja, a. and m. iBrahim. 2004. Regional workshop on Inclusive Education ‘Getting All Children into School and Helping Them Learn’, Bangkok, Thailand, Retrieved from http://unesco.org.pk/education/icfe/resources/res1.pdf
Barriga, S.r. 2011. Futures stolen: barriers to education for children withdisabilities in Nepal. New York, N.Y. : Human Rights Watch. Retrieved fromhttps://searchworks.stanford.edu/view/9371707
Berwal, S. 2012. Barriers to inclusive education for the disabled learners. Journal of Teacher Education and Research, Vol. 3, No. 1. pp. 98-108.
Booth, t. and m. ainScow. 1998. From them to us. Creative Print Design. London.
Chapter 9.indd 124 12-11-2021 12:29:44

125Administrative Barriers to the Implementation of Inclusive Education
Burch, p., g. theohariS and e. rauScher. 2010. Class size reduction in practice: Investigating the influence of elementary school principal. Educational Policy. Vol. 24, No. 2. pp. 330–358.
cenSuS of india data. 2011. Ministry of Home Affairs, Government of India http://www.censusindia.gov.in/2011census/PCA/PCA_Highlights/pca_highlights_file/India/Chapter-1.pdf
cook, B., m. Semmel and m. gerBer. 1999. Attitudes of principals and special education teachers towards the inclusion of students with mild disabilities: critical differences of opinions. Remedial and Special Education. Vol. 20, No. 4. pp. 199–207.
furney, k.S., j. aiken., S. haSazi and k. clark. 2005. Meeting the needs of all students: Contribution of Effective School Leaders. Journal of School Leadership. Vol. 15, No. 5. pp. 546–570.
hegarty, S. and m. alur. 2002. Education and children with special needs. New Delhi: Sage Publications.
irvine, a., l. lupart, j., t. loreman and d. richmond macghie. 2010. Educational leadership to create authentic leadership in inclusive schools. The experiences of principals in a Canadian Rural School District. Exceptionality Education International. Vol. 20, No. 2. pp. 70–88.
jacoBS, j.e., S. tonnSen and c. Baker. l. 2004. Shaping the role of the principal in special education: what do we know and where do we want to go. Journal of scholarship and practice: Research and Best Practices that Advance the Profession of Educational Administration. Vol. 1, No.1. pp. 7–12.
kalyanpur, m. 2008. Equality, quality and quantity: challenges in inclusive education policy and service provision in India. International Journal of Inclusive Education. Vol. 12, No. 3. pp. 243–262.
lohidhaSan. m.k., Safeena Beegam and mohammed BaSheer. k. 2012. A Critical Analysis of Inclusive Education in the Perspective of RTE in Palakkad District, District Institute of Education and Training, Palakkad, Kerala. Retrieved from http://dietpalakkad.org/wp-content/uploads/downloads/2013/11/Research-Study-Report-Abstract-DIET-Palakkad-2013.pdf
limaye, S. 2016. Factors influencing the accessibility of education for children with disabilities in India. Global Education Review. Vol. 3, No. 3. pp. 43–56.
national Sample Survey organiSation. 2003. Disabled Persons in India, Report No. 485 (58/26/1), Ministry of Statistics and Programme Implementation, Government of India, Retrieved from mospi.nic.in/sites/default/files/publication_reports/485_final.pdf
pandey, y. 2009. A study of barriers in the implementation of inclusive education at the elementary level. (Unpublished Ph.D Thesis), Department of Educational Studies, Jamia Millia Islamia University, New Delhi
pivik, j., j. mccomaS and m. laflamme. 2002. Barriers and facilitators to inclusive education. Exceptional children. Vol. 69, No. 1. pp. 97–107.
Quinn, S. and k. ryBa. 2002. Linking inclusive policies with best teaching practices. In Deboroh Fraser, Roger Moltzen and Ken Ryba (Eds) Learners with special needs in Aotearoa. Dunmore Press. New Zealand.
Chapter 9.indd 125 12-11-2021 12:29:44

126 Journal of Indian Education August 2020
raShtriya madhyamik ShikSha aBhiyan. Ministry of Human Resource Development. National Informatics Centre. Retrieved on 2nd February 2019.
right of children to free and compulSory act, 2009, (2009). Ministry of Law and Justice, Government of India, New Delhi
roSS, j.a. and m. Burger. 2009. Equity and Leadership: Research bases strategies for school leaders. School Leadership and Management. Vol. 29, No. 5. pp. 463–476.
Sarva ShikSha aBhiyan. 2003. Programme for Universal Elementary Education. Department of Elementary Education and Literacy, Ministry of Human Resource and Development Government of India. Retrieved from http://www.educationforallinindia.com/ssa.htm
ScruggS, t. and m. maStropieri. 1996. Teacher preparation of Mainstreaming/inclusion, 1958–1995: A research Synthesis. Exceptional Children. Vol. 63, No. 1. pp. 59–74.
Singal, n. 2006. Inclusive Education in India: International concept, national interpretation. International Journal of Disability, Development and Education. Vol. 53, No. 3. pp. 351–369. doi: 10.1080 /10349120600847797.
Sharma, u., t. loreman and j. Simi. 2017. Stakeholder perspectives on barriers andfacilitators of inclusive education in the Solomon Islands. Journal of Research in Special Eduation Needs. 17, 143–151. doi:10.1111/1471-3802.12375
Shepherd, k. 2006. Supporting all students: The role of school principals in expanding general education capacity using resource to interventions teams. Journal of Special Education Leadership. Vol. 19, No. 2. pp. 30–38.
Shruti, taneja johanSSon. 2014. A critical and contextual approach to inclusive education: perspectives from an Indian context, International Journal of Inclusive Education. 18:12, 1219-1236, doi: 10.1080/13603116.2014.885594
Smith, r. and p. leonard. 2005. Collaboration for Inclusion: Practitioners Perspectives. Equity and Excellence in Education. Vol. 38, No. 4. pp. 269–279.
Stanley, l.m. 2015. Perceptions of Elementary Educators toward Inclusion. Electronic Theses and Dissertations. Paper 2529. http://dc.etsu.edu/etd/2529.
StevenSon, jacoBSon., r., jacoBSon, j. and a. halinton. 2006. Principals’ perception of critical skills needed for administration of special education. Journal of Special Education Leadership. Vol. 19, No.2. pp. 39–47.
thakur, a.S. and a. thakur. 2012. Inclusive education: concepts, practices and issues. Agarwal Publications. Agra.
the rightS of perSonS with diSaBilitieS act, 2016. Retrieved from disabilityaffairs.gov.in. on 8th January 2019.
uneSco. 2005. Guidelines for inclusion: ensuring access to education for all. Retrieved from www.unesco.org/education/inclusive
———. 2019. N FOR NOSE: State of the Education Report for India 2019, Children with Disabilities: Retrieved from http://digitallibrary.in.one.un.org/TempPdfFiles/3793_1.pdf
valeo, a. 2008. Inclusive Education Systems: Teacher and Administrators Views. International Journal of Special Education. Vol. 23, No. 2. pp. 8–16.
weBhi, S. 2007. Barriers to education for people with disabilities in Bekaa, Lebanon. Retrieved from https://scholarspace.manoa.hawaii.edu/bitstream/10125/58330/1/858.pdf
Chapter 9.indd 126 12-11-2021 12:29:44
Reservation Policy of Government Issues in Manipur University
Leisangthem Binita Devi*
*Ex-Project Consultant, NIEPA, New Delhi
IntroductIon
Reservation in our country is a form of affirmative action to improve the well-being of the backward, underprivileged and under-represented communities defined primarily by their caste or tribe. The reservation policies under the Constitution of our country, the beneficiaries are primarily Scheduled Castes (SC), Scheduled Tribes (ST) and Other Backward Classes
AbstractThe Reservation Policy in India is centered on the Constitutional Framework for reservation. The Constitution of India provides reservations in (political, educational and employment). Reservation is a form of affirmative action in which a percentage of seats are reserved in educational institutions, Government services and Political bodies of the State and Central. In this paper, policies of reservation of the Government of India (GoI) in higher education has been highlighted. In addition to that, the various policies related to reservation of seats and issues related to reservation in the Manipur University are also analysed and discussed. Further, the paper discusses the need to understand those issues and problems of reservation policies in higher education of Manipur University.
(OBC). The policies of reservation in admission and recruitment of staff at Manipur University have been an issue (Leisangthem, 2017). The problems and issues related to reservation of seats in admission need to be resolved in time to retain and maintain the academic atmosphere of the University in long run as well as for the future career of the students. In 2008, there has been problem of reservation in the recruitment of
Chapter 10.indd 127 12-11-2021 12:31:03

128 Journal of Indian Education August 2020
teaching staff (Leisangthem, 2017) and issues of reservation of seats in admission of students in the Manipur University after the implementation of the Central Educational Institutions Act, 2006 (CEI, Act, 2006) and Amendment Act 2012. The issue of reservation became worse in 2016 resulting in the total shut down of Manipur University for a few weeks after protest by students regarding reservation of seats in admission. So, there is a need to understand this issue and problems of reservation policy in the University.
EarlIEr rEsEarchEs In rEsErvatIon PolIcIEs
There have been many researches and policy analysis of the Government reservation policies by the researchers across different disciplines. The aim of the Indian reservation system is to boost the opportunities for improved social and instructive position of the underprivileged communities and, thus, allow them to take their equitable place in the conventional Indian society (Jangir, 2013). The underlying theory is that the under-representation of the identifiable groups is a legacy of the Indian caste systems. The Constitution of India listed some erstwhile groups as Scheduled Castes and Scheduled Tribes (Yesu and Gokulraja, 2015). Reservation has today become a major social issue and therefore needs a more in-depth solution (Rathod, 2012). The reservation policy was only for 10 years after the
independence, for upliftment of SC and ST but no step has been taken to amend or revise or change it. Nearly 33 per cent voting is done by SC and ST so if the Government make change in reservation policy then they have to suffer a lot for the same (Jangir, 2013). In 1982, the Constitution specified 15 per cent and 7.5 per cent of vacancies in public sector and government-aided educational institutes as a quota reserved for the SC and ST candidates respectively, for a period of five years, after which the quota system would be reviewed. This period was routinely extended by the succeeding governments. The Supreme Court of India ruled that reservations cannot exceed 50 per cent (which it judged would violate equal access guaranteed by the Constitution) and put a cap on reservations (Jangir, 2013). Reservations are intended to increase the social diversity in campuses by lowering the entry criteria for certain identifiable groups that are grossly under-represented in proportion to their numbers in the general population (Yesu and Gokulraja, 2015). Scholars have argued that the low caste movements first arose in the south because of the greater ritual repression there by the Brahmins, compared to the north (Rathod, 2012). The goal of reservation in India is to bring about an improvement in the welfare of people who are economically and socially depressed. But, who should be eligible for reservation, the criterion has been a
Chapter 10.indd 128 12-11-2021 12:31:03
129Reservation Policy of Government— Issues in Manipur University
person’s caste rather than his income or wealth (Jangir, 2013). These reservations are also dividing Indians in the name of castes or groups which are a sign of a concern for our nation in the long run. Caste-based consciousness wills farther caste divisions (Rathod, 2012). During the Vedic period, a person’s ‘Varna’ (not ‘caste’) was determined by their socio-economic duties which were assigned by the local superintendent or of their own accord, and ‘Varna’ was originally not defined by one’s birth into any exacting family. Over the years caste has been defined by one’s birth (Jangir, 2013). In 1990, the whole process of reservations got intensified with implementation of recommendations made by the Mandal Commission (Rathod, 2012). Caste is the most used criteria to identify under-represented groups. However, there are other identifiable criteria for under-representation: gender (women), state of domicile (North Eastern States, Bihar and Uttar Pradesh), rural people, etc. are under-represented, as revealed by the Government of India sponsored National Family Health and National Sample surveys (Yesu and Gokulraja, 2015). When, in 2006, the government announced its decision to extend reservations for OBCs to higher education, the criticisms became even sharper and was accompanied by the belief that the policy would adversely affect the country’s economic growth (Mahajan, 2008). The Act, (CEI Act, amendment
2008) has not had a significant positive impact on OBC participation in states that have introduced the policy (Basant and Sen, 2016). Researchers have found that political representation of socio-economically marginalised groups generate positive policy and welfare outcomes, and the presence of these leaders can impact children and students to improve educational aspirations, attainment, and performance through a role model effect (Cho, 2014).
rEsErvatIon PolIcy of GoI and uGc GuIdElInEs for rEsErvatIon PolIcy ImPlEmEntatIon
The Legislative Department under the Ministry of Law and Justice, has published the Gazette of India, the Central Educational Institutions (Reservation in Admission) Act, 2006 passed by the Act of Parliament. It is an Act to provide the reservation in admission of the students belonging to the Scheduled Castes, the Scheduled Tribes and Other Backward Classes of citizens, to certain Central Educational Institutions established, maintained or aided by the Central Government and for the matters connected therewith and incidental thereto. The reservation of seats in admission is 15 per cent seats for the Scheduled Castes, 7.5 per cent seats for Scheduled Tribes and 27 per cent seats for Other Backward Classes are reserved out of the annual permitted strength in each branch of study or faculty. The CEI Act, 2006 was amended in 2012. The Central
Chapter 10.indd 129 12-11-2021 12:31:03

130 Journal of Indian Education August 2020
Government (MHRD, Department of Secondary and Higher Education) has issued the directions to the University Grants Commission in 2006, which states the following: The Article 46 of the Constitution, which states that, “The State shall promote, with special care, the education and economic interests of the weaker sections of the people, in particular of the Scheduled Castes and Scheduled Tribes, and shall protect them from social injustice and all forms of social exploitation. The policy of the Central Government is that in the Central Universities receiving grants-in-aid from the public exchequer, the percentage of reservation in admissions and recruitments in teaching and non-teaching posts is 15 per cent for SC and 7.5 per cent for ST. The Government has directed the UGC to ensure effective implementation of the reservation policy in the Central Universities and those of Institutions Deemed to be Universities receiving aid from the public funds except in minority institutions under Article 30 (1) of the Constitution. The UGC has the mandate of maintaining the standards of higher education regarding adequate representation of teaching and non-teaching staff as well as of students belonging to SC and ST communities in all the Universities, Deemed to be Universities, Colleges and other grant-in-aid or research Institutions and Centres. So, UGC has issued policy guidelines to all the Universities, Deemed to be
Universities, Colleges and other grant-in-aid or research Institutions and Centres, directed to adopt the guidelines by appropriate resolution by the respective Governing/Executive Bodies/Syndicate/Senate etc. for effective implementation of those guidelines. The reservation of SC and ST communities is applicable to all admissions to Undergraduate, Postgraduate, M. Phil. and Ph. D. courses of educational institutions.
The relaxation and concession in respect of educational qualification, age, experience and qualifying marks/standard etc. will be as per existing government rules in all cases of admissions, recruitments, appointments, promotions and other assignments of entitlements to the members of SC/ST. All the educational institutions have the extent of reservation applicable as 15 per cent for SC and 7.5 per cent for ST. Without prejudice to the provisions of 15 per cent for SC and 7.5 per cent for ST in all the educational institutions, and functioning within any State will follow the percentage of reservation prescribed by the respective State Government. No restriction of per centage is applicable while filling-up of back-log/short-fall vacancies of SC/ST.
ProcEdurE In mattErs of rEsErvatIon for admIssIon as PEr uGc GuIdElInEs
Those SC/ST candidates who have appeared in national or state/common or University or Institution tests held
Chapter 10.indd 130 12-11-2021 12:31:03
131Reservation Policy of Government— Issues in Manipur University
for the purpose of admission can seek admission or claim reservation in order to avail the quota of seats reserved for them. In cases where test does not prescribed as necessary for selecting candidates for admission, a merit list should be arranged among the SC/ST candidates based on the marks obtained in the qualifying examination. Rules of reservation are applicable for under-graduate as well as post-graduate levels and research degrees. Each academic year should have a percentage of reservation applied separately and not whenever interviews take place, or recruitment is made. Rules of interchangeability among SCs and STs are applicable, wherever necessary to fill-up the number of vacant seats. The vacant seats in the reserved quota should not be filled by any non-SC/ST candidates in case no eligible reserved candidates are available. All institutions (Universities, Deemed to be Universities, Colleges and other grant-in-aid or research Institutions and Centres) should give the maximum possible encouragement and support to girls of SC/ST in admission. Each University/Institution should appoint a Liaison Officer, who will be responsible for monitoring the implementation of reservation under those guidelines. All the Universities/Institutions should establish an SC/ST Cell in order to process the grievances of the members of these communities. An Advisory Committee with Vice
Chancellor or Principal as Chairman should be constituted to review the implementation of reservation policy in admission and capacity programmes for successful passing of SC/STs in examinations. The Universities should initiate action to effect necessary amendments to their Acts/Statutes for the statutory support for reservation in admission, appointments to teaching and non-teaching posts and representation of SC/ST in their bodies like Syndicate, Executive Council, Academic Council, Selection Committees, etc. The Ministry of Human Resource and Development has directed the Registrar of universities to follow the reservation policy in admissions in all courses as provisions contained in the Central Educational Institutions Act, 2006 and as amended in 2012 (Reservation in Admission).
rEsErvatIon PolIcy of admIssIon In manIPur unIvErsIty
In the Manipur University, seats for candidates belonging to SC/ST/OBC/PWD are reserved as per Government of India norms (B.Ed. course prospectus, Manipur University, 2017). The SC/ST/OBC candidates who have secured marks above the level up to which general category candidates are selected then they will not be counted towards reserved quota and will be included in the general merit list of admission. Two seats are reserved for the candidates who have participated in the events
Chapter 10.indd 131 12-11-2021 12:31:03
132 Journal of Indian Education August 2020
representing the State/University at the inter University/National/International competition of sports or other co-curricular activities. They should have participated when they were at the post 10+2 level. In case of PG courses, only one seat is reserved in each disciplines of Biochemistry, Biotechnology, Adult Education, Mass Communication, Anthropology, Forestry and Environmental Science, Earth Sciences, Dance (Manipuri) and Library and Information Science and two seats are reserved in each of the other disciplines for such candidates.
In each discipline, three per cent of the seats are reserved for PWD candidates that can be availed by producing a certificate from the competent authority. If suitable candidates are not available, reserved seats are deemed to be unreserved as per Government of India norms. In case of PG courses, if the Defence Service personnel fulfil the prescribed qualifications for admission to the discipline concerned then one supernumerary seat will be given. Five per cent of seats are reserved for the wards of the Indian workers in the Gulf out of the 15 per cent supernumerary seats for foreign students. For the displaced Kashmiri migrants, two supernumerary seats will be provided. The Myanmarese students subject to the nomination by the Government of Myanmar, two supernumerary seats in the Department of Teacher Education may be given. The candidates may
not appear in the admission test and special concession may be given in tuition and lodging fees. In case of PG courses, the Myanmarese students subject to the nomination by the Government of Myanmar may be given two supernumerary seats in different departments under the school of Humanities and Social Sciences.
The children of the regular employees of the University will be given two supernumerary seats in the Department (BA Dance and BA Music). In case of PG program, the child of the regular employees of the University will be given one supernumerary seats in each Department with laboratory component and two supernumerary seats in each department without laboratory component. At least 20 per cent of the total seats preference will be given to the students of other states (domicile) in the Department (BA Dance and BA Music). In Ph.D. and Master’s program in the Department of Life Sciences, Chemistry, Physics and Manipuri, preference may be given to the students of other states by domicile to the extent of at least 20 per cent of the prescribed seats under the Special Assistance Programme of the University Grants Commission.
IssuEs of rEsErvatIon PolIcy of mu aftEr uPGradatIon Into cEntral unIvErsIty
Manipur University was a State University till 2005 and it has been upgraded into a Central University
Chapter 10.indd 132 12-11-2021 12:31:03
133Reservation Policy of Government— Issues in Manipur University
in December 2005. When, it was a State University, it had followed State reservation policy. According to the State norm, 31 per cent of seats were reserved for the candidates belonging to ST and 2 per cent of seat reserved for the SC candidates in admission. According to the Central University norm, 7.5 per cent of seats should be reserved for ST candidates and 15 per cent for SC in admission of students and the recruitment of vacant post of teaching staff.
When the University was State University, the reservation of a seat in admission for ST candidates in each discipline was thirty-one per cent and two per cent for candidates who belong to SC category. It has been following the State University reservation norm. The unfilled seats, if any, reserved for SC candidates will be filled up by admitting ST candidates and vice-versa. As per the Government of India Gazette No.5 of 2006, capacity expansion for OBC reservation is implemented from the 2008-09 session. Reservation of OBC student on admission as per Central University norm is 27 per cent. This 27 per cent of seat were to be covered within three years, so, nine per cent is covered in the academic session 2008-2009 (Leisangthem, 2017). Those who have secured marks above the level up to which general category students are admitted, should not be counted towards reserved quota at all and should be included in the general merit list of admission. One seat is reserved in each of
the disciplines of Anthropology, Earth Sciences, Biochemistry, Adult Education, Dance (Manipuri), Mass Communication, Library and Information Science for candidates who have represented State/University at the Inter-University National/ International competition of sports or other extra-curricular activities and two seats are reserved in each of the other disciplines for such candidates. Such when, candidates should have participated in the events when they were at post 10+2 level. Three percent of seats in each discipline are reserved for disabled persons. One supernumerary seat was given in every discipline of the University to the Defense Services personnel in case they fulfill the prescribed qualifications for admissions to the discipline concerned. Five per cent seats out of the 15 per cent supernumerary seats for foreign students were reserved for the wards of Indian workers in the Gulf. One supernumerary seat also may be provided to the displaced Kashmiri migrants. Preference may be given to the students of other States (by domicile) on at least 20 per cent of the prescribed seats in the Department of Life Sciences under the Special Assistance Programme of the University Grants Commission. Reserved seats were deemed to be unreserved if suitable candidates were not available.
In the month of September and October 2008, the reservation issue hampered the academic atmosphere
Chapter 10.indd 133 12-11-2021 12:31:03

134 Journal of Indian Education August 2020
of the Manipur University. This issue started when the Vice-Chancellor of the Manipur University tried to recruit three Guest Lecturers of the History Department as per Central University norm. In 2008, the Tribal union met the then Prime Minister regarding reservation policy in the Manipur University, the State Government’s reservation norm should be allowed to follow instead of Central Government’s reservation norm. Manipur University has been following State reservation norm since it was a State University which had 31 per cent seats reserved for ST candidates and after upgradation
to Central University status, it has been reduced to 7.5 per cent seats reservation. The Tribal Union were against this new reservation policy which has reduced the reserved seats for tribal candidates (Leisangthem, 2017).
When University was a State University, the seat reservation system for SC was two per cent, 31 per cent for ST and 17 per cent for OBC. After, it has been upgraded into a Central University, the reservation of seat is 15 percent for SC, 7.5 per cent for ST and 27 per cent for OBC (Leisangthem, 2017).
Table 1 A
Students Enrolment in Manipur University Teaching Departments (2015–16)
Course GENERAL SC ST OBC PWD TotalM F T M F T M F T M F T M F T M F
UG 69 72 141 16 8 24 22 28 50 70 76 146 - - - 177 184
PG 268 237 505 77 69 146 473 398 871 383 549 932 4 - 4 1205 1253
Diploma 43 25 68 2 4 6 23 12 35 48 41 89 - - - 116 82
PhD 75 86 161 48 38 86 78 59 137 136 123 259 3 3 6 340 309
Total 455 420 875 143 119 262 596 497 1093 637 789 1426 7 3 10 1838 1828
Grand Total: 3666
Source: Manipur University WebsiteM–Male F–Female T–Total Male and Female
The above table shows the enrolment of students in Manipur University in different level of courses and categories of students both male and female. There are five categories of students ie, General, SC, ST, OBC
and PWD. The grand total of both male and female students enrolled in the academic year 2015-16 is 3666 and there is not much gap in the number of male and female enrolment.
Chapter 10.indd 134 12-11-2021 12:31:03

135Reservation Policy of Government— Issues in Manipur University
Table 1 B
Students Enrolment in Manipur University Teaching Departments (2015–16)
Course GENERAL SC ST OBC PWD Total
M F % M F % M F % M F % M F % M F
UG 141 39 24 7 50 14 146 40 - - 361
PG 505 21 146 6 871 35 932 38 4 0.1 2458
Diploma 68 34 6 3 35 18 89 45 - - 198
PhD 161 25 86 13 137 21 259 40 6 0.9 649
Total 875 24 262 7 1093 30 1426 39 10 0.2 3666
Grand Total: 3666
Source: Manipur University WebsiteMF–Both Male and Female T–Total Male and Female
This table is same as above Table no. 1A but in this table, number of per cent enroled in each categories of students (both male and female) is calculated. The PWD students’ enrolment in UG and Diploma course for the academic session 2015-16 is nil. The percentage of students enroled in OBC category is higher
Table 2 A
Students Enrolment in Manipur University Teaching Departments (2011–12)
Course GENERAL SC ST OBC PWD Total
M F T M F T M F T M F T M F T M F
UG 8 11 19 4 3 7 8 1 9 19 31 50 - - - 39 46
PG 126 167 293 68 95 163 352 190 542 480 668 1148 - - - 1026 1120
Sub Total 134 178 312 72 98 170 360 191 551 499 699 1198 - - - 1065 1166
PhD 175 195 370 51 21 72 77 49 126 130 117 247 - - - 433 382
Total 309 373 682 123 119 242 437 240 677 629 816 1445 - - - 1498 1548
Grand Total: 3046
Source: Manipur University Website M–Male F–Female T–Total Male and Female
than General category of students for all level of courses in the academic year 2015-16. ST category students enroled in UG course is 14 per cent and in PG course is 35 per cent. SC category students enroled in Diploma course is 3 per cent and in Ph.D. course is 13 per cent.
Chapter 10.indd 135 12-11-2021 12:31:03
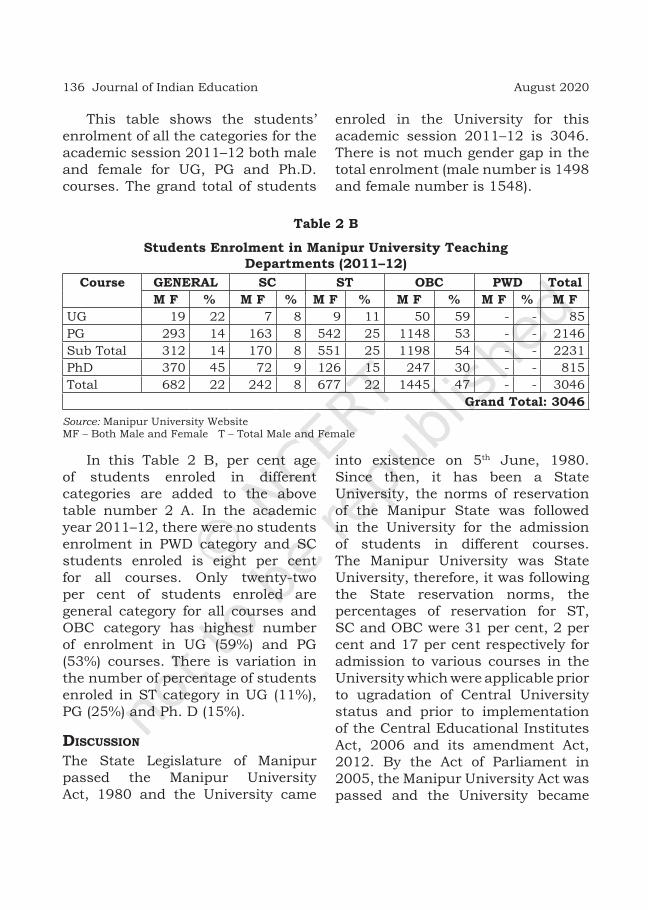
136 Journal of Indian Education August 2020
This table shows the students’ enrolment of all the categories for the academic session 2011–12 both male and female for UG, PG and Ph.D. courses. The grand total of students
enroled in the University for this academic session 2011–12 is 3046. There is not much gender gap in the total enrolment (male number is 1498 and female number is 1548).
Table 2 B
Students Enrolment in Manipur University Teaching Departments (2011–12)
Course GENERAL SC ST OBC PWD TotalM F % M F % M F % M F % M F % M F
UG 19 22 7 8 9 11 50 59 - - 85PG 293 14 163 8 542 25 1148 53 - - 2146Sub Total 312 14 170 8 551 25 1198 54 - - 2231PhD 370 45 72 9 126 15 247 30 - - 815Total 682 22 242 8 677 22 1445 47 - - 3046
Grand Total: 3046Source: Manipur University Website MF – Both Male and Female T – Total Male and Female
In this Table 2 B, per cent age of students enroled in different categories are added to the above table number 2 A. In the academic year 2011–12, there were no students enrolment in PWD category and SC students enroled is eight per cent for all courses. Only twenty-two per cent of students enroled are general category for all courses and OBC category has highest number of enrolment in UG (59%) and PG (53%) courses. There is variation in the number of percentage of students enroled in ST category in UG (11%), PG (25%) and Ph. D (15%).
dIscussIon
The State Legislature of Manipur passed the Manipur University Act, 1980 and the University came
into existence on 5th June, 1980. Since then, it has been a State University, the norms of reservation of the Manipur State was followed in the University for the admission of students in different courses. The Manipur University was State University, therefore, it was following the State reservation norms, the percentages of reservation for ST, SC and OBC were 31 per cent, 2 per cent and 17 per cent respectively for admission to various courses in the University which were applicable prior to ugradation of Central University status and prior to implementation of the Central Educational Institutes Act, 2006 and its amendment Act, 2012. By the Act of Parliament in 2005, the Manipur University Act was passed and the University became
Chapter 10.indd 136 12-11-2021 12:31:03
137Reservation Policy of Government— Issues in Manipur University
a Central University on 3rd October, 2005. In 2006, CEI Act (Reservation in Admission), 2006 was passed and came into implementation in 2007-08. The CEI Act, 2006 and its amendment Act is applicable to the Manipur University for the reservation of seats in the different courses of the University which is governed by the clauses (i), (ii) and (iii) of Section 3 of CEI Act of 2006 which leads to the percentage of reservation for the candidates of SC, ST and OBC at 15 per cent, 7.5 per cent and 27 per cent respectively. The Manipur University being a Central University has been open to all the eligible candidates of the country for admission and norms for reservation of seats provided in part of Section 3 of CEI Act, 2006 is applicable but it is unrealistic to the demographic population of the State. The State of Manipur has a high tribal population, a very small SC population and lower OBC population as compared to all India demographic status. The CEI Act, 2006, seat reservation percentages of ST, SC and OBC are completely different from the actual existing demography of the Manipur. This reservation policy of CEI Act, 2006 and its amendment Act, 2012, completely side-lines the actual needs of the people of Manipur and the students of higher education in Manipur State in particular.
The State Government of Manipur, the Manipur University’s governing bodies and decision-making bodies should understand the demographic reality of the State rather than
following the Central Government reservation norms which creates problems among the students and issues of reservation has always been hampering the academic atmosphere of the University time and again, in 2008 then, in 2016. The reservation issue was started way back from academic session 2008-2009, when the then VC tried to recruit three Guest teachers for History Department according to the Central University reservation norm CEI Act, 2006 (Leisangthem, 2017). The ST students and Tribal Union were protesting against the University for following the CEI Act, 2006 which has deducted the reservation seats for the ST candidates. The reservation problem has been worsening the academic atmosphere of the University since upgradation into Central University status. The Manipur University following the CEI Act, 2006 and the amendment Act, 2012 has created problems among the students due to unrealistic approach of the University without considering the demographic status of the State. It has deprived the rights of tribal students of higher education in the State and as a result they have protested and the University was totally shut down for few weeks in 2016. If Manipur University continues to follow the CEI Act, 2006 and its amendment Act 2012, reservation of number of seats in the admission of different courses, then it will effectively deprive higher education in Manipur University to most of the
Chapter 10.indd 137 12-11-2021 12:31:03

138 Journal of Indian Education August 2020
tribal students in Manipur and nearby regions which also have huge tribal populations. The implementation of reservation policy in accordance with the Manipur University’s central status is primarily incompatible with the ground reality of the State. This need is specifically relevant provided the fact that Manipur University is the main university providing general education to the students of higher education and it has also affiliated 90 Colleges which are existing in Manipur which provides higher education in the State (Leisangthem, 2017).
conclusIon
The Manipur University was established as State University in 1980, since then it has been following State Reservation norms in admission of students. The University has followed the State Reservation Policy of 31 per cent for ST and 2 per cent for SC for admission into various courses of the University, in keeping with the demographic reality of Manipur. Subsequently, the Manipur University was upgraded to Central University status in 2005. In 2006, the Manipur University has to implement the Central Educational Institutions (Reservation in Admission) Act,
2006. This resulted in a reservation distribution that gave 15 per cent for SC, 7.5 per cent for ST and 27 per cent for OBC, as in prevalent in all Central Educational Institutions of the country. The problem with these numbers is that these percentages are completely different from the actual existing demographic reality of Manipur. The population of Manipur is 28.56 lakhs according to the 2011 population census of India. Out of this population, 3.41 per cent is scheduled castes communities, 40.88 percent are of scheduled tribes, 55.71 per cent are other communities (Economic Survey Manipur, 2017). Manipur is a State with a high tribal population and a very small SC population, these new reservation numbers completely side lines the actual needs of Manipuri society in the context of the Manipur University.
Since, education is included in the concurrent list of our constitution, it is the responsibility of both the State Government and Central Government to solve this issue of reservation of seats in the Manipur University. A proper measure to resolve the issue of reservation for long term is the need of the hour.
rEfErEncEs
Basant, R. anD g. sen. 2016. Impact of Affirmative Action in Higher Education for the Other Backward Classes in India. Working Paper Series: Research and Publications. IIM, Ahmedabad.
Cho, e.Y.e. 2014. The Impact of Reservation Policy on Education in India: An Evaluation of Karnataka’s Gram Panchayat Presidency Reservation and Children’s Education
Chapter 10.indd 138 12-11-2021 12:31:03

139Reservation Policy of Government— Issues in Manipur University
Attainment for Scheduled Caste and Scheduled Tribe Household (Masters Dissertation). The Sanford School of Public Policy, Duke University.
DepaRtment of peRsonneL anD tRaining, ministRY of peRsonneL, puBLiC gRievanCes anD pensions. 2013. Nomination of Liaison Officer and Setting up of Reservation Cell in each Ministry for Enforcement of Orders of Reservation in Posts and Services of Central Government. Government of India, New Delhi.
DepaRtment of univeRsitY anD higheR eDuCation. 2003. Report of the Manipur State Higher Education Commission, (Part-II). Government of Manipur.
———. (22nD-23RD oCtoBeR, 2004). A Two-Day Workshop on Higher Education. Government of Manipur.
goveRnment of manipuR, DiReCtoRate of eConomiCs anD statistiCs. 2017. Economic Survey Manipur 2016–2017. Imphal, Manipur.
imphaL fRee pRess. 10 oCtoBeR, 2016. Tribal students leave MU campus in protest. Retrieved from https://www.ifp.co.in/page/items/34863/tribal-students-leave-mu-campus-in-protest/
JangiR, s.K. 2013. Reservation Policy and Indian Constitution in India. American International Journal of Research in Humanities, Arts and Social Sciences. Pp. 126–128.
Leisangthem, B.D. 2011. Problems of Academic Administration in the Institution - A Case Study of Manipur University. Saarbrucken, Germany: LAP LAMBERT Academic Publishing GmbH and Co.KG.
———. 2017a. Development of Higher Education in Manipur. New Delhi: Astral International Pvt. Ltd.
———. 2017B. Organisational Structure of Higher Education in Manipur. Journal of Educational Planning and Administration. New Delhi: Vol XXXI, No. 3. pp 185–202.
mahaJan, g. 2008. Higher Education Reservations and India’s Economic Growth: An Examination. The Centre for International Governance Innovation (CIGI) Working Emerging Economies, Paper No. 36. Waterloo, Ontario, Canada.
manipuR univeRsitY. 2017. Department of Dance and Music. Information Brochure to Admission to BA Dance and BA Music (Hons) 2017–2018. Canchipur, Manipur.
———. 2017. Department of Teacher Education. Information Brochure to Admission to Bachelor of Education (B.Ed.) and Master of Education (M.Ed.) 2017–2018. Canchipur, Manipur.
———. 1980. The Manipur University Act, 1980. Canchipur, Manipur.———. 1997. Minimum Requirements of Infrastructures and General Guidelines for
Introduction of the New Scheme of Studies and Examinations with Effect from 1997, Three Years Degree Course. Canchipur, Manipur.
———. 2003. Prospectus: Bulletin of Information for Admission. Canchipur, Manipur.———. 2005. The Manipur University Act, 2005. Canchipur, Manipur.———. 2008. Prospectus: Bulletin of Information for Admission. Canchipur, Manipur.———. 2017. Prospectus 2017–18, MA/MSc /M.Com/MCA/M. Li Sc. Canchipur, Manipur.———. 2017. Prospectus for Admission to Pre Ph.D. Programme 2017–2018. Canchipur,
Manipur.
Chapter 10.indd 139 12-11-2021 12:31:03

140 Journal of Indian Education August 2020
ministRY of human ResouRCe DeveLopment, DepaRtment of higheR eDuCation. 2014. Reservation Policy for Person with Disabilities- Supreme Court Directions. GoI: New Delhi.
ministRY of Law anD JustiCe, LegisLative DepaRtment. 2007. The Gazette of India: the Central Educational Institutions (Reservation in Admission) Act, 2006. GoI: New Delhi.
———. June. 2012. The Gazette of India: the Central Educational Institutions (Reservation in Admission) Amendment Act, 2012. GoI: New Delhi.
RaJ, s.Y.s. anD p. goKuLRaJa. 2015. An Analysis of Reservation System in India. International Journal of Research. Vol. 2, Issue10.
RathoD, D.g. 2012. Politics of Caste-Based Reservation in India. Review of Research. Vol.1. pp.1–4.
Retna, s.K. 2011. The Reservation System in India- An evaluation of political reservation and poverty reduction (Doctoral dissertation). Georgetown University, Washington, D.C.
the teLegRaph. 14 oCtoBeR, 2016. Students Intensify Protests. Retrieved from https://www.telegraphindia.com/1161014/jsp/northeast/story_113319.jsp
the times of inDia. 13 oCtoBeR, 2016. Tribal students leave campus en masse. Retrieved from https://timesofindia.indiatimes.com/city/imphal/Tribalstudents-leave-campus-en-masse/articleshow/54824951.cms
univeRsitY gRants Commission. 2006. UGC Guidelines for Strict Implementation of Reservation Policy of the Government in Universities, Deemed to be University, Colleges and Other Grants-in-Aid Institutions and Centres. New Delhi.
———. 2008. Relaxation in “Good Academic Record” up to the Graduation Level for SC/ST candidates for the appointment of Lecturer or equivalent post in Universities and Colleges. New Delhi.
———. 2013. Relaxation of Marks, Qualifications/Experience etc. for Schedule Tribe Candidates. New Delhi.
———. 2014. Reservation Policy for Person with Disabilities. New Delhi.———. 2016. Implementation of Reservation Policy in Admission and Appointment. New Delhi.———. septemBeR, 2012. The Central Educational Institutions (Reservation in Admission)
Amendment Act, 2012. New Delhi.
Chapter 10.indd 140 12-11-2021 12:31:03
Private Tuition Industry in India Students’ Perspective
RajendRa PRasad* and anshu KumaRi**
*Assistant Professor, Department of Education, CIE, University of Delhi**Ex-M.Ed Student, Department of Education, CIE, University of Delhi
IntroductIon The historical perspective of tuition witnessed that India had a unique education system. It was social school or Ashram sponsored by the society or kings where everyone was eligible to take education. However, education was prominently limited to family profession. Further, the
AbstractStudents in our country take private tuitions at a large scale that creates social, educational and financial problems for the middle and poor class students. This is an important but ignored section in educational research. This research paper seeks to find out the various forces which pull students to take private tuition outside the school. Students’ perspective was the central point of this research. Descriptive research method was adopted with quantitative approach to investigate the problem. A Five-point Likert Scale on student’s perspective towards private tuition was constructed and standardised. Findings revealed that the school teachers are themselves the key forces to press upon the students to take private tuitions. Factors like tutor’s reputation, friendliness and personal understanding, independency to choose skilled and effective tutor, tuition as guarantee of academic improvement, aspiration for high grades, lengthy syllabus and its non-completion and poor monitoring system in schools etc. attract the students to take private tuitions.
process of education started to distort when few kings engaged private tutors for their kith and kins. The best illustrative example can be picked from the Mahabharata where, Guru Dronacharya was exclusively employed for Kauravs and Pandavs. In ancient times, “A tutor was not merely someone who imparted knowledge to
142 Journal of Indian Education August 2020
his pupils but also responsible for teaching challenges about life, and how to conduct themselves in their society and at the wider front. It was also said that the tutor is a sculptor of souls; an educator and not just a teacher, for it was often the tutor, not the parent, who took care of the child’s education.” (Jon, 2018). During the British rule, this became norm and elites were keeping private tutors for their wards and commoners were going to schools. With the advent of democracy, a sense of equity and equal opportunity had come, even then rich and capable preferred home tuition for their wards as many of them could not give up their self-recognition on being elite. The economic reforms of liberalisation and privatisation had an impact on education sector and private tuition has emerged as business and great market forces now-a-days. The report of NSSO (2015) indicates that 81 per cent students in Tripura and 78 per cent in West Bengal take private tuition whereas one out of four students involved in private tuition at National level. Further, ASSOCHAM (2013) also endorsed similar statistics that about 87 per cent primary school children and up to 95 per cent of high school students received private tutoring in metro cities. Surprisingly, “94.8 per cent students take tuitions of mathematics subject in rural areas whereas; this figure is 88.8 per cent in urban areas (Sujatha, 2014). While talking about duration and joining time of private tuition, 74.06 per cent
students joined in the beginning of the academic session till end (ibid: 7). Actually, no level of education has an exemption from private tuitions. The roots of private tuition have taken place from Nursery-KG to senior secondary education, and even in higher education. As a result, the size of tuition market and revenue is increasing tremendously. The ASSOCHAM report (2013) evidenced that the market size of the private coaching industry, which was about Rs. 1.54 lakh crore in 2013 and assumed that it is likely to touch Rs. 2.6 lakh crore by the end of 2015. Similarly, Gupta (2016) in his article titled “Business of private tutorials in India now a multibillion dollar industry”, reveals that parents of the middle class families spend one-third of their monthly income on private tuitions. More than five lakhs tutors are engaged in private tutoring in Delhi NCR only. Further reports show shocking figures as regards to charges of private tuition that private tutors charge Rs. 1,000 to 4,000 per hour for individual or one to one basis. For group tuition, fee ranges between Rs. 1,000 to 6,000. It is a wonder that 78 per cent of parents spend Rs. 1,000 to 3,000 per month for primary level learners and Rs. 5,000 for secondary level students. Doesn’t the harrowing figure pose a question mark on our mainstream education? Definitely, the success of the private tutors comes out due to inability to provide quality education or failure of mainstream education system.

143Private Tuition Industry in India— Students’ Perspective
Forces behInd PrIvate tuItIon
There emerges few basic questions, ‘Why do parents send their children for private tuition? Are parents not satisfied with the education that students get in schools? Answering these questions is a bit complicated. “Every parent wants to see their child outperform in schools. This is also enhanced by the societal pressure to perform well as everyone feels that once someone gets good marks then the road to success in life will be little smoother” (Sujatha, 2014). This grade aspiration in the Indian education system is being fuelled by the problems related to school education. Providing quality education which considered as a passport to success is the ultimate dream of every parent for their children. Parents are willing to spend disproportionately and beyond the capacity, dominantly in higher economic class and one can understand it that 5 per cent riches in urban India spent almost 29 times of educational expenditure as compared to middle income group in rural India (NSSO, 2015). Parents believe that private tutors try to go beyond and teach what is required for the level of entrance exams. They tend to provide an environment that helps in learning better. Private tutors are accountable for the desired results.
The ASER report (2018) presents very discouraging figures that only 70 per cent students of Class VII can read a text of Class II. Similarly, only 44 per cent students in Class VIII can solve division problems having 3 digit
numbers by 1 digit number correctly. Nationally, in the age group of 14 to 16, only 50 per cent of male students can accurately solve a problem of division in comparison to 44 per cent of female students. These figures are sufficient to understand that status of primary pillars of learning are in the poorest condition. In such case, when students enter in secondary education, they find it difficult to cope with high order of learning. Therefore, in order to reduce examination anxiety and aspiration for extra academic push in such urgency, they have to look towards magical stick like private tuition to excel level of academic achievement.
Under these circumstances, why should parents not send their children for private tuition? Conscious and aware parents will answer the reason for ‘quality education’. But, what is quality education in age of competition? “The simple answer could be to achieve ‘good scores’ in exams” (Jangir, R.K. and Ashok, 2018). The reason behind this affinity for the grades or scores is minimum cut off criteria in most of the competitions. In order to clear this first hurdle, one must score higher grades putting him in the short listing for further scrutiny such as admission into college, scholarship, and job, etc. Thus, a student, is always under constant pressure to score higher grades. In this scenario, students and parents see tuition as a sure shot solution. Unfortunately, with vested interest teachers and

144 Journal of Indian Education August 2020
tuition centres not just exploit but also create a rosy picture to persuade them and many a time create situation in one or the other way, so even those who do not require, are forced to be a part of tuition culture. Nowadays, private tuition emerged as pivotal force out of demand and supply in current education market. (Sujatha, 2014) Teacher is a central point to encourage the private tuition. “Quality of teacher is one of the major factors to surge tuition habit among students” (Shihab and Sultana, 2017). Someone would argue that government school teachers who have been selected out through rigorous competitive examsare considered to be a non-performer as sometimes found to be overworked and overburdened with activities other than teaching which are not accountable for results. Whereas, at the same time, teachers in private schools, except few, are paid less, which could be a major cause of their dissatisfaction. Apart from this, the type of service such as contract, guest or ad-hoc also creates a kind of job insecurity which compels the teachers to make conscious efforts to involve in private tuition to fulfil financial requirements. Here, other questions come into light. Why is it so? Or, what kind of panacea private tutors have? On the basis of that, the tutors declare if the wards do not perform and get expected results, their entire money will be returned. Why do school teachers not declare so? Do the private tutors teach with
more commitment and dedication? Are they more interpretive to explain the concepts and topics? Probably, tutors make the groups according to the level of achievement of the students and diagnose the hard spot or weakness of learning, while in formal education sector all students learn together with less individual attention. Students feel easy and comfortable with tutors to share and express about their learning difficulties. Private tutors teach students according to examination pattern. Tutors assess the issues and help in competitive examinations also. They provide enriched material and train students how to answer smartly to score high grades. It attracts students to take private tuitions. On the other hand, a single teacher has to teach multiple subjects in schools. It makes very difficult to cover the syllabus of multiple subjects that leads to the non-completion of the syllabus within time frame and obviously quality of teaching also deteriorates.
Mainly in the metropolitan cities, there is a trend of tuitions of non-academic subjects like singing, dancing, musical instruments, painting, drawing, martial arts etc. on the name of all round development of child which keeps them occupied and slowly fosters the habit of taking tuition among the students in academic subjects. In case of nuclear families, both mother and father are working to earn the bread and butter. Neither it is possible for father nor for
145Private Tuition Industry in India— Students’ Perspective
mother to pick up the wards from the school which makes difficult to manage both job and schooling of children. In this emergent situation, nuclear families have to look up towards the ‘Private Education Centre’ which provides pick and drop facilities from school to home. These private centres also arrange some means of entertainment to students on the name of the co-curricular activities and provide lunch in the afternoon. They also help the students in completing the homework given by the schools when their mother and father come back from work. The personnel of these private education centres drop the students at their homes in the evening.
What LIterature says At international level, private tuition has been noticed as a global problem. Research studies at international level present contrasting findings that it enhances student’s performance (Cheung, 2013; Khamis, 2012; Kinyaduka, 2014; Dooley, Liu and Yin, 2018; Shihab and Sultana, 2017). But, how can ethical issues related to teachers be ignored? Education is being compromised in public schools (Hartmann, 2008; Kiyaduka, 2014; Melese and Abebe, 2017). Some research findings support to private tuition as student gets individual attention by private tutors (Suleman and Hussain, 2014; Kinyaduka, 2014). Studies also stressed that private tuitions help to keep the pace with peers; it’s more into increasing
competition in academic achievement and create division in society (Azam, 2016). Private tuitions help to extend the social network as students can meet diverse groups from other schools (Khamis, 2012). Similarly, research also points out that private tuitions have benefits but for a short term, in the long run the students’ performance declined with number of years of private tuition (Nam, 2013). In developed countries, where people have abundance of resources and choices. There are certain factors that are still inducing student’s behaviour towards private tuition. A comparative study done by Cheung (2013) in context to Hong Kong, South Korea and Japan shows ‘prevalence in tuition as student wanted to do best in their academics rather than only improve’. Entrich (2019) in his study in Japan talks about ‘how parents and student’s own aspiration influences the decision about private tuition’. In the context of developing countries, Shihab and Sultana (2017) reported that ‘enhanced academic performance is the factor behind increase in Private tuition in Bangladesh’. Similarly, Sujatha (2014) in India emphasises on parental and peer pressure and desire to score more in examination. There is a similarity noticed about the methodology of private tuition in case of Hong Kong and India. It is being offered through companies in Hong Kong (Bray, Way,Lykins and Kwo, 2013). Similarly, in case of India, many private companies

146 Journal of Indian Education August 2020
like BYJU’S, Vedantu, and Bharat Tutors have entered in private tuition market. “Mostly, teachers of developing countries compromise on classroom teaching to increase the revenue from the private tuitions” (Jayachandran, 2014). Actually, the issue of private tuition is widely spread over many disciplines such as sociology, psychology, education, and economics etc. which make it complex and difficult to understand. It shows that private tuition is a complex research area. At international level, private tuitions have been investigated and explained by a diversity in study settings, category, sample, types of teachers, parents and peer pressure, dominancy of parents and students in taking decision, types of school, economy, and pedagogy which make difficult to compare the findings and draw the conclusions in Indian context.
Whereas, at the national level, ASSOCHAM (2013) and NSSO (2015) prepared status reports about private tuition in the country but these reports are only indicators about representation of students who are engaged in private tuition. It does not provide solutions. Research issues related to private tuition is a neglected area at national level. However, some researchers had conducted research taking private tuition problem in India but they had used standardised tool to collect data. (Sharma and Kalia, 2015; Kotaky and Hazarika, 2016; Sripriya and Ramesh, 2017; Chingthem, 2015; Ghoshal, 2018).
Similarly, some studies were done on very small samples which indicate about less generalisation power. (Das and Das, 2013; Sharma and Kalia, 2015; Chingthem, 2015). Therefore, due to this technicality, findings of these studies are under questions. This problem will remain unsolved until we make students part of research. Therefore, exploring students’ varied views and determine forces which are accountable for private tuition, is much crucial and need of the hour to frame policies to overcome the problem of private tuition among the students.
Justification of the StudyPrivate tuition is not a problem of any particular class. It has become a major problem to all classes of the society. Even, many teacher have to send their children to take private tuition. There may be immediate benefits of private tuition but “in the long term it declines when the number of hours of private tuition lengthened” (Liu, 2012). It has been observed that students have to take the private tuition of multiple subjects such as Mathematics, Science (Physics and Chemistry), and language (especially English) in addition to school hours.Further, it is important to note that no policy of Government of India since independence or before independence encourages students for taking private tuitions, yet not only academically poor but also bright students are engaged in private tuitions to excel their academic achievement and pay

147Private Tuition Industry in India— Students’ Perspective
high amount of money. Why is it so? Sometimes, it is out of the capacity of parents to pay huge money for private tuitions that lead to create an imbalance in home budget. Despite heavy expenditure on public education, why do students take private tuition? This study has been done to provide valuable empirical inputs with students’ point of view to policy planners to plan better in a way that private tuition doesn’t get overemphasised over formal education and at same time serve societal needs. Knowing the forces of private tuition, parents would also be able to play their effective role in learning of students.
Operational Definitions of Terms Used Private tuition: It points to shadow education that is held outside school premises in which both students and teachers are engaged in teaching learning process. Tutor assists academically one or more students in particular subject/skill on payment basis.Students’ perspective: It refers to students’ opinion about those forces/factors which compel students to take private tuition outside school premises.
Objectives 1. To study students’ perspective
towards private tuition.2. To study male and female
students’ perspective towards private tuition.
Hypotheses There is no significant difference in male and female students’ perspectives towards private tuition.
Research Design Research method: This study adopted descriptive research method with the quantitative approach to find out students’ perspectives towards taking the private tuition.
Sample and sampling technique: Four hundred students of class tenth were selected by simple random technique from forty secondary schools located in different areas of North Delhi i.e. Model Town, Narela, Alipur, Saraswati Vihar, and Rohini. Further, in order to identify the student’s engagement in private tuition they were asked about it and only those students were included in the research who confirmed that they took private tuition and consented to be part of the research.
Tool UsedDescription of tool: In order to collect the data, a five point Likert rating scale was constructed and standardised by the authors. Private tuition scale consists of total 58 items. It has five dimensions namely Psychological, Social, Academic, Personal, and Administrative. Item analysis was done to secure the discrimination index of every item. Only those items which had significant‘t’value, were included in the final version of scale. The scale was very highly reliable because

148 Journal of Indian Education August 2020
coefficient of reliability of the scale was (0.93) which was computed by the split-half method. The validation of the scale was done with the help of experts. They were requested to rate the items on a 10-point rating scale on the criteria whether each item is able to assess the different dimensions of private tuition for which this rating scale has been framed and only those items were included in the scale which were rated at least 7 or above. Z-score norms were also developed for meaningful interpretation of row scores.
Analysis of DataThe quantitative data collected from secondary school students, were
analysed through different descriptive statistics like Mean and Standard Deviation. Under the inferential statistics, ‘t’-test was applied to test the null hypotheses. Chi-square was used to test the equal probability of frequencies.
Results and DiscussionWith reference to first objective, i.e. to study students’ perspective towards private tuition. The collected data was organised and tabulated according to different dimensions of private tuition, i.e., psychological forces, social forces, personal forces, academic forces, and administrative forces. Dimension wise analysis is presented below.
Table 1
Psychological Forces for Taking Private TuitionS.
No.Item
DescriptionStrongly
Agree Agree Undecided Disagree Strongly Disagree x2
1. Tuition facilitates deep understanding.
31 (7.75%)
174 (43.50%)
131 (32.75%)
50 (12.50%)
14 (3.50%)
238.7*
2. Private tuition helps children to realise their potentials.
32 (8.00%)
178 (44.50%)
87 (21.75%)
98 (24.50%)
5 (1.25%)
223.8*
3. In private tuition, feedback is quick and relevant.
41 (10.25%)
173 (43.25%)
74 (18.50%)
82 (20.50%)
30 (7.50%)
158.9*
4. Tuition is a blessing for those students who shy away from public speaking.
35 (8.75%)
67 (16.75%)
102 (25.50%)
175 (43.75%)
21 (5.25%)
189.8*
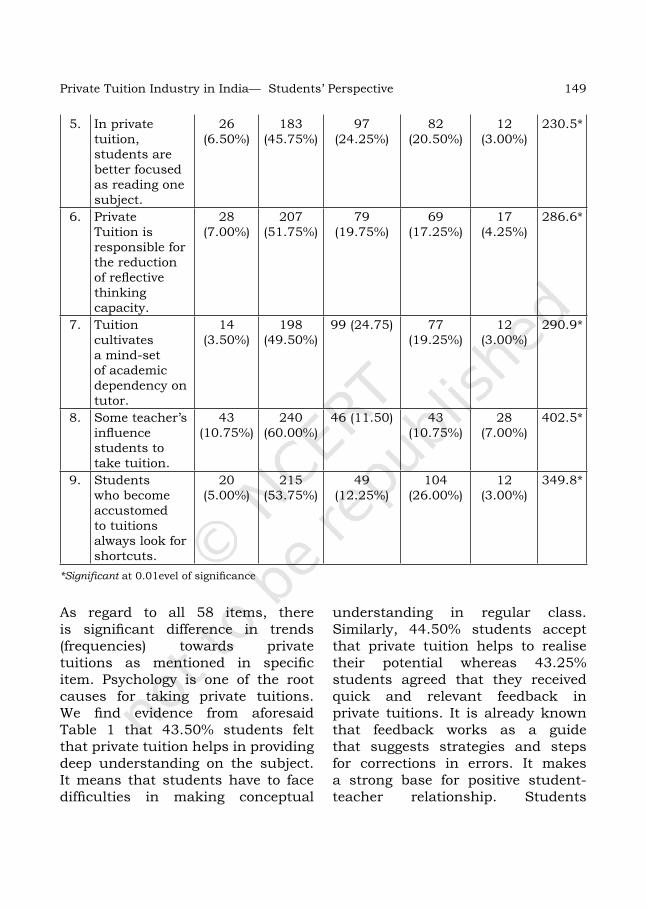
149Private Tuition Industry in India— Students’ Perspective
5. In private tuition, students are better focused as reading one subject.
26 (6.50%)
183 (45.75%)
97 (24.25%)
82 (20.50%)
12 (3.00%)
230.5*
6. Private Tuition is responsible for the reduction of reflective thinking capacity.
28 (7.00%)
207 (51.75%)
79 (19.75%)
69 (17.25%)
17 (4.25%)
286.6*
7. Tuition cultivates a mind-set of academic dependency on tutor.
14 (3.50%)
198 (49.50%)
99 (24.75) 77 (19.25%)
12 (3.00%)
290.9*
8. Some teacher’s influence students to take tuition.
43 (10.75%)
240 (60.00%)
46 (11.50) 43 (10.75%)
28 (7.00%)
402.5*
9. Students who become accustomed to tuitions always look for shortcuts.
20 (5.00%)
215 (53.75%)
49 (12.25%)
104 (26.00%)
12 (3.00%)
349.8*
*Significant at 0.01evel of significance
As regard to all 58 items, there is significant difference in trends (frequencies) towards private tuitions as mentioned in specific item. Psychology is one of the root causes for taking private tuitions. We find evidence from aforesaid Table 1 that 43.50% students felt that private tuition helps in providing deep understanding on the subject. It means that students have to face difficulties in making conceptual
understanding in regular class. Similarly, 44.50% students accept that private tuition helps to realise their potential whereas 43.25% students agreed that they received quick and relevant feedback in private tuitions. It is already known that feedback works as a guide that suggests strategies and steps for corrections in errors. It makes a strong base for positive student- teacher relationship. Students
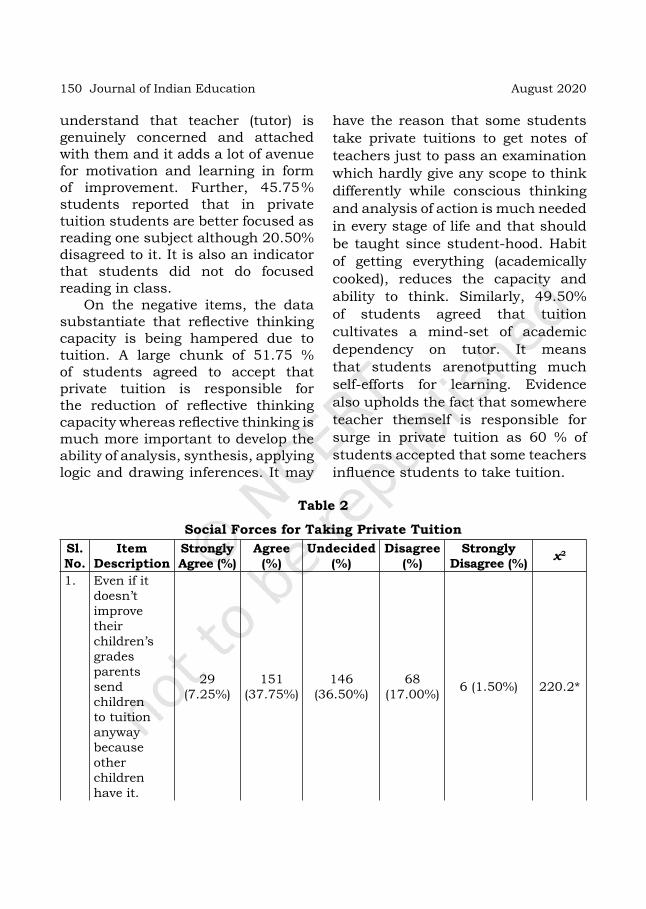
150 Journal of Indian Education August 2020
understand that teacher (tutor) is genuinely concerned and attached with them and it adds a lot of avenue for motivation and learning in form of improvement. Further, 45.75 % students reported that in private tuition students are better focused as reading one subject although 20.50% disagreed to it. It is also an indicator that students did not do focused reading in class.
On the negative items, the data substantiate that reflective thinking capacity is being hampered due to tuition. A large chunk of 51.75 % of students agreed to accept that private tuition is responsible for the reduction of reflective thinking capacity whereas reflective thinking is much more important to develop the ability of analysis, synthesis, applying logic and drawing inferences. It may
have the reason that some students take private tuitions to get notes of teachers just to pass an examination which hardly give any scope to think differently while conscious thinking and analysis of action is much needed in every stage of life and that should be taught since student-hood. Habit of getting everything (academically cooked), reduces the capacity and ability to think. Similarly, 49.50% of students agreed that tuition cultivates a mind-set of academic dependency on tutor. It means that students arenotputting much self-efforts for learning. Evidence also upholds the fact that somewhere teacher themself is responsible for surge in private tuition as 60 % of students accepted that some teachers influence students to take tuition.
Table 2
Social Forces for Taking Private TuitionSl. No.
Item Description
StronglyAgree (%)
Agree (%)
Undecided (%)
Disagree (%)
StronglyDisagree (%) x2
1. Even if it doesn’t improve their children’s grades parents send children to tuition anyway because other children have it.
29 (7.25%)
151 (37.75%)
146 (36.50%)
68 (17.00%) 6 (1.50%) 220.2*

151Private Tuition Industry in India— Students’ Perspective
2. Increase in tuition is due to both parents working.
3 (0.75%) 199 (49.75%)
112 (28.00%)
64 (16.00%) 22 (5.50%) 309.2*
3. Selection of particular subject tuition depends upon friend circle.
39 (10.00%)
197 (49.25%)
102 (25.50%)
45 (11.25%) 17 (4.25%) 263.1*
4. Selection of particular subject tuition depends upon how renowned the tutor is.
40 (10.00%)
193 (48.25%)
118 (29.50%)
34 (8.50%) 15 (3.75%) 276.9*
5. Parents see tuition as investment in child’s future socio economic status.
18 (4.50%)
88 (22.00%)
87 (21.75%)
192 (48.00%) 15 (3.75%) 259.1*
6. Tutors are more friendly and under-standing to students.
17 (4.25%)
166 (41.50%)
97 (24.25%)
113 (28.25%) 7 (1.75%) 225.90*
7. Tuition provides space for group study.
13 (3.25%)
268 (67.00%)
64 (16.00%)
40 (10.00%) 15 (3.75%) 573.9*
8. Private tuition is unfair because it gives rich children advantage over poor children.
27 (6.75%)
185 (46.25%)
85 (21.25%)
95 (23.75%) 8 (2.00%) 240.9*

152 Journal of Indian Education August 2020
9. Tuition contributes towards constraints of the time to interact with parents.
12 (3.00%)
184 (46.00%)
94 (23.50%)
87 (21.75%) 23 (5.75%) 236.7*
10. Tuition is restricting student’s time for fun activities and sports.
26 (7.00%)
180 (45.00%)
117 (29.25%)
67 (16.75%) 8 (2.00%) 242.8*
*Significant at 0.0 level of significance
As regards to Table 2, 37.75% of students were found agreed even if private tuition doesn’t improve grades, parents send their children to take tuitions anyway because other children have it, while merely 17% of them disagreed on it. It shows that there is a tendency of sending children to tuition to be at par with others. Similarly, 49.75% of students agreed that increase in tuition is due to both parents working. Likewise, 49.25 % of students expressed that selection of particular subject tuition depends upon friend circle which indicates that feedback and experience of student to fellow students about particular tutor leaves a good impression. In other words, suggestions of either peers or seniors (friends) play a role of influencer in decision making process about selecting private tutor of particular subject because adolescents influence each other a lot in adolescence period. Even,
sometimes they give more weightage to suggestions of peers over parent’s suggestions’. Further, 48.25 % of students responded that selection of particular subject tuition depends upon how renowned the tutor is. It points that reputation of private tutor is also one of important force for private tuition. Similarly, 41.5 0% of the students agreed that tutors are more friendly and understanding to students. This finding is natural when someone being a teacher behaves like a friend during the teaching-learning process. It gives a comfort zone and removes fear and hesitation from the mind of students which open new avenues to solve various problems associated with learning. It may be the reason that students perceive private tutor as friendly tutor. Further, evidence also upholds the fact that 67% of students agree to the statement that private tuition provides space
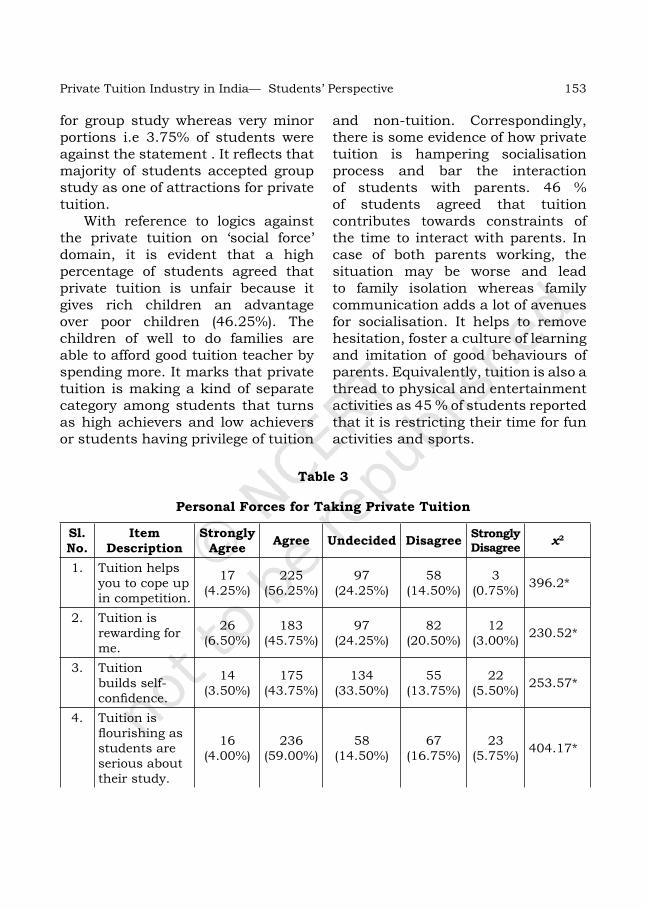
153Private Tuition Industry in India— Students’ Perspective
for group study whereas very minor portions i.e 3.75% of students were against the statement . It reflects that majority of students accepted group study as one of attractions for private tuition.
With reference to logics against the private tuition on ‘social force’ domain, it is evident that a high percentage of students agreed that private tuition is unfair because it gives rich children an advantage over poor children (46.25%). The children of well to do families are able to afford good tuition teacher by spending more. It marks that private tuition is making a kind of separate category among students that turns as high achievers and low achievers or students having privilege of tuition
Table 3
Personal Forces for Taking Private Tuition
Sl. No.
Item Description
Strongly Agree Agree Undecided Disagree Strongly
Disagree χ2
1. Tuition helps you to cope up in competition.
17 (4.25%)
225 (56.25%)
97 (24.25%)
58 (14.50%)
3 (0.75%) 396.2*
2. Tuition is rewarding for me.
26 (6.50%)
183 (45.75%)
97 (24.25%)
82 (20.50%)
12 (3.00%) 230.52*
3. Tuition builds self-confidence.
14 (3.50%)
175 (43.75%)
134 (33.50%)
55 (13.75%)
22 (5.50%) 253.57*
4. Tuition is flourishing as students are serious about their study.
16 (4.00%)
236 (59.00%)
58 (14.50%)
67 (16.75%)
23 (5.75%) 404.17*
and non-tuition. Correspondingly, there is some evidence of how private tuition is hampering socialisation process and bar the interaction of students with parents. 46 % of students agreed that tuition contributes towards constraints of the time to interact with parents. In case of both parents working, the situation may be worse and lead to family isolation whereas family communication adds a lot of avenues for socialisation. It helps to remove hesitation, foster a culture of learning and imitation of good behaviours of parents. Equivalently, tuition is also a thread to physical and entertainment activities as 45 % of students reported that it is restricting their time for fun activities and sports.

154 Journal of Indian Education August 2020
5. Parent education level and lack of subject knowledge contributes in increase in tuition.
26 (6.50%)
186 (46.50%)
100 (25.00%)
81 (20.25%)
7 (1.75%) 248.52*
6. Aspirations of higher grades in examination contribute to increased tuition.
25 (6.25%)
215 (53.75%)
69 (17.25%)
57 (14.25%)
34 (8.50%) 300.2*
7. Selection of particular subject tuition depends upon the proximity of tuition centre.
25 (6.25%)
195 (48.75%)
78 (19.50%)
84 (21.00%)
18 (4.50%) 251.425*
8. Tuition pressurises to finish the work.
18 (4.50%)
201 (50.25%)
106 (26.50%)
50 (12.50%)
25 (6.25%) 288.57*
9. Private tuitions help to prepare well for competitive examinations.
20 (5.00%)
24 (56.00%)
111 (27.75%)
42 (10.50%)
3 (0.75%) 408.37*
10. In private tuition lessons could be customised as per individual need.
36 (9.00%)
209 (52.25%)
83 (20.75%)
59 (14.75%)
13 (3.25%) 293.95*
11. Private tuition grants opportunity to choose effective and skilled teacher.
14 (3.50%)
220 (55.00%)
65 (16.25%)
94 (23.50%)
7 (1.75%) 371.32*

155Private Tuition Industry in India— Students’ Perspective
12. The tuition centre encourages group discussions, unlike conventional class where talking is not allowed.
38 (9.50%)
208 (52.00%)
88 (22.00%)
57 (14.25%)
9 (2.25%) 297.27*
13. Tuition works as a remedial program for a student who learns at their own pace.
26 (6.50%)
170 (42.50%)
114 (28.50%)
68 (17.00%)
22 (5.50%) 196*
14. Tuition is not helpful, even harmful.
9 (2.25%)
81 (20.25%)
97 (24.25%)
194 (48.50%)
19 (4.75%) 275.6*
15. Teacher’s unwillingness to take extra classes lead to surge in tuition trend.
19 (4.75%)
155 (38.75%)
97 (24.25%)
81 (20.25%)
48 (12.00%) 133.25*
16. Private tuition is not the best way of learning for individual students.
12 (3.00%)
66 (16.50%)
74 (18.50%)
225 (56.25%)
23 (5.75%) 364.12*
17. Private tuition is an outcome of stress on result oriented performances.
5 (1.25%)
88 (22.00%)
86 (21.50%)
97 (49.25%)
24 (6.00%) 281.87*
*Significant at 0.0 level of significance
As far as ‘personal’ forces for taking private tuition are concerned it is evident from Table 3, that students agreed that it helps to cope up in competition (56.25%), builds
self-confidence (43.75%), tuition is flourishing as students are serious about their study (59%) and parent education level and lack of subject knowledge, contributes in increase

156 Journal of Indian Education August 2020
in tuition (46.50%). It points that in those cases where a child is a first generation learner or parents lack specific subject knowledge, tuition may be a forced choice to fill the void. Further, students also agreed that aspirations of higher grades in examination contribute to increased tuition (53.75%) and only 14.25 % disagreed and 8.50% strongly disagreed to it. It is because that in our education system and society, those students who secure higher grades are considered as achievers and successful. Moreover, students do not get help for competitive examinations in regular class as students agreed that tuitions help to prepare well for competitive examinations (56%), pressurises to finish the work (50.25%), and even in private tuitions, lessons could be
customised as per individual needs (52.25%). Likewise, facts indicate about very highlighting point that private tuition grants opportunity to choose effective and skilled teacher (55%) while merely 1.75% strongly disagree to it. Students also agreed that private tuition works as a remedial program for a student who learns at their own pace (42.50%).
As regard to rationales against private tuition on personal forces, a high percentage of students disagreed that tuition is not helpful, even harmful (48.50%) and private tuition is not the best way of learning for individual student (56.25%). Whereas, data also substantiate about stunning fact that students agreed that teacher’s unwillingness to take extra classes lead to surge in tuition trend (38.75%).
Table 4
Academic Forces for Taking Private TuitionSl. No.
Item Description
Strongly Agree Agree Undecided Disagree Strongly
Disagree χ2
1. School teachers pay less attention as they know that student take tuition.
17 (4.25%)
196 (49.00%)
70 (17.50%)
103 (25.75%)
14 (3.50%) 280.12*
2. Students pay less attention in class as they know that tuition teacher will cover the syllabus.
28 (7.00%)
148 (37.00%)
119 (29.75%)
96 (24.00%) 9 (2.25%) 176.82*
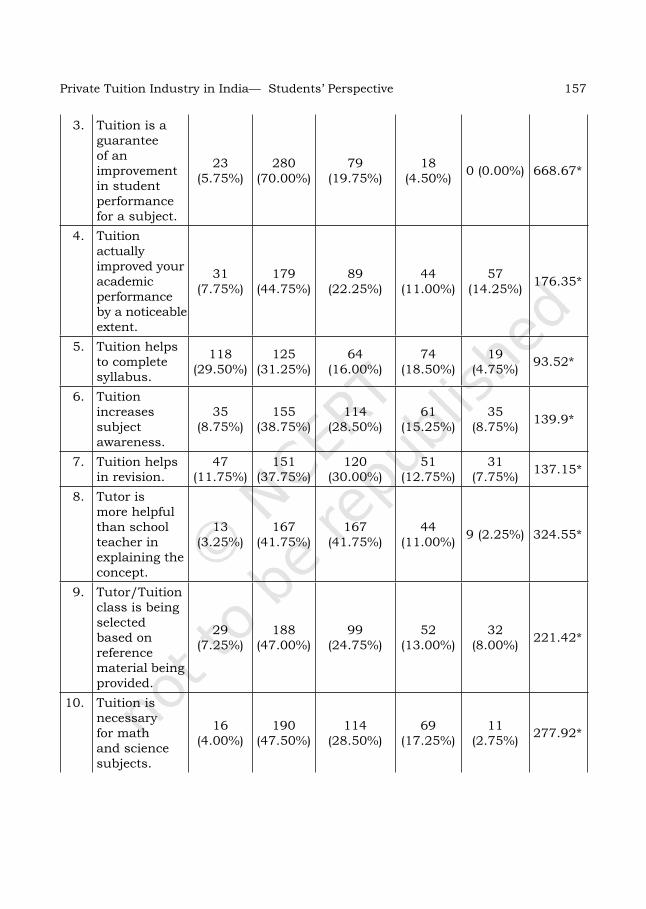
157Private Tuition Industry in India— Students’ Perspective
3. Tuition is a guarantee of an improvement in student performance for a subject.
23 (5.75%)
280 (70.00%)
79 (19.75%)
18 (4.50%) 0 (0.00%) 668.67*
4. Tuition actually improved your academic performance by a noticeable extent.
31 (7.75%)
179 (44.75%)
89 (22.25%)
44 (11.00%)
57 (14.25%) 176.35*
5. Tuition helps to complete syllabus.
118 (29.50%)
125 (31.25%)
64 (16.00%)
74 (18.50%)
19 (4.75%) 93.52*
6. Tuition increases subject awareness.
35 (8.75%)
155 (38.75%)
114 (28.50%)
61 (15.25%)
35 (8.75%) 139.9*
7. Tuition helps in revision.
47 (11.75%)
151 (37.75%)
120 (30.00%)
51 (12.75%)
31 (7.75%) 137.15*
8. Tutor is more helpful than school teacher in explaining the concept.
13 (3.25%)
167 (41.75%)
167 (41.75%)
44 (11.00%) 9 (2.25%) 324.55*
9. Tutor/Tuition class is being selected based on reference material being provided.
29 (7.25%)
188 (47.00%)
99 (24.75%)
52 (13.00%)
32 (8.00%) 221.42*
10. Tuition is necessary for math and science subjects.
16 (4.00%)
190 (47.50%)
114 (28.50%)
69 (17.25%)
11 (2.75%) 277.92*

158 Journal of Indian Education August 2020
11. Tuition is necessary for students who are poor in studies.
18 (4.50%)
195 (48.75%)
96 (24.00%)
56 (14.00%)
35 (8.75%) 249.07*
12. In private tuition lots of practice helps in academic performance.
24 (6.00%)
215 (53.75%)
90 (22.50%)
60 (15.00%)
11 (2.75%) 332.77*
13. Tuition focuses on scoring more in upcoming exams rather than upgrading subject knowledge.
29 (7.25%)
185 (46.25%)
73 (18.25%)
95 (23.75%)
18 (4.50%) 221.8*
14. In tuition one gets a readymade answer for the examination.
19 (4.75%)
194 (48.50%)
97 (24.25%)
81 (20.25%) 9 (2.25%) 275.6*
15. Tuition grants better scope of revision and practice to students in comparison to school.
35 (8.75%)
220 (55.00%)
103 (25.75%)
31 (7.75%)
11 (2.75%) 366.45*
16. Tuition is not necessary for Social science subjects.
32 (8.00%)
54 (13.50%)
98 (24.50%)
193 (48.25%)
23 (5.75%) 241.52*
17. In tuition one is expected to memorize the topic not to explore.
11 (2.75%)
69 (17.25%)
119 (29.75%)
190 (47.50%)
11 (2.75%) 290.8*
18. Tuition cannot be substitute to school.
11 (2.75%)
61 (15.25%)
88 (22.00%)
210 (52.50%)
30 (7.50%) 307.32*
*Significant at 0.0 level of significance

159Private Tuition Industry in India— Students’ Perspective
Table 4 shows that 49 % of students responded that school teachers pay less attention as they know that students take tuition. It is simply about strategies of school teachers to attract students for tuition. Furthermore, 37 % of students accepted that they themselves pay less attention in class as they know that tuition teacher will cover the syllabus in private tuition which hints that private tuition is making students to be non-serious, careless and divert mind from meaningful learning in regular classes. Regular school class is just a formality to pass a school day. It indicates that due to private tuition neither school teachers nor students are sincere about teaching-learning in regular school classes. Further, students had viewed stunningly that tuition is a guarantee of an improvement in student performance for a subject (70%) while only (4.50%) disagreed to it. It points to student’s belief system that tuition can help in achieving success that lead to progression. Alike, 44.75% of students agreed that tuition actually improved academic performance by a noticeable extent, though only 14.25% strongly disagreed to it. Further, 29.50% of students were found to be strongly agreed and 31.25% agree that tuition helps to complete the syllabus. It messages that teacher do not complete the syllabus in school which may force students to think to take private tuition to complete the syllabus. Furthermore, 38.75% of students
agreed that tuition increases subject awareness, tuition helps in revision (37.75%), tutor is more helpful than school teacher in explaining the concept (41.75%), tutor/tuition is being selected based on reference material being provided (47%). Similarly, 47.50% students agreed that tuition is necessary for math and science subjects whereas only 2.75% strongly disagreed to it. Tuition is necessary for students who are poor in studies (48.75%). In addition, the practice is one of the invitations for tuition as (53.75%) students agreed that in private tuition lots of practice helps in academic performance while only 2.75 % strongly disagreed to it. In the same way, aspiration towards high scoring also pulls to tuition, it is evident that 46.25% students agreed that tuition focuses on scoring more in upcoming exams rather than upgrading subject knowledge. In tuition, one gets readymade answer for the examination (48.50%).
Whereas, on the negative items of ‘academic components’ of private tuition, students disagreed that tuition is not necessary for Social Science subjects (48.25%). Similarly, 47.50% students disagreed that in tuition, one is expected to memorise the topic, not to explore it. Further, a large chunk, 52.50 % of students was found to be disagreeing that tuition cannot be a substitute to school. It means that students take tuition to be similar to school and develop wrong perception about school due to private tuition.

160 Journal of Indian Education August 2020
Table 5
Administrative Forces for Taking Private Tuition
Sl. No. Item Description Strongly
Agree % Agree % Undecided %
Disagree %
Strongly Disagree
%χ2
1.Syllabus is too wide to be covered in school time alone.
24 (6.00%)
226 (56.50%)
90 (22.50%)
55 (13.75%) 5 (1.25%) 385.03*
2.
Teaching learning environment is very much favourable for me in tuition.
46 (11.50%)
174 (43.50%)
117 (29.25%)
63 (15.75%) 0 (0.00%) 225.63*
3.
Attendance in Private tuition is more important than school.
35 (8.75%)
103 (55.00%)
103 (25.75%)
31 (7.75%) 11 (2.75%) 366.45*
4.
Private Tuition is spreading as school is not interested to monitor teachers.
13 (3.25%)
101 (48.75%)
101 (25.25%)
71 (17.75%) 20 (5.00%) 272.95*
*Significant at 0.0level of significance
It is evident from Table 5 that 56.50 % of students agreed that syllabus is too wide to be covered in school time alone followed by teaching learning environment is very much favourable for them in tuition (43.50%), and attendance in private tuition is more important than
Table 6
Gender Difference in Students’ Perspectives towards Private Tuition
N Mean SD df t-value
Male 318 189.31 21.30398 0.68
Female 82 191.1 21.028
school (55%) Surprisingly, 48.57% of students reported that private tuition is spreading as school is not interested to monitor teachers. It is a question mark on administrative accountability of administrators of schools.

161Private Tuition Industry in India— Students’ Perspective
As regard to gender difference, it is evident from table, that mean and SD values of male and female students’ perspectives towards private tuition are (189.31, 191.1) and (21.30, 21.028) respectively. The mean value (191.1) of female students’ perspectives towards private tuition is not significantly greater than the mean value (189.31) of male students for df 398 at 0.01 level of significance. Therefore, the null hypothesis “There is no significant difference in male and female students’ perspectives towards private tuition” is accepted. Hence, it can be concluded that gender does not create any significant difference in students’ perspectives towards private tuition.
dIscussIon and concLusIon While investigating the issue of private tuition, findings highlights certain dominant forces which surge the tuition habits among the students. Surprisingly, same school teachers were found as key force because some school teachers deliberately influence students to take private tuition. However, it is against the teacher’s code of ethics. Similar findings have been endorsed by other researchers that private tutors treat students and parents strategically to keep them impressed to take private tuition (Sujatha, 2014; Das and Das 2013). Deep understanding and quick feedback were also good psychological forces for private tuition. Further, Sulemann and Hussain (2014) confirmed in
their research that private tuition is effective in raising motivation level of students. In case of social forces, both parents working, friends’ circle, tutors’ reputation, tutors to be friendly and personal understanding and opportunity to group study were dominant forces to attract students to take private tuition. These findings are consistent with findings of Khamis (2012) who found that private tuition helps to extend the social network as students can meet with diverse group from other school. Whereas under the person forces, preparation for competition, parents’ lack of subject knowledge, aspiration for high grades, individual needs, independency to choose skilled and effective tutor, remedial interventions in tuition and unwillingness of school teacher to take extra classes, were accountable for private tuition. Similarly, due to academic reasons such as less attention by teachers towards students, tuition as guarantee of academic improvement, revision and practice intuition, good explanation of concepts, facility of reference material, helps in completing syllabus, students’ poor status of academic achievement, and readymade answers for cracking exams, mainly invite students to take private tuition. It is important to note that mostly students reported that tuition is necessary for math and science subjects that indicate about poor teaching inschoolsfor mathematics and science subjects. Sujatha (2014) also reported similar

162 Journal of Indian Education August 2020
findings in her survey that students take private tuition 90.4% in maths and 84.8% in science subjects. In case of administrative forces, like priority of attendance in private tuition, wideness of syllabus and its non-completion within time frame and poor monitoring system in schools, also encourage private tuition culture among the students. These findings were also supported by Azam (2015), Kiyaduka (2014), Melese and Abebe (2017), Hartmann (2008).
In view of the above findings and discussion, it can be asserted if appropriate actions are not taken timely to limit private tuition, that the size of the tuition industry will spread at large scale in future. Subsequently, not only the budget management of middle class families will be messed up largely but will also create a serious gap between the students of poor and rich families. Middle and poor class families will feel depressed on their inability to send their sons/daughters to private tuition due to the financial crisis. Further, private tuition is a great threat to the constitutional provision of ‘equality and equity’. Not only private tuition kills the students’ leisure time but also restricts the students to involve in the sports activity which negatively affects physical health of the students. Private tuition also prohibits the students to interact with parents because it hardly leaves time to talk and discuss with parents after attending school and private tuition. Additionally, students have
to complete the homework given in school and private tuition. Hence, gradually, socialisation process of the students also hampers. Private tuition also interferes with the freedom of students to participate in the community work and limit the interaction with siblings or neighbours. Moreover, this study has the evidence that private tuition mar the reflecting thinking capacity of students. Hence, private tuition is necessary evil in our society and education system. But, there is a question, what is the solution? All the stakeholders of the education system such as policy planners, educational administration, teachers and parents must be accountable. First, policy planners are required to frame remedial teaching policy at national level to excel the academic achievement of academically poor students. Second, however, the success of remedial teaching is dependent on effective and compulsory internal monitoring system by educational administration. Members of School Management Committee and Parent Teacher Association should be a part of this monitoring system. Third, it has been found through the review of related literature and this study that poor handling of students or compromised teaching in schools, was one of the factors responsible for increase in private tuition. Therefore, teachers should be trained about conducting constructive teaching because constructive teaching makes learners active rather than

163Private Tuition Industry in India— Students’ Perspective
passive. Learners self-construct the knowledge in their cultural and social environment. Students themselves develop layout of the experiment, formulate, test, process, conduct the experiment, infer, conclude and interpret the results and draw conclusions. Students also validate and verify the idea and modify own old knowledge. Experiential learning is much more important rather than feeding of content into empty bottles with the superfluous knowledge. Constructivism follows learner centered approach teaching that encourage cooperative learning, inquiry, debate, discussion, and sharing of thoughts among the students. Teacher is the leader of democratic learning group in place of controller of the class. In other words, the teacher is the facilitator of knowledge construction under the constructive teaching. Thus, quality teaching based on constructive approach is very much significant
to avoid the evils of private tuition. Fourth, in order to change the psychology of both students and parents, they should be counselled that private tuition is not guaranteed to excel the academic achievement. Private tuition not only breaks all round development and education of students but also nurtures the mind-set of dependency and fosters the rote learning that increase the possibility of restricting the flow of critical thinking. Further, although schools are not responsible for training to pass competitive examinations yet in the age of the competition, it cannot be ignored. Therefore, there is a need to debate and discourse in academia. Can we establish link with board and competitive examinations to short out the problem? What type of pattern should be followed? Therefore, researchers need to explore the answers of these questions in further research.
reFerences
aseR CentRe. 2018. Annual Status of Education Report. New Delhi. Retrieved from www.asercentre.org
azam, m. 2016. Private Tutoring: Evidence from India (Discussion Paper No. 8770). Retrieved from http://ftp.iza.org/dp8770.pdf
BRay, m., d. Wang., C. LyKins and O. KWO. 2013. The effectiveness of private tutoring: Students’ perception in comparison with mainstream schooling in Hong Kong. Retrieved from https://www.researchgate.net/publication/257788733_The_effectiveness_of_private_tutoring_Students’_perceptions_in_comparison_with_mainstream_schooling_in_Hong_Kong#read
Cheung, s. 2013. Private Tutoring of Students in Hong Kong. Youth Hong Kong. Vol. 5. pp. 39–41. Retrieved from https https://yrc.hkfyg.org.hk>sites PDF

164 Journal of Indian Education August 2020
Chingthem, t. 2015. Attitude of parents towards private tuition: a case study. Voice of Research. Vol. 6. Retrieved fromwww.voiceofresearch.org
das, g.C. and R. das. 2013. An Empirical View on Private Tutoring in School Mathematics of Kamrup District. International Journal of Scientific and Research Publications, 3. Retrieved from https://www.ijsrp.org
dOOLey, K., L.L. Liu and y.m. yin. 2018. Supplying private tuition: Edu-business and Asian migration in Australia. Studies in the Cultural Politics of Education. doihttps://doi.org/10.1080/01596306.2018.1461063.
entRiCh, R.s. 2015. The Decision for Shadow Education in Japan:Students’ Choice or Parents’ Pressure? Social Science Japan Journal. Vol. 18, No. 2. pp. 193–216. Retrieved from https://academic.oup.com/ssjj/article/18/2/193/1623097
ghOshaL, t. 2018. Role performance of private tutors and school teachers with regard to their quality of instruction, mode of behaviour, sincerity and subject knowledge. International Journal of Current Research. 10, 74364–74367. Retrieved from www.journalcra.com
guPta, s. 2016, juLy. Business of private tutorials in India now a multi-billion-dollar industry. Businessworld. Retrieved from http://www.businessworld.in/article/Business-Of-Private-Tutorials-In-India-Now-A-Multi-Billion-Dollar-Industry/28-07-2016-100972/
haRtmann, s. 2008. The informal market of education in Egypt: private tutoring and its implications. Institut für Ethnologie und Afrikastudien. Working Paper, 88. Retrieved from https://www.blogs.uni-mainz.de/fb07-ifeas/files/2019/07/AP88.pdf
jangiR, R.K. and ashOK. 2018. The Parallel market for education in India: In context of Private Tutoring. International Journal of Applied Social Science. Vol. 5, No. 11. pp. 1957–1964
jayaChandRan, s. 2014. Incentives to teach badly: After-school tutoring in develop-incountries. Journal of Development Economics. Vol. 108. pp. 190–205. doi:http://dx.doi.org/10.1016/j.jdeveco.2014.02.008 .
jOn. 2018. The history of private tuition [Blog post]. Retrieved from http://www.superprof.blog/tutoring-past-and-present.
Khamis, a.m. 2012. Assessing Stakeholders Perceptions on Private Tuition in Zanzibar (Master’s thesis). Retrieved from https://scholarworks.umass.edu/cie_capstones (uma.cie.capstones.1017)
KinyaduKa, K.d. 2014. Private tutoring: A critical analysis of world experiences. Merit Research Journal of Education and Review. Vol. 2, No. 8. pp. 135–140. Retrieved from https://meritresearchjournals.com
KOtaKy, R. and m. hazaRiKa. 2016. Private Tutoring at the Secondary level in Assam. IOSR Journal of Research and Method in Education. Vol. 6. pp. 19–25. Retrieved fromhttps://www.iosrjournals.org.
Liu, j. 2012. Does cram schooling matter? Who goes to cram schools? Evidence from Taiwan. Retrieved from https://www.sciencedirect.com/science/article/pii/S0738059311000150?casa_token=sa7E7pDDPxYAAAAA:gubFpgtqluyE5XcutJFObNY_VC45TqumfBXFE3cgz8ygOSKgWY_2NKl1nwB3b9yzNQOERnXFSgtV.
meLese, W. and m. aBeBe. 2017. Demand and supply of supplementary private tutoring in upper primary schools of Ethiopia. International Online Journal of Educational Sciences. Vol. 9, No. 3. pp. 629–640. Retrieved fromhttp://mts.iojes.net

165Private Tuition Industry in India— Students’ Perspective
nam, s.j. 2013. The Relationship between Private Tutoring and Academic Achievement —An Application of a Multivariate Latent Growth Model. International Journal of Human Ecology. Vol. 14. pp. 29–39.doi: 10.6115/ijhe.2013.14.1.29
nssO. 2015. Key Indicator of social consumption in India: Education. 71st round survey. Ministry of Statistics and Program Implementation Government of India. Retrieved from www.mospi.nic.in>nss_rep_575
shaRma, s. and a. K. KaLia. 2015. A study of attitude of parents towards private tuition at senior secondary level, Rohtak. International journal of applied research. Vol. 1, No. 8. pp. 722–725. Retrieved fromwww.allresearchjournal.com.
shihaB, R. sK. and n. suLtana. 2017. Sensing the Necessity and Impacts of Private Tuition in English among Secondary Students in Khulna, Bangladesh. Global Journal of Human-Social Science. Vol. 17. Retrieved from https://globaljournals.org.
sRiPRiya, s. and R. Ramesh. 2017. Attitude towards private tuition among selected 10th standard and 12th standard students. International Journal of Advanced Research and Review, Vol. 2, No. 6. pp. 76–79. Retrieved fromwww.ijar.in
sujhata, K. 2014. Private tuition in India: trends and issues. Centre international d’études pédagogiques. Retrieved from http://journals.openedition.org/ries/3913
suLeman, Q. and i. hussain. 2014. Effects of Private Tuition on the academic achievement of secondary school students in subject of mathematics in Kohat division, Pakistan. Journal of Education and Learning. Vol. 8, No. 1. pp. 29–40. Retrieved from www.macrothink.org.
On Students’ Well-being in the Indian Context
A Review
*Junior Project Fellow, Department of Educational Psychology and Foundations of Education, NCERT, New Delhi
**Professor, Department of Educational Psychology and Foundations of Education, NCERT, New Delhi.
IntroductIon
In this context, it comes as a necessity to explore the dimension of well-being. How people evaluate their lives is referred to as psychological well-being. There are two different types of views—hedonic and eudaimonic perspectives (Tennant et al. 2007). There are two approaches to hedonic well-being which are concerned with
Vineet Gairola* and Prabhat Kumar mishra**
AbstractThe aim of this review paper is to understand and theorise different researches in the field of student well-being in the Indian context. The field of education and schooling are the doorways to realising one’s potential to the fullest. However, behavioural and psychological problems in students continue to increase. Educationists, counselors, researchers, and teachers need a feasible approach to create a facilitating environment for the students engaged in teaching-learning process. This paper will focus on how mental health and students’ well-being are connected. Helpful interventions related to students’ well-being will be discussed. Researches on how gender, school climate, self-esteem, meaning making process, emotional intelligence, and academic achievement relate to psychological well-being will be explored.
the immediate states of pleasure and happiness. On the other hand, eudaimonic well-being relates to actualisation of human potentials (Ryan and Deci, 2001). Hedonic well-being in contemporary understanding is referred to as subjective well-being (SWB), which comprises life satisfaction, the presence of positive mood, and the absence of negative

167On Students’ Well-being in the Indian Context— A Review
mood (Ryan and Deci, 2001). Similarly, eudaimonic well-being is referred to as psychological well-being (PWB). It comprises autonomy, personal growth, self- acceptance, life purpose, mastery, and positive relatedness (Ryff and Keyes,1995).
Well-being has been defined as “fundamental to the quality of life and productivity of individuals, families, communities and nations, enabling people to experience life as meaningful and to be creative and active citizens” (World Health Organisation (WHO), 2005). What constitutes as well-being has been apart of quite alot debate for along time. Different dimensions of well-being have been identified. The dimensions identified by researchers are: confidence, usefulness, interest in life, problem solving, autonomy, positive relationships, thinking clearly and creatively, energy, happiness, and optimism (Tennant et al., 2007). Twelve dimensions of psychological well-being have also been identified by Bhogale and Jai Prakash (1995). These are meaninglessness, somatic symptoms, self-esteem, positive effect, daily activities, life satisfaction, suicidal ideas, personal control, social support, tension, wellness, and general efficiency.
Psychological well-being of students is under threat in modern times due to fast pace lifestyle and societal pressure. There is a need to strengthen this crucial stage by providing quality interventions and focusing holistically, which would help in the overall development of
adolescent students. They can benefit by acquiring the knowledge, attitudes, values, and skills in a variety of ways which will improve their scholastic performance. Enhancing skills among students will enable them to make informed choices and responsible decisions related to their health and well-being. Healthy and well-adjusted students of today will become the productive citizens and empathic leaders of tomorrow.
dynamIcs of student Well-beIng
One of the major theorisations related to well-being was done by Bradburn (1969), who stated well-being is ‘happiness’. He referenced that whether an individual will be high or low in psychological well-being relies upon what is in abundance—positive or negative effect (Bradburn, 1969).
The six components of well-being have been recognised—self acceptance, environmental mastery, positive relationships, autonomy, purpose in life, and personal growth (Ryff, 1989). Throughout the schooling life, be it being in primary school or secondary school, well-being plays a critical role. It serves as a key factor for emotional stability and scholastic process (Gutman and Vorhaus, 2012). Along these lines, it is not something which is out of the blue—it colours entire fabric of students’ scholastic experience. This results in schools being inclusive. There are two standpoints to look at well-being. One is “the view that wellbeing consists of pleasure or

168 Journal of Indian Education August 2020
happiness” and the other is the idea that “wellbeing consists of fulfilling or realising one’s true nature” (Ryan and Deci, 2001).
Well-beIng of IndIan students
Stress, anxiety, well-being and mental healthWhat is the most prominent factor in determining stress experienced by students in the academic settings? Saha and Mishra (2016) investigated the impact of stress on the students of Kendriya Vidyalaya, Bareilly. A sample of 200 students studying in 10th-12th was taken. It was uncovered that 81 per cent of the students found expectations from significant others and parents to be stressful. It was seen as the most perceptible factor of stress and worry in students.
Mental health and educational adjustment of school students were investigated by Malathi and Rajeshwar (2018). Findings showed that school adjustment of students depended upon their gender, class in which they were studying, parental occupation, and school management. Academic adjustment was observed to be better in schools founded by government. However, emotional adjustment was found higher in students from English and privately managed schools (Malathi and Rajeshwar, 2018).
A longitudinal study for three years with children and adolescents aged 4–11 years was carried out
by Malhotra, Kohli, Kapoor, and Pradhan (2009). It showed incidence of child and adolescent psychiatric disorder to be eighteen thousand per year. Pattanayak and Mehta (2012) in their investigation identified how the prevalence rate of depression, which in childhood was found to be around 1–2 per cent increases dramatically to 10–20 per cent by late adolescence. Sharma, Vijay, and Chaturvedi (2008) noted how suicidal ideation and attempts can be seen more in females as compared to male adolescents. It was seen that 4–16 per cent adolescents have suicidal ideation and suicide attempt have been made by 0.4–5 per cent.
These statistics indicate that there is a growing need for critical research along with palpable and substantial interventions which would benefit student well-being.
Anxiety and academic achievements are closely entwined to one another. Akhtar (1978) elucidated how there is a negative correlation between anxiety and academic achievements. What is fascinating is that adolescents who are academically sound use problem focused coping strategy and on the other hand, adolescents who are relatively less competent are inclined towards the use of emotion focused coping strategies (Rath and Nanda, 2011). This tells us that thought processes and actions are closely related to each other.
Stressful life events are associated with low psychological well-being

169On Students’ Well-being in the Indian Context— A Review
(Bhatti and Channabasavanna, 1985). Psychological well-being is influenced by academic stress. Urban adolescents are high in scholarly tension as compared to rural adolescents (Kohli and Malik, 2013). The underlying root cause in experience of high stress levels in Indian students is precisely because of examination system, the way exams are carried out. Stress faced during exam time can prompt anxiety and depression for which they are taken to counselors and even psychiatric assistance (Garg, 2004).
Higher numbers of stressful events are experienced by psychologically distraught boys and girls as compared to boys and girls with balanced orientation (Patel, Shah, Patel, Tilwani, and Vankar, 1998). Events which are experienced as stressful and unpleasant increase the ideation towards being depressed (Mohanraj, Subbhiah and Watson, 2010).
One of the core mental health dimensions is adjustment and good adjustment is straight forwardly related to improved academic achievement (Mohan and Gulati, 1986). Similar findings were indicated by Devi (1982). This demonstrates that well-being of students is legitimately interwoven with their academic outcomes and adjustment.
The above-mentioned researches indicate that expectations from parents and significant others are the prominent factors which causes stress among students. School adjustment of students depended
upon their gender, class in which they were studying, parental occupation, and school management. Focusing on the students and improving their holistic well-being would be productive not just at the individual level—the overall productivity of the schooling institutions would improve as well.
The above-mentioned findings will help in developing a better understanding about the impact of mental health factors like stress and anxiety among adolescent students.
Based on the findings of the above mentioned studies, an intervention plan can be developed to reduce academic stress which would further improve academic performance. Moreover, researches on the impact of yoga and stress would channelise new theorisations to understand the dimension of well-being. Adaptation problems experienced by school- going adolescents need to be carefully examined further to ease the students from various stressors thus, fostering a facilitating environment.
Helpful InterventIons related to student Well-beIng
The life skill approach model developed by Bharat and Kumar (2010) demonstrated that psychosocial aptitudes can be improved by participatory methods and experiential learning systems. 55,000 secondary school adolescents from Karnataka benefitted through improved self-esteem, coping, and school adjustment. A mindfulness

170 Journal of Indian Education August 2020
program was led by Anand and Sharma (2014) with school adolescents and the findings revealed that students showed reduction in stress— be it academic in nature, peer related or in relation to general well-being.
Student well-being in relation to genderVataliya (2014) researched psycho-logical well-being of adolescent boys and girls.
A sample of 30 adolescent boys and 30 adolescent girls from 11th class were randomly selected from Bhavnagar city of Gujarat. Psychological well-being was estimated by Psychological Well-being Questionnaire developed by Sudha. A significant difference was noted between boys and girls on psychological well-being.
On the other hand, Kulkarni and Patki (2016) explored emotional intelligence, experienced bullying and the difference between male and female secondary school students on psychological well-being. A random sample of 87 students from 7th, 8th, 9th, and 10th class was taken. To gauge psychological well-being, Psychological General Wellbeing Index formulated by Harold Dupuy was utilised. Results demonstrated that there was an insignificant difference among male and female students on psychological well-being.
Dadhania (2015) explored mental health and psychological well-being in adolescent boys and girls. Sudha’s Psychological Well-being
Scale was utilised for the same. A sample of 40 adolescent boys and 40 adolescent girls from 10th class was taken from the Junagadh city of Gujarat. Results indicated critical contrasts among boys and girls with regards to psychological well-being and boys were found to have higher psychological well-being than girls.
School climate and well-beingEmotional needs of students in Navodaya Vidyalaya were explored by Rao (2001). A training program was developed for teachers to meet the students’ emotional needs. A purposive sample of the principal, 20 Navodaya Vidyalaya teachers, and 10 students from each class was taken. It was revealed that controlling and suppressive environment will not help in meeting emotional needs of students. Rather, supportive teachers, gentleness along with self-discipline will help the students. Behavior of teachers changed significantly with students in the intervention via training program. Knowledge and skills provided in the training program were utilised and it brought desirable changes in the attitude of students and teachers.
Self-esteem and psychological well-beingThe relationship between peer victimisation, self-esteem, and psychosocial well-being among adolescents were examined by Bhau and Tung (2019). A sample of 96 adolescents (52 females and 44

171On Students’ Well-being in the Indian Context— A Review
males), of age extending between 12 to 16 years was taken. It was noted that peer victimisation, self-esteem, and psychosocial well-being are negatively correlated.
Similarly, research conducted by Singh and Singh (2013) which concentrated on the role of depression and self-esteem in psychological well-being of students found out that psychological well-being of students is adversely affected by depression and low self-esteem.
Bhupinder and Rakhi (2009) studied self-efficacy and well-being of adolescents with respect to the type of family and gender. 50 adolescent boys and 50 adolescent girls were taken from joint and nuclear families to gauge self-efficacy and well-being. Results showed a huge impact of gender and type of family on self-efficacy. Be that as it may, no noteworthy effect was found in the measure of well-being.
Meaning in life and psychological well-beingStudents’ subjective experience related to belief in a just world and its relation to their subjective well-being were examined by Kamble and Dalbert (2012). A sample of 278 Indian students from two private English-medium schools was taken. It was noted that students’ personal belief in just world was identified to their experience of justice and well-being. The more the students believe in a just world, the more they thought that they are being treated
in a reasonable manner by their parents and teachers, which in turn diminished their distress. Teacher justice explained distress at school.
Rathi and Rastogi (2007) investigated meaning in life and psychological well-being in pre- adolescents and adolescents. A sample of 104 students (34 boys and 20 girls were from the adolescence period in 12th class; 31 boys and 19 girls were from pre-adolescence in 9th class) was taken. Meaning in life and psychological well-being was measured by Personal Meaning Profile Scale by Paul Wong and Well-Being Manifestation Measure Scale by Masse was utilised. Results pointed out that psychological well-being and meaning in life have a strong positive correlation. Thus, students who perceived their life to be having a meaning had higher levels of psychological well-being. Pre-adolescents had elevated levels of psychological well-being and personal meaning as compared to adolescents. Girls were significantly higher in the dimension of personal meaning as compared to boys.
Training programs in terms of enhancing the school climate are effective in improving overall well-being of students. As the researchers suggest—gentleness, supportive teachers, and self-discipline are important constituents of bringing about a practical change in student- teacher interaction. The impact of inclusive practices will open new

172 Journal of Indian Education August 2020
doors to understanding the elements well-being. The researchers have indicated a significant positive relationship between meaning in life and psychological well-being. There is a need to explore the field of Vipassana, Dhyanaetcetera (renamed and propagated as mindfulness by the West without acknowledging its roots) in relation to school adolescents. In that manner, students would practically understand the elements of Bharat’s rich heritage. The time has come to create a much-awaited correspondence between technologies of the ancient seers and applying them to the present contexts specifically in the domain of education, psychology of education, and its practice.
Emotional intelligence, academic achievement, and psychological well-beingShaheen and Shaheen (2016) studied emotional intelligence in relation to psychological well-being of students. A sample of 50 boys and 50 girls (100 students) were randomly selected from the secondary schools of Aligarh Muslim University, Aligarh. The outcomes showed that emotional intelligence and psychological well-being are positively correlated. There was no significant difference found between psychological well-being of boys and girls. However, scores of girls on emotional intelligence were essentially higher than that of boys.
The relation between emotional intelligence and academic achievement of students were
deciphered by Bhadouria (2013). The results exhibited that without emotional intelligence, academic achievement of students didn’t guarantee future success and lack of emotional intelligence also indicated frail personality and relation building in schools, which is an important facet of quality education. A significant positive relation was noted between motivation towards academic achievement and emotional intelligence (Roy, Sinha, and Suman, 2013). High, average, and low achievers varied fundamentally in their degree of emotional intelligence (Roy, Sinha, and Suman, 2013).
Social skills play a very critical role in determining the general well-being of students.
A huge contrast remains in the general well-being of social skill deficient and non-deficient school students. Students who are deficient in social skills are lower in general well-being as compared to non-deficient school students. Social skills have a significant impact on the scholastic accomplishment of school students and play a major role in determining the emotional intelligence of school students (Devi, 2015). Patel (2015) studied emotional intelligence and psychological well-being of adolescents. A sample of 160 students (40 boys and 40 girls from urban; 40 boys and 40 girls from rural) from urban and rural areas was randomly selected. Psychological well-being was measured through Psychological Well-being Scale
173On Students’ Well-being in the Indian Context— A Review
developed by Sisodia and Choudhary. Discoveries brought up higher psychological well-being of students in urban area as compared to rural area. Psychological well-being of males was found to be higher than females.
The researches have shown that emotional intelligence is positively correlated with psychological well-being. A significant positive relationship was also noted between motivation towards academic achievement and emotional intelligence. Keeping in mind the zeitgeist of present time, emotional intelligence and listening, communicating, and relating with oneself and others is something that can be explored through intervention programs in schools of both rural and urban areas. Intervention programs in schools of both rural and urban areas will help us better understand the thread between geographical and the psychological.
Implications of Research for Creating a Facilitating EnvironmentBehavioural and psychological problems in students are on the rise. Hence, it is of utmost necessity to explore and elucidate the dimension of student well-being. Promotion of mental health and well-being of adolescents can be done through improving
psychosocial skills, resilience, using teachers as facilitators, and having a comprehensive participatory experiential approach towards well-being (Vranda, 2015). Doors are open to devise new creative ways to facilitate well-being of students because even after decades of research, this area remains a dire concern. The amalgamation of various researches will lead us towards various patterns and gaps which can further facilitate the process of researching the vicissitude of student well-being. This would further aid particularly in social policy and planning. Nation can flourish only when children are educated and are physically and emotionally well.
conclusIon
Consequently, detailed compreh- ension for improving student well-being comes as a fundamental advance to improve the frontiers of education in the Indian context. A growing need to concentrate on student well-being has been noted by educationists, counselors, researchers, teachers, and students themselves. Many thinkers have devoted their lives in attempts to bring changes in the education system to facilitate students’ well-being. These steps should be encouraged, facilitated, and acted upon. As we know, well done is better than well said.

174 Journal of Indian Education August 2020
references
aKhtar, s. 1978. A Study of Anxiety in relation to Academic Achievement. (Unpublished M.Ed. dissertation). Aligarh Muslim University, Aligarh.
anand, u. and m.P. sharma. 2014. Effectiveness of a Mindfulness-based Stress Reduction Program on Stress and Well-being in Adolescents in a School Setting. Indian Journal of Positive Psychology. Vol. 5, No. 1. pp. 17–22.
bhadouria, P. 2013. Role of emotional intelligence for academic achievement for student.Research Journal of Educational Sciences. Vol. 1, No. 2. pp. 8–12.
bharat, s. and K.V.K. Kumar. 2010. Empowering adolescents with life skills education in school mental health program: Does it work? Indian Journal of Psychiatry. Vol. 52, No. 4. pp. 344–349.
bhatti, r.s. and s.m. ChannabasaVanna. 1985. Study of Neuroses: Life Events and Personality Dimensions. Indian Journal of Psychiatry. Vol. 27, No. 2. pp. 127–137.
bhau, s. and s. tunG. 2019. Relationship of Peer Victimisation with Self-esteem and Psychological Well-being among Adolescents. Indian Journal of Psychology and Education. Vol. 9, No. 1. pp. 76–81.
bhoGale, s. and i.J. PraKash. 1995. Development of Psychological Well-being (PWB) Questionnaire. Journal of Personality and Clinical Studies. Vol. 11, No. 2. pp. 5–9.
bhuPinder, s. and u. raKhi. 2009. Self-efficacy and Well-being of Adolescents. Journal of the Indian Academy of Applied Psychology. Vol. 35, No. 2. pp. 227–232.
bradburn, n. 1969. The Structure of Psychological Well-Being. Chicago: Aldine Pub. Co. Dadhania, D. A. 2015. Mental Health and Psychological Well-being in Adolescent Boys and Girls. International Journal of Public Mental Health and Neurosciences. Vol. 2, No. 3.
deVi, b. 1982. Certain Psychological Factors of Adjustment Influencing Achievement among School Children. Indian Journal of Psychology. Vol. 57. pp. 143–153.
deVi, m. 2015. Study of Emotional Intelligence General Well-being and Academic Achievement among Social Skills Deficient and Non deficient School Students. (Unpublished doctoral dissertation). Maharshi Dayanand University, Haryana. Retrieved from http://hdl.handle.net/10603/208373.
GarG, r. 2004. Clinical Study of Psychological Factors and Comorbidity in Major Depressive Disorder in Adolescents. (Unpublished M.D. thesis). All India Institute of Medical Sciences, New Delhi.
Gutman, l.m. and J. Vorhaus. 2012. The Impact of Pupil Behaviour and Well-being on Educational Outcomes. London: Childhood Wellbeing Research Centre.
Kamble, s.V. and C. dalbert. 2012. Belief in a Just World and Well-being in Indian Schools.International Journal of Psychology. Vol. 47, No. 4. pp. 269–278. https://doi.org/10.1080/00207594.2011.626047.
Kohli, s. and a. maliK. 2013. Anxiety and Well-being amongst Rural and Urban Adolescents.Indian Journal of Positive Psychology. Vol. 4, No. 2. pp. 148–152.
KulKarni, n. and s. PatKi. 2016. A Study of Emotional Intelligence, Experienced Bullying and Psychological Well-being among Secondary School Students from Boarding Schools. International Journal of Indian Psychology. Vol. 3, No. 4. p. 68.

175On Students’ Well-being in the Indian Context— A Review
malathi, P. and G. raJeshwar. 2018. Study of Mental Health and Educational Adjustment of School Students. International Journal of Academic Research. Vol. 5, No. 5. pp. 93–100.
malhotra, s., a. Kohli., m. KaPoor and b. Pradhan. 2009. Incidence of Childhood Psychiatric Disorders in India. Indian Journal of Psychiatry. Vol. 51. pp. 101–107.
mohanraJ, r., K. subbhiah and b. watson. 2010. Risk and Protective Factors to Depressive Symptoms in School-going Adolescents. Journal of Indian Association of Child and Adolescent Mental Health. Vol. 6. pp. 101–119.
mohan, J. and a. Gulati. 1986. Academic Achievement: A Review of Determinants. Indian Psychological Review. Vol. 30, No. 4.
Patel, h.a. 2015. Emotional Intelligence and Psychological Well-being of Adolescents.International Journal for Technological Research in Engineering. Vol. 2, No. 10.
Patel, s., r. shah., h. Patel., m. tilwani and G. K. VanKar. 1998. Depressive Symptomatology among Adolescent School Girls. Indian Journal of Psychiatry. Vol. 40, No. 35.
PattanayaK, r.d. and m. mehta. 2012. Childhood and Adolescent Depression. In U. Nayar (Ed.), International handbook on mental health of children and adolescents: Culture, policy and practices (pp. 21–38). Sage Publications. New Delhi.
rao, r.b.s. 2001. Development of an In-service Training Programme for Navodaya Vidyalaya Teachers in Meeting Students’ Emotional Needs. (Unpublished doctoral dissertation). The Maharaja Sayajirao University of Baroda, Vadodara.
rath, s. and s. nanda. 2011. Adolescent’s Coping: Understanding the Role of Gender and Academic Competence. Indian Journal of Positive Psychology. Vol. 2, No. 2. pp. 136–139.
rathi, n. and r. rastoGi. 2007. Meaning in Life and Psychological Well-being in Pre-adolescents and Adolescents. Journal of the Indian Academy of Applied Psychology. Vol. 33, No. 1. pp. 31–38.
roy, b., r. sinha and s. suman. 2013. Emotional Intelligence and Academic Achievement Motivation among Adolescents: A Relationship Study. International Refereed Research Journal. Vol. 4, No. 2. pp. 126–130.
ryan, r. and e. deCi. 2001. Happiness and Human Potentials: A Review of Research on Hedonic and Eudaimonic Well-being. Annual Review of Psychology. Vol. 52. pp. 141–166.
ryff, C.d. 1989. Happiness is Everything, or is it? Explorations on the Meaning of Psychological Well-being. Journal of Personality and Social Psychology. Vol. 57, No. 6. pp. 1069–1081.
ryff, C.d. and C.l. Keyes. 1995. The Structure of Psychological Well-being Revisited.Journal of Personality and Social Psychology. Vol. 69. pp. 719–727.
saha, s. and s. mishra. 2016. An Exploration of Academic Stressors and Stress Intervention Designs among Students of Kendriya Vidyalaya (NER, Bareilly). Indian Journal of Psychology and Education. Vol. 6, No. 1. pp. 42–49.
shaheen, s. and h. shaheen. 2016. Emotional Intelligence in Relation to Psychological Well-being among Students. The International Journal of Indian Psychology. Vol. 3, No. 4. pp. 206–213. DIP: 18.01.115/20160304.
sharma, r., l. ViJay and s. ChaturVedi. 2008. Suicidal Behavior amongst Adolescent Students in South Delhi. Indian Journal of Psychiatry. Vol. 50, pp. 30–33.
176 Journal of Indian Education August 2020
sinGh, a.K. and s. sinGh. 2013. Psychological Well-being of Students: Role of Depression and Self Esteem. Indian Journal of Psychology and Education. Vol. 3, No. 1. pp. 59–66.
tennant, r., l. hiller., r. fishwiCK., s. Platt., s. JosePh., s. weiCh., J. ParKinson., J. seCKer and s. stewart-brown. 2007. The Warkwick-Edinburgh Mental Well-being Scale (WEMWBS): Development and UK validation. Health and Quality of Life Outcomes. Vol. 5, No. 63.
Vataliya, a.P. 2014. Psychological Well-being in Adolescence of Gender Difference. Global Journal of Research Analysis. Vol. 3, No. 3.
Vranda, m.n. 2015. Promotion of Mental Health and Well-being of Adolescents in Schools- A NIMHANS Model. Journal of Psychiatry. Vol. 18, No. 5. DOI: 10.4172/2378- 5756.1000303.
world health orGanization. 2005. Mental Health Declaration for Europe. Helsinki, Finland.

Kanyashree Prakalpa in West Bengal
Desirability and Promises
*PhD student, Institute of Development Studies, Kolkata**Associate Professor, Institute of Development Studies, Kolkata
IntroductIon
Kanyashree Prakalpa (KP), a conditional cash transfer (CCT) programme in education in West Bengal was initiated by the TMC Trinamool Congress led state
Soumi mukherjee* and Subrata mukherjee**
AbstractGirls’ education in West Bengal is neither constrained by poor physical access to schools nor by high school fees, especially in government and government aided schools. This paper attempts to understand the need for conditional cash transfer programmes in education for girl students in West Bengal by using representative sample survey data. The paper compares Kanyashree Prakalpa (KP) with similar programmes in India and by using qualitative data, the paper tries to understand the interplay between educational progress and conditional cash transfers. The paper finds that KP is similar, in terms of conditions and transfers, to its predecessors like the Ladli scheme. Access to free education in West Bengal is easier compared to other states and data shows that most educational expenditure is incurred on private tuitions. Noticeably, the KP targets girls’ dropout in a state where boys’ dropouts are higher. The state government’s emphasis on a demand side intervention like KP should not substitute its equally important role in addressing supply side issues in the school education sector.
government in 2013. KP transfers cash directly to girls between 13 to 18 years on the condition that they are enrolled in schools, unmarried and the family income does not excess ` 120,000 (` 100,000 previously)
178 Journal of Indian Education August 2020
annually. Presently, a girl under this programme receives an annual stipend of ̀ 750 (previously ̀ 500) and a one-time grant of ` 25,000 when 18 and unmarried. In 2017, almost four years after the launch of the programme, United Nations awarded the UN Public Services first prize to Government of West Bengal for its Kanyashree programme, out of 552 nominations from 62 countries. So far, more than 5.77 million girls have been brought under this programme and the programme is claimed to have improved the well-being of the girls, especially those from socio-economically disadvantaged families by incentivising them to continue to study for a longer period of time. Against this backdrop, the purpose of this commentary is three fold: first it assesses the desirability and suitability of this programme in the context of West Bengal by looking at relevant data sources (such as NSS and NFHS); second, it compares and contrasts KP with other similar programmes in India; and finally it presents some evidence from a primary survey.
GIrls’ educatIon and under-aGe marrIaGe In West BenGal
We explore the National Sample Survey (NSS) 71st round (Government of India, 2015) data to understand various demand and supply side factors pertaining to school education for the age group of 12–19 years reported by the households. NSS estimates show that West Bengal has
the highest percentage of students attending government schools (rural: 90 per cent; urban: 75 per cent) compared to other major Indian states including Kerala, Tamil Nadu and Maharashtra. The state also has the highest percentage of students who avail free education, especially a larger percentage of girls avail free education compared to boys (rural boys: 21.7 per cent, rural girls: 26.9 per cent; urban boys: 47.6 per cent, urban girls: 52.3 per cent), (Figures estimated from NSS 71st Round unit record data). Schools are located at a close proximity to residences in West Bengal (75 per cent of the students have their schools within 3 kilometers from home). This is expected to work against dropouts due to distance, a common cause for girl dropouts in secondary levels, as found in many studies. However, private tuitions play a dominant role in the education system in the state as it has the highest percentage of students taking private tuitions in both rural (85 per cent) and urban (90 per cent) areas and there is hardly any boy-girl difference.
School dropouts in West Bengal show a distinct pattern compared to the other states, especially in rural areas where higher percentage of boys (31 per cent) drops out than girls (20 per cent). Among all classes, maximum dropouts happen after class eight. This is probably due to the fact that from ninth standard one needs to clear examinations to be promoted to the next class,
179Kanyashree Prakalpa in West Bengal— Desirability and Promises
though non-merit grade promotion has found to have negligible effect on school continuation in other contexts (King et al 2016). Like other states, in West Bengal too, most of the dropouts are observed in government schools. There could be two dominant reasons for this. First, majority of the students, who are at higher risk of dropout, enter government schools possibly due to their easy accessibility and lower costs. Second, curriculum and quality of government schools are not conducive enough for retaining students with higher risks of dropout. Whereas a demand-centric CCT scheme may address the first reason effectively, it can barely address the second reason.
Financial problems and disinterest in education are the two dominant reasons for dropout among boys and girls in West Bengal. For the girls, marriage is another important reason followed by engagement in domestic works, whereas for the boys, engagement in income generating activities is the next important reason. All the causes for dropout, as listed by NSS, can be reclassified into two broad categories: demand side and supply side factors (Table 1). The demand-side factors are problems or reasons closely associated with the characteristics of the girls or their families, whereas supply side factors are related to the geographical location, infrastructure and quality of the schools. In West Bengal, though demand side factors-related mostly to the opportunity cost
of education seem to be dominant for dropouts, but the importance of supply side factors— like access to quality education cannot be ignored either when analysing the causes for school dropouts among adolescents. Further, a reason like not interested in education may not be considered as a pure demand side reason as it is largely a reflection of the failure of the education system that it is not able to retain the students, mostly coming from poor and/or with illiterate parents. It is also important to remember that a programme like KP addresses the demand side constraints faced by the girls and not the boys who show higher dropped out. Instead of complementing the household’s education budget, KP may substitute a parents’ commitment to spend on education for their children – known as problem of fungibility in the literature (Das et al, 2005). Private tuition occupies a huge share in a household’s expenses on education for their children (rural boys: 28.9%, rural girls: 32%; urban boys: 65.4 per cent, urban girls: 64.5 per cent). West Bengal not only has the highest percentage of students availing private tuition but here students spend the most on private tuitions as compared to other major Indian states. If KP does not suffer from the problem of fungibility, the additional money available to the households through this scheme may only facilitate for the increase in the private tuitions.

180 Journal of Indian Education August 2020
Table 1
Distribution of dropout (age group 12-19 years) by reasons in West Bengal
Reasons for Dropout Rural Male
Rural Female
Urban Male
Urban Female
Demand side factorsNot interested in education 28.7 20.3 37.0 27.2Financial constraint 48.6 38.4 38.7 35.9Engaged domestic 0.4 13.3 4.7 7.4Engaged economic 13.2 3.5 9.4 2.5No tradition in the community 0.0 0.0 0.0 0.9
Unable to cope up or failure 2.4 4.3 3.0 4.4Completed desired level 0.7 0.0 0.0 0.0Preparation for competitive exams 0.0 0.0 0.0 0.3
Marriage 0.0 13.8 0.0 13.4Supply side and other factorsSchool far off 0.0 0.7 0.0 0.1Unfriendly atmosphere 0.5 0.0 0.0 0.6Others 5.6 5.8 7.3 7.4
Note: Noor insignificant frequency reported for supply side factors like ‘timing of school not suitable’, ‘language or medium of instruction used unfamiliar’, ‘inadequate teachers’, ‘quality of teachers poor’, non-availability of female teachers and ‘non-availability of girls toilet’, so omitted from the table. Source: Estimated from NSS 71st round unit-record data
NSS estimates show that an insignificant percentage of girls (12–19 year age group) in West Bengal is married (rural: 10 per cent, urban: 7 per cent) – figures which are better only in comparison to rural Bihar, rural Jharkhand, rural Rajasthan and urban Assam. The higher percentage of under-age marriage in the state is corroborated by the recent NFHS 4 (2014–15) and baseline survey for KP (Government of West Bengal 2014) data. The percentage of currently married women
(20–24 year age group) who were married before reaching 18 years is highest in West Bengal (40.7 per cent). With the exception of three states, a strong negative relationship (correlation coefficient –0.7928) is observed between the incidence of under-age marriage and female literacy rate (2011 Census) measured at the state level (Figure 1) and surprisingly West Bengal is one of the outlier states with high incidence of under-age marriage in spite of having high female literacy rate.

181Kanyashree Prakalpa in West Bengal— Desirability and Promises
Source: Census 2011 and National Family Health Survey 4 Figure 1: Scatter showing the association between female literacy and
under-age marriage.
KP and other sImIlar schemes Scheme like KP is not new in the parlance of CCT. Other similar schemes have been in function since 1994 in Haryana named Apni Beti Apna Dhan. The Ladli scheme has also been rolled out in several states of India. The primary motive of all these schemes has been similar, that is, to improve the position of women in family and reduce underage marriages.
The eligibility criteria in the other CCT schemes in India are layered.
In KP, the criteria has been kept simple by only focusing on family income (income certificate signed by local councilor/ or Pradhan), marital status and enrolment in school. In Ladli, domicile and family size form a part of the eligibility criteria. Similar is the case with Ladli Laxmi Yojana of Madhya Pradesh where the benefits are available to non-income tax payee families and female orphans only. The child should be registered in an Anganwadi (ICDS) (Shekhar, 2012). In international schemes

182 Journal of Indian Education August 2020
like Progresa (Mexico), Turkey SSF (Turkey) and PATH (Jamaica) along with enrollment, 85% attendance has also been kept as a condition (Rawlings, 2005). These conditions, present in other schemes, are missing in the KP. Another difference from other Indian schemes is that KP gives annual stipend and a one-time stipend when a girl turns 18. In the Ladli scheme in Delhi, the families receive cash benefits at different stages. Similarly, in Ladli Laxmi Yojana of Madhya Pradesh, a stipend of Rs. 2,000 is given when a girl reaches Class 6 and increases till she reaches the Class 11. On completion of 21 years, a girl receives about 1 lakh. In KP, the cash transfer has been kept simple by giving the same amount each year.
oBservatIons from the fIeld
The qualitative data has been collected from 3 districts in West Bengal, North 24 Parganas district (Bongaon and Baduria blocks), Burdwan district (Manteswar block) and Kolkata (Lake Town-Patipukur, Garden Reach and Dhakuria areas). The districts and the interviewees were selected based on convenience and snow balling. Three types of semi-structured questionnaires were used. First, for beneficiaries of KP, here 27 girls, between (12–19 years of age) who have either received KP money (19) or were in the process of receiving it (8) were interviewed. Second, 15 girls who had dropped (ST: 1, SC: 4, Muslims: 9; others: 1)
participated in the interviews. Third, 12 boys (including 2 dropped out) were interviewed from these districts. In addition to the interviews, 2 focus groups discussions with 19 girls and their mothers were also conducted. A total of 3 school head teachers were interviewed on the accessibility and impact of KP on their students.
Majority (21) of the KP beneficiaries knew the correct process of application to receive the benefits and none of them faced any problems in getting the income certificates. Most of students were enroled into government or government sponsored schools close to their houses and did not have to travel much to reach their schools. The students (both in rural and urban areas we surveyed) hardly spent any money on travel for going to school and coaching or on snacks. All the parents (mothers, in this case) opined that the cost of private tuition took up the majority share of their educational expenditure.
The main reason for dropout among the girls was marriage though they mentioned financial constraints as well. Out of all dropped out girls, six had received the scholarship money from KP annually and two of them had also received the one-time grant. However, they dropped out after receiving the money and did not continue higher secondary education. One of the girls explained that, “The money has been kept for my marriage and it was difficult for my father to pay for my education any further.” Another girl said that

183Kanyashree Prakalpa in West Bengal— Desirability and Promises
the money was not a strong incentive for her to continue study and if her parents found a suitable groom, they wouldn’t wait for the money. Among the Muslim girls, marriage was the most predominant reason for drop out and none of them mentioned any financial problems. Out of nine dropped out Muslim girls, four received at least some money from KP. For the two dropped out boys, financial constraint was the major reason for quitting school and out of 10 currently in school boys, five reported that they have friends who dropped out of the school in search of jobs in other states.
None of the parents had found the financial eligibility criterion a strict one to meet as it was not difficult to get the income certificate from local councilors or Gram Panchayat members. However, they did find age limit to be a rigid criterion. The parents and the students expressed different opinions on cash versus kind benefits. The mothers preferred the direct cash transfer as they could use it on immediate needs like books, clothes, or shoes. Although they added that, these are expenses that are in any which way borne by them. Benefits from KP were certainly helpful but these expenses were not entirely dependent on the transfers. However, the students felt that it would have been better if their school fees were waived and if they got all their books for free. One girl said, “It would take the pressure off our head. We would not have to worry about
school fees and books. All we would then have to do is study.”
When a mother of a girl was asked why she continued with the tuitions as she complained about the huge costs of private tuition, her reply was, “Then what is the point of sending the children to school. They hardly learn anything there. Tuitions are very important. I talk to the tuition teacher every now and then. He lets me pay in installments. I also often keep money due with him. But, he still agrees. If I can educate my children well then they will at least be earning as private tutors.” Three parents of male students said that they sent their sons for tuitions to prevent them from roaming around the streets after school hours. Students have also complained about the lack of support from teachers in government schools and linked it to their poor attendance to schools. There is a common perception that without private tuitions, education is incomplete.
concludInG remarKs Girls’ education in West Bengal is neither constrained by poor physical access to schools nor by high school fees, especially in government and government aided schools. But, excessive dependence on private tuitions is a unique feature of the state which makes the school education more expensive. This is an issue which needs serious attention. However, higher dependence on private tuition is not indicative of poor quality of teaching in government schools as

184 Journal of Indian Education August 2020
dependence on private tuition is observed among students studying in both government and private schools. Though we came across cases of early marriages among beneficiaries and KP money being spent on marriage and other non-educational purposes instead of furthering girls’ education, this does not seem to be the general pattern. Being a demand side intervention, KP is unlikely to improve the supply side constraints and government’s focus on a demand
side intervention like KP should not substitute its equally important role in reducing supply side constraints in the school education sector. To make KP more performance oriented, it may be argued that attendance in school should be added as a criterion. KP, being a girl-centric programme may aggravate the already existing high male-female difference in dropout rate, an issue which needs attention as well.
references
daS, j, Q-t do, and b Özler. 2005. Reassessing Conditional Cash Transfer Programs, World Bank Research Observer. Vol. 20, No. 1. pp. 57–80.
Government of india. 2015. Key Indicators of Social Consumption in India Education (NSS 71st Round: January-June 2014), National Sample Survey Office.
Government of WeSt benGal. 2014. Baseline Survey for KanyasreePrakalpa, GoWB and UNICEF.
kinG, em., Pf. orazem and em. Paterno. 2016. ‘Promotion with and without Learning: Effects on Student Enrollment and Dropout Behavior’, World Bank Economic Review.Vol. 30, No. 3. pp. 580–602.
raWlinGS, b.l. and Gm. rubio. 2005. ‘Evaluating the Impact of Conditional Cash Transfer Programs’, World Bank Research Observer. Vol. 20, No. 1. pp. 29–55.
Shekhar, tv. 2012. ‘Ladlis and Lakshmis Financial Incentive Schemes for the Girl Child’, Economic and Political Weekly. Vol. 47, No. 17. pp. 58–65.

Guidelines for Contributors
Original manuscripts of the articles must be sent in English, typed in Times New Roman - 12pt., double space, on one side of A-4 paper with sufficient margins, to
The Academic Editor Journal of Indian Education
Department of Teacher Education, NCERTSri Aurobindo Marg, New Delhi 110016 E-mail: [email protected]
[email protected] articles must be submitted in both soft (CD or E-mail) and hard copy format.An abstract of the paper in not more than 150 words must be sent with each manuscript. Diagram or line drawings must be supplied separately, numbered neatly for identification and their position in the text clearly indicated. Tables may be given as part of the text.References need to be listed at the end of the article, in alphabetical order, as follows:Lannier, J. and J. LittLe. 1986. Research on Teacher Education. In M. Wittrock (Ed.), Handbook of Research on Teaching. 3rd ed. Macmillan, New York.narayan, Jayanthi and M. aJit. 1991. Development of Skills in a Mentally Retarded Child: The Effect of Home Training. Indian Educational Review. Vol. 28, No. 3. pp. 29–41.
R.N. 26915/75
Subscriptions are invited from educationists, institutions, research scholars, teachers and students for the journals published by the NCERT.
For further enquiries, please write to :
Chief Business Manager, Publication DivisionNational Council of Educational Research and Training
Sri Aurobindo Marg, New Delhi 110016
E-mail: [email protected], Phone: 011-26562708, Fax: 011-26851070
Revised Rates of NCERT Educational Journals(w.e.f. 1.1.2009)
Title Single Annual Copy Subscription
School Science ` 55.00 ` 220.00A Quarterly Journal for Secondary Schools
Indian Educational Review ` 50.00 ` 100.00 A Half-Yearly Research Journal
Journal of Indian Education ` 45.00 ` 180.00 A Quarterly Journal of Education
भारतीय आधुनिक नशक्ा (त्रैमानिक) ` 50.00 ` 200.00 (Bharatiya Aadhunik Shiksha) A Quarterly Journal in Hindi
Primary Teacher ` 65.00 ` 260.00 A Quarterly Journal for Primary Teachers
प्ाथनमक नशक्क (त्रैमानिक) ` 65.00 ` 260.00 (Prathmik Shikshak) A Quarterly Journal in Hindi for Primary Teachers
Published by the Head, Publication Division, National Council of Educational Research and Training, Sri Aurobindo Marg, New Delhi 110016 and printed at Saraswati Offset Printer (P) Ltd., A-5, Naraina Industrial Area, Phase-II, New Delhi 110028
Journ
al of Indian
Edu
cation