August 10-13, 2020 Council Meeting Webinar Briefing Book ...
488
August 10-13, 2020 Council Meeting Webinar Briefing Book Directory Meeting Web Page: http://www.mafmc.org/briefing/august-2020 Webinar: http://mafmc.adobeconnect.com/august2020/ The table below summarizes the briefing documents included under each tab in the main briefing book (some items may reference documents located in other tabs). Click on the blue text in the left column to jump to the beginning of the tab. Additional briefing materials will be posted as supplemental documents on the meeting page linked above. For ease of reference, each document appears in the Bookmarks panel on the left side of the window, with an interactive link to each listed document. To show the Bookmarks panel while viewing the briefing book in Adobe Reader or Acrobat, click on the ribbon icon on the left side panel. Document bookmarks may have limited functionality if you are viewing the briefing book in a browser. Agenda 1. August 2020 MAFMC Meeting Agenda 2. June 2020 Council Motions MAFMC Stock Status 3. Stock Status of MAFMC-Managed Species 4. Stock Size and Fishing Mortality Ratios for MAFMC-Managed Species Tab 01: Mackerel, Squid, Butterfish Specifications 1. Monitoring Committee Summary Memo 1. July 2020 SSC Report – see Tab 11 2. Staff Memo: Butterfish, Longfin Squid, and Mackerel ABCs 3. MSB Fishery Performance Report 4. Atlantic Mackerel Fishery Information Document 5. Longfin Squid Fishery Information Document 6. Butterfish Fishery Information Document 7. Public Comments Tab 02: River Herring and Shad Cap for the Mackerel Fishery 1. Staff Memo Tab 03: Swearing-In of New and Reappointed Members and Election of Officers 1. Department of Commerce Announces 2020 Appointments to the Regional Fishery Management Councils (Mid-Atlantic Excerpt) 2. Oath of Office 3. SOPP Excerpt - Election of Officers Tab 04: Bluefish 2021 Specifications Review 1. Monitoring Committee recommendation summary 2. July 2020 SSC Report – see Tab 11 3. Staff Memo: 2021 Bluefish Specifications Review 4. Bluefish 2020 Northeast Fisheries Science Center data update 5. Bluefish Fishery Performance Report 6. Bluefish Fishery Information Document
-
Upload
khangminh22 -
Category
Documents
-
view
0 -
download
0
Transcript of August 10-13, 2020 Council Meeting Webinar Briefing Book ...
August 10-13, 2020 Council Meeting Webinar Briefing Book Directory
Meeting Web Page: http://www.mafmc.org/briefing/august-2020
Webinar: http://mafmc.adobeconnect.com/august2020/
The table below summarizes the briefing documents included under each tab in the main briefing book (some items may reference documents located in other tabs). Click on the blue text in the left column to jump to the beginning of the tab. Additional briefing materials will be posted as supplemental documents on the meeting page linked above. For ease of reference, each document appears in the Bookmarks panel on the left side of the window, with an interactive link to each listed document. To show the Bookmarks panel while viewing the briefing book in Adobe Reader or Acrobat, click on the ribbon icon on the left side panel. Document bookmarks may have limited functionality if you are viewing the briefing book in a browser.
Agenda 1. August 2020 MAFMC Meeting Agenda 2. June 2020 Council Motions
MAFMC Stock Status 3. Stock Status of MAFMC-Managed Species 4. Stock Size and Fishing Mortality Ratios for MAFMC-Managed Species
Tab 01: Mackerel, Squid, Butterfish Specifications
1. Monitoring Committee Summary Memo 1. July 2020 SSC Report – see Tab 11 2. Staff Memo: Butterfish, Longfin Squid, and Mackerel ABCs 3. MSB Fishery Performance Report 4. Atlantic Mackerel Fishery Information Document 5. Longfin Squid Fishery Information Document 6. Butterfish Fishery Information Document 7. Public Comments
Tab 02: River Herring and Shad Cap for the Mackerel Fishery
1. Staff Memo
Tab 03: Swearing-In of New and Reappointed Members and Election of Officers
1. Department of Commerce Announces 2020 Appointments to the Regional Fishery Management Councils (Mid-Atlantic Excerpt)
2. Oath of Office 3. SOPP Excerpt - Election of Officers
Tab 04: Bluefish 2021 Specifications Review
1. Monitoring Committee recommendation summary 2. July 2020 SSC Report – see Tab 11 3. Staff Memo: 2021 Bluefish Specifications Review 4. Bluefish 2020 Northeast Fisheries Science Center data update 5. Bluefish Fishery Performance Report 6. Bluefish Fishery Information Document
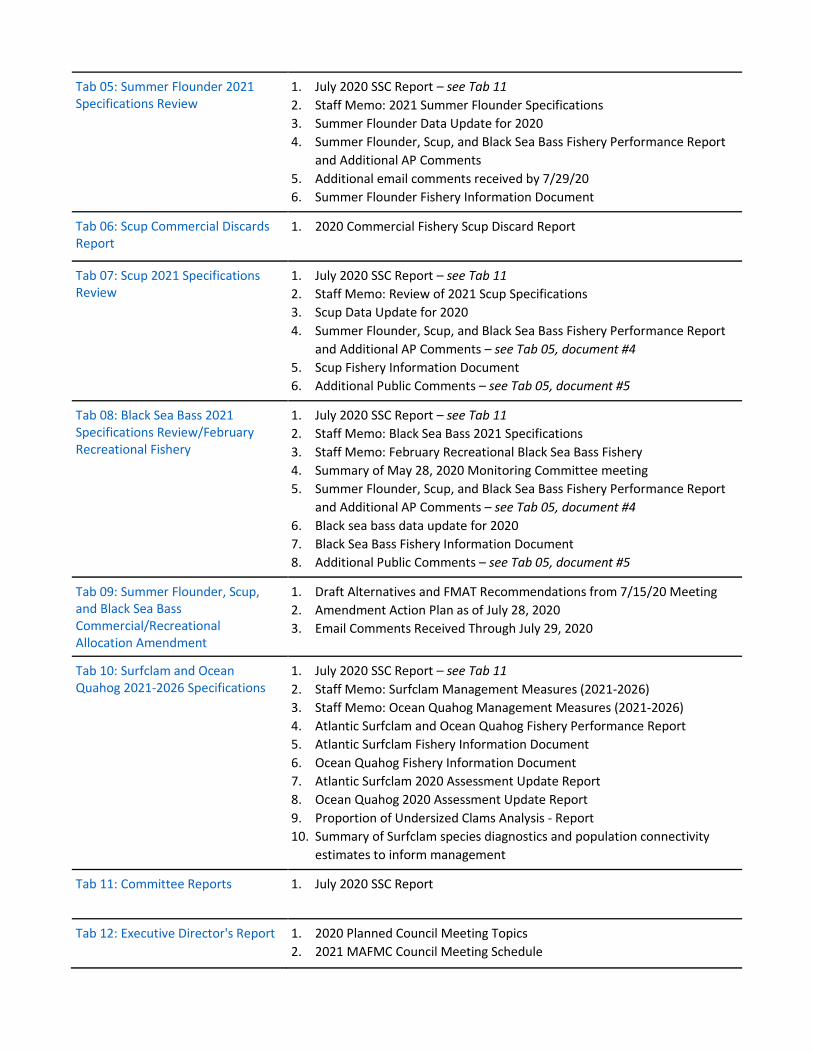
Tab 05: Summer Flounder 2021 Specifications Review
1. July 2020 SSC Report – see Tab 11 2. Staff Memo: 2021 Summer Flounder Specifications 3. Summer Flounder Data Update for 2020 4. Summer Flounder, Scup, and Black Sea Bass Fishery Performance Report
and Additional AP Comments 5. Additional email comments received by 7/29/20 6. Summer Flounder Fishery Information Document
Tab 06: Scup Commercial Discards Report
1. 2020 Commercial Fishery Scup Discard Report
Tab 07: Scup 2021 Specifications Review
1. July 2020 SSC Report – see Tab 11 2. Staff Memo: Review of 2021 Scup Specifications 3. Scup Data Update for 2020 4. Summer Flounder, Scup, and Black Sea Bass Fishery Performance Report
and Additional AP Comments – see Tab 05, document #4 5. Scup Fishery Information Document 6. Additional Public Comments – see Tab 05, document #5
Tab 08: Black Sea Bass 2021 Specifications Review/February Recreational Fishery
1. July 2020 SSC Report – see Tab 11 2. Staff Memo: Black Sea Bass 2021 Specifications 3. Staff Memo: February Recreational Black Sea Bass Fishery 4. Summary of May 28, 2020 Monitoring Committee meeting 5. Summer Flounder, Scup, and Black Sea Bass Fishery Performance Report
and Additional AP Comments – see Tab 05, document #4 6. Black sea bass data update for 2020 7. Black Sea Bass Fishery Information Document 8. Additional Public Comments – see Tab 05, document #5
Tab 09: Summer Flounder, Scup, and Black Sea Bass Commercial/Recreational Allocation Amendment
1. Draft Alternatives and FMAT Recommendations from 7/15/20 Meeting 2. Amendment Action Plan as of July 28, 2020 3. Email Comments Received Through July 29, 2020
Tab 10: Surfclam and Ocean Quahog 2021-2026 Specifications
1. July 2020 SSC Report – see Tab 11 2. Staff Memo: Surfclam Management Measures (2021-2026) 3. Staff Memo: Ocean Quahog Management Measures (2021-2026) 4. Atlantic Surfclam and Ocean Quahog Fishery Performance Report 5. Atlantic Surfclam Fishery Information Document 6. Ocean Quahog Fishery Information Document 7. Atlantic Surfclam 2020 Assessment Update Report 8. Ocean Quahog 2020 Assessment Update Report 9. Proportion of Undersized Clams Analysis - Report 10. Summary of Surfclam species diagnostics and population connectivity
estimates to inform management
Tab 11: Committee Reports 1. July 2020 SSC Report
Tab 12: Executive Director's Report 1. 2020 Planned Council Meeting Topics 2. 2021 MAFMC Council Meeting Schedule
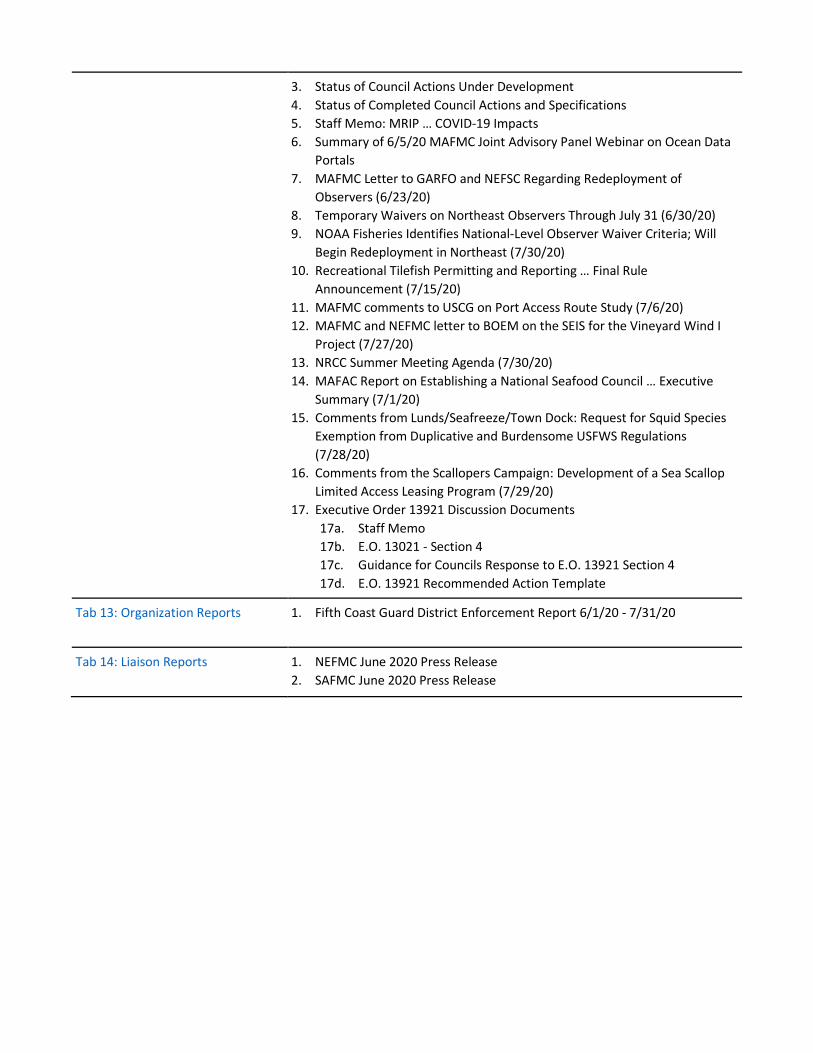
3. Status of Council Actions Under Development 4. Status of Completed Council Actions and Specifications 5. Staff Memo: MRIP … COVID-19 Impacts 6. Summary of 6/5/20 MAFMC Joint Advisory Panel Webinar on Ocean Data
Portals 7. MAFMC Letter to GARFO and NEFSC Regarding Redeployment of
Observers (6/23/20) 8. Temporary Waivers on Northeast Observers Through July 31 (6/30/20) 9. NOAA Fisheries Identifies National-Level Observer Waiver Criteria; Will
Begin Redeployment in Northeast (7/30/20) 10. Recreational Tilefish Permitting and Reporting … Final Rule
Announcement (7/15/20) 11. MAFMC comments to USCG on Port Access Route Study (7/6/20) 12. MAFMC and NEFMC letter to BOEM on the SEIS for the Vineyard Wind I
Project (7/27/20) 13. NRCC Summer Meeting Agenda (7/30/20) 14. MAFAC Report on Establishing a National Seafood Council … Executive
Summary (7/1/20) 15. Comments from Lunds/Seafreeze/Town Dock: Request for Squid Species
Exemption from Duplicative and Burdensome USFWS Regulations (7/28/20)
16. Comments from the Scallopers Campaign: Development of a Sea Scallop Limited Access Leasing Program (7/29/20)
17. Executive Order 13921 Discussion Documents 17a. Staff Memo 17b. E.O. 13021 - Section 4 17c. Guidance for Councils Response to E.O. 13921 Section 4 17d. E.O. 13921 Recommended Action Template
Tab 13: Organization Reports 1. Fifth Coast Guard District Enforcement Report 6/1/20 - 7/31/20
Tab 14: Liaison Reports 1. NEFMC June 2020 Press Release 2. SAFMC June 2020 Press Release

1
August 2020 Council Meeting Webinar Tuesday, August 10 – Thursday, August 13, 2020
Due to public health concerns related to the spread of COVID-19 (coronavirus), the Mid-Atlantic Fishery Management Council’s August meeting will be conducted by webinar only. This webinar-based meeting replaces the in-person meeting previously scheduled to be held in Philadelphia PA.
Briefing materials and webinar connection are available on the Council’s website at http://www.mafmc.org/briefing/august-2020.
Agenda
Monday, August 10th 1:00 p.m. Council Convenes
1:00 p.m. – 3:30 p.m. Mackerel, Squid, Butterfish Committee, Meeting as a Committee of the Whole – Butterfish, Longfin Squid, and Atlantic Mackerel Specifications (Tab 1)
– Review SSC, Advisory Panel, Monitoring Committee, and staff recommendations
– Adopt 2021-2023 specifications for longfin squid including butterfish cap – Adopt 2021-2022 specifications for butterfish and mackerel
3:30 p.m. – 4:00 p.m. River Herring/Shad (RH/S) Committee, Meeting as a Committee of the Whole – RH/S Cap for the Mackerel Fishery (Tab 2)
– Review RH/S cap operation – Adopt 2021-2022 RH/S cap for the mackerel fishery
4:00 p.m. – 5:00 p.m. Acknowledge Outgoing Council Members
5:00 p.m. Council Adjourns
Tuesday, August 11th 9:00 a.m. Council Convenes
9:00 a.m. – 9:30 a.m. Swearing in of New and Reappointed Council Members and Election of Officers (Tab 3)
9:30 a.m. Council Meeting with the Atlantic States Marine Fisheries Commission’s Summer Flounder, Scup, and Black Sea Bass and Bluefish Boards
2
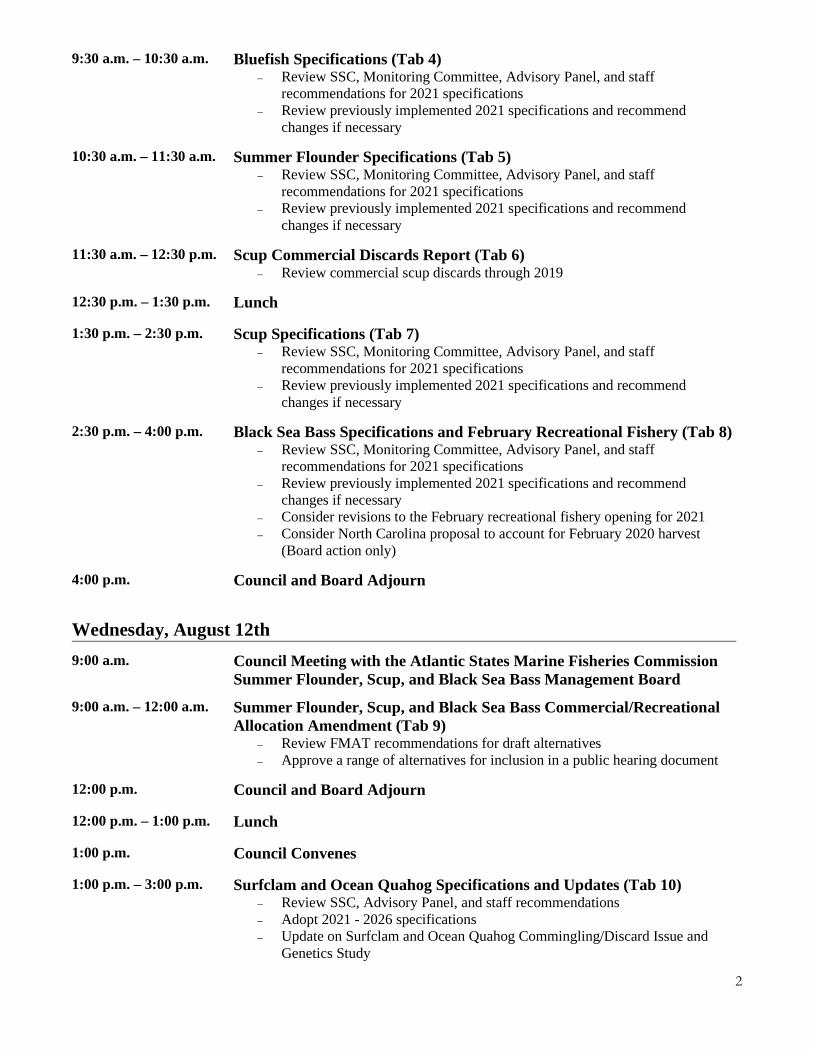
9:30 a.m. – 10:30 a.m. Bluefish Specifications (Tab 4) – Review SSC, Monitoring Committee, Advisory Panel, and staff
recommendations for 2021 specifications – Review previously implemented 2021 specifications and recommend
changes if necessary
10:30 a.m. – 11:30 a.m. Summer Flounder Specifications (Tab 5) – Review SSC, Monitoring Committee, Advisory Panel, and staff
recommendations for 2021 specifications – Review previously implemented 2021 specifications and recommend
changes if necessary
11:30 a.m. – 12:30 p.m. Scup Commercial Discards Report (Tab 6) – Review commercial scup discards through 2019
12:30 p.m. – 1:30 p.m. Lunch
1:30 p.m. – 2:30 p.m. Scup Specifications (Tab 7) – Review SSC, Monitoring Committee, Advisory Panel, and staff
recommendations for 2021 specifications – Review previously implemented 2021 specifications and recommend
changes if necessary
2:30 p.m. – 4:00 p.m. Black Sea Bass Specifications and February Recreational Fishery (Tab 8) – Review SSC, Monitoring Committee, Advisory Panel, and staff
recommendations for 2021 specifications – Review previously implemented 2021 specifications and recommend
changes if necessary – Consider revisions to the February recreational fishery opening for 2021 – Consider North Carolina proposal to account for February 2020 harvest
(Board action only)
4:00 p.m. Council and Board Adjourn
Wednesday, August 12th
9:00 a.m. Council Meeting with the Atlantic States Marine Fisheries Commission Summer Flounder, Scup, and Black Sea Bass Management Board
9:00 a.m. – 12:00 a.m. Summer Flounder, Scup, and Black Sea Bass Commercial/Recreational Allocation Amendment (Tab 9)
– Review FMAT recommendations for draft alternatives – Approve a range of alternatives for inclusion in a public hearing document
12:00 p.m. Council and Board Adjourn
12:00 p.m. – 1:00 p.m. Lunch
1:00 p.m. Council Convenes
1:00 p.m. – 3:00 p.m. Surfclam and Ocean Quahog Specifications and Updates (Tab 10) – Review SSC, Advisory Panel, and staff recommendations – Adopt 2021 - 2026 specifications – Update on Surfclam and Ocean Quahog Commingling/Discard Issue and
Genetics Study
3
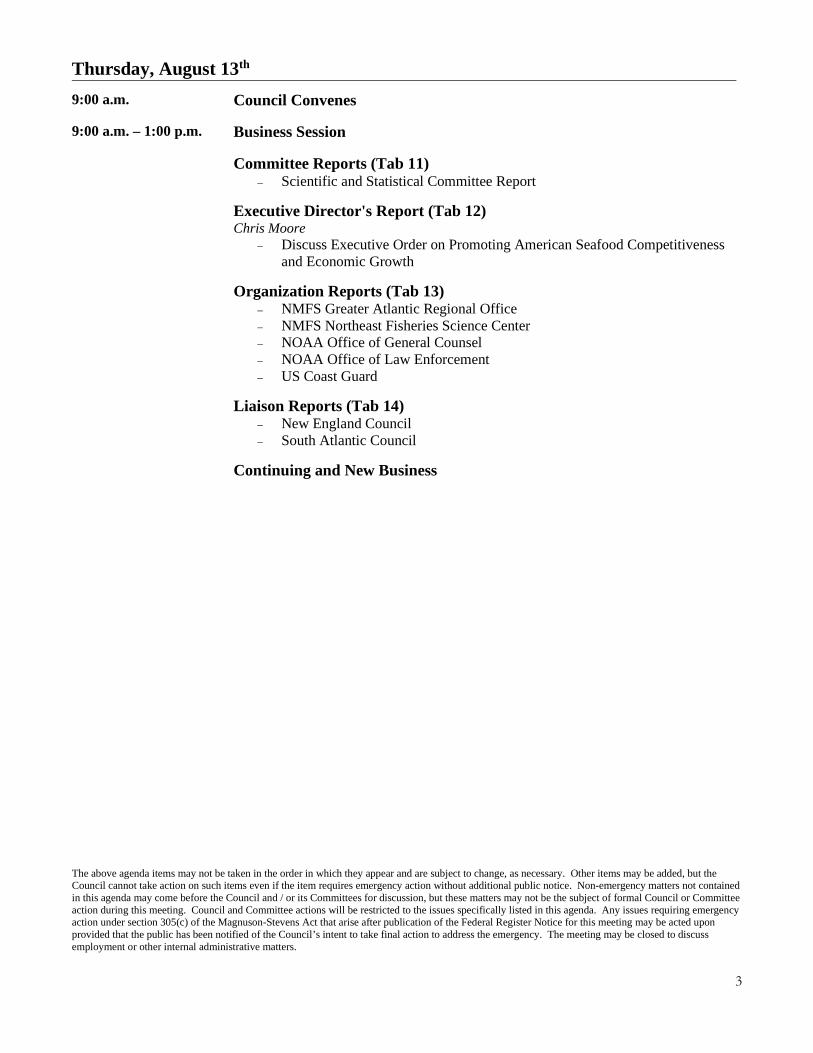
Thursday, August 13th 9:00 a.m. Council Convenes
9:00 a.m. – 1:00 p.m. Business Session
Committee Reports (Tab 11) – Scientific and Statistical Committee Report
Executive Director's Report (Tab 12) Chris Moore
– Discuss Executive Order on Promoting American Seafood Competitiveness and Economic Growth
Organization Reports (Tab 13) – NMFS Greater Atlantic Regional Office – NMFS Northeast Fisheries Science Center – NOAA Office of General Counsel – NOAA Office of Law Enforcement – US Coast Guard
Liaison Reports (Tab 14) – New England Council – South Atlantic Council
Continuing and New Business The above agenda items may not be taken in the order in which they appear and are subject to change, as necessary. Other items may be added, but the Council cannot take action on such items even if the item requires emergency action without additional public notice. Non-emergency matters not contained in this agenda may come before the Council and / or its Committees for discussion, but these matters may not be the subject of formal Council or Committee action during this meeting. Council and Committee actions will be restricted to the issues specifically listed in this agenda. Any issues requiring emergency action under section 305(c) of the Magnuson-Stevens Act that arise after publication of the Federal Register Notice for this meeting may be acted upon provided that the public has been notified of the Council’s intent to take final action to address the emergency. The meeting may be closed to discuss employment or other internal administrative matters.

4
June 2020 Council Motions Black Sea Bass Commercial State Allocation Amendment Move to remove the dynamic base allocation sub-option from the trigger option. Council: Clark/Bolen (9/9) Board: Clark/Bolen Motion fails for lack of Council majority Based on the recent MRIP data utilized and the increased commercial quota I make a motion to refer back to the PDT/FMAT re-evaluation of the triggers and including trigger levels of 3.5 million and 4.5 million pounds. Council: Hughes/Cimino (14/3/1) Board: Cimino/Clark (7/3/1/0) Motion carries Move to add a sub-alternative for in-season closures based on the coastwide quota plus a percent buffer. Council: Heins/Clark Board: Meserve/McNamee Motion approved by consensus by Board and Council Summer Flounder, Scup, and Black Sea Bass Commercial/Recreational Allocation Amendment Move that the Council and Board accept all the FMAT’s recommendations for this amendment. Council: DiLernia/Heins Board: Clark/Batsavage Move to substitute to remove options 2.3, 2.4, 2.5, 4.2, 8.1, and 8.2 from further consideration and add 10 for further consideration. Council: Nolan/Wilke (9/10/0) Board: Reid/Hasbrouck Motion fails for lack of Council majority Move to amend the original motion to add “the Council and Board will consider initiating an action by the end of 2020 to develop a recreational accountability and accounting joint action.” Council: Hughes/Nolan (10/9/1) Board: Hasbrouck/Reid (8/2/1) Motion carries Amended motion become main motion: Move that the Council and Board accept all the FMAT’s recommendations for this amendment. The Council and Board will consider initiating an action by the end of 2020 to develop a recreational accountability and accounting joint action. Council: 16/2/0 Board: 10/1/0/0 Motion carries Bluefish Allocation and Rebuilding Amendment Move to remove from the bluefish allocation and rebuilding amendment: 2.06-2.09 (Allocations based on catch data, NEFSC discards), 2.10-2.13 (Allocations based on landings data), 6.2.08-6.2.10 (For-hire sector separation allocations based on catch data, NEFSC discards). Council - Heins/DiLernia: Board – Hart/Meserve: Motion to amend to remove 2.10-2.13 from the motion. Council - Nowalsky/Clark: 17/3/0 Board – Nowalsky/Reid: 12/2/0 Motion carries Amended motion become main motion: Move to remove from the bluefish allocation and rebuilding amendment: 2.06-2.09 (Allocations based on catch data, NEFSC discards), 6.2.08-6.2.10 (For-hire sector separation allocations based on catch data, NEFSC discards). Council: 19/0/0 Board: 14/0/0/0 Motion carries Move to exclude the Florida regional allocation proposal and add an option for a minimum default allocation. Council – Gwin/Cimino Board – Meserve/Patterson Move to substitute to add an option for a minimum default allocation.
5
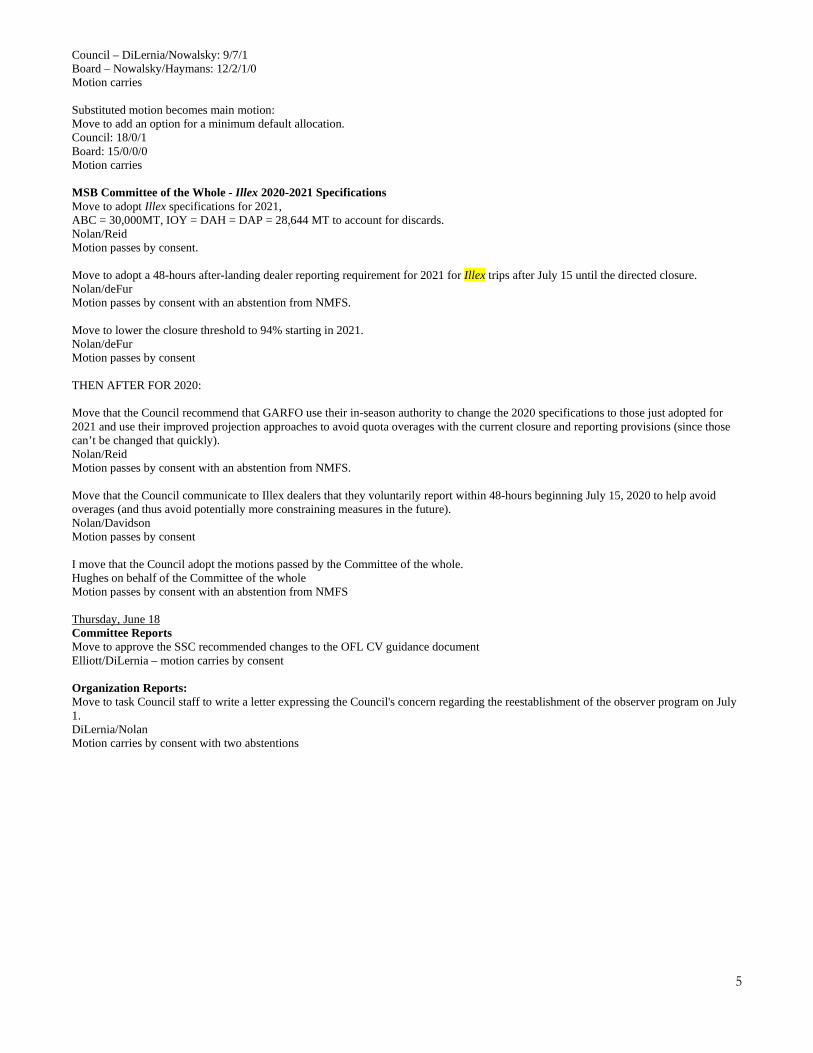
Council – DiLernia/Nowalsky: 9/7/1 Board – Nowalsky/Haymans: 12/2/1/0 Motion carries Substituted motion becomes main motion: Move to add an option for a minimum default allocation. Council: 18/0/1 Board: 15/0/0/0 Motion carries MSB Committee of the Whole - Illex 2020-2021 Specifications Move to adopt Illex specifications for 2021, ABC = 30,000MT, IOY = DAH = DAP = 28,644 MT to account for discards. Nolan/Reid Motion passes by consent. Move to adopt a 48-hours after-landing dealer reporting requirement for 2021 for Illex trips after July 15 until the directed closure. Nolan/deFur Motion passes by consent with an abstention from NMFS. Move to lower the closure threshold to 94% starting in 2021. Nolan/deFur Motion passes by consent THEN AFTER FOR 2020: Move that the Council recommend that GARFO use their in-season authority to change the 2020 specifications to those just adopted for 2021 and use their improved projection approaches to avoid quota overages with the current closure and reporting provisions (since those can’t be changed that quickly). Nolan/Reid Motion passes by consent with an abstention from NMFS. Move that the Council communicate to Illex dealers that they voluntarily report within 48-hours beginning July 15, 2020 to help avoid overages (and thus avoid potentially more constraining measures in the future). Nolan/Davidson Motion passes by consent I move that the Council adopt the motions passed by the Committee of the whole. Hughes on behalf of the Committee of the whole Motion passes by consent with an abstention from NMFS Thursday, June 18 Committee Reports Move to approve the SSC recommended changes to the OFL CV guidance document Elliott/DiLernia – motion carries by consent Organization Reports: Move to task Council staff to write a letter expressing the Council's concern regarding the reestablishment of the observer program on July 1. DiLernia/Nolan Motion carries by consent with two abstentions

Stock Status of MAFMC-Managed Species
(as of 7/29/20)
SPECIES
STATUS DETERMINATION CRITERIA
Stock Status
Most Recent Assessment Overfishing Fthreshold
Overfished ½ BMSY
Summer Flounder
F35%MSP=0.448 63 million lbs
No overfishing Not overfished
Most recent benchmark assessment was 2018.
Scup
F40%MSP=0.215 103.64 million lbs
No overfishing Not overfished
Most recent operational assessment was 2019.
Black Sea Bass
F40%MSP=0.46 15.53 million lbs
No overfishing Not overfished
Most recent operational assessment was 2019.
Bluefish
F35%SPR=0.183 219.05
million lbs No overfishing
Overfished Most recent operational assessment was 2019.
Illex Squid (short finned)
Unknown Unknown Unknown
Unknown
Most recent benchmark assessment was 2006; not able to determine current exploitation rates or stock biomass.
Longfin Squid
Unknown 46.7
million lbs Unknown
Not overfished
Most recent assessment was 2020; not able to determine current exploitation rates.
Atlantic Mackerel
F40%=0.26 217.0 million
pounds Overfishing Overfished
Most recent benchmark assessment was 2017
Butterfish
FProxy=2/3M
=0.81 50.3
million lbs No overfishing Not overfished
Most recent assessment was 2020.

SPECIES
STATUS DETERMINATION CRITERIA
Stock Status
Most Recent Assessment Overfishing Fthreshold
Overfished ½ BMSY
Surfclam
F/Fthreshold = 1a SSB/SSBthreshold = 1b No overfishing
Not overfished Most recent assessment was 2020
Ocean Quahog
F/Fthreshold = 1c SSB/SSBthreshold =1d No overfishing Not overfished
Most recent assessment was 2020.
Golden Tilefish
F38%MSP=0.310 10.46
million lbs No overfishing Not overfished
Most recent assessment update was 2017.
Blueline Tilefish
Unknown Unknown
South of Cape Hatteras: No overfishing Not overfished
North of Cape Hatteras:
Unknown Unknown
Most recent benchmark assessment was 2017.
Spiny Dogfish (Joint mgmt with
NEFMC)
FMSY=0.2439
175.6 million lbs
Female SSB
No overfishing Not overfished
Most recent assessment update was 2018.
Monkfish (Joint mgmt with
NEFMC)
NFMA & SFMA FMAX=0.2
NFMA - 1.25 kg/tow
SFMA - 0.93 kg/tow
(autumn trawl survey)
Unknown Unknown
Recent benchmark failed peer review and invalidated previous 2010 benchmark assessment results. Operational assessment in 2019 used survey data to scale earlier ABC.
Chub Mackerel
At least 3,026 MT of catch per
year
At least 3,026 MT of catch three years in
a row
No overfishing Not overfished No stock assessment.
SOURCES: Office of Sustainable Fisheries - Status Report of U.S. Fisheries; SAW/SARC, SEDAR, and TRAC Assessment Reports.
a Fthreshold is calculated as 4.136 times the mean F during 1982 - 2015 b SSBthreshold is calculated as SSB0/4 c Fthreshold is 0.019 d SSBthreshold is calculated as 0.4*SSB0

Stock Size Relative to Biological Reference Points(as of 7/29/20)
22%46%
67% 69%78%
89%
119%
150%
173%
198%
237%
0%
25%
50%
75%
100%
125%
150%
175%
200%
225%
250%
½ Bmsy
Overfished Threshold
Bmsy
Rebuilt
Not
Ove
rfis
hed
Ove
rfis
hed
Notes:• Unknown Bmsy - Illex squid, monkfish (NFMA & SFMA),
blueline tilefish (North of Cape Hatteras), and chub mackerel.
• Of the 15 species managed by the Council, 5 are above Bmsy, 6 are below Bmsy, and 4 are unknown.
Year of data used to determine stock sizeAtlantic Mackerel 2016Black Sea Bass 2018Bluefish 2018Butterfish 2019Golden Tilefish 2016Longfin Squid 2018-2019
(average)Ocean Quahog 2016Spiny Dogfish 2018Surfclam 2019Scup 2018Summer Flounder 2017

Fishing Mortality Ratios for MAFMC-Managed Species
(as of 7/29/20)
0.24 0.26 0.26
0.73 0.75 0.80 0.80 0.830.91
1.81
0.00
0.25
0.50
0.75
1.00
1.25
1.50
1.75
2.00
F cur
rent
/Fm
sy
Ove
rfis
hing
is
occu
rrin
gO
verf
ishi
ng is
not
oc
curr
ing
Overfishing threshold
Notes:• Unknown fishing mortality: Illex squid, Longfin squid, monkfish
(NFMA and SFMA), blueline tilefish (North of Cape Hatteras), and chub mackerel.
• Of the 15 species managed by the Council, 9 are above Fmsy, 1 is above, and 5 are unknown.
Year of data used to determine fishing mortalityAtlantic Mackerel 2016Black Sea Bass 2018Bluefish 2018Butterfish 2019Golden Tilefish 2016Ocean Quahog 2019Spiny Dogfish 2017Surfclam 2019Scup 2018Summer Flounder 2017
Page 1 of 1
M E M O R A N D U M
Date: July 28, 2020
To: Council
From: J. Didden, staff
Subject: MSB Specifications
The following materials are enclosed for mackerel, longfin squid, and butterfish specifications:
Monitoring Committee Summary Memo
SSC Report – See Committee Reports Tab
Assessments/Data Updates are available at the SSC Page: https://www.mafmc.org/ssc-
meetings/2020/july-22-23
Staff ABC Recommendation Memo to Chris Moore
Fishery Performance Report
Fishery Information Documents
Public Comments for Briefing Book
Mid-Atlantic Fishery Management Council 800 North State Street, Suite 201, Dover, DE 19901
Phone: 302-674-2331 ǀ FAX: 302-674-5399 ǀ www.mafmc.org Michael P. Luisi, Chairman ǀ G. Warren Elliott, Vice Chairman
Christopher M. Moore, Ph.D., Executive Director

Page 1 of 5
M E M O R A N D U M
Date: July 28, 2020
To: Council
From: J. Didden, staff
Subject: Monitoring Committee Summary, MSB Specifications
The Mackerel, Squid, and Butterfish (MSB) Monitoring Committee met on July 27, 2020 to review the Acceptable Biological Catch (ABC) recommendations of the Council’s Scientific and Statistical Committee (SSC). All Monitoring Committee members attended – attendance details are available by contacting Council staff.
Atlantic Mackerel
The SSC recommended the status quo ABC of 29,184 metric tons (MT) for 2021-2022. A management track assessment for mackerel is expected in 2021. The Monitoring Committee recommended that other specifications also remain status quo, same as 2020.
Table 1. Recommended Mackerel Specifications (ALL MT)
All other measures (e.g. closure provisions and the 129 MT River Herring/Shad (RH/S) cap) would remain as well. The Monitoring Committee did not discuss the RH/S cap directly, but has noted in the past that while it will control RH/S catch in the mackerel fishery, the cap is not biologically based and cap estimates may have high uncertainty depending on the number of observed trips (6 in 2020 with a cap estimate of 21 MT to date as of July 27, 2020). Staff still plans a series of discussion papers on RH/S later in the year.
Mid-Atlantic Fishery Management Council 800 North State Street, Suite 201, Dover, DE 19901
Phone: 302-674-2331 ǀ FAX: 302-674-5399 ǀ www.mafmc.org Michael P. Luisi, Chairman ǀ G. Warren Elliott, Vice Chairman
Christopher M. Moore, Ph.D., Executive Director
Page 2 of 5
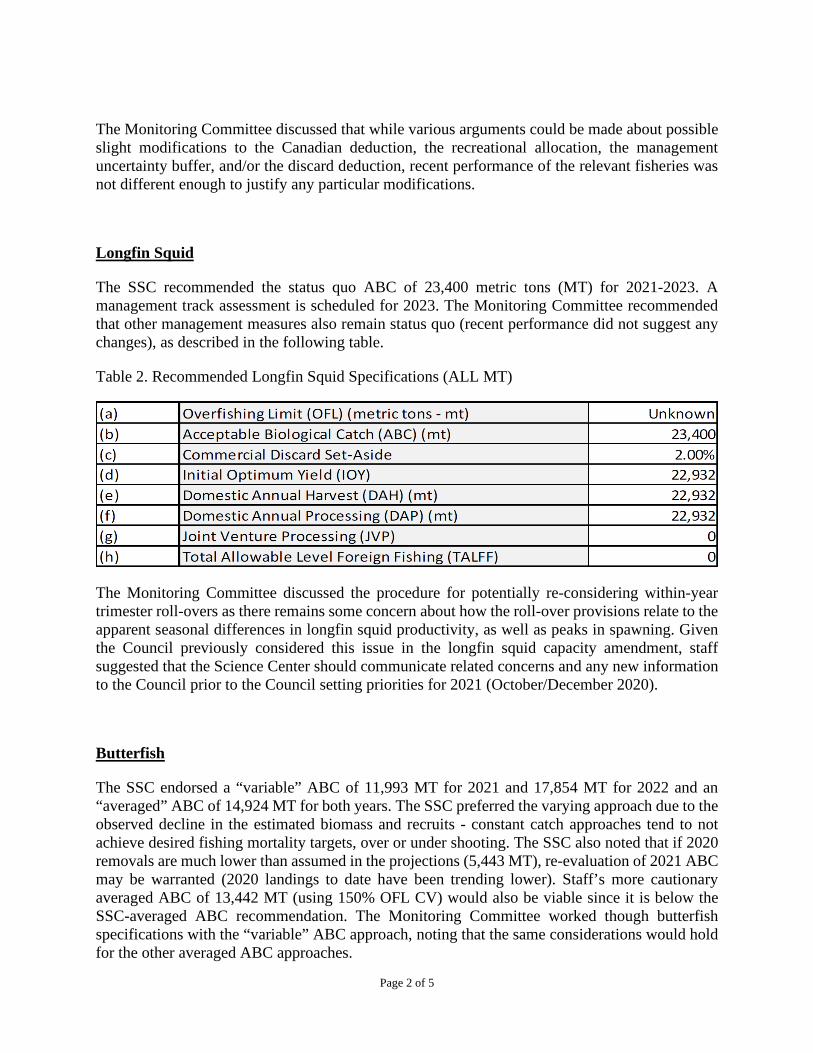
The Monitoring Committee discussed that while various arguments could be made about possible slight modifications to the Canadian deduction, the recreational allocation, the management uncertainty buffer, and/or the discard deduction, recent performance of the relevant fisheries was not different enough to justify any particular modifications.
Longfin Squid
The SSC recommended the status quo ABC of 23,400 metric tons (MT) for 2021-2023. A management track assessment is scheduled for 2023. The Monitoring Committee recommended that other management measures also remain status quo (recent performance did not suggest any changes), as described in the following table.
Table 2. Recommended Longfin Squid Specifications (ALL MT)
The Monitoring Committee discussed the procedure for potentially re-considering within-year trimester roll-overs as there remains some concern about how the roll-over provisions relate to the apparent seasonal differences in longfin squid productivity, as well as peaks in spawning. Given the Council previously considered this issue in the longfin squid capacity amendment, staff suggested that the Science Center should communicate related concerns and any new information to the Council prior to the Council setting priorities for 2021 (October/December 2020).
Butterfish
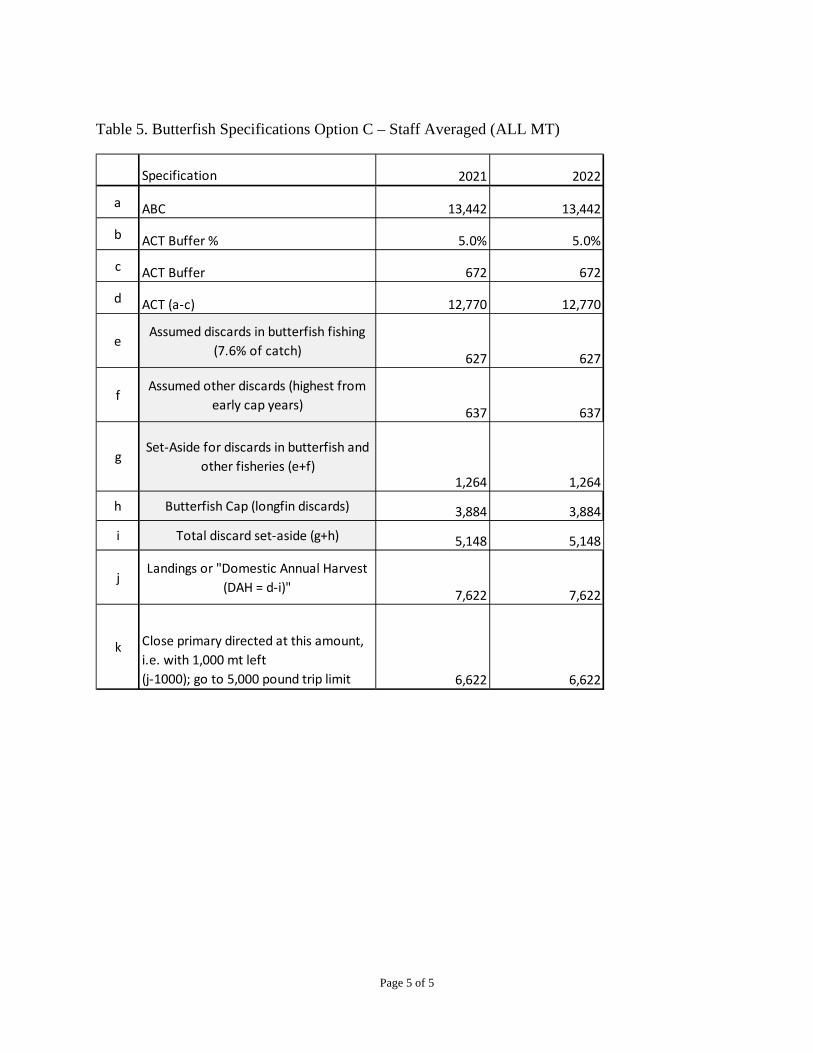
The SSC endorsed a “variable” ABC of 11,993 MT for 2021 and 17,854 MT for 2022 and an “averaged” ABC of 14,924 MT for both years. The SSC preferred the varying approach due to the observed decline in the estimated biomass and recruits - constant catch approaches tend to not achieve desired fishing mortality targets, over or under shooting. The SSC also noted that if 2020 removals are much lower than assumed in the projections (5,443 MT), re-evaluation of 2021 ABC may be warranted (2020 landings to date have been trending lower). Staff’s more cautionary averaged ABC of 13,442 MT (using 150% OFL CV) would also be viable since it is below the SSC-averaged ABC recommendation. The Monitoring Committee worked though butterfish specifications with the “variable” ABC approach, noting that the same considerations would hold for the other averaged ABC approaches.
Page 3 of 5
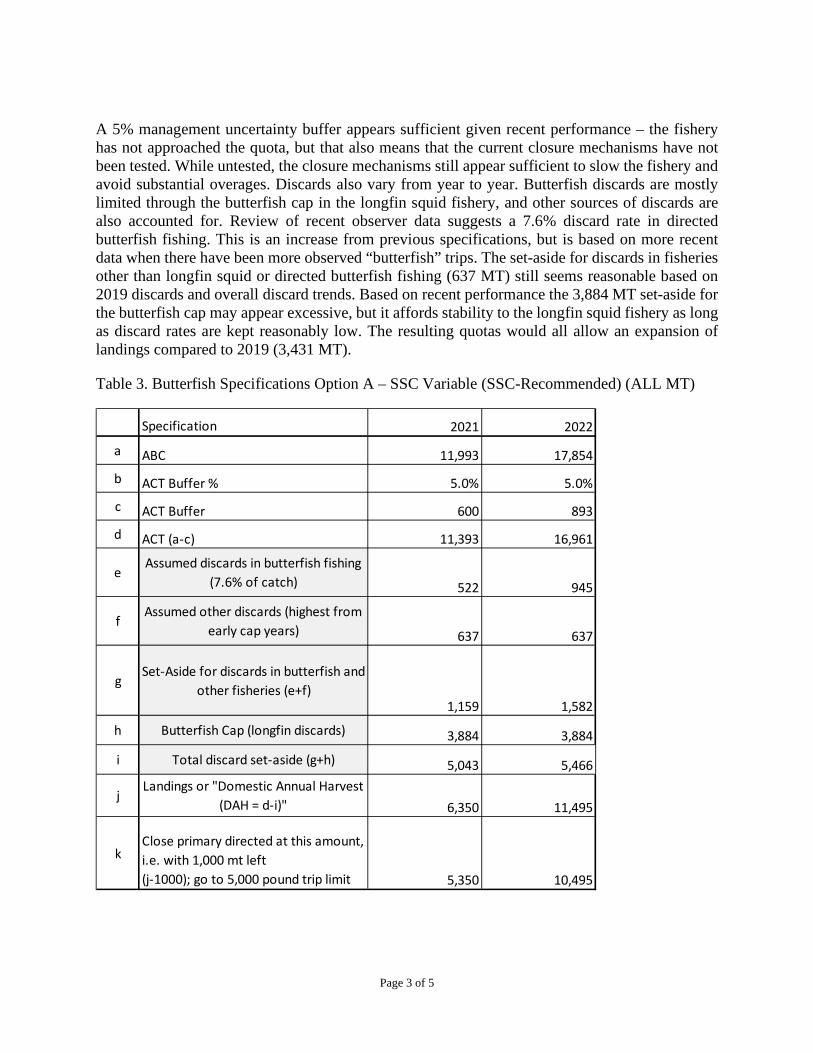
A 5% management uncertainty buffer appears sufficient given recent performance – the fishery has not approached the quota, but that also means that the current closure mechanisms have not been tested. While untested, the closure mechanisms still appear sufficient to slow the fishery and avoid substantial overages. Discards also vary from year to year. Butterfish discards are mostly limited through the butterfish cap in the longfin squid fishery, and other sources of discards are also accounted for. Review of recent observer data suggests a 7.6% discard rate in directed butterfish fishing. This is an increase from previous specifications, but is based on more recent data when there have been more observed “butterfish” trips. The set-aside for discards in fisheries other than longfin squid or directed butterfish fishing (637 MT) still seems reasonable based on 2019 discards and overall discard trends. Based on recent performance the 3,884 MT set-aside for the butterfish cap may appear excessive, but it affords stability to the longfin squid fishery as long as discard rates are kept reasonably low. The resulting quotas would all allow an expansion of landings compared to 2019 (3,431 MT).
Table 3. Butterfish Specifications Option A – SSC Variable (SSC-Recommended) (ALL MT)
Specification 2021 2022
a ABC 11,993 17,854
b ACT Buffer % 5.0% 5.0%
c ACT Buffer 600 893
d ACT (a-c) 11,393 16,961
eAssumed discards in butterfish fishing
(7.6% of catch) 522 945
fAssumed other discards (highest from
early cap years) 637 637
gSet-Aside for discards in butterfish and
other fisheries (e+f)1,159 1,582
h Butterfish Cap (longfin discards) 3,884 3,884
i Total discard set-aside (g+h) 5,043 5,466
jLandings or "Domestic Annual Harvest
(DAH = d-i)" 6,350 11,495
kClose primary directed at this amount, i.e. with 1,000 mt left (j-1000); go to 5,000 pound trip limit 5,350 10,495

Page 4 of 5
Table 4. Butterfish Specifications Option B – SSC Averaged (ALL MT)
Specification 2021 2022a ABC 14,924 14,924b ACT Buffer % 5.0% 5.0%c ACT Buffer 746 746d ACT (a-c) 14,178 14,178
eAssumed discards in butterfish fishing
(7.6% of catch) 734 734
fAssumed other discards (highest from
early cap years) 637 637
gSet-Aside for discards in butterfish and
other fisheries (e+f)1,371 1,371
h Butterfish Cap (longfin discards) 3,884 3,884
i Total discard set-aside (g+h) 5,255 5,255
jLandings or "Domestic Annual Harvest
(DAH = d-i)" 8,923 8,923
kClose primary directed at this amount, i.e. with 1,000 mt left (j-1000); go to 5,000 pound trip limit 7,923 7,923
Page 5 of 5
Table 5. Butterfish Specifications Option C – Staff Averaged (ALL MT)
Specification 2021 2022
a ABC 13,442 13,442
b ACT Buffer % 5.0% 5.0%
c ACT Buffer 672 672
d ACT (a-c) 12,770 12,770
eAssumed discards in butterfish fishing
(7.6% of catch) 627 627
fAssumed other discards (highest from
early cap years) 637 637
gSet-Aside for discards in butterfish and
other fisheries (e+f)1,264 1,264
h Butterfish Cap (longfin discards) 3,884 3,884
i Total discard set-aside (g+h) 5,148 5,148
jLandings or "Domestic Annual Harvest
(DAH = d-i)" 7,622 7,622
k Close primary directed at this amount, i.e. with 1,000 mt left (j-1000); go to 5,000 pound trip limit 6,622 6,622

SSC Report is behind Tab 11
Page 1 of 3
M E M O R A N D U M
Date: July 7, 2020
To: C. Moore
From: J. Didden
Subject: Butterfish, Longfin Squid, and Mackerel ABCs
Butterfish
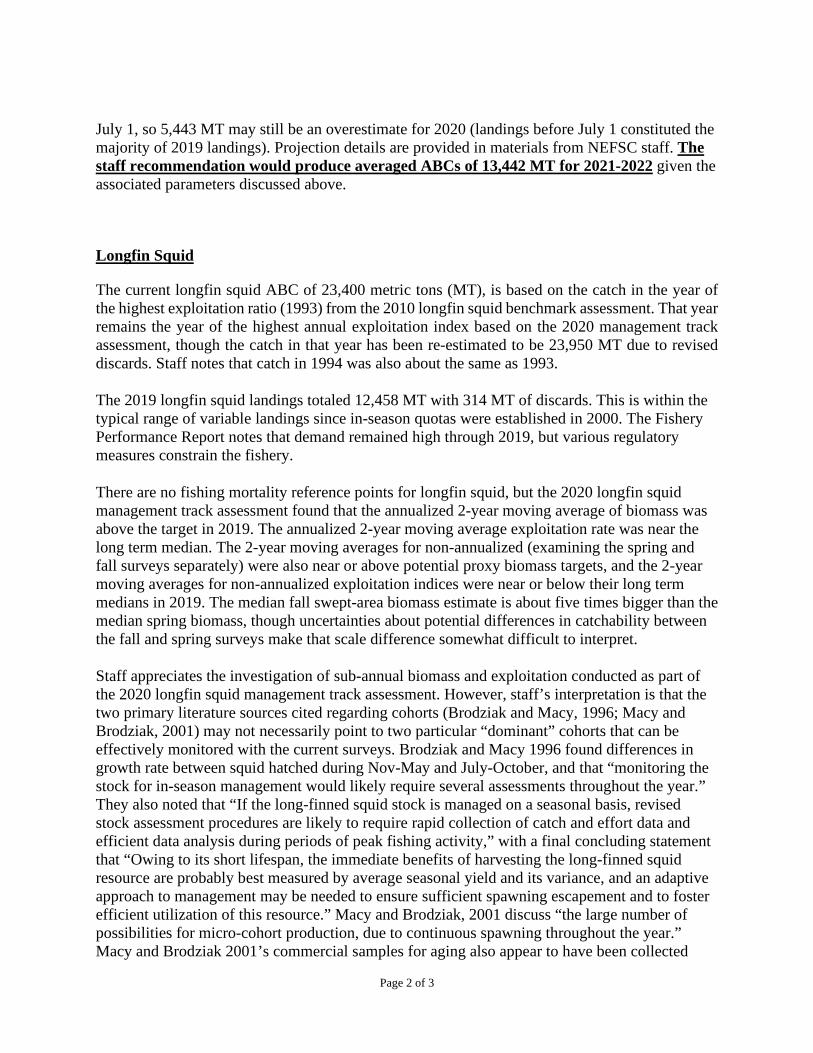
The current butterfish acceptable biological catch (ABC) of 32,063 metric tons1 (MT) is based on projections conducted in 2017 when the last update of the butterfish assessment occurred. The projections used the Council’s risk policy at the time and the SSC’s assignment of a 100% coefficient of variation (CV) to the projected overfishing level (OFL).
The 2019 butterfish landings totaled 3,431 MT with 1,651 MT of discards. This was the highest catch since directed fishing was allowed to increase in 2012. The Fishery Performance Report notes there are limited domestic markets for butterfish and the re-establishment of export markets is a long-term process that also requires butterfish of a particular size and quality.
The 2020 butterfish management track assessment found butterfish to be not overfished without overfishing in 2019, but if the full 2020 ABC was caught, projections suggest overfishing would have occurred and the stock would have become overfished. The last projections from 2017 overestimated stock biomass trends, largely due to the disconnect between projected and realized recruitment. Recruitment, while variable, has been generally declining since 1999 and recent years have seen historically low recruitment.
Due to this disconnect, Council staff requested that NMFS Northeast Fisheries Science Center (NEFSC) staff run projections sampling potential recruitments from just the last 10 years rather than the full time series (i.e. consider using lower recruitment). Given the trends in recruitment and the recent overly optimistic assessment projections, staff is recommending that 2021-2022 ABCs be based on averaged ABC projections using just the last 10 years for potential recruitment and a 150% CV, combined with the Council’s new risk policy. The projections also assume a 2020 catch of 5,443 MT (instead of the full 2020 ABC). This was developed based on the 2019 catch of 5,082 MT and accounting for increasing the trend since 2013 (Excel trend calculation). Preliminary 2020 landings though July 1 are about half of 2019 landings through
1 One metric ton equals approximately 2,205 pounds, so 32,063 metric tons equals about 70.7 million pounds.
Mid-Atlantic Fishery Management Council 800 North State Street, Suite 201, Dover, DE 19901
Phone: 302-674-2331 ǀ FAX: 302-674-5399 ǀ www.mafmc.org Michael P. Luisi, Chairman ǀ G. Warren Elliott, Vice Chairman
Christopher M. Moore, Ph.D., Executive Director
Page 2 of 3
July 1, so 5,443 MT may still be an overestimate for 2020 (landings before July 1 constituted the majority of 2019 landings). Projection details are provided in materials from NEFSC staff. The staff recommendation would produce averaged ABCs of 13,442 MT for 2021-2022 given the associated parameters discussed above.
Longfin Squid
The current longfin squid ABC of 23,400 metric tons (MT), is based on the catch in the year of the highest exploitation ratio (1993) from the 2010 longfin squid benchmark assessment. That year remains the year of the highest annual exploitation index based on the 2020 management track assessment, though the catch in that year has been re-estimated to be 23,950 MT due to revised discards. Staff notes that catch in 1994 was also about the same as 1993.
The 2019 longfin squid landings totaled 12,458 MT with 314 MT of discards. This is within the typical range of variable landings since in-season quotas were established in 2000. The Fishery Performance Report notes that demand remained high through 2019, but various regulatory measures constrain the fishery.
There are no fishing mortality reference points for longfin squid, but the 2020 longfin squid management track assessment found that the annualized 2-year moving average of biomass was above the target in 2019. The annualized 2-year moving average exploitation rate was near the long term median. The 2-year moving averages for non-annualized (examining the spring and fall surveys separately) were also near or above potential proxy biomass targets, and the 2-year moving averages for non-annualized exploitation indices were near or below their long term medians in 2019. The median fall swept-area biomass estimate is about five times bigger than the median spring biomass, though uncertainties about potential differences in catchability between the fall and spring surveys make that scale difference somewhat difficult to interpret.
Staff appreciates the investigation of sub-annual biomass and exploitation conducted as part of the 2020 longfin squid management track assessment. However, staff’s interpretation is that the two primary literature sources cited regarding cohorts (Brodziak and Macy, 1996; Macy and Brodziak, 2001) may not necessarily point to two particular “dominant” cohorts that can be effectively monitored with the current surveys. Brodziak and Macy 1996 found differences in growth rate between squid hatched during Nov-May and July-October, and that “monitoring the stock for in-season management would likely require several assessments throughout the year.” They also noted that “If the long-finned squid stock is managed on a seasonal basis, revised stock assessment procedures are likely to require rapid collection of catch and effort data and efficient data analysis during periods of peak fishing activity,” with a final concluding statement that “Owing to its short lifespan, the immediate benefits of harvesting the long-finned squid resource are probably best measured by average seasonal yield and its variance, and an adaptive approach to management may be needed to ensure sufficient spawning escapement and to foster efficient utilization of this resource.” Macy and Brodziak, 2001 discuss “the large number of possibilities for micro-cohort production, due to continuous spawning throughout the year.” Macy and Brodziak 2001’s commercial samples for aging also appear to have been collected

Page 3 of 3
during a limited portion of the year. Macy and Brodziak 2001 do note that L. gahi has two main spawning periods, and that longfin squid make similar ontogenetic descents in the water column as L. gahi. Staff supports continued development of sub-annual assessment and management approaches to longfin squid, but at this time recommends the current annual longfin squid ABC of 23,400 MT for 2021-2023.
Atlantic Mackerel
The current mackerel ABC of 29,184 metric tons (MT), is based on the projected catch in the first year (2019) of a rebuilding program designed to rebuild mackerel by June 2023. Catches in 2020 and 2021 were originally slated to increase given the projected increases in biomass. These projections were predicated on a rebuilding strategy that recognized a strong 2015 year class in the assessment results and moderate year classes subsequently. At its May 2019 meeting, the SSC considered results from the 2019 Canadian Atlantic mackerel assessment, which indicated lower than expected recruitment in 2016-2018. The SSC determined that it would not be appropriate to recommend the original higher 2020 ABC level based on recruitment levels in 2016-2018 that may be lower than those anticipated in the rebuilding plan. Instead, the SSC recommended maintaining the ABC for 2020 at the level established for 2019 (29,184 MT). A management track assessment was anticipated in 2020 but has been delayed to 2021 due COVID-19-related data delays.
The 2019 U.S. mackerel landings totaled 5,379 MT with 200 MT of discards. 2019 recreational catch was 2,119 MT (new MRIP methodology which the last assessment did not use), and 2019 Canadian catch was 8,557 (preliminary). Total catch was 16,255 MT, among the lowest in the time series, but as noted in the Fishery Performance Report, U.S. commercial landings were constrained after a river herring and shad cap closure early in the year. Canadian landings were constrained by a quota closure in early September 2019. 2018 landings were also restricted, though less so than 2019, by the same mechanisms in both countries.
Compared to the original rebuilding projections, 2017 catch was 3,494 MT higher (+20%) than assumed, 2018 catch was almost the same as assumed, and 2019 catch was 12,929 MT less (-44%) than projected. The 2017/2018 catches were approximated for projections due to data limitations at the time, and the 2019 catch was limited by the various closures discussed above.
The NEFSC provided a mackerel data update including information on: catch, the NEFSC spring bottom trawl survey, egg/ichthyoplankton surveys, catch location, commercial landings at age, U.S. commercial discards at age, U.S. recreational catch-at-age, and the most recent Canadian assessment. Based on a review of the available information, the mackerel situation does not appear substantially changed since last reviewed. Accordingly, staff recommends maintaining the current mackerel ABC of 29,184 metric tons (MT) for 2021-2022 (until the 2021 assessment can be used).
1
Atlantic Mackerel, Squid, and Butterfish Fishery Performance Reports
July 2020 The Mid-Atlantic Fishery Management Council's (Council) Mackerel-Squid-Butterfish (MSB) Advisory Panel (AP) met via webinar on July 6, 2020 to review the Fishery Information Documents and develop the following Fishery Performance Reports. The primary purpose of these reports is to contextualize catch histories for the Scientific and Statistical Committee (SSC) by providing information about fishing effort, market trends, environmental changes, and other factors. The trigger questions below were posed to the AP to generate discussion. Please note: The AP comments described below are not necessarily consensus or majority statements. Advisory Panel members present: Katie Almeida, Joseph Gordon, Howard King, Eleanor Bochenek, Gerry O’Neil, Jeff Kaelin, Meghan Lapp, Greg DiDomenico, and Pam Lyons Gromen.
Others present: Jason Didden, Doug Christel, Aly Pitts, Dan Farnham Jr, Zoe Goozner, Ryan Clark, Zack Greenberg, Peter Hughes, Alissa Wilson, and Eric Reid.
Trigger questions:
1. What factors have influenced recent catch (markets, environment, regulations, etc.)? 2. Are the current fishery regulations appropriate? How could they be improved? 3. What would you recommend as research priorities? 4. What else is important for the Council to know?
For organizational purposes, the summary is broken down by MSB species. Each species discussion began by reviewing the species’ “information document.” Some general points were also made as described immediately below.
1.1 General
Concern was voiced that shifting thermal habitat suitability is impacting the distribution and/or productivity of MSB species, and needs to be taken into account by assessments/management.
There is concern that assessments will be hurt if surveys are limited by wind development.
Concern was voiced about the potential effects of data gaps from missed observer coverage due to COVID-19.
Tariffs affect prices and profitability, and therefore trade. If a buyer is in China, that buyer may try to negotiate price based on what they know they will have to absorb in tariffs.
2
1.2 Butterfish
Market/Economic Conditions
2019 butterfish demand was good for the right size and quality of butterfish.
There is still limited interest in this fishery by the typical MSB fishery participant, but it’s a substantial fishery for some.
Traditional markets disappeared (export to Japan – breakfast) and it’s a long-term process to re-establish markets. Domestic fresh markets are limited, though suppliers are working on ways to expand the market.
Environmental Conditions
See point above in general section about shifting thermal habitat.
Management Issues
The Northeast Canyons and Seamounts Marine Monument was negatively impacting access to butterfish until mid-2020, especially large butterfish that command the best prices.
Other Issues – None mentioned
Research Priorities
Integrating state surveys is important for this species in terms of observing recruitment.
There was support voiced for the SSC providing catch advice that continues to incorporate forage concerns (see the 1992 Patterson paper, the butterfish assessment, and previous SSC approaches). It was also noted that the Fmsy proxy used in the assessment explicitly accounts for the forage role of butterfish.
3
1.3 Longfin Squid
Market/Economic Conditions
Demand continued to be good through 2019 but COVID-19 had drastic impacts on early-2020 demand. Retail trade has provided an outlet for some longfin squid products. COVID-19 will continue to increase market uncertainties for the foreseeable future.
Environmental Conditions
See point above in general section about shifting thermal habitat.
Management Issues
Area/gear limitations negatively affect fishing/landings. Scup, Tilefish, and Fixed/Mobile Gear Restricted Areas (GRAs) have made longfin squid fishing more difficult. Large mesh requirements on George’s Bank also restrict targeting of longfin squid in an areas where fishermen have been seeing signs of longfin squid. The Northeast Canyons and Seamounts Marine Monument may have also been negatively impacting access to areas where longfin squid could have been caught.
Other Issues
Windfarm development continues to be a major concern for the longfin squid fishery given overlap between potential wind farm areas and squid fishery areas.
Research Priorities
Concern was voiced that the spring NEFSC survey may have low catchability for longfin. A public comment also voiced concern about the general catchability of longfin in a bottom trawl survey. These concerns would apply to using the two indices separately, and raises the question whether attempting to assess/manage the stock in multiple cohorts is ready for implementation or is more appropriate to address through/after a research-track assessment process. It needs to be more clearly described how the existing evidence supports two primary cohorts (which happen to align with the surveys). The existing tight controls on this fishery suggest that a careful approach to implementing substantial changes is warranted. There was discussion whether NEAMAP (inshore VIMS) data was included in the assessment update data – staff confirmed it was, in the same fashion as the benchmark and previous update.
4
1.4 Mackerel
Market/Economic Conditions
See RH/S cap discussion below re: 2019. In 2020 fish disappeared before COVID-19 effects were substantially affecting fishing.
Environmental Conditions
See point above in general section about shifting thermal habitat. Mackerel availability continues to be highly variable.
Management Issues
The RH/S cap had substantial negative impacts on the mackerel fishery in 2018/2019. There are discrepancies between New England and the Mid-Atlantic that are hamstringing the mackerel fishery (especially given it’s a high-volume fishery), while substantial RH/S cap remains in the Atlantic herring fishery.
The Atlantic Herring fishery has become a choke-species for the Atlantic mackerel fishery.
In early 2020, the fishery collaborated to avoid RH/S and also luckily encountered mackerel further north early with observers onboard to benefit the cap estimates and give the fishery a chance (the previous year’s ratio is used in a transition method until enough new trips are observed, so the fishery can potentially be shut down based on the previous year’s data).
The current status of mackerel remains overfished.
Other Issues – None mentioned
Research Priorities – None mentioned
1
Atlantic Mackerel Fishery Information Document
July 2020
This Fishery Information Document provides a brief overview of the biology, stock condition, management system, and fishery performance for Atlantic mackerel (“mackerel” hereafter), with an emphasis on 2019. Data sources for Fishery Information Documents include unpublished National Marine Fisheries Service (NMFS) survey, dealer, vessel trip report (VTR), permit, and Marine Recreational Information Program (MRIP) databases and should be considered preliminary. For more resources, including previous Fishery Information Documents, please visit http://www.mafmc.org/msb.
Basic Biology Mackerel is a semi-pelagic/semi-demersal (may be found near the bottom or higher in the water column) schooling species primarily distributed between Labrador (Newfoundland, Canada) and North Carolina. The stock is considered to comprise two spawning contingents: a northern contingent spawning primarily in the southern Gulf of St. Lawrence and a southern contingent spawning in the Mid-Atlantic Bight, Southern New England and the western Gulf of Maine. The two contingents mix during winter months on the Northeast U.S. shelf. The Canadian fishery likely primarily catches the northern contingent while the U.S. fishery likely catches both contingents. Mackerel spawning occurs during spring and summer and progresses from south to north as surface waters warm. Atlantic mackerel are serial, or batch spawners. Eggs are pelagic. Post-larvae gradually transform from planktonic to swimming and schooling behavior at about 30-50 mm. Approximately 50% of fish are mature at age 2 and about 99% were mature at age 3 (for 2007-2016 fish) according to the recent benchmark assessment. Atlantic mackerel are opportunistic feeders that can ingest prey either by individual selection of prey organisms or by passive filter feeding. See https://www.nefsc.noaa.gov/nefsc/habitat/efh/ for more life history information.
Key Facts
• Mackerel is in a rebuilding period. • Like 2018, the mackerel fishery was closed early in 2019 due to the river herring and shad
cap (March 12, 2019), so mackerel landings were constrained independent of the mackerel quota and/or mackerel availability.
• A mackerel assessment update was delayed until 2021 due to data delays associated with COVID-19. NMFS will be providing a data update instead.
2
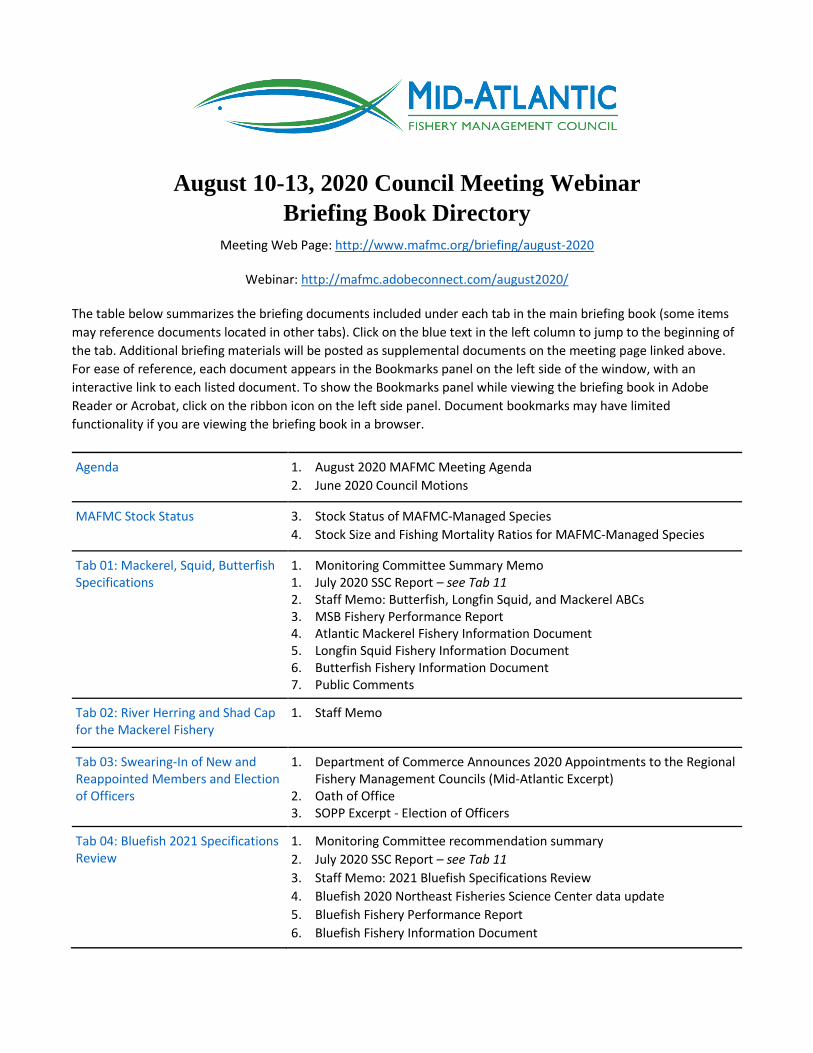
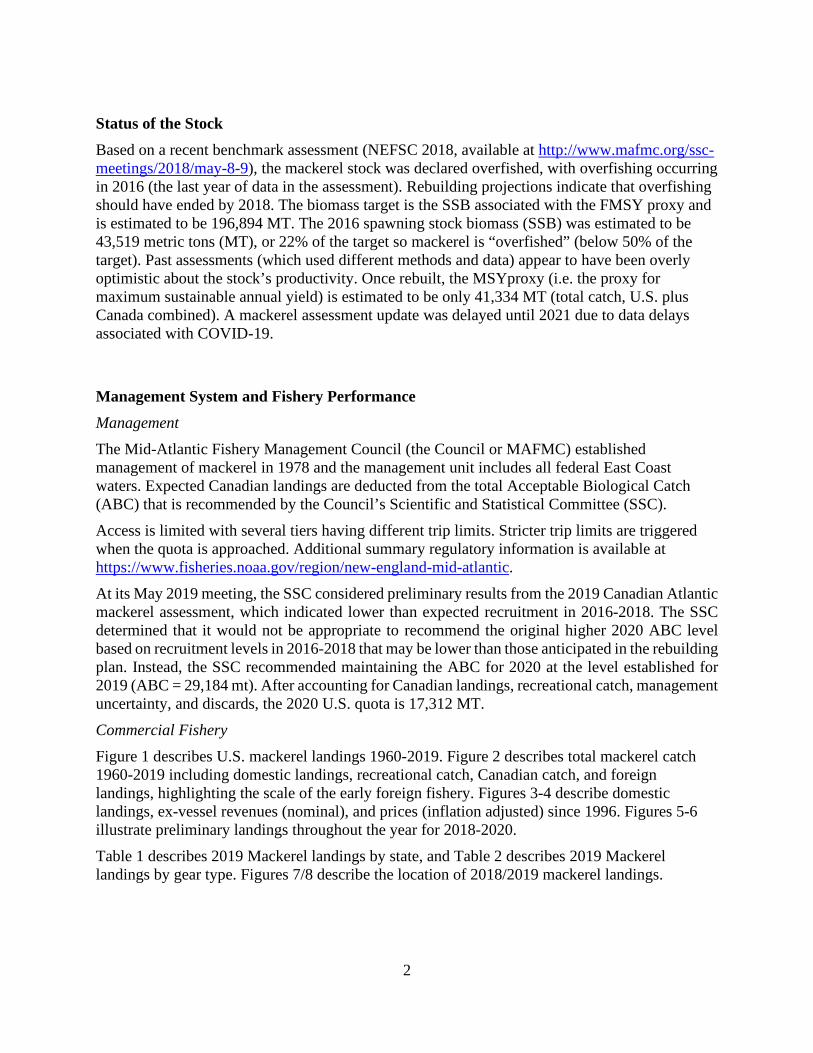
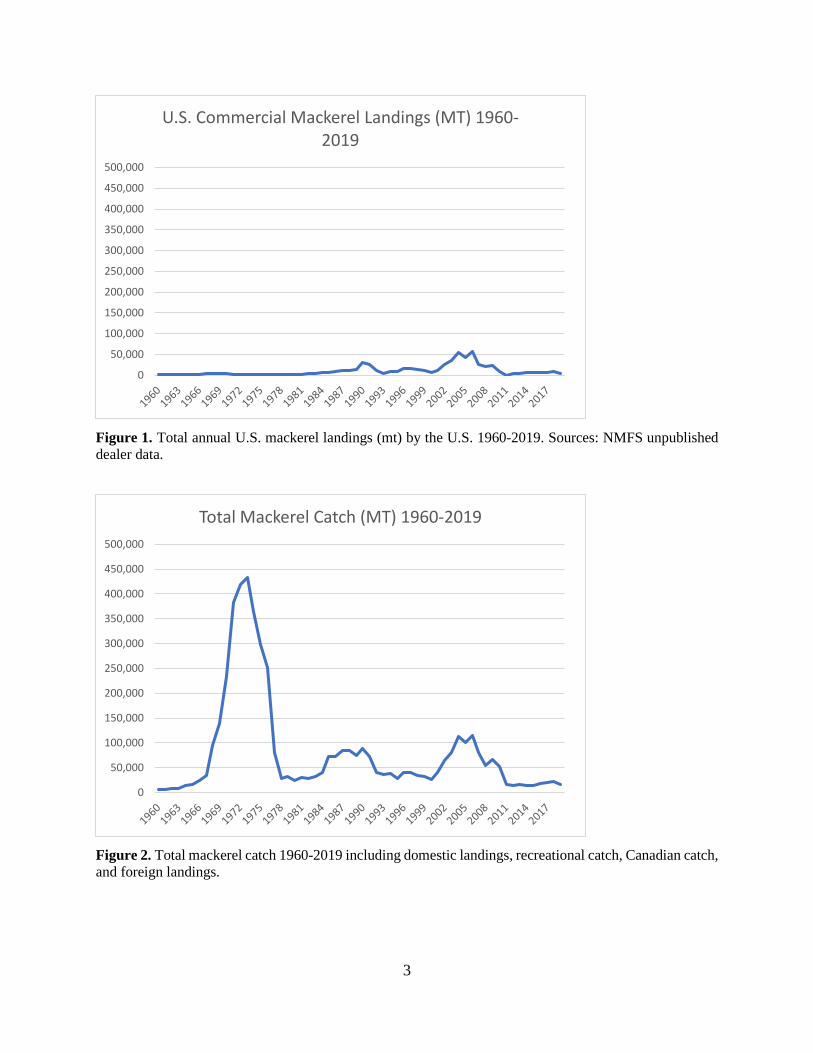
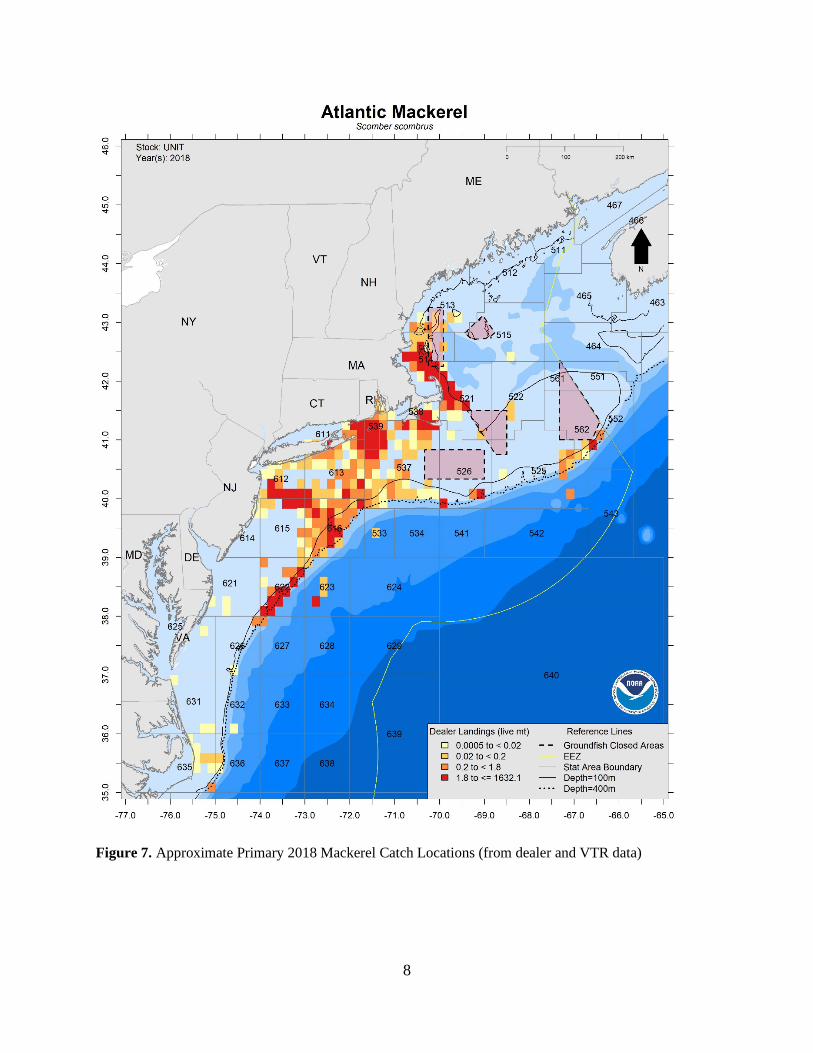
Status of the Stock Based on a recent benchmark assessment (NEFSC 2018, available at http://www.mafmc.org/ssc-meetings/2018/may-8-9), the mackerel stock was declared overfished, with overfishing occurring in 2016 (the last year of data in the assessment). Rebuilding projections indicate that overfishing should have ended by 2018. The biomass target is the SSB associated with the FMSY proxy and is estimated to be 196,894 MT. The 2016 spawning stock biomass (SSB) was estimated to be 43,519 metric tons (MT), or 22% of the target so mackerel is “overfished” (below 50% of the target). Past assessments (which used different methods and data) appear to have been overly optimistic about the stock’s productivity. Once rebuilt, the MSYproxy (i.e. the proxy for maximum sustainable annual yield) is estimated to be only 41,334 MT (total catch, U.S. plus Canada combined). A mackerel assessment update was delayed until 2021 due to data delays associated with COVID-19. Management System and Fishery Performance Management The Mid-Atlantic Fishery Management Council (the Council or MAFMC) established management of mackerel in 1978 and the management unit includes all federal East Coast waters. Expected Canadian landings are deducted from the total Acceptable Biological Catch (ABC) that is recommended by the Council’s Scientific and Statistical Committee (SSC). Access is limited with several tiers having different trip limits. Stricter trip limits are triggered when the quota is approached. Additional summary regulatory information is available at https://www.fisheries.noaa.gov/region/new-england-mid-atlantic. At its May 2019 meeting, the SSC considered preliminary results from the 2019 Canadian Atlantic mackerel assessment, which indicated lower than expected recruitment in 2016-2018. The SSC determined that it would not be appropriate to recommend the original higher 2020 ABC level based on recruitment levels in 2016-2018 that may be lower than those anticipated in the rebuilding plan. Instead, the SSC recommended maintaining the ABC for 2020 at the level established for 2019 (ABC = 29,184 mt). After accounting for Canadian landings, recreational catch, management uncertainty, and discards, the 2020 U.S. quota is 17,312 MT. Commercial Fishery Figure 1 describes U.S. mackerel landings 1960-2019. Figure 2 describes total mackerel catch 1960-2019 including domestic landings, recreational catch, Canadian catch, and foreign landings, highlighting the scale of the early foreign fishery. Figures 3-4 describe domestic landings, ex-vessel revenues (nominal), and prices (inflation adjusted) since 1996. Figures 5-6 illustrate preliminary landings throughout the year for 2018-2020. Table 1 describes 2019 Mackerel landings by state, and Table 2 describes 2019 Mackerel landings by gear type. Figures 7/8 describe the location of 2018/2019 mackerel landings.
3
Figure 1. Total annual U.S. mackerel landings (mt) by the U.S. 1960-2019. Sources: NMFS unpublished dealer data.
Figure 2. Total mackerel catch 1960-2019 including domestic landings, recreational catch, Canadian catch, and foreign landings.
0
50,000
100,000
150,000
200,000
250,000
300,000
350,000
400,000
450,000
500,000
U.S. Commercial Mackerel Landings (MT) 1960-2019
0
50,000
100,000
150,000
200,000
250,000
300,000
350,000
400,000
450,000
500,000
Total Mackerel Catch (MT) 1960-2019

4
THIS SPACE INTENTIONALLY LEFT BLANK
Figure 3. U.S. Mackerel Landings and Nominal Mackerel Ex-Vessel Values 1996-2019. Source: NMFS unpublished dealer data.
THIS SPACE INTENTIONALLY LEFT BLANK
$0
$2,000,000
$4,000,000
$6,000,000
$8,000,000
$10,000,000
$12,000,000
$14,000,000
$16,000,000
$18,000,000
$20,000,000
0
10,000
20,000
30,000
40,000
50,000
60,000
1996
1997
1998
1999
2000
2001
2002
2003
2004
2005
2006
2007
2008
2009
2010
2011
2012
2013
2014
2015
2016
2017
2018
2019
Mackerel Landings (MT, left and solid blue line) and Ex-VesselRevenues (nominal dollars, right and dashed orange line) 1996-2019
Landings (mt)
Revenues (Nominal)

5
Figure 4. Ex-Vessel Mackerel Prices 1996-2019 Adjusted to 2019 Dollars Source: NMFS unpublished dealer data.
THIS SPACE INTENTIONALLY LEFT BLANK
0
100
200
300
400
500
600
700
800
900
100019
96
1997
1998
1999
2000
2001
2002
2003
2004
2005
2006
2007
2008
2009
2010
2011
2012
2013
2014
2015
2016
2017
2018
2019
Mackerel Inflation-Adjusted Price $/MT
6
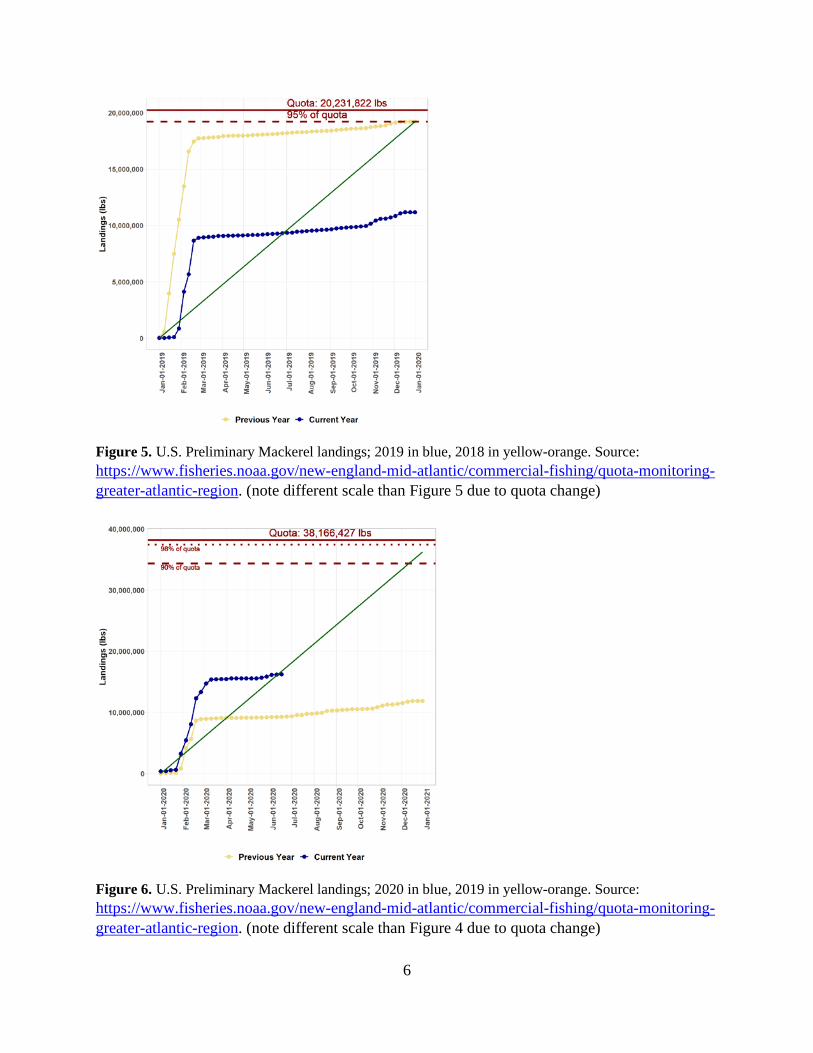
Figure 5. U.S. Preliminary Mackerel landings; 2019 in blue, 2018 in yellow-orange. Source: https://www.fisheries.noaa.gov/new-england-mid-atlantic/commercial-fishing/quota-monitoring-greater-atlantic-region. (note different scale than Figure 5 due to quota change)
Figure 6. U.S. Preliminary Mackerel landings; 2020 in blue, 2019 in yellow-orange. Source: https://www.fisheries.noaa.gov/new-england-mid-atlantic/commercial-fishing/quota-monitoring-greater-atlantic-region. (note different scale than Figure 4 due to quota change)

7
Table 1. Commercial Mackerel landings (live weight) by state in 2019. Source: NMFS unpublished dealer data.
Table 2. Commercial Mackerel landings (live weight) by gear in 2019. Source: NMFS unpublished dealer data.
State Metric_TonsNJ 2,501MA 1,622RI 587ME 254NY 49CT 22Other 13Total 5,047
GEAR Landings (MT)
TRAWL,OTTER,BOTTOM,FISH 3,313TRAWL,OTTER,MIDWATER PAIRED 857LONGLINE, BOTTOM 223UNKNOWN 203HAND LINE, OTHER 168TRAWL,OTTER,MIDWATER 143HANDLINE,AUTO JIG 75Other 64Total 5,047
8
Figure 7. Approximate Primary 2018 Mackerel Catch Locations (from dealer and VTR data)

9
Figure 8. Approximate Primary 2019 Mackerel Catch Locations (from dealer and VTR data)
THIS IS THE END OF THE DOCUMENT
1
Longfin Squid Fishery Information Document
July 2020
This Fishery Information Document provides a brief overview of the biology, stock condition, management system, and fishery performance for longfin squid (“longfin” hereafter, formerly known as “Loligo”), with an emphasis on 2019. Data sources for Fishery Information Documents include unpublished National Marine Fisheries Service (NMFS) survey, dealer, vessel trip report (VTR), permit, and Marine Recreational Information Program (MRIP) databases and should be considered preliminary. For more resources, including previous Fishery Information Documents, please visit http://www.mafmc.org/msb.
Basic Biology Longfin squid is a neritic (from the shore to the edge of the continental shelf), semi-pelagic schooling cephalopod species primarily distributed between Georges Bank and Cape Hatteras, NC. The squid, and the fishery, generally occur offshore in the winter and inshore during the summer, with mixing and migrations from one to the other in spring and fall. Spawning/ recruitment occurs year-round with seasonal peaks in cohorts. The average lifespan of a cohort is about six months. Individuals hatched inshore during the summer are taken in the winter offshore fishery and those hatched in the winter are taken in the inshore summer fishery. Age data indicate that NEFSC spring surveys (March-April) capture longfin squid that were hatched during the previous six months, in the fall, and those caught in the NEFSC fall surveys (September-October) were hatched during the previous spring. Longfin squid attach egg masses to the substrate and fixed objects. Fishing and spawning mortality occur concurrently inshore during late spring through fall. The locations of spawning sites offshore at other times of the year are not well understood. Additional life history information is detailed in the EFH document for the species, located at: http://www.nefsc.noaa.gov/nefsc/habitat/efh/.
Key Facts
• Longfin had a management track assessment in 2020. Based on 2019 data the fishery was not overfished. Overfishing reference points are not available.
• Longfin landings were 7% higher in 2019 compared to 2018 but still substantially below the quota; there were no seasonal trimester closures in 2018.
• Substantial variability is to be expected with squid species.

2
Status of the Stock Based on a recent management track assessment, the status of longfin squid is not overfished but there are no overfishing reference points available (available at https://apps-nefsc.fisheries.noaa.gov/saw/sasi/sasi_report_options.php). See Figure 1 for trends in biomass from the assessment. The assessment also presented unaveraged trends based on the spring and fall surveys separately representing two dominant cohorts, and solicited input from the reviewers about moving to considering the two dominant cohorts separately. The reviewers supported moving forward with such an approach - Since the median fall biomass is about five times bigger than the median spring biomass, there could be considerable management implications if the surveys are ultimately used to manage two cohorts separately.
Figure 1. Annualized biomass estimates (annual averages of the NEFSC spring and fall survey biomass estimates in mt) of longfin in relation to the existing BMSY proxy (42,205 mt) and annual catches during 1987-2019 (when fishing was solely conducted by the USA fleet). The grey line represents the annualized biomass two-year moving averages which are used to determine stock status. Some years near the end are missing due to missing survey data. Management System and Fishery Performance Management The Council established management of longfin in 1978 and the management unit includes all federal East Coast waters. Access is limited with several moratorium permit categories. The quota is divided into three, 4-month Trimesters - 43% (Jan-Apr), 17% (May-Aug), and 40% (Sept-Dec). Unused quota can roll over into later trimesters within a year depending on the amount of longfin landed. Underages from T1 that are greater than 25% are reallocated to Trimesters 2 and 3 (split equally between both trimesters) of the same year. However, the T2 quota may only be increased by 50% via rollover and the remaining portion of the underage is reallocated to T3. Any underages for T1
3
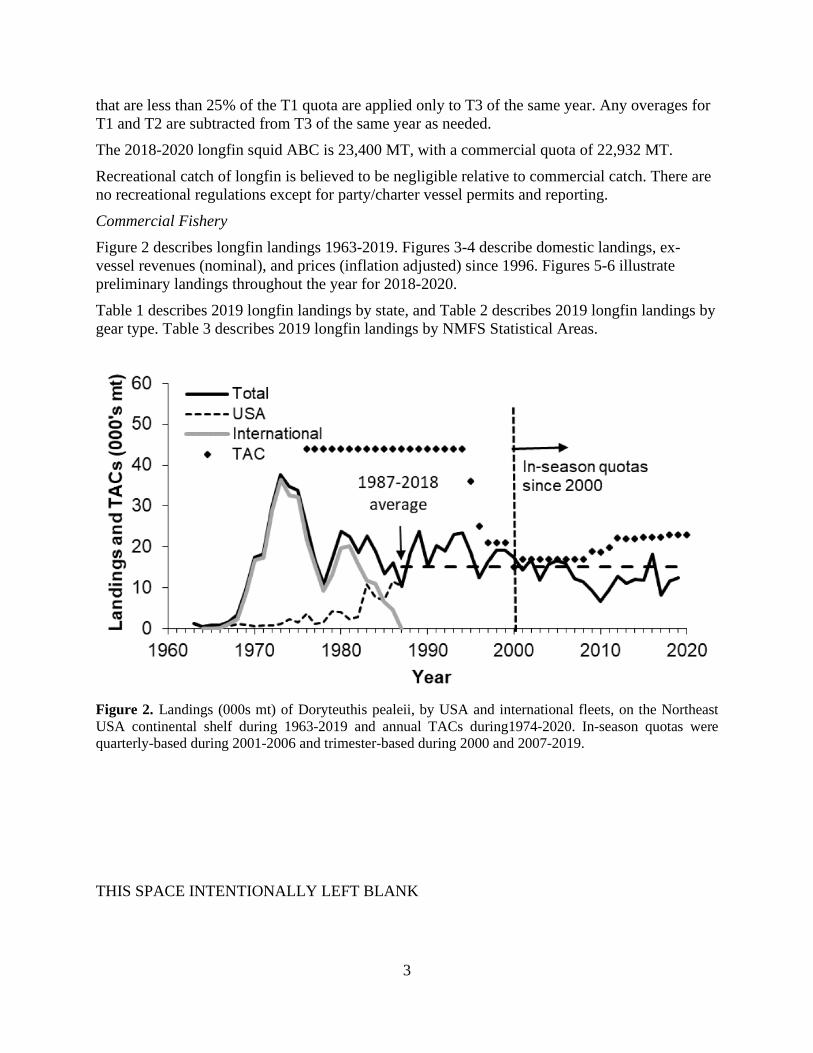
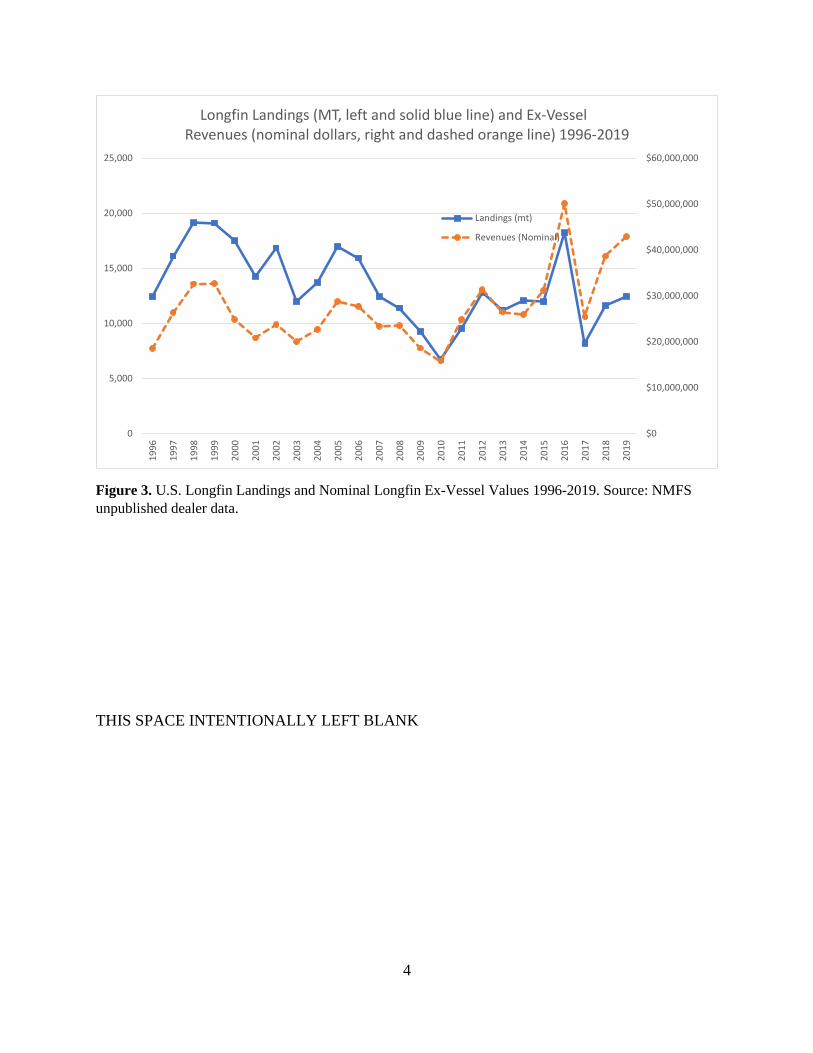
that are less than 25% of the T1 quota are applied only to T3 of the same year. Any overages for T1 and T2 are subtracted from T3 of the same year as needed. The 2018-2020 longfin squid ABC is 23,400 MT, with a commercial quota of 22,932 MT. Recreational catch of longfin is believed to be negligible relative to commercial catch. There are no recreational regulations except for party/charter vessel permits and reporting. Commercial Fishery Figure 2 describes longfin landings 1963-2019. Figures 3-4 describe domestic landings, ex-vessel revenues (nominal), and prices (inflation adjusted) since 1996. Figures 5-6 illustrate preliminary landings throughout the year for 2018-2020. Table 1 describes 2019 longfin landings by state, and Table 2 describes 2019 longfin landings by gear type. Table 3 describes 2019 longfin landings by NMFS Statistical Areas.
Figure 2. Landings (000s mt) of Doryteuthis pealeii, by USA and international fleets, on the Northeast USA continental shelf during 1963-2019 and annual TACs during1974-2020. In-season quotas were quarterly-based during 2001-2006 and trimester-based during 2000 and 2007-2019.
THIS SPACE INTENTIONALLY LEFT BLANK
4
Figure 3. U.S. Longfin Landings and Nominal Longfin Ex-Vessel Values 1996-2019. Source: NMFS unpublished dealer data.
THIS SPACE INTENTIONALLY LEFT BLANK
$0
$10,000,000
$20,000,000
$30,000,000
$40,000,000
$50,000,000
$60,000,000
0
5,000
10,000
15,000
20,000
25,00019
96
1997
1998
1999
2000
2001
2002
2003
2004
2005
2006
2007
2008
2009
2010
2011
2012
2013
2014
2015
2016
2017
2018
2019
Longfin Landings (MT, left and solid blue line) and Ex-VesselRevenues (nominal dollars, right and dashed orange line) 1996-2019
Landings (mt)
Revenues (Nominal)

5
Figure 4. Ex-Vessel Longfin Prices 1996-2019 Adjusted to 2019 Dollars Source: NMFS unpublished dealer data.
THIS SPACE INTENTIONALLY LEFT BLANK
0
500
1000
1500
2000
2500
3000
3500
400019
96
1997
1998
1999
2000
2001
2002
2003
2004
2005
2006
2007
2008
2009
2010
2011
2012
2013
2014
2015
2016
2017
2018
2019
Longfin Inflation-Adjusted Price $/MT

6
Figure 5. U.S. Preliminary Longfin landings; 2019 in blue, 2018 in yellow-orange. Source: https://www.fisheries.noaa.gov/new-england-mid-atlantic/commercial-fishing/quota-monitoring-greater-atlantic-region.
Figure 6. U.S. Preliminary Longfin landings; 2020 Trimester 1 in blue, 2019 Trimester 1 in yellow-orange. Source: https://www.fisheries.noaa.gov/new-england-mid-atlantic/commercial-fishing/quota-monitoring-greater-atlantic-region.

7
Table 1. Commercial Longfin landings (live weight) by state in 2019. Source: NMFS unpublished dealer data.
Table 2. Commercial Longfin landings (live weight) by gear in 2019. Source: NMFS unpublished dealer data.
Table 3. Commercial longfin landings by statistical area in 2019. Source: NMFS unpublished VTR data.
THIS IS THE END OF THE DOCUMENT
State Metric_TonsRI 6,040NJ 2,203NY 1,828MA 1,188CT 980Other/Unknown 216Total 12,457
GEAR Landings (MT)
TRAWL,OTTER,BOTTOM,FISH 10,582UNKNOWN 1,290TRAWL,OTTER,BOTTOM,OTHER 380DREDGE, OTHER 187Other 19Total 12,457
Stat Area Metric_Tons616 3,182622 2,502537 1,616613 771626 747538 552623 493612 316562 196611 178539 177627 141525 106
Other 600Total 11,577
1
Butterfish Fishery Information Document
July 2020
This Fishery Information Document provides a brief overview of the biology, stock condition, management system, and fishery performance for butterfish, with an emphasis on 2019. Data sources for Fishery Information Documents include unpublished National Marine Fisheries Service (NMFS) survey, dealer, vessel trip report (VTR), permit, and Marine Recreational Information Program (MRIP) databases and should be considered preliminary. For more resources, including previous Fishery Information Documents, please visit http://www.mafmc.org/msb.
Basic Biology Atlantic butterfish is a semi-pelagic/semi-demersal schooling fish species primarily distributed between Nova Scotia, Canada and Florida. They are most abundant from the Gulf of Maine to Cape Hatteras and are fast-growing, short-lived, and form loose schools. They winter near the edge of the continental shelf in the Middle Atlantic Bight and migrate inshore in the spring into Mid-Atlantic, southern New England, and Gulf of Maine waters. During the summer, butterfish occur over the entire mid-Atlantic shelf from sheltered bays and estuaries out to about 200 m. In late fall, butterfish move southward and offshore in response to falling water temperatures. Butterfish are short-lived and grow rapidly; few individuals live beyond 3 years and most are sexually mature at 1-2 years of age. The maximum age reported is 6 years. Juvenile butterfish range from 16 mm to about 120 mm. During their first year, they grow to 76-127 mm, or about half their adult size. Early-spawned individuals are 76-102 mm in the fall; late-spawned individuals are 51-76 mm in the fall and 76-127 mm the following spring. Adult butterfish range from about 120 mm to 305mm with an average length of 150-230 mm. See https://www.nefsc.noaa.gov/nefsc/habitat/efh/ for more life history information.
Key Facts
• 2019 landings were about double 2018 landings and similar to 2017. Landings have generally been variable and well below the quota in recent years.
• Butterfish just had a management track assessment update, which concluded biomass has been trending down but the stock is not overfished nor experiencing overfishing. Recruitment is variable but has been trending lower since 1999. Spawning stock biomass (SSB) in 2019 was estimated to be 69% of the target.
• Considerable variability is expected in abundance, availability, and landings.

2
Status of the Stock Based on a recent management track assessment, the status of butterfish is not overfished with no overfishing occurring (available at https://apps-nefsc.fisheries.noaa.gov/saw/sasi/sasi_report_options.php). However, declining recruitment has led to declines in biomass (Figure 1), and as of 2019 biomass is estimated to have been only 69% of the target. Projections run based on typical long-term recruitment predict a rapid increase in biomass, but that will only occur when the trend in recruitment reverses. Initial projections using lower, more recent (last 10 years) recruitment and a high level of uncertainty suggest that considering substantial reductions in acceptable biological catch (ABC) may be warranted.
Figure 1. Butterfish recruitment (vertical bars), and the spawning stock biomass (blue line) 1989-2019. Management System and Fishery Performance Management The Mid-Atlantic Fishery Management Council (the Council or MAFMC) established management of butterfish in 1978 and the management unit includes all federal East Coast waters. Limited access commercial vessels can fish year-round, subject to applicable gear requirements. Trip limits are triggered when the quota is approached. Incidental permits are limited to 600 pounds per trip. Additional summary regulatory information is available at
3
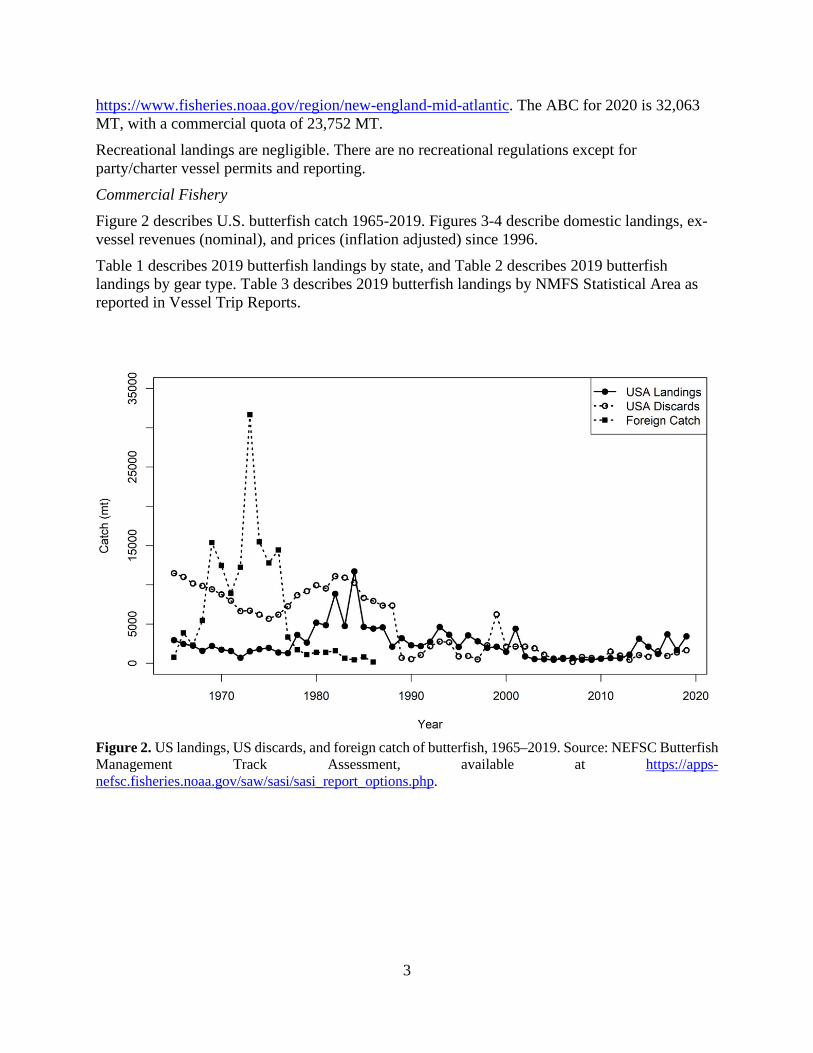
https://www.fisheries.noaa.gov/region/new-england-mid-atlantic. The ABC for 2020 is 32,063 MT, with a commercial quota of 23,752 MT. Recreational landings are negligible. There are no recreational regulations except for party/charter vessel permits and reporting. Commercial Fishery Figure 2 describes U.S. butterfish catch 1965-2019. Figures 3-4 describe domestic landings, ex-vessel revenues (nominal), and prices (inflation adjusted) since 1996. Table 1 describes 2019 butterfish landings by state, and Table 2 describes 2019 butterfish landings by gear type. Table 3 describes 2019 butterfish landings by NMFS Statistical Area as reported in Vessel Trip Reports.
Figure 2. US landings, US discards, and foreign catch of butterfish, 1965–2019. Source: NEFSC Butterfish Management Track Assessment, available at https://apps-nefsc.fisheries.noaa.gov/saw/sasi/sasi_report_options.php.

4
Figure 3. U.S. Butterfish Landings and Nominal Butterfish Ex-Vessel Values 1996-2019. Source: NMFS unpublished dealer data.
THIS SPACE INTENTIONALLY LEFT BLANK
$0
$1,000,000
$2,000,000
$3,000,000
$4,000,000
$5,000,000
$6,000,000
$7,000,000
0
500
1,000
1,500
2,000
2,500
3,000
3,500
4,000
4,500
5,000
1996
1997
1998
1999
2000
2001
2002
2003
2004
2005
2006
2007
2008
2009
2010
2011
2012
2013
2014
2015
2016
2017
2018
2019
Butterfish Landings (MT, left and solid blue line) and Ex-VesselRevenues (nominal dollars, right and dashed orange line) 1996-2019
Landings (mt)
Revenues (Nominal)
5
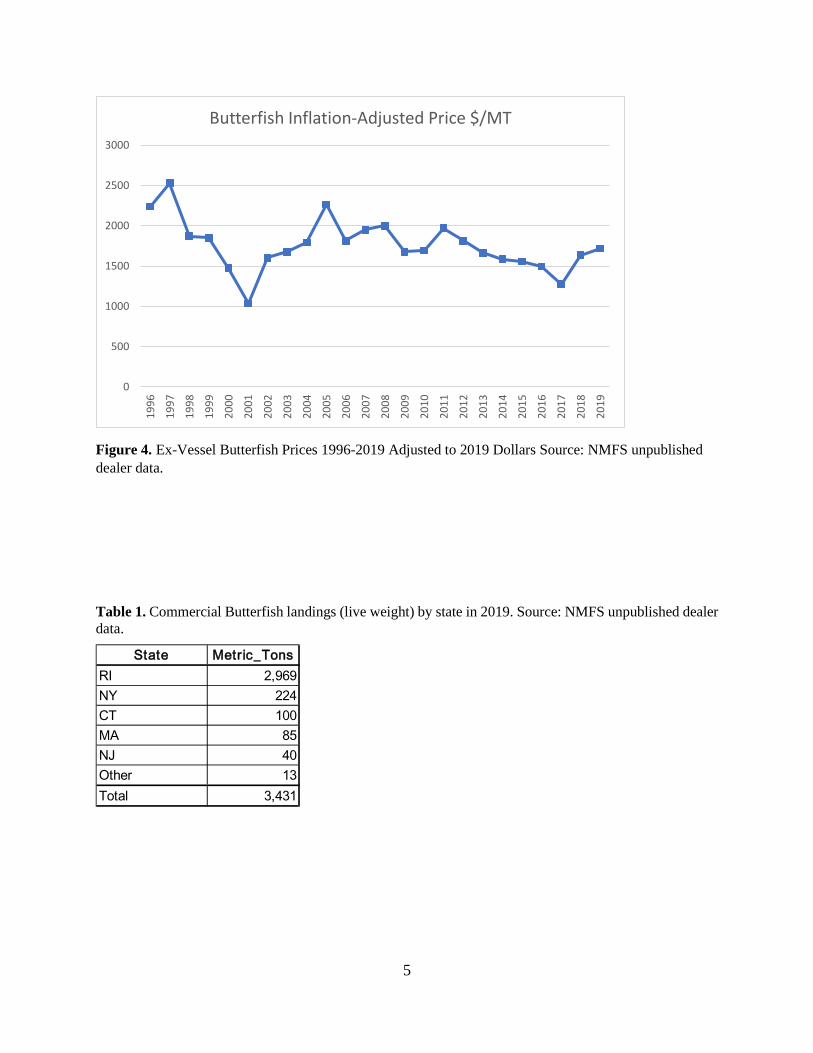
Figure 4. Ex-Vessel Butterfish Prices 1996-2019 Adjusted to 2019 Dollars Source: NMFS unpublished dealer data.
Table 1. Commercial Butterfish landings (live weight) by state in 2019. Source: NMFS unpublished dealer data.
0
500
1000
1500
2000
2500
300019
96
1997
1998
1999
2000
2001
2002
2003
2004
2005
2006
2007
2008
2009
2010
2011
2012
2013
2014
2015
2016
2017
2018
2019
Butterfish Inflation-Adjusted Price $/MT
State Metric_TonsRI 2,969NY 224CT 100MA 85NJ 40Other 13Total 3,431
6
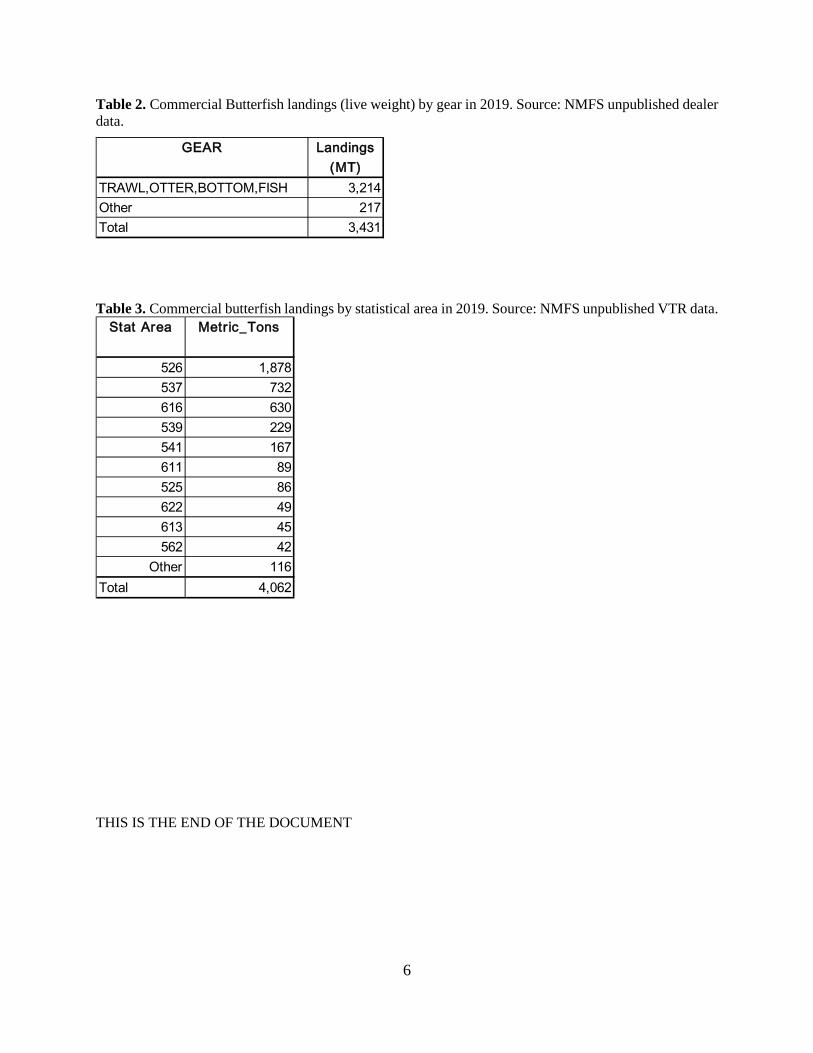
Table 2. Commercial Butterfish landings (live weight) by gear in 2019. Source: NMFS unpublished dealer data.
Table 3. Commercial butterfish landings by statistical area in 2019. Source: NMFS unpublished VTR data.
THIS IS THE END OF THE DOCUMENT
GEAR Landings (MT)
TRAWL,OTTER,BOTTOM,FISH 3,214Other 217Total 3,431
Stat Area Metric_Tons
526 1,878537 732616 630539 229541 167611 89525 86622 49613 45562 42
Other 116Total 4,062
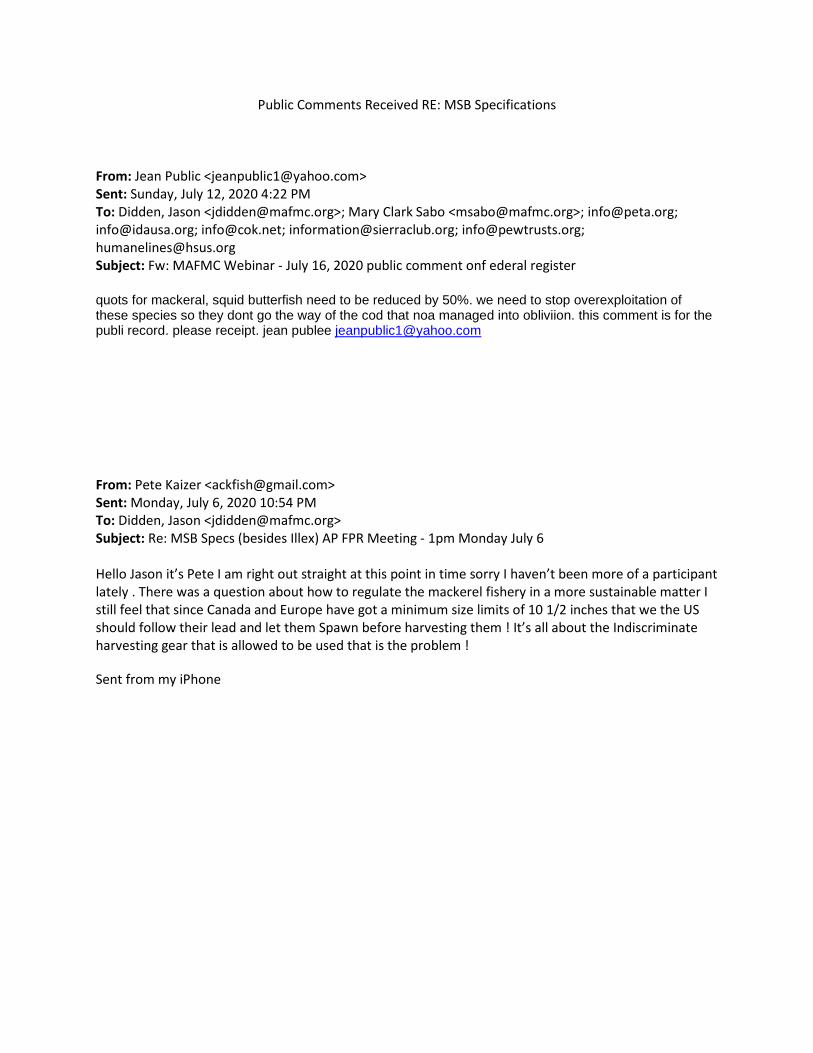
Public Comments Received RE: MSB Specifications From: Jean Public <[email protected]> Sent: Sunday, July 12, 2020 4:22 PM To: Didden, Jason <[email protected]>; Mary Clark Sabo <[email protected]>; [email protected]; [email protected]; [email protected]; [email protected]; [email protected]; [email protected] Subject: Fw: MAFMC Webinar - July 16, 2020 public comment onf ederal register quots for mackeral, squid butterfish need to be reduced by 50%. we need to stop overexploitation of these species so they dont go the way of the cod that noa managed into obliviion. this comment is for the publi record. please receipt. jean publee [email protected] From: Pete Kaizer <[email protected]> Sent: Monday, July 6, 2020 10:54 PM To: Didden, Jason <[email protected]> Subject: Re: MSB Specs (besides Illex) AP FPR Meeting - 1pm Monday July 6 Hello Jason it’s Pete I am right out straight at this point in time sorry I haven’t been more of a participant lately . There was a question about how to regulate the mackerel fishery in a more sustainable matter I still feel that since Canada and Europe have got a minimum size limits of 10 1/2 inches that we the US should follow their lead and let them Spawn before harvesting them ! It’s all about the Indiscriminate harvesting gear that is allowed to be used that is the problem !
Sent from my iPhone
Page 1 of 1
M E M O R A N D U M
Date: July 30, 2020
To: Council
From: J. Didden, staff
Subject: River Herring and Shad (RH/S)
Based on staff’s understanding of Council intent regarding the RH/S cap, no changes appear
warranted if the Council also maintains the current mackerel specifications. The cap is currently
set at 129 MT. At the current cap, the mackerel fishery can operate if it achieves a historically
relatively low bycatch ratio (as has occurred in 2020), but will be shut down early if it achieves a
relatively high bycatch ratio (e.g. 2018 and 2019). As discussed in the MSB Monitoring Committee
summary, the cap will limit RH/S catch in the mackerel fishery, but the cap is not biologically
based and cap estimates may have high uncertainty depending on the number of observed trips (6
so far in 2020 with a cap estimate of 21 MT).
Staff still plans on completing a series of discussion papers on RH/S later in the year, which may
suggest some additional options regarding RH/S caps (New England alignment, cap modifications
based on survey trends, geographic bycatch hot spots, etc.).
Mid-Atlantic Fishery Management Council 800 North State Street, Suite 201, Dover, DE 19901
Phone: 302-674-2331 ǀ FAX: 302-674-5399 ǀ www.mafmc.org Michael P. Luisi, Chairman ǀ G. Warren Elliott, Vice Chairman
Christopher M. Moore, Ph.D., Executive Director
Department of Commerce Announces 2020 Appointments to the Regional Fishery Management Councils June 22, 2020
The Secretary of Commerce announces the appointment of 22 new and returning members of the eight regional fishery management councils.
Feature Story | National
The U.S. Department of Commerce today announced the appointment of 22 members to the regional fishery management councils that partner with NOAA Fisheries to manage marine fishery resources.
Established by the Magnuson-Stevens Fishery Conservation and Management Act, councils are responsible for developing region-specific fishery management plans that safeguard and enhance the nation’s fisheries resources. Council members represent diverse groups, including commercial and recreational fishing industries, environmental organizations, and academia. They are vital to fulfilling the act’s requirements to end overfishing, rebuild fish stocks, and manage them sustainably.
NOAA Fisheries works closely with the councils through the process of developing fishery management plans. We also review, approve, and implement the plans.
Each year, the Secretary of Commerce appoints approximately one-third of the total 72 appointed members to the eight regional councils. The Secretary selects members from nominations submitted by the governors of fishing states, territories and tribal governments.
Council members are appointed to both state-specific and regional seats—also known as obligatory and at-large seats, respectively. Council members serve a three-year term and may be reappointed to serve three consecutive terms.
An asterisk preceding a member’s name indicates a reappointment.
Mid-Atlantic Council The Mid-Atlantic Council includes members from the states of Delaware, Maryland, New Jersey, New York, North Carolina, Pennsylvania, and Virginia. 2020 appointees will fill four obligatory seats for Maryland, North Carolina, New York and Pennsylvania and one at-large seat.
Obligatory seat: *Earl Gwin (Maryland)
*F. Dewey Hemilright (North Carolina)
Paul Risi (New York)
Michelle Duval (Pennsylvania)
At-large seats: Danny Farnham (New York)
2.2 Oath of Office As trustees of the nation’s fishery resources, all voting members must take an oath specified by the Secretary as follows: I, [name of the person taking oath], as a duly appointed member of a Regional Fishery Management Council established under the Magnuson-Stevens Fishery Conservation and Management Act, hereby promise to conserve and manage the living marine resources of the United States of America by carrying out the business of the Council for the greatest overall benefit of the Nation. I recognize my responsibility to serve as a knowledgeable and experienced trustee of the Nation’s marine fisheries resources, being careful to balance competing private or regional interests, and always aware and protective of the public interest in those resources. I commit myself to uphold the provisions, standards, and requirements of the Magnuson-Stevens Fishery Conservation and Management Act and other applicable law, and shall conduct myself at all times according to the rules of conduct prescribed by the Secretary of Commerce. This oath is given freely and without mental reservation or purpose of evasion.

2.4 OFFICERS AND TERMS OF OFFICE 2.4.1 General
(a) A Chair and a Vice Chair shall be elected annually at the first Council meetingfollowing the seating of new Council members (on or after August 11 of each year) by thevoting members of the Council present and voting; each such officer shall serve for aperiod of one year and until a successor is elected.(b) Officers may succeed themselves.(c) The Council may elect other officers as it deems necessary.
2.4.2 Nominations The Chair shall appoint a Nominating Committee, who shall make its nominations (at least two for each office) at the beginning of the election process. Following the Committee's nomination, any voting member may nominate additional candidates from the floor. When nominations are closed the election shall be held.
2.4.3 Elections (a) The election of Chair will be held first, followed by the election for Vice Chair. If onlyone candidate accepts the nomination for an office, the Chairman of the NominatingCommittee shall cast all votes for that candidate. If there are two or more candidates, theelection shall be by a secret ballot with the votes tabulated by two or more Tellersappointed by the Council Chair.(b) The Tellers shall use the following rules to determine the winning candidate:
(1) To win, a candidate must receive a majority of the votes cast.(2) If no candidate receives a majority of the votes, the Tellers shall declare noelection. If there are more than two candidates, the candidate receiving thelowest number of vote shall be dropped from consideration and a vote will betaken for the remaining candidates. This process will continue until a candidatereceives a majority of the vote cast.(3) Those preferring not to vote for any candidate shall check "ABSTAIN" on theballot.(4) The number of ballots cast for an individual shall not be announced. AnyCouncil member who questions the result may review the ballots. The ballots willnot identify which Council member cast a particular ballot.
2.4.4 Special Elections In the event that the Chair cannot fulfill the Chair's obligations for the balance of the Chair's term, a special election will be held at the next scheduled Council meeting to fill the position of Chair. In the event that the Vice Chair cannot fulfill the Vice Chair's obligations for the balance of the Vice Chair's term, a special election will be held at the next scheduled Council meeting to fill the position of Vice Chair. The procedures for nominations and elections set forth above will be followed for special elections.
2.4.5 Authority of the Chair (a) The Council Chair shall be the chief executive officer of the Council. Subject only tothe authority of the Council, the Chair shall have general charge and supervision over,and responsibility for the business and affairs of the Council. Unless otherwise directedby the Council, the Chair may enter into and execute in the name of the Council,contracts or other instruments in the regular course of business or contract or otherinstruments not in the regular course of business which are authorized, either generallyor specifically, by the Council. The Council Chair shall have the general powers and

duties of management usually vested in the office of the Chair of the Board of a corporation. (b) The Council Chair shall have the authority to appoint and dissolve committees ofCouncil members, name their officers and membership, and describe their functions,duties, and responsibilities consistent with the Charter of the Council, the Act, and otherapplicable law.(c) The Council Chair shall also have the full authority to call meetings as necessary forthe conduct of the Council's business.(d) The Council Chair shall have the authority to authorize reimbursement of travelexpenses and/or compensation of any eligible members of the Council, its committees orsubpanels except that proper notification, at the direction of the Chair, in the FederalRegister of a regular meeting of the Council or one of its committees or subpanels shallconstitute authorization for travel expenses and/or compensation to be paid to eligiblemembers.(e) The Council Chair shall have the authority to authorize, approve, or disapprove allmeetings of Council subpanels or committees.(f) In the event of the absence or inability of the Council Chair to serve or fulfill theChair's obligations, the Council Vice-Chair shall assume authority and duties of theChair.

Page 1 of 1
M E M O R A N D U M
Date: July 30, 2020
To: Council and Board
From: Matthew Seeley, Council staff
Subject: 2021 Bluefish Specifications Review
The Council and Board will review 2021 specifications for bluefish on Tuesday, August 11, 2020. Recreational management measures for 2021 will be considered later in 2020. Materials listed below are provided for the Council and Board’s consideration of this agenda item.
Please note that some materials are behind other tabs. Items are listed in reverse chronological order.
1) Monitoring Committee recommendation summary
2) September 2020 Scientific and Statistical Committee meeting report (behind Tab11)
3) Staff memo on 2021 bluefish specifications dated June 29, 2020
4) Bluefish 2020 Northeast Fisheries Science Center data update
5) 2020 Advisory Panel Fishery Performance Report
6) 2020 Bluefish Fishery Information Document
Mid-Atlantic Fishery Management Council 800 North State Street, Suite 201, Dover, DE 19901
Phone: 302-674-2331 ǀ FAX: 302-674-5399 ǀ www.mafmc.org Michael P. Luisi, Chairman ǀ G. Warren Elliott, Vice Chairman
Christopher M. Moore, Ph.D., Executive Director

1
Bluefish Monitoring Committee Meeting Summary
July 28, 2020 Monitoring Committee Members: Matthew Seeley (Council Staff), Dustin Colson Leaning (ASMFC), Cynthia Ferrio (GARFO), Mike Celestino (NJ-F&W), Richard Wong (DE-F&W), Eric Durrell (MD-DNR), Nicole Lengyel Costa (RI-DMF), Jim Gartland (VIMS), Tony Wood (NEFSC), Kurt Gottschall (CT), Joseph Munyandorero (FL FWC), David Behringer (NC DMF), Same Truesdell (MA DMF), and John Maniscalco (NY DEC). Others in attendance: José Montañez (Council Staff), Dewey Hemilright (MAFMC), Mike Waine (ASA), Greg DiDomenico (Lund’s Fisheries). Introduction The Bluefish Monitoring Committee (MC) received a presentation including a summary of the Scientific and Statistical Committee’s (SSC's) acceptable biological catch (ABC) recommendation for 2021, recent fishery performance, and the 2020 Northeast Fisheries Science Center (NEFSC) bluefish data update. The SSC recommended a status quo ABC of 7,385 mt (16.28 M lbs) for 2021. The ABC recommendation reflects the results of the 2019 bluefish operational assessment, which designated the bluefish stock as overfished with overfishing not occurring and is in line with the rebuilding projections set within the Bluefish Allocation and Rebuilding Amendment. Following the presentation, the MC discussed various sources of management uncertainty, estimates of discards (recreational and commercial), 2021 expected recreational landings, transfers from the recreational to commercial fishery, commercial management measures, and the implications of COVID-19. Additionally, the MC was offered an opportunity to comment on the status of the Bluefish Allocation and Rebuilding Amendment. Management Uncertainty Considering the bluefish flowchart (Figure 1) in the Fishery Management Plan, management uncertainty is accounted for prior to the sector specific annual catch target (ACT) split, which means management uncertainty will affect both the resulting recreational harvest limit (RHL) and commercial quota (CQ), even if management uncertainty exists in only one of the two sectors. The MC recognizes that this may be a concern moving forward since reductions for management uncertainty for only one sector is not feasible. Thus, the MC discussed and is in full support of the alternatives being developed in the Bluefish Allocation and Rebuilding Amendment. Regarding specifications, the MC discussed various sources of management uncertainty in considering an adjustment from the annual catch limit (ACL) to the fishery-specific annual catch target.
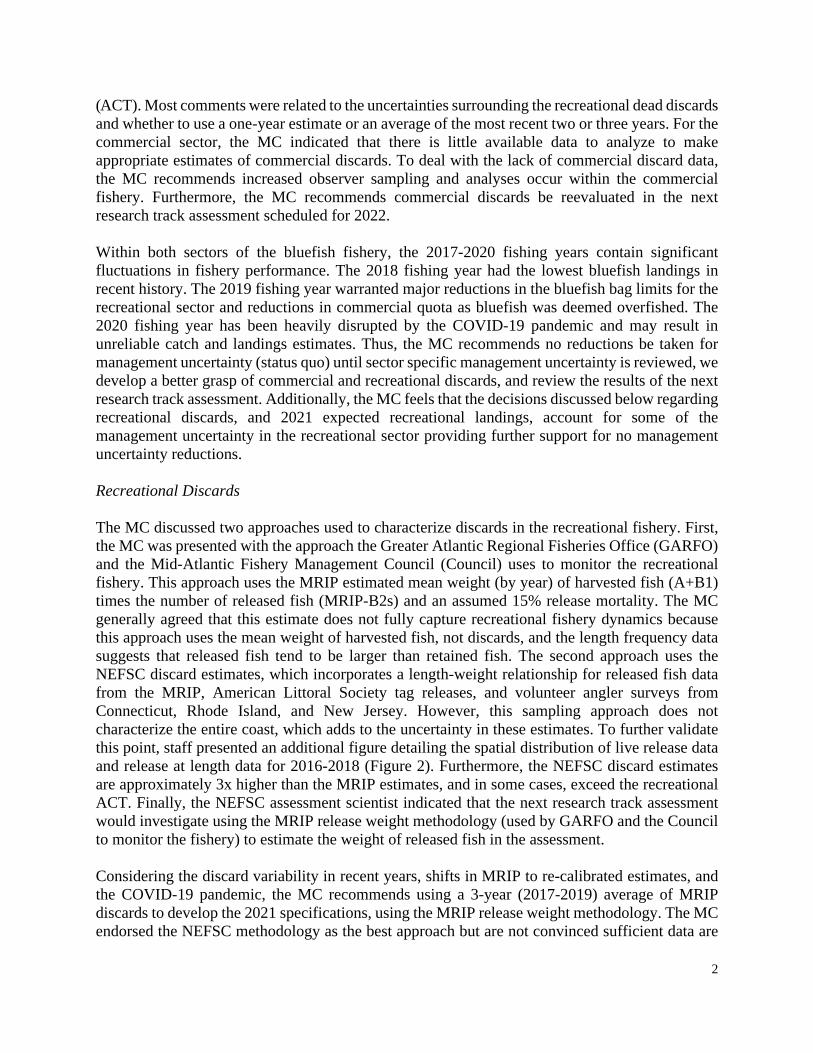
2
(ACT). Most comments were related to the uncertainties surrounding the recreational dead discards and whether to use a one-year estimate or an average of the most recent two or three years. For the commercial sector, the MC indicated that there is little available data to analyze to make appropriate estimates of commercial discards. To deal with the lack of commercial discard data, the MC recommends increased observer sampling and analyses occur within the commercial fishery. Furthermore, the MC recommends commercial discards be reevaluated in the next research track assessment scheduled for 2022. Within both sectors of the bluefish fishery, the 2017-2020 fishing years contain significant fluctuations in fishery performance. The 2018 fishing year had the lowest bluefish landings in recent history. The 2019 fishing year warranted major reductions in the bluefish bag limits for the recreational sector and reductions in commercial quota as bluefish was deemed overfished. The 2020 fishing year has been heavily disrupted by the COVID-19 pandemic and may result in unreliable catch and landings estimates. Thus, the MC recommends no reductions be taken for management uncertainty (status quo) until sector specific management uncertainty is reviewed, we develop a better grasp of commercial and recreational discards, and review the results of the next research track assessment. Additionally, the MC feels that the decisions discussed below regarding recreational discards, and 2021 expected recreational landings, account for some of the management uncertainty in the recreational sector providing further support for no management uncertainty reductions. Recreational Discards The MC discussed two approaches used to characterize discards in the recreational fishery. First, the MC was presented with the approach the Greater Atlantic Regional Fisheries Office (GARFO) and the Mid-Atlantic Fishery Management Council (Council) uses to monitor the recreational fishery. This approach uses the MRIP estimated mean weight (by year) of harvested fish (A+B1) times the number of released fish (MRIP-B2s) and an assumed 15% release mortality. The MC generally agreed that this estimate does not fully capture recreational fishery dynamics because this approach uses the mean weight of harvested fish, not discards, and the length frequency data suggests that released fish tend to be larger than retained fish. The second approach uses the NEFSC discard estimates, which incorporates a length-weight relationship for released fish data from the MRIP, American Littoral Society tag releases, and volunteer angler surveys from Connecticut, Rhode Island, and New Jersey. However, this sampling approach does not characterize the entire coast, which adds to the uncertainty in these estimates. To further validate this point, staff presented an additional figure detailing the spatial distribution of live release data and release at length data for 2016-2018 (Figure 2). Furthermore, the NEFSC discard estimates are approximately 3x higher than the MRIP estimates, and in some cases, exceed the recreational ACT. Finally, the NEFSC assessment scientist indicated that the next research track assessment would investigate using the MRIP release weight methodology (used by GARFO and the Council to monitor the fishery) to estimate the weight of released fish in the assessment. Considering the discard variability in recent years, shifts in MRIP to re-calibrated estimates, and the COVID-19 pandemic, the MC recommends using a 3-year (2017-2019) average of MRIP discards to develop the 2021 specifications, using the MRIP release weight methodology. The MC endorsed the NEFSC methodology as the best approach but are not convinced sufficient data are

3
available to inform the calculations, and hence believe the MRIP approach, while not ideal, has less uncertainty in comparison. Consequently, the MC believes it would be helpful to evaluate the potential or need for a coastwide biological sampling program to provide additional data for the NEFSC approach. The MC also discussed the cyclical nature of more restrictive management measures potentially resulting in more releases. The 3-year average results in discards of 6.32 M lbs as opposed to the initial staff recommendation of using the 2019 MRIP discards of 5.17 M lbs. The MC indicated that the 3-year average attempts to smooth the uncertainties associated with the recreational discards. Commercial Discards The MC discussed recent reports of increased commercial discards in the bluefish fishery. Commercial discards were not included in the benchmark stock assessment or operational assessment as they were deemed negligible (SAW 60). Last year, some Advisory Panel members indicated that in recent years (i.e., since 2015) localized discards in the commercial fishery are increasing and may not be insignificant. Some MC members (and members of the public, through public comment on the call) also noted that commercial releases may increase in conjunction with, and because of, reductions in quota. The MC further discussed that while commercial discards may have been negligible in the past, with reduced commercial quotas in recent years, the number of regulatory discards could be more significant. As noted in the Management Uncertainty section of this document, the MC recommends that increased observer sampling and analyses occur within the commercial fishery to better understand commercial discards prior to the 2022 research track assessment. 2021 Expected Recreational Landings (ERL) In recent years, expected recreational landings have been calculated from three-year averages using the most recent complete fishing years during the July MC meeting. This year, the MC recommends waiting until the November Recreational Measures MC meeting to provide a recommendation for ERL. In November, wave 4 recreational data will be available for 2020 and projections can be made using the most up to date data. However, the MC does have major concerns with the fact that the recreational management measures (reductions in bag limits) developed in 2019 were not officially finalized until mid-2020. Additionally, the MC is concerned with the MRIP landing and effort estimates for 2020 as a result of the COVID-19 pandemic. Thus, the MC will review the 2020 projections in November, but may also consider other approaches to develop ERL that have not yet been discussed. Transfers The MC recommends no transfer be applied from the recreational fishery to commercial fishery. No transfer can occur (as indicated in the regulations) because the recreational fishery is anticipated to harvest the full RHL.

4
Resulting Commercial Quota and RHL The resulting RHL and CQ recommended by the MC for 2021 specifications are 7.19 M lbs and 2.77 M lbs, respectively (Table 1). The decisions made by the MC to recommend MRIP-based 3-year average recreational discard estimates and no transfer, on top of the already restricted quotas results in a very low CQ and RHL for 2021. Defining the RHL and CQ in this manner likely accounts for a large amount of the uncertainty present in the management of the bluefish stock, which faces rebuilding over the next few years. The Monitoring Committee acknowledges that such low levels of allowable landings present challenges to managers and fishery participants. The MC also noted that the 2021 recommended CQ of 2.77 M lbs is the smallest in recent years, especially considering the 2019 commercial landings (2.78 M lbs) would have exceeded the quota. However, the MC recommends no commercial management measures because the states have discretion to alter their own commercial trip and size limits. A federal size limit could be imposed; however, in reviewing the state-by-state commercial bluefish regulations, the MC noted that many states have already implemented minimum size limits. Additionally, the average size of bluefish varies state to state and the MC does not currently have the data to make an informed decision regarding a single coastwide minimum size limit and does not believe the additional burden on the commercial sector is warranted. If adjustments to a federal season were to be considered, implementation would need to occur through a framework action. Recreational Management Measures The MC needs Council/Board action on the RHLs and CQs prior to identifying the associated recreational management measures. To constrain harvest to the RHL, the MC will review the current management measures in place and will reconvene in November 2020 to utilize the Council approved RHLs and CQs to set management measures (as conducted in 2019).
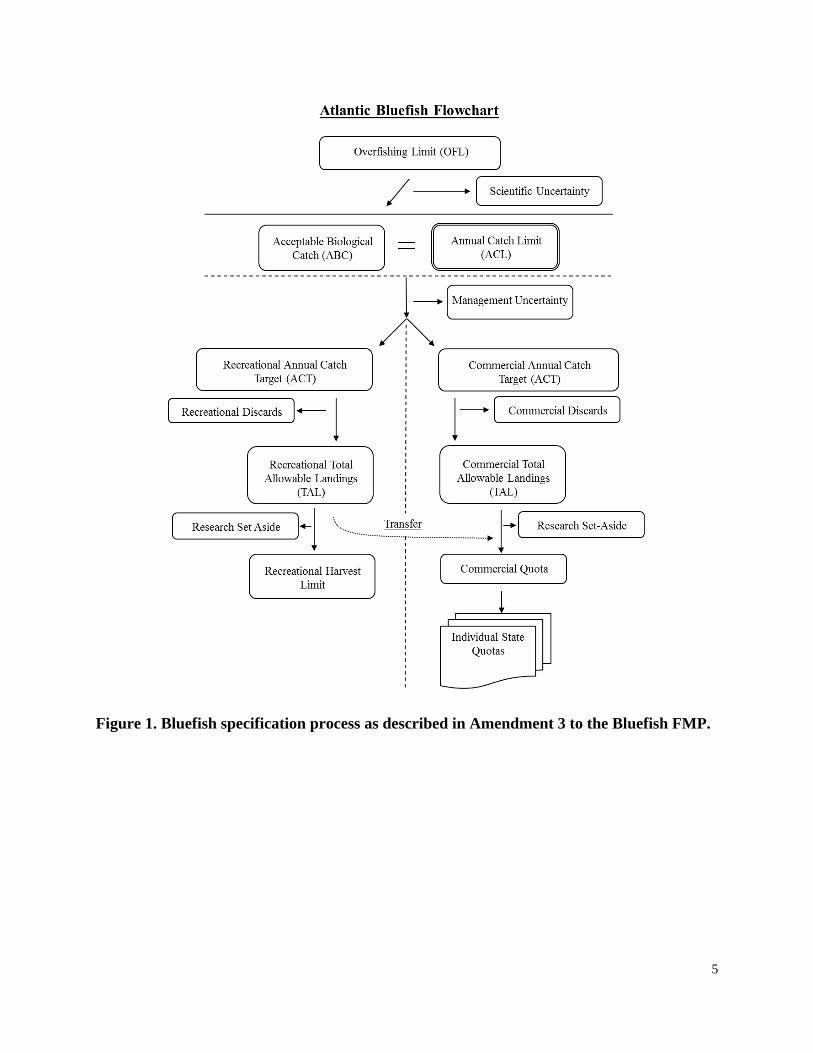
5
Figure 1. Bluefish specification process as described in Amendment 3 to the Bluefish FMP.

6
Figure 2. Bluefish total spatial distribution of MRIP live releases and release at length data from the American Littoral Society and volunteer angler survey data (2016-2018).
0% 10% 20% 30% 40% 50% 60%
FLGASCNCVAMDDENJ
NYCTRI
MANHME
Percent of data set associated with each state
Total spatial distribution of live releases and release at length data (2016-2018)
ALS & state volunteer angler survey data MRIP live releases (B2s)
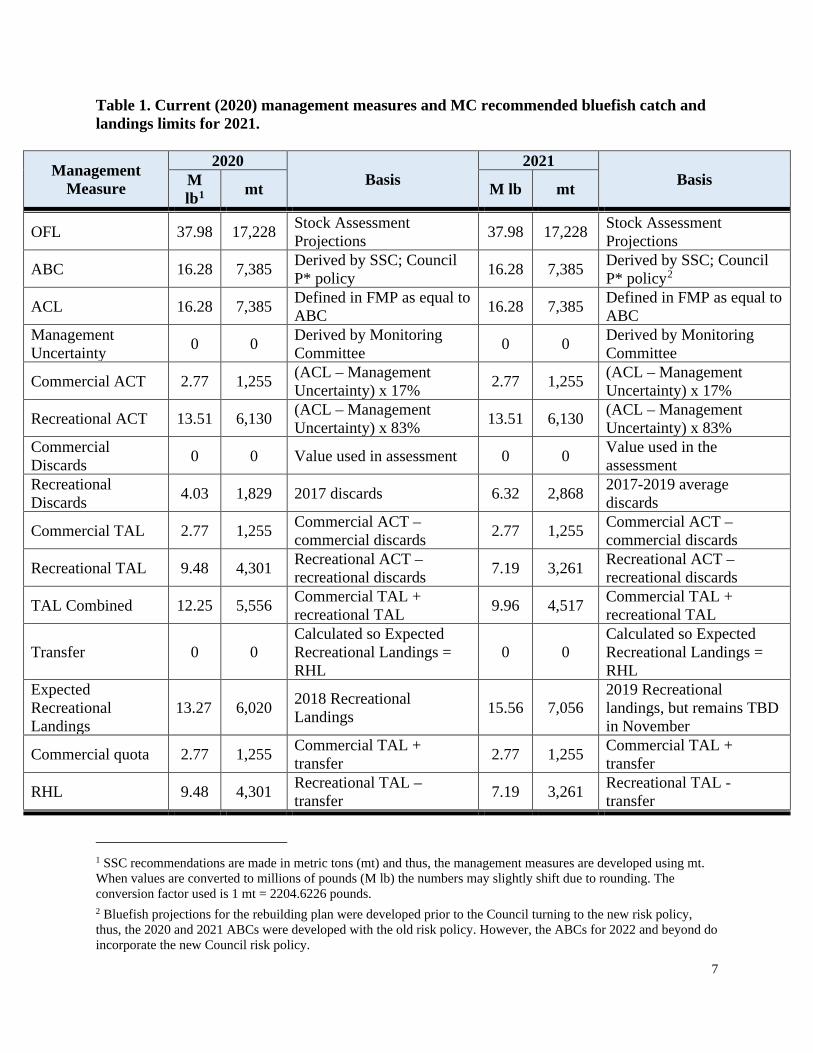
7
Table 1. Current (2020) management measures and MC recommended bluefish catch and landings limits for 2021.
Management Measure
2020 Basis
2021 Basis M
lb1 mt M lb mt
OFL 37.98 17,228 Stock Assessment Projections 37.98 17,228 Stock Assessment
Projections
ABC 16.28 7,385 Derived by SSC; Council P* policy 16.28 7,385 Derived by SSC; Council
P* policy2
ACL 16.28 7,385 Defined in FMP as equal to ABC 16.28 7,385 Defined in FMP as equal to
ABC Management Uncertainty 0 0 Derived by Monitoring
Committee 0 0 Derived by Monitoring Committee
Commercial ACT 2.77 1,255 (ACL – Management Uncertainty) x 17% 2.77 1,255 (ACL – Management
Uncertainty) x 17%
Recreational ACT 13.51 6,130 (ACL – Management Uncertainty) x 83% 13.51 6,130 (ACL – Management
Uncertainty) x 83% Commercial Discards 0 0 Value used in assessment 0 0 Value used in the
assessment Recreational Discards 4.03 1,829 2017 discards 6.32 2,868 2017-2019 average
discards
Commercial TAL 2.77 1,255 Commercial ACT – commercial discards 2.77 1,255 Commercial ACT –
commercial discards
Recreational TAL 9.48 4,301 Recreational ACT – recreational discards 7.19 3,261 Recreational ACT –
recreational discards
TAL Combined 12.25 5,556 Commercial TAL + recreational TAL 9.96 4,517 Commercial TAL +
recreational TAL
Transfer 0 0 Calculated so Expected Recreational Landings = RHL
0 0 Calculated so Expected Recreational Landings = RHL
Expected Recreational Landings
13.27 6,020 2018 Recreational Landings 15.56 7,056
2019 Recreational landings, but remains TBD in November
Commercial quota 2.77 1,255 Commercial TAL + transfer 2.77 1,255 Commercial TAL +
transfer
RHL 9.48 4,301 Recreational TAL – transfer 7.19 3,261 Recreational TAL -
transfer
1 SSC recommendations are made in metric tons (mt) and thus, the management measures are developed using mt. When values are converted to millions of pounds (M lb) the numbers may slightly shift due to rounding. The conversion factor used is 1 mt = 2204.6226 pounds. 2 Bluefish projections for the rebuilding plan were developed prior to the Council turning to the new risk policy, thus, the 2020 and 2021 ABCs were developed with the old risk policy. However, the ABCs for 2022 and beyond do incorporate the new Council risk policy.

8

SSC Report is behind Tab 11
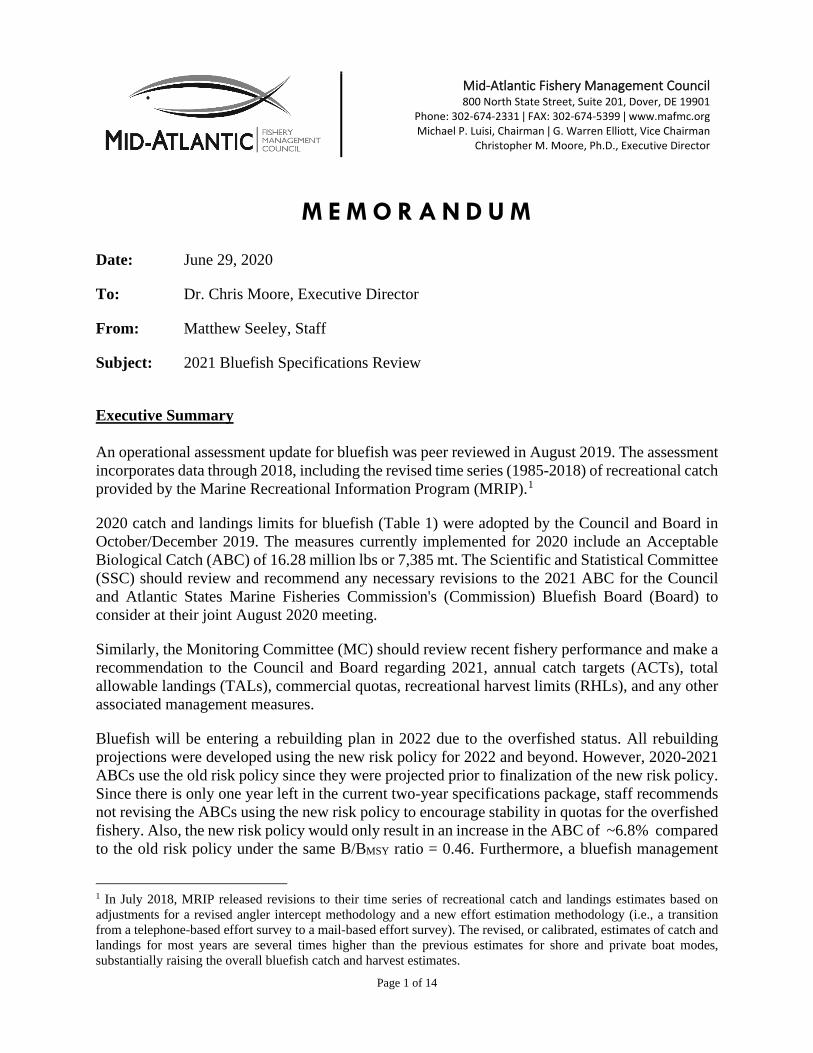
Page 1 of 14
M E M O R A N D U M
Date: June 29, 2020
To: Dr. Chris Moore, Executive Director
From: Matthew Seeley, Staff
Subject: 2021 Bluefish Specifications Review
Executive Summary An operational assessment update for bluefish was peer reviewed in August 2019. The assessment incorporates data through 2018, including the revised time series (1985-2018) of recreational catch provided by the Marine Recreational Information Program (MRIP).1
2020 catch and landings limits for bluefish (Table 1) were adopted by the Council and Board in October/December 2019. The measures currently implemented for 2020 include an Acceptable Biological Catch (ABC) of 16.28 million lbs or 7,385 mt. The Scientific and Statistical Committee (SSC) should review and recommend any necessary revisions to the 2021 ABC for the Council and Atlantic States Marine Fisheries Commission's (Commission) Bluefish Board (Board) to consider at their joint August 2020 meeting.
Similarly, the Monitoring Committee (MC) should review recent fishery performance and make a recommendation to the Council and Board regarding 2021, annual catch targets (ACTs), total allowable landings (TALs), commercial quotas, recreational harvest limits (RHLs), and any other associated management measures.
Bluefish will be entering a rebuilding plan in 2022 due to the overfished status. All rebuilding projections were developed using the new risk policy for 2022 and beyond. However, 2020-2021 ABCs use the old risk policy since they were projected prior to finalization of the new risk policy. Since there is only one year left in the current two-year specifications package, staff recommends not revising the ABCs using the new risk policy to encourage stability in quotas for the overfished fishery. Also, the new risk policy would only result in an increase in the ABC of ~6.8% compared to the old risk policy under the same B/BMSY ratio = 0.46. Furthermore, a bluefish management
1 In July 2018, MRIP released revisions to their time series of recreational catch and landings estimates based on adjustments for a revised angler intercept methodology and a new effort estimation methodology (i.e., a transition from a telephone-based effort survey to a mail-based effort survey). The revised, or calibrated, estimates of catch and landings for most years are several times higher than the previous estimates for shore and private boat modes, substantially raising the overall bluefish catch and harvest estimates.
Mid-Atlantic Fishery Management Council 800 North State Street, Suite 201, Dover, DE 19901
Phone: 302-674-2331 ǀ FAX: 302-674-5399 ǀ www.mafmc.org Michael P. Luisi, Chairman ǀ G. Warren Elliott, Vice Chairman
Christopher M. Moore, Ph.D., Executive Director
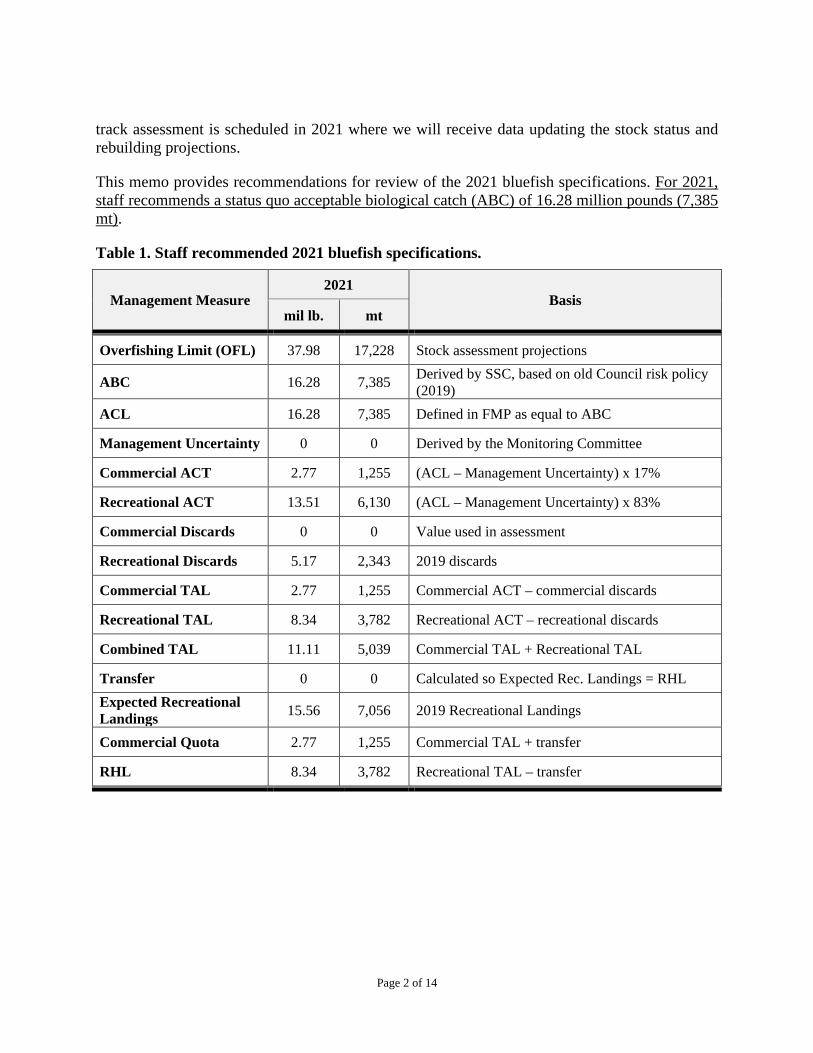
Page 2 of 14
track assessment is scheduled in 2021 where we will receive data updating the stock status and rebuilding projections.
This memo provides recommendations for review of the 2021 bluefish specifications. For 2021, staff recommends a status quo acceptable biological catch (ABC) of 16.28 million pounds (7,385 mt).
Table 1. Staff recommended 2021 bluefish specifications.
Management Measure 2021
Basis mil lb. mt
Overfishing Limit (OFL) 37.98 17,228 Stock assessment projections
ABC 16.28 7,385 Derived by SSC, based on old Council risk policy (2019)
ACL 16.28 7,385 Defined in FMP as equal to ABC
Management Uncertainty 0 0 Derived by the Monitoring Committee
Commercial ACT 2.77 1,255 (ACL – Management Uncertainty) x 17%
Recreational ACT 13.51 6,130 (ACL – Management Uncertainty) x 83%
Commercial Discards 0 0 Value used in assessment
Recreational Discards 5.17 2,343 2019 discards
Commercial TAL 2.77 1,255 Commercial ACT – commercial discards
Recreational TAL 8.34 3,782 Recreational ACT – recreational discards
Combined TAL 11.11 5,039 Commercial TAL + Recreational TAL
Transfer 0 0 Calculated so Expected Rec. Landings = RHL Expected Recreational Landings 15.56 7,056 2019 Recreational Landings
Commercial Quota 2.77 1,255 Commercial TAL + transfer
RHL 8.34 3,782 Recreational TAL – transfer
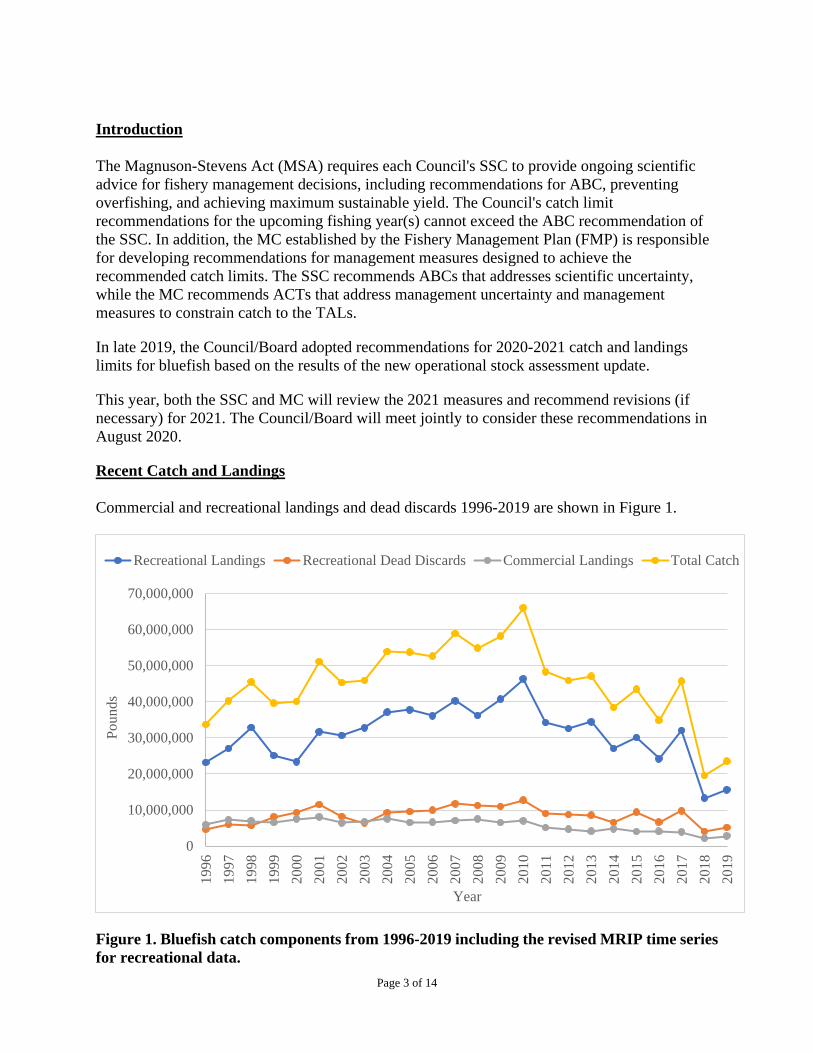
Page 3 of 14
Introduction The Magnuson-Stevens Act (MSA) requires each Council's SSC to provide ongoing scientific advice for fishery management decisions, including recommendations for ABC, preventing overfishing, and achieving maximum sustainable yield. The Council's catch limit recommendations for the upcoming fishing year(s) cannot exceed the ABC recommendation of the SSC. In addition, the MC established by the Fishery Management Plan (FMP) is responsible for developing recommendations for management measures designed to achieve the recommended catch limits. The SSC recommends ABCs that addresses scientific uncertainty, while the MC recommends ACTs that address management uncertainty and management measures to constrain catch to the TALs.
In late 2019, the Council/Board adopted recommendations for 2020-2021 catch and landings limits for bluefish based on the results of the new operational stock assessment update.
This year, both the SSC and MC will review the 2021 measures and recommend revisions (if necessary) for 2021. The Council/Board will meet jointly to consider these recommendations in August 2020.
Recent Catch and Landings Commercial and recreational landings and dead discards 1996-2019 are shown in Figure 1.
Figure 1. Bluefish catch components from 1996-2019 including the revised MRIP time series for recreational data.
0
10,000,000
20,000,000
30,000,000
40,000,000
50,000,000
60,000,000
70,000,000
1996
1997
1998
1999
2000
2001
2002
2003
2004
2005
2006
2007
2008
2009
2010
2011
2012
2013
2014
2015
2016
2017
2018
2019
Poun
ds
Year
Recreational Landings Recreational Dead Discards Commercial Landings Total Catch
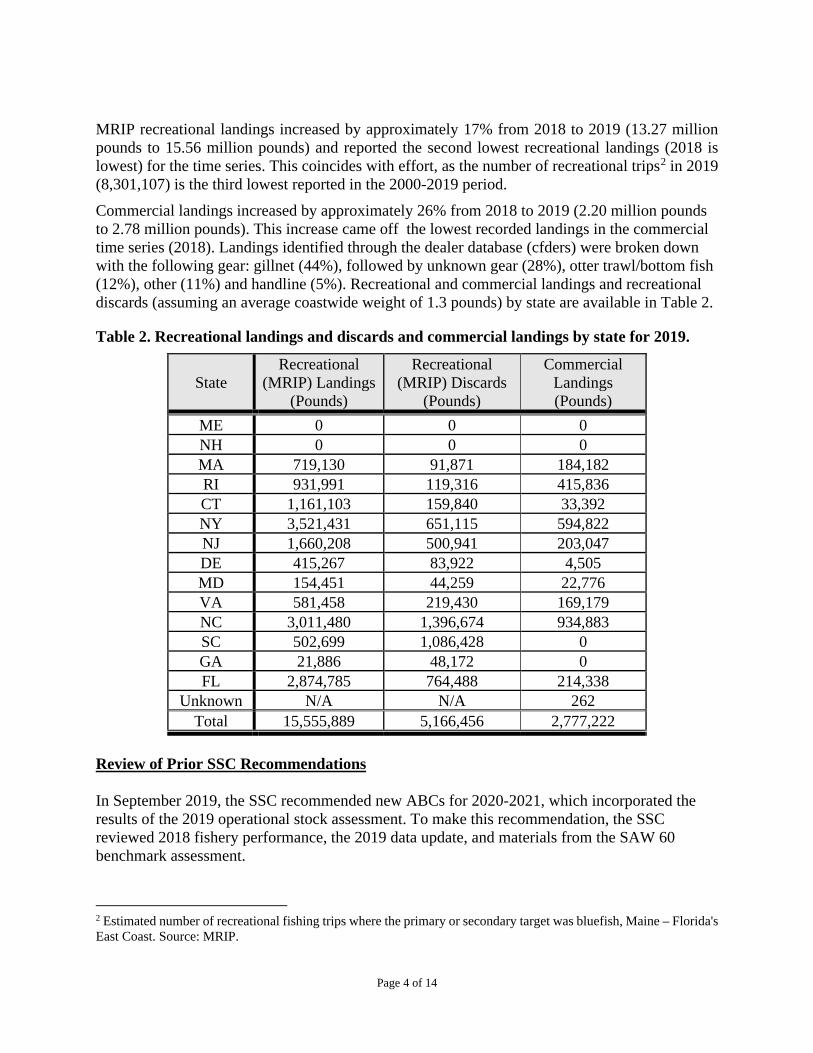
Page 4 of 14
MRIP recreational landings increased by approximately 17% from 2018 to 2019 (13.27 million pounds to 15.56 million pounds) and reported the second lowest recreational landings (2018 is lowest) for the time series. This coincides with effort, as the number of recreational trips2 in 2019 (8,301,107) is the third lowest reported in the 2000-2019 period. Commercial landings increased by approximately 26% from 2018 to 2019 (2.20 million pounds to 2.78 million pounds). This increase came off the lowest recorded landings in the commercial time series (2018). Landings identified through the dealer database (cfders) were broken down with the following gear: gillnet (44%), followed by unknown gear (28%), otter trawl/bottom fish (12%), other (11%) and handline (5%). Recreational and commercial landings and recreational discards (assuming an average coastwide weight of 1.3 pounds) by state are available in Table 2.
Table 2. Recreational landings and discards and commercial landings by state for 2019.
State Recreational
(MRIP) Landings (Pounds)
Recreational (MRIP) Discards
(Pounds)
Commercial Landings (Pounds)
ME 0 0 0 NH 0 0 0 MA 719,130 91,871 184,182 RI 931,991 119,316 415,836 CT 1,161,103 159,840 33,392 NY 3,521,431 651,115 594,822 NJ 1,660,208 500,941 203,047 DE 415,267 83,922 4,505 MD 154,451 44,259 22,776 VA 581,458 219,430 169,179 NC 3,011,480 1,396,674 934,883 SC 502,699 1,086,428 0 GA 21,886 48,172 0 FL 2,874,785 764,488 214,338
Unknown N/A N/A 262 Total 15,555,889 5,166,456 2,777,222
Review of Prior SSC Recommendations In September 2019, the SSC recommended new ABCs for 2020-2021, which incorporated the results of the 2019 operational stock assessment. To make this recommendation, the SSC reviewed 2018 fishery performance, the 2019 data update, and materials from the SAW 60 benchmark assessment.
2 Estimated number of recreational fishing trips where the primary or secondary target was bluefish, Maine – Florida's East Coast. Source: MRIP.
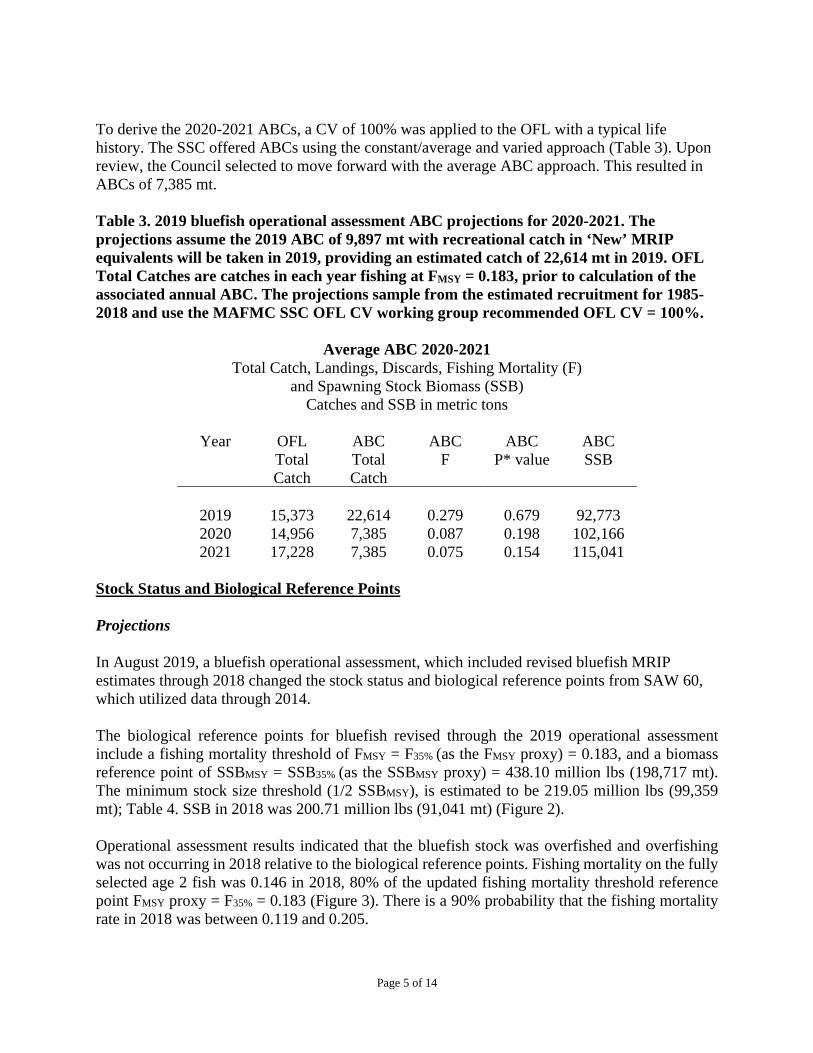
Page 5 of 14
To derive the 2020-2021 ABCs, a CV of 100% was applied to the OFL with a typical life history. The SSC offered ABCs using the constant/average and varied approach (Table 3). Upon review, the Council selected to move forward with the average ABC approach. This resulted in ABCs of 7,385 mt. Table 3. 2019 bluefish operational assessment ABC projections for 2020-2021. The projections assume the 2019 ABC of 9,897 mt with recreational catch in ‘New’ MRIP equivalents will be taken in 2019, providing an estimated catch of 22,614 mt in 2019. OFL Total Catches are catches in each year fishing at FMSY = 0.183, prior to calculation of the associated annual ABC. The projections sample from the estimated recruitment for 1985-2018 and use the MAFMC SSC OFL CV working group recommended OFL CV = 100%.
Average ABC 2020-2021 Total Catch, Landings, Discards, Fishing Mortality (F)
and Spawning Stock Biomass (SSB) Catches and SSB in metric tons
Year OFL ABC ABC ABC ABC
Total Catch
Total Catch
F P* value SSB
2019 15,373 22,614 0.279 0.679 92,773 2020 14,956 7,385 0.087 0.198 102,166 2021 17,228 7,385 0.075 0.154 115,041
Stock Status and Biological Reference Points Projections In August 2019, a bluefish operational assessment, which included revised bluefish MRIP estimates through 2018 changed the stock status and biological reference points from SAW 60, which utilized data through 2014. The biological reference points for bluefish revised through the 2019 operational assessment include a fishing mortality threshold of FMSY = F35% (as the FMSY proxy) = 0.183, and a biomass reference point of SSBMSY = SSB35% (as the SSBMSY proxy) = 438.10 million lbs (198,717 mt). The minimum stock size threshold (1/2 SSBMSY), is estimated to be 219.05 million lbs (99,359 mt); Table 4. SSB in 2018 was 200.71 million lbs (91,041 mt) (Figure 2). Operational assessment results indicated that the bluefish stock was overfished and overfishing was not occurring in 2018 relative to the biological reference points. Fishing mortality on the fully selected age 2 fish was 0.146 in 2018, 80% of the updated fishing mortality threshold reference point FMSY proxy = F35% = 0.183 (Figure 3). There is a 90% probability that the fishing mortality rate in 2018 was between 0.119 and 0.205.
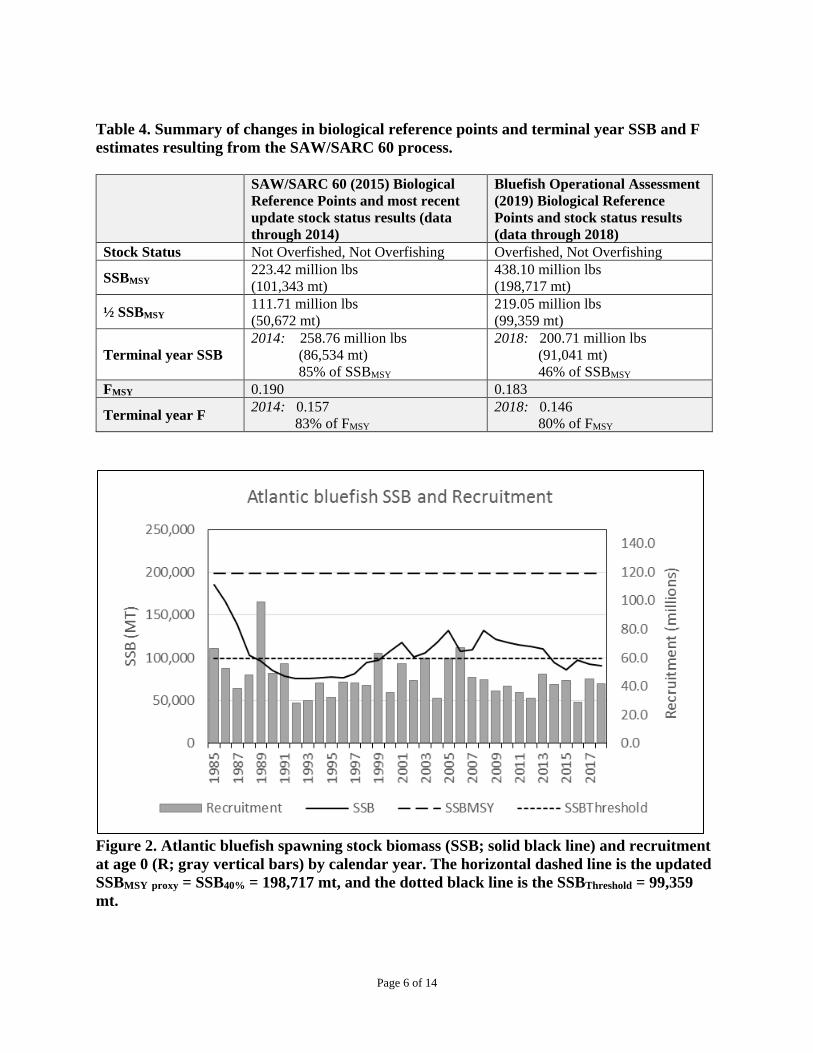
Page 6 of 14
Table 4. Summary of changes in biological reference points and terminal year SSB and F estimates resulting from the SAW/SARC 60 process.
SAW/SARC 60 (2015) Biological Reference Points and most recent update stock status results (data through 2014)
Bluefish Operational Assessment (2019) Biological Reference Points and stock status results (data through 2018)
Stock Status Not Overfished, Not Overfishing Overfished, Not Overfishing
SSBMSY 223.42 million lbs (101,343 mt)
438.10 million lbs (198,717 mt)
½ SSBMSY 111.71 million lbs (50,672 mt)
219.05 million lbs (99,359 mt)
Terminal year SSB 2014: 258.76 million lbs (86,534 mt) 85% of SSBMSY
2018: 200.71 million lbs (91,041 mt) 46% of SSBMSY
FMSY 0.190 0.183
Terminal year F 2014: 0.157 83% of FMSY
2018: 0.146 80% of FMSY
Figure 2. Atlantic bluefish spawning stock biomass (SSB; solid black line) and recruitment at age 0 (R; gray vertical bars) by calendar year. The horizontal dashed line is the updated SSBMSY proxy = SSB40% = 198,717 mt, and the dotted black line is the SSBThreshold = 99,359 mt.
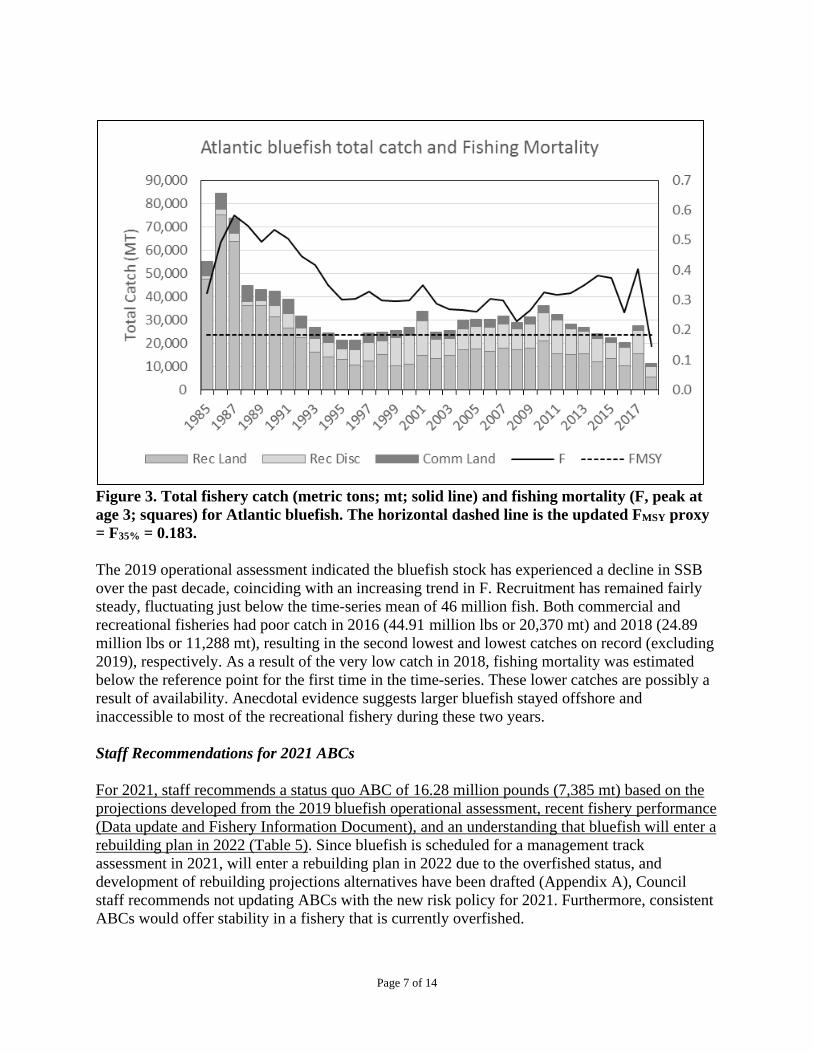
Page 7 of 14
Figure 3. Total fishery catch (metric tons; mt; solid line) and fishing mortality (F, peak at age 3; squares) for Atlantic bluefish. The horizontal dashed line is the updated FMSY proxy = F35% = 0.183. The 2019 operational assessment indicated the bluefish stock has experienced a decline in SSB over the past decade, coinciding with an increasing trend in F. Recruitment has remained fairly steady, fluctuating just below the time-series mean of 46 million fish. Both commercial and recreational fisheries had poor catch in 2016 (44.91 million lbs or 20,370 mt) and 2018 (24.89 million lbs or 11,288 mt), resulting in the second lowest and lowest catches on record (excluding 2019), respectively. As a result of the very low catch in 2018, fishing mortality was estimated below the reference point for the first time in the time-series. These lower catches are possibly a result of availability. Anecdotal evidence suggests larger bluefish stayed offshore and inaccessible to most of the recreational fishery during these two years. Staff Recommendations for 2021 ABCs For 2021, staff recommends a status quo ABC of 16.28 million pounds (7,385 mt) based on the projections developed from the 2019 bluefish operational assessment, recent fishery performance (Data update and Fishery Information Document), and an understanding that bluefish will enter a rebuilding plan in 2022 (Table 5). Since bluefish is scheduled for a management track assessment in 2021, will enter a rebuilding plan in 2022 due to the overfished status, and development of rebuilding projections alternatives have been drafted (Appendix A), Council staff recommends not updating ABCs with the new risk policy for 2021. Furthermore, consistent ABCs would offer stability in a fishery that is currently overfished.
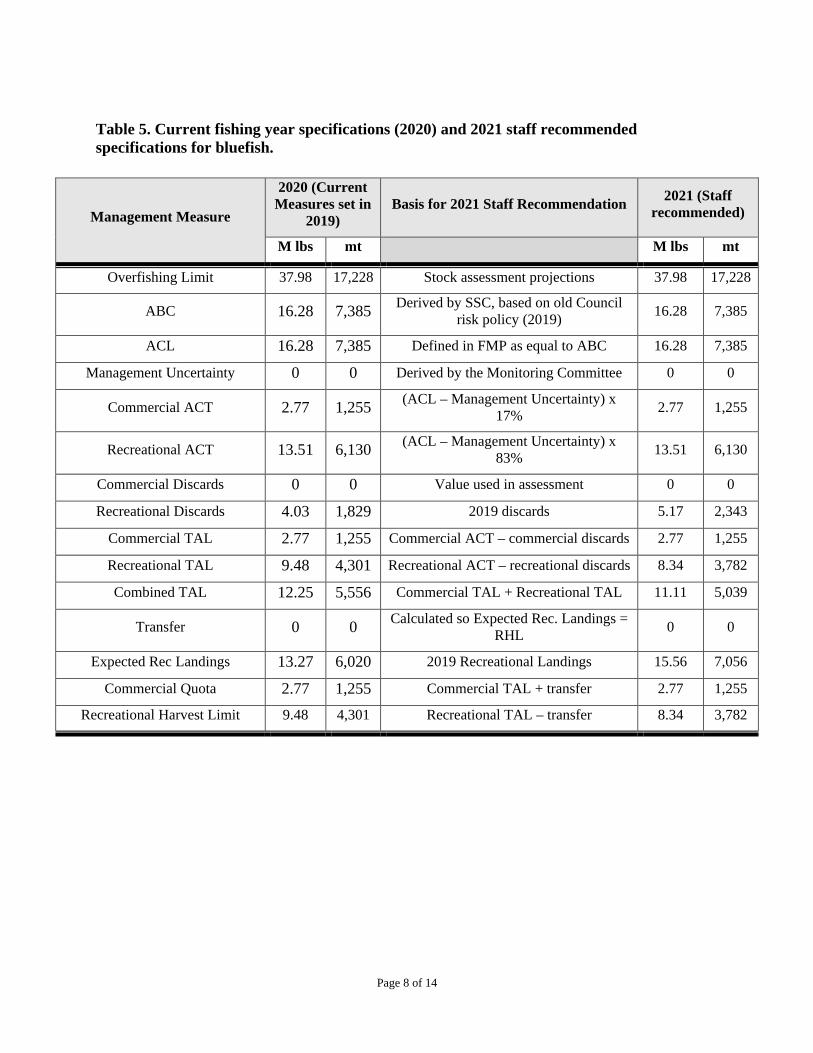
Page 8 of 14
Table 5. Current fishing year specifications (2020) and 2021 staff recommended specifications for bluefish.
Management Measure
2020 (Current Measures set in
2019) Basis for 2021 Staff Recommendation 2021 (Staff
recommended)
M lbs mt M lbs mt
Overfishing Limit 37.98 17,228 Stock assessment projections 37.98 17,228
ABC 16.28 7,385 Derived by SSC, based on old Council risk policy (2019) 16.28 7,385
ACL 16.28 7,385 Defined in FMP as equal to ABC 16.28 7,385
Management Uncertainty 0 0 Derived by the Monitoring Committee 0 0
Commercial ACT 2.77 1,255 (ACL – Management Uncertainty) x 17% 2.77 1,255
Recreational ACT 13.51 6,130 (ACL – Management Uncertainty) x 83% 13.51 6,130
Commercial Discards 0 0 Value used in assessment 0 0
Recreational Discards 4.03 1,829 2019 discards 5.17 2,343
Commercial TAL 2.77 1,255 Commercial ACT – commercial discards 2.77 1,255
Recreational TAL 9.48 4,301 Recreational ACT – recreational discards 8.34 3,782
Combined TAL 12.25 5,556 Commercial TAL + Recreational TAL 11.11 5,039
Transfer 0 0 Calculated so Expected Rec. Landings = RHL 0 0
Expected Rec Landings 13.27 6,020 2019 Recreational Landings 15.56 7,056
Commercial Quota 2.77 1,255 Commercial TAL + transfer 2.77 1,255
Recreational Harvest Limit 9.48 4,301 Recreational TAL – transfer 8.34 3,782
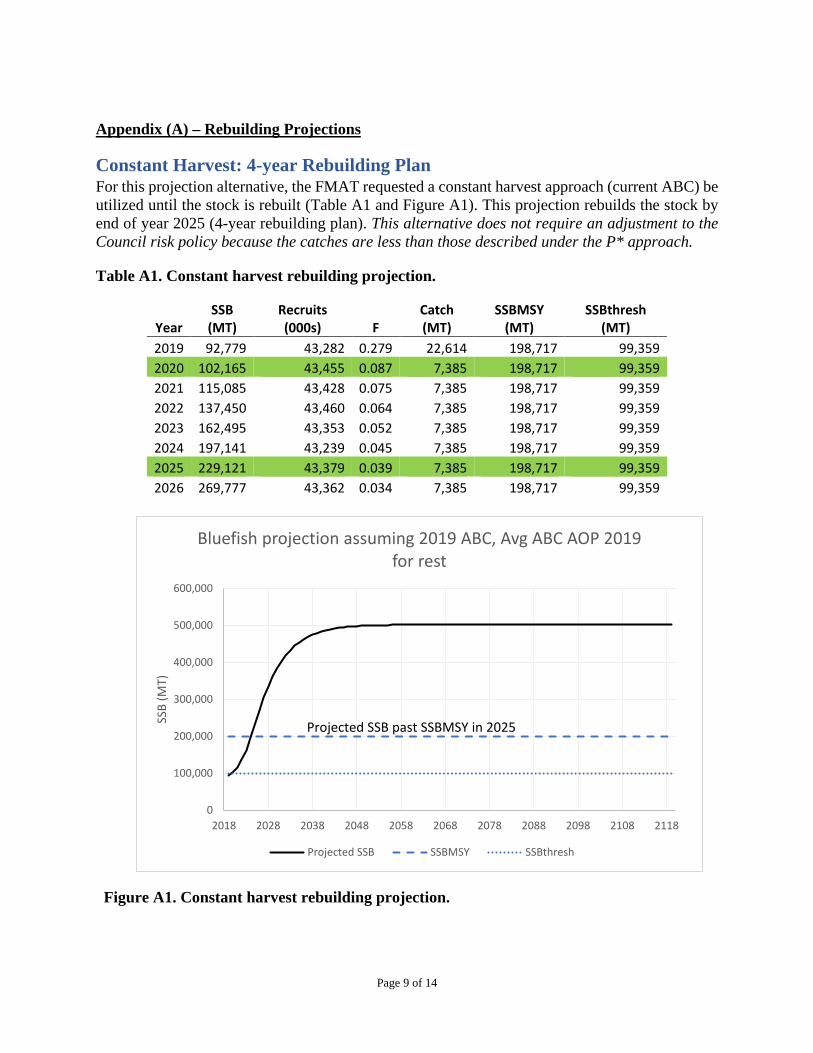
Page 9 of 14
Appendix (A) – Rebuilding Projections
Constant Harvest: 4-year Rebuilding Plan For this projection alternative, the FMAT requested a constant harvest approach (current ABC) be utilized until the stock is rebuilt (Table A1 and Figure A1). This projection rebuilds the stock by end of year 2025 (4-year rebuilding plan). This alternative does not require an adjustment to the Council risk policy because the catches are less than those described under the P* approach.
Table A1. Constant harvest rebuilding projection.
Year SSB
(MT) Recruits (000s) F
Catch (MT)
SSBMSY (MT)
SSBthresh (MT)
2019 92,779 43,282 0.279 22,614 198,717 99,359 2020 102,165 43,455 0.087 7,385 198,717 99,359 2021 115,085 43,428 0.075 7,385 198,717 99,359 2022 137,450 43,460 0.064 7,385 198,717 99,359 2023 162,495 43,353 0.052 7,385 198,717 99,359 2024 197,141 43,239 0.045 7,385 198,717 99,359 2025 229,121 43,379 0.039 7,385 198,717 99,359 2026 269,777 43,362 0.034 7,385 198,717 99,359
Figure A1. Constant harvest rebuilding projection.
0
100,000
200,000
300,000
400,000
500,000
600,000
2018 2028 2038 2048 2058 2068 2078 2088 2098 2108 2118
SSB
(MT)
Bluefish projection assuming 2019 ABC, Avg ABC AOP 2019 for rest
Projected SSB SSBMSY SSBthresh
Projected SSB past SSBMSY in 2025
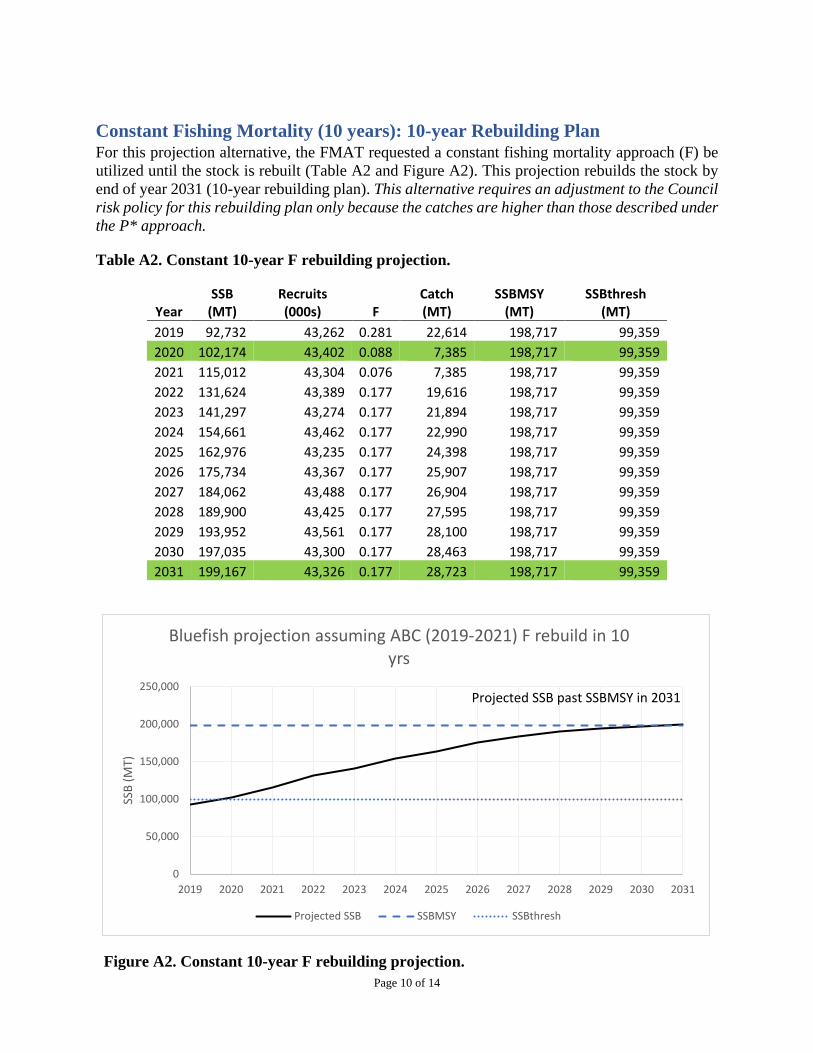
Page 10 of 14
Constant Fishing Mortality (10 years): 10-year Rebuilding Plan For this projection alternative, the FMAT requested a constant fishing mortality approach (F) be utilized until the stock is rebuilt (Table A2 and Figure A2). This projection rebuilds the stock by end of year 2031 (10-year rebuilding plan). This alternative requires an adjustment to the Council risk policy for this rebuilding plan only because the catches are higher than those described under the P* approach.
Table A2. Constant 10-year F rebuilding projection.
Year SSB
(MT) Recruits (000s) F
Catch (MT)
SSBMSY (MT)
SSBthresh (MT)
2019 92,732 43,262 0.281 22,614 198,717 99,359 2020 102,174 43,402 0.088 7,385 198,717 99,359 2021 115,012 43,304 0.076 7,385 198,717 99,359 2022 131,624 43,389 0.177 19,616 198,717 99,359 2023 141,297 43,274 0.177 21,894 198,717 99,359 2024 154,661 43,462 0.177 22,990 198,717 99,359 2025 162,976 43,235 0.177 24,398 198,717 99,359 2026 175,734 43,367 0.177 25,907 198,717 99,359 2027 184,062 43,488 0.177 26,904 198,717 99,359 2028 189,900 43,425 0.177 27,595 198,717 99,359 2029 193,952 43,561 0.177 28,100 198,717 99,359 2030 197,035 43,300 0.177 28,463 198,717 99,359 2031 199,167 43,326 0.177 28,723 198,717 99,359
Figure A2. Constant 10-year F rebuilding projection.
0
50,000
100,000
150,000
200,000
250,000
2019 2020 2021 2022 2023 2024 2025 2026 2027 2028 2029 2030 2031
SSB
(MT)
Bluefish projection assuming ABC (2019-2021) F rebuild in 10 yrs
Projected SSB SSBMSY SSBthresh
Projected SSB past SSBMSY in 2031
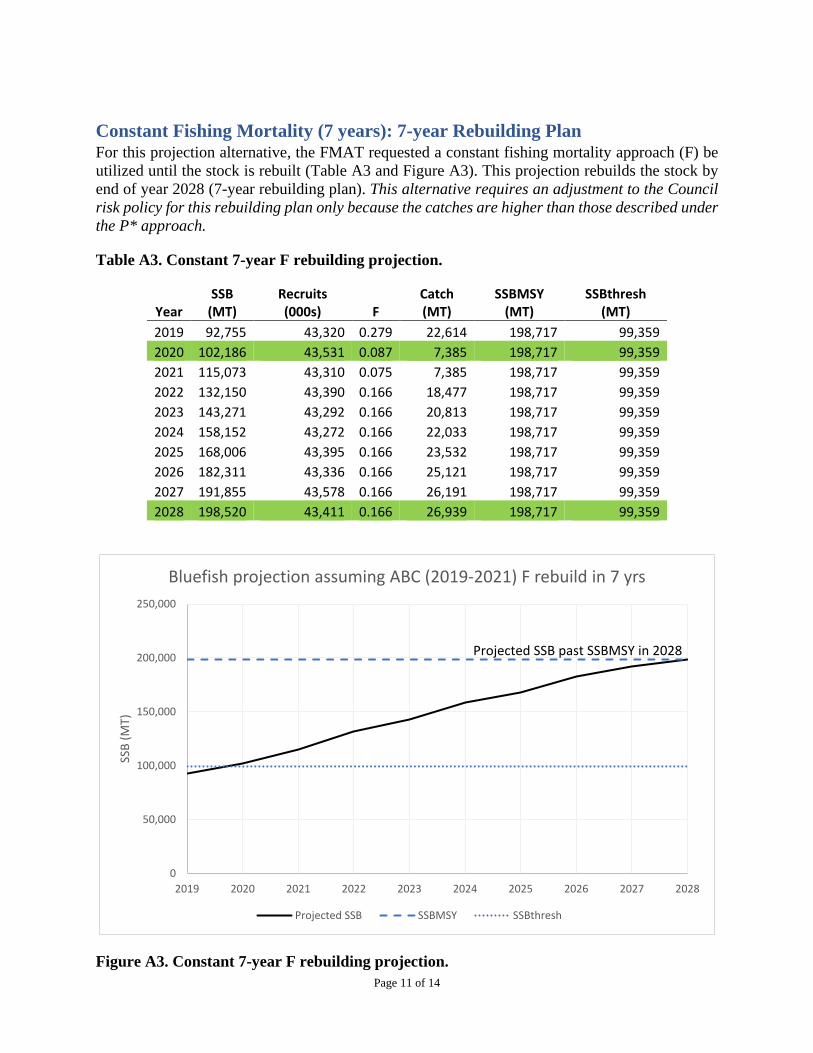
Page 11 of 14
Constant Fishing Mortality (7 years): 7-year Rebuilding Plan For this projection alternative, the FMAT requested a constant fishing mortality approach (F) be utilized until the stock is rebuilt (Table A3 and Figure A3). This projection rebuilds the stock by end of year 2028 (7-year rebuilding plan). This alternative requires an adjustment to the Council risk policy for this rebuilding plan only because the catches are higher than those described under the P* approach.
Table A3. Constant 7-year F rebuilding projection.
Year SSB
(MT) Recruits (000s) F
Catch (MT)
SSBMSY (MT)
SSBthresh (MT)
2019 92,755 43,320 0.279 22,614 198,717 99,359 2020 102,186 43,531 0.087 7,385 198,717 99,359 2021 115,073 43,310 0.075 7,385 198,717 99,359 2022 132,150 43,390 0.166 18,477 198,717 99,359 2023 143,271 43,292 0.166 20,813 198,717 99,359 2024 158,152 43,272 0.166 22,033 198,717 99,359 2025 168,006 43,395 0.166 23,532 198,717 99,359 2026 182,311 43,336 0.166 25,121 198,717 99,359 2027 191,855 43,578 0.166 26,191 198,717 99,359 2028 198,520 43,411 0.166 26,939 198,717 99,359
Figure A3. Constant 7-year F rebuilding projection.
0
50,000
100,000
150,000
200,000
250,000
2019 2020 2021 2022 2023 2024 2025 2026 2027 2028
SSB
(MT)
Bluefish projection assuming ABC (2019-2021) F rebuild in 7 yrs
Projected SSB SSBMSY SSBthresh
Projected SSB past SSBMSY in 2028
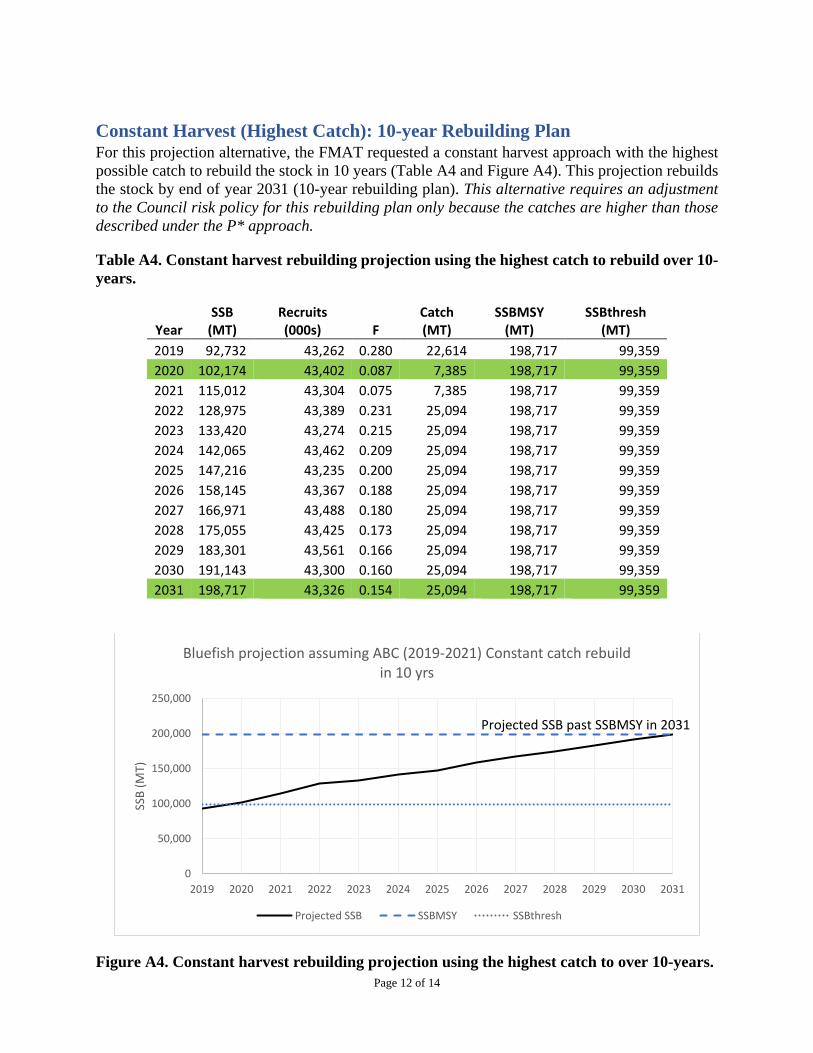
Page 12 of 14
Constant Harvest (Highest Catch): 10-year Rebuilding Plan For this projection alternative, the FMAT requested a constant harvest approach with the highest possible catch to rebuild the stock in 10 years (Table A4 and Figure A4). This projection rebuilds the stock by end of year 2031 (10-year rebuilding plan). This alternative requires an adjustment to the Council risk policy for this rebuilding plan only because the catches are higher than those described under the P* approach.
Table A4. Constant harvest rebuilding projection using the highest catch to rebuild over 10-years.
Year SSB
(MT) Recruits (000s) F
Catch (MT)
SSBMSY (MT)
SSBthresh (MT)
2019 92,732 43,262 0.280 22,614 198,717 99,359 2020 102,174 43,402 0.087 7,385 198,717 99,359 2021 115,012 43,304 0.075 7,385 198,717 99,359 2022 128,975 43,389 0.231 25,094 198,717 99,359 2023 133,420 43,274 0.215 25,094 198,717 99,359 2024 142,065 43,462 0.209 25,094 198,717 99,359 2025 147,216 43,235 0.200 25,094 198,717 99,359 2026 158,145 43,367 0.188 25,094 198,717 99,359 2027 166,971 43,488 0.180 25,094 198,717 99,359 2028 175,055 43,425 0.173 25,094 198,717 99,359 2029 183,301 43,561 0.166 25,094 198,717 99,359 2030 191,143 43,300 0.160 25,094 198,717 99,359 2031 198,717 43,326 0.154 25,094 198,717 99,359
Figure A4. Constant harvest rebuilding projection using the highest catch to over 10-years.
0
50,000
100,000
150,000
200,000
250,000
2019 2020 2021 2022 2023 2024 2025 2026 2027 2028 2029 2030 2031
SSB
(MT)
Bluefish projection assuming ABC (2019-2021) Constant catch rebuild in 10 yrs
Projected SSB SSBMSY SSBthresh
Projected SSB past SSBMSY in 2031
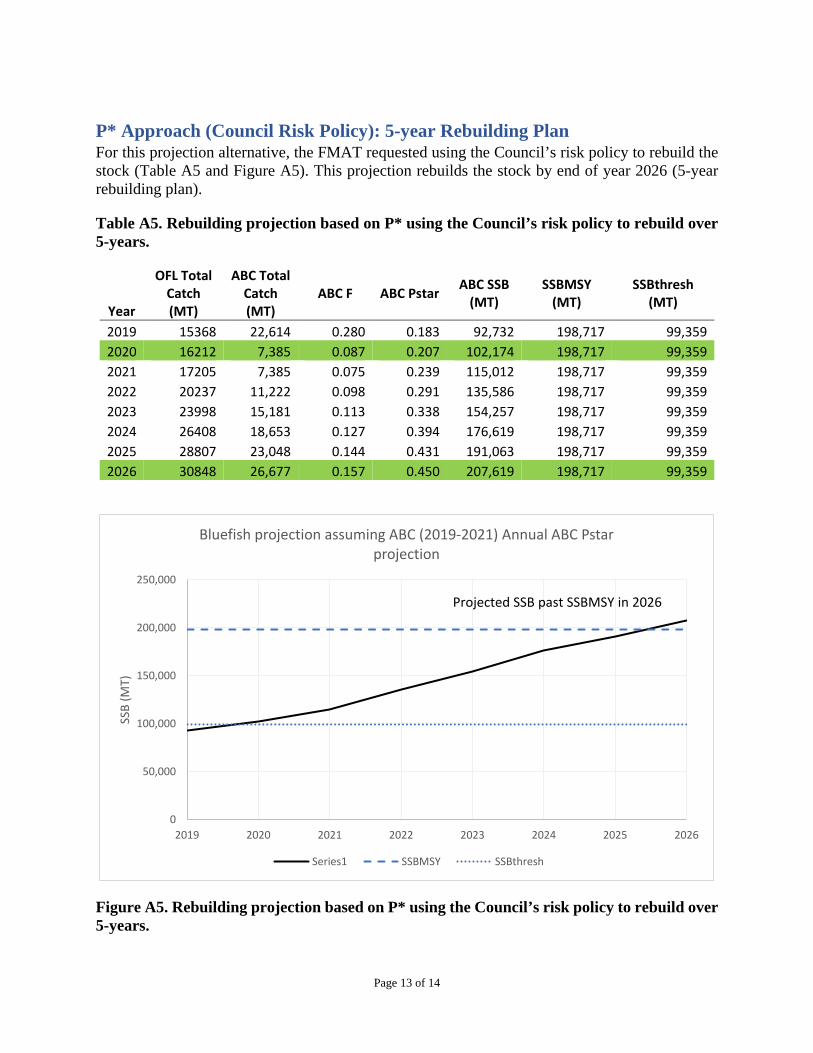
Page 13 of 14
P* Approach (Council Risk Policy): 5-year Rebuilding Plan For this projection alternative, the FMAT requested using the Council’s risk policy to rebuild the stock (Table A5 and Figure A5). This projection rebuilds the stock by end of year 2026 (5-year rebuilding plan).
Table A5. Rebuilding projection based on P* using the Council’s risk policy to rebuild over 5-years.
Year
OFL Total Catch (MT)
ABC Total Catch (MT)
ABC F ABC Pstar ABC SSB (MT)
SSBMSY (MT)
SSBthresh (MT)
2019 15368 22,614 0.280 0.183 92,732 198,717 99,359 2020 16212 7,385 0.087 0.207 102,174 198,717 99,359 2021 17205 7,385 0.075 0.239 115,012 198,717 99,359 2022 20237 11,222 0.098 0.291 135,586 198,717 99,359 2023 23998 15,181 0.113 0.338 154,257 198,717 99,359 2024 26408 18,653 0.127 0.394 176,619 198,717 99,359 2025 28807 23,048 0.144 0.431 191,063 198,717 99,359 2026 30848 26,677 0.157 0.450 207,619 198,717 99,359
Figure A5. Rebuilding projection based on P* using the Council’s risk policy to rebuild over 5-years.
0
50,000
100,000
150,000
200,000
250,000
2019 2020 2021 2022 2023 2024 2025 2026
SSB
(MT)
Bluefish projection assuming ABC (2019-2021) Annual ABC Pstar projection
Series1 SSBMSY SSBthresh
Projected SSB past SSBMSY in 2026

Page 14 of 14
Below, catch and spawning stock biomass are compared for all five rebuilding projections. The spawning stock biomass target is 198,717 mt.
Figure A6. Rebuilding projection comparisons for catch and spawning stock biomass.
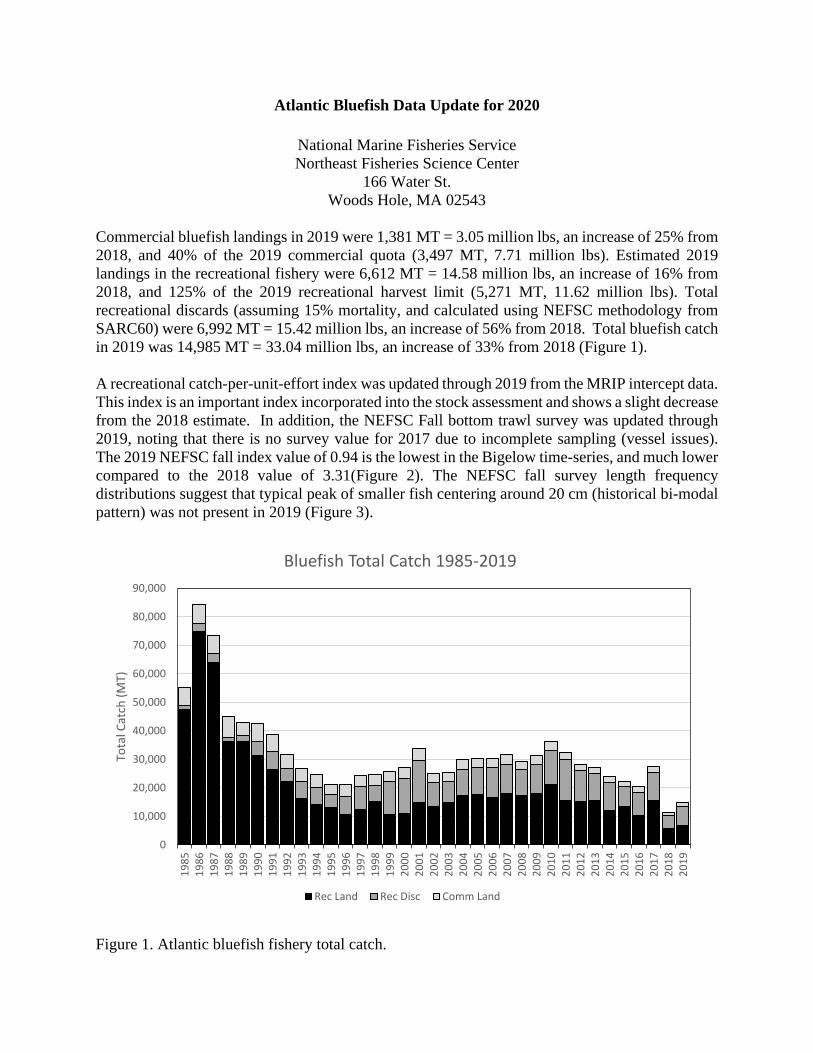
Atlantic Bluefish Data Update for 2020
National Marine Fisheries Service Northeast Fisheries Science Center
166 Water St. Woods Hole, MA 02543
Commercial bluefish landings in 2019 were 1,381 MT = 3.05 million lbs, an increase of 25% from 2018, and 40% of the 2019 commercial quota (3,497 MT, 7.71 million lbs). Estimated 2019 landings in the recreational fishery were 6,612 MT = 14.58 million lbs, an increase of 16% from 2018, and 125% of the 2019 recreational harvest limit (5,271 MT, 11.62 million lbs). Total recreational discards (assuming 15% mortality, and calculated using NEFSC methodology from SARC60) were 6,992 MT = 15.42 million lbs, an increase of 56% from 2018. Total bluefish catch in 2019 was 14,985 MT = 33.04 million lbs, an increase of 33% from 2018 (Figure 1). A recreational catch-per-unit-effort index was updated through 2019 from the MRIP intercept data. This index is an important index incorporated into the stock assessment and shows a slight decrease from the 2018 estimate. In addition, the NEFSC Fall bottom trawl survey was updated through 2019, noting that there is no survey value for 2017 due to incomplete sampling (vessel issues). The 2019 NEFSC fall index value of 0.94 is the lowest in the Bigelow time-series, and much lower compared to the 2018 value of 3.31(Figure 2). The NEFSC fall survey length frequency distributions suggest that typical peak of smaller fish centering around 20 cm (historical bi-modal pattern) was not present in 2019 (Figure 3).
Figure 1. Atlantic bluefish fishery total catch.
0
10,000
20,000
30,000
40,000
50,000
60,000
70,000
80,000
90,000
1985
1986
1987
1988
1989
1990
1991
1992
1993
1994
1995
1996
1997
1998
1999
2000
2001
2002
2003
2004
2005
2006
2007
2008
2009
2010
2011
2012
2013
2014
2015
2016
2017
2018
2019
Tota
l Cat
ch (M
T)
Bluefish Total Catch 1985-2019
Rec Land Rec Disc Comm Land
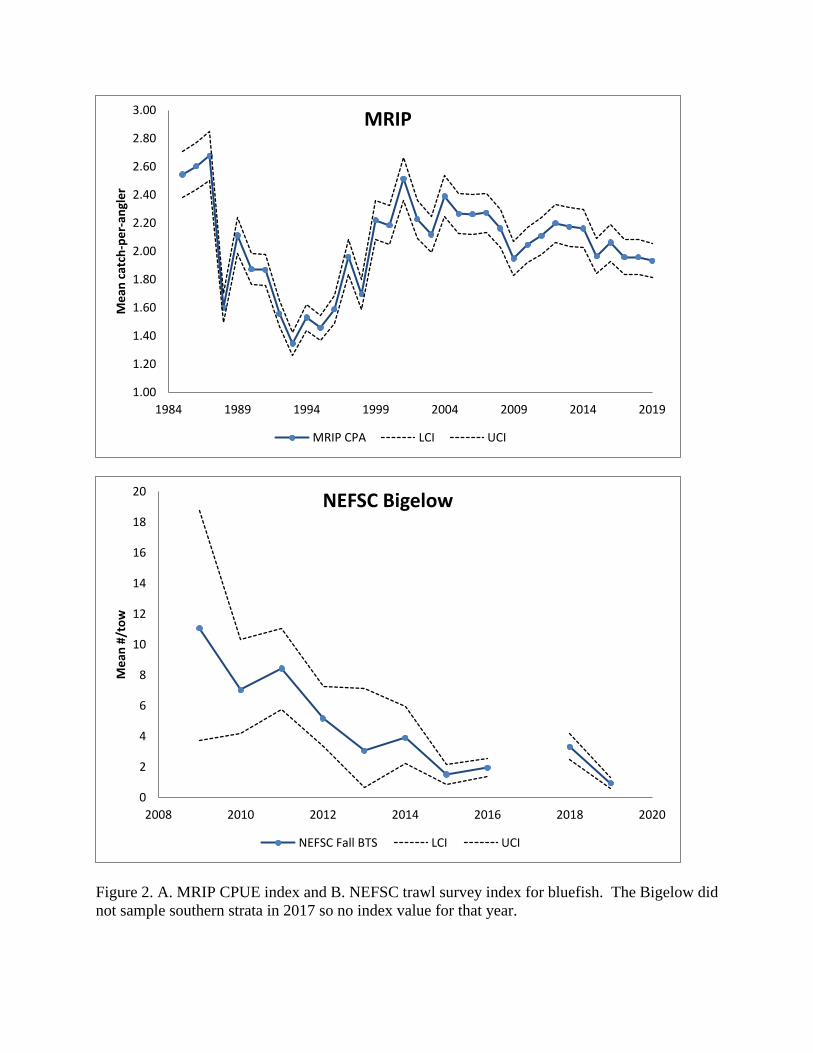
Figure 2. A. MRIP CPUE index and B. NEFSC trawl survey index for bluefish. The Bigelow did not sample southern strata in 2017 so no index value for that year.
1.00
1.20
1.40
1.60
1.80
2.00
2.20
2.40
2.60
2.80
3.00
1984 1989 1994 1999 2004 2009 2014 2019
Mea
n ca
tch-
per-
angl
erMRIP
MRIP CPA LCI UCI
0
2
4
6
8
10
12
14
16
18
20
2008 2010 2012 2014 2016 2018 2020
Mea
n #/
tow
NEFSC Bigelow
NEFSC Fall BTS LCI UCI
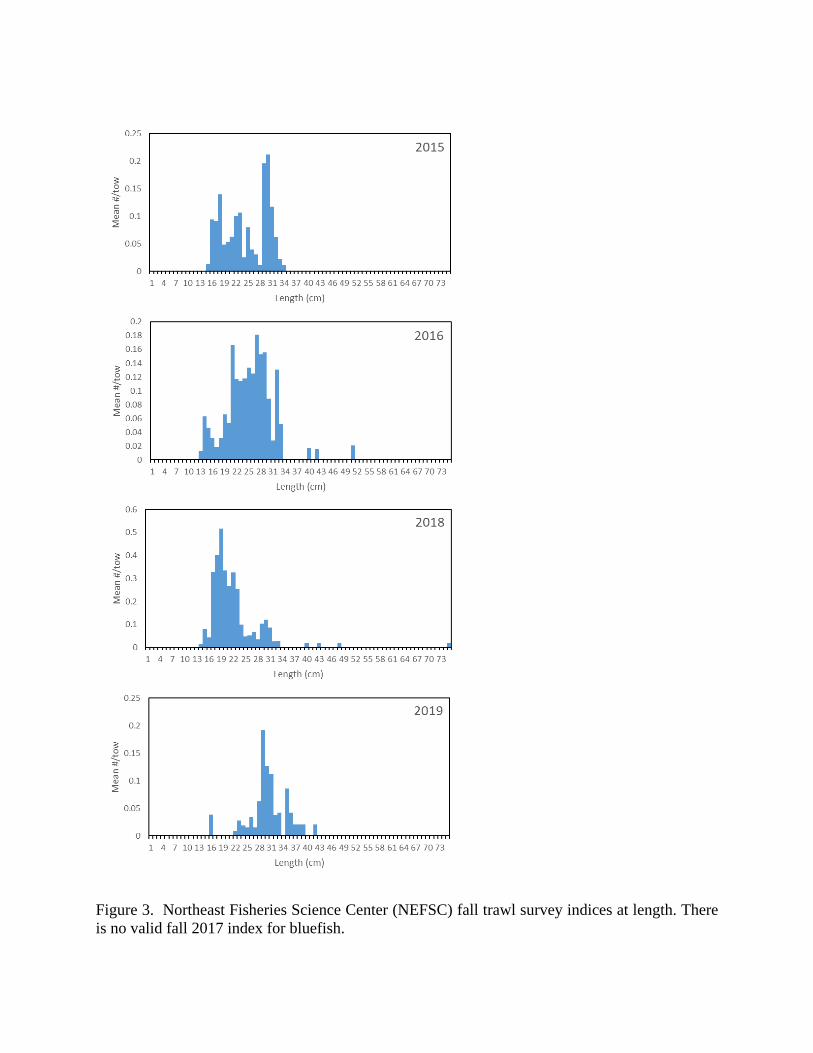
Figure 3. Northeast Fisheries Science Center (NEFSC) fall trawl survey indices at length. There is no valid fall 2017 index for bluefish.
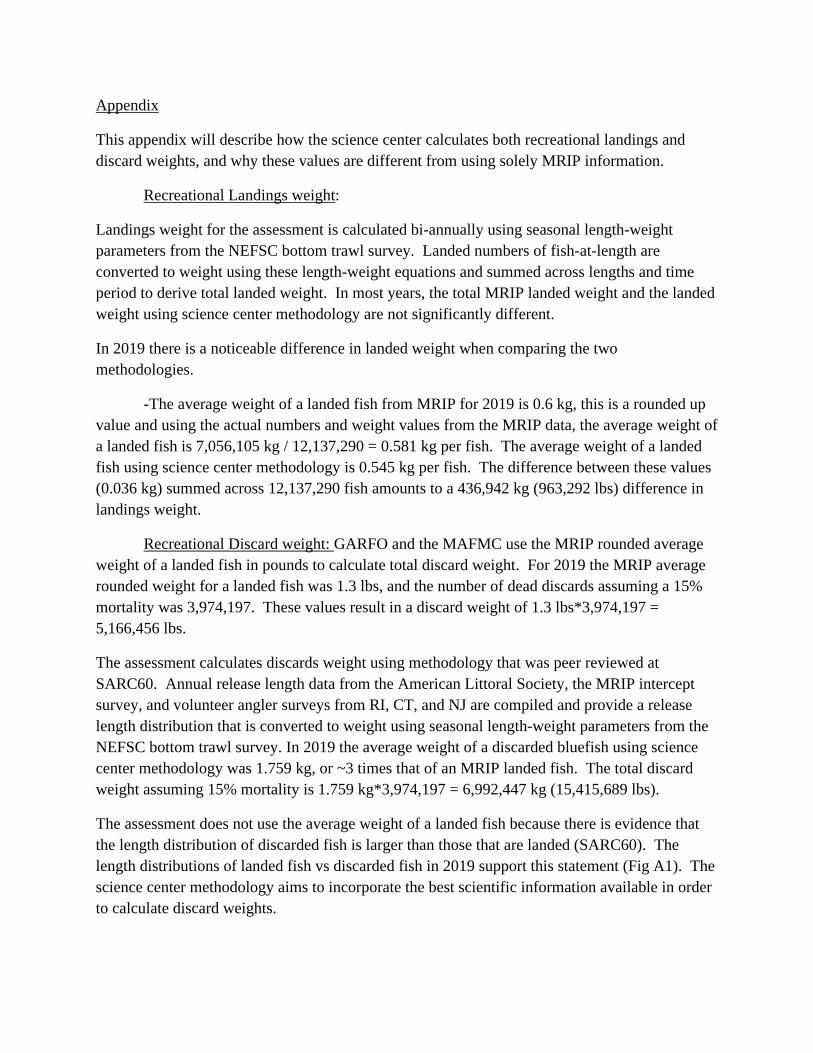
Appendix
This appendix will describe how the science center calculates both recreational landings and discard weights, and why these values are different from using solely MRIP information.
Recreational Landings weight:
Landings weight for the assessment is calculated bi-annually using seasonal length-weight parameters from the NEFSC bottom trawl survey. Landed numbers of fish-at-length are converted to weight using these length-weight equations and summed across lengths and time period to derive total landed weight. In most years, the total MRIP landed weight and the landed weight using science center methodology are not significantly different.
In 2019 there is a noticeable difference in landed weight when comparing the two methodologies.
-The average weight of a landed fish from MRIP for 2019 is 0.6 kg, this is a rounded up value and using the actual numbers and weight values from the MRIP data, the average weight of a landed fish is 7,056,105 kg / 12,137,290 = 0.581 kg per fish. The average weight of a landed fish using science center methodology is 0.545 kg per fish. The difference between these values (0.036 kg) summed across 12,137,290 fish amounts to a 436,942 kg (963,292 lbs) difference in landings weight.
Recreational Discard weight: GARFO and the MAFMC use the MRIP rounded average weight of a landed fish in pounds to calculate total discard weight. For 2019 the MRIP average rounded weight for a landed fish was 1.3 lbs, and the number of dead discards assuming a 15% mortality was 3,974,197. These values result in a discard weight of 1.3 lbs*3,974,197 = 5,166,456 lbs.
The assessment calculates discards weight using methodology that was peer reviewed at SARC60. Annual release length data from the American Littoral Society, the MRIP intercept survey, and volunteer angler surveys from RI, CT, and NJ are compiled and provide a release length distribution that is converted to weight using seasonal length-weight parameters from the NEFSC bottom trawl survey. In 2019 the average weight of a discarded bluefish using science center methodology was 1.759 kg, or ~3 times that of an MRIP landed fish. The total discard weight assuming 15% mortality is 1.759 kg*3,974,197 = 6,992,447 kg (15,415,689 lbs).
The assessment does not use the average weight of a landed fish because there is evidence that the length distribution of discarded fish is larger than those that are landed (SARC60). The length distributions of landed fish vs discarded fish in 2019 support this statement (Fig A1). The science center methodology aims to incorporate the best scientific information available in order to calculate discard weights.

Figure A1. Landed lengths versus discarded lengths for bluefish in 2019.
0
100000
200000
300000
400000
500000
600000
700000
800000
900000
1 5 9 13 17 21 25 29 33 37 41 45 49 53 57 61 65 69 73 77 81 85 89 93 97
Num
bers
Length (cm)
2019 bluefish expanded landed vs discard lengths
Landed Discarded
Bluefish Fishery Performance Report
June 2020 The Mid-Atlantic Fishery Management Council's (Council) and the Atlantic States Marine Fisheries Commission’s Bluefish Advisory Panels (AP) met via webinar on June 23, 2020 to review the Fishery Information Document and develop the following Fishery Performance Report. The primary purpose of this report is to contextualize catch histories by providing information about fishing effort, market trends, environmental changes, and other factors. A series of trigger questions listed below were posed to the AP to generate discussion of observations in the bluefish fishery. Please note: Advisor comments described below are not necessarily consensus or majority statements. MAFMC Advisory Panel members present: Vince Cannuli (MD), Victor Hartley III (NJ), and Judith Weis (NY). ASMFC Advisory Panel members present: Robert Lorenz (NC), Paul Caruso (MA), and Rusty Hudson (FL) Others present: Chris Batsavage (MAFMC), Dustin Colson Leaning (ASMFC Staff), Greg DiDomenico (Lunds), Steve Cannizzo (NY), Cynthia Ferrio (GARFO), Paul Rago (MAFMC SSC), Sonny Gwin (MAFMC), Mary Sabo (MAFMC Staff), and Matthew Seeley (MAFMC Staff).
Trigger questions
1. What factors have influenced recent catch (markets/economy, environment, regulations, other factors)?
2. Are the current fishery regulations appropriate? How could they be improved? 3. What would you recommend as research priorities? 4. What else is important for the Council to know?
Factors Influencing Catch Recreational There was consensus on the increase in bluefish abundance coastwide with an emphasis on NY and NJ from 2018 to 2019. Southern states (FL) experienced this abundance, however, it was short lived due to many weather-related issues (hurricanes and nor’easters). Advisors also continue to indicate that larger bluefish are often identified to be further offshore and not available to anglers that typically target them (private anglers may not want to travel to where the bluefish are). Small fish (1-3 lbs) were available early in the year while larger fish (5-10 lbs)

were not present for long periods of time. Paul Caruso (MA) – Bluefish have been scarce in MA. The fishery only marginally improved from 2018 to 2019, and 2018 was one of the worst years we have experienced for the bluefish fishery. There was a lot more smaller fish (2-3-year-old fish) later in the year. The larger fish were hardly ever seen in the spring of 2019 and we think abundance was the primary driver of the recent catch. Abundance may be related to the environment because we are not seeing any sand eels. A few rod and reel fishermen and gillnetters catch bluefish as bycatch. The change in recreational regulations does not matter much to the recreational fishermen. Captain Victor Hartley (NJ) – There are a whole lot of fish offshore. The for-hire fleet does not go far enough offshore to target where the biomass is. There is a large fleet of for-hire fishermen who target bluefish in the NJ area as their primary species. Most for-hire boats did well in 2019 when targeting bluefish. In terms of bait, Raritan Bay has so much menhaden you can “walk on top of them”. There are a lot of whales and consistent bait in the area. This is the reason for the higher bluefish abundance this year. Steven Cannizzo (NY-Public) – Party/charter industry in NY. We came off a warm winter with no runoff or ice, however, in April the weather changed and then everything got shut down because of COVID-19. The NY/NJ Bight and Hudson River is an extremely important area for forage fish. The absence of icing and freezing of nearshore habitats helped with bait abundance. Prior to the shutdown, we had an amazing run of weakfish, which was the best in my memory. There were also lots of striped bass coming through the sound. The for-hire fleet have seen so many sand eels in NY and are now seeing a whiting fishery for the first time in a long while. There was also a bluefin tuna run on the beach in 30-40 feet of water due to the abundance of sand eels. NY has seen one of the finest bluefish runs in recent years. Small, medium, and large bluefish are abundant. The shore-based fishermen have seen a huge amount of availability resulting in an abundance of people fishing from shore Bob Lorenz (NC) – Bluefish have historically been a fish that experiences a cyclical nature. Even when we did not manage them there was a big spike in the 80s. Bluefish are not a primary target for recreational fishermen. In NC, most bluefish targeted are around 1-3 pounds. Vince Cannuli (MD) – This spring there was a good run of bluefish, both nearshore/inshore and they have been chasing the menhaden inshore. The headboats have not been targeting bluefish in MD, however, the charter vessels are continuing to target bluefish. Two years ago, there were schools of menhaden like what we are seeing now. Last year there were few nearshore schools of menhaden like prior years. There was not a lot of striped mullet last year, but there was a good amount of brown shrimp. There are acres of adult sized menhaden, which is in part why MD gets a good bluefish run. They have been getting good size bluefish upwards of 30 inches. The bay did not freeze at all, which helps the forage species. Commercial Captain Victor Hartley (NJ) – Larger bluefish are offshore and available to the commercial fishermen. Steven Cannizzo (NY-Public) – The commercial fishermen are upset that they have maxed out their quota due to the low amounts. When you see whiting in the mudhole, it bodes well for the rest of the fisheries. Rusty Hudson (FL) – 2018 was one of the best years they have had in FL (gillnet fishery). However, 2019 was not a good year due to Hurricane Dorian and the continued nor’easters all fall continuing into January, which really hurt FL commercial fishermen. Occasionally, mackerel fishermen target bluefish offshore. The commercial and recreational sampling has paused for 2020 due to COVID-19, which is an issue. Additionally, the estimate of commercial landings for FL was wrong in ACCSP for 2018.

Market/Economic Conditions Captain Victor Hartley (NJ) – The economy is going to be tough on fishermen. The COVID-19 factor is huge and hurts a lot of for-hire fishermen. Bluefish are not going to be hit as hard because you do not have as many passengers on the boats (i.e. not targeted as often as species like striped bass). Rusty Hudson (FL) – The value of bluefish the past couple years has been at a great price per pound. The demand has remained high. The price per pound has gotten up to $1.00, which is much higher than recent prices of around $0.30. Vince Cannuli (MD) – Last year, MD had a good run of bluefish and anglers were confused as to why there was a change in bag limit. This seems to be an example of over management.
Management Issues Captain Victor Hartley (NJ) – The for-hire fleet is not happy about the 5 fish bag limit. Steven Cannizzo (NY-Public) – For-hire fishermen need a higher bag limit and the Council should explore for-hire sector separation. We are very positive of the future years due to the abundance of bait, and specifically, sand eels. This will be very good for the bluefish fishery.
Research Priorities Paul Caruso (MA) – Bait abundance is certainly a factor in the northern states and should be researched further. He would be interested to know how harvest has occurred. Abundance in the north is related to the amount of harvest in the south. It would be great to understand how catch in the southern states affects harvest in the northern states. Bob Lorenz (NC) – Researchers should investigate the cyclical nature of bluefish that has been observed since before the early 1980s.
Other Issues There seemed to be consensus amongst advisors that they prefer regulations and management measures to remain more stable. Increases in quota are appreciated, however, if they are going to be followed by declines, stakeholders prefer management measures that remain stable.
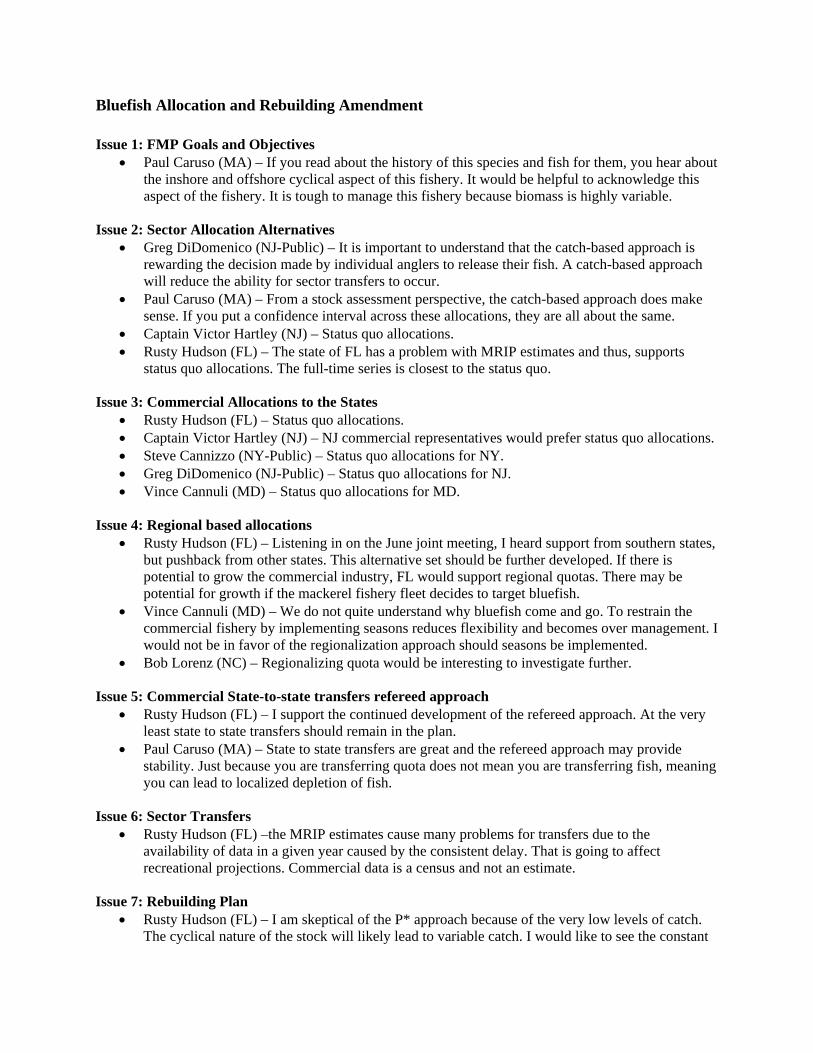
Bluefish Allocation and Rebuilding Amendment Issue 1: FMP Goals and Objectives
• Paul Caruso (MA) – If you read about the history of this species and fish for them, you hear about the inshore and offshore cyclical aspect of this fishery. It would be helpful to acknowledge this aspect of the fishery. It is tough to manage this fishery because biomass is highly variable.
Issue 2: Sector Allocation Alternatives
• Greg DiDomenico (NJ-Public) – It is important to understand that the catch-based approach is rewarding the decision made by individual anglers to release their fish. A catch-based approach will reduce the ability for sector transfers to occur.
• Paul Caruso (MA) – From a stock assessment perspective, the catch-based approach does make sense. If you put a confidence interval across these allocations, they are all about the same.
• Captain Victor Hartley (NJ) – Status quo allocations. • Rusty Hudson (FL) – The state of FL has a problem with MRIP estimates and thus, supports
status quo allocations. The full-time series is closest to the status quo. Issue 3: Commercial Allocations to the States
• Rusty Hudson (FL) – Status quo allocations. • Captain Victor Hartley (NJ) – NJ commercial representatives would prefer status quo allocations. • Steve Cannizzo (NY-Public) – Status quo allocations for NY. • Greg DiDomenico (NJ-Public) – Status quo allocations for NJ. • Vince Cannuli (MD) – Status quo allocations for MD.
Issue 4: Regional based allocations
• Rusty Hudson (FL) – Listening in on the June joint meeting, I heard support from southern states, but pushback from other states. This alternative set should be further developed. If there is potential to grow the commercial industry, FL would support regional quotas. There may be potential for growth if the mackerel fishery fleet decides to target bluefish.
• Vince Cannuli (MD) – We do not quite understand why bluefish come and go. To restrain the commercial fishery by implementing seasons reduces flexibility and becomes over management. I would not be in favor of the regionalization approach should seasons be implemented.
• Bob Lorenz (NC) – Regionalizing quota would be interesting to investigate further. Issue 5: Commercial State-to-state transfers refereed approach
• Rusty Hudson (FL) – I support the continued development of the refereed approach. At the very least state to state transfers should remain in the plan.
• Paul Caruso (MA) – State to state transfers are great and the refereed approach may provide stability. Just because you are transferring quota does not mean you are transferring fish, meaning you can lead to localized depletion of fish.
Issue 6: Sector Transfers
• Rusty Hudson (FL) –the MRIP estimates cause many problems for transfers due to the availability of data in a given year caused by the consistent delay. That is going to affect recreational projections. Commercial data is a census and not an estimate.
Issue 7: Rebuilding Plan
• Rusty Hudson (FL) – I am skeptical of the P* approach because of the very low levels of catch. The cyclical nature of the stock will likely lead to variable catch. I would like to see the constant

harvest 10-year approach used. The next management track assessment may show that the stock is doing much better than previously thought.
• Bob Lorenz (NC) – I support a longer rebuilding plan. The cyclical nature of the fish could rebound the stock quite quickly. Due to that, we should not overburden the fisheries with restrictive measures.
• Greg DiDomenico (NJ-Public) – I support the longer rebuilding plan. • Captain Victor Hartley (NJ) – I support a longer rebuilding plan for stability’s sake.
Issue 8: Sector Specific management uncertainty
• No comments Issue 9: For-Hire Sector Separation
• Captain Victor Hartley (NJ) – Recreational sector separation should continue to be developed and ultimately implemented. We need to improve management and better use the data we have available for recreational fisheries. Moving to for-hire sector separation is important because we already have VTR data. If we went that route (rec sector separation) we would need a committee of for-hire members to help inform management decisions. There would need to be meetings to discuss setting seasons, bag limit, min size, etc. If people do not submit VTRs, they should not be part of the for-hire allocation.
• Steve Cannizzo (NY-Public) – The for-hire industry needs to be protected against changes in bag limit. There has to be a sector separation or allowance. The allocations should be set using MRIP data since not all vessels submit VTRs. We want as much flexibility as possible for for-hire and recreational fishermen. We would prefer the alternative of for-hire sector “allowances”, which allows a higher bag limit without needing a separate allocation.
• Bob Lorenz (NC) – Fisheries management must be considered fair. The differing bag limits between the two sectors is not fair anymore. The recreational NGOs are going to be against sector separation. There needs to be a fair allocation between for-hire/commercial/private anglers. Additionally, there is an increasing number of private boat anglers that are concerned about for-hire and commercial fisher jobs and economic vitality. These individual recreational anglers could likely support some sector separation in recreational fisheries as a matter of fairness and support to the for-hire fishers who have better and more accurate recording of catches than private anglers.
Issue 10: de minimis
• No comments

Late Comments (not on the webinar) From: Capt. TJ Karbowski [mailto:[email protected]] Sent: Thursday, June 25, 2020 3:28 AM To: Dustin C. Leaning <[email protected]> Subject: Re: [External] Re: Following up after the Bluefish Advisory Panel Meeting
Comments:
Bluefish abundance in Long Island Sound is directly related to the amount of baitfish abundance. When small baitfish such as silversides, junvenile butterfish, juvenile squid or peanut bunker are abundant, generally there are small to medium size bluefish. When adult menhaden are abundant, generally there are large (alligator) bluefish.
The absence of large bluefish the last 5 or so years in our area correlates with the absence of menhaden we have had. Our town, Clinton, CT is known as the “Bluefish Capitol of the World”. Clinton even annually held the annual “Bluefish Festival” for as long as I can remember (possibly even before I was born). The bluefish numbers have been so poor the last several years, that somewhere around 2015 the town actually discontinued the event. At the event would be tables set up with various prepared bluefish dishes; fried, smoked etc. competitions. People couldn’t find bluefish to cook!
This spring (2020), although I cannot say with certainty (but likely due to the COVID-19 effect on the commercial market), that the commercial pair trawlers squid boats that usually operate off of Rhode Island in the spring might not have worked the area as hard, or maybe even at all this year. This is the best run of spring squid in Long Island Sound in at least 8 -10 years. The Sound is currently teeming with life. Squid, Menhaden, Butterfish, Stripers, Bluefish, Fluke, Porgies, Black Sea Bass. It is back to the way it used to be.
Also please keep in mind that Omega Protein has had reg changes this year. I think all of this contributed to the success of this season. – Starting in 2014 (The year Omega Protein started taking most of their quota from the Chesapeake after getting banned from fishing in North Carolina) Long Island Sound was virtually BARREN of life. The Sound was virtually DEAD. Also around this time was when the Rhode Island squid boats started pair trawling for squid just over the border of the entrance to Long Island Sound. – We have not had a decent run of fluke until this year because of this. We ALWAYS had a reliable spring fluke run before that.
Regs: Bluefish regs should be- approx 15 per person. –This is needed for head boat “marketing” and a realistic retention limit for “snappers”. There is not enough rec. anglers harvesting bluefish to even put a small dent in the population. The time and effort involved in the bluefish regulation process should be spent on studying and regulating their forage species which ACTUALLY DOES affect the health of the stock. Set the regs at 15 per. person for at least 5 years and revisit it then.
Research Priorities: Regulate their forage better. That’s the problem.

Allocation: Leave it status quo. No need to pin the recs and commercials against each other.
Additional Comments:
Regulating this species down to 3 per person is ridiculous and highlights how flawed the system is; especially MRIP. In 2019 they had Connecticut anglers harvesting THOUSANDS of bluefish just from “shore” mode alone. The laughable part was was the harvest numbers were logged at a time of year when bluefish aren’t even in the Sound. The “New” MRIP numbers are a total SHAM.
Thank you, Capt. TJ Karbowski Rock & Roll Charters Clinton, CT 203.314.3765 https://rockandrollcharters.com/
1
Bluefish Fishery Information Document
June 2020
This Fishery Information Document provides a brief overview of the biology, stock condition, management system, and fishery performance for bluefish with an emphasis on 2019. Data sources for Fishery Information Documents are generally from unpublished National Marine Fisheries Service (NMFS) survey, dealer, vessel trip report (VTR), permit, and Marine Recreational Information Program (MRIP) databases and should be considered preliminary. For more resources, including previous Fishery Information Documents, please visit http://www.mafmc.org/bluefish/.
Basic Biology Bluefish are found worldwide in tropical and subtropical waters, but in the western North Atlantic range from Nova Scotia and Bermuda to Argentina. Bluefish travel in schools of like-sized individuals and undertake seasonal migrations, moving into the Middle Atlantic Bight (MAB) during spring and then south or farther offshore during fall. Within the MAB they occur in large bays and estuaries as well as across the entire continental shelf. Juvenile stages have been recorded in all estuaries within the MAB, but eggs and larvae occur in oceanic waters (Able and Fahay 1998). Bluefish have fast growth rates and reach lengths of 3.5 ft and can weigh up to 27 pounds (Bigelow and Schroeder 1953). Bluefish live to age 12 and greater (Salerno et al. 2001).
Key Facts
• According to 2019 operational assessment, bluefish is overfished and overfishing is not occurring. The bluefish stock will enter a rebuilding plan in 2022 to rebuild the stock to the SSBMSY proxy = 438.10 million lbs (198,717 mt).
• In 2019, specifications remained status quo from 2018. However, 2019 is the transition year for when recreational landings are reported using only new MRIP estimates. The 2019 ABC, RHL, and Commercial Quota was developed using old MRIP estimates and cannot be directly compared to the new recreational landings estimates.
• Recreational landings increased from 13.27 million pounds to 15.56 million pounds from 2018 to 2019 (~17% increase).
• Commercial landings increased from 2.20 million pounds to 2.78 million pounds from 2018 to 2019 (~26% increase).

2
Bluefish eat a wide variety of prey items. The species has been described by Bigelow and Schroeder (1953) as “perhaps the most ferocious and bloodthirsty fish in the sea, leaving in its wake a trail of dead and mangled mackerel, menhaden, herring, alewives, and other species on which it preys." Bluefish born in a given year (young of the year) typically fall into two distinct size classes suggesting that there are two spawning events along the east coast. Studies suggest, however, that spawning is a single, continuous event, but that young are lost from the middle portion resulting in the appearance of a split season (Smith et al. 1994). As a result of the bimodal size distribution, young are referred to as spring-spawned or summer-spawned. In the MAB, spring-spawned bluefish appear to be the dominant component of the stock. Status of the Stock The last bluefish benchmark stock assessment was peer reviewed in June 2015 and approved for use by management at SAW/SARC 60. This benchmark assessment uses a forward-projecting statistical catch-at-age model called ASAP (Age Structured Assessment Program). For the most recent benchmark, the catch-at-age matrices were completely reconstructed to incorporate new age data, including archived historical samples that had not been processed at the time the last benchmark (SAW/SARC 41; 2005) was conducted, and to correct aging errors in the earlier years of the time series (NEFSC 2015). 2019 Operational Assessment Update In August 2019, a bluefish operational assessment, which included revised bluefish MRIP estimates through 2018 changed the stock status and biological reference points from SAW 60, which utilized data through 2014. All information from this operational assessment were and should be interpreted as preliminary results until publication of the final report. The biological reference points for bluefish revised through the 2019 operational assessment include a fishing mortality threshold of FMSY = F35% (as the FMSY proxy) = 0.183, and a biomass reference point of SSBMSY = SSB35% (as the SSBMSY proxy) = 438.10 million lbs (198,717 mt). The minimum stock size threshold (1/2 SSBMSY), is estimated to be 219.05 million lbs (99,359 mt); Table 3. SSB in 2018 was 200.71 million lbs (91,041 mt). Operational assessment results indicated that the bluefish stock was overfished, and overfishing was not occurring in 2018 relative to the biological reference points. Fishing mortality on the fully selected age 2 fish was 0.146 in 2018, 80% of the updated fishing mortality threshold reference point FMSY proxy = F35% = 0.183. Management System and Fishery Performance Management The Mid-Atlantic Fishery Management Council (Council or MAFMC) and the Atlantic States Marine Fisheries Commission (ASMFC) work cooperatively to develop fishery regulations for

3
bluefish off the east coast of the United States. The Council and Commission work in conjunction with the National Marine Fisheries Service (NMFS), which serves as the federal implementation and enforcement entity. This cooperative management endeavor was developed because a significant portion of the catch is taken from both state waters (0-3 miles offshore) and federal waters (3-200 miles offshore, also known as the Exclusive Economic Zone or EEZ). The management unit for bluefish is the U.S. waters in the western Atlantic Ocean. The Bluefish Fishery Management Plan (FMP) was implemented in 1990 and established the Mid-Atlantic Fishery Management Council’s management authority over the fishery in federal waters. Amendment 1, implemented in 2000, addressed stock rebuilding and created the Bluefish Monitoring Committee which meets annually to make management measure recommendations to the Council. Amendment 3 incorporated the development of annual catch limits (ACLs) and accountability measures (AMs) into the specification process and Amendment 4 modified recreational accountability measures to accommodate uncertainty in recreational management and catch estimation. The original FMP and subsequent amendments and frameworks are available at: http://www.mafmc.org/fisheries/fmp/bluefish. For bluefish, the annual catch target (ACT) is split 83 percent and 17 percent into recreational and commercial ACTs, respectively, and the discarded component of that catch is deducted to arrive at recreational and commercial total allowable landings (TAL). Additionally, landings above the expected recreational harvest can be “transferred” from the recreational to the commercial fishery as long as the final commercial quota does not exceed 10.5 million pounds. The Council's Scientific and Statistical Committee (SSC) reviews assessment results and the Advisory Panel’s fishery performance report and determines the allowable biological catch (ABC) for the upcoming year. The Council's Bluefish Monitoring Committee develops and recommends specific coastwide management measures (commercial quota, recreational harvest limit) that will achieve the catch target and makes further adjustments to total catch as needed based on management uncertainty. Finally, the Council and Board meet jointly to develop recommendations to be submitted to the NMFS. An amendment to the Bluefish FMP is being developed to address a variety of changes and concerns with the fishery. The amendment is addressing sector FMP Goals and Objectives, sector allocations, commercial allocations to the states, transfer processes, the rebuilding plan, and other issues. More information can be accessed here: https://www.mafmc.org/actions/bluefish-allocation-amendment. Fishery Performance Relative to Management Measures The current commercial landings are slightly behind the 2019 landings (Figure 1; as of May 19, 2020). The recreational and commercial landings relative to specified management measures are provided in Table 1. In 2019, MRIP reported the recreational fishery landed 15.56 million pounds compared to the 11.62 million pounds RHL. The recreational landings cannot be directly compared to the RHL because the RHL was set using old MRIP data while the 2019 recreational landings are being reported in new MRIP estimates. 2020 will be the first year that all catch/landings can be compared to the ABC/Commercial quota/RHL. The commercial fishery
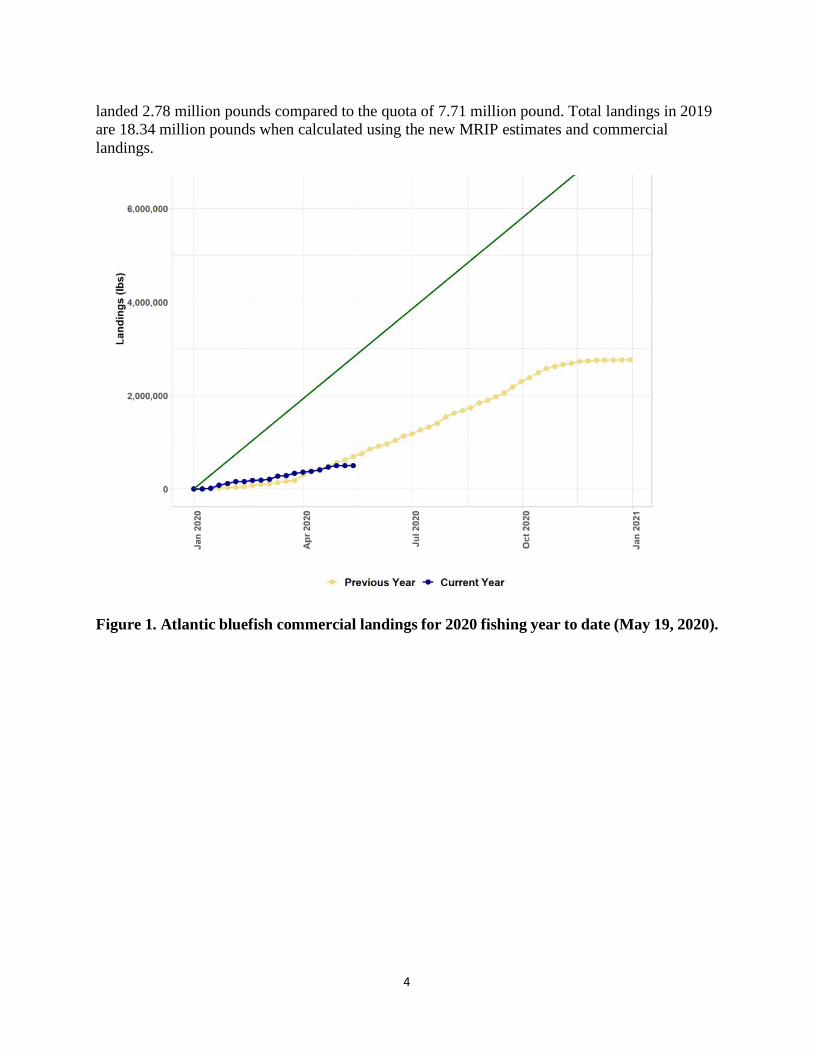
4
landed 2.78 million pounds compared to the quota of 7.71 million pound. Total landings in 2019 are 18.34 million pounds when calculated using the new MRIP estimates and commercial landings.
Figure 1. Atlantic bluefish commercial landings for 2020 fishing year to date (May 19, 2020).
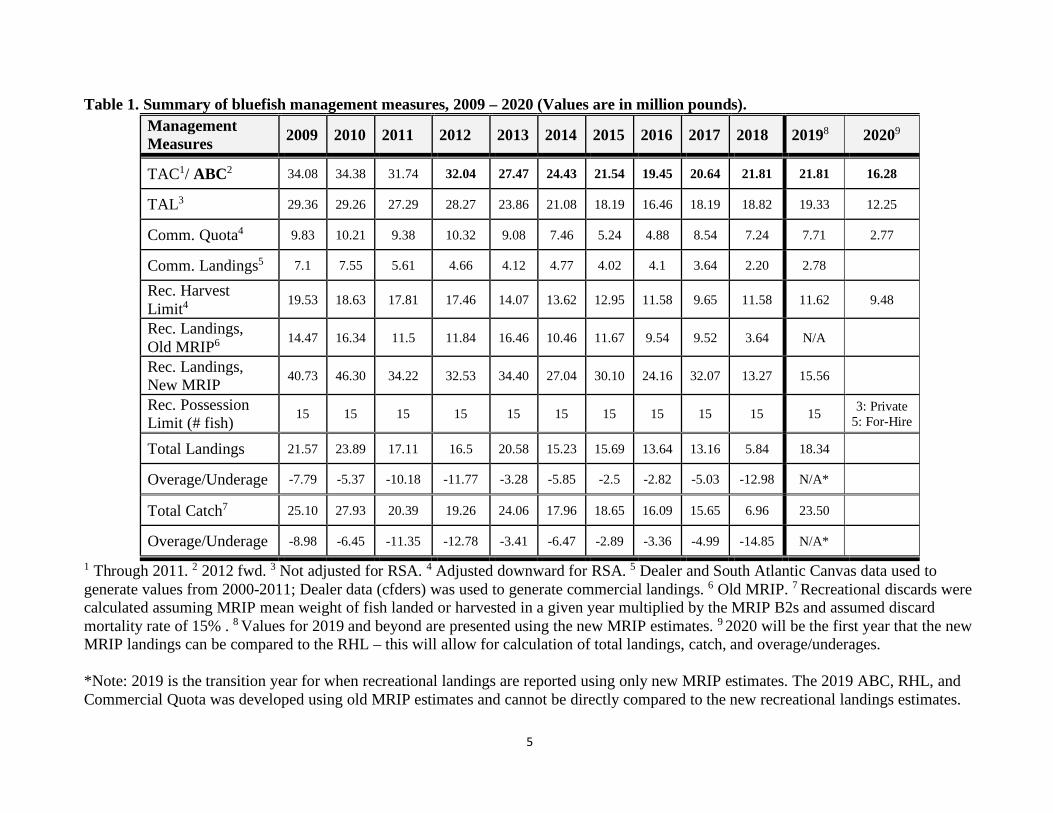
5
Table 1. Summary of bluefish management measures, 2009 – 2020 (Values are in million pounds). Management Measures 2009 2010 2011 2012 2013 2014 2015 2016 2017 2018 20198 20209
TAC1/ ABC2 34.08 34.38 31.74 32.04 27.47 24.43 21.54 19.45 20.64 21.81 21.81 16.28
TAL3 29.36 29.26 27.29 28.27 23.86 21.08 18.19 16.46 18.19 18.82 19.33 12.25
Comm. Quota4 9.83 10.21 9.38 10.32 9.08 7.46 5.24 4.88 8.54 7.24 7.71 2.77
Comm. Landings5 7.1 7.55 5.61 4.66 4.12 4.77 4.02 4.1 3.64 2.20 2.78
Rec. Harvest Limit4 19.53 18.63 17.81 17.46 14.07 13.62 12.95 11.58 9.65 11.58 11.62 9.48
Rec. Landings, Old MRIP6 14.47 16.34 11.5 11.84 16.46 10.46 11.67 9.54 9.52 3.64 N/A
Rec. Landings, New MRIP 40.73 46.30 34.22 32.53 34.40 27.04 30.10 24.16 32.07 13.27 15.56
Rec. Possession Limit (# fish) 15 15 15 15 15 15 15 15 15 15 15 3: Private
5: For-Hire
Total Landings 21.57 23.89 17.11 16.5 20.58 15.23 15.69 13.64 13.16 5.84 18.34
Overage/Underage -7.79 -5.37 -10.18 -11.77 -3.28 -5.85 -2.5 -2.82 -5.03 -12.98 N/A*
Total Catch7 25.10 27.93 20.39 19.26 24.06 17.96 18.65 16.09 15.65 6.96 23.50
Overage/Underage -8.98 -6.45 -11.35 -12.78 -3.41 -6.47 -2.89 -3.36 -4.99 -14.85 N/A*
1 Through 2011. 2 2012 fwd. 3 Not adjusted for RSA. 4 Adjusted downward for RSA. 5 Dealer and South Atlantic Canvas data used to generate values from 2000-2011; Dealer data (cfders) was used to generate commercial landings. 6 Old MRIP. 7 Recreational discards were calculated assuming MRIP mean weight of fish landed or harvested in a given year multiplied by the MRIP B2s and assumed discard mortality rate of 15% . 8 Values for 2019 and beyond are presented using the new MRIP estimates. 9 2020 will be the first year that the new MRIP landings can be compared to the RHL – this will allow for calculation of total landings, catch, and overage/underages. *Note: 2019 is the transition year for when recreational landings are reported using only new MRIP estimates. The 2019 ABC, RHL, and Commercial Quota was developed using old MRIP estimates and cannot be directly compared to the new recreational landings estimates.
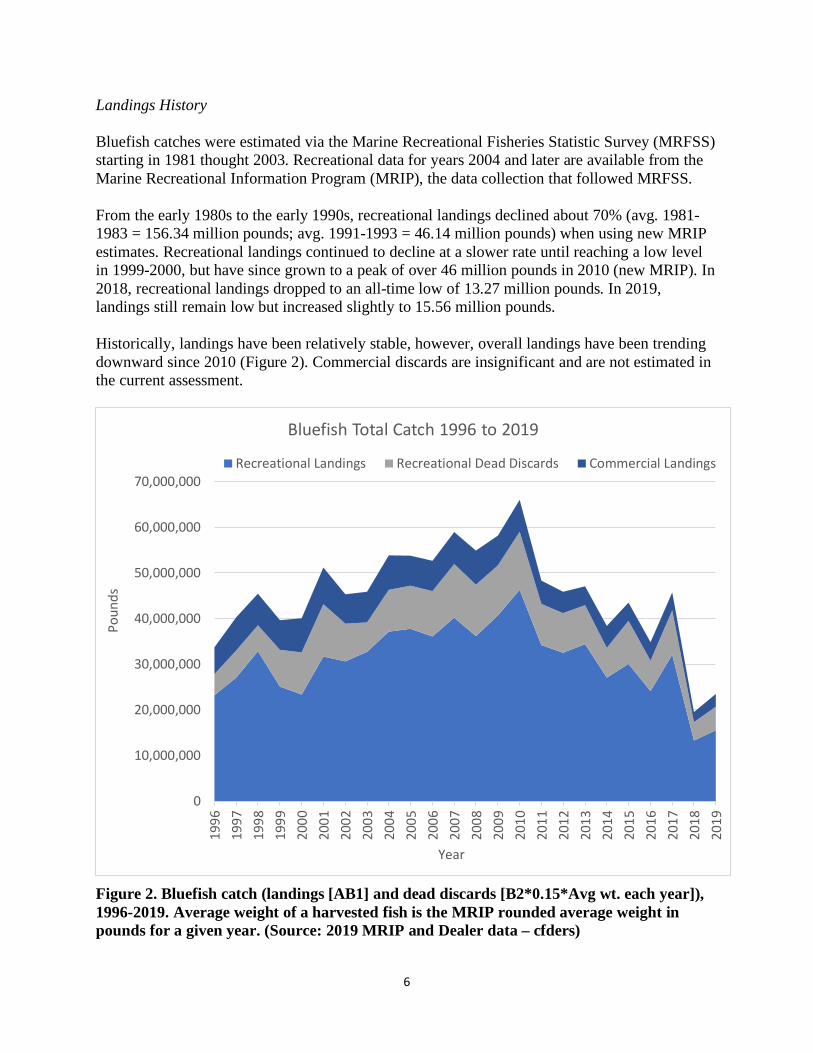
6
Landings History Bluefish catches were estimated via the Marine Recreational Fisheries Statistic Survey (MRFSS) starting in 1981 thought 2003. Recreational data for years 2004 and later are available from the Marine Recreational Information Program (MRIP), the data collection that followed MRFSS. From the early 1980s to the early 1990s, recreational landings declined about 70% (avg. 1981-1983 = 156.34 million pounds; avg. 1991-1993 = 46.14 million pounds) when using new MRIP estimates. Recreational landings continued to decline at a slower rate until reaching a low level in 1999-2000, but have since grown to a peak of over 46 million pounds in 2010 (new MRIP). In 2018, recreational landings dropped to an all-time low of 13.27 million pounds. In 2019, landings still remain low but increased slightly to 15.56 million pounds. Historically, landings have been relatively stable, however, overall landings have been trending downward since 2010 (Figure 2). Commercial discards are insignificant and are not estimated in the current assessment.
Figure 2. Bluefish catch (landings [AB1] and dead discards [B2*0.15*Avg wt. each year]), 1996-2019. Average weight of a harvested fish is the MRIP rounded average weight in pounds for a given year. (Source: 2019 MRIP and Dealer data – cfders)
0
10,000,000
20,000,000
30,000,000
40,000,000
50,000,000
60,000,000
70,000,000
1996
1997
1998
1999
2000
2001
2002
2003
2004
2005
2006
2007
2008
2009
2010
2011
2012
2013
2014
2015
2016
2017
2018
2019
Poun
ds
Year
Bluefish Total Catch 1996 to 2019
Recreational Landings Recreational Dead Discards Commercial Landings
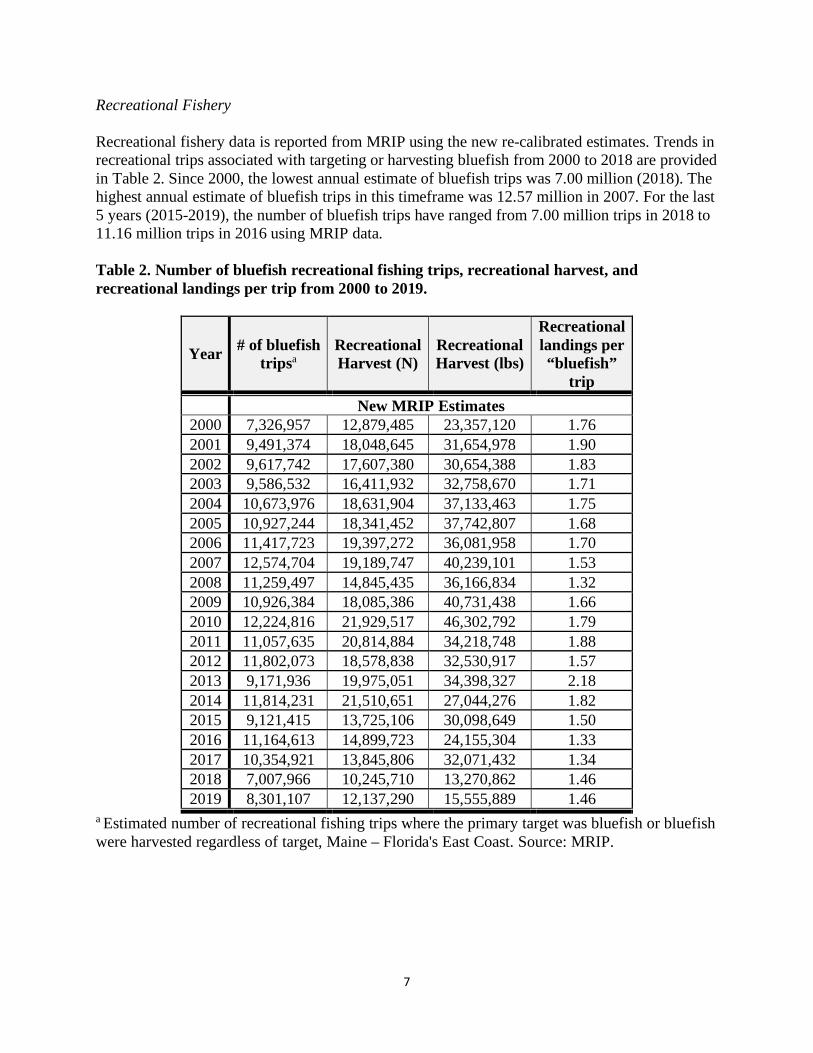
7
Recreational Fishery Recreational fishery data is reported from MRIP using the new re-calibrated estimates. Trends in recreational trips associated with targeting or harvesting bluefish from 2000 to 2018 are provided in Table 2. Since 2000, the lowest annual estimate of bluefish trips was 7.00 million (2018). The highest annual estimate of bluefish trips in this timeframe was 12.57 million in 2007. For the last 5 years (2015-2019), the number of bluefish trips have ranged from 7.00 million trips in 2018 to 11.16 million trips in 2016 using MRIP data. Table 2. Number of bluefish recreational fishing trips, recreational harvest, and recreational landings per trip from 2000 to 2019.
Year # of bluefish tripsa
Recreational Harvest (N)
Recreational Harvest (lbs)
Recreational landings per “bluefish”
trip New MRIP Estimates
2000 7,326,957 12,879,485 23,357,120 1.76 2001 9,491,374 18,048,645 31,654,978 1.90 2002 9,617,742 17,607,380 30,654,388 1.83 2003 9,586,532 16,411,932 32,758,670 1.71 2004 10,673,976 18,631,904 37,133,463 1.75 2005 10,927,244 18,341,452 37,742,807 1.68 2006 11,417,723 19,397,272 36,081,958 1.70 2007 12,574,704 19,189,747 40,239,101 1.53 2008 11,259,497 14,845,435 36,166,834 1.32 2009 10,926,384 18,085,386 40,731,438 1.66 2010 12,224,816 21,929,517 46,302,792 1.79 2011 11,057,635 20,814,884 34,218,748 1.88 2012 11,802,073 18,578,838 32,530,917 1.57 2013 9,171,936 19,975,051 34,398,327 2.18 2014 11,814,231 21,510,651 27,044,276 1.82 2015 9,121,415 13,725,106 30,098,649 1.50 2016 11,164,613 14,899,723 24,155,304 1.33 2017 10,354,921 13,845,806 32,071,432 1.34 2018 7,007,966 10,245,710 13,270,862 1.46 2019 8,301,107 12,137,290 15,555,889 1.46
a Estimated number of recreational fishing trips where the primary target was bluefish or bluefish were harvested regardless of target, Maine – Florida's East Coast. Source: MRIP.

8
Recreational Landings by State Recreational catch and harvest by state for 2019 are provided in Table 3. The greatest overall catches (includes discards) occurred in North Carolina with 9.92 million fish, followed by South Carolina, New York, and Florida, which all exceeded 6 million fish. The greatest harvest of bluefish by weight in 2019 occurred in New York with 3.52 million pounds, followed by North Carolina with 3.01 million pounds, Florida with 2.87 million pounds, and New Jersey and Connecticut over 1 million pounds. According to MRIP, 0 bluefish were caught in Maine and New Hampshire. Average weights, based on dividing MRIP landings in weight by landings in number for each state, suggest that bluefish size tends to increase toward the north along the Atlantic coast (outside of Florida). Table 3. MRIP estimates of 2019 bluefish recreational harvest, total catch, and average weight.
State Harvest Catch
Pounds Number Average wt (lbs) Number
New MRIP Estimates ME 0 0 0 0 NH 0 0 0 0 MA 719,130 265,628 2.7 736,761 RI 931,991 379,715 2.5 991,593 CT 1,161,103 670,401 1.7 1,490,095 NY 3,521,431 3,037,380 1.2 6,376,431 NJ 1,660,208 741,722 2.2 3,310,648 DE 415,267 151,469 2.7 581,840 MD 154,451 111,769 1.4 338,737 VA 581,458 756,717 0.8 1,882,000 NC 3,011,480 2,752,589 1.1 9,915,020 SC 502,699 877,372 0.6 6,448,797 GA 21,886 26,364 0.8 273,400 FL 2,874,785 2,366,165 1.2 6,286,615
Total 15,555,889 12,137,291 - 38,631,937
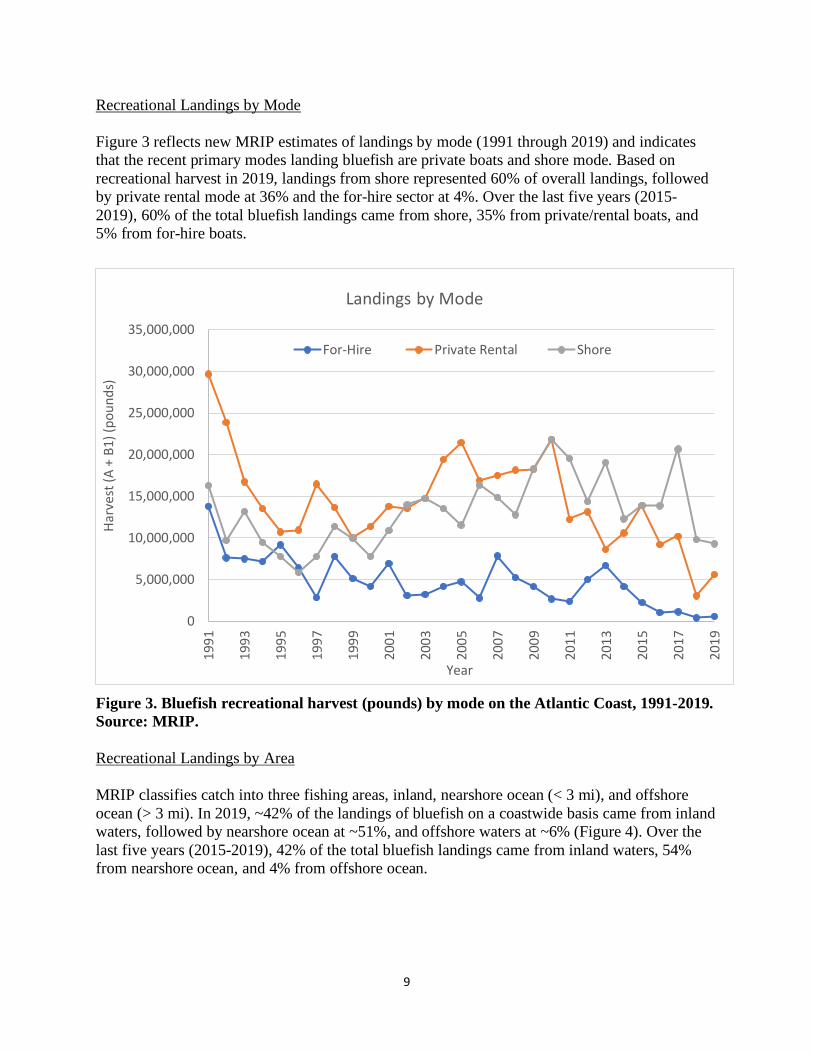
9
Recreational Landings by Mode Figure 3 reflects new MRIP estimates of landings by mode (1991 through 2019) and indicates that the recent primary modes landing bluefish are private boats and shore mode. Based on recreational harvest in 2019, landings from shore represented 60% of overall landings, followed by private rental mode at 36% and the for-hire sector at 4%. Over the last five years (2015-2019), 60% of the total bluefish landings came from shore, 35% from private/rental boats, and 5% from for-hire boats.
Figure 3. Bluefish recreational harvest (pounds) by mode on the Atlantic Coast, 1991-2019. Source: MRIP. Recreational Landings by Area MRIP classifies catch into three fishing areas, inland, nearshore ocean (< 3 mi), and offshore ocean (> 3 mi). In 2019, ~42% of the landings of bluefish on a coastwide basis came from inland waters, followed by nearshore ocean at ~51%, and offshore waters at ~6% (Figure 4). Over the last five years (2015-2019), 42% of the total bluefish landings came from inland waters, 54% from nearshore ocean, and 4% from offshore ocean.
0
5,000,000
10,000,000
15,000,000
20,000,000
25,000,000
30,000,000
35,000,000
1991
1993
1995
1997
1999
2001
2003
2005
2007
2009
2011
2013
2015
2017
2019
Harv
est (
A +
B1) (
poun
ds)
Year
Landings by Mode
For-Hire Private Rental Shore

10
Figure 4. Bluefish recreational harvest (pounds) by area on the Atlantic Coast, 1991-201. Source: MRIP. Recreational Discards In the recreational fishery, bluefish released alive (B2) are estimated by MRIP. To calculate discards1, a 15% mortality rate is applied to the B2 value. In 2019, there were 3.97 million bluefish dead discards, which represents a downward trend from the 2001 peak of 6.37 million bluefish dead discards (Figure 5).
1 To estimate discards in pounds, multiply the number of dead discards times the average weight of fish in a given year. For more detailed results, characterize the average weight of a bluefish by state and mode using the MRIP query tool: https://www.st.nmfs.noaa.gov/recreational-fisheries/data-and-documentation/queries/index.
0
5,000,000
10,000,000
15,000,000
20,000,000
25,000,000
30,000,000
35,000,000
1991
1993
1995
1997
1999
2001
2003
2005
2007
2009
2011
2013
2015
2017
2019
Harv
est (
A +
B1) (
Poun
ds)
Year
Landings by Area
Inland Ocean (<= 3 MI) Ocean (> 3 MI)
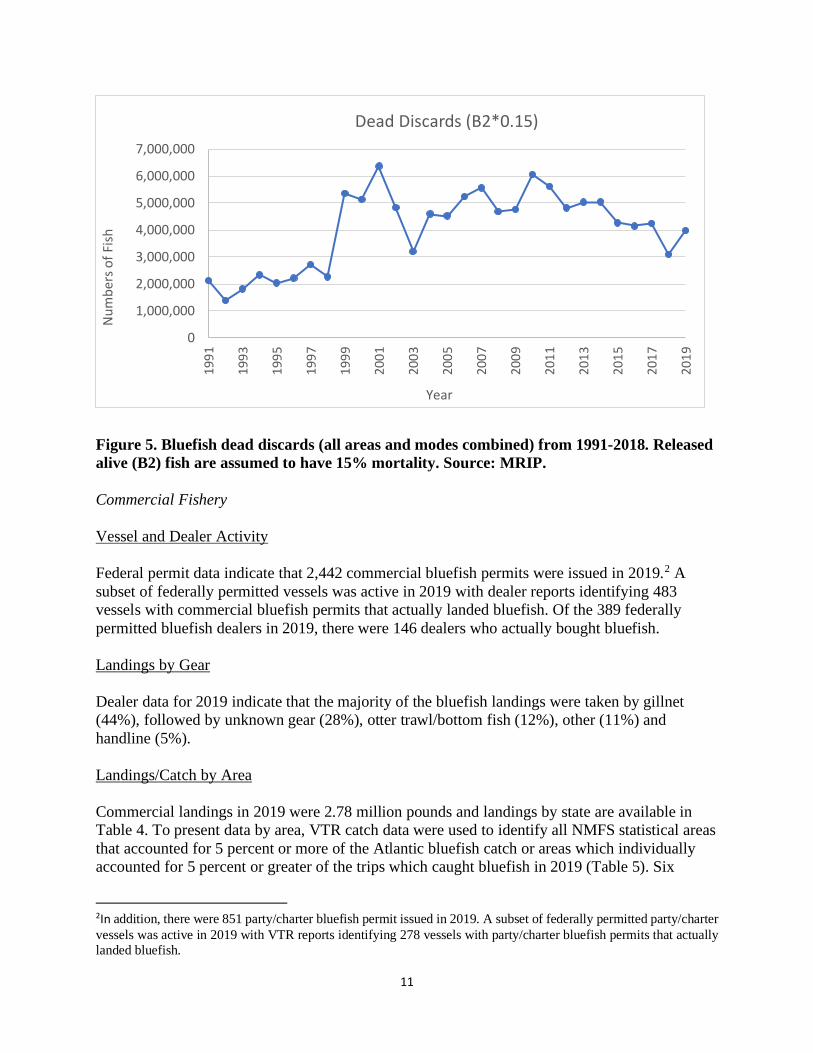
11
Figure 5. Bluefish dead discards (all areas and modes combined) from 1991-2018. Released alive (B2) fish are assumed to have 15% mortality. Source: MRIP. Commercial Fishery Vessel and Dealer Activity Federal permit data indicate that 2,442 commercial bluefish permits were issued in 2019.2 A subset of federally permitted vessels was active in 2019 with dealer reports identifying 483 vessels with commercial bluefish permits that actually landed bluefish. Of the 389 federally permitted bluefish dealers in 2019, there were 146 dealers who actually bought bluefish. Landings by Gear Dealer data for 2019 indicate that the majority of the bluefish landings were taken by gillnet (44%), followed by unknown gear (28%), otter trawl/bottom fish (12%), other (11%) and handline (5%). Landings/Catch by Area Commercial landings in 2019 were 2.78 million pounds and landings by state are available in Table 4. To present data by area, VTR catch data were used to identify all NMFS statistical areas that accounted for 5 percent or more of the Atlantic bluefish catch or areas which individually accounted for 5 percent or greater of the trips which caught bluefish in 2019 (Table 5). Six
2In addition, there were 851 party/charter bluefish permit issued in 2019. A subset of federally permitted party/charter vessels was active in 2019 with VTR reports identifying 278 vessels with party/charter bluefish permits that actually landed bluefish.
0
1,000,000
2,000,000
3,000,000
4,000,000
5,000,000
6,000,000
7,000,000
1991
1993
1995
1997
1999
2001
2003
2005
2007
2009
2011
2013
2015
2017
2019
Num
bers
of F
ish
Year
Dead Discards (B2*0.15)
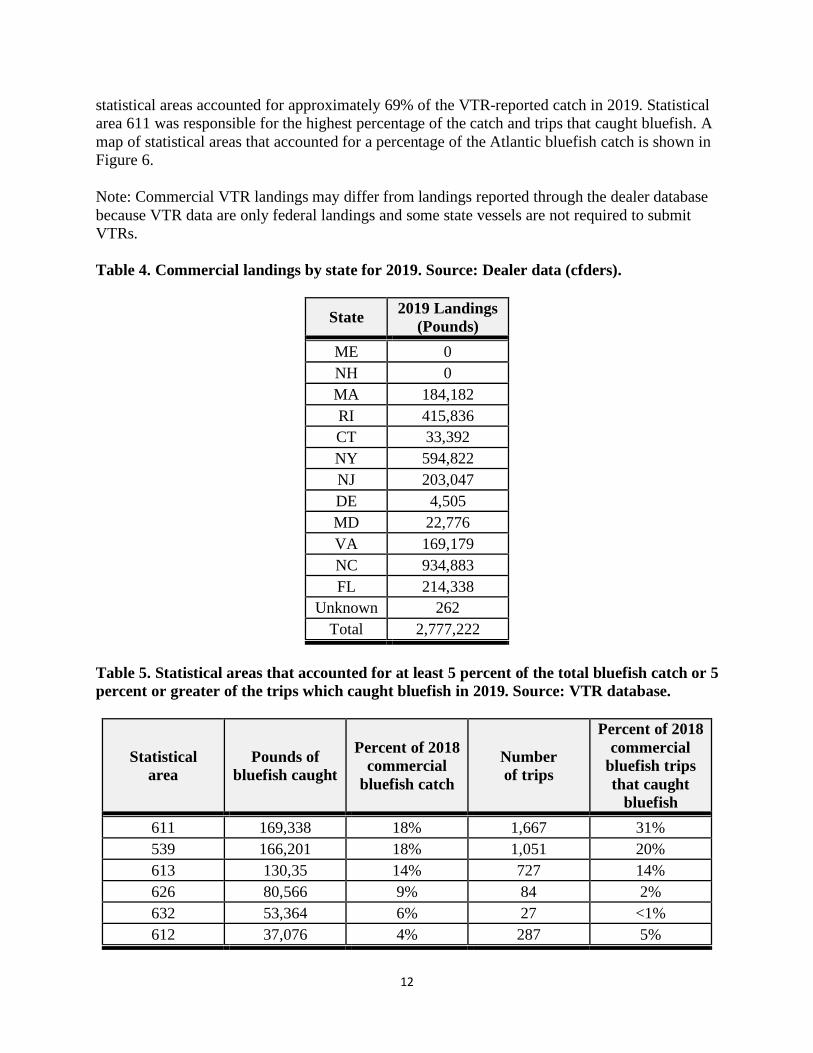
12
statistical areas accounted for approximately 69% of the VTR-reported catch in 2019. Statistical area 611 was responsible for the highest percentage of the catch and trips that caught bluefish. A map of statistical areas that accounted for a percentage of the Atlantic bluefish catch is shown in Figure 6. Note: Commercial VTR landings may differ from landings reported through the dealer database because VTR data are only federal landings and some state vessels are not required to submit VTRs. Table 4. Commercial landings by state for 2019. Source: Dealer data (cfders).
State 2019 Landings (Pounds)
ME 0 NH 0 MA 184,182 RI 415,836 CT 33,392 NY 594,822 NJ 203,047 DE 4,505 MD 22,776 VA 169,179 NC 934,883 FL 214,338
Unknown 262 Total 2,777,222
Table 5. Statistical areas that accounted for at least 5 percent of the total bluefish catch or 5 percent or greater of the trips which caught bluefish in 2019. Source: VTR database.
Statistical area
Pounds of bluefish caught
Percent of 2018 commercial
bluefish catch
Number of trips
Percent of 2018 commercial
bluefish trips that caught
bluefish 611 169,338 18% 1,667 31% 539 166,201 18% 1,051 20% 613 130,35 14% 727 14% 626 80,566 9% 84 2% 632 53,364 6% 27 <1% 612 37,076 4% 287 5%
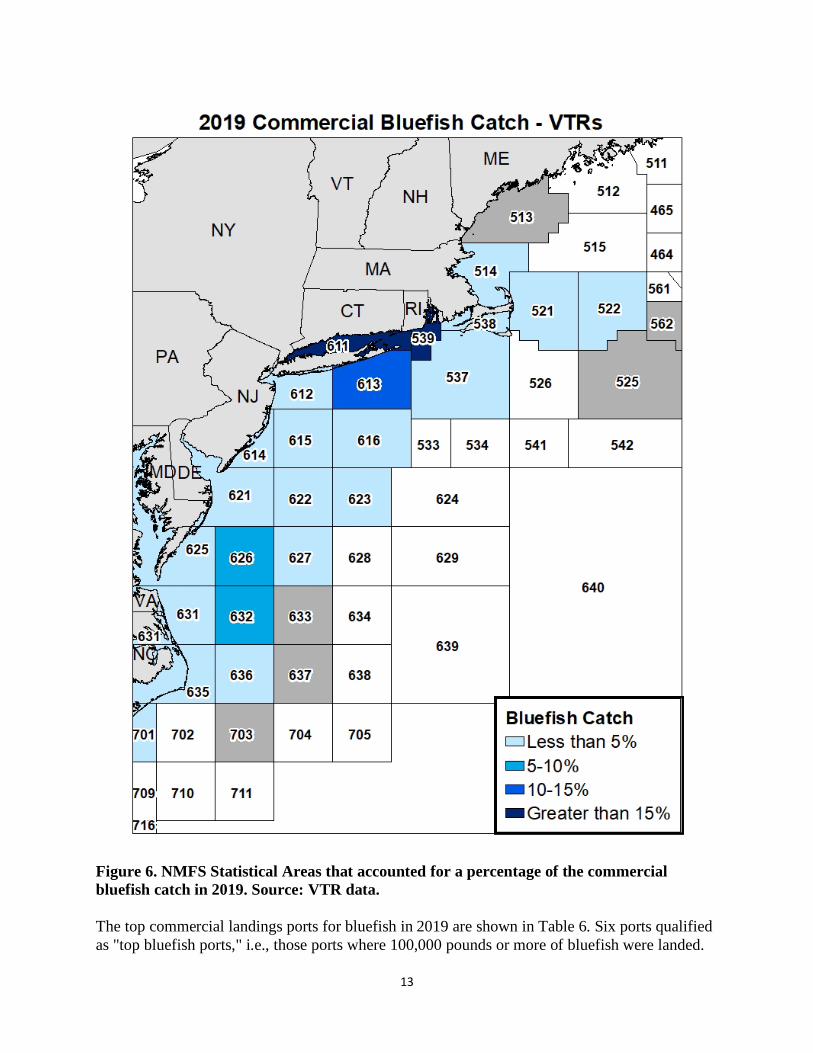
13
Figure 6. NMFS Statistical Areas that accounted for a percentage of the commercial bluefish catch in 2019. Source: VTR data. The top commercial landings ports for bluefish in 2019 are shown in Table 6. Six ports qualified as "top bluefish ports," i.e., those ports where 100,000 pounds or more of bluefish were landed.

14
Hatteras, NC was the most active commercial bluefish port with almost 400,000 pounds landed. The ports and communities that are dependent on bluefish are described in Amendment 1 to the FMP (available at http://www.mafmc.org/fisheries/fmp/bluefish). Additional information on "Community Profiles for the Northeast US Fisheries" can be found at http://www.nefsc.noaa.gov/read/socialsci/community_profiles/. Table 6. Bluefish landings in pounds by port based on NMFS 2019 dealer data (cfders).
Porta Pounds
% of total commercial
bluefish landings
# vessels
Hatteras, NC 393,056 14% 8 Point Judith, RI 283,941 10% 99 Wanchese, NC 273,277 10% 25 Montauk, NY 269,418 10% 78
Hampton Bays, NY 147,959 5% 30 Little Compton, RI 111,107 4% 14
a Since this table includes only the “top ports” (ports where landings of bluefish were > 100,000 pounds), it does not include all landings for the year. Revenue According to dealer data, commercial vessels landed about 2.78 million pounds of bluefish valued at approximately $2.37 million in 2019. Average coastwide ex-vessel price of bluefish was $0.85 per pound in 2019, a ~10% decrease from the previous year (2018 price = $0.94 per pound). The relative value of bluefish is very low among commercially landed species, less than 1% of the total value, respectively of all finfish and shellfish landed along the U.S. Atlantic coast in 2019. A time series of bluefish revenue and price is provided in Figure 7.

15
Figure 7. Landings, ex-vessel value, and price (adjusted to 2018 real dollars, 2019 unadjusted) for bluefish, 2000-2019. Bycatch The commercial bluefish fishery is primarily prosecuted with gillnets and handlines, although there are other small localized fisheries, such as the beach seine fishery that operates along the Outer Banks of North Carolina. Many of these fisheries do not fish exclusively for bluefish, but target a combination of species including croaker, mullet, Spanish mackerel, spot, striped bass, and weakfish. Given the mixed-species nature of the bluefish fishery, incidental catch of non-target species is not directly attributable to the bluefish fishery.
$0.00
$0.10
$0.20
$0.30
$0.40
$0.50
$0.60
$0.70
$0.80
$0.90
$1.00
0
1,000,000
2,000,000
3,000,000
4,000,000
5,000,000
6,000,000
7,000,000
8,000,000
9,000,000
2000
2001
2002
2003
2004
2005
2006
2007
2008
2009
2010
2011
2012
2013
2014
2015
2016
2017
2018
2019
Adju
sted
Pric
e ($
/Pou
nds)
Land
ings
(Pou
nds)
and
Ex-
vess
el V
alue
($)
Year
Bluefish Landings, Value, and Price
Ex-Vessel Value ($) Landings (Pounds) Adjusted $/Pound

16
References Able, K.W. and M.P. Fahay. 1998. The first year in the life of estuarine fishes in the Middle Atlantic Bight. Rutgers University Press, New Brunswick, NJ. 342 p. Bigelow, H.B. and W.C. Schroeder. 1953. Fishes of the Gulf of Maine. U.S. Fish Wildl. Serv., Fish. Bull. 53. 577 p. Salerno, D.J., J. Burnett, and R.M. Ibara. 2001. Age, growth, maturity and spatial distribution of bluefish, Pomatomus saltatrix (Linnaeus), off the northeast coast of the United States, 1985-96. J. Northwest Atl. Fish. Sci., 29: 31-39. Smith, W., P. Berrien, and T. Potthoff. 1994. Spawning patterns of bluefish, Pomatomus saltatrix, in the northeast continental shelf ecosystem. Bull. Mar. Sci. 54(1): 8-16. NEFSC (Northeast Fisheries Science Center). 2015. 60th Northeast Regional Stock Assessment Workshop (60th SAW) Assessment Report. NEFSC Reference Document 15-08; 870 pp. Wood, T. 2014. Bluefish 2014 Stock Assessment Update Data and Model Update Through 2013. Coastal/Pelagic Working Group, Northeast Fisheries Science Center, National Marine Fisheries Service, Woods Hole, MA. 37 p. NEFSC (Northeast Fisheries Science Center). 2019. Atlantic Bluefish Operational Assessment for 2019, Northeast Fisheries Science Center, National Marine Fisheries Service, Woods Hole, MA. Wood, A. 2017. Personal communication. Atlantic bluefish assessment lead. NMFS/NEFSC/READ/PDB. Woods Hole, MA.

Page 1 of 1
M E M O R A N D U M
Date: July 30, 2020
To: Council and Board
From: Kiley Dancy, Staff
Subject: Summer Flounder Specifications Review for 2021
On Tuesday, August 11, the Council and Board will review previously adopted 2021 specifications
for summer flounder and consider modifications based on revised SSC and Monitoring Committee
recommendations. These modified recommendations were developed to update the 2021
specifications for consistency with the Council's revised risk policy adopted in December 2019.
Materials listed below are provided for the Council and Board’s consideration of this agenda item.
Please note that some materials are behind other tabs and some will be posted to supplemental
materials.
1) July 2020 Scientific and Statistical Committee meeting report (behind Tab 11)
2) Staff memo on 2021 summer flounder specifications dated July 7, 2020
3) Summer Flounder Data Update for 2020
4) June 2020 Advisory Panel Fishery Performance Report and additional AP comments
received through July 9, 2020
5) Additional written comments received through July 29, 2020
6) 2020 Summer Flounder Fishery Information Document
The following documents will be added as supplemental meeting materials on the August meeting
page on the Council's website:
1) Monitoring Committee meeting summary from July 27
2) Advisory Panel meeting summary from July 29
Mid-Atlantic Fishery Management Council 800 North State Street, Suite 201, Dover, DE 19901
Phone: 302-674-2331 ǀ FAX: 302-674-5399 ǀ www.mafmc.org Michael P. Luisi, Chairman ǀ G. Warren Elliott, Vice Chairman
Christopher M. Moore, Ph.D., Executive Director

SSC Report is behind Tab 11
Page | 1
Mid-Atlantic Fishery Management Council 800 North State Street, Suite 201, Dover, DE 19901
Phone: 302-674-2331 ǀ FAX: 302-674-5399 ǀ www.mafmc.org
Michael P. Luisi, Chairman ǀ G. Warren Elliott, Vice Chairman
Christopher M. Moore, Ph.D., Executive Director
M E M O R A N D U M
DATE: July 7, 2020
TO: Chris Moore, Executive Director
FROM: Kiley Dancy, Staff
SUBJECT: Review of Summer Flounder Specifications for 2021
Executive Summary
In 2019, multi-year specifications for summer flounder were set for 2019 (revised) through 2021 based
on the results of a benchmark stock assessment developed and peer reviewed in 2018 through the 66th
Stock Assessment Workshop/Stock Assessment Review Committee (SAW/SARC 66; NEFSC 2019).1
The assessment incorporated data through 2017, including the revised time series (1981-2017) of
recreational catch provided by the Marine Recreational Information Program (MRIP).2
The 2018 stock assessment indicates that the summer flounder stock was not overfished and overfishing
was not occurring in 2017. Spawning stock biomass (SSB) was estimated to be 98.22 million lb (44,552
mt) in 2017, 78% of SSB at maximum sustainable yield (SSBMSY = 126.01 million lb/57,159 mt). The
fishing mortality rate (F) in 2017 was 0.334, 25% below the fishing mortality threshold reference point
(FMSY proxy = F35% = 0.448).
In February 2019, the Council and the Atlantic States Marine Fisheries Commission's (Commission's)
Summer Flounder, Scup, and Black Sea Bass Board (Board) approved constant three-year catch and
landings limits for 2019-2021 based on a three-year averaging approach. The revised 2019 specifications
were implemented via interim final rule on May 17, 2019 (84 FR 22392), and the 2020-2021
specifications were implemented via final rule on October 9, 2019 (84 FR 54041).
The measures currently implemented include an Acceptable Biological Catch (ABC) for 2019-2021 of
25.03 million lb (11,354 mt). This ABC and the corresponding sector-specific catch and landings limits
for 2021 may remain unchanged if the Scientific and Statistical Committee (SSC), Council, and Board
determine that no changes are warranted. However, the Council recommended revisions to their risk
1 Northeast Fisheries Science Center (NEFSC). 2019. 66th Northeast Regional Stock Assessment Workshop (66th SAW)
Assessment Summary Report. US Dept Commer, Northeast Fish Sci Cent Ref Doc. 19-01; 40 p. Available from:
https://www.nefsc.noaa.gov/publications/crd/crd1908/.
2 In July 2018, MRIP released revisions to their time series of recreational catch and landings estimates based on adjustments
for a revised angler intercept methodology and a new effort estimation methodology (i.e., a transition from a telephone-based
effort survey to a mail-based effort survey). The revised estimates of catch and landings for most years are several times
higher than the previous estimates for shore and private boat modes.

Page | 2
policy in December 2019 with the intent that 2021 specifications would reflect the new policy. As such,
the SSC should consider whether the 2021 summer flounder ABC warrants revision.
Similarly, the Monitoring Committee will review recent fishery performance and make a
recommendation to the Council and Board regarding any potential modifications to the implemented
2021 commercial and recreational Annual Catch Limits (ACLs) and Annual Catch Targets (ACTs) as
well as the set of commercial management measures that can be modified through specifications.
The currently implemented 2021 catch and landings limits are shown in Table 1. Staff recommend
modifying the currently implemented catch and landings limits for 2021 to reflect recent changes to the
Council's risk policy recommended in December 2019 (Table 2). The revised risk policy includes an
increased acceptable risk of overfishing at most biomass thresholds, and as such would result in an 8%
increase in the 2021 summer flounder ABC if applied. The methods used to derive these measures are
described in more detail later in this memo.
Table 1: Currently implemented catch and landings limits for summer flounder for 2021. These
measures are identical to those implemented for 2019 and 2020, with the exception of the OFL which
varies slightly in each year. The sector-specific catch and landings limits are initial limits prior to any
deductions for past overages.
Measure 2021
Basis mil lb mt
OFL 31.67 14,367 Stock projections
ABC 25.03 11,354 SSC recommendation for 3-year averaged approach with
projections sampling from recent 7-year recruitment series
ABC Landings
Portion 19.21 8,715 Stock projections
ABC Discards
Portion 5.82 2,639 Stock projections
Expected
Commercial
Discards
2.00 907 34% of ABC discards portion, based on 2015-2017 average %
discards by sector (using new MRIP data)
Expected
Recreational
Discards
3.82 1,732 66% of ABC discards portion, based on 2015-2017 average %
discards by sector (using new MRIP data)
Commercial
ACL 13.53 6,136
60% of ABC landings portion (FMP allocation) + expected
commercial discards
Commercial
ACT 13.53 6,136 No deduction from ACL for management uncertainty
Commercial
Quota 11.53 5,229 Commercial ACT, minus expected commercial discards
Recreational
ACL 11.51 5,218
40% of ABC landings portion (FMP allocation) + expected
recreational discards
Recreational
ACT 11.51 5,218 No deduction from ACL for management uncertainty
RHL 7.69 3,486 Recreational ACT, minus expected recreational discards

Page | 3
Table 2: Staff recommended revisions to 2021 catch and landings limits for summer flounder based on
the revised Council risk policy recommended in December 2019. The sector-specific catch and landings
limits are initial limits prior to any deductions for past overages.
Measure 2021
Basis mil lb mt
OFL 31.67 14,367 Stock projections
ABC 27.11 12,297 Staff recommendation applying revised Council risk policy to
existing OFL
ABC Landings
Portion 20.81 9,439
Maintains existing projections for discards: landings
proportions
ABC Discards
Portion 6.30 2,858
Maintains existing projections for discards: landings
proportions
Expected
Commercial
Discards
2.14 972
Maintains current discards split: 34% of ABC discards portion,
based on 2015-2017 average % discards by sector (using new
MRIP data)
Expected
Recreational
Discards
4.16 1,886
Maintains current discards split: 66% of ABC discards portion,
based on 2015-2017 average % discards by sector (using new
MRIP data)
Commercial
ACL 14.63 6,635
60% of ABC landings portion (FMP allocation) + expected
commercial discards
Commercial
ACT 14.63 6,635
Staff recommendation: Maintain no deduction from ACL for
management uncertainty
Commercial
Quota 12.49 5,663 Commercial ACT, minus expected commercial discards
Recreational
ACL 12.48 5,662
40% of ABC landings portion (FMP allocation) + expected
recreational discards
Recreational
ACT 12.48 5,662
Staff recommendation: Maintain no deduction from ACL for
management uncertainty
RHL 8.32 3,776 Recreational ACT, minus expected recreational discards
Staff recommend no changes to the commercial minimum size or mesh exemption requirements for
2021. As described below in "Commercial Management Measures," staff recommend further evaluation
of commercial mesh size issues in 2021 for potential application in 2022, in particular consideration of
phasing out the 6" square minimum mesh size regulation, leaving the 5.5" diamond minimum mesh size
in place. In addition, the MC should consider whether changes to the small mesh exemption program
should be evaluated.
Additional relevant information about the fishery and past management measures is presented in the
Fishery Performance Report for summer flounder developed by the Council and Commission Advisory
Panels, as well as in the corresponding Summer Flounder Fishery Information Document prepared by
Council staff.3
3 The Fishery Information Document and Fishery Performance Report are available at: https://www.mafmc.org/council-
events/2020/july-ssc-meeting.
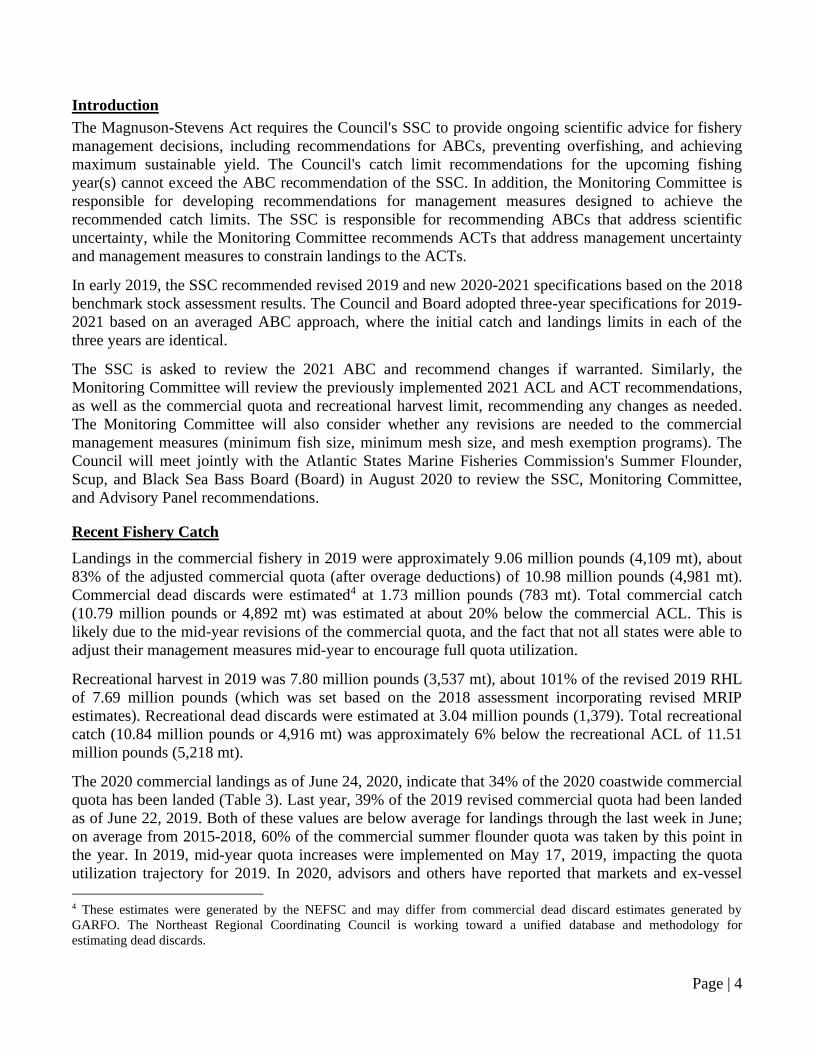
Page | 4
Introduction
The Magnuson-Stevens Act requires the Council's SSC to provide ongoing scientific advice for fishery
management decisions, including recommendations for ABCs, preventing overfishing, and achieving
maximum sustainable yield. The Council's catch limit recommendations for the upcoming fishing
year(s) cannot exceed the ABC recommendation of the SSC. In addition, the Monitoring Committee is
responsible for developing recommendations for management measures designed to achieve the
recommended catch limits. The SSC is responsible for recommending ABCs that address scientific
uncertainty, while the Monitoring Committee recommends ACTs that address management uncertainty
and management measures to constrain landings to the ACTs.
In early 2019, the SSC recommended revised 2019 and new 2020-2021 specifications based on the 2018
benchmark stock assessment results. The Council and Board adopted three-year specifications for 2019-
2021 based on an averaged ABC approach, where the initial catch and landings limits in each of the
three years are identical.
The SSC is asked to review the 2021 ABC and recommend changes if warranted. Similarly, the
Monitoring Committee will review the previously implemented 2021 ACL and ACT recommendations,
as well as the commercial quota and recreational harvest limit, recommending any changes as needed.
The Monitoring Committee will also consider whether any revisions are needed to the commercial
management measures (minimum fish size, minimum mesh size, and mesh exemption programs). The
Council will meet jointly with the Atlantic States Marine Fisheries Commission's Summer Flounder,
Scup, and Black Sea Bass Board (Board) in August 2020 to review the SSC, Monitoring Committee,
and Advisory Panel recommendations.
Recent Fishery Catch
Landings in the commercial fishery in 2019 were approximately 9.06 million pounds (4,109 mt), about
83% of the adjusted commercial quota (after overage deductions) of 10.98 million pounds (4,981 mt).
Commercial dead discards were estimated4 at 1.73 million pounds (783 mt). Total commercial catch
(10.79 million pounds or 4,892 mt) was estimated at about 20% below the commercial ACL. This is
likely due to the mid-year revisions of the commercial quota, and the fact that not all states were able to
adjust their management measures mid-year to encourage full quota utilization.
Recreational harvest in 2019 was 7.80 million pounds (3,537 mt), about 101% of the revised 2019 RHL
of 7.69 million pounds (which was set based on the 2018 assessment incorporating revised MRIP
estimates). Recreational dead discards were estimated at 3.04 million pounds (1,379). Total recreational
catch (10.84 million pounds or 4,916 mt) was approximately 6% below the recreational ACL of 11.51
million pounds (5,218 mt).
The 2020 commercial landings as of June 24, 2020, indicate that 34% of the 2020 coastwide commercial
quota has been landed (Table 3). Last year, 39% of the 2019 revised commercial quota had been landed
as of June 22, 2019. Both of these values are below average for landings through the last week in June;
on average from 2015-2018, 60% of the commercial summer flounder quota was taken by this point in
the year. In 2019, mid-year quota increases were implemented on May 17, 2019, impacting the quota
utilization trajectory for 2019. In 2020, advisors and others have reported that markets and ex-vessel
4 These estimates were generated by the NEFSC and may differ from commercial dead discard estimates generated by
GARFO. The Northeast Regional Coordinating Council is working toward a unified database and methodology for
estimating dead discards.

Page | 5
prices (and therefore landings) are substantially down due to the COVID-19 pandemic.
Table 3: The 2020 state-by-state commercial quotas and the amount of summer flounder landed by
commercial fishermen, in each state as of June 24, 2020.
State Cumulative Landings (lb) Quota (lb)a Percent of Quota
(%)
ME 0 5,484
NH 0 53
MA 213,963 786,399 27%
RI 1,003,205 1,808,248 55%
CT 104,853 260,241 40%
NY 346,635 881,698 39%
NJ 568,284 1,928,391 29%
DE 0 0 0%
MD 27,757 235,108 12%
VA 864,440 2,457,822 35%
NC 788,890 3,164,505 25%
Totals 3,918,027 11,530,000 34% a
Quotas adjusted for overages. Source: NMFS Weekly Quota Report with data reported through June 24, 2020.
As of this memo, recreational estimates for 2020 are only available through wave 2 (March/April),
which does not provide meaningful information about 2020 recreational harvest trends for summer
flounder given that in recent years wave 2 has accounted for less than 1% of annual summer flounder
harvest.
Stock Status and Biological Reference Points
The recent benchmark stock assessment was developed through the 66th SAW process, and peer
reviewed at the 66th SARC from November 27-30, 2018. The assessment incorporated the revised time
series of recreational catch from MRIP, which is 30% higher on average compared to the previous
summer flounder estimates for 1981-2017. The MRIP estimate revisions account for changes in both the
angler intercept survey and recreational effort survey methodologies. While fishing mortality rates were
not strongly affected by incorporating these revisions, increased recreational catch resulted in increased
estimates of stock size compared to past assessments.
The biological reference points for summer flounder as revised through the SAW/SARC 66 process
include a fishing mortality threshold of FMSY = F35% (as the FMSY proxy) = 0.448, and a biomass
reference point of SSBMSY = SSB35% (as the SSBMSY proxy) = 126.01 million lb = 57,159 mt. The
minimum stock size threshold (1/2 SSBMSY), is estimated to be 63.01 million lb (28,580 mt; Figure 1).
Assessment results indicate that the summer flounder stock was not overfished and overfishing was not
occurring in 2017. Fishing mortality on the fully selected age 4 fish ranged between 0.744 and 1.622
during 1982-1996 and then decreased to 0.245 in 2007. Since 2007 the fishing mortality rate (F) has
increased, and in 2017 was estimated at 0.334, below the SAW 66 FMSY proxy of F35% = 0.448 (Figure
2). The 90% confidence interval for F in 2017 was 0.276 to 0.380.

Page | 6
SSB decreased from 67.13 million lb (30,451 mt) in 1982 to 16.33 million lb (7,408 mt) in 1989, and
then increased to 152.46 million lb (69,153 mt) in 2003. SSB has decreased since 2003 and was
estimated to be 98.22 million lb (44,552 mt) in 2017, about 78% of SSBMSY = 126.01 million lb (57,159
mt), and 56% above the ½ SSBMSY proxy = ½ SSB35% = 63.01 million lb (28,580 mt; Figure 1). The 90%
confidence interval for SSB in 2017 was 39,195 to 50,935 mt.
Figure 1: Summer flounder spawning stock biomass (SSB; solid line) and recruitment at age 0 (R; vertical
bars) 1980-2017. The horizontal dashed line is the 2018 SAW66 recommended target biomass reference
point proxy, SSBMSY = SSB35% = 57,159 mt. The horizontal solid line is the 2018 SAW66 recommended
threshold biomass reference point proxy ½ SSBMSY = ½ SSB35% = 28,580 mt. Source: NEFSC 2019.
010,00020,00030,00040,00050,00060,00070,00080,00090,000100,000110,000
0
10,000
20,000
30,000
40,000
50,000
60,000
70,000
80,000
1980 1985 1990 1995 2000 2005 2010 2015 2020
R (a
ge 0
, 000
s)
SSB
(mt)
Spawning Stock Biomass (SSB) and Recruitment (R)
R SSBSSBMSY = SSB35% = 57,159 mt 1/2 SSBMSY = 1/2 SSB35% = 28,580 mt

Page | 7
Figure 2: Total fishery catch (mt; solid line) and fully-recruited fishing mortality (F, peak at age 4; squares)
of summer flounder. The horizontal solid line is the 2018 SAW66 recommended fishing mortality reference
point proxy FMSY = F35% = 0.448. Source: NEFSC 2019.
Recruitment of juvenile summer flounder has been below-average in most years since 2011, although
the driving factors behind this trend have not been identified. Bottom trawl survey data also indicate a
recent trend of decreasing length and weight at age, which implies slower growth and delayed maturity.
These factors affected the change in biological reference points used to determine stock status.
In June 2020, the Northeast Fisheries Science Center (NEFSC) provided a data update for 20205,
including updated landings information as well as federal trawl survey indices through 2019. The data
update indicates that the NEFSC spring survey index of summer flounder stock biomass decreased by
4% from 2018 to 2019 and the fall index decreased by 36% from 2018 to 2019. The NEFSC fall survey
length frequency distributions suggest that an above average year class recruited to the stock in 2018.
The 2020 data update does not provide information on state survey indices.
Review of Prior SSC Recommendations
In February 2019, the SSC recommended, and the Council and Board adopted, three-year ABCs for
summer flounder for 2019-2021, based on new stock status information and projections from the 2018
assessment.
The SSC indicated that the approach to estimating uncertainty in the overfishing limit (OFL) had not
changed since the previous benchmark (SAW/SARC 57). Accordingly, the SSC maintained its
determination that the assessment should be assigned an “SSC-modified OFL probability distribution.”
In this type of assessment, the SSC provides its own estimate of uncertainty in the distribution of the
OFL. The SSC continued the application of a 60% OFL CV, because: (1) the latest benchmark
assessment did not result in major changes to the quality of the data and model that the SSC has
5 Available at https://www.mafmc.org/s/Summer_flounder_2020_Data_Update.pdf.
0.00.20.40.60.81.01.21.41.61.8
0
5,000
10,000
15,000
20,000
25,000
30,000
35,000
1980 1985 1990 1995 2000 2005 2010 2015 2020
F ( a
ge 4
)
Tota
l Cat
ch (m
t)Total Catch and Fishing Mortality (F)
Total Catch F (age 4) FMSY= F35% = 0.448
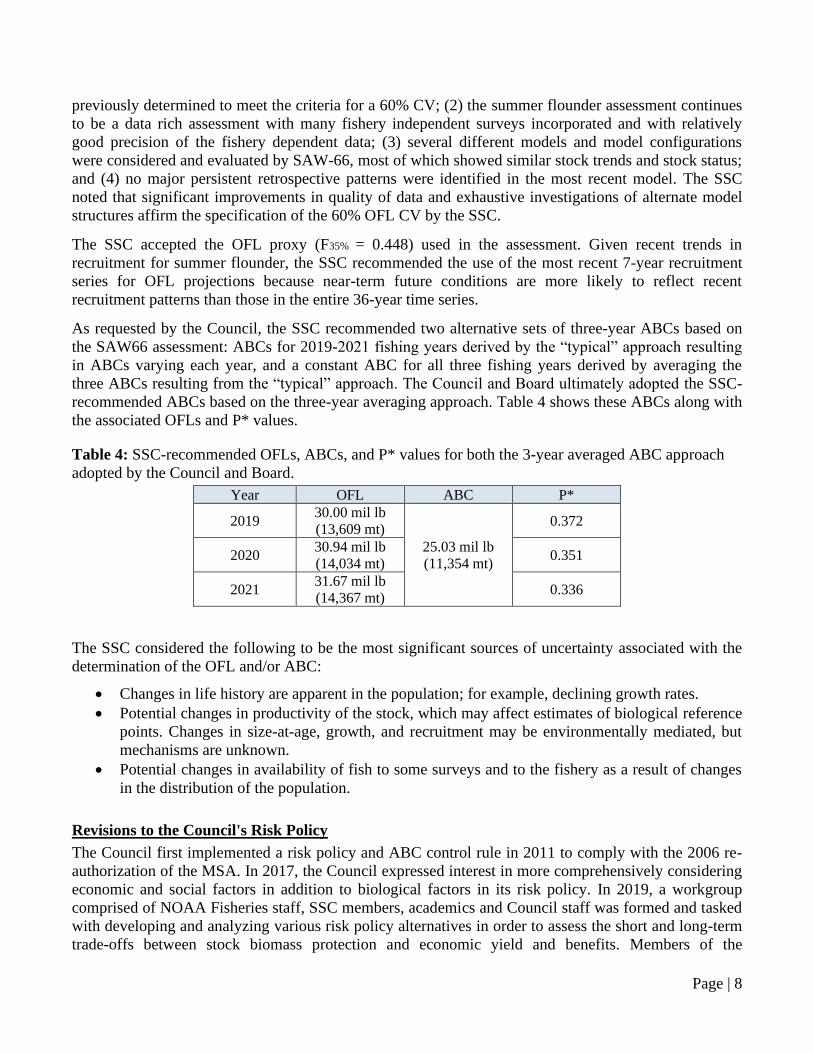
Page | 8
previously determined to meet the criteria for a 60% CV; (2) the summer flounder assessment continues
to be a data rich assessment with many fishery independent surveys incorporated and with relatively
good precision of the fishery dependent data; (3) several different models and model configurations
were considered and evaluated by SAW-66, most of which showed similar stock trends and stock status;
and (4) no major persistent retrospective patterns were identified in the most recent model. The SSC
noted that significant improvements in quality of data and exhaustive investigations of alternate model
structures affirm the specification of the 60% OFL CV by the SSC.
The SSC accepted the OFL proxy (F35% = 0.448) used in the assessment. Given recent trends in
recruitment for summer flounder, the SSC recommended the use of the most recent 7-year recruitment
series for OFL projections because near-term future conditions are more likely to reflect recent
recruitment patterns than those in the entire 36-year time series.
As requested by the Council, the SSC recommended two alternative sets of three-year ABCs based on
the SAW66 assessment: ABCs for 2019-2021 fishing years derived by the “typical” approach resulting
in ABCs varying each year, and a constant ABC for all three fishing years derived by averaging the
three ABCs resulting from the “typical” approach. The Council and Board ultimately adopted the SSC-
recommended ABCs based on the three-year averaging approach. Table 4 shows these ABCs along with
the associated OFLs and P* values.
Table 4: SSC-recommended OFLs, ABCs, and P* values for both the 3-year averaged ABC approach
adopted by the Council and Board.
Year OFL ABC P*
2019 30.00 mil lb
(13,609 mt)
25.03 mil lb
(11,354 mt)
0.372
2020 30.94 mil lb
(14,034 mt) 0.351
2021 31.67 mil lb
(14,367 mt) 0.336
The SSC considered the following to be the most significant sources of uncertainty associated with the
determination of the OFL and/or ABC:
• Changes in life history are apparent in the population; for example, declining growth rates.
• Potential changes in productivity of the stock, which may affect estimates of biological reference
points. Changes in size-at-age, growth, and recruitment may be environmentally mediated, but
mechanisms are unknown.
• Potential changes in availability of fish to some surveys and to the fishery as a result of changes
in the distribution of the population.
Revisions to the Council's Risk Policy
The Council first implemented a risk policy and ABC control rule in 2011 to comply with the 2006 re-
authorization of the MSA. In 2017, the Council expressed interest in more comprehensively considering
economic and social factors in addition to biological factors in its risk policy. In 2019, a workgroup
comprised of NOAA Fisheries staff, SSC members, academics and Council staff was formed and tasked
with developing and analyzing various risk policy alternatives in order to assess the short and long-term
trade-offs between stock biomass protection and economic yield and benefits. Members of the
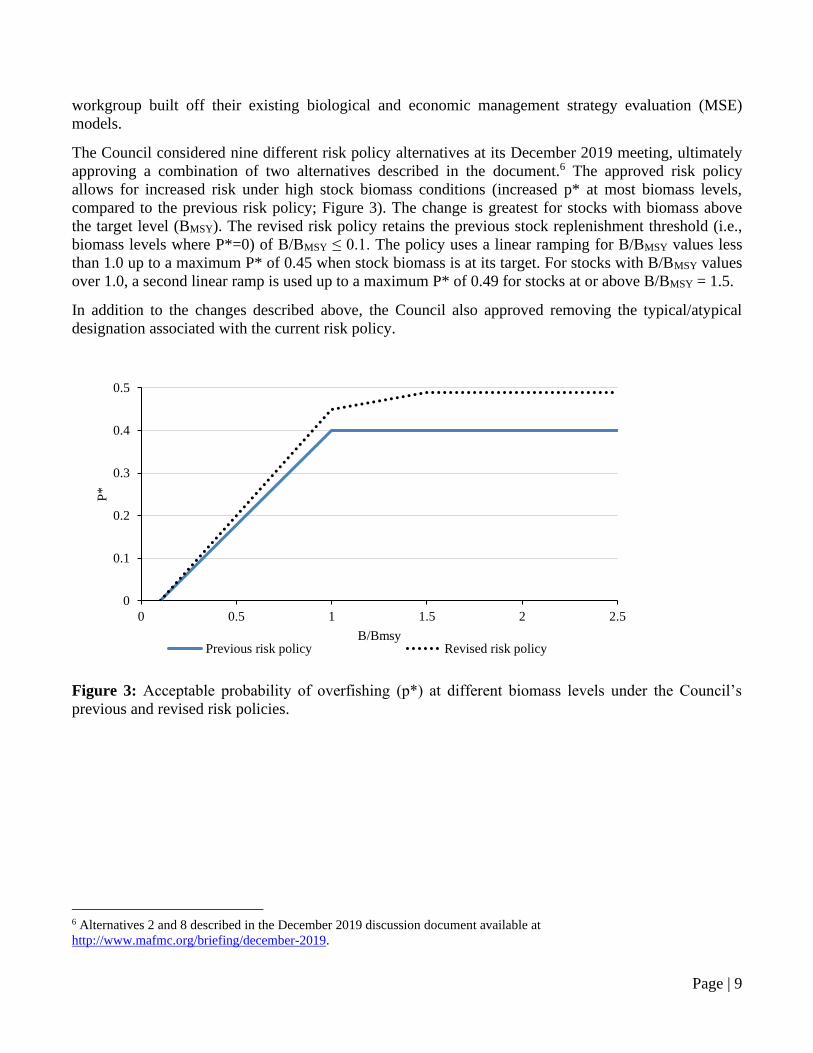
Page | 9
workgroup built off their existing biological and economic management strategy evaluation (MSE)
models.
The Council considered nine different risk policy alternatives at its December 2019 meeting, ultimately
approving a combination of two alternatives described in the document.6 The approved risk policy
allows for increased risk under high stock biomass conditions (increased p* at most biomass levels,
compared to the previous risk policy; Figure 3). The change is greatest for stocks with biomass above
the target level (BMSY). The revised risk policy retains the previous stock replenishment threshold (i.e.,
biomass levels where P*=0) of B/BMSY ≤ 0.1. The policy uses a linear ramping for B/BMSY values less
than 1.0 up to a maximum P* of 0.45 when stock biomass is at its target. For stocks with B/BMSY values
over 1.0, a second linear ramp is used up to a maximum P* of 0.49 for stocks at or above B/BMSY = 1.5.
In addition to the changes described above, the Council also approved removing the typical/atypical
designation associated with the current risk policy.
Figure 3: Acceptable probability of overfishing (p*) at different biomass levels under the Council’s
previous and revised risk policies.
6 Alternatives 2 and 8 described in the December 2019 discussion document available at
http://www.mafmc.org/briefing/december-2019.
0
0.1
0.2
0.3
0.4
0.5
0 0.5 1 1.5 2 2.5
P*
B/BmsyPrevious risk policy Revised risk policy

Page | 10
Staff Recommendation for 2021 ABC
Staff recommend revising the previously implemented specifications for summer flounder for the 2021
fishing year based on the recent revisions to the Council's risk policy, as described in Table 5. This
would revise the 2021 ABC from 25.03 million pounds (11,354 mt) to 27.11 million pounds (12,297
mt). This represents an 8% increase in the ABC. Recommended revisions were calculated based on the
Council's revised risk policy using the currently implemented 2021 OFL of 31.67 million pounds
(14,365 mt), a projected 2021 B/Bmsy of 0.88, and the SSCs currently applied OFL CV of 60%.
Table 5: Current and staff recommended 2021 ABCs and P* values.
Measure 2021: Current 2021: Staff
Recommendation
ABC 25.03 mil lb (11,354 mt) 27.11 mil lb (12,297 mt)
P* 0.34 0.39
Sector-Specific Catch and Landings Limits
Recreational and Commercial Annual Catch Limits
The summer flounder ABC includes both landings and discards, and is divided into the commercial and
recreational ACLs (Figure 4). Staff recommend maintaining the currently implemented split of the ABC
into expected discards (23%) and landings (77%), which was included in the NEFSC's ABC projections
based on the proportion at age of discards vs. landings for the terminal 5 years in the assessment (i.e.,
2013-2017. This proportion is very close to average estimated discards/landings for the past several
years (Table 6).
Table 6: Percentage of total summer flounder catch from actual fishery landings and estimated discards,
2015-2019, based on NEFSC data. Landings Discards
2015 82% 18%
2016 81% 19%
2017 75% 25%
2018 76% 24%
2019 78% 22%
Based on the allocation percentages in the FMP, 60% of the amount of the ABC expected to be landed is
allocated to the commercial fishery, and 40% to the recreational fishery. Discards are typically
apportioned based on the discards contribution from each fishing sector using a 3-year moving average
percentage.

Page | 11
When 2019-2021 specifications were set in early 2019, the most recent three-year period of available
data was 2015-2017. The discard percentages by sector were calculated using the revised MRIP data,
resulting in an estimated at 66% of dead discards attributable to the recreational fishery and 34% to the
commercial fishery (Table 1). The Monitoring Committee should consider whether more recent data
should be used to split the expected discards between the commercial and recreational fisheries, such as
the three-year average of discards by sector from 2017-2019 (estimated at 59% from the recreational
fishery and 41% from the commercial fishery). This would result in a shift of 441,000 pounds (200 mt)
of projected discards from the recreational ACL to the commercial ACL and does not impact the
landings limits. Staff recommend maintaining the current distribution of projected discards based on
2015-2017 given that this difference is minor, and recent discards trends indicate that neither
configuration is expected to meaningfully influence whether either sector exceeds its ACL. In addition,
the proportions of discards by sector from 2015-2017 are more consistent with trends in most of the last
10 years (using revised MRIP data), while the proportion from 2017-2019 is more heavily influenced by
the year 2018 which saw a lower proportion of recreational discards than usual (a 50/50 split between
the sectors).
Figure 4: Flowchart for summer flounder catch and landings limits.

Page | 12
Annual Catch Targets and Accountability Measures
The Monitoring Committee is responsible for recommending ACTs, which are intended to account for
management uncertainty. The Monitoring Committee should consider all relevant sources of
management uncertainty in the summer flounder fishery and provide the technical basis, including any
formulaic control rules, for any reduction in catch when recommending an ACT. ACTs may be reduced
upon implementation in some cases if an Accountability Measure (AM) is triggered for a given fishery,
as described below.
Management uncertainty is comprised of two parts: uncertainty in the ability of managers to control
catch and uncertainty in quantifying the true catch (i.e., estimation errors). Management uncertainty can
occur because of a lack of sufficient information about the catch (e.g., due to late reporting,
underreporting, and/or misreporting of landings or bycatch) or because of a lack of management
precision (i.e., the ability to constrain catch to desired levels).
Commercial landings have generally been near the commercial quotas for the last five years (2015-
2019), with the exception of 2019 which had a more notable underage given a substantial mid-year
increase in quota (Table 7). The NMFS Regional Administrator has in-season closure authority for the
commercial summer flounder fishery, and commercial quota monitoring systems in place are typically
effective in allowing timely reactions to landings levels that approach quotas. As such, any landings-
based overages tend to be small in magnitude and are deducted from state quotas in the following years.
Commercial ACL overages caused by higher than projected discards result in a payback amount scaled
based on estimates of stock biomass relative to the biomass target. This occurred in 2019 based on a
2017 ACL overage driven by discards; the revised 2019 commercial ACT was reduced by 547,000
pounds based on the scaling calculation using the biomass estimate from the most recent assessment. For
2020, no commercial AM was triggered based on 2018 performance. While 2019 catch estimates are
available from the NEFSC, GARFO estimates of commercial catch used in the ACL evaluation may
differ and are still being finalized for 2019. Thus, it is not known at this time what the magnitude of any
reductions would be for the 2021 commercial ACT.
The Monitoring Committee had previously recommended closely monitoring commercial discards
trends due to discards-driven overages of the commercial ACL in 2017 and 2018; however, in these
years, a large proportion of discards were likely the result of below-average quotas. Observer data for
observed trawl hauls from 2015-2019 supports this conclusion (Table 8). Commercial discards
decreased in 2019, possibly due in part to increased quotas although this is difficult to determine given
the mid-year quota change. Note that observer data show an increased proportion of observed discards
attributed to "too small," possibly driven by an above average 2018 year class as indicated by fishery
independent surveys. The commercial sector was under their commercial ACL by approximately 20% in
2019.
Staff recommend maintaining commercial ACTs set equal to the ACLs for 2021, such that no reduction
in catch is taken for management uncertainty.
For the recreational fishery, performance relative to past RHLs cannot be evaluated using the revised
MRIP data, since past harvest limits were set based on assessments that used the old data. A
performance evaluation for 2015-2019 using a combination of old and new MRIP data is provided in
Table 7 (2015-2018 uses pre-calibration MRIP data). Data for 2019 are from the revised MRIP
methodology and can be compared to the 2019 limits given that they were set using the new assessment
which incorporated revised MRIP information. Compared to the commercial fishery, recreational
performance has been much more variable relative to the RHLs given the difficulty forecasting
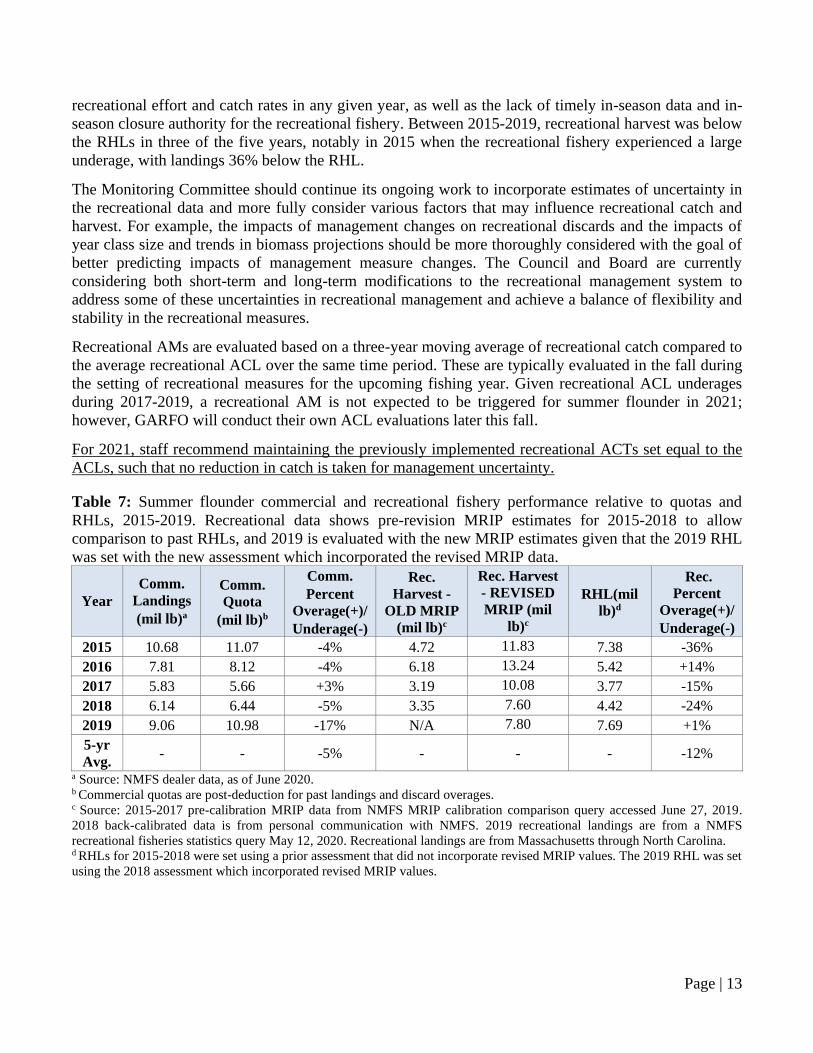
Page | 13
recreational effort and catch rates in any given year, as well as the lack of timely in-season data and in-
season closure authority for the recreational fishery. Between 2015-2019, recreational harvest was below
the RHLs in three of the five years, notably in 2015 when the recreational fishery experienced a large
underage, with landings 36% below the RHL.
The Monitoring Committee should continue its ongoing work to incorporate estimates of uncertainty in
the recreational data and more fully consider various factors that may influence recreational catch and
harvest. For example, the impacts of management changes on recreational discards and the impacts of
year class size and trends in biomass projections should be more thoroughly considered with the goal of
better predicting impacts of management measure changes. The Council and Board are currently
considering both short-term and long-term modifications to the recreational management system to
address some of these uncertainties in recreational management and achieve a balance of flexibility and
stability in the recreational measures.
Recreational AMs are evaluated based on a three-year moving average of recreational catch compared to
the average recreational ACL over the same time period. These are typically evaluated in the fall during
the setting of recreational measures for the upcoming fishing year. Given recreational ACL underages
during 2017-2019, a recreational AM is not expected to be triggered for summer flounder in 2021;
however, GARFO will conduct their own ACL evaluations later this fall.
For 2021, staff recommend maintaining the previously implemented recreational ACTs set equal to the
ACLs, such that no reduction in catch is taken for management uncertainty.
Table 7: Summer flounder commercial and recreational fishery performance relative to quotas and
RHLs, 2015-2019. Recreational data shows pre-revision MRIP estimates for 2015-2018 to allow
comparison to past RHLs, and 2019 is evaluated with the new MRIP estimates given that the 2019 RHL
was set with the new assessment which incorporated the revised MRIP data.
Year
Comm.
Landings
(mil lb)a
Comm.
Quota
(mil lb)b
Comm.
Percent
Overage(+)/
Underage(-)
Rec.
Harvest -
OLD MRIP
(mil lb)c
Rec. Harvest
- REVISED
MRIP (mil
lb)c
RHL(mil
lb)d
Rec.
Percent
Overage(+)/
Underage(-)
2015 10.68 11.07 -4% 4.72 11.83 7.38 -36%
2016 7.81 8.12 -4% 6.18 13.24 5.42 +14%
2017 5.83 5.66 +3% 3.19 10.08 3.77 -15%
2018 6.14 6.44 -5% 3.35 7.60 4.42 -24%
2019 9.06 10.98 -17% N/A 7.80 7.69 +1%
5-yr
Avg. - - -5% - - - -12%
a Source: NMFS dealer data, as of June 2020. b Commercial quotas are post-deduction for past landings and discard overages. c Source: 2015-2017 pre-calibration MRIP data from NMFS MRIP calibration comparison query accessed June 27, 2019.
2018 back-calibrated data is from personal communication with NMFS. 2019 recreational landings are from a NMFS
recreational fisheries statistics query May 12, 2020. Recreational landings are from Massachusetts through North Carolina. d RHLs for 2015-2018 were set using a prior assessment that did not incorporate revised MRIP values. The 2019 RHL was set
using the 2018 assessment which incorporated revised MRIP values.
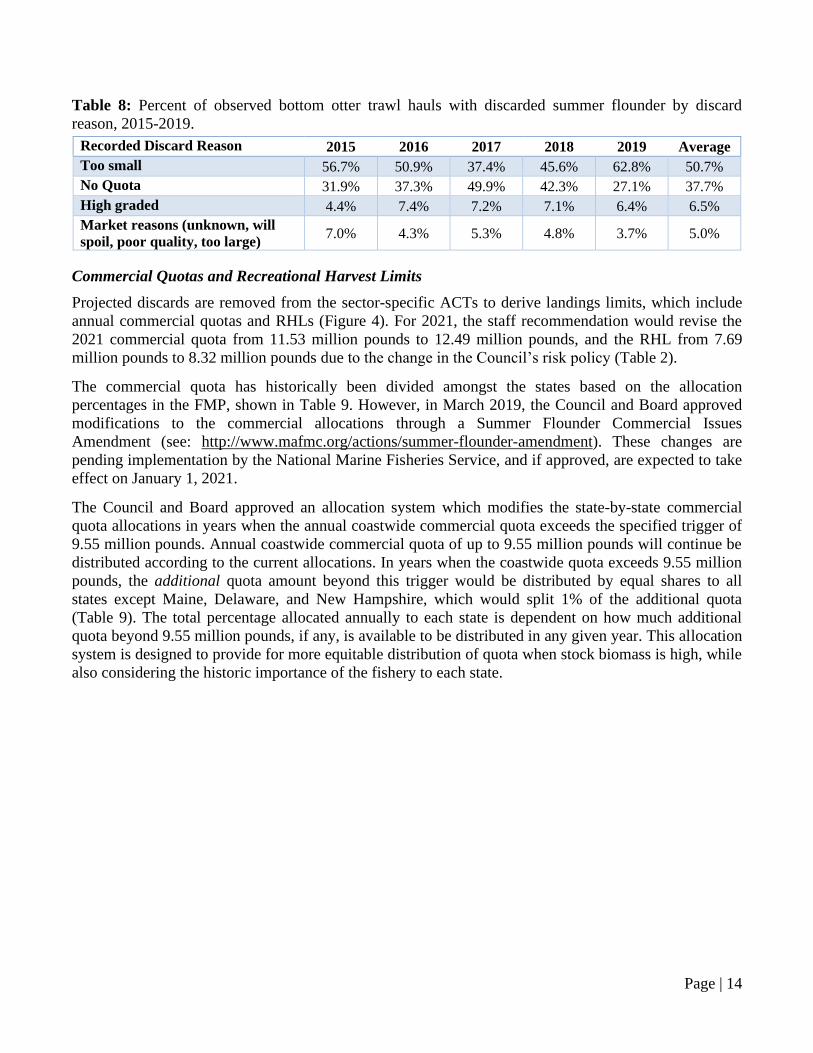
Page | 14
Table 8: Percent of observed bottom otter trawl hauls with discarded summer flounder by discard
reason, 2015-2019.
Recorded Discard Reason 2015 2016 2017 2018 2019 Average
Too small 56.7% 50.9% 37.4% 45.6% 62.8% 50.7%
No Quota 31.9% 37.3% 49.9% 42.3% 27.1% 37.7%
High graded 4.4% 7.4% 7.2% 7.1% 6.4% 6.5%
Market reasons (unknown, will
spoil, poor quality, too large) 7.0% 4.3% 5.3% 4.8% 3.7% 5.0%
Commercial Quotas and Recreational Harvest Limits
Projected discards are removed from the sector-specific ACTs to derive landings limits, which include
annual commercial quotas and RHLs (Figure 4). For 2021, the staff recommendation would revise the
2021 commercial quota from 11.53 million pounds to 12.49 million pounds, and the RHL from 7.69
million pounds to 8.32 million pounds due to the change in the Council’s risk policy (Table 2).
The commercial quota has historically been divided amongst the states based on the allocation
percentages in the FMP, shown in Table 9. However, in March 2019, the Council and Board approved
modifications to the commercial allocations through a Summer Flounder Commercial Issues
Amendment (see: http://www.mafmc.org/actions/summer-flounder-amendment). These changes are
pending implementation by the National Marine Fisheries Service, and if approved, are expected to take
effect on January 1, 2021.
The Council and Board approved an allocation system which modifies the state-by-state commercial
quota allocations in years when the annual coastwide commercial quota exceeds the specified trigger of
9.55 million pounds. Annual coastwide commercial quota of up to 9.55 million pounds will continue be
distributed according to the current allocations. In years when the coastwide quota exceeds 9.55 million
pounds, the additional quota amount beyond this trigger would be distributed by equal shares to all
states except Maine, Delaware, and New Hampshire, which would split 1% of the additional quota
(Table 9). The total percentage allocated annually to each state is dependent on how much additional
quota beyond 9.55 million pounds, if any, is available to be distributed in any given year. This allocation
system is designed to provide for more equitable distribution of quota when stock biomass is high, while
also considering the historic importance of the fishery to each state.
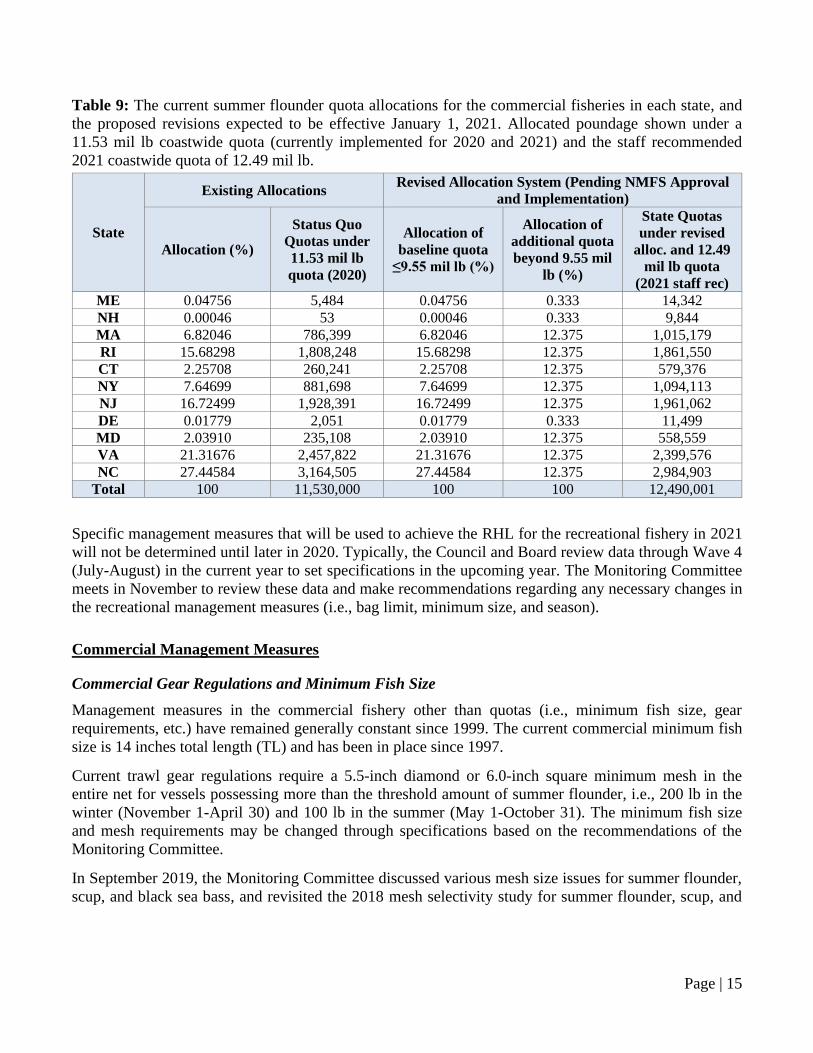
Page | 15
Table 9: The current summer flounder quota allocations for the commercial fisheries in each state, and
the proposed revisions expected to be effective January 1, 2021. Allocated poundage shown under a
11.53 mil lb coastwide quota (currently implemented for 2020 and 2021) and the staff recommended
2021 coastwide quota of 12.49 mil lb.
State
Existing Allocations Revised Allocation System (Pending NMFS Approval
and Implementation)
Allocation (%)
Status Quo
Quotas under
11.53 mil lb
quota (2020)
Allocation of
baseline quota
≤9.55 mil lb (%)
Allocation of
additional quota
beyond 9.55 mil
lb (%)
State Quotas
under revised
alloc. and 12.49
mil lb quota
(2021 staff rec)
ME 0.04756 5,484 0.04756 0.333 14,342
NH 0.00046 53 0.00046 0.333 9,844
MA 6.82046 786,399 6.82046 12.375 1,015,179
RI 15.68298 1,808,248 15.68298 12.375 1,861,550
CT 2.25708 260,241 2.25708 12.375 579,376
NY 7.64699 881,698 7.64699 12.375 1,094,113
NJ 16.72499 1,928,391 16.72499 12.375 1,961,062
DE 0.01779 2,051 0.01779 0.333 11,499
MD 2.03910 235,108 2.03910 12.375 558,559
VA 21.31676 2,457,822 21.31676 12.375 2,399,576
NC 27.44584 3,164,505 27.44584 12.375 2,984,903
Total 100 11,530,000 100 100 12,490,001
Specific management measures that will be used to achieve the RHL for the recreational fishery in 2021
will not be determined until later in 2020. Typically, the Council and Board review data through Wave 4
(July-August) in the current year to set specifications in the upcoming year. The Monitoring Committee
meets in November to review these data and make recommendations regarding any necessary changes in
the recreational management measures (i.e., bag limit, minimum size, and season).
Commercial Management Measures
Commercial Gear Regulations and Minimum Fish Size
Management measures in the commercial fishery other than quotas (i.e., minimum fish size, gear
requirements, etc.) have remained generally constant since 1999. The current commercial minimum fish
size is 14 inches total length (TL) and has been in place since 1997.
Current trawl gear regulations require a 5.5-inch diamond or 6.0-inch square minimum mesh in the
entire net for vessels possessing more than the threshold amount of summer flounder, i.e., 200 lb in the
winter (November 1-April 30) and 100 lb in the summer (May 1-October 31). The minimum fish size
and mesh requirements may be changed through specifications based on the recommendations of the
Monitoring Committee.
In September 2019, the Monitoring Committee discussed various mesh size issues for summer flounder,
scup, and black sea bass, and revisited the 2018 mesh selectivity study for summer flounder, scup, and

Page | 16
black sea bass by Hasbrouck et al. (2018)7. The document provided for that discussion is available at
https://www.mafmc.org/s/FSB-Mesh-Size-Issues-Overview-Sept-2019.pdf, and the MC report can be
found at: https://www.mafmc.org/s/SFSBSB_MC_Summary_Sept_2019_FINAL.pdf. The Hasbrouck et
al. study suggest that, in general, the current minimum mesh sizes are effective at releasing catch of
most undersized and immature fish, but modifications could be considered to allow for consistent mesh
sizes for black sea bass and scup, and to potentially reduce discards of undersized summer flounder. As
described in the meeting summary, the MC identified additional analyses and input needed from
industry before recommending changes to the mesh size regulations.
For summer flounder, the MC had noted that the selectivity curve described in the study for 6.0" square
mesh does not appear to be equivalent to that of the 5.5" diamond. Instead, the 6.0" square is much more
similar to a 5.0" diamond mesh. The 6.0" square mesh releases less than 50% of minimum size fish. The
MC had some concerns with the amount of undersized summer flounder caught with the 6.0" square
mesh and recommended further exploring the impacts of this mesh size. Phasing out the use of 6.0"
square mesh for summer flounder could reduce discards of undersized fish. The Monitoring Committee
noted that further analysis should be done on how many vessels are currently using 6.0" square vs. 5.5"
diamond mesh.
While the MC was supportive of continuing to analyze this issue, the group recognized that it should be
a lower priority issue in the near term given other pressing management concerns for this FMP such as
responding to the 2019 scup and black sea bass operational assessments, and the amendment to address
sector allocation concerns for all three species driven by recent recreational estimate changes. The
Council and Board also agreed that while this issue should still be pursued, it was not a near-term
priority given other management activities.
Staff recommend no changes to the current 14-inch minimum fish size, or seasonal possession
thresholds triggering the minimum mesh size at this time. Staff recommend that additional work to
evaluate minimum mesh requirements be conducted in 2021 for potential application in 2022, in
particular consideration of phasing out the 6.0" square mesh size for summer flounder.
Minimum Mesh Size Exemption Programs
Small Mesh Exemption Area
Vessels landing more than 200 lb of summer flounder east of longitude 72° 30.0'W, from November 1
through April 30, and using mesh smaller than 5.5-inch diamond or 6.0-inch square are required to
obtain a small mesh exemption program (SMEP) permit from NMFS. The exemption is designed to
allow vessels to retain some bycatch of summer flounder while operating in other small-mesh fisheries.
The FMP requires that observer data be reviewed annually to determine whether vessels fishing seaward
of the SMEP line with smaller than the required minimum mesh size and landing more than 200 lb of
summer flounder are discarding more than 10% (by weight) of their summer flounder catch per trip.
Typically, staff evaluate the Northeast Fisheries Observer Program (NEFOP) data for the period from
November 1 in the previous year to April 30 in the current year. However, when this analysis is
conducted each summer, complete observer data is not yet available through the end of April in the
current year. As such, a year-long lag in the analysis is used.
Over the past few years, these evaluations have shown an increased percentage in the number of
7 Available at: http://www.mafmc.org/s/Tab08_SFSBSB-Mesh-Selectivity-Study-Apr2018.pdf

Page | 17
observed trips in the small mesh exemption area landing over 200 pounds of summer flounder but
discarding more than 10% of their summer flounder catch. The MC has identified this as a potential
management issue which should be tracked to determine if changes to the program are needed. The MC
has also noted that these increases in discards are possibly related to decreased commercial quotas,
especially from 2017 through the first half of 2019.
Staff evaluated NEFOP data for the relevant November-April periods from November 1, 2012 through
April 30, 2019. For 2019, a total of 646 trips with at least one tow were observed east of 72° 30.0'W and
354 of these trips used small mesh (Table 10). Of those 354 trips, 164 trips (46%) reported landing more
than 200 lb of summer flounder. Of those 164 trips, 53 trips (32%) discarded more than 10% of their
summer flounder catch. The percentage of trips that met all these criteria relative to the total number of
observed trips east of 72° 30.0'W is 8.2% (53/646 trips). The prior two relevant time periods showed
6.5% of observed trips east of the line that met the criteria. In prior years, this percentage has been closer
to 2-5% (Table 10). While the amount of observed discards from these trips is low relative to the
commercial catch limit, because these observed trips are a subset of the fishery operating under this
exemption, the actual extent of discards under the exemption program is not known.
The MC should consider whether changes may be needed to this exemption program given the increased
proportion of observed trips discarding more than 10% of their summer flounder catch while using this
exemption program. Because similar data is not yet available for the November 2019-April 2020 period,
it is possible that the quota increase implemented for 2019-2021 will reduce the rates of summer
flounder discarding observed under the below-average quotas of 2017-2019 (pre-revision).
The number of vessels issued a letter of authorization (LOA) for the small mesh exemption program has
remained relatively stable since 2013, with a slight increase in 2019 (Table 11).
Based on the information described above, staff recommend that the MC identify additional analysis or
industry input needed to inform potential changes to the small mesh exemption program, likely to be
conducted in 2021 for potential application in 2022.

Page | 18
Table 10: Numbers of observed trips that meet specific criteria based on NEFOP data from November 1-April 30 from November 2012
through April 2019.
Criteria
Nov. 1, 2012
– Apr. 30,
2013
Nov. 1, 2013
– Apr. 30,
2014
Nov. 1, 2014
– April 30,
2015
Nov. 1, 2015
– April 30,
2016
Nov. 1, 2016
– April 30,
2017
Nov. 1, 2017
– April 30,
2018
Nov. 1, 2018
– April 30,
2019
A Observed trips with at least one catch
record east of 72° 30' W Longitude 395 382 401 391 555 724 646
B
That met the criteria in row A and
used small mesh at some point during
their trip
139 113 172 252 376 364 354
C
That met the criteria in rows A-B and
landed more than 200 pounds summer
flounder on whole trip
63 35 72 92 150 135 164
D
That met the criteria in rows A-C and
discarded >10% of summer flounder
catch east of 72° 30' W Longitude
8 7 21 18 36 47 53
E
% of observed trips with catch east of
72° 30' W Longitude that also used
small mesh, landed >200 pounds of
summer flounder, and discarded >10%
of summer flounder catch (row D/row
A)
2.00% 1.80% 5.20% 4.60% 6.50% 6.50% 8.20%
F
Total summer flounder discards
(pounds) from trips meeting criteria in
A-D
1,472 2,140 14,579 16,470 14,640 33,868 18,186
G
Total summer flounder landings
(pounds) from trips meeting criteria in
A-D
4,342 5,876 15,224 23,295 25,472 76,780 59,960
H Total catch (pounds) from trips
meeting criteria in A-D 5,814 8,016 29,804 39,763 40,113 110,648 69,145
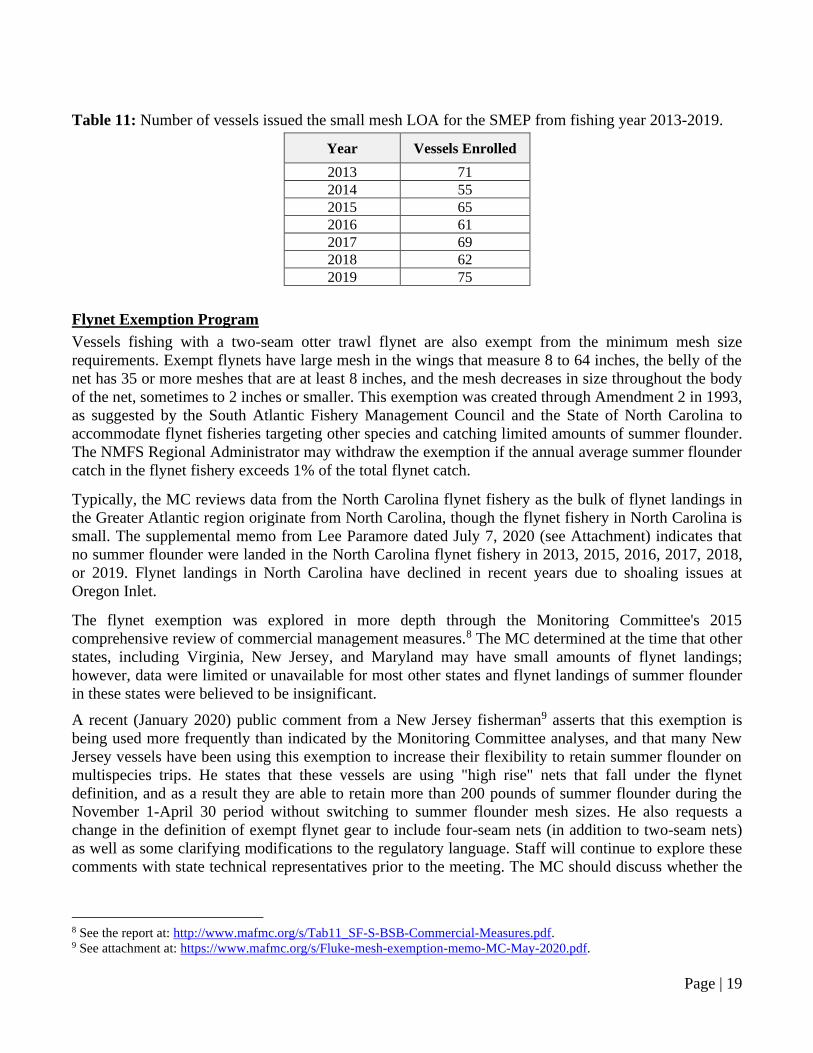
Page | 19
Table 11: Number of vessels issued the small mesh LOA for the SMEP from fishing year 2013-2019.
Year Vessels Enrolled
2013 71
2014 55
2015 65
2016 61
2017 69
2018 62
2019 75
Flynet Exemption Program
Vessels fishing with a two-seam otter trawl flynet are also exempt from the minimum mesh size
requirements. Exempt flynets have large mesh in the wings that measure 8 to 64 inches, the belly of the
net has 35 or more meshes that are at least 8 inches, and the mesh decreases in size throughout the body
of the net, sometimes to 2 inches or smaller. This exemption was created through Amendment 2 in 1993,
as suggested by the South Atlantic Fishery Management Council and the State of North Carolina to
accommodate flynet fisheries targeting other species and catching limited amounts of summer flounder.
The NMFS Regional Administrator may withdraw the exemption if the annual average summer flounder
catch in the flynet fishery exceeds 1% of the total flynet catch.
Typically, the MC reviews data from the North Carolina flynet fishery as the bulk of flynet landings in
the Greater Atlantic region originate from North Carolina, though the flynet fishery in North Carolina is
small. The supplemental memo from Lee Paramore dated July 7, 2020 (see Attachment) indicates that
no summer flounder were landed in the North Carolina flynet fishery in 2013, 2015, 2016, 2017, 2018,
or 2019. Flynet landings in North Carolina have declined in recent years due to shoaling issues at
Oregon Inlet.
The flynet exemption was explored in more depth through the Monitoring Committee's 2015
comprehensive review of commercial management measures.8 The MC determined at the time that other
states, including Virginia, New Jersey, and Maryland may have small amounts of flynet landings;
however, data were limited or unavailable for most other states and flynet landings of summer flounder
in these states were believed to be insignificant.
A recent (January 2020) public comment from a New Jersey fisherman9 asserts that this exemption is
being used more frequently than indicated by the Monitoring Committee analyses, and that many New
Jersey vessels have been using this exemption to increase their flexibility to retain summer flounder on
multispecies trips. He states that these vessels are using "high rise" nets that fall under the flynet
definition, and as a result they are able to retain more than 200 pounds of summer flounder during the
November 1-April 30 period without switching to summer flounder mesh sizes. He also requests a
change in the definition of exempt flynet gear to include four-seam nets (in addition to two-seam nets)
as well as some clarifying modifications to the regulatory language. Staff will continue to explore these
comments with state technical representatives prior to the meeting. The MC should discuss whether the
8 See the report at: http://www.mafmc.org/s/Tab11_SF-S-BSB-Commercial-Measures.pdf. 9 See attachment at: https://www.mafmc.org/s/Fluke-mesh-exemption-memo-MC-May-2020.pdf.

Page | 20
comments raised represent a potential issue with the flynet definition, compliance, or enforcement, and
whether future analyses of this exemption program need to be modified.
Based on this information, staff preliminarily recommend no change to the summer flounder flynet
exemption program in 2021. However, staff recommend further evaluation of the use of flynets or
flynet-type gear in other states that may be utilizing this exemption and exploration of whether changes
to the exemption or annual analysis are needed.
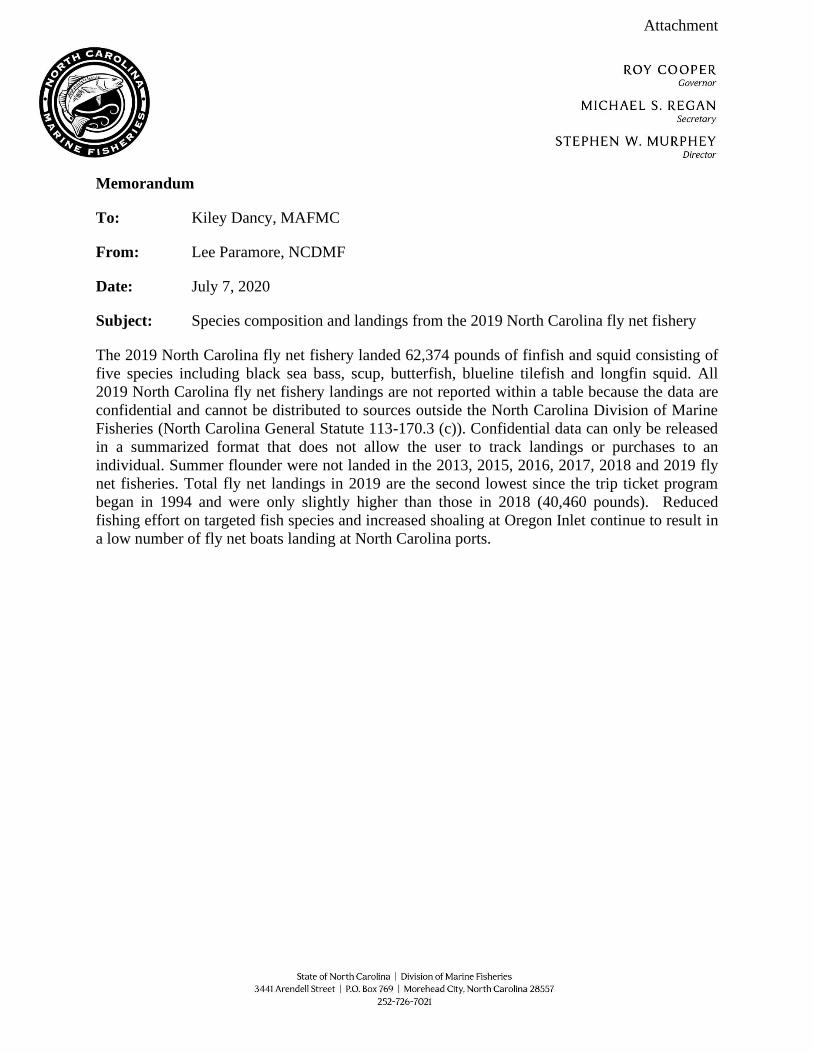
Attachment
Memorandum
To: Kiley Dancy, MAFMC
From: Lee Paramore, NCDMF
Date: July 7, 2020
Subject: Species composition and landings from the 2019 North Carolina fly net fishery
The 2019 North Carolina fly net fishery landed 62,374 pounds of finfish and squid consisting of
five species including black sea bass, scup, butterfish, blueline tilefish and longfin squid. All
2019 North Carolina fly net fishery landings are not reported within a table because the data are
confidential and cannot be distributed to sources outside the North Carolina Division of Marine
Fisheries (North Carolina General Statute 113-170.3 (c)). Confidential data can only be released
in a summarized format that does not allow the user to track landings or purchases to an
individual. Summer flounder were not landed in the 2013, 2015, 2016, 2017, 2018 and 2019 fly
net fisheries. Total fly net landings in 2019 are the second lowest since the trip ticket program
began in 1994 and were only slightly higher than those in 2018 (40,460 pounds). Reduced
fishing effort on targeted fish species and increased shoaling at Oregon Inlet continue to result in
a low number of fly net boats landing at North Carolina ports.

1
Summer flounder Data Update for 2020
National Marine Fisheries Service Northeast Fisheries Science Center
166 Water St. Woods Hole, MA 02543
Fishery and Survey Data Reported 2019 landings in the commercial fishery were 4,109 mt = 9.059 million lb, an increase of 47% from 2018, and 82% of the 2019 commercial quota. Estimated 2019 landings in the recreational fishery were 3,537 mt = 7.798 million lb, an increase of 3% from 2018, and 101% of the 2019 recreational harvest limit. Total commercial and recreational landings in 2019 were 7,646 mt = 16.857 million lb, an increase of 23% from 2018. The NEFSC spring survey index of summer flounder stock biomass decreased by 4% from 2018 to 2019; the fall index decreased by 36% from 2018 to 2019 (Figure 2). The NEFSC fall survey length frequency distributions suggest that an above average year class (mode at about 20 cm total length) recruited to the stock in 2018 (Figure 3).
Figure 1. Summer flounder fishery landings (includes ‘New’ Marine Recreational Information Program [MRIP] estimates of recreational landings).
0
2,500
5,000
7,500
10,000
12,500
15,000
17,500
20,000
Met
ric to
ns
Year
Summer Flounder Fishery Landings: 1982-2019 with 'New' MRIP
Comm Landings Recr Landings
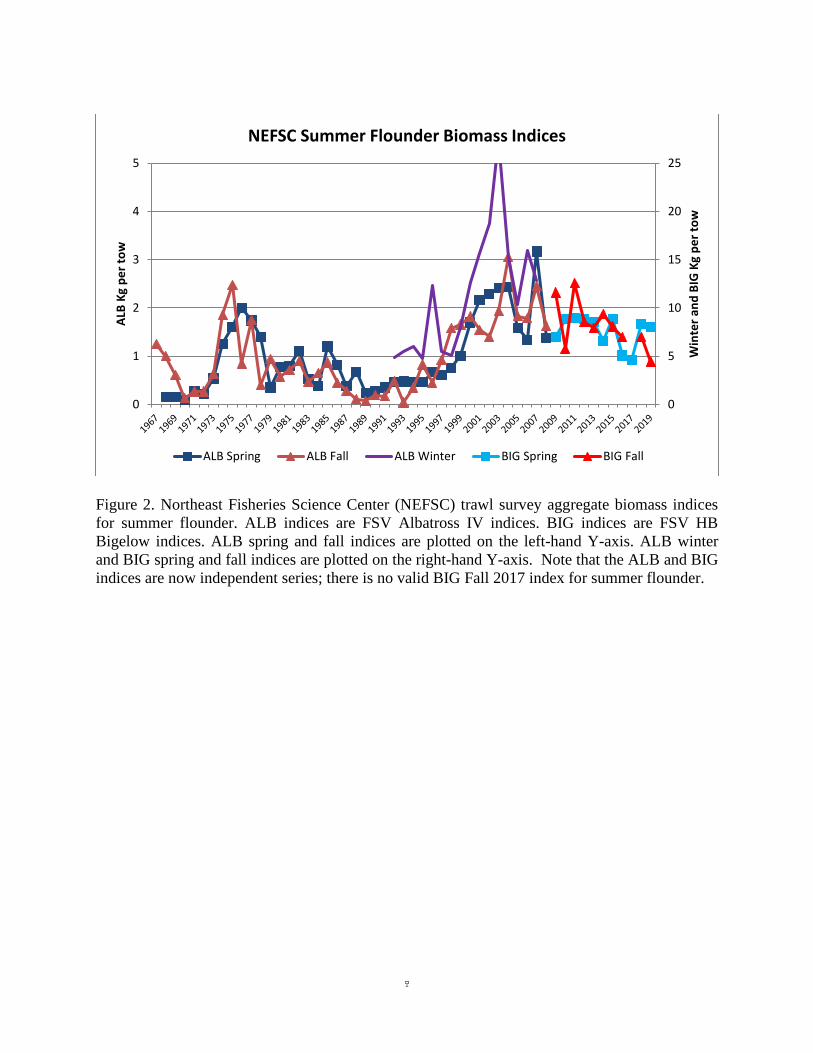
2
Figure 2. Northeast Fisheries Science Center (NEFSC) trawl survey aggregate biomass indices for summer flounder. ALB indices are FSV Albatross IV indices. BIG indices are FSV HB Bigelow indices. ALB spring and fall indices are plotted on the left-hand Y-axis. ALB winter and BIG spring and fall indices are plotted on the right-hand Y-axis. Note that the ALB and BIG indices are now independent series; there is no valid BIG Fall 2017 index for summer flounder.
0
5
10
15
20
25
0
1
2
3
4
5
Win
ter a
nd B
IG K
g pe
r tow
ALB
Kg p
er to
wNEFSC Summer Flounder Biomass Indices
ALB Spring ALB Fall ALB Winter BIG Spring BIG Fall

3
Figure 3. Northeast Fisheries Science Center (NEFSC) fall trawl survey FSV HB Bigelow indices at length.
1
Summer Flounder, Scup, and Black Sea Bass Fishery Performance Report June 2020
The Mid-Atlantic Fishery Management Council's (Council’s) Summer Flounder, Scup, and Black Sea Bass Advisory Panel (AP) met jointly with the Atlantic States Marine Fisheries Commission’s (Commission’s) Summer Flounder, Scup, and Black Sea Bass AP on June 29, 2020 to review the Fishery Information Documents and develop the following Fishery Performance Report for the three species. The primary purpose of this report is to contextualize catch histories for the Scientific and Statistical Committee (SSC) by providing information about fishing effort, market trends, environmental changes, and other factors. A series of questions listed below were posed to the AP to generate discussion. Please note: Advisor comments described below are not necessarily consensus or majority statements.
Additional comments provided by advisors via email are attached to this document.
Council Advisory Panel members present: Bonnie Brady (NY), Jeff Deem (VA), Skip Feller (VA), James Fletcher (NC), Carl Forsberg (NY), Robin Scott (NJ), Chris Spies (NY), Joan Berko (NJ)
Commission Advisory Panel members present: Frank Blount (RI), Jack Conway (CT), Greg DiDomenico (NJ), Marc Hoffman (NY), Bill Shillingford (NJ)
Others present: Chris Batsavage (Council/Board member, NC DMF), Julia Beaty (MAFMC Staff), Alan Bianchi (NC DMF), Steve Cannizzo (NY RFHFA), Joe Cimino (Council/Board member, NJ DEP), Dustin Colson Leaning (ASMFC Staff), Karson Coutré (MAFMC Staff), Kiley Dancy (MAFMC Staff), Steve Doctor (MD DNR), Emily Keiley (NMFS GARFO), Caitlin Starks (ASMFC Staff), Corinne Truesdale (RIDEM)
Trigger questions 1. What factors influenced recent catch (markets/economy, environment, regulations, other
factors)? 2. Are the current fishery regulations appropriate? How could they be improved? 3. What would you recommend as research priorities? 4. What else is important for the Council to know?

2
General Comments One advisor asked if the Council and Commission are violating the recent Presidential Executive Order by forcing fishermen to discard fish that could be used.
Impacts of COVID-19 on Fishing Effort Multiple advisors described how the for-hire fishery is recovering from recent COVID-19 closures. Even with the current restrictions on the number of people per trip, they are booking many trips and are attempting to make up for lost opportunity earlier in the season. One advisor said the for-hire and bait and tackle industries feel extreme pressure to make up for as much lost business as possible before the fall when demand typically drops off. One advisor said the for-hire industry is also being negatively impacted by decreased availability of fishing equipment due to tackle warehouse shortages.
Advisors reported that commercial markets and ex-vessel prices have been down substantially due in large part to restaurant closures, as described for each species below.
Additional species-specific comments on COVID-19 impacts are described later in this document.
Environmental Conditions One advisor noted that since additional restrictions have been put on the menhaden fishery, there are more sharks inshore due to an overabundance of menhaden. He believes the increased abundance of sharks may be having an impact on other species, for example by chasing bluefish and striped bass offshore. He questioned what additional impacts sharks are having on managed species such as black sea bass and summer flounder.
Recreational Data Concerns A few advisors expressed concern with the Marine Recreational Information Program (MRIP) data, which they see as inaccurate and fundamentally flawed.
One advisor stated that MRIP uses an estimated number of anglers in New York that is at least twice the true number. He also stated that MRIP has refused to tell him exactly how many anglers they are estimating for New York. Staff and others clarified that MRIP estimates effort in number of trips and does not use a specific number of anglers to generate catch and harvest estimates.
One advisor requested that the Council implement mandatory private angler reporting via cell phones, specifically using technology associated with the Bluefin Data trip ticket system used by North Carolina. He has spoken with representatives of this company who have said that they could implement such a system for the recreational fisheries. He said if the Council and SSC don’t pursue private angler reporting despite the ability to do so, they should produce a statement explaining why they don’t want recreational data that is comparable to the commercial data.
Advisory Panel Participation Advisors had multiple suggestions for how to improve AP participation. Multiple advisors requested that future webinar AP meetings occur in the evenings to increase attendance. One advisor noted that different groups have different needs and although evening webinars may work best for most of the group, some commercial fishermen may find them challenging as they are often up at 3:00 or 4:00 am. A few advisors noted that the weeks before and after July 4th and

3
Labor Day are some of the worst times to hold AP meetings. One AP member requested more frequent reminders of upcoming meetings.
One member of the public said AP participation may also be low because advisors are frustrated and the Council and Commission should do a better job of listening to and addressing advisor concerns.
Summer Flounder Market/Economic Conditions Several advisors said summer flounder has been selling for a much cheaper price than usual. The market is primarily restaurants and demand has been greatly reduced due to COVID-19 and restaurant closures.
One advisor said supermarket demand is mostly for farmed fish. The ex-vessel price for summer flounder has been so low that it has not been worth it for many vessels to go fishing. One advisor reported about $1 per pound recently, compared to the $3-4 coastwide average in recent years, and also noted that New York is more beholden than other states to a fresh fish market.
One advisor noted that medium size summer flounder set the market price. Restaurants can portion the fish; however, the consumer who cooks at home does not want a large fish and this impacts demand at fish markets. He believes it is a problem that imported fish tend to fit the size that consumers want and fisheries like summer flounder are at a disadvantage due to the current minimum size limits. This advisor supported lowering the minimum size below 14 inches to be able to target smaller male fish.
Environmental Conditions and General Fishing Trends One advisor said commercial fishermen on the north side of Long Island Sound are seeing fewer summer flounder than they have seen in years, and the catch per day is down. One member of the public disagreed with this statement, saying that in his discussions with a for-hire captain who fishes in Long Island Sound, their season has been very good so far for summer flounder due to a warm winter followed by a cold spring, and they are reporting some of the best fishing in years. However, he noted that on the south shore and west end of Long Island, trends have been the opposite, with low catch rates and a slow season that has just started to improve in the last few years.
One advisor stated that fishing in Rhode Island has been slow and some of the worst catch rates they have seen in years.
Another advisor reported that on the eastern shore of Virginia, recreational fishing was slow to get started this year due to a cold spring and the impacts of COVID-19, but effort has been high in recent weeks. He said summer flounder fishing has been good so far, with a higher rate of keepers per throwback than usual.
Management Issues A few advisors questioned the recreational data from MRIP on summer flounder landings by recreational fishing mode. One questioned the estimate that 10% of summer flounder landings come from shore-based anglers, stating that based on data he has seen, it should be more like 80%.

4
Another advisor said he believed 10% from shore is too high for the eastern shore of Virginia, but otherwise the proportions by mode seemed approximately correct. Another advisor said it's difficult to believe that three times as many fish are caught from the private and shore modes compared to party/charter, but he also said MRIP is unreliable in general.
One advisor requested consideration by the SSC and Council/Board of a recreational total length limit for summer flounder (i.e., a cumulative length limit where anglers can keep up to a specified total number of inches of fish) with mandatory retention of all fish caught until the length limit is reached.
Scup Management Issues One advisor said that in earlier years, any size scup could be landed and larger fish were being left in the population. During this time he said that biomass was at its lowest while recruitment was high. In recent years, biomass is high and recruitment is low because we are removing the spawning adults due to size restrictions. He also felt the mesh size and minimum size for scup should be decreased in the commercial fishery. He said there used to be a market for small scup but due to management, this market has transitioned to imported fish such as tilapia. He also reiterated the need for a cumulative length limit in the recreational fishery to eliminate discards along with cellphone reporting.
One advisor said that in Massachusetts the primary for-hire season for scup is during wave 3, which was partially closed this year due to COVID-19 restrictions. Once for-hire businesses were permitted to reopen, charter vessels were restricted to 8 people to comply with social distancing guidelines. He wanted to know how management was going to address the gap in collection of MRIP intercept data due to COVID-19 and hoped that managers take into account the impacts the pandemic has had on fishing effort, specifically the reduced for-hire effort.
Market/Economic Conditions One advisor noted that along with the COVID-19 issues that apply to all three species, scup markets started becoming depressed back in January of this year when foreign markets for scup were being impacted by the pandemic. Scup prices got as low as $0.10 per pound when the market collapsed.
Another advisor agreed and added that although they are seeing an abundance of scup, there is no market on the commercial side. On the recreational side, people are catching them and taking them home. He felt that recreational effort was greatly reduced and was concerned about what MRIP would estimate for catch this season given greatly reduced intercept sampling due to COVID-19.
Black Sea Bass Market Issues Commercial black sea bass landings through mid-June 2020 are on a very similar trajectory as 2019, despite widespread restaurant closures due to the coronavirus pandemic. One advisor said that although the price of black sea bass decreased from as much as $4-6 per pound to $1.50 per pound due to decreased demand, the price was still higher than many other species (see above).

5
For this reason, fishermen who continued to fish despite the greatly decreased market demand tended to target black sea bass rather than other species.
Biological Issues One advisor said most trawl surveys don’t sample more than three miles from shore, yet black sea bass have been caught as far as 100 miles from shore in lobster pots. This could result in the stock assessment under-estimating biomass. Council staff clarified that the Northeast Fisheries Science Center trawl surveys operate well beyond 3 miles from shore. He added that black sea bass are so abundant that they are wiping out populations of shellfish such as lobsters and clams. He requested an emergency opening of the recreational fishery and an increase in the commercial quota to help bring down the black sea bass population and take pressure off other stocks.
One advisor said he has heard that 2020 has been a good year so far for commercial and recreational black sea bass fisheries off Virginia. Another advisor said it has been a very good spring for recreational black sea bass fishing off Virginia. He added that the February recreational fishery was phenomenal and September through December were also very good.
Commercial Catch Locations and Distribution of Stock Advisors discussed the figure in the Fishery Information Document which shows that statistical area 616 had the highest proportion of commercial black sea bass catch in 2019 based on federal VTR data. Multiple advisors agreed that the distribution of black sea bass catch is impacted by fishing effort targeting summer flounder. For example, one advisor said that vessels intending to land summer flounder in North Carolina and Virginia travel to the Hudson Canyon area to target summer flounder. They do not make dedicated black sea bass trips, but catch black sea bass on trips where they are primarily targeting summer flounder. Another advisor added that the distribution of black sea bass catch is also is driven by vessels based in other states in addition to North Carolina and Virginia. Many vessels hold summer flounder permits in multiple states and some of those permits allow an incidental limit of black sea bass. For example, she said New York fishermen have to buy summer flounder permits from multiple states in order to be competitive in the market due to New York’s comparatively low allocation of the summer flounder quota.
A few advisors asked if most of the commercial catch in statistical area 616 occurred during the winter. One advisor said most North Carolina summer flounder landings occur during November through February, with an occasional trip in April or May and black sea bass landings may follow a similar pattern. He also noted that the summer flounder trip limits impact black sea bass effort. Subsequent examination of the data revealed that 91% of the catch reported on federal VTRs for statistical area 616 in 2019 occurred during January-April and December. This information was not provided during the AP meeting.
One advisor said the black sea bass stock has expanded both north and south.
Recreational Fishery One advisor said the MRIP estimates showing much higher black sea bass catch from anglers on private and rental boats compared to party/charter boats are unbelievable.
A few advisors asked why staff referred to the 2016 and 2017 black sea bass recreational harvest estimates as outliers. They also asked why other estimates are not considered outliers and why the outlier estimates have not been replaced by more reasonable estimates. Staff explained that the
6
Monitoring and Technical Committees agreed that the 2016 and 2017 black sea bass estimates are unbelievably high due to individual state/wave/mode level estimates (i.e., New York in wave 6 2016 for all modes and New Jersey in wave 3 2017 for the private/rental mode only). One advisor said the New York wave 4 estimate for 2015 should also be considered an outlier.
Staff explained that the MRIP estimates are calculated through a national, standardized process; therefore, MRIP staff have said they are unwilling to revise the official estimates unless they detect an error in the calculations, which is not the case for black sea bass. However, the Council and Commission can use modified estimates in the management process. Staff noted that one goal of the ongoing Recreational Reform Initiative is to develop a standardized and statistically robust process that can be used to examine all MRIP estimates for both high and low outliers and adjust those estimates as appropriate.1 This would make it more likely that adjusted estimates could be used in more parts of the management process. One member of the public said he supported this concept. He added that separate management of the private and for-hire sectors could help address some issues of MRIP uncertainty as the for-hire sector reports their catch through vessel trip reports.
1 More information on the Recreational Reform Initiative is available at: https://www.mafmc.org/actions/recreational-reform-initiative.
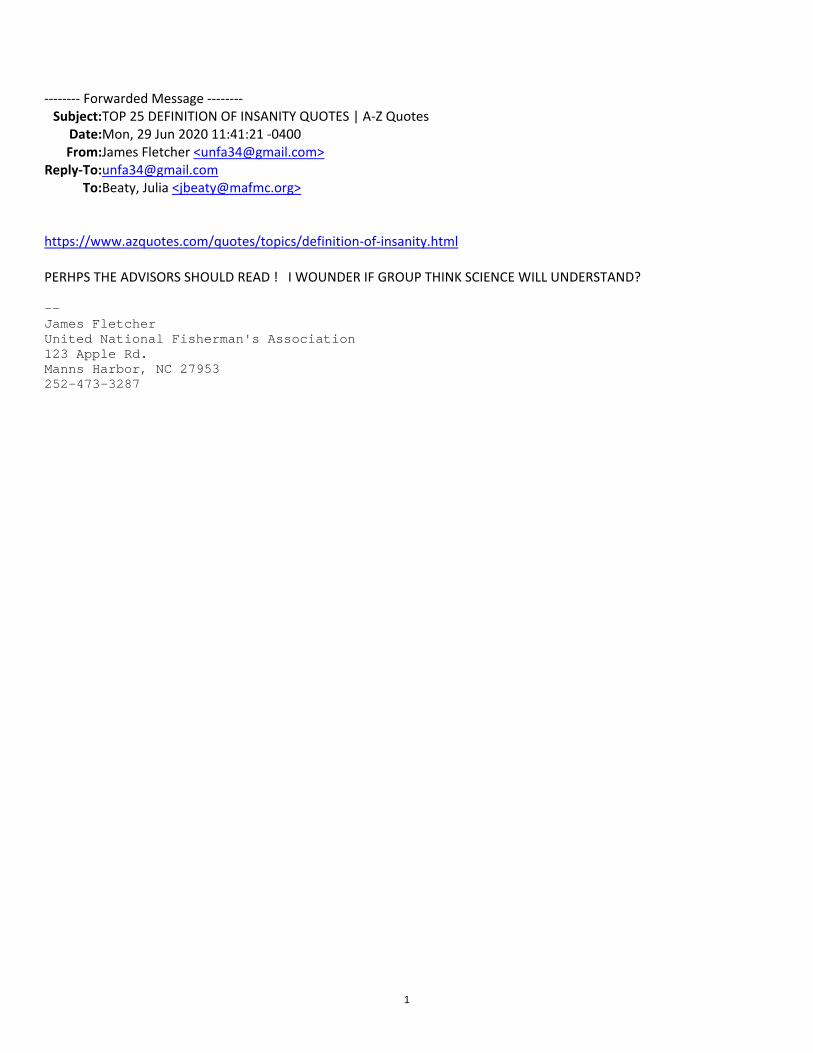
1
‐‐‐‐‐‐‐‐ Forwarded Message ‐‐‐‐‐‐‐‐ Subject: TOP 25 DEFINITION OF INSANITY QUOTES | A‐Z Quotes
Date: Mon, 29 Jun 2020 11:41:21 ‐0400 From: James Fletcher <[email protected]>
Reply‐To: [email protected]: Beaty, Julia <[email protected]>
https://www.azquotes.com/quotes/topics/definition‐of‐insanity.html
PERHPS THE ADVISORS SHOULD READ ! I WOUNDER IF GROUP THINK SCIENCE WILL UNDERSTAND?
-- James Fletcher United National Fisherman's Association 123 Apple Rd. Manns Harbor, NC 27953 252-473-3287
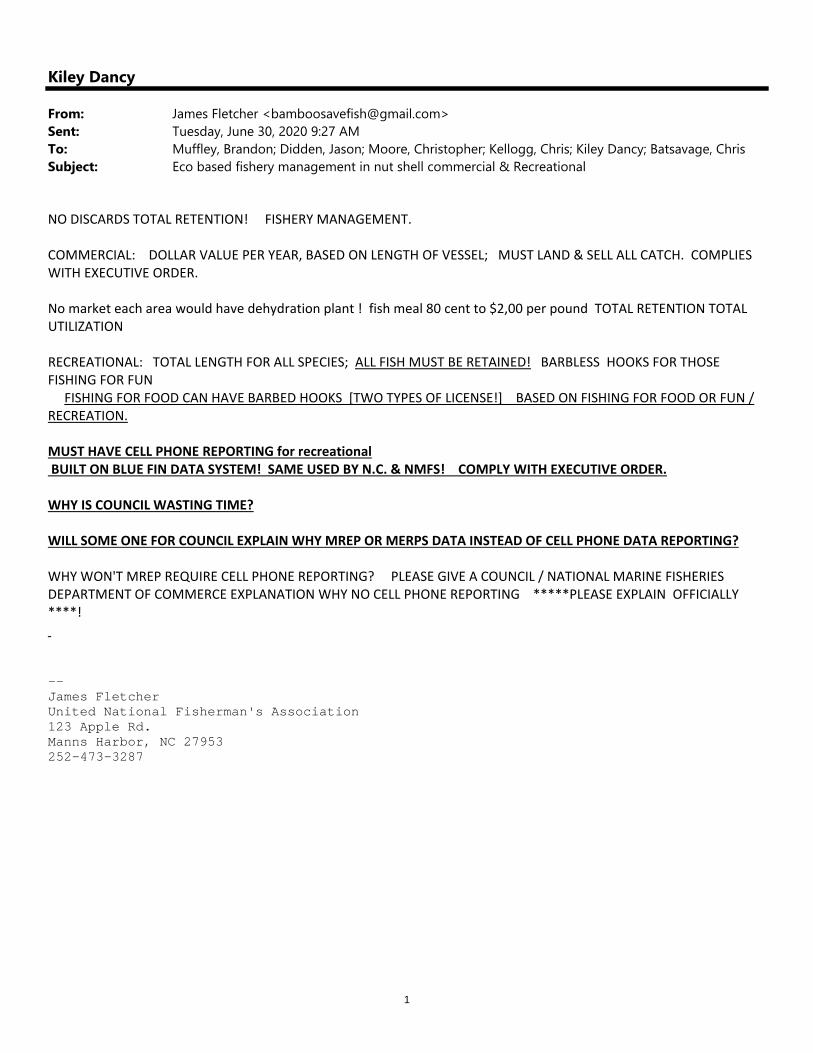
1
Kiley Dancy
From: James Fletcher <[email protected]>Sent: Tuesday, June 30, 2020 9:27 AMTo: Muffley, Brandon; Didden, Jason; Moore, Christopher; Kellogg, Chris; Kiley Dancy; Batsavage, ChrisSubject: Eco based fishery management in nut shell commercial & Recreational
NO DISCARDS TOTAL RETENTION! FISHERY MANAGEMENT.
COMMERCIAL: DOLLAR VALUE PER YEAR, BASED ON LENGTH OF VESSEL; MUST LAND & SELL ALL CATCH. COMPLIES WITH EXECUTIVE ORDER.
No market each area would have dehydration plant ! fish meal 80 cent to $2,00 per pound TOTAL RETENTION TOTAL UTILIZATION
RECREATIONAL: TOTAL LENGTH FOR ALL SPECIES; ALL FISH MUST BE RETAINED! BARBLESS HOOKS FOR THOSE FISHING FOR FUN FISHING FOR FOOD CAN HAVE BARBED HOOKS [TWO TYPES OF LICENSE!] BASED ON FISHING FOR FOOD OR FUN / RECREATION.
MUST HAVE CELL PHONE REPORTING for recreational BUILT ON BLUE FIN DATA SYSTEM! SAME USED BY N.C. & NMFS! COMPLY WITH EXECUTIVE ORDER.
WHY IS COUNCIL WASTING TIME?
WILL SOME ONE FOR COUNCIL EXPLAIN WHY MREP OR MERPS DATA INSTEAD OF CELL PHONE DATA REPORTING?
WHY WON'T MREP REQUIRE CELL PHONE REPORTING? PLEASE GIVE A COUNCIL / NATIONAL MARINE FISHERIES DEPARTMENT OF COMMERCE EXPLANATION WHY NO CELL PHONE REPORTING *****PLEASE EXPLAIN OFFICIALLY ****!
-- James Fletcher United National Fisherman's Association 123 Apple Rd. Manns Harbor, NC 27953 252-473-3287
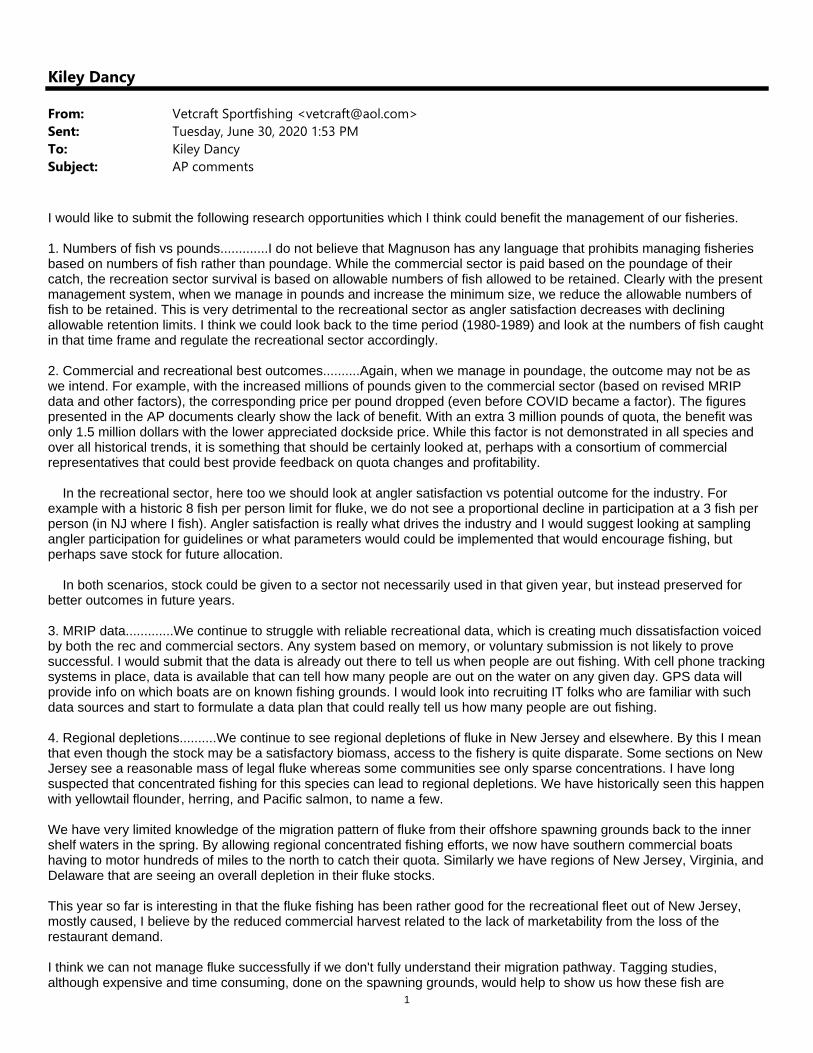
1
Kiley Dancy
From: Vetcraft Sportfishing <[email protected]>Sent: Tuesday, June 30, 2020 1:53 PMTo: Kiley DancySubject: AP comments
I would like to submit the following research opportunities which I think could benefit the management of our fisheries.
1. Numbers of fish vs pounds.............I do not believe that Magnuson has any language that prohibits managing fisheries based on numbers of fish rather than poundage. While the commercial sector is paid based on the poundage of their catch, the recreation sector survival is based on allowable numbers of fish allowed to be retained. Clearly with the present management system, when we manage in pounds and increase the minimum size, we reduce the allowable numbers of fish to be retained. This is very detrimental to the recreational sector as angler satisfaction decreases with declining allowable retention limits. I think we could look back to the time period (1980-1989) and look at the numbers of fish caught in that time frame and regulate the recreational sector accordingly.
2. Commercial and recreational best outcomes..........Again, when we manage in poundage, the outcome may not be as we intend. For example, with the increased millions of pounds given to the commercial sector (based on revised MRIP data and other factors), the corresponding price per pound dropped (even before COVID became a factor). The figures presented in the AP documents clearly show the lack of benefit. With an extra 3 million pounds of quota, the benefit was only 1.5 million dollars with the lower appreciated dockside price. While this factor is not demonstrated in all species and over all historical trends, it is something that should be certainly looked at, perhaps with a consortium of commercial representatives that could best provide feedback on quota changes and profitability.
In the recreational sector, here too we should look at angler satisfaction vs potential outcome for the industry. For example with a historic 8 fish per person limit for fluke, we do not see a proportional decline in participation at a 3 fish per person (in NJ where I fish). Angler satisfaction is really what drives the industry and I would suggest looking at sampling angler participation for guidelines or what parameters would could be implemented that would encourage fishing, but perhaps save stock for future allocation.
In both scenarios, stock could be given to a sector not necessarily used in that given year, but instead preserved for better outcomes in future years.
3. MRIP data.............We continue to struggle with reliable recreational data, which is creating much dissatisfaction voiced by both the rec and commercial sectors. Any system based on memory, or voluntary submission is not likely to prove successful. I would submit that the data is already out there to tell us when people are out fishing. With cell phone tracking systems in place, data is available that can tell how many people are out on the water on any given day. GPS data will provide info on which boats are on known fishing grounds. I would look into recruiting IT folks who are familiar with such data sources and start to formulate a data plan that could really tell us how many people are out fishing.
4. Regional depletions..........We continue to see regional depletions of fluke in New Jersey and elsewhere. By this I mean that even though the stock may be a satisfactory biomass, access to the fishery is quite disparate. Some sections on New Jersey see a reasonable mass of legal fluke whereas some communities see only sparse concentrations. I have long suspected that concentrated fishing for this species can lead to regional depletions. We have historically seen this happen with yellowtail flounder, herring, and Pacific salmon, to name a few.
We have very limited knowledge of the migration pattern of fluke from their offshore spawning grounds back to the inner shelf waters in the spring. By allowing regional concentrated fishing efforts, we now have southern commercial boats having to motor hundreds of miles to the north to catch their quota. Similarly we have regions of New Jersey, Virginia, and Delaware that are seeing an overall depletion in their fluke stocks.
This year so far is interesting in that the fluke fishing has been rather good for the recreational fleet out of New Jersey, mostly caused, I believe by the reduced commercial harvest related to the lack of marketability from the loss of the restaurant demand.
I think we can not manage fluke successfully if we don't fully understand their migration pathway. Tagging studies, although expensive and time consuming, done on the spawning grounds, would help to show us how these fish are

2
migrating back inshore. Much valuable data could be obtained knowing where these fish return and could help us manage the fishery better to prevent the long haul for the commercial fleet and also even out the inshore fishery for the recreational sector. Oceanic dynamic metrics have not been drastic enough to explain the sparsity of the stock in the southern end of its' range, where it once thrived in abundance.
Capt Harv Vetcraft Sportfishing Cape May, New Jersey Call or Text 610-742-3891 Email: [email protected] www.vetcraftsportfishing.com
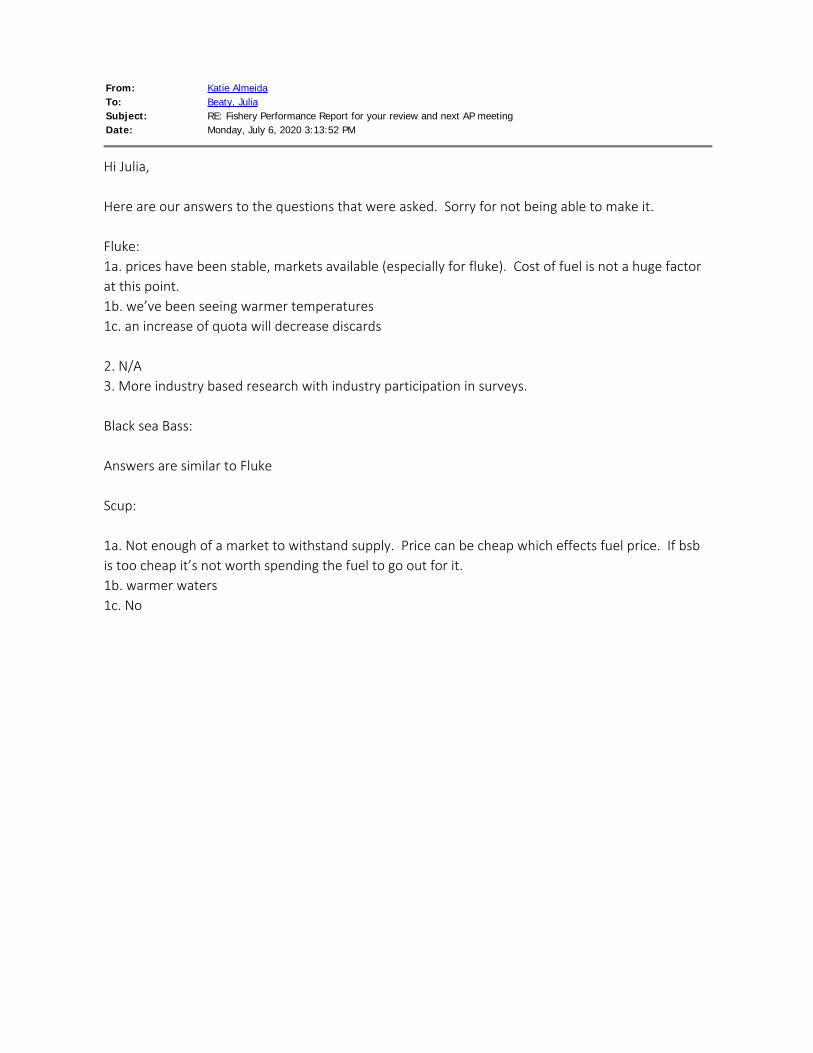
From: Katie AlmeidaTo: Beaty, JuliaSubject: RE: Fishery Performance Report for your review and next AP meetingDate: Monday, July 6, 2020 3:13:52 PM
Hi Julia,
Here are our answers to the questions that were asked. Sorry for not being able to make it.
Fluke:1a. prices have been stable, markets available (especially for fluke). Cost of fuel is not a huge factorat this point.1b. we’ve been seeing warmer temperatures1c. an increase of quota will decrease discards
2. N/A3. More industry based research with industry participation in surveys.
Black sea Bass:
Answers are similar to Fluke
Scup:
1a. Not enough of a market to withstand supply. Price can be cheap which effects fuel price. If bsbis too cheap it’s not worth spending the fuel to go out for it.1b. warmer waters1c. No

1
From: PAUL CARUSO [mailto:[email protected]] Sent: Monday, July 6, 2020 2:17 PM To: Dustin C. Leaning <[email protected]> Subject: [External] Re: Fishery Performance Report for your review and next AP meeting
Sorry Dustin, Don't know how I missed that call. For recreational performance in MA, 2019 fluke fishing was even worse than in 2018. Few legal (17" plus) were inshore and available to the shore, and most of the private boat mode anglers. If you wanted legal fluke the run was 23+miles, out of reach for vessels under 25 feet. There seemed to be little for forage inshore (no sand eels). Sea bass fishing was good in 2019 but the lack of a late fall season continues to restrain recreational harvest here in MA. Even though only few of the PB mode vessels here target scup there seemed to be plenty of scup of all sizes around in 2019, as in 2018.
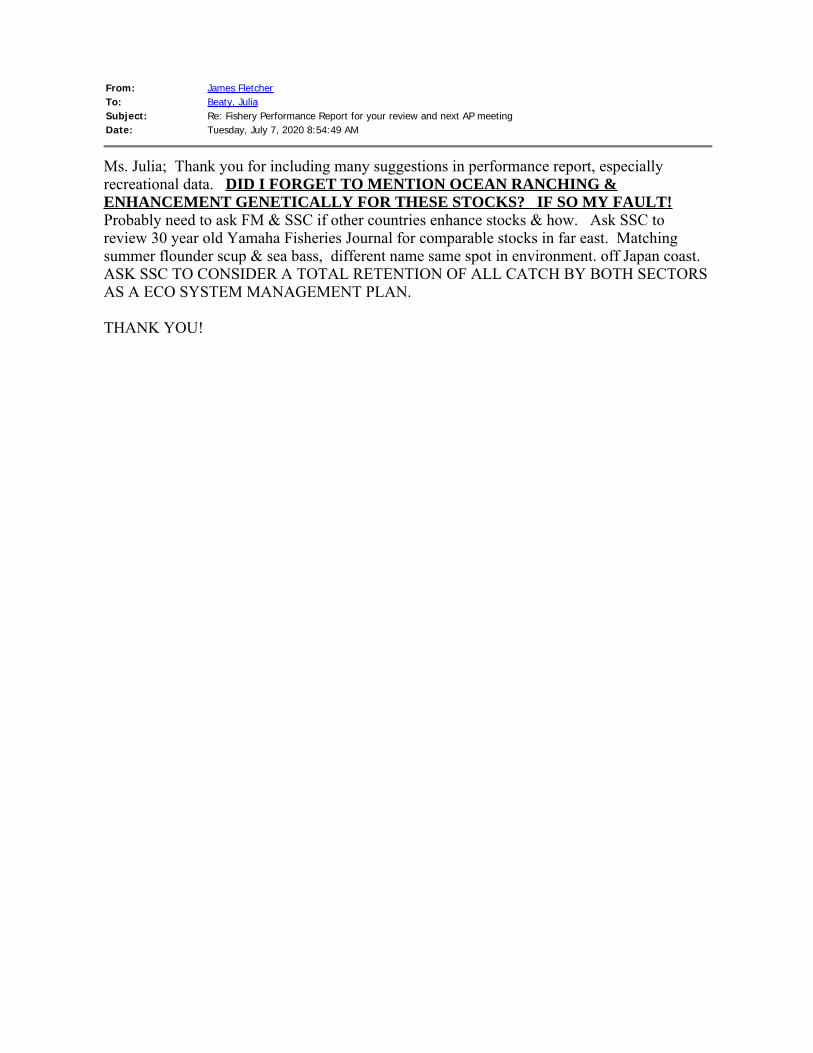
From: James FletcherTo: Beaty, JuliaSubject: Re: Fishery Performance Report for your review and next AP meetingDate: Tuesday, July 7, 2020 8:54:49 AM
Ms. Julia; Thank you for including many suggestions in performance report, especially recreational data. DID I FORGET TO MENTION OCEAN RANCHING &ENHANCEMENT GENETICALLY FOR THESE STOCKS? IF SO MY FAULT! Probably need to ask FM & SSC if other countries enhance stocks & how. Ask SSC to review 30 year old Yamaha Fisheries Journal for comparable stocks in far east. Matching summer flounder scup & sea bass, different name same spot in environment. off Japan coast. ASK SSC TO CONSIDER A TOTAL RETENTION OF ALL CATCH BY BOTH SECTORS AS A ECO SYSTEM MANAGEMENT PLAN.
THANK YOU!

1
From: HOFFMAN [mailto:[email protected]] Sent: Wednesday, July 8, 2020 6:44 PM To: Dustin C. Leaning <[email protected]> Subject: [External] Re: Fishery Performance Report for your review and next AP meeting
Dustin
Please be aware that Steve Canizzo's comment about the abundance of fluke came from a party boat captain whose website is designed to sell fares on his boat. The captain is notorious for making statements that are self-serving. I have no problem with anybody having a different opinion than mine. Bonnie Brady confirmed my statement about fluking being slow. We were talking about the same area. Frank Blount from Rhode Island also stated that fluking was slow in his area which is just across Long Island Sound from where Bonnie and I were speaking of.
As to MRIP's mysterious numbers that I have been asking for, The dock intercepts give them the average catch per angler. The mail survey tells them how often an angler goes fishing. Then the numbers are applied to a multiple. Whatever the name of that multiple factor is (# of fishermen, x factor), you cannot get to a total number of trips without it. What is that multiple factor for each state? Why is it so secret?
With regard to the biomass surveys, Bob Beal told me that almost all of the surveys are within 3 miles as well as other people involved with the fisheries. Do some surveys go out to 4 or 5 miles? Certainly, but no surveys go 10 miles out. That was agreed to by your staff, the same person who said they go beyond 3 miles.
Try talking to some of your other panel members on the lobster and other shell fish panels. Ask how far out the lobstermen are getting seabass in their traps. How come the inshore lobsterman is extinct south of Cape Cod? Could it be that the seabass ate all the juveniles? We have 250% of the targeted biomass inshore. How many fish are outside of the limited trawl surveys. Why don't we try to find out? If we went to 10 fish per angler at 14" and I am dead wrong, the worst that could happen is that in five years we would fall back to 200%.
How has the vast increase in menhaden affected other species? How has the increase in sharks to inshore areas affected other species? Has it caused bluefish to move further offshore? Has it affected fluke?
Everything that happens to one species affects many others. These are my comments with regard to your summary.
Regards,
Marc Hoffman
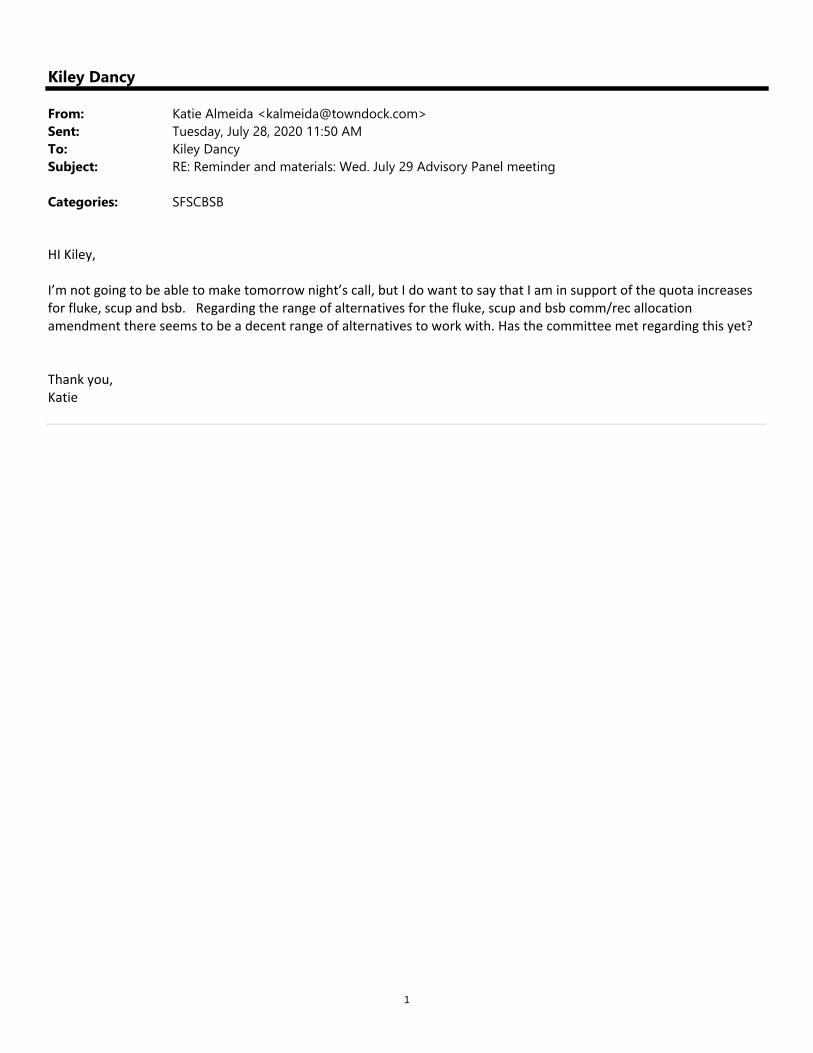
1
Kiley Dancy
From: Katie Almeida <[email protected]>Sent: Tuesday, July 28, 2020 11:50 AMTo: Kiley DancySubject: RE: Reminder and materials: Wed. July 29 Advisory Panel meeting
Categories: SFSCBSB
HI Kiley,
I’m not going to be able to make tomorrow night’s call, but I do want to say that I am in support of the quota increases for fluke, scup and bsb. Regarding the range of alternatives for the fluke, scup and bsb comm/rec allocation amendment there seems to be a decent range of alternatives to work with. Has the committee met regarding this yet?
Thank you, Katie

1
Kiley Dancy
From: James Fletcher <[email protected]>Sent: Wednesday, July 29, 2020 9:21 AMTo: Kiley DancySubject: Re: Reminder and materials: Wed. July 29 Advisory Panel meeting
SOME ON MC. STATED 6000 VESSEL PERMITS. THIS IS NOT CORRECT! As an advisor I AM UPSET THE MC WOULD NOT ADDRESS ELECTRONIC REPORTING BY RECREATIONAL FISHERS! Also not addressing total length retention. WHAT IS THE MC JOB? Would you allow advisors to discuss electronic reporting by recreational & total length WHO IS SUPPOSED TO ADDRESS THESE TWO ISSUES? IWHAT IS REASON FOR NOT NEEDING ELECTRONIC REPORTING FROM EEZ.?
1
Summer Flounder Fishery Information Document
June 2020
This document provides a brief overview of the biology, stock condition, management system, and
fishery performance for summer flounder (Paralichthys dentatus) with an emphasis on 2019. Data
sources include unpublished National Marine Fisheries Service (NMFS) survey, dealer, vessel trip
report (VTR), permit, and Marine Recreational Information Program (MRIP) databases and should
be considered preliminary. For more resources on summer flounder management, including
previous Fishery Information Documents, please visit http://www.mafmc.org/sf-s-bsb.
Basic Biology
Summer flounder spawn during the fall and winter over the open ocean areas of the continental
shelf. From October to May, larvae and postlarvae migrate inshore, entering coastal and estuarine
nursery areas. Juveniles are distributed inshore and in many estuaries throughout the range of the
species during spring, summer, and fall. Adult summer flounder exhibit strong seasonal inshore-
offshore movements, normally inhabiting shallow coastal and estuarine waters during the warmer
months of the year and remaining offshore during the colder months.
Summer flounder habitat includes pelagic waters, demersal waters, saltmarsh creeks, seagrass
beds, mudflats, and open bay areas from the Gulf of Maine through North Carolina. Summer
flounder are opportunistic feeders; their prey includes a variety of fish and crustaceans. While the
natural predators of adult summer flounder are not fully documented, larger predators (e.g., large
sharks, rays, and monkfish) probably include summer flounder in their diets.1
Key Facts:
• The 2018 benchmark stock assessment found that in 2017, summer flounder was not
overfished and overfishing was not occurring. Incorporation of a revised time series of
recreational data from MRIP contributed to an increase in estimated stock biomass
compared to the previous assessment.
• The 2019 and 2020 data updates show signs of an above-average 2018 year class.
• Commercial quotas and recreational harvest limits were increased mid-year in 2019 by
about 50% each. Given that the revised MRIP harvest estimates for the recreational
fishery were approximately equal to the new recreational harvest limit for 2019,
recreational measures could not be liberalized in 2019.
• Commercial landings increased by about 47% between 2018 and 2019 (from 6.14 mil
lb to 9.06 mil lb), while recreational landings were similar between these two years
(7.60 mil lb and 7.80 mil lb).
• Average commercial ex-vessel price consistently increased from 2011 through 2017 to
a high of $4.40 per pound, but fell somewhat in 2019 to $3.15 per pound.

2
Spawning occurs during autumn and early winter, and the larvae are transported toward coastal
areas by prevailing water currents. Development of post larvae and juveniles occurs primarily
within bays and estuarine areas. Most fish are sexually mature by age 2. The largest fish are
females, which can attain lengths over 90 cm (36 in) and weights up to 11.8 kg (26 lb). The
Northeast Fisheries Science Center (NEFSC) commercial fishery sampling in 2018 observed the
oldest summer flounder collected to date, a 57 cm fish (likely a male) estimated to be age 20. Also
sampled were two age 17 fish, at 52 cm (likely a male) and at 72 cm (likely a female). Two large
(likely female) fish at 80 and 82 cm were both estimated to be age 9, from the 2009 year class (the
6th largest of the 36 year modeled time series). These samples indicate that increased survival of
summer flounder over the last two decades has allowed fish of both sexes to grow to the oldest
ages estimated to date.2
Status of the Stock
The most recent benchmark summer flounder stock assessment was completed and reviewed
during the 66th Stock Assessment Workshop and Stock Assessment Review Committee
(SAW/SARC 66) in November 2018.3 This assessment uses a statistical catch at age model (the
age-structured assessment program, or “ASAP” model). Stock assessment and peer review reports
are available online at the Northeast Fisheries Science Center (NEFSC) website:
http://www.nefsc.noaa.gov/saw/reports.html.
The assessment incorporated the revised time series of recreational catch from MRIP, which is
30% higher on average compared to the previous summer flounder estimates for 1981-2017. The
MRIP estimate revisions account for changes in both the angler intercept survey and recreational
effort survey methodologies. While fishing mortality rates were not strongly affected by
incorporating these revisions, increased recreational catch resulted in increased estimates of stock
size compared to past assessments.
The biological reference points for summer flounder as revised through the recent benchmark
assessment are described in Table 1.
Table 1: Summary of biological reference points and terminal year SSB and F estimates from
the 2018 benchmark stock assessment.
2018 stock assessment Biological Reference Points and
stock status results (data through 2017)
SSBMSY (biomass target) 126.01 mil lb (57,159 mt)
½ SSBMSY (minimum stock size, or
overfished, threshold) 63.01 mil lb (28,580 mt)
Terminal year SSB (2017) 98.22 mil lb (44,552 mt) 78% of SSBMSY (not overfished)
FMSY PROXY = F35% (overfishing
threshold) 0.448
Terminal year F (2017) 0.334 25% below FMSY (not overfishing)
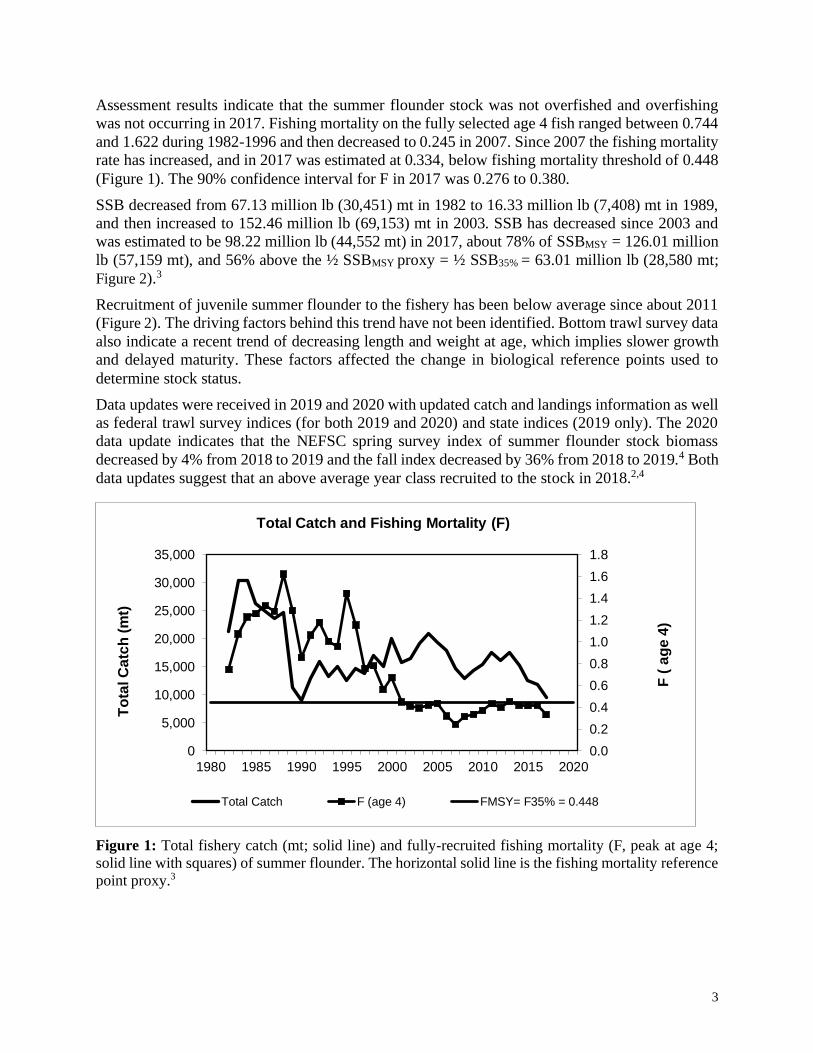
3
Assessment results indicate that the summer flounder stock was not overfished and overfishing
was not occurring in 2017. Fishing mortality on the fully selected age 4 fish ranged between 0.744
and 1.622 during 1982-1996 and then decreased to 0.245 in 2007. Since 2007 the fishing mortality
rate has increased, and in 2017 was estimated at 0.334, below fishing mortality threshold of 0.448
(Figure 1). The 90% confidence interval for F in 2017 was 0.276 to 0.380.
SSB decreased from 67.13 million lb (30,451) mt in 1982 to 16.33 million lb (7,408) mt in 1989,
and then increased to 152.46 million lb (69,153) mt in 2003. SSB has decreased since 2003 and
was estimated to be 98.22 million lb (44,552 mt) in 2017, about 78% of SSBMSY = 126.01 million
lb (57,159 mt), and 56% above the ½ SSBMSY proxy = ½ SSB35% = 63.01 million lb (28,580 mt;
Figure 2).3
Recruitment of juvenile summer flounder to the fishery has been below average since about 2011
(Figure 2). The driving factors behind this trend have not been identified. Bottom trawl survey data
also indicate a recent trend of decreasing length and weight at age, which implies slower growth
and delayed maturity. These factors affected the change in biological reference points used to
determine stock status.
Data updates were received in 2019 and 2020 with updated catch and landings information as well
as federal trawl survey indices (for both 2019 and 2020) and state indices (2019 only). The 2020
data update indicates that the NEFSC spring survey index of summer flounder stock biomass
decreased by 4% from 2018 to 2019 and the fall index decreased by 36% from 2018 to 2019.4 Both
data updates suggest that an above average year class recruited to the stock in 2018.2,4
Figure 1: Total fishery catch (mt; solid line) and fully-recruited fishing mortality (F, peak at age 4;
solid line with squares) of summer flounder. The horizontal solid line is the fishing mortality reference
point proxy.3
0.00.20.40.60.81.01.21.41.61.8
0
5,000
10,000
15,000
20,000
25,000
30,000
35,000
1980 1985 1990 1995 2000 2005 2010 2015 2020
F ( a
ge 4
)
Tota
l Cat
ch (m
t)
Total Catch and Fishing Mortality (F)
Total Catch F (age 4) FMSY= F35% = 0.448

4
Figure 2: Summer flounder spawning stock biomass (SSB; solid line) and recruitment at age 0 (R;
vertical bars) 1980-2017. The horizontal dashed line is the target biomass reference point. The
horizontal solid line is the threshold biomass reference point.3
Management System and Fishery Performance
Management
The Mid-Atlantic Fishery Management Council (Council) and the Atlantic States Marine Fisheries
Commission (Commission or ASMFC) work cooperatively to develop fishery regulations for
summer flounder off the east coast of the United States. The Council and Commission work in
conjunction with NMFS, which serves as the federal implementation and enforcement entity. This
cooperative management endeavor was developed because a significant portion of the catch is
taken from both state (0-3 miles offshore) and federal waters (3-200 miles offshore, also known as
the Exclusive Economic Zone, or EEZ).
The joint Fishery Management Plan (FMP) for summer flounder became effective in 1988, and
established the management unit for summer flounder as U.S. waters from the southern border of
North Carolina northward to the U.S.-Canadian border. The FMP also established measures to
ensure effective management of summer flounder fisheries, which currently include catch and
landings limits, commercial quotas, recreational harvest limits, minimum fish sizes, gear
regulations, permit requirements, and other provisions as prescribed by the FMP.
There are large commercial and recreational fisheries for summer flounder. These fisheries are
managed primarily using output controls (catch and landings limits), with 60 percent of the total
allowable landings allocated to the commercial fishery as a commercial quota and 40 percent
allocated to the recreational fishery as a recreational harvest limit. Management also uses
minimum fish sizes, gear regulations, permit requirements, and other provisions as prescribed by
the FMP. The Summer Flounder FMP, including subsequent Amendments and Frameworks, are
available on the Council website at: http://www.mafmc.org/fisheries/fmp/sf-s-bsb.
010,00020,00030,00040,00050,00060,00070,00080,00090,000100,000110,000
0
10,000
20,000
30,000
40,000
50,000
60,000
70,000
80,000
1980 1985 1990 1995 2000 2005 2010 2015 2020
R (a
ge 0
, 000
s)
SSB
(mt)
Spawning Stock Biomass (SSB) and Recruitment (R)
R SSBSSBMSY = SSB35% = 57,159 mt 1/2 SSBMSY = 1/2 SSB35% = 28,580 mt
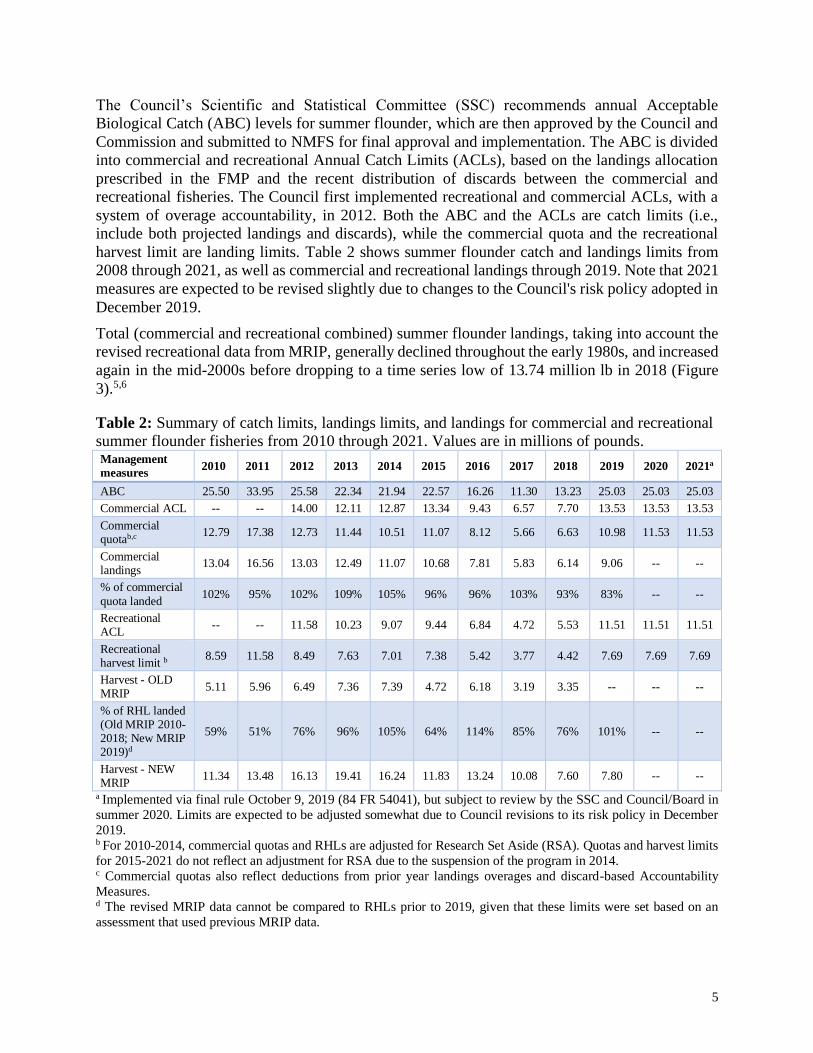
5
The Council’s Scientific and Statistical Committee (SSC) recommends annual Acceptable
Biological Catch (ABC) levels for summer flounder, which are then approved by the Council and
Commission and submitted to NMFS for final approval and implementation. The ABC is divided
into commercial and recreational Annual Catch Limits (ACLs), based on the landings allocation
prescribed in the FMP and the recent distribution of discards between the commercial and
recreational fisheries. The Council first implemented recreational and commercial ACLs, with a
system of overage accountability, in 2012. Both the ABC and the ACLs are catch limits (i.e.,
include both projected landings and discards), while the commercial quota and the recreational
harvest limit are landing limits. Table 2 shows summer flounder catch and landings limits from
2008 through 2021, as well as commercial and recreational landings through 2019. Note that 2021
measures are expected to be revised slightly due to changes to the Council's risk policy adopted in
December 2019.
Total (commercial and recreational combined) summer flounder landings, taking into account the
revised recreational data from MRIP, generally declined throughout the early 1980s, and increased
again in the mid-2000s before dropping to a time series low of 13.74 million lb in 2018 (Figure
3).5,6
Table 2: Summary of catch limits, landings limits, and landings for commercial and recreational
summer flounder fisheries from 2010 through 2021. Values are in millions of pounds. Management
measures 2010 2011 2012 2013 2014 2015 2016 2017 2018 2019 2020 2021a
ABC 25.50 33.95 25.58 22.34 21.94 22.57 16.26 11.30 13.23 25.03 25.03 25.03
Commercial ACL -- -- 14.00 12.11 12.87 13.34 9.43 6.57 7.70 13.53 13.53 13.53
Commercial quotab,c
12.79 17.38 12.73 11.44 10.51 11.07 8.12 5.66 6.63 10.98 11.53 11.53
Commercial landings
13.04 16.56 13.03 12.49 11.07 10.68 7.81 5.83 6.14 9.06 -- --
% of commercial
quota landed 102% 95% 102% 109% 105% 96% 96% 103% 93% 83% -- --
Recreational ACL
-- -- 11.58 10.23 9.07 9.44 6.84 4.72 5.53 11.51 11.51 11.51
Recreational harvest limit b
8.59 11.58 8.49 7.63 7.01 7.38 5.42 3.77 4.42 7.69 7.69 7.69
Harvest - OLD MRIP
5.11 5.96 6.49 7.36 7.39 4.72 6.18 3.19 3.35 -- -- --
% of RHL landed (Old MRIP 2010-2018; New MRIP 2019)d
59% 51% 76% 96% 105% 64% 114% 85% 76% 101% -- --
Harvest - NEW MRIP
11.34 13.48 16.13 19.41 16.24 11.83 13.24 10.08 7.60 7.80 -- --
a Implemented via final rule October 9, 2019 (84 FR 54041), but subject to review by the SSC and Council/Board in
summer 2020. Limits are expected to be adjusted somewhat due to Council revisions to its risk policy in December
2019. b For 2010-2014, commercial quotas and RHLs are adjusted for Research Set Aside (RSA). Quotas and harvest limits
for 2015-2021 do not reflect an adjustment for RSA due to the suspension of the program in 2014. c Commercial quotas also reflect deductions from prior year landings overages and discard-based Accountability
Measures. d The revised MRIP data cannot be compared to RHLs prior to 2019, given that these limits were set based on an
assessment that used previous MRIP data.
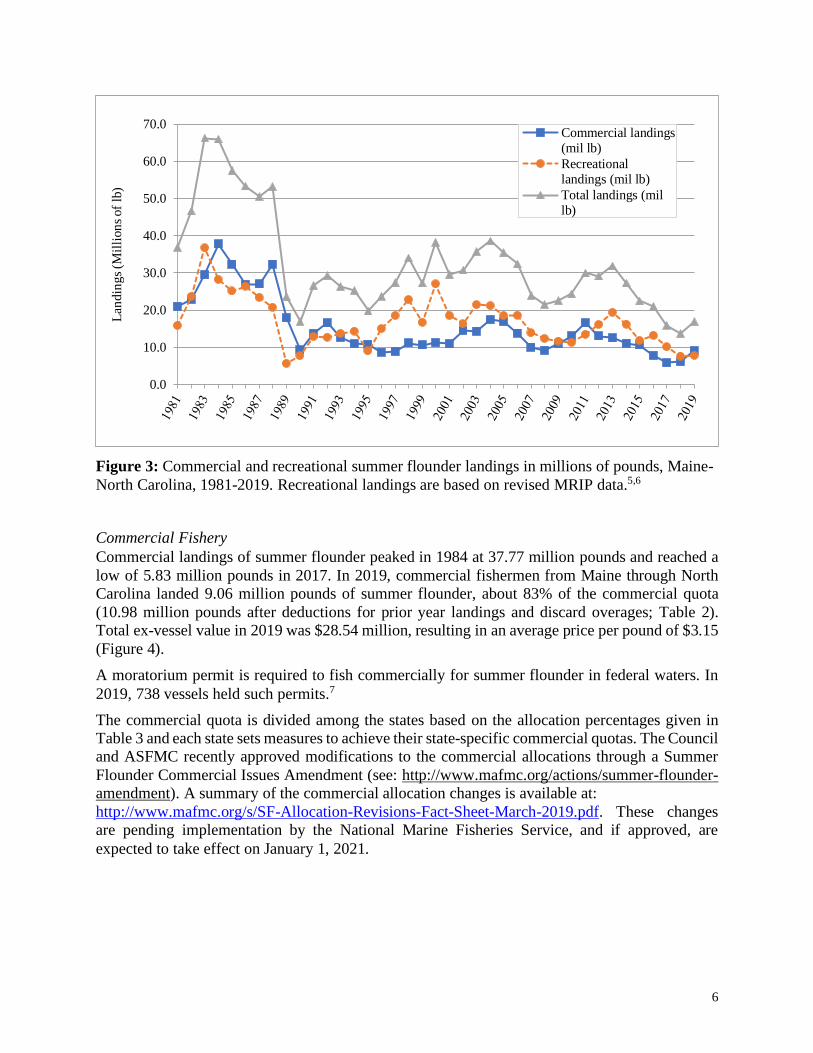
6
Figure 3: Commercial and recreational summer flounder landings in millions of pounds, Maine-
North Carolina, 1981-2019. Recreational landings are based on revised MRIP data.5,6
Commercial Fishery
Commercial landings of summer flounder peaked in 1984 at 37.77 million pounds and reached a
low of 5.83 million pounds in 2017. In 2019, commercial fishermen from Maine through North
Carolina landed 9.06 million pounds of summer flounder, about 83% of the commercial quota
(10.98 million pounds after deductions for prior year landings and discard overages; Table 2).
Total ex-vessel value in 2019 was $28.54 million, resulting in an average price per pound of $3.15
(Figure 4).
A moratorium permit is required to fish commercially for summer flounder in federal waters. In
2019, 738 vessels held such permits.7
The commercial quota is divided among the states based on the allocation percentages given in
Table 3 and each state sets measures to achieve their state-specific commercial quotas. The Council
and ASFMC recently approved modifications to the commercial allocations through a Summer
Flounder Commercial Issues Amendment (see: http://www.mafmc.org/actions/summer-flounder-
amendment). A summary of the commercial allocation changes is available at:
http://www.mafmc.org/s/SF-Allocation-Revisions-Fact-Sheet-March-2019.pdf. These changes
are pending implementation by the National Marine Fisheries Service, and if approved, are
expected to take effect on January 1, 2021.
0.0
10.0
20.0
30.0
40.0
50.0
60.0
70.0L
andin
gs
(Mil
lion
s of
lb)
Commercial landings
(mil lb)
Recreational
landings (mil lb)
Total landings (mil
lb)
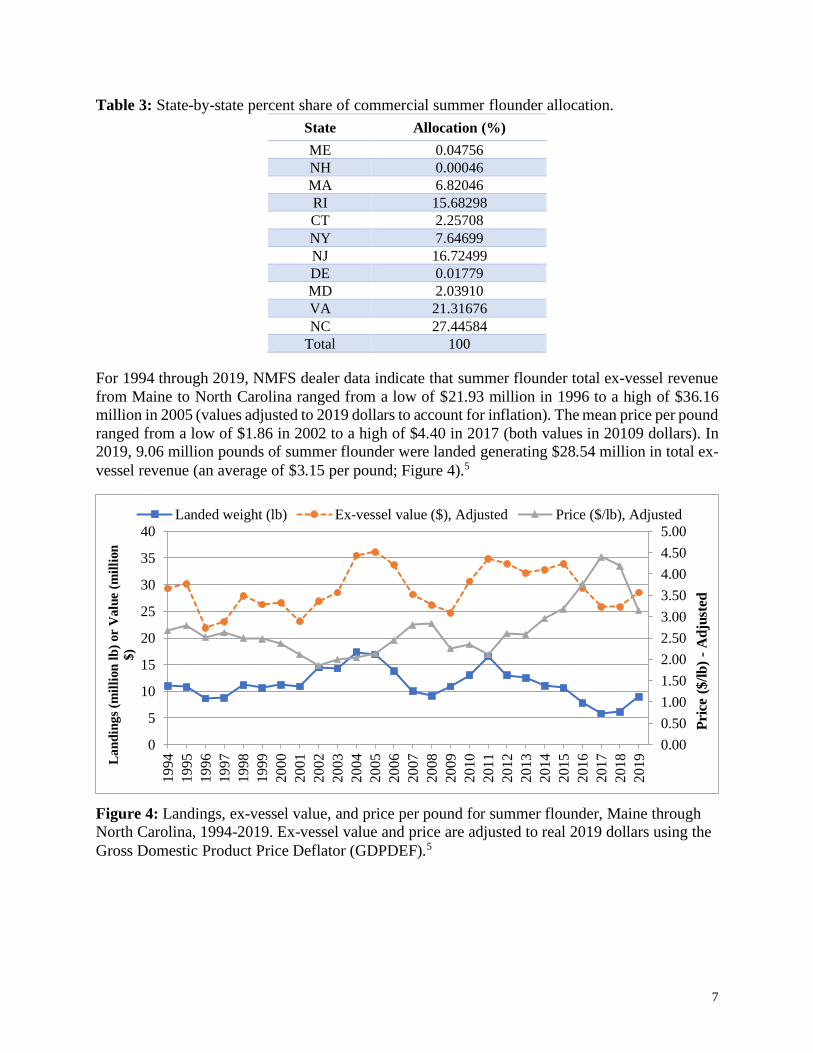
7
Table 3: State-by-state percent share of commercial summer flounder allocation.
State Allocation (%)
ME 0.04756
NH 0.00046
MA 6.82046
RI 15.68298
CT 2.25708
NY 7.64699
NJ 16.72499
DE 0.01779
MD 2.03910
VA 21.31676
NC 27.44584
Total 100
For 1994 through 2019, NMFS dealer data indicate that summer flounder total ex-vessel revenue
from Maine to North Carolina ranged from a low of $21.93 million in 1996 to a high of $36.16
million in 2005 (values adjusted to 2019 dollars to account for inflation). The mean price per pound
ranged from a low of $1.86 in 2002 to a high of $4.40 in 2017 (both values in 20109 dollars). In
2019, 9.06 million pounds of summer flounder were landed generating $28.54 million in total ex-
vessel revenue (an average of $3.15 per pound; Figure 4).5
Figure 4: Landings, ex-vessel value, and price per pound for summer flounder, Maine through
North Carolina, 1994-2019. Ex-vessel value and price are adjusted to real 2019 dollars using the
Gross Domestic Product Price Deflator (GDPDEF).5
0.00
0.50
1.00
1.50
2.00
2.50
3.00
3.50
4.00
4.50
5.00
0
5
10
15
20
25
30
35
40
19
94
19
95
19
96
19
97
19
98
19
99
20
00
20
01
20
02
20
03
20
04
20
05
20
06
20
07
20
08
20
09
20
10
20
11
20
12
20
13
20
14
20
15
20
16
20
17
20
18
20
19
Pri
ce (
$/l
b)
-A
dju
sted
Lan
din
gs
(mil
lion
lb
) or V
alu
e (
mil
lion
$)
Landed weight (lb) Ex-vessel value ($), Adjusted Price ($/lb), Adjusted

8
VTR data for 2019 indicate that the bulk of the summer flounder landings were taken by bottom
otter trawls (97 percent). All other gear types each accounted for less than 1 percent of landings.8
Current regulations require a 14-inch total length minimum fish size in the commercial fishery.
Trawl nets are required to have 5.5-inch diamond or 6-inch square minimum mesh in the entire
net for vessels possessing more than the threshold amount of summer flounder (i.e., 200 lb from
November 1-April 30 and 100 lb from May 1-October 31).
According to federal VTR data, statistical areas 616 and 537 were responsible for the highest
percentage of commercial summer flounder catch (27% and 23% respectively; Table 4). While
statistical area 539 accounted for only 6% of 2019 summer flounder catch, this area had the highest
number of trips that caught summer flounder (2,510 trips).8 Note that discards on VTRs are self-
reported (Table 4; Figure 5).
At least 100,000 pounds of summer flounder were landed by commercial fishermen in 17 ports in
8 states in 2019. These ports accounted for 87% of all 2019 commercial summer flounder landings.
Point Judith, RI and Beaufort, NC were the leading ports in 2019 in pounds of summer flounder
landed, while Point Judith, RI was the leading port in number of vessels landing summer flounder
(Table 5).5
Over 175 federally permitted dealers from Maine through North Carolina bought summer flounder
in 2019. More dealers from New York bought summer flounder than any other state (Table 6). All
dealers combined bought approximately $28.54 million worth of summer flounder in 2019.5
Table 4: Statistical areas that accounted for at least 5 percent of the total summer flounder catch
in 2019, with associated number of trips.8
Statistical Area Percent of 2019 Commercial
Summer Flounder Catch Number of Trips
616 27% 1,052
537 23% 1,469
613 13% 1,455
622 8% 272
612 7% 1,076
539 6% 2,510
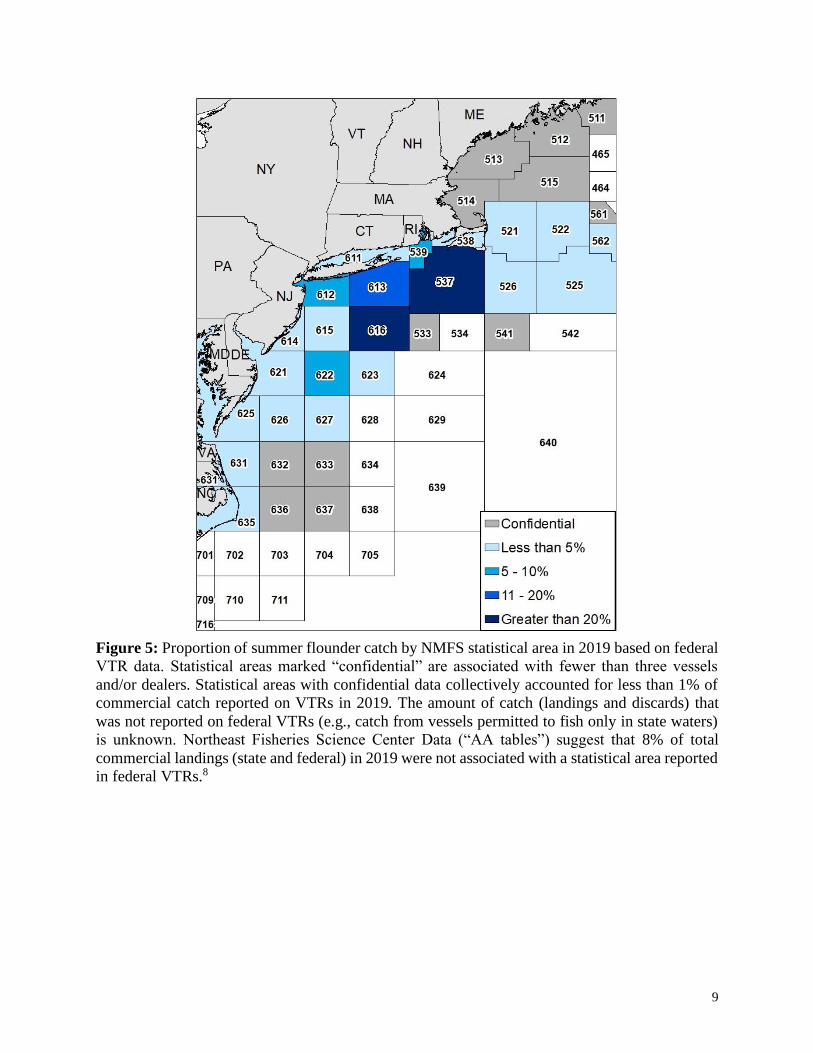
9
Figure 5: Proportion of summer flounder catch by NMFS statistical area in 2019 based on federal
VTR data. Statistical areas marked “confidential” are associated with fewer than three vessels
and/or dealers. Statistical areas with confidential data collectively accounted for less than 1% of
commercial catch reported on VTRs in 2019. The amount of catch (landings and discards) that
was not reported on federal VTRs (e.g., catch from vessels permitted to fish only in state waters)
is unknown. Northeast Fisheries Science Center Data (“AA tables”) suggest that 8% of total
commercial landings (state and federal) in 2019 were not associated with a statistical area reported
in federal VTRs.8
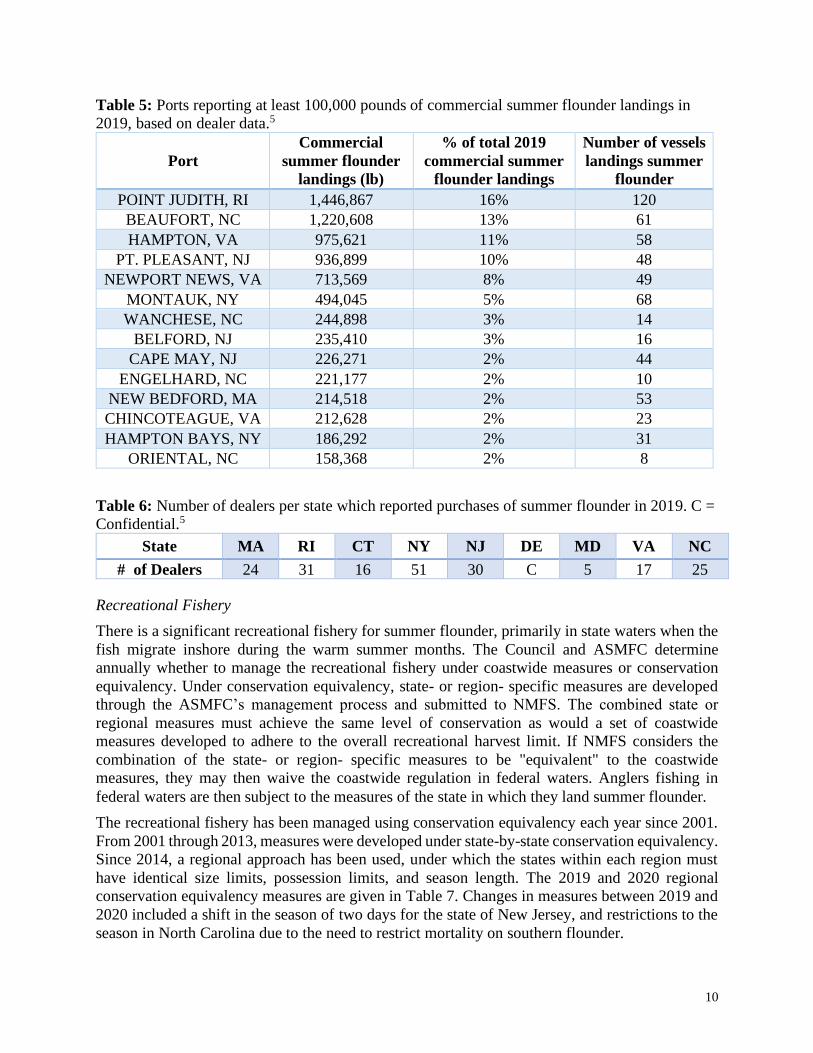
10
Table 5: Ports reporting at least 100,000 pounds of commercial summer flounder landings in
2019, based on dealer data.5
Port
Commercial
summer flounder
landings (lb)
% of total 2019
commercial summer
flounder landings
Number of vessels
landings summer
flounder
POINT JUDITH, RI 1,446,867 16% 120
BEAUFORT, NC 1,220,608 13% 61
HAMPTON, VA 975,621 11% 58
PT. PLEASANT, NJ 936,899 10% 48
NEWPORT NEWS, VA 713,569 8% 49
MONTAUK, NY 494,045 5% 68
WANCHESE, NC 244,898 3% 14
BELFORD, NJ 235,410 3% 16
CAPE MAY, NJ 226,271 2% 44
ENGELHARD, NC 221,177 2% 10
NEW BEDFORD, MA 214,518 2% 53
CHINCOTEAGUE, VA 212,628 2% 23
HAMPTON BAYS, NY 186,292 2% 31
ORIENTAL, NC 158,368 2% 8
Table 6: Number of dealers per state which reported purchases of summer flounder in 2019. C =
Confidential.5
State MA RI CT NY NJ DE MD VA NC
# of Dealers 24 31 16 51 30 C 5 17 25
Recreational Fishery
There is a significant recreational fishery for summer flounder, primarily in state waters when the
fish migrate inshore during the warm summer months. The Council and ASMFC determine
annually whether to manage the recreational fishery under coastwide measures or conservation
equivalency. Under conservation equivalency, state- or region- specific measures are developed
through the ASMFC’s management process and submitted to NMFS. The combined state or
regional measures must achieve the same level of conservation as would a set of coastwide
measures developed to adhere to the overall recreational harvest limit. If NMFS considers the
combination of the state- or region- specific measures to be "equivalent" to the coastwide
measures, they may then waive the coastwide regulation in federal waters. Anglers fishing in
federal waters are then subject to the measures of the state in which they land summer flounder.
The recreational fishery has been managed using conservation equivalency each year since 2001.
From 2001 through 2013, measures were developed under state-by-state conservation equivalency.
Since 2014, a regional approach has been used, under which the states within each region must
have identical size limits, possession limits, and season length. The 2019 and 2020 regional
conservation equivalency measures are given in Table 7. Changes in measures between 2019 and
2020 included a shift in the season of two days for the state of New Jersey, and restrictions to the
season in North Carolina due to the need to restrict mortality on southern flounder.
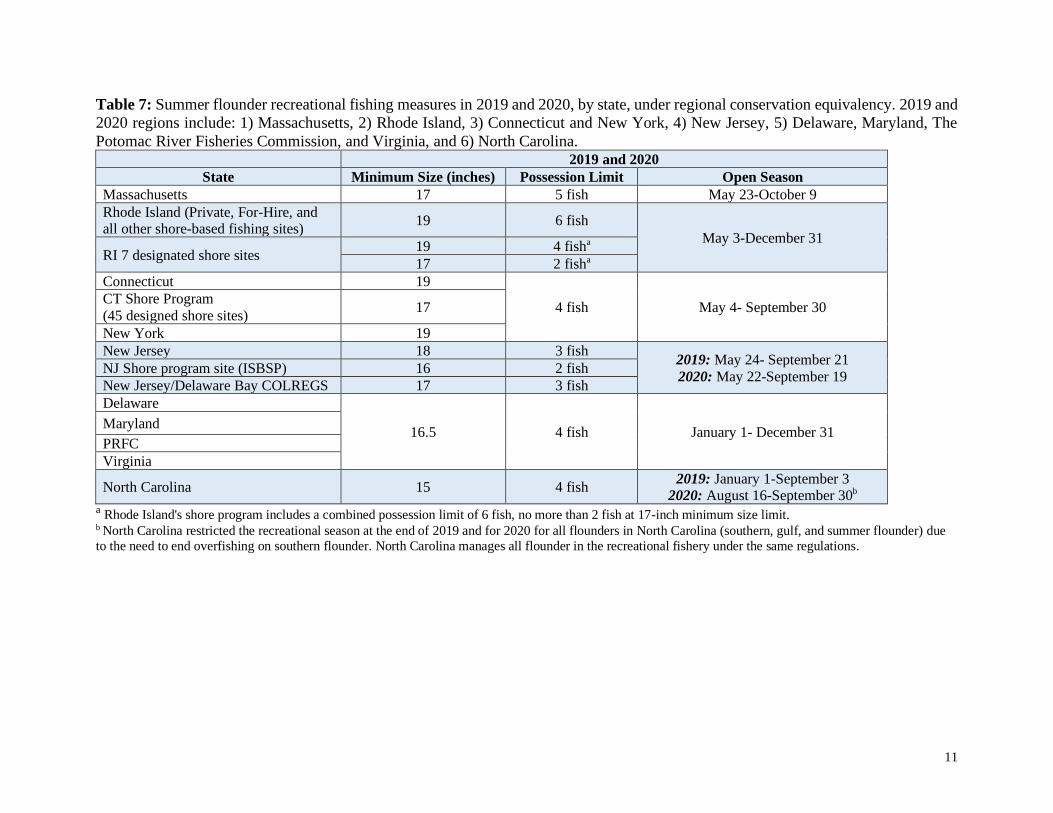
11
Table 7: Summer flounder recreational fishing measures in 2019 and 2020, by state, under regional conservation equivalency. 2019 and
2020 regions include: 1) Massachusetts, 2) Rhode Island, 3) Connecticut and New York, 4) New Jersey, 5) Delaware, Maryland, The
Potomac River Fisheries Commission, and Virginia, and 6) North Carolina. 2019 and 2020
State Minimum Size (inches) Possession Limit Open Season
Massachusetts 17 5 fish May 23-October 9
Rhode Island (Private, For-Hire, and all other shore-based fishing sites)
19 6 fish
May 3-December 31
RI 7 designated shore sites 19 4 fisha
17 2 fisha
Connecticut 19
4 fish May 4- September 30 CT Shore Program
(45 designed shore sites) 17
New York 19
New Jersey 18 3 fish 2019: May 24- September 21
2020: May 22-September 19 NJ Shore program site (ISBSP) 16 2 fish
New Jersey/Delaware Bay COLREGS 17 3 fish
Delaware
16.5 4 fish January 1- December 31 Maryland
PRFC
Virginia
North Carolina 15 4 fish 2019: January 1-September 3
2020: August 16-September 30b
a Rhode Island's shore program includes a combined possession limit of 6 fish, no more than 2 fish at 17-inch minimum size limit. b North Carolina restricted the recreational season at the end of 2019 and for 2020 for all flounders in North Carolina (southern, gulf, and summer flounder) due
to the need to end overfishing on southern flounder. North Carolina manages all flounder in the recreational fishery under the same regulations.

12
In July 2018, MRIP released revisions to their time series of recreational catch and landings
estimates based on adjustments for a revised angler intercept methodology and a new effort
estimation methodology (i.e., a transition from a telephone-based effort survey to a mail-based
effort survey). The revised estimates of catch and landings are several times higher than the
previous estimates for shore and private boat modes, substantially raising the overall summer
flounder catch and harvest estimates. On average, the new landings estimates for summer flounder
(in pounds) are 1.8 times higher over the time series 1981-2017, and 2.3 times higher over the past
10 years (2008-2017). In 2017, new estimates of landings in pounds were 3.16 times higher than
the previous estimates.
Revised MRIP estimates indicate that recreational catch for summer flounder peaked in 2010 with
58.89 million fish caught. Recreational harvest peaked in 1983, with 25.78 million fish landed,
totaling 36.74 million pounds. Recreational catch reached a low in 1989 with 5.06 million fish
caught. Recreational harvest in numbers of fish reached a low in 2019 with 2.38 million fish landed
(7.80 million pounds), while recreational harvest in pounds was lowest in 1989 at 5.66 million
pounds (Figure 6).6
Figure 6: MRIP estimates of recreational summer flounder harvest in numbers of fish and pounds
and catch in numbers of fish, ME - NC, 1981 - 2019. All series represent revised MRIP estimates.6
For-hire vessels carrying passengers in federal waters must obtain a federal party/charter permit.
In 2019, 821 vessels held summer flounder federal party/charter permits.7 Many of these vessels
also hold recreational permits for scup and black sea bass.
0
10
20
30
40
50
60
70
1981
1982
1983
1984
1985
1986
1987
1988
1989
1990
1991
1992
1993
1994
1995
1996
1997
1998
1999
2000
2001
2002
2003
2004
2005
2006
2007
2008
2009
2010
2011
2012
2013
2014
2015
2016
2017
2018
2019
mil
lions
(lb o
r fi
sh)
Landings (lb) Landings (no) catch (no)

13
On average, an estimated 83 percent of the recreational landings (in numbers of fish) occurred in
state waters over the past ten years, and about 79 percent of landings came from state waters in
2019 (Table 8). The majority of summer flounder were landed in New York and New Jersey in
2019 (70%; Table 9).6
About 87% of recreational summer flounder harvest in 2019 was from anglers who fished on
private or rental boats. About 3% was from party or charter boats, and about 10% was from anglers
fishing from shore. The revised MRIP methodology resulted in an increase in the amount of harvest
estimated to occur from private and shore modes while making only minor changes to the estimates
for party/charter modes, modifying the percentages attributable to each mode (Table 10).6
Table 8: Estimated percentage of summer flounder recreational landings (in numbers of fish)
from state vs. federal waters, Maine through North Carolina, 2010-2019 (revised MRIP data).6
Year State <= 3 mi EEZ > 3 mi
2010 93% 7%
2011 94% 6%
2012 86% 14%
2013 77% 23%
2014 78% 22%
2015 82% 18%
2016 79% 21%
2017 80% 20%
2018 83% 17%
2019 79% 21%
Avg. 2010 - 2019 83% 17%
Avg. 2017 - 2019 81% 19%
Table 9: State contribution (as a percentage) to total recreational landings of summer flounder
(in numbers of fish), from Maine through North Carolina, 2017-2019 (revised MRIP data).6
State 2017 2018 2019 2017-2019 average
Maine 0% 0% 0% 0%
New Hampshire 0% 0% 0% 0%
Massachusetts 2% 3% 2% 2%
Rhode Island 5% 7% 9% 7%
Connecticut 4% 6% 4% 5%
New York 37% 27% 24% 29%
New Jersey 38% 43% 46% 43%
Delaware 3% 4% 4% 3%
Maryland 2% 2% 3% 2%
Virginia 6% 6% 6% 6%
North Carolina 3% 2% 1% 2%
Total 100% 100% 100% 100%

14
Table 10: The percent of summer flounder landings (in number of fish) by recreational fishing
mode, Maine through North Carolina, 1981-2019 (revised MRIP data).6
Year Shore Party/Charter Private/Rental Total number of fish
landed (millions)
2010 10% 4% 86% 3.51
2011 4% 3% 93% 4.33
2012 9% 3% 88% 5.74
2013 11% 4% 85% 6.60
2014 7% 8% 84% 5.36
2015 7% 7% 86% 4.03
2016 8% 4% 89% 4.30
2017 13% 4% 83% 3.17
2018 11% 6% 84% 2.41
2019 10% 3% 87% 2.38
% of Total, 1981-2019 14% 7% 78% --
% of Total, 2015-2019 9% 6% 85% --
References
1 Packer, D. B, S. J. Griesbach, P. L. Berrien, C. A. Zetlin, D. L. Johnson, and W.W. Morse.
1999. Essential Fish Habitat Source Document: Summer Flounder, Paralichthys dentatus, Life
History and Habitat Characteristics. NOAA Technical Memorandum NMFS-NE-151.
2 Northeast Fisheries Science Center. 2019. Data Update for Summer Flounder.
3 Northeast Fisheries Science Center (NEFSC). 2019. 66th Northeast Regional Stock Assessment
Workshop (66th SAW) Assessment Summary Report. US Dept Commer, Northeast Fish Sci
Cent Ref Doc. 19-01; 40 p. Available from:
https://www.nefsc.noaa.gov/publications/crd/crd1908/.
4 Northeast Fisheries Science Center. 2020. Data Update for Summer Flounder.
5 Unpublished NMFS dealer data as of May 7, 2020.
6 Personal communication from the National Marine Fisheries Service, Fisheries Statistics
Division. Accessed May 12, 2020. Available at: http://www.st.nmfs.noaa.gov/recreational-
fisheries/index.
7 Unpublished NMFS permit data as of January 17, 2020.
8 Unpublished NMFS Vessel Trip Report (VTR) data as of February 28, 2020.
Page 1 of 1
M E M O R A N D U M
Date: July 29, 2020
To: Council and Board
From: Karson Coutre, Staff
Subject: Scup Commercial Discards Report
The Council and Board will review commercial scup discards on Tuesday, August 11, 2020.
Materials listed below are provided for the Council and Board’s consideration of this agenda item.
1) 2020 Commercial Fishery Scup Discard Report
A Monitoring Committee meeting summary from their July 27, 2020 meeting will be added to the
supplemental meeting materials on the August meeting page under the Summer Flounder 2021
Specifications agenda item (Tab 5).
Mid-Atlantic Fishery Management Council 800 North State Street, Suite 201, Dover, DE 19901
Phone: 302-674-2331 ǀ FAX: 302-674-5399 ǀ www.mafmc.org Michael P. Luisi, Chairman ǀ G. Warren Elliott, Vice Chairman
Christopher M. Moore, Ph.D., Executive Director

1
Commercial Fishery Scup Discard Report
2020
Background This document focuses on scup discards in the commercial fishery estimated using the methodology that was peer-reviewed and approved in the 2015 benchmark stock assessment. Scup trawl discards are estimated by calendar quarter, statistical area, and three mesh categories: large (i.e. 5” or greater), small (i.e. smaller than 5” but larger than 2.125”), and squid (i.e. 2.125” or less). Estimated discards are calculated using observer, VTR, and dealer data (NEFSC 2015). Commercial discards for other gear types are not estimated in this manner and are not incorporated into the stock assessment since other gear types account for comparatively small amounts of scup catch.
The scup Gear Restricted Areas (GRAs) became effective November 2000 and have been modified several times. They were designed to reduce bycatch of juvenile scup in small mesh fisheries. Currently, the Southern GRA is in effect from January 1 - March 15. The Northern GRA is in effect from November 1 - December 31. The most recent change in boundary of southern scup GRA became effective January 1, 2017 (Figure 1). Vessels fishing in the GRAs during the affected times of year may not fish for, possess, or land longfin squid, black sea bass, or silver hake/whiting unless they use diamond mesh of at least 5 inches in diameter.
Effective January 1, 2016, the incidental scup possession limit for trawl vessels using mesh smaller than 5 inches in diameter during November-April increased from 500 pounds to 1,000 pounds. This change was intended to reduce scup discards considering the large increase in scup biomass since this regulation was last changed. Effective January 1, 2019, the incidental scup possession limit from April 15-June 15 was further increased to 2,000 pounds to allow the spring small mesh inshore fisheries for longfin squid to retain, rather than discard, more of the scup they catch incidentally.
The 2015 year class was estimated to be 326 million fish, the largest year class in the assessment time series since 1984 (NEFSC 2019). In 2017, these fish were mostly too small (< 8 inches/ <20 cm) to be landed in the commercial fishery (Mark Terceiro, NEFSC, personal communication). However, by 2018, they should have been fully recruited to the fishery (i.e. at least 9 inches in length). Recruitment decreased during 2016-2018. Based on the 2019 operational assessment, spawning stock biomass (SSB) is projected to further decrease toward the target unless more above average year classes recruit to the stock in the short term (Figure 2).
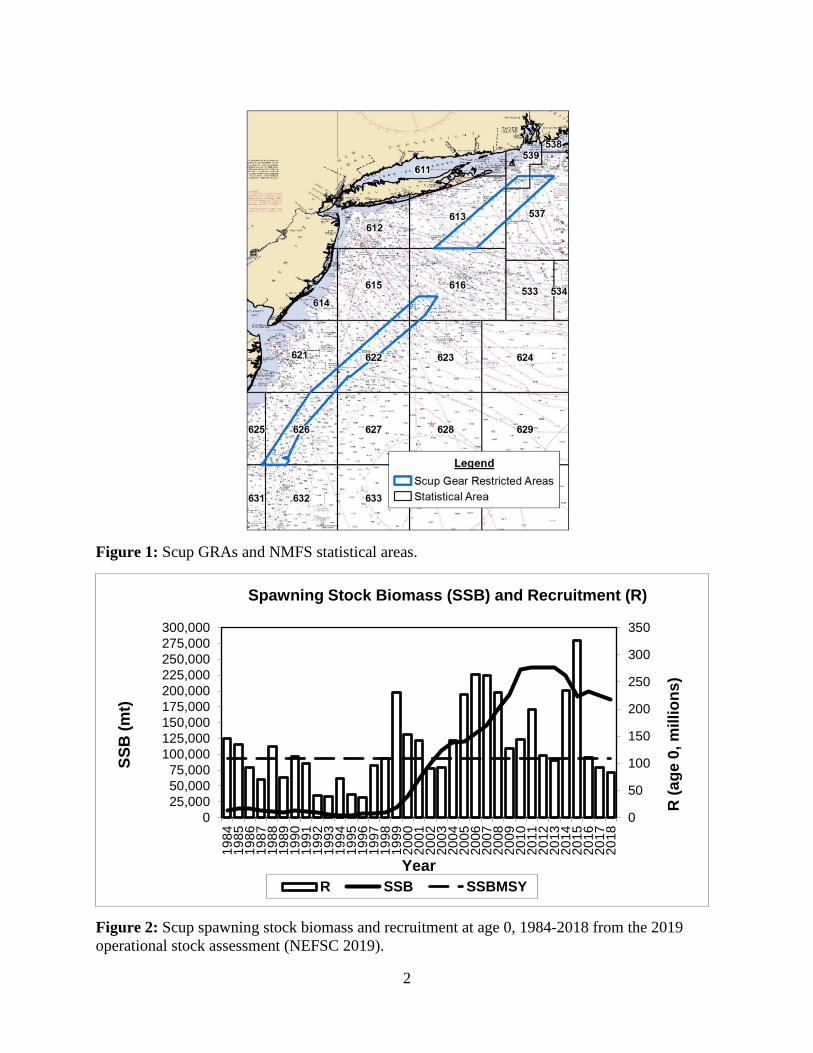
2
Figure 1: Scup GRAs and NMFS statistical areas.
Figure 2: Scup spawning stock biomass and recruitment at age 0, 1984-2018 from the 2019 operational stock assessment (NEFSC 2019).
0
50
100
150
200
250
300
350
025,00050,00075,000
100,000125,000150,000175,000200,000225,000250,000275,000300,000
1984
1985
1986
1987
1988
1989
1990
1991
1992
1993
1994
1995
1996
1997
1998
1999
2000
2001
2002
2003
2004
2005
2006
2007
2008
2009
2010
2011
2012
2013
2014
2015
2016
2017
2018
R (a
ge 0
, mill
ions
)
SSB
(mt)
Year
Spawning Stock Biomass (SSB) and Recruitment (R)
R SSB SSBMSY
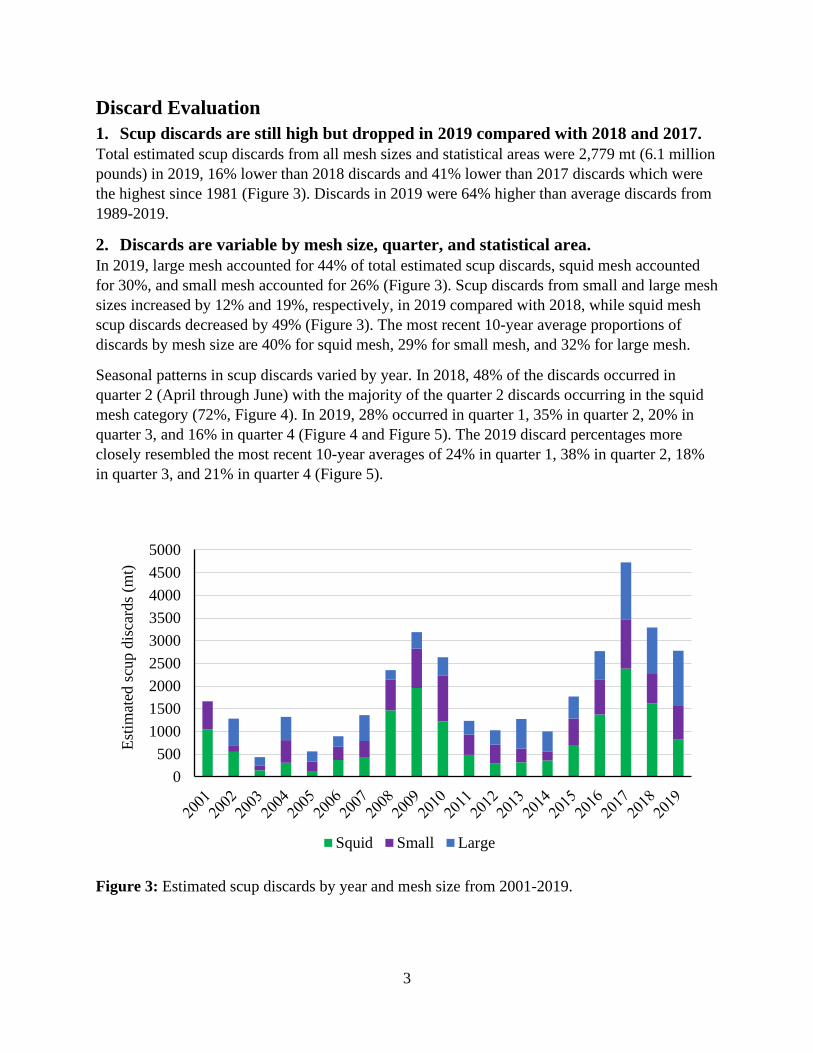
3
Discard Evaluation 1. Scup discards are still high but dropped in 2019 compared with 2018 and 2017. Total estimated scup discards from all mesh sizes and statistical areas were 2,779 mt (6.1 million pounds) in 2019, 16% lower than 2018 discards and 41% lower than 2017 discards which were the highest since 1981 (Figure 3). Discards in 2019 were 64% higher than average discards from 1989-2019.
2. Discards are variable by mesh size, quarter, and statistical area. In 2019, large mesh accounted for 44% of total estimated scup discards, squid mesh accounted for 30%, and small mesh accounted for 26% (Figure 3). Scup discards from small and large mesh sizes increased by 12% and 19%, respectively, in 2019 compared with 2018, while squid mesh scup discards decreased by 49% (Figure 3). The most recent 10-year average proportions of discards by mesh size are 40% for squid mesh, 29% for small mesh, and 32% for large mesh.
Seasonal patterns in scup discards varied by year. In 2018, 48% of the discards occurred in quarter 2 (April through June) with the majority of the quarter 2 discards occurring in the squid mesh category (72%, Figure 4). In 2019, 28% occurred in quarter 1, 35% in quarter 2, 20% in quarter 3, and 16% in quarter 4 (Figure 4 and Figure 5). The 2019 discard percentages more closely resembled the most recent 10-year averages of 24% in quarter 1, 38% in quarter 2, 18% in quarter 3, and 21% in quarter 4 (Figure 5).
Figure 3: Estimated scup discards by year and mesh size from 2001-2019.
0500
100015002000250030003500400045005000
Estim
ated
scup
dis
card
s (m
t)
Squid Small Large

4
Figure 4: 2018 and 2019 estimated discards by quarter and mesh size.
0
200
400
600
800
1000
1200
Q1 Q2 Q3 Q4
Estim
ated
scup
dis
card
s (m
t)2018
Squid mesh
Small mesh
Large mesh
0
200
400
600
800
1000
1200
Q1 Q2 Q3 Q4Quarter
2019
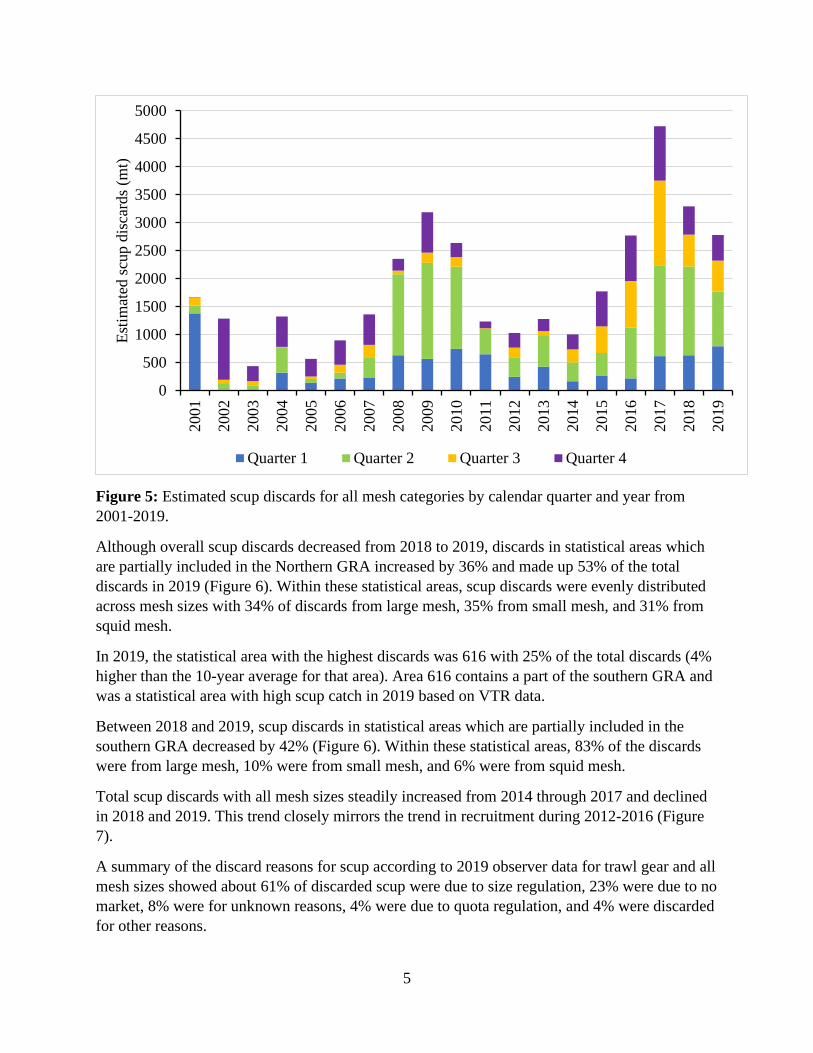
5
Figure 5: Estimated scup discards for all mesh categories by calendar quarter and year from 2001-2019.
Although overall scup discards decreased from 2018 to 2019, discards in statistical areas which are partially included in the Northern GRA increased by 36% and made up 53% of the total discards in 2019 (Figure 6). Within these statistical areas, scup discards were evenly distributed across mesh sizes with 34% of discards from large mesh, 35% from small mesh, and 31% from squid mesh.
In 2019, the statistical area with the highest discards was 616 with 25% of the total discards (4% higher than the 10-year average for that area). Area 616 contains a part of the southern GRA and was a statistical area with high scup catch in 2019 based on VTR data.
Between 2018 and 2019, scup discards in statistical areas which are partially included in the southern GRA decreased by 42% (Figure 6). Within these statistical areas, 83% of the discards were from large mesh, 10% were from small mesh, and 6% were from squid mesh.
Total scup discards with all mesh sizes steadily increased from 2014 through 2017 and declined in 2018 and 2019. This trend closely mirrors the trend in recruitment during 2012-2016 (Figure 7).
A summary of the discard reasons for scup according to 2019 observer data for trawl gear and all mesh sizes showed about 61% of discarded scup were due to size regulation, 23% were due to no market, 8% were for unknown reasons, 4% were due to quota regulation, and 4% were discarded for other reasons.
0
500
1000
1500
2000
2500
3000
3500
4000
4500
5000
2001
2002
2003
2004
2005
2006
2007
2008
2009
2010
2011
2012
2013
2014
2015
2016
2017
2018
2019
Estim
ated
scup
dis
card
s (m
t)
Quarter 1 Quarter 2 Quarter 3 Quarter 4
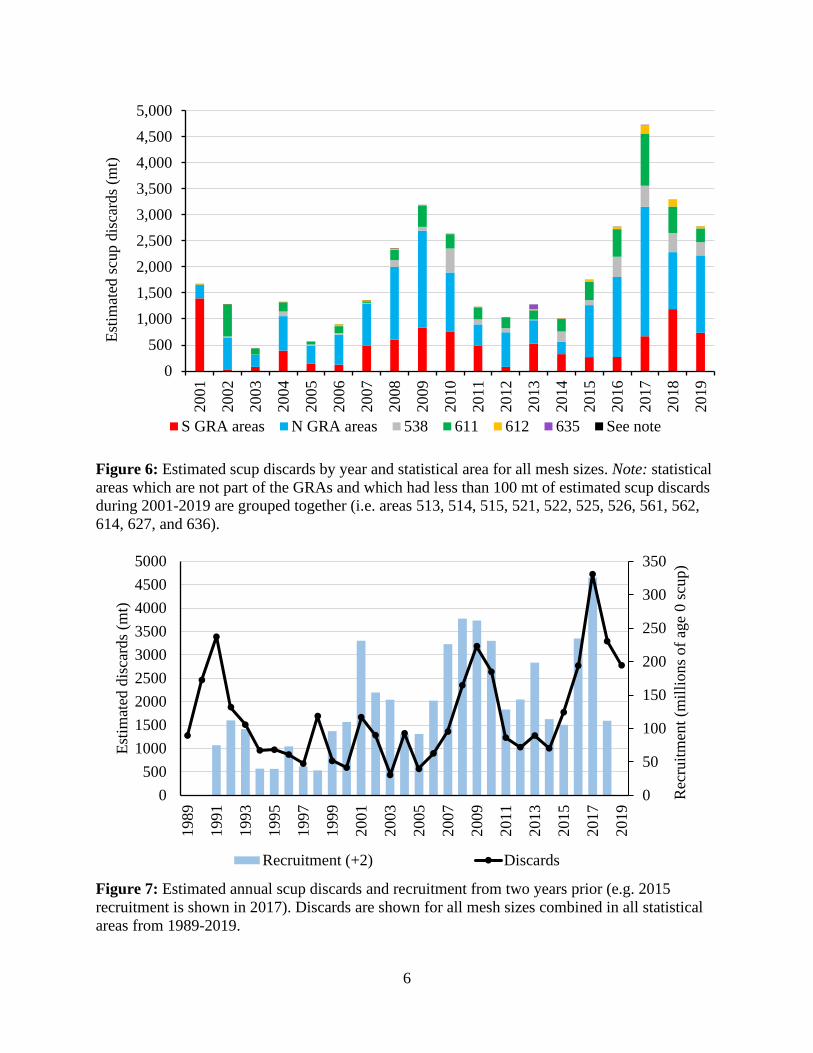
6
Figure 6: Estimated scup discards by year and statistical area for all mesh sizes. Note: statistical areas which are not part of the GRAs and which had less than 100 mt of estimated scup discards during 2001-2019 are grouped together (i.e. areas 513, 514, 515, 521, 522, 525, 526, 561, 562, 614, 627, and 636).
Figure 7: Estimated annual scup discards and recruitment from two years prior (e.g. 2015 recruitment is shown in 2017). Discards are shown for all mesh sizes combined in all statistical areas from 1989-2019.
0500
1,0001,5002,0002,5003,0003,5004,0004,5005,000
2001
2002
2003
2004
2005
2006
2007
2008
2009
2010
2011
2012
2013
2014
2015
2016
2017
2018
2019
Estim
ated
scup
dis
card
s (m
t)
S GRA areas N GRA areas 538 611 612 635 See note
0
50
100
150
200
250
300
350
0500
100015002000250030003500400045005000
1989
1991
1993
1995
1997
1999
2001
2003
2005
2007
2009
2011
2013
2015
2017
2019
Rec
ruitm
ent (
mill
ions
of a
ge 0
scup
)
Estim
ated
dis
card
s (m
t)
Recruitment (+2) Discards

7
3. Average scup discards were lower after GRA implementation, while the effects of recent GRA modification are unknown.
Discards from statistical areas that are partially included in the southern GRA during quarter 1 were compared before and after the GRA implementation in 2000. The pre-GRA discard average was 344 mt and the post-GRA average was 224 mt, a 35% decrease in discards (Figure 8). Note that the southern GRA is not in effect for the entirety of quarter 1.
Discards from statistical areas that are partially included in the northern GRA during quarter 4 were compared before and after the GRA implementation. The pre-GRA discard average was 426 mt and the post-GRA average was 172 mt, a 60% decrease in discards (Figure 8). Note that the northern GRA is not in effect for the entirety of quarter 4.
Annual discard estimates (all quarters, mesh sizes, and areas) as a proportion of SSB averaged 20% from 1989-1999 and 1% from 2001-2019 (Figure 9).
The most recent boundary change to the southern GRA became effective in 2017 which coincided with the record-high 2015 year class reaching 2 years of age. This influx of juvenile scup too small to be landed likely contributed to the high discards in 2017 (Figure 7). Based on NEFSC trawl data from 1972-2016, trends in areas of high scup biomass show that scup currently and historically have had high biomass in locations within the GRA boundaries (see appendix).
Figure 8: Average estimated scup discards from statistical areas that are partially included in the GRAs during the quarter they are in effect. Discard estimates were averaged across the years before and after the GRAs were in effect.
0.0
50.0
100.0
150.0
200.0
250.0
300.0
350.0
400.0
450.0
Southern GRA areas (Q1) Northern GRA areas (Q4)
Aver
age
Dis
card
s (m
t) Pre GRA
Post GRA
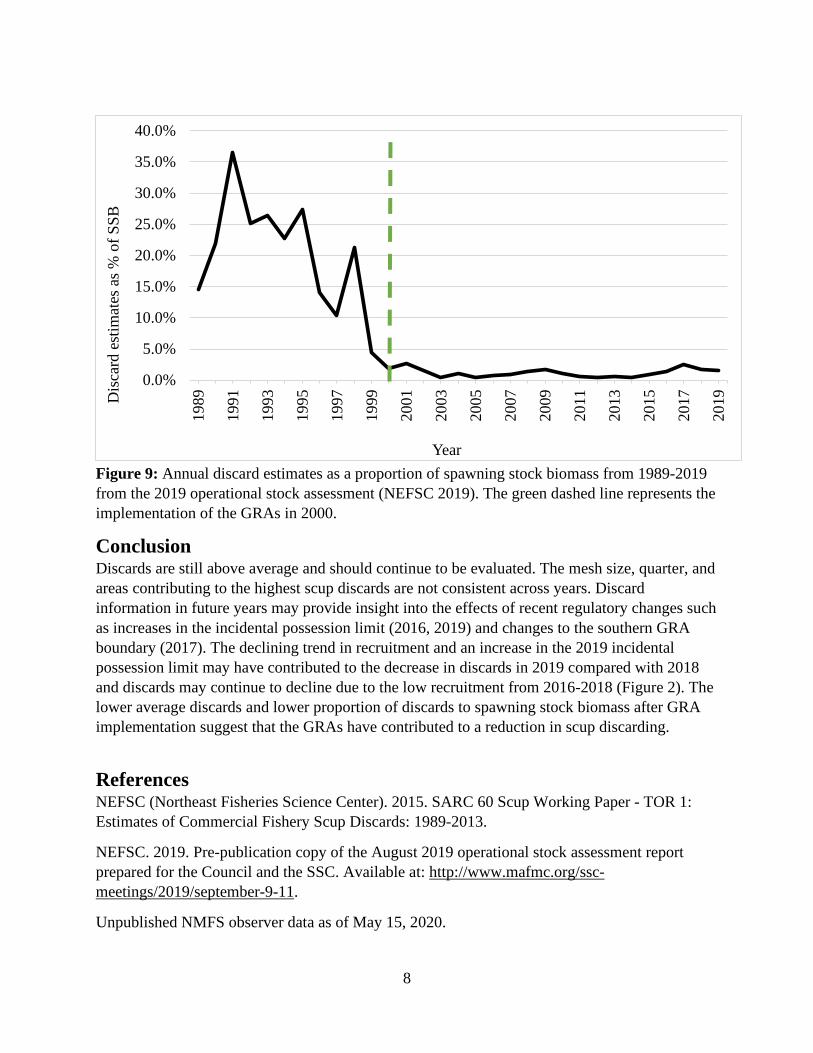
8
Figure 9: Annual discard estimates as a proportion of spawning stock biomass from 1989-2019 from the 2019 operational stock assessment (NEFSC 2019). The green dashed line represents the implementation of the GRAs in 2000.
Conclusion Discards are still above average and should continue to be evaluated. The mesh size, quarter, and areas contributing to the highest scup discards are not consistent across years. Discard information in future years may provide insight into the effects of recent regulatory changes such as increases in the incidental possession limit (2016, 2019) and changes to the southern GRA boundary (2017). The declining trend in recruitment and an increase in the 2019 incidental possession limit may have contributed to the decrease in discards in 2019 compared with 2018 and discards may continue to decline due to the low recruitment from 2016-2018 (Figure 2). The lower average discards and lower proportion of discards to spawning stock biomass after GRA implementation suggest that the GRAs have contributed to a reduction in scup discarding.
References NEFSC (Northeast Fisheries Science Center). 2015. SARC 60 Scup Working Paper - TOR 1: Estimates of Commercial Fishery Scup Discards: 1989-2013.
NEFSC. 2019. Pre-publication copy of the August 2019 operational stock assessment report prepared for the Council and the SSC. Available at: http://www.mafmc.org/ssc-meetings/2019/september-9-11.
Unpublished NMFS observer data as of May 15, 2020.
0.0%
5.0%
10.0%
15.0%
20.0%
25.0%
30.0%
35.0%
40.0%
1989
1991
1993
1995
1997
1999
2001
2003
2005
2007
2009
2011
2013
2015
2017
2019D
isca
rd e
stim
ates
as %
of S
SB
Year
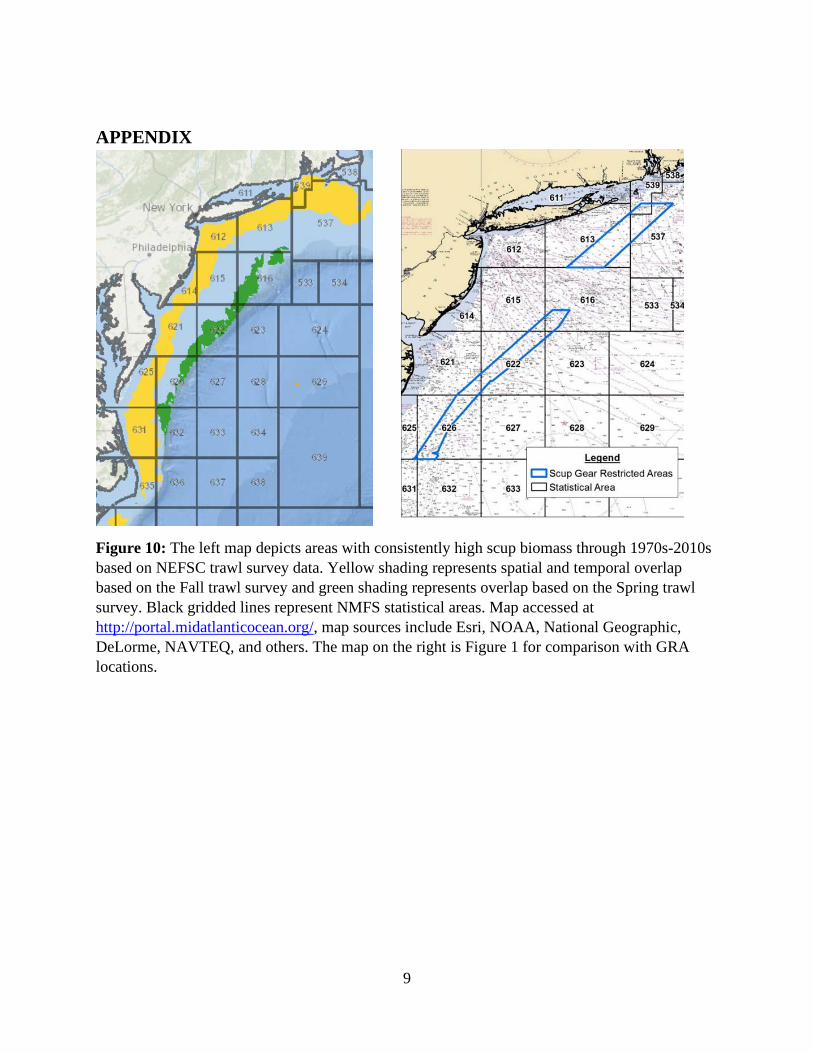
9
APPENDIX
Figure 10: The left map depicts areas with consistently high scup biomass through 1970s-2010s based on NEFSC trawl survey data. Yellow shading represents spatial and temporal overlap based on the Fall trawl survey and green shading represents overlap based on the Spring trawl survey. Black gridded lines represent NMFS statistical areas. Map accessed at http://portal.midatlanticocean.org/, map sources include Esri, NOAA, National Geographic, DeLorme, NAVTEQ, and others. The map on the right is Figure 1 for comparison with GRA locations.
Page 1 of 1
M E M O R A N D U M
Date: July 29, 2020
To: Council and Board
From: Karson Coutre, Staff
Subject: Scup Specifications Review for 2021
On Tuesday, August 11, the Council and Board will review previously adopted 2021 specifications for scup and consider modifications based on revised SSC and Monitoring Committee recommendations. These modified recommendations were developed to update the 2021 specifications for consistency with the Council's revised risk policy adopted in December 2019. Materials listed below are provided for the Council and Board’s consideration of this agenda item.
Please note that some materials are behind other tabs and some will be posted to supplemental materials.
1) July 2020 Scientific and Statistical Committee meeting report (behind Tab 11)
2) Staff memo on 2021 scup specifications dated July 7, 2020
3) Scup Data Update for 2020
4) June 2020 Advisory Panel Fishery Performance Report and additional AP comments received through July 9, 2020 (behind Tab 5)
5) 2020 Scup Fishery Information Document
6) Additional public comments received through July 29, 2020 (behind Tab 5)
The following documents will be added as supplemental meeting materials on the August meeting page under the Summer Flounder 2021 Specifications agenda item (Tab 5):
1) Monitoring Committee meeting summary from July 27
2) Advisory Panel meeting summary from July 29
Mid-Atlantic Fishery Management Council 800 North State Street, Suite 201, Dover, DE 19901
Phone: 302-674-2331 ǀ FAX: 302-674-5399 ǀ www.mafmc.org Michael P. Luisi, Chairman ǀ G. Warren Elliott, Vice Chairman
Christopher M. Moore, Ph.D., Executive Director

SSC Report is behind Tab 11
Page | 1
M E M O R A N D U M DATE: July 7, 2020
TO: Chris Moore, Executive Director
FROM: Karson Coutre, Staff
SUBJECT: Review of 2021 Scup Specifications
Executive Summary In 2019, specifications for scup were set for 2020 and 2021 based on the results of an operational stock assessment which was peer reviewed and accepted in August 2019. This assessment incorporated fishery catch and fishery-independent survey data through 2018, including revised recreational catch data provided by the Marine Recreational Information Program (MRIP) for 1989-2018.
The 2019 assessment indicates that the scup stock was not overfished, and overfishing was not occurring in 2018 relative to the updated biological reference points calculated through the assessment. Spawning stock biomass (SSB) was estimated to be about 411 million pounds (186,578 mt) in 2018, about 2 times the SSBMSY proxy reference point (i.e. SSB40%) of 207 million pounds (94,020 mt). Fishing mortality (F) on fully selected age 3 scup was 0.158 in 2018, about 73% of the FMSY proxy reference point (F40%) of 0.215. The 2015 year class is estimated to be the largest in the time series at 326 million fish, while the 2016-2018 year classes are estimated to be below average.1
The Council and the Atlantic States Marine Fisheries Commission’s (ASMFC’s) Summer Flounder, Scup, and Black Sea Bass Management Board (Board) adopted 2020-2021 annually varying specifications at their October 2019 meeting. These catch and landings limits (Table 1) were implemented via final rule May 15, 2020 (85 FR 29345), replacing the interim 2020 measures adopted in mid-2019 (84 FR 54041).
The 2021 measures currently implemented include an Acceptable Biological Catch (ABC) of 30.67 million lb or 13,913 mt, which is 14% lower than the 2020 ABC. This ABC and the corresponding sector-specific catch and landings limits for 2021 may remain unchanged if the Scientific and Statistical Committee (SSC), Council, and Board determine that no changes are warranted. However, the Council adopted revisions to their risk policy in December 2019. The SSC should consider whether the 2021 scup ABC should be revised based on the new risk policy.
Similarly, the Monitoring Committee will review recent fishery performance and make a recommendation to the Council and Board regarding any potential modifications to the implemented 2021 commercial and
1 A prepublication copy of the August 2019 operational stock assessment report prepared for the Council and the SSC is available at: http://www.mafmc.org/ssc-meetings/2019/september-9-11
Mid-Atlantic Fishery Management Council 800 North State Street, Suite 201, Dover, DE 19901
Phone: 302-674-2331 ǀ FAX: 302-674-5399 ǀ www.mafmc.org Michael P. Luisi, Chairman ǀ G. Warren Elliott, Vice Chairman
Christopher M. Moore, Ph.D., Executive Director
Page | 2
recreational Annual Catch Limits (ACLs) and Annual Catch Targets (ACTs) as well as the set of commercial management measures that can be modified through specifications.
The currently implemented 2020 and 2021 catch and landings limits are shown in Table 1. The methods used to derive these measures are described in more detail later in this memo.
As described below, staff recommend modifying the currently implemented catch and landings limits for 2021 to reflect recent changes to the Council's risk policy adopted in December 2019. Staff recommend no changes to the commercial measures for the scup fishery, including the minimum fish size, mesh size requirements and associated incidental possession limits, or pot/trap gear requirements for 2021.
Additional relevant information about the fishery and past management measures is presented in the Fishery Performance Report for scup developed by the Council and Commission Advisory Panels, as well as in the corresponding Scup Fishery Information Document prepared by Council staff.2
2 The Fishery Information Document and Fishery Performance Report are available at: https://www.mafmc.org/council-events/2020/july-ssc-meeting.
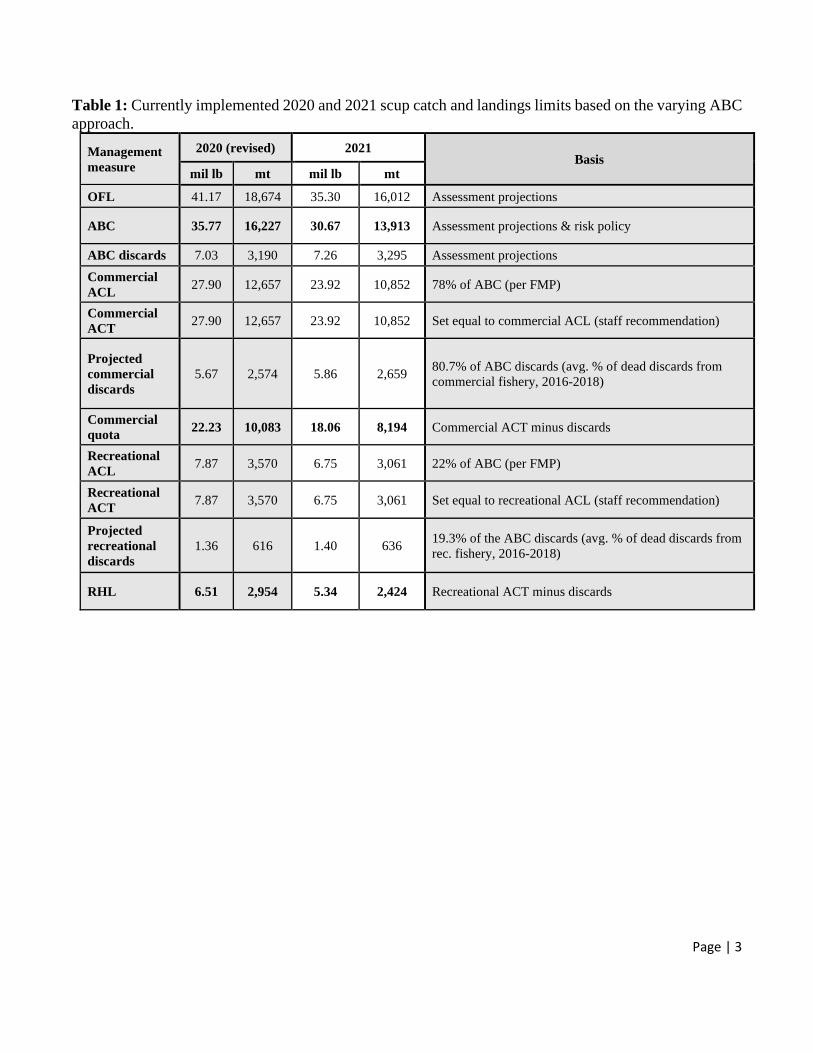
Page | 3
Table 1: Currently implemented 2020 and 2021 scup catch and landings limits based on the varying ABC approach.
Management measure
2020 (revised) 2021 Basis
mil lb mt mil lb mt
OFL 41.17 18,674 35.30 16,012 Assessment projections
ABC 35.77 16,227 30.67 13,913 Assessment projections & risk policy
ABC discards 7.03 3,190 7.26 3,295 Assessment projections Commercial ACL 27.90 12,657 23.92 10,852 78% of ABC (per FMP)
Commercial ACT 27.90 12,657 23.92 10,852 Set equal to commercial ACL (staff recommendation)
Projected commercial discards
5.67 2,574 5.86 2,659 80.7% of ABC discards (avg. % of dead discards from commercial fishery, 2016-2018)
Commercial quota 22.23 10,083 18.06 8,194 Commercial ACT minus discards
Recreational ACL 7.87 3,570 6.75 3,061 22% of ABC (per FMP)
Recreational ACT 7.87 3,570 6.75 3,061 Set equal to recreational ACL (staff recommendation)
Projected recreational discards
1.36 616 1.40 636 19.3% of the ABC discards (avg. % of dead discards from rec. fishery, 2016-2018)
RHL 6.51 2,954 5.34 2,424 Recreational ACT minus discards
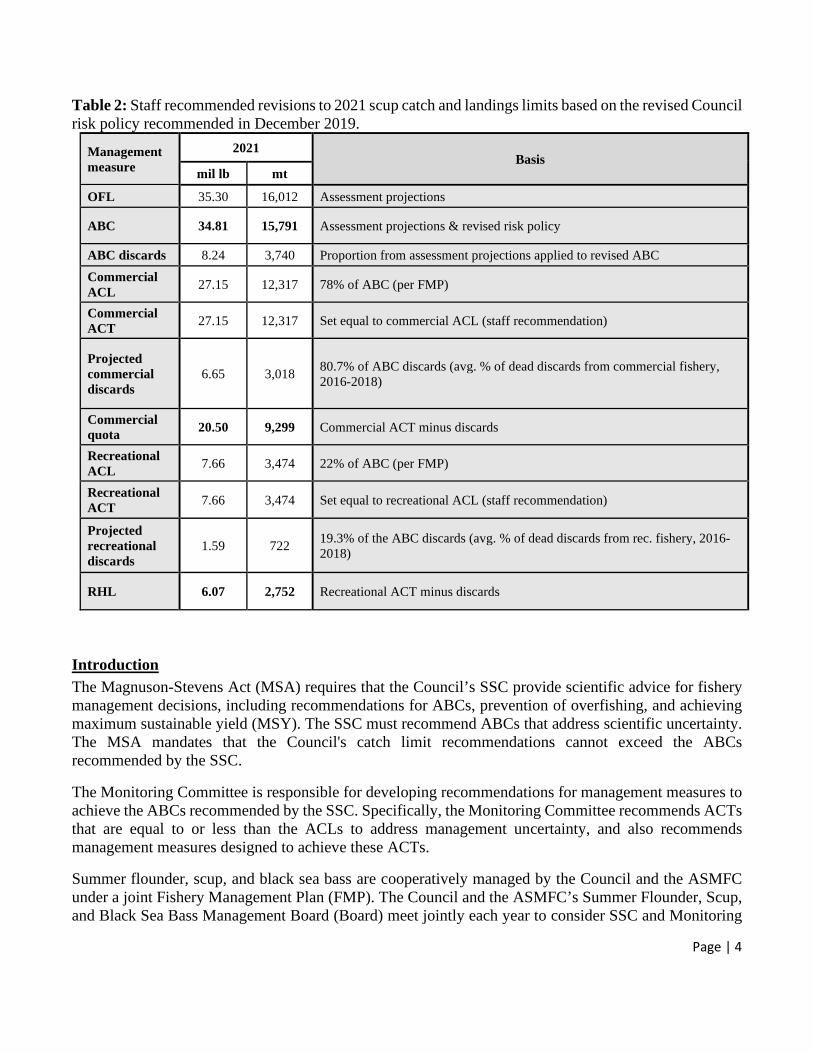
Page | 4
Table 2: Staff recommended revisions to 2021 scup catch and landings limits based on the revised Council risk policy recommended in December 2019.
Management measure
2021 Basis
mil lb mt
OFL 35.30 16,012 Assessment projections
ABC 34.81 15,791 Assessment projections & revised risk policy
ABC discards 8.24 3,740 Proportion from assessment projections applied to revised ABC Commercial ACL 27.15 12,317 78% of ABC (per FMP)
Commercial ACT 27.15 12,317 Set equal to commercial ACL (staff recommendation)
Projected commercial discards
6.65 3,018 80.7% of ABC discards (avg. % of dead discards from commercial fishery, 2016-2018)
Commercial quota 20.50 9,299 Commercial ACT minus discards
Recreational ACL 7.66 3,474 22% of ABC (per FMP)
Recreational ACT 7.66 3,474 Set equal to recreational ACL (staff recommendation)
Projected recreational discards
1.59 722 19.3% of the ABC discards (avg. % of dead discards from rec. fishery, 2016-2018)
RHL 6.07 2,752 Recreational ACT minus discards
Introduction The Magnuson-Stevens Act (MSA) requires that the Council’s SSC provide scientific advice for fishery management decisions, including recommendations for ABCs, prevention of overfishing, and achieving maximum sustainable yield (MSY). The SSC must recommend ABCs that address scientific uncertainty. The MSA mandates that the Council's catch limit recommendations cannot exceed the ABCs recommended by the SSC.
The Monitoring Committee is responsible for developing recommendations for management measures to achieve the ABCs recommended by the SSC. Specifically, the Monitoring Committee recommends ACTs that are equal to or less than the ACLs to address management uncertainty, and also recommends management measures designed to achieve these ACTs.
Summer flounder, scup, and black sea bass are cooperatively managed by the Council and the ASMFC under a joint Fishery Management Plan (FMP). The Council and the ASMFC’s Summer Flounder, Scup, and Black Sea Bass Management Board (Board) meet jointly each year to consider SSC and Monitoring
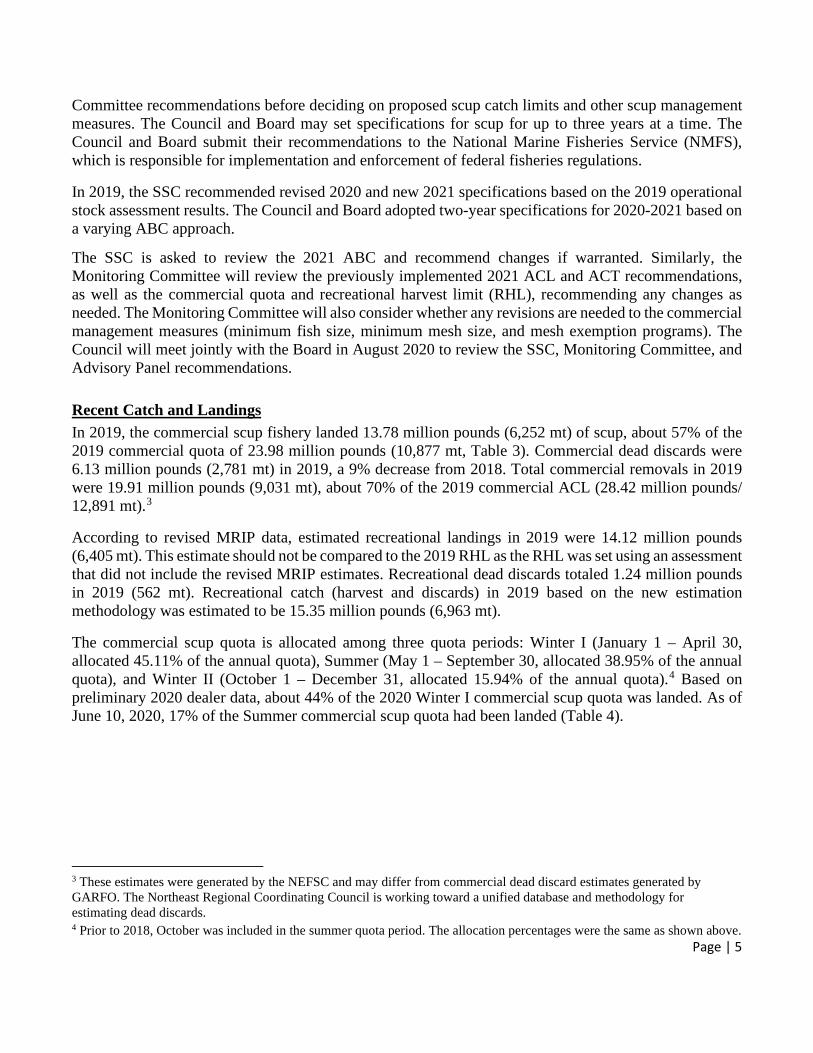
Page | 5
Committee recommendations before deciding on proposed scup catch limits and other scup management measures. The Council and Board may set specifications for scup for up to three years at a time. The Council and Board submit their recommendations to the National Marine Fisheries Service (NMFS), which is responsible for implementation and enforcement of federal fisheries regulations.
In 2019, the SSC recommended revised 2020 and new 2021 specifications based on the 2019 operational stock assessment results. The Council and Board adopted two-year specifications for 2020-2021 based on a varying ABC approach.
The SSC is asked to review the 2021 ABC and recommend changes if warranted. Similarly, the Monitoring Committee will review the previously implemented 2021 ACL and ACT recommendations, as well as the commercial quota and recreational harvest limit (RHL), recommending any changes as needed. The Monitoring Committee will also consider whether any revisions are needed to the commercial management measures (minimum fish size, minimum mesh size, and mesh exemption programs). The Council will meet jointly with the Board in August 2020 to review the SSC, Monitoring Committee, and Advisory Panel recommendations.
Recent Catch and Landings In 2019, the commercial scup fishery landed 13.78 million pounds (6,252 mt) of scup, about 57% of the 2019 commercial quota of 23.98 million pounds (10,877 mt, Table 3). Commercial dead discards were 6.13 million pounds (2,781 mt) in 2019, a 9% decrease from 2018. Total commercial removals in 2019 were 19.91 million pounds (9,031 mt), about 70% of the 2019 commercial ACL (28.42 million pounds/ 12,891 mt).3
According to revised MRIP data, estimated recreational landings in 2019 were 14.12 million pounds (6,405 mt). This estimate should not be compared to the 2019 RHL as the RHL was set using an assessment that did not include the revised MRIP estimates. Recreational dead discards totaled 1.24 million pounds in 2019 (562 mt). Recreational catch (harvest and discards) in 2019 based on the new estimation methodology was estimated to be 15.35 million pounds (6,963 mt).
The commercial scup quota is allocated among three quota periods: Winter I (January 1 – April 30, allocated 45.11% of the annual quota), Summer (May 1 – September 30, allocated 38.95% of the annual quota), and Winter II (October 1 – December 31, allocated 15.94% of the annual quota).4 Based on preliminary 2020 dealer data, about 44% of the 2020 Winter I commercial scup quota was landed. As of June 10, 2020, 17% of the Summer commercial scup quota had been landed (Table 4).
3 These estimates were generated by the NEFSC and may differ from commercial dead discard estimates generated by GARFO. The Northeast Regional Coordinating Council is working toward a unified database and methodology for estimating dead discards. 4 Prior to 2018, October was included in the summer quota period. The allocation percentages were the same as shown above.

Page | 6
Table 3: Scup commercial and recreational landings relative to quotas and RHLs (in millions of pounds), 2015-2019. The RHL overage/underage evaluation is based on recreational harvest estimates using the old MRIP-estimation methodology.
Year Com. landings
Com. quota
Quota underage
Rec. harvest (old MRIP estimates)
RHL RHL underage
Rec. harvest (new MRIP estimates)
2015 17.03 21.23 -20% 4.41 6.80 -35% 11.93 2016 15.76 20.47 -23% 4.26 6.09 -30% 10.00 2017 15.44 18.38 -16% 5.42 5.50 -1% 13.53 2018 13.37 23.98 -44% 5.61 7.37 -24% 12.98 2019 13.78 23.98 -43% 7.37 14.12
Table 4: Commercial scup landings during the 2020 Winter I and Summer quota periods (as of the week ending June 10, 2020), according to preliminary data from NMFS weekly landings reports. The Winter I quota is a coast-wide quota. The Summer period quota is allocated among states under the Commission’s FMP.
State Winter I
Landings (pounds) January 1 – April 29, 2020*
Summer Landings (pounds)
May 1 – June 10, 2020* Maine
N/A
0 New Hampshire 0 Massachusetts 50,335 Rhode Island 796,371 Connecticut 64,048 New York 502,545 New Jersey 9,286 Delaware 0 Maryland 0 Virginia 5,943 North Carolina 194 Other 0 Total landings 4,730,147 1,428,726 Quota 10,820,000 8,658,277 Percent of Quota 44% 17%
*Note: The Winter I period lasts from January 1 through April 30. The 2019 Summer period lasts from May 1 through September 30. Landings in this table are from the NMFS quota monitoring site, which reports landings by week, rather than by quota period; thus, the Winter I landings shown above do not account for 100% of the 2020 Winter I landings.

Page | 7
Stock Status and Biological Reference Points A scup operational stock assessment was peer reviewed and accepted in August 2019. This assessment retained the model structure of the previous benchmark stock assessment, completed in 2015,5 and incorporated fishery catch and fishery-independent survey data through 2018, including revised recreational data provided by MRIP for 1981-2018. The following information is based on the prepublication draft of the August 2019 operational assessment prepared for use by the Council and SSC.6
The updated fishing mortality reference point is FMSY proxy = F40% = 0.215 and the updated biomass reference point is SSB MSY proxy = SSB40% = 207.279 million pounds (94,020 mt). The minimum biomass threshold of ½ SSB MSY proxy = ½ SSB40% = 103.639 million pounds (47,010 mt, Table 5).
According to the 2019 operational stock assessment, the scup stock north of Cape Hatteras, North Carolina extending north to the US-Canada border was not overfished and overfishing was not occurring in 2018. Spawning stock biomass (SSB) was estimated to be about 411 million pounds (186,578 mt) in 2018, about 2 times the SSBMSY proxy reference point of 207 million pounds (94,020 mt, Figure 1), meaning that the stock was not overfished in 2018. Fishing mortality on fully selected age 3 scup was 0.158 in 2018, about 73% of the FMSY proxy reference point of 0.215 (Figure 2), meaning that overfishing was not occurring in 2018. The 2015 year class is estimated to be the largest in the time series at 326 million fish, while the 2016-2018 year classes are estimated to be below average at 112 million fish, 93 million fish and 83 million fish, respectively (Figure 1).
In July 2020, Northeast Fisheries Science Center (NEFSC) provided a data update for 2020, including updated landings information as well as NEFSC trawl survey indices through 2019. From 2018 to 2019, survey indices of abundance decreased for the fall survey (4.35 to 2.24 kg/tow) and increased for the spring survey (1.24 to 2.59 kg/tow).7
5 60th Northeast Stock Assessment Workshop (2015) assessment report and peer review summaries are available at: https://www.nefsc.noaa.gov/saw/reports.html 6 Available at: http://www.mafmc.org/ssc-meetings/2019/september-9-11 7 Available at: https://www.mafmc.org/council-events/2020/july-ssc-meeting
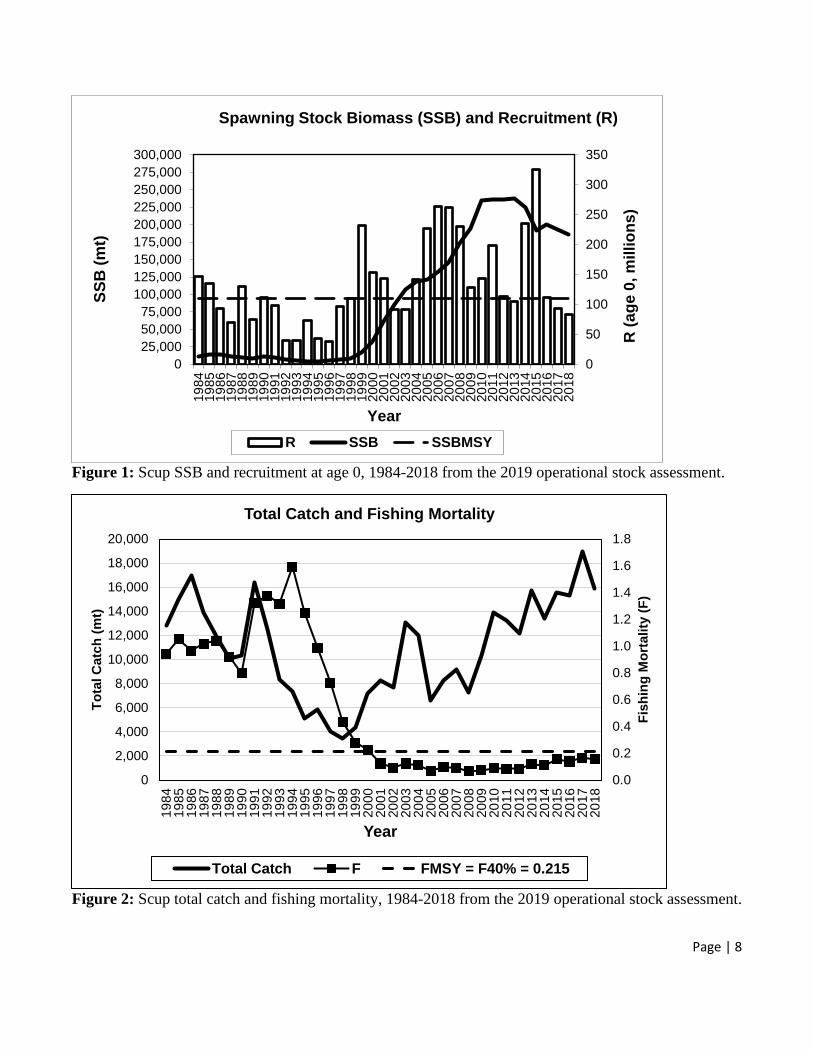
Page | 8
Figure 1: Scup SSB and recruitment at age 0, 1984-2018 from the 2019 operational stock assessment.
Figure 2: Scup total catch and fishing mortality, 1984-2018 from the 2019 operational stock assessment.
0
50
100
150
200
250
300
350
025,00050,00075,000
100,000125,000150,000175,000200,000225,000250,000275,000300,000
1984
1985
1986
1987
1988
1989
1990
1991
1992
1993
1994
1995
1996
1997
1998
1999
2000
2001
2002
2003
2004
2005
2006
2007
2008
2009
2010
2011
2012
2013
2014
2015
2016
2017
2018
R (a
ge 0
, mill
ions
)
SSB
(mt)
Year
Spawning Stock Biomass (SSB) and Recruitment (R)
R SSB SSBMSY
0.0
0.2
0.4
0.6
0.8
1.0
1.2
1.4
1.6
1.8
0
2,000
4,000
6,000
8,000
10,000
12,000
14,000
16,000
18,000
20,000
1984
1985
1986
1987
1988
1989
1990
1991
1992
1993
1994
1995
1996
1997
1998
1999
2000
2001
2002
2003
2004
2005
2006
2007
2008
2009
2010
2011
2012
2013
2014
2015
2016
2017
2018
Fish
ing
Mor
talit
y (F
)
Tota
l Cat
ch (m
t)
Year
Total Catch and Fishing Mortality
Total Catch F FMSY = F40% = 0.215
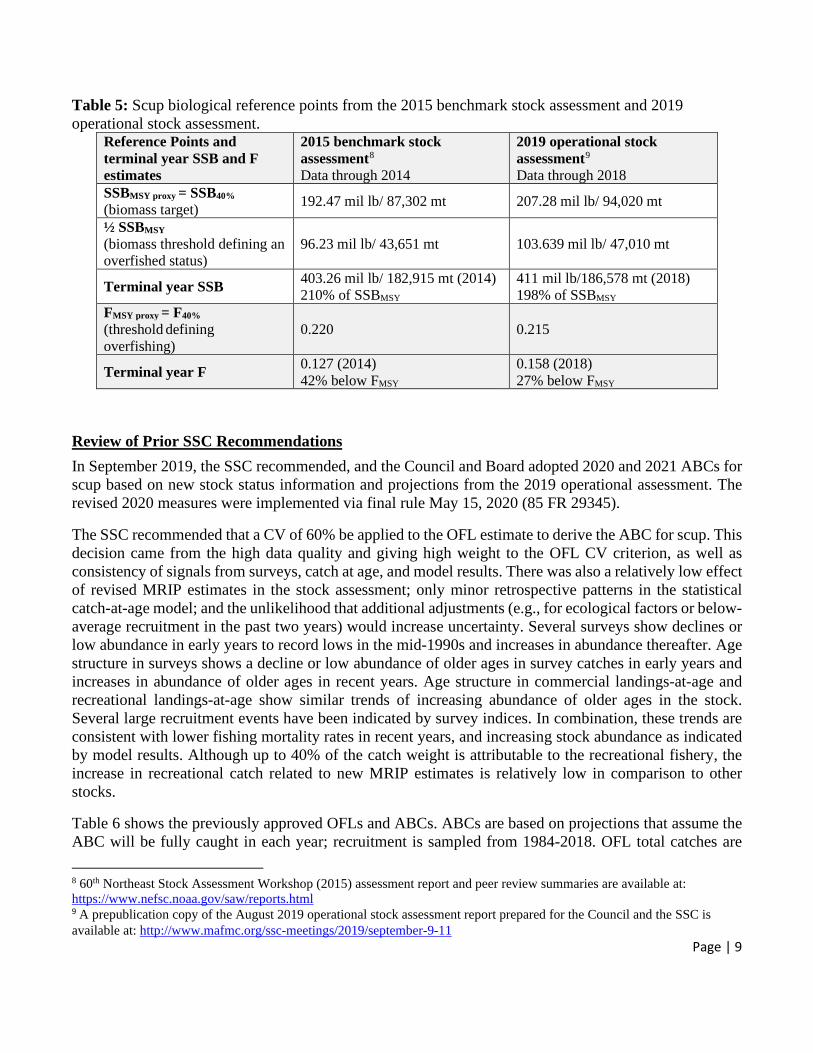
Page | 9
Table 5: Scup biological reference points from the 2015 benchmark stock assessment and 2019 operational stock assessment.
Reference Points and terminal year SSB and F estimates
2015 benchmark stock assessment8 Data through 2014
2019 operational stock assessment9 Data through 2018
SSBMSY proxy = SSB40%
(biomass target) 192.47 mil lb/ 87,302 mt 207.28 mil lb/ 94,020 mt
½ SSBMSY
(biomass threshold defining an overfished status)
96.23 mil lb/ 43,651 mt 103.639 mil lb/ 47,010 mt
Terminal year SSB 403.26 mil lb/ 182,915 mt (2014) 210% of SSBMSY
411 mil lb/186,578 mt (2018) 198% of SSBMSY
FMSY proxy = F40%
(threshold defining overfishing)
0.220 0.215
Terminal year F 0.127 (2014) 42% below FMSY
0.158 (2018) 27% below FMSY
Review of Prior SSC Recommendations In September 2019, the SSC recommended, and the Council and Board adopted 2020 and 2021 ABCs for scup based on new stock status information and projections from the 2019 operational assessment. The revised 2020 measures were implemented via final rule May 15, 2020 (85 FR 29345).
The SSC recommended that a CV of 60% be applied to the OFL estimate to derive the ABC for scup. This decision came from the high data quality and giving high weight to the OFL CV criterion, as well as consistency of signals from surveys, catch at age, and model results. There was also a relatively low effect of revised MRIP estimates in the stock assessment; only minor retrospective patterns in the statistical catch-at-age model; and the unlikelihood that additional adjustments (e.g., for ecological factors or below-average recruitment in the past two years) would increase uncertainty. Several surveys show declines or low abundance in early years to record lows in the mid-1990s and increases in abundance thereafter. Age structure in surveys shows a decline or low abundance of older ages in survey catches in early years and increases in abundance of older ages in recent years. Age structure in commercial landings-at-age and recreational landings-at-age show similar trends of increasing abundance of older ages in the stock. Several large recruitment events have been indicated by survey indices. In combination, these trends are consistent with lower fishing mortality rates in recent years, and increasing stock abundance as indicated by model results. Although up to 40% of the catch weight is attributable to the recreational fishery, the increase in recreational catch related to new MRIP estimates is relatively low in comparison to other stocks.
Table 6 shows the previously approved OFLs and ABCs. ABCs are based on projections that assume the ABC will be fully caught in each year; recruitment is sampled from 1984-2018. OFL total catches are
8 60th Northeast Stock Assessment Workshop (2015) assessment report and peer review summaries are available at: https://www.nefsc.noaa.gov/saw/reports.html 9 A prepublication copy of the August 2019 operational stock assessment report prepared for the Council and the SSC is available at: http://www.mafmc.org/ssc-meetings/2019/september-9-11
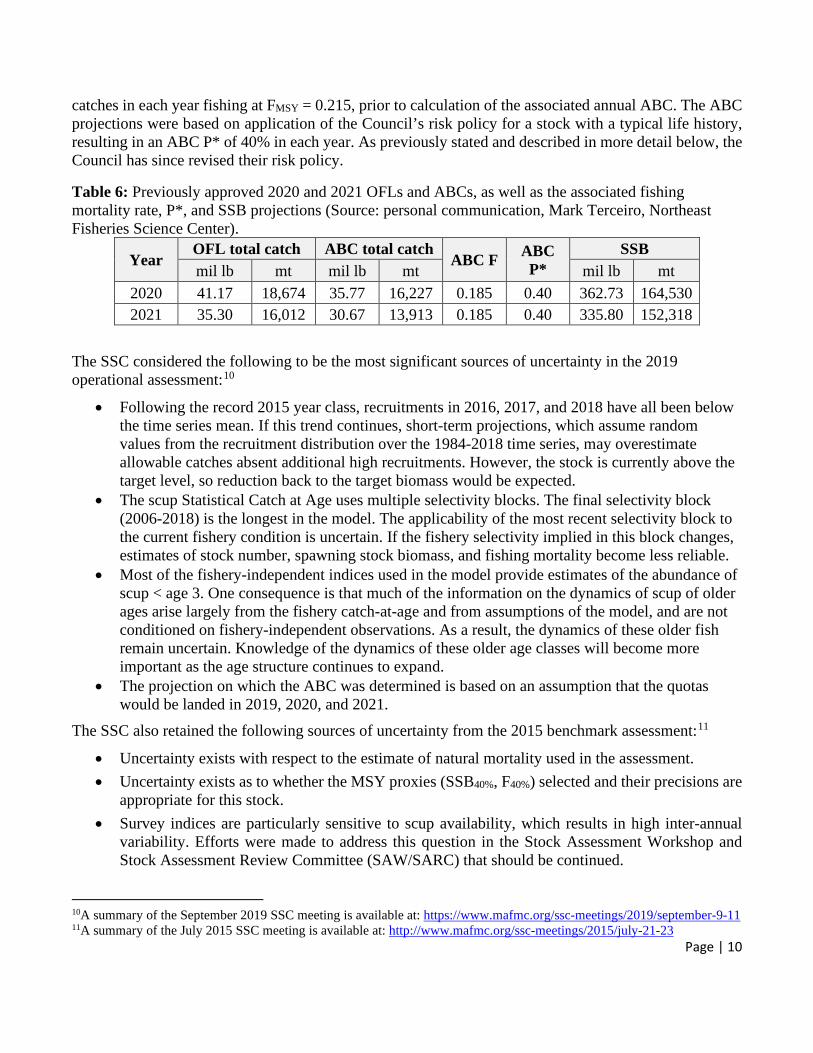
Page | 10
catches in each year fishing at FMSY = 0.215, prior to calculation of the associated annual ABC. The ABC projections were based on application of the Council’s risk policy for a stock with a typical life history, resulting in an ABC P* of 40% in each year. As previously stated and described in more detail below, the Council has since revised their risk policy.
Table 6: Previously approved 2020 and 2021 OFLs and ABCs, as well as the associated fishing mortality rate, P*, and SSB projections (Source: personal communication, Mark Terceiro, Northeast Fisheries Science Center).
Year OFL total catch ABC total catch
ABC F ABC P*
SSB mil lb mt mil lb mt mil lb mt
2020 41.17 18,674 35.77 16,227 0.185 0.40 362.73 164,530 2021 35.30 16,012 30.67 13,913 0.185 0.40 335.80 152,318
The SSC considered the following to be the most significant sources of uncertainty in the 2019 operational assessment:10
• Following the record 2015 year class, recruitments in 2016, 2017, and 2018 have all been below the time series mean. If this trend continues, short-term projections, which assume random values from the recruitment distribution over the 1984-2018 time series, may overestimate allowable catches absent additional high recruitments. However, the stock is currently above the target level, so reduction back to the target biomass would be expected.
• The scup Statistical Catch at Age uses multiple selectivity blocks. The final selectivity block (2006-2018) is the longest in the model. The applicability of the most recent selectivity block to the current fishery condition is uncertain. If the fishery selectivity implied in this block changes, estimates of stock number, spawning stock biomass, and fishing mortality become less reliable.
• Most of the fishery-independent indices used in the model provide estimates of the abundance of scup < age 3. One consequence is that much of the information on the dynamics of scup of older ages arise largely from the fishery catch-at-age and from assumptions of the model, and are not conditioned on fishery-independent observations. As a result, the dynamics of these older fish remain uncertain. Knowledge of the dynamics of these older age classes will become more important as the age structure continues to expand.
• The projection on which the ABC was determined is based on an assumption that the quotas would be landed in 2019, 2020, and 2021.
The SSC also retained the following sources of uncertainty from the 2015 benchmark assessment:11
• Uncertainty exists with respect to the estimate of natural mortality used in the assessment. • Uncertainty exists as to whether the MSY proxies (SSB40%, F40%) selected and their precisions are
appropriate for this stock. • Survey indices are particularly sensitive to scup availability, which results in high inter-annual
variability. Efforts were made to address this question in the Stock Assessment Workshop and Stock Assessment Review Committee (SAW/SARC) that should be continued.
10A summary of the September 2019 SSC meeting is available at: https://www.mafmc.org/ssc-meetings/2019/september-9-11 11A summary of the July 2015 SSC meeting is available at: http://www.mafmc.org/ssc-meetings/2015/july-21-23

Page | 11
Revisions to the Council's Risk Policy The Council first implemented a risk policy and ABC control rule in 2011 to comply with the 2006 re-authorization of the MSA. In 2017, the Council expressed interest in more comprehensively considering economic and social factors in addition to biological factors in its risk policy. In 2019, a workgroup comprised of NOAA Fisheries staff, SSC members, academics and Council staff was formed and tasked with developing and analyzing various risk policy alternatives in order to assess the short and long-term trade-offs between stock biomass protection and economic yield and benefits. Members of the workgroup built off their existing biological and economic management strategy evaluation (MSE) models.
The Council considered nine different risk policy alternatives at its December 2019 meeting, ultimately approving a combination of two alternatives described in the document.12 The approved risk policy allows for increased risk under high stock biomass conditions (increased P* at most biomass levels, compared to the previous risk policy; Figure 3). The change is greatest for stocks with biomass above the target level (BMSY). The revised risk policy retains the previous stock replenishment threshold (i.e., biomass levels where P*=0) of B/BMSY ≤ 0.1. The policy uses a linear ramping for B/BMSY values less than 1.0 up to a maximum P* of 0.45 when stock biomass is at its target. For stocks with B/BMSY values over 1.0, a second linear ramp is used up to a maximum P* of 0.49 for stocks at or above B/BMSY = 1.5.
In addition to the changes described above, the Council also approved removing the typical/atypical designation associated with the current risk policy.
Figure 3: Acceptable probability of overfishing (P*) at different biomass levels under the Council’s previous and revised risk policies.
12 Alternatives 2 and 8 described in the December 2019 discussion document available at http://www.mafmc.org/briefing/december-2019.
0
0.1
0.2
0.3
0.4
0.5
0 0.5 1 1.5 2 2.5
P*
B/BmsyPrevious risk policy Revised risk policy
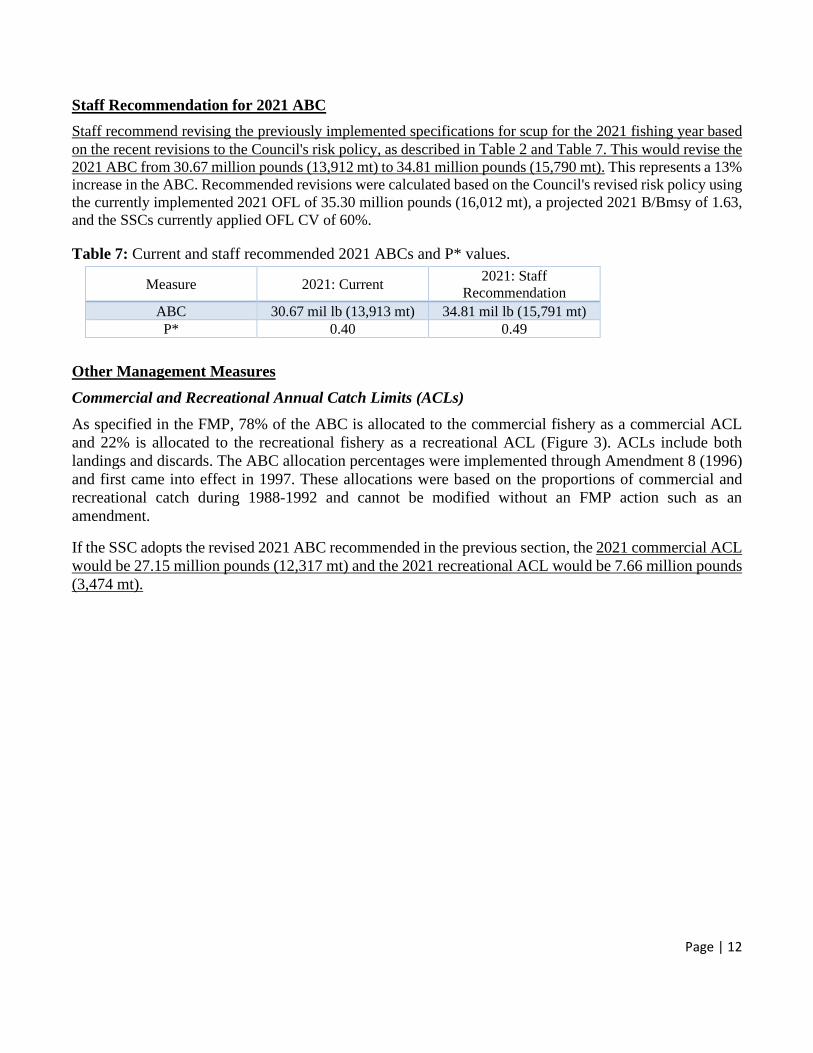
Page | 12
Staff Recommendation for 2021 ABC Staff recommend revising the previously implemented specifications for scup for the 2021 fishing year based on the recent revisions to the Council's risk policy, as described in Table 2 and Table 7. This would revise the 2021 ABC from 30.67 million pounds (13,912 mt) to 34.81 million pounds (15,790 mt). This represents a 13% increase in the ABC. Recommended revisions were calculated based on the Council's revised risk policy using the currently implemented 2021 OFL of 35.30 million pounds (16,012 mt), a projected 2021 B/Bmsy of 1.63, and the SSCs currently applied OFL CV of 60%.
Table 7: Current and staff recommended 2021 ABCs and P* values.
Measure 2021: Current 2021: Staff Recommendation
ABC 30.67 mil lb (13,913 mt) 34.81 mil lb (15,791 mt) P* 0.40 0.49
Other Management Measures Commercial and Recreational Annual Catch Limits (ACLs) As specified in the FMP, 78% of the ABC is allocated to the commercial fishery as a commercial ACL and 22% is allocated to the recreational fishery as a recreational ACL (Figure 3). ACLs include both landings and discards. The ABC allocation percentages were implemented through Amendment 8 (1996) and first came into effect in 1997. These allocations were based on the proportions of commercial and recreational catch during 1988-1992 and cannot be modified without an FMP action such as an amendment.
If the SSC adopts the revised 2021 ABC recommended in the previous section, the 2021 commercial ACL would be 27.15 million pounds (12,317 mt) and the 2021 recreational ACL would be 7.66 million pounds (3,474 mt).
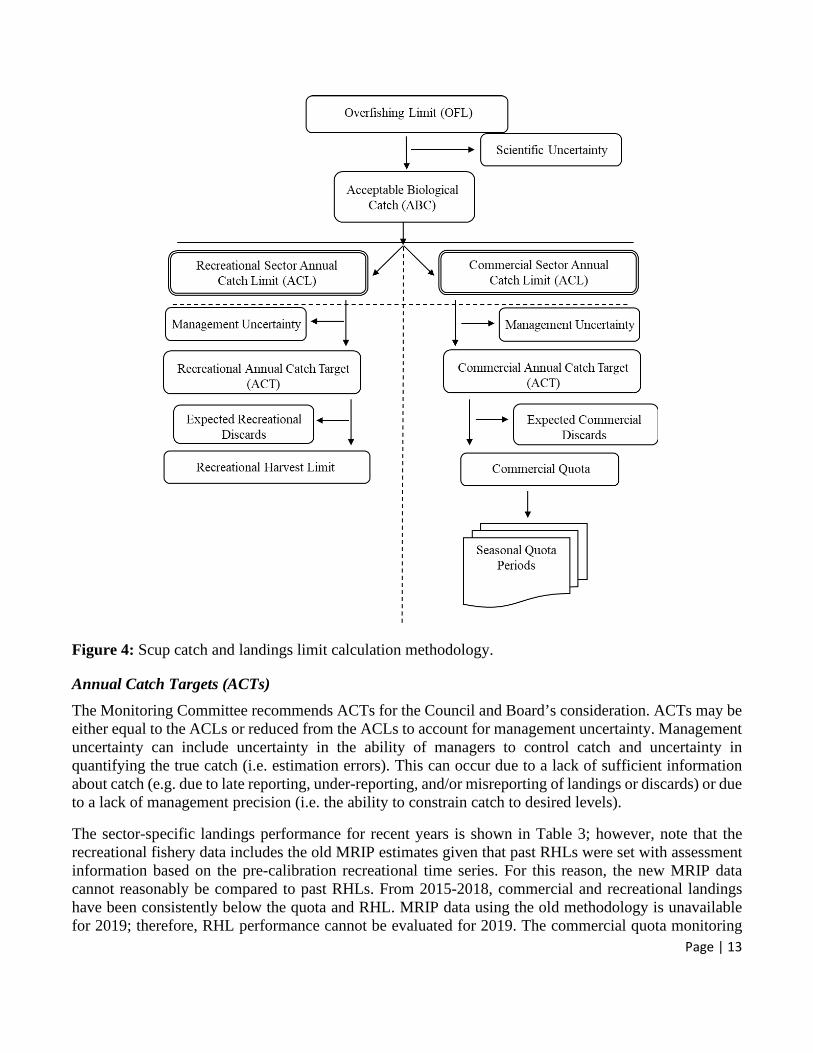
Page | 13
Figure 4: Scup catch and landings limit calculation methodology.
Annual Catch Targets (ACTs) The Monitoring Committee recommends ACTs for the Council and Board’s consideration. ACTs may be either equal to the ACLs or reduced from the ACLs to account for management uncertainty. Management uncertainty can include uncertainty in the ability of managers to control catch and uncertainty in quantifying the true catch (i.e. estimation errors). This can occur due to a lack of sufficient information about catch (e.g. due to late reporting, under-reporting, and/or misreporting of landings or discards) or due to a lack of management precision (i.e. the ability to constrain catch to desired levels).
The sector-specific landings performance for recent years is shown in Table 3; however, note that the recreational fishery data includes the old MRIP estimates given that past RHLs were set with assessment information based on the pre-calibration recreational time series. For this reason, the new MRIP data cannot reasonably be compared to past RHLs. From 2015-2018, commercial and recreational landings have been consistently below the quota and RHL. MRIP data using the old methodology is unavailable for 2019; therefore, RHL performance cannot be evaluated for 2019. The commercial quota monitoring
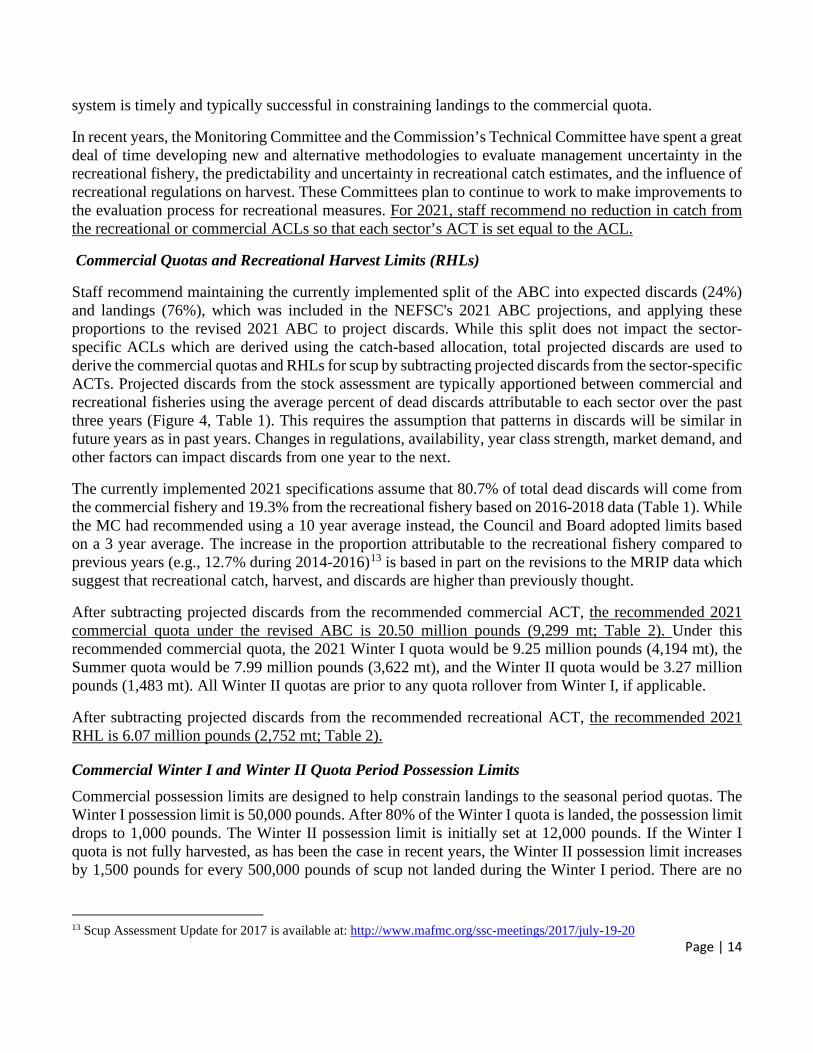
Page | 14
system is timely and typically successful in constraining landings to the commercial quota.
In recent years, the Monitoring Committee and the Commission’s Technical Committee have spent a great deal of time developing new and alternative methodologies to evaluate management uncertainty in the recreational fishery, the predictability and uncertainty in recreational catch estimates, and the influence of recreational regulations on harvest. These Committees plan to continue to work to make improvements to the evaluation process for recreational measures. For 2021, staff recommend no reduction in catch from the recreational or commercial ACLs so that each sector’s ACT is set equal to the ACL.
Commercial Quotas and Recreational Harvest Limits (RHLs)
Staff recommend maintaining the currently implemented split of the ABC into expected discards (24%) and landings (76%), which was included in the NEFSC's 2021 ABC projections, and applying these proportions to the revised 2021 ABC to project discards. While this split does not impact the sector-specific ACLs which are derived using the catch-based allocation, total projected discards are used to derive the commercial quotas and RHLs for scup by subtracting projected discards from the sector-specific ACTs. Projected discards from the stock assessment are typically apportioned between commercial and recreational fisheries using the average percent of dead discards attributable to each sector over the past three years (Figure 4, Table 1). This requires the assumption that patterns in discards will be similar in future years as in past years. Changes in regulations, availability, year class strength, market demand, and other factors can impact discards from one year to the next.
The currently implemented 2021 specifications assume that 80.7% of total dead discards will come from the commercial fishery and 19.3% from the recreational fishery based on 2016-2018 data (Table 1). While the MC had recommended using a 10 year average instead, the Council and Board adopted limits based on a 3 year average. The increase in the proportion attributable to the recreational fishery compared to previous years (e.g., 12.7% during 2014-2016)13 is based in part on the revisions to the MRIP data which suggest that recreational catch, harvest, and discards are higher than previously thought.
After subtracting projected discards from the recommended commercial ACT, the recommended 2021 commercial quota under the revised ABC is 20.50 million pounds (9,299 mt; Table 2). Under this recommended commercial quota, the 2021 Winter I quota would be 9.25 million pounds (4,194 mt), the Summer quota would be 7.99 million pounds (3,622 mt), and the Winter II quota would be 3.27 million pounds (1,483 mt). All Winter II quotas are prior to any quota rollover from Winter I, if applicable.
After subtracting projected discards from the recommended recreational ACT, the recommended 2021 RHL is 6.07 million pounds (2,752 mt; Table 2).
Commercial Winter I and Winter II Quota Period Possession Limits Commercial possession limits are designed to help constrain landings to the seasonal period quotas. The Winter I possession limit is 50,000 pounds. After 80% of the Winter I quota is landed, the possession limit drops to 1,000 pounds. The Winter II possession limit is initially set at 12,000 pounds. If the Winter I quota is not fully harvested, as has been the case in recent years, the Winter II possession limit increases by 1,500 pounds for every 500,000 pounds of scup not landed during the Winter I period. There are no
13 Scup Assessment Update for 2017 is available at: http://www.mafmc.org/ssc-meetings/2017/july-19-20

Page | 15
federal possession limits during the Summer quota period; however, there are state possession limits.
Most commercial scup trips in recent years landed well below the Winter I and Winter II possession limits. These possession limits have not been modified since 2012, when the Winter I limit increased from 30,000 to 50,000 pounds and 2014 when the initial Winter II limit increased from 2,000 to 12,000 pounds. In 2018, the Council and Commission moved October from the Summer period to the Winter II period, resulting in a higher trip limit being in effect during that month. Staff recommend no changes to the Winter I and Winter II possession limits for 2021.
Commercial Minimum Fish Size The minimum size for retention of scup in the commercial fishery is 9 inches total length. This regulation applies to all commercial landings of scup, including landings of incidental catch. This measure was first implemented in 1996, when scup were first managed by the Council and Commission. The Council and Board considered modifying this measure in 2005, 2012, and in 2015. After reviewing this measure in detail 2015, the Monitoring Committee, Council, and Board all recommended no changes. The rationale for this recommendation is described in the Summer Founder, Scup, and Black Sea Bass Commercial Management Measures Review document from 2015.14 In the past, advisors have expressed differing opinions on the commercial minimum fish size for scup. Staff recommend that this regulation remain unchanged in 2021.
Commercial Trawl Mesh Size Trawl vessels which possess more than 1,000 pounds of scup from October 1 through April 14, more than 2,000 pounds of scup from April 15 through June 15, and more than 200 pounds of scup from May 1 through August 31 must use a minimum mesh size of 5.0 inches. These regulations were modified in 2015 (effective in 2016) and 2018 (effective in 2019). In late 2015, the Council approved an increase in the November-April incidental limit from 500 to 1,000 pounds in recognition of the substantial increase in SSB and expansion of the age structure of the population since this measure was last modified in 2004. In August 2019, the Council approved an increase in the incidental scup possession limit during April 15-June 15 to 2,000 pounds to decrease discards in the spring inshore squid fisheries.
The Council recently funded a project which analyzed the selectivity of multiple codend mesh sizes relative to summer flounder, black sea bass and scup retention in the commercial bottom trawl fishery in the Mid-Atlantic region. Results confirmed that the current minimum mesh sizes for all three species are effective at releasing most fish smaller than the commercial minimum sizes (i.e., 14 inches total length for summer flounder, 9 inches total length for scup, and 11 inches total length for black sea bass). The study was not able to identify a common mesh size for all three species that would be effective at minimizing discards under the current minimum fish size limits. However, the authors concluded that a common mesh size of 4.5 or 5 inches diamond for scup and black sea bass would be effective at releasing undersized fish.
The Monitoring Committee reviewed the results of this study in 2018 and recommended no changes to the commercial minimum mesh sizes for 2019. They recommended clarification of the objectives of the Council regarding consideration the mesh sizes (e.g., establishing a common minimum mesh size,
14 The Summer Flounder, Scup, and Black Sea Bass Commercial Management Measures Review is available at: http://www.mafmc.org/briefing/december-2015

Page | 16
minimizing discards, and/or maintaining or increasing catches of legal-sized fish). Input from the commercial fishing industry should be sought before any minimum mesh size changes are considered.
Staff will continue to work with the Monitoring Committee and Advisory Panel in 2020 to further analyze and consider potential changes to mesh size regulations. Currently, staff recommend no changes to the scup minimum mesh sizes and associated possession limits for 2021.
Commercial Pot and Trap Regulations
NMFS dealer data show that pots/traps accounted for about 5% of scup commercial landings in 2019. Pots and traps used in the commercial scup fishery must have either a circular escape vent with a 3.1 inch minimum diameter or square or rectangular escape vents with each side being at least 2.25 inches in length. The Council and Commission hosted a workshop in 2005 to review several studies on vent size. Workshop participants did not recommend any changes in the vent sizes for the commercial scup fishery. The Monitoring Committee reviewed these measures in 2015 and recommend no changes. Staff recommend no changes to these measures for 2021.
Recreational Seasons, Possession Limits, and Minimum Size The Council and Board will discuss 2021 recreational scup seasons, possession limits, and minimum fish sizes at their joint meeting in December 2020. Data from the first four “waves” (i.e. the two-month reporting increments for recreational data) of 2020 recreational landings are expected to be available in October 2020. The Monitoring Committee will meet in November to review these landings data and make recommendations for any necessary changes in recreational management measures. Staff have no recommendations for 2021 recreational management measures at this time.

Scup Data Update for 2020
National Marine Fisheries Service
Northeast Fisheries Science Center
166 Water St.
Woods Hole, MA 02543
Reported 2019 landings in the commercial fishery were 6,252 mt = 13.784 million lb, an increase
of 3% from 2018, and 57% of the 2019 commercial quota. Estimated 2019 landings in the
recreational fishery were 6,403 mt = 14.116 million lb, an increase of 9% from 2018, and 192%
of the 2019 recreational harvest limit. Total commercial and recreational landings in 2019 were
12,655 mt = 27.899 million lb, an increase of 6% from 2018 (Figure 1).
The NEFSC fall 2015 and spring 2016 survey biomass indices were record highs for the time
series, although both seasonal indices have since decreased (Figure 2). The NEFSC fall survey
length frequency distributions suggest that a very large year class (modes at less than 10 cm fork
length) recruited to the stock in 2015 (Figure 3).
Figure 1. Scup fishery total landings.
0
1,000
2,000
3,000
4,000
5,000
6,000
7,000
8,000
9,000
10,000
Met
ric
ton
s
Year
Scup Fishery Total Landings: 1981-2019 with 'New' MRIP
Commercial Landings Recreational Landings
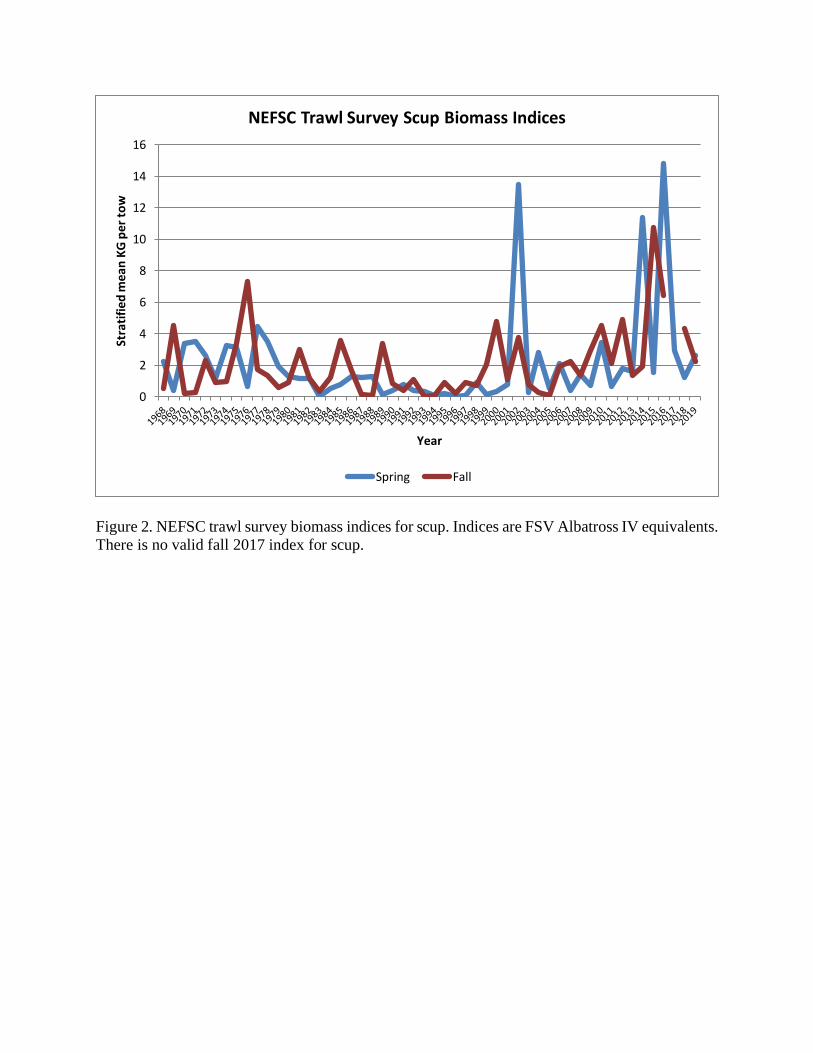
Figure 2. NEFSC trawl survey biomass indices for scup. Indices are FSV Albatross IV equivalents.
There is no valid fall 2017 index for scup.
0
2
4
6
8
10
12
14
16
Stra
tifi
ed m
ean
KG
per
to
w
Year
NEFSC Trawl Survey Scup Biomass Indices
Spring Fall
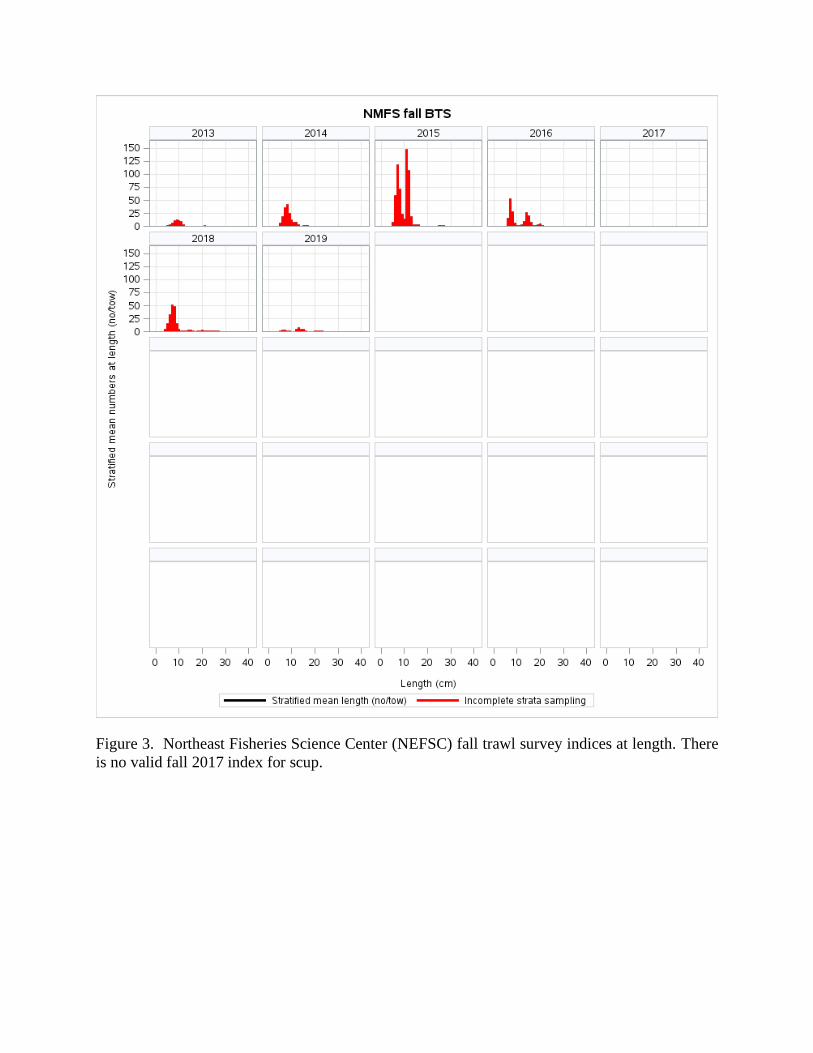
Figure 3. Northeast Fisheries Science Center (NEFSC) fall trawl survey indices at length. There
is no valid fall 2017 index for scup.

The Summer Flounder, Scup, and Black Sea Bass
Fishery Performance Report is behind Tab 5

1
Scup Fishery Information Document
June 2020
This Fishery Information Document provides a brief overview of the biology, stock condition,
management system, and fishery performance for scup (Stenotomus chrysops) with an emphasis
on 2019. Data Sources for Fishery Information Documents are generally from unpublished
National Marine Fisheries Service (NMFS) survey, dealer, vessel trip report (VTR), permit, and
Marine Recreational Information Program (MRIP) databases and should be considered
preliminary. For more resources on scup management, including previous Fishery Information
Documents, please visit http://www.mafmc.org/sf-s-bsb/.
Basic Biology
Scup are a schooling, demersal (i.e., bottom-dwelling) species. They are found in a variety of
habitats in the Mid-Atlantic. Scup essential fish habitat includes demersal waters, areas with sandy
or muddy bottoms, mussel beds, and sea grass beds from the Gulf of Maine through Cape Hatteras,
North Carolina. Scup undertake extensive seasonal migrations between coastal and offshore
waters. They are found in estuaries and coastal waters during the spring and summer. In the fall
and winter, they move offshore and to the south, to outer continental shelf waters south off New
Jersey. Scup spawn once annually over weedy or sandy areas, mostly off southern New England.
Spawning takes place from May through August and usually peaks in June and July.1
About 50% of scup are sexually mature at two years of age and about 17 cm (about 7 inches) total
length. Nearly all scup older than three years of age are sexually mature. Scup reach a maximum
age of at least 14 years. They may live as long as 20 years; however, few scup older than 7 years
are caught in the Mid-Atlantic.2, 3
Key Facts:
• An operational assessment using data through 2018 indicated that the scup stock was
not overfished, and overfishing was not occurring in 2018.
• Commercial landings increased by about 0.4 million pounds and recreational landings
increased by about 1.2 million pounds from 2018 to 2019.
• Commercial discards decreased by 9% from 2018 to 2019 but remain above average.
• Price per pound decreased by $0.07 and total ex-vessel value decreased by $0.7
million in 2019.
• The majority of the 14.12 million pounds of scup harvested recreationally in 2019 was
caught by private vessels (56%) and anglers fishing from shore (29%).
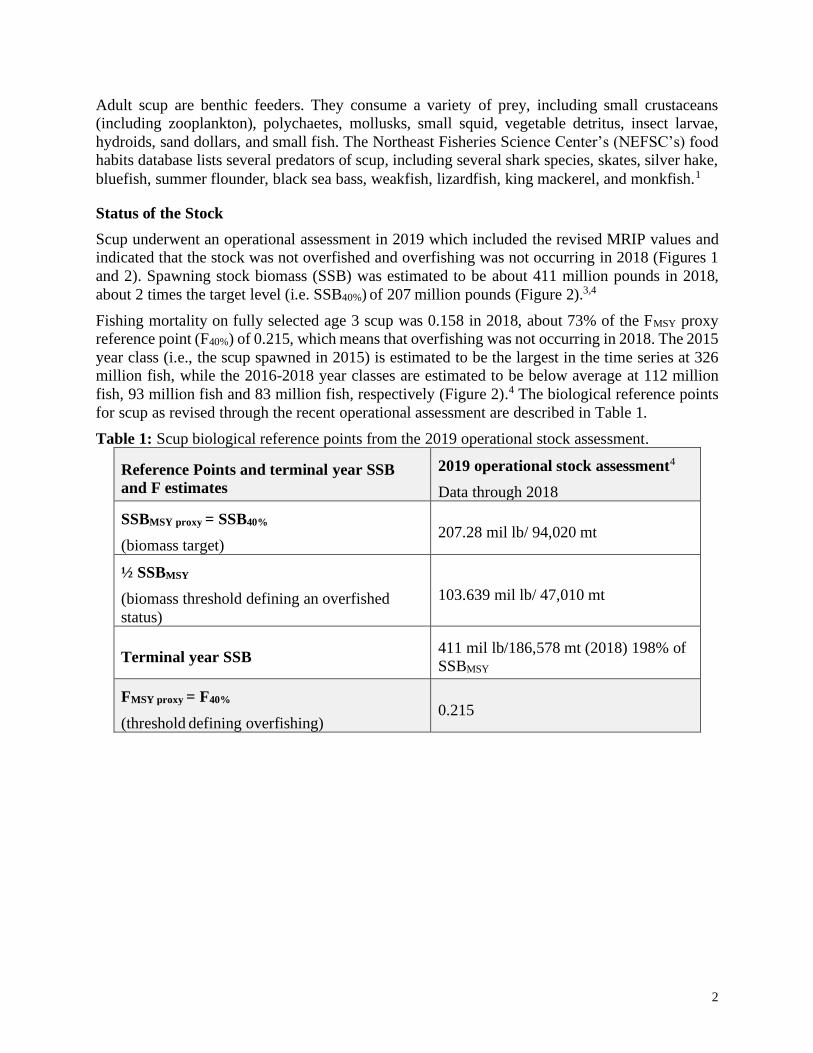
2
Adult scup are benthic feeders. They consume a variety of prey, including small crustaceans
(including zooplankton), polychaetes, mollusks, small squid, vegetable detritus, insect larvae,
hydroids, sand dollars, and small fish. The Northeast Fisheries Science Center’s (NEFSC’s) food
habits database lists several predators of scup, including several shark species, skates, silver hake,
bluefish, summer flounder, black sea bass, weakfish, lizardfish, king mackerel, and monkfish.1
Status of the Stock
Scup underwent an operational assessment in 2019 which included the revised MRIP values and
indicated that the stock was not overfished and overfishing was not occurring in 2018 (Figures 1
and 2). Spawning stock biomass (SSB) was estimated to be about 411 million pounds in 2018,
about 2 times the target level (i.e. SSB40%) of 207 million pounds (Figure 2).3,4
Fishing mortality on fully selected age 3 scup was 0.158 in 2018, about 73% of the FMSY proxy
reference point (F40%) of 0.215, which means that overfishing was not occurring in 2018. The 2015
year class (i.e., the scup spawned in 2015) is estimated to be the largest in the time series at 326
million fish, while the 2016-2018 year classes are estimated to be below average at 112 million
fish, 93 million fish and 83 million fish, respectively (Figure 2).4 The biological reference points
for scup as revised through the recent operational assessment are described in Table 1.
Table 1: Scup biological reference points from the 2019 operational stock assessment.
Reference Points and terminal year SSB
and F estimates
2019 operational stock assessment4
Data through 2018
SSBMSY proxy = SSB40%
(biomass target) 207.28 mil lb/ 94,020 mt
½ SSBMSY
(biomass threshold defining an overfished
status)
103.639 mil lb/ 47,010 mt
Terminal year SSB 411 mil lb/186,578 mt (2018) 198% of
SSBMSY
FMSY proxy = F40%
(threshold defining overfishing) 0.215

3
Figure 1: Total fishery catch and fishing mortality rate (F) for fully selected age 3 scup, 1984-
2018. The horizontal dashed line is the fishing mortality reference point from the from the 2019
operational stock assessment. Overfishing is occurring when the fishing mortality rate exceeds
this threshold.4
Figure 2: Scup spawning stock biomass and Recruitment, 1984-2018. The horizontal dashed line
is the biomass target from the from the 2019 operational stock assessment.4
0.0
0.2
0.4
0.6
0.8
1.0
1.2
1.4
1.6
1.8
02,0004,0006,0008,000
10,00012,00014,00016,00018,00020,000
1984
1985
1986
1987
1988
1989
1990
1991
1992
1993
1994
1995
1996
1997
1998
1999
2000
2001
2002
2003
2004
2005
2006
2007
2008
2009
2010
2011
2012
2013
2014
2015
2016
2017
2018
Fish
ing
Mor
talit
y (F
)
Tota
l Cat
ch (m
t)
Year
Total Catch and Fishing Mortality
Total Catch F FMSY = F40% = 0.215
0
50
100
150
200
250
300
350
025,00050,00075,000
100,000125,000150,000175,000200,000225,000250,000275,000300,000
1984
1985
1986
1987
1988
1989
1990
1991
1992
1993
1994
1995
1996
1997
1998
1999
2000
2001
2002
2003
2004
2005
2006
2007
2008
2009
2010
2011
2012
2013
2014
2015
2016
2017
2018
R (a
ge 0
, mill
ions
)
SSB
(mt)
Year
Spawning Stock Biomass (SSB) and Recruitment (R)
R SSB SSBMSY
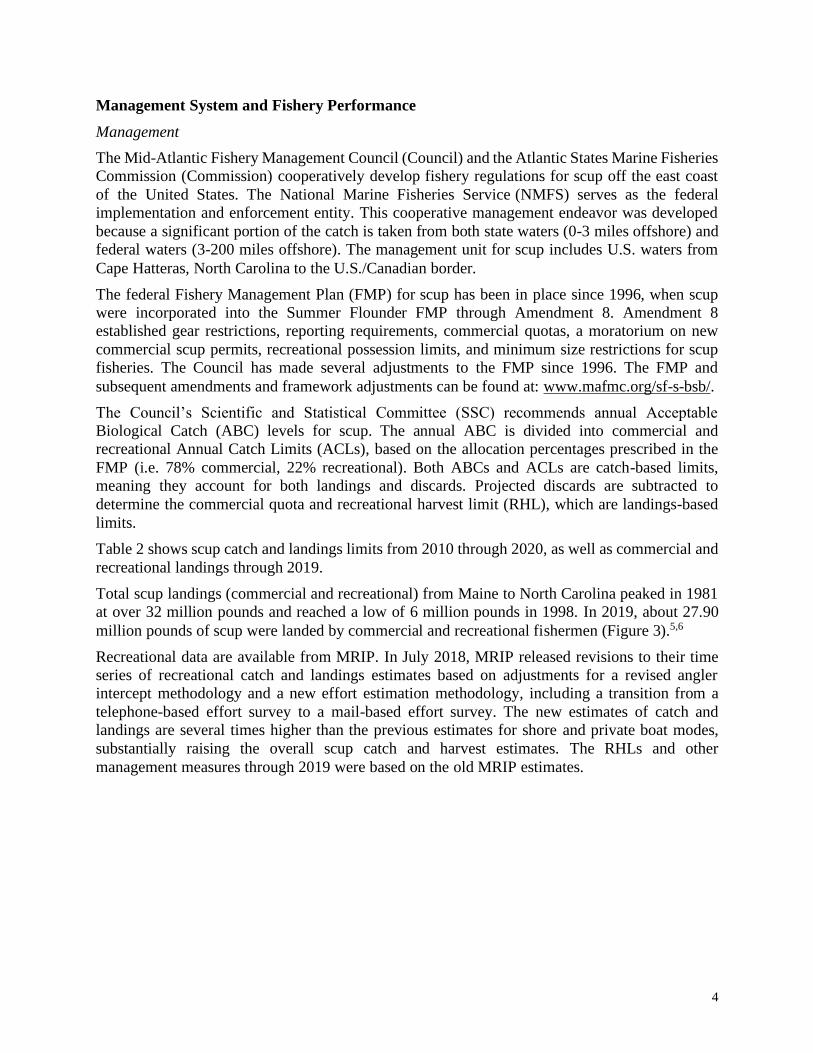
4
Management System and Fishery Performance
Management
The Mid-Atlantic Fishery Management Council (Council) and the Atlantic States Marine Fisheries
Commission (Commission) cooperatively develop fishery regulations for scup off the east coast
of the United States. The National Marine Fisheries Service (NMFS) serves as the federal
implementation and enforcement entity. This cooperative management endeavor was developed
because a significant portion of the catch is taken from both state waters (0-3 miles offshore) and
federal waters (3-200 miles offshore). The management unit for scup includes U.S. waters from
Cape Hatteras, North Carolina to the U.S./Canadian border.
The federal Fishery Management Plan (FMP) for scup has been in place since 1996, when scup
were incorporated into the Summer Flounder FMP through Amendment 8. Amendment 8
established gear restrictions, reporting requirements, commercial quotas, a moratorium on new
commercial scup permits, recreational possession limits, and minimum size restrictions for scup
fisheries. The Council has made several adjustments to the FMP since 1996. The FMP and
subsequent amendments and framework adjustments can be found at: www.mafmc.org/sf-s-bsb/.
The Council’s Scientific and Statistical Committee (SSC) recommends annual Acceptable
Biological Catch (ABC) levels for scup. The annual ABC is divided into commercial and
recreational Annual Catch Limits (ACLs), based on the allocation percentages prescribed in the
FMP (i.e. 78% commercial, 22% recreational). Both ABCs and ACLs are catch-based limits,
meaning they account for both landings and discards. Projected discards are subtracted to
determine the commercial quota and recreational harvest limit (RHL), which are landings-based
limits.
Table 2 shows scup catch and landings limits from 2010 through 2020, as well as commercial and
recreational landings through 2019.
Total scup landings (commercial and recreational) from Maine to North Carolina peaked in 1981
at over 32 million pounds and reached a low of 6 million pounds in 1998. In 2019, about 27.90
million pounds of scup were landed by commercial and recreational fishermen (Figure 3).5,6
Recreational data are available from MRIP. In July 2018, MRIP released revisions to their time
series of recreational catch and landings estimates based on adjustments for a revised angler
intercept methodology and a new effort estimation methodology, including a transition from a
telephone-based effort survey to a mail-based effort survey. The new estimates of catch and
landings are several times higher than the previous estimates for shore and private boat modes,
substantially raising the overall scup catch and harvest estimates. The RHLs and other
management measures through 2019 were based on the old MRIP estimates.

5
Table 2: Summary of scup catch limits, landings limits, and landings, 2010 through 2020. Values are in millions of pounds unless
otherwise noted.
Measure 2010 2011 2012 2013 2014 2015 2016 2017 2018 2019 2020 2021d
ABC 17.09 51.70 40.88 38.71 35.99 33.77 31.11 28.40 39.14 36.43 35.77 30.67
TACa 17.09 31.92 -- -- -- -- -- -- -- -- -- --
Commercial ACL -- -- 31.89 30.19 28.07 26.35 24.26 22.15 30.53 28.42 27.90 23.92
Commercial quotab 10.68 20.36 27.91 23.53 21.95 21.23 20.47 18.38 23.98 23.98 22.23 18.06
Commercial landings 10.40 15.03 14.88 17.87 15.96 17.03 15.76 15.44 13.37 13.78 -- --
% of commercial
quota landed 97% 74% 53% 76% 72% 80% 77% 84% 55% 57% -- --
Recreational ACL -- -- 8.99 8.52 7.92 7.43 6.84 6.25 8.61 8.01 7.87 6.75
RHLb 3.01 5.74 8.45 7.55 7.03 6.80 6.09 5.50 7.37 7.37 6.51 5.34
Recreational landings,
old MRIP estimates 5.97 3.67 4.17 5.37 4.43 4.41 4.26 5.42 5.61 -- -- --
% of RHL harvested
(based on old MRIP
estimates)c
198% 64% 49% 71% 63% 65% 70% 98% 76% -- -- --
Recreational landings,
new MRIP estimates 12.48 10.32 8.27 12.64 10.27 12.17 10.00 13.53 12.98 14.12 -- --
a Prior to implementation of the 2011 Omnibus ACLs and AMs Amendment, the Council specified a Total Allowable Catch (TAC). After implementation of this
amendment, the Council specified ABCs instead of TACs. Both terms refer to the total catch limit in a given year. The difference between the TAC and the ABC
in 2011 was due to the Council specifying a more conservative limit than that recommended by the SSC.
b Commercial quotas and RHLs reflect the removal of projected discards from the sector-specific ACLs. For 2006-2014, these limits were also adjusted for Research
Set Aside.
c The percent of RHL harvested is based on a comparison of the RHL to the previous or old MRIP estimates. The RHLs prior to 2020 did not account for the new
MRIP estimates, which were released in July 2018 and were not incorporated into a stock assessment until 2019; therefore, it would be inappropriate to compare past RHLs to the revised MRIP estimates. d The 2021 measures are subject to revision by the SSC, the Council, and the Commission.
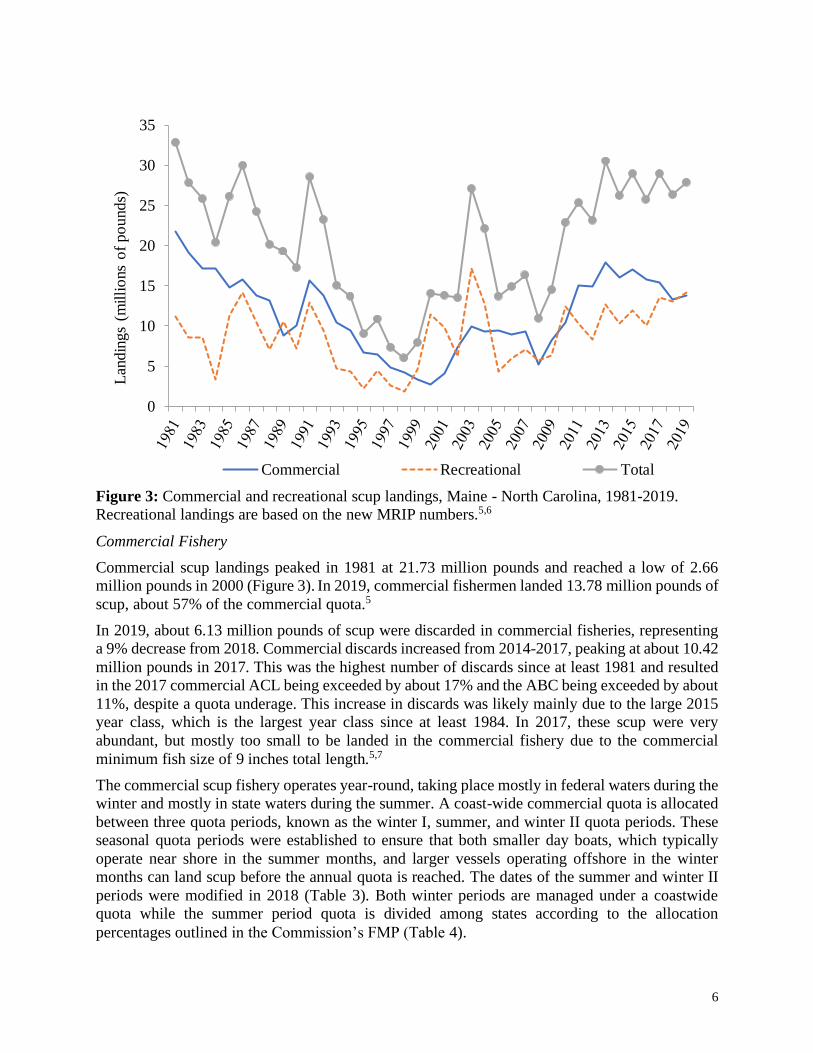
6
Figure 3: Commercial and recreational scup landings, Maine - North Carolina, 1981-2019.
Recreational landings are based on the new MRIP numbers.5,6
Commercial Fishery
Commercial scup landings peaked in 1981 at 21.73 million pounds and reached a low of 2.66
million pounds in 2000 (Figure 3). In 2019, commercial fishermen landed 13.78 million pounds of
scup, about 57% of the commercial quota.5
In 2019, about 6.13 million pounds of scup were discarded in commercial fisheries, representing
a 9% decrease from 2018. Commercial discards increased from 2014-2017, peaking at about 10.42
million pounds in 2017. This was the highest number of discards since at least 1981 and resulted
in the 2017 commercial ACL being exceeded by about 17% and the ABC being exceeded by about
11%, despite a quota underage. This increase in discards was likely mainly due to the large 2015
year class, which is the largest year class since at least 1984. In 2017, these scup were very
abundant, but mostly too small to be landed in the commercial fishery due to the commercial
minimum fish size of 9 inches total length.5,7
The commercial scup fishery operates year-round, taking place mostly in federal waters during the
winter and mostly in state waters during the summer. A coast-wide commercial quota is allocated
between three quota periods, known as the winter I, summer, and winter II quota periods. These
seasonal quota periods were established to ensure that both smaller day boats, which typically
operate near shore in the summer months, and larger vessels operating offshore in the winter
months can land scup before the annual quota is reached. The dates of the summer and winter II
periods were modified in 2018 (Table 3). Both winter periods are managed under a coastwide
quota while the summer period quota is divided among states according to the allocation
percentages outlined in the Commission’s FMP (Table 4).
0
5
10
15
20
25
30
35L
andin
gs
(milli
ons
of
po
unds)
Commercial Recreational Total
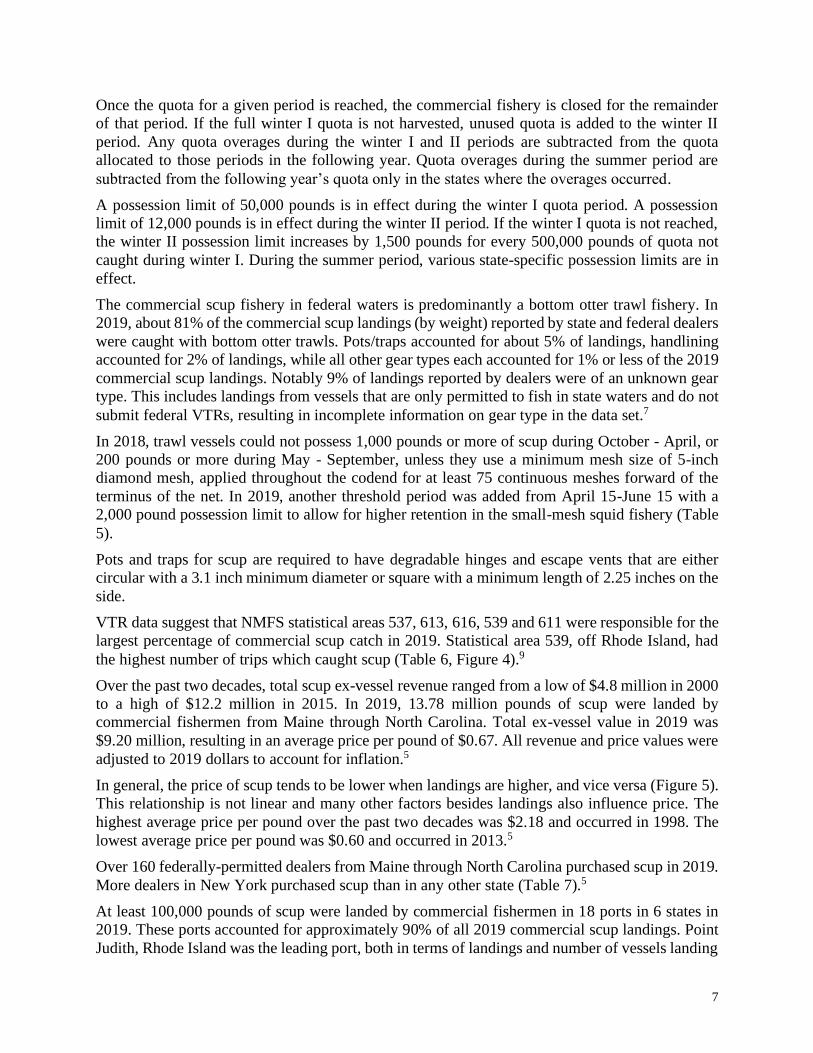
7
Once the quota for a given period is reached, the commercial fishery is closed for the remainder
of that period. If the full winter I quota is not harvested, unused quota is added to the winter II
period. Any quota overages during the winter I and II periods are subtracted from the quota
allocated to those periods in the following year. Quota overages during the summer period are
subtracted from the following year’s quota only in the states where the overages occurred.
A possession limit of 50,000 pounds is in effect during the winter I quota period. A possession
limit of 12,000 pounds is in effect during the winter II period. If the winter I quota is not reached,
the winter II possession limit increases by 1,500 pounds for every 500,000 pounds of quota not
caught during winter I. During the summer period, various state-specific possession limits are in
effect.
The commercial scup fishery in federal waters is predominantly a bottom otter trawl fishery. In
2019, about 81% of the commercial scup landings (by weight) reported by state and federal dealers
were caught with bottom otter trawls. Pots/traps accounted for about 5% of landings, handlining
accounted for 2% of landings, while all other gear types each accounted for 1% or less of the 2019
commercial scup landings. Notably 9% of landings reported by dealers were of an unknown gear
type. This includes landings from vessels that are only permitted to fish in state waters and do not
submit federal VTRs, resulting in incomplete information on gear type in the data set.7
In 2018, trawl vessels could not possess 1,000 pounds or more of scup during October - April, or
200 pounds or more during May - September, unless they use a minimum mesh size of 5-inch
diamond mesh, applied throughout the codend for at least 75 continuous meshes forward of the
terminus of the net. In 2019, another threshold period was added from April 15-June 15 with a
2,000 pound possession limit to allow for higher retention in the small-mesh squid fishery (Table
5).
Pots and traps for scup are required to have degradable hinges and escape vents that are either
circular with a 3.1 inch minimum diameter or square with a minimum length of 2.25 inches on the
side.
VTR data suggest that NMFS statistical areas 537, 613, 616, 539 and 611 were responsible for the
largest percentage of commercial scup catch in 2019. Statistical area 539, off Rhode Island, had
the highest number of trips which caught scup (Table 6, Figure 4).9
Over the past two decades, total scup ex-vessel revenue ranged from a low of $4.8 million in 2000
to a high of $12.2 million in 2015. In 2019, 13.78 million pounds of scup were landed by
commercial fishermen from Maine through North Carolina. Total ex-vessel value in 2019 was
$9.20 million, resulting in an average price per pound of $0.67. All revenue and price values were
adjusted to 2019 dollars to account for inflation.5
In general, the price of scup tends to be lower when landings are higher, and vice versa (Figure 5).
This relationship is not linear and many other factors besides landings also influence price. The
highest average price per pound over the past two decades was $2.18 and occurred in 1998. The
lowest average price per pound was $0.60 and occurred in 2013.5
Over 160 federally-permitted dealers from Maine through North Carolina purchased scup in 2019.
More dealers in New York purchased scup than in any other state (Table 7).5
At least 100,000 pounds of scup were landed by commercial fishermen in 18 ports in 6 states in
2019. These ports accounted for approximately 90% of all 2019 commercial scup landings. Point
Judith, Rhode Island was the leading port, both in terms of landings and number of vessels landing
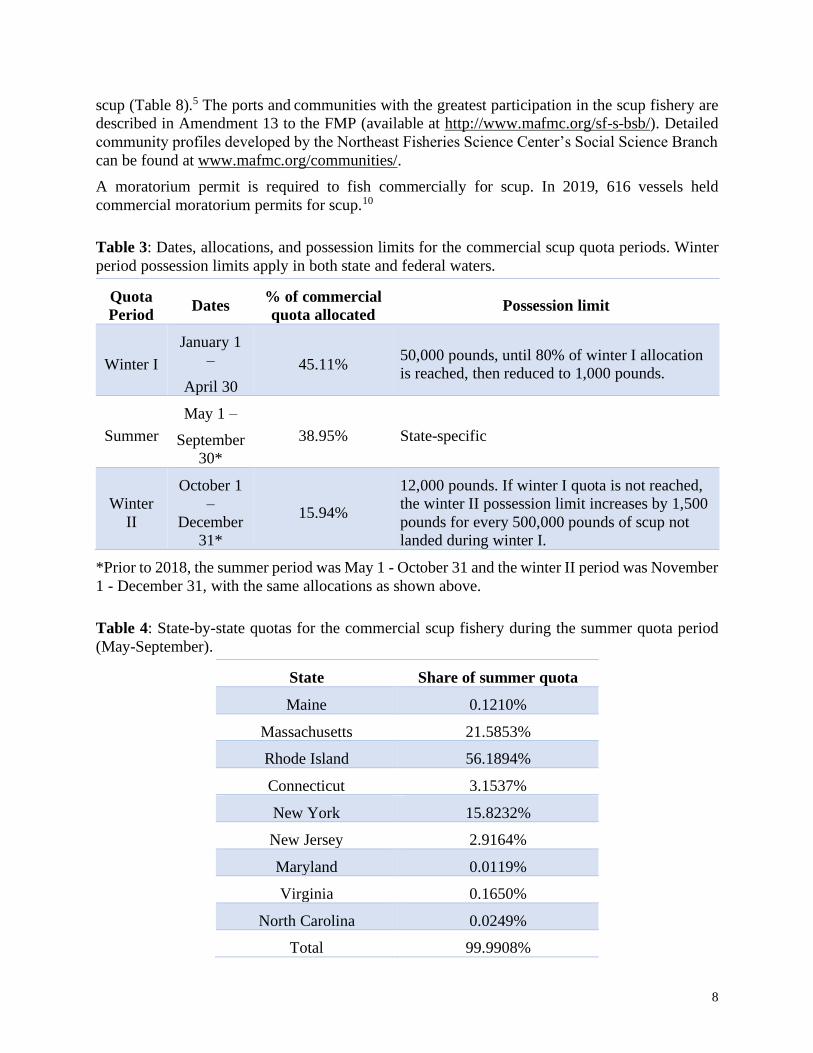
8
scup (Table 8).5 The ports and communities with the greatest participation in the scup fishery are
described in Amendment 13 to the FMP (available at http://www.mafmc.org/sf-s-bsb/). Detailed
community profiles developed by the Northeast Fisheries Science Center’s Social Science Branch
can be found at www.mafmc.org/communities/.
A moratorium permit is required to fish commercially for scup. In 2019, 616 vessels held
commercial moratorium permits for scup.10
Table 3: Dates, allocations, and possession limits for the commercial scup quota periods. Winter
period possession limits apply in both state and federal waters.
Quota
Period Dates
% of commercial
quota allocated Possession limit
Winter I
January 1
–
April 30
45.11% 50,000 pounds, until 80% of winter I allocation
is reached, then reduced to 1,000 pounds.
Summer
May 1 –
September
30*
38.95% State-specific
Winter
II
October 1
–
December
31*
15.94%
12,000 pounds. If winter I quota is not reached,
the winter II possession limit increases by 1,500
pounds for every 500,000 pounds of scup not
landed during winter I.
*Prior to 2018, the summer period was May 1 - October 31 and the winter II period was November
1 - December 31, with the same allocations as shown above.
Table 4: State-by-state quotas for the commercial scup fishery during the summer quota period
(May-September).
State Share of summer quota
Maine 0.1210%
Massachusetts 21.5853%
Rhode Island 56.1894%
Connecticut 3.1537%
New York 15.8232%
New Jersey 2.9164%
Maryland 0.0119%
Virginia 0.1650%
North Carolina 0.0249%
Total 99.9908%
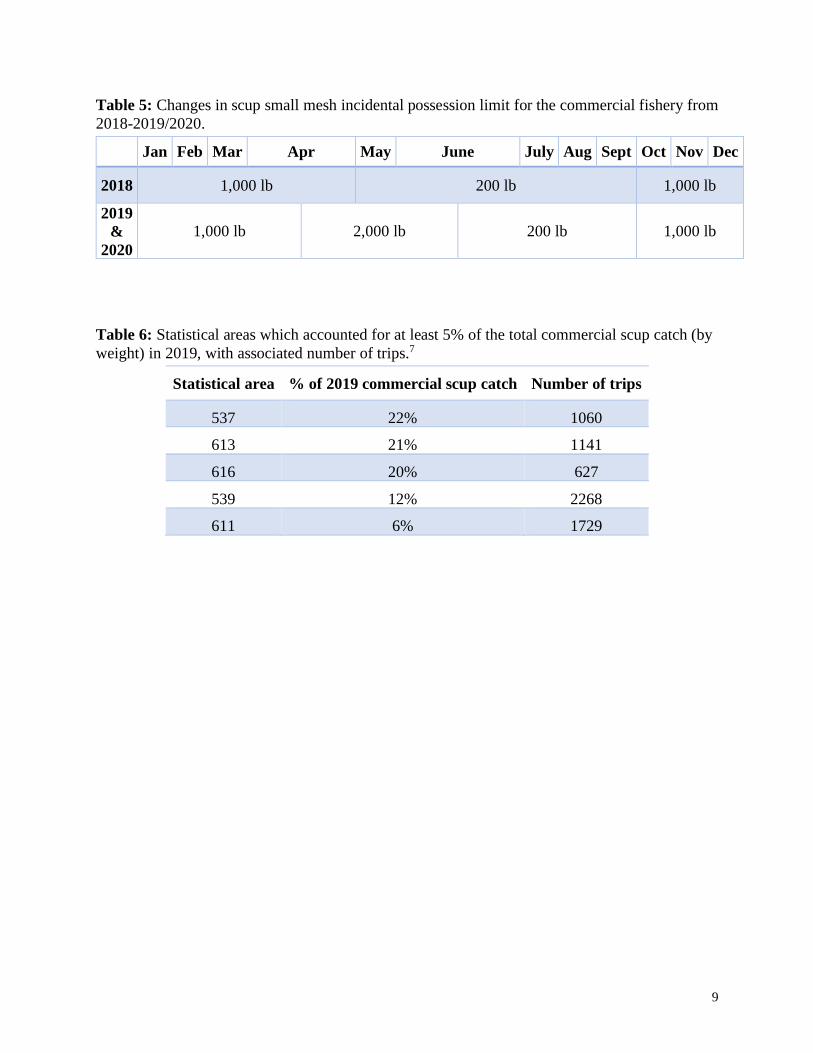
9
Table 5: Changes in scup small mesh incidental possession limit for the commercial fishery from
2018-2019/2020.
Jan Feb Mar Apr May June July Aug Sept Oct Nov Dec
2018 1,000 lb 200 lb 1,000 lb
2019
&
2020
1,000 lb 2,000 lb 200 lb 1,000 lb
Table 6: Statistical areas which accounted for at least 5% of the total commercial scup catch (by
weight) in 2019, with associated number of trips.7
Statistical area % of 2019 commercial scup catch Number of trips
537 22% 1060
613 21% 1141
616 20% 627
539 12% 2268
611 6% 1729
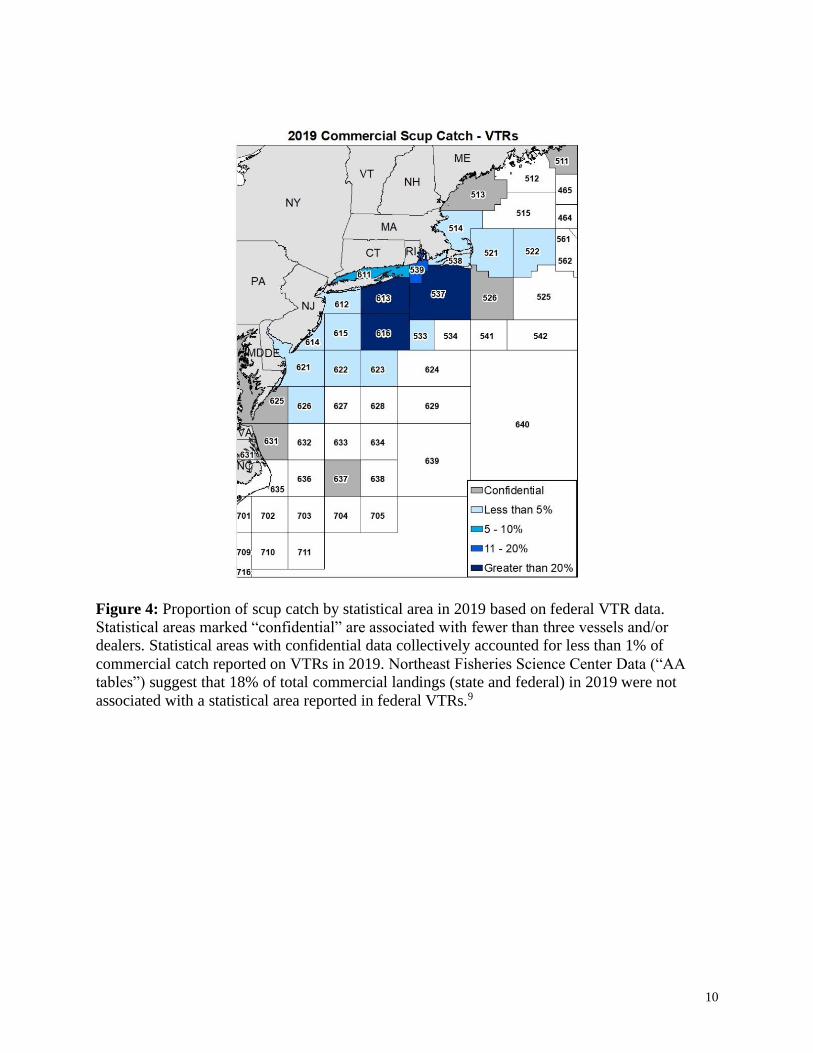
10
Figure 4: Proportion of scup catch by statistical area in 2019 based on federal VTR data.
Statistical areas marked “confidential” are associated with fewer than three vessels and/or
dealers. Statistical areas with confidential data collectively accounted for less than 1% of
commercial catch reported on VTRs in 2019. Northeast Fisheries Science Center Data (“AA
tables”) suggest that 18% of total commercial landings (state and federal) in 2019 were not
associated with a statistical area reported in federal VTRs.9

11
Figure 5: Landings, ex-vessel value, and price for scup from Maine through North Carolina, 1994-
2019. Ex-vessel value and price are inflation-adjusted to 2019 dollars using the Gross Domestic
Product Price Deflator.5
Table 7: Number of dealers per state which reported purchases of scup in 2019. C = Confidential.5
State MA RI CT NY NJ DE MD VA NC
Number of
Dealers 24 32 17 42 21 C C 12 12
0.00
0.50
1.00
1.50
2.00
2.50
0
2
4
6
8
10
12
14
16
18
20
1994
1996
1998
2000
2002
2004
2006
2008
2010
2012
2014
2016
2018
Pri
ce (
$/l
b)
, A
dju
sted
Lan
din
gs
(mil
lio
ns
of
po
un
ds)
or
valu
e
(mil
lio
ns
of
do
llars
, ad
just
ed)
Landed weight (lb) Ex-vessel value ($), Adjusted Price ($/lb), Adjusted

12
Table 8: Ports reporting at least 100,000 pounds of scup landings in 2019, based on NMFS dealer
data. C = Confidential.5
Port Scup Landings
(lb)
% of total
commercial scup
landings
Number of vessels
POINT JUDITH, RI 3,831,399 28% 127
MONTAUK, NY 2,939,960 21% 76
PT. PLEASANT, NJ 1,382,156 10% 36
NEW BEDFORD, MA 902,313 7% 52
STONINGTON, CT 539,479 4% 19
MATTITUCK, NY 326,299 2% 7
NEW LONDON, CT 325,359 2% 7
HAMPTON BAYS, NY 315,355 2% 30
CAPE MAY, NJ 304,501 2% 20
HAMPTON, VA 275,071 2% 39
LITTLE COMPTON, RI 236,024 2% 11
OCEAN CITY, MD 222,251 2% 4
EAST HAVEN, CT 196,976 1% 7
WARWICK, RI 164,180 1% C
AMMAGANSETT, NY 142,573 1% C
BELFORD, NJ 127,752 1% 15
NEWPORT, RI 121,788 1% 11
CHINCOTEAGUE, VA 109,757 1% 12
Scup Gear Restricted Areas
Two scup gear restricted areas (GRAs) were first implemented in 2000 with the goal of reducing
scup discards in small-mesh fisheries. The GRA boundaries have been modified multiple times
since their initial implementation. The current boundaries are shown in Figure 6. Trawl vessels
may not fish for or possess longfin squid, black sea bass, or silver hake in the Northern GRA from
November 1 – December 31 and in the Southern GRA from January 1 – March 15 unless they use
mesh which is at least 5 inches in diameter. The GRAs are thought to have contributed to the
recovery of the scup population in the mid- to late-2000s.8 As previously stated, commercial scup
discards increased by 71% between 2016 and 2017, likely due to the large 2015 year class.4
Although discards decreased by about 41% in 2019 compared with the record high discards in
2017, they still remain well above average. Further analysis is needed to evaluate the impact of the
GRA modification on commercial scup discards in 2017-2019.

13
Figure 6: The Scup Gear Restricted Areas.
Recreational Fishery
The recreational scup fishery is managed on a coast-wide basis in federal waters. Current federal
regulations include a minimum size of 9 inches total length, a year-round open season, and a
possession limit of 50 scup (Table 9). These measures have been unchanged since 2015.
As previously described, MRIP released a revised time series of recreational fishery data in July
2018. The revised catch, harvest, and effort estimates for scup are substantially higher than the
previous estimates. Information presented in this section is based on the new estimates.
The Commission applies a regional management approach to recreational scup fisheries in state
waters, where New York, Rhode Island, Connecticut, and Massachusetts develop regulations
intended to achieve 97% of the recreational harvest limit. The minimum fish size, possession limit,
and open season for recreational scup fisheries in state waters vary by state. State waters measures
remained unchanged from 2015 through 2017. Massachusetts through New Jersey liberalized their
minimum size limits and/or seasons in 2018 compared to 2017 and there were very minor changes
in the state regulations from 2018 to 2019. There were no changes to state measures from 2019 to
2020 (Table 10).
From 1981-2019, recreational catch of scup peaked in 2017 at 41.20 million scup and landings
peaked in 1986 with an estimated 30.43 million scup landed by recreational fishermen from Maine
through North Carolina. Recreational catch was lowest in 1998 when an estimated 6.86 million
scup were caught and 2.74 million scup were landed. Recreational anglers from Maine through
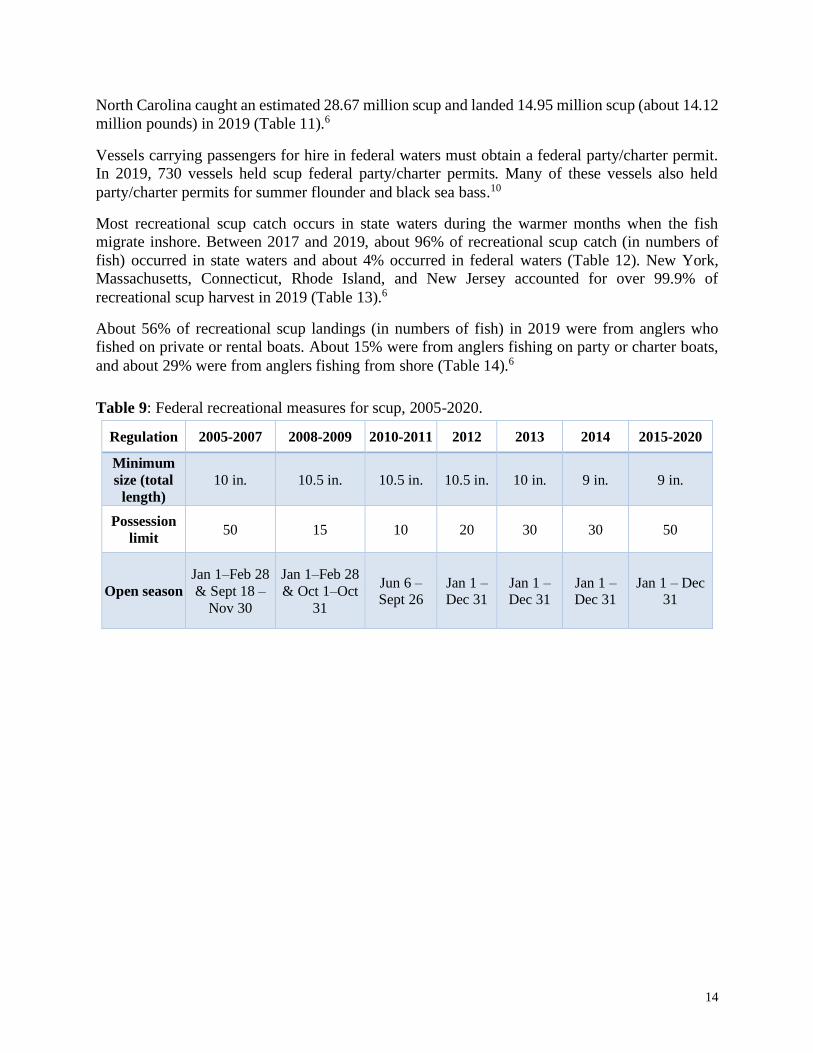
14
North Carolina caught an estimated 28.67 million scup and landed 14.95 million scup (about 14.12
million pounds) in 2019 (Table 11).6
Vessels carrying passengers for hire in federal waters must obtain a federal party/charter permit.
In 2019, 730 vessels held scup federal party/charter permits. Many of these vessels also held
party/charter permits for summer flounder and black sea bass.10
Most recreational scup catch occurs in state waters during the warmer months when the fish
migrate inshore. Between 2017 and 2019, about 96% of recreational scup catch (in numbers of
fish) occurred in state waters and about 4% occurred in federal waters (Table 12). New York,
Massachusetts, Connecticut, Rhode Island, and New Jersey accounted for over 99.9% of
recreational scup harvest in 2019 (Table 13).6
About 56% of recreational scup landings (in numbers of fish) in 2019 were from anglers who
fished on private or rental boats. About 15% were from anglers fishing on party or charter boats,
and about 29% were from anglers fishing from shore (Table 14).6
Table 9: Federal recreational measures for scup, 2005-2020.
Regulation 2005-2007 2008-2009 2010-2011 2012 2013 2014 2015-2020
Minimum
size (total
length)
10 in. 10.5 in. 10.5 in. 10.5 in. 10 in. 9 in. 9 in.
Possession
limit 50 15 10 20 30 30 50
Open season
Jan 1–Feb 28
& Sept 18 –
Nov 30
Jan 1–Feb 28
& Oct 1–Oct
31
Jun 6 – Sept 26
Jan 1 – Dec 31
Jan 1 – Dec 31
Jan 1 – Dec 31
Jan 1 – Dec 31
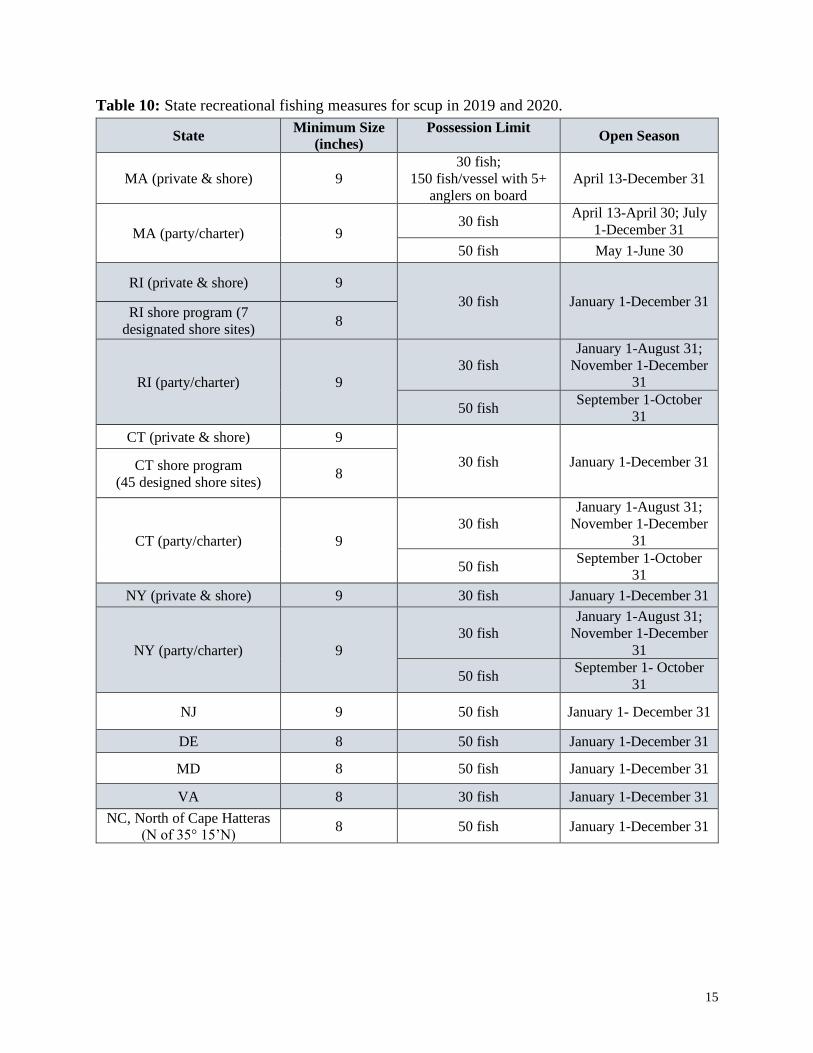
15
Table 10: State recreational fishing measures for scup in 2019 and 2020.
State Minimum Size
(inches)
Possession Limit Open Season
MA (private & shore) 9
30 fish;
150 fish/vessel with 5+
anglers on board
April 13-December 31
MA (party/charter) 9 30 fish
April 13-April 30; July
1-December 31
50 fish May 1-June 30
RI (private & shore) 9
30 fish January 1-December 31 RI shore program (7
designated shore sites) 8
RI (party/charter) 9
30 fish
January 1-August 31;
November 1-December 31
50 fish September 1-October
31
CT (private & shore) 9
30 fish January 1-December 31 CT shore program
(45 designed shore sites) 8
CT (party/charter) 9
30 fish
January 1-August 31;
November 1-December
31
50 fish September 1-October
31
NY (private & shore) 9 30 fish January 1-December 31
NY (party/charter) 9
30 fish
January 1-August 31;
November 1-December
31
50 fish September 1- October
31
NJ 9 50 fish January 1- December 31
DE 8 50 fish January 1-December 31
MD 8 50 fish January 1-December 31
VA 8 30 fish January 1-December 31
NC, North of Cape Hatteras (N of 35° 15’N)
8 50 fish January 1-December 31

16
Table 11: Estimated recreational catch and harvest of scup, Maine - North Carolina, 2010- 2019,
based on the revised MRIP estimates.6
Year Recreational catch
(millions of fish)
Recreational harvest
(millions of fish)
Recreational harvest
(millions of pounds)
% of catch
retained
2010 25.13 10.60 12.48 42%
2011 18.52 7.60 10.32 41%
2012 21.24 7.33 8.27 35%
2013 25.88 11.55 12.64 45%
2014 20.88 9.49 10.27 45%
2015 25.15 11.50 12.17 46%
2016 31.49 9.14 10.00 29%
2017 41.20 13.82 13.53 34%
2018 30.37 14.55 12.98 48%
2019 28.67 14.95 14.12 52%
Table 12: Estimated percent of scup (in numbers of fish) caught by recreational fishermen in
state and federal waters, Maine - North Carolina, 2010 – 20198, based on the revised MRIP
estimates.6
Year State waters Federal waters
2010 94.4% 5.6%
2011 98.5% 1.5%
2012 99.7% 0.3%
2013 96.3% 3.7%
2014 96.5% 3.5%
2015 98.9% 1.1%
2016 93.5% 6.5%
2017 96.0% 4.0%
2018 96.2% 3.8%
2019 95.5% 4.5%
2010-2019 average 96.6% 3.4%
2017-2019 average 95.9% 4.1%
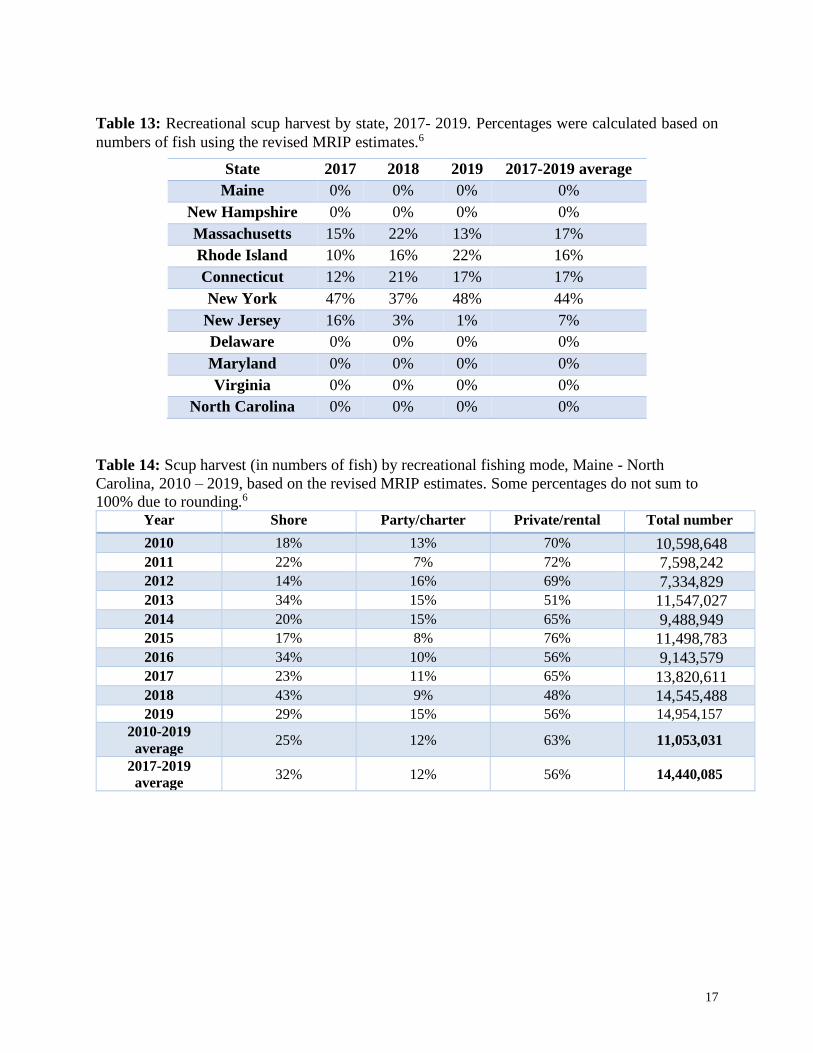
17
Table 13: Recreational scup harvest by state, 2017- 2019. Percentages were calculated based on
numbers of fish using the revised MRIP estimates.6
State 2017 2018 2019 2017-2019 average
Maine 0% 0% 0% 0%
New Hampshire 0% 0% 0% 0%
Massachusetts 15% 22% 13% 17%
Rhode Island 10% 16% 22% 16%
Connecticut 12% 21% 17% 17%
New York 47% 37% 48% 44%
New Jersey 16% 3% 1% 7%
Delaware 0% 0% 0% 0%
Maryland 0% 0% 0% 0%
Virginia 0% 0% 0% 0%
North Carolina 0% 0% 0% 0%
Table 14: Scup harvest (in numbers of fish) by recreational fishing mode, Maine - North
Carolina, 2010 – 2019, based on the revised MRIP estimates. Some percentages do not sum to
100% due to rounding.6
Year Shore Party/charter Private/rental Total number
2010 18% 13% 70% 10,598,648 2011 22% 7% 72% 7,598,242 2012 14% 16% 69% 7,334,829 2013 34% 15% 51% 11,547,027
2014 20% 15% 65% 9,488,949 2015 17% 8% 76% 11,498,783
2016 34% 10% 56% 9,143,579 2017 23% 11% 65% 13,820,611 2018 43% 9% 48% 14,545,488 2019 29% 15% 56% 14,954,157
2010-2019
average 25% 12% 63% 11,053,031
2017-2019
average 32% 12% 56% 14,440,085

18
References 1 Steimle, F.W, C. A. Zetlin, P. L. Berrien, D. L. Johnson, S. Chang. 1999. Essential Fish Habitat
source document: Scup, Stenotomus chrysops, life history and habitat characteristics. NOAA
Technical Memorandum NMFS-NE-149; 39 p.
2 Northeast Data Poor Stocks Working Group. 2009. The northeast data poor stocks working
group report, part A: skate species complex, deep sea red crab, Atlantic wolf fish, scup, and
black sea bass. Northeast Fish Science Center Reference Document 09-02; 496 p. Available at:
http://www.nefsc.noaa.gov/publications/crd/crd0902/.
3 Northeast Fisheries Science Center. 2015. 60th Northeast Regional Stock Assessment (60th
SAW) assessment report. Northeast Fisheries Science Center Reference Document 15-08.
Available at: http://www.nefsc.noaa.gov/publications/.
4 Northeast Fisheries Science Center. 2019. Prepublication copy of the August 2019 operational
stock assessment report prepared for the Council and the SSC. Available at:
http://www.mafmc.org/ssc-meetings/2019/september-9-11
5 Unpublished NMFS commercial fish dealer data (i.e., “DERS”), which include both state and
federal dealer data).
6 Personal communication from the National Marine Fisheries Service, Fisheries Statistics
Division. Accessed June 2020. Available at: https://www.st.nmfs.noaa.gov/recreational-
fisheries/data-and-documentation/queries/index.
7 Unpublished NMFS dealer data (i.e., “AA tables”, which include both state and federal dealer
data).
8 Terceiro, M., A. Miller. 2014. Commercial fishery scup discarding and the Gear Restricted
Areas (GRAs). White paper for the Mid-Atlantic Fishery Management Council. 30 p.
9 Unpublished NMFS Vessel Trip Report data.
10 Unpublished NMFS permit data.

Additional public comments are behind Tab 5

Page 1 of 1
M E M O R A N D U M
Date: July 31, 2020
To: Council and Board
From: Julia Beaty, Staff
Subject: Black Sea Bass 2021 Specifications Review, Including February Recreational Fishery
On August 11, the Council and Board will review previously adopted 2021 specifications for black sea bass and will consider modifications based on revised SSC and Monitoring Committee recommendations. These modified recommendations account for changes to the Council's revised risk policy adopted in December 2019. In addition, the Council and Board will consider if changes are needed to the February 2021 recreational black sea bass fishery. Recreational management measures for the remainder of 2021 will be considered later in 2020. Materials listed below are provided for the Council and Board’s consideration of this agenda item. Please note that some materials are behind other tabs and some will be posted as supplemental materials.
1) July 2020 SSC meeting report (behind Tab 11)2) Staff memo on 2021 black sea bass specifications dated July 9, 20203) Staff memo on February recreational black sea bass fishery dated May 22, 20204) Summary of May 28, 2020 Monitoring Committee meeting5) June 2020 Advisory Panel Fishery Performance Report and additional AP comments
received through July 9, 2020 (behind Tab 5 or available here)6) Black sea bass data update for 20207) 2020 Black Sea Bass Fishery Information Document8) Additional public comments received through July 29, 2020 (behind Tab 5)
The following documents will be added as supplemental meeting materials on the August meeting page on the Council's website:
1) Monitoring Committee meeting summary from July 27 (to be posted as supplementalunder Tab 5)
2) Advisory Panel meeting summary from July 29 (to be posted as supplemental under Tab5)
Mid-Atlantic Fishery Management Council 800 North State Street, Suite 201, Dover, DE 19901
Phone: 302-674-2331 ǀ FAX: 302-674-5399 ǀ www.mafmc.org Michael P. Luisi, Chairman ǀ G. Warren Elliott, Vice Chairman
Christopher M. Moore, Ph.D., Executive Director
SSC Report is behind Tab 11
Page | 1
M E M O R A N D U M
DATE: July 9, 2020
TO: Chris Moore, Executive Director
FROM: Julia Beaty, Staff
SUBJECT: 2021 Black Sea Bass Specifications
Executive Summary This memorandum includes information to assist the Mid-Atlantic Fishery Management Council’s (Council’s) Scientific and Statistical Committee (SSC) and Monitoring Committee in: 1) reviewing and potentially revising the previously approved 2021 catch and landings limits for black sea bass, 2) considering commercial management measures for 2021, and 3) considering any needed changes to the black sea bass recreational fishery in February 2021 only. Recreational management measures for the remainder of 2021 will be considered later in 2020. Additional information on fishery performance and past management measures can be found in the 2020 Black Sea Bass Fishery Information Document and the 2020 Summer Flounder, Scup, and Black Sea Bass Fishery Performance Report developed by advisors.1
A black sea bass operational stock assessment was peer reviewed and accepted in August 2019. This assessment incorporated fishery catch and fishery-independent survey data through 2018, including revised recreational catch data provided by the Marine Recreational Information Program (MRIP) for 1989-2018.2
The 2019 operational assessment found that the black sea bass stock north of Cape Hatteras, North Carolina was not overfished and overfishing was not occurring in 2018. Spawning stock biomass (SSB) in 2018 was 73.65 million pounds (33,407 mt, adjusted for retrospective bias), 2.4 times the updated biomass reference point (i.e., SSBMSY proxy = SSB40%=31.07 million pounds/14,092 mt). The average fishing mortality rate (F) on fully selected ages 6-7 fish in 2018 was 0.42 (adjusted for retrospective
1 Available at: http://www.mafmc.org/sf-s-bsb 2 The revised MRIP data are based on a new estimation methodology accounting for changes to the angler intercept methodology and the transition from a telephone-based effort survey to a mail-based effort survey. The revised estimates of catch and landings are several times higher than the previous estimates for shore and private boat modes, substantially raising the overall black sea bass catch and harvest estimates. For example, estimates of black sea bass harvest in weight for 2014-2018 using the revised methodology are on average 2.32 times the estimates using the old methodology.
Mid-Atlantic Fishery Management Council 800 North State Street, Suite 201, Dover, DE 19901
Phone: 302-674-2331 ǀ FAX: 302-674-5399 ǀ www.mafmc.org Michael P. Luisi, Chairman ǀ G. Warren Elliott, Vice Chairman
Christopher M. Moore, Ph.D., Executive Director
Page | 2
bias), 91% of the updated fishing mortality threshold reference point (i.e., FMSY proxy = F40% = 0.46).3 The results of the 2019 operational assessment are described in more detail on pages 5-7.
The Council and the Atlantic States Marine Fisheries Commission’s (ASMFC’s or Commission’s) Summer Flounder, Scup, and Black Sea Bass Management Board (Board) approved 2020-2021 catch and landings limits for black sea bass in October 2019 based on the Acceptable Biological Catch (ABC) recommendations of the Council’s SSC. These previously approved 2021 catch and landings limits are shown in Table 1 and were implemented via final rule on May 15, 2020 (85 Federal Register 29345).
The Council approved revisions to their risk policy in December 2019 with the intent that 2021 catch and landings limits would reflect the new policy. Therefore, the SSC is tasked with considering whether their previously recommended 2021 ABC should be revised to account for the change in the risk policy, or for other reasons.
The Monitoring Committee will review and, if appropriate, recommend changes to the previously approved 2021 Annual Catch Limits (ACLs), Annual Catch Targets (ACTs), commercial quotas, recreational harvest limits (RHLs). They will also recommend any necessary modifications to commercial gear restrictions, minimum fish sizes, and other commercial measures, and any necessary changes to the black sea bass recreational fishery for February 2021 only.
The Council and the Board will meet jointly in August 2020 to review the recommendations of the SSC and Monitoring Committee, as well as input from advisors. They will then consider revising their previously approved catch and landings limits for 2021, and any desired changes to the commercial management measures for 2021, as well as any desired changes the February 2021 recreational fishery. Recreational management measures for the remainder of 2021 will be considered in later in 2020.
As described in more detail below, staff recommend revisions to the 2021 catch and landings limits to account for revisions to the Council’s risk policy. Staff also recommend that the discard projections used to calculate the 2021 catch and landings limits be revised to help prevent ABC and OFL overages. Staff also recommend revisions to the February 2021 recreational fishery to account for recent changes in the MRIP data. No other changes to recreational management measures in 2021 are recommended at this time. Recreational management measures for March-December will be consider later in 2020.
Staff do not recommend any changes to the current federal commercial management measures, including the minimum fish size, mesh size requirements and associated incidental possession limits, or pot/trap gear requirements for 2021.
3 A prepublication copy of the August 2019 operational stock assessment report prepared for the Council and the SSC is available at: http://www.mafmc.org/ssc-meetings/2019/september-9-11
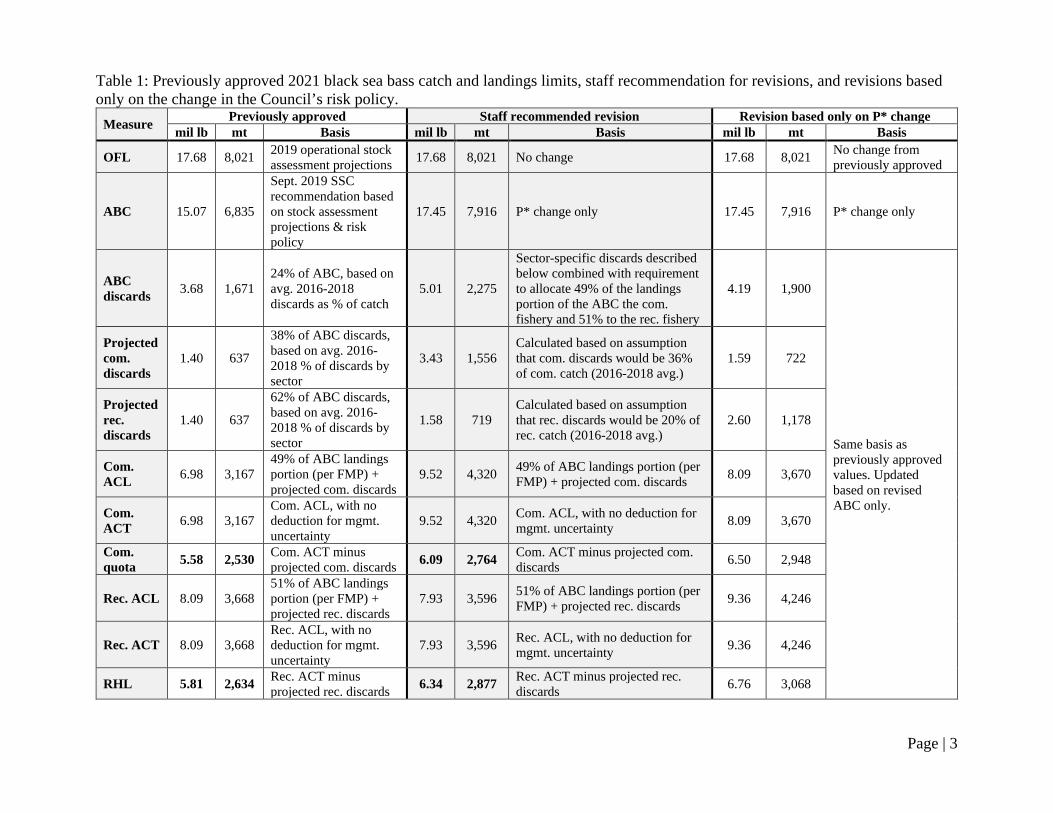
Page | 3
Table 1: Previously approved 2021 black sea bass catch and landings limits, staff recommendation for revisions, and revisions based only on the change in the Council’s risk policy.
Measure Previously approved Staff recommended revision Revision based only on P* change mil lb mt Basis mil lb mt Basis mil lb mt Basis
OFL 17.68 8,021 2019 operational stock assessment projections 17.68 8,021 No change 17.68 8,021 No change from
previously approved
ABC 15.07 6,835
Sept. 2019 SSC recommendation based on stock assessment projections & risk policy
17.45 7,916 P* change only 17.45 7,916 P* change only
ABC discards 3.68 1,671
24% of ABC, based on avg. 2016-2018 discards as % of catch
5.01 2,275
Sector-specific discards described below combined with requirement to allocate 49% of the landings portion of the ABC the com. fishery and 51% to the rec. fishery
4.19 1,900
Same basis as previously approved values. Updated based on revised ABC only.
Projected com. discards
1.40 637
38% of ABC discards, based on avg. 2016-2018 % of discards by sector
3.43 1,556 Calculated based on assumption that com. discards would be 36% of com. catch (2016-2018 avg.)
1.59 722
Projected rec. discards
1.40 637
62% of ABC discards, based on avg. 2016-2018 % of discards by sector
1.58 719 Calculated based on assumption that rec. discards would be 20% of rec. catch (2016-2018 avg.)
2.60 1,178
Com. ACL 6.98 3,167
49% of ABC landings portion (per FMP) + projected com. discards
9.52 4,320 49% of ABC landings portion (per FMP) + projected com. discards 8.09 3,670
Com. ACT 6.98 3,167
Com. ACL, with no deduction for mgmt. uncertainty
9.52 4,320 Com. ACL, with no deduction for mgmt. uncertainty 8.09 3,670
Com. quota 5.58 2,530 Com. ACT minus
projected com. discards 6.09 2,764 Com. ACT minus projected com. discards 6.50 2,948
Rec. ACL 8.09 3,668 51% of ABC landings portion (per FMP) + projected rec. discards
7.93 3,596 51% of ABC landings portion (per FMP) + projected rec. discards 9.36 4,246
Rec. ACT 8.09 3,668 Rec. ACL, with no deduction for mgmt. uncertainty
7.93 3,596 Rec. ACL, with no deduction for mgmt. uncertainty 9.36 4,246
RHL 5.81 2,634 Rec. ACT minus projected rec. discards 6.34 2,877 Rec. ACT minus projected rec.
discards 6.76 3,068
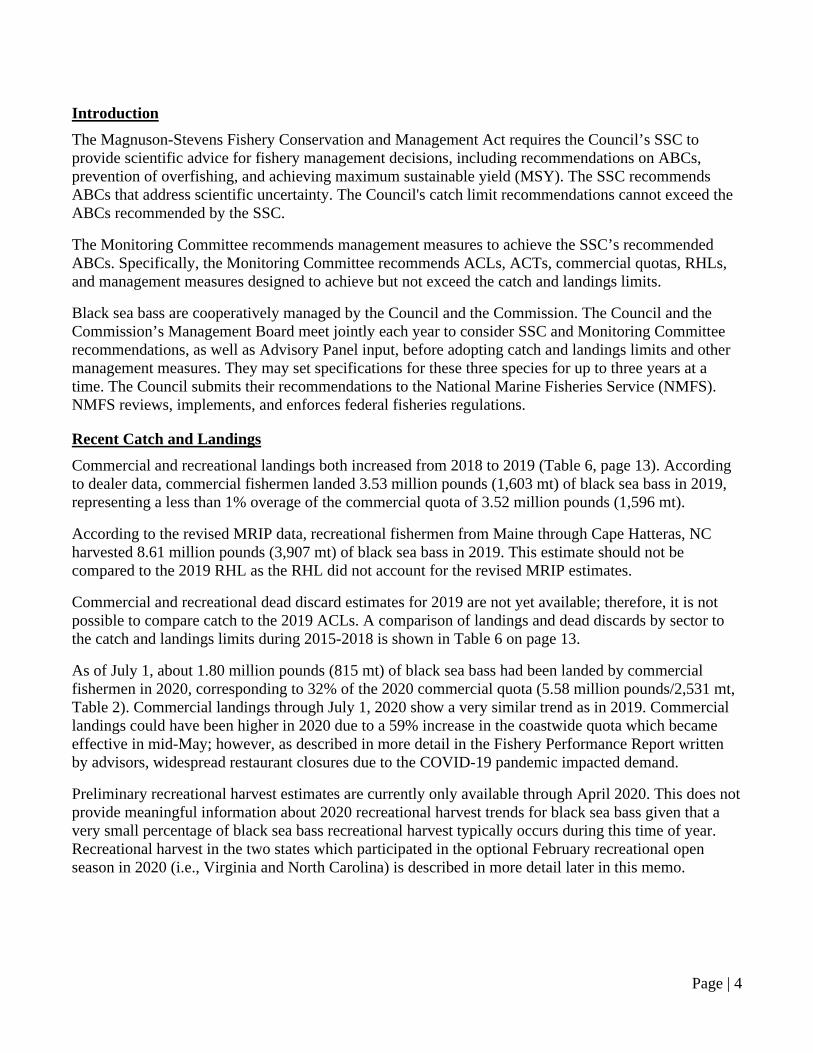
Page | 4
Introduction The Magnuson-Stevens Fishery Conservation and Management Act requires the Council’s SSC to provide scientific advice for fishery management decisions, including recommendations on ABCs, prevention of overfishing, and achieving maximum sustainable yield (MSY). The SSC recommends ABCs that address scientific uncertainty. The Council's catch limit recommendations cannot exceed the ABCs recommended by the SSC.
The Monitoring Committee recommends management measures to achieve the SSC’s recommended ABCs. Specifically, the Monitoring Committee recommends ACLs, ACTs, commercial quotas, RHLs, and management measures designed to achieve but not exceed the catch and landings limits.
Black sea bass are cooperatively managed by the Council and the Commission. The Council and the Commission’s Management Board meet jointly each year to consider SSC and Monitoring Committee recommendations, as well as Advisory Panel input, before adopting catch and landings limits and other management measures. They may set specifications for these three species for up to three years at a time. The Council submits their recommendations to the National Marine Fisheries Service (NMFS). NMFS reviews, implements, and enforces federal fisheries regulations.
Recent Catch and Landings Commercial and recreational landings both increased from 2018 to 2019 (Table 6, page 13). According to dealer data, commercial fishermen landed 3.53 million pounds (1,603 mt) of black sea bass in 2019, representing a less than 1% overage of the commercial quota of 3.52 million pounds (1,596 mt).
According to the revised MRIP data, recreational fishermen from Maine through Cape Hatteras, NC harvested 8.61 million pounds (3,907 mt) of black sea bass in 2019. This estimate should not be compared to the 2019 RHL as the RHL did not account for the revised MRIP estimates.
Commercial and recreational dead discard estimates for 2019 are not yet available; therefore, it is not possible to compare catch to the 2019 ACLs. A comparison of landings and dead discards by sector to the catch and landings limits during 2015-2018 is shown in Table 6 on page 13.
As of July 1, about 1.80 million pounds (815 mt) of black sea bass had been landed by commercial fishermen in 2020, corresponding to 32% of the 2020 commercial quota (5.58 million pounds/2,531 mt, Table 2). Commercial landings through July 1, 2020 show a very similar trend as in 2019. Commercial landings could have been higher in 2020 due to a 59% increase in the coastwide quota which became effective in mid-May; however, as described in more detail in the Fishery Performance Report written by advisors, widespread restaurant closures due to the COVID-19 pandemic impacted demand.
Preliminary recreational harvest estimates are currently only available through April 2020. This does not provide meaningful information about 2020 recreational harvest trends for black sea bass given that a very small percentage of black sea bass recreational harvest typically occurs during this time of year. Recreational harvest in the two states which participated in the optional February recreational open season in 2020 (i.e., Virginia and North Carolina) is described in more detail later in this memo.

Page | 5
Table 2: 2020 commercial black sea bass landings by state with data reported through July 1, 2020, according to preliminary data from NMFS weekly quota reports available at: https://www.fisheries.noaa.gov/new-england-mid-atlantic/quota-monitoring-greater-atlantic-region.
State Landings (lb) ME 0 NH 0 MA 7,440 RI 249,595 CT 14,557 NY 145,844 NJ 525,111 DE 157,061 MD 220,820 VA 287,955 NC 189,832
Total 1,798,215 2020 Commercial Quota 5,580,000 Percent of Quota Landed 32%
Stock Status and Biological Reference Points A black sea bass operational stock assessment was peer reviewed and accepted in August 2019. This assessment retained the model structure of the 2016 benchmark stock assessment,4 and incorporated fishery data and fishery-independent survey data through 2018, including revised recreational data provided by MRIP for 1989-2018. The following information is based on the prepublication draft of the August 2019 operational assessment prepared for use by the Council and SSC.5
As with the 2016 benchmark assessment, the 2019 operational assessment has a regional structure. The stock was modeled as two separate sub-units (north and south) divided at approximately Hudson Canyon. Each sub-unit was modeled separately and the average F and combined biomass and SSB across sub-units were used to develop stock-wide reference points. As with the 2016 benchmark assessment, the peer reviewers of the 2019 operational assessment concluded that “although the two-area model had a more severe retrospective pattern in opposite directions in each area sub-unit than when a single unit was assumed, it provides reasonable model estimates after the retrospective corrections and combining the two spatial units. Thus, even though reference points are generated and stock status determinations are conducted for each subunit, the combined projections should be used.”
Due to the lack of a stock/recruit relationship, a direct calculation of MSY and associated reference points was not feasible and proxy reference points were used. SSB calculations and SSB reference points account for mature males and females. The reference points and terminal year SSB and F estimates from the 2019 operational assessment are shown in Table 3.
A comparison of the 2018 SSB and F estimates to the reference points indicates that the black sea bass stock north of Cape Hatteras, North Carolina was not overfished and overfishing was not occurring in
4 Available at: https://www.nefsc.noaa.gov/saw/reports.html 5 Available at: http://www.mafmc.org/ssc-meetings/2019/september-9-11

Page | 6
2018. SSB in 2018 was estimated at 73.65 million pounds (33,407 mt, adjusted for retrospective bias), 2.4 times the updated biomass reference point (i.e., SSBMSY proxy = SSB40%=31.07 million pounds/14,092 mt). The average fishing mortality rate on fully selected ages 6-7 fish in 2018 was 0.42 (adjusted for retrospective bias), 91% of the updated fishing mortality threshold reference point (i.e., FMSY proxy = F40% = 0.46; Table 3). The 2018 estimates of F and SSB were adjusted for internal model retrospective error (Figure 1). Figure 2 and Figure 3 show the time series of estimated SSB, recruitment, fishing mortality, and catch without retrospective adjustments.
The 2011 year class was estimated to be the largest in the time series at 144.7 million fish. The 2015 year class was the second largest at 79.4 million fish. Recruitment of the 2017 year class as age 1 in 2018 was estimated at 16.0 million, well below the 1989-2018 average of 36 million fish (Figure 2).
Updated estimates of spawning stock biomass, fishing mortality, and recruitment since the 2019 operational stock assessment are not currently available. In July 2020, the Northeast Fisheries Science Center (NEFSC) provided updated landings information as well as NEFSC trawl survey indices through spring 2020. This data update did not show signs of trends in catch or stock status which were not evident in the 2019 operational assessment or described elsewhere in this memo.
Table 3: Black sea bass biological reference points from the 2019 operational stock assessment. Metric Estimate
SSBMSY proxy = SSB40% (biomass target) 31.07 mil lb / 14,092 mt ½ SSBMSY (biomass threshold defining an overfished state)
15.53 mil lb / 7,046 mt
SSB in 2018 73.65 mil lb / 33,407 mt (2018). Adjusted for retrospective bias. 240% of SSBMSY.
FMSY proxy = F40% (threshold defining overfishing) 0.46
F in 2018 0.42 (2018). Adjusted for retrospective bias. Fully selected ages 6-7. 9% below FMSY.
Figure 1: Estimates of black sea bass SSB and F relative to the biological reference points from the 2019 operational stock assessment. The red filled circle with 90% confidence intervals shows the un-adjusted 2018 estimates. The open circle shows the retrospectively adjusted estimates for 2018. (Source: prepublication copy of the August 2019 operational stock assessment report.)
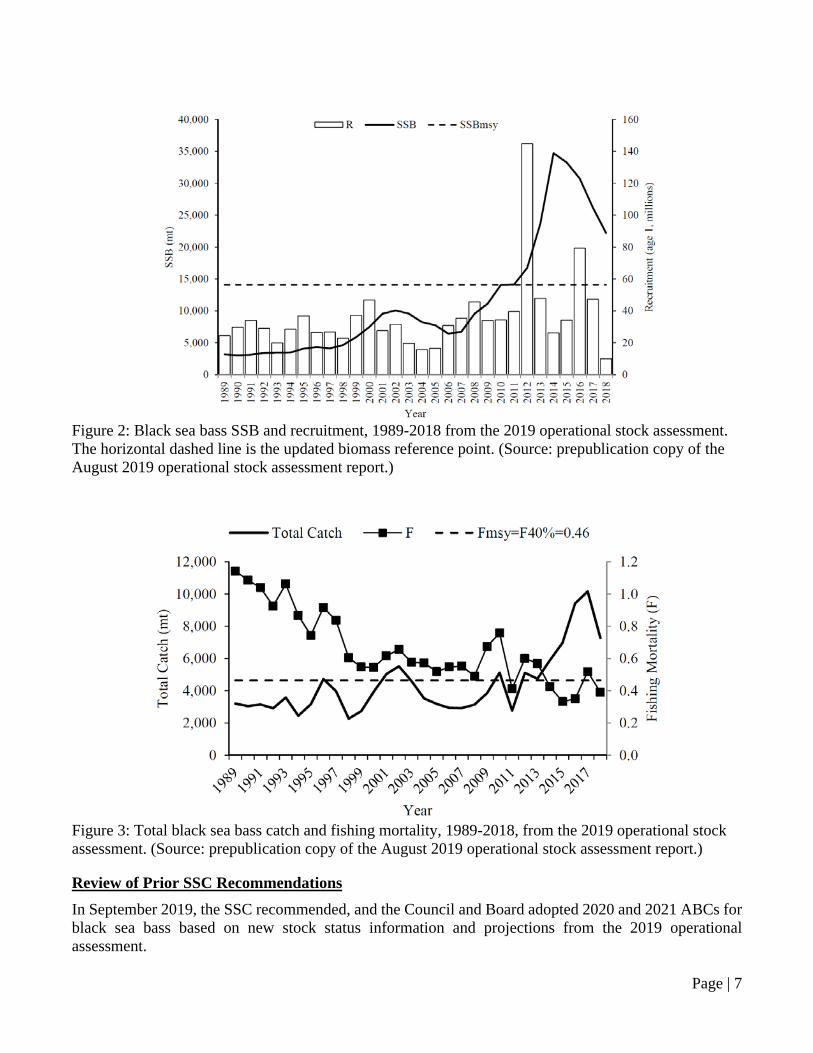
Page | 7
Figure 2: Black sea bass SSB and recruitment, 1989-2018 from the 2019 operational stock assessment. The horizontal dashed line is the updated biomass reference point. (Source: prepublication copy of the August 2019 operational stock assessment report.)
Figure 3: Total black sea bass catch and fishing mortality, 1989-2018, from the 2019 operational stock assessment. (Source: prepublication copy of the August 2019 operational stock assessment report.)
Review of Prior SSC Recommendations
In September 2019, the SSC recommended, and the Council and Board adopted 2020 and 2021 ABCs for black sea bass based on new stock status information and projections from the 2019 operational assessment.
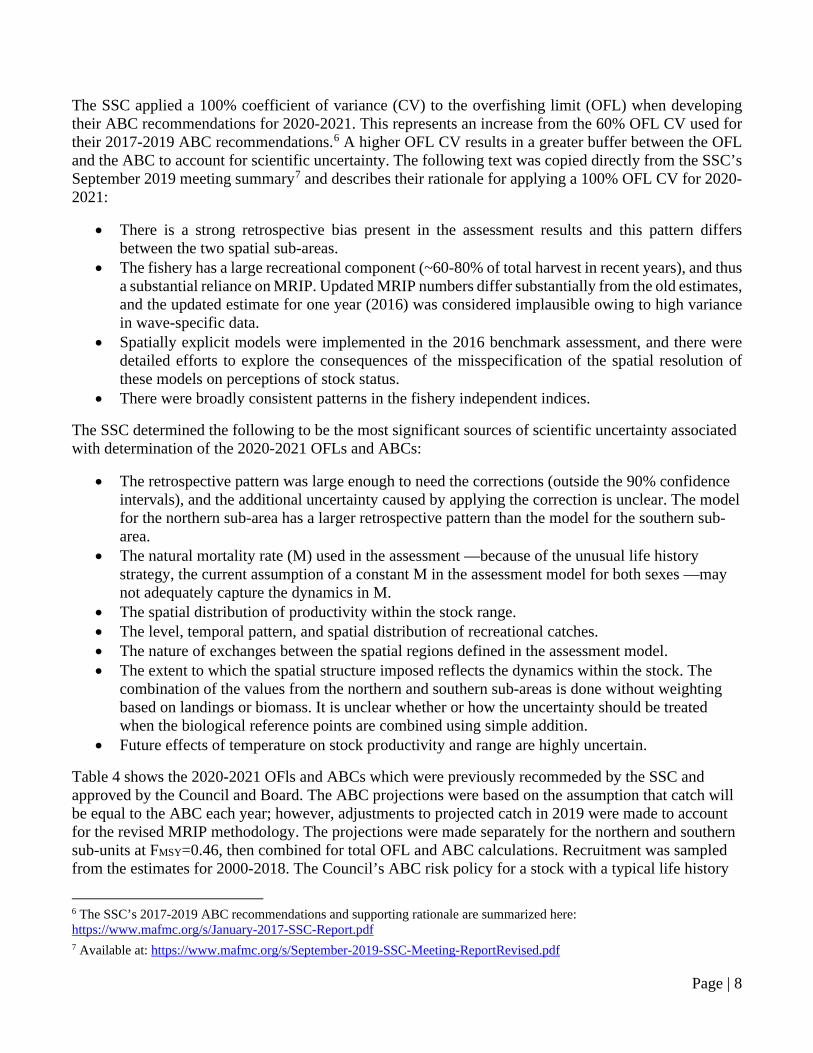
Page | 8
The SSC applied a 100% coefficient of variance (CV) to the overfishing limit (OFL) when developing their ABC recommendations for 2020-2021. This represents an increase from the 60% OFL CV used for their 2017-2019 ABC recommendations.6 A higher OFL CV results in a greater buffer between the OFL and the ABC to account for scientific uncertainty. The following text was copied directly from the SSC’s September 2019 meeting summary7 and describes their rationale for applying a 100% OFL CV for 2020-2021:
• There is a strong retrospective bias present in the assessment results and this pattern differs between the two spatial sub-areas.
• The fishery has a large recreational component (~60-80% of total harvest in recent years), and thus a substantial reliance on MRIP. Updated MRIP numbers differ substantially from the old estimates, and the updated estimate for one year (2016) was considered implausible owing to high variance in wave-specific data.
• Spatially explicit models were implemented in the 2016 benchmark assessment, and there were detailed efforts to explore the consequences of the misspecification of the spatial resolution of these models on perceptions of stock status.
• There were broadly consistent patterns in the fishery independent indices.
The SSC determined the following to be the most significant sources of scientific uncertainty associated with determination of the 2020-2021 OFLs and ABCs:
• The retrospective pattern was large enough to need the corrections (outside the 90% confidence intervals), and the additional uncertainty caused by applying the correction is unclear. The model for the northern sub-area has a larger retrospective pattern than the model for the southern sub-area.
• The natural mortality rate (M) used in the assessment —because of the unusual life history strategy, the current assumption of a constant M in the assessment model for both sexes —may not adequately capture the dynamics in M.
• The spatial distribution of productivity within the stock range. • The level, temporal pattern, and spatial distribution of recreational catches. • The nature of exchanges between the spatial regions defined in the assessment model. • The extent to which the spatial structure imposed reflects the dynamics within the stock. The
combination of the values from the northern and southern sub-areas is done without weighting based on landings or biomass. It is unclear whether or how the uncertainty should be treated when the biological reference points are combined using simple addition.
• Future effects of temperature on stock productivity and range are highly uncertain.
Table 4 shows the 2020-2021 OFls and ABCs which were previously recommeded by the SSC and approved by the Council and Board. The ABC projections were based on the assumption that catch will be equal to the ABC each year; however, adjustments to projected catch in 2019 were made to account for the revised MRIP methodology. The projections were made separately for the northern and southern sub-units at FMSY=0.46, then combined for total OFL and ABC calculations. Recruitment was sampled from the estimates for 2000-2018. The Council’s ABC risk policy for a stock with a typical life history
6 The SSC’s 2017-2019 ABC recommendations and supporting rationale are summarized here: https://www.mafmc.org/s/January-2017-SSC-Report.pdf 7 Available at: https://www.mafmc.org/s/September-2019-SSC-Meeting-ReportRevised.pdf

Page | 9
was applied, resulting in an ABC P* (i.e., probability of overfishing) of 40% on average across the two years. As previously stated and described in more detail below, the Council has since revised their risk policy. The SSC should consider whether revisions to their previously recommened 2021 ABC are necessary given the change in the risk policy.
Table 4: 2020-2021 OFL and ABCs recommended by the SSC and approved by the Council and Board in 2020, as well as associated fishing mortality rate, P*, and SSB projections. (Source: personal communication, Gary Shepherd, NEFSC.)
Year OFL total catch ABC total catch ABC F ABC P* SSB MT Mil. lb MT Mil. lb MT Mil. lb
2020 8,795 19.39 6,835 15.07 0.30 38% 23,688 52.22 2021 8,021 17.68 6,835 15.07 0.33 42% 22,282 52.22
Revisions to the Council's Risk Policy The Council first implemented a risk policy and ABC control rule in 2011 to comply with the 2006 re-authorization of the MSA. In 2017, the Council expressed interest in more comprehensively considering economic and social factors, in addition to biological factors, in their risk policy. In 2019, a workgroup comprised of NMFS staff, SSC members, academics, and Council staff was formed and tasked with developing and analyzing various risk policy alternatives in order to assess the short and long-term trade-offs between stock biomass protection and economic yield and benefits. Members of the workgroup built off their existing biological and economic management strategy evaluation models.
The Council considered nine different risk policy alternatives in December 2019, ultimately approving a combination of two alternatives.8 The approved risk policy allows for increased risk under high stock biomass conditions (increased P* at most biomass levels, compared to the previous risk policy; Figure 4). The change is greatest for stocks with biomass above the target level (BMSY). The revised risk policy retains the previous stock replenishment threshold (i.e., biomass levels where P*=0) of B/BMSY ≤ 0.1. The policy uses a linear ramping for B/BMSY values less than 1.0 up to a maximum P* of 0.45 when stock biomass is at its target. For stocks with B/BMSY values over 1.0, a second linear ramp is used up to a maximum P* of 0.49 for stocks at or above B/BMSY = 1.5. In addition, the Council also removed the typical/atypical designation from the risk policy.
8 Alternatives 2 and 8 described in the December 2019 discussion document available at http://www.mafmc.org/briefing/december-2019.
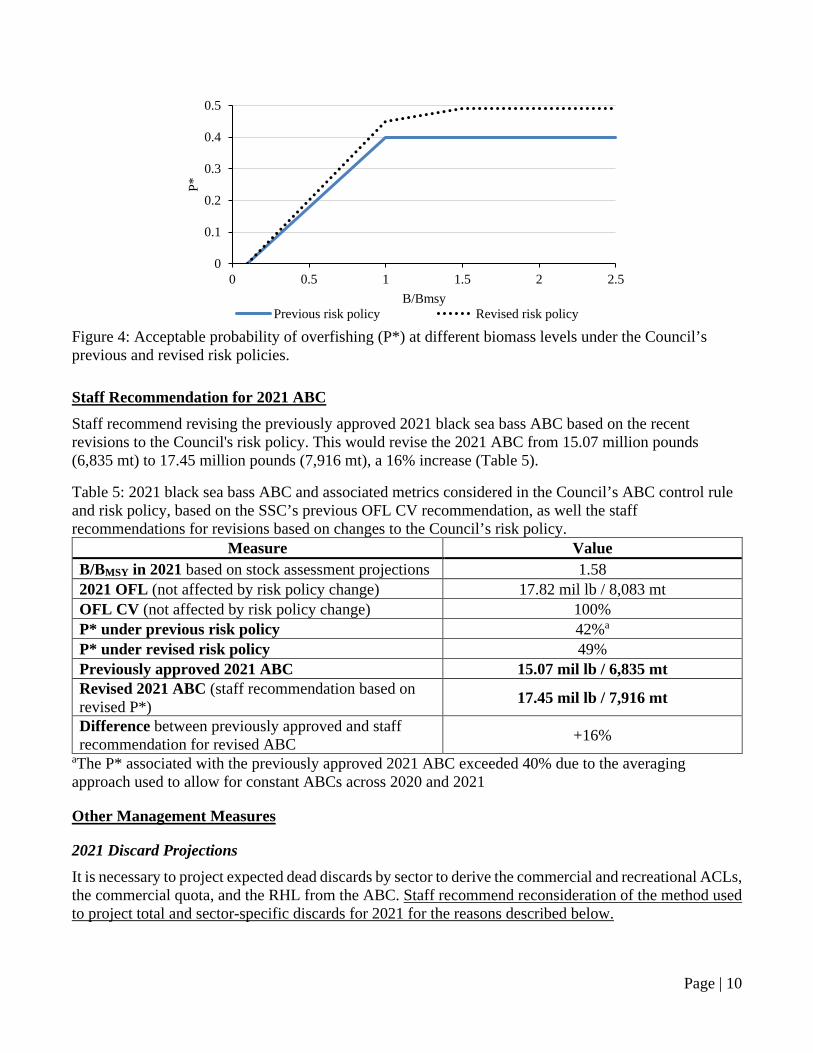
Page | 10
Figure 4: Acceptable probability of overfishing (P*) at different biomass levels under the Council’s previous and revised risk policies.
Staff Recommendation for 2021 ABC Staff recommend revising the previously approved 2021 black sea bass ABC based on the recent revisions to the Council's risk policy. This would revise the 2021 ABC from 15.07 million pounds (6,835 mt) to 17.45 million pounds (7,916 mt), a 16% increase (Table 5).
Table 5: 2021 black sea bass ABC and associated metrics considered in the Council’s ABC control rule and risk policy, based on the SSC’s previous OFL CV recommendation, as well the staff recommendations for revisions based on changes to the Council’s risk policy.
Measure Value B/BMSY in 2021 based on stock assessment projections 1.58 2021 OFL (not affected by risk policy change) 17.82 mil lb / 8,083 mt OFL CV (not affected by risk policy change) 100% P* under previous risk policy 42%a
P* under revised risk policy 49% Previously approved 2021 ABC 15.07 mil lb / 6,835 mt Revised 2021 ABC (staff recommendation based on revised P*) 17.45 mil lb / 7,916 mt
Difference between previously approved and staff recommendation for revised ABC +16%
aThe P* associated with the previously approved 2021 ABC exceeded 40% due to the averaging approach used to allow for constant ABCs across 2020 and 2021
Other Management Measures
2021 Discard Projections It is necessary to project expected dead discards by sector to derive the commercial and recreational ACLs, the commercial quota, and the RHL from the ABC. Staff recommend reconsideration of the method used to project total and sector-specific discards for 2021 for the reasons described below.
0
0.1
0.2
0.3
0.4
0.5
0 0.5 1 1.5 2 2.5
P*
B/BmsyPrevious risk policy Revised risk policy
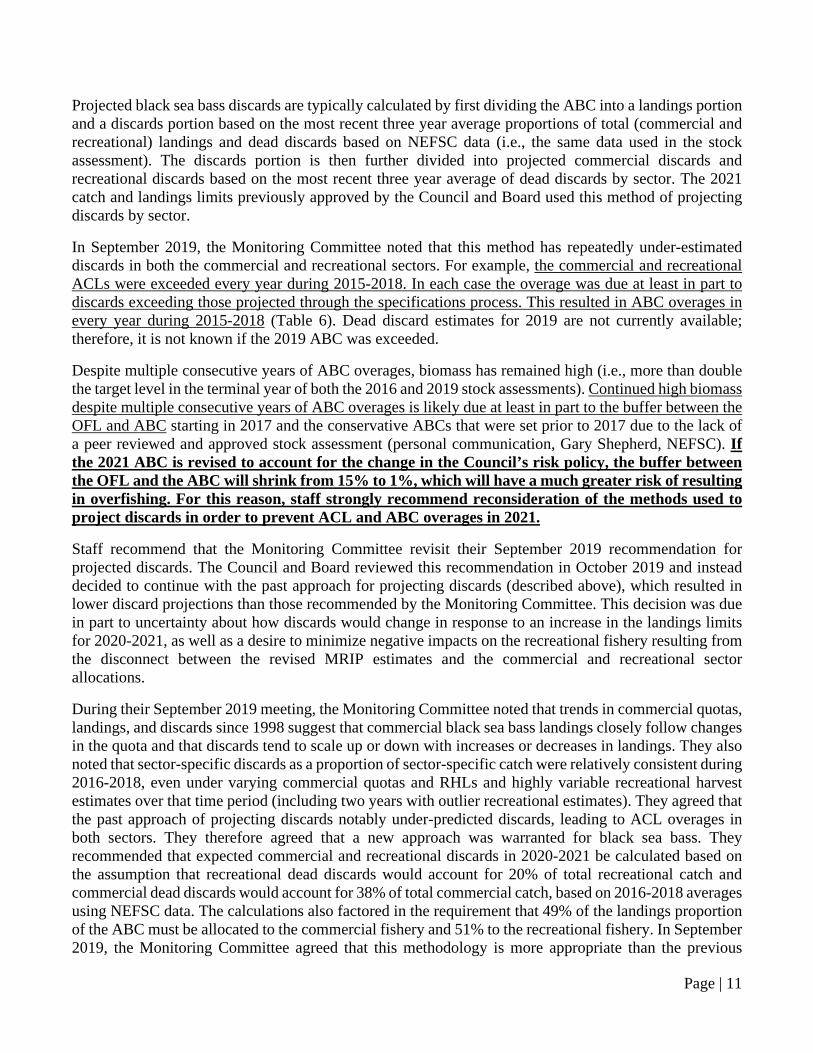
Page | 11
Projected black sea bass discards are typically calculated by first dividing the ABC into a landings portion and a discards portion based on the most recent three year average proportions of total (commercial and recreational) landings and dead discards based on NEFSC data (i.e., the same data used in the stock assessment). The discards portion is then further divided into projected commercial discards and recreational discards based on the most recent three year average of dead discards by sector. The 2021 catch and landings limits previously approved by the Council and Board used this method of projecting discards by sector.
In September 2019, the Monitoring Committee noted that this method has repeatedly under-estimated discards in both the commercial and recreational sectors. For example, the commercial and recreational ACLs were exceeded every year during 2015-2018. In each case the overage was due at least in part to discards exceeding those projected through the specifications process. This resulted in ABC overages in every year during 2015-2018 (Table 6). Dead discard estimates for 2019 are not currently available; therefore, it is not known if the 2019 ABC was exceeded.
Despite multiple consecutive years of ABC overages, biomass has remained high (i.e., more than double the target level in the terminal year of both the 2016 and 2019 stock assessments). Continued high biomass despite multiple consecutive years of ABC overages is likely due at least in part to the buffer between the OFL and ABC starting in 2017 and the conservative ABCs that were set prior to 2017 due to the lack of a peer reviewed and approved stock assessment (personal communication, Gary Shepherd, NEFSC). If the 2021 ABC is revised to account for the change in the Council’s risk policy, the buffer between the OFL and the ABC will shrink from 15% to 1%, which will have a much greater risk of resulting in overfishing. For this reason, staff strongly recommend reconsideration of the methods used to project discards in order to prevent ACL and ABC overages in 2021.
Staff recommend that the Monitoring Committee revisit their September 2019 recommendation for projected discards. The Council and Board reviewed this recommendation in October 2019 and instead decided to continue with the past approach for projecting discards (described above), which resulted in lower discard projections than those recommended by the Monitoring Committee. This decision was due in part to uncertainty about how discards would change in response to an increase in the landings limits for 2020-2021, as well as a desire to minimize negative impacts on the recreational fishery resulting from the disconnect between the revised MRIP estimates and the commercial and recreational sector allocations.
During their September 2019 meeting, the Monitoring Committee noted that trends in commercial quotas, landings, and discards since 1998 suggest that commercial black sea bass landings closely follow changes in the quota and that discards tend to scale up or down with increases or decreases in landings. They also noted that sector-specific discards as a proportion of sector-specific catch were relatively consistent during 2016-2018, even under varying commercial quotas and RHLs and highly variable recreational harvest estimates over that time period (including two years with outlier recreational estimates). They agreed that the past approach of projecting discards notably under-predicted discards, leading to ACL overages in both sectors. They therefore agreed that a new approach was warranted for black sea bass. They recommended that expected commercial and recreational discards in 2020-2021 be calculated based on the assumption that recreational dead discards would account for 20% of total recreational catch and commercial dead discards would account for 38% of total commercial catch, based on 2016-2018 averages using NEFSC data. The calculations also factored in the requirement that 49% of the landings proportion of the ABC must be allocated to the commercial fishery and 51% to the recreational fishery. In September 2019, the Monitoring Committee agreed that this methodology is more appropriate than the previous
Page | 12
methodology as it scales discards with expected changes in landings, consistent with observed patterns in the fishery. It also gives equal weight to the sector-specific proportions in each of the three years, thus downplaying the influence of any potential single year outliers. Staff recommend that the Monitoring Committee consider whether this method should be used to revise the 2021 discard projections. Updated discard projections based on this methodology are shown in Table 1.
It is worth noting that the NMFS Greater Atlantic Regional Fisheries Office (GARFO) and the NEFSC are working to develop a new system of estimating discards with the goal of both groups using the same estimates in the future. This work is ongoing. In recent years, the NEFSC discard estimates have been used for specifications calculations based on the advice of the Monitoring Committee. Staff recommend continued use of the NEFSC discard estimates in the specifications process until the outcome of the ongoing collaboration between GARFO and the NEFSC is known.
Recreational and Commercial ACLs Based on the allocation percentages defined in the FMP, 49% of the total allowable landings (i.e., the proportion of the ABC that is expected to be landed as opposed to discarded) are allocated to the commercial fishery and 51% to the recreational fishery. These allocations are combined with expected commercial and recreational discards to calculate sector-specific ACLs.
These allocations were implemented through Amendment 9 (1996) and first came into effect in 1998. They were based on the proportions of commercial and recreational landings during 1983-1992 and do not reflect the current understanding of the proportion of catch and landings from the commercial and recreational sectors based on the revised time series of MRIP data and current commercial fishery data. The Council and Board are in the process of developing an FMP Amendment to consider if changes to these allocations should be made. Any changes made to these allocations will not be implemented until 2022 or later.
The change in the Council’s risk policy and the staff recommendation for projected discards (both described above) would result in a revised 2021 commercial ACL of 9.52 million pounds (4,320 mt), an increase of 36% compared to the previously approved 2021 commercial ACL. It would result in a revised 2021 recreational ACL of 7.93 million pounds (3,596 mt), a decrease of 2% compared to the previously approved 2021 recreational ACL. Although the recreational ACL would decrease, as described below, the RHL would increase due to the recommended change in the discard estimates (Table 1).
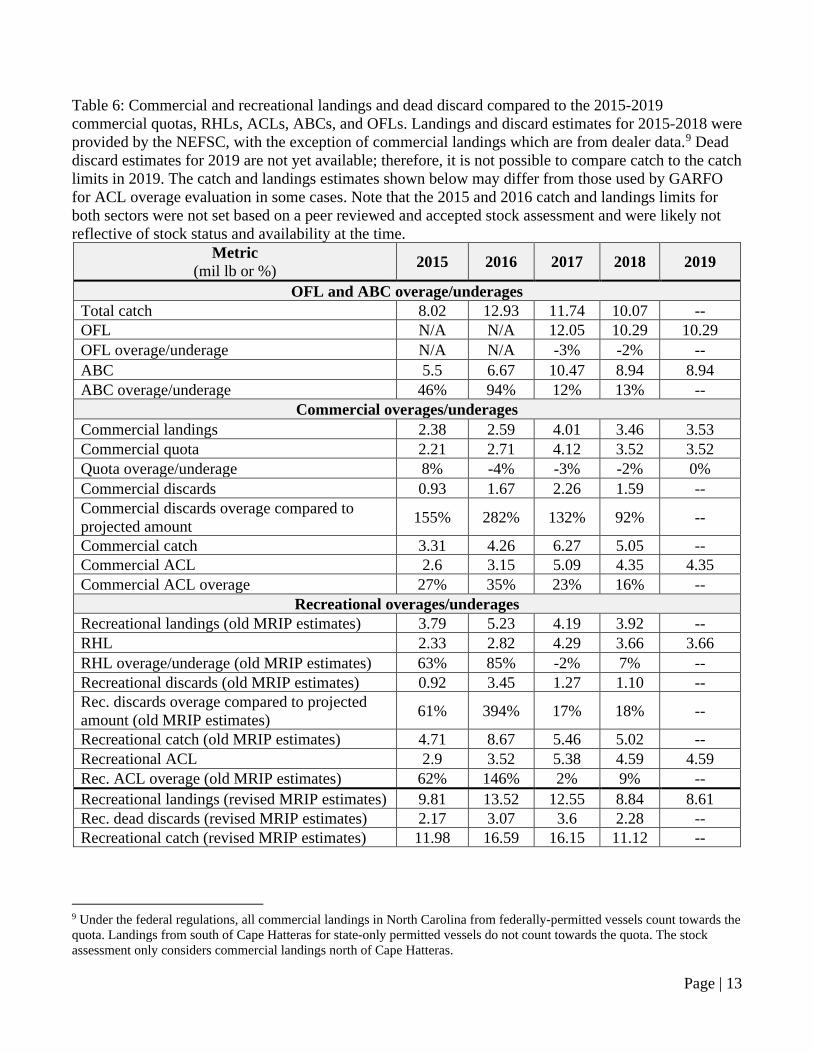
Page | 13
Table 6: Commercial and recreational landings and dead discard compared to the 2015-2019 commercial quotas, RHLs, ACLs, ABCs, and OFLs. Landings and discard estimates for 2015-2018 were provided by the NEFSC, with the exception of commercial landings which are from dealer data.9 Dead discard estimates for 2019 are not yet available; therefore, it is not possible to compare catch to the catch limits in 2019. The catch and landings estimates shown below may differ from those used by GARFO for ACL overage evaluation in some cases. Note that the 2015 and 2016 catch and landings limits for both sectors were not set based on a peer reviewed and accepted stock assessment and were likely not reflective of stock status and availability at the time.
Metric (mil lb or %) 2015 2016 2017 2018 2019
OFL and ABC overage/underages Total catch 8.02 12.93 11.74 10.07 -- OFL N/A N/A 12.05 10.29 10.29 OFL overage/underage N/A N/A -3% -2% -- ABC 5.5 6.67 10.47 8.94 8.94 ABC overage/underage 46% 94% 12% 13% --
Commercial overages/underages Commercial landings 2.38 2.59 4.01 3.46 3.53 Commercial quota 2.21 2.71 4.12 3.52 3.52 Quota overage/underage 8% -4% -3% -2% 0% Commercial discards 0.93 1.67 2.26 1.59 -- Commercial discards overage compared to projected amount 155% 282% 132% 92% --
Commercial catch 3.31 4.26 6.27 5.05 -- Commercial ACL 2.6 3.15 5.09 4.35 4.35 Commercial ACL overage 27% 35% 23% 16% --
Recreational overages/underages Recreational landings (old MRIP estimates) 3.79 5.23 4.19 3.92 -- RHL 2.33 2.82 4.29 3.66 3.66 RHL overage/underage (old MRIP estimates) 63% 85% -2% 7% -- Recreational discards (old MRIP estimates) 0.92 3.45 1.27 1.10 -- Rec. discards overage compared to projected amount (old MRIP estimates) 61% 394% 17% 18% --
Recreational catch (old MRIP estimates) 4.71 8.67 5.46 5.02 -- Recreational ACL 2.9 3.52 5.38 4.59 4.59 Rec. ACL overage (old MRIP estimates) 62% 146% 2% 9% -- Recreational landings (revised MRIP estimates) 9.81 13.52 12.55 8.84 8.61 Rec. dead discards (revised MRIP estimates) 2.17 3.07 3.6 2.28 -- Recreational catch (revised MRIP estimates) 11.98 16.59 16.15 11.12 --
9 Under the federal regulations, all commercial landings in North Carolina from federally-permitted vessels count towards the quota. Landings from south of Cape Hatteras for state-only permitted vessels do not count towards the quota. The stock assessment only considers commercial landings north of Cape Hatteras.

Page | 14
Recreational and Commercial ACTs ACTs are set less than or equal to the sector-specific ACLs to account for management uncertainty (Figure 5). Management uncertainty is comprised of two parts: uncertainty in the ability of managers to control catch and uncertainty in quantifying the true catch (i.e., estimation errors). Management uncertainty can occur due to a lack of sufficient information about the catch (e.g., due to late reporting, underreporting, and/or misreporting of landings or discards) or because of a lack of management precision (i.e., the ability to constrain catch to desired levels). The Monitoring Committee considers all relevant sources of management uncertainty in the black sea bass fishery when recommending ACTs.
Commercial landings have not exceeded the quota by more than 1% since 2015 (2015-2019, Table 6). The commercial quota monitoring system is timely and typically successful in constraining landings to the commercial quota. In contrast, the recreational fishery exceeded the RHL in several recent years, with substantial overages prior to 2017 (based on the old MRIP data, Table 6). It should be noted that the revised time series of MRIP data was released in July 2018 and was first incorporated into a stock assessment in August 2019; therefore, RHLs prior to 2020 did not account for these revised estimates. Past RHLs should not be compared against the revised estimates. In addition, the Monitoring Committee has noted that these recreational overages occurred when the stock was rapidly expanding and availability to anglers was very high. At the same time, due to the lack of an approved stock assessment prior to 2017, the RHLs were set at levels not reflective of the large and increasing stock abundance. Analysis using the 2016 stock assessment indicated that RHLs during the few years prior to 2017 would have been approximately double those implemented if they had been set using the new assessment model, and overages would likely not have occurred to the same degree.
In recent years, the Monitoring Committee and the ASMFC’s Technical Committee have been working to develop new and alternative methodologies to evaluate management uncertainty in the recreational fishery, the predictability and uncertainty in recreational catch estimates, and the influence of recreational regulations on harvest. Some of this work has been incorporated into the ongoing Recreational Reform Initiative.10
The Monitoring Committee has generally not recommended deductions from the ACLs to the ACTs in either sector to account for management uncertainty. Staff recommend careful consideration of management uncertainty for 2021 given the potential for a greatly reduced scientific uncertainty buffer between the OFL and ABC under the Council’s revised risk policy as well as due to concerns about discard projections described above. Specifically, if the projected discard estimates continue to be based on the past methodology which consistently under-estimated actual discards (Table 6), then management uncertainty may warrant more serious consideration than if an alternative approach to discards is used. It is worth noting that commercial and recreational discard projections cannot be calculated separately given that the sector allocations are landings-based, rather than catch based. This means that the discard projections in one sector impact the catch and landings limits in the other sector. Management uncertainty, however, can be addressed separately for each sector.
It is also worth noting that the 2020 discard estimates will likely be highly uncertain given several months without commercial fisheries observer coverage or MRIP angler access point sampling due to the COVID-19 pandemic. This will pose challenges for evaluating discards against projected estimates in future years.
10 More information is available at: https://www.mafmc.org/actions/recreational-reform-initiative.
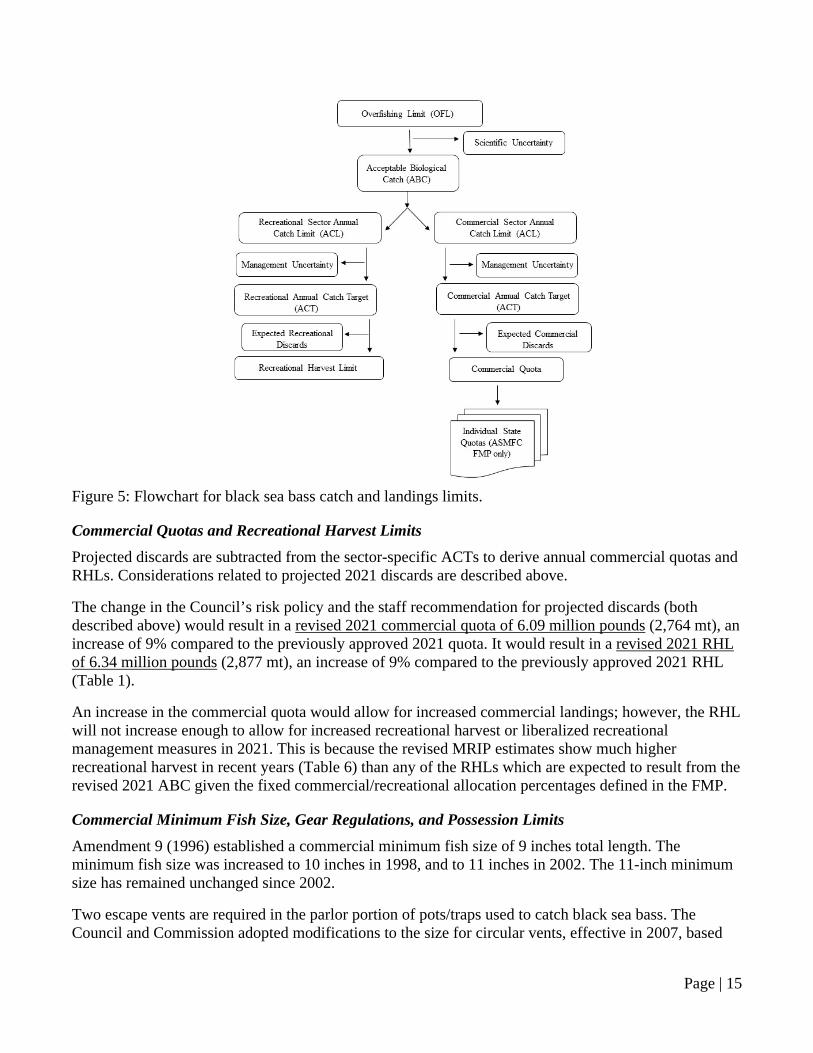
Page | 15
Figure 5: Flowchart for black sea bass catch and landings limits.
Commercial Quotas and Recreational Harvest Limits Projected discards are subtracted from the sector-specific ACTs to derive annual commercial quotas and RHLs. Considerations related to projected 2021 discards are described above.
The change in the Council’s risk policy and the staff recommendation for projected discards (both described above) would result in a revised 2021 commercial quota of 6.09 million pounds (2,764 mt), an increase of 9% compared to the previously approved 2021 quota. It would result in a revised 2021 RHL of 6.34 million pounds (2,877 mt), an increase of 9% compared to the previously approved 2021 RHL (Table 1).
An increase in the commercial quota would allow for increased commercial landings; however, the RHL will not increase enough to allow for increased recreational harvest or liberalized recreational management measures in 2021. This is because the revised MRIP estimates show much higher recreational harvest in recent years (Table 6) than any of the RHLs which are expected to result from the revised 2021 ABC given the fixed commercial/recreational allocation percentages defined in the FMP.
Commercial Minimum Fish Size, Gear Regulations, and Possession Limits Amendment 9 (1996) established a commercial minimum fish size of 9 inches total length. The minimum fish size was increased to 10 inches in 1998, and to 11 inches in 2002. The 11-inch minimum size has remained unchanged since 2002.
Two escape vents are required in the parlor portion of pots/traps used to catch black sea bass. The Council and Commission adopted modifications to the size for circular vents, effective in 2007, based
Page | 16
on the findings of a Council and Commission sponsored workshop. The minimum circle vent size increased from 2.375 inches to 2.5 inches. The requirements of 1.375 inches x 5.75 inches for rectangular vents and 2 inches for square vents remained unchanged.
Amendment 9 also established gear regulations that became effective in December 1996 and were modified in 1998 and again in 2002. Current regulations, unchanged since 2002, state that trawl vessels that possess 500 pounds or more of black sea bass from January 1 through March 31, or 100 pounds or more from April 1 through December 31, must fish with nets that have a minimum mesh size of 4.5-inch diamond mesh throughout the codend for at least 75 continuous meshes forward of the terminus of the net. For codends with less than 75 meshes, the entire net must have a minimum mesh size of 4.5-inch diamond mesh.
Beyond the possession limits associated with the minimum trawl mesh size, there are no federal waters commercial possession limits for black sea bass. Several states set commercial possession limits that apply within state waters to help ensure that commercial landings do not exceed each state’s allocation as defined in the Commission’s FMP. In recent years, a few advisors have requested consideration a federal waters commercial possession limit to help prevent negative impacts on the price of black sea bass resulting from individual trawl trips with high landings. Other advisors have disagreed with this recommendation. At this time, Council staff recommend no changes to the current federal regulations regarding commercial black sea bass possession limits.
The Council recently funded a project which analyzed the selectivity of multiple codend mesh sizes relative to summer flounder, black sea bass, and scup retention in the commercial bottom trawl fishery in the Mid-Atlantic region. Results confirmed that the current minimum mesh sizes for all three species are effective at releasing most fish smaller than the commercial minimum sizes (i.e., 14 inches total length for summer flounder, 9 inches total length for scup, and 11 inches total length for black sea bass). The study was not able to identify a common mesh size for all three species that would be effective at minimizing discards under the current minimum fish size limits. However, the authors concluded that a common mesh size of 4.5 or 5 inches diamond for scup and black sea bass would be effective at releasing undersized fish.11
The Monitoring Committee reviewed the results of this study in 2018 and recommended no changes to the commercial minimum mesh sizes for 2019. They recommended clarification of the objectives of the Council regarding consideration of the mesh sizes (e.g., establishing a common minimum mesh size, minimizing discards, and/or maintaining or increasing catches of legal-sized fish). Input from the commercial fishing industry should be sought before any minimum mesh size changes are considered.
Staff will continue to work with the Monitoring Committee and Advisory Panel in 2020 to further analyze and consider potential changes to mesh size regulations. Currently, staff recommend no changes to the black sea bass minimum mesh sizes and associated possession limits, or other commercial management measures for 2021.
11 11 Hasbrouck, E., S. Curatolo-Wagemann, T. Froelich, K. Gerbino, D. Kuehn, P. Sullivan, J. Knight. 2018. Determining Selectivity and Optimum Mesh Size to Harvest Three Commercially Important Mid-Atlantic Species - A Report to the Mid-Atlantic Fishery Management Council and the Atlantic States Marine Fisheries Commission. Available at: http://www.mafmc.org/s/Tab08_SFSBSB-Mesh-Selectivity-Study-Apr2018.pdf

Page | 17
February 2021 Recreational Management Measures The Council and the Commission allowed states to open their recreational black sea bass fisheries during February 2018-2020 under specific constraints. The recreational black sea bass fishery was previously closed during January and February for several years. States were required to opt-in to the February opening during 2018-2020. Participating states were required to have a 12.5 inch minimum fish size limit and a 15 fish possession limit during February (identical to the federal recreational measures). Participating states were required to adjust their recreational management measures during the rest of the year to account for expected February harvest to help ensure that the coastwide RHL was not exceeded as a result of the February opening. Expected February harvest by state was pre-defined based on an analysis of vessel trip report data from federally permitted for-hire vessels in February 2013, the last year the recreational fishery was open in February prior to 2018. To date, only Virginia and North Carolina have participated in this optional opening.
Detailed background information on the February recreational fishery in 2018-2020 and considerations for 2021 can be found in various documents which were previously provided to the Monitoring Committee and are available at: https://www.mafmc.org/council-events/2020/sfsbsb-mc-meeting-july27. This information is not repeated here.
During their May 2020 meeting, the Monitoring Committee reviewed performance of the recreational black sea bass fishery during February 2018-2020 and considered if any management changes are needed for February 2021. They will continue these discussions during their July 2020 meeting and make recommendations on any necessary changes for the Council and Board to consider in August 2020.
Staff recommend revisions to the values for expected February harvest by state to account for recent revisions to the MRIP (see the staff memo dated May 22, 2020, available at the link above). Staff also recommend that the Council and Board clarify certain aspects of the requirements for state participation in this optional opening, including requirements for quantifying February harvest and requirements for changes to recreational management measures later in the year if February harvest exceeds the expected value in any individual state. Staff caution against participation in this optional fishery by states which are not able to modify their measures later in the year to account for greater than expected February harvest.
The Monitoring Committee will discuss recreational management measures for the rest of 2021 in the fall of 2020, after preliminary MRIP data through August 2020 are available. Management measures for the February 2021 recreational fishery must be considered earlier in 2020 to allow sufficient time for the federal rulemaking process if any changes are needed.
Staff have no recommendations for recreational management measures for black sea bass during March-December 2021 at this time.
Page 1 of 7
M E M O R A N D U M
Date: May 22, 2020
To: Summer Flounder, Scup, and Black Sea Bass Monitoring Committee
From: Julia Beaty (MAFMC staff), Caitlin Starks (ASMFC staff)
Subject: February 2021 recreational black sea bass fishery
Introduction
The Mid-Atlantic Fishery Management Council (Council) and the Atlantic States Marine
Fisheries Commission’s Summer Flounder, Scup, and Black Sea Bass Management Board
(Board) allowed states to open their recreational black sea bass fisheries during February 2018-
2020 under specific constraints (see page 2). The recreational black sea bass fishery was
previously closed during January and February for several years.
During their May 2020 meeting, the Monitoring Committee will review performance of the
recreational black sea bass fishery during February 2018-2020 and consider if any management
changes are needed for the February 2021 recreational fishery. For example, changes to the
values for expected February harvest by state may warrant consideration due to recent revisions
to the Marine Recreational Information Program (MRIP) data and after considering estimated
February harvest during 2018-2020 in the states which were open.
The Monitoring Committee will discuss recreational management measures for the rest of 2021
in the fall of 2020, after preliminary MRIP data through August 2020 are available. Management
measures for the February 2021 recreational fishery must be considered earlier in 2020 to allow
sufficient time for the federal rulemaking process if any changes are needed.
Discussion questions for Monitoring Committee
• Should the black sea bass recreational fishery be open in 2021 under the same constraints
in place for 2018-2020, or are any changes needed?
• Should the values for expected February harvest by state (Table 1) be modified? If so,
how (e.g., see pages 6-7).
• Should a different approach be used that does not rely on expected harvest in pounds (e.g.
states only propose changes to measures once February harvest estimate is available)?
• Should the Council and Board adopt specific requirements for how states monitor their
February harvest? Or is the current process sufficient (i.e., monitoring requirements are
Mid-Atlantic Fishery Management Council 800 North State Street, Suite 201, Dover, DE 19901
Phone: 302-674-2331 ǀ FAX: 302-674-5399 ǀ www.mafmc.org Michael P. Luisi, Chairman ǀ G. Warren Elliott, Vice Chairman
Christopher M. Moore, Ph.D., Executive Director

Page 2 of 7
unspecified; states develop proposals, Technical Committee reviews, and Board
approves)?
• Should the Council and Board adopt specific requirements for how states should account
for greater than expected February harvest? Or is the current process sufficient (i.e.,
management responses are unspecified; states develop proposals, Technical Committee
reviews, and Board approves)?
• Some states are not able to adjust their measures in-season to account for higher than
expected February harvest. If any of these states participate in the February opening in
the future, how should they account for higher than expected February harvest? For
example, would paybacks in a future year be appropriate given that states are not held to
hard annual harvest targets and given that recreational overage paybacks are not required
in most other situations under current stock status? Would it be appropriate, fair, and
equitable to not require a management response to higher than expected February
harvest? Would it be fair and equitable to prevent states from participating in the
February opening if they cannot implement a management response to overages?
• Should the Council and Board consider any other changes to the February recreational
black sea bass fishery for 2021?
Background
During 2010-2012 and 2014-2017, the recreational black sea bass fishery was closed during
wave 1 (January and February) in state and federal waters. This closure was partially the result of
limited recreational harvest data during this time of year (North Carolina is the only state in the
management unit which conducts MRIP sampling during January and February) and concerns
about constraining harvest to the recreational harvest limit (RHL). The recreational fishery was
open during wave 1 in 2013 in federal waters and in many states. In recent years, some
recreational fishery stakeholders requested a wave 1 opening to allow for increased fishing
opportunities in light of the positive stock status indicated by the 2016 benchmark stock
assessment.
The Council and Board agreed to open the recreational black sea bass fishery in federal waters
during February 1-28, 2018-2020 and gave states the option of opening their fisheries under
specific constraints. Participating states were required to have a minimum fish size of 12.5 inches
and a 15 fish possession limit, identical to the federal waters measures. Participating states were
also required to account for expected February harvest when developing recreational
management measures for the rest of the fishing year to help ensure that the coastwide RHL
would not be exceeded due to the February opening. The Council and Board recommended a
total expected February harvest estimate of 100,000 pounds, distributed among states based on
the analysis summarized in the next section. Participating states submitted proposals to the
Technical Committee describing how they would account for February harvest when setting their
recreational management measures for the rest of the year. The proposals (as modified after
Technical Committee feedback, if needed) were then sent to the Board for review and approval
before they could be implemented.
Only Virginia and North Carolina participated in the 2018-2020 February opening. Estimated
February harvest and resulting changes to the management measures in Virginia and North
Carolina are summarized on pages 3-6.
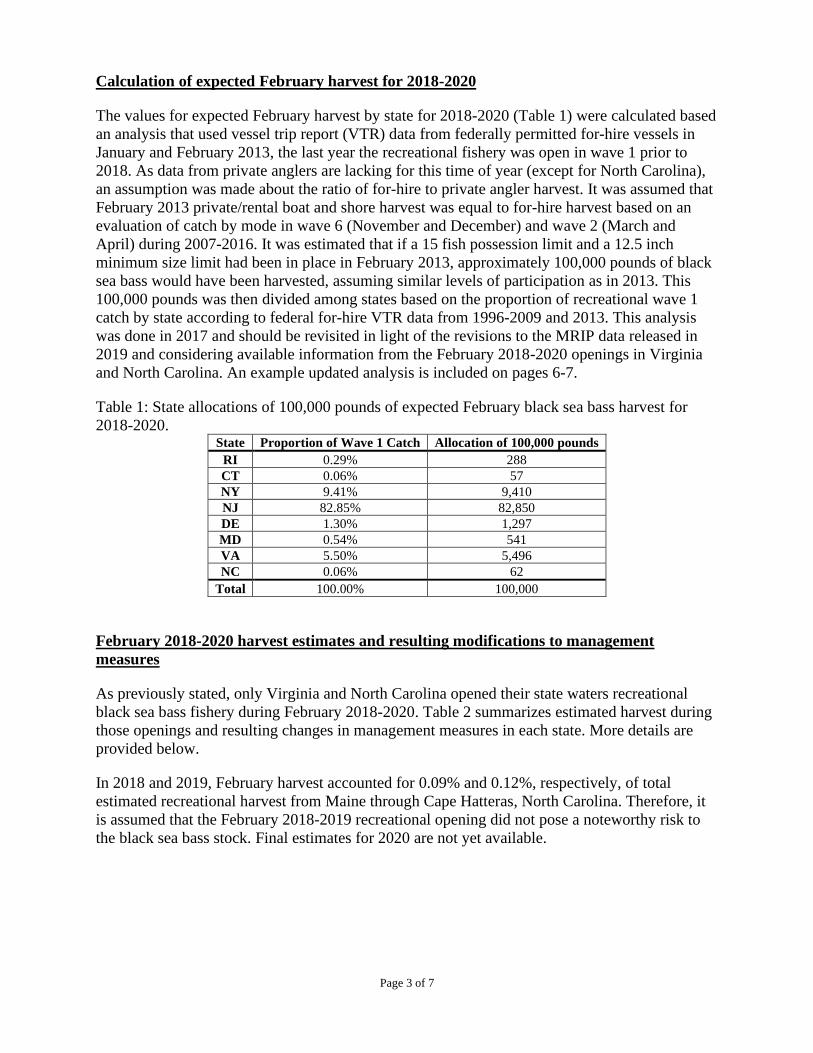
Page 3 of 7
Calculation of expected February harvest for 2018-2020
The values for expected February harvest by state for 2018-2020 (Table 1) were calculated based
an analysis that used vessel trip report (VTR) data from federally permitted for-hire vessels in
January and February 2013, the last year the recreational fishery was open in wave 1 prior to
2018. As data from private anglers are lacking for this time of year (except for North Carolina),
an assumption was made about the ratio of for-hire to private angler harvest. It was assumed that
February 2013 private/rental boat and shore harvest was equal to for-hire harvest based on an
evaluation of catch by mode in wave 6 (November and December) and wave 2 (March and
April) during 2007-2016. It was estimated that if a 15 fish possession limit and a 12.5 inch
minimum size limit had been in place in February 2013, approximately 100,000 pounds of black
sea bass would have been harvested, assuming similar levels of participation as in 2013. This
100,000 pounds was then divided among states based on the proportion of recreational wave 1
catch by state according to federal for-hire VTR data from 1996-2009 and 2013. This analysis
was done in 2017 and should be revisited in light of the revisions to the MRIP data released in
2019 and considering available information from the February 2018-2020 openings in Virginia
and North Carolina. An example updated analysis is included on pages 6-7.
Table 1: State allocations of 100,000 pounds of expected February black sea bass harvest for
2018-2020. State Proportion of Wave 1 Catch Allocation of 100,000 pounds
RI 0.29% 288
CT 0.06% 57
NY 9.41% 9,410
NJ 82.85% 82,850
DE 1.30% 1,297
MD 0.54% 541
VA 5.50% 5,496
NC 0.06% 62
Total 100.00% 100,000
February 2018-2020 harvest estimates and resulting modifications to management
measures
As previously stated, only Virginia and North Carolina opened their state waters recreational
black sea bass fishery during February 2018-2020. Table 2 summarizes estimated harvest during
those openings and resulting changes in management measures in each state. More details are
provided below.
In 2018 and 2019, February harvest accounted for 0.09% and 0.12%, respectively, of total
estimated recreational harvest from Maine through Cape Hatteras, North Carolina. Therefore, it
is assumed that the February 2018-2019 recreational opening did not pose a noteworthy risk to
the black sea bass stock. Final estimates for 2020 are not yet available.
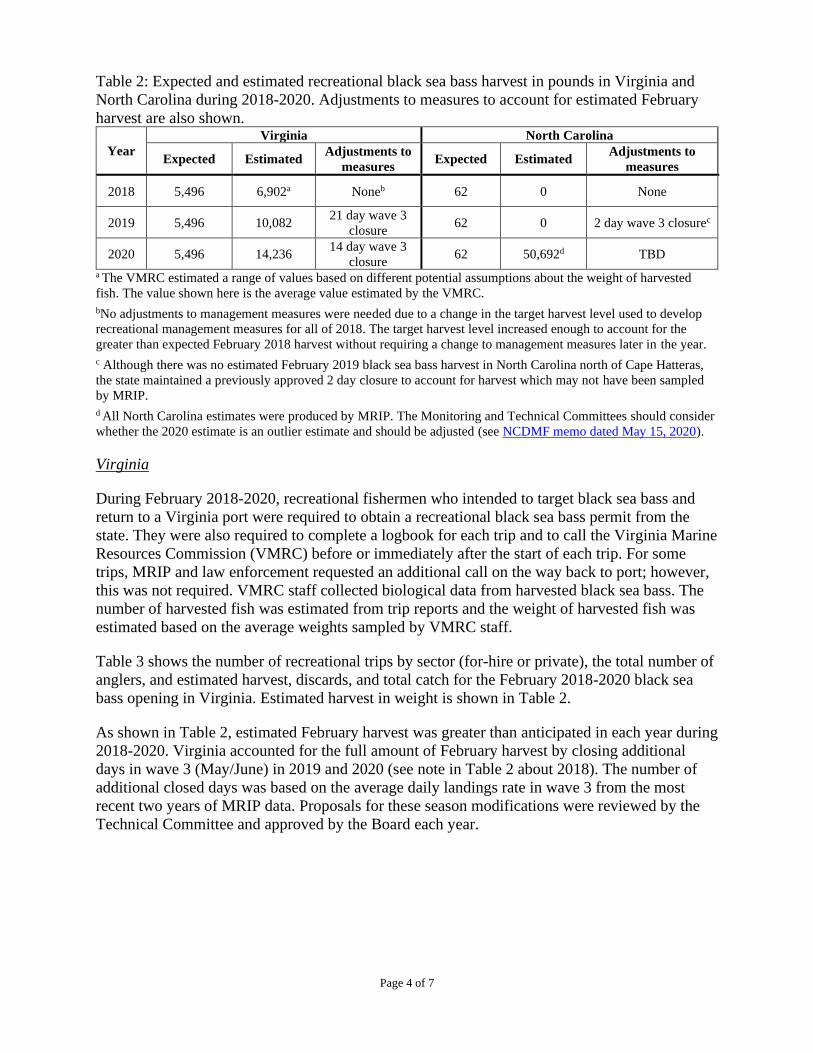
Page 4 of 7
Table 2: Expected and estimated recreational black sea bass harvest in pounds in Virginia and
North Carolina during 2018-2020. Adjustments to measures to account for estimated February
harvest are also shown.
Year
Virginia North Carolina
Expected Estimated Adjustments to
measures Expected Estimated
Adjustments to
measures
2018 5,496 6,902a Noneb 62 0 None
2019 5,496 10,082 21 day wave 3
closure 62 0 2 day wave 3 closurec
2020 5,496 14,236 14 day wave 3
closure 62 50,692d TBD
a The VMRC estimated a range of values based on different potential assumptions about the weight of harvested
fish. The value shown here is the average value estimated by the VMRC.
bNo adjustments to management measures were needed due to a change in the target harvest level used to develop
recreational management measures for all of 2018. The target harvest level increased enough to account for the
greater than expected February 2018 harvest without requiring a change to management measures later in the year.
c Although there was no estimated February 2019 black sea bass harvest in North Carolina north of Cape Hatteras,
the state maintained a previously approved 2 day closure to account for harvest which may not have been sampled
by MRIP.
d All North Carolina estimates were produced by MRIP. The Monitoring and Technical Committees should consider
whether the 2020 estimate is an outlier estimate and should be adjusted (see NCDMF memo dated May 15, 2020).
Virginia
During February 2018-2020, recreational fishermen who intended to target black sea bass and
return to a Virginia port were required to obtain a recreational black sea bass permit from the
state. They were also required to complete a logbook for each trip and to call the Virginia Marine
Resources Commission (VMRC) before or immediately after the start of each trip. For some
trips, MRIP and law enforcement requested an additional call on the way back to port; however,
this was not required. VMRC staff collected biological data from harvested black sea bass. The
number of harvested fish was estimated from trip reports and the weight of harvested fish was
estimated based on the average weights sampled by VMRC staff.
Table 3 shows the number of recreational trips by sector (for-hire or private), the total number of
anglers, and estimated harvest, discards, and total catch for the February 2018-2020 black sea
bass opening in Virginia. Estimated harvest in weight is shown in Table 2.
As shown in Table 2, estimated February harvest was greater than anticipated in each year during
2018-2020. Virginia accounted for the full amount of February harvest by closing additional
days in wave 3 (May/June) in 2019 and 2020 (see note in Table 2 about 2018). The number of
additional closed days was based on the average daily landings rate in wave 3 from the most
recent two years of MRIP data. Proposals for these season modifications were reviewed by the
Technical Committee and approved by the Board each year.

Page 5 of 7
Table 3: Summary of the Virginia February 2018-2020 recreational black sea bass fishery catch
and participation information. Information is based on federal VTRs and the Virginia reporting
system. Not all trip reports provided all catch and participation information. Variables with
incomplete information which may not be representative of all trips are denoted with *. Virginia February 2018-2020
Year Sector # of
trips
Total
anglers*
Harvest
(# of fish)
Discards*
(# of fish)
Total catch
(# of fish)
2018
For-Hire 17 199 1,996 675 2,671
Private 44 96 1,140 334 1,474
Unknown 1 - 30 - 30
Total 62 295 3,166 1,009 4,175
2019
For-Hire 12 206 2,560 466 3,026
Private 59 190 1,838 1,321 3,159
Unknown 0 0 0 0 0
Total 71 396 4,398 1,787 6,185
2020
For-Hire 30 305 4,045 574 4,619
Private 109 377 2,800 2,560 5,360
Unknown 16 - 583 - 583
Total 155 682 7,428 3,134 10,562
2018-2020 average
For-Hire 20 237 2,867 572 3,439
Private 71 221 1,926 1,405 3,331
Unknown 6 0 204 0 204
Total 96 458 4,997 1,977 6,974
North Carolina
North Carolina did not implement a sampling protocol specific to the February black sea bass
opening; however, North Carolina is the only state in the management unit which carries out
shoreside intercept surveys through MRIP during wave 1. MRIP samplers in North Carolina
were instructed to collect length and weight data on black sea bass harvested in February as well
as information on reported releases, catch and harvest per angler, and fishing locations. North
Carolina Department of Marine Fisheries (NCDMF) staff worked with charter boat captains to
collect black sea bass carcasses for age and growth samples.
Table 4 shows a summary of North Carolina private angler black sea bass catch and harvest
north of Cape Hatteras during February 2018-2020 based on MRIP estimates. Table 5 shows
available information on for-hire participation in the February 2018-2020 opening in North
Carolina. As shown in Table 4 and Table 5, the only harvest in North Carolina estimated by
MRIP for wave 1 2018-2020 was from private anglers in 2020.
NCDMF staff have indicated that the 2020 February harvest estimate of 50,692 pounds is
unbelievable high.1 The Monitoring and Technical Committees should consider whether this is
an outlier estimate and should be adjusted, and for future years, whether it is appropriate to rely
solely on MRIP estimates for management of the North Carolina February fishery.
Table 2 lists changes to North Carolina’s management measures in 2018 and 2019 to account for
the February opening. Changes to their 2020 management measures have yet to be determined.
1 For more information, see the memo from NCDMF dated May 15, 2020, available at:
https://www.mafmc.org/council-events/2020/sfsbsb-mc-may28.
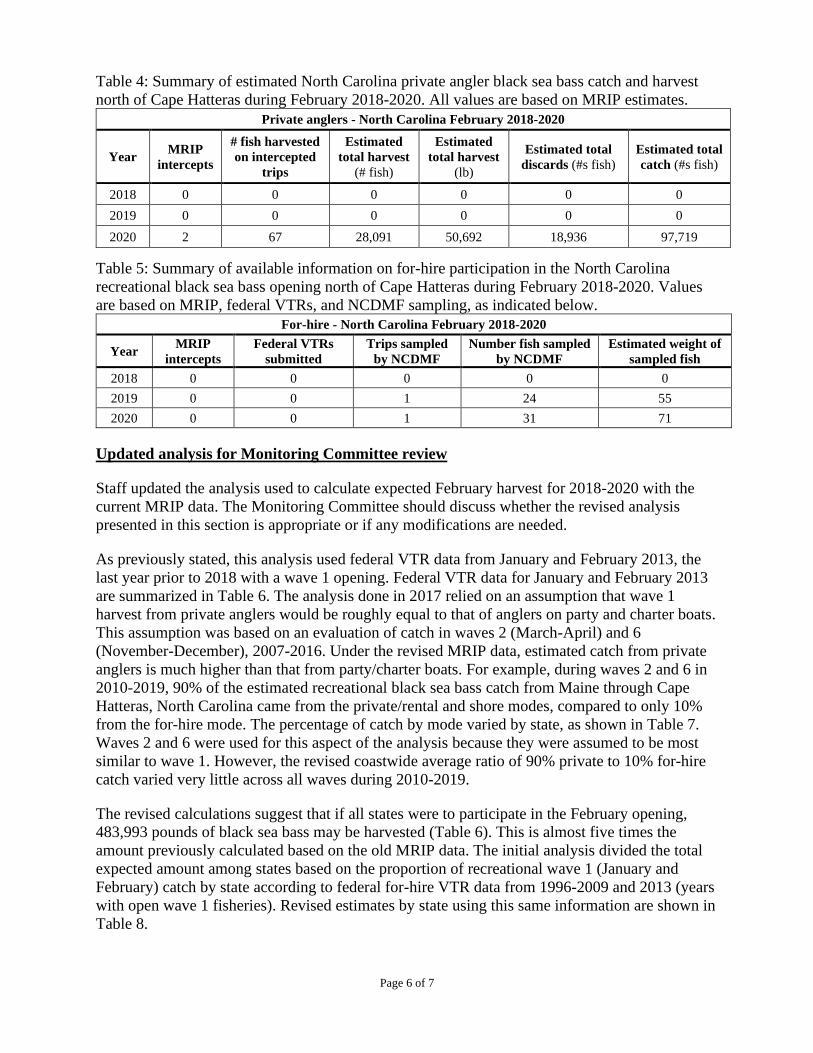
Page 6 of 7
Table 4: Summary of estimated North Carolina private angler black sea bass catch and harvest
north of Cape Hatteras during February 2018-2020. All values are based on MRIP estimates.
Private anglers - North Carolina February 2018-2020
Year MRIP
intercepts
# fish harvested
on intercepted
trips
Estimated
total harvest
(# fish)
Estimated
total harvest
(lb)
Estimated total
discards (#s fish)
Estimated total
catch (#s fish)
2018 0 0 0 0 0 0
2019 0 0 0 0 0 0
2020 2 67 28,091 50,692 18,936 97,719
Table 5: Summary of available information on for-hire participation in the North Carolina
recreational black sea bass opening north of Cape Hatteras during February 2018-2020. Values
are based on MRIP, federal VTRs, and NCDMF sampling, as indicated below.
For-hire - North Carolina February 2018-2020
Year MRIP
intercepts
Federal VTRs
submitted
Trips sampled
by NCDMF
Number fish sampled
by NCDMF
Estimated weight of
sampled fish
2018 0 0 0 0 0
2019 0 0 1 24 55
2020 0 0 1 31 71
Updated analysis for Monitoring Committee review
Staff updated the analysis used to calculate expected February harvest for 2018-2020 with the
current MRIP data. The Monitoring Committee should discuss whether the revised analysis
presented in this section is appropriate or if any modifications are needed.
As previously stated, this analysis used federal VTR data from January and February 2013, the
last year prior to 2018 with a wave 1 opening. Federal VTR data for January and February 2013
are summarized in Table 6. The analysis done in 2017 relied on an assumption that wave 1
harvest from private anglers would be roughly equal to that of anglers on party and charter boats.
This assumption was based on an evaluation of catch in waves 2 (March-April) and 6
(November-December), 2007-2016. Under the revised MRIP data, estimated catch from private
anglers is much higher than that from party/charter boats. For example, during waves 2 and 6 in
2010-2019, 90% of the estimated recreational black sea bass catch from Maine through Cape
Hatteras, North Carolina came from the private/rental and shore modes, compared to only 10%
from the for-hire mode. The percentage of catch by mode varied by state, as shown in Table 7.
Waves 2 and 6 were used for this aspect of the analysis because they were assumed to be most
similar to wave 1. However, the revised coastwide average ratio of 90% private to 10% for-hire
catch varied very little across all waves during 2010-2019.
The revised calculations suggest that if all states were to participate in the February opening,
483,993 pounds of black sea bass may be harvested (Table 6). This is almost five times the
amount previously calculated based on the old MRIP data. The initial analysis divided the total
expected amount among states based on the proportion of recreational wave 1 (January and
February) catch by state according to federal for-hire VTR data from 1996-2009 and 2013 (years
with open wave 1 fisheries). Revised estimates by state using this same information are shown in
Table 8.
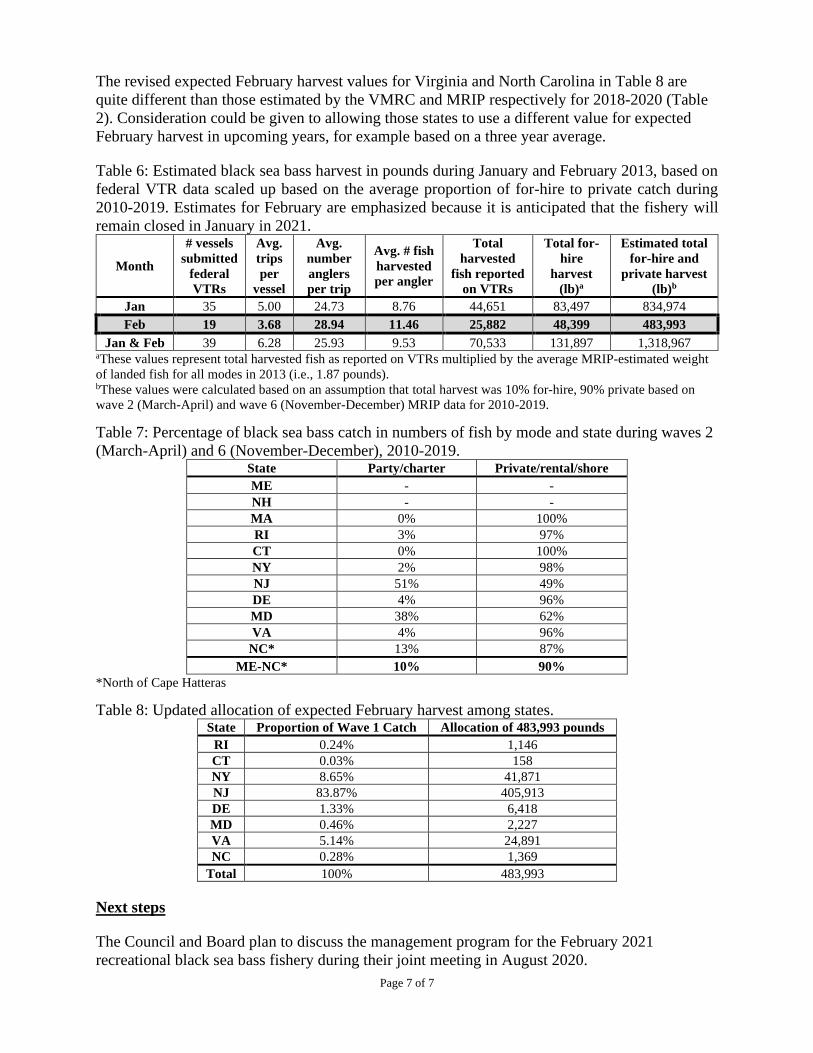
Page 7 of 7
The revised expected February harvest values for Virginia and North Carolina in Table 8 are
quite different than those estimated by the VMRC and MRIP respectively for 2018-2020 (Table
2). Consideration could be given to allowing those states to use a different value for expected
February harvest in upcoming years, for example based on a three year average.
Table 6: Estimated black sea bass harvest in pounds during January and February 2013, based on
federal VTR data scaled up based on the average proportion of for-hire to private catch during
2010-2019. Estimates for February are emphasized because it is anticipated that the fishery will
remain closed in January in 2021.
Month
# vessels
submitted
federal
VTRs
Avg.
trips
per
vessel
Avg.
number
anglers
per trip
Avg. # fish
harvested
per angler
Total
harvested
fish reported
on VTRs
Total for-
hire
harvest
(lb)a
Estimated total
for-hire and
private harvest
(lb)b
Jan 35 5.00 24.73 8.76 44,651 83,497 834,974
Feb 19 3.68 28.94 11.46 25,882 48,399 483,993
Jan & Feb 39 6.28 25.93 9.53 70,533 131,897 1,318,967 aThese values represent total harvested fish as reported on VTRs multiplied by the average MRIP-estimated weight
of landed fish for all modes in 2013 (i.e., 1.87 pounds). bThese values were calculated based on an assumption that total harvest was 10% for-hire, 90% private based on
wave 2 (March-April) and wave 6 (November-December) MRIP data for 2010-2019.
Table 7: Percentage of black sea bass catch in numbers of fish by mode and state during waves 2
(March-April) and 6 (November-December), 2010-2019. State Party/charter Private/rental/shore
ME - -
NH - -
MA 0% 100%
RI 3% 97%
CT 0% 100%
NY 2% 98%
NJ 51% 49%
DE 4% 96%
MD 38% 62%
VA 4% 96%
NC* 13% 87%
ME-NC* 10% 90%
*North of Cape Hatteras
Table 8: Updated allocation of expected February harvest among states. State Proportion of Wave 1 Catch Allocation of 483,993 pounds
RI 0.24% 1,146
CT 0.03% 158
NY 8.65% 41,871
NJ 83.87% 405,913
DE 1.33% 6,418
MD 0.46% 2,227
VA 5.14% 24,891
NC 0.28% 1,369
Total 100% 483,993
Next steps
The Council and Board plan to discuss the management program for the February 2021
recreational black sea bass fishery during their joint meeting in August 2020.
1
Summer Flounder, Scup, and Black Sea Bass Monitoring Committee
Meeting Summary May 28, 2020
Webinar
Monitoring Committee Attendees: Julia Beaty (MAFMC staff), Peter Clarke (NJ DEP), Dustin Colson Leaning (ASMFC staff), Karson Coutré (MAFMC staff), Kiley Dancy (MAFMC staff), Steve Doctor (MD DNR), Emily Keiley (GARFO), Alexa Kretsch (VMRC), John Maniscalco (NY DEC), Lee Paramore (NC DMF), Caitlin Starks (ASFMC staff), Rachel Sysak (NY DEC), Mark Terceiro (NEFSC), Corinne Truesdale (RI DEM), Sam Truesdell (MA DMF), Greg Wojcik (CT DEP), Rich Wong (DNREC), Tony Wood (NEFSC) Additional Attendees: Annie, Steve Cannizzo (NY RFFA), Mike Celestino (NJ DEP, Bluefish MC), Nicole Lengyel Costa (RI DEM, Bluefish MC), Maureen Davidson (NY DEC, Council/Board member), Greg DiDomenico (Lund’s Fisheries), Tony DiLernia (Council member), Cynthia Ferrio (GARFO, Bluefish MC), James Fletcher (United National Fishermen’s Association), Jeff Kaelin (Lund’s Fisheries), Joseph Munyandorero (FL FWC, Bluefish MC), Adam Nowalsky (Council/Board member), Eric Reid (Council member), SRW, Mike Waine (ASA), Kate Wilke (Council member), Amy Zimney (SC DNR, Bluefish MC)
Meeting Summary
The Summer Flounder, Scup, and Black Sea Bass Monitoring Committee met via webinar on Thursday May 28, 2020 to discuss several topics. The Bluefish Monitoring Committee was invited to participate in the discussion of the Recreational Reform Initiative as this initiative also addresses bluefish.
Briefing materials considered by the Monitoring Committee are available at: https://www.mafmc.org/council-events/2020/sfsbsb-mc-may28.
Recreational Reform Initiative
Council staff summarized a draft outline of the Recreational Reform Initiative developed by the Recreational Reform Steering Committee. The Monitoring Committee was generally supportive of continued development of all approaches in the Steering Committee outline. Monitoring Committee comments on each objective in the outline are summarized below. Objective 1: Better incorporate uncertainty in the MRIP data into the management process Objective 1 in the Steering Committee outline contains three specific suggestions for better considering uncertainty in the MRIP data. The first suggestion is to adopt a standardized process for identifying and smoothing outlier MRIP estimates to be applied to both high and low outliers. The Monitoring Committee agreed that it would be very beneficial to adopt such a process.
2
The group agreed that outliers could be identified using the Modified Thompson Tau approach used in the past for some black sea bass outliers, or other methods. One Monitoring Committee member said there are multiple potentially appropriate methods for identifying outliers and consideration should be given to which methods are most appropriate for different circumstances. For example, a multi-faceted approach could be considered. Another Monitoring Committee member said consideration should be given to the appropriate level at which the estimates are examined for outliers, for example, at the state/wave/mode/year level or the coastwide annual level. MRIP estimates are used in many parts of the management process, including in the stock assessment, development of annual catch and landings limits, comparison of catch to the annual catch limit (ACL) to determine if accountability measures are triggered, and development of recreational management measures. To date, smoothed outliers have only been used in a few instances to develop recreational management measures for black sea bass. They have not been used for other purposes for summer flounder, scup, and black sea bass. For example, the smoothed black sea bass estimates for 2016 and 2017 were not used in the 2019 operational stock assessment due to concerns about the appropriateness of smoothing only two high estimates in recent years without examining the entire time series for both high and low outliers. Several Monitoring Committee members noted that this creates a potentially problematic disconnect with other parts of the management process. The group agreed that adoption of a standardized method for identifying and smoothing both high and low outliers would increase the likelihood of being able to use smoothed estimates in all parts of the management process. The group agreed that it would be very important to identify and smooth both high and low outliers and to have a standardized process. One Monitoring Committee member noted that even if smoothed estimates were used in management, no change would be made to the official MRIP estimates. The group agreed that it could be beneficial to have MRIP staff provide feedback on the process to identify and smooth outliers to help increase buy-in for using smoothed estimates in multiple parts of the management process. The intent would not be to have MRIP staff approve the smoothed estimates, but rather to provide feedback on the appropriateness of any methods developed. The second specific suggestion under objective 1 is to use an “envelope of uncertainty” approach to determine if changes to recreational management measures are needed. Under this approach, a certain range above and below the projected harvest estimate (e.g., based on percent standard error) would be defined for comparison against the upcoming year’s recreational harvest limit (RHL). If the RHL falls within the pre-defined range above and below the projected harvest estimate, then no changes would be made to management measures. The Monitoring Committee agreed that this is worth pursuing and that further discussion is needed on defining the appropriate envelope. One Monitoring Committee member noted that the group has struggled to define similar metrics in the past and asked if the Council and Board would determine how to define the envelope or if it would be a Monitoring Committee decision. One Monitoring Committee member said that, given their technical expertise, it may be more appropriate for the Monitoring Committee to recommend the appropriate envelope, rather than the Council and Board. The third specific suggestion under objective 1 is to consider the appropriateness of using preliminary current year MRIP data in the management process. The Monitoring Committee agreed that this may warrant further consideration. One member noted that MRIP has changed

3
the timing of when they incorporate for-hire data into their estimates. In the past, preliminary estimates were sometimes released without the incorporation of for-hire vessel trip report (VTR) data. VTR data were incorporated into the final estimates. Under the current process, VTRs are incorporated into the preliminary estimates, so the differences between the preliminary and final estimates may not be as great as they were in the past. He recommended an evaluation of the scale of the change from preliminary to final estimates under the current MRIP estimation methodology. He also noted that final data may be appropriate for longer-term decisions including development of management measures that are intended to be in place for multiple years. However, he cautioned that if only final data are used for annual adjustments to measures, there will be a greater disconnect between the data used and current operating conditions than if preliminary current year data were also considered. One Steering Committee member said the Steering Committee’s intent for all three suggestions under objective 1 was not to ask the Monitoring Committee to second guess and revise the MRIP estimates, but rather to think about the impact that outliers can have on recreational management. For example, outlier estimates can lead to significant changes in management measures from year to year which may not be reflective of a true conservation need. Objective 2: Develop guidelines for maintaining status quo measures The second objective in the Steering Committee outline is to develop a process for considering both recreational harvest data (all considerations under objective 1 could apply) and multiple stock status metrics (biomass, fishing mortality, recruitment) when deciding if measures should remain unchanged. The Monitoring Committee was generally supportive of this approach. One Monitoring Committee member said it would be helpful to give greater consideration to how expected catch (i.e., landings and dead discards) compares to the ACL, rather than focusing on the RHL as the primary management target when setting management measures for the following year. She questioned whether the Fishery Management Plan would need to be modified to provide more flexibility in this regard. Another Monitoring Committee member said the group tends to be most comfortable with estimates of expected landings and dead discards when they are based on assessment data. He thought it could be helpful to give stock status metrics from the assessments greater consideration in the process of determining how to change management measures. For example, he feels more confident in the need for more restrictive measures in response to a stock assessment rather than in response to recreational harvest estimates alone, which can be quite variable. Objective 3: Develop process for setting multi-year recreational management measures The third objective in the Steering Committee outline is to develop a process for setting recreational management measures for two years at a time with a commitment to making no changes in the interim year. This would include not reacting to new data that would otherwise allow for liberalizations or require restrictions. The Monitoring Committee was very supportive of this approach. The Monitoring Committee agreed that this approach could lead to compounding overages or underages of catch and harvest limits. However, this could represent just as much of a conservation benefit as a conservation risk.

4
Multiple Monitoring Committee members said maintaining the same measures for at least two years can allow for better evaluation of the effectiveness of the measures at constraining harvest. The group discussed how harvest can fluctuate widely under constant management measures. Having more years of constant measures would allow for a better understanding of the variations in harvest. One member clarified that the proposal was for two years and not a longer time period because it is anticipated that updated stock assessment information will be available every two years. This would allow for management to react to updated stock assessment information. One Monitoring Committee member said this approach could pull together many aspects of the other approaches in the Steering Committee outline and it could be a good way to move forward with the goal of stability in management measures. For example, it could allow for use of final MRIP estimates (see objective 1), would allow for consideration of the timing of the management measures recommendation (see objective 5), would allow for changes to be considered in response to updated stock assessment information, and would allow for year-to-year stability in recreational management measures. The group discussed how state conservation equivalency could work under this approach. There was a general consensus that the approach would work best with a strong commitment to no changes at the federal or state level during the two years. One Monitoring Committee member noted that it could be difficult to explain to stakeholders why they may have to forego potential liberalizations in the interim year under this approach. She recommended that this approach be evaluated from a socioeconomic perspective. Another Monitoring Committee member recommended consideration of the benefits of this approach in terms of compliance with and enforcement of the management measures. Objective 4: Consider improvements to the process used to make changes to state and federal recreational management measures The third objective in the Steering Committee outline relates to improvements to the process used to make changes to state and federal waters recreational management measures. The Steering Committee has not discussed this objective in great detail. A few Monitoring Committee members said it would be beneficial to have guidelines on how to best use MRIP data at the state/mode/wave levels. The group agreed that additional analysis is needed to better understand the limitations of the MRIP data for any given species before recommendations can be made for how to best use the MRIP data. For example, one Monitoring Committee member said it may be challenging to develop robust guidelines that could be applied uniformly across all states as MRIP sampling is not consistent across states and states with more frequent intercepts of the species in question may be put at an advantage. One bluefish Monitoring Committee member said regional measures, especially for shared water bodies, are worth considering and can help address concerns about using MRIP data at too fine of a scale. Objective 5: Consider making recommendations for federal waters recreational management measures earlier in the year The Steering Committee has discussed the idea of recommending federal waters recreational management measures in August or October rather than December of each year. The Monitoring
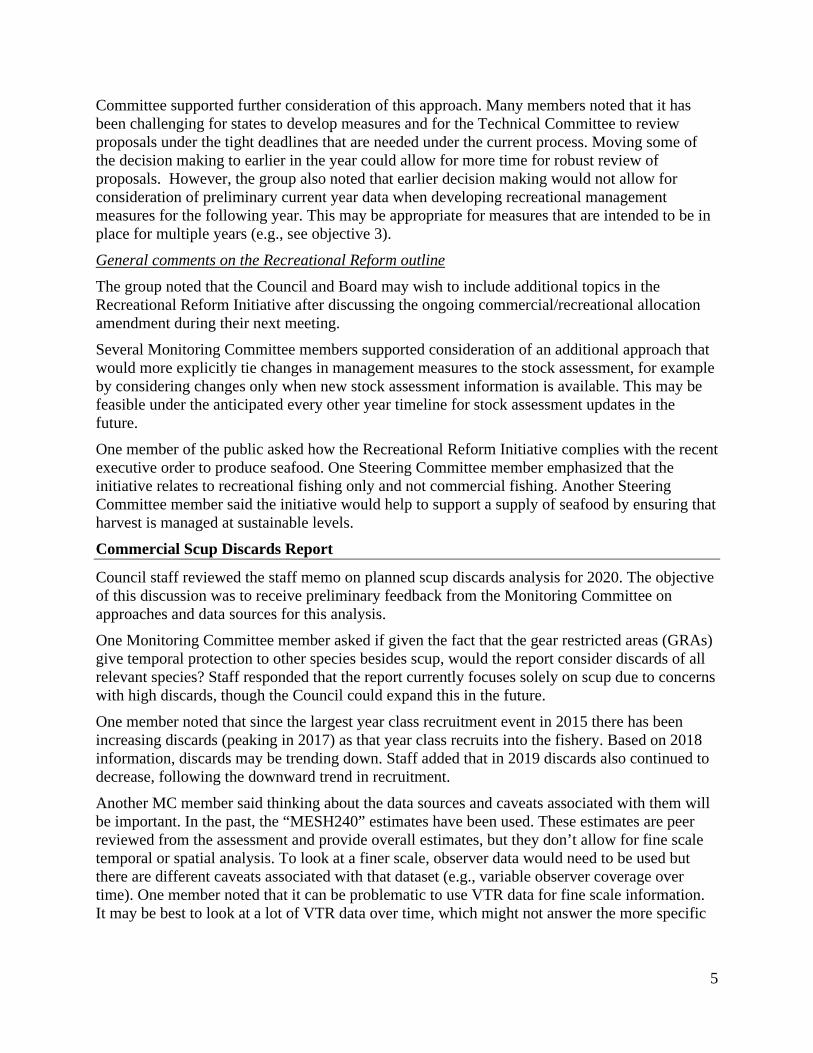
5
Committee supported further consideration of this approach. Many members noted that it has been challenging for states to develop measures and for the Technical Committee to review proposals under the tight deadlines that are needed under the current process. Moving some of the decision making to earlier in the year could allow for more time for robust review of proposals. However, the group also noted that earlier decision making would not allow for consideration of preliminary current year data when developing recreational management measures for the following year. This may be appropriate for measures that are intended to be in place for multiple years (e.g., see objective 3). General comments on the Recreational Reform outline The group noted that the Council and Board may wish to include additional topics in the Recreational Reform Initiative after discussing the ongoing commercial/recreational allocation amendment during their next meeting. Several Monitoring Committee members supported consideration of an additional approach that would more explicitly tie changes in management measures to the stock assessment, for example by considering changes only when new stock assessment information is available. This may be feasible under the anticipated every other year timeline for stock assessment updates in the future. One member of the public asked how the Recreational Reform Initiative complies with the recent executive order to produce seafood. One Steering Committee member emphasized that the initiative relates to recreational fishing only and not commercial fishing. Another Steering Committee member said the initiative would help to support a supply of seafood by ensuring that harvest is managed at sustainable levels. Commercial Scup Discards Report
Council staff reviewed the staff memo on planned scup discards analysis for 2020. The objective of this discussion was to receive preliminary feedback from the Monitoring Committee on approaches and data sources for this analysis. One Monitoring Committee member asked if given the fact that the gear restricted areas (GRAs) give temporal protection to other species besides scup, would the report consider discards of all relevant species? Staff responded that the report currently focuses solely on scup due to concerns with high discards, though the Council could expand this in the future. One member noted that since the largest year class recruitment event in 2015 there has been increasing discards (peaking in 2017) as that year class recruits into the fishery. Based on 2018 information, discards may be trending down. Staff added that in 2019 discards also continued to decrease, following the downward trend in recruitment. Another MC member said thinking about the data sources and caveats associated with them will be important. In the past, the “MESH240” estimates have been used. These estimates are peer reviewed from the assessment and provide overall estimates, but they don’t allow for fine scale temporal or spatial analysis. To look at a finer scale, observer data would need to be used but there are different caveats associated with that dataset (e.g., variable observer coverage over time). One member noted that it can be problematic to use VTR data for fine scale information. It may be best to look at a lot of VTR data over time, which might not answer the more specific
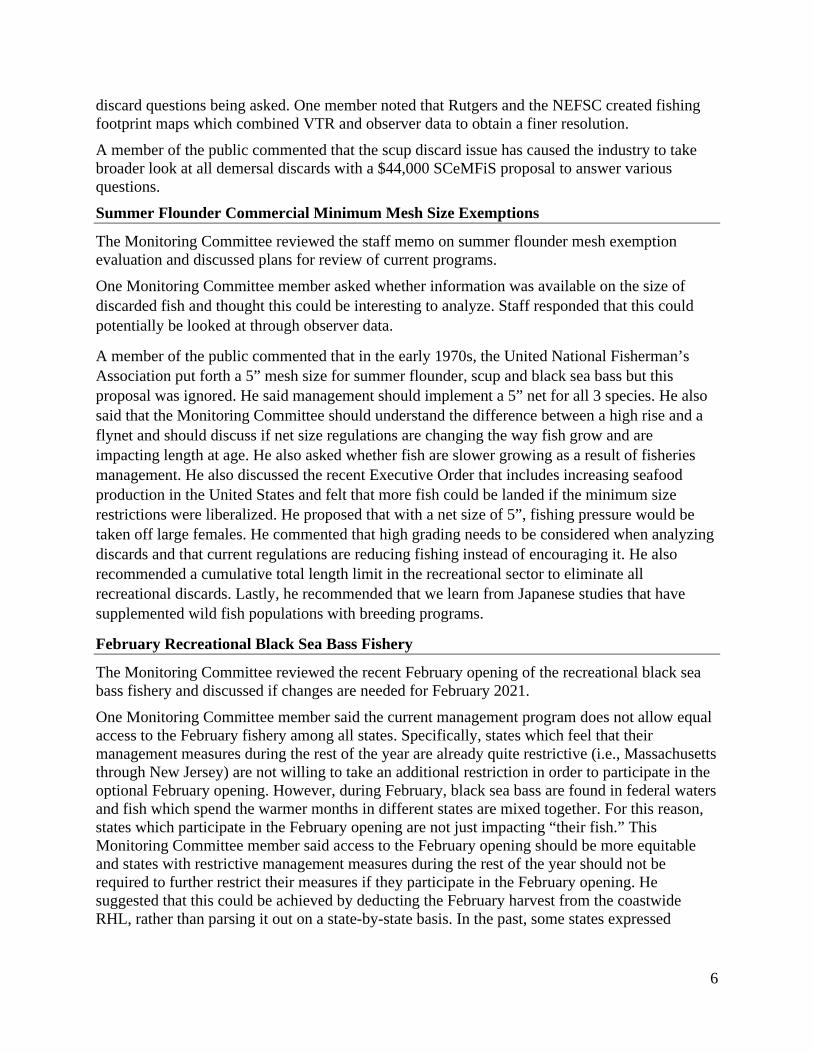
6
discard questions being asked. One member noted that Rutgers and the NEFSC created fishing footprint maps which combined VTR and observer data to obtain a finer resolution. A member of the public commented that the scup discard issue has caused the industry to take broader look at all demersal discards with a $44,000 SCeMFiS proposal to answer various questions. Summer Flounder Commercial Minimum Mesh Size Exemptions
The Monitoring Committee reviewed the staff memo on summer flounder mesh exemption evaluation and discussed plans for review of current programs. One Monitoring Committee member asked whether information was available on the size of discarded fish and thought this could be interesting to analyze. Staff responded that this could potentially be looked at through observer data.
A member of the public commented that in the early 1970s, the United National Fisherman’s Association put forth a 5” mesh size for summer flounder, scup and black sea bass but this proposal was ignored. He said management should implement a 5” net for all 3 species. He also said that the Monitoring Committee should understand the difference between a high rise and a flynet and should discuss if net size regulations are changing the way fish grow and are impacting length at age. He also asked whether fish are slower growing as a result of fisheries management. He also discussed the recent Executive Order that includes increasing seafood production in the United States and felt that more fish could be landed if the minimum size restrictions were liberalized. He proposed that with a net size of 5”, fishing pressure would be taken off large females. He commented that high grading needs to be considered when analyzing discards and that current regulations are reducing fishing instead of encouraging it. He also recommended a cumulative total length limit in the recreational sector to eliminate all recreational discards. Lastly, he recommended that we learn from Japanese studies that have supplemented wild fish populations with breeding programs.
February Recreational Black Sea Bass Fishery
The Monitoring Committee reviewed the recent February opening of the recreational black sea bass fishery and discussed if changes are needed for February 2021. One Monitoring Committee member said the current management program does not allow equal access to the February fishery among all states. Specifically, states which feel that their management measures during the rest of the year are already quite restrictive (i.e., Massachusetts through New Jersey) are not willing to take an additional restriction in order to participate in the optional February opening. However, during February, black sea bass are found in federal waters and fish which spend the warmer months in different states are mixed together. For this reason, states which participate in the February opening are not just impacting “their fish.” This Monitoring Committee member said access to the February opening should be more equitable and states with restrictive management measures during the rest of the year should not be required to further restrict their measures if they participate in the February opening. He suggested that this could be achieved by deducting the February harvest from the coastwide RHL, rather than parsing it out on a state-by-state basis. In the past, some states expressed

7
concern about an “off the top” approach like this as not all states would likely participate in the opening, but all would be impacted if adjustments are made at the coastwide level. Another Monitoring Committee member asked if states could provide estimates of how many vessels or trips would be expected to target black sea bass during February if the season were open in their state. Alternatively, the number of for-hire trips for all species during February in recent years could be examined using federal VTRs. This could be a starting point for evaluating the potential amount of effort in the February black sea bass fishery and could help provide a better understanding of the impacts of moving to a system where February harvest is taken off the RHL. The Monitoring Committee agreed that the system used by Virginia to monitor their February harvest (i.e., permit requirements, logbooks, and call ins) and adjust their season length later in the year as needed has worked well. The group agreed that MRIP estimates should not be used to monitor February harvest and make adjustments to measures later in the year. The challenge of determining the appropriate season adjustment in North Carolina to account for an unreasonable MRIP estimate in February 2020 clearly illustrates this point. The current February management program requires estimation of harvest at a finer scale than is generally appropriate for the MRIP data. Currently, North Carolina is the only state in the management unit which conducts MRIP sampling during January and February. One Monitoring Committee member said the additional monitoring required during February is a burden on states. States may not see this burden as worthwhile, especially if they are required to further restrict their already restrictive measures to participate in the optional February opening. A coastwide, standardized monitoring system could be beneficial. Equitable access is also challenging under the current program as not all states are able to modify their measures later in the year to account for higher than expected February harvest. One Monitoring Committee member asked if these states could pre-determine different management measures which would be implemented at different levels of February harvest. In this way, the response to estimated February harvest would be automatic. One Monitoring Committee member noted that if the updated assumption of 90% for-hire and 10% recreational harvest during February relies heavily on wave 6 MRIP data from 2016, then this this assumption may not be valid as wave 6 in 2016 included an estimate from New York that has been widely accepted as an unrealistically high outlier. Public comments One Council member said he supported the approach of taking February harvest “off the top” of the RHL as the February fishery occurs in federal waters and fish from different areas are mixed together. In addition, anglers can travel to different states to participate in this fishery. Participation should not be limited to residents of states with openings. One member of the public from New York noted that the current management program relies on old data and is especially problematic that it places a strong emphasis on data from a few months after Superstorm Sandy. He said the majority of fishing activity during this time of year is in the for-hire sector and the primary driver for fishing activity during this time of year is cod, not black sea bass, as they can be caught closer in shore. He added that February harvest is very weather-dependent. He said it is a small fishery and the opening should not require restrictions

8
during the rest of the year. He added that black sea bass migration has changed. They are wintering further south than the used to. One member of the public asked what percentage of black sea bass harvested during the February recreational fishery in Virginia were males. He claimed that “everything the Council has done in the past has been to target the females.” He added that recreational fishermen should be required to report their catch through smart phones immediately after each trip, at least during the February recreational black sea bass fishery. He said this will illustrate the true extent of the inaccuracies in the data used in management to date. One Council and Board member noted that the 50% private, 50% for-hire assumption used in the previous analysis generated much debate. He said the updated 90% private, 10% for-hire assumption based on the revised MRIP data does not seem reasonable for wave 1 as for-hire vessels tend to be larger than private vessels and thus better able to fish in the rough weather conditions during wave 1. He requested that the Monitoring Committee further evaluate the updated 90%/10% assumption, perhaps using information other than MRIP data from waves 2 and 6 as those waves can have milder weather than wave 1. After the Monitoring Committee discussion ended, the ASMFC’s Technical Committee met to discuss the February 2020 recreational black sea bass fishery in North Carolina and review a proposal for a season modification to account for higher than expected February harvest. A summary of this discussion is available at https://www.mafmc.org/council-events/2020/sfsbsb-mc-meeting-july27.

The Summer Flounder, Scup, and Black Sea Bass
Fishery Performance Report is behind Tab 5
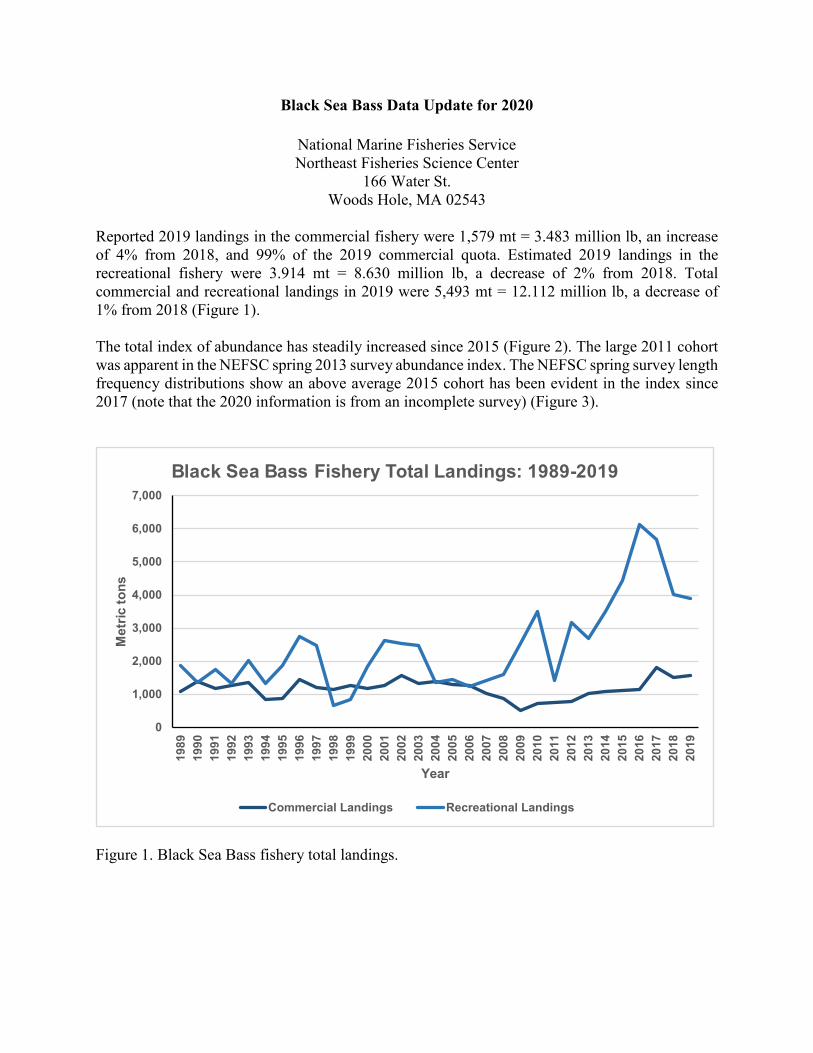
Black Sea Bass Data Update for 2020
National Marine Fisheries Service Northeast Fisheries Science Center
166 Water St. Woods Hole, MA 02543
Reported 2019 landings in the commercial fishery were 1,579 mt = 3.483 million lb, an increase of 4% from 2018, and 99% of the 2019 commercial quota. Estimated 2019 landings in the recreational fishery were 3.914 mt = 8.630 million lb, a decrease of 2% from 2018. Total commercial and recreational landings in 2019 were 5,493 mt = 12.112 million lb, a decrease of 1% from 2018 (Figure 1). The total index of abundance has steadily increased since 2015 (Figure 2). The large 2011 cohort was apparent in the NEFSC spring 2013 survey abundance index. The NEFSC spring survey length frequency distributions show an above average 2015 cohort has been evident in the index since 2017 (note that the 2020 information is from an incomplete survey) (Figure 3).
Figure 1. Black Sea Bass fishery total landings.
0
1,000
2,000
3,000
4,000
5,000
6,000
7,000
1989
1990
1991
1992
1993
1994
1995
1996
1997
1998
1999
2000
2001
2002
2003
2004
2005
2006
2007
2008
2009
2010
2011
2012
2013
2014
2015
2016
2017
2018
2019
Met
ric to
ns
Year
Black Sea Bass Fishery Total Landings: 1989-2019
Commercial Landings Recreational Landings
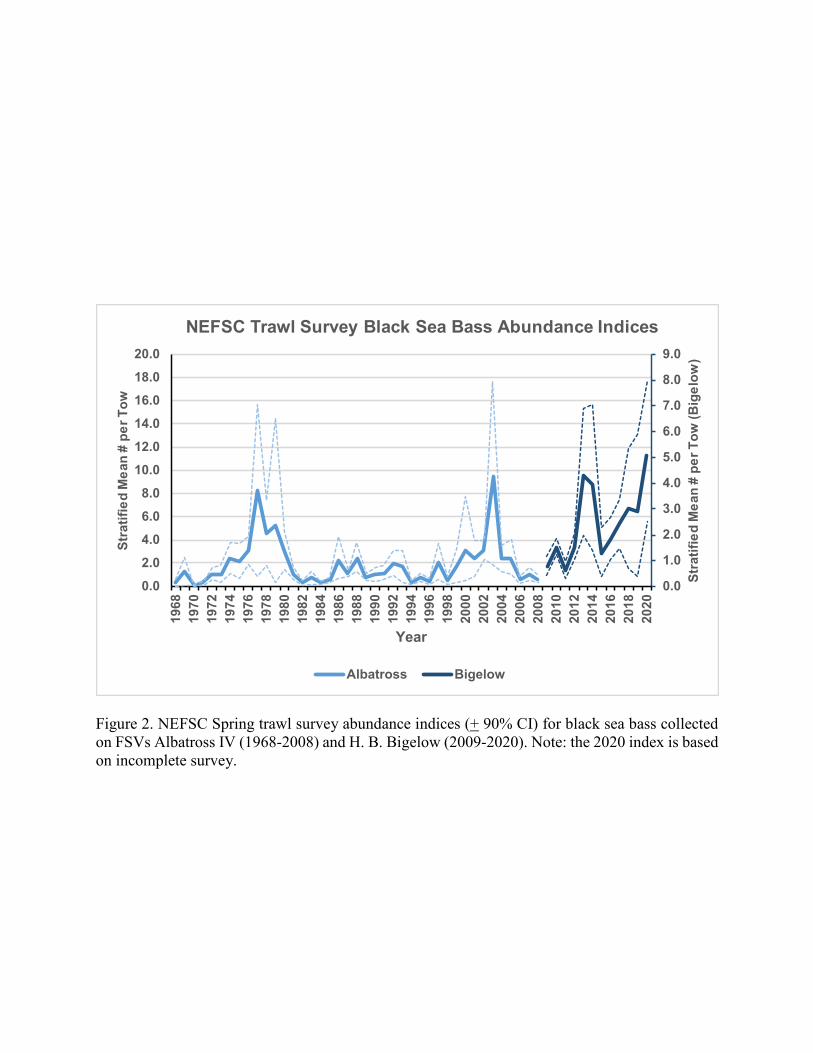
Figure 2. NEFSC Spring trawl survey abundance indices (+ 90% CI) for black sea bass collected on FSVs Albatross IV (1968-2008) and H. B. Bigelow (2009-2020). Note: the 2020 index is based on incomplete survey.
0.0
1.0
2.0
3.0
4.0
5.0
6.0
7.0
8.0
9.0
0.02.04.06.08.0
10.012.014.016.018.020.0
1968
1970
1972
1974
1976
1978
1980
1982
1984
1986
1988
1990
1992
1994
1996
1998
2000
2002
2004
2006
2008
2010
2012
2014
2016
2018
2020
Stra
tifie
d M
ean
# pe
r Tow
(Big
elow
)
Stra
tifie
d M
ean
# pe
r Tow
Year
NEFSC Trawl Survey Black Sea Bass Abundance Indices
Albatross Bigelow

Figure 3. Northeast Fisheries Science Center (NEFSC) spring trawl survey black sea bass indices at length. Indices since 2009 are uncalibrated Bigelow values. Note: the 2020 index is based on incomplete survey.

Figure 3 (cont’d). Northeast Fisheries Science Center (NEFSC) spring trawl survey black sea bass indices at length. Indices since 2009 are uncalibrated Bigelow values. Note: the 2020 index is based on incomplete survey.

1
Black Sea Bass Fishery Information Document
June 2020
This document provides a brief overview of the biology, stock condition, management system, and
fishery performance for black sea bass (Centropristis striata) with an emphasis on 2019. Data
sources include unpublished National Marine Fisheries Service (NMFS) fisheries-independent
trawl survey data, commercial fish dealer reports, vessel trip reports (VTRs), permit data, and
Marine Recreational Information Program (MRIP) data. All data should be considered
preliminary. For more resources on black sea bass management, including previous Fishery
Information Documents, please visit http://www.mafmc.org/sf-s-bsb.
Basic Biology
Black sea bass are distributed from the Gulf of Maine through the Gulf of Mexico. Genetic studies
have identified three stocks within that region. This document focuses on the stock from the Gulf
of Maine through Cape Hatteras, North Carolina.
Adult and juvenile black sea bass are mostly found on the continental shelf. Young of the year
(i.e., fish less than one year old) can be found in estuaries. Adults show strong site fidelity during
the summer and prefer to be near structures such as rocky reefs, coral patches, cobble and rock
fields, mussel beds, and shipwrecks. Black sea bass migrate to offshore wintering areas starting in
the fall. During the winter, young of the year are distributed across the shelf and adults and
juveniles are found near the shelf edge. During the fall, adults and juveniles off New York and
north move offshore and travel along the shelf edge to as far south as Virginia. Most return to
northern inshore areas by May. Black sea bass off New Jersey to Maryland travel southeast to the
shelf edge during the late fall. Black sea bass off Virginia and Maryland travel a shorter distance
due east to the shelf edge, which is closer to shore than in areas to the north.1,2
Key Facts
• Black sea bass are not overfished and overfishing is not occurring, according to the most
recent stock assessment which included data through 2018. Incorporation of a revised
time series of MRIP data and data on the large 2015 year class both contributed to an
increase in estimated stock biomass compared to the previous assessment.
• In 2019, about 3.53 million pounds of black sea bass were landed by commercial
fishermen, a slight increase from 2019. Commercial fish dealers paid an average of $3.41
per pound of black sea bass, a slight decrease from 2018.
• Recreational fishermen harvested an estimated 8.61 million pounds of black sea bass in
2019, a 9% increase from 2018. Anglers fishing from private vessels accounted for 79%
of black sea bass harvest (in numbers of fish) in 2019.

2
Black sea bass are protogynous hermaphrodites, meaning they are born female and some later
transition to males, usually around 2-5 years of age. Male black sea bass are either of the dominant
or subordinate type. Dominant males are larger than subordinate males and develop a bright blue
nuccal hump during the spawning season. About 25% of black sea bass are male at 15 cm (about
6 inches), with increasing proportions of males at larger sizes until about 50 cm, when about 70-
80% of black sea bass are male. Results from a simulation model highlight the importance of
subordinate males in spawning success. This increases the resiliency of the population to
exploitation compared to other species with a more typical protogynous life history. About half of
black sea bass are sexually mature by 2 years of age and 21 cm (about 8 inches) in length. Black
sea bass reach a maximum size of about 60 cm (about 24 inches) and a maximum age of about 12
years.2, 3
Black sea bass in the mid-Atlantic spawn in nearshore continental shelf areas at depths of 20-50
meters. Spawning usually takes place between April and October. During the summer, adult black
sea bass share habitats with tautog, hakes, conger eel, sea robins and other migratory fish species.
Essential fish habitat for black sea bass consists of pelagic waters, structured habitat, rough bottom,
shellfish, sand, and shell, from the Gulf of Maine through Cape Hatteras, North Carolina. Juveniles
and adults mostly feed on crustaceans, small fish, and squid. The Northeast Fisheries Science
Center (NEFSC) food habits database lists spiny dogfish, Atlantic angel shark, skates, spotted
hake, summer flounder, windowpane flounder, and monkfish as predators of black sea bass.1
Status of the Stock
A black sea bass operational stock assessment was peer reviewed and accepted in August 2019. It
incorporated fishery data and fishery-independent survey data through 2018, including revised
MRIP data for 1989-2018. The assessment concluded that the black sea bass stock north of Cape
Hatteras, North Carolina was not overfished and overfishing was not occurring in 2018. Spawning
stock biomass in 2018 was estimated to be 2.4 times the target level. The average fishing mortality
rate on fully selected ages 6-7 fish in 2018 was 9% below the fishing mortality threshold reference
point, meaning that overfishing was not occurring in 2018 (Table 1). Figure 1 and Figure 2 show
the time series of estimated spawning stock biomass, recruitment, fishing mortality, and catch from
the most recent stock assessment. The values for fishing mortality and spawning stock biomass
were adjusted for 2018 only to account for retrospective bias in the model.4
The 2011 year class (i.e., those fish spawned in 2011) was estimated to be the largest in the time
series at 144.7 million fish. The 2015 year class was the second largest at 79.4 million fish. The
2011 year class had a major impact on recent stock dynamics and was much more prevalent off
Massachusetts through New York compared to New Jersey and south. The large 2015 year class
is more evenly between the northern (ME-NY) and southern (NJ-NC) states. Recruitment of the
2017 year class as age 1 in 2018 was estimated at 16.0 million fish, well below the 1989-2018
average of 36 million fish (Figure 1).4 Recruitment estimates for 2018-2020 are not yet available.
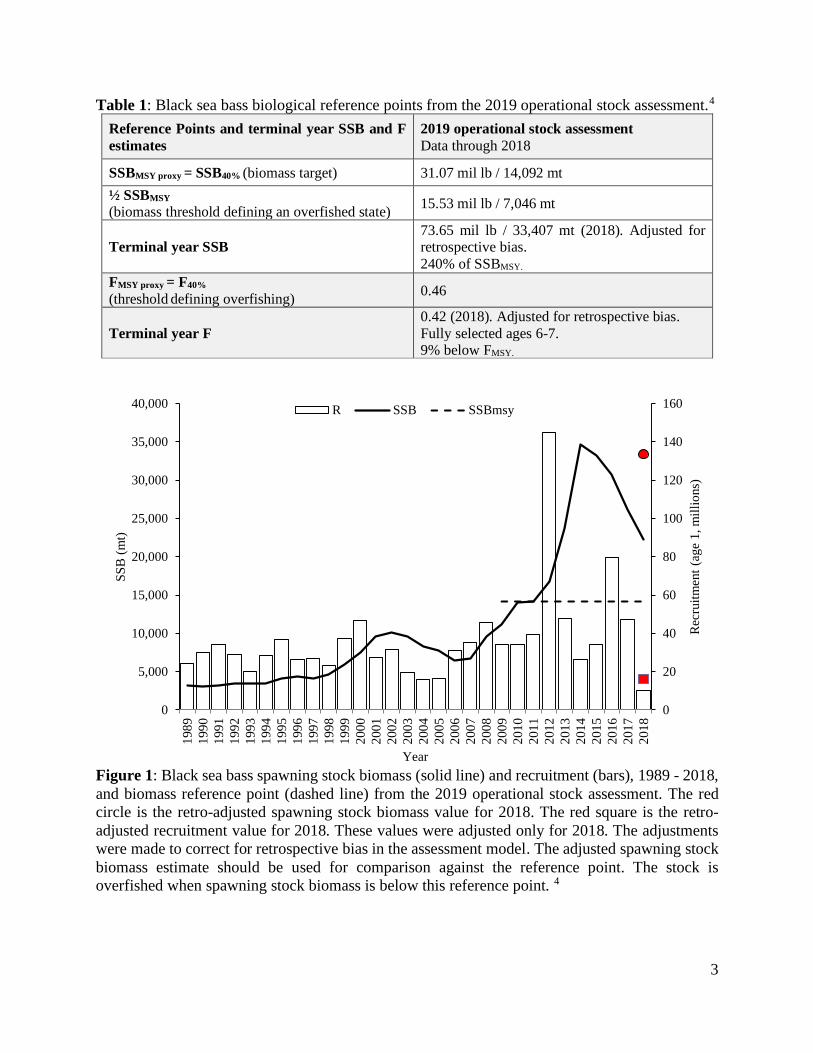
3
Table 1: Black sea bass biological reference points from the 2019 operational stock assessment.4
Reference Points and terminal year SSB and F
estimates
2019 operational stock assessment
Data through 2018
SSBMSY proxy = SSB40% (biomass target) 31.07 mil lb / 14,092 mt
½ SSBMSY
(biomass threshold defining an overfished state) 15.53 mil lb / 7,046 mt
Terminal year SSB
73.65 mil lb / 33,407 mt (2018). Adjusted for retrospective bias.
240% of SSBMSY.
FMSY proxy = F40%
(threshold defining overfishing) 0.46
Terminal year F
0.42 (2018). Adjusted for retrospective bias.
Fully selected ages 6-7. 9% below FMSY.
Figure 1: Black sea bass spawning stock biomass (solid line) and recruitment (bars), 1989 - 2018,
and biomass reference point (dashed line) from the 2019 operational stock assessment. The red
circle is the retro-adjusted spawning stock biomass value for 2018. The red square is the retro-
adjusted recruitment value for 2018. These values were adjusted only for 2018. The adjustments
were made to correct for retrospective bias in the assessment model. The adjusted spawning stock
biomass estimate should be used for comparison against the reference point. The stock is
overfished when spawning stock biomass is below this reference point. 4
0
20
40
60
80
100
120
140
160
0
5,000
10,000
15,000
20,000
25,000
30,000
35,000
40,000
198
9
199
0
199
1
199
2
199
3
199
4
199
5
199
6
199
7
199
8
199
9
200
0
200
1
200
2
200
3
200
4
200
5
200
6
200
7
200
8
200
9
201
0
201
1
201
2
201
3
201
4
201
5
201
6
201
7
201
8
Rec
ruit
men
t (a
ge
1, m
illi
ons)
SS
B (
mt)
Year
R SSB SSBmsy
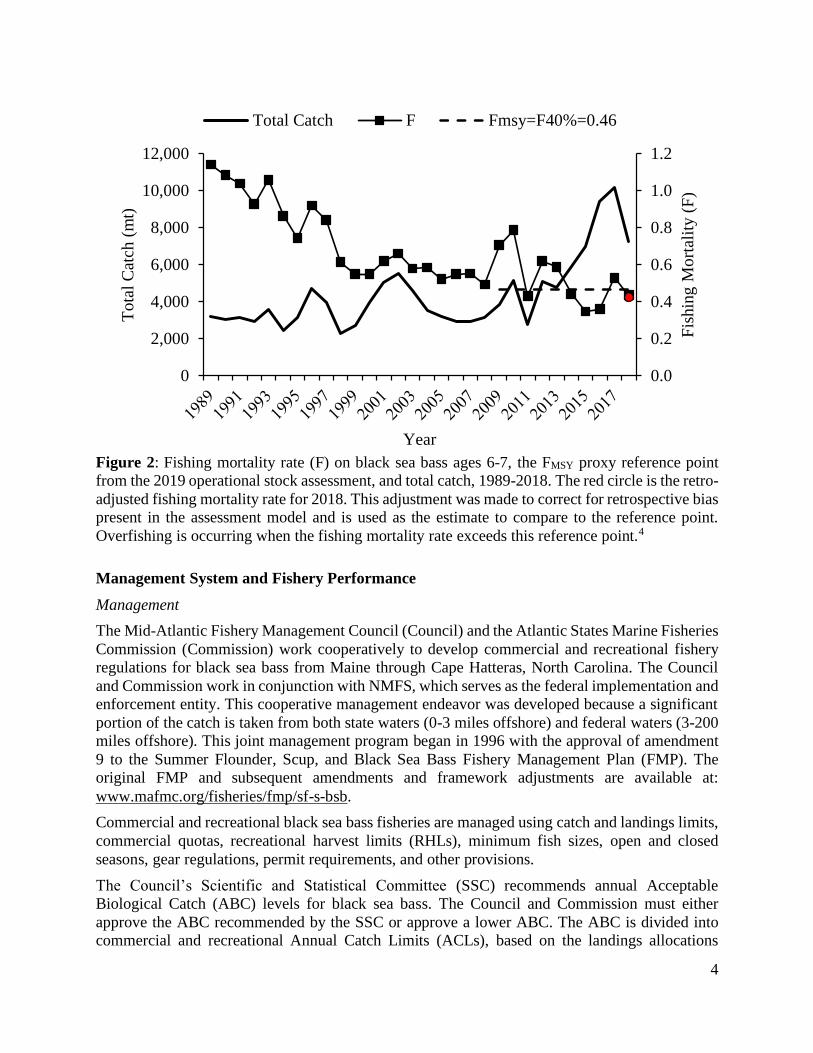
4
Figure 2: Fishing mortality rate (F) on black sea bass ages 6-7, the FMSY proxy reference point
from the 2019 operational stock assessment, and total catch, 1989-2018. The red circle is the retro-
adjusted fishing mortality rate for 2018. This adjustment was made to correct for retrospective bias
present in the assessment model and is used as the estimate to compare to the reference point.
Overfishing is occurring when the fishing mortality rate exceeds this reference point.4
Management System and Fishery Performance
Management
The Mid-Atlantic Fishery Management Council (Council) and the Atlantic States Marine Fisheries
Commission (Commission) work cooperatively to develop commercial and recreational fishery
regulations for black sea bass from Maine through Cape Hatteras, North Carolina. The Council
and Commission work in conjunction with NMFS, which serves as the federal implementation and
enforcement entity. This cooperative management endeavor was developed because a significant
portion of the catch is taken from both state waters (0-3 miles offshore) and federal waters (3-200
miles offshore). This joint management program began in 1996 with the approval of amendment
9 to the Summer Flounder, Scup, and Black Sea Bass Fishery Management Plan (FMP). The
original FMP and subsequent amendments and framework adjustments are available at:
www.mafmc.org/fisheries/fmp/sf-s-bsb.
Commercial and recreational black sea bass fisheries are managed using catch and landings limits,
commercial quotas, recreational harvest limits (RHLs), minimum fish sizes, open and closed
seasons, gear regulations, permit requirements, and other provisions.
The Council’s Scientific and Statistical Committee (SSC) recommends annual Acceptable
Biological Catch (ABC) levels for black sea bass. The Council and Commission must either
approve the ABC recommended by the SSC or approve a lower ABC. The ABC is divided into
commercial and recreational Annual Catch Limits (ACLs), based on the landings allocations
0.0
0.2
0.4
0.6
0.8
1.0
1.2
0
2,000
4,000
6,000
8,000
10,000
12,000
Fis
hin
g M
ort
alit
y (
F)
To
tal
Cat
ch (
mt)
Year
Total Catch F Fmsy=F40%=0.46

5
prescribed in the FMP (i.e., 49% commercial, 51% recreational) and the recent distribution of
discards between the commercial and recreational fisheries. The Council and Commission are
currently developing an amendment to consider revising these allocation percentages.5
The Council and Commission also approve commercial and recreational annual catch targets
(ACTs), which are set equal to or less than the respective ACLs to account for management
uncertainty. To date, the black sea bass ACTs have always been set equal to the ACLs. The ABC,
ACLs, and ACTs are catch limits which account for both landings and discards, while the
commercial quota and RHL are landing limits. The commercial quota and RHL are calculated by
subtracting expected discards from the respective ACTs.
Table 2 shows black sea bass catch and landings limits from 2010 through 2021, as well as
commercial and recreational landings through 2019. Total landings (commercial and recreational)
peaked in 2017 at 15.5 million pounds. About 12.15 million pounds of black sea bass were landed
by commercial and recreational fishermen from Maine through Cape Hatteras, North Carolina in
2019 (Figure 3).6,7
In July 2018, MRIP released revisions to their time series of recreational catch and landings
estimates based on adjustments for a revised angler intercept methodology and a new effort
estimation methodology, including a transition from a telephone-based effort survey to a mail-
based effort survey. The revised estimates of catch and landings are several times higher than the
previous estimates for shore and private boat modes, substantially raising the overall black sea
bass catch and harvest estimates. The RHLs and other management measures through 2019 were
based on the previous MRIP estimates and should not be compared against the revised MRIP
estimates. The revised MRIP estimates were incorporated into the 2019 operational stock
assessment and were used to derive the catch and landings limits for 2020-2021.

6
Table 2: Summary of catch and landings limits, and landings for commercial and recreational black sea bass fisheries from Maine
through Cape Hatteras, NC 2010 through 2021. All values are in millions of pounds unless otherwise noted.
Management measure 2010a 2011a 2012a 2013a 2014a 2015a 2016b 2017c 2018c 2019c 2020&
2021c
ABC 4.50 4.50 4.50 5.50 5.50 5.50 6.67 10.47 8.94 8.94 15.07
Commercial ACL -- -- 1.98 2.60 2.60 2.60 3.15 5.09 4.35 4.35 6.98
Commercial quotad 1.76 1.71 1.71 2.17 2.17 2.21 2.71 4.12 3.52 3.52 5.58
Commercial landings 1.73 1.69 1.72 2.26 2.40 2.38 2.59 4.01 3.46 3.53 --
% of commercial quota
landed 98% 99% 101% 104% 111% 108% 96% 97% 98% 100% --
Recreational ACL -- -- 1.86 2.90 2.90 2.90 3.52 5.38 4.59 4.59 8.09
RHLd 1.83 1.78 1.32 2.26 2.26 2.33 2.82 4.29 3.66 3.66 5.81
Recreational landings,
old MRIP estimates 3.19 1.17 3.18 2.46 3.67 3.79 5.19 4.16 3.82 -- --
% of RHL harvested
(old MRIP estimates)e 174% 66% 241% 109% 162% 163% 184% 97% 104% -- --
Recreational landings,
revised MRIP estimates 8.07 3.27 7.04 5.69 7.24 9.06 12.05 11.50 7.92 8.61 --
a Measures in 2010-2015 were based on a constant catch approach used by the Council’s SSC to set the ABC. b Measures in 2016 were based on ABC that was set using a data poor management strategy evaluation approach. c Measures in 2017-2021 were set based on a peer reviewed and approved stock assessment. The 2020-2021 measures are based on a stock assessment update that
incorporated the revised time series of MRIP data. The 2021 measures are subject to revision by the SSC, the Council, and the Commission. d The commercial quotas and RHLs for 2006-2014 account for deductions for the Research Set Aside program. e The percent of RHL harvested is based on a comparison of the RHL to the previous or old MRIP estimates. The RHLs did not account for the new MRIP estimates,
which were released in July 2018 and were not incorporated into a stock assessment until 2019; therefore, it would be inappropriate to compare past RHLs to the
revised MRIP estimates.

7
Figure 3: Commercial and recreational black sea bass landings in millions of pounds from Maine
through Cape Hatteras, North Carolina, 1981-2019. Recreational landings are based on the revised
MRIP estimates.6,7
Commercial Fishery
Commercial black sea bass landings peaked in 2017 at 4.01 million pounds, and were at their
lowest in 2009, when 1.18 million pounds were landed (Figure 3). About 3.53 million pounds of
black sea bass were landed by commercial fishermen in 2019, very close to the commercial quota
of 3.52 million pounds (Table 2).7
Black sea bass are a valuable commercial species. Total ex-vessel value averaged $12.40 million
per year during 2017-2019. In some fisheries, ex-vessel price tends to decrease with increases in
landings. However, during 2010-2019, the opposite occurred for black sea bass. During these
years, the average annual ex-vessel black sea bass price per pound tended to increase with increases
in landings (Figure 4).6 Landings have generally increased over time as the quotas increased;
therefore, the relationship between price and landings could reflect increased market demand over
time rather than a causal relationship between price and landings. This is not to say that sudden
increases of black sea bass on the market do not cause decreases in price. Some fishermen and
dealers have said that temporary price drops can occur at both the local and regional levels due to
increases in the coastwide quota, state-specific seasonal openings, or individual trawl trips with
high landings, all of which can be inter-related. These sudden price drops are often temporary and
the price usually rises again.
According to federal VTR data, statistical area 616, which includes important fishing areas near
Hudson Canyon, was responsible for the largest percentage of commercial black sea bass catch
(landings and discards) in 2019 (i.e., 39%). Statistical area 621, off southern New Jersey,
Delaware, and Maryland accounted for the second highest proportion of catch (9%), followed by
statistical area 622 off Delaware (8%), statistical area 615 off New Jersey (7%), and statistical area
537, south of Massachusetts and Rhode Island (5%; Table 3, Figure 5). Statistical area 611, in
Long Island Sound, and statistical area 539, off Rhode Island, had the highest number of trips
0
2
4
6
8
10
12
14
16
18
19
81
19
83
1985
1987
19
89
19
91
19
93
19
95
19
97
1999
2001
20
03
20
05
20
07
20
09
20
11
2013
2015
20
17
20
19
Lan
din
gs
(mil
lion
s of
poun
ds)
Commercial landings
Recreational landings
Total landings

8
which reported black sea bass catch on federal VTRs in 2019 (over 1,500 trips each); however
they each accounted for less than 5% of total black sea bass catch.8
In 2019, most commercial black sea bass landings from state and federally-permitted vessels
occurred in New Jersey (20%) and Virginia (18%).7 The percentage of landings by state is driven
by and closely matches the state-by-state commercial quota allocations managed by the
Commission (Table 4). States set measures to achieve their state-specific commercial quotas. The
Council and Commission are currently developing a management action to consider if these state
allocations should be modified.9
At least 100,000 pounds of black sea bass were landed in each of 10 ports in 7 states from Maine
through North Carolina in 2019. These 10 ports collectively accounted for over 66% of all
commercial black sea bass landings in 2019 (Table 5).7 Detailed community profiles developed by
the NEFSC Social Science Branch can be found at www.mafmc.org/communities/.
Over 189 federally-permitted dealers from Maine through North Carolina purchased black sea bass
in 2019. More dealers bought black sea bass in New York than in any other state (Table 6).7
A moratorium permit is required to fish commercially for black sea bass in federal waters. In 2019,
657 federal commercial black sea bass permits were issued.10
A minimum commercial black sea bass size limit of 11 inches total length has been in place in
federal waters since 2002. There is no federal waters black sea bass possession limit; however,
states set possession limits for state waters.
State and federal dealer data, coupled with federal VTR data, indicate that at least 57% of
commercial black sea bass landings in 2019 were caught with bottom otter trawl gear. At least
22% was caught with fish or lobster pots/traps, at least 13% with hand lines, and 1% with gill nets.
Seven percent of commercial landings in 2019 were associated with an unknown gear type; this
includes landings from state-only permitted vessels which do not submit federal VTRs. Other gear
types each accounted for 1% or less of total commercial catch in 2019.11
Any federally-permitted vessel which uses otter trawl gear and catches more than 500 pounds of
black sea bass from January through March, or more than 100 pounds from April through
December, must use nets with a minimum mesh size of 4.5-inch diamond mesh applied throughout
the codend for at least 75 continuous meshes forward of the end of the net. Pots and traps used to
commercially harvest black sea bass must have two escape vents with degradable hinges in the
parlor. The escape vents must measure 1.375 inches by 5.75 inches if rectangular, 2 inches by 2
inches if square, or have a diameter of 2.5 inches if circular.

9
Figure 4: Landings, ex-vessel value, and average price for black sea bass, ME-NC, 1994-2019.
Ex-vessel value and price are inflation-adjusted to 2019 dollars using the Gross Domestic Product
Price Deflator.7
Table 3: Statistical areas that accounted for at least 5% of the total commercial black sea bass
catch in 2019 based on federal VTRs, with associated number of trips.8
Statistical Area Percent of 2019 Commercial
Black Sea Bass Catch Number of Trips
616 39% 761
621 10% 332
622 8% 104
615 7% 175
537 5% 774
0.00
0.50
1.00
1.50
2.00
2.50
3.00
3.50
4.00
0
2
4
6
8
10
12
14
1994
1996
1998
2000
2002
2004
2006
2008
2010
2012
2014
2016
2018
Pri
ce (
$/l
b,
adju
sted
)
Lan
din
gs
(mil l
b)
or
val
ue
(mil $
, ad
just
ed)
Landings Ex-vessel value Avg. price per pound

10
Figure 5: Proportion of black sea bass catch by statistical area in 2019 based on federal VTR
data. Statistical areas marked “confidential” are associated with fewer than three vessels and/or
dealers. Statistical areas with confidential data collectively accounted for less than 1% of
commercial catch reported on VTRs in 2019. The amount of catch that was not reported on
federal VTRs (e.g., catch from vessels permitted to fish only in state waters) is unknown.
Northeast Fisheries Science Center Data (“AA tables”) suggest that 20% of total commercial
landings (state and federal) in 2019 were not associated with a statistical area reported on
federal VTRs.8,11
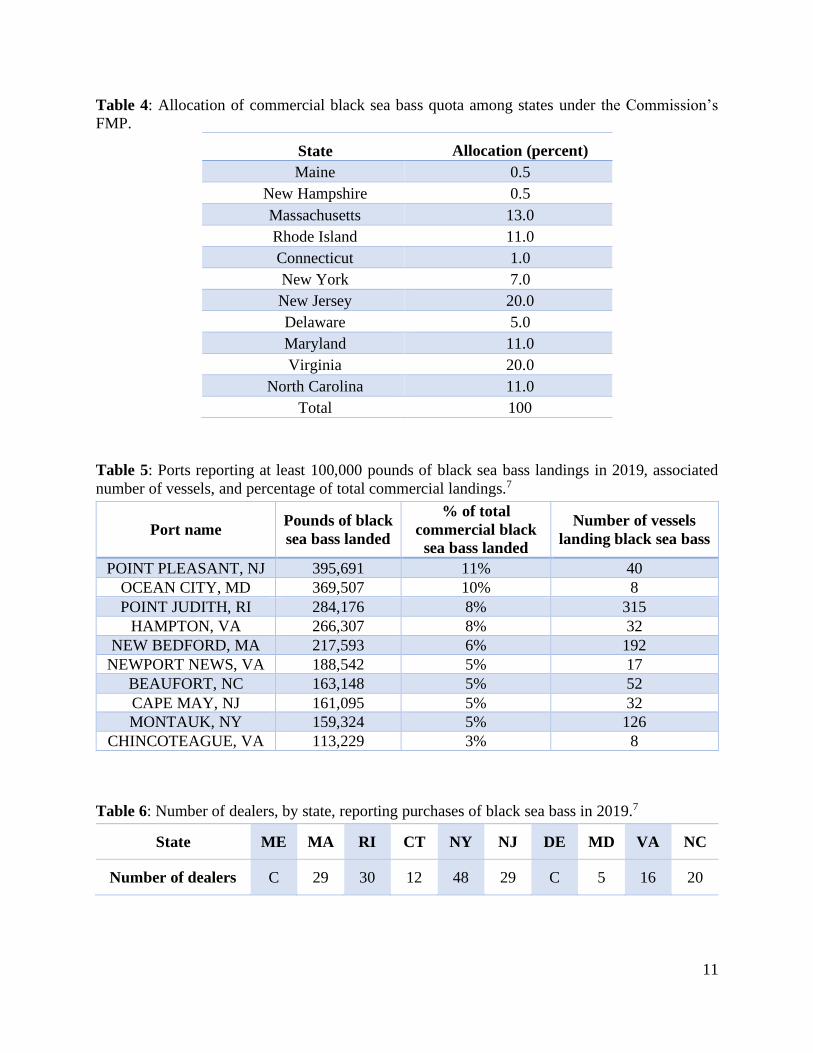
11
Table 4: Allocation of commercial black sea bass quota among states under the Commission’s
FMP.
State Allocation (percent)
Maine 0.5
New Hampshire 0.5
Massachusetts 13.0
Rhode Island 11.0
Connecticut 1.0
New York 7.0
New Jersey 20.0
Delaware 5.0
Maryland 11.0
Virginia 20.0
North Carolina 11.0
Total 100
Table 5: Ports reporting at least 100,000 pounds of black sea bass landings in 2019, associated
number of vessels, and percentage of total commercial landings.7
Port name Pounds of black
sea bass landed
% of total
commercial black
sea bass landed
Number of vessels
landing black sea bass
POINT PLEASANT, NJ 395,691 11% 40
OCEAN CITY, MD 369,507 10% 8
POINT JUDITH, RI 284,176 8% 315
HAMPTON, VA 266,307 8% 32
NEW BEDFORD, MA 217,593 6% 192
NEWPORT NEWS, VA 188,542 5% 17
BEAUFORT, NC 163,148 5% 52
CAPE MAY, NJ 161,095 5% 32
MONTAUK, NY 159,324 5% 126
CHINCOTEAGUE, VA 113,229 3% 8
Table 6: Number of dealers, by state, reporting purchases of black sea bass in 2019.7
State ME MA RI CT NY NJ DE MD VA NC
Number of dealers C 29 30 12 48 29 C 5 16 20

12
Recreational Fishery
The Council develops coast-wide regulations for the recreational black sea bass fishery in federal
waters, including a minimum fish size limit, a possession limit, and open and closed seasons (Table
7). The Commission and member states develop recreational measures in state waters (Table 8).
As previously described, the revised time series of MRIP estimates for black sea bass catch,
harvest, and effort are substantially higher than the previous estimates, largely due to increased
estimates for private anglers. Information presented in this section is based on the revised
estimates.
Between 1981 and 2019, recreational catch of black sea bass from Maine through Cape Hatteras,
NC was lowest in 1984 at 4.73 million fish and was highest in 2017 at 41.19 million fish.
Recreational harvest in weight was highest in 2016 at 12.05 million pounds; however, harvest in
numbers of fish was highest in 1986 at 19.28 million fish. Recreational harvest in weight was
lowest in 1981 at 1.53 million pounds, while harvest in numbers of fish was lowest in 1998 at 1.56
million fish.6
In 2019, an estimated 4.38 million black sea bass, at about 8.61 million pounds, were harvested by
recreational anglers from Maine through Cape Hatteras, North Carolina (Figure 3, Table 9).6
Harvest prior to 2020 should not be compared against the respective RHLs as the RHLs prior to
2020 do not account for the recent changes in the MRIP estimation methodology.
In 2019, 62% of black sea bass harvested by recreational fishermen from Maine through North
Carolina (in numbers of fish) were caught in state waters and about 38% in federal waters (Table
10). Most of the recreational harvest in 2019 was landed in New York (36%), followed by New
Jersey (19%), Massachusetts, Rhode Island, and Connecticut (12 each%; Table 11).6
For-hire vessels carrying passengers in federal waters must obtain a federal party/charter permit.
In 2019, 812 vessels held a federal party/charter permit.10
About 79% of the recreational black sea bass harvest in 2019 came from anglers fishing on private
or rental boats, about 18% from anglers aboard party or charter boats, and 3% from anglers fishing
from shore (Table 12).6
Table 7: Federal black sea bass recreational measures, Maine - Cape Hatteras, NC, 2007 - 2020.
Year Min. size Bag limit Open season
2007-2008 12” 25 Jan 1 - Dec 31
2009 12.5” 25 Jan 1 - Oct 5
2010-2011 12.5” 25 May 22 - Oct 11; Nov 1 - Dec 31
2012 12.5” 25 May 19 - Oct 14; Nov 1 - Dec 31
2013 12.5” 20 Jan 1 - Feb 28; May 19 - Oct 14; Nov 1 - Dec 31
2014 12.5” 15 May 19 - Sept 18; Oct 18 - Dec 31
2015-2017 12.5” 15 May 15 - Sept 21; Oct 22 - Dec 31
2018-2020 12.5” 15 Feb 1 - 28; May 15 - Dec 31

13
Table 8: State waters black sea bass recreational measures in 2018-2020. Measures were the same
across all years unless otherwise noted.
State Min.
Size
Bag
Limit Open Season
Maine 13” 10
fish May 19 - Sept 21; Oct 18 - Dec 31
New Hampshire 13” 10
fish Jan 1 - Dec 31
Massachusetts 15” 5 fish 2018: May 19 - Sept 12
2019 & 2020: May 18 - Sept 8
Rhode Island 15” 3 fish Jun 24 - Aug 31
7 fish Sept 1 - Dec 31
Connecticut private &
shore 15” 5 fish May 19 - Dec 31
CT authorized
party/charter
monitoring program
vessels
15”
5 fish May 19 - Aug 31
7 fish Sept 1- Dec 31
New York 15” 3 fish Jun 23 - Aug 31
7 fish Sept 1- Dec 31
New Jersey
12.5”
10
fish May 15 - Jun 22
2 fish Jul 1- Aug 31
10
fish Oct 8 - Oct 31
13” 15
fish Nov 1 - Dec 31
Delaware 12.5” 15
fish May 15 - Dec 31
Maryland 12.5” 15
fish May 15 - Dec 31
Virginia 12.5” 15
fish
2018: Feb 1 - 28; May 15 - Dec 31
2019: Feb 1-28; May 15-31; June 22-Dec 31
2020: Feb 1 - 28; May 29 - Dec 31
North Carolina, North
of Cape Hatteras (35°
15’N)
12.5 15
fish
2018: Feb 1 - 28; May 15 - Dec 31
2019: Feb 1 - 28; May 17 - Dec 31
2020: Feb 1 - 28; May 17 - TBD

14
Table 9: Estimated recreational black sea bass catch and harvest from Maine through Cape
Hatteras, North Carolina, 20010-2019, based on the revised MRIP estimates.6
Year Catch
(millions of fish)
Harvest
(millions of fish)
Harvest
(millions of pounds)
% of catch
retained
2010 26.42 5.10 8.07 19%
2011 12.47 1.78 3.27 14%
2012 34.95 3.69 7.04 11%
2013 25.78 3.02 5.69 12%
2014 23.89 3.97 7.24 17%
2015 24.11 4.94 9.06 20%
2016 35.80 5.84 12.05 16%
2017 41.19 5.70 11.50 14%
2018 24.99 3.99 7.92 16%
2019 32.32 4.38 8.61 14%
Table 10: Estimated percentage of black sea bass recreational harvest (in numbers of fish) in state
and federal waters, from Maine through North Carolina, 2010-2019, based on the revised MRIP
estiamtes.6
Year State waters Federal waters
2010 64% 36%
2011 65% 35%
2012 69% 31%
2013 67% 33%
2014 68% 32%
2015 69% 31%
2016 59% 41%
2017 40% 60%
2018 61% 39%
2019 62% 38%
2010-2019 average 61% 39%
2017-2019 average 53% 47%
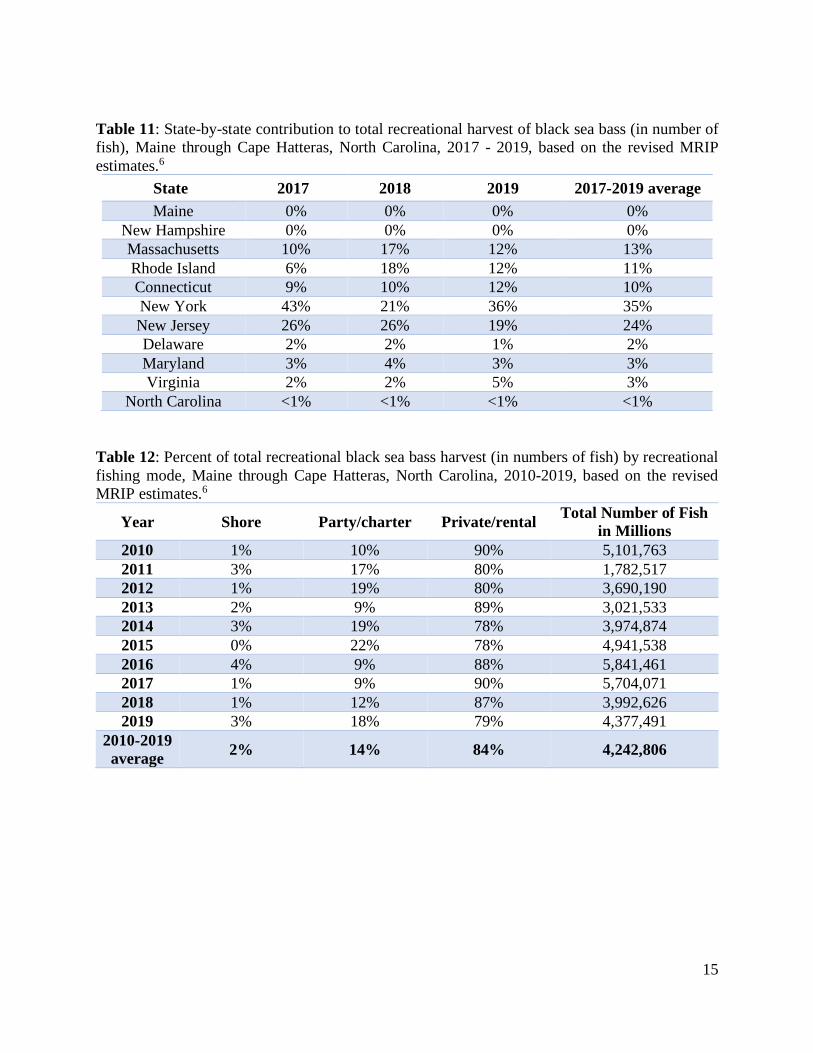
15
Table 11: State-by-state contribution to total recreational harvest of black sea bass (in number of
fish), Maine through Cape Hatteras, North Carolina, 2017 - 2019, based on the revised MRIP
estimates.6
State 2017 2018 2019 2017-2019 average
Maine 0% 0% 0% 0%
New Hampshire 0% 0% 0% 0%
Massachusetts 10% 17% 12% 13%
Rhode Island 6% 18% 12% 11%
Connecticut 9% 10% 12% 10%
New York 43% 21% 36% 35%
New Jersey 26% 26% 19% 24%
Delaware 2% 2% 1% 2%
Maryland 3% 4% 3% 3%
Virginia 2% 2% 5% 3%
North Carolina <1% <1% <1% <1%
Table 12: Percent of total recreational black sea bass harvest (in numbers of fish) by recreational
fishing mode, Maine through Cape Hatteras, North Carolina, 2010-2019, based on the revised
MRIP estimates.6
Year Shore Party/charter Private/rental Total Number of Fish
in Millions
2010 1% 10% 90% 5,101,763
2011 3% 17% 80% 1,782,517
2012 1% 19% 80% 3,690,190
2013 2% 9% 89% 3,021,533
2014 3% 19% 78% 3,974,874
2015 0% 22% 78% 4,941,538
2016 4% 9% 88% 5,841,461
2017 1% 9% 90% 5,704,071
2018 1% 12% 87% 3,992,626
2019 3% 18% 79% 4,377,491
2010-2019
average 2% 14% 84% 4,242,806

16
References
1 Drohan, A.F., J. P. Manderson, D. B. Packer. 2007. Essential fish habitat source document: black
sea bass, Centropristis striata, life history and habitat characteristics, 2nd edition. NOAA
Technical Memorandum NMFS NE 200..
2 Northeast Fisheries Science Center. 2017. 62nd Northeast Regional Stock Assessment Workshop
(62nd SAW) Assessment Report. Northeast Fisheries Science Center Reference Doc. 17-03. 822
p. Available at: https://www.nefsc.noaa.gov/publications/crd/crd1703/
3 Blaylock, J. and G.R. Shepherd. 2016. Evaluating the vulnerability of an atypical protogynous
hermaphrodite to fishery exploitation: results from a population model for black sea bass
(Centropristis striata). Fishery Bulletin 114(4): 476-489.
4 Northeast Fisheries Science Center. 2019. Prepublication copy of the August 2019 operational
stock assessment report prepared for the Council and the SSC. Available at:
http://www.mafmc.org/ssc-meetings/2019/september-9-11
5 More information on the Summer Flounder, Scup, and Black Sea Bass Commercial/Recreational
Allocation Amendment is available at: https://www.mafmc.org/actions/sfsbsb-allocation-
amendment.
6 Personal communication from the National Marine Fisheries Service, Fisheries Statistics
Division. Accessed June 18, 2020. Available at: https://www.st.nmfs.noaa.gov/recreational-
fisheries/data-and-documentation/queries/index
7 Unpublished NMFS commercial fish dealer data (i.e., “DERS”), which include both state and
federal dealer data).
8 Unpublished NMFS VTR data.
9 More information on the Black Sea Bass Commercial State Allocation Amendment/Addendum
is available at: https://www.mafmc.org/actions/bsb-commercial-allocation.
10 Unpublished NMFS permit data.
11 Unpublished NEFSC commercial fish dealer data (i.e., “AA tables”), which include both state
and federal dealer data).
Additional public comments are behind Tab 5
Page 1 of 4
M E M O R A N D U M
Date: July 30, 2020
To: Council and Board
From: Kiley Dancy, Karson Coutre, and Julia Beaty, Council Staff
Dustin Colson Leaning and Caitlin Starks, Commission Staff
Subject: Draft Range of Alternatives for the Summer Flounder, Scup, and Black Sea Bass
Commercial/Recreational Allocation Amendment
On Wednesday, August 12, the Council and Board will review a draft range of alternatives for the
Summer Flounder, Scup, and Black Sea Bass Commercial/Recreational Allocation Amendment
recommended by the Fishery Management Action Team (FMAT) and approve a range of
alternatives for inclusion in a public hearing document. A public hearing document and
Commission draft amendment document will be developed for approval at the December 2020
joint meeting.
The briefing materials for this meeting include:
1) Draft alternatives and FMAT Recommendations from their July 15, 2020 meeting
2) Amendment Action Plan as of July 28, 2020
3) Email comments received through July 29, 2020
An Advisory Panel meeting summary from their July 29, 2020 meeting will be added to the
supplemental meeting materials on the August meeting page on the Council’s website.
A condensed summary of the alternatives recommended by the FMAT for inclusion in a public
hearing document is included below. Additional background information, analysis, and FMAT
comments can be found in the FMAT recommendation summary document behind this cover
memo.
1) Modified Commercial/Recreational Allocation Percentages
a) Summer Flounder
• Catch based
o Alt 1a-1: 44% commercial, 56% recreational at Acceptable Biological Catch
(ABC) level, based on 2004-2018 data
o Alt 1a-2: 43% commercial, 57% recreational at ABC level, based on multiple
approaches including 2009-2018 base years, approximate status quo harvest per
Mid-Atlantic Fishery Management Council 800 North State Street, Suite 201, Dover, DE 19901
Phone: 302-674-2331 ǀ FAX: 302-674-5399 ǀ www.mafmc.org Michael P. Luisi, Chairman ǀ G. Warren Elliott, Vice Chairman
Christopher M. Moore, Ph.D., Executive Director

Page 2 of 4
sector compared to 2017/2018, and average of other approaches approved by
Council/Board in June 2020.
o Alt 1a-3: 40% commercial, 60% recreational at ABC level, based on 2014-
2018 data
• Landings based
o Alt 1a-4: 60% commercial, 40% recreational at Total Allowable Landings
(TAL) level, No action/status quo (1980-1989 data, pre-revision)
o Alt 1a-5: 55% commercial, 45% recreational at TAL level, based on same
base years with revised data (1981-1989 data must be used due to lack of 1980
MRIP data)
o Alt 1a-6: 45% commercial, 55% recreational at TAL level, based on multiple
approaches in including 2009-2018 and 2004-2018 data
o Alt 1a-7: 41% commercial, 59% recreational at TAL level, based on 2014-
2018 data
b) Scup
• Catch based
o Alt 1b-1: 78% commercial, 22% recreational at ABC level, No action/status
quo (1988-1992 data, pre-revision)
o Alt 1b-2: 65% commercial, 35% recreational at ABC level, based on same
base years with revised data (1988-1992, post revision)
o Alt 1b-3: 61% commercial, 39% recreational at ABC level, based on multiple
approaches including 2009-2018 base years and average of other approaches
approved by Council/Board in June 2020
o Alt 1b-4: 59% commercial, 41% recreational at ABC level, based on
approximate status quo harvest per sector compared to 2018/2019
• Landings based
o Alt 1b-5: 57% commercial, 43% recreational at TAL level, based on multiple
approaches including same base years with revised data; 2014-2018 base years;
2009-2018 base years
o Alt 1b-6: 56% commercial, 44% recreational at TAL level, based on 2004-
2018 base years
o Alt 1b-7: 50% commercial, 50% recreational at TAL level, based on
approximate status quo harvest per sector compared to 2018/2019
c) Black Sea Bass
• Catch based
o Alt 1c-1: 32% commercial, 68% recreational, based on Attempt to maintain
close to status quo harvest per sector compared to 2018/2019
o Alt 1c-2: 28% commercial, 72% recreational, based on 2004-2018 base years
o Alt 1c-3: 24% commercial, 76% recreational, based on 2009-2018 base years
• Landings based
o Alt 1c-4: 49% commercial, 51% recreational, No action/status quo (1983-1992
data, pre-revisions)
o Alt 1c-5: 45% commercial, 55% recreational, based on same base years,

Page 3 of 4
revised data (1983-1992)
o Alt 1c-6: 29% commercial, 71% recreational, based on attempt to maintain
close to status quo harvest per sector compared to 2018/2019 and average of other
approaches approved by Council/Board in June 2020
o Alt 1c-7: 22% commercial, 78% recreational, based on 2009-2018 and 2014-
2018 base years
d) Phase-in Approaches
• Alt 1d-1: No phase in (no action/status quo)
• Alt 1d-2: Phase in with change evenly spread over 2 years
• Alt 1d-3: Phase in with change evenly spread over 3 years
• Alt 1d-4: Phase in with change evenly spread over 5 years
2) Recreational Sector Separation Alternatives
a) Summer Flounder
• Alt 2a-1: No sector separation for summer flounder (no action/status quo)
• Alt 2a-2: Separate private and for-hire sub-ACLs with 96% of recreational ACL to
private/shore, 4% for-hire, based on 2009-2018 and 2004-2018 MRIP dead catch in
numbers of fish
• Alt 2a-3: Separate private and for-hire sub-ACLs with 94% of recreational ACL to
private/shore, 6% for-hire, based on 1981-2018 dead catch in numbers of fish
b) Scup
• Alt 2b-1: No sector separation for scup (no action/status quo)
• Alt 2b-2: Separate private and for-hire sub-ACLs with 91% of recreational ACL to
private/shore, 9% for-hire, based on 1981-2018 and 2014-2018 MRIP dead catch in
numbers of fish
• Alt 2b-3: Separate private and for-hire sub-ACLs with 90% of recreational ACL to
private/shore, 10% for-hire, based on 2004-2018 dead catch in numbers of fish
c) Black Sea Bass
• Alt 2c-1: No sector separation for black sea bass (no action/status quo)
• Alt 2c-2: Separate private and for-hire sub-ACLs with 90% of recreational ACL to
private/shore, 10% for-hire, based on 2009-2018 MRIP dead catch in numbers of fish
• Alt 2c-3: Separate private and for-hire sub-ACLs with 87% of recreational ACL to
private/shore, 13% for-hire, based on 2004-2018 dead catch in numbers of fish
3) Alternatives for Transfers between Sectors
• Alt 3a: No action (no transfers)
• Alt 3b-1: Allow for bi-directional transfers through specifications process with pre-defined
guidelines and process.
• Alt 3b-2: Allow for bi-directional transfers through specifications process as needed, with
limited pre-determined guidelines.

Page 4 of 4
• Alt 3c-1: No transfer cap specified; the Council and Board can recommend any amount of
transfer between fisheries.
• Alt 3c-2: Maximum transfer amount set at 5% of the ABC.
• Alt 3c-3: Maximum transfer amount at 10% of the ABC.
• Alt 3c-4: Maximum transfer amount set at 15% of the ABC.
4) Framework/Addendum Alternatives
• Alt 4a: No action/status quo (changes to commercial/recreational allocations must be
made through an amendment)
• Alt 4b: Allow changes to commercial/recreational allocations and other measures
included in this amendment to be made through framework actions/addenda

1
Summer Flounder, Scup, and Black Sea Bass Commercial/Recreational Allocation Amendment
Draft Range of Alternatives and FMAT Recommendations, July 2020
The Fishery Management Action Team (FMAT) met on July 15, 2020 to recommend specific draft
alternatives based on the approaches retained for consideration by the Council and Board at their June
2020 meeting. At their August 12 meeting, the Council and Board plan to approve a range of alternatives
for inclusion in a public hearing document.
FMAT-recommended alternatives, as well as comments and considerations for each category, are
described below for 1) modified commercial/recreational allocation percentages, 2) recreational sector
separation, 3) transfer provisions, and 4) framework provisions. The basis for the approaches included
here are described in more detail in the summary of the May 2020 FMAT meetings, available at
https://www.mafmc.org/s/Tab03_SFSBSB-ComRecAllocationAmd_2020-06.pdf.
Additional potential configurations of alternatives considered by the FMAT but not recommended for the
range of alternatives are listed in Appendices B-D.
1) Modified Commercial/Recreational Allocation Percentages
a) Summer Flounder
The FMAT recommends consideration of the following specific alternatives for revised commercial/
recreational summer flounder allocation percentages. Some alternatives use allocations at the catch level
(acceptable biological catch or ABC), while others allocate at the landings level (total allowable landings
or TAL). Appendix A includes additional information about catch vs. landings based allocations. The
current allocations for summer flounder are landings-based. Under landings-based alternatives, discards
would continue to be split by sector based on recent discard trends after considering Monitoring
Committee (MC) recommendations. Under catch based allocations, discards are accounted for in the
allocations. Because discards would be split differently under catch vs. landings based approaches, the
percentages under these two categories of approaches are not directly comparable in terms of their
resulting catch and landings limits (see Appendix A for additional details).
The alternatives in this section are mutually exclusive, meaning the Council and Board can only choose
one of the alternatives from 1a-1 through 1a-7.
i) Summer Flounder Catch Based Percentages
Alternative Basis (refer to May FMAT Meeting Summary for more detail)
1a-1: 44% commercial, 56% recreational
2004-2018 base years
1a-2: 43% commercial, 57% recreational
Supported by multiple approaches (i.e., 2009-2018 base years, approximate status quo harvest per sector compared to 2017/2018, and average of other approaches approved by Council/Board in June 2020)
1a-3: 40% commercial, 60% recreational
2014-2018 base years
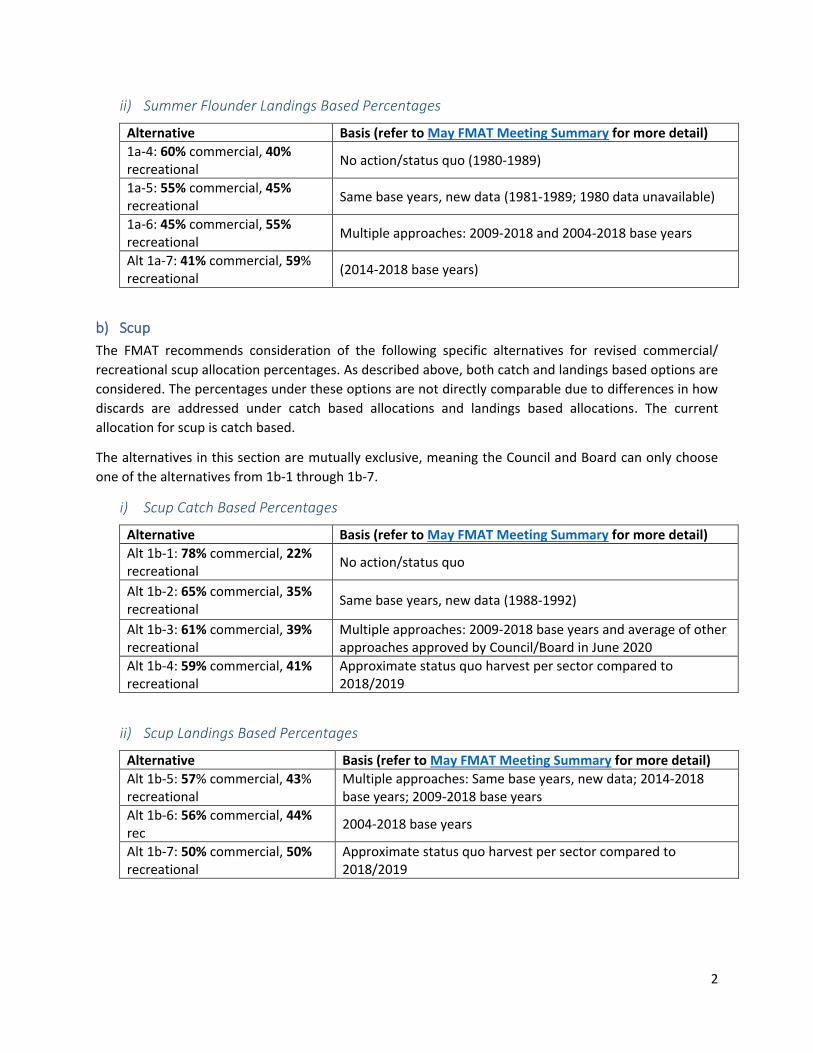
2
ii) Summer Flounder Landings Based Percentages
Alternative Basis (refer to May FMAT Meeting Summary for more detail)
1a-4: 60% commercial, 40% recreational
No action/status quo (1980-1989)
1a-5: 55% commercial, 45% recreational
Same base years, new data (1981-1989; 1980 data unavailable)
1a-6: 45% commercial, 55% recreational
Multiple approaches: 2009-2018 and 2004-2018 base years
Alt 1a-7: 41% commercial, 59% recreational
(2014-2018 base years)
b) Scup
The FMAT recommends consideration of the following specific alternatives for revised commercial/
recreational scup allocation percentages. As described above, both catch and landings based options are
considered. The percentages under these options are not directly comparable due to differences in how
discards are addressed under catch based allocations and landings based allocations. The current
allocation for scup is catch based.
The alternatives in this section are mutually exclusive, meaning the Council and Board can only choose
one of the alternatives from 1b-1 through 1b-7.
i) Scup Catch Based Percentages
Alternative Basis (refer to May FMAT Meeting Summary for more detail)
Alt 1b-1: 78% commercial, 22% recreational
No action/status quo
Alt 1b-2: 65% commercial, 35% recreational
Same base years, new data (1988-1992)
Alt 1b-3: 61% commercial, 39% recreational
Multiple approaches: 2009-2018 base years and average of other approaches approved by Council/Board in June 2020
Alt 1b-4: 59% commercial, 41% recreational
Approximate status quo harvest per sector compared to 2018/2019
ii) Scup Landings Based Percentages
Alternative Basis (refer to May FMAT Meeting Summary for more detail)
Alt 1b-5: 57% commercial, 43% recreational
Multiple approaches: Same base years, new data; 2014-2018 base years; 2009-2018 base years
Alt 1b-6: 56% commercial, 44% rec
2004-2018 base years
Alt 1b-7: 50% commercial, 50% recreational
Approximate status quo harvest per sector compared to 2018/2019

3
c) Black Sea Bass
The FMAT recommends consideration of the following specific alternatives for revised commercial/
recreational black sea bass allocation percentages. As described above, both catch and landings based
options are considered. The percentages under these options are not be directly comparable due to
differences in how discards are addressed under catch based allocations and landings based allocations.
The current allocation for black sea bass is landings based.
The alternatives in this section are mutually exclusive, meaning the Council and Board can only choose
one of the alternatives from 1c-1 through 1c-7.
i) Black Sea Bass Catch Based Percentages
Alternative Basis (refer to May FMAT Meeting Summary for more detail)
Alt 1c-1: 32% commercial, 68% recreational
Attempt to maintain close to status quo harvest per sector compared to 2018/2019
Alt 1c-2: 28% commercial, 72% recreational
2004-2018 base years
Alt 1c-3: 24% commercial, 76% recreational
2009-2018 base years
ii) Black Sea Bass Landings Based Percentages
Alternative Basis (refer to May FMAT Meeting Summary for more detail)
Alt1c-4: 49% commercial, 51% recreational
No action/status quo
Alt 1c-5: 45% commercial, 55% recreational
Same base years, new data (1983-1992)
Alt 1c-6: 29% commercial, 71% recreational
Attempt to maintain close to status quo harvest per sector compared to 2018/2019 and average of other approaches approved by Council/Board in June 2020
Alt 1c-7: 22% commercial, 78% recreational
2009-2018 and 2014-2018 base years
FMAT Comments for Allocation Percentages for All Three Species
The FMAT agreed that the percentage allocation alternatives taken out to public hearings should define a
reasonable range and should also include specific options from within that range. The FMAT did not think
it would be appropriate to include only a high and low option with the understanding that the Council and
Board could choose any final allocation percentages from within that range. They agreed that each
alternative taken out to public hearings should have a clearly stated basis. This would not preclude public
comments from recommending other allocation percentages and it would not prevent the Council and
Board from choosing a different option from within the range with appropriate justification. It would,
however, make it clear which alternatives are supported by a justification discussed by the FMAT.
One FMAT member noted that some of the retained alternatives for catch and landings-based allocations
have the same basis. The FMAT agreed that this could be beneficial, but it is not necessary to retain the
same basis for each category when determining the final range of alternatives.
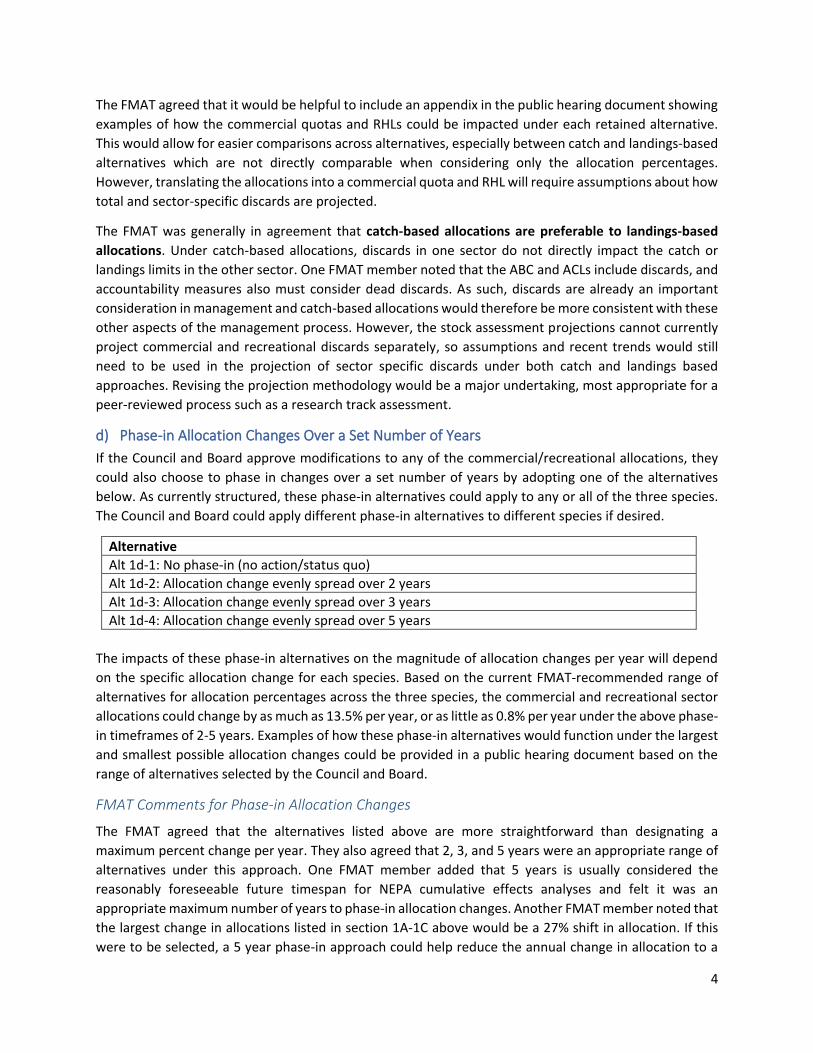
4
The FMAT agreed that it would be helpful to include an appendix in the public hearing document showing
examples of how the commercial quotas and RHLs could be impacted under each retained alternative.
This would allow for easier comparisons across alternatives, especially between catch and landings-based
alternatives which are not directly comparable when considering only the allocation percentages.
However, translating the allocations into a commercial quota and RHL will require assumptions about how
total and sector-specific discards are projected.
The FMAT was generally in agreement that catch-based allocations are preferable to landings-based
allocations. Under catch-based allocations, discards in one sector do not directly impact the catch or
landings limits in the other sector. One FMAT member noted that the ABC and ACLs include discards, and
accountability measures also must consider dead discards. As such, discards are already an important
consideration in management and catch-based allocations would therefore be more consistent with these
other aspects of the management process. However, the stock assessment projections cannot currently
project commercial and recreational discards separately, so assumptions and recent trends would still
need to be used in the projection of sector specific discards under both catch and landings based
approaches. Revising the projection methodology would be a major undertaking, most appropriate for a
peer-reviewed process such as a research track assessment.
d) Phase-in Allocation Changes Over a Set Number of Years
If the Council and Board approve modifications to any of the commercial/recreational allocations, they
could also choose to phase in changes over a set number of years by adopting one of the alternatives
below. As currently structured, these phase-in alternatives could apply to any or all of the three species.
The Council and Board could apply different phase-in alternatives to different species if desired.
Alternative
Alt 1d-1: No phase-in (no action/status quo)
Alt 1d-2: Allocation change evenly spread over 2 years
Alt 1d-3: Allocation change evenly spread over 3 years
Alt 1d-4: Allocation change evenly spread over 5 years
The impacts of these phase-in alternatives on the magnitude of allocation changes per year will depend
on the specific allocation change for each species. Based on the current FMAT-recommended range of
alternatives for allocation percentages across the three species, the commercial and recreational sector
allocations could change by as much as 13.5% per year, or as little as 0.8% per year under the above phase-
in timeframes of 2-5 years. Examples of how these phase-in alternatives would function under the largest
and smallest possible allocation changes could be provided in a public hearing document based on the
range of alternatives selected by the Council and Board.
FMAT Comments for Phase-in Allocation Changes
The FMAT agreed that the alternatives listed above are more straightforward than designating a
maximum percent change per year. They also agreed that 2, 3, and 5 years were an appropriate range of
alternatives under this approach. One FMAT member added that 5 years is usually considered the
reasonably foreseeable future timespan for NEPA cumulative effects analyses and felt it was an
appropriate maximum number of years to phase-in allocation changes. Another FMAT member noted that
the largest change in allocations listed in section 1A-1C above would be a 27% shift in allocation. If this
were to be selected, a 5 year phase-in approach could help reduce the annual change in allocation to a
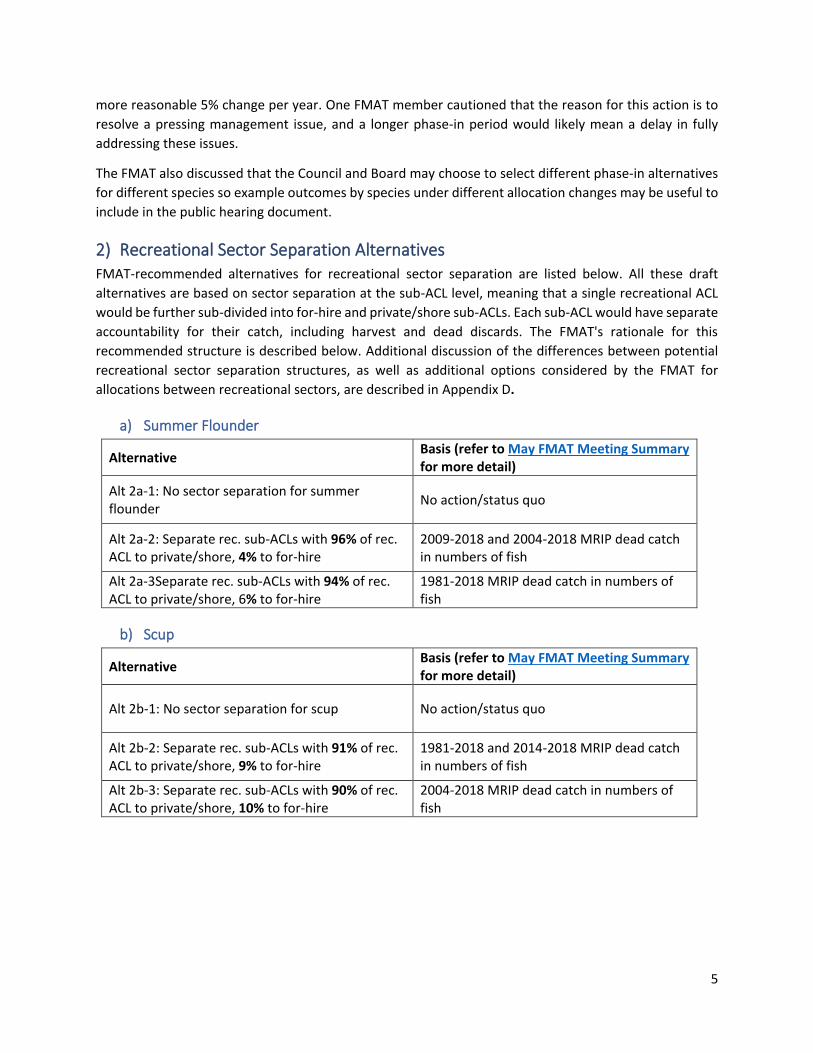
5
more reasonable 5% change per year. One FMAT member cautioned that the reason for this action is to
resolve a pressing management issue, and a longer phase-in period would likely mean a delay in fully
addressing these issues.
The FMAT also discussed that the Council and Board may choose to select different phase-in alternatives
for different species so example outcomes by species under different allocation changes may be useful to
include in the public hearing document.
2) Recreational Sector Separation Alternatives FMAT-recommended alternatives for recreational sector separation are listed below. All these draft
alternatives are based on sector separation at the sub-ACL level, meaning that a single recreational ACL
would be further sub-divided into for-hire and private/shore sub-ACLs. Each sub-ACL would have separate
accountability for their catch, including harvest and dead discards. The FMAT's rationale for this
recommended structure is described below. Additional discussion of the differences between potential
recreational sector separation structures, as well as additional options considered by the FMAT for
allocations between recreational sectors, are described in Appendix D.
a) Summer Flounder
Alternative Basis (refer to May FMAT Meeting Summary for more detail)
Alt 2a-1: No sector separation for summer flounder
No action/status quo
Alt 2a-2: Separate rec. sub-ACLs with 96% of rec. ACL to private/shore, 4% to for-hire
2009-2018 and 2004-2018 MRIP dead catch in numbers of fish
Alt 2a-3Separate rec. sub-ACLs with 94% of rec. ACL to private/shore, 6% to for-hire
1981-2018 MRIP dead catch in numbers of fish
b) Scup
Alternative Basis (refer to May FMAT Meeting Summary for more detail)
Alt 2b-1: No sector separation for scup No action/status quo
Alt 2b-2: Separate rec. sub-ACLs with 91% of rec. ACL to private/shore, 9% to for-hire
1981-2018 and 2014-2018 MRIP dead catch in numbers of fish
Alt 2b-3: Separate rec. sub-ACLs with 90% of rec. ACL to private/shore, 10% to for-hire
2004-2018 MRIP dead catch in numbers of fish
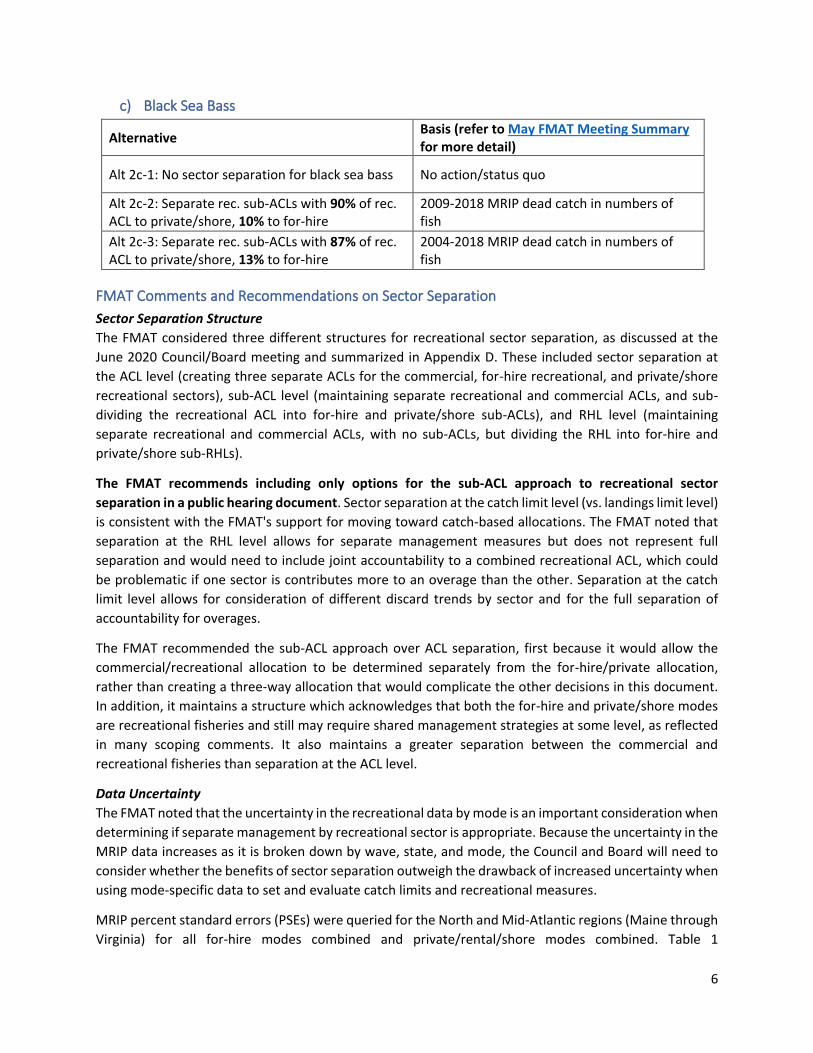
6
c) Black Sea Bass
Alternative Basis (refer to May FMAT Meeting Summary for more detail)
Alt 2c-1: No sector separation for black sea bass No action/status quo
Alt 2c-2: Separate rec. sub-ACLs with 90% of rec. ACL to private/shore, 10% to for-hire
2009-2018 MRIP dead catch in numbers of fish
Alt 2c-3: Separate rec. sub-ACLs with 87% of rec. ACL to private/shore, 13% to for-hire
2004-2018 MRIP dead catch in numbers of fish
FMAT Comments and Recommendations on Sector Separation
Sector Separation Structure
The FMAT considered three different structures for recreational sector separation, as discussed at the
June 2020 Council/Board meeting and summarized in Appendix D. These included sector separation at
the ACL level (creating three separate ACLs for the commercial, for-hire recreational, and private/shore
recreational sectors), sub-ACL level (maintaining separate recreational and commercial ACLs, and sub-
dividing the recreational ACL into for-hire and private/shore sub-ACLs), and RHL level (maintaining
separate recreational and commercial ACLs, with no sub-ACLs, but dividing the RHL into for-hire and
private/shore sub-RHLs).
The FMAT recommends including only options for the sub-ACL approach to recreational sector
separation in a public hearing document. Sector separation at the catch limit level (vs. landings limit level)
is consistent with the FMAT's support for moving toward catch-based allocations. The FMAT noted that
separation at the RHL level allows for separate management measures but does not represent full
separation and would need to include joint accountability to a combined recreational ACL, which could
be problematic if one sector is contributes more to an overage than the other. Separation at the catch
limit level allows for consideration of different discard trends by sector and for the full separation of
accountability for overages.
The FMAT recommended the sub-ACL approach over ACL separation, first because it would allow the
commercial/recreational allocation to be determined separately from the for-hire/private allocation,
rather than creating a three-way allocation that would complicate the other decisions in this document.
In addition, it maintains a structure which acknowledges that both the for-hire and private/shore modes
are recreational fisheries and still may require shared management strategies at some level, as reflected
in many scoping comments. It also maintains a greater separation between the commercial and
recreational fisheries than separation at the ACL level.
Data Uncertainty
The FMAT noted that the uncertainty in the recreational data by mode is an important consideration when
determining if separate management by recreational sector is appropriate. Because the uncertainty in the
MRIP data increases as it is broken down by wave, state, and mode, the Council and Board will need to
consider whether the benefits of sector separation outweigh the drawback of increased uncertainty when
using mode-specific data to set and evaluate catch limits and recreational measures.
MRIP percent standard errors (PSEs) were queried for the North and Mid-Atlantic regions (Maine through
Virginia) for all for-hire modes combined and private/rental/shore modes combined. Table 1
7
demonstrates that the PSEs do increase for the for-hire mode when separated from the combined mode
data. PSEs for the private/shore modes combined are slightly higher than those for all modes combined,
but there is less of a difference from the combined modes PSEs given that private and shore estimates
account for most of the harvest for these three species. PSEs also vary by species, with summer flounder
having the lowest PSEs, followed by black sea bass and scup.
The FMAT considered the possible use of VTR data in these options (see the allocation options discussion
below), but ultimately recommended against incorporating VTR data into these alternatives. The FMAT
notes that there are not comparable estimates of uncertainty for VTR data because these data are not an
expanded estimate associated with sampling uncertainty.
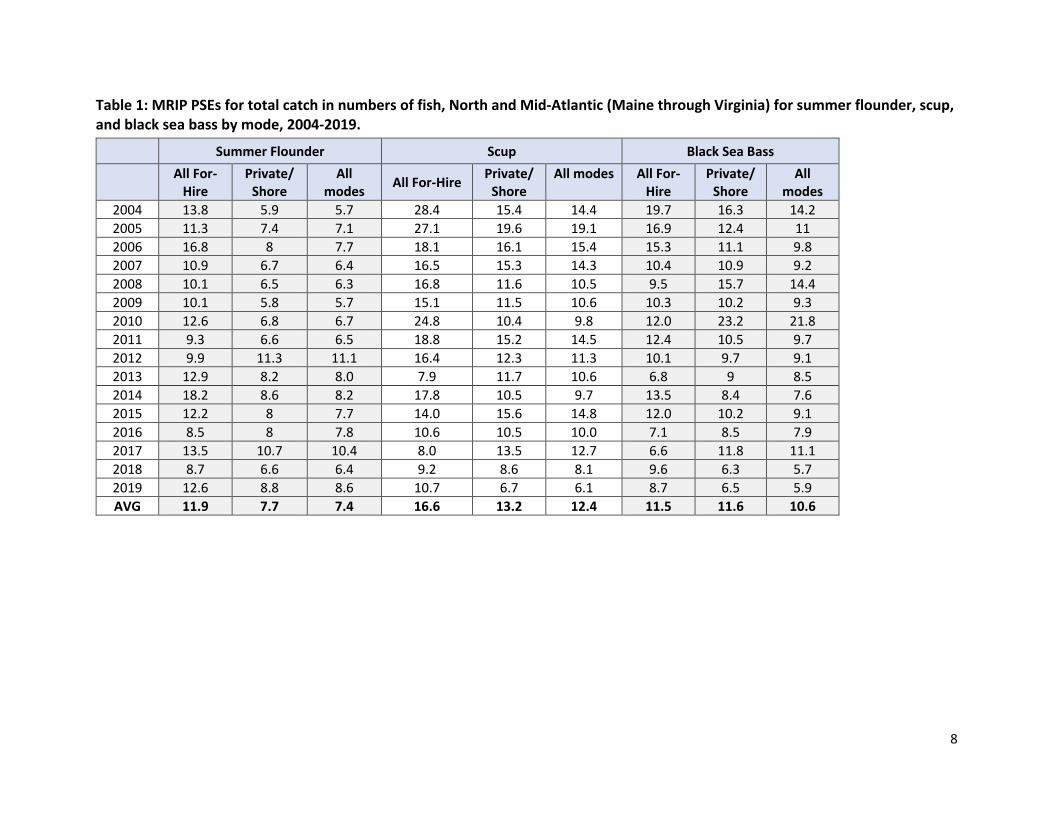
8
Table 1: MRIP PSEs for total catch in numbers of fish, North and Mid-Atlantic (Maine through Virginia) for summer flounder, scup, and black sea bass by mode, 2004-2019.
Summer Flounder Scup Black Sea Bass
All For-Hire
Private/ Shore
All modes
All For-Hire Private/
Shore All modes All For-
Hire Private/
Shore All
modes
2004 13.8 5.9 5.7 28.4 15.4 14.4 19.7 16.3 14.2
2005 11.3 7.4 7.1 27.1 19.6 19.1 16.9 12.4 11
2006 16.8 8 7.7 18.1 16.1 15.4 15.3 11.1 9.8
2007 10.9 6.7 6.4 16.5 15.3 14.3 10.4 10.9 9.2
2008 10.1 6.5 6.3 16.8 11.6 10.5 9.5 15.7 14.4
2009 10.1 5.8 5.7 15.1 11.5 10.6 10.3 10.2 9.3
2010 12.6 6.8 6.7 24.8 10.4 9.8 12.0 23.2 21.8
2011 9.3 6.6 6.5 18.8 15.2 14.5 12.4 10.5 9.7
2012 9.9 11.3 11.1 16.4 12.3 11.3 10.1 9.7 9.1
2013 12.9 8.2 8.0 7.9 11.7 10.6 6.8 9 8.5
2014 18.2 8.6 8.2 17.8 10.5 9.7 13.5 8.4 7.6
2015 12.2 8 7.7 14.0 15.6 14.8 12.0 10.2 9.1
2016 8.5 8 7.8 10.6 10.5 10.0 7.1 8.5 7.9
2017 13.5 10.7 10.4 8.0 13.5 12.7 6.6 11.8 11.1
2018 8.7 6.6 6.4 9.2 8.6 8.1 9.6 6.3 5.7
2019 12.6 8.8 8.6 10.7 6.7 6.1 8.7 6.5 5.9
AVG 11.9 7.7 7.4 16.6 13.2 12.4 11.5 11.6 10.6
9
Recreational Sector Allocation Options
The FMAT recommends using data on dead catch in numbers of fish as the basis for determining
allocations to the for-hire and private recreational sectors. This is consistent with the FMAT
recommendation of sector separation at the catch limit level, as opposed to at the landings limit level. At
their previous meeting, the FMAT noted that separate dead discard estimates in weight are not currently
available by recreational sector, and that while it would be technically possible to generate these
estimates, it may not be entirely defensible given the extensive “borrowing” of data between the sectors
when generating estimates of catch in weight.
The FMAT identified the alternatives listed in the tables above as reasonable options for an allocation
basis given recent trends in the fisheries. For scup and summer flounder, many of the different time series
considered resulted in the same or very similar percentages. For black sea bass, the percentage allocation
options varied more widely depending on the time frame evaluated. The FMAT did not believe it was
appropriate to include an allocation option for black sea bass using the full time series (i.e., 1981-2018),
because catch trends by recreational sector show private/shore catch increasing over the time series and
for-hire catch decreasing. Therefore, for black sea bass, the full time series average proportions are not
reflective of recent fishery conditions. Using the full time series for summer flounder and scup does not
appear to have the same issue since the proportions by mode from 1981-2018 are identical to or closely
match those of more recent years.
The FMAT discussed the possibility of basing for-hire allocations on Vessel Trip Report (VTR) data rather
than MRIP data. This was in response to many scoping comments that requested managers make better
use of existing VTR data, and/or noted that the for-hire sector should be managed using VTR data instead
of MRIP data. The FMAT reviewed example allocation options using VTR data in place of MRIP data for
the for-hire sector and found that for all three species, this resulted in lower allocation to the for-hire
sector for most base years considered. A major issue with this approach is that while all federally
permitted for-hire vessels are required to report electronically via eVTRs, not all states require VTRs for
state-only permitted vessels. This means that the estimates of catch and harvest from VTR data
underrepresent harvest from the for-hire mode.
In addition, the FMAT had some general concerns about mixing VTR and MRIP data as the basis for
allocations, as well as concerns about the accuracy of self-reported VTR data, and potentially higher bias
in the reported discard data in particular. Another FMAT member said discards reported on VTRs are
supposed to be best estimates and captains should be reporting discards to the best of their ability, just
like landings. FMAT members noted that sector separation could provide an incentive for improved for-
hire data collection and validation which would allow the for-hire sector to operate more independently
from MRIP data. The FMAT agreed that while sector separation could be considered now based on MRIP
data, greater use of for-hire VTR data in management could be possible in the future if VTR data collection
is expanded to additional vessels and/or if additional validation work is carried out.

10
3) Alternatives for Transfers between Sectors
3) Alternatives for Transfers between Sectors
a) No action/status quo
Alt 3a: Do not modify the FMP to allow transfers of annual quota between the commercial and
recreational sectors.
b) Options for sector transfers (assuming no recreational sector separation)
Alt 3b-1: Allow for bi-directional transfers through specifications process with pre-defined guidelines
and process.
Under this alternative, the Board and the Council would have the ability to recommend that a portion of
the total ABC be transferred between the recreational and commercial sectors in the form of a landings
limit transfer. The need for a sector transfer would be assessed annually through the specifications
process and considered by the Council and Board when annual catch and landings limits are adopted
(typically at the August joint meeting).
Prior to the meeting, the Monitoring Committee (MC) would develop projections of next year’s landings
for both the recreational and the commercial sectors using considerations such as catch in prior years,
recent or expected changes in management measures (e.g., possession limits, minimum size limits,
seasons, quotas), trends in fishery effort, and changes in abundance and biomass levels. Projected
commercial and recreational landings would be compared to the initial proposed sector landings limits
(RHL and quota) for the upcoming fishing year. If, based on this comparison, one sector appears likely to
substantially under-harvest its limit in the coming year, and the other sector is expected to exceed its
limit, the MC and Council/Board may recommend that a portion of the landings limit be transferred to the
other sector up to a maximum percentage of the ABC (see Transfer Caps). For the purposes of maintaining
accurate accounting and accountability at the ACL level, both sector’s ACLs would be adjusted to reflect
the transfer at the landings limit level. If both sectors are projected to harvest at or below their respective
landings limits for that year, then no transfer is recommended. It is worth noting that if landings limits
were to increase above recent levels, it may be challenging to predict if one or both sectors will have an
underage. Transfers would not occur if the stock is overfished or overfishing is occurring.
Based on the Council and Board's catch limit and transfer recommendations, NOAA Fisheries would
implement specifications in December for the new fishing year. Given that recreational measures are
typically adopted in December (usually before the specifications final rule has published), recreational
measures would need to be developed based on the expected adjusted (post-transfer) RHL.
If transfers between the commercial and recreational sectors are an option, some changes to the
accountability measures (AMs) may also need to be considered. For example, AMs could specify that if
the MC determines that a too-liberal transfer caused the donating fishery's ACL, or the combined ABC, to
be exceeded, the transfer amount could be deducted from the receiving fishery in a subsequent year.
Alt 3b-2: Allow for bi-directional transfers through specifications process as needed, up to a maximum
percent with limited pre-determined guidelines.
This alternative would allow for transfers between the commercial and recreational sectors through
11
specifications on an as-needed basis, based on the recommendations of the Council and Board after
considering the advice of the MC. Rather than using the more prescriptive process outlined above for
projecting and evaluating expected commercial and recreational landings relative to their limits, the MC
and Council/Board could take into account any relevant factors regarding the needs of each fishery sector,
including recent data and performance, effort dynamics, market factors, data changes, recruitment
dynamics, or other factors. Some FMAT members expressed concern about this option as it is likely to be
challenging for the MC to recommend a specific transfer amount without pre-determined guidelines,
making the decision more of a policy determination. However, other FMAT members thought this
alternative was important to retain as it allows for flexibility to address unforeseen circumstances or
circumstances other than a projected underage in one sector. Under this alternative, as with alternative
3b-1, transfers would not occur if the stock is overfished or overfishing is occurring.
c) Transfer Caps
These alternatives would only be selected if transfer provisions were adopted under alternative set 3b
above, and would specify a maximum percent of the ABC that could be transferred from one sector to
another in the form of a landings limit transfer.
Alt 3c-1: No transfer cap specified; the Council and Board can recommend any amount of transfer
between fisheries.
Alt 3c-2: Maximum transfer amount set at 5% of the ABC.
Alt 3c-3: Maximum transfer amount at 10% of the ABC.
Alt 3c-4: Maximum transfer amount set at 15% of the ABC.
FMAT Comments and Recommendations on Transfer Provisions
The FMAT discussed (via email) a number of questions related to configuration of potential transfer
provisions as described below.
Are transfer provisions needed for these fisheries?
Transfers are a management tool that offer the potential for increased fishing opportunities in the
commercial or recreational sectors for these fisheries. The summer flounder and black sea bass fisheries
however have tended to achieve high quota (ACL & RHL) in both the commercial and recreational sectors,
making it unclear how often transfers may be useful for these fisheries in the future. The scup fishery has
seen both sectors under-harvest in recent years when evaluated using old MRIP data. FMAT members
noted that under higher revised MRIP estimates, there could be utility in allowing transfer from the
commercial to the recreational sector for scup; however, if allocations are revised, this situation may
change. Future utilization rates for all three species are difficult to predict, given the recent changes in
MRIP data and the fact that in most prior years, recreational performance can only be evaluated using old
data. In addition, potential allocation changes should ideally minimize the near-term need for transfers.
Existing recreational to commercial transfers in the bluefish FMP have not often had to account for
expected changes in the recreational measures from year to year, as bluefish recreational management
measures prior to 2020 had remained very stable. For summer flounder, scup, and black sea bass, there
is typically a desire to revisit the recreational management measures annually and liberalize them where
possible (especially for summer flounder and black sea bass in recent years). Recreational stakeholders
12
are unlikely to approve of a transfer from the recreational to the commercial sector unless recreational
measures are liberalized to an extent where a bag limit increase or a minimum size reduction is no longer
sought after. This is unlikely to occur within the black sea bass and summer flounder fishery in the
foreseeable future (and perhaps in the future for scup). For this reason, a transfer from the recreational
sector to the commercial sector seems unlikely to be recommended in the foreseeable future.
In addition, transfers from the commercial fishery to the recreational fishery are likely to be contentious
unless persistent underages are occurring within each state’s commercial fishery. Even if the commercial
fishery is underachieving its coastwide quota on an annual basis, there may still be several states that are
maximizing use of their state quotas. To transfer away from the sector as a whole will have disparate
impacts across states. As noted below, the timing of a commercial to recreational transfer may also not
align with the timing of recreational specifications, meaning it's possible that recreational measures may
not be able to be adjusted based on a transfer to the recreational fishery, meaning the benefit would
primarily be a lower likelihood of exceeding the recreational limits.
These concerns should all be carefully considered when the Council and Board consider any specific
transfer amounts in a given year, if alternatives 3b-1 or 3b-2 are approved.
What is the timing and process for the transfer process?
In the alternatives described above, the Council and Board would likely need to determine the transfer
amount in August (or the equivalent meeting where catch and landings limits are set). The transfer would
be implemented with the final specifications rule in December. The FMAT expressed some concern about
the availability and timing of data that would be used to support a transfer. In mid-August, there is
limited data available from the current fishing year to project the following year's expected landings. It
is likely that additional data would need to be used such as from the most recent complete fishing year.
For the recreational fishery, this may result in a disconnect between projected recreational landings
assumed in mid-August (when current year data is available through only wave 2) and projected
recreational landings used to set recreational measures in December (current year data available through
wave 4 or 5). However, waiting to determining the transfer amount until December is likely to create
stakeholder confusion given that one set of limits would be adopted in August, followed by a possible
revision in December at approximately the same time the final rule would be published for the original
recommendations. Using prior year or earlier data may create difficulties accounting for changes in
management measures and may set up a situation where overages are more likely to occur due to
transfer amounts that may be inappropriate for the next year's conditions.
The FMAT considered whether a post-implementation adjustment process could be used for these
fisheries similar to what is done for bluefish early in the relevant fishing year based on an evaluation of
more complete prior year data.1 However, the FMAT concluded that this is unlikely to be feasible under
the current specifications timing for summer flounder, scup, and black sea bass, in particular the timing
of the recreational measures process. Recreational measures are considered in December, followed by
any necessary adjustments to state measures typically in February/March of the following year. Federal
recreational measures are often not finalized in the regulations until May or June. Due to this timing,
1 For bluefish (recreational to commercial transfer), once preliminary prior year MRIP estimates are available (usually in February), NOAA Fisheries compares the estimate of recreational harvest for the previous year to the recreational RHL to make any necessary adjustments before finalizing the amount of landings transferred.
13
under a commercial to recreational transfer, recreational measures would likely not be able to be
adjusted to account for any transfers, which would eliminate most of the benefit of this transfer type.
Based on this information, the FMAT determined that a post-implementation adjustment process is not
feasible for this FMP if transfers are adopted.
At what level should the transfer occur?
If the Council and Board want to retain transfer provisions in this action, the FMAT proposes projecting
and transferring based on landings, with corresponding adjustments to the sector ACLs for catch
accounting purposes. Consideration was given to projections and transfers at the catch limit level, but
catch projections would likely be associated with increased uncertainty and potential data timing
challenges associated with projecting dead discards by fishery. Currently, discards are projected at the
combined commercial and recreational level and separated by sector based on the allocation (for scup)
or recent trends in discards by sector (for summer flounder and black sea bass). Projecting discards by
sector has proven difficult especially when trying to account for changes in quotas, other regulatory
changes, year class strength, and recruitment events.
How should a transfer cap be determined?
The transition from old (pre-calibration) MRIP data to revised MRIP data makes it difficult to analyze an
appropriate transfer cap for future years, since past performance can only be evaluated using old MRIP
data. Past performance is also based on the existing allocation splits which could be modified through this
action, potentially decreasing the need for transfers. The recommended transfer cap options (5%, 10%,
and 15% of the ABC) are determined based on what the FMAT considered a reasonable range of options
for this type of transfer. The FMAT does not recommend transfer caps higher than this due to the potential
to create large fluctuations in the allocation from year to year, and the fact that larger changes in the
specified allocation may need to be longer-term and taken up through a framework or addendum.
The FMAT noted some concerns with the combination of no transfer cap (alternative 3c-1) with
alternative 3b-2 (limited guidelines for transfers through specifications) and recommends that the
Council and Board not adopt these two options together. The group noted that this combination would
impose difficult policy decisions on the MC that would need to be made each year with a larger range of
possible outcomes, which could result in regular proposals for larger transfers that need to be evaluated
and justified.
When should transfers be prohibited?
The FMAT recommends that no transfers be allowed when a stock is in an overfished condition or
undergoing overfishing.
The FMAT also discussed whether it would be appropriate to prohibit transfers when a stock is under a
rebuilding plan but no longer overfished. The FMAT acknowledged that transfers have the potential to
add management uncertainty given the use of projections, and could impact the rebuilding timeline if
they cause ACLs to be exceeded. However, under a rebuilding plan, catch limits will be set using a lower
tolerance for risk of overfishing, and allowing sectors to achieve (but not exceed) their limits would not
be expected to negatively impact the stock.
How could transfers be handled under recreational sector separation?
The FMAT discussed how transfer provisions could be incorporated under a sector separation
14
management structure, if adopted by the Council and Board (see alternative set 2). The FMAT's general
consensus is that recreational sector separation greatly complicates the development of transfer options,
at least when attempting to develop these approaches simultaneously. The FMAT's recommendation is
that if sector separation is adopted, the Council and Board wait until sector separation is implemented
before determining if transfer provisions are needed and how they would operate under sector
separation. Transfer provisions under sector separation could potentially be developed through a
separate future framework/addendum.
Other options considered by the FMAT include:
● Tri-directional transfers occur between all three sectors: The FMAT strongly recommends against
this option at this time given that it greatly complicates the specifications process with the need
to address additional considerations such as which direction transfers should occur, in which
order, and based on which criteria. The development of this option would require that projections
be conducted for each sector individually. Recreational projections are already uncertain and
challenging. Projections based on further separation of the MRIP data into state, mode, and wave
will result in the use of estimates with high PSEs (high uncertainty). If this option is desired, the
FMAT would need substantially more time to evaluate its feasibility.
● Transfers occur only between the commercial fishery and the combined recreational fishery
sector level (at recreational ACL or total RHL level): While this approach is simpler than the one
above, it would be difficult to account for situations where one of the recreational sectors is
expected to substantially under-harvest while the other is projected to meet or exceed their limit
(i.e., transfers may be driven by one sector but impact both sectors). The same concerns about
misuse of MRIP data apply here as well, as projections would likely need to occur by mode and
then be combined into a recreational fishery projection, in order to evaluate projected
recreational sector-specific overages/underages and determine whether a transfer would be
problematic for one recreational sector.
4) Framework/Addendum Alternatives
Alternative
Alt 4a: No action/status quo (changes to commercial/recreational allocations must be made through an amendment)
Alt 4b: Allow changes to commercial/ recreational allocations and other measures included in this amendment including recreational sector separation and corresponding allocations, sector transfers, and triggers to be made through framework actions/addenda
The FMAT did not discuss this category of alternatives at their July meeting. Their previous
recommendation in May 2020 was to keep this option in for consideration. The Council and Board could
narrow the list of measures under alternative 4b during final action if desired. In addition, the Council and
Board could recommend splitting this alternative into separate sub-alternatives for public hearings to
facilitate separate consideration of different types of frameworkable measures.

15
5) Appendices
Appendix A: Catch vs. Landings Based Approaches
Both catch and landings-based allocation approaches are described in this document. This appendix provides additional clarification of the differences in those approaches.
Under the current catch-based allocation for scup, the ABC is divided into a commercial and recreational ACL based on the allocation percentages defined in the FMP. Sector-specific expected discards are subtracted from the sector-specific ACLs to derive a commercial quota and a recreational harvest limit.
Under the current process for landings-based allocations for summer flounder and black sea bass, the ABC is first divided into expected landings and expected discards based on recent trends in the fisheries and the advice of the MC. The sector allocations are applied to the landings portion of the ABC. The sector-specific ACLs are equal to the landings-based allocations plus the expected discards by sector. Under this system, higher expected discards in one sector can result in a reduced ACL in the other sector. Under a catch-based allocation (as for scup), expected discards in one sector do not impact the ACL in the other sector.
In addition, if discards are included directly in the allocation (i.e., a catch-based allocation), there may be a greater incentive for each sector to reduce discards in order to increase their allowable landings. This was part of the rationale for creating a catch-based allocation for scup. Commercial scup discards were a concern at the time of development of Amendment 8 which implemented the current allocations.
Figure 1 below demonstrates this concept through a comparison of a hypothetical catch-based 50/50 allocation and a landings-based 50/50 allocation for the "blue" and "green" sectors. In this example both sectors have equal expected landings but the green sector has higher expected dead discards than the blue sector. Under a landings-based 50/50 allocation, the green sector will have a higher ACL than the blue sector due to its greater expected discards. Under a catch-based 50/50 allocation, both sectors will have equal ACLs. The blue sector will have a higher quota than the green sector due to its lower expected discards.
The reliability and timeliness of discard estimates should be considered when assessing catch- versus landings-based allocations. Depending upon the methodology and data used, recreational discard estimates can be quite variable. MRIP does not provide weight estimates for recreational releases, and thus the method used for stock assessments by the Northeast Fisheries Science Center has previously been used to develop estimates of dead discards in pounds of fish. Dead discards estimates are integral to both catch- and landings-based allocations.

16
Figure 1: Comparison of hypothetical catch-based 50/50 allocation and landings based
50/50 allocation for the "blue" and "green" sectors under two different scenarios for
expected landings and discards.

17
Appendix B: Other Options Considered for Percentage Change Allocations
Percentage allocation options considered by the FMAT but not recommended for inclusion in a public
hearing document are listed below for each species. These options were not recommended because
they resulted in very similar outcomes to other recommended options, fell within the range of other
options, and/or were supported by only one rationale.
Summer Flounder Allocation Percentages
Category Alternative Basis
i. Summer flounder landings-based percentages
46% commercial, 54% recreational
Average of other approaches approved by Council/Board in June 2020
43% commercial, 57% recreational
Approximate status quo harvest per sector compared to 2017/2018
Scup Allocation Percentages
Category Alternative Basis
i. Scup catch-based percentages
62% commercial, 38% recreational
2014-2018 base years
60% commercial, 40% recreational
2004-2018 base years
ii. Scup landings-based percentages
55% commercial, 46% recreational
Average of other approaches approved by Council/Board in June 2020
Black Sea Bass Allocation Percentages
Category Alternative Basis
i. BSB catch-based percentages
27% commercial, 73% recreational
Average of other approaches approved by Council/Board in June 2020
25% commercial, 75% recreational
2014-2018 base years
ii. BSB landings-based percentages
27% commercial, 73% recreational
2004-2018 base years
Phase in Allocation Options
As described in section 1d, the FMAT also considered specifying options for a phase in using a maximum
percent allocation shift in each year rather than a number of years. Ultimately the FMAT thought this may
be more complicated, as well as more difficult to determine appropriate options at this stage of
amendment development. A set number of years (with an appropriate range of years to select from)
would accomplish the same goal in a more straightforward manner.
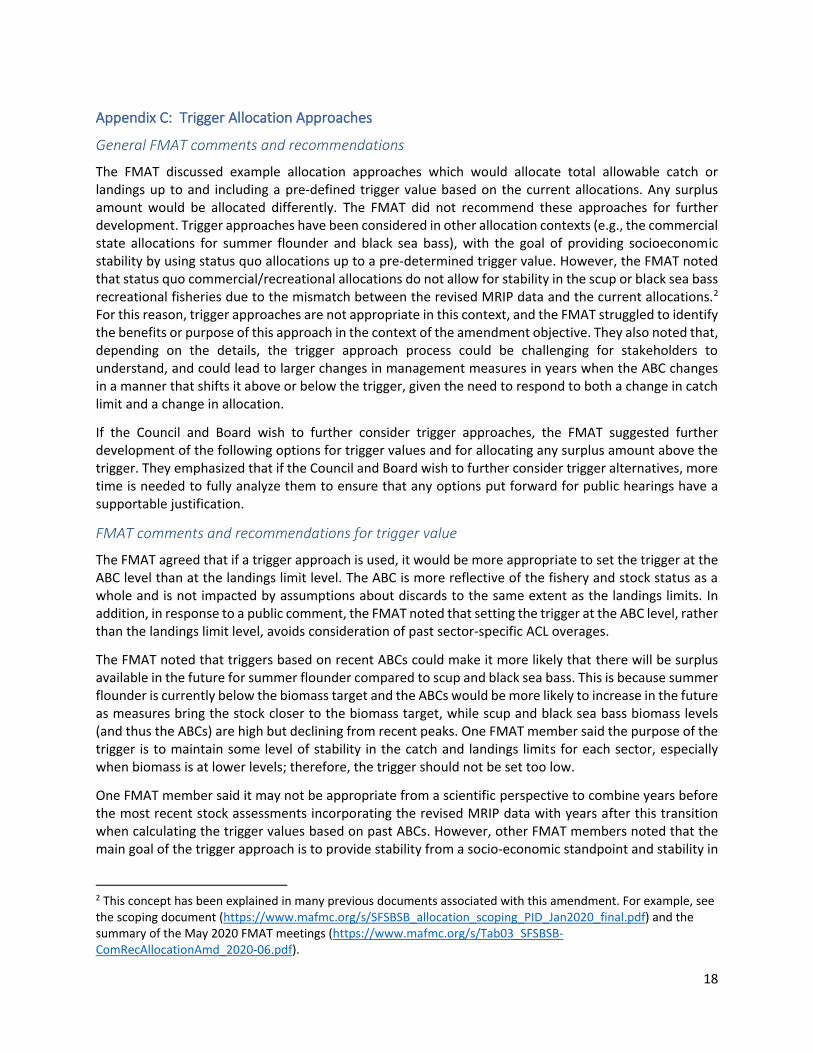
18
Appendix C: Trigger Allocation Approaches
General FMAT comments and recommendations
The FMAT discussed example allocation approaches which would allocate total allowable catch or landings up to and including a pre-defined trigger value based on the current allocations. Any surplus amount would be allocated differently. The FMAT did not recommend these approaches for further development. Trigger approaches have been considered in other allocation contexts (e.g., the commercial state allocations for summer flounder and black sea bass), with the goal of providing socioeconomic stability by using status quo allocations up to a pre-determined trigger value. However, the FMAT noted that status quo commercial/recreational allocations do not allow for stability in the scup or black sea bass recreational fisheries due to the mismatch between the revised MRIP data and the current allocations.2 For this reason, trigger approaches are not appropriate in this context, and the FMAT struggled to identify the benefits or purpose of this approach in the context of the amendment objective. They also noted that, depending on the details, the trigger approach process could be challenging for stakeholders to understand, and could lead to larger changes in management measures in years when the ABC changes in a manner that shifts it above or below the trigger, given the need to respond to both a change in catch limit and a change in allocation.
If the Council and Board wish to further consider trigger approaches, the FMAT suggested further development of the following options for trigger values and for allocating any surplus amount above the trigger. They emphasized that if the Council and Board wish to further consider trigger alternatives, more time is needed to fully analyze them to ensure that any options put forward for public hearings have a supportable justification.
FMAT comments and recommendations for trigger value
The FMAT agreed that if a trigger approach is used, it would be more appropriate to set the trigger at the ABC level than at the landings limit level. The ABC is more reflective of the fishery and stock status as a whole and is not impacted by assumptions about discards to the same extent as the landings limits. In addition, in response to a public comment, the FMAT noted that setting the trigger at the ABC level, rather than the landings limit level, avoids consideration of past sector-specific ACL overages.
The FMAT noted that triggers based on recent ABCs could make it more likely that there will be surplus available in the future for summer flounder compared to scup and black sea bass. This is because summer flounder is currently below the biomass target and the ABCs would be more likely to increase in the future as measures bring the stock closer to the biomass target, while scup and black sea bass biomass levels (and thus the ABCs) are high but declining from recent peaks. One FMAT member said the purpose of the trigger is to maintain some level of stability in the catch and landings limits for each sector, especially when biomass is at lower levels; therefore, the trigger should not be set too low.
One FMAT member said it may not be appropriate from a scientific perspective to combine years before the most recent stock assessments incorporating the revised MRIP data with years after this transition when calculating the trigger values based on past ABCs. However, other FMAT members noted that the main goal of the trigger approach is to provide stability from a socio-economic standpoint and stability in
2 This concept has been explained in many previous documents associated with this amendment. For example, see the scoping document (https://www.mafmc.org/s/SFSBSB_allocation_scoping_PID_Jan2020_final.pdf) and the summary of the May 2020 FMAT meetings (https://www.mafmc.org/s/Tab03_SFSBSB-ComRecAllocationAmd_2020-06.pdf).
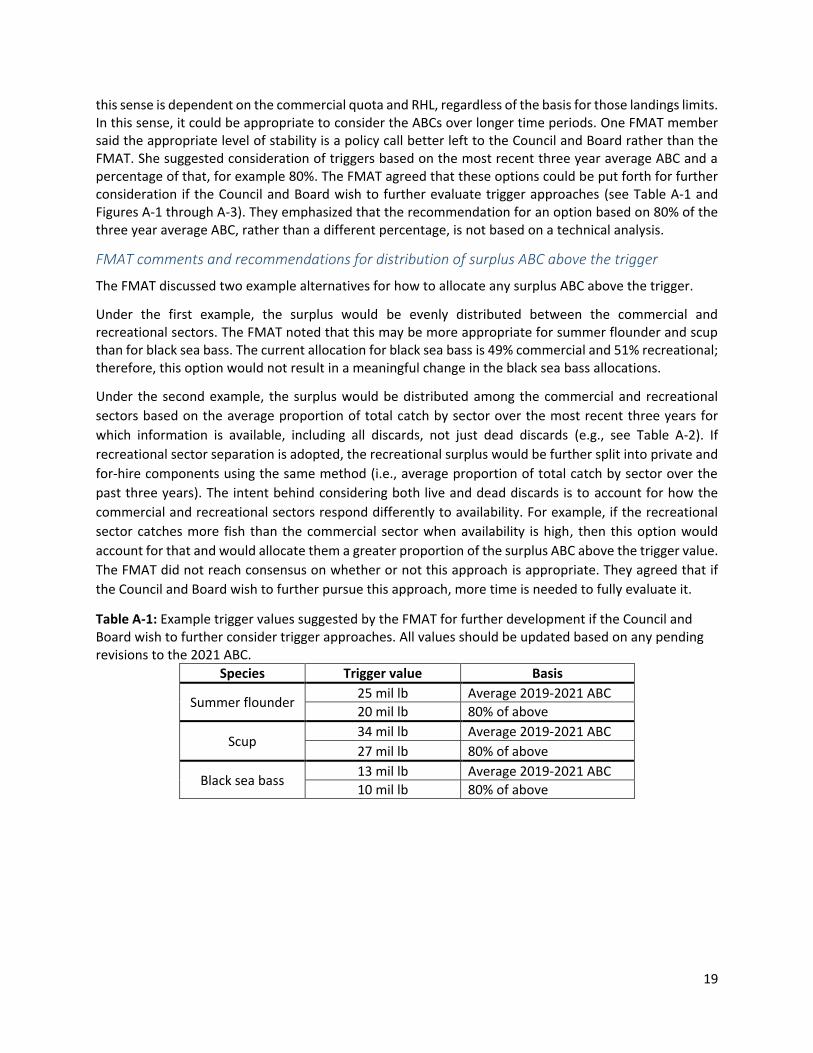
19
this sense is dependent on the commercial quota and RHL, regardless of the basis for those landings limits. In this sense, it could be appropriate to consider the ABCs over longer time periods. One FMAT member said the appropriate level of stability is a policy call better left to the Council and Board rather than the FMAT. She suggested consideration of triggers based on the most recent three year average ABC and a percentage of that, for example 80%. The FMAT agreed that these options could be put forth for further consideration if the Council and Board wish to further evaluate trigger approaches (see Table A-1 and Figures A-1 through A-3). They emphasized that the recommendation for an option based on 80% of the three year average ABC, rather than a different percentage, is not based on a technical analysis.
FMAT comments and recommendations for distribution of surplus ABC above the trigger
The FMAT discussed two example alternatives for how to allocate any surplus ABC above the trigger.
Under the first example, the surplus would be evenly distributed between the commercial and recreational sectors. The FMAT noted that this may be more appropriate for summer flounder and scup than for black sea bass. The current allocation for black sea bass is 49% commercial and 51% recreational; therefore, this option would not result in a meaningful change in the black sea bass allocations.
Under the second example, the surplus would be distributed among the commercial and recreational
sectors based on the average proportion of total catch by sector over the most recent three years for
which information is available, including all discards, not just dead discards (e.g., see Table A-2). If
recreational sector separation is adopted, the recreational surplus would be further split into private and
for-hire components using the same method (i.e., average proportion of total catch by sector over the
past three years). The intent behind considering both live and dead discards is to account for how the
commercial and recreational sectors respond differently to availability. For example, if the recreational
sector catches more fish than the commercial sector when availability is high, then this option would
account for that and would allocate them a greater proportion of the surplus ABC above the trigger value.
The FMAT did not reach consensus on whether or not this approach is appropriate. They agreed that if
the Council and Board wish to further pursue this approach, more time is needed to fully evaluate it.
Table A-1: Example trigger values suggested by the FMAT for further development if the Council and Board wish to further consider trigger approaches. All values should be updated based on any pending revisions to the 2021 ABC.
Species Trigger value Basis
Summer flounder 25 mil lb Average 2019-2021 ABC
20 mil lb 80% of above
Scup 34 mil lb Average 2019-2021 ABC
27 mil lb 80% of above
Black sea bass 13 mil lb Average 2019-2021 ABC
10 mil lb 80% of above

20
Figure A-1: Comparison of potential catch-based trigger values shown in Table A-1 to the summer
flounder ABCs over the past 10 years.
Figure A-3: Comparison of potential catch-based trigger values shown in Table A-1 to the scup ABCs over
the past 10 years.
10
15
20
25
30
2012
2013
2014
2015
2016
2017
2018
2019
2020
2021
Mil
lb
Summer Flounder Catch-Based Triggers
25 mil lb trigger
20 mil lb trigger
ABCs
20
25
30
35
40
45
2012
2013
2014
2015
2016
2017
2018
2019
2020
2021
Mil
lb
Scup Catch-Based Triggers
34 mil lb trigger
27 mil lb trigger
ABCs

21
Figure A-5: Comparison of potential catch-based trigger values shown in Table A-1 to the black sea bass
ABCs over the past 10 years.
Table A-2: Average percentage of total catch in weight (including landings and both live and dead
discards) of summer flounder, scup, and black sea bass from the commercial and recreational sectors,
2010-2018 based on data provided through the most recent stock assessments. Dead discard estimates
were scaled up to account for total discards based on the discard mortality rates (i.e., 80% commercial
summer flounder, 10% recreational summer flounder, 100% commercial scup, 15% recreational scup,
100% commercial trawl black sea bass, 15% commercial non-trawl black sea bass, and 15% recreational
black sea bass).
Year Summer flounder Scup Black sea bass
Com Rec Com Rec Com Rec
2010 20% 80% 41% 59% 10% 90%
2011 21% 79% 50% 50% 21% 79%
2012 19% 81% 49% 51% 8% 92%
2013 18% 82% 50% 50% 15% 85%
2014 18% 82% 51% 49% 15% 85%
2015 21% 79% 50% 50% 13% 87%
2016 18% 82% 49% 51% 12% 88%
2017 16% 84% 47% 53% 15% 85%
2018 23% 77% 48% 52% 18% 82%
2016-2018 avg 19% 81% 48% 52% 15% 85%
0
2
4
6
8
10
12
14
16
2012
2013
2014
2015
2016
2017
2018
2019
2020
2021
Mil
lb
Black Sea Bass Catch-Based Triggers
13 mil lb trigger
10 mil lb trigger
ABCs
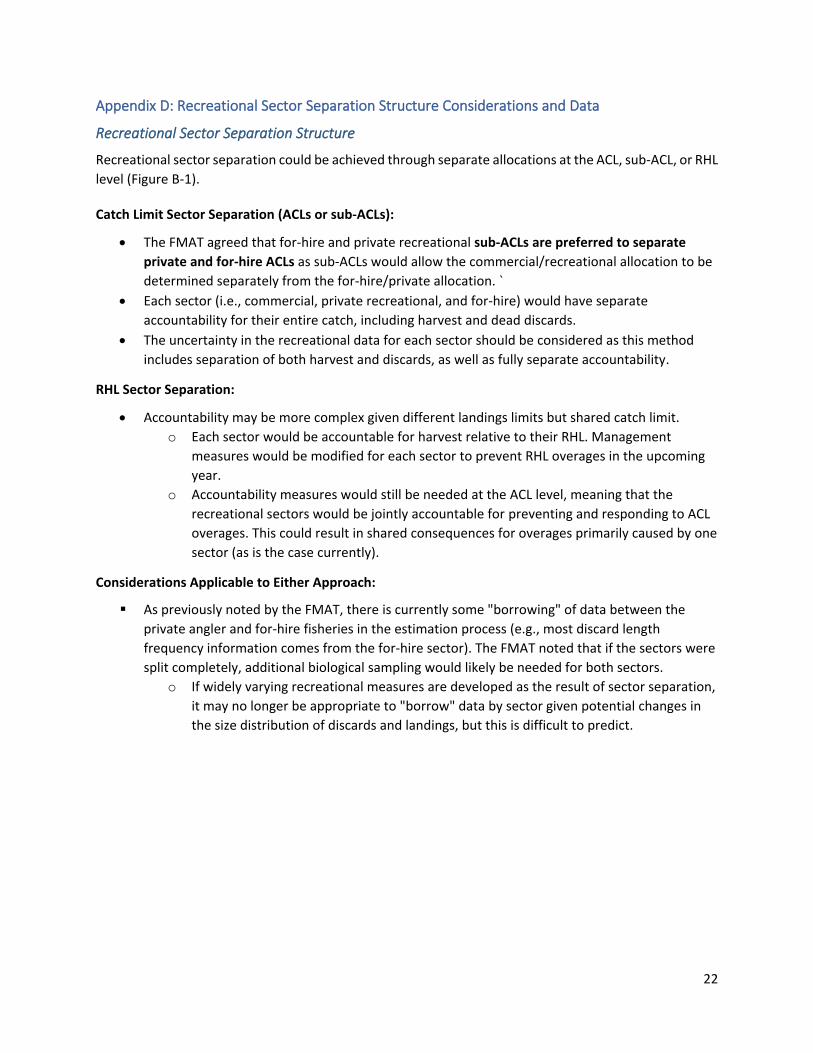
22
Appendix D: Recreational Sector Separation Structure Considerations and Data
Recreational Sector Separation Structure
Recreational sector separation could be achieved through separate allocations at the ACL, sub-ACL, or RHL
level (Figure B-1).
Catch Limit Sector Separation (ACLs or sub-ACLs):
• The FMAT agreed that for-hire and private recreational sub-ACLs are preferred to separate
private and for-hire ACLs as sub-ACLs would allow the commercial/recreational allocation to be
determined separately from the for-hire/private allocation. `
• Each sector (i.e., commercial, private recreational, and for-hire) would have separate
accountability for their entire catch, including harvest and dead discards.
• The uncertainty in the recreational data for each sector should be considered as this method
includes separation of both harvest and discards, as well as fully separate accountability.
RHL Sector Separation:
• Accountability may be more complex given different landings limits but shared catch limit.
o Each sector would be accountable for harvest relative to their RHL. Management
measures would be modified for each sector to prevent RHL overages in the upcoming
year.
o Accountability measures would still be needed at the ACL level, meaning that the
recreational sectors would be jointly accountable for preventing and responding to ACL
overages. This could result in shared consequences for overages primarily caused by one
sector (as is the case currently).
Considerations Applicable to Either Approach:
▪ As previously noted by the FMAT, there is currently some "borrowing" of data between the
private angler and for-hire fisheries in the estimation process (e.g., most discard length
frequency information comes from the for-hire sector). The FMAT noted that if the sectors were
split completely, additional biological sampling would likely be needed for both sectors.
o If widely varying recreational measures are developed as the result of sector separation,
it may no longer be appropriate to "borrow" data by sector given potential changes in
the size distribution of discards and landings, but this is difficult to predict.

23
Figure B-1: Conceptual flowcharts of potential recreational sector separation
configurations including A) status quo, B) separate ACL allocations, C) Sub-ACL
allocations, and D) separate RHLs.
Recreational Sector Separation Allocation Options
The FMAT-recommended allocation options shown in section 2 were calculated using MRIP dead catch
in numbers of fish. As described in section 2, the FMAT also considered but did not recommend
allocation options that substituted federal VTR data for the for-hire MRIP estimates. The basis for the
FMAT-recommended options listed in section 2, as well as additional options not recommended, is
described below.
ABC
Rec ACL
RHL
Com ACL
Com quota
ABC
Private Rec ACL
Private RHL
For-Hire Rec ACL
For-Hire RHL
Com ACL
Com quota
ABC
Rec ACL
Private rec Sub-
ACL
Private rec RHL
For-Hire Sub-ACL
For-Hire RHL
Com ACL
Com quota
ABC
Rec ACL
RHL
Private rec RHL
For-hire RHL
Com ACL
Com quota
A B
C
D
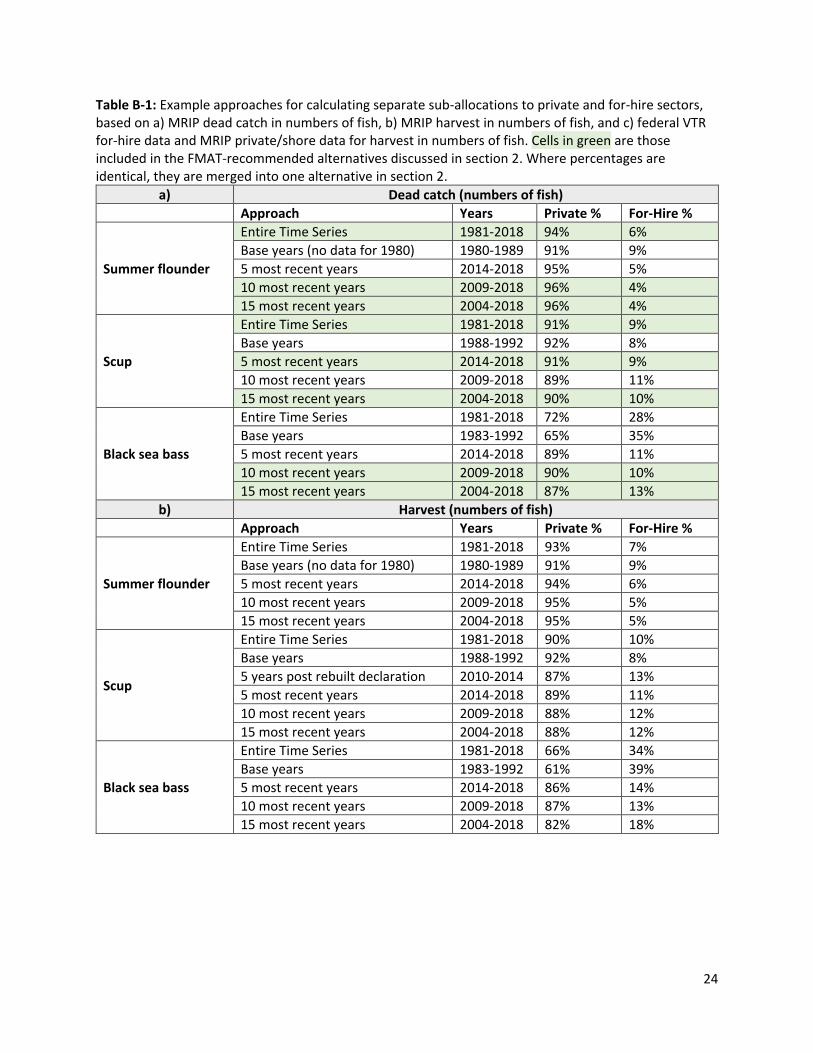
24
Table B-1: Example approaches for calculating separate sub-allocations to private and for-hire sectors, based on a) MRIP dead catch in numbers of fish, b) MRIP harvest in numbers of fish, and c) federal VTR for-hire data and MRIP private/shore data for harvest in numbers of fish. Cells in green are those included in the FMAT-recommended alternatives discussed in section 2. Where percentages are identical, they are merged into one alternative in section 2.
a) Dead catch (numbers of fish) Approach Years Private % For-Hire %
Summer flounder
Entire Time Series 1981-2018 94% 6%
Base years (no data for 1980) 1980-1989 91% 9%
5 most recent years 2014-2018 95% 5%
10 most recent years 2009-2018 96% 4%
15 most recent years 2004-2018 96% 4%
Scup
Entire Time Series 1981-2018 91% 9%
Base years 1988-1992 92% 8%
5 most recent years 2014-2018 91% 9%
10 most recent years 2009-2018 89% 11%
15 most recent years 2004-2018 90% 10%
Black sea bass
Entire Time Series 1981-2018 72% 28%
Base years 1983-1992 65% 35%
5 most recent years 2014-2018 89% 11%
10 most recent years 2009-2018 90% 10%
15 most recent years 2004-2018 87% 13%
b) Harvest (numbers of fish)
Approach Years Private % For-Hire %
Summer flounder
Entire Time Series 1981-2018 93% 7%
Base years (no data for 1980) 1980-1989 91% 9%
5 most recent years 2014-2018 94% 6%
10 most recent years 2009-2018 95% 5%
15 most recent years 2004-2018 95% 5%
Scup
Entire Time Series 1981-2018 90% 10%
Base years 1988-1992 92% 8%
5 years post rebuilt declaration 2010-2014 87% 13%
5 most recent years 2014-2018 89% 11%
10 most recent years 2009-2018 88% 12%
15 most recent years 2004-2018 88% 12%
Black sea bass
Entire Time Series 1981-2018 66% 34%
Base years 1983-1992 61% 39%
5 most recent years 2014-2018 86% 14%
10 most recent years 2009-2018 87% 13%
15 most recent years 2004-2018 82% 18%

25
c) Harvest in numbers, using federal VTR data for for-hire portion
Summer flounder
Entire Time series 1995-2018 98% 2%
5 most recent years 2014-2018 98% 2%
10 most recent years 2009-2018 98% 2%
15 most recent years 2004-2018 98% 2%
Scup
Entire Time series 1995-2018 93% 7%
5 most recent years 2014-2018 93% 7%
10 most recent years 2009-2018 93% 7%
15 most recent years 2004-2018 94% 6%
Black sea bass
Entire Time series 1995-2018 79% 21%
5 most recent years 2014-2018 92% 8%
10 most recent years 2009-2018 91% 9%
15 most recent years 2004-2018 87% 13%
Appendix E: FMAT Meeting Attendance
FMAT webinar meeting attendance from July 15, 2020, 9AM-12PM:
FMAT members: Greg Ardini (NEFSC), Julia Beaty (MAFMC staff), Karson Coutre (MAFMC staff), Kiley
Dancy (MAFMC staff), Marianne Ferguson (GARFO), Emily Keiley (GARFO), Dustin Colson Leaning
(ASMFC staff), Caitlin Starks (ASMFC staff), Mark Terceiro (NEFSC)
Others: Rick Bellavance, Maya Drzewicki, James Fletcher, Jeff Kaelin, Adam Nowalsky, Mike Waine

1
Action Plan for Commercial/Recreational Allocation Amendment to the
Summer Flounder, Scup, and Black Sea Bass Fishery Management Plan
Draft as of 7/28/2020
http://www.mafmc.org/actions/sfsbsb-allocation-amendment
Amendment Goal: The purpose of this amendment is to review and consider revisions to the
commercial/recreational sector allocations for the summer flounder, scup, and black sea bass fisheries.
This action aims to address the allocation-related impacts of the revised data on catch and landings for
the recreational and commercial sectors. This is a joint amendment of the Mid-Atlantic Fishery
Management Council and Atlantic States Marine Fisheries Commission.
Type of NEPA Analysis Expected: To be determined - Environmental Assessment (EA) or
Environmental Impact Statement (EIS), depending on scope of action and alternatives considered.
Additional Expertise Sought: The Council’s Fishery Management Action Team (FMAT) for this
action will be composed of Council and Commission staff and management partners from the Greater
Atlantic Regional Fisheries Office and Northeast Fisheries Science Center, with input from other
organizations as appropriate.
Agency FMAT Role Person(s)
MAFMC Council staff (summer flounder) Kiley Dancy
MAFMC Council staff (scup) Karson Coutré
MAFMC Council staff (black sea bass) Julia Beaty
ASMFC Commission staff (summer flounder and scup) Dustin Colson Leaning
ASMFC Commission staff (black sea bass) Caitlin Starks
NMFS GARFO Sustainable fisheries Emily Keiley
NMFS GARFO NEPA Marianne Ferguson
NMFS NEFSC Socioeconomics Greg Ardini
NMFS NEFSC Stock assessment/population dynamics
(consult as needed) Gary Shepherd
NMFS NEFSC Stock assessment/population dynamics
(consult as needed) Mark Terceiro
NMFS GARFO General counsel (consult as needed) John Almeida

2
Types of Measures Expected to be Considered: The Council and Board will review and consider
revisions to the commercial/recreational sector allocations for summer flounder, scup, and black sea
bass. The types of alternatives currently under consideration include:
• No action/status quo;
• Updating the current allocation percentages using the existing base years but with revised MRIP
data;
• Using alternative base years to derive new allocation percentages;
• Using different allocation approaches which do not rely on base years;
• Considering whether each allocation should be catch based or landings based;
• Considering separate allocations to modes within the recreational fishery (for-hire vs.
private/shore fisheries);
• Considering whether a transfer of allocation from one sector to another should be allowed
through specifications;
• Considering whether future allocation changes, recreational sector separation, or allocation
transfer provisions could be implemented through a framework/addendum rather than an
amendment;
• Considering whether allocations should be static or dynamic, including possible approaches that
evaluate these allocations on a more frequent basis;
• Other approaches to be determined.
Applicable laws/issues:
Magnuson-Stevens Act Yes
National Environmental Policy Act Yes
Administrative Procedures Act Yes
Regulatory Flexibility Act Yes
Paperwork Reduction Act Possibly; depends on data collection needs
Coastal Zone Management Act Possibly; depends on effects of the action on the resources of the
coastal states in the management unit
Endangered Species Act Possibly; level of consultation, if necessary, depends on the
actions taken
Marine Mammal Protection Act Possibly; depends on actions taken
E.O. 12866 (Regulatory Planning and
Review) Yes
E.O. 12630 (Takings) Possibly; legal review will confirm
E.O. 13123 (Federalism) Possibly; legal review will confirm
Essential Fish Habitat Possibly
Information Quality Act Yes
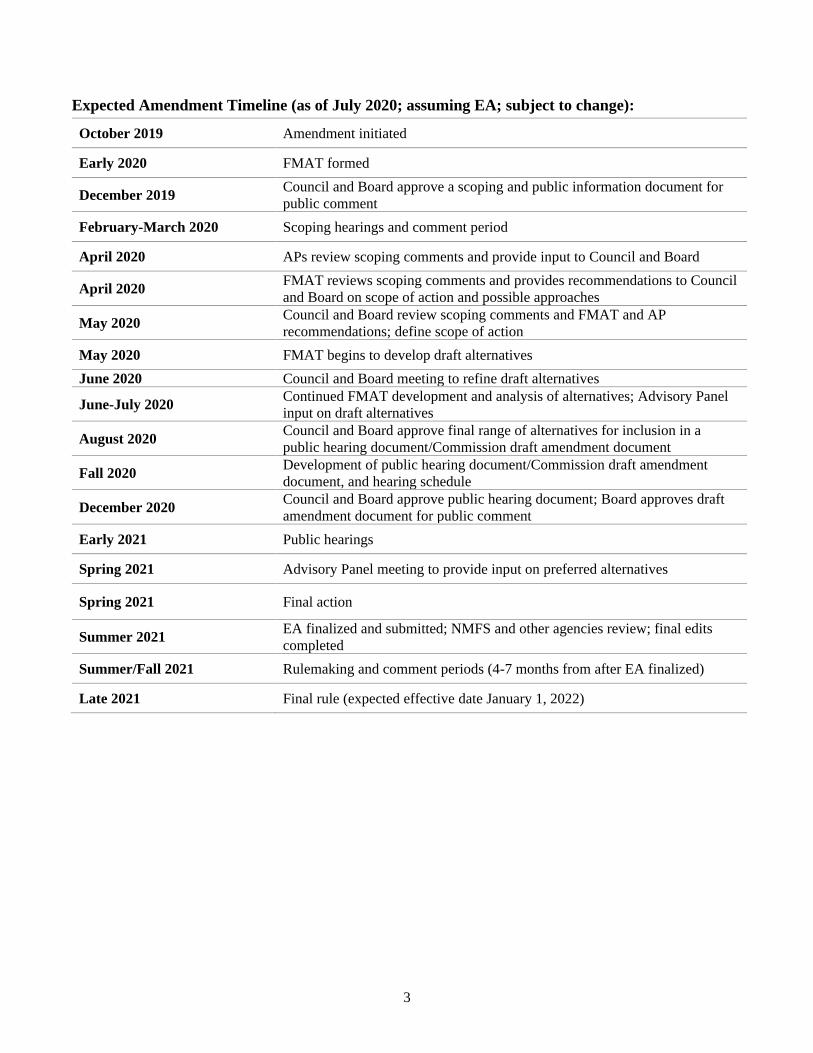
3
Expected Amendment Timeline (as of July 2020; assuming EA; subject to change):
October 2019 Amendment initiated
Early 2020 FMAT formed
December 2019 Council and Board approve a scoping and public information document for
public comment
February-March 2020 Scoping hearings and comment period
April 2020 APs review scoping comments and provide input to Council and Board
April 2020 FMAT reviews scoping comments and provides recommendations to Council
and Board on scope of action and possible approaches
May 2020 Council and Board review scoping comments and FMAT and AP
recommendations; define scope of action
May 2020 FMAT begins to develop draft alternatives
June 2020 Council and Board meeting to refine draft alternatives
June-July 2020 Continued FMAT development and analysis of alternatives; Advisory Panel
input on draft alternatives
August 2020 Council and Board approve final range of alternatives for inclusion in a
public hearing document/Commission draft amendment document
Fall 2020 Development of public hearing document/Commission draft amendment
document, and hearing schedule
December 2020 Council and Board approve public hearing document; Board approves draft
amendment document for public comment
Early 2021 Public hearings
Spring 2021 Advisory Panel meeting to provide input on preferred alternatives
Spring 2021 Final action
Summer 2021 EA finalized and submitted; NMFS and other agencies review; final edits
completed
Summer/Fall 2021 Rulemaking and comment periods (4-7 months from after EA finalized)
Late 2021 Final rule (expected effective date January 1, 2022)

1
Kiley Dancy
From: Kiley DancySent: Friday, July 10, 2020 10:57 AMTo: Beaty, JuliaSubject: FW: SCUP / Fluke SCEMFIS Economic reports
From: Moore, Christopher <[email protected]> Sent: Wednesday, July 8, 2020 2:30 PM To: Kiley Dancy <[email protected]> Subject: FW: SCUP / Fluke SCEMFIS Economic reports fya
From: Greg DiDomenico <[email protected]> Date: Wednesday, July 8, 2020 at 1:40 PM To: Christopher Moore <[email protected]> Cc: Jeff Kaelin <[email protected]> Subject: SCUP / Fluke SCEMFIS Economic reports Chris , Attached are 3 documents regarding the economic impacts of the fluke and scup fisheries. Please make them available to the FMAT. I think it could be informative as they continue the Allocation Amendment. Thanks Greg DiDomenico Lund’s Fisheries
Microsoft Word - Econ Activity Summer Flounder May 2020.docx
updatedscup markup tjm5917.xlsx [Read-Only]
SCUP-original-Ec_Impact_Explanation-tjm_rm.pdf
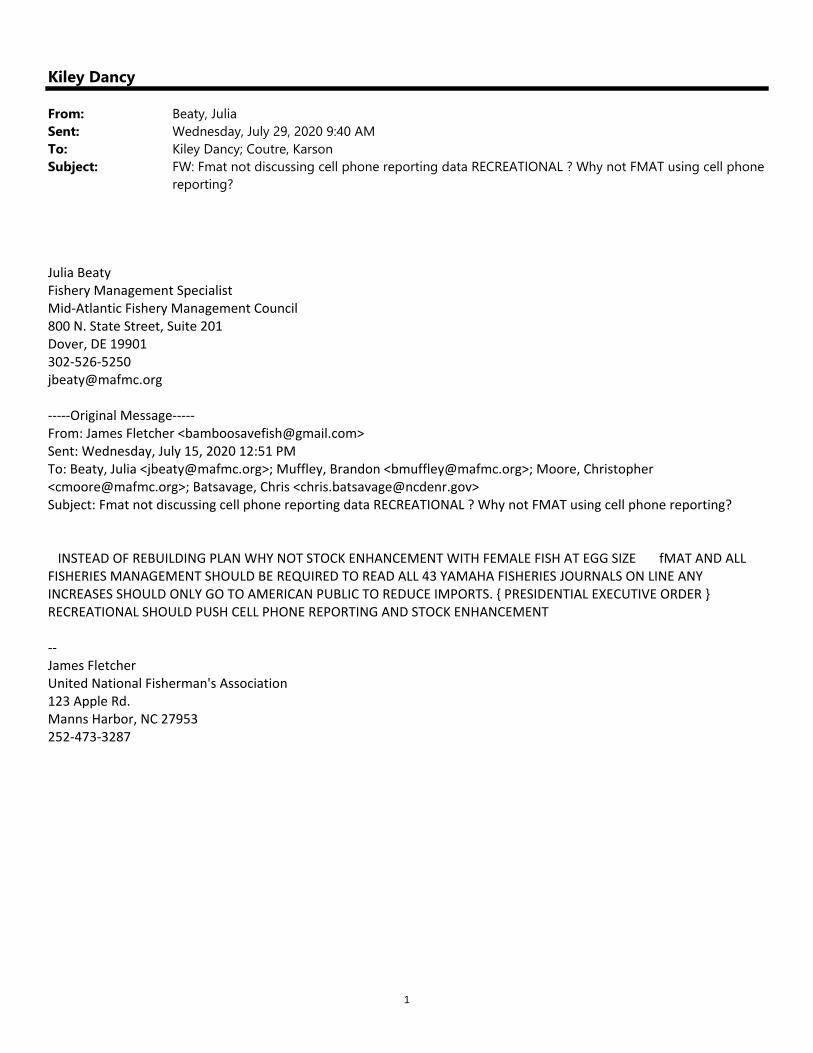
1
Kiley Dancy
From: Beaty, JuliaSent: Wednesday, July 29, 2020 9:40 AMTo: Kiley Dancy; Coutre, KarsonSubject: FW: Fmat not discussing cell phone reporting data RECREATIONAL ? Why not FMAT using cell phone
reporting?
Julia Beaty Fishery Management Specialist Mid‐Atlantic Fishery Management Council 800 N. State Street, Suite 201 Dover, DE 19901 302‐526‐5250 [email protected] ‐‐‐‐‐Original Message‐‐‐‐‐ From: James Fletcher <[email protected]> Sent: Wednesday, July 15, 2020 12:51 PM To: Beaty, Julia <[email protected]>; Muffley, Brandon <[email protected]>; Moore, Christopher <[email protected]>; Batsavage, Chris <[email protected]> Subject: Fmat not discussing cell phone reporting data RECREATIONAL ? Why not FMAT using cell phone reporting? INSTEAD OF REBUILDING PLAN WHY NOT STOCK ENHANCEMENT WITH FEMALE FISH AT EGG SIZE fMAT AND ALL FISHERIES MANAGEMENT SHOULD BE REQUIRED TO READ ALL 43 YAMAHA FISHERIES JOURNALS ON LINE ANY INCREASES SHOULD ONLY GO TO AMERICAN PUBLIC TO REDUCE IMPORTS. { PRESIDENTIAL EXECUTIVE ORDER } RECREATIONAL SHOULD PUSH CELL PHONE REPORTING AND STOCK ENHANCEMENT ‐‐ James Fletcher United National Fisherman's Association 123 Apple Rd. Manns Harbor, NC 27953 252‐473‐3287
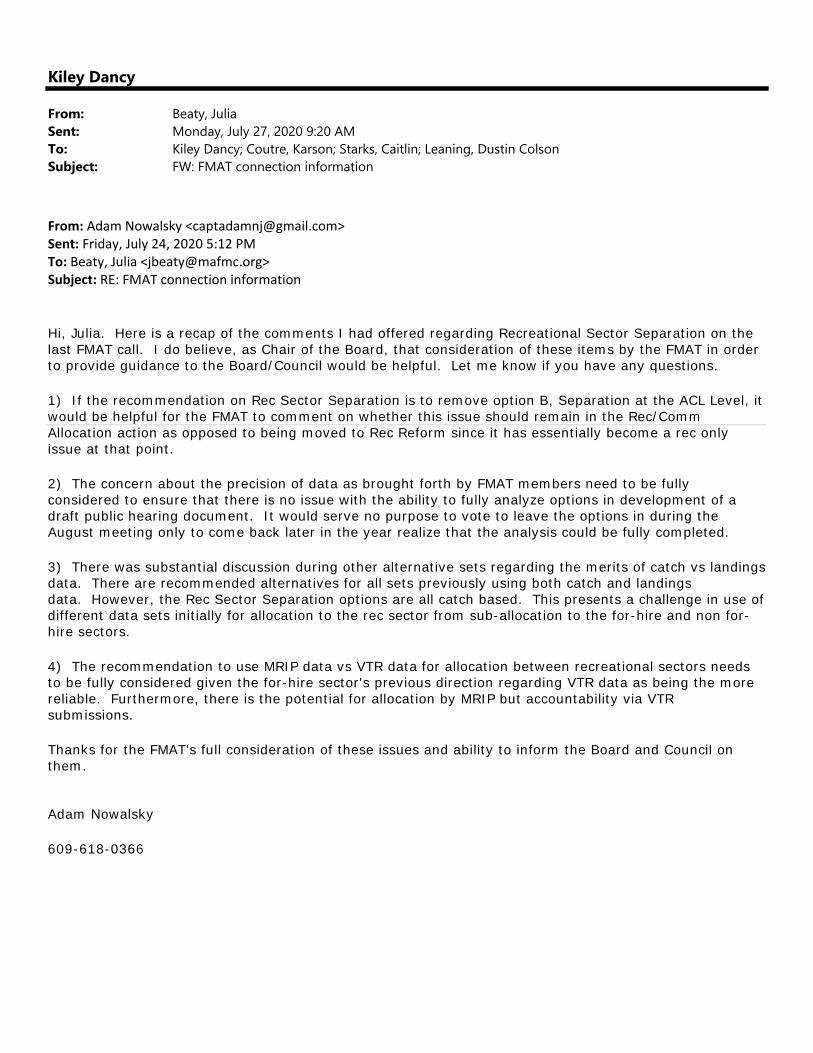
Kiley Dancy
From: Beaty, JuliaSent: Monday, July 27, 2020 9:20 AMTo: Kiley Dancy; Coutre, Karson; Starks, Caitlin; Leaning, Dustin ColsonSubject: FW: FMAT connection information
From: Adam Nowalsky <[email protected]> Sent: Friday, July 24, 2020 5:12 PM To: Beaty, Julia <[email protected]> Subject: RE: FMAT connection information
Hi, Julia. Here is a recap of the comments I had offered regarding Recreational Sector Separation on the last FMAT call. I do believe, as Chair of the Board, that consideration of these items by the FMAT in order to provide guidance to the Board/Council would be helpful. Let me know if you have any questions.
1) If the recommendation on Rec Sector Separation is to remove option B, Separation at the ACL Level, itwould be helpful for the FMAT to comment on whether this issue should remain in the Rec/CommAllocation action as opposed to being moved to Rec Reform since it has essentially become a rec onlyissue at that point.
2) The concern about the precision of data as brought forth by FMAT members need to be fullyconsidered to ensure that there is no issue with the ability to fully analyze options in development of adraft public hearing document. It would serve no purpose to vote to leave the options in during theAugust meeting only to come back later in the year realize that the analysis could be fully completed.
3) There was substantial discussion during other alternative sets regarding the merits of catch vs landingsdata. There are recommended alternatives for all sets previously using both catch and landingsdata. However, the Rec Sector Separation options are all catch based. This presents a challenge in use ofdifferent data sets initially for allocation to the rec sector from sub-allocation to the for-hire and non for-hire sectors.
4) The recommendation to use MRIP data vs VTR data for allocation between recreational sectors needsto be fully considered given the for-hire sector's previous direction regarding VTR data as being the morereliable. Furthermore, there is the potential for allocation by MRIP but accountability via VTRsubmissions.
Thanks for the FMAT's full consideration of these issues and ability to inform the Board and Council on them.
Adam Nowalsky
609-618-0366

1
Kiley Dancy
From: Katie Almeida <[email protected]>Sent: Tuesday, July 28, 2020 11:50 AMTo: Kiley DancySubject: RE: Reminder and materials: Wed. July 29 Advisory Panel meeting
Categories: SFSCBSB
HI Kiley,
I’m not going to be able to make tomorrow night’s call, but I do want to say that I am in support of the quota increases for fluke, scup and bsb. Regarding the range of alternatives for the fluke, scup and bsb comm/rec allocation amendment there seems to be a decent range of alternatives to work with. Has the committee met regarding this yet?
Thank you, Katie

Page 1 of 1
M E M O R A N D U M
Date: July 27, 2020
To: Council
From: Jessica Coakley and José Montañez, Staff
Subject: Atlantic Surfclam and Ocean Quahog Specifications (2021-2026)
The following are included for consideration by the Council on the above subject: 1) July 2020 SSC Report – See Committee Report Tab 2) Surfclam Staff Memo dated July 7, 2020 3) Quahog Staff Memo dated July 7, 2020 4) Atlantic Surfclam and Ocean Quahog Fishery Performance Report 5) Atlantic Surfclam Fishery Information Document 6) Ocean Quahog Fishery Information Document 7) Atlantic Surfclam 2020 Assessment Update Report 8) Ocean Quahog 2020 Assessment Update Report 9) Proportion of Undersized Clams Analysis - Report More detailed Atlantic Surfclam and Ocean Quahog assessment reports (both present and past) are available at the following website: https://apps-nefsc.fisheries.noaa.gov/saw/reviews_report_options.php In addition, a short summary (item 10) of the project entitled "Surfclam species diagnostics and population connectivity estimates to inform management" is provided for that project update.
Mid-Atlantic Fishery Management Council 800 North State Street, Suite 201, Dover, DE 19901
Phone: 302-674-2331 ǀ FAX: 302-674-5399 ǀ www.mafmc.org Michael P. Luisi, Chairman ǀ G. Warren Elliott, Vice Chairman
Christopher M. Moore, Ph.D., Executive Director

SSC Report is behind Tab 11

Page 1 of 9
M E M O R A N D U M
Date: July 7, 2020
To: Chris Moore, Executive Director
From: Jessica Coakley and José Montañez, Staff
Subject: Surfclam Management Measures (2021-2026)
Executive Summary The most current assessment of the Atlantic surfclam (Spisula solidissima) stock is a management track assessment of the existing 2016 benchmark Stock Synthesis (SS) assessment which indicated the stock is not overfished and overfishing is not occurring in 2019 (Hennen 2020). Based on the previous assessment the stock was also not overfished, and overfishing was not occurring (in 2016; NEFSC 2017). Assessment reports can be found here: https://fish.nefsc.noaa.gov/saw/reviews_report_options.php.
Specifications were last developed for 2018-2020. For this cycle, staff recommend specifications be set for 6 years (2021-2026) to create administrative efficiencies in addressing the National Environmental Policy Act (NEPA) requirements as a result of the new stock assessment process, which is expected to assess surfclam and ocean quahog on a 4 and 6 year cycle, respectively. The staff recommendation for acceptable biological catches (ABCs) for each year for 2021-2026 is around 39,000 - 47,000 mt each year (see box on page 4 for exact values). The fishery management plan specifies that the annual catch limit (ACL) equals the ABC. Staff recommend an annual catch target (ACT) = 29,363 mt and a commercial quota of 26,218 mt (3.40 million bushels) for each year, 2021-2026. This is the same ACT and commercial quota that has been implemented since 2004. Staff recommend the surfclam minimum size be suspended in 2021, but also recommend that the Council encourage the fishing industry to work to avoid landing large numbers of undersized clams. Introduction
The Magnuson Stevens Act requires each Council's Scientific and Statistical Committee (SSC) to provide, among other things, ongoing scientific advice for fishery management decisions, including recommendations for ABC, preventing overfishing, and maximum sustainable yield. The Council's catch limit recommendations for the upcoming fishing year(s) cannot exceed the ABC recommendation of the SSC. In this memorandum, information is presented to assist the development of measures for the Council to consider for the 2021-2026 fishery for surfclam. The SSC will recommend an ABC for the surfclam fishery that addresses scientific uncertainty. Based on the SSC recommendations, the Council will make recommendations for ACLs, ACTs, and other implemented measures, and provide those recommendations to the NMFS Northeast Regional Administrator.
Mid-Atlantic Fishery Management Council 800 North State Street, Suite 201, Dover, DE 19901
Phone: 302-674-2331 ǀ FAX: 302-674-5399 ǀ www.mafmc.org Michael P. Luisi, Chairman ǀ G. Warren Elliott, Vice Chairman
Christopher M. Moore, Ph.D., Executive Director
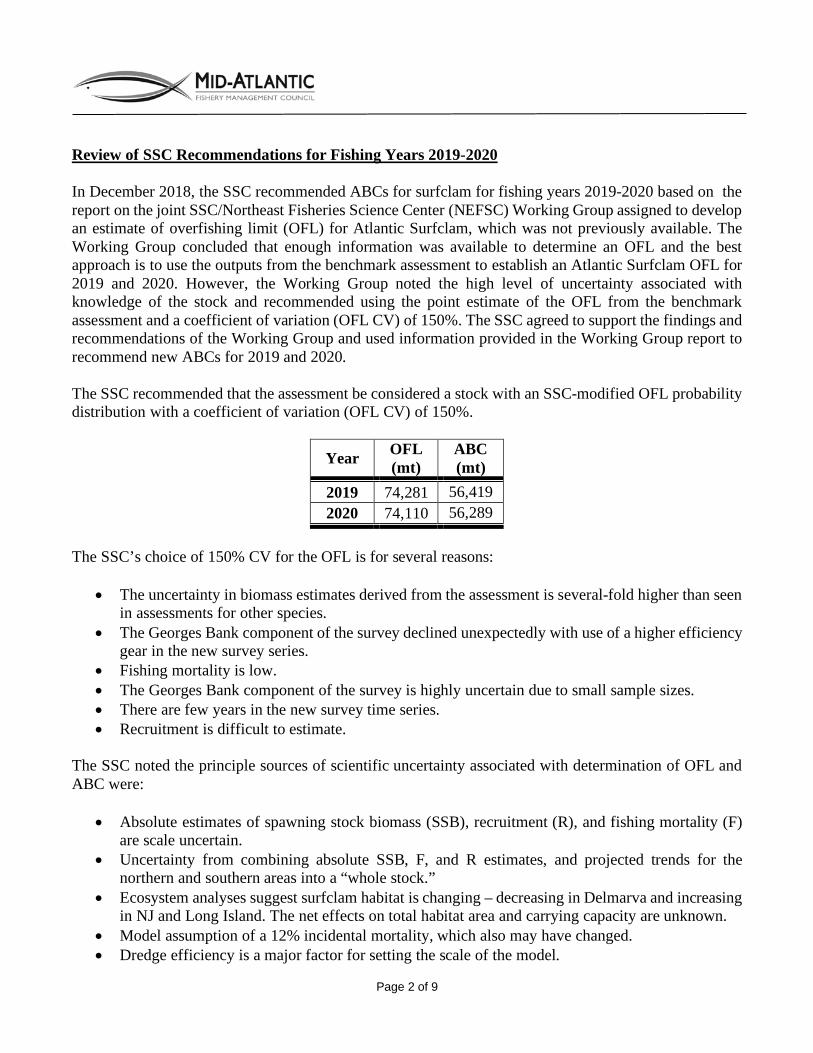
Page 2 of 9
Review of SSC Recommendations for Fishing Years 2019-2020 In December 2018, the SSC recommended ABCs for surfclam for fishing years 2019-2020 based on the report on the joint SSC/Northeast Fisheries Science Center (NEFSC) Working Group assigned to develop an estimate of overfishing limit (OFL) for Atlantic Surfclam, which was not previously available. The Working Group concluded that enough information was available to determine an OFL and the best approach is to use the outputs from the benchmark assessment to establish an Atlantic Surfclam OFL for 2019 and 2020. However, the Working Group noted the high level of uncertainty associated with knowledge of the stock and recommended using the point estimate of the OFL from the benchmark assessment and a coefficient of variation (OFL CV) of 150%. The SSC agreed to support the findings and recommendations of the Working Group and used information provided in the Working Group report to recommend new ABCs for 2019 and 2020. The SSC recommended that the assessment be considered a stock with an SSC-modified OFL probability distribution with a coefficient of variation (OFL CV) of 150%.
Year OFL (mt)
ABC (mt)
2019 74,281 56,419 2020 74,110 56,289
The SSC’s choice of 150% CV for the OFL is for several reasons:
• The uncertainty in biomass estimates derived from the assessment is several-fold higher than seen in assessments for other species.
• The Georges Bank component of the survey declined unexpectedly with use of a higher efficiency gear in the new survey series.
• Fishing mortality is low. • The Georges Bank component of the survey is highly uncertain due to small sample sizes. • There are few years in the new survey time series. • Recruitment is difficult to estimate.
The SSC noted the principle sources of scientific uncertainty associated with determination of OFL and ABC were:
• Absolute estimates of spawning stock biomass (SSB), recruitment (R), and fishing mortality (F) are scale uncertain.
• Uncertainty from combining absolute SSB, F, and R estimates, and projected trends for the northern and southern areas into a “whole stock.”
• Ecosystem analyses suggest surfclam habitat is changing – decreasing in Delmarva and increasing in NJ and Long Island. The net effects on total habitat area and carrying capacity are unknown.
• Model assumption of a 12% incidental mortality, which also may have changed. • Dredge efficiency is a major factor for setting the scale of the model.
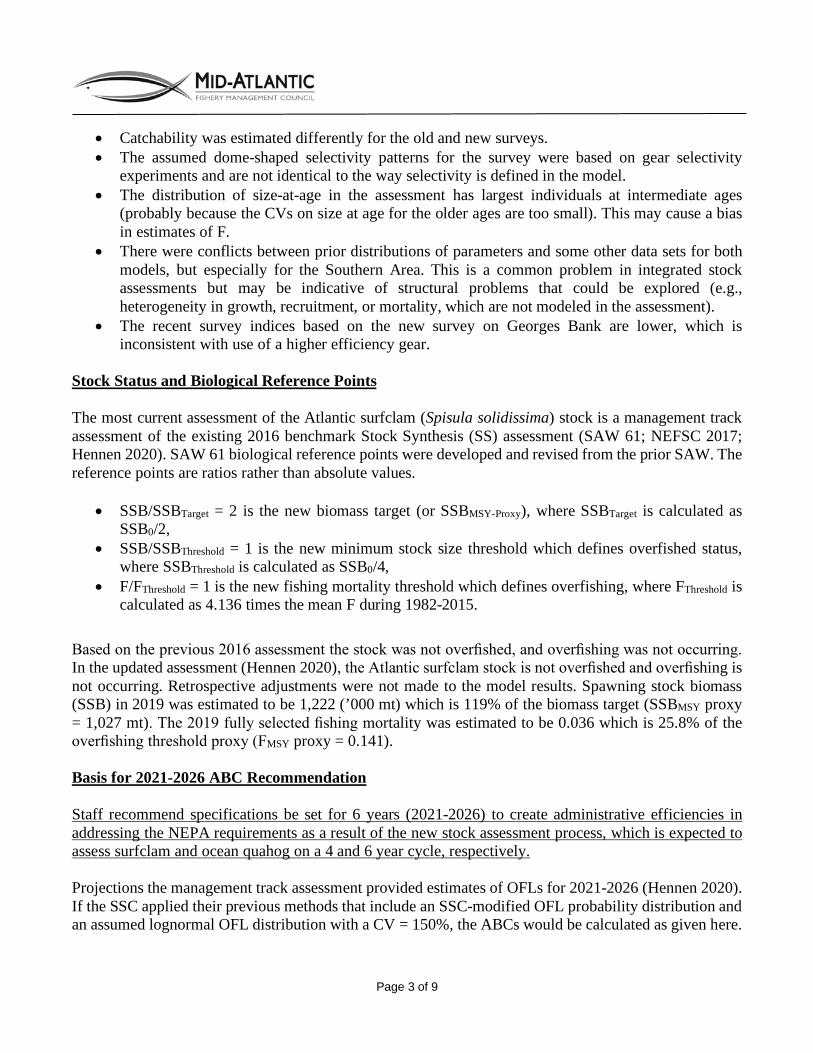
Page 3 of 9
• Catchability was estimated differently for the old and new surveys. • The assumed dome-shaped selectivity patterns for the survey were based on gear selectivity
experiments and are not identical to the way selectivity is defined in the model. • The distribution of size-at-age in the assessment has largest individuals at intermediate ages
(probably because the CVs on size at age for the older ages are too small). This may cause a bias in estimates of F.
• There were conflicts between prior distributions of parameters and some other data sets for both models, but especially for the Southern Area. This is a common problem in integrated stock assessments but may be indicative of structural problems that could be explored (e.g., heterogeneity in growth, recruitment, or mortality, which are not modeled in the assessment).
• The recent survey indices based on the new survey on Georges Bank are lower, which is inconsistent with use of a higher efficiency gear.
Stock Status and Biological Reference Points The most current assessment of the Atlantic surfclam (Spisula solidissima) stock is a management track assessment of the existing 2016 benchmark Stock Synthesis (SS) assessment (SAW 61; NEFSC 2017; Hennen 2020). SAW 61 biological reference points were developed and revised from the prior SAW. The reference points are ratios rather than absolute values.
• SSB/SSBTarget = 2 is the new biomass target (or SSBMSY-Proxy), where SSBTarget is calculated as SSB0/2,
• SSB/SSBThreshold = 1 is the new minimum stock size threshold which defines overfished status, where SSBThreshold is calculated as SSB0/4,
• F/FThreshold = 1 is the new fishing mortality threshold which defines overfishing, where FThreshold is calculated as 4.136 times the mean F during 1982-2015.
Based on the previous 2016 assessment the stock was not overfished, and overfishing was not occurring. In the updated assessment (Hennen 2020), the Atlantic surfclam stock is not overfished and overfishing is not occurring. Retrospective adjustments were not made to the model results. Spawning stock biomass (SSB) in 2019 was estimated to be 1,222 (’000 mt) which is 119% of the biomass target (SSBMSY proxy = 1,027 mt). The 2019 fully selected fishing mortality was estimated to be 0.036 which is 25.8% of the overfishing threshold proxy (FMSY proxy = 0.141). Basis for 2021-2026 ABC Recommendation Staff recommend specifications be set for 6 years (2021-2026) to create administrative efficiencies in addressing the NEPA requirements as a result of the new stock assessment process, which is expected to assess surfclam and ocean quahog on a 4 and 6 year cycle, respectively. Projections the management track assessment provided estimates of OFLs for 2021-2026 (Hennen 2020). If the SSC applied their previous methods that include an SSC-modified OFL probability distribution and an assumed lognormal OFL distribution with a CV = 150%, the ABCs would be calculated as given here.
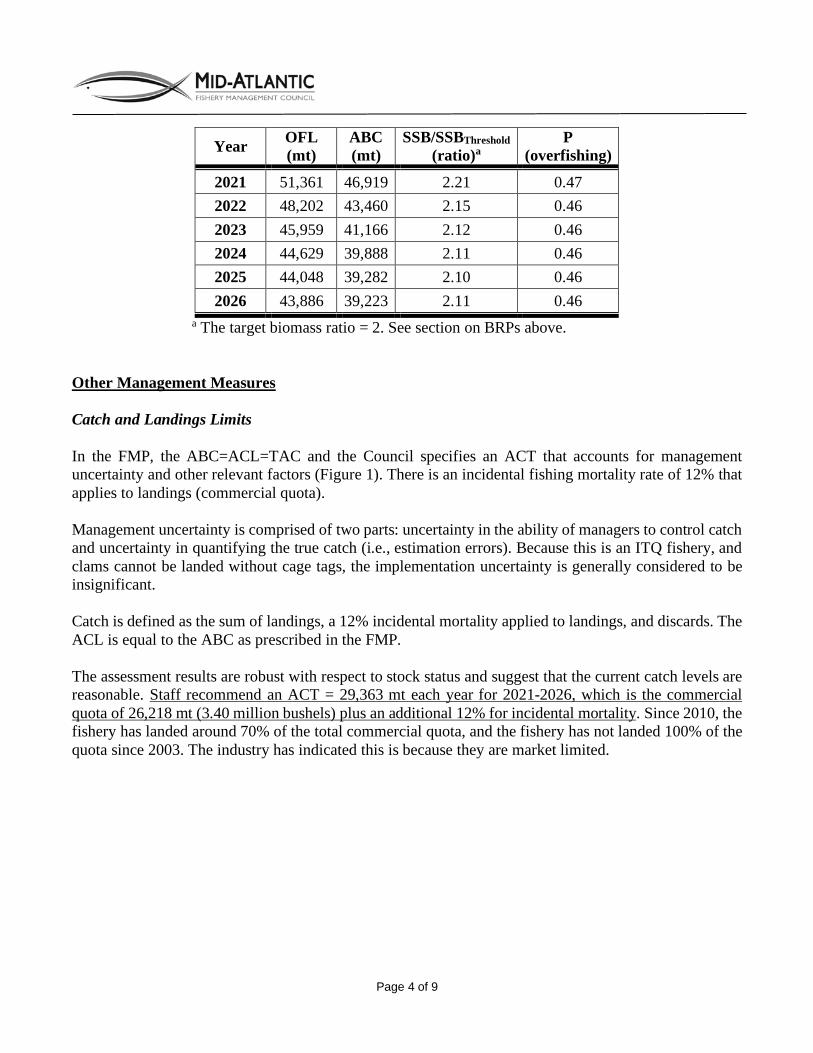
Page 4 of 9
Year OFL (mt)
ABC (mt)
SSB/SSBThreshold (ratio)a
P (overfishing)
2021 51,361 46,919 2.21 0.47 2022 48,202 43,460 2.15 0.46 2023 45,959 41,166 2.12 0.46 2024 44,629 39,888 2.11 0.46 2025 44,048 39,282 2.10 0.46 2026 43,886 39,223 2.11 0.46
a The target biomass ratio = 2. See section on BRPs above. Other Management Measures Catch and Landings Limits In the FMP, the ABC=ACL=TAC and the Council specifies an ACT that accounts for management uncertainty and other relevant factors (Figure 1). There is an incidental fishing mortality rate of 12% that applies to landings (commercial quota). Management uncertainty is comprised of two parts: uncertainty in the ability of managers to control catch and uncertainty in quantifying the true catch (i.e., estimation errors). Because this is an ITQ fishery, and clams cannot be landed without cage tags, the implementation uncertainty is generally considered to be insignificant. Catch is defined as the sum of landings, a 12% incidental mortality applied to landings, and discards. The ACL is equal to the ABC as prescribed in the FMP. The assessment results are robust with respect to stock status and suggest that the current catch levels are reasonable. Staff recommend an ACT = 29,363 mt each year for 2021-2026, which is the commercial quota of 26,218 mt (3.40 million bushels) plus an additional 12% for incidental mortality. Since 2010, the fishery has landed around 70% of the total commercial quota, and the fishery has not landed 100% of the quota since 2003. The industry has indicated this is because they are market limited.
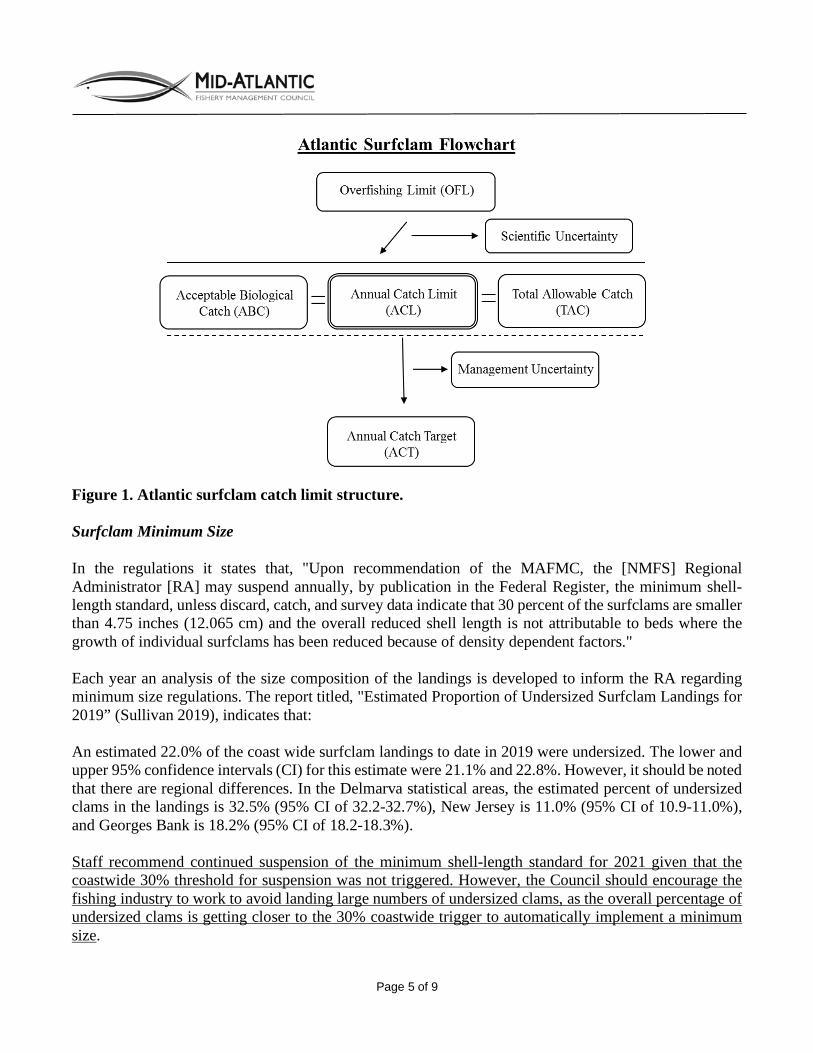
Page 5 of 9
Figure 1. Atlantic surfclam catch limit structure. Surfclam Minimum Size In the regulations it states that, "Upon recommendation of the MAFMC, the [NMFS] Regional Administrator [RA] may suspend annually, by publication in the Federal Register, the minimum shell-length standard, unless discard, catch, and survey data indicate that 30 percent of the surfclams are smaller than 4.75 inches (12.065 cm) and the overall reduced shell length is not attributable to beds where the growth of individual surfclams has been reduced because of density dependent factors." Each year an analysis of the size composition of the landings is developed to inform the RA regarding minimum size regulations. The report titled, "Estimated Proportion of Undersized Surfclam Landings for 2019” (Sullivan 2019), indicates that: An estimated 22.0% of the coast wide surfclam landings to date in 2019 were undersized. The lower and upper 95% confidence intervals (CI) for this estimate were 21.1% and 22.8%. However, it should be noted that there are regional differences. In the Delmarva statistical areas, the estimated percent of undersized clams in the landings is 32.5% (95% CI of 32.2-32.7%), New Jersey is 11.0% (95% CI of 10.9-11.0%), and Georges Bank is 18.2% (95% CI of 18.2-18.3%). Staff recommend continued suspension of the minimum shell-length standard for 2021 given that the coastwide 30% threshold for suspension was not triggered. However, the Council should encourage the fishing industry to work to avoid landing large numbers of undersized clams, as the overall percentage of undersized clams is getting closer to the 30% coastwide trigger to automatically implement a minimum size.
Page 6 of 9
Small Surfclam Areas The regulations state that, the "[NMFS] Regional Administrator [RA] may close an area to surfclams and ocean quahog fishing if he/she determines, based on logbook entries, processors' reports, survey cruises, or other information, that the area contains surfclams of which: (i) Sixty percent or more are smaller than 4.5 inches (11.43 cm); and (ii) Not more than 15 percent are larger than 5.5 inches (13.97 cm) in size." The last time this provision was applied was during the 1980's with three area closures (Atlantic City, NJ, Ocean City, MD, and Chincoteague, VA), with the last of the three areas reopening in 1991. An analysis of surfclam size distribution has been provided by the NEFSC (Hennen 2020). Because the commercial fishing gear selects for larger clams and does not sample small clams well, fishery-dependent data would not be representative of the proportions at size in an area. The fishery-independent clam survey conducted by the NEFSC does capture smaller surfclam than the commercial fishery lands, has randomly selected stations within each survey strata, and provides a sample of the proportions of small (<4.5 inches), large (>4.5 inches and <5.5 inches), and extra-large clams (>5.5 inches) in the sampling strata. However, it should be noted that the survey is conducted with a large commercial dredge and likely does not sample small clams well; although it is probably the best information available to address this regulation. Stations within each strata that were candidates for the criteria listed in the regulations (see i and ii above) were mapped (Figures 2 and 3). This information is presented so the Council can monitor changes in the distribution of surfclam size composition over time and determine if a closure is appropriate. Staff recommend the Council continue to monitor these spatial differences in the fishery.

Page 7 of 9
Figure 2. 2011-2014 NEFSC Clam survey stations where surfclams sampled met the small clam area criteria. Source: Hennen 2020.
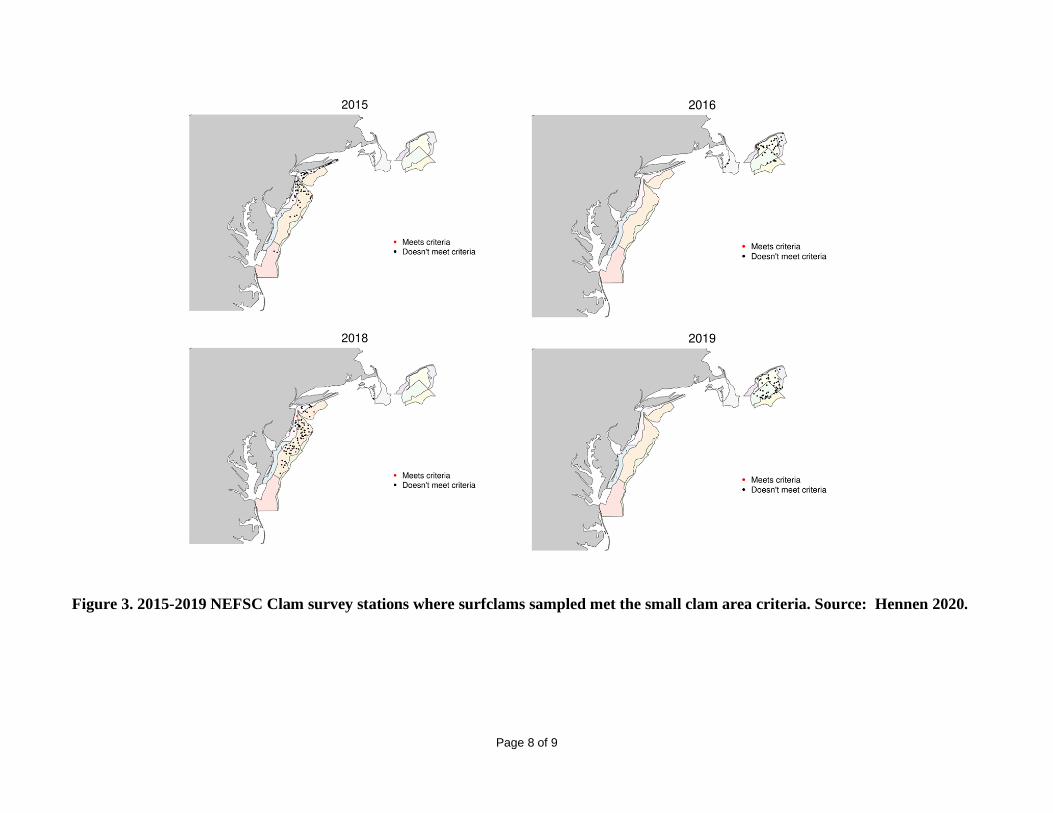
Page 8 of 9
Figure 3. 2015-2019 NEFSC Clam survey stations where surfclams sampled met the small clam area criteria. Source: Hennen 2020.
Page 9 of 9
References Hennen, Dan. Personal Communication. June 14 and 24, 2020. NOAA Fisheries, Northeast Fisheries Science Center, 166 Water St., Woods Hole, MA 02543. Northeast Fisheries Science Center. 2017. 61st Northeast Regional Stock Assessment Workshop (61st SAW) Assessment Report. US Dept Commer, Northeast Fish Sci Cent Ref Doc. 17-05; 466 p. Available from: National Marine Fisheries Service, 166 Water Street, Woods Hole, MA 02543-1026, or online at http://www.nefsc.noaa.gov/publications. Sullivan, John. 2019. Estimated Proportion of Undersized Surfclam Landings for 2019. NOAA Fisheries Greater Atlantic Region Fisheries Office report dated November 26, 2019.

M E M O R A N D U M
Date: July 7, 2020
To: Chris Moore, Executive Director
From: Jessica Coakley and José Montañez, Staff
Subject: Ocean Quahog Management Measures (2021-2026)
Executive Summary The most current assessment of the ocean quahog (Arctica islandica) stock is a management track assessment of the existing 2017 benchmark Stock Synthesis (SS) assessment which indicated the stock is not overfished and overfishing is not occurring in 2019 (Hennen 2020). Based on the previous assessment the stock was also not overfished, and overfishing was not occurring (in 2016; NEFSC 2017). Assessment reports can be found here: https://fish.nefsc.noaa.gov/saw/reviews_report_options.php. Specifications were last developed for 2018-2020. For this cycle, staff recommend specifications be set for 6 years (2021-2026) to create administrative efficiencies in addressing the National Environmental Policy Act (NEPA) requirements as a result of the new stock assessment process, which is expected to assess surfclam and ocean quahog on a 4 and 6 year cycle, respectively. The staff recommendation for acceptable biological catches (ABCs) for each year for 2021-2026 is around 44,000 mt each year (see box on page 3 for exact values). The fishery management plan specifies that the annual catch limit (ACL) equals the ABC. Staff recommend a non-Maine fishery ACT (annual catch target) of 25,400 mt with a Maine ACT of 524 mt for each year, 2021-2026; combined these are equal to the ABC=ACL. This results in a commercial quota of 24,190 mt (5.3 million bushels) and a quota for the Maine quahog fishery of 499 mt (100,000 Maine bushels). These are the same quotas that have been implemented since 2005. Introduction The Magnuson Stevens Act requires each Council's Scientific and Statistical Committee (SSC) to provide, among other things, ongoing scientific advice for fishery management decisions, including recommendations for ABC, preventing overfishing, and maximum sustainable yield. The Council's catch limit recommendations for the upcoming fishing year(s) cannot exceed the ABC recommendation of the SSC. In this memorandum, information is presented to assist the development of measures for the Council to consider for the 2021-2026 fishery for ocean quahog. The SSC will recommend an ABC for the ocean quahog fishery that addresses scientific uncertainty. Based on the SSC recommendations, the Council will make recommendations for ACLs, ACTs, and other implemented measures, and provide those recommendations to the NMFS Northeast Regional Administrator.
Mid-Atlantic Fishery Management Council 800 North State Street, Suite 201, Dover, DE 19901
Phone: 302-674-2331 ǀ FAX: 302-674-5399 ǀ www.mafmc.org Michael P. Luisi, Chairman ǀ G. Warren Elliott, Vice Chairman
Christopher M. Moore, Ph.D., Executive Director
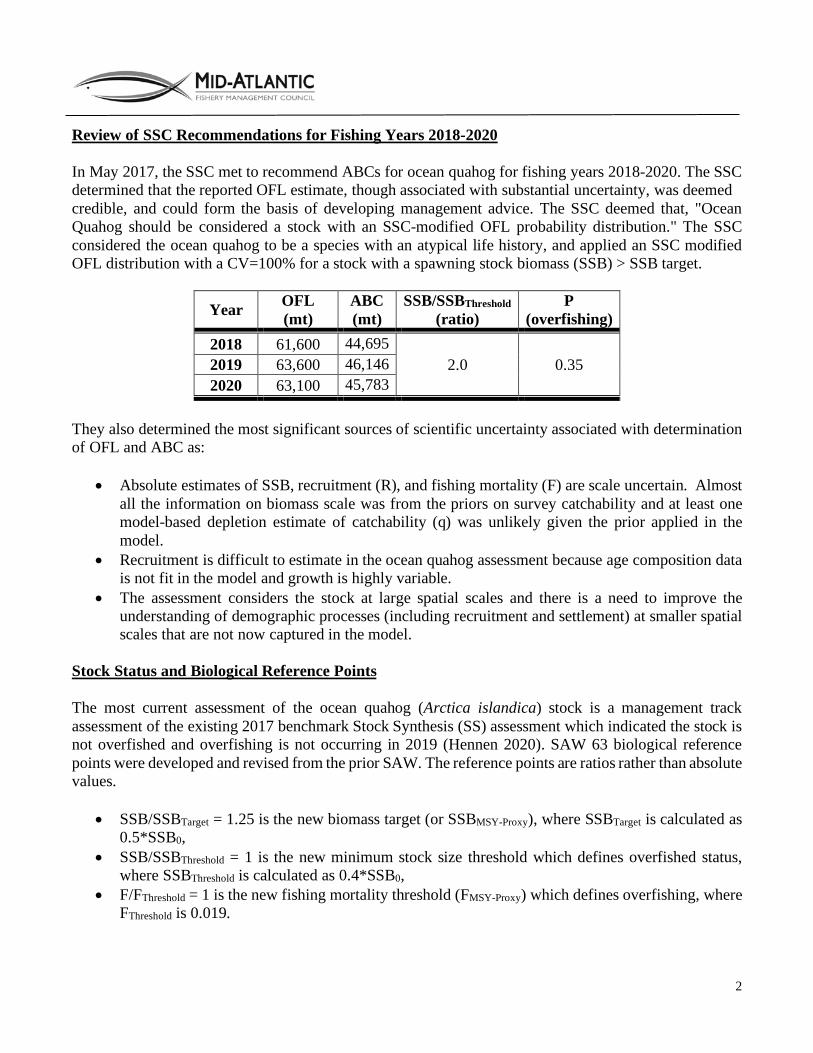
2
Review of SSC Recommendations for Fishing Years 2018-2020 In May 2017, the SSC met to recommend ABCs for ocean quahog for fishing years 2018-2020. The SSC determined that the reported OFL estimate, though associated with substantial uncertainty, was deemed credible, and could form the basis of developing management advice. The SSC deemed that, "Ocean Quahog should be considered a stock with an SSC-modified OFL probability distribution." The SSC considered the ocean quahog to be a species with an atypical life history, and applied an SSC modified OFL distribution with a CV=100% for a stock with a spawning stock biomass (SSB) > SSB target.
Year OFL (mt)
ABC (mt)
SSB/SSBThreshold (ratio)
P (overfishing)
2018 61,600 44,695 2.0 0.35 2019 63,600 46,146
2020 63,100 45,783 They also determined the most significant sources of scientific uncertainty associated with determination of OFL and ABC as:
• Absolute estimates of SSB, recruitment (R), and fishing mortality (F) are scale uncertain. Almost all the information on biomass scale was from the priors on survey catchability and at least one model-based depletion estimate of catchability (q) was unlikely given the prior applied in the model.
• Recruitment is difficult to estimate in the ocean quahog assessment because age composition data is not fit in the model and growth is highly variable.
• The assessment considers the stock at large spatial scales and there is a need to improve the understanding of demographic processes (including recruitment and settlement) at smaller spatial scales that are not now captured in the model.
Stock Status and Biological Reference Points The most current assessment of the ocean quahog (Arctica islandica) stock is a management track assessment of the existing 2017 benchmark Stock Synthesis (SS) assessment which indicated the stock is not overfished and overfishing is not occurring in 2019 (Hennen 2020). SAW 63 biological reference points were developed and revised from the prior SAW. The reference points are ratios rather than absolute values.
• SSB/SSBTarget = 1.25 is the new biomass target (or SSBMSY-Proxy), where SSBTarget is calculated as 0.5*SSB0,
• SSB/SSBThreshold = 1 is the new minimum stock size threshold which defines overfished status, where SSBThreshold is calculated as 0.4*SSB0,
• F/FThreshold = 1 is the new fishing mortality threshold (FMSY-Proxy) which defines overfishing, where FThreshold is 0.019.
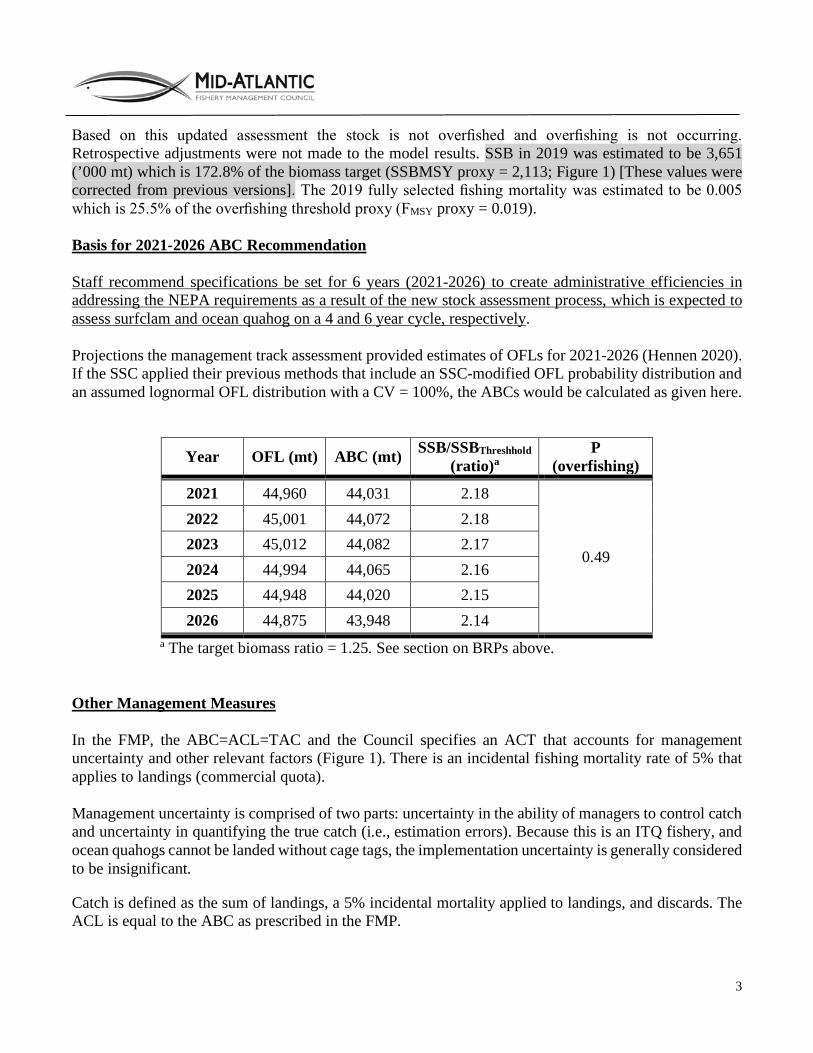
3
Based on this updated assessment the stock is not overfished and overfishing is not occurring. Retrospective adjustments were not made to the model results. SSB in 2019 was estimated to be 3,651 (’000 mt) which is 172.8% of the biomass target (SSBMSY proxy = 2,113; Figure 1) [These values were corrected from previous versions]. The 2019 fully selected fishing mortality was estimated to be 0.005 which is 25.5% of the overfishing threshold proxy (FMSY proxy = 0.019). Basis for 2021-2026 ABC Recommendation Staff recommend specifications be set for 6 years (2021-2026) to create administrative efficiencies in addressing the NEPA requirements as a result of the new stock assessment process, which is expected to assess surfclam and ocean quahog on a 4 and 6 year cycle, respectively. Projections the management track assessment provided estimates of OFLs for 2021-2026 (Hennen 2020). If the SSC applied their previous methods that include an SSC-modified OFL probability distribution and an assumed lognormal OFL distribution with a CV = 100%, the ABCs would be calculated as given here.
Year OFL (mt) ABC (mt) SSB/SSBThreshhold (ratio)a
P (overfishing)
2021 44,960 44,031 2.18
0.49
2022 45,001 44,072 2.18 2023 45,012 44,082 2.17 2024 44,994 44,065 2.16 2025 44,948 44,020 2.15 2026 44,875 43,948 2.14
a The target biomass ratio = 1.25. See section on BRPs above. Other Management Measures In the FMP, the ABC=ACL=TAC and the Council specifies an ACT that accounts for management uncertainty and other relevant factors (Figure 1). There is an incidental fishing mortality rate of 5% that applies to landings (commercial quota). Management uncertainty is comprised of two parts: uncertainty in the ability of managers to control catch and uncertainty in quantifying the true catch (i.e., estimation errors). Because this is an ITQ fishery, and ocean quahogs cannot be landed without cage tags, the implementation uncertainty is generally considered to be insignificant.
Catch is defined as the sum of landings, a 5% incidental mortality applied to landings, and discards. The ACL is equal to the ABC as prescribed in the FMP.
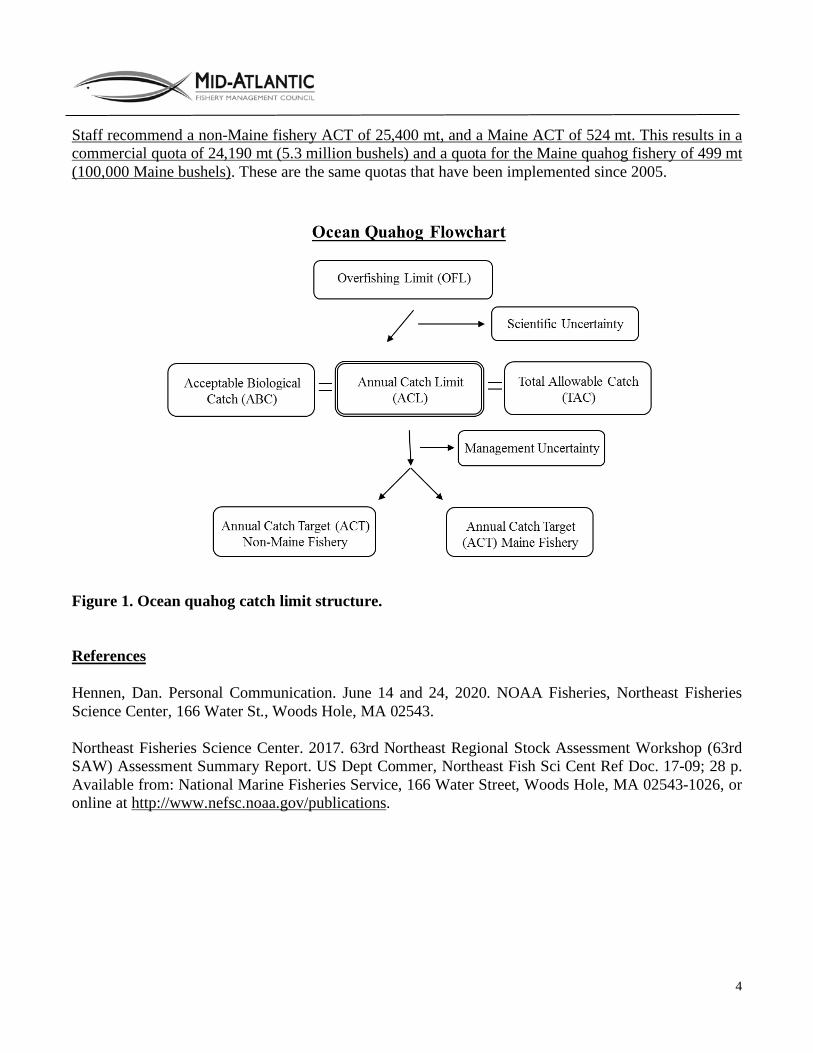
4
Staff recommend a non-Maine fishery ACT of 25,400 mt, and a Maine ACT of 524 mt. This results in a commercial quota of 24,190 mt (5.3 million bushels) and a quota for the Maine quahog fishery of 499 mt (100,000 Maine bushels). These are the same quotas that have been implemented since 2005.
Figure 1. Ocean quahog catch limit structure. References Hennen, Dan. Personal Communication. June 14 and 24, 2020. NOAA Fisheries, Northeast Fisheries Science Center, 166 Water St., Woods Hole, MA 02543. Northeast Fisheries Science Center. 2017. 63rd Northeast Regional Stock Assessment Workshop (63rd SAW) Assessment Summary Report. US Dept Commer, Northeast Fish Sci Cent Ref Doc. 17-09; 28 p. Available from: National Marine Fisheries Service, 166 Water Street, Woods Hole, MA 02543-1026, or online at http://www.nefsc.noaa.gov/publications.
1
Atlantic Surfclam and Ocean Quahog Fishery Performance Report
July 2020
The Mid-Atlantic Fishery Management Council's (Council) Atlantic Surfclam and Ocean Quahog (SCOQ) Advisory Panel (AP) met via webinar on July 8, 2020 to review the Fishery Information Documents and develop the following Fishery Performance Report. The primary purpose of this report is to contextualize catch histories for the Scientific and Statistical Committee (SSC) and Council by providing information about fishing effort, market trends, environmental changes, and other factors. A series of trigger questions listed below were posed to the AP to generate discussion of observations in these fisheries. Please note: Advisor comments described below are not necessarily consensus or majority statements; in those cases, the differences in opinions are noted.
Advisory Panel members present: Thomas Alspach, Thomas Dameron, Michael Ferrigno, Peter Himchak, Samuel Martin, Jeff Pike, and David Wallace. (did not attend: David Belanger, Howard King, and Ken McDermott)
Others present: Jessica Coakley and José Montañez (Council staff), Doug Potts (GARFO), Peter DeFur and Peter Hughes (Council members), Doug Copeland (Atlantic Shores Offshore Wind), and Ron Larsen (Sea Risk Solutions LLC).
Trigger questions:
1. What factors have influenced recent catch (markets/economy, environment, regulations, other factors)?
2. Are the current fishery regulations appropriate? How could they be improved? 3. What would you recommend as research priorities? 4. What else is important for the Council to know?
Critical Issues (not in any priority order)
COVID-19: Sales to restaurants (foodservice) was very low year-on-year for the months of March, April, May, and June; with the expectation that the effects of this may be ongoing and/or longer lasting. Seventy-five (75) percent of all seafood is sold in restaurants in the U.S. Because of the pandemic landings and sales have been reduced. All processors are continuing to operate to protect jobs within their organizations, causing inventories to rise dramatically. Inventory is being built without additional sales. This causes additional storage costs as well as other expenses, which cannot continue in perpetuity without increased demand and sales. If this continues, it may result in lower/reduced landings. When and if retail starts opening back up this will help relieve some of these added expenses.
2
Research: It is important that the Council continue to support any research projects that would support increasing harvest opportunities within the Great South Channel Habitat Management Area.
Offshore Development: The development of wind energy has become a critical issue for our industry which is further addressed later in this report.
Quotas
The advisors would like to see status quo quotas for the upcoming fishing years. The stability in the quota translates into stability in the fishery and market under normal circumstances (which do not include pandemics). There is uncertainty in the market in 2020 under COVID-19. The peer review committee that did the surfclam 2020 assessment agreed that it was well done and surfclams are not overfished and overfishing is not occurring. The industry is of the opinion that the Council’s Scientific and Statistical Committee (SSC) will agree with the peer reviewers since two of the members are SSC members. The surfclam assessment will not be reviewed by NEFSC for at least four years. Therefore, the surfclam assessment will be used for the next four years, with an annual review. The ocean quahog population was not assessed because the NEFSC decided that the previous assessment was still relevant for the next six years [Staff: A management track assessment was provided by the NEFSC in 2020].
Market/Economic Conditions For surfclams and ocean quahogs, there are occasional landings in Ocean City, MD. It used to be significant but is no longer. Cape May and Wildwood, NJ are no longer significant. Most of the fleet is fishing out of Pt. Pleasant and Atlantic City, NJ, Oceanview, NY, Hyannis, MA (surfclams only), and New Bedford and Fairhaven, MA. Trucking costs and the distance needed to travel to harvest clams has put greater economy on scale and location. Fuel prices declined and stabilized in recent years giving some relief to industry participants. Fuel prices continue to be stable.
Increasing foreign imports and foreign competition puts a constraint on price, and the price cannot be increased to absorb all the additional costs and still be competitive in the marketplace. Clearwater is operating under a different group of regulations in Canada; they entered into an agreement with indigenous tribes which entitles them to catch 100% of their Canadian fishery Arctic clam quota (30,000 mt). As a result, their excess chopped clam product is being sold in U.S. markets, as a high-quality product at a lower price. This is exerting additional pressure on the marketplace. The limit in demand for clams in the market is driven by many market factors including foreign seafood competition, other products in the marketplace (e.g. chicken, etc.), shifting toward healthier market products (e.g. clam sushi, etc. versus a fried or cream-based product), and competition with other ingredients, as clams typically are not a center of the plate product. There are also some complicating factors related to U.S. relationships with China and the EU in terms of marketing and sales, including trade tariffs.
In terms of positive marketing developments, one processor (LaMonica Fine Foods) has developed a line of canned products for the retail market with a fall 2020 roll out date. All

3
processors are looking into ways to adjust to current market conditions with ready-to-eat product lines as the fresh retail and restaurant sales have declined.
COVID-19 dominates issues related to the market and economic conditions. It is unclear how and when this will impact or change the markets going forward.
Environmental Conditions
Many species (including surfclams and ocean quahogs) are moving northward and into deeper waters. This movement is temperature driven. Historically, about half the quota for quahogs used to be taken in the Southern area. Surfclams are increasing in these Southern areas, possibly because of the faster growth rates for surfclams settling when compared to quahogs. The natural shift in the stock distribution northwards has driven the movement of the fishery. For more details, see the Surfclam Fishery Information Document.
General Fishing Trends
The landings per unit effort (LPUE) is not indicative of stock abundance because it only reflects the fishing occurring in a few ten-minute squares (see Fishery Information Documents). The LPUE has leveled off in recent years. The LPUE continues to be higher on Georges Bank and there are 6 permitted vessels (4 currently fishing) in the open portion of the Georges Banks closed area. Vessels previously fishing in areas that are now closed on Nantucket Shoals (which tend to be smaller vessels) have to travel greater distances to land surfclams resulting in both increased expenses and decreased income.
Fleet Capacity
One new vessel replacement has occurred for a medium size vessel working out of Atlantic City, NJ. Fleet capacity continues to stay static. The overall quotas are not being harvested. The driving factors are from the marketplace and not an inability to catch the quota. The processors are unable to demand the prices at which the products are sold, because the vendors essentially dictate the prices to the processors. This has limited the amount of capitalization that can be done in this fishery. The fleet continues to age, and there have been limited new builds, which has resulted in increased maintenance time spent to refurbish vessels.
Optimum Yield (OY)
The industry was comfortable with a maximum OY of 3.4 million bushels for surfclams in terms of production. For ocean quahogs a maximum OY of 6 million bushels is reasonable in terms of production. Landings for quahogs have been below the OY range because of demand for quahogs.
Offshore Development
The clam advisors are concerned about the BOEM wind farm leasing process and potential impacts to historically important fishing areas. The industry’s opportunities to engage with developers on wind array siting relative to the most productive clam fishing beds has not been
4
productive. This resistance in cooperation lends to the notion that the clam fishery and the ocean wind developers cannot coexist as the developers have made no attempt to give the clam industry any consideration in their layout of their arrays and the spacing between the turbines which will make it unsafe for clam vessels to work within wind farms. Siting is critical in terms of ensuring reasonable fishing access. It has been the experience of the clam industry that any communications by BOEM or wind energy developers is purely perfunctory and true mitigation efforts will not be made.
In the New England and Mid-Atlantic region, offshore wind development is out of control. The industry feels that no matter how hard you try to engage with developers on these issues, you are having no effect or influence. The spatial and operation requirements of the fishery (considering things like weather, tides, safety, etc.) need to be accounted for to ensure access to the wind arrays, but at present that is not happening. These arrays become de-facto Marine Protected Areas and the Councils and industry have nothing to say about how the fishing grounds are managed within the arrays. Unlike finfish, clams do not move, so once the vessels cannot fish in an area those resources are lost to the fishery and the value it brings to the economy. These areas are also likely to be lost to survey data further impacting the biomass estimates of the fishery.
The Council needs to consider the biological impacts on the fishery itself, and other cumulative environmental effects that may occur. These should include things like productivity of the resource, larval displacement, scour and sediment suspension, hydrographic changes, and effects of sounds and other pressures on the zooplankton community (which includes food for clams). In addition, in water structures from offshore wind or other types of closures (e.g. Great South Channel Habitat Management Area) will result in vessels having to travel further and having a larger carbon footprint.
Science and Research Initiatives
Industry continues to do research with the Science Center for Marine Fisheries (SCeMFiS), an industry, university, and National Science Foundation (NSF) supported research center and that has several completed, ongoing and recently funded research projects: http://scemfis.org
There is an ongoing BOEM funded project led by Rutgers University to identify economic impacts of wind energy development on the surfclam industry.
There is an ongoing RODA Knowledge Trust project (funded by NYSERDA) for surfclams and ocean quahogs (as well as some other fisheries) designed to identify economic exposures of lost access for harvesters, processer and shoreside facilities of as a result of future build out of wind energy lease sites.
Research Priorities
The AP feels that MAFMC start to consider how the fisheries independent surveys will take place within wind energy arrays once constructed.
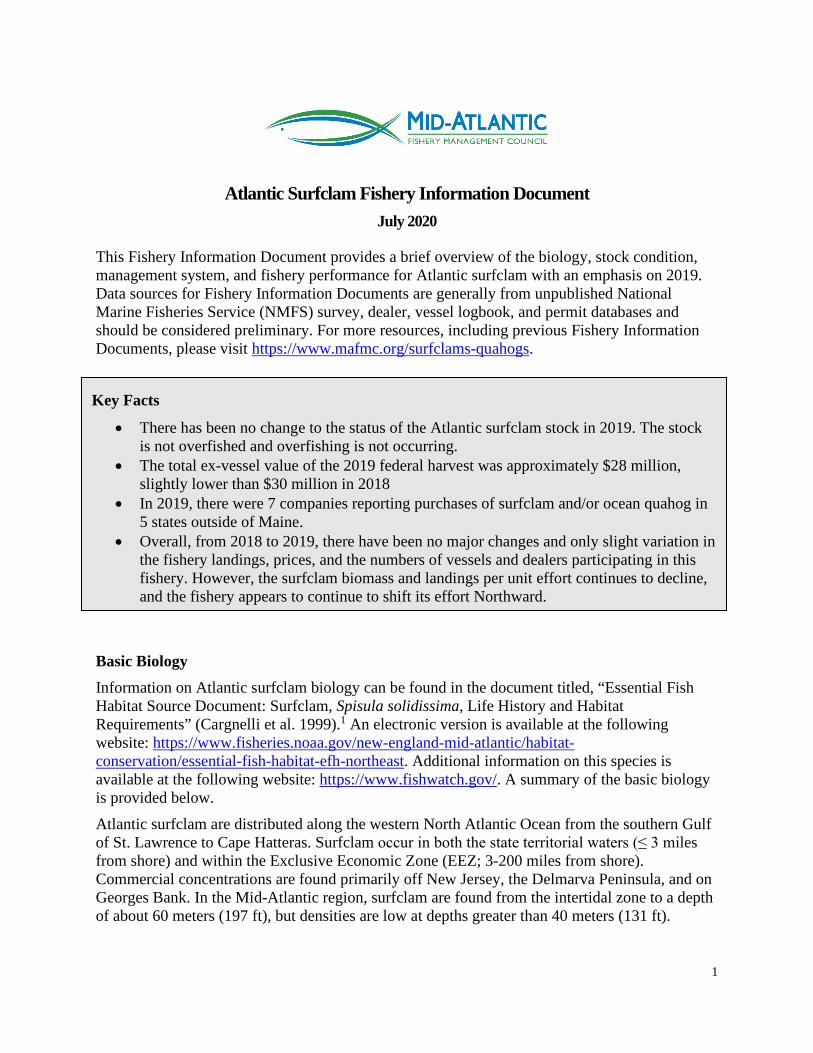
1
Atlantic Surfclam Fishery Information Document
July 2020
This Fishery Information Document provides a brief overview of the biology, stock condition, management system, and fishery performance for Atlantic surfclam with an emphasis on 2019. Data sources for Fishery Information Documents are generally from unpublished National Marine Fisheries Service (NMFS) survey, dealer, vessel logbook, and permit databases and should be considered preliminary. For more resources, including previous Fishery Information Documents, please visit https://www.mafmc.org/surfclams-quahogs.
Basic Biology Information on Atlantic surfclam biology can be found in the document titled, “Essential Fish Habitat Source Document: Surfclam, Spisula solidissima, Life History and Habitat Requirements” (Cargnelli et al. 1999).1 An electronic version is available at the following website: https://www.fisheries.noaa.gov/new-england-mid-atlantic/habitat-conservation/essential-fish-habitat-efh-northeast. Additional information on this species is available at the following website: https://www.fishwatch.gov/. A summary of the basic biology is provided below. Atlantic surfclam are distributed along the western North Atlantic Ocean from the southern Gulf of St. Lawrence to Cape Hatteras. Surfclam occur in both the state territorial waters (≤ 3 miles from shore) and within the Exclusive Economic Zone (EEZ; 3-200 miles from shore). Commercial concentrations are found primarily off New Jersey, the Delmarva Peninsula, and on Georges Bank. In the Mid-Atlantic region, surfclam are found from the intertidal zone to a depth of about 60 meters (197 ft), but densities are low at depths greater than 40 meters (131 ft).
Key Facts
• There has been no change to the status of the Atlantic surfclam stock in 2019. The stock is not overfished and overfishing is not occurring.
• The total ex-vessel value of the 2019 federal harvest was approximately $28 million, slightly lower than $30 million in 2018
• In 2019, there were 7 companies reporting purchases of surfclam and/or ocean quahog in 5 states outside of Maine.
• Overall, from 2018 to 2019, there have been no major changes and only slight variation in the fishery landings, prices, and the numbers of vessels and dealers participating in this fishery. However, the surfclam biomass and landings per unit effort continues to decline, and the fishery appears to continue to shift its effort Northward.

2
The maximum size of surfclam is about 22.5 cm (8.9 inches) shell length, but surfclam larger than 20 cm (7.9 inches) are rare. The maximum age exceeds 30 years and surfclam of 15-20 years of age are common in many areas. Surfclam are capable of reproduction in their first year of life, although full maturity may not be reached until the second year. Eggs and sperm are shed directly into the water column. Recruitment to the bottom occurs after a planktonic larval period of about three weeks. Atlantic surfclam are suspension feeders on phytoplankton, and use siphons which are extended above the surface of the substrate to pump in water. Predators of surfclam include certain species of crabs, sea stars, snails, and other crustaceans, as well as fish predators such cod and haddock.
Status of the Stock The most current assessment of the Atlantic surfclam (Spisula solidissima) stock is a management track assessment of the existing 2016 benchmark Stock Synthesis (SS) assessment (SAW 61; NEFSC 2017).2, 3 Based on the previous assessment the stock was not overfished, and overfishing was not occurring. This assessment updates commercial fishery catch data, research survey indices of abundance, commercial length composition, survey length composition and conditional age at length data as well as the analytical SS assessment model and reference points through 2019. Stock projections have been updated through 2026. Based on this updated assessment, the Atlantic surfclam stock is not overfished and overfishing is not occurring (Figures 1-2). Retrospective adjustments were not made to the model results. Spawning stock biomass (SSB) in 2019 was estimated to be 1,222 (’000 mt) which is 119% of the biomass target (SSBMSY proxy = 1,027; Figure 1). The 2019 fully selected fishing mortality was estimated to be 0.036 which is 25.8% of the overfishing threshold proxy (FMSY proxy = 0.141; Figure 2). Management System and Fishery Performance Management There have been no major changes to the overall management system since the Individual Fishing Quota (ITQ) system was implemented in 1990. The Fishery Management Plan (FMP) for Atlantic surfclam (Spisula solidissima) became effective in 1977. The FMP established the management unit as all Atlantic surfclam in the Atlantic EEZ. The FMP is managed by the Mid-Atlantic Fishery Management Council (Council), in conjunction with the NMFS as the Federal implementation and enforcement entity. The primary management tool is the specification of an annual quota, which is allocated to the holders of allocation shares (ITQs) at the beginning of each calendar year as specified in Amendment 8 to the FMP (1988). In addition to the Federal water fishery, there is a small fishery prosecuted in the state waters of New York, New Jersey, and Massachusetts. The FMP, including subsequent Amendments and Frameworks, is available on the Council website at: https://www.mafmc.org/.
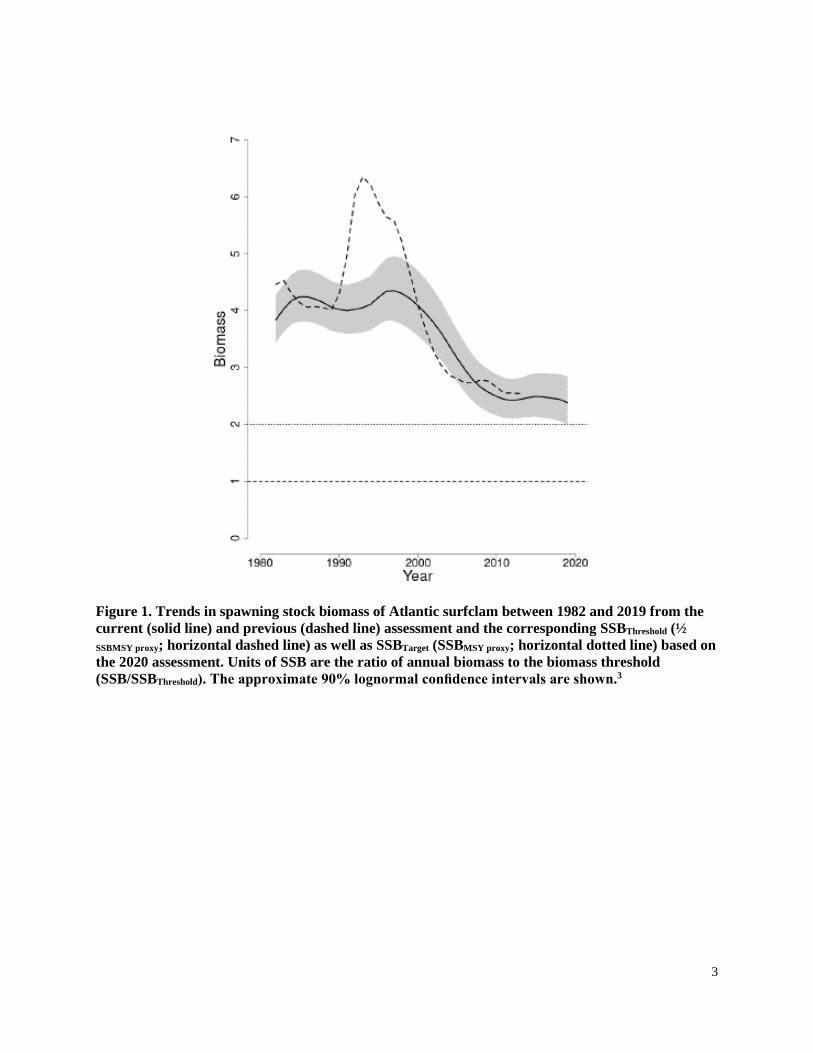
3
Figure 1. Trends in spawning stock biomass of Atlantic surfclam between 1982 and 2019 from the current (solid line) and previous (dashed line) assessment and the corresponding SSBThreshold (½ SSBMSY proxy; horizontal dashed line) as well as SSBTarget (SSBMSY proxy; horizontal dotted line) based on the 2020 assessment. Units of SSB are the ratio of annual biomass to the biomass threshold (SSB/SSBThreshold). The approximate 90% lognormal confidence intervals are shown.3

4
Figure 2. Trends in the fully selected fishing mortality (FFull) of Atlantic surf-clam between 1982 and 2019 from the current (solid line) and previous (dashed line) assessment and the corresponding FThreshold (FMSY proxy=0.141; horizontal dashed line), based on the 2020 assessment. Units of fishing mortality are the ratio of annual F to the F threshold (F/FThreshold). The approximate 90% lognormal confidence intervals are shown.3
Commercial Fishery The commercial fishery for surfclam in Federal waters is prosecuted with large vessels and hydraulic dredges. Surfclam landings and commercial quotas are given in Table 1 and Figure 3. The areas where ocean quahog are found is shown in Figure 4. The distribution of the fishery has changed over time, as shown in Figures 5-8, with a shift to increased landings in Southern New England and Georges Bank areas.
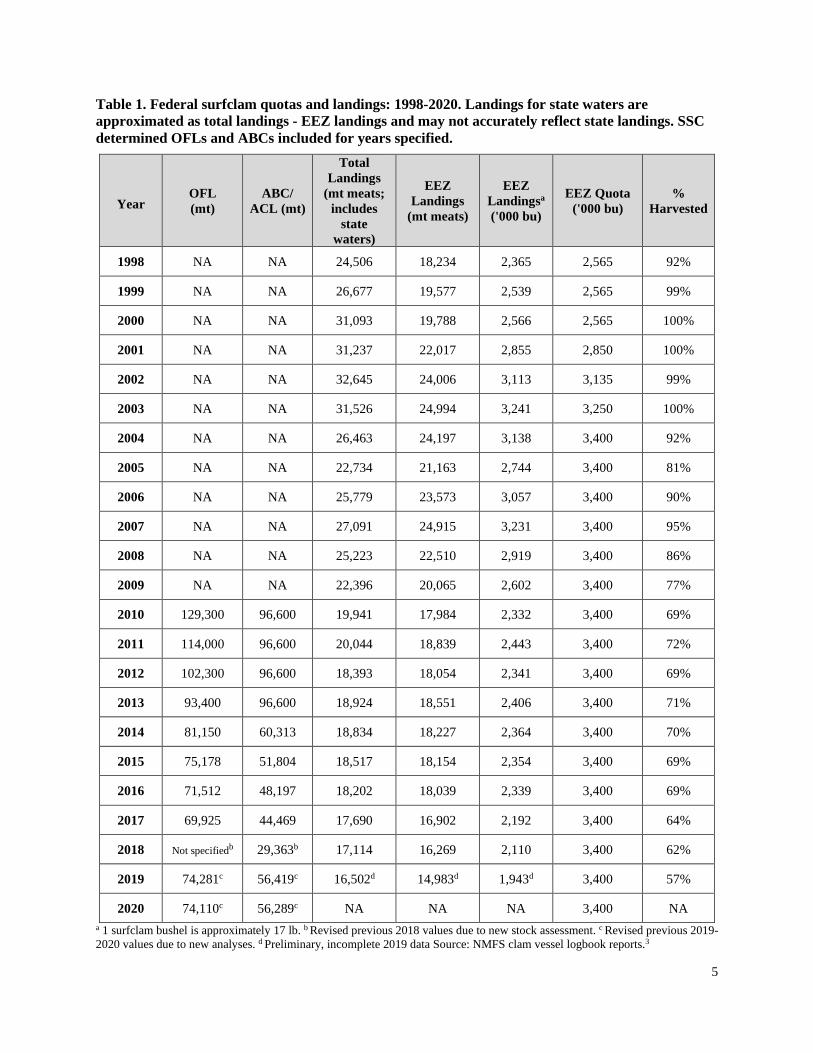
5
Table 1. Federal surfclam quotas and landings: 1998-2020. Landings for state waters are approximated as total landings - EEZ landings and may not accurately reflect state landings. SSC determined OFLs and ABCs included for years specified.
Year OFL (mt)
ABC/ ACL (mt)
Total Landings
(mt meats; includes
state waters)
EEZ Landings
(mt meats)
EEZ Landingsa
('000 bu)
EEZ Quota ('000 bu)
% Harvested
1998 NA NA 24,506 18,234 2,365 2,565 92%
1999 NA NA 26,677 19,577 2,539 2,565 99%
2000 NA NA 31,093 19,788 2,566 2,565 100%
2001 NA NA 31,237 22,017 2,855 2,850 100%
2002 NA NA 32,645 24,006 3,113 3,135 99%
2003 NA NA 31,526 24,994 3,241 3,250 100%
2004 NA NA 26,463 24,197 3,138 3,400 92%
2005 NA NA 22,734 21,163 2,744 3,400 81%
2006 NA NA 25,779 23,573 3,057 3,400 90%
2007 NA NA 27,091 24,915 3,231 3,400 95%
2008 NA NA 25,223 22,510 2,919 3,400 86%
2009 NA NA 22,396 20,065 2,602 3,400 77%
2010 129,300 96,600 19,941 17,984 2,332 3,400 69%
2011 114,000 96,600 20,044 18,839 2,443 3,400 72%
2012 102,300 96,600 18,393 18,054 2,341 3,400 69%
2013 93,400 96,600 18,924 18,551 2,406 3,400 71%
2014 81,150 60,313 18,834 18,227 2,364 3,400 70%
2015 75,178 51,804 18,517 18,154 2,354 3,400 69%
2016 71,512 48,197 18,202 18,039 2,339 3,400 69%
2017 69,925 44,469 17,690 16,902 2,192 3,400 64%
2018 Not specifiedb 29,363b 17,114 16,269 2,110 3,400 62%
2019 74,281c 56,419c 16,502d 14,983d 1,943d 3,400 57%
2020 74,110c 56,289c NA NA NA 3,400 NA a 1 surfclam bushel is approximately 17 lb. b Revised previous 2018 values due to new stock assessment. c Revised previous 2019-2020 values due to new analyses. d Preliminary, incomplete 2019 data Source: NMFS clam vessel logbook reports.3

6
Figure 9 provides the distribution of surfclam landings in “important” ten minute squares (TMSQ). Important means that a square ranked in the top 10 TMSQ for total landings during any five-year period (1980-1984, 1985-1989, 1990-1994, 1995-1999, 2000-2004, 2005-2009, 2010-2019). Data for 2019 are incomplete and preliminary, and included in the last time block. Additional information of the length composition of port sampled surfclam, and their associated sample sizes by area, are available in the stock assessment reports and management track assessment provided.3 Port and Community Description When Amendment 13 to the FMP was developed, the Council hired Dr. Bonnie McCay and her associates at Rutgers University to describe the ports and communities that are associated with the surfclam and ocean quahog fisheries. The researchers did an extensive job characterizing the three main fisheries (non-Maine ocean quahog, Maine ocean quahog, and surfclam). The McCay team characterizations of the ports and communities are based on government census and labor statistics and on observations and interviews carried out during the late 1990s and in the fall of 2001. The description of the fishing gear, areas fished, etc. are fully described in Amendment 13. Communities from Maine to Virginia are involved in the harvesting and processing of surfclam and ocean quahog. Ports in New Jersey and Massachusetts handle the most volume and value, particularly Atlantic City and Point Pleasant, New Jersey, and New Bedford, Massachusetts. There are also landings in Ocean City, Maryland, and the Jonesport and Beals Island areas of Maine. Additional information on "Snapshots of Human Communities and Fisheries in the Northeast" can be found at: https://fish.nefsc.noaa.gov/read/socialsci/communitySnapshots.php.
Figure 3. Surfclam landings (total and EEZ) during 1965-2018, and preliminary 2019.3

7
Figure 4. Surfclam stock assessment regions and NEFSC shellfish survey strata. The shaded strata are where surfclam are found.
Figure 5. Surfclam landings from the US EEZ during 1979-2018, and preliminary 2019.3
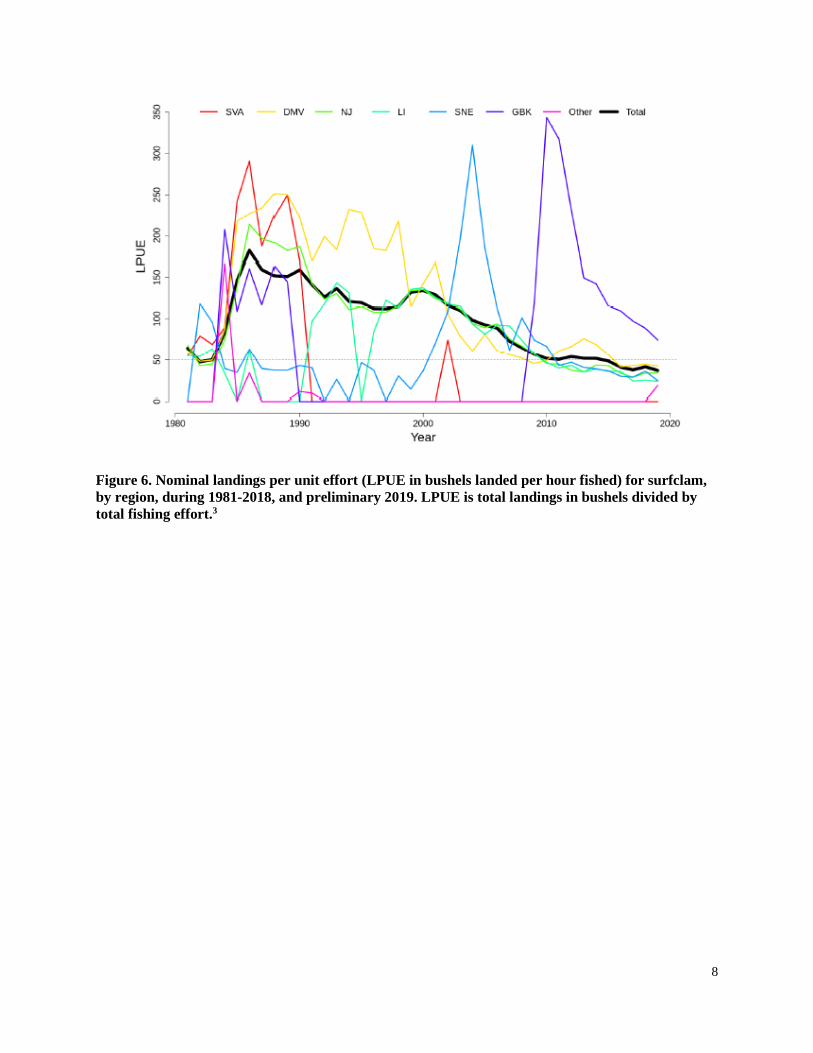
8
Figure 6. Nominal landings per unit effort (LPUE in bushels landed per hour fished) for surfclam, by region, during 1981-2018, and preliminary 2019. LPUE is total landings in bushels divided by total fishing effort.3

9
Figure 7. Average surfclam landings by ten-minute squares over time, 1981-2000. Only squares where more the 5 kilo bushels were caught are shown.3

10
Figure 8. Average surfclam landings by ten-minute squares over time, 2001-2018, and preliminary 2019. Only squares where more the 5 kilo bushels were caught are shown.3
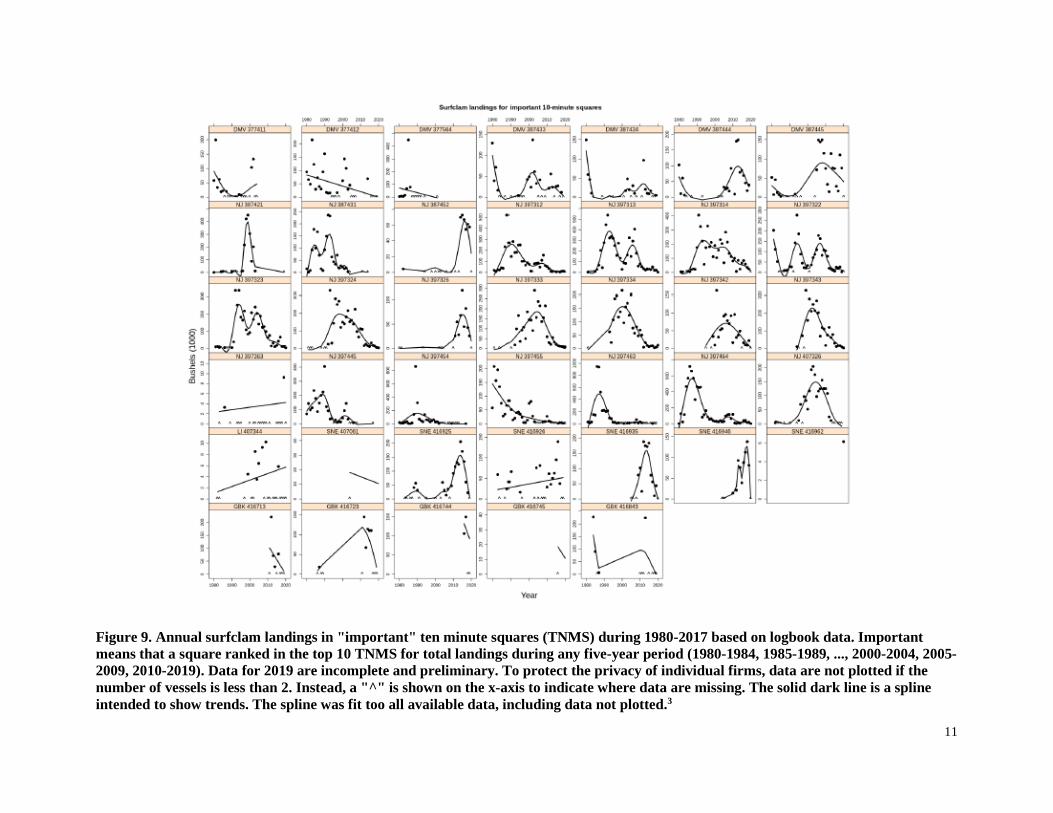
11
Figure 9. Annual surfclam landings in "important" ten minute squares (TNMS) during 1980-2017 based on logbook data. Important means that a square ranked in the top 10 TNMS for total landings during any five-year period (1980-1984, 1985-1989, ..., 2000-2004, 2005-2009, 2010-2019). Data for 2019 are incomplete and preliminary. To protect the privacy of individual firms, data are not plotted if the number of vessels is less than 2. Instead, a "^" is shown on the x-axis to indicate where data are missing. The solid dark line is a spline intended to show trends. The spline was fit too all available data, including data not plotted.3
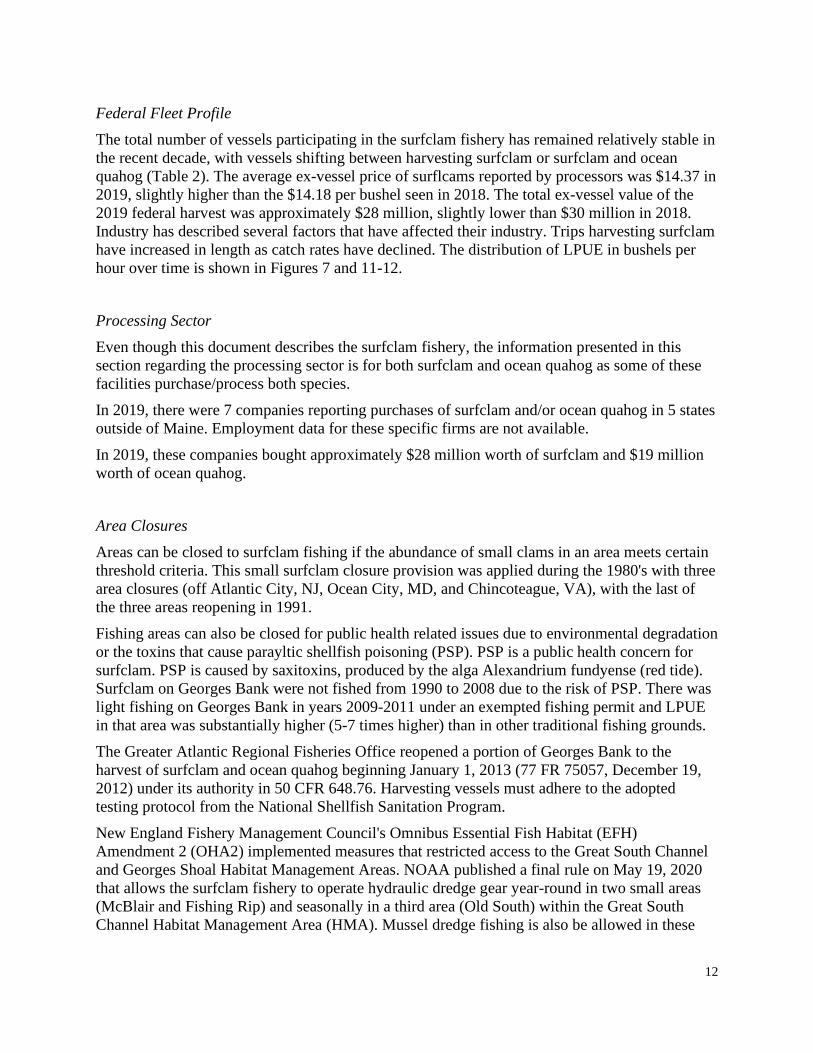
12
Federal Fleet Profile The total number of vessels participating in the surfclam fishery has remained relatively stable in the recent decade, with vessels shifting between harvesting surfclam or surfclam and ocean quahog (Table 2). The average ex-vessel price of surflcams reported by processors was $14.37 in 2019, slightly higher than the $14.18 per bushel seen in 2018. The total ex-vessel value of the 2019 federal harvest was approximately $28 million, slightly lower than $30 million in 2018. Industry has described several factors that have affected their industry. Trips harvesting surfclam have increased in length as catch rates have declined. The distribution of LPUE in bushels per hour over time is shown in Figures 7 and 11-12. Processing Sector Even though this document describes the surfclam fishery, the information presented in this section regarding the processing sector is for both surfclam and ocean quahog as some of these facilities purchase/process both species. In 2019, there were 7 companies reporting purchases of surfclam and/or ocean quahog in 5 states outside of Maine. Employment data for these specific firms are not available. In 2019, these companies bought approximately $28 million worth of surfclam and $19 million worth of ocean quahog. Area Closures Areas can be closed to surfclam fishing if the abundance of small clams in an area meets certain threshold criteria. This small surfclam closure provision was applied during the 1980's with three area closures (off Atlantic City, NJ, Ocean City, MD, and Chincoteague, VA), with the last of the three areas reopening in 1991. Fishing areas can also be closed for public health related issues due to environmental degradation or the toxins that cause parayltic shellfish poisoning (PSP). PSP is a public health concern for surfclam. PSP is caused by saxitoxins, produced by the alga Alexandrium fundyense (red tide). Surfclam on Georges Bank were not fished from 1990 to 2008 due to the risk of PSP. There was light fishing on Georges Bank in years 2009-2011 under an exempted fishing permit and LPUE in that area was substantially higher (5-7 times higher) than in other traditional fishing grounds. The Greater Atlantic Regional Fisheries Office reopened a portion of Georges Bank to the harvest of surfclam and ocean quahog beginning January 1, 2013 (77 FR 75057, December 19, 2012) under its authority in 50 CFR 648.76. Harvesting vessels must adhere to the adopted testing protocol from the National Shellfish Sanitation Program. New England Fishery Management Council's Omnibus Essential Fish Habitat (EFH) Amendment 2 (OHA2) implemented measures that restricted access to the Great South Channel and Georges Shoal Habitat Management Areas. NOAA published a final rule on May 19, 2020 that allows the surfclam fishery to operate hydraulic dredge gear year-round in two small areas (McBlair and Fishing Rip) and seasonally in a third area (Old South) within the Great South Channel Habitat Management Area (HMA). Mussel dredge fishing is also be allowed in these
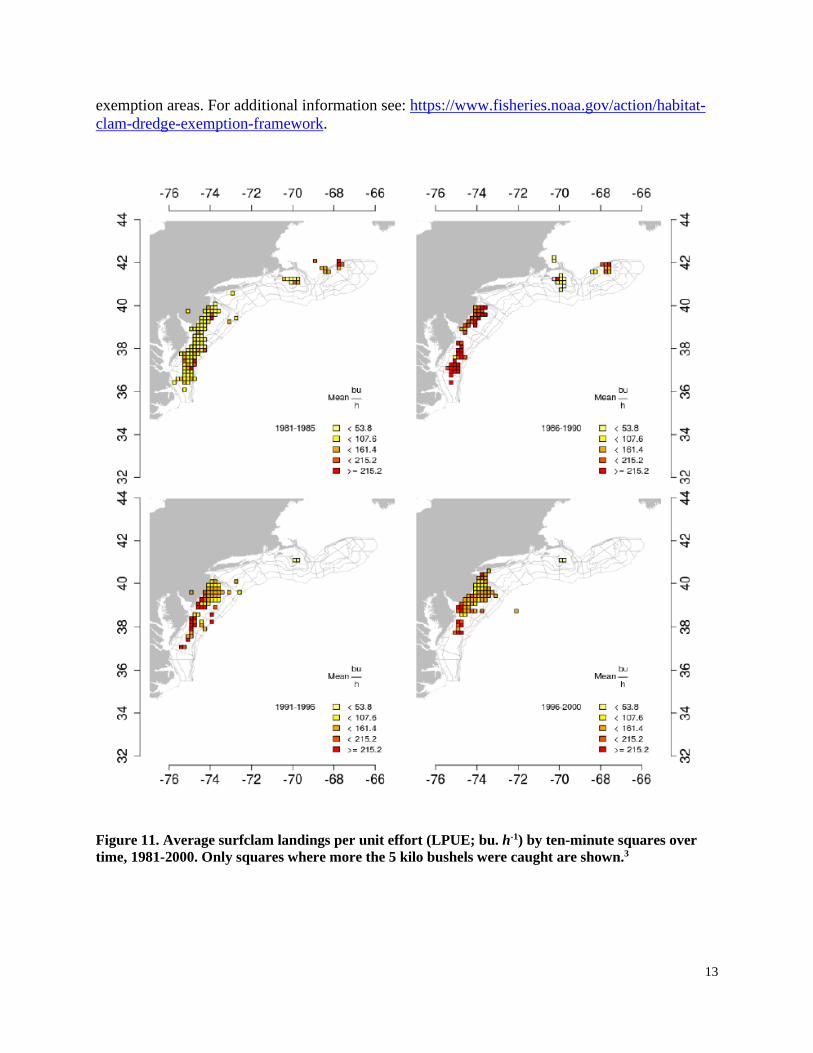
13
exemption areas. For additional information see: https://www.fisheries.noaa.gov/action/habitat-clam-dredge-exemption-framework.
Figure 11. Average surfclam landings per unit effort (LPUE; bu. h-1) by ten-minute squares over time, 1981-2000. Only squares where more the 5 kilo bushels were caught are shown.3

14
Figure 12. Average surfclam landings per unit effort (LPUE; bu. h-1) by ten-minute squares over time, 2001-2018 and preliminary 2019. Only squares where more the 5 kilo bushels were caught are shown.3

15
Table 2. Federal fleet profile, 2010 through 2019.
2010 2011 2012 2013 2014 2015 2016 2017 2018 2019
Harvesting BOTH surfclam & ocean
quahog 12 12 13 7 7 6 8 14 8 7
Harvesting only surfclam 22 24 29 33 31 31 30 26 31 36
Total Vessels 34 36 42 40 38 37 38 40 39 43 Source: NMFS clam vessel logbooks. References 1. Cargnelli, L., S. Griesbach, D. Packer, and E. Weissberger. 1999. Essential Fish Habitat Source Document: Atlantic Surfclam, Spisula solidissima, Life History and Habitat Characteristics. NOAA Tech. Memo. NMFS-NE-142.
2. Northeast Fisheries Science Center. 2016. 61st Northeast Regional Stock Assessment Workshop (61st SAW) Assessment Summary Report. US Dept Commer, Northeast Fish Sci Cent Ref Doc. 16-13; 26 p. Available from: National Marine Fisheries Service, 166 Water Street, Woods Hole, MA 02543-1026, or online at http://www.nefsc.noaa.gov/publications.
3. Hennen, Dan. Personal Communication. June 14, 2020. NOAA Fisheries, Northeast Fisheries Science Center, 166 Water St., Woods Hole, MA 02543.
1
Ocean Quahog Fishery Information Document
July 2020
This Fishery Information Document provides a brief overview of the biology, stock condition, management system, and fishery performance for ocean quahog with an emphasis on 2019. Data sources for Fishery Information Documents are generally from unpublished National Marine Fisheries Service (NMFS) survey, dealer, vessel logbook, and permit databases and should be considered preliminary. For more resources, including previous Fishery Information Documents, please visit http://www.mafmc.org/surfclams-quahogs.
Basic Biology Information on ocean quahog biology can be found in the document titled, “Essential Fish Habitat Source Document: Ocean Quahog, Arctica islandica, Life History and Habitat Requirements” (Cargnelli et al. 1999).1 An electronic version is available at the following website: https://www.fisheries.noaa.gov/new-england-mid-atlantic/habitat-conservation/essential-fish-habitat-efh-northeast. Additional information on this species is available at the following website: https://www.fishwatch.gov/. A summary of the basic biology is provided below.
The ocean quahog is a bivalve mollusk distributed in temperate and boreal waters on both sides of the North Atlantic Ocean. In the Northeast Atlantic, quahog occur from Newfoundland to Cape Hatteras from depths of about 8 to 400 meters (26 to 1,312 ft). Ocean quahog further north occur closer to shore. The US stock resource is almost entirely within the Exclusive Economic Zone (EEZ; 3-200 miles from shore), outside of state waters, and at depths between 20 and 80 meters (66 and 262 ft). However, in the northern range, ocean quahog inhabit waters closer to
Key Facts
• There has been no change to the status of the ocean quahog stock in 2019. The stock is not overfished and overfishing is not occurring.
• The total ex-vessel value of the 2019 federal harvest was approximately $19 million, lower than the $24 million in 2018.
• In 2019, there were 7 companies reporting purchases of surfclam and/or ocean quahog in 5 states outside of Maine.
• Overall, from 2018 to 2019, there has been a decrease in landings and overall value of the fishery. The numbers of dealers and vessels participating in this surfclam and ocean quahog fisheries has generally remained stable.
• The fishery appears to continue to shift its effort Northward, and has shown increased effort in the Southern New England and Geroges Bank area in recent years.
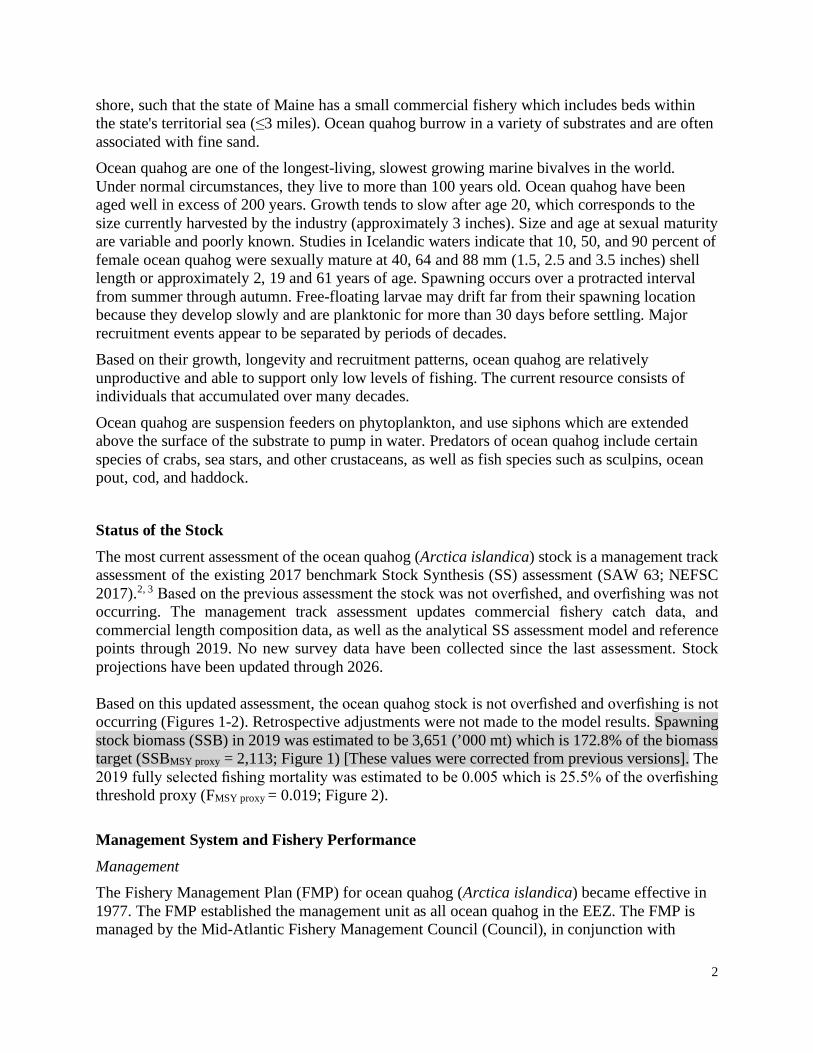
2
shore, such that the state of Maine has a small commercial fishery which includes beds within the state's territorial sea (≤3 miles). Ocean quahog burrow in a variety of substrates and are often associated with fine sand. Ocean quahog are one of the longest-living, slowest growing marine bivalves in the world. Under normal circumstances, they live to more than 100 years old. Ocean quahog have been aged well in excess of 200 years. Growth tends to slow after age 20, which corresponds to the size currently harvested by the industry (approximately 3 inches). Size and age at sexual maturity are variable and poorly known. Studies in Icelandic waters indicate that 10, 50, and 90 percent of female ocean quahog were sexually mature at 40, 64 and 88 mm (1.5, 2.5 and 3.5 inches) shell length or approximately 2, 19 and 61 years of age. Spawning occurs over a protracted interval from summer through autumn. Free-floating larvae may drift far from their spawning location because they develop slowly and are planktonic for more than 30 days before settling. Major recruitment events appear to be separated by periods of decades. Based on their growth, longevity and recruitment patterns, ocean quahog are relatively unproductive and able to support only low levels of fishing. The current resource consists of individuals that accumulated over many decades.
Ocean quahog are suspension feeders on phytoplankton, and use siphons which are extended above the surface of the substrate to pump in water. Predators of ocean quahog include certain species of crabs, sea stars, and other crustaceans, as well as fish species such as sculpins, ocean pout, cod, and haddock.
Status of the Stock
The most current assessment of the ocean quahog (Arctica islandica) stock is a management track assessment of the existing 2017 benchmark Stock Synthesis (SS) assessment (SAW 63; NEFSC 2017).2, 3 Based on the previous assessment the stock was not overfished, and overfishing was not occurring. The management track assessment updates commercial fishery catch data, and commercial length composition data, as well as the analytical SS assessment model and reference points through 2019. No new survey data have been collected since the last assessment. Stock projections have been updated through 2026. Based on this updated assessment, the ocean quahog stock is not overfished and overfishing is not occurring (Figures 1-2). Retrospective adjustments were not made to the model results. Spawning stock biomass (SSB) in 2019 was estimated to be 3,651 (’000 mt) which is 172.8% of the biomass target (SSBMSY proxy = 2,113; Figure 1) [These values were corrected from previous versions]. The 2019 fully selected fishing mortality was estimated to be 0.005 which is 25.5% of the overfishing threshold proxy (FMSY proxy = 0.019; Figure 2). Management System and Fishery Performance
Management The Fishery Management Plan (FMP) for ocean quahog (Arctica islandica) became effective in 1977. The FMP established the management unit as all ocean quahog in the EEZ. The FMP is managed by the Mid-Atlantic Fishery Management Council (Council), in conjunction with
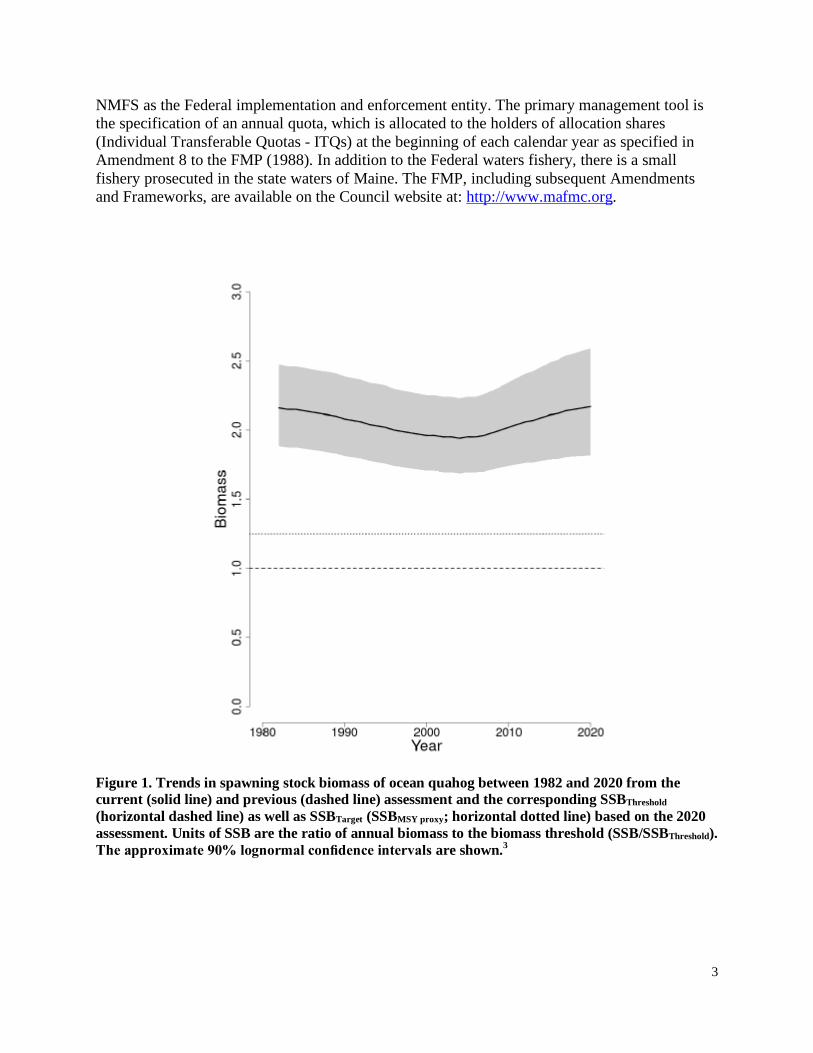
3
NMFS as the Federal implementation and enforcement entity. The primary management tool is the specification of an annual quota, which is allocated to the holders of allocation shares (Individual Transferable Quotas - ITQs) at the beginning of each calendar year as specified in Amendment 8 to the FMP (1988). In addition to the Federal waters fishery, there is a small fishery prosecuted in the state waters of Maine. The FMP, including subsequent Amendments and Frameworks, are available on the Council website at: http://www.mafmc.org.
Figure 1. Trends in spawning stock biomass of ocean quahog between 1982 and 2020 from the current (solid line) and previous (dashed line) assessment and the corresponding SSBThreshold
(horizontal dashed line) as well as SSBTarget (SSBMSY proxy; horizontal dotted line) based on the 2020 assessment. Units of SSB are the ratio of annual biomass to the biomass threshold (SSB/SSBThreshold). The approximate 90% lognormal confidence intervals are shown.3
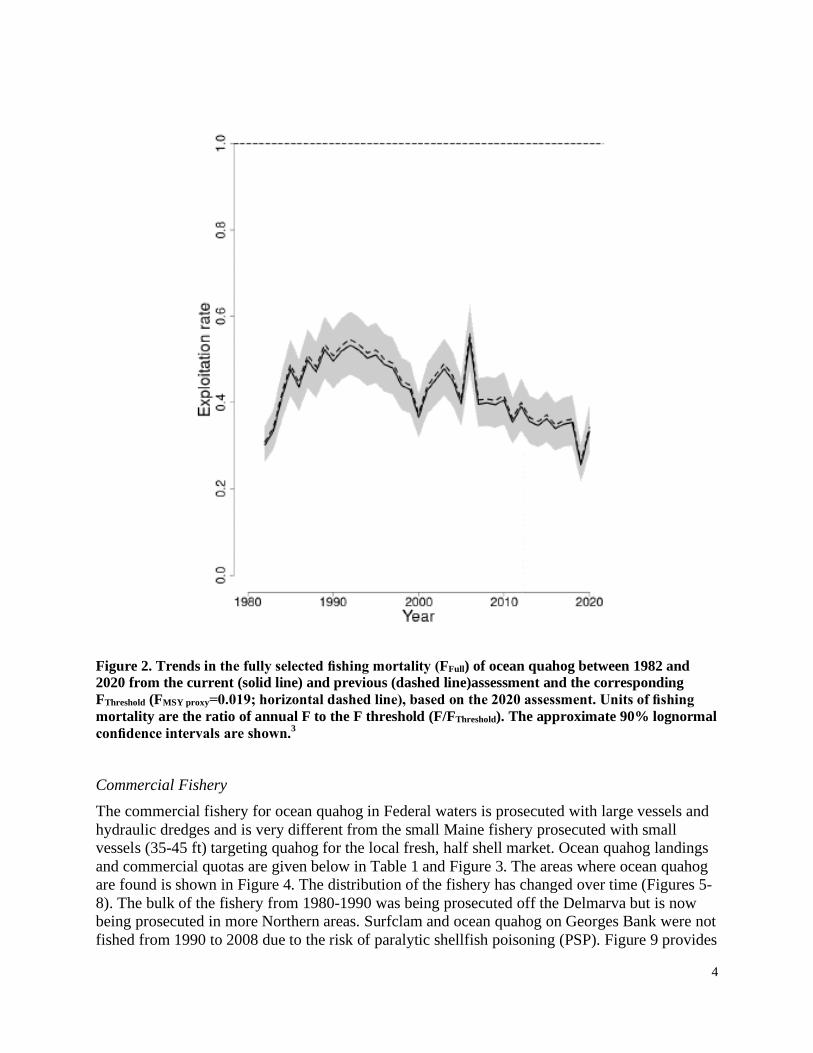
4
Figure 2. Trends in the fully selected fishing mortality (FFull) of ocean quahog between 1982 and 2020 from the current (solid line) and previous (dashed line)assessment and the corresponding FThreshold (FMSY proxy=0.019; horizontal dashed line), based on the 2020 assessment. Units of fishing mortality are the ratio of annual F to the F threshold (F/FThreshold). The approximate 90% lognormal confidence intervals are shown.3
Commercial Fishery The commercial fishery for ocean quahog in Federal waters is prosecuted with large vessels and hydraulic dredges and is very different from the small Maine fishery prosecuted with small vessels (35-45 ft) targeting quahog for the local fresh, half shell market. Ocean quahog landings and commercial quotas are given below in Table 1 and Figure 3. The areas where ocean quahog are found is shown in Figure 4. The distribution of the fishery has changed over time (Figures 5-8). The bulk of the fishery from 1980-1990 was being prosecuted off the Delmarva but is now being prosecuted in more Northern areas. Surfclam and ocean quahog on Georges Bank were not fished from 1990 to 2008 due to the risk of paralytic shellfish poisoning (PSP). Figure 9 provides
5
the distribution of ocean quahog landings in “important” ten minute squares (TMSQ). Important means that a square ranked in the top 10 TMSQ for total landings during any five-year period (1980-1984, 1985-1989, 1990-1994, 1995-1999, 2000-2004, 2005-2009, 2010-2019). Data for 2019 are incomplete and preliminary, and included in the last time block. Additional information of the length composition of port sampled ocean quahog, and their associated sample sizes by area, are available in the stock assessment reports and management track assessment provided.3
Port and Community Description
When Amendment 13 to the FMP was developed, the Council hired Dr. Bonnie McCay and her associates at Rutgers University to describe the ports and communities that are associated with the surfclam and ocean quahog fisheries. The researchers did an extensive job characterizing the three main fisheries (non-Maine ocean quahog, Maine ocean quahog, and surfclam).
The McCay team characterizations of the ports and communities are based on government census and labor statistics and on observations and interviews carried out during the late 1990s and in the fall of 2001. The description of the fishing gear, areas fished, etc. are fully described in Amendment 13.
Figure 3. Ocean quahog landings (total and EEZ) during 1965-2018, and preliminary 2019.3
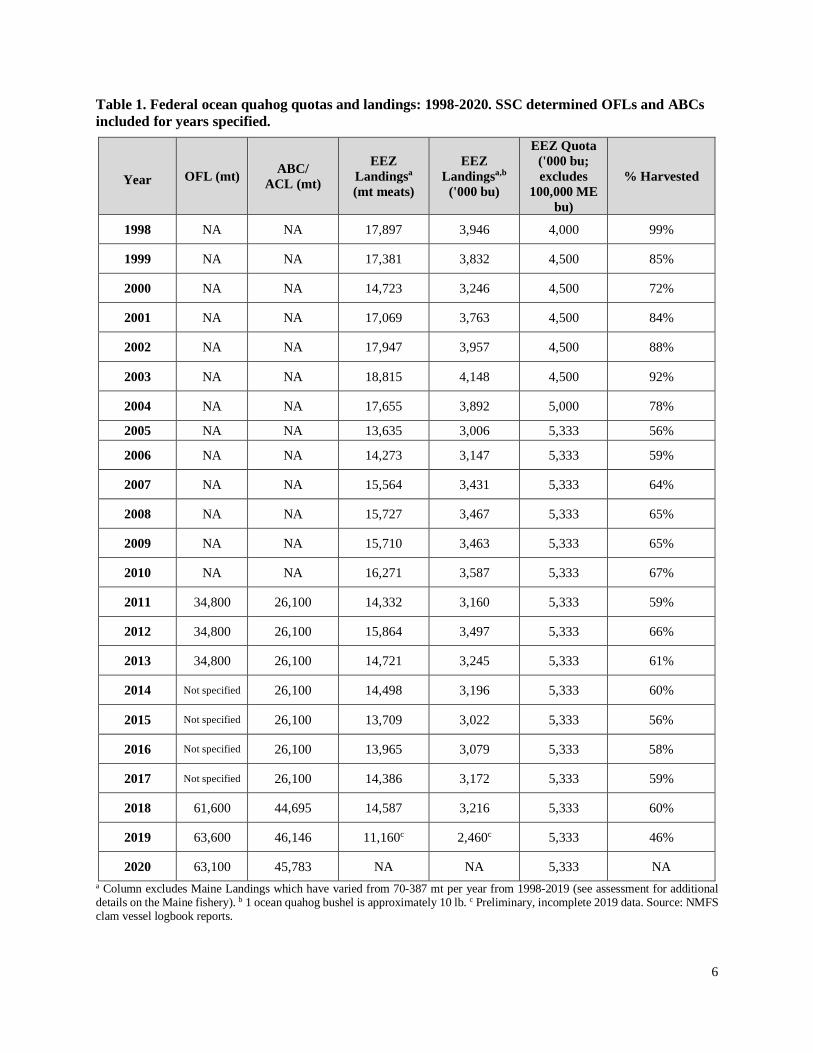
6
Table 1. Federal ocean quahog quotas and landings: 1998-2020. SSC determined OFLs and ABCs included for years specified.
Year OFL (mt) ABC/ ACL (mt)
EEZ Landingsa
(mt meats)
EEZ Landingsa,b
('000 bu)
EEZ Quota ('000 bu; excludes
100,000 ME bu)
% Harvested
1998 NA NA 17,897 3,946 4,000 99%
1999 NA NA 17,381 3,832 4,500 85%
2000 NA NA 14,723 3,246 4,500 72%
2001 NA NA 17,069 3,763 4,500 84%
2002 NA NA 17,947 3,957 4,500 88%
2003 NA NA 18,815 4,148 4,500 92%
2004 NA NA 17,655 3,892 5,000 78%
2005 NA NA 13,635 3,006 5,333 56%
2006 NA NA 14,273 3,147 5,333 59%
2007 NA NA 15,564 3,431 5,333 64%
2008 NA NA 15,727 3,467 5,333 65%
2009 NA NA 15,710 3,463 5,333 65%
2010 NA NA 16,271 3,587 5,333 67%
2011 34,800 26,100 14,332 3,160 5,333 59%
2012 34,800 26,100 15,864 3,497 5,333 66%
2013 34,800 26,100 14,721 3,245 5,333 61%
2014 Not specified 26,100 14,498 3,196 5,333 60%
2015 Not specified 26,100 13,709 3,022 5,333 56%
2016 Not specified 26,100 13,965 3,079 5,333 58%
2017 Not specified 26,100 14,386 3,172 5,333 59%
2018 61,600 44,695 14,587 3,216 5,333 60%
2019 63,600 46,146 11,160c 2,460c 5,333 46%
2020 63,100 45,783 NA NA 5,333 NA a Column excludes Maine Landings which have varied from 70-387 mt per year from 1998-2019 (see assessment for additional details on the Maine fishery). b 1 ocean quahog bushel is approximately 10 lb. c Preliminary, incomplete 2019 data. Source: NMFS clam vessel logbook reports.

7
Communities from Maine to Virginia are involved in the harvesting and processing of surfclam and ocean quahog. Ports in New Jersey and Massachusetts handle the most volume and value, particularly Atlantic City and Point Pleasant, New Jersey, and New Bedford, Massachusetts. There are also landings in Ocean City, Maryland, and the Jonesport and Beals Island areas of Maine. The small scale Maine fishery is entirely for ocean quahog, which are sold as shellstock for the half-shell market. The other fisheries are industrialized ones for surfclam and ocean quahog, which are hand shucked or steam-shucked and processed into fried, canned, and frozen products.
Additional information on "Snapshots of Human Communities and Fisheries in the Northeast" can be found at: https://www.nefsc.noaa.gov/read/socialsci/communitySnapshots.php.
Figure 4. Ocean quahog stock assessment regions and NEFSC shellfish survey strata. The shaded strata are where quahog are found.
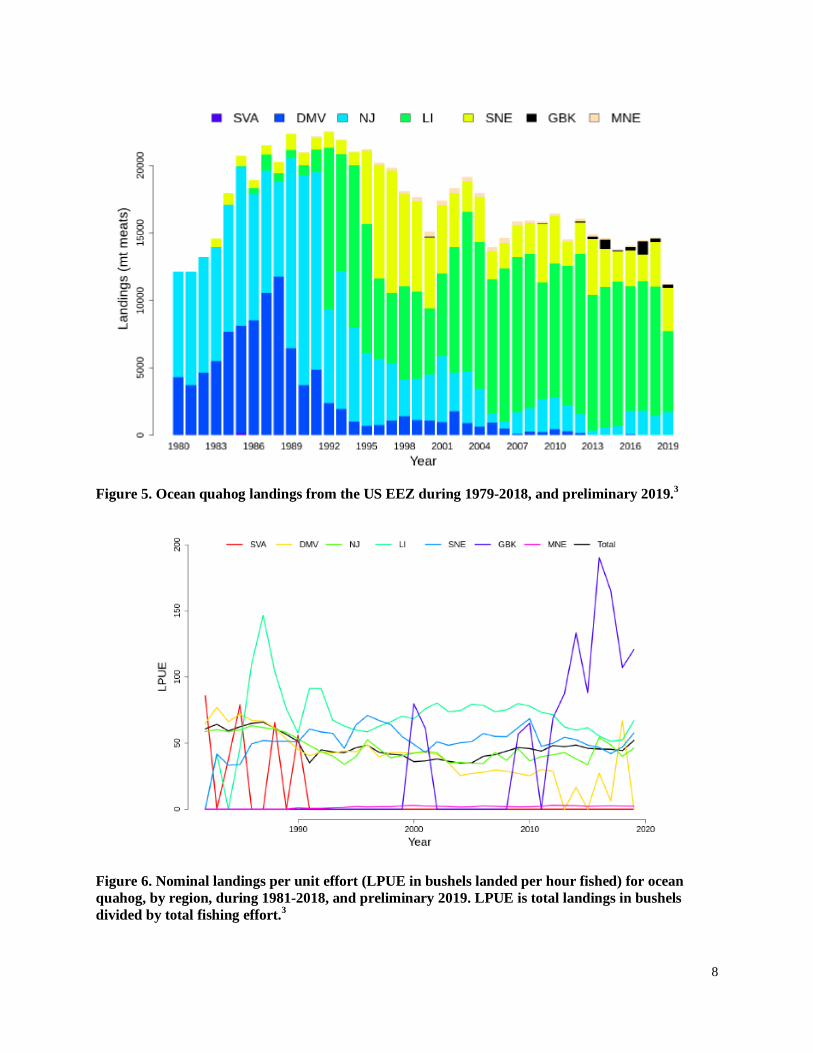
8
Figure 5. Ocean quahog landings from the US EEZ during 1979-2018, and preliminary 2019.3
Figure 6. Nominal landings per unit effort (LPUE in bushels landed per hour fished) for ocean quahog, by region, during 1981-2018, and preliminary 2019. LPUE is total landings in bushels divided by total fishing effort.3
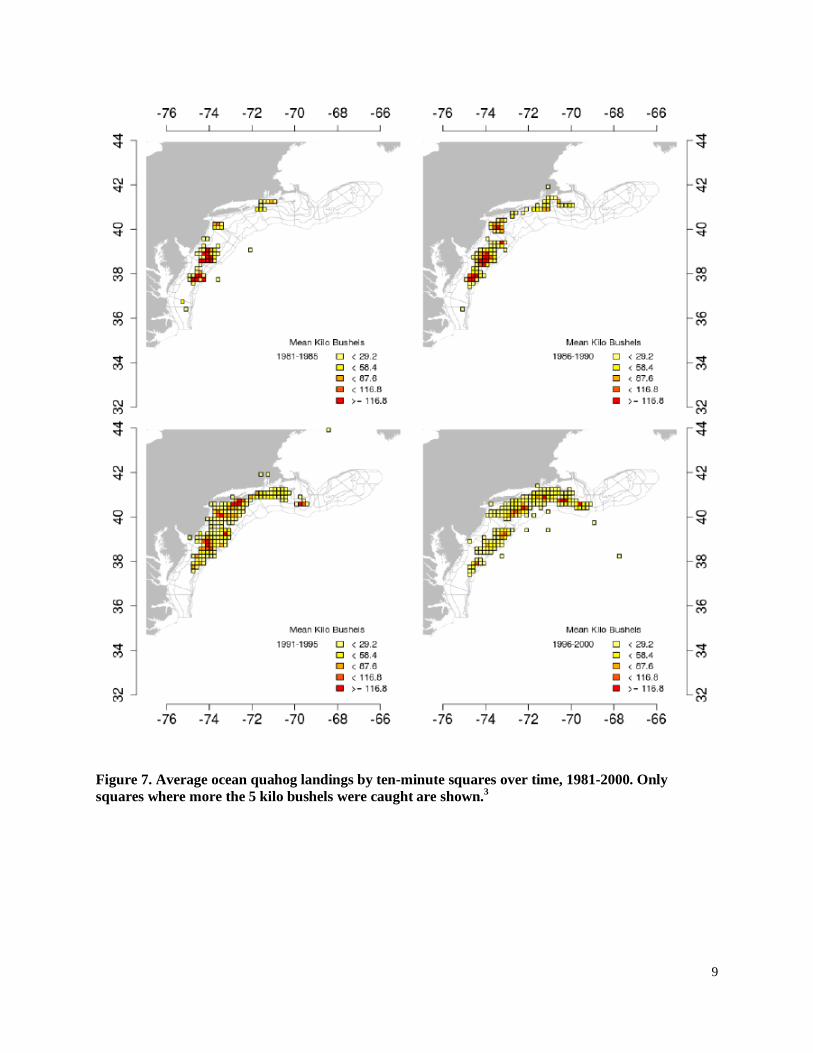
9
Figure 7. Average ocean quahog landings by ten-minute squares over time, 1981-2000. Only squares where more the 5 kilo bushels were caught are shown.3

10
Figure 8. Average ocean quahog landings by ten-minute squares over time, 2001-2017, and preliminary 2018. Only squares where more the 5 kilo bushels were caught are shown.3

11
Figure 9. Annual ocean quahog landings in "important" ten minute squares (TNMS) during 1980-2017 based on logbook data. Important means that a square ranked in the top 10 TNMS for total landings during any five-year period (1980-1984, 1985-1989, ..., 2000-2004, 2005-2009, 2010-2018). Data for 2019 are incomplete and preliminary. To protect the privacy of individual firms, data are not plotted if the number of vessels is less than 2. Instead, a "^" is shown on the x-axis to indicate where data are missing. The solid dark line is a spline intended to show trends. The spline was fit too all available data, including data not plotted.3
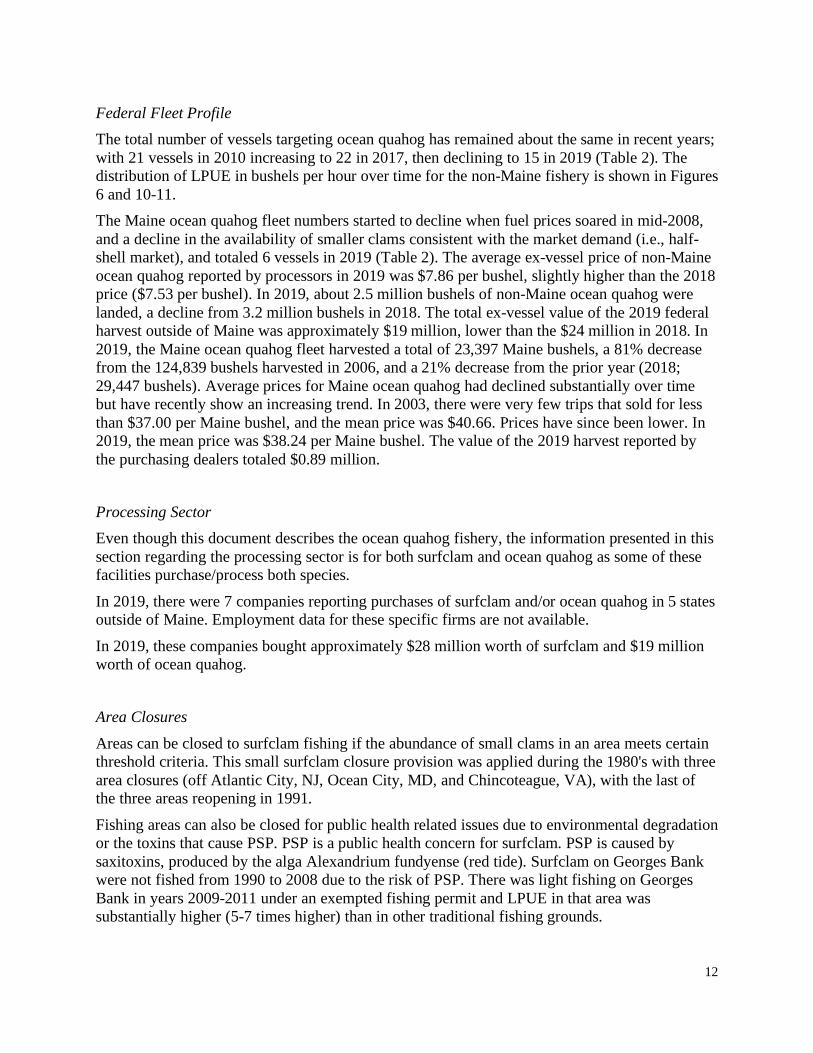
12
Federal Fleet Profile The total number of vessels targeting ocean quahog has remained about the same in recent years; with 21 vessels in 2010 increasing to 22 in 2017, then declining to 15 in 2019 (Table 2). The distribution of LPUE in bushels per hour over time for the non-Maine fishery is shown in Figures 6 and 10-11. The Maine ocean quahog fleet numbers started to decline when fuel prices soared in mid-2008, and a decline in the availability of smaller clams consistent with the market demand (i.e., half-shell market), and totaled 6 vessels in 2019 (Table 2). The average ex-vessel price of non-Maine ocean quahog reported by processors in 2019 was $7.86 per bushel, slightly higher than the 2018 price ($7.53 per bushel). In 2019, about 2.5 million bushels of non-Maine ocean quahog were landed, a decline from 3.2 million bushels in 2018. The total ex-vessel value of the 2019 federal harvest outside of Maine was approximately $19 million, lower than the $24 million in 2018. In 2019, the Maine ocean quahog fleet harvested a total of 23,397 Maine bushels, a 81% decrease from the 124,839 bushels harvested in 2006, and a 21% decrease from the prior year (2018; 29,447 bushels). Average prices for Maine ocean quahog had declined substantially over time but have recently show an increasing trend. In 2003, there were very few trips that sold for less than $37.00 per Maine bushel, and the mean price was $40.66. Prices have since been lower. In 2019, the mean price was $38.24 per Maine bushel. The value of the 2019 harvest reported by the purchasing dealers totaled $0.89 million.
Processing Sector Even though this document describes the ocean quahog fishery, the information presented in this section regarding the processing sector is for both surfclam and ocean quahog as some of these facilities purchase/process both species.
In 2019, there were 7 companies reporting purchases of surfclam and/or ocean quahog in 5 states outside of Maine. Employment data for these specific firms are not available.
In 2019, these companies bought approximately $28 million worth of surfclam and $19 million worth of ocean quahog.
Area Closures
Areas can be closed to surfclam fishing if the abundance of small clams in an area meets certain threshold criteria. This small surfclam closure provision was applied during the 1980's with three area closures (off Atlantic City, NJ, Ocean City, MD, and Chincoteague, VA), with the last of the three areas reopening in 1991.
Fishing areas can also be closed for public health related issues due to environmental degradation or the toxins that cause PSP. PSP is a public health concern for surfclam. PSP is caused by saxitoxins, produced by the alga Alexandrium fundyense (red tide). Surfclam on Georges Bank were not fished from 1990 to 2008 due to the risk of PSP. There was light fishing on Georges Bank in years 2009-2011 under an exempted fishing permit and LPUE in that area was substantially higher (5-7 times higher) than in other traditional fishing grounds.

13
The Greater Atlantic Regional Fisheries Office reopened a portion of Georges Bank to the harvest of surfclam and ocean quahog beginning January 1, 2013 (77 FR 75057, December 19, 2012) under its authority in 50 CFR 648.76. Harvesting vessels must adhere to the adopted testing protocol from the National Shellfish Sanitation Program.
New England Fishery Management Council's Omnibus Essential Fish Habitat (EFH) Amendment 2 (OHA2) implemented measures that restricted access to the Great South Channel and Georges Shoal Habitat Management Areas. NOAA published a final rule on May 19, 2020 that allows the surfclam fishery to operate hydraulic dredge gear year-round in two small areas (McBlair and Fishing Rip) and seasonally in a third area (Old South) within the Great South Channel Habitat Management Area (HMA). Mussel dredge fishing is also be allowed in these exemption areas. For additional information see: https://www.fisheries.noaa.gov/action/habitat-clam-dredge-exemption-framework.
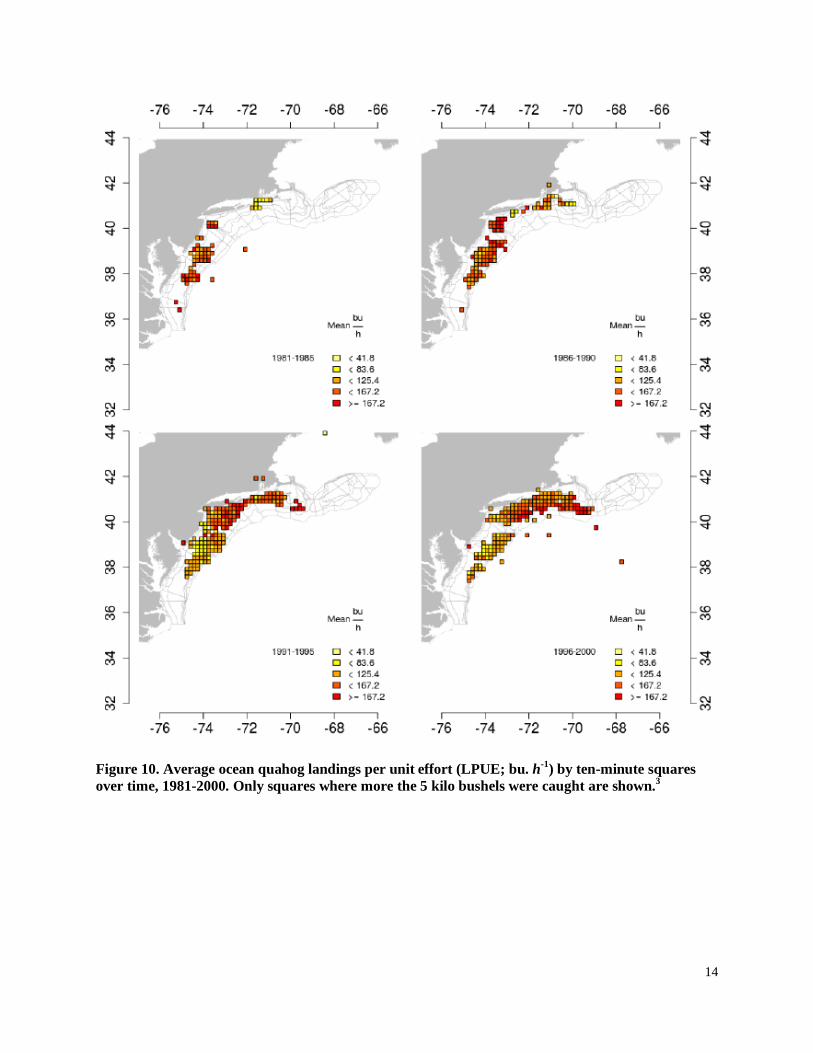
14
Figure 10. Average ocean quahog landings per unit effort (LPUE; bu. h-1) by ten-minute squares over time, 1981-2000. Only squares where more the 5 kilo bushels were caught are shown.3

15
Figure 11. Average ocean quahog landings per unit effort (LPUE; bu. h-1) by ten-minute squares over time, 2001-2018 and preliminary 2019. Only squares where more the 5 kilo bushels were caught are shown.3

16
Table 2. Federal fleet profile, 2010 through 2019.
2010 2011 2012 2013 2014 2015 2016 2017 2018 2019
Non-Maine Vessels Harvesting BOTH surfclam & ocean
quahog
12 12 13 7 7 6 8 14 8 7
Non-Maine Vessels Harvesting only ocean quahog
9 7 6 9 9 10 9 8 8 8
Total Non-Maine Vessels 21 19 19 16 16 16 17 22 16 15
Maine Ocean Quahog Vessels 15 13 12 11 9 8 8 8 8 6
Source: NMFS clam vessel logbooks.
References 1. Cargnelli, L., S. Griesbach, D. Packer, and E. Weissberger. 1999. Essential Fish Habitat Source Document: Ocean Quahog, Arctica islandica, Life History and Habitat Characteristics. NOAA Tech. Memo. NMFS-NE-148.
2. Fisheries Science Center. 2017. 63rd Northeast Regional Stock Assessment Workshop (63rd SAW) Assessment Summary Report. US Dept Commer, Northeast Fish Sci Cent Ref Doc. 17-09; 28 p. Available from: National Marine Fisheries Service, 166 Water Street, Woods Hole, MA 02543-1026, or online at http://www.nefsc.noaa.gov/publications.
3. Hennen, Dan. Personal Communication. June 14, 2020. NOAA Fisheries, Northeast Fisheries Science Center, 166 Water St., Woods Hole, MA 02543.
draft working paper for peer review only
Atlantic surfclam
2020 Assessment Update Report
U.S. Department of CommerceNational Oceanic and Atmospheric Administration
National Marine Fisheries ServiceNortheast Fisheries Science Center
Woods Hole, Massachusetts
Compiled May 2020

This assessment of the Atlantic surfclam (Spissula solidissima) stock is a management trackassessment of the existing 2016 benchmark Stock Synthesis (SS) assessment (NEFSC 2017).Based on the previous assessment the stock was not overfished, and overfishing was not occurring.This assessment updates commercial fishery catch data, research survey indices of abundance,commercial length composition, survey length composition and conditional age at length data aswell as the analytical SS assessment model and reference points through 2019. Stock projectionshave been updated through 2026
State of Stock: Based on this updated assessment, the Atlantic surfclam (Spissula solidissima)stock is not overfished and overfishing is not occurring (Figures 1-2). Retrospective adjustmentswere not made to the model results. Spawning stock biomass (SSB) in 2019 was estimated to be1,222 (’000 mt) which is 119% of the biomass target (SSBMSY proxy = 1,027; Figure 1). The2019 fully selected fishing mortality was estimated to be 0.036 which is 25.8% of the overfishingthreshold proxy (FMSY proxy = 0.141; Figure 2).
Table 1: Catch and status table for Atlantic surfclam. All data weights are in(mt) model results are ratios relative to reference points. Model results are fromthe current SS assessment.
2010 2011 2012 2013 2014 2015 2016 2017 2018 2019Data
Landings South 16,672 16,452 14,408 14,148 14,992 15,014 13,502 12,083 12,307 11,728Landings North 1,311 2,387 3,646 4,403 3,236 4,104 4,837 4,819 3,962 3,245Discards South 9 4 0 3 2 79 42 21 130 0Discards North 1 1 0 1 0 22 15 8 42 0Catch for Assessment 17,992 18,844 18,054 18,555 18,230 19,219 18,396 16,932 16,441 14,973
Model ResultsSSB
SSBThreshold2.49 2.44 2.42 2.44 2.47 2.49 2.48 2.46 2.44 2.38
FFThreshold
0.246 0.273 0.272 0.287 0.293 0.308 0.293 0.271 0.273 0.258RR0
1.155 1.217 0.961 0.78 1.105 0.808 0.784 0.583 0.793 0.991
Table 2: Comparison of reference points estimated in an earlier assessmentand from the current assessment update. An FMSY proxy was used for theoverfishing threshold and was based on a simulation study and scaled to thecurrent assessment.
2016 2020FMSY proxy 0.019 0.141 (0.087 - 0.222)SSBMSY (’000 mt) 2688 1027 (583 - 1470)MSY (’000 mt) 92 252
Overfishing No NoOverfished No No
Projections: Short term projections of biomass were derived by assumming average recruitment
2020 Assessment Update of Atlantic surfclam draft working paper for peer review only1
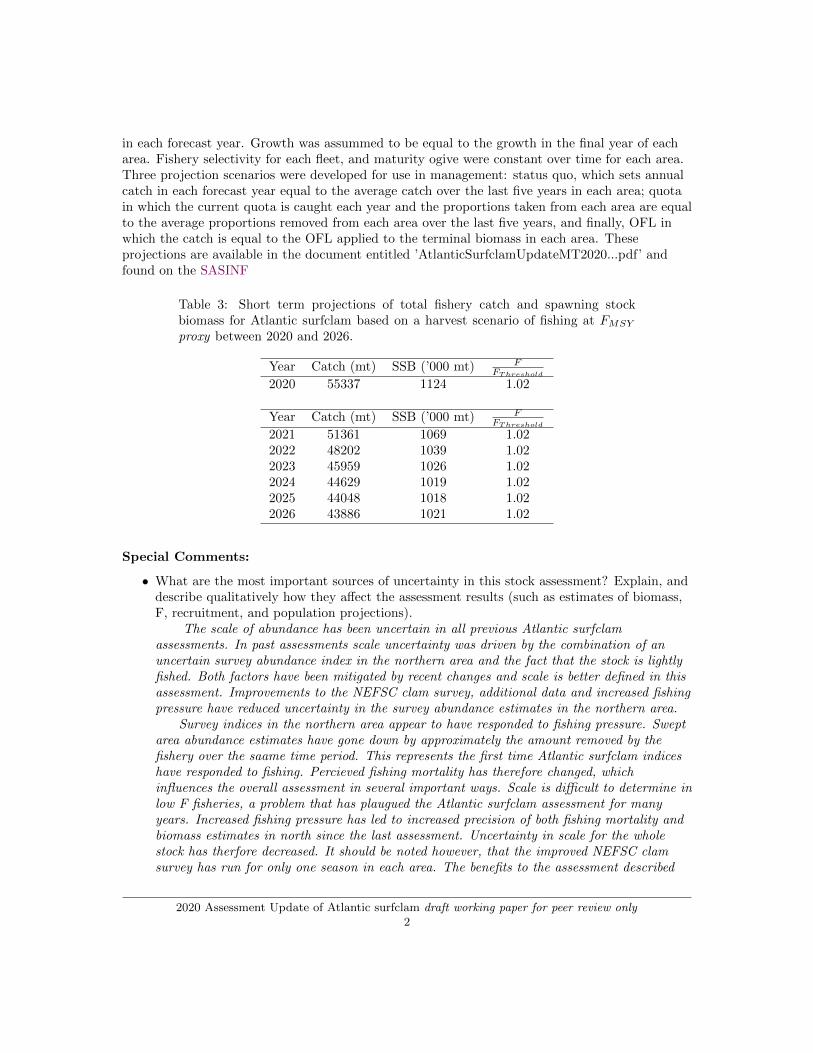
in each forecast year. Growth was assummed to be equal to the growth in the final year of eacharea. Fishery selectivity for each fleet, and maturity ogive were constant over time for each area.Three projection scenarios were developed for use in management: status quo, which sets annualcatch in each forecast year equal to the average catch over the last five years in each area; quotain which the current quota is caught each year and the proportions taken from each area are equalto the average proportions removed from each area over the last five years, and finally, OFL inwhich the catch is equal to the OFL applied to the terminal biomass in each area. Theseprojections are available in the document entitled ’AtlanticSurfclamUpdateMT2020...pdf’ andfound on the SASINF
Table 3: Short term projections of total fishery catch and spawning stockbiomass for Atlantic surfclam based on a harvest scenario of fishing at FMSY
proxy between 2020 and 2026.
Year Catch (mt) SSB (’000 mt) FFThreshold
2020 55337 1124 1.02
Year Catch (mt) SSB (’000 mt) FFThreshold
2021 51361 1069 1.022022 48202 1039 1.022023 45959 1026 1.022024 44629 1019 1.022025 44048 1018 1.022026 43886 1021 1.02
Special Comments:
• What are the most important sources of uncertainty in this stock assessment? Explain, anddescribe qualitatively how they affect the assessment results (such as estimates of biomass,F, recruitment, and population projections).
The scale of abundance has been uncertain in all previous Atlantic surfclamassessments. In past assessments scale uncertainty was driven by the combination of anuncertain survey abundance index in the northern area and the fact that the stock is lightlyfished. Both factors have been mitigated by recent changes and scale is better defined in thisassessment. Improvements to the NEFSC clam survey, additional data and increased fishingpressure have reduced uncertainty in the survey abundance estimates in the northern area.
Survey indices in the northern area appear to have responded to fishing pressure. Sweptarea abundance estimates have gone down by approximately the amount removed by thefishery over the saame time period. This represents the first time Atlantic surfclam indiceshave responded to fishing. Percieved fishing mortality has therefore changed, whichinfluences the overall assessment in several important ways. Scale is difficult to determine inlow F fisheries, a problem that has plaugued the Atlantic surfclam assessment for manyyears. Increased fishing pressure has led to increased precision of both fishing mortality andbiomass estimates in north since the last assessment. Uncertainty in scale for the wholestock has therfore decreased. It should be noted however, that the improved NEFSC clamsurvey has run for only one season in each area. The benefits to the assessment described
2020 Assessment Update of Atlantic surfclam draft working paper for peer review only2

here accrue in part because of restratification, which may induce spatial biases as pastsurveys were not conducted under the current stratification. Additional survey years usingthe new stratification will be important in bearing out, or reducing confidence in, the currentmodel outputs.
Estimates of recruitment remain uncertain as the survey and commercial gear does notselect for younger animals. Uncertainty in recruitment is relatively unimportant in this stockdue to species longevity, and relatively low fishing mortality overall.
• Does this assessment model have a retrospective pattern? If so, is the pattern minor, ormajor? (A major retrospective pattern occurs when the adjusted SSB or FFull lies outsideof the approximate joint confidence region for SSB and FFull).
Retrospective adjustments to F are not appropriate for this stock because the referencepoints are based on trend rather than scale and adjusting the terminal estimate of F wouldrequire adjusting the reference point as well. Furthermore a seven year Mohn’s ρ cannot becalculated because there are no observations of the MCD survey in the north before 2013.Therefore components of the model relevant to that survey cannot be estimated. Futureassessments of Atlantic surfclam could provide a seven year Mohn’s ρ calculation, but unlessthe F reference point is changed to more traditional values, retrospective adjustments do notmake sense. Retrospective adjustments to biomass based on a 6 year Mohn’s ρ are possible,but not warranted in this case as the retrospective pattern in SSB is minor (see the documententitled ’AtlanticSurfclamUpdateMT2020...pdf’ at SASINF for more discussion ofretrospective patterns).
• Based on this stock assessment, are population projections well determined or uncertain? Ifthis stock is in a rebuilding plan, how do the projections compare to the rebuilding schedule?
Population projections for Atlantic surfclam, are reasonably well determined andprojected biomass from the last assessment was within the confidence bounds of the biomassestimated in the current assessment. This stock was not in a rebuilding plan.
• Describe any changes that were made to the current stock assessment, beyond incorporatingadditional years of data and the effect these changes had on the assessment and stock status.
Several changes were made to the Atlantic surfclam assessment for this update. Themost significant of these was the shift from two models with one area each, to one model withtwo areas. Other important changes were the inclusion of time varying growth in thesouthern area, and allowing the model to estimate selectivity parameters. Time varyinggrowth was modeled as a trend in the average maximum size as well as a trend in the VonBertalanffy K parameter. The assessment model estimated most of the selectivity parametersfor both commercial and survey fleets in this update, where previously they were fixed. Thesechanges are discussed in more detail the section ’Build a Bridge’ in the document entitled’AtlanticSurfclamUpdateMT2020...pdf’ and found at SASINF.
• If the stock status has changed a lot since the previous assessment, explain why thisoccurred.
Stock status did not change. Perception of abundance in the northern area, however, haschanged. At one time abundance in the northern area was believed to be about equal toabundance in the south. Currently, abundance in the northern area appears low and there isno evidence of strong recruitment in recent years. Early survey data from the northern areais not fit well by the model, but is likely to be of relatively low quality. Therefore the unfished
2020 Assessment Update of Atlantic surfclam draft working paper for peer review only3

abundance in the northern area is probably not well described. Abundance in the northernarea may never have been very high compared to the abundance in the southern area.
One consequence of the perception of lower biomass in the north is that fishing mortalitythere appears to be higher. This in turn affects the F trend for the whole stock and thus theestimate of the F reference point.
• Provide qualitative statements describing the condition of the stock that relate to stockstatus.
The Atlantic surfclam stock remains lightly fished and at relatively high abundance inthe southern area. The scale of the abundance agrees closely with the swept area abundanceestimates for each area (see the section ’Plan B Assessment’ in the document entitled’AtlanticSurfclamUpdateMT2020...pdf’ at SASINF.
• Indicate what data or studies are currently lacking and which would be needed most toimprove this stock assessment in the future.
While the overall abundance of Atlantic surfclam remains at or above it’s targetabundance, the clam industry may be concerned about declining catch rates as the remainingdense aggregations of Atlantic surfclam are fished down. If reduced density makes theAtlantic surfclam fishery economically non-viable, the fishery could contract or even collapsewithout the stock ever being overfished or experiencing overfishing. Some management onsmaller spatial scales, with the objective of maintaining dense aggregations, may bewaranted, and should probably be investigated.
• Are there other important issues?Atlantic surfclam mature very quickly (<2 years) and are not selected by commercial
gear until they are 5 to 7 years old. A traditional FMSY reference point will therefore benearly infinite. A trend based alternative has been used here, and in the previous assessment,but the methods for deriving it should perhaps be revisited given the changes in growth in thesouthern area. Previous assumptions regarding growth under warming conditions (fastergrowth to a smaller maximum size) may not be correct. The model estimated here shows areduced Von Bertalanffy K parameter, as well as a reduced average maximum size over timein the southern area. This would be consistent with slower growth to a smaller maximumsize. There is new research supporting this hypothesis. Pousse et al (in review) studiedAtlantic surfclam and ocean acidification and their results indicate that scope for growth islikely to be much lower under OA conditions. In addition, the current low stock size in thenorthern area may provide a basis for estimating the steepness parameter of the stockrecruitment relationship in Atlantic surfclam, which has not previously been possible due tothe lack of any observed low stock abundance condition. A new management strategyevaluation of Atlantic surfclam may be warranted.
References:Northeast Fisheries Science Center. 2016. In: 61st Northeast Regional Stock AssessmentWorkshop (61st SAW) Assessment Summary Report. US Dept Commer, Northeast Fish Sci CentRef Doc. 16-13; 26 p. http://www.nefsc.noaa.gov/publications/
Pousse, E., HennenD., Munroe, D., Hart, D., Redman, D., Wikfors, G., Sennefelder, G., Lindsay,
2020 Assessment Update of Atlantic surfclam draft working paper for peer review only4

J., White, L., Dixon, M., Poach, M., Meseck, S., Li, Y. In Review. Physiological response ofAtlantic surfclam, Spisula solidissima, to ocean acidification. Science of the Total Environment.In Review.
2020 Assessment Update of Atlantic surfclam draft working paper for peer review only5
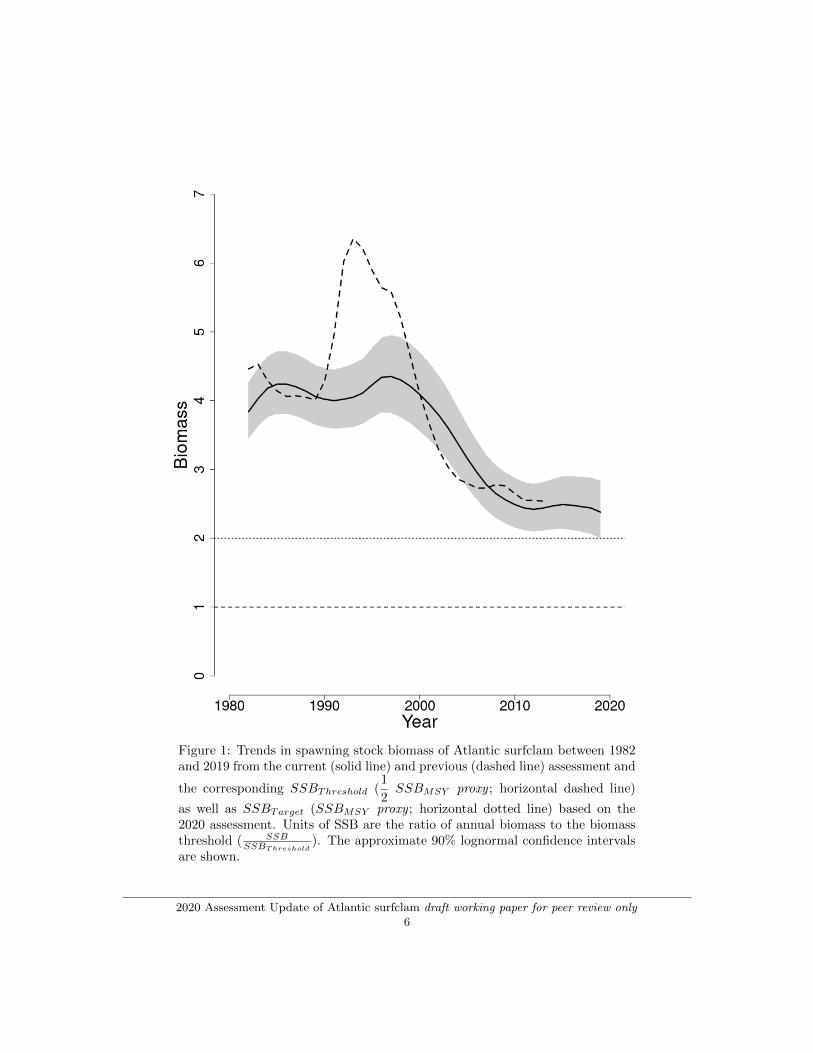
Figure 1: Trends in spawning stock biomass of Atlantic surfclam between 1982and 2019 from the current (solid line) and previous (dashed line) assessment and
the corresponding SSBThreshold (1
2SSBMSY proxy ; horizontal dashed line)
as well as SSBTarget (SSBMSY proxy ; horizontal dotted line) based on the2020 assessment. Units of SSB are the ratio of annual biomass to the biomassthreshold ( SSB
SSBThreshold). The approximate 90% lognormal confidence intervals
are shown.
2020 Assessment Update of Atlantic surfclam draft working paper for peer review only6

Figure 2: Trends in the fully selected fishing mortality (FFull) of Atlantic surf-clam between 1982 and 2019 from the current (solid line) and previous (dashedline) assessment and the corresponding FThreshold (FMSY proxy=0.141; hori-zontal dashed line), based on the 2020 assessment. Units of fishing mortalityare the ratio of annual F to the F threshold ( F
FThreshold). The approximate 90%
lognormal confidence intervals are shown.
2020 Assessment Update of Atlantic surfclam draft working paper for peer review only7

Figure 3: Trends in RR0
of Atlantic surfclam between 1982 and 2019 from thecurrent (solid line) and previous (dashed line) assessment. Units of recruit-ment are the ratio of annual R to the unfished R ( R
R0). The approximate 90%
lognormal confidence intervals are shown.
2020 Assessment Update of Atlantic surfclam draft working paper for peer review only8

Figure 4: Total catch of Atlantic surfclam between 1982 and 2019 by fleet anddisposition (landings and discards).
2020 Assessment Update of Atlantic surfclam draft working paper for peer review only9

Figure 5: Indices of biomass for the Atlantic surfclam between 1982 and 2019for the Northeast Fisheries Science Center (NEFSC) clam surveys in the northand south. The RD survey units are weight per tow (kg) and the MCD surveyunits are swept area numbers (n). The approximate 90% lognormal confidenceintervals are shown.
2020 Assessment Update of Atlantic surfclam draft working paper for peer review only10
draft working paper for peer review only
Ocean quahog
2020 Assessment Update Report
U.S. Department of CommerceNational Oceanic and Atmospheric Administration
National Marine Fisheries ServiceNortheast Fisheries Science Center
Woods Hole, Massachusetts
Compiled July 2020

This assessment of the ocean quahog (Arctica islandica) stock is a management track assessmentof the existing 2017 benchmark Stock Synthesis (SS) assessment (NEFSC 2017). Based on theprevious assessment the stock was not overfished, and overfishing was not occurring. Thisassessment updates commercial fishery catch data, and commercial length composition data, aswell as the analytical SS assessment model and reference points through 2019. No new survey datahave been collected since the last assessment. Stock projections have been updated through 2026
State of Stock: Based on this updated assessment the, ocean quahog (Arctica islandica) stock isnot overfished and overfishing is not occurring (Figures 1-2). Retrospective adjustments were notmade to the model results. Spawning stock biomass (SSB) in 2019 was estimated to be 3,651(’000 mt) which is 172.8% of the biomass target (SSBMSY proxy = 2,113; Figure 1). The 2019fully selected fishing mortality was estimated to be 0.005 which is 25.5% of the overfishingthreshold proxy (FMSY proxy = 0.019; Figure 2).
Table 1: Catch and status table for ocean quahog. All data weights are in (mt)model results are ratios relative to reference points. Model results are from thecurrent SS assessment.
2010 2011 2012 2013 2014 2015 2016 2017 2018 2019Data
Landings South 16,257 14,332 15,757 14,555 13,817 13,629 13,689 13,406 14,328 10,928Landings North 13 0 106 166 681 81 276 980 258 232Discards South 5 7 104 5 2 1,682 566 623 795 0Discards North 0 0 1 0 0 10 11 46 14 0Catch for Assessment 16,275 14,339 15,968 14,726 14,500 15,402 14,542 15,055 15,396 11,160
Model ResultsSpawning Stock Biomass 2.02 2.04 2.06 2.07 2.09 2.11 2.12 2.14 2.15 2.16FFull 0.406 0.354 0.391 0.356 0.347 0.363 0.34 0.35 0.354 0.255Recruits (age 3) 0.995 0.997 0.997 0.997 0.997 0.998 0.998 0.998 0.998 0.998
Table 2: Comparison of reference points estimated in an earlier assessmentand from the current assessment update. An FMSY proxy was used for theoverfishing threshold and was based on a simulation study and scaled to thecurrent assessment.
2017 2020FMSY proxy 0.019 0.019 (0.011 - 0.032)SSBMSY (’000 mt) 2,014 2,113 (1,754 - 2,473)MSY (’000 mt) 73 77
Overfishing No NoOverfished No No
Projections: Short term projections of biomass were derived by assumming average recruitmentin each forecast year. Growth, fishery selectivity, and maturity ogive, were constant over time for
2020 Assessment Update of ocean quahog draft working paper for peer review only1

each area and used in projection. Three projection scenarios were developed for use inmanagement: status quo, which sets annual catch in each forecast year equal to the average catchover the last five years in each area; quota in which the current quota is caught each year and theproportions taken from each area are equal to the average proportions removed from each areaover the last five years, and finally, OFL in which the catch is equal to the OFL applied to theterminal biomass in each area. These projections are available in the document entitled’OceanQuahogUpdateMT2020...pdf’ and found on the SASINF
Table 3: Short term projections of total fishery catch and spawning stockbiomass for ocean quahog based on a harvest scenario of fishing at FMSY proxybetween 2020 and 2026.
Year Catch (mt) SSB (’000 mt) FFull
2020 44893 3694 1.02
Year Catch (mt) SSB (’000 mt) FFull
2021 44961 3686 1.022022 45001 3675 1.022023 45012 3664 1.022024 44994 3650 1.022025 44948 3636 1.022026 44875 3620 1.02
Special Comments:
• What are the most important sources of uncertainty in this stock assessment? Explain, anddescribe qualitatively how they affect the assessment results (such as estimates of biomass,F, recruitment, and population projections).
Scale has been uncertain in all previous ocean quahog assessments. Scale uncertainty isdriven by the the fact that the stock is lightly fished. Survey indices generally do not respondto contrast in fishing intensity and the model has difficulty deciding on scale once there areenough animals to make fishing an unimportant driver of total mortality. Additionally, theNEFSC clam survey did not survey the northern area very well in the early part of the timeseries. Evidence for this includes relatively low precision and improbably large changes inabundance for a very long lived species that was not being fished at the time. Recent changesto the NEFSC clam survey have improved performance of the survey and the assessment forAtlantic surfclam. Scale is expected to be better defined in future assessments once newocean quahog survey data are collected.
Estimates of recruitment remain uncertain as the survey gear does not select well foryounger animals. Uncertainty in recruitment is relatively unimportant in this stock due totheir longevity and low fishing mortality.
• Does this assessment model have a retrospective pattern? If so, is the pattern minor, ormajor? (A major retrospective pattern occurs when the adjusted SSB or FFull lies outsideof the approximate joint confidence region for SSB and FFull).
No retrospective adjustment of spawning stock biomass or fishing mortality in 2019 was
2020 Assessment Update of ocean quahog draft working paper for peer review only2

required. The 7-year Mohn’s ρ, relative to SSB, was 0.008 in 2019. The 7-year Mohn’s ρ,relative to F, was -0.038 in 2019.
• Based on this stock assessment, are population projections well determined or uncertain? Ifthis stock is in a rebuilding plan, how do the projections compare to the rebuilding schedule?
Population projections for ocean quahog, are reasonably well determined and projectedbiomass from the last assessment was within the confidence bounds of the biomass estimatedin the current assessment. This stock was not in a rebuilding plan.
• Describe any changes that were made to the current stock assessment, beyond incorporatingadditional years of data and the effect these changes had on the assessment and stock status.
No changes were made to the ocean quahog assessment for this update beyond updatingto the latest version of Stock Sythesis. No new survey data was available, but the NEFSCclam survey was re-stratified see the section ’Build a Bridge’ in’OceanQuahogUpdateMT2020...pdf ’ found on the SASINF.
• If the stock status has changed a lot since the previous assessment, explain why thisoccurred.
Stock status did not change. Without any new survey data since the last assessment,there was very little change of any kind.
• Provide qualitative statements describing the condition of the stock that relate to stockstatus.
The assessment shows that the ocean quahog stock remains lightly fished and atrelatively high abundance. Empirical estimates of abundance and exploitation rate supportassessment results - see the section entitled ’Plan B assessment’ in’OceanQuahogUpdateMT2020...pdf ’ found on the SASINF.
• Indicate what data or studies are currently lacking and which would be needed most toimprove this stock assessment in the future.
There is little age data for ocean quahog available due to the high cost of aging.Therefore growth changes over time are relatively poorly known. Additional work on age andgrowth would be useful.
• Are there other important issues?No.
References:Northeast Fisheries Science Center. 2017. In: 63rd Northeast Regional Stock AssessmentWorkshop (63rd SAW) Assessment Summary Report. US DeptCommer, Northeast Fish Sci Cent Ref Doc. 17-10; 409 p. http://www.nefsc.noaa.gov/publications/
2020 Assessment Update of ocean quahog draft working paper for peer review only3

Figure 1: Trends in spawning stock biomass of ocean quahog between 1982 and2020 from the current (solid line) and previous (dashed line) assessment and
the corresponding SSBThreshold (1
2SSBMSY proxy ; horizontal dashed line)
as well as SSBTarget (SSBMSY proxy ; horizontal dotted line) based on the2020 assessment. Units of SSB are the ratio of annual biomass to the biomassthreshold ( SSB
SSBThreshold). The approximate 90% lognormal confidence intervals
are shown.
2020 Assessment Update of ocean quahog draft working paper for peer review only4
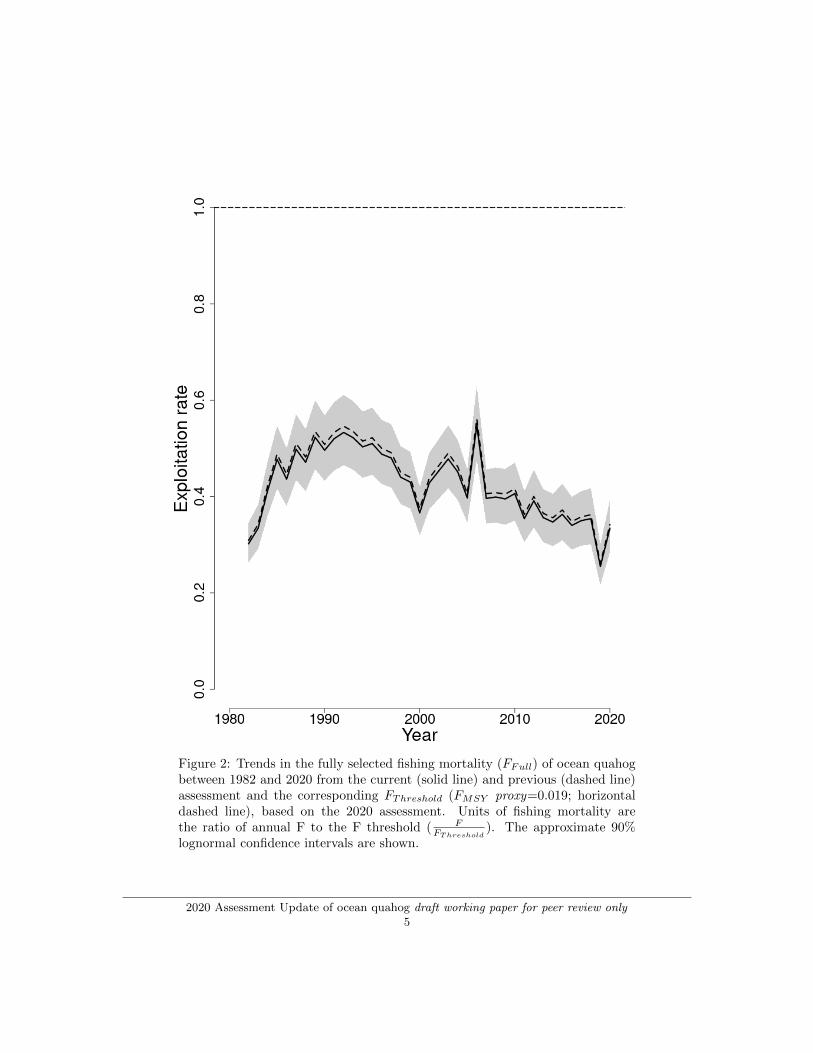
Figure 2: Trends in the fully selected fishing mortality (FFull) of ocean quahogbetween 1982 and 2020 from the current (solid line) and previous (dashed line)assessment and the corresponding FThreshold (FMSY proxy=0.019; horizontaldashed line), based on the 2020 assessment. Units of fishing mortality arethe ratio of annual F to the F threshold ( F
FThreshold). The approximate 90%
lognormal confidence intervals are shown.
2020 Assessment Update of ocean quahog draft working paper for peer review only5
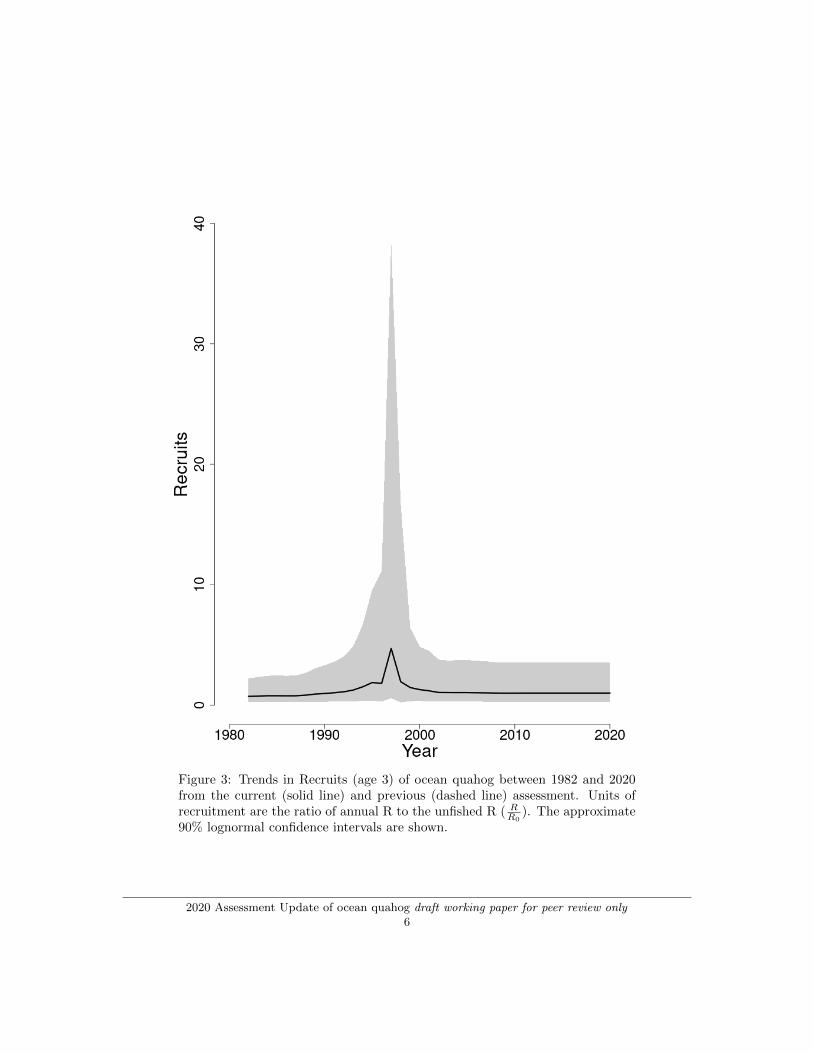
Figure 3: Trends in Recruits (age 3) of ocean quahog between 1982 and 2020from the current (solid line) and previous (dashed line) assessment. Units ofrecruitment are the ratio of annual R to the unfished R ( R
R0). The approximate
90% lognormal confidence intervals are shown.
2020 Assessment Update of ocean quahog draft working paper for peer review only6
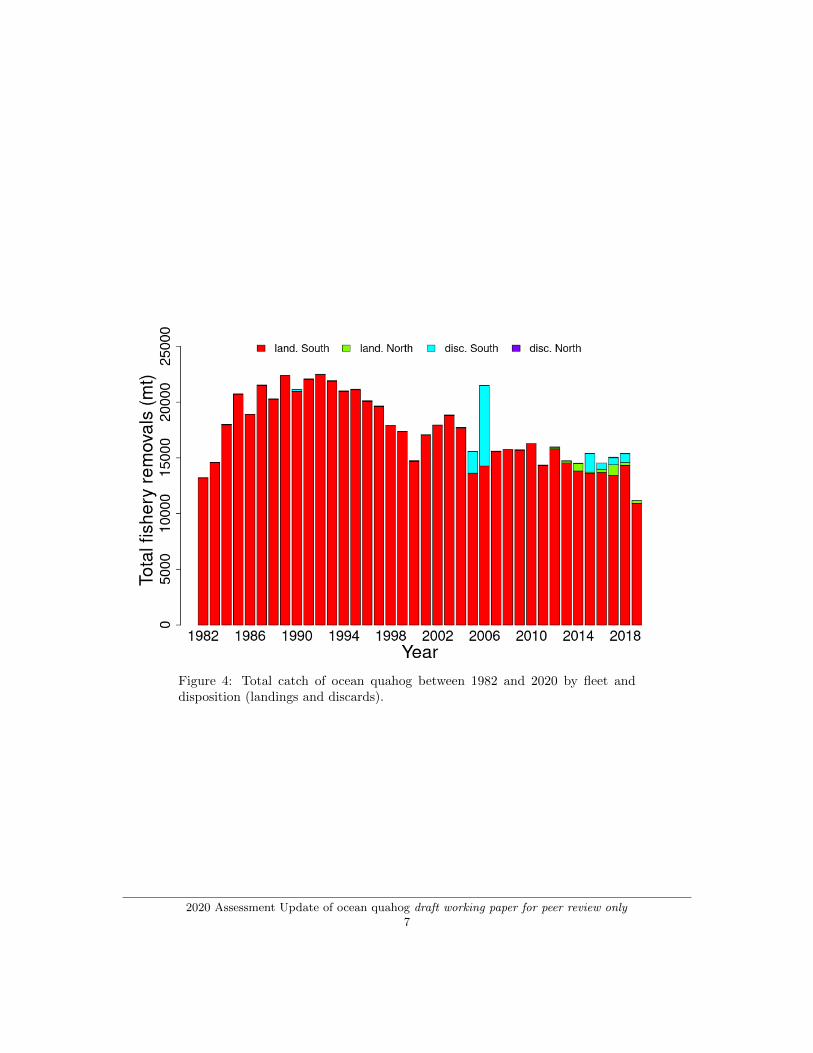
Figure 4: Total catch of ocean quahog between 1982 and 2020 by fleet anddisposition (landings and discards).
2020 Assessment Update of ocean quahog draft working paper for peer review only7
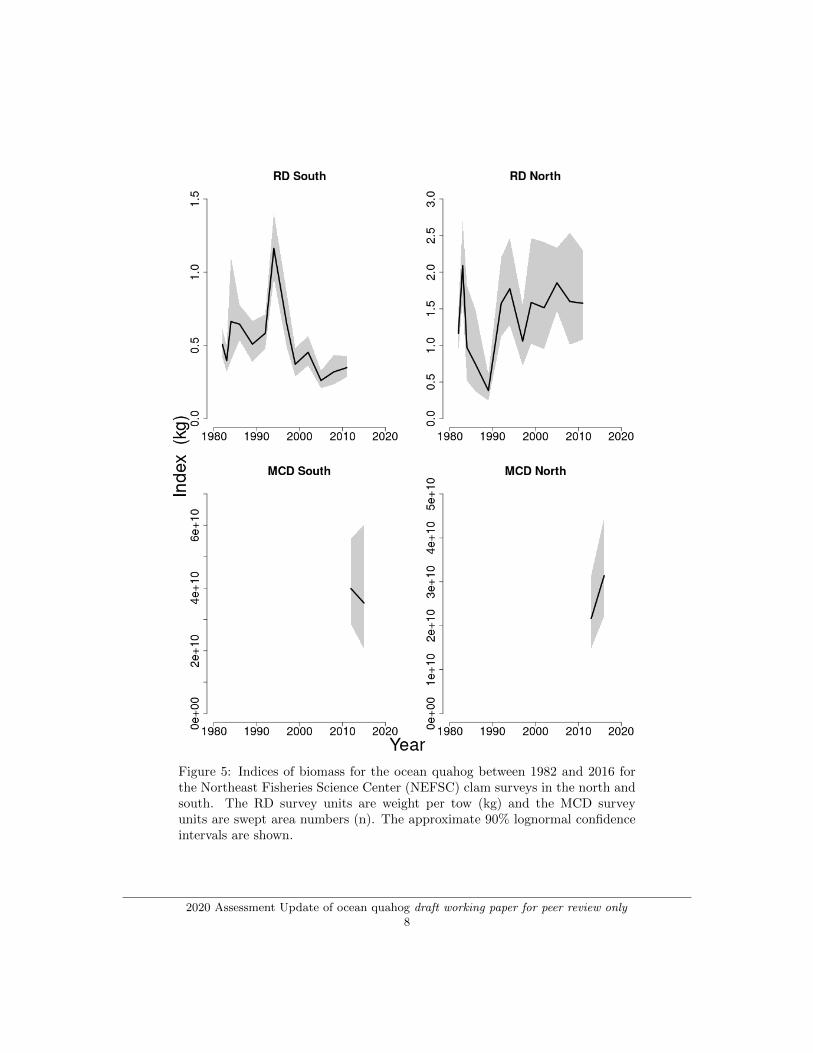
Figure 5: Indices of biomass for the ocean quahog between 1982 and 2016 forthe Northeast Fisheries Science Center (NEFSC) clam surveys in the north andsouth. The RD survey units are weight per tow (kg) and the MCD surveyunits are swept area numbers (n). The approximate 90% lognormal confidenceintervals are shown.
2020 Assessment Update of ocean quahog draft working paper for peer review only8
Estimated Proportion of Undersized Surfclam Landings for 2019
John Sullivan. Analysis and Program Support Division
Greater Atlantic Regional Fisheries Office National Marine Fisheries Service
November 26, 2019 Introduction The Code of Federal Regulations includes a provision for the suspension of minimum landing size regulations for surfclam (Spisula solidissima) [CFR 50, §648.75 (b)(3)]:
“upon recommendation of the Mid-Atlantic Fishery Management Council (MAFMC), the Regional Administrator may suspend annually, by publication in the Federal Register, the minimum shell-height standard unless discard, catch, and survey data indicate that 30 percent of the surfclams are smaller than 4.75 inches (12.065 cm) and the overall reduced shell height is not attributable to beds where the growth of individual surfclams has been reduced because of density dependent factors.”
Each year an analysis of the size composition of surfclam landings is conducted to inform any recommendation by the Mid-Atlantic Council to the Regional Administrator concerning surfclam minimum size restrictions. The following report summarizes the analysis of Atlantic surfclam landings in 2019. Data Sources and Procedures Samples of surfclam landings were collected from the Georges Bank, New Jersey and DelMarVa stock areas. These samples were not evenly distributed and, therefore, had to be weighted by stock area and volume. The coast-wide distribution of undersized surfclams was then calculated. The estimate for coast wide undersized surfclams landed was determined by calculating a weighted average proportion of undersized surfclams with equation 1:
= ∑
=PWP j
n
ijcˆˆ
1
(1)
where
Pcˆ is the estimated coast wide proportion of undersized surfclams landed
W j
is the proportion of landings from stock area j in the coast wide reported landings,
as calculated with equation 2:
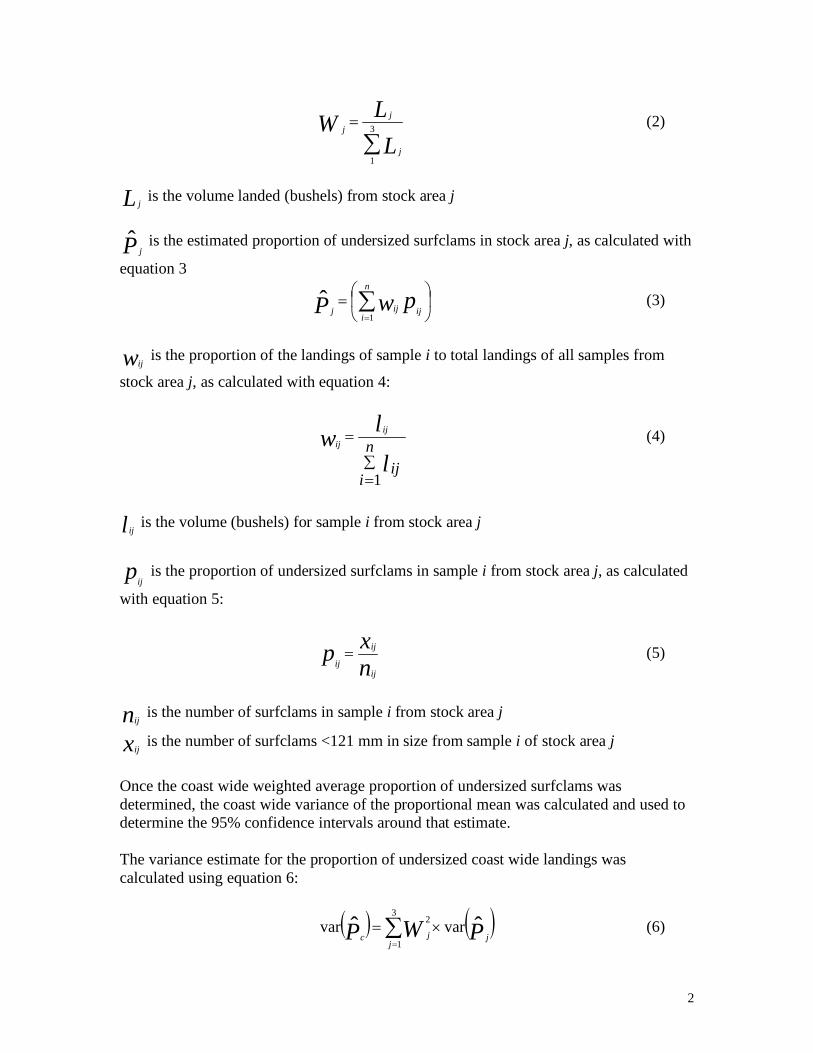
2
∑
= 3
1L
LWj
jj (2)
Lj is the volume landed (bushels) from stock area j
P jˆ is the estimated proportion of undersized surfclams in stock area j, as calculated with
equation 3
= ∑
=pwP ij
n
iijj
1ˆ (3)
wij
is the proportion of the landings of sample i to total landings of all samples from
stock area j, as calculated with equation 4:
∑=
=n
iijl
lw ijij
1
(4)
lij
is the volume (bushels) for sample i from stock area j
pij
is the proportion of undersized surfclams in sample i from stock area j, as calculated
with equation 5:
nxp
ij
ij
ij= (5)
nij
is the number of surfclams in sample i from stock area j
xij is the number of surfclams <121 mm in size from sample i of stock area j
Once the coast wide weighted average proportion of undersized surfclams was determined, the coast wide variance of the proportional mean was calculated and used to determine the 95% confidence intervals around that estimate. The variance estimate for the proportion of undersized coast wide landings was calculated using equation 6:
( ) ( )PWP jj
jcˆˆ varvar
3
1
2×= ∑=
(6)
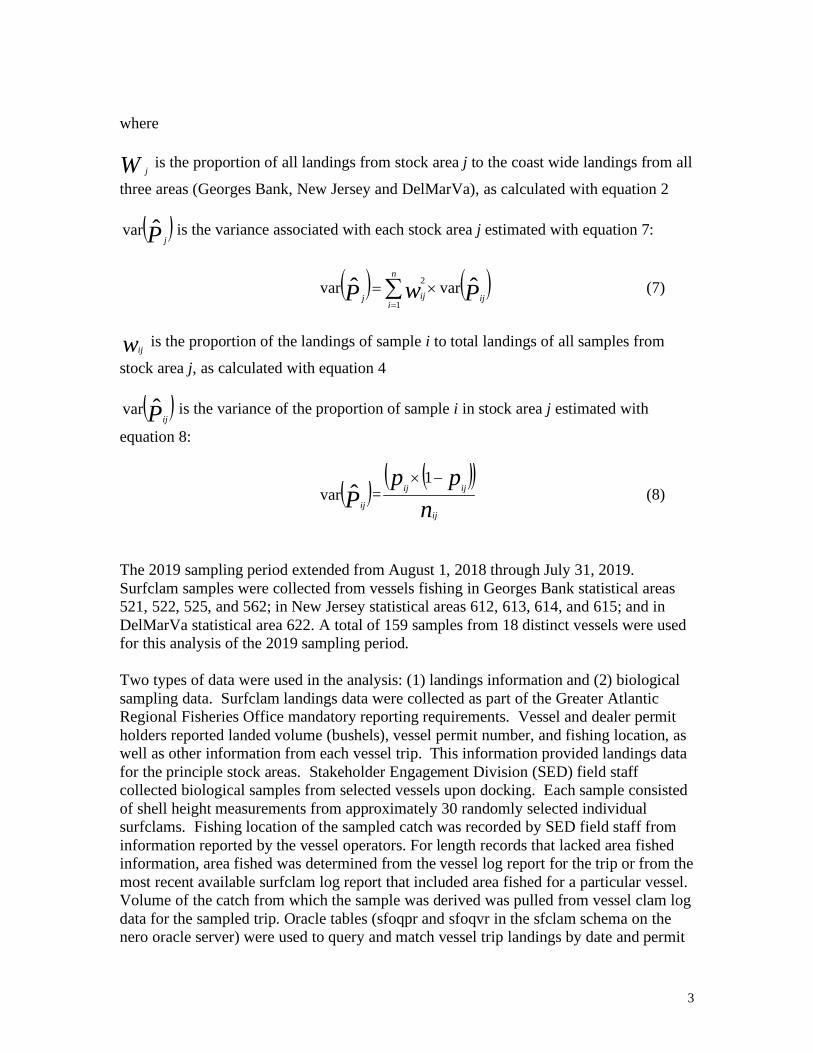
3
where W j
is the proportion of all landings from stock area j to the coast wide landings from all
three areas (Georges Bank, New Jersey and DelMarVa), as calculated with equation 2
( )P jˆvar is the variance associated with each stock area j estimated with equation 7:
( ) ( )PwP ij
n
iijj
ˆˆ varvar1
2 ×= ∑=
(7)
wij
is the proportion of the landings of sample i to total landings of all samples from
stock area j, as calculated with equation 4
( )Pijˆvar is the variance of the proportion of sample i in stock area j estimated with
equation 8:
( )Pijˆvar =
( )( )n
ppij
ijij−× 1
(8)
The 2019 sampling period extended from August 1, 2018 through July 31, 2019. Surfclam samples were collected from vessels fishing in Georges Bank statistical areas 521, 522, 525, and 562; in New Jersey statistical areas 612, 613, 614, and 615; and in DelMarVa statistical area 622. A total of 159 samples from 18 distinct vessels were used for this analysis of the 2019 sampling period. Two types of data were used in the analysis: (1) landings information and (2) biological sampling data. Surfclam landings data were collected as part of the Greater Atlantic Regional Fisheries Office mandatory reporting requirements. Vessel and dealer permit holders reported landed volume (bushels), vessel permit number, and fishing location, as well as other information from each vessel trip. This information provided landings data for the principle stock areas. Stakeholder Engagement Division (SED) field staff collected biological samples from selected vessels upon docking. Each sample consisted of shell height measurements from approximately 30 randomly selected individual surfclams. Fishing location of the sampled catch was recorded by SED field staff from information reported by the vessel operators. For length records that lacked area fished information, area fished was determined from the vessel log report for the trip or from the most recent available surfclam log report that included area fished for a particular vessel. Volume of the catch from which the sample was derived was pulled from vessel clam log data for the sampled trip. Oracle tables (sfoqpr and sfoqvr in the sfclam schema on the nero oracle server) were used to query and match vessel trip landings by date and permit
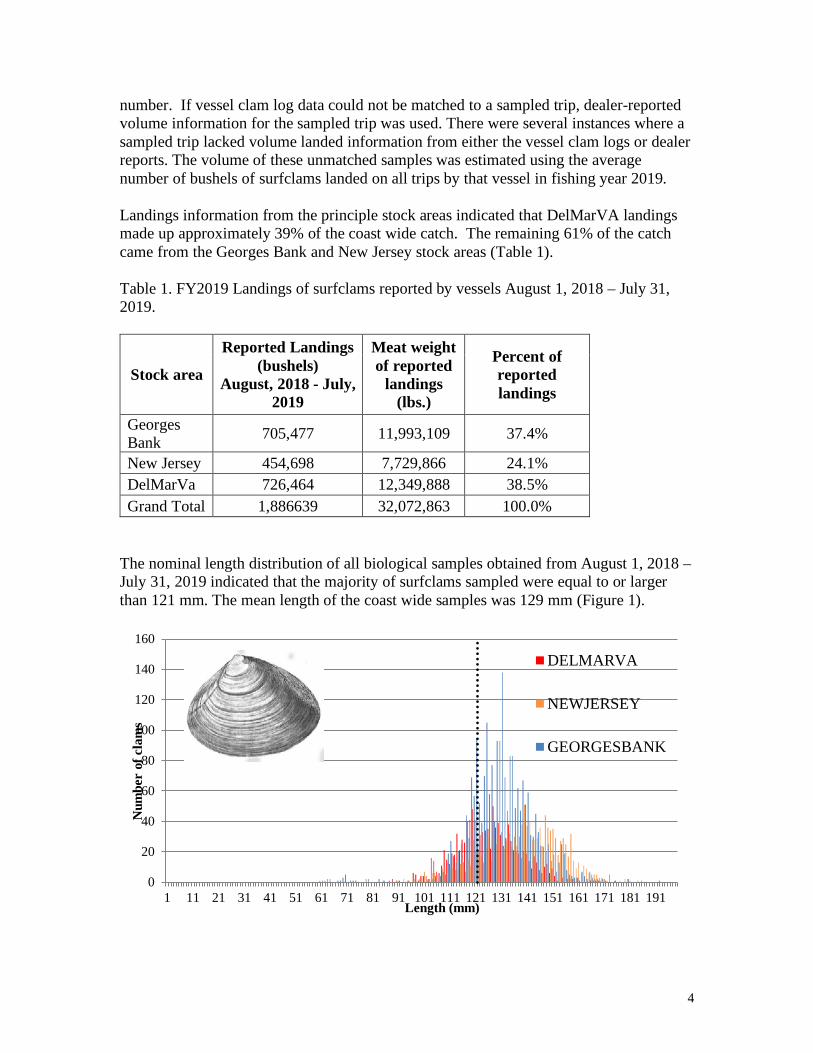
4
number. If vessel clam log data could not be matched to a sampled trip, dealer-reported volume information for the sampled trip was used. There were several instances where a sampled trip lacked volume landed information from either the vessel clam logs or dealer reports. The volume of these unmatched samples was estimated using the average number of bushels of surfclams landed on all trips by that vessel in fishing year 2019. Landings information from the principle stock areas indicated that DelMarVA landings made up approximately 39% of the coast wide catch. The remaining 61% of the catch came from the Georges Bank and New Jersey stock areas (Table 1). Table 1. FY2019 Landings of surfclams reported by vessels August 1, 2018 – July 31, 2019.
Stock area
Reported Landings (bushels)
August, 2018 - July, 2019
Meat weight of reported
landings (lbs.)
Percent of reported landings
Georges Bank 705,477 11,993,109 37.4%
New Jersey 454,698 7,729,866 24.1% DelMarVa 726,464 12,349,888 38.5% Grand Total 1,886639 32,072,863 100.0%
The nominal length distribution of all biological samples obtained from August 1, 2018 – July 31, 2019 indicated that the majority of surfclams sampled were equal to or larger than 121 mm. The mean length of the coast wide samples was 129 mm (Figure 1).
0
20
40
60
80
100
120
140
160
1 11 21 31 41 51 61 71 81 91 101 111 121 131 141 151 161 171 181 191
Num
ber
of c
lam
s
Length (mm)
DELMARVA
NEWJERSEY
GEORGESBANK
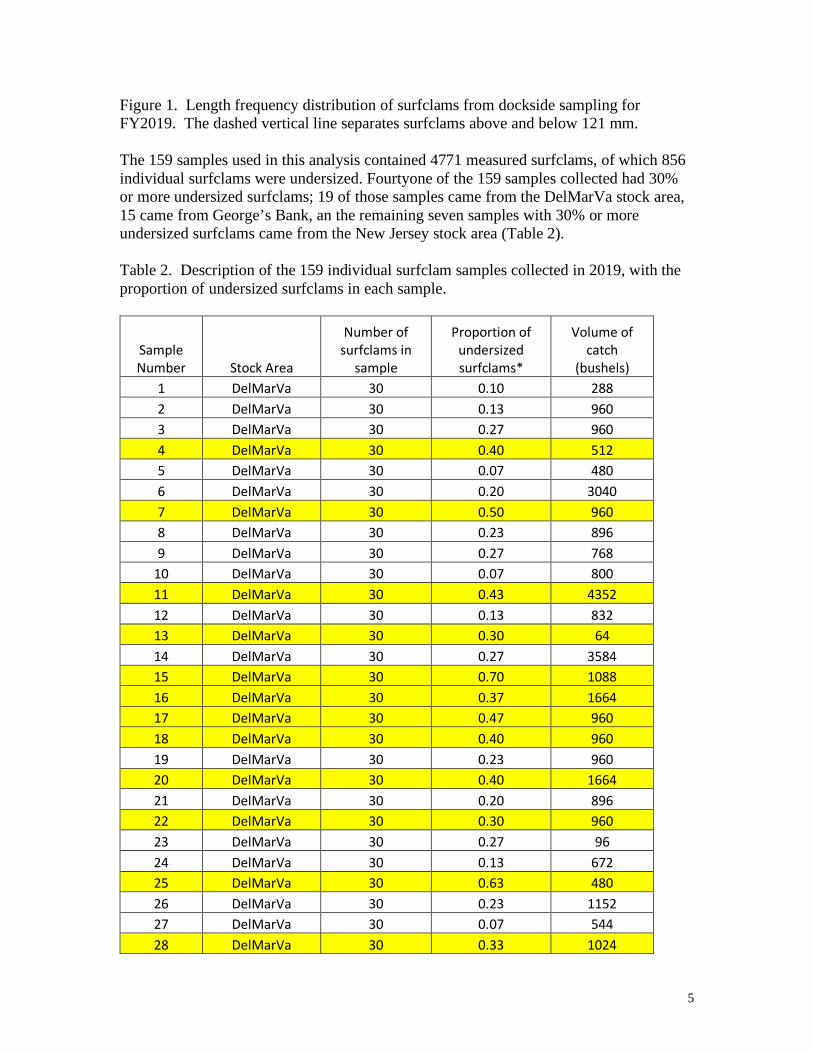
5
Figure 1. Length frequency distribution of surfclams from dockside sampling for FY2019. The dashed vertical line separates surfclams above and below 121 mm. The 159 samples used in this analysis contained 4771 measured surfclams, of which 856 individual surfclams were undersized. Fourtyone of the 159 samples collected had 30% or more undersized surfclams; 19 of those samples came from the DelMarVa stock area, 15 came from George’s Bank, an the remaining seven samples with 30% or more undersized surfclams came from the New Jersey stock area (Table 2). Table 2. Description of the 159 individual surfclam samples collected in 2019, with the proportion of undersized surfclams in each sample.
Sample Number Stock Area
Number of surfclams in
sample
Proportion of undersized surfclams*
Volume of catch
(bushels) 1 DelMarVa 30 0.10 288 2 DelMarVa 30 0.13 960 3 DelMarVa 30 0.27 960 4 DelMarVa 30 0.40 512 5 DelMarVa 30 0.07 480 6 DelMarVa 30 0.20 3040 7 DelMarVa 30 0.50 960 8 DelMarVa 30 0.23 896 9 DelMarVa 30 0.27 768
10 DelMarVa 30 0.07 800 11 DelMarVa 30 0.43 4352 12 DelMarVa 30 0.13 832 13 DelMarVa 30 0.30 64 14 DelMarVa 30 0.27 3584 15 DelMarVa 30 0.70 1088 16 DelMarVa 30 0.37 1664 17 DelMarVa 30 0.47 960 18 DelMarVa 30 0.40 960 19 DelMarVa 30 0.23 960 20 DelMarVa 30 0.40 1664 21 DelMarVa 30 0.20 896 22 DelMarVa 30 0.30 960 23 DelMarVa 30 0.27 96 24 DelMarVa 30 0.13 672 25 DelMarVa 30 0.63 480 26 DelMarVa 30 0.23 1152 27 DelMarVa 30 0.07 544 28 DelMarVa 30 0.33 1024
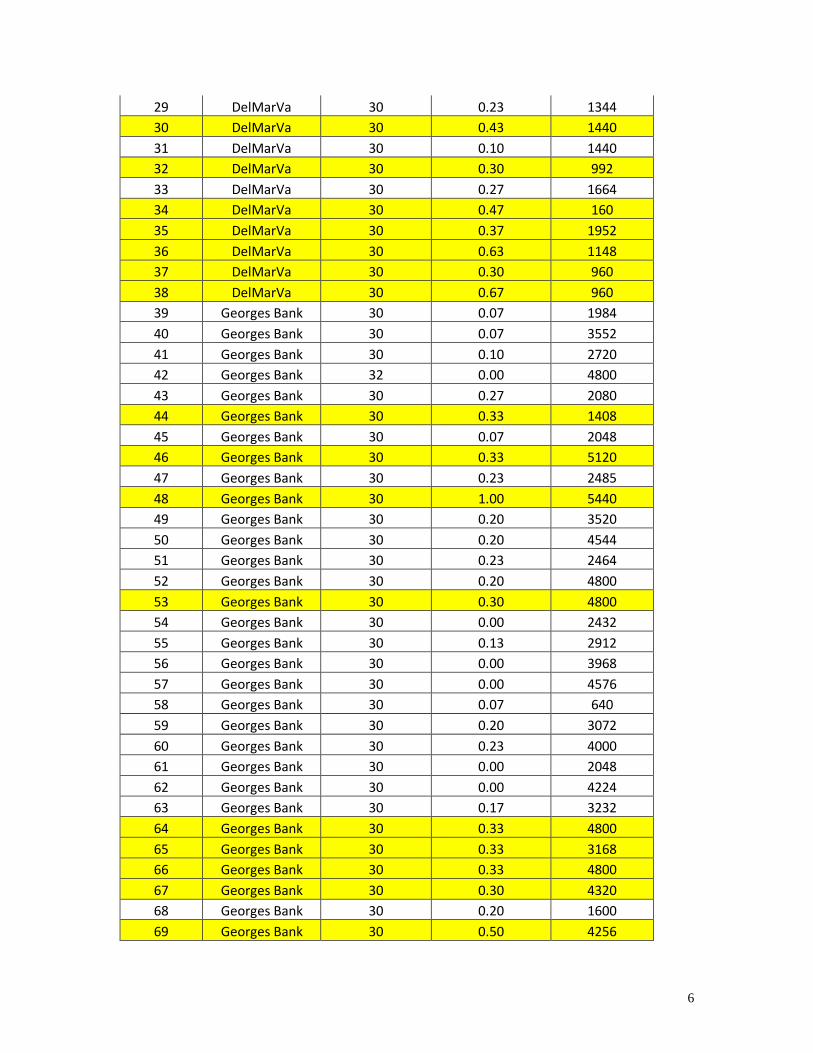
6
29 DelMarVa 30 0.23 1344 30 DelMarVa 30 0.43 1440 31 DelMarVa 30 0.10 1440 32 DelMarVa 30 0.30 992 33 DelMarVa 30 0.27 1664 34 DelMarVa 30 0.47 160 35 DelMarVa 30 0.37 1952 36 DelMarVa 30 0.63 1148 37 DelMarVa 30 0.30 960 38 DelMarVa 30 0.67 960 39 Georges Bank 30 0.07 1984 40 Georges Bank 30 0.07 3552 41 Georges Bank 30 0.10 2720 42 Georges Bank 32 0.00 4800 43 Georges Bank 30 0.27 2080 44 Georges Bank 30 0.33 1408 45 Georges Bank 30 0.07 2048 46 Georges Bank 30 0.33 5120 47 Georges Bank 30 0.23 2485 48 Georges Bank 30 1.00 5440 49 Georges Bank 30 0.20 3520 50 Georges Bank 30 0.20 4544 51 Georges Bank 30 0.23 2464 52 Georges Bank 30 0.20 4800 53 Georges Bank 30 0.30 4800 54 Georges Bank 30 0.00 2432 55 Georges Bank 30 0.13 2912 56 Georges Bank 30 0.00 3968 57 Georges Bank 30 0.00 4576 58 Georges Bank 30 0.07 640 59 Georges Bank 30 0.20 3072 60 Georges Bank 30 0.23 4000 61 Georges Bank 30 0.00 2048 62 Georges Bank 30 0.00 4224 63 Georges Bank 30 0.17 3232 64 Georges Bank 30 0.33 4800 65 Georges Bank 30 0.33 3168 66 Georges Bank 30 0.33 4800 67 Georges Bank 30 0.30 4320 68 Georges Bank 30 0.20 1600 69 Georges Bank 30 0.50 4256
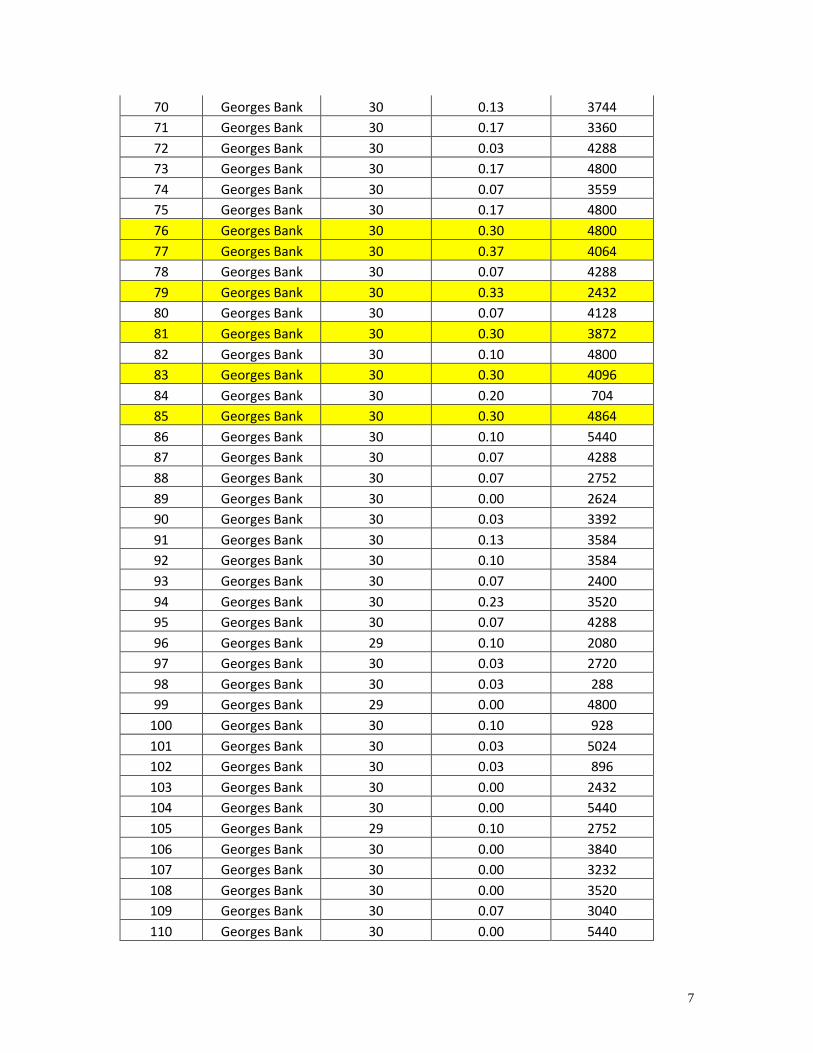
7
70 Georges Bank 30 0.13 3744 71 Georges Bank 30 0.17 3360 72 Georges Bank 30 0.03 4288 73 Georges Bank 30 0.17 4800 74 Georges Bank 30 0.07 3559 75 Georges Bank 30 0.17 4800 76 Georges Bank 30 0.30 4800 77 Georges Bank 30 0.37 4064 78 Georges Bank 30 0.07 4288 79 Georges Bank 30 0.33 2432 80 Georges Bank 30 0.07 4128 81 Georges Bank 30 0.30 3872 82 Georges Bank 30 0.10 4800 83 Georges Bank 30 0.30 4096 84 Georges Bank 30 0.20 704 85 Georges Bank 30 0.30 4864 86 Georges Bank 30 0.10 5440 87 Georges Bank 30 0.07 4288 88 Georges Bank 30 0.07 2752 89 Georges Bank 30 0.00 2624 90 Georges Bank 30 0.03 3392 91 Georges Bank 30 0.13 3584 92 Georges Bank 30 0.10 3584 93 Georges Bank 30 0.07 2400 94 Georges Bank 30 0.23 3520 95 Georges Bank 30 0.07 4288 96 Georges Bank 29 0.10 2080 97 Georges Bank 30 0.03 2720 98 Georges Bank 30 0.03 288 99 Georges Bank 29 0.00 4800
100 Georges Bank 30 0.10 928 101 Georges Bank 30 0.03 5024 102 Georges Bank 30 0.03 896 103 Georges Bank 30 0.00 2432 104 Georges Bank 30 0.00 5440 105 Georges Bank 29 0.10 2752 106 Georges Bank 30 0.00 3840 107 Georges Bank 30 0.00 3232 108 Georges Bank 30 0.00 3520 109 Georges Bank 30 0.07 3040 110 Georges Bank 30 0.00 5440

8
111 Georges Bank 31 0.03 3392 112 Georges Bank 30 0.10 4288 113 Georges Bank 30 0.00 5440 114 New Jersey 30 0.50 928 115 New Jersey 30 0.03 480 116 New Jersey 30 0.53 996 117 New Jersey 30 0.07 480 118 New Jersey 30 0.20 960 119 New Jersey 30 0.17 512 120 New Jersey 30 0.03 704 121 New Jersey 30 0.43 1024 122 New Jersey 30 0.10 512 123 New Jersey 30 0.37 747 124 New Jersey 30 0.03 480 125 New Jersey 30 0.07 480 126 New Jersey 30 0.13 480 127 New Jersey 30 0.03 480 128 New Jersey 30 0.00 896 129 New Jersey 30 0.00 960 130 New Jersey 30 0.10 480 131 New Jersey 30 0.00 480 132 New Jersey 30 0.00 480 133 New Jersey 30 0.00 2048 134 New Jersey 30 0.00 2048 135 New Jersey 30 0.03 704 136 New Jersey 30 0.00 480 137 New Jersey 30 0.00 1472 138 New Jersey 30 0.00 640 139 New Jersey 30 0.07 832 140 New Jersey 30 0.07 1760 141 New Jersey 30 0.13 480 142 New Jersey 30 0.03 1536 143 New Jersey 30 0.47 1440 144 New Jersey 30 0.03 960 145 New Jersey 30 0.17 960 146 New Jersey 30 0.10 480 147 New Jersey 30 0.03 544 148 New Jersey 30 0.00 960 149 New Jersey 30 0.63 960 150 New Jersey 30 0.00 960 151 New Jersey 30 0.20 864

9
152 New Jersey 30 0.03 768 153 New Jersey 30 0.00 736 154 New Jersey 30 0.00 672 155 New Jersey 30 0.13 1920 156 New Jersey 31 0.16 1344 157 New Jersey 30 0.30 2688 158 New Jersey 30 0.23 1344 159 New Jersey 30 0.07 1344
*samples with more than 30% undersized surfclams are highlighted. Estimation Results An estimated 22.0% of the coast wide surfclam landings to date in 2019 were undersized. The lower and upper 95% confidence bounds for this estimate were 21.1% and 22.8%. These estimates are below the 30% maximum that would preclude the Regional Administrator from suspending the minimum shell height standard (Table 3). Table 3. Proportional distribution of 2019 undersized surfclams by area and coast-wide.
Area Estimated percentage of surfclams <121 mm
Lower 95% Confidence Interval
Upper 95% Confidence Interval
Georges Bank 18.2% 18.2% 18.3% New Jersey 11.0% 10.9% 11.0% DelMarVa 32.5% 32.2% 32.7%
Coast-wide* 22.0% 21.1% 22.8% * weighted mean
Surfclam species diagnostics and population connectivity estimates to inform management
PI: Dr. Matthew Hare, Cornell University
Executive Summary:
Recent research has demonstrated that the commercially important surfclam, Spisula solidissima solidissima, has an overlapping range with populations of its sister-taxon, Spisula solidissima similis. The two ranges overlap nearshore in shallow shelf waters where S.s. solidissama grows slower and has a reduced maximum size, making it impossible to distinguish the two taxa in the field. In general, options for management of the surfclam fishery depend on connectivity between centers of abundance such as Georges Bank and the New Jersey shelf. In addition, the abundance, distribution and habitat affinities of the newly discovered S.s. similis populations need to be determined to properly interpret survey data and optimize nearshore regulations. Fortunately, the two taxa are easily distinguished using genetic markers and these data have provided preliminary indications of S.s. similis range distribution and suggest occasional hybridization with S.s. solidissima. The proposed study will develop an efficient, low-cost species diagnostic based on nuclear DNA markers so that large numbers of survey samples can be identified to determine the range and habitat affinities of each taxon. Second, a subset of samples from each taxon, including Georgia samples of S.s. similis, will be analyzed with high resolution genomic techniques to quantify the amount of gene flow connectivity occurring among populations of each clam taxon, as well as verify hybridization.
1
M E M O R A N D U M
Date: July 31, 2020
To: Michael P. Luisi, Chairman, MAMFC
From: Paul J. Rago, Ph.D., Chair, MAFMC Scientific and Statistical Committee
Subject: Report of the July 22 – 23, 2020 SSC Meeting
The SSC met via webinar on the 22nd and 23rd of July, 2020 to address the following topics: (1) ABC specifications for 2021-26 for Atlantic Surfclam, (2) ABC specifications for 2021-26 for Ocean Quahog, (3) ABC specifications for 2021-22 for Butterfish, (4) ABC specifications for 2021-2023 for Longfin Squid, (5) ABC specifications for 2021 for Atlantic Mackerel, (6) reviewed previously recommended ABC for Bluefish, and updated previously recommended 2021 ABCs with respect to the Councils recent risk policy for (7) Summer Flounder, (8) Scup, and (9) Black Sea Bass. The SSC also received two additional presentations on recent Council decisions related to the allocation amendment for (10) Summer Flounder, Scup, and Black Sea Bass, and the similar amendment for (11) Bluefish. Finally, under (12) Other Business the SSC proposed formation of a working group on role of economic factors in the ABC setting process and expressed concerns about the Council’s risk policy for long lived species (Attachment 1).
All 20 of the SSC members participated in the meeting (Attachment 2). The meeting was held entirely via webinar due to concerns regarding the COVID 19 pandemic. The webinar allowed attendees to participate by phone and computer speakers. In the face of some technical problems this caused and despite a packed agenda, the support of Council staff, especially Brandon Muffley, Jason Didden and Mary Sabo, was exemplary.
The meeting opened with a review of the Agenda with a special note that this would be the first time the SSC would be implementing the determination of the OFL CV level during the meeting. This meeting also represented the first time that the NRCC approved stock assessment strategy was implemented which included data updates for 5 species, a Level 1 Management Track Review for one species, a Level 2 Management Track for one species, and Level 3 ManagementTrack reviews for 2 species. The Council’s recently approved risk policy for overfishing was applied for the first time as well to not only those stock with updated assessments but also for stocks that had previously approved multiyear ABCs. The newly revised Council risk policy, results in slightly higher ABC determinations over all levels of stock biomass.
Mid-Atlantic Fishery Management Council 800 North State Street, Suite 201, Dover, DE 19901
Phone: 302-674-2331 ǀ FAX: 302-674-5399 ǀ www.mafmc.org Michael P. Luisi, Chairman ǀ G. Warren Elliott, Vice Chairman
Christopher M. Moore, Ph.D., Executive Director
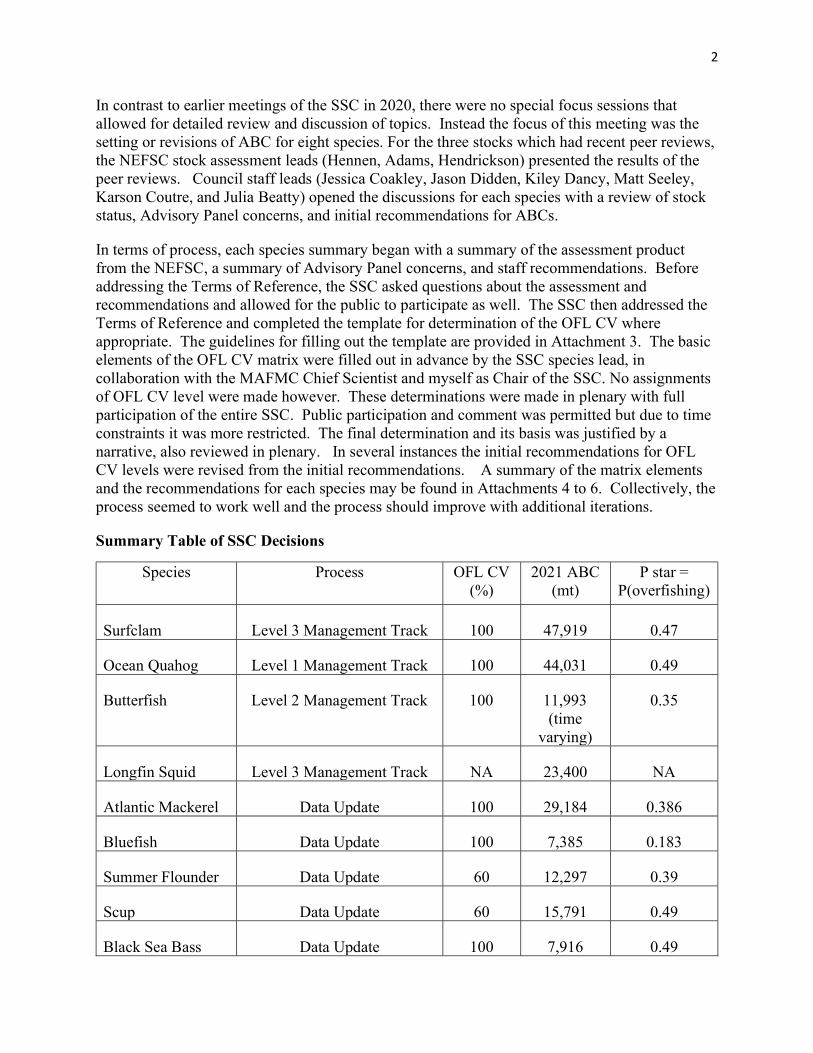
2
In contrast to earlier meetings of the SSC in 2020, there were no special focus sessions that allowed for detailed review and discussion of topics. Instead the focus of this meeting was the setting or revisions of ABC for eight species. For the three stocks which had recent peer reviews, the NEFSC stock assessment leads (Hennen, Adams, Hendrickson) presented the results of the peer reviews. Council staff leads (Jessica Coakley, Jason Didden, Kiley Dancy, Matt Seeley, Karson Coutre, and Julia Beatty) opened the discussions for each species with a review of stock status, Advisory Panel concerns, and initial recommendations for ABCs.
In terms of process, each species summary began with a summary of the assessment product from the NEFSC, a summary of Advisory Panel concerns, and staff recommendations. Before addressing the Terms of Reference, the SSC asked questions about the assessment and recommendations and allowed for the public to participate as well. The SSC then addressed the Terms of Reference and completed the template for determination of the OFL CV where appropriate. The guidelines for filling out the template are provided in Attachment 3. The basic elements of the OFL CV matrix were filled out in advance by the SSC species lead, in collaboration with the MAFMC Chief Scientist and myself as Chair of the SSC. No assignments of OFL CV level were made however. These determinations were made in plenary with full participation of the entire SSC. Public participation and comment was permitted but due to time constraints it was more restricted. The final determination and its basis was justified by a narrative, also reviewed in plenary. In several instances the initial recommendations for OFL CV levels were revised from the initial recommendations. A summary of the matrix elements and the recommendations for each species may be found in Attachments 4 to 6. Collectively, the process seemed to work well and the process should improve with additional iterations.
Summary Table of SSC Decisions
Species Process OFL CV (%)
2021 ABC (mt)
P star = P(overfishing)
Surfclam Level 3 Management Track 100 47,919 0.47
Ocean Quahog Level 1 Management Track 100 44,031 0.49
Butterfish Level 2 Management Track 100 11,993 (time
varying)
0.35
Longfin Squid Level 3 Management Track NA 23,400 NA
Atlantic Mackerel Data Update 100 29,184 0.386
Bluefish Data Update 100 7,385 0.183
Summer Flounder Data Update 60 12,297 0.39
Scup Data Update 60 15,791 0.49
Black Sea Bass Data Update 100 7,916 0.49
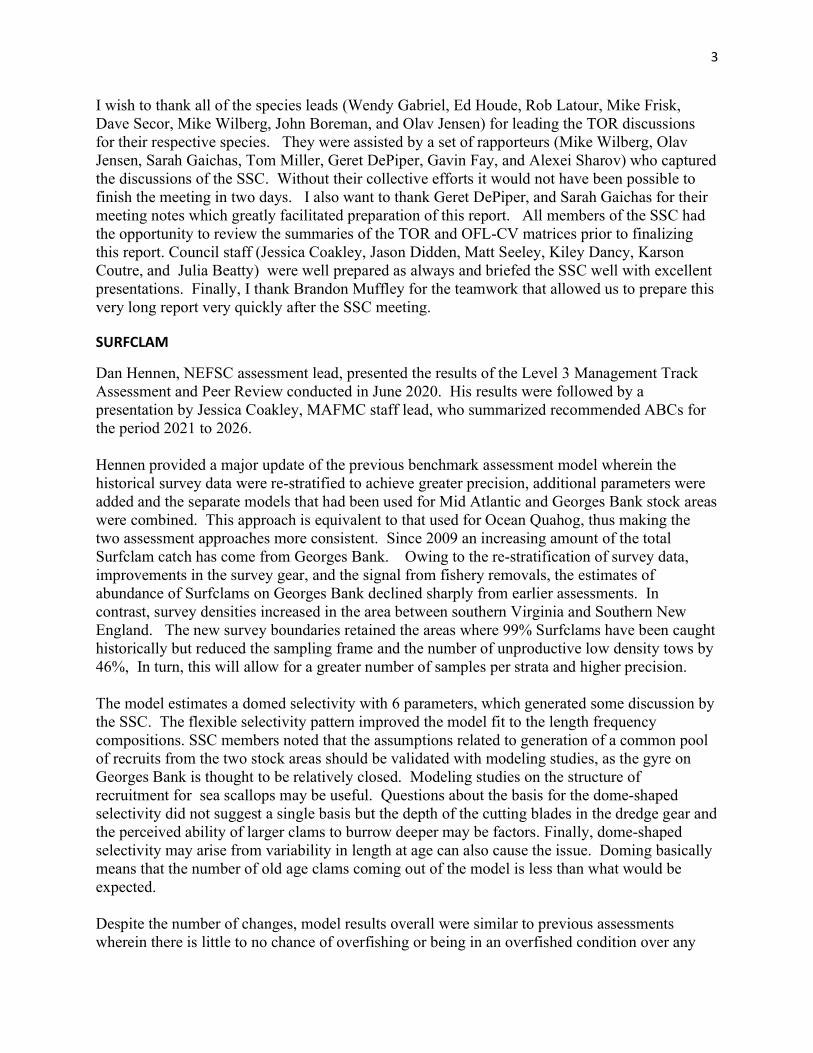
3
I wish to thank all of the species leads (Wendy Gabriel, Ed Houde, Rob Latour, Mike Frisk, Dave Secor, Mike Wilberg, John Boreman, and Olav Jensen) for leading the TOR discussions for their respective species. They were assisted by a set of rapporteurs (Mike Wilberg, Olav Jensen, Sarah Gaichas, Tom Miller, Geret DePiper, Gavin Fay, and Alexei Sharov) who captured the discussions of the SSC. Without their collective efforts it would not have been possible to finish the meeting in two days. I also want to thank Geret DePiper, and Sarah Gaichas for their meeting notes which greatly facilitated preparation of this report. All members of the SSC had the opportunity to review the summaries of the TOR and OFL-CV matrices prior to finalizing this report. Council staff (Jessica Coakley, Jason Didden, Matt Seeley, Kiley Dancy, Karson Coutre, and Julia Beatty) were well prepared as always and briefed the SSC well with excellent presentations. Finally, I thank Brandon Muffley for the teamwork that allowed us to prepare this very long report very quickly after the SSC meeting.
SURFCLAM
Dan Hennen, NEFSC assessment lead, presented the results of the Level 3 Management Track Assessment and Peer Review conducted in June 2020. His results were followed by a presentation by Jessica Coakley, MAFMC staff lead, who summarized recommended ABCs for the period 2021 to 2026. Hennen provided a major update of the previous benchmark assessment model wherein the historical survey data were re-stratified to achieve greater precision, additional parameters were added and the separate models that had been used for Mid Atlantic and Georges Bank stock areas were combined. This approach is equivalent to that used for Ocean Quahog, thus making the two assessment approaches more consistent. Since 2009 an increasing amount of the total Surfclam catch has come from Georges Bank. Owing to the re-stratification of survey data, improvements in the survey gear, and the signal from fishery removals, the estimates of abundance of Surfclams on Georges Bank declined sharply from earlier assessments. In contrast, survey densities increased in the area between southern Virginia and Southern New England. The new survey boundaries retained the areas where 99% Surfclams have been caught historically but reduced the sampling frame and the number of unproductive low density tows by 46%, In turn, this will allow for a greater number of samples per strata and higher precision. The model estimates a domed selectivity with 6 parameters, which generated some discussion by the SSC. The flexible selectivity pattern improved the model fit to the length frequency compositions. SSC members noted that the assumptions related to generation of a common pool of recruits from the two stock areas should be validated with modeling studies, as the gyre on Georges Bank is thought to be relatively closed. Modeling studies on the structure of recruitment for sea scallops may be useful. Questions about the basis for the dome-shaped selectivity did not suggest a single basis but the depth of the cutting blades in the dredge gear and the perceived ability of larger clams to burrow deeper may be factors. Finally, dome-shaped selectivity may arise from variability in length at age can also cause the issue. Doming basically means that the number of old age clams coming out of the model is less than what would be expected. Despite the number of changes, model results overall were similar to previous assessments wherein there is little to no chance of overfishing or being in an overfished condition over any

4
plausible range of harvest levels or forecast periods. Comparisons of previous abundance estimates with those updated in this assessment are comparable to earlier assessments but are well below the SAW 61 estimates which had large variations in scale. Recruitment appears to be consistently strong in both stock areas. Comments from the public requested clarification on the basis of the scale changes and expressed concerns about the reduction of the survey area. It was noted that the present survey focuses on areas with much higher overall densities, and that the excluded areas constitute a relatively small fraction of the total biomass. Nonetheless, the presence of Surfclams outside the area of the survey would mean that estimates of fishing mortality rates would be underestimated. Most certainly these areas are not considered economically feasible fishing areas with present technologies. Another concern was the apparent mixing of Surfclams with the Southern Surflam (common name Ravenelli’s Surfclam) in inshore areas. A genetic study on the magnitude of this problem is underway. Jessica Coakley, MAFMC staff lead, followed with a report from the Advisory Panel and recommendations for ABCs. The fleet increased slightly by 4 vessels, to a total of 43 vessels in 2019. Compared to 2018, the 7 processors in 5 states handled about a 7% decrease in ex-vessel value even though average price per bushel increased by about 1%. Industry advisor identified three critical issues: the effects of Covid 19 on retail sales, support for research to increase harvest opportunities in the Great South Channel, and the challenges of offshore wind energy development. Staff recommendations included setting specifications for 6 years, consistent with NRCC approved schedule of years between assessments. The draft recommendation was to use an OFL CV of 150% and update the quotas with the Council’s revised risk policy. Further, the staff recommended the suspension of the 4.75” minimum size restriction on landings given the regulatory capacity to do so when 30% or less of the clams are under the size limit. Current estimates suggest that 22% of the clams are undersized; for economic reasons, undersized clams should be avoided. The SSC’s responses to the terms of reference provided by the MAFMC (in italics) are as follows. For Atlantic Surfclam, the SSC will provide a written report that identifies the following for the 2021-2026 fishing years: 1) Based on the criteria identified in the Acceptable Biological Catch (ABC) control rule,
assign the stock to one of four types of control rules (analytically derived, modified by the assessment team, modified by the SSC, or OFL cannot be specified) the SSC deems most appropriate for the information content of the most recent stock assessment; The SSC deemed that Atlantic Surfclam should be considered a stock with an SSC-modified OFL probability distribution.
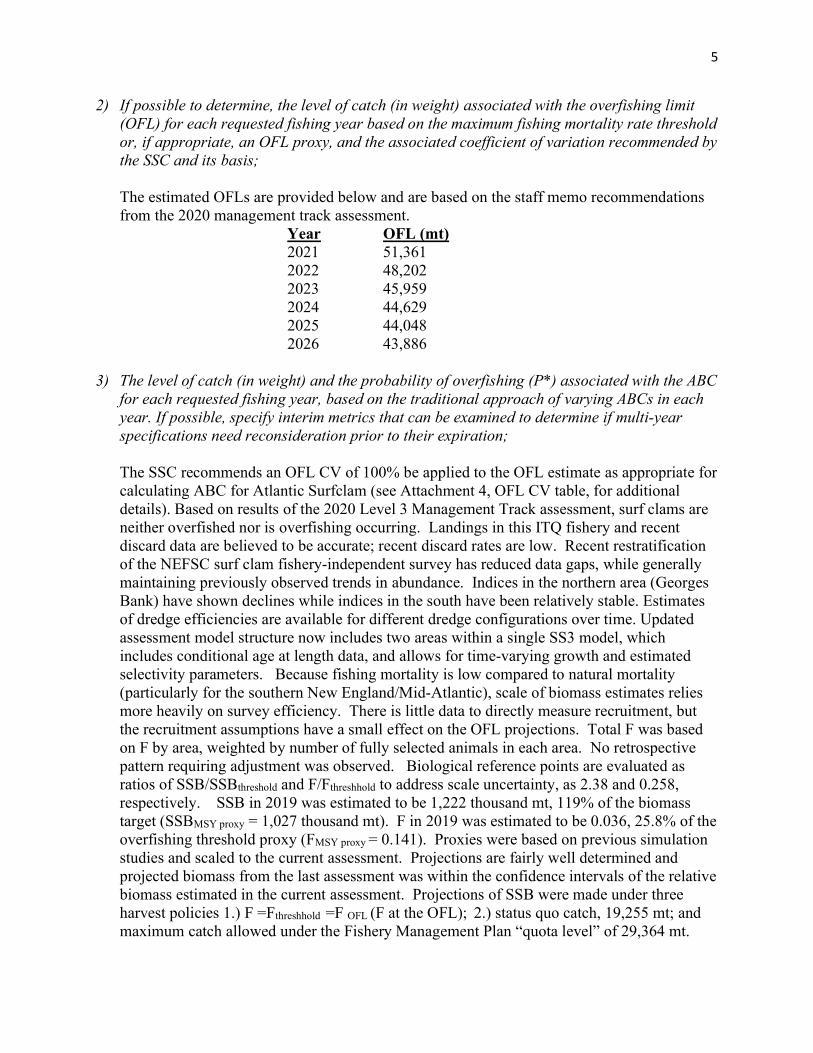
5
2) If possible to determine, the level of catch (in weight) associated with the overfishing limit (OFL) for each requested fishing year based on the maximum fishing mortality rate threshold or, if appropriate, an OFL proxy, and the associated coefficient of variation recommended by the SSC and its basis; The estimated OFLs are provided below and are based on the staff memo recommendations from the 2020 management track assessment.
Year OFL (mt) 2021 51,361 2022 48,202 2023 45,959 2024 44,629 2025 44,048 2026 43,886
3) The level of catch (in weight) and the probability of overfishing (P*) associated with the ABC
for each requested fishing year, based on the traditional approach of varying ABCs in each year. If possible, specify interim metrics that can be examined to determine if multi-year specifications need reconsideration prior to their expiration; The SSC recommends an OFL CV of 100% be applied to the OFL estimate as appropriate for calculating ABC for Atlantic Surfclam (see Attachment 4, OFL CV table, for additional details). Based on results of the 2020 Level 3 Management Track assessment, surf clams are neither overfished nor is overfishing occurring. Landings in this ITQ fishery and recent discard data are believed to be accurate; recent discard rates are low. Recent restratification of the NEFSC surf clam fishery-independent survey has reduced data gaps, while generally maintaining previously observed trends in abundance. Indices in the northern area (Georges Bank) have shown declines while indices in the south have been relatively stable. Estimates of dredge efficiencies are available for different dredge configurations over time. Updated assessment model structure now includes two areas within a single SS3 model, which includes conditional age at length data, and allows for time-varying growth and estimated selectivity parameters. Because fishing mortality is low compared to natural mortality (particularly for the southern New England/Mid-Atlantic), scale of biomass estimates relies more heavily on survey efficiency. There is little data to directly measure recruitment, but the recruitment assumptions have a small effect on the OFL projections. Total F was based on F by area, weighted by number of fully selected animals in each area. No retrospective pattern requiring adjustment was observed. Biological reference points are evaluated as ratios of SSB/SSBthreshold and F/Fthreshhold to address scale uncertainty, as 2.38 and 0.258, respectively. SSB in 2019 was estimated to be 1,222 thousand mt, 119% of the biomass target (SSBMSY proxy = 1,027 thousand mt). F in 2019 was estimated to be 0.036, 25.8% of the overfishing threshold proxy (FMSY proxy = 0.141). Proxies were based on previous simulation studies and scaled to the current assessment. Projections are fairly well determined and projected biomass from the last assessment was within the confidence intervals of the relative biomass estimated in the current assessment. Projections of SSB were made under three harvest policies 1.) F =Fthreshhold =F OFL (F at the OFL); 2.) status quo catch, 19,255 mt; and maximum catch allowed under the Fishery Management Plan “quota level” of 29,364 mt.

6
The 2020 management track assessment has a substantial shift in scale from the previous benchmark assessment. Under any scenario, biomass will remain above the biomass threshold. Under the second and third scenarios, projected Fs will be lower than the fishing mortality threshold. The status quo catch scenario appears most likely, based on historical landings and fishery conditions. Simulation analyses were conducted in the most recent benchmark assessment to identify the fishing mortality rate threshold. Using an OFL with a lognormal distribution with a CV = 100%, the SSC recommends the following ABCs:
Year ABC (mt) 2021 47,919 2022 44,522 2023 42,237 2024 40,946 2025 40,345 2026 40,264
4) The most significant sources of scientific uncertainty associated with determination of OFL
and ABC;
There was a large change in the estimated abundance from the previous benchmark to the most recent assessment.
The estimated dome-shaped selectivity patterns for the survey were not completely consistent with gear selectivity experiments.
Ecosystem analyses suggest Surfclam habitat is changing –decreasing in Delmarva and increasing in NJ and Long Island. The net effects on total habitat area and carrying capacity are unknown.
Model assumption of a 12% incidental mortality, which may have changed. The prior distribution on dredge efficiency has an unknown effect on setting the scale
of the model. Catchability was estimated differently for the old and new surveys. The abundance of southern Surfclam within the Atlantic Surfclam stock area remains
unknown. 5) Ecosystem considerations accounted for in the stock assessment, as appropriate, and any
additional ecosystem considerations that the SSC considered in selecting the ABC, including the basis for those additional considerations; No additional ecosystem considerations were taken into account in selecting the ABC.
6) Research or monitoring recommendations that would reduce the scientific uncertainty in the
ABC recommendation and/or improve the assessment level;
Need for increased understanding in the link/relationship between the OFL and reproductive potential of the Atlantic Surfclam stock.
7
Reproductive consequences of fishery operations and relationship of clam density (i.e., high concentration areas versus low density patches); clam density differences in Georges Bank and Southern Region.
Recovery potential of heavily fished areas. Increased understanding of stock dynamics at smaller spatial scales –scale needed is
likely finer than current survey gear and survey design. Evidence suggests that patch density in bivalves at small spatial scales can have a substantial impact on reproductive success.
The prior on survey dredge efficiency has an unknown effect on the scale of the model –more work may be needed.
Consider methods to estimate natural mortality (M) from the assessments by using data from shells and recently dead individuals.
Continue to develop the institutional capacity and support for age-length integrated models.
Include Nantucket Shoals in the surveyed area for Atlantic Surfclam. Explore the exchange of recruitment between the two stock areas (in particular
whether the southern area contributes recruits to Georges Bank). Continue the genetics study to determine the contribution of southern Surfclam in the
Atlantic Surfclam stock area. 7) The materials considered by the SSC in reaching its recommendations;
SSC TORs for Atlantic Surfclam Staff Memo: 2021-2026 Atlantic Surfclam ABC Recommendations Draft 2020 Management Track Assessment Report and NEFSC Data Portal
(https://apps-nefsc.fisheries.noaa.gov/saw/sasi/sasi_report_options.php) Draft 2020 Management Track Assessment Peer Review Panel Summary Report Draft OFL CV Decision Criteria Summary for Atlantic Surfclam 2020 Advisory Panel Atlantic Surfclam and Ocean Quahog Fishery Performance
Report 2020 Atlantic Surfclam Fishery Information Document Background: Proportion of Undersized Clams Analysis 61st SAW/SARC Assessment Summary Report (2016) 61st SAW/SARC Assessment Report (2016)
8) A conclusion that the recommendations provided by the SSC are based on scientific information the SSC believes meets the applicable National Standard guidelines for best scientific information available. The SSC believes that the recommendations provided are based on scientific information that meets the applicable National Standard guidelines for best scientific information available.
8
OCEAN QUAHOG
Dan Hennen, NEFSC assessment lead, presented the results of the Level 1 2020 Management Track Assessment. His results were followed by a presentation by Jessica Coakley, MAFMC staff lead, who summarized recommended ABCs for the period 2021 to 2026. Given that the Ocean Quahog was most recently assessed as a benchmark in 2019 and that no new survey data were available, the primary change in this assessment update was the inclusion of the revised survey data based on the peer-reviewed re-stratification. As with Surfclams, the revised survey domains were much smaller in the northern areas with an overall reduction in stock area of 31% while in the southern areas the reduction was only 7%. Because the reduced survey domains had higher average densities, the changes in total swept area biomass were much less with only an 8% reduction. The biomass estimates in the model updated with the revised survey estimates were essentially equivalent to the earlier model. Similarly, the differences in F and B reference points were less than 0.5% The model results had almost no retrospective pattern. The stock biomass can be expressed in integer multiples of the B threshold levels and the current F to Fthreshold level is 0.342. Analyses of the uncertainty intervals for the stock assessment results suggest little to no chance of overfishing or becoming overfished in the next 6 years at current harvest levels. Jessica Coakley, MAFMC staff lead, followed with a report from the Advisory Panel and recommendations for ABCs. Overall ex-vessel value decreased by $5 million from 2018 to $19 million in 2019. Concerns expressed by industry advisors for Surfclams were the same for Ocean Quahogs. Coakley provided the SSC with projected ABCs under an assumed OFL CV of 100%. SSC discussions generally focused on the concerns about setting quotas for species that live for hundreds of years. The current assessment period of record constitutes a small fraction of the species lifespan. Recruitment is poorly understood but there has been consistent evidence of smaller Ocean Quahogs in study areas. The low rate of harvesting complicates the ability to observe a wider dynamic range desirable in models purporting to show the effects of exploitation. MSE-like simulations were conducted by Hennen (2015) to support the current basis for reference points. One of the model peculiarities highlighted by the SSC was the estimated pulse of recruitment the late 1990’s that is almost certainly modeling artifact rather than driven by an observed increase in survey density. Hennen reported that our best understanding of recruitment is steady low values across years. Collectively, these issues led to concerns by the SSC of allowing a harvest rate that would have only a 49% risk of overfishing. Further provisions for “atypical” life histories are summarized under Other Business. The SSC’s responses to the terms of reference provided by the MAFMC (in italics) are as follows. For Ocean Quahog, the SSC will provide a written report that identifies the following for the 2021-2026 fishing years: 1) Based on the criteria identified in the Acceptable Biological Catch (ABC) control rule,
assign the stock to one of four types of control rules (analytically derived, modified by the
9
assessment team, modified by the SSC, or OFL cannot be specified) the SSC deems most appropriate for the information content of the most recent stock assessment; The SSC deemed that Ocean Quahog should be considered a stock with an SSC-modified OFL probability distribution. The reported OFL estimate, though associated with substantial uncertainty, was deemed credible, and could form the basis of developing management advice.
2) If possible to determine, the level of catch (in weight) associated with the overfishing limit (OFL) for each requested fishing year based on the maximum fishing mortality rate threshold or, if appropriate, an OFL proxy, and the associated coefficient of variation recommended by the SSC and its basis; The levels in catch associated with the accepted OFL (F=0.019) for the relevant fishing years are:
Year OFL(mt) 2021 44,960 2022 45,001 2023 45,012 2024 44,994 2025 44,948 2026 44,875
3) The level of catch (in weight) and the probability of overfishing (P*) associated with the ABC
for each requested fishing year, based on the traditional approach of varying ABCs in each year. If appropriate, specify interim metrics that can be examined to determine if multi-year specifications need reconsideration prior to their expiration;
The SSC recommends an OFL CV of 100% be applied to the OFL estimate as appropriate for calculating ABC for Ocean Quahog (see Attachment 5, OFL CV table, for additional details). The Ocean Quahog is a lightly fished stock under limited entry management. Based on the results of the 2020 Level 1 Management Track Assessment update, the stock is neither overfished nor experiencing overfishing. Catches are well documented; they tend to be concentrated in a relatively few ten-minute squares. Fishery-independent surveys conducted since the 1980s indicate little long-term change in stock biomass. Most catches continue to be taken in the southern region of the fishery, with modest landings from the north (Georges Bank). Discards and bycatch mortality (small clams) are at low levels and reasonably well documented. No changes were made in the Ocean Quahog assessment for 2020 beyond updating to the latest version of the Stock Synthesis model. No new survey data were available. However, data from the newly designed and re-stratified NEFSC Clam Survey were used in this updated assessment. Recruitment is poorly defined but no obvious patterns or trends are seen. The poorly defined recruitment may be of minor concern because of individual longevity (>100 years) and low fishing mortality (likely F < 0.01). Reference points are ratios rather than absolute values, allowing conclusions about stock status despite considerable scale uncertainty. The low F and prevailing market conditions suggest that stock status will not change rapidly. In this regard, it is notable that SSB/SSBthr is >2.1 and
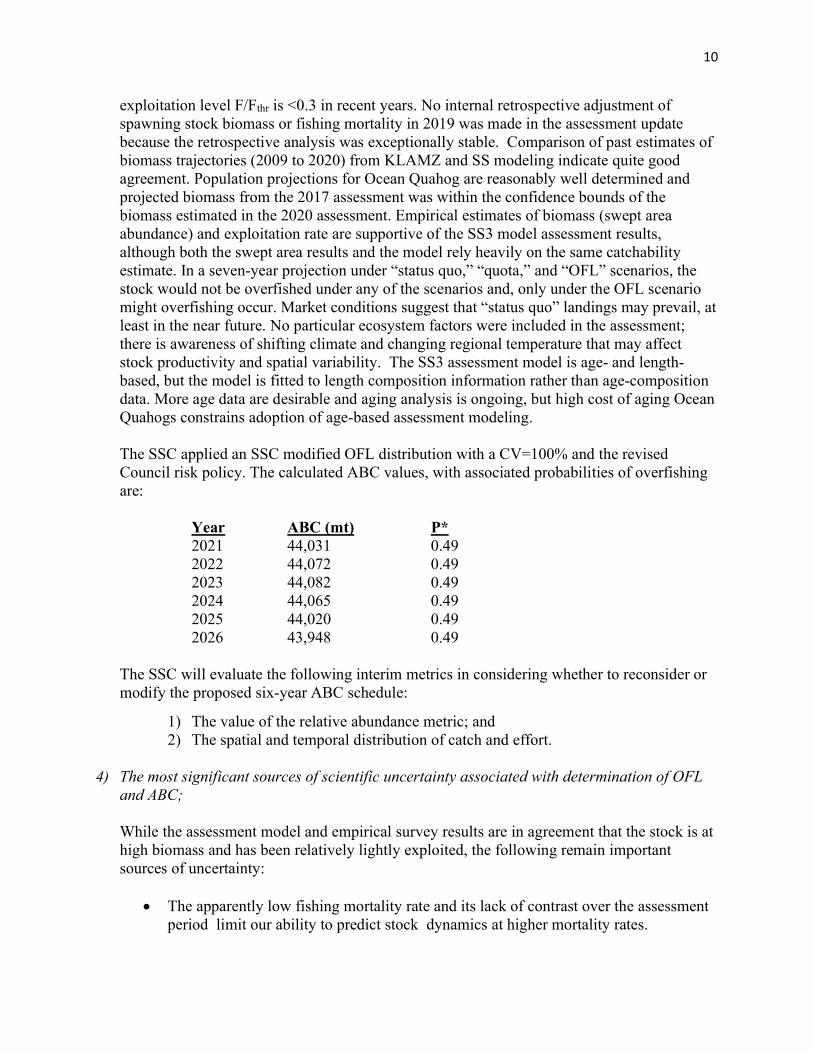
10
exploitation level F/Fthr is <0.3 in recent years. No internal retrospective adjustment of spawning stock biomass or fishing mortality in 2019 was made in the assessment update because the retrospective analysis was exceptionally stable. Comparison of past estimates of biomass trajectories (2009 to 2020) from KLAMZ and SS modeling indicate quite good agreement. Population projections for Ocean Quahog are reasonably well determined and projected biomass from the 2017 assessment was within the confidence bounds of the biomass estimated in the 2020 assessment. Empirical estimates of biomass (swept area abundance) and exploitation rate are supportive of the SS3 model assessment results, although both the swept area results and the model rely heavily on the same catchability estimate. In a seven-year projection under “status quo,” “quota,” and “OFL” scenarios, the stock would not be overfished under any of the scenarios and, only under the OFL scenario might overfishing occur. Market conditions suggest that “status quo” landings may prevail, at least in the near future. No particular ecosystem factors were included in the assessment; there is awareness of shifting climate and changing regional temperature that may affect stock productivity and spatial variability. The SS3 assessment model is age- and length-based, but the model is fitted to length composition information rather than age-composition data. More age data are desirable and aging analysis is ongoing, but high cost of aging Ocean Quahogs constrains adoption of age-based assessment modeling. The SSC applied an SSC modified OFL distribution with a CV=100% and the revised Council risk policy. The calculated ABC values, with associated probabilities of overfishing are:
Year ABC (mt) P* 2021 44,031 0.49 2022 44,072 0.49 2023 44,082 0.49 2024 44,065 0.49 2025 44,020 0.49 2026 43,948 0.49
The SSC will evaluate the following interim metrics in considering whether to reconsider or modify the proposed six-year ABC schedule:
1) The value of the relative abundance metric; and 2) The spatial and temporal distribution of catch and effort.
4) The most significant sources of scientific uncertainty associated with determination of OFL
and ABC;
While the assessment model and empirical survey results are in agreement that the stock is at high biomass and has been relatively lightly exploited, the following remain important sources of uncertainty:
The apparently low fishing mortality rate and its lack of contrast over the assessment period limit our ability to predict stock dynamics at higher mortality rates.
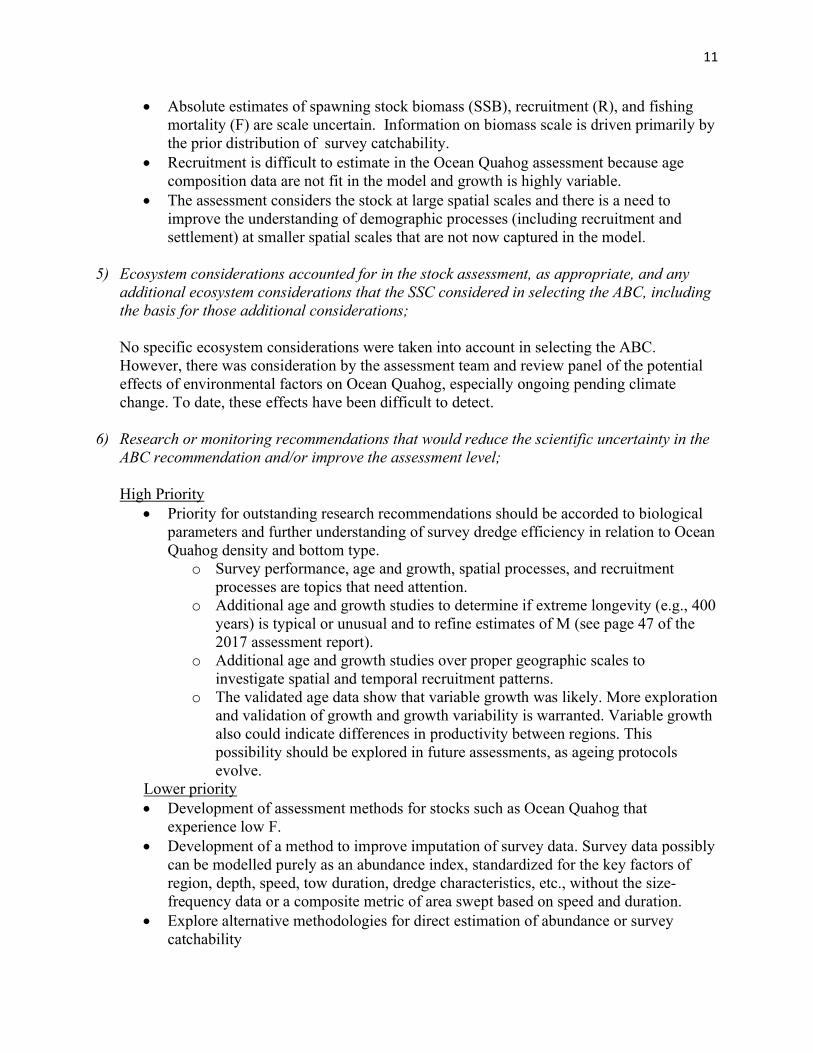
11
Absolute estimates of spawning stock biomass (SSB), recruitment (R), and fishing mortality (F) are scale uncertain. Information on biomass scale is driven primarily by the prior distribution of survey catchability.
Recruitment is difficult to estimate in the Ocean Quahog assessment because age composition data are not fit in the model and growth is highly variable.
The assessment considers the stock at large spatial scales and there is a need to improve the understanding of demographic processes (including recruitment and settlement) at smaller spatial scales that are not now captured in the model.
5) Ecosystem considerations accounted for in the stock assessment, as appropriate, and any
additional ecosystem considerations that the SSC considered in selecting the ABC, including the basis for those additional considerations; No specific ecosystem considerations were taken into account in selecting the ABC. However, there was consideration by the assessment team and review panel of the potential effects of environmental factors on Ocean Quahog, especially ongoing pending climate change. To date, these effects have been difficult to detect.
6) Research or monitoring recommendations that would reduce the scientific uncertainty in the
ABC recommendation and/or improve the assessment level; High Priority
Priority for outstanding research recommendations should be accorded to biological parameters and further understanding of survey dredge efficiency in relation to Ocean Quahog density and bottom type.
o Survey performance, age and growth, spatial processes, and recruitment processes are topics that need attention.
o Additional age and growth studies to determine if extreme longevity (e.g., 400 years) is typical or unusual and to refine estimates of M (see page 47 of the 2017 assessment report).
o Additional age and growth studies over proper geographic scales to investigate spatial and temporal recruitment patterns.
o The validated age data show that variable growth was likely. More exploration and validation of growth and growth variability is warranted. Variable growth also could indicate differences in productivity between regions. This possibility should be explored in future assessments, as ageing protocols evolve.
Lower priority Development of assessment methods for stocks such as Ocean Quahog that
experience low F. Development of a method to improve imputation of survey data. Survey data possibly
can be modelled purely as an abundance index, standardized for the key factors of region, depth, speed, tow duration, dredge characteristics, etc., without the size-frequency data or a composite metric of area swept based on speed and duration.
Explore alternative methodologies for direct estimation of abundance or survey catchability
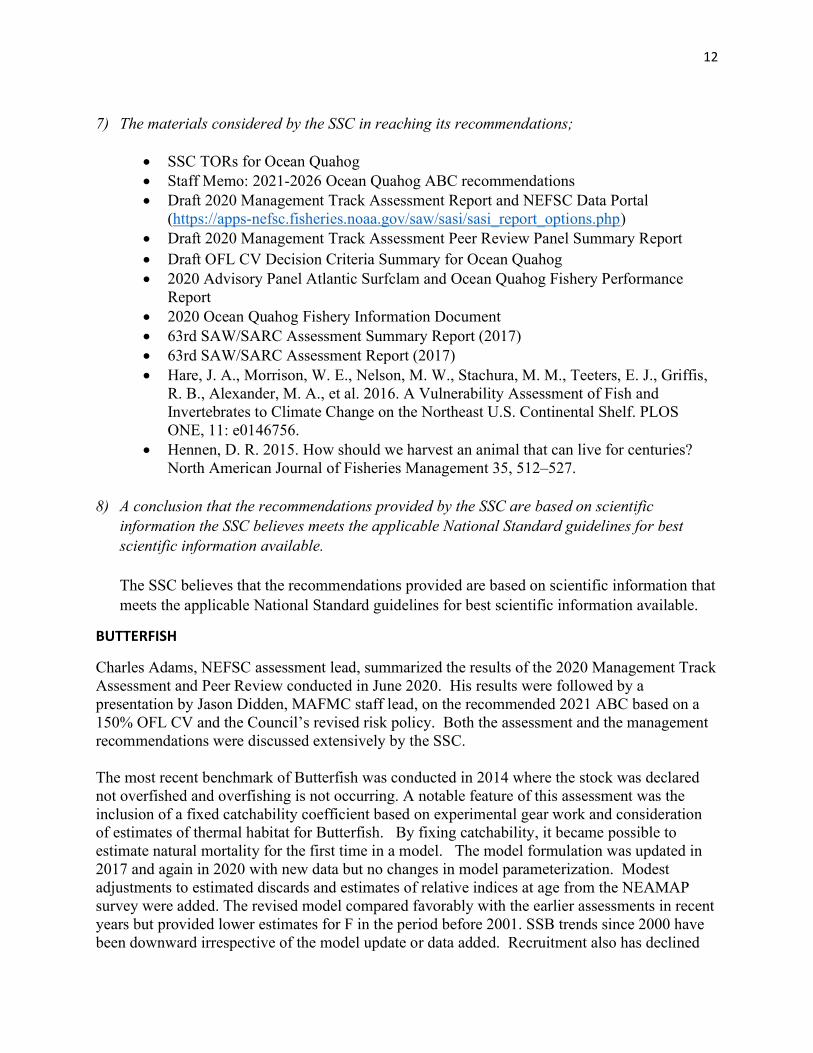
12
7) The materials considered by the SSC in reaching its recommendations;
SSC TORs for Ocean Quahog Staff Memo: 2021-2026 Ocean Quahog ABC recommendations Draft 2020 Management Track Assessment Report and NEFSC Data Portal
(https://apps-nefsc.fisheries.noaa.gov/saw/sasi/sasi_report_options.php) Draft 2020 Management Track Assessment Peer Review Panel Summary Report Draft OFL CV Decision Criteria Summary for Ocean Quahog 2020 Advisory Panel Atlantic Surfclam and Ocean Quahog Fishery Performance
Report 2020 Ocean Quahog Fishery Information Document 63rd SAW/SARC Assessment Summary Report (2017) 63rd SAW/SARC Assessment Report (2017) Hare, J. A., Morrison, W. E., Nelson, M. W., Stachura, M. M., Teeters, E. J., Griffis,
R. B., Alexander, M. A., et al. 2016. A Vulnerability Assessment of Fish and Invertebrates to Climate Change on the Northeast U.S. Continental Shelf. PLOS ONE, 11: e0146756.
Hennen, D. R. 2015. How should we harvest an animal that can live for centuries? North American Journal of Fisheries Management 35, 512–527.
8) A conclusion that the recommendations provided by the SSC are based on scientific
information the SSC believes meets the applicable National Standard guidelines for best scientific information available. The SSC believes that the recommendations provided are based on scientific information that meets the applicable National Standard guidelines for best scientific information available.
BUTTERFISH
Charles Adams, NEFSC assessment lead, summarized the results of the 2020 Management Track Assessment and Peer Review conducted in June 2020. His results were followed by a presentation by Jason Didden, MAFMC staff lead, on the recommended 2021 ABC based on a 150% OFL CV and the Council’s revised risk policy. Both the assessment and the management recommendations were discussed extensively by the SSC. The most recent benchmark of Butterfish was conducted in 2014 where the stock was declared not overfished and overfishing is not occurring. A notable feature of this assessment was the inclusion of a fixed catchability coefficient based on experimental gear work and consideration of estimates of thermal habitat for Butterfish. By fixing catchability, it became possible to estimate natural mortality for the first time in a model. The model formulation was updated in 2017 and again in 2020 with new data but no changes in model parameterization. Modest adjustments to estimated discards and estimates of relative indices at age from the NEAMAP survey were added. The revised model compared favorably with the earlier assessments in recent years but provided lower estimates for F in the period before 2001. SSB trends since 2000 have been downward irrespective of the model update or data added. Recruitment also has declined
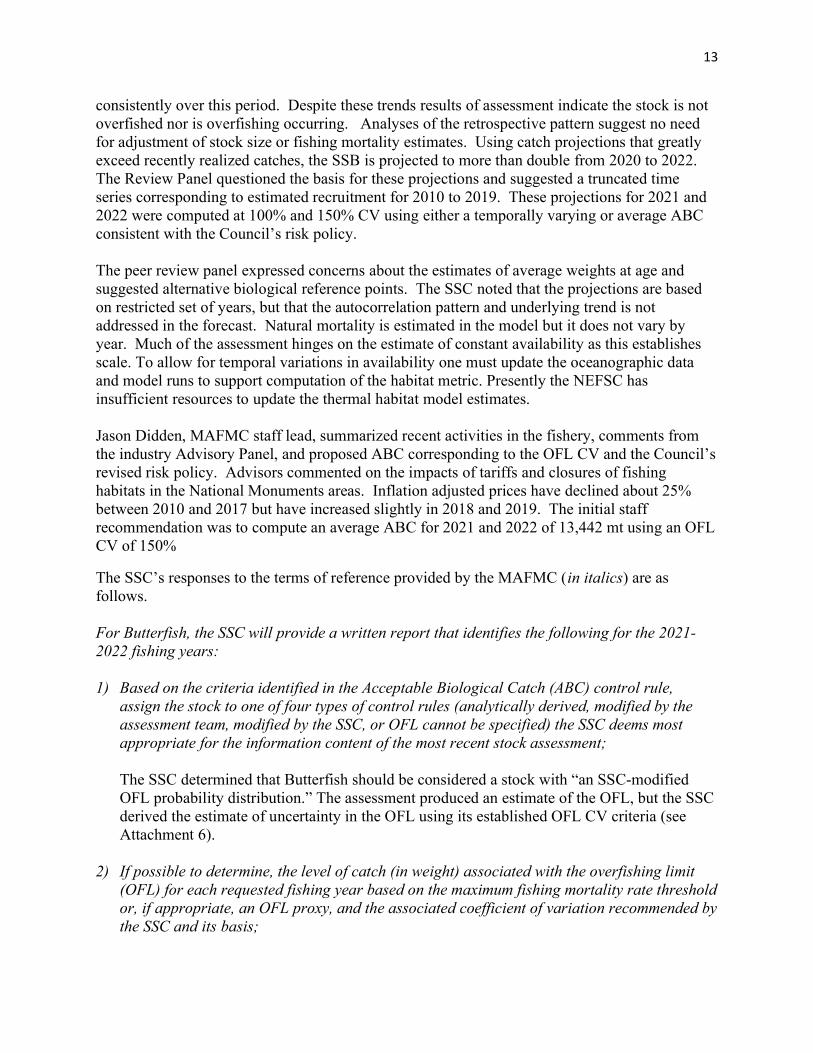
13
consistently over this period. Despite these trends results of assessment indicate the stock is not overfished nor is overfishing occurring. Analyses of the retrospective pattern suggest no need for adjustment of stock size or fishing mortality estimates. Using catch projections that greatly exceed recently realized catches, the SSB is projected to more than double from 2020 to 2022. The Review Panel questioned the basis for these projections and suggested a truncated time series corresponding to estimated recruitment for 2010 to 2019. These projections for 2021 and 2022 were computed at 100% and 150% CV using either a temporally varying or average ABC consistent with the Council’s risk policy. The peer review panel expressed concerns about the estimates of average weights at age and suggested alternative biological reference points. The SSC noted that the projections are based on restricted set of years, but that the autocorrelation pattern and underlying trend is not addressed in the forecast. Natural mortality is estimated in the model but it does not vary by year. Much of the assessment hinges on the estimate of constant availability as this establishes scale. To allow for temporal variations in availability one must update the oceanographic data and model runs to support computation of the habitat metric. Presently the NEFSC has insufficient resources to update the thermal habitat model estimates. Jason Didden, MAFMC staff lead, summarized recent activities in the fishery, comments from the industry Advisory Panel, and proposed ABC corresponding to the OFL CV and the Council’s revised risk policy. Advisors commented on the impacts of tariffs and closures of fishing habitats in the National Monuments areas. Inflation adjusted prices have declined about 25% between 2010 and 2017 but have increased slightly in 2018 and 2019. The initial staff recommendation was to compute an average ABC for 2021 and 2022 of 13,442 mt using an OFL CV of 150%
The SSC’s responses to the terms of reference provided by the MAFMC (in italics) are as follows. For Butterfish, the SSC will provide a written report that identifies the following for the 2021-2022 fishing years: 1) Based on the criteria identified in the Acceptable Biological Catch (ABC) control rule,
assign the stock to one of four types of control rules (analytically derived, modified by the assessment team, modified by the SSC, or OFL cannot be specified) the SSC deems most appropriate for the information content of the most recent stock assessment; The SSC determined that Butterfish should be considered a stock with “an SSC-modified OFL probability distribution.” The assessment produced an estimate of the OFL, but the SSC derived the estimate of uncertainty in the OFL using its established OFL CV criteria (see Attachment 6).
2) If possible to determine, the level of catch (in weight) associated with the overfishing limit (OFL) for each requested fishing year based on the maximum fishing mortality rate threshold or, if appropriate, an OFL proxy, and the associated coefficient of variation recommended by the SSC and its basis;
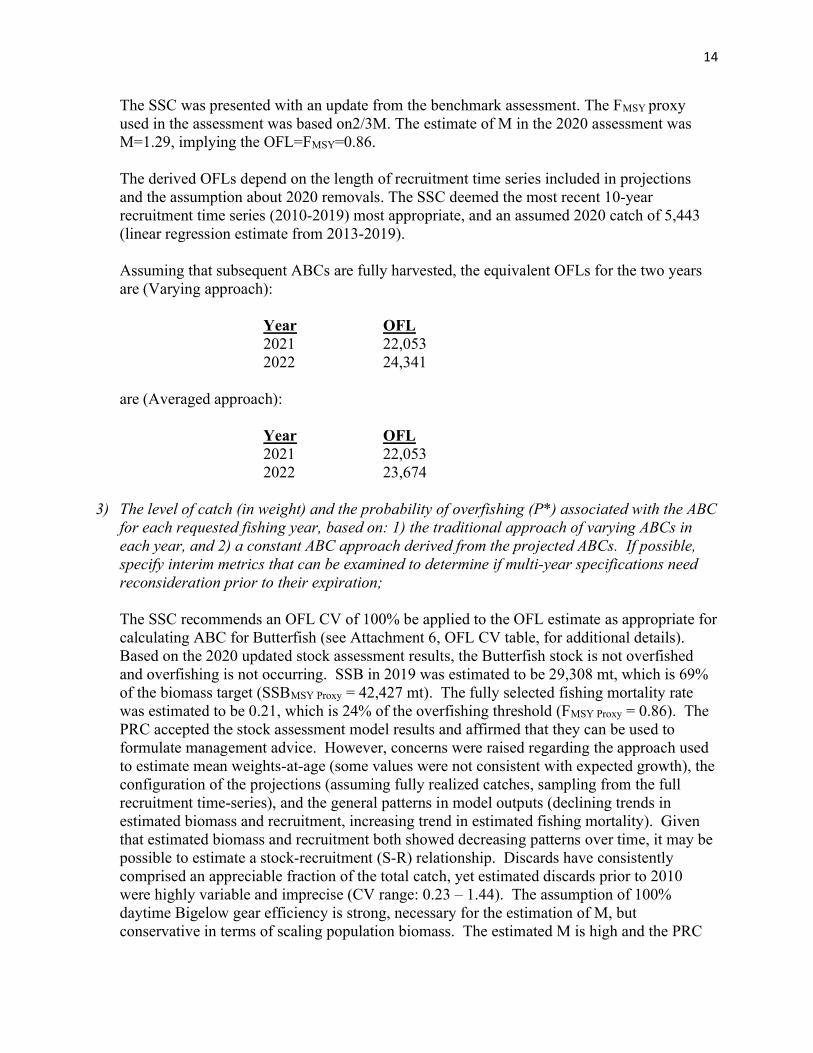
14
The SSC was presented with an update from the benchmark assessment. The FMSY proxy used in the assessment was based on2/3M. The estimate of M in the 2020 assessment was M=1.29, implying the OFL=FMSY=0.86. The derived OFLs depend on the length of recruitment time series included in projections and the assumption about 2020 removals. The SSC deemed the most recent 10-year recruitment time series (2010-2019) most appropriate, and an assumed 2020 catch of 5,443 (linear regression estimate from 2013-2019). Assuming that subsequent ABCs are fully harvested, the equivalent OFLs for the two years are (Varying approach):
Year OFL 2021 22,053 2022 24,341
are (Averaged approach):
Year OFL 2021 22,053 2022 23,674
3) The level of catch (in weight) and the probability of overfishing (P*) associated with the ABC
for each requested fishing year, based on: 1) the traditional approach of varying ABCs in each year, and 2) a constant ABC approach derived from the projected ABCs. If possible, specify interim metrics that can be examined to determine if multi-year specifications need reconsideration prior to their expiration; The SSC recommends an OFL CV of 100% be applied to the OFL estimate as appropriate for calculating ABC for Butterfish (see Attachment 6, OFL CV table, for additional details). Based on the 2020 updated stock assessment results, the Butterfish stock is not overfished and overfishing is not occurring. SSB in 2019 was estimated to be 29,308 mt, which is 69% of the biomass target (SSBMSY Proxy = 42,427 mt). The fully selected fishing mortality rate was estimated to be 0.21, which is 24% of the overfishing threshold (FMSY Proxy = 0.86). The PRC accepted the stock assessment model results and affirmed that they can be used to formulate management advice. However, concerns were raised regarding the approach used to estimate mean weights-at-age (some values were not consistent with expected growth), the configuration of the projections (assuming fully realized catches, sampling from the full recruitment time-series), and the general patterns in model outputs (declining trends in estimated biomass and recruitment, increasing trend in estimated fishing mortality). Given that estimated biomass and recruitment both showed decreasing patterns over time, it may be possible to estimate a stock-recruitment (S-R) relationship. Discards have consistently comprised an appreciable fraction of the total catch, yet estimated discards prior to 2010 were highly variable and imprecise (CV range: 0.23 – 1.44). The assumption of 100% daytime Bigelow gear efficiency is strong, necessary for the estimation of M, but conservative in terms of scaling population biomass. The estimated M is high and the PRC

15
noted that the magnitude of M leaves little expected biomass by age 4 (M = 1.29 implies annual survival = 0.28 and cumulative survival to age 4 = 0.006). The fishing mortality reference point originated from deliberations of the MAMFC SSC when setting an ABC for Butterfish required ad-hoc methods (~2013), and a valid criticism of the estimator used for the FMSY Proxy is that it does not functionally relate to SSB, which is important to consider in the context of the potential existence of an S-R relationship. The short-term projections are likely not informative about near-term fishing effects given the aforementioned points raised about how they were configured. Using an OFL with a lognormal distribution with a CV = 100%, the SSC recommends the following ABCs (Varying approach):
Year ABC 2021 11,993 2022 17,854
(Average approach):
Year ABC 2021 14,924 2022 14,924
The SSC prefers the varying approach due to the observed decline in the estimated biomass and recruits (consistent with recommendations in past years). However, if removals in 2020 are much lower than assumed in the projections (5,443 t), re-evaluation of 2021 ABC may be warranted.
The expected probability of overfishing in these projections is low (average P* <0.35). As an interim measure, the SSC will evaluate survey CPUEs (NEAMAP and NEFSC Fall survey) as indices of annual recruitment for possible action.
4) The most significant sources of scientific uncertainty associated with determination of OFL
and ABC;
The thermal habitat model could not be updated, so changes from the long term average availability which stabilizes q and allows estimation of M cannot be evaluated.
The foundation for the OFL (Fmsy=2/3M) was ad hoc rather than being derived internally in the model. The application of an assumed q-value to estimate M, while novel and well thought out, contributes to uncertainty.
The assessment was limited to a period of low stock productivity (due to lack of discard data early in the time series), well after a period of higher exploitation, which reduces the data contrast available to the model.
Conflicting trends among seasonal surveys were not incorporated in the model. There are residual trends in the survey data that might be explained by environmental
or biotic (predation) factors that were not incorporated in the model.

16
There appears to be a declining trend in annual recruitment. Although most recent recruitment was used in projections, this trend is not projected suggesting projections may be uncertain.
5) Ecosystem considerations accounted for in the stock assessment, as appropriate, and any
additional ecosystem considerations that the SSC considered in selecting the ABC, including the basis for those additional considerations; There were no specific ecosystem considerations in the population dynamics model. However, the OFL was based on a proxy that incorporated consideration of the role of Butterfish as a forage species. Additionally, the calculation of availability of the fish to the survey did incorporate considerations of temperature as a factor influencing fish distributions.
6) Research or monitoring recommendations that would reduce the scientific uncertainty in the
ABC recommendation and/or improve the assessment level;
Evaluate approaches to estimate population scale (e.g., independent estimates of survey availability, natural mortality);
Consider alternative approaches/options to produce a streamlined, reproducible, automated thermal habitat index for this assessment;
Conduct simulation studies to evaluate the uncertainty in the ad hoc Fmsy proxy; Consideration of alternative reference points that link to stock biomass; Evaluate approaches to include additional surveys, e.g., from States, in the assessment
model; Analyze additional estimation of consumptive demand of predators to identify critical
periods of overlap of predators and prey; Reconsider stock structure and degree of exchange with the South Atlantic stock
component; and Evaluate alternative methods for estimating weights at age.
7) The materials considered by the SSC in reaching its recommendations;
SSC TORs for Butterfish Staff Memo: Butterfish, Longfin Squid, and Mackerel ABC recommendations Draft 2020 Butterfish Management Track Assessment Report and NEFSC Data Portal
(https://apps-nefsc.fisheries.noaa.gov/saw/sasi/sasi_report_options.php) Draft 2020 Management Track Assessment Peer Review Panel Summary Report OFL/ABC Butterfish Stock Projections Draft OFL CV Decision Criteria Summary for Butterfish 2020 Advisory Panel Atlantic Mackerel, Longfin Squid, and Butterfish Fishery
Performance Report 2020 Butterfish Fishery Information Document 58th SAW/SARC Assessment Summary Report (2014) 58th SAW/SARC Assessment Report (2014)
17
Johnson et al 2010 ICES JMS: https://doi.org/10.1093/icesjms/fsu055
8) A conclusion that the recommendations provided by the SSC are based on scientific information the SSC believes meets the applicable National Standard guidelines for best scientific information available.
The SSC believes that the recommendations provided are based on scientific information that meets the applicable National Standard guidelines for best scientific information available.
LONGFIN SQUID
Lisa Hendrickson, NEFSC assessment lead, began with a summary of the findings of the June 2020 Level 3 Management Track peer review and was followed by a summary of recent catches, advisory panel report and initial ABC recommendations by Jason Didden (MAFMC staff lead). Longfin squid is an index-based stock assessment whose stock status is not overfished but overfishing status is unknown. The current assessment approach uses an annualized estimate of relative abundance based on the NEFSC spring and fall bottom trawl surveys. Much of the presentation and the reviewers’ comments addressed the potential use of a two-cohort model based on the premise that the juveniles produced during a seasonal survey in one season support the fishery in the subsequent survey period. In other words, the offspring of the Fall BTS become the adults in the following spring BTS and support the landings during that period. Cross-seasonal linkages are important because growth rates are higher in the summer than in winter, suggesting possible differences in the magnitude of fisheries the cohorts can support. Notably, the fall BTS biomass indices average about five times higher than those in the spring. A case was made for recognizing these differences by redefining the assessment with a more biologically realistic model. The Management Track Review Panel endorsed the concept of such a model but neither the results were not considered sufficient for catch recommendations. Advances in modeling approaches may be sufficient to implement a dynamic model based on these concepts in the future. The SSC noted that modeling decisions about population structure are critical since errors of lumping vs separating cohort dynamics can be equally problematic. Genetic studies of the stock have produced conflicting results. Future management track assessments will continue to develop a revised basis for determining stock status using approaches tailored to Longfin Squid life history. Jason Didden, MAFMC staff lead, reported that prices for Longfin Squid have been trending upwards generally since 2000 with the highest prices ever observed in 2019. The fishery is regulated by trimester with target allocations of 43%, 17% and 40%, respectively. Recent catches have been below target levels due to lower demands from restaurants (Covid 19). Staff support the concept of sub-annual stock assessment methods for future assessments but not presently. The staff recommendation was an ABC of 23,400 mt for 2021 to 2023. It was noted that peak catches in the early 1970s were between 31,000 and 39,000 mt. Questions from SSC and the public raised concerns about the evidence for seasonal recruitment (age distributions), variations in seasonal prices, and effects of management regulations in areas under the jurisdiction of the SAFMC plans. No recent aging studies have been conducted. Prices appear to vary only slightly during the season. The existing NEFSC trawl surveys are considered
18
to be representative of most of the stock since Doryteuthis species don’t typically extend below 450 meters and commercial catch rates in fisheries south of Cape Hatteras are lower than in the Mid Atlantic. The SSC’s responses to the terms of reference provided by the MAFMC (in italics) are as follows. For Longfin Squid, the SSC will provide a written report that identifies the following for the 2021-2023 fishing years: 1) Based on the criteria identified in the Acceptable Biological Catch (ABC) control rule,
assign the stock to one of four types of control rules (analytically derived, modified by the assessment team, modified by the SSC, or OFL cannot be specified) the SSC deems most appropriate for the information content of the most recent stock assessment; The SSC determines that the OFL cannot be specified given the available information. Assessment of this stock is based on a catch over biomass index. This does not allow estimation of a maximum fishing mortality rate threshold. This is unchanged from the previous SSC determinations.
2) If possible to determine, the level of catch (in weight) associated with the overfishing limit (OFL) for each requested fishing year based on the maximum fishing mortality rate threshold or, if appropriate, an OFL proxy, and the associated coefficient of variation recommended by the SSC and its basis; Because an OFL cannot be specified given the current state of knowledge, it is possible neither to specify the level of catch associated with the OFL, nor to define a coefficient of variability associated with OFL on which an ABC could be defined.
3) The level of catch (in weight) and the probability of overfishing (P*) associated with the ABC
for each requested fishing year, based on: 1) the traditional approach of varying ABCs in each year, and 2) a constant ABC approach derived from the projected ABCs. If possible, specify interim metrics that can be examined to determine if multi-year specifications need reconsideration prior to their expiration; Since OFL, its uncertainty and therefore P* cannot be defined, the SSC cannot address the individual elements of this Term of Reference.
The Longfin Squid population is characterized by two intra-annual cohorts. Previous catch advice has been developed by deriving an annual estimate of the average of productivities of the two intra-annual cohorts. Following precedence, the SSC recommends an ABC for a three-year period (2021-2023) of 23,400 mt, the same as has been set since 2012 by the SSC. This estimate is based on catch levels that occurred during a period of apparent relatively light exploitation (1976-2009) according to the 2010 Longfin Squid assessment, and based on empirical evidence appears to be sustainable.
19
The SSC notes that cohort specific reference points presented during the management track assessment bring into question whether the 1976-2009 period was a period of low exploitation.
The SSC will consider the following data sources to evaluate whether to reconsider the three-year ABC specification:
1. Total landings –in particular deviation from average; 2. Substantial changes in the relative abundances of the two intra-annual cohorts. 3. Substantial changes in the exploitation indices of intra-annual cohorts.
4) The most significant sources of scientific uncertainty associated with determination of OFL
and ABC; The SSC notes the following sources of uncertainty in ABC
Apparent differences in productivity of the two intra-annual cohorts is not accounted for as ABC is simply the average of the two cohorts;
Annual catch advice for intra-annual cohorts likely smooths biotic and abiotic influences on the relative abundance, productivities and catchabilities of each cohort;
Because of its short life span, the high and variable rate of natural mortality, and the delay in collating survey and catch information, there is an inherent lag in information pertaining to the current state of the stock and the ability to estimate reference points;
Surveys cover unknown portion of entire range (variable availability) –the range may extend beyond survey coverage;
The timing of surveys is variable which can complicate interpretation of abundance in a migratory species;
Using a bottom trawl survey gear for a semi-pelagic species may induce variation in the indices of abundance and obscure the true signal; and
Highly variable survey trends.
5) Ecosystem considerations accounted for in the stock assessment, as appropriate, and any additional ecosystem considerations that the SSC considered in selecting the ABC, including the basis for those additional considerations;
No specific ecosystem considerations were used in the 2020 assessment update, nor taken into account in the SSC’s ABC determination.
6) Research or monitoring recommendations that would reduce the scientific uncertainty in the
ABC recommendation and/or improve the assessment level;
Continue development of a stock assessment approach that is specifically tailored to the squid life cycle and data availability. One avenue is to consider if assessment or management approaches for other semelparous species might be useful because they offer different approaches to modeling and reference point determination.
Develop a cohort-specific assessment approach for determining stock status and trends. Given the empirical evidence for differences in productivity between the
20
cohort, the current annual average approach likely overestimates biological reference points for one cohort and underestimates it for the other.
If cohort-specific methods cannot be developed, explore the benefits and challenges of alternative weightings of semi-annual surveys other than simple averaging.
Explore impacts of system productivity and oceanographic correlates with trends in Longfin Squid availability, recruitment, growth, and abundance. This could include:
o Development of approaches to standardize surveys relative to changes in environmental conditions and survey timing to improve understanding of availability and catchability to the surveys.
o Evaluation of methods of incorporating ecological relationships, predation, and oceanic events that influence abundance and availability.
Continue to monitor the performance of the squid fisheries and related fisheries in relation to the full breadth of regulatory measures with a view towards improving the economics of the fisheries.
Evaluate approaches to real time management including expanding age and growth studies to better estimate average growth patterns and to discern seasonal productivity/catchability patterns.
Until real-time assessment is feasible, expand cohort analysis to understand dynamics of Longfin Squid to support stock assessments and the incorporation of seasonal indices.
Refine understanding of stock range and structure. In particular, determination of the extent of population closure would be of utility.
Research addressing seasonal trends in egg production and maturation. Aging of squid within intra-annual cohorts to determine vital rates in support of
assessment modeling. Develop an operating model with intra-cohort dynamics to support simulation
experiments to evaluate key stock assessment assumptions pertaining to separating versus combining intra-annual cohorts.
Deployment of sonar camera on headrope of survey gear to estimate gear avoidance. 7) The materials considered by the SSC in reaching its recommendations;
SSC TORs for Longfin Squid Staff Memo: Butterfish, Longfin Squid, and Mackerel ABC recommendations Draft 2020 Longfin Squid Management Track Assessment Report and NEFSC Data
Portal (https://apps-nefsc.fisheries.noaa.gov/saw/sasi/sasi_report_options.php) 2020 Management Track Assessment Peer Review Panel Summary Report 2020 Advisory Panel Atlantic Mackerel, Longfin Squid, and Butterfish Fishery
Performance Report 2020 Longfin Squid Fishery Information Document 51st SAW/SARC Assessment Summary Report (2010) 51st SAW/SARC Assessment Report (2010)

21
8) A conclusion that the recommendations provided by the SSC are based on scientific information the SSC believes meets the applicable National Standard guidelines for best scientific information available.
The SSC believes that the recommendations provided are based on scientific information that meets the applicable National Standard guidelines for best scientific information available.
ATLANTIC MACKEREL
Jason Didden, MAFMC staff lead, began with a update of the fishery and an initial recommendation for ABCs in 2021. It was noted that Mackerel landings are limited by bycatch limits for river herring and shad. The most recent Canadian assessment (held in March 2019) recommended low catches for the northern contingent of the Atlantic Mackerel stock. An advantage of postponing the Management Track assessment for Atlantic Mackerel until June 2021 is that it will synchronize the assessment efforts of both countries and avoid the mismatch that presently occurs. Questions were raised about the availability of the 2015 year class to the fishery. Their low abundance in recent catches may be due to movements offshore because there is no evidence that a large-scale mortality had occurred. Offshore movements of Mackerel in the spring tend to be abrupt. Further concerns were expressed with missing egg survey and the spring trawl survey in 2020. Catch data and the 2019 egg survey data will however, be available. The SSC optimistically noted that an ICES working group for northwest Atlantic Mackerel had been formed but had not yet met. The SSC’s responses to the terms of reference provided by the MAFMC (in italics) are as follows. For Atlantic Mackerel, the SSC will provide a written statement that identifies the following for the 2021 fishing year and interim 2022 fishing year: 1) The appropriateness of the staff recommendation to implement status quo ABC specifications
for the 2021 fishing season and interim status quo 2022 specifications until revised specifications can be implemented based on the results of a management track stock assessment to be completed in mid-2021. If status quo is inappropriate, specify an alternative ABC for 2021 and interim ABC for 2022 and provide any supporting information used to make this determination; The SSC endorses the staff recommendation of 29,184 MT for the 2021 and 2022 fishing year, equal to ABC specifications for fishing year 2019 and 2020. The SSCs justification includes:
Low level of recent recruitments evidenced in the:
o The 2018 Canadian stock assessment, o NEFSC spring survey, and o Updated estimates of catch-at-age in the recreational and commercial data.
22
Persistent, low levels of spawning stock biomass in the 2018 Canadian assessment. High estimates of fishing mortality in the 2018 Canadian assessment. The unknown impacts of the 2019 closure of the Mackerel fishery in response to the river
herring / shad cap. Updated catch at age information, particularly the age 3 index which does not indicate
recovery. 2) Provide any relevant data and/or assessment considerations for the 2021 management track
assessment.
Published DFO assessment (through 2018) Mid-2021 NEFSC assessment will align with the DFO assessment for the Northern
Contingent, which should allow for fully updated inputs from the Northern Contingent into the Southern Contingent assessment.
Recreational landings proportion estimated to be high (38.8% since 2010) Lack of egg and NEFSC Spring Trawl survey data from the US in 2020 to inform the
management track assessment Since 2000, the southern contingent has represented only 6.4% of the combined stock
SSB DFO SSB trends likely representative of the entire spawning stock Atlantic Mackerel NEFSC trawl survey indices continue to be estimated at the high end
of historical levels. Swept area biomass estimates might inform interpretation of this phenomenon, and whether it is an artifact of availability and catchability assumptions.
The estimated size of the most recent year class in the assessment drives assumptions about rebuilding times, OFLs, and ABCs;
Conversion of egg survey results to the spawning stock biomass estimate; The assessment is sensitive to the distribution of Atlantic Mackerel, which has been
changing and may continue to change; Trawl survey representation of abundance and age structure; The assumption of fixed natural mortality rate and data gaps associated with major
predators of Mackerel; and Missing catch information from bait and recreational fisheries in Canada.
BLUEFISH
Matt Seeley, MAFMC staff lead, provided a summary of recent council actions and noted that 2021 would be the second year of 2-year rebuilding specifications package. Tony Wood, NEFSC assessment lead, provided an update on survey and biological information. Based on the 2019 Management Track assessment, the stock is overfished but overfishing is not occurring. Catches and survey indices have been trending downward over the past decade. Commercial landings in 2020 were similar to the seasonal patterns in 2019 with no strong effects of reduced demand. The SSC expressed concerns about the effects of Covid 19 potentially leading to increased recreational catches in 2020, noting that private boat fishing was considered one of the safer

23
outdoor activities. Any potential overages by the recreational fleet may adversely affect the commercial fishery. Recreational dead discards have been higher than landings since 1996, perhaps reflecting a preference for smaller average sized fish. Some fishermen have reported abundant Bluefish stock offshore out of the range of most harvesters. It was noted that high abundance of sandeels generally bodes well for Bluefish stocks. Linkages of this trend to more broad-based environmental drivers, such as the North Atlantic Oscillation, are unknown. Questions were raised about the potential utility of a mandatory angler reporting system based on cell phones. Responses suggested that this methodology was still not ready for incorporation into routine monitoring. Because the stock is in a rebuilding program and application of the Council’s revised risk policy has minimal effects Council staff did not recommend any changes from the current ABC of 7,385 mt for 2021. There was no disagreement by members of the SSC. SUMMER FLOUNDER
Kiley Dancy, MAFMC staff lead, briefed the SSC on recent trends in the fishery and conclusions of the Advisory Panel. The current status of Summer Flounder is not overfished and overfishing is not occurring based on the 2018 benchmark assessment. Mark Terceiro, NEFSC assessment lead, prepared a data update whose results were incorporated into Kiley’s presentation. The 2021 fishing year will be the third year of a constant ABC policy developed in 2019 with catch limit of 11,354 mt. Council staff recommended an 8% increase in the 2021 catch limit to 12,297 mt consistent with the revised Council risk policy that allows 39% probability of overfishing compared to previous level of 34%. Survey data suggest that the 2018 year class may be above average and this is partially supported by evidence from the fishery and various state surveys. The fall index in 2019 decreased by 36% but the 2019 spring index declined by only 8%. Overall, the survey indices have been varying without trend for the past decade but catches have been trending downward over the same period. Recreational landings in 2019 were about the same as in 2018. Commercial fishermen report recent increases in landings as harvesters compensate for earlier disruptions from Covid 19 related shutdowns. In recognition of reduced average recruitment in the 2018 benchmark assessment, catch projections use only the recruitment estimates from the most recent 7 years. Trends in average weights at age are decreasing but the differences may be due to the increased survival of males which tend to be smaller as age than females, irrespective of environmental conditions. Historically, males over 10 years old were rare but are now seen as old as 19 years old. The SSC expressed some concern that the rebuilding of the stock does appear to be rapid. It was noted that rebuilding was predicted to be slow under the harvest policy adopted. Only 86% of the 2019 quota was taken so there may be some effect on rebuilding that is not built into the current 3 year ABC. The 2018 year class will not fully recruit to the fishery for 3 or 4 years. Concerns about increasing discards during this transition were expressed. The Council’s MSE project for Summer Flounder will be looking at these potential effects. A member of the public suggested a

24
total length limit of all landed fish (i. e., sum of all lengths) as a way of reducing discard mortality but there have been no analyses of the efficacy of such measures in the Northeast. The SSC’s responses to the terms of reference provided by the MAFMC (in italics) are as follows. For Summer Flounder, the SSC will provide a written statement that identifies the following for the 2021 fishing year: 1) Specify a revised ABC for the 2021 fishing season based on the Council’s recently approved
changes to the risk policy. If revising the 2021 ABC with the new risk policy is inappropriate, specify an alternative ABC for 2021 (e.g., previous recommendation) and provide any supporting information used to make this determination; The SSC received a presentation from Kiley Dancy (MAFMC staff) comprising a data and fishery update and a review of previously recommended 2021 ABC. The SSC initially developed ABC recommendations for the 2021 fishing year during its February 2019 webinar, based on the SAW66 benchmark assessment.
The data update suggests an above average year class in 2018. These fish will not be fully recruited to the landings in the fishery until 2022. There may be some expected increase in the discards in 2021 from this year class, but this cohort is not included in the projections. This implies some uncertainty over the reliability in the projections from the assessment in assuming the 2019 ABCs given the current information.
However, the SSC determined this was not a rationale for not applying the new Council risk policy. The SSC recommended that the ABC for the 2021 fishing year should be revised based on December 2019 changes to the MAFMC risk policy and the staff recommendations. The SSC recommends an ABC of 12,297 mt.
This represents an 8% increase in the ABC over the previous 2021 ABC recommendation (11,354 mt). The revised ABC is calculated based on a currently implemented 2021 OFL of 14,365 mt, a projected 2021 B/Bmsy of 0.88, a P* value of 0.39 under the revised risk policy, and the currently applied OFL CV of 60%.
2) Provide any relevant data and/or assessment considerations for the 2021 management track
assessment.
The SSC endorses the research recommendations provided in the SAW-66 assessment report.
The SSC notes that many of its recommendations made at the February 2019 meeting are appropriate for a research track assessment and not for the management track assessment scheduled for 2021.
The 2020 data update received by the SSC at this meeting suggests an above average year class in 2018. These fish will not be fully recruited to the landings in the fishery until 2022.
25
There may be some expected increase in the discards in 2021 from this year class, but this cohort is not included in the projections. Therefore, for the 2021 management track assessment, the SSC recommends:
1. Verifying the strength of the 2018 year class based on a synthesis of the various surveys included in the assessment. (3 years of data on this year class will be available)
2. Quantify the size, magnitude, and uncertainty of the discards. SCUP
Karson Coutre, MAFMC staff lead, briefed the SSC with updates of fishery independent and dependent data provided Mark Terceiro, NEFSC assessment lead. Karson also summarized the relevant sections of the Fishery Performance Report prepared by the MAFMC and ASMFC Summer Flounder/Scup/Black Sea Bass Advisory Panels and made initial recommendations on ABC revisions for 2021. Based on the 2019 assessment Scup are presently 63% above Bmsy (not overfished) and slightly below the Fmsy threshold (overfishing not occurring). Landings in 2019 have been relatively stable since 2013, typically at or below harvest limits in both the recreational and commercial fisheries. Stock biomass has been declining as forecasted but is thought to be well above the Bmsy level. Under the Council’s revised risk policy, the probability of overfishing limit is set to 0.49 which resulted in a recommended ABC increase of 13% from 13,913 mt to 15,791 mt in 2021. Based on the 2019 assessment, recruitments for 2016 to 2018 appear to be below average but presence of any trend cannot be verified. The SSC’s responses to the terms of reference provided by the MAFMC (in italics) are as follows. For Scup, the SSC will provide a written statement that identifies the following for the 2021 fishing year: 1) Specify a revised ABC for the 2021 fishing season based on the Council’s recently approved
changes to the risk policy. If revising the 2021 ABC with the new risk policy is inappropriate, specify an alternative ABC for 2021 (e.g., previous recommendation) and provide any supporting information used to make this determination;
The SSC recommends an ABC of 15,791 mt for the 2021 fishing season, based on the Council’s revised risk policy (P* = 0.49). The SSC notes that, although stock biomass remains well above BMSY, indices of recruitment and stock biomass have declined in recent years. At the same time, total removals in 2019 were below ABC and the removals in 2020 are likely to be below the ABC as well.
2) Provide any relevant data and/or assessment considerations for the 2021 management track assessment.
26
The SSC recommends consideration of the following issues for the 2021 management track assessment, if possible: The Scup Statistical Catch at Age assessment model uses multiple selectivity blocks. The
final selectivity block (2006-2018) is the longest in the model. The applicability of the most recent selectivity block to the current fishery condition is uncertain. If the fishery selectivity implied in this block changes, estimates of stock number, spawning stock biomass, and fishing mortality become less reliable.
Improve estimates of discards and discard mortality for commercial and recreational fisheries.
Recruitment indices for Scup have been declining in recent years. The 2021 management track assessment should consider the implications on stock biomass projections should this trend continue.
Most of the fishery-independent indices used in the model provide estimates of the abundance of Scup < age 3. One consequence is that much of the information on the dynamics of Scup of older ages arises largely from the fishery catch-at-age and from assumptions of the model, and are not conditioned on fishery-independent observations. As a result, the dynamics of these older fish remain uncertain. Knowledge of the dynamics of these older age classes will become more important as the age structure continues to expand.
The projection on which the ABC was determined assumes that the quotas would be landed in 2019, 2020, and 2021; however, landings in recent years have been below the quotas and perhaps a more realistic assumption should be used in future projections.
Uncertainty exists with respect to the estimate of natural mortality used in the assessment. Uncertainty exists as to whether the MSY proxies (SSB40%, F40%) selected and their
precisions are appropriate for this stock. Survey indices are particularly sensitive to Scup availability, which results in high inter-
annual variability. Efforts were made to address this question in the Stock Assessment Workshop and Stock Assessment Review Committee (SAW/SARC) in 2017 that should be continued in the 2021 management track assessment.
BLACK SEA BASS
Julia Beaty (MAFMC staff) briefed the SSC on the management history and recent NEFSC data update for Black Sea Bass prepared by Gary Shepherd. The assessment model was not updated for this meeting but data on commercial and recreational landings and discards were provided. Survey data and trends in size composition suggest a broad range of size and age classes in the population. Julia also summarized the relevant sections of the Fishery Performance Report prepared by the MAFMC and ASMFC Joint Summer Flounder/Scup/Black Sea Bass Advisory Panels. Notably, prices for Black Sea Bass have declined sharply in 2020 from $4-6/lb to $1.50 in response to reduced demand, but the trajectory of seasonal commercial landings in 2020 is comparable to that observed in 2019. Advisers reported that abundance trends in both southern and northern areas appear strong; this observation is consistent with survey trends with the 2015 year class

27
dominant in both areas. Gary reported that the 2018 year class may also be above average but confirmation must await a model update. Depending on its strength, one might expect increased discarding in fisheries constrained by size limits. New information on mortality rates of discarded fish is available and could be incorporated in the next assessment given the Management Track guidelines. Julia reviewed the previously approved 2021 and 2020 OFLs and ABCs and recommended an updated ABC value for 2021 consistent with the Council’s revised risk policy. Based on the 2019 stock status and the new policy the revised risk of overfishing criterion increases from 42% to 49%. This increased risk policy permits an increased ABC from 6,835 to 7,916 mt for 2021. Concerns were expressed about the consequences of actual catches exceeding or falling below ABCs during the interim years of a projection period. Generally, it is assumed that the ABC is taken during a multiyear specification period. Ideally the realized catches for a given interim year would be used to update the guidance of future projection years. However, the implications of this purely scientific exercise on management decisions has not been considered by the Council or GARFO. The SSC’s responses to the terms of reference provided by the MAFMC (in italics) are as follows. For Black Sea Bass, the SSC will provide a written statement that identifies the following for the 2021 fishing year: 1) Specify a revised ABC for the 2021 fishing season based on the Council’s recently approved
changes to the risk policy. If revising the 2021 ABC with the new risk policy is inappropriate, specify an alternative ABC for 2021 (e.g., previous recommendation) and provide any supporting information used to make this determination;
The SSC recommends a revised ABC of 7,916 MT for 2021. This ABC is based on the same methods applied by the SSC in 2018 and is adjusted for the updated Council risk policy. This is based upon projections that assume that ABC is taken and not exceeded, as it has been frequently in recent years. Given the small buffer, if the ABC is exceeded, there is a high likelihood of the stock experiencing overfishing. This is based on the observation that stock indicators in the data update have not changed our perception of the stock:
2018 and 2019 catches were stable across recreational and commercial fisheries. Incomplete information from 2020 suggests an increase in the survey index. The survey
index remained similar between 2018 and 2019. Some recruitment signal is apparent in 2019 and incomplete 2020 survey length
frequencies.
28
Council staff noted and the SSC agreed with the need for improved discard projection to prevent ACL and ABC overages as the revised risk policy gets applied, as it reduces the buffer between ABC and OFL to 1%.
2) Provide any relevant data and/or assessment considerations for the 2021 management track
assessment.
The SSC endorses the list of research recommendations included in the 62nd SARC report. In addition, the SSC recommends:
Consider basing harvest projections on the actual catch (including overages) in relation to the ABCs. This would be particularly important in later years of the projection.
Investigate the implications of size structure (progression of strong year classes) on projected discard mortality
Effort to improve precision of discard estimates, estimate uncertainty in discards Update discard mortality rates based on new research (to the extent that these depth-
specific mortality estimates can be appropriately matched to recreational catch from similar depths):
o Zemeckis, D.R., Kneebone, J., Capizzano, C.W., Bochenek, E.A., Hoffman, W.S.,
Grothues, T., Mandelman, J.W. and Jensen, O.P. 2020. Estimating and reducing the discard mortality of black sea bass (Centropristis striata) in a deepwater Mid-Atlantic recreational fishery. Fishery Bulletin. 118:105-119.
o Rudershausen, P.J., B. J. Runde, and J. A. Buckel. 2020. Effectiveness of venting and descender devices at increasing rates of post-release survival of black sea bass. North American Journal of Fisheries Management. 40:125-132
UPDATE ON COUNCIL AMENDMENTS
Matt Seeley, MAFMC staff lead, made two presentations to the SSC on the recent management actions of the Council with respect to allocations of Summer Flounder, Scup and Black Sea Bass FMP amendment and the Bluefish FMP amendment. The presentations were for information purposes only, although each had important economic implications and may benefit from further analyses by the SSC on alternative quantitative bases. For both FMPs the primary driver for the changes were increases in the magnitude of recreational catches from the revised MRIP estimates. Current allocation patterns are based on historical landing patterns ranging from 1980 to 1992 depending on the species. Revisions to the statistical methodologies and survey methods have revealed substantial underestimation of recreational catches, thereby prompting reconsideration of the bases for allocation. A variety of alternative bases have been proposed by the FMAT and approved by the Council. The SSC questioned why all of the alternatives based on economic benefits had been removed from consideration. Members of the SSC noted that various econometric methods can allow for economic value to be revealed using surveys of harvesters in both recreational and commercial fisheries. Such approaches may have value as a bottom up strategy for estimating relative values. It was noted that recreational and commercial sectors in Alaska routinely trade quotas
29
among groups and such procedures might work in the Mid-Atlantic. Several SSC members suggested that earlier inclusion of the SSC could have helped with selection of alternatives. Members expressed anticipation of the final conclusions of the Schnier and Hicks report on Summer Flounder economic model. Collectively the discussions of the FMP amendments provided substantial motivation for the Socio-Economics Working Group outlined under Other Business.
Other Business
Development of a Socio Economics Working Group
The SSC discussed the role of economists and social scientists in the work of the SSC. It was noted that all assessments have economic implications for the affected industries as well as the nation as a whole, as defined in the MSA. Economists participate extensively in the various FMATs of the Council, but specific requests to the SSC from the Council are infrequent. In view of the recently approved increase in the number of social scientists on the SSC a working group was proposed to better define the role of economists in the process of setting ABCs. A workshop, entitled Socioeconomic Aspects in Stock Assessments Workshop (SEASAW), was held in New Orleans in February 2020. Results of that workshop are not yet available but may provide timely input to a working group. The SSC endorsed the concept of a working group and noted that the white paper presented to the Council in August 2019 would also be instructive. The increasing focus on ecosystem considerations, tradeoffs among user groups, evaluation of control rules, communication of socioeconomic risks to Council, and upcoming challenges of offshore energy development were all mentioned as tasks where economic and social sciences could contribute. Given the need to maintain boundaries between science, management and policy decisions, some SSC members expressed concerns that the economic aspects follow after the biological concerns are addressed.
The SSC agreed that a working group would be helpful and a request for its formation would be proposed at the August 2020 Council meeting. A poll will be sent to SSC members to solicit participants with expertise in economics and stock assessment, and to define some terms of reference.
Biological Concerns Regarding Council Risk Policy
At its July 2020 meeting, the SSC developed ABC specifications for Ocean Quahog using the new Council’s risk policy. In our deliberations, the SSC accepted the OFL from the most recently updated assessment. The SSC then worked through our nine-step process for estimating the level of scientific uncertainty associated with the OFL. The SSC determined a CV of 100% was appropriate for Quahog. Using this level of scientific uncertainty in the application of the Council’s new risk policy resulted in a recommended ABC that represented a 49% probability of exceeding the overfishing level.
The SSC expresses concern that the removal of the “atypical life history” category from the Council’s risk policy may have resulted in a recommended ABC associated with a higher level of risk of overfishing than intended for this species. Quahog is believed to live an extraordinarily

30
long time, with maximum age in excess of 500 years – perhaps 10 times longer than most species with which the Council works. As a result, if we do exceed the true overfishing level, it would take a long time for us to recognize declines in the stock, and the stock may take an extraordinarily long time to recover. Accordingly, the SSC recommends flexibility in the risk policy to account for the unusual characteristics of this species.
Public comments on this topic noted that clams have recovered from catastrophic natural events in recent history. Miscellaneous The SSC also considered a proposal to develop a white paper for Council use on the relative merits of time-varying vs constant multiyear harvest policies. Considerations of current stock status and trends would be important aspects of this scientific guidance. There was insufficient time to discuss this concept and further consideration would have to be delayed to the September meeting.
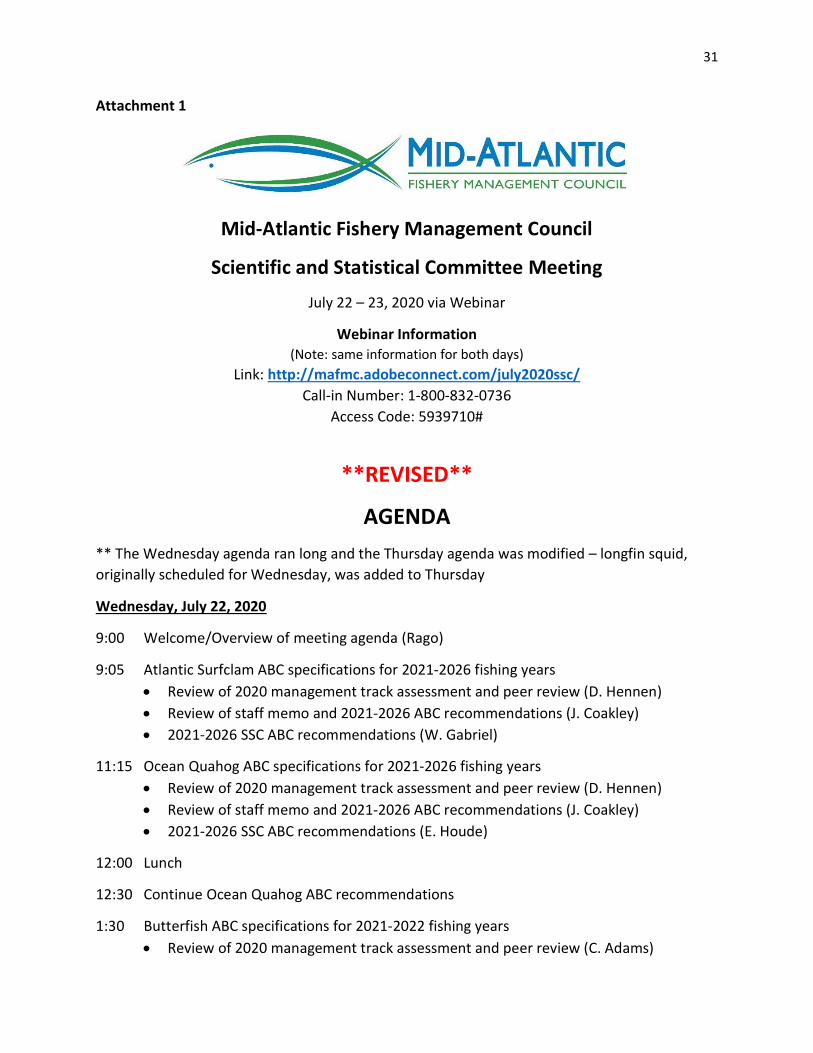
31
Attachment 1
Mid-Atlantic Fishery Management Council
Scientific and Statistical Committee Meeting
July 22 – 23, 2020 via Webinar
Webinar Information (Note: same information for both days)
Link: http://mafmc.adobeconnect.com/july2020ssc/ Call-in Number: 1-800-832-0736
Access Code: 5939710#
**REVISED**
AGENDA
** The Wednesday agenda ran long and the Thursday agenda was modified – longfin squid, originally scheduled for Wednesday, was added to Thursday
Wednesday, July 22, 2020
9:00 Welcome/Overview of meeting agenda (Rago)
9:05 Atlantic Surfclam ABC specifications for 2021-2026 fishing years Review of 2020 management track assessment and peer review (D. Hennen) Review of staff memo and 2021-2026 ABC recommendations (J. Coakley) 2021-2026 SSC ABC recommendations (W. Gabriel)
11:15 Ocean Quahog ABC specifications for 2021-2026 fishing years Review of 2020 management track assessment and peer review (D. Hennen) Review of staff memo and 2021-2026 ABC recommendations (J. Coakley) 2021-2026 SSC ABC recommendations (E. Houde)
12:00 Lunch
12:30 Continue Ocean Quahog ABC recommendations
1:30 Butterfish ABC specifications for 2021-2022 fishing years Review of 2020 management track assessment and peer review (C. Adams)

32
Review of staff memo and 2021-2022 ABC recommendations (J. Didden) 2021-2022 SSC ABC recommendations (R. Latour)
5:30 Adjourn
Thursday, July 23, 2020
8:30 Longfin Squid ABC specifications for 2021-2023 fishing years Review of 2020 management track assessment and peer review (L. Hendrickson) Review of staff memo and 2021-2023 ABC recommendations (J. Didden) 2021-2023 SSC ABC recommendations (M. Frisk)
10:30 Atlantic Mackerel ABC specifications for 2021 fishing year
Review of staff memo and 2021 ABC recommendation (J. Didden) 2021 SSC ABC recommendation (D. Secor)
11:30 Bluefish data and fishery update; review of previously recommended 2021 ABC (M. Seeley)
12:30 Lunch 1:00 Summer flounder data and fishery update; review of previously recommended 2021
ABC (K. Dancy) Revised 2021 SSC ABC recommendation with new Council risk policy (M. Wilberg)
2:00 Scup data and fishery update; review of previously recommended 2021 ABC (K. Coutre) Revised 2021 SSC ABC recommendation with new Council risk policy (J. Boreman)
3:00 Black Sea Bass data and fishery update; review of previously recommended 2021 ABC (J. Beaty) Revised 2021 SSC ABC recommendation with new Council risk policy (O. Jensen)
4:00 Update and feedback on Council actions: Summer Flounder, Scup, and Black Sea Bass Commercial/Recreational Allocation Amendment; Bluefish Allocation and Rebuilding Amendment (Council staff)
5:00 Other business
5:30 Adjourn
Note: agenda topic times are approximate and subject to change

33
Attachment 2
MAFMC Scientific and Statistical Committee July 22-23, 2020
Meeting Attendance via Webinar
Name Affiliation SSC Members in Attendance: Paul Rago (SSC Chairman) NOAA Fisheries (retired) Tom Miller University of Maryland – CBL Ed Houde University of Maryland – CBL (emeritus) Dave Secor University of Maryland – CBL John Boreman NOAA Fisheries (retired) Geret DePiper NOAA Fisheries NEFSC Lee Anderson University of Delaware (emeritus) Jorge Holzer University of Maryland Yan Jiao Virginia Tech University Rob Latour VIMS Brian Rothschild Univ. of Massachusetts – Dartmouth (emeritus) Olaf Jensen Rutgers University Sarah Gaichas NOAA Fisheries NEFSC Wendy Gabriel NOAA Fisheries NEFSC Mike Wilberg (Vice-Chairman) University of Maryland – CBL Alexei Sharov Maryland Dept. of Natural Resources Mike Frisk Stony Brook University Mark Holliday NOAA Fisheries (retired) Cynthia Jones Old Dominion University Gavin Fay U. Massachusetts—Dartmouth Others in attendance (includes presenters and members of public who spoke): G. Warren Elliott MAFMC Vice-Chair Tony DiLernia (July 23rd only) MAFMC Jason Didden MAFMC staff Brandon Muffley MAFMC staff José Montañez MAFMC staff Jessica Coakley (July 22nd only) MAFMC staff Mary Sabo MAFMC staff Lisa Hendrickson (July 23rd only) NOAA Fisheries NEFSC Dan Hennen (July 22nd only) NOAA Fisheries NEFSC Charles Adams (July 22nd only) NOAA Fisheries NEFSC Karson Coutré MAFMC staff Kiley Dancy (July 23rd only) MAFMC staff Matt Seeley MAFMC staff Julia Beaty MAFMC staff Kiersten Curti (July 23rd only) NOAA Fisheries NEFSC Mark Terceiro NOAA Fisheries NEFSC

34
Tony Wood (July 23rd only) NOAA Fisheries NEFSC Gary Shepherd (July 23rd only) NOAA Fisheries NEFSC James Fletcher United National Fisherman’s Assoc. Dave Wallace (July 22nd only) Wallace and Associates Greg DiDomenico Lunds Fisheries Jeff Kaelin Lunds Fisheries Eric Reid Seafreeze, NEFMC Vice-Chair
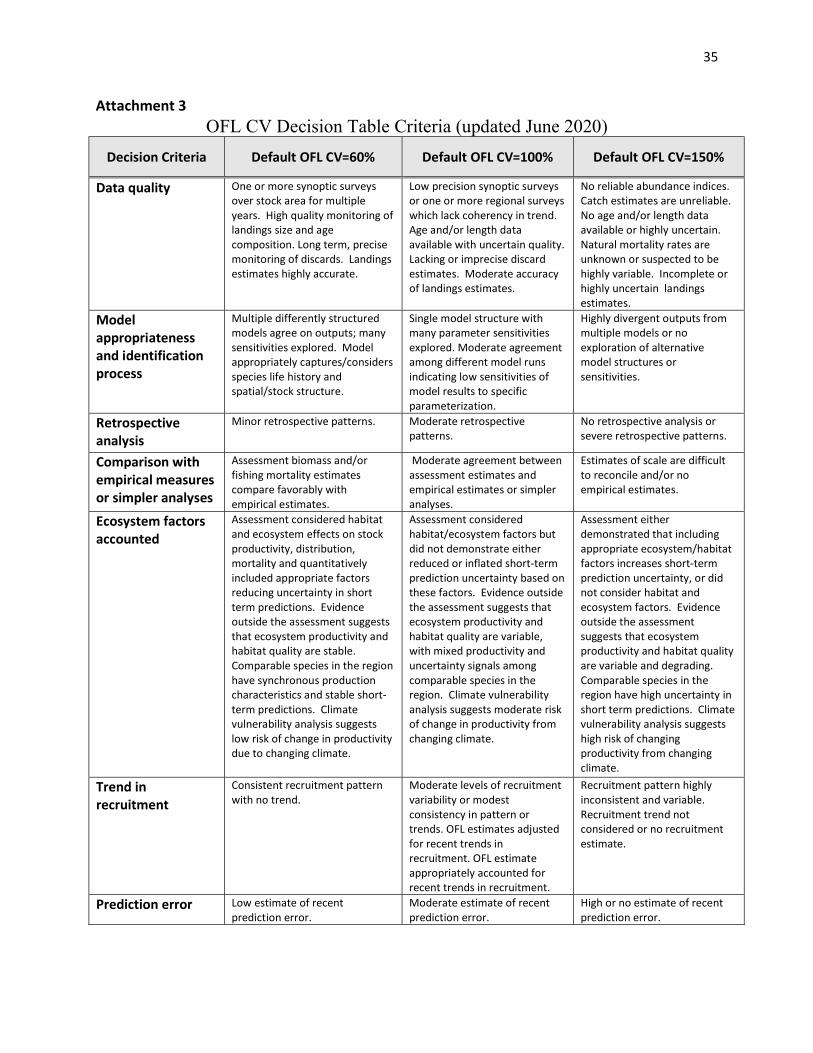
35
Attachment 3 OFL CV Decision Table Criteria (updated June 2020)
Decision Criteria Default OFL CV=60% Default OFL CV=100% Default OFL CV=150%
Data quality One or more synoptic surveys over stock area for multiple years. High quality monitoring of landings size and age composition. Long term, precise monitoring of discards. Landings estimates highly accurate.
Low precision synoptic surveys or one or more regional surveys which lack coherency in trend. Age and/or length data available with uncertain quality. Lacking or imprecise discard estimates. Moderate accuracy of landings estimates.
No reliable abundance indices. Catch estimates are unreliable. No age and/or length data available or highly uncertain. Natural mortality rates are unknown or suspected to be highly variable. Incomplete or highly uncertain landings estimates.
Model appropriateness and identification process
Multiple differently structured models agree on outputs; many sensitivities explored. Model appropriately captures/considers species life history and spatial/stock structure.
Single model structure with many parameter sensitivities explored. Moderate agreement among different model runs indicating low sensitivities of model results to specific parameterization.
Highly divergent outputs from multiple models or no exploration of alternative model structures or sensitivities.
Retrospective analysis
Minor retrospective patterns. Moderate retrospective patterns.
No retrospective analysis or severe retrospective patterns.
Comparison with empirical measures or simpler analyses
Assessment biomass and/or fishing mortality estimates compare favorably with empirical estimates.
Moderate agreement between assessment estimates and empirical estimates or simpler analyses.
Estimates of scale are difficult to reconcile and/or no empirical estimates.
Ecosystem factors accounted
Assessment considered habitat and ecosystem effects on stock productivity, distribution, mortality and quantitatively included appropriate factors reducing uncertainty in short term predictions. Evidence outside the assessment suggests that ecosystem productivity and habitat quality are stable. Comparable species in the region have synchronous production characteristics and stable short-term predictions. Climate vulnerability analysis suggests low risk of change in productivity due to changing climate.
Assessment considered habitat/ecosystem factors but did not demonstrate either reduced or inflated short-term prediction uncertainty based on these factors. Evidence outside the assessment suggests that ecosystem productivity and habitat quality are variable, with mixed productivity and uncertainty signals among comparable species in the region. Climate vulnerability analysis suggests moderate risk of change in productivity from changing climate.
Assessment either demonstrated that including appropriate ecosystem/habitat factors increases short-term prediction uncertainty, or did not consider habitat and ecosystem factors. Evidence outside the assessment suggests that ecosystem productivity and habitat quality are variable and degrading. Comparable species in the region have high uncertainty in short term predictions. Climate vulnerability analysis suggests high risk of changing productivity from changing climate.
Trend in recruitment
Consistent recruitment pattern with no trend.
Moderate levels of recruitment variability or modest consistency in pattern or trends. OFL estimates adjusted for recent trends in recruitment. OFL estimate appropriately accounted for recent trends in recruitment.
Recruitment pattern highly inconsistent and variable. Recruitment trend not considered or no recruitment estimate.
Prediction error Low estimate of recent prediction error.
Moderate estimate of recent prediction error.
High or no estimate of recent prediction error.

36
Assessment accuracy under different fishing pressures
High degree of contrast in landings and surveys with apparent response in indices to changes in removals. Fishing mortality at levels expected to influence population dynamics in recent years.
Moderate agreement in the surveys to changes in catches. Observed moderate fishing mortality in fishery (i.e., lack of high fishing mortality in recent years).
Relatively little change in surveys or catches over time. Low precision of estimates. Low fishing mortality in recent years. “One-way” trips for production models.
Simulation analysis/MSE
Can be used to evaluate different combinations of uncertainties and indicate the most appropriate OFL CV for a particular stock assessment.
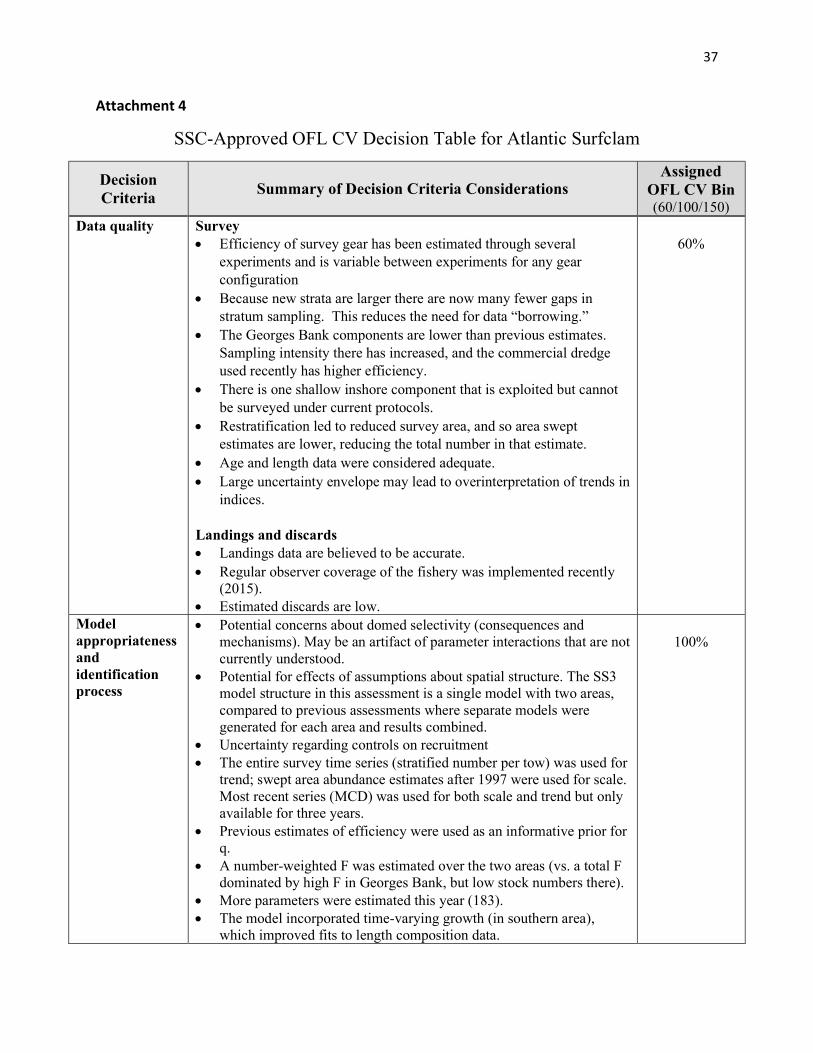
37
Attachment 4
SSC-Approved OFL CV Decision Table for Atlantic Surfclam
Decision Criteria
Summary of Decision Criteria Considerations Assigned
OFL CV Bin (60/100/150)
Data quality
Survey Efficiency of survey gear has been estimated through several
experiments and is variable between experiments for any gear configuration
Because new strata are larger there are now many fewer gaps in stratum sampling. This reduces the need for data “borrowing.”
The Georges Bank components are lower than previous estimates. Sampling intensity there has increased, and the commercial dredge used recently has higher efficiency.
There is one shallow inshore component that is exploited but cannot be surveyed under current protocols.
Restratification led to reduced survey area, and so area swept estimates are lower, reducing the total number in that estimate.
Age and length data were considered adequate. Large uncertainty envelope may lead to overinterpretation of trends in
indices. Landings and discards Landings data are believed to be accurate. Regular observer coverage of the fishery was implemented recently
(2015). Estimated discards are low.
60%
Model appropriateness and identification process
Potential concerns about domed selectivity (consequences and mechanisms). May be an artifact of parameter interactions that are not currently understood.
Potential for effects of assumptions about spatial structure. The SS3 model structure in this assessment is a single model with two areas, compared to previous assessments where separate models were generated for each area and results combined.
Uncertainty regarding controls on recruitment The entire survey time series (stratified number per tow) was used for
trend; swept area abundance estimates after 1997 were used for scale. Most recent series (MCD) was used for both scale and trend but only available for three years.
Previous estimates of efficiency were used as an informative prior for q.
A number-weighted F was estimated over the two areas (vs. a total F dominated by high F in Georges Bank, but low stock numbers there).
More parameters were estimated this year (183). The model incorporated time-varying growth (in southern area),
which improved fits to length composition data.
100%

38
Model sensitivities included comparisons of trajectories of earlier assessments with models incorporating changes to new model (SS3), restratification, and addition of discard estimates.
Model sensitivities included comparisons of trajectories of models incorporating area effects, estimating growth in the north, estimating selectivity in both areas, removing apparently erroneous length composition data, allowing time varying growth in the south, and changing the method of estimating overall stock F; sensitivity to R0, the scale-setting parameter; and a variety of other features.
MCMC was used to evaluate uncertainties from maximum likelihood estimates. R0 (unfished recruitment parameter) and recruitment parameters, with roughly similar results as MLE approximate.
There is some sensitivity to initial starting parameter values. Stock-recruitment relationship appears flat, because of the high
steepness parameter: there were no observations of recruitment at low stock sizes to inform this parameter.
Linf declined over time. Retrospective analysis
Historical retrospective showed approximately similar trends although different scales. This model scales biomass lower than previous ones.
Peels based on 6 years indicate only minor internal retrospective patterns: Mohn’s rho does not indicate the need for adjustments.
60%
Comparison with empirical measures or simpler analyses
Swept area biomass estimates and ratios of efficiency-corrected swept area/catch (F proxy) were of similar scale to model results; but both analyses make similar survey catchability assumptions.
60%
Ecosystem factors accounted
Climate vulnerability indicates a high risk Effects of southern Surfclam unknown No ecosystem factors were considered explicitly in the assessment,
although the separation into two areas allows responsiveness to potentially different productivities in the two areas, and time-varying growth allows responsiveness to changing but unspecified ecological factors.
If distribution moves deeper as temperatures increase, that shift would be reflected in deeper survey strata that sample Ocean Quahog.
Increasing ocean acidification may affect growth.
150%
Trend in recruitment
No trend, but not much information on recruitment Timeseries average recruitment used. OFL projections insensitive to
assumptions about recruitment because of six year lag in recruitment to the fishery
Neither survey nor commercial operations select for young Surfclams.
The effect of a single year’s recruitment on stock size and stock status is likely small because of the number of ages in the stock.
100%
Prediction error
Large scale difference between previous benchmark and current management track assessment
Most of the prediction error would seem to be related to uncertainties of scale (bias rather than variance).
150%

39
Performance and precision is compared to earlier assessments (see sensitivity analyses above).
F/Fthreshhold = 0.26, with CV = 0.25; SSB/SSBthreshold = 2.38 with CV = 0.11.
Assessment accuracy under different fishing pressures
High signal of fishing on Georges Bank, low signal in southern New England/Mid Atlantic
Fishing mortality appears low relative to natural mortality, which makes scale estimates difficult, reduces the amount of information that can be obtained from fishery dependent data, and increases reliance on estimates of survey efficiency.
Increases in F are emerging in the Georges Bank component, however. This may lead to increased accuracy associated with dynamics in that area.
100%
Simulation analysis/MSE
Previous benchmark assessment included simulation analyses to choose and test the fishing mortality rate threshold and reference point
A “Plan B” simplified approach was also developed and compared.
100%

40
Attachment 5
SSC-Approved OFL CV Decision Table for Ocean Quahog
Decision Criteria Summary of Decision Criteria Considerations
Assigned OFL CV Bin (60/100/150)
Data quality Accurate landings data – mandatory logbook reporting Discards are variable but low compared to landings (generally <5%) Long-term survey, recently redesigned (restratified), covering stock
area to improve survey efficiency and precision No new survey data since the last assessment, but restratifcation of the
survey and its data used in the most recent assessment update Dredge efficiency and selectivity data and evaluation available to
inform models Comprehensive length-frequency information from landings and
survey; little age and growth information is available Recruitment data sparse, but probably adequate for assessment of this
long-lived species Given the slow life history, the survey data cover a limited number of
generations
60%
Model appropriateness and identification process
SS3 model; two areas (S and N) to provide assessment for whole stock. Other models applied in the past
Model well documented but its efficacy constrained by low F. Trends well described but scale still uncertain
Model generally captures fishery-specific traits for this extremely long-lived species, but performance of reference points for such species is uncertain. Nevertheless, the reference points used have performed well in simulation testing (Hennen, D.R. 2015)
Comparison made among the assessment baseline model and models with different structures
Comprehensive model testing and simulations, including Markov Chain Monte Carlo (MCMC) run to evaluate model performance and uncertainty
100%
Retrospective analysis
No retrospective adjustment of spawning stock biomass or fishing mortality required because the internal retrospective analysis was exceptionally stable.
Comparisons for several previous assessments and assessment models Scales differ between early assessments (before 2004) and more recent
assessment, but trends are similar Current assessment (2020) and previous (2017) very similar; SSB a bit
higher in 2020.
60%
Comparison with empirical measures or simpler analyses
Swept area biomasses from surveys are supportive of, and similar to, modeled stock.
Probability distributions for B and F reference points similar to those from SS3
Because catchability assumptions are identical in both the model and the swept area biomass calculations, these metrics are not independent and provide limited confirmation of the model.
100%

41
Ecosystem factors accounted
No stock-relevant ecosystem factors included in the assessment or model
No ecosystem factors outside the stock assessment included in developing reference points.
Awareness of probable ongoing climate change and probable future offshore or northward shifts in distribution, or potential changes in productivity
Vulnerability analysis classified this stock as vulnerable ("very high" vulnerability) to climate/ecosystem change (Hare et al. 2016)
150%
Trend in recruitment
Recruitment trends or levels not well known or described, but perhaps not critical for model performance in this long-lived species.
Recruitment in this long-lived species is not important for short-term forecasts.
No indication of highly variable recruitment, but aging errors potentially could give rise to a false belief that many age classes are present in the population.
No stock-recruitment relationship. Low power to detect a S-R relationship given limited range of observed SSB
OFL estimates apparently are adjusted by the recruitment proxy generated in the model. The SS3 model has a technical constraint dealing with the low and apparently invariable recruitments. The model accounts for apparent increases in abundance by introducing a single large recruitment near the middle of the time series.
100%
Prediction error
Prediction errors are considered in the assessment Model performance and precision are compared to earlier assessments
(bridging) Model performance consistent with earlier modeling. Scale shifts but
trends are consistent Prediction CV for F2020/Fthr = 0.342 is 0.295; Prediction CV for
SSB2020/SSBthr = 2.17 is 0.108. These CV’s are relatively low. Projected biomass from the last assessment was within the confidence
bounds of the biomass estimated in the current assessment
100%
Assessment accuracy under different fishing pressures
Estimates and projections probably are valid (accurate) but consistently low F makes it difficult to confirm scales
The long time series of survey data, catches and trends lend credence to the assessment results despite low F, uncertainty in recruitment, uncertainty in selectivity, and questions about growth patterns
Exploitation is low; F <0.01 and has not varied greatly over the years. Relative F may be declining in the most recent years and F/Fthr <0.3 in the most recent years
While scale is uncertain, relative SSB/SSBthr remains >2, with little change over years or in projected years, probably as expected given the low F and little incentive for fishery to increase effort
150%
Simulation analysis/MSE
No MSE was conducted for this assessment, but an earlier simulation-based approach to assessment was conducted that informs management strategies and alternatives.
100%
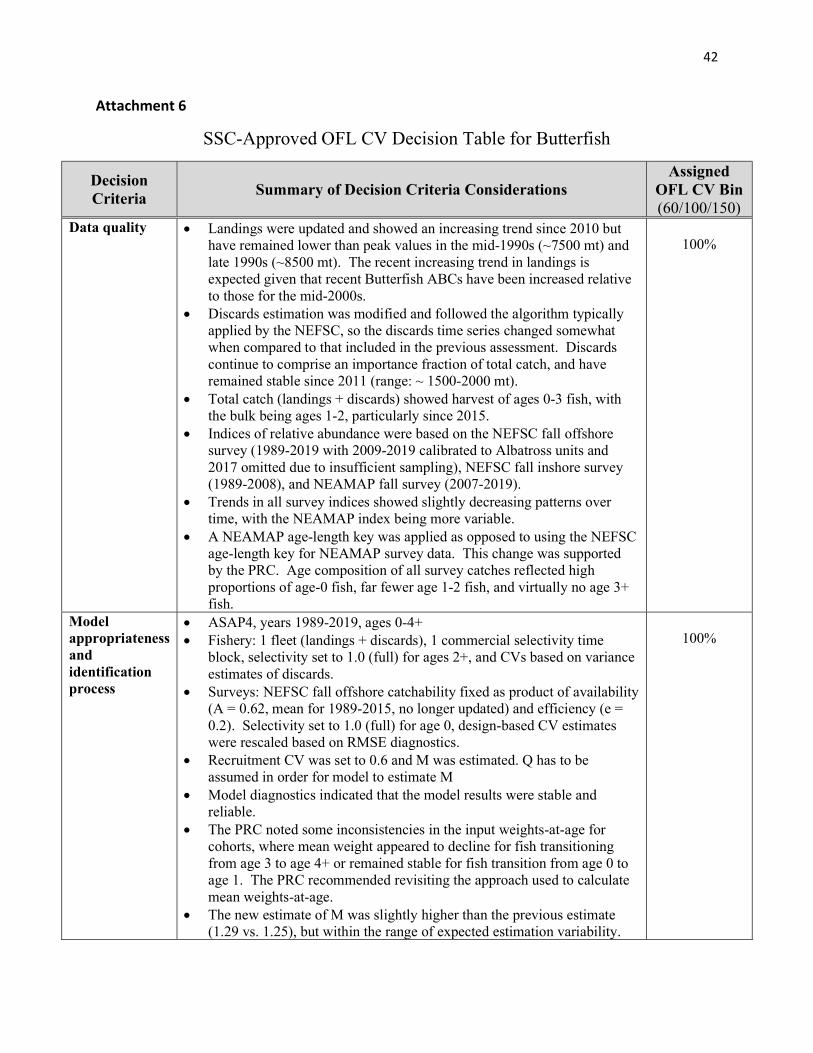
42
Attachment 6
SSC-Approved OFL CV Decision Table for Butterfish
Decision Criteria
Summary of Decision Criteria Considerations Assigned
OFL CV Bin (60/100/150)
Data quality Landings were updated and showed an increasing trend since 2010 but have remained lower than peak values in the mid-1990s (~7500 mt) and late 1990s (~8500 mt). The recent increasing trend in landings is expected given that recent Butterfish ABCs have been increased relative to those for the mid-2000s.
Discards estimation was modified and followed the algorithm typically applied by the NEFSC, so the discards time series changed somewhat when compared to that included in the previous assessment. Discards continue to comprise an importance fraction of total catch, and have remained stable since 2011 (range: ~ 1500-2000 mt).
Total catch (landings + discards) showed harvest of ages 0-3 fish, with the bulk being ages 1-2, particularly since 2015.
Indices of relative abundance were based on the NEFSC fall offshore survey (1989-2019 with 2009-2019 calibrated to Albatross units and 2017 omitted due to insufficient sampling), NEFSC fall inshore survey (1989-2008), and NEAMAP fall survey (2007-2019).
Trends in all survey indices showed slightly decreasing patterns over time, with the NEAMAP index being more variable.
A NEAMAP age-length key was applied as opposed to using the NEFSC age-length key for NEAMAP survey data. This change was supported by the PRC. Age composition of all survey catches reflected high proportions of age-0 fish, far fewer age 1-2 fish, and virtually no age 3+ fish.
100%
Model appropriateness and identification process
ASAP4, years 1989-2019, ages 0-4+ Fishery: 1 fleet (landings + discards), 1 commercial selectivity time
block, selectivity set to 1.0 (full) for ages 2+, and CVs based on variance estimates of discards.
Surveys: NEFSC fall offshore catchability fixed as product of availability (A = 0.62, mean for 1989-2015, no longer updated) and efficiency (e = 0.2). Selectivity set to 1.0 (full) for age 0, design-based CV estimates were rescaled based on RMSE diagnostics.
Recruitment CV was set to 0.6 and M was estimated. Q has to be assumed in order for model to estimate M
Model diagnostics indicated that the model results were stable and reliable.
The PRC noted some inconsistencies in the input weights-at-age for cohorts, where mean weight appeared to decline for fish transitioning from age 3 to age 4+ or remained stable for fish transition from age 0 to age 1. The PRC recommended revisiting the approach used to calculate mean weights-at-age.
The new estimate of M was slightly higher than the previous estimate (1.29 vs. 1.25), but within the range of expected estimation variability.
100%
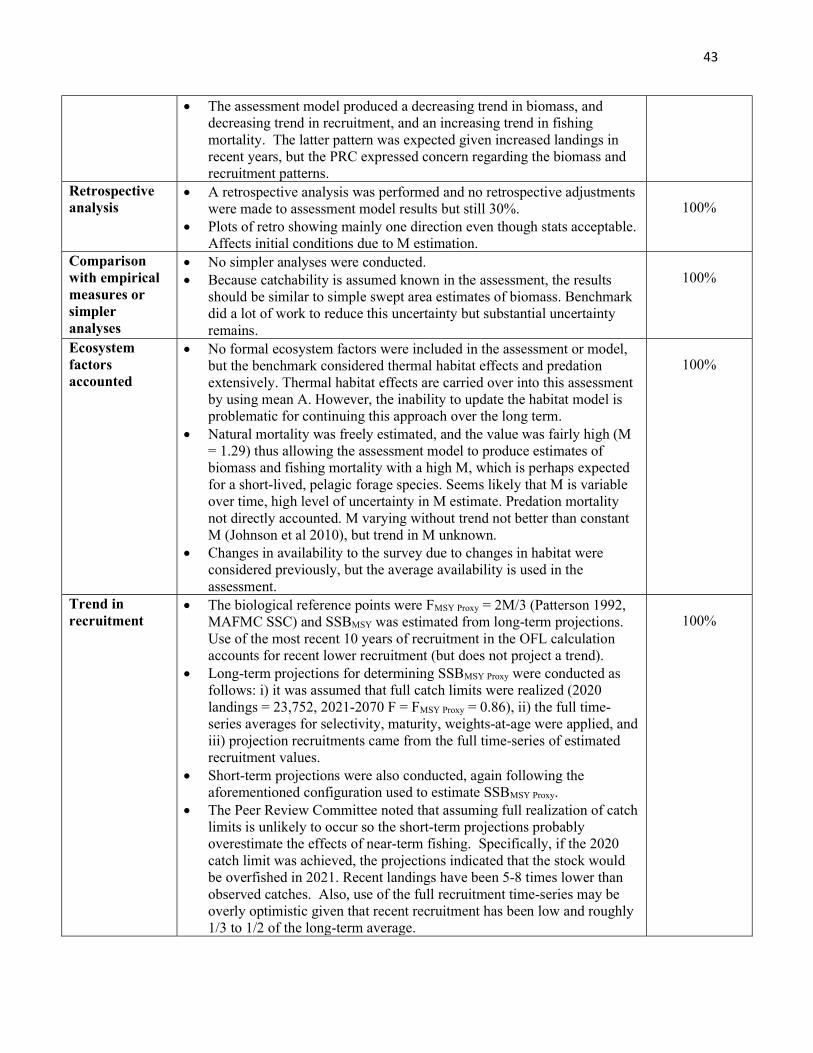
43
The assessment model produced a decreasing trend in biomass, and decreasing trend in recruitment, and an increasing trend in fishing mortality. The latter pattern was expected given increased landings in recent years, but the PRC expressed concern regarding the biomass and recruitment patterns.
Retrospective analysis
A retrospective analysis was performed and no retrospective adjustments were made to assessment model results but still 30%.
Plots of retro showing mainly one direction even though stats acceptable. Affects initial conditions due to M estimation.
100%
Comparison with empirical measures or simpler analyses
No simpler analyses were conducted. Because catchability is assumed known in the assessment, the results
should be similar to simple swept area estimates of biomass. Benchmark did a lot of work to reduce this uncertainty but substantial uncertainty remains.
100%
Ecosystem factors accounted
No formal ecosystem factors were included in the assessment or model, but the benchmark considered thermal habitat effects and predation extensively. Thermal habitat effects are carried over into this assessment by using mean A. However, the inability to update the habitat model is problematic for continuing this approach over the long term.
Natural mortality was freely estimated, and the value was fairly high (M = 1.29) thus allowing the assessment model to produce estimates of biomass and fishing mortality with a high M, which is perhaps expected for a short-lived, pelagic forage species. Seems likely that M is variable over time, high level of uncertainty in M estimate. Predation mortality not directly accounted. M varying without trend not better than constant M (Johnson et al 2010), but trend in M unknown.
Changes in availability to the survey due to changes in habitat were considered previously, but the average availability is used in the assessment.
100%
Trend in recruitment
The biological reference points were FMSY Proxy = 2M/3 (Patterson 1992, MAFMC SSC) and SSBMSY was estimated from long-term projections. Use of the most recent 10 years of recruitment in the OFL calculation accounts for recent lower recruitment (but does not project a trend).
Long-term projections for determining SSBMSY Proxy were conducted as follows: i) it was assumed that full catch limits were realized (2020 landings = 23,752, 2021-2070 F = FMSY Proxy = 0.86), ii) the full time-series averages for selectivity, maturity, weights-at-age were applied, and iii) projection recruitments came from the full time-series of estimated recruitment values.
Short-term projections were also conducted, again following the aforementioned configuration used to estimate SSBMSY Proxy.
The Peer Review Committee noted that assuming full realization of catch limits is unlikely to occur so the short-term projections probably overestimate the effects of near-term fishing. Specifically, if the 2020 catch limit was achieved, the projections indicated that the stock would be overfished in 2021. Recent landings have been 5-8 times lower than observed catches. Also, use of the full recruitment time-series may be overly optimistic given that recent recruitment has been low and roughly 1/3 to 1/2 of the long-term average.
100%

44
Prediction error
Three model runs were examined (bridging): Run 1 added data for 2017-2019 to the 2017 model; Run 2 used the newly estimated time series of discards; and Run 3 included application of the NEAMAP age-length key.
No substantial differences in model outputs were detected across the three runs.
Assessment model diagnostics were well considered and showed plausible fits and results.
No uncertainty estimates of BRPs were provided (e.g., CVs absent for F2019/FMSY Proxy or SSB2019/ SSBMSY Proxy).
Major sources of uncertainty appear to be: o Discard estimates were highly variable and imprecise. o Commercial catch data were aged with NEFSC age-length keys. o Estimation of M required the assumption that the daytime
Bigelow survey efficiency was 100%. o Use of FMSY Proxy = 2M/3 may be problematic since the estimator
is not tied to SSB. Difficult to assess prediction error based on bridging runs, but
consistency with past assessments. This may be due to similar assumptions across assessments with respect to survey catchability.
Assessment accuracy under different fishing pressures
Accuracy of assessment results were not characterized in relation to different fishing pressures.
F has been increasing in recent years so should be more informative. BRPs were recalculated to enable internal consistency with the estimate
of M.
100%
Simulation analysis/MSE
The assessment results and subsequent management advice were not informed by simulation analysis or MSE.
100%
M E M O R A N D U M Date: July 31, 2020
To: Council
From: Chris Moore
Subject: Executive Director’s Report
The following materials are enclosed for Council review at the August 2020 Council Meeting during the Executive Director’s Report:
1. 2020 Planned Meeting Topics 2. 2021 Council Meeting Schedule 3. Status of Council Actions Under Development 4. Status of Completed Council Actions and Specifications 5. Staff Memo: MRIP – COVID-19 Impacts 6. Summary of 6/5/20 MAFMC Joint Advisory Panel Webinar on Ocean Data Portals 7. MAFMC Letter to GARFO and NEFSC Regarding Redeployment of Observers (6/23/20) 8. Temporary Waivers on Northeast Observers Through July 31 (6/30/20) 9. NOAA Fisheries Identifies National-Level Observer Waiver Criteria; Will Begin Redeployment
in Northeast (7/30/20) 10. Recreational Tilefish Permitting and Reporting – Final Rule Announcement (7/15/20) 11. MAFMC comments to USCG on Port Access Route Study (7/6/20) 12. MAFMC and NEFMC letter to BOEM on the SEIS for the Vineyard Wind I Project (7/27/20) 13. NRCC Summer Meeting Agenda (7/30/20) 14. MAFAC Report on Establishing a National Seafood Council – Executive Summary (7/1/20) 15. Comments from Lunds/Seafreeze/Town Dock: Request for Squid Species Exemption from
Duplicative and Burdensome USFWS Regulations (7/28/20) 16. Comments from the Scallopers Campaign: Development of a Sea Scallop Limited Access
Limited Access Leasing Program (7/29/20) 17. Executive Order 13921 Discussion Documents:
a. Staff Memo b. Executive Order 13921 – Section 4 c. Guidance for Councils Response to E.O. 13921 Section 4 d. E.O. 13921 Recommended Action Template
Mid-Atlantic Fishery Management Council 800 North State Street, Suite 201, Dover, DE 19901
Phone: 302-674-2331 ǀ FAX: 302-674-5399 ǀ www.mafmc.org Michael P. Luisi, Chairman ǀ G. Warren Elliott, Vice Chairman
Christopher M. Moore, Ph.D., Executive Director
2020 Planned Council Meeting Topics
Updated 7/29/20
Joint MAFMC/ASMFC Meeting: August 6, 2020 Note: The following topics were originally planned for the August 10-13 Council Meeting.
• Black Sea Bass Commercial State Allocation Amendment: Approve Range of Alternatives • Bluefish Allocation and Rebuilding Amendment: Approve Range of Alternatives Continue
Development of Alternatives • Recreational Reform Initiative: Update • Black Sea Bass February Recreational Fishery: Review
August 2020 Council Meeting: August 10-13, 2020
• Swearing-In of New and Reappointed Council Members • Election of Officers • Mackerel and Butterfish 2021-2022 Specifications • Longfin Squid (Including Butterfish Cap) 2021-2023 Specifications • River Herring and Shad Cap (RH/S) (Mackerel) for 2021-2022 • Bluefish 2021 Specifications: Review • Summer Flounder, Scup, and Black Sea Bass 2021 Specifications: Review • Commercial Scup Discards and Gear Restricted Areas: Review • Summer Flounder, Scup, and Black Sea Bass Commercial/Recreational Allocation Amendment:
Approve Range of Alternatives • Atlantic Surfclam And Ocean Quahog 2021-2026 Specifications • Surfclam and Ocean Quahog Commingling Issue: Update • Surfclam Genetic Study: Update • Executive Order 13921: Discuss
October 2020 Council Meeting: October 6-8, 2020 (Riverhead, NY)
• 2021 Implementation Plan: Discuss Draft Deliverables • Research Priorities Update: Tracking Progress to Address Priorities • Spiny Dogfish 2021 and 2022 Specifications • Surfclam and Ocean Quahog Commingling Issue: Update (moved to August) • Surfclam Genetic Study: Update(moved to August) • Joint Council-SSC meeting • Final Report on HMS Diet Study (delayed due to COVID-19) • Chub Mackerel 2021 Specifications: Review • EAFM Updates: Summer Flounder Management Strategy Evaluation and other EAFM activities • Climate Change Scenario Planning Initiative: Update • Executive Order 13921: Develop and Prioritize Council Recommendations

December 2020 Council Meeting: December 14-17, 2020 (Baltimore, MD)
• 2021 Implementation Plan: Approve • Summer Flounder, Scup, and Black Sea Bass 2021 Recreational Management Measures: Develop
and Approve • Summer Flounder, Scup, And Black Sea Bass Commercial/Recreational Allocation Amendment:
Approve Public Hearing Document • Black Sea Bass Commercial State Allocation Amendment: Final Action • Bluefish Allocation and Rebuilding Amendment: Approve Public Hearing Document • Recreational Reform Initiative: Update • Update on Habitat Activities • Review RH/S White Papers
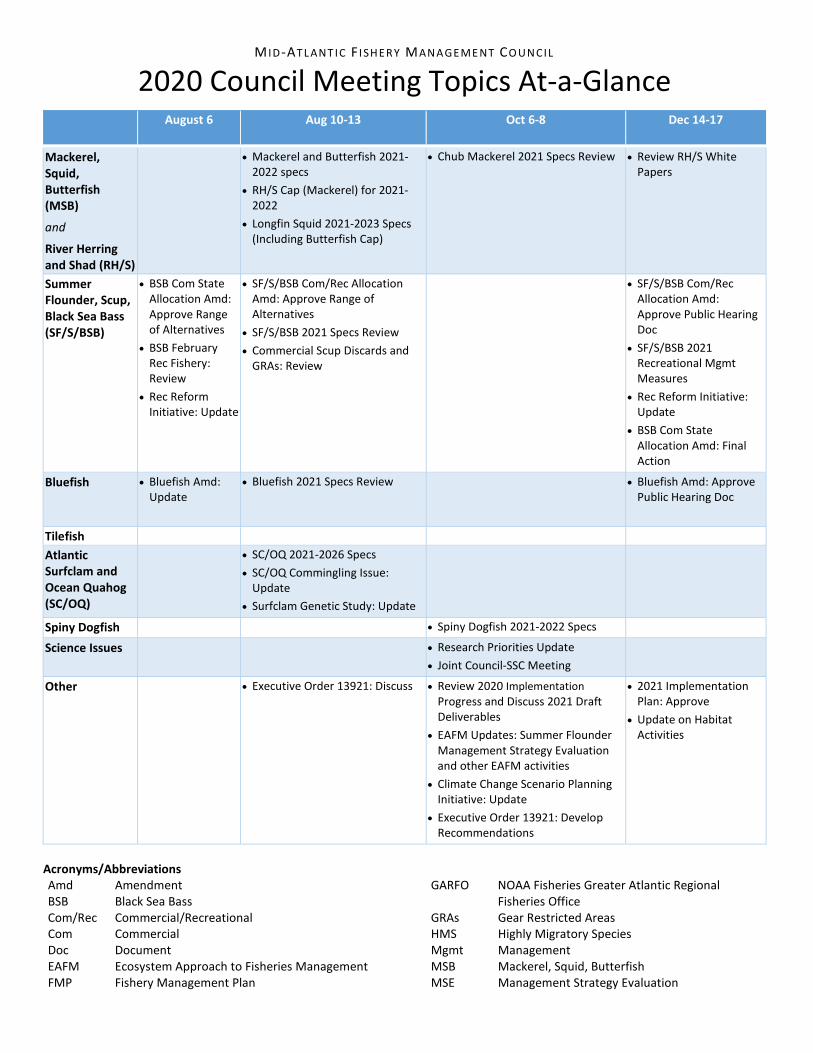
MID-AT L ANT IC FI SHERY MAN A GEME NT CO UN CIL
2020 Council Meeting Topics At-a-Glance August 6 Aug 10-13
Oct 6-8 Dec 14-17
Mackerel, Squid, Butterfish (MSB)
and
River Herring and Shad (RH/S)
• Mackerel and Butterfish 2021-2022 specs
• RH/S Cap (Mackerel) for 2021-2022
• Longfin Squid 2021-2023 Specs (Including Butterfish Cap)
• Chub Mackerel 2021 Specs Review • Review RH/S White Papers
Summer Flounder, Scup, Black Sea Bass (SF/S/BSB)
• BSB Com State Allocation Amd: Approve Range of Alternatives
• BSB February Rec Fishery: Review
• Rec Reform Initiative: Update
• SF/S/BSB Com/Rec Allocation Amd: Approve Range of Alternatives
• SF/S/BSB 2021 Specs Review • Commercial Scup Discards and
GRAs: Review
• SF/S/BSB Com/Rec Allocation Amd: Approve Public Hearing Doc
• SF/S/BSB 2021 Recreational Mgmt Measures
• Rec Reform Initiative: Update
• BSB Com State Allocation Amd: Final Action
Bluefish • Bluefish Amd: Update
• Bluefish 2021 Specs Review • Bluefish Amd: Approve Public Hearing Doc
Tilefish Atlantic Surfclam and Ocean Quahog (SC/OQ)
• SC/OQ 2021-2026 Specs • SC/OQ Commingling Issue:
Update • Surfclam Genetic Study: Update
Spiny Dogfish • Spiny Dogfish 2021-2022 Specs Science Issues • Research Priorities Update
• Joint Council-SSC Meeting
Other • Executive Order 13921: Discuss • Review 2020 Implementation Progress and Discuss 2021 Draft Deliverables
• EAFM Updates: Summer Flounder Management Strategy Evaluation and other EAFM activities
• Climate Change Scenario Planning Initiative: Update
• Executive Order 13921: Develop Recommendations
• 2021 Implementation Plan: Approve
• Update on Habitat Activities
Acronyms/Abbreviations Amd Amendment BSB Black Sea Bass Com/Rec Commercial/Recreational Com Commercial Doc Document EAFM Ecosystem Approach to Fisheries Management FMP Fishery Management Plan
GARFO NOAA Fisheries Greater Atlantic Regional Fisheries Office
GRAs Gear Restricted Areas HMS Highly Migratory Species Mgmt Management MSB Mackerel, Squid, Butterfish MSE Management Strategy Evaluation

Mtg Meeting NEFSC Northeast Fisheries Science Center Pres Presentation Rec Recreational RH/S River Herring and Shad
SC/OQ Atlantic Surfclam and Ocean Quahog SF/S/BSB Summer Flounder, Scup, Black Sea Bass Specs Specifications SSC Scientific and Statistical Committee
Actions Referenced in this Document • BSB Com State Allocation Amd: Black Sea Bass Commercial State Allocation Amendment • Bluefish Amd: Bluefish Allocation and Rebuilding Amendment • Rec Reform Initiative: Recreational Management Reform Initiative • SF-S-BSB Com/Rec Allocation Amd: Summer Flounder, Scup, Black Sea Bass Commercial/Recreational Allocation
Amendment • Illex Permitting & MSB Goals Amd: Illex Permitting and Mackerel, Squid, Butterfish FMP Goals and Objectives Amendment

MAFMC 2021 COUNCIL MEETINGS February 9-11, 2021
Durham Marriot 201 Foster St. Durham, NC 27701 919-768-6000
Durham Convention Center 301 W. Morgan St. Durham, NC 27701 919-956-9404
April 6-8, 2021
Seaview, a Dolce Hotel 401 South New York Rd. Galloway, NJ 08205 609-652-1800
June 8-10, 2021
Hilton Virginia Beach Oceanfront 3001 Atlantic Ave Virginia Beach, VA 757-213-3000
August 9-12, 2021
The Notary Hotel 21 N. Juniper St. Philadelphia, PA 215-496-3200
October 5-7, 2021
Yotel Hotel 570 10th Ave. New York, NY 10036 646-449-7700
December 13-16, 2021
Westin Annapolis 100 Westgate Circle Annapolis, MD 21401 410-972-4300

Status of Council Actions Under Development AS OF 7/29/20
FMP Action Description Status Staff Lead
Summer Flounder, Scup, Black Sea Bass
Commercial/ Recreational Allocation Amendment
This joint MAFMC/ASMFC amendment will reevaluate and potentially revise the commercial and recreational sector allocations for summer flounder, scup, and black sea bass. This action was initiated in part to address the allocation-related impacts of the revised recreational data from MRIP. http://www.mafmc.org/actions/sfsbsb-allocation-amendment
The Council and Board will review FMAT recommendations and approve a range of alternatives at the August 2020 Council Meeting.
Dancy/Coutre/ Beaty
Black Sea Bass Commercial State Allocation Amendment
This joint MAFMC/ASMFC action will consider adjusting the allocations of the black sea bass commercial quota among states and whether the allocations should be managed jointly by the Council and Commission.
The Council and Board will approve a final range of alternatives for public comment when they meet jointly on August 6 during the ASMFC’s Summer 2020 Meeting.
Beaty
Bluefish Bluefish Allocation and Rebuilding Amendment
This joint MAFMC/ASMFC amendment considers potential revisions to the allocation of Atlantic bluefish between the commercial and recreational fisheries and the commercial allocations to the states. This action will also review the goals and objectives of the bluefish FMP and the quota transfer processes and establish a rebuilding plan for bluefish. http://www.mafmc.org/actions/bluefish-allocation-amendment
The Council and Board will review the FMAT discussion document and provide guidance to the FMAT on further development of alternatives when they meet jointly on August 6 during the ASMFC’s Summer 2020 Meeting.
Seeley
Surfclam and Ocean Quahog
Surfclam and Ocean Quahog Commingling/ Discarding Issues
As surfclams have shifted toward deeper water in recent years, catches including both surfclams and ocean quahogs (“commingling”) have become more common, resulting in increased discards of surfclams on quahog trips and vice versa. Current regulations do not allow surfclams and ocean quahogs to be landed on the same trip. The Council is exploring options to address this issue.
An FMAT will be established in June/July 2020.
Coakley/Montañez

FMP Action Description Status Staff Lead
Omnibus Omnibus Amendment for Data Modernization
This amendment will address the regulatory changes needed to fully implement the Agency’s Fishery-Dependent Data Initiative.
The Council last received an update at the October 2018 meeting.
GARFO/ NEFSC
Non-FMP Golden and Blueline Tilefish Private Recreational Permitting and Reporting Issues
This action implements permitting and reporting requirements for private recreational tilefish vessels. The action was approved in a final rule amending the golden tilefish FMP to include blueline tilefish in November 2017 with delayed implementation. https://www.mafmc.org/rec-tilefish-evtr
A final rule for this action was published on 7/16/20 with an implementation date of 8/16/20. The Council is coordinating outreach efforts with GARFO.
GARFO lead MAFMC Contact: Seeley
Recreational Reform Initiative
This is a joint initiative with the ASMFC to develop strategies to increase management flexibility and stability for jointly managed recreational fisheries (i.e., black sea bass, summer flounder, scup, and bluefish).
The Council and Board will receive an update when they meet jointly on August 6 during the ASMFC’s Summer 2020 Meeting.
Beaty
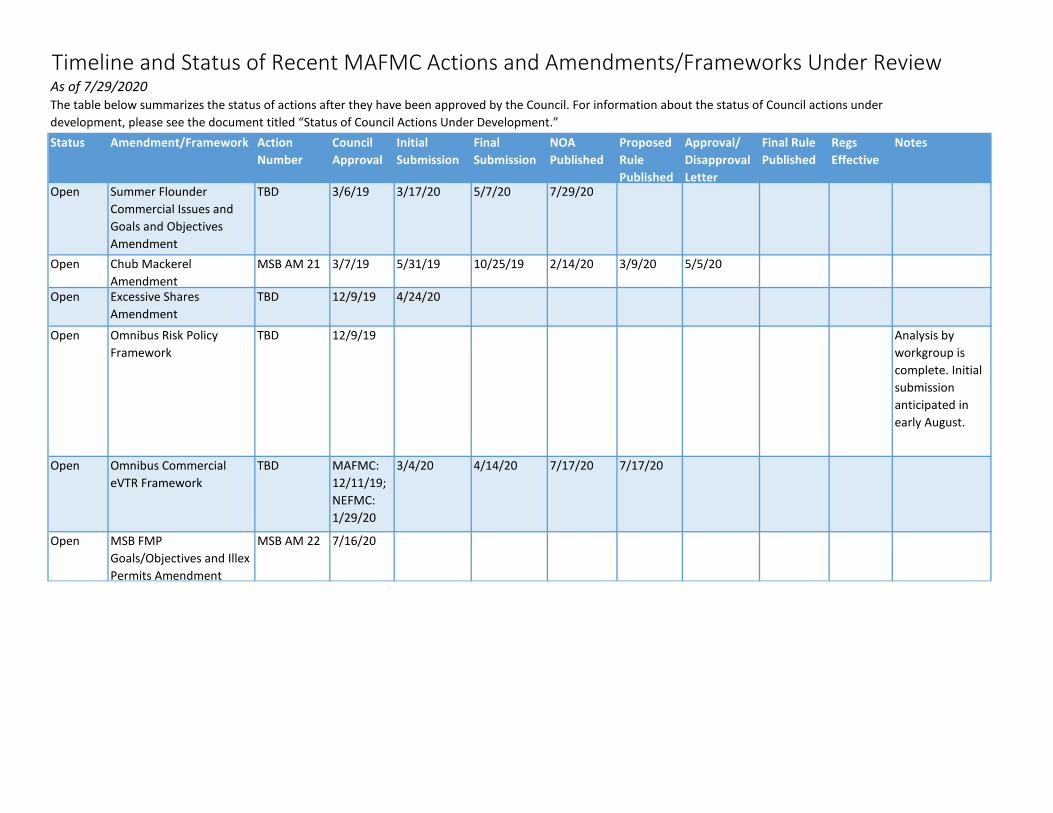
Timeline and Status of Recent MAFMC Actions and Amendments/Frameworks Under ReviewAs of 7/29/2020
Status Amendment/Framework Action Number
Council Approval
Initial Submission
Final Submission
NOA Published
Proposed Rule Published
Approval/ Disapproval Letter
Final Rule Published
Regs Effective
Notes
Open Summer Flounder Commercial Issues and Goals and Objectives Amendment
TBD 3/6/19 3/17/20 5/7/20 7/29/20
Open Chub Mackerel Amendment
MSB AM 21 3/7/19 5/31/19 10/25/19 2/14/20 3/9/20 5/5/20
Open Excessive Shares Amendment
TBD 12/9/19 4/24/20
Open Omnibus Risk Policy Framework
TBD 12/9/19 Analysis by workgroup is complete. Initial submission anticipated in early August.
Open Omnibus Commercial eVTR Framework
TBD MAFMC: 12/11/19; NEFMC: 1/29/20
3/4/20 4/14/20 7/17/20 7/17/20
Open MSB FMP Goals/Objectives and Illex Permits Amendment
MSB AM 22 7/16/20
The table below summarizes the status of actions after they have been approved by the Council. For information about the status of Council actions under development, please see the document titled “Status of Council Actions Under Development.”

Timeline and Status of Current and Upcoming Specifications for MAFMC FisheriesAs of 7/29/20Current Specifications Year(s) Council
ApprovalInitial Submission
Final Submission
Proposed Rule
Final Rule Regs Effective
Notes
Golden Tilefish 2018-2020 4/11/17 6/5/17 8/16/17 9/7/17 11/7/17 11/2/17 2019 specs were reviewed in April 2018. No changes were recommended.
Golden Tilefish 2021-2022 4/8/20 5/11/20 7 21 20Blueline Tilefish 2019-2021 4/11/18 8/17/18 10/24/18 11/19/18 2/12/19 2/12/19Surfclam and Ocean Quahog 2018-2020 6/6/17 8/14/17 9/22/17 12/8/17 2/6/18 3/8/18 2020 specs were reviewed in June
2019. No changes were recommended.
Longfin Squid and Butterfish 2018-2020 6/7/17 8/24/17 12/13/17 3/1/18 4/2/18 2019 specs were reviewed in October 2018. No changes were recommended.
Illex Squid 2019-2020 10/3/18 12/4/18 2/11/19 5/1/19 8/2/19 8/1/19Illex Squid 2020-2021 6/17/20Atlantic Mackerel (MSB FW 13) 2019-2021 8/13/18 9/27/18 2/28/19 6/7/19 10/30/19 11/29/19Atlantic Mackerel (including RH/S cap)
2020 6/5/19 8/22/19 9/30/19 12/17/19 2/27/20 2/27/20
Chub mackerel 2020-2022 3/7/19 5/31/19 10/25/19 3/9/20Scup 2020-2021 10/8/19 1/15/20 3/5/20 5/14/20 5/15/20 Revised specifications based on
the 2019 operational stock assessment
Bluefish 2020 3/7/19 6/11/19 7/24/19 7/26/19 10/9/19 1/1/20 Interim specs to be replaced as soon as possible after results of 2019 operational assessment are available.
Bluefish 2020-2021 12/10/19 1/23/20 3/19/20 5/25/20 6/29/20 6/29/20Summer Flounder 2020-2021 3/6/19 6/25/19 7/18/19 7/26/19 10/9/19 1/1/20Black Sea Bass 2020-2021 10/9/19 1/15/20 3/5/20 5/14/20 5/15/20 Revised specifications based on
the 2019 operational stock assessment
Spiny Dogfish 2019-2021 10/2/18 11/30/18 3/5/19 3/29/19 5/15/19 5/15/19 In multi-year specs
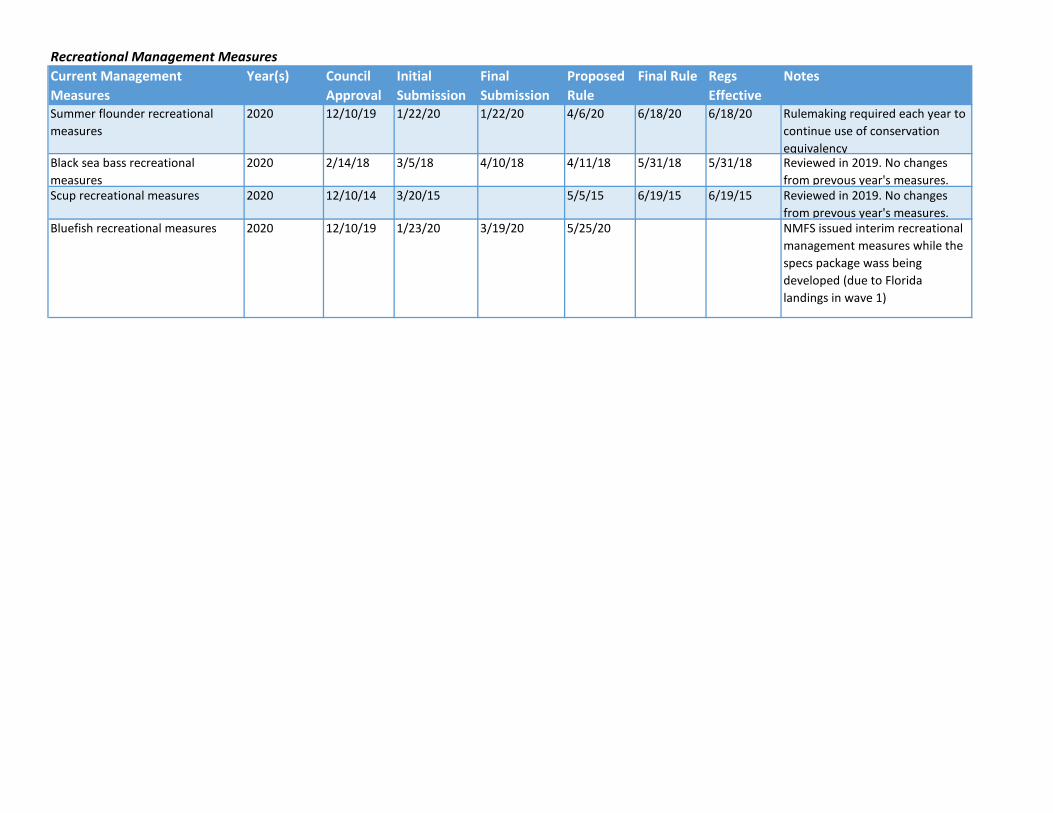
Recreational Management MeasuresCurrent Management Measures
Year(s) Council Approval
Initial Submission
Final Submission
Proposed Rule
Final Rule Regs Effective
Notes
Summer flounder recreational measures
2020 12/10/19 1/22/20 1/22/20 4/6/20 6/18/20 6/18/20 Rulemaking required each year to continue use of conservation equivalency
Black sea bass recreational measures
2020 2/14/18 3/5/18 4/10/18 4/11/18 5/31/18 5/31/18 Reviewed in 2019. No changes from prevous year's measures.
Scup recreational measures 2020 12/10/14 3/20/15 5/5/15 6/19/15 6/19/15 Reviewed in 2019. No changes from prevous year's measures.
Bluefish recreational measures 2020 12/10/19 1/23/20 3/19/20 5/25/20 NMFS issued interim recreational management measures while the specs package wass being developed (due to Florida landings in wave 1)
Page 1 of 1
M E M O R A N D U M
Date: July 30, 2020
To: Chris Moore
From: J. Didden, K. Dancy
Subject: MRIP – COVID-19 Impacts
To support Council discussion regarding the Marine Recreational Information Program (MRIP) and COVID-19 impacts during the Executive Director’s report, Dr. Richard Cody will be available to provide an update and answer questions. Several staff attended the American Saltwater Guides Association’s related Q&A session with MRIP staff. A recording of that session can be viewed here: https://www.facebook.com/salth2oguides/videos/288417992374255/.
Staff’s Understanding of the Current Situation:
APAIS (the access-point catch surveys) coverage gaps began in mid-March and are still persisting in some areas/modes. Resumption of sampling activities has not been consistent by state, and safety measures have probably reduced interviewer productivity.
There has been minimal effect on overall effort surveying through the mail-based Fishing Effort Survey and telephone-based For-Hire Survey. However, APAIS is used to bin effort by location (e.g. inland vs. ocean) and account/adjust for out-of-state fishing activity.
Options for production of catch estimates are still being evaluated, and MRIP is looking at various modeling/imputation approaches. 2020 catch estimates may be limited to annual estimates (no or limited wave estimates).
This is a dynamic situation and more updated information may be available at the time of the Council meeting.
Mid-Atlantic Fishery Management Council 800 North State Street, Suite 201, Dover, DE 19901
Phone: 302-674-2331 ǀ FAX: 302-674-5399 ǀ www.mafmc.org Michael P. Luisi, Chairman ǀ G. Warren Elliott, Vice Chairman
Christopher M. Moore, Ph.D., Executive Director

1
MAFMC Joint Advisory Panel Webinar
on Mid-Atlantic and Northeast Ocean Data Portals June 5th, 2020
The Mid-Atlantic Fishery Management Council hosted a webinar meeting for all of its Advisory Panels (APs), including the Mackerel, Squid, and Butterfish AP; the Summer Flounder, Scup, and Black Sea Bass AP; the Bluefish AP; the Spiny Dogfish AP; the Surfclam and Ocean Quahog AP; the Tilefish AP; the Ecosystem and Ocean Planning AP; and the River Herring and Shad AP. The purpose of this meeting was for AP members to develop recommendations on how the fisheries they participate in could be displayed on the Mid-Atlantic Data Portal and the Northeast Ocean Data Portal.
The AP comments listed below represent the input of individuals and are not consensus statements.
AP Attendees: Fred Akers, Katie Almeida, Carl Benson, Bonnie Brady, Tom Dameron, Jeff Deem, Jeremy Firestone, Joseph Gordon, Gary Grunseich, Annie Hawkins, Lyndie Hice-Dunton, Peter Himchak, Gregory Hueth, Jeff Kaelin, Howard King, Meghan Lapp, June Lewis, Carl LoBue, Pam Lyons Gromen, Gerry O’Neill, Jeffrey Pike, Michael Plaia, Bob Price, Christopher Spies, Amy Trice, David Wallace, Judith Weis, and Douglas Zemeckis.
Other attendees: Julia Beaty (MAFMC staff), Avalon Bristow (MARCO), Jessica Coakley (MAFMC staff), Karson Coutré (MAFMC staff), Scott Curatolo-Wagemann (Cornell Cooperative Extension), Kiley Dancy (MAFMC staff), Zoe Goozner, Fiona Hogan (RODA staff), Lane Johnston (RODA staff), Laura McKay (Virginia DEQ), José Montañez (MAFMC staff), Nick Napoli (NROC and MARCO), Matt Seely (MAFMC staff), Emily Shumchenia (NROC), Karl Vilacoba (Monmouth University), Alissa Wilson.
View the webinar recording
Webinar Summary
Presentations
The meeting began with a brief introduction and background information, provided by Nick Napoli, on the fisheries data enhancement project between the Northeast Regional Ocean Council (NROC), the Mid-Atlantic Regional Council on the Ocean (MARCO), and the Responsible Offshore Development Alliance (RODA). As part of this introduction, Nick Napoli gave an overview of the Mid-Atlantic and Northeast Ocean Data Portals (“Portals”), including: existing data sets, history of development, and examples of current uses. He mentioned that the Data Portal Team spends significant time vetting data products on the Portals with experts and other stakeholders that are most engaged in the various depicted activities. The fisheries data enhancement project, funded through Federal appropriation dollars in Fiscal Year 2019, aims to increase communication with the fisheries industry in order to further vet existing fisheries data products on the Portals, as well as get recommendations for new products.

2
Nick Napoli followed this introduction with an overview of the four fisheries data themes on the Mid-Atlantic Ocean Data Portal: (1) Fishery Management Areas; (2) Communities at Sea (Vessel Trip Report - VTR); (3) Vessel Monitoring System (VMS); and (4) Automatic Identification System (AIS). The maps are mostly broken out by gear type or Fishery Management Plan (FMP), although some had to be combined. MARCO, NROC and the Portal Teams know there are limitations with any dataset. Through this project, they are seeking more context about those limitations, and suggestions for how to address them.
Fiona Hogan described RODA’s role in the project, which is to ensure fisheries data is presented as accurately as possible on the Portals. She explained that regulatory bodies and other industries are looking at the Portals, so it’s important to make sure the data products are as descriptive as possible. She invited interested fishermen to join future webinars to give additional input, or to contact her directly for one-on-one meetings. She also reviewed the feedback that has been received to-date. So far, the project team has heard recommendations to improve metadata describing data limitations and providing management context, and show fisheries closed areas. Additionally, not all the FMPs managed by MAFMC are broken out on the Portals, and the lobster and recreational fisheries are not yet included at all.
AP Feedback
An AP member noted that the previous Federal Administration created Regional Planning Bodies, and the Nature Conservancy developed a data portal during that process. He asked that since the Portal funding goes back to 2009, was the TNC data portal assimilated into the current data portals? MARCO/NROC staff responded that TNC has been a partner in both the Northeast and Mid-Atlantic Ocean Data Portals since they were established. This AP member was likely thinking about the same portals that are actually owned by NROC and MARCO, respectively.
The AP member also noted that there recently has been many data requests of fishermen, such as this current data enhancement project as well as RODA’s Fisheries Knowledge Trust project. He said it is difficult for fishermen to satisfy everyone’s requests. RODA staff provided additional information regarding the difference between this project and the Fisheries Knowledge Trust. The latter focuses on industry-owned data that may otherwise be confidential and is currently limited to two pilot studies working with the herring/mackerel and clam fleets.
One AP member said their organization has historically been wary of MARCO. It has taken a long time for fisheries to be an equal partner in this. The development of these maps has been helpful, but it appears that BOEM is not paying adequate attention to them.
One AP member said that it would be useful for a number of reasons for the industry to be able to manage its own data, such as through RODA’s Knowledge Trust project. The Knowledge Trust, according to this AP member, is a good alternative to be able to easily access data (VMS, VTR, dealer, habitat, temperature) to inform management decisions related to offshore wind and fissures issues like the herring exclusion zone where fishing would be displaced. This individual said the maps on the Portal are useful and wants to see increased use. Some specific questions and suggestions were offered:
● For monkfish, is it possible to show effort by gear type?

3
● Menhaden fishing isn’t part of the portals, but there is no VMS in that fishery since it’s state-managed. Will VTRs help show the fishery information, and would this incur data confidentiality issues?
● Any economic information you can import into this is extremely valuable to us. The industry is being challenged by the wind developers and even our state to provide information on economic impacts, but this information is currently not available on the Portal.
● For recreational fishing, can party/charter activity be tracked through VTRs?
Regarding the question related to displaying monkfish effort by gear type, Nick Napoli responded that the codes would have to be further examined to determine the possibility of breaking out the data by gear type using VMS. He said the idea of adding economic information to the Portal was explored some years ago, but ultimately it was decided to not incorporate that information due to disparities between fisheries. However, offshore wind energy development might warrant renewed consideration of adding this information to the Portal. An AP member suggested that, if economic data were put on the Portal, it would be necessary for the user to be able to filter the data by wind energy lease polygons, or priority or secondary call area polygons.
An AP member expressed gratitude for the Portal as a resource, and was specifically pleased that Essential Fish Habitat (EFH) is nicely portrayed on the Mid-Atlantic Portal. The AP member expressed an interest in understanding where black seabass eggs are. It was also requested that the Carl N. Shuster, Jr. Horseshoe Crab Reserve be depicted on the Portal, as there is an overlap between Ørsted’s New Jersey lease and the reserve. This request has since been addressed and this area is available on the MARCO Ocean Data Portal.
Fiona Hogan responded that Declared out of Fishery (DOF) information is not available on the public site yet, but that the project team are considering combining those data, or explaining the management context of why they’re not there.
An AP member raised a question about the time period of available data for herring, mackerel, and squid: are there any data from before 2014, and if not, is there a way to incorporate pre-2014 data? Nick Napoli responded that the data from 2014 on are the most reliable, and inquired about whether VMS was utilized prior to that year. He said that the Portal currently has herring, mackerel, and squid data from 2014-2016. He mentioned that the Portal Team is collecting data from the most recent time period and is soliciting feedback on how to work with those data. One recommendation has been to group data according to fishing year rather than calendar year for applicable fisheries. Additionally, for squid, it would be good to get recommendations on how to handle codes; primary and sub-codes can get mixed, which is why there is a “pelagics” category shown and a separate category where squid was the primary trip.
The AP member mentioned that herring, mackerel, and squid VTR data would be available for years prior to 2014 and inquired if there would be a way to build that in. Nick Napoli responded that yes, this would be possible, and it would take one to two years of work to achieve. In the interim, it may be possible to update the squid fishing VMS data and get input on how to allocate the code maps, then try to parse out squid fishing activity from existing VTR data.
An AP member responded that the Illex fishery required VMS in 2016, but it was different for longfin. It would be helpful to overlay VMS and VTR data by fishery, instead of only being able to see one or the
4
other. Nick Napoli responded that the Portals are organized by data source, and asked if grouping by fishery would be more useful.
An AP member asked whether the regulatory zones for herring and mackerel spawning areas and closed areas appear on the portals. Nick Napoli responded that this has come up in previous discussions during this project. There is a folder for management areas, a separate folder for VTR data, and so on. He speculated that perhaps this needs to be by fishery instead. He encouraged additional feedback on how to incorporate past management regimes into that data. Fiona Hogan added that specific spawning closures for herring/mackerel are not currently on the Portals, but the four management areas are.
An AP member expressed concern that the Portals are being relied upon for management decisions but may not be comprehensive. An example of this was when BOEM used the MARCO Data Portal maps to inform the Empire Wind project, but the maps had only included fisheries data from 2006-2010 (which was later updated to 2012). An AP member added that data on the Portals should go back to the start of a Fisheries Management Plan to show any changes in management. Fiona Hogan responded that there are pros and cons of various time series, for example if using a snapshot of years that is too short you might miss out on periodic shifts in fishing patterns or might not see the effect of regulatory actions (e.g. sectors).
Nick Napoli asked for input on whether data sets should be changed from calendar year to fishing year, and, if so, could multiple years be grouped together?
An AP member responded that it is important to pair the timing of the closed areas to the fisheries data, so that you can see why people may not be fishing in a given area. This may be off if you lump a certain number of years together, and the current data sets do not always line up. This is why spatial regulations need to be reflected in the data: retention of a species was prohibited at a given time, and this does not necessarily mean the species did not exist in that area or was depleted. Clustering years might also mask really good or really bad years, which needs to be taken into consideration if grouping.
Fiona Hogan asked for feedback on transit data, such as whether or how specific fisheries were using AIS. An AP member responded that, in general, speeds vary by fishery and therefore there is variation in thresholds for transit versus fishing or other activities. It may be difficult to get the necessary VTR data due to confidentiality restrictions. This AP member suggested that the project team consider how to show that fishing is occurring in some areas even if the data is confidential. Nick Napoli mentioned that the project’s upcoming fishery-specific webinars might provide an opportunity for the project team to discuss more detail about operational speeds for various fisheries, as well as confidentiality topics. Nick Napoli also said that the Fisheries Knowledge Trust may help address concerns about data confidentiality.
An AP member asked whether fisheries data in the Portals can be filtered by wind energy polygons, or secondary or primary lease area polygons? Nick Napoli responded that it may be possible to look at each lease area and provide economic information for those areas as a separate layer.
An AP member who participates in the herring fishery mentioned that there might not be much value-added for AIS data for herring, as captains typically shut off AIS at 12 miles. Nick Napoli explained that AIS data currently on the portals is not broken down by speed, though it would be possible to do that or to show directional travel.
5
An AP member expressed appreciation for this meeting and the information provided about data currently on the Portals. In particular the AIS information is very relevant to what they have provided to two wind energy developers about transit patterns.
Nick Napoli asked for additional suggestions regarding AIS, and noted that many people turn it off and that the signal is diminished further offshore. An AP member asked if it would be possible to have an AIS layer for offshore wind industry vessels. Nick Napoli explained that offshore wind industry vessel traffic can be seen in several different layers. For example, survey vessel activity appears prominently in the last several years of AIS data, especially 2018-2019. There are also several websites where you can see current activity, such as marinetraffic.com.
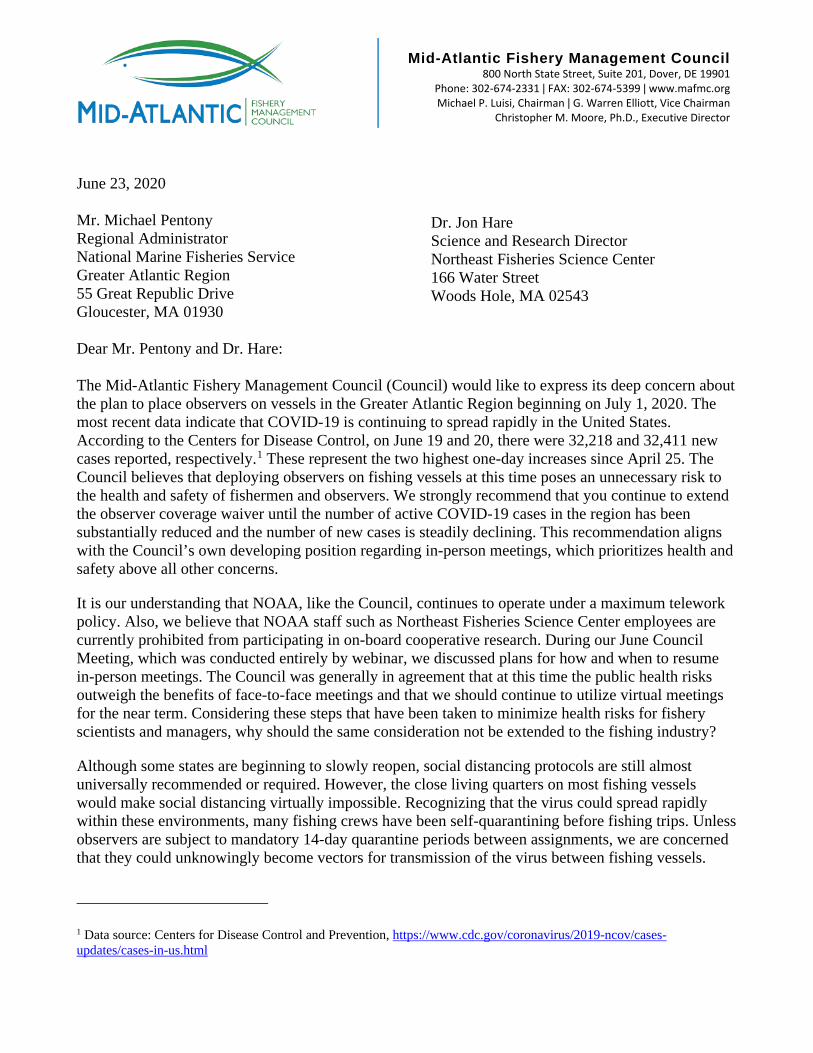
Mid-Atlantic Fishery Management Council 800 North State Street, Suite 201, Dover, DE 19901
Phone: 302-674-2331 ǀ FAX: 302-674-5399 ǀ www.mafmc.org Michael P. Luisi, Chairman ǀ G. Warren Elliott, Vice Chairman
Christopher M. Moore, Ph.D., Executive Director
June 23, 2020 Mr. Michael Pentony Regional Administrator National Marine Fisheries Service Greater Atlantic Region 55 Great Republic Drive Gloucester, MA 01930
Dr. Jon Hare Science and Research Director Northeast Fisheries Science Center 166 Water Street Woods Hole, MA 02543
Dear Mr. Pentony and Dr. Hare: The Mid-Atlantic Fishery Management Council (Council) would like to express its deep concern about the plan to place observers on vessels in the Greater Atlantic Region beginning on July 1, 2020. The most recent data indicate that COVID-19 is continuing to spread rapidly in the United States. According to the Centers for Disease Control, on June 19 and 20, there were 32,218 and 32,411 new cases reported, respectively.1 These represent the two highest one-day increases since April 25. The Council believes that deploying observers on fishing vessels at this time poses an unnecessary risk to the health and safety of fishermen and observers. We strongly recommend that you continue to extend the observer coverage waiver until the number of active COVID-19 cases in the region has been substantially reduced and the number of new cases is steadily declining. This recommendation aligns with the Council’s own developing position regarding in-person meetings, which prioritizes health and safety above all other concerns.
It is our understanding that NOAA, like the Council, continues to operate under a maximum telework policy. Also, we believe that NOAA staff such as Northeast Fisheries Science Center employees are currently prohibited from participating in on-board cooperative research. During our June Council Meeting, which was conducted entirely by webinar, we discussed plans for how and when to resume in-person meetings. The Council was generally in agreement that at this time the public health risks outweigh the benefits of face-to-face meetings and that we should continue to utilize virtual meetings for the near term. Considering these steps that have been taken to minimize health risks for fishery scientists and managers, why should the same consideration not be extended to the fishing industry?
Although some states are beginning to slowly reopen, social distancing protocols are still almost universally recommended or required. However, the close living quarters on most fishing vessels would make social distancing virtually impossible. Recognizing that the virus could spread rapidly within these environments, many fishing crews have been self-quarantining before fishing trips. Unless observers are subject to mandatory 14-day quarantine periods between assignments, we are concerned that they could unknowingly become vectors for transmission of the virus between fishing vessels.
1 Data source: Centers for Disease Control and Prevention, https://www.cdc.gov/coronavirus/2019-ncov/cases-updates/cases-in-us.html
In evaluating the costs and benefits of redeploying observers, we encourage you to consider not only the health risks to individuals onboard the fishing vessels but also the potential lost wages/revenues if a vessel cannot operate due to an infection caused by an observer. Given the known risks of the ongoing pandemic, is NOAA planning to assume liability for the health costs and other legal or financial ramifications resulting from an infection transmitted by an observer? This is an issue of concern for the fishing industry and should be addressed before observers are redeployed.
The Council recognizes and appreciates that observers provide valuable data that support the effective management of U.S. fisheries. While losing additional observer data will be challenging from a science and management perspective, there are existing methods to compensate for missing data that can likely help bridge any data gaps. However, there is no way to compensate for a lost life.
In closing, the Council does not believe that the observer program can be safely operated at this time and urges you to reconsider your plans to lift the observer waiver. The Council and NOAA Fisheries share a responsibility to promote the safety of human life at sea, and we hope that you will reconsider your position on this issue. Thank you for your consideration of these comments.
Sincerely,
Michael P. Luisi Chairman, Mid-Atlantic Fishery Management Council cc: Mid-Atlantic Council Members
Dr. Chris Moore Mr. Sam Rauch
Temporary Waivers on Northeast Observers, Monitors Through July 31, Resuming Coverage August 1 June 30, 2020
NOAA Fisheries has temporarily waived the requirement for vessels with Greater Atlantic Region fishing permits to carry a fishery observer or at-sea monitor through July 31. Observer coverage to resume August 1.
Bulletin | New England/Mid-Atlantic
June 30, 2020
Although we had announced plans to resume observer deployments on July 1, we recognize the COVID-19 pandemic continues to evolve and as such, has required us to re-evaluate and adapt to changing circumstances. In response, NOAA Fisheries is extending the waiver granted to vessels with Greater Atlantic Region fishing permits to carry human observers or at-sea monitors through July 31, 2020.
This action is authorized by 50 CFR 648.11, which provides the Greater Atlantic Regional Administrator authority to waive observer requirements, and is also consistent with the criteria described in the agency's emergency rule on observer waivers during the COVID-19 pandemic.
We intend to begin redeploying observers and at-sea monitors on vessels fishing in northeast fisheries on August 1. During the month of July, we will continue to work with regional observer and at-sea monitoring service providers to finalize their observer redeployment plans, conduct outreach with industry, and finalize our internal programs and policies that will support the safe and effective redeployment of observers and at-sea monitors in the region.
Observers and at-sea monitors are an essential component of commercial fishing operations and provide critical information that is necessary to keep fisheries open and to provide sustainable seafood to our nation during this time. We will continue to monitor all local public health notifications, as well as the Centers for Disease Control and Prevention (CDC) for updates. We are committed to protecting the public health and ensuring the safety of fishermen, observers, and others, while fulfilling our mission to maintain our nation's seafood supply and conserving marine life.
As has been done throughout the rest of the country, it is the intent of NOAA Fisheries to begin redeploying observers as soon as it is safe and appropriate to do so. While we intend to begin redeploying observers on August 1, we recognize that this public health crisis continues to evolve and changing conditions may warrant re-evaluating these plans. Should our plans regarding re-deploying observers and at-sea monitors change, we will announce any changes as soon as practicable.

NOAA Fisheries Identifies National-Level Observer Waiver Criteria; Will Begin Redeployment in Northeast July 30, 2020
A message from NOAA Fisheries Assistant Administrator Chris Oliver.
Leadership Message | Alaska New England/Mid-Atlantic Pacific Islands Southeast West Coast National
Providing seafood to the country remains an essential function even in these extraordinary times, and adequately monitoring United States fisheries remains an essential part of that process.
To improve transparency in our approach to observer deployment, we have established national-level criteria for vessels to be waived (released) from observer or at-sea monitor coverage. Going forward, observer or monitor coverage may be waived, for both full and partial-coverage fisheries, on a trip-specific basis if one of the following two criteria are met:
(1) Observers or at-sea monitors are not available for deployment; or
(2) The observer providers cannot meet the safety protocols imposed by a state on commercial fishing crew or by the vessel or vessel company on its crew. Within our limited authority, our efforts are intended to ensure observers and monitors are following the same safety protocols that fishermen are following.
We recognize that there are differences for observer and at-sea monitor deployment across fisheries, and have heard the concerns expressed about how observer coverage varies regionally, and even within regions. Given the diversity in our fisheries, from the composition of the fleets to how the fisheries are prosecuted, regional flexibility will continue in the detailed implementation of the two waiver criteria. We believe this adaptable approach will allow us to be transparent with stakeholders as well as responsive to ever-evolving changes on the ground. We also continue to encourage the use of electronic monitoring, as appropriate, as an additional option.
On August 14, we will resume deployment of observers and at-sea monitors in the Northeast partial-coverage fisheries. We are maintaining existing observer and monitor, both at-sea and shoreside, coverage throughout our other regions. Vessels should continue to seek observer and monitor coverage waivers through their regular regional process.
NOAA Fisheries has been working with the regional observer and monitor providers to enact safety protocols that match those that are in effect for vessel operators and crew, during this continually evolving situation. The contractual relationships between industry, NOAA Fisheries, and observer providers vary by region and sometimes within a region.
Observers and monitors, at-sea and shoreside, are an essential component of commercial fishing operations and provide critical information that is necessary to keep fisheries open and to provide sustainable seafood to our nation during this time. We will continue to monitor all local public health notifications, as well as the Centers for Disease Control and Prevention, for updates. We are committed to the health and safety of fishermen, observers, and others while fulfilling our mission to maintain our nation's seafood supply and conserving marine life.
Chris Oliver NOAA Fisheries Assistant Administrator
NEWS
Final Rule to Implement Permitting and Reporting Requirements for Private Recreational Tilefish Vessels in the Mid-Atlantic July 15, 2020
Effective August 17, 2020.
Bulletin | New England/Mid-Atlantic | Mid-Atlantic Beginning August 17, 2020, NOAA Fisheries will require private recreational tilefish vessels, fishing north of the North Carolina/Virginia border, to have a federal recreational tilefish vessel permit and file catch reports. These changes were approved in Amendment 6 to the Tilefish Fishery Management Plan. This action is being taken to better characterize and monitor the recreational fisheries for both blueline tilefish and golden tilefish.
Apply for your federal private recreational tilefish vessel permit through Fish Online. You must apply for this permit using our online system, we are not providing paper applications for this permit. This new permit is required even if a vessel already holds a for-hire tilefish permit.
Private recreational tilefish anglers must also fill out and submit an electronic vessel trip report within 24 hours of returning to port for trips where tilefish were targeted and/or retained. Reports can be submitted through any NOAA Fisheries approved electronic reporting system.
For more information, please see the final rule as published in the Federal Register.

Mid-Atlantic Fishery Management Council 800 North State Street, Suite 201, Dover, DE 19901
Phone: 302-674-2331 ǀ FAX: 302-674-5399 ǀ www.mafmc.org Michael P. Luisi, Chairman ǀ G. Warren Elliott, Vice Chairman
Christopher M. Moore, Ph.D., Executive Director
Mr. Jerry Barnes and Mr. Matt Creelman
Fifth Coast Guard District
431 Crawford Street
Portsmouth, VA 23704
July 6, 2020
Dear Mr. Barnes and Mr. Creelman,
Please accept these comments from the Mid-Atlantic Fishery Management Council (the Council) on
the request for comments on the ongoing Port Access Route Study (PARS) for the Seacoast of New
Jersey including offshore approaches to the Delaware Bay.
The Council manages more than 64 marine species1 in federal waters and is composed of members
from the coastal states of New York through North Carolina (including Pennsylvania). Fishing activity
for all Council-managed commercial and recreational fisheries occurs within the study area for this
PARS. Marine fisheries are profoundly important to the social and economic well-being of Mid-
Atlantic communities and provide numerous benefits to the nation, including domestic food security.
The study area for this PARS encompasses 5 wind energy lease areas. Wind energy development off
the U.S. east coast is advancing at a rapid pace. The Council has concerns about the potential for the
coexistence of fisheries and large-scale offshore wind projects, but supports policies for U.S. wind
energy development that will sustain the health of marine ecosystems and fisheries resources. Risks to
marine ecosystems and fisheries must be minimized.2 Our main concerns regarding offshore wind
energy development include: 1) the ability of commercial and recreational fishing vessels to continue
to safely fish in and transit through the wind energy areas; 2) the continued operation of fisheries-
independent surveys conducted by the National Marine Fisheries Service, states, and other entities; and
3) search and rescue operations.
This PARS should consider all available data to understand patterns of commercial and recreational
fishing vessel activity in the area, including vessel monitoring system (VMS), automatic information
system (AIS), vessel trip report (VTR), and fisheries observer data. Each of these data sets have
limitations, which must be explicitly considered and acknowledged in the PARS. For example, data on
fishing and transiting locations derived from VMS, AIS, and VTRs do not account for all fishing
activity in the area. Specifically, smaller vessels, vessels which only operate in state waters, and
private recreational anglers are under-represented and/or completely missing from these data sets. It is
1 14 species (summer flounder, scup, black sea bass, bluefish, Atlantic mackerel, Illex and longfin squids, butterfish,
Atlantic surfclams, ocean quahogs, golden and blueline tilefish, spiny dogfish [joint with the New England Fishery
Management Council], and monkfish [joint with the New England Fishery Management Council]) are managed in specific
fishery management plans. More than 50 additional species are managed as ecosystem components across all fishery
management plans.
2 The Council’s policy on offshore wind energy development is available at https://www.mafmc.org/actions/offshore-
energy.
2
imperative that these data sets be supplemented with extensive input from commercial and recreational
fishery stakeholders. Stakeholder input should be collected through a variety of channels, including in-
person workshops and meetings, webinars, online comment forms, written communications, and phone
calls. We are concerned that the ongoing COVID-19 pandemic will limit the Coast Guard’s ability to
collect stakeholder input through in-person meetings, which can be especially important for discussing
and reviewing spatial data. In addition, some stakeholders feel most comfortable providing input in-
person. We urge the Coast Guard to hold in-person meetings with as many stakeholders as possible
once health risks have been minimized.
Input provided by fishermen through previous efforts should also be considered. This input is very
valuable, though not focused on the study area for this PARS. For example, the Responsible Offshore
Development Alliance (RODA) put forward a proposal for transit routes through the lease areas off
southern New England.3 In addition, RODA and the New York State Energy Research and
Development Authority (NYSERDA) worked with many fishermen to summarize commercial fishing
transit patterns in the New York Bight.4 Similar input focused on the study area for this PARS should
be obtained. In addition, given limitations with the available data sets, extensive stakeholder input on
recreational fishing activity should also be sought.
Lastly, we urge the Coast Guard to issue clear and unambiguous guidance regarding wind farm layout
restrictions that are necessary to allow for safe vessel transit, fishing activity, and search and rescue
operations. These recommendations will be very important for the Bureau of Ocean Energy
Management and wind developers to consider. For example, consideration should be given to concerns
expressed by the New England Fishery Management Council regarding ambiguous statements about
the minimum recommended spacing between wind turbines in the draft PARS for the areas offshore of
Massachusetts and Rhode Island (MARIPARS). Those concerns are not repeated here but can be found
in the letter linked below.5 The conclusions made in the final reports for the New Jersey and
approaches to Delaware Bay PARS should be less ambiguous. It is important to note that the Coast
Guard’s recommendations in the MARIPARS build off an agreement by developers to use a uniform
layout across multiple leases in that area. No such agreement currently exists for the leases in the
region of this PARS; therefore, clear Coast Guard advice on this matter will be especially important.
The Council looks forward to working with the Coast Guard to ensure that any future wind
development activities minimize impacts to the marine environment and can be developed in a manner
that ensures coexistence with our fisheries.
Sincerely,
Christopher M. Moore, PhD
Executive Director, Mid-Atlantic Fishery Management Council
cc: M. Luisi, W. Elliott, J. Beaty
3 https://rodafisheries.org/wp-content/uploads/2020/01/200103-MA_RI-layout-proposal.pdf 4 https://www.nyftwg.com/new-york-bight-transit-lane-workshop-2/ 5 https://s3.amazonaws.com/nefmc.org/200316-NEFMC-to-USCG-re-MARIPARS.pdf
July 27, 2020
Program Manager, Bureau of Ocean Energy Management Office of Renewable Energy Programs 45600 Woodland Road (VAM-OREP) Sterling, Virginia 20166
Dear Sir/Madam,
Please accept these comments from the New England Fishery Management Council (New England Council) and Mid-Atlantic Fishery Management Council (Mid-Atlantic Council) on the Supplemental Environmental Impact Statement for the Vineyard Wind I project proposed offshore of Massachusetts. Please note that we have not considered the revised NEPA regulations published on July 16 (85 FR 43304) in the development of these comments.
The New England Council has primary management jurisdiction over 28 marine fishery species in federal waters and is composed of members from Connecticut to Maine. The Mid-Atlantic Council manages more than 64 marine species1 in federal waters and is composed of members from the coastal states of New York to North Carolina (including Pennsylvania). In addition to managing these fisheries, both Councils have enacted measures to identify and conserve essential fish habitats, protect deep sea corals, and manage forage fisheries sustainably. The Councils support policies for U.S. wind energy development and operations that will sustain the health of marine ecosystems and fisheries resources. While the Councils recognize the importance of domestic energy development to U.S. economic security, we note that the marine fisheries throughout New England and the Mid-Atlantic, including within the project area of Vineyard Wind 1 and in surrounding areas, are profoundly important to the social and economic well-being of communities in the Northeast U.S. and provide numerous benefits to the nation, including domestic food security.
General comments
Relative to the cumulative effects analysis, we appreciate BOEM’s expanded assessment of how many wind farm projects constitute reasonably foreseeable future actions, and find that this revised scope combined with more robust evaluation of potential impacts provides a better foundation for understanding the overall effects of the project. While acknowledging these improvements, we are concerned about the integration of the DEIS and SEIS into a comprehensive FEIS. We know BOEM is working under Secretarial Order regarding maximum document length and worry that page limits will relegate too much content to appendices, making the document hard to follow. BOEM should carefully consider whether some information from the appendices can be included in the body of the FEIS. For example, the written descriptions and maps of resource geographic analysis areas (Appendix A.1 and
1 Fourteen species are managed with specific Fishery Management Plans, and over 50 forage species are managed as “ecosystem components” within the Mid-Atlantic Council’s FMPs.

A.7, respectively) are fundamental to understanding the assessment and would be helpful to include in the body of the document. In addition, Tables 3-1 and 3-2 in Appendix B which provide impact definitions (negligible, minor, moderate, major) are important, and should be pulled forward. To the extent that information must be placed in an appendix, it is essential that BOEM hyperlink to relevant sections of the document so that related information can be easily identified. It would also be useful to include hyperlinks to figures, tables, and section headings throughout the body of the EIS itself. To the extent that the EIS references the COP, BOEM should provide very specific references to the relevant volumes and sections (with page numbers, if possible), as the COP itself is a complex document. Ideally the FEIS document would stand alone and not incorporate DEIS and SEIS sections by reference. Given revisions to the project over time, referencing entire sections of the DEIS and SEIS would be very confusing.
During preparation of the FEIS, BOEM should ensure that an assessment of magnitude (minor, moderate, major) is made for all alternatives and VECs. Also, we recognize that it is an editorial decision to specify magnitude but not direction for adverse impacts (vs. magnitude and direction for beneficial impacts), but it might improve clarity to identify the direction of adverse impacts, or, at the very least, reiterate this caveat at intervals throughout the text. In addition, BOEM should be careful when summarizing the effects of an alternative on a VEC when a range of positive and negative outcomes are expected, over different time frames, due to a range of impact producing factors (IPFs; for example, the diverse range of IPFs and effects associated with fish, invertebrates, and EFH). This is not a significant issue when reading the text, where differences across IPFs are clearly laid out, but should be noted as a caveat where impacts are summarized, for example in Table ES-2 on page ES-5. Some readers may not read much more than these summary tables. Further, depending on the VEC and IPFs in question, an assessment of net effects might not be appropriate, and instead a range of effects should be specified.
Management alternatives
It would be helpful for the FEIS to identify BOEM’s preferred action, as indicated by NEPA regulations (EIS documents shall “identify the agency’s preferred alternatives, if one or more exists…in the final statement” (CFR § 1502.14 (e)). It would also be informative to clearly outline which actions are feasible and preferred on the part of Vineyard Wind. Specifically, Vineyard Wind and other developers have agreed to a 1x1 nautical mile east-west oriented layout (Alternative D2), which differs from the original layout outlined in the COP, and is not part of the ‘proposed action’ alternative (Alternative A). Also, Vineyard Wind has negotiated with the local community around the Covell’s Beach cable landfall (Alternative B), vs. the New Hampshire Ave. landfall (included in Alternative A). The June 3, 2020 COP2 does not provide any additional clarity as to which options might be likely or preferred. While many readers may be aware of these developments, the FEIS should convey which are the most likely outcomes, and the proposed action as defined in the FEIS should reflect these plans released by the developers.
We appreciate BOEM’s analysis of the transit lane alternative (Alternative F), as recommended by fishery stakeholders. However, as described on pages 2-4 and 2-5 of the SEIS, the transit lane
2 https://www.boem.gov/sites/default/files/documents/renewable-energy/Vineyard-Wind-COP-Volume-I-Appendix-I-Complete.pdf
Alternative F does not seem feasible. For example, a discussion of issues associated with the cables indicates a need for technically impossible factory joints should the transit lanes be incorporated into the design, which seems to render Alternative F impossible to execute. Is this a function of having a 2 or 4 nm distance between wind turbine generators (WTGs) that would need to be covered by longer sections of inter-array cable? With respect to tradeoffs around power loss under Alternative F, is this related to the footprint of the project and turbine spacing? Or to increasing distance from shore as additional areas of the lease are built out? Finally, in the context of regional demand, it would be helpful to understand how the placement of 2 or 4 nm transit lanes throughout the MA and MA-RI WEAs intersects with the use of larger 14 MW WTGs, vs. the 10 MW originally considered. As compared to the original project design, it seems that loss of turbine placements due to transit lanes might be balanced out by generating more electricity per turbine, thereby still meeting regional demand. Perhaps an in-depth analysis of number of WTGs vs. WTG capacity would show that this is not the case, but a discussion of these tradeoffs would help to demonstrate this.
Also related to the alternatives, the FEIS should be clear that in the context of both direct and cumulative impacts, no action (Alternative G) means that the Vineyard Wind I project would not be built, but that other nearby wind farms are still presumed likely. Readers may assume that no action means no offshore wind construction in the region, especially because this is the first large-scale wind farm to reach this stage of development.
Finfish, Invertebrates, and Essential Fish Habitat
Multiple aspects of wind farm construction and operations involve noise production. Noise can negatively affect biological processes for many species of fishes and invertebrates. The SEIS indicates that pile driving will generate the most impacts. We ask that BOEM carefully evaluate the information on pile size and hammer energy provided in the Vineyard Wind I COP, as well as information available for other reasonably foreseeable future projects, to ensure that the radial estimates of impacted area are accurate (e.g. the difference in effects between 2,500 kJ vs. 4,000 kJ hammers). It would be useful to monitor noise during construction activities to ground truth these estimates at as many locations as possible. Time of year restrictions related to pile driving should be considered as a mitigation measure, since some species, including longfin squid, could be disproportionately affected if most pile driving occurs in summer during their spawning season.
Recreational fishing
It is our understanding that the geographic scope for private recreational fishing will be expanded for the FEIS. This is necessary as the geographic scope for private recreational fishing as defined in the SEIS excludes impacts to communities based in Rhode Island, Connecticut, and New York. Precise information on the location of private fishing trips is lacking; however, private recreational fishing effort based out of states other than Massachusetts does occur within the wind energy lease areas included in the geographic area of the analysis. The grouping of private recreational fishing with "recreation and tourism," rather than with commercial and for-hire fisheries, is not intuitive to us and makes it challenging for readers to understand the full picture of potential impacts on all fishery sectors.
Navigation and Vessel Traffic, Other Uses

We continue to hear concerns from commercial fishing partners about navigation safety, including the potential for impacts due to use of radar. The continued ability of the Coast Guard to effectively conduct search and rescue, or SAR operations, described in the Other Uses analysis, is also of concern. The ability of fishing vessels to operate within the Vineyard Wind I and adjacent wind farms will influence the magnitude of negative effects of the projects on commercial fisheries.
Mitigation and monitoring
With a project of this scope, there are many opportunities for mitigation of negative effects, via changes in project design or construction methods, and through compensation funds. A clear description of mitigation measures (which are summarized in the DEIS, but not described in the SEIS) will be important to understanding the impacts of the proposed action and should be included in the FEIS. The document should indicate which mitigation measures are assumed in the EIS analyses and which measures might be required as conditions on the construction permit. It is challenging to piece these mitigation elements together, absent a consolidated summary. This should include a summary of fisheries mitigation funds for fishermen from Massachusetts and Rhode Island, as well as a description of how fishermen from other states can be compensated appropriately for any losses.
Related to this, a robust monitoring program, while not mitigation per se, is important to understanding project effects and adaptively managing wind farm construction in the region going forward. In terms of process, it would be helpful to understand how Vineyard Wind and other regional developers will be held accountable to monitoring plans, as well as the mechanism for modifying these plans over time. Given that large scale offshore wind development is new for our region, and that the spatial scale of reasonably foreseeable projects is unprecedented world-wide, there are certain to be effects that we cannot fully anticipate at present. We appreciate developer commitments to the work of the Responsible Offshore Science Alliance and the coordination around monitoring that will result, but these are voluntary agreements, vs. permit conditions.
There are many opportunities for learning and adaptive management going forward. For example, the SEIS discusses that there may be positive effects associated with the creation of artificial hard bottom habitats. A range of materials could be used for scour protection and for cable armoring where burial is not possible. These materials will likely have different ecological benefits, depending on the species. Materials can be selected for their expected benefits, and/or the effects of different types of materials might be compared. Time of year restrictions on construction and maintenance, e.g. to protect fish spawning activity, also provide an opportunity for data gathering and adaptive approaches. These windows may shift over time as the region continues to experience the effects of climate change. Such shifts could have implications for best practices related to operations and maintenance of the Vineyard Wind I project, as well as other projects in the region.
Relationship to other projects
Vineyard Wind I does not exist in a vacuum, and the relationship between this project and others is important. Consistency of layout across this and future projects is critical to mitigating certain types of adverse impacts, including on fishing operations. Learning from the construction process and from monitoring should lead to adaptive management, for this and other projects. BOEM should articulate how it will ensure that regional development occurs in a coordinated manner across projects. For example, once the Vineyard Wind I turbine layout is established, will extension of this layout to
adjacent projects in the MA and MA-RI WEAs be assumed in future COPs, and be the starting point for future EIS analyses? Should a single planning and environmental evaluation process be conducted when multiple projects wish to use similar routes for their export cables? If the effects of installation or operation are found to be unacceptable despite best efforts to mitigate them, will this information be used to alter future projects?
Conclusion
We appreciate the opportunity to provide comments to ensure this EIS provides a comprehensive and effective evaluation of expected impacts from the Vineyard Wind I project. The Councils look forward to working with Bureau of Ocean Energy Management to ensure that any wind development in our region minimizes impacts on the marine environment and can be developed in a manner that ensures coexistence of our fisheries with future wind development activities.
Please contact us if you have any questions.
Sincerely,
Thomas A. Nies Executive Director, New England Fishery Management Council
Dr. Christopher M. Moore Executive Director, Mid-Atlantic Fishery Management Council
cc: James. Bennett, BOEM Renewable Energy Program Walter Cruickshank, Acting Director, BOEM Michael Pentony, Reg. Admin, GARFO
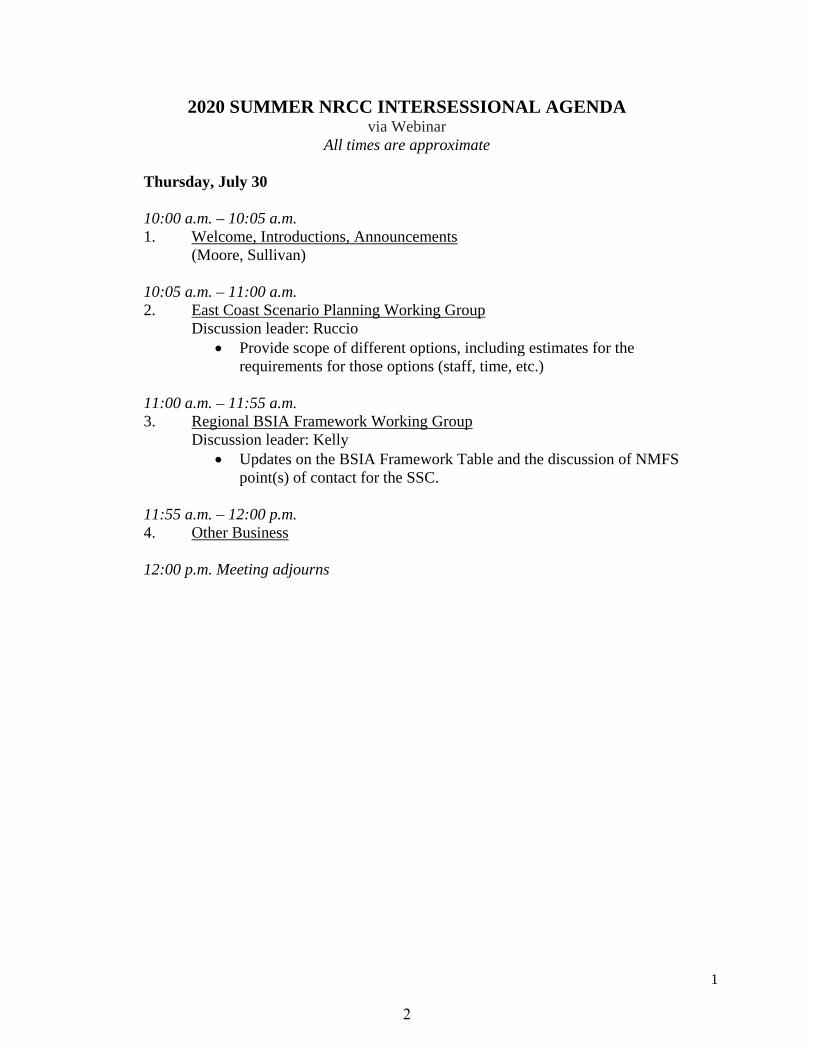
1
2020 SUMMER NRCC INTERSESSIONAL AGENDA via Webinar
All times are approximate
Thursday, July 30
10:00 a.m. – 10:05 a.m. 1. Welcome, Introductions, Announcements
(Moore, Sullivan)
10:05 a.m. – 11:00 a.m. 2. East Coast Scenario Planning Working Group
Discussion leader: Ruccio Provide scope of different options, including estimates for the
requirements for those options (staff, time, etc.)
11:00 a.m. – 11:55 a.m. 3. Regional BSIA Framework Working Group
Discussion leader: Kelly Updates on the BSIA Framework Table and the discussion of NMFS
point(s) of contact for the SSC.
11:55 a.m. – 12:00 p.m. 4. Other Business
12:00 p.m. Meeting adjourns
2
Establishing a National Seafood Council
Report and Recommendations from the Marine Fisheries Advisory Committee
July 1, 2020
Report and Recommendations from the Marine Fisheries Advisory Committee
Executive Summary Since 2018, the Marine Fisheries Advisory Committee (MAFAC) has been considering what the federal government can do to help improve consumer confidence in, and subsequently consumption of, U.S. seafood in our country, in order to support and increase value of our sustainably managed fisheries and aquaculture. Increasing the consumption of U.S. seafood will also directly improve the health of the American people and support U.S. jobs. Facilitating this is not only in the best interest of the seafood industry but also is a service to the public. Most importantly, MAFAC identified the need to elevate the narrative of the inherent sustainability behind the management practices and harvesting of U.S. wild-capture and aquaculture seafood products, which are not adequately appreciated in the public marketplace.
In investigating what the federal government’s role could be to increase U.S. consumption of U.S. seafood, MAFAC learned about the Fish and Seafood Promotion Act of 1986 (FSPA) and identified components of it as potentially viable options to achieving this goal. Specifically, MAFAC determined that establishment of an industry led and federally overseen National Seafood Council under the FSPA could be an effective mechanism to reach the stated goals. To test this hypothesis, MAFAC members developed a concept for what a National Seafood
Council could look like and gathered feedback from the U.S. seafood community. Additionally, MAFAC sought feedback from advisors on the FSPA and implementing regulations in their current forms, to evaluate feasibility of their implementation.
Amidst the later stages of MAFAC’s work, the COVID-19 crisis escalated in the United States, creating significant challenges in the U.S. seafood supply chain. These challenges only amplify the need for a National Seafood Council. This Council could enhance resilience for all U.S. seafood-related industries in the face of future disruptions.
Following external engagement and significant Committee discussion, MAFAC is confident the concept for a National Seafood Council will benefit the U.S. seafood industry and, indeed, the consumer. This report documents MAFAC’s findings and the recommendations for its implementation. If NOAA Fisheries, NOAA, and the Department of Commerce agree with MAFAC’s assessment and recommendations, MAFAC encourages swift implementation and continued communication on this topic with industry and other stakeholders. The timing is appropriate, and industry appears supportive. Any delay could stall and lessen the positive momentum and synergistic opportunities that currently exist.
3
The full report can be viewed on this page under "Recommendations and Report to the Agency."

1
July 28, 2020 Dr. Chris Moore Executive Director Mid-Atlantic Fishery Management Council 800 North State Street, Suite 201, Dover, DE 19901 RE: Request for Inclusion of a Squid Species Exemption from Duplicative and Burdensome USFWS Regulations, in the Council’s Identification of Important Regulatory Reforms Pursuant to Executive Order (EO) 13921 Promoting American Seafood Competitiveness and Economic Growth Dear Dr. Moore: We learned during the May 27-28 meeting of the Regional Fishery Management Councils’ Council Coordinating Committee we first heard that the National Marine Fisheries Service (NMFS) will be surveying the Councils to gather ideas to reduce regulatory barriers negatively affecting American seafood competitiveness, consistent with EO 13921. After listening to your report on the EO to the Council last month, and receiving your recent EO Comment Form announcement, we understand that the Council is now actively soliciting ideas. We were pleased to hear your response to Council Member Dewey Hemilright’s question about the possibility of HMS ideas being solicited, even though those regulatory constraints lie outside the Council’s immediate jurisdiction. With this in mind, we are asking the Council to support recommending to NMFS the reform of a U.S. Fish & Wildlife Service (USFWS) Loligo and Illex squid fishery regulatory issue, which is having serious negative economic and competitive effects on our businesses. The issue is directly related to the inclusion of squid fishery products in a USFWS inspection and user fee system established for monitoring the import and export of certain types of protected wildlife products (at 50 CFR 14). NMFS has taken a position in opposition to the USFWS’ justification for including U.S.-produced squid species as part of these program in the past, including most recently in Congressional testimony in 2016. Encouraging NMFS and USFWS to reform this program will not require any changes to the Council’s Mackerel, Squid, Butterfish Fishery Management Plan (MSB FMP). These USFWS policies and regulations require squid producers to ship U.S. squid only from designated ports, and pay duplicative inspection fees, paperwork fees, and license fees; all leading to higher costs for our goods and delays in the shipment of our perishable seafood products year-round. The USFWS regulations in question are intended to apply to small shipments of wildlife species of concern, to prevent abuse through the unauthorized trade in protected animals. This program should have nothing to do with the legitimate commercial production and distribution of US seafood, including squid. Virtually all other US commercial fishery products are exempt from this program and these rules.
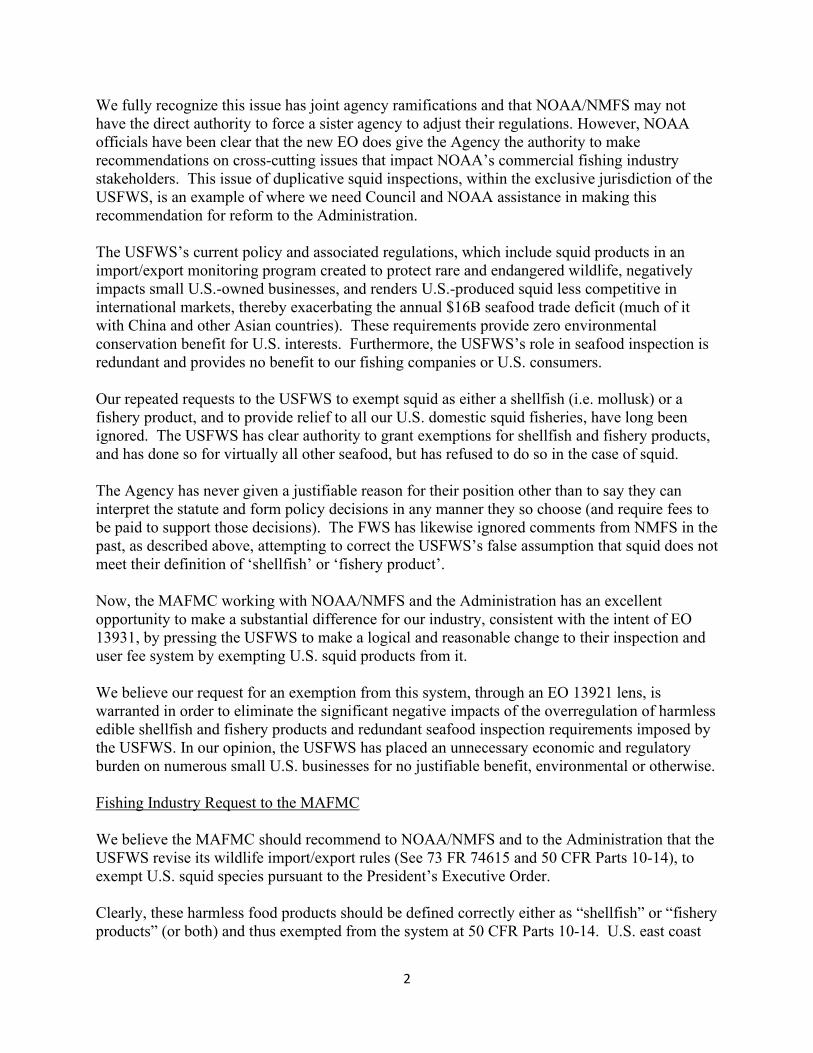
2
We fully recognize this issue has joint agency ramifications and that NOAA/NMFS may not have the direct authority to force a sister agency to adjust their regulations. However, NOAA officials have been clear that the new EO does give the Agency the authority to make recommendations on cross-cutting issues that impact NOAA’s commercial fishing industry stakeholders. This issue of duplicative squid inspections, within the exclusive jurisdiction of the USFWS, is an example of where we need Council and NOAA assistance in making this recommendation for reform to the Administration. The USFWS’s current policy and associated regulations, which include squid products in an import/export monitoring program created to protect rare and endangered wildlife, negatively impacts small U.S.-owned businesses, and renders U.S.-produced squid less competitive in international markets, thereby exacerbating the annual $16B seafood trade deficit (much of it with China and other Asian countries). These requirements provide zero environmental conservation benefit for U.S. interests. Furthermore, the USFWS’s role in seafood inspection is redundant and provides no benefit to our fishing companies or U.S. consumers. Our repeated requests to the USFWS to exempt squid as either a shellfish (i.e. mollusk) or a fishery product, and to provide relief to all our U.S. domestic squid fisheries, have long been ignored. The USFWS has clear authority to grant exemptions for shellfish and fishery products, and has done so for virtually all other seafood, but has refused to do so in the case of squid. The Agency has never given a justifiable reason for their position other than to say they can interpret the statute and form policy decisions in any manner they so choose (and require fees to be paid to support those decisions). The FWS has likewise ignored comments from NMFS in the past, as described above, attempting to correct the USFWS’s false assumption that squid does not meet their definition of ‘shellfish’ or ‘fishery product’. Now, the MAFMC working with NOAA/NMFS and the Administration has an excellent opportunity to make a substantial difference for our industry, consistent with the intent of EO 13931, by pressing the USFWS to make a logical and reasonable change to their inspection and user fee system by exempting U.S. squid products from it. We believe our request for an exemption from this system, through an EO 13921 lens, is warranted in order to eliminate the significant negative impacts of the overregulation of harmless edible shellfish and fishery products and redundant seafood inspection requirements imposed by the USFWS. In our opinion, the USFWS has placed an unnecessary economic and regulatory burden on numerous small U.S. businesses for no justifiable benefit, environmental or otherwise. Fishing Industry Request to the MAFMC We believe the MAFMC should recommend to NOAA/NMFS and to the Administration that the USFWS revise its wildlife import/export rules (See 73 FR 74615 and 50 CFR Parts 10-14), to exempt U.S. squid species pursuant to the President’s Executive Order. Clearly, these harmless food products should be defined correctly either as “shellfish” or “fishery products” (or both) and thus exempted from the system at 50 CFR Parts 10-14. U.S. east coast
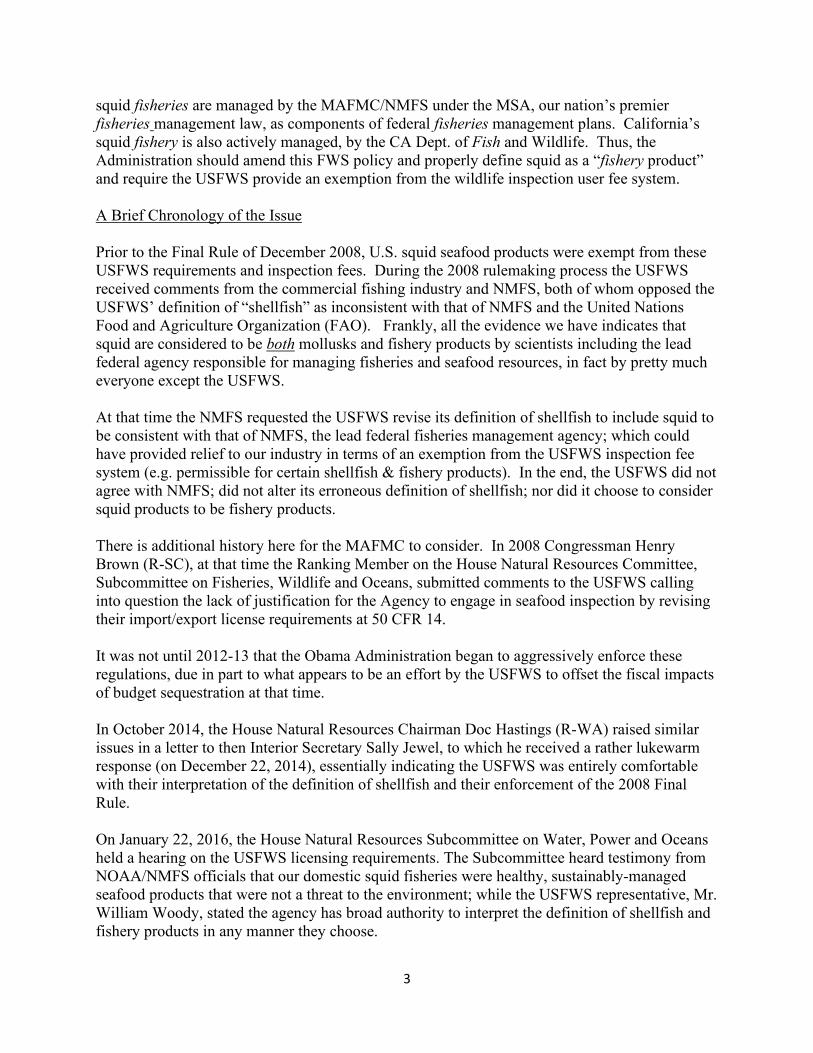
3
squid fisheries are managed by the MAFMC/NMFS under the MSA, our nation’s premier fisheries management law, as components of federal fisheries management plans. California’s squid fishery is also actively managed, by the CA Dept. of Fish and Wildlife. Thus, the Administration should amend this FWS policy and properly define squid as a “fishery product” and require the USFWS provide an exemption from the wildlife inspection user fee system. A Brief Chronology of the Issue Prior to the Final Rule of December 2008, U.S. squid seafood products were exempt from these USFWS requirements and inspection fees. During the 2008 rulemaking process the USFWS received comments from the commercial fishing industry and NMFS, both of whom opposed the USFWS’ definition of “shellfish” as inconsistent with that of NMFS and the United Nations Food and Agriculture Organization (FAO). Frankly, all the evidence we have indicates that squid are considered to be both mollusks and fishery products by scientists including the lead federal agency responsible for managing fisheries and seafood resources, in fact by pretty much everyone except the USFWS. At that time the NMFS requested the USFWS revise its definition of shellfish to include squid to be consistent with that of NMFS, the lead federal fisheries management agency; which could have provided relief to our industry in terms of an exemption from the USFWS inspection fee system (e.g. permissible for certain shellfish & fishery products). In the end, the USFWS did not agree with NMFS; did not alter its erroneous definition of shellfish; nor did it choose to consider squid products to be fishery products. There is additional history here for the MAFMC to consider. In 2008 Congressman Henry Brown (R-SC), at that time the Ranking Member on the House Natural Resources Committee, Subcommittee on Fisheries, Wildlife and Oceans, submitted comments to the USFWS calling into question the lack of justification for the Agency to engage in seafood inspection by revising their import/export license requirements at 50 CFR 14.
It was not until 2012-13 that the Obama Administration began to aggressively enforce these regulations, due in part to what appears to be an effort by the USFWS to offset the fiscal impacts of budget sequestration at that time.
In October 2014, the House Natural Resources Chairman Doc Hastings (R-WA) raised similar issues in a letter to then Interior Secretary Sally Jewel, to which he received a rather lukewarm response (on December 22, 2014), essentially indicating the USFWS was entirely comfortable with their interpretation of the definition of shellfish and their enforcement of the 2008 Final Rule. On January 22, 2016, the House Natural Resources Subcommittee on Water, Power and Oceans held a hearing on the USFWS licensing requirements. The Subcommittee heard testimony from NOAA/NMFS officials that our domestic squid fisheries were healthy, sustainably-managed seafood products that were not a threat to the environment; while the USFWS representative, Mr. William Woody, stated the agency has broad authority to interpret the definition of shellfish and fishery products in any manner they choose.

4
On June 22, 2017, three coastal Republican Members of Congress sent a joint letter to then Secretary Zinke requesting a review of the USFWS regulations and an exemption from the current user fee system regime. To date, we have not seen any helpful signs from the Agency. We believe both the President’s EO 13771 and EO 13921 provide a legitimate and consistent opportunity for the Federal Government to reexamine this situation. We appreciate the possibility that the Council could now provide us with an opportunity to regain momentum on this issue by including it in your response to the NMFS’ solicitation of issues negatively affecting American seafood competitiveness. It is also important to recognize the Council’s long-term efforts to develop measures to sustain the east coast squid fisheries, as part of the MSB FMP. Along with those efforts, our companies have been able to partner in the Marine Stewardship Council’s (MSC) certification of our Atlantic Loligo and Illex squid products, which are in demand here, in Canada, Europe, and Asia. The mission of the MSC is to use their ecolabel and fishery certification program to contribute to the health of the world’s oceans by recognizing and rewarding sustainable fishing practices. By working with them, we can influence the choices people make when buying seafood and transform the world’s seafood market to a sustainable future by offering top quality U.S. seafood products. Clearly, MSC-certified squid products pose no threat to the environment despite the fact that the USFWS user fee and monitoring system treats them in a manner similar to a CITES, ESA, or Lacey Act-listed species of concern. These squid species (and products made thereof) are not listed as injurious under 50 CFR part 16; they are not ESA-listed or candidates for listing (part 17); nor are they a CITES species (part 23). These species are not considered to be aquatic invasive species nor are they a threat to the U.S. environment in any way -- so the justification for inclusion in the USFWS declaration process for fish and wildlife defies common sense. The specific domestic fisheries being directly harmed by the USFWS’ policy and associated regulations are these: Atlantic Longfin/Loligo squid Harvest season: Offshore September through mid-April; Inshore May through August Available quota level: 50,555,887 lbs. (22,932 mt) 2017 Harvest level: 17,993,000 lbs. (8,162 mt); Value: $23.4 million ex vessel 2018 Harvest level: 25,588,130 lbs. (11,588 mt); Value: $38 million ex vessel 2019 Harvest level: 27,213,341 lbs. (12,242 mt); Value: $39 million ex vessel Atlantic Shortfin/Illex squid Harvest season: May through October Available quota: 50,518,927 lbs. (26,000 mt) 2017 Harvest level: 49,612,500 lbs. (22,500 mt); Value: $22.5 million ex vessel 2018 Harvest level: 53,177,989 lbs. (24,117 mt); Value: $23.6 million ex vessel 2019 Harvest level: 54,729,757 lbs. (24,825 mt); Value; $28 million ex vessel
5
California Market / Loligo squid Harvest season: April 1 through March 31, or attainment of 118,000 short ton harvest limit 2017 Harvest level: 137,671,129 lbs. (62,446.57 mt); Value $68,726,265 ex vessel 2018 Harvest level: 73,145,367 lbs. (33,178.5 mt); Value: $35,767,673 ex vessel 2019 Landings: 27,198,474 lbs. (12,337.14 mt); Value: $13,434,163 ex vessel Monitoring/Inspections of Squid Fisheries, Processing and Trade As referenced above, U.S. squid fisheries are carefully managed and closely monitored in their respective regions by the federal government via the requirements of the Magnuson-Stevens Fishery Conservation and Management Act (MSA) and through the Secretary of Commerce pursuant to his authorities over NOAA and NMFS. In addition to monitoring by the federal government, California’s squid fishery is actively managed by the California Department of Fish and Wildlife. These fisheries are sustainably managed, they are not being overfished and overfishing is not occurring. In fact, the Atlantic Longfin squid fishery was the first squid fishery in the world to secure MSC certification, on May 22, 2018, and the Atlantic Shortfin (Illex) squid fishery was subsequently certified as MSC-sustainable on May 2, 2019. These certifications by a nongovernmental third-party is further evidence these fisheries are well-managed and not a threat to the marine ecosystem or U.S. commerce and thus should not require redundant USFWS oversight. Squid are harvested by trawl (Atlantic) and purse seine (Pacific) gear on U.S.-owned/operated commercial fishing vessels on trips of short duration (e.g. typically 1 to 4 days; all within the U.S. EEZ). The vessels are subject to U.S. Coast Guard inspection and on-the-water federal observer coverage requirements by NOAA staff and contractors, in addition to compliance with the NOAA/NMFS Office of Law Enforcement (OLE). Product quality is commonly maintained at-sea through the use of refrigerated sea water systems. The harvest is offloaded at shore-side plants in any number of coastal States (including but not limited to Massachusetts, Rhode Island, New Jersey, Virginia and California). There, product is subject to further processing under additional laws and chain of custody protocols. Once the fresh squid are delivered to shore-side plants, for product not destined for the fresh market, it is processed/cleaned/packed/frozen for human consumption in both domestic and export markets. Market conditions vary by year and squid products are regularly imported and exported by U.S. companies, but the majority of U.S squid being harvested and processed today (approximately 65%) is destined for export markets. In addition to vessel monitoring requirements; squid processing plants are subject to site inspections by the Department of Commerce and the Food & Drug Administration (FDA) as well as the CA Department of Fish and Wildlife, State Sanitation Departments, Bureau of Weights and Measures (scales) and even the local Fire Department. Squid processing plants are also required to meet comprehensive Hazard Analysis Critical Control Point (“HACCP”) food safety requirements.
6
In sum, the fishery production process for squid is already monitored by federal and state governments and the products are of high quality, therefore seafood inspection by the USFWS is costly overkill and frequently threatens the timely and safe delivery of a highly-perishable product to our customers. On the trade monitoring side, squid export shipments are tracked by the U.S. Department of Commerce (USDOC). Frozen squid are lot inspected by the USDOC. This also enables USDOC to issue health certificates required by non-EU Countries. Import documentation is checked by the FDA and U.S. Customs Service. Shipments are periodically flagged and inspected by the FDA. There is no need for additional USFWS oversight. Added Cost of USFWS Oversight and the U.S. Seafood Trade Deficit Squid are generally considered to be a higher volume, lower value product so any fees associated with USFWS policies and regulations add layers of costs that make U.S. products more expensive to produce and thus less competitive in the international market. This undermines U.S. trade policy and increases our trade deficit, especially with China and Japan. Further, the FWS’s limiting of the ports which can be used for squid exporting (to conduct duplicative inspections of shipments already inspected by USDOC) prevents companies from getting the best freight rates, further negatively impacting US product competitiveness abroad. There are hundreds of import/export shipments, consisting of thousands of containers in the aggregate, of U.S. squid products each year, originating on both the East and West coasts. Collectively, the U.S. companies moving these shipments are subject to many tens of thousands of dollars of additive fees courtesy of the USFWS and for no environmental or economic benefit to the U.S. All the costs noted below must be added to the costs that U.S. squid producers must pay to export their products overseas while they attempt to successfully compete in international markets. Furthermore, we understand there is growing interest among some U.S. companies to export fresh squid products, particularly to Canada, but they are unable to develop these additional business opportunities due to the overly burdensome USFWS regulations and cost of the fee system. In a very real sense, the USFWS is also harming the development of new U.S. products for export markets. These fees should also be considered in the context of squid container shipments which range in the size of 35,000 pounds to 55,000 pounds (per container) with values ranging from $25,000 to $150,000 (depending on the species and market grade). As such, the size of these shipments far exceeds the Agency’s current exemption for “trade in small volumes of low-value non-federally protected wildlife parts and products” which requires wildlife shipments where the quantity in each shipment of wildlife parts or products is 25 or fewer and the total value of each wildlife shipment is $5,000 or less. ● Every U.S. company exporting/importing squid must secure a USFWS license at a cost of $100.

7
● There is a $93 USFWS base inspection rate for EACH squid shipment leaving/entering the U.S. ● In addition, there is a $53 per hour overtime (OT) fee that companies may be required to pay the USFWS. This is particularly impactful on some West coast companies where approximately 90% of shipments are loaded on a Thursday/Friday and sail on the following Sunday/Monday. This may lead to thousands of dollars in OT payments to the federal government for a redundant layer of seafood inspection. ● The USFWS allows U.S. companies to only ship squid through designated ports. Any shipments not going through a port on the official list are subject to an added “non-designated port inspection fee” of $146 per shipment. There are also FWS time requirements for advance notice and any inspection delays may also negatively impact the buyer process under rapidly changing market conditions. ● These U.S. companies must also pay staff time and hire freight firms to manage the USFWS paperwork requirements. We thank you for this opportunity to seek the Council’s support for including a recommendation to the Administration to exempt squid species from the USFWS wildlife import/export requirements, in response to the opportunities provided to U.S. seafood producers by EO 13921. We truly appreciate your consideration of our request. Please do not hesitate to contact any of us for additional information. Respectfully submitted,
Jeff Reichle Meghan Lapp Ryan Clark Jeffrey B. Reichle Meghan Lapp Ryan G. Clark Chairman Fisheries Liaison, Gen Mgr. President & CEO Lund’s Fisheries, Inc. Seafreeze, Ltd, Seafreeze Shoreside The Town Dock Attachment: The following memo summarizing this issue, and a copy of this letter, were provided to Interior Secretary Bernhardt at a Roundtable Discussion in Boston, July 21, 2020.
USFWS IMPORT/EXPORT REGULATIONS FOR SHELLFISH & FISHERY PRODUCTS ARE HARMING U.S.
SEAFOOD COMPANIES The USFWS regulates the trade of shellfish and fishery products under the wildlife laws enforced by the Agency at 50 CFR 14. The Agency provides exemptions from these import/export regulations for certain shellfish and non-living fishery products if they are for human or animal consumption and the species is not listed as injurious under the Lacey Act (50 CFR Part 16), does not require a permit under the Endangered Species Act (50 CRF Part 17), or is not listed under CITES (50 CFR 23).

8
The USFWS has the authority to determine whether a species meets the definition of “shellfish or fishery product” in the context of these regulations and provide exemptions for such products. Despite these possible exemptions -- the Agency continues to apply costly and unworkable import/export requirements on U.S. edible squid products. The products are not ESA/CITES-listed, are not considered injurious, and pose no threat to the environment. They are fishery products intended for human consumption, plain and simple. On December 9, 2008 the USFWS published a final rule (73 FR 74615) to revise subpart I – Import/Export Licenses of 50 CFR14 to clarify license and fee requirements and revise statutory exemptions. The U.S. commercial fishing industry and NOAA/NMFS had commented on the proposed changes with respect to the inclusion of shipments of squid products. Both the fishing industry and NOAA/NMFS questioned the USFWS interpretation of the definition of “shellfish” (i.e. aquatic invertebrates with a shell) and noted the USFWS inconsistencies with FAO’s inclusion of squid species in the class Cephalopoda as shellfish. In the final rule the USFWS agreed the organisms were indeed mollusks but chose not to consider them to be aquatic invertebrates with a shell as per the existing USFWS definition of shellfish. Furthermore, the Agency has refused to consider (and exempt) squid products as “fishery products”, a policy decision that defies logic. Thus, the USFWS is treating edible domestic frozen squid for human consumption exactly as they treat Lacey Act-listed injurious and invasive zebra mussels and Chinese mitten crabs, CITES-listed paddlefish and queen conch, ESA-listed fresh water mussels, and fertilized salmonid & trout eggs. Based on questionable interpretations of “shellfish and fishery products” the USFWS continues to charge individual U.S. seafood companies tens of thousands of dollars each year in license fees, employee paperwork time, fines, storage, delays and travel/overtime for Agency employees to overregulate a harmless U.S. seafood product. Here is just one example of the USFWS flawed and burdensome system, there are many. The Agency requires at least a 48-hour notice prior to an export shipment but will not clear a shipment until it gets close to the export date. Companies that have provided the Agency with as much as a 10-day advance notice do not see their export clearances until after the “port cut” – the last day a company can deliver a full container to the terminal in order to load the vessel that has been booked for the delivery. If a company misses a port cut they are paying $500-600 per day until the container boards the next vessel (about 9 days). Terminals are typically open for receiving just 2-3 days prior to the port cut and there is just a 3-4 day window to deliver loaded containers. If a company must wait for Agency clearance to begin the loading process they will miss every shipment because the Agency cannot provide timely approvals until after the port cut. In addition, if the Agency rejects a container on the basis they want to inspect the contents they require a company to deliver the loaded container to a bonded warehouse at the company’s expense. Timing is critical when we are delivering refrigerated cargo due to its perishable nature. The Agency process is last minute and structured in a way that makes it impossible to load the vessel as customers require which can also result in added costs per container. Here are a few of the costs enumerated below -- Carrier detention: $300/day for 9 days. $2700 Chassis use: $35/day for 9 days. $315 Storage at trucker’s yard: $150/day for 9 days. $1350 Rolled booking charge: $500

9
Trucking to Bonded Cold Storage: $1200 Last Minute Appointment at Bonded Cold Storage: $1000 Squid are generally considered to be a higher volume, lower value product so any fees associated with USFWS policies and regulations add layers of costs that make U.S. products more expensive to produce and thus less competitive in the international market. This undermines U.S. trade policy and our trade deficit, especially with China and Japan. Further, the Agency’s limiting of the ports which can be used for squid exporting (to conduct duplicative inspections of shipments already inspected by USDOC) may prevent companies from getting the best freight rates, further negatively impacting US product competitiveness abroad. There are hundreds of import/export shipments, consisting of thousands of containers in the aggregate, of U.S. squid products every year, originating on both the East and West coasts. Collectively, the U.S. companies moving these shipments are subject to many tens of thousands of dollars of additive fees courtesy of the USFWS and for no environmental or economic benefit to the U.S. All the costs of USFWS compliance must be added to the bottom line for U.S. squid producers to export their products overseas and to successfully compete in international markets. In conclusion, we believe President Trump’s recent Executive Order 13921 designed to remove unnecessary regulatory burden on the U.S. seafood industry and promote trade opportunities should be the tool by which the USFWS exempts domestic squid products from costly and unworkable inspections, licenses and user fees. We also believe Congress did not intend for the USFWS to interject unscientific policy decisions into our national seafood inspection system, especially for shellfish and fishery products that are not a protected species and pose no threat to the environment. The USFWS has no justifiable reason to treat U.S. squid products differently than other edible fishery products and should include squid products in the regulatory definition of “shellfish & fishery products” at 50 CFR-Chapter1-Subchapter B-Part 14.21(a)(1) and exempt these products from the inspections, licenses and user fees. Prepared by: Rick Marks, ROMEA; [email protected] (July 21, 2020)
###
Dr. Chris Moore Mid-Atlantic Fishery Management Council 800 North State Street, Suite 201 Dover, DE 19901 July 29, 2020 Dear Dr. Moore, Over the last year, the Scallopers Campaign has been working with participants in the Limited Access (LA) Atlantic sea scallop fishery to secure much needed operational flexibility through the development of a leasing program. We have worked closely with the New England Fishery Management Council’s (NEFMC) Sea Scallop Advisory Panel (AP) to ensure that the development of a leasing program is a high work priority for 2021. Within the past twelve months, the AP has voted four times in support of the development of a leasing program for the LA fleet. We bring this issue to the attention of the Mid-Atlantic Fishery Management Council (MAFMC) for two reasons.
• First, industry support for leasing among LA scallop vessels homeported in the Mid-Atlantic
region is overwhelming. The sea scallop fishery is among the Mid-Atlantic’s most important and highest revenue fisheries. Despite the social and economic importance of the fishery to the Mid-Atlantic’s fishing and processing industries, the Mid-Atlantic Council only has two votes on the NEFMC’s Scallop Oversight Committee.
• Unfortunately, representatives from the Mid-Atlantic cannot vote on the NEFMC, including the Council’s annual priority-setting process. Given the importance of this issue to the scallop fishery and the overwhelming level of support from the fleet homeported in the Mid-Atlantic, we request that the Mid-Atlantic Council transmit a request to the NEFMC asking them to include initiating a leasing amendment to the Atlantic Sea Scallop FMP in its 2021 priorities.
The Mid-Atlantic scallop fleet is ready to engage in the amendment process. As you may know, there are more LA scallop vessels homeported in the MAFMC region than in that of the NEFMC. An overwhelming 70% of LA vessels support initiating the process to develop a leasing program for the fishery. Within the vessels homeported in the Mid-Atlantic states, support rises to 83%. Please reference the attached information sheet for additional numbers. Additional resources, including an issues statement describing the purpose and need for the action, are available at ScallopersCampaign.org. The Scallopers Campaign strongly believes in the ability of the NEFMC’s plan amendment process, with the benefit of input from the AP, the PDT, the Scallop Committee and the public, to develop an effective leasing program. The industry is eager to begin the discussion, and we ask your support in requesting
the NEFMC to consider and include the issue in their 2021 priorities to initiate the process and engage the Mid-Atlantic fleet in the discussion. Sincerely,
Jeffrey Pike Rick Robins
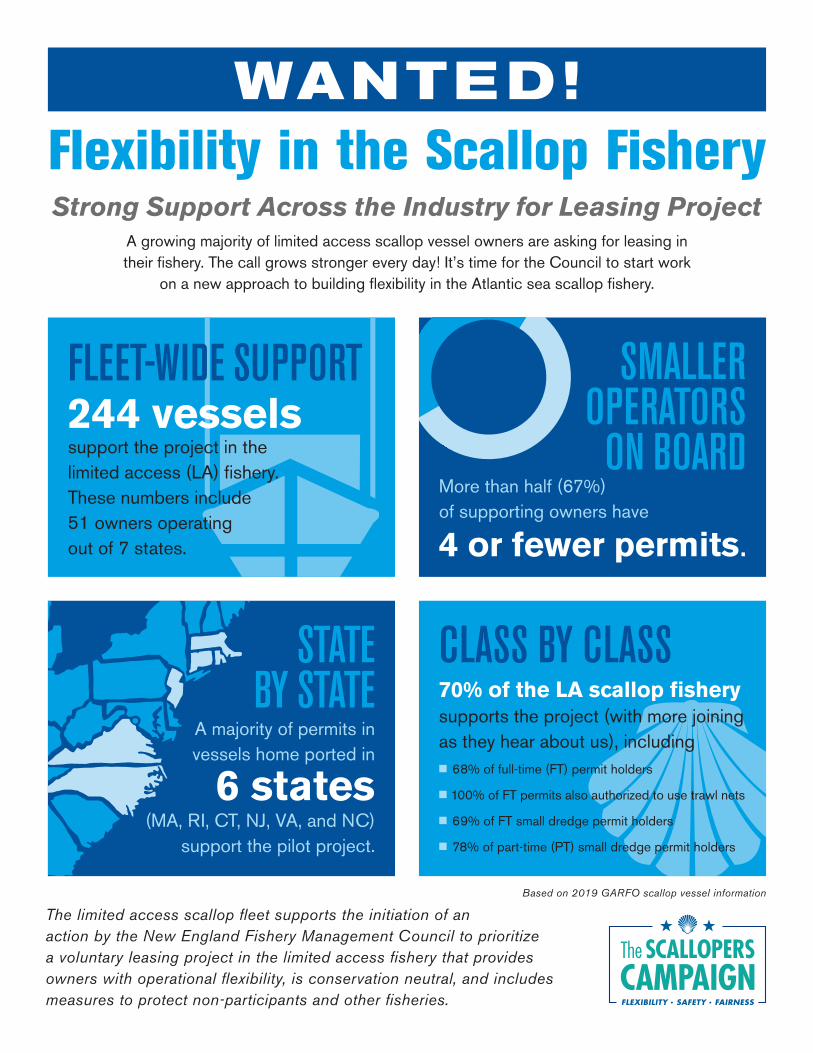
WANTED!Flexibility in the Scallop FisheryStrong Support Across the Industry for Leasing Project
A growing majority of limited access scallop vessel owners are asking for leasing in their fishery. The call grows stronger every day! It’s time for the Council to start work
on a new approach to building flexibility in the Atlantic sea scallop fishery.
The limited access scallop fleet supports the initiation of an action by the New England Fishery Management Council to prioritize a voluntary leasing project in the limited access fishery that provides owners with operational flexibility, is conservation neutral, and includes measures to protect non-participants and other fisheries.
Based on 2019 GARFO scallop vessel information
FLEET-WIDE SUPPORT
STATE BY STATE
SMALLER OPERATORS ON BOARD
CLASS BY CLASS
244 vessels support the project in the limited access (LA) fishery. These numbers include 51 owners operating out of 7 states.
A majority of permits in vessels home ported in
6 states (MA, RI, CT, NJ, VA, and NC)
support the pilot project.
More than half (67%) of supporting owners have
4 or fewer permits.
70% of the LA scallop fishery supports the project (with more joining as they hear about us), includingn 68% of full-time (FT) permit holders
n 100% of FT permits also authorized to use trawl nets
n 69% of FT small dredge permit holders
n 78% of part-time (PT) small dredge permit holders
Page 1 of 1
M E M O R A N D U M
Date: July 30, 2020
To: Chris Moore, Executive Director
From: Mary Sabo, Staff
Subject: Executive Order on Promoting American Seafood Competitiveness and Economic Growth
On May 7, 2020, the President of the United States signed an Executive Order on Promoting American Seafood Competitiveness and Economic Growth. The purpose of this Executive Order is “to strengthen the American economy; improve the competitiveness of American industry; ensure food security; provide environmentally safe and sustainable seafood; support American workers; ensure coordinated, predictable, and transparent Federal actions; and remove unnecessary regulatory burdens.”
Section 4 of the Executive Order requires each Regional Fishery Management Council to submit, within 180 days of the date of this order, a prioritized list of recommended actions to reduce burdens on domestic fishing and to increase production within sustainable fisheries, including a proposal for initiating each recommended action within 1 year of the date of this order. Recommendations must be consistent with the requirements of the Magnuson-Stevens Fishery Conservation and Management Act and other applicable laws. The Council’s list of recommendations is due to NOAA Fisheries on November 2, 2020.
Council staff have solicited public input on potential changes to regulations, orders, guidance documents, or other similar actions that could reduce burdens on domestic fishing and/or increase fishery production. Staff have similarly requested input from Council members. Comments are being collected via email and an online comment form through August 5 and will then be compiled and posted as a supplemental document on the August meeting page. During the Executive Director’s Report, the Council will review comments received and provide additional input and direction to staff.
Enclosed behind this memo are several supporting documents for Council consideration:
• Executive Order 13921 on Promoting American Seafood Competitiveness and EconomicGrowth – Section 4
• Guidance for Councils Response to E.O. 13921 Section 4 (provided by NOAA Fisheries)• E.O. 13921 Recommended Action Template (provided by NOAA Fisheries)
Mid-Atlantic Fishery Management Council 800 North State Street, Suite 201, Dover, DE 19901
Phone: 302-674-2331 ǀ FAX: 302-674-5399 ǀ www.mafmc.org Michael P. Luisi, Chairman ǀ G. Warren Elliott, Vice Chairman
Christopher M. Moore, Ph.D., Executive Director

The following is an excerpt from the Executive Order on Promoting American Seafood Competitiveness and Economic Growth. To view the full Executive Order, visit https://www.federalregister.gov/documents/2020/05/12/2020-10315/promoting-american-seafood-competitiveness-and-economic-growth.
Sec. 4. Removing Barriers to American Fishing. (a) The Secretary of Commerce shall request each Regional Fishery Management Council to submit, within 180 days of the date of this order, a prioritized list of recommended actions to reduce burdens on domestic fishing and to increase production within sustainable fisheries, including a proposal for initiating each recommended action within 1 year of the date of this order.
(i) Recommended actions may include changes to regulations, orders, guidance documents, or other similar agency actions.
(ii) Recommended actions shall be consistent with the requirements of the Magnuson-Stevens Fishery Conservation and Management Act (16 U.S.C. 1801 et seq.); the Endangered Species Act of 1973 (16 U.S.C. 1531 et seq.); the Marine Mammal Protection Act (16 U.S.C. 1361 et seq.); and other applicable laws.
(iii) Consistent with section 302(f) of the Magnuson-Stevens Fishery Conservation and Management Act (16 U.S.C. 1852(f)), and within existing appropriations, the Secretary of Commerce shall provide administrative and technical support to the Regional Fishery Management Councils to carry out this subsection.
(b) The Secretary of Commerce shall review and, as appropriate and to the extent permitted by law, update the Department of Commerce’s contribution to the Unified Regulatory Agenda based on an evaluation of the lists received pursuant to subsection (a) of this section.
(c) the Assistant to the President for Economic Policy, the Assistant to the President for Domestic Policy, and the Chair of the Council on Environmental Quality a report evaluating the recommendations described in subsection (a) of this section and describing any actions taken to implement those recommendations. This report shall be updated annually for the following 2 years.

Guidance for Councils Response to E.O. 13921 Section 4
In response to Executive Order 13921, a formal request was sent to the Regional Fishery Management Councils for a prioritized list of recommended actions “to reduce burdens on domestic fishing and to increase production within sustainable fisheries” by November 2, 2020, as required under Section 4 of the order. To provide further details and instructions for submissions, this document spells out guidance for Councils in formatting their responses.
Examples have been provided in the attached template table EO13921 Recommended Actions Template to provide a framework for responding to the request. Please develop your prioritized list and send a copy of the completed table (one response per Council) by email to Kelly Denit and copy Morgan Corey, Office of Sustainable Fisheries. To facilitate tracking recommended actions, please provide the following information in your response:
Indicate the priority number relative to other proposed actions in order of preference, with 1 being the highest priority, and assign a unique priority number to each proposed action (i.e., only one action assigned to priority 1, 2, 3, etc.). If possible, consider bundling actions by FMP or by fishery before prioritizing.
Classify the recommended action(s) type as a Regulation, Order, Guidance, or Other Similar Agency Action using the dropdown list.
Identify the relevant Code of Federal Regulations (CFR) Citation under Title 50, if applicable (CFR information here).
Describe the recommended action, including current regulation implications and issues that could be addressed by taking the action(s).
Explain how the recommended action(s) reduces burdens on domestic fishing and/or increases production within sustainable fisheries. Be as specific as possible (qualitative information is enough) to detail the anticipated effects (social, economic, biological) of taking the action(s).
Outline a proposal for initiating each recommended action, including the current status of discussions, steps to be taken, expected timeline for Council discussion and decisions.

E.O. 13921 Recommended Action Template – Provided by NOAA Fisheries on 7/16/20
Council(s) Priority Number
Action type (e.g. Changes to Regulations, Orders, Guidance Documents, Other Similar Agency Actions)
Relevant CFR Citation under Title 50 (if applicable)
Description of recommended action(s)
Rationale of how the recommended action(s) reduces burdens on domestic fishing and increases production within sustainable fisheries
Proposal for initiating each recommended action(s) within 1 year of the date of this order (i.e., by May 7, 2021)
Example - XFMC 1 Regulation 50 CFR 622 This regulation would modify provisions for Fish A vessels transiting through cold weather closed areas with Fish A on board in federal waters. The proposed action would allow trawl doors in the rack (cradle), nets in the rigging and tied down, and trawl net on the deck during transit. Currently, Fish A vessels transiting cold weather closed areas with Fish A on board are required to stow a trawl net with a mesh size of less than 4 inches below deck. Fishermen have requested a change to these transit provisions as vessel design changes have limited access to below deck storage, the need to disassemble the trawl gear prior to stowing nets below deck in rough conditions is a safety at sea concern, and some fishermen have avoided transiting the closed areas entirely.
Because of safety at sea concerns caused by shoals in state waters off State B, federally permitted Fish A vessels from states north of State B that operate off of State B during cold weather closures, but have been unable to store fishing gear according to the current transit regulations, have been forced to land their catch in State B rather than at their homeport. The proposed changes would make it easier for these vessels to comply with the gear stowage requirements and, as a result, more easily return to their homeport with Fish A on board. Also, the proposed changes were recommended by the Council's Law Enforcement Advisory Panel, who indicated these changes would make it easier for enforcement officers to see if Fish A fishermen are complying with the transit provisions. As such, the burden on law enforcement officers would also be effectively reduced.
Rulemaking requested by Gulf Council at their June meeting. Proposed rule anticipated to publish by October 2020.
Example - XFMC 2 Guidance Document n/a Revise guidance document to increase process efficiencies.
Removing unnecessary time lags in the process may reduce start up cost for the producers as well as may allow facilities to more easily start production.
Plan to engage in discussion with NMFS on possible revision to timing and text at January 2021 Council meeting.

FIFTH COAST GUARD DISTRICT
ENFORCEMENT REPORT
June 1 2020 – 31 July 2020
Presented to the Mid-Atlantic Fisheries Management Council Prepared By:
Enforcement Branch Fifth Coast Guard District
ii
Table of Contents Page I. Mid-Atlantic Fisheries Enforcement and Marine Protected Species Operations ....................... 1 II. Commercial Fishing Vessel Safety Efforts ............................................................................... 2 III. Search and Rescue Highlights ................................................................................................. 2 IV. Outreach Information............................................................................................................... 3
List of Abbreviations CFVS – Commercial Fishing Vessel Safety SAR – Search and Rescue HC-130 – USCG Fixed-Wing Aircraft WLB – 225’ Buoy Tender WPB – 87’ Patrol Boat P/C – Pleasure Craft STA – USCG Small Boat Station F/V – Fishing Vessel EPIRB – Emergency Position Indicating Radio Beacon A/S – Air Station WMEC – 210’ or 270’ Medium Endurance Cutter SEC - Sector M/V – Motor Vessel M/T – Motor Tanker FRC – 154’ Fast Response Cutter

1
I. Mid-Atlantic Fisheries Enforcement and Marine Protected Species Operations
Operations Summary During this period, major cutters, patrol boats and stations conducted fisheries patrols in the Mid-Atlantic in an effort to curtail illegal fishing and promote safety of life at sea within D5’s AOR. Throughout this period, units conducted 120 boarding’s. We did not meet our targeted boarding’s as a result of a reduction of at-sea enforcement due to COVID-19. Boarding Statistics (Note: “This Period” data should be considered preliminary and is subject to change) 1 June 2020 – 31 July 2020 Activities Comparison to FY19 Fisheries Boarding’s .......................................................................120........................................... 234 Fisheries Boarding’s w/Fishery Violations .........................................2............................................... 8 Violation Rate .............................................................................. 1.6%........................................ .3.4%
Activities Fiscal Year 2020 Comparison to FY19 Fisheries Boarding’s .......................................................................577........................................... 881 Fisheries Boarding’s w/Fishery Violations .......................................22............................................. 33 Violation Rate .............................................................................. 3.8%......................................... 3.7%
Violation Summary Violations were issued for retaining undersize HMS species aboard a recreational vessel and targeting HMS without a federal fisheries permit. Marine Protected Species Support Summary 1. On two separate occasions Coast Guard assets responded to reports of entangled leatherback sea turtles. In both cases the responding units were successful at detangling the turtles. One turtle was trailing gear commonly associated with a crab pot and the other was entangled with three high-flyer markers. 2. In early July the District 5 Command Center received a report of a deceased whale off of New Jersey. It was later determined to be the carcass of a juvenile North Atlantic Right Whale. Coast Guard resources responded, located the carcass, and assisted transporting the whale to shore where a subsequent necropsy was completed to further understand/determine the cause of death.
II. Commercial Fishing Vessel Safety Efforts (June 1, 2020 –July 31, 2020)
Fishing Vessel Dockside Safety Examinations .................. This Period.................. Fiscal Year to Date Dockside Exams................................................................................62........................................... 294 Decals Issued ....................................................................................56........................................... 262

2
Commercial Fishing Vessel Safety Terminations.............................00............................................. 07
III. Search and Rescue Highlights From June 1, 2020 – June 1, 2020, there were 5 marine casualties / terminations reported involving commercial fishing vessels:
• Allision – 1 o CAPT BRADEN (O.N. 56112) 19 JULY 2020 – F/V CAPT BRADEN allided with the
Middle Thorofare Bridge (aka 2-Mile Bridge) while navigating through the span resulting in damage to fendering system.
• Capsize – 0
• Collision – 0
• Damage to Environment (Pollution/Hazmat) – 1
o SENECA (O.N. 532569) 05 JUNE 2020 – The crew of the F/V SENECA pumped oil bilge water directly into the Bay River creating a visible sheen.
• Death/Missing – 0
• Fire – 1
o DOUBLE G (O.N. 1124673) 05 JULY 2020 – USCG rescued the crew of the F/V DOUBLE G after the vessel caught fire 13 NM off Cape Lookout. The DOUBLE G eventually burned to the waterline and sank.
• Flooding – 1
o WOODER BAYBIE (MD9930CH) 19 JUNE 2020 – The F/V WOODER BAYBIE sank at the dock in Choptank Marina.
• Fouling – 0 o
• Grounding – 0
• Injury – 0
• Loss of Propulsion/Steering – 1
o ESCAPE (O.N. 628864) 09 JUN 2020 – The F/V ESCAPE became disabled and grounded when her steering arm failed near the Oregon Inlet Marina.
• MEDEVAC – 0
• Fall(s) Overboard – 0
3
• Sinking – 0
• Terminations – 0
IV. Outreach - CFVS Information NSTR

New England Fishery Management Council
FOR IMMEDIATE RELEASE PRESS CONTACT: Janice PlanteJuly 10, 2020 (607) 592-4817, [email protected]
New England Fishery Management Council | 50 Water Street, Mill 2 | Newburyport, MA 01950Phone: (978) 465-0492 | Fax: (978) 465-3116 | www.nefmc.org
Council Discusses Skates, Atlantic Herring, Red Hake, EBFM,Habitat, and Research Priorities at June Meeting
The New England Fishery Management Council met June 23-25, 2020 by webinar. In addition to the news already released about groundfish, monkfish, and scallops, here’s an overview of the other issues the Council worked on during this meeting.
Research Priorities: After considering input from its various fishery-related committees and the Scientific and Statistical Committee, the Council agreed to submit an updated list of Research Priorities and Data Needs for 2020-2024 to NOAA Fisheries.
Skates: At the end of last year, the Council tasked its Skate Committee with defining a clear problem statement, goals, and objectives for Draft Amendment 5 to the Northeast Skate Complex Fishery Management Plan (FMP). The amendment is being developed to consider whether limited access is appropriate for the skate wing and/or skate bait fisheries. The committee worked on this task in late-March using additional data provided by the Skate Plan Development Team. The Council reviewed the new problem statement, along with an additional objective, and discussed whether it wanted to continue pursuing the development of a limited access program for skates. The Council did not approve the problem statement but agreed to have the committee continue to work on its initial tasking.
• All skate-related documents reviewed by the Council, including the Amendment 5 discussion documentand presentation, are available here.
• The Skate Committee will meet on Thursday, August 6, 2020 to continue its work.
Winter skate, pictured above, is the primary species harvested for human consumption in the wing fishery. Seven species of skates are managed as a complex under a single fishery management plan.
– NOAA Fisheries photo
Atlantic Herring: The Council discussed two actions under its Herring Committee report.
• Framework Adjustment 8 – This action has two components: (a) specifications for the 2021-2023 fishing years; and (b) adjustments to the Atlantic Herring FMP that potentially inhibit the mackerel fishery from achieving its optimum yield.
Ø The specifications will be based on results from a new management track stock assessment for Atlantic herring that was peer reviewed on June 22, 2020. The Council’s Herring Committee,
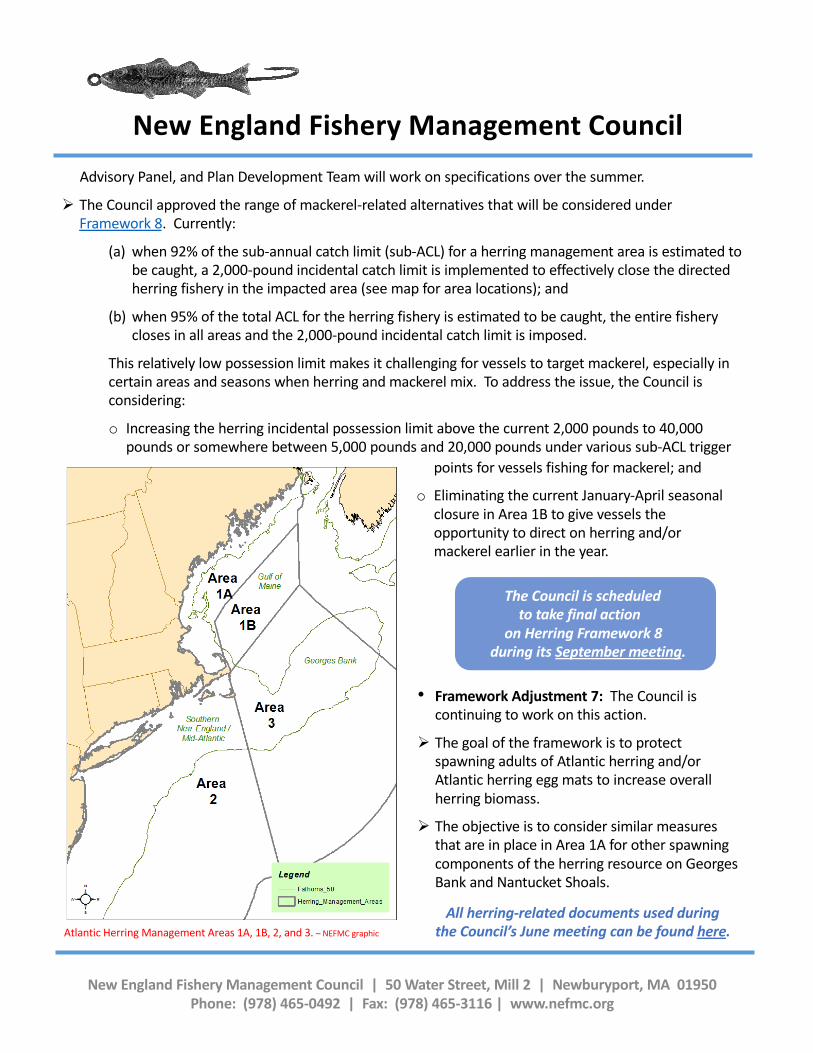
New England Fishery Management Council
New England Fishery Management Council | 50 Water Street, Mill 2 | Newburyport, MA 01950
Phone: (978) 465-0492 | Fax: (978) 465-3116 | www.nefmc.org
Advisory Panel, and Plan Development Team will work on specifications over the summer.
Ø The Council approved the range of mackerel-related alternatives that will be considered under Framework 8. Currently:
(a) when 92% of the sub-annual catch limit (sub-ACL) for a herring management area is estimated to be caught, a 2,000-pound incidental catch limit is implemented to effectively close the directed herring fishery in the impacted area (see map for area locations); and
(b) when 95% of the total ACL for the herring fishery is estimated to be caught, the entire fishery closes in all areas and the 2,000-pound incidental catch limit is imposed.
This relatively low possession limit makes it challenging for vessels to target mackerel, especially in certain areas and seasons when herring and mackerel mix. To address the issue, the Council is considering:
o Increasing the herring incidental possession limit above the current 2,000 pounds to 40,000 pounds or somewhere between 5,000 pounds and 20,000 pounds under various sub-ACL trigger
Atlantic Herring Management Areas 1A, 1B, 2, and 3. – NEFMC graphic
• Framework Adjustment 7: The Council is continuing to work on this action.
Ø The goal of the framework is to protect spawning adults of Atlantic herring and/or Atlantic herring egg mats to increase overall herring biomass.
Ø The objective is to consider similar measures that are in place in Area 1A for other spawning components of the herring resource on Georges Bank and Nantucket Shoals.
All herring-related documents used duringthe Council’s June meeting can be found here.
o points for vessels fishing for mackerel; and
o Eliminating the current January-April seasonal closure in Area 1B to give vessels the opportunity to direct on herring and/or mackerel earlier in the year.
The Council is scheduled to take final action
on Herring Framework 8 during its September meeting.
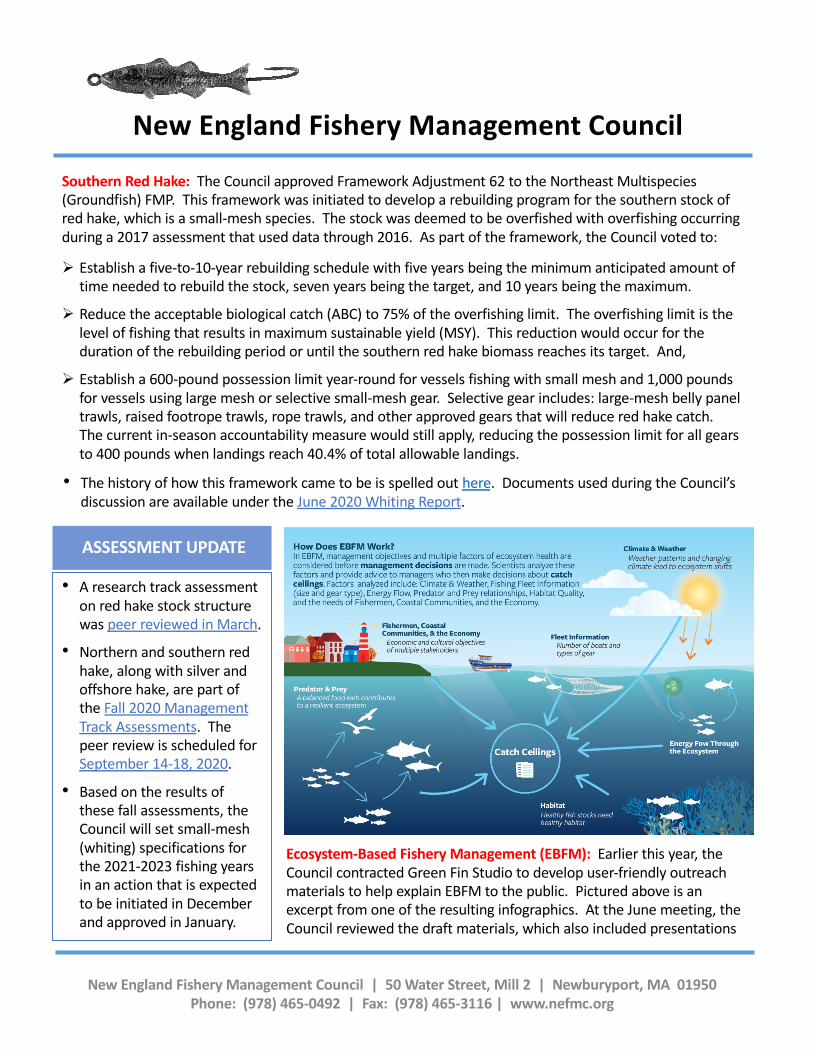
New England Fishery Management Council
New England Fishery Management Council | 50 Water Street, Mill 2 | Newburyport, MA 01950
Phone: (978) 465-0492 | Fax: (978) 465-3116 | www.nefmc.org
Southern Red Hake: The Council approved Framework Adjustment 62 to the Northeast Multispecies (Groundfish) FMP. This framework was initiated to develop a rebuilding program for the southern stock of red hake, which is a small-mesh species. The stock was deemed to be overfished with overfishing occurring during a 2017 assessment that used data through 2016. As part of the framework, the Council voted to:
Ø Establish a five-to-10-year rebuilding schedule with five years being the minimum anticipated amount of time needed to rebuild the stock, seven years being the target, and 10 years being the maximum.
Ø Reduce the acceptable biological catch (ABC) to 75% of the overfishing limit. The overfishing limit is the level of fishing that results in maximum sustainable yield (MSY). This reduction would occur for the duration of the rebuilding period or until the southern red hake biomass reaches its target. And,
Ø Establish a 600-pound possession limit year-round for vessels fishing with small mesh and 1,000 pounds for vessels using large mesh or selective small-mesh gear. Selective gear includes: large-mesh belly panel trawls, raised footrope trawls, rope trawls, and other approved gears that will reduce red hake catch. The current in-season accountability measure would still apply, reducing the possession limit for all gears to 400 pounds when landings reach 40.4% of total allowable landings.
ASSESSMENT UPDATE
Ecosystem-Based Fishery Management (EBFM): Earlier this year, the Council contracted Green Fin Studio to develop user-friendly outreach materials to help explain EBFM to the public. Pictured above is an excerpt from one of the resulting infographics. At the June meeting, the Council reviewed the draft materials, which also included presentations
• A research track assessment on red hake stock structure was peer reviewed in March.
• Northern and southern red hake, along with silver and offshore hake, are part of the Fall 2020 Management Track Assessments. The peer review is scheduled for September 14-18, 2020.
• Based on the results of these fall assessments, the Council will set small-mesh (whiting) specifications for the 2021-2023 fishing years in an action that is expected to be initiated in December and approved in January.
• The history of how this framework came to be is spelled out here. Documents used during the Council’s discussion are available under the June 2020 Whiting Report.
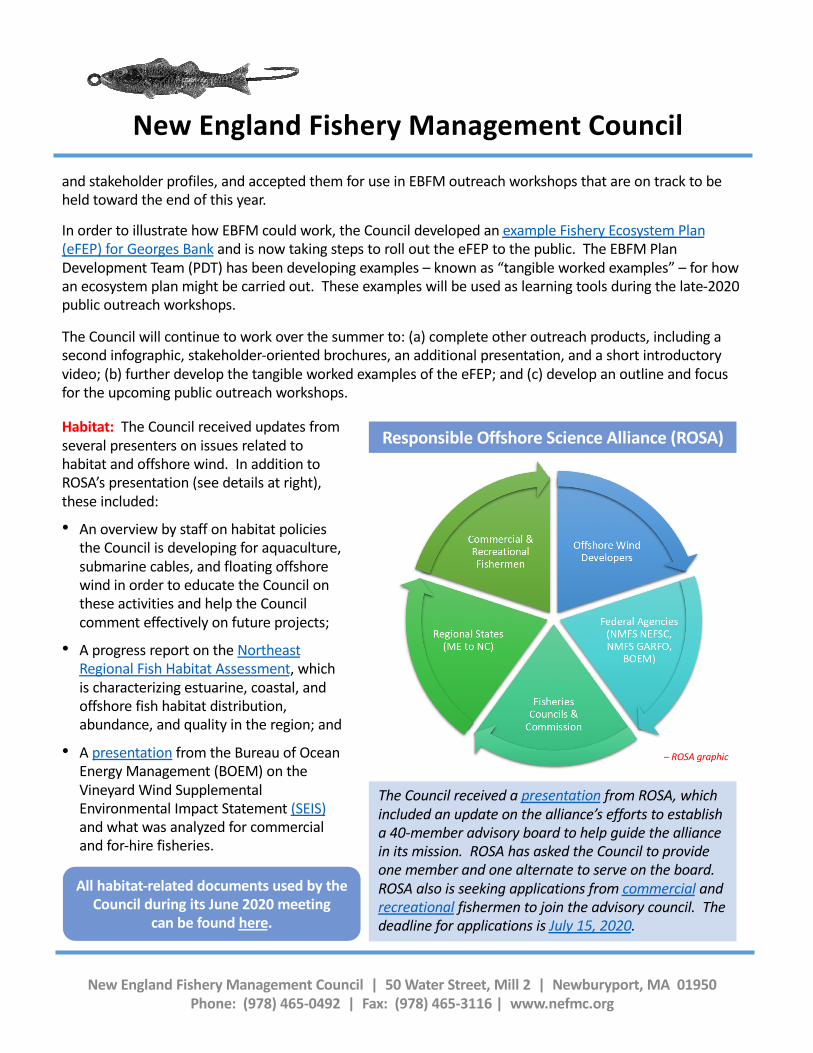
New England Fishery Management Council
New England Fishery Management Council | 50 Water Street, Mill 2 | Newburyport, MA 01950
Phone: (978) 465-0492 | Fax: (978) 465-3116 | www.nefmc.org
and stakeholder profiles, and accepted them for use in EBFM outreach workshops that are on track to be held toward the end of this year.
In order to illustrate how EBFM could work, the Council developed an example Fishery Ecosystem Plan (eFEP) for Georges Bank and is now taking steps to roll out the eFEP to the public. The EBFM Plan Development Team (PDT) has been developing examples – known as “tangible worked examples” – for how an ecosystem plan might be carried out. These examples will be used as learning tools during the late-2020 public outreach workshops.
The Council will continue to work over the summer to: (a) complete other outreach products, including a second infographic, stakeholder-oriented brochures, an additional presentation, and a short introductory video; (b) further develop the tangible worked examples of the eFEP; and (c) develop an outline and focus for the upcoming public outreach workshops.
Habitat: The Council received updates from several presenters on issues related to habitat and offshore wind. In addition to ROSA’s presentation (see details at right), these included:
• An overview by staff on habitat policies the Council is developing for aquaculture, submarine cables, and floating offshore wind in order to educate the Council on these activities and help the Council comment effectively on future projects;
• A progress report on the Northeast Regional Fish Habitat Assessment, which is characterizing estuarine, coastal, and offshore fish habitat distribution, abundance, and quality in the region; and
• A presentation from the Bureau of Ocean Energy Management (BOEM) on the Vineyard Wind Supplemental Environmental Impact Statement (SEIS)and what was analyzed for commercial and for-hire fisheries.
The Council received a presentation from ROSA, which included an update on the alliance’s efforts to establish a 40-member advisory board to help guide the alliance in its mission. ROSA has asked the Council to provide one member and one alternate to serve on the board. ROSA also is seeking applications from commercial and recreational fishermen to join the advisory council. The deadline for applications is July 15, 2020.
Responsible Offshore Science Alliance (ROSA)
All habitat-related documents used by the
Council during its June 2020 meeting
can be found here.
– ROSA graphic

Council Addresses Broad Range of Federal Fisheries Issues During Meeting Week
Best fishing practices; new stock assessments for King Mackerel, Red Porgy, and Greater Amberjack, Special Management Zones; and COVID-19 impacts top the agenda
Members of the South Atlantic Fishery Management Council held their quarterly June meeting this week via webinar due to COVID-19 and public health concerns. The meeting, originally scheduled to take place in Key West, Florida, began with a discussion of best fishing practices, emphasizing the Council’s outreach campaign and new resources for fishermen now available from the Council’s website. Information includes proper handling techniques, identifying signs of barotrauma, how-to videos demonstrating effectiveness of descending devices, and an online tutorial. Links to state-level resources for the region are also available through the new webpage. Council members have consistently supported the use of best practices to help improve survival of released fish. In September 2019, the Council approved Snapper Grouper Regulatory Amendment 29 requiring descending devices be onboard and readily available when fishing for snapper grouper species and other measures promoting best practices. NOAA Fisheries announced the Final Rule for Regulatory Amendment 29 earlier today, implementing the best fishing practice measures effective July 15, 2020. NOAA Fisheries recently announced the opening of the Red Snapper season for both recreational and commercial fishermen, with a recreational season scheduled for the weekend of July 10, 11, 12, and the following Friday, July 17, 2020. “We encourage fishermen to take advantage of instructional videos and other best fishing practices information available online prior to the opening of this year’s Red Snapper season,” explained Council Chair, Jessica McCawley. During the Council meeting state agency representatives provided updates on sampling efforts planned for the recreational opening, including carcass collections and dockside sampling, dependent upon restrictions in place for COVID-19. COVID-19 Impacts The Council discussed the impacts of COVID-19 on fisheries and fishing communities after receiving input from its advisory panels, updates from state agencies, and public comment, most noting the detrimental effects on fishing-related businesses including for-hire and commercial fishermen. There was much discussion about the economic importance of the Red Snapper fishery and the benefit of additional fishing days. However, under the mandates of Magnuson-Stevens Act, the Council must adhere to the current annual catch limit and cannot simply add additional fishing days. The Council agreed to send a letter to the Secretary of Commerce addressing Red Snapper concerns and the effects of the pandemic, as well as expressing their willingness to work with NOAA Fisheries to expand access to the fishery. In an effort to help mitigate some of the negative impacts of COVID-19, the Council will request that NOAA Fisheries take emergency action to increase the federal recreational bag limit for Atlantic King Mackerel to 4 fish per person/day off east Florida through the Mid-Atlantic and request emergency action to increase the
(Continued)
South Atlantic Fishery Management Council News Release
FOR IMMEDIATE RELEASE June 12, 2020
CONTACT: Kim Iverson Public Information Officer Toll Free: 866/SAFMC-10 or 843/571-4366 [email protected]
federal commercial trip limit for Vermilion Snapper to 1,500 pounds gutted weight. If approved, the emergency actions would be effective for 180 days and could be extended for an additional 185 days. It is anticipated the new regulations could be implemented within the next three months. The Council will consider requesting emergency action during its September meeting to allow the carry-over of unused annual catch limits from 2020 into 2021 after reviewing additional analyses. Stock Assessments There was good news regarding Atlantic King Mackerel and Greater Amberjack stocks following recent assessments that found neither stock overfished nor undergoing overfishing. Council members received the results of recent stock assessments from NOAA Fisheries Southeast Fisheries Science Center and recommendations from its Scientific and Statistical Committee during this week’s meeting. Harvest has remained relatively consistent and both the King Mackerel and Greater Amberjack stocks have benefited from strong recruitment years (lots of fish born within the year). The Council will develop amendments to adjust catch levels and allocations as needed based on the recent assessments and recommendations. The Red Porgy stock continues to face challenges. Despite a rebuilding plan being in place for almost 3 decades, the stock assessment finds Red Porgy remains overfished and is undergoing overfishing, with chronically low recruitment. The Council will begin work on an amendment to end overfishing and address rebuilding the stock. Special Management Zones The Council approved the designation of specified artificial reefs in federal waters off the North Carolina and South Carolina coasts as Special Management Zones, addressing concerns from members of the Council’s Law Enforcement Advisory Panel regarding how the circular shape of areas complicates enforcement. At the states’ request, the Council approved Snapper Grouper Regulatory Amendment 34 that would designate 30 artificial reef sites off of North Carolina and 4 sites off of South Carolina as Special Management Zones. The designations would limit fishing gear types when targeting snapper grouper species and restrict harvest by spear to recreational bag limits for the SMZs in North Carolina. In South Carolina, the harvest of snapper grouper species in the designated SMZs would be limited to recreational bag limits. The amendment must be approved by the Secretary of Commerce before implementation.
Other Business Council members continued to develop management actions for Dolphin and Wahoo through draft Amendment 10 to the Dolphin Wahoo Fishery Management Plan. The Council received fishing level recommendations for both species from its Scientific and Statistical Committee using recalibrated recreational fishing effort estimates from NOAA Fisheries’ Marine Recreational Information Program. The new catch levels will be included in the amendment as the Council considers management actions that include modifications to accountability measures, allocations, and current vessel limits for Dolphin. The Council received numerous public comments from recreational fishermen and for-hire captains in South Florida and the Florida Keys expressing concerns about the decline of the Dolphin fishery in their area. Additional information about this week’s meeting, including a Story Map highlighting actions, Committee Reports, and Summary Motions are available from the Council’s website at: https://safmc.net/june-2020-council-meeting-details/. The next meeting of the Council is scheduled for September 14-18, 2020 in Charleston, South Carolina. The South Atlantic Fishery Management Council, one of eight regional councils, conserves and manages fish stocks from three
to 200 miles offshore of North Carolina, South Carolina, Georgia and east Florida.