FY2013 Results Briefing
28
FY2013 FY2013 FY2013 FY2013 Results Briefing Results Briefing Results Briefing Results Briefing May 9, 2014 May 9, 2014 URL http://housefoods-group.com
-
Upload
khangminh22 -
Category
Documents
-
view
0 -
download
0
Transcript of FY2013 Results Briefing

FY2013FY2013FY2013FY2013Results BriefingResults BriefingResults BriefingResults Briefing
May 9, 2014May 9, 2014
URL http://housefoods-group.com

Contents
FY2013 Results pp. 3 - 9
Full-Year Plan for FY2014
Major Businesses: Strategies and Initiatives
pp. 10 - 14
pp 15 19 Major Businesses: Strategies and Initiatives pp. 15 - 19
(Supplementary materials) Supplementary Description pp. 20 - 28
(History of businesses (Abstract) / Major new products and varieties for the spring and summer 2014 / Initiatives of(History of businesses (Abstract) / Major new products and varieties for the spring and summer 2014 / Initiatives of the House Foods Group / Trends of cost reductions and capital investment / Breakdowns of non-operating income and expenses and extraordinary income and loss / Changes in consolidated cash flows / Targeted performance and management indexes for the final year of the Fourth Medium-Term Business Plan / Content of business segments in the Fourth Medium-Term Business Plan)
Copyright (c) 2014 House Foods Group Inc. All rights reserved. 2
)
FY2013 ResultsFY2013 ResultsFY2013 ResultsFY2013 Results
The profitability of the two domestic core businesses declinedThe profitability of the two domestic core businesses declinedp yp ydue to the intensified competition in mature markets anddue to the intensified competition in mature markets and
competition with competitors’ products.competition with competitors’ products.Income decreased, due in part to temporary costs incurred for the switch to a Income decreased, due in part to temporary costs incurred for the switch to a holding company system and 100th anniversary business, in addition to costs holding company system and 100th anniversary business, in addition to costs
for upfront investment in marketing for the International Businessfor upfront investment in marketing for the International Business
3
for upfront investment in marketing for the International Business.for upfront investment in marketing for the International Business.

FY2013 Consolidated Performance
FY2012 performance
FY2013 revised target
FY2013 performance
Year on year (%)Comparison with
revised target (%)
ROS (%)
Net sales 209.8 232.0 232.6 +22.8 (110.9) +0.6 (100.3) -
(Billion yen) Breakdown by segment
Net sales
Spice / Seasoning / Processed Food Business 123.9 124.9 125.5 +1.6 (101.3) +0.6 (100.5) -
Health Food Business 42.8 40.4 39.5 -3.2 ( 92.4) -0.9 ( 97.9) -
International Business 14.7 19.2 19.7 +5.0 (134.2) +0.5 (102.8) -
54.0%
17.0%
8.5%
20.6%
Other Food Related Business 28.4 47.5 47.8 +19.4 (168.2) +0.3 (100.7) -
Operating income 11.4 9.5 9.6 -1.9 ( 83.8) +0.1 (100.9) 4.14.7%
Operating income
Spice / Seasoning / Processed Food Business 8.2 6.4 6.9 -1.2 ( 85.0) +0.5 (107.5) 5.5
Health Food Business 1.9 1.9 1.6 -0.3 ( 83.3) -0.3 ( 83.4) 4.0
International Business 0.7 0.4 0.6 -0.1 ( 91.2) +0.2 (154.2) 3.1 72.3%
16.5%
6.4%.7%
0.7 0.4 0.6 0.1 ( 91.2) 0.2 (154.2) 3.1
Other Food Related Business 0.7 0.8 0.5 -0.2 ( 64.4) -0.3 ( 60.2) 0.9
Non-operating income (expenses) 2.0 1.3 1.4 -0.6 ( 68.5) +0.1 (105.7) -( p )
Ordinary income 13.4 10.8 11.0 -2.5 ( 81.5) +0.2 (101.5) -
Extraordinary income (loss) -0.2 2.5 2.5 +2.7 ( - ) -0.1 ( 97.3) -
Copyright (c) 2014 House Foods Group Inc. All rights reserved. 4
Net income 8.3 8.6 8.8 +0.5 (106.5) +0.2 (102.2) -

FY2013 Performance by Business Segment(Spice / Seasoning / Processed Food Business)
(Billion yen)
13.3期営業利益
Spice / Seasoning / Processed Food Business
FY2013Full-year
performanceYear on year
(%)Comparison with revised target (%)
Net sales 125.5 +1.6 (101.3) +0.6 (100.5)
O ti i 6 9 1 2 ( 85 0) +0 5 (107 5)
Analysis of operating income change
8.2
( y )
Operating income in FY2012
原価率変動
売上高変動
Operating income 6.9 -1.2 ( 85.0) +0.5 (107.5)
Breakdown of sales (main factors)
Spice / Seasoning / Processed Food Business
FY2013Full-year
fYear on year
(%)Comparison with revised t t (%)
-0.6
+0.5
Change in cost of sales ratio
Change in sales
人件費・その他経
マーケティングコ
スト(率変動・…
Processed Food Business performance (%) target (%)
Curry roux 37.7 +0.6 (101.6) +1.2 (103.3)
Stew roux 13.6 +0.2 (101.5) +0.2 (101.6)
0 3
-0.8(Change in and change in the ratio of) marketing costsChange in personnel expenses and other
14.3期営業利益
費削減Hashed beef sauce roux 4.0 +0.0 (100.7) -0.0 ( 99.8)
Spice 16.9 +0.6 (103.5) -0.4 ( 97.5)
Retort pouched curry 14.0 +0.9 (107.2) +0.6 (104.2)6.9
-0.3
Operating income in FY2013
expenses and other expenses
Packaged noodles 6.1 -0.5 ( 91.9) +0.0 (100.7)
Snack 7.6 -0.2 ( 97.9) -0.3 ( 96.7)
Dessert 3.5 -0.2 ( 94.2) -0.1 ( 97.4)
Food service products 16.0 +0.1 (100.9) -0.5 ( 97.3)
The Company took initiatives to improve the brand value, including a full-line strategy by price.Both sales and market share increased, but income declined due to the increase in promotion expenses given intensified competition in the first half and temporary costs exclusively for this fiscal year.
Copyright (c) 2014 House Foods Group Inc. All rights reserved. 5
p y y yThe Company renewed the roux products by renewing their production processes, and thereby further improved their taste and convenience.The Company focused further on the spread of products meeting customer needs for faster-cooking and easy-cooking products such as MitsuboshiShokkan.

(Billion yen)
FY2013 Performance by Business Segment(Health Food Business)
Health Food BusinessFY2013
Full-year performance
Year on year (%)
Comparison with revised target (%)
Net sales 39.5 -3.2 ( 92.4) -0.9 ( 97.9)
1 6 0 3 0 3
Analysis of operating income change
13.3期営業利益Operating income in FY2012 1.9
( y )
Operating income 1.6 -0.3 ( 83.3) -0.3 ( 83.4)
Breakdown of sales (main factors)
Health Food BusinessFY2013
Full-year performance
Year on year (%)
Comparison with revised target (%)
原価率変動
売上高変動
Change in cost of sales ratio
Change in sales
-0.1
-1.5
performance target (%)
Ukon No Chikara 13.0 -2.2 ( 85.6) -0.2 ( 98.5)
Mega Shaki 2.6 +0.5 (121.9) -0.5 ( 83.6)人件費・その他経
マーケティングコ
スト(率変動・…
(Change in and change in the ratio of) marketing costs
sales ratio
Change in personnel
+0.4
C1000 15.9 -1.2 ( 93.1) -0.1 ( 99.1)
のれん償却負担軽
減
人件費 その他経
費削減expenses and other expenses
+0.2
+0.7Decrease in burden of goodwill amortization
14.3期営業利益Operating income in FY2013 1.6
The Health Food Business, which had previously been operated by two companies, was integrated into House Wellness Foods, and business development capability was strengthened under the integrated production, sales, and administration system.Ukon No Chikara: Sales declined significantly due to intensified competition with products from competitors.Mega Shaki: Steady growth was achieved as the promotion worked well. However, the planned value was not achieved.C1000: Vit i L a glass bottled prod ct sho ed stead performance d e to the e pansion of the offering b t L W t a plastic bottled
Copyright (c) 2014 House Foods Group Inc. All rights reserved. 6
C1000: Vitamin Lemon, a glass-bottled product, showed steady performance due to the expansion of the offering, but Lemon Water, a plastic-bottled product, struggled.Income decreased despite the decrease in the amortization of goodwill due to the decline in sales of major products.

FY2013 Comparison (Billion yen)
FY2013 Performance by Business Segment(International Business)
13.3期営業利益
International BusinessFY2013
Full-year performance
Year on year (%)
Comparison with revised target (%)
Net sales 19.7 +5.0 (134.2) +0.5 (102.8)
Operating income 0 6 -0 1 ( 91 2) +0 2 (154 2)
Analysis of operating income change
Operating income in FY2012 0.7
( y )
中国カレー事業
米国豆腐事業Operating income 0.6 -0.1 ( 91.2) +0.2 (154.2)
Breakdown of sales (main factors)
China curry business
Businesses in the United States
International BusinessFY2013
Full-year performance
Year on year (%)
Comparison with revised target (%)
-0.1
+0.1
東南アジア事業
アジアレストラン事業
Businesses in Southeast Asia
Restaurant business in Asia
Businesses in the United States 9.7 +2.2 (129.7) +0.5 (105.1)
Tofu business 7.2 +1.6 (128.7) +0.4 (105.9)
Restaurant business(11 restaurants) 1.4 +0.3 (124.3) +0.1 (106.0)
2 2 0 9 0 1
-0.0
-0.1
14.3期営業利益
Businesses in the
Sales increased as the market expanded owing to the increase in the population of Asian Americans and growing health
Operating income in FY2013
China curry business 2.2 +0.9 (163.8) -0.1 ( 97.5)
Restaurant business in Asia 4.2 +1.5 (154.2) +0.2 (105.0)
China (36 restaurants) 2.6 +1.0 (159.3) +0.1 (102.1)
Taiwan (21 restaurants) 1.2 +0.5 (168.9) +0.1 (110.5)
0.6
in the United States
consciousness.Soybean prices soared, but profitability improved following the price revision in October.
China curry business
The Company increased offerings in new areas and by new suppliers.A company overseeing the China business was established in November, and a system for accelerating business operations was
South Korea(21 restaurants) 0.4 +0.0 (105.0) +0.0 (108.7)
Businesses in Southeast Asia 0.8 +0.4 (209.7) -0.0 ( 96.6)
Thailand 0.8 +0.4 (199.9) +0.1 (111.2)
Vi 0 0 +0 0 ( ) 0 1 ( 26 4)The fiscal year of the businesses in the United States, the China curry business, and the restaurant business in Asia ends in December.The number of restaurants in each country above is as of March 31, 2014.
(Reference) Exchange rateInternational FY2012 FY2013 International FY2012 FY2013
November, and a system for accelerating business operations was established.
Restaurant business in Asia
(China)Management companies were established in Beijing and Guangzhou, in addition to one in Shanghai.A system for accelerating new restaurant openings has been established.
(Taiwan) Efforts were focused on the development of new business categories to expand contacts with customers
Vietnam 0.0 +0.0 ( - ) -0.1 ( 26.4)
Copyright (c) 2014 House Foods Group Inc. All rights reserved. 7
Business (Unit)
Full-year performance
Full-year performance
Business(Unit)
Full-year performance
Full-year performance
United States (USD) 86.58 105.39 South Korea (KRW) 0.081 0.10China (CNY) 13.91 17.36 Thailand (THB) 3.20 3.17
Taiwan (TWD) 2.98 3.51 Vietnam (VND) 0.00449 0.00488
( ) business categories to expand contacts with customers.Businesses in Southeast Asia
(Thailand) C-Vitt grew positively, mainly in convenience stores. (Vietnam) The homemade dessert business was launched during
the fiscal year.

(Billion yen)
FY2013 Performance by Business Segment(Other Food Related Business)
Other Food Related Business
FY2013Full-year
performanceYear on year
(%)Comparison with revised target (%)
Net sales 47.8 +19.4 (168.2) +0.3 (100.7)
O ti i 0 5 0 2 ( 64 4) 0 3 ( 60 2)
House Logistics Service (transport and warehousing)
The company took measures to expand the logistics operations commissioned by companies outside the Group, but its profitability was adversely affected by an increase in
( y )
Operating income 0.5 -0.2 ( 64.4) -0.3 ( 60.2)
Breakdown of sales (main factors)
Other Food Related Business
FY2013Full-year Year on year
(%)Comparison with revised
subcontract costs.
The consolidation of logistics bases was furthered.16 bases 14 bases (as of March 2014)
D li Ch f ( i t d )Business yperformance (%) target (%)
House Logistics Service (consolidated) 13.7 -0.1 ( 99.0) -0.5 ( 96.6)
Delica Chef 14 4 +0 5 (103 8) +0 5 (103 6) Vox Trading Co Ltd (import sales etc of foodstuffs)
Delica Chef (convenience store vendor)
Desserts and deli products showed steady performance owing to an increase in demand for home meal replacements.
Delica Chef 14.4 +0.5 (103.8) +0.5 (103.6)
Vox Trading Co., Ltd. (consolidated) 17.2 +17.2 ( - ) -0.3 ( 98.2)
Vox Trading Co., Ltd. (import, sales, etc. of foodstuffs)
Became a consolidated subsidiary and has been contributingto the increase in net sales.
*Purpose of including Vox Trading Co., Ltd. in the Group:Stable procurement of safe, secure ingredients and p g
improvement of traceability.
Profile of Vox Trading Co., Ltd.
Established 2002
Head office Chuo-ku, Tokyo
Capital 500 million yen
Copyright (c) 2014 House Foods Group Inc. All rights reserved. 8
Capital 500 million yen
Representative Haruki KawabeWasabi (Japanese horse radish) Frozen fruits Frozen vegetables

FY2013 Operating Income Change Analysis Changes in operating income by business segment (Billi ) Changes in operating income by business segment
Operating income in FY2012 11.4-1.2
(Billion yen)
Spice / Seasoning /Processed Food Business
-0.3
-0.1
0 2 Decrease
Health Food Business
Other Food Related Business
International Business
9.6
-0.2¥1.85 billion
-0.0Consolidation adjustments
Other Food Related Business
Operating income in FY2013
Factors compared to the previous year by business segment (change in amount)Spice / Seasoning /Processed Food Business -1.22 Health Food Business -0.32 International Business
Other Food Related Business -0.31
Businesses in the United
(Billion yen)
Change in sales +0.5 Change in sales -1.5 Businesses in the United States -0.1
Change in cost of sales ratio -0.6 Change in cost of sales ratio -0.1 China curry business +0.1
(Change in and change in the ratio of) marketing costs -0.8 (Change in and change in the
ratio of) marketing costs +0.4 Businesses in Southeast Asia (Entry into Vietnam) -0.1ratio of) marketing costs ratio of) marketing costs (Entry into Vietnam)
Change in personnelexpenses and other expenses -0.3 Change in personnel
expenses and other expenses +0.2Affiliates in Japan(House Logistics Service/Delica Chef)
-0.2
Decrease in burden of +0 7
Copyright (c) 2014 House Foods Group Inc. All rights reserved. 9
Decrease in burden of goodwill amortization +0.7
* Temporary costs exclusively for FY2013: Approx. ¥1.1 billion (for switch to a holding company, 100th anniversary business, etc.)

F llF ll Y Pl fY Pl f FY2014FY2014FullFull--Year Plan for Year Plan for FY2014FY2014
The Company will broaden its business perspective under a holding The Company will broaden its business perspective under a holding company system. The Company will focus its effortscompany system. The Company will focus its efforts on initiatives for on initiatives for
increasing the brand value and costincreasing the brand value and cost--competitiveness competitiveness of the two domestic of the two domestic core businesses and aim to strengthen and expand priority areas in the core businesses and aim to strengthen and expand priority areas in the
International Business as a growing businessInternational Business as a growing business
10
International Business as a growing business.International Business as a growing business.

FY2014 Full-Year Targets for Consolidated Income (Loss)/Performance by Business Segment
FY2012 performance
FY2013 performance
FY2014full-year target Year on year (%) ROS (%)
Net sales 209.8 232.6 238.0 +5.4 (102.3) -
(Billion yen)
Net sales
Breakdown by segment
Spice / Seasoning / Processed Food Business 123.9 125.5 128.0 +2.5 (102.0) -
Health Food Business 42.8 39.5 40.5 +1.0 (102.4) -
International Business 14.7 19.7 23.0 +3.3 (116.6) -
53.8%
17.0%
9.7%
19.5%
Other Food Related Business 28.4 47.8 46.5 -1.3 ( 97.2) -
Operating income 11.4 9.6 11.5 +1.9 (119.9) 4.8
Spice / Seasoning / Processed
Operating income
7 0%Spice / Seasoning / Processed Food Business 8.2 6.9 7.5 +0.6 (108.1) 5.9
Health Food Business 1.9 1.6 2.2 +0.6 (138.8) 5.4
International Business 0.7 0.6 1.0 +0.4 (162.1) 4.365.2%
19.1%
8.7% 7.0%
Other Food Related Business 0.7 0.5 0.8 +0.3 (177.2) 1.7
Non-operating income (expenses) 2.0 1.4 1.4 +0.0 (101.9) -
Ordinary income 13.4 11.0 12.9 +1.9 (117.7) -
Extraordinary income (loss) -0.2 2.5 -0.1 -2.6 ( - ) -
N t i 8 3 8 8 8 5 0 3 ( 96 7)
Copyright (c) 2014 House Foods Group Inc. All rights reserved. 11
Net income 8.3 8.8 8.5 -0.3 ( 96.7) -

Breakdown of sales by
FY2014 Full-Year Targets for Consolidated Income (Loss)/Performance by Business Segment
FY2013 performance FY2014 full-year target Year on year (%)
Spice / Seasoning / Processed Food Business 125.5 128.0 +2.5 (102.0)Curry roux 37.7 36.5 -1.2 ( 96.7)Stew roux 13 6 13 5 -0 1 ( 99 0)
Breakdown of sales by Business Segment (Billion yen)
Stew roux 13.6 13.5 -0.1 ( 99.0)Hashed beef sauce roux 4.0 4.1 +0.0 (100.5)Spice 16.9 17.4 +0.5 (102.7)Retort pouched curry 14.0 14.0 -0.0 ( 99.7)Packaged noodles 6 1 6 0 0 1 ( 98 7)Packaged noodles 6.1 6.0 -0.1 ( 98.7)Snack 7.6 7.8 +0.3 (103.7)Dessert 3.5 4.0 +0.5 (112.9)Food service products 16.0 16.7 +0.7 (104.3)
H lth F d B i 39 5 40 5 +1 0 (102 4)Health Food Business 39.5 40.5 +1.0 (102.4)Ukon No Chikara 13.0 15.6 +2.6 (120.2)Mega Shaki 2.6 2.6 -0.1 ( 97.6)C1000 15.9 13.4 -2.5 ( 84.3)
I i l B i 19 7 23 0 3 3 (116 6)International Business 19.7 23.0 +3.3 (116.6)Businesses in the United States 9.7 10.7 +1.0 (110.4)China curry business 2.2 3.2 +1.0 (146.1)Restaurant business in Asia 4.2 5.2 +0.9 (122.5)Businesses in Southeast Asia 0.8 1.4 +0.6 (169.4)
Other Food Related Business 47.8 46.5 -1.3 ( 97.2)House Logistics Service (consolidated) 13.7 14.8 +1.1 (108.2)Delica Chef 14.4 14.7 +0.3 (102.2)
Copyright (c) 2014 House Foods Group Inc. All rights reserved. 12
Vox Trading Co., Ltd. (consolidated) 17.2 15.0 -2.2 ( 87.4)Consolidated sales 232.6 238.0 +5.4 (102.3)
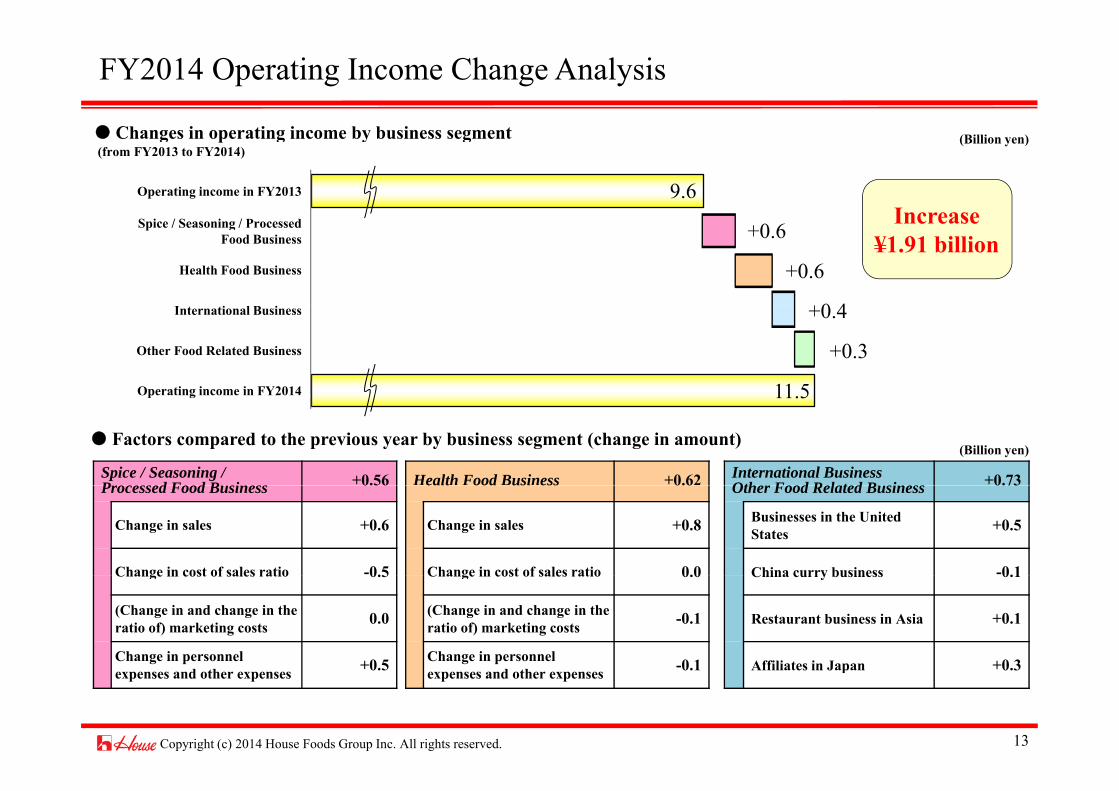
FY2014 Operating Income Change Analysis
C i i i i Changes in operating income by business segment(from FY2013 to FY2014)
Operating income in FY2013 9.6
(Billion yen)
Increase+0.6
+0.6
+0 4
Spice / Seasoning / Processed Food Business
Health Food Business
i i
Increase¥1.91 billion
11 5
+0.4
+0.3Other Food Related Business
International Business
Operating income in FY2014 11.5p g
Factors compared to the previous year by business segment (change in amount)
Spice / Seasoning / P d F d B i +0.56 Health Food Business +0.62 International Business
Oth F d R l t d B i +0.73
(Billion yen)
Processed Food Business 0.56 ealt ood usi ess 0.6 Other Food Related Business 0.73
Change in sales +0.6 Change in sales +0.8 Businesses in the United States +0.5
Change in cost of sales ratio -0.5 Change in cost of sales ratio 0.0 China curry business -0.1Change in cost of sales ratio 0.5 Change in cost of sales ratio 0.0 China curry business 0.1
(Change in and change in the ratio of) marketing costs 0.0 (Change in and change in the
ratio of) marketing costs -0.1 Restaurant business in Asia +0.1
Change in personnel +0 5 Change in personnel 0 1 Affiliates in Japan +0 3
Copyright (c) 2014 House Foods Group Inc. All rights reserved. 13
expenses and other expenses +0.5 expenses and other expenses -0.1 Affiliates in Japan +0.3

Consolidated net sales and operating income targets for FY2014
Comparison between planned values for the final year of the Fourth Medium-Term Business Plan and full-year targets for FY2014
(Billion yen) Consolidated net sales and operating income targets for FY2014
Planned values for the final year of the
Fourth Medium-Term Business Plan
Comparison with FY2011
FY2014full-year target
Difference from FY2011
Comparison with FY2011
Difference from planned value
Comparison with
planned value
(Billion yen)
Net sales 230.0 107.3% 238.0 +23.7 111.1% +8.0 103.5%
Operating income 18.0 128.1% 11.5 -2.6 81.8% -6.5 63.9%
Spice / Seasoning /
Operating margin 7.8% +1.2 Pt 4.8% -1.7 Pt ‒ -3.0 Pt ‒
Sales targets for FY2014 by business segment in the Fourth Medium-Term Business Plan
Processed Food Business
132.4 102.4% 128.0 -1.2 99.0% -4.4 96.7%
Health Food Business 50.0 108.7% 40.5 -5.5 88.1% -9.5 81.0%
International Business 20.0 170.0% 23.0 +11.2 195.5% +3.0 115.0%
Oth F d R l t dOther Food Related Business 27.6 101.0% 46.5 +19.2 170.2% +18.9 168.5%
Purchase of treasury sharesTotal shares to be purchased: 3 000 000 shares (2 8% of the total number of shares outstanding [excluding treasury shares])
Copyright (c) 2014 House Foods Group Inc. All rights reserved. 14
Total shares to be purchased: 3,000,000 shares (2.8% of the total number of shares outstanding [excluding treasury shares])Total cost of purchase: 6.0 billion yenPurchase period: May 9 to August 8 * The shares to be purchased will be retired.

Major Businesses:Major Businesses:Strategies and InitiativesStrategies and Initiatives
Spice / Seasoning / Processed Food Business
Core business
Achieving growth and improving profitability in the domestic market
Health Food Business Strengthening the position and creating new areas by
15
Health Food Business focusing on functional drinks
International Business Growing business Realizing growth by promoting business in each area

FY2014 Full-Year Performance Targets by Business Segment(Spice / Seasoning / Processed Food Business) (Billion yen)
Spice / Seasoning / Processed Food Business
FY2013full-year
performanceFY2014 full-year target
Year on year (%)
Net sales 125.5 128.0 +2.5 (102.0)
O ti i 6 9 7 5 +0 6 (108 1)
●Goals of the initiativesAchieving growth and improving profitabilityin the domestic market
Strengthening existing areas
Spice / Seasoning / FY2013 FY2014 full Year on year
Operating income 6.9 7.5 +0.6 (108.1)
Breakdown of sales (main factors)
- Curry roux - Stew rouxStrengthening initiatives for improving the value of the menus of curry roux and stew roux(enhancing the brand power and implementing promotions to gain support for the good taste and enjoyment of the menus)Spice / Seasoning /
Processed Food Business full-year performance
FY2014 full-year target
Year on year (%)
Curry roux 37.7 36.5 -1.2 ( 96.7)
Stew roux 13.6 13.5 -0.1 ( 99.0)
- Retort pouched curryResponding to customer demand for variety (strengtheninginitiatives regarding mid-priced products)
- Food service productsIncreasing users by suggesting high value-added productsStew ou 13.6 13.5 0.1 ( 99.0)
Hashed beef sauce roux 4.0 4.1 +0.0 (100.5)
Spice 16.9 17.4 +0.5 (102.7)
Increasing users by suggesting high value added products
Expanding new areas- Increasing market shares by expanding the lineup of faster-
cooking and easy-cooking products such as Mitsuboshi Shokkan- Expanding the offering of care food products and increasing
Retort pouched curry 14.0 14.0 -0.0 ( 99.7)- Expanding the offering of care food products and increasing
their sales
Improving profitability- Effective allocation of marketing costs
R f f l i ti b (14 b t th d f FY2013
* Faster-cooking and easy-cooking products: Positive growth of approx. 1.2 billion yen
- Reform of logistics bases (14 bases at the end of FY2013 11 bases at the end of FY2014)
Copyright (c) 2014 House Foods Group Inc. All rights reserved. 16

(Billion yen)
FY2014 Full-Year Performance Targets by Business Segment(Health Food Business)
Health Food BusinessFY2013full-year
performanceFY2014 full-year target
Year on year (%)
Net sales 39.5 40.5 +1.0 (102.4)
O ti i 1 6 2 2 +0 6 (138 8)
●Goals of the initiativesStrengthening the position and creating new areas by focusing on functional drinks
Operating income 1.6 2.2 +0.6 (138.8)
Health Food BusinessFY2013full year FY2014 full- Year on year
Rebranding Ukon No Chikara- Creating new demand from a customer point of view
Launch of Ukon No Chikara Liver Plus (May)- Enhancing the appeal of the category and increasing the desire to
purchase existing productsReinforcing efforts in channels of foc s
Breakdown of sales (main factors)
Health Food Business full-year performance year target
y(%)
Ukon No Chikara 13.0 15.6 +2.6 (120.2)
- Reinforcing efforts in channels of focus
C1000- Implementing measures for the entire brand to promote the value
of vitamin C- Expanding the offering by reforming the sales system
Mega Shaki 2.6 2.6 -0.1 ( 97.6)
C1000C1000 15.9 13.4 -2.5 ( 84.3)
- Expanding the offering by reforming the sales system
Creating a new category- Entering the energy drink market with a new approach
highlighting the “Japanese-style” element based on the theory of Chinese medicine.
Ukon No Chikara New CategoryC1000
Uk N Chik Li PlUkon No Chikara Liver Plus
[Ingredients]Liver extract: 200mgExtract of three types of Ukon(turmeric): 500mgCurcumin: 40mg
Promoting the impact of vitamin consumption for the entire brand
NEW
An energy drink based on the concept of “Japanese style.” Its ingredients include spices such as star anise and jujube, which are said to have been used by the Japanese since ancient
SAMURIDE ENERGY DRINKNEW
Copyright (c) 2014 House Foods Group Inc. All rights reserved. 17
Launched on May 12, 2014(in convenience stores and train station kiosks only)
have been used by the Japanese since ancient times.
Launched on March 17, 2014 (in convenience stores and train station kiosks only)

(Billion yen)
● Mi i i h I i l B i
FY2014 Full-Year Performance Targets by Business Segment(International Business)
International BusinessFY2013full-year
performanceFY2014 full-year target
Year on year (%)
Net sales 19.7 23.0 +3.3 (116.6)
O ti i 0 6 1 0 +0 4 (162 1)
[Tofu business in the United States] Offering the (health) benefits of soybeans
● Mission in each International Business
80Sales in the U.S. tofu business (Million dollars)
Operating income 0.6 1.0 +0.4 (162.1)
International BusinessFY2013full-year
performanceFY2014 full-year target
Year on year (%)
69
77
20
40
60 Breakdown of sales (main factors)
[China curry business]
Businesses in the United States 9.7 10.7 +1.0 (110.4)
Tofu business 7.2 8.1 +0.9 (112.2)
Restaurant business 1.4 1.5 +0.1 (109.1)
2 2 3 2 +1 0
0
20
06.12 07.12 08.12 09.12 10.12 11.12 12.12 13.12 14.12
[China curry business] Developing curry and rice into a popular dish in China
China curry business 2.2 3.2 +1.0 (146.1)
Restaurant business in Asia 4.2 5.2 +0.9 (122.5)
China 2.6 3.4 +0.8 (132.5)
Taiwan 1.2 1.3 +0.1 (105.8)184
150
200Sales in the China curry business (Million yuan)
1.3 +0.1 (105.8)
South Korea 0.4 0.4 +0.0 (108.9)
Businesses in Southeast Asia 0.8 1.4 +0.6 (169.4)
Thailand 0.8 1.1 +0.3 (141.4)
127
0
50
100
Vietnam 0.0 0.3 +0.2 (736.3)
[Restaurant business in Asia] Base for spreading Japanese-style curry
The fiscal year of the businesses in the United States, the China curry business, and the restaurant business in Asia ends in December
006.12 07.12 08.12 09.12 10.12 11.12 12.12 13.12 14.12
(Reference) Exchange rateInternational FY2013 FY2014 International FY2013 FY2014
Copyright (c) 2014 House Foods Group Inc. All rights reserved. 18
[Businesses in Southeast Asia] Offering the riches and pleasure of food
Business (Unit)
Full-year performance
Full-year target
Business(Unit)
Full-year performance
Full-year target
United States (USD) 105.39 105.00 South Korea (KRW) 0.10 0.10China (CNY) 17.36 17.50 Thailand (THB) 3.17 3.20
Taiwan (TWD) 3.51 3.30 Vietnam (VND) 0.00488 0.0046
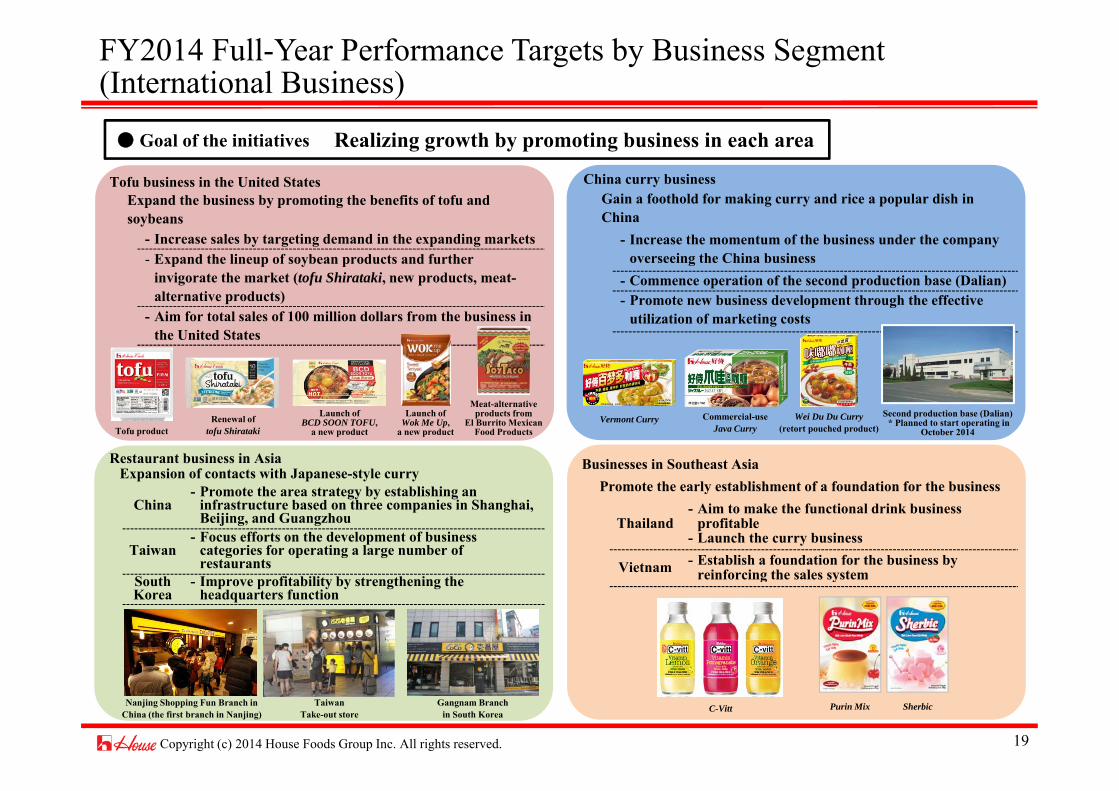
FY2014 Full-Year Performance Targets by Business Segment(International Business)
Tofu business in the United StatesExpand the business by promoting the benefits of tofu and
b
Realizing growth by promoting business in each area
China curry businessGain a foothold for making curry and rice a popular dish in China
● Goal of the initiatives
soybeans- Increase sales by targeting demand in the expanding markets- Expand the lineup of soybean products and further
invigorate the market (tofu Shirataki, new products, meat-alternative products)
China- Increase the momentum of the business under the company
overseeing the China business- Commence operation of the second production base (Dalian)- Promote new business development through the effective
- Aim for total sales of 100 million dollars from the business in the United States
p gutilization of marketing costs
Restaurant business in AsiaExpansion of contacts with Japanese-style curry
Renewal oftofu Shirataki
Launch ofBCD SOON TOFU,
a new product
Launch ofWok Me Up,
a new product
Meat-alternative products from
El Burrito MexicanFood Products
Second production base (Dalian)* Planned to start operating in
October 2014
Businesses in Southeast AsiaPromote the early establishment of a foundation for the business
Tofu productVermont Curry Commercial-use
Java CurryWei Du Du Curry
(retort pouched product)
China- Promote the area strategy by establishing an
infrastructure based on three companies in Shanghai, Beijing, and Guangzhou
Taiwan- Focus efforts on the development of business
categories for operating a large number of restaurants
Promote the early establishment of a foundation for the business
Thailand- Aim to make the functional drink business
profitable- Launch the curry business
Vietnam - Establish a foundation for the business by reinforcing the sales systemSouth
Korea- Improve profitability by strengthening the
headquarters functionreinforcing the sales system
Copyright (c) 2014 House Foods Group Inc. All rights reserved. 19
C-Vitt Purin Mix SherbicTaiwanTake-out store
Nanjing Shopping Fun Branch in China (the first branch in Nanjing)
Gangnam Branch in South Korea

Supplementary DescriptionSupplementary DescriptionSupplementary DescriptionSupplementary Description
20

History of businesses (Abstract)
19901913 Urakami Shoten, an enterprise dealing in herbal
medicines, foundedSpice
‒1950s1995 Liquid seasoning1997 Entry into China (Restaurants)
Health foods
1990sC1000
Launched1926 Launch of powder curry start1934 Hashed beef sauce
2000 Entry into Taiwan (Restaurants)1960s‒1980s2000s
Ukon No Chikara
Health foods Launched in 1991
1960 Curry roux1964 Dessert1966 Stew1970 Retort pouched food (Sun House Foods)
2002 Retort pouched curry (China)2004 Ukon extract drink2005 Curry roux (China)
Health foods
Launched in 2004
Vermont Curry
Launched in 1963p ( )Transport and warehousing(House Logistics Service)
1973 Instant noodles1977 Snacks
2006 Health foods(House Wellness Foods)
2007 Entry into South Korea(Restaurants)
2010
Launched in 1963
Stew Mix
Vermont Curry (China)
Launched in 2005
1983 Entry into USA (Restaurants, Tofu)Mineral water
1985 Deli products (Delica Chef)
2010 Transfer of the mineral water business2011 Entry into Thailand (House House OsotspaOsotspa Foods Co., Ltd.)Foods Co., Ltd.)2012 Entry into Vietnam (House Foods Vietnam Co., Ltd.)House Foods Vietnam Co., Ltd.)
2010sLaunched in 1966
2012 Entry into Vietnam (House Foods Vietnam Co., Ltd.)House Foods Vietnam Co., Ltd.)2013 Import/sales of foodstuffs (Vox Trading Co., Ltd.)
Switch to a holding company system(the company name changed toHouse Foods Group Inc.)
SAMURIDE
Kukure CurryTongari Corn tofu (USA)
Copyright (c) 2014 House Foods Group Inc. All rights reserved. 21
2014 Energy drink Launched in 2014
Launched in1971
Launched in 1978
Launched in 1983

Major new products and varieties for the spring and summer 2014 Tax is not included. Prices in parentheses are for reference. New product
Category ProductSuggestedretail price
(reference price)
On-shelfdate
Dessert 150g Fruiche (Zeitaku Ichigo, Zeitaku Peach) Open (¥208) Feb. 3Product that can
p f f New product
be cooked in a microwave oven
Rakuchin Deli (Mango Beef Curry, Spicy Ratatouille, Brown Stew) Open (¥246) Feb. 17
Seasoning Kongari Deli (11-shu No Spice Ga Kiita Fried Chicken, Kosho Kaoru Pepper Chicken, Kobumikan Kaoru Tom Yum Chicken) Open (¥141) Feb. 17
Drink C1000 Green Lemonade ¥140 Feb. 10
Drink PLUSSY1000 Fe Orange ¥124 Feb. 10
Drink SAMURIDE ENERGY DRINK ¥190 Mar. 17
Drink Ukon No Chikara Liver Plus Open (¥324) May 12
VarietyDessert 200g Fruiche (Melon) ¥180 Feb. 3
Seasoning for specific menus
Mitsuboshi Shokkan (Fuwa Fuwa Tofu Hamburg, Kawame Kari Kari Garlic Chicken, Yawaraka Torimune Demi Chicken) Open (¥180) Feb. 17
Gekikara Cooking (Rakara Shiru Nashi Tantanmen No Moto Retsukara Ramen Soup No
Variety
Seasoning Gekikara Cooking (Rakara Shiru Nashi Tantanmen No Moto, Retsukara Ramen Soup No Moto, Moukara Soup Curry No Moto) Open (¥110) Feb. 17
Chowder 140g Gochiso Chowder <Ebi Cream Chowder> Open (¥240) Feb. 17Spice Papan 28 g Melon Pan Aji ¥130 Feb. 17
Retort pouched
curryThe Hotel Curry Maroyaka Rich Jitate Open (¥227) Feb. 17
curry
Curry roux Vermont Curry Ama Kuchi, Chu-Kara, Kara Kuchi (230 g, 115 g) 230 g: ¥295115 g: ¥180
Feb. 17Curry roux Indo Curry Chu-Kara, Kara Kuchi (230 g, 115 g) Feb. 17
185 g: ¥295
Renewal
Copyright (c) 2014 House Foods Group Inc. All rights reserved. 22
Curry roux Java Curry Ama Kuchi, Chu-Kara, Kara Kuchi (185 g, 104 g) 185 g: ¥295104 g: ¥180 Feb. 17
Hashed beef sauce roux 160 g Jukusei Demiglace Sauce No Hashed Beef ¥275 Feb. 17

Initiatives of the House Foods Group
House Shoku To Nou No Taiken Kyoshitsu (experience-based class for food and agriculture education)In 2013, this program won the Director-General of Food Safety and Consumer Affairs Bureau Award in the First Shoku to Nou Rin
Efforts regarding basic research
Consumer Affairs Bureau Award in the First Shoku to Nou RinGyogyou no Shokuiku Yuryo Katsudou Hyousho, a Ministry of Agriculture, Forestry and Fisheries program for honoring outstanding activities in education on food, agriculture, forestry, and fisheries.
It is an experience-based class held under the theme of food, the i d d i I f i l l k d h
A team of researchers from House Foods was awarded an Ig Nobel P i i 2013 Th b d d h d h
House Foods won an Ig NobelPrize for its study of onions
environment, and education. It focuses on agricultural work, and the participants are families who join the classes on a continuous basis.Classes are held with the cooperation of organizations including NPOs, and the participants learn that food, agriculture, and the environment are linked to themselves.I FY2013 t t l f 29 l h ld i i l ti th h t J
Prize in 2013. The team members attended the award ceremony that was held in the Sanders Theatre at Harvard University on September 12, 2013. The team was awarded the prize for its discovery of an enzyme in onions that generates lacrimatory factor, which was published in the British journal Nature in 2002.
Status of inclusion in SRI indices (as of March 31, 2014)
In FY2013, a total of 29 classes were held in six locations throughout Japan.
House Foods Group Inc. has been continuously selected as a constituent of the FTSE4Good Index, one of the leading indices of socially responsible investment (SRI) since 2006(SRI), since 2006.
*The FTSE4Good Index is a global indicator of responsible investment, in which the FTSE Group tracks approximately 2,400 listed companies worldwide, selecting company stocks that have met international standards in areas such as the environment and society
Copyright (c) 2014 House Foods Group Inc. All rights reserved. 23
environment and society.

Trends of cost reductions and capital investment
Trends of cost reductions (from the year ago level)
-90 -105 -153500
0
FY2012full-year
performance
FY2013full-year
performanceCost reductions
Materials cost Logistics cost Total
FY2011full-year
performance
Trends of cost reductions (from the year-ago level)
(Million yen)
-1,007-772 - 750
1 500
-1,000
-500FY2011 1,007 90 1,097
FY2012 772 105 877
FY2013 750 153 903 -1,500 Materials LogisticsFY2013 750 153 903
Trends of capital investment
The full-year target projected for FY2014 is ¥980m, or ¥630m for materials cost and ¥350m for logistics cost.
Capital investmentMajor capital investment
Depreciation
Investment Leases Total Investment Leases Total
Transfer of facilities and replacement of production
FY2011 4,889 597 5,485p p
facilities for the Higashi-Osaka Plant Introduction of equipment for fortified rice for House Wellness Foods
5,356 458 5,814
FY2012 5,684 433 6,117Replacement of building and production facilities for House Foods America CorporationConstruction of new building for the Osaka Head 5,020 382 5,402gOffice
FY2013 11,115 395 11,510Purchase of land for Delica Chef Corporation's plant and installation of production facilitiesInvestment related to the roux production line for House Foods
5,056 333 5,389
I t ll ti f D li Ch f’ d ti f iliti
Copyright (c) 2014 House Foods Group Inc. All rights reserved. 24
FY2014 plan 13,100 400 13,500Installation of Delica Chef’s production facilities Investment related to the roux production line for Dalian Horie Yamatoya Food Co., Ltd.
5,800 300 6,100

Breakdowns of non-operating income and expenses and extraordinary income and loss
(Million yen)
FY2012 FY2013 Year on year
Interest income 486 549 +63
FY2012 FY2013 Year on year
Gain on sales of non-current assets 25 3,110 +3,085
(Million yen) Non-operating income and expenses Extraordinary income and loss
Dividend income 559 599 +40Share of profit of entities accounted for using equity method
415 458 +43
Foreign exchange gains 360 305 -55
assetsReversal of allowance for doubtful accounts 0 20 +19Gain on sales of investment securities 10 108 +98Other 13 2 -11
Other (incl. income from leasehold properties) 277 376 +99Total non-operating income 2,096 2,287 +190Interest expenses 44 221 +177C i i f 141 +141
Total extraordinary income 49 3,240 +3,191Loss on retirement ofnon-current assets 189 240 +51Loss on sales of non-current assets 11 124 +113
Commission fee ‒ 141 +141Compensation expenses ‒ 287 +287Other (incl. expenses for leasehold properties) 48 265 +217Total non-operating expenses 92 913 +821
Loss on valuation of investment securities ‒ 1 +1Loss on valuation of membership 29 24 -5Impairment loss ‒ 129 +129Loss on disaster 33 +33p g p Loss on disaster ‒ 33 +33Loss on step acquisitions ‒ 69 +69Provision for loss on guarantees ‒ 152 +152Other 27 7 -21Total extraordinary loss 256 778 +522
FY2013 Gain on sales of non-current assets Extraordinary income from the sale of land that
i l th it f th H F d f t
Copyright (c) 2014 House Foods Group Inc. All rights reserved. 25
was previously the site of the House Foods factory

Changes in consolidated cash flows
Cash flows from operating activities -4 066
(Million yen)FY2011 FY2012 FY2013
Cash flows from operating activities 17,098 12,884 8,818
(Million yen) Changes in consolidated cash flows Major factors of changes in consolidated
cash flows (Comparison of FY2012 and FY2013)
Cash flows from operating activities -4,066
Major factors
Increase (decrease) in notes and accounts payable –trade -4,483
p g 17,098 12,884 8,818Cash flows from investing activities -19,069 -1,841 -7,471Cash flows from financing activities -2,836 -4,943 -68Cash and cash equivalents at end of period 41 190 47 715 49 586 Loss (gain) on sales of non-current assets -2,972
Income taxes paid +1,976
Cash flows from investing activities -5,630
Cash and cash equivalents at end of period 41,190 47,715 49,586Free cash flow* -1,971 11,043 1,347
* Free cash flow = Cash flows from operating activities + Cash flows from investing activities
20,000営業CF
Major factors
Payments into time deposits -5,036Purchase of property, plant and equipment -4,749Proceeds from sales of investment securities -3,206
(Million yen)
CF from operating activities
CF from investing
0
10,000 投資CF
財務CF
フリーCF
Cash flo s from financing acti ities +4 874
,Proceeds from sales of property, plant and equipment +3,025Proceeds from withdrawal of time deposits +2,789
CF from investing activities
CF from financing activities
Free CF
-20,000
-10,000 Cash flows from financing activities +4,874
Major factors
Increase in short-term loans payable +40,113Purchase of treasury shares +1 306
FY2011 FY2012 FY2013
Copyright (c) 2014 House Foods Group Inc. All rights reserved. 26
Purchase of treasury shares +1,306Decrease in short-term loans payable -36,223

Targeted performance and management indexesfor the final year of the Fourth Medium-Term Business Plan
Basic concept and initiatives1) Position the two domestic businesses as core businesses and accelerate overseas expansion by positioning the International Business
as a growing business2) Establish an optimal organizational structure for consolidated management to continue growth and expansion3) C ti t b l t i iti ti t i d l t bilit t titi d CSR i iti ti
Consolidated net sales and operating income targets for FY2014 Net sales: ¥230bn (107.3% of FY2011 level)O ti i ¥18b (128 1% f FY2011 l l)
FY2011 FY2014
* Operating margin 6 6% 7 8%
3) Continue to bolster initiatives to increase development capability, cost competitiveness and CSR initiatives
Business segment Position of the business Net sales targetComparison with FY2011
Operating income target
Comparison with FY2011 ROS Difference
from FY2011
Operating income: ¥18bn (128.1% of FY2011 level) * Operating margin 6.6% 7.8%
Breakdown by business segment: Net sales and operating income targets for the final year (FY2014)
Spice / Seasoning / Processed Food Business Core businessCore business
¥132.4bn 102.4% ¥10.5bn 105.7% 7.9% +0.2
Health Food Business ¥50.0bn 108.7% ¥5.5bn 217.2% 11.0% +5.5
International Business Growing businessGrowing business ¥20.0bn 170.0% ¥1.0bn 153.6% 5.0% -0.5gg 0.0bn 70.0% .0bn 53.6% 5.0% 0.5
Other Food Related Business ¥27.6bn 101.0% ¥1.0bn 107.0% 3.6% +0.2Operating income for the Health Food Business in FY2011 includes goodwill amortization of House Wellness Foods (¥1,345m) (Comparison vs FY2011: 217.2% Actual comparison:141.9%)
Guidelines concerning business investments
Utilize 50 billion yen as business investment funds and aim for growth and expansion of businesses.
Guidelines concerning retained earnings
Secure consolidated payout ratio at 30% or higher
Copyright (c) 2014 House Foods Group Inc. All rights reserved. 27
Borrow 20 billion yen, which is equivalent to around 10% of shareholders’ equity, as necessary, and set 70 billion yen as the upper limit of business investment.
Flexibly implement stock buybacks by considering the business environment, capital needs and trends in share prices and the stock market.

B i t G
Content of business segments in the Fourth Medium-Term Business Plan (As of March 31, 2014)
Business segment Group company name
Spice / Seasoning /Spice / Seasoning /Processed Food BusinessProcessed Food Business
House Foods CorporationHouse Foods CorporationSun House Foods Corporation / Sun House Foods Corporation / Sun Supply CorporationSun Supply CorporationAsaokaAsaoka Spice K KSpice K KProcessed Food BusinessProcessed Food Business AsaokaAsaoka Spice K.K.Spice K.K.House AiHouse Ai--Factory CorporationFactory Corporation
Health Food BusinessHealth Food Business House Wellness Foods CorporationHouse Wellness Foods Corporation
United StatesUnited States House Foods Holding USA, Inc. / House Foods America CorporationHouse Foods Holding USA, Inc. / House Foods America CorporationEl Burrito Mexican Food Products CorporationEl Burrito Mexican Food Products Corporation
ChinaChina House Foods China Inc. / House Foods China Inc. / Shanghai House Foods Co., Ltd.Shanghai House Foods Co., Ltd.
International BusinessInternational Business
Shanghai House Curry Coco Shanghai House Curry Coco IchibanyaIchibanya Restaurant, Inc.Restaurant, Inc.House Restaurant Management (Beijing) Co., Ltd. / House Restaurant House Restaurant Management (Beijing) Co., Ltd. / House Restaurant Management (Guangzhou) Co., Ltd.Management (Guangzhou) Co., Ltd.
South KoreaSouth Korea Curry House Korea CorporationCurry House Korea CorporationTaiwanTaiwan Taiwan Curry House Restaurant, Inc.Taiwan Curry House Restaurant, Inc.ThailandThailand House House OsotspaOsotspa Foods Co., Ltd.Foods Co., Ltd.VietnamVietnam House Foods Vietnam Co., Ltd.House Foods Vietnam Co., Ltd.
House Logistics Service Corporation / High Net CorporationHouse Logistics Service Corporation / High Net Corporation
Other Food Related BusinessOther Food Related Business
House Logistics Service Corporation / High Net CorporationHouse Logistics Service Corporation / High Net CorporationDelicaDelica Chef CorporationChef CorporationHouse Food Analytical Laboratory Inc.House Food Analytical Laboratory Inc.HorieHorie YamatoyaYamatoya Co., Ltd. / Dalian Co., Ltd. / Dalian HorieHorie YamatoyaYamatoya Food Co., Ltd.Food Co., Ltd.VoxVox Trading Co Ltd / Tim Food Co Ltd / PT JavaTrading Co Ltd / Tim Food Co Ltd / PT Java AgritechAgritech
Copyright (c) 2014 House Foods Group Inc. All rights reserved. 28
VoxVox Trading Co., Ltd. / Tim Food Co., Ltd. / PT. Java Trading Co., Ltd. / Tim Food Co., Ltd. / PT. Java AgritechAgritech