INTERIM FINANCIAL RESULTS BRIEFING - THK
23
Copyright THK CO., LTD. 2015. All rights reserved. November 13 rd 2015 THK CO., LTD. President & CEO AKIHIRO TERAMACHI This presentation material contains forward looking statements that reflect the Company ’ s business plans, performance projections, and management strategy . Such statements are based on information currently available to the Company . However, changes in the operating environment may cause actual results and achievements to differ from those anticipated in this corporate presentation material . Also, please let you know that this presentation material includes reference information that are not exactly accounts indication matters . INTERIM FINANCIAL RESULTS BRIEFING
-
Upload
khangminh22 -
Category
Documents
-
view
6 -
download
0
Transcript of INTERIM FINANCIAL RESULTS BRIEFING - THK

Copyright THK CO., LTD. 2015. All rights reserved.
November 13rd 2015
THK CO., LTD.
President & CEO
AKIHIRO TERAMACHI
This presentation material contains forward looking statements that reflect the Company’sbusiness plans, performance projections, and management strategy. Such statements are basedon information currently available to the Company. However, changes in the operatingenvironment may cause actual results and achievements to differ from those anticipated in thiscorporate presentation material. Also, please let you know that this presentation materialincludes reference information that are not exactly accounts indication matters.
INTERIM FINANCIAL RESULTS BRIEFING

Copyright THK CO., LTD. 2015. All rights reserved.
Ⅰ. Financial Results for 1st Half of Fiscal 2015
Contents
Ⅲ. About Our Strategy
Ⅱ. Financial Forecast for Fiscal 2015

Copyright THK CO., LTD. 2015. All rights reserved.
Ⅰ. Financial Results for 1st Half of Fiscal 2015

Copyright THK CO., LTD. 2015. All rights reserved.
Financial Highlights
3
Net sales increased 5.6% year on year to 112.1 billion yen
Operating income decreased by 12.7% year on year to 12.4 billion yen
In Japan, demands for small machine tools and electronics-related products, which had been so far strong, decreased, and the domestic sales decreased compared with the same period of the previous year.
In international markets, in the Americas, demands for general machines and transportation equipment were sound. In Europe, demands for machine tools and general machines showed a trend of recovery. In China, demands were favorable in a wide range of areas, mainly in machine tools.In addition, due to the continued depreciation of yen and other reasons, overseas sales increased, compared with the same period of the previous year.
With the weaker demands than forecast, both the sales and the operating income were lower than the plan. Under these circumstances, we strived for the control costs on a short-term basis,while implementing the measures to increase the topline for the future growth.
Efforts to control the costs on a short-term basis, while executing measures for future growth
Increase of fixed cost due to investments for the future growth
*Geographic sales is based onwhere our customers are located.

Copyright THK CO., LTD. 2015. All rights reserved.
48,43552,617 55,994 57,367 54,681
14,044
14,85516,886
17,97020,141
8,714
9,713
10,40710,049 10,96817,904
19,180
22,91726,085
26,395
Trend in Net Sales
4
89,099millions of yen
96,366
106,207111,471
*Geographic sales is based on where ourcustomers are located.
Asia and other | Y/Y
*China ( Industrial Equipment)*Taiwan*Singapore
18.9%19.3%22.9%
Europe | Y/Y
*Machine tools *General machinery*Electronics
12.6%2.2%0.6%
16.0%30.0%3.2%
The Americas | Y/Y
*Machine tools *General machinery*Electronics
7.4%1.3%7.6%
*Machine tools *General machinery*Electronics
Japan | Y/Y
Up 15.2%
Up 5.4%
Up 19.3%
Down 2.3%
UpUpDown
UpUpDown
DownUpUp
DownUpDown
Exchange rate
Japan
Europe
Asia and other
The Americas
112,186
1H 2H 1H 2H 1H
2014/3 2015/3 2016/3
1US$ 95.59 99.71 102.47 109.24 120.24
1EUR 125.50 133.88 140.43 140.43 134.17

Copyright THK CO., LTD. 2015. All rights reserved.
前上期
営業利益
数量効果
為替の影響
変動費比率の変化
固定費の増加
M&A関連費用
今上期
営業利益
[Reference] Operating Income - Cause of Change -
5
Operating incomeby segment
Japan11,432 million
The Americas1,075 million
Europe468 billion
Other845 million
Adjustments( 1,245 ) million
China( 87 ) million
14.3Billionsof yen
12.4Billionsof yen
+0.4+0.7
( 2.1)
( 1.1 )
Effect due to
IncreasedSales
FY2014 1HOperating
Income
Change inVariable
CostRatio
ForeignExchange
RateDifference
Increase in FixedCost
FY2015 1HOperatingIncome
M&Arelated cost
+0.3

Copyright THK CO., LTD. 2015. All rights reserved.
156,966
255,024
253,729 155,671
Assets, Liabilities and Net Assets
6
Liabilities
Net Assets
Current Assets
Fixed Assets
Total Assets 410,695 millions of yenUp ¥ 37,084 million from previous period
* L&S business of TRW is consolidated only for the balance sheet in the second quarter of the financial year ending in March 31, 2016.
Cash and Cash in Account | Y/Y :
Cash Flows from Operating Activities : ¥ 6,549 million
Cash Flows from Investing Activities : ¥ ( 53,072 ) million
Cash Flows from Financing Activities : ¥ 19,871 million
Foreign Currency Translation Adjustments on Cash and Cash Equivalents : ¥ ( 635 ) million
Accounts Receivable | Y/Y : Up ¥ 10,439 million
Inventories | Y/Y : Up ¥ 8,052 million
Down ¥ 27,287 million
Property, Plant and Equipment | Y/Y :
Investments and Other | Y/Y :
Intangibles | Y/Y : Up ¥ 33,526 million
Up ¥ 10,557 million
■CAPEX :■Depreciation :
¥ 7,281 million¥ 5,759 million
Down ¥ 6,684 millionfrom previous period
Up ¥ 4,525 million from previous period
Up ¥ 32,559 million from previous period
Up ¥ 43,769 million from previous period
Net income attributable to owners of the parent :
Current Liabilities | Y/Y : Up ¥ 32,367 million
■Accounts Payable | Y/Y : Up ¥ 10,356 million
■Short-term bank loans | Y/Y :
Up ¥ 23,984 million
Long-term Liabilities | Y/Y : Up ¥ 192 million
■Income Taxes Payable | Y/Y :Down ¥ 3,606 million
Dividends paid : ¥ ( 3,792 ) millionGoodwill | Y/Y : Up ¥ 33,382 million
Down ¥ 315 million
¥ 7,709 million

Copyright THK CO., LTD. 2015. All rights reserved.
Ⅱ. Financial Forecast for Fiscal 2015

Copyright THK CO., LTD. 2015. All rights reserved.
(14.3) (6.8)0.6 10.4 20.7 19.4 30.5
13.5 12.2 0.5 (10.5)
0
10
20
30
1-3 4-6 7-9 10-12 1-3 4-6 7-9 10-12 1-3 4-6 7-9
2013 2014 2015
Orders Received by Region
8
*exclude export
THK (Domestic)
THK Holdings of America THK Europe
THK TAIWANTHK(CHINA) + THK(SHANGHAI)
1.6 (0.4)14.6 22.4
5.6 9.7 6.7 5.0 2.4 3.3 (7.5)
0
20
40
60
80
1-3 4-6 7-9 10-12 1-3 4-6 7-9 10-12 1-3 4-6 7-9
2013 2014 2015
0.2 9.2 15.8 1.0 (1.6) (7.6) 7.0 9.1 20.7 16.4 (0.3)
0
20
40
60
80
1-3 4-6 7-9 10-12 1-3 4-6 7-9 10-12 1-3 4-6 7-9
2013 2014 2015
(2.8) 16.9 36.5 74.9 60.5 43.0 42.3 35.8
4.0 (26.7)(31.3)
0
200
400
600
800
1-3 4-6 7-9 10-12 1-3 4-6 7-9 10-12 1-3 4-6 7-9
2013 2014 2015
30.8 0.4 (16.1)(13.0)
13.3 (7.7) 3.1 14.6 16.0 (14.3)(19.1)
0
200
400
600
800
1-3 4-6 7-9 10-12 1-3 4-6 7-9 10-12 1-3 4-6 7-9
2013 2014 2015
前年同期比、10億円
前年同期比、100万ドル 前年同期比、100万ユーロ
前年同期比、100万元 前年同期比、100万台湾ドル
Y/Y, millions of dollar
Y/Y, millions of CNY
Y/Y, billions of Yen
Y/Y, millions of Euro
Y/Y, millions of NT dollar

Copyright THK CO., LTD. 2015. All rights reserved.
+7.1billionsof yen
9
Control of investmentsfor increase of production
Improvement of efficiency of variousfixed cost in global-level
FY2015(E) Fixed Cost (Y/Y)
ForecastRevision
Continuation of Investments for the future growth
FY2015 (before revision) FY2015 (after revision)
Promotion of middle-term measuresCapital expenditure for boosting productivity
+3.0billionsof yen
Short-Term Basis : Cost Control
Cost Control
Review of various expenses

Copyright THK CO., LTD. 2015. All rights reserved.
Financial Forecast (Consolidated)
10
2016/3 2015/3FY Revised
Nov. ForecastFY May
Forecast1H Results FY Results
Net Sales 215,000 240,000 112,186 217,678Y/Y -1.2% +10.3% +5.6% +17.4%
Operating Income 21,000 32,000 12,488 28,388
Y/Y -26.0% +12.7% -12.7% +63.4%
Ordinary
Income19,600 34,100 11,694 34,031
Y/Y -42.4% +0.2% -24.4% +44.1%Net income attributable to owners of the parent
13,300 23,100 7,709 22,705
Y/Y -41.4% +1.7% -29.2% +45.6%
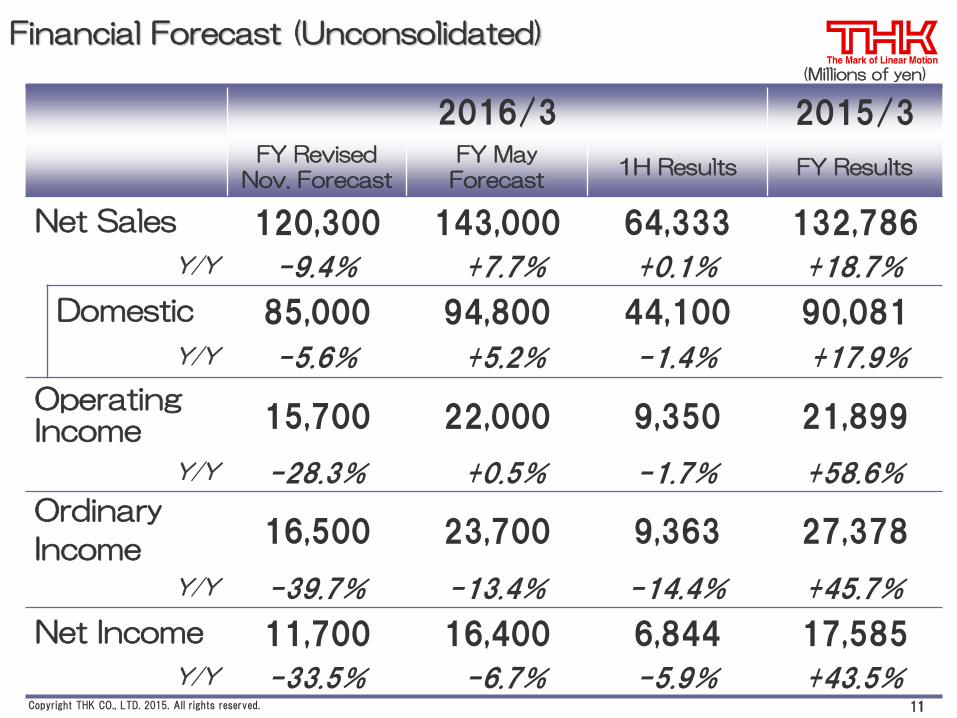
(Millions of yen)
*Our Group took over the L&S business of TRW Automotive Inc. in Europe and North America on August 31, 2015.Its effects on the forecast of consolidated results of the period ending March 31, 2016 will be made public without delay upon determination.
Copyright THK CO., LTD. 2015. All rights reserved.
(Millions of yen)
Financial Forecast (Unconsolidated)
11
2016/3 2015/3FY Revised
Nov. ForecastFY May
Forecast1H Results FY Results
Net Sales 120,300 143,000 64,333 132,786Y/Y -9.4% +7.7% +0.1% +18.7%
Domestic 85,000 94,800 44,100 90,081
Y/Y -5.6% +5.2% -1.4% +17.9%
Operating Income 15,700 22,000 9,350 21,899
Y/Y -28.3% +0.5% -1.7% +58.6%
Ordinary
Income16,500 23,700 9,363 27,378
Y/Y -39.7% -13.4% -14.4% +45.7%
Net Income 11,700 16,400 6,844 17,585Y/Y -33.5% -6.7% -5.9% +43.5%

Copyright THK CO., LTD. 2015. All rights reserved.
Ⅲ. About Our Strategy

Copyright THK CO., LTD. 2015. All rights reserved.
About Our Strategy
13
Two strategic axes for achievement of long-term
management target
Development of New Business AreasFull-Scale Globalization
新規分野への展開Expand sales for automotive partsExpand sales for the newly
developed products
Re-establish sales strategy・Enhancement of sales network・Strengthening of acquiring volume zone・Reinforcement of marketing/strategy functions
Develop the consumer goods domain ona company-wide level
Expand sales for the newlydeveloped products
Improvement of Potential for Growth
Cost Control on a Short-Term Basis
Major Middle-Term Measures

Copyright THK CO., LTD. 2015. All rights reserved. 14
The most important area of enhancement of Sales Network
Sales Bases 12Production Bases 4Development Bases 1
Sales Bases 59Production Bases 12Development Bases 1
Sales Bases 9Production Bases 7
Europe Asia and other The Americas
Sales Bases Production Bases Expand of Sales Network
Enhancement of Sales Network

Copyright THK CO., LTD. 2015. All rights reserved.
India
China
ASEAN
Sales Bases
Production Bases
Sales Bases 5THK India
15
Sales Bases 36Production Bases 5Development Bases 1
Sales Bases 2Production Bases 3
Sales networks
Scheduled to deploy in other countries in the future
Corresponding area: Singapore, Malaysia, Philippines, Thailand, Indonesia, Vietnam
Support Japanese companies to expandinto local in Japanese
ASEAN Customer Support
Enhancement of Sales Network
October 2015Delhi office opened
Delhi Office

Copyright THK CO., LTD. 2015. All rights reserved. 16
THK Manufacturingof Vietnam (VNM)
SAMICK THK(ANSEONG) (KOR)
SAMICK THK(DALSEONG) (KOR)
THK RHYTHMTHAILAND (THA)
THK RHYTHMMALAYSIA (MYS)
SAMICK THK(Head Office Plant) (KOR)
THK MANUFACTURING OFCHINA (LIAONING) (CHN)
THK RHYTHMCHANGZHOU (CHN)
THK RHYTHMGUANGZHOU (CHN)
THK MANUFACTURING OFCHINA (WUXI) (CHN)
THK Manufacturingof Ireland (IRL)
THK Manufacturingof Europe (FRA)
THK MANUFACTURING OF CHINA (CHANGZHOU)Scheduled to start of operation in 2016
THK Manufacturingof America (USA)
THK RHYTHM MEXICANA (MEX)
SAMICK THK(SEONGSEO) (KOR)
Europe
China
The Americas
Asia and Other
DALIAN THK Transfer & ExpansionStart of operation in February, 2015
Enhancement of the Global Manufacturing Structure
THK RHYTHM AUTOMOTIVE CZECH (CZE)THK RHYTHM AUTOMOTIVE GmbH (DEU)
THK RHYTHM AUTOMOTIVEMICHIGAN (USA) THK RHYTHM AUTOMOTIVE CANADA (CAN)
THK RHYTHMNORTH AMERICA (USA)

Copyright THK CO., LTD. 2015. All rights reserved.
Develop the Consumer Goods Domain on a Company-wide Level
17
Control stick
Table sliding system
Aircraft
Reclining Seats
Linear MotionCore Technology
Wind power generation
Robots
Medical equipment
Renewable Energy
Solar light generators
Hydroelectric generator
CT scanner
Surgical robot
Robot Hand
Support robot for disaster rescue
Support robot used in plant

Copyright THK CO., LTD. 2015. All rights reserved. 18
ACE Division Orders User Breakdown of FY2015 1H
Seismic Isolation and Damping System
Seismic isolation and damping system forhousing and other
1%
Seismic isolation and damping system for building
78%
Seismic IsolationPlatforms Table
21%
OrdersUp 22%
from previousyear
The number of adoption grows rapidly
Seismic Isolation Platforms Table
Seismic Isolation and Damping for Building
Higher damping performance compared with previous products
Seismic Isolation and Damping for House
Being adopted by a steadily increasing number of buildings
Develop the Consumer Goods Domain on a Company-wide Level :Seismic Isolation and Damping System

Copyright THK CO., LTD. 2015. All rights reserved.
Expansion of Sales of Automotive Parts
19
Esta
blish
men
t of G
loba
l-level B
usin
ess Base
Development of New Products for Automobile
・Supply system ・Mass production
technology・Quality assurance
system ・Development
capabilities
THK RHYTHM
THK RHYTHM AUTOMOTIVE
THK RHYTHMTHAILAND (THA)
THK RHYTHMMALAYSIA (MYS)
THK RHYTHMCHANGZHOU (CHN)
THK RHYTHMGUANGZHOU (CHN)
THK RHYTHMMEXICANA (MEX)
Acceleration of Development of New Products for Automobile
THK RHYTHM AUTOMOTIVEGmbH (DEU)
THK RHYTHM AUTOMOTIVE CZECH (CZE)
THK RHYTHM AUTOMOTIVEMICHIGAN (USA) THK RHYTHM AUTOMOTIVE CANADA (CAN)
THK RHYTHMNORTH AMERICA(USA)
Electric powersteering parts
Next-generationsuspension parts
Next-generationbrake parts
Stabilizer link ballInterior
L&S Products

Copyright THK CO., LTD. 2015. All rights reserved.
19.9%18.5%
17.6% 17.9%19.5%
71.7% 71.3% 68.9% 69.5% 69.4%
8,090 8,113 8,508 8,851 9,208 472 500 558 674 730
1,731 1,826 1,907 2,168 2,157 2,243 2,134 2,222 2,276 2,288 5,214 5,205 5,503 5,964
7,508
63,859 68,702 73,205 77,448 77,804
Trends in COGS and SG&A
20
Millions of yen
COGS ratio
17,753Millionsof yen
18,700
SG&A ratio
Other | Y/Y : up ¥ 2,005 million, or 36.4%
R&D | Y/Y : up ¥ 66 million, or 3.0%
Sales & Distribution Costs | Y/Y : up ¥ 249 million, or 13.1%
Depreciation and Amortization | Y/Y :up ¥ 171 million, or 30.7%
Personnel Costs | Y/Y : up ¥ 700 million, or 8.2%
17,780
Sales-cost ratio increased by 0.5 points Y/Y
19,935
COGS
SG&A
21,893
1H 2H 1H 2H 1H
2014/3 2015/3 2016/3
1H 2H 1H 2H 1H
2014/3 2015/3 2016/3
・Increase of fixed cost due to investmentsfor the future growth

Copyright THK CO., LTD. 2015. All rights reserved.
Support Statement –Trends in Orders, Sales and Backlog(Domestic – Unconsolidated) -
21
1-3 4-6 7-9 10-12 1-3 4-6 7-9 10-12 1-3 4-6 7-9 10-12 1-3 4-6 7-9 10-12 1-3 4-6 7-9 10-12 1-3 4-6 7-9 10-12 1-3 4-6 7-9 10-12 1-3 4-6 7-9 10-12 1-3 4-6 7-9
2007 2008 2009 2010 2011 2012 2013 2014 2015
Orders 24,907 25,067 25,371 27,509 27,201 27,794 23,950 14,913 7,809 7,815 10,818 14,953 18,753 25,450 27,147 24,217 23,684 23,168 19,573 18,962 20,201 21,130 17,701 17,728 17,321 19,701 17,801 19,565 20,902 23,517 23,234 22,197 23,460 23,637 20,805
Sales 25,988 24,923 24,320 27,077 27,081 26,048 25,524 19,834 11,473 7,787 10,698 13,726 17,209 20,942 23,922 22,433 24,215 23,817 23,461 20,650 20,872 20,315 19,638 17,737 17,747 18,115 18,384 19,131 20,793 21,266 23,479 21,895 23,439 22,240 21,859
Backlog 11,883 12,027 13,078 13,511 13,631 15,378 13,804 8,883 5,219 5,247 5,367 6,594 8,138 12,645 15,870 17,655 17,124 16,475 12,587 10,899 10,229 11,044 9,107 9,098 8,673 10,259 9,677 10,111 10,220 12,471 12,225 12,528 12,549 13,945 12,891
0
5,000
10,000
15,000
20,000
25,000
30,000Orders
Sales
Backlog
(Millions of yen)

Copyright THK CO., LTD. 2015. All rights reserved.
Support Statement –Trends in Orders Classified by Industry (Unconsolidated)–
22
1-3 4-6 7-9 10-12 1-3 4-6 7-9 10-12 1-3 4-6 7-9 10-12 1-3 4-6 7-9 10-12 1-3 4-6 7-9 10-12 1-3 4-6 7-9 10-12 1-3 4-6 7-9 10-12 1-3 4-6 7-9 10-12 1-3 4-6 7-9
2007 2008 2009 2010 2011 2012 2013 2014 2015
Machine tool 3,658 3,926 3,925 3,965 3,727 3,635 3,263 1,319 527 535 846 1,612 2,164 3,443 4,020 3,808 4,183 3,970 3,423 3,318 3,681 3,721 3,536 3,114 2,117 2,439 2,683 2,753 3,129 4,004 4,188 4,160 4,370 4,339 3,014
General Machinery 4,217 4,581 4,603 4,833 4,835 4,942 3,969 2,219 1,091 1,268 1,654 2,445 3,216 4,730 4,627 3,792 4,056 3,896 3,428 2,875 3,300 3,301 2,797 2,878 2,782 3,272 2,972 3,133 3,545 3,908 3,398 3,466 3,813 4,183 3,561
Electronics 5,515 5,600 5,812 6,149 5,657 5,984 5,159 2,809 1,514 1,315 2,406 3,763 4,127 5,372 6,394 5,762 4,695 4,998 3,204 3,184 3,519 4,337 2,514 3,037 3,152 3,852 2,774 3,146 3,492 4,446 4,547 4,177 3,779 3,628 2,896
0
1,000
2,000
3,000
4,000
5,000
6,000
7,000
Machine tool
General Machinery
Electronics
(Millions of yen)