
ANNUAL REPORT | 2017 - Open Briefing
100
ANNUAL REPORT | 2017
-
Upload
khangminh22 -
Category
Documents
-
view
0 -
download
0
Transcript of ANNUAL REPORT | 2017 - Open Briefing

ANNUAL REPORT | 2017


ANNUAL REPORT 2017 // WWW.OROTONGROUP.COM
54
6
7
8
15
21
34
35
36
37
38
39
40
87
88
96
98
TABLE OF CONTENTS
Corporate directory
Chairman’s statement
Operating and financial review
Director’s report
Remuneration report
Corporate governance statement
Auditor’s independence declaration
Statement of profit or loss and
other comprehensive income
Statement of financial position
Statement of changes in equity
Statement of cash flows
Notes to the financial statements
Director’ declaration
Independent auditor’s report to the
members of OrotonGroup Limited
Shareholder Information
Brand retail store listing

ANNUAL REPORT 2017 // WWW.OROTONGROUP.COM
6
Australian Business Number (ABN) 14 000 038 675
Directors Mr John P Schmoll (Non-Executive Chairman) Ms Maria Martin (Non-Executive Director)Mr Ross B Lane (Interim Managing Director and CEO)
Company secretaryMs Vanessa De Bono
Notice of annual general meetingThe details of the annual general meeting of OrotonGroup Limited are:
Hilton Sydney Level 1, 488 George St Sydney, NSW 2000, Australia 11:00am on Friday 1 December 2017
Registered officeLevel 2, 409 George Street, Waterloo NSW 2017, Australia
Principal place of business Level 2, 409 George Street, Waterloo NSW 2017, Australia
Share registerLink Market Services LimitedLevel 12, 680 George Street, Sydney NSW 2000, AustraliaPhone: + 61 2 8280 7100
AuditorPricewaterhouseCoopers One International Towers Sydney Watermans QuayBarangaroo NSW 2000, Australia
SolicitorsArnold Bloch Leibler Level 21, 333 Collins Street, Melbourne VIC 3000, Australia
Stock exchange listingOrotonGroup Limited shares are listed on the Australian Securities Exchange (ASX code: ORL)
WebsiteCorporate address: www.orotongroup.com Oroton online: www.oroton.com
General informationThe financial statements cover OrotonGroup Limited as a consolidated entity (referred to hereafter as the ‘consolidated entity’ or the ‘Group’) consisting of OrotonGroup Limited (referred to hereafter as the ‘company’ or the ‘parent entity’) and the entities it controlled at the end of, or during, the year. The financial statements are presented in Australian dollars, which is OrotonGroup Limited’s functional and presentation currency.
OrotonGroup Limited is a listed public company limited by share , incorporated and domiciled in Australia. Its registered office and principal place of business is: Level 2409 George Street,Waterloo NSW 2017,Australia
A description of the nature of the consolidated entity’s operations and its principal activities are included in the directors’ report, which is not part of the financial statements.
The financial statements were authorised for issue, in accordance with a resolution of directors, on 28 September 2017. The directors have the power to amend and reissue the financial statements.
Through the use of the internet, we have ensured that our corporate reporting is timely and complete. All press releases, financial reports and other information are available on our website: www.orotongroup.com
6CORPORATE DIRECTORY // 29 JULY 2017

ANNUAL REPORT 2017 // WWW.OROTONGROUP.COM
7
Dear Shareholders,
On behalf of the Board of Directors, please find attached the 2017 Annual Report.
The results in FY17 reflect not only a soft and very competitive retail environment and adverse currency impacts, but also the impacts of the important Strategic Review undertaken during the latter part of the year and accordingly the noncore costs associated primarily with the termination of the Gap Franchise Agreement.
Group Revenue declined 10% from FY16 mainly due to exiting noncore categories in Oroton, reduced sales in Gap and Oroton Factory Outlets and one less week of trading. Earnings before interest, tax, depreciation, amortisation and impairments (EBITDA) was a $7.0m loss (FY16: $12.9m profit). On an underlying basis, excluding the impact of noncore costs and income, EBITDA was a $2.7m profit.
Group net debt at year end was $5.4m (FY16 $2.8m net cash).
The outcome of the first phase of the Strategic Review announced in May 2017 has been the important decision to focus on the core Oroton brand. To this end, the Company has now terminated the Australian Gap franchise agreement and reached in principle agreements with major landlords to exit its Gap store lease commitments at the end of 1H18. The FY17 results include $11.3m of costs associated with the planned exit of the Gap Franchise.
The Gap franchise termination, agreements with major Gap landlords and the extension of the Group’s financing arrangements with Westpac to 5 October 2018, are important milestones in the Strategic Review.
We have a renewed focus on the creative direction of the Oroton brand, together with enhancing our customer experience at all touch points across all channels. We are proud of the recent launch of the Spring/Summer campaign and rejuvenated website.
Unfortunately, currency impacts will continue to be a major headwind for the Company in FY18.
The progression of the Strategic Review continues to be a key priority which may include a sale, refinancing of debt facilities or recapitalisation of the Company. It is aimed at maximising value and creating options for the Company and its stakeholders. Whilst the Group continues to engage with interested parties in the process, there is no certainty this process will result in a proposal or transaction for OrotonGroup
We have an experienced and dedicated CEO and management team and staff to whom the Board is most grateful for their hard work during this period of transition.
I would like to sincerely thank my board colleagues, our business partners, customers and shareholders for their support and contribution to our business as we progressed many difficult but fundamentally important initiatives.
The Company is also particularly fortunate that one of its major shareholders, Will Vicars, agreed on 31 July 2017 to provide credit support to Westpac, which will allow it sufficient time and financial flexibility to work through the Gap closure, focus resources on the core Oroton brand and explore the various strategic options in an orderly and comprehensive manner.
We trust that you will find this annual report informative and helpful. I also draw your attention to the included Operating and Financial Review which further discusses our operations, financial position and business strategies.
We look forward to meeting our shareholders at the upcoming Annual General Meeting.
John P SchmollNon-Executive Chairman
6 CHAIRMAN’S STATEMENT // 29 JULY 2017

ANNUAL REPORT 2017 // WWW.OROTONGROUP.COM
8
The purpose of the operating and financial review is to enhance the periodic financial reporting and provide shareholders with additional information regarding the Group’s operations, financial position, business strategies and prospects. The review complements the Financial Report on pages 36 to 86; and the ASX Full Year Results Announcement and Investor Presentation dated 29 September 2017.
The Company’s financial report for the year ended 29 July 2017 contains an independent auditor’s report which includes a material uncertainty related to going concern that may cast significant doubt about the Group’s ability to continue as a going concern. The Company has prepared the accounts on a going concern basis. For further information, refer to Note 1 to the financial statements, together with the auditor’s report.
Company overview and principal activitiesThe Group’s principal activities is to design, procure and distribute premium owned or licensed brands through retail, online and wholesale channels.
The Group has:
• A strong presence as a multi channel retailer including online, first retail stores, concessions, factory outlets and wholesale for both their owned brand Oroton and a licensed partnership for Gap;
• An Oroton design and production team that develops men’s and women’s accessories from the Sydney Head Office;• Licensed the Oroton brand for the design, production and distribution of sunglasses / optical;• Acquired an equity share in an Australian lifestyle fashion accessories brand, TDE Pty Limited (“TDE”).
During the year, the principal activities of the Group were the design, development, marketing and distribution of leather goods, and related accessories under the Oroton brand name in Australia, New Zealand and Asia.
The Group commenced operating the Gap brand in Australia in November 2013 under a 10 year Franchise Agreement. On 4 August 2017 the Group entered into a binding agreement with Gap Inc to discontinue the Gap franchise business in Australia with store closures targeted for completion by 31 January 2018 (Refer Note 37 – Events after the reporting period).
The Group continued to provide shared service support and brand services to Brooks Brothers Australia during the year ended 29 July 2017 for a service fee, following the sale of its joint venture interest in July 2015. The provision of those services will be scaled down during the year ending 28 July 2018.
On 4 April 2017 the Group acquired 31.4% of TDE, an Australian lifestyle fashion accessories brand which complements the Group’s core Oroton brand. With a strong online business TDE will accelerate the Group’s online offering and strengthen the Group’s exposure to TDE’s younger market segment (Refer Note 12 – Investments accounted for using the equity method).
Strategic InitiativesThe Group commenced a Strategic Review in May 2017 (“Strategic Review”) focused on improving its overall business performance, maximising value and creating options for the company and its stakeholders. Subsequently a number of parties expressed interest in potentially participating in various strategic options, and the Board decided to commence a formal process in response to explore these options (“Strategic Process”) and to invite additional parties to participate in the process. The Strategic Process may involve a sale, refinancing of debt facilities or recapitalisation of the Company. It is premature to comment in detail on potential structures, terms or outcomes.
Since commencing the Strategic Review the Group has:• extended its Facility Agreement with Westpac from 16 April 2018 to 5 October 2018;• terminated the Gap Franchise Agreement with Gap stores targeted to close by 31 January 2018; and• reached in principle agreements with major Gap Landlords to exit its Gap lease commitments.
Together, these are important milestones in the Strategic Review. Importantly, the extension of the Group’s financing arrangements, made possible by the credit support of one of the Company’s major shareholders, Will Vicars, enables the Group sufficient time and financial flexibility to work through the closure of the Gap franchise, further focus resources on the future strategy for the core Oroton brand and pursue the Strategic Processes in an orderly and comprehensive manner.
8OPERATING AND FINANCIAL REVIEW // 29 JULY 2017

ANNUAL REPORT 2017 // WWW.OROTONGROUP.COM
9
Group Operating Results
Year to 29 July 2017 - Reported2017
$’0002016
$’000
Revenue 123,205 136,439
EBITDA(1) (6,952) 12,917
Comprising:
- Oroton 12,902 19,894
- Gap (11,349) 957
- Unallocated (8,505) (7,934)
EBIT(2) (17,323) 6,214
Comprising:
- Oroton 6,268 16,000
- Gap (14,551) (1,356)
- Unallocated (9,040) (8,430)
Net profit/(loss) after taxation (14,258) 3,443
Earnings per share (EPS) (cents) (34.68) 8.43
Dividend per share (cents) - 9.00
Net (debt) / cash (5,366) 2,816
For comparable basis purposes the underlying results(3) are shown below excluding:
• 2017: costs associated with the end of Gap franchise arrangements, Strategic Review and management separation; share of profits of associates accounted for using the equity method; and non-cash store asset impairments for Oroton and Gap;
• 2016: non-cash store asset impairments for Oroton and Gap.
The directors are of the opinion that underlying results provides useful information about the ongoing financial performance of the Group.(4)
Year to 29 July 2017 – Underlying(3), (4)
2017$’000
2016$’000
EBITDA(1), (3) 2,703 12,917
Comprising:
- Oroton 12,902 19,894
- Gap (2,502) 957
- Unallocated (7,697) (7,934)
EBIT(2), (3) (1,670) 7,857
Comprising:
- Oroton 9,809 16,757
- Gap (3,247) (470)
- Unallocated (8,232) (8,430)
Net profit/(loss) after taxation(3) (3,350) 4,641
Earnings per share (EPS) (cents)(3) (8.15) 11.36
(1) Earnings before Interest, Tax, Depreciation, Amortisation and Impairment.
(2) Earnings before Interest Received, Finance Costs and Income Tax Expense.
(3) Underlying results for the year to 29 July 2017 are reconciled to IFRS audited measurements on page 11. Underlying comparatives are reconciled to IFRS audited measurements through the add back of non-cash store asset impairments totalling $1,643,000.
(4) This information should be considered as supplements to the Statement of Profit and Loss and Other Comprehensive Income that has been presented in accordance with the Australian Accounting Standards and not as a replacement for them. Because these non-IFRS measures are not based on Australian Accounting Standards, they do not have standard definitions, and the way OrotonGroup has calculated these measures may differ from similarly titled measures used by other companies. Readers should therefore not place undue reliance on these non-IFRS financial measures.
8 OPERATING AND FINANCIAL REVIEW // 29 JULY 2017

ANNUAL REPORT 2017 // WWW.OROTONGROUP.COM
10
Revenue for the consolidated entity for the year was $123,205,000 which was 9.7% lower than revenue from the prior period of $136,439,000, primarily due to exiting non-core Oroton categories such as apparel, footwear and lingerie ($5,700,000), reduced sales in Gap ($3,400,000) and Oroton Outlets ($2,200,000) and one less week of trading in Oroton ($1,800,000).
Group EBIT decreased to a loss of $17,323,000 from the prior period profit of $6,214,000 principally driven by:
a) A decline in Gap Segment EBIT of $13,195,000 (FY17: $14,551,000 loss FY16: $1,356,000 loss) comprising: • $11,304,000 of non-core costs associated with the exit of the Gap Franchise Agreement. These include the cost to exit
lease contracts of $5,164,000, net unavoidable onerous lease costs of $2,882,000, inventory provisions of $917,000, hedge contract ineffectiveness of $938,000, professional fees incurred of $695,000, make good depreciation of $124,000 and non-cash store asset impairments of $2,333,000. These costs were partially offset with the accelerated unwind of fixed rental increases of $570,000, accelerated amortisation of deferred lease incentives of $916,000 and reversal of make good provisions of $263,000;
• a decrease in underlying EBITDA from Gap trading of $3,459,000 resulting from poor trading especially during the Spring / Summer season and April mid season and end of season sale periods in an aggressive and discount driven apparel market and higher purchasing costs denominated in United States dollar (USD) of $800,000; and
• a reduction in depreciation of $558,000 mainly due to the prior year impairments and other stores being fully depreciated offset by non-core make good depreciation of $124,000 noted above.
b) A decline in Oroton Segment EBIT of $9,732,000 (FY17: $6,268,000 profit FY16: $16,000,000 profit) principally due to: • a reduction in sales of $9,750,000 mainly due to exiting non-core categories, a reduction in Outlet sales and one less
week of trading resulting in a reduction in Oroton constant currency gross margin dollars of $3,500,000; • higher USD denominated purchasing costs impacting cost of goods sold by approximately $2,600,000; and • additional non cash store asset impairments across Oroton of $2,784,000 compared to the prior period due to the lower
than expected trading results of the Oroton brand.
c) Other non-core costs of $831,000 comprising $458,000 of termination benefits and professional fees paid for management separation, and professional fees for the Strategic Review of the Group of $373,000.
The Group’s loss after income tax was $14,258,000 compared to the prior year profit of $3,443,000 after deducting from the Group EBIT $308,000 of net finance charges (FY16: $342,000) and income tax benefits of $3,373,000 (FY16: $2,429,000 expense).
The Board did not declare an interim or final dividend in the year ending 29 July 2017 (FY16: 9.0 cents per share).
10OPERATING AND FINANCIAL REVIEW // 29 JULY 2017

ANNUAL REPORT 2017 // WWW.OROTONGROUP.COM
11
Reconciliation of Reported Results to Underlying Results
Year to 29 July 2017 Note(1)
EBITDA$’000
EBIT$’000
Net loss after tax$’000
Reported (6,952) (17,323) (14,258)
Add back/(deduct):
Share of profits of associates accounted for using the equity method (23) (23) (23)
Management separation (2) 458 458 458
Strategic review (2) 1,068 1,068 1,068
Inventory provision (2) 917 917 917
Hedge contract ineffectiveness (2) 938 938 938
Costs to exit lease contracts (2) 5,164 5,164 5,164
Net unavoidable onerous lease costs (2) 2,882 2,882 2,882
Unwind of fixed rent increase (2) (570) (570) (570)
Accelerated amortisation of deferred lease incentives (2) (916) (916) (916)
Reversal of make good provision (263) (263) (263)
Make good asset depreciation - 124 124
Impairment of non-current assets (2) - 5,874 5,874
Income tax benefit (3) - - (4,745)
Underlying 2,703 (1,670) (3,350)
(1) Refer Note 3 – Individually significant items.
(2) Individually significant items that have an impact on income tax.
(3) Income tax impact of the items in note (2) above.
OrotonDuring the year:
• the focus on limited edition products and core women’s handbag has enhanced the Oroton product offer with Women’s handbags achieving +8% revenue growth in First Retail/Concession stores and importantly +13% gross margin dollar growth in constant currency;
• the impact of upgraded visual merchandising standards has created a more luxury shopping environment, is attracting new customers to the brand, and is achieving positive like for like sales in First Retail and Concession stores from continuing categories; and
• the investment in both paid and organic search and affiliate programs, product page redesigns and updates to checkout have all resulted in a 10% increase in the number of visits to the Oroton online store; organic search continues to be the highest driver of sessions and revenue with the recently launched new mobile responsive site expected to improve conversion in the new financial year; the mix of Online sales fell from ~12% in 2016 to ~11% in 2017 of total Oroton sales.
These initiatives were offset by the impact of a soft retail environment during Sale periods in FY17 which commenced from Boxing Day and continued during the Mid Season and End of Season Sale periods. Importantly sales growth was positive during new season launch periods with total sales from continuing categories in the First Retail and Concession stores +1.3%, whilst the Oroton brand total sales declined 9.3% compared to the prior period. This reduction in sales of 9.3% was predominantly due to exiting non-core Oroton categories such as apparel, footwear and lingerie, reduced sales in Oroton Outlets and one less week of trading in Oroton.
The above results were achieved in a heavily promotion driven and competitive retail environment where consumers remained cautious with their spending as well as increased international competition including in the Factory Outlet channel.
Improved margin generation from increased retail prices and higher average selling price products were offset by the downward pressure on gross margin due to the weakening of the AUD.
The Group rationalised the international store portfolio in Asia with the closure of all international markets except Malaysia. The International store portfolio in Asia was 4 at year end (2016: 8).
10 OPERATING AND FINANCIAL REVIEW // 29 JULY 2017
ANNUAL REPORT 2017 // WWW.OROTONGROUP.COM
12
Net international losses were reduced to ~$240,000 for the year (FY16: ~$1,900,000) with the closure of loss making or marginal stores over the last 2 years. Underlying International losses improved by ~$1,500,000 after removing the impact of non-cash asset write-downs in 2016. With the closure of loss making or marginal stores the International channel is now EBITDA positive.
There were 59 Oroton stores trading at year end (FY16: 63 stores). 1 new domestic First Retail store was opened at Sydney International Airport, together with 2 Myer concession stores in Sydney and Melbourne, and 2 Outlet stores in Sydney and Malaysia, while 9 free standing, concession or franchise stores were closed due to marginal performance. The Group will continue to review stores at lease expiry across the portfolio to rationalise the “bricks” store network.
GAPGap performance deteriorated over FY17, with underlying EBITDA declining by $3,459,000 (FY17:$2,502,000 loss FY16:$957,000 profit). Sales declined by 11% driven by the Spring / Summer range which did not resonate internationally and during the important Mid Season and End of Season Sale periods. The above results were achieved in a heavily promotion and discount driven apparel market where consumers remained cautious with their spending as well as increased international competition in all locations. Gross margin in constant currency declined 120bps.
Brooks BrothersShared service support and Brand management services were provided to Brooks Brothers Australia during the current financial year following the end of the joint venture between OrotonGroup and Brooks Brothers in July 2015. Shared service support will significantly reduce in the next 12 months. The Group rents head office space to, and receives income from, Brooks Brothers Australia.
The Group had $2,250,000 of outstanding loans to Brooks Brothers International LLC at the end of the prior period. In July 2017 Brooks Brothers International LLC repaid these outstanding loans in accordance with the agreed timing for repayment.
Financial PositionNet debt at year end was $5,366,000, compared to net cash of $2,816,000 at the prior year end.
The Group’s operating cash used before interest and tax for the year was $1,019,000 (FY16: $17,006,000 cash from operating before income and tax) due to a decrease in underlying EBITDA of $10,214,000, and an increase in working capital across Oroton and Gap driven mainly by an increase in inventory volumes and higher purchasing costs denominated in foreign currency.
Investment in capital expenditure in the year was $4,966,000 including 5 new Oroton stores, 9 refurbished or renovated Oroton stores including 3 factory outlets, and investment in the Group’s supply chain systems and new mobile responsive site.
In the current year Brooks Brothers International LLC repaid $2,250,000 of outstanding loans. In the prior year the Company initiated a share buy-back resulting in $348,000 of shares being purchased on market.
In the current year the Group acquired 31.4% of TDE Pty Limited for $4,500,000 plus contingent consideration of $660,000 (see note 18). The $4,500,000 consideration was comprised of $2,670,000 of cash and OrotonGroup Limited shares to the value of $1,830,000 (see note 22).
The Group has a $35,000,000 bank facility in place at the date of this report to support continued investment and growth in the Group in FY18. At 29 July 2017 $20,872,000 remained unused.
Business RisksThere are a number of factors, both specific to the Group and of a general nature, which may threaten both the future operating and financial performance of the Group and the outcome of an investment in the Group.
The Company’s financial report for the year ended 29 July 2017 contains an independent auditor’s report which includes a material uncertainty related to going concern that may cast significant doubt about the Group’s ability to continue as a going concern. For further information, refer to Note 1 to the financial statements, together with the auditor’s report.
12OPERATING AND FINANCIAL REVIEW // 29 JULY 2017

ANNUAL REPORT 2017 // WWW.OROTONGROUP.COM
13
In addition to the information contained in Note 1, the specific material business risks faced by the Group, and how the Group manages these risks, are set out below:
• Consumer Discretionary Spending and Trends Operating in the retail industry, the Group relies on consumer discretionary spend and consumer sentiment. Adverse
change to the general economic and retail environment can impact financial results. The Group mitigates this risk by keeping abreast of global economic and consumer data and industry trends and managing inventory and expenses in line with changes in the environment.
In FY18 the Group will manage the wind down of the Gap stores with closure of these stores targeted for 31 January 2018. The results of the wind down will be impacted by the overall retail environment and the ability to drive traffic into the 6 Gap stores during peak sale periods.
• Competition and Margin Risk The highly competitive nature of the retail market combined with new entrants to the market, manufacturing cost and
raw material price increases, do have an impact on the financial results of the Group. This is mitigated by carefully managing intake margins, working with key long term suppliers, and managing the Group’s intellectual property and brand development. The Group closely monitors price and quality against a range of retailers and brand owners to ensure it maintains its competitive stance within its sector.
• Foreign Exchange Exposure The Group relies significantly on imported products which are paid for primarily in US dollars and as a result has
transactional exposure. A stronger US dollar will generally have a negative effect on the Group’s reported earnings.
Depending on the timing of expected cashflows, the group enters into forward exchange contracts to mitigate certain foreign exchange exposures and to introduce some cost certainty for planning purposes.
The Group also has a translational exposure as its international earnings are translated into Australian dollars for reporting purposes. This is not a material part of the business as international sales represent only approximately 3% of Group sales.
• Increased Cost of Doing Business and Property Portfolio Management The Group operates under the Modern Retail Award for store based staff in Australia and also has lease agreements –
all of which have inbuilt annual cost escalations. The Group is focussed on improving operating efficiencies including rigorous rent negotiations on lease expiry and effective store rostering which can to some extent offset some of these cost increases.
The Group’s stores are leased and therefore subject to negotiation at the end of each lease term. The Group actively manages its portfolio against financial and operational criteria which must be met for both new and existing stores. There is no guarantee that stores will be renewed at the end of each lease on terms acceptable to the Group. The potential impact of a single store closure is mitigated by the number of stores the group operates and a strong online presence in the Oroton brand.
Risk managementThe company’s risk management is further discussed in the Corporate Governance Statement which can be viewed at www.orotongroup.com.au/investor-relations/corporate-governance
DividendsThe following fully franked dividends have been paid, declared or recommended since the end of the preceding year:
Cents per ordinary share $’000
Final dividend recommended: - -
Dividends paid in the year: 3.0 1,221
Final FY16 dividend paid 3.0 1,221
Interim FY17 dividend paid - -
12 OPERATING AND FINANCIAL REVIEW // 29 JULY 2017

ANNUAL REPORT 2017 // WWW.OROTONGROUP.COM
Directors InterestsAs at the date of this report, the interest of the directors in shares or other instruments of OrotonGroup Limited were:
Ordinary shares Performance Rights Retention Rights
John P Schmoll 60,000 - -
Maria Martin 10,000 - -
Ross B Lane 8,931,166* - -
* Mr Robert Lane, Mr Ross Lane, Mr Tom Lane and Mrs Anna Hookway (nee Lane) entered into a Deed dated 21 October 2008 which requires them to act co-operatively with each other in relation to the consolidated entity’s affairs. Under this deed as at 29 July 2017, 8,931,166 ordinary shares are beneficially owned by Mr Robert Lane, Mr Ross Lane, Mr Tom Lane and Mrs Anna Hookway (nee Lane), or persons or entities associated with or controlled by them. See directors’ report page 17 for further information on the Lane Deed.
14 14OPERATING AND FINANCIAL REVIEW // 29 JULY 2017

ANNUAL REPORT 2017 // WWW.OROTONGROUP.COM
1515
The directors present their report, together with the financial statements, on the consolidated entity (referred to hereafter as the ‘consolidated entity’ or the ‘Group’) consisting of OrotonGroup Limited (referred to hereafter as the ‘company’ or ‘parent entity’) and the entities it controlled at the end of, or during, the year ended 29 July 2017.
DirectorsThe following persons were directors of OrotonGroup Limited during the whole of the financial year and up to the date of this report, unless otherwise stated: John P SchmollMark Newman (resigned 11 April 2017) Ross B LaneMaria MartinJ Will Vicars (resigned 23 May 2017)
Principal activitiesDuring the financial year the principal activities of the consolidated entity consisted of:• Retailing and wholesaling of leather goods, fashion
apparel and related accessories under the Oroton label;• Retailing of fashion apparel under the Gap label; and• Licensing of the Oroton brand name.
DividendsDividends paid during the financial year were as follows:
Consolidated
2017 2016
$’000 $’000
Final dividend for the year ended 30 July 2016 (2016: 25 July 2015) of 3.0 cents (2016: 2.0 cents) per fully paid ordinary share fully franked based on a tax rate of 30%
Interim dividend for the year ended 29 July 2017 (2016: 30 July 2016) of nil cents (2016: 6.0 cents) per fully paid ordinary share fully franked based on a tax rate of 30%
1,221 817
- 2,453
1,221 3,270
Review of operationsRefer to the ‘operating and financial review’ on pages 8 to 14 for further information on the consolidated entity’s operations, financial position, business strategies and prospects.
Significant changes in the state of affairsOn 4 April 2017 the consolidated entity acquired 31.4% of TDE Pty Limited (“TDE”), an Australian lifestyle fashion accessories brand, for $4,500,000 plus contingent
consideration of $660,000, see notes 12 and 18.
There were no other significant changes in the state of affairs of the consolidated entity during the financial year.
Matters subsequent to the end of the financial yearWestpac FinancingOn 31 July 2017 the consolidated entity negotiated amendments to terms of the facility agreement with its financier to allow the continuing use of its existing $35,000,000 facility and an extension of maturity to 5 October 2018 from 16 April 2018 for the $31,000,000 working capital and trade finance facilities. The $4,000,000 bank overdraft facility continues to be repayable and terminable on demand.
In order to secure the continuation of the consolidated entity’s facilities, the consolidated entity had commercial-in-confidence discussions with numerous substantial shareholders gauging their interest in providing a measure of credit support to the financier.
Through the Strategic Process review first announced on 17 May 2017 and alongside those shareholder discussions, certain alternative financing options were explored, however an amendment of the existing facility was determined to be the preferred option to provide certainty of funding from both a cost and timing perspective. To that end, and to enable the financier to continue making facilities available to the consolidated entity, and as the consolidated entity continues to pursue various Strategic Processes, entities controlled by Mr J Will Vicars (Vicars Entities) entered into a put and call arrangement with the financier to provide critical credit support.
The subject of the put and call arrangement is the financier’s interest in the $35,000,000 of facilities committed to the consolidated entity including a $20,000,000 working capital advance facility and $15,000,000 of bank overdraft and trade finance facilities. The put element of the arrangement enables the financier to transfer the working capital advance facility to Vicars Entities at face value upon an event of a default or on 16 April 2018. The call element of the arrangement enables Vicar Entities to purchase all of the financier’s facilities at face value any time until one month after 16 April 2018. The consolidated entity is not a party to the put and call arrangement between the financier and Vicars Entities, although it was involved in facilitating the arrangements.
As part of the amendments agreed with the financier, the consolidated entity will pay an amendment fee of $1,500,000 to the financier, which reflected a more favourable outcome relative to alternative financing options explored. The financier will pay an equivalent option fee to Vicars Entities. As the agreement was entered into after the current year end, the fees associated with the extension of maturity are a non-adjusting subsequent event, which are expected to be incurred in the year ended 28 July 2018.
14 DIRECTORS’ REPORT // 29 JULY 2017

ANNUAL REPORT 2017 // WWW.OROTONGROUP.COM
16
End of Gap franchise arrangementsOn 4 August 2017 the consolidated entity entered into a binding agreement with Gap Inc to discontinue the Gap franchise business in Australia, with store closures targeted for completion by 31 January 2018.
The consolidated entity has recognised a total net expense of $11,304,000 in the 29 July 2017 financial statements as a consequence of the planned closure. This is comprised of non-current asset impairments of $2,333,000, make good asset depreciation of $124,000, strategic review costs of $695,000, an inventory provision of $917,000, hedge contract ineffectiveness of $938,000 and net onerous lease expense of $6,297,000.
As the agreement was entered into after the current year end, other fees and redundancy costs associated with the closure of the Gap franchise business in Australia are a non-adjusting subsequent event, which are expected to be incurred in the year ended 28 July 2018. Redundancy and termination costs associated with the closure are estimated to be approximately $1,157,000, while the consolidated entity is unable to estimate the final amount to be paid for other fees.
Since year end the consolidated entity has reached agreements in principle with the major Gap store lessors to exit the Gap store lease contracts. The key settlement terms agreed include amounts payable and timing of payment on exit. These agreements are currently being documented. The agreed costs to exit these leases has been included in the calculation of the provision for onerous leases recognised in the 29 July 2017 financial statements, see note 17.
No other matter or circumstance has arisen since 29 July 2017 that has significantly affected, or may significantly affect the consolidated entity’s operations, the results of those operations, or the consolidated entity’s state of affairs in future financial years.
Likely developments and expected results of operationsThe consolidated entity’s primary focus is the development of premium lifestyle retail fashion brands. The consolidated entity’s philosophy is to maximise shareholder returns and sustainable profit growth within a framework of an appropriate capital management strategy, ethical organisational culture and support of the OrotonGroup and wider community.
The consolidated entity continues to progress its previously announced Strategic Review and financing continues to be a key priority of the consolidated entity. The strategic processes, which are part of this review, are aimed at maximising value for the company and its stakeholders and may include a sale, recapitalisation and/or refinancing of debt facilities. The outcome of the strategic process remains unknown as the directors continue to engage with interested parties and invite additional parties to participate in the process.
Further information as to likely developments in the operations of the consolidated entity have not been included in this report as the directors believe that to include such information would be likely to prejudice the consolidated entity.
Environmental regulationThe consolidated entity is not subject to any significant environmental regulation under Australian Commonwealth or State law.
Social contributionOrotonGroup recognises the importance of social purpose and our overall responsibility to our shareholders, employees, customers and the communities in which we operate. The consolidated entity has provided support in many ways, both financial and non-financial including product donations, cash pledges, fund-raising activities and volunteering.
During the year Oroton launched a collaboration with the Great Barrier Reef Foundation on an exclusive summer capsule collection. The collection included a series of bag charms that paid homage to the Reef’s striking beauty and unique underwater landscape. OrotonGroup donated 100% of profits from all charm sales to the Great Barrier Reef Foundation, to support the important work being done to preserve one of Australia’s natural treasures for generations to come.
We continued to support Cancer Council and Smith Family as well as many other charities including Red Kite, Red Noseand Aids Trust Australia. The consolidated entity recognisesthat there is always more that every individual and organisation can, and should, do to support community well being and advancement. The consolidated entity remains committed to our efforts in this area.
Information on directors
Name: John P Schmoll
Title: Independent Non-Executive Chairman
Qualifications: B.Com, FCA, FAICD
Experience and expertise: John Schmoll completed his executive career on his retirement as Chief Financial Officer of Coles Myer Ltd. Prior to this he held senior corporate and professional roles in Australia and South Africa including
16DIRECTORS’ REPORT // 29 JULY 2017

ANNUAL REPORT 2017 // WWW.OROTONGROUP.COM
17
Arthur Young and Edgars Stores Ltd (South Africa’s largest apparel and homewares retailer). Since his retirement he has accepted various non-executive public company director positions (either as chairman or chairman of audit/risk committee) and undertaken some executive coaching roles. Accordingly, he brings to OrotonGroup over 40 years of experience in finance, investor relations, information technology and corporate governance, primarily in the distribution and financial sectors.
Other current directorships: None
Former directorships (last 3 years): Non-Executive Director Patties Foods Ltd. Prior to this John was also Non-ExecutiveChairman of Breville Group Ltd, a Non-Executive Director of Australian Leisure and Hospitality Limited, AWB Ltd, Chandler Macleod Ltd and Golden Circle Ltd.
Special responsibilities: Member of the Audit Committee and People and Organisation Committee.
Interests in shares: John has an interest as a trustee and member of the Earlswood Superannuation Fund which holds 60,000 (2016: 60,000) ordinary shares.
Interests in rights: None
Name: Ross B Lane
Title: Interim Managing Director and CEO
Experience and expertise: Ross Lane has broad retail experience from successful participation in a number of retail businesses together with having been Managing Director of OrotonGroup. Limited from 1996 to 2006, and prior to that, holding various positions within the consolidated entity.
Other current directorships: None
Former directorships (last 3 years): None
Special responsibilities: Member of the People and Organisation Committee.
Interests in shares: Mr Robert Lane, Mr Ross Lane, Mr Tom Lane and Mrs Anna Hookway (nee Lane) entered into a Deed dated 21 October 2008 which requires them to act co-operatively with each other in relation to the consolidated
entity’s affairs. Under this deed, as at 29 July 2017, 8,931,166 (2016: 8,931,166) ordinary shares representing 21.28% (2016: 21.94%) of the issued share capital of OrotonGroup Limited are beneficially owned by Mr Robert Lane, Mr Ross Lane, Mr Tom Lane and Mrs Anna Hookway (nee Lane), or persons or entities associated with or controlled by them.
Interests in rights: None
Name: Maria Martin
Title: Independent Non-Executive Director
Qualifications: BCom, FCA, GAICD
Experience and expertise: Maria Martin is an experienced Non-Executive Director, businessperson and Chartered Accountant. Maria’s previous experience includes significant audit, advisory and transactional experience from 15 years as a partner at PricewaterhouseCoopers where she worked with a variety of clients and industries including retail and consumer goods.
Other current directorships: Non-Executive Director and Chair of Board Audit and Risk Management Committee of amaysim Australia Limited, a customer centric technology company delivering amazingly simple mobile, devices, energy and broadband to consumers. The amaysim Group is the fourth largest independent mobile services provider in Australia.
Former directorships (last 3 years): None
Special responsibilities: Chair of the Audit Committee and the People and Organisation Committee.
Interests in shares: Maria has a relevant interest in 10,000 (2016: 10,000) ordinary shares.
Interests in rights: None
16 DIRECTORS’ REPORT // 29 JULY 2017

ANNUAL REPORT 2017 // WWW.OROTONGROUP.COM
18
‘Other current directorships’ quoted above are current directorships for listed entities only and excludes directorships in all other types of entities, unless otherwise stated.
‘Former directorships (in the last 3 years)’ quoted above are directorships held in the last 3 years for listed entities only and excludes directorships in all other types of entities, unless otherwise stated.
Company secretaryVanessa De Bono was appointed company secretary in May 2015. She is a Chartered Accountant with over 20 years experience in senior financial positions in the luxury apparel and accessories industry. Vanessa started her career with Pricewaterhouse in Australia, held senior finance roles at L’Oreal Luxury Group Australia and prior to joining OrotonGroup she spent 11 years with Louis Vuitton, initially as Finance Director of Louis Vuitton Oceania and most recently as Chief Financial Officer of Louis Vuitton China.
Meetings of directorsThe number of meetings of the company’s Board of Directors (‘the Board’) and of each Board committee held during the year ended 29 July 2017, and the number of meetings attended by each director were:
Full Board Audit CommitteePeople and Organisation
Committee
Scheduled meetings 10 4 4
Unscheduled 33 - -
Attended Held Attended Held Attended Held
John P Schmoll 43 43 4 4 4 4
Mark Newman 7 7 - - - -
Maria Martin 43 43 4 4 4 4
Ross B Lane 42 43 - - 2 3
J Will Vicars 8 9 2 3 - -
Held: represents the number of meetings held during the time the director held office or was a member of the relevant committee.
Loans to directors and executivesThere have not been any loans made to directors of OrotonGroup Limited or any other key management personnel of the consolidated entity, including their personally related parties, for the 2017 and 2016 years.
Shares under performance rightsUnissued ordinary shares of OrotonGroup Limited under performance rights at the date of this report are as follows:
Grant date Expiry dateExercise
priceNumber
under rights
9 October 2015 18 September 2020 $0.00 153,228
21 October 2016 20 September 2020 $0.00 115,460
21 October 2016 18 September 2021 $0.00 115,460
384,148
No person entitled to exercise the performance rights had or has any right by virtue of the performance right to participate in any share issue of the company or of any other body corporate.
18DIRECTORS’ REPORT // 29 JULY 2017

ANNUAL REPORT 2017 // WWW.OROTONGROUP.COM
19
Shares under retention rightsUnissued ordinary shares of OrotonGroup Limited under retention rights at the date of this report are as follows:
Grant date Expiry dateExercise
priceNumber
under rights
9 January 2015 19 September 2019 $0.00 35,892
9 October 2015 19 September 2019 $0.00 60,000
95,892 No person entitled to exercise the retention rights had or has any right by virtue of the retention right to participate in any share issue of the company or of any other body corporate.
Indemnity and insurance of officersThe company has indemnified the directors and officers of the company on a full indemnity basis and to the full extent permitted by law, against all losses or liabilities incurred by the director or officer, in their capacity as a director or officer.
During the financial year, the company paid a premium in respect of a contract to insure the directors and officers of the company against a liability to the extent permitted by the Corporations Act 2001. The contract of insurance prohibits disclosure of the nature of liability and the amount of the premium.
Indemnity and insurance of auditorThe company has not, during or since the financial year, indemnified or agreed to indemnify the auditor of the company or any related entity against a liability incurred by the auditor.
During the financial year, the company has not paid a premium in respect of a contract to insure the auditor of the company or any related entity.
Proceedings on behalf of the companyNo person has applied to the Court under section 237 of the Corporations Act 2001 for leave to bring proceedings on behalf of the company, or to intervene in any proceedings to which the company is a party for the purpose of taking responsibility on behalf of the company for all or part of those proceedings.
Non-audit servicesDetails of the amounts paid or payable to the auditor for non-audit services provided during the financial year by the auditor are outlined in note 36 to the financial statements.
The directors are satisfied that the provision of non-audit services during the financial year, by the auditor (or by another person or firm on the auditor’s behalf), is compatible with the general standard of independence for auditors imposed by the Corporations Act 2001. The directors are of the opinion that the services as disclosed in note 36 to the financial statements do not compromise the external auditor’s independence requirements of the Corporations Act 2001 for the following reasons:• all non-audit services have been reviewed and approved to ensure that they do not impact the integrity and objectivity
of the auditor; and• none of the services undermine the general principles relating to auditor independence as set out in APES 110 Code
of Ethics for Professional Accountants issued by the Accounting Professional and Ethical Standards Board, including reviewing or auditing the auditor’s own work, acting in a management or decision-making capacity for the company, acting as advocate for the company or jointly sharing economic risks and rewards.
Rounding of amountsThe company is of a kind referred to in Corporations Instrument 2016/191, issued by the Australian Securities and Investments Commission, relating to ‘rounding-off’. Amounts in this report have been rounded off in accordance with that Corporations Instrument to the nearest thousand dollars, or in certain cases, the nearest dollar.
18 DIRECTORS’ REPORT // 29 JULY 2017

ANNUAL REPORT 2017 // WWW.OROTONGROUP.COM
20
Auditor’s independence declarationA copy of the auditor’s independence declaration as required under section 307C of the Corporations Act 2001 is set out on page 35.
AuditorPricewaterhouseCoopers Australia continues in office in accordance with section 327 of the Corporations Act 2001.
This report is made in accordance with a resolution of directors, pursuant to section 298(2)(a) of the Corporations Act 2001.
On behalf of the directors
John P SchmollNon-Executive Chairman
28 September 2017 Sydney
20DIRECTORS’ REPORT // 29 JULY 2017

ANNUAL REPORT 2017 // WWW.OROTONGROUP.COM
2121
Letter from the Chair of the People and Organisation Committee
Dear Shareholders
On behalf of the Board, I am pleased to present OrotonGroup Limited’s 2017 remuneration report and importantly, I would like to begin by acknowledging the challenging year we have faced operationally. Whilst the year began encouragingly, with like for like sales positive for both Oroton and Gap brands at this time last year, this was outweighed by sluggish sales in a much publicised, highly discounted and soft retail market in key sales periods from Boxing Day onwards. This together with currency headwinds, lower sales volumes in Oroton factory outlets, increased Gap losses and discontinued Oroton product categories, has resulted in significant falls across all of the Group’s key financial metrics. The above events and circumstances have had significant remuneration consequences in the year ended 29 July 2017, with no short term incentives paid to key executives, and all long term incentives either lapsing without vesting or being assigned a zero probability of vesting.
Amidst these challenging retail conditions, we welcomed Ross Lane as Interim Managing Director and CEO on 11 April 2017, promoted Vanessa De Bono to Chief Financial and Operating Officer (“CFOO”) and launched a Strategic Review for the Company.
It has been busy strategically both during the year and post year end with:
• the acquisition of a 31.4% interest in TDE Pty Limited, a rapidly growing Australian lifestyle fashion accessories brand with more than 50% of revenue generated from online sales;
• the termination of the Australian Gap franchise agreement;• in principle agreements with major Gap store lessors to exit the Gap store lease contracts, targeting Gap store closures
by 31 January 2018; and• arrangement of credit support to facilitate the extension of the Group’s financing facilities.
The Committee and Board recognises the continued strong performance by Key Executives, juggling both operational and strategic initiatives which are important milestones for the Group, as it focuses on the future strategy for our iconic Oroton brand and explores various strategic options for the future. In these circumstances, a conditional retention benefit was granted to the CFOO on 14 June 2017.
The Board is committed to the alignment of our executive remuneration with the creation of long term value for our shareholders. We hope that this Remuneration Report sets out clearly both how and why we incentivise the Executives of our Company. Please contact us directly if you have suggestions for improvements in how we do so.
Yours sincerely,
Maria MartinChair of the People and Organisation Committee
20 REMUNERATION REPORT // 29 JULY 2017

ANNUAL REPORT 2017 // WWW.OROTONGROUP.COM
22
The Directors of OrotonGroup present the Remuneration Report for the company and its controlled entities for the year ended 29 July 2017 (FY17). The report forms part of the Directors’ Report and has been audited in accordance with the Corporations Act 2001 except where otherwise stated.
The report is set out under the following sections:
Remuneration 1. Who this report covers 2. Remuneration Strategy, Governance and Policy 3. Executive remuneration outcomes FY17 4. Details of remuneration
Other information 5. Service agreements 6. Share-based compensation 7. Additional information
Remuneration
1. Who this report coversThe report sets out the remuneration information for the company’s Executive Key Management Personnel (KMP) and Non- Executive Directors, all of whom are accountable for planning, directing and managing the affairs of the company and its controlled entities. The Directors and KMP in office during the financial year were as follows:
Non- Executive DirectorsJohn P Schmoll - ChairmanRoss B Lane (Non-Executive Director to 10 April 2017) Maria MartinJ Will Vicars (resigned 23 May 2017)
Executive DirectorMark Newman - Managing Director and CEO (resigned 11 April 2017)Ross B Lane - Interim Managing Director and CEO (appointed 11 April 2017)
Other Key Management PersonnelVanessa De Bono - Company Secretary and Chief Financial and Operating Officer (CFOO)
In this Report, Executive Directors and other Key Management Personnel are collectively referred to as “Executives”.
2. Remuneration Strategy, Governance and PolicyThe Board is responsible for determining remuneration for Executives of the Group and Non-Executive Directors, and is advised by the People and Organisation Committee. This committee provides independent advice on remuneration, incentive policies and practices and specific recommendations on remuneration packages for Directors and senior Executives. Further information on the role of the People and Organisation Committee can be found in the Corporate Governance Statement which can be viewed at www.orotongroup.com.au/investor-relations/corporate-governance.
During the financial year ended 29 July 2017, the People and Organisation Committee engaged in periodic discussions withexternal advisors on remuneration strategy and issues, however it did not receive any formal remuneration recommendations from remuneration consultants.
The objective of the Group’s reward strategy is to ensure competitive compensation levels that attract and retain skilled and relevant talent to the Group and align remuneration with OrotonGroup’s strategy.
OrotonGroup is committed to an Executive remuneration framework that is focused on:
• Driving a performance culture• Linking executive pay to the achievement of the Group’s strategy and business objectives.
22REMUNERATION REPORT // 29 JULY 2017

ANNUAL REPORT 2017 // WWW.OROTONGROUP.COM
23
The overriding objective is to provide satisfactory returns to shareholders and the remuneration principles are focussed on driving the leadership performance and behaviours consistent with achieving this objective.
2.1 Non-Executive Director RemunerationFees and payments to Non-Executive Directors and the Chairman are fixed and reflect the responsibilities and demands of their roles. There are no performance-related elements. These fees and payments are reviewed annually by the Board.
The pool for Non-Executive Directors’ fees is capped at $700,000, as approved by shareholders at the 2010 Annual General Meeting. Non-Executive Directors with duties of chairing a committee receive additional fees.
Non-Executive Directors and Chairman Fees were reviewed in September 2017. Prior to this review, the last review had been in 2014, when aggregate Non-Executive Director and Chairman fees were reduced by $100,000. After considering benchmark fees paid to other listed Non-Executive Directors and Chairman, fees were increased in aggregate by $39,000 per annum, effective from 1 October 2016. The total Non-Executive and Chairman fees paid by the Company on an annual basis remains significantly below the cap agreed by Shareholders in 2010. The table below shows the annual fees (including superannuation and excluding non-monetary benefits) before and after this change:
2017 2016
From 1 October 2016$
To 30 September 2016 $ $
Base fee for Non-Executive Chairman 170,000 160,000 160,000
Base fee for Non-Executive Director 90,000 84,000 84,000
Additional fees for Audit Committee Chair 20,000 12,000 12,000
Additional fees for People and Organisation Committee Chair 15,000 12,000 12,000
Effective from 15 May 2017, and in accordance with the Constitution, the Board agreed a temporary special exertion fee of $1,500 per week be paid to Non-Executive Director Maria Martin for special exertion as a consequence of the Strategic Review process, considered over and above her normal duties. The additional fee will continue until the completion of the Strategic Review process.
2.2 Executive RemunerationOur Executive remuneration framework has historically been comprised of fixed annual remuneration, short-term incentives and long-term incentives (LTI’s). During the current period Ross Lane, a Non-Executive Director, was appointed Interim Managing Director and CEO. The Board decided no LTI would be provided to Ross Lane in his executive role, and his total target remuneration was set at a lower level than the prior CEO’s total target remuneration excluding LTI’s.
The graphs below show the mix of these components as a percentage of total target annual remuneration for the 2017 financial year. The former CEO’s graph of total remuneration shown below has been illustrated on a comparable basis to the Interim CEO’s graph, and excludes any potential LTI, as the former CEO’s 2017 LTI entitlement was cancelled during the year. The actual results are included in Section 4.
Company Secretary and CFOO
Former Executives
Fixed Remuneration (FR)
Target Bonus (STI)
Performance Rights (LTI)
Interim Managing Director and CEO
Current Executives
Managing Director and CEO
22%33%
22%56%
67%
33%
67%
22 REMUNERATION REPORT // 29 JULY 2017

ANNUAL REPORT 2017 // WWW.OROTONGROUP.COM
24
2.2.1 Fixed Remuneration (FR)Base pay and benefitsBase pay is structured as a total employment cost package including superannuation which may be delivered as a combination of cash and prescribed non-financial benefits.
Base pay for Executives is reviewed annually, and on promotion, to ensure the pay is competitive with the market. Fixed remuneration increases are based on merit or where there has been a material change in role or responsibility or the market rate for comparable roles. A summary of actual fixed versus at risk pay for each Executive appears in section 4.
SuperannuationRetirement benefits are delivered to the employee’s choice of Superannuation Fund. The company has no interest or ongoing liability to the fund or the employee in respect of retirement benefits.
2.2.2 At Risk RemunerationShort-term incentives (STI)OrotonGroup operates short-term cash incentive (STI) programs that reward Executives for the achievement of predetermined key performance indicators (KPIs) established for each financial year, according to the accountabilities of his/her role and its impact on the organisation’s performance. The Chair of the Board in conjunction with the People and Organisation Committee is responsible for assessing whether the KPIs are met. In exceptional circumstances, discretionary bonuses may be recommended for Executives to the Board by the People and Organisation Committee.
The table below provides a snapshot of the Group’s Executive STI framework and key KPIs for permanent employees. The target and maximum STI for these employees have remained unchanged from the prior period. Other strategic KPI’s drive leadership performance and behaviours consistent with achievement of the Group’s strategy and creation of short to medium term benefits for shareholders. This ensures that the total STI is a variable annual incentive, where challenging performance measures are set to incentivise superior performance. A minimum FY17 EBIT achievement of 80% of target EBIT was required before management was entitled to receive any STI. Achievement of EBIT targets is assessed based on comparison of targets to audited accounts of the Company.
ExecutiveProfit KPI –
70% weightingOther Strategic KPI –
30% weighting At risk Weight*
Vanessa De Bono Group EBIT • Supply Chain and Logistics• Improved gross margin and like for like sales• Gap online store
Target40% of FRMaximum:54% of FR
Mark Newman (resigned 11 April 2017)
Group EBIT • Improved gross margin and like for like sales• Channel mix • Product development and marketing
Target 50% of FRMaximum
68% of FR
• “Target” relates to the available STI on achievement of the Profit KPI and Other Strategic KPI; this could be increased to the “Maximum” STI if the EBIT target in the Profit KPI is overachieved.
Ross Lane was appointed Interim Managing Director and CEO on 11 April 2017, with a target and maximum short-term incentive of 50% of his fixed remuneration, on a pro-rata basis for the period he remains in the role. The short-term incentive objectives during the interim period of Ross Lane’s appointment relate to repositioning the core Oroton business and driving an effective completion of the Group’s formal Strategic Review announced in May 2017. This short-term incentive will be assessed on completion of the strategic review.
Long-term incentives (LTI)The purpose of the long-term incentive plan is to reward Executives for the creation of shareholder value. The plan provides rewards to Executives who have a direct impact on the company’s performance against long-term performance hurdles. Under the plan, incentives are delivered as performance rights, issued for nil consideration to participants. The primary hurdle for the performance rights is earnings per share (“EPS”). EPS was chosen as a performance hurdle because it ensures a strong link with the creation of shareholder value. LTIs generally have a three year term and are most commonly issued as performance rights.
Performance rights awards are based on 40-50% percent of the participant’s fixed annual remuneration. The number of
24REMUNERATION REPORT // 29 JULY 2017

ANNUAL REPORT 2017 // WWW.OROTONGROUP.COM
25
performance rights granted is calculated based on the face value of the shares, which is calculated as the company’s volume weighted average share price (VWAP) for a 7 day period prior to the grant of the award.
Performance Rights based on EPS hurdlesEPS represents the earnings per share from operations as reported in the audited accounts of OrotonGroup Limited. EPS hurdles are set by the Board based on the Group’s strategic financial plans.
Performance rights will vest and become exercisable if the EPS hurdles are satisfied for the relevant period. If the performance hurdle is not met or if the participant ceases to be employed by the company, any unvested performance rights will lapse unless otherwise determined by the Board. Board discretion is only applied in exceptional circumstances.
Retention rightsRetention rights are occasionally granted to Executives entitling them to a certain number of fully paid ordinary shares in the company provided they are still employed at a date predetermined by the Board. Retention rights will vest and become exercisable at the end of the vesting period if the participant remains employed and has not provided notice of resignation.
Other information relating to performance and retention rightsOrotonGroup operates the Oroton Performance Based Incentive Scheme (“Principle LTI Plan”). Under this plan, performance rights (excluding those awarded to the Managing Director) are recommended by the People and Organisation Committee and put to the Board for approval. Under the Principle LTI Plan, performance rights awarded to the Managing Director are recommended by the People and Organisation Committee to the Board and put to the OrotonGroup Limited for approval at the Annual General Meeting.
OrotonGroup also operates the Oroton Performance Based Incentive Plan (“Other LTI Plan”) which was established during FY15 with reference to new ASIC guidelines released in November 2014. Under the Other LTI Plan, grants may be awarded to the Managing Director without shareholder approval, provided they fall within the ASX listing rule requirement that should those performance rights under the Other LTI Plan vest, any shares transferred to a participant are purchased on market and not issued directly by OrotonGroup. No grants were made under the Other LTI plan during FY16 or FY17.
Shares provided to participants under performance and retention right grants are purchased on market by the OrotonGroup Share Plan Company. These shares are held in the OrotonGroup Trust when purchased until they are transferred to participants on the vesting of their performance and retention rights.
There are no cash alternatives to performance and retention rights. The rights cannot be transferred and are not quoted on the Australian Stock Exchange. Holders of rights are not entitled to notice of, or attend, a meeting of shareholders of the company, or receive any dividends declared by the company, until the rights have vested and are then converted into shares.
More information on the Oroton Long Term Incentive Schemes is set out in note 35 to the financial statements.
Details of the last five years earnings and total shareholders return appear in section 7 of this report.
3. Executive Remuneration outcomes FY17This section provides a summary of the key financial results for OrotonGroup and also how these results have been reflected in the Executive remuneration.
OrotonGroup Financial PerformanceThe table below sets out OrotonGroup’s financial performance
2017$’000
2016$’000 % change
EBIT (17,323) 6,214 -378.8%
EBITDA* (6,952) 12,917 -153.8%
NPAT (14,258) 3,443 -514.1%
EPS (cents) (34.68) 8.43 -511.4%
Underlying EBIT* (1,670) 7,857 -121.3%
Underlying EBITDA* 2,703 12,917 -79.1%
Underlying EPS (cents)* (8.15) 11.36 -171.7%
* Refer to Group and Underlying Results Section of the Operating and Financial Review for definition.
24 REMUNERATION REPORT // 29 JULY 2017

ANNUAL REPORT 2017 // WWW.OROTONGROUP.COM
26
Fixed RemunerationFixed executive remuneration was reviewed in September 2016 to ensure it remained competitive with the market. After considering benchmarks for comparable roles, Mark Newman and Vanessa De Bono received an increase to their fixed remuneration, effective from 1 October 2016. Prior to this review, the last review of fixed remuneration had been in 2014 for the CEO and 2015 for the CFO. Vanessa De Bono received a further fixed remuneration increase effective 16 May 2017 as a result of her promotion to Chief Financial and Operating Officer. Vanessa De Bono also continues in her role as the Group’s Company Secretary.
STI outcomesGiven the disappointing results for the FY17 financial year, no short-term incentives will be paid in respect of the current period. The performance of each Executive against their FY17 KPI’s is set out below. The total target STI for Executives is unchanged from the prior year, and the FY17 STI outcomes reflect the fact that the minimum EBIT target was missed in FY17 Refer Section 2 for details of STI framework.
Executive FY17 KPI’s
Target STI as a % of fixed
remunerationAwarded STI as a % of target STI
Forfeited STI as a % of target STI Actual STI
Ross Lane Strategic Objectives
50% 0% 100% -
Vanessa De Bono EBIT (70%) andother strategic
objectives (30%)
40% 0% 100% -
Mark Newman EBIT (70%) andother strategic
objectives (30%)
50% 0% 100% -
LTI outcomesDetails of the framework for LTI schemes are included in Section 2.
Rights granted, lapsed and or assigned a zero probability in the current period which have impacted statutory remuneration included in Section 4, are as follows:
• A total of 105,825 performance rights were granted to Executives with a performance condition based on FY17 EPS and a two year retention period to FY18 (of these rights, 66,875 were for the former CEO and were approved at the AGM). These rights were partially expensed during the period however since they have been assigned a vesting probability of zero, the associated expense was reversed. Mark Newman’s rights were forfeited upon his resignation (ref PR15, PR17); and
• A total of 105,825 performance rights were granted to Executives with a performance condition based on FY17 EPS and a three year retention period to FY19 (of these rights, 66,875 were for the former CEO and were approved at the AGM). Mark Newman’s rights were partially expensed during the period, however due to his resignation, the associated expense was reversed (ref PR16, PR18).
500,000 performance rights granted to former CEO Mark Newman in FY15 were forfeited during the year due to Mark’s resignation. These rights had EPS and revenue performance conditions for FY17 of 58c and $254.5m respectively (200,000 rights) and for FY19 of 89c and $324m respectively (300,000 rights) based on the groups previous strategic plans. The lapsing of these rights had no impact on statutory remuneration in FY17 as they were previously assigned a zero probability of vesting (ref PR 9 & PR10).
Performance rights PR 14 granted to former CEO Mark Newman in FY16 were forfeited with his resignation on 10 April 2017. The FY16 EPS hurdle of 13.5c was not met. The lapsing of these rights had no impact on statutory remuneration in FY17 as they were previously assigned a zero probability of vesting.
References are to the relevant performance rights scheme, and further details are included in a summary table of all schemes outstanding in Section 6.
26REMUNERATION REPORT // 29 JULY 2017

ANNUAL REPORT 2017 // WWW.OROTONGROUP.COM
27
4. Details of remunerationExecutive take-home payThe following table summarises the take-home pay that has been realised by executives based on performance criteria being met. The amounts disclosed below are not the same as the remuneration expensed in relation to each executive in accordance with the accounting standards ($1,565,094 for 2017, see ‘Statutory Remuneration” section below) and do not comply with accounting standards. The directors believe that the remuneration included in this table may provide useful information because when calculating the statutory remuneration expense:
• Long Term Incentive (LTI) awards are expensed over the vesting period, based on their assessed value when originally granted. This expense may be significantly different to the LTI value if and when they vest to the executive;
• LTI amounts are included before they are actually received by the executives; and• In some circumstances, LTI amounts are recorded as statutory remuneration when no rights vest to the executive and in
other cases there can be negative remuneration from LTI’s in a given year due to non-vesting.
Executive
Fixed Pay: Salary and Super (a)
$Cash Bonus (a)
$
Long-term Incentives (b)
$
Other payments (c)
$Total
$
Ross Lane
2017* 190,357 - - - 190,357
2016 - - - - -
Mark Newman
2017** 479,538 - - 471,421 950,959
2016 658,737 130,000 - - 788,737
Vanessa De Bono
2017 445,820 - - - 445,820
2016 405,377 80,000 - - 485,377
*Ross Lane was appointed Interim Managing Director and CEO on 11 April 2017. These figures exclude any directors fees.
**Mark Newman resigned on 11 April 2017.
(a) Fixed pay: Salary and Super and Cash bonus are as per the statutory remuneration table below.
(b) Long Term Incentive figures represent the actual value of performance and retention rights realised in relation to the 2016 and 2017 financial years. No performance conditions were completely satisfied in relation to performance or retention rights during these financial years. Details of LTI awards expense calculated in accordance with accounting standards is included below and described as ‘Statutory Remuneration’.
(c) Other payments are comprised of contractual benefits to Mark Newman on resignation as per the Statutory remuneration table below, and actual cash payments for long service entitlements paid on resignation and exclude any previous long service leave accruals in the statutory accounts.
26 REMUNERATION REPORT // 29 JULY 2017
ANNUAL REPORT 2017 // WWW.OROTONGROUP.COM
28
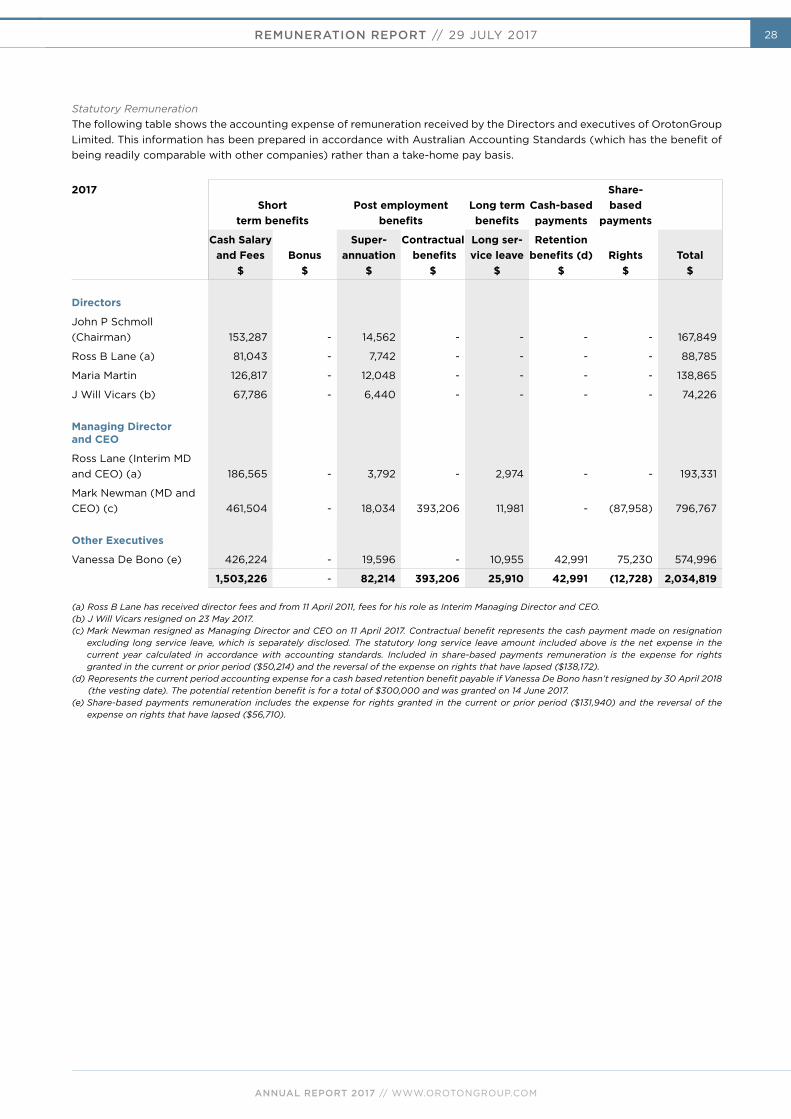
Statutory RemunerationThe following table shows the accounting expense of remuneration received by the Directors and executives of OrotonGroup Limited. This information has been prepared in accordance with Australian Accounting Standards (which has the benefit of being readily comparable with other companies) rather than a take-home pay basis.
2017Short
term benefitsPost employment
benefitsLong term benefits
Cash-based payments
Share-based
payments
Cash Salary and Fees
$Bonus
$
Super- annuation
$
Contractual benefits
$
Long ser-vice leave
$
Retention benefits (d)
$Rights
$Total
$
Directors
John P Schmoll (Chairman) 153,287 - 14,562 - - - - 167,849
Ross B Lane (a) 81,043 - 7,742 - - - - 88,785
Maria Martin 126,817 - 12,048 - - - - 138,865
J Will Vicars (b) 67,786 - 6,440 - - - - 74,226
Managing Director and CEO
Ross Lane (Interim MD and CEO) (a) 186,565 - 3,792 - 2,974 - - 193,331
Mark Newman (MD and CEO) (c) 461,504 - 18,034 393,206 11,981 - (87,958) 796,767
Other Executives
Vanessa De Bono (e) 426,224 - 19,596 - 10,955 42,991 75,230 574,996
1,503,226 - 82,214 393,206 25,910 42,991 (12,728) 2,034,819
(a) Ross B Lane has received director fees and from 11 April 2011, fees for his role as Interim Managing Director and CEO.(b) J Will Vicars resigned on 23 May 2017.(c) Mark Newman resigned as Managing Director and CEO on 11 April 2017. Contractual benefit represents the cash payment made on resignation
excluding long service leave, which is separately disclosed. The statutory long service leave amount included above is the net expense in the current year calculated in accordance with accounting standards. Included in share-based payments remuneration is the expense for rights granted in the current or prior period ($50,214) and the reversal of the expense on rights that have lapsed ($138,172).
(d) Represents the current period accounting expense for a cash based retention benefit payable if Vanessa De Bono hasn’t resigned by 30 April 2018 (the vesting date). The potential retention benefit is for a total of $300,000 and was granted on 14 June 2017.
(e) Share-based payments remuneration includes the expense for rights granted in the current or prior period ($131,940) and the reversal of the expense on rights that have lapsed ($56,710).
28REMUNERATION REPORT // 29 JULY 2017

ANNUAL REPORT 2017 // WWW.OROTONGROUP.COM
29
2016Short
term benefits Post employment benefitsLong term benefits
Share-based payments
Name
Cash Salary and Fees
$Bonus
$
Super- annuation
$
Contractual benefits
$Long service
leave $Rights
$Total
$
Non-Executive Directors
John P Schmoll (Chairman) 148,083 - 14,068 - - - 162,151
Ross B Lane 77,743 - 7,386 - - - 85,129
Maria Martin (a) 96,256 - 9,144 - - - 105,400
J Will Vicars 77,743 - 7,386 - - - 85,129
Samuel S Weiss (a) 30,638 - 2,911 - - - 33,549
Executive Directors
Mark Newman (MD and CEO) (b) 639,144 130,000 19,593 - 10,652 (228,977) 570,412
Other Executives
Vanessa De Bono (c) 385,784 80,000 19,593 - 6,462 60,970 552,809
1,455,391 210,000 80,081 - 17,114 (168,007) 1,594,579
(a) Maria Martin was appointed chair of the People and Organisation Committee on 27 November 2015, following the retirement of Samuel S Weiss as Non-Executive Director and Chair of the People and Organisation Committee on this date.
(b) Share-based payments remuneration includes the expense for rights granted in the current or prior period ($177,150) and the reversal of the expense on rights that have lapsed or where vesting probability is zero ($406,127).
(c) Share-based payments remuneration includes the expense for rights granted in the current or prior period ($76,231) and the reversal of the expense on rights that have lapsed or where vesting probability is zero ($15,261).
28 REMUNERATION REPORT // 29 JULY 2017

ANNUAL REPORT 2017 // WWW.OROTONGROUP.COM
30
Other Information
5. Service agreementsOn appointment to the Board, all Non-Executive Directors enter into a service agreement with the company in the form of a letter of appointment. The letter summarises Board policies and terms, including compensation, relevant to the office of Director.
Remuneration and other terms of employment for all Executives are also formalised in service agreements. All contracts with Executives may be terminated early by either party subject to notice periods and termination payments as detailed below.
Name Term of agreementBase salary including superannuation (a)
Termination benefit (b)
Mark NewmanManaging Director and CEO(until 11 April 2017)
Agreement terminated on 11 April 2017
$690,000 6 months base salary
Ross B LaneInterim Managing Director and CEO
Ongoing commencing 11 April 2017, 3 month
notice period
$610,000 3 months base salary
Vanessa De BonoCompany Secretary and CFO(until 16 May 2017)
Agreement terminated on change of role on
16 May 2017
$435,000 3 months base salary
Vanessa De Bono Company Secretary and Chief Financial and Operating Officer (from 16 May 2017)
Ongoing commencing 16 May 2017, 6 month
notice period
$522,500 6 months base salary
(a) Base salaries quoted are for the year ended 29 July 2017; they are reviewed annually by the People and Organisation Committee.(b) Termination benefits are payable on early termination by the company, other than for gross misconduct, unless otherwise indicated.
30REMUNERATION REPORT // 29 JULY 2017

ANNUAL REPORT 2017 // WWW.OROTONGROUP.COM
31
6. Share-based compensation Issue of sharesNo shares were issued to directors or Executives during the financial year.
Performance rightsThe following table summarises the performance based Executive LTI awards in place during the financial year. All awards in this table are performance rights based on EPS targets and have a nil exercise price:
RefGrant date (a)
Vesting and exercisable date Expiry date
Grant recipient
Performance period (b)
Fair value per right at grant date Status
PR09 3 Dec 2014 19 Sept 2017 19 Sept 2019Mark
Newman FY15 - FY17 $3.24
Forfeited in FY17, FY16 vesting
probability zero
PR10 3 Dec 2014 17 Sept 2019 17 Sept 2021Mark
Newman FY15 - FY19 $3.11
Forfeited in FY17, FY16 vesting
probability zero
PR13 9 Oct 2015 18 Sept 2018 18 Sept 2020Vanessa De Bono FY16 - FY18 $2.20
FY17 & FY16 vestingprobability zero
PR14 27 Nov 2015 18 Sept 2018 18 Sept 2020Mark
Newman FY16 - FY18 $2.63
Forfeited in FY17, FY16 vesting
probability zero
PR15 21 Oct 2016 20 Sept 2018 20 Sept 2020Vanessa De Bono FY17 - FY18 $2.07
FY17 vesting probability zero
PR16 21 Oct 2016 19 Sept 2019 19 Sept 2021Vanessa De Bono FY17 - FY19 $1.99
FY16 vesting probability zero
PR17 1 Dec 2016 20 Sept 2018 20 Sept 2020Mark
Newman FY17 - FY18 $2.14
Forfeited in FY17, FY17 vesting
probability zero
PR18 1 Dec 2016 19 Sept 2019 19 Sept 2021Mark
Newman FY17 - FY19 $2.06
Forfeited in FY17, FY17 vesting
probability zero
(a) In some instances the grant date will not correlate to the beginning of the performance period. This includes additional rights granted for a performance period where the initial grant for the period has been assigned a vesting probability of zero.
(b) The performance period shows the year of grant followed by the year the LTI is assessed in. For example FY15-FY17 denotes an LTI granted during financial year 2015 that will vest after finalisation of FY17 results.
Performance rights granted carry no dividend or voting rights. For information relating to vesting hurdles, please refer to share-based payments note 35.
30 REMUNERATION REPORT // 29 JULY 2017

ANNUAL REPORT 2017 // WWW.OROTONGROUP.COM
32
Further details of performance rights granted, vested, assigned a vesting probability of zero, or lapsed for Executives during the year ended 29 July 2017 are set out below:
Name Ref Grant dateVesting and
exercisable date
Number of rights granted
Value of rights
granted during
the year*$
Number of rights vested during
the year
Number of rights lapsed or forfeited during
the year
Value of rights lapsed during
the year*$
Mark NewmanPR09
3 December 2014
19 September 2017 200,000 - - 200,000 324,000
PR103 December
201417 September
2019 300,000 - - 300,000 486,000
PR1427 November
201518 September
2018 135,983 - - 135,983 220,292
PR171 December
201620 September
2018 66,875 143,370 66,875 108,338
PR181 December
201620 September
2019 66,875 137,901 66,875 108,338
Vanessa De BonoPR15 21 October 2016
20 September 2018** 38,950 80,608 - - -
PR16 21 October 201620 September
2019** 38,950 77,533 - - -
* Value of rights granted during the year is based on the fair value at the time of grant. Value of rights lapsed during the year is based on the share price on the date the rights lapsed.
Retention share rightsThe following table summarises the retention share rights in place during the financial year. All awards have a nil exercise price.
Name Grant date
Vesting and exercisable
date
Fair value per right at grant
date
Number of rights granted
Value of rights
granted during the
year$
Number of rights vested during
the year
Number of rights lapsed during
the year
Value of rights lapsed
during the year
$
Mark Newman 9 January 2015
19 September 2017 $3.30 43,735 - - 43,735 $70,851
Vanessa De Bono 9 October 2015
19 September 2017 $2.27 60,000 - - - -
Retention rights granted carry no dividend or voting rights. For information relating to vesting hurdles, please refer to share- based payments note 35.
32REMUNERATION REPORT // 29 JULY 2017

ANNUAL REPORT 2017 // WWW.OROTONGROUP.COM
33
Shares and rights held by key management personnelThe table below shows the number of OrotonGroup shares owned and outstanding rights held by each Executive at 29 July 2017:
Name Shares Rights
Ross B Lane* 8,931,166 -
Vanessa De Bono** - 137,900
* Mr Robert Lane, Mr Ross Lane, Mr Tom Lane and Mrs Anna Hookway (nee Lane) entered into a Deed dated 21 October 2008 which requires them to act co-operatively with each other in relation to the consolidated entity’s affairs. Under this deed as at 29 July 2017, 8,931,166 ordinary shares are beneficially owned by Mr Robert Lane, Mr Ross Lane, Mr Tom Lane and Mrs Anna Hookway (nee Lane), or persons or entities associated with or controlled by them. See directors’ report page 12 for further information on the Lane Deed.
** Outstanding rights of 137,900 include 77,900 rights (PR15 & PR16) which have both been assigned a vesting probability of zero and 60,000 retention rights.
7. Additional InformationThe earnings of the consolidated entity for the five years to 29 July 2017 are summarised below:
Total Business
2013$’000
Continuing Business*
2013$’000
2014$’000
2015$’000
2016$’000
2017$’000
Sales revenue 185,104 99,421 123,911 130,785 135,493 123,205
EBITDA 47,930 16,846 18,756 10,889 12,917 (6,952)
EBIT 40,230 11,870 13,257 5,625 6,214 (17,323)
Profit after income tax 27,453 7,141 8,258 2,620 3,443 (14,258)
STI cash bonus paid at % of available target** 79% 79% 38% 36% 43% 0%
LTI achieved - - 35% - - -
*Continuing business shows the results of continuing operations only and excludes the Ralph Lauren discontinued business.**Short-term incentive targets include non-financial objectives; see section 4.2.2 for further details.
The factors that are considered to affect total shareholders return (‘TSR’) are summarised below:
2013 2014 2015 2016 2017
Share price at financial year end ($A) 7.19 4.72 1.91 2.28 1.10
Total dividends declared (cents per share) 50.00 16.00 6.50 9.00 -
Basic earnings per share (cents per share) 67.15 20.20 6.41 8.43 (34.68)
32 REMUNERATION REPORT // 29 JULY 2017

ANNUAL REPORT 2017 // WWW.OROTONGROUP.COM
34
OrotonGroup Limited (the “Consolidated Entity”) and the Board are committed to achieving and demonstrating the highest standard of corporate governance. The Consolidated Entity has reviewed its corporate governance practices against the Corporate Governance Principles and Recommendations (3rd Edition) published by the ASX Corporate Governance Council.
The 2017 Corporate Governance Statement is dated as at 29 July 2017 and reflects the corporate governance practices in place throughout the 2017 financial year. The 2017 Corporate Governance Statement was approved by the board on 28 September 2017. A description of the Consolidated Entity’s current corporate governance practices is set out in the Consolidated Entity’s Corporate Governance Statement which can be viewed at www.orotongroup.com.au/investor- relations/corporate-governance.
34CORPORATE GOVERNANACE STATEMENT // 29 JULY 2017

ANNUAL REPORT 2017 // WWW.OROTONGROUP.COM
35
Auditor’s Independence Declaration
As lead auditor for the audit of OrotonGroup Limited for the year ended 29 July 2017, I declare that to the best of my knowledge and belief, there have been:
(a) no contraventions of the auditor independence requirements of the Corporations Act 2001 inrelation to the audit; and
(b) no contraventions of any applicable code of professional conduct in relation to the audit.
This declaration is in respect of OrotonGroup Limited and the entities it controlled during the period.
Kristin Stubbins Sydney Partner PricewaterhouseCoopers
28 September 2017
PricewaterhouseCoopers, ABN 52 780 433 757 One International Towers Sydney, Watermans Quay, Barangaroo, GPO BOX 2650, SYDNEY NSW 2001 T: +61 2 8266 0000, F: +61 2 8266 9999, www.pwc.com.au
Liability limited by a scheme approved under Professional Standards Legislation.
34 AUDITOR’S INDEPENDENCE DECLARATION // 29 JULY 2017

ANNUAL REPORT 2017 // WWW.OROTONGROUP.COM
36
Consolidated
2017 2016
Note $’000 $’000
Revenue 5 123,205 136,439
Share of profits of associates accounted for using the equity method 23 -
Other income 202 106
Expenses
Cost of sales 3 (51,781) (54,408)
Warehouse and distribution (4,476) (3,723)
Marketing (3,794) (3,522)
Selling 3 (58,455) (56,613)
Administration 3 (22,184) (11,954)
Finance costs (371) (453)
Profit/(loss) before income tax benefit/(expense) (17,631) 5,872
Income tax benefit/(expense) 9 3,373 (2,429)
Profit/(loss) after income tax benefit/(expense) for the year attributable to the owners of OrotonGroup Limited (14,258) 3,443
Other comprehensive income/(loss)
Items that may be reclassified subsequently to profit or loss
Net change in the fair value of cash flow hedges taken to equity, net of tax 23 (3,224) (8,624)
Foreign currency translation 23 (184) (157)
Other comprehensive income/(loss) for the year, net of tax (3,408) (8,781)
Total comprehensive income/(loss) for the year attributable to the owners of OrotonGroup Limited (17,666) (5,338)
Cents Cents
Basic earnings per share 8 (34.68) 8.43
Diluted earnings per share 8 (34.68) 8.41
The above statement of profit or loss and other comprehensive income should be read in conjunction with the accompanying notes.
36STATEMENT OF PROFIT OR LOSS AND OTHER COMPREHENSIVE INCOME // YEAR ENDED 29 JULY 2017

ANNUAL REPORT 2017 // WWW.OROTONGROUP.COM
37
The above statement of financial position should be read in conjunction with the accompanying notes.
Consolidated
2017 2016
Note $’000 $’000Assets
Current assets
Cash and cash equivalents 1,634 2,816
Trade and other receivables 10 3,327 5,446
Inventories 11 35,467 30,656
Derivative financial instruments 24 - 989
Tax receivable 9 - 381
Total current assets 40,428 40,288
Non-current assets
Investments accounted for using the equity method 12 6,812 -
Property, plant and equipment 13 5,291 10,814
Intangibles 14 1,183 1,070
Deferred tax 9 8,515 3,542
Other financial assets 20 46 -
Total non-current assets 21,847 15,426
Total assets 62,275 55,714
Liabilities
Current liabilities
Trade and other payables 15 16,154 12,334
Borrowings 16 7,000 -
Derivative financial instruments 24 6,777 -
Income tax 9 144 -
Provisions - current 17 8,697 1,007
Total current liabilities 38,772 13,341
Non-current liabilities
Other payables 18 660 -
Derivative financial instruments 24 - 1,398
Provisions - non-current 19 3,016 5,259
Other financial liabilities 20 1,143 -
Total non-current liabilities 4,819 6,657
Total liabilities 43,591 19,998
Net assets 18,684 35,716
Equity
Issued capital 22 24,005 22,175
Reserves 23 (5,948) (2,565)
Retained profits 627 16,106
Total equity 18,684 35,716
36 STATEMENT OF FINANCIAL POSITION // AS AT 29 JULY 2017

ANNUAL REPORT 2017 // WWW.OROTONGROUP.COM
38
The above statement of changes in equity should be read in conjunction with the accompanying notes.
Issued capital Reserves Retained profits Total equity
$’000 $’000 $’000 $’000
Consolidated
Balance at 26 July 2015 22,523 6,420 15,933 44,876
Profit after income tax expense for the year - - 3,443 3,443
Other comprehensive income/(loss) for the year, net of tax - (8,781) - (8,781)
Total comprehensive income/ (loss) for the year - (8,781) 3,443 (5,338)
Transactions with owners in their capacity as owners:
Share buy-back (348) - - (348)
Net movement in share-based payments reserve - (204) - (204)
Dividends paid (note 7) - - (3,270) (3,270)
Balance at 30 July 2016 22,175 (2,565) 16,106 35,716
Issued capital Reserves Retained profits Total equity
$’000 $’000 $’000 $’000
Consolidated
Balance at 31 July 2016 22,175 (2,565) 16,106 35,716
Loss after income tax benefit for the year - - (14,258) (14,258)
Other comprehensive income/(loss) for the year, net of tax - (3,408) - (3,408)
Total comprehensive income/(loss) for the year - (3,408) (14,258) (17,666)
Transactions with owners in their capacity as owners:
Contributions of equity, net of transaction costs (note 22) 1,830 - - 1,830
Net movement in share-based payments reserve - 25 - 25
Dividends paid (note 7) - - (1,221) (1,221)
Balance at 29 July 2017 24,005 (5,948) 627 18,684
STATEMENT OF CHANGES IN EQUITY // FOR THE YEAR ENDED 29 JULY 2017 38

ANNUAL REPORT 2017 // WWW.OROTONGROUP.COM
39
Consolidated
2017 2016
Note $’000 $’000
Cash flows from operating activities
Receipts from customers (inclusive of GST) 134,548 151,873
Payments to suppliers and employees (inclusive of GST) (135,567) (134,867)
(1,019) 17,006
Interest received 6 4
Interest and other finance costs paid (371) (453)
Income taxes refunded/(paid) 307 (2,732)
Net cash (used in)/from operating activities 21 (1,077) 13,825
Cash flows from investing activities
Payment for expenses relating to investments (532) -
Payment for investments accounted for using the equity method (2,670) -
Repayment of loan from Brooks Brothers International, LLC 2,250 1,000
Payments for property, plant and equipment 13 (4,018) (1,859)
Payments for software 14 (948) (827)
Proceeds from release of security deposits 34 145
Net cash used in investing activities (5,884) (1,541)
Cash flows from financing activities
Proceeds from borrowings 27,500 11,000
Payments for share buy-backs - (348)
Dividends paid 7 (1,221) (3,270)
Repayment of borrowings (20,500) (19,000)
Shares purchased through employee share trust 23 - (31)
Net cash from/(used in) financing activities 5,779 (11,649)
Net (decrease)/increase in cash and cash equivalents (1,182) 635
Cash and cash equivalents at the beginning of the financial year 2,816 2,181
Cash and cash equivalents at the end of the financial year 1,634 2,816
The above statement of cash flows should be read in conjunction with the accompanying notes.
STATEMENT OF CASH FLOWS // FOR THE YEAR ENDED 29 JULY 201738

ANNUAL REPORT 2017 // WWW.OROTONGROUP.COM
4040
Note 1. Significant accounting policies The principal accounting policies adopted in the preparation of the financial statements are set out either in the respective notes or below. These policies have been consistently applied to all the years presented, unless otherwise stated. Basis of preparationThese general purpose financial statements have been prepared in accordance with Australian Accounting Standards and Interpretations issued by the Australian Accounting Standards Board (‘AASB’) and the Corporations Act 2001, as appropriate for for-profit oriented entities. These financial statements also comply with International Financial Reporting Standards as issued by the International Accounting Standards Board (‘IASB’).
The current accounting period is for the 52 weeks ended 29 July 2017 and the comparative accounting period is for the 53 weeks ended 30 July 2016.
The financial statements have been prepared under the historical cost convention, except for, where applicable, certain classes of property, plant and equipment and derivative financial instruments.
Going concernThe financial statements of the consolidated entity have been prepared on a going concern basis which contemplates the realisation of assets and the discharge of liabilities in the ordinary course of business.
During the year ended 29 July 2017, the consolidated entity incurred a loss after income tax for the year of $14,258,000 (2016: profit after income tax of $3,443,000) and an EBITDA loss of $6,952,000 (2016: EBITDA profit of $12,917,000). Net cash outflows from operating activities were $1,077,000 (2016: net cash inflows of $13,825,000).
Significant items which impacted the FY17 EBITDA results include expenses recognised due to the termination of the Gap Franchise Agreement of $8,847,000, a decline in Gap trading performance of $3,459,000, and a decline in Oroton EBITDA of $6,992,000 and significant other corporate costs of $831,000 compared to the prior period. The consolidated entity also recognised non-cash fixed asset impairments of $2,333,000 in Gap and $3,541,000 in Oroton.
As at 29 July 2017, the consolidated entity had cash and cash equivalents of $1,634,000 (2016: $2,816,000) and current borrowings of $7,000,000 (2016: $nil). Borrowings and $2,320,000 of derivative financial liabilities which relate to the 2019 financial year were classified as current at year end as the related facility amendment extending maturity was signed after year end on 31 July 2017.
On 31 July 2017 the consolidated entity executed a facility amendment agreement to allow continuing use of its existing $35,000,000 facility and an extension of maturity to 5 October 2018 from 16 April 2018 for the $31,000,000 working capital and trade finance facilities. The $4,000,000 bank overdraft facility continues to be repayable and terminable on demand. As part of this amendment, entities controlled by Mr J Will Vicars (Vicars Entities) entered into a put and call arrangement with the financier to provide critical credit support to 16 April 2018. Refer Note 37 for further details. The conditions of this facility were varied, prior to and post 29 July 2017 due to a potential default which was reset and an actual default which was promptly waived.
The current conditions of this facility require the consolidated entity to complete certain Gap closure milestones with Gap Inc and Gap landlords. The Gap closure milestones have been achieved with Gap Inc and Gap landlords, subject to the execution of legally binding documents with Gap landlords – refer note 37. Other current conditions of this facility have been or are expected to be achieved.
The consolidated entity has prepared a detailed cash flow forecast for the next 12 months beyond the date of signing this report, which supports the consolidated entity’s ability to continue as a going concern. The consolidated entity uses best estimate assumptions in the development of cash flow forecasts. The ability of the consolidated entity to satisfy its banking covenants and operate within the facility limits, and therefore retain access to existing bank facilities for the next twelve months is subject to key assumptions, including:
• achievement of the Company’s budget for the year ended 28 July 2018, particularly forecast Oroton sales, forecast Gap revenues and costs related to the wind down of Gap stores targeted for completion by 31 January 2018 and forecast costs related to the ongoing Strategic Review previously announced;
NOTES TO THE FINANCIAL STATEMENTS // 29 JULY 2017 40

ANNUAL REPORT 2017 // WWW.OROTONGROUP.COM
41
Note 1. Significant accounting policies (continued)
• ongoing availability of the consolidated entity’s $4,000,000 bank overdraft facility; and
• that the existing bank facilities will continue in accordance with their terms following any exercise of the put and call option in respect of them.
In the event there are significant variations from these assumptions, the consolidated entity considers that it has options available to meet its obligations including sourcing additional or alternate funding or terms from financiers and shareholders.
The consolidated entity also continues to progress various Strategic Processes as previously announced, which may include a sale, recapitalisation and/or refinancing of debt facilities. The progression of the Strategic Processes continues to be a key priority and is aimed at maximising value and creating options for the Company and its stakeholders. Whilst the consolidated entity continues to engage with interested parties and invite additional parties to participate in the process, there is no certainty this process will result in a proposal or transaction for OrotonGroup.
As a result of these matters, there is a material uncertainty that may cast significant doubt on the consolidated entity’s ability to continue as a going concern and therefore the consolidated entity may be unable to realise its assets and discharge its liabilities in the ordinary course of business.
At this time, having regard to the matters set out above, the Directors consider that it is reasonable to expect that the Group will be successful in the above matters and, accordingly, have prepared the consolidated financial statements on a going concern basis in the belief that the Group will realise their assets and settle their liabilities and commitments in the normal course of business and for at least the amounts stated in the financial report. No adjustments have been made to the financial report relating to the recoverability and classification of the asset carrying amounts or the amounts and classification of liabilities that might be necessary should the Group not continue as a going concern.
Principles of consolidationThe consolidated financial statements incorporate the assets and liabilities of all subsidiaries of OrotonGroup Limited (‘company’ or ‘parent entity’) as at 29 July 2017 and the results of all subsidiaries for the year then ended. OrotonGroup Limited and its subsidiaries together are referred to in these financial statements as the ‘consolidated entity’.
Subsidiaries are all those entities over which the consolidated entity has control. The consolidated entity controls an entity when the consolidated entity is exposed to, or has rights to, variable returns from its involvement with the entity and has the ability to affect those returns through its power to direct the activities of the entity.
The consolidated entity utilises a trust to administer the consolidated entity’s employee share scheme. The trust is consolidated into the consolidated entity. Treasury shares acquired by the trust are recorded in the share-based payment trust reserve. Information relating to these shares is disclosed in note 23.
Intercompany transactions, balances and unrealised gains on transactions between entities in the consolidated entity are eliminated. Unrealised losses are also eliminated unless the transaction provides evidence of the impairment of the asset transferred. Accounting policies of subsidiaries are consistent with the policies adopted by the consolidated entity.
Rounding of amountsThe company is of a kind referred to in Corporations Instrument 2016/191, issued by the Australian Securities and Investments Commission, relating to ‘rounding-off’. Amounts in this report have been rounded off in accordance with that Corporations Instrument to the nearest thousand dollars, or in certain cases, the nearest dollar.
Cash and cash equivalentsCash and cash equivalents includes cash on hand, deposits held at call with financial institutions, other short-term, highly liquid investments with original maturities of three months or less that are readily convertible to known amounts of cash and which are subject to an insignificant risk of changes in value.
Foreign currency translationThe financial statements are presented in Australian dollars, which is OrotonGroup Limited’s functional and presentation currency. Foreign currency transactionsForeign currency transactions are translated into Australian dollars using the exchange rates prevailing at the dates of the transactions. Foreign exchange gains and losses resulting from the settlement of such transactions and from the translation of assets and liabilities denominated in foreign currencies at financial year end are recognised in profit or loss.
NOTES TO THE FINANCIAL STATEMENTS // 29 JULY 201740

ANNUAL REPORT 2017 // WWW.OROTONGROUP.COM
4242
Note 1. Significant accounting policies (continued)
Foreign operationsThe assets and liabilities of foreign operations are translated into Australian dollars using the exchange rates at the reporting date. The revenues and expenses of foreign operations are translated into Australian dollars using the average exchange rates, which approximate the rates at the dates of the transactions. All resulting foreign exchange differences are recognised in other comprehensive income through the foreign currency reserve in equity. The foreign currency reserve is recognised in profit or loss when the foreign operation or net investment is disposed of.
Investments and other financial assetsInvestments and other financial assets are initially measured at fair value. Transaction costs are included as part of the initial measurement, except for financial assets at fair value through profit or loss. They are subsequently measured at either amortised cost or fair value depending on their classification. Classification is determined based on the purpose of the acquisition and subsequent reclassification to other categories is restricted.
Financial assets are derecognised when the rights to receive cash flows from the financial assets have expired or have been transferred and the consolidated entity has transferred substantially all the risks and rewards of ownership.
Loans and receivablesLoans and receivables are non-derivative financial assets with fixed or determinable payments that are not quoted in an active market. They are carried at amortised cost using the effective interest rate method. Gains and losses are recognised in profit or loss when the asset is derecognised or impaired. New or amended Accounting Standards and Interpretations adoptedCertain new and amended Australian Accounting Standards and Interpretations have been published that are not mandatory for the period ended 29 July 2017. The consolidated entity’s assessment of the net impact of these new standards and interpretations is outlined below:
AASB 9 Financial InstrumentsAASB 9 replaces AASB 139 and addresses the classification, measurement and derecognition of financial assets and financial liabilities. It also addresses the new hedge accounting requirements, including changes to hedge effectiveness testing, treatment of hedging costs and risk components that can be hedged.
AASB 9 introduces a new expected-loss impairment model that will require entities to account for expected credit losses at the time of recognising the asset.
The consolidated entity does not expect the adoption of the new standard to have a material impact on its classification and measurement of financial assets and financial liabilities, its hedging arrangements or its results.
The consolidated entity has decided not to early adopt AASB 9.
AASB 15 Revenue from contracts with customersThe AASB has issued a new standard for the recognition of revenue. This will replace AASB 118 which covers revenue arising from the sale of goods the rendering of services and AASB 111 which covers construction contracts.
The new standard is based on the principle that revenue is recognised when control of a good or service transfers to a customer.
The consolidated entity has identified the following areas that are likely to be affected:
Rights of return: AASB 15 requires separate presentation on the balance sheet of the right to recover goods from a customer and the refund obligation.
The consolidated entity is still currently evaluating the impact of the new standard. The standard permits either a full retrospective or a modified retrospective approach for adoption. The consolidated entity has decided not to early adopt AASB 15. AASB 16 LeasesAASB 16 will result in the recognition of almost all leases on the statement of financial position, as the distinction between operating leases and financing leases is removed. Under the new standard, an asset (the right to use the leased item) and a financial liability for future payments are recognised. The only exceptions are short-term and low-value leases.
NOTES TO THE FINANCIAL STATEMENTS // 29 JULY 2017 42

ANNUAL REPORT 2017 // WWW.OROTONGROUP.COM
43
Note 1. Significant accounting policies (continued)
Given the number of retail stores and warehouses the consolidated entity leases under operating leases, and the non- cancellable operating lease commitments held by the consolidated entity at 29 July 2017 of $36,322,000, it is expected that the impact of this standard will be significant. However, the consolidated entity has not yet determined to what extent these commitments will result in the recognition of an asset and a liability for future payments and how this will affect the consolidated entity’s statement of profit or loss and classification of cash flows.
Due to the timing of issue of the new standard, the consolidated entity is still currently evaluating the impact of the new standard. The consolidated entity has decided not to early adopt AASB 16.
There are no other standards that are not yet effective and that would be expected to have a material impact on the entity in the current or future reporting periods and on foreseeable future transactions.
Note 2. Critical accounting judgements, estimates and assumptions The preparation of the financial statements requires management to make judgements, estimates and assumptions that affect the reported amounts in the financial statements. Management continually evaluates its judgements and estimates in relation to assets, liabilities, contingent liabilities, revenue and expenses. Management bases its judgements, estimates and assumptionson historical experience and on other various factors, including expectations of future events, management believes to be reasonable under the circumstances. The resulting accounting judgements and estimates will seldom equal the related actual results. The judgements, estimates and assumptions that have a significant risk of causing a material adjustment to the carrying amounts of assets and liabilities within the next financial year are included in the following notes:
• 9. Income tax;• 11. Inventories;• 13. Property, plant and equipment;• 17. Provisions;• 35. Share-based payments; and• 37. Events after the reporting period.
Note 3. Individually significant items Included within the 2017 statement of profit or loss and other comprehensive income are certain significant items incurred outside the ordinary course of our trading operations. In particular, these items relate to:
• End of Gap franchise arrangements including onerous lease expense of $8,046,000, accelerated unwind of fixed rental increases of $570,000, accelerated amortisation of deferred lease incentives of $916,000, reversal of make good provision of $263,000, inventory provision of $917,000, make good asset depreciation of $124,000, hedge contract ineffectiveness of $938,000 and non-cash store asset impairments of $2,333,000;
• Termination benefits and professional fees paid for management separation of $458,000;• Professional fees for the consolidated entity’s strategic review of the Group and Gap of $373,000 and $695,000 respectively;• Non-cash store asset impairments for Oroton of $3,541,000.
Included within the 2016 statement of profit or loss and other comprehensive income are certain significant items incurred outside the ordinary course of our trading operations. In particular, these items relate to:
• Non-cash store asset impairments for Oroton and Gap of $757,000 and $886,000 respectively.
NOTES TO THE FINANCIAL STATEMENTS // 29 JULY 201742

ANNUAL REPORT 2017 // WWW.OROTONGROUP.COM
4444
Note 3. Individually significant Items (continued)
These individually significant items have been included in the statement of profit or loss and other comprehensive income as follows:
Consolidated
2017 2016
$’000 $’000
Cost of sales Inventory provision (917) -
(917) -
Selling Accelerated unwind of fixed rent increases 570 -
Accelerated amortisation of deferred lease incentives 916 -
Reversal of make good provision 263 -
Make good asset depreciation (124) -
Impairment of non-current assets (see notes 13 and 14) (5,874) (1,643)
(4,249) (1,643)
Administration Management separation (458) -
Strategic review (1,068) -
Hedge contract ineffectiveness (938) -
Onerous lease expense (see note 17) (8,046) -
(10,510) -
Note 4. Operating Segments
Identification of reportable operating segmentsManagement has determined the operating segments, the Oroton and Gap brands, based on internal reports that are reviewed and used by the Board of Directors (collectively referred to as the Chief Operating Decision Maker (‘CODM’)) in assessing performance and in determining the allocation of resources.
In prior years the operating segments were aggregated in accordance with AASB 8. Management performs an analysis at the end of each reporting period to evaluate the similarity of the Oroton and Gap brands, specifically considering economic characteristics, including long term average gross margins, and the similar nature of the operating segments’ production, supply chain, customers, regulatory environment and operating risks. The analysis performed at 29 July 2017 indicated that it was no longer appropriate to aggregate the operating segments given increasing differences between each operating segment’s long term average gross margin. As a result, the Oroton and Gap brands are now presented as separate operating segments for the year ended 29 July 2017, and the comparatives have been restated.
The CODM reviews Revenue, EBIT (earnings before interest and tax), EBITDA (earnings before interest, tax, depreciation, amortisation and impairment) and Underlying EBITDA (underlying earnings before interest, tax, depreciation, amortisation and impairment) on a monthly basis.
NOTES TO THE FINANCIAL STATEMENTS // 29 JULY 2017 44

ANNUAL REPORT 2017 // WWW.OROTONGROUP.COM
45
Note 4. Operating Segments (continued)
Operating segment information
Oroton Brand Gap Brand Unallocated Total
Consolidated - 2017 $’000 $’000 $’000 $’000
Revenue
Revenue from external customers 93,445 27,548 - 120,993
Licence and franchise fees 1,332 - - 1,332
Total sales revenue 94,777 27,548 - 122,325
Management fees - - 817 817
Interest received - - 63 63
Total Revenue 94,777 27,548 880 123,205
Underlying EBITDA 12,902 (2,502) (7,697) 2,703
Share of profits of associates accounted for using the equity method - - 23 23
Management separation - - (458) (458)
Strategic review - (695) (373) (1,068)
Inventory provision - (917) - (917)
Hedge contract ineffectiveness - (938) - (938)
Net onerous lease expense* - (6,297) - (6,297)
Segment EBITDA 12,902 (11,349) (8,505) (6,952)
Depreciation and amortisation** (3,093) (869) (535) (4,497)
Impairment of non-current assets (3,541) (2,333) - (5,874)
Segment EBIT 6,268 (14,551) (9,040) (17,323)
Interest received 63
Finance costs (371)
Profit/(loss) before income tax benefit (17,631)
Income tax benefit 3,373
Profit/(loss) before income tax benefit (14,258)
* Onerous lease expense of $8,046,000 net of accelerated unwind of fixed rental increases ($570,000), accelerated amortisation of deferred lease incentives ($916,000) and reversal of make good provision ($263,000).
** Depreciation and amortisation expense for Gap Brand includes $124,000 of non-underlying make good depreciation.
NOTES TO THE FINANCIAL STATEMENTS // 29 JULY 201744

ANNUAL REPORT 2017 // WWW.OROTONGROUP.COM
4646
Note 4. Operating Segments (continued)
Oroton Brand Gap Brand Unallocated Total
Consolidated - 2016 $’000 $’000 $’000 $’000
Revenue
Revenue from external customers 103,234 30,966 - 134,200
Licence and franchise fees 1,293 - - 1,293
Total sales revenue 104,527 30,966 - 135,493
Management fees - - 835 835
Interest received - - 111 111
Total revenue 104,527 30,966 946 136,439
Underlying and Segment EBITDA 19,894 957 (7,934) 12,917
Depreciation and amortisation (3,137) (1,427) (496) (5,060)
Impairment of non-current assets (757) (886) - (1,643)
Segment EBIT 16,000 (1,356) (8,430) 6,214
Interest received 111
Finance costs (453)
Profit/(loss) before income tax expense 5,872
Income tax expense (2,429)
Profit after income tax expense 3,443
Types of products and servicesThe reportable segments operate principally in the retailing and wholesaling of fashion apparel and accessories.
NOTES TO THE FINANCIAL STATEMENTS // 29 JULY 2017 46

ANNUAL REPORT 2017 // WWW.OROTONGROUP.COM
47
Note 5. Revenue
Consolidated
2017 2016
$’000 $’000
Sales revenue
Sale of goods 120,993 134,200
Licence and franchise fees 1,332 1,293
122,325 135,493
Other revenue
Management fees 817 835
Interest received 63 111
880 946
Revenue 123,205 136,439
Accounting policy for revenue recognitionRevenue is measured at the fair value of the consideration received or receivable. Amounts disclosed as revenue are net of returns, trade allowances, rebates and amounts collected on behalf of third parties.
The consolidated entity recognises revenue when the amount of revenue can be reliably measured, it is probable that future economic benefits will flow to the entity and specific criteria have been met for each of the consolidated entity’s activities as described below.
Sale of goodsThe consolidated entity operates retail stores and a premium wholesaling business. Revenue from the sale of goods is recognised when a group entity sells a product to the customer. Retail sales are usually paid via credit card or cash. Revenue from licence fees, franchise fees and commissions are recognised and accrued in the period in which the fees are earned.
Interest incomeInterest income is recognised on a time proportion basis using the effective interest method. When a receivable is impaired, the consolidated entity reduces the carrying amount to its recoverable amount, being the estimated future cash flow discounted at the original effective interest rate of the instrument, and continues unwinding the discount as interest income. Interest income on impaired loans is recognised using the original effective interest rate.
Other revenueOther revenue is recognised when it is received or when the right to receive payment is established.
NOTES TO THE FINANCIAL STATEMENTS // 29 JULY 201746

ANNUAL REPORT 2017 // WWW.OROTONGROUP.COM
4848
Note 6. ExpensesConsolidated
2017 2016
$’000 $’000
Profit/(loss) before income tax includes the following specific expenses:
Depreciation, amortisation and impairment of assets
Depreciation of plant and equipment 3,868 4,639
Impairment of plant and equipment 5,668 1,643
Amortisation of software 629 421
Impairment of software 206 -
Total depreciation, amortisation and impairment of assets 10,371 6,703
Rental expense relating to operating leases
Minimum lease payments 24,538 24,384
Amortisation of deferred lease incentives (1,799) (1,004)
Amortisation of fixed rental increases (749) (190)
Total rental expense relating to operating leases 21,990 23,190
Superannuation expense
Defined contribution superannuation expense 2,051 2,095
Employee benefits expense excluding superannuation
Employee benefits expense excluding superannuation 25,254 25,752
Other charges against assets
Inventories 1,829 982
Net foreign exchange loss/(gain)
Foreign exchange loss/(gain) 3 (36)
Hedge contract ineffectiveness 938 -
Net foreign exchange loss/(gain) 941 (36)
Onerous lease expense
Costs to exit lease contracts 5,164 -
Net unavoidable lease costs 2,882 -
Total onerous lease expense 8,046 -
NOTES TO THE FINANCIAL STATEMENTS // 29 JULY 2017 48

ANNUAL REPORT 2017 // WWW.OROTONGROUP.COM
49
Note 7. Dividends
DividendsDividends paid during the financial year were as follows:
Consolidated
2017 2016
$’000 $’000
Final dividend for the year ended 30 July 2016 (2016: 25 July 2015) of 3.0 cents (2016: 2.0 cents) per fully paid ordinary share fully franked based on a tax rate of 30% 1,221 817
Interim dividend for the year ended 29 July 2017 (2016: 30 July 2016) of nil cents (2016: 6.0 cents) per fully paid ordinary share fully franked based on a tax rate of 30% - 2,453
1,221 3,270
Franking credits
Consolidated
2017 2016
$’000 $’000
Franking credits available for subsequent financial years based on a tax rate of 30% 25,043 25,491
The above amounts represent the balance of the franking account as at the end of the financial year, adjusted for:
• franking credits that will arise from the payment of the amount of the provision for income tax at the reporting date• franking debits that will arise from the payment of dividends recognised as a liability at the reporting date• franking credits that will arise from the receipt of dividends recognised as receivables at the reporting date
Accounting policy for dividendsDividends are recognised when declared during the financial year and no longer at the discretion of the company.
Note 8. Earnings per share
Consolidated
2017 2016
$’000 $’000
Profit/(loss) after income tax attributable to the owners of OrotonGroup Limited (14,258) 3,443
Number Number
Weighted average number of ordinary shares used in calculating basic earnings per share 41,115,206 40,864,452
Adjustments for calculation of diluted earnings per share:
Rights - 95,630
Weighted average number of ordinary shares used in calculating diluted earnings per share 41,115,206 40,960,082
NOTES TO THE FINANCIAL STATEMENTS // 29 JULY 201748

ANNUAL REPORT 2017 // WWW.OROTONGROUP.COM
5050
Note 8. Earnings per share (continued)
Cents Cents
Basic earnings per share (34.68) 8.43
Diluted earnings per share (34.68) 8.41
Accounting policy for earnings per share Basic earnings per share Basic earnings per share is calculated by dividing the profit attributable to the owners of OrotonGroup Limited, excluding any costs of servicing equity other than ordinary shares, by the weighted average number of ordinary shares outstanding during the financial year, adjusted for bonus elements in ordinary shares issued during the financial year.
Diluted earnings per share Diluted earnings per share adjusts the figures used in the determination of basic earnings per share to take into account the after income tax effect of interest and other financing costs associated with dilutive potential ordinary shares and the weighted average number of shares assumed to have been issued for no consideration in relation to dilutive potential ordinary shares.
Note 9. Income taxConsolidated
2017 2016
$’000 $’000
Income tax expense/(benefit)
Current tax - 2,429
Deferred tax - origination and reversal of temporary differences (3,591) (60)
Adjustment recognised for prior periods 218 60
Aggregate income tax expense/(benefit) (3,373) 2,429
Deferred tax included in income tax expense/(benefit) comprises:
Increase in deferred tax assets (3,591) (60)
Numerical reconciliation of income tax expense/(benefit) and tax at the statutory rate
Profit/(loss) before income tax benefit/(expense) (17,631) 5,872
Tax at the statutory tax rate of 30% (5,289) 1,792
Tax effect amounts which are not deductible/(taxable) in calculating taxable income:
Sundry items 84 86
(5,205) 1,848
Adjustment recognised for prior periods 218 60
Current year tax losses not recognised 1,560 332
Difference in overseas tax rates 54 189
Income tax expense/(benefit) (3,373) 2,429
NOTES TO THE FINANCIAL STATEMENTS // 29 JULY 2017 50

ANNUAL REPORT 2017 // WWW.OROTONGROUP.COM
51
Note 9. Income Tax (continued)
Consolidated
2017 2016
$’000 $’000
Amounts credited directly to equity
Deferred tax assets (1,382) (3,696)
Tax losses not recognised
Unused tax capital losses for which no deferred tax asset has been recognised 18,938 18,938
Potential tax benefit @ 30% 5,681 5,681
Unused tax losses for which no deferred tax asset has been recognised 17,122 11,591
Potential tax benefit at statutory tax rates 3,754 2,167
The above potential tax benefit for capital losses has not been recognised in the statement of financial position. The tax capital losses can only be utilised against capital gains in the future if the continuity of ownership test is passed, or failing that, the same business test is passed.
The consolidated entity recognises a deferred tax asset for tax losses to the extent that forecasts support their utilisation. The unrecorded tax losses of the Australian tax consolidated group of $4,862,000 and unrecorded overseas tax losses of $12,260,000 are available for utilisation, however the directors consider it prudent not to recognise these as their utilisation is not expected in the short term. However they will remain available indefinitely for offset against future taxable profits, subject to continuing to meet the statutory tax tests.
NOTES TO THE FINANCIAL STATEMENTS // 29 JULY 201750

ANNUAL REPORT 2017 // WWW.OROTONGROUP.COM
5252
Note 9. Income Tax (continued)
Consolidated
2017 2016
$’000 $’000
Deferred tax asset Deferred tax asset comprises temporary differences attributable to:
Amounts recognised in profit or loss:
Tax losses - 26
Employee benefits 682 519
Provision for bad debts 10 10
Accrued expenses 59 204
Deferred revenue 106 151
Depreciation - 19
Inventory provision 380 50
Lease incentives and fixed rental increases 673 1,365
Onerous lease provision 2,414 -
Inventory valuation 519 485
Store asset impairments 2,041 464
6,884 3,293
Amounts recognised in equity:
Derivative financial instruments 1,631 249
Deferred tax asset 8,515 3,542
Amount expected to be recovered within 12 months 6,649 2,311
Amount expected to be recovered after more than 12 months 1,866 1,231
8,515 3,542
Movements:
Opening balance 3,542 (214)
Credited to profit or loss 3,591 60
Credited to equity 1,382 3,696
Closing balance 8,515 3,542
Consolidated
2017 2016
$’000 $’000
Income tax refund due
Income tax refund due - 381
NOTES TO THE FINANCIAL STATEMENTS // 29 JULY 2017 52

ANNUAL REPORT 2017 // WWW.OROTONGROUP.COM
53
Note 9. Income Tax (continued)
Consolidated
2017 2016
$’000 $’000
Provision for income tax
Provision for income tax 144 -
Accounting policy for income taxThe income tax expense or benefit for the period is the tax payable on that period’s taxable income based on the applicable income tax rate for each jurisdiction, adjusted by the changes in deferred tax assets and liabilities attributable to temporary differences, unused tax losses and the adjustment recognised for prior periods, where applicable.
Deferred tax assets and liabilities are recognised for temporary differences at the tax rates expected to be applied when the assets are recovered or liabilities are settled, based on those tax rates that are enacted or substantively enacted, except for:
• When the deferred income tax asset or liability arises from the initial recognition of goodwill or an asset or liability in a transaction that is not a business combination and that, at the time of the transaction, affects neither the accounting nor taxable profits; or
• When the taxable temporary difference is associated with interests in subsidiaries, associates or joint ventures, and the timing of the reversal can be controlled and it is probable that the temporary difference will not reverse in the foreseeable future.
Deferred tax assets are recognised for deductible temporary differences and unused tax losses only if it is probable that future taxable amounts will be available to utilise those temporary differences and losses.
The carrying amount of recognised and unrecognised deferred tax assets are reviewed at each reporting date. Deferred tax assets recognised are reduced to the extent that it is no longer probable that future taxable profits will be available for the carrying amount to be recovered. Previously unrecognised deferred tax assets are recognised to the extent that it is probable that there are future taxable profits available to recover the asset.
Deferred tax assets and liabilities are offset only where there is a legally enforceable right to offset current tax assets against current tax liabilities and deferred tax assets against deferred tax liabilities; and they relate to the same taxable authority on either the same taxable entity or different taxable entities which intend to settle simultaneously.
OrotonGroup Limited (the ‘head entity’) and its wholly-owned Australian subsidiaries have formed an income tax consolidated group under the tax consolidation regime. The head entity and each subsidiary in the tax consolidated group continue to account for their own current and deferred tax amounts. There is no formal tax sharing agreement in place. The tax consolidated group has applied the ‘separate taxpayer within group’ approach in determining the appropriate amount of taxes to allocate to members of the tax consolidated group.
In addition to its own current and deferred tax amounts, the head entity also recognises the current tax liabilities (or assets) and the deferred tax assets arising from unused tax losses and unused tax credits assumed from each subsidiary in the tax consolidated group.
Critical accounting judgements, estimates and assumptionsThe consolidated entity is subject to income taxes in the jurisdictions in which it operates. Judgement is required in determining the provision for income tax. There are many transactions and calculations undertaken during the ordinary course of business for which the ultimate tax determination is uncertain. The consolidated entity recognises liabilities for anticipated tax audit issues based on the consolidated entity’s current understanding of the tax law. Where the final tax outcome of these matters is different from the carrying amounts, such differences will impact the current and deferred tax provisions in the period in which such determination is made.
A deferred tax asset is recognised only to the extent that it is probable that future taxable profits will be available against which the deductible temporary differences or unused tax losses can be utilised. The consolidated entity assesses the recoverability of deferred tax assets at each reporting date. This involves the use of forecasts which incorporate a number of key estimates and assumptions, including future trading performance.
NOTES TO THE FINANCIAL STATEMENTS // 29 JULY 201752

ANNUAL REPORT 2017 // WWW.OROTONGROUP.COM
5454
Note 10. Trade and other receivables
Consolidated
2017 2016
$’000 $’000
Trade receivables 1,317 966
Other receivables 30 7
Receivable from Brooks Brothers International, LLC - 2,193
30 2,200
Prepayments 1,576 1,842
Security deposits 404 438
3,327 5,446
Past due but not impairedCustomers with balances past due but without provision for impairment of receivables amount to $101,000 as at 29 July 2017 ($76,000 as at 30 July 2016).
The consolidated entity did not consider a credit risk on the aggregate balances after reviewing the credit terms of customers based on recent collection practices.
The ageing of the past due but not impaired receivables are as follows:
Consolidated
2017 2016
$’000 $’000
0 to 3 months overdue 101 21
3 to 6 months overdue - 5
Over 6 months overdue - 50
101 76
Foreign exchange and interest rate riskInformation about the consolidated entity’s exposure to foreign currency risk and interest rate risk in relation to trade and other receivables is provided in note 25. Fair value and credit riskDue to the short-term nature of these receivables, their carrying amount is assumed to approximate their fair value.
The maximum exposure to credit risk at the reporting date is the carrying amount of each class of receivables mentioned above. The fair value of securities held for certain trade receivables is insignificant. Refer to note 25 for more information on the risk management policy of the consolidated entity.
Accounting policy for trade and other receivablesTrade receivables are initially recognised at fair value and subsequently measured at amortised cost using the effective interest method, less any provision for impairment. Trade receivables are generally due for settlement within 30 days.
NOTES TO THE FINANCIAL STATEMENTS // 29 JULY 2017 54

ANNUAL REPORT 2017 // WWW.OROTONGROUP.COM
55
Note 10. Trade and other receivables (continued)
Collectability of trade receivables is reviewed on an ongoing basis. Debts which are known to be uncollectable are written off by reducing the carrying amount directly. A provision for impairment of trade receivables is raised when there is objective evidence that the consolidated entity will not be able to collect all amounts due according to the original terms of the receivables. Significant financial difficulties of the debtor, probability that the debtor will enter bankruptcy or financial reorganisation and default or delinquency in payments (more than 60 days overdue) are considered indicators that the trade receivable may be impaired. The amount of the impairment allowance is the difference between the asset’s carrying amount and the present value of estimated future cash flows, discounted at the original effective interest rate. Cash flows relating to short-term receivables are not discounted if the effect of discounting is immaterial.
Other receivables are recognised at amortised cost, less any provision for impairment.
Note 11. Inventories
Consolidated
2017 2016
$’000 $’000
Finished goods - at cost 36,734 30,928
Less: Provision (1,267) (272)
35,467 30,656
Accounting policy for inventoriesFinished goods are stated at the lower of cost and net realisable value on a ‘weighted average cost’ basis. Cost comprises of purchase and delivery costs, net of rebates and discounts received or receivable.
Net realisable value is the estimated selling price in the ordinary course of business less the estimated costs of completion and the estimated costs necessary to make the sale.
Critical accounting judgements, estimates and assumptionsThe provision for impairment of inventories is comprised of the provision for stock obsolescence, the provision for shrinkage and a provision to reduce the carrying value of Gap stock to net realisable value. The assessment of these provisions requires a degree of estimation and judgement.
The level of the provision for stock obsolescence is assessed by taking into account the recent sales experience, the ageing of inventories and other factors that affect inventory obsolescence.
The level of the provision for shrinkage is assessed by taking into account the typical variance levels identified during cyclical inventory count procedures at retail stores throughout the year.
The consolidated entity has entered into a binding agreement to discontinue the Gap franchise in Australia, see note 37. The net realisable value of Gap inventories reflects estimates of likely sales prices, which takes into consideration forecast demand, the profile of stock on hand and other factors.
Note 12. Investments accounted for using the equity method
Consolidated
2017 2016
$’000 $’000
Investment in TDE Pty Limited 6,812 -
Refer to note 29 for further information on interests in associates.
NOTES TO THE FINANCIAL STATEMENTS // 29 JULY 201754

ANNUAL REPORT 2017 // WWW.OROTONGROUP.COM
5656
Note 12. Investments accounted for using the equity method (continued)
Investment in TDE Pty LimitedOn 4 April 2017 the consolidated entity acquired 31.4% of TDE Pty Limited, an Australian lifestyle fashion accessories brand, for $4,500,000 plus contingent consideration of $660,000, see note 18. The $4,500,000 consideration was comprised of $2,670,000 of cash and OrotonGroup Limited shares to the value of $1,830,000, see note 22.
As part of the acquisition, TDE Pty Limited granted the consolidated entity two call options that, if both exercised, give theconsolidated entity the right to acquire additional shares that would result in the consolidated entity’s shareholding in TDE Pty Limited increasing to 50.1%. The call options expire on 4 April 2019 and 25 January 2021 respectively. The consolidated entity granted TDE Pty Limited two put options that, if both exercised, would require the consolidated entity to acquire up to 100% of the shares in TDE Pty Limited. Each respective put option can only be exercised if the consolidated entity has not exercised its call option and TDE Pty Limited has met certain performance targets, the put options expire on 4 April 2019 and 25 January 2021 respectively. Details of the instruments issued as part of this acquisition are set out in note 20.
The consolidated entity is represented by two Non-Executive Directors on the Board of TDE Pty Limited. These Directors are entitled to one vote each out of a maximum of six votes on board resolutions. The Board requires a 75% majority to approve any major decisions including business plans and material changes to the scope of the business.
Accounting policy for associatesAssociates are entities over which the consolidated entity has significant influence but not control or joint control. Investments in associates are accounted for using the equity method. Under the equity method, the share of the profits or losses of the associate is recognised in profit or loss and the share of the movements in equity is recognised in other comprehensive income. Investments in associates are carried in the statement of financial position at cost plus post-acquisition changes in the consolidated entity’s share of net assets of the associate. Goodwill relating to the associate is included in the carrying amount of the investment and is neither amortised nor individually tested for impairment. Dividends received or receivable from associates reduce the carrying amount of the investment.
When the consolidated entity’s share of losses in an associate equals or exceeds its interest in the associate, including any unsecured long-term receivables, the consolidated entity does not recognise further losses, unless it has incurred obligations or made payments on behalf of the associate.
The consolidated entity discontinues the use of the equity method upon the loss of significant influence over the associate and recognises any retained investment at its fair value. Any difference between the associate’s carrying amount, fair value of the retained investment and proceeds from disposal is recognised in profit or loss.
Note 13. Property, plant and equipment
Consolidated
2017 2016
$’000 $’000
Plant and equipment - at cost 35,448 36,160
Less: Accumulated depreciation and impairment (30,157) (25,346)
5,291 10,814
NOTES TO THE FINANCIAL STATEMENTS // 29 JULY 2017 56

ANNUAL REPORT 2017 // WWW.OROTONGROUP.COM
57
Note 13. Property, plant and equipment (continued)
ReconciliationsReconciliations of the written down values at the beginning and end of the current and previous financial year are set out below:
Plant and
equipment Total
$’000 $’000
Consolidated
Balance at 26 July 2015 15,328 15,328
Additions 1,859 1,859
Disposals (91) (91)
Impairment of assets (1,643) (1,643)
Depreciation expense (4,639) (4,639)
Balance at 30 July 2016 10,814 10,814
Additions 4,018 4,018
Disposals (5) (5)
Impairment of assets (5,668) (5,668)
Depreciation expense (3,868) (3,868)
Balance at 29 July 2017 5,291 5,291
Accounting policy for property, plant and equipmentPlant and equipment is stated at historical cost less accumulated depreciation and impairment. Historical cost includes expenditure that is directly attributable to the acquisition of the items.
Plant and equipment is depreciated on a straight line basis over their estimated useful lives commencing from the time the asset is held ready for use. Items of plant and equipment are depreciated at rates ranging from 12.5% to 33.3% per annum.
The residual values, useful lives and depreciation methods are reviewed, and adjusted if appropriate, at each reporting date.
Leasehold improvements are depreciated over the lease term or the estimated useful life of the assets.
An item of property, plant and equipment is derecognised upon disposal or when there is no future economic benefit to the consolidated entity. Gains and losses between the carrying amount and the disposal proceeds are taken to profit or loss.
Accounting policy for impairment of non-financial assetsNon-financial assets are reviewed for impairment whenever events or changes in circumstances indicate that the carrying amount may not be recoverable. An impairment loss is recognised for the amount by which the asset’s carrying amount exceeds its recoverable amount.
Recoverable amount is the higher of an asset’s fair value less costs of disposal and value-in-use. The value-in-use is the present value of the estimated future cash flows relating to the asset using a pre-tax discount rate specific to the asset or cash-generating unit to which the asset belongs. Assets that do not have independent cash flows are grouped together to form a cash-generating unit.
Critical accounting judgements, estimates and assumptionsThe consolidated entity assesses impairment of property, plant and equipment at each reporting date by evaluating conditions specific to the consolidated entity and to the particular asset that may lead to impairment. Store fixed assets are assessed for impairment on a store by store basis. If an impairment trigger exists, the recoverable amount of the asset is determined. This involves fair value less costs to sell or value-in-use calculations, which incorporate a number of key estimates and assumptions, including future trading performance.
As a consequence of the planned closure of Gap stores in 2018 see note 37, and expected future Gap losses, all Gap store assets and specific corporate assets (including intangibles, see note 14) supporting the Gap brand have been fully impaired at 29 July 2017.
NOTES TO THE FINANCIAL STATEMENTS // 29 JULY 201756

ANNUAL REPORT 2017 // WWW.OROTONGROUP.COM
5858
Note 14. Intangibles
Consolidated
2017 2016
$’000 $’000
Software - at cost 9,283 8,321
Less: Accumulated amortisation and impairment (8,100) (7,251)
1,183 1,070
ReconciliationsReconciliations of the written down values at the beginning and end of the current and previous financial year are set out below:
Software Total
$’000 $’000
Consolidated
Balance at 26 July 2015 671 671
Additions 827 827
Disposals (7) (7)
Amortisation expense (421) (421)
Balance at 30 July 2016 1,070 1,070
Additions 948 948
Impairment of assets (206) (206)
Amortisation expense (629) (629)
Balance at 29 July 2017 1,183 1,183
Accounting policy for intangible assetsIntangible assets acquired separately are initially recognised at cost. Finite life intangible assets are subsequently measured at cost less amortisation and any impairment. The gains or losses recognised in profit or loss arising from the derecognition of intangible assets are measured as the difference between net disposal proceeds and the carrying amount of the intangible asset. The method and useful lives of finite life intangible assets are reviewed annually. Changes in the expected pattern of consumption or useful life are accounted for prospectively by changing the amortisation method or period.
SoftwareSignificant costs associated with software are deferred and amortised on a straight-line basis over the period of their expected benefit, being their finite life of 4 years.
Note 15. Trade and other payablesConsolidated
2017 2016
$’000 $’000
Trade payables 8,644 6,743
Other payables 7,510 5,591
16,154 12,334
Refer to note 25 for further information on financial instruments.
NOTES TO THE FINANCIAL STATEMENTS // 29 JULY 2017 58
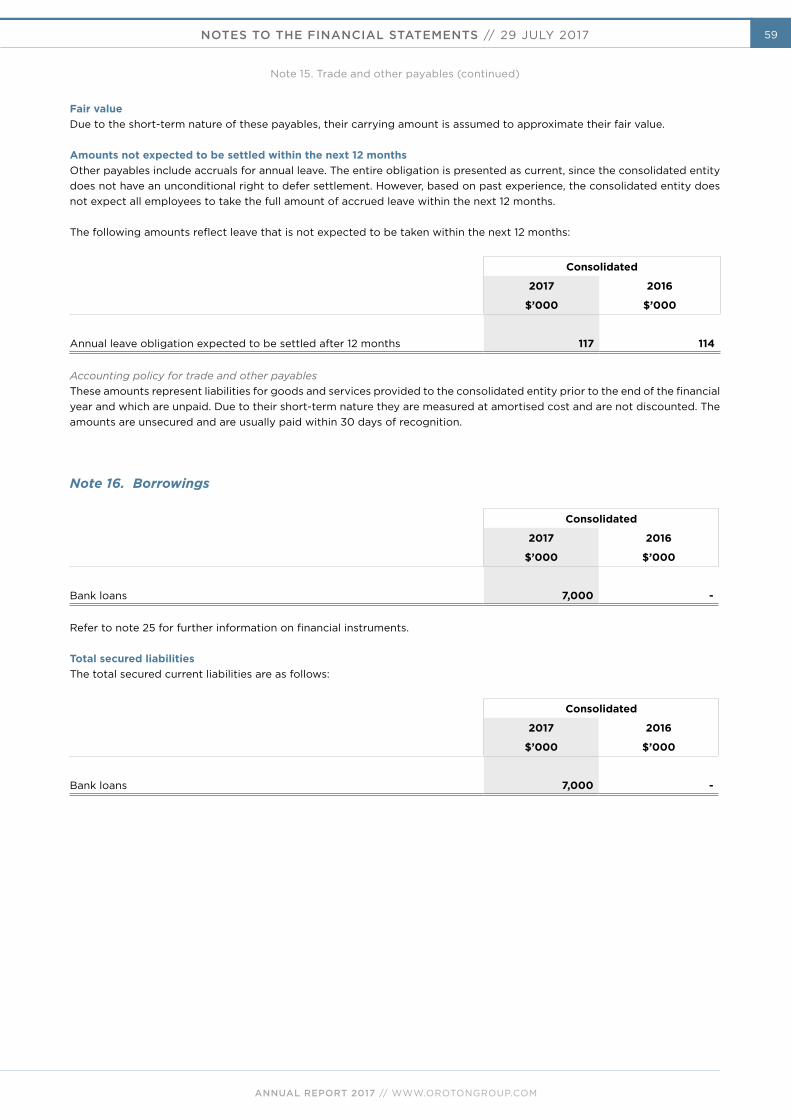
ANNUAL REPORT 2017 // WWW.OROTONGROUP.COM
59
Fair valueDue to the short-term nature of these payables, their carrying amount is assumed to approximate their fair value. Amounts not expected to be settled within the next 12 monthsOther payables include accruals for annual leave. The entire obligation is presented as current, since the consolidated entity does not have an unconditional right to defer settlement. However, based on past experience, the consolidated entity does not expect all employees to take the full amount of accrued leave within the next 12 months.
The following amounts reflect leave that is not expected to be taken within the next 12 months:
Consolidated
2017 2016
$’000 $’000
Annual leave obligation expected to be settled after 12 months 117 114
Accounting policy for trade and other payablesThese amounts represent liabilities for goods and services provided to the consolidated entity prior to the end of the financial year and which are unpaid. Due to their short-term nature they are measured at amortised cost and are not discounted. The amounts are unsecured and are usually paid within 30 days of recognition.
Note 16. Borrowings
Consolidated
2017 2016
$’000 $’000
Bank loans 7,000 -
Refer to note 25 for further information on financial instruments.
Total secured liabilitiesThe total secured current liabilities are as follows:
Consolidated
2017 2016
$’000 $’000
Bank loans 7,000 -
Note 15. Trade and other payables (continued)
NOTES TO THE FINANCIAL STATEMENTS // 29 JULY 201758

ANNUAL REPORT 2017 // WWW.OROTONGROUP.COM
6060
Note 16. Borrowings (continued)
Financing arrangementsAt the reporting date the consolidated entity had access to the following lines of credit:
Consolidated
2017 2016
$’000 $’000
Total facilities
Bank overdraft 4,000 8,000
Working capital advances 20,000 18,000
Trade finance facilities* 11,000 14,000
35,000 40,000
Used at the reporting date
Bank overdraft - -
Working capital advances 7,000 -
Trade finance facilities* 7,128 7,060
14,128 7,060
Unused at the reporting date
Bank overdraft 4,000 8,000
Working capital advances 13,000 18,000
Trade finance facilities* 3,872 6,940
20,872 32,940
*Trade finance facilities include letters of credit and bank guarantees.
The financing arrangements are secured by a first mortgage over the consolidated entity’s assets. At balance date the consolidated entity had access to the cash balances as disclosed in the Statement of Financial Position. In addition, the consolidated entity had access to various undrawn bank facilities.
The bank overdraft, working capital and trade finance facilities may be drawn at any time. Bank facilities are arranged with general terms, conditions and covenants being set and agreed from time to time.
The conditions of this facility were varied prior to, and post, 29 July 2017 due to a potential default which was reset and actual default which was promptly waived.
On 31 July 2017 the consolidated entity executed a facility amendment agreement to allow continuing use of its existing $35,000,000 facility and an extension of maturity to 5 October 2018 from 16 April 2018 for the $31,000,000 working capital and trade finance facilities. The $4,000,000 bank overdraft facility continues to be repayable and terminable on demand. As part of this amendment, entities controlled by Mr J Will Vicars (Vicars Entities) entered into a put and call arrangement with the financier to provide critical credit support. Details of the negotiated amendment terms are set out in note 37. As thefacility amendment agreement was executed after the end of the reporting period the bank loans drawn under this facility have been classified as current at 29 July 2017.
Accounting policy for borrowingsLoans and borrowings are initially recognised at the fair value of the consideration received, net of transaction costs. They are subsequently measured at amortised cost using the effective interest method. All other finance costs are expensed in the period in which they are incurred.
Where there is an unconditional right to defer settlement of the liability for at least 12 months after the reporting date, the loans or borrowings are classified as non-current.
NOTES TO THE FINANCIAL STATEMENTS // 29 JULY 2017 60

ANNUAL REPORT 2017 // WWW.OROTONGROUP.COM
61
Note 17. Provisions - current
Consolidated
2017 2016
$’000 $’000
Employee benefits 186 200
Deferred lease incentives 465 807
Onerous leases 8,046 -
8,697 1,007
Deferred lease incentivesThe provision represents operating lease incentives received. The incentives are allocated to profit or loss in such a manner that the rent expense is recognised on a straight-line basis over the lease term. Onerous leasesThe consolidated entity has recognised a provision for onerous leases in relation to the closure of Gap stores, and agree-ments to exit lease contracts, see note 37. The provision represents the present value of the estimated future lease costs that will be incurred for Gap stores until the end of the lease terms where the obligation is expected to exceed the economic benefit to be received. The estimated lease exit costs are based on in principle agreements reached with lessors. Expected economic benefit reflects management’s estimate of the net inflows excluding lease costs from operating the stores until closure. At 29 July 2017 the provision is comprised of $5,164,000 of costs to exit the lease contracts and $2,882,000 of net unavoidable lease costs that are expected to be incurred in the period up to the closure of the stores.
Movements in provisionsMovements in each class of provision during the current financial year, other than employee benefits, are set out below:
Deferred lease incentives
$’000Onerous leases
$’000
Consolidated - 2017
Carrying amount at the start of the year 807 -
Additional provisions recognised 26 8,046
Amounts transferred from non-current 747 -
Amounts used (1,115) -
Carrying amount at the end of the year 465 8,046
Amounts not expected to be settled within the next 12 monthsThe current provision for long service leave includes all unconditional entitlements where employees have completed the required period of service and also those where employees are entitled to pro-rata payments in certain circumstances. The entire amount is presented as current, since the consolidated entity does not have an unconditional right to defer settlement. However, based on past experience, the consolidated entity does not expect all employees to take the full amount of accrued long service leave or require payment within the next 12 months.
The following amounts reflect leave that is not expected to be taken within the next 12 months:
Consolidated
2017 2016
$’000 $’000
Long service leave obligation expected to be settled after 12 months 142 176
NOTES TO THE FINANCIAL STATEMENTS // 29 JULY 201760

ANNUAL REPORT 2017 // WWW.OROTONGROUP.COM
6262
Note 17. Provision - current (continued)
Accounting policy for provisionsProvisions are recognised when the consolidated entity has a present (legal or constructive) obligation as a result of a past event, it is probable the consolidated entity will be required to settle the obligation, and a reliable estimate can be made of the amount of the obligation. The amount recognised as a provision is the best estimate of the consideration required to settle the present obligation at the reporting date, taking into account the risks and uncertainties surrounding the obligation. If the time value of money is material, provisions are discounted using a current pre-tax rate specific to the liability. The increase in the provision resulting from the passage of time is recognised as a finance cost.
Accounting policy for employee benefits Short-term employee benefits Liabilities for wages and salaries, including non-monetary benefits, annual leave and long service leave expected to be settled wholly within 12 months of the reporting date are measured at the amounts expected to be paid when the liabilities are settled.
Defined contribution superannuation expenseContributions to defined contribution superannuation plans are expensed in the period in which they are incurred.
Employee benefit on-costsEmployee benefit on-costs, including payroll tax, are recognised and included in employee benefit liabilities when the related employee benefit liability is incurred.
BonusesThe consolidated entity recognises a liability and an expense for bonuses based on a formula that takes into consideration the profit attributable to the company’s shareholders after certain adjustments. The consolidated entity recognises a provision when contractually obliged or where there is a past practice that has created a constructive obligation.
Critical accounting judgements, estimates and assumptionsThe consolidated entity has recognised a provision for onerous leases in relation to the closure of Gap stores, and exit of lease contracts, see note 37, based on the lower of the estimated unavoidable net costs of meeting all lease obligations and management’s best estimate of the compensation expected to be payable to lessors as a result of early termination of the contracts. Estimates differ depending on the agreements management has reached with lessors on the timing and likely termination costs, and management’s estimates of the net inflows, excluding lease costs, from operating the stores until closure. The estimates and judgements applied have a risk of causing a material adjustment in subsequent periods. Any changes in subsequent periods due to revisions to estimates or assumptions or as a result of the final realisation of the assets and liabilities upon closure of the Gap stores will be recognised in the consolidated entity’s future profit or loss.
Note 18. Other payables
Consolidated
2017 2016
$’000 $’000
Contingent consideration payable 660 -
Refer to note 25 for further information on financial instruments.
Contingent consideration payableAs part of the acquisition of TDE Pty Limited, see note 12, the consolidated entity agreed to issue a fixed value of OrotonGroup Limited shares to the founders of TDE Pty Limited subject to TDE Pty Limited meeting specific performance targets for the year ending 28 July 2018. The number of shares to be issued is based on the volume weighted average price of OrotonGroup Limited’s shares. The contingent consideration is therefore accounted for as a liability as the terms provide for the consolidated entity to issue a variable number of shares at a fixed amount.
Fair valueContingent consideration payable is measured based on the probability of meeting earnings targets, discounted using a current pre-tax rate specific to the liability.
NOTES TO THE FINANCIAL STATEMENTS // 29 JULY 2017 62

ANNUAL REPORT 2017 // WWW.OROTONGROUP.COM
63
Note 19. Provisions - non-current
Consolidated
2017 2016
$’000 $’000
Employee benefits 316 313
Deferred lease incentives 773 2,100
Lease make good provision 912 1,178
Fixed rental increases 1,015 1,668
3,016 5,259
Deferred lease incentivesThe provision represents operating lease incentives received. The incentives are allocated to profit or loss in such a manner that the rent expense is recognised on a straight-line basis over the lease term. Lease make good provisionThe provision represents the present value of the estimated costs, based on historical actual costs, to make good the premises leased by the consolidated entity at the end of the respective lease terms. Fixed rental increasesThe consolidated entity is required to straight line fixed rental increases over the lease term resulting in a provision for fixed rental increases.
Movements in provisionsMovements in each class of provision during the current financial year, other than employee benefits, are set out below:
Deferredlease
incentives$’000
Leasemake good
$’000
Fixed rentalincreases
$’000
Consolidated - 2017
Carrying amount at the start of the year 2,100 1,178 1,668
Additional provisions recognised 104 97 96
Amounts transferred to current (747) - -
Amounts used (684) (100) (749)
Unused amounts reversed - (263) -
Carrying amount at the end of the year 773 912 1,015
Accounting policy for other long-term employee benefitsThe liability for long service leave not expected to be settled within 12 months of the reporting date are recognised in non- current liabilities, provided there is an unconditional right to defer settlement of the liability. The liability is measured as the present value of expected future payments to be made in respect of services provided by employees up to the reporting date using the projected unit credit method. Consideration is given to expected future wage and salary levels, experience of employee departures and periods of service. Expected future payments, if material, are discounted using market yields at the reporting date on high quality corporate bonds with terms to maturity and currency that match, as closely as possible, the estimated future cash outflows.
NOTES TO THE FINANCIAL STATEMENTS // 29 JULY 201762

ANNUAL REPORT 2017 // WWW.OROTONGROUP.COM
6464
Note 20. Other financial assets and liabilities
Consolidated
2017 2016
$’000 $’000
Other financial assets
Call option over investments accounted for using the equity method 46 -
Other financial liabilities
Put option over investments accounted for using the equity method 1,143 -
Call option over investments accounted for using the equity methodTDE Pty Limited granted the consolidated entity an option that gives the consolidated entity the right to acquire an additional 8.6% shareholding in TDE Pty Limited. The exercise of this option will result in the consolidated entity’s total shareholding in TDE Pty Limited increasing to 40%. This option expires on 4 April 2019.
TDE Pty Limited granted the consolidated entity a second option that gives the consolidated entity the right to purchase shares from each of the founders that would take the consolidated entity’s ownership of TDE Pty Limited to 50.1%. The fair value of this option at 29 July 2017 is nil as the terms are such that the option price at the time the options are exercised would approximate the market value of the shares at that time. This option expires on 25 January 2021.
Put option over investments accounted for using the equity methodThe consolidated entity granted TDE Pty Limited an option to require the consolidated entity to acquire an additional 8.6% shareholding in TDE Pty Limited. This put option can only be exercised if TDE Pty Limited meets certain performance thresholds relating to the year ending 28 July 2018 and the consolidated entity does not exercise its call option. The exercise of this option would result in the consolidated entity’s total shareholding in TDE Pty Limited increasing to 40%. This option expires on 4 April 2019.
The consolidated entity granted TDE Pty Limited a second option to require the consolidated entity to purchase up to 100% of the shares in TDE Pty Limited that are held by the founders. This put option can only be exercised if the consolidated entity has exercised its second call option. The exercise of this option would result in the consolidated entity’s total shareholding in TDE Pty Limited increasing to 100%. As the exercise of this option is reliant upon the exercise of the consolidated entity’s second call option, which has a fair value at 29 July 2017 of nil (see above), it follows that the fair value of this put option at 29 July 2017 is also nil. This option expires on 25 January 2021.
Accounting policy for other financial assets and liabilitiesOther financial assets and liabilities at 29 July 2017 relate to the call and put option over investments accounted for using the equity method. These specific financial assets and liabilities have been initially recognised at fair value on the date the contract was entered into and will be subsequently remeasured to their fair value at each reporting date.
NOTES TO THE FINANCIAL STATEMENTS // 29 JULY 2017 64

ANNUAL REPORT 2017 // WWW.OROTONGROUP.COM
65
Note 21. Reconciliation of profit/(loss) after income tax to net cash (used in)/ from operating activities
Consolidated
2017 2016
$’000 $’000
Profit/(loss) after income tax benefit/(expense) for the year (14,258) 3,443
Adjustments for:
Depreciation and amortisation 4,497 5,060
Impairment of non-current assets 5,874 1,643
Net loss on disposal of property, plant and equipment 5 91
Net loss on disposal of intangibles - 7
Non-cash employee benefits expense/(benefit) share-based payments 25 (173)
Foreign currency differences (184) (157)
Share of profits of associates accounted for using the equity method (23) -
Change in operating assets and liabilities:
Decrease/(increase) in trade and other receivables (165) 2,964
Decrease/(increase) in inventories (4,811) 7,057
Decrease/(increase) in income tax refund due 525 (241)
Increase in deferred tax assets (3,591) (62)
Increase/(decrease) in trade and other payables 4,644 (5,763)
Increase in derivative liabilities 938 -
Increase/(decrease) in other provisions 5,447 (44)
Net cash (used in)/from operating activities (1,077) 13,825
Note 22. Issued capital
Consolidated Consolidated
2017 2016 2017 2016
Shares Shares $’000 $’000
Ordinary shares - fully paid 41,975,077 40,713,009 24,005 22,175
NOTES TO THE FINANCIAL STATEMENTS // 29 JULY 201764
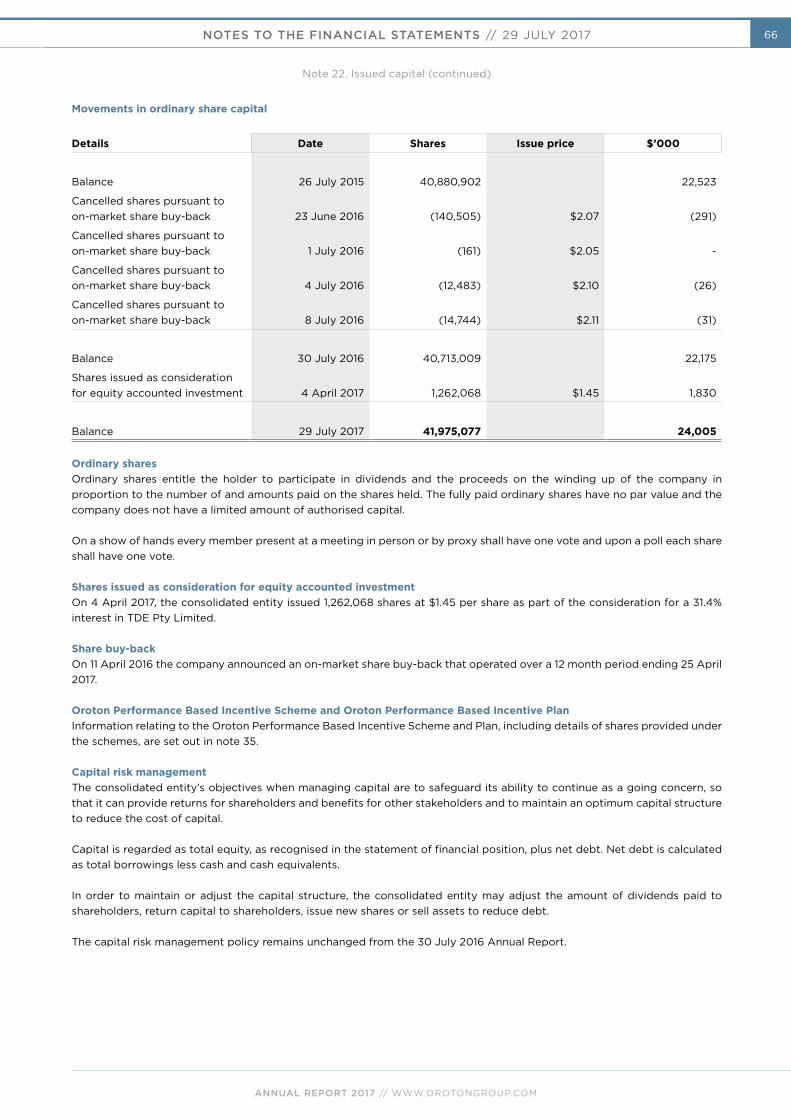
ANNUAL REPORT 2017 // WWW.OROTONGROUP.COM
6666
Note 22. Issued capital (continued)
Movements in ordinary share capital
Details Date Shares Issue price $’000
Balance 26 July 2015 40,880,902 22,523
Cancelled shares pursuant to on-market share buy-back 23 June 2016 (140,505) $2.07 (291)
Cancelled shares pursuant to on-market share buy-back 1 July 2016 (161) $2.05 -
Cancelled shares pursuant to on-market share buy-back 4 July 2016 (12,483) $2.10 (26)
Cancelled shares pursuant to on-market share buy-back 8 July 2016 (14,744) $2.11 (31)
Balance 30 July 2016 40,713,009 22,175
Shares issued as consideration for equity accounted investment 4 April 2017 1,262,068 $1.45 1,830
Balance 29 July 2017 41,975,077 24,005
Ordinary sharesOrdinary shares entitle the holder to participate in dividends and the proceeds on the winding up of the company in proportion to the number of and amounts paid on the shares held. The fully paid ordinary shares have no par value and the company does not have a limited amount of authorised capital.
On a show of hands every member present at a meeting in person or by proxy shall have one vote and upon a poll each share shall have one vote. Shares issued as consideration for equity accounted investmentOn 4 April 2017, the consolidated entity issued 1,262,068 shares at $1.45 per share as part of the consideration for a 31.4% interest in TDE Pty Limited.
Share buy-backOn 11 April 2016 the company announced an on-market share buy-back that operated over a 12 month period ending 25 April 2017. Oroton Performance Based Incentive Scheme and Oroton Performance Based Incentive PlanInformation relating to the Oroton Performance Based Incentive Scheme and Plan, including details of shares provided under the schemes, are set out in note 35. Capital risk managementThe consolidated entity’s objectives when managing capital are to safeguard its ability to continue as a going concern, so that it can provide returns for shareholders and benefits for other stakeholders and to maintain an optimum capital structure to reduce the cost of capital.
Capital is regarded as total equity, as recognised in the statement of financial position, plus net debt. Net debt is calculated as total borrowings less cash and cash equivalents.
In order to maintain or adjust the capital structure, the consolidated entity may adjust the amount of dividends paid to shareholders, return capital to shareholders, issue new shares or sell assets to reduce debt.
The capital risk management policy remains unchanged from the 30 July 2016 Annual Report.
NOTES TO THE FINANCIAL STATEMENTS // 29 JULY 2017 66

ANNUAL REPORT 2017 // WWW.OROTONGROUP.COM
67
Note 22. Issued capital (continued)
Accounting policy for issued capitalOrdinary shares are classified as equity.
Incremental costs directly attributable to the issue of new shares or rights are shown in equity as a deduction, net of tax, from the proceeds.
Note 23. Reserves
Consolidated
2017 2016
$’000 $’000
Foreign currency reserve 410 594
Share-based payments reserve (2,563) (2,588)
Hedging reserve - cash flow hedges (3,795) (571)
(5,948) (2,565)
Foreign currency reserveThe reserve is used to recognise exchange differences arising from translation of the financial statements of foreign operations to Australian dollars. Share-based payments reserveThe reserve is used to recognise the fair value of all shares and performance rights both issued and issued but not exercised under the employee share plans. Hedging reserve - cash flow hedgesThe reserve is used to record gains or losses on a hedging instrument in a cash flow hedge that are recognised directly in equity. Amounts are recognised in profit and loss when the associated hedged transaction affects profit and loss.
NOTES TO THE FINANCIAL STATEMENTS // 29 JULY 201766
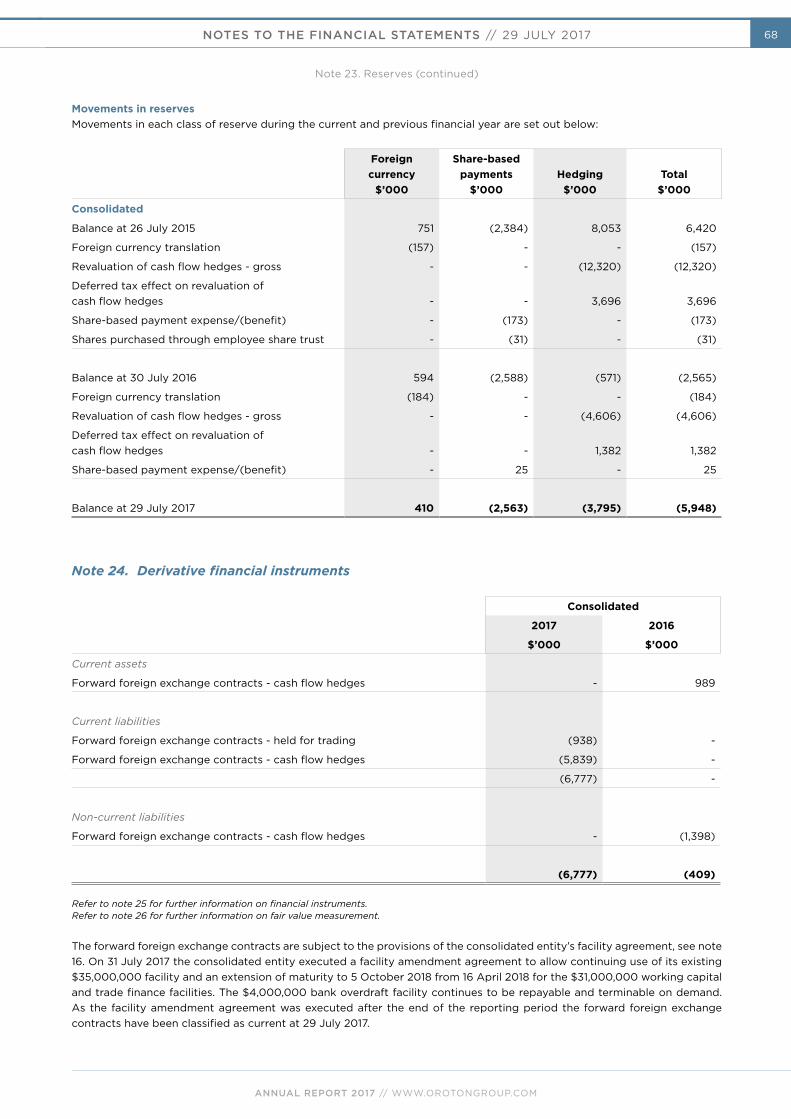
ANNUAL REPORT 2017 // WWW.OROTONGROUP.COM
6868
Note 23. Reserves (continued)
Movements in reservesMovements in each class of reserve during the current and previous financial year are set out below:
Foreigncurrency
$’000
Share-based payments
$’000Hedging
$’000Total
$’000
Consolidated
Balance at 26 July 2015 751 (2,384) 8,053 6,420
Foreign currency translation (157) - - (157)
Revaluation of cash flow hedges - gross - - (12,320) (12,320)
Deferred tax effect on revaluation of cash flow hedges - - 3,696 3,696
Share-based payment expense/(benefit) - (173) - (173)
Shares purchased through employee share trust - (31) - (31)
Balance at 30 July 2016 594 (2,588) (571) (2,565)
Foreign currency translation (184) - - (184)
Revaluation of cash flow hedges - gross - - (4,606) (4,606)
Deferred tax effect on revaluation of cash flow hedges - - 1,382 1,382
Share-based payment expense/(benefit) - 25 - 25
Balance at 29 July 2017 410 (2,563) (3,795) (5,948)
Note 24. Derivative financial instruments
Consolidated
2017 2016
$’000 $’000
Current assets
Forward foreign exchange contracts - cash flow hedges - 989
Current liabilities
Forward foreign exchange contracts - held for trading (938) -
Forward foreign exchange contracts - cash flow hedges (5,839) -
(6,777) -
Non-current liabilities
Forward foreign exchange contracts - cash flow hedges - (1,398)
(6,777) (409)
Refer to note 25 for further information on financial instruments.Refer to note 26 for further information on fair value measurement.
The forward foreign exchange contracts are subject to the provisions of the consolidated entity’s facility agreement, see note 16. On 31 July 2017 the consolidated entity executed a facility amendment agreement to allow continuing use of its existing $35,000,000 facility and an extension of maturity to 5 October 2018 from 16 April 2018 for the $31,000,000 working capital and trade finance facilities. The $4,000,000 bank overdraft facility continues to be repayable and terminable on demand. As the facility amendment agreement was executed after the end of the reporting period the forward foreign exchange contracts have been classified as current at 29 July 2017.
NOTES TO THE FINANCIAL STATEMENTS // 29 JULY 2017 68
ANNUAL REPORT 2017 // WWW.OROTONGROUP.COM
69
Note 24. Derivative financial instruments (continued)
Forward foreign exchange contracts - held for tradingForward foreign exchange contracts held by the consolidated entity that are identified as surplus to hedging requirements are held for trading, with any movements in the mark to market valuation of the derivative contract recognised in the profit or loss.
Accounting policy for derivative financial instrumentsDerivatives are initially recognised at fair value on the date a derivative contract is entered into and are subsequently remeasured to their fair value at each reporting date. The accounting for subsequent changes in fair value depends on whether the derivative is designated as a hedging instrument, and if so, the nature of the item being hedged.
Derivatives are classified as current or non-current depending on the expected period of realisation.
Cash flow hedgesCash flow hedges are used to cover the consolidated entity’s exposure to variability in cash flows that is attributable to particular risks associated with a recognised asset or liability or a firm commitment which could affect profit or loss. The effective portion of the gain or loss on the hedging instrument is recognised in other comprehensive income through the cash flow hedges reserve in equity, whilst the ineffective portion is recognised in profit or loss. Amounts taken to equity are transferred out of equity and included in the measurement of the hedged transaction when the forecast transaction occurs.
Cash flow hedges are tested for effectiveness on a regular basis both retrospectively and prospectively to ensure that each hedge is highly effective and continues to be designated as a cash flow hedge. If the forecast transaction is no longer expected to occur, the amounts recognised in equity are transferred to profit or loss.
If the hedging instrument is sold, terminated, expires, exercised without replacement or rollover, or if the hedge becomes ineffective and is no longer a designated hedge, the amounts previously recognised in equity remain in equity until the forecast transaction occurs.
Note 25. Financial instruments Financial risk management objectivesThe consolidated entity’s activities expose it to a variety of financial risks: market risk (including foreign currency risk and interest rate risk), credit risk and liquidity risk. The consolidated entity’s overall risk management program focuses on the unpredictability of financial markets and seeks to minimise potential adverse effects on the financial performance of the consolidated entity. The consolidated entity uses derivative financial instruments such as forward foreign exchange contracts to hedge certain risk exposures. Derivatives are exclusively used for hedging purposes, i.e. not as trading or other speculative instruments. The consolidated entity uses different methods to measure different types of risk to which it is exposed. These methods include sensitivity analysis in the case of interest rate and foreign exchange risks and ageing analysis for credit risk.
Financial risk management is carried out by the Finance department (Finance) under policies approved by the Board of Directors. Finance identifies and evaluates financial risks in close co-operation with the consolidated entity’s operating units. The Board provides principles for overall risk management, as well as written policies covering specific areas, such as mitigating foreign exchange, interest rate and credit risk and use of derivative financial instruments.
Market riskForeign currency riskThe consolidated entity undertakes certain transactions denominated in foreign currency and is exposed to foreign currency risk through foreign exchange rate fluctuations. This is primarily through the purchase of inventory in United States Dollars.
Foreign exchange risk arises from future commercial transactions and recognised financial assets and financial liabilities denominated in a currency that is not the entity’s functional currency. The risk is measured using sensitivity analysis and cash flow forecasting.
In order to protect against exchange rate movements, the consolidated entity has entered into forward exchange contracts to purchase US dollars. These contracts are hedging highly probable forecasted cash flows for the ensuing financial year. Management has a risk management policy to hedge 85% of anticipated transactions in US dollars for the subsequent 24 months.
NOTES TO THE FINANCIAL STATEMENTS // 29 JULY 201768

ANNUAL REPORT 2017 // WWW.OROTONGROUP.COM
7070
Note 25. Financial Instructions (continued)
The maturity, settlement amounts and the average contractual exchange rates of the consolidated entity’s outstanding forward foreign exchange contracts at the reporting date were as follows:
Sell Australian dollars Average exchange rates
2017 2016 2017 2016
$’000 $’000
Buy US dollars
0 - 6 months 25,814 25,174 0.7074 0.7934
6 - 12 months 20,448 23,319 0.7339 0.7319
12 - 24 months 35,097 41,265 0.7398 0.7154
Amounts disclosed above represent currency sold measured at contract rate.
The proportion of gain or loss on the hedging instrument that is determined to be an effective hedge is recognised directly in equity. When the cash flows occur, the consolidated entity adjusts the initial measurement of the component recognised in the statement of financial position by the related amount deferred in equity.
At the reporting date the fair value of these contracts represented a net liability of $6,777,000 (2016: $409,000).
The carrying amount of the consolidated entity’s foreign currency denominated financial assets and financial liabilities at the reporting date were as follows:
Assets Liabilities
2017 2016 2017 2016
$’000 $’000 $’000 $’000
Consolidated
US dollars 812 221 2,100 3,267
The consolidated entity had net liabilities denominated in foreign currency of AU$1,288,000 (assets AU$812,000 less liabilities AU$2,100,000) as at 29 July 2017. Based on this exposure, had the Australian Dollar weakened/strengthened by 10% against the US Dollar with all other variables held constant, and including the effect of changes in the fair value of forward exchange contracts, the consolidated entity’s profit after tax for the year would have been $350,000 higher/$1,991,000 lower and equity for the year would have been $5,070,000 higher/$5,850,000 lower. The equity adjustment is higher because the consolidated entity uses hedge accounting. The 10% change is the expected overall volatility of the US Dollar. The actual foreign exchange loss for the year ended 29 July 2017 was $941,000 (2016: gain of $36,000). Price riskThe consolidated entity is not exposed to any significant price risk. Interest rate riskInterest rate risk refers to the risk that the future cash flows of a financial instrument will fluctuate because of changes in market interest rates. The consolidated entity’s exposure to movements in interest rates arises from its borrowings, totalling$7,000,000, which are subject to variable interest rates.
An increase in interest rates by one percentage point (100 basis points) would have an adverse effect on profit after tax of$49,000 per annum.
Credit riskCredit risk refers to the risk that a counterparty will default on its contractual obligations resulting in financial loss to the consolidated entity. The consolidated entity has policies in place to ensure that sales of products are made to customers with an appropriate credit history. Derivative counterparts and cash transactions are limited to high credit quality financial institutions. The maximum exposure to credit risk, excluding the value of any collateral or other security, at the reporting date to recognised financial assets, is the carrying amount, net of any provisions for impairment of those assets, as disclosed in the statement of financial position and notes to the financial statements.
NOTES TO THE FINANCIAL STATEMENTS // 29 JULY 2017 70

ANNUAL REPORT 2017 // WWW.OROTONGROUP.COM
71
Note 25. Financial Instructions (continued)
Liquidity riskPrudent liquidity risk management implies maintaining sufficient cash and marketable securities, the availability of funding through an adequate amount of committed credit facilities and the ability to close out market positions. The consolidated entity manages liquidity risk by continuously monitoring forecast and actual cash flows and matching the maturity profiles of financial assets and liabilities. Due to the dynamic nature of the underlying businesses, the consolidated entity finance department aims at maintaining flexibility in funding by keeping committed credit lines available. Surplus funds are generally only invested in instruments that are tradeable in highly liquid markets.
The consolidated entity maintains relationships with banks with at least an A+ credit rating.
Financing arrangementsUnused borrowing facilities at the reporting date:
Consolidated
2017 2016
$’000 $’000
Bank overdraft 4,000 8,000
Working capital advances 13,000 18,000
Trade finance facilities 3,872 6,940
20,872 32,940
The bank overdraft, working capital and trade finance facilities may be drawn at any time. Bank facilities are arranged with general terms, conditions and covenants being set and agreed from time to time.
On 31 July 2017 the consolidated entity executed a facility amendment agreement to allow continuing use of its existing $35,000,000 facility and an extension of maturity to 5 October 2018 from 16 April 2018 for the $31,000,000 working capital and trade finance facilities. The $4,000,000 bank overdraft facility continues to be repayable and terminable on demand. To enable the financier to continue making facilities available to the consolidated entity, and as the consolidated entity continues to pursue various Strategic Review processes, entities controlled by Mr J Will Vicars (Vicars Entities) entered into a put and call arrangement with the financier to provide critical credit support. Details of the negotiated amendment terms are set out in note 37.
NOTES TO THE FINANCIAL STATEMENTS // 29 JULY 201770

ANNUAL REPORT 2017 // WWW.OROTONGROUP.COM
7272
Note 25. Financial Instructions (continued)
Remaining contractual maturitiesThe following tables detail the consolidated entity’s remaining contractual maturity for its financial instrument liabilities. The tables have been drawn up based on the undiscounted cash flows of financial liabilities based on the earliest date on which the financial liabilities are required to be paid. The tables include both interest and principal cash flows disclosed as remaining contractual maturities and therefore these totals may differ from their carrying amount in the statement of financial position.
Weighted average
interest rate1 year or
lessBetween 1
and 2 yearsBetween 2 and 5 years
Over 5 years
Remaining contractual maturities
Consolidated - 2017 % $’000 $’000 $’000 $’000 $’000
Non-derivatives
Non-interest bearing
Trade payables - 8,644 - - - 8,644
Other payables - 7,510 675 - - 8,185
Other financial liabilities - - 1,143 - - 1,143
Interest-bearing - variable
Bank loans 2.34% 7,000 - - - 7,000
Total non-derivatives - 23,154 1,818 - - 24,972
Derivatives
Forward foreign exchange contracts net settled - 6,777 - - - 6,777
Total derivatives 6,777 - - - 6,777
Weighted average
interest rate1 year or
lessBetween 1
and 2 yearsBetween 2 and 5 years
Over 5 years
Remaining contractual maturities
Consolidated - 2016 % $’000 $’000 $’000 $’000 $’000
Non-derivatives
Non-interest bearing
Trade payables - 6,743 - - - 6,743
Other payables - 5,591 - - - 5,591
Total non-derivatives 12,334 - - - 12,334
Derivatives
Forward foreign exchange contracts net settled - - (1,398) - - (1,398)
Total derivatives - (1,398) - - (1,398)
The cash flows in the maturity analysis above are not expected to occur significantly earlier than contractually disclosed above.
Fair value of financial instrumentsUnless otherwise stated, the carrying amounts of financial instruments reflect their fair value.
NOTES TO THE FINANCIAL STATEMENTS // 29 JULY 2017 72

ANNUAL REPORT 2017 // WWW.OROTONGROUP.COM
73
Note 26. Fair value measurement Fair value hierarchyThe following tables detail the consolidated entity’s assets and liabilities, measured or disclosed at fair value, using a three level hierarchy, based on the lowest level of input that is significant to the entire fair value measurement, being:Level 1: Quoted prices (unadjusted) in active markets for identical assets or liabilities that the entity can access at the
measurement dateLevel 2: Inputs other than quoted prices included within Level 1 that are observable for the asset or liability, either directly
or indirectlyLevel 3: Unobservable inputs for the asset or liability
Level 1 $'000
Level 2$’000
Level 3$’000
Total$’000Consolidated - 2017
Assets
Call option over investments accounted for using the equity method - - 46 46
Total assets - - 46 46
Liabilities
Forward foreign exchange contracts - 6,777 - 6,777
Contingent consideration payable - - 660 660
Put option over investments accounted for using the equity method - - 1,143 1,143
Total liabilities - 6,777 1,803 8,580
Level 1 $'000
Level 2$’000
Level 3$’000
Total$’000Consolidated - 2016
Liabilities
Forward foreign exchange contracts - 409 - 409
Total liabilities - 409 - 409
There were no transfers between levels during the financial year.
The carrying amounts of trade and other receivables and trade and other payables are assumed to approximate their fair values due to their short-term nature. Valuation techniques for fair value measurements categorised within level 2Derivative financial instruments have been valued using quoted market rates. This valuation technique maximises the use of observable market data where it is available and relies as little as possible on entity specific estimates.
NOTES TO THE FINANCIAL STATEMENTS // 29 JULY 201772

ANNUAL REPORT 2017 // WWW.OROTONGROUP.COM
7474
Note 26. Fair value measurement (continued)
Level 3 assets and liabilitiesMovements in level 3 assets and liabilities during the current and previous financial year are set out below:
Total
Consolidated $'000
Balance at 26 July 2015 -
Balance at 30 July 2016 -
Recognition of call option over investments accounted for using the equity method 46
Recognition of contingent consideration payable (660)
Recognition of put option over investments accounted for using the equity method (1,143)
Balance at 29 July 2017 (1,757)
Valuation techniques for fair value measurements categorised within level 3The call and put options over investments accounted for using the equity method have been valued using a Black-Scholes model, utilising observable market data where it is available. The Black-Scholes model requires entity and instrument specific measures to derive a valuation.
The contingent consideration payable has been valued based on the terms of the deed between the consolidated entity and the founders of TDE Pty Limited. The amount payable is variable based on the achievement of certain performance targets related to the year ending 28 July 2018. The carrying value of the contingent consideration payable is adjusted for the probability of TDE Pty Limited achieving those targets.
Accounting policy for fair value measurementWhen an asset or liability, financial or non-financial, is measured at fair value for recognition or disclosure purposes, the fair value is based on the price that would be received to sell an asset or paid to transfer a liability in an orderly transaction between market participants at the measurement date; and assumes that the transaction will take place either: in the principal market; or in the absence of a principal market, in the most advantageous market.
Fair value is measured using the assumptions that market participants would use when pricing the asset or liability, assuming they act in their economic best interests. For non-financial assets, the fair value measurement is based on its highest and best use. Valuation techniques that are appropriate in the circumstances and for which sufficient data are available to measure fair value, are used, maximising the use of relevant observable inputs and minimising the use of unobservable inputs.
Assets and liabilities measured at fair value are classified, into three levels, using a fair value hierarchy that reflects the significance of the inputs used in making the measurements. Classifications are reviewed at each reporting date and transfers between levels are determined based on a reassessment of the lowest level of input that is significant to the fair value measurement.
For recurring and non-recurring fair value measurements, external valuers may be used when internal expertise is either not available or when the valuation is deemed to be significant. External valuers are selected based on market knowledge and reputation. Where there is a significant change in fair value of an asset or liability from one period to another, an analysis is undertaken, which includes a verification of the major inputs applied in the latest valuation and a comparison, where applicable, with external sources of data.
NOTES TO THE FINANCIAL STATEMENTS // 29 JULY 2017 74

ANNUAL REPORT 2017 // WWW.OROTONGROUP.COM
75
Note 27. Commitments
Consolidated
2017 2016
Capital commitments $’000 $’000
Committed at the reporting date:
Property, plant and equipment 95 53
Intangible assets - software 253 301
348 354
Lease commitments - operating
Committed at the reporting date:
Within one year 20,608 18,924
One to five years 15,467 37,601
More than five years 247 4,674
36,322 61,199
Included in the operating lease commitments is $5,164,000 of costs to exit Gap store leases and $4,145,000 of lease payments that will be incurred in the period up to the exit of the lease contracts, all due within one year from balance date. The costs to exit Gap store leases of $5,164,000 have been provided for in an onerous lease provision at 29 July 2017. Of the $4,145,000 of lease payment that will be incurred in the period up to the exit of the lease contracts, $2,882,000 has been provided for as an onerous lease provision at 29 July 2017 and the remaining $1,263,000 will be offset by estimated future net inflows from operating the stores until closure. No other amounts relating to Gap store leases are included in the above operating lease commitments.
Not included in the operating lease commitments are contingent rental payments which may arise in the event that a pre-determined percentage of sales produced in certain leased shops exceed the basic rent provided for in the lease. The contingent rentals payable are based on varying percentages of sales revenue.
Operating lease commitments includes contracted amounts for various retail outlets and offices under non-cancellable operating leases expiring within one to ten years with, in some cases, options to extend. The leases have various escalation clauses. On renewal, the terms of the leases are renegotiated.
Accounting policy for leasesThe determination of whether an arrangement is or contains a lease is based on the substance of the arrangement and requires an assessment of whether the fulfilment of the arrangement is dependent on the use of a specific asset or assets and the arrangement conveys a right to use the asset.
A distinction is made between finance leases, which effectively transfer from the lessor to the lessee substantially all the risks and benefits incidental to the ownership of leased assets, and operating leases, under which the lessor effectively retains substantially all such risks and benefits.
Operating lease payments, net of any incentives received from the lessor, are charged to profit or loss on a straight-line basis over the term of the lease.
NOTES TO THE FINANCIAL STATEMENTS // 29 JULY 201774

ANNUAL REPORT 2017 // WWW.OROTONGROUP.COM
7676
Note 28. Contingent liabilities Details and estimates of maximum amounts of contingent liabilities are as follows:
Guarantees and letters of responsibility have been given to lending institutions by OrotonGroup Limited and OrotonGroup (Australia) Pty Limited in respect of borrowings and documentary letters of credit of controlled entities in the normal course of business. Entities in the consolidated entity have guaranteed each other in respect of amounts advanced under banking and finance arrangements in the normal course of business.
OrotonGroup Limited has guaranteed OrotonGroup (Australia) Pty Limited, OrotonGroup (Licence Company) Pty Limited and OrotonGroup (New Zealand) Pty Limited in respect of the tenancy of a total of 52 (2016: 56) properties, occupied in the normal course of business. The contingent liability under the leases, covering the period to the lease expiry dates, is assessed at $27,295,000 at 29 July 2017 (2016: $59,429,000).
No material liabilities, not already provided for in the financial statements, are anticipated in respect of the above.
Note 29. Interests in associates
Interests in associates are accounted for using the equity method of accounting. Information relating to associates that are material to the consolidated entity are set out below:
Name
Principal place of business / Country of
incorporation
Ownership interest
2017%
2016%
TDE Pty Limited Australia 31.40% -
TDE Pty Limited 2017
$’000
Reconciliation of the consolidated entity’s carrying amount
Investment in associate 4,500
Share of profit after income tax 23
Costs directly attributable to acquisition of investment 532
Fair value of contingent considerable payable 660
Fair value of call option over investment in associate (46)
Fair value of put option over investment in associate 1,143
Closing carrying amount 6,812
Investment in associateConsideration paid by the consolidated entity to acquire a 31.4% ownership interest in TDE Pty Limited. Total consideration paid comprised of $2,670,000 of cash and OrotonGroup Limited shares to the value of $1,830,000, see note 22.
Costs directly attributable to acquisition of investmentComprised of professional fees for services that are directly attributable to the consolidated entity’s acquisition of TDE Pty Limited.
Contingent consideration payableDetails of the contingent consideration payable to TDE Pty Limited are set out in note 18.
Call and put options over investment in associateDetails of the call and put options granted as part of the acquisition of TDE Pty Limited are set out in note 20.
NOTES TO THE FINANCIAL STATEMENTS // 29 JULY 2017 76

ANNUAL REPORT 2017 // WWW.OROTONGROUP.COM
77
Note 30. Interests in subsidiaries The consolidated financial statements incorporate the assets, liabilities and results of the following subsidiaries in accordance with the accounting policy described in note 1:
Name
Principal place of business / Country of
incorporation
Ownership interest
2017%
2016%
OrotonGroup (Australia) Pty Limited Australia 100.00% 100.00%
OrotonGroup (Number One) Pty Limited Australia 100.00% 100.00%
OrotonGroup (New Zealand) Pty Limited New Zealand 100.00% 100.00%
Oroton Share Plan Company Pty Limited Australia 100.00% 100.00%
OrotonGroup (International) Pty Limited Australia 100.00% 100.00%
OrotonGroup (Malaysia) Sdn Bhd Malaysia 100.00% 100.00%
OrotonGroup (Singapore) Pty Ltd Singapore 100.00% 100.00%
OrotonGroup (Hong Kong) Ltd Hong Kong 100.00% 100.00%
Oroton (Shanghai) Trading Co., Ltd China 100.00% 100.00%
OrotonGroup (Licence Company) Pty Limited Australia 100.00% 100.00%
Note 31. Deed of cross guarantee The following entities are party to a deed of cross guarantee under which each company guarantees the debts of the other: OrotonGroup LimitedOrotonGroup (Australia) Pty LimitedOrotonGroup (Number One) Pty LimitedOrotonGroup (New Zealand) Pty LimitedOroton Share Plan Company Pty LimitedOrotonGroup (Licence Company) Pty Limited
By entering into the deed, the wholly-owned entities have been relieved from the requirement to prepare financial statements and directors’ report under Corporations Instrument 2016/785 issued by the Australian Securities and Investments Commission.
The above companies represent a ‘Closed Group’ for the purposes of the Corporations Instrument, and as there are no other parties to the deed of cross guarantee that are controlled by OrotonGroup Limited, they also represent the ‘Extended Closed Group’.
NOTES TO THE FINANCIAL STATEMENTS // 29 JULY 201776
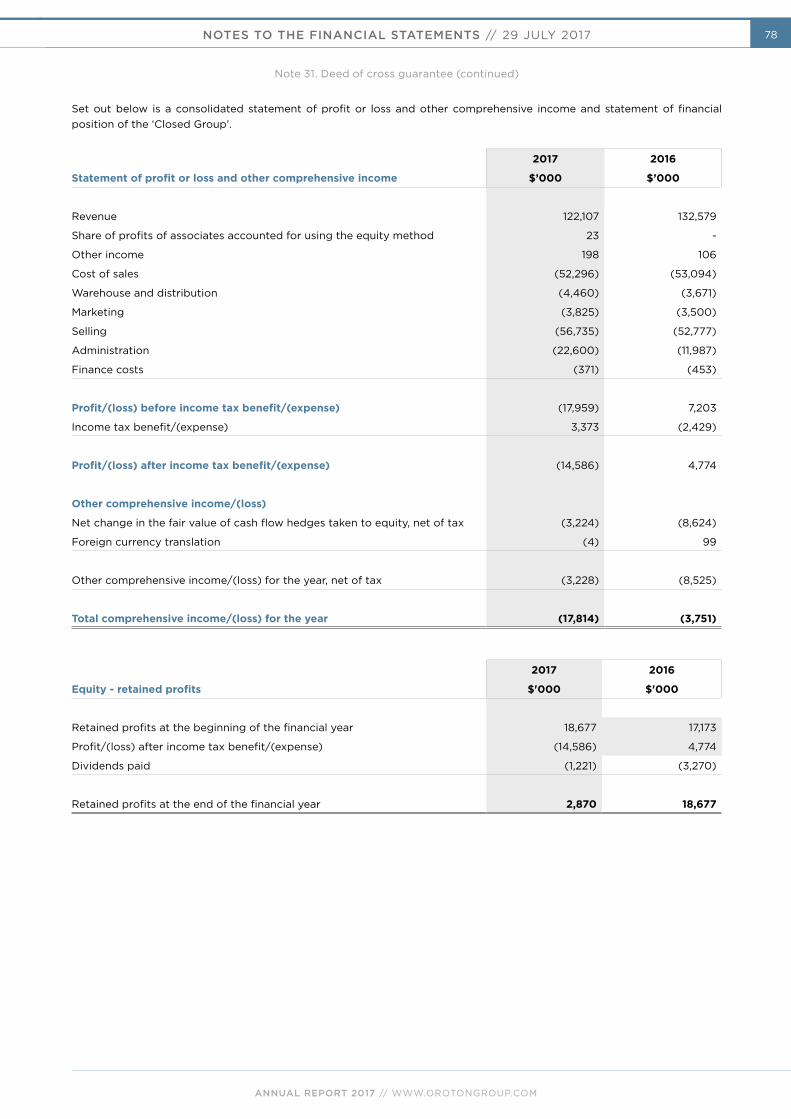
ANNUAL REPORT 2017 // WWW.OROTONGROUP.COM
7878
Note 31. Deed of cross guarantee (continued)
Set out below is a consolidated statement of profit or loss and other comprehensive income and statement of financial position of the ‘Closed Group’.
2017 2016
Statement of profit or loss and other comprehensive income $’000 $’000
Revenue 122,107 132,579
Share of profits of associates accounted for using the equity method 23 -
Other income 198 106
Cost of sales (52,296) (53,094)
Warehouse and distribution (4,460) (3,671)
Marketing (3,825) (3,500)
Selling (56,735) (52,777)
Administration (22,600) (11,987)
Finance costs (371) (453)
Profit/(loss) before income tax benefit/(expense) (17,959) 7,203
Income tax benefit/(expense) 3,373 (2,429)
Profit/(loss) after income tax benefit/(expense) (14,586) 4,774
Other comprehensive income/(loss)
Net change in the fair value of cash flow hedges taken to equity, net of tax (3,224) (8,624)
Foreign currency translation (4) 99
Other comprehensive income/(loss) for the year, net of tax (3,228) (8,525)
Total comprehensive income/(loss) for the year (17,814) (3,751)
2017 2016
Equity - retained profits $'000 $'000
Retained profits at the beginning of the financial year 18,677 17,173
Profit/(loss) after income tax benefit/(expense) (14,586) 4,774
Dividends paid (1,221) (3,270)
Retained profits at the end of the financial year 2,870 18,677
NOTES TO THE FINANCIAL STATEMENTS // 29 JULY 2017 78

ANNUAL REPORT 2017 // WWW.OROTONGROUP.COM
79
Note 31. Deed of cross guarantee (continued)
2017 2016
Statement of financial position $’000 $’000
Current assets
Cash and cash equivalents 1,324 2,245
Trade and other receivables 2,917 4,909
Inventories 34,958 29,963
Derivative financial instruments - 989
Tax receivable - 381
39,199 38,487
Non-current assets
Receivables 2,769 4,701
Investments accounted for using the equity method 6,812 -
Investments in subsidiaries outside the Closed Group - 167
Property, plant and equipment 5,069 10,773
Intangibles 1,183 1,069
Deferred tax 8,515 3,542
Other financial assets 46 -
24,394 20,252
Total assets 63,593 58,739
Current liabilities
Trade and other payables 15,763 11,839
Borrowings 7,000 -
Derivative financial instruments 6,777 -
Income tax 144 -
Provisions - current 8,697 1,007
38,381 12,846
Non-current liabilities
Other payables 660 -
Derivative financial instruments - 1,398
Provisions - non-current 2,973 5,154
Other financial liabilities 1,143 -
4,776 6,552
Total liabilities 43,157 19,398
Net assets 20,436 39,341
Equity
Issued capital 24,005 22,175
Reserves (6,439) (1,511)
Retained profits 2,870 18,677
Total equity 20,436 39,341
NOTES TO THE FINANCIAL STATEMENTS // 29 JULY 201778

ANNUAL REPORT 2017 // WWW.OROTONGROUP.COM
8080
Note 32. Parent entity information Set out below is the supplementary information about the parent entity. Statement of profit or loss and other comprehensive income
Parent
2017 2016
$’000 $’000
Profit/(loss) after income tax (16,645) 3,269
Total comprehensive income/(loss) (16,645) 3,269
Statement of financial position
Parent
2017 2016
$’000 $’000
Total current assets 2 2,575
Total assets 20,653 34,742
Total current liabilities 166 22
Total liabilities 1,969 22
Equity
Issued capital 24,005 22,175
Reserves 32 32
Retained profits/(accumulated losses) (5,353) 12,513
Total equity 18,684 34,720
Guarantees entered into by the parent entity in relation to the debts of its subsidiariesThe parent entity and some of its subsidiaries are party to a deed of cross guarantee under which each company guarantees the debts of the others. OrotonGroup (Licence Company) Pty Limited, the trading entity for the Gap brand business in Australia, had a deficiency of assets at 29 July 2017. No deficiencies of assets existed in any of these subsidiaries as at 30 July 2016.
Contingent liabilitiesContingent liabilities are set out in note 28. Capital commitments - Property, plant and equipmentThe parent entity had no capital commitments for property, plant and equipment at as 29 July 2017 and 30 July 2016. Significant accounting policiesThe accounting policies of the parent entity are consistent with those of the consolidated entity, as disclosed in note 1, except for the following:
• Investments in subsidiaries are accounted for at cost, less any impairment, in the parent entity.
NOTES TO THE FINANCIAL STATEMENTS // 29 JULY 2017 80

ANNUAL REPORT 2017 // WWW.OROTONGROUP.COM
81
Note 33. Related party transactions Parent entityOrotonGroup Limited is the parent entity. SubsidiariesInterests in subsidiaries are set out in note 30. AssociatesInterests in associates are set out in note 29. Key management personnelDisclosures relating to key management personnel are set out in note 34 and the remuneration report included in the directors’ report.
Transactions with related partiesThere were no transactions with related parties during the current and previous financial year.
Receivable from and payable to related partiesThere were no trade receivables from or trade payables to related parties at the current and previous reporting date.
Arrangements with related partiesOn 20 June 2017 the consolidated entity executed an agreement with one of its major shareholders and former director, Mr J Will Vicars, and entities controlled by him, providing up to $3,000,000 credit support of its working capital advance facilitywith Westpac. The $3,000,000 credit support arrangement expired on 31 July 2017 and was not utilised.
On 31 July 2017 the consolidated entity executed a facility amendment agreement to allow the continuing use of its existing $35,000,000 facility and an extension of maturity to 5 October 2018 from 16 April 2018 for the $31,000,000 working capital and trade finance facilities. The $4,000,000 bank overdraft facility continues to be repayable and terminable on demand. To enable the financier to continue making facilities available, entities controlled by Mr J Will Vicars entered into a put and call arrangement with the financier to provide critical credit support. Further details of the extension of maturity and this credit support arrangement are set out in note 37.
Note 34. Key management personnel disclosures CompensationDetailed remuneration disclosures are provided in the Remuneration Report on pages 21 to 33.
Consolidated
2017 2016
$ $
Short-term employee benefits 1,503,226 1,665,391
Post-employment benefits 475,420 80,081
Long-term benefits 25,910 17,114
Cash-based payments 42,991 -
Share-based payments (12,728) (168,007)
2,034,819 1,594,579
Loans to key management personnelThere have not been any loans made to the directors of OrotonGroup Limited or any other key management personnel of the consolidated entity, including their personally related parties for the 2017 and 2016 financial years. There were no other transactions involving key management personnel during the 2017 and 2016 financial years.
NOTES TO THE FINANCIAL STATEMENTS // 29 JULY 201780

ANNUAL REPORT 2017 // WWW.OROTONGROUP.COM
8282
Note 35. Share-based payments Oroton Performance Based IncentivesOroton performance based incentives are designed to provide long and short-term incentives to deliver shareholder returns. Under the scheme, participants are granted rights which only vest if certain performance standards and service periods are met. Participation in the scheme is at the Board’s discretion and no individual has a contractual right to participate in the scheme or to receive any guaranteed benefits.
The amount of performance rights that will vest depends on the achievement of the earnings per share (EPS) performance condition attached.
Once vested, the performance rights remain exercisable for a period of two years. Performance rights are granted under the scheme for no consideration and carry no dividend or voting rights.
When exercisable, each performance right is convertible into one ordinary share. The performance rights have no exercise price.
In addition to performance rights, in certain circumstances, employees are granted retention rights in order to encourage longevity of employment for key employees.
Set out below are summaries of performance rights granted under the plan:
2017Exercise
price
Balance atthe start of
the year Granted Exercised
Expired/forfeited/
other
Balance atthe end ofthe yearGrant date Expiry date
03/12/2014 19/09/2019 $0.00 200,000 - - (200,000) -
03/12/2014 17/09/2021 $0.00 300,000 - - (300,000) -
09/10/2015 18/09/2020 $0.00 168,347 - - (15,119) 153,228
27/11/2015 18/09/2020 $0.00 135,983 - - (135,983) -
21/10/2016 20/09/2020 $0.00 - 115,460 - - 115,460
21/10/2016 18/09/2021 $0.00 - 115,460 - - 115,460
01/12/2016 20/09/2020 $0.00 - 66,875 - (66,875) -
01/12/2016 19/09/2021 $0.00 - 66,875 - (66,875) -
804,330 364,670 - (784,852) 384,148
2016Exercise
price
Balance atthe start of
the year Granted Exercised
Expired/forfeited/
other
Balance atthe end ofthe yearGrant date Expiry date
15/10/2013 30/07/2018 $0.00 74,695 - - (74,695) -
28/11/2013 30/07/2018 $0.00 56,122 - - (56,122) -
03/12/2014 19/09/2019 $0.00 200,000 - - - 200,000
03/12/2014 17/09/2021 $0.00 300,000 - - - 300,000
09/01/2015 20/09/2018 $0.00 181,846 - - (181,846) -
09/10/2015 18/09/2020 $0.00 - 297,891 - (129,544) 168,347
27/11/2015 18/09/2020 $0.00 - 135,983 - - 135,983
812,663 433,874 - (442,207) 804,330
*Rights have a vesting probability of zero as at 29 July 2017, but will lapse in the future.
The weighted average remaining contractual life of performance rights outstanding at the end of the period was 3.44 years (2016: 4.26 years). Fair value of performance rights grantedThe assessed fair value at grant date of performance rights granted during the years ended 29 July 2017 and 30 July 2016 is disclosed in the table below. The fair value at grant date is determined using a Black-Scholes pricing model for grants with an EPS hurdle. These valuations take into account the exercise price, the term of the performance right, the impact of dilution,
NOTES TO THE FINANCIAL STATEMENTS // 29 JULY 2017 82

ANNUAL REPORT 2017 // WWW.OROTONGROUP.COM
83
the share price at grant date and expected price volatility of the underlying share, the expected dividend yield and the risk free interest rate for the term of the performance right.
Retention rightsSet out below are summaries of retention rights granted under the plan:
2017Exercise
price
Balance atthe start of
the year Granted Exercised
Expired/forfeited/
other
Balance atthe end ofthe yearGrant date Expiry date
09/01/2015 19/09/2019 $0.00 83,842 - - (47,950) 35,892
09/10/2015 19/09/2019 $0.00 60,000 - - - 60,000
143,842 - - (47,950) 95,892
2016Exercise
price
Balance atthe start of
the year Granted Exercised
Expired/forfeited/
other
Balance atthe end ofthe yearGrant date Expiry date
04/12/2012 25/07/2017 $0.00 12,519 - (12,519) - -
09/01/2015 19/09/2019 $0.00 161,341 - - (77,499) 83,842
09/10/2015 19/09/2019 $0.00 - 60,000 - - 60,000
173,860 60,000 (12,519) (77,499) 143,842
The weighted average remaining contractual life of retention rights outstanding at the end of the financial year was 2.14 years (2016: 3.14 years).
The model inputs for performance rights granted during the years ended 29 July 2017 and 30 July 2016 are as follows:
• performance rights are granted with no consideration and vest based on OrotonGroup Limited’s performance; or based on other pre-determined performance related targets.
• all performance rights granted during the year have a nil exercise price.
Share priceat grant
dateExercise
priceExpectedvolatility
Dividendyield
Risk-freeinterest rate
Fair valueat grant
dateGrant date Expiry date
09/01/2015 15/09/2017 $3.70 $0.00 33.00% 4.30% 2.50% $3.590
09/01/2015 20/09/2018 $3.70 $0.00 33.00% 4.35% 2.50% $3.440
09/10/2015 18/09/2020 $2.38 $0.00 53.00% 2.70% 1.90% $2.200
27/11/2015 18/09/2020 $2.84 $0.00 53.00% 2.70% 1.90% $2.630
21/10/2016 20/09/2020 $2.23 $0.00 38.80% 3.90% 1.70% $2.070
21/10/2016 19/09/2021 $2.23 $0.00 38.80% 3.90% 1.70% $1.990
01/12/2016 20/09/2020 $2.30 $0.00 39.30% 3.90% 1.70% $2.144
01/12/2016 19/09/2021 $2.30 $0.00 39.30% 3.90% 1.70% $2.062
The model inputs for retention rights granted during the years ended 29 July 2017 and 30 July 2016 are as follows:
Grant date Expiry date
Share priceat grant
dateExercise
priceExpectedvolatility
Dividendyield
Risk-freeinterest rate
Fair valueat grant
date
09/01/2015 19/09/2019 $3.70 $0.00 33.00% 4.30% 2.60% $3.300
09/10/2015 19/09/2019 $2.38 $0.00 53.00% 2.70% 1.90% $2.270
The expected volatility was determined based on a four year historic volatility of OrotonGroup Limited’s share prices.
Performance rights and retention rights granted under the scheme carry no dividend or voting rights. There were 364,670 (2016: 433,874) performance rights and nil (2016: 60,000) retention rights granted in the 2017 financial year.
Note 35. Share-based payments (continued)
NOTES TO THE FINANCIAL STATEMENTS // 29 JULY 201782

ANNUAL REPORT 2017 // WWW.OROTONGROUP.COM
8484
Expenses arising from share-based payment transactionsTotal expenses arising from share-based payment transactions recognised during the period as part of employee benefit expense was a net expense of $25,000 in 2017 (2016: $173,000 net expense) for the consolidated entity.
Accounting policy for share-based paymentsEquity-settled transactions are awards of shares, or rights over shares, that are provided to employees in exchange for the rendering of services.
The cost of equity-settled transactions are measured at fair value on grant date. Fair value is independently determined using either the Monte Carlo or Black-Scholes option pricing model that takes into account the exercise price, the term of the right, the impact of dilution, the share price at grant date and expected price volatility of the underlying share, the expected dividend yield and the risk free interest rate for the term of the right, together with non-vesting conditions that do not determine whether the consolidated entity receives the services that entitle the employees to receive payment. No account is taken of any other vesting conditions.
The cost of equity-settled transactions are recognised as an expense with a corresponding increase in equity over the vesting period. The cumulative charge to profit or loss is calculated based on the grant date fair value of the award, the best estimate of the number of awards that are likely to vest and the expired portion of the vesting period. The amount recognised in profit or loss for the period is the cumulative amount calculated at each reporting date less amounts already recognised in previous periods.
Market conditions are taken into consideration in determining fair value. Therefore any awards subject to market conditions are considered to vest irrespective of whether or not that market condition has been met, provided all other conditions are satisfied.
If equity-settled awards are modified, as a minimum an expense is recognised as if the modification has not been made. An additional expense is recognised, over the remaining vesting period, for any modification that increases the total fair value of the share-based compensation benefit as at the date of modification.
If the non-vesting condition is within the control of the consolidated entity or employee, the failure to satisfy the condition is treated as a cancellation. If the condition is not within the control of the consolidated entity or employee and is not satisfied during the vesting period, any remaining expense for the award is recognised over the remaining vesting period, unless the award is forfeited.
If equity-settled awards are cancelled, it is treated as if it has vested on the date of cancellation, and any remaining expense is recognised immediately. If a new replacement award is substituted for the cancelled award, the cancelled and new award is treated as if they were a modification.
Critical accounting judgements, estimates and assumptionsThe consolidated entity measures the cost of equity-settled transactions with employees by reference to the fair value of the equity instruments at the date at which they are granted. The fair value is determined by using either the Monte Carlo or Black-Scholes model taking into account the terms and conditions upon which the instruments were granted.
Note 35. Share-based payments (continued)
NOTES TO THE FINANCIAL STATEMENTS // 29 JULY 2017 84
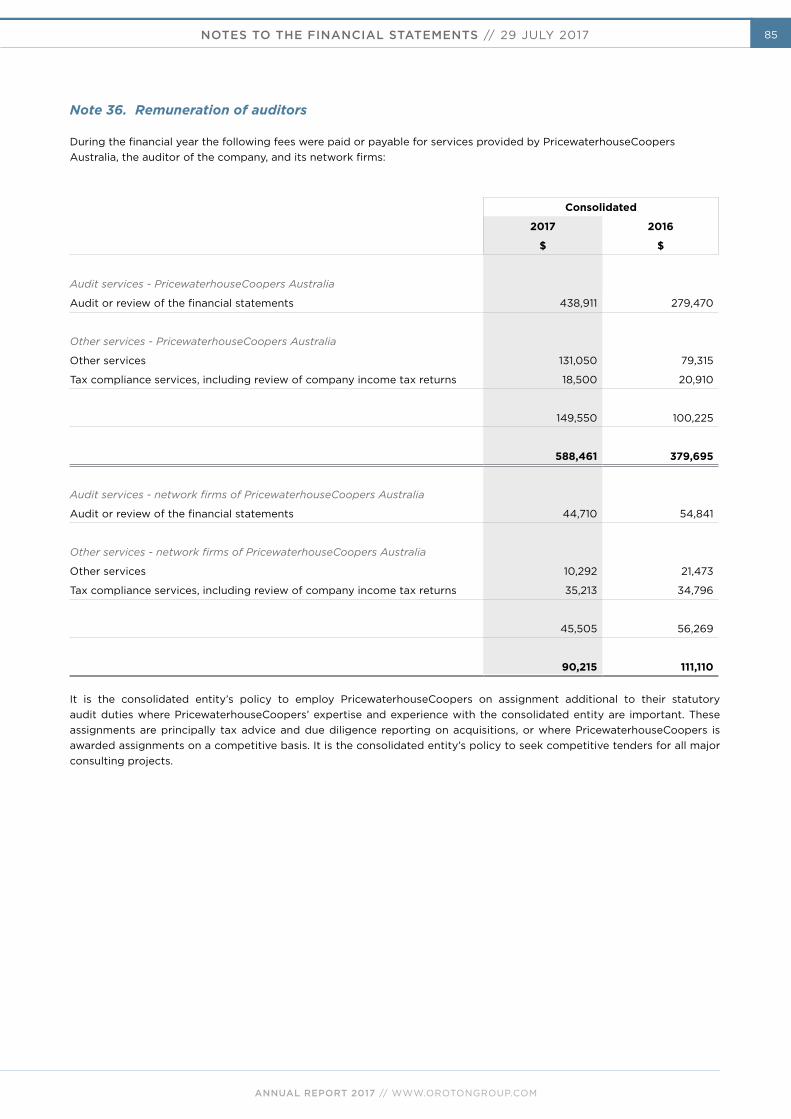
ANNUAL REPORT 2017 // WWW.OROTONGROUP.COM
85
Note 36. Remuneration of auditors During the financial year the following fees were paid or payable for services provided by PricewaterhouseCoopersAustralia, the auditor of the company, and its network firms:
Consolidated
2017 2016
$ $
Audit services - PricewaterhouseCoopers Australia
Audit or review of the financial statements 438,911 279,470
Other services - PricewaterhouseCoopers Australia
Other services 131,050 79,315
Tax compliance services, including review of company income tax returns 18,500 20,910
149,550 100,225
588,461 379,695
Audit services - network firms of PricewaterhouseCoopers Australia
Audit or review of the financial statements 44,710 54,841
Other services - network firms of PricewaterhouseCoopers Australia
Other services 10,292 21,473
Tax compliance services, including review of company income tax returns 35,213 34,796
45,505 56,269
90,215 111,110
It is the consolidated entity’s policy to employ PricewaterhouseCoopers on assignment additional to their statutory audit duties where PricewaterhouseCoopers’ expertise and experience with the consolidated entity are important. These assignments are principally tax advice and due diligence reporting on acquisitions, or where PricewaterhouseCoopers is awarded assignments on a competitive basis. It is the consolidated entity’s policy to seek competitive tenders for all major consulting projects.
NOTES TO THE FINANCIAL STATEMENTS // 29 JULY 201784

ANNUAL REPORT 2017 // WWW.OROTONGROUP.COM
86
Note 37. Events after the reporting period Westpac FinancingOn 31 July 2017 the consolidated entity negotiated amendments to terms of the facility agreement with its financier to allow the continuing use of its existing $35,000,000 facility and an extension of maturity to 5 October 2018 from 16 April 2018 for the $31,000,000 working capital and trade finance facilities. The $4,000,000 bank overdraft facility continues to be repayable and terminable on demand.
In order to secure the continuation of the consolidated entity’s facilities, the consolidated entity had commercial-in-confidence discussions with numerous substantial shareholders gauging their interest in providing a measure of credit support to the financier.
Through the Strategic Process review first announced on 17 May 2017 and alongside those shareholder discussions, certain alternative financing options were explored, however an amendment of the existing facility was determined to be the preferred option to provide certainty of funding from both a cost and timing perspective. To that end, and to enable the financier to continue making facilities available to the consolidated entity, and as the consolidated entity continues to pursue various Strategic Processes, entities controlled by Mr J Will Vicars (Vicars Entities) entered into a put and call arrangement with the financier to provide critical credit support.
The subject of the put and call arrangement is the financier’s interest in the $35,000,000 of facilities committed to the consolidated entity including a $20,000,000 working capital advance facility and $15,000,000 of bank overdraft and trade finance facilities. The put element of the arrangement enables the financier to transfer the working capital advance facility to Vicars Entities at face value upon an event of a default or on 16 April 2018. The call element of the arrangement enables Vicar Entities to purchase all of the financier’s facilities at face value any time until one month after 16 April 2018. The consolidated entity is not a party to the put and call arrangement between the financier and Vicars Entities, although it was involved in facilitating the arrangements.
As part of the amendments agreed with the financier, the consolidated entity will pay an amendment fee of $1,500,000 to the financier, which reflected a more favourable outcome relative to alternative financing options explored. The financier will pay an equivalent option fee to Vicars Entities. As the agreement was entered into after the current year end, the fees associated with the extension of maturity are a non-adjusting subsequent event, which are expected to be incurred in the year ended 28 July 2018.
End of Gap franchise arrangementsOn 4 August 2017 the consolidated entity entered into a binding agreement with Gap Inc to discontinue the Gap franchise business in Australia, with store closures targeted for completion by 31 January 2018.
The consolidated entity has recognised a total net expense of $11,304,000 in the 29 July 2017 financial statements as a consequence of the planned closure. This is comprised of non-current asset impairments of $2,333,000, make good asset depreciation of $124,000, strategic review costs of $695,000, an inventory provision of $917,000, hedge contract ineffectiveness of $938,000 and net onerous lease expense of $6,297,000.
As the agreement was entered into after the current year end, other fees and redundancy costs associated with the closure of the Gap franchise business in Australia are a non-adjusting subsequent event, which are expected to be incurred in the year ended 28 July 2018. Redundancy and termination costs associated with the closure are estimated to be approximately $1,157,000, while the consolidated entity is unable to estimate the final amount to be paid for other fees.
Since year end the consolidated entity has reached agreements in principle with the major Gap store lessors to exit the Gap store lease contracts. The key settlement terms agreed include amounts payable and timing of payment on exit. These agreements are currently being documented. The agreed costs to exit these leases has been included in the calculation of the provision for onerous leases recognised in the 29 July 2017 financial statements, see note 17.
No other matter or circumstance has arisen since 29 July 2017 that has significantly affected, or may significantly affect the consolidated entity’s operations, the results of those operations, or the consolidated entity’s state of affairs in future financial years.
86 NOTES TO THE FINANCIAL STATEMENTS // 29 JULY 2017 86

ANNUAL REPORT 2017 // WWW.OROTONGROUP.COM
8787
In the directors’ opinion: • the attached financial statements and notes comply with the Corporations Act 2001, the Accounting Standards, the
Corporations Regulations 2001 and other mandatory professional reporting requirements;
• the attached financial statements and notes comply with International Financial Reporting Standards as issued by the International Accounting Standards Board as described in note 1 to the financial statements;
• the attached financial statements and notes give a true and fair view of the consolidated entity’s financial position as at 29 July 2017 and of its performance for the financial year ended on that date;
• there are reasonable grounds to believe that the company will be able to pay its debts as and when they become due and payable; and
• at the date of this declaration, there are reasonable grounds to believe that the members of the Extended Closed Group will be able to meet any obligations or liabilities to which they are, or may become, subject by virtue of the deed of cross guarantee described in note 31 to the financial statements.
The directors have been given the declarations required by section 295A of the Corporations Act 2001.
Signed in accordance with a resolution of directors made pursuant to section 295(5)(a) of the Corporations Act 2001.
On behalf of the directors
John P SchmollNon-Executive Chairman 28 September 2017Sydney
DIRECTORS’ DECLARATION // 29 JULY 201786

ANNUAL REPORT 2017 // WWW.OROTONGROUP.COM
88 INDEPENDENT AUDITOR’S REPORT TO THE MEMBERS // 30 JULY 2017 88

ANNUAL REPORT 2017 // WWW.OROTONGROUP.COM
89INDEPENDENT AUDITOR’S REPORT TO THE MEMBERS // 30 JULY 201788

ANNUAL REPORT 2017 // WWW.OROTONGROUP.COM
90 INDEPENDENT AUDITOR’S REPORT // 29 JULY 2017 90

ANNUAL REPORT 2017 // WWW.OROTONGROUP.COM
91INDEPENDENT AUDITOR’S REPORT // 29 JULY 201790

ANNUAL REPORT 2017 // WWW.OROTONGROUP.COM
92 INDEPENDENT AUDITOR’S REPORT // 29 JULY 2017 92

ANNUAL REPORT 2017 // WWW.OROTONGROUP.COM
93INDEPENDENT AUDITOR’S REPORT // 29 JULY 201792

ANNUAL REPORT 2017 // WWW.OROTONGROUP.COM
94 INDEPENDENT AUDITOR’S REPORT // 29 JULY 2017 94

ANNUAL REPORT 2017 // WWW.OROTONGROUP.COM
96
The shareholder information set out below was applicable as at 4 October 2017. Distribution of equitable securities
Analysis of number of equitable security holders by size of holding:
Number of holdersof ordinary shares
1 to 1,000 1,024
1,001 to 5,000 821
5,001 to 10,000 178
10,001 to 100,000 160
100,001 and over 23
2,206
Holding less than a marketable parcel 746
Equity security holders Twenty largest quoted equity security holdersThe names of the twenty largest security holders of quoted equity securities are listed below:
Ordinary shares
Number held% of total
shares issued
UBS NOMINEES PTY LTD 5,625,946 13.40%
J P MORGAN NOMINEES AUSTRALIA LIMITED 3,406,452 8.12%
CITICORP NOMINEES PTY LIMITED 3,273,063 7.80%
GAZAL CORPORATION LIMITED 3,083,349 7.35%
HSBC CUSTODY NOMINEES (AUSTRALIA) LIMITED 3,048,698 7.26%
HAZAKSON PTY LTD 2,150,000 5.12%
ROBERT BOYD LANE 2,097,974 5.00%
VELCARA PTY LIMITED 1,504,896 3.59%
HUBBAS PTY LTD 1,433,334 3.41%
SCANNA CAPITAL PTY LTD 1,305,520 3.11%
BNP PARIBAS NOMINEES PTY LTD 1,055,348 2.51%
BATIHA PTY LTD 872,311 2.08%
NATIONAL NOMINEES LIMITED 852,432 2.03%
FEXARY PTY LTD 716,666 1.71%
JW INVESTMENTS PTY LTD 621,830 1.48%
MANDERRAH PTY LTD 569,757 1.36%
CJH HOLDINGS PTY LIMITED 540,729 1.29%
WOODROSS NOMINEES PTY LTD 393,759 0.94%
BLUE ONION CAPITAL PTY LTD 302,166 0.72%
BNP PARIBAS NOMS PTY LTD 261,917 0.62%
33,116,147 78.89
SHAREHOLDER INFORMATION // 30 JULY 2017 96

ANNUAL REPORT 2017 // WWW.OROTONGROUP.COM
97
Unquoted equity securities
Numberon issue
Numberof holders
Performance rights over ordinary shares issued 384,148 8
Retention rights over ordinary shares issued 95,892 3
Substantial holdersSubstantial holders in the company are set out below:
Ordinary shares
Number held% of total
shares issued
Robert Lane, Ross Lane, Tom Lane and Anna Hookway under the deed dated 21 October 2008 8,931,166 21.28
J W Vicars 7,629,920 18.18
Perennial Value Management Limited 3,507,975 8.36
Gazal Corporation Limited 3,083,349 7.35
Spheria Asset Management 2,922,523 6.96
Voting rightsThe voting rights attached to ordinary shares are set out below: Ordinary sharesOn a show of hands every member present at a meeting in person or by proxy shall have one vote and upon a poll each share shall have one vote.
There are no other classes of equity securities.
SHAREHOLDER INFORMATION // 30 JULY 201796

ANNUAL REPORT 2017 // WWW.OROTONGROUP.COM
98
MALAYSIA
KLCC Shop 118A-2, Level 1 Suria KLCC Kuala Lumpur City Centre 50088 Kuala Lumpur
Johor BahruSuite 314Johor Premium OutletsPersiaran Indah PuraKulai 81000 Johor Bahru
1 UtamaShop G358 1 Lebur Bandar UtamaBandar Utama City Center, Bandar Utama 47800, Petaling Jaya, Selangor Darul Ehsan
GentingGenting Premium Outlets Suite 81069000 Genting Highlands, Pahang
AUSTRALIA
ACT
Canberra Shop CF22, Canberra CentreCity Walk Canberra ACT 2601
NEW SOUTH WALES
Bondi Junction Shop 4003, Westfield Shopping town 500 Oxford Street Bondi Junction NSW 2022
Burwood Shop 209, Westfield Shopping town 100 Burwood Road Burwood NSW 2134
Castle Hill Shop 508, Level 46-14 Castle StreetCastle Towers Shopping CentreCastle Hill NSW 2154
Chatswood Shop L128, Gallery Level Chatswood Chase 91 Archer Street Chatswood NSW 2067
David Jones BondiWestfield Shopping town Bondi Junction NSW 2022
David Jones Chatswood91 Archer Street Chatswood NSW 2067
David Jones Elizabeth Street86 – 108 Castlereagh Street Sydney NSW 2000
Drummoyne (Factory Outlet)Shop 32 Birkenhead Point Shopping CentreRoseby StreetDrummoyne NSW 2047
Homebush (Factory Outlet) Shop 3-027Direct Factory Outlets (DFO)3/1-5 Underwood RoadHomebush NSW 2140
Hornsby Shop 2081, Westfield Hornsby 236 Pacific Highway Hornsby NSW 2077
Kotara Shop 2059, Westfield Kotara Cnr Park Ave and Northcott Drive Kotara NSW 2289
Macquarie Centre Shop 2217, Macquarie Shopping Centre Cnr Herring & Waterloo Roads North Ryde NSW 2113
Miranda Shop 2151, Westfield Shoppingtown 600 The Kingsway Miranda NSW 2228 Parramatta Shop 4052, Westfield Parramatta 159-175 Church Street Parramatta NSW 2150
Pitt St Mall Shop 1A, 183 Pitt Street Mall (cnr King St) Sydney NSW 2000
QVBShop 19, Ground FloorQueen Victoria Building Sydney NSW 2000
Sydney Domestic Airport Shop 64, Terminal 3Sydney Domestic AirportMascot NSW 2020
Warringah Mall Shop 1056, Warringah Mall Cnr Old Pittwater Rd & Condamine Street Brookvale NSW 2100
Westfield Sydney Shop 4014A Cnr Pitt St Mall and Market St Sydney 2000
Sydney International Airport Shop lr-13 T1 International Terminal Sydney (Kingsford Smith) Airport Mascot NSW 2020
Liverpool (Factory Outlet) Shop 9B5 Viscount Place Liverpool NSW 2170
Myer SydneyGround Floor Myer436 George StreetSydney NSW 2000
QUEENSLAND
Biggera Waters (Factory Outlet) Shop C48, Harbourtown Shopping Centre 9 Gateway Drive Biggera Waters QLD 4216
Brisbane Airport (Factory Outlet) Shop T30 DFO Brisbane Airport QLD 4007
Cairns (Factory Outlet) Shop T62, Cairns DFO 274 Mulgrave Road Cairns QLD 4870
Carindale Shop 1047, Westfield Carindale 1151 Creek Road Carindale QLD 4152
David Jones Queens Plaza 210 Queen StreetBrisbane QLD 4000
Brisbane CBDShop 14A Macarthur Central Cnr Elizabeth & Edwards Streets Brisbane QLD 4000
Indooroopily Shop 2011, Indooroopilly Shopping Centre 318 Moggill Road Indooroopily QLD 4068
Pacific Fair Shop 1526 Ground FloorHooker Boulevarde Pacific Fair QLD 4218
Robina Shop 4080A, Robina Town Centre Drive Robina QLD 4230
SOUTH AUSTRALIA
Adelaide 32 Gawler Place (Off Rundle Mall) Adelaide SA 5000
Adelaide Harbourtown,(Factory Outlet) Shop T1D, 727 Tapleys Hill RoadWest Beach, SA 5024
BurnsideShop 122, Burnside Shopping VillagePortrush Road, Glenside SA 5065
David Jones Adelaide Central Plaza, 100 Rundle MallAdelaide SA 5000
MarionOaklands Park Shop 1054/5 Westfield Marion 297 Diagonal Road Oaklands Park SA 5046
VICTORIA
Chadstone Shop G-019, Chadstone Shopping Centre 1341 Dandenong Road Chadstone VIC 3148
OROTON
BRAND RETAIL STORE LISTING 98

ANNUAL REPORT 2017 // WWW.OROTONGROUP.COM
99
GAP
David Jones Bourke Street310 Bourke Street Melbourne VIC 3000
David Jones Chadstone Princes HighwayChadstone VIC 3148
Doncaster Shop 1153, Westfield Doncaster Shopping Centre 619 Doncaster Road (Cnr Williamsons Rd) Doncaster VIC 3108
EastlandShop 2096171-175 Maroondah HwyRingwood VIC 3134
EmporiumShop G-035, 295 Lonsdale StreetMelbourne VIC 3000
Essendon (Factory Outlet) Oroton DFO Shop T105 Essendon 100 Bulla RoadStrathmore VIC 3046
Highpoint Shop 3529, Highpoint Shopping CentreRosamond RoadMaribyrnong VIC 3032
Moorabbin (Factory Outlet) Oroton Factory OutletG155 DFO Moorabbin Airport250 Centre Dandenong RoadMoorabbin VIC 3194
Nunawading (Factory Outlet) Shop 02, Brand Smart Outlet Mall 286 Whitehorse Road Nunawading VIC 3131
Myer Melbourne Ground Floor Myer 314-336 Bourke Street Melbourne VIC 3000
WESTERN AUSTRALIA
David Jones Hay StreetGround Floor David Jones Hay St MallPerth WA 6000
Garden City Shop 175 Garden City Shopping Centre 125 Riseley Street Booragoon WA 6154
West Perth(Factory Outlet)Shop B15, Watertown840 Wellington StreetWest Perth WA 6005
Hay St Shop 4, 810-820 Hay StreetPerth WA 6000
Karrinyup Shop G25 200 Karrinyup Road Karrinyup WA 6018
NEW ZEALAND
Osborne St24 Osborne St Newmarket Auckland 1023
Onehunga(Factory Outlet)Shop 14ADress Smart Factory Outlet Centre405/151 Arthur Street Onehurga Auckland 1061
NEW SOUTH WALES
Macquarie CentreShop MM02, Macquarie Shopping CentreCnr Herring & Waterloo Roads,North Ryde, NSW 2113
Westfield Sydney188 Pitt StreetSydney, NSW 2000
MirandaShop 3186/3187, Westfield Shoppingtown 600 KingswayMiranda NSW 2228
ParramattaShop 2114/6Westfield Parramatta159-175 Church StreetParramatta, NSW 2150
VICTORIA
Melbourne Central211 La Trobe StreetMelbourne, VIC 3000
Chadstone Shop G041 Chadstone Shopping Centre1341 Dandenong RdChadstone, VIC 3148
BRAND RETAIL STORE LISTING98