COVID-19 Results Briefing Bangladesh February 18, 2022 ...
31
Bangladesh COVID-19 Results Briefing Bangladesh February 18, 2022 This document contains summary information on the latest projections from the IHME model on COVID-19 in Bangladesh. The model was run on February 17, 2022, with data through February 14, 2022. Current situation • Daily infections in the last week decreased to 627,000 per day on average compared to 899,000 the week before (Figure 1.1). Daily hospital census in the last week (through February 14) decreased to 19,000 per day on average compared to 27,000 the week before. • Daily reported cases in the last week decreased to 6,400 per day on average compared to 10,000 the week before (Figure 2.1). • Reported deaths due to COVID-19 in the last week increased to 38 per day on average compared to 33 the week before (Figure 3.1). • Total deaths due to COVID-19 in the last week increased to 380 per day on average compared to 340 the week before (Figure 3.1). This makes COVID-19 the number 2 cause of death in Bangladesh this week (Table 1). Estimated total daily deaths due to COVID-19 in the past week were 10.2 times larger than the reported number of deaths. • The daily rate of reported deaths due to COVID-19 is greater than 4 per million in no countries (Figure 4.1). • The daily rate of total deaths due to COVID-19 is greater than 4 per million in no countries (Figure 4.2). • We estimate that 84% of people in Bangladesh have been infected at least once as of February 14 (Figure 6.1). Effective R, computed using cases, hospitalizations, and deaths, is greater than 1 in five countries. Effective R in Bangladesh was 0.7 on February 3 (Figure 7.1). • The infection-detection rate in Bangladesh was close to 0% on February 14 (Figure 8.1). • Based on the GISAID and various national databases, combined with our variant spread model, we estimate the current prevalence of variants of concern (Figures 9.1-9.5). We estimate that the Alpha variant is circulating in five countries, that the Beta variant is circulating in two countries, that the Delta variant is circulating in eight countries, that the Gamma variant is circulating in four countries, and that the Omicron variant is circulating in eight countries. Trends in drivers of transmission • Mobility last week was 30% higher than the pre-COVID-19 baseline (Figure 11.1). Mobility was lower than 30% of baseline in one country and 0 subnational locations in the region. • As of February 14, in the COVID-19 Trends and Impact Survey, 53% of people self-report that they always wore a mask when leaving their home compared to 53% last week (Figure 13.1). • There were 25 diagnostic tests per 100,000 people on February 14 (Figure 15.1). • As of February 14, five countries have reached 70% or more of the population who have received at least one vaccine dose, and two countries have reached 70% or more of the population who are fully vaccinated (Figure 17.1). 63% of people in Bangladesh have received at least one vaccine dose, and 42% are fully vaccinated. • In Bangladesh, 90.5% of the population that is 12 years and older say they would accept, or would probably accept, a vaccine for COVID-19. Note that vaccine acceptance is calculated using survey data from the 18+ population. This is down by 2.2 percentage points from last week. The proportion of the population who are open to receiving a COVID-19 vaccine ranges from 66% in Timor-Leste to 100% in Bhutan (Figure 19.1). • In our current reference scenario, we expect that 111.2 million people will be vaccinated with at least one dose by June 1 (Figure 20.1). We expect that 66% of the population will be fully vaccinated by June 1. covid19.healthdata.org Institute for Health Metrics and Evaluation
-
Upload
khangminh22 -
Category
Documents
-
view
3 -
download
0
Transcript of COVID-19 Results Briefing Bangladesh February 18, 2022 ...
Bangladesh
COVID-19 Results BriefingBangladeshFebruary 18, 2022This document contains summary information on the latest projections from the IHME model on COVID-19in Bangladesh. The model was run on February 17, 2022, with data through February 14, 2022.
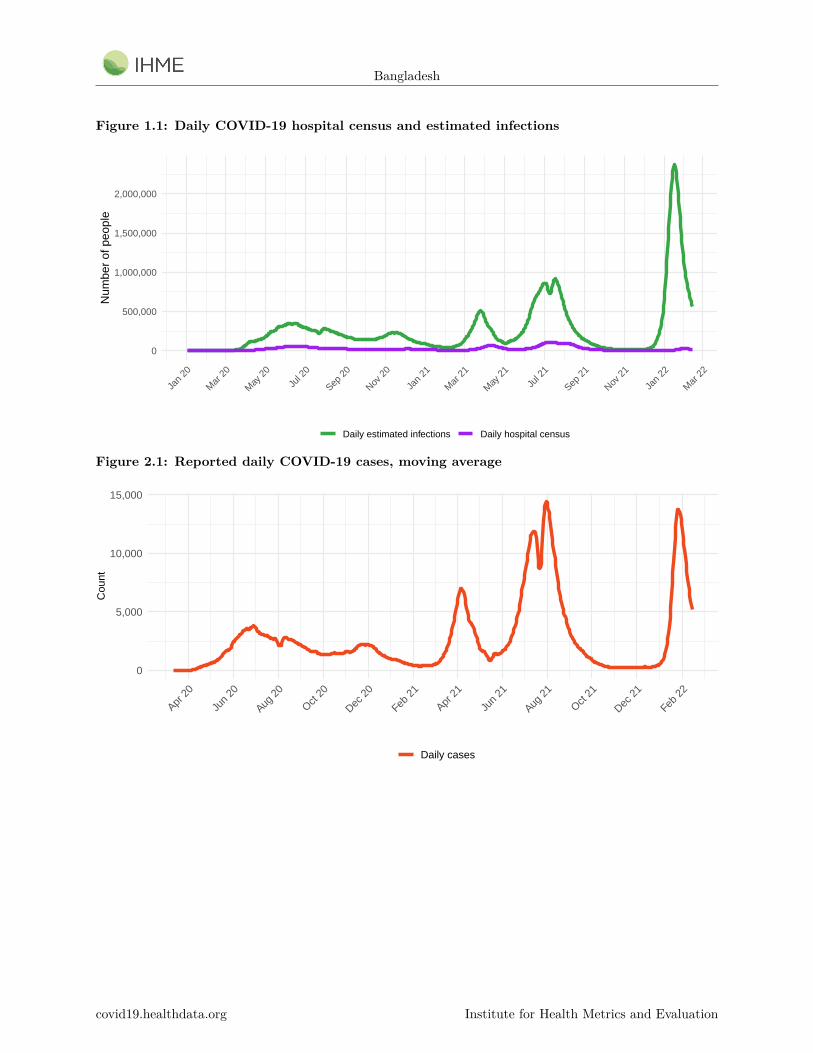
Current situation• Daily infections in the last week decreased to 627,000 per day on average compared to 899,000 the week
before (Figure 1.1). Daily hospital census in the last week (through February 14) decreased to 19,000per day on average compared to 27,000 the week before.
• Daily reported cases in the last week decreased to 6,400 per day on average compared to 10,000 theweek before (Figure 2.1).
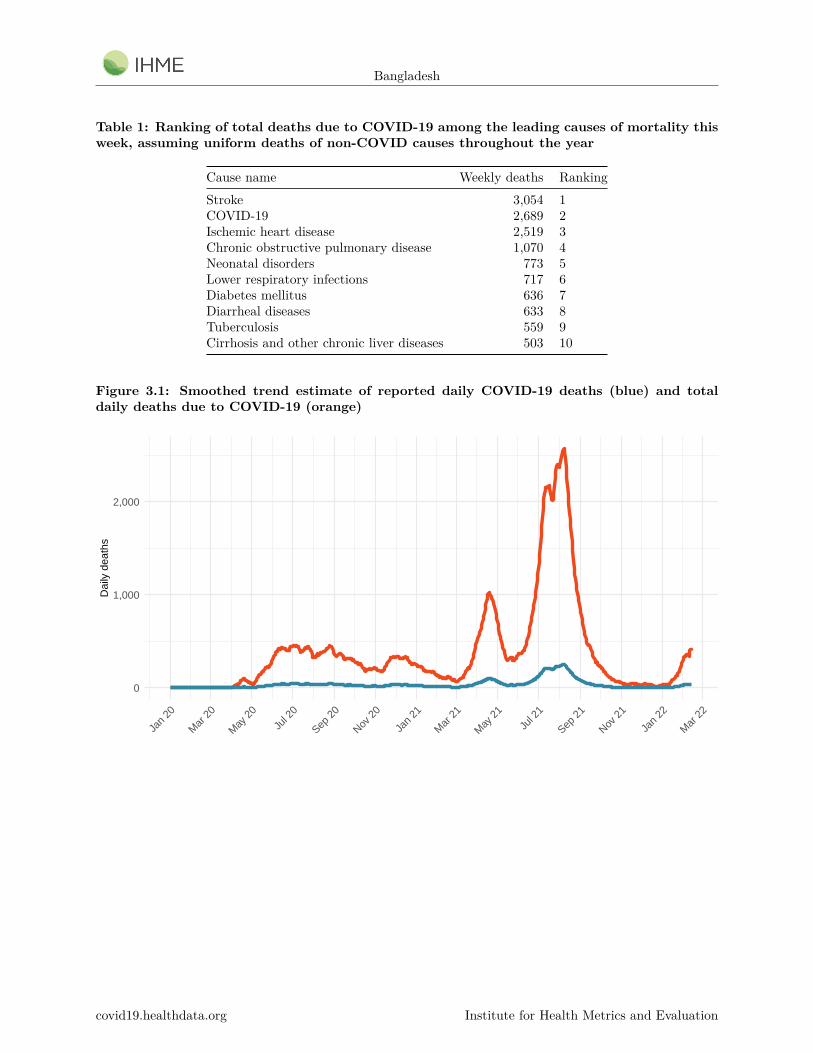
• Reported deaths due to COVID-19 in the last week increased to 38 per day on average compared to 33the week before (Figure 3.1).
• Total deaths due to COVID-19 in the last week increased to 380 per day on average compared to 340the week before (Figure 3.1). This makes COVID-19 the number 2 cause of death in Bangladesh thisweek (Table 1). Estimated total daily deaths due to COVID-19 in the past week were 10.2 times largerthan the reported number of deaths.
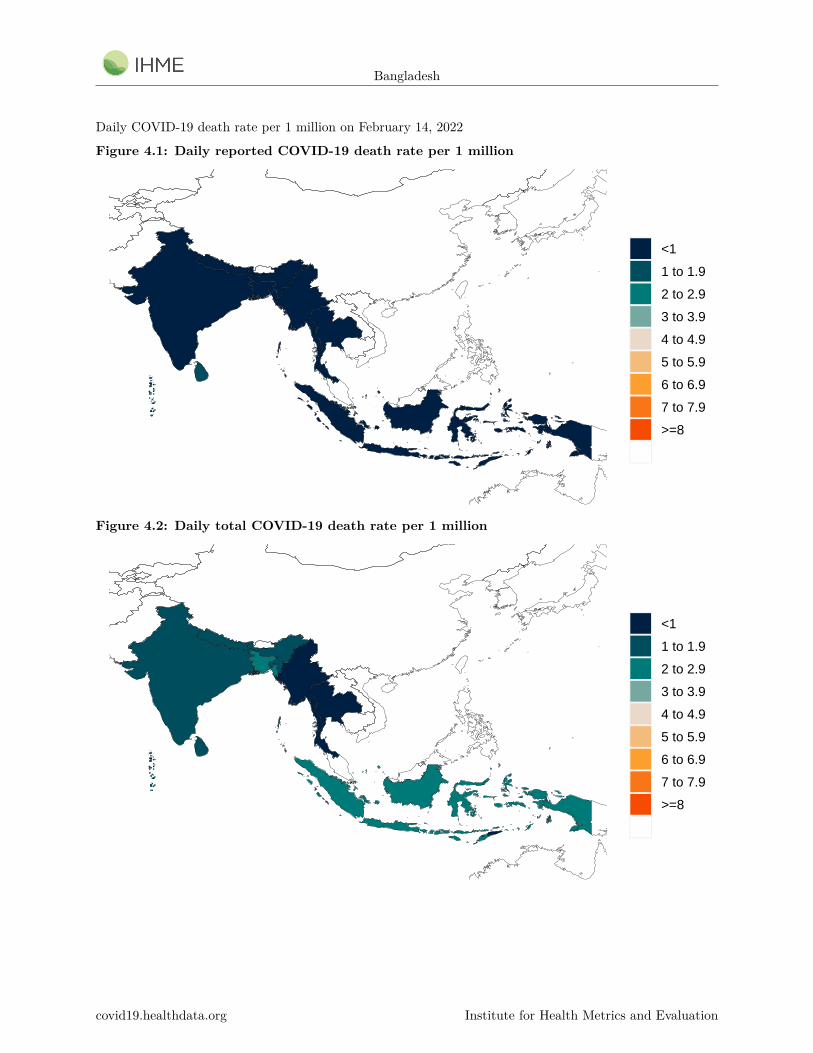
• The daily rate of reported deaths due to COVID-19 is greater than 4 per million in no countries (Figure4.1).
• The daily rate of total deaths due to COVID-19 is greater than 4 per million in no countries (Figure4.2).
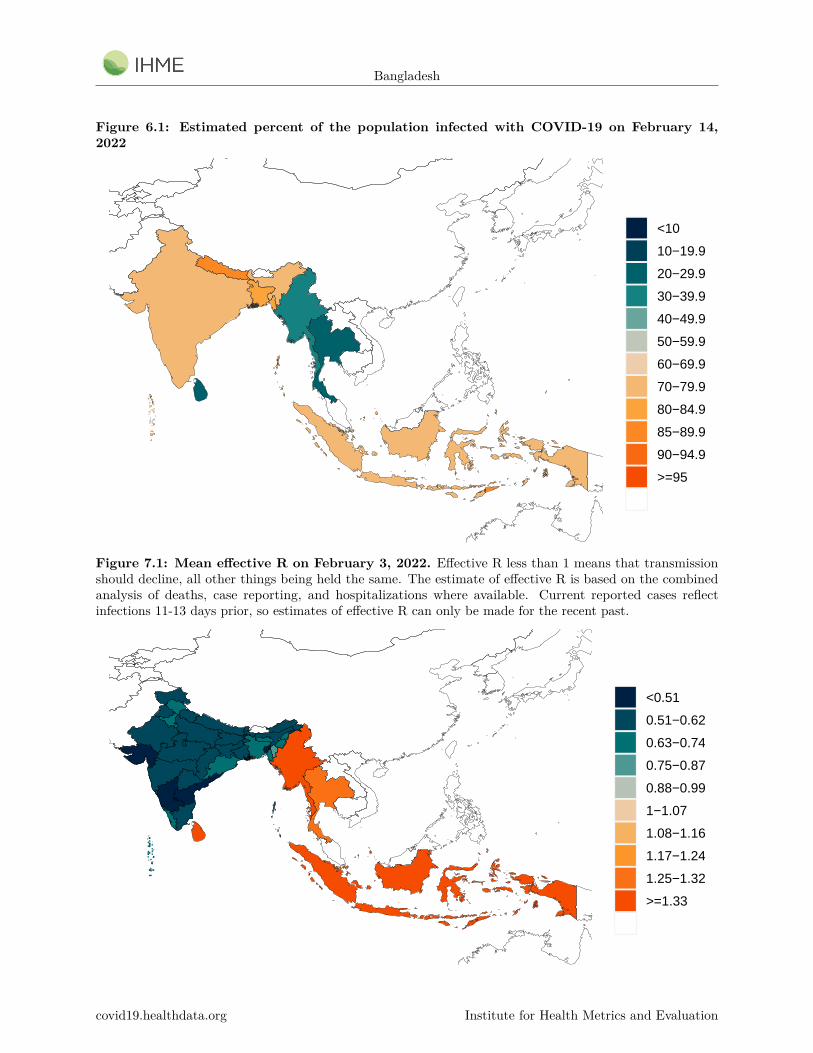
• We estimate that 84% of people in Bangladesh have been infected at least once as of February 14(Figure 6.1). Effective R, computed using cases, hospitalizations, and deaths, is greater than 1 in fivecountries. Effective R in Bangladesh was 0.7 on February 3 (Figure 7.1).
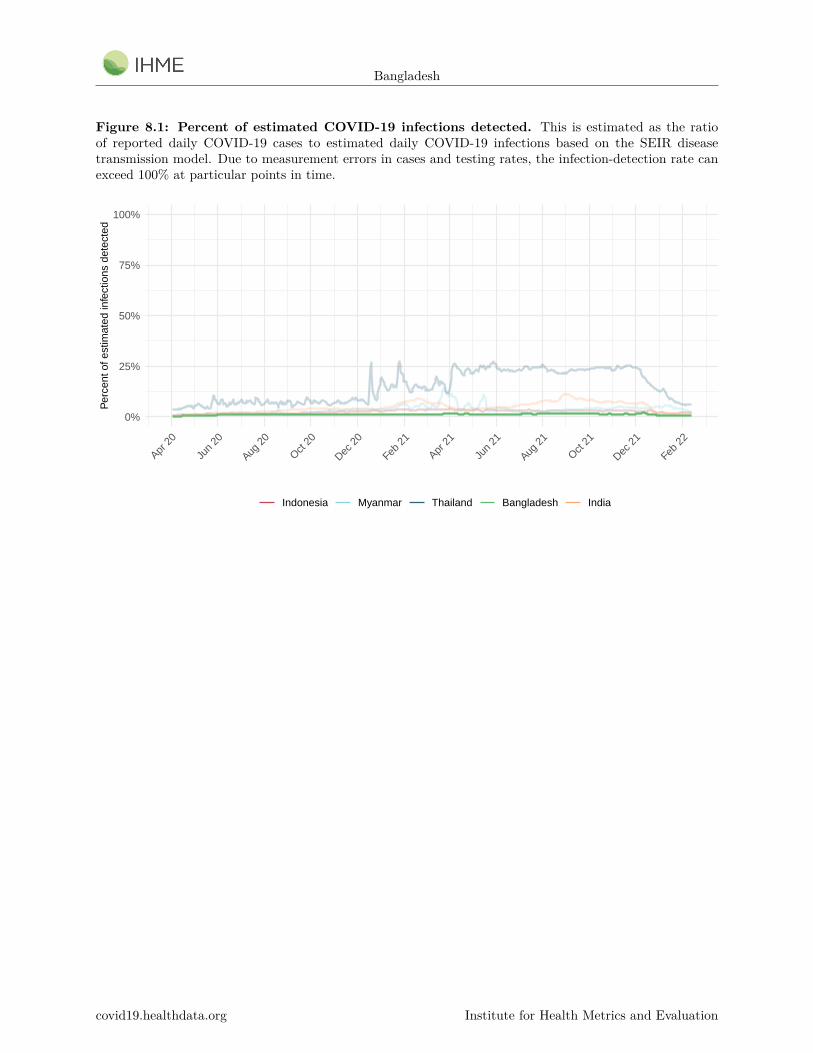
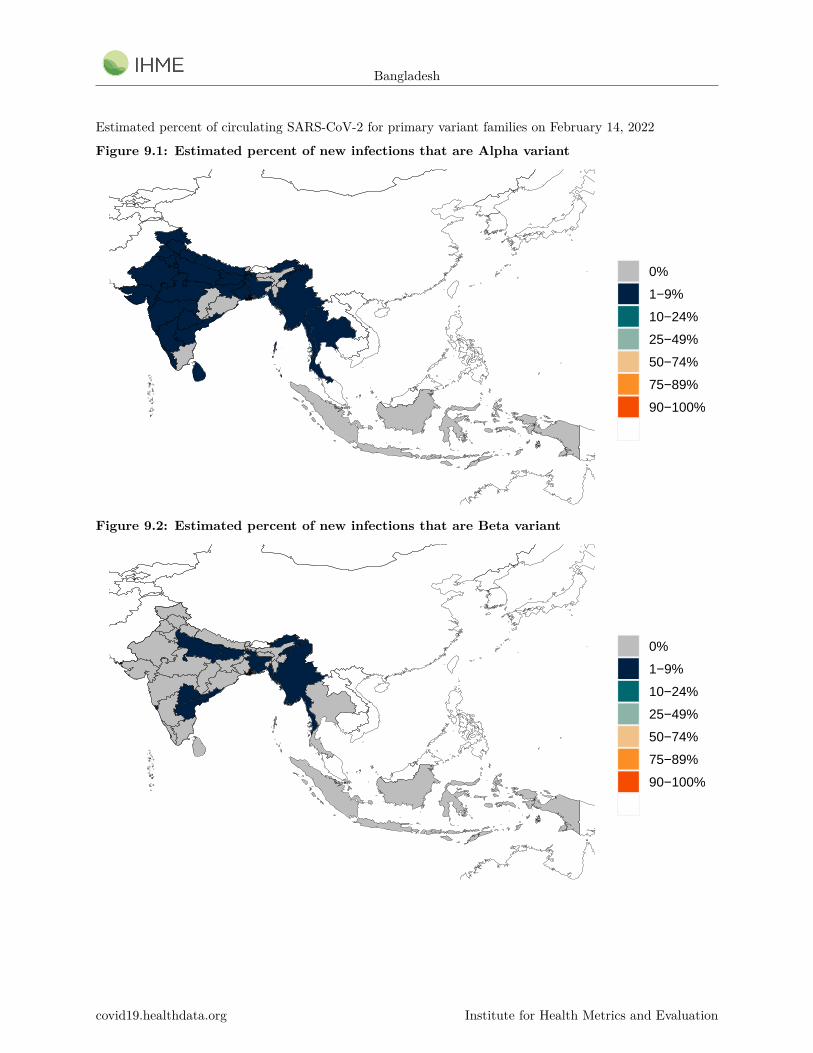
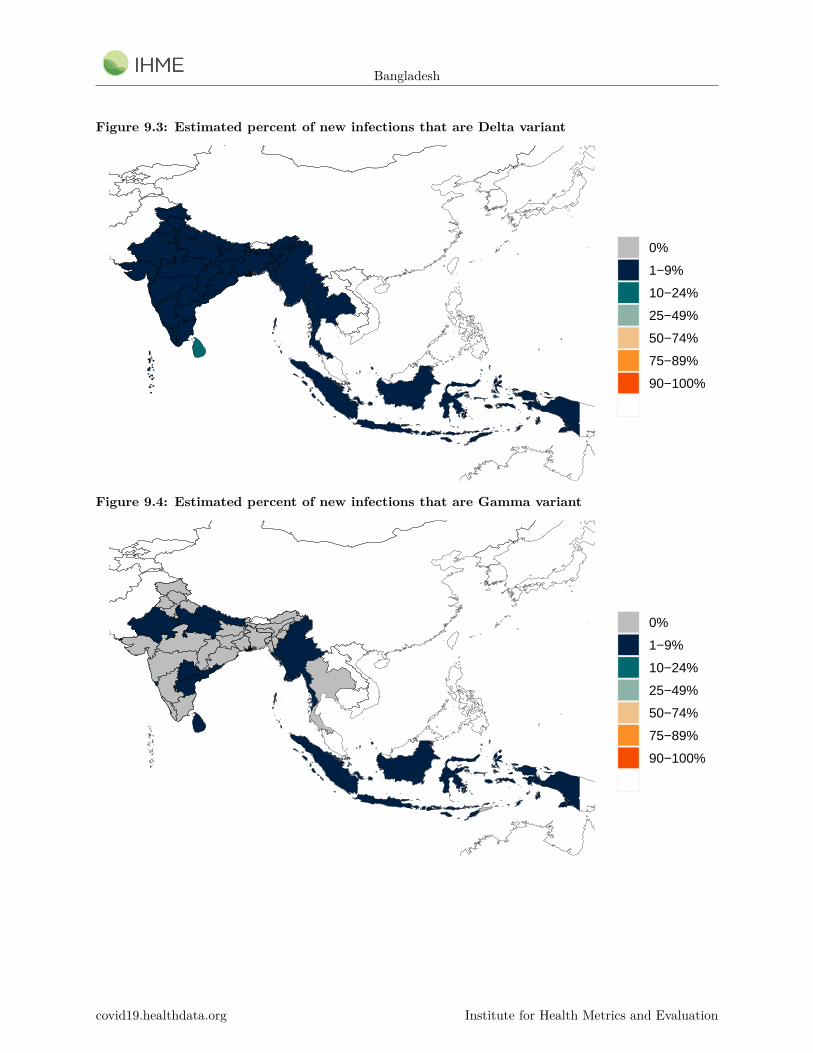
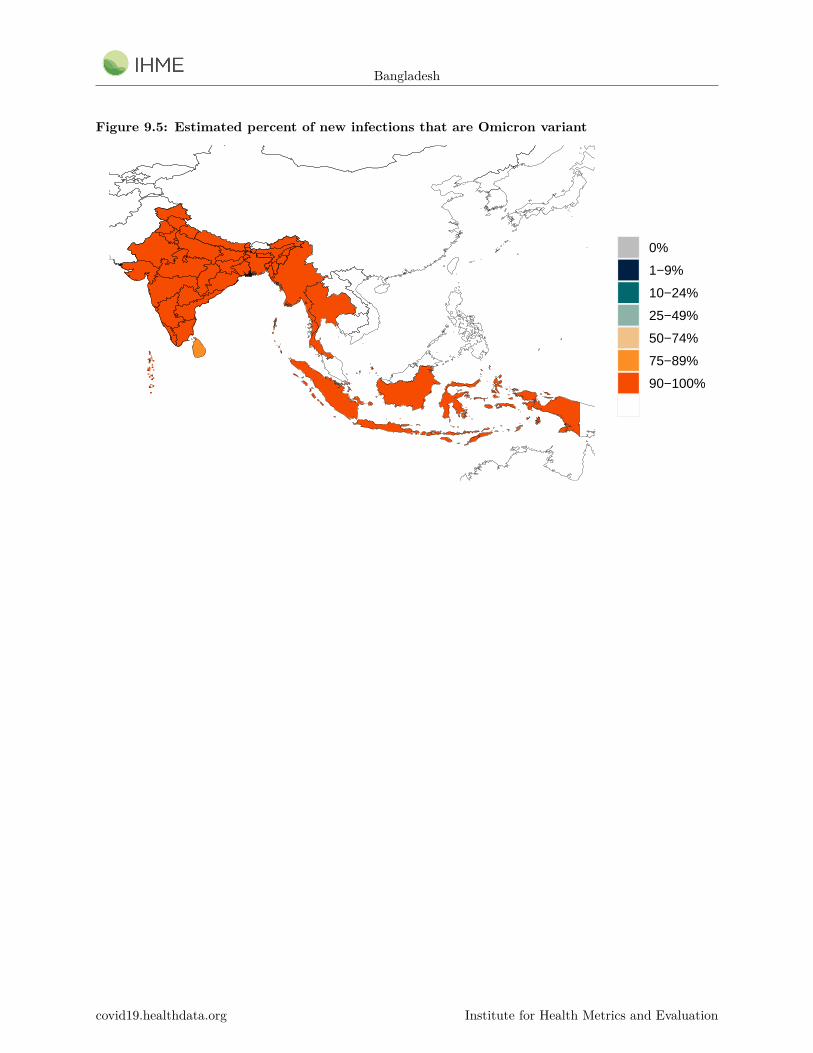
• The infection-detection rate in Bangladesh was close to 0% on February 14 (Figure 8.1).• Based on the GISAID and various national databases, combined with our variant spread model, we
estimate the current prevalence of variants of concern (Figures 9.1-9.5). We estimate that the Alphavariant is circulating in five countries, that the Beta variant is circulating in two countries, that theDelta variant is circulating in eight countries, that the Gamma variant is circulating in four countries,and that the Omicron variant is circulating in eight countries.
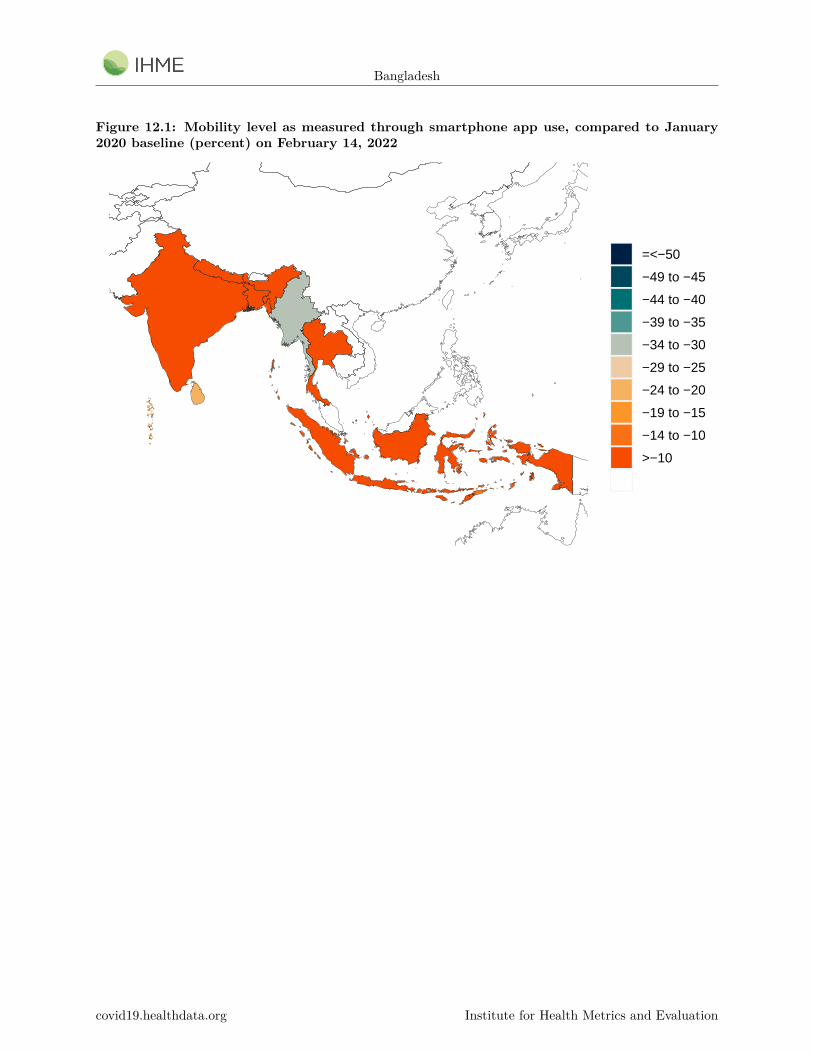
Trends in drivers of transmission• Mobility last week was 30% higher than the pre-COVID-19 baseline (Figure 11.1). Mobility was lower
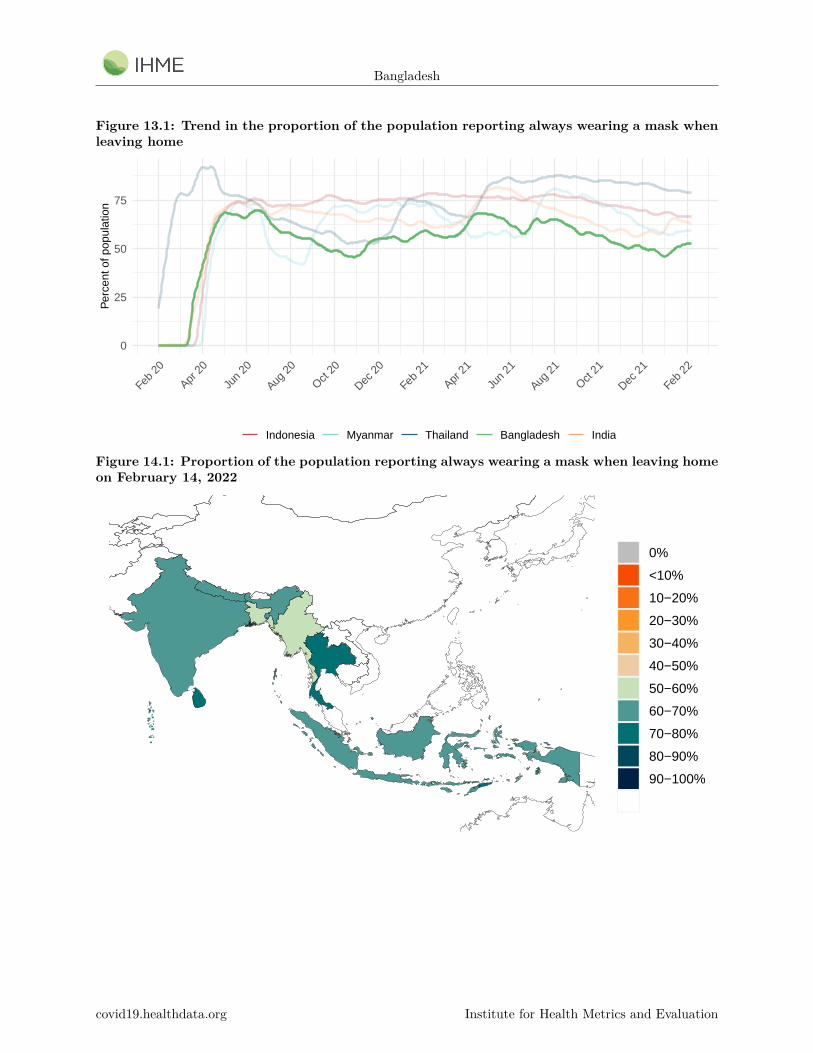
than 30% of baseline in one country and 0 subnational locations in the region.• As of February 14, in the COVID-19 Trends and Impact Survey, 53% of people self-report that they
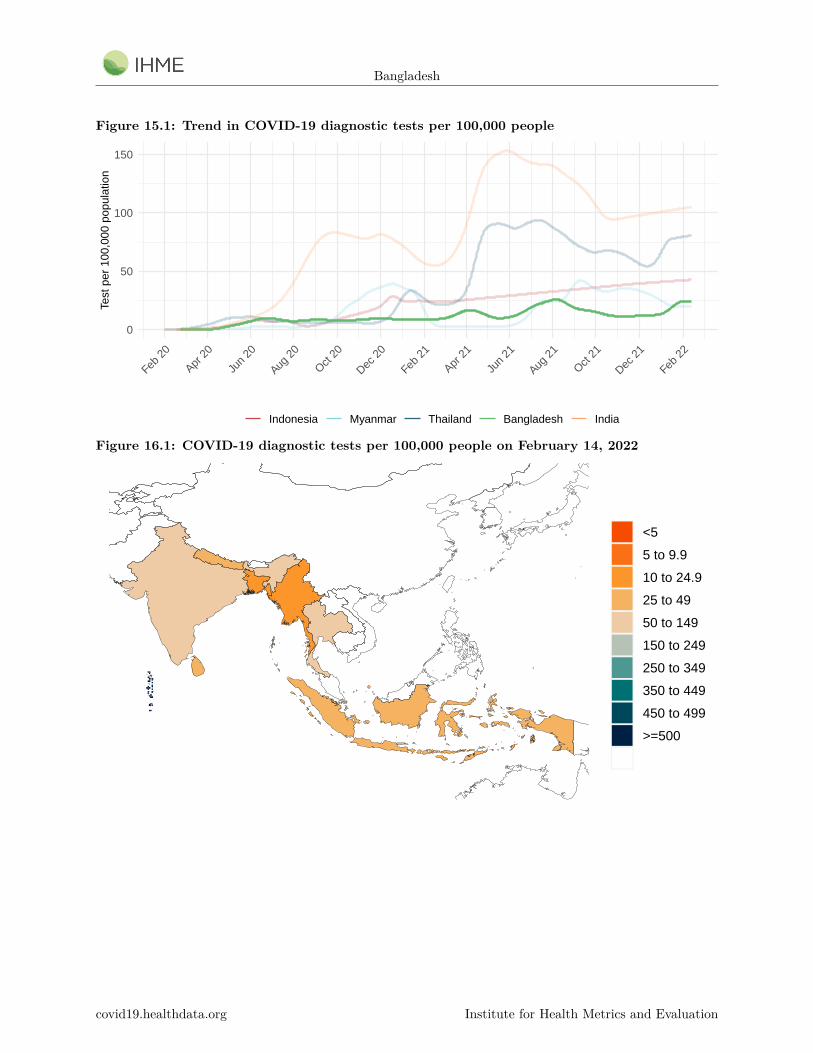
always wore a mask when leaving their home compared to 53% last week (Figure 13.1).• There were 25 diagnostic tests per 100,000 people on February 14 (Figure 15.1).• As of February 14, five countries have reached 70% or more of the population who have received at
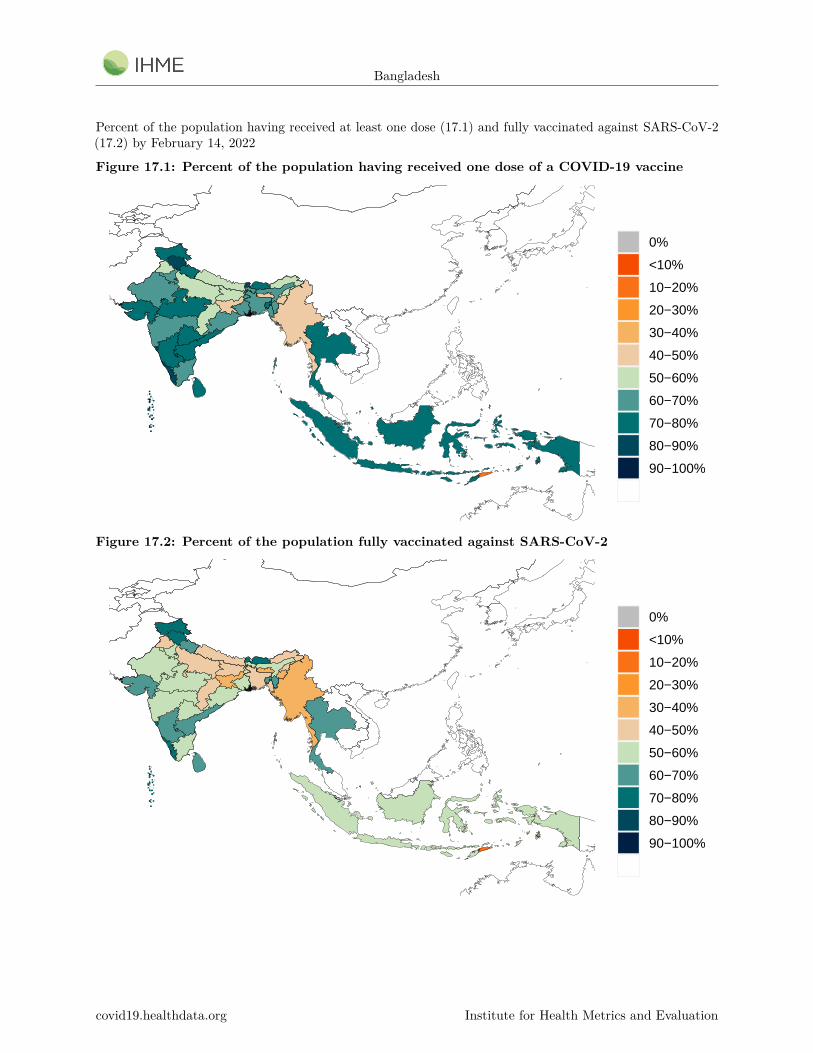
least one vaccine dose, and two countries have reached 70% or more of the population who are fullyvaccinated (Figure 17.1). 63% of people in Bangladesh have received at least one vaccine dose, and 42%are fully vaccinated.
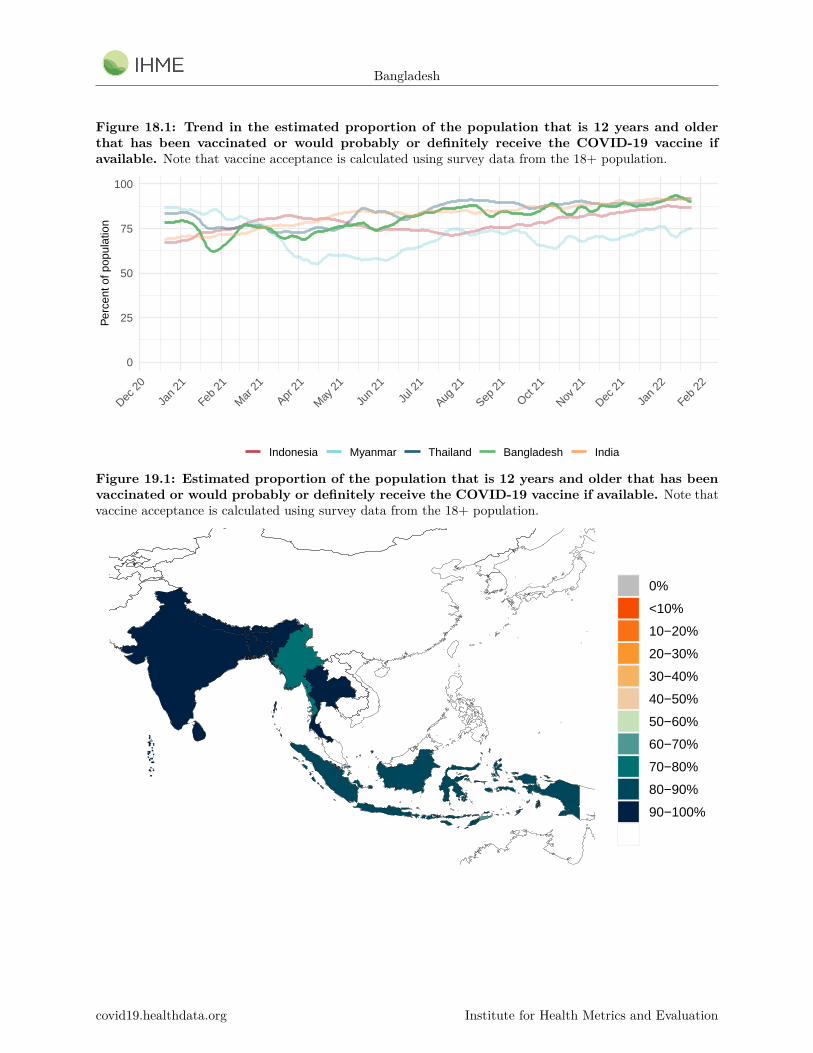
• In Bangladesh, 90.5% of the population that is 12 years and older say they would accept, or wouldprobably accept, a vaccine for COVID-19. Note that vaccine acceptance is calculated using survey datafrom the 18+ population. This is down by 2.2 percentage points from last week. The proportion of thepopulation who are open to receiving a COVID-19 vaccine ranges from 66% in Timor-Leste to 100% inBhutan (Figure 19.1).
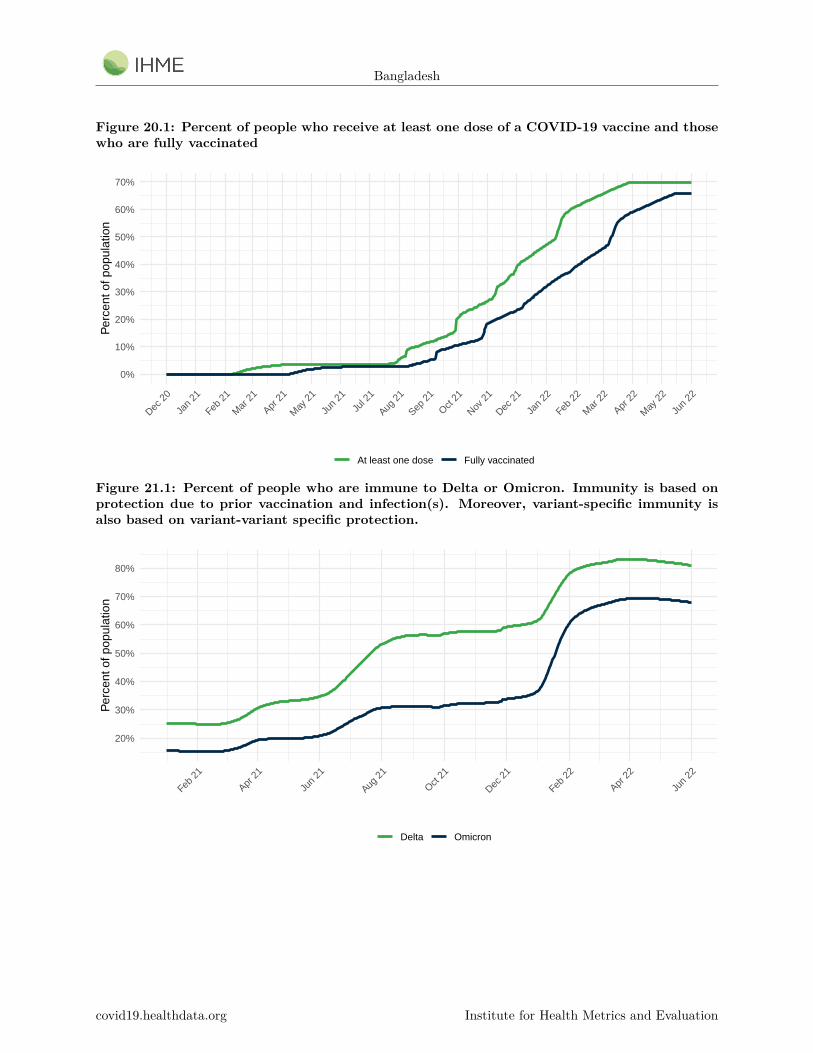
• In our current reference scenario, we expect that 111.2 million people will be vaccinated with at leastone dose by June 1 (Figure 20.1). We expect that 66% of the population will be fully vaccinated byJune 1.
covid19.healthdata.org Institute for Health Metrics and Evaluation
Bangladesh
Projections and scenariosWe produce three scenarios when projecting COVID-19. The reference scenario is our forecast of what wethink is most likely to happen:
• Vaccines are distributed at the expected pace. Brand- and variant-specific vaccine efficacy is updatedusing the latest available information from peer-reviewed publications and other reports.
• Future mask use is the mean of mask use over the last seven days.• Mobility increases as vaccine coverage increases.• Omicron variant spreads according to our flight and local spread model.• 80% of those who have had two doses of vaccine (or one dose for Johnson & Johnson) receive a third
dose at six months after their second dose.
The 80% mask use scenario makes all the same assumptions as the reference scenario but assumes alllocations reach 80% mask use within seven days. If a location currently has higher than 80% use, mask useremains at the current level.
The third dose scenario is the same as the reference scenario but assumes that 100% of those who havereceived two doses of vaccine will get a third dose at six months.
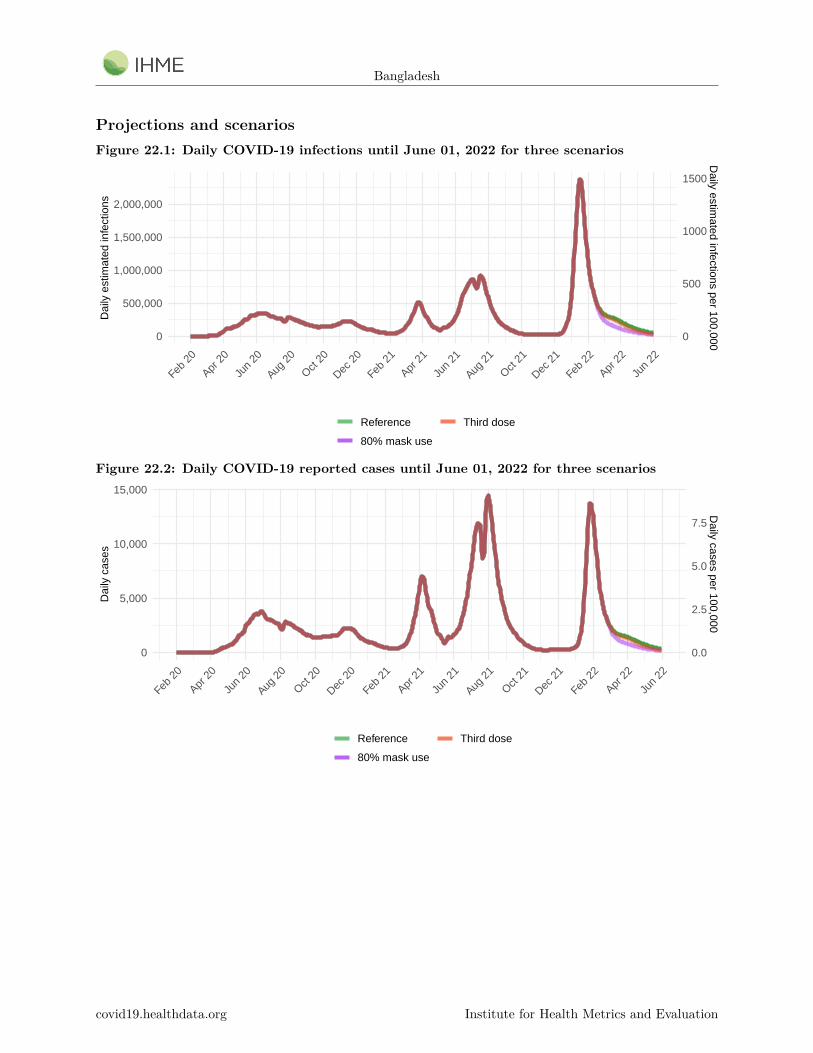
ProjectionsInfections
• Daily estimated infections in the reference scenario will decline to 49,060 by June 1, 2022 (Figure22.1).
• Daily estimated infections in the 80% mask use scenario will decline to 24,390 by June 1, 2022(Figure 22.1).
• Daily estimated infections in the third dose scenario will decline to 26,960 by June 1, 2022 (Figure22.1).
Cases
• Daily estimated cases in the reference scenario will decline to 320 by June 1, 2022 (Figure 22.2).• Daily estimated cases in the 80% mask use scenario will decline to 160 by June 1, 2022 (Figure
22.2).• Daily estimated cases in the third dose scenario will decline to 190 by June 1, 2022 (Figure 22.2).
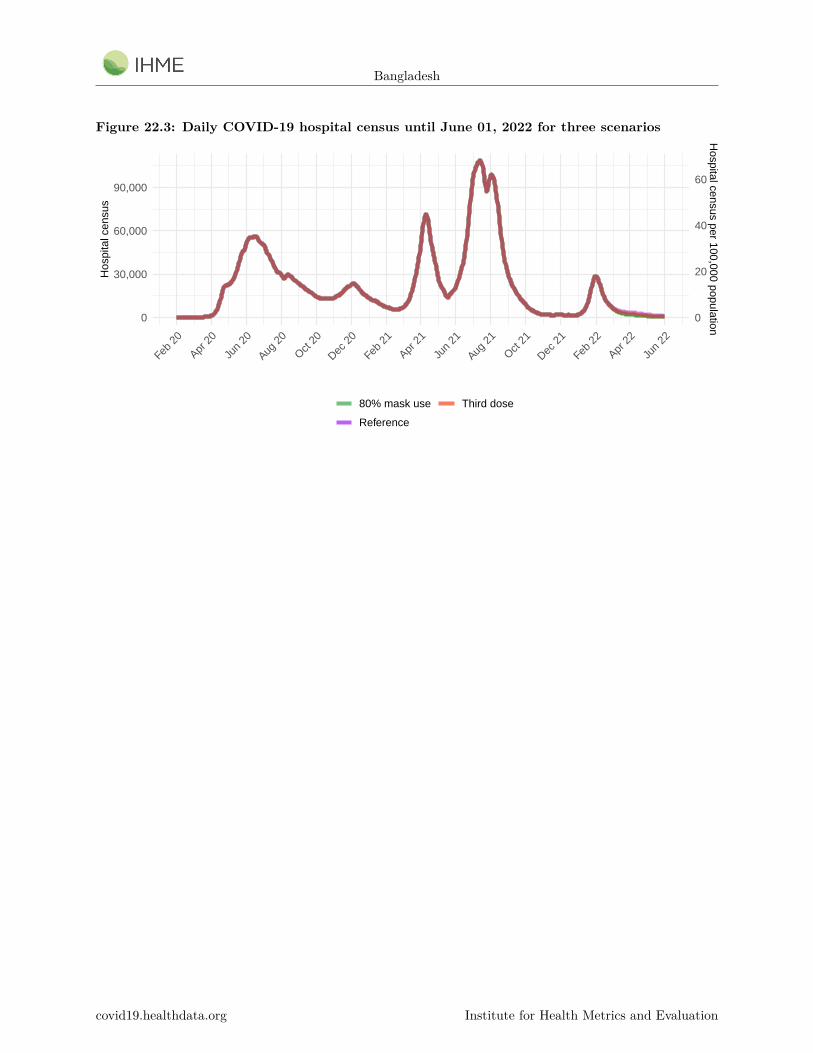
Hospitalizations
• Daily hospital census in the reference scenario will decline to 910 by June 1, 2022 (Figure 22.3).• Daily hospital census in the 80% mask use scenario will decline to 450 by June 1, 2022 (Figure 22.3).• Daily hospital census in the third dose scenario will decline to 440 by June 1, 2022 (Figure 22.3).
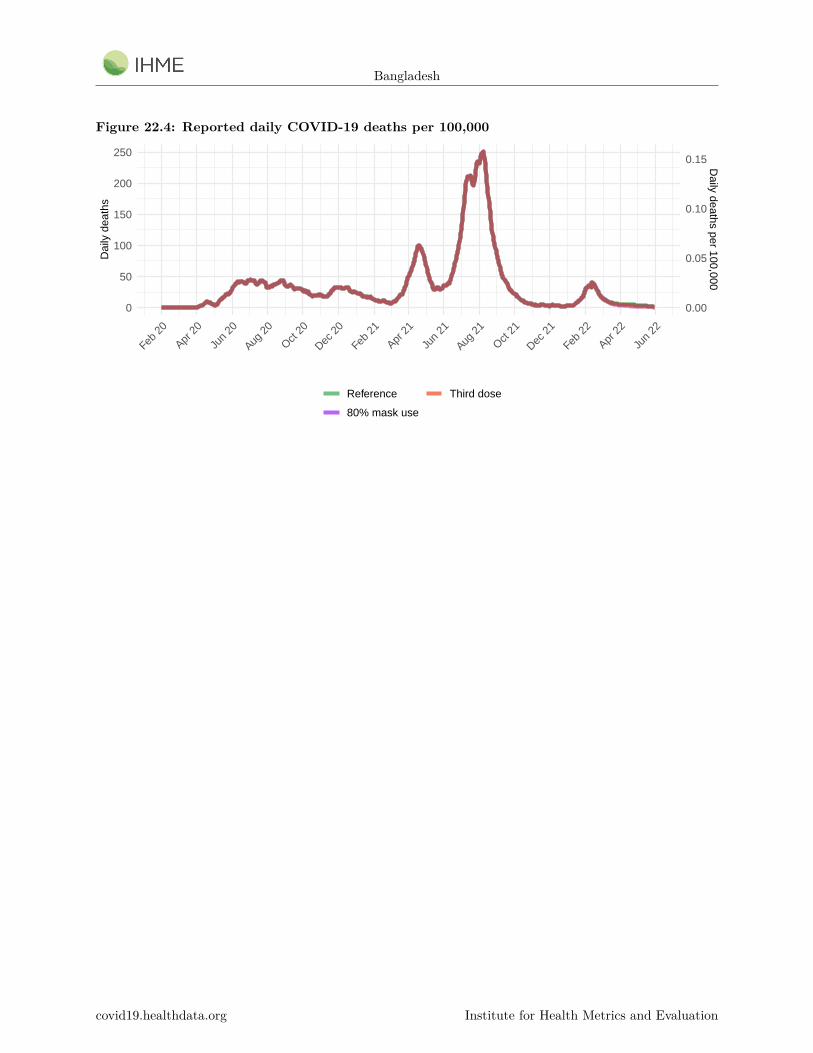
Deaths
• In our reference scenario, our model projects 30,000 cumulative reported deaths due to COVID-19on June 1. This represents 880 additional deaths from February 14 to June 1. Daily reported COVID-19deaths in the reference scenario will decline to no by June 1, 2022 (Figure 22.4).
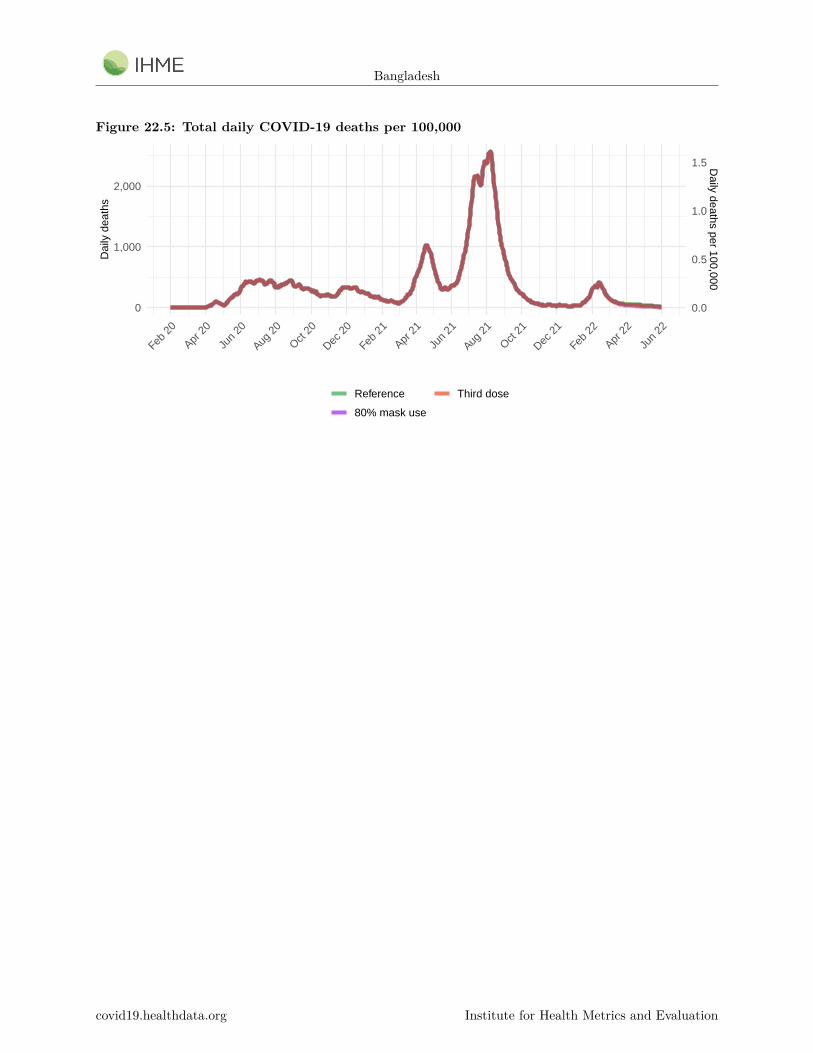
• Under our reference scenario, our model projects 304,000 cumulative total deaths due to COVID-19on June 1. This represents 8,900 additional deaths from February 14 to June 1 (Figure 25.2).
• In our 80% mask use scenario, our model projects 30,000 cumulative reported deaths due to COVID-19 on June 1. This represents 750 additional deaths from February 14 to June 1. Daily reportedCOVID-19 deaths in the 80% mask use scenario will decline to no by June 1, 2022 (Figure 22.4).
covid19.healthdata.org Institute for Health Metrics and Evaluation
Bangladesh
• In our third dose scenario, our model projects 30,000 cumulative reported deaths due to COVID-19on June 1. This represents 780 additional deaths from February 14 to June 1. Daily reported COVID-19deaths in the third dose scenario will decline to no by June 1, 2022 (Figure 22.4).
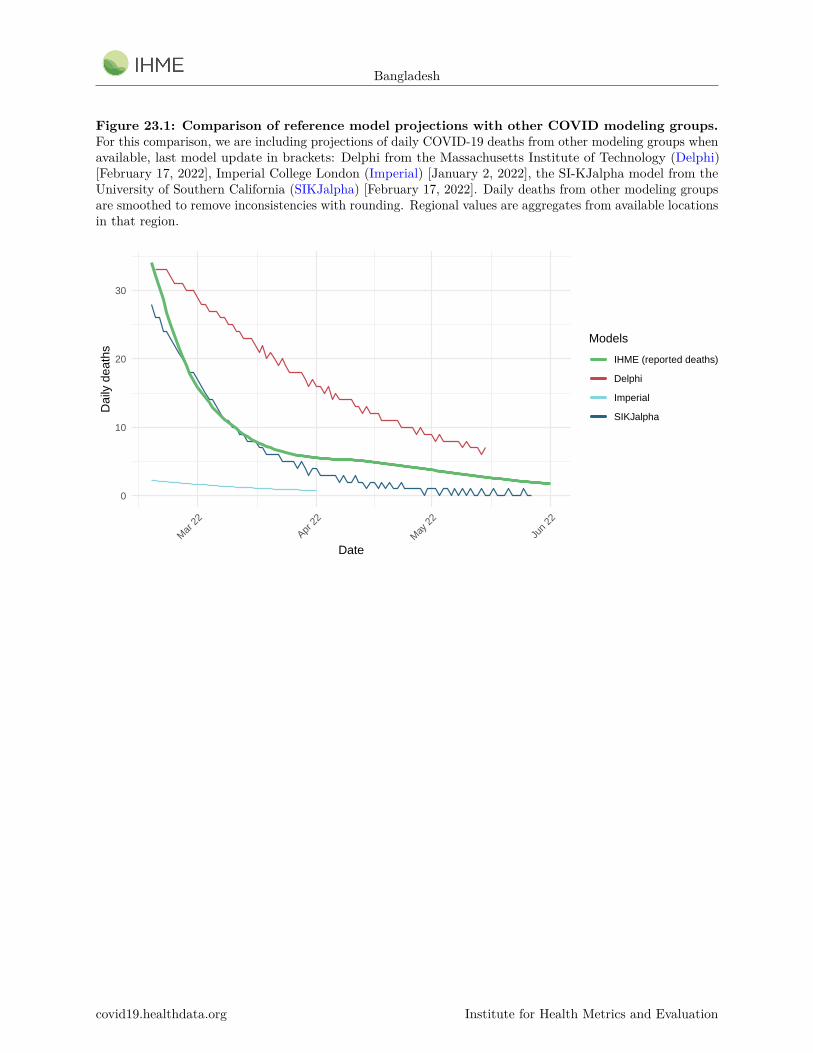
• Figure 23.1 compares our reference scenario forecasts to other publicly archived models. Forecasts arewidely divergent.
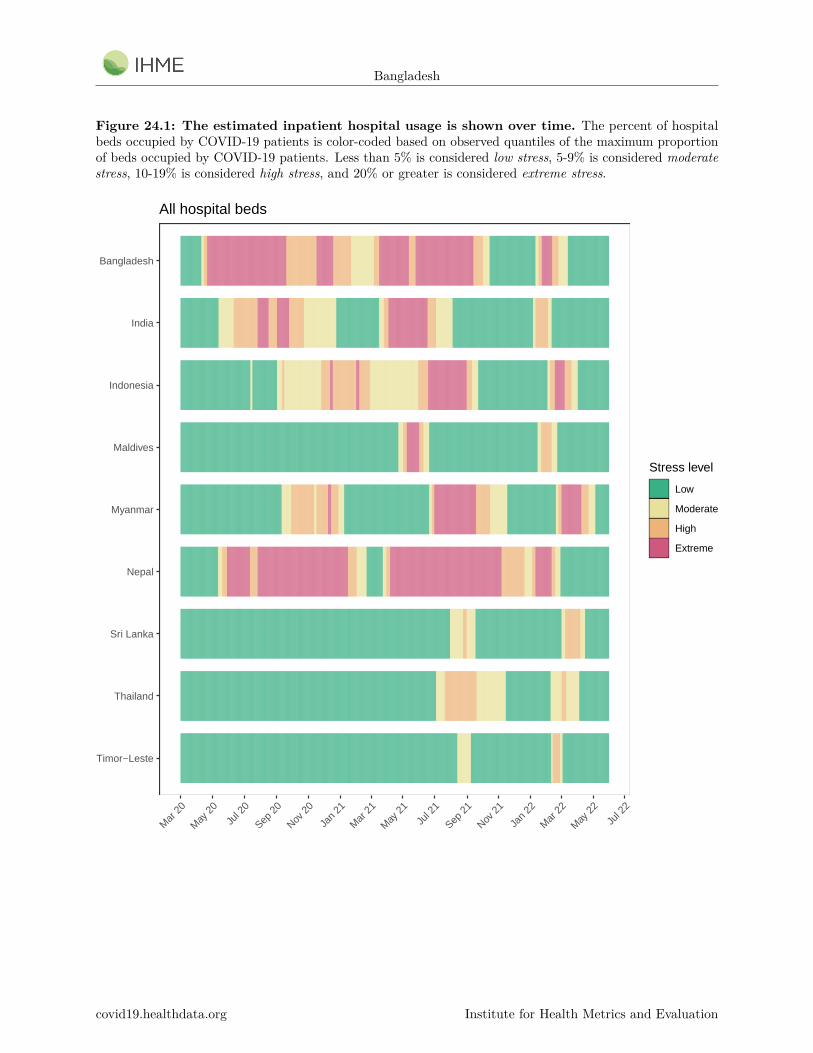
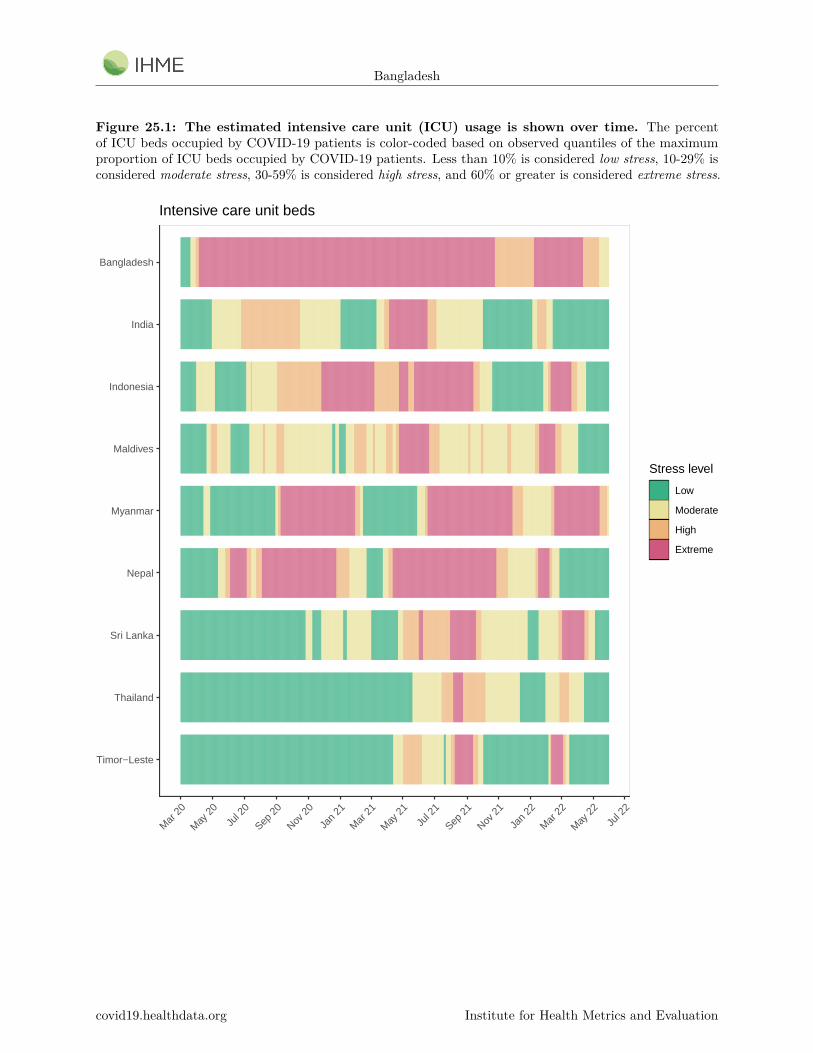
• At some point from February through June 1, 7 countries will have high or extreme stress on hospitalbeds (Figure 24.1). At some point from February through June 1, 7 countries will have high or extremestress on intensive care unit (ICU) capacity (Figure 25.1).
covid19.healthdata.org Institute for Health Metrics and Evaluation

Bangladesh
Model updatesNo model updates.
covid19.healthdata.org Institute for Health Metrics and Evaluation
Bangladesh
Figure 1.1: Daily COVID-19 hospital census and estimated infections
0
500,000
1,000,000
1,500,000
2,000,000
Jan
20
Mar
20
May
20
Jul 2
0
Sep 2
0
Nov 2
0
Jan
21
Mar
21
May
21
Jul 2
1
Sep 2
1
Nov 2
1
Jan
22
Mar
22
Num
ber
of p
eopl
e
Daily estimated infections Daily hospital census
Figure 2.1: Reported daily COVID-19 cases, moving average
0
5,000
10,000
15,000
Apr 2
0
Jun
20
Aug 2
0
Oct 20
Dec 2
0
Feb
21
Apr 2
1
Jun
21
Aug 2
1
Oct 21
Dec 2
1
Feb
22
Cou
nt
Daily cases
covid19.healthdata.org Institute for Health Metrics and Evaluation
Bangladesh
Table 1: Ranking of total deaths due to COVID-19 among the leading causes of mortality thisweek, assuming uniform deaths of non-COVID causes throughout the year
Cause name Weekly deaths RankingStroke 3,054 1COVID-19 2,689 2Ischemic heart disease 2,519 3Chronic obstructive pulmonary disease 1,070 4Neonatal disorders 773 5Lower respiratory infections 717 6Diabetes mellitus 636 7Diarrheal diseases 633 8Tuberculosis 559 9Cirrhosis and other chronic liver diseases 503 10
Figure 3.1: Smoothed trend estimate of reported daily COVID-19 deaths (blue) and totaldaily deaths due to COVID-19 (orange)
0
1,000
2,000
Jan
20
Mar
20
May
20
Jul 2
0
Sep 2
0
Nov 2
0
Jan
21
Mar
21
May
21
Jul 2
1
Sep 2
1
Nov 2
1
Jan
22
Mar
22
Dai
ly d
eath
s
covid19.healthdata.org Institute for Health Metrics and Evaluation
Bangladesh
Daily COVID-19 death rate per 1 million on February 14, 2022
Figure 4.1: Daily reported COVID-19 death rate per 1 million
<1
1 to 1.9
2 to 2.9
3 to 3.9
4 to 4.9
5 to 5.9
6 to 6.9
7 to 7.9
>=8
Figure 4.2: Daily total COVID-19 death rate per 1 million
<1
1 to 1.9
2 to 2.9
3 to 3.9
4 to 4.9
5 to 5.9
6 to 6.9
7 to 7.9
>=8
covid19.healthdata.org Institute for Health Metrics and Evaluation
Bangladesh
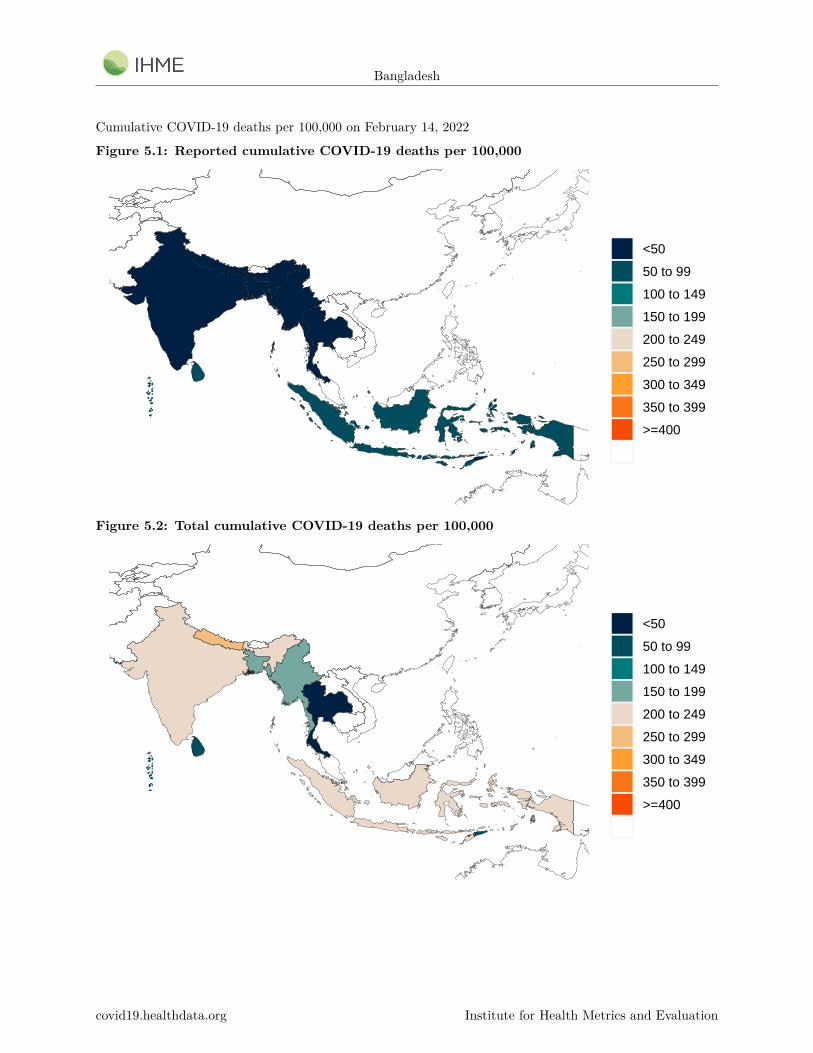
Cumulative COVID-19 deaths per 100,000 on February 14, 2022
Figure 5.1: Reported cumulative COVID-19 deaths per 100,000
<50
50 to 99
100 to 149
150 to 199
200 to 249
250 to 299
300 to 349
350 to 399
>=400
Figure 5.2: Total cumulative COVID-19 deaths per 100,000
<50
50 to 99
100 to 149
150 to 199
200 to 249
250 to 299
300 to 349
350 to 399
>=400
covid19.healthdata.org Institute for Health Metrics and Evaluation
Bangladesh
Figure 6.1: Estimated percent of the population infected with COVID-19 on February 14,2022
<10
10−19.9
20−29.9
30−39.9
40−49.9
50−59.9
60−69.9
70−79.9
80−84.9
85−89.9
90−94.9
>=95
Figure 7.1: Mean effective R on February 3, 2022. Effective R less than 1 means that transmissionshould decline, all other things being held the same. The estimate of effective R is based on the combinedanalysis of deaths, case reporting, and hospitalizations where available. Current reported cases reflectinfections 11-13 days prior, so estimates of effective R can only be made for the recent past.
<0.51
0.51−0.62
0.63−0.74
0.75−0.87
0.88−0.99
1−1.07
1.08−1.16
1.17−1.24
1.25−1.32
>=1.33
covid19.healthdata.org Institute for Health Metrics and Evaluation
Bangladesh
Figure 8.1: Percent of estimated COVID-19 infections detected. This is estimated as the ratioof reported daily COVID-19 cases to estimated daily COVID-19 infections based on the SEIR diseasetransmission model. Due to measurement errors in cases and testing rates, the infection-detection rate canexceed 100% at particular points in time.
0%
25%
50%
75%
100%
Apr 2
0
Jun
20
Aug 2
0
Oct 20
Dec 2
0
Feb
21
Apr 2
1
Jun
21
Aug 2
1
Oct 21
Dec 2
1
Feb
22
Per
cent
of e
stim
ated
infe
ctio
ns d
etec
ted
Indonesia Myanmar Thailand Bangladesh India
covid19.healthdata.org Institute for Health Metrics and Evaluation
Bangladesh
Estimated percent of circulating SARS-CoV-2 for primary variant families on February 14, 2022
Figure 9.1: Estimated percent of new infections that are Alpha variant
0%
1−9%
10−24%
25−49%
50−74%
75−89%
90−100%
Figure 9.2: Estimated percent of new infections that are Beta variant
0%
1−9%
10−24%
25−49%
50−74%
75−89%
90−100%
covid19.healthdata.org Institute for Health Metrics and Evaluation
Bangladesh
Figure 9.3: Estimated percent of new infections that are Delta variant
0%
1−9%
10−24%
25−49%
50−74%
75−89%
90−100%
Figure 9.4: Estimated percent of new infections that are Gamma variant
0%
1−9%
10−24%
25−49%
50−74%
75−89%
90−100%
covid19.healthdata.org Institute for Health Metrics and Evaluation
Bangladesh
Figure 9.5: Estimated percent of new infections that are Omicron variant
0%
1−9%
10−24%
25−49%
50−74%
75−89%
90−100%
covid19.healthdata.org Institute for Health Metrics and Evaluation
Bangladesh
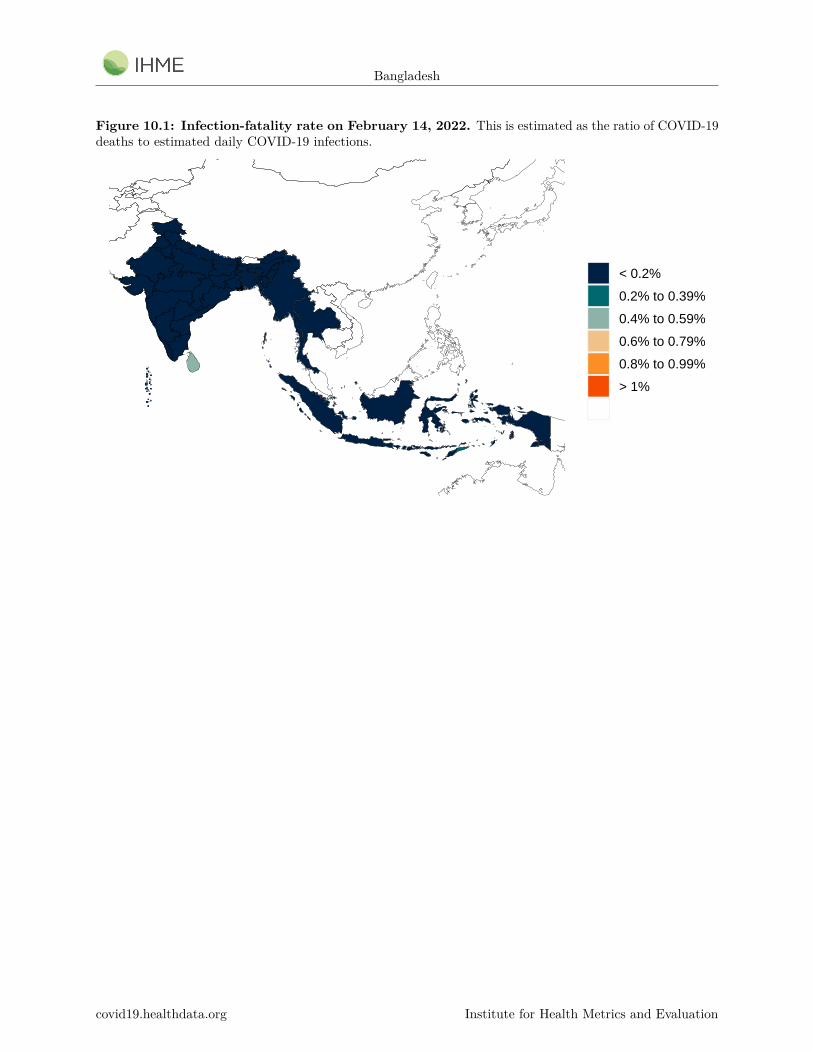
Figure 10.1: Infection-fatality rate on February 14, 2022. This is estimated as the ratio of COVID-19deaths to estimated daily COVID-19 infections.
< 0.2%
0.2% to 0.39%
0.4% to 0.59%
0.6% to 0.79%
0.8% to 0.99%
> 1%
covid19.healthdata.org Institute for Health Metrics and Evaluation

Bangladesh
Critical driversTable 2: Current mandate implementation
Prim
ary
scho
ol c
losu
re
Sec
onda
ry s
choo
l clo
sure
Hig
her
scho
ol c
losu
re
Ent
ry r
estr
ictio
ns fo
r so
me
non−
resi
dent
s
Ent
ry r
estr
ictio
ns fo
r al
l non
−re
side
nts
Indi
vidu
al m
ovem
ents
res
tric
ted
Cur
few
for
busi
ness
es
Indi
vidu
al c
urfe
w
Gat
herin
g lim
it: 6
indo
or, 1
0 ou
tdoo
r
Gat
herin
g lim
it: 1
0 in
door
, 25
outd
oor
Gat
herin
g lim
it: 2
5 in
door
, 50
outd
oor
Gat
herin
g lim
it: 5
0 in
door
, 100
out
door
Gat
herin
g lim
it: 1
00 in
door
, 250
out
door
Res
taur
ants
clo
sed
Bar
s cl
osed
Res
taur
ants
/ ba
rs c
lose
d
Res
taur
ants
/ ba
rs c
urbs
ide
only
Gym
s, p
ools
, oth
er le
isur
e cl
osed
Non
−es
sent
ial r
etai
l clo
sed
Non
−es
sent
ial r
etai
l cur
bsid
e on
ly
Non
−es
sent
ial w
orkp
lace
s cl
osed
Sta
y ho
me
orde
r
Sta
y ho
me
fine
Mas
k m
anda
te
Mas
k m
anda
te fi
ne
Timor−Leste
Thailand
Sri Lanka
Nepal
Myanmar
Maldives
Indonesia
India
Bhutan
Bangladesh
Mandate in placeMandate in place(imposed this week)Mandate in place(updated from previous reporting)
Mandate imposed in some subnational locationsMandate imposed in some subnational locations(imposed this week)Mandate imposed in some subnational locations(updated from previous reporting)
No mandateNo mandate(lifted this week)No mandate(updated from previous reporting)
*Not all locations are measured at the subnational level.
covid19.healthdata.org Institute for Health Metrics and Evaluation

Bangladesh
Figure 11.1: Trend in mobility as measured through smartphone app use, compared to January2020 baseline
−50
0
50
Dec 1
9
Feb
20
Apr 2
0
Jun
20
Aug 2
0
Oct 20
Dec 2
0
Feb
21
Apr 2
1
Jun
21
Aug 2
1
Oct 21
Dec 2
1
Feb
22
Per
cent
red
uctio
n fr
om a
vera
ge m
obili
ty
Indonesia Myanmar Thailand Bangladesh India
covid19.healthdata.org Institute for Health Metrics and Evaluation
Bangladesh
Figure 12.1: Mobility level as measured through smartphone app use, compared to January2020 baseline (percent) on February 14, 2022
=<−50
−49 to −45
−44 to −40
−39 to −35
−34 to −30
−29 to −25
−24 to −20
−19 to −15
−14 to −10
>−10
covid19.healthdata.org Institute for Health Metrics and Evaluation
Bangladesh
Figure 13.1: Trend in the proportion of the population reporting always wearing a mask whenleaving home
0
25
50
75
Feb
20
Apr 2
0
Jun
20
Aug 2
0
Oct 20
Dec 2
0
Feb
21
Apr 2
1
Jun
21
Aug 2
1
Oct 21
Dec 2
1
Feb
22
Per
cent
of p
opul
atio
n
Indonesia Myanmar Thailand Bangladesh India
Figure 14.1: Proportion of the population reporting always wearing a mask when leaving homeon February 14, 2022
0%
<10%
10−20%
20−30%
30−40%
40−50%
50−60%
60−70%
70−80%
80−90%
90−100%
covid19.healthdata.org Institute for Health Metrics and Evaluation
Bangladesh
Figure 15.1: Trend in COVID-19 diagnostic tests per 100,000 people
0
50
100
150
Feb
20
Apr 2
0
Jun
20
Aug 2
0
Oct 20
Dec 2
0
Feb
21
Apr 2
1
Jun
21
Aug 2
1
Oct 21
Dec 2
1
Feb
22
Test
per
100
,000
pop
ulat
ion
Indonesia Myanmar Thailand Bangladesh India
Figure 16.1: COVID-19 diagnostic tests per 100,000 people on February 14, 2022
<5
5 to 9.9
10 to 24.9
25 to 49
50 to 149
150 to 249
250 to 349
350 to 449
450 to 499
>=500
covid19.healthdata.org Institute for Health Metrics and Evaluation
Bangladesh
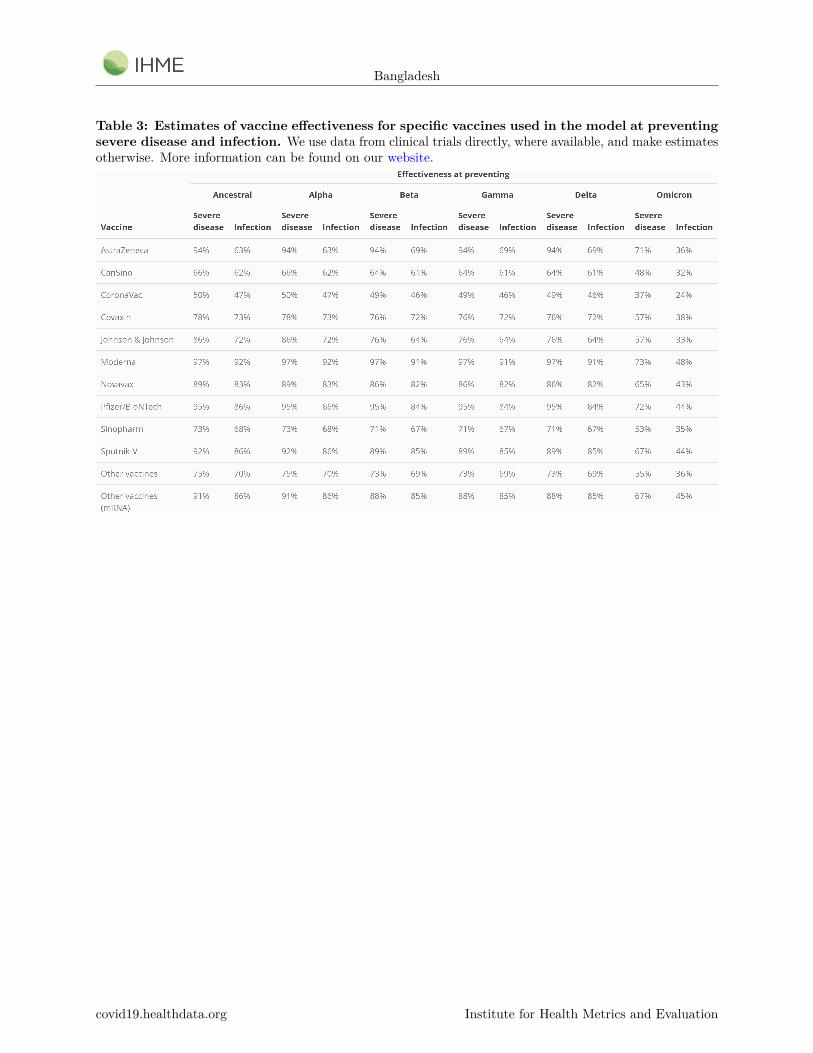
Table 3: Estimates of vaccine effectiveness for specific vaccines used in the model at preventingsevere disease and infection. We use data from clinical trials directly, where available, and make estimatesotherwise. More information can be found on our website.
covid19.healthdata.org Institute for Health Metrics and Evaluation
Bangladesh
Percent of the population having received at least one dose (17.1) and fully vaccinated against SARS-CoV-2(17.2) by February 14, 2022
Figure 17.1: Percent of the population having received one dose of a COVID-19 vaccine
0%
<10%
10−20%
20−30%
30−40%
40−50%
50−60%
60−70%
70−80%
80−90%
90−100%
Figure 17.2: Percent of the population fully vaccinated against SARS-CoV-2
0%
<10%
10−20%
20−30%
30−40%
40−50%
50−60%
60−70%
70−80%
80−90%
90−100%
covid19.healthdata.org Institute for Health Metrics and Evaluation
Bangladesh
Figure 18.1: Trend in the estimated proportion of the population that is 12 years and olderthat has been vaccinated or would probably or definitely receive the COVID-19 vaccine ifavailable. Note that vaccine acceptance is calculated using survey data from the 18+ population.
0
25
50
75
100
Dec 2
0
Jan
21
Feb
21
Mar
21
Apr 2
1
May
21
Jun
21
Jul 2
1
Aug 2
1
Sep 2
1
Oct 21
Nov 2
1
Dec 2
1
Jan
22
Feb
22
Per
cent
of p
opul
atio
n
Indonesia Myanmar Thailand Bangladesh India
Figure 19.1: Estimated proportion of the population that is 12 years and older that has beenvaccinated or would probably or definitely receive the COVID-19 vaccine if available. Note thatvaccine acceptance is calculated using survey data from the 18+ population.
0%
<10%
10−20%
20−30%
30−40%
40−50%
50−60%
60−70%
70−80%
80−90%
90−100%
covid19.healthdata.org Institute for Health Metrics and Evaluation
Bangladesh
Figure 20.1: Percent of people who receive at least one dose of a COVID-19 vaccine and thosewho are fully vaccinated
0%
10%
20%
30%
40%
50%
60%
70%
Dec 2
0
Jan
21
Feb
21
Mar
21
Apr 2
1
May
21
Jun
21
Jul 2
1
Aug 2
1
Sep 2
1
Oct 21
Nov 2
1
Dec 2
1
Jan
22
Feb
22
Mar
22
Apr 2
2
May
22
Jun
22
Per
cent
of p
opul
atio
n
At least one dose Fully vaccinated
Figure 21.1: Percent of people who are immune to Delta or Omicron. Immunity is based onprotection due to prior vaccination and infection(s). Moreover, variant-specific immunity isalso based on variant-variant specific protection.
20%
30%
40%
50%
60%
70%
80%
Feb
21
Apr 2
1
Jun
21
Aug 2
1
Oct 21
Dec 2
1
Feb
22
Apr 2
2
Jun
22
Per
cent
of p
opul
atio
n
Delta Omicron
covid19.healthdata.org Institute for Health Metrics and Evaluation
Bangladesh
Projections and scenariosFigure 22.1: Daily COVID-19 infections until June 01, 2022 for three scenarios
0
500,000
1,000,000
1,500,000
2,000,000
0
500
1000
1500
Feb
20
Apr 2
0
Jun
20
Aug 2
0
Oct 20
Dec 2
0
Feb
21
Apr 2
1
Jun
21
Aug 2
1
Oct 21
Dec 2
1
Feb
22
Apr 2
2
Jun
22
Dai
ly e
stim
ated
infe
ctio
nsD
aily estimated infections per 100,000
Reference
80% mask use
Third dose
Figure 22.2: Daily COVID-19 reported cases until June 01, 2022 for three scenarios
0
5,000
10,000
15,000
0.0
2.5
5.0
7.5
Feb
20
Apr 2
0
Jun
20
Aug 2
0
Oct 20
Dec 2
0
Feb
21
Apr 2
1
Jun
21
Aug 2
1
Oct 21
Dec 2
1
Feb
22
Apr 2
2
Jun
22
Dai
ly c
ases
Daily cases per 100,000
Reference
80% mask use
Third dose
covid19.healthdata.org Institute for Health Metrics and Evaluation
Bangladesh
Figure 22.3: Daily COVID-19 hospital census until June 01, 2022 for three scenarios
0
30,000
60,000
90,000
0
20
40
60
Feb
20
Apr 2
0
Jun
20
Aug 2
0
Oct 20
Dec 2
0
Feb
21
Apr 2
1
Jun
21
Aug 2
1
Oct 21
Dec 2
1
Feb
22
Apr 2
2
Jun
22
Hos
pita
l cen
sus
Hospital census per 100,000 population
80% mask use
Reference
Third dose
covid19.healthdata.org Institute for Health Metrics and Evaluation
Bangladesh
Figure 22.4: Reported daily COVID-19 deaths per 100,000
0
50
100
150
200
250
0.00
0.05
0.10
0.15
Feb
20
Apr 2
0
Jun
20
Aug 2
0
Oct 20
Dec 2
0
Feb
21
Apr 2
1
Jun
21
Aug 2
1
Oct 21
Dec 2
1
Feb
22
Apr 2
2
Jun
22
Dai
ly d
eath
sD
aily deaths per 100,000
Reference
80% mask use
Third dose
covid19.healthdata.org Institute for Health Metrics and Evaluation
Bangladesh
Figure 22.5: Total daily COVID-19 deaths per 100,000
0
1,000
2,000
0.0
0.5
1.0
1.5
Feb
20
Apr 2
0
Jun
20
Aug 2
0
Oct 20
Dec 2
0
Feb
21
Apr 2
1
Jun
21
Aug 2
1
Oct 21
Dec 2
1
Feb
22
Apr 2
2
Jun
22
Dai
ly d
eath
sD
aily deaths per 100,000
Reference
80% mask use
Third dose
covid19.healthdata.org Institute for Health Metrics and Evaluation
Bangladesh
Figure 23.1: Comparison of reference model projections with other COVID modeling groups.For this comparison, we are including projections of daily COVID-19 deaths from other modeling groups whenavailable, last model update in brackets: Delphi from the Massachusetts Institute of Technology (Delphi)[February 17, 2022], Imperial College London (Imperial) [January 2, 2022], the SI-KJalpha model from theUniversity of Southern California (SIKJalpha) [February 17, 2022]. Daily deaths from other modeling groupsare smoothed to remove inconsistencies with rounding. Regional values are aggregates from available locationsin that region.
0
10
20
30
Mar
22
Apr 2
2
May
22
Jun
22
Date
Dai
ly d
eath
s
Models
IHME (reported deaths)
Delphi
Imperial
SIKJalpha
covid19.healthdata.org Institute for Health Metrics and Evaluation
Bangladesh
Figure 24.1: The estimated inpatient hospital usage is shown over time. The percent of hospitalbeds occupied by COVID-19 patients is color-coded based on observed quantiles of the maximum proportionof beds occupied by COVID-19 patients. Less than 5% is considered low stress, 5-9% is considered moderatestress, 10-19% is considered high stress, and 20% or greater is considered extreme stress.
Timor−Leste
Thailand
Sri Lanka
Nepal
Myanmar
Maldives
Indonesia
India
Bangladesh
Mar
20
May
20
Jul 2
0
Sep 2
0
Nov 2
0
Jan
21
Mar
21
May
21
Jul 2
1
Sep 2
1
Nov 2
1
Jan
22
Mar
22
May
22
Jul 2
2
Stress level
Low
Moderate
High
Extreme
All hospital beds
covid19.healthdata.org Institute for Health Metrics and Evaluation
Bangladesh
Figure 25.1: The estimated intensive care unit (ICU) usage is shown over time. The percentof ICU beds occupied by COVID-19 patients is color-coded based on observed quantiles of the maximumproportion of ICU beds occupied by COVID-19 patients. Less than 10% is considered low stress, 10-29% isconsidered moderate stress, 30-59% is considered high stress, and 60% or greater is considered extreme stress.
Timor−Leste
Thailand
Sri Lanka
Nepal
Myanmar
Maldives
Indonesia
India
Bangladesh
Mar
20
May
20
Jul 2
0
Sep 2
0
Nov 2
0
Jan
21
Mar
21
May
21
Jul 2
1
Sep 2
1
Nov 2
1
Jan
22
Mar
22
May
22
Jul 2
2
Stress level
Low
Moderate
High
Extreme
Intensive care unit beds
covid19.healthdata.org Institute for Health Metrics and Evaluation
Bangladesh
More informationData sources:
Mask use and vaccine confidence data are from the The Delphi Group at Carnegie Mellon University andUniversity of Maryland COVID-19 Trends and Impact Surveys, in partnership with Facebook. Mask use dataare also from Premise, the Kaiser Family Foundation, and the YouGov COVID-19 Behaviour Tracker survey.
Genetic sequence and metadata are primarily from the GISAID Initiative. Further details available on theCOVID-19 model FAQ page.
A note of thanks:
We wish to warmly acknowledge the support of these and others who have made our COVID-19 estimationefforts possible.
More information:
For all COVID-19 resources at IHME, visit http://www.healthdata.org/covid.
To download our most recent results, visit our Data downloads page.
Questions? Requests? Feedback? Please contact us at https://www.healthdata.org/covid/contact-us.
covid19.healthdata.org Institute for Health Metrics and Evaluation