Results Briefing for Fiscal Year Ended Jan. 31, 2019 - Pigeon
46
Results Briefing for Fiscal Year Ended Jan. 31, 2019 March 5, 2019 President & COO Shigeru Yamashita (Securities Code:7956)
-
Upload
khangminh22 -
Category
Documents
-
view
0 -
download
0
Transcript of Results Briefing for Fiscal Year Ended Jan. 31, 2019 - Pigeon
Results Briefing for
Fiscal Year Ended Jan. 31, 2019
March 5, 2019
President & COO
Shigeru Yamashita
(Securities Code:7956)
Title, Contents 1 - 2
Results for Term Ended Jan.2019 3 - 17
Forecasts for Term Ending Dec.2019 18 - 31
Approach to Enhance Corporate Value 32 - 36

Results for Term
Ended Jan. 31, 2019
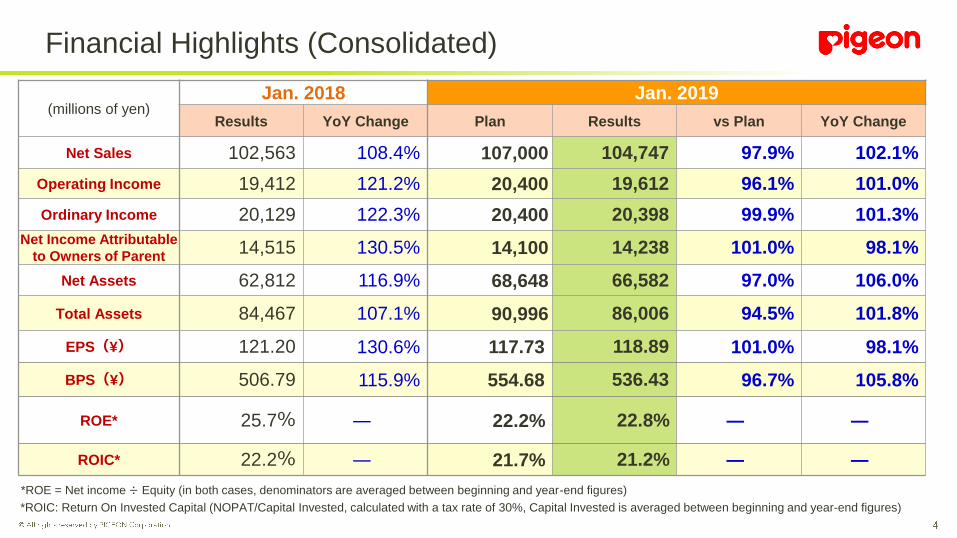
Financial Highlights (Consolidated)
(millions of yen) Jan. 2018 Jan. 2019
Results YoY Change Plan Results vs Plan YoY Change
Net Sales 102,563 108.4% 107,000 104,747 97.9% 102.1%
Operating Income 19,412 121.2% 20,400 19,612 96.1% 101.0%
Ordinary Income 20,129 122.3% 20,400 20,398 99.9% 101.3%
Net Income Attributable
to Owners of Parent 14,515 130.5% 14,100 14,238 101.0% 98.1%
Net Assets 62,812 116.9% 68,648 66,582 97.0% 106.0%
Total Assets 84,467 107.1% 90,996 86,006 94.5% 101.8%
EPS(¥) 121.20 130.6% 117.73 118.89 101.0% 98.1%
BPS(¥) 506.79 115.9% 554.68 536.43 96.7% 105.8%
ROE* 25.7% ― 22.2% 22.8% ― ―
ROIC* 22.2% ― 21.7% 21.2% ― ―
*ROE = Net income ÷ Equity (in both cases, denominators are averaged between beginning and year-end figures)
*ROIC: Return On Invested Capital (NOPAT/Capital Invested, calculated with a tax rate of 30%, Capital Invested is averaged between beginning and year-end figures)
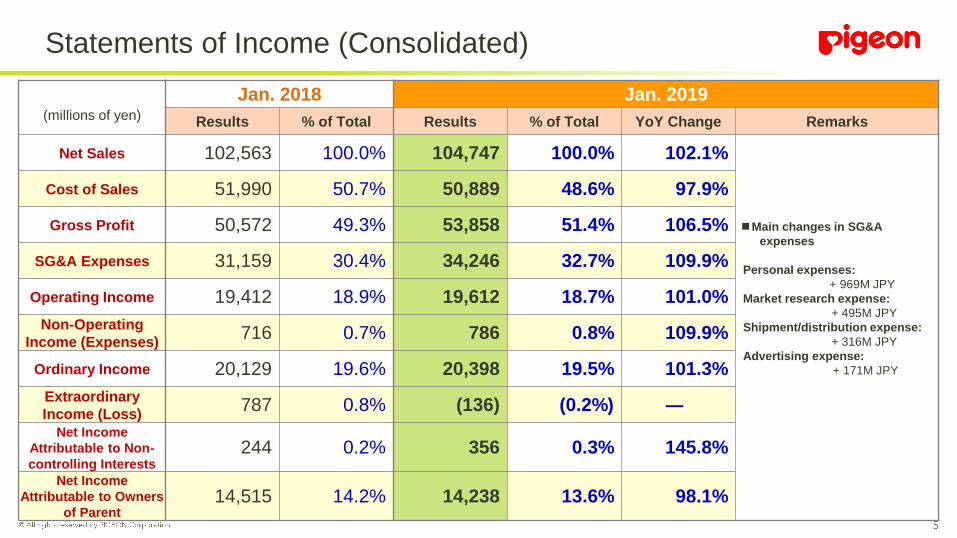
Statements of Income (Consolidated)
(millions of yen)
Jan. 2018 Jan. 2019
Results % of Total Results % of Total YoY Change Remarks
Net Sales 102,563 100.0% 104,747 100.0% 102.1%
■Main changes in SG&A
expenses
Personal expenses:
+ 969M JPY
Market research expense:
+ 495M JPY
Shipment/distribution expense:
+ 316M JPY
Advertising expense:
+ 171M JPY
Cost of Sales 51,990 50.7% 50,889 48.6% 97.9%
Gross Profit 50,572 49.3% 53,858 51.4% 106.5%
SG&A Expenses 31,159 30.4% 34,246 32.7% 109.9%
Operating Income 19,412 18.9% 19,612 18.7% 101.0%
Non-Operating
Income (Expenses) 716 0.7% 786 0.8% 109.9%
Ordinary Income 20,129 19.6% 20,398 19.5% 101.3%
Extraordinary
Income (Loss) 787 0.8% (136) (0.2%) ―
Net Income
Attributable to Non-
controlling Interests 244 0.2% 356 0.3% 145.8%
Net Income
Attributable to Owners
of Parent 14,515 14.2% 14,238 13.6% 98.1%
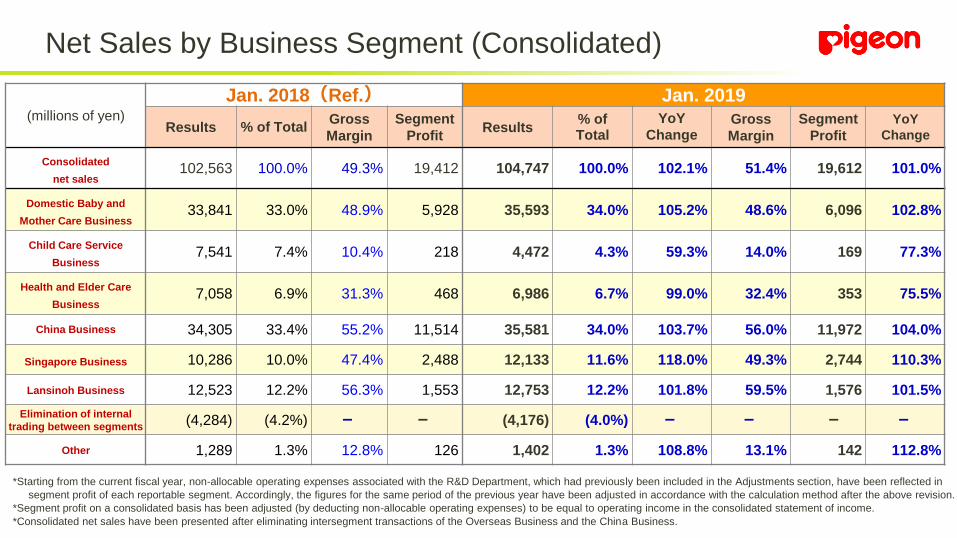
Net Sales by Business Segment (Consolidated)
(millions of yen)
Jan. 2018(Ref.) Jan. 2019
Results % of Total Gross
Margin
Segment
Profit Results
% of Total
YoY
Change Gross
Margin
Segment
Profit
YoY
Change
Consolidated
net sales 102,563 100.0% 49.3% 19,412 104,747 100.0% 102.1% 51.4% 19,612 101.0%
Domestic Baby and
Mother Care Business 33,841 33.0% 48.9% 5,928 35,593 34.0% 105.2% 48.6% 6,096 102.8%
Child Care Service
Business 7,541 7.4% 10.4% 218 4,472 4.3% 59.3% 14.0% 169 77.3%
Health and Elder Care
Business 7,058 6.9% 31.3% 468 6,986 6.7% 99.0% 32.4% 353 75.5%
China Business 34,305 33.4% 55.2% 11,514 35,581 34.0% 103.7% 56.0% 11,972 104.0%
Singapore Business 10,286 10.0% 47.4% 2,488 12,133 11.6% 118.0% 49.3% 2,744 110.3%
Lansinoh Business 12,523 12.2% 56.3% 1,553 12,753 12.2% 101.8% 59.5% 1,576 101.5%
Elimination of internal
trading between segments (4,284) (4.2%) - - (4,176) (4.0%) - - - -
Other 1,289 1.3% 12.8% 126 1,402 1.3% 108.8% 13.1% 142 112.8%
*Starting from the current fiscal year, non-allocable operating expenses associated with the R&D Department, which had previously been included in the Adjustments section, have been reflected in
segment profit of each reportable segment. Accordingly, the figures for the same period of the previous year have been adjusted in accordance with the calculation method after the above revision.
*Segment profit on a consolidated basis has been adjusted (by deducting non-allocable operating expenses) to be equal to operating income in the consolidated statement of income.
*Consolidated net sales have been presented after eliminating intersegment transactions of the Overseas Business and the China Business.
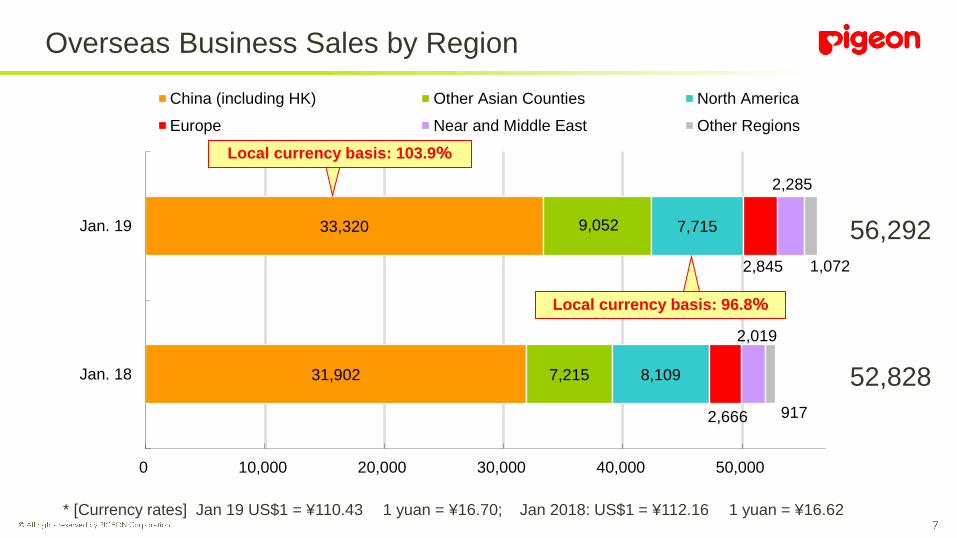
31,902
33,320
7,215
9,052
8,109
7,715
2,666
2,845
2,019
2,285
917
1,072
0 10,000 20,000 30,000 40,000 50,000
Jan. 18
Jan. 19
China (including HK) Other Asian Counties North America
Europe Near and Middle East Other Regions
Overseas Business Sales by Region
* [Currency rates] Jan 19 US$1 = ¥110.43 1 yuan = ¥16.70; Jan 2018: US$1 = ¥112.16 1 yuan = ¥16.62
Local currency basis: 96.8%
Local currency basis: 103.9%
56,292
52,828
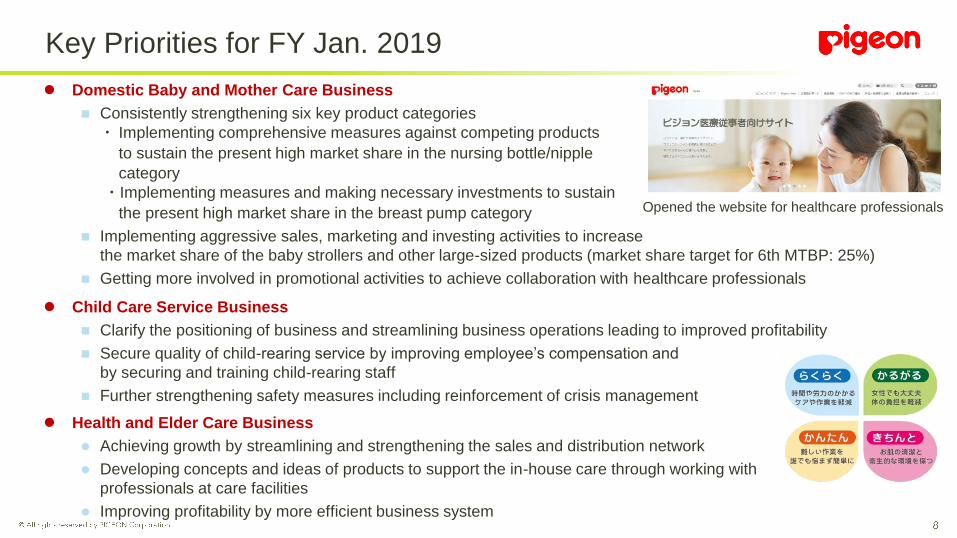
Domestic Baby and Mother Care Business
Consistently strengthening six key product categories
・ Implementing comprehensive measures against competing products
to sustain the present high market share in the nursing bottle/nipple
category
・Implementing measures and making necessary investments to sustain
the present high market share in the breast pump category
Implementing aggressive sales, marketing and investing activities to increase
the market share of the baby strollers and other large-sized products (market share target for 6th MTBP: 25%)
Getting more involved in promotional activities to achieve collaboration with healthcare professionals
Child Care Service Business
Clarify the positioning of business and streamlining business operations leading to improved profitability
Secure quality of child-rearing service by improving employee’s compensation and
by securing and training child-rearing staff
Further strengthening safety measures including reinforcement of crisis management
Health and Elder Care Business
Achieving growth by streamlining and strengthening the sales and distribution network
Developing concepts and ideas of products to support the in-house care through working with
professionals at care facilities
Improving profitability by more efficient business system
Key Priorities for FY Jan. 2019
Opened the website for healthcare professionals
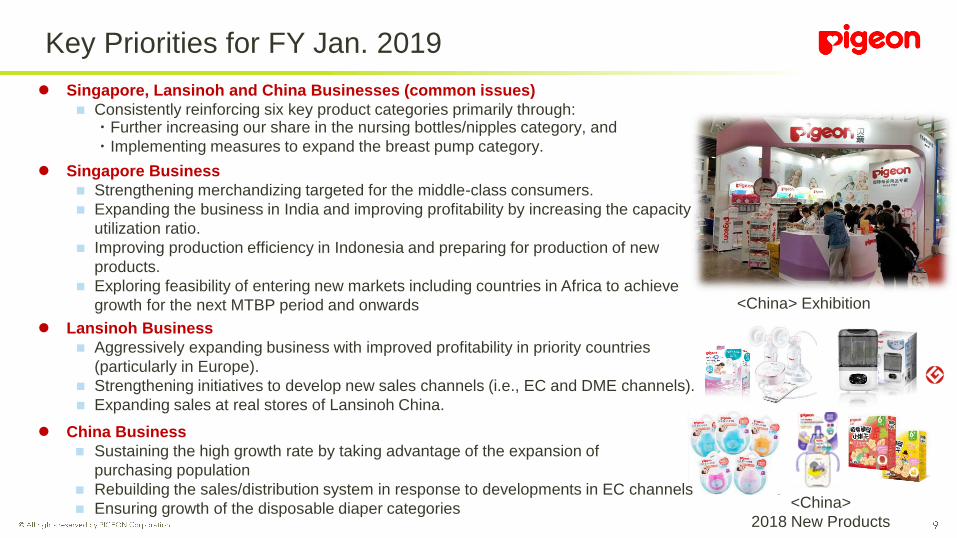
Key Priorities for FY Jan. 2019
<China>
2018 New Products
<China> Exhibition
Singapore, Lansinoh and China Businesses (common issues)
Consistently reinforcing six key product categories primarily through: ・Further increasing our share in the nursing bottles/nipples category, and
・Implementing measures to expand the breast pump category.
Singapore Business
Strengthening merchandizing targeted for the middle-class consumers.
Expanding the business in India and improving profitability by increasing the capacity
utilization ratio.
Improving production efficiency in Indonesia and preparing for production of new
products.
Exploring feasibility of entering new markets including countries in Africa to achieve
growth for the next MTBP period and onwards
Lansinoh Business
Aggressively expanding business with improved profitability in priority countries
(particularly in Europe).
Strengthening initiatives to develop new sales channels (i.e., EC and DME channels).
Expanding sales at real stores of Lansinoh China.
China Business
Sustaining the high growth rate by taking advantage of the expansion of
purchasing population
Rebuilding the sales/distribution system in response to developments in EC channels
Ensuring growth of the disposable diaper categories
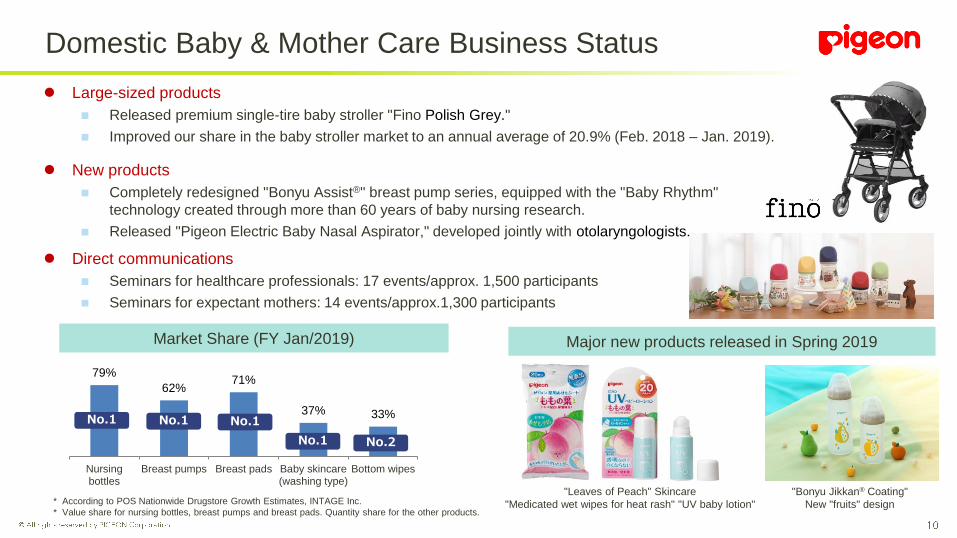
Domestic Baby & Mother Care Business Status
New products
Completely redesigned "Bonyu Assist®" breast pump series, equipped with the "Baby Rhythm"
technology created through more than 60 years of baby nursing research.
Released "Pigeon Electric Baby Nasal Aspirator," developed jointly with otolaryngologists.
Large-sized products
Released premium single-tire baby stroller "Fino Polish Grey."
Improved our share in the baby stroller market to an annual average of 20.9% (Feb. 2018 – Jan. 2019).
Direct communications
Seminars for healthcare professionals: 17 events/approx. 1,500 participants
Seminars for expectant mothers: 14 events/approx.1,300 participants
Market Share (FY Jan/2019) Major new products released in Spring 2019
79%
62% 71%
37% 33%
Nursingbottles
Breast pumps Breast pads Baby skincare(washing type)
Bottom wipes
* According to POS Nationwide Drugstore Growth Estimates, INTAGE Inc.
* Value share for nursing bottles, breast pumps and breast pads. Quantity share for the other products.
"Leaves of Peach" Skincare
"Medicated wet wipes for heat rash" "UV baby lotion"
"Bonyu Jikkan® Coating"
New "fruits" design
No.1 No.1 No.1
No.1 No.2
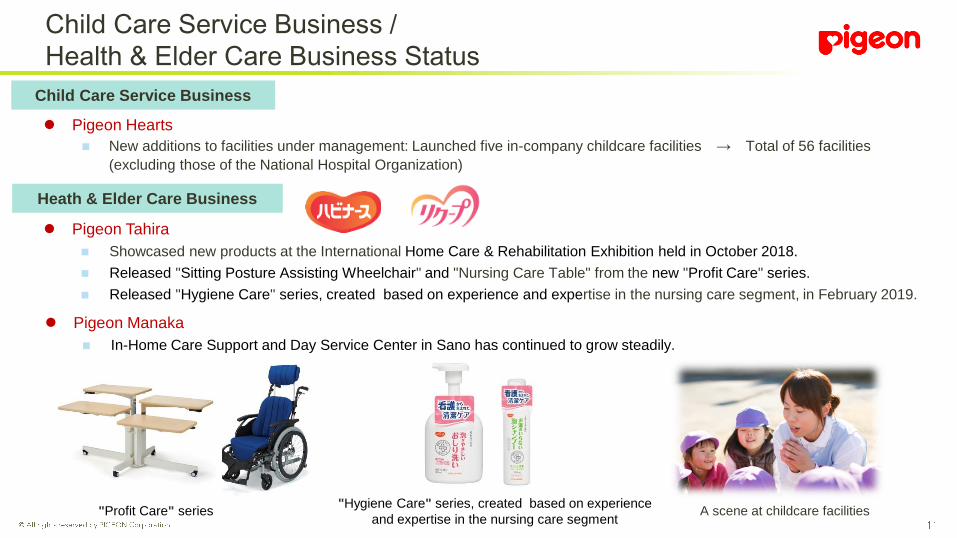
Child Care Service Business /
Health & Elder Care Business Status
Pigeon Tahira
Showcased new products at the International Home Care & Rehabilitation Exhibition held in October 2018.
Released "Sitting Posture Assisting Wheelchair" and "Nursing Care Table" from the new "Profit Care" series.
Released "Hygiene Care" series, created based on experience and expertise in the nursing care segment, in February 2019.
Pigeon Manaka
In-Home Care Support and Day Service Center in Sano has continued to grow steadily.
Pigeon Hearts
New additions to facilities under management: Launched five in-company childcare facilities → Total of 56 facilities
(excluding those of the National Hospital Organization)
Child Care Service Business
Heath & Elder Care Business
"Profit Care" series A scene at childcare facilities "Hygiene Care" series, created based on experience
and expertise in the nursing care segment
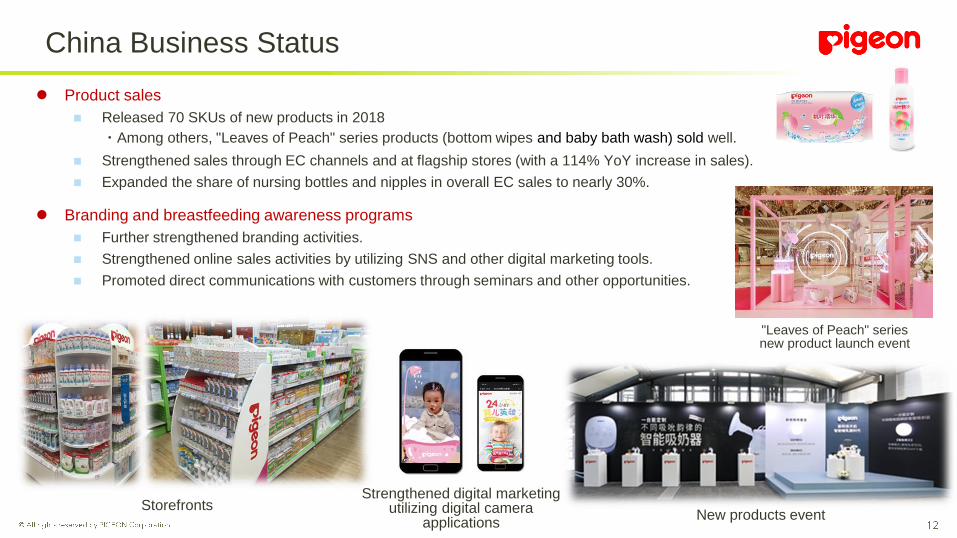
China Business Status
New products event
Product sales
Released 70 SKUs of new products in 2018
・Among others, "Leaves of Peach" series products (bottom wipes and baby bath wash) sold well.
Strengthened sales through EC channels and at flagship stores (with a 114% YoY increase in sales).
Expanded the share of nursing bottles and nipples in overall EC sales to nearly 30%.
Branding and breastfeeding awareness programs
Further strengthened branding activities.
Strengthened online sales activities by utilizing SNS and other digital marketing tools.
Promoted direct communications with customers through seminars and other opportunities.
Strengthened digital marketing utilizing digital camera
applications
Storefronts
"Leaves of Peach" series new product launch event
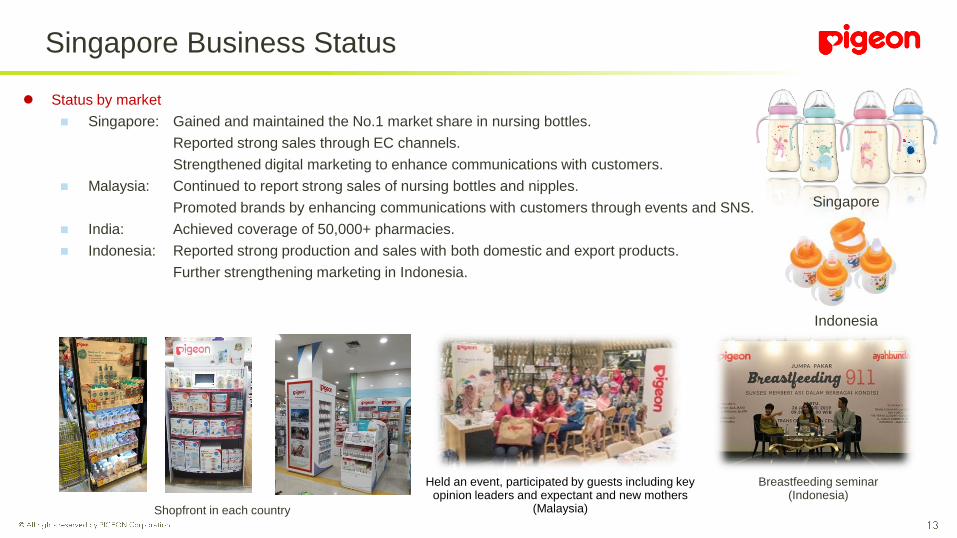
Singapore Business Status
Status by market
Singapore: Gained and maintained the No.1 market share in nursing bottles.
Reported strong sales through EC channels.
Strengthened digital marketing to enhance communications with customers.
Malaysia: Continued to report strong sales of nursing bottles and nipples.
Promoted brands by enhancing communications with customers through events and SNS.
India: Achieved coverage of 50,000+ pharmacies.
Indonesia: Reported strong production and sales with both domestic and export products.
Further strengthening marketing in Indonesia.
Shopfront in each country
Held an event, participated by guests including key opinion leaders and expectant and new mothers
(Malaysia)
Singapore
Indonesia
Breastfeeding seminar (Indonesia)
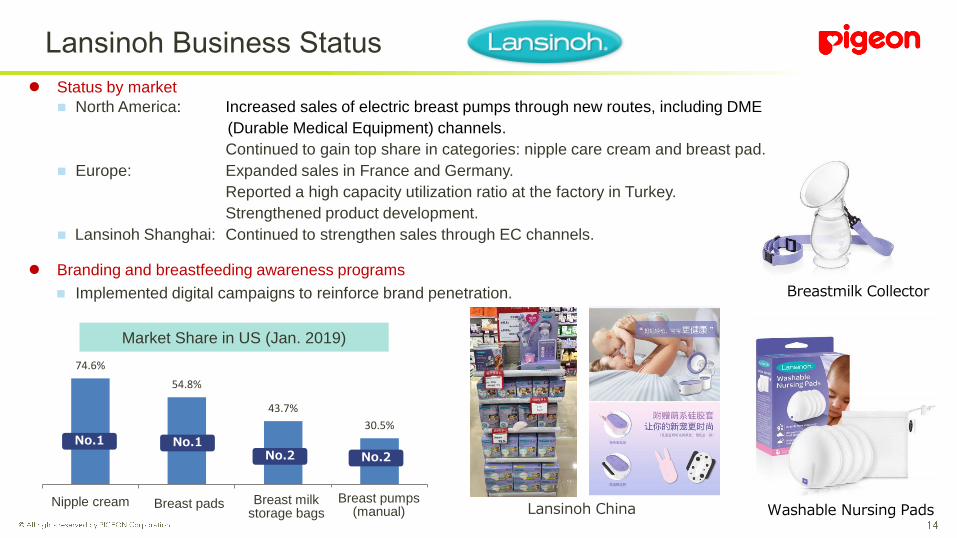
Lansinoh Business Status
Lansinoh China
Breastmilk Collector
Washable Nursing Pads
Market Share in US (Jan. 2019)
Branding and breastfeeding awareness programs
Implemented digital campaigns to reinforce brand penetration.
Status by market
North America: Increased sales of electric breast pumps through new routes, including DME
(Durable Medical Equipment) channels.
Continued to gain top share in categories: nipple care cream and breast pad.
Europe: Expanded sales in France and Germany.
Reported a high capacity utilization ratio at the factory in Turkey.
Strengthened product development.
Lansinoh Shanghai: Continued to strengthen sales through EC channels.
74.6%
54.8%
43.7%
30.5%
乳首クリーム 母乳パッド 母乳保存バッグ さく乳器(手動) Nipple cream Breast pads Breast milk storage bags
Breast pumps (manual)
No.1 No.1 No.2 No.2

<Ref.>Consolidated Balance Sheet (Highlights)
(millions of yen)
Jan. 2018 Jan. 2019
Results Results YoY Change
(Amount)
YoY Change
(%)
Cash and Deposits 31,346 30,949 (397) 98.7%
Notes and Accounts
Receivable 16,440 15,004 (1,436) 91.3%
Inventories 8,713 10,605 +1,891 121.7%
Notes and Accounts
Payable 5,194 4,567 (627) 87.9%
Electronically Recorded
Obligations – Operating 1,797 1,960 +163 109.1%
Borrowings 0 0 - -
Net Assets 62,812 66,582 +3,770 106.0%
Total Assets 84,467 86,006 +1,539 101.8%
Equity Ratio 71.9% 74.7% - +2.8pt
Balance at
Biginnig
Operating
Activities
Investing
Activities
Financing
Activities
Translation
Adjustment
Balance at
End
Balance at
Biginnig
Operating
Activities
Investing
Activities
Financing
Activities
Translation
Adjustment
Balance at
End
30,052 17,094 (3,586) (12,812) 599 31,346 31,346 13,632 (4,704) (8,338) (986) 30,949
Jan. 2018 Jan. 2019
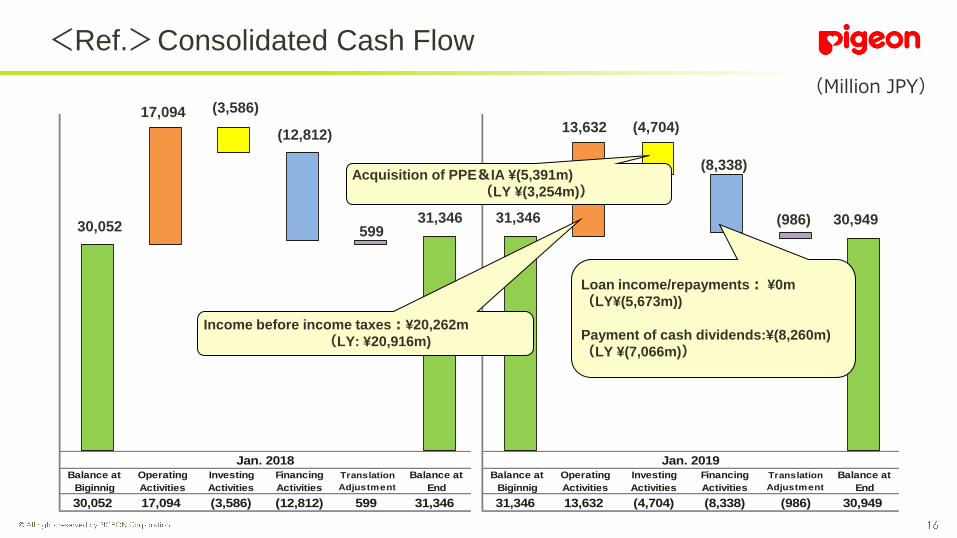
<Ref.>Consolidated Cash Flow
(Million JPY)
Loan income/repayments: ¥0m
(LY¥(5,673m))
Payment of cash dividends:¥(8,260m)
(LY ¥(7,066m))
Income before income taxes:¥20,262m
(LY: ¥20,916m)
Acquisition of PPE&IA ¥(5,391m)
(LY ¥(3,254m))
30,052
17,094 (3,586)
(12,812)
599 31,346 31,346
13,632 (4,704)
(8,338)
(986) 30,949
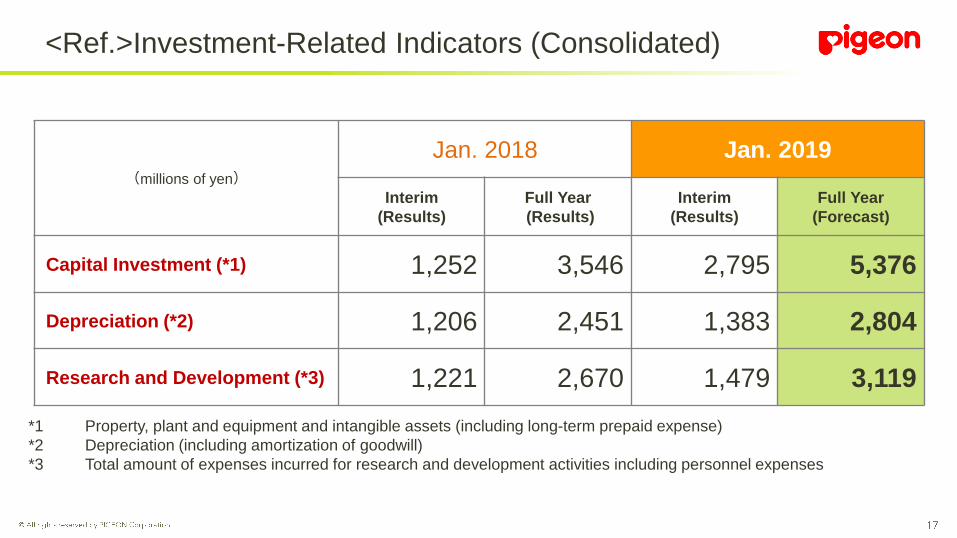
<Ref.>Investment-Related Indicators (Consolidated)
(millions of yen)
Jan. 2018 Jan. 2019
Interim
(Results)
Full Year
(Results)
Interim
(Results)
Full Year
(Forecast)
Capital Investment (*1) 1,252 3,546 2,795 5,376
Depreciation (*2) 1,206 2,451 1,383 2,804
Research and Development (*3) 1,221 2,670 1,479 3,119
*1 Property, plant and equipment and intangible assets (including long-term prepaid expense)
*2 Depreciation (including amortization of goodwill)
*3 Total amount of expenses incurred for research and development activities including personnel expenses

Forecasts for Term Ending Dec. 2019
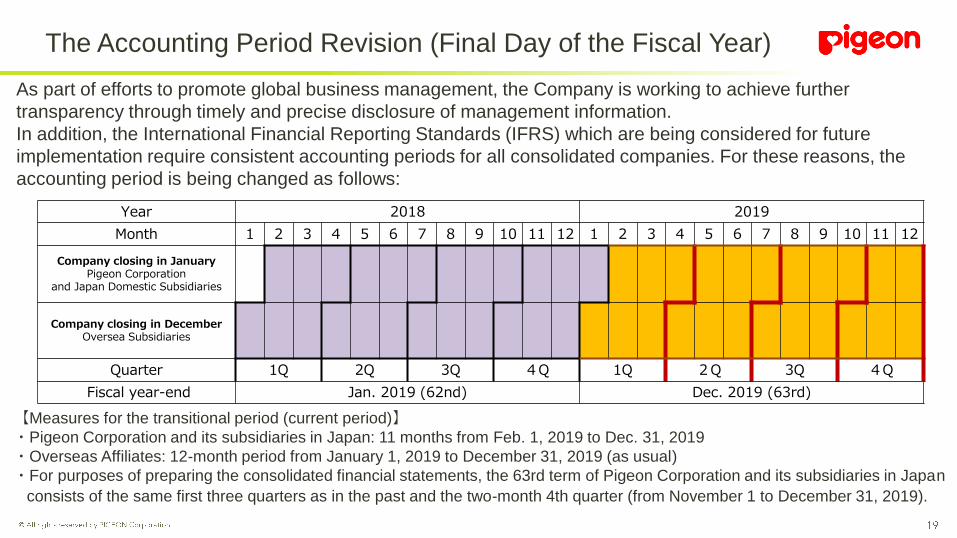
The Accounting Period Revision (Final Day of the Fiscal Year)
As part of efforts to promote global business management, the Company is working to achieve further
transparency through timely and precise disclosure of management information.
In addition, the International Financial Reporting Standards (IFRS) which are being considered for future
implementation require consistent accounting periods for all consolidated companies. For these reasons, the
accounting period is being changed as follows:
【Measures for the transitional period (current period)】
・Pigeon Corporation and its subsidiaries in Japan: 11 months from Feb. 1, 2019 to Dec. 31, 2019
・Overseas Affiliates: 12-month period from January 1, 2019 to December 31, 2019 (as usual)
・For purposes of preparing the consolidated financial statements, the 63rd term of Pigeon Corporation and its subsidiaries in Japan
consists of the same first three quarters as in the past and the two-month 4th quarter (from November 1 to December 31, 2019).
Year 2018 2019
Month 1 2 3 4 5 6 7 8 9 10 11 12 1 2 3 4 5 6 7 8 9 10 11 12
Company closing in January Pigeon Corporation
and Japan Domestic Subsidiaries
Company closing in December Oversea Subsidiaries
Quarter 1Q 2Q 3Q 4Q 1Q 2Q 3Q 4Q
Fiscal year-end Jan. 2019 (62nd) Dec. 2019 (63rd)
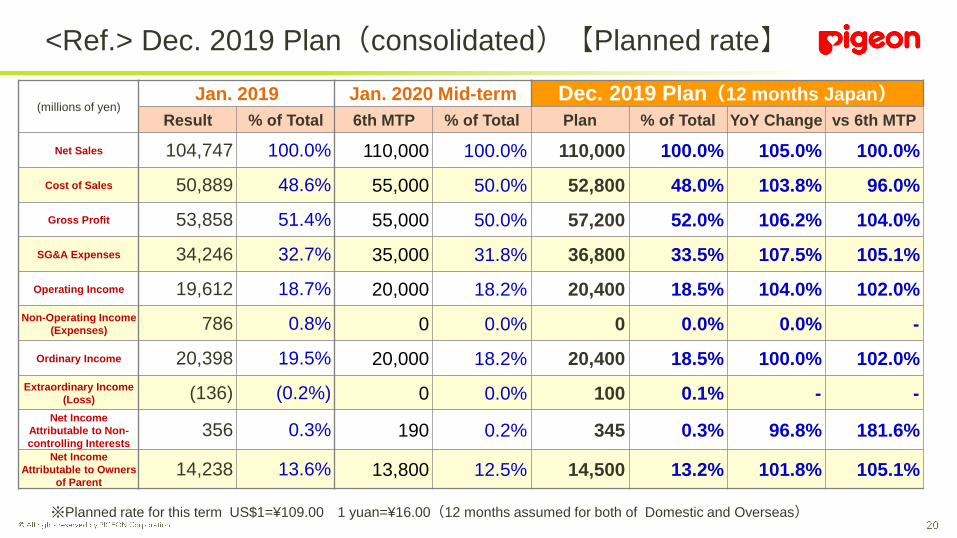
<Ref.> Dec. 2019 Plan(consolidated)【Planned rate】
(millions of yen) Jan. 2019 Jan. 2020 Mid-term Dec. 2019 Plan(12 months Japan)
Result % of Total 6th MTP % of Total Plan % of Total YoY Change vs 6th MTP
Net Sales 104,747 100.0% 110,000 100.0% 110,000 100.0% 105.0% 100.0%
Cost of Sales 50,889 48.6% 55,000 50.0% 52,800 48.0% 103.8% 96.0%
Gross Profit 53,858 51.4% 55,000 50.0% 57,200 52.0% 106.2% 104.0%
SG&A Expenses 34,246 32.7% 35,000 31.8% 36,800 33.5% 107.5% 105.1%
Operating Income 19,612 18.7% 20,000 18.2% 20,400 18.5% 104.0% 102.0%
Non-Operating Income
(Expenses) 786 0.8% 0 0.0% 0 0.0% 0.0% -
Ordinary Income 20,398 19.5% 20,000 18.2% 20,400 18.5% 100.0% 102.0%
Extraordinary Income
(Loss) (136) (0.2%) 0 0.0% 100 0.1% - - Net Income
Attributable to Non-
controlling Interests 356 0.3% 190 0.2% 345 0.3% 96.8% 181.6%
Net Income
Attributable to Owners
of Parent 14,238 13.6% 13,800 12.5% 14,500 13.2% 101.8% 105.1%
※Planned rate for this term US$1=¥109.00 1 yuan=¥16.00(12 months assumed for both of Domestic and Overseas)
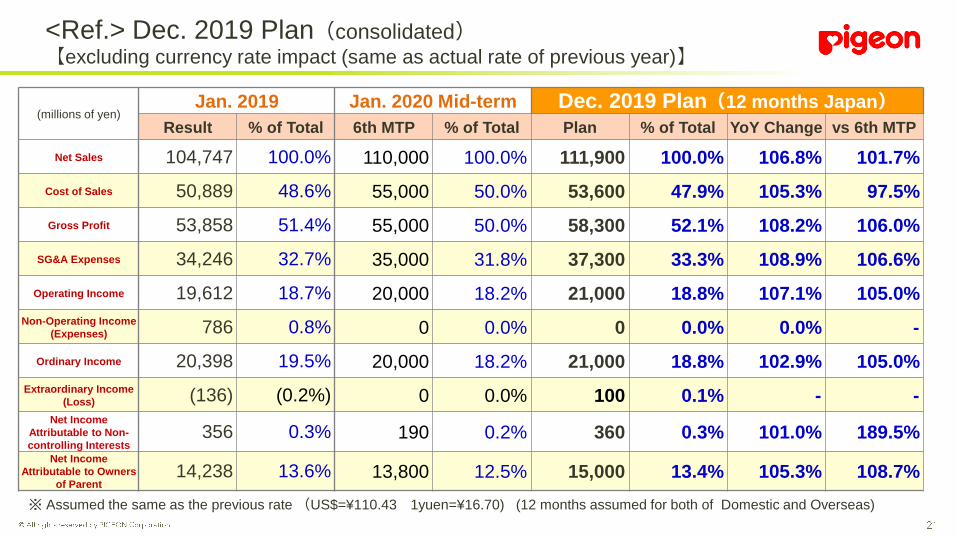
<Ref.> Dec. 2019 Plan(consolidated) 【excluding currency rate impact (same as actual rate of previous year)】
(millions of yen) Jan. 2019 Jan. 2020 Mid-term Dec. 2019 Plan(12 months Japan)
Result % of Total 6th MTP % of Total Plan % of Total YoY Change vs 6th MTP
Net Sales 104,747 100.0% 110,000 100.0% 111,900 100.0% 106.8% 101.7%
Cost of Sales 50,889 48.6% 55,000 50.0% 53,600 47.9% 105.3% 97.5%
Gross Profit 53,858 51.4% 55,000 50.0% 58,300 52.1% 108.2% 106.0%
SG&A Expenses 34,246 32.7% 35,000 31.8% 37,300 33.3% 108.9% 106.6%
Operating Income 19,612 18.7% 20,000 18.2% 21,000 18.8% 107.1% 105.0%
Non-Operating Income
(Expenses) 786 0.8% 0 0.0% 0 0.0% 0.0% -
Ordinary Income 20,398 19.5% 20,000 18.2% 21,000 18.8% 102.9% 105.0%
Extraordinary Income
(Loss) (136) (0.2%) 0 0.0% 100 0.1% - - Net Income
Attributable to Non-
controlling Interests 356 0.3% 190 0.2% 360 0.3% 101.0% 189.5%
Net Income
Attributable to Owners
of Parent 14,238 13.6% 13,800 12.5% 15,000 13.4% 105.3% 108.7%
※ Assumed the same as the previous rate (US$=¥110.43 1yuen=¥16.70) (12 months assumed for both of Domestic and Overseas)
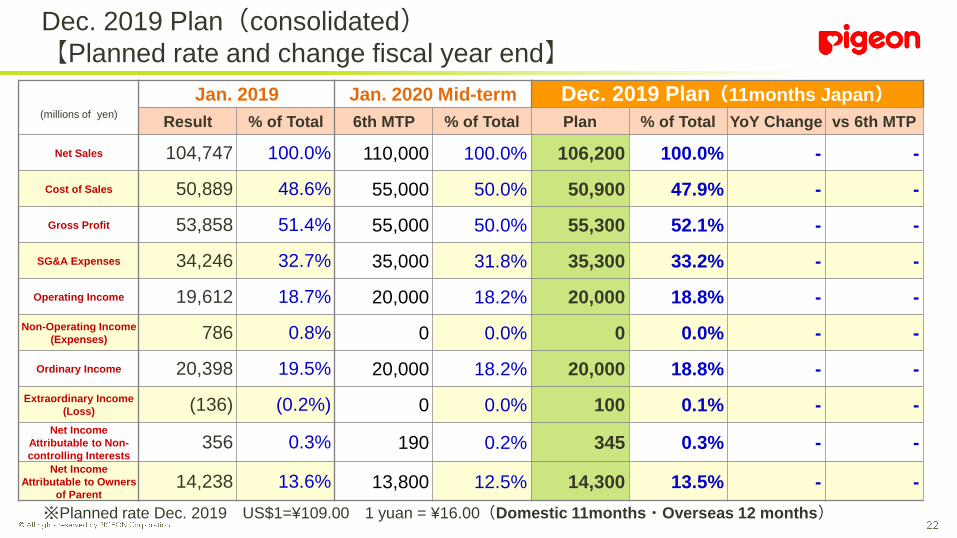
Dec. 2019 Plan(consolidated)
【Planned rate and change fiscal year end】
(millions of yen)
Jan. 2019 Jan. 2020 Mid-term Dec. 2019 Plan(11months Japan)
Result % of Total 6th MTP % of Total Plan % of Total YoY Change vs 6th MTP
Net Sales 104,747 100.0% 110,000 100.0% 106,200 100.0% - -
Cost of Sales 50,889 48.6% 55,000 50.0% 50,900 47.9% - -
Gross Profit 53,858 51.4% 55,000 50.0% 55,300 52.1% - -
SG&A Expenses 34,246 32.7% 35,000 31.8% 35,300 33.2% - -
Operating Income 19,612 18.7% 20,000 18.2% 20,000 18.8% - -
Non-Operating Income
(Expenses) 786 0.8% 0 0.0% 0 0.0% - -
Ordinary Income 20,398 19.5% 20,000 18.2% 20,000 18.8% - -
Extraordinary Income
(Loss) (136) (0.2%) 0 0.0% 100 0.1% - -
Net Income
Attributable to Non-
controlling Interests 356 0.3% 190 0.2% 345 0.3% - -
Net Income
Attributable to Owners
of Parent 14,238 13.6% 13,800 12.5% 14,300 13.5% - -
※Planned rate Dec. 2019 US$1=¥109.00 1 yuan = ¥16.00(Domestic 11months・Overseas 12 months)
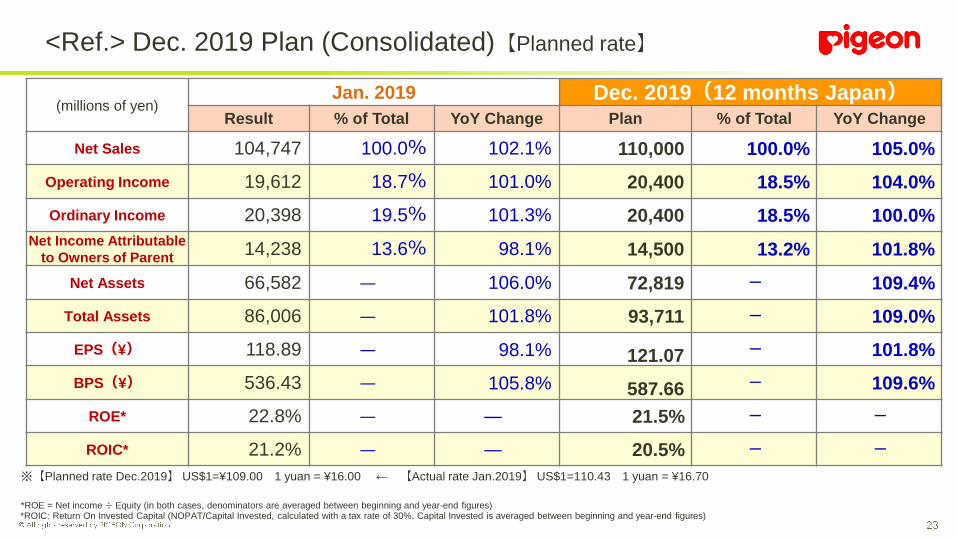
<Ref.> Dec. 2019 Plan (Consolidated)【Planned rate】
(millions of yen) Jan. 2019 Dec. 2019(12 months Japan)
Result % of Total YoY Change Plan % of Total YoY Change
Net Sales 104,747 100.0% 102.1% 110,000 100.0% 105.0%
Operating Income 19,612 18.7% 101.0% 20,400 18.5% 104.0%
Ordinary Income 20,398 19.5% 101.3% 20,400 18.5% 100.0%
Net Income Attributable
to Owners of Parent 14,238 13.6% 98.1% 14,500 13.2% 101.8%
Net Assets 66,582 ― 106.0% 72,819 - 109.4%
Total Assets 86,006 ― 101.8% 93,711 - 109.0%
EPS(¥) 118.89 ― 98.1% 121.07 - 101.8%
BPS(¥) 536.43 ― 105.8% 587.66 - 109.6%
ROE* 22.8% ― ― 21.5% - -
ROIC* 21.2% ― ― 20.5% - -
※【Planned rate Dec.2019】 US$1=¥109.00 1 yuan = ¥16.00 ← 【Actual rate Jan.2019】 US$1=110.43 1 yuan = ¥16.70
*ROE = Net income ÷ Equity (in both cases, denominators are averaged between beginning and year-end figures) *ROIC: Return On Invested Capital (NOPAT/Capital Invested, calculated with a tax rate of 30%, Capital Invested is averaged between beginning and year-end figures)
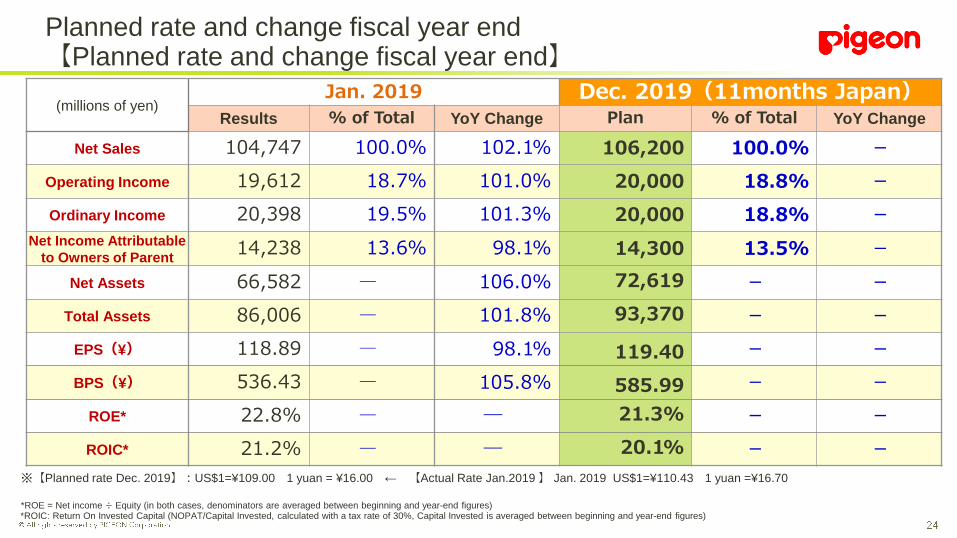
Planned rate and change fiscal year end 【Planned rate and change fiscal year end】
(millions of yen) Jan. 2019 Dec. 2019(11months Japan)
Results % of Total YoY Change Plan % of Total YoY Change
Net Sales 104,747 100.0% 102.1% 106,200 100.0% -
Operating Income 19,612 18.7% 101.0% 20,000 18.8% -
Ordinary Income 20,398 19.5% 101.3% 20,000 18.8% -
Net Income Attributable
to Owners of Parent 14,238 13.6% 98.1% 14,300 13.5% -
Net Assets 66,582 ― 106.0% 72,619 - -
Total Assets 86,006 ― 101.8% 93,370 - -
EPS(¥) 118.89 ― 98.1% 119.40 - -
BPS(¥) 536.43 ― 105.8% 585.99 - -
ROE* 22.8% ― ― 21.3% - -
ROIC* 21.2% ― ― 20.1% - -
※【Planned rate Dec. 2019】:US$1=¥109.00 1 yuan = ¥16.00 ← 【Actual Rate Jan.2019 】 Jan. 2019 US$1=¥110.43 1 yuan =¥16.70
*ROE = Net income ÷ Equity (in both cases, denominators are averaged between beginning and year-end figures) *ROIC: Return On Invested Capital (NOPAT/Capital Invested, calculated with a tax rate of 30%, Capital Invested is averaged between beginning and year-end figures)
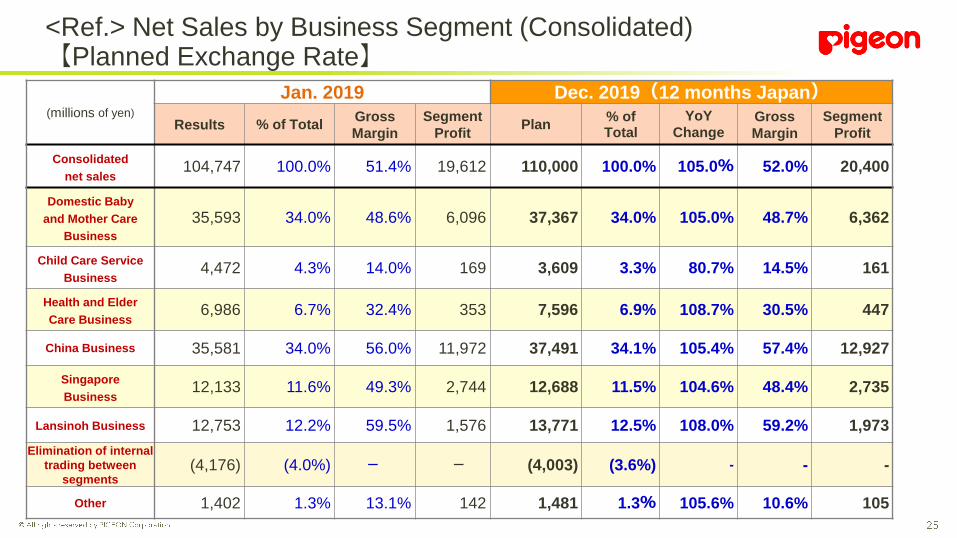
<Ref.> Net Sales by Business Segment (Consolidated) 【Planned Exchange Rate】
(millions of yen)
Jan. 2019 Dec. 2019(12 months Japan)
Results % of Total Gross
Margin
Segment
Profit Plan
% of Total
YoY
Change Gross
Margin
Segment
Profit
Consolidated
net sales 104,747 100.0% 51.4% 19,612 110,000 100.0% 105.0% 52.0% 20,400
Domestic Baby
and Mother Care
Business
35,593 34.0% 48.6% 6,096 37,367 34.0% 105.0% 48.7% 6,362
Child Care Service
Business 4,472 4.3% 14.0% 169 3,609 3.3% 80.7% 14.5% 161
Health and Elder
Care Business 6,986 6.7% 32.4% 353 7,596 6.9% 108.7% 30.5% 447
China Business 35,581 34.0% 56.0% 11,972 37,491 34.1% 105.4% 57.4% 12,927
Singapore
Business 12,133 11.6% 49.3% 2,744 12,688 11.5% 104.6% 48.4% 2,735
Lansinoh Business 12,753 12.2% 59.5% 1,576 13,771 12.5% 108.0% 59.2% 1,973
Elimination of internal
trading between
segments (4,176) (4.0%) - - (4,003) (3.6%) - - -
Other 1,402 1.3% 13.1% 142 1,481 1.3% 105.6% 10.6% 105
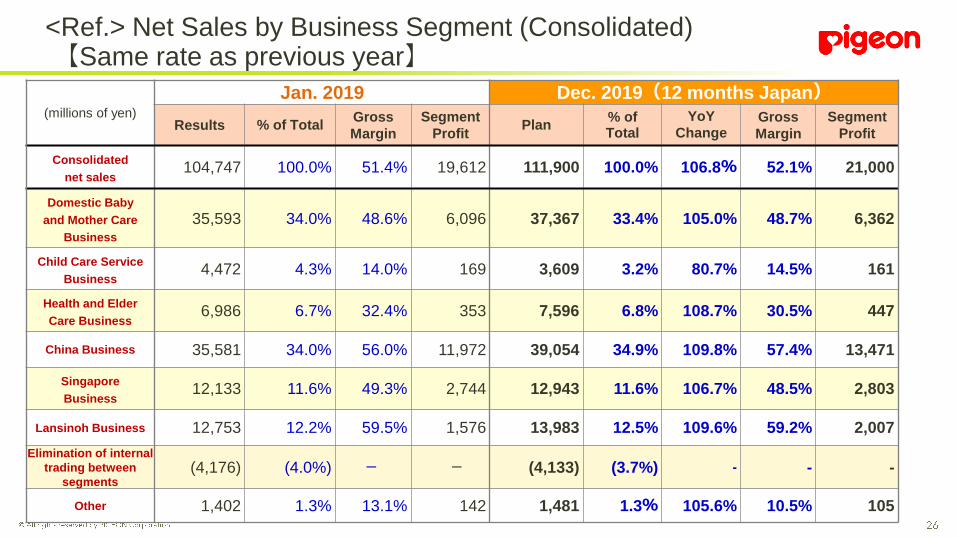
<Ref.> Net Sales by Business Segment (Consolidated) 【Same rate as previous year】
(millions of yen)
Jan. 2019 Dec. 2019(12 months Japan)
Results % of Total Gross
Margin
Segment
Profit Plan
% of Total
YoY
Change Gross
Margin
Segment
Profit
Consolidated
net sales 104,747 100.0% 51.4% 19,612 111,900 100.0% 106.8% 52.1% 21,000
Domestic Baby
and Mother Care
Business
35,593 34.0% 48.6% 6,096 37,367 33.4% 105.0% 48.7% 6,362
Child Care Service
Business 4,472 4.3% 14.0% 169 3,609 3.2% 80.7% 14.5% 161
Health and Elder
Care Business 6,986 6.7% 32.4% 353 7,596 6.8% 108.7% 30.5% 447
China Business 35,581 34.0% 56.0% 11,972 39,054 34.9% 109.8% 57.4% 13,471
Singapore
Business 12,133 11.6% 49.3% 2,744 12,943 11.6% 106.7% 48.5% 2,803
Lansinoh Business 12,753 12.2% 59.5% 1,576 13,983 12.5% 109.6% 59.2% 2,007
Elimination of internal
trading between
segments (4,176) (4.0%) - - (4,133) (3.7%) - - -
Other 1,402 1.3% 13.1% 142 1,481 1.3% 105.6% 10.5% 105

Net Sales by Business Segment (Consolidated) 【Planned rate and change fiscal year end】
(millions of yen)
Jan. 2019 Dec. 2019(11 months Japan)
Results % of Total Gross
Margin
Segment
Profit Plan
% of Total
YoY
Change Gross
Margin
Segment
Profit
Consolidated
net sales 104,747 100.0% 51.4% 19,612 106,200 100.0% - 52.1% 20,000
Domestic Baby and
Mother Care
Business
35,593 34.0% 48.6% 6,096 34,771 32.7% - 48.7% 5,944
Child Care Service
Business 4,472 4.3% 14.0% 169 3,312 3.1% - 14.3% 138
Health and Elder
Care Business 6,986 6.7% 32.4% 353 6,874 6.5% - 30.4% 375
China Business 35,581 34.0% 56.0% 11,972 37,491 35.3% - 56.9% 12,797
Singapore Business 12,133 11.6% 49.3% 2,744 12,656 11.9% - 47.9% 2,650
Lansinoh Business 12,753 12.2% 59.5% 1,576 13,771 13.0% - 59.2% 1,984
Elimination of internal
trading between
segments (4,176) (4.0%) - - (4,043) (3.8%) - - -
Other 1,402 1.3% 13.1% 142 1,368 1.3% - 10.7% 98
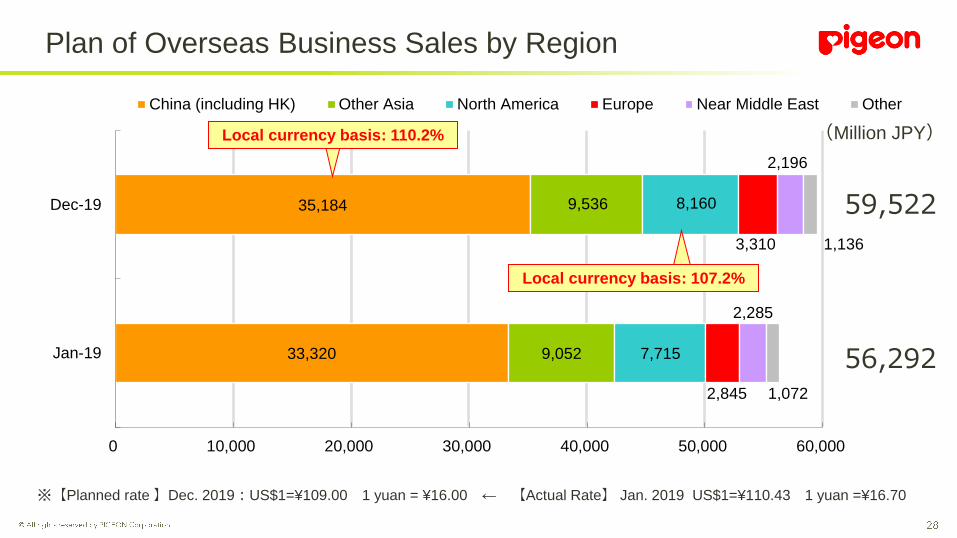
33,320
35,184
9,052
9,536
7,715
8,160
2,845
3,310
2,285
2,196
1,072
1,136
0 10,000 20,000 30,000 40,000 50,000 60,000
Jan-19
Dec-19
China (including HK) Other Asia North America Europe Near Middle East Other
Plan of Overseas Business Sales by Region
59,522
56,292
(Million JPY)
Local currency basis: 107.2%
Local currency basis: 110.2%
※【Planned rate 】Dec. 2019:US$1=¥109.00 1 yuan = ¥16.00 ← 【Actual Rate】 Jan. 2019 US$1=¥110.43 1 yuan =¥16.70
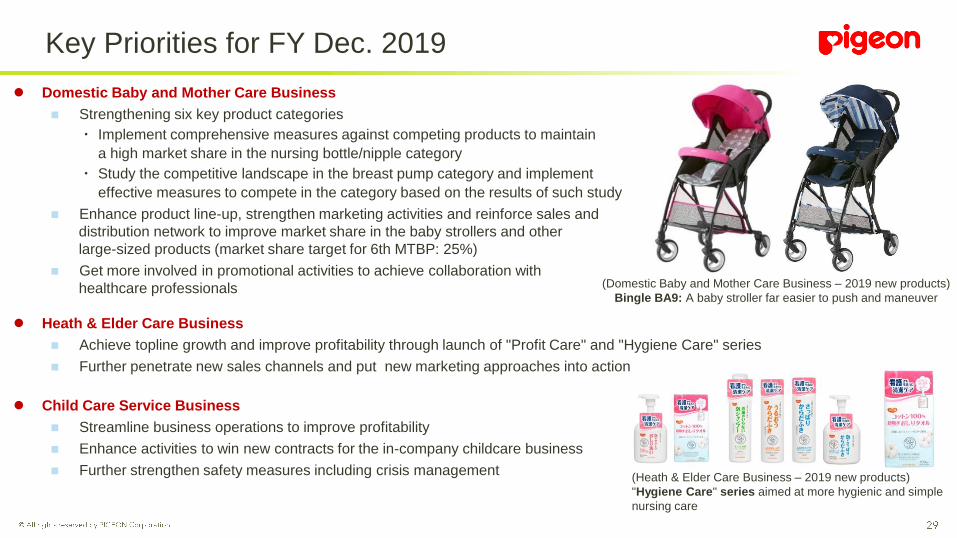
Key Priorities for FY Dec. 2019
Domestic Baby and Mother Care Business
Strengthening six key product categories
・ Implement comprehensive measures against competing products to maintain
a high market share in the nursing bottle/nipple category
・ Study the competitive landscape in the breast pump category and implement
effective measures to compete in the category based on the results of such study
Enhance product line-up, strengthen marketing activities and reinforce sales and
distribution network to improve market share in the baby strollers and other
large-sized products (market share target for 6th MTBP: 25%)
Get more involved in promotional activities to achieve collaboration with
healthcare professionals
Heath & Elder Care Business
Achieve topline growth and improve profitability through launch of "Profit Care" and "Hygiene Care" series
Further penetrate new sales channels and put new marketing approaches into action
Child Care Service Business
Streamline business operations to improve profitability
Enhance activities to win new contracts for the in-company childcare business
Further strengthen safety measures including crisis management
(Domestic Baby and Mother Care Business – 2019 new products)
Bingle BA9: A baby stroller far easier to push and maneuver
(Heath & Elder Care Business – 2019 new products)
"Hygiene Care" series aimed at more hygienic and simple
nursing care

Key Priorities for FY Dec. 2019
China Business
Initiatives towards double-digit growth (local currency basis)
Launch new products in key product categories: Release 63 SKUs of new products in 2019
Conduct intensive sales promotion activities at EC events.
Show 3D images of products on smartphone displays to let customers feel more convinced
when selecting products.
Singapore Business
Singapore: Reinforce development organizational structure to enhance products
for middle-class consumers.
Singapore: Further strengthen brand power through digital marketing.
India: Achieve topline growth through improvement in brand recognition, strengthening
of local product development structure and other measures.
Indonesia: Achieve double-digit topline growth and further improve production functions.
Study feasibility of entering new markets including countries in Africa to achieve growth
for the next MTBP period and beyond.
Lansinoh Business
New product development: Strengthen development structure and innovate core breastfeeding products.
Create new values and expand business through collaboration with outside parties.
Enter new markets including countries in Europe, Asia and Africa.
Expand new channels including EC and DME.
<China>
Strengthening branding activities
<India>
TV commercial for improving brand
recognition
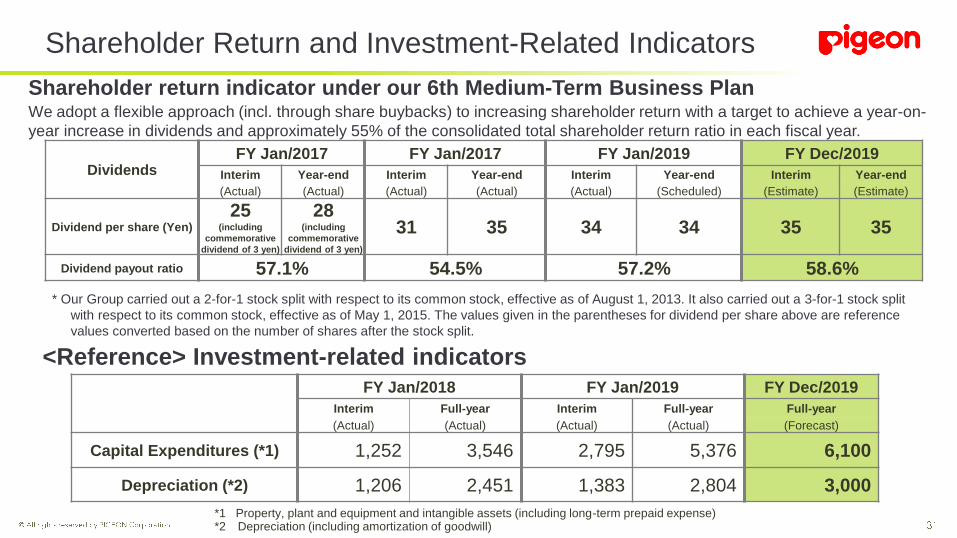
Shareholder Return and Investment-Related Indicators
Shareholder return indicator under our 6th Medium-Term Business Plan We adopt a flexible approach (incl. through share buybacks) to increasing shareholder return with a target to achieve a year-on-
year increase in dividends and approximately 55% of the consolidated total shareholder return ratio in each fiscal year.
<Reference> Investment-related indicators
Dividends FY Jan/2017 FY Jan/2017 FY Jan/2019 FY Dec/2019
Interim Year-end Interim Year-end Interim Year-end Interim Year-end
(Actual) (Actual) (Actual) (Actual) (Actual) (Scheduled) (Estimate) (Estimate)
Dividend per share (Yen)
25 (including
commemorative
dividend of 3 yen)
28 (including
commemorative
dividend of 3 yen)
31 35 34 34 35 35
Dividend payout ratio 57.1% 54.5% 57.2% 58.6%
FY Jan/2018 FY Jan/2019 FY Dec/2019
Interim Full-year Interim Full-year Full-year
(Actual) (Actual) (Actual) (Actual) (Forecast)
Capital Expenditures (*1) 1,252 3,546 2,795 5,376 6,100
Depreciation (*2) 1,206 2,451 1,383 2,804 3,000
* Our Group carried out a 2-for-1 stock split with respect to its common stock, effective as of August 1, 2013. It also carried out a 3-for-1 stock split
with respect to its common stock, effective as of May 1, 2015. The values given in the parentheses for dividend per share above are reference
values converted based on the number of shares after the stock split.
*1 Property, plant and equipment and intangible assets (including long-term prepaid expense) *2 Depreciation (including amortization of goodwill)
Approach to Enhance Corporate Value
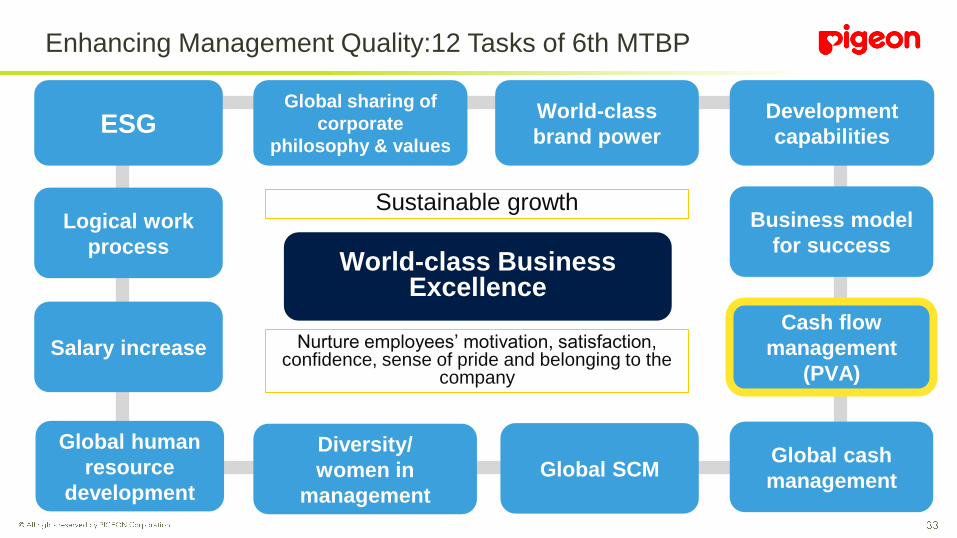
Enhancing Management Quality:12 Tasks of 6th MTBP
Nurture employees’ motivation, satisfaction, confidence, sense of pride and belonging to the
company
Sustainable growth
World-class Business Excellence
Logical work
process
Global sharing of
corporate
philosophy & values
Development
capabilities
Salary increase
Global human
resource
development
Diversity/
women in
management
Business model
for success
Cash flow
management
(PVA)
Global SCM Global cash
management
World-class
brand power ESG
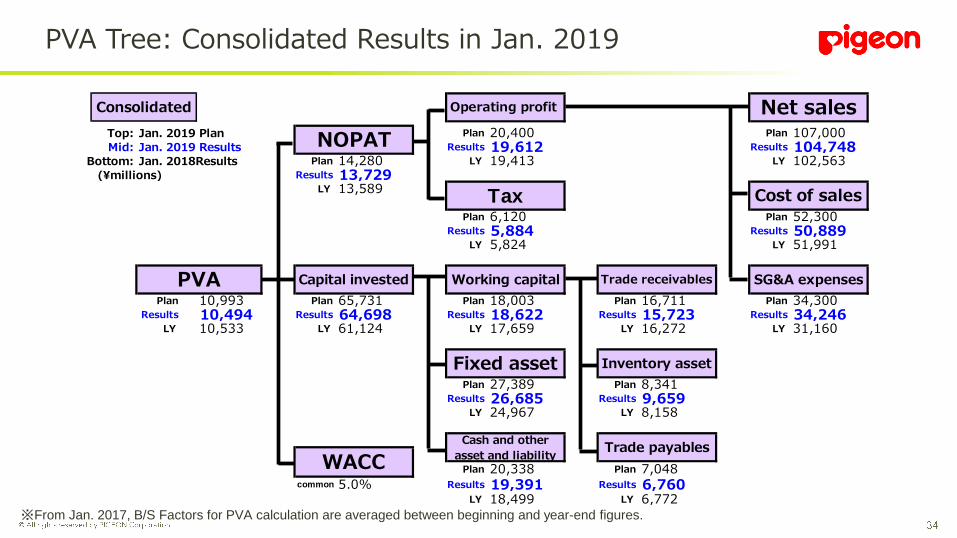
Top: Jan. 2019 Plan Plan 20,400 Plan 107,000Mid: Jan. 2019 Results Results 19,612 Results 104,748
Bottom: Jan. 2018Results Plan 14,280 LY 19,413 LY 102,563 (\millions) Results 13,729
LY 13,589
Plan 6,120 Plan 52,300Results 5,884 Results 50,889
LY 5,824 LY 51,991
Plan 10,993 Plan 65,731 Plan 18,003 Plan 16,711 Plan 34,300Results 10,494 Results 64,698 Results 18,622 Results 15,723 Results 34,246
LY 10,533 LY 61,124 LY 17,659 LY 16,272 LY 31,160
(参考)
Plan 27,389 Plan 8,341Results 26,685 Results 9,659 見込 0
LY 24,967 LY 8,158 前期 0
Plan 20,338 Plan 7,048 見込 0common 5.0% Results 19,391 Results 6,760 前期 0
LY 18,499 LY 6,772
Cash and other
asset and liabilityTrade payables 発送費
WACC
PVA Capital invested Working capital Trade receivables SG&A expenses
Fixed asset Inventory asset研究開発費
Consolidated Operating profit Net sales
NOPAT
Tax Cost of sales
PVA Tree: Consolidated Results in Jan. 2019
※From Jan. 2017, B/S Factors for PVA calculation are averaged between beginning and year-end figures.
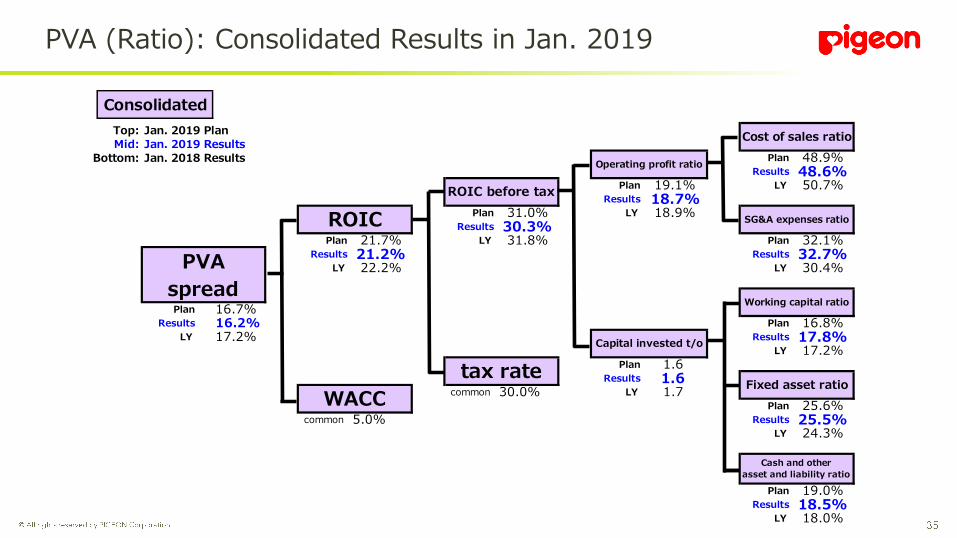
PVA (Ratio): Consolidated Results in Jan. 2019
Top: Jan. 2019 Plan
Mid: Jan. 2019 Results
Bottom: Jan. 2018 Results Plan 48.9%Results 48.6%
Plan 19.1% LY 50.7%Results 18.7%
Plan 31.0% LY 18.9%Results 30.3%
Plan 21.7% LY 31.8% Plan 32.1%Results 21.2% Results 32.7%
LY 22.2% LY 30.4%
Plan 16.7%Results 16.2% Plan 16.8%
LY 17.2% Results 17.8%LY 17.2%
Plan 1.6Results 1.6
common 30.0% LY 1.7Plan 25.6%
common 5.0% Results 25.5%LY 24.3%
Plan 19.0%Results 18.5%
LY 18.0%
Fixed asset ratio
Cash and other
asset and liability ratio
WACC
Capital invested t/o
tax rate
Operating profit ratio
Cost of sales ratio
SG&A expenses ratio
Consolidated
PVA
spread
ROIC
ROIC before tax
Working capital ratio
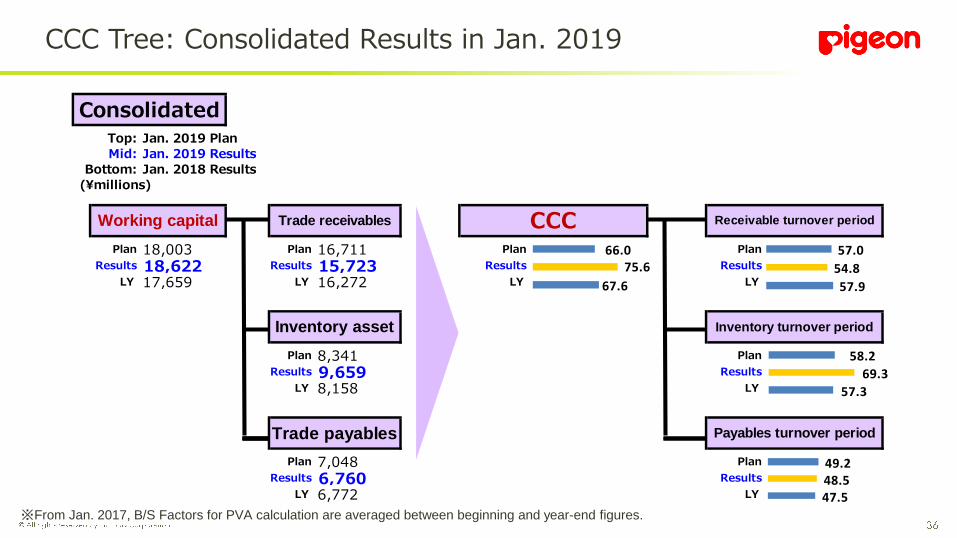
CCC Tree: Consolidated Results in Jan. 2019
Top: Jan. 2019 Plan
Mid: Jan. 2019 Results
Bottom: Jan. 2018 Results
(\millions)
Plan 18,003 Plan 16,711 Plan Plan
Results 18,622 Results 15,723 Results Results
LY 17,659 LY 16,272 LY LY
Plan 8,341 Plan
Results 9,659 Results
LY 8,158 LY
Plan 7,048 Plan
Results 6,760 Results
LY 6,772 LY
Trade payables
Receivable turnover period
Inventory turnover period
Payables turnover period
Consolidated
Working capital Trade receivables CCC
Inventory asset
67.6
75.666.0
57.9
54.8
57.0
57.3
69.3
58.2
47.548.549.2
※From Jan. 2017, B/S Factors for PVA calculation are averaged between beginning and year-end figures.

Appendix

Sharing what it takes
for us to grow in the future

※SCM: Supply Chain Management
Nurture employees’ motivation, satisfaction, confidence, sense of pride and belonging to the
company
Sustainable growth
World-class Business Excellence
Logical work
process
Global sharing of
corporate
philosophy & values
Development
capabilities
Salary increase
Global human
resource
development
Diversity/
women in
management
Business model
for success
Cash flow
management
(PVA)
Global SCM Global cash
management
World-class
brand power ESG
6th Medium-term Business Plan: 12 tasks
From our public notice on January 15 2019
1. Overview of Organizational Changes
To bolster enterprise value, the Pigeon Group has established a global head office (GHO), to
integrate head-office functions Group-wide. Under this framework, the Group is working
continually to concentrate and strengthen those functions. In addition, the Group is dividing its
segments responsible for operations and growth into four businesses, mostly by region: The
Japan Business (Domestic Baby & Mother Care Business, Health & Elder Care Business,
Child Care Service Business), China Business, Singapore Business and Lansinoh Business.
With these clearly defined roles and responsibilities, these four businesses maintain liaison
with GHO to pursue continuous, long-term growth.
The point is…
What I would like to achieve under the new organization structure
41
In accordance with a growth scenario of the Pigeon Group
formulated by GHO from a “total optimization” perspective,
we will preferentially invest our management resources to
make the scenario a reality. In line with the basic strategy,
four profit-earning business divisions (namely, Japan, China,
Singapore, and Lansinoh) agilely address changes in
environment with autonomous leadership to continue
enhancing profitability of the Group as a whole, thus making
Pigeon a great place to work with higher employee morale
and higher corporate value.
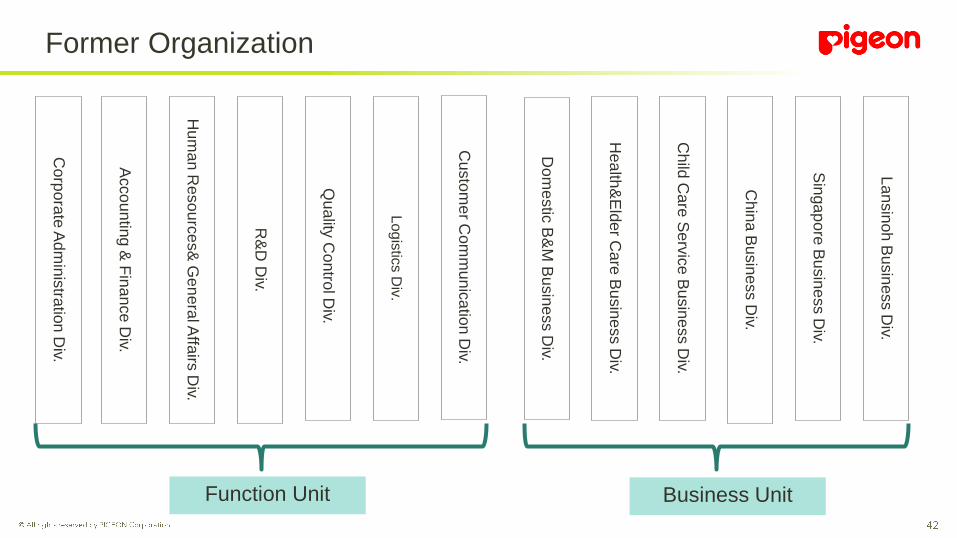
Former Organization
Corp
ora
te A
dm
inis
tratio
n D
iv.
Acco
un
ting &
Fin
an
ce
Div.
Hum
an
Reso
urc
es&
Ge
ne
ral A
ffairs
Div.
R&
D D
iv.
Dom
estic
B&
M B
usin
ess D
iv.
He
alth
&E
lder C
are
Bu
sin
ess D
iv.
Sin
ga
po
re B
usin
ess D
iv.
Chin
a B
usin
ess D
iv.
Child
Care
Se
rvic
e B
usin
ess D
iv.
Log
istic
s D
iv.
Qu
ality
Co
ntro
l Div.
La
nsin
oh B
usin
ess D
iv.
Custo
me
r Com
mu
nic
atio
n D
iv. Business Unit Function Unit
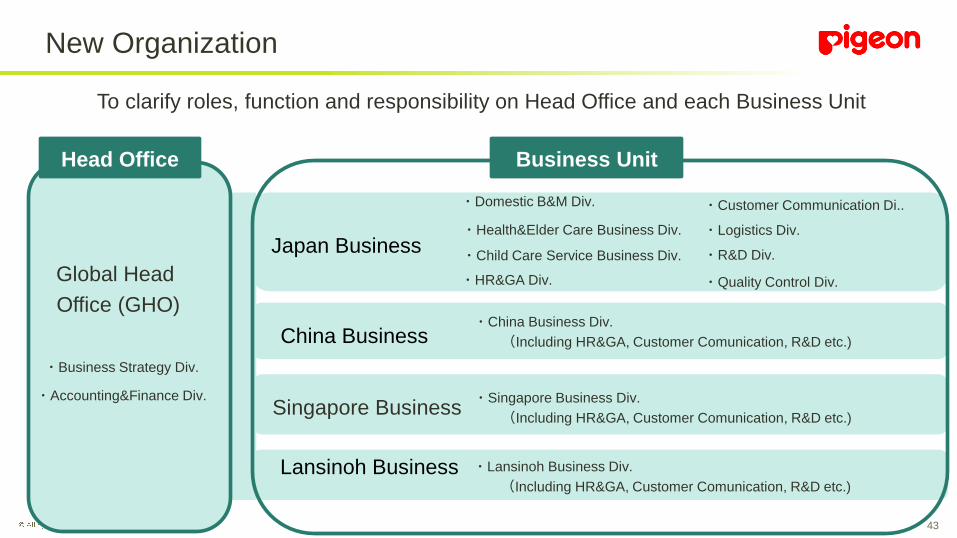
New Organization
43
Head Office
Japan Business
China Business
Singapore Business
Lansinoh Business
To clarify roles, function and responsibility on Head Office and each Business Unit
・Business Strategy Div.
・Accounting&Finance Div.
・HR&GA Div.
・R&D Div.
・Domestic B&M Div.
・Health&Elder Care Business Div.
・Child Care Service Business Div.
・Logistics Div.
・Quality Control Div.
・Customer Communication Di..
Global Head
Office (GHO) ・China Business Div.
(Including HR&GA, Customer Comunication, R&D etc.)
・Singapore Business Div.
(Including HR&GA, Customer Comunication, R&D etc.)
・Lansinoh Business Div.
(Including HR&GA, Customer Comunication, R&D etc.)
Business Unit
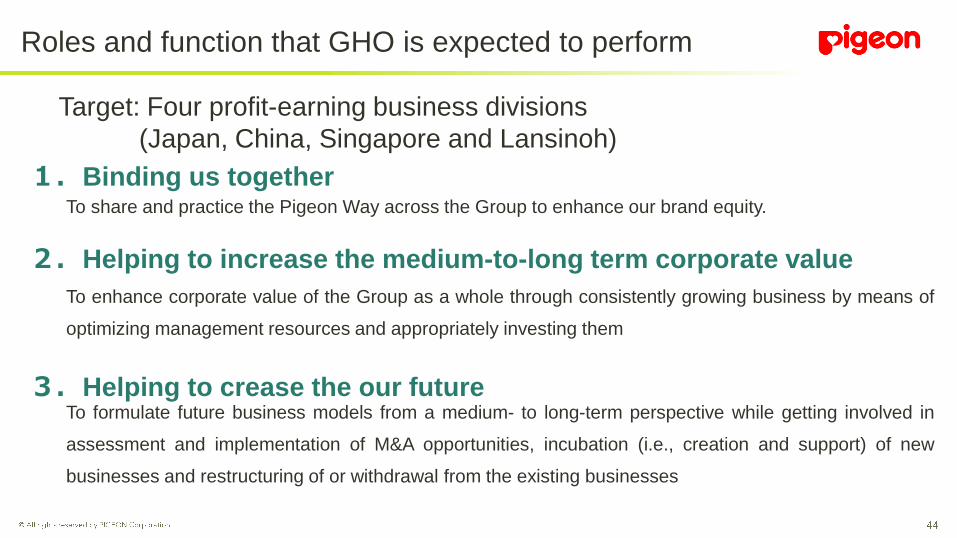
Roles and function that GHO is expected to perform
Target: Four profit-earning business divisions
(Japan, China, Singapore and Lansinoh) 1.Binding us together To share and practice the Pigeon Way across the Group to enhance our brand equity.
2.Helping to increase the medium-to-long term corporate value
To enhance corporate value of the Group as a whole through consistently growing business by means of
optimizing management resources and appropriately investing them
3.Helping to crease the our future To formulate future business models from a medium- to long-term perspective while getting involved in
assessment and implementation of M&A opportunities, incubation (i.e., creation and support) of new
businesses and restructuring of or withdrawal from the existing businesses
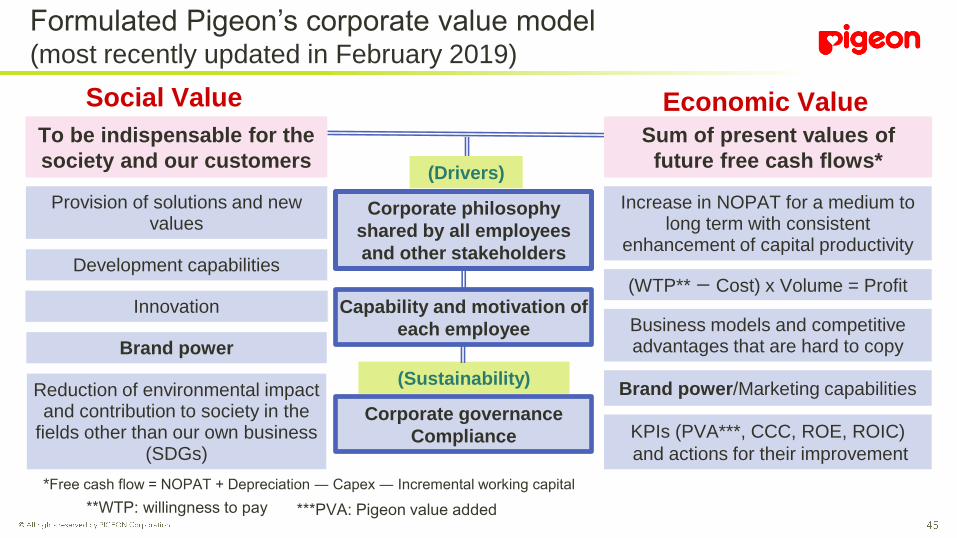
Formulated Pigeon’s corporate value model (most recently updated in February 2019)
**WTP: willingness to pay ***PVA: Pigeon value added
Capability and motivation of
each employee
Corporate philosophy
shared by all employees
and other stakeholders
(Drivers)
*Free cash flow = NOPAT + Depreciation ― Capex ― Incremental working capital
Corporate governance
Compliance
(Sustainability)
To be indispensable for the
society and our customers
Social Value
Provision of solutions and new values
Development capabilities
Reduction of environmental impact and contribution to society in the
fields other than our own business (SDGs)
Brand power
Innovation
Economic Value
Sum of present values of
future free cash flows*
Increase in NOPAT for a medium to long term with consistent
enhancement of capital productivity
Business models and competitive advantages that are hard to copy
KPIs (PVA***, CCC, ROE, ROIC)
and actions for their improvement
Brand power/Marketing capabilities
(WTP** ー Cost) x Volume = Profit
Corporate Overview
Disclaimer on Forward-Looking Statements This material includes certain forward-looking statements about the Pigeon Group. To the extent that statements in this material do not related to historical or current facts, they constitute forward-looking statements. These forward-looking statements are based on the current assumptions and judgments of the Pigeon Group in light of the information currently available to it, and involve know and unknown risks, uncertainties and other factors, which may affect the statements made in this material.
Head Office
4-4, Nihonbashi-Hisamatsucho, Chuo-ku, Tokyo
103-8480, Japan
URL http://www.pigeon.co.jp/
http://www.pigeon.com/